UNITED STATES
SECURITIES AND EXCHANGE COMMISSION
Washington, D.C. 20549
FORM N-CSR
CERTIFIED SHAREHOLDER REPORT OF REGISTERED
MANAGEMENT INVESTMENT COMPANIES
Investment Company Act file number 811-3114
Fidelity Select Portfolios
(Exact name of registrant as specified in charter)
82 Devonshire St., Boston, Massachusetts 02109
(Address of principal executive offices) (Zip code)
Scott C. Goebel, Secretary
82 Devonshire St.
Boston, Massachusetts 02109
(Name and address of agent for service)
Registrant's telephone number, including area code: 617-563-7000
Date of fiscal year end: | February 28 |
| |
Date of reporting period: | August 31, 2012 |
Item 1. Reports to Stockholders
Fidelity®
Select Portfolios®
Industrials Sector
Air Transportation Portfolio
Defense and Aerospace Portfolio
Environment and Alternative Energy Portfolio
Industrial Equipment Portfolio
Industrials Portfolio
Transportation Portfolio
Semiannual Report
August 31, 2012
(Fidelity Cover Art)
Contents
To view a fund's proxy voting guidelines and proxy voting record for the 12-month period ended June 30, visit http://www.fidelity.com/proxyvotingresults or visit the Securities and Exchange Commission's (SEC) web site at http://www.sec.gov. You may also call 1-800-544-8544 to request a free copy of the proxy voting guidelines.
Standard & Poor's, S&P and S&P 500 are registered service marks of The McGraw-Hill Companies, Inc. and have been licensed for use by Fidelity Distributors Corporation.
Other third party marks appearing herein are the property of their respective owners.
All other marks appearing herein are registered or unregistered trademarks or service marks of FMR LLC or an affiliated company. © 2012 FMR LLC. All rights reserved.
This report and the financial statements contained herein are submitted for the general information of the shareholders of the funds. This report is not authorized for distribution to prospective investors in the funds unless preceded or accompanied by an effective prospectus.
A fund files its complete schedule of portfolio holdings with the SEC for the first and third quarters of each fiscal year on Form N-Q. Forms N-Q are available on the SEC's web site at http://www.sec.gov. A fund's Forms N-Q may be reviewed and copied at the SEC's Public Reference Room in Washington, DC. Information regarding the operation of the SEC's Public Reference Room may be obtained by calling 1-800-SEC-0330. For a complete list of a fund's portfolio holdings, view the most recent holdings listing, semiannual report, or annual report on Fidelity's web site at http://www.fidelity.com, http://www.advisor.fidelity.com, or http://www.401k.com, as applicable.
NOT FDIC INSURED • MAY LOSE VALUE • NO BANK GUARANTEE
Neither the funds nor Fidelity Distributors Corporation is a bank.
Semiannual Report
As a shareholder of a Fund, you incur two types of costs: (1) transaction costs, including redemption fees and (2) ongoing costs, including management fees and other Fund expenses. This Example is intended to help you understand your ongoing costs (in dollars) of investing in the Funds and to compare these costs with the ongoing costs of investing in other mutual funds.
The Example is based on an investment of $1,000 invested at the beginning of the period and held for the entire period (March 1, 2012 to August 31, 2012).
Actual Expenses
The first line of the accompanying table for each fund provides information about actual account values and actual expenses. You may use the information in this line, together with the amount you invested, to estimate the expenses that you paid over the period. Simply divide your account value by $1,000.00 (for example, an $8,600 account value divided by $1,000.00 = 8.6), then multiply the result by the number in the first line for a fund under the heading entitled "Expenses Paid During Period" to estimate the expenses you paid on your account during this period. A small balance maintenance fee of $12.00 that is charged once a year may apply for certain accounts with a value of less than $2,000. This fee is not included in the table below. If it was, the estimate of expenses you paid during the period would be higher, and your ending account value lower, by this amount. In addition, each Fund, as a shareholder in the underlying Fidelity Central Funds, will indirectly bear its pro-rata share of the fees and expenses incurred by the underlying Fidelity Central Funds. These fees and expenses are not included in the Fund's annualized expense ratio used to calculate the expense estimate in the table below.
Hypothetical Example for Comparison Purposes
The second line of the accompanying table for each fund provides information about hypothetical account values and hypothetical expenses based on a fund's actual expense ratio and an assumed rate of return of 5% per year before expenses, which is not the Fund's actual return. The hypothetical account values and expenses may not be used to estimate the actual ending account balance or expenses you paid for the period. You may use this information to compare the ongoing costs of investing in the Fund and other funds. To do so, compare this 5% hypothetical example with the 5% hypothetical examples that appear in the shareholder reports of the other funds. A small balance maintenance fee of $12.00 that is charged once a year may apply for certain accounts with a value of less than $2,000. This fee is not included in the table below. If it was, the estimate of expenses you paid during the period would be higher, and your ending account value lower, by this amount. In addition, each Fund, as a shareholder in the underlying Fidelity Central Funds, will indirectly bear its pro-rata share of the fees and expenses incurred by the underlying Fidelity Central Funds. These fees and expenses are not included in the Fund's annualized expense ratio used to calculate the expense estimate in the table below.
Please note that the expenses shown in the table are meant to highlight your ongoing costs only and do not reflect any transaction costs. Therefore, the second line of the table is useful in comparing ongoing costs only, and will not help you determine the relative total costs of owning different funds. In addition, if these transactional costs were included, your costs would have been higher.
| Annualized Expense Ratio | Beginning
Account Value
March 1, 2012 | Ending
Account Value
August 31, 2012 | Expenses Paid
During Period*
March 1, 2012 to August 31, 2012 |
Air Transportation Portfolio | .96% | | | |
Actual | | $ 1,000.00 | $ 964.60 | $ 4.75 |
HypotheticalA | | $ 1,000.00 | $ 1,020.37 | $ 4.89 |
Defense and Aerospace Portfolio | .85% | | | |
Actual | | $ 1,000.00 | $ 963.30 | $ 4.21 |
HypotheticalA | | $ 1,000.00 | $ 1,020.92 | $ 4.33 |
Environment and Alternative Energy Portfolio | 1.00% | | | |
Actual | | $ 1,000.00 | $ 970.70 | $ 4.97 |
HypotheticalA | | $ 1,000.00 | $ 1,020.16 | $ 5.09 |
Industrial Equipment Portfolio | .83% | | | |
Actual | | $ 1,000.00 | $ 963.60 | $ 4.11 |
HypotheticalA | | $ 1,000.00 | $ 1,021.02 | $ 4.23 |
Industrials Portfolio | .85% | | | |
Actual | | $ 1,000.00 | $ 989.30 | $ 4.26 |
HypotheticalA | | $ 1,000.00 | $ 1,020.92 | $ 4.33 |
Transportation Portfolio | .90% | | | |
Actual | | $ 1,000.00 | $ 973.40 | $ 4.48 |
HypotheticalA | | $ 1,000.00 | $ 1,020.67 | $ 4.58 |
A 5% return per year before expenses
* Expenses are equal to each Fund's annualized expense ratio, multiplied by the average account value over the period, multiplied by 184/365 (to reflect the one-half year period).
Semiannual Report
Air Transportation Portfolio
Investment Changes (Unaudited)
Top Ten Stocks as of August 31, 2012 |
| % of fund's
net assets | % of fund's net assets
6 months ago |
United Parcel Service, Inc. Class B | 12.6 | 14.6 |
FedEx Corp. | 6.6 | 6.9 |
Textron, Inc. | 5.9 | 7.6 |
The Boeing Co. | 5.6 | 5.0 |
Rockwell Collins, Inc. | 5.3 | 7.8 |
Precision Castparts Corp. | 4.8 | 4.6 |
Southwest Airlines Co. | 4.7 | 4.4 |
Delta Air Lines, Inc. | 4.2 | 4.0 |
WestJet Airlines Ltd. | 4.0 | 1.2 |
Ryanair Holdings PLC sponsored ADR | 4.0 | 4.9 |
| 57.7 | |
Top Industries (% of fund's net assets) |
As of August 31, 2012 |
 | Air Freight & Logistics | 32.4% | |
 | Airlines | 31.3% | |
 | Aerospace & Defense | 26.1% | |
 | Road & Rail | 0.5% | |
 | Transportation Infrastructure | 0.5% | |
 | All Others* | 9.2% | |

As of February 29, 2012 |
| Aerospace & Defense | 34.9% | |
| Air Freight & Logistics | 31.7% | |
| Airlines | 27.5% | |
| Transportation Infrastructure | 1.3% | |
| Road & Rail | 1.0% | |
| All Others* | 3.6% | |

* Includes short-term investments and net other assets. |
Semiannual Report
Air Transportation Portfolio
Investments August 31, 2012 (Unaudited)
Showing Percentage of Net Assets
Common Stocks - 91.7% |
| Shares | | Value |
AEROSPACE & DEFENSE - 26.1% |
Aerospace & Defense - 26.1% |
Bombardier, Inc. Class B (sub. vtg.) | 205,300 | | $ 728,937 |
Ducommun, Inc. (a) | 12,400 | | 182,032 |
Embraer SA sponsored ADR | 19,300 | | 520,135 |
Meggitt PLC | 50,945 | | 319,689 |
Precision Castparts Corp. | 19,000 | | 3,060,520 |
Rockwell Collins, Inc. | 68,900 | | 3,367,143 |
Textron, Inc. | 139,800 | | 3,735,456 |
The Boeing Co. | 50,500 | | 3,605,700 |
TransDigm Group, Inc. (a) | 2,200 | | 304,964 |
United Technologies Corp. | 10,500 | | 838,425 |
| | 16,663,001 |
AIR FREIGHT & LOGISTICS - 32.4% |
Air Freight & Logistics - 32.4% |
Air Transport Services Group, Inc. (a) | 66,200 | | 307,830 |
C.H. Robinson Worldwide, Inc. | 33,800 | | 1,913,418 |
Expeditors International of Washington, Inc. | 58,200 | | 2,130,702 |
FedEx Corp. | 48,400 | | 4,241,292 |
Forward Air Corp. | 43,400 | | 1,459,108 |
Hub Group, Inc. Class A (a) | 5,900 | | 177,590 |
Kintetsu World Express, Inc. | 3,100 | | 96,979 |
Pacer International, Inc. (a) | 137,100 | | 562,110 |
United Parcel Service, Inc. Class B | 108,900 | | 8,037,910 |
UTI Worldwide, Inc. | 126,300 | | 1,734,099 |
| | 20,661,038 |
AIRLINES - 31.3% |
Airlines - 31.3% |
Alaska Air Group, Inc. (a) | 64,200 | | 2,153,910 |
Allegiant Travel Co. (a) | 15,300 | | 1,013,472 |
Copa Holdings SA Class A | 6,600 | | 512,358 |
Dart Group PLC | 460,586 | | 539,364 |
Delta Air Lines, Inc. (a) | 312,002 | | 2,698,817 |
JetBlue Airways Corp. (a)(d) | 154,200 | | 755,580 |
Ryanair Holdings PLC sponsored ADR (a) | 81,500 | | 2,529,760 |
SkyWest, Inc. | 120,300 | | 1,055,031 |
Southwest Airlines Co. | 333,200 | | 2,978,808 |
Spirit Airlines, Inc. (a) | 4,600 | | 89,930 |
United Continental Holdings, Inc. (a) | 112,585 | | 2,077,193 |
US Airways Group, Inc. (a) | 94,700 | | 1,009,502 |
WestJet Airlines Ltd. | 147,600 | | 2,552,960 |
| | 19,966,685 |
|
| Shares | | Value |
INDUSTRIAL CONGLOMERATES - 0.3% |
Industrial Conglomerates - 0.3% |
General Electric Co. | 7,700 | | $ 159,467 |
MACHINERY - 0.4% |
Construction & Farm Machinery & Heavy Trucks - 0.4% |
ASL Marine Holdings Ltd. | 577,000 | | 280,052 |
MEDIA - 0.2% |
Movies & Entertainment - 0.2% |
Advanced Inflight Alliance AG | 26,100 | | 134,597 |
ROAD & RAIL - 0.5% |
Trucking - 0.5% |
Tegma Gestao Logistica SA | 20,900 | | 329,474 |
TRANSPORTATION INFRASTRUCTURE - 0.5% |
Airport Services - 0.5% |
Wesco Aircraft Holdings, Inc. (a) | 23,100 | | 322,014 |
TOTAL COMMON STOCKS (Cost $50,251,361) |
58,516,328
|
Money Market Funds - 8.3% |
| | | |
Fidelity Cash Central Fund, 0.17% (b) | 5,191,099 | | 5,191,099 |
Fidelity Securities Lending Cash Central Fund, 0.18% (b)(c) | 118,650 | | 118,650 |
TOTAL MONEY MARKET FUNDS (Cost $5,309,749) |
5,309,749
|
TOTAL INVESTMENT PORTFOLIO - 100.0% (Cost $55,561,110) | 63,826,077 |
NET OTHER ASSETS (LIABILITIES) - 0.0% | | 456 |
NET ASSETS - 100% | $ 63,826,533 |
Legend |
(a) Non-income producing |
(b) Affiliated fund that is available only to investment companies and other accounts managed by Fidelity Investments. The rate quoted is the annualized seven-day yield of the fund at period end. A complete unaudited listing of the fund's holdings as of its most recent quarter end is available upon request. In addition, each Fidelity Central Fund's financial statements are available on the SEC's website or upon request. |
(c) Investment made with cash collateral received from securities on loan. |
(d) Security or a portion of the security is on loan at period end. |
Affiliated Central Funds |
Information regarding fiscal year to date income earned by the Fund from investments in Fidelity Central Funds is as follows: |
Fund | Income earned |
Fidelity Cash Central Fund | $ 3,237 |
Fidelity Securities Lending Cash Central Fund | 2,055 |
Total | $ 5,292 |
Other Information |
The following is a summary of the inputs used, as of August 31, 2012, involving the Fund's assets and liabilities carried at fair value. The inputs or methodology used for valuing securities may not be an indication of the risk associated with investing in those securities. For more information on valuation inputs, and their aggregation into the levels used in the table below, please refer to the Security Valuation section in the accompanying Notes to Financial Statements. |
Valuation Inputs at Reporting Date: |
Description | Total | Level 1 | Level 2 | Level 3 |
Investments in Securities: | | | | |
Common Stocks | $ 58,516,328 | $ 58,419,349 | $ 96,979 | $ - |
Money Market Funds | 5,309,749 | 5,309,749 | - | - |
Total Investments in Securities: | $ 63,826,077 | $ 63,729,098 | $ 96,979 | $ - |
Distribution of investments by country or territory of incorporation, as a percentage of total net assets, is as follows. (Unaudited) |
United States of America | 84.0% |
Canada | 5.1% |
Ireland | 4.0% |
British Virgin Islands | 2.7% |
United Kingdom | 1.3% |
Brazil | 1.3% |
Others (Individually Less Than 1%) | 1.6% |
| 100.0% |
See accompanying notes which are an integral part of the financial statements.
Semiannual Report
Air Transportation Portfolio
Statement of Assets and Liabilities
| August 31, 2012 (Unaudited) |
| | |
Assets | | |
Investment in securities, at value (including securities loaned of $110,740) - See accompanying schedule: Unaffiliated issuers (cost $50,251,361) | $ 58,516,328 | |
Fidelity Central Funds (cost $5,309,749) | 5,309,749 | |
Total Investments (cost $55,561,110) | | $ 63,826,077 |
Cash | | 34,511 |
Receivable for fund shares sold | | 212,623 |
Dividends receivable | | 121,915 |
Distributions receivable from Fidelity Central Funds | | 810 |
Other receivables | | 125 |
Total assets | | 64,196,061 |
| | |
Liabilities | | |
Payable for fund shares redeemed | $ 184,985 | |
Accrued management fee | 30,145 | |
Other affiliated payables | 16,189 | |
Other payables and accrued expenses | 19,559 | |
Collateral on securities loaned, at value | 118,650 | |
Total liabilities | | 369,528 |
| | |
Net Assets | | $ 63,826,533 |
Net Assets consist of: | | |
Paid in capital | | $ 54,555,901 |
Undistributed net investment income | | 64,604 |
Accumulated undistributed net realized gain (loss) on investments and foreign currency transactions | | 941,025 |
Net unrealized appreciation (depreciation) on investments and assets and liabilities in foreign currencies | | 8,265,003 |
Net Assets, for 1,735,729 shares outstanding | | $ 63,826,533 |
Net Asset Value, offering price and redemption price per share ($63,826,533 ÷ 1,735,729 shares) | | $ 36.77 |
Statement of Operations
Six months ended August 31, 2012 (Unaudited) |
| | |
Investment Income | | |
Dividends | | $ 387,812 |
Interest | | 42 |
Income from Fidelity Central Funds (including $2,055 from security lending) | | 5,292 |
Total income | | 393,146 |
| | |
Expenses | | |
Management fee | $ 190,565 | |
Transfer agent fees | 87,223 | |
Accounting and security lending fees | 13,436 | |
Custodian fees and expenses | 3,975 | |
Independent trustees' compensation | 236 | |
Registration fees | 15,912 | |
Audit | 17,222 | |
Legal | 135 | |
Miscellaneous | 270 | |
Total expenses before reductions | 328,974 | |
Expense reductions | (432) | 328,542 |
Net investment income (loss) | | 64,604 |
Realized and Unrealized Gain (Loss) Net realized gain (loss) on: | | |
Investment securities: | | |
Unaffiliated issuers | 1,676,429 | |
Foreign currency transactions | (1,461) | |
Total net realized gain (loss) | | 1,674,968 |
Change in net unrealized appreciation (depreciation) on: Investment securities | (4,244,349) | |
Assets and liabilities in foreign currencies | 36 | |
Total change in net unrealized appreciation (depreciation) | | (4,244,313) |
Net gain (loss) | | (2,569,345) |
Net increase (decrease) in net assets resulting from operations | | $ (2,504,741) |
See accompanying notes which are an integral part of the financial statements.
Semiannual Report
Statement of Changes in Net Assets
| Six months ended August 31, 2012 (Unaudited) | Year ended
February 29,
2012 |
Increase (Decrease) in Net Assets | | |
Operations | | |
Net investment income (loss) | $ 64,604 | $ 90,065 |
Net realized gain (loss) | 1,674,968 | 5,278,424 |
Change in net unrealized appreciation (depreciation) | (4,244,313) | (6,836,239) |
Net increase (decrease) in net assets resulting from operations | (2,504,741) | (1,467,750) |
Distributions to shareholders from net investment income | - | (110,454) |
Distributions to shareholders from net realized gain | - | (10,568,849) |
Total distributions | - | (10,679,303) |
Share transactions
Proceeds from sales of shares | 14,435,692 | 45,337,897 |
Reinvestment of distributions | - | 9,888,534 |
Cost of shares redeemed | (20,758,775) | (83,900,972) |
Net increase (decrease) in net assets resulting from share transactions | (6,323,083) | (28,674,541) |
Redemption fees | 1,954 | 3,029 |
Total increase (decrease) in net assets | (8,825,870) | (40,818,565) |
| | |
Net Assets | | |
Beginning of period | 72,652,403 | 113,470,968 |
End of period (including undistributed net investment income of $64,604 and undistributed net income of $0, respectively) | $ 63,826,533 | $ 72,652,403 |
Other Information Shares | | |
Sold | 378,775 | 1,190,480 |
Issued in reinvestment of distributions | - | 264,574 |
Redeemed | (548,994) | (2,184,942) |
Net increase (decrease) | (170,219) | (729,888) |
Financial Highlights
| Six months ended
August 31, 2012 | Years ended February 28, |
| (Unaudited) | 2012 K | 2011 | 2010 | 2009 | 2008 K |
Selected Per-Share Data | | | | | | |
Net asset value, beginning of period | $ 38.12 | $ 43.05 | $ 35.32 | $ 17.35 | $ 37.47 | $ 50.74 |
Income from Investment Operations | | | | | | |
Net investment income (loss) D | .04 | .05 | .17 G | (.07) | (.10) | (.04) H |
Net realized and unrealized gain (loss) | (1.39) | .46 I | 7.68 | 18.04 | (17.05) | (7.61) |
Total from investment operations | (1.35) | .51 | 7.85 | 17.97 | (17.15) | (7.65) |
Distributions from net investment income | - | (.05) | (.13) | - | - | - |
Distributions from net realized gain | - | (5.39) | - | - | (2.99) | (5.63) |
Total distributions | - | (5.44) | (.13) | - | (2.99) | (5.63) |
Redemption fees added to paid in capital D | - L | - L | .01 | - L | .02 | .01 |
Net asset value, end of period | $ 36.77 | $ 38.12 | $ 43.05 | $ 35.32 | $ 17.35 | $ 37.47 |
Total Return B,C | (3.54)% | 2.01% | 22.26% | 103.57% | (49.44)% | (16.72)% |
Ratios to Average Net Assets E,J | | | | | | |
Expenses before reductions | .96% A | .96% | .92% | 1.05% | 1.08% | 1.01% |
Expenses net of fee waivers, if any | .96% A | .96% | .92% | 1.05% | 1.08% | 1.01% |
Expenses net of all reductions | .96% A | .95% | .91% | 1.01% | 1.07% | 1.01% |
Net investment income (loss) | .19% A | .12% | .43% G | (.28)% | (.37)% | (.08)% H |
Supplemental Data | | | | | | |
Net assets, end of period (000 omitted) | $ 63,827 | $ 72,652 | $ 113,471 | $ 94,425 | $ 34,911 | $ 46,943 |
Portfolio turnover rate F | 45% A | 102% | 161% | 165% | 66% | 47% |
A Annualized B Total returns for periods of less than one year are not annualized. C Total returns would have been lower if certain expenses had not been reduced during the applicable periods shown. D Calculated based on average shares outstanding during the period. E Fees and expenses of any underlying Fidelity Central Funds are not included in the Fund's expense ratio. The Fund indirectly bears its proportionate share of the expenses of any underlying Fidelity Central Funds. F Amount does not include the portfolio activity of any underlying Fidelity Central Funds. G Investment income per share reflects a large, non-recurring dividend which amounted to $.12 per share. Excluding this non-recurring dividend, the ratio of net investment income (loss) to average net assets would have been .14%. H Investment income per share reflects a large, non-recurring dividend which amounted to $.10 per share. Excluding this non-recurring dividend, the ratio of net investment income (loss) to average net assets would have been (.28)%. I The amount shown for a share outstanding does not correspond with the aggregate net gain (loss) on investments for the period due to the timing of sales and repurchases of shares in relation to fluctuating market values of the investments of the Fund. J Expense ratios reflect operating expenses of the Fund. Expenses before reductions do not reflect amounts reimbursed by the investment adviser or reductions from brokerage service arrangements or reductions from other expense offset arrangements and do not represent the amount paid by the Fund during periods when reimbursements or reductions occur. Expenses net of fee waivers reflect expenses after reimbursement by the investment adviser but prior to reductions from brokerage service arrangements or other expense offset arrangements. Expenses net of all reductions represent the net expenses paid by the Fund. K For the year ended February 29. L Amount represents less than $.01 per share. |
See accompanying notes which are an integral part of the financial statements.
Semiannual Report
Defense and Aerospace Portfolio
Investment Changes (Unaudited)
Top Ten Stocks as of August 31, 2012 |
| % of fund's
net assets | % of fund's net assets
6 months ago |
United Technologies Corp. | 20.5 | 22.7 |
The Boeing Co. | 13.6 | 13.4 |
Precision Castparts Corp. | 6.6 | 6.5 |
Raytheon Co. | 5.7 | 5.0 |
TransDigm Group, Inc. | 4.7 | 3.9 |
Honeywell International, Inc. | 4.6 | 6.1 |
Textron, Inc. | 4.5 | 4.6 |
Esterline Technologies Corp. | 3.9 | 3.6 |
General Dynamics Corp. | 3.5 | 0.7 |
Rockwell Collins, Inc. | 3.1 | 5.0 |
| 70.7 | |
Top Industries (% of fund's net assets) |
As of August 31, 2012 |
| Aerospace & Defense | 93.7% | |
| Metals & Mining | 2.1% | |
| Trading Companies & Distributors | 1.4% | |
| Electrical Equipment | 1.1% | |
| Electronic Equipment & Components | 0.7% | |
| All Others* | 1.0% | |

As of February 29, 2012 |
| Aerospace & Defense | 89.4% | |
| Metals & Mining | 2.4% | |
| Trading Companies & Distributors | 2.1% | |
| Electrical Equipment | 0.9% | |
| Electronic Equipment & Components | 0.9% | |
| All Others* | 4.3% | |

* Includes short-term investments and net other assets. |
Semiannual Report
Defense and Aerospace Portfolio
Investments August 31, 2012 (Unaudited)
Showing Percentage of Net Assets
Common Stocks - 99.5% |
| Shares | | Value |
AEROSPACE & DEFENSE - 93.7% |
Aerospace & Defense - 93.7% |
BE Aerospace, Inc. (a) | 380,469 | | $ 15,317,682 |
DigitalGlobe, Inc. (a)(d) | 332,345 | | 6,902,806 |
Ducommun, Inc. (a)(e) | 545,164 | | 8,003,008 |
Embraer SA sponsored ADR | 313,000 | | 8,435,350 |
Esterline Technologies Corp. (a) | 396,934 | | 23,736,653 |
Exelis, Inc. | 357,620 | | 3,611,962 |
General Dynamics Corp. | 325,699 | | 21,336,541 |
HEICO Corp. (d) | 181,664 | | 6,329,174 |
Honeywell International, Inc. | 478,528 | | 27,969,962 |
Lockheed Martin Corp. | 201,388 | | 18,354,502 |
Meggitt PLC | 1,492,500 | | 9,365,711 |
Moog, Inc. Class A (a) | 287,431 | | 10,528,598 |
MTU Aero Engines Holdings AG | 98,712 | | 7,532,784 |
Northrop Grumman Corp. | 183,069 | | 12,245,485 |
Orbital Sciences Corp. (a) | 965,511 | | 13,324,052 |
Precision Castparts Corp. | 251,337 | | 40,485,364 |
Raytheon Co. | 614,156 | | 34,712,097 |
Rockwell Collins, Inc. | 388,454 | | 18,983,747 |
Rolls-Royce Group PLC | 367,800 | | 4,794,732 |
SIFCO Industries, Inc. | 82,763 | | 1,559,255 |
Teledyne Technologies, Inc. (a) | 223,831 | | 14,439,338 |
Textron, Inc. | 1,041,166 | | 27,819,956 |
The Boeing Co. | 1,168,237 | | 83,412,122 |
TransDigm Group, Inc. (a) | 207,833 | | 28,809,810 |
United Technologies Corp. | 1,571,178 | | 125,458,562 |
| | 573,469,253 |
ELECTRICAL EQUIPMENT - 1.1% |
Electrical Components & Equipment - 1.1% |
AMETEK, Inc. | 188,014 | | 6,450,760 |
ELECTRONIC EQUIPMENT & COMPONENTS - 0.7% |
Electronic Equipment & Instruments - 0.7% |
FLIR Systems, Inc. | 224,500 | | 4,445,100 |
MACHINERY - 0.5% |
Industrial Machinery - 0.5% |
Woodward, Inc. | 90,700 | | 3,168,151 |
METALS & MINING - 2.1% |
Diversified Metals & Mining - 0.5% |
Titanium Metals Corp. | 244,400 | | 2,991,456 |
|
| Shares | | Value |
Steel - 1.6% |
Carpenter Technology Corp. | 127,100 | | $ 6,006,746 |
Haynes International, Inc. | 77,909 | | 3,798,064 |
| | 9,804,810 |
TOTAL METALS & MINING | | 12,796,266 |
TRADING COMPANIES & DISTRIBUTORS - 1.4% |
Trading Companies & Distributors - 1.4% |
AerCap Holdings NV (a) | 259,307 | | 3,280,234 |
Air Lease Corp. Class A (a)(d) | 263,800 | | 5,439,556 |
| | 8,719,790 |
TOTAL COMMON STOCKS (Cost $544,515,864) |
609,049,320
|
Money Market Funds - 1.3% |
| | | |
Fidelity Cash Central Fund, 0.17% (b) | 4,300,390 | | 4,300,390 |
Fidelity Securities Lending Cash Central Fund, 0.18% (b)(c) | 3,896,100 | | 3,896,100 |
TOTAL MONEY MARKET FUNDS (Cost $8,196,490) |
8,196,490
|
TOTAL INVESTMENT PORTFOLIO - 100.8% (Cost $552,712,354) | 617,245,810 |
NET OTHER ASSETS (LIABILITIES) - (0.8)% | (5,088,719) |
NET ASSETS - 100% | $ 612,157,091 |
Legend |
(a) Non-income producing |
(b) Affiliated fund that is available only to investment companies and other accounts managed by Fidelity Investments. The rate quoted is the annualized seven-day yield of the fund at period end. A complete unaudited listing of the fund's holdings as of its most recent quarter end is available upon request. In addition, each Fidelity Central Fund's financial statements are available on the SEC's website or upon request. |
(c) Investment made with cash collateral received from securities on loan. |
(d) Security or a portion of the security is on loan at period end. |
(e) Affiliated company |
Affiliated Central Funds |
Information regarding fiscal year to date income earned by the Fund from investments in Fidelity Central Funds is as follows: |
Fund | Income earned |
Fidelity Cash Central Fund | $ 19,439 |
Fidelity Securities Lending Cash Central Fund | 27,992 |
Total | $ 47,431 |
Other Affiliated Issuers |
An affiliated company is a company in which the Fund has ownership of at least 5% of the voting securities. Fiscal year to date transactions with companies which are or were affiliates are as follows: |
Affiliate | Value, beginning of period | Purchases | Sales Proceeds | Dividend Income | Value,
end of
period |
Ducommun, Inc. | $ - | $ 7,563,548 | $ - | $ - | $ 8,003,008 |
Total | $ - | $ 7,563,548 | $ - | $ - | $ 8,003,008 |
Other Information |
All investments are categorized as Level 1 under the Fair Value Hierarchy. The inputs or methodology used for valuing securities may not be an indication of the risk associated with investing in those securities. For more information on valuation inputs, please refer to the Security Valuation section in the accompanying Notes to Financial Statements. |
See accompanying notes which are an integral part of the financial statements.
Semiannual Report
Defense and Aerospace Portfolio
Statement of Assets and Liabilities
| August 31, 2012 (Unaudited) |
| | |
Assets | | |
Investment in securities, at value (including securities loaned of $3,788,181) - See accompanying schedule: Unaffiliated issuers (cost $536,952,316) | $ 601,046,312 | |
Fidelity Central Funds (cost $8,196,490) | 8,196,490 | |
Other affiliated issuers (cost $7,563,548) | 8,003,008 | |
Total Investments (cost $552,712,354) | | $ 617,245,810 |
Receivable for fund shares sold | | 207,333 |
Dividends receivable | | 2,235,167 |
Distributions receivable from Fidelity Central Funds | | 6,533 |
Other receivables | | 2,828 |
Total assets | | 619,697,671 |
| | |
Liabilities | | |
Payable for investments purchased | $ 1,402,607 | |
Payable for fund shares redeemed | 1,788,744 | |
Accrued management fee | 288,075 | |
Other affiliated payables | 143,481 | |
Other payables and accrued expenses | 21,573 | |
Collateral on securities loaned, at value | 3,896,100 | |
Total liabilities | | 7,540,580 |
| | |
Net Assets | | $ 612,157,091 |
Net Assets consist of: | | |
Paid in capital | | $ 554,587,325 |
Undistributed net investment income | | 2,904,668 |
Accumulated undistributed net realized gain (loss) on investments and foreign currency transactions | | (9,869,400) |
Net unrealized appreciation (depreciation) on investments and assets and liabilities in foreign currencies | | 64,534,498 |
Net Assets, for 7,416,087 shares outstanding | | $ 612,157,091 |
Net Asset Value, offering price and redemption price per share ($612,157,091 ÷ 7,416,087 shares) | | $ 82.54 |
Statement of Operations
Six months ended August 31, 2012 (Unaudited) |
| | |
Investment Income | | |
Dividends | | $ 5,555,263 |
Income from Fidelity Central Funds (including $27,992 from security lending) | | 47,431 |
Total income | | 5,602,694 |
| | |
Expenses | | |
Management fee | $ 1,772,951 | |
Transfer agent fees | 756,683 | |
Accounting and security lending fees | 117,433 | |
Custodian fees and expenses | 5,459 | |
Independent trustees' compensation | 2,174 | |
Registration fees | 22,800 | |
Audit | 17,667 | |
Legal | 1,253 | |
Miscellaneous | 3,843 | |
Total expenses before reductions | 2,700,263 | |
Expense reductions | (7,439) | 2,692,824 |
Net investment income (loss) | | 2,909,870 |
Realized and Unrealized Gain (Loss) Net realized gain (loss) on: | | |
Investment securities: | | |
Unaffiliated issuers | (4,981,715) | |
Foreign currency transactions | 3,274 | |
Total net realized gain (loss) | | (4,978,441) |
Change in net unrealized appreciation (depreciation) on: Investment securities | (23,186,375) | |
Assets and liabilities in foreign currencies | 1,042 | |
Total change in net unrealized appreciation (depreciation) | | (23,185,333) |
Net gain (loss) | | (28,163,774) |
Net increase (decrease) in net assets resulting from operations | | $ (25,253,904) |
See accompanying notes which are an integral part of the financial statements.
Semiannual Report
Statement of Changes in Net Assets
| Six months ended August 31, 2012 (Unaudited) | Year ended
February 29,
2012 |
Increase (Decrease) in Net Assets | | |
Operations | | |
Net investment income (loss) | $ 2,909,870 | $ 4,716,023 |
Net realized gain (loss) | (4,978,441) | 81,261,739 |
Change in net unrealized appreciation (depreciation) | (23,185,333) | (23,583,052) |
Net increase (decrease) in net assets resulting from operations | (25,253,904) | 62,394,710 |
Distributions to shareholders from net investment income | (1,047,065) | (4,239,094) |
Distributions to shareholders from net realized gain | (1,406,058) | (953,357) |
Total distributions | (2,453,123) | (5,192,451) |
Share transactions
Proceeds from sales of shares | 71,288,742 | 165,263,521 |
Reinvestment of distributions | 2,365,491 | 5,004,209 |
Cost of shares redeemed | (114,947,584) | (224,292,010) |
Net increase (decrease) in net assets resulting from share transactions | (41,293,351) | (54,024,280) |
Redemption fees | 3,121 | 15,836 |
Total increase (decrease) in net assets | (68,997,257) | 3,193,815 |
| | |
Net Assets | | |
Beginning of period | 681,154,348 | 677,960,533 |
End of period (including undistributed net investment income of $2,904,668 and undistributed net investment income of $1,041,863, respectively) | $ 612,157,091 | $ 681,154,348 |
Other Information Shares | | |
Sold | 852,509 | 2,079,372 |
Issued in reinvestment of distributions | 28,339 | 64,501 |
Redeemed | (1,383,169) | (2,893,816) |
Net increase (decrease) | (502,321) | (749,943) |
Financial Highlights
| Six months ended August 31, 2012 | Years ended February 28, |
| (Unaudited) | 2012 I | 2011 | 2010 | 2009 | 2008 I |
Selected Per-Share Data | | | | | | |
Net asset value, beginning of period | $ 86.02 | $ 78.21 | $ 62.05 | $ 38.96 | $ 79.93 | $ 84.46 |
Income from Investment Operations | | | | | | |
Net investment income (loss) D | .38 | .56 | .42 | .73 G | .58 | .24 |
Net realized and unrealized gain (loss) | (3.53) | 7.87 | 16.17 | 23.32 | (36.29) | 2.46 |
Total from investment operations | (3.15) | 8.43 | 16.59 | 24.05 | (35.71) | 2.70 |
Distributions from net investment income | (.14) | (.51) | (.43) | (.96) | (.51) | (.14) |
Distributions from net realized gain | (.19) | (.12) | - | - | (4.75) | (7.10) |
Total distributions | (.33) | (.62) K | (.43) | (.96) | (5.26) | (7.24) |
Redemption fees added to paid in capital D | - J | - J | - J | - J | - J | .01 |
Net asset value, end of period | $ 82.54 | $ 86.02 | $ 78.21 | $ 62.05 | $ 38.96 | $ 79.93 |
Total Return B,C | (3.67)% | 10.87% | 26.79% | 62.05% | (47.61)% | 2.80% |
Ratios to Average Net Assets E,H | | | | | | |
Expenses before reductions | .85% A | .86% | .88% | .95% | .88% | .87% |
Expenses net of fee waivers, if any | .85% A | .86% | .88% | .95% | .88% | .87% |
Expenses net of all reductions | .85% A | .86% | .88% | .94% | .88% | .87% |
Net investment income (loss) | .92% A | .72% | .62% | 1.39% G | .91% | .27% |
Supplemental Data | | | | | | |
Net assets, end of period (000 omitted) | $ 612,157 | $ 681,154 | $ 677,961 | $ 609,095 | $ 436,291 | $ 1,207,867 |
Portfolio turnover rate F | 52% A | 56% | 43% | 70% | 58% | 57% |
A Annualized B Total returns for periods of less than one year are not annualized. C Total returns would have been lower if certain expenses had not been reduced during the applicable periods shown. D Calculated based on average shares outstanding during the period. E Fees and expenses of any underlying Fidelity Central Funds are not included in the Fund's expense ratio. The Fund indirectly bears its proportionate share of the expenses of any underlying Fidelity Central Funds. F Amount does not include the portfolio activity of any underlying Fidelity Central Funds. G Investment income per share reflects a large, non-recurring dividend which amounted to $.20 per share. Excluding this non-recurring dividend, the ratio of net investment income (loss) to average net assets would have been 1.01%. H Expense ratios reflect operating expenses of the Fund. Expenses before reductions do not reflect amounts reimbursed by the investment adviser or reductions from brokerage service arrangements or reductions from other expense offset arrangements and do not represent the amount paid by the Fund during periods when reimbursements or reductions occur. Expenses net of fee waivers reflect expenses after reimbursement by the investment adviser but prior to reductions from brokerage service arrangements or other expense offset arrangements. Expenses net of all reductions represent the net expenses paid by the Fund. I For the year ended February 29. J Amount represents less than $.01 per share. K Total distributions of $.623 per share is comprised of distributions from net investment income of $.508 and distributions from net realized gain of $.115 per share. |
See accompanying notes which are an integral part of the financial statements.
Semiannual Report
Environment and Alternative Energy Portfolio
Investment Changes (Unaudited)
Top Ten Stocks as of August 31, 2012 |
| % of fund's
net assets | % of fund's net assets
6 months ago |
Danaher Corp. | 10.1 | 8.7 |
Emerson Electric Co. | 9.2 | 8.9 |
Republic Services, Inc. | 6.3 | 7.7 |
Stericycle, Inc. | 5.4 | 6.0 |
Air Products & Chemicals, Inc. | 5.0 | 5.1 |
Ashland, Inc. | 4.8 | 5.4 |
Ecolab, Inc. | 4.4 | 4.6 |
Enel SpA | 4.3 | 5.5 |
Ingersoll-Rand PLC | 4.2 | 0.4 |
Eaton Corp. | 3.9 | 4.9 |
| 57.6 | |
Top Industries (% of fund's net assets) |
As of August 31, 2012 |
| Energy Efficiency | 35.6% | |
| Water Infrastructure & Technologies | 21.1% | |
| Waste Management & Technologies | 19.7% | |
| Environmental Support Services | 13.4% | |
| Renewable & Alternative Energy | 8.3% | |
| All Others* | 1.9% | |

As of February 29, 2012 |
| Energy Efficiency | 26.7% | |
| Waste Management & Technologies | 19.8% | |
| Renewable & Alternative Energy | 17.2% | |
| Water Infrastructure & Technologies | 16.2% | |
| Environmental Support Services | 15.5% | |
| All Others* | 4.6% | |

* Includes short-term investments and net other assets. |
Semiannual Report
Environment and Alternative Energy Portfolio
Investments August 31, 2012 (Unaudited)
Showing Percentage of Net Assets
Common Stocks - 98.8% |
| Shares | | Value |
Energy Efficiency - 35.2% |
Buildings Energy Efficiency - 12.4% |
Apogee Enterprises, Inc. | 18,900 | | $ 298,620 |
Cree, Inc. (a)(d) | 38,000 | | 1,071,600 |
Ingersoll-Rand PLC | 58,500 | | 2,735,460 |
Johnson Controls, Inc. | 81,100 | | 2,206,731 |
Lennox International, Inc. | 17,300 | | 821,923 |
Owens Corning (a) | 28,700 | | 957,432 |
TOTAL BUILDINGS ENERGY EFFICIENCY | | 8,091,766 |
Diversified Energy Efficiency - 1.0% |
Corning, Inc. | 56,500 | | 677,435 |
Industrial Energy Efficiency - 1.4% |
ON Semiconductor Corp. (a) | 143,100 | | 891,513 |
Power Network Efficiency - 19.0% |
Eaton Corp. | 56,500 | | 2,526,680 |
Emerson Electric Co. | 118,900 | | 6,030,608 |
ESCO Technologies, Inc. | 12,300 | | 435,789 |
Exide Technologies (a) | 83,300 | | 254,898 |
Hubbell, Inc. Class B | 30,000 | | 2,424,600 |
Quanta Services, Inc. (a) | 31,400 | | 753,600 |
TOTAL POWER NETWORK EFFICIENCY | | 12,426,175 |
Transport Energy Efficiency - 1.4% |
Sensata Technologies Holding BV (a) | 31,200 | | 936,936 |
TOTAL ENERGY EFFICIENCY | | 23,023,825 |
Environmental Support Services - 13.4% |
Diversified Environmental - 10.3% |
Air Products & Chemicals, Inc. | 39,400 | | 3,253,652 |
Parker Hannifin Corp. | 28,500 | | 2,279,430 |
Praxair, Inc. | 11,300 | | 1,192,150 |
TOTAL DIVERSIFIED ENVIRONMENTAL | | 6,725,232 |
Environmental Consultancies - 3.1% |
AECOM Technology Corp. (a) | 25,500 | | 494,445 |
Jacobs Engineering Group, Inc. (a) | 39,300 | | 1,553,922 |
TOTAL ENVIRONMENTAL CONSULTANCIES | | 2,048,367 |
TOTAL ENVIRONMENTAL SUPPORT SERVICES | | 8,773,599 |
Pollution Control - 1.1% |
Pollution Control Solutions - 1.1% |
Tenneco, Inc. (a) | 22,700 | | 689,399 |
|
| Shares | | Value |
Renewable & Alternative Energy - 8.3% |
Biofuels - 0.5% |
Amyris, Inc. (a)(d) | 110,100 | | $ 343,512 |
Renewable Energy Developers and Independent Power Producers (IPPs) - 7.2% |
Empresa Nacional de Electricidad SA sponsored ADR | 13,300 | | 655,158 |
Enel SpA | 841,670 | | 2,773,670 |
Tractebel Energia SA | 76,000 | | 1,263,983 |
TOTAL RENEWABLE ENERGY DEVELOPERS AND INDEPENDENT POWER PRODUCERS (IPPs) | | 4,692,811 |
Solar Energy Generation Equipment - 0.6% |
GT Advanced Technologies, Inc. (a)(d) | 73,900 | | 428,620 |
TOTAL RENEWABLE & ALTERNATIVE ENERGY | | 5,464,943 |
Waste Management & Technologies - 19.7% |
General Waste Management - 8.3% |
Republic Services, Inc. | 148,900 | | 4,117,085 |
Waste Management, Inc. | 37,600 | | 1,300,208 |
TOTAL GENERAL WASTE MANAGEMENT | | 5,417,293 |
Hazardous Waste Management - 6.7% |
EnergySolutions, Inc. (a) | 204,400 | | 500,780 |
Stericycle, Inc. (a) | 38,500 | | 3,523,520 |
US Ecology, Inc. | 20,600 | | 387,280 |
TOTAL HAZARDOUS WASTE MANAGEMENT | | 4,411,580 |
Recycling and Value Added Waste Processing - 4.7% |
Commercial Metals Co. | 63,400 | | 807,716 |
Covanta Holding Corp. | 75,500 | | 1,291,050 |
Interface, Inc. | 31,300 | | 429,749 |
Schnitzer Steel Industries, Inc. Class A | 20,400 | | 563,448 |
TOTAL RECYCLING AND VALUE ADDED WASTE PROCESSING | | 3,091,963 |
TOTAL WASTE MANAGEMENT & TECHNOLOGIES | | 12,920,836 |
Water Infrastructure & Technologies - 21.1% |
Water Infrastructure - 1.8% |
Aegion Corp. (a) | 58,400 | | 1,139,968 |
Water Treatment Equipment - 19.3% |
Ashland, Inc. | 42,700 | | 3,144,001 |
Common Stocks - continued |
| Shares | | Value |
Water Infrastructure & Technologies - continued |
Water Treatment Equipment - continued |
Danaher Corp. | 123,600 | | $ 6,621,252 |
Ecolab, Inc. | 45,100 | | 2,887,753 |
TOTAL WATER TREATMENT EQUIPMENT | | 12,653,006 |
TOTAL WATER INFRASTRUCTURE & TECHNOLOGIES | | 13,792,974 |
TOTAL COMMON STOCKS (Cost $64,243,866) |
64,665,576
|
Convertible Bonds - 0.4% |
| Principal
Amount | | |
Energy Efficiency - 0.4% |
Buildings Energy Efficiency - 0.4% |
Aspen Aerogels, Inc. 8% 6/1/14 (e)
(Cost $275,800) | $ 275,800 | |
275,800
|
Cash Equivalents - 3.3% |
| Shares | | |
Fidelity Cash Central Fund, 0.17% (b) | 466,013 | | 466,013 |
Fidelity Securities Lending Cash Central Fund, 0.18% (b)(c) | 1,683,400 | | 1,683,400 |
TOTAL CASH EQUIVALENTS (Cost $2,149,413) |
2,149,413
|
TOTAL INVESTMENT PORTFOLIO - 102.5% (Cost $66,669,079) | 67,090,789 |
NET OTHER ASSETS (LIABILITIES) - (2.5)% | (1,612,341) |
NET ASSETS - 100% | $ 65,478,448 |
Legend |
(a) Non-income producing |
(b) Affiliated fund that is available only to investment companies and other accounts managed by Fidelity Investments. The rate quoted is the annualized seven-day yield of the fund at period end. A complete unaudited listing of the fund's holdings as of its most recent quarter end is available upon request. In addition, each Fidelity Central Fund's financial statements are available on the SEC's website or upon request. |
(c) Investment made with cash collateral received from securities on loan. |
(d) Security or a portion of the security is on loan at period end. |
(e) Restricted securities - Investment in securities not registered under the Securities Act of 1933 (excluding 144A issues). At the end of the period, the value of restricted securities (excluding 144A issues) amounted to $275,800 or 0.4% of net assets. |
Additional information on each restricted holding is as follows: |
Security | Acquisition Date | Acquisition Cost |
Aspen Aerogels, Inc. 8% 6/1/14 | 6/1/11 | $ 275,800 |
Affiliated Central Funds |
Information regarding fiscal year to date income earned by the Fund from investments in Fidelity Central Funds is as follows: |
Fund | Income earned |
Fidelity Cash Central Fund | $ 464 |
Fidelity Securities Lending Cash Central Fund | 37,175 |
Total | $ 37,639 |
Other Information |
The following is a summary of the inputs used, as of August 31, 2012, involving the Fund's assets and liabilities carried at fair value. The inputs or methodology used for valuing securities may not be an indication of the risk associated with investing in those securities. For more information on valuation inputs, and their aggregation into the levels used in the table below, please refer to the Security Valuation section in the accompanying Notes to Financial Statements. |
Valuation Inputs at Reporting Date: |
Description | Total | Level 1 | Level 2 | Level 3 |
Investments in Securities: | | | | |
Common Stocks | $ 64,665,576 | $ 64,665,576 | $ - | $ - |
Convertible Bonds | 275,800 | - | - | 275,800 |
Money Market Funds | 2,149,413 | 2,149,413 | - | - |
Total Investments in Securities: | $ 67,090,789 | $ 66,814,989 | $ - | $ 275,800 |
Distribution of investments by country or territory of incorporation, as a percentage of total net assets, is as follows. (Unaudited) |
United States of America | 87.2% |
Italy | 4.3% |
Ireland | 4.2% |
Brazil | 1.9% |
Netherlands | 1.4% |
Chile | 1.0% |
| 100.0% |
See accompanying notes which are an integral part of the financial statements.
Semiannual Report
Environment and Alternative Energy Portfolio
Statement of Assets and Liabilities
| August 31, 2012 (Unaudited) |
| | |
Assets | | |
Investment in securities, at value (including securities loaned of $1,640,420) - See accompanying schedule: Unaffiliated issuers (cost $64,519,666) | $ 64,941,376 | |
Fidelity Central Funds (cost $2,149,413) | 2,149,413 | |
Total Investments (cost $66,669,079) | | $ 67,090,789 |
Receivable for fund shares sold | | 61,293 |
Dividends receivable | | 114,626 |
Interest receivable | | 27,580 |
Distributions receivable from Fidelity Central Funds | | 3,414 |
Total assets | | 67,297,702 |
| | |
Liabilities | | |
Payable for fund shares redeemed | $ 68,647 | |
Accrued management fee | 30,448 | |
Other affiliated payables | 18,024 | |
Other payables and accrued expenses | 18,735 | |
Collateral on securities loaned, at value | 1,683,400 | |
Total liabilities | | 1,819,254 |
| | |
Net Assets | | $ 65,478,448 |
Net Assets consist of: | | |
Paid in capital | | $ 76,612,752 |
Undistributed net investment income | | 434,967 |
Accumulated undistributed net realized gain (loss) on investments and foreign currency transactions | | (11,990,503) |
Net unrealized appreciation (depreciation) on investments and assets and liabilities in foreign currencies | | 421,232 |
Net Assets, for 4,133,070 shares outstanding | | $ 65,478,448 |
Net Asset Value, offering price and redemption price per share ($65,478,448 ÷ 4,133,070 shares) | | $ 15.84 |
Statement of Operations
Six months ended August 31, 2012 (Unaudited) |
| | |
Investment Income | | |
Dividends | | $ 730,936 |
Interest | | 11,093 |
Income from Fidelity Central Funds (including $37,175 from security lending) | | 37,639 |
Total income | | 779,668 |
| | |
Expenses | | |
Management fee | $ 187,921 | |
Transfer agent fees | 101,782 | |
Accounting and security lending fees | 13,317 | |
Custodian fees and expenses | 2,847 | |
Independent trustees' compensation | 230 | |
Registration fees | 14,338 | |
Audit | 17,121 | |
Legal | 158 | |
Miscellaneous | 431 | |
Total expenses before reductions | 338,145 | |
Expense reductions | (166) | 337,979 |
Net investment income (loss) | | 441,689 |
Realized and Unrealized Gain (Loss) Net realized gain (loss) on: | | |
Investment securities: | | |
Unaffiliated issuers | (388,520) | |
Foreign currency transactions | (9,736) | |
Total net realized gain (loss) | | (398,256) |
Change in net unrealized appreciation (depreciation) on: Investment securities | (2,279,427) | |
Assets and liabilities in foreign currencies | (427) | |
Total change in net unrealized appreciation (depreciation) | | (2,279,854) |
Net gain (loss) | | (2,678,110) |
Net increase (decrease) in net assets resulting from operations | | $ (2,236,421) |
See accompanying notes which are an integral part of the financial statements.
Semiannual Report
Statement of Changes in Net Assets
| Six months ended August 31, 2012 (Unaudited) | Year ended
February 29,
2012 |
Increase (Decrease) in Net Assets | | |
Operations | | |
Net investment income (loss) | $ 441,689 | $ 1,005,199 |
Net realized gain (loss) | (398,256) | (5,141,157) |
Change in net unrealized appreciation (depreciation) | (2,279,854) | (10,791,584) |
Net increase (decrease) in net assets resulting from operations | (2,236,421) | (14,927,542) |
Distributions to shareholders from net investment income | (8,735) | (910,843) |
Share transactions
Proceeds from sales of shares | 5,904,186 | 43,448,137 |
Reinvestment of distributions | 8,404 | 874,813 |
Cost of shares redeemed | (16,133,937) | (47,411,226) |
Net increase (decrease) in net assets resulting from share transactions | (10,221,347) | (3,088,276) |
Redemption fees | 1,455 | 5,933 |
Total increase (decrease) in net assets | (12,465,048) | (18,920,728) |
| | |
Net Assets | | |
Beginning of period | 77,943,496 | 96,864,224 |
End of period (including undistributed net investment income of $434,967 and undistributed net investment income of $2,013, respectively) | $ 65,478,448 | $ 77,943,496 |
Other Information Shares | | |
Sold | 376,599 | 2,426,768 |
Issued in reinvestment of distributions | 529 | 56,886 |
Redeemed | (1,020,678) | (2,755,970) |
Net increase (decrease) | (643,550) | (272,316) |
Financial Highlights
| Six months ended August 31, 2012 | Years ended February 28, |
| (Unaudited) | 2012 H | 2011 | 2010 | 2009 | 2008 H |
Selected Per-Share Data | | | | | | |
Net asset value, beginning of period | $ 16.32 | $ 19.19 | $ 14.94 | $ 10.94 | $ 17.71 | $ 17.21 |
Income from Investment Operations | | | | | | |
Net investment income (loss) D | .10 | .20 | .10 | .11 | .06 | .04 |
Net realized and unrealized gain (loss) | (.58) | (2.88) | 4.22 | 4.03 | (6.76) | .53 |
Total from investment operations | (.48) | (2.68) | 4.32 | 4.14 | (6.70) | .57 |
Distributions from net investment income | - I | (.19) | (.07) | (.14) | (.07) | (.07) |
Redemption fees added to paid in capital D,I | - | - | - | - | - | - |
Net asset value, end of period | $ 15.84 | $ 16.32 | $ 19.19 | $ 14.94 | $ 10.94 | $ 17.71 |
Total Return B,C | (2.93)% | (13.92)% | 28.96% | 37.77% | (37.88)% | 3.27% |
Ratios to Average Net Assets E,G | | | | | | |
Expenses before reductions | 1.00% A | 1.01% | 1.08% | 1.08% | 1.06% | 1.08% |
Expenses net of fee waivers, if any | 1.00% A | 1.01% | 1.08% | 1.08% | 1.06% | 1.08% |
Expenses net of all reductions | 1.00% A | 1.00% | 1.07% | 1.08% | 1.06% | 1.07% |
Net investment income (loss) | 1.31% A | 1.15% | .59% | .82% | .37% | .22% |
Supplemental Data | | | | | | |
Net assets, end of period (000 omitted) | $ 65,478 | $ 77,943 | $ 96,864 | $ 47,186 | $ 39,004 | $ 38,510 |
Portfolio turnover rate F | 45% A | 183% | 190% | 132% | 107% | 76% |
A Annualized B Total returns for periods of less than one year are not annualized. C Total returns would have been lower if certain expenses had not been reduced during the applicable periods shown. D Calculated based on average shares outstanding during the period. E Fees and expenses of any underlying Fidelity Central Funds are not included in the Fund's expense ratio. The Fund indirectly bears its proportionate share of the expenses of any underlying Fidelity Central Funds. F Amount does not include the portfolio activity of any underlying Fidelity Central Funds. G Expense ratios reflect operating expenses of the Fund. Expenses before reductions do not reflect amounts reimbursed by the investment adviser or reductions from brokerage service arrangements or reductions from other expense offset arrangements and do not represent the amount paid by the Fund during periods when reimbursements or reductions occur. Expenses net of fee waivers reflect expenses after reimbursement by the investment adviser but prior to reductions from brokerage service arrangements or other expense offset arrangements. Expenses net of all reductions represent the net expenses paid by the Fund. H For the year ended February 29. I Amount represents less than $.01 per share. |
See accompanying notes which are an integral part of the financial statements.
Semiannual Report
Industrial Equipment Portfolio
Investment Changes (Unaudited)
Top Ten Stocks as of August 31, 2012 |
| % of fund's
net assets | % of fund's net assets
6 months ago |
General Electric Co. | 17.8 | 13.0 |
3M Co. | 6.0 | 0.0 |
United Technologies Corp. | 5.8 | 7.1 |
Caterpillar, Inc. | 5.6 | 6.9 |
Emerson Electric Co. | 3.8 | 4.3 |
Honeywell International, Inc. | 3.8 | 4.9 |
Cummins, Inc. | 3.6 | 5.0 |
Illinois Tool Works, Inc. | 3.2 | 0.0 |
Regal-Beloit Corp. | 2.9 | 4.0 |
Raytheon Co. | 2.8 | 0.0 |
| 55.3 | |
Top Industries (% of fund's net assets) |
As of August 31, 2012 |
| Industrial Conglomerates | 26.9% | |
| Machinery | 26.8% | |
| Aerospace & Defense | 17.5% | |
| Electrical Equipment | 12.1% | |
| Construction & Engineering | 2.9% | |
| All Others* | 13.8% | |

As of February 29, 2012 |
| Machinery | 29.5% | |
| Aerospace & Defense | 18.5% | |
| Industrial Conglomerates | 16.0% | |
| Electrical Equipment | 12.7% | |
| Building Products | 7.2% | |
| All Others* | 16.1% | |

* Includes short-term investments and net other assets. |
Semiannual Report
Industrial Equipment Portfolio
Investments August 31, 2012 (Unaudited)
Showing Percentage of Net Assets
Common Stocks - 92.4% |
| Shares | | Value |
AEROSPACE & DEFENSE - 17.5% |
Aerospace & Defense - 17.5% |
Alliant Techsystems, Inc. | 22,500 | | $ 1,102,275 |
American Science & Engineering, Inc. | 11,900 | | 707,693 |
Honeywell International, Inc. | 192,000 | | 11,222,400 |
Precision Castparts Corp. | 39,600 | | 6,378,768 |
Raytheon Co. | 148,200 | | 8,376,264 |
Rockwell Collins, Inc. | 51,700 | | 2,526,579 |
Teledyne Technologies, Inc. (a) | 20,100 | | 1,296,651 |
The Boeing Co. | 14,200 | | 1,013,880 |
TransDigm Group, Inc. (a) | 17,100 | | 2,370,402 |
United Technologies Corp. | 214,900 | | 17,159,765 |
| | 52,154,677 |
AIR FREIGHT & LOGISTICS - 0.5% |
Air Freight & Logistics - 0.5% |
C.H. Robinson Worldwide, Inc. | 13,800 | | 781,218 |
Expeditors International of Washington, Inc. | 18,500 | | 677,285 |
| | 1,458,503 |
BUILDING PRODUCTS - 2.6% |
Building Products - 2.6% |
AAON, Inc. | 42,200 | | 776,480 |
Armstrong World Industries, Inc. | 18,100 | | 795,857 |
Gibraltar Industries, Inc. (a) | 70,241 | | 767,734 |
Owens Corning (a) | 51,800 | | 1,728,048 |
Quanex Building Products Corp. | 150,178 | | 2,628,115 |
Simpson Manufacturing Co. Ltd. | 37,600 | | 956,168 |
| | 7,652,402 |
CONSTRUCTION & ENGINEERING - 2.9% |
Construction & Engineering - 2.9% |
Fluor Corp. | 63,600 | | 3,275,400 |
Jacobs Engineering Group, Inc. (a) | 60,400 | | 2,388,216 |
KBR, Inc. | 64,800 | | 1,755,432 |
Larsen & Toubro Ltd. | 23,059 | | 557,693 |
Primoris Services Corp. | 65,300 | | 803,190 |
| | 8,779,931 |
ELECTRICAL EQUIPMENT - 12.1% |
Electrical Components & Equipment - 11.6% |
Acuity Brands, Inc. | 21,600 | | 1,385,856 |
AMETEK, Inc. | 79,650 | | 2,732,792 |
Emerson Electric Co. | 221,400 | | 11,229,408 |
GrafTech International Ltd. (a) | 95,800 | | 897,646 |
Hubbell, Inc. Class B | 20,900 | | 1,689,138 |
II-VI, Inc. (a) | 53,400 | | 993,240 |
Regal-Beloit Corp. | 127,332 | | 8,666,216 |
Rockwell Automation, Inc. | 51,000 | | 3,675,060 |
Roper Industries, Inc. | 30,400 | | 3,124,816 |
| | 34,394,172 |
|
| Shares | | Value |
Heavy Electrical Equipment - 0.5% |
AZZ, Inc. | 27,600 | | $ 876,576 |
Bharat Heavy Electricals Ltd. | 165,641 | | 636,163 |
| | 1,512,739 |
TOTAL ELECTRICAL EQUIPMENT | | 35,906,911 |
ELECTRONIC EQUIPMENT & COMPONENTS - 0.3% |
Electronic Equipment & Instruments - 0.3% |
FLIR Systems, Inc. | 41,300 | | 817,740 |
INDUSTRIAL CONGLOMERATES - 26.9% |
Industrial Conglomerates - 26.9% |
3M Co. | 191,600 | | 17,742,160 |
Danaher Corp. | 155,400 | | 8,324,778 |
General Electric Co. | 2,553,455 | | 52,882,053 |
Raven Industries, Inc. | 28,200 | | 856,434 |
| | 79,805,425 |
MACHINERY - 26.8% |
Construction & Farm Machinery & Heavy Trucks - 12.9% |
Ashok Leyland Ltd. | 1,508,133 | | 559,523 |
Caterpillar, Inc. | 194,000 | | 16,554,020 |
Cummins, Inc. | 110,400 | | 10,720,944 |
Joy Global, Inc. | 52,700 | | 2,813,126 |
Manitowoc Co., Inc. | 87,200 | | 1,123,136 |
PACCAR, Inc. | 100,900 | | 4,026,919 |
WABCO Holdings, Inc. (a) | 14,000 | | 822,080 |
Wabtec Corp. | 21,000 | | 1,640,940 |
| | 38,260,688 |
Industrial Machinery - 13.9% |
Actuant Corp. Class A | 42,800 | | 1,203,536 |
Alfa Laval AB | 43,200 | | 739,766 |
Blount International, Inc. (a) | 59,800 | | 770,224 |
Donaldson Co., Inc. | 57,700 | | 2,036,233 |
Flowserve Corp. | 19,100 | | 2,438,306 |
Gorman-Rupp Co. | 28,900 | | 795,906 |
Graco, Inc. | 30,100 | | 1,486,940 |
Illinois Tool Works, Inc. | 158,300 | | 9,385,607 |
Ingersoll-Rand PLC | 139,100 | | 6,504,316 |
Lincoln Electric Holdings, Inc. | 36,200 | | 1,493,250 |
Middleby Corp. (a) | 11,800 | | 1,358,770 |
Nordson Corp. | 26,500 | | 1,558,465 |
Pall Corp. | 41,400 | | 2,298,114 |
Parker Hannifin Corp. | 58,800 | | 4,702,824 |
Sun Hydraulics Corp. | 42,300 | | 979,245 |
Valmont Industries, Inc. | 11,600 | | 1,470,300 |
Weg SA | 75,600 | | 748,589 |
Woodward, Inc. | 35,800 | | 1,250,494 |
| | 41,220,885 |
TOTAL MACHINERY | | 79,481,573 |
Common Stocks - continued |
| Shares | | Value |
TRADING COMPANIES & DISTRIBUTORS - 2.6% |
Trading Companies & Distributors - 2.6% |
Applied Industrial Technologies, Inc. | 30,700 | | $ 1,248,876 |
Houston Wire & Cable Co. | 66,300 | | 727,311 |
MSC Industrial Direct Co., Inc. Class A | 24,100 | | 1,670,130 |
Watsco, Inc. | 16,500 | | 1,245,090 |
WESCO International, Inc. (a) | 47,400 | | 2,738,772 |
| | 7,630,179 |
TRANSPORTATION INFRASTRUCTURE - 0.2% |
Highways & Railtracks - 0.2% |
CCR SA | 87,700 | | 788,043 |
TOTAL COMMON STOCKS (Cost $240,437,270) |
274,475,384
|
Money Market Funds - 7.5% |
| Shares | | Value |
Fidelity Cash Central Fund, 0.17% (b)
(Cost $22,248,565) | 22,248,565 | | $ 22,248,565 |
TOTAL INVESTMENT PORTFOLIO - 99.9% (Cost $262,685,835) | | 296,723,949 |
NET OTHER ASSETS (LIABILITIES) - 0.1% | | 211,623 |
NET ASSETS - 100% | $ 296,935,572 |
Legend |
(a) Non-income producing |
(b) Affiliated fund that is available only to investment companies and other accounts managed by Fidelity Investments. The rate quoted is the annualized seven-day yield of the fund at period end. A complete unaudited listing of the fund's holdings as of its most recent quarter end is available upon request. In addition, each Fidelity Central Fund's financial statements are available on the SEC's website or upon request. |
Affiliated Central Funds |
Information regarding fiscal year to date income earned by the Fund from investments in Fidelity Central Funds is as follows: |
Fund | Income earned |
Fidelity Cash Central Fund | $ 13,629 |
Fidelity Securities Lending Cash Central Fund | 1,015 |
Total | $ 14,644 |
Other Affiliated Issuers |
An affiliated company is a company in which the Fund has ownership of at least 5% of the voting securities. Fiscal year to date transactions with companies which are or were affiliates are as follows: |
Affiliate | Value, beginning of period | Purchases | Sales Proceeds | Dividend Income | Value,
end of
period |
Key Technology, Inc. | $ 3,964,961 | $ - | $ 2,818,293 | $ - | $ - |
Total | $ 3,964,961 | $ - | $ 2,818,293 | $ - | $ - |
Other Information |
All investments are categorized as Level 1 under the Fair Value Hierarchy. The inputs or methodology used for valuing securities may not be an indication of the risk associated with investing in those securities. For more information on valuation inputs, please refer to the Security Valuation section in the accompanying Notes to Financial Statements. |
See accompanying notes which are an integral part of the financial statements.
Semiannual Report
Industrial Equipment Portfolio
Statement of Assets and Liabilities
| August 31, 2012 (Unaudited) |
| | |
Assets | | |
Investment in securities, at value - See accompanying schedule: Unaffiliated issuers (cost $240,437,270) | $ 274,475,384 | |
Fidelity Central Funds (cost $22,248,565) | 22,248,565 | |
Total Investments (cost $262,685,835) | | $ 296,723,949 |
Receivable for fund shares sold | | 18,016 |
Dividends receivable | | 579,130 |
Distributions receivable from Fidelity Central Funds | | 3,000 |
Other receivables | | 1,343 |
Total assets | | 297,325,438 |
| | |
Liabilities | | |
Payable for fund shares redeemed | 170,648 | |
Accrued management fee | 137,624 | |
Transfer agent fee payable | 45,600 | |
Other affiliated payables | 9,597 | |
Other payables and accrued expenses | 26,397 | |
Total liabilities | | 389,866 |
| | |
Net Assets | | $ 296,935,572 |
Net Assets consist of: | | |
Paid in capital | | $ 266,584,797 |
Undistributed net investment income | | 1,191,103 |
Accumulated undistributed net realized gain (loss) on investments and foreign currency transactions | | (4,878,415) |
Net unrealized appreciation (depreciation) on investments and assets and liabilities in foreign currencies | | 34,038,087 |
Net Assets, for 8,488,858 shares outstanding | | $ 296,935,572 |
Net Asset Value, offering price and redemption price per share ($296,935,572 ÷ 8,488,858 shares) | | $ 34.98 |
Statement of Operations
Six months ended August 31, 2012 (Unaudited) |
| | |
Investment Income | | |
Dividends | | $ 2,486,802 |
Interest | | 55 |
Income from Fidelity Central Funds (including $1,015 from security lending) | | 14,644 |
Total income | | 2,501,501 |
| | |
Expenses | | |
Management fee | $ 870,269 | |
Transfer agent fees | 309,336 | |
Accounting and security lending fees | 60,913 | |
Custodian fees and expenses | 11,423 | |
Independent trustees' compensation | 1,071 | |
Registration fees | 23,075 | |
Audit | 22,454 | |
Legal | 636 | |
Miscellaneous | 1,529 | |
Total expenses before reductions | 1,300,706 | |
Expense reductions | (2,411) | 1,298,295 |
Net investment income (loss) | | 1,203,206 |
Realized and Unrealized Gain (Loss) Net realized gain (loss) on: | | |
Investment securities: | | |
Unaffiliated issuers (net of foreign taxes of $17,457) | 3,311,489 | |
Other affiliated issuers | (2,048,055) | |
Foreign currency transactions | 48,438 | |
Total net realized gain (loss) | | 1,311,872 |
Change in net unrealized appreciation (depreciation) on: Investment securities (net of decrease in deferred foreign taxes of $31,751) | (16,683,230) | |
Assets and liabilities in foreign currencies | (2,569) | |
Total change in net unrealized appreciation (depreciation) | | (16,685,799) |
Net gain (loss) | | (15,373,927) |
Net increase (decrease) in net assets resulting from operations | | $ (14,170,721) |
See accompanying notes which are an integral part of the financial statements.
Semiannual Report
Industrial Equipment Portfolio
Financial Statements - continued
Statement of Changes in Net Assets
| Six months ended August 31, 2012 (Unaudited) | Year ended
February 29,
2012 |
Increase (Decrease) in Net Assets | | |
Operations | | |
Net investment income (loss) | $ 1,203,206 | $ 2,683,212 |
Net realized gain (loss) | 1,311,872 | 6,338,922 |
Change in net unrealized appreciation (depreciation) | (16,685,799) | (7,805,695) |
Net increase (decrease) in net assets resulting from operations | (14,170,721) | 1,216,439 |
Distributions to shareholders from net investment income | (625,508) | (2,550,520) |
Distributions to shareholders from net realized gain | - | (1,033,874) |
Total distributions | (625,508) | (3,584,394) |
Share transactions
Proceeds from sales of shares | 45,905,370 | 175,476,236 |
Reinvestment of distributions | 617,206 | 3,511,222 |
Cost of shares redeemed | (86,466,853) | (187,624,495) |
Net increase (decrease) in net assets resulting from share transactions | (39,944,277) | (8,637,037) |
Redemption fees | 2,063 | 8,044 |
Total increase (decrease) in net assets | (54,738,443) | (10,996,948) |
| | |
Net Assets | | |
Beginning of period | 351,674,015 | 362,670,963 |
End of period (including undistributed net investment income of $1,191,103 and undistributed net investment income of $613,405, respectively) | $ 296,935,572 | $ 351,674,015 |
Other Information Shares | | |
Sold | 1,298,855 | 5,105,217 |
Issued in reinvestment of distributions | 17,415 | 104,395 |
Redeemed | (2,497,073) | (5,569,458) |
Net increase (decrease) | (1,180,803) | (359,846) |
Financial Highlights
| Six months ended August 31, 2012 | Years ended February 28, |
| (Unaudited) | 2012 I | 2011 | 2010 | 2009 | 2008 I |
Selected Per-Share Data | | | | | | |
Net asset value, beginning of period | $ 36.37 | $ 36.16 | $ 26.16 | $ 13.98 | $ 32.45 | $ 31.50 |
Income from Investment Operations | | | | | | |
Net investment income (loss) D | .13 | .28 | .26 | .19 | .33 | .28 |
Net realized and unrealized gain (loss) | (1.45) | .29 G | 9.89 | 12.22 | (17.96) | 2.73 |
Total from investment operations | (1.32) | .57 | 10.15 | 12.41 | (17.63) | 3.01 |
Distributions from net investment income | (.07) | (.26) | (.15) | (.23) | (.34) | (.23) |
Distributions from net realized gain | - | (.10) | - | - | (.50) | (1.83) |
Total distributions | (.07) | (.36) | (.15) | (.23) | (.84) | (2.06) |
Redemption fee added to paid in capital D,J | - | - | - | - | - | - |
Net asset value, end of period | $ 34.98 | $ 36.37 | $ 36.16 | $ 26.16 | $ 13.98 | $ 32.45 |
Total Return B,C | (3.64)% | 1.66% | 38.87% | 89.06% | (55.46)% | 9.25% |
Ratios to Average Net Assets E,H | | | | | | |
Expenses before reductions | .83% A | .84% | .89% | .95% | .90% | .88% |
Expenses net of fee waivers, if any | .83% A | .84% | .89% | .95% | .90% | .88% |
Expenses net of all reductions | .83% A | .84% | .88% | .94% | .90% | .88% |
Net investment income (loss) | .77% A | .85% | .85% | .87% | 1.22% | .80% |
Supplemental Data | | | | | | |
Net assets, end of period (000 omitted) | $ 296,936 | $ 351,674 | $ 362,671 | $ 120,368 | $ 47,260 | $ 169,045 |
Portfolio turnover rate F | 85% A | 101% | 82% | 74% | 136% | 92% |
A Annualized B Total returns for periods of less than one year are not annualized. C Total returns would have been lower if certain expenses had not been reduced during the applicable periods shown. D Calculated based on average shares outstanding during the period. E Fees and expenses of any underlying Fidelity Central Funds are not included in the Fund's expense ratio. The Fund indirectly bears its proportionate share of the expenses of any underlying Fidelity Central Funds. F Amount does not include the portfolio activity of any underlying Fidelity Central Funds. G The amount shown for a share outstanding does not correspond with the aggregate net gain (loss) on investments for the period due to the timing of sales and repurchases of shares in relation to fluctuating market values of the investments of the Fund. H Expense ratios reflect operating expenses of the Fund. Expenses before reductions do not reflect amounts reimbursed by the investment adviser or reductions from brokerage service arrangements or reductions from other expense offset arrangements and do not represent the amount paid by the Fund during periods when reimbursements or reductions occur. Expenses net of fee waivers reflect expenses after reimbursement by the investment adviser but prior to reductions from brokerage service arrangements or other expense offset arrangements. Expenses net of all reductions represent the net expenses paid by the Fund. I For the year ended February 29. J Amount represents less than $.01 per share. |
See accompanying notes which are an integral part of the financial statements.
Semiannual Report
Industrials Portfolio
Investment Changes (Unaudited)
Top Ten Stocks as of August 31, 2012 |
| % of fund's
net assets | % of fund's net assets
6 months ago |
General Electric Co. | 14.8 | 11.0 |
United Technologies Corp. | 6.2 | 6.2 |
3M Co. | 4.1 | 3.6 |
Danaher Corp. | 3.9 | 3.6 |
Union Pacific Corp. | 3.6 | 3.4 |
Honeywell International, Inc. | 3.4 | 3.1 |
Cummins, Inc. | 3.2 | 3.4 |
Tyco International Ltd. | 2.5 | 2.2 |
Emerson Electric Co. | 2.5 | 3.2 |
Textron, Inc. | 2.4 | 2.1 |
| 46.6 | |
Top Industries (% of fund's net assets) |
As of August 31, 2012 |
| Industrial Conglomerates | 26.2% | |
| Machinery | 20.3% | |
| Aerospace & Defense | 14.0% | |
| Electrical Equipment | 7.7% | |
| Road & Rail | 7.2% | |
| All Others* | 24.6% | |

As of February 29, 2012 |
| Machinery | 22.4% | |
| Industrial Conglomerates | 21.0% | |
| Aerospace & Defense | 13.0% | |
| Electrical Equipment | 11.2% | |
| Road & Rail | 6.2% | |
| All Others* | 26.2% | |

* Includes short-term investments and net other assets. |
Semiannual Report
Industrials Portfolio
Investments August 31, 2012 (Unaudited)
Showing Percentage of Net Assets
Common Stocks - 95.2% |
| Shares | | Value |
AEROSPACE & DEFENSE - 13.9% |
Aerospace & Defense - 13.9% |
Honeywell International, Inc. | 326,396 | | $ 19,077,846 |
Precision Castparts Corp. | 34,700 | | 5,589,476 |
Teledyne Technologies, Inc. (a) | 78,800 | | 5,083,388 |
Textron, Inc. | 520,833 | | 13,916,658 |
United Technologies Corp. | 439,397 | | 35,085,850 |
| | 78,753,218 |
AIR FREIGHT & LOGISTICS - 1.9% |
Air Freight & Logistics - 1.9% |
United Parcel Service, Inc. Class B | 147,065 | | 10,854,868 |
BUILDING PRODUCTS - 1.3% |
Building Products - 1.3% |
Owens Corning (a) | 230,854 | | 7,701,289 |
COMMERCIAL SERVICES & SUPPLIES - 2.6% |
Diversified Support Services - 0.3% |
Aggreko PLC | 42,700 | | 1,600,108 |
Copart, Inc. (a) | 7,439 | | 198,696 |
| | 1,798,804 |
Environmental & Facility Services - 1.4% |
Republic Services, Inc. | 286,915 | | 7,933,200 |
Office Services & Supplies - 0.3% |
Mine Safety Appliances Co. | 50,100 | | 1,746,987 |
Security & Alarm Services - 0.6% |
Corrections Corp. of America | 96,799 | | 3,224,375 |
TOTAL COMMERCIAL SERVICES & SUPPLIES | | 14,703,366 |
CONSTRUCTION & ENGINEERING - 4.8% |
Construction & Engineering - 4.8% |
AECOM Technology Corp. (a) | 362,004 | | 7,019,258 |
EMCOR Group, Inc. | 237,568 | | 6,564,004 |
Jacobs Engineering Group, Inc. (a) | 184,885 | | 7,310,353 |
MasTec, Inc. (a) | 110,186 | | 2,009,793 |
Quanta Services, Inc. (a) | 173,875 | | 4,173,000 |
| | 27,076,408 |
ELECTRICAL EQUIPMENT - 7.7% |
Electrical Components & Equipment - 7.7% |
AMETEK, Inc. | 282,512 | | 9,692,987 |
Emerson Electric Co. | 279,928 | | 14,197,948 |
GrafTech International Ltd. (a) | 345,378 | | 3,236,192 |
Hubbell, Inc. Class B | 87,026 | | 7,033,441 |
Prysmian SpA | 182,137 | | 3,049,213 |
Regal-Beloit Corp. | 96,012 | | 6,534,577 |
| | 43,744,358 |
ENERGY EQUIPMENT & SERVICES - 0.3% |
Oil & Gas Equipment & Services - 0.3% |
McDermott International, Inc. (a) | 172,346 | | 1,919,934 |
|
| Shares | | Value |
INDUSTRIAL CONGLOMERATES - 26.2% |
Industrial Conglomerates - 26.2% |
3M Co. | 249,133 | | $ 23,069,716 |
Carlisle Companies, Inc. | 100,446 | | 5,257,344 |
Danaher Corp. | 413,298 | | 22,140,374 |
General Electric Co. | 4,042,415 | | 83,718,411 |
Tyco International Ltd. | 256,494 | | 14,461,132 |
| | 148,646,977 |
MACHINERY - 20.3% |
Construction & Farm Machinery & Heavy Trucks - 6.6% |
Cummins, Inc. | 189,761 | | 18,427,691 |
Deere & Co. | 111,046 | | 8,340,665 |
Manitowoc Co., Inc. | 486,249 | | 6,262,887 |
Oshkosh Truck Corp. (a) | 87,300 | | 2,212,182 |
Toro Co. | 59,200 | | 2,202,240 |
| | 37,445,665 |
Industrial Machinery - 13.7% |
Actuant Corp. Class A | 113,316 | | 3,186,446 |
Dover Corp. | 147,111 | | 8,504,487 |
Flowserve Corp. | 41,000 | | 5,234,060 |
Graco, Inc. | 111,900 | | 5,527,860 |
Illinois Tool Works, Inc. | 226,369 | | 13,421,418 |
Ingersoll-Rand PLC | 166,142 | | 7,768,800 |
Pall Corp. | 106,860 | | 5,931,799 |
Parker Hannifin Corp. | 114,214 | | 9,134,836 |
SPX Corp. | 29,600 | | 1,891,440 |
Timken Co. | 97,833 | | 3,928,973 |
TriMas Corp. (a) | 263,529 | | 5,665,874 |
Valmont Industries, Inc. | 58,253 | | 7,383,568 |
| | 77,579,561 |
TOTAL MACHINERY | | 115,025,226 |
MARINE - 0.5% |
Marine - 0.5% |
Kirby Corp. (a) | 52,600 | | 2,769,390 |
PROFESSIONAL SERVICES - 5.6% |
Human Resource & Employment Services - 2.0% |
Manpower, Inc. | 109,300 | | 4,056,123 |
Towers Watson & Co. | 135,450 | | 7,357,644 |
| | 11,413,767 |
Research & Consulting Services - 3.6% |
Bureau Veritas SA | 46,678 | | 4,306,495 |
Dun & Bradstreet Corp. | 68,440 | | 5,540,218 |
IHS, Inc. Class A (a) | 69,988 | | 7,981,432 |
Nielsen Holdings B.V. (a) | 94,344 | | 2,645,406 |
| | 20,473,551 |
TOTAL PROFESSIONAL SERVICES | | 31,887,318 |
Common Stocks - continued |
| Shares | | Value |
ROAD & RAIL - 7.2% |
Railroads - 6.1% |
CSX Corp. | 423,372 | | $ 9,508,935 |
Genesee & Wyoming, Inc. Class A (a) | 70,751 | | 4,496,934 |
Union Pacific Corp. | 171,098 | | 20,778,141 |
| | 34,784,010 |
Trucking - 1.1% |
J.B. Hunt Transport Services, Inc. | 101,619 | | 5,328,900 |
Quality Distribution, Inc. (a) | 81,087 | | 788,977 |
| | 6,117,877 |
TOTAL ROAD & RAIL | | 40,901,887 |
TRADING COMPANIES & DISTRIBUTORS - 2.6% |
Trading Companies & Distributors - 2.6% |
W.W. Grainger, Inc. | 24,219 | | 4,988,145 |
Watsco, Inc. | 66,900 | | 5,048,274 |
WESCO International, Inc. (a) | 81,950 | | 4,735,071 |
| | 14,771,490 |
TRANSPORTATION INFRASTRUCTURE - 0.3% |
Airport Services - 0.3% |
Wesco Aircraft Holdings, Inc. (a) | 110,102 | | 1,534,822 |
TOTAL COMMON STOCKS (Cost $452,073,517) |
540,290,551
|
Convertible Preferred Stocks - 0.1% |
| | | |
AEROSPACE & DEFENSE - 0.1% |
Aerospace & Defense - 0.1% |
United Technologies Corp. 7.50%
(Cost $580,000) | 11,600 | |
647,512
|
Convertible Bonds - 0.5% |
| Principal Amount | | |
BUILDING PRODUCTS - 0.5% |
Building Products - 0.5% |
Aspen Aerogels, Inc.: | | | | |
8% 6/1/14 (d) | | $ 1,179,681 | | 1,179,681 |
8% 12/6/14 (d) | | 1,108,200 | | 1,108,200 |
8% 12/6/14 (d) | | 240,400 | | 240,400 |
TOTAL CONVERTIBLE BONDS (Cost $2,528,281) |
2,528,281
|
U.S. Treasury Obligations - 0.1% |
|
U.S. Treasury Bills, yield at date of purchase 0.1% 11/23/12 (c)
(Cost $269,936) | | 270,000 | |
269,949
|
Money Market Funds - 4.0% |
| Shares | | Value |
Fidelity Cash Central Fund, 0.17% (b)
(Cost $22,846,944) | 22,846,944 | | $ 22,846,944 |
TOTAL INVESTMENT PORTFOLIO - 99.9% (Cost $478,298,678) | 566,583,237 |
NET OTHER ASSETS (LIABILITIES) - 0.1% | | 706,042 |
NET ASSETS - 100% | $ 567,289,279 |
Futures Contracts |
| Expiration Date | | Underlying Face Amount at Value | | Unrealized Appreciation/(Depreciation) |
Purchased |
Equity Index Contracts |
149 CME E-mini Industrial Select Sector Index Contracts | Sept. 2012 | | $ 5,384,860 | | $ 319,681 |
|
The face value of futures purchased as a percentage of net assets is 1.0% |
Legend |
(a) Non-income producing |
(b) Affiliated fund that is available only to investment companies and other accounts managed by Fidelity Investments. The rate quoted is the annualized seven-day yield of the fund at period end. A complete unaudited listing of the fund's holdings as of its most recent quarter end is available upon request. In addition, each Fidelity Central Fund's financial statements are available on the SEC's website or upon request. |
(c) Security or a portion of the security was pledged to cover margin requirements for futures contracts. At the period end, the value of securities pledged amounted to $269,490. |
(d) Restricted securities - Investment in securities not registered under the Securities Act of 1933 (excluding 144A issues). At the end of the period, the value of restricted securities (excluding 144A issues) amounted to $2,528,281 or 0.4% of net assets. |
Additional information on each restricted holding is as follows: |
Security | Acquisition Date | Acquisition Cost |
Aspen Aerogels, Inc. 8% 6/1/14 | 6/14/11 | $ 1,179,681 |
Aspen Aerogels, Inc. 8% 12/6/14 | 12/6/11 - 6/12/12 | $ 1,348,600 |
Affiliated Central Funds |
Information regarding fiscal year to date income earned by the Fund from investments in Fidelity Central Funds is as follows: |
Fund | Income earned |
Fidelity Cash Central Fund | $ 18,044 |
Fidelity Securities Lending Cash Central Fund | 24,602 |
Total | $ 42,646 |
Other Information |
The following is a summary of the inputs used, as of August 31, 2012, involving the Fund's assets and liabilities carried at fair value. The inputs or methodology used for valuing securities may not be an indication of the risk associated with investing in those securities. For more information on valuation inputs, and their aggregation into the levels used in the table below, please refer to the Security Valuation section in the accompanying Notes to Financial Statements. |
Valuation Inputs at Reporting Date: |
Description | Total | Level 1 | Level 2 | Level 3 |
Investments in Securities: | | | | |
Common Stocks | $ 540,290,551 | $ 540,290,551 | $ - | $ - |
Convertible Preferred Stocks | 647,512 | 647,512 | - | - |
Convertible Bonds | 2,528,281 | - | - | 2,528,281 |
U.S. Treasury Obligations | 269,949 | - | 269,949 | - |
Money Market Funds | 22,846,944 | 22,846,944 | - | - |
Total Investments in Securities: | $ 566,583,237 | $ 563,785,007 | $ 269,949 | $ 2,528,281 |
Derivative Instruments: | | | | |
Assets | | | | |
Futures Contracts | $ 319,681 | $ 319,681 | $ - | $ - |
Value of Derivative Instruments |
The following table is a summary of the Fund's value of derivative instruments by primary risk exposure as of August 31, 2012. For additional information on derivative instruments, please refer to the Derivative Instruments section in the accompanying Notes to Financial Statements. |
Primary Risk Exposure /
Derivative Type | Value |
| Asset | Liability |
Equity Risk | | |
Futures Contracts (a) | $ 319,681 | $ - |
Total Value of Derivatives | $ 319,681 | $ - |
(a) Reflects cumulative appreciation/(depreciation) on futures contracts as disclosed on the Schedule of Investments. Only the period end variation margin is separately disclosed on the Statement of Assets and Liabilities. |
See accompanying notes which are an integral part of the financial statements.
Semiannual Report
Industrials Portfolio
Statement of Assets and Liabilities
| August 31, 2012 (Unaudited) |
| | |
Assets | | |
Investment in securities, at value - See accompanying schedule: Unaffiliated issuers (cost $455,451,734) | $ 543,736,293 | |
Fidelity Central Funds (cost $22,846,944) | 22,846,944 | |
Total Investments (cost $478,298,678) | | $ 566,583,237 |
Receivable for investments sold | | 1,919,063 |
Receivable for fund shares sold | | 456,231 |
Dividends receivable | | 1,188,259 |
Interest receivable | | 184,041 |
Distributions receivable from Fidelity Central Funds | | 3,621 |
Receivable for daily variation margin on futures contracts | | 26,820 |
Other receivables | | 3,808 |
Total assets | | 570,365,080 |
| | |
Liabilities | | |
Payable for investments purchased | $ 2,032,549 | |
Payable for fund shares redeemed | 621,774 | |
Accrued management fee | 264,031 | |
Other affiliated payables | 127,331 | |
Other payables and accrued expenses | 30,116 | |
Total liabilities | | 3,075,801 |
| | |
Net Assets | | $ 567,289,279 |
Net Assets consist of: | | |
Paid in capital | | $ 478,867,009 |
Undistributed net investment income | | 2,631,053 |
Accumulated undistributed net realized gain (loss) on investments and foreign currency transactions | | (2,813,023) |
Net unrealized appreciation (depreciation) on investments | | 88,604,240 |
Net Assets, for 23,413,756 shares outstanding | | $ 567,289,279 |
Net Asset Value, offering price and redemption price per share ($567,289,279 ÷ 23,413,756 shares) | | $ 24.23 |
Statement of Operations
Six months ended August 31, 2012 (Unaudited) |
| | |
Investment Income | | |
Dividends | | $ 4,836,769 |
Interest | | 96,385 |
Income from Fidelity Central Funds (including $24,602 from security lending) | | 42,646 |
Total income | | 4,975,800 |
| | |
Expenses | | |
Management fee | $ 1,534,695 | |
Transfer agent fees | 649,380 | |
Accounting and security lending fees | 104,664 | |
Custodian fees and expenses | 15,615 | |
Independent trustees' compensation | 1,836 | |
Registration fees | 18,478 | |
Audit | 22,484 | |
Legal | 1,037 | |
Miscellaneous | 3,243 | |
Total expenses before reductions | 2,351,432 | |
Expense reductions | (8,410) | 2,343,022 |
Net investment income (loss) | | 2,632,778 |
Realized and Unrealized Gain (Loss) Net realized gain (loss) on: | | |
Investment securities: | | |
Unaffiliated issuers | 271,191 | |
Foreign currency transactions | (13,888) | |
Futures contracts | 91,418 | |
Total net realized gain (loss) | | 348,721 |
Change in net unrealized appreciation (depreciation) on: Investment securities | (7,011,885) | |
Assets and liabilities in foreign currencies | 6,228 | |
Futures contracts | (164,698) | |
Total change in net unrealized appreciation (depreciation) | | (7,170,355) |
Net gain (loss) | | (6,821,634) |
Net increase (decrease) in net assets resulting from operations | | $ (4,188,856) |
See accompanying notes which are an integral part of the financial statements.
Semiannual Report
Statement of Changes in Net Assets
| Six months ended August 31, 2012 (Unaudited) | Year ended
February 29,
2012 |
Increase (Decrease) in Net Assets | | |
Operations | | |
Net investment income (loss) | $ 2,632,778 | $ 4,310,507 |
Net realized gain (loss) | 348,721 | 9,524,497 |
Change in net unrealized appreciation (depreciation) | (7,170,355) | (21,575,556) |
Net increase (decrease) in net assets resulting from operations | (4,188,856) | (7,740,552) |
Distributions to shareholders from net investment income | (1,190,780) | (2,779,155) |
Distributions to shareholders from net realized gain | (3,190,389) | (14,525,491) |
Total distributions | (4,381,169) | (17,304,646) |
Share transactions
Proceeds from sales of shares | 94,567,995 | 270,843,106 |
Reinvestment of distributions | 4,291,339 | 16,826,943 |
Cost of shares redeemed | (74,147,606) | (283,961,470) |
Net increase (decrease) in net assets resulting from share transactions | 24,711,728 | 3,708,579 |
Redemption fees | 3,547 | 29,536 |
Total increase (decrease) in net assets | 16,145,250 | (21,307,083) |
| | |
Net Assets | | |
Beginning of period | 551,144,029 | 572,451,112 |
End of period (including undistributed net investment income of $2,631,053 and undistributed net investment income of $1,189,055, respectively) | $ 567,289,279 | $ 551,144,029 |
Other Information Shares | | |
Sold | 4,040,540 | 11,294,394 |
Issued in reinvestment of distributions | 177,769 | 710,628 |
Redeemed | (3,123,663) | (12,365,187) |
Net increase (decrease) | 1,094,646 | (360,165) |
Financial Highlights
| Six months ended August 31, 2012 | Years ended February 28, |
| (Unaudited) | 2012 I | 2011 | 2010 | 2009 | 2008 I |
Selected Per-Share Data | | | | | | |
Net asset value, beginning of period | $ 24.69 | $ 25.24 | $ 18.39 | $ 10.12 | $ 20.50 | $ 20.70 |
Income from Investment Operations | | | | | | |
Net investment income (loss) D | .11 | .19 | .15 | .11 | .18 | .11 |
Net realized and unrealized gain (loss) | (.37) | .01 G | 6.80 | 8.27 | (10.35) | 1.40 |
Total from investment operations | (.26) | .20 | 6.95 | 8.38 | (10.17) | 1.51 |
Distributions from net investment income | (.05) | (.13) | (.10) | (.11) | (.15) | (.09) |
Distributions from net realized gain | (.14) | (.62) | - | - | (.06) | (1.62) |
Total distributions | (.20) K | (.75) | (.10) | (.11) | (.21) | (1.71) |
Redemption fees added to paid in capital D,J | - | - | - | - | - | - |
Net asset value, end of period | $ 24.23 | $ 24.69 | $ 25.24 | $ 18.39 | $ 10.12 | $ 20.50 |
Total Return B,C | (1.07)% | .94% | 37.85% | 82.95% | (49.92)% | 7.14% |
Ratios to Average Net Assets E,H | | | | | | |
Expenses before reductions | .85% A | .87% | .90% | .97% | 1.00% | 1.00% |
Expenses net of fee waivers, if any | .85% A | .87% | .90% | .97% | 1.00% | 1.00% |
Expenses net of all reductions | .85% A | .86% | .90% | .97% | .99% | .99% |
Net investment income (loss) | .96% A | .83% | .69% | .71% | 1.08% | .49% |
Supplemental Data | | | | | | |
Net assets, end of period (000 omitted) | $ 567,289 | $ 551,144 | $ 572,451 | $ 253,287 | $ 83,542 | $ 124,443 |
Portfolio turnover rate F | 75% A | 102% | 80% | 106% | 132% | 108% |
A Annualized B Total returns for periods of less than one year are not annualized. C Total returns would have been lower if certain expenses had not been reduced during the applicable periods shown. D Calculated based on average shares outstanding during the period. E Fees and expenses of any underlying Fidelity Central Funds are not included in the Fund's expense ratio. The Fund indirectly bears its proportionate share of the expenses of any underlying Fidelity Central Funds. F Amount does not include the portfolio activity of any underlying Fidelity Central Funds. G The amount shown for a share outstanding does not correspond with the aggregate net gain (loss) on investments for the period due to the timing of sales and repurchases of shares in relation to fluctuating market values of the investments of the Fund. H Expense ratios reflect operating expenses of the Fund. Expenses before reductions do not reflect amounts reimbursed by the investment adviser or reductions from brokerage service arrangements or reductions from other expense offset arrangements and do not represent the amount paid by the Fund during periods when reimbursements or reductions occur. Expenses net of fee waivers reflect expenses after reimbursement by the investment adviser but prior to reductions from brokerage service arrangements or other expense offset arrangements. Expenses net of all reductions represent the net expenses paid by the Fund. I For the year ended February 29. J Amount represents less than $.01 per share. K Total distributions of $.20 per share is comprised of distributions from net investment income of $.053 and distributions from net realized gain of $.142 per share. |
See accompanying notes which are an integral part of the financial statements.
Semiannual Report
Transportation Portfolio
Investment Changes (Unaudited)
Top Ten Stocks as of August 31, 2012 |
| % of fund's
net assets | % of fund's net assets
6 months ago |
Union Pacific Corp. | 19.7 | 16.4 |
United Parcel Service, Inc. Class B | 17.0 | 18.5 |
Norfolk Southern Corp. | 5.7 | 4.3 |
CSX Corp. | 5.7 | 6.8 |
FedEx Corp. | 5.0 | 3.9 |
Delta Air Lines, Inc. | 3.5 | 3.5 |
Southwest Airlines Co. | 3.3 | 3.3 |
J.B. Hunt Transport Services, Inc. | 2.6 | 0.6 |
C.H. Robinson Worldwide, Inc. | 2.5 | 3.5 |
United Continental Holdings, Inc. | 2.4 | 2.7 |
| 67.4 | |
Top Industries (% of fund's net assets) |
As of August 31, 2012 |
| Road & Rail | 41.5% | |
| Air Freight & Logistics | 30.0% | |
| Airlines | 14.9% | |
| Marine | 2.7% | |
| Oil, Gas & Consumable Fuels | 1.8% | |
| All Others* | 9.1% | |

As of February 29, 2012 |
| Road & Rail | 39.5% | |
| Air Freight & Logistics | 33.9% | |
| Airlines | 15.8% | |
| Marine | 5.3% | |
| Oil, Gas & Consumable Fuels | 2.9% | |
| All Others* | 2.6% | |

* Includes short-term investments and net other assets. |
Semiannual Report
Transportation Portfolio
Investments August 31, 2012 (Unaudited)
Showing Percentage of Net Assets
Common Stocks - 91.5% |
| Shares | | Value |
AIR FREIGHT & LOGISTICS - 30.0% |
Air Freight & Logistics - 30.0% |
Air Transport Services Group, Inc. (a) | 426,608 | | $ 1,983,727 |
C.H. Robinson Worldwide, Inc. | 78,696 | | 4,454,981 |
Expeditors International of Washington, Inc. | 43,300 | | 1,585,213 |
FedEx Corp. | 102,600 | | 8,990,838 |
Forward Air Corp. | 48,700 | | 1,637,294 |
Hub Group, Inc. Class A (a) | 62,200 | | 1,872,220 |
Pacer International, Inc. (a) | 193,654 | | 793,981 |
United Parcel Service, Inc. Class B | 414,300 | | 30,579,483 |
UTI Worldwide, Inc. | 141,200 | | 1,938,676 |
| | 53,836,413 |
AIRLINES - 14.9% |
Airlines - 14.9% |
Alaska Air Group, Inc. (a) | 108,700 | | 3,646,885 |
Copa Holdings SA Class A | 21,400 | | 1,661,282 |
Dart Group PLC | 638,217 | | 747,377 |
Delta Air Lines, Inc. (a) | 728,202 | | 6,298,947 |
Republic Airways Holdings, Inc. (a) | 205,400 | | 914,030 |
SkyWest, Inc. | 134,500 | | 1,179,565 |
Southwest Airlines Co. | 659,300 | | 5,894,142 |
Spirit Airlines, Inc. (a) | 70,600 | | 1,380,230 |
United Continental Holdings, Inc. (a)(d) | 230,036 | | 4,244,164 |
US Airways Group, Inc. (a) | 78,100 | | 832,546 |
| | 26,799,168 |
AUTO COMPONENTS - 0.2% |
Auto Parts & Equipment - 0.2% |
Stoneridge, Inc. (a) | 64,208 | | 405,795 |
CONSTRUCTION & ENGINEERING - 0.0% |
Construction & Engineering - 0.0% |
Cosco International Holdings Ltd. | 24,000 | | 9,283 |
MACHINERY - 0.6% |
Construction & Farm Machinery & Heavy Trucks - 0.6% |
ASL Marine Holdings Ltd. | 1,250,200 | | 606,796 |
Wabtec Corp. | 5,900 | | 461,026 |
| | 1,067,822 |
MARINE - 2.1% |
Marine - 2.1% |
Diana Shipping, Inc. (a) | 25,100 | | 165,911 |
Kirby Corp. (a) | 60,020 | | 3,160,053 |
Navios Maritime Holdings, Inc. | 128,500 | | 461,315 |
| | 3,787,279 |
MEDIA - 0.3% |
Movies & Entertainment - 0.3% |
Advanced Inflight Alliance AG | 87,100 | | 449,173 |
|
| Shares | | Value |
OIL, GAS & CONSUMABLE FUELS - 1.8% |
Oil & Gas Storage & Transport - 1.8% |
Navios Maritime Acquisition Corp. | 493,332 | | $ 1,327,063 |
Scorpio Tankers, Inc. (a) | 351,500 | | 1,869,980 |
| | 3,197,043 |
ROAD & RAIL - 41.5% |
Railroads - 31.1% |
CSX Corp. | 453,419 | | 10,183,791 |
Norfolk Southern Corp. | 142,800 | | 10,347,288 |
Union Pacific Corp. | 291,368 | | 35,383,730 |
| | 55,914,809 |
Trucking - 10.4% |
Con-way, Inc. | 101,400 | | 3,073,434 |
Contrans Group, Inc.: | | | |
(sub. vtg.) (a)(e) | 12,800 | | 125,046 |
Class A | 74,100 | | 723,899 |
J.B. Hunt Transport Services, Inc. | 88,200 | | 4,625,208 |
Landstar System, Inc. | 64,100 | | 3,030,007 |
Marten Transport Ltd. | 64,000 | | 1,128,960 |
Old Dominion Freight Lines, Inc. (a) | 20,400 | | 913,512 |
Quality Distribution, Inc. (a) | 97,200 | | 945,756 |
Ryder System, Inc. | 42,700 | | 1,708,427 |
Swift Transporation Co. (a) | 199,000 | | 1,621,850 |
Tegma Gestao Logistica SA | 30,900 | | 487,118 |
Vitran Corp., Inc. (a) | 64,600 | | 272,612 |
| | 18,655,829 |
TOTAL ROAD & RAIL | | 74,570,638 |
TRANSPORTATION INFRASTRUCTURE - 0.1% |
Airport Services - 0.1% |
Wesco Aircraft Holdings, Inc. (a) | 16,200 | | 225,828 |
TOTAL COMMON STOCKS (Cost $141,367,495) |
164,348,442
|
Convertible Bonds - 0.6% |
| Principal Amount | | |
MARINE - 0.6% |
Marine - 0.6% |
DryShips, Inc. 5% 12/1/14
(Cost $1,118,904) | | $ 1,500,000 | |
1,168,125
|
Money Market Funds - 3.1% |
| Shares | | Value |
Fidelity Cash Central Fund, 0.17% (b) | 4,049,467 | | $ 4,049,467 |
Fidelity Securities Lending Cash Central Fund, 0.18% (b)(c) | 1,510,575 | | 1,510,575 |
TOTAL MONEY MARKET FUNDS (Cost $5,560,042) |
5,560,042
|
TOTAL INVESTMENT PORTFOLIO - 95.2% (Cost $148,046,441) | 171,076,609 |
NET OTHER ASSETS (LIABILITIES) - 4.8% | | 8,556,222 |
NET ASSETS - 100% | $ 179,632,831 |
Legend |
(a) Non-income producing |
(b) Affiliated fund that is available only to investment companies and other accounts managed by Fidelity Investments. The rate quoted is the annualized seven-day yield of the fund at period end. A complete unaudited listing of the fund's holdings as of its most recent quarter end is available upon request. In addition, each Fidelity Central Fund's financial statements are available on the SEC's website or upon request. |
(c) Investment made with cash collateral received from securities on loan. |
(d) Security or a portion of the security is on loan at period end. |
(e) Security exempt from registration under Rule 144A of the Securities Act of 1933. These securities may be resold in transactions exempt from registration, normally to qualified institutional buyers. At the end of the period, the value of these securities amounted to $125,046 or 0.1% of net assets. |
Affiliated Central Funds |
Information regarding fiscal year to date income earned by the Fund from investments in Fidelity Central Funds is as follows: |
Fund | Income earned |
Fidelity Cash Central Fund | $ 5,794 |
Fidelity Securities Lending Cash Central Fund | 21,768 |
Total | $ 27,562 |
Other Information |
The following is a summary of the inputs used, as of August 31, 2012, involving the Fund's assets and liabilities carried at fair value. The inputs or methodology used for valuing securities may not be an indication of the risk associated with investing in those securities. For more information on valuation inputs, and their aggregation into the levels used in the table below, please refer to the Security Valuation section in the accompanying Notes to Financial Statements. |
Valuation Inputs at Reporting Date: |
Description | Total | Level 1 | Level 2 | Level 3 |
Investments in Securities: | | | | |
Common Stocks | $ 164,348,442 | $ 164,348,442 | $ - | $ - |
Convertible Bonds | 1,168,125 | - | 1,168,125 | - |
Money Market Funds | 5,560,042 | 5,560,042 | - | - |
Total Investments in Securities: | $ 171,076,609 | $ 169,908,484 | $ 1,168,125 | $ - |
See accompanying notes which are an integral part of the financial statements.
Semiannual Report
Transportation Portfolio
Statement of Assets and Liabilities
| August 31, 2012 (Unaudited) |
| | |
Assets | | |
Investment in securities, at value (including securities loaned of $1,479,757) - See accompanying schedule: Unaffiliated issuers (cost $142,486,399) | $ 165,516,567 | |
Fidelity Central Funds (cost $5,560,042) | 5,560,042 | |
Total Investments (cost $148,046,441) | | $ 171,076,609 |
Receivable for investments sold | | 11,106,240 |
Receivable for fund shares sold | | 71,555 |
Dividends receivable | | 614,654 |
Interest receivable | | 18,750 |
Distributions receivable from Fidelity Central Funds | | 3,295 |
Other receivables | | 1,645 |
Total assets | | 182,892,748 |
| | |
Liabilities | | |
Payable for investments purchased | $ 767,618 | |
Payable for fund shares redeemed | 825,320 | |
Accrued management fee | 88,159 | |
Other affiliated payables | 48,730 | |
Other payables and accrued expenses | 19,515 | |
Collateral on securities loaned, at value | 1,510,575 | |
Total liabilities | | 3,259,917 |
| | |
Net Assets | | $ 179,632,831 |
Net Assets consist of: | | |
Paid in capital | | $ 150,406,584 |
Undistributed net investment income | | 903,058 |
Accumulated undistributed net realized gain (loss) on investments and foreign currency transactions | | 5,293,021 |
Net unrealized appreciation (depreciation) on investments | | 23,030,168 |
Net Assets, for 3,555,375 shares outstanding | | $ 179,632,831 |
Net Asset Value, offering price and redemption price per share ($179,632,831 ÷ 3,555,375 shares) | | $ 50.52 |
Statement of Operations
Six months ended August 31, 2012 (Unaudited) |
| | |
Investment Income | | |
Dividends | | $ 1,611,189 |
Interest | | 103,741 |
Income from Fidelity Central Funds (including $21,768 from security lending) | | 27,562 |
Total income | | 1,742,492 |
| | |
Expenses | | |
Management fee | $ 550,655 | |
Transfer agent fees | 253,995 | |
Accounting and security lending fees | 38,649 | |
Custodian fees and expenses | 4,367 | |
Independent trustees' compensation | 681 | |
Registration fees | 17,282 | |
Audit | 17,325 | |
Legal | 393 | |
Miscellaneous | 1,113 | |
Total expenses before reductions | 884,460 | |
Expense reductions | (1,759) | 882,701 |
Net investment income (loss) | | 859,791 |
Realized and Unrealized Gain (Loss) Net realized gain (loss) on: | | |
Investment securities: | | |
Unaffiliated issuers | 5,785,011 | |
Foreign currency transactions | (3,937) | |
Total net realized gain (loss) | | 5,781,074 |
Change in net unrealized appreciation (depreciation) on investment securities | | (11,794,742) |
Net gain (loss) | | (6,013,668) |
Net increase (decrease) in net assets resulting from operations | | $ (5,153,877) |
See accompanying notes which are an integral part of the financial statements.
Semiannual Report
Statement of Changes in Net Assets
| Six months ended August 31, 2012 (Unaudited) | Year ended
February 29,
2012 |
Increase (Decrease) in Net Assets | | |
Operations | | |
Net investment income (loss) | $ 859,791 | $ 1,316,210 |
Net realized gain (loss) | 5,781,074 | 26,283,910 |
Change in net unrealized appreciation (depreciation) | (11,794,742) | (33,149,377) |
Net increase (decrease) in net assets resulting from operations | (5,153,877) | (5,549,257) |
Distributions to shareholders from net investment income | (277,065) | (833,762) |
Distributions to shareholders from net realized gain | (3,802,357) | (13,901,565) |
Total distributions | (4,079,422) | (14,735,327) |
Share transactions
Proceeds from sales of shares | 32,497,683 | 76,064,406 |
Reinvestment of distributions | 3,953,303 | 14,262,117 |
Cost of shares redeemed | (60,234,459) | (324,641,792) |
Net increase (decrease) in net assets resulting from share transactions | (23,783,473) | (234,315,269) |
Redemption fees | 2,305 | 17,488 |
Total increase (decrease) in net assets | (33,014,467) | (254,582,365) |
| | |
Net Assets | | |
Beginning of period | 212,647,298 | 467,229,663 |
End of period (including undistributed net investment income of $903,058 and undistributed net investment income of $320,332, respectively) | $ 179,632,831 | $ 212,647,298 |
Other Information Shares | | |
Sold | 624,503 | 1,419,391 |
Issued in reinvestment of distributions | 76,025 | 277,875 |
Redeemed | (1,155,797) | (5,990,879) |
Net increase (decrease) | (455,269) | (4,293,613) |
Financial Highlights
| Six months ended August 31, 2012 | Years ended February 28, |
| (Unaudited) | 2012 I | 2011 | 2010 | 2009 | 2008 I |
Selected Per-Share Data | | | | | | |
Net asset value, beginning of period | $ 53.02 | $ 56.26 | $ 42.01 | $ 23.89 | $ 44.34 | $ 53.00 |
Income from Investment Operations | | | | | | |
Net investment income (loss) D | .23 | .26 | .27 | .29 | .29 | .19 G |
Net realized and unrealized gain (loss) | (1.61) | (.34) | 14.13 | 18.21 | (19.29) | (4.66) |
Total from investment operations | (1.38) | (.08) | 14.40 | 18.50 | (19.00) | (4.47) |
Distributions from net investment income | (.08) | (.17) | (.17) | (.36) | (.25) | (.07) |
Distributions from net realized gain | (1.04) | (2.99) | - | (.02) | (1.21) | (4.13) |
Total distributions | (1.12) | (3.16) | (.17) | (.38) | (1.46) | (4.20) |
Redemption fees added to paid in capital D | - J | - J | .02 | - J | .01 | .01 |
Net asset value, end of period | $ 50.52 | $ 53.02 | $ 56.26 | $ 42.01 | $ 23.89 | $ 44.34 |
Total Return B,C | (2.66)% | .16% | 34.32% | 77.62% | (44.20)% | (8.89)% |
Ratios to Average Net Assets E,H | | | | | | |
Expenses before reductions | .90% A | .88% | .90% | 1.03% | 1.03% | .99% |
Expenses net of fee waivers, if any | .90% A | .88% | .90% | 1.03% | 1.03% | .99% |
Expenses net of all reductions | .89% A | .87% | .90% | 1.00% | 1.03% | .99% |
Net investment income (loss) | .87% A | .49% | .53% | .90% | .79% | .36% G |
Supplemental Data | | | | | | |
Net assets, end of period (000 omitted) | $ 179,633 | $ 212,647 | $ 467,230 | $ 107,842 | $ 79,705 | $ 92,432 |
Portfolio turnover rate F | 28% A | 82% | 114% | 265% | 81% | 84% |
A Annualized B Total returns for periods of less than one year are not annualized. C Total returns would have been lower if certain expenses had not been reduced during the applicable periods shown. D Calculated based on average shares outstanding during the period. E Fees and expenses of any underlying Fidelity Central Funds are not included in the Fund's expense ratio. The Fund indirectly bears its proportionate share of the expenses of any underlying Fidelity Central Funds. F Amount does not include the portfolio activity of any underlying Fidelity Central Funds. G Investment income per share reflects a large, non-recurring dividend which amounted to $.08 per share. Excluding this non-recurring dividend, the ratio of net investment income (loss) to average net assets would have been .21%. H Expense ratios reflect operating expenses of the Fund. Expenses before reductions do not reflect amounts reimbursed by the investment adviser or reductions from brokerage service arrangements or reductions from other expense offset arrangements and do not represent the amount paid by the Fund during periods when reimbursements or reductions occur. Expenses net of fee waivers reflect expenses after reimbursement by the investment adviser but prior to reductions from brokerage service arrangements or other expense offset arrangements. Expenses net of all reductions represent the net expenses paid by the Fund. I For the year ended February 29. J Amount represents less than $.01 per share. |
See accompanying notes which are an integral part of the financial statements.
Semiannual Report
Notes to Financial Statements
For the period ended August 31, 2012 (Unaudited)
1. Organization.
Air Transportation Portfolio, Defense and Aerospace Portfolio, Environment and Alternative Energy Portfolio, Industrial Equipment Portfolio, Industrials Portfolio, and Transportation Portfolio (the Funds) are non-diversified funds of Fidelity Select Portfolios (the Trust). The Trust is registered under the Investment Company Act of 1940, as amended (the 1940 Act), as an open-end management investment company organized as a Massachusetts business trust. The Funds invest primarily in securities of companies whose principal business activities fall within specific industries. Each Fund is authorized to issue an unlimited number of shares.
2. Investments in Fidelity Central Funds.
The Funds invest in Fidelity Central Funds, which are open-end investment companies available only to other investment companies and accounts managed by Fidelity Management & Research Company (FMR) and its affiliates. The Funds' Schedules of Investments list each of the Fidelity Central Funds held as of period end, if any, as an investment of each Fund, but do not include the underlying holdings of each Fidelity Central Fund. As an Investing Fund, each Fund indirectly bears its proportionate share of the expenses of the underlying Fidelity Central Funds.
The Money Market Central Funds seek preservation of capital and current income and are managed by Fidelity Investments Money Management, Inc. (FIMM), an affiliate of FMR.
A complete unaudited list of holdings for each Fidelity Central Fund is available upon request or at the Securities and Exchange Commission (the SEC) web site at www.sec.gov. In addition, the financial statements of the Fidelity Central Funds are available on the SEC web site or upon request.
3. Significant Accounting Policies.
The financial statements have been prepared in conformity with accounting principles generally accepted in the United States of America (GAAP), which require management to make certain estimates and assumptions at the date of the financial statements. Actual results could differ from those estimates. Subsequent events, if any, through the date that the financial statements were issued have been evaluated in the preparation of the financial statements. The following summarizes the significant accounting policies of the Funds:
Security Valuation. Investments are valued as of 4:00 p.m. Eastern time on the last calendar day of the period. In accordance with valuation policies and procedures approved by the Board of Trustees (the Board), each Fund attempts to obtain prices from one or more third party pricing vendor or broker to value their investments. When current market prices, quotations or rates are not readily available or reliable, securities will be fair valued in good faith by the FMR Fair Value Committee (the Committee), in accordance with procedures adopted by each Fund's Board. Factors used in determining fair value vary by security type and may include market or security specific events, changes in interest rates and credit quality. The frequency with which these procedures are used cannot be predicted and they may be utilized to a significant extent. The Committee oversees each Fund's valuation policies and procedures and is responsible for approving and reporting to the Board all fair value determinations.
Each Fund categorizes the inputs to valuation techniques used to value their investments into a disclosure hierarchy consisting of three levels as shown below:
Level 1 - quoted prices in active markets for identical investments
Level 2 - other significant observable inputs (including quoted prices for similar investments, interest rates, prepayment speeds, etc.)
Level 3 - unobservable inputs (including the Fund's own assumptions based on the best information available)
Valuation techniques used to value each Fund's investments by major category are as follows:
Equity securities, including restricted securities, for which market quotations are readily available, are valued at the last reported sale price or official closing price as reported by a third party pricing vendor on the primary market or exchange on which they are traded and are categorized as Level 1 in the hierarchy. In the event there were no sales during the day or closing prices are not available, securities are valued at the last quoted bid price or may be valued using the last available price and are generally categorized as Level 2 in the hierarchy. For foreign equity securities, when significant market or security specific events arise, comparisons to the valuation of American Depositary Receipts (ADRs), futures contracts, Exchange-Traded Funds (ETFs) and certain indexes as well as quoted prices for similar securities are used and are categorized as Level 2 in the hierarchy. Utilizing these techniques may result in transfers between Level 1 and Level 2. For restricted equity securities and private placements where observable inputs are limited, assumptions about market activity and risk are used and these securities are categorized as Level 3 in the hierarchy.
Semiannual Report
3. Significant Accounting Policies - continued
Security Valuation - continued
Debt securities, including restricted securities, are valued based on evaluated prices received from third party pricing vendors or from brokers who make markets in such securities. For corporate bonds and U.S. government and government agency obligations, pricing vendors utilize matrix pricing which considers yield or price of bonds of comparable quality, coupon, maturity and type as well as broker-supplied prices and are generally categorized as Level 2 in the hierarchy. When independent prices are unavailable or unreliable, debt securities may be valued utilizing pricing methodologies which consider similar factors that would be used by third party pricing vendors. These are generally categorized as Level 2 in the hierarchy but may be Level 3 depending on the circumstances.
Futures contracts are valued at the settlement price established each day by the board of trade or exchange on which they are traded and are categorized as Level 1 in the hierarchy. Investments in open-end mutual funds, including the Fidelity Central Funds, are valued at their closing net asset value each business day and are categorized as Level 1 in the hierarchy.
Changes in valuation techniques may result in transfers in or out of an assigned level within the disclosure hierarchy. The aggregate value of investments by input level, as of August 31, 2012, is included at the end of each applicable Fund's Schedule of Investments.
Foreign Currency Translation. The Funds may use foreign currency contracts to facilitate transactions in foreign-denominated securities. Gains and losses from these transactions may arise from changes in the value of the foreign currency or if the counterparties do not perform under the contracts' terms.
Foreign-denominated assets, including investment securities, and liabilities are translated into U.S. dollars at the exchange rates at period end. Purchases and sales of investment securities, income and dividends received and expenses denominated in foreign currencies are translated into U.S. dollars at the exchange rate in effect on the transaction date.
The effects of exchange rate fluctuations on investments are included with the net realized and unrealized gain (loss) on investment securities. Other foreign currency transactions resulting in realized and unrealized gain (loss) are disclosed separately.
Investment Transactions and Income. For financial reporting purposes, the Funds' investment holdings and NAV include trades executed through the end of the last business day of the period. The NAV per share for processing shareholder transactions is calculated as of the close of business of the New York Stock Exchange (NYSE), normally 4:00 p.m. Eastern time and includes trades executed through the end of the prior business day. Gains and losses on securities sold are determined on the basis of identified cost and may include proceeds received from litigation. Dividend income is recorded on the ex-dividend date, except for certain dividends from foreign securities where the ex-dividend date may have passed, which are recorded as soon as the Funds are informed of the ex-dividend date. Non-cash dividends included in dividend income, if any, are recorded at the fair market value of the securities received. Distributions received on securities that represent a return of capital or capital gains are recorded as a reduction of cost of investments and/or as a realized gain. The Funds estimate the components of distributions received that may be considered return of capital distributions or capital gain distributions. Interest income and distributions from the Fidelity Central Funds are accrued as earned. Interest income includes coupon interest and amortization of premium and accretion of discount on debt securities. Investment income is recorded net of foreign taxes withheld where recovery of such taxes is uncertain.
Expenses. Expenses directly attributable to a fund are charged to that fund. Expenses attributable to more than one fund are allocated among the respective funds on the basis of relative net assets or other appropriate methods. Expense estimates are accrued in the period to which they relate and adjustments are made when actual amounts are known.
Income Tax Information and Distributions to Shareholders. Each year, each Fund intends to qualify as a regulated investment company under Subchapter M of the Internal Revenue Code, including distributing substantially all of its taxable income and realized gains. As a result, no provision for income taxes is required. Each Fund files a U.S. federal tax return, in addition to state and local tax returns as required. A fund's federal income tax returns are subject to examination by the Internal Revenue Service (IRS) for a period of three fiscal years after they are filed. State and local tax returns may be subject to examination for an additional fiscal year depending on the jurisdiction. Foreign taxes are provided for based on each Fund's understanding of the tax rules and rates that exist in the foreign markets in which it invests.
Distributions are declared and recorded on the ex-dividend date. Income and capital gain distributions are determined in accordance with income tax regulations, which may differ from GAAP.
Capital accounts within the financial statements are adjusted for permanent book-tax differences. These adjustments have no impact on net assets or the results of operations. Temporary book-tax differences will reverse in a subsequent period.
Book-tax differences are primarily due to foreign currency transactions, certain foreign taxes, market discount, partnerships, deferred trustees compensation, capital loss carryforwards and losses deferred due to wash sales, future transactions and excise tax regulations.
Semiannual Report
Notes to Financial Statements (Unaudited) - continued
3. Significant Accounting Policies - continued
Income Tax Information and Distributions to Shareholders - continued
The federal tax cost of investment securities and unrealized appreciation (depreciation) as of period end were as follows for each Fund:
| Tax cost | Gross unrealized appreciation | Gross unrealized depreciation | Net unrealized appreciation (depreciation) on securities and
other investments |
Air Transportation Portfolio | $ 55,687,506 | $ 10,031,426 | $ (1,892,855) | $ 8,138,571 |
Defense and Aerospace Portfolio | 557,825,049 | 82,037,975 | (22,617,214) | 59,420,761 |
Environment and Alternative Energy Portfolio | 67,473,288 | 6,061,140 | (6,443,639) | (382,499) |
Industrial Equipment Portfolio | 263,154,348 | 37,764,329 | (4,194,728) | 33,569,601 |
Industrials Portfolio | 480,660,696 | 94,977,940 | (9,055,399) | 85,922,541 |
Transportation Portfolio | 148,227,620 | 29,859,125 | (7,010,136) | 22,848,989 |
Capital loss carryforwards are only available to offset future capital gains of the Funds to the extent provided by regulations and may be limited. Under the Regulated Investment Company Modernization Act of 2010 (the Act), the Funds are permitted to carry forward capital losses incurred in taxable years beginning after December 22, 2010 for an unlimited period and such capital losses are required to be used prior to any losses that expire. At February 29, 2012, capital loss carryforwards were as follows:
| Fiscal year of
expiration
2018 |
Environment and Alternative Energy Portfolio | $ (6,465,946) |
| No expiration | | |
| Short-term | Total no
expiration | Total capital loss
carryfoward |
Environment and Alternative Energy Portfolio | $ (3,902,668) | $ (3,902,668) | $ (10,368,614) |
Industrial Equipment Portfolio | (3,358,221) | (3,358,221) | (3,358,221) |
Trading (Redemption) Fees. Shares held by investors in the Funds less than 30 days are subject to a redemption fee equal to .75% of the net asset value of shares redeemed. All redemption fees, which reduce the proceeds of the shareholder redemption, are retained by the Funds and accounted for as an addition to paid in capital.
New Accounting Pronouncement. In December 2011, the Financial Accounting Standards Board issued Accounting Standard Update No. 2011-11, Disclosures about Offsetting Assets and Liabilities. The update creates new disclosure requirements requiring entities to disclose both gross and net information for derivatives and other financial instruments that are either offset in the Statement of Assets and Liabilities or subject to an enforceable master netting arrangement or similar agreement. The disclosure requirements are effective for annual reporting periods beginning on or after January 1, 2013, and interim periods within those annual periods. Management is currently evaluating the impact of the update's adoption on the Fund's financial statement disclosures.
4. Operating Policies.
Restricted Securities. The Funds may invest in securities that are subject to legal or contractual restrictions on resale. These securities generally may be resold in transactions exempt from registration or to the public if the securities are registered. Disposal of these securities may involve time-consuming negotiations and expense, and prompt sale at an acceptable price may be difficult. Information regarding restricted securities is included at the end of each applicable Fund's Schedule of Investments.
Semiannual Report
5. Derivative Instruments.
Risk Exposures and the Use of Derivative Instruments. Industrials Portfolio's (the Fund) investment objective allows the Fund to enter into various types of derivative contracts, including futures contracts. Derivatives are investments whose value is primarily derived from underlying assets, indices or reference rates and may be transacted on an exchange or over-the-counter (OTC). Derivatives may involve a future commitment to buy or sell a specified instrument based on specified terms, to exchange future cash flows at periodic intervals based on a notional principal amount, or for one party to make one or more payments upon the occurrence of specified events in exchange for periodic payments from the other party.
The Fund used derivatives to increase returns, to gain exposure to certain types of assets and to manage exposure to certain risks as defined below. The success of any strategy involving derivatives depends on analysis of numerous economic factors, and if the strategies for investment do not work as intended, the Fund may not achieve its objectives.
The Fund's use of derivatives increased or decreased its exposure to the following risk:
Equity Risk | Equity risk relates to the fluctuations in the value of financial instruments as a result of changes in market prices (other than those arising from interest rate risk or foreign exchange risk), whether caused by factors specific to an individual investment, its issuer, or all factors affecting all instruments traded in a market or market segment. |
The Fund is also exposed to additional risks from investing in derivatives, such as liquidity risk and counterparty credit risk. Liquidity risk is the risk that the Fund will be unable to close out the derivative in the open market in a timely manner. Counterparty credit risk is the risk that the counterparty will not be able to fulfill its obligation to the Fund. Counterparty credit risk related to exchange-traded futures contracts is minimal because of the protection provided by the exchange on which they trade.
Investing in derivatives may involve greater risks than investing in the underlying assets directly and, to varying degrees, may involve risk of loss in excess of any initial investment and collateral received and amounts recognized in the Statement of Assets and Liabilities. In addition, there may be the risk that the change in value of the derivative contract does not correspond to the change in value of the underlying instrument.
Futures Contracts. A futures contract is an agreement between two parties to buy or sell a specified underlying instrument for a fixed price at a specified future date. The Fund used futures contracts to manage its exposure to the stock market.
Upon entering into a futures contract, a fund is required to deposit either cash or securities (initial margin) with a clearing broker in an amount equal to a certain percentage of the face value of the contract. Futures contracts are marked-to-market daily and subsequent payments (variation margin) are made or received by a fund depending on the daily fluctuations in the value of the futures contracts and are recorded as unrealized appreciation or (depreciation). This receivable and/or payable is included in daily variation margin on futures contracts in the Statement of Assets and Liabilities. Realized gain or (loss) is recorded upon the expiration or closing of a futures contract. The net realized gain (loss) and change in net unrealized appreciation (depreciation) on futures contracts during the period is included in the Statement of Operations.
Any open futures contracts at period end are shown in the Schedule of Investments under the caption "Futures Contracts." The underlying face amount at value reflects each contract's exposure to the underlying instrument at period end and is representative of activity for the period. Securities deposited to meet initial margin requirements are identified in the Schedule of Investments.
During the period the Fund recognized net realized gain (loss) of $(164,698) and a change in net unrealized appreciation (depreciation) of $319,681 related to its investment in futures contracts. These amounts are included in the Statement of Operations.
6. Purchases and Sales of Investments.
Purchases and sales of securities, other than short-term securities, are noted in the table below.
| Purchases ($) | Sales ($) |
Air Transportation Portfolio | 14,544,645 | 23,932,867 |
Defense and Aerospace Portfolio | 159,391,686 | 182,798,558 |
Environment and Alternative Energy Portfolio | 15,166,275 | 25,496,447 |
Industrial Equipment Portfolio | 126,737,657 | 180,567,633 |
Industrials Portfolio | 211,570,933 | 200,081,149 |
Transportation Portfolio | 26,471,538 | 66,032,394 |
Semiannual Report
Notes to Financial Statements (Unaudited) - continued
7. Fees and Other Transactions with Affiliates.
Management Fee. FMR and its affiliates provide the Funds with investment management related services for which the Funds pay a monthly management fee. The management fee is the sum of an individual fund fee rate and an annualized group fee rate. The individual fund fee rate is applied to each Fund's average net assets. The group fee rate is based upon the average net assets of all the mutual funds advised by FMR. The group fee rate decreases as assets under management increase and increases as assets under management decrease. For the period, each Fund's annualized management fee rate expressed as a percentage of each Fund's average net assets was as follows:
| Individual Rate | Group Rate | Total |
Air Transportation Portfolio | .30% | .26% | .56% |
Defense and Aerospace Portfolio | .30% | .26% | .56% |
Environment and Alternative Energy Portfolio | .30% | .26% | .56% |
Industrial Equipment Portfolio | .30% | .26% | .56% |
Industrials Portfolio | .30% | .26% | .56% |
Transportation Portfolio | .30% | .26% | .56% |
Transfer Agent Fees. Fidelity Investments Institutional Operations Company, Inc. (FIIOC), an affiliate of FMR, is the Funds' transfer, dividend disbursing and shareholder servicing agent. FIIOC receives account fees and asset-based fees that vary according to account size and type of account. FIIOC pays for typesetting, printing and mailing of shareholder reports, except proxy statements. For the period, transfer agent fees were equivalent to the following annualized rates expressed as a percentage of average net assets:
Air Transportation Portfolio | .26% |
Defense and Aerospace Portfolio | .24% |
Environment and Alternative Energy Portfolio | .30% |
Industrial Equipment Portfolio | .20% |
Industrials Portfolio | .24% |
Transportation Portfolio | .26% |
Accounting and Security Lending Fees. Fidelity Service Company, Inc. (FSC), an affiliate of FMR, maintains each Fund's accounting records. The accounting fee is based on the level of average net assets for each month. Under a separate contract, FSC administers the security lending program. The security lending fee is based on the number and duration of lending transactions.
Brokerage Commissions. Certain Funds placed a portion of their portfolio transactions with brokerage firms which are affiliates of the investment adviser. The commissions paid to these affiliated firms were as follows:
| Amount |
Air Transportation Portfolio | $ 339 |
Defense and Aerospace Portfolio | 1,762 |
Environment and Alternative Energy Portfolio | 1,030 |
Industrial Equipment Portfolio | 5,675 |
Industrials Portfolio | 5,491 |
Transportation Portfolio | 3,423 |
8. Committed Line of Credit.
Certain Funds participate with other funds managed by FMR or an affiliate in a $4.25 billion credit facility (the "line of credit") to be utilized for temporary or emergency purposes to fund shareholder redemptions or for other short-term liquidity purposes. The participating funds have agreed to pay commitment fees on their pro-rata portion of the line of credit, which are reflected in Miscellaneous expenses on the Statement of Operations, and are as follows:
Air Transportation Portfolio | $ 97 |
Defense and Aerospace Portfolio | 936 |
Environment and Alternative Energy Portfolio | 103 |
Industrial Equipment Portfolio | 462 |
Industrials Portfolio | 762 |
Transportation Portfolio | 297 |
During the period, there were no borrowings on this line of credit.
Semiannual Report
9. Security Lending.
Certain Funds lend portfolio securities through a lending agent from time to time in order to earn additional income. For equity securities, a lending agent is used and may loan securities to certain qualified borrowers, including Fidelity Capital Markets (FCM), a broker-dealer affiliated with the Funds. On the settlement date of the loan, each applicable Fund receives collateral (in the form of U.S. Treasury obligations, letters of credit and/or cash) against the loaned securities and maintains collateral in an amount not less than 100% of the market value of the loaned securities during the period of the loan. The market value of the loaned securities is determined at the close of business of the Funds and any additional required collateral is delivered to the Funds on the next business day. If the borrower defaults on its obligation to return the securities loaned because of insolvency or other reasons, a fund could experience delays and costs in recovering the securities loaned or in gaining access to the collateral. Any cash collateral received is invested in the Fidelity Securities Lending Cash Central Fund. The value of loaned securities and cash collateral at period end are disclosed on each applicable Fund's Statement of Assets and Liabilities. At period end, there were no security loans outstanding with FCM. Security lending income represents the income earned on investing cash collateral, less rebates paid to borrowers and any lending agent fees associated with the loan, plus any premium payments received for lending certain types of securities. Security lending income is presented on each applicable Fund's Statement of Operations as a component of income from Fidelity Central Funds. FCM security lending activity as of and during the period was as follows:
| Security Lending
Income From Securities Loaned to FCM |
Environment and Alternative Energy Portfolio | $ 2,503 |
10. Expense Reductions.
Many of the brokers with whom FMR places trades on behalf of certain Funds provided services to these Funds in addition to trade execution. These services included payments of expenses on behalf of each applicable Fund. In addition, through arrangements with each applicable Fund's custodian, credits realized as a result of uninvested cash balances were used to reduce each applicable Fund's expenses. All of the applicable expense reductions are noted in the table below.
| Brokerage Service
reduction | Custody
expense
reduction |
Air Transportation Portfolio | $ 432 | $ - |
Defense and Aerospace Portfolio | 7,436 | 3 |
Environment and Alternative Energy Portfolio | 166 | - |
Industrial Equipment Portfolio | 2,411 | - |
Industrials Portfolio | 8,406 | 4 |
Transportation Portfolio | 1,759 | - |
11. Other.
The Funds' organizational documents provide former and current trustees and officers with a limited indemnification against liabilities arising in connection with the performance of their duties to the Funds. In the normal course of business, the Funds may also enter into contracts that provide general indemnifications. The Funds' maximum exposure under these arrangements is unknown as this would be dependent on future claims that may be made against the Funds. The risk of material loss from such claims is considered remote.
At the end of the period, Fidelity VIP FundsManager 60% was the owner of record of approximately 26% and 18% of the total outstanding shares of the Industrial Equipment Portfolio and Industrials Portfolio, respectively. Strategic Advisers U.S. Opportunities Fund was the owner of record of approximately 12% and 21% of the total outstanding shares of the Industrial Equipment Portfolio and Industrials Portfolio, respectively. Mutual funds managed by FMR or its affiliates were the owners of record in the aggregate, of approximately 45% and 50% of the total outstanding shares of Industrial Equipment Portfolio and Industrials Portfolio, respectively.
Semiannual Report
Board Approval of Investment Advisory Contracts and Management Fees
Air Transportation Portfolio
Defense and Aerospace Portfolio
Environment and Alternative Energy Portfolio
Industrial Equipment Portfolio
Industrials Portfolio
Transportation Portfolio
Each year, the Board of Trustees, including the Independent Trustees (together, the Board), votes on the renewal of the management contract and sub-advisory agreements (together, the Advisory Contracts) for each fund. The Board, assisted by the advice of fund counsel and Independent Trustees' counsel, requests and considers a broad range of information relevant to the renewal of the Advisory Contracts throughout the year.
The Board meets regularly and, at each of its meetings, considers factors that are relevant to its annual consideration of the renewal of each fund's Advisory Contracts, including the services and support provided to each fund and its shareholders. The Board has established various standing committees, each composed of and chaired by Independent Trustees with varying backgrounds, to which the Board has assigned specific subject matter responsibilities in order to enhance effective decision-making by the Board. The Board, acting directly and through its Committees, requests and receives information concerning the annual consideration of the renewal of each fund's Advisory Contracts. The Board also meets as needed to consider matters specifically related to the Board's annual consideration of the renewal of Advisory Contracts. Members of the Board may also meet with trustees of other Fidelity funds through ad hoc joint committees to discuss certain matters relevant to the Fidelity funds.
At its July 2012 meeting, the Board of Trustees, including the Independent Trustees, unanimously determined to renew each fund's Advisory Contracts. In reaching its determination, the Board considered all factors it believed relevant, including (i) the nature, extent, and quality of the services to be provided to each fund and its shareholders (including the investment performance of each fund); (ii) the competitiveness of each fund's management fee and total expense ratio relative to peer funds; (iii) the total costs of the services to be provided by and the profits to be realized by Fidelity from its relationship with each fund; (iv) the extent to which economies of scale exist and would be realized as each fund grows; and (v) whether fee levels reflect these economies of scale, if any, for the benefit of fund shareholders.
In considering whether to renew the Advisory Contracts for each fund, the Board reached a determination, with the assistance of fund counsel and Independent Trustees' counsel and through the exercise of its business judgment, that the renewal of the Advisory Contracts is in the best interests of each fund and its shareholders and that the compensation payable under the Advisory Contracts is fair and reasonable. The Board's decision to renew the Advisory Contracts was not based on any single factor, but rather was based on a comprehensive consideration of all the information provided to the Board at its meetings throughout the year. The Board, in reaching its determination to renew the Advisory Contracts, is aware that shareholders in each fund have a broad range of investment choices available to them, including a wide choice among mutual funds offered by Fidelity's competitors, and that each fund's shareholders, who have the opportunity to review and weigh the disclosure provided by the fund in its prospectus and other public disclosures, have chosen to invest in that fund, managed by Fidelity.
Nature, Extent, and Quality of Services Provided. The Board considered the staffing within the investment adviser, FMR, and the sub-advisers (together, the Investment Advisers), including the backgrounds of the funds' investment personnel, and also considered the funds' investment objectives, strategies, and related investment philosophies. The Independent Trustees also had discussions with senior management of Fidelity's investment operations and investment groups. The Board considered the structure of the portfolio manager compensation program and whether this structure provides appropriate incentives to act in the best interests of each fund.
Resources Dedicated to Investment Management and Support Services. The Board and the Fund Oversight and Research Committees reviewed the general qualifications and capabilities of the Investment Advisers' investment staff, including its size, education, experience, and resources, as well as the Investment Advisers' approach to recruiting, training, managing, and compensating investment personnel. The Board also noted that FMR has continued to increase the resources devoted to non-U.S. offices, including expansion of Fidelity's global investment organization. The Board noted that Fidelity's analysts have extensive resources, tools and capabilities that allow them to conduct sophisticated quantitative and fundamental analysis, as well as credit analysis of issuers, counterparties and guarantors. The Board also believes that Fidelity's investment professionals have sufficient access to global information and data so as to provide competitive investment results over time, and that those professionals also have access to sophisticated tools that permit them to assess portfolio construction and risk and performance attribution characteristics continuously, as well as to transmit new information and research conclusions rapidly around the world. Additionally, in its deliberations, the Board considered the Investment Advisers' trading and risk management capabilities and resources, which are an integral part of the investment management process.
Shareholder and Administrative Services. The Board considered (i) the nature, extent, quality, and cost of advisory, administrative, and shareholder services performed by the Investment Advisers and their affiliates under the Advisory Contracts and under separate agreements covering transfer agency, pricing and bookkeeping, and securities lending services for each fund; (ii) the nature and extent of the supervision of third party service providers, principally custodians and subcustodians; and (iii) the resources devoted to, and the record of compliance with, each fund's compliance policies and procedures. The Board also reviewed the allocation of fund brokerage, including allocations to brokers affiliated with the Investment Advisers, the use of brokerage commissions to pay fund expenses, and the use of "soft" commission dollars to pay for research services.
Semiannual Report
Board Approval of Investment Advisory Contracts and Management Fees - continued
The Board noted that the growth of fund assets over time across the complex allows Fidelity to reinvest in the development of services designed to enhance the value or convenience of the Fidelity funds as investment vehicles. These services include 24-hour access to account information and market information through telephone representatives and over the Internet, investor education materials and asset allocation tools, and the expanded availability of Fidelity Investor Centers.
Investment in a Large Fund Family. The Board considered the benefits to shareholders of investing in a Fidelity fund, including the benefits of investing in a fund that is part of a large family of funds offering a variety of investment disciplines and providing a large variety of mutual fund investor services. The Board noted that Fidelity had taken, or had made recommendations that resulted in the Fidelity funds taking, a number of actions over the previous year that benefited particular funds, including (i) continuing to dedicate additional resources to investment research and support of the senior management team that oversees asset management; (ii) persisting in efforts to enhance Fidelity's research capabilities, in particular, international research; (iii) launching new funds and making other enhancements to meet client needs for global and income-oriented solutions; (iv) continuing to launch dedicated lower cost underlying funds to meet investment management's portfolio construction needs related to expanding underlying fund options, specifically for the Freedom Fund product lines; (v) adopting a "Stock Selector" sector neutral investment approach and employing a team of portfolio managers who are sector specialists to manage certain funds; (vi) rationalizing product lines and gaining increased efficiencies through the mergers of several funds into other funds; (vii) strengthening the Spartan Index Fund product line by adding new funds and/or new low-cost institutional share classes, restructuring fund expenses to accommodate new classes, and reducing investment minimums for certain classes of shares; (viii) modifying the eligibility criteria for Institutional Class shares to increase their appeal to government entities and charitable investors; and (ix) reducing certain transfer agent fee rates.
Investment Performance. The Board considered whether each fund has operated in accordance with its investment objective, as well as its record of compliance with its investment restrictions. It also reviewed each fund's absolute investment performance, as well as each fund's relative investment performance measured over multiple periods against a third-party-sponsored index that reflects the market sector in which the fund invests. The Board noted that FMR believes that no meaningful peer group exists for the funds principally because most other funds in each fund's third-party peer group focus on different industries or sectors than the fund. For each fund, the following charts considered by the Board show, over the one-, three-, and five-year periods ended December 31, 2011, the fund's cumulative total returns and the cumulative total returns of a third-party-sponsored index ("benchmark").
Air Transportation Portfolio
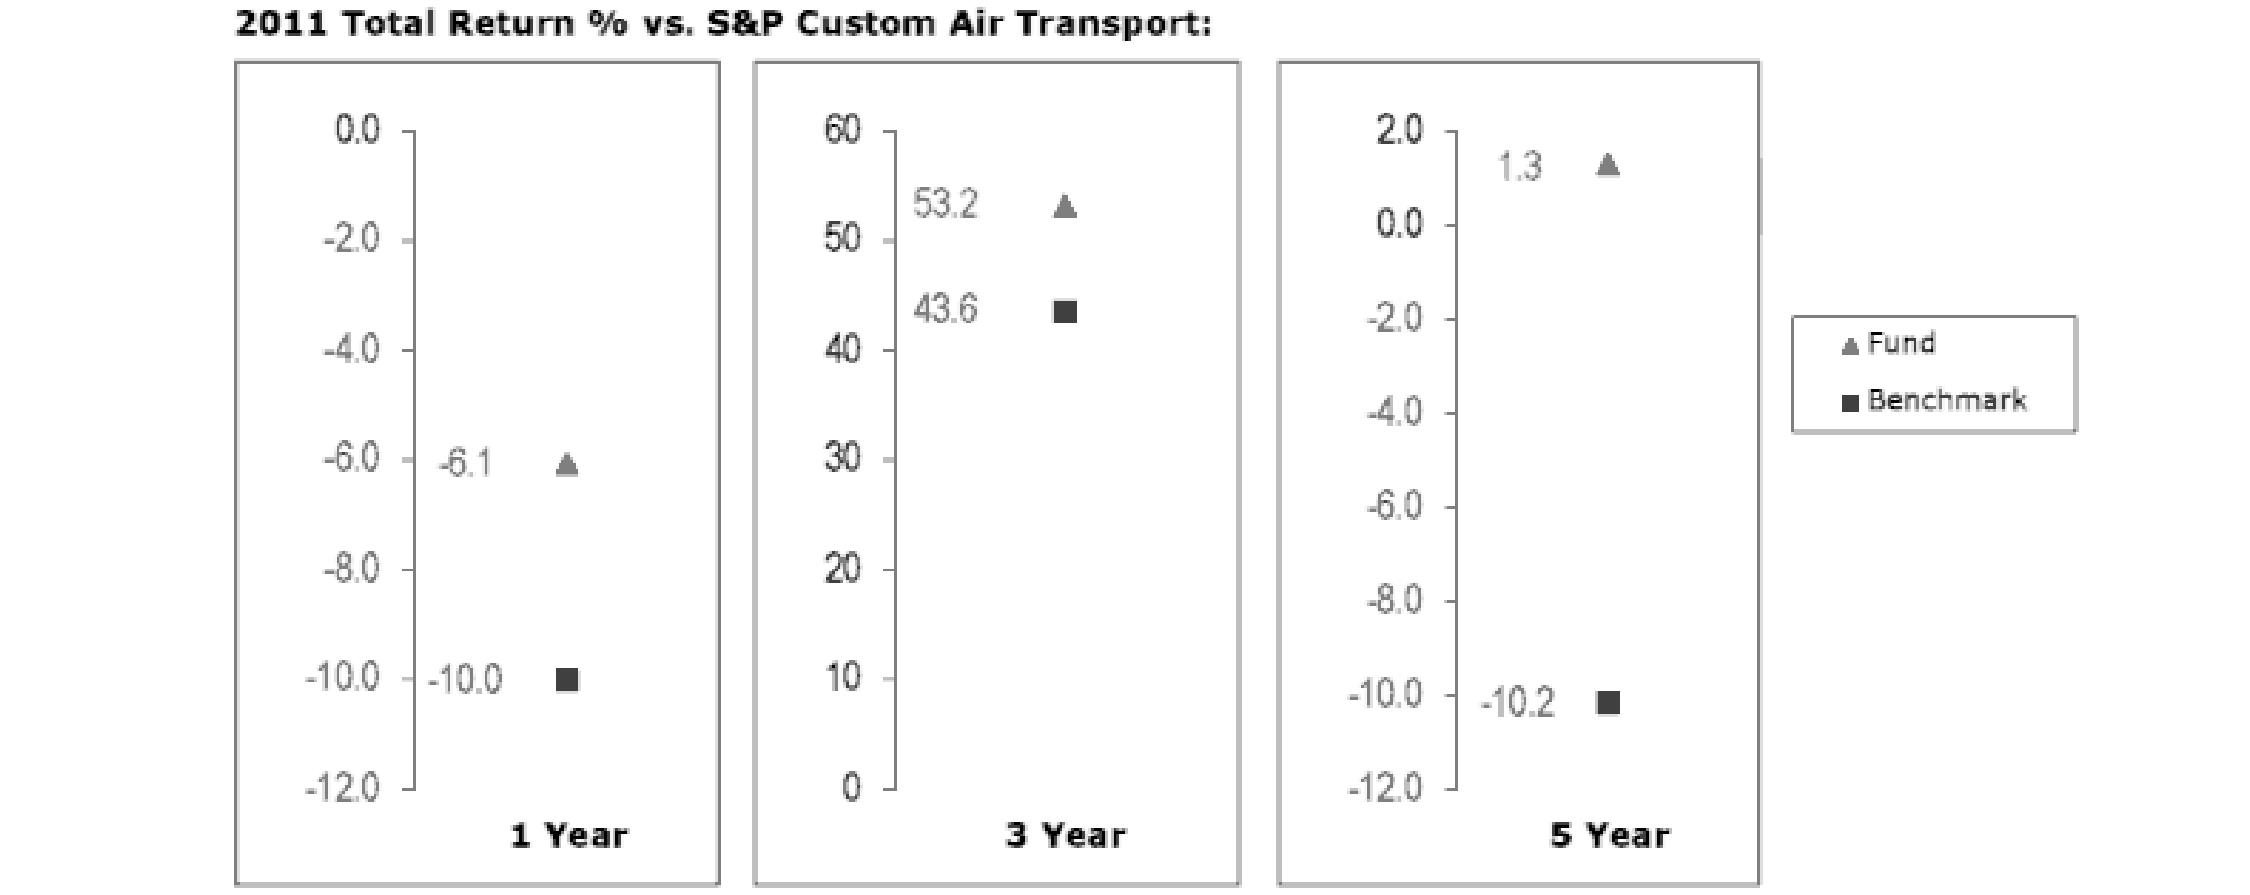
The Board noted that the investment performance of the fund compared favorably to its benchmark for all the periods shown. The Board noted that there was a portfolio management change for the fund in January 2012. The Board also reviewed the fund's performance since inception as well as performance in the current year.
Semiannual Report
Defense and Aerospace Portfolio
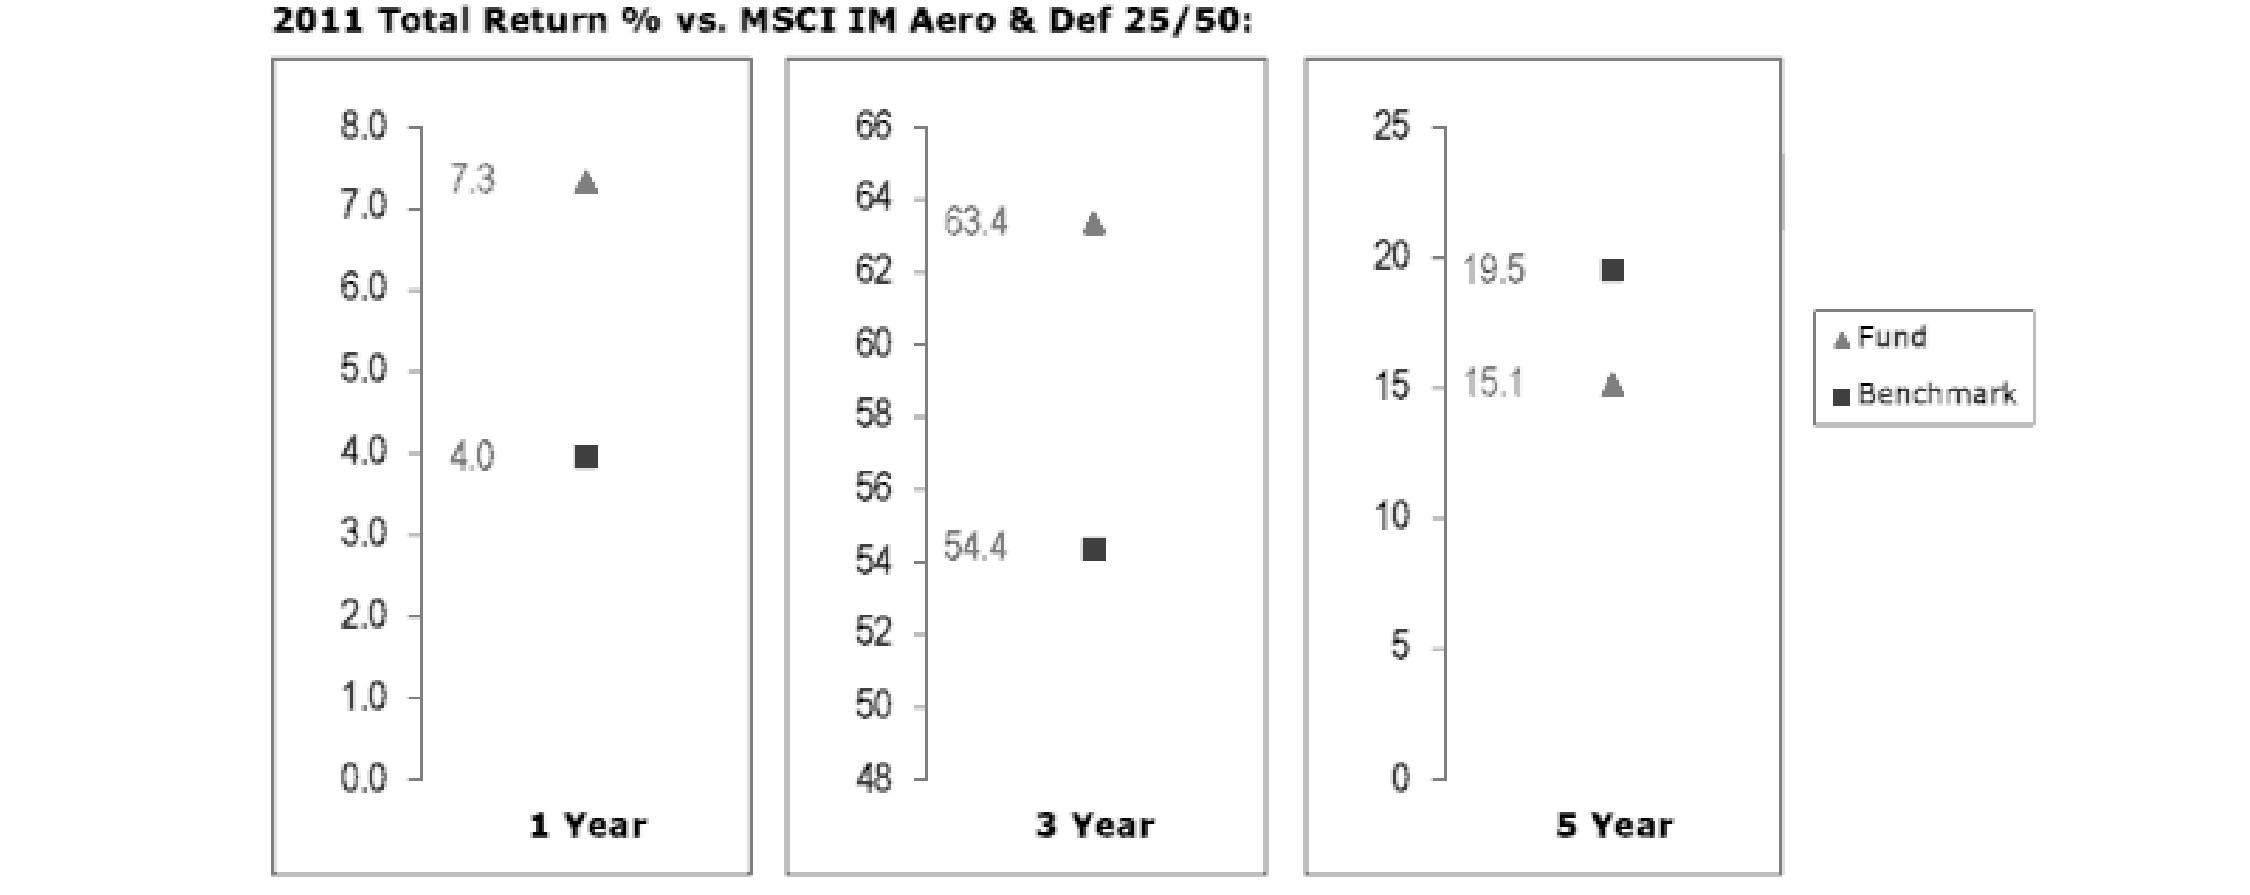
The Board noted that the investment performance of the fund compared favorably to its benchmark for the one- and three-year periods, although the fund's five-year cumulative total return was lower than its benchmark. The Board noted that there was a portfolio management change for the fund in January 2012. The Board also reviewed the fund's performance since inception as well as performance in the current year.
Environment and Alternative Energy Portfolio
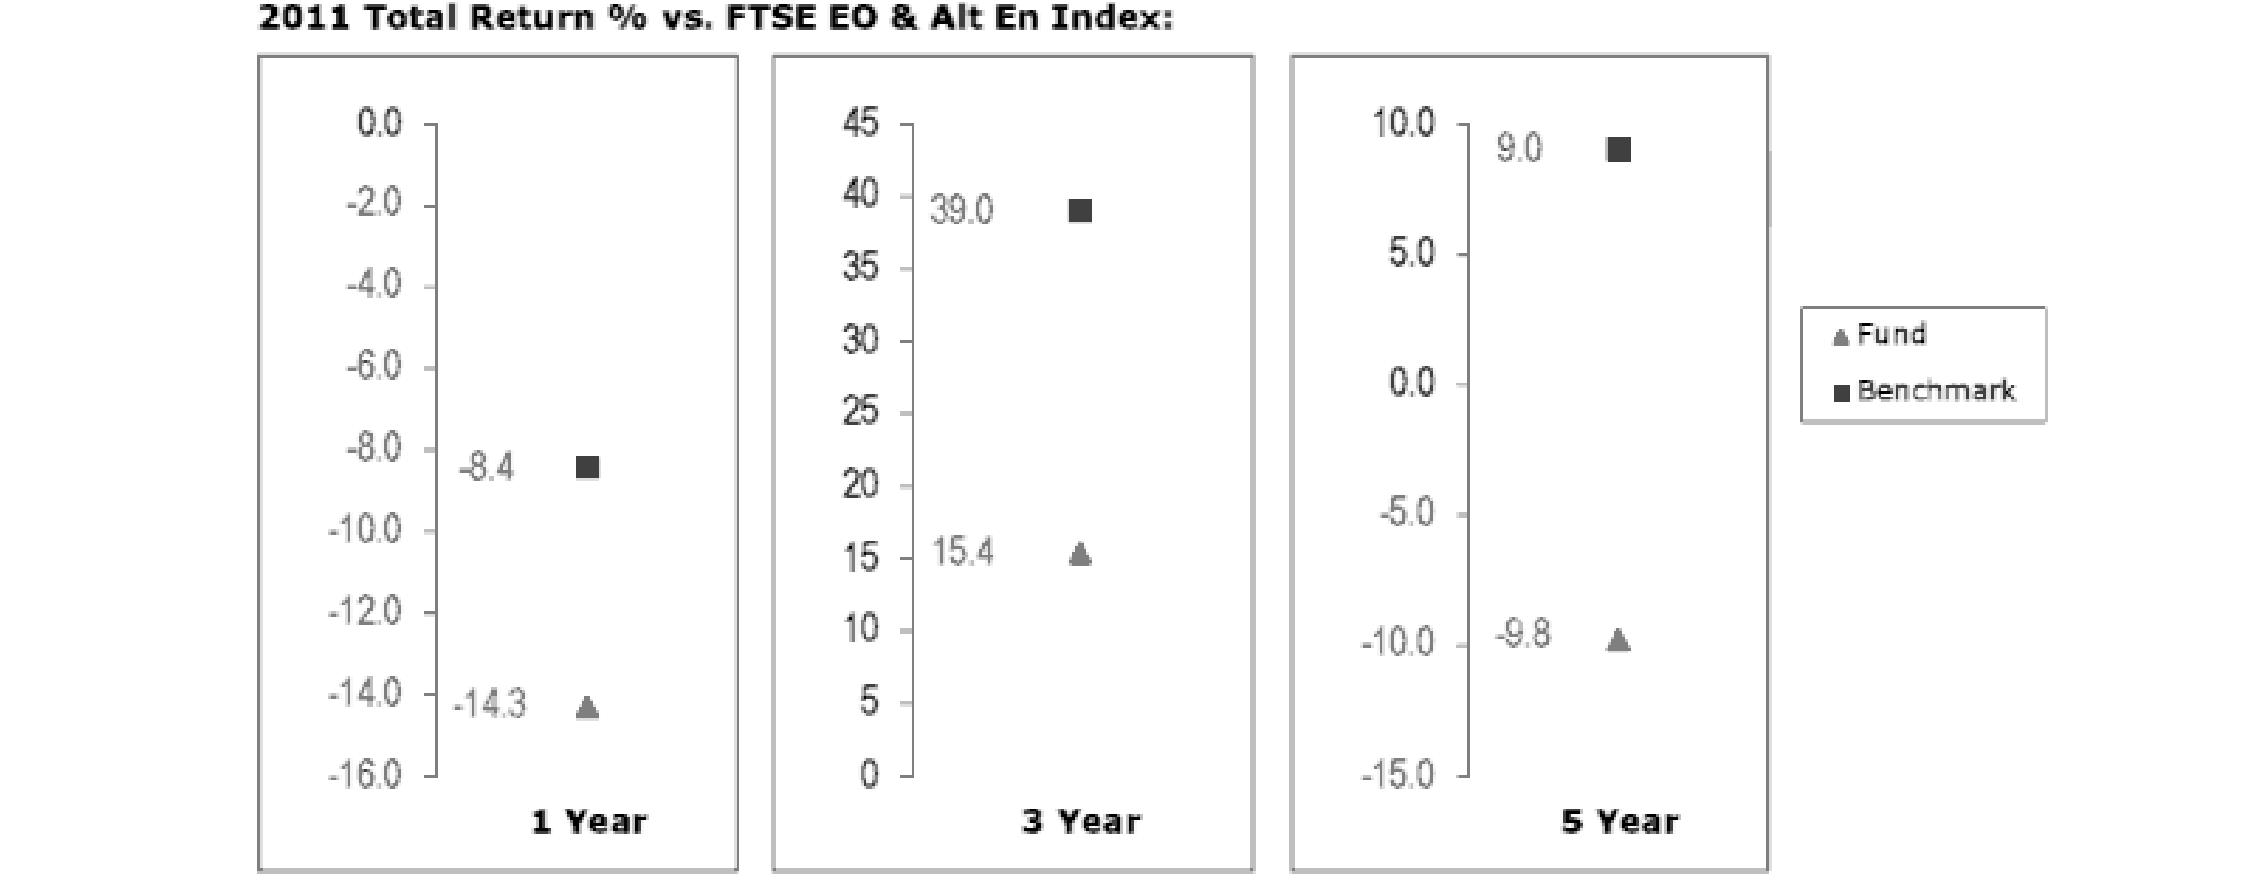
The Board noted that the investment performance of the fund was lower than its benchmark for all the periods shown. The Board discussed with FMR actions to improve the fund's below-benchmark performance. The Board noted that this fund had underperformed in the past and discussed with FMR its disappointment with the continued underperformance of the fund. The Board also reviewed the fund's performance since inception as well as performance in the current year. The Board will continue to closely monitor the performance of the fund in the coming year and discuss with FMR other appropriate actions to address the performance of the fund.
Semiannual Report
Board Approval of Investment Advisory Contracts and Management Fees - continued
Industrial Equipment Portfolio
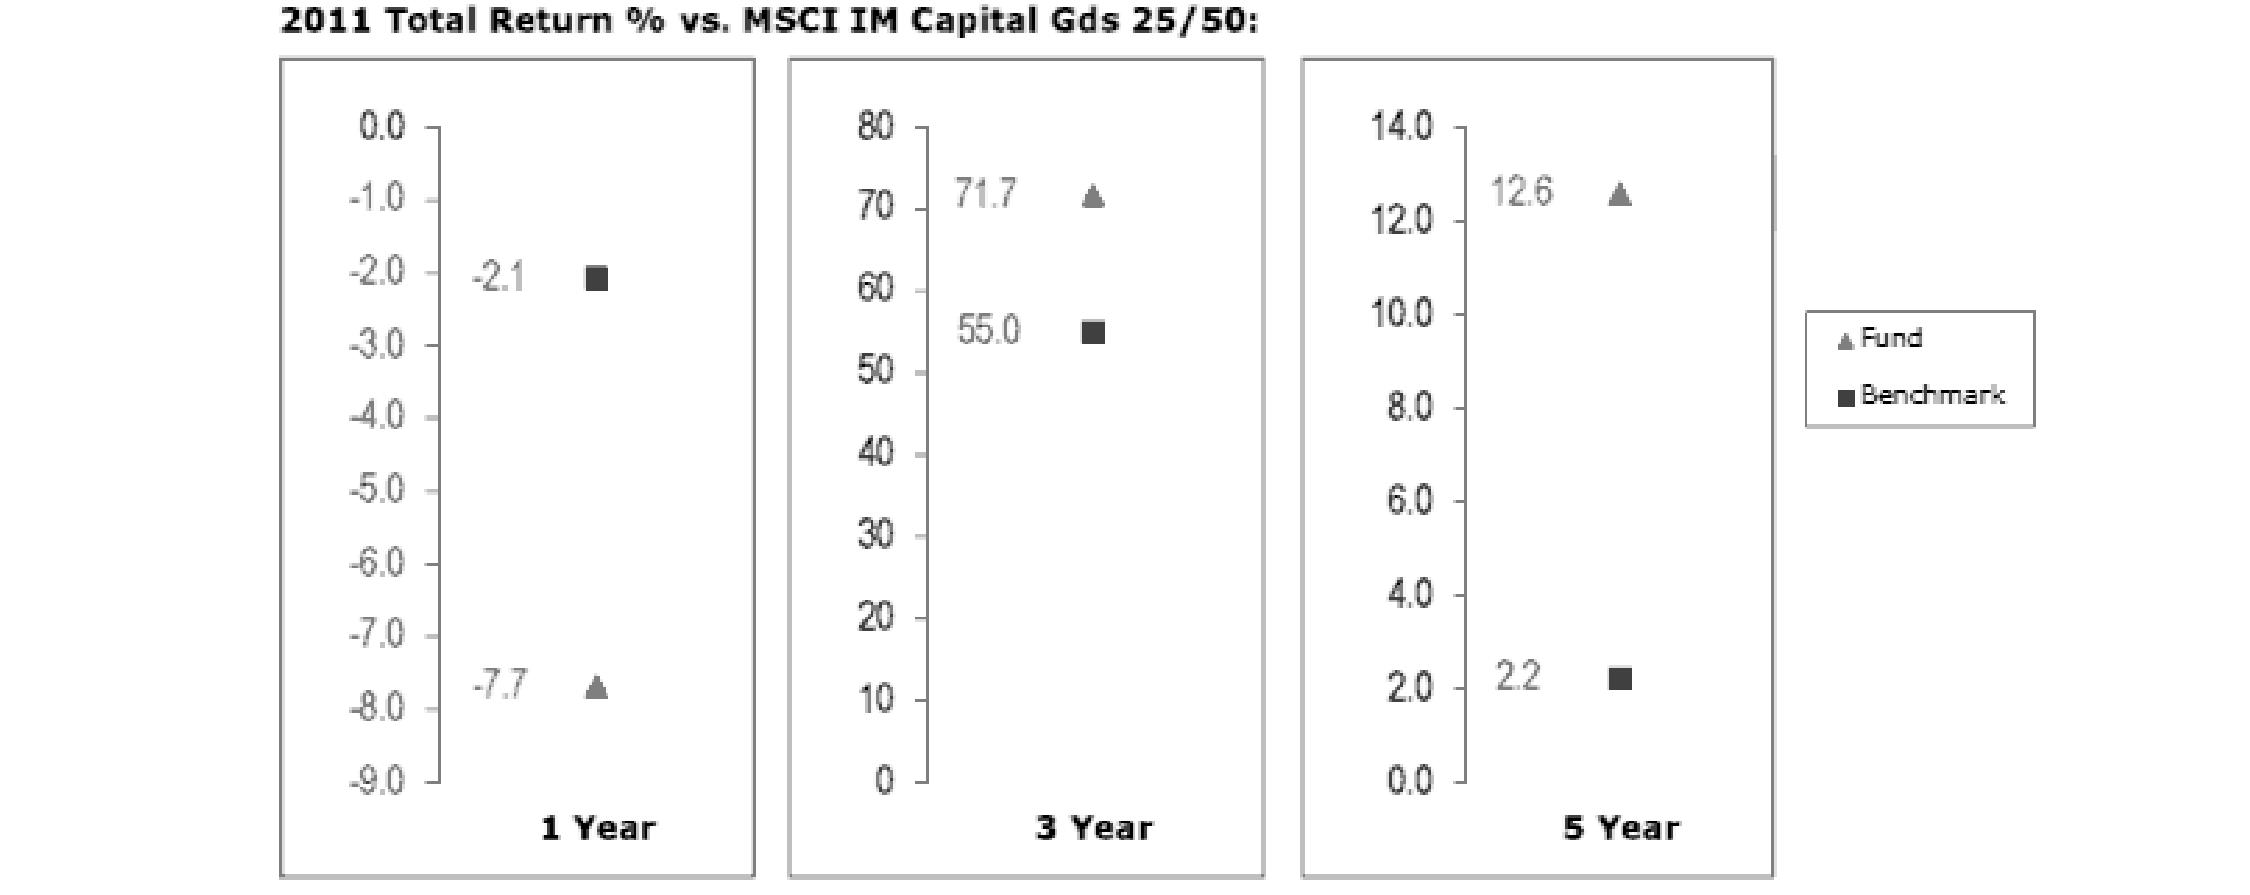
The Board noted that the investment performance of the fund compared favorably to its benchmark for the three- and five-year periods, although the fund's one-year total return was lower than its benchmark. The Board also reviewed the fund's performance since inception as well as performance in the current year.
Industrials Portfolio
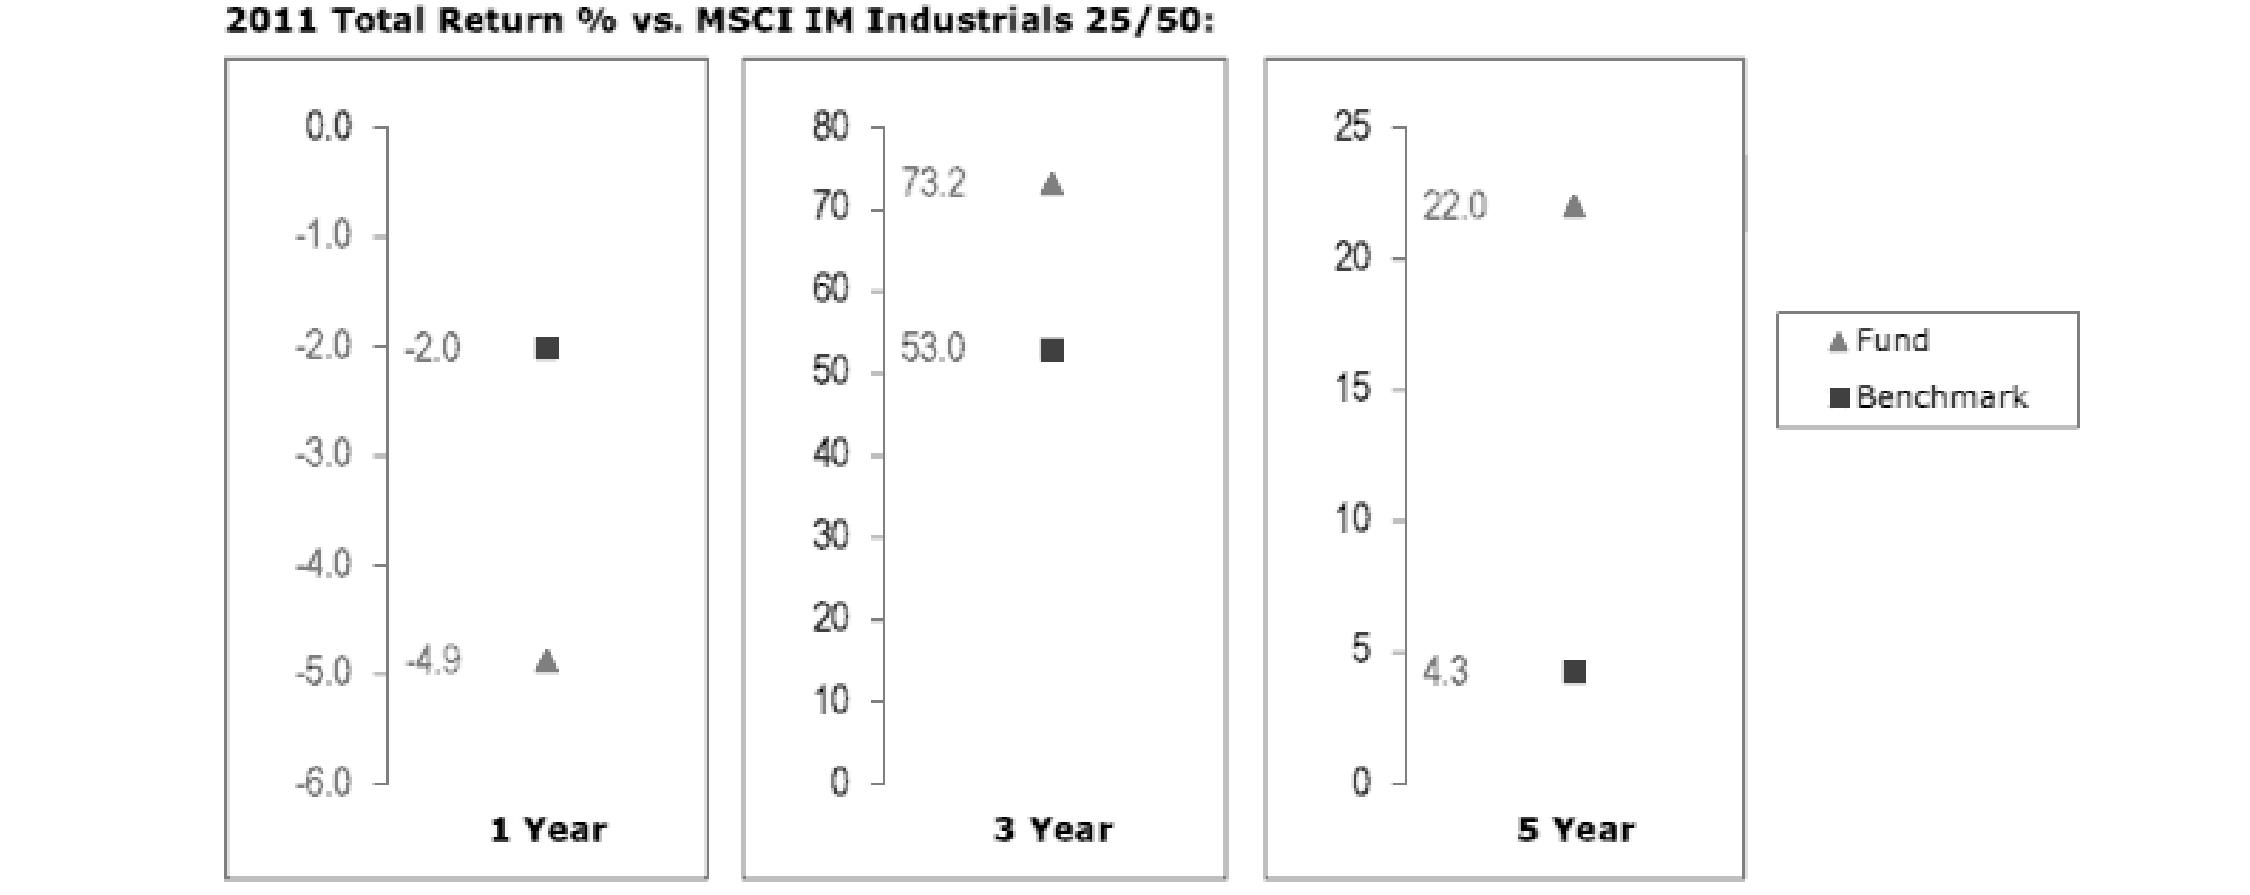
The Board noted that the investment performance of the fund compared favorably to its benchmark for the three- and five-year periods, although the fund's one-year total return was lower than its benchmark. The Board also reviewed the fund's performance since inception as well as performance in the current year.
Semiannual Report
Transportation Portfolio
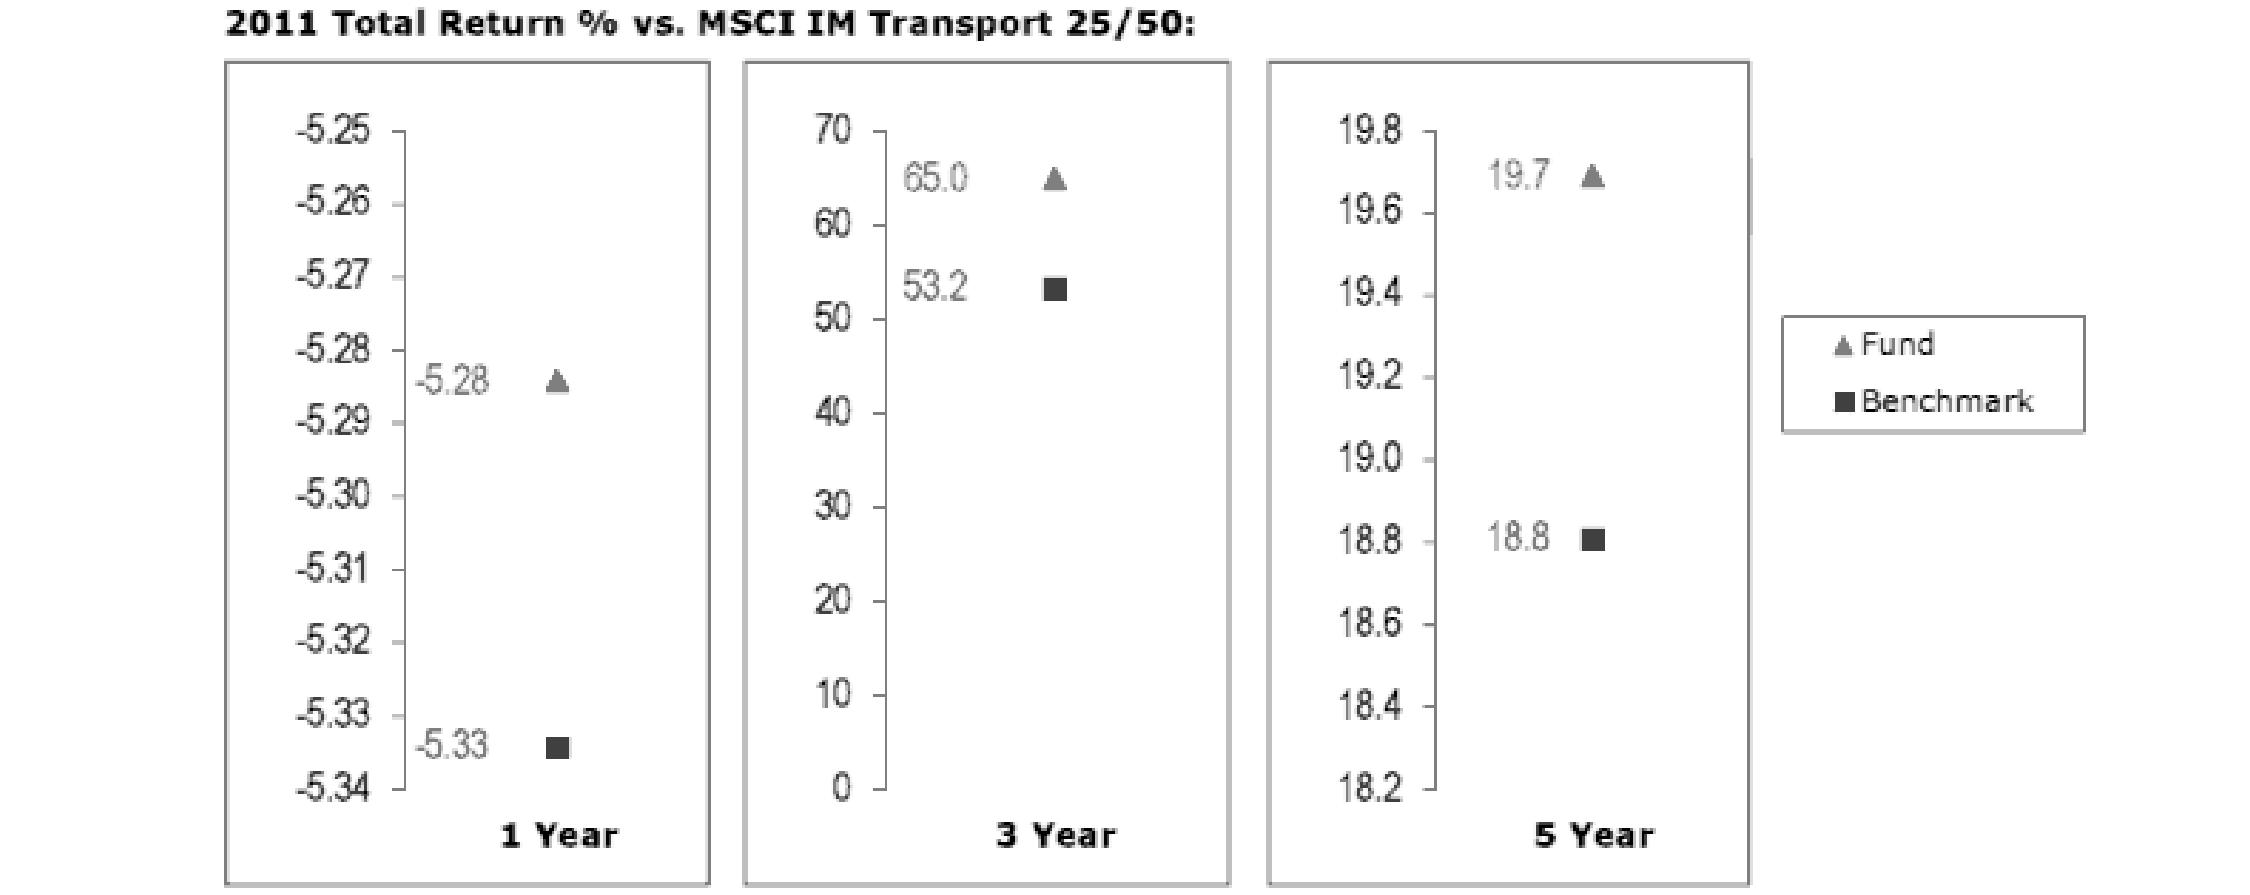
The Board noted that the investment performance of the fund compared favorably to its benchmark for all the periods shown. The Board noted that there was a portfolio management change for the fund in January 2012. The Board also reviewed the fund's performance since inception as well as performance in the current year.
Based on its review, the Board concluded that the nature, extent, and quality of services provided to each fund under the Advisory Contracts should benefit each fund's shareholders.
Competitiveness of Management Fee and Total Expense Ratio. The Board considered each fund's management fee and total expense ratio compared to "mapped groups" of competitive funds and classes. Fidelity creates "mapped groups" by combining similar Lipper investment objective categories that have comparable management fee characteristics. Combining Lipper investment objective categories aids the Board's management fee and total expense ratio comparisons by broadening the competitive group used for comparison and by reducing the number of universes to which various Fidelity funds are compared.
Management Fee. The Board considered two proprietary management fee comparisons for the 12-month periods shown in the charts below. The group of Lipper funds used by the Board for management fee comparisons is referred to below as the "Total Mapped Group." The Total Mapped Group comparison focuses on a fund's standing relative to the total universe of comparable funds available to investors in terms of gross management fees before expense reimbursements or caps. "TMG %" represents the percentage of funds in the Total Mapped Group that had management fees that were lower than a fund's. For example, a TMG % of 6% means that 94% of the funds in the Total Mapped Group had higher management fees than a fund. The "Asset-Size Peer Group" (ASPG) comparison focuses on a fund's standing relative to non-Fidelity funds similar in size to the fund within the Total Mapped Group. The ASPG represents at least 15% of the funds in the Total Mapped Group with comparable asset size and management fee characteristics, subject to a minimum of 50 funds (or all funds in the Total Mapped Group if fewer than 50). Additional information, such as the ASPG quartile in which a fund's management fee ranked, is also included in the charts and considered by the Board.
Semiannual Report
Board Approval of Investment Advisory Contracts and Management Fees - continued
Air Transportation Portfolio
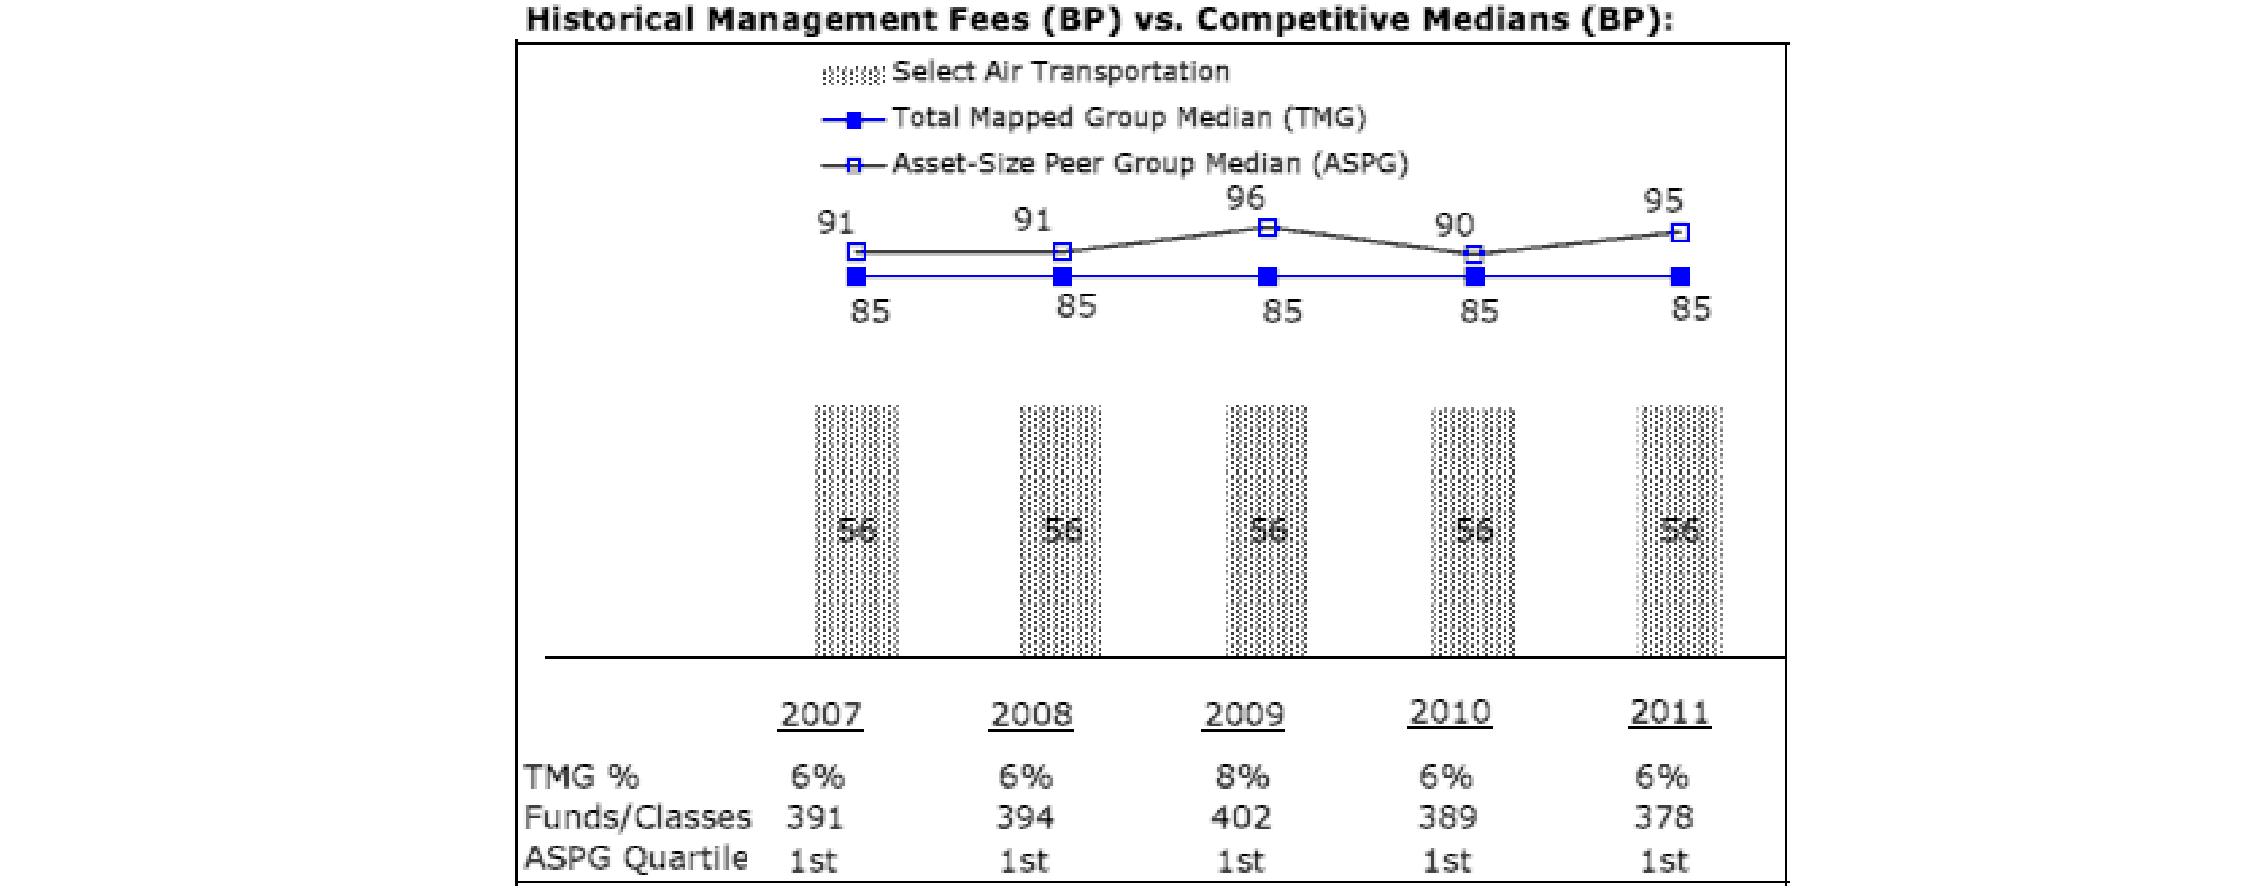
Defense and Aerospace Portfolio
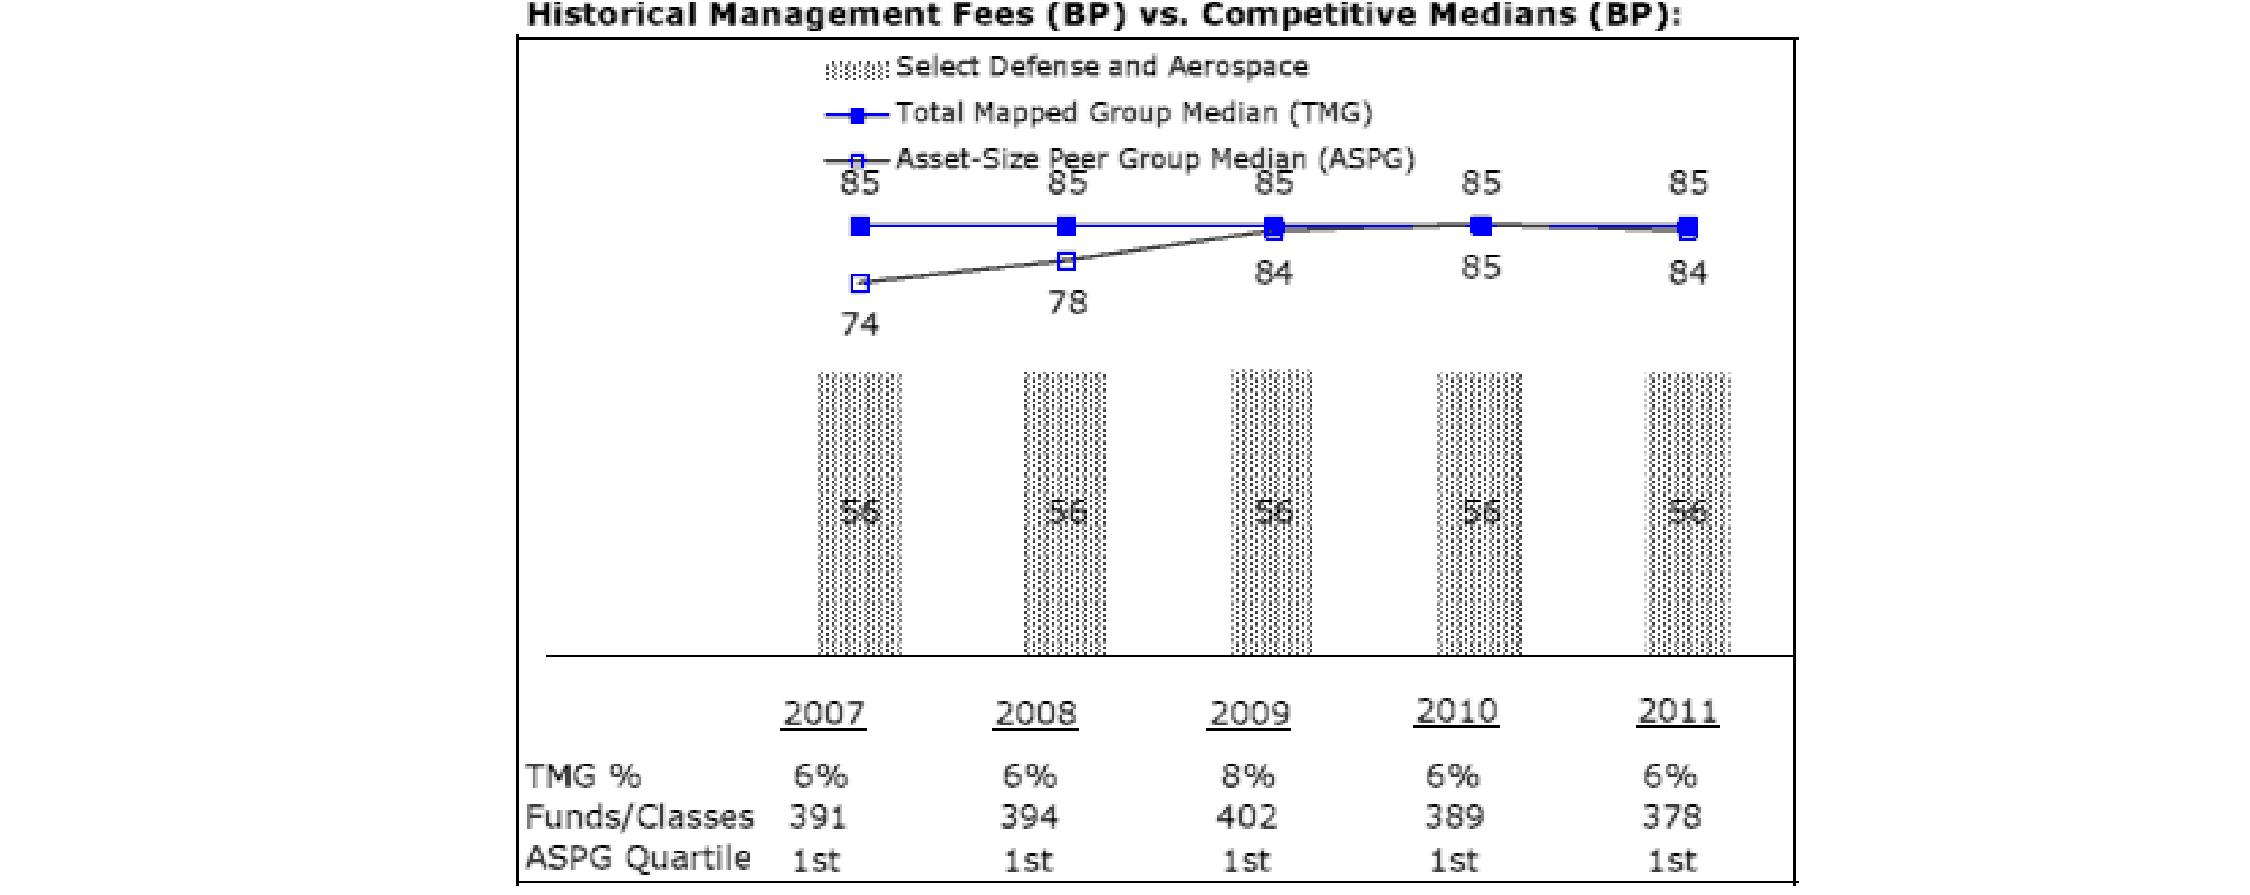
Semiannual Report
Environment and Alternative Energy Portfolio
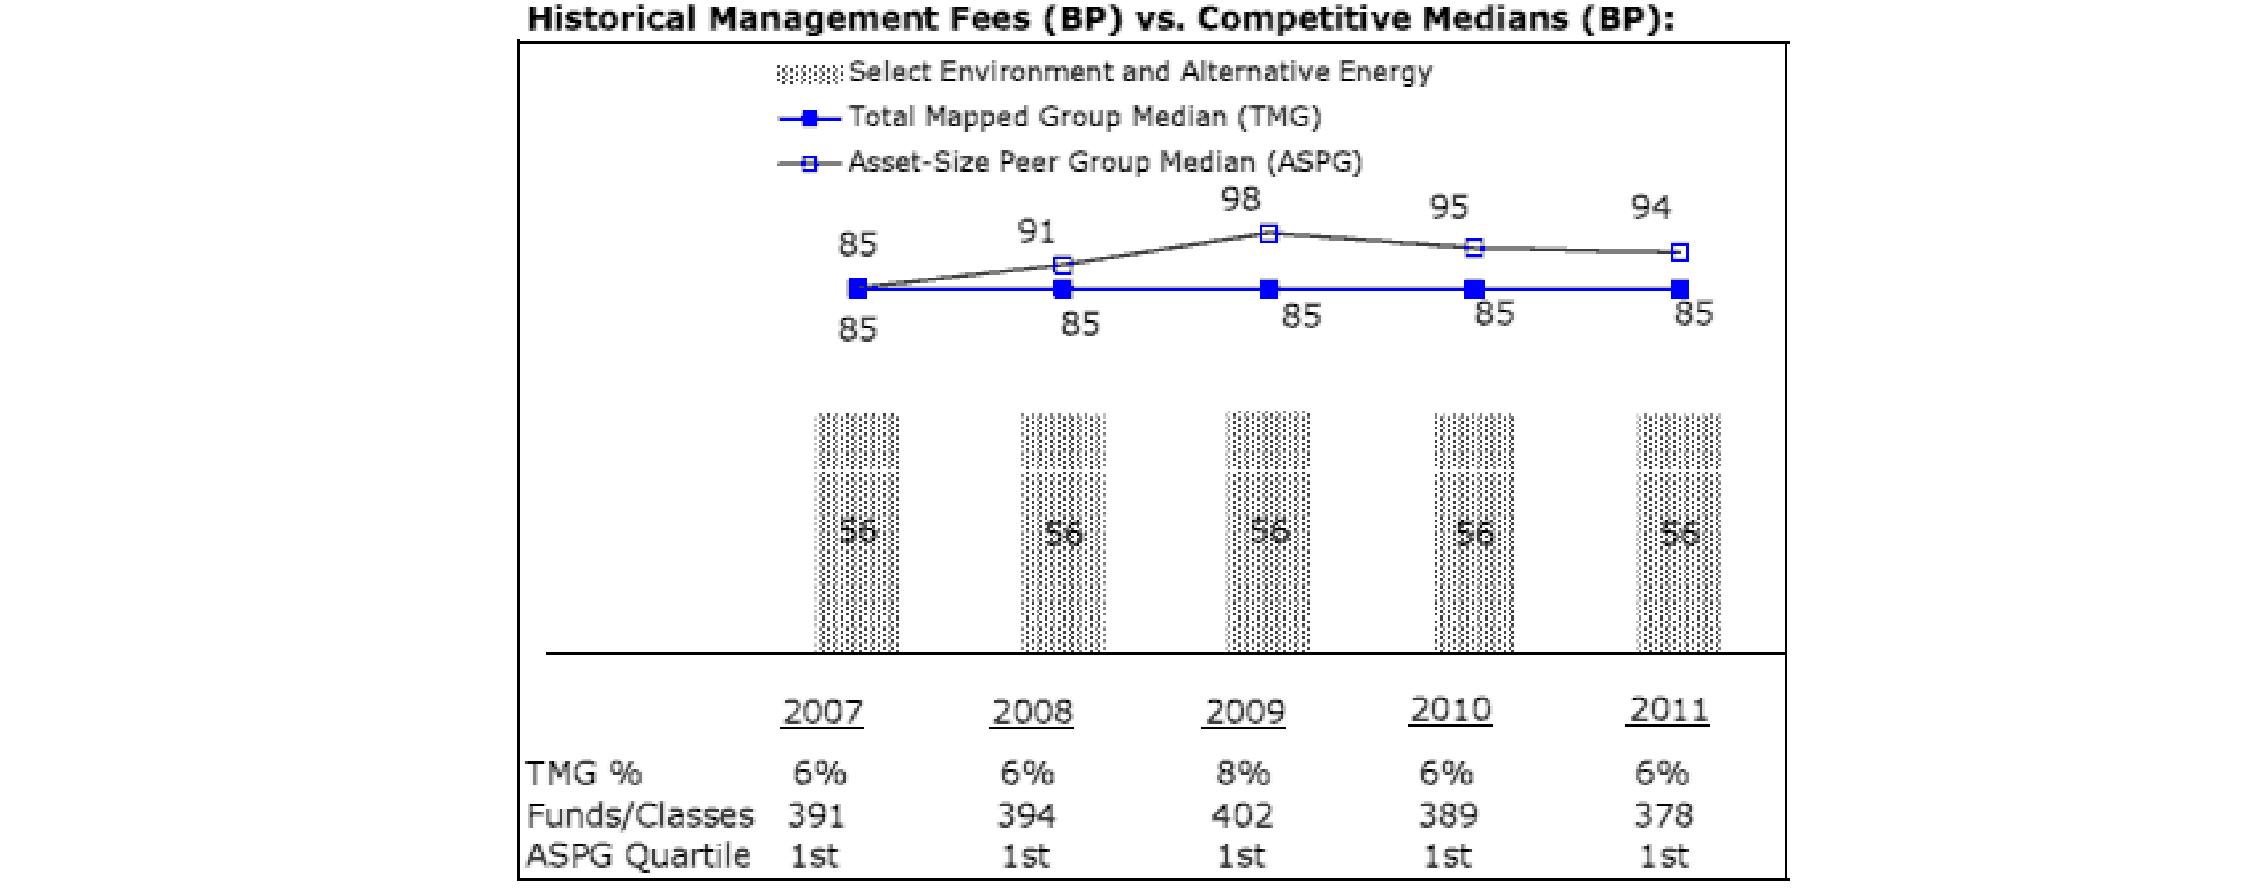
Industrial Equipment Portfolio
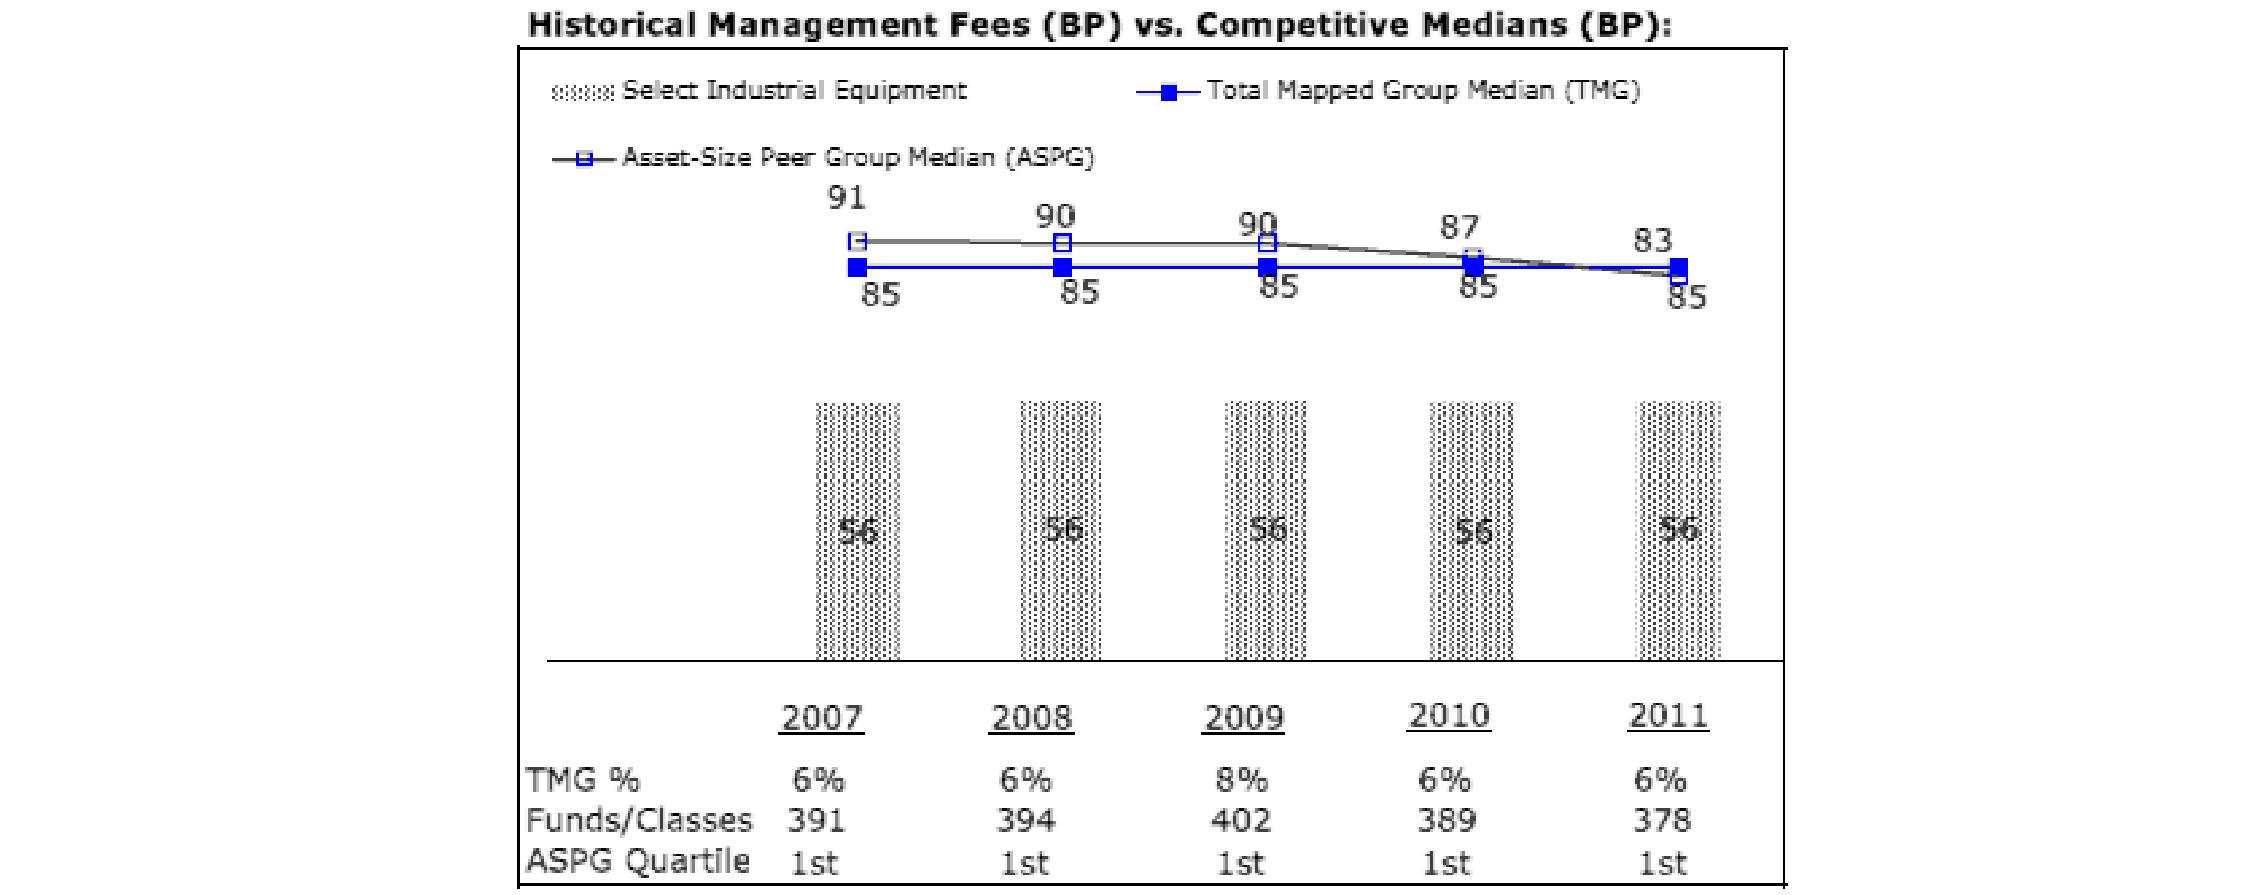
Semiannual Report
Board Approval of Investment Advisory Contracts and Management Fees - continued
Industrials Portfolio
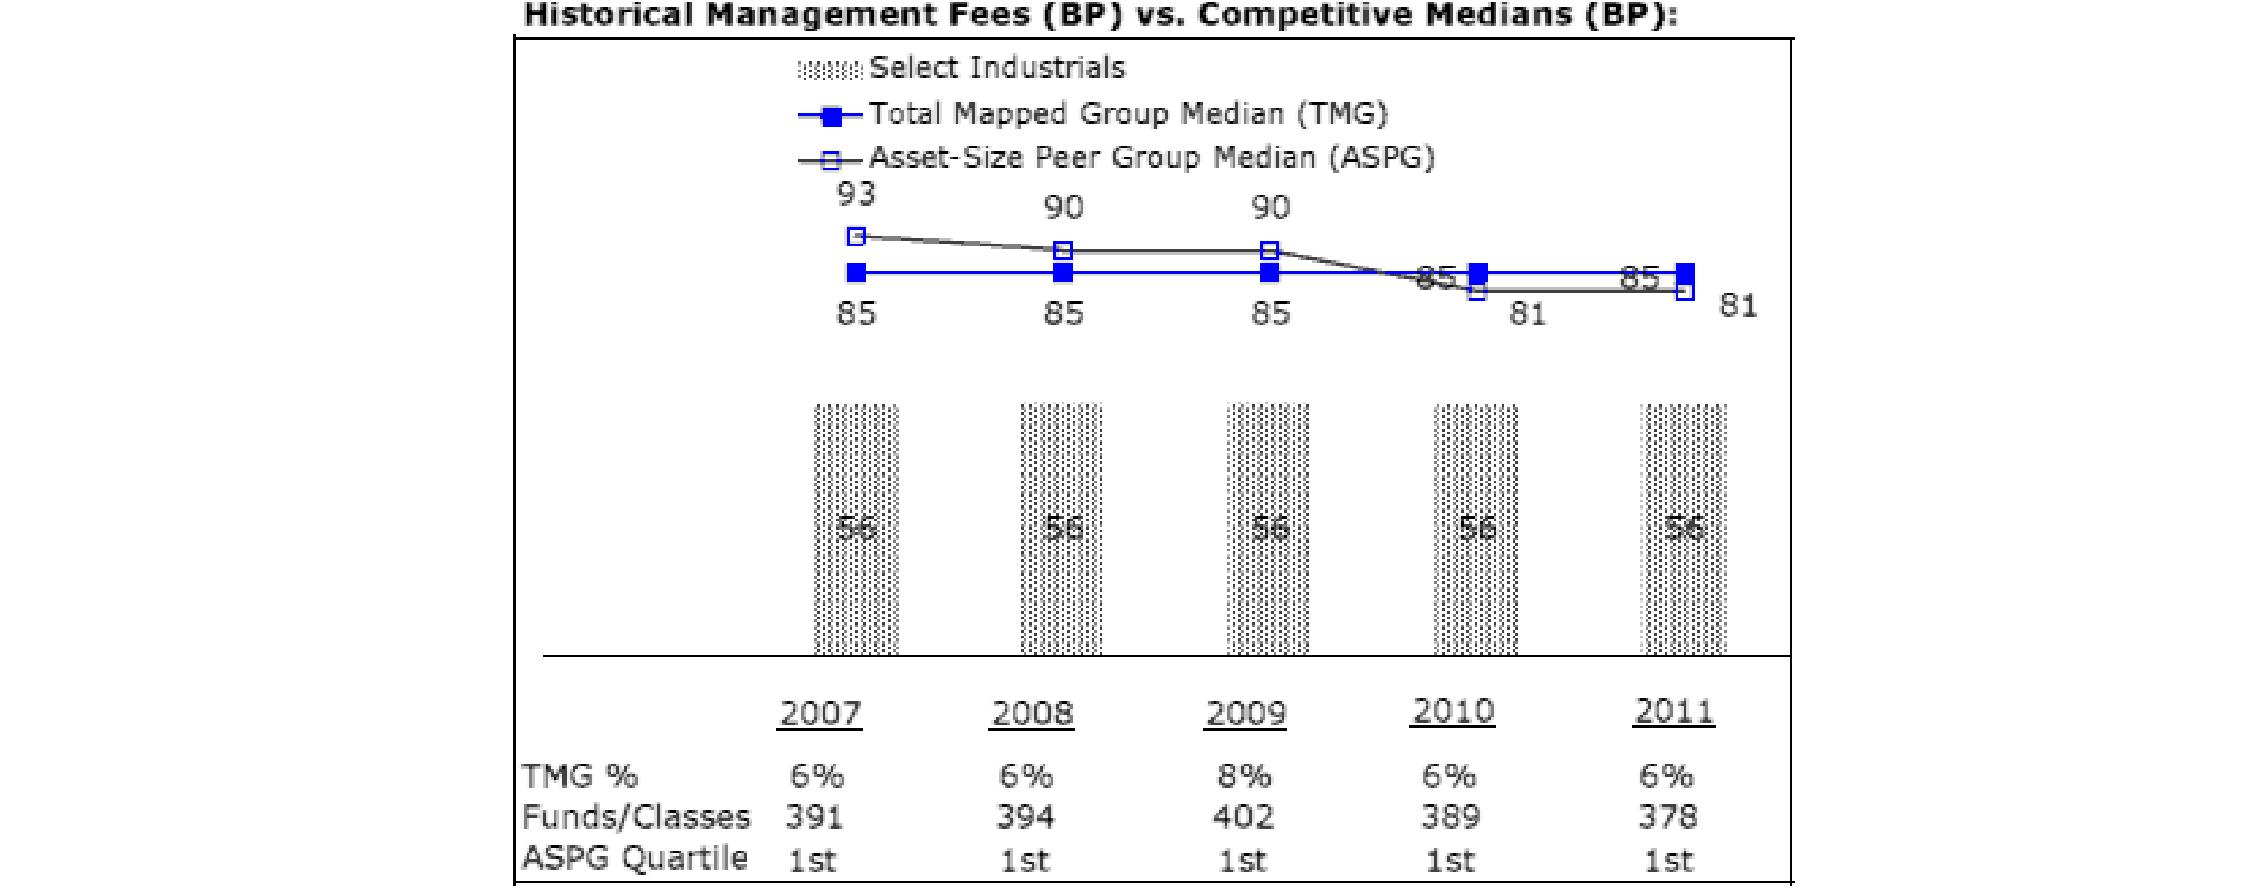
Transportation Portfolio
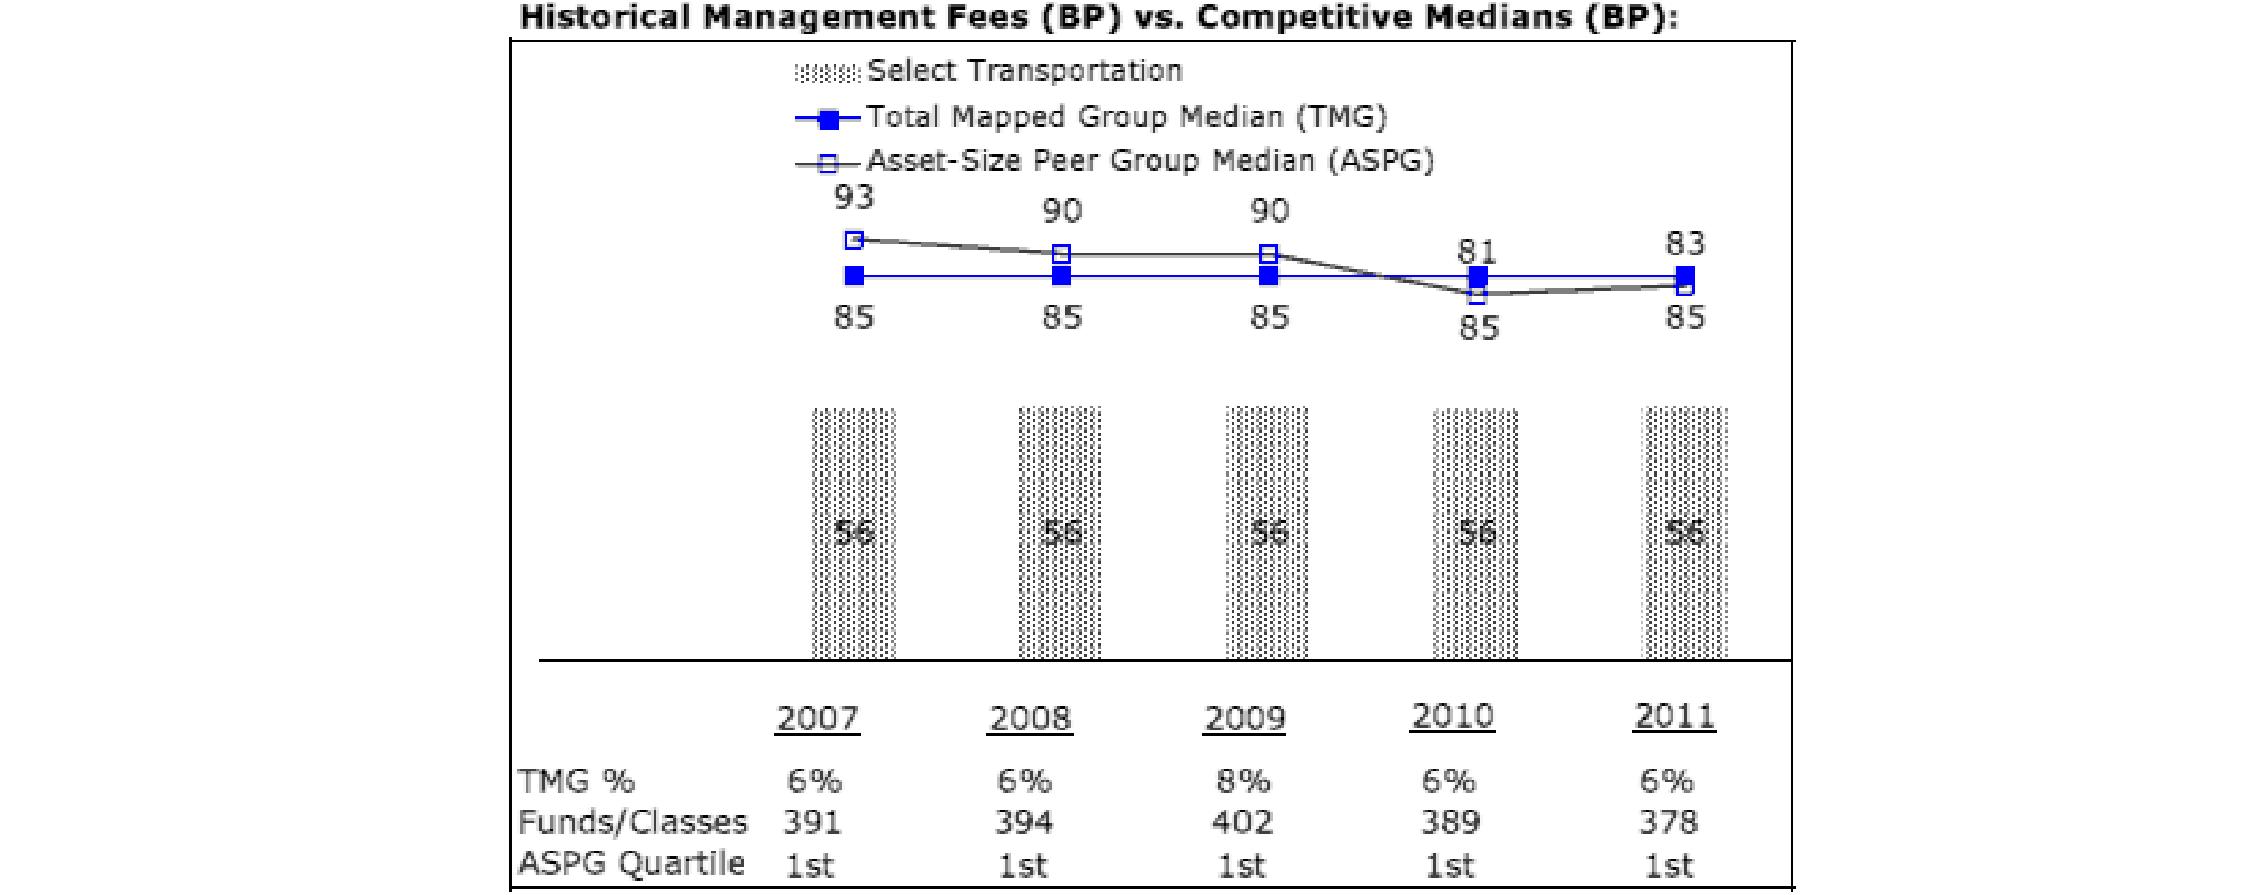
The Board noted that each fund's management fee ranked below the median of its Total Mapped Group and below the median of its ASPG for 2011.
Based on its review, the Board concluded that each fund's management fee is fair and reasonable in light of the services that the fund receives and the other factors considered.
Total Expense Ratio. In its review of each fund's total expense ratio, the Board considered the fund's management fee as well as other fund expenses, such as transfer agent fees, pricing and bookkeeping fees, and custodial, legal, and audit fees. The Board also noted the effects of any waivers and reimbursements on fees and expenses. As part of its review, the Board also considered the current and historical total expense ratios of each fund compared to competitive fund median expenses. Each fund is compared to those funds and classes in the Total Mapped Group (used by the Board for management fee comparisons) that have a similar sales load structure.
The Board noted that each fund's total expense ratio ranked below its competitive median for 2011.
Fees Charged to Other Fidelity Clients. The Board also considered Fidelity fee structures and other information with respect to clients of FMR and its affiliates, such as other mutual funds advised or subadvised by FMR or its affiliates, pension plan clients, and other institutional clients. The Board noted the findings of the 2010 ad hoc joint committee (created with the board of other Fidelity funds), which reviewed and compared Fidelity's institutional investment advisory business with its business of providing services to the Fidelity funds, including the differences in services provided, fees charged, and costs incurred, as well as competition in their respective marketplaces.
Semiannual Report
Based on its review of total expense ratios and fees charged to other Fidelity clients, the Board concluded that each fund's total expense ratio was reasonable in light of the services that the fund and its shareholders receive and the other factors considered.
Costs of the Services and Profitability. The Board considered the revenues earned and the expenses incurred by Fidelity in conducting the business of developing, marketing, distributing, managing, administering and servicing each fund and its shareholders. The Board also considered the level of Fidelity's profits in respect of all the Fidelity funds.
On an annual basis, FMR presents to the Board Fidelity's profitability for each fund. Fidelity calculates the profitability for each fund, as well as aggregate profitability for groups of Fidelity funds and all Fidelity funds, using a series of detailed revenue and cost allocation methodologies which originate with the books and records of Fidelity on which Fidelity's audited financial statements are based. The Audit Committee of the Board reviews any significant changes from the prior year's methodologies.
PricewaterhouseCoopers LLP (PwC), independent registered public accounting firm and auditor to Fidelity and certain Fidelity funds, has been engaged annually by the Board as part of the Board's assessment of Fidelity's profitability analysis. PwC's engagement includes the review and assessment of Fidelity's methodologies used in determining the revenues and expenses attributable to Fidelity's mutual fund business, and completion of agreed-upon procedures surrounding the mathematical accuracy of fund profitability and its conformity to allocation methodologies. After considering PwC's reports issued under the engagement and information provided by Fidelity, the Board concluded that while other allocation methods may also be reasonable, Fidelity's profitability methodologies are reasonable in all material respects.
The Board also reviewed Fidelity's non-fund businesses and fall-out benefits related to the mutual fund business as well as cases where Fidelity's affiliates may benefit from or be related to the funds' business.
The Board considered the costs of the services provided by and the profits realized by Fidelity in connection with the operation of each fund and was satisfied that the profitability was not excessive in the circumstances.
Economies of Scale. The Board considered whether there have been economies of scale in respect of the management of the Fidelity funds, whether the Fidelity funds (including each fund) have appropriately benefited from any such economies of scale, and whether there is potential for realization of any further economies of scale. The Board considered the extent to which each fund will benefit from economies of scale through increased services to the fund, through waivers or reimbursements, or through fee or expense reductions. The Board also noted that in 2009, it and the board of other Fidelity funds created an ad hoc committee (the Economies of Scale Committee) to analyze whether FMR attains economies of scale in respect of the management and servicing of the Fidelity funds, whether the Fidelity funds have appropriately benefited from such economies of scale, and whether there is potential for realization of any further economies of scale.
The Board recognized that each fund's management contract incorporates a "group fee" structure, which provides for lower group fee rates as total fund assets under FMR's management increase, and for higher group fee rates as total fund assets under FMR's management decrease. FMR calculates the group fee rates based on a tiered asset "breakpoint" schedule that varies based on asset class. The Board considered that the group fee is designed to deliver the benefits of economies of scale to fund shareholders when total Fidelity fund assets increase, even if assets of any particular fund are unchanged or have declined, because some portion of Fidelity's costs are attributable to services provided to all Fidelity funds, and all funds benefit if those costs can be allocated among more assets. The Board concluded that, given the group fee structure, fund shareholders will benefit from lower management fees as assets under FMR's management increase at the fund complex level, regardless of whether Fidelity achieves any such economies of scale.
The Board concluded, taking into account the analysis of the Economies of Scale Committee, that economies of scale, if any, are being appropriately shared between fund shareholders and Fidelity.
Additional Information Requested by the Board. In order to develop fully the factual basis for consideration of the Fidelity funds' Advisory Contracts, the Board requested and received additional information on certain topics, including (i) fund performance trends, actions to be taken by FMR to improve certain funds' overall performance, and Fidelity's long-term strategies for certain funds; (ii) the potential to further rationalize the Fidelity fund lineup with the possibility of achieving savings for the funds and Fidelity; (iii) Fidelity's compensation structure for portfolio managers and other key investment personnel; (iv) the amount of the investment that each portfolio manager has made in the Fidelity fund(s) that he or she manages; (v) the realization of fall-out benefits in certain Fidelity business units; (vi) Fidelity's group fee structures, the potential impact of regulatory changes on such structures, and the rationale for the individual fee rates of certain funds; (vii) fund profitability methodology, including Fidelity's cost allocation methodology, and the impact of certain factors on fund profitability results; (viii) trends regarding industry use of performance fee structures and the possibility of implementing performance fee structures for additional funds; and (ix) the impact of net redemptions from the Fidelity funds.
Based on its evaluation of all of the conclusions noted above, and after considering all factors it believed relevant, the Board ultimately concluded that the advisory fee structures are fair and reasonable, and that each fund's Advisory Contracts should be renewed.
Semiannual Report
Semiannual Report
Investment Adviser
Fidelity Management & Research Company
Boston, MA
Investment Sub-Advisers
FMR Co., Inc.
Fidelity Management & Research
(U.K.) Inc.
Fidelity Management & Research
(Hong Kong) Limited
Fidelity Management & Research
(Japan) Inc.
General Distributor
Fidelity Distributors Corporation
Smithfield, RI
Transfer and Service Agents
Fidelity Investments Institutional Operations Company, Inc.
Boston, MA
Fidelity Service Company, Inc.
Boston, MA
Custodian
Brown Brothers Harriman & Co.
Boston, MA
Corporate Headquarters
82 Devonshire Street
Boston, MA 02109
1-800-544-8888
The Fidelity Telephone Connection
Mutual Fund 24-Hour Service
Exchanges/Redemptions
and Account Assistance 1-800-544-6666
Product Information 1-800-544-8888
Retirement Accounts 1-800-544-4774
(8 a.m. - 9 p.m.)
TDD Service 1-800-544-0118
for the deaf and hearing impaired
(9 a.m. - 9 p.m. Eastern time)
Fidelity Automated Service
Telephone (FAST®)
1-800-544-5555
Automated line for quickest service
SELCI-USAN-1012
1.813659.107
Fidelity®
Select Portfolios®
Utilities Sector
Utilities Portfolio
Semiannual Report
August 31, 2012
(Fidelity Cover Art)
Contents
To view a fund's proxy voting guidelines and proxy voting record for the 12-month period ended June 30, visit http://www.fidelity.com/proxyvotingresults or visit the Securities and Exchange Commission's (SEC) web site at http://www.sec.gov. You may also call 1-800-544-8544 to request a free copy of the proxy voting guidelines.
Standard & Poor's, S&P and S&P 500 are registered service marks of The McGraw-Hill Companies, Inc. and have been licensed for use by Fidelity Distributors Corporation.
Other third party marks appearing herein are the property of their respective owners.
All other marks appearing herein are registered or unregistered trademarks or service marks of FMR LLC or an affiliated company. © 2012 FMR LLC. All rights reserved.
This report and the financial statements contained herein are submitted for the general information of the shareholders of the fund. This report is not authorized for distribution to prospective investors in the fund unless preceded or accompanied by an effective prospectus.
A fund files its complete schedule of portfolio holdings with the SEC for the first and third quarters of each fiscal year on Form N-Q. Forms N-Q are available on the SEC's web site at http://www.sec.gov. A fund's Forms N-Q may be reviewed and copied at the SEC's Public Reference Room in Washington, DC. Information regarding the operation of the SEC's Public Reference Room may be obtained by calling 1-800-SEC-0330. For a complete list of a fund's portfolio holdings, view the most recent holdings listing, semiannual report, or annual report on Fidelity's web site at http://www.fidelity.com, http://www.advisor.fidelity.com, or http://www.401k.com, as applicable.
NOT FDIC INSURED • MAY LOSE VALUE • NO BANK GUARANTEE
Neither the fund nor Fidelity Distributors Corporation is a bank.
Semiannual Report
Utilities Portfolio
As a shareholder of the Fund, you incur two types of costs: (1) transaction costs, including redemption fees and (2) ongoing costs, including management fees and other Fund expenses. This Example is intended to help you understand your ongoing costs (in dollars) of investing in the Fund and to compare these costs with the ongoing costs of investing in other mutual funds.
The Example is based on an investment of $1,000 invested at the beginning of the period and held for the entire period (March 1, 2012 to August 31, 2012).
Actual Expenses
The first line of the accompanying table provides information about actual account values and actual expenses. You may use the information in this line, together with the amount you invested, to estimate the expenses that you paid over the period. Simply divide your account value by $1,000.00 (for example, an $8,600 account value divided by $1,000.00 = 8.6), then multiply the result by the number in the first line under the heading entitled "Expenses Paid During Period" to estimate the expenses you paid on your account during this period. A small balance maintenance fee of $12.00 that is charged once a year may apply for certain accounts with a value of less than $2,000. This fee is not included in the table below. If it was, the estimate of expenses you paid during the period would be higher, and your ending account value lower, by this amount. In addition, the Fund, as a shareholder in the underlying Fidelity Central Funds, will indirectly bear its pro-rata share of the fees and expenses incurred by the underlying Fidelity Central Funds. These fees and expenses are not included in the Fund's annualized expense ratio used to calculate the expense estimate in the table below.
Hypothetical Example for Comparison Purposes
The second line of the accompanying table provides information about hypothetical account values and hypothetical expenses based on the Fund's actual expense ratio and an assumed rate of return of 5% per year before expenses, which is not the Fund's actual return. The hypothetical account values and expenses may not be used to estimate the actual ending account balance or expenses you paid for the period. You may use this information to compare the ongoing costs of investing in the Fund and other funds. To do so, compare this 5% hypothetical example with the 5% hypothetical examples that appear in the shareholder reports of the other funds. A small balance maintenance fee of $12.00 that is charged once a year may apply for certain accounts with a value of less than $2,000. This fee is not included in the table below. If it was, the estimate of expenses you paid during the period would be higher, and your ending account value lower, by this amount. In addition, the Fund, as a shareholder in the underlying Fidelity Central Funds, will indirectly bear its pro-rata share of the fees and expenses incurred by the underlying Fidelity Central Funds. These fees and expenses are not included in the Fund's annualized expense ratio used to calculate the expense estimate in the table below.
Please note that the expenses shown in the table are meant to highlight your ongoing costs only and do not reflect any transaction costs. Therefore, the second line of the table is useful in comparing ongoing costs only, and will not help you determine the relative total costs of owning different funds. In addition, if these transactional costs were included, your costs would have been higher.
| Annualized
Expense Ratio | Beginning
Account Value
March 1, 2012 | Ending
Account Value
August 31, 2012 | Expenses Paid
During Period*
March 1, 2012
to August 31, 2012 |
Actual | .84% | $ 1,000.00 | $ 1,075.20 | $ 4.39 |
Hypothetical (5% return per year before expenses) | | $ 1,000.00 | $ 1,020.97 | $ 4.28 |
* Expenses are equal to the Fund's annualized expense ratio, multiplied by the average account value over the period, multiplied by 184/365 (to reflect the one-half year period).
Semiannual Report
Utilities Portfolio
Investment Changes (Unaudited)
Top Ten Stocks as of August 31, 2012 |
| % of fund's
net assets | % of fund's net assets
6 months ago |
Duke Energy Corp. | 14.7 | 8.4 |
PG&E Corp. | 8.3 | 6.8 |
American Electric Power Co., Inc. | 7.9 | 3.5 |
Edison International | 7.5 | 7.3 |
FirstEnergy Corp. | 7.3 | 9.7 |
CenterPoint Energy, Inc. | 4.9 | 0.0 |
Sempra Energy | 4.8 | 8.7 |
NiSource, Inc. | 4.6 | 4.2 |
The AES Corp. | 4.4 | 4.9 |
NRG Energy, Inc. | 4.1 | 0.0 |
| 68.5 | |
Top Industries (% of fund's net assets) |
As of August 31, 2012 |
 | Electric Utilities | 52.9% | |
 | Multi-Utilities | 22.6% | |
 | Independent Power Producers & Energy Traders | 13.3% | |
 | Gas Utilities | 5.7% | |
 | Water Utilities | 3.2% | |
 | All Others* | 2.3% | |

As of February 29, 2012 |
| Electric Utilities | 44.8% | |
| Multi-Utilities | 22.4% | |
| Independent Power Producers & Energy Traders | 10.8% | |
| Oil, Gas & Consumable Fuels | 8.2% | |
| Gas Utilities | 5.1% | |
| All Others* | 8.7% | |

* Includes short-term investments and net other assets. |
Semiannual Report
Utilities Portfolio
Investments August 31, 2012 (Unaudited)
Showing Percentage of Net Assets
Common Stocks - 98.8% |
| Shares | | Value |
ELECTRIC UTILITIES - 52.9% |
Electric Utilities - 52.9% |
American Electric Power Co., Inc. | 1,075,639 | | $ 46,241,721 |
Duke Energy Corp. | 1,326,953 | | 85,960,014 |
Edison International | 1,000,473 | | 43,810,713 |
FirstEnergy Corp. | 974,141 | | 42,569,962 |
Great Plains Energy, Inc. | 690,905 | | 14,730,095 |
ITC Holdings Corp. | 55,355 | | 3,984,453 |
NextEra Energy, Inc. | 347,692 | | 23,403,149 |
Northeast Utilities | 441,991 | | 16,649,801 |
OGE Energy Corp. | 333,269 | | 18,013,189 |
Southern Co. | 130,167 | | 5,900,470 |
UIL Holdings Corp. | 220,840 | | 7,769,151 |
| | 309,032,718 |
GAS UTILITIES - 5.7% |
Gas Utilities - 5.7% |
Atmos Energy Corp. | 166,103 | | 5,803,639 |
National Fuel Gas Co. | 137,876 | | 6,880,012 |
ONEOK, Inc. | 456,751 | | 20,339,122 |
| | 33,022,773 |
INDEPENDENT POWER PRODUCERS & ENERGY TRADERS - 13.3% |
Independent Power Producers & Energy Traders - 13.3% |
Black Hills Corp. | 25,900 | | 885,780 |
Calpine Corp. (a) | 1,325,339 | | 23,259,699 |
GenOn Energy, Inc. (a) | 1,519,619 | | 3,844,636 |
NRG Energy, Inc. | 1,119,894 | | 23,898,538 |
The AES Corp. | 2,253,902 | | 25,671,944 |
| | 77,560,597 |
MULTI-UTILITIES - 22.6% |
Multi-Utilities - 22.6% |
CenterPoint Energy, Inc. | 1,403,264 | | 28,612,553 |
NiSource, Inc. | 1,102,123 | | 26,825,674 |
PG&E Corp. | 1,123,697 | | 48,779,687 |
Sempra Energy | 420,655 | | 27,847,361 |
| | 132,065,275 |
|
| Shares | | Value |
OIL, GAS & CONSUMABLE FUELS - 1.1% |
Oil & Gas Storage & Transport - 1.1% |
Cheniere Energy, Inc. (a) | 432,935 | | $ 6,390,121 |
WATER UTILITIES - 3.2% |
Water Utilities - 3.2% |
American Water Works Co., Inc. | 505,500 | | 18,637,785 |
Companhia de Saneamento Basico do Estado de Sao Paulo (SABESP) sponsored ADR | 1,700 | | 144,687 |
| | 18,782,472 |
TOTAL COMMON STOCKS (Cost $554,433,179) |
576,853,956
|
Money Market Funds - 0.8% |
| | | |
Fidelity Cash Central Fund, 0.17% (b)
(Cost $4,620,467) | 4,620,467 | |
4,620,467
|
TOTAL INVESTMENT PORTFOLIO - 99.6% (Cost $559,053,646) | | 581,474,423 |
NET OTHER ASSETS (LIABILITIES) - 0.4% | | 2,458,393 |
NET ASSETS - 100% | $ 583,932,816 |
Legend |
(a) Non-income producing |
(b) Affiliated fund that is available only to investment companies and other accounts managed by Fidelity Investments. The rate quoted is the annualized seven-day yield of the fund at period end. A complete unaudited listing of the fund's holdings as of its most recent quarter end is available upon request. In addition, each Fidelity Central Fund's financial statements are available on the SEC's website or upon request. |
Affiliated Central Funds |
Information regarding fiscal year to date income earned by the Fund from investments in Fidelity Central Funds is as follows: |
Fund | Income earned |
Fidelity Cash Central Fund | $ 11,875 |
Fidelity Securities Lending Cash Central Fund | 28,783 |
Total | $ 40,658 |
Other Information |
All investments are categorized as Level 1 under the Fair Value Hierarchy. The inputs or methodology used for valuing securities may not be an indication of the risk associated with investing in those securities. For more information on valuation inputs, please refer to the Security Valuation section in the accompanying Notes to Financial Statements. |
See accompanying notes which are an integral part of the financial statements.
Semiannual Report
Utilities Portfolio
Statement of Assets and Liabilities
| August 31, 2012 (Unaudited) |
| | |
Assets | | |
Investment in securities, at value - See accompanying schedule: Unaffiliated issuers (cost $554,433,179) | $ 576,853,956 | |
Fidelity Central Funds (cost $4,620,467) | 4,620,467 | |
Total Investments (cost $559,053,646) | | $ 581,474,423 |
Receivable for investments sold | | 147,778 |
Receivable for fund shares sold | | 659,868 |
Dividends receivable | | 3,198,271 |
Distributions receivable from Fidelity Central Funds | | 1,312 |
Other receivables | | 3,121 |
Total assets | | 585,484,773 |
| | |
Liabilities | | |
Payable for fund shares redeemed | $ 1,121,420 | |
Accrued management fee | 279,598 | |
Transfer agent fee payable | 109,190 | |
Other affiliated payables | 18,989 | |
Other payables and accrued expenses | 22,760 | |
Total liabilities | | 1,551,957 |
| | |
Net Assets | | $ 583,932,816 |
Net Assets consist of: | | |
Paid in capital | | $ 581,186,127 |
Undistributed net investment income | | 7,169,903 |
Accumulated undistributed net realized gain (loss) on investments | | (26,843,991) |
Net unrealized appreciation (depreciation) on investments | | 22,420,777 |
Net Assets, for 10,382,405 shares outstanding | | $ 583,932,816 |
Net Asset Value, offering price and redemption price per share ($583,932,816 ÷ 10,382,405 shares) | | $ 56.24 |
Statement of Operations
Six months ended August 31, 2012 (Unaudited) |
| | |
Investment Income | | |
Dividends | | $ 9,438,362 |
Interest | | 95 |
Income from Fidelity Central Funds | | 40,658 |
Total income | | 9,479,115 |
| | |
Expenses | | |
Management fee | $ 1,557,186 | |
Transfer agent fees | 612,618 | |
Accounting and security lending fees | 105,660 | |
Custodian fees and expenses | 6,516 | |
Independent trustees' compensation | 1,904 | |
Registration fees | 34,293 | |
Audit | 17,392 | |
Legal | 1,496 | |
Interest | 62 | |
Miscellaneous | 2,126 | |
Total expenses before reductions | 2,339,253 | |
Expense reductions | (42,458) | 2,296,795 |
Net investment income (loss) | | 7,182,320 |
Realized and Unrealized Gain (Loss) Net realized gain (loss) on: | | |
Investment securities: | | |
Unaffiliated issuers | | 25,637,588 |
Change in net unrealized appreciation (depreciation) on investment securities | | 5,868,286 |
Net gain (loss) | | 31,505,874 |
Net increase (decrease) in net assets resulting from operations | | $ 38,688,194 |
See accompanying notes which are an integral part of the financial statements.
Semiannual Report
Statement of Changes in Net Assets
| Six months ended
August 31, 2012
(Unaudited) | Year ended
February 29,
2012 |
Increase (Decrease) in Net Assets | | |
Operations | | |
Net investment income (loss) | $ 7,182,320 | $ 13,914,571 |
Net realized gain (loss) | 25,637,588 | 37,618,924 |
Change in net unrealized appreciation (depreciation) | 5,868,286 | (16,724,019) |
Net increase (decrease) in net assets resulting from operations | 38,688,194 | 34,809,476 |
Distributions to shareholders from net investment income | (2,489,449) | (12,398,149) |
Share transactions
Proceeds from sales of shares | 158,775,342 | 378,621,055 |
Reinvestment of distributions | 2,389,046 | 11,907,757 |
Cost of shares redeemed | (132,405,669) | (348,108,330) |
Net increase (decrease) in net assets resulting from share transactions | 28,758,719 | 42,420,482 |
Redemption fees | 6,028 | 40,172 |
Total increase (decrease) in net assets | 64,963,492 | 64,871,981 |
| | |
Net Assets | | |
Beginning of period | 518,969,324 | 454,097,343 |
End of period (including undistributed net investment income of $7,169,903 and undistributed net investment income of $2,477,032, respectively) | $ 583,932,816 | $ 518,969,324 |
Other Information Shares | | |
Sold | 2,854,775 | 7,340,663 |
Issued in reinvestment of distributions | 44,489 | 231,406 |
Redeemed | (2,391,397) | (6,728,327) |
Net increase (decrease) | 507,867 | 843,742 |
Financial Highlights
| Six months ended
August 31, 2012 | Years ended February 28, |
| (Unaudited) | 2012 H | 2011 | 2010 | 2009 | 2008 H |
Selected Per-Share Data | | | | | | |
Net asset value, beginning of period | $ 52.56 | $ 50.28 | $ 42.24 | $ 34.94 | $ 57.09 | $ 58.27 |
Income from Investment Operations | | | | | | |
Net investment income (loss) D | .71 | 1.43 | 1.14 | 1.21 | .99 | .84 |
Net realized and unrealized gain (loss) | 3.23 | 1.99 | 8.09 | 7.34 | (22.29) | (.82) |
Total from investment operations | 3.94 | 3.42 | 9.23 | 8.55 | (21.30) | .02 |
Distributions from net investment income | (.26) | (1.14) | (1.19) | (1.25) | (.85) | (1.21) |
Redemption fees added to paid in capital D | - I | - I | - I | - I | - I | .01 |
Net asset value, end of period | $ 56.24 | $ 52.56 | $ 50.28 | $ 42.24 | $ 34.94 | $ 57.09 |
Total Return B, C | 7.52% | 6.85% | 22.07% | 24.50% | (37.47)% | (.22)% |
Ratios to Average Net Assets E, G | | | | | | |
Expenses before reductions | .84% A | .86% | .90% | .95% | .89% | .88% |
Expenses net of fee waivers, if any | .84% A | .86% | .90% | .95% | .89% | .88% |
Expenses net of all reductions | .82% A | .84% | .87% | .93% | .89% | .87% |
Net investment income (loss) | 2.57% A | 2.78% | 2.46% | 2.98% | 1.95% | 1.35% |
Supplemental Data | | | | | | |
Net assets, end of period (000 omitted) | $ 583,933 | $ 518,969 | $ 454,097 | $ 335,992 | $ 301,529 | $ 606,083 |
Portfolio turnover rate F | 156% A | 202% | 238% | 226% | 167% | 121% |
A Annualized
B Total returns for periods of less than one year are not annualized.
C Total returns would have been lower if certain expenses had not been reduced during the applicable periods shown.
D Calculated based on average shares outstanding during the period.
E Fees and expenses of any underlying Fidelity Central Funds are not included in the Fund's expense ratio. The Fund indirectly bears its proportionate share of the expenses of any underlying Fidelity Central Funds.
F Amount does not include the portfolio activity of any underlying Fidelity Central Funds.
G Expense ratios reflect operating expenses of the Fund. Expenses before reductions do not reflect amounts reimbursed by the investment adviser or reductions from brokerage service arrangements or reductions from other expense offset arrangements and do not represent the amount paid by the Fund during periods when reimbursements or reductions occur. Expenses net of fee waivers reflect expenses after reimbursement by the investment adviser but prior to reductions from brokerage service arrangements or other expense offset arrangements. Expenses net of all reductions represent the net expenses paid by the Fund.
H For the year ended February 29.
I Amount represents less than $.01 per share.
See accompanying notes which are an integral part of the financial statements.
Semiannual Report
Notes to Financial Statements
For the period ended August 31, 2012 (Unaudited)
1. Organization.
Utilities Portfolio (the Fund) is a non-diversified fund of Fidelity Select Portfolios (the Trust) and is authorized to issue an unlimited number of shares. The Trust is registered under the Investment Company Act of 1940, as amended (the 1940 Act), as an open-end management investment company organized as a Massachusetts business trust. The Fund invests primarily in securities of companies whose principal business activities fall within specific industries.
2. Investments in Fidelity Central Funds.
The Fund invests in Fidelity Central Funds, which are open-end investment companies available only to other investment companies and accounts managed by Fidelity Management & Research Company (FMR) and its affiliates. The Fund's Schedule of Investments lists each of the Fidelity Central Funds held as of period end, if any, as an investment of the Fund, but does not include the underlying holdings of each Fidelity Central Fund. As an Investing Fund, the Fund indirectly bears its proportionate share of the expenses of the underlying Fidelity Central Funds.
The Money Market Central Funds seek preservation of capital and current income and are managed by Fidelity Investments Money Management, Inc. (FIMM), an affiliate of FMR.
A complete unaudited list of holdings for each Fidelity Central Fund is available upon request or at the Securities and Exchange Commission (the SEC) web site at www.sec.gov. In addition, the financial statements of the Fidelity Central Funds are available on the SEC web site or upon request.
3. Significant Accounting Policies.
The financial statements have been prepared in conformity with accounting principles generally accepted in the United States of America (GAAP), which require management to make certain estimates and assumptions at the date of the financial statements. Actual results could differ from those estimates. Subsequent events, if any, through the date that the financial statements were issued have been evaluated in the preparation of the financial statements. The following summarizes the significant accounting policies of the Fund:
Security Valuation. Investments are valued as of 4:00 p.m. Eastern time on the last calendar day of the period. In accordance with valuation policies and procedures approved by the Board of Trustees (the Board), the Fund attempts to obtain prices from one or more third party pricing vendor or broker to value its investments. When current market prices, quotations or rates are not readily available or reliable, securities will be fair valued in good faith by the FMR Fair Value Committee (the Committee), in accordance with procedures adopted by the Fund's Board. Factors used in determining fair value vary by security type and may include market or security specific events. The frequency with which these procedures are used cannot be predicted and they may be utilized to a significant extent. The Committee oversees the Fund's valuation policies and procedures and is responsible for approving and reporting to the Board all fair value determinations.
The Fund categorizes the inputs to valuation techniques used to value its investments into a disclosure hierarchy consisting of three levels as shown below:
Level 1 - quoted prices in active markets for identical investments
Level 2 - other significant observable inputs (including quoted prices for similar investments, interest rates, prepayment speeds, etc.)
Level 3 - unobservable inputs (including the Fund's own assumptions based on the best information available)
Valuation techniques used to value the Fund's investments by major category are as follows:
Equity securities, including restricted securities, for which market quotations are readily available, are valued at the last reported sale price or official closing price as reported by a third party pricing vendor on the primary market or exchange on which they are traded and are categorized as Level 1 in the hierarchy. In the event there were no sales during the day or closing prices are not available, securities are valued at the last quoted bid price or may be valued using the last available price and are generally categorized as Level 2 in the hierarchy. For foreign equity securities, when significant market or security specific events arise, comparisons to the valuation of American Depositary Receipts (ADRs), futures contracts, Exchange-Traded Funds (ETFs) and certain indexes as well as quoted prices for similar securities are used and are categorized as Level 2 in the hierarchy. Utilizing these techniques may result in transfers between Level 1 and Level 2.
Investments in open-end mutual funds, including the Fidelity Central Funds, are valued at their closing net asset value each business day and are categorized as Level 1 in the hierarchy.
Changes in valuation techniques may result in transfers in or out of an assigned level within the disclosure hierarchy.
Investment Transactions and Income. For financial reporting purposes, the Fund's investment holdings and NAV include trades executed through the end of the last business day of the period. The NAV per share for processing shareholder transactions is calculated as of the close of business of the New York Stock Exchange (NYSE), normally 4:00 p.m. Eastern time and includes trades executed through the end of the prior business day. Gains and
Semiannual Report
3. Significant Accounting Policies - continued
Investment Transactions and Income - continued
losses on securities sold are determined on the basis of identified cost and may include proceeds received from litigation. Dividend income is recorded on the ex-dividend date, except for certain dividends from foreign securities where the ex-dividend date may have passed, which are recorded as soon as the Fund is informed of the ex-dividend date. Non-cash dividends included in dividend income, if any, are recorded at the fair market value of the securities received. Interest income and distributions from the Fidelity Central Funds are accrued as earned. Interest income includes coupon interest and amortization of premium and accretion of discount on debt securities.
Expenses. Expenses directly attributable to a fund are charged to that fund. Expenses attributable to more than one fund are allocated among the respective funds on the basis of relative net assets or other appropriate methods. Expense estimates are accrued in the period to which they relate and adjustments are made when actual amounts are known.
Income Tax Information and Distributions to Shareholders. Each year, the Fund intends to qualify as a regulated investment company under Subchapter M of the Internal Revenue Code, including distributing substantially all of its taxable income and realized gains. As a result, no provision for income taxes is required. The Fund files a U.S. federal tax return, in addition to state and local tax returns as required. A fund's federal income tax returns are subject to examination by the Internal Revenue Service (IRS) for a period of three fiscal years after they are filed. State and local tax returns may be subject to examination for an additional fiscal year depending on the jurisdiction.
Distributions are declared and recorded on the ex-dividend date. Income and capital gain distributions are determined in accordance with income tax regulations, which may differ from GAAP.
Capital accounts within the financial statements are adjusted for permanent book-tax differences. These adjustments have no impact on net assets or the results of operations. Temporary book-tax differences will reverse in a subsequent period.
Book-tax differences are primarily due to foreign currency transactions, deferred trustees compensation, capital loss carryfowards, and losses deferred due to wash sales.
The federal tax cost of investment securities and unrealized appreciation (depreciation) as of period end were as follows:
Gross unrealized appreciation | $ 29,276,561 |
Gross unrealized depreciation | (7,404,582) |
Net unrealized appreciation (depreciation) on securities and other investments | $ 21,871,979 |
| |
Tax cost | $ 559,602,444 |
Capital loss carryforwards are only available to offset future capital gains of the Fund to the extent provided by regulations and may be limited. Under the Regulated Investment Company Modernization Act of 2010 (the Act), the Fund is permitted to carry forward capital losses incurred in taxable years beginning after December 22, 2010 for an unlimited period and such capital losses are required to be used prior to any losses that expire. At February 29, 2012 capital loss carryforwards were as follows:
Fiscal year of expiration | |
2017 | $ (6,906,616) |
2018 | (44,684,056) |
Total capital loss carryforward | $ (51,590,672) |
Trading (Redemption) Fees. Shares held by investors in the Fund less than 30 days are subject to a redemption fee equal to .75% of the net asset value of shares redeemed. All redemption fees, which reduce the proceeds of the shareholder redemption, are retained by the Fund and accounted for as an addition to paid in capital.
New Accounting Pronouncement. In December 2011, the Financial Accounting Standards Board issued Accounting Standard Update No. 2011-11, Disclosures about Offsetting Assets and Liabilities. The update creates new disclosure requirements requiring entities to disclose both gross and net information for derivatives and other financial instruments that are either offset in the Statement of Assets and Liabilities or subject to an enforceable master netting arrangement or similar agreement. The disclosure requirements are effective for annual reporting periods beginning on or after January 1, 2013, and interim periods within those annual periods. Management is currently evaluating the impact of the update's adoption on the Fund's financial statement disclosures.
Semiannual Report
Notes to Financial Statements (Unaudited) - continued
4. Purchases and Sales of Investments.
Purchases and sales of securities short-term securities, aggregated $476,092,988 and $422,740,575, respectively.
5. Fees and Other Transactions with Affiliates.
Management Fee. FMR and its affiliates provide the Fund with investment management related services for which the Fund pays a monthly management fee. The management fee is the sum of an individual fund fee rate that is based on an annual rate of .30% of the Fund's average net assets and an annualized group fee rate that averaged .26% during the period. The group fee rate is based upon the average net assets of all the mutual funds advised by FMR. The group fee rate decreases as assets under management increase and increases as assets under management decrease. For the period, the total annualized management fee rate was .56% of the Fund's average net assets.
Transfer Agent Fees. Fidelity Investments Institutional Operations Company, Inc. (FIIOC), an affiliate of FMR, is the Fund's transfer, dividend disbursing and shareholder servicing agent. FIIOC receives account fees and asset-based fees that vary according to account size and type of account. FIIOC pays for typesetting, printing and mailing of shareholder reports, except proxy statements. For the period, the transfer agent fees were equivalent to an annualized rate of .22% of average net assets.
Accounting and Security Lending Fees. Fidelity Service Company, Inc.(FSC),an affiliate of FMR, maintains the Fund's accounting records. The accounting fee is based on the level of average net assets for each month. Under a separate contract, FSC administers the security lending program. The security lending fee is based on the number and duration of lending transactions.
Brokerage Commissions. The Fund placed a portion of its portfolio transactions with brokerage firms which are affiliates of the investment adviser. The commissions paid to these affiliated firms were $9,025 for the period.
Interfund Lending Program. Pursuant to an Exemptive Order issued by the SEC, the Fund, along with other registered investment companies having management contracts with FMR, may participate in an interfund lending program. This program provides an alternative credit facility allowing the funds to borrow from, or lend money to, other participating affiliated funds. At period end, there were no interfund loans outstanding. The Fund's activity in this program during the period for which loans were outstanding was as follows:
Borrower or Lender | Average
Loan Balance | Weighted Average
Interest Rate | Interest
Expense |
Borrower | $ 5,461,000 | .41% | $ 62 |
6. Committed Line of Credit.
The Fund participates with other funds managed by FMR or an affiliate in a $4.25 billion credit facility (the "line of credit") to be utilized for temporary or emergency purposes to fund shareholder redemptions or for other short-term liquidity purposes. The Fund has agreed to pay commitment fees on its pro-rata portion of the line of credit, which amounted to $785 and is reflected in Miscellaneous expenses on the Statement of Operations. During the period, there were no borrowings on this line of credit.
7. Security Lending.
The Fund lends portfolio securities through a lending agent from time to time in order to earn additional income. For equity securities, a lending agent is used and may loan securities to certain qualified borrowers, including Fidelity Capital Markets (FCM), a broker-dealer affiliated with the Fund. On the settlement date of the loan, the Fund receives collateral (in the form of U.S. Treasury obligations, letters of credit and/or cash) against the loaned securities and maintains collateral in an amount not less than 100% of the market value of the loaned securities during the period of the loan. The market value of the loaned securities is determined at the close of business of the Fund and any additional required collateral is delivered to the Fund on the next business day. If the borrower defaults on its obligation to return the securities loaned because of insolvency or other reasons, a fund could experience delays and costs in recovering the securities loaned or in gaining access to the collateral. Any cash collateral received is invested in the Fidelity Securities Lending Cash Central Fund. At period end, there were no security loans outstanding. Security lending income represents the income earned on investing cash collateral, less rebates paid to borrowers and any lending agent fees associated with the loan, plus any premium payments received for lending certain types of securities. Security lending income is presented in the Statement of Operations as a component of income from Fidelity Central Funds. Total security lending income during the period amounted to $28,783. During the period, there were no securities loaned to FCM.
8. Expense Reductions.
Many of the brokers with whom FMR places trades on behalf of the Fund provided services to the Fund in addition to trade execution. These services included payments of certain expenses on behalf of the Fund totaling $42,458 for the period.
Semiannual Report
9. Other.
The Fund's organizational documents provide former and current trustees and officers with a limited indemnification against liabilities arising in connection with the performance of their duties to the Fund. In the normal course of business, the Fund may also enter into contracts that provide general indemnifications. The Fund's maximum exposure under these arrangements is unknown as this would be dependent on future claims that may be made against the Fund. The risk of material loss from such claims is considered remote.
At the end of the period, Fidelity VIP Funds Manager 60% Portfolio was the owner of record of approximately 14% of the total outstanding shares of Utilities Portfolio.
Semiannual Report
Board Approval of Investment Advisory Contracts and Management Fees
Utilities Portfolio
Each year, the Board of Trustees, including the Independent Trustees (together, the Board), votes on the renewal of the management contract and sub-advisory agreements (together, the Advisory Contracts) for the fund. The Board, assisted by the advice of fund counsel and Independent Trustees' counsel, requests and considers a broad range of information relevant to the renewal of the Advisory Contracts throughout the year.
The Board meets regularly and, at each of its meetings, considers factors that are relevant to its annual consideration of the renewal of the fund's Advisory Contracts, including the services and support provided to the fund and its shareholders. The Board has established various standing committees, each composed of and chaired by Independent Trustees with varying backgrounds, to which the Board has assigned specific subject matter responsibilities in order to enhance effective decision-making by the Board. The Board, acting directly and through its Committees, requests and receives information concerning the annual consideration of the renewal of the fund's Advisory Contracts. The Board also meets as needed to consider matters specifically related to the Board's annual consideration of the renewal of Advisory Contracts. Members of the Board may also meet with trustees of other Fidelity funds through ad hoc joint committees to discuss certain matters relevant to the Fidelity funds.
At its July 2012 meeting, the Board of Trustees, including the Independent Trustees, unanimously determined to renew the fund's Advisory Contracts. In reaching its determination, the Board considered all factors it believed relevant, including (i) the nature, extent, and quality of the services to be provided to the fund and its shareholders (including the investment performance of the fund); (ii) the competitiveness of the fund's management fee and total expense ratio relative to peer funds; (iii) the total costs of the services to be provided by and the profits to be realized by Fidelity from its relationship with the fund; (iv) the extent to which economies of scale exist and would be realized as the fund grows; and (v) whether fee levels reflect these economies of scale, if any, for the benefit of fund shareholders.
In considering whether to renew the Advisory Contracts for the fund, the Board reached a determination, with the assistance of fund counsel and Independent Trustees' counsel and through the exercise of its business judgment, that the renewal of the Advisory Contracts is in the best interests of the fund and its shareholders and that the compensation payable under the Advisory Contracts is fair and reasonable. The Board's decision to renew the Advisory Contracts was not based on any single factor, but rather was based on a comprehensive consideration of all the information provided to the Board at its meetings throughout the year. The Board, in reaching its determination to renew the Advisory Contracts, is aware that shareholders in the fund have a broad range of investment choices available to them, including a wide choice among mutual funds offered by Fidelity's competitors, and that the fund's shareholders, who have the opportunity to review and weigh the disclosure provided by the fund in its prospectus and other public disclosures, have chosen to invest in this fund, managed by Fidelity.
Nature, Extent, and Quality of Services Provided. The Board considered the staffing within the investment adviser, FMR, and the sub-advisers (together, the Investment Advisers), including the backgrounds of the fund's investment personnel, and also considered the fund's investment objective, strategies, and related investment philosophy. The Independent Trustees also had discussions with senior management of Fidelity's investment operations and investment groups. The Board considered the structure of the portfolio manager compensation program and whether this structure provides appropriate incentives to act in the best interests of the fund.
Resources Dedicated to Investment Management and Support Services. The Board and the Fund Oversight and Research Committees reviewed the general qualifications and capabilities of the Investment Advisers' investment staff, including its size, education, experience, and resources, as well as the Investment Advisers' approach to recruiting, training, managing, and compensating investment personnel. The Board also noted that FMR has continued to increase the resources devoted to non-U.S. offices, including expansion of Fidelity's global investment organization. The Board noted that Fidelity's analysts have extensive resources, tools and capabilities that allow them to conduct sophisticated quantitative and fundamental analysis, as well as credit analysis of issuers, counterparties and guarantors. The Board also believes that Fidelity's investment professionals have sufficient access to global information and data so as to provide competitive investment results over time, and that those professionals also have access to sophisticated tools that permit them to assess portfolio construction and risk and performance attribution characteristics continuously, as well as to transmit new information and research conclusions rapidly around the world. Additionally, in its deliberations, the Board considered the Investment Advisers' trading and risk management capabilities and resources, which are an integral part of the investment management process.
Shareholder and Administrative Services. The Board considered (i) the nature, extent, quality, and cost of advisory, administrative, and shareholder services performed by the Investment Advisers and their affiliates under the Advisory Contracts and under separate agreements covering transfer agency, pricing and bookkeeping, and securities lending services for the fund; (ii) the nature and extent of the supervision of third party service providers, principally custodians and subcustodians; and (iii) the resources devoted to, and the record of compliance with, the fund's compliance policies and procedures. The Board also reviewed the allocation of fund brokerage, including allocations to brokers affiliated with the Investment Advisers, the use of brokerage commissions to pay fund expenses, and the use of "soft" commission dollars to pay for research services.
The Board noted that the growth of fund assets over time across the complex allows Fidelity to reinvest in the development of services designed to enhance the value or convenience of the Fidelity funds as investment vehicles. These services include 24-hour access to account information and market information through telephone representatives and over the Internet, investor education materials and asset allocation tools, and the expanded availability of Fidelity Investor Centers.
Semiannual Report
Investment in a Large Fund Family. The Board considered the benefits to shareholders of investing in a Fidelity fund, including the benefits of investing in a fund that is part of a large family of funds offering a variety of investment disciplines and providing a large variety of mutual fund investor services. The Board noted that Fidelity had taken, or had made recommendations that resulted in the Fidelity funds taking, a number of actions over the previous year that benefited particular funds, including (i) continuing to dedicate additional resources to investment research and support of the senior management team that oversees asset management; (ii) persisting in efforts to enhance Fidelity's research capabilities, in particular, international research; (iii) launching new funds and making other enhancements to meet client needs for global and income-oriented solutions; (iv) continuing to launch dedicated lower cost underlying funds to meet investment management's portfolio construction needs related to expanding underlying fund options, specifically for the Freedom Fund product lines; (v) adopting a "Stock Selector" sector neutral investment approach and employing a team of portfolio managers who are sector specialists to manage certain funds; (vi) rationalizing product lines and gaining increased efficiencies through the mergers of several funds into other funds; (vii) strengthening the Spartan Index Fund product line by adding new funds and/or new low-cost institutional share classes, restructuring fund expenses to accommodate new classes, and reducing investment minimums for certain classes of shares; (viii) modifying the eligibility criteria for Institutional Class shares to increase their appeal to government entities and charitable investors; and (ix) reducing certain transfer agent fee rates.
Investment Performance. The Board considered whether the fund has operated in accordance with its investment objective, as well as its record of compliance with its investment restrictions. It also reviewed the fund's absolute investment performance, as well as the fund's relative investment performance measured over multiple periods against a third-party-sponsored index that reflects the market sector in which the fund invests. The Board noted that FMR believes that no meaningful peer group exists for the fund principally because most other funds in the fund's third-party peer group focus on different industries or sectors than the fund. The following charts considered by the Board show, over the one-, three-, and five-year periods ended December 31, 2011, the fund's cumulative total returns and the cumulative total returns of a third-party-sponsored index ("benchmark").
Utilities Portfolio
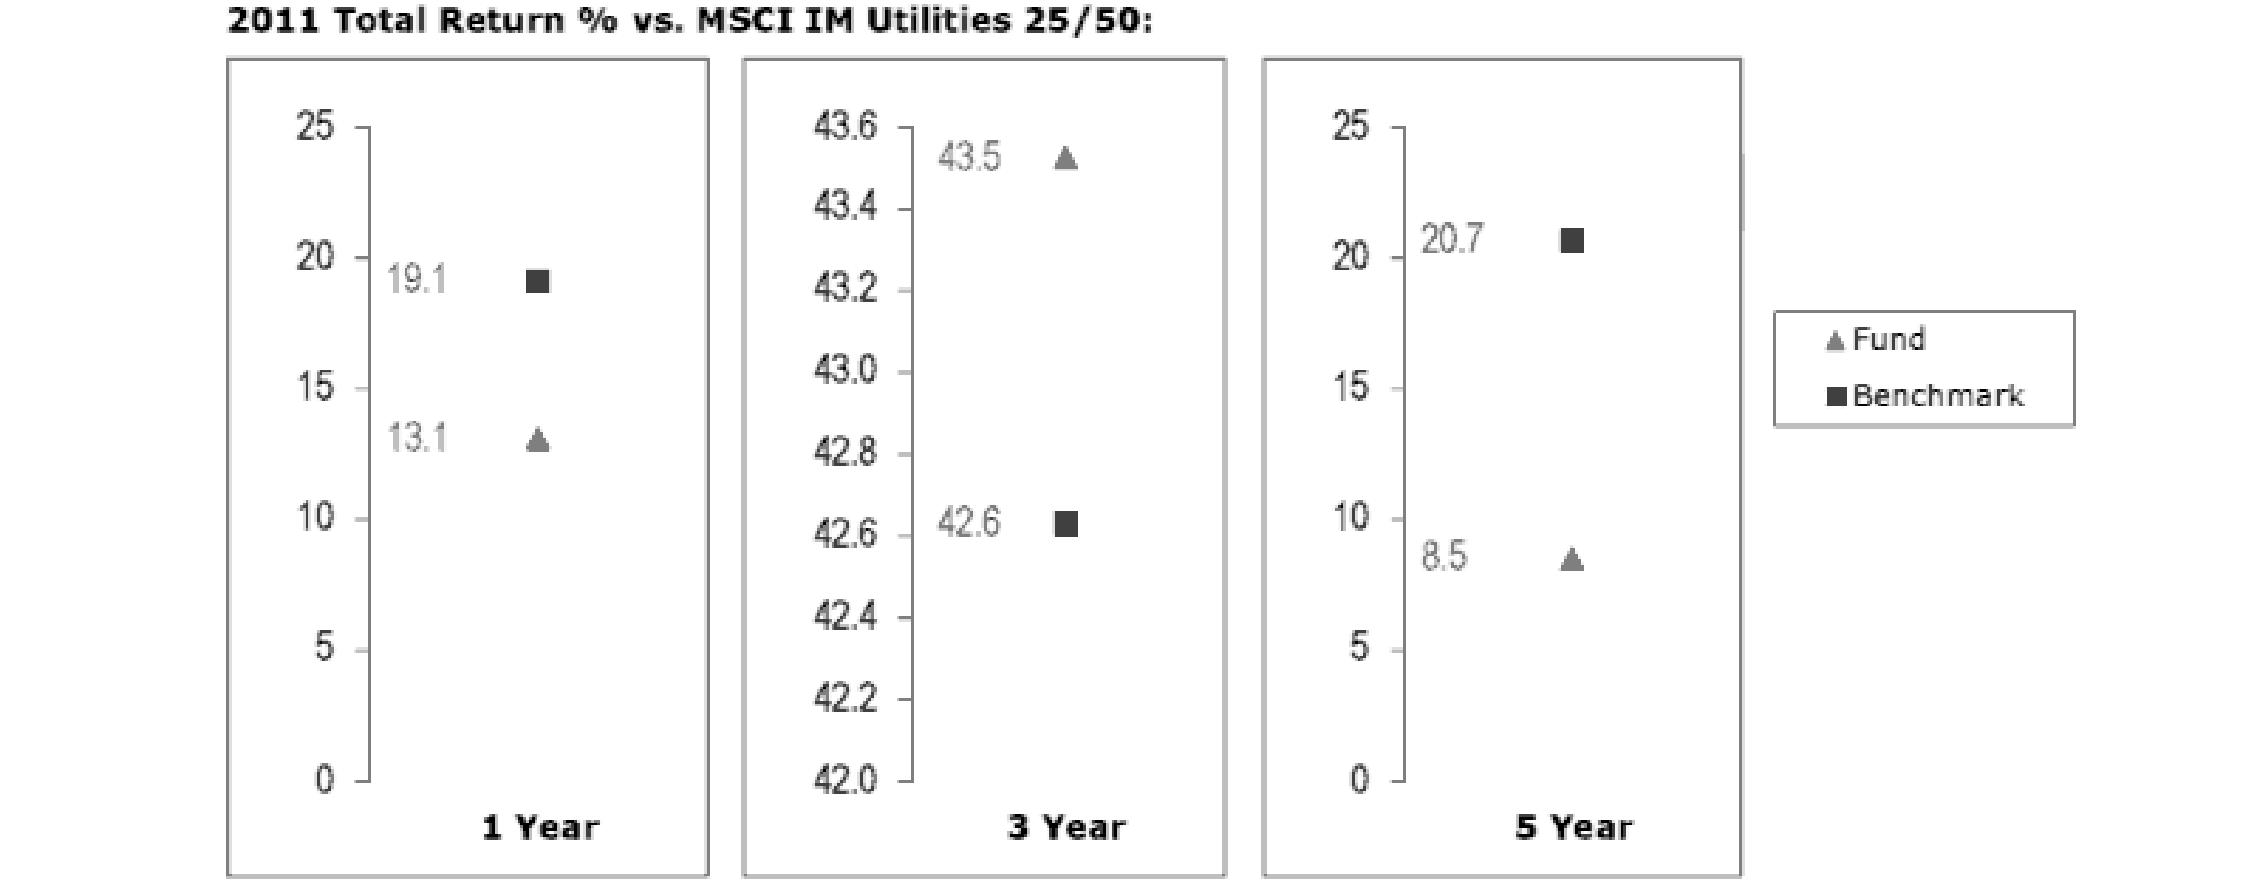
The Board noted that the investment performance of the fund was lower than its benchmark for the one- and five-year periods, although the fund's three-year cumulative total return compared favorably to its benchmark. The Board also reviewed the fund's performance since inception as well as performance in the current year. The Board will closely monitor the performance of the fund in the coming year.
Based on its review, the Board concluded that the nature, extent, and quality of services provided to the fund under the Advisory Contracts should benefit the fund's shareholders.
Competitiveness of Management Fee and Total Expense Ratio. The Board considered the fund's management fee and total expense ratio compared to "mapped groups" of competitive funds and classes. Fidelity creates "mapped groups" by combining similar Lipper investment objective categories that have comparable management fee characteristics. Combining Lipper investment objective categories aids the Board's management fee and total expense ratio comparisons by broadening the competitive group used for comparison and by reducing the number of universes to which various Fidelity funds are compared.
Management Fee. The Board considered two proprietary management fee comparisons for the 12-month periods shown in the chart below. The group of Lipper funds used by the Board for management fee comparisons is referred to below as the "Total Mapped Group." The Total Mapped Group comparison focuses on a fund's standing relative to the total universe of comparable funds available to investors in terms of gross management fees before expense reimbursements or caps. "TMG %" represents the percentage of funds in the Total Mapped Group that had management fees that were lower than the fund's. For example, a TMG % of 6% means that 94% of the funds in the Total Mapped Group had higher management fees than the fund. The "Asset-Size Peer Group" (ASPG) comparison focuses on a fund's standing relative to non-Fidelity funds similar in size to the fund within the Total Mapped Group. The ASPG represents at least 15% of the funds in the Total Mapped Group with comparable asset size and management fee characteristics, subject to a minimum of 50 funds (or all funds in the Total Mapped Group if fewer than 50). Additional information, such as the ASPG quartile in which the fund's management fee ranked, is also included in the chart and considered by the Board.
Semiannual Report
Board Approval of Investment Advisory Contracts and Management Fees - continued
Utilities Portfolio
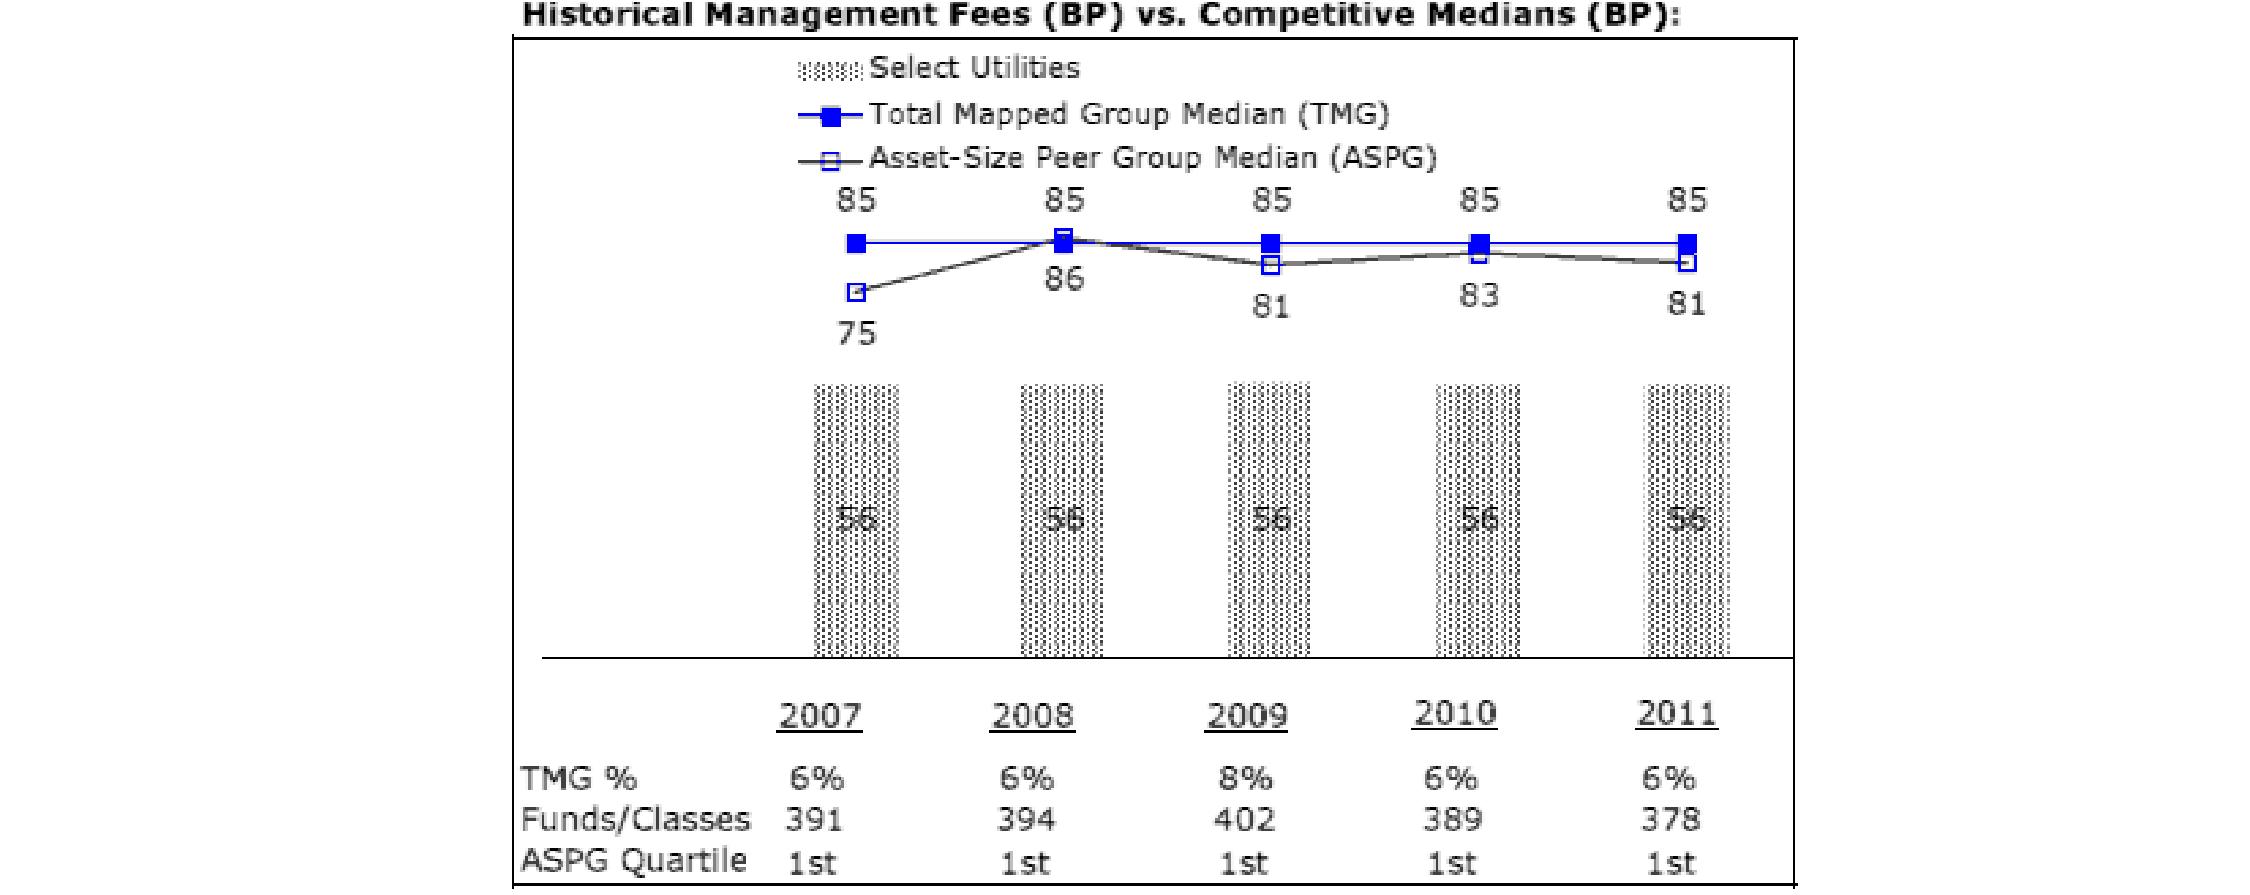
The Board noted that the fund's management fee ranked below the median of its Total Mapped Group and below the median of its ASPG for 2011.
Based on its review, the Board concluded that the fund's management fee is fair and reasonable in light of the services that the fund receives and the other factors considered.
Total Expense Ratio. In its review of the fund's total expense ratio, the Board considered the fund's management fee as well as other fund expenses, such as transfer agent fees, pricing and bookkeeping fees, and custodial, legal, and audit fees. The Board also noted the effects of any waivers and reimbursements on fees and expenses. As part of its review, the Board also considered the current and historical total expense ratios of the fund compared to competitive fund median expenses. The fund is compared to those funds and classes in the Total Mapped Group (used by the Board for management fee comparisons) that have a similar sales load structure.
The Board noted that the fund's total expense ratio ranked below its competitive median for 2011.
Fees Charged to Other Fidelity Clients. The Board also considered Fidelity fee structures and other information with respect to clients of FMR and its affiliates, such as other mutual funds advised or subadvised by FMR or its affiliates, pension plan clients, and other institutional clients. The Board noted the findings of the 2010 ad hoc joint committee (created with the board of other Fidelity funds), which reviewed and compared Fidelity's institutional investment advisory business with its business of providing services to the Fidelity funds, including the differences in services provided, fees charged, and costs incurred, as well as competition in their respective marketplaces.
Based on its review of total expense ratios and fees charged to other Fidelity clients, the Board concluded that the fund's total expense ratio was reasonable in light of the services that the fund and its shareholders receive and the other factors considered.
Costs of the Services and Profitability. The Board considered the revenues earned and the expenses incurred by Fidelity in conducting the business of developing, marketing, distributing, managing, administering and servicing the fund and its shareholders. The Board also considered the level of Fidelity's profits in respect of all the Fidelity funds.
On an annual basis, FMR presents to the Board Fidelity's profitability for the fund. Fidelity calculates the profitability for each fund, as well as aggregate profitability for groups of Fidelity funds and all Fidelity funds, using a series of detailed revenue and cost allocation methodologies which originate with the books and records of Fidelity on which Fidelity's audited financial statements are based. The Audit Committee of the Board reviews any significant changes from the prior year's methodologies.
Semiannual Report
PricewaterhouseCoopers LLP (PwC), independent registered public accounting firm and auditor to Fidelity and certain Fidelity funds, has been engaged annually by the Board as part of the Board's assessment of Fidelity's profitability analysis. PwC's engagement includes the review and assessment of Fidelity's methodologies used in determining the revenues and expenses attributable to Fidelity's mutual fund business, and completion of agreed-upon procedures surrounding the mathematical accuracy of fund profitability and its conformity to allocation methodologies. After considering PwC's reports issued under the engagement and information provided by Fidelity, the Board concluded that while other allocation methods may also be reasonable, Fidelity's profitability methodologies are reasonable in all material respects.
The Board also reviewed Fidelity's non-fund businesses and fall-out benefits related to the mutual fund business as well as cases where Fidelity's affiliates may benefit from or be related to the fund's business.
The Board considered the costs of the services provided by and the profits realized by Fidelity in connection with the operation of the fund and was satisfied that the profitability was not excessive in the circumstances.
Economies of Scale. The Board considered whether there have been economies of scale in respect of the management of the Fidelity funds, whether the Fidelity funds (including the fund) have appropriately benefited from any such economies of scale, and whether there is potential for realization of any further economies of scale. The Board considered the extent to which the fund will benefit from economies of scale through increased services to the fund, through waivers or reimbursements, or through fee or expense reductions. The Board also noted that in 2009, it and the board of other Fidelity funds created an ad hoc committee (the Economies of Scale Committee) to analyze whether FMR attains economies of scale in respect of the management and servicing of the Fidelity funds, whether the Fidelity funds have appropriately benefited from such economies of scale, and whether there is potential for realization of any further economies of scale.
The Board recognized that the fund's management contract incorporates a "group fee" structure, which provides for lower group fee rates as total fund assets under FMR's management increase, and for higher group fee rates as total fund assets under FMR's management decrease. FMR calculates the group fee rates based on a tiered asset "breakpoint" schedule that varies based on asset class. The Board considered that the group fee is designed to deliver the benefits of economies of scale to fund shareholders when total Fidelity fund assets increase, even if assets of any particular fund are unchanged or have declined, because some portion of Fidelity's costs are attributable to services provided to all Fidelity funds, and all funds benefit if those costs can be allocated among more assets. The Board concluded that, given the group fee structure, fund shareholders will benefit from lower management fees as assets under FMR's management increase at the fund complex level, regardless of whether Fidelity achieves any such economies of scale.
The Board concluded, taking into account the analysis of the Economies of Scale Committee, that economies of scale, if any, are being appropriately shared between fund shareholders and Fidelity.
Additional Information Requested by the Board. In order to develop fully the factual basis for consideration of the Fidelity funds' Advisory Contracts, the Board requested and received additional information on certain topics, including (i) fund performance trends, actions to be taken by FMR to improve certain funds' overall performance, and Fidelity's long-term strategies for certain funds; (ii) the potential to further rationalize the Fidelity fund lineup with the possibility of achieving savings for the funds and Fidelity; (iii) Fidelity's compensation structure for portfolio managers and other key investment personnel; (iv) the amount of the investment that each portfolio manager has made in the Fidelity fund(s) that he or she manages; (v) the realization of fall-out benefits in certain Fidelity business units; (vi) Fidelity's group fee structures, the potential impact of regulatory changes on such structures, and the rationale for the individual fee rates of certain funds; (vii) fund profitability methodology, including Fidelity's cost allocation methodology, and the impact of certain factors on fund profitability results; (viii) trends regarding industry use of performance fee structures and the possibility of implementing performance fee structures for additional funds; and (ix) the impact of net redemptions from the Fidelity funds.
Based on its evaluation of all of the conclusions noted above, and after considering all factors it believed relevant, the Board ultimately concluded that the advisory fee structures are fair and reasonable, and that the fund's Advisory Contracts should be renewed.
Semiannual Report
Semiannual Report
Investment Adviser
Fidelity Management & Research Company
Boston, MA
Investment Sub-Advisers
FMR Co., Inc.
Fidelity Management & Research
(U.K.) Inc.
Fidelity Management & Research
(Hong Kong) Limited
Fidelity Management & Research
(Japan) Inc.
General Distributor
Fidelity Distributors Corporation
Smithfield, RI
Transfer and Service Agents
Fidelity Investments Institutional
Operations Company, Inc.
Boston, MA
Fidelity Service Company, Inc.
Boston, MA
Custodian
Brown Brothers Harriman & Co.
Boston, MA
Corporate Headquarters
82 Devonshire Street
Boston, MA 02109
1-800-544-8888
The Fidelity Telephone Connection
Mutual Fund 24-Hour Service
Exchanges/Redemptions
and Account Assistance 1-800-544-6666
Product Information 1-800-544-8888
Retirement Accounts 1-800-544-4774
(8 a.m. - 9 p.m.)
TDD Service 1-800-544-0118
for the deaf and hearing impaired
(9 a.m. - 9 p.m. Eastern time)
Fidelity Automated Service
Telephone (FAST®)
1-800-544-5555
Automated line for quickest service
SELUTL-USAN-1012
1.813629.107
Fidelity®
Select Portfolios®
Information Technology Sector
Communications Equipment Portfolio
Computers Portfolio
Electronics Portfolio
IT Services Portfolio
Software and Computer Services Portfolio
Technology Portfolio
Semiannual Report
August 31, 2012
(Fidelity Cover Art)
Contents
To view a fund's proxy voting guidelines and proxy voting record for the 12-month period ended June 30, visit http://www.fidelity.com/proxyvotingresults or visit the Securities and Exchange Commission's (SEC) web site at http://www.sec.gov. You may also call 1-800-544-8544 to request a free copy of the proxy voting guidelines.
Standard & Poor's, S&P and S&P 500 are registered service marks of The McGraw-Hill Companies, Inc. and have been licensed for use by Fidelity Distributors Corporation.
Other third party marks appearing herein are the property of their respective owners.
All other marks appearing herein are registered or unregistered trademarks or service marks of FMR LLC or an affiliated company. © 2012 FMR LLC. All rights reserved.
This report and the financial statements contained herein are submitted for the general information of the shareholders of the funds. This report is not authorized for distribution to prospective investors in the funds unless preceded or accompanied by an effective prospectus.
A fund files its complete schedule of portfolio holdings with the SEC for the first and third quarters of each fiscal year on Form N-Q. Forms N-Q are available on the SEC's web site at http://www.sec.gov. A fund's Forms N-Q may be reviewed and copied at the SEC's Public Reference Room in Washington, DC. Information regarding the operation of the SEC's Public Reference Room may be obtained by calling 1-800-SEC-0330. For a complete list of a fund's portfolio holdings, view the most recent holdings listing, semiannual report, or annual report on Fidelity's web site at http://www.fidelity.com, http://www.advisor.fidelity.com, or http://www.401k.com, as applicable.
NOT FDIC INSURED • MAY LOSE VALUE • NO BANK GUARANTEE
Neither the funds nor Fidelity Distributors Corporation is a bank.
Semiannual Report
As a shareholder of a Fund, you incur two types of costs: (1) transaction costs, including redemption fees and (2) ongoing costs, including management fees and other Fund expenses. This Example is intended to help you understand your ongoing costs (in dollars) of investing in the Funds and to compare these costs with the ongoing costs of investing in other mutual funds.
The Example is based on an investment of $1,000 invested at the beginning of the period and held for the entire period (March 1, 2012 to August 31, 2012).
Actual Expenses
The first line of the accompanying table for each fund provides information about actual account values and actual expenses. You may use the information in this line, together with the amount you invested, to estimate the expenses that you paid over the period. Simply divide your account value by $1,000.00 (for example, an $8,600 account value divided by $1,000.00 = 8.6), then multiply the result by the number in the first line for a fund under the heading entitled "Expenses Paid During Period" to estimate the expenses you paid on your account during this period. A small balance maintenance fee of $12.00 that is charged once a year may apply for certain accounts with a value of less than $2,000. This fee is not included in the table below. If it was, the estimate of expenses you paid during the period would be higher, and your ending account value lower, by this amount. In addition, each Fund, as a shareholder in the underlying Fidelity Central Funds, will indirectly bear its pro-rata share of the fees and expenses incurred by the underlying Fidelity Central Funds. These fees and expenses are not included in the Fund's annualized expense ratio used to calculate the expense estimate in the table below.
Hypothetical Example for Comparison Purposes
The second line of the accompanying table for each fund provides information about hypothetical account values and hypothetical expenses based on a fund's actual expense ratio and an assumed rate of return of 5% per year before expenses, which is not the Fund's actual return. The hypothetical account values and expenses may not be used to estimate the actual ending account balance or expenses you paid for the period. You may use this information to compare the ongoing costs of investing in the Fund and other funds. To do so, compare this 5% hypothetical example with the 5% hypothetical examples that appear in the shareholder reports of the other funds. A small balance maintenance fee of $12.00 that is charged once a year may apply for certain accounts with a value of less than $2,000. This fee is not included in the table below. If it was, the estimate of expenses you paid during the period would be higher, and your ending account value lower, by this amount. In addition, each Fund, as a shareholder in the underlying Fidelity Central Funds, will indirectly bear its pro-rata share of the fees and expenses incurred by the underlying Fidelity Central Funds. These fees and expenses are not included in the Fund's annualized expense ratio used to calculate the expense estimate in the table below.
Please note that the expenses shown in the table are meant to highlight your ongoing costs only and do not reflect any transaction costs. Therefore, the second line of the table is useful in comparing ongoing costs only, and will not help you determine the relative total costs of owning different funds. In addition, if these transactional costs were included, your costs would have been higher.
| Annualized
Expense Ratio | Beginning
Account Value
March 1, 2012 | Ending
Account Value
August 31, 2012 | Expenses Paid
During Period*
March 1, 2012
to August 31, 2012 |
Communications Equipment Portfolio | .94% | | | |
Actual | | $ 1,000.00 | $ 895.70 | $ 4.49 |
HypotheticalA | | $ 1,000.00 | $ 1,020.47 | $ 4.79 |
Computers Portfolio | .85% | | | |
Actual | | $ 1,000.00 | $ 988.40 | $ 4.26 |
HypotheticalA | | $ 1,000.00 | $ 1,020.92 | $ 4.33 |
Electronics Portfolio | .84% | | | |
Actual | | $ 1,000.00 | $ 882.20 | $ 3.99 |
HypotheticalA | | $ 1,000.00 | $ 1,020.97 | $ 4.28 |
IT Services Portfolio | .86% | | | |
Actual | | $ 1,000.00 | $ 1,024.10 | $ 4.39 |
HypotheticalA | | $ 1,000.00 | $ 1,020.87 | $ 4.38 |
Software and Computer Services Portfolio | .82% | | | |
Actual | | $ 1,000.00 | $ 1,014.90 | $ 4.16 |
HypotheticalA | | $ 1,000.00 | $ 1,021.07 | $ 4.18 |
Technology Portfolio | .82% | | | |
Actual | | $ 1,000.00 | $ 1,016.90 | $ 4.17 |
HypotheticalA | | $ 1,000.00 | $ 1,021.07 | $ 4.18 |
A 5% return per year before expenses
* Expenses are equal to each Fund's annualized expense ratio, multiplied by the average account value over the period, multiplied by 184/365 (to reflect the one-half year period).
Semiannual Report
Communications Equipment Portfolio
Investment Changes (Unaudited)
Top Ten Stocks as of August 31, 2012 |
| % of fund's
net assets | % of fund's net assets
6 months ago |
QUALCOMM, Inc. | 20.2 | 17.4 |
Cisco Systems, Inc. | 16.6 | 19.7 |
Telefonaktiebolaget LM Ericsson (B Shares) sponsored ADR | 5.0 | 5.1 |
Juniper Networks, Inc. | 4.1 | 4.2 |
Motorola Solutions, Inc. | 3.4 | 3.5 |
Brocade Communications Systems, Inc. | 3.3 | 2.9 |
Polycom, Inc. | 2.6 | 4.2 |
Riverbed Technology, Inc. | 2.4 | 2.3 |
Harris Corp. | 1.9 | 2.6 |
F5 Networks, Inc. | 1.8 | 2.2 |
| 61.3 | |
Top Industries (% of fund's net assets) |
As of August 31, 2012 |
| Communications Equipment | 80.4% | |
| Semiconductors & Semiconductor Equipment | 4.1% | |
| Electronic Equipment & Components | 3.8% | |
| Computers & Peripherals | 0.7% | |
| Media | 0.3% | |
| All Others* | 10.7% | |

As of February 29, 2012 |
| Communications Equipment | 81.2% | |
| Semiconductors & Semiconductor Equipment | 5.7% | |
| Electronic Equipment & Components | 3.2% | |
| Software | 2.5% | |
| Internet Software & Services | 1.1% | |
| All Others* | 6.3% | |

* Includes short-term investments and net other assets. |
Semiannual Report
Communications Equipment Portfolio
Investments August 31, 2012 (Unaudited)
Showing Percentage of Net Assets
Common Stocks - 89.8% |
| Shares | | Value |
COMMUNICATIONS EQUIPMENT - 80.4% |
Communications Equipment - 80.4% |
Acme Packet, Inc. (a)(d) | 207,191 | | $ 3,955,276 |
ADTRAN, Inc. | 204,300 | | 4,145,247 |
Alcatel-Lucent SA sponsored ADR (a)(d) | 649,643 | | 734,097 |
Aruba Networks, Inc. (a)(d) | 249,423 | | 4,901,162 |
Brocade Communications Systems, Inc. (a) | 1,544,541 | | 8,958,338 |
Ciena Corp. (a) | 52,600 | | 719,042 |
Cisco Systems, Inc. | 2,371,076 | | 45,240,130 |
Comtech Telecommunications Corp. | 117,000 | | 3,290,040 |
Emulex Corp. (a) | 118,700 | | 813,095 |
F5 Networks, Inc. (a) | 51,635 | | 5,033,896 |
Finisar Corp. (a)(d) | 315,152 | | 4,330,188 |
Harris Corp. | 107,700 | | 5,065,131 |
Infinera Corp. (a)(d) | 395,400 | | 2,245,872 |
InterDigital, Inc. (d) | 94,400 | | 3,186,000 |
JDS Uniphase Corp. (a) | 140,300 | | 1,569,957 |
Juniper Networks, Inc. (a) | 650,112 | | 11,337,953 |
Motorola Solutions, Inc. | 195,981 | | 9,340,454 |
NETGEAR, Inc. (a) | 107,650 | | 3,936,761 |
Nokia Corp. sponsored ADR (d) | 1,650,330 | | 4,653,931 |
Plantronics, Inc. | 50,600 | | 1,804,396 |
Polycom, Inc. (a) | 693,163 | | 7,222,758 |
QUALCOMM, Inc. | 900,319 | | 55,333,605 |
Research In Motion Ltd. (a)(d) | 599,600 | | 4,011,326 |
Riverbed Technology, Inc. (a) | 333,342 | | 6,663,507 |
Sycamore Networks, Inc. (a) | 122,400 | | 1,809,072 |
Telefonaktiebolaget LM Ericsson (B Shares) sponsored ADR (d) | 1,480,780 | | 13,771,254 |
ViaSat, Inc. (a) | 105,700 | | 4,090,590 |
Wi-Lan, Inc. | 300,100 | | 1,552,635 |
| | 219,715,713 |
COMPUTERS & PERIPHERALS - 0.7% |
Computer Hardware - 0.7% |
Apple, Inc. | 2,000 | | 1,330,480 |
Super Micro Computer, Inc. (a) | 54,800 | | 675,684 |
| | 2,006,164 |
ELECTRICAL EQUIPMENT - 0.3% |
Electrical Components & Equipment - 0.3% |
Prysmian SpA | 43,000 | | 719,877 |
ELECTRONIC EQUIPMENT & COMPONENTS - 3.8% |
Electronic Components - 0.4% |
Vishay Intertechnology, Inc. (a) | 130,000 | | 1,242,800 |
Electronic Manufacturing Services - 3.4% |
Fabrinet (a) | 127,700 | | 1,529,846 |
Flextronics International Ltd. (a) | 519,700 | | 3,497,581 |
TE Connectivity Ltd. | 120,700 | | 4,245,019 |
| | 9,272,446 |
TOTAL ELECTRONIC EQUIPMENT & COMPONENTS | | 10,515,246 |
|
| Shares | | Value |
MEDIA - 0.3% |
Advertising - 0.3% |
Digital Generation, Inc. (a)(d) | 71,400 | | $ 796,110 |
SEMICONDUCTORS & SEMICONDUCTOR EQUIPMENT - 4.1% |
Semiconductor Equipment - 0.6% |
ASML Holding NV | 25,900 | | 1,470,343 |
Semiconductors - 3.5% |
Altera Corp. | 72,900 | | 2,721,357 |
Analog Devices, Inc. | 115,900 | | 4,605,866 |
GSI Technology, Inc. (a) | 257,500 | | 1,143,300 |
Texas Instruments, Inc. | 40,800 | | 1,184,832 |
| | 9,655,355 |
TOTAL SEMICONDUCTORS & SEMICONDUCTOR EQUIPMENT | | 11,125,698 |
SOFTWARE - 0.2% |
Systems Software - 0.2% |
Allot Communications Ltd. (a) | 26,700 | | 705,414 |
TOTAL COMMON STOCKS (Cost $266,928,993) |
245,584,222
|
Money Market Funds - 24.9% |
| | | |
Fidelity Cash Central Fund, 0.17% (b) | 29,536,796 | | 29,536,796 |
Fidelity Securities Lending Cash Central Fund, 0.18% (b)(c) | 38,436,000 | | 38,436,000 |
TOTAL MONEY MARKET FUNDS (Cost $67,972,796) |
67,972,796
|
TOTAL INVESTMENT PORTFOLIO - 114.7% (Cost $334,901,789) | | 313,557,018 |
NET OTHER ASSETS (LIABILITIES) - (14.7)% | | (40,176,381) |
NET ASSETS - 100% | $ 273,380,637 |
Legend |
(a) Non-income producing |
(b) Affiliated fund that is available only to investment companies and other accounts managed by Fidelity Investments. The rate quoted is the annualized seven-day yield of the fund at period end. A complete unaudited listing of the fund's holdings as of its most recent quarter end is available upon request. In addition, each Fidelity Central Fund's financial statements are available on the SEC's website or upon request. |
(c) Investment made with cash collateral received from securities on loan. |
(d) Security or a portion of the security is on loan at period end. |
Affiliated Central Funds |
Information regarding fiscal year to date income earned by the Fund from investments in Fidelity Central Funds is as follows: |
Fund | Income earned |
Fidelity Cash Central Fund | $ 4,668 |
Fidelity Securities Lending Cash Central Fund | 143,813 |
Total | $ 148,481 |
Other Information |
All investments are categorized as Level 1 under the Fair Value Hierarchy. The inputs or methodology used for valuing securities may not be an indication of the risk associated with investing in those securities. For more information on valuation inputs, please refer to the Security Valuation section in the accompanying Notes to Financial Statements. |
Distribution of investments by country or territory of incorporation, as a percentage of total net assets, is as follows. (Unaudited) |
United States of America | 86.4% |
Sweden | 5.0% |
Canada | 2.1% |
Finland | 1.7% |
Switzerland | 1.5% |
Singapore | 1.3% |
Others (Individually Less Than 1%) | 2.0% |
| 100.0% |
See accompanying notes which are an integral part of the financial statements.
Semiannual Report
Communications Equipment Portfolio
Statement of Assets and Liabilities
| August 31, 2012 (Unaudited) |
| | |
Assets | | |
Investment in securities, at value (including securities loaned of $37,039,033) - See accompanying schedule: Unaffiliated issuers (cost $266,928,993) | $ 245,584,222 | |
Fidelity Central Funds (cost $67,972,796) | 67,972,796 | |
Total Investments (cost $334,901,789) | | $ 313,557,018 |
Receivable for fund shares sold | | 100,647 |
Dividends receivable | | 72,467 |
Distributions receivable from Fidelity Central Funds | | 10,683 |
Total assets | | 313,740,815 |
| | |
Liabilities | | |
Payable for investments purchased | $ 1,528,844 | |
Payable for fund shares redeemed | 198,210 | |
Accrued management fee | 114,779 | |
Other affiliated payables | 62,239 | |
Other payables and accrued expenses | 20,106 | |
Collateral on securities loaned, at value | 38,436,000 | |
Total liabilities | | 40,360,178 |
| | |
Net Assets | | $ 273,380,637 |
Net Assets consist of: | | |
Paid in capital | | $ 349,944,570 |
Undistributed net investment income | | 884,163 |
Accumulated undistributed net realized gain (loss) on investments and foreign currency transactions | | (56,103,325) |
Net unrealized appreciation (depreciation) on investments | | (21,344,771) |
Net Assets, for 12,458,425 shares outstanding | | $ 273,380,637 |
Net Asset Value, offering price and redemption price per share ($273,380,637 ÷ 12,458,425 shares) | | $ 21.94 |
Statement of Operations
Six months ended August 31, 2012 (Unaudited) |
| | |
Investment Income | | |
Dividends | | $ 1,956,805 |
Income from Fidelity Central Funds (including $143,813 from security lending) | | 148,481 |
Total income | | 2,105,286 |
| | |
Expenses | | |
Management fee | $ 722,871 | |
Transfer agent fees | 371,388 | |
Accounting and security lending fees | 53,068 | |
Custodian fees and expenses | 28,929 | |
Independent trustees' compensation | 910 | |
Registration fees | 19,956 | |
Audit | 20,702 | |
Legal | 1,233 | |
Miscellaneous | 1,785 | |
Total expenses before reductions | 1,220,842 | |
Expense reductions | (12,725) | 1,208,117 |
Net investment income (loss) | | 897,169 |
Realized and Unrealized Gain (Loss) Net realized gain (loss) on: | | |
Investment securities: | | |
Unaffiliated issuers | 6,913,617 | |
Foreign currency transactions | 329 | |
Total net realized gain (loss) | | 6,913,946 |
Change in net unrealized appreciation (depreciation) on investment securities | | (40,142,975) |
Net gain (loss) | | (33,229,029) |
Net increase (decrease) in net assets resulting from operations | | $ (32,331,860) |
See accompanying notes which are an integral part of the financial statements.
Semiannual Report
Statement of Changes in Net Assets
| Six months ended August 31, 2012 (Unaudited) | Year ended
February 29,
2012 |
Increase (Decrease) in Net Assets | | |
Operations | | |
Net investment income (loss) | $ 897,169 | $ 471,999 |
Net realized gain (loss) | 6,913,946 | (28,111,790) |
Change in net unrealized appreciation (depreciation) | (40,142,975) | (70,792,607) |
Net increase (decrease) in net assets resulting from operations | (32,331,860) | (98,432,398) |
Distributions to shareholders from net investment income | (62,124) | (390,659) |
Share transactions
Proceeds from sales of shares | 50,530,995 | 125,804,694 |
Reinvestment of distributions | 59,715 | 376,474 |
Cost of shares redeemed | (77,419,323) | (281,569,831) |
Net increase (decrease) in net assets resulting from share transactions | (26,828,613) | (155,388,663) |
Redemption fees | 5,066 | 15,056 |
Total increase (decrease) in net assets | (59,217,531) | (254,196,664) |
| | |
Net Assets | | |
Beginning of period | 332,598,168 | 586,794,832 |
End of period (including undistributed net investment income of $884,163 and undistributed net investment income of $49,118, respectively) | $ 273,380,637 | $ 332,598,168 |
Other Information Shares | | |
Sold | 2,292,702 | 4,687,831 |
Issued in reinvestment of distributions | 2,506 | 16,777 |
Redeemed | (3,409,923) | (10,954,733) |
Net increase (decrease) | (1,114,715) | (6,250,125) |
Financial Highlights
| Six months ended August 31, 2012 | Years ended February 28, |
| (Unaudited) | 2012 J | 2011 | 2010 | 2009 | 2008 J |
Selected Per-Share Data | | | | | | |
Net asset value, beginning of period | $ 24.50 | $ 29.60 | $ 20.79 | $ 10.72 | $ 19.50 | $ 20.64 |
Income from Investment Operations | | | | | | |
Net investment income (loss) D | .08 | .03 | (.10) | (.07) G | .04 | (.12) |
Net realized and unrealized gain (loss) | (2.63) | (5.10) | 8.91 | 10.20 | (8.77) | (1.02) |
Total from investment operations | (2.55) | (5.07) | 8.81 | 10.13 | (8.73) | (1.14) |
Distributions from net investment income | (.01) | (.03) | - | (.06) | (.05) | - |
Redemption fees added to paid in capital D, K | - | - | - | - | - | - |
Net asset value, end of period | $ 21.94 | $ 24.50 | $ 29.60 | $ 20.79 | $ 10.72 | $ 19.50 |
Total Return B, C | (10.43)% | (17.13)% | 42.38% | 94.47% | (44.79)% | (5.52)% |
Ratios to Average Net Assets E, H | | | | | | |
Expenses before reductions | .94% A | .90% | .91% | .97% | .95% | .93% |
Expenses net of fee waivers, if any | .94% A | .90% | .91% | .97% | .95% | .93% |
Expenses net of all reductions | .93% A | .89% | .90% | .95% | .94% | .93% |
Net investment income (loss) | .69% A | .12% | (.43)% | (.41)% G | .25% | (.55)% |
Supplemental Data | | | | | | |
Net assets, end of period (000 omitted) | $ 273,381 | $ 332,598 | $ 586,795 | $ 336,910 | $ 125,918 | $ 241,213 |
Portfolio turnover rate F | 38% A | 91% | 85% | 143% I | 120% | 39% |
A Annualized
B Total returns for periods of less than one year are not annualized.
C Total returns would have been lower if certain expenses had not been reduced during the applicable periods shown.
D Calculated based on average shares outstanding during the period.
E Fees and expenses of any underlying Fidelity Central Funds are not included in the Fund's expense ratio. The Fund indirectly bears its proportionate share of the expenses of any underlying Fidelity Central Funds.
F Amount does not include the portfolio activity of any underlying Fidelity Central Funds.
G Investment income per share reflects a large, non-recurring dividend which amounted to $.04 per share. Excluding this non-recurring dividend, the ratio of net investment income (loss) to average net assets would have been (.63)%.
H Expense ratios reflect operating expenses of the Fund. Expenses before reductions do not reflect amounts reimbursed by the investment adviser or reductions from brokerage service arrangements or reductions from other expense offset arrangements and do not represent the amount paid by the Fund during periods when reimbursements or reductions occur. Expenses net of fee waivers reflect expenses after reimbursement by the investment adviser but prior to reductions from brokerage service arrangements or other expense offset arrangements. Expenses net of all reductions represent the net expenses paid by the Fund.
I The portfolio turnover rate does not include the assets acquired in the merger.
J For the year ended February 29.
K Amount represents less than $.01 per share.
See accompanying notes which are an integral part of the financial statements.
Semiannual Report
Computers Portfolio
Investment Changes (Unaudited)
Top Ten Stocks as of August 31, 2012 |
| % of fund's
net assets | % of fund's net assets
6 months ago |
Apple, Inc. | 25.0 | 22.0 |
IBM Corp. | 13.5 | 9.6 |
EMC Corp. | 6.4 | 8.4 |
NCR Corp. | 5.3 | 4.7 |
Teradata Corp. | 3.7 | 3.5 |
Electronics for Imaging, Inc. | 3.3 | 1.9 |
Western Digital Corp. | 3.2 | 3.7 |
NetApp, Inc. | 3.1 | 3.8 |
Seagate Technology | 3.0 | 3.5 |
SanDisk Corp. | 2.6 | 4.8 |
| 69.1 | |
Top Industries (% of fund's net assets) |
As of August 31, 2012 |
| Computers & Peripherals | 68.7% | |
| IT Services | 18.1% | |
| Electronic Equipment & Components | 3.7% | |
| Communications Equipment | 2.5% | |
| Semiconductors & Semiconductor Equipment | 2.0% | |
| All Others* | 5.0% | |

As of February 29, 2012 |
| Computers & Peripherals | 73.4% | |
| IT Services | 13.6% | |
| Communications Equipment | 3.6% | |
| Electronic Equipment & Components | 1.0% | |
| Semiconductors & Semiconductor Equipment | 1.0% | |
| All Others* | 7.4% | |

* Includes short-term investments and net other assets. |
Semiannual Report
Computers Portfolio
Investments August 31, 2012 (Unaudited)
Showing Percentage of Net Assets
Common Stocks - 96.0% |
| Shares | | Value |
COMMUNICATIONS EQUIPMENT - 2.5% |
Communications Equipment - 2.5% |
Motorola Solutions, Inc. | 357,900 | | $ 17,057,514 |
Polycom, Inc. (a) | 324,730 | | 3,383,687 |
| | 20,441,201 |
COMPUTERS & PERIPHERALS - 68.7% |
Computer Hardware - 40.1% |
Apple, Inc. | 308,300 | | 205,093,491 |
Avid Technology, Inc. (a) | 687,150 | | 6,328,652 |
Cray, Inc. (a) | 1,102,500 | | 12,579,525 |
Dell, Inc. | 1,615,407 | | 17,107,160 |
Diebold, Inc. | 194,300 | | 6,330,294 |
Hewlett-Packard Co. | 1,209,905 | | 20,423,196 |
NCR Corp. (a) | 1,946,700 | | 43,586,613 |
Silicon Graphics International Corp. (a)(d) | 393,800 | | 3,363,052 |
Stratasys, Inc. (a) | 147,831 | | 9,558,752 |
Super Micro Computer, Inc. (a) | 403,200 | | 4,971,456 |
| | 329,342,191 |
Computer Storage & Peripherals - 28.6% |
Electronics for Imaging, Inc. (a) | 1,741,615 | | 26,907,952 |
EMC Corp. (a) | 1,991,178 | | 52,348,070 |
Imation Corp. (a) | 719,236 | | 4,106,838 |
Immersion Corp. (a) | 710,290 | | 4,077,065 |
Intermec, Inc. (a) | 993,221 | | 5,879,868 |
Intevac, Inc. (a) | 393,790 | | 2,441,498 |
Lexmark International, Inc. Class A (d) | 256,800 | | 5,575,128 |
NetApp, Inc. (a) | 734,760 | | 25,363,915 |
Novatel Wireless, Inc. (a) | 1,196,424 | | 2,428,741 |
OCZ Technology Group, Inc. (a)(d) | 958,200 | | 5,423,412 |
QLogic Corp. (a) | 157,408 | | 1,915,655 |
Quantum Corp. (a) | 3,858,200 | | 6,173,120 |
Rimage Corp. | 240,000 | | 1,651,200 |
SanDisk Corp. (a) | 522,800 | | 21,549,816 |
Seagate Technology | 772,800 | | 24,737,328 |
Smart Technologies, Inc. Class A (a) | 50,000 | | 74,500 |
STEC, Inc. (a) | 615,780 | | 4,562,930 |
Synaptics, Inc. (a)(d) | 267,200 | | 8,128,224 |
Western Digital Corp. (a) | 634,084 | | 26,517,393 |
Xyratex Ltd. | 410,800 | | 4,543,448 |
| | 234,406,101 |
TOTAL COMPUTERS & PERIPHERALS | | 563,748,292 |
ELECTRONIC EQUIPMENT & COMPONENTS - 3.7% |
Electronic Manufacturing Services - 2.4% |
Flextronics International Ltd. (a) | 1,525,000 | | 10,263,250 |
Jabil Circuit, Inc. | 430,000 | | 9,795,400 |
| | 20,058,650 |
|
| Shares | | Value |
Technology Distributors - 1.3% |
Arrow Electronics, Inc. (a) | 284,900 | | $ 10,327,625 |
TOTAL ELECTRONIC EQUIPMENT & COMPONENTS | | 30,386,275 |
INTERNET SOFTWARE & SERVICES - 0.5% |
Internet Software & Services - 0.5% |
Velti PLC (a)(d) | 588,600 | | 4,078,998 |
IT SERVICES - 18.1% |
IT Consulting & Other Services - 18.1% |
EPAM Systems, Inc. | 408,800 | | 7,154,000 |
IBM Corp. | 569,548 | | 110,976,428 |
Teradata Corp. (a) | 405,157 | | 30,945,892 |
| | 149,076,320 |
SEMICONDUCTORS & SEMICONDUCTOR EQUIPMENT - 2.0% |
Semiconductors - 2.0% |
RF Micro Devices, Inc. (a) | 1,000,000 | | 3,750,000 |
Samsung Electronics Co. Ltd. | 12,000 | | 13,050,042 |
| | 16,800,042 |
SOFTWARE - 0.5% |
Application Software - 0.5% |
BroadSoft, Inc. (a)(d) | 107,200 | | 3,881,712 |
TOTAL COMMON STOCKS (Cost $656,440,106) |
788,412,840
|
Money Market Funds - 4.7% |
| | | |
Fidelity Cash Central Fund, 0.17% (b) | 15,616,392 | | 15,616,392 |
Fidelity Securities Lending Cash Central Fund, 0.18% (b)(c) | 22,602,028 | | 22,602,028 |
TOTAL MONEY MARKET FUNDS (Cost $38,218,420) |
38,218,420
|
TOTAL INVESTMENT PORTFOLIO - 100.7% (Cost $694,658,526) | | 826,631,260 |
NET OTHER ASSETS (LIABILITIES) - (0.7)% | | (5,779,101) |
NET ASSETS - 100% | $ 820,852,159 |
Legend |
(a) Non-income producing |
(b) Affiliated fund that is available only to investment companies and other accounts managed by Fidelity Investments. The rate quoted is the annualized seven-day yield of the fund at period end. A complete unaudited listing of the fund's holdings as of its most recent quarter end is available upon request. In addition, each Fidelity Central Fund's financial statements are available on the SEC's website or upon request. |
(c) Investment made with cash collateral received from securities on loan. |
(d) Security or a portion of the security is on loan at period end. |
Affiliated Central Funds |
Information regarding fiscal year to date income earned by the Fund from investments in Fidelity Central Funds is as follows: |
Fund | Income earned |
Fidelity Cash Central Fund | $ 22,382 |
Fidelity Securities Lending Cash Central Fund | 301,607 |
Total | $ 323,989 |
Other Information |
All investments are categorized as Level 1 under the Fair Value Hierarchy. The inputs or methodology used for valuing securities may not be an indication of the risk associated with investing in those securities. For more information on valuation inputs, please refer to the Security Valuation section in the accompanying Notes to Financial Statements. |
See accompanying notes which are an integral part of the financial statements.
Semiannual Report
Computers Portfolio
Statement of Assets and Liabilities
| August 31, 2012 (Unaudited) |
| | |
Assets | | |
Investment in securities, at value (including securities loaned of $22,241,533) - See accompanying schedule: Unaffiliated issuers (cost $656,440,106) | $ 788,412,840 | |
Fidelity Central Funds (cost $38,218,420) | 38,218,420 | |
Total Investments (cost $694,658,526) | | $ 826,631,260 |
Receivable for investments sold | | 33,168,037 |
Receivable for fund shares sold | | 686,802 |
Dividends receivable | | 574,857 |
Distributions receivable from Fidelity Central Funds | | 92,121 |
Other receivables | | 168,541 |
Total assets | | 861,321,618 |
| | |
Liabilities | | |
Payable for investments purchased | $ 16,402,409 | |
Payable for fund shares redeemed | 883,088 | |
Accrued management fee | 377,906 | |
Other affiliated payables | 173,585 | |
Other payables and accrued expenses | 30,443 | |
Collateral on securities loaned, at value | 22,602,028 | |
Total liabilities | | 40,469,459 |
| | |
Net Assets | | $ 820,852,159 |
Net Assets consist of: | | |
Paid in capital | | $ 778,511,476 |
Accumulated net investment loss | | (274,166) |
Accumulated undistributed net realized gain (loss) on investments and foreign currency transactions | | (89,292,410) |
Net unrealized appreciation (depreciation) on investments and assets and liabilities in foreign currencies | | 131,907,259 |
Net Assets, for 12,797,896 shares outstanding | | $ 820,852,159 |
Net Asset Value, offering price and redemption price per share ($820,852,159 ÷ 12,797,896 shares) | | $ 64.14 |
Statement of Operations
Six months ended August 31, 2012 (Unaudited) |
| | |
Investment Income | | |
Dividends | | $ 3,152,335 |
Interest | | 21 |
Income from Fidelity Central Funds (including $301,607 from security lending) | | 323,989 |
Total income | | 3,476,345 |
| | |
Expenses | | |
Management fee | $ 2,223,734 | |
Transfer agent fees | 937,789 | |
Accounting and security lending fees | 139,893 | |
Custodian fees and expenses | 19,351 | |
Independent trustees' compensation | 2,685 | |
Registration fees | 51,708 | |
Audit | 21,556 | |
Legal | 1,612 | |
Miscellaneous | 3,360 | |
Total expenses before reductions | 3,401,688 | |
Expense reductions | (12,403) | 3,389,285 |
Net investment income (loss) | | 87,060 |
Realized and Unrealized Gain (Loss) Net realized gain (loss) on: | | |
Investment securities: | | |
Unaffiliated issuers | (29,644,550) | |
Foreign currency transactions | (74) | |
Total net realized gain (loss) | | (29,644,624) |
Change in net unrealized appreciation (depreciation) on: Investment securities | 14,949,963 | |
Assets and liabilities in foreign currencies | (21,269) | |
Total change in net unrealized appreciation (depreciation) | | 14,928,694 |
Net gain (loss) | | (14,715,930) |
Net increase (decrease) in net assets resulting from operations | | $ (14,628,870) |
See accompanying notes which are an integral part of the financial statements.
Semiannual Report
Statement of Changes in Net Assets
| Six months ended August 31, 2012 (Unaudited) | Year ended
February 29,
2012 |
Increase (Decrease) in Net Assets | | |
Operations | | |
Net investment income (loss) | $ 87,060 | $ (1,808,619) |
Net realized gain (loss) | (29,644,624) | (13,271,623) |
Change in net unrealized appreciation (depreciation) | 14,928,694 | 67,711,464 |
Net increase (decrease) in net assets resulting from operations | (14,628,870) | 52,631,222 |
Share transactions
Proceeds from sales of shares | 241,935,380 | 303,359,134 |
Cost of shares redeemed | (165,207,759) | (206,780,928) |
Net increase (decrease) in net assets resulting from share transactions | 76,727,621 | 96,578,206 |
Redemption fees | 40,410 | 16,407 |
Total increase (decrease) in net assets | 62,139,161 | 149,225,835 |
| | |
Net Assets | | |
Beginning of period | 758,712,998 | 609,487,163 |
End of period (including accumulated net investment loss of $274,166 and accumulated net investment loss of $361,226, respectively) | $ 820,852,159 | $ 758,712,998 |
Other Information Shares | | |
Sold | 3,728,694 | 5,122,159 |
Redeemed | (2,622,618) | (3,621,731) |
Net increase (decrease) | 1,106,076 | 1,500,428 |
Financial Highlights
| Six months ended August 31, 2012 | Years ended February 28, |
| (Unaudited) | 2012 H | 2011 | 2010 | 2009 | 2008 H |
Selected Per-Share Data | | | | | | |
Net asset value, beginning of period | $ 64.89 | $ 59.80 | $ 43.59 | $ 23.44 | $ 40.26 | $ 39.29 |
Income from Investment Operations | | | | | | |
Net investment income (loss) D | .01 | (.18) | (.25) | (.07) | (.02) | (.12) |
Net realized and unrealized gain (loss) | (.76) | 5.27 | 16.46 | 20.22 | (16.80) | 1.09 |
Total from investment operations | (.75) | 5.09 | 16.21 | 20.15 | (16.82) | .97 |
Redemption fees added to paid in capital D, I | - | - | - | - | - | - |
Net asset value, end of period | $ 64.14 | $ 64.89 | $ 59.80 | $ 43.59 | $ 23.44 | $ 40.26 |
Total Return B, C | (1.16)% | 8.51% | 37.19% | 85.96% | (41.78)% | 2.47% |
Ratios to Average Net Assets E, G | | | | | | |
Expenses before reductions | .85% A | .86% | .89% | .95% | .92% | .92% |
Expenses net of fee waivers, if any | .85% A | .86% | .89% | .95% | .92% | .92% |
Expenses net of all reductions | .85% A | .85% | .88% | .92% | .91% | .91% |
Net investment income (loss) | .02% A | (.32)% | (.50)% | (.18)% | (.05)% | (.26)% |
Supplemental Data | | | | | | |
Net assets, end of period (000 omitted) | $ 820,852 | $ 758,713 | $ 609,487 | $ 502,708 | $ 207,163 | $ 437,251 |
Portfolio turnover rate F | 163% A | 193% | 141% | 269% | 183% | 234% |
A Annualized
B Total returns for periods of less than one year are not annualized.
C Total returns would have been lower if certain expenses had not been reduced during the applicable periods shown.
D Calculated based on average shares outstanding during the period.
E Fees and expenses of any underlying Fidelity Central Funds are not included in the Fund's expense ratio. The Fund indirectly bears its proportionate share of the expenses of any underlying Fidelity Central Funds.
F Amount does not include the portfolio activity of any underlying Fidelity Central Funds.
G Expense ratios reflect operating expenses of the Fund. Expenses before reductions do not reflect amounts reimbursed by the investment adviser or reductions from brokerage service arrangements or reductions from other expense offset arrangements and do not represent the amount paid by the Fund during periods when reimbursements or reductions occur. Expenses net of fee waivers reflect expenses after reimbursement by the investment adviser but prior to reductions from brokerage service arrangements or other expense offset arrangements. Expenses net of all reductions represent the net expenses paid by the Fund.
H For the year ended February 29.
I Amount represents less than $.01 per share.
See accompanying notes which are an integral part of the financial statements.
Semiannual Report
Electronics Portfolio
Investment Changes (Unaudited)
Top Ten Stocks as of August 31, 2012 |
| % of fund's
net assets | % of fund's net assets
6 months ago |
Broadcom Corp. Class A | 9.5 | 7.9 |
Texas Instruments, Inc. | 9.1 | 9.5 |
Altera Corp. | 5.2 | 3.2 |
Intersil Corp. Class A | 4.6 | 4.2 |
Freescale Semiconductor Holdings I Ltd. | 4.5 | 3.5 |
Marvell Technology Group Ltd. | 4.2 | 8.4 |
QUALCOMM, Inc. | 4.0 | 1.8 |
Avago Technologies Ltd. | 4.0 | 2.0 |
NXP Semiconductors NV | 3.8 | 3.6 |
ON Semiconductor Corp. | 3.7 | 3.3 |
| 52.6 | |
Top Industries (% of fund's net assets) |
As of August 31, 2012 |
| Semiconductors & Semiconductor Equipment | 78.2% | |
| Electronic Equipment & Components | 9.5% | |
| Communications Equipment | 6.6% | |
| Computers & Peripherals | 1.3% | |
| Software | 0.1% | |
| All Others* | 4.3% | |

As of February 29, 2012 |
| Semiconductors & Semiconductor Equipment | 83.2% | |
| Electronic Equipment & Components | 6.0% | |
| Computers & Peripherals | 3.8% | |
| Communications Equipment | 3.7% | |
| Internet Software & Services | 0.7% | |
| All Others* | 2.6% | |

* Includes short-term investments and net other assets. |
Semiannual Report
Electronics Portfolio
Investments August 31, 2012 (Unaudited)
Showing Percentage of Net Assets
Common Stocks - 95.7% |
| Shares | | Value |
BIOTECHNOLOGY - 0.0% |
Biotechnology - 0.0% |
Arrowhead Research Corp. warrants 5/21/17 (a)(f) | 285,468 | | $ 3 |
COMMUNICATIONS EQUIPMENT - 6.6% |
Communications Equipment - 6.6% |
Acme Packet, Inc. (a) | 222,420 | | 4,245,998 |
Brocade Communications Systems, Inc. (a) | 769,879 | | 4,465,298 |
Finisar Corp. (a) | 192,328 | | 2,642,587 |
Polycom, Inc. (a) | 756,422 | | 7,881,917 |
QUALCOMM, Inc. | 632,073 | | 38,847,207 |
Research In Motion Ltd. (a)(d) | 171,700 | | 1,148,673 |
Riverbed Technology, Inc. (a) | 241,837 | | 4,834,322 |
| | 64,066,002 |
COMPUTERS & PERIPHERALS - 1.3% |
Computer Hardware - 0.5% |
Hewlett-Packard Co. | 264,730 | | 4,468,642 |
Computer Storage & Peripherals - 0.8% |
Fusion-io, Inc. (a) | 4,100 | | 114,882 |
Lexmark International, Inc. Class A (d) | 49,100 | | 1,065,961 |
SanDisk Corp. (a) | 172,868 | | 7,125,619 |
| | 8,306,462 |
TOTAL COMPUTERS & PERIPHERALS | | 12,775,104 |
ELECTRONIC EQUIPMENT & COMPONENTS - 9.5% |
Electronic Components - 2.0% |
Aeroflex Holding Corp. (a) | 1,781,466 | | 12,648,409 |
Amphenol Corp. Class A | 6,800 | | 413,916 |
Corning, Inc. | 295,341 | | 3,541,139 |
InvenSense, Inc. (d) | 226,494 | | 2,849,295 |
| | 19,452,759 |
Electronic Manufacturing Services - 7.5% |
Benchmark Electronics, Inc. (a) | 517,133 | | 8,299,985 |
Fabrinet (a) | 89,612 | | 1,073,552 |
Flextronics International Ltd. (a) | 3,268,978 | | 22,000,222 |
Jabil Circuit, Inc. | 1,018,893 | | 23,210,383 |
Plexus Corp. (a) | 18 | | 538 |
TE Connectivity Ltd. | 75,000 | | 2,637,750 |
TTM Technologies, Inc. (a) | 1,372,745 | | 14,551,097 |
Uni-Pixel Inc. (a) | 27,800 | | 167,634 |
| | 71,941,161 |
Technology Distributors - 0.0% |
Avnet, Inc. (a) | 10,000 | | 322,100 |
TOTAL ELECTRONIC EQUIPMENT & COMPONENTS | | 91,716,020 |
SEMICONDUCTORS & SEMICONDUCTOR EQUIPMENT - 78.2% |
Semiconductor Equipment - 4.4% |
Advanced Energy Industries, Inc. (a) | 795 | | 10,152 |
Amkor Technology, Inc. (a)(d) | 1,955 | | 9,169 |
|
| Shares | | Value |
Applied Materials, Inc. | 170,516 | | $ 1,993,332 |
ASML Holding NV | 148,960 | | 8,456,459 |
Cabot Microelectronics Corp. | 3,300 | | 109,791 |
Cohu, Inc. | 1,100 | | 9,680 |
Cymer, Inc. (a) | 206,550 | | 11,711,385 |
Entegris, Inc. (a) | 569,009 | | 5,001,589 |
KLA-Tencor Corp. | 70,600 | | 3,622,486 |
Lam Research Corp. (a) | 319,973 | | 10,920,678 |
MEMC Electronic Materials, Inc. (a) | 5,538 | | 14,842 |
Nanometrics, Inc. (a) | 22,400 | | 341,152 |
Nova Measuring Instruments Ltd. (a) | 15,800 | | 124,188 |
Teradyne, Inc. (a) | 1,730 | | 27,023 |
| | 42,351,926 |
Semiconductors - 73.8% |
Advanced Micro Devices, Inc. (a) | 5,260,459 | | 19,568,907 |
Alpha & Omega Semiconductor Ltd. (a) | 412,527 | | 3,914,881 |
Altera Corp. | 1,337,616 | | 49,933,205 |
Analog Devices, Inc. | 173,900 | | 6,910,786 |
Applied Micro Circuits Corp. (a) | 364,277 | | 1,861,455 |
ARM Holdings PLC sponsored ADR | 17 | | 463 |
Atmel Corp. (a) | 1,834,203 | | 10,876,824 |
Avago Technologies Ltd. | 1,053,247 | | 38,517,243 |
BCD Semiconductor Manufacturing Ltd. ADR (a)(e) | 1,423,208 | | 5,137,781 |
Broadcom Corp. Class A | 2,573,953 | | 91,452,551 |
Cirrus Logic, Inc. (a) | 125,000 | | 5,208,750 |
Cypress Semiconductor Corp. | 1,834,476 | | 21,298,266 |
Entropic Communications, Inc. (a) | 693,518 | | 3,765,803 |
Exar Corp. (a) | 15,000 | | 114,150 |
Fairchild Semiconductor International, Inc. (a) | 70,895 | | 1,029,395 |
First Solar, Inc. (a)(d) | 127,042 | | 2,539,570 |
Freescale Semiconductor Holdings I Ltd. (a)(d) | 4,340,627 | | 43,449,676 |
Inphi Corp. (a) | 246,700 | | 2,930,796 |
Intel Corp. | 1,262,483 | | 31,347,453 |
Intermolecular, Inc. | 554,894 | | 4,106,216 |
International Rectifier Corp. (a) | 113,656 | | 1,978,751 |
Intersil Corp. Class A | 5,064,672 | | 44,721,054 |
Lattice Semiconductor Corp. (a) | 245,500 | | 954,995 |
Linear Technology Corp. | 2,100 | | 69,353 |
LSI Corp. (a) | 372,319 | | 2,900,365 |
M/A-COM Technology Solutions, Inc. | 222,763 | | 2,566,230 |
MagnaChip Semiconductor Corp. (a) | 162,138 | | 2,190,484 |
Marvell Technology Group Ltd. | 4,012,272 | | 40,844,929 |
Maxim Integrated Products, Inc. | 144,500 | | 3,921,730 |
MediaTek, Inc. | 284,000 | | 3,040,787 |
Micron Technology, Inc. (a) | 3,964,795 | | 24,621,377 |
Monolithic Power Systems, Inc. (a) | 200 | | 4,312 |
Motech Industries, Inc. | 1 | | 1 |
NVIDIA Corp. (a) | 2,063,212 | | 28,946,864 |
NXP Semiconductors NV (a) | 1,564,837 | | 36,491,999 |
O2Micro International Ltd. sponsored ADR (a) | 567,385 | | 2,014,217 |
Common Stocks - continued |
| Shares | | Value |
SEMICONDUCTORS & SEMICONDUCTOR EQUIPMENT - CONTINUED |
Semiconductors - continued |
ON Semiconductor Corp. (a) | 5,660,053 | | $ 35,262,130 |
Peregrine Semiconductor Corp. | 58,900 | | 936,510 |
PMC-Sierra, Inc. (a) | 2,187,620 | | 12,797,577 |
RDA Microelectronics, Inc. sponsored ADR (a) | 57,882 | | 519,780 |
Renesas Electronics Corp. (a)(d) | 557,100 | | 1,881,602 |
RF Micro Devices, Inc. (a) | 1,652,755 | | 6,197,831 |
Samsung Electronics Co. Ltd. | 1,834 | | 1,994,481 |
Skyworks Solutions, Inc. (a) | 655,666 | | 19,971,586 |
Spansion, Inc. Class A | 355,556 | | 4,064,005 |
STATS ChipPAC Ltd. (a) | 7,325,000 | | 1,909,847 |
Texas Instruments, Inc. | 3,018,684 | | 87,662,583 |
Volterra Semiconductor Corp. (a) | 16,900 | | 402,727 |
Xilinx, Inc. | 5,000 | | 169,550 |
| | 713,001,828 |
TOTAL SEMICONDUCTORS & SEMICONDUCTOR EQUIPMENT | | 755,353,754 |
SOFTWARE - 0.1% |
Home Entertainment Software - 0.1% |
Zynga, Inc. | 294,500 | | 824,600 |
TOTAL COMMON STOCKS (Cost $1,137,625,251) |
924,735,483
|
Money Market Funds - 9.4% |
| | | |
Fidelity Cash Central Fund, 0.17% (b) | 45,596,946 | | 45,596,946 |
Fidelity Securities Lending Cash Central Fund, 0.18% (b)(c) | 44,608,664 | | 44,608,664 |
TOTAL MONEY MARKET FUNDS (Cost $90,205,610) |
90,205,610
|
TOTAL INVESTMENT PORTFOLIO - 105.1% (Cost $1,227,830,861) | | 1,014,941,093 |
NET OTHER ASSETS (LIABILITIES) - (5.1)% | | (49,006,812) |
NET ASSETS - 100% | $ 965,934,281 |
Legend |
(a) Non-income producing |
(b) Affiliated fund that is available only to investment companies and other accounts managed by Fidelity Investments. The rate quoted is the annualized seven-day yield of the fund at period end. A complete unaudited listing of the fund's holdings as of its most recent quarter end is available upon request. In addition, each Fidelity Central Fund's financial statements are available on the SEC's website or upon request. |
(c) Investment made with cash collateral received from securities on loan. |
(d) Security or a portion of the security is on loan at period end. |
(e) Affiliated company |
(f) Restricted securities - Investment in securities not registered under the Securities Act of 1933 (excluding 144A issues). At the end of the period, the value of restricted securities (excluding 144A issues) amounted to $3 or 0.0% of net assets. |
Additional information on each restricted holding is as follows: |
Security | Acquisition Date | Acquisition Cost |
Arrowhead Research Corp. warrants 5/21/17 | 5/18/07 | $ 1,033,745 |
Affiliated Central Funds |
Information regarding fiscal year to date income earned by the Fund from investments in Fidelity Central Funds is as follows: |
Fund | Income earned |
Fidelity Cash Central Fund | $ 11,392 |
Fidelity Securities Lending Cash Central Fund | 154,815 |
Total | $ 166,207 |
Other Affiliated Issuers |
An affiliated company is a company in which the Fund has ownership of at least 5% of the voting securities. Fiscal year to date transactions with companies which are or were affiliates are as follows: |
Affiliate | Value,
beginning of
period | Purchases | Sales
Proceeds | Dividend
Income | Value,
end of
period |
BCD Semiconductor Manufacturing Ltd. ADR | $ 7,544,993 | $ 934,707 | $ 1,482,297 | $ - | $ 5,137,781 |
Total | $ 7,544,993 | $ 934,707 | $ 1,482,297 | $ - | $ 5,137,781 |
Other Information |
The following is a summary of the inputs used, as of August 31, 2012, involving the Fund's assets and liabilities carried at fair value. The inputs or methodology used for valuing securities may not be an indication of the risk associated with investing in those securities. For more information on valuation inputs, and their aggregation into the levels used in the table below, please refer to the Security Valuation section in the accompanying Notes to Financial Statements. |
Valuation Inputs at Reporting Date: |
Description | Total | Level 1 | Level 2 | Level 3 |
Investments in Securities: | | | | |
Common Stocks | $ 924,735,483 | $ 922,853,878 | $ 1,881,602 | $ 3 |
Money Market Funds | 90,205,610 | 90,205,610 | - | - |
Total Investments in Securities: | $ 1,014,941,093 | $ 1,013,059,488 | $ 1,881,602 | $ 3 |
Distribution of investments by country or territory of incorporation, as a percentage of total net assets, is as follows. (Unaudited) |
United States of America | 77.7% |
Bermuda | 9.1% |
Singapore | 6.5% |
Netherlands | 4.7% |
Others (Individually Less Than 1%) | 2.0% |
| 100.0% |
See accompanying notes which are an integral part of the financial statements.
Semiannual Report
Electronics Portfolio
Statement of Assets and Liabilities
| August 31, 2012 (Unaudited) |
| | |
Assets | | |
Investment in securities, at value (including securities loaned of $43,527,535) - See accompanying schedule: Unaffiliated issuers (cost $1,127,384,538) | $ 919,597,702 | |
Fidelity Central Funds (cost $90,205,610) | 90,205,610 | |
Other affiliated issuers (cost $10,240,713) | 5,137,781 | |
Total Investments (cost $1,227,830,861) | | $ 1,014,941,093 |
Cash | | 2,158 |
Receivable for investments sold | | 4,081,724 |
Receivable for fund shares sold | | 111,792 |
Dividends receivable | | 938,831 |
Distributions receivable from Fidelity Central Funds | | 55,083 |
Other receivables | | 49,426 |
Total assets | | 1,020,180,107 |
| | |
Liabilities | | |
Payable for investments purchased | $ 7,556,451 | |
Payable for fund shares redeemed | 1,346,643 | |
Accrued management fee | 452,103 | |
Other affiliated payables | 210,987 | |
Other payables and accrued expenses | 70,978 | |
Collateral on securities loaned, at value | 44,608,664 | |
Total liabilities | | 54,245,826 |
| | |
Net Assets | | $ 965,934,281 |
Net Assets consist of: | | |
Paid in capital | | $ 1,439,978,280 |
Distributions in excess of net investment income | | (197,815) |
Accumulated undistributed net realized gain (loss) on investments and foreign currency transactions | | (260,956,806) |
Net unrealized appreciation (depreciation) on investments and assets and liabilities in foreign currencies | | (212,889,378) |
Net Assets, for 20,548,379 shares outstanding | | $ 965,934,281 |
Net Asset Value, offering price and redemption price per share ($965,934,281 ÷ 20,548,379 shares) | | $ 47.01 |
Statement of Operations
Six months ended August 31, 2012 (Unaudited) |
| | |
Investment Income | | |
Dividends | | $ 4,640,494 |
Interest | | 15,298 |
Income from Fidelity Central Funds (including $154,815 from security lending) | | 166,207 |
Total income | | 4,821,999 |
| | |
Expenses | | |
Management fee | $ 2,918,943 | |
Transfer agent fees | 1,199,214 | |
Accounting and security lending fees | 179,770 | |
Custodian fees and expenses | 34,226 | |
Independent trustees' compensation | 3,829 | |
Depreciation in deferred trustee compensation account | (27) | |
Registration fees | 27,563 | |
Audit | 20,010 | |
Legal | 3,034 | |
Interest | 1,409 | |
Miscellaneous | 6,293 | |
Total expenses before reductions | 4,394,264 | |
Expense reductions | (34,233) | 4,360,031 |
Net investment income (loss) | | 461,968 |
Realized and Unrealized Gain (Loss) Net realized gain (loss) on: | | |
Investment securities: | | |
Unaffiliated issuers | (3,002,111) | |
Other affiliated issuers | 329,384 | |
Foreign currency transactions | (13,569) | |
Total net realized gain (loss) | | (2,686,296) |
Change in net unrealized appreciation (depreciation) on: Investment securities | (141,265,958) | |
Assets and liabilities in foreign currencies | 390 | |
Total change in net unrealized appreciation (depreciation) | | (141,265,568) |
Net gain (loss) | | (143,951,864) |
Net increase (decrease) in net assets resulting from operations | | $ (143,489,896) |
See accompanying notes which are an integral part of the financial statements.
Semiannual Report
Statement of Changes in Net Assets
| Six months ended August 31, 2012 (Unaudited) | Year ended
February 29,
2012 |
Increase (Decrease) in Net Assets | | |
Operations | | |
Net investment income (loss) | $ 461,968 | $ 345,599 |
Net realized gain (loss) | (2,686,296) | 164,105,931 |
Change in net unrealized appreciation (depreciation) | (141,265,568) | (175,704,422) |
Net increase (decrease) in net assets resulting from operations | (143,489,896) | (11,252,892) |
Distributions to shareholders from net investment income | - | (1,262,911) |
Share transactions
Proceeds from sales of shares | 73,742,590 | 318,638,191 |
Reinvestment of distributions | - | 1,197,593 |
Cost of shares redeemed | (256,069,994) | (402,899,738) |
Net increase (decrease) in net assets resulting from share transactions | (182,327,404) | (83,063,954) |
Redemption fees | 10,501 | 56,684 |
Total increase (decrease) in net assets | (325,806,799) | (95,523,073) |
| | |
Net Assets | | |
Beginning of period | 1,291,741,080 | 1,387,264,153 |
End of period (including distributions in excess of net investment income of $197,815 and distributions in excess of net investment income of $659,783, respectively) | $ 965,934,281 | $ 1,291,741,080 |
Other Information Shares | | |
Sold | 1,492,962 | 6,469,469 |
Issued in reinvestment of distributions | - | 25,727 |
Redeemed | (5,184,918) | (8,254,694) |
Net increase (decrease) | (3,691,956) | (1,759,498) |
Financial Highlights
| Six months ended August 31, 2012 | Years ended February 28, |
| (Unaudited) | 2012 H | 2011 | 2010 | 2009 | 2008 H |
Selected Per-Share Data | | | | | | |
Net asset value, beginning of period | $ 53.29 | $ 53.36 | $ 39.66 | $ 21.13 | $ 37.17 | $ 46.14 |
Income from Investment Operations | | | | | | |
Net investment income (loss) D | .02 | .01 | .06 | .31 | .34 | .17 |
Net realized and unrealized gain (loss) | (6.30) | (.02) | 13.75 | 18.57 | (16.19) | (8.85) |
Total from investment operations | (6.28) | (.01) | 13.81 | 18.88 | (15.85) | (8.68) |
Distributions from net investment income | - | (.06) | (.11) | (.34) | (.19) | (.17) |
Distributions from net realized gain | - | - | - | (.01) | - | (.12) |
Total distributions | - | (.06) | (.11) | (.35) | (.19) | (.29) |
Redemption fees added to paid in capital D, I | - | - | - | - | - | - |
Net asset value, end of period | $ 47.01 | $ 53.29 | $ 53.36 | $ 39.66 | $ 21.13 | $ 37.17 |
Total Return B, C | (11.78)% | (.01)% | 34.87% | 89.51% | (42.63)% | (18.95)% |
Ratios to Average Net Assets E, G | | | | | | |
Expenses before reductions | .84% A | .84% | .86% | .92% | .89% | .87% |
Expenses net of fee waivers, if any | .84% A | .84% | .86% | .92% | .89% | .87% |
Expenses net of all reductions | .83% A | .83% | .86% | .91% | .88% | .86% |
Net investment income (loss) | .09% A | .03% | .13% | .92% | 1.05% | .36% |
Supplemental Data | | | | | | |
Net assets, end of period (000 omitted) | $ 965,934 | $ 1,291,741 | $ 1,387,264 | $ 1,104,541 | $ 563,453 | $ 1,201,825 |
Portfolio turnover rate F | 92% A | 137% | 101% | 71% | 91% | 87% |
A Annualized
B Total returns for periods of less than one year are not annualized.
C Total returns would have been lower if certain expenses had not been reduced during the applicable periods shown.
D Calculated based on average shares outstanding during the period.
E Fees and expenses of any underlying Fidelity Central Funds are not included in the Fund's expense ratio. The Fund indirectly bears its proportionate share of the expenses of any underlying Fidelity Central Funds.
F Amount does not include the portfolio activity of any underlying Fidelity Central Funds.
G Expense ratios reflect operating expenses of the Fund. Expenses before reductions do not reflect amounts reimbursed by the investment adviser or reductions from brokerage service arrangements or reductions from other expense offset arrangements and do not represent the amount paid by the Fund during periods when reimbursements or reductions occur. Expenses net of fee waivers reflect expenses after reimbursement by the investment adviser but prior to reductions from brokerage service arrangements or other expense offset arrangements. Expenses net of all reductions represent the net expenses paid by the Fund.
H For the year ended February 29.
I Amount represents less than $.01 per share.
See accompanying notes which are an integral part of the financial statements.
Semiannual Report
IT Services Portfolio
Investment Changes (Unaudited)
Top Ten Stocks as of August 31, 2012 |
| % of fund's
net assets | % of fund's net assets
6 months ago |
Cognizant Technology Solutions Corp. Class A | 9.1 | 14.2 |
Visa, Inc. Class A | 9.1 | 7.7 |
IBM Corp. | 8.2 | 8.3 |
MasterCard, Inc. Class A | 7.6 | 9.7 |
Accenture PLC Class A | 7.0 | 9.3 |
Virtusa Corp. | 5.3 | 3.2 |
EPAM Systems, Inc. | 3.3 | 1.9 |
ExlService Holdings, Inc. | 3.2 | 0.0 |
Sapient Corp. | 3.0 | 0.8 |
Fidelity National Information Services, Inc. | 3.0 | 2.5 |
| 58.8 | |
Top Industries (% of fund's net assets) |
As of August 31, 2012 |
| IT Services | 87.1% | |
| Software | 6.4% | |
| Internet Software & Services | 3.1% | |
| Office Electronics | 1.3% | |
| Computers & Peripherals | 1.0% | |
| All Others* | 1.1% | |

As of February 29, 2012 |
| IT Services | 91.0% | |
| Software | 2.4% | |
| Internet Software & Services | 1.8% | |
| Consumer Finance | 1.5% | |
| Office Electronics | 0.9% | |
| All Others* | 2.4% | |

* Includes short-term investments and net other assets. |
Semiannual Report
IT Services Portfolio
Investments August 31, 2012 (Unaudited)
Showing Percentage of Net Assets
Common Stocks - 99.8% |
| Shares | | Value |
COMMERCIAL SERVICES & SUPPLIES - 0.8% |
Diversified Support Services - 0.8% |
Performant Financial Corp. | 222,222 | | $ 2,411,109 |
COMMUNICATIONS EQUIPMENT - 0.0% |
Communications Equipment - 0.0% |
Palo Alto Networks, Inc. | 400 | | 25,752 |
COMPUTERS & PERIPHERALS - 1.0% |
Computer Hardware - 1.0% |
Hewlett-Packard Co. | 400 | | 6,752 |
NCR Corp. (a) | 144,700 | | 3,239,833 |
| | 3,246,585 |
INTERNET SOFTWARE & SERVICES - 3.1% |
Internet Software & Services - 3.1% |
Demandware, Inc. (d) | 85,520 | | 2,223,520 |
E2open, Inc. | 135,100 | | 1,723,876 |
Web.com Group, Inc. (a) | 343,700 | | 5,722,605 |
| | 9,670,001 |
IT SERVICES - 87.1% |
Data Processing & Outsourced Services - 39.0% |
Alliance Data Systems Corp. (a)(d) | 24,248 | | 3,337,737 |
Automatic Data Processing, Inc. | 600 | | 34,848 |
Broadridge Financial Solutions, Inc. | 7,800 | | 184,704 |
Cardtronics, Inc. (a) | 101,700 | | 2,873,025 |
Cass Information Systems, Inc. | 12,320 | | 493,046 |
Convergys Corp. | 60,900 | | 944,559 |
CoreLogic, Inc. (a) | 1,600 | | 39,360 |
CSG Systems International, Inc. (a) | 18,100 | | 383,901 |
DST Systems, Inc. | 9,400 | | 478,272 |
Euronet Worldwide, Inc. (a) | 42,500 | | 754,800 |
ExlService Holdings, Inc. (a) | 391,500 | | 10,088,955 |
Fidelity National Information Services, Inc. | 297,800 | | 9,380,700 |
Fiserv, Inc. (a) | 73,000 | | 5,205,630 |
FleetCor Technologies, Inc. (a) | 91,200 | | 3,938,016 |
Genpact Ltd. | 88,500 | | 1,615,125 |
Global Cash Access Holdings, Inc. (a) | 351,300 | | 2,694,471 |
Global Payments, Inc. | 86,800 | | 3,615,220 |
Heartland Payment Systems, Inc. | 38,900 | | 1,181,782 |
Higher One Holdings, Inc. (a) | 2,700 | | 33,291 |
Jack Henry & Associates, Inc. | 6,600 | | 243,936 |
Lender Processing Services, Inc. | 31,300 | | 878,591 |
MasterCard, Inc. Class A | 56,540 | | 23,910,766 |
ModusLink Global Solutions, Inc. (a) | 4,400 | | 13,420 |
NeuStar, Inc. Class A (a) | 85,600 | | 3,215,992 |
Paychex, Inc. | 800 | | 26,608 |
Syntel, Inc. | 26,000 | | 1,515,800 |
Teletech Holdings, Inc. (a) | 37,500 | | 619,125 |
The Western Union Co. | 168,300 | | 2,963,763 |
TNS, Inc. (a) | 103,900 | | 1,517,979 |
Total System Services, Inc. | 1,300 | | 30,134 |
VeriFone Systems, Inc. (a) | 207,100 | | 7,194,654 |
|
| Shares | | Value |
Visa, Inc. Class A | 224,412 | | $ 28,780,839 |
WNS Holdings Ltd. sponsored ADR (a) | 481,429 | | 4,997,233 |
Wright Express Corp. (a) | 600 | | 39,504 |
| | 123,225,786 |
IT Consulting & Other Services - 48.1% |
Accenture PLC Class A | 356,700 | | 21,972,720 |
Acxiom Corp. (a) | 193,400 | | 3,299,404 |
Booz Allen Hamilton Holding Corp. Class A | 86,700 | | 1,591,812 |
Camelot Information Systems, Inc. ADR (a) | 805,344 | | 1,465,726 |
CGI Group, Inc. Class A (sub. vtg.) (a) | 132,000 | | 3,446,797 |
Ciber, Inc. (a) | 236,200 | | 819,614 |
Cognizant Technology Solutions Corp. Class A (a) | 449,166 | | 28,872,390 |
EPAM Systems, Inc. | 588,600 | | 10,300,500 |
Forrester Research, Inc. | 97,600 | | 2,857,728 |
Gartner, Inc. Class A (a) | 7,500 | | 370,425 |
HCL Technologies Ltd. | 1,614 | | 15,825 |
HiSoft Technology International Ltd. ADR (a) | 445,400 | | 5,055,290 |
IBM Corp. | 132,250 | | 25,768,913 |
iGate Corp. (a) | 92,607 | | 1,491,899 |
ManTech International Corp. Class A | 86,600 | | 1,939,840 |
Maximus, Inc. | 128,700 | | 6,999,993 |
NCI, Inc. Class A (a) | 199,300 | | 1,456,883 |
SAIC, Inc. | 136,300 | | 1,664,223 |
Sapient Corp. | 935,400 | | 9,456,894 |
ServiceSource International, Inc. (a) | 201,500 | | 1,865,890 |
Teradata Corp. (a) | 27,200 | | 2,077,536 |
Unisys Corp. (a) | 98,940 | | 2,090,602 |
Virtusa Corp. (a) | 1,000,132 | | 16,902,231 |
| | 151,783,135 |
TOTAL IT SERVICES | | 275,008,921 |
OFFICE ELECTRONICS - 1.3% |
Office Electronics - 1.3% |
Xerox Corp. | 549,300 | | 4,048,341 |
PROFESSIONAL SERVICES - 0.1% |
Research & Consulting Services - 0.1% |
eClerx | 24,389 | | 334,769 |
SOFTWARE - 6.4% |
Application Software - 4.3% |
Autodesk, Inc. (a) | 44,500 | | 1,381,725 |
Descartes Systems Group, Inc. (a) | 68,400 | | 570,376 |
Ellie Mae, Inc. (a) | 134,400 | | 3,463,488 |
Guidewire Software, Inc. (d) | 249,600 | | 7,126,080 |
Intuit, Inc. | 600 | | 35,124 |
QLIK Technologies, Inc. (a) | 33,985 | | 718,783 |
Splunk, Inc. | 600 | | 20,640 |
Zensar Technologies Ltd. | 65,071 | | 288,820 |
| | 13,605,036 |
Common Stocks - continued |
| Shares | | Value |
SOFTWARE - CONTINUED |
Systems Software - 2.1% |
Check Point Software Technologies Ltd. (a) | 144,600 | | $ 6,664,614 |
Eloqua, Inc. | 5,300 | | 74,147 |
Proofpoint, Inc. | 1,000 | | 12,980 |
| | 6,751,741 |
TOTAL SOFTWARE | | 20,356,777 |
TOTAL COMMON STOCKS (Cost $266,494,118) |
315,102,255
|
Money Market Funds - 2.6% |
| | | |
Fidelity Cash Central Fund, 0.17% (b) | 2,180,423 | | 2,180,423 |
Fidelity Securities Lending Cash Central Fund, 0.18% (b)(c) | 5,914,575 | | 5,914,575 |
TOTAL MONEY MARKET FUNDS (Cost $8,094,998) |
8,094,998
|
TOTAL INVESTMENT PORTFOLIO - 102.4% (Cost $274,589,116) | | 323,197,253 |
NET OTHER ASSETS (LIABILITIES) - (2.4)% | | (7,448,361) |
NET ASSETS - 100% | $ 315,748,892 |
Legend |
(a) Non-income producing |
(b) Affiliated fund that is available only to investment companies and other accounts managed by Fidelity Investments. The rate quoted is the annualized seven-day yield of the fund at period end. A complete unaudited listing of the fund's holdings as of its most recent quarter end is available upon request. In addition, each Fidelity Central Fund's financial statements are available on the SEC's website or upon request. |
(c) Investment made with cash collateral received from securities on loan. |
(d) Security or a portion of the security is on loan at period end. |
Affiliated Central Funds |
Information regarding fiscal year to date income earned by the Fund from investments in Fidelity Central Funds is as follows: |
Fund | Income earned |
Fidelity Cash Central Fund | $ 5,640 |
Fidelity Securities Lending Cash Central Fund | 30,627 |
Total | $ 36,267 |
Other Information |
All investments are categorized as Level 1 under the Fair Value Hierarchy. The inputs or methodology used for valuing securities may not be an indication of the risk associated with investing in those securities. For more information on valuation inputs, please refer to the Security Valuation section in the accompanying Notes to Financial Statements. |
Distribution of investments by country or territory of incorporation, as a percentage of total net assets, is as follows. (Unaudited) |
United States of America | 85.2% |
Ireland | 7.0% |
Israel | 2.1% |
Cayman Islands | 1.6% |
Bailiwick of Jersey | 1.6% |
Canada | 1.3% |
Others (Individually Less Than 1%) | 1.2% |
| 100.0% |
See accompanying notes which are an integral part of the financial statements.
Semiannual Report
IT Services Portfolio
Statement of Assets and Liabilities
| August 31, 2012 (Unaudited) |
| | |
Assets | | |
Investment in securities, at value (including securities loaned of $5,855,565) - See accompanying schedule: Unaffiliated issuers (cost $266,494,118) | $ 315,102,255 | |
Fidelity Central Funds (cost $8,094,998) | 8,094,998 | |
Total Investments (cost $274,589,116) | | $ 323,197,253 |
Receivable for fund shares sold | | 71,885 |
Dividends receivable | | 181,680 |
Distributions receivable from Fidelity Central Funds | | 2,311 |
Other receivables | | 24,334 |
Total assets | | 323,477,463 |
| | |
Liabilities | | |
Payable for fund shares redeemed | $ 1,008,298 | |
Accrued management fee | 147,020 | |
Other affiliated payables | 70,104 | |
Other payables and accrued expenses | 588,574 | |
Collateral on securities loaned, at value | 5,914,575 | |
Total liabilities | | 7,728,571 |
| | |
Net Assets | | $ 315,748,892 |
Net Assets consist of: | | |
Paid in capital | | $ 277,300,542 |
Accumulated net investment loss | | (486,634) |
Accumulated undistributed net realized gain (loss) on investments and foreign currency transactions | | (9,669,166) |
Net unrealized appreciation (depreciation) on investments and assets and liabilities in foreign currencies | | 48,604,150 |
Net Assets, for 13,130,368 shares outstanding | | $ 315,748,892 |
Net Asset Value, offering price and redemption price per share ($315,748,892 ÷ 13,130,368 shares) | | $ 24.05 |
Statement of Operations
Six months ended August 31, 2012 (Unaudited) |
| | |
Investment Income | | |
Dividends | | $ 969,969 |
Income from Fidelity Central Funds (including $30,627 from security lending) | | 36,267 |
Total income | | 1,006,236 |
| | |
Expenses | | |
Management fee | $ 874,228 | |
Transfer agent fees | 363,794 | |
Accounting and security lending fees | 61,629 | |
Custodian fees and expenses | 12,194 | |
Independent trustees' compensation | 1,029 | |
Registration fees | 15,243 | |
Audit | 21,708 | |
Legal | 564 | |
Interest | 265 | |
Miscellaneous | 1,084 | |
Total expenses before reductions | 1,351,738 | |
Expense reductions | (6,037) | 1,345,701 |
Net investment income (loss) | | (339,465) |
Realized and Unrealized Gain (Loss) Net realized gain (loss) on: | | |
Investment securities: | | |
Unaffiliated issuers | (7,253,373) | |
Foreign currency transactions | (38,780) | |
Total net realized gain (loss) | | (7,292,153) |
Change in net unrealized appreciation (depreciation) on: Investment securities (net of increase in deferred foreign taxes of $16,492) | 9,500,130 | |
Assets and liabilities in foreign currencies | (2,383) | |
Total change in net unrealized appreciation (depreciation) | | 9,497,747 |
Net gain (loss) | | 2,205,594 |
Net increase (decrease) in net assets resulting from operations | | $ 1,866,129 |
See accompanying notes which are an integral part of the financial statements.
Semiannual Report
IT Services Portfolio
Financial Statements - continued
Statement of Changes in Net Assets
| Six months ended August 31, 2012 (Unaudited) | Year ended
February 29,
2012 |
Increase (Decrease) in Net Assets | | |
Operations | | |
Net investment income (loss) | $ (339,465) | $ (449,605) |
Net realized gain (loss) | (7,292,153) | 2,836,074 |
Change in net unrealized appreciation (depreciation) | 9,497,747 | 11,969,009 |
Net increase (decrease) in net assets resulting from operations | 1,866,129 | 14,355,478 |
Distributions to shareholders from net realized gain | (4,164,408) | (1,972,671) |
Share transactions
Proceeds from sales of shares | 119,801,079 | 205,367,309 |
Reinvestment of distributions | 4,072,995 | 1,911,677 |
Cost of shares redeemed | (54,952,674) | (102,517,642) |
Net increase (decrease) in net assets resulting from share transactions | 68,921,400 | 104,761,344 |
Redemption fees | 2,106 | 7,354 |
Total increase (decrease) in net assets | 66,625,227 | 117,151,505 |
| | |
Net Assets | | |
Beginning of period | 249,123,665 | 131,972,160 |
End of period (including accumulated net investment loss of $486,634 and accumulated net investment loss of $147,169, respectively) | $ 315,748,892 | $ 249,123,665 |
Other Information Shares | | |
Sold | 4,837,015 | 9,259,270 |
Issued in reinvestment of distributions | 165,233 | 83,735 |
Redeemed | (2,353,761) | (4,775,238) |
Net increase (decrease) | 2,648,487 | 4,567,767 |
Financial Highlights
| Six months ended August 31, 2012 | Years ended February 28, |
| (Unaudited) | 2012 H | 2011 | 2010 | 2009 | 2008 H |
Selected Per-Share Data | | | | | | |
Net asset value, beginning of period | $ 23.77 | $ 22.31 | $ 17.08 | $ 10.62 | $ 14.77 | $ 17.40 |
Income from Investment Operations | | | | | | |
Net investment income (loss) D | (.03) | (.05) | (.03) | (.05) | (.02) | (.06) |
Net realized and unrealized gain (loss) | .61 | 1.86 | 5.26 | 6.51 | (4.14) | (.25) |
Total from investment operations | .58 | 1.81 | 5.23 | 6.46 | (4.16) | (.31) |
Distributions from net realized gain | (.30) | (.35) | - | - | - | (2.32) |
Redemption fees added to paid in capital D | - I | - I | - I | - I | .01 | - I |
Net asset value, end of period | $ 24.05 | $ 23.77 | $ 22.31 | $ 17.08 | $ 10.62 | $ 14.77 |
Total Return B, C | 2.41% | 8.18% | 30.62% | 60.83% | (28.10)% | (2.94)% |
Ratios to Average Net Assets E, G | | | | | | |
Expenses before reductions | .86% A | .91% | .94% | .99% | 1.00% | 1.06% |
Expenses net of fee waivers, if any | .86% A | .91% | .94% | .99% | 1.00% | 1.06% |
Expenses net of all reductions | .86% A | .91% | .94% | .99% | 1.00% | 1.06% |
Net investment income (loss) | (.22)% A | (.24)% | (.16)% | (.31)% | (.14)% | (.32)% |
Supplemental Data | | | | | | |
Net assets, end of period (000 omitted) | $ 315,749 | $ 249,124 | $ 131,972 | $ 96,631 | $ 48,039 | $ 38,842 |
Portfolio turnover rate F | 142% A | 143% | 156% | 131% | 140% | 212% |
A Annualized
B Total returns for periods of less than one year are not annualized.
C Total returns would have been lower if certain expenses had not been reduced during the applicable periods shown.
D Calculated based on average shares outstanding during the period.
E Fees and expenses of any underlying Fidelity Central Funds are not included in the Fund's expense ratio. The Fund indirectly bears its proportionate share of the expenses of any underlying Fidelity Central Funds.
F Amount does not include the portfolio activity of any underlying Fidelity Central Funds.
G Expense ratios reflect operating expenses of the Fund. Expenses before reductions do not reflect amounts reimbursed by the investment adviser or reductions from brokerage service arrangements or reductions from other expense offset arrangements and do not represent the amount paid by the Fund during periods when reimbursements or reductions occur. Expenses net of fee waivers reflect expenses after reimbursement by the investment adviser but prior to reductions from brokerage service arrangements or other expense offset arrangements. Expenses net of all reductions represent the net expenses paid by the Fund.
H For the year ended February 29.
I Amount represents less than $.01 per share.
See accompanying notes which are an integral part of the financial statements.
Semiannual Report
Software and Computer Services Portfolio
Investment Changes (Unaudited)
Top Ten Stocks as of August 31, 2012 |
| % of fund's
net assets | % of fund's net assets
6 months ago |
Microsoft Corp. | 13.9 | 16.7 |
Google, Inc. Class A | 10.8 | 3.6 |
Oracle Corp. | 6.8 | 7.7 |
IBM Corp. | 5.8 | 4.4 |
Comverse Technology, Inc. | 4.4 | 0.5 |
Cognizant Technology Solutions Corp. Class A | 4.0 | 1.3 |
eBay, Inc. | 3.4 | 2.5 |
Visa, Inc. Class A | 3.0 | 4.2 |
Apple, Inc. | 2.9 | 6.4 |
salesforce.com, Inc. | 2.7 | 2.7 |
| 57.7 | |
Top Industries (% of fund's net assets) |
As of August 31, 2012 |
| Software | 45.4% | |
| Internet Software & Services | 21.5% | |
| IT Services | 19.3% | |
| Computers & Peripherals | 3.6% | |
| Communications Equipment | 1.9% | |
| All Others* | 8.3% | |

As of February 29, 2012 |
| Software | 46.2% | |
| IT Services | 21.7% | |
| Internet Software & Services | 14.2% | |
| Computers & Peripherals | 7.5% | |
| Communications Equipment | 3.3% | |
| All Others* | 7.1% | |

* Includes short-term investments and net other assets. |
Semiannual Report
Software and Computer Services Portfolio
Investments August 31, 2012 (Unaudited)
Showing Percentage of Net Assets
Common Stocks - 96.0% |
| Shares | | Value |
CAPITAL MARKETS - 0.2% |
Asset Management & Custody Banks - 0.2% |
ICG Group, Inc. (a) | 367,789 | | $ 3,354,236 |
COMMUNICATIONS EQUIPMENT - 1.9% |
Communications Equipment - 1.9% |
Acme Packet, Inc. (a) | 214,700 | | 4,098,623 |
Infinera Corp. (a) | 400,000 | | 2,272,000 |
Polycom, Inc. (a) | 2,591,221 | | 27,000,523 |
Riverbed Technology, Inc. (a) | 134,700 | | 2,692,653 |
| | 36,063,799 |
COMPUTERS & PERIPHERALS - 3.6% |
Computer Hardware - 2.9% |
Apple, Inc. | 81,300 | | 54,084,012 |
Cray, Inc. (a) | 7 | | 80 |
| | 54,084,092 |
Computer Storage & Peripherals - 0.7% |
Electronics for Imaging, Inc. (a) | 413,620 | | 6,390,429 |
SanDisk Corp. (a) | 187,200 | | 7,716,384 |
| | 14,106,813 |
TOTAL COMPUTERS & PERIPHERALS | | 68,190,905 |
DIVERSIFIED TELECOMMUNICATION SERVICES - 1.0% |
Alternative Carriers - 1.0% |
inContact, Inc. (a)(e) | 3,318,456 | | 18,915,199 |
ELECTRONIC EQUIPMENT & COMPONENTS - 1.8% |
Electronic Manufacturing Services - 1.0% |
Fabrinet (a) | 513,434 | | 6,150,939 |
Flextronics International Ltd. (a) | 816,800 | | 5,497,064 |
Jabil Circuit, Inc. | 150,000 | | 3,417,000 |
TE Connectivity Ltd. | 86,700 | | 3,049,239 |
| | 18,114,242 |
Technology Distributors - 0.8% |
Arrow Electronics, Inc. (a) | 422,457 | | 15,314,066 |
TOTAL ELECTRONIC EQUIPMENT & COMPONENTS | | 33,428,308 |
INTERNET SOFTWARE & SERVICES - 21.5% |
Internet Software & Services - 21.5% |
Active Network, Inc. (a)(e) | 3,534,780 | | 39,801,623 |
Akamai Technologies, Inc. (a) | 225,000 | | 8,439,750 |
Blinkx PLC (a)(d) | 5,000,000 | | 3,652,055 |
Constant Contact, Inc. (a)(d) | 75,814 | | 1,482,164 |
Digital River, Inc. (a) | 82,300 | | 1,371,118 |
E2open, Inc. | 130,000 | | 1,658,800 |
eBay, Inc. (a) | 1,347,400 | | 63,961,078 |
Facebook, Inc. Class A | 339,800 | | 6,143,584 |
Google, Inc. Class A (a) | 298,300 | | 204,362,347 |
IAC/InterActiveCorp | 76,400 | | 3,960,576 |
KIT digital, Inc. (a) | 1,927,816 | | 6,265,402 |
Liquidity Services, Inc. (a) | 17,300 | | 906,347 |
|
| Shares | | Value |
LogMeIn, Inc. (a) | 40,000 | | $ 879,200 |
MercadoLibre, Inc. (d) | 40,800 | | 3,246,864 |
Rackspace Hosting, Inc. (a) | 146,800 | | 8,805,064 |
Responsys, Inc. (a) | 931,355 | | 8,931,694 |
SciQuest, Inc. (a) | 141,949 | | 2,391,841 |
SPS Commerce, Inc. (a) | 85,636 | | 2,992,978 |
Velti PLC (a)(d) | 579,600 | | 4,016,628 |
Vocus, Inc. (a) | 75,000 | | 1,456,500 |
Web.com Group, Inc. (a) | 476,045 | | 7,926,149 |
Yahoo!, Inc. (a) | 1,609,600 | | 23,580,640 |
| | 406,232,402 |
IT SERVICES - 19.3% |
Data Processing & Outsourced Services - 5.7% |
Fidelity National Information Services, Inc. | 400,000 | | 12,600,000 |
FleetCor Technologies, Inc. (a) | 48,400 | | 2,089,912 |
Global Payments, Inc. | 149,400 | | 6,222,510 |
MasterCard, Inc. Class A | 55,000 | | 23,259,500 |
VeriFone Systems, Inc. (a) | 195,200 | | 6,781,248 |
Visa, Inc. Class A | 442,000 | | 56,686,500 |
WNS Holdings Ltd. sponsored ADR (a) | 101,791 | | 1,056,591 |
| | 108,696,261 |
IT Consulting & Other Services - 13.6% |
Acxiom Corp. (a) | 105,000 | | 1,791,300 |
Amdocs Ltd. | 160,000 | | 5,158,400 |
Camelot Information Systems, Inc. ADR (a)(e) | 2,301,356 | | 4,188,468 |
Cognizant Technology Solutions Corp. Class A (a) | 1,180,800 | | 75,901,824 |
EPAM Systems, Inc. | 901,925 | | 15,783,688 |
HCL Technologies Ltd. | 1 | | 10 |
HiSoft Technology International Ltd. ADR (a) | 69,928 | | 793,683 |
IBM Corp. | 564,089 | | 109,912,742 |
iGate Corp. (a) | 27,000 | | 434,970 |
Lionbridge Technologies, Inc. (a)(e) | 6,154,175 | | 21,601,154 |
Sapient Corp. | 285,390 | | 2,885,293 |
Teradata Corp. (a) | 39,900 | | 3,047,562 |
Unisys Corp. (a) | 123,100 | | 2,601,103 |
Virtusa Corp. (a) | 742,012 | | 12,540,003 |
| | 256,640,200 |
TOTAL IT SERVICES | | 365,336,461 |
MEDIA - 1.1% |
Advertising - 1.1% |
MDC Partners, Inc. Class A (sub. vtg.) (e) | 2,090,668 | | 21,136,648 |
SEMICONDUCTORS & SEMICONDUCTOR EQUIPMENT - 0.2% |
Semiconductors - 0.2% |
RF Micro Devices, Inc. (a) | 953,700 | | 3,576,375 |
Common Stocks - continued |
| Shares | | Value |
SOFTWARE - 45.4% |
Application Software - 17.8% |
Actuate Corp. (a) | 245,000 | | $ 1,712,550 |
Adobe Systems, Inc. (a) | 56,100 | | 1,754,247 |
AsiaInfo-Linkage, Inc. (a) | 885,200 | | 10,622,400 |
Aspen Technology, Inc. (a) | 162,215 | | 3,954,802 |
Autodesk, Inc. (a) | 56,000 | | 1,738,800 |
BroadSoft, Inc. (a)(d) | 51,500 | | 1,864,815 |
Callidus Software, Inc. (a)(d)(e) | 2,375,667 | | 10,619,231 |
Citrix Systems, Inc. (a) | 458,100 | | 35,589,789 |
Compuware Corp. (a) | 2,480,100 | | 24,801,000 |
Comverse Technology, Inc. (a)(e) | 14,047,054 | | 84,282,324 |
Concur Technologies, Inc. (a) | 115,800 | | 8,383,920 |
Descartes Systems Group, Inc. (a) | 1,429,500 | | 11,920,355 |
Ebix, Inc. (d) | 561,925 | | 13,480,581 |
Ellie Mae, Inc. (a) | 119,600 | | 3,082,092 |
Guidewire Software, Inc. | 371,500 | | 10,606,325 |
Informatica Corp. (a) | 149,600 | | 4,876,960 |
Kenexa Corp. (a) | 50,000 | | 2,292,000 |
Kingdee International Software Group Co. Ltd. (a) | 6,654,000 | | 995,189 |
Nuance Communications, Inc. (a) | 613,600 | | 14,634,360 |
Parametric Technology Corp. (a) | 182,900 | | 3,886,625 |
Pegasystems, Inc. | 71,400 | | 1,929,942 |
PROS Holdings, Inc. (a) | 132,200 | | 2,284,416 |
QLIK Technologies, Inc. (a) | 417,800 | | 8,836,470 |
salesforce.com, Inc. (a) | 353,878 | | 51,376,008 |
SolarWinds, Inc. (a) | 43,200 | | 2,370,816 |
Solera Holdings, Inc. | 120,000 | | 4,935,600 |
Synchronoss Technologies, Inc. (a) | 62,932 | | 1,448,065 |
Synopsys, Inc. (a) | 264,410 | | 8,733,462 |
TIBCO Software, Inc. (a) | 19,400 | | 580,448 |
TiVo, Inc. (a) | 267,100 | | 2,427,939 |
Verint Systems, Inc. (a) | 48,864 | | 1,398,976 |
| | 337,420,507 |
Home Entertainment Software - 0.6% |
Activision Blizzard, Inc. | 628,400 | | 7,389,984 |
Electronic Arts, Inc. (a) | 200,000 | | 2,666,000 |
Take-Two Interactive Software, Inc. (a) | 131,500 | | 1,347,875 |
| | 11,403,859 |
Systems Software - 27.0% |
BMC Software, Inc. (a) | 142,600 | | 5,903,640 |
CA Technologies, Inc. | 259,700 | | 6,759,991 |
Check Point Software Technologies Ltd. (a) | 92,800 | | 4,277,152 |
CommVault Systems, Inc. (a) | 40,000 | | 2,016,800 |
Eloqua, Inc. | 197,300 | | 2,760,227 |
|
| Shares | | Value |
Fortinet, Inc. (a) | 294,200 | | $ 7,799,242 |
Imperva, Inc. | 120,665 | | 3,654,943 |
Infoblox, Inc. (d) | 62,664 | | 1,365,449 |
Microsoft Corp. | 8,545,900 | | 263,384,638 |
NetSuite, Inc. (a) | 85,600 | | 4,868,928 |
Oracle Corp. | 4,080,700 | | 129,154,155 |
Pervasive Software, Inc. (a) | 541,212 | | 4,502,884 |
Red Hat, Inc. (a) | 31,500 | | 1,765,260 |
Rovi Corp. (a) | 150,000 | | 2,301,000 |
ServiceNow, Inc. (d) | 223,700 | | 6,957,070 |
Sourcefire, Inc. (a) | 44,600 | | 2,314,294 |
Symantec Corp. (a) | 2,181,600 | | 38,897,928 |
VMware, Inc. Class A (a) | 234,200 | | 20,853,168 |
Websense, Inc. (a) | 81,700 | | 1,256,546 |
| | 510,793,315 |
TOTAL SOFTWARE | | 859,617,681 |
TOTAL COMMON STOCKS (Cost $1,608,202,316) |
1,815,852,014
|
Money Market Funds - 5.9% |
| | | |
Fidelity Cash Central Fund, 0.17% (b) | 89,617,491 | | 89,617,491 |
Fidelity Securities Lending Cash Central Fund, 0.18% (b)(c) | 22,176,732 | | 22,176,732 |
TOTAL MONEY MARKET FUNDS (Cost $111,794,223) |
111,794,223
|
TOTAL INVESTMENT PORTFOLIO - 101.9% (Cost $1,719,996,539) | | 1,927,646,237 |
NET OTHER ASSETS (LIABILITIES) - (1.9)% | | (35,531,766) |
NET ASSETS - 100% | $ 1,892,114,471 |
Legend |
(a) Non-income producing |
(b) Affiliated fund that is available only to investment companies and other accounts managed by Fidelity Investments. The rate quoted is the annualized seven-day yield of the fund at period end. A complete unaudited listing of the fund's holdings as of its most recent quarter end is available upon request. In addition, each Fidelity Central Fund's financial statements are available on the SEC's website or upon request. |
(c) Investment made with cash collateral received from securities on loan. |
(d) Security or a portion of the security is on loan at period end. |
(e) Affiliated company |
Affiliated Central Funds |
Information regarding fiscal year to date income earned by the Fund from investments in Fidelity Central Funds is as follows: |
Fund | Income earned |
Fidelity Cash Central Fund | $ 45,268 |
Fidelity Securities Lending Cash Central Fund | 1,373,899 |
Total | $ 1,419,167 |
Other Affiliated Issuers |
An affiliated company is a company in which the Fund has ownership of at least 5% of the voting securities. Fiscal year to date transactions with companies which are or were affiliates are as follows: |
Affiliate | Value,
beginning of
period | Purchases | Sales
Proceeds | Dividend
Income | Value,
end of
period |
Active Network, Inc. | $ 31,326,256 | $ 24,420,977 | $ - | $ - | $ 39,801,623 |
Callidus Software, Inc. | 16,897,742 | 406,500 | - | - | 10,619,231 |
Camelot Information Systems, Inc. ADR | 4,176,153 | 1,935,729 | 827,853 | - | 4,188,468 |
Comverse Technology, Inc. | 8,625,912 | 72,631,518 | - | - | 84,282,324 |
inContact, Inc. | 14,738,399 | 2,756,672 | - | - | 18,915,199 |
Lionbridge Technologies, Inc. | 13,016,304 | 3,256,430 | - | - | 21,601,154 |
MDC Partners, Inc. Class A (sub. vtg.) | 16,274,035 | 8,859,754 | - | 390,732 | 21,136,648 |
Total | $ 105,054,801 | $ 114,267,580 | $ 827,853 | $ 390,732 | $ 200,544,647 |
Other Information |
All investments are categorized as Level 1 under the Fair Value Hierarchy. The inputs or methodology used for valuing securities may not be an indication of the risk associated with investing in those securities. For more information on valuation inputs, please refer to the Security Valuation section in the accompanying Notes to Financial Statements. |
See accompanying notes which are an integral part of the financial statements.
Semiannual Report
Software and Computer Services Portfolio
Statement of Assets and Liabilities
| August 31, 2012 (Unaudited) |
| | |
Assets | | |
Investment in securities, at value (including securities loaned of $21,927,607) - See accompanying schedule: Unaffiliated issuers (cost $1,393,800,547) | $ 1,615,307,367 | |
Fidelity Central Funds (cost $111,794,223) | 111,794,223 | |
Other affiliated issuers (cost $214,401,769) | 200,544,647 | |
Total Investments (cost $1,719,996,539) | | $ 1,927,646,237 |
Receivable for investments sold | | 9,481,402 |
Receivable for fund shares sold | | 2,186,438 |
Dividends receivable | | 2,461,163 |
Distributions receivable from Fidelity Central Funds | | 147,474 |
Other receivables | | 362,989 |
Total assets | | 1,942,285,703 |
| | |
Liabilities | | |
Payable for investments purchased | $ 24,835,370 | |
Payable for fund shares redeemed | 1,905,150 | |
Accrued management fee | 855,816 | |
Other affiliated payables | 362,416 | |
Other payables and accrued expenses | 35,748 | |
Collateral on securities loaned, at value | 22,176,732 | |
Total liabilities | | 50,171,232 |
| | |
Net Assets | | $ 1,892,114,471 |
Net Assets consist of: | | |
Paid in capital | | $ 1,620,452,611 |
Undistributed net investment income | | 1,315,724 |
Accumulated undistributed net realized gain (loss) on investments and foreign currency transactions | | 62,749,071 |
Net unrealized appreciation (depreciation) on investments and assets and liabilities in foreign currencies | | 207,597,065 |
Net Assets, for 21,841,984 shares outstanding | | $ 1,892,114,471 |
Net Asset Value, offering price and redemption price per share ($1,892,114,471 ÷ 21,841,984 shares) | | $ 86.63 |
Statement of Operations
Six months ended August 31, 2012 (Unaudited) |
| | |
Investment Income | | |
Dividends (including $390,732 earned from other affiliated issuers) | | $ 7,009,001 |
Interest | | 52 |
Income from Fidelity Central Funds (including $1,373,899 from security lending) | | 1,419,167 |
Total income | | 8,428,220 |
| | |
Expenses | | |
Management fee | $ 4,890,938 | |
Transfer agent fees | 1,874,620 | |
Accounting and security lending fees | 272,402 | |
Custodian fees and expenses | 22,740 | |
Independent trustees' compensation | 5,806 | |
Registration fees | 75,518 | |
Audit | 20,522 | |
Legal | 3,753 | |
Interest | 254 | |
Miscellaneous | 7,710 | |
Total expenses before reductions | 7,174,263 | |
Expense reductions | (62,188) | 7,112,075 |
Net investment income (loss) | | 1,316,145 |
Realized and Unrealized Gain (Loss) Net realized gain (loss) on: | | |
Investment securities: | | |
Unaffiliated issuers | 71,041,652 | |
Other affiliated issuers | (679,887) | |
Foreign currency transactions | (59,065) | |
Total net realized gain (loss) | | 70,302,700 |
Change in net unrealized appreciation (depreciation) on: Investment securities | (46,648,236) | |
Assets and liabilities in foreign currencies | 30,860 | |
Total change in net unrealized appreciation (depreciation) | | (46,617,376) |
Net gain (loss) | | 23,685,324 |
Net increase (decrease) in net assets resulting from operations | | $ 25,001,469 |
See accompanying notes which are an integral part of the financial statements.
Semiannual Report
Software and Computer Services Portfolio
Financial Statements - continued
Statement of Changes in Net Assets
| Six months ended August 31, 2012 (Unaudited) | Year ended
February 29,
2012 |
Increase (Decrease) in Net Assets | | |
Operations | | |
Net investment income (loss) | $ 1,316,145 | $ (935,778) |
Net realized gain (loss) | 70,302,700 | 205,635,526 |
Change in net unrealized appreciation (depreciation) | (46,617,376) | (18,881,690) |
Net increase (decrease) in net assets resulting from operations | 25,001,469 | 185,818,058 |
Distributions to shareholders from net realized gain | (90,672,703) | (181,184,664) |
Share transactions
Proceeds from sales of shares | 466,397,537 | 585,190,987 |
Reinvestment of distributions | 87,359,131 | 174,047,914 |
Cost of shares redeemed | (217,620,329) | (441,554,331) |
Net increase (decrease) in net assets resulting from share transactions | 336,136,339 | 317,684,570 |
Redemption fees | 33,848 | 44,203 |
Total increase (decrease) in net assets | 270,498,953 | 322,362,167 |
| | |
Net Assets | | |
Beginning of period | 1,621,615,518 | 1,299,253,351 |
End of period (including undistributed net investment income of $1,315,724 and accumulated net investment loss of $421, respectively) | $ 1,892,114,471 | $ 1,621,615,518 |
Other Information Shares | | |
Sold | 5,373,216 | 6,956,029 |
Issued in reinvestment of distributions | 1,016,513 | 2,132,816 |
Redeemed | (2,574,613) | (5,241,268) |
Net increase (decrease) | 3,815,116 | 3,847,577 |
Financial Highlights
| Six months ended August 31, 2012 | Years ended February 28, |
| (Unaudited) | 2012 H | 2011 | 2010 | 2009 | 2008 H |
Selected Per-Share Data | | | | | | |
Net asset value, beginning of period | $ 89.96 | $ 91.63 | $ 72.29 | $ 44.38 | $ 66.77 | $ 65.47 |
Income from Investment Operations | | | | | | |
Net investment income (loss) D | .06 | (.06) | (.11) | (.04) | (.07) | (.20) |
Net realized and unrealized gain (loss) | 1.24 | 10.39 | 22.28 | 27.95 | (22.32) | 1.49 |
Total from investment operations | 1.30 | 10.33 | 22.17 | 27.91 | (22.39) | 1.29 |
Distributions from net realized gain | (4.63) | (12.00) | (2.83) | - | - | - |
Redemption fees added to paid in capital D | - I | - I | - I | - I | - I | .01 |
Net asset value, end of period | $ 86.63 | $ 89.96 | $ 91.63 | $ 72.29 | $ 44.38 | $ 66.77 |
Total Return B, C | 1.49% | 13.08% | 30.85% | 62.89% | (33.53)% | 1.99% |
Ratios to Average Net Assets E, G | | | | | | |
Expenses before reductions | .82% A | .82% | .84% | .90% | .87% | .86% |
Expenses net of fee waivers, if any | .82% A | .82% | .84% | .90% | .87% | .86% |
Expenses net of all reductions | .81% A | .81% | .83% | .89% | .87% | .86% |
Net investment income (loss) | .15% A | (.07)% | (.13)% | (.07)% | (.12)% | (.27)% |
Supplemental Data | | | | | | |
Net assets, end of period (000 omitted) | $ 1,892,114 | $ 1,621,616 | $ 1,299,253 | $ 984,803 | $ 488,980 | $ 767,777 |
Portfolio turnover rate F | 108% A | 238% | 189% | 56% | 49% | 38% |
A Annualized
B Total returns for periods of less than one year are not annualized.
C Total returns would have been lower if certain expenses had not been reduced during the applicable periods shown.
D Calculated based on average shares outstanding during the period.
E Fees and expenses of any underlying Fidelity Central Funds are not included in the Fund's expense ratio. The Fund indirectly bears its proportionate share of the expenses of any underlying Fidelity Central Funds.
F Amount does not include the portfolio activity of any underlying Fidelity Central Funds.
G Expense ratios reflect operating expenses of the Fund. Expenses before reductions do not reflect amounts reimbursed by the investment adviser or reductions from brokerage service arrangements or reductions from other expense offset arrangements and do not represent the amount paid by the Fund during periods when reimbursements or reductions occur. Expenses net of fee waivers reflect expenses after reimbursement by the investment adviser but prior to reductions from brokerage service arrangements or other expense offset arrangements. Expenses net of all reductions represent the net expenses paid by the Fund.
H For the year ended February 29.
I Amount represents less than $.01 per share.
See accompanying notes which are an integral part of the financial statements.
Semiannual Report
Technology Portfolio
Investment Changes (Unaudited)
Top Ten Stocks as of August 31, 2012 |
| % of fund's
net assets | % of fund's net assets
6 months ago |
Apple, Inc. | 21.5 | 16.9 |
Google, Inc. Class A | 6.4 | 1.4 |
Visa, Inc. Class A | 3.6 | 1.1 |
salesforce.com, Inc. | 2.6 | 2.6 |
QUALCOMM, Inc. | 2.6 | 3.0 |
IBM Corp. | 2.3 | 1.6 |
eBay, Inc. | 2.2 | 1.5 |
Altera Corp. | 1.8 | 1.9 |
Cree, Inc. | 1.8 | 1.2 |
Oracle Corp. | 1.6 | 1.0 |
| 46.4 | |
Top Industries (% of fund's net assets) |
As of August 31, 2012 |
| Computers & Peripherals | 24.4% | |
| Software | 17.5% | |
| Semiconductors & Semiconductor Equipment | 16.0% | |
| Internet Software & Services | 11.3% | |
| IT Services | 8.1% | |
| All Others* | 22.7% | |

As of February 29, 2012 |
| Software | 23.2% | |
| Semiconductors & Semiconductor Equipment | 21.7% | |
| Computers & Peripherals | 19.6% | |
| Communications Equipment | 9.0% | |
| Internet Software & Services | 7.9% | |
| All Others* | 18.6% | |

* Includes short-term investments and net other assets. |
Semiannual Report
Technology Portfolio
Investments August 31, 2012 (Unaudited)
Showing Percentage of Net Assets
Common Stocks - 91.1% |
| Shares | | Value |
AEROSPACE & DEFENSE - 0.3% |
Aerospace & Defense - 0.3% |
DigitalGlobe, Inc. (a) | 208,406 | | $ 4,328,593 |
GeoEye, Inc. (a) | 80,929 | | 2,171,325 |
| | 6,499,918 |
AUTOMOBILES - 0.1% |
Automobile Manufacturers - 0.1% |
Tesla Motors, Inc. (a) | 40,095 | | 1,143,509 |
CHEMICALS - 0.6% |
Specialty Chemicals - 0.6% |
JSR Corp. | 757,600 | | 12,948,345 |
COMMUNICATIONS EQUIPMENT - 6.5% |
Communications Equipment - 6.5% |
AAC Acoustic Technology Holdings, Inc. | 1,065,000 | | 3,618,222 |
Acme Packet, Inc. (a) | 483,924 | | 9,238,109 |
ADTRAN, Inc. | 153,505 | | 3,114,616 |
ADVA AG Optical Networking (a) | 97,916 | | 633,036 |
Aruba Networks, Inc. (a)(d) | 71,615 | | 1,407,235 |
Brocade Communications Systems, Inc. (a) | 40,810 | | 236,698 |
Ciena Corp. (a)(d) | 405,366 | | 5,541,353 |
Cisco Systems, Inc. | 1,782,385 | | 34,007,906 |
Comba Telecom Systems Holdings Ltd. | 198,000 | | 51,058 |
F5 Networks, Inc. (a) | 18,236 | | 1,777,828 |
Finisar Corp. (a) | 550,152 | | 7,559,088 |
Infinera Corp. (a) | 310,023 | | 1,760,931 |
JDS Uniphase Corp. (a) | 96,147 | | 1,075,885 |
Juniper Networks, Inc. (a) | 85,421 | | 1,489,742 |
Motorola Solutions, Inc. | 56,503 | | 2,692,933 |
NETGEAR, Inc. (a) | 5,884 | | 215,178 |
Polycom, Inc. (a) | 763,423 | | 7,954,868 |
QUALCOMM, Inc. | 974,828 | | 59,912,929 |
Research In Motion Ltd. (a) | 145,900 | | 976,071 |
Riverbed Technology, Inc. (a) | 1,287 | | 25,727 |
Sandvine Corp. (a) | 1,941,200 | | 2,250,104 |
Sandvine Corp. (U.K.) (a) | 2,252,512 | | 2,582,134 |
Spirent Communications PLC | 87,200 | | 219,460 |
ZTE Corp. (H Shares) | 110,800 | | 146,572 |
| | 148,487,683 |
COMPUTERS & PERIPHERALS - 24.4% |
Computer Hardware - 22.8% |
Advantech Co. Ltd. | 465,000 | | 1,618,095 |
Apple, Inc. | 743,186 | | 494,397,050 |
ASUSTeK Computer, Inc. | 133,000 | | 1,330,579 |
Foxconn Technology Co. Ltd. | 190,050 | | 724,921 |
Getac Technology Corp. | 1,373,000 | | 987,704 |
Hewlett-Packard Co. | 172,345 | | 2,909,184 |
Lenovo Group Ltd. | 6,764,000 | | 5,494,259 |
Pegatron Corp. | 1,751,000 | | 2,199,955 |
Quanta Computer, Inc. | 1,366,000 | | 3,533,034 |
|
| Shares | | Value |
Stratasys, Inc. (a) | 122,227 | | $ 7,903,198 |
Wistron Corp. | 908,250 | | 1,018,047 |
| | 522,116,026 |
Computer Storage & Peripherals - 1.6% |
ADLINK Technology, Inc. | 5,750 | | 5,945 |
Catcher Technology Co. Ltd. | 43,000 | | 215,094 |
EMC Corp. (a) | 490,727 | | 12,901,213 |
Fusion-io, Inc. (a) | 132,500 | | 3,712,650 |
Gemalto NV | 27,406 | | 2,172,035 |
NetApp, Inc. (a) | 7,012 | | 242,054 |
SanDisk Corp. (a) | 372,436 | | 15,351,812 |
SIMPLO Technology Co. Ltd. | 110,000 | | 651,454 |
Synaptics, Inc. (a) | 38,330 | | 1,165,999 |
Wacom Co. Ltd. | 486 | | 1,099,281 |
| | 37,517,537 |
TOTAL COMPUTERS & PERIPHERALS | | 559,633,563 |
DIVERSIFIED CONSUMER SERVICES - 0.0% |
Education Services - 0.0% |
Educomp Solutions Ltd. | 53,012 | | 138,151 |
ELECTRICAL EQUIPMENT - 0.0% |
Electrical Components & Equipment - 0.0% |
Dynapack International Technology Corp. | 40,000 | | 193,395 |
ELECTRONIC EQUIPMENT & COMPONENTS - 2.7% |
Electronic Components - 1.6% |
Aeroflex Holding Corp. (a) | 60,538 | | 429,820 |
Amphenol Corp. Class A | 379 | | 23,070 |
Cheng Uei Precision Industries Co. Ltd. | 584,739 | | 1,164,117 |
Chimei Innolux Corp. (a) | 51,000 | | 16,348 |
FLEXium Interconnect, Inc. | 132,000 | | 598,454 |
InvenSense, Inc. | 33,991 | | 427,607 |
Omron Corp. | 31,600 | | 622,055 |
Tong Hsing Electronics Industries Ltd. | 2,434,000 | | 8,103,289 |
Universal Display Corp. (a)(d) | 528,037 | | 21,316,854 |
Vishay Intertechnology, Inc. (a) | 122,847 | | 1,174,417 |
Yageo Corp. | 6,108,000 | | 1,761,668 |
Zhen Ding Technology Holding Ltd. | 195,300 | | 620,788 |
| | 36,258,487 |
Electronic Equipment & Instruments - 0.3% |
Chroma ATE, Inc. | 1,088,644 | | 2,280,226 |
Hitachi High-Technologies Corp. | 14,900 | | 370,839 |
Keyence Corp. | 4,350 | | 1,150,338 |
National Instruments Corp. | 8,188 | | 210,923 |
SFA Engineering Corp. | 4,365 | | 189,416 |
SNU Precision Co. Ltd. (a) | 22,427 | | 136,486 |
Test Research, Inc. | 59,016 | | 94,585 |
TPK Holdings Co. | 183,284 | | 2,373,303 |
| | 6,806,116 |
Common Stocks - continued |
| Shares | | Value |
ELECTRONIC EQUIPMENT & COMPONENTS - CONTINUED |
Electronic Manufacturing Services - 0.7% |
Hon Hai Precision Industry Co. Ltd. (Foxconn) | 245,300 | | $ 696,003 |
Jabil Circuit, Inc. | 344,391 | | 7,845,227 |
Ju Teng International Holdings Ltd. | 1,826,000 | | 812,241 |
KEMET Corp. (a) | 4,077 | | 18,999 |
TE Connectivity Ltd. | 23,294 | | 819,250 |
Trimble Navigation Ltd. (a) | 141,776 | | 6,954,113 |
| | 17,145,833 |
Technology Distributors - 0.1% |
Arrow Electronics, Inc. (a) | 47 | | 1,704 |
Digital China Holdings Ltd. (H Shares) | 423,000 | | 681,735 |
Redington India Ltd. | 174,887 | | 236,542 |
VST Holdings Ltd. | 2,990,000 | | 558,990 |
WPG Holding Co. Ltd. | 340,200 | | 401,816 |
WT Microelectronics Co. Ltd. | 52,529 | | 60,988 |
| | 1,941,775 |
TOTAL ELECTRONIC EQUIPMENT & COMPONENTS | | 62,152,211 |
HEALTH CARE EQUIPMENT & SUPPLIES - 0.2% |
Health Care Equipment - 0.2% |
Biosensors International Group Ltd. (a) | 4,882,000 | | 4,836,960 |
China Kanghui Holdings sponsored ADR (a) | 500 | | 12,495 |
| | 4,849,455 |
HEALTH CARE TECHNOLOGY - 0.2% |
Health Care Technology - 0.2% |
athenahealth, Inc. (a) | 1,500 | | 132,555 |
So-net M3, Inc. | 837 | | 4,440,447 |
| | 4,573,002 |
HOUSEHOLD DURABLES - 0.0% |
Household Appliances - 0.0% |
Haier Electronics Group Co. Ltd. (a) | 53,000 | | 62,390 |
HOUSEHOLD PRODUCTS - 0.0% |
Household Products - 0.0% |
NVC Lighting Holdings Ltd. | 546,000 | | 101,372 |
INDUSTRIAL CONGLOMERATES - 0.1% |
Industrial Conglomerates - 0.1% |
Samsung Techwin Co. Ltd. | 24,982 | | 1,568,826 |
INTERNET & CATALOG RETAIL - 1.4% |
Internet Retail - 1.4% |
Amazon.com, Inc. (a) | 70,328 | | 17,457,519 |
E-Commerce China Dangdang, Inc. ADR (a) | 990 | | 5,029 |
Expedia, Inc. | 27,100 | | 1,391,856 |
Rakuten, Inc. | 1,102,700 | | 10,661,176 |
|
| Shares | | Value |
Start Today Co. Ltd. (d) | 154,300 | | $ 2,252,124 |
TripAdvisor, Inc. (a) | 26,892 | | 899,268 |
| | 32,666,972 |
INTERNET SOFTWARE & SERVICES - 11.3% |
Internet Software & Services - 11.3% |
Active Network, Inc. (a) | 134,901 | | 1,518,985 |
Akamai Technologies, Inc. (a) | 199,804 | | 7,494,648 |
Baidu.com, Inc. sponsored ADR (a) | 1,838 | | 204,827 |
Bankrate, Inc. (a)(d) | 65,219 | | 1,120,462 |
Bazaarvoice, Inc. (d) | 8,500 | | 126,140 |
Blinkx PLC (a) | 500,000 | | 365,206 |
Cornerstone OnDemand, Inc. (a) | 166,615 | | 4,466,948 |
DealerTrack Holdings, Inc. (a) | 7,000 | | 193,830 |
eBay, Inc. (a) | 1,068,824 | | 50,737,075 |
ExactTarget, Inc. | 48,500 | | 1,026,745 |
Facebook, Inc.: | | | |
Class A | 660 | | 11,933 |
Class B (a)(f) | 122,522 | | 1,993,678 |
Google, Inc. Class A (a) | 215,124 | | 147,379,301 |
INFO Edge India Ltd. | 114,388 | | 688,491 |
Kakaku.com, Inc. (d) | 53,400 | | 1,919,253 |
LogMeIn, Inc. (a) | 513 | | 11,276 |
Mail.ru Group Ltd. GDR (e) | 5,600 | | 183,512 |
MercadoLibre, Inc. (d) | 41,936 | | 3,337,267 |
Millennial Media, Inc. (d) | 96,600 | | 1,113,798 |
NHN Corp. | 100 | | 22,888 |
Open Text Corp. (a) | 400 | | 21,502 |
Qihoo 360 Technology Co. Ltd. ADR (a)(d) | 106,770 | | 2,390,580 |
Rackspace Hosting, Inc. (a) | 123,235 | | 7,391,635 |
Renren, Inc. ADR (a)(d) | 18,800 | | 72,004 |
Responsys, Inc. (a) | 347,871 | | 3,336,083 |
Saba Software, Inc. (a) | 10,000 | | 94,000 |
SciQuest, Inc. (a) | 244,370 | | 4,117,635 |
SINA Corp. (a) | 4,631 | | 259,799 |
SouFun Holdings Ltd. ADR (d) | 123,173 | | 1,675,153 |
Tencent Holdings Ltd. | 71,000 | | 2,169,560 |
Velti PLC (a) | 32,400 | | 224,532 |
VeriSign, Inc. (a) | 24,700 | | 1,177,696 |
Vocus, Inc. (a) | 312,561 | | 6,069,935 |
XO Group, Inc. (a) | 16,300 | | 129,422 |
Yahoo!, Inc. (a) | 13,750 | | 201,438 |
Yandex NV (a) | 85,249 | | 1,800,459 |
YouKu.com, Inc. ADR (a) | 239,683 | | 4,024,278 |
| | 259,071,974 |
IT SERVICES - 8.1% |
Data Processing & Outsourced Services - 4.8% |
Automatic Data Processing, Inc. | 114,883 | | 6,672,405 |
Fidelity National Information Services, Inc. | 167,495 | | 5,276,093 |
Fiserv, Inc. (a) | 30,100 | | 2,146,431 |
Global Payments, Inc. | 98,518 | | 4,103,275 |
Common Stocks - continued |
| Shares | | Value |
IT SERVICES - CONTINUED |
Data Processing & Outsourced Services - continued |
Jack Henry & Associates, Inc. | 62,208 | | $ 2,299,208 |
MasterCard, Inc. Class A | 10,252 | | 4,335,571 |
Paychex, Inc. | 7,115 | | 236,645 |
Syntel, Inc. | 23,201 | | 1,352,618 |
VeriFone Systems, Inc. (a) | 5,919 | | 205,626 |
Visa, Inc. Class A | 642,993 | | 82,463,852 |
WNS Holdings Ltd. sponsored ADR (a) | 26,900 | | 279,222 |
| | 109,370,946 |
IT Consulting & Other Services - 3.3% |
Accenture PLC Class A | 119,541 | | 7,363,726 |
Bit-isle, Inc. | 4,900 | | 40,081 |
Camelot Information Systems, Inc. ADR (a) | 555 | | 1,010 |
ChinaSoft International Ltd. (a) | 50,000 | | 11,282 |
Cognizant Technology Solutions Corp. Class A (a) | 3,430 | | 220,480 |
HiSoft Technology International Ltd. ADR (a) | 36,166 | | 410,484 |
IBM Corp. | 264,485 | | 51,534,902 |
ServiceSource International, Inc. (a)(d) | 1,458,762 | | 13,508,136 |
Teradata Corp. (a) | 30,097 | | 2,298,809 |
Virtusa Corp. (a) | 49,000 | | 828,100 |
| | 76,217,010 |
TOTAL IT SERVICES | | 185,587,956 |
LIFE SCIENCES TOOLS & SERVICES - 0.1% |
Life Sciences Tools & Services - 0.1% |
Illumina, Inc. (a) | 25,400 | | 1,068,832 |
WuXi PharmaTech Cayman, Inc. sponsored ADR (a) | 87,200 | | 1,259,168 |
| | 2,328,000 |
MACHINERY - 0.4% |
Industrial Machinery - 0.4% |
Airtac International Group | 536,000 | | 2,618,396 |
Fanuc Corp. | 2,500 | | 410,778 |
HIWIN Technologies Corp. | 228,154 | | 1,648,920 |
Mirle Automation Corp. | 301,893 | | 200,508 |
Nippon Thompson Co. Ltd. | 452,000 | | 1,688,062 |
Shin Zu Shing Co. Ltd. | 753,000 | | 2,746,244 |
| | 9,312,908 |
MEDIA - 0.7% |
Advertising - 0.5% |
Dentsu, Inc. | 500 | | 12,743 |
Focus Media Holding Ltd. ADR | 470,444 | | 11,314,178 |
ReachLocal, Inc. (a) | 43,033 | | 540,925 |
| | 11,867,846 |
|
| Shares | | Value |
Cable & Satellite - 0.2% |
DIRECTV (a) | 89,000 | | $ 4,636,010 |
DISH Network Corp. Class A | 7,233 | | 231,384 |
| | 4,867,394 |
Movies & Entertainment - 0.0% |
IMAX Corp. (a) | 19,570 | | 395,510 |
TOTAL MEDIA | | 17,130,750 |
OFFICE ELECTRONICS - 0.0% |
Office Electronics - 0.0% |
Xerox Corp. | 27,023 | | 199,160 |
PHARMACEUTICALS - 0.1% |
Pharmaceuticals - 0.1% |
China Medical System Holding Ltd. | 3,994,500 | | 2,106,448 |
PROFESSIONAL SERVICES - 0.1% |
Research & Consulting Services - 0.1% |
Acacia Research Corp. - Acacia Technologies (a) | 27,700 | | 729,618 |
IHS, Inc. Class A (a) | 20,600 | | 2,349,224 |
| | 3,078,842 |
REAL ESTATE MANAGEMENT & DEVELOPMENT - 0.0% |
Real Estate Services - 0.0% |
E-House China Holdings Ltd. ADR | 186,422 | | 881,776 |
SEMICONDUCTORS & SEMICONDUCTOR EQUIPMENT - 15.7% |
Semiconductor Equipment - 2.2% |
Amkor Technology, Inc. (a) | 4,848 | | 22,737 |
Applied Materials, Inc. | 287,872 | | 3,365,224 |
Asia Pacific Systems, Inc. (a) | 42,349 | | 394,061 |
ASM International NV: | | | |
unit | 192,791 | | 6,753,469 |
(Netherlands) | 112,900 | | 3,976,157 |
ASML Holding NV | 189,403 | | 10,752,408 |
Cymer, Inc. (a) | 171,423 | | 9,719,684 |
Dainippon Screen Manufacturing Co. Ltd. | 56,000 | | 302,883 |
Entegris, Inc. (a) | 322,643 | | 2,836,032 |
GCL-Poly Energy Holdings Ltd. | 96,000 | | 14,729 |
GT Advanced Technologies, Inc. (a) | 4,100 | | 23,780 |
ICD Co. Ltd. | 52,302 | | 715,019 |
KLA-Tencor Corp. | 4,618 | | 236,950 |
Lam Research Corp. (a) | 6,213 | | 212,050 |
Micronics Japan Co. Ltd. | 105,900 | | 324,421 |
Rubicon Technology, Inc. (a) | 1,926 | | 16,217 |
Teradyne, Inc. (a) | 72,805 | | 1,137,214 |
Ultratech, Inc. (a) | 179,595 | | 5,923,043 |
Visual Photonics Epitaxy Co. Ltd. | 2,380,500 | | 3,385,126 |
| | 50,111,204 |
Semiconductors - 13.5% |
Advanced Micro Devices, Inc. (a) | 3,611 | | 13,433 |
Alpha & Omega Semiconductor Ltd. (a) | 25,812 | | 244,956 |
Common Stocks - continued |
| Shares | | Value |
SEMICONDUCTORS & SEMICONDUCTOR EQUIPMENT - CONTINUED |
Semiconductors - continued |
Altera Corp. | 1,130,607 | | $ 42,205,559 |
Analog Devices, Inc. | 5,826 | | 231,525 |
Applied Micro Circuits Corp. (a) | 453,625 | | 2,318,024 |
ARM Holdings PLC sponsored ADR | 9,175 | | 249,927 |
Atmel Corp. (a) | 35,096 | | 208,119 |
Avago Technologies Ltd. | 123,388 | | 4,512,299 |
Broadcom Corp. Class A | 718,446 | | 25,526,386 |
Cavium, Inc. (a)(d) | 505,551 | | 16,329,297 |
Cirrus Logic, Inc. (a) | 348,303 | | 14,513,786 |
Cree, Inc. (a)(d) | 1,457,489 | | 41,101,190 |
Cypress Semiconductor Corp. | 16,994 | | 197,300 |
Dialog Semiconductor PLC (a) | 86,734 | | 1,867,144 |
Diodes, Inc. (a) | 1,138 | | 21,042 |
Duksan Hi-Metal Co. Ltd. (a) | 34,690 | | 665,474 |
Epistar Corp. | 576,000 | | 1,171,774 |
Fairchild Semiconductor International, Inc. (a) | 1,780 | | 25,846 |
Freescale Semiconductor Holdings I Ltd. (a) | 2,121 | | 21,231 |
Genesis Photonics, Inc. | 49,803 | | 38,077 |
Global Unichip Corp. | 73,000 | | 266,236 |
Hittite Microwave Corp. (a) | 18,478 | | 967,693 |
Imagination Technologies Group PLC (a) | 1,152,552 | | 10,925,576 |
Infineon Technologies AG | 32,031 | | 221,386 |
Inotera Memories, Inc. (a) | 9,550,000 | | 1,639,224 |
Inphi Corp. (a) | 125,395 | | 1,489,693 |
International Rectifier Corp. (a) | 58,126 | | 1,011,974 |
Intersil Corp. Class A | 218,600 | | 1,930,238 |
JA Solar Holdings Co. Ltd. ADR (a)(d) | 124,687 | | 118,453 |
LSI Corp. (a) | 690,878 | | 5,381,940 |
MagnaChip Semiconductor Corp. (a) | 119,729 | | 1,617,539 |
Marvell Technology Group Ltd. | 1,741 | | 17,723 |
Maxim Integrated Products, Inc. | 53 | | 1,438 |
MediaTek, Inc. | 1,729,506 | | 18,517,815 |
Mellanox Technologies Ltd. (a) | 52,100 | | 5,959,719 |
Micrel, Inc. | 22,021 | | 218,889 |
Micron Technology, Inc. (a) | 2,478,083 | | 15,388,895 |
Monolithic Power Systems, Inc. (a) | 445,605 | | 9,607,244 |
MStar Semiconductor, Inc. | 653,000 | | 5,210,978 |
Novatek Microelectronics Corp. | 725,000 | | 2,340,901 |
NVIDIA Corp. (a) | 18,332 | | 257,198 |
NXP Semiconductors NV (a) | 603,895 | | 14,082,831 |
O2Micro International Ltd. sponsored ADR (a) | 44,200 | | 156,910 |
Omnivision Technologies, Inc. (a) | 320,961 | | 5,215,616 |
ON Semiconductor Corp. (a) | 28,538 | | 177,792 |
Phison Electronics Corp. | 187,000 | | 1,414,060 |
PMC-Sierra, Inc. (a) | 179,949 | | 1,052,702 |
Power Integrations, Inc. | 78,302 | | 2,712,381 |
Radiant Opto-Electronics Corp. | 264,710 | | 1,138,128 |
Rambus, Inc. (a) | 502,661 | | 2,151,389 |
|
| Shares | | Value |
RF Micro Devices, Inc. (a) | 1,232,238 | | $ 4,620,893 |
Samsung Electronics Co. Ltd. | 1,817 | | 1,975,994 |
Semtech Corp. (a) | 87,294 | | 2,140,449 |
Seoul Semiconductor Co. Ltd. | 34,306 | | 626,337 |
Silicon Laboratories, Inc. (a) | 5,500 | | 210,320 |
Silicon Motion Technology Corp. sponsored ADR (a) | 110,000 | | 1,687,400 |
SK Hynix, Inc. | 208,620 | | 3,900,851 |
Skyworks Solutions, Inc. (a) | 468,814 | | 14,280,074 |
Spreadtrum Communications, Inc. ADR (d) | 630,777 | | 12,464,154 |
STMicroelectronics NV | 51,400 | | 305,121 |
STMicroelectronics NV (NY Shares) unit (d) | 380,580 | | 2,260,645 |
Taiwan Surface Mounting Technology Co. Ltd. | 326,750 | | 537,896 |
Texas Instruments, Inc. | 39,205 | | 1,138,513 |
Trina Solar Ltd. (a)(d) | 30,406 | | 137,131 |
TriQuint Semiconductor, Inc. (a) | 238,819 | | 1,327,834 |
United Microelectronics Corp. | 11,000 | | 4,430 |
Vanguard International Semiconductor Corp. | 52,000 | | 26,359 |
Win Semiconductors Corp. | 685,569 | | 869,377 |
Xilinx, Inc. | 670 | | 22,720 |
YoungTek Electronics Corp. | 2,536 | | 5,982 |
| | 311,197,430 |
TOTAL SEMICONDUCTORS & SEMICONDUCTOR EQUIPMENT | | 361,308,634 |
SOFTWARE - 17.5% |
Application Software - 9.5% |
Adobe Systems, Inc. (a) | 6,775 | | 211,854 |
ANSYS, Inc. (a) | 87,516 | | 6,099,865 |
AsiaInfo-Linkage, Inc. (a) | 614,713 | | 7,376,556 |
Aspen Technology, Inc. (a) | 571,400 | | 13,930,732 |
Autodesk, Inc. (a) | 64,722 | | 2,009,618 |
AutoNavi Holdings Ltd. ADR (a) | 17,224 | | 214,611 |
Blackbaud, Inc. | 40,000 | | 975,200 |
BroadSoft, Inc. (a) | 309,802 | | 11,217,930 |
Citrix Systems, Inc. (a) | 293,570 | | 22,807,453 |
Compuware Corp. (a) | 97,900 | | 979,000 |
Comverse Technology, Inc. (a) | 26,230 | | 157,380 |
Concur Technologies, Inc. (a) | 139,215 | | 10,079,166 |
Descartes Systems Group, Inc. (a) | 419,000 | | 3,493,969 |
Informatica Corp. (a) | 195,343 | | 6,368,182 |
Intuit, Inc. | 18,608 | | 1,089,312 |
JDA Software Group, Inc. (a) | 37,737 | | 1,162,300 |
Jive Software, Inc. (d) | 148,600 | | 2,242,374 |
Kingdee International Software Group Co. Ltd. (a) | 35,111,600 | | 5,251,382 |
Manhattan Associates, Inc. (a) | 14,555 | | 736,192 |
MicroStrategy, Inc. Class A (a) | 50,897 | | 6,388,082 |
Nuance Communications, Inc. (a) | 471,352 | | 11,241,745 |
Parametric Technology Corp. (a) | 613,049 | | 13,027,291 |
Common Stocks - continued |
| Shares | | Value |
SOFTWARE - CONTINUED |
Application Software - continued |
Pegasystems, Inc. (d) | 241,249 | | $ 6,520,960 |
PROS Holdings, Inc. (a) | 26,200 | | 452,736 |
QLIK Technologies, Inc. (a) | 241,854 | | 5,115,212 |
RealPage, Inc. (a)(d) | 13,700 | | 349,487 |
salesforce.com, Inc. (a) | 414,142 | | 60,125,136 |
SolarWinds, Inc. (a) | 117,412 | | 6,443,571 |
Splunk, Inc. | 445 | | 15,308 |
Synchronoss Technologies, Inc. (a) | 278,649 | | 6,411,713 |
Synopsys, Inc. (a) | 7,993 | | 264,009 |
TIBCO Software, Inc. (a) | 114,785 | | 3,434,367 |
TiVo, Inc. (a) | 26,100 | | 237,249 |
VanceInfo Technologies, Inc. ADR (a) | 239,600 | | 2,036,600 |
| | 218,466,542 |
Home Entertainment Software - 1.0% |
Activision Blizzard, Inc. | 19,590 | | 230,378 |
Capcom Co. Ltd. | 308,600 | | 6,154,127 |
Giant Interactive Group, Inc. ADR (d) | 1,507,755 | | 7,282,457 |
Nintendo Co. Ltd. | 1,700 | | 191,740 |
Perfect World Co. Ltd. sponsored ADR Class B | 664,770 | | 7,438,776 |
Take-Two Interactive Software, Inc. (a) | 195,638 | | 2,005,290 |
| | 23,302,768 |
Systems Software - 7.0% |
Allot Communications Ltd. (a) | 83,500 | | 2,206,070 |
Ariba, Inc. (a) | 240,757 | | 10,759,430 |
BMC Software, Inc. (a) | 5,404 | | 223,726 |
Check Point Software Technologies Ltd. (a) | 4,413 | | 203,395 |
CommVault Systems, Inc. (a) | 157,265 | | 7,929,301 |
Fortinet, Inc. (a) | 214,737 | | 5,692,678 |
Infoblox, Inc. | 8,900 | | 193,931 |
Insyde Software Corp. | 305,000 | | 1,097,049 |
Microsoft Corp. | 936,936 | | 28,876,368 |
NetSuite, Inc. (a) | 120,500 | | 6,854,040 |
Oracle Corp. | 1,129,044 | | 35,734,243 |
Progress Software Corp. (a) | 53,422 | | 1,027,305 |
Red Hat, Inc. (a) | 360,202 | | 20,185,720 |
ServiceNow, Inc. | 5,500 | | 171,050 |
Sourcefire, Inc. (a) | 44,806 | | 2,324,983 |
Symantec Corp. (a) | 867,050 | | 15,459,502 |
Totvs SA | 242,400 | | 4,710,912 |
VMware, Inc. Class A (a) | 189,726 | | 16,893,203 |
| | 160,542,906 |
TOTAL SOFTWARE | | 402,312,216 |
|
| Shares | | Value |
WIRELESS TELECOMMUNICATION SERVICES - 0.6% |
Wireless Telecommunication Services - 0.6% |
SBA Communications Corp. Class A (a) | 211,220 | | $ 12,626,732 |
TOTAL COMMON STOCKS (Cost $1,806,010,583) |
2,090,964,188
|
Convertible Bonds - 0.3% |
| Principal Amount | | |
SEMICONDUCTORS & SEMICONDUCTOR EQUIPMENT - 0.3% |
Semiconductors - 0.3% |
JA Solar Holdings Co. Ltd. 4.5% 5/15/13
(Cost $6,105,866) | | $ 6,990,000 | |
6,448,275
|
Money Market Funds - 11.6% |
| Shares | | |
Fidelity Cash Central Fund, 0.17% (b) | 198,600,925 | | 198,600,925 |
Fidelity Securities Lending Cash Central Fund, 0.18% (b)(c) | 69,477,654 | | 69,477,654 |
TOTAL MONEY MARKET FUNDS (Cost $268,078,579) |
268,078,579
|
TOTAL INVESTMENT PORTFOLIO - 103.0% (Cost $2,080,195,028) | | 2,365,491,042 |
NET OTHER ASSETS (LIABILITIES) - (3.0)% | | (69,741,936) |
NET ASSETS - 100% | $ 2,295,749,106 |
Legend |
(a) Non-income producing |
(b) Affiliated fund that is available only to investment companies and other accounts managed by Fidelity Investments. The rate quoted is the annualized seven-day yield of the fund at period end. A complete unaudited listing of the fund's holdings as of its most recent quarter end is available upon request. In addition, each Fidelity Central Fund's financial statements are available on the SEC's website or upon request. |
(c) Investment made with cash collateral received from securities on loan. |
(d) Security or a portion of the security is on loan at period end. |
(e) Security exempt from registration under Rule 144A of the Securities Act of 1933. These securities may be resold in transactions exempt from registration, normally to qualified institutional buyers. At the end of the period, the value of these securities amounted to $183,512 or 0.0% of net assets. |
(f) Restricted securities - Investment in securities not registered under the Securities Act of 1933 (excluding 144A issues). At the end of the period, the value of restricted securities (excluding 144A issues) amounted to $1,993,678 or 0.1% of net assets. |
Additional information on each restricted holding is as follows: |
Security | Acquisition Date | Acquisition Cost |
Facebook, Inc. Class B | 3/31/11 - 5/19/11 | $ 3,063,881 |
Affiliated Central Funds |
Information regarding fiscal year to date income earned by the Fund from investments in Fidelity Central Funds is as follows: |
Fund | Income earned |
Fidelity Cash Central Fund | $ 124,885 |
Fidelity Securities Lending Cash Central Fund | 342,614 |
Total | $ 467,499 |
Other Information |
The following is a summary of the inputs used, as of August 31, 2012, involving the Fund's assets and liabilities carried at fair value. The inputs or methodology used for valuing securities may not be an indication of the risk associated with investing in those securities. For more information on valuation inputs, and their aggregation into the levels used in the table below, please refer to the Security Valuation section in the accompanying Notes to Financial Statements. |
Valuation Inputs at Reporting Date: |
Description | Total | Level 1 | Level 2 | Level 3 |
Investments in Securities: | | | | |
Common Stocks | $ 2,090,964,188 | $ 2,044,072,266 | $ 46,891,922 | $ - |
Convertible Bonds | 6,448,275 | - | 6,448,275 | - |
Money Market Funds | 268,078,579 | 268,078,579 | - | - |
Total Investments in Securities: | $ 2,365,491,042 | $ 2,312,150,845 | $ 53,340,197 | $ - |
The following is a summary of transfers between Level 1 and Level 2 for the period ended August 31, 2012. Transfers are assumed to have occurred at the beginning of the period, and are primarily attributable to the valuation techniques used for foreign equity securities, as discussed in the accompanying Notes to Financial Statements: |
Transfers | Total |
Level 1 to Level 2 | $ 34,178,059 |
Level 2 to Level 1 | $ 0 |
Distribution of investments by country or territory of incorporation, as a percentage of total net assets, is as follows. (Unaudited) |
United States of America | 86.5% |
Cayman Islands | 3.6% |
Taiwan | 3.0% |
Japan | 2.0% |
Netherlands | 1.9% |
Others (Individually Less Than 1%) | 3.0% |
| 100.0% |
See accompanying notes which are an integral part of the financial statements.
Semiannual Report
Technology Portfolio
Statement of Assets and Liabilities
| August 31, 2012 (Unaudited) |
| | |
Assets | | |
Investment in securities, at value (including securities loaned of $67,997,314) - See accompanying schedule: Unaffiliated issuers (cost $1,812,116,449) | $ 2,097,412,463 | |
Fidelity Central Funds (cost $268,078,579) | 268,078,579 | |
Total Investments (cost $2,080,195,028) | | $ 2,365,491,042 |
Cash | | 2,837,864 |
Foreign currency held at value (cost $7,028) | | 7,050 |
Receivable for investments sold | | 3,682,376 |
Receivable for fund shares sold | | 2,371,218 |
Dividends receivable | | 1,102,194 |
Interest receivable | | 92,618 |
Distributions receivable from Fidelity Central Funds | | 60,620 |
Other receivables | | 32,278 |
Total assets | | 2,375,677,260 |
| | |
Liabilities | | |
Payable for investments purchased | $ 6,954,655 | |
Payable for fund shares redeemed | 1,929,090 | |
Accrued management fee | 1,046,852 | |
Other affiliated payables | 440,496 | |
Other payables and accrued expenses | 79,407 | |
Collateral on securities loaned, at value | 69,477,654 | |
Total liabilities | | 79,928,154 |
| | |
Net Assets | | $ 2,295,749,106 |
Net Assets consist of: | | |
Paid in capital | | $ 2,107,248,057 |
Accumulated net investment loss | | (140,480) |
Accumulated undistributed net realized gain (loss) on investments and foreign currency transactions | | (96,654,191) |
Net unrealized appreciation (depreciation) on investments and assets and liabilities in foreign currencies | | 285,295,720 |
Net Assets, for 22,226,500 shares outstanding | | $ 2,295,749,106 |
Net Asset Value, offering price and redemption price per share ($2,295,749,106 ÷ 22,226,500 shares) | | $ 103.29 |
Statement of Operations
Six months ended August 31, 2012 (Unaudited) |
| | |
Investment Income | | |
Dividends | | $ 8,559,863 |
Interest | | 712,523 |
Income from Fidelity Central Funds (including $342,614 from security lending) | | 467,499 |
Total income | | 9,739,885 |
| | |
Expenses | | |
Management fee | $ 6,326,126 | |
Transfer agent fees | 2,393,425 | |
Accounting and security lending fees | 347,969 | |
Custodian fees and expenses | 88,487 | |
Independent trustees' compensation | 7,764 | |
Registration fees | 36,699 | |
Audit | 28,074 | |
Legal | 4,767 | |
Miscellaneous | 13,936 | |
Total expenses before reductions | 9,247,247 | |
Expense reductions | (128,094) | 9,119,153 |
Net investment income (loss) | | 620,732 |
Realized and Unrealized Gain (Loss) Net realized gain (loss) on: | | |
Investment securities: | | |
Unaffiliated issuers | 123,867,144 | |
Foreign currency transactions | (155,795) | |
Total net realized gain (loss) | | 123,711,349 |
Change in net unrealized appreciation (depreciation) on: Investment securities | (93,800,428) | |
Assets and liabilities in foreign currencies | 42,277 | |
Total change in net unrealized appreciation (depreciation) | | (93,758,151) |
Net gain (loss) | | 29,953,198 |
Net increase (decrease) in net assets resulting from operations | | $ 30,573,930 |
See accompanying notes which are an integral part of the financial statements.
Semiannual Report
Technology Portfolio
Financial Statements - continued
Statement of Changes in Net Assets
| Six months ended August 31, 2012 (Unaudited) | Year ended
February 29,
2012 |
Increase (Decrease) in Net Assets | | |
Operations | | |
Net investment income (loss) | $ 620,732 | $ (6,863,734) |
Net realized gain (loss) | 123,711,349 | 107,613,980 |
Change in net unrealized appreciation (depreciation) | (93,758,151) | (171,622,723) |
Net increase (decrease) in net assets resulting from operations | 30,573,930 | (70,872,477) |
Share transactions
Proceeds from sales of shares | 216,461,253 | 465,453,767 |
Cost of shares redeemed | (301,230,145) | (930,572,293) |
Net increase (decrease) in net assets resulting from share transactions | (84,768,892) | (465,118,526) |
Redemption fees | 18,533 | 96,786 |
Total increase (decrease) in net assets | (54,176,429) | (535,894,217) |
| | |
Net Assets | | |
Beginning of period | 2,349,925,535 | 2,885,819,752 |
End of period (including accumulated net investment loss of $140,480 and accumulated net investment loss of $761,212, respectively) | $ 2,295,749,106 | $ 2,349,925,535 |
Other Information Shares | | |
Sold | 2,133,908 | 4,881,110 |
Redeemed | (3,044,497) | (9,932,865) |
Net increase (decrease) | (910,589) | (5,051,755) |
Financial Highlights
| Six months ended August 31, 2012 | Years ended February 28, |
| (Unaudited) | 2012 I | 2011 | 2010 | 2009 | 2008 I |
Selected Per-Share Data | | | | | | |
Net asset value, beginning of period | $ 101.57 | $ 102.37 | $ 72.24 | $ 37.12 | $ 66.65 | $ 69.84 |
Income from Investment Operations | | | | | | |
Net investment income (loss) D | .03 | (.27) | (.37) | (.13) | .15 | (.36) G |
Net realized and unrealized gain (loss) | 1.69 | (.53) | 30.50 | 35.25 | (29.57) | (2.84) |
Total from investment operations | 1.72 | (.80) | 30.13 | 35.12 | (29.42) | (3.20) |
Distributions from net investment income | - | - | - | - | (.11) | - |
Redemption fees added to paid in capital D | - J | - J | - J | - J | - J | .01 |
Net asset value, end of period | $ 103.29 | $ 101.57 | $ 102.37 | $ 72.24 | $ 37.12 | $ 66.65 |
Total Return B, C | 1.69% | (.78)% | 41.71% | 94.61% | (44.15)% | (4.57)% |
Ratios to Average Net Assets E, H | | | | | | |
Expenses before reductions | .82% A | .82% | .85% | .92% | .90% | .89% |
Expenses net of fee waivers, if any | .82% A | .82% | .85% | .92% | .90% | .89% |
Expenses net of all reductions | .80% A | .81% | .83% | .89% | .89% | .88% |
Net investment income (loss) | .05% A | (.29)% | (.44)% | (.21)% | .26% | (.47)% G |
Supplemental Data | | | | | | |
Net assets, end of period (000 omitted) | $ 2,295,749 | $ 2,349,926 | $ 2,885,820 | $ 1,994,894 | $ 773,373 | $ 1,549,499 |
Portfolio turnover rate F | 152% A | 196% | 136% | 127% | 235% | 204% |
A Annualized
B Total returns for periods of less than one year are not annualized.
C Total returns would have been lower if certain expenses had not been reduced during the applicable periods shown.
D Calculated based on average shares outstanding during the period.
E Fees and expenses of any underlying Fidelity Central Funds are not included in the Fund's expense ratio. The Fund indirectly bears its proportionate share of the expenses of any underlying Fidelity Central Funds.
F Amount does not include the portfolio activity of any underlying Fidelity Central Funds.
G Investment income per share reflects a large, non-recurring dividend which amounted to $.05 per share. Excluding this non-recurring dividend, the ratio of net investment income (loss) to average net assets would have been (.53)%.
H Expense ratios reflect operating expenses of the Fund. Expenses before reductions do not reflect amounts reimbursed by the investment adviser or reductions from brokerage service arrangements or reductions from other expense offset arrangements and do not represent the amount paid by the Fund during periods when reimbursements or reductions occur. Expenses net of fee waivers reflect expenses after reimbursement by the investment adviser but prior to reductions from brokerage service arrangements or other expense offset arrangements. Expenses net of all reductions represent the net expenses paid by the Fund.
I For the year ended February 29.
J Amount represents less than $.01 per share.
See accompanying notes which are an integral part of the financial statements.
Semiannual Report
Notes to Financial Statements
For the period ended August 31, 2012 (Unaudited)
1. Organization.
Communications Equipment Portfolio, Computers Portfolio, Electronics Portfolio, IT Services Portfolio, Software and Computer Services Portfolio, and Technology Portfolio (the Funds) are non-diversified funds of Fidelity Select Portfolios (the Trust). The Trust is registered under the Investment Company Act of 1940, as amended (the 1940 Act), as an open-end management investment company organized as a Massachusetts business trust. The Funds invest primarily in securities of companies whose principal business activities fall within specific industries. Each Fund is authorized to issue an unlimited number of shares. Certain Funds' investments in emerging markets can be subject to social, economic, regulatory and political uncertainties and can be extremely volatile.
2. Investments in Fidelity Central Funds.
The Funds invest in Fidelity Central Funds, which are open-end investment companies available only to other investment companies and accounts managed by Fidelity Management & Research Company (FMR) and its affiliates. The Funds' Schedules of Investments list each of the Fidelity Central Funds held as of period end, if any, as an investment of each Fund, but do not include the underlying holdings of each Fidelity Central Fund. As an Investing Fund, each Fund indirectly bears its proportionate share of the expenses of the underlying Fidelity Central Funds.
The Money Market Central Funds seek preservation of capital and current income and are managed by Fidelity Investments Money Management, Inc. (FIMM), an affiliate of FMR.
A complete unaudited list of holdings for each Fidelity Central Fund is available upon request or at the Securities and Exchange Commission (the SEC) web site at www.sec.gov. In addition, the financial statements of the Fidelity Central Funds are available on the SEC web site or upon request.
3. Significant Accounting Policies.
The financial statements have been prepared in conformity with accounting principles generally accepted in the United States of America (GAAP), which require management to make certain estimates and assumptions at the date of the financial statements. Actual results could differ from those estimates. Subsequent events, if any, through the date that the financial statements were issued have been evaluated in the preparation of the financial statements. The following summarizes the significant accounting policies of the Funds:
Security Valuation. Investments are valued as of 4:00 p.m. Eastern time on the last calendar day of the period. In accordance with valuation policies and procedures approved by the Board of Trustees (the Board), each Fund attempts to obtain prices from one or more third party pricing vendor or broker to value their investments. When current market prices, quotations or rates are not readily available or reliable, securities will be fair valued in good faith by the FMR Fair Value Committee (the Committee), in accordance with procedures adopted by each Fund's Board. Factors used in determining fair value vary by security type and may include market or security specific events, changes in interest rates and credit quality. The frequency with which these procedures are used cannot be predicted and they may be utilized to a significant extent. The Committee oversees each Fund's valuation policies and procedures and is responsible for approving and reporting to the Board all fair value determinations.
Each Fund categorizes the inputs to valuation techniques used to value their investments into a disclosure hierarchy consisting of three levels as shown below:
Level 1 - quoted prices in active markets for identical investments
Level 2 - other significant observable inputs (including quoted prices for similar investments, interest rates, prepayment speeds, etc.)
Level 3 - unobservable inputs (including the Fund's own assumptions based on the best information available)
Valuation techniques used to value each Fund's investments by major category are as follows:
Equity securities, including restricted securities, for which market quotations are readily available, are valued at the last reported sale price or official closing price as reported by a third party pricing vendor on the primary market or exchange on which they are traded and are categorized as Level 1 in the hierarchy. In the event there were no sales during the day or closing prices are not available, securities are valued at the last quoted bid price or may be valued using the last available price and are generally categorized as Level 2 in the hierarchy. For foreign equity securities, when significant market or security specific events arise, comparisons to the valuation of American Depositary Receipts (ADRs), futures contracts, Exchange-Traded Funds (ETFs) and certain indexes as well as quoted prices for similar securities are used and are categorized as Level 2 in the hierarchy. Utilizing these techniques may result in transfers between Level 1 and Level 2. For restricted equity securities and private placements where observable inputs are limited, assumptions about market activity and risk are used and these securities are categorized as Level 3 in the hierarchy.
Debt securities, including restricted securities, are valued based on evaluated prices received from third party pricing vendors or from brokers who make markets in such securities. For corporate bonds, pricing vendors utilize matrix pricing which considers yield or price of bonds of comparable quality, coupon, maturity and type as well as broker-supplied prices and are generally categorized as Level 2 in the hierarchy. When independent prices
Semiannual Report
3. Significant Accounting Policies - continued
Security Valuation - continued
are unavailable or unreliable, debt securities may be valued utilizing pricing methodologies which consider similar factors that would be used by third party pricing vendors. These are generally categorized as Level 2 in the hierarchy but may be Level 3 depending on the circumstances.
Investments in open-end mutual funds, including the Fidelity Central Funds, are valued at their closing net asset value each business day and are categorized as Level 1 in the hierarchy.
Changes in valuation techniques may result in transfers in or out of an assigned level within the disclosure hierarchy. The aggregate value of investments by input level, as of August 31, 2012, including information on transfers between Levels 1 and 2, is included at the end of each Fund's Schedule of Investments.
Foreign Currency Translation. The Funds may use foreign currency contracts to facilitate transactions in foreign-denominated securities. Gains and losses from these transactions may arise from changes in the value of the foreign currency or if the counterparties do not perform under the contracts' terms.
Foreign-denominated assets, including investment securities, and liabilities are translated into U.S. dollars at the exchange rates at period end. Purchases and sales of investment securities, income and dividends received and expenses denominated in foreign currencies are translated into U.S. dollars at the exchange rate in effect on the transaction date.
The effects of exchange rate fluctuations on investments are included with the net realized and unrealized gain (loss) on investment securities. Other foreign currency transactions resulting in realized and unrealized gain (loss) are disclosed separately.
Investment Transactions and Income. For financial reporting purposes, the Funds' investment holdings and NAV include trades executed through the end of the last business day of the period. The NAV per share for processing shareholder transactions is calculated as of the close of business of the New York Stock Exchange (NYSE), normally 4:00 p.m. Eastern time and includes trades executed through the end of the prior business day. Gains and losses on securities sold are determined on the basis of identified cost and may include proceeds received from litigation. Dividend income is recorded on the ex-dividend date, except for certain dividends from foreign securities where the ex-dividend date may have passed, which are recorded as soon as the Funds are informed of the ex-dividend date. Non-cash dividends included in dividend income, if any, are recorded at the fair market value of the securities received. Distributions received on securities that represent a return of capital or capital gain are recorded as a reduction of cost of investments and/or as a realized gain. The Funds estimate the components of distributions received that may be considered return of capital distributions or capital gain distributions. Interest income and distributions from the Fidelity Central Funds are accrued as earned. Interest income includes coupon interest and amortization of premium and accretion of discount on debt securities. Investment income is recorded net of foreign taxes withheld where recovery of such taxes is uncertain.
Expenses. Expenses directly attributable to a fund are charged to that fund. Expenses attributable to more than one fund are allocated among the respective funds on the basis of relative net assets or other appropriate methods. Expense estimates are accrued in the period to which they relate and adjustments are made when actual amounts are known.
Deferred Trustee Compensation. Under a Deferred Compensation Plan (the Plan) for Electronics Portfolio, independent Trustees may elect to defer receipt of a portion of their annual compensation. Deferred amounts are invested in a cross-section of Fidelity funds, are marked-to-market and remain in the Fund until distributed in accordance with the Plan. The investment of deferred amounts and the offsetting payable to the Trustees are included in the accompanying Statement of Assets and Liabilities.
Income Tax Information and Distributions to Shareholders. Each year, each Fund intends to qualify as a regulated investment company under Subchapter M of the Internal Revenue Code, including distributing substantially all of its taxable income and realized gains. As a result, no provision for income taxes is required. Each Fund files a U.S. federal tax return, in addition to state and local tax returns as required. A fund's federal income tax returns are subject to examination by the Internal Revenue Service (IRS) for a period of three fiscal years after they are filed. State and local tax returns may be subject to examination for an additional fiscal year depending on the jurisdiction. Foreign taxes are provided for based on each Fund's understanding of the tax rules and rates that exist in the foreign markets in which it invests.
Distributions are declared and recorded on the ex-dividend date. Income and capital gain distributions are determined in accordance with income tax regulations, which may differ from GAAP.
Capital accounts within the financial statements are adjusted for permanent book-tax differences. These adjustments have no impact on net assets or the results of operations. Temporary book-tax differences will reverse in a subsequent period.
Semiannual Report
Notes to Financial Statements (Unaudited) - continued
3. Significant Accounting Policies - continued
Income Tax Information and Distributions to Shareholders - continued
Book-tax differences are primarily due to foreign currency transactions, deferred trustees compensation, net operating losses, certain foreign taxes, market discount, capital loss carryforwards, and losses deferred due to wash sales and excise tax regulations.
The federal tax cost of investment securities and unrealized appreciation (depreciation) as of period end were as follows for each Fund:
| Tax cost | Gross unrealized
appreciation | Gross unrealized
depreciation | Net unrealized
appreciation
(depreciation) on
securities and
other investments |
Communications Equipment Portfolio | $ 339,702,862 | $ 12,829,731 | $ (38,975,575) | $ (26,145,844) |
Computers Portfolio | 719,707,319 | 174,615,424 | (67,691,483) | 106,923,941 |
Electronics Portfolio | 1,237,086,760 | 27,695,691 | (249,841,358) | (222,145,667) |
IT Services Portfolio | 278,449,045 | 54,862,681 | (10,114,473) | 44,748,208 |
Software and Computer Services Portfolio | 1,726,525,721 | 281,552,024 | (80,431,508) | 201,120,516 |
Technology Portfolio | 2,103,698,397 | 389,522,930 | (127,730,285) | 261,792,645 |
Capital loss carryforwards are only available to offset future capital gains of the Funds to the extent provided by regulations and may be limited. Under the Regulated Investment Company Modernization Act of 2010 (the Act), the Funds are permitted to carry forward capital losses incurred in taxable years beginning after December 22, 2010 for an unlimited period and such capital losses are required to be used prior to any losses that expire. At February 29, 2012, capital loss carryforwards were as follows:
| Fiscal year of expiration | |
| 2016 | 2017 | 2018 | Total with expiration |
Communications Equipment Portfolio | $ (935,658) | $ (13,662,912) | $ - | $ (14,598,570) |
Computers Portfolio | - | (6,925,599) | - | (6,925,599) |
Electronics Portfolio | - | (167,121,160) | (71,079,130) | (238,200,290) |
Technology Portfolio | - | (57,701,411) | (55,192,523) | (112,893,934) |
In addition, certain of the Funds intend to elect to defer to the fiscal year ending February 28, 2013 capital losses recognized during the period November 1, 2011 to February 29, 2012. Loss deferrals were as follows:
| Capital losses |
Communications Equipment Portfolio | $ (43,652,088) |
Computers Portfolio | (26,458,867) |
Technology Portfolio | (80,616,595) |
Trading (Redemption) Fees. Shares held by investors in the Funds less than 30 days are subject to a redemption fee equal to .75% of the net asset value of shares redeemed. All redemption fees, which reduce the proceeds of the shareholder redemption, are retained by the Funds and accounted for as an addition to paid in capital.
New Accounting Pronouncement. In December 2011, the Financial Accounting Standards Board issued Accounting Standard Update No. 2011-11, Disclosures about Offsetting Assets and Liabilities. The update creates new disclosure requirements requiring entities to disclose both gross and net information for derivatives and other financial instruments that are either offset in the Statement of Assets and Liabilities or subject to an enforceable master netting arrangement or similar agreement. The disclosure requirements are effective for annual reporting periods beginning on or after January 1, 2013, and interim periods within those annual periods. Management is currently evaluating the impact of the update's adoption on the Funds' financial statement disclosures.
4. Operating Policies.
Restricted Securities. The Funds may invest in securities that are subject to legal or contractual restrictions on resale. These securities generally may be resold in transactions exempt from registration or to the public if the securities are registered. Disposal of these securities may involve time-consuming negotiations and expense, and prompt sale at an acceptable price may be difficult. Information regarding restricted securities is included at the end of each applicable Fund's Schedule of Investments.
Semiannual Report
5. Purchases and Sales of Investments.
Purchases and sales of securities, other than short-term securities, are noted in the table below.
| Purchases ($) | Sales ($) |
Communications Equipment Portfolio | 49,673,744 | 86,487,033 |
Computers Portfolio | 714,324,170 | 623,131,685 |
Electronics Portfolio | 484,781,445 | 672,500,421 |
IT Services Portfolio | 284,240,278 | 215,941,484 |
Software and Computer Services Portfolio | 1,114,501,046 | 923,979,514 |
Technology Portfolio | 1,624,307,354 | 1,822,442,728 |
6. Fees and Other Transactions with Affiliates.
Management Fee. FMR and its affiliates provide the Funds with investment management related services for which the Funds pay a monthly management fee. The management fee is the sum of an individual fund fee rate and an annualized group fee rate. The individual fund fee rate is applied to each Fund's average net assets. The group fee rate is based upon the average net assets of all the mutual funds advised by FMR. The group fee rate decreases as assets under management increase and increases as assets under management decrease. For the period, each Fund's annualized management fee rate expressed as a percentage of each Fund's average net assets was as follows:
| Individual Rate | Group Rate | Total |
Communications Equipment Portfolio | .30% | .26% | .56% |
Computers Portfolio | .30% | .26% | .56% |
Electronics Portfolio | .30% | .26% | .56% |
IT Services Portfolio | .30% | .26% | .56% |
Software and Computer Services Portfolio | .30% | .26% | .56% |
Technology Portfolio | .30% | .26% | .56% |
Transfer Agent Fees. Fidelity Investments Institutional Operations Company, Inc. (FIIOC), an affiliate of FMR, is the Funds' transfer, dividend disbursing and shareholder servicing agent. FIIOC receives account fees and asset-based fees that vary according to account size and type of account. FIIOC pays for typesetting, printing and mailing of shareholder reports, except proxy statements. For the period, transfer agent fees were equivalent to the following annualized rates expressed as a percentage of average net assets:
Communications Equipment Portfolio | .29% |
Computers Portfolio | .24% |
Electronics Portfolio | .23% |
IT Services Portfolio | .23% |
Software and Computer Services Portfolio | .21% |
Technology Portfolio | .21% |
Accounting and Security Lending Fees. Fidelity Service Company, Inc. (FSC), an affiliate of FMR, maintains each Fund's accounting records. The accounting fee is based on the level of average net assets for each month. Under a separate contract, FSC administers the security lending program. The security lending fee is based on the number and duration of lending transactions.
Brokerage Commissions. Certain Funds placed a portion of their portfolio transactions with brokerage firms which are affiliates of the investment adviser. The commissions paid to these affiliated firms were as follows:
| Amount |
Communications Equipment Portfolio | $ 4,857 |
Computers Portfolio | 44,781 |
Electronics Portfolio | 74,244 |
IT Services Portfolio | 11,440 |
Software and Computer Services Portfolio | 49,394 |
Technology Portfolio | 60,421 |
Semiannual Report
Notes to Financial Statements (Unaudited) - continued
6. Fees and Other Transactions with Affiliates - continued
Interfund Lending Program. Pursuant to an Exemptive Order issued by the SEC, the Funds, along with other registered investment companies having management contracts with FMR, may participate in an interfund lending program. This program provides an alternative credit facility allowing the funds to borrow from, or lend money to, other participating affiliated funds. At period end, there were no interfund loans outstanding. Each applicable fund's activity in this program during the period for which loans were outstanding was as follows:
| Borrower
or Lender | Average
Loan Balance | Weighted Average
Interest Rate | Interest
Expense |
Electronics Portfolio | Borrower | $ 9,334,077 | .42% | $ 1,409 |
IT Services Portfolio | Borrower | $ 3,804,833 | .42% | 265 |
Software and Computer Services Portfolio | Borrower | $ 5,594,750 | .41% | 254 |
7. Committed Line of Credit.
Certain Funds participate with other funds managed by FMR or an affiliate in a $4.25 billion credit facility (the "line of credit") to be utilized for temporary or emergency purposes to fund shareholder redemptions or for other short-term liquidity purposes. The participating funds have agreed to pay commitment fees on their pro-rata portion of the line of credit, which are reflected in Miscellaneous expenses on the Statement of Operations, and are as follows:
Communications Equipment Portfolio | $ 417 |
Computers Portfolio | 1,050 |
Electronics Portfolio | 1,617 |
IT Services Portfolio | 403 |
Software and Computer Services Portfolio | 2,320 |
Technology Portfolio | 3,228 |
During the period, there were no borrowings on this line of credit.
8. Security Lending.
Certain Funds lend portfolio securities through a lending agent from time to time in order to earn additional income. For equity securities, a lending agent is used and may loan securities to certain qualified borrowers, including Fidelity Capital Markets (FCM), a broker-dealer affiliated with the Funds. On the settlement date of the loan, each applicable Fund receives collateral (in the form of U.S. Treasury obligations, letters of credit and/or cash) against the loaned securities and maintains collateral in an amount not less than 100% of the market value of the loaned securities during the period of the loan. The market value of the loaned securities is determined at the close of business of the Funds and any additional required collateral is delivered to the Funds on the next business day. If the borrower defaults on its obligation to return the securities loaned because of insolvency or other reasons, a fund could experience delays and costs in recovering the securities loaned or in gaining access to the collateral. Any cash collateral received is invested in the Fidelity Securities Lending Cash Central Fund. The value of loaned securities and cash collateral at period end are disclosed on each applicable Fund's Statement of Assets and Liabilities. Security lending income represents the income earned on investing cash collateral, less rebates paid to borrowers and any lending agent fees associated with the loan, plus any premium payments received for lending certain types of securities. Security lending income is presented on each applicable Fund's Statement of Operations as a component of income from Fidelity Central Funds. FCM security lending activity as of and during the period was as follows:
| Security Lending
Income From
Securities Loaned
to FCM | Value of Securities
Loaned to FCM at
Period End |
Communications Equipment Portfolio | $ 2,216 | $ 169,200 |
Computers Portfolio | 25,651 | - |
Electronics Portfolio | 8,968 | 1,293,199 |
IT Services Portfolio | 2 | - |
Software and Computer Services Portfolio | 30,853 | 586,278 |
Technology Portfolio | 87,565 | 1,365,703 |
Semiannual Report
9. Expense Reductions.
Many of the brokers with whom FMR places trades on behalf of certain Funds provided services to these Funds in addition to trade execution. These services included payments of expenses on behalf of each applicable Fund. In addition, through arrangements with each applicable Fund's custodian, credits realized as a result of uninvested cash balances were used to reduce each applicable Fund's expenses. All of the applicable expense reductions are noted in the table below.
| Brokerage Service
reduction | Custody expense
reduction |
Communications Equipment Portfolio | $ 12,725 | $ - |
Computers Portfolio | 12,390 | 13 |
Electronics Portfolio | 34,233 | - |
IT Services Portfolio | 6,037 | - |
Software and Computer Services Portfolio | 62,161 | 27 |
Technology Portfolio | 128,021 | 73 |
10. Other.
The Funds' organizational documents provide former and current trustees and officers with a limited indemnification against liabilities arising in connection with the performance of their duties to the Funds. In the normal course of business, the Funds may also enter into contracts that provide general indemnifications. The Funds' maximum exposure under these arrangements is unknown as this would be dependent on future claims that may be made against the Funds. The risk of material loss from such claims is considered remote.
At the end of the period, Strategic Advisers U.S. Opportunity Fund was the owner of record of approximately 27% and 11% of the total outstanding shares of IT Services Portfolio and Computers Portfolio, respectively. VIP FundsManager 60% Portfolio was the owner of record of approximately 16% and 12% of the total outstanding shares of IT Services Portfolio and Computers Portfolio, respectively. Mutual funds managed by FMR or its affiliates were the owners of record, in the aggregate, of approximately 53% and 30% of the total outstanding shares of IT Services Portfolio and Computers Portfolio, respectively.
Semiannual Report
Board Approval of Investment Advisory Contracts and Management Fees
Communications Equipment Portfolio
Computers Portfolio
Electronics Portfolio
IT Services Portfolio
Software and Computer Services Portfolio
Technology Portfolio
Each year, the Board of Trustees, including the Independent Trustees (together, the Board), votes on the renewal of the management contract and sub-advisory agreements (together, the Advisory Contracts) for each fund. The Board, assisted by the advice of fund counsel and Independent Trustees' counsel, requests and considers a broad range of information relevant to the renewal of the Advisory Contracts throughout the year.
The Board meets regularly and, at each of its meetings, considers factors that are relevant to its annual consideration of the renewal of each fund's Advisory Contracts, including the services and support provided to each fund and its shareholders. The Board has established various standing committees, each composed of and chaired by Independent Trustees with varying backgrounds, to which the Board has assigned specific subject matter responsibilities in order to enhance effective decision-making by the Board. The Board, acting directly and through its Committees, requests and receives information concerning the annual consideration of the renewal of each fund's Advisory Contracts. The Board also meets as needed to consider matters specifically related to the Board's annual consideration of the renewal of Advisory Contracts. Members of the Board may also meet with trustees of other Fidelity funds through ad hoc joint committees to discuss certain matters relevant to the Fidelity funds.
At its July 2012 meeting, the Board of Trustees, including the Independent Trustees, unanimously determined to renew each fund's Advisory Contracts. In reaching its determination, the Board considered all factors it believed relevant, including (i) the nature, extent, and quality of the services to be provided to each fund and its shareholders (including the investment performance of each fund); (ii) the competitiveness of each fund's management fee and total expense ratio relative to peer funds; (iii) the total costs of the services to be provided by and the profits to be realized by Fidelity from its relationship with each fund; (iv) the extent to which economies of scale exist and would be realized as each fund grows; and (v) whether fee levels reflect these economies of scale, if any, for the benefit of fund shareholders.
In considering whether to renew the Advisory Contracts for each fund, the Board reached a determination, with the assistance of fund counsel and Independent Trustees' counsel and through the exercise of its business judgment, that the renewal of the Advisory Contracts is in the best interests of each fund and its shareholders and that the compensation payable under the Advisory Contracts is fair and reasonable. The Board's decision to renew the Advisory Contracts was not based on any single factor, but rather was based on a comprehensive consideration of all the information provided to the Board at its meetings throughout the year. The Board, in reaching its determination to renew the Advisory Contracts, is aware that shareholders in each fund have a broad range of investment choices available to them, including a wide choice among mutual funds offered by Fidelity's competitors, and that each fund's shareholders, who have the opportunity to review and weigh the disclosure provided by the fund in its prospectus and other public disclosures, have chosen to invest in that fund, managed by Fidelity.
Nature, Extent, and Quality of Services Provided. The Board considered the staffing within the investment adviser, FMR, and the sub-advisers (together, the Investment Advisers), including the backgrounds of the funds' investment personnel, and also considered the funds' investment objectives, strategies, and related investment philosophies. The Independent Trustees also had discussions with senior management of Fidelity's investment operations and investment groups. The Board considered the structure of the portfolio manager compensation program and whether this structure provides appropriate incentives to act in the best interests of each fund.
Resources Dedicated to Investment Management and Support Services. The Board and the Fund Oversight and Research Committees reviewed the general qualifications and capabilities of the Investment Advisers' investment staff, including its size, education, experience, and resources, as well as the Investment Advisers' approach to recruiting, training, managing, and compensating investment personnel. The Board also noted that FMR has continued to increase the resources devoted to non-U.S. offices, including expansion of Fidelity's global investment organization. The Board noted that Fidelity's analysts have extensive resources, tools and capabilities that allow them to conduct sophisticated quantitative and fundamental analysis, as well as credit analysis of issuers, counterparties and guarantors. The Board also believes that Fidelity's investment professionals have sufficient access to global information and data so as to provide competitive investment results over time, and that those professionals also have access to sophisticated tools that permit them to assess portfolio construction and risk and performance attribution characteristics continuously, as well as to transmit new information and research conclusions rapidly around the world. Additionally, in its deliberations, the Board considered the Investment Advisers' trading and risk management capabilities and resources, which are an integral part of the investment management process.
Shareholder and Administrative Services. The Board considered (i) the nature, extent, quality, and cost of advisory, administrative, and shareholder services performed by the Investment Advisers and their affiliates under the Advisory Contracts and under separate agreements covering transfer agency, pricing and bookkeeping, and securities lending services for each fund; (ii) the nature and extent of the supervision of third party service providers, principally custodians and subcustodians; and (iii) the resources devoted to, and the record of compliance with, each fund's compliance policies and procedures. The Board also reviewed the allocation of fund brokerage, including allocations to brokers affiliated with the Investment Advisers, the use of brokerage commissions to pay fund expenses, and the use of "soft" commission dollars to pay for research services.
Semiannual Report
Board Approval of Investment Advisory Contracts and Management Fees - continued
The Board noted that the growth of fund assets over time across the complex allows Fidelity to reinvest in the development of services designed to enhance the value or convenience of the Fidelity funds as investment vehicles. These services include 24-hour access to account information and market information through telephone representatives and over the Internet, investor education materials and asset allocation tools, and the expanded availability of Fidelity Investor Centers.
Investment in a Large Fund Family. The Board considered the benefits to shareholders of investing in a Fidelity fund, including the benefits of investing in a fund that is part of a large family of funds offering a variety of investment disciplines and providing a large variety of mutual fund investor services. The Board noted that Fidelity had taken, or had made recommendations that resulted in the Fidelity funds taking, a number of actions over the previous year that benefited particular funds, including (i) continuing to dedicate additional resources to investment research and support of the senior management team that oversees asset management; (ii) persisting in efforts to enhance Fidelity's research capabilities, in particular, international research; (iii) launching new funds and making other enhancements to meet client needs for global and income-oriented solutions; (iv) continuing to launch dedicated lower cost underlying funds to meet investment management's portfolio construction needs related to expanding underlying fund options, specifically for the Freedom Fund product lines; (v) adopting a "Stock Selector" sector neutral investment approach and employing a team of portfolio managers who are sector specialists to manage certain funds; (vi) rationalizing product lines and gaining increased efficiencies through the mergers of several funds into other funds; (vii) strengthening the Spartan Index Fund product line by adding new funds and/or new low-cost institutional share classes, restructuring fund expenses to accommodate new classes, and reducing investment minimums for certain classes of shares; (viii) modifying the eligibility criteria for Institutional Class shares to increase their appeal to government entities and charitable investors; and (ix) reducing certain transfer agent fee rates.
Investment Performance. The Board considered whether each fund has operated in accordance with its investment objective, as well as its record of compliance with its investment restrictions. It also reviewed each fund's absolute investment performance, as well as each fund's relative investment performance measured over multiple periods against a third-party-sponsored index that reflects the market sector in which the fund invests. The Board noted that FMR believes that no meaningful peer group exists for the funds principally because most other funds in each fund's third-party peer group focus on different industries or sectors than the fund. For each fund, the following charts considered by the Board show, over the one-, three-, and five-year periods ended December 31, 2011, the fund's cumulative total returns and the cumulative total returns of a third-party-sponsored index ("benchmark").
Communications Equipment Portfolio
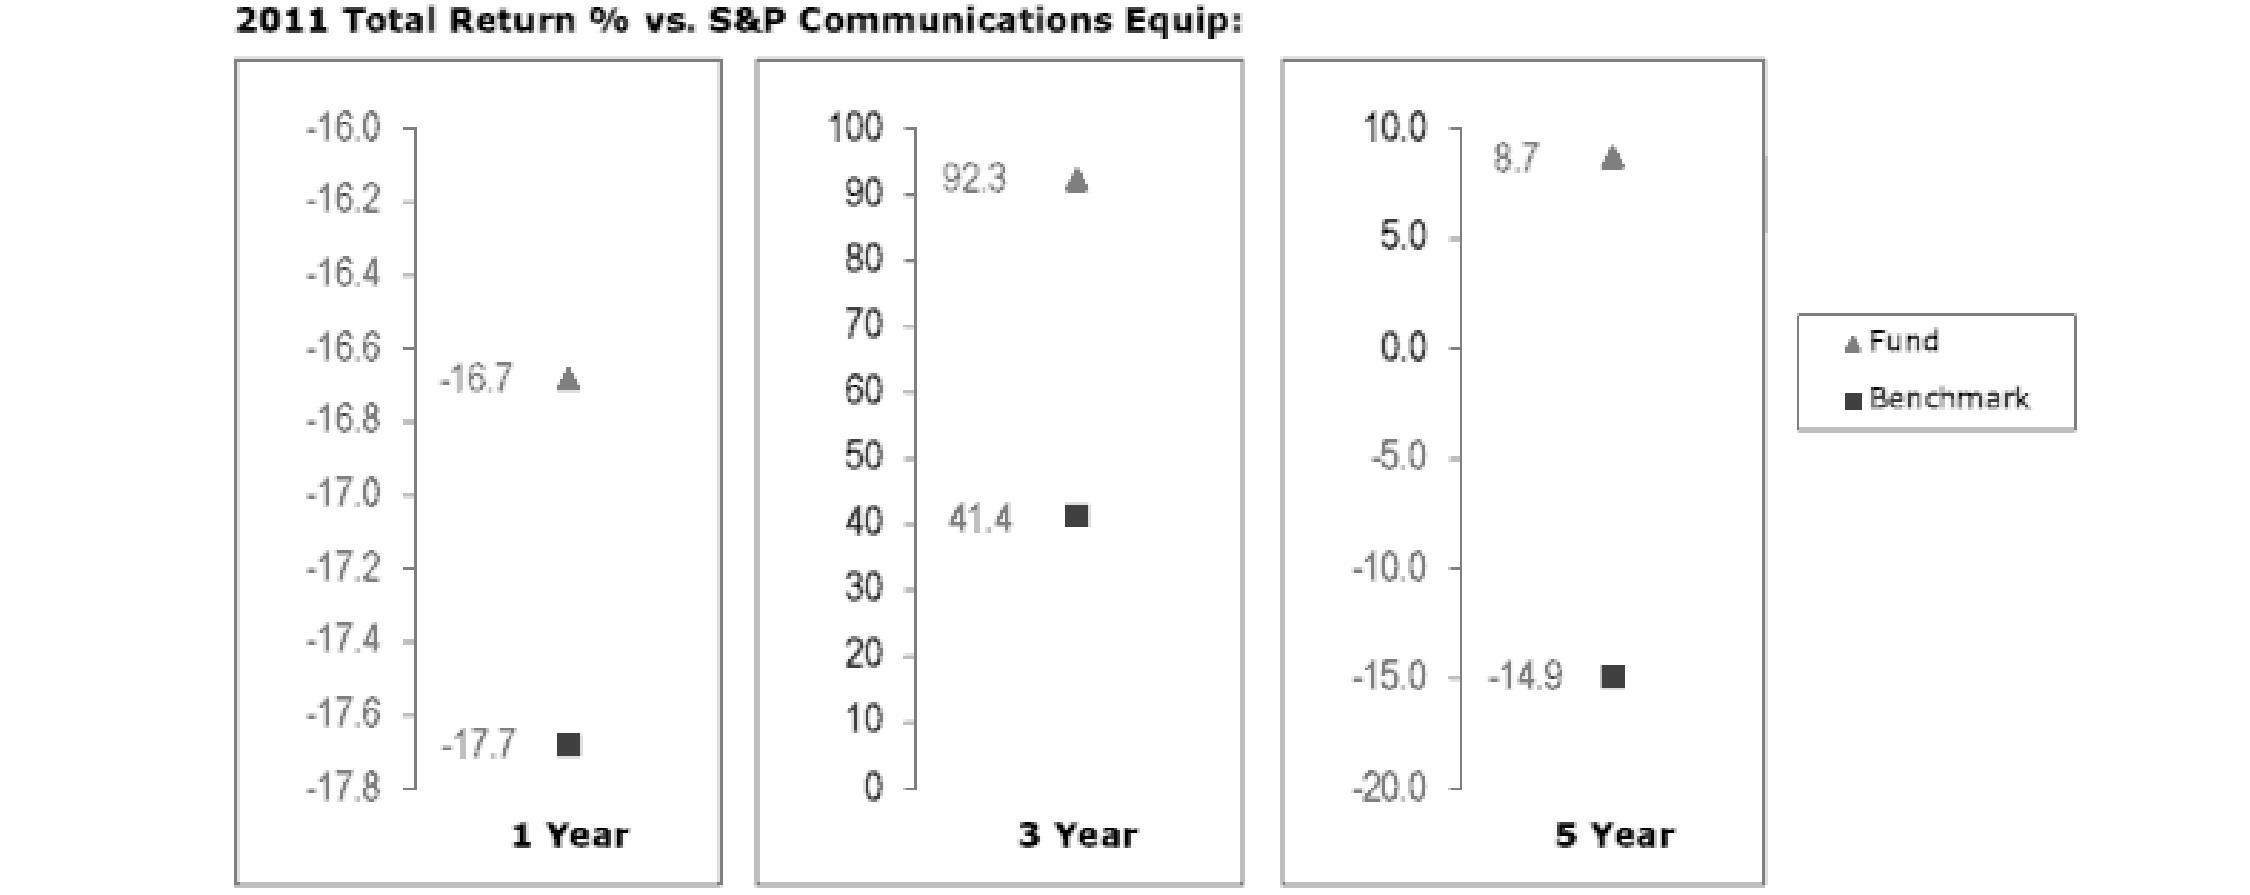
The Board noted that the investment performance of the fund compared favorably to its benchmark for all the periods shown. The Board noted that there was a portfolio management change for the fund in January 2012. The Board also reviewed the fund's performance since inception as well as performance in the current year.
Semiannual Report
Computers Portfolio
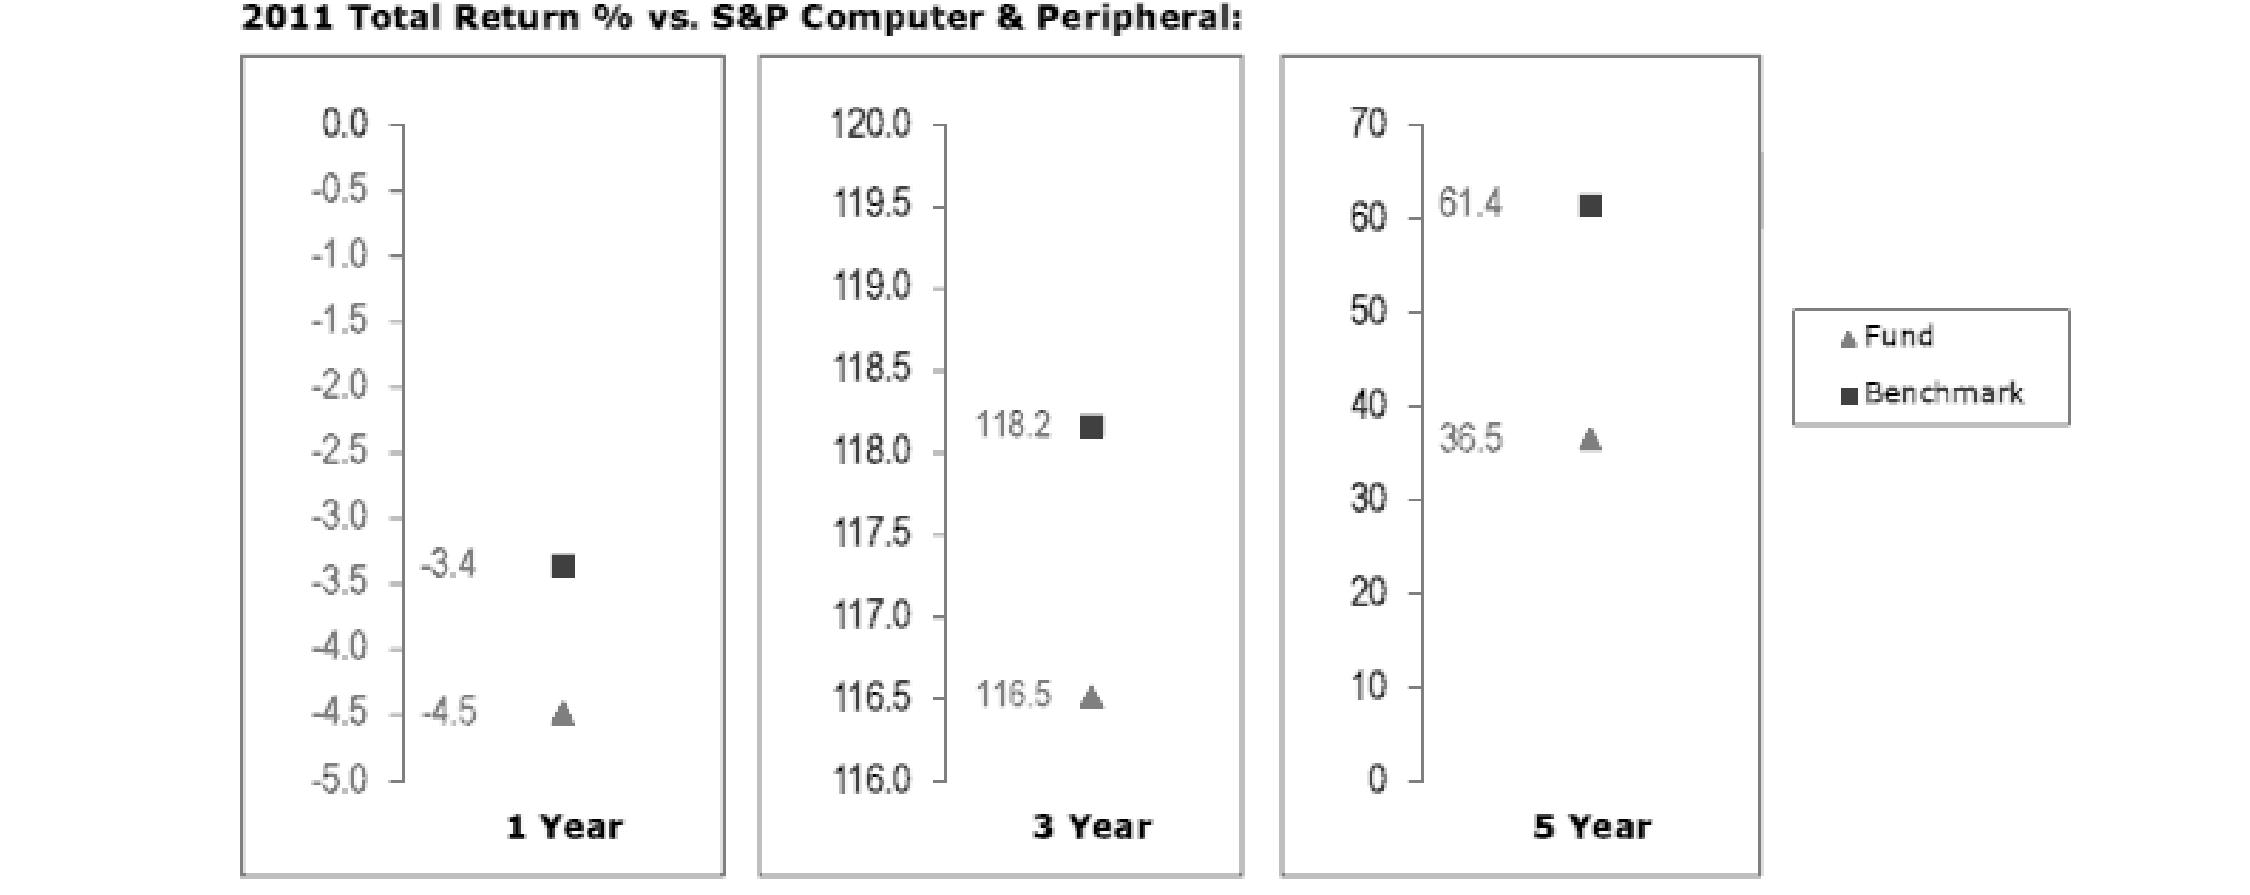
The Board noted that the investment performance of the fund was lower than its benchmark for all the periods shown. The Board discussed with FMR actions to improve the fund's below-benchmark performance. The Board noted that this fund had underperformed in the past and discussed with FMR its disappointment with the continued underperformance of the fund. The Board also reviewed the fund's performance since inception as well as performance in the current year. The Board will continue to closely monitor the performance of the fund in the coming year and discuss with FMR other appropriate actions to address the performance of the fund.
Electronics Portfolio
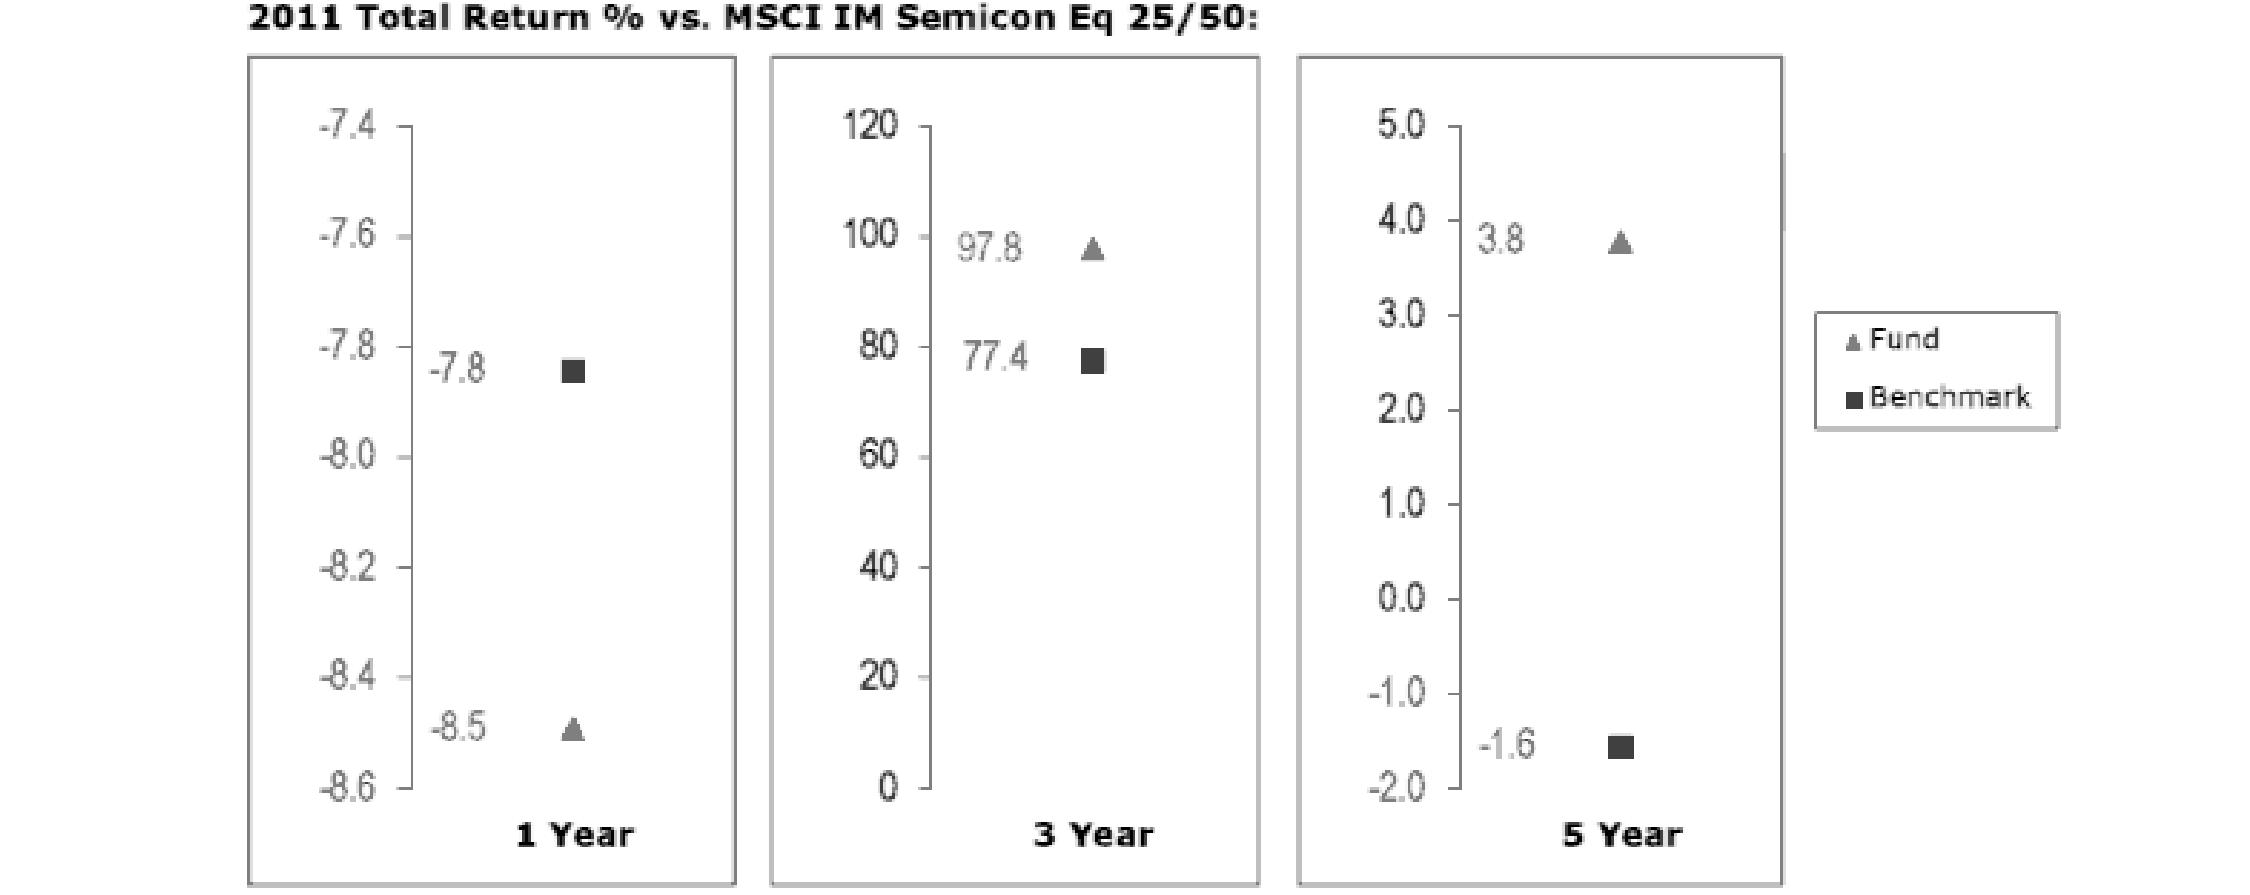
The Board noted that the investment performance of the fund compared favorably to its benchmark for the three- and five-year periods, although the fund's one-year total return was lower than its benchmark. The Board also reviewed the fund's performance since inception as well as performance in the current year.
Semiannual Report
Board Approval of Investment Advisory Contracts and Management Fees - continued
IT Services Portfolio
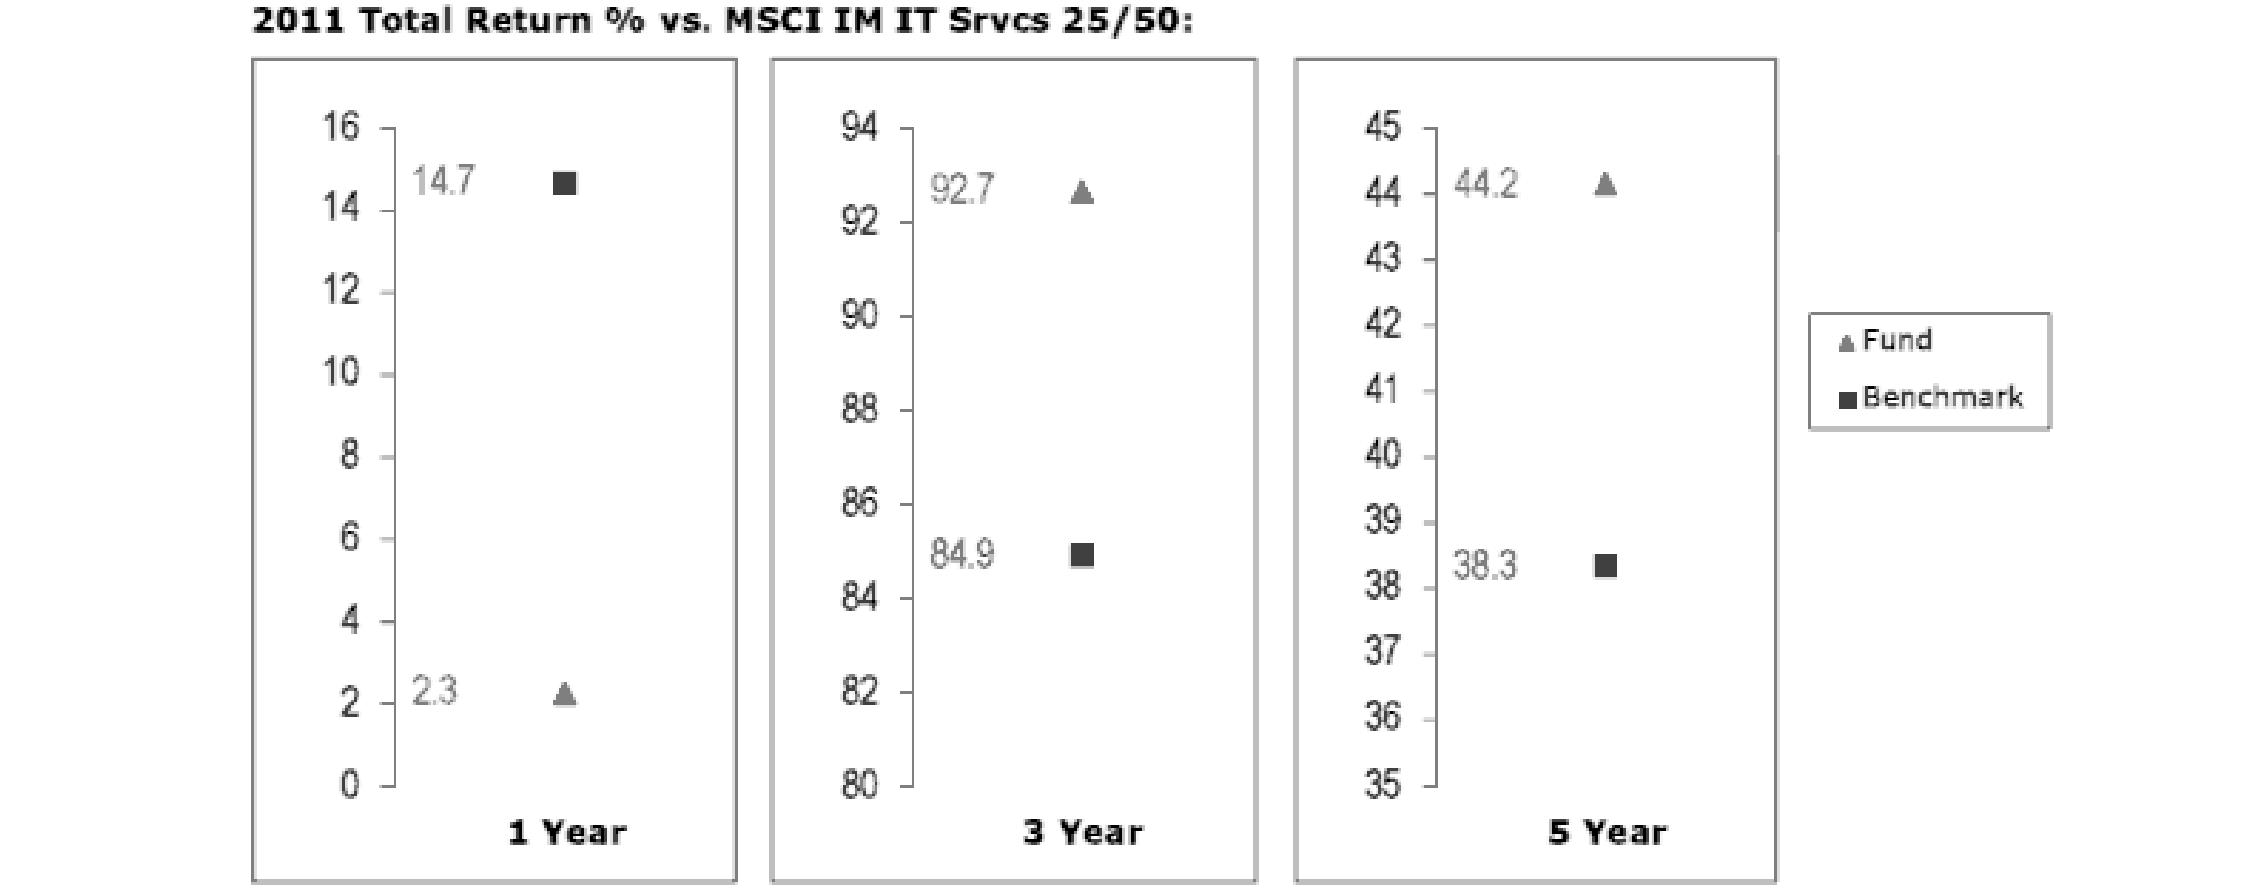
The Board noted that the investment performance of the fund compared favorably to its benchmark for the three- and five-year periods, although the fund's one-year total return was lower than its benchmark. The Board also reviewed the fund's performance since inception as well as performance in the current year.
Software and Computer Services Portfolio
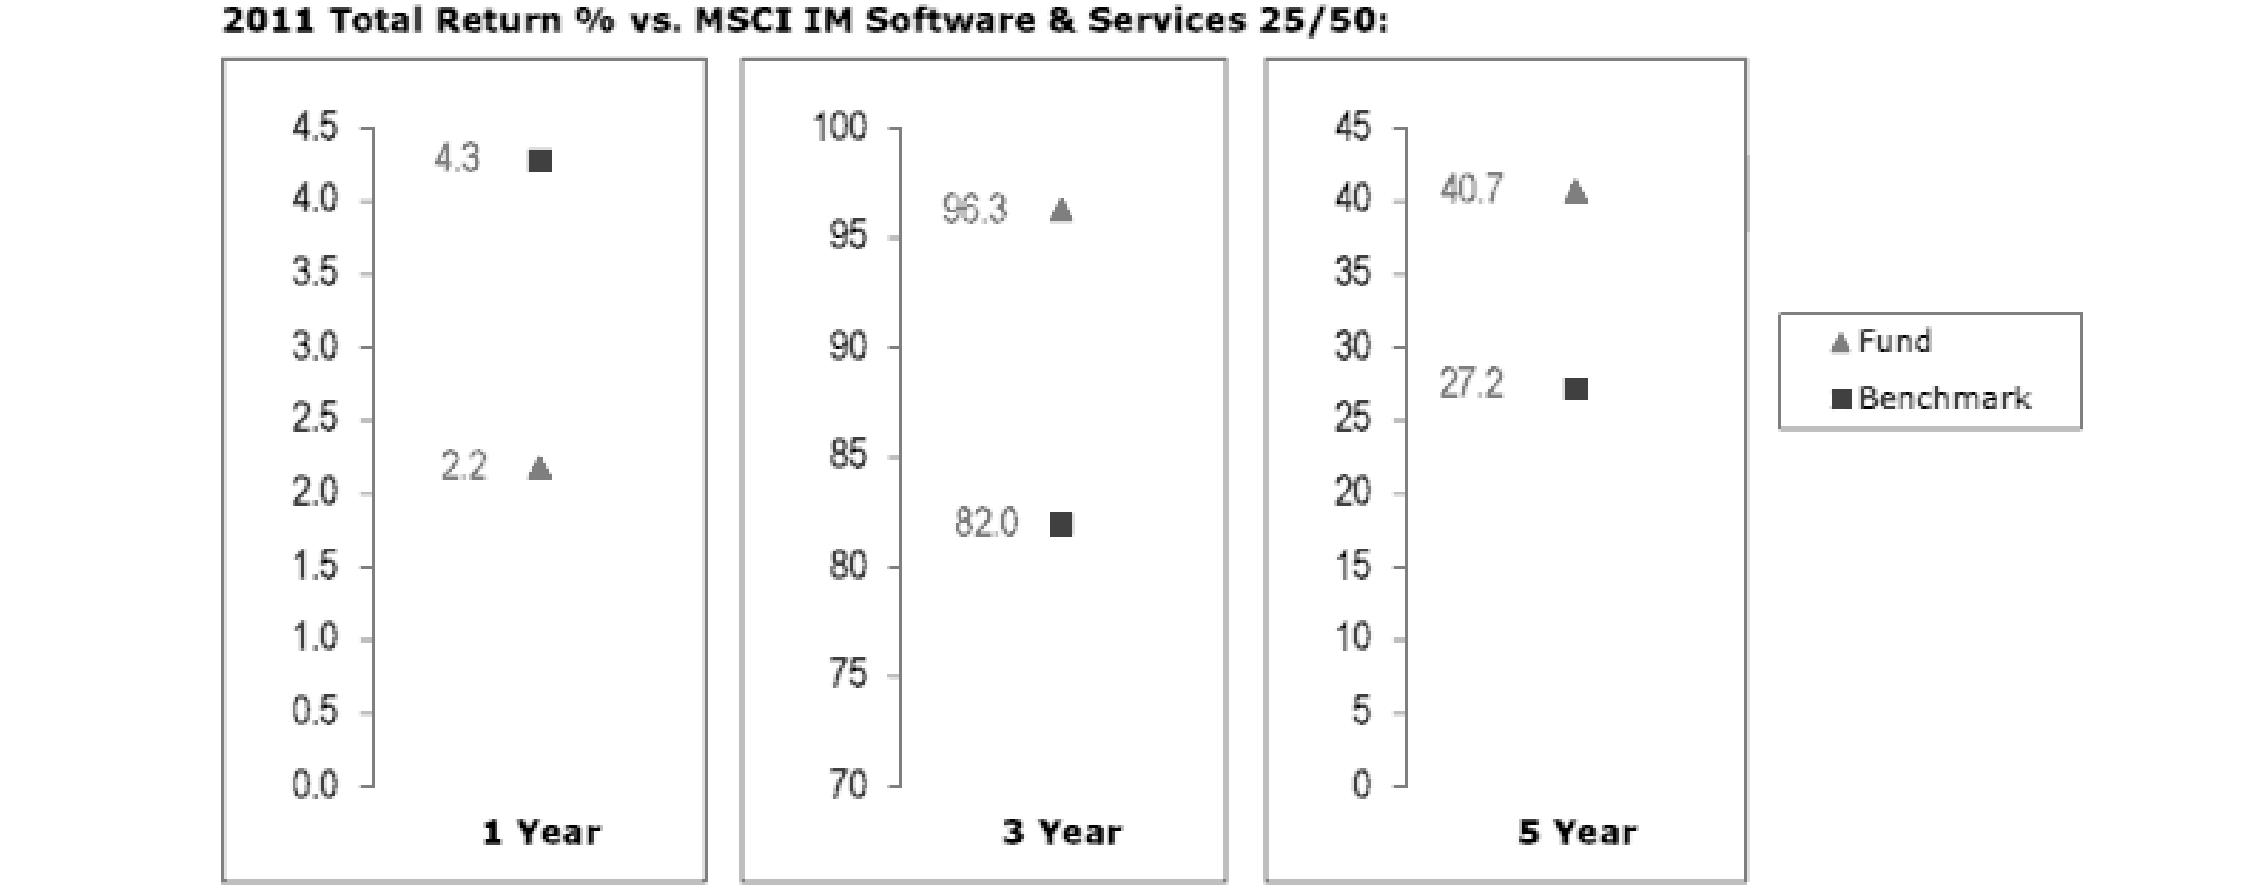
The Board noted that the investment performance of the fund compared favorably to its benchmark for the three- and five-year periods, although the fund's one-year total return was lower than its benchmark. The Board also reviewed the fund's performance since inception as well as performance in the current year.
Semiannual Report
Technology Portfolio
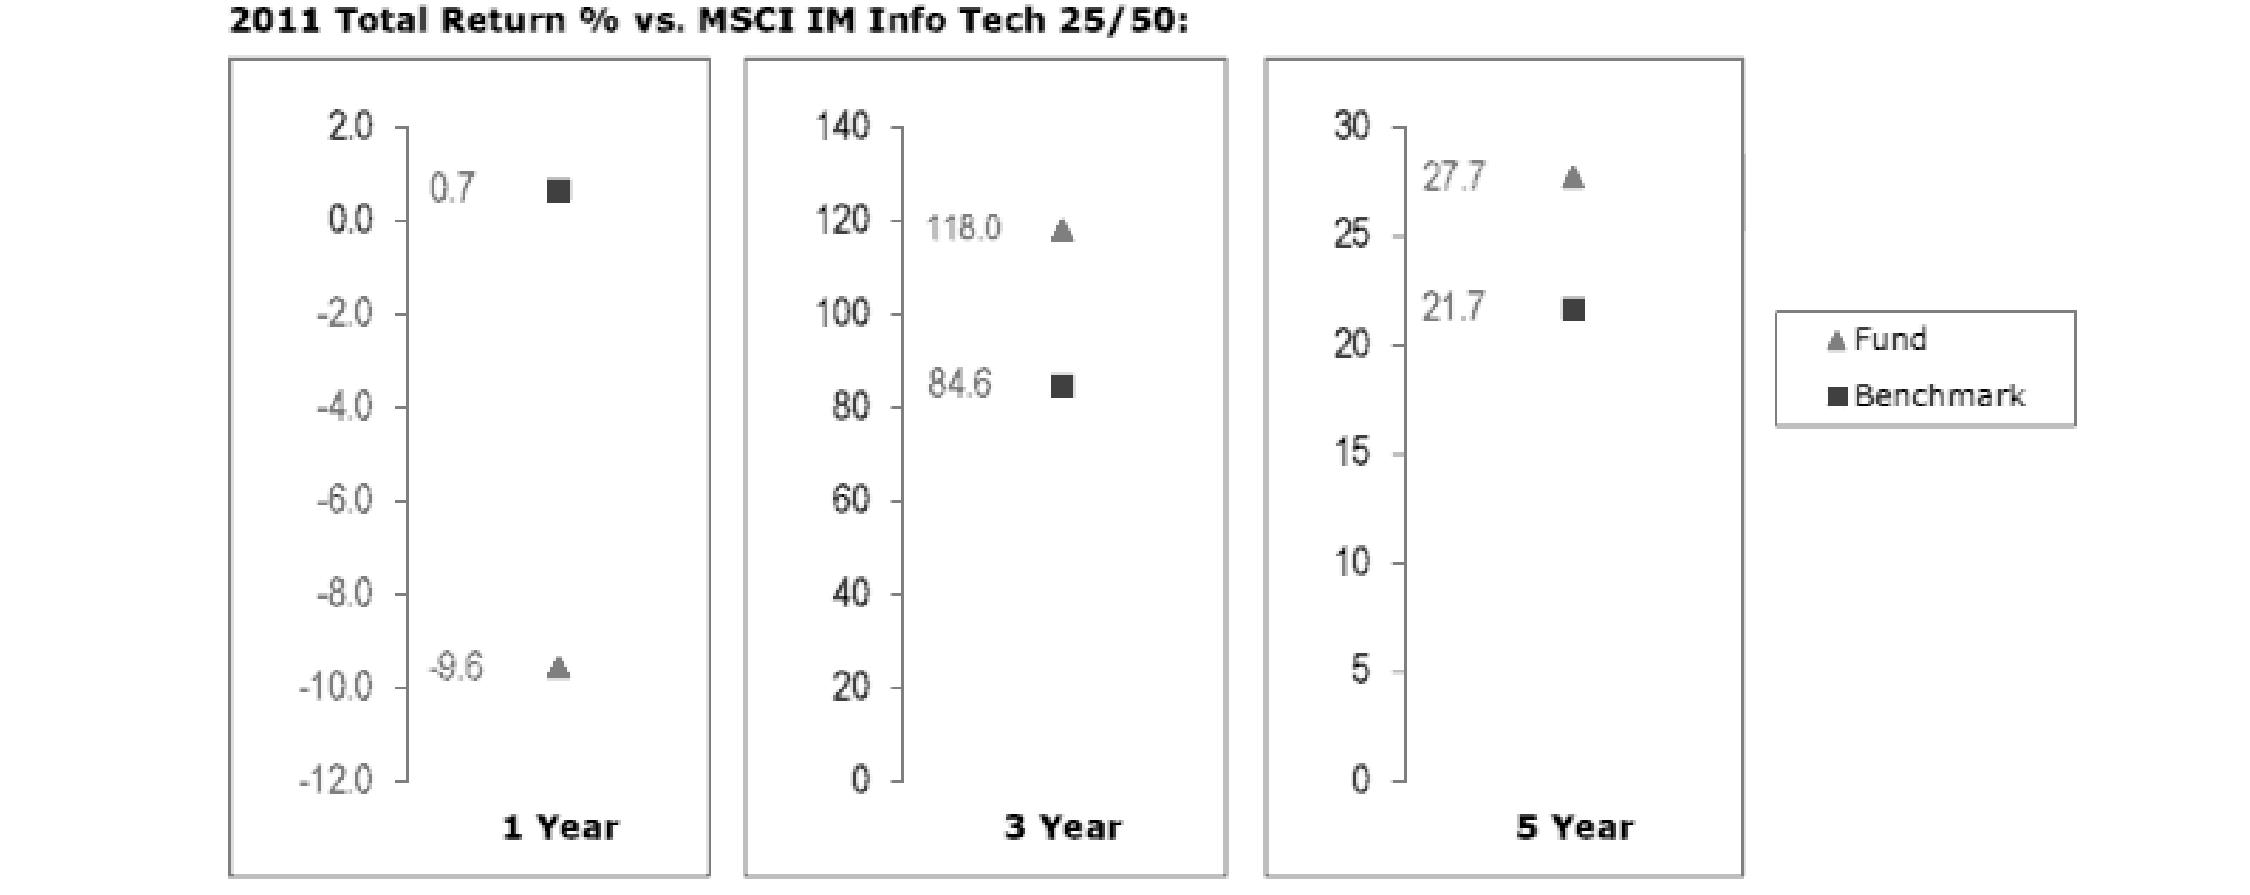
The Board noted that the investment performance of the fund compared favorably to its benchmark for the three- and five-year periods, although the fund's one-year total return was lower than its benchmark. The Board also reviewed the fund's performance since inception as well as performance in the current year.
Based on its review, the Board concluded that the nature, extent, and quality of services provided to each fund under the Advisory Contracts should benefit each fund's shareholders.
Competitiveness of Management Fee and Total Expense Ratio. The Board considered each fund's management fee and total expense ratio compared to "mapped groups" of competitive funds and classes. Fidelity creates "mapped groups" by combining similar Lipper investment objective categories that have comparable management fee characteristics. Combining Lipper investment objective categories aids the Board's management fee and total expense ratio comparisons by broadening the competitive group used for comparison and by reducing the number of universes to which various Fidelity funds are compared.
Management Fee. The Board considered two proprietary management fee comparisons for the 12-month periods shown in the charts below. The group of Lipper funds used by the Board for management fee comparisons is referred to below as the "Total Mapped Group." The Total Mapped Group comparison focuses on a fund's standing relative to the total universe of comparable funds available to investors in terms of gross management fees before expense reimbursements or caps. "TMG %" represents the percentage of funds in the Total Mapped Group that had management fees that were lower than a fund's. For example, a TMG % of 6% means that 94% of the funds in the Total Mapped Group had higher management fees than a fund. The "Asset-Size Peer Group" (ASPG) comparison focuses on a fund's standing relative to non-Fidelity funds similar in size to the fund within the Total Mapped Group. The ASPG represents at least 15% of the funds in the Total Mapped Group with comparable asset size and management fee characteristics, subject to a minimum of 50 funds (or all funds in the Total Mapped Group if fewer than 50). Additional information, such as the ASPG quartile in which a fund's management fee ranked, is also included in the charts and considered by the Board.
Semiannual Report
Board Approval of Investment Advisory Contracts and Management Fees - continued
Communications Equipment Portfolio
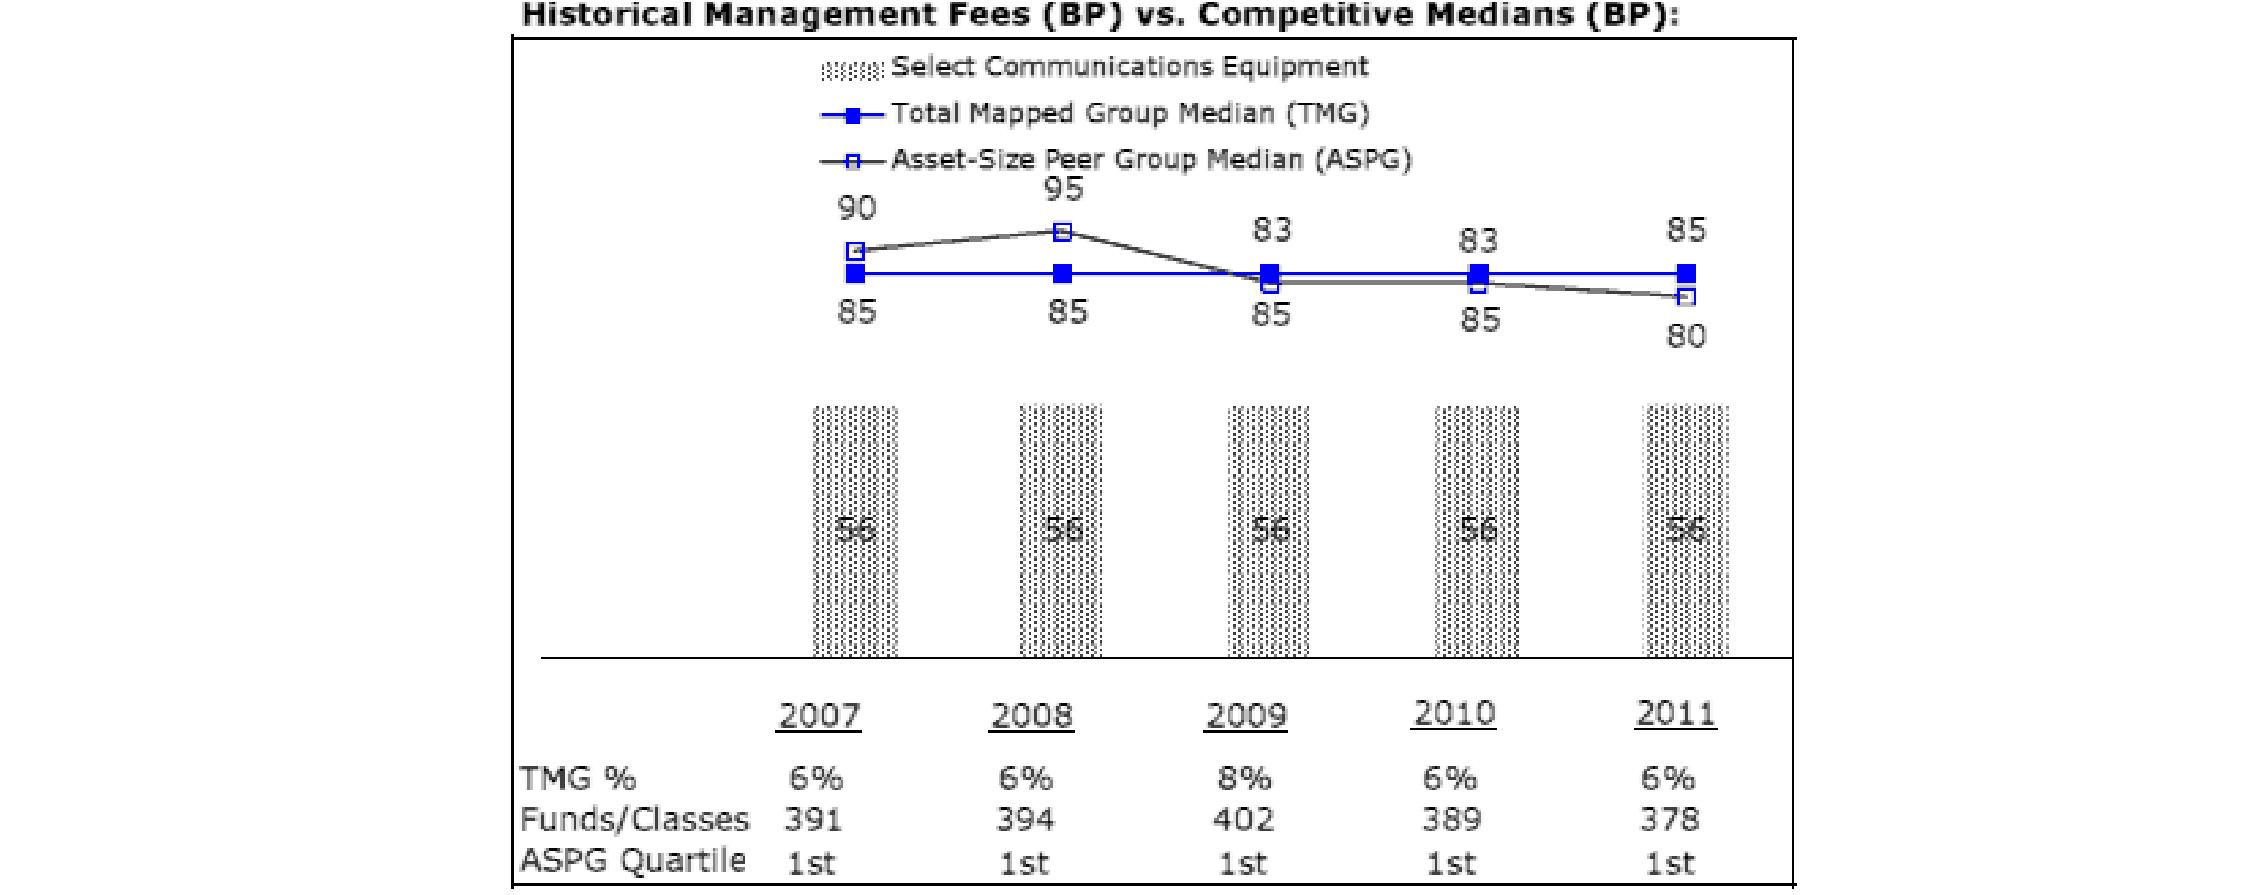
Computers Portfolio
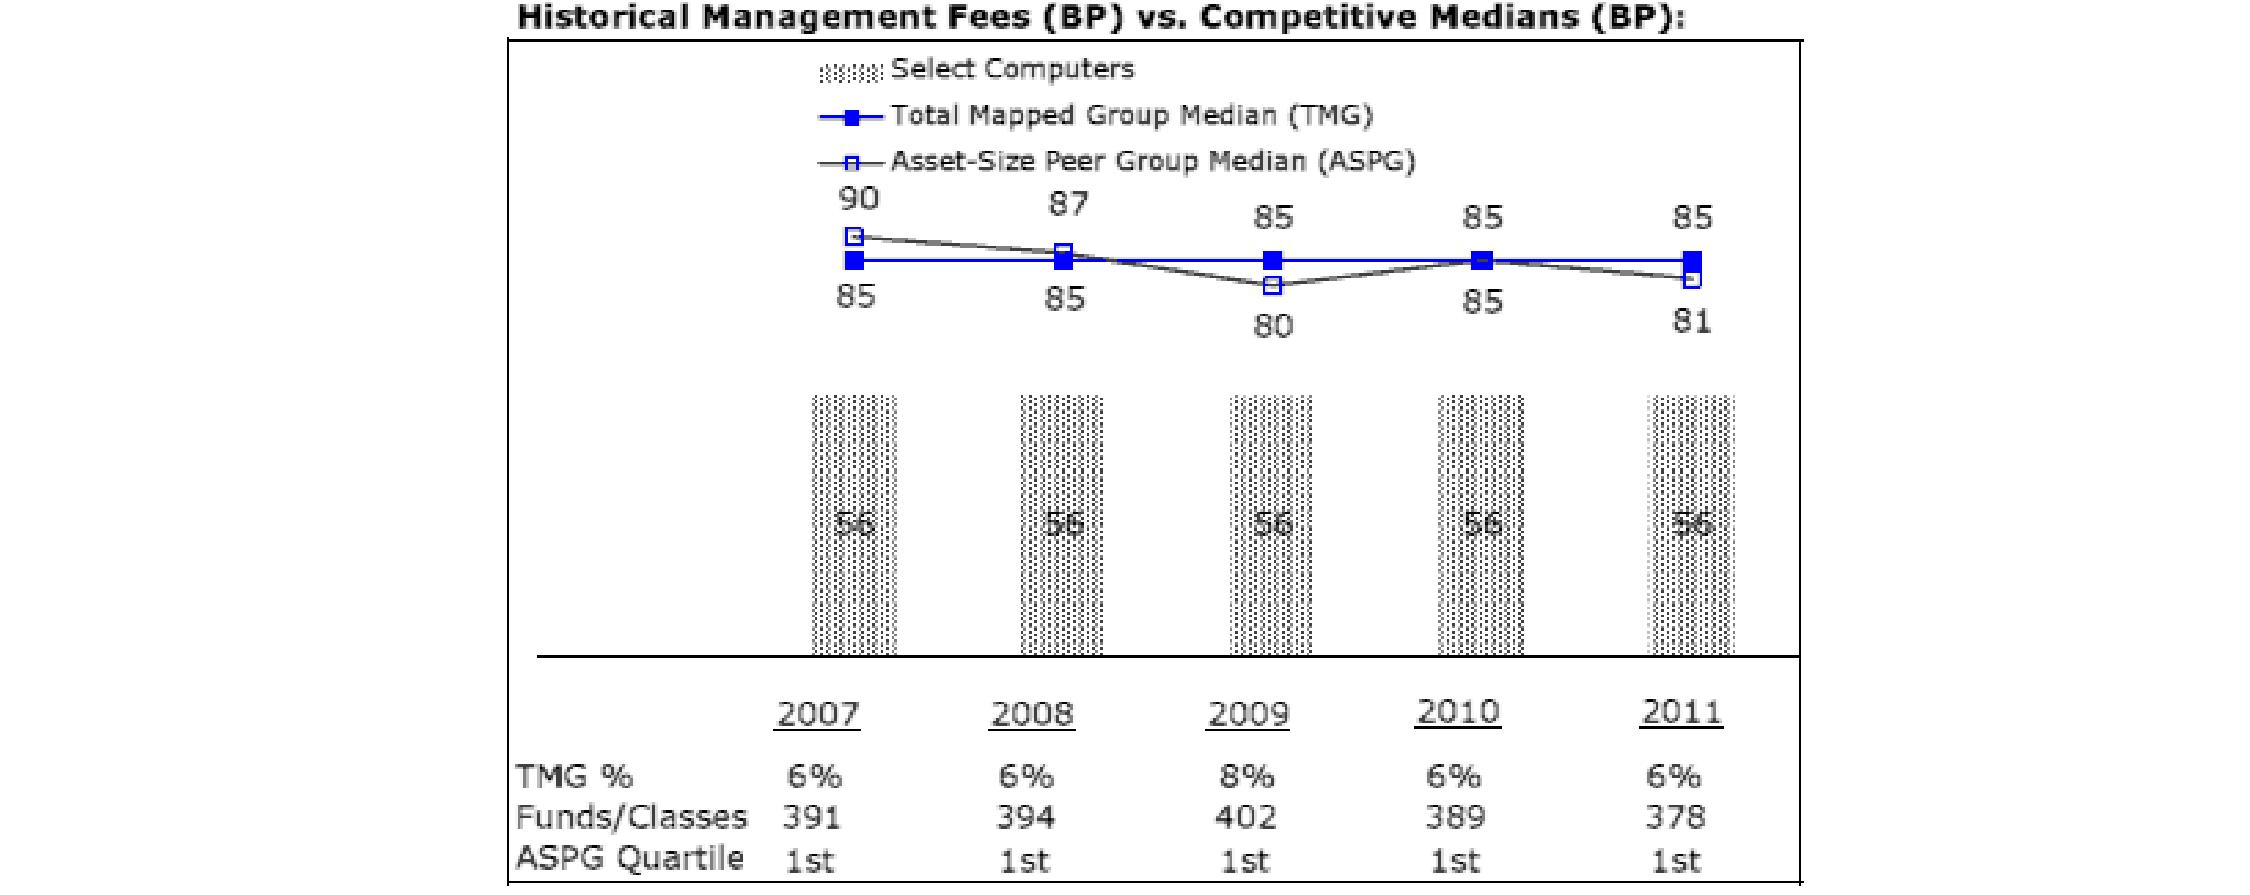
Semiannual Report
Electronics Portfolio
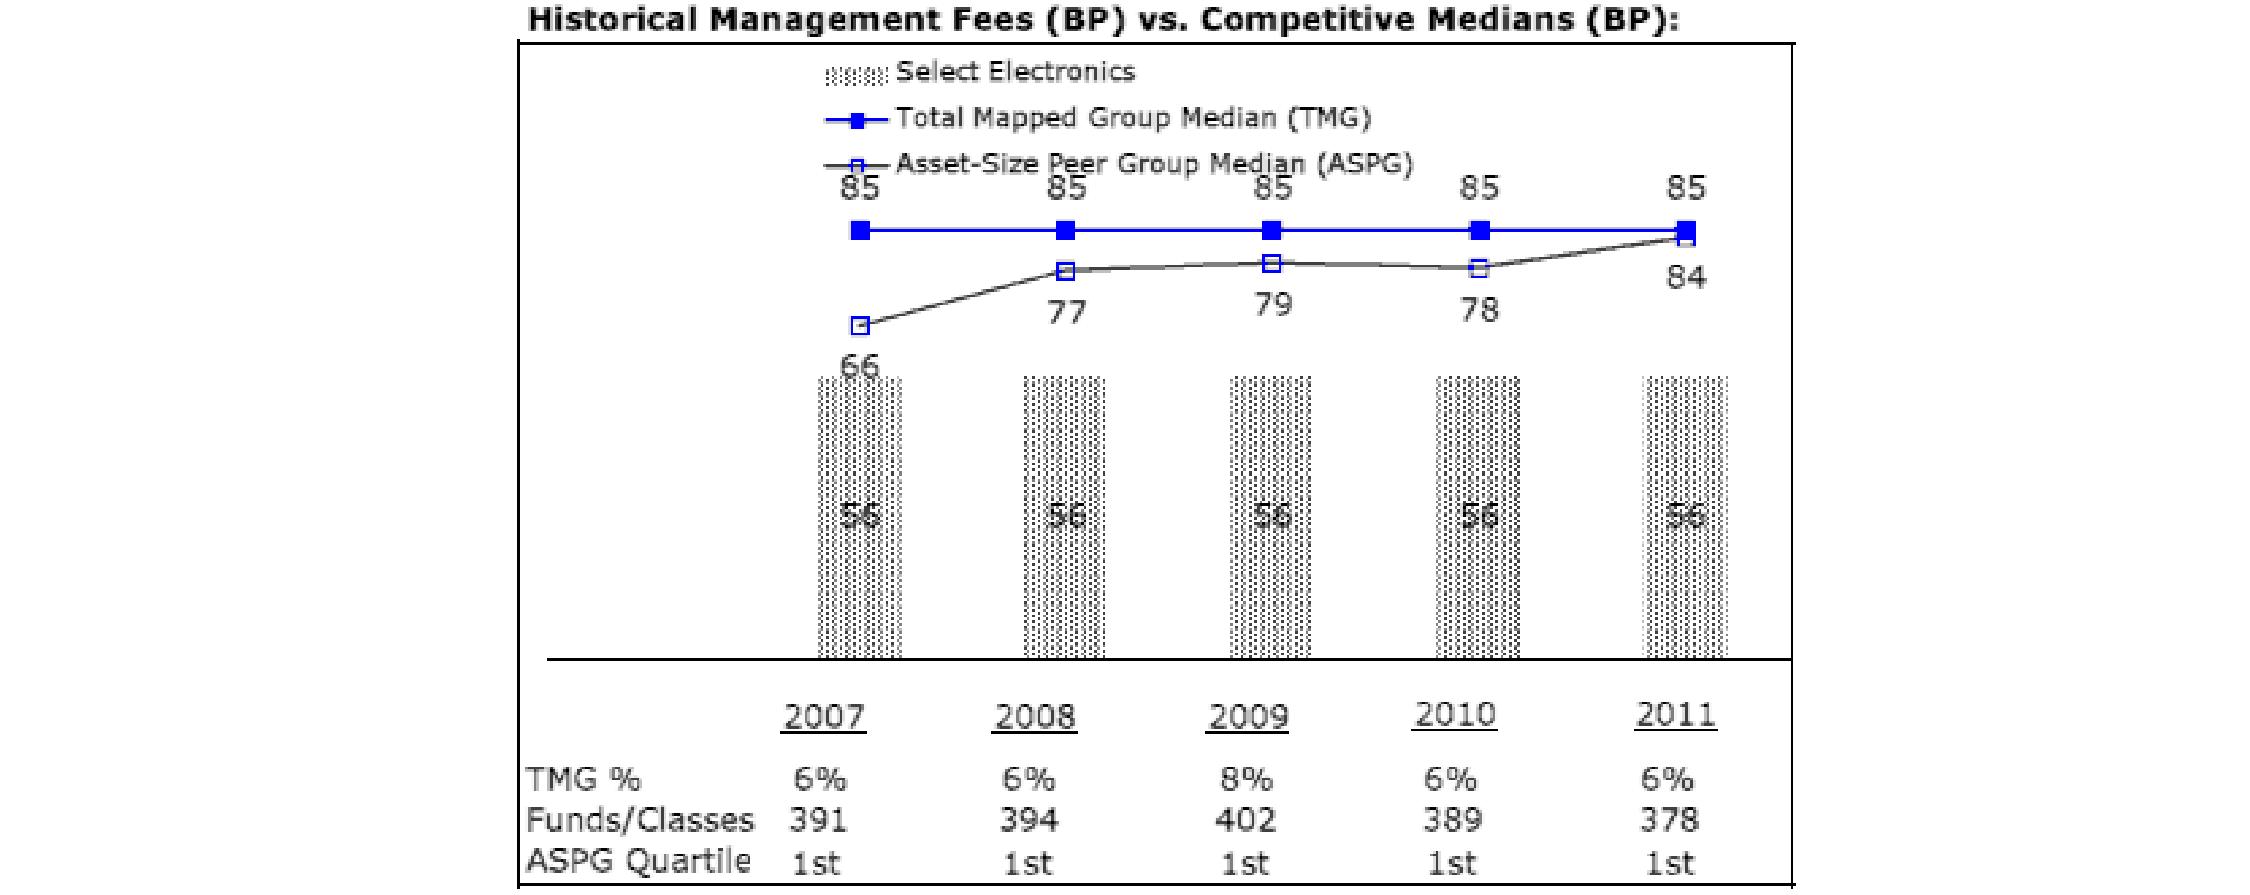
IT Services Portfolio
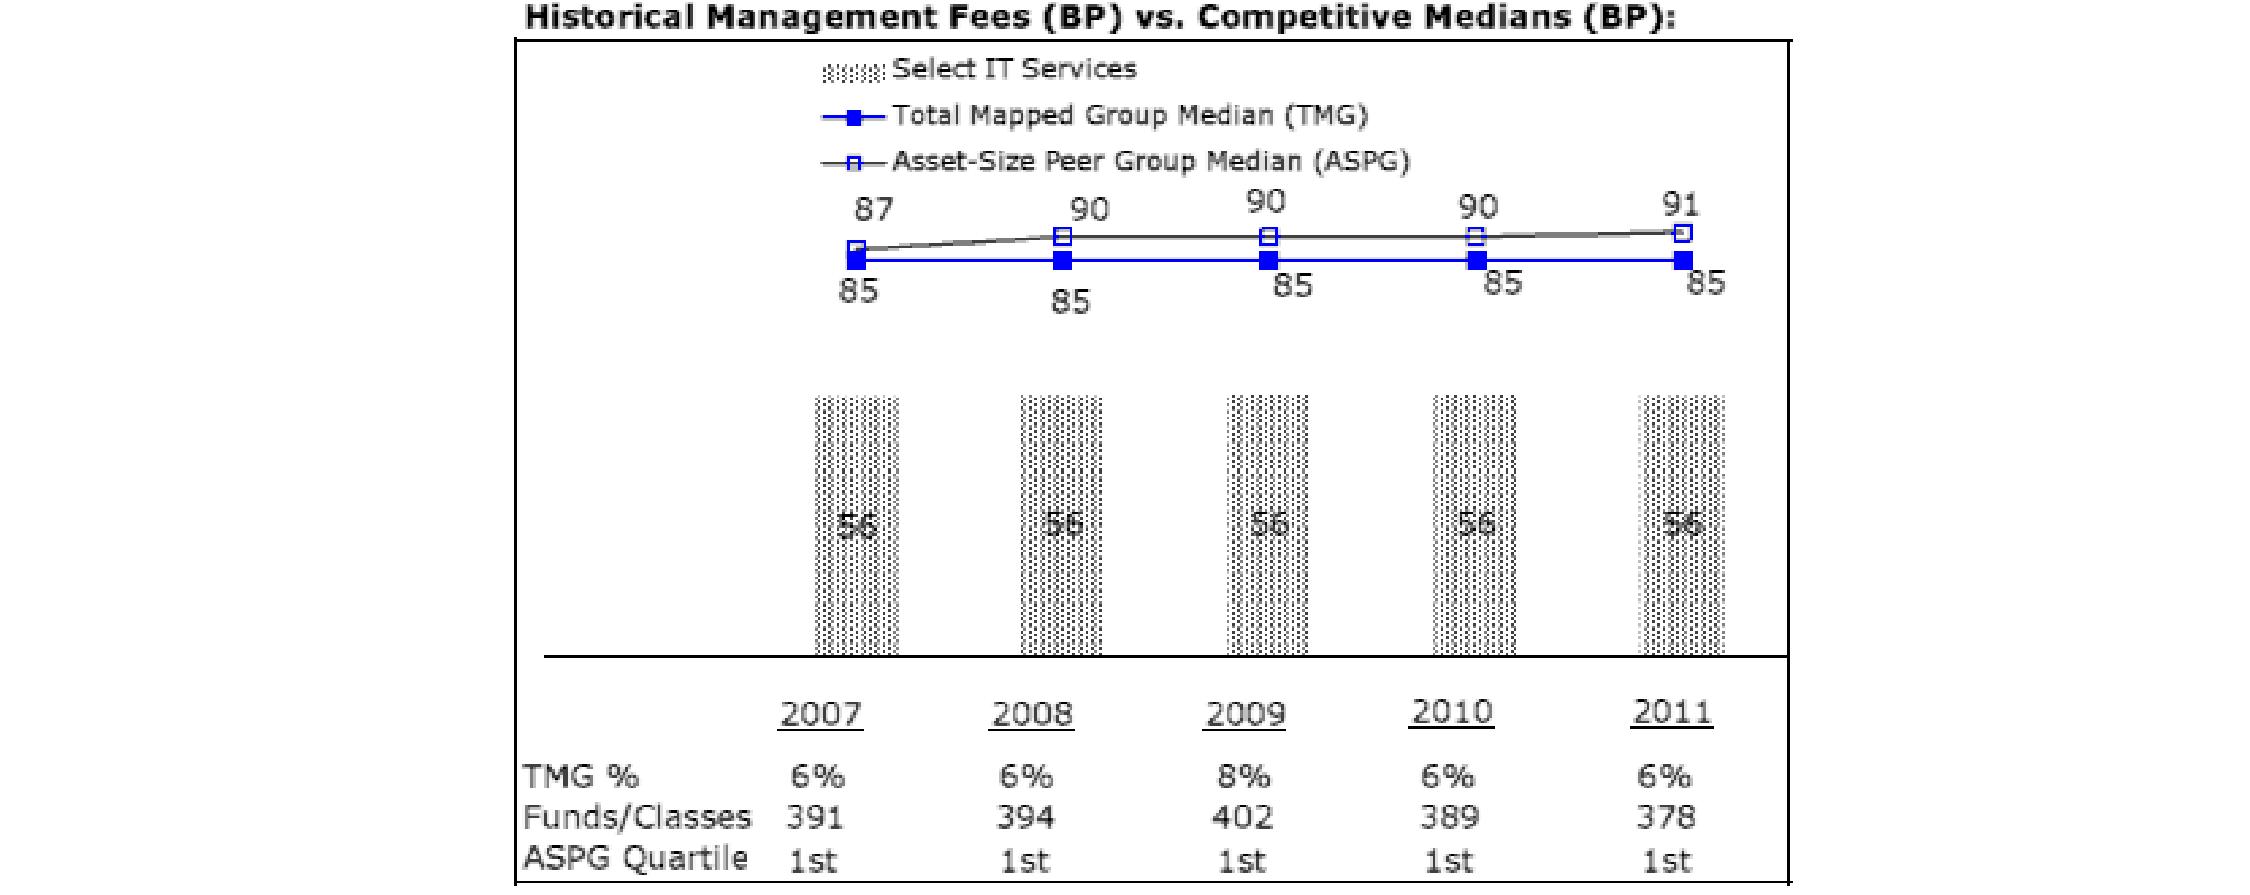
Semiannual Report
Board Approval of Investment Advisory Contracts and Management Fees - continued
Software and Computer Services Portfolio
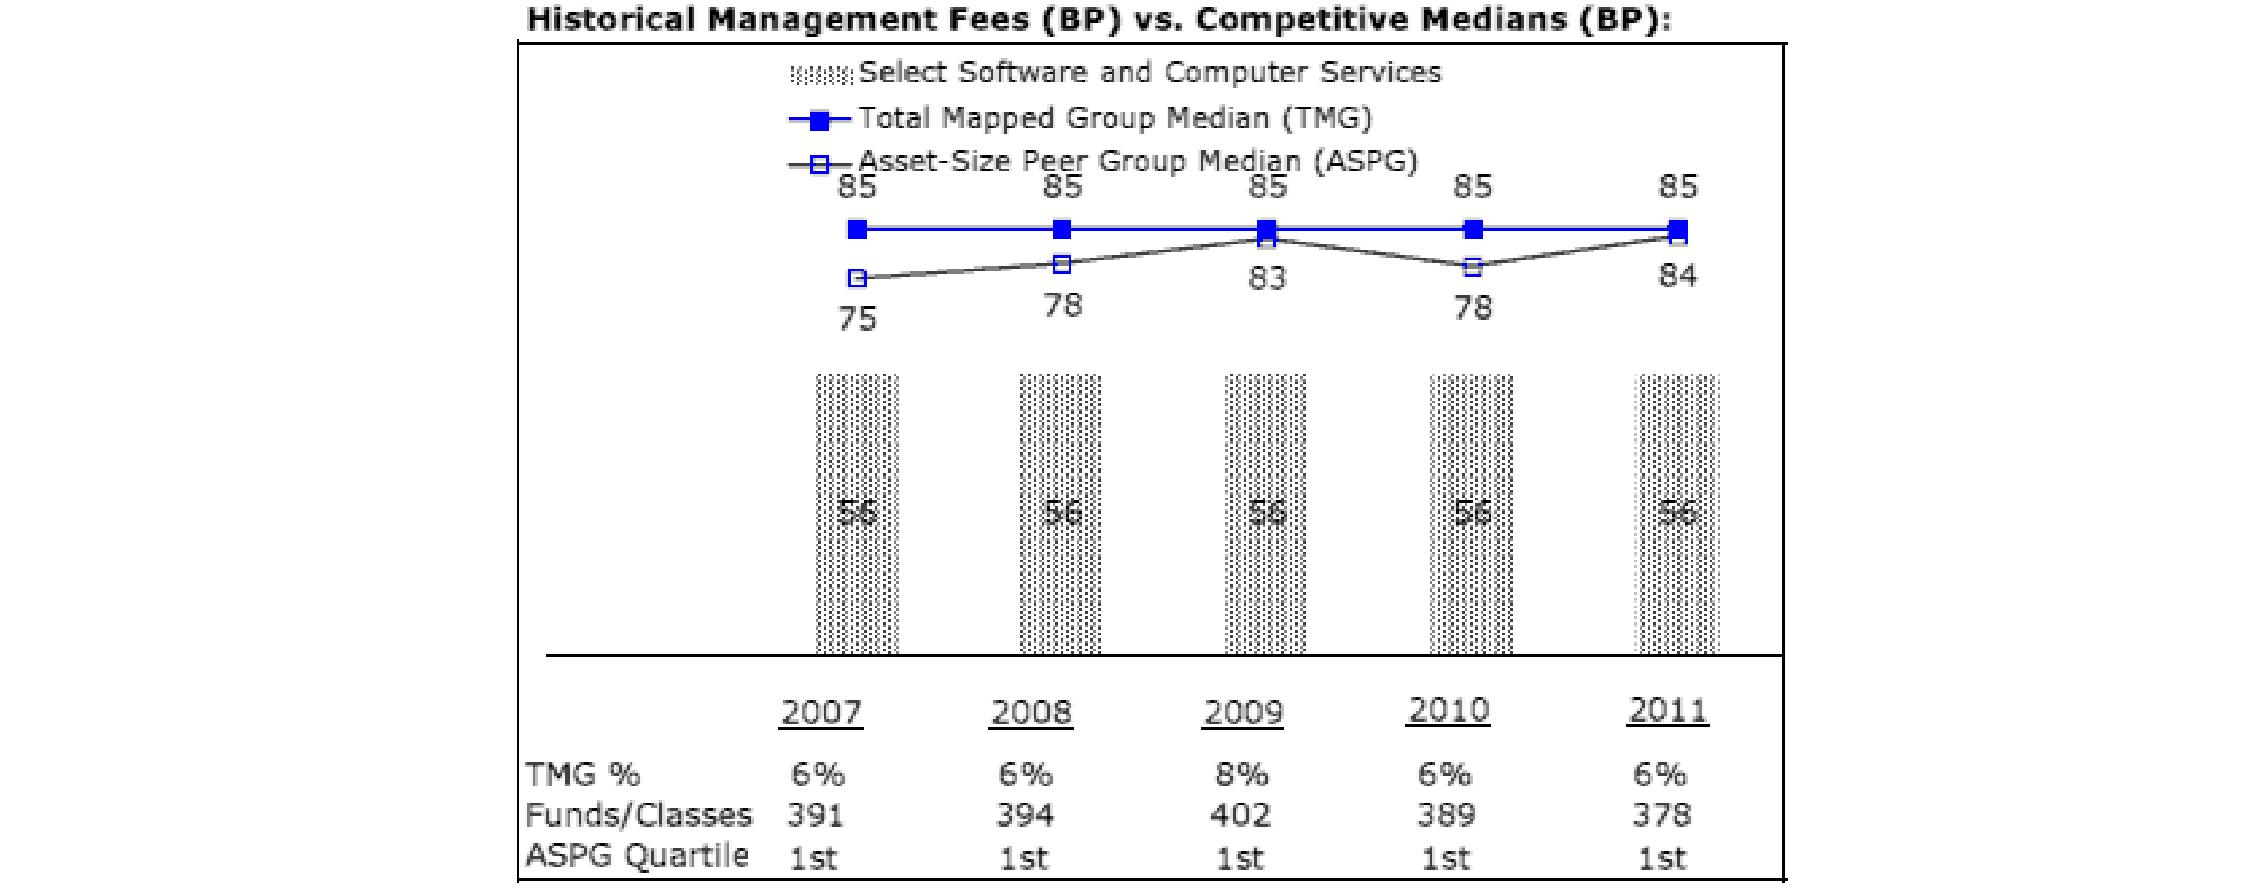
Technology Portfolio
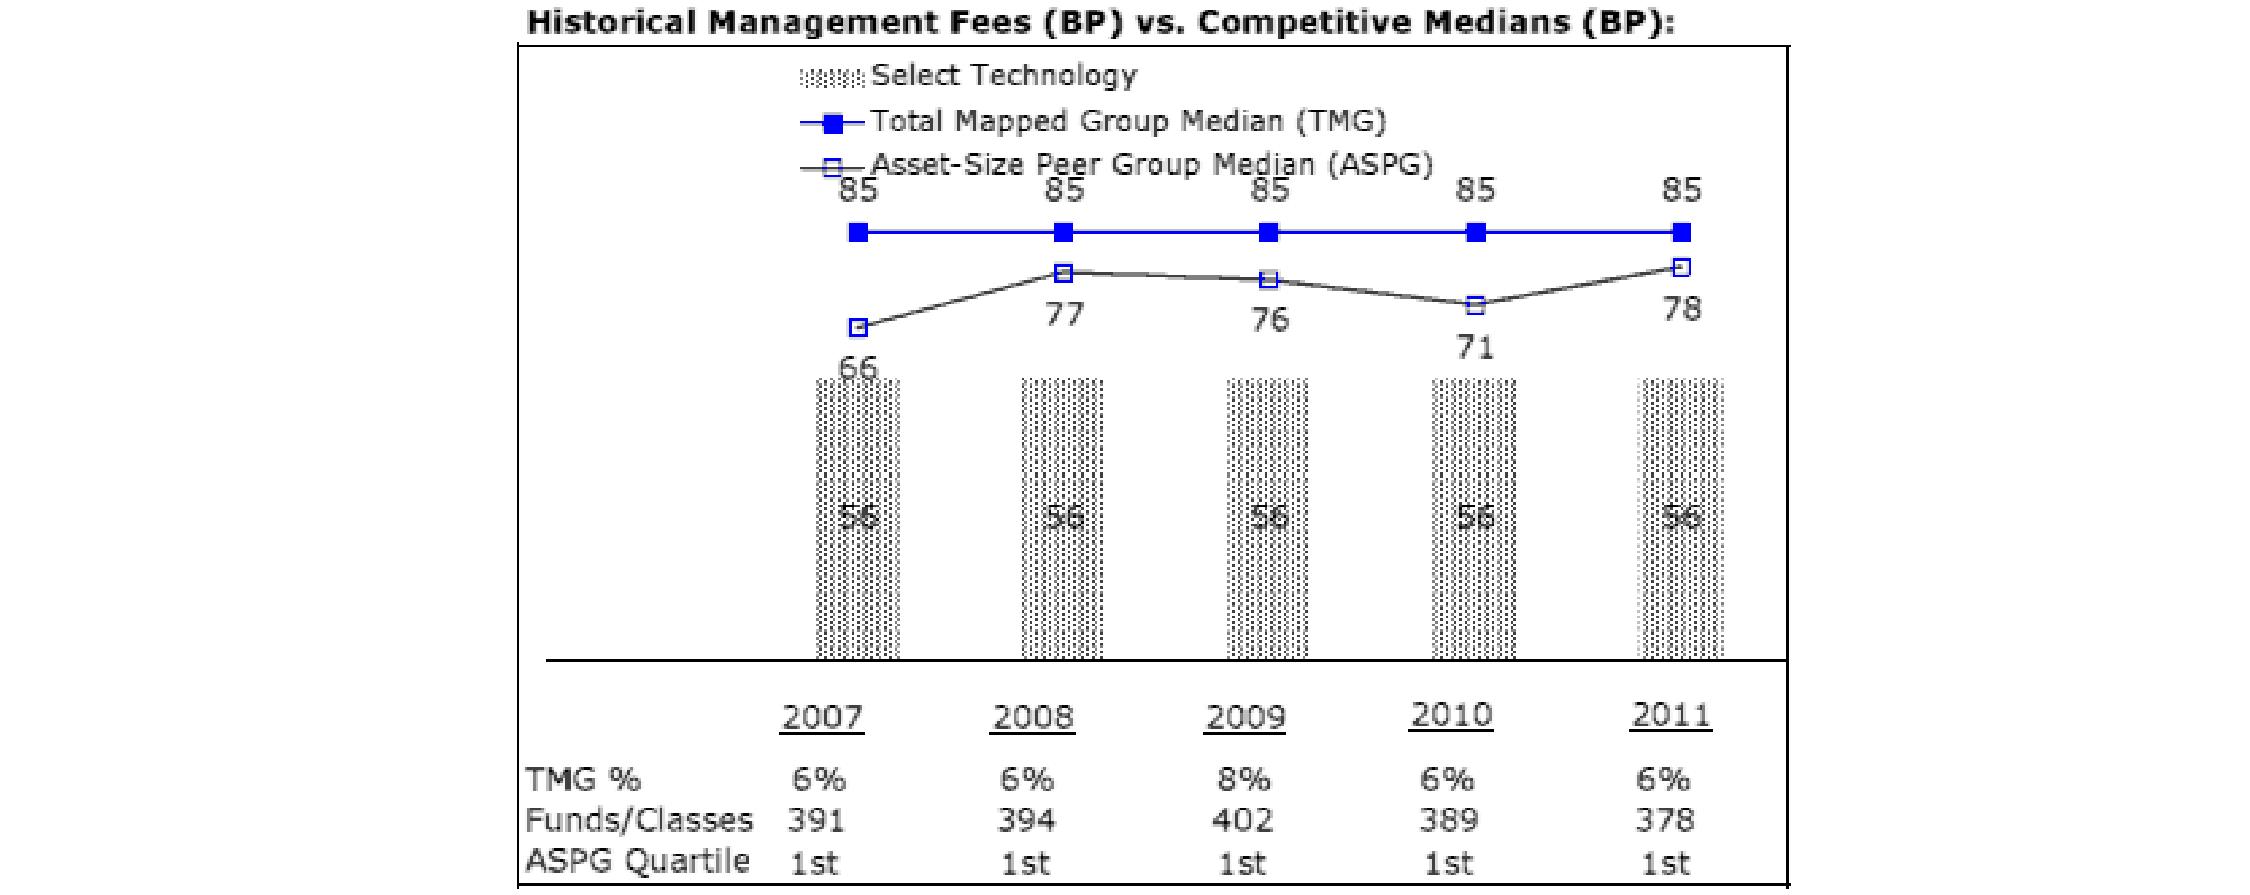
The Board noted that each fund's management fee ranked below the median of its Total Mapped Group and below the median of its ASPG for 2011.
Based on its review, the Board concluded that each fund's management fee is fair and reasonable in light of the services that the fund receives and the other factors considered.
Total Expense Ratio. In its review of each fund's total expense ratio, the Board considered the fund's management fee as well as other fund expenses, such as transfer agent fees, pricing and bookkeeping fees, and custodial, legal, and audit fees. The Board also noted the effects of any waivers and reimbursements on fees and expenses. As part of its review, the Board also considered the current and historical total expense ratios of each fund compared to competitive fund median expenses. Each fund is compared to those funds and classes in the Total Mapped Group (used by the Board for management fee comparisons) that have a similar sales load structure.
The Board noted that each fund's total expense ratio ranked below its competitive median for 2011.
Fees Charged to Other Fidelity Clients. The Board also considered Fidelity fee structures and other information with respect to clients of FMR and its affiliates, such as other mutual funds advised or subadvised by FMR or its affiliates, pension plan clients, and other institutional clients. The Board noted the findings of the 2010 ad hoc joint committee (created with the board of other Fidelity funds), which reviewed and compared Fidelity's institutional investment advisory business with its business of providing services to the Fidelity funds, including the differences in services provided, fees charged, and costs incurred, as well as competition in their respective marketplaces.
Semiannual Report
Based on its review of total expense ratios and fees charged to other Fidelity clients, the Board concluded that each fund's total expense ratio was reasonable in light of the services that the fund and its shareholders receive and the other factors considered.
Costs of the Services and Profitability. The Board considered the revenues earned and the expenses incurred by Fidelity in conducting the business of developing, marketing, distributing, managing, administering and servicing each fund and its shareholders. The Board also considered the level of Fidelity's profits in respect of all the Fidelity funds.
On an annual basis, FMR presents to the Board Fidelity's profitability for each fund. Fidelity calculates the profitability for each fund, as well as aggregate profitability for groups of Fidelity funds and all Fidelity funds, using a series of detailed revenue and cost allocation methodologies which originate with the books and records of Fidelity on which Fidelity's audited financial statements are based. The Audit Committee of the Board reviews any significant changes from the prior year's methodologies.
PricewaterhouseCoopers LLP (PwC), independent registered public accounting firm and auditor to Fidelity and certain Fidelity funds, has been engaged annually by the Board as part of the Board's assessment of Fidelity's profitability analysis. PwC's engagement includes the review and assessment of Fidelity's methodologies used in determining the revenues and expenses attributable to Fidelity's mutual fund business, and completion of agreed-upon procedures surrounding the mathematical accuracy of fund profitability and its conformity to allocation methodologies. After considering PwC's reports issued under the engagement and information provided by Fidelity, the Board concluded that while other allocation methods may also be reasonable, Fidelity's profitability methodologies are reasonable in all material respects.
The Board also reviewed Fidelity's non-fund businesses and fall-out benefits related to the mutual fund business as well as cases where Fidelity's affiliates may benefit from or be related to the funds' business.
The Board considered the costs of the services provided by and the profits realized by Fidelity in connection with the operation of each fund and was satisfied that the profitability was not excessive in the circumstances.
Economies of Scale. The Board considered whether there have been economies of scale in respect of the management of the Fidelity funds, whether the Fidelity funds (including each fund) have appropriately benefited from any such economies of scale, and whether there is potential for realization of any further economies of scale. The Board considered the extent to which each fund will benefit from economies of scale through increased services to the fund, through waivers or reimbursements, or through fee or expense reductions. The Board also noted that in 2009, it and the board of other Fidelity funds created an ad hoc committee (the Economies of Scale Committee) to analyze whether FMR attains economies of scale in respect of the management and servicing of the Fidelity funds, whether the Fidelity funds have appropriately benefited from such economies of scale, and whether there is potential for realization of any further economies of scale.
The Board recognized that each fund's management contract incorporates a "group fee" structure, which provides for lower group fee rates as total fund assets under FMR's management increase, and for higher group fee rates as total fund assets under FMR's management decrease. FMR calculates the group fee rates based on a tiered asset "breakpoint" schedule that varies based on asset class. The Board considered that the group fee is designed to deliver the benefits of economies of scale to fund shareholders when total Fidelity fund assets increase, even if assets of any particular fund are unchanged or have declined, because some portion of Fidelity's costs are attributable to services provided to all Fidelity funds, and all funds benefit if those costs can be allocated among more assets. The Board concluded that, given the group fee structure, fund shareholders will benefit from lower management fees as assets under FMR's management increase at the fund complex level, regardless of whether Fidelity achieves any such economies of scale.
The Board concluded, taking into account the analysis of the Economies of Scale Committee, that economies of scale, if any, are being appropriately shared between fund shareholders and Fidelity.
Additional Information Requested by the Board. In order to develop fully the factual basis for consideration of the Fidelity funds' Advisory Contracts, the Board requested and received additional information on certain topics, including (i) fund performance trends, actions to be taken by FMR to improve certain funds' overall performance, and Fidelity's long-term strategies for certain funds; (ii) the potential to further rationalize the Fidelity fund lineup with the possibility of achieving savings for the funds and Fidelity; (iii) Fidelity's compensation structure for portfolio managers and other key investment personnel; (iv) the amount of the investment that each portfolio manager has made in the Fidelity fund(s) that he or she manages; (v) the realization of fall-out benefits in certain Fidelity business units; (vi) Fidelity's group fee structures, the potential impact of regulatory changes on such structures, and the rationale for the individual fee rates of certain funds; (vii) fund profitability methodology, including Fidelity's cost allocation methodology, and the impact of certain factors on fund profitability results; (viii) trends regarding industry use of performance fee structures and the possibility of implementing performance fee structures for additional funds; and (ix) the impact of net redemptions from the Fidelity funds.
Based on its evaluation of all of the conclusions noted above, and after considering all factors it believed relevant, the Board ultimately concluded that the advisory fee structures are fair and reasonable, and that each fund's Advisory Contracts should be renewed.
Semiannual Report
Semiannual Report
Investment Adviser
Fidelity Management & Research Company
Boston, MA
Investment Sub-Advisers
FMR Co., Inc.
Fidelity Management & Research (U.K.) Inc.
Fidelity Management & Research (Hong Kong) Limited
Fidelity Management & Research (Japan) Inc.
General Distributor
Fidelity Distributors Corporation
Smithfield, RI
Transfer and Service Agents
Fidelity Investments Institutional Operations Company, Inc.
Boston, MA
Fidelity Service Company, Inc.
Boston, MA
Custodian
Brown Brothers Harriman & Co.
Boston, MA
Corporate Headquarters
82 Devonshire Street
Boston, MA 02109
1-800-544-8888
The Fidelity Telephone Connection
Mutual Fund 24-Hour Service
Exchanges/Redemptions
and Account Assistance 1-800-544-6666
Product Information 1-800-544-8888
Retirement Accounts 1-800-544-4774
(8 a.m. - 9 p.m.)
TDD Service 1-800-544-0118
for the deaf and hearing impaired
(9 a.m. - 9 p.m. Eastern time)
Fidelity Automated Service
Telephone (FAST®)
1-800-544-5555
Automated line for quickest service
SELTEC-USAN-1012
1.813671.107
Fidelity®
Select Portfolios®
Energy Sector
Energy Portfolio
Energy Service Portfolio
Natural Gas Portfolio
Natural Resources Portfolio
Semiannual Report
August 31, 2012
(Fidelity Cover Art)
Contents
To view a fund's proxy voting guidelines and proxy voting record for the 12-month period ended June 30, visit http://www.fidelity.com/proxyvotingresults or visit the Securities and Exchange Commission's (SEC) web site at http://www.sec.gov. You may also call 1-800-544-8544 to request a free copy of the proxy voting guidelines.
Standard & Poor's, S&P and S&P 500 are registered service marks of The McGraw-Hill Companies, Inc. and have been licensed for use by Fidelity Distributors Corporation.
Other third party marks appearing herein are the property of their respective owners.
All other marks appearing herein are registered or unregistered trademarks or service marks of FMR LLC or an affiliated company. © 2012 FMR LLC. All rights reserved.
This report and the financial statements contained herein are submitted for the general information of the shareholders of the funds. This report is not authorized for distribution to prospective investors in the funds unless preceded or accompanied by an effective prospectus.
A fund files its complete schedule of portfolio holdings with the SEC for the first and third quarters of each fiscal year on Form N-Q. Forms N-Q are available on the SEC's web site at http://www.sec.gov. A fund's Forms N-Q may be reviewed and copied at the SEC's Public Reference Room in Washington, DC. Information regarding the operation of the SEC's Public Reference Room may be obtained by calling 1-800-SEC-0330. For a complete list of a fund's portfolio holdings, view the most recent holdings listing, semiannual report, or annual report on Fidelity's web site at http://www.fidelity.com, http://www.advisor.fidelity.com, or http://www.401k.com, as applicable.
NOT FDIC INSURED • MAY LOSE VALUE • NO BANK GUARANTEE
Neither the funds nor Fidelity Distributors Corporation is a bank.
Semiannual Report
As a shareholder of a Fund, you incur two types of costs: (1) transaction costs, including redemption fees and (2) ongoing costs, including management fees and other Fund expenses. This Example is intended to help you understand your ongoing costs (in dollars) of investing in the Funds and to compare these costs with the ongoing costs of investing in other mutual funds.
The Example is based on an investment of $1,000 invested at the beginning of the period and held for the entire period (March 1, 2012 to August 31, 2012).
Actual Expenses
The first line of the accompanying table for each fund provides information about actual account values and actual expenses. You may use the information in this line, together with the amount you invested, to estimate the expenses that you paid over the period. Simply divide your account value by $1,000.00 (for example, an $8,600 account value divided by $1,000.00 = 8.6), then multiply the result by the number in the first line for a fund under the heading entitled "Expenses Paid During Period" to estimate the expenses you paid on your account during this period. A small balance maintenance fee of $12.00 that is charged once a year may apply for certain accounts with a value of less than $2,000. This fee is not included in the table below. If it was, the estimate of expenses you paid during the period would be higher, and your ending account value lower, by this amount. In addition, each Fund, as a shareholder in the underlying Fidelity Central Funds, will indirectly bear its pro-rata share of the fees and expenses incurred by the underlying Fidelity Central Funds. These fees and expenses are not included in the Fund's annualized expense ratio used to calculate the expense estimate in the table below.
Hypothetical Example for Comparison Purposes
The second line of the accompanying table for each fund provides information about hypothetical account values and hypothetical expenses based on a fund's actual expense ratio and an assumed rate of return of 5% per year before expenses, which is not the Fund's actual return. The hypothetical account values and expenses may not be used to estimate the actual ending account balance or expenses you paid for the period. You may use this information to compare the ongoing costs of investing in the Fund and other funds. To do so, compare this 5% hypothetical example with the 5% hypothetical examples that appear in the shareholder reports of the other funds. A small balance maintenance fee of $12.00 that is charged once a year may apply for certain accounts with a value of less than $2,000. This fee is not included in the table below. If it was, the estimate of expenses you paid during the period would be higher, and your ending account value lower, by this amount. In addition, each Fund, as a shareholder in the underlying Fidelity Central Funds, will indirectly bear its pro-rata share of the fees and expenses incurred by the underlying Fidelity Central Funds. These fees and expenses are not included in the Fund's annualized expense ratio used to calculate the expense estimate in the table below.
Please note that the expenses shown in the table are meant to highlight your ongoing costs only and do not reflect any transaction costs. Therefore, the second line of the table is useful in comparing ongoing costs only, and will not help you determine the relative total costs of owning different funds. In addition, if these transactional costs were included, your costs would have been higher.
| Annualized
Expense Ratio | Beginning
Account Value
March 1, 2012 | Ending
Account Value
August 31, 2012 | Expenses Paid
During Period*
March 1, 2012
to August 31, 2012 |
Energy Portfolio | .83% | | | |
Actual | | $ 1,000.00 | $ 923.40 | $ 4.02 |
HypotheticalA | | $ 1,000.00 | $ 1,021.02 | $ 4.23 |
Energy Service Portfolio | .83% | | | |
Actual | | $ 1,000.00 | $ 925.60 | $ 4.03 |
HypotheticalA | | $ 1,000.00 | $ 1,021.02 | $ 4.23 |
Natural Gas Portfolio | .88% | | | |
Actual | | $ 1,000.00 | $ 947.80 | $ 4.32 |
HypotheticalA | | $ 1,000.00 | $ 1,020.77 | $ 4.48 |
Natural Resources Portfolio | .86% | | | |
Actual | | $ 1,000.00 | $ 897.90 | $ 4.11 |
HypotheticalA | | $ 1,000.00 | $ 1,020.87 | $ 4.38 |
A 5% return per year before expenses
* Expenses are equal to each Fund's annualized expense ratio, multiplied by the average account value over the period, multiplied by 184/365 (to reflect the one-half year period).
Semiannual Report
Energy Portfolio
Investment Changes (Unaudited)
Top Ten Stocks as of August 31, 2012 |
| % of fund's
net assets | % of fund's net assets
6 months ago |
Chevron Corp. | 11.8 | 15.0 |
Exxon Mobil Corp. | 10.1 | 7.1 |
Occidental Petroleum Corp. | 7.0 | 7.5 |
National Oilwell Varco, Inc. | 5.1 | 4.9 |
Hess Corp. | 3.3 | 5.2 |
EQT Corp. | 3.3 | 0.8 |
Noble Corp. | 3.2 | 1.7 |
Schlumberger Ltd. | 3.1 | 5.5 |
Cabot Oil & Gas Corp. | 2.9 | 0.9 |
Tesoro Corp. | 2.7 | 0.9 |
| 52.5 | |
Top Industries (% of fund's net assets) |
As of August 31, 2012 |
 | Oil, Gas &
Consumable Fuels | 73.7% | |
 | Energy Equipment
& Services | 23.2% | |
 | Chemicals | 0.6% | |
 | Construction & Engineering | 0.5% | |
 | Hotels, Restaurants
& Leisure** | 0.0% | |
 | All Others* | 2.0% | |

As of February 29, 2012 |
| Oil, Gas &
Consumable Fuels | 74.0% | |
 | Energy Equipment
& Services | 23.0% | |
 | Chemicals | 1.4% | |
| Construction & Engineering | 0.5% | |
| All Others* | 1.1% | |

* Includes short-term investments and net other assets. |
** Amount represents less than 0.1%. |
Semiannual Report
Energy Portfolio
Investments August 31, 2012 (Unaudited)
Showing Percentage of Net Assets
Common Stocks - 98.0% |
| Shares | | Value |
CHEMICALS - 0.6% |
Specialty Chemicals - 0.6% |
LyondellBasell Industries NV Class A | 255,441 | | $ 12,475,738 |
CONSTRUCTION & ENGINEERING - 0.5% |
Construction & Engineering - 0.5% |
Foster Wheeler AG (a) | 470,700 | | 10,308,330 |
ENERGY EQUIPMENT & SERVICES - 23.2% |
Oil & Gas Drilling - 7.3% |
Discovery Offshore S.A. (a)(e) | 2,394,308 | | 4,338,001 |
Ensco PLC Class A | 723,973 | | 41,534,331 |
Noble Corp. | 1,736,296 | | 66,222,329 |
Northern Offshore Ltd. | 1,076,682 | | 2,080,778 |
Ocean Rig UDW, Inc. (United States) | 497,900 | | 8,329,867 |
Rowan Companies PLC (a) | 640,584 | | 22,535,745 |
Tuscany International Drilling, Inc. (a) | 3,442,200 | | 1,117,427 |
Vantage Drilling Co. (a) | 3,038,700 | | 4,618,824 |
| | 150,777,302 |
Oil & Gas Equipment & Services - 15.9% |
Anton Oilfield Services Group | 1,334,000 | | 266,595 |
Cameron International Corp. (a) | 192,300 | | 10,520,733 |
Compagnie Generale de Geophysique SA (a) | 384,381 | | 11,111,565 |
Core Laboratories NV | 35,600 | | 4,349,964 |
FMC Technologies, Inc. (a) | 306,000 | | 14,333,040 |
Fugro NV (Certificaten Van Aandelen) unit | 608,464 | | 37,018,819 |
Gulfmark Offshore, Inc. Class A (a) | 452,894 | | 15,887,522 |
Halliburton Co. | 804,683 | | 26,361,415 |
McDermott International, Inc. (a) | 546,700 | | 6,090,238 |
National Oilwell Varco, Inc. | 1,349,108 | | 106,309,710 |
Oil States International, Inc. (a) | 271,721 | | 21,259,451 |
Schlumberger Ltd. | 887,194 | | 64,215,102 |
Superior Energy Services, Inc. (a) | 169,176 | | 3,513,786 |
Total Energy Services, Inc. | 173,000 | | 2,421,912 |
Weatherford International Ltd. (a) | 503,273 | | 5,918,490 |
| | 329,578,342 |
TOTAL ENERGY EQUIPMENT & SERVICES | | 480,355,644 |
HOTELS, RESTAURANTS & LEISURE - 0.0% |
Casinos & Gaming - 0.0% |
Icahn Enterprises LP rights (a) | 215,902 | | 2 |
OIL, GAS & CONSUMABLE FUELS - 73.7% |
Coal & Consumable Fuels - 1.2% |
Cloud Peak Energy, Inc. (a) | 285,600 | | 5,023,704 |
Peabody Energy Corp. | 912,225 | | 19,731,427 |
| | 24,755,131 |
|
| Shares | | Value |
Integrated Oil & Gas - 37.4% |
Chevron Corp. | 2,178,506 | | $ 244,341,231 |
ENI SpA sponsored ADR | 123,000 | | 5,425,530 |
Exxon Mobil Corp. | 2,389,202 | | 208,577,335 |
Hess Corp. | 1,377,255 | | 69,592,695 |
InterOil Corp. (a)(d) | 185,500 | | 14,754,670 |
Murphy Oil Corp. | 366,652 | | 18,820,247 |
Occidental Petroleum Corp. | 1,719,385 | | 146,164,919 |
Royal Dutch Shell PLC Class A sponsored ADR | 426,018 | | 29,808,479 |
Suncor Energy, Inc. | 1,249,900 | | 39,066,111 |
| | 776,551,217 |
Oil & Gas Exploration & Production - 25.5% |
Anadarko Petroleum Corp. | 470,332 | | 32,579,898 |
Apache Corp. | 598,127 | | 51,289,390 |
Bill Barrett Corp. (a) | 86,000 | | 1,885,980 |
BPZ Energy, Inc. (a) | 807,923 | | 1,850,144 |
C&C Energia Ltd. (a) | 375,600 | | 2,358,574 |
Cabot Oil & Gas Corp. | 1,480,350 | | 61,301,294 |
Cobalt International Energy, Inc. (a) | 426,200 | | 9,679,002 |
Comstock Resources, Inc. (a) | 1,041,860 | | 17,180,271 |
Concho Resources, Inc. (a) | 227,100 | | 20,379,954 |
Energen Corp. | 160,512 | | 8,194,138 |
EOG Resources, Inc. | 396,044 | | 42,891,565 |
EQT Corp. | 1,255,510 | | 67,747,320 |
EV Energy Partners LP | 185,700 | | 11,656,389 |
Gran Tierra Energy, Inc. (Canada) (a) | 1,214,700 | | 5,397,297 |
Halcon Resources Corp. (f) | 1,010,000 | | 7,756,800 |
Harvest Natural Resources, Inc. (a)(d) | 398,850 | | 3,402,191 |
Kodiak Oil & Gas Corp. (a) | 254,600 | | 2,276,124 |
Marathon Oil Corp. | 891,797 | | 24,809,793 |
Midstates Petroleum Co., Inc. | 617,800 | | 5,035,070 |
Noble Energy, Inc. | 456,044 | | 40,086,268 |
Northern Oil & Gas, Inc. (a) | 257,519 | | 4,207,860 |
Painted Pony Petroleum Ltd. (a)(e) | 15,500 | | 148,907 |
Pioneer Natural Resources Co. | 453,858 | | 44,187,615 |
Plains Exploration & Production Co. (a) | 362,034 | | 14,235,177 |
Rosetta Resources, Inc. (a) | 641,205 | | 27,533,343 |
SM Energy Co. | 381,665 | | 18,026,038 |
TAG Oil Ltd. (a) | 237,500 | | 1,539,564 |
TAG Oil Ltd. (e) | 36,500 | | 236,607 |
| | 527,872,573 |
Oil & Gas Refining & Marketing - 6.9% |
Calumet Specialty Products Partners LP | 369,699 | | 10,540,118 |
Marathon Petroleum Corp. | 716,206 | | 37,063,661 |
Northern Tier Energy LP Class A | 626,045 | | 11,456,624 |
Tesoro Corp. | 1,425,304 | | 56,641,581 |
Valero Energy Corp. | 882,721 | | 27,593,858 |
| | 143,295,842 |
Common Stocks - continued |
| Shares | | Value |
OIL, GAS & CONSUMABLE FUELS - CONTINUED |
Oil & Gas Storage & Transport - 2.7% |
Atlas Energy LP | 98,278 | | $ 3,347,349 |
Atlas Pipeline Partners, LP | 335,658 | | 11,660,759 |
Cheniere Energy, Inc. (a) | 225,000 | | 3,321,000 |
Markwest Energy Partners LP | 110,300 | | 5,856,930 |
Tesoro Logistics LP | 239,222 | | 10,422,903 |
Williams Companies, Inc. | 643,617 | | 20,769,521 |
| | 55,378,462 |
TOTAL OIL, GAS & CONSUMABLE FUELS | | 1,527,853,225 |
TOTAL COMMON STOCKS (Cost $1,703,970,388) |
2,030,992,939
|
Money Market Funds - 1.2% |
| | | |
Fidelity Cash Central Fund, 0.17% (b) | 19,583,360 | | 19,583,360 |
Fidelity Securities Lending Cash Central Fund, 0.18% (b)(c) | 6,247,250 | | 6,247,250 |
TOTAL MONEY MARKET FUNDS (Cost $25,830,610) |
25,830,610
|
TOTAL INVESTMENT PORTFOLIO - 99.2% (Cost $1,729,800,998) | | 2,056,823,549 |
NET OTHER ASSETS (LIABILITIES) - 0.8% | | 16,631,657 |
NET ASSETS - 100% | $ 2,073,455,206 |
Legend |
(a) Non-income producing |
(b) Affiliated fund that is available only to investment companies and other accounts managed by Fidelity Investments. The rate quoted is the annualized seven-day yield of the fund at period end. A complete unaudited listing of the fund's holdings as of its most recent quarter end is available upon request. In addition, each Fidelity Central Fund's financial statements are available on the SEC's website or upon request. |
(c) Investment made with cash collateral received from securities on loan. |
(d) Security or a portion of the security is on loan at period end. |
(e) Security exempt from registration under Rule 144A of the Securities Act of 1933. These securities may be resold in transactions exempt from registration, normally to qualified institutional buyers. At the end of the period, the value of these securities amounted to $4,723,515 or 0.2% of net assets. |
(f) Restricted securities - Investment in securities not registered under the Securities Act of 1933 (excluding 144A issues). At the end of the period, the value of restricted securities (excluding 144A issues) amounted to $7,756,800 or 0.4% of net assets. |
Additional information on each restricted holding is as follows: |
Security | Acquisition Date | Acquisition Cost |
Halcon Resources Corp. | 3/1/12 | $ 9,090,000 |
Affiliated Central Funds |
Information regarding fiscal year to date income earned by the Fund from investments in Fidelity Central Funds is as follows: |
Fund | Income earned |
Fidelity Cash Central Fund | $ 25,276 |
Fidelity Securities Lending Cash Central Fund | 225,307 |
Total | $ 250,583 |
Other Information |
The following is a summary of the inputs used, as of August 31, 2012, involving the Fund's assets and liabilities carried at fair value. The inputs or methodology used for valuing securities may not be an indication of the risk associated with investing in those securities. For more information on valuation inputs, and their aggregation into the levels used in the table below, please refer to the Security Valuation section in the accompanying Notes to Financial Statements. |
Valuation Inputs at Reporting Date: |
Description | Total | Level 1 | Level 2 | Level 3 |
Investments in Securities: | | | | |
Common Stocks | $ 2,030,992,939 | $ 2,019,881,372 | $ 11,111,565 | $ 2 |
Money Market Funds | 25,830,610 | 25,830,610 | - | - |
Total Investments in Securities: | $ 2,056,823,549 | $ 2,045,711,982 | $ 11,111,565 | $ 2 |
Distribution of investments by country or territory of incorporation, as a percentage of total net assets, is as follows. (Unaudited) |
United States of America | 80.7% |
United Kingdom | 4.5% |
Switzerland | 4.0% |
Curacao | 3.1% |
Canada | 3.1% |
Netherlands | 2.6% |
Others (Individually Less Than 1%) | 2.0% |
| 100.0% |
See accompanying notes which are an integral part of the financial statements.
Semiannual Report
Energy Portfolio
Statement of Assets and Liabilities
| August 31, 2012 (Unaudited) |
| | |
Assets | | |
Investment in securities, at value (including securities loaned of $6,111,346) - See accompanying schedule: Unaffiliated issuers (cost $1,703,970,388) | $ 2,030,992,939 | |
Fidelity Central Funds (cost $25,830,610) | 25,830,610 | |
Total Investments (cost $1,729,800,998) | | $ 2,056,823,549 |
Receivable for investments sold | | 20,456,694 |
Receivable for fund shares sold | | 945,099 |
Dividends receivable | | 5,634,042 |
Distributions receivable from Fidelity Central Funds | | 39,335 |
Other receivables | | 10,399 |
Total assets | | 2,083,909,118 |
| | |
Liabilities | | |
Payable for fund shares redeemed | $ 2,763,544 | |
Accrued management fee | 967,220 | |
Other affiliated payables | 436,744 | |
Other payables and accrued expenses | 39,154 | |
Collateral on securities loaned, at value | 6,247,250 | |
Total liabilities | | 10,453,912 |
| | |
Net Assets | | $ 2,073,455,206 |
Net Assets consist of: | | |
Paid in capital | | $ 1,753,549,681 |
Undistributed net investment income | | 11,474,341 |
Accumulated undistributed net realized gain (loss) on investments and foreign currency transactions | | (18,594,200) |
Net unrealized appreciation (depreciation) on investments and assets and liabilities in foreign currencies | | 327,025,384 |
Net Assets, for 40,787,890 shares outstanding | | $ 2,073,455,206 |
Net Asset Value, offering price and redemption price per share ($2,073,455,206 ÷ 40,787,890 shares) | | $ 50.84 |
Statement of Operations
Six months ended August 31, 2012 (Unaudited) |
| | |
Investment Income | | |
Dividends | | $ 19,843,043 |
Interest | | 47 |
Income from Fidelity Central Funds | | 250,583 |
Total income | | 20,093,673 |
| | |
Expenses | | |
Management fee | $ 5,827,850 | |
Transfer agent fees | 2,407,409 | |
Accounting and security lending fees | 317,446 | |
Custodian fees and expenses | 28,893 | |
Independent trustees' compensation | 7,159 | |
Registration fees | 44,435 | |
Audit | 18,930 | |
Legal | 4,340 | |
Interest | 1,434 | |
Miscellaneous | 14,996 | |
Total expenses before reductions | 8,672,892 | |
Expense reductions | (53,844) | 8,619,048 |
Net investment income (loss) | | 11,474,625 |
Realized and Unrealized Gain (Loss) Net realized gain (loss) on: | | |
Investment securities: | | |
Unaffiliated issuers | (11,658,817) | |
Foreign currency transactions | 20,140 | |
Total net realized gain (loss) | | (11,638,677) |
Change in net unrealized appreciation (depreciation) on: Investment securities | (200,540,211) | |
Assets and liabilities in foreign currencies | (3,849) | |
Total change in net unrealized appreciation (depreciation) | | (200,544,060) |
Net gain (loss) | | (212,182,737) |
Net increase (decrease) in net assets resulting from operations | | $ (200,708,112) |
See accompanying notes which are an integral part of the financial statements.
Semiannual Report
Financial Statements - continued
Statement of Changes in Net Assets
| Six months ended
August 31, 2012
(Unaudited) | Year ended
February 29,
2012 |
Increase (Decrease) in Net Assets | | |
Operations | | |
Net investment income (loss) | $ 11,474,625 | $ 19,550,432 |
Net realized gain (loss) | (11,638,677) | 168,510,187 |
Change in net unrealized appreciation (depreciation) | (200,544,060) | (444,437,546) |
Net increase (decrease) in net assets resulting from operations | (200,708,112) | (256,376,927) |
Distributions to shareholders from net investment income | - | (18,440,144) |
Distributions to shareholders from net realized gain | (3,408,924) | (1,534,468) |
Total distributions | (3,408,924) | (19,974,612) |
Share transactions
Proceeds from sales of shares | 202,044,548 | 831,405,883 |
Reinvestment of distributions | 3,275,517 | 19,134,753 |
Cost of shares redeemed | (432,216,763) | (1,102,939,381) |
Net increase (decrease) in net assets resulting from share transactions | (226,896,698) | (252,398,745) |
Redemption fees | 20,943 | 175,722 |
Total increase (decrease) in net assets | (430,992,791) | (528,574,562) |
| | |
Net Assets | | |
Beginning of period | 2,504,447,997 | 3,033,022,559 |
End of period (including undistributed net investment income of $11,474,341 and distributions in excess of net investment income of $284, respectively) | $ 2,073,455,206 | $ 2,504,447,997 |
Other Information Shares | | |
Sold | 4,070,519 | 15,055,782 |
Issued in reinvestment of distributions | 63,186 | 366,408 |
Redeemed | (8,761,565) | (20,368,627) |
Net increase (decrease) | (4,627,860) | (4,946,437) |
Financial Highlights
| Six months ended
August 31, 2012 | Years ended February 28, |
| (Unaudited) | 2012 H | 2011 | 2010 | 2009 | 2008 H |
Selected Per-Share Data | | | | | | |
Net asset value, beginning of period | $ 55.14 | $ 60.22 | $ 43.55 | $ 27.43 | $ 64.48 | $ 48.80 |
Income from Investment Operations | | | | | | |
Net investment income (loss) D | 0.27 | .41 | .29 | .07 | .02 | .01 |
Net realized and unrealized gain (loss) | (4.49) | (5.06) | 16.63 | 16.14 | (35.81) | 19.61 |
Total from investment operations | (4.22) | (4.65) | 16.92 | 16.21 | (35.79) | 19.62 |
Distributions from net investment income | - | (.40) | (.25) | (.09) | (.01) | (.05) |
Distributions from net realized gain | (.08) | (.03) | - | - | (1.26) | (3.90) |
Total distributions | (.08) | (.43) | (.25) | (.09) | (1.27) | (3.95) |
Redemption fees added to paid in capital D | - I | - I | - I | - I | .01 | .01 |
Net asset value, end of period | $ 50.84 | $ 55.14 | $ 60.22 | $ 43.55 | $ 27.43 | $ 64.48 |
Total Return B, C | (7.66)% | (7.68)% | 38.95% | 59.11% | (56.63)% | 40.72% |
Ratios to Average Net Assets E, G | | | | | | |
Expenses before reductions | .83% A | .83% | .85% | .90% | .83% | .84% |
Expenses net of fee waivers, if any | .83% A | .83% | .85% | .90% | .83% | .84% |
Expenses net of all reductions | .82% A | .82% | .85% | .90% | .83% | .84% |
Net investment income (loss) | 1.10% A | .77% | .64% | .18% | .03% | .02% |
Supplemental Data | | | | | | |
Net assets, end of period (000 omitted) | $ 2,073,455 | $ 2,504,448 | $ 3,033,023 | $ 2,134,018 | $ 1,337,382 | $ 3,155,852 |
Portfolio turnover rate F | 89% A | 90% | 107% | 97% | 148% | 55% |
A Annualized B Total returns for periods of less than one year are not annualized. C Total returns would have been lower if certain expenses had not been reduced during the applicable periods shown. D Calculated based on average shares outstanding during the period. E Fees and expenses of any underlying Fidelity Central Funds are not included in the Fund's expense ratio. The Fund indirectly bears its proportionate share of the expenses of any underlying Fidelity Central Funds. F Amount does not include the portfolio activity of any underlying Fidelity Central Funds. G Expense ratios reflect operating expenses of the Fund. Expenses before reductions do not reflect amounts reimbursed by the investment adviser or reductions from brokerage service arrangements or reductions from other expense offset arrangements and do not represent the amount paid by the Fund during periods when reimbursements or reductions occur. Expenses net of fee waivers reflect expenses after reimbursement by the investment adviser but prior to reductions from brokerage service arrangements or other expense offset arrangements. Expenses net of all reductions represent the net expenses paid by the Fund. H For the year ended February 29. I Amount represents less than $.01 per share. |
See accompanying notes which are an integral part of the financial statements.
Semiannual Report
Energy Service Portfolio
Investment Changes (Unaudited)
Top Ten Stocks as of August 31, 2012 |
| % of fund's
net assets | % of fund's net assets
6 months ago |
Schlumberger Ltd. | 17.7 | 18.2 |
National Oilwell Varco, Inc. | 12.2 | 10.7 |
Halliburton Co. | 10.0 | 12.1 |
Cameron International Corp. | 9.5 | 8.4 |
FMC Technologies, Inc. | 4.8 | 3.5 |
Noble Corp. | 4.7 | 4.9 |
Oceaneering International, Inc. | 3.5 | 3.3 |
Ensco PLC Class A | 3.1 | 0.0 |
Dresser-Rand Group, Inc. | 3.0 | 1.4 |
Oil States International, Inc. | 2.7 | 2.7 |
| 71.2 | |
Top Industries (% of fund's net assets) |
As of August 31, 2012 |
| Energy Equipment & Services | 92.4% | |
| Machinery | 1.1% | |
 | Construction & Engineering | 0.5% | |
| All Others* | 6.0% | |

As of February 29, 2012 |
| Energy Equipment & Services | 93.6% | |
| Machinery | 0.8% | |
| All Others* | 5.6% | |

* Includes short-term investments and net other assets. |
Semiannual Report
Energy Service Portfolio
Investments August 31, 2012 (Unaudited)
Showing Percentage of Net Assets
Common Stocks - 94.0% |
| Shares | | Value |
CONSTRUCTION & ENGINEERING - 0.5% |
Construction & Engineering - 0.5% |
Fluor Corp. | 111,200 | | $ 5,726,800 |
ENERGY EQUIPMENT & SERVICES - 92.4% |
Oil & Gas Drilling - 14.3% |
Cathedral Energy Services Ltd. | 422,000 | | 2,782,653 |
Discovery Offshore S.A. (a)(e) | 578,100 | | 1,047,400 |
Ensco PLC Class A | 628,600 | | 36,062,782 |
Eurasia Drilling Co. Ltd. GDR (Reg. S) | 155,300 | | 4,666,765 |
Helmerich & Payne, Inc. | 80,472 | | 3,672,742 |
Noble Corp. | 1,431,635 | | 54,602,559 |
Ocean Rig UDW, Inc.: | | | |
(Norway) | 1,500 | | 23,295 |
(United States) | 727,900 | | 12,177,767 |
Pacific Drilling SA (a) | 528,000 | | 5,068,800 |
Rowan Companies PLC (a) | 859,100 | | 30,223,138 |
Tuscany International Drilling, Inc. (a) | 10,514,500 | | 3,413,279 |
Vantage Drilling Co. (a) | 7,516,000 | | 11,424,320 |
| | 165,165,500 |
Oil & Gas Equipment & Services - 78.1% |
Anton Oilfield Services Group | 10,186,000 | | 2,035,637 |
Baker Hughes, Inc. | 511,222 | | 23,311,723 |
C&J Energy Services, Inc. (a) | 46,700 | | 940,071 |
Cameron International Corp. (a) | 2,009,788 | | 109,955,501 |
Core Laboratories NV | 226,900 | | 27,724,911 |
Dresser-Rand Group, Inc. (a) | 688,800 | | 34,867,056 |
Exterran Holdings, Inc. (a)(d) | 392,200 | | 7,212,558 |
FMC Technologies, Inc. (a) | 1,182,262 | | 55,377,152 |
Forum Energy Technologies, Inc. (d) | 520,300 | | 12,315,501 |
Global Geophysical Services, Inc. (a) | 561,913 | | 2,579,181 |
Gulf Island Fabrication, Inc. | 130,700 | | 3,400,814 |
Halliburton Co. | 3,548,499 | | 116,248,827 |
Helix Energy Solutions Group, Inc. (a) | 715,600 | | 12,608,872 |
Hornbeck Offshore Services, Inc. (a) | 252,000 | | 9,787,680 |
ION Geophysical Corp. (a) | 276,355 | | 1,804,598 |
McDermott International, Inc. (a) | 2,080,400 | | 23,175,656 |
National Oilwell Varco, Inc. | 1,791,062 | | 141,135,686 |
Oceaneering International, Inc. | 747,900 | | 40,042,566 |
Oil States International, Inc. (a) | 404,800 | | 31,671,552 |
Petrofac Ltd. | 324,900 | | 7,748,705 |
Schlumberger Ltd. | 2,837,611 | | 205,386,283 |
|
| Shares | | Value |
Tesco Corp. (a) | 782,485 | | $ 7,950,048 |
Weatherford International Ltd. (a) | 2,379,671 | | 27,984,931 |
| | 905,265,509 |
TOTAL ENERGY EQUIPMENT & SERVICES | | 1,070,431,009 |
MACHINERY - 1.1% |
Industrial Machinery - 1.1% |
Rotork PLC | 359,200 | | 12,536,419 |
TOTAL COMMON STOCKS (Cost $882,275,502) |
1,088,694,228
|
Money Market Funds - 6.2% |
| | | |
Fidelity Cash Central Fund, 0.17% (b) | 69,725,444 | | 69,725,444 |
Fidelity Securities Lending Cash Central Fund, 0.18% (b)(c) | 2,688,750 | | 2,688,750 |
TOTAL MONEY MARKET FUNDS (Cost $72,414,194) |
72,414,194
|
TOTAL INVESTMENT PORTFOLIO - 100.2% (Cost $954,689,696) | | 1,161,108,422 |
NET OTHER ASSETS (LIABILITIES) - (0.2)% | | (2,679,289) |
NET ASSETS - 100% | $ 1,158,429,133 |
Legend |
(a) Non-income producing |
(b) Affiliated fund that is available only to investment companies and other accounts managed by Fidelity Investments. The rate quoted is the annualized seven-day yield of the fund at period end. A complete unaudited listing of the fund's holdings as of its most recent quarter end is available upon request. In addition, each Fidelity Central Fund's financial statements are available on the SEC's website or upon request. |
(c) Investment made with cash collateral received from securities on loan. |
(d) Security or a portion of the security is on loan at period end. |
(e) Security exempt from registration under Rule 144A of the Securities Act of 1933. These securities may be resold in transactions exempt from registration, normally to qualified institutional buyers. At the end of the period, the value of these securities amounted to $1,047,400 or 0.1% of net assets. |
Affiliated Central Funds |
Information regarding fiscal year to date income earned by the Fund from investments in Fidelity Central Funds is as follows: |
Fund | Income earned |
Fidelity Cash Central Fund | $ 33,616 |
Fidelity Securities Lending Cash Central Fund | 17,540 |
Total | $ 51,156 |
Other Information |
All investments are categorized as Level 1 under the Fair Value Hierarchy. The inputs or methodology used for valuing securities may not be an indication of the risk associated with investing in those securities. For more information on valuation inputs, please refer to the Security Valuation section in the accompanying Notes to Financial Statements. |
Distribution of investments by country or territory of incorporation, as a percentage of total net assets, is as follows. (Unaudited) |
United States of America | 58.8% |
Curacao | 17.7% |
Switzerland | 7.1% |
United Kingdom | 6.8% |
Netherlands | 2.4% |
Panama | 2.0% |
Cayman Islands | 1.6% |
Canada | 1.3% |
Marshall Islands | 1.1% |
Others (Individually Less Than 1%) | 1.2% |
| 100.0% |
See accompanying notes which are an integral part of the financial statements.
Semiannual Report
Energy Service Portfolio
Statement of Assets and Liabilities
| August 31, 2012 (Unaudited) |
| | |
Assets | | |
Investment in securities, at value (including securities loaned of $2,646,936) - See accompanying schedule: Unaffiliated issuers (cost $882,275,502) | $ 1,088,694,228 | |
Fidelity Central Funds (cost $72,414,194) | 72,414,194 | |
Total Investments (cost $954,689,696) | | $ 1,161,108,422 |
Receivable for fund shares sold | | 1,157,057 |
Dividends receivable | | 1,360,173 |
Distributions receivable from Fidelity Central Funds | | 11,882 |
Other receivables | | 7,616 |
Total assets | | 1,163,645,150 |
| | |
Liabilities | | |
Payable for fund shares redeemed | $ 1,733,657 | |
Accrued management fee | 537,568 | |
Other affiliated payables | 229,252 | |
Other payables and accrued expenses | 26,790 | |
Collateral on securities loaned, at value | 2,688,750 | |
Total liabilities | | 5,216,017 |
| | |
Net Assets | | $ 1,158,429,133 |
Net Assets consist of: | | |
Paid in capital | | $ 1,030,634,326 |
Undistributed net investment income | | 211,182 |
Accumulated undistributed net realized gain (loss) on investments and foreign currency transactions | | (78,834,906) |
Net unrealized appreciation (depreciation) on investments and assets and liabilities in foreign currencies | | 206,418,531 |
Net Assets, for 17,141,012 shares outstanding | | $ 1,158,429,133 |
Net Asset Value, offering price and redemption price per share ($1,158,429,133 ÷ 17,141,012 shares) | | $ 67.58 |
Statement of Operations
Six months ended August 31, 2012 (Unaudited) |
| | |
Investment Income | | |
Dividends | | $ 5,287,310 |
Interest | | 24 |
Income from Fidelity Central Funds | | 51,156 |
Total income | | 5,338,490 |
| | |
Expenses | | |
Management fee | $ 3,159,485 | |
Transfer agent fees | 1,266,896 | |
Accounting and security lending fees | 185,224 | |
Custodian fees and expenses | 12,574 | |
Independent trustees' compensation | 3,889 | |
Registration fees | 36,329 | |
Audit | 18,067 | |
Legal | 2,370 | |
Miscellaneous | 9,633 | |
Total expenses before reductions | 4,694,467 | |
Expense reductions | (20,942) | 4,673,525 |
Net investment income (loss) | | 664,965 |
Realized and Unrealized Gain (Loss) Net realized gain (loss) on: | | |
Investment securities: | | |
Unaffiliated issuers | (33,701,423) | |
Foreign currency transactions | (14,609) | |
Total net realized gain (loss) | | (33,716,032) |
Change in net unrealized appreciation (depreciation) on: Investment securities | (80,439,065) | |
Assets and liabilities in foreign currencies | (195) | |
Total change in net unrealized appreciation (depreciation) | | (80,439,260) |
Net gain (loss) | | (114,155,292) |
Net increase (decrease) in net assets resulting from operations | | $ (113,490,327) |
See accompanying notes which are an integral part of the financial statements.
Semiannual Report
Energy Service Portfolio
Financial Statements - continued
Statement of Changes in Net Assets
| Six months ended
August 31, 2012
(Unaudited) | Year ended
February 29,
2012 |
Increase (Decrease) in Net Assets | | |
Operations | | |
Net investment income (loss) | $ 664,965 | $ (1,903,878) |
Net realized gain (loss) | (33,716,032) | 154,277,931 |
Change in net unrealized appreciation (depreciation) | (80,439,260) | (472,064,401) |
Net increase (decrease) in net assets resulting from operations | (113,490,327) | (319,690,348) |
Share transactions
Proceeds from sales of shares | 216,230,327 | 683,109,205 |
Cost of shares redeemed | (326,613,200) | (1,022,036,053) |
Net increase (decrease) in net assets resulting from share transactions | (110,382,873) | (338,926,848) |
Redemption fees | 13,861 | 214,497 |
Total increase (decrease) in net assets | (223,859,339) | (658,402,699) |
| | |
Net Assets | | |
Beginning of period | 1,382,288,472 | 2,040,691,171 |
End of period (including undistributed net investment income of $211,182 and accumulated net investment loss of $453,783, respectively) | $ 1,158,429,133 | $ 1,382,288,472 |
Other Information Shares | | |
Sold | 3,277,175 | 8,913,160 |
Redeemed | (5,069,353) | (13,741,994) |
Net increase (decrease) | (1,792,178) | (4,828,834) |
Financial Highlights
| Six months ended
August 31, 2012 | Years ended February 28, |
| (Unaudited) | 2012 J | 2011 | 2010 | 2009 | 2008 J |
Selected Per-Share Data | | | | | | |
Net asset value, beginning of period | $ 73.01 | $ 85.88 | $ 58.27 | $ 33.87 | $ 92.62 | $ 66.82 |
Income from Investment Operations | | | | | | |
Net investment income (loss) D | .04 | (.09) | (.04) | .02 G | (.02) H | (.21) |
Net realized and unrealized gain (loss) | (5.47) | (12.79) | 27.65 | 24.41 | (54.75) | 28.45 |
Total from investment operations | (5.43) | (12.88) | 27.61 | 24.43 | (54.77) | 28.24 |
Distributions from net investment income | - | - | - | (.04) | - | - |
Distributions from net realized gain | - | - | - | - | (4.00) | (2.46) |
Total distributions | - | - | - | (.04) | (4.00) | (2.46) |
Redemption fees added to paid in capital D | - K | .01 | - K | .01 | .02 | .02 |
Net asset value, end of period | $ 67.58 | $ 73.01 | $ 85.88 | $ 58.27 | $ 33.87 | $ 92.62 |
Total Return B, C | (7.44)% | (14.99)% | 47.38% | 72.15% | (61.89)% | 42.91% |
Ratios to Average Net Assets E, I | | | | | | |
Expenses before reductions | .83% A | .82% | .85% | .91% | .82% | .83% |
Expenses net of fee waivers, if any | .83% A | .82% | .85% | .91% | .82% | .83% |
Expenses net of all reductions | .82% A | .81% | .85% | .91% | .82% | .83% |
Net investment income (loss) | .12% A | (.12)% | (.06)% | .04% G | (.03)% H | (.23)% |
Supplemental Data | | | | | | |
Net assets, end of period (000 omitted) | $ 1,158,429 | $ 1,382,288 | $ 2,040,691 | $ 1,282,428 | $ 740,946 | $ 2,256,105 |
Portfolio turnover rate F | 33% A | 74% | 85% | 84% | 82% | 64% |
A Annualized B Total returns for periods of less than one year are not annualized. C Total returns would have been lower if certain expenses had not been reduced during the applicable periods shown. D Calculated based on average shares outstanding during the period. E Fees and expenses of any underlying Fidelity Central Funds are not included in the Fund's expense ratio. The Fund indirectly bears its proportionate share of the expenses of any underlying Fidelity Central Funds. F Amount does not include the portfolio activity of any underlying Fidelity Central Funds. G Investment income per share reflects a large, non-recurring dividend which amounted to $.10 per share. Excluding this non-recurring dividend, the ratio of net investment income (loss) to average net assets would have been (.15)%. H Investment income per share reflects a large, non-recurring dividend which amounted to $.07 per share. Excluding this non-recurring dividend, the ratio of net investment income (loss) to average net assets would have been (.11)%. I Expense ratios reflect operating expenses of the Fund. Expenses before reductions do not reflect amounts reimbursed by the investment adviser or reductions from brokerage service arrangements or reductions from other expense offset arrangements and do not represent the amount paid by the Fund during periods when reimbursements or reductions occur. Expenses net of fee waivers reflect expenses after reimbursement by the investment adviser but prior to reductions from brokerage service arrangements or other expense offset arrangements. Expenses net of all reductions represent the net expenses paid by the Fund. J For the year ended February 29. K Amount represents less than $.01 per share. |
See accompanying notes which are an integral part of the financial statements.
Semiannual Report
Natural Gas Portfolio
Investment Changes (Unaudited)
Top Ten Stocks as of August 31, 2012 |
| % of fund's
net assets | % of fund's net assets
6 months ago |
Anadarko Petroleum Corp. | 10.9 | 11.0 |
Apache Corp. | 9.8 | 11.4 |
Duke Energy Corp. | 9.3 | 8.7 |
Williams Companies, Inc. | 6.6 | 6.5 |
Sempra Energy | 6.0 | 6.2 |
Noble Energy, Inc. | 5.5 | 5.6 |
Cameron International Corp. | 4.4 | 4.7 |
Dominion Resources, Inc. | 4.1 | 2.6 |
Suncor Energy, Inc. | 2.9 | 1.9 |
Chesapeake Energy Corp. | 2.8 | 3.4 |
| 62.3 | |
Top Industries (% of fund's net assets) |
As of August 31, 2012 |
| Oil, Gas & Consumable Fuels | 55.6% | |
| Energy Equipment & Services | 12.2% | |
| Electric Utilities | 12.0% | |
| Multi-Utilities | 11.6% | |
| Gas Utilities | 3.6% | |
| All Others* | 5.0% | |

As of February 29, 2012 |
| Oil, Gas & Consumable Fuels | 60.2% | |
| Energy Equipment & Services | 14.7% | |
| Multi-Utilities | 10.2% | |
| Electric Utilities | 8.7% | |
| Gas Utilities | 2.4% | |
| All Others* | 3.8% | |

* Includes short-term investments and net other assets. |
Semiannual Report
Natural Gas Portfolio
Investments August 31, 2012 (Unaudited)
Showing Percentage of Net Assets
Common Stocks - 95.0% |
| Shares | | Value |
ELECTRIC UTILITIES - 12.0% |
Electric Utilities - 12.0% |
Duke Energy Corp. | 984,956 | | $ 63,805,450 |
Pepco Holdings, Inc. (d) | 166,700 | | 3,218,977 |
Southern Co. | 331,700 | | 15,035,961 |
| | 82,060,388 |
ENERGY EQUIPMENT & SERVICES - 12.2% |
Oil & Gas Drilling - 5.3% |
Ensco PLC Class A | 203,400 | | 11,669,058 |
Helmerich & Payne, Inc. | 310,300 | | 14,162,092 |
Rowan Companies PLC (a) | 284,900 | | 10,022,782 |
| | 35,853,932 |
Oil & Gas Equipment & Services - 6.9% |
Cameron International Corp. (a) | 543,500 | | 29,734,885 |
Halliburton Co. | 254,000 | | 8,321,040 |
National Oilwell Varco, Inc. | 115,900 | | 9,132,920 |
| | 47,188,845 |
TOTAL ENERGY EQUIPMENT & SERVICES | | 83,042,777 |
GAS UTILITIES - 3.6% |
Gas Utilities - 3.6% |
Atmos Energy Corp. | 223,848 | | 7,821,249 |
National Fuel Gas Co. | 331,500 | | 16,541,850 |
| | 24,363,099 |
MULTI-UTILITIES - 11.6% |
Multi-Utilities - 11.6% |
Dominion Resources, Inc. | 533,400 | | 27,992,832 |
NiSource, Inc. | 397,500 | | 9,675,150 |
Sempra Energy | 619,177 | | 40,989,517 |
| | 78,657,499 |
OIL, GAS & CONSUMABLE FUELS - 55.6% |
Integrated Oil & Gas - 4.9% |
InterOil Corp. (a)(d) | 169,900 | | 13,513,846 |
Suncor Energy, Inc. | 636,000 | | 19,878,428 |
| | 33,392,274 |
Oil & Gas Exploration & Production - 44.1% |
Americas Petrogas, Inc. (a) | 681,400 | | 1,258,076 |
Americas Petrogas, Inc. (a)(e) | 232,000 | | 428,344 |
Anadarko Petroleum Corp. | 1,069,000 | | 74,049,629 |
Apache Corp. | 777,333 | | 66,656,305 |
Cabot Oil & Gas Corp. | 316,700 | | 13,114,547 |
Celtic Exploration Ltd. (a) | 388,300 | | 6,515,325 |
Chesapeake Energy Corp. (d) | 999,600 | | 19,342,260 |
Cobalt International Energy, Inc. (a) | 74,100 | | 1,682,811 |
Crew Energy, Inc. (a) | 504,900 | | 3,211,487 |
Crown Point Energy, Inc. (e) | 747,316 | | 344,944 |
Denbury Resources, Inc. (a) | 606,675 | | 9,397,396 |
Devon Energy Corp. | 294,946 | | 17,056,727 |
EOG Resources, Inc. | 175,285 | | 18,983,366 |
|
| Shares | | Value |
Halcon Resources Corp. (f) | 160,000 | | $ 1,228,800 |
Kosmos Energy Ltd. (a) | 164,300 | | 1,590,424 |
Madalena Ventures, Inc. (a) | 3,034,000 | | 892,579 |
Noble Energy, Inc. | 427,607 | | 37,586,655 |
Painted Pony Petroleum Ltd. (a)(e) | 5,500 | | 52,838 |
Painted Pony Petroleum Ltd. Class A (a) | 745,200 | | 7,159,061 |
Petrobank Energy & Resources Ltd. (a) | 289,800 | | 3,636,648 |
Southwestern Energy Co. (a) | 213,200 | | 6,636,916 |
Voyager Oil & Gas, Inc. warrants 2/4/16 (a) | 105,016 | | 14,394 |
WPX Energy, Inc. | 639,933 | | 9,982,955 |
| | 300,822,487 |
Oil & Gas Storage & Transport - 6.6% |
Williams Companies, Inc. | 1,395,799 | | 45,042,434 |
TOTAL OIL, GAS & CONSUMABLE FUELS | | 379,257,195 |
TOTAL COMMON STOCKS (Cost $642,299,140) |
647,380,958
|
Money Market Funds - 5.4% |
| | | |
Fidelity Cash Central Fund, 0.17% (b) | 20,177,067 | | 20,177,067 |
Fidelity Securities Lending Cash Central Fund, 0.18% (b)(c) | 16,719,725 | | 16,719,725 |
TOTAL MONEY MARKET FUNDS (Cost $36,896,792) |
36,896,792
|
TOTAL INVESTMENT PORTFOLIO - 100.4% (Cost $679,195,932) | | 684,277,750 |
NET OTHER ASSETS (LIABILITIES) - (0.4)% | | (2,599,110) |
NET ASSETS - 100% | $ 681,678,640 |
Legend |
(a) Non-income producing |
(b) Affiliated fund that is available only to investment companies and other accounts managed by Fidelity Investments. The rate quoted is the annualized seven-day yield of the fund at period end. A complete unaudited listing of the fund's holdings as of its most recent quarter end is available upon request. In addition, each Fidelity Central Fund's financial statements are available on the SEC's website or upon request. |
(c) Investment made with cash collateral received from securities on loan. |
(d) Security or a portion of the security is on loan at period end. |
(e) Security exempt from registration under Rule 144A of the Securities Act of 1933. These securities may be resold in transactions exempt from registration, normally to qualified institutional buyers. At the end of the period, the value of these securities amounted to $826,126 or 0.1% of net assets. |
(f) Restricted securities - Investment in securities not registered under the Securities Act of 1933 (excluding 144A issues). At the end of the period, the value of restricted securities (excluding 144A issues) amounted to $1,228,800 or 0.2% of net assets. |
Additional information on each restricted holding is as follows: |
Security | Acquisition Date | Acquisition Cost |
Halcon Resources Corp. | 3/1/12 | $ 1,440,000 |
Affiliated Central Funds |
Information regarding fiscal year to date income earned by the Fund from investments in Fidelity Central Funds is as follows: |
Fund | Income earned |
Fidelity Cash Central Fund | $ 27,286 |
Fidelity Securities Lending Cash Central Fund | 336,787 |
Total | $ 364,073 |
Other Information |
The following is a summary of the inputs used, as of August 31, 2012, involving the Fund's assets and liabilities carried at fair value. The inputs or methodology used for valuing securities may not be an indication of the risk associated with investing in those securities. For more information on valuation inputs, and their aggregation into the levels used in the table below, please refer to the Security Valuation section in the accompanying Notes to Financial Statements. |
Valuation Inputs at Reporting Date: |
Description | Total | Level 1 | Level 2 | Level 3 |
Investments in Securities: | | | | |
Common Stocks | $ 647,380,958 | $ 647,366,564 | $ 14,394 | $ - |
Money Market Funds | 36,896,792 | 36,896,792 | - | - |
Total Investments in Securities: | $ 684,277,750 | $ 684,263,356 | $ 14,394 | $ - |
Distribution of investments by country or territory of incorporation, as a percentage of total net assets, is as follows. (Unaudited) |
United States of America | 88.3% |
Canada | 8.3% |
United Kingdom | 3.2% |
Others (Individually Less Than 1%) | 0.2% |
| 100.0% |
See accompanying notes which are an integral part of the financial statements.
Semiannual Report
Natural Gas Portfolio
Statement of Assets and Liabilities
| August 31, 2012 (Unaudited) |
| | |
Assets | | |
Investment in securities, at value (including securities loaned of $16,370,031) - See accompanying schedule: Unaffiliated issuers (cost $642,299,140) | $ 647,380,958 | |
Fidelity Central Funds (cost $36,896,792) | 36,896,792 | |
Total Investments (cost $679,195,932) | | $ 684,277,750 |
Receivable for investments sold | | 14,207,200 |
Receivable for fund shares sold | | 837,366 |
Dividends receivable | | 1,877,749 |
Distributions receivable from Fidelity Central Funds | | 97,709 |
Other receivables | | 4 |
Total assets | | 701,297,778 |
| | |
Liabilities | | |
Payable to custodian bank | $ 133,882 | |
Payable for fund shares redeemed | 2,235,681 | |
Accrued management fee | 332,125 | |
Other affiliated payables | 173,116 | |
Other payables and accrued expenses | 24,609 | |
Collateral on securities loaned, at value | 16,719,725 | |
Total liabilities | | 19,619,138 |
| | |
Net Assets | | $ 681,678,640 |
Net Assets consist of: | | |
Paid in capital | | $ 1,130,584,977 |
Undistributed net investment income | | 4,048,139 |
Accumulated undistributed net realized gain (loss) on investments and foreign currency transactions | | (458,039,374) |
Net unrealized appreciation (depreciation) on investments and assets and liabilities in foreign currencies | | 5,084,898 |
Net Assets, for 21,925,813 shares outstanding | | $ 681,678,640 |
Net Asset Value, offering price and redemption price per share ($681,678,640 ÷ 21,925,813 shares) | | $ 31.09 |
Statement of Operations
Six months ended August 31, 2012 (Unaudited) |
| | |
Investment Income | | |
Dividends | | $ 6,687,313 |
Income from Fidelity Central Funds | | 364,073 |
Total income | | 7,051,386 |
| | |
Expenses | | |
Management fee | $ 1,891,537 | |
Transfer agent fees | 902,030 | |
Accounting and security lending fees | 124,049 | |
Custodian fees and expenses | 8,918 | |
Independent trustees' compensation | 2,283 | |
Registration fees | 36,661 | |
Audit | 17,605 | |
Legal | 1,357 | |
Miscellaneous | 4,912 | |
Total expenses before reductions | 2,989,352 | |
Expense reductions | (868) | 2,988,484 |
Net investment income (loss) | | 4,062,902 |
Realized and Unrealized Gain (Loss) Net realized gain (loss) on: | | |
Investment securities: | | |
Unaffiliated issuers | 1,083,434 | |
Foreign currency transactions | (2,974) | |
Total net realized gain (loss) | | 1,080,460 |
Change in net unrealized appreciation (depreciation) on: Investment securities | (41,884,012) | |
Assets and liabilities in foreign currencies | 33,954 | |
Total change in net unrealized appreciation (depreciation) | | (41,850,058) |
Net gain (loss) | | (40,769,598) |
Net increase (decrease) in net assets resulting from operations | | $ (36,706,696) |
See accompanying notes which are an integral part of the financial statements.
Semiannual Report
Statement of Changes in Net Assets
| Six months ended
August 31, 2012
(Unaudited) | Year ended
February 29,
2012 |
Increase (Decrease) in Net Assets | | |
Operations | | |
Net investment income (loss) | $ 4,062,902 | $ 7,111,150 |
Net realized gain (loss) | 1,080,460 | 5,423,932 |
Change in net unrealized appreciation (depreciation) | (41,850,058) | (127,183,989) |
Net increase (decrease) in net assets resulting from operations | (36,706,696) | (114,648,907) |
Distributions to shareholders from net investment income | (1,212,780) | (7,350,892) |
Distributions to shareholders from net realized gain | (1,080,476) | - |
Total distributions | (2,293,256) | (7,350,892) |
Share transactions
Proceeds from sales of shares | 124,119,463 | 317,625,822 |
Reinvestment of distributions | 2,138,288 | 6,793,558 |
Cost of shares redeemed | (149,270,683) | (448,864,133) |
Net increase (decrease) in net assets resulting from share transactions | (23,012,932) | (124,444,753) |
Redemption fees | 11,132 | 42,090 |
Total increase (decrease) in net assets | (62,001,752) | (246,402,462) |
| | |
Net Assets | | |
Beginning of period | 743,680,392 | 990,082,854 |
End of period (including undistributed net investment income of $4,048,139 and undistributed net investment income of $1,198,017, respectively) | $ 681,678,640 | $ 743,680,392 |
Other Information Shares | | |
Sold | 4,132,687 | 9,161,528 |
Issued in reinvestment of distributions | 68,382 | 211,560 |
Redeemed | (4,873,230) | (13,898,138) |
Net increase (decrease) | (672,161) | (4,525,050) |
Financial Highlights
| Six months ended August 31, 2012 | Years ended February 28, |
| (Unaudited) | 2012 I | 2011 | 2010 | 2009 | 2008 I |
Selected Per-Share Data | | | | | | |
Net asset value, beginning of period | $ 32.91 | $ 36.50 | $ 31.34 | $ 19.16 | $ 49.91 | $ 39.61 |
Income from Investment Operations | | | | | | |
Net investment income (loss) D | .18 | .26 | .29 G | (.04) | (.05) | (.05) |
Net realized and unrealized gain (loss) | (1.90) | (3.56) | 5.19 | 12.22 | (28.62) | 14.53 |
Total from investment operations | (1.72) | (3.30) | 5.48 | 12.18 | (28.67) | 14.48 |
Distributions from net investment income | (.06) | (.29) | (.26) | - | - | - |
Distributions from net realized gain | (.05) | - | (.06) | - | (2.09) | (4.19) |
Total distributions | (.10) K | (.29) | (.32) | - | (2.09) | (4.19) |
Redemption fees added to paid in capital D | - J | - J | - J | - J | .01 | .01 |
Net asset value, end of period | $ 31.09 | $ 32.91 | $ 36.50 | $ 31.34 | $ 19.16 | $ 49.91 |
Total Return B, C | (5.22)% | (9.03)% | 17.58% | 63.57% | (59.99)% | 38.08% |
Ratios to Average Net Assets E, H | | | | | | |
Expenses before reductions | .88% A | .86% | .89% | .93% | .85% | .85% |
Expenses net of fee waivers, if any | .88% A | .86% | .89% | .93% | .85% | .85% |
Expenses net of all reductions | .88% A | .86% | .88% | .93% | .85% | .85% |
Net investment income (loss) | 1.20% A | .81% | .95% G | (.13)% | (.13)% | (.10)% |
Supplemental Data | | | | | | |
Net assets, end of period (000 omitted) | $ 681,679 | $ 743,680 | $ 990,083 | $ 1,141,747 | $ 705,002 | $ 1,603,270 |
Portfolio turnover rate F | 50% A | 63% | 167% | 110% | 81% | 68% |
A Annualized B Total returns for periods of less than one year are not annualized. C Total returns would have been lower if certain expenses had not been reduced during the applicable periods shown. D Calculated based on average shares outstanding during the period. E Fees and expenses of any underlying Fidelity Central Funds are not included in the Fund's expense ratio. The Fund indirectly bears its proportionate share of the expenses of any underlying Fidelity Central Funds. F Amount does not include the portfolio activity of any underlying Fidelity Central Funds. G Investment income per share reflects a large, non-recurring dividend which amounted to $.15 per share. Excluding this non-recurring dividend, the ratio of net investment income (loss) to average net assets would have been .47%. H Expense ratios reflect operating expenses of the Fund. Expenses before reductions do not reflect amounts reimbursed by the investment adviser or reductions from brokerage service arrangements or reductions from other expense offset arrangements and do not represent the amount paid by the Fund during periods when reimbursements or reductions occur. Expenses net of fee waivers reflect expenses after reimbursement by the investment adviser but prior to reductions from brokerage service arrangements or other expense offset arrangements. Expenses net of all reductions represent the net expenses paid by the Fund. I For the year ended February 29. J Amount represents less than $.01 per share. K Total distributions of $.10 per share is comprised of distributions from net investment income of $.055 and distributions from net realized gain of $.049 per share. |
See accompanying notes which are an integral part of the financial statements.
Semiannual Report
Natural Resources Portfolio
Investment Changes (Unaudited)
Top Ten Stocks as of August 31, 2012 |
| % of fund's
net assets | % of fund's net assets
6 months ago |
Occidental Petroleum Corp. | 7.3 | 7.4 |
Chevron Corp. | 5.5 | 8.6 |
National Oilwell Varco, Inc. | 4.3 | 3.8 |
Hess Corp. | 3.5 | 5.0 |
Cabot Oil & Gas Corp. | 3.2 | 1.0 |
EQT Corp. | 3.2 | 0.8 |
Exxon Mobil Corp. | 3.0 | 0.0 |
Noble Corp. | 2.9 | 1.6 |
Schlumberger Ltd. | 2.7 | 4.6 |
Tesoro Corp. | 2.6 | 0.9 |
| 38.2 | |
Top Industries (% of fund's net assets) |
As of August 31, 2012 |
| Oil, Gas & Consumable Fuels | 60.9% | |
| Energy Equipment & Services | 21.7% | |
| Metals & Mining | 11.8% | |
| Containers & Packaging | 1.8% | |
| Chemicals | 1.3% | |
| All Others* | 2.5% | |

As of February 29, 2012 |
| Oil, Gas & Consumable Fuels | 60.4% | |
| Energy Equipment & Services | 21.2% | |
| Metals & Mining | 13.8% | |
| Chemicals | 2.1% | |
| Containers & Packaging | 1.4% | |
| All Others* | 1.1% | |

* Includes short-term investments and net other assets. |
Semiannual Report
Natural Resources Portfolio
Investments August 31, 2012 (Unaudited)
Showing Percentage of Net Assets
Common Stocks - 98.1% |
| Shares | | Value |
CHEMICALS - 1.3% |
Specialty Chemicals - 1.3% |
LyondellBasell Industries NV Class A | 314,700 | | $ 15,369,948 |
CONSTRUCTION & ENGINEERING - 0.6% |
Construction & Engineering - 0.6% |
Foster Wheeler AG (a) | 299,000 | | 6,548,100 |
CONTAINERS & PACKAGING - 1.8% |
Metal & Glass Containers - 1.5% |
Ball Corp. | 196,000 | | 8,265,320 |
Crown Holdings, Inc. (a) | 240,600 | | 8,721,750 |
| | 16,987,070 |
Paper Packaging - 0.3% |
Rock-Tenn Co. Class A | 50,900 | | 3,398,593 |
TOTAL CONTAINERS & PACKAGING | | 20,385,663 |
ENERGY EQUIPMENT & SERVICES - 21.7% |
Oil & Gas Drilling - 7.0% |
Discovery Offshore S.A. (a)(e) | 1,522,800 | | 2,759,005 |
Ensco PLC Class A | 420,700 | | 24,135,559 |
Noble Corp. | 869,700 | | 33,170,358 |
Northern Offshore Ltd. | 945,000 | | 1,826,292 |
Ocean Rig UDW, Inc. (United States) | 388,100 | | 6,492,913 |
Rowan Companies PLC (a) | 230,800 | | 8,119,544 |
Tuscany International Drilling, Inc. (a) | 885,100 | | 287,326 |
Vantage Drilling Co. (a) | 1,977,700 | | 3,006,104 |
| | 79,797,101 |
Oil & Gas Equipment & Services - 14.7% |
Cameron International Corp. (a) | 106,600 | | 5,832,086 |
Compagnie Generale de Geophysique SA (a) | 238,000 | | 6,880,029 |
Core Laboratories NV | 19,700 | | 2,407,143 |
FMC Technologies, Inc. (a) | 190,900 | | 8,941,756 |
Fugro NV (Certificaten Van Aandelen) unit | 351,729 | | 21,399,117 |
Gulfmark Offshore, Inc. Class A (a) | 225,000 | | 7,893,000 |
Halliburton Co. | 534,600 | | 17,513,496 |
McDermott International, Inc. (a) | 343,900 | | 3,831,046 |
National Oilwell Varco, Inc. | 630,258 | | 49,664,330 |
Oil States International, Inc. (a) | 126,800 | | 9,920,832 |
Schlumberger Ltd. | 418,992 | | 30,326,641 |
Total Energy Services, Inc. | 100,000 | | 1,399,949 |
Weatherford International Ltd. (a) | 155,400 | | 1,827,504 |
| | 167,836,929 |
TOTAL ENERGY EQUIPMENT & SERVICES | | 247,634,030 |
HOTELS, RESTAURANTS & LEISURE - 0.0% |
Casinos & Gaming - 0.0% |
Icahn Enterprises LP rights (a) | 282,600 | | 3 |
|
| Shares | | Value |
METALS & MINING - 11.8% |
Diversified Metals & Mining - 2.8% |
Anglo American PLC (United Kingdom) | 146,800 | | $ 4,079,187 |
Freeport-McMoRan Copper & Gold, Inc. | 444,934 | | 16,066,567 |
Kenmare Resources PLC (a) | 4,978,800 | | 3,027,840 |
Teck Resources Ltd. Class B (sub. vtg.) | 239,200 | | 6,610,001 |
Turquoise Hill Resources Ltd. (a) | 218,025 | | 1,751,720 |
| | 31,535,315 |
Gold - 8.1% |
AngloGold Ashanti Ltd. sponsored ADR | 207,400 | | 6,616,060 |
Barrick Gold Corp. (d) | 328,600 | | 12,670,643 |
Gold Fields Ltd. sponsored ADR | 609,500 | | 7,509,040 |
Goldcorp, Inc. | 277,800 | | 11,405,089 |
Harmony Gold Mining Co. Ltd. sponsored ADR | 549,400 | | 4,691,876 |
IAMGOLD Corp. | 534,600 | | 6,990,610 |
Kinross Gold Corp. | 295,867 | | 2,629,262 |
Newcrest Mining Ltd. | 457,317 | | 11,646,560 |
Newmont Mining Corp. | 285,500 | | 14,469,140 |
Randgold Resources Ltd. sponsored ADR | 51,600 | | 5,313,252 |
Yamana Gold, Inc. | 470,000 | | 8,038,752 |
| | 91,980,284 |
Precious Metals & Minerals - 0.9% |
Pan American Silver Corp. | 128,600 | | 2,258,246 |
Silver Wheaton Corp. | 243,200 | | 8,408,071 |
| | 10,666,317 |
TOTAL METALS & MINING | | 134,181,916 |
OIL, GAS & CONSUMABLE FUELS - 60.9% |
Coal & Consumable Fuels - 1.0% |
Cloud Peak Energy, Inc. (a) | 135,900 | | 2,390,481 |
Peabody Energy Corp. | 419,300 | | 9,069,459 |
| | 11,459,940 |
Integrated Oil & Gas - 24.8% |
Chevron Corp. | 562,900 | | 63,134,864 |
ENI SpA sponsored ADR | 68,100 | | 3,003,891 |
Exxon Mobil Corp. | 393,100 | | 34,317,630 |
Hess Corp. | 794,600 | | 40,151,138 |
InterOil Corp. (a)(d) | 102,000 | | 8,113,080 |
Murphy Oil Corp. | 192,000 | | 9,855,360 |
Occidental Petroleum Corp. | 980,200 | | 83,326,801 |
Royal Dutch Shell PLC Class A sponsored ADR | 176,300 | | 12,335,711 |
Suncor Energy, Inc. | 914,700 | | 28,589,305 |
| | 282,827,780 |
Oil & Gas Exploration & Production - 25.9% |
Anadarko Petroleum Corp. | 145,300 | | 10,064,931 |
Apache Corp. | 344,800 | | 29,566,600 |
BPZ Energy, Inc. (a)(d) | 500,300 | | 1,145,687 |
C&C Energia Ltd. (a) | 232,500 | | 1,459,980 |
Common Stocks - continued |
| Shares | | Value |
OIL, GAS & CONSUMABLE FUELS - CONTINUED |
Oil & Gas Exploration & Production - continued |
Cabot Oil & Gas Corp. | 879,800 | | $ 36,432,518 |
Canadian Natural Resources Ltd. | 239,600 | | 7,289,479 |
Cobalt International Energy, Inc. (a) | 260,000 | | 5,904,600 |
Comstock Resources, Inc. (a) | 525,300 | | 8,662,197 |
Concho Resources, Inc. (a) | 120,700 | | 10,831,618 |
Energen Corp. | 89,100 | | 4,548,555 |
EOG Resources, Inc. | 215,100 | | 23,295,330 |
EQT Corp. | 665,200 | | 35,894,192 |
EV Energy Partners LP | 124,800 | | 7,833,696 |
Gran Tierra Energy, Inc. (Canada) (a) | 1,354,200 | | 6,017,140 |
Halcon Resources Corp. (f) | 570,000 | | 4,377,600 |
Harvest Natural Resources, Inc. (a)(d) | 228,900 | | 1,952,517 |
Kodiak Oil & Gas Corp. (a) | 143,200 | | 1,280,208 |
Marathon Oil Corp. | 551,100 | | 15,331,602 |
Midstates Petroleum Co., Inc. | 342,200 | | 2,788,930 |
Noble Energy, Inc. | 261,500 | | 22,985,850 |
Northern Oil & Gas, Inc. (a) | 143,500 | | 2,344,790 |
Painted Pony Petroleum Ltd. (a)(e) | 9,500 | | 91,266 |
Pioneer Natural Resources Co. | 251,100 | | 24,447,096 |
Plains Exploration & Production Co. (a) | 180,300 | | 7,089,396 |
Rosetta Resources, Inc. (a) | 326,800 | | 14,032,792 |
SM Energy Co. | 201,600 | | 9,521,568 |
TAG Oil Ltd. (a) | 126,100 | | 817,427 |
TAG Oil Ltd. (e) | 20,400 | | 132,240 |
| | 296,139,805 |
Oil & Gas Refining & Marketing - 6.4% |
Calumet Specialty Products Partners LP | 215,600 | | 6,146,756 |
Marathon Petroleum Corp. | 405,500 | | 20,984,625 |
Northern Tier Energy LP Class A | 348,000 | | 6,368,400 |
Tesoro Corp. | 746,500 | | 29,665,910 |
Valero Energy Corp. | 320,700 | | 10,025,082 |
| | 73,190,773 |
Oil & Gas Storage & Transport - 2.8% |
Atlas Energy LP | 73,000 | | 2,486,380 |
Atlas Pipeline Partners, LP | 221,600 | | 7,698,384 |
Cheniere Energy, Inc. (a) | 138,100 | | 2,038,356 |
Markwest Energy Partners LP | 63,100 | | 3,350,610 |
|
| Shares | | Value |
Tesoro Logistics LP | 134,400 | | $ 5,855,808 |
Williams Companies, Inc. | 339,100 | | 10,942,757 |
| | 32,372,295 |
TOTAL OIL, GAS & CONSUMABLE FUELS | | 695,990,593 |
TOTAL COMMON STOCKS (Cost $1,047,332,399) |
1,120,110,253
|
Money Market Funds - 2.7% |
| | | |
Fidelity Cash Central Fund, 0.17% (b) | 9,876,526 | | 9,876,526 |
Fidelity Securities Lending Cash Central Fund, 0.18% (b)(c) | 21,383,500 | | 21,383,500 |
TOTAL MONEY MARKET FUNDS (Cost $31,260,026) |
31,260,026
|
TOTAL INVESTMENT PORTFOLIO - 100.8% (Cost $1,078,592,425) | | 1,151,370,279 |
NET OTHER ASSETS (LIABILITIES) - (0.8)% | | (9,468,699) |
NET ASSETS - 100% | $ 1,141,901,580 |
Legend |
(a) Non-income producing |
(b) Affiliated fund that is available only to investment companies and other accounts managed by Fidelity Investments. The rate quoted is the annualized seven-day yield of the fund at period end. A complete unaudited listing of the fund's holdings as of its most recent quarter end is available upon request. In addition, each Fidelity Central Fund's financial statements are available on the SEC's website or upon request. |
(c) Investment made with cash collateral received from securities on loan. |
(d) Security or a portion of the security is on loan at period end. |
(e) Security exempt from registration under Rule 144A of the Securities Act of 1933. These securities may be resold in transactions exempt from registration, normally to qualified institutional buyers. At the end of the period, the value of these securities amounted to $2,982,511 or 0.3% of net assets. |
(f) Restricted securities - Investment in securities not registered under the Securities Act of 1933 (excluding 144A issues). At the end of the period, the value of restricted securities (excluding 144A issues) amounted to $4,377,600 or 0.4% of net assets. |
Additional information on each restricted holding is as follows: |
Security | Acquisition Date | Acquisition Cost |
Halcon Resources Corp. | 3/1/12 | $ 5,130,000 |
Affiliated Central Funds |
Information regarding fiscal year to date income earned by the Fund from investments in Fidelity Central Funds is as follows: |
Fund | Income earned |
Fidelity Cash Central Fund | $ 13,609 |
Fidelity Securities Lending Cash Central Fund | 167,859 |
Total | $ 181,468 |
Other Information |
The following is a summary of the inputs used, as of August 31, 2012, involving the Fund's assets and liabilities carried at fair value. The inputs or methodology used for valuing securities may not be an indication of the risk associated with investing in those securities. For more information on valuation inputs, and their aggregation into the levels used in the table below, please refer to the Security Valuation section in the accompanying Notes to Financial Statements. |
Valuation Inputs at Reporting Date: |
Description | Total | Level 1 | Level 2 | Level 3 |
Investments in Securities: | | | | |
Common Stocks | $ 1,120,110,253 | $ 1,113,230,221 | $ 6,880,029 | $ 3 |
Money Market Funds | 31,260,026 | 31,260,026 | - | - |
Total Investments in Securities: | $ 1,151,370,279 | $ 1,144,490,247 | $ 6,880,029 | $ 3 |
Distribution of investments by country or territory of incorporation, as a percentage of total net assets, is as follows. (Unaudited) |
United States of America | 70.5% |
Canada | 9.4% |
United Kingdom | 4.3% |
Switzerland | 3.7% |
Netherlands | 3.4% |
Curacao | 2.7% |
South Africa | 1.7% |
Australia | 1.0% |
Others (Individually Less Than 1%) | 3.3% |
| 100.0% |
See accompanying notes which are an integral part of the financial statements.
Semiannual Report
Natural Resources Portfolio
Statement of Assets and Liabilities
| August 31, 2012 (Unaudited) |
| | |
Assets | | |
Investment in securities, at value (including securities loaned of $21,286,743) - See accompanying schedule: Unaffiliated issuers (cost $1,047,332,399) | $ 1,120,110,253 | |
Fidelity Central Funds (cost $31,260,026) | 31,260,026 | |
Total Investments (cost $1,078,592,425) | | $ 1,151,370,279 |
Receivable for investments sold | | 11,251,328 |
Receivable for fund shares sold | | 899,023 |
Dividends receivable | | 2,196,952 |
Distributions receivable from Fidelity Central Funds | | 42,745 |
Other receivables | | 7,244 |
Total assets | | 1,165,767,571 |
| | |
Liabilities | | |
Payable for fund shares redeemed | $ 1,639,634 | |
Accrued management fee | 533,926 | |
Other affiliated payables | 272,575 | |
Other payables and accrued expenses | 36,356 | |
Collateral on securities loaned, at value | 21,383,500 | |
Total liabilities | | 23,865,991 |
| | |
Net Assets | | $ 1,141,901,580 |
Net Assets consist of: | | |
Paid in capital | | $ 1,201,192,062 |
Distributions in excess of net investment income | | (1,600,171) |
Accumulated undistributed net realized gain (loss) on investments and foreign currency transactions | | (130,472,453) |
Net unrealized appreciation (depreciation) on investments and assets and liabilities in foreign currencies | | 72,782,142 |
Net Assets, for 35,961,725 shares outstanding | | $ 1,141,901,580 |
Net Asset Value, offering price and redemption price per share ($1,141,901,580 ÷ 35,961,725 shares) | | $ 31.75 |
Statement of Operations
Six months ended August 31, 2012 (Unaudited) |
| | |
Investment Income | | |
Dividends | | $ 10,577,935 |
Interest | | 35 |
Income from Fidelity Central Funds | | 181,468 |
Total income | | 10,759,438 |
| | |
Expenses | | |
Management fee | $ 3,280,223 | |
Transfer agent fees | 1,520,079 | |
Accounting and security lending fees | 191,795 | |
Custodian fees and expenses | 26,755 | |
Independent trustees' compensation | 4,065 | |
Registration fees | 24,809 | |
Audit | 17,807 | |
Legal | 2,467 | |
Interest | 255 | |
Miscellaneous | 9,557 | |
Total expenses before reductions | 5,077,812 | |
Expense reductions | (29,477) | 5,048,335 |
Net investment income (loss) | | 5,711,103 |
Realized and Unrealized Gain (Loss) Net realized gain (loss) on: | | |
Investment securities: | | |
Unaffiliated issuers | (41,156,870) | |
Foreign currency transactions | 10,319 | |
Total net realized gain (loss) | | (41,146,551) |
Change in net unrealized appreciation (depreciation) on: Investment securities | (112,544,228) | |
Assets and liabilities in foreign currencies | (493) | |
Total change in net unrealized appreciation (depreciation) | | (112,544,721) |
Net gain (loss) | | (153,691,272) |
Net increase (decrease) in net assets resulting from operations | | $ (147,980,169) |
See accompanying notes which are an integral part of the financial statements.
Semiannual Report
Statement of Changes in Net Assets
| Six months ended
August 31, 2012
(Unaudited) | Year ended
February 29,
2012 |
Increase (Decrease) in Net Assets | | |
Operations | | |
Net investment income (loss) | $ 5,711,103 | $ 9,525,458 |
Net realized gain (loss) | (41,146,551) | 95,126,213 |
Change in net unrealized appreciation (depreciation) | (112,544,721) | (309,447,822) |
Net increase (decrease) in net assets resulting from operations | (147,980,169) | (204,796,151) |
Distributions to shareholders from net investment income | - | (11,394,017) |
Distributions to shareholders from net realized gain | - | (3,192,087) |
Total distributions | - | (14,586,104) |
Share transactions
Proceeds from sales of shares | 97,373,218 | 534,526,277 |
Reinvestment of distributions | - | 13,954,763 |
Cost of shares redeemed | (238,085,498) | (870,401,869) |
Net increase (decrease) in net assets resulting from share transactions | (140,712,280) | (321,920,829) |
Redemption fees | 13,519 | 119,543 |
Total increase (decrease) in net assets | (288,678,930) | (541,183,541) |
| | |
Net Assets | | |
Beginning of period | 1,430,580,510 | 1,971,764,051 |
End of period (including distributions in excess of net investment income of $1,600,171 and distributions in excess of net investment income of $7,311,274, respectively) | $ 1,141,901,580 | $ 1,430,580,510 |
Other Information Shares | | |
Sold | 3,127,210 | 14,620,404 |
Issued in reinvestment of distributions | - | 409,738 |
Redeemed | (7,628,203) | (25,039,254) |
Net increase (decrease) | (4,500,993) | (10,009,112) |
Financial Highlights
| Six months ended August 31, 2012 | Years ended February 28, |
| (Unaudited) | 2012 H | 2011 | 2010 | 2009 | 2008 H |
Selected Per-Share Data | | | | | | |
Net asset value, beginning of period | $ 35.36 | $ 39.07 | $ 27.66 | $ 17.24 | $ 39.00 | $ 28.75 |
Income from Investment Operations | | | | | | |
Net investment income (loss) D | .15 | .20 | .12 | - I | .01 | .03 |
Net realized and unrealized gain (loss) | (3.76) | (3.59) | 11.49 | 10.54 | (21.29) | 11.74 |
Total from investment operations | (3.61) | (3.39) | 11.61 | 10.54 | (21.28) | 11.77 |
Distributions from net investment income | - | (.26) | (.11) | (.02) | (.01) | (.03) |
Distributions from net realized gain | - | (.06) | (.09) | (.10) | (.48) | (1.50) |
Total distributions | - | (.32) | (.20) | (.12) | (.49) | (1.53) |
Redemption fees added to paid in capital D | - I | - I | - I | - I | .01 | .01 |
Net asset value, end of period | $ 31.75 | $ 35.36 | $ 39.07 | $ 27.66 | $ 17.24 | $ 39.00 |
Total Return B, C | (10.21)% | (8.63)% | 42.09% | 61.13% | (55.24)% | 41.62% |
Ratios to Average Net Assets E, G | | | | | | |
Expenses before reductions | .86% A | .84% | .88% | .93% | .85% | .85% |
Expenses net of fee waivers, if any | .86% A | .84% | .88% | .93% | .85% | .85% |
Expenses net of all reductions | .86% A | .84% | .87% | .92% | .84% | .85% |
Net investment income (loss) | .97% A | .58% | .39% | (.01)% | .03% | .09% |
Supplemental Data | | | | | | |
Net assets, end of period (000 omitted) | $ 1,141,902 | $ 1,430,581 | $ 1,971,764 | $ 1,484,857 | $ 923,110 | $ 2,428,375 |
Portfolio turnover rate F | 77% A | 88% | 113% | 85% | 136% | 44% |
A Annualized B Total returns for periods of less than one year are not annualized. C Total returns would have been lower if certain expenses had not been reduced during the applicable periods shown. D Calculated based on average shares outstanding during the period. E Fees and expenses of any underlying Fidelity Central Funds are not included in the Fund's expense ratio. The Fund indirectly bears its proportionate share of the expenses of any underlying Fidelity Central Funds. F Amount does not include the portfolio activity of any underlying Fidelity Central Funds. G Expense ratios reflect operating expenses of the Fund. Expenses before reductions do not reflect amounts reimbursed by the investment adviser or reductions from brokerage service arrangements or reductions from other expense offset arrangements and do not represent the amount paid by the Fund during periods when reimbursements or reductions occur. Expenses net of fee waivers reflect expenses after reimbursement by the investment adviser but prior to reductions from brokerage service arrangements or other expense offset arrangements. Expenses net of all reductions represent the net expenses paid by the Fund. H For the year ended February 29. I Amount represents less than $.01 per share. |
See accompanying notes which are an integral part of the financial statements.
Semiannual Report
Notes to Financial Statements
For the period ended August 31, 2012 (Unaudited)
1. Organization.
Energy Portfolio, Energy Service Portfolio, Natural Gas Portfolio and Natural Resources Portfolio (the Funds) are funds of Fidelity Select Portfolios (the Trust). Energy Portfolio, Energy Service Portfolio and Natural Gas Portfolio are non-diversified funds. The Trust is registered under the Investment Company Act of 1940, as amended (the 1940 Act), as an open-end management investment company organized as a Massachusetts business trust. The Funds invest primarily in securities of companies whose principal business activities fall within specific industries. Each Fund is authorized to issue an unlimited number of shares. The Natural Resources Portfolio may also invest in certain precious metals. Investments in emerging markets, if applicable, can be subject to social, economic, regulatory and political uncertainties and can be extremely volatile.
2. Investments in Fidelity Central Funds.
The Funds invest in Fidelity Central Funds, which are open-end investment companies available only to other investment companies and accounts managed by Fidelity Management & Research Company (FMR) and its affiliates. The Funds' Schedules of Investments list each of the Fidelity Central Funds held as of period end, if any, as an investment of each Fund, but do not include the underlying holdings of each Fidelity Central Fund. As an Investing Fund, each Fund indirectly bears its proportionate share of the expenses of the underlying Fidelity Central Funds.
The Money Market Central Funds seek preservation of capital and current income and are managed by Fidelity Investments Money Management, Inc. (FIMM), an affiliate of FMR.
A complete unaudited list of holdings for each Fidelity Central Fund is available upon request or at the Securities and Exchange Commission (the SEC) web site at www.sec.gov. In addition, the financial statements of the Fidelity Central Funds are available on the SEC web site or upon request.
3. Significant Accounting Policies.
The financial statements have been prepared in conformity with accounting principles generally accepted in the United States of America (GAAP), which require management to make certain estimates and assumptions at the date of the financial statements. Actual results could differ from those estimates. Subsequent events, if any, through the date that the financial statements were issued have been evaluated in the preparation of the financial statements. The following summarizes the significant accounting policies of the Funds:
Security Valuation. Investments are valued as of 4:00 p.m. Eastern time on the last calendar day of the period. In accordance with valuation policies and procedures approved by the Board of Trustees (the Board), each Fund attempts to obtain prices from one or more third party pricing vendor or broker to value their investments. When current market prices, quotations or rates are not readily available or reliable, securities will be fair valued in good faith by the FMR Fair Value Committee (the Committee), in accordance with procedures adopted by each Fund's Board. Factors used in determining fair value vary by security type and may include market or security specific events. The frequency with which these procedures are used cannot be predicted and they may be utilized to a significant extent. The Committee oversees each Fund's valuation policies and procedures and is responsible for approving and reporting to the Board all fair value determinations.
Each Fund categorizes the inputs to valuation techniques used to value their investments into a disclosure hierarchy consisting of three levels as shown below:
Level 1 - quoted prices in active markets for identical investments
Level 2 - other significant observable inputs (including quoted prices for similar investments, interest rates, prepayment speeds, etc.)
Level 3 - unobservable inputs (including the Fund's own assumptions based on the best information available)
Valuation techniques used to value each Fund's investments by major category are as follows:
Equity securities, including restricted securities, for which market quotations are readily available, are valued at the last reported sale price or official closing price as reported by a third party pricing vendor on the primary market or exchange on which they are traded and are categorized as Level 1 in the hierarchy. In the event there were no sales during the day or closing prices are not available, securities are valued at the last quoted bid price or may be valued using the last available price and are generally categorized as Level 2 in the hierarchy. For foreign equity securities, when significant market or security specific events arise, comparisons to the valuation of American Depositary Receipts (ADRs), futures contracts, Exchange-Traded Funds (ETFs) and certain indexes as well as quoted prices for similar securities are used and are categorized as Level 2 in the hierarchy. Utilizing these techniques may result in transfers between Level 1 and Level 2. For restricted equity securities and private placements where observable inputs are limited, assumptions about market activity and risk are used and these securities are categorized as Level 3 in the hierarchy.
Investments in open-end mutual funds, including the Fidelity Central Funds, are valued at their closing net asset value each business day and are categorized as Level 1 in the hierarchy.
Changes in valuation techniques may result in transfers in or out of an assigned level within the disclosure hierarchy. The aggregate value of investments by input level, as of August 31, 2012, is included at the end of each Fund's Schedule of Investments.
Semiannual Report
3. Significant Accounting Policies - continued
Foreign Currency Translation. The Funds may use foreign currency contracts to facilitate transactions in foreign-denominated securities. Gains and losses from these transactions may arise from changes in the value of the foreign currency or if the counterparties do not perform under the contracts' terms.
Foreign-denominated assets, including investment securities, and liabilities are translated into U.S. dollars at the exchange rates at period end. Purchases and sales of investment securities, income and dividends received and expenses denominated in foreign currencies are translated into U.S. dollars at the exchange rate in effect on the transaction date.
The effects of exchange rate fluctuations on investments are included with the net realized and unrealized gain (loss) on investment securities. Other foreign currency transactions resulting in realized and unrealized gain (loss) are disclosed separately.
Investment Transactions and Income. For financial reporting purposes, the Funds' investment holdings and NAV include trades executed through the end of the last business day of the period. The NAV per share for processing shareholder transactions is calculated as of the close of business of the New York Stock Exchange (NYSE), normally 4:00 p.m. Eastern time and includes trades executed through the end of the prior business day. Gains and losses on securities sold are determined on the basis of identified cost and may include proceeds received from litigation. Dividend income is recorded on the ex-dividend date, except for certain dividends from foreign securities where the ex-dividend date may have passed, which are recorded as soon as the Funds are informed of the ex-dividend date. Non-cash dividends included in dividend income, if any, are recorded at the fair market value of the securities received. Distributions received on securities that represent a return of capital or capital gain are recorded as a reduction of cost of investments and/or as a realized gain. The Funds estimate the components of distributions received that may be considered return of capital distributions or capital gain distributions. Interest income and distributions from the Fidelity Central Funds are accrued as earned. Interest income includes coupon interest and amortization of premium and accretion of discount on debt securities. Investment income is recorded net of foreign taxes withheld where recovery of such taxes is uncertain.
Expenses. Expenses directly attributable to a fund are charged to that fund. Expenses attributable to more than one fund are allocated among the respective funds on the basis of relative net assets or other appropriate methods. Expense estimates are accrued in the period to which they relate and adjustments are made when actual amounts are known.
Income Tax Information and Distributions to Shareholders. Each year, each Fund intends to qualify as a regulated investment company under Subchapter M of the Internal Revenue Code, including distributing substantially all of its taxable income and realized gains. As a result, no provision for income taxes is required. Each Fund files a U.S. federal tax return, in addition to state and local tax returns as required. A fund's federal income tax returns are subject to examination by the Internal Revenue Service (IRS) for a period of three fiscal years after they are filed. State and local tax returns may be subject to examination for an additional fiscal year depending on the jurisdiction. Foreign taxes are provided for based on each Fund's understanding of the tax rules and rates that exist in the foreign markets in which it invests.
Distributions are declared and recorded on the ex-dividend date. Income and capital gain distributions are determined in accordance with income tax regulations, which may differ from GAAP.
Capital accounts within the financial statements are adjusted for permanent book-tax differences. These adjustments have no impact on net assets or the results of operations. Temporary book-tax differences will reverse in a subsequent period.
Book-tax differences are primarily due to foreign currency transactions, passive foreign investment companies (PFIC), partnerships, deferred trustees compensation, net operating losses, capital loss carryforwards and losses deferred due to wash sales and excise tax regulations.
The federal tax cost of investment securities and unrealized appreciation (depreciation) as of period end were as follows for each Fund:
| Tax cost | Gross unrealized
appreciation | Gross unrealized
depreciation | Net unrealized
appreciation
(depreciation) on
securities and
other investments |
Energy Portfolio | $ 1,737,003,077 | $ 406,619,096 | $ (86,798,624) | $ 319,820,472 |
Energy Service Portfolio | 957,597,755 | 237,888,996 | (34,378,329) | 203,510,667 |
Natural Gas Portfolio | 681,859,045 | 60,582,470 | (58,163,765) | 2,418,705 |
Natural Resources Portfolio | 1,087,906,395 | 135,895,100 | (72,431,216) | 63,463,884 |
Semiannual Report
Notes to Financial Statements (Unaudited) - continued
3. Significant Accounting Policies - continued
Income Tax Information and Distributions to Shareholders - continued
Capital loss carryforwards are only available to offset future capital gains of the Funds to the extent provided by regulations and may be limited. Under the Regulated Investment Company Modernization Act of 2010 (the Act), the Funds are permitted to carry forward capital losses incurred in taxable years beginning after December 22, 2010 for an unlimited period and such capital losses are required to be used prior to any losses that expire. At February 29, 2012, capital loss carryforwards were as follows:
| Fiscal year of expiration | |
| 2017 | 2018 | 2019 | Total capital loss
carryforward |
| | | | |
Natural Gas Portfolio | $ (25,933,522) | $ (193,661,853) | $ (208,776,307) | $ (428,371,682) |
Natural Resources Portfolio | - | (47,558,563) | - | (47,558,563) |
In addition, certain of the Funds intend to elect to defer to the fiscal year ending February 28, 2013 capital losses recognized during the period November 1, 2011 to February 29, 2012. Loss deferrals were as follows:
| Capital losses |
Energy Service Portfolio | $ (24,929,036) |
Natural Gas Portfolio | (26,489,786) |
Natural Resources Portfolio | (32,586,967) |
Trading (Redemption) Fees. Shares held by investors in the Funds less than 30 days are subject to a redemption fee equal to .75% of the net asset value of shares redeemed. All redemption fees, which reduce the proceeds of the shareholder redemption, are retained by the Funds and accounted for as an addition to paid in capital.
New Accounting Pronouncement. In December 2011, the Financial Accounting Standards Board issued Accounting Standard Update No. 2011-11, Disclosures about Offsetting Assets and Liabilities. The update creates new disclosure requirements requiring entities to disclose both gross and net information for derivatives and other financial instruments that are either offset in the Statement of Assets and Liabilities or subject to an enforceable master netting arrangement or similar agreement. The disclosure requirements are effective for annual reporting periods beginning on or after January 1, 2013, and interim periods within those annual periods. Management is currently evaluating the impact of the update's adoption on the Fund's financial statement disclosures.
4. Operating Policies.
Restricted Securities. The Funds may invest in securities that are subject to legal or contractual restrictions on resale. These securities generally may be resold in transactions exempt from registration or to the public if the securities are registered. Disposal of these securities may involve time-consuming negotiations and expense, and prompt sale at an acceptable price may be difficult. Information regarding restricted securities is included at the end of each applicable Fund's Schedule of Investments.
5. Purchases and Sales of Investments.
Purchases and sales of securities, other than short-term securities, are noted in the table below.
| Purchases ($) | Sales ($) |
Energy Portfolio | 929,422,110 | 1,161,593,814 |
Energy Service Portfolio | 185,734,441 | 288,169,222 |
Natural Gas Portfolio | 163,122,350 | 189,790,737 |
Natural Resources Portfolio | 454,672,147 | 603,004,179 |
6. Fees and Other Transactions with Affiliates.
Management Fee. FMR and its affiliates provide the Funds with investment management related services for which the Funds pay a monthly management fee. The management fee is the sum of an individual fund fee rate and an annualized group fee rate. The individual fund fee rate is applied to each Fund's average net assets. The group fee rate is based upon the average net assets of all the mutual funds advised by FMR. The group fee rate
Semiannual Report
6. Fees and Other Transactions with Affiliates - continued
Management Fee - continued
decreases as assets under management increase and increases as assets under management decrease. For the period, each Fund's annualized management fee rate expressed as a percentage of each Fund's average net assets was as follows:
| Individual Rate | Group Rate | Total |
Energy Portfolio | .30% | .26% | .56% |
Energy Service Portfolio | .30% | .26% | .56% |
Natural Gas Portfolio | .30% | .26% | .56% |
Natural Resources Portfolio | .30% | .26% | .56% |
Transfer Agent Fees. Fidelity Investments Institutional Operations Company, Inc. (FIIOC), an affiliate of FMR, is the Funds' transfer, dividend disbursing and shareholder servicing agent. FIIOC receives account fees and asset-based fees that vary according to account size and type of account. FIIOC pays for typesetting, printing and mailing of shareholder reports, except proxy statements. For the period, transfer agent fees were equivalent to the following annualized rates expressed as a percentage of average net assets:
Energy Portfolio | .23% |
Energy Service Portfolio | .22% |
Natural Gas Portfolio | .27% |
Natural Resources Portfolio | .26% |
Accounting and Security Lending Fees. Fidelity Service Company, Inc. (FSC), an affiliate of FMR, maintains each Fund's accounting records. The accounting fee is based on the level of average net assets for each month. Under a separate contract, FSC administers the security lending program. The security lending fee is based on the number and duration of lending transactions.
Brokerage Commissions. Certain Funds placed a portion of their portfolio transactions with brokerage firms which are affiliates of the investment adviser. The commissions paid to these affiliated firms were as follows:
| Amount |
Energy Portfolio | $ 11,965 |
Energy Service Portfolio | 1,781 |
Natural Gas Portfolio | 1,908 |
Natural Resources Portfolio | 5,248 |
Interfund Lending Program. Pursuant to an Exemptive Order issued by the SEC, the Funds, along with other registered investment companies having management contracts with FMR, may participate in an interfund lending program. This program provides an alternative credit facility allowing the funds to borrow from, or lend money to, other participating affiliated funds. At period end, there were no interfund loans outstanding. Each applicable fund's activity in this program during the period for which loans were outstanding was as follows:
| Borrower
or Lender | Average
Loan Balance | Weighted Average
Interest Rate | Interest
Expense |
Energy Portfolio | Borrower | $ 7,400,294 | .41% | $ 1,434 |
Natural Resources Portfolio | Borrower | 3,184,714 | .41% | 255 |
7. Committed Line of Credit.
Certain Funds participate with other funds managed by FMR or an affiliate in a $4.25 billion credit facility (the "line of credit") to be utilized for temporary or emergency purposes to fund shareholder redemptions or for other short-term liquidity purposes. The participating funds have agreed to pay commitment fees on their pro-rata portion of the line of credit, which are reflected in Miscellaneous expenses on the Statement of Operations, and are as follows:
Energy Portfolio | $ 3,205 |
Energy Service Portfolio | 1,758 |
Natural Gas Portfolio | 1,005 |
Natural Resources Portfolio | 1,839 |
During the period, there were no borrowings on this line of credit.
Semiannual Report
Notes to Financial Statements (Unaudited) - continued
8. Security Lending.
Certain Funds lend portfolio securities through a lending agent from time to time in order to earn additional income. For equity securities, a lending agent is used and may loan securities to certain qualified borrowers, including Fidelity Capital Markets (FCM), a broker-dealer affiliated with the Funds. On the settlement date of the loan, each applicable Fund receives collateral (in the form of U.S. Treasury obligations, letters of credit and/or cash) against the loaned securities and maintains collateral in an amount not less than 100% of the market value of the loaned securities during the period of the loan. The market value of the loaned securities is determined at the close of business of the Funds and any additional required collateral is delivered to the Funds on the next business day. If the borrower defaults on its obligation to return the securities loaned because of insolvency or other reasons, a fund could experience delays and costs in recovering the securities loaned or in gaining access to the collateral. Any cash collateral received is invested in the Fidelity Securities Lending Cash Central Fund. The value of loaned securities and cash collateral at period end are disclosed on each applicable Fund's Statement of Assets and Liabilities. Security lending income represents the income earned on investing cash collateral, less rebates paid to borrowers and any lending agent fees associated with the loan, plus any premium payments received for lending certain types of securities. Security lending income is presented on each applicable Fund's Statement of Operations as a component of income from Fidelity Central Funds. Security lending activity as of and during the period was as follows:
| Total Security
Lending Income | Security Lending Income From Securities
Loaned to FCM | Value of Securities
Loaned to FCM
at Period End |
Energy Portfolio | $ 225,307 | $ 6,398 | $ 715,860 |
Energy Service Portfolio | 17,540 | 981 | - |
Natural Gas Portfolio | 336,787 | 7,927 | - |
Natural Resources Portfolio | 167,859 | - | - |
9. Expense Reductions.
Many of the brokers with whom FMR places trades on behalf of certain Funds provided services to these Funds in addition to trade execution. These services included payments of expenses on behalf of each applicable Fund. In addition, through arrangements with each applicable Fund's custodian, credits realized as a result of uninvested cash balances were used to reduce each applicable Fund's expenses. All of the applicable expense reductions are noted in the table below.
| Brokerage Service
reduction | Custody
expense
reduction |
| | |
Energy Portfolio | $ 53,844 | $ - |
Energy Service Portfolio | 20,936 | 6 |
Natural Gas Portfolio | 854 | 14 |
Natural Resources Portfolio | 29,477 | - |
10. Other.
The Funds' organizational documents provide former and current trustees and officers with a limited indemnification against liabilities arising in connection with the performance of their duties to the Funds. In the normal course of business, the Funds may also enter into contracts that provide general indemnifications. The Funds' maximum exposure under these arrangements is unknown as this would be dependent on future claims that may be made against the Funds. The risk of material loss from such claims is considered remote.
Semiannual Report
Board Approval of Investment Advisory Contracts and Management Fees
Energy Portfolio
Energy Service Portfolio
Natural Gas Portfolio
Natural Resources Portfolio
Each year, the Board of Trustees, including the Independent Trustees (together, the Board), votes on the renewal of the management contract and sub-advisory agreements (together, the Advisory Contracts) for each fund. The Board, assisted by the advice of fund counsel and Independent Trustees' counsel, requests and considers a broad range of information relevant to the renewal of the Advisory Contracts throughout the year.
The Board meets regularly and, at each of its meetings, considers factors that are relevant to its annual consideration of the renewal of each fund's Advisory Contracts, including the services and support provided to each fund and its shareholders. The Board has established various standing committees, each composed of and chaired by Independent Trustees with varying backgrounds, to which the Board has assigned specific subject matter responsibilities in order to enhance effective decision-making by the Board. The Board, acting directly and through its Committees, requests and receives information concerning the annual consideration of the renewal of each fund's Advisory Contracts. The Board also meets as needed to consider matters specifically related to the Board's annual consideration of the renewal of Advisory Contracts. Members of the Board may also meet with trustees of other Fidelity funds through ad hoc joint committees to discuss certain matters relevant to the Fidelity funds.
At its July 2012 meeting, the Board of Trustees, including the Independent Trustees, unanimously determined to renew each fund's Advisory Contracts. In reaching its determination, the Board considered all factors it believed relevant, including (i) the nature, extent, and quality of the services to be provided to each fund and its shareholders (including the investment performance of each fund); (ii) the competitiveness of each fund's management fee and total expense ratio relative to peer funds; (iii) the total costs of the services to be provided by and the profits to be realized by Fidelity from its relationship with each fund; (iv) the extent to which economies of scale exist and would be realized as each fund grows; and (v) whether fee levels reflect these economies of scale, if any, for the benefit of fund shareholders.
In considering whether to renew the Advisory Contracts for each fund, the Board reached a determination, with the assistance of fund counsel and Independent Trustees' counsel and through the exercise of its business judgment, that the renewal of the Advisory Contracts is in the best interests of each fund and its shareholders and that the compensation payable under the Advisory Contracts is fair and reasonable. The Board's decision to renew the Advisory Contracts was not based on any single factor, but rather was based on a comprehensive consideration of all the information provided to the Board at its meetings throughout the year. The Board, in reaching its determination to renew the Advisory Contracts, is aware that shareholders in each fund have a broad range of investment choices available to them, including a wide choice among mutual funds offered by Fidelity's competitors, and that each fund's shareholders, who have the opportunity to review and weigh the disclosure provided by the fund in its prospectus and other public disclosures, have chosen to invest in that fund, managed by Fidelity.
Nature, Extent, and Quality of Services Provided. The Board considered the staffing within the investment adviser, FMR, and the sub-advisers (together, the Investment Advisers), including the backgrounds of the funds' investment personnel, and also considered the funds' investment objectives, strategies, and related investment philosophies. The Independent Trustees also had discussions with senior management of Fidelity's investment operations and investment groups. The Board considered the structure of the portfolio manager compensation program and whether this structure provides appropriate incentives to act in the best interests of each fund.
Resources Dedicated to Investment Management and Support Services. The Board and the Fund Oversight and Research Committees reviewed the general qualifications and capabilities of the Investment Advisers' investment staff, including its size, education, experience, and resources, as well as the Investment Advisers' approach to recruiting, training, managing, and compensating investment personnel. The Board also noted that FMR has continued to increase the resources devoted to non-U.S. offices, including expansion of Fidelity's global investment organization. The Board noted that Fidelity's analysts have extensive resources, tools and capabilities that allow them to conduct sophisticated quantitative and fundamental analysis, as well as credit analysis of issuers, counterparties and guarantors. The Board also believes that Fidelity's investment professionals have sufficient access to global information and data so as to provide competitive investment results over time, and that those professionals also have access to sophisticated tools that permit them to assess portfolio construction and risk and performance attribution characteristics continuously, as well as to transmit new information and research conclusions rapidly around the world. Additionally, in its deliberations, the Board considered the Investment Advisers' trading and risk management capabilities and resources, which are an integral part of the investment management process.
Shareholder and Administrative Services. The Board considered (i) the nature, extent, quality, and cost of advisory, administrative, and shareholder services performed by the Investment Advisers and their affiliates under the Advisory Contracts and under separate agreements covering transfer agency, pricing and bookkeeping, and securities lending services for each fund; (ii) the nature and extent of the supervision of third party service providers, principally custodians and subcustodians; and (iii) the resources devoted to, and the record of compliance with, each fund's compliance policies and procedures. The Board also reviewed the allocation of fund brokerage, including allocations to brokers affiliated with the Investment Advisers, the use of brokerage commissions to pay fund expenses, and the use of "soft" commission dollars to pay for research services.
Semiannual Report
The Board noted that the growth of fund assets over time across the complex allows Fidelity to reinvest in the development of services designed to enhance the value or convenience of the Fidelity funds as investment vehicles. These services include 24-hour access to account information and market information through telephone representatives and over the Internet, investor education materials and asset allocation tools, and the expanded availability of Fidelity Investor Centers.
Investment in a Large Fund Family. The Board considered the benefits to shareholders of investing in a Fidelity fund, including the benefits of investing in a fund that is part of a large family of funds offering a variety of investment disciplines and providing a large variety of mutual fund investor services. The Board noted that Fidelity had taken, or had made recommendations that resulted in the Fidelity funds taking, a number of actions over the previous year that benefited particular funds, including (i) continuing to dedicate additional resources to investment research and support of the senior management team that oversees asset management; (ii) persisting in efforts to enhance Fidelity's research capabilities, in particular, international research; (iii) launching new funds and making other enhancements to meet client needs for global and income-oriented solutions; (iv) continuing to launch dedicated lower cost underlying funds to meet investment management's portfolio construction needs related to expanding underlying fund options, specifically for the Freedom Fund product lines; (v) adopting a "Stock Selector" sector neutral investment approach and employing a team of portfolio managers who are sector specialists to manage certain funds; (vi) rationalizing product lines and gaining increased efficiencies through the mergers of several funds into other funds; (vii) strengthening the Spartan Index Fund product line by adding new funds and/or new low-cost institutional share classes, restructuring fund expenses to accommodate new classes, and reducing investment minimums for certain classes of shares; (viii) modifying the eligibility criteria for Institutional Class shares to increase their appeal to government entities and charitable investors; and (ix) reducing certain transfer agent fee rates.
Investment Performance. The Board considered whether each fund has operated in accordance with its investment objective, as well as its record of compliance with its investment restrictions. It also reviewed each fund's absolute investment performance, as well as each fund's relative investment performance measured over multiple periods against a third-party-sponsored index that reflects the market sector in which the fund invests. The Board noted that FMR believes that no meaningful peer group exists for the funds principally because most other funds in each fund's third-party peer group focus on different industries or sectors than the fund. For each fund, the following charts considered by the Board show, over the one-, three-, and five-year periods ended December 31, 2011, the fund's cumulative total returns and the cumulative total returns of a third-party-sponsored index ("benchmark").
Energy Portfolio
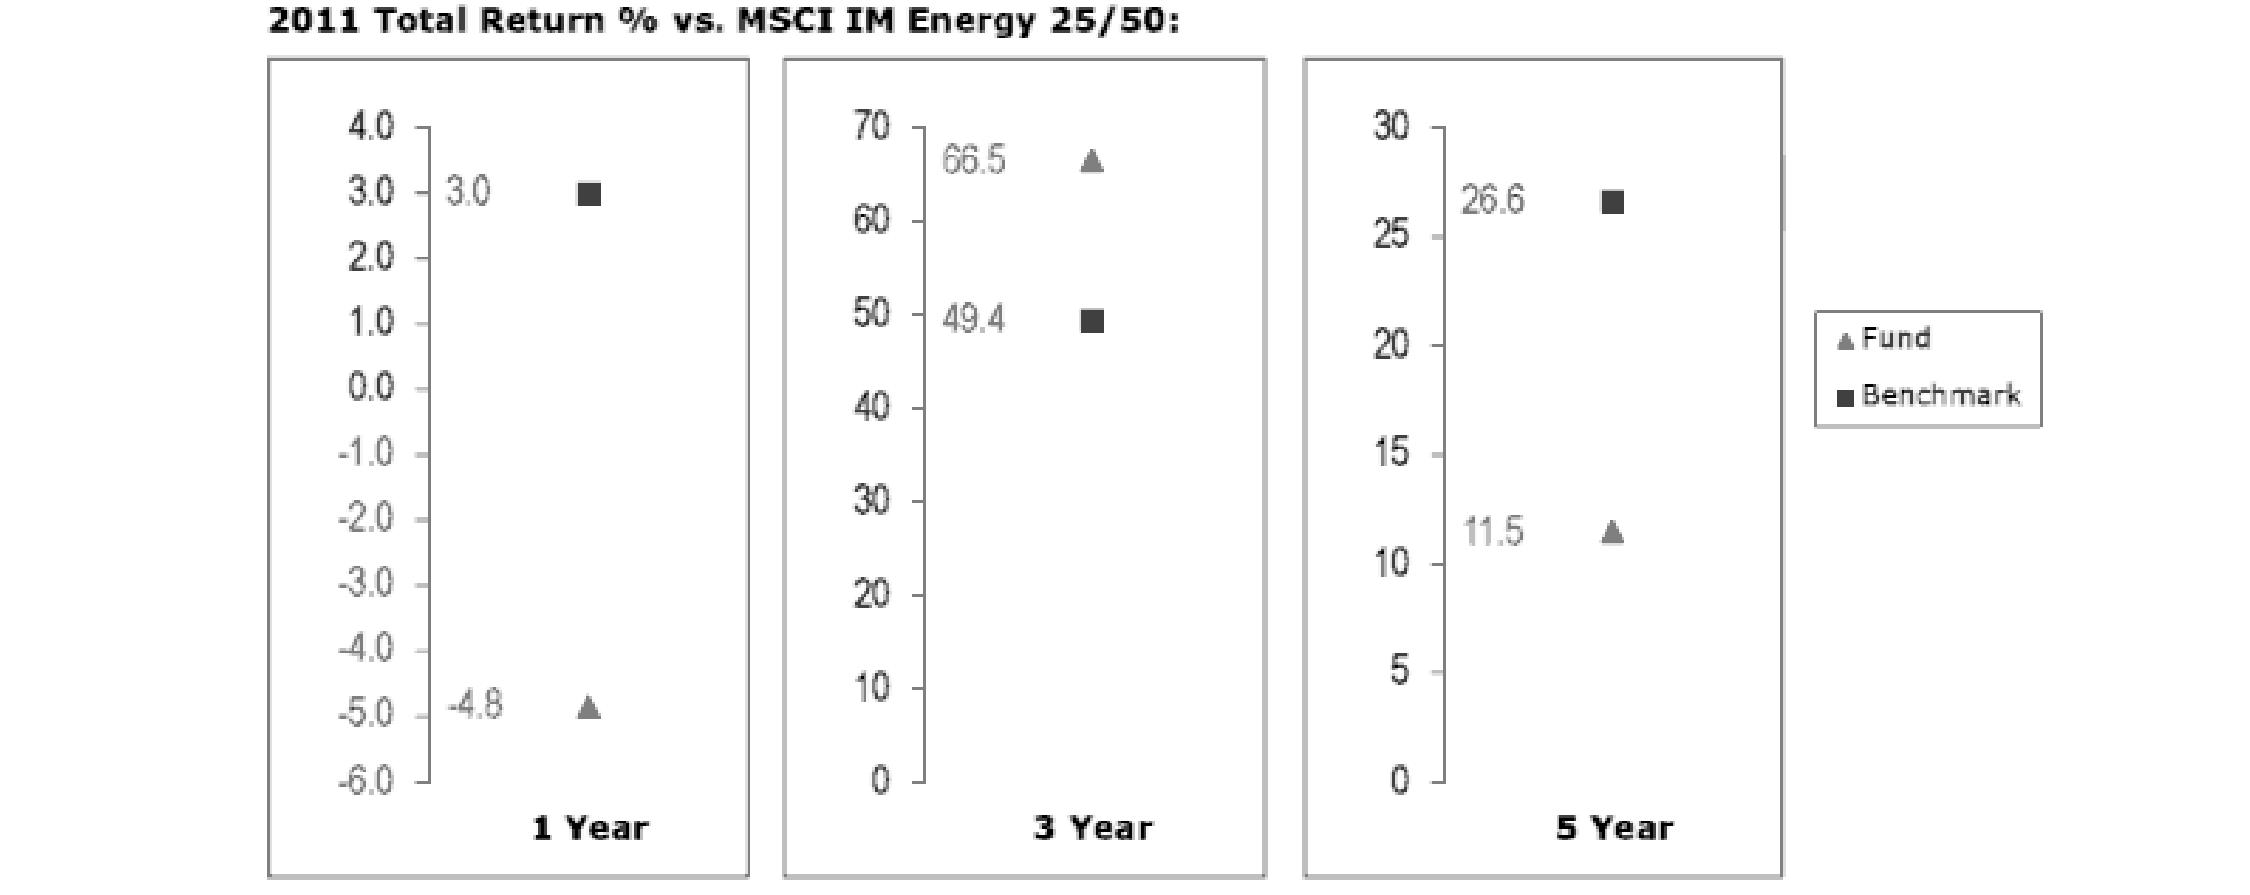
The Board noted that the investment performance of the fund was lower than its benchmark for the one- and five-year periods, although the fund's three-year cumulative total return compared favorably to its benchmark. The Board also reviewed the fund's performance since inception as well as performance in the current year. The Board will closely monitor the performance of the fund in the coming year.
Semiannual Report
Board Approval of Investment Advisory Contracts and Management Fees - continued
Energy Service Portfolio
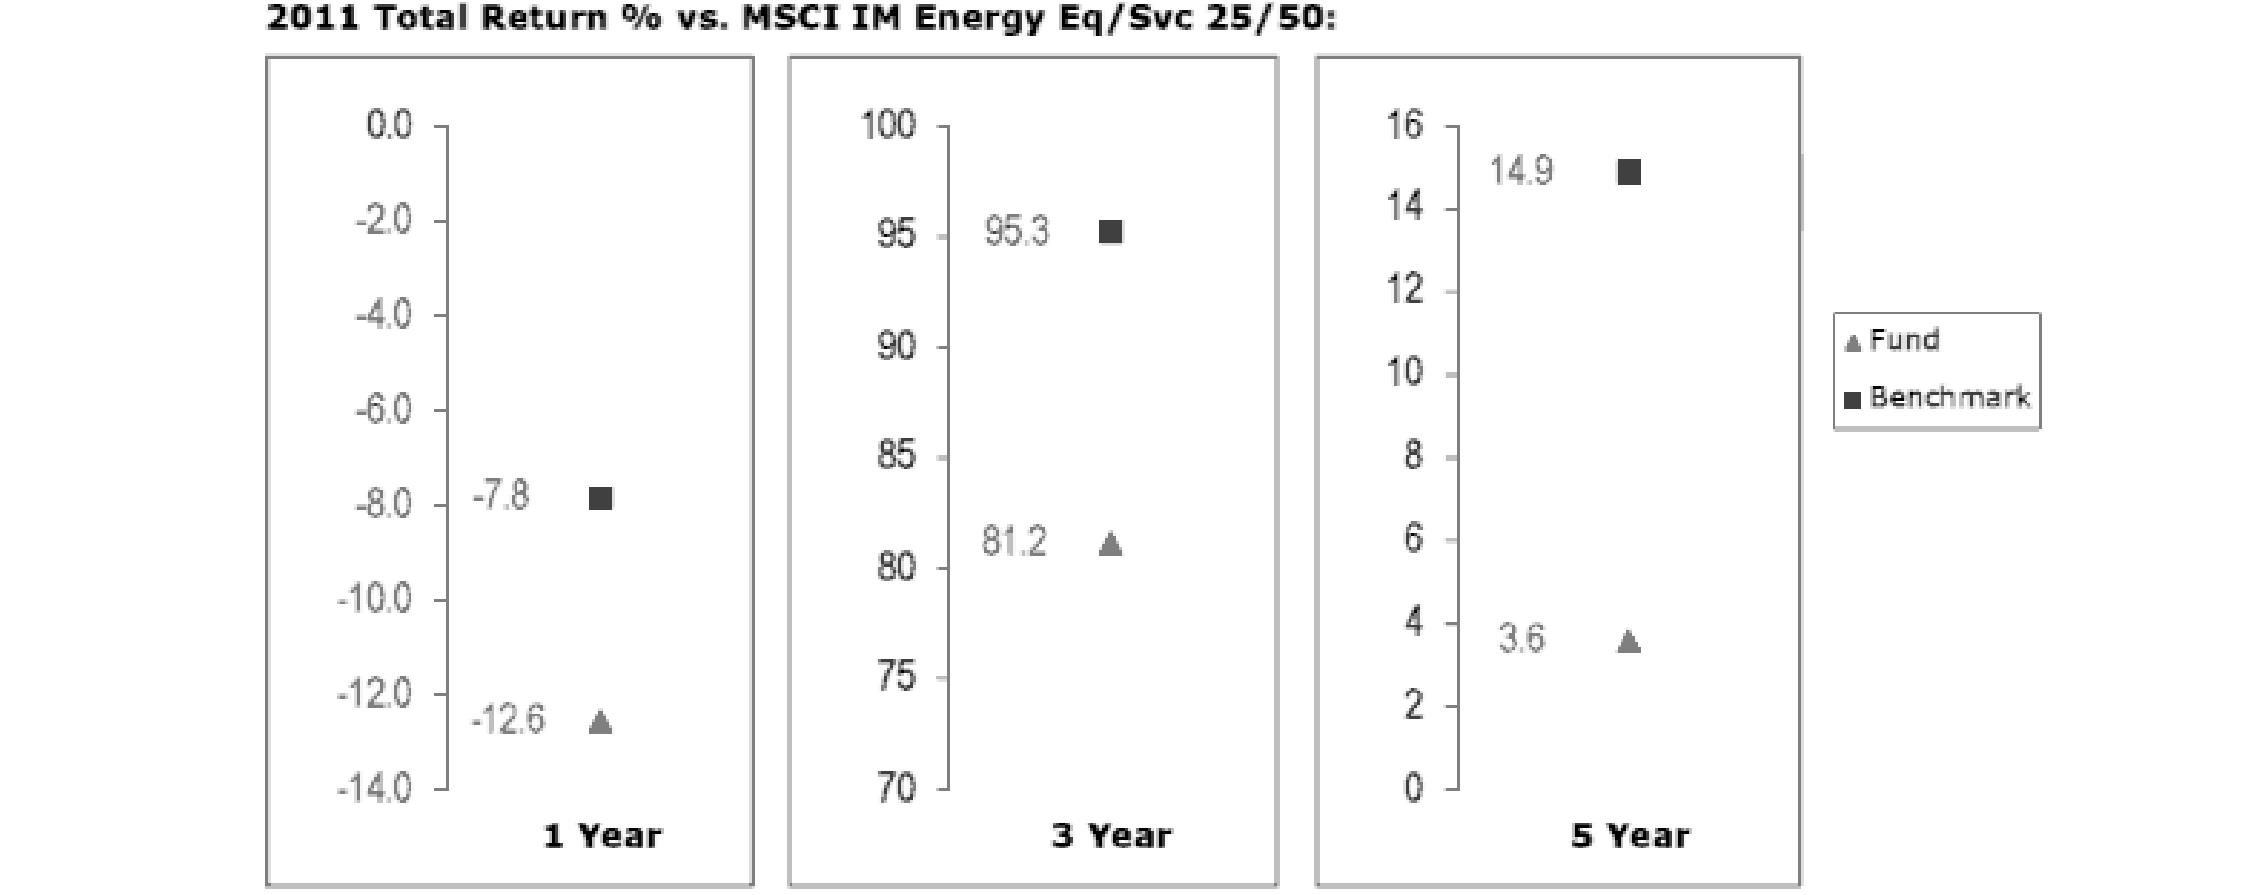
The Board noted that the investment performance of the fund was lower than its benchmark for all the periods shown. The Board discussed with FMR actions to improve the fund's below-benchmark performance. The Board noted that this fund had underperformed in the past and discussed with FMR its disappointment with the continued underperformance of the fund. The Board also reviewed the fund's performance since inception as well as performance in the current year. The Board will continue to closely monitor the performance of the fund in the coming year and discuss with FMR other appropriate actions to address the performance of the fund.
Natural Gas Portfolio
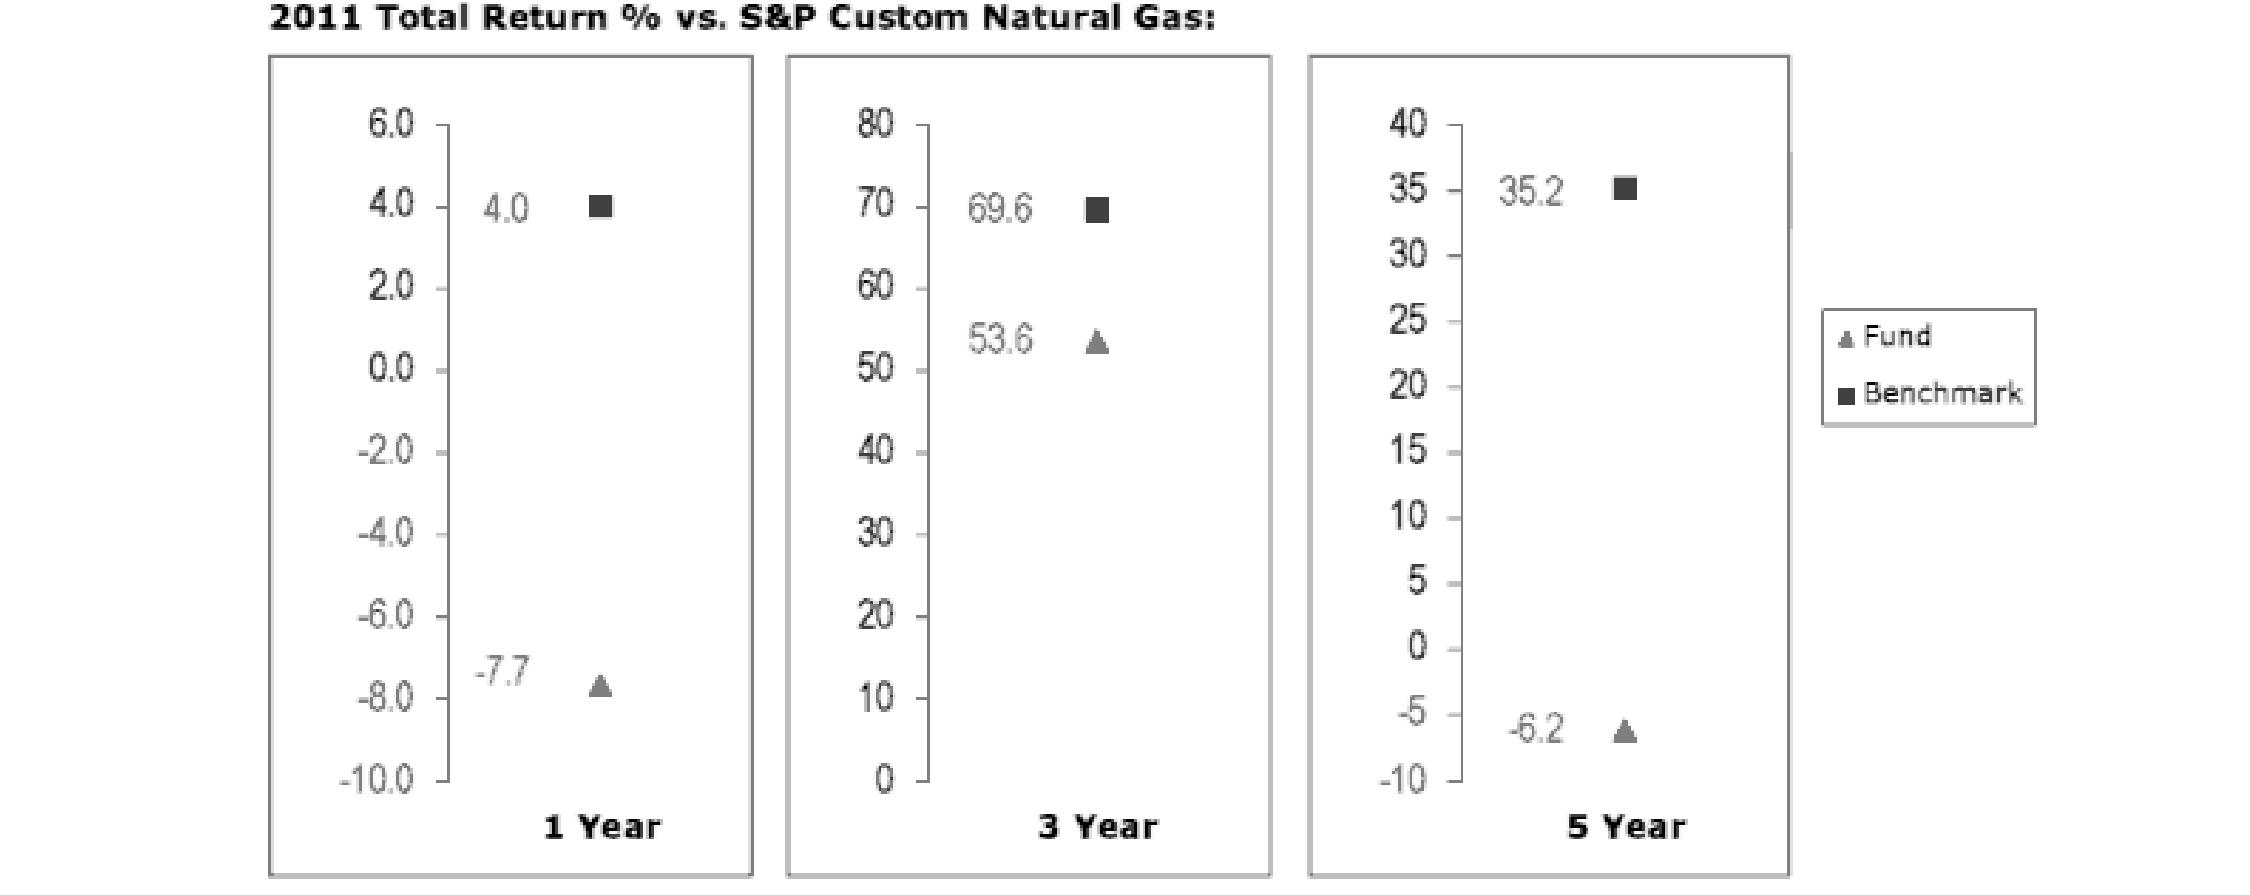
The Board noted that the investment performance of the fund was lower than its benchmark for all the periods shown. The Board discussed with FMR actions to improve the fund's below-benchmark performance. The Board noted that this fund had underperformed in the past and discussed with FMR its disappointment with the continued underperformance of the fund. The Board also reviewed the fund's performance since inception as well as performance in the current year. The Board will continue to closely monitor the performance of the fund in the coming year and discuss with FMR other appropriate actions to address the performance of the fund.
Semiannual Report
Natural Resources Portfolio
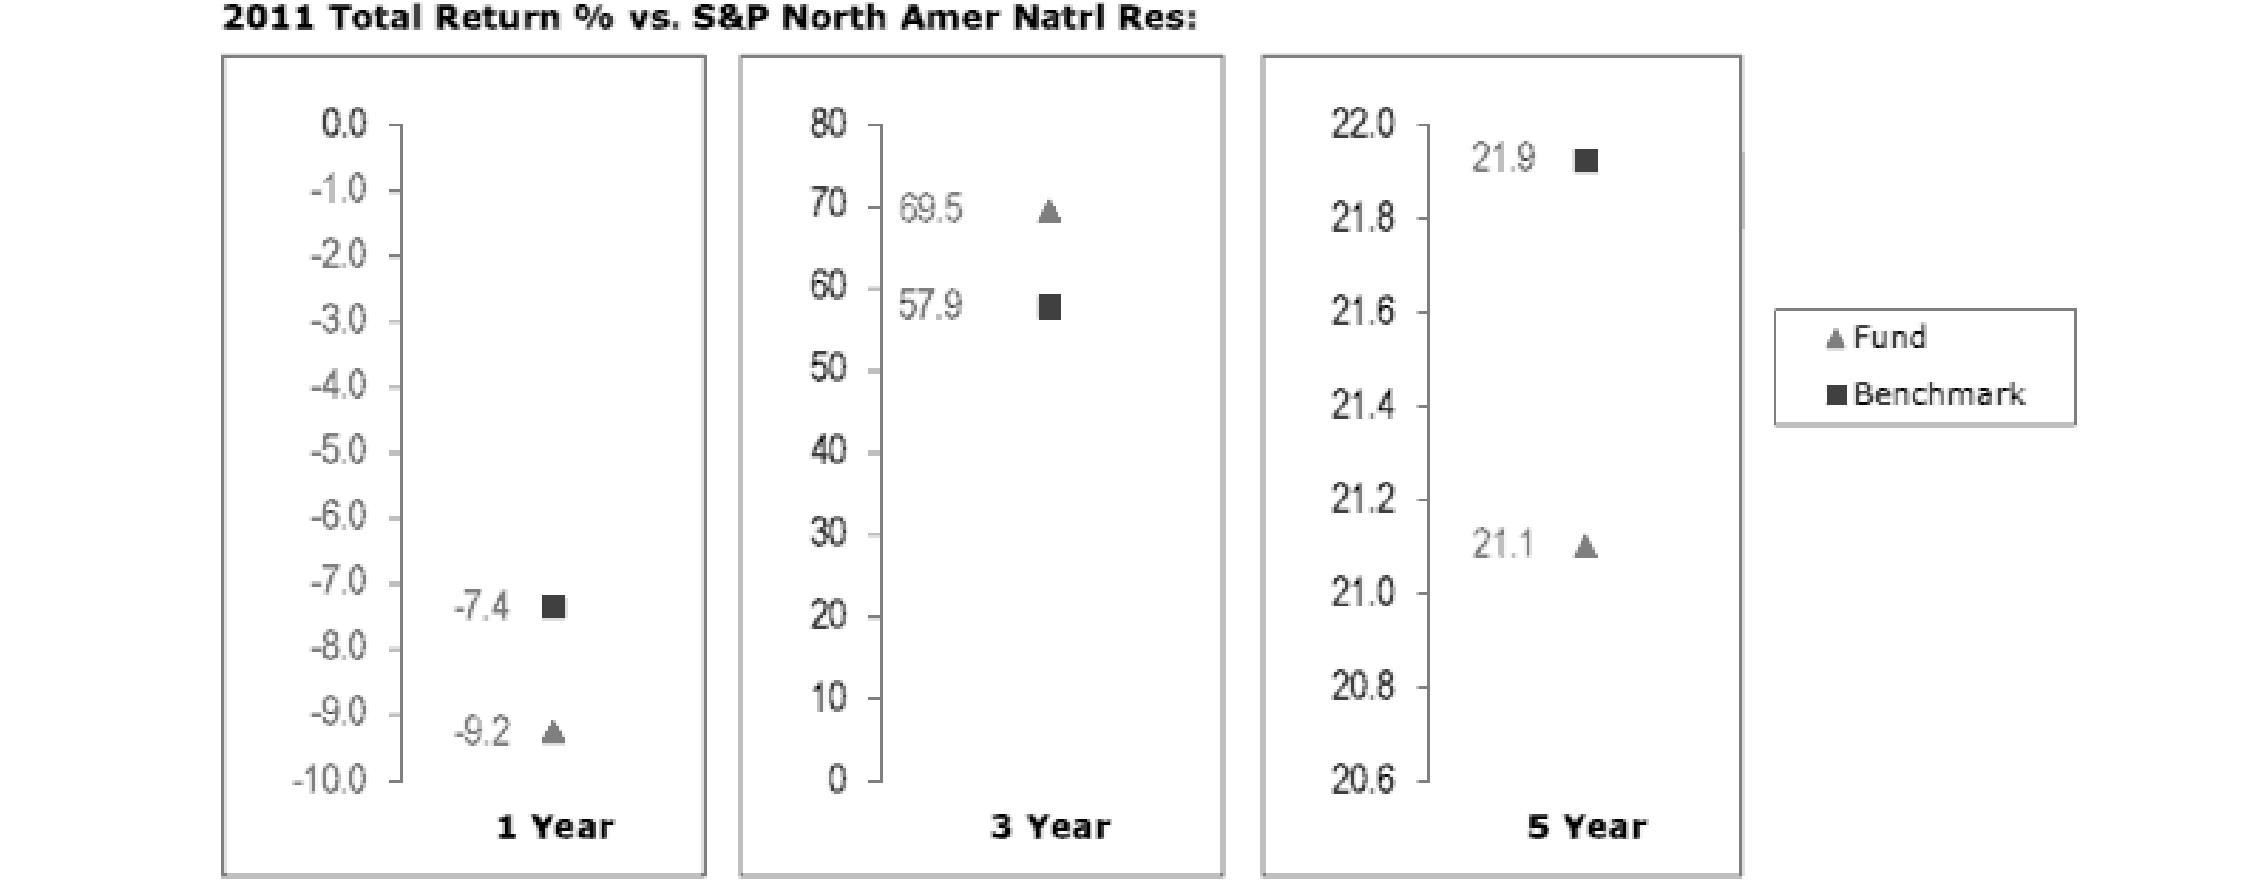
The Board noted that the investment performance of the fund was lower than its benchmark for the one- and five-year periods, although the fund's three-year cumulative total return compared favorably to its benchmark. The Board also reviewed the fund's performance since inception as well as performance in the current year. The Board will closely monitor the performance of the fund in the coming year.
Based on its review, the Board concluded that the nature, extent, and quality of services provided to each fund under the Advisory Contracts should benefit each fund's shareholders.
Competitiveness of Management Fee and Total Expense Ratio. The Board considered each fund's management fee and total expense ratio compared to "mapped groups" of competitive funds and classes. Fidelity creates "mapped groups" by combining similar Lipper investment objective categories that have comparable management fee characteristics. Combining Lipper investment objective categories aids the Board's management fee and total expense ratio comparisons by broadening the competitive group used for comparison and by reducing the number of universes to which various Fidelity funds are compared.
Management Fee. The Board considered two proprietary management fee comparisons for the 12-month periods shown in the charts below. The group of Lipper funds used by the Board for management fee comparisons is referred to below as the "Total Mapped Group." The Total Mapped Group comparison focuses on a fund's standing relative to the total universe of comparable funds available to investors in terms of gross management fees before expense reimbursements or caps. "TMG %" represents the percentage of funds in the Total Mapped Group that had management fees that were lower than a fund's. For example, a TMG % of 6% means that 94% of the funds in the Total Mapped Group had higher management fees than a fund. The "Asset-Size Peer Group" (ASPG) comparison focuses on a fund's standing relative to non-Fidelity funds similar in size to the fund within the Total Mapped Group. The ASPG represents at least 15% of the funds in the Total Mapped Group with comparable asset size and management fee characteristics, subject to a minimum of 50 funds (or all funds in the Total Mapped Group if fewer than 50). Additional information, such as the ASPG quartile in which a fund's management fee ranked, is also included in the charts and considered by the Board.
Semiannual Report
Board Approval of Investment Advisory Contracts and Management Fees - continued
Energy Portfolio

Energy Service Portfolio
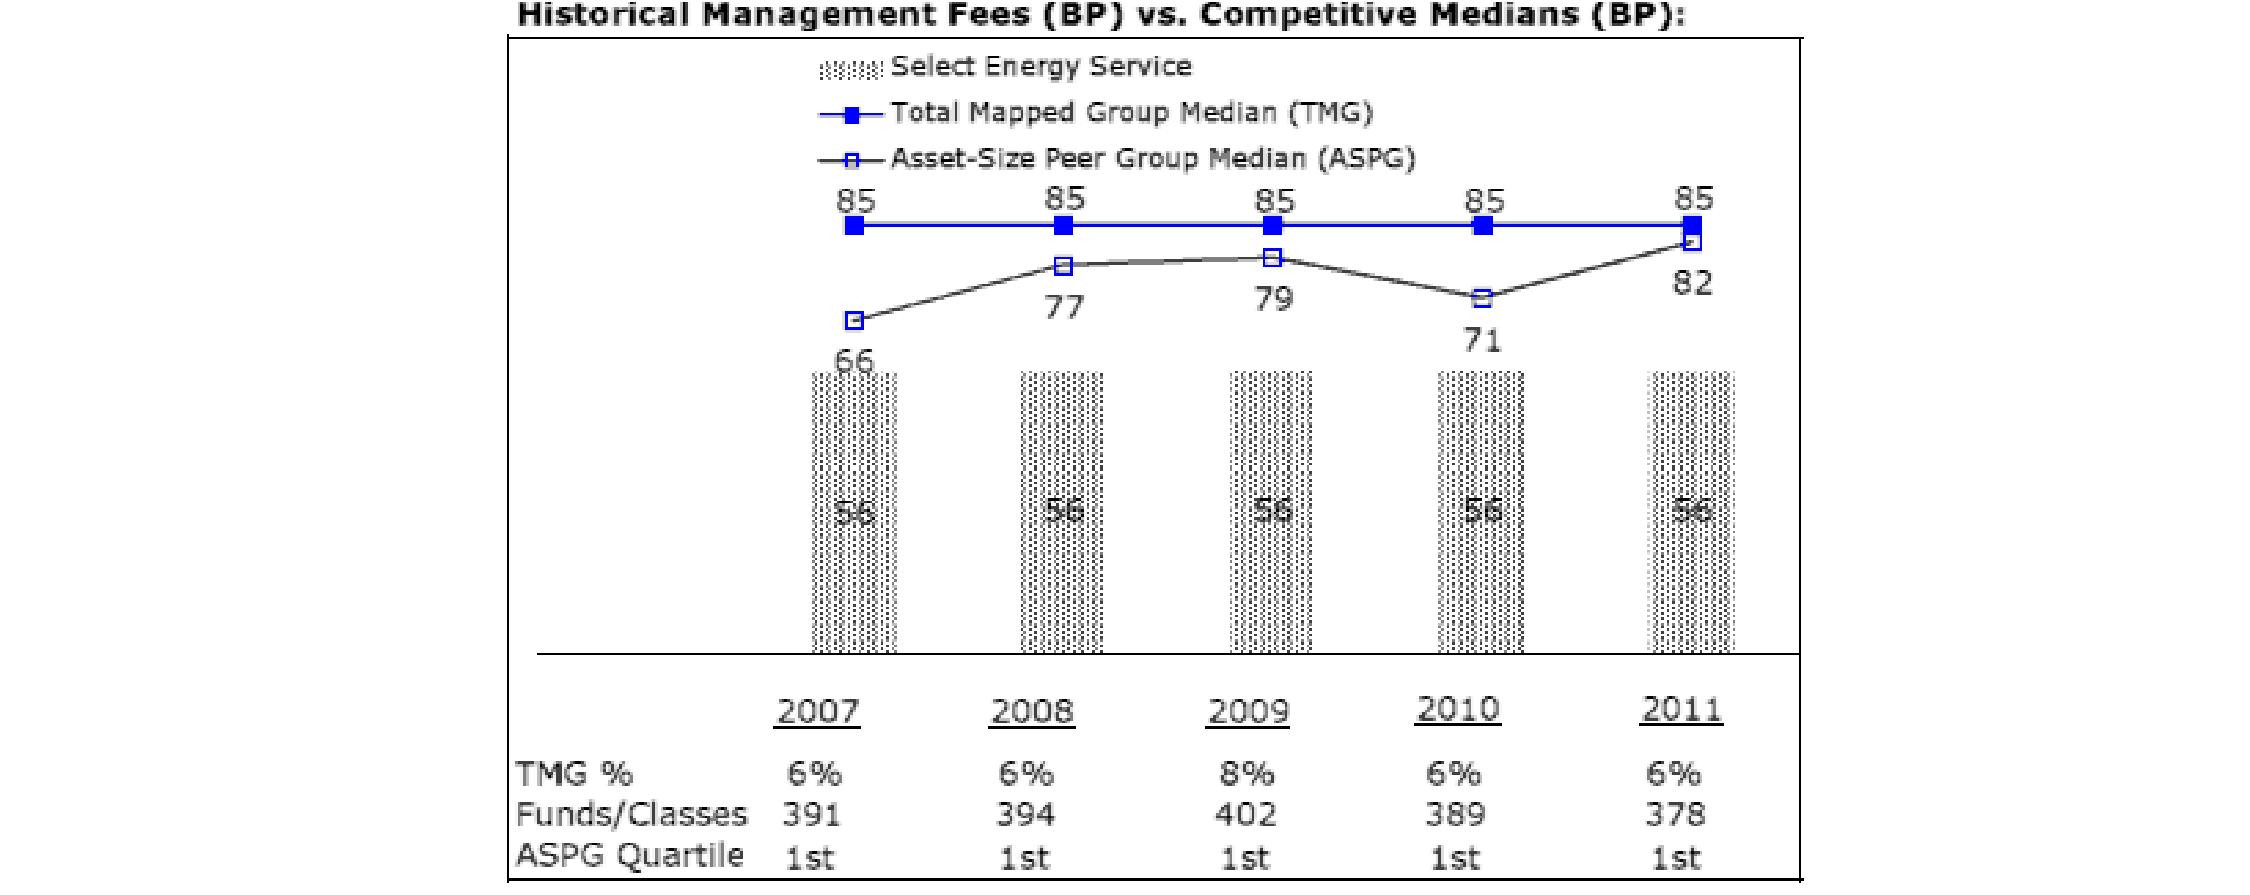
Semiannual Report
Natural Gas Portfolio
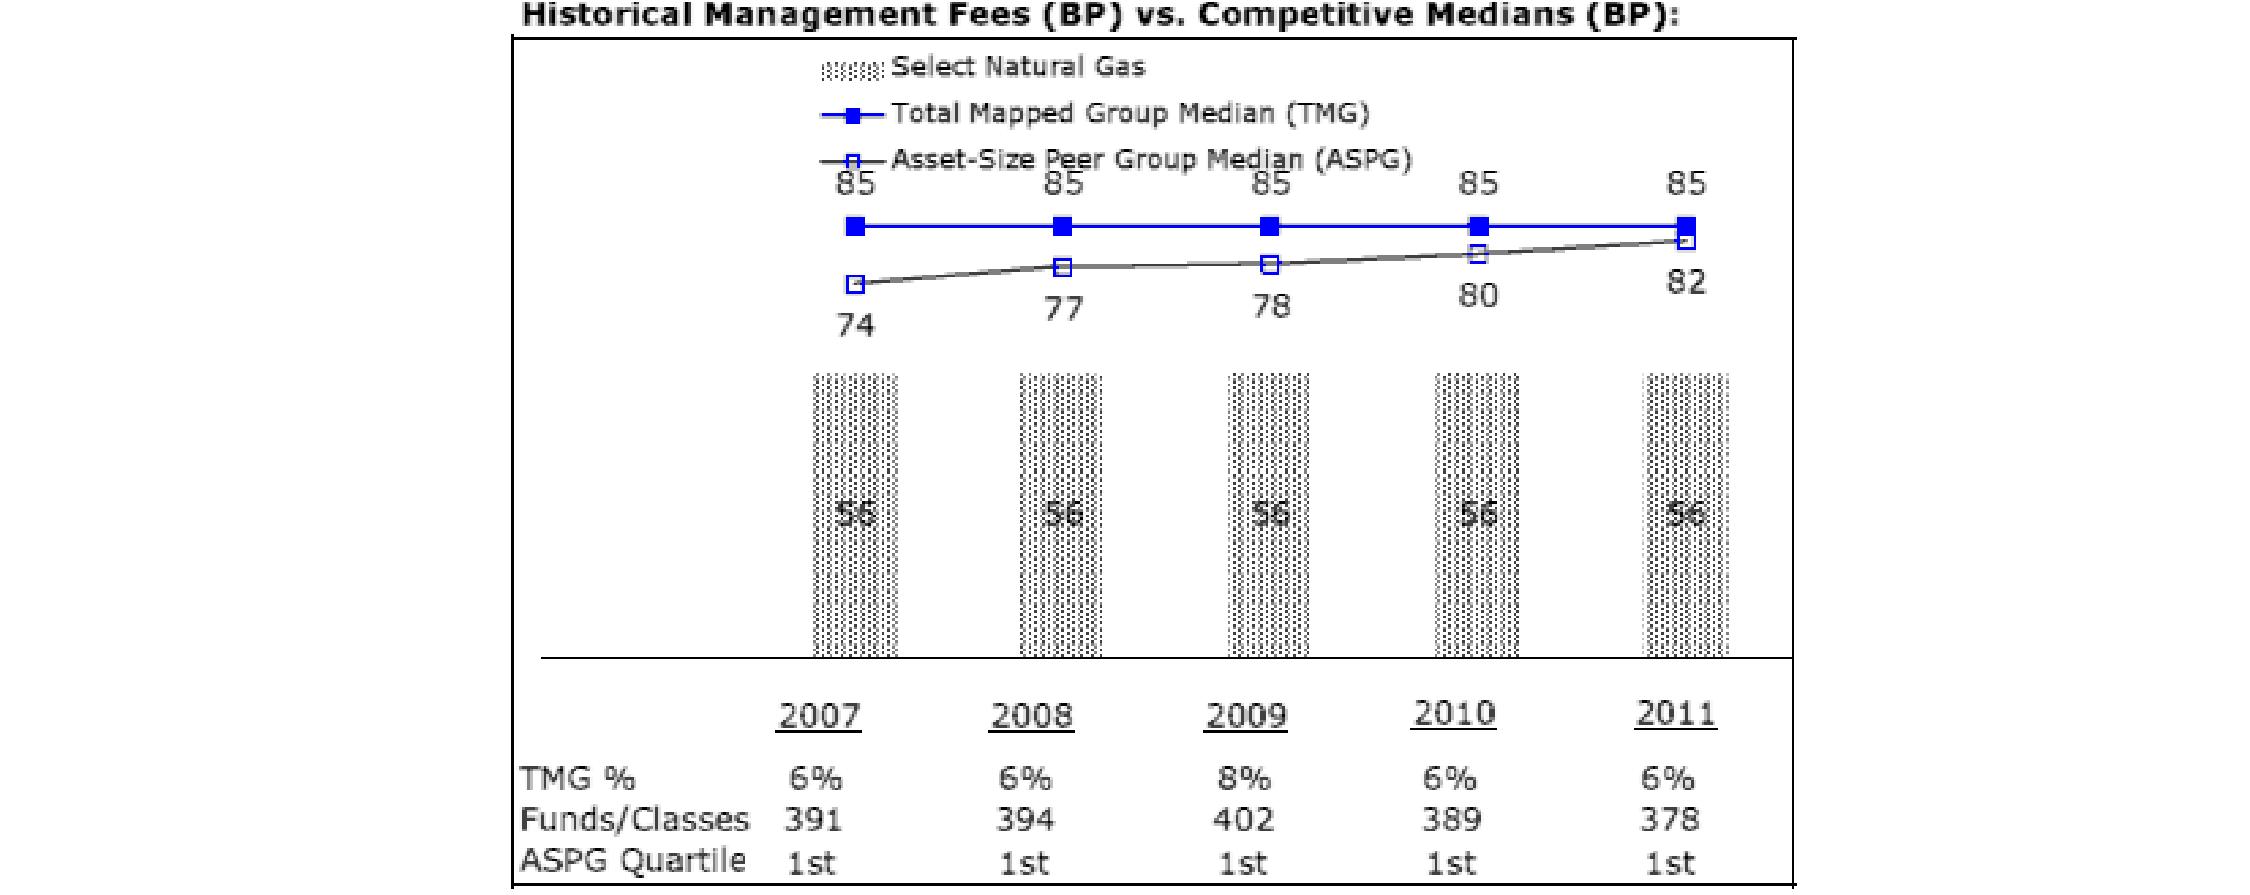
Natural Resources Portfolio
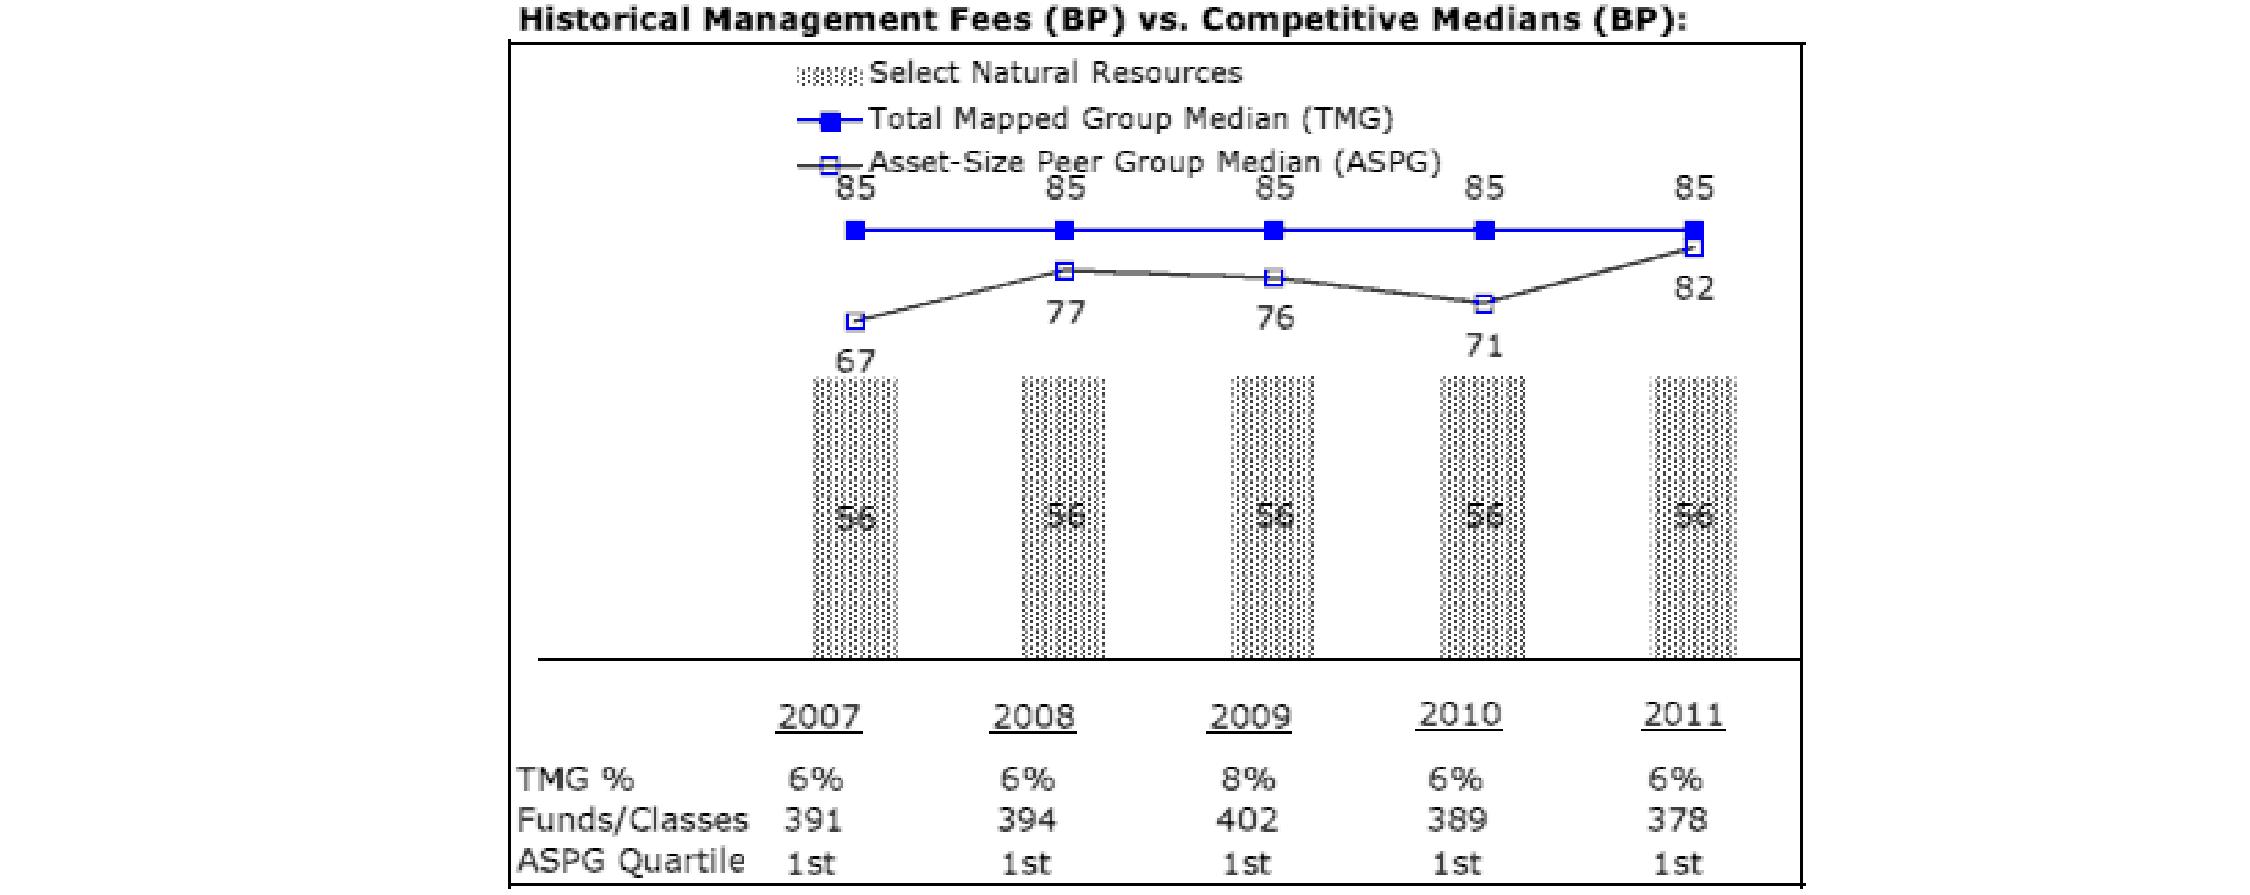
The Board noted that each fund's management fee ranked below the median of its Total Mapped Group and below the median of its ASPG for 2011.
Based on its review, the Board concluded that each fund's management fee is fair and reasonable in light of the services that the fund receives and the other factors considered.
Total Expense Ratio. In its review of each fund's total expense ratio, the Board considered the fund's management fee as well as other fund expenses, such as transfer agent fees, pricing and bookkeeping fees, and custodial, legal, and audit fees. The Board also noted the effects of any waivers and reimbursements on fees and expenses. As part of its review, the Board also considered the current and historical total expense ratios of each fund compared to competitive fund median expenses. Each fund is compared to those funds and classes in the Total Mapped Group (used by the Board for management fee comparisons) that have a similar sales load structure.
The Board noted that each fund's total expense ratio ranked below its competitive median for 2011.
Fees Charged to Other Fidelity Clients. The Board also considered Fidelity fee structures and other information with respect to clients of FMR and its affiliates, such as other mutual funds advised or subadvised by FMR or its affiliates, pension plan clients, and other institutional clients. The Board noted the findings of the 2010 ad hoc joint committee (created with the board of other Fidelity funds), which reviewed and compared Fidelity's institutional investment advisory business with its business of providing services to the Fidelity funds, including the differences in services provided, fees charged, and costs incurred, as well as competition in their respective marketplaces.
Semiannual Report
Board Approval of Investment Advisory Contracts and Management Fees - continued
Based on its review of total expense ratios and fees charged to other Fidelity clients, the Board concluded that each fund's total expense ratio was reasonable in light of the services that the fund and its shareholders receive and the other factors considered.
Costs of the Services and Profitability. The Board considered the revenues earned and the expenses incurred by Fidelity in conducting the business of developing, marketing, distributing, managing, administering and servicing each fund and its shareholders. The Board also considered the level of Fidelity's profits in respect of all the Fidelity funds.
On an annual basis, FMR presents to the Board Fidelity's profitability for each fund. Fidelity calculates the profitability for each fund, as well as aggregate profitability for groups of Fidelity funds and all Fidelity funds, using a series of detailed revenue and cost allocation methodologies which originate with the books and records of Fidelity on which Fidelity's audited financial statements are based. The Audit Committee of the Board reviews any significant changes from the prior year's methodologies.
PricewaterhouseCoopers LLP (PwC), independent registered public accounting firm and auditor to Fidelity and certain Fidelity funds, has been engaged annually by the Board as part of the Board's assessment of Fidelity's profitability analysis. PwC's engagement includes the review and assessment of Fidelity's methodologies used in determining the revenues and expenses attributable to Fidelity's mutual fund business, and completion of agreed-upon procedures surrounding the mathematical accuracy of fund profitability and its conformity to allocation methodologies. After considering PwC's reports issued under the engagement and information provided by Fidelity, the Board concluded that while other allocation methods may also be reasonable, Fidelity's profitability methodologies are reasonable in all material respects.
The Board also reviewed Fidelity's non-fund businesses and fall-out benefits related to the mutual fund business as well as cases where Fidelity's affiliates may benefit from or be related to the funds' business.
The Board considered the costs of the services provided by and the profits realized by Fidelity in connection with the operation of each fund and was satisfied that the profitability was not excessive in the circumstances.
Economies of Scale. The Board considered whether there have been economies of scale in respect of the management of the Fidelity funds, whether the Fidelity funds (including each fund) have appropriately benefited from any such economies of scale, and whether there is potential for realization of any further economies of scale. The Board considered the extent to which each fund will benefit from economies of scale through increased services to the fund, through waivers or reimbursements, or through fee or expense reductions. The Board also noted that in 2009, it and the board of other Fidelity funds created an ad hoc committee (the Economies of Scale Committee) to analyze whether FMR attains economies of scale in respect of the management and servicing of the Fidelity funds, whether the Fidelity funds have appropriately benefited from such economies of scale, and whether there is potential for realization of any further economies of scale.
The Board recognized that each fund's management contract incorporates a "group fee" structure, which provides for lower group fee rates as total fund assets under FMR's management increase, and for higher group fee rates as total fund assets under FMR's management decrease. FMR calculates the group fee rates based on a tiered asset "breakpoint" schedule that varies based on asset class. The Board considered that the group fee is designed to deliver the benefits of economies of scale to fund shareholders when total Fidelity fund assets increase, even if assets of any particular fund are unchanged or have declined, because some portion of Fidelity's costs are attributable to services provided to all Fidelity funds, and all funds benefit if those costs can be allocated among more assets. The Board concluded that, given the group fee structure, fund shareholders will benefit from lower management fees as assets under FMR's management increase at the fund complex level, regardless of whether Fidelity achieves any such economies of scale.
The Board concluded, taking into account the analysis of the Economies of Scale Committee, that economies of scale, if any, are being appropriately shared between fund shareholders and Fidelity.
Additional Information Requested by the Board. In order to develop fully the factual basis for consideration of the Fidelity funds' Advisory Contracts, the Board requested and received additional information on certain topics, including (i) fund performance trends, actions to be taken by FMR to improve certain funds' overall performance, and Fidelity's long-term strategies for certain funds; (ii) the potential to further rationalize the Fidelity fund lineup with the possibility of achieving savings for the funds and Fidelity; (iii) Fidelity's compensation structure for portfolio managers and other key investment personnel; (iv) the amount of the investment that each portfolio manager has made in the Fidelity fund(s) that he or she manages; (v) the realization of fall-out benefits in certain Fidelity business units; (vi) Fidelity's group fee structures, the potential impact of regulatory changes on such structures, and the rationale for the individual fee rates of certain funds; (vii) fund profitability methodology, including Fidelity's cost allocation methodology, and the impact of certain factors on fund profitability results; (viii) trends regarding industry use of performance fee structures and the possibility of implementing performance fee structures for additional funds; and (ix) the impact of net redemptions from the Fidelity funds.
Semiannual Report
Based on its evaluation of all of the conclusions noted above, and after considering all factors it believed relevant, the Board ultimately concluded that the advisory fee structures are fair and reasonable, and that each fund's Advisory Contracts should be renewed.
Semiannual Report
Investment Adviser
Fidelity Management & Research Company
Boston, MA
Investment Sub-Advisers
FMR Co., Inc.
Fidelity Management & Research
(U.K.) Inc.
Fidelity Management & Research
(Hong Kong) Limited
Fidelity Management & Research
(Japan) Inc.
General Distributor
Fidelity Distributors Corporation
Smithfield, RI
Transfer and Service Agents
Fidelity Investments Institutional Operations Company, Inc.
Boston, MA
Fidelity Service Company, Inc.
Boston, MA
Custodian
Brown Brothers Harriman & Co.
Boston, MA
Corporate Headquarters
82 Devonshire Street
Boston, MA 02109
1-800-544-8888
The Fidelity Telephone Connection
Mutual Fund 24-Hour Service
Exchanges/Redemptions
and Account Assistance 1-800-544-6666
Product Information 1-800-544-8888
Retirement Accounts 1-800-544-4774
(8 a.m. - 9 p.m.)
TDD Service 1-800-544-0118
for the deaf and hearing impaired
(9 a.m. - 9 p.m. Eastern time)
Fidelity Automated Service
Telephone (FAST®)
1-800-544-5555
Automated line for quickest service

SELNR-USAN-1012
1.813653.107
Fidelity®
Select Portfolios®
Health Care Sector
Biotechnology Portfolio
Health Care Portfolio
Medical Delivery Portfolio
Medical Equipment and Systems Portfolio
Pharmaceuticals Portfolio
Semiannual Report
August 31, 2012
(Fidelity Cover Art)
Contents
To view a fund's proxy voting guidelines and proxy voting record for the 12-month period ended June 30, visit http://www.fidelity.com/proxyvotingresults or visit the Securities and Exchange Commission's (SEC) web site at http://www.sec.gov. You may also call 1-800-544-8544 to request a free copy of the proxy voting guidelines.
Standard & Poor's, S&P and S&P 500 are registered service marks of The McGraw-Hill Companies, Inc. and have been licensed for use by Fidelity Distributors Corporation.
Other third party marks appearing herein are the property of their respective owners.
All other marks appearing herein are registered or unregistered trademarks or service marks of FMR LLC or an affiliated company. © 2012 FMR LLC. All rights reserved.
Semiannual Report
This report and the financial statements contained herein are submitted for the general information of the shareholders of the funds. This report is not authorized for distribution to prospective investors in the funds unless preceded or accompanied by an effective prospectus.
A fund files its complete schedule of portfolio holdings with the SEC for the first and third quarters of each fiscal year on Form N-Q. Forms N-Q are available on the SEC's web site at http://www.sec.gov. A fund's Forms N-Q may be reviewed and copied at the SEC's Public Reference Room in Washington, DC. Information regarding the operation of the SEC's Public Reference Room may be obtained by calling 1-800-SEC-0330. For a complete list of a fund's portfolio holdings, view the most recent holdings listing, semiannual report, or annual report on Fidelity's web site at http://www.fidelity.com, http://www.advisor.fidelity.com, or http://www.401k.com, as applicable.
NOT FDIC INSURED • MAY LOSE VALUE • NO BANK GUARANTEE
Neither the funds nor Fidelity Distributors Corporation is a bank.
Semiannual Report
As a shareholder of a Fund, you incur two types of costs: (1) transaction costs, including redemption fees and (2) ongoing costs, including management fees and other Fund expenses. This Example is intended to help you understand your ongoing costs (in dollars) of investing in the Funds and to compare these costs with the ongoing costs of investing in other mutual funds.
The Example is based on an investment of $1,000 invested at the beginning of the period and held for the entire period (March 1, 2012 to August 31, 2012).
Actual Expenses
The first line of the accompanying table for each fund provides information about actual account values and actual expenses. You may use the information in this line, together with the amount you invested, to estimate the expenses that you paid over the period. Simply divide your account value by $1,000.00 (for example, an $8,600 account value divided by $1,000.00 = 8.6), then multiply the result by the number in the first line for a fund under the heading entitled "Expenses Paid During Period" to estimate the expenses you paid on your account during this period. A small balance maintenance fee of $12.00 that is charged once a year may apply for certain accounts with a value of less than $2,000. This fee is not included in the table below. If it was, the estimate of expenses you paid during the period would be higher, and your ending account value lower, by this amount. In addition, each Fund, as a shareholder in the underlying Fidelity Central Funds, will indirectly bear its pro-rata share of the fees and expenses incurred by the underlying Fidelity Central Funds. These fees and expenses are not included in the Fund's annualized expense ratio used to calculate the expense estimate in the table below.
Hypothetical Example for Comparison Purposes
The second line of the accompanying table for each fund provides information about hypothetical account values and hypothetical expenses based on a fund's actual expense ratio and an assumed rate of return of 5% per year before expenses, which is not the Fund's actual return. The hypothetical account values and expenses may not be used to estimate the actual ending account balance or expenses you paid for the period. You may use this information to compare the ongoing costs of investing in the Fund and other funds. To do so, compare this 5% hypothetical example with the 5% hypothetical examples that appear in the shareholder reports of the other funds. A small balance maintenance fee of $12.00 that is charged once a year may apply for certain accounts with a value of less than $2,000. This fee is not included in the table below. If it was, the estimate of expenses you paid during the period would be higher, and your ending account value lower, by this amount. In addition, each Fund, as a shareholder in the underlying Fidelity Central Funds, will indirectly bear its pro-rata share of the fees and expenses incurred by the underlying Fidelity Central Funds. These fees and expenses are not included in the Fund's annualized expense ratio used to calculate the expense estimate in the table below.
Please note that the expenses shown in the table are meant to highlight your ongoing costs only and do not reflect any transaction costs. Therefore, the second line of the table is useful in comparing ongoing costs only, and will not help you determine the relative total costs of owning different funds. In addition, if these transactional costs were included, your costs would have been higher.
| Annualized Expense Ratio | Beginning
Account Value
March 1, 2012 | Ending
Account Value
August 31, 2012 | Expenses Paid
During Period*
March 1, 2012 to
August 31, 2012 |
Biotechnology Portfolio | .81% | | | |
Actual | | $ 1,000.00 | $ 1,171.80 | $ 4.43 |
HypotheticalA | | $ 1,000.00 | $ 1,021.12 | $ 4.13 |
Health Care Portfolio | .79% | | | |
Actual | | $ 1,000.00 | $ 1,072.50 | $ 4.13 |
HypotheticalA | | $ 1,000.00 | $ 1,021.22 | $ 4.02 |
Medical Delivery Portfolio | .86% | | | |
Actual | | $ 1,000.00 | $ 980.90 | $ 4.29 |
HypotheticalA | | $ 1,000.00 | $ 1,020.87 | $ 4.38 |
Medical Equipment and Systems Portfolio | .84% | | | |
Actual | | $ 1,000.00 | $ 1,005.70 | $ 4.25 |
HypotheticalA | | $ 1,000.00 | $ 1,020.97 | $ 4.28 |
Pharmaceuticals Portfolio | .86% | | | |
Actual | | $ 1,000.00 | $ 1,071.30 | $ 4.49 |
HypotheticalA | | $ 1,000.00 | $ 1,020.87 | $ 4.38 |
A 5% return per year before expenses
* Expenses are equal to each Fund's annualized expense ratio, multiplied by the average account value over the period, multiplied by 184/365 (to reflect the one-half year period).
Semiannual Report
Biotechnology Portfolio
Investment Changes (Unaudited)
Top Ten Stocks as of August 31, 2012 |
| % of fund's
net assets | % of fund's net assets
6 months ago |
Gilead Sciences, Inc. | 11.6 | 9.2 |
Amgen, Inc. | 10.6 | 5.8 |
Biogen Idec, Inc. | 7.8 | 4.9 |
Regeneron Pharmaceuticals, Inc. | 4.7 | 3.8 |
Onyx Pharmaceuticals, Inc. | 4.1 | 1.4 |
Vertex Pharmaceuticals, Inc. | 3.7 | 3.7 |
Celgene Corp. | 3.6 | 6.8 |
Medivation, Inc. | 2.9 | 3.7 |
Alexion Pharmaceuticals, Inc. | 2.9 | 4.1 |
Pharmacyclics, Inc. | 2.0 | 0.9 |
| 53.9 | |
Top Industries (% of fund's net assets) |
As of August 31, 2012 |
 | Biotechnology | 94.4% | |
 | Pharmaceuticals | 4.3% | |
 | Life Sciences Tools
& Services | 0.4% | |
 | Health Care Equipment & Supplies | 0.2% | |
 | Health Care Providers
& Services | 0.0% | |
 | All Others* | 0.7% | |

As of February 29, 2012 |
| Biotechnology | 93.1% | |
| Pharmaceuticals | 5.9% | |
| Life Sciences Tools
& Services | 0.6% | |
| Health Care Equipment & Supplies | 0.3% | |
| All Others* | 0.1% | |

* Includes short-term investments and net other assets. |
Semiannual Report
Biotechnology Portfolio
Investments August 31, 2012 (Unaudited)
Showing Percentage of Net Assets
Common Stocks - 99.0% |
| Shares | | Value |
BIOTECHNOLOGY - 94.2% |
Biotechnology - 94.2% |
A.P. Pharma, Inc. (f) | 14,288,530 | | $ 9,451,863 |
Acadia Pharmaceuticals, Inc. (a)(d)(e) | 3,088,375 | | 5,497,308 |
Achillion Pharmaceuticals, Inc. (a) | 750,608 | | 5,276,774 |
Acorda Therapeutics, Inc. (a) | 1,153,614 | | 26,360,080 |
Addex Pharmaceuticals Ltd. (a) | 940 | | 7,483 |
Aegerion Pharmaceuticals, Inc. (a) | 829,804 | | 11,550,872 |
Affymax, Inc. (a) | 949,683 | | 16,799,892 |
Agenus, Inc. (a)(d)(e) | 150,089 | | 688,909 |
Agenus, Inc. warrants 6/9/18 (a)(e)(f) | 1,548,000 | | 201,743 |
Alexion Pharmaceuticals, Inc. (a) | 644,519 | | 69,098,882 |
Alkermes PLC (a) | 936,348 | | 17,181,986 |
Alnylam Pharmaceuticals, Inc. (a)(d) | 1,563,203 | | 28,590,983 |
AMAG Pharmaceuticals, Inc. (a) | 834,351 | | 12,340,051 |
Amarin Corp. PLC ADR (a)(d) | 1,453,395 | | 19,896,978 |
Amgen, Inc. | 3,025,095 | | 253,865,972 |
Amicus Therapeutics, Inc. (a) | 130,782 | | 640,832 |
Anacor Pharmaceuticals, Inc. (a) | 359,358 | | 2,210,052 |
Arena Pharmaceuticals, Inc. (a)(d) | 3,861,344 | | 34,906,550 |
ARIAD Pharmaceuticals, Inc. (a) | 1,944,405 | | 39,976,967 |
ArQule, Inc. (a)(e) | 3,114,980 | | 16,322,495 |
AVEO Pharmaceuticals, Inc. (a)(d) | 389,487 | | 3,735,180 |
Biogen Idec, Inc. (a) | 1,281,456 | | 187,848,635 |
BioInvent International AB (a)(d) | 557,920 | | 246,852 |
BioMarin Pharmaceutical, Inc. (a) | 1,085,450 | | 40,530,703 |
Bionovo, Inc. (a) | 714,685 | | 11,435 |
Bionovo, Inc. warrants 2/2/16 (a) | 1,043,150 | | 9,469 |
Biospecifics Technologies Corp. (a) | 21,004 | | 394,455 |
BioTime, Inc. (a)(d) | 547,683 | | 2,218,116 |
Catalyst Pharmaceutical Partners, Inc. (a)(d)(e) | 2,004,418 | | 3,006,627 |
Catalyst Pharmaceutical Partners, Inc.: | | | |
warrants 5/2/17 (a)(e) | 141,443 | | 39,206 |
warrants 5/30/17 (a)(e) | 282,100 | | 140,726 |
Celgene Corp. (a) | 1,200,114 | | 86,456,213 |
Cell Therapeutics, Inc. (a)(d) | 10,165,268 | | 4,421,892 |
Cell Therapeutics, Inc. warrants 7/6/16 (a) | 835,596 | | 71,545 |
Celldex Therapeutics, Inc. (a)(d) | 1,839,005 | | 10,371,988 |
Cepheid, Inc. (a) | 537,200 | | 20,273,928 |
Clovis Oncology, Inc. (d) | 275,387 | | 4,816,519 |
Codexis, Inc. (a)(d) | 796,958 | | 1,809,095 |
Cubist Pharmaceuticals, Inc. (a) | 558,508 | | 25,803,070 |
Cytokinetics, Inc. (e) | 6,380,800 | | 4,843,027 |
Cytokinetics, Inc. warrants 6/25/17 (a)(e) | 3,828,480 | | 78,459 |
Dendreon Corp. (a)(d) | 1,442,852 | | 6,478,405 |
Durata Therapeutics, Inc. | 208,400 | | 1,785,988 |
Dyax Corp. (a) | 3,284,405 | | 7,422,755 |
Dynavax Technologies Corp. (a) | 2,926,243 | | 11,441,610 |
Emergent BioSolutions, Inc. (a) | 275,700 | | 4,061,061 |
Enzon Pharmaceuticals, Inc. (a) | 468,666 | | 3,168,182 |
Exact Sciences Corp. (a) | 766,261 | | 7,608,972 |
|
| Shares | | Value |
Exelixis, Inc. (a)(d) | 1,280,168 | | $ 5,671,144 |
Genomic Health, Inc. (a) | 281,585 | | 9,703,419 |
Geron Corp. (a)(d) | 1,249,811 | | 3,449,478 |
Gilead Sciences, Inc. (a) | 4,810,972 | | 277,544,972 |
Halozyme Therapeutics, Inc. (a) | 2,245,668 | | 13,024,874 |
Idenix Pharmaceuticals, Inc. (a) | 1,164,949 | | 6,581,962 |
ImmunoGen, Inc. (a)(d) | 984,415 | | 14,165,732 |
Immunomedics, Inc. (a) | 564,485 | | 1,902,314 |
Incyte Corp. (a)(d) | 1,134,380 | | 22,698,944 |
Infinity Pharmaceuticals, Inc. (a) | 467,034 | | 8,481,337 |
InterMune, Inc. (a)(d) | 1,926,202 | | 14,196,109 |
Ironwood Pharmaceuticals, Inc. Class A (a) | 1,636,338 | | 20,503,315 |
Isis Pharmaceuticals, Inc. (a)(d) | 1,037,791 | | 14,124,336 |
Keryx Biopharmaceuticals, Inc. (a)(d) | 792,900 | | 1,617,516 |
Lexicon Pharmaceuticals, Inc. (a) | 7,393,223 | | 16,560,820 |
Ligand Pharmaceuticals, Inc. Class B (a) | 472,128 | | 8,163,093 |
MannKind Corp. (a)(d) | 839,622 | | 2,266,979 |
Medivation, Inc. (a) | 668,398 | | 70,088,214 |
Merrimack Pharmaceuticals, Inc. | 44,600 | | 355,016 |
Metabolix, Inc. (a)(d) | 958,844 | | 1,601,269 |
Momenta Pharmaceuticals, Inc. (a)(d) | 537,248 | | 7,580,569 |
Myriad Genetics, Inc. (a) | 853,918 | | 21,339,411 |
Neurocrine Biosciences, Inc. (a) | 732,669 | | 5,407,097 |
NeurogesX, Inc. (a) | 3,131,785 | | 782,946 |
NewLink Genetics Corp. (d) | 367,162 | | 5,125,582 |
Novavax, Inc. (a)(d)(e) | 7,560,804 | | 15,424,040 |
Novelos Therapeutics, Inc. (a)(e) | 2,334,890 | | 2,334,890 |
Novelos Therapeutics, Inc. warrants 12/6/16 (a)(e) | 2,362,400 | | 983,424 |
NPS Pharmaceuticals, Inc. (a) | 1,640,126 | | 12,497,760 |
OncoGenex Pharmaceuticals, Inc. (a) | 247,395 | | 3,386,838 |
Oncothyreon, Inc. (a) | 216,310 | | 1,144,280 |
Onyx Pharmaceuticals, Inc. (a) | 1,352,845 | | 97,296,612 |
Opko Health, Inc. (a)(d) | 2,180,300 | | 9,680,532 |
Oragenics, Inc. (f) | 1,558,058 | | 3,505,631 |
OREXIGEN Therapeutics, Inc. (a)(d) | 2,266,463 | | 10,131,090 |
Osiris Therapeutics, Inc. (a)(d) | 466,118 | | 4,218,368 |
PDL BioPharma, Inc. (d) | 1,368,233 | | 10,070,195 |
Pharmacyclics, Inc. (a)(d) | 708,754 | | 47,429,818 |
PolyMedix, Inc. (a)(e) | 5,775,434 | | 1,963,648 |
PolyMedix, Inc. warrants 4/10/16 (a)(e) | 2,961,167 | | 507,983 |
Progenics Pharmaceuticals, Inc. (a)(e) | 2,748,532 | | 11,214,011 |
PROLOR Biotech, Inc. (a)(d) | 1,232,084 | | 6,024,891 |
Protalix BioTherapeutics, Inc. (a)(d) | 1,226,342 | | 6,659,037 |
Puma Biotechnology, Inc. | 833,601 | | 11,670,414 |
Raptor Pharmaceutical Corp. (a)(d) | 1,595,879 | | 7,931,519 |
Regeneron Pharmaceuticals, Inc. (a) | 762,787 | | 112,930,615 |
Rigel Pharmaceuticals, Inc. (a) | 1,147,051 | | 10,690,515 |
Sangamo Biosciences, Inc. (a)(d) | 1,205,172 | | 6,471,774 |
Sarepta Therapeutics, Inc. (a)(d) | 5,633 | | 89,114 |
Savient Pharmaceuticals, Inc. (a)(d) | 1,314,987 | | 1,735,783 |
Seattle Genetics, Inc. (a)(d) | 860,619 | | 22,840,828 |
Common Stocks - continued |
| Shares | | Value |
BIOTECHNOLOGY - CONTINUED |
Biotechnology - continued |
SIGA Technologies, Inc. (a)(d) | 1,726,114 | | $ 5,109,297 |
Sophiris Bio, Inc. | 2,502,000 | | 977,195 |
Sorrento Therapeutics, Inc. (f) | 11,780,000 | | 2,385,450 |
Spectrum Pharmaceuticals, Inc. (a)(d) | 1,883,308 | | 22,524,364 |
Sunesis Pharmaceuticals, Inc. (a)(d) | 725,964 | | 2,301,306 |
Synageva BioPharma Corp. (a) | 217,700 | | 10,876,292 |
Synergy Pharmaceuticals, Inc. (a) | 708,800 | | 3,508,560 |
Synergy Pharmaceuticals, Inc. warrants 11/14/16 (a) | 354,400 | | 754,872 |
Synta Pharmaceuticals Corp. (a)(d) | 2,424,956 | | 15,931,961 |
Synthetic Biologics, Inc. (a) | 900 | | 1,809 |
Targacept, Inc. (a) | 594,796 | | 2,676,582 |
Theravance, Inc. (a)(d) | 861,569 | | 22,978,045 |
Threshold Pharmaceuticals, Inc. (a)(d) | 1,298,778 | | 11,442,234 |
Threshold Pharmaceuticals, Inc. warrants 3/16/16 (a) | 631,520 | | 4,412,045 |
Tranzyme, Inc. (a)(d) | 764,186 | | 3,224,865 |
Trius Therapeutics, Inc. (a) | 988,906 | | 5,488,428 |
United Therapeutics Corp. (a) | 576,651 | | 31,208,352 |
Vanda Pharmaceuticals, Inc. (a)(e) | 1,625,800 | | 7,137,262 |
Verastem, Inc. | 97,067 | | 836,718 |
Vertex Pharmaceuticals, Inc. (a) | 1,646,462 | | 87,805,818 |
Vical, Inc. (a)(d) | 4,038,130 | | 14,658,412 |
XOMA Corp. (a) | 2,423,778 | | 8,410,510 |
ZIOPHARM Oncology, Inc. (a)(d) | 2,149,292 | | 10,681,981 |
| | 2,257,063,201 |
HEALTH CARE EQUIPMENT & SUPPLIES - 0.2% |
Health Care Equipment - 0.2% |
Alsius Corp. (a) | 314,300 | | 3 |
Aradigm Corp. (a) | 6,398,160 | | 742,187 |
InVivo Therapeutics Holdings Corp. (a)(d) | 1,639,800 | | 3,459,978 |
| | 4,202,168 |
HEALTH CARE PROVIDERS & SERVICES - 0.0% |
Health Care Services - 0.0% |
OvaScience, Inc. (f) | 212,300 | | 1,167,650 |
LIFE SCIENCES TOOLS & SERVICES - 0.4% |
Life Sciences Tools & Services - 0.4% |
BG Medicine, Inc. (a)(e) | 1,177,641 | | 4,675,235 |
ChromaDex, Inc. (a)(d) | 2,417,600 | | 1,641,550 |
Transgenomic, Inc. (a) | 554,882 | | 527,138 |
|
| Shares | | Value |
Transgenomic, Inc. (f) | 2,838,000 | | $ 2,696,100 |
Transgenomic, Inc. warrants 2/3/17 (a)(f) | 1,419,000 | | 19,359 |
| | 9,559,382 |
PERSONAL PRODUCTS - 0.0% |
Personal Products - 0.0% |
MYOS Corp. (f) | 1,666,700 | | 390,008 |
PHARMACEUTICALS - 4.2% |
Pharmaceuticals - 4.2% |
AcelRx Pharmaceuticals, Inc. (a) | 1,041,900 | | 3,021,510 |
Auxilium Pharmaceuticals, Inc. (a) | 427,051 | | 9,950,288 |
AVANIR Pharmaceuticals Class A (a)(d) | 5,003,317 | | 16,611,012 |
Corcept Therapeutics, Inc. (a)(d) | 46,569 | | 134,584 |
Elan Corp. PLC sponsored ADR (a) | 1,005,298 | | 11,420,185 |
Horizon Pharma, Inc. (a)(d) | 89,700 | | 398,268 |
Horizon Pharma, Inc. warrants 2/28/17 (a) | 319,539 | | 163,050 |
Jazz Pharmaceuticals PLC (a) | 106,217 | | 4,833,936 |
Omeros Corp. (a)(d) | 925,183 | | 8,724,476 |
Optimer Pharmaceuticals, Inc. (a)(d) | 398,061 | | 5,982,857 |
Pacira Pharmaceuticals, Inc. (a)(d) | 474,041 | | 8,608,585 |
TherapeuticsMD, Inc. (a) | 1,409,900 | | 4,779,561 |
Transcept Pharmaceuticals, Inc. (a) | 94,000 | | 627,920 |
Ventrus Biosciences, Inc. (a)(d) | 437,701 | | 1,654,510 |
ViroPharma, Inc. (a) | 331,699 | | 8,823,193 |
XenoPort, Inc. (a) | 776,869 | | 7,240,419 |
Zogenix, Inc. (a) | 3,213,108 | | 7,615,066 |
Zogenix, Inc. warrants 7/27/17 (a) | 498,465 | | 43,017 |
| | 100,632,437 |
TOTAL COMMON STOCKS (Cost $1,876,195,371) |
2,373,014,846
|
Convertible Preferred Stocks - 0.3% |
| | | |
BIOTECHNOLOGY - 0.2% |
Biotechnology - 0.2% |
bluebird bio (f) | 535,716 | | 267,108 |
Xenon Pharmaceuticals, Inc. Series E (a)(f) | 981,626 | | 3,416,058 |
| | 3,683,166 |
PHARMACEUTICALS - 0.1% |
Pharmaceuticals - 0.1% |
Agios Pharmaceuticals, Inc. Series C (f) | 229,509 | | 1,127,142 |
KaloBios Pharmaceuticals, Inc. Series E (a)(f) | 693,000 | | 2,356,200 |
| | 3,483,342 |
TOTAL CONVERTIBLE PREFERRED STOCKS (Cost $10,474,427) |
7,166,508
|
Money Market Funds - 12.2% |
| Shares | | Value |
Fidelity Cash Central Fund, 0.17% (b) | 17,059,447 | | $ 17,059,447 |
Fidelity Securities Lending Cash Central Fund, 0.18% (b)(c) | 274,793,996 | | 274,793,996 |
TOTAL MONEY MARKET FUNDS (Cost $291,853,443) |
291,853,443
|
TOTAL INVESTMENT PORTFOLIO - 111.5% (Cost $2,178,523,241) | | 2,672,034,797 |
NET OTHER ASSETS (LIABILITIES) - (11.5)% | | (276,534,163) |
NET ASSETS - 100% | $ 2,395,500,634 |
Legend |
(a) Non-income producing |
(b) Affiliated fund that is available only to investment companies and other accounts managed by Fidelity Investments. The rate quoted is the annualized seven-day yield of the fund at period end. A complete unaudited listing of the fund's holdings as of its most recent quarter end is available upon request. In addition, each Fidelity Central Fund's financial statements are available on the SEC's website or upon request. |
(c) Investment made with cash collateral received from securities on loan. |
(d) Security or a portion of the security is on loan at period end. |
(e) Affiliated company |
(f) Restricted securities - Investment in securities not registered under the Securities Act of 1933 (excluding 144A issues). At the end of the period, the value of restricted securities (excluding 144A issues) amounted to $26,984,312 or 1.1% of net assets. |
Additional information on each restricted holding is as follows: |
Security | Acquisition Date | Acquisition Cost |
A.P. Pharma, Inc. | 7/25/12 | $ 7,501,478 |
Agenus, Inc. warrants 6/9/18 | 1/9/08 | $ 1,930,622 |
Agios Pharmaceuticals, Inc. Series C | 11/16/11 | $ 1,127,142 |
bluebird bio | 7/23/12 | $ 266,947 |
KaloBios Pharmaceuticals, Inc. Series E | 5/2/12 | $ 2,356,200 |
MYOS Corp. | 7/2/12 | $ 416,675 |
Oragenics, Inc. | 7/31/12 | $ 2,337,087 |
OvaScience, Inc. | 3/29/12 | $ 1,167,650 |
Sorrento Therapeutics, Inc. | 5/15/12 | $ 1,884,800 |
Transgenomic, Inc. | 2/3/12 | $ 2,828,200 |
Transgenomic, Inc. warrants 2/3/17 | 2/3/12 | $ 9,800 |
Xenon Pharmaceuticals, Inc. Series E | 3/23/01 | $ 6,724,138 |
Affiliated Central Funds |
Information regarding fiscal year to date income earned by the Fund from investments in Fidelity Central Funds is as follows: |
Fund | Income earned |
Fidelity Cash Central Fund | $ 10,812 |
Fidelity Securities Lending Cash Central Fund | 3,433,620 |
Total | $ 3,444,432 |
Other Affiliated Issuers |
An affiliated company is a company in which the Fund has ownership of at least 5% of the voting securities. Fiscal year to date transactions with companies which are or were affiliates are as follows: |
Affiliate | Value, beginning of period | Purchases | Sales
Proceeds | Dividend Income | Value,
end of
period |
Acadia Pharmaceuticals, Inc. | $ 5,217,290 | $ 1,138,909 | $ 1,006,870 | $ - | $ 5,497,308 |
AcelRx Pharmaceuticals, Inc. | 2,938,158 | - | - | - | - |
Agenus, Inc. | 1,182,412 | - | 1,326,203 | - | 688,909 |
Agenus, Inc. warrants 6/9/18 | 210,780 | - | - | - | 201,743 |
ArQule, Inc. | 6,759,157 | 14,501,481 | 391,948 | - | 16,322,495 |
BG Medicine, Inc. | 5,510,191 | 2,915,171 | 7,359 | - | 4,675,235 |
Catalyst Pharmaceutical Partners, Inc. | 1,960,391 | 225,677 | 36,826 | - | 3,006,627 |
Catalyst Pharmaceutical Partners, Inc. warrants 5/2/17 | 72,699 | - | - | - | 39,206 |
Catalyst Pharmaceutical Partners, Inc. warrants 5/30/17 | - | 3 | - | - | 140,726 |
Cytokinetics, Inc. | - | 4,849,408 | - | - | 4,843,027 |
Cytokinetics, Inc. warrants 6/25/17 | - | - | - | - | 78,459 |
Novavax, Inc. | 3,095,123 | 7,859,673 | 72,613 | - | 15,424,040 |
Novelos Therapeutics, Inc. | 1,181,200 | - | 54,744 | - | 2,334,890 |
Novelos Therapeutics, Inc. warrants 12/6/16 | 46,546 | - | - | - | 983,424 |
OREXIGEN Therapeutics, Inc. | 12,734,873 | 4,344,338 | 6,750,019 | - | - |
PolyMedix, Inc. | 7,699,034 | - | 151,839 | - | 1,963,648 |
PolyMedix, Inc. warrants 4/10/16 | 2,392,472 | - | - | - | 507,983 |
Progenics Pharmaceuticals, Inc. | 21,224,629 | 6,368,747 | 698,061 | - | 11,214,011 |
Vanda Pharmaceuticals, Inc. | - | 8,137,480 | 303,037 | - | 7,137,262 |
Ventrus Biosciences, Inc. | 7,280,513 | - | 2,561,734 | - | - |
Total | $ 79,505,468 | $ 50,340,887 | $ 13,361,253 | $ - | $ 75,058,993 |
Other Information |
The following is a summary of the inputs used, as of August 31, 2012, involving the Fund's assets and liabilities carried at fair value. The inputs or methodology used for valuing securities may not be an indication of the risk associated with investing in those securities. For more information on valuation inputs, and their aggregation into the levels used in the table below, please refer to the Security Valuation section in the accompanying Notes to Financial Statements. |
Valuation Inputs at Reporting Date: |
Description | Total | Level 1 | Level 2 | Level 3 |
Investments in Securities: | | | | |
Common Stocks | $ 2,373,014,846 | $ 2,349,444,215 | $ 22,402,978 | $ 1,167,653 |
Convertible Preferred Stocks | 7,166,508 | - | - | 7,166,508 |
Money Market Funds | 291,853,443 | 291,853,443 | - | - |
Total Investments in Securities: | $ 2,672,034,797 | $ 2,641,297,658 | $ 22,402,978 | $ 8,334,161 |
See accompanying notes which are an integral part of the financial statements.
Semiannual Report
Biotechnology Portfolio
Statement of Assets and Liabilities
| August 31, 2012 (Unaudited) |
| | |
Assets | | |
Investment in securities, at value (including securities loaned of $262,079,684) - See accompanying schedule: Unaffiliated issuers (cost $1,799,157,262) | $ 2,305,122,361 | |
Fidelity Central Funds (cost $291,853,443) | 291,853,443 | |
Other affiliated issuers (cost $87,512,536) | 75,058,993 | |
Total Investments (cost $2,178,523,241) | | $ 2,672,034,797 |
Cash | | 213,836 |
Receivable for investments sold | | 607,583 |
Receivable for fund shares sold | | 7,510,169 |
Dividends receivable | | 939,346 |
Distributions receivable from Fidelity Central Funds | | 630,426 |
Other receivables | | 40,998 |
Total assets | | 2,681,977,155 |
| | |
Liabilities | | |
Payable for investments purchased | $ 7,782,219 | |
Payable for fund shares redeemed | 2,362,579 | |
Accrued management fee | 1,076,842 | |
Other affiliated payables | 428,435 | |
Other payables and accrued expenses | 32,450 | |
Collateral on securities loaned, at value | 274,793,996 | |
Total liabilities | | 286,476,521 |
| | |
Net Assets | | $ 2,395,500,634 |
Net Assets consist of: | | |
Paid in capital | | $ 1,886,510,314 |
Accumulated net investment loss | | (3,635,810) |
Accumulated undistributed net realized gain (loss) on investments and foreign currency transactions | | 19,114,574 |
Net unrealized appreciation (depreciation) on investments | | 493,511,556 |
Net Assets, for 22,124,513 shares outstanding | | $ 2,395,500,634 |
Net Asset Value, offering price and redemption price per share ($2,395,500,634 ÷ 22,124,513 shares) | | $ 108.27 |
Statement of Operations
Six months ended August 31, 2012 (Unaudited) |
| | |
Investment Income | | |
Dividends | | $ 1,588,997 |
Interest | | 345 |
Income from Fidelity Central Funds (including $3,433,620 from security lending) | | 3,444,432 |
Total income | | 5,033,774 |
| | |
Expenses | | |
Management fee | $ 5,502,147 | |
Transfer agent fees | 2,008,744 | |
Accounting and security lending fees | 325,141 | |
Custodian fees and expenses | 20,209 | |
Independent trustees' compensation | 6,617 | |
Registration fees | 80,254 | |
Audit | 20,756 | |
Legal | 3,951 | |
Interest | 1,780 | |
Miscellaneous | 7,946 | |
Total expenses before reductions | 7,977,545 | |
Expense reductions | (85,763) | 7,891,782 |
Net investment income (loss) | | (2,858,008) |
Realized and Unrealized Gain (Loss) Net realized gain (loss) on: | | |
Investment securities: | | |
Unaffiliated issuers | 48,633,626 | |
Other affiliated issuers | (5,325,624) | |
Foreign currency transactions | 972 | |
Total net realized gain (loss) | | 43,308,974 |
Change in net unrealized appreciation (depreciation) on investment securities | | 267,032,700 |
Net gain (loss) | | 310,341,674 |
Net increase (decrease) in net assets resulting from operations | | $ 307,483,666 |
See accompanying notes which are an integral part of the financial statements.
Semiannual Report
Financial Statements - continued
Statement of Changes in Net Assets
| Six months ended August 31, 2012 (Unaudited) | Year ended
February 29,
2012 |
Increase (Decrease) in Net Assets | | |
Operations | | |
Net investment income (loss) | $ (2,858,008) | $ (3,384,036) |
Net realized gain (loss) | 43,308,974 | 152,368,279 |
Change in net unrealized appreciation (depreciation) | 267,032,700 | 201,752,872 |
Net increase (decrease) in net assets resulting from operations | 307,483,666 | 350,737,115 |
Distributions to shareholders from net realized gain | (94,956,301) | (1,786,490) |
Share transactions
Proceeds from sales of shares | 714,592,489 | 771,494,800 |
Reinvestment of distributions | 89,418,687 | 1,665,527 |
Cost of shares redeemed | (362,923,101) | (393,289,579) |
Net increase (decrease) in net assets resulting from share transactions | 441,088,075 | 379,870,748 |
Redemption fees | 55,110 | 102,179 |
Total increase (decrease) in net assets | 653,670,550 | 728,923,552 |
| | |
Net Assets | | |
Beginning of period | 1,741,830,084 | 1,012,906,532 |
End of period (including accumulated net investment loss of $3,635,810 and accumulated net investment loss of $777,802, respectively) | $ 2,395,500,634 | $ 1,741,830,084 |
Other Information Shares | | |
Sold | 6,961,442 | 8,809,741 |
Issued in reinvestment of distributions | 974,060 | 19,987 |
Redeemed | (3,624,329) | (4,701,921) |
Net increase (decrease) | 4,311,173 | 4,127,807 |
Financial Highlights
| Six months ended August 31, 2012 | Years ended February 28, |
| (Unaudited) | 2012 K | 2011 | 2010 | 2009 | 2008 K |
Selected Per-Share Data | | | | | | |
Net asset value, beginning of period | $ 97.78 | $ 74.01 | $ 67.83 | $ 54.62 | $ 62.59 | $ 63.89 |
Income from Investment Operations | | | | | | |
Net investment income (loss) D | (.15) | (.23) | (.41) G | (.39) H | (.38) I | (.53) |
Net realized and unrealized gain (loss) | 15.99 | 24.11 | 6.59 | 13.60 | (7.60) | (.77) |
Total from investment operations | 15.84 | 23.88 | 6.18 | 13.21 | (7.98) | (1.30) |
Distributions from net realized gain | (5.35) | (.12) | - | - | - | - |
Redemption fees added to paid in capital D | - L | .01 | - L | - L | .01 | - L |
Net asset value, end of period | $ 108.27 | $ 97.78 | $ 74.01 | $ 67.83 | $ 54.62 | $ 62.59 |
Total Return B, C | 17.18% | 32.31% | 9.11% | 24.19% | (12.73)% | (2.03)% |
Ratios to Average Net Assets E, J | | | | | | |
Expenses before reductions | .81% A | .83% | .87% | .91% | .89% | .89% |
Expenses net of fee waivers, if any | .81% A | .83% | .87% | .91% | .89% | .89% |
Expenses net of all reductions | .80% A | .83% | .86% | .91% | .89% | .89% |
Net investment income (loss) | (.29)% A | (.27)% | (.59)% G | (.64)% H | (.61)% I | (.79)% |
Supplemental Data | | | | | | |
Net assets, end of period (000 omitted) | $ 2,395,501 | $ 1,741,830 | $ 1,012,907 | $ 1,068,656 | $ 1,152,137 | $ 1,088,003 |
Portfolio turnover rate F | 60% A | 106% | 119% | 109% | 55% | 143% |
AAnnualized BTotal returns for periods of less than one year are not annualized. CTotal returns would have been lower if certain expenses had not been reduced during the applicable periods shown. DCalculated based on average shares outstanding during the period. EFees and expenses of any underlying Fidelity Central Funds are not included in the Fund's expense ratio. The Fund indirectly bears its proportionate share of the expenses of any underlying Fidelity Central Funds. FAmount does not include the portfolio activity of any underlying Fidelity Central Funds. GInvestment income per share reflects a large, non-recurring dividend which amounted to $.11 per share. Excluding this non-recurring dividend, the ratio of net investment income (loss) to average net assets would have been (.75)%. HInvestment income per share reflects a large, non-recurring dividend which amounted to $.09 per share. Excluding this non-recurring dividend, the ratio of net investment income (loss) to average net assets would have been (.78)%. IInvestment income per share reflects a large, non-recurring dividend which amounted to $.05 per share. Excluding this non-recurring dividend, the ratio of net investment income (loss) to average net assets would have been (.69)%. JExpense ratios reflect operating expenses of the Fund. Expenses before reductions do not reflect amounts reimbursed by the investment adviser or reductions from brokerage service arrangements or reductions from other expense offset arrangements and do not represent the amount paid by the Fund during periods when reimbursements or reductions occur. Expenses net of fee waivers reflect expenses after reimbursement by the investment adviser but prior to reductions from brokerage service arrangements or other expense offset arrangements. Expenses net of all reductions represent the net expenses paid by the Fund. KFor the year ended February 29. LAmount represents less than $.01 per share. |
See accompanying notes which are an integral part of the financial statements.
Semiannual Report
Health Care Portfolio
Investment Changes (Unaudited)
Top Ten Stocks as of August 31, 2012 |
| % of fund's
net assets | % of fund's net assets
6 months ago |
Amgen, Inc. | 7.7 | 7.2 |
Pfizer, Inc. | 7.1 | 0.4 |
Merck & Co., Inc. | 6.1 | 3.8 |
UnitedHealth Group, Inc. | 4.9 | 5.1 |
Gilead Sciences, Inc. | 4.9 | 4.2 |
Eli Lilly & Co. | 4.1 | 1.2 |
Catamaran Corp. | 3.1 | 0.0 |
Johnson & Johnson | 2.9 | 0.0 |
Watson Pharmaceuticals, Inc. | 2.9 | 0.9 |
Biogen Idec, Inc. | 2.2 | 2.7 |
| 45.9 | |
Top Industries (% of fund's net assets) |
As of August 31, 2012 |
| Pharmaceuticals | 31.6% | |
| Biotechnology | 28.1% | |
| Health Care Providers
& Services | 21.8% | |
| Health Care Equipment
& Supplies | 8.8% | |
| Health Care Technology | 3.2% | |
| All Others* | 6.5% | |

As of February 29, 2012 |
| Health Care Providers
& Services | 31.0% | |
| Biotechnology | 26.8% | |
| Pharmaceuticals | 18.9% | |
| Health Care Equipment
& Supplies | 13.2% | |
| Food & Staples Retailing | 2.8% | |
| All Others* | 7.3% | |

* Includes short-term investments and net other assets. |
Semiannual Report
Health Care Portfolio
Investments August 31, 2012 (Unaudited)
Showing Percentage of Net Assets
Common Stocks - 96.8% |
| Shares | | Value |
BIOTECHNOLOGY - 28.0% |
Biotechnology - 28.0% |
Achillion Pharmaceuticals, Inc. (a)(d) | 900,000 | | $ 6,327,000 |
Acorda Therapeutics, Inc. (a) | 300,000 | | 6,855,000 |
Alexion Pharmaceuticals, Inc. (a) | 65,000 | | 6,968,650 |
AMAG Pharmaceuticals, Inc. (a) | 151,707 | | 2,243,747 |
Amgen, Inc. | 2,140,000 | | 179,588,799 |
ARIAD Pharmaceuticals, Inc. (a) | 700,000 | | 14,392,000 |
AVEO Pharmaceuticals, Inc. (a) | 400,000 | | 3,836,000 |
Biogen Idec, Inc. (a) | 350,000 | | 51,306,500 |
BioMarin Pharmaceutical, Inc. (a) | 1,040,000 | | 38,833,600 |
Biovitrum AB (a) | 1,210,552 | | 4,698,014 |
Discovery Laboratories, Inc. (a)(d) | 1,750,000 | | 5,635,000 |
Dynavax Technologies Corp. (a)(d) | 4,000,000 | | 15,640,000 |
Gilead Sciences, Inc. (a) | 2,000,000 | | 115,380,000 |
Grifols SA ADR | 700,000 | | 14,399,000 |
Infinity Pharmaceuticals, Inc. (a) | 500,000 | | 9,080,000 |
Lexicon Pharmaceuticals, Inc. (a) | 1,600,000 | | 3,584,000 |
Medivation, Inc. (a) | 240,000 | | 25,166,400 |
Merrimack Pharmaceuticals, Inc. | 37,600 | | 299,296 |
Merrimack Pharmaceuticals, Inc. (f) | 350,000 | | 2,507,400 |
Momenta Pharmaceuticals, Inc. (a) | 300,000 | | 4,233,000 |
Neurocrine Biosciences, Inc. (a) | 1,005,500 | | 7,420,590 |
NPS Pharmaceuticals, Inc. (a) | 800,000 | | 6,096,000 |
Onyx Pharmaceuticals, Inc. (a) | 200,000 | | 14,384,000 |
Progenics Pharmaceuticals, Inc. (a) | 300,000 | | 1,224,000 |
Puma Biotechnology, Inc. | 555,556 | | 7,777,784 |
Seattle Genetics, Inc. (a) | 400,000 | | 10,616,000 |
Spectrum Pharmaceuticals, Inc. (a) | 500,000 | | 5,980,000 |
Synageva BioPharma Corp. (a) | 440,000 | | 21,982,400 |
Targacept, Inc. (a) | 1,000,000 | | 4,500,000 |
Theravance, Inc. (a)(d) | 550,000 | | 14,668,500 |
Thrombogenics NV (a) | 200,000 | | 7,023,555 |
United Therapeutics Corp. (a) | 280,000 | | 15,153,600 |
Vertex Pharmaceuticals, Inc. (a) | 400,000 | | 21,332,000 |
Vical, Inc. (a) | 1,280,000 | | 4,646,400 |
ZIOPHARM Oncology, Inc. (a) | 503,120 | | 2,500,506 |
| | 656,278,741 |
DIVERSIFIED CONSUMER SERVICES - 0.4% |
Specialized Consumer Services - 0.4% |
Carriage Services, Inc. (e) | 996,904 | | 9,012,012 |
FOOD & STAPLES RETAILING - 0.8% |
Drug Retail - 0.8% |
CVS Caremark Corp. | 400,000 | | 18,220,000 |
Drogasil SA | 40,200 | | 425,190 |
| | 18,645,190 |
HEALTH CARE EQUIPMENT & SUPPLIES - 8.8% |
Health Care Equipment - 7.7% |
Boston Scientific Corp. (a) | 8,500,000 | | 45,900,000 |
C.R. Bard, Inc. | 200,000 | | 19,622,000 |
|
| Shares | | Value |
China Kanghui Holdings sponsored ADR (a) | 372,468 | | $ 9,307,975 |
Conceptus, Inc. (a) | 400,000 | | 7,604,000 |
CONMED Corp. | 250,000 | | 6,755,000 |
Covidien PLC | 300,000 | | 16,815,000 |
Genmark Diagnostics, Inc. (a) | 1,342,600 | | 10,109,778 |
HeartWare International, Inc. (a) | 190,400 | | 17,054,128 |
Insulet Corp. (a) | 530,000 | | 11,114,100 |
Opto Circuits India Ltd. | 1,300,000 | | 2,886,808 |
Volcano Corp. (a) | 300,000 | | 8,484,000 |
William Demant Holding A/S (a) | 80,000 | | 6,900,568 |
Wright Medical Group, Inc. (a) | 400,000 | | 8,280,000 |
Zeltiq Aesthetics, Inc. (d) | 1,019,727 | | 5,404,553 |
Zimmer Holdings, Inc. | 60,000 | | 3,706,800 |
| | 179,944,710 |
Health Care Supplies - 1.1% |
The Cooper Companies, Inc. | 300,000 | | 25,155,000 |
TOTAL HEALTH CARE EQUIPMENT & SUPPLIES | | 205,099,710 |
HEALTH CARE PROVIDERS & SERVICES - 21.8% |
Health Care Distributors & Services - 0.7% |
Amplifon SpA | 1,200,000 | | 5,029,188 |
McKesson Corp. | 115,000 | | 10,017,650 |
| | 15,046,838 |
Health Care Facilities - 1.7% |
Brookdale Senior Living, Inc. (a) | 900,000 | | 19,557,000 |
Emeritus Corp. (a) | 425,980 | | 8,528,120 |
Hanger, Inc. (a) | 300,000 | | 8,583,000 |
LCA-Vision, Inc. (a) | 900,000 | | 3,861,000 |
| | 40,529,120 |
Health Care Services - 9.0% |
Accretive Health, Inc. (a)(d) | 566,312 | | 6,733,450 |
Catamaran Corp. (a) | 830,000 | | 72,041,390 |
Express Scripts Holding Co. (a) | 400,000 | | 25,048,000 |
Fresenius Medical Care AG & Co. KGaA | 280,000 | | 20,146,206 |
HMS Holdings Corp. (a) | 400,000 | | 13,784,000 |
MEDNAX, Inc. (a) | 520,000 | | 36,025,600 |
Omnicare, Inc. | 225,000 | | 7,285,500 |
Quest Diagnostics, Inc. | 500,000 | | 30,235,000 |
| | 211,299,146 |
Managed Health Care - 10.4% |
Aetna, Inc. | 600,000 | | 23,046,000 |
Centene Corp. (a) | 180,000 | | 7,309,800 |
CIGNA Corp. | 400,000 | | 18,308,000 |
Health Net, Inc. (a) | 859,550 | | 19,984,538 |
Humana, Inc. | 380,000 | | 26,630,400 |
Qualicorp SA (a) | 1,600,000 | | 15,724,913 |
UnitedHealth Group, Inc. | 2,125,000 | | 115,387,500 |
Common Stocks - continued |
| Shares | | Value |
HEALTH CARE PROVIDERS & SERVICES - CONTINUED |
Managed Health Care - continued |
Universal American Spin Corp. (a) | 72,119 | | $ 652,677 |
WellPoint, Inc. | 270,000 | | 16,164,900 |
| | 243,208,728 |
TOTAL HEALTH CARE PROVIDERS & SERVICES | | 510,083,832 |
HEALTH CARE TECHNOLOGY - 2.7% |
Health Care Technology - 2.7% |
athenahealth, Inc. (a)(d) | 200,000 | | 17,674,000 |
Cerner Corp. (a) | 545,000 | | 39,861,300 |
HealthStream, Inc. (a) | 225,000 | | 6,394,500 |
| | 63,929,800 |
IT SERVICES - 0.8% |
IT Consulting & Other Services - 0.8% |
Maximus, Inc. | 340,000 | | 18,492,600 |
LIFE SCIENCES TOOLS & SERVICES - 0.4% |
Life Sciences Tools & Services - 0.4% |
Furiex Pharmaceuticals, Inc. (a) | 96,938 | | 1,788,506 |
Illumina, Inc. (a)(d) | 200,000 | | 8,416,000 |
| | 10,204,506 |
PERSONAL PRODUCTS - 0.5% |
Personal Products - 0.5% |
Prestige Brands Holdings, Inc. (a) | 770,000 | | 12,366,200 |
PHARMACEUTICALS - 31.6% |
Pharmaceuticals - 31.6% |
Cadence Pharmaceuticals, Inc. (a)(d) | 900,000 | | 3,546,000 |
Elan Corp. PLC sponsored ADR (a) | 1,500,000 | | 17,040,000 |
Eli Lilly & Co. | 2,150,000 | | 96,556,500 |
Endo Pharmaceuticals Holdings, Inc. (a) | 600,000 | | 19,092,000 |
Hi-Tech Pharmacal Co., Inc. (a) | 150,000 | | 5,353,500 |
Johnson & Johnson | 1,000,000 | | 67,430,000 |
Meda AB (A Shares) | 1,000,000 | | 9,860,771 |
Merck & Co., Inc. | 3,300,000 | | 142,065,000 |
Optimer Pharmaceuticals, Inc. (a)(d) | 830,300 | | 12,479,409 |
Pacira Pharmaceuticals, Inc. (a) | 250,000 | | 4,540,000 |
Pfizer, Inc. | 7,000,000 | | 167,020,000 |
Shire PLC sponsored ADR | 400,000 | | 36,216,000 |
UCB SA | 200,000 | | 9,810,840 |
Valeant Pharmaceuticals International, Inc. (Canada) (a) | 750,000 | | 38,399,696 |
ViroPharma, Inc. (a) | 1,400,000 | | 37,240,000 |
Watson Pharmaceuticals, Inc. (a) | 820,000 | | 66,707,000 |
XenoPort, Inc. (a) | 889,998 | | 8,294,781 |
| | 741,651,497 |
|
| Shares | | Value |
PROFESSIONAL SERVICES - 0.5% |
Research & Consulting Services - 0.5% |
Advisory Board Co. (a) | 280,000 | | $ 12,412,400 |
SOFTWARE - 0.5% |
Application Software - 0.5% |
Nuance Communications, Inc. (a) | 450,000 | | 10,732,500 |
TOTAL COMMON STOCKS (Cost $1,886,039,313) | 2,268,908,988 |
Convertible Preferred Stocks - 0.6% |
| | | |
BIOTECHNOLOGY - 0.1% |
Biotechnology - 0.1% |
Ariosa Diagnostics (f) | 496,689 | | 3,000,002 |
HEALTH CARE TECHNOLOGY - 0.5% |
Health Care Technology - 0.5% |
Castlight Health, Inc. Series D (a)(f) | 1,784,800 | | 12,493,600 |
TOTAL CONVERTIBLE PREFERRED STOCKS (Cost $13,774,054) | 15,493,602 |
Money Market Funds - 3.9% |
| | | |
Fidelity Cash Central Fund, 0.17% (b) | 52,289,246 | | 52,289,246 |
Fidelity Securities Lending Cash Central Fund, 0.18% (b)(c) | 38,654,698 | | 38,654,698 |
TOTAL MONEY MARKET FUNDS (Cost $90,943,944) | 90,943,944 |
TOTAL INVESTMENT PORTFOLIO - 101.3% (Cost $1,990,757,311) | 2,375,346,534 |
NET OTHER ASSETS (LIABILITIES) - (1.3)% | | (31,495,870) |
NET ASSETS - 100% | $ 2,343,850,664 |
Legend |
(a) Non-income producing |
(b) Affiliated fund that is available only to investment companies and other accounts managed by Fidelity Investments. The rate quoted is the annualized seven-day yield of the fund at period end. A complete unaudited listing of the fund's holdings as of its most recent quarter end is available upon request. In addition, each Fidelity Central Fund's financial statements are available on the SEC's website or upon request. |
(c) Investment made with cash collateral received from securities on loan. |
(d) Security or a portion of the security is on loan at period end. |
(e) Affiliated company |
(f) Restricted securities - Investment in securities not registered under the Securities Act of 1933 (excluding 144A issues). At the end of the period, the value of restricted securities (excluding 144A issues) amounted to $18,001,002 or 0.8% of net assets. |
Additional information on each restricted holding is as follows: |
Security | Acquisition Date | Acquisition Cost |
Ariosa Diagnostics | 11/30/11 | $ 3,000,002 |
Castlight Health, Inc. Series D | 4/25/12 | $ 10,774,052 |
Merrimack Pharmaceuticals, Inc. | 3/31/11 | $ 2,450,000 |
Affiliated Central Funds |
Information regarding fiscal year to date income earned by the Fund from investments in Fidelity Central Funds is as follows: |
Fund | Income earned |
Fidelity Cash Central Fund | $ 44,465 |
Fidelity Securities Lending Cash Central Fund | 292,607 |
Total | $ 337,072 |
Other Affiliated Issuers |
An affiliated company is a company in which the Fund has ownership of at least 5% of the voting securities. Fiscal year to date transactions with companies which are or were affiliates are as follows: |
Affiliate | Value,
beginning of
period | Purchases | Sales
Proceeds | Dividend
Income | Value,
end of
period |
Carriage Services, Inc. | $ 5,971,455 | $ - | $ - | $ 49,845 | $ 9,012,012 |
Genmark Diagnostics, Inc. | 3,923,962 | 1,671,998 | - | - | - |
Total | $ 9,895,417 | $ 1,671,998 | $ - | $ 49,845 | $ 9,012,012 |
Other Information |
The following is a summary of the inputs used, as of August 31, 2012, involving the Fund's assets and liabilities carried at fair value. The inputs or methodology used for valuing securities may not be an indication of the risk associated with investing in those securities. For more information on valuation inputs, and their aggregation into the levels used in the table below, please refer to the Security Valuation section in the accompanying Notes to Financial Statements. |
Valuation Inputs at Reporting Date: |
Description | Total | Level 1 | Level 2 | Level 3 |
Investments in Securities: | | | | |
Common Stocks | $ 2,268,908,988 | $ 2,246,255,382 | $ 22,653,606 | $ - |
Convertible Preferred Stocks | 15,493,602 | - | - | 15,493,602 |
Money Market Funds | 90,943,944 | 90,943,944 | - | - |
Total Investments in Securities: | $ 2,375,346,534 | $ 2,337,199,326 | $ 22,653,606 | $ 15,493,602 |
Distribution of investments by country or territory of incorporation, as a percentage of total net assets, is as follows. (Unaudited) |
United States of America | 88.0% |
Canada | 4.7% |
Bailiwick of Jersey | 1.5% |
Ireland | 1.4% |
Others (Individually Less Than 1%) | 4.4% |
| 100.0% |
See accompanying notes which are an integral part of the financial statements.
Semiannual Report
Health Care Portfolio
Statement of Assets and Liabilities
| August 31, 2012 (Unaudited) |
| | |
Assets | | |
Investment in securities, at value (including securities loaned of $37,765,756) - See accompanying schedule: Unaffiliated issuers (cost $1,894,113,102) | $ 2,275,390,578 | |
Fidelity Central Funds (cost $90,943,944) | 90,943,944 | |
Other affiliated issuers (cost $5,700,265) | 9,012,012 | |
Total Investments (cost $1,990,757,311) | | $ 2,375,346,534 |
Receivable for investments sold | | 3,895,594 |
Receivable for fund shares sold | | 6,255,901 |
Dividends receivable | | 3,992,274 |
Distributions receivable from Fidelity Central Funds | | 56,694 |
Other receivables | | 65,536 |
Total assets | | 2,389,612,533 |
| | |
Liabilities | | |
Payable to custodian bank | $ 837,268 | |
Payable for investments purchased | 3,755,776 | |
Payable for fund shares redeemed | 927,375 | |
Accrued management fee | 1,067,036 | |
Other affiliated payables | 417,949 | |
Other payables and accrued expenses | 101,767 | |
Collateral on securities loaned, at value | 38,654,698 | |
Total liabilities | | 45,761,869 |
| | |
Net Assets | | $ 2,343,850,664 |
Net Assets consist of: | | |
Paid in capital | | $ 1,813,595,445 |
Undistributed net investment income | | 5,112,001 |
Accumulated undistributed net realized gain (loss) on investments and foreign currency transactions | | 140,558,789 |
Net unrealized appreciation (depreciation) on investments and assets and liabilities in foreign currencies | | 384,584,429 |
Net Assets, for 16,874,846 shares outstanding | | $ 2,343,850,664 |
Net Asset Value, offering price and redemption price per share ($2,343,850,664 ÷ 16,874,846 shares) | | $ 138.90 |
Statement of Operations
Six months ended August 31, 2012 (Unaudited) |
| | |
Investment Income | | |
Dividends (including $49,845 earned from other affiliated issuers) | | $ 13,502,196 |
Interest | | 2,855 |
Income from Fidelity Central Funds (including $292,607 from security lending) | | 337,072 |
Total income | | 13,842,123 |
| | |
Expenses | | |
Management fee | $ 6,173,396 | |
Transfer agent fees | 2,121,851 | |
Accounting and security lending fees | 338,984 | |
Custodian fees and expenses | 56,881 | |
Independent trustees' compensation | 7,556 | |
Registration fees | 35,557 | |
Audit | 22,121 | |
Legal | 4,277 | |
Miscellaneous | 12,544 | |
Total expenses before reductions | 8,773,167 | |
Expense reductions | (80,695) | 8,692,472 |
Net investment income (loss) | | 5,149,651 |
Realized and Unrealized Gain (Loss) Net realized gain (loss) on: | | |
Investment securities: | | |
Unaffiliated issuers | 149,933,724 | |
Foreign currency transactions | (55,754) | |
Total net realized gain (loss) | | 149,877,970 |
Change in net unrealized appreciation (depreciation) on: Investment securities | 1,778,638 | |
Assets and liabilities in foreign currencies | (2,661) | |
Total change in net unrealized appreciation (depreciation) | | 1,775,977 |
Net gain (loss) | | 151,653,947 |
Net increase (decrease) in net assets resulting from operations | | $ 156,803,598 |
See accompanying notes which are an integral part of the financial statements.
Semiannual Report
Statement of Changes in Net Assets
| Six months ended August 31, 2012 (Unaudited) | Year ended
February 29,
2012 |
Increase (Decrease) in Net Assets | | |
Operations | | |
Net investment income (loss) | $ 5,149,651 | $ 1,031 |
Net realized gain (loss) | 149,877,970 | 269,212,000 |
Change in net unrealized appreciation (depreciation) | 1,775,977 | (93,355,802) |
Net increase (decrease) in net assets resulting from operations | 156,803,598 | 175,857,229 |
Distributions to shareholders from net realized gain | (57,628,797) | (176,290,692) |
Share transactions
Proceeds from sales of shares | 191,280,249 | 643,651,462 |
Reinvestment of distributions | 54,846,728 | 167,043,397 |
Cost of shares redeemed | (177,684,498) | (625,716,838) |
Net increase (decrease) in net assets resulting from share transactions | 68,442,479 | 184,978,021 |
Redemption fees | 9,331 | 75,308 |
Total increase (decrease) in net assets | 167,626,611 | 184,619,866 |
| | |
Net Assets | | |
Beginning of period | 2,176,224,053 | 1,991,604,187 |
End of period (including undistributed net investment income of $5,112,001 and distributions in excess of net investment income of $37,650, respectively) | $ 2,343,850,664 | $ 2,176,224,053 |
Other Information Shares | | |
Sold | 1,428,555 | 4,810,845 |
Issued in reinvestment of distributions | 425,796 | 1,397,502 |
Redeemed | (1,332,886) | (4,725,720) |
Net increase (decrease) | 521,465 | 1,482,627 |
Financial Highlights
| Six months ended August 31, 2012 | Years ended February 28, |
| (Unaudited) | 2012 J | 2011 | 2010 | 2009 | 2008 J |
Selected Per-Share Data | | | | | | |
Net asset value, beginning of period | $ 133.07 | $ 133.93 | $ 109.17 | $ 73.65 | $ 114.24 | $ 126.78 |
Income from Investment Operations | | | | | | |
Net investment income (loss) D | .31 | - K | .04 | .06 | .42 | .39 H |
Net realized and unrealized gain (loss) | 9.06 | 10.86 | 24.90 | 35.71 | (35.98) | 1.63 |
Total from investment operations | 9.37 | 10.86 | 24.94 | 35.77 | (35.56) | 2.02 |
Distributions from net investment income | - | - | (.17) | (.25) | (.37) | (.39) |
Distributions from net realized gain | (3.54) | (11.72) | (.01) | (.01) | (4.66) | (14.17) |
Total distributions | (3.54) | (11.72) | (.18) | (.25) L | (5.03) | (14.56) |
Redemption fees added to paid in capital D,K | - | - | - | - | - | - |
Net asset value, end of period | $ 138.90 | $ 133.07 | $ 133.93 | $ 109.17 | $ 73.65 | $ 114.24 |
Total Return B,C | 7.25% | 9.10% | 22.86% | 48.65% | (32.34)% | .72% |
Ratios to Average Net Assets E,I | | | | | | |
Expenses before reductions | .79% A | .80% | .82% | .88% | .86% | .85% |
Expenses net of fee waivers, if any | .79% A | .80% | .82% | .88% | .86% | .85% |
Expenses net of all reductions | .78% A | .80% | .82% | .87% | .86% | .84% |
Net investment income (loss) | .46% A | .00% G | .03% | .07% | .44% | .30% H |
Supplemental Data | | | | | | |
Net assets, end of period (000 omitted) | $ 2,343,851 | $ 2,176,224 | $ 1,991,604 | $ 1,727,742 | $ 1,191,143 | $ 1,948,147 |
Portfolio turnover rate F | 105% A | 130% | 99% | 116% | 173% | 120% |
AAnnualized BTotal returns for periods of less than one year are not annualized. CTotal returns would have been lower if certain expenses had not been reduced during the applicable periods shown. DCalculated based on average shares outstanding during the period. EFees and expenses of any underlying Fidelity Central Funds are not included in the Fund's expense ratio. The Fund indirectly bears its proportionate share of the expenses of any underlying Fidelity Central Funds. FAmount does not include the portfolio activity of any underlying Fidelity Central Funds. GAmount represents less than .01%. HInvestment income per share reflects a large, non-recurring dividend which amounted to $.13 per share. Excluding this non-recurring dividend, the ratio of net investment income (loss) to average net assets would have been .20%. IExpense ratios reflect operating expenses of the Fund. Expenses before reductions do not reflect amounts reimbursed by the investment adviser or reductions from brokerage service arrangements or reductions from other expense offset arrangements and do not represent the amount paid by the Fund during periods when reimbursements or reductions occur. Expenses net of fee waivers reflect expenses after reimbursement by the investment adviser but prior to reductions from brokerage service arrangements or other expense offset arrangements. Expenses net of all reductions represent the net expenses paid by the Fund. JFor the year ended February 29. KAmount represents less than $.01 per share. LTotal distributions of $.25 per share is comprised of distributions from net investment income of $.245 and distributions from net realized gain of $.005 per share. |
See accompanying notes which are an integral part of the financial statements.
Semiannual Report
Medical Delivery Portfolio
Investment Changes (Unaudited)
Top Ten Stocks as of August 31, 2012 |
| % of fund's
net assets | % of fund's net assets
6 months ago |
UnitedHealth Group, Inc. | 19.4 | 16.6 |
Express Scripts Holding Co. | 17.0 | 10.0 |
McKesson Corp. | 6.9 | 7.4 |
WellPoint, Inc. | 6.2 | 8.5 |
CIGNA Corp. | 5.0 | 4.7 |
Humana, Inc. | 4.9 | 4.3 |
Aetna, Inc. | 4.9 | 4.5 |
Quest Diagnostics, Inc. | 4.6 | 0.1 |
Laboratory Corp. of America Holdings | 4.2 | 0.0 |
AmerisourceBergen Corp. | 3.7 | 2.2 |
| 76.8 | |
Top Industries (% of fund's net assets) |
As of August 31, 2012 |
| Health Care Providers
& Services | 95.8% | |
 | Diversified Consumer Services | 0.5% | |
 | Health Care Equipment
& Supplies | 0.5% | |
| Life Sciences Tools
& Services | 0.3% | |
| All Others* | 2.9% | |

As of February 29, 2012 |
| Health Care Providers
& Services | 87.6% | |
| Health Care Technology | 4.2% | |
| Food & Staples Retailing | 2.4% | |
| Diversified Consumer Services | 1.4% | |
| Biotechnology | 1.2% | |
| All Others* | 3.2% | |

* Includes short-term investments and net other assets. |
Semiannual Report
Medical Delivery Portfolio
Investments August 31, 2012 (Unaudited)
Showing Percentage of Net Assets
Common Stocks - 97.1% |
| Shares | | Value |
DIVERSIFIED CONSUMER SERVICES - 0.5% |
Specialized Consumer Services - 0.5% |
Weight Watchers International, Inc. (d) | 74,600 | | $ 3,563,642 |
HEALTH CARE EQUIPMENT & SUPPLIES - 0.5% |
Health Care Equipment - 0.3% |
Opto Circuits India Ltd. | 870,385 | | 1,932,795 |
Health Care Supplies - 0.2% |
DENTSPLY International, Inc. | 48,800 | | 1,769,976 |
TOTAL HEALTH CARE EQUIPMENT & SUPPLIES | | 3,702,771 |
HEALTH CARE PROVIDERS & SERVICES - 95.8% |
Health Care Distributors & Services - 16.4% |
AmerisourceBergen Corp. | 720,452 | | 27,751,811 |
Henry Schein, Inc. (a) | 306,100 | | 23,511,541 |
McKesson Corp. | 589,500 | | 51,351,345 |
MWI Veterinary Supply, Inc. (a) | 53,900 | | 5,434,198 |
Patterson Companies, Inc. | 428,600 | | 14,559,542 |
| | 122,608,437 |
Health Care Facilities - 4.1% |
Capital Senior Living Corp. (a) | 161,500 | | 1,942,845 |
LifePoint Hospitals, Inc. (a) | 500 | | 20,210 |
The Ensign Group, Inc. | 96,500 | | 2,840,960 |
Universal Health Services, Inc. Class B | 493,100 | | 19,699,345 |
VCA Antech, Inc. (a) | 319,800 | | 6,184,932 |
| | 30,688,292 |
Health Care Services - 33.2% |
Air Methods Corp. (a) | 45,600 | | 5,314,224 |
Catamaran Corp. (a) | 40,906 | | 3,550,512 |
Chemed Corp. | 146,200 | | 9,653,586 |
Corvel Corp. (a) | 61,300 | | 2,684,940 |
Express Scripts Holding Co. (a) | 2,030,250 | | 127,134,255 |
Laboratory Corp. of America Holdings (a) | 360,200 | | 31,679,590 |
Landauer, Inc. | 63,500 | | 3,723,640 |
LHC Group, Inc. (a) | 92,900 | | 1,616,460 |
MEDNAX, Inc. (a) | 278,600 | | 19,301,408 |
Metropolitan Health Networks, Inc. (a) | 318,700 | | 2,562,348 |
Quest Diagnostics, Inc. | 573,100 | | 34,655,357 |
Team Health Holdings, Inc. (a) | 212,600 | | 6,069,730 |
| | 247,946,050 |
|
| Shares | | Value |
Managed Health Care - 42.1% |
Aetna, Inc. | 943,156 | | $ 36,226,622 |
Centene Corp. (a) | 174,200 | | 7,074,262 |
CIGNA Corp. | 820,400 | | 37,549,708 |
Humana, Inc. | 516,972 | | 36,229,398 |
Magellan Health Services, Inc. (a) | 118,900 | | 5,898,629 |
UnitedHealth Group, Inc. | 2,670,997 | | 145,035,137 |
WellPoint, Inc. | 778,400 | | 46,602,808 |
| | 314,616,564 |
TOTAL HEALTH CARE PROVIDERS & SERVICES | | 715,859,343 |
LIFE SCIENCES TOOLS & SERVICES - 0.3% |
Life Sciences Tools & Services - 0.3% |
Waters Corp. (a) | 28,900 | | 2,317,491 |
TOTAL COMMON STOCKS (Cost $613,612,108) | 725,443,247 |
Money Market Funds - 2.3% |
| | | |
Fidelity Cash Central Fund, 0.17% (b) | 13,698,107 | | 13,698,107 |
Fidelity Securities Lending Cash Central Fund, 0.18% (b)(c) | 3,636,750 | | 3,636,750 |
TOTAL MONEY MARKET FUNDS (Cost $17,334,857) | 17,334,857 |
TOTAL INVESTMENT PORTFOLIO - 99.4% (Cost $630,946,965) | | 742,778,104 |
NET OTHER ASSETS (LIABILITIES) - 0.6% | | 4,441,049 |
NET ASSETS - 100% | $ 747,219,153 |
Legend |
(a) Non-income producing |
(b) Affiliated fund that is available only to investment companies and other accounts managed by Fidelity Investments. The rate quoted is the annualized seven-day yield of the fund at period end. A complete unaudited listing of the fund's holdings as of its most recent quarter end is available upon request. In addition, each Fidelity Central Fund's financial statements are available on the SEC's website or upon request. |
(c) Investment made with cash collateral received from securities on loan. |
(d) Security or a portion of the security is on loan at period end. |
Affiliated Central Funds |
Information regarding fiscal year to date income earned by the Fund from investments in Fidelity Central Funds is as follows: |
Fund | Income earned |
Fidelity Cash Central Fund | $ 9,790 |
Fidelity Securities Lending Cash Central Fund | 183,506 |
Total | $ 193,296 |
Other Information |
All investments are categorized as Level 1 under the Fair Value Hierarchy. The inputs or methodology used for valuing securities may not be an indication of the risk associated with investing in those securities. For more information on valuation inputs, please refer to the Security Valuation section in the accompanying Notes to Financial Statements. |
See accompanying notes which are an integral part of the financial statements.
Semiannual Report
Medical Delivery Portfolio
Statement of Assets and Liabilities
| August 31, 2012 (Unaudited) |
| | |
Assets | | |
Investment in securities, at value (including securities loaned of $3,563,642) - See accompanying schedule: Unaffiliated issuers (cost $613,612,108) | $ 725,443,247 | |
Fidelity Central Funds (cost $17,334,857) | 17,334,857 | |
Total Investments (cost $630,946,965) | | $ 742,778,104 |
Cash | | 1,346,541 |
Foreign currency held at value (cost $5) | | 5 |
Receivable for investments sold | | 9,592,717 |
Receivable for fund shares sold | | 347,041 |
Dividends receivable | | 269,799 |
Distributions receivable from Fidelity Central Funds | | 4,662 |
Other receivables | | 48,446 |
Total assets | | 754,387,315 |
| | |
Liabilities | | |
Payable for investments purchased | $ 1,333,810 | |
Payable for fund shares redeemed | 1,630,559 | |
Accrued management fee | 350,504 | |
Other affiliated payables | 186,178 | |
Other payables and accrued expenses | 30,361 | |
Collateral on securities loaned, at value | 3,636,750 | |
Total liabilities | | 7,168,162 |
| | |
Net Assets | | $ 747,219,153 |
Net Assets consist of: | | |
Paid in capital | | $ 605,026,315 |
Accumulated net investment loss | | (644,761) |
Accumulated undistributed net realized gain (loss) on investments and foreign currency transactions | | 31,008,460 |
Net unrealized appreciation (depreciation) on investments and assets and liabilities in foreign currencies | | 111,829,139 |
Net Assets, for 12,435,426 shares outstanding | | $ 747,219,153 |
Net Asset Value, offering price and redemption price per share ($747,219,153 ÷ 12,435,426 shares) | | $ 60.09 |
Statement of Operations
Six months ended August 31, 2012 (Unaudited) |
| | |
Investment Income | | |
Dividends | | $ 3,235,591 |
Interest | | 163 |
Income from Fidelity Central Funds (including $183,506 from security lending) | | 193,296 |
Total income | | 3,429,050 |
| | |
Expenses | | |
Management fee | $ 2,404,003 | |
Transfer agent fees | 1,024,511 | |
Accounting and security lending fees | 149,891 | |
Custodian fees and expenses | 18,162 | |
Independent trustees' compensation | 2,961 | |
Registration fees | 54,385 | |
Audit | 17,848 | |
Legal | 1,704 | |
Interest | 1,077 | |
Miscellaneous | 4,944 | |
Total expenses before reductions | 3,679,486 | |
Expense reductions | (77,861) | 3,601,625 |
Net investment income (loss) | | (172,575) |
Realized and Unrealized Gain (Loss) Net realized gain (loss) on: | | |
Investment securities: | | |
Unaffiliated issuers | 59,851,551 | |
Foreign currency transactions | (20,299) | |
Total net realized gain (loss) | | 59,831,252 |
Change in net unrealized appreciation (depreciation) on: Investment securities | (85,566,693) | |
Assets and liabilities in foreign currencies | (5,239) | |
Total change in net unrealized appreciation (depreciation) | | (85,571,932) |
Net gain (loss) | | (25,740,680) |
Net increase (decrease) in net assets resulting from operations | | $ (25,913,255) |
See accompanying notes which are an integral part of the financial statements.
Semiannual Report
Medical Delivery Portfolio
Financial Statements - continued
Statement of Changes in Net Assets
| Six months ended
August 31, 2012
(Unaudited) | Year ended
February 29,
2012 |
Increase (Decrease) in Net Assets | | |
Operations | | |
Net investment income (loss) | $ (172,575) | $ (358,264) |
Net realized gain (loss) | 59,831,252 | 20,993,184 |
Change in net unrealized appreciation (depreciation) | (85,571,932) | 35,164,416 |
Net increase (decrease) in net assets resulting from operations | (25,913,255) | 55,799,336 |
Share transactions
Proceeds from sales of shares | 187,829,664 | 856,410,093 |
Cost of shares redeemed | (285,077,707) | (608,437,132) |
Net increase (decrease) in net assets resulting from share transactions | (97,248,043) | 247,972,961 |
Redemption fees | 22,369 | 185,986 |
Total increase (decrease) in net assets | (123,138,929) | 303,958,283 |
| | |
Net Assets | | |
Beginning of period | 870,358,082 | 566,399,799 |
End of period (including accumulated net investment loss of $644,761 and accumulated net investment loss of $472,186, respectively) | $ 747,219,153 | $ 870,358,082 |
Other Information Shares | | |
Sold | 3,003,644 | 14,989,950 |
Redeemed | (4,774,671) | (11,022,680) |
Net increase (decrease) | (1,771,027) | 3,967,270 |
Financial Highlights
| Six months ended
August 31, 2012 | Years ended February 28, |
| (Unaudited) | 2012 I | 2011 | 2010 | 2009 | 2008 I |
Selected Per-Share Data | | | | | | |
Net asset value, beginning of period | $ 61.26 | $ 55.32 | $ 44.38 | $ 25.53 | $ 45.27 | $ 51.02 |
Income from Investment Operations | | | | | | |
Net investment income (loss) D | (.01) | (.03) | (.25) | (.24) | (.18) | .11 G |
Net realized and unrealized gain (loss) | (1.16) | 5.96 | 11.19 | 19.09 | (19.18) | (1.69) |
Total from investment operations | (1.17) | 5.93 | 10.94 | 18.85 | (19.36) | (1.58) |
Distributions from net investment income | - | - | - | - | (.03) | - |
Distributions from net realized gain | - | - | - | - | (.35) | (4.17) |
Total distributions | - | - | - | - | (.38) | (4.17) |
Redemption fees added to paid in capital D | - J | .01 | - J | - J | - J | - J |
Net asset value, end of period | $ 60.09 | $ 61.26 | $ 55.32 | $ 44.38 | $ 25.53 | $ 45.27 |
Total Return B,C | (1.91)% | 10.74% | 24.65% | 73.83% | (43.05)% | (4.00)% |
Ratios to Average Net Assets E,H | | | | | | |
Expenses before reductions | .86% A | .86% | .89% | .96% | .94% | .92% |
Expenses net of fee waivers, if any | .86% A | .86% | .89% | .96% | .94% | .92% |
Expenses net of all reductions | .84% A | .84% | .88% | .96% | .94% | .91% |
Net investment income (loss) | (.04)% A | (.05)% | (.54)% | (.67)% | (.50)% | .22% G |
Supplemental Data | | | | | | |
Net assets, end of period (000 omitted) | $ 747,219 | $ 870,358 | $ 566,400 | $ 466,110 | $ 263,503 | $ 540,497 |
Portfolio turnover rate F | 103% A | 86% | 55% | 50% | 122% | 113% |
AAnnualized BTotal returns for periods of less than one year are not annualized. CTotal returns would have been lower if certain expenses had not been reduced during the applicable periods shown. DCalculated based on average shares outstanding during the period. EFees and expenses of any underlying Fidelity Central Funds are not included in the Fund's expense ratio. The Fund indirectly bears its proportionate share of the expenses of any underlying Fidelity Central Funds. FAmount does not include the portfolio activity of any underlying Fidelity Central Funds. GInvestment income per share reflects a large, non-recurring dividend which amounted to $.38 per share. Excluding this non-recurring dividend, the ratio of net investment income (loss) to average net assets would have been (.52) %. HExpense ratios reflect operating expenses of the Fund. Expenses before reductions do not reflect amounts reimbursed by the investment adviser or reductions from brokerage service arrangements or reductions from other expense offset arrangements and do not represent the amount paid by the Fund during periods when reimbursements or reductions occur. Expenses net of fee waivers reflect expenses after reimbursement by the investment adviser but prior to reductions from brokerage service arrangements or other expense offset arrangements. Expenses net of all reductions represent the net expenses paid by the Fund. IFor the year ended February 29. JAmount represents less than $.01 per share. |
See accompanying notes which are an integral part of the financial statements.
Semiannual Report
Medical Equipment and Systems Portfolio
Investment Changes (Unaudited)
Top Ten Stocks as of August 31, 2012 |
| % of fund's
net assets | % of fund's net assets
6 months ago |
Covidien PLC | 11.2 | 14.2 |
Boston Scientific Corp. | 6.7 | 6.6 |
Zimmer Holdings, Inc. | 6.3 | 2.7 |
Stryker Corp. | 5.9 | 6.1 |
Baxter International, Inc. | 5.8 | 8.5 |
Medtronic, Inc. | 5.0 | 1.4 |
C.R. Bard, Inc. | 4.7 | 3.7 |
The Cooper Companies, Inc. | 3.8 | 3.9 |
St. Jude Medical, Inc. | 3.8 | 1.6 |
DENTSPLY International, Inc. | 3.5 | 3.6 |
| 56.7 | |
Top Industries (% of fund's net assets) |
As of August 31, 2012 |
| Health Care Equipment
& Supplies | 88.7% | |
| Health Care Providers
& Services | 7.8% | |
| Biotechnology | 1.7% | |
| Health Care Technology | 0.9% | |
| All Others* | 0.9% | |

As of February 29, 2012 |
| Health Care Equipment
& Supplies | 83.3% | |
| Health Care Providers
& Services | 12.1% | |
| Life Sciences Tools
& Services | 1.1% | |
| Health Care Technology | 0.9% | |
| Biotechnology | 0.1% | |
| All Others* | 2.5% | |

* Includes short-term investments and net other assets. |
Semiannual Report
Medical Equipment and Systems Portfolio
Investments August 31, 2012 (Unaudited)
Showing Percentage of Net Assets
Common Stocks - 98.4% |
| Shares | | Value |
BIOTECHNOLOGY - 1.5% |
Biotechnology - 1.5% |
Grifols SA ADR (d) | 900,000 | | $ 18,513,000 |
HEALTH CARE EQUIPMENT & SUPPLIES - 88.7% |
Health Care Equipment - 77.6% |
ArthroCare Corp. (a) | 300,000 | | 8,874,000 |
Baxter International, Inc. | 1,250,000 | | 73,350,000 |
Boston Scientific Corp. (a) | 15,500,000 | | 83,700,000 |
C.R. Bard, Inc. | 600,000 | | 58,866,000 |
CareFusion Corp. (a) | 570,000 | | 14,973,900 |
China Kanghui Holdings sponsored ADR (a)(d) | 502,700 | | 12,562,473 |
Conceptus, Inc. (a) | 500,000 | | 9,505,000 |
CONMED Corp. | 300,000 | | 8,106,000 |
Covidien PLC | 2,500,000 | | 140,125,000 |
Cyberonics, Inc. (a) | 200,000 | | 9,986,000 |
Edwards Lifesciences Corp. (a) | 270,000 | | 27,569,700 |
Exactech, Inc. (a) | 529,400 | | 8,544,516 |
Fisher & Paykel Healthcare Corp. | 4,000,000 | | 6,909,240 |
Genmark Diagnostics, Inc. (a) | 1,130,306 | | 8,511,204 |
Globus Medical, Inc. | 200,000 | | 3,184,000 |
HeartWare International, Inc. (a) | 87,700 | | 7,855,289 |
HeartWare International, Inc. CDI (a) | 5,500,000 | | 14,092,166 |
Hill-Rom Holdings, Inc. | 800,003 | | 22,184,083 |
Hologic, Inc. (a) | 700,000 | | 13,741,000 |
Insulet Corp. (a) | 1,160,000 | | 24,325,200 |
Integra LifeSciences Holdings Corp. (a) | 385,700 | | 15,173,438 |
Intuitive Surgical, Inc. (a) | 60,000 | | 29,507,400 |
Ion Beam Applications SA (a) | 400,000 | | 2,138,260 |
Mako Surgical Corp. (a)(d) | 400,000 | | 6,592,000 |
Masimo Corp. (a) | 300,000 | | 6,624,000 |
Medtronic, Inc. | 1,540,000 | | 62,616,400 |
Natus Medical, Inc. (a) | 600,000 | | 7,026,000 |
NxStage Medical, Inc. (a) | 600,000 | | 7,650,000 |
Opto Circuits India Ltd. | 1,300,000 | | 2,886,808 |
Orthofix International NV (a) | 60,000 | | 2,539,200 |
Sirona Dental Systems, Inc. (a) | 125,000 | | 6,642,500 |
St. Jude Medical, Inc. | 1,250,000 | | 47,200,000 |
Stryker Corp. | 1,400,000 | | 74,564,000 |
Tornier BV (a) | 650,000 | | 11,648,000 |
Trauson Holdings Co. Ltd. | 6,057,000 | | 2,233,514 |
Varian Medical Systems, Inc. (a)(d) | 250,000 | | 14,697,500 |
Volcano Corp. (a) | 750,000 | | 21,210,000 |
Wright Medical Group, Inc. (a) | 550,000 | | 11,385,000 |
|
| Shares | | Value |
Zeltiq Aesthetics, Inc. (d) | 900,000 | | $ 4,770,000 |
Zimmer Holdings, Inc. | 1,280,000 | | 79,078,400 |
| | 973,147,191 |
Health Care Supplies - 11.1% |
Align Technology, Inc. (a) | 600,000 | | 20,370,000 |
DENTSPLY International, Inc. | 1,200,000 | | 43,524,000 |
OraSure Technologies, Inc. (a) | 600,000 | | 5,826,000 |
The Cooper Companies, Inc. | 570,000 | | 47,794,500 |
The Spectranetics Corp. (a) | 900,000 | | 10,926,000 |
Unilife Corp. (a)(d) | 2,000,000 | | 5,980,000 |
Vascular Solutions, Inc. (a) | 400,000 | | 5,244,000 |
| | 139,664,500 |
TOTAL HEALTH CARE EQUIPMENT & SUPPLIES | | 1,112,811,691 |
HEALTH CARE PROVIDERS & SERVICES - 7.8% |
Health Care Distributors & Services - 0.3% |
Amplifon SpA | 1,000,000 | | 4,190,990 |
Health Care Facilities - 0.7% |
Hanger, Inc. (a) | 300,000 | | 8,583,000 |
Health Care Services - 4.3% |
Accretive Health, Inc. (a)(d) | 301,700 | | 3,587,213 |
Catamaran Corp. (a) | 410,000 | | 35,586,710 |
Quest Diagnostics, Inc. | 250,000 | | 15,117,500 |
| | 54,291,423 |
Managed Health Care - 2.5% |
Health Net, Inc. (a) | 382,000 | | 8,881,500 |
UnitedHealth Group, Inc. | 400,000 | | 21,720,000 |
| | 30,601,500 |
TOTAL HEALTH CARE PROVIDERS & SERVICES | | 97,666,913 |
HEALTH CARE TECHNOLOGY - 0.4% |
Health Care Technology - 0.4% |
athenahealth, Inc. (a)(d) | 60,000 | | 5,302,200 |
TOTAL COMMON STOCKS (Cost $1,092,121,254) |
1,234,293,804
|
Convertible Preferred Stocks - 0.7% |
| | | |
BIOTECHNOLOGY - 0.2% |
Biotechnology - 0.2% |
Ariosa Diagnostics (e) | 331,126 | | 2,000,001 |
HEALTH CARE TECHNOLOGY - 0.5% |
Health Care Technology - 0.5% |
Castlight Health, Inc. Series D (a)(e) | 999,300 | | 6,995,100 |
TOTAL CONVERTIBLE PREFERRED STOCKS (Cost $8,032,335) |
8,995,101
|
Money Market Funds - 3.2% |
| Shares | | Value |
Fidelity Cash Central Fund, 0.17% (b) | 11,204,953 | | $ 11,204,953 |
Fidelity Securities Lending Cash Central Fund, 0.18% (b)(c) | 29,048,261 | | 29,048,261 |
TOTAL MONEY MARKET FUNDS (Cost $40,253,214) |
40,253,214
|
TOTAL INVESTMENT PORTFOLIO - 102.3% (Cost $1,140,406,803) | | 1,283,542,119 |
NET OTHER ASSETS (LIABILITIES) - (2.3)% | | (28,371,265) |
NET ASSETS - 100% | $ 1,255,170,854 |
Legend |
(a) Non-income producing |
(b) Affiliated fund that is available only to investment companies and other accounts managed by Fidelity Investments. The rate quoted is the annualized seven-day yield of the fund at period end. A complete unaudited listing of the fund's holdings as of its most recent quarter end is available upon request. In addition, each Fidelity Central Fund's financial statements are available on the SEC's website or upon request. |
(c) Investment made with cash collateral received from securities on loan. |
(d) Security or a portion of the security is on loan at period end. |
(e) Restricted securities - Investment in securities not registered under the Securities Act of 1933 (excluding 144A issues). At the end of the period, the value of restricted securities (excluding 144A issues) amounted to $8,995,101 or 0.7% of net assets. |
Additional information on each restricted holding is as follows: |
Security | Acquisition Date | Acquisition Cost |
Ariosa Diagnostics | 11/30/11 | $ 2,000,001 |
Castlight Health, Inc. Series D | 4/25/12 | $ 6,032,334 |
Affiliated Central Funds |
Information regarding fiscal year to date income earned by the Fund from investments in Fidelity Central Funds is as follows: |
Fund | Income earned |
Fidelity Cash Central Fund | $ 23,473 |
Fidelity Securities Lending Cash Central Fund | 411,386 |
Total | $ 434,859 |
Other Affiliated Issuers |
An affiliated company is a company in which the Fund has ownership of at least 5% of the voting securities. Fiscal year to date transactions with companies which are or were affiliates are as follows: |
Affiliate | Value, beginning of period | Purchases | Sales Proceeds | Dividend Income | Value,
end of
period |
Genmark Diagnostics, Inc. | $ 4,160,254 | $ 555,059 | $ - | $ - | $ - |
Total | $ 4,160,254 | $ 555,059 | $ - | $ - | $ - |
Other Information |
The following is a summary of the inputs used, as of August 31, 2012, involving the Fund's assets and liabilities carried at fair value. The inputs or methodology used for valuing securities may not be an indication of the risk associated with investing in those securities. For more information on valuation inputs, and their aggregation into the levels used in the table below, please refer to the Security Valuation section in the accompanying Notes to Financial Statements. |
Valuation Inputs at Reporting Date: |
Description | Total | Level 1 | Level 2 | Level 3 |
Investments in Securities: | | | | |
Common Stocks | $ 1,234,293,804 | $ 1,234,293,804 | $ - | $ - |
Convertible Preferred Stocks | 8,995,101 | - | - | 8,995,101 |
Money Market Funds | 40,253,214 | 40,253,214 | - | - |
Total Investments in Securities: | $ 1,283,542,119 | $ 1,274,547,018 | $ - | $ 8,995,101 |
Distribution of investments by country or territory of incorporation, as a percentage of total net assets, is as follows. (Unaudited) |
United States of America | 81.0% |
Ireland | 11.2% |
Canada | 2.8% |
Spain | 1.5% |
Cayman Islands | 1.2% |
Others (Individually Less Than 1%) | 2.3% |
| 100.0% |
See accompanying notes which are an integral part of the financial statements.
Semiannual Report
Medical Equipment and Systems Portfolio
Statement of Assets and Liabilities
| August 31, 2012 (Unaudited) |
| | |
Assets | | |
Investment in securities, at value (including securities loaned of $28,421,140) - See accompanying schedule: Unaffiliated issuers (cost $1,100,153,589) | $ 1,243,288,905 | |
Fidelity Central Funds (cost $40,253,214) | 40,253,214 | |
Total Investments (cost $1,140,406,803) | | $ 1,283,542,119 |
Receivable for investments sold | | 2,416,232 |
Receivable for fund shares sold | | 353,999 |
Dividends receivable | | 8,490 |
Distributions receivable from Fidelity Central Funds | | 45,137 |
Other receivables | | 10,573 |
Total assets | | 1,286,376,550 |
| | |
Liabilities | | |
Payable for investments purchased | $ 50,794 | |
Payable for fund shares redeemed | 1,192,778 | |
Accrued management fee | 586,936 | |
Other affiliated payables | 282,497 | |
Other payables and accrued expenses | 44,430 | |
Collateral on securities loaned, at value | 29,048,261 | |
Total liabilities | | 31,205,696 |
| | |
Net Assets | | $ 1,255,170,854 |
Net Assets consist of: | | |
Paid in capital | | $ 1,092,533,654 |
Distributions in excess of net investment income | | (46,955) |
Accumulated undistributed net realized gain (loss) on investments and foreign currency transactions | | 19,549,961 |
Net unrealized appreciation (depreciation) on investments and assets and liabilities in foreign currencies | | 143,134,194 |
Net Assets, for 45,421,703 shares outstanding | | $ 1,255,170,854 |
Net Asset Value, offering price and redemption price per share ($1,255,170,854 ÷ 45,421,703 shares) | | $ 27.63 |
Statement of Operations
Six months ended August 31, 2012 (Unaudited) |
| | |
Investment Income | | |
Dividends | | $ 5,440,581 |
Interest | | 102 |
Income from Fidelity Central Funds (including $411,386 from security lending) | | 434,859 |
Total income | | 5,875,542 |
| | |
Expenses | | |
Management fee | $ 3,653,073 | |
Transfer agent fees | 1,526,788 | |
Accounting and security lending fees | 211,678 | |
Custodian fees and expenses | 29,642 | |
Independent trustees' compensation | 4,451 | |
Registration fees | 19,414 | |
Audit | 21,649 | |
Legal | 2,584 | |
Miscellaneous | 8,593 | |
Total expenses before reductions | 5,477,872 | |
Expense reductions | (33,033) | 5,444,839 |
Net investment income (loss) | | 430,703 |
Realized and Unrealized Gain (Loss) Net realized gain (loss) on: | | |
Investment securities: | | |
Unaffiliated issuers | 28,810,743 | |
Foreign currency transactions | (5,602) | |
Total net realized gain (loss) | | 28,805,141 |
Change in net unrealized appreciation (depreciation) on: Investment securities (net of decrease in deferred foreign taxes of $110,782) | (22,178,121) | |
Assets and liabilities in foreign currencies | (222) | |
Total change in net unrealized appreciation (depreciation) | | (22,178,343) |
Net gain (loss) | | 6,626,798 |
Net increase (decrease) in net assets resulting from operations | | $ 7,057,501 |
See accompanying notes which are an integral part of the financial statements.
Semiannual Report
Financial Statements - continued
Statement of Changes in Net Assets
| Six months ended
August 31, 2012
(Unaudited) | Year ended
February 29,
2012 |
Increase (Decrease) in Net Assets | | |
Operations | | |
Net investment income (loss) | $ 430,703 | $ 275,186 |
Net realized gain (loss) | 28,805,141 | 99,115,448 |
Change in net unrealized appreciation (depreciation) | (22,178,343) | (120,778,603) |
Net increase (decrease) in net assets resulting from operations | 7,057,501 | (21,387,969) |
Distributions to shareholders from net investment income | - | (720,894) |
Distributions to shareholders from net realized gain | (25,956,922) | (68,879,454) |
Total distributions | (25,956,922) | (69,600,348) |
Share transactions
Proceeds from sales of shares | 56,479,526 | 442,706,650 |
Reinvestment of distributions | 24,930,405 | 66,786,926 |
Cost of shares redeemed | (168,356,647) | (465,899,006) |
Net increase (decrease) in net assets resulting from share transactions | (86,946,716) | 43,594,570 |
Redemption fees | 5,178 | 63,013 |
Total increase (decrease) in net assets | (105,840,959) | (47,330,734) |
| | |
Net Assets | | |
Beginning of period | 1,361,011,813 | 1,408,342,547 |
End of period (including distributions in excess of net investment income of $46,955 and distributions in excess of net investment income of $477,658, respectively) | $ 1,255,170,854 | $ 1,361,011,813 |
Other Information Shares | | |
Sold | 2,040,006 | 15,011,136 |
Issued in reinvestment of distributions | 909,869 | 2,628,709 |
Redeemed | (6,097,458) | (16,731,272) |
Net increase (decrease) | (3,147,583) | 908,573 |
Financial Highlights
| Six months ended
August 31, 2012 | Years ended February 28, |
| (Unaudited) | 2012 I | 2011 | 2010 | 2009 | 2008 I |
Selected Per-Share Data | | | | | | |
Net asset value, beginning of period | $ 28.02 | $ 29.55 | $ 25.23 | $ 17.30 | $ 24.41 | $ 23.67 |
Income from Investment Operations | | | | | | |
Net investment income (loss) D | .01 | .01 | (.01) G | (.03) | .01 | (.05) |
Net realized and unrealized gain (loss) | .14 | (.10) | 4.33 | 7.96 | (6.35) | 2.97 |
Total from investment operations | .15 | (.09) | 4.32 | 7.93 | (6.34) | 2.92 |
Distributions from net investment income | - | (.02) | - | - | (.01) | - |
Distributions from net realized gain | (.54) | (1.43) | - | - | (.77) | (2.18) |
Total distributions | (.54) | (1.44) K | - | - | (.78) | (2.18) |
Redemption fees added to paid in capital D | - J | - J | - J | - J | .01 | - J |
Net asset value, end of period | $ 27.63 | $ 28.02 | $ 29.55 | $ 25.23 | $ 17.30 | $ 24.41 |
Total Return B,C | .57% | .23% | 17.12% | 45.84% | (26.81)% | 12.57% |
Ratios to Average Net Assets E,H | | | | | | |
Expenses before reductions | .84% A | .84% | .86% | .91% | .87% | .88% |
Expenses net of fee waivers, if any | .84% A | .84% | .86% | .91% | .87% | .88% |
Expenses net of all reductions | .83% A | .84% | .86% | .90% | .87% | .88% |
Net investment income (loss) | .07% A | .02% | (.04)% G | (.13)% | .06% | (.20)% |
Supplemental Data | | | | | | |
Net assets, end of period (000 omitted) | $ 1,255,171 | $ 1,361,012 | $ 1,408,343 | $ 1,377,991 | $ 1,012,464 | $ 1,169,861 |
Portfolio turnover rate F | 65% A | 120% | 92% | 83% | 116% | 129% |
AAnnualized BTotal returns for periods of less than one year are not annualized. CTotal returns would have been lower if certain expenses had not been reduced during the applicable periods shown. DCalculated based on average shares outstanding during the period. EFees and expenses of any underlying Fidelity Central Funds are not included in the Fund's expense ratio. The Fund indirectly bears its proportionate share of the expenses of any underlying Fidelity Central Funds. FAmount does not include the portfolio activity of any underlying Fidelity Central Funds. GInvestment income per share reflects a large, non-recurring dividend which amounted to $.04 per share. Excluding this non-recurring dividend, the ratio of net investment income (loss) to average net assets would have been (.18)%. HExpense ratios reflect operating expenses of the Fund. Expenses before reductions do not reflect amounts reimbursed by the investment adviser or reductions from brokerage service arrangements or reductions from other expense offset arrangements and do not represent the amount paid by the Fund during periods when reimbursements or reductions occur. Expenses net of fee waivers reflect expenses after reimbursement by the investment adviser but prior to reductions from brokerage service arrangements or other expense offset arrangements. Expenses net of all reductions represent the net expenses paid by the Fund. IFor the year ended February 29. JAmount represents less than $.01 per share. KTotal distributions of $1.44 per share is comprised of distributions from net investment income of $.015 and distributions from net realized gain of $1.426 per share. |
See accompanying notes which are an integral part of the financial statements.
Semiannual Report
Pharmaceuticals Portfolio
Investment Changes (Unaudited)
Top Ten Stocks as of August 31, 2012 |
| % of fund's
net assets | % of fund's net assets
6 months ago |
Merck & Co., Inc. | 8.2 | 6.5 |
Sanofi SA sponsored ADR | 7.4 | 7.3 |
Pfizer, Inc. | 6.5 | 4.5 |
GlaxoSmithKline PLC sponsored ADR | 5.8 | 6.3 |
Johnson & Johnson | 5.4 | 2.3 |
Novo Nordisk A/S Series B sponsored ADR | 4.4 | 3.9 |
Abbott Laboratories | 3.8 | 2.7 |
Eli Lilly & Co. | 3.7 | 2.9 |
Valeant Pharmaceuticals International, Inc. (Canada) | 3.6 | 4.0 |
Novartis AG sponsored ADR | 3.2 | 2.7 |
| 52.0 | |
Top Industries (% of fund's net assets) |
As of August 31, 2012 |
| Pharmaceuticals | 87.7% | |
| Biotechnology | 6.9% | |
| Health Care Providers
& Services | 1.6% | |
| Health Care Equipment
& Supplies | 0.3% | |
| Personal Products | 0.3% | |
| All Others* | 3.2% | |

As of February 29, 2012 |
| Pharmaceuticals | 83.4% | |
| Biotechnology | 7.3% | |
| Health Care Providers
& Services | 1.9% | |
| Health Care Equipment
& Supplies | 1.7% | |
| Life Sciences Tools
& Services | 0.8% | |
| All Others* | 4.9% | |

* Includes short-term investments and net other assets. |
Semiannual Report
Pharmaceuticals Portfolio
Investments August 31, 2012 (Unaudited)
Showing Percentage of Net Assets
Common Stocks - 97.0% |
| Shares | | Value |
BIOTECHNOLOGY - 6.9% |
Biotechnology - 6.9% |
Acorda Therapeutics, Inc. (a) | 39,000 | | $ 891,150 |
Alnylam Pharmaceuticals, Inc. (a) | 38,800 | | 709,652 |
AMAG Pharmaceuticals, Inc. (a) | 153,000 | | 2,262,870 |
Amgen, Inc. | 39,000 | | 3,272,880 |
ARIAD Pharmaceuticals, Inc. (a) | 152,500 | | 3,135,400 |
Astex Pharmaceuticals, Inc. (a)(d) | 202,000 | | 571,660 |
Biogen Idec, Inc. (a) | 16,000 | | 2,345,440 |
BioMarin Pharmaceutical, Inc. (a) | 146,500 | | 5,470,310 |
BioMimetic Therapeutics, Inc. (a) | 151,500 | | 581,760 |
Cubist Pharmaceuticals, Inc. (a) | 120,000 | | 5,544,000 |
Discovery Laboratories, Inc. (a) | 28,200 | | 90,804 |
DUSA Pharmaceuticals, Inc. (a) | 205,000 | | 1,096,750 |
Grifols SA (a) | 45,000 | | 1,267,862 |
ImmunoGen, Inc. (a) | 19,100 | | 274,849 |
Insmed, Inc. (a) | 8,300 | | 26,892 |
Medivation, Inc. (a) | 73,000 | | 7,654,780 |
Merrimack Pharmaceuticals, Inc. | 13,500 | | 107,460 |
Neurocrine Biosciences, Inc. (a) | 224,794 | | 1,658,980 |
NPS Pharmaceuticals, Inc. (a) | 120,000 | | 914,400 |
Onyx Pharmaceuticals, Inc. (a) | 86,800 | | 6,242,656 |
Pharmacyclics, Inc. (a) | 16,000 | | 1,070,720 |
Puma Biotechnology, Inc. | 133,333 | | 1,866,662 |
QLT, Inc. (a) | 103,500 | | 783,495 |
Sarepta Therapeutics, Inc. (a)(d) | 5,000 | | 79,100 |
Synageva BioPharma Corp. (a) | 9,600 | | 479,616 |
Theravance, Inc. (a) | 119,900 | | 3,197,733 |
Threshold Pharmaceuticals, Inc. (a) | 115,000 | | 1,013,150 |
United Therapeutics Corp. (a) | 54,500 | | 2,949,540 |
Vical, Inc. (a) | 70,000 | | 254,100 |
ZIOPHARM Oncology, Inc. (a) | 55,000 | | 273,350 |
| | 56,088,021 |
HEALTH CARE EQUIPMENT & SUPPLIES - 0.3% |
Health Care Equipment - 0.0% |
Genmark Diagnostics, Inc. (a) | 45,500 | | 342,615 |
Health Care Supplies - 0.3% |
Align Technology, Inc. (a) | 44,000 | | 1,493,800 |
Antares Pharma, Inc. (a)(d) | 225,000 | | 873,000 |
| | 2,366,800 |
TOTAL HEALTH CARE EQUIPMENT & SUPPLIES | | 2,709,415 |
HEALTH CARE PROVIDERS & SERVICES - 1.6% |
Health Care Services - 0.5% |
Catamaran Corp. (a) | 47,717 | | 4,141,686 |
Managed Health Care - 1.1% |
CIGNA Corp. | 25,000 | | 1,144,250 |
|
| Shares | | Value |
Qualicorp SA (a) | 50,000 | | $ 491,404 |
UnitedHealth Group, Inc. | 124,000 | | 6,733,200 |
| | 8,368,854 |
TOTAL HEALTH CARE PROVIDERS & SERVICES | | 12,510,540 |
LIFE SCIENCES TOOLS & SERVICES - 0.2% |
Life Sciences Tools & Services - 0.2% |
Illumina, Inc. (a)(d) | 28,400 | | 1,195,072 |
Patheon, Inc. (a) | 75,000 | | 208,471 |
| | 1,403,543 |
PERSONAL PRODUCTS - 0.3% |
Personal Products - 0.3% |
MYOS Corp. (e) | 2,000,000 | | 468,000 |
Neptune Technologies & Bioressources, Inc. (a) | 15,000 | | 67,500 |
Prestige Brands Holdings, Inc. (a) | 121,892 | | 1,957,586 |
| | 2,493,086 |
PHARMACEUTICALS - 87.7% |
Pharmaceuticals - 87.7% |
Abbott Laboratories | 465,690 | | 30,521,323 |
Akorn, Inc. (a) | 314,100 | | 4,347,144 |
Alexza Pharmaceuticals, Inc. (a)(d) | 25,000 | | 120,250 |
Allergan, Inc. | 202,300 | | 17,424,099 |
AstraZeneca PLC sponsored ADR (d) | 530,100 | | 24,803,379 |
Auxilium Pharmaceuticals, Inc. (a) | 146,200 | | 3,406,460 |
Bristol-Myers Squibb Co. | 696,110 | | 22,978,591 |
Cadence Pharmaceuticals, Inc. (a)(d) | 331,300 | | 1,305,322 |
Cardiome Pharma Corp. (a) | 297,400 | | 97,548 |
Columbia Laboratories, Inc. (a) | 570,600 | | 610,542 |
Daiichi Sankyo Kabushiki Kaisha | 190,000 | | 3,146,320 |
Dechra Pharmaceuticals PLC | 40,000 | | 312,679 |
DepoMed, Inc. (a) | 274,000 | | 1,449,460 |
Dr. Reddy's Laboratories Ltd. sponsored ADR | 107,400 | | 3,226,296 |
Durect Corp. (a) | 744,500 | | 781,725 |
Elan Corp. PLC sponsored ADR (a) | 1,419,400 | | 16,124,384 |
Eli Lilly & Co. | 664,200 | | 29,829,222 |
Endo Pharmaceuticals Holdings, Inc. (a) | 194,400 | | 6,185,808 |
Endo Pharmaceuticals Holdings, Inc. rights (a) | 9,000 | | 0 |
Forest Laboratories, Inc. (a) | 471,520 | | 16,357,029 |
GlaxoSmithKline PLC sponsored ADR | 1,033,400 | | 47,009,366 |
Hi-Tech Pharmacal Co., Inc. (a) | 66,000 | | 2,355,540 |
Hospira, Inc. (a) | 95,000 | | 3,190,100 |
Impax Laboratories, Inc. (a) | 198,500 | | 4,698,495 |
Jazz Pharmaceuticals PLC (a) | 201,000 | | 9,147,510 |
Johnson & Johnson | 645,100 | | 43,499,093 |
MAP Pharmaceuticals, Inc. (a) | 27,112 | | 364,385 |
Meda AB (A Shares) | 90,000 | | 887,469 |
Medicis Pharmaceutical Corp. Class A | 150,200 | | 4,740,312 |
Merck & Co., Inc. | 1,551,536 | | 66,793,623 |
Mylan, Inc. (a) | 550,200 | | 12,968,214 |
Common Stocks - continued |
| Shares | | Value |
PHARMACEUTICALS - CONTINUED |
Pharmaceuticals - continued |
Nektar Therapeutics (a)(d) | 380,500 | | $ 3,264,690 |
Novartis AG sponsored ADR | 445,198 | | 26,271,134 |
Novo Nordisk A/S Series B sponsored ADR | 224,500 | | 35,271,195 |
Obagi Medical Products, Inc. (a) | 158,000 | | 2,110,880 |
Ono Pharmaceutical Co. Ltd. | 28,000 | | 1,742,740 |
Optimer Pharmaceuticals, Inc. (a)(d) | 293,000 | | 4,403,790 |
Pain Therapeutics, Inc. (a) | 156,721 | | 623,750 |
Paladin Labs, Inc. (a) | 121,600 | | 5,182,263 |
Par Pharmaceutical Companies, Inc. (a) | 97,400 | | 4,850,520 |
Perrigo Co. | 106,400 | | 11,700,808 |
Pfizer, Inc. | 2,200,388 | | 52,501,258 |
Pozen, Inc. (a) | 120,000 | | 781,200 |
Questcor Pharmaceuticals, Inc. (a)(d) | 134,200 | | 5,829,648 |
Roche Holding AG (participation certificate) | 22,000 | | 4,005,028 |
Sagent Pharmaceuticals, Inc. (a) | 25,000 | | 361,500 |
Salix Pharmaceuticals Ltd. (a) | 159,900 | | 7,029,204 |
Sanofi SA sponsored ADR | 1,459,022 | | 59,746,951 |
Santarus, Inc. (a) | 466,500 | | 2,882,970 |
Shire PLC sponsored ADR | 189,000 | | 17,112,060 |
Sucampo Pharmaceuticals, Inc. Class A (a) | 27,000 | | 128,790 |
Teva Pharmaceutical Industries Ltd. sponsored ADR | 586,289 | | 23,205,319 |
The Medicines Company (a) | 175,500 | | 4,508,595 |
UCB SA | 47,000 | | 2,305,547 |
Valeant Pharmaceuticals International, Inc. (Canada) (a)(d) | 574,927 | | 29,436,029 |
Vectura Group PLC (a) | 275,000 | | 366,793 |
Virbac SA | 11,467 | | 2,073,334 |
ViroPharma, Inc. (a) | 214,100 | | 5,695,060 |
Warner Chilcott PLC | 251,000 | | 3,418,620 |
Watson Pharmaceuticals, Inc. (a) | 158,800 | | 12,918,380 |
XenoPort, Inc. (a) | 285,000 | | 2,656,200 |
| | 711,065,944 |
TOTAL COMMON STOCKS (Cost $633,645,548) |
786,270,549
|
Convertible Preferred Stocks - 0.0% |
| | | |
PHARMACEUTICALS - 0.0% |
Pharmaceuticals - 0.0% |
Agios Pharmaceuticals, Inc. Series C (e)
(Cost $250,054) | 50,916 | |
250,054
|
Money Market Funds - 5.9% |
| Shares | | Value |
Fidelity Cash Central Fund, 0.17% (b) | 22,696,903 | | $ 22,696,903 |
Fidelity Securities Lending Cash Central Fund, 0.18% (b)(c) | 25,231,618 | | 25,231,618 |
TOTAL MONEY MARKET FUNDS (Cost $47,928,521) |
47,928,521
|
TOTAL INVESTMENT PORTFOLIO - 102.9% (Cost $681,824,123) | 834,449,124 |
NET OTHER ASSETS (LIABILITIES) - (2.9)% | (23,448,967) |
NET ASSETS - 100% | $ 811,000,157 |
Legend |
(a) Non-income producing |
(b) Affiliated fund that is available only to investment companies and other accounts managed by Fidelity Investments. The rate quoted is the annualized seven-day yield of the fund at period end. A complete unaudited listing of the fund's holdings as of its most recent quarter end is available upon request. In addition, each Fidelity Central Fund's financial statements are available on the SEC's website or upon request. |
(c) Investment made with cash collateral received from securities on loan. |
(d) Security or a portion of the security is on loan at period end. |
(e) Restricted securities - Investment in securities not registered under the Securities Act of 1933 (excluding 144A issues). At the end of the period, the value of restricted securities (excluding 144A issues) amounted to $718,054 or 0.1% of net assets. |
Additional information on each restricted holding is as follows: |
Security | Acquisition Date | Acquisition Cost |
Agios Pharmaceuticals, Inc. Series C | 11/16/11 | $ 250,054 |
MYOS Corp. | 7/2/12 | $ 500,000 |
Affiliated Central Funds |
Information regarding fiscal year to date income earned by the Fund from investments in Fidelity Central Funds is as follows: |
Fund | Income earned |
Fidelity Cash Central Fund | $ 25,439 |
Fidelity Securities Lending Cash Central Fund | 191,091 |
Total | $ 216,530 |
Other Information |
The following is a summary of the inputs used, as of August 31, 2012, involving the Fund's assets and liabilities carried at fair value. The inputs or methodology used for valuing securities may not be an indication of the risk associated with investing in those securities. For more information on valuation inputs, and their aggregation into the levels used in the table below, please refer to the Security Valuation section in the accompanying Notes to Financial Statements. |
Valuation Inputs at Reporting Date: |
Description | Total | Level 1 | Level 2 | Level 3 |
Investments in Securities: | | | | |
Common Stocks | $ 786,270,549 | $ 780,913,489 | $ 5,357,060 | $ - |
Convertible Preferred Stocks | 250,054 | - | - | 250,054 |
Money Market Funds | 47,928,521 | 47,928,521 | - | - |
Total Investments in Securities: | $ 834,449,124 | $ 828,842,010 | $ 5,357,060 | $ 250,054 |
Distribution of investments by country or territory of incorporation, as a percentage of total net assets, is as follows. (Unaudited) |
United States of America | 60.3% |
United Kingdom | 8.9% |
France | 7.7% |
Canada | 4.8% |
Denmark | 4.4% |
Switzerland | 3.7% |
Ireland | 3.5% |
Israel | 2.9% |
Bailiwick of Jersey | 2.1% |
Others (Individually Less Than 1%) | 1.7% |
| 100.0% |
See accompanying notes which are an integral part of the financial statements.
Semiannual Report
Pharmaceuticals Portfolio
Statement of Assets and Liabilities
| August 31, 2012 (Unaudited) |
| | |
Assets | | |
Investment in securities, at value (including securities loaned of $24,333,776) - See accompanying schedule: Unaffiliated issuers (cost $633,895,602) | $ 786,520,603 | |
Fidelity Central Funds (cost $47,928,521) | 47,928,521 | |
Total Investments (cost $681,824,123) | | $ 834,449,124 |
Receivable for investments sold | | 154,312 |
Receivable for fund shares sold | | 1,037,995 |
Dividends receivable | | 3,363,596 |
Distributions receivable from Fidelity Central Funds | | 30,053 |
Other receivables | | 2,727 |
Total assets | | 839,037,807 |
| | |
Liabilities | | |
Payable for investments purchased | $ 1,546,337 | |
Payable for fund shares redeemed | 677,279 | |
Accrued management fee | 373,629 | |
Other affiliated payables | 180,105 | |
Other payables and accrued expenses | 28,682 | |
Collateral on securities loaned, at value | 25,231,618 | |
Total liabilities | | 28,037,650 |
| | |
Net Assets | | $ 811,000,157 |
Net Assets consist of: | | |
Paid in capital | | $ 642,630,038 |
Undistributed net investment income | | 6,884,035 |
Accumulated undistributed net realized gain (loss) on investments and foreign currency transactions | | 8,862,400 |
Net unrealized appreciation (depreciation) on investments and assets and liabilities in foreign currencies | | 152,623,684 |
Net Assets, for 53,946,266 shares outstanding | | $ 811,000,157 |
Net Asset Value, offering price and redemption price per share ($811,000,157 ÷ 53,946,266 shares) | | $ 15.03 |
Statement of Operations
Six months ended August 31, 2012 (Unaudited) |
| | |
Investment Income | | |
Dividends | | $ 10,416,259 |
Interest | | 40 |
Income from Fidelity Central Funds (including $191,091 from security lending) | | 216,530 |
Income before foreign taxes withheld | | 10,632,829 |
Less foreign taxes withheld | | (545,413) |
Total income | | 10,087,416 |
| | |
Expenses | | |
Management fee | $ 2,080,128 | |
Transfer agent fees | 909,401 | |
Accounting and security lending fees | 135,590 | |
Custodian fees and expenses | 16,589 | |
Independent trustees' compensation | 2,458 | |
Registration fees | 43,888 | |
Audit | 18,900 | |
Legal | 1,383 | |
Miscellaneous | 3,742 | |
Total expenses before reductions | 3,212,079 | |
Expense reductions | (10,123) | 3,201,956 |
Net investment income (loss) | | 6,885,460 |
Realized and Unrealized Gain (Loss) Net realized gain (loss) on: | | |
Investment securities: | | |
Unaffiliated issuers | 13,900,700 | |
Foreign currency transactions | (21,656) | |
Total net realized gain (loss) | | 13,879,044 |
Change in net unrealized appreciation (depreciation) on: Investment securities | 30,547,818 | |
Assets and liabilities in foreign currencies | 1,730 | |
Total change in net unrealized appreciation (depreciation) | | 30,549,548 |
Net gain (loss) | | 44,428,592 |
Net increase (decrease) in net assets resulting from operations | | $ 51,314,052 |
See accompanying notes which are an integral part of the financial statements.
Semiannual Report
Financial Statements - continued
Statement of Changes in Net Assets
| Six months ended
August 31, 2012
(Unaudited) | Year ended
February 29,
2012 |
Increase (Decrease) in Net Assets | | |
Operations | | |
Net investment income (loss) | $ 6,885,460 | $ 6,424,503 |
Net realized gain (loss) | 13,879,044 | 4,591,223 |
Change in net unrealized appreciation (depreciation) | 30,549,548 | 55,847,467 |
Net increase (decrease) in net assets resulting from operations | 51,314,052 | 66,863,193 |
Distributions to shareholders from net investment income | (2,290,725) | (4,623,019) |
Distributions to shareholders from net realized gain | (1,781,675) | (11,091,469) |
Total distributions | (4,072,400) | (15,714,488) |
Share transactions
Proceeds from sales of shares | 154,894,278 | 525,622,548 |
Reinvestment of distributions | 3,968,087 | 15,307,379 |
Cost of shares redeemed | (110,992,701) | (267,283,200) |
Net increase (decrease) in net assets resulting from share transactions | 47,869,664 | 273,646,727 |
Redemption fees | 6,483 | 66,684 |
Total increase (decrease) in net assets | 95,117,799 | 324,862,116 |
| | |
Net Assets | | |
Beginning of period | 715,882,358 | 391,020,242 |
End of period (including undistributed net investment income of $6,884,035 and undistributed net investment income of $2,289,300, respectively) | $ 811,000,157 | $ 715,882,358 |
Other Information Shares | | |
Sold | 10,652,653 | 39,011,957 |
Issued in reinvestment of distributions | 284,044 | 1,159,149 |
Redeemed | (7,708,423) | (20,142,513) |
Net increase (decrease) | 3,228,274 | 20,028,593 |
Financial Highlights
| Six months ended
August 31, 2012 | Years ended February 28, |
| (Unaudited) | 2012 H | 2011 | 2010 | 2009 | 2008 H |
Selected Per-Share Data | | | | | | |
Net asset value, beginning of period | $ 14.11 | $ 12.74 | $ 10.93 | $ 7.60 | $ 10.52 | $ 10.88 |
Income from Investment Operations | | | | | | |
Net investment income (loss) D | .13 | .15 | .17 | .14 | .18 | .10 |
Net realized and unrealized gain (loss) | .87 | 1.64 | 1.96 | 3.35 | (2.91) | .13 |
Total from investment operations | 1.00 | 1.79 | 2.13 | 3.49 | (2.73) | .23 |
Distributions from net investment income | (.05) | (.11) | (.13) | (.16) | (.13) | (.11) |
Distributions from net realized gain | (.04) | (.31) | (.19) | - | (.06) | (.48) |
Total distributions | (.08) J | (.42) | (.32) | (.16) | (.19) | (.59) |
Redemption fees added to paid in capital D,I | - | - | - | - | - | - |
Net asset value, end of period | $ 15.03 | $ 14.11 | $ 12.74 | $ 10.93 | $ 7.60 | $ 10.52 |
Total Return B,C | 7.13% | 14.34% | 19.68% | 46.05% | (26.23)% | 1.64% |
Ratios to Average Net Assets E,G | | | | | | |
Expenses before reductions | .86% A | .89% | .94% | 1.01% | 1.00% | .95% |
Expenses net of fee waivers, if any | .86% A | .89% | .94% | 1.01% | 1.00% | .95% |
Expenses net of all reductions | .86% A | .88% | .94% | 1.00% | .99% | .95% |
Net investment income (loss) | 1.84% A | 1.12% | 1.42% | 1.49% | 1.89% | .85% |
Supplemental Data | | | | | | |
Net assets, end of period (000 omitted) | $ 811,000 | $ 715,882 | $ 391,020 | $ 235,535 | $ 142,011 | $ 167,330 |
Portfolio turnover rate F | 51% A | 73% | 102% | 221% | 240% | 119% |
AAnnualized BTotal returns for periods of less than one year are not annualized. CTotal returns would have been lower if certain expenses had not been reduced during the applicable periods shown. DCalculated based on average shares outstanding during the period. EFees and expenses of any underlying Fidelity Central Funds are not included in the Fund's expense ratio. The Fund indirectly bears its proportionate share of the expenses of any underlying Fidelity Central Funds. FAmount does not include the portfolio activity of any underlying Fidelity Central Funds. GExpense ratios reflect operating expenses of the Fund. Expenses before reductions do not reflect amounts reimbursed by the investment adviser or reductions from brokerage service arrangements or reductions from other expense offset arrangements and do not represent the amount paid by the Fund during periods when reimbursements or reductions occur. Expenses net of fee waivers reflect expenses after reimbursement by the investment adviser but prior to reductions from brokerage service arrangements or other expense offset arrangements. Expenses net of all reductions represent the net expenses paid by the Fund. HFor the year ended February 29. IAmount represents less than $.01 per share. JTotal distributions of $.08 per share is comprised of distributions from net investment income of $.045 and distributions from net realized gain of $.035 per share. |
See accompanying notes which are an integral part of the financial statements.
Semiannual Report
Notes to Financial Statements
For the period ended August 31, 2012 (Unaudited)
1. Organization.
Biotechnology Portfolio, Health Care Portfolio, Medical Delivery Portfolio, Medical Equipment and Systems Portfolio and Pharmaceuticals Portfolio (the Funds) are non-diversified funds of Fidelity Select Portfolios (the Trust). The Trust is registered under the Investment Company Act of 1940, as amended (the 1940 Act), as an open-end management investment company organized as a Massachusetts business trust. The Funds invest primarily in securities of companies whose principal business activities fall within specific industries. Each Fund is authorized to issue an unlimited number of shares.
2. Investments in Fidelity Central Funds.
The Funds invest in Fidelity Central Funds, which are open-end investment companies available only to other investment companies and accounts managed by Fidelity Management & Research Company (FMR) and its affiliates. The Funds' Schedules of Investments list each of the Fidelity Central Funds held as of period end, if any, as an investment of each Fund, but do not include the underlying holdings of each Fidelity Central Fund. As an Investing Fund, each Fund indirectly bears its proportionate share of the expenses of the underlying Fidelity Central Funds.
The Money Market Central Funds seek preservation of capital and current income and are managed by Fidelity Investments Money Management, Inc. (FIMM), an affiliate of FMR.
A complete unaudited list of holdings for each Fidelity Central Fund is available upon request or at the Securities and Exchange Commission (the SEC) web site at www.sec.gov. In addition, the financial statements of the Fidelity Central Funds are available on the SEC web site or upon request.
3. Significant Accounting Policies.
The financial statements have been prepared in conformity with accounting principles generally accepted in the United States of America (GAAP), which require management to make certain estimates and assumptions at the date of the financial statements. Actual results could differ from those estimates. Subsequent events, if any, through the date that the financial statements were issued have been evaluated in the preparation of the financial statements. The following summarizes the significant accounting policies of the Funds:
Security Valuation. Investments are valued as of 4:00 p.m. Eastern time on the last calendar day of the period. In accordance with valuation policies and procedures approved by the Board of Trustees (the Board), each Fund attempts to obtain prices from one or more third party pricing vendor or broker to value their investments. When current market prices, quotations or rates are not readily available or reliable, securities will be fair valued in good faith by the FMR Fair Value Committee (the Committee), in accordance with procedures adopted by each Fund's Board. Factors used in determining fair value vary by security type and may include market or security specific events. The frequency with which these procedures are used cannot be predicted and they may be utilized to a significant extent. The Committee oversees each Fund's valuation policies and procedures and is responsible for approving and reporting to the Board all fair value determinations.
Each Fund categorizes the inputs to valuation techniques used to value their investments into a disclosure hierarchy consisting of three levels as shown below:
Level 1 - quoted prices in active markets for identical investments
Level 2 - other significant observable inputs (including quoted prices for similar investments, interest rates, prepayment speeds, etc.)
Level 3 - unobservable inputs (including the Fund's own assumptions based on the best information available)
Valuation techniques used to value each Fund's investments by major category are as follows:
Equity securities, including restricted securities, for which market quotations are readily available, are valued at the last reported sale price or official closing price as reported by a third party pricing vendor on the primary market or exchange on which they are traded and are categorized as Level 1 in the hierarchy. In the event there were no sales during the day or closing prices are not available, securities are valued at the last quoted bid price or may be valued using the last available price and are generally categorized as Level 2 in the hierarchy. For foreign equity securities, when significant market or security specific events arise, comparisons to the valuation of American Depositary Receipts (ADRs), futures contracts, Exchange-Traded Funds (ETFs) and certain indexes as well as quoted prices for similar securities are used and are categorized as Level 2 in the hierarchy. Utilizing these techniques may result in transfers between Level 1 and Level 2. For restricted equity securities and private placements where observable inputs are limited, assumptions about market activity and risk are used and these securities are categorized as Level 3 in the hierarchy.
Investments in open-end mutual funds, including the Fidelity Central Funds, are valued at their closing net asset value each business day and are categorized as Level 1 in the hierarchy.
Changes in valuation techniques may result in transfers in or out of an assigned level within the disclosure hierarchy. The aggregate value of investments by input level, as of August 31, 2012, is included at the end of each Fund's Schedule of Investments.
Semiannual Report
Notes to Financial Statements (Unaudited) - continued
3. Significant Accounting Policies - continued
Foreign Currency Translation. The Funds may use foreign currency contracts to facilitate transactions in foreign-denominated securities. Gains and losses from these transactions may arise from changes in the value of the foreign currency or if the counterparties do not perform under the contracts' terms.
Foreign-denominated assets, including investment securities, and liabilities are translated into U.S. dollars at the exchange rates at period end. Purchases and sales of investment securities, income and dividends received and expenses denominated in foreign currencies are translated into U.S. dollars at the exchange rate in effect on the transaction date.
The effects of exchange rate fluctuations on investments are included with the net realized and unrealized gain (loss) on investment securities. Other foreign currency transactions resulting in realized and unrealized gain (loss) are disclosed separately.
Investment Transactions and Income. For financial reporting purposes, the Funds' investment holdings and NAV include trades executed through the end of the last business day of the period. The NAV per share for processing shareholder transactions is calculated as of the close of business of the New York Stock Exchange (NYSE), normally 4:00 p.m. Eastern time and includes trades executed through the end of the prior business day. Gains and losses on securities sold are determined on the basis of identified cost and may include proceeds received from litigation. Dividend income is recorded on the ex-dividend date, except for certain dividends from foreign securities where the ex-dividend date may have passed, which are recorded as soon as the Funds are informed of the ex-dividend date. Non-cash dividends included in dividend income, if any, are recorded at the fair market value of the securities received. Distributions received on securities that represent a return of capital or capital gain are recorded as a reduction of cost of investments and/or as a realized gain. The Funds estimate the components of distributions received that may be considered return of capital distributions or capital gain distributions. Interest income and distributions from the Fidelity Central Funds are accrued as earned. Interest income includes coupon interest and amortization of premium and accretion of discount on debt securities. Investment income is recorded net of foreign taxes withheld where recovery of such taxes is uncertain.
Expenses. Expenses directly attributable to a fund are charged to that fund. Expenses attributable to more than one fund are allocated among the respective funds on the basis of relative net assets or other appropriate methods. Expense estimates are accrued in the period to which they relate and adjustments are made when actual amounts are known.
Deferred Trustee Compensation. Under a Deferred Compensation Plan (the Plan) for Health Care Portfolio, independent Trustees may elect to defer receipt of a portion of their annual compensation. Deferred amounts are invested in a cross-section of Fidelity funds, are marked-to-market and remain in the Fund until distributed in accordance with the Plan. The investment of deferred amounts and the offsetting payable to the Trustees are included in the accompanying Statement of Assets and Liabilities.
Income Tax Information and Distributions to Shareholders. Each year, each Fund intends to qualify as a regulated investment company under Subchapter M of the Internal Revenue Code, including distributing substantially all of its taxable income and realized gains. As a result, no provision for income taxes is required. Each Fund files a U.S. federal tax return, in addition to state and local tax returns as required. A fund's federal income tax returns are subject to examination by the Internal Revenue Service (IRS) for a period of three fiscal years after they are filed. State and local tax returns may be subject to examination for an additional fiscal year depending on the jurisdiction. Foreign taxes are provided for based on each Fund's understanding of the tax rules and rates that exist in the foreign markets in which it invests.
Distributions are declared and recorded on the ex-dividend date. Income and capital gain distributions are determined in accordance with income tax regulations, which may differ from GAAP.
Capital accounts within the financial statements are adjusted for permanent book-tax differences. These adjustments have no impact on net assets or the results of operations. Temporary book-tax differences will reverse in a subsequent period.
Book-tax differences are primarily due to foreign currency transactions, deferred trustees compensation, net operating losses, capital loss carryforwards and losses deferred due to wash sales and excise tax regulations.
The federal tax cost of investment securities and unrealized appreciation (depreciation) as of period end were as follows for each Fund:
| Tax cost | Gross unrealized appreciation | Gross unrealized depreciation | Net unrealized appreciation (depreciation) on securities and other investments |
Biotechnology Portfolio | $2,196,109,891 | $ 643,253,855 | $ (167,328,949) | $ 475,924,906 |
Health Care Portfolio | 1,993,059,929 | 445,813,985 | (63,527,380) | 382,286,605 |
Medical Delivery Portfolio | 635,349,352 | 126,506,543 | (19,077,791) | 107,428,752 |
Medical Equipment and Systems Portfolio | 1,143,220,746 | 199,167,428 | (58,846,055) | 140,321,373 |
Pharmaceuticals Portfolio | 686,767,361 | 162,576,724 | (14,894,961) | 147,681,763 |
Semiannual Report
3. Significant Accounting Policies - continued
Income Tax Information and Distributions to Shareholders - continued
Capital loss carryforwards are only available to offset future capital gains of the Funds to the extent provided by regulations and may be limited. Under the Regulated Investment Company Modernization Act of 2010 (the Act), the Funds are permitted to carry forward capital losses incurred in taxable years beginning after December 22, 2010 for an unlimited period and such capital losses are required to be used prior to any losses that expire. At February 29, 2012, capital loss carryforwards were as follows:
| Fiscal year of
expiration | |
| 2018 | Total capital loss
carryforward |
Medical Delivery Portfolio | $ (20,373,659) | $ (20,373,659) |
Trading (Redemption) Fees. Shares held by investors in the Funds less than 30 days are subject to a redemption fee equal to .75% of the net asset value of shares redeemed. All redemption fees, which reduce the proceeds of the shareholder redemption, are retained by the Funds and accounted for as an addition to paid in capital.
New Accounting Pronouncement. In December 2011, the Financial Accounting Standards Board issued Accounting Standard Update No. 2011-11, Disclosures about Offsetting Assets and Liabilities. The update creates new disclosure requirements requiring entities to disclose both gross and net information for derivatives and other financial instruments that are either offset in the Statement of Assets and Liabilities or subject to an enforceable master netting arrangement or similar agreement. The disclosure requirements are effective for annual reporting periods beginning on or after January 1, 2013, and interim periods within those annual periods. Management is currently evaluating the impact of the update's adoption on the Fund's financial statement disclosures.
4. Operating Policies.
Restricted Securities. The Funds may invest in securities that are subject to legal or contractual restrictions on resale. These securities generally may be resold in transactions exempt from registration or to the public if the securities are registered. Disposal of these securities may involve time-consuming negotiations and expense, and prompt sale at an acceptable price may be difficult. Information regarding restricted securities is included at the end of each applicable Fund's Schedule of Investments.
5. Purchases and Sales of Investments.
Purchases and sales of securities, other than short-term securities, are noted in the table below.
| Purchases ($) | Sales ($) |
Biotechnology Portfolio | 926,350,342 | 595,755,279 |
Health Care Portfolio | 1,150,948,497 | 1,173,973,738 |
Medical Delivery Portfolio | 435,819,519 | 536,361,159 |
Medical Equipment and Systems Portfolio | 421,040,018 | 512,420,685 |
Pharmaceuticals Portfolio | 235,430,334 | 185,285,252 |
6. Fees and Other Transactions with Affiliates.
Management Fee. FMR and its affiliates provide the Funds with investment management related services for which the Funds pay a monthly management fee. The management fee is the sum of an individual fund fee rate and an annualized group fee rate. The individual fund fee rate is applied to each Fund's average net assets. The group fee rate is based upon the average net assets of all the mutual funds advised by FMR. The group fee rate decreases as assets under management increase and increases as assets under management decrease. For the period, each Fund's annualized management fee rate expressed as a percentage of each Fund's average net assets was as follows:
| Individual Rate | Group Rate | Total |
Biotechnology Portfolio | .30% | .26% | .56% |
Health Care Portfolio | .30% | .26% | .56% |
Medical Delivery Portfolio | .30% | .26% | .56% |
Medical Equipment and Systems Portfolio | .30% | .26% | .56% |
Pharmaceuticals Portfolio | .30% | .26% | .56% |
Semiannual Report
Notes to Financial Statements (Unaudited) - continued
6. Fees and Other Transactions with Affiliates - continued
Transfer Agent Fees. Fidelity Investments Institutional Operations Company, Inc. (FIIOC), an affiliate of FMR, is the Funds' transfer, dividend disbursing and shareholder servicing agent. FIIOC receives account fees and asset-based fees that vary according to account size and type of account. FIIOC pays for typesetting, printing and mailing of shareholder reports, except proxy statements. For the period, transfer agent fees were equivalent to the following annualized rates expressed as a percentage of average net assets:
Biotechnology Portfolio | .20% |
Health Care Portfolio | .19% |
Medical Delivery Portfolio | .24% |
Medical Equipment and Systems Portfolio | .23% |
Pharmaceuticals Portfolio | .24% |
Accounting and Security Lending Fees. Fidelity Service Company, Inc. (FSC), an affiliate of FMR, maintains each Fund's accounting records. The accounting fee is based on the level of average net assets for each month. Under a separate contract, FSC administers the security lending program. The security lending fee is based on the number and duration of lending transactions.
Brokerage Commissions. Certain Funds placed a portion of their portfolio transactions with brokerage firms which are affiliates of the investment adviser. The commissions paid to these affiliated firms were as follows:
| Amount |
Biotechnology Portfolio | $ 18,290 |
Health Care Portfolio | 13,862 |
Medical Delivery Portfolio | 18,468 |
Medical Equipment and Systems Portfolio | 8,715 |
Pharmaceuticals Portfolio | 6,184 |
Interfund Lending Program. Pursuant to an Exemptive Order issued by the SEC, the Funds, along with other registered investment companies having management contracts with FMR, may participate in an interfund lending program. This program provides an alternative credit facility allowing the funds to borrow from, or lend money to, other participating affiliated funds. At period end, there were no interfund loans outstanding. Each applicable fund's activity in this program during the period for which loans were outstanding was as follows:
| Borrower or
Lender | Average Daily Loan Balance | Weighted Average Interest Rate | Interest
Expense |
Biotechnology Portfolio | Borrower | $ 9,169,667 | .39% | $ 1,780 |
Medical Delivery Portfolio | Borrower | 10,745,222 | .40% | 1,077 |
7. Committed Line of Credit.
Certain Funds participate with other funds managed by FMR or an affiliate in a $4.25 billion credit facility (the "line of credit") to be utilized for temporary or emergency purposes to fund shareholder redemptions or for other short-term liquidity purposes. The participating funds have agreed to pay commitment fees on their pro-rata portion of the line of credit, which are reflected in Miscellaneous expenses on the Statement of Operations, and are as follows:
Biotechnology Portfolio | $ 2,477 |
Health Care Portfolio | 3,089 |
Medical Delivery Portfolio | 1,242 |
Medical Equipment and Systems Portfolio | 1,899 |
Pharmaceuticals Portfolio | 1,021 |
During the period, there were no borrowings on this line of credit.
Semiannual Report
8. Security Lending.
Certain Funds lend portfolio securities through a lending agent from time to time in order to earn additional income. For equity securities, a lending agent is used and may loan securities to certain qualified borrowers, including Fidelity Capital Markets (FCM), a broker-dealer affiliated with the Funds. On the settlement date of the loan, each applicable Fund receives collateral (in the form of U.S. Treasury obligations, letters of credit and/or cash) against the loaned securities and maintains collateral in an amount not less than 100% of the market value of the loaned securities during the period of the loan. The market value of the loaned securities is determined at the close of business of the Funds and any additional required collateral is delivered to the Funds on the next business day. If the borrower defaults on its obligation to return the securities loaned because of insolvency or other reasons, a fund could experience delays and costs in recovering the securities loaned or in gaining access to the collateral. Any cash collateral received is invested in the Fidelity Securities Lending Cash Central Fund. The value of loaned securities and cash collateral at period end are disclosed on each applicable Fund's Statement of Assets and Liabilities. Security lending income represents the income earned on investing cash collateral, less rebates paid to borrowers and any lending agent fees associated with the loan, plus any premium payments received for lending certain types of securities. Security lending income is presented on each applicable Fund's Statement of Operations as a component of income from Fidelity Central Funds. FCM security lending activity as of and during the period was as follows:
| Security Lending Income From Securities Loaned to FCM | Value of Securities Loaned to FCM at Period End |
Biotechnology Portfolio | $ 170,358 | $ 6,611,319 |
Health Care Portfolio | 7,473 | 3,040,537 |
Medical Delivery Portfolio | 23,100 | - |
Medical Equipment and Systems Portfolio | 59,372 | 3,556,324 |
Pharmaceuticals Portfolio | 1,965 | 1,520,400 |
9. Expense Reductions.
Many of the brokers with whom FMR places trades on behalf of certain Funds provided services to these Funds in addition to trade execution. These services included payments of expenses on behalf of each applicable Fund. In addition, through arrangements with each applicable Fund's custodian, credits realized as a result of uninvested cash balances were used to reduce each applicable Fund's expenses. All of the applicable expense reductions are noted in the table below.
| Brokerage Service reduction | Custody
expense
reduction |
| | |
Biotechnology Portfolio | $ 85,718 | $ 45 |
Health Care Portfolio | 80,608 | 87 |
Medical Delivery Portfolio | 77,860 | 1 |
Medical Equipment and Systems Portfolio | 33,015 | 18 |
Pharmaceuticals Portfolio | 10,105 | 18 |
10. Other.
The Funds' organizational documents provide former and current trustees and officers with a limited indemnification against liabilities arising in connection with the performance of their duties to the Funds. In the normal course of business, the Funds may also enter into contracts that provide general indemnifications. The Funds' maximum exposure under these arrangements is unknown as this would be dependent on future claims that may be made against the Funds. The risk of material loss from such claims is considered remote.
At the end of the period, the Strategic Advisers U.S. Opportunity Fund was the owner of record of approximately 12% of the total outstanding shares of Pharmaceuticals Portfolio. Mutual funds managed by FMR or its affiliates were the owners of record, in the aggregate, of approximately 27% of the total outstanding shares of Pharmaceuticals Portfolio.
Semiannual Report
Board Approval of Investment Advisory Contracts and Management Fees
Biotechnology Portfolio
Health Care Portfolio
Medical Delivery Portfolio
Medical Equipment and Systems Portfolio
Pharmaceuticals Portfolio
Each year, the Board of Trustees, including the Independent Trustees (together, the Board), votes on the renewal of the management contract and sub-advisory agreements (together, the Advisory Contracts) for each fund. The Board, assisted by the advice of fund counsel and Independent Trustees' counsel, requests and considers a broad range of information relevant to the renewal of the Advisory Contracts throughout the year.
The Board meets regularly and, at each of its meetings, considers factors that are relevant to its annual consideration of the renewal of each fund's Advisory Contracts, including the services and support provided to each fund and its shareholders. The Board has established various standing committees, each composed of and chaired by Independent Trustees with varying backgrounds, to which the Board has assigned specific subject matter responsibilities in order to enhance effective decision-making by the Board. The Board, acting directly and through its Committees, requests and receives information concerning the annual consideration of the renewal of each fund's Advisory Contracts. The Board also meets as needed to consider matters specifically related to the Board's annual consideration of the renewal of Advisory Contracts. Members of the Board may also meet with trustees of other Fidelity funds through ad hoc joint committees to discuss certain matters relevant to the Fidelity funds.
At its July 2012 meeting, the Board of Trustees, including the Independent Trustees, unanimously determined to renew each fund's Advisory Contracts. In reaching its determination, the Board considered all factors it believed relevant, including (i) the nature, extent, and quality of the services to be provided to each fund and its shareholders (including the investment performance of each fund); (ii) the competitiveness of each fund's management fee and total expense ratio relative to peer funds; (iii) the total costs of the services to be provided by and the profits to be realized by Fidelity from its relationship with each fund; (iv) the extent to which economies of scale exist and would be realized as each fund grows; and (v) whether fee levels reflect these economies of scale, if any, for the benefit of fund shareholders.
In considering whether to renew the Advisory Contracts for each fund, the Board reached a determination, with the assistance of fund counsel and Independent Trustees' counsel and through the exercise of its business judgment, that the renewal of the Advisory Contracts is in the best interests of each fund and its shareholders and that the compensation payable under the Advisory Contracts is fair and reasonable. The Board's decision to renew the Advisory Contracts was not based on any single factor, but rather was based on a comprehensive consideration of all the information provided to the Board at its meetings throughout the year. The Board, in reaching its determination to renew the Advisory Contracts, is aware that shareholders in each fund have a broad range of investment choices available to them, including a wide choice among mutual funds offered by Fidelity's competitors, and that each fund's shareholders, who have the opportunity to review and weigh the disclosure provided by the fund in its prospectus and other public disclosures, have chosen to invest in that fund, managed by Fidelity.
Nature, Extent, and Quality of Services Provided. The Board considered the staffing within the investment adviser, FMR, and the sub-advisers (together, the Investment Advisers), including the backgrounds of the funds' investment personnel, and also considered the funds' investment objectives, strategies, and related investment philosophies. The Independent Trustees also had discussions with senior management of Fidelity's investment operations and investment groups. The Board considered the structure of the portfolio manager compensation program and whether this structure provides appropriate incentives to act in the best interests of each fund.
Resources Dedicated to Investment Management and Support Services. The Board and the Fund Oversight and Research Committees reviewed the general qualifications and capabilities of the Investment Advisers' investment staff, including its size, education, experience, and resources, as well as the Investment Advisers' approach to recruiting, training, managing, and compensating investment personnel. The Board also noted that FMR has continued to increase the resources devoted to non-U.S. offices, including expansion of Fidelity's global investment organization. The Board noted that Fidelity's analysts have extensive resources, tools and capabilities that allow them to conduct sophisticated quantitative and fundamental analysis, as well as credit analysis of issuers, counterparties and guarantors. The Board also believes that Fidelity's investment professionals have sufficient access to global information and data so as to provide competitive investment results over time, and that those professionals also have access to sophisticated tools that permit them to assess portfolio construction and risk and performance attribution characteristics continuously, as well as to transmit new information and research conclusions rapidly around the world. Additionally, in its deliberations, the Board considered the Investment Advisers' trading and risk management capabilities and resources, which are an integral part of the investment management process.
Shareholder and Administrative Services. The Board considered (i) the nature, extent, quality, and cost of advisory, administrative, and shareholder services performed by the Investment Advisers and their affiliates under the Advisory Contracts and under separate agreements covering transfer agency, pricing and bookkeeping, and securities lending services for each fund; (ii) the nature and extent of the supervision of third party service providers, principally custodians and subcustodians; and (iii) the resources devoted to, and the record of compliance with, each fund's compliance policies and procedures. The Board also reviewed the allocation of fund brokerage, including allocations to brokers affiliated with the Investment Advisers, the use of brokerage commissions to pay fund expenses, and the use of "soft" commission dollars to pay for research services.
Semiannual Report
Board Approval of Investment Advisory Contracts and Management Fees - continued
The Board noted that the growth of fund assets over time across the complex allows Fidelity to reinvest in the development of services designed to enhance the value or convenience of the Fidelity funds as investment vehicles. These services include 24-hour access to account information and market information through telephone representatives and over the Internet, investor education materials and asset allocation tools, and the expanded availability of Fidelity Investor Centers.
Investment in a Large Fund Family. The Board considered the benefits to shareholders of investing in a Fidelity fund, including the benefits of investing in a fund that is part of a large family of funds offering a variety of investment disciplines and providing a large variety of mutual fund investor services. The Board noted that Fidelity had taken, or had made recommendations that resulted in the Fidelity funds taking, a number of actions over the previous year that benefited particular funds, including (i) continuing to dedicate additional resources to investment research and support of the senior management team that oversees asset management; (ii) persisting in efforts to enhance Fidelity's research capabilities, in particular, international research; (iii) launching new funds and making other enhancements to meet client needs for global and income-oriented solutions; (iv) continuing to launch dedicated lower cost underlying funds to meet investment management's portfolio construction needs related to expanding underlying fund options, specifically for the Freedom Fund product lines; (v) adopting a "Stock Selector" sector neutral investment approach and employing a team of portfolio managers who are sector specialists to manage certain funds; (vi) rationalizing product lines and gaining increased efficiencies through the mergers of several funds into other funds; (vii) strengthening the Spartan Index Fund product line by adding new funds and/or new low-cost institutional share classes, restructuring fund expenses to accommodate new classes, and reducing investment minimums for certain classes of shares; (viii) modifying the eligibility criteria for Institutional Class shares to increase their appeal to government entities and charitable investors; and (ix) reducing certain transfer agent fee rates.
Investment Performance. The Board considered whether each fund has operated in accordance with its investment objective, as well as its record of compliance with its investment restrictions. It also reviewed each fund's absolute investment performance, as well as each fund's relative investment performance measured over multiple periods against a third-party-sponsored index that reflects the market sector in which the fund invests. The Board noted that FMR believes that no meaningful peer group exists for the funds principally because most other funds in each fund's third-party peer group focus on different industries or sectors than the fund. For each fund, the following charts considered by the Board show, over the one-, three-, and five-year periods ended December 31, 2011, the fund's cumulative total returns and the cumulative total returns of a third-party-sponsored index ("benchmark").
Biotechnology Portfolio
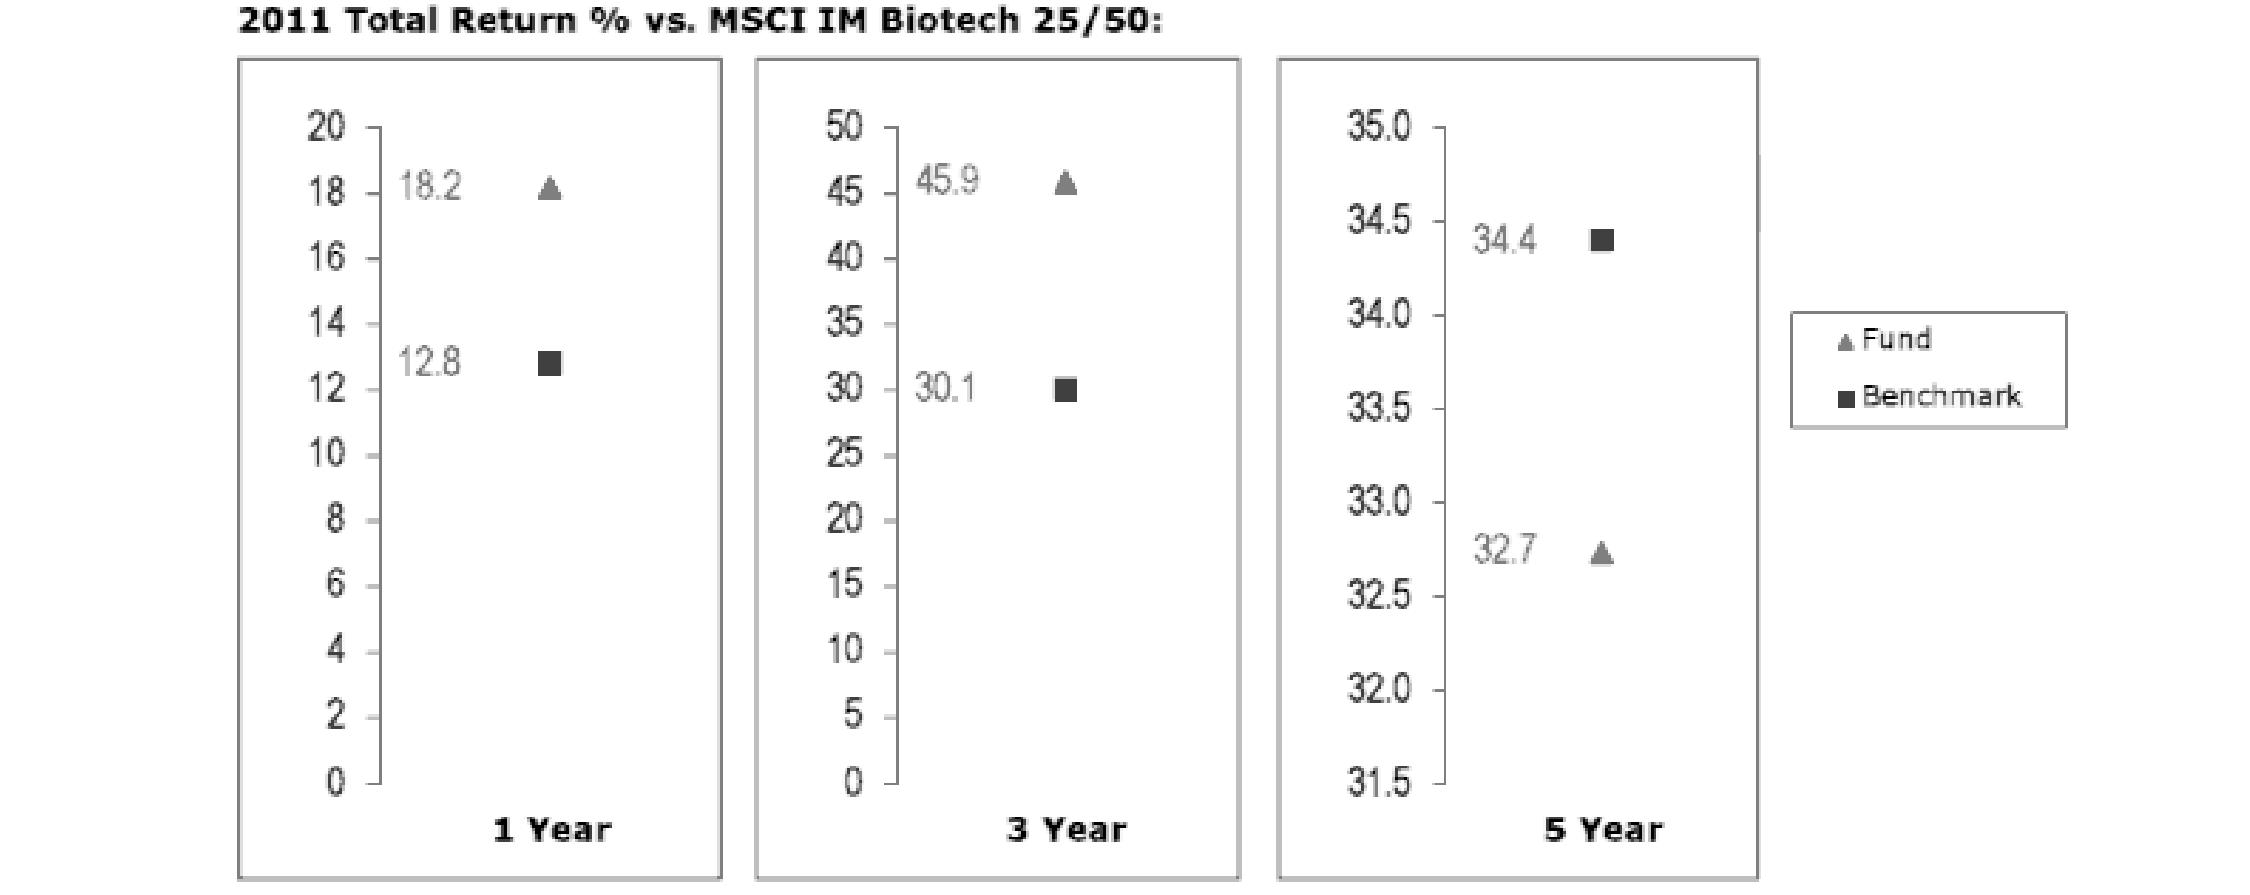
The Board noted that the investment performance of the fund compared favorably to its benchmark for the one- and three-year periods, although the fund's five-year cumulative total return was lower than its benchmark. The Board also reviewed the fund's performance since inception as well as performance in the current year.
Semiannual Report
Health Care Portfolio
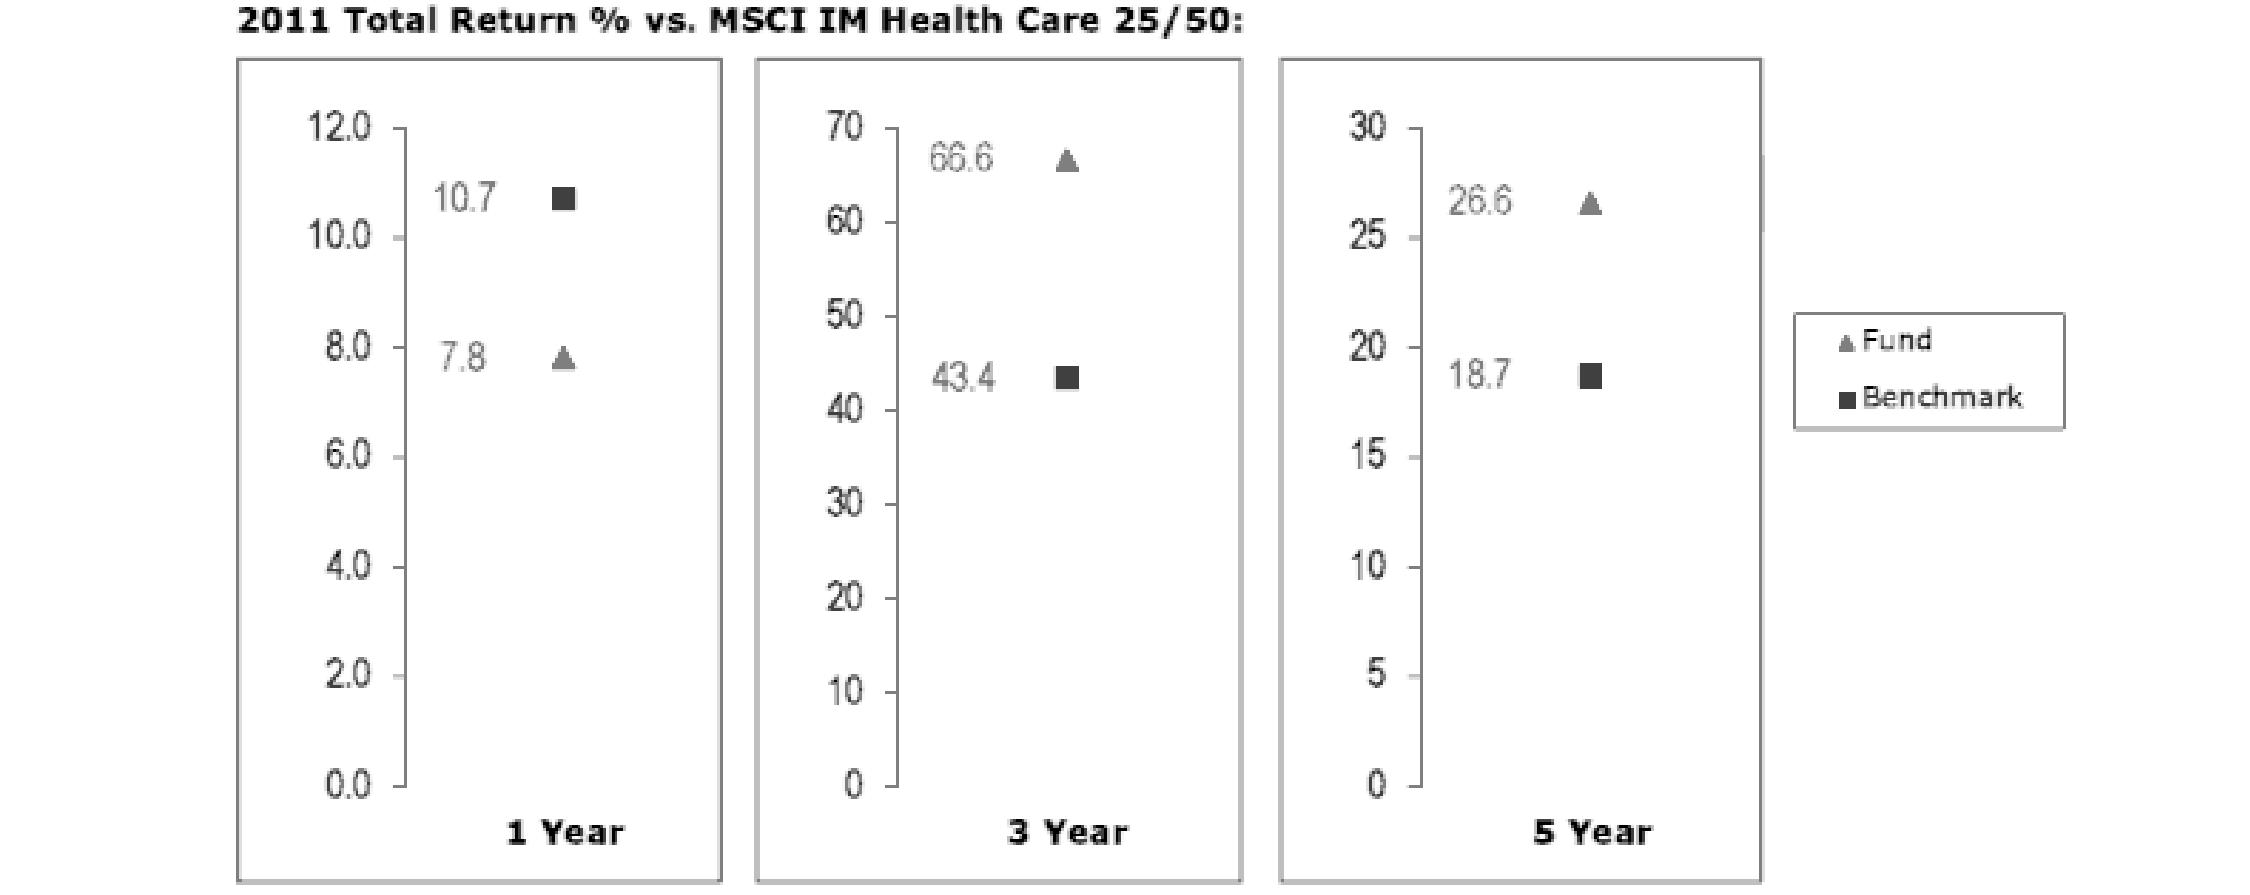
The Board noted that the investment performance of the fund compared favorably to its benchmark for the three- and five-year periods, although the fund's one-year total return was lower than its benchmark. The Board also reviewed the fund's performance since inception as well as performance in the current year.
Medical Delivery Portfolio
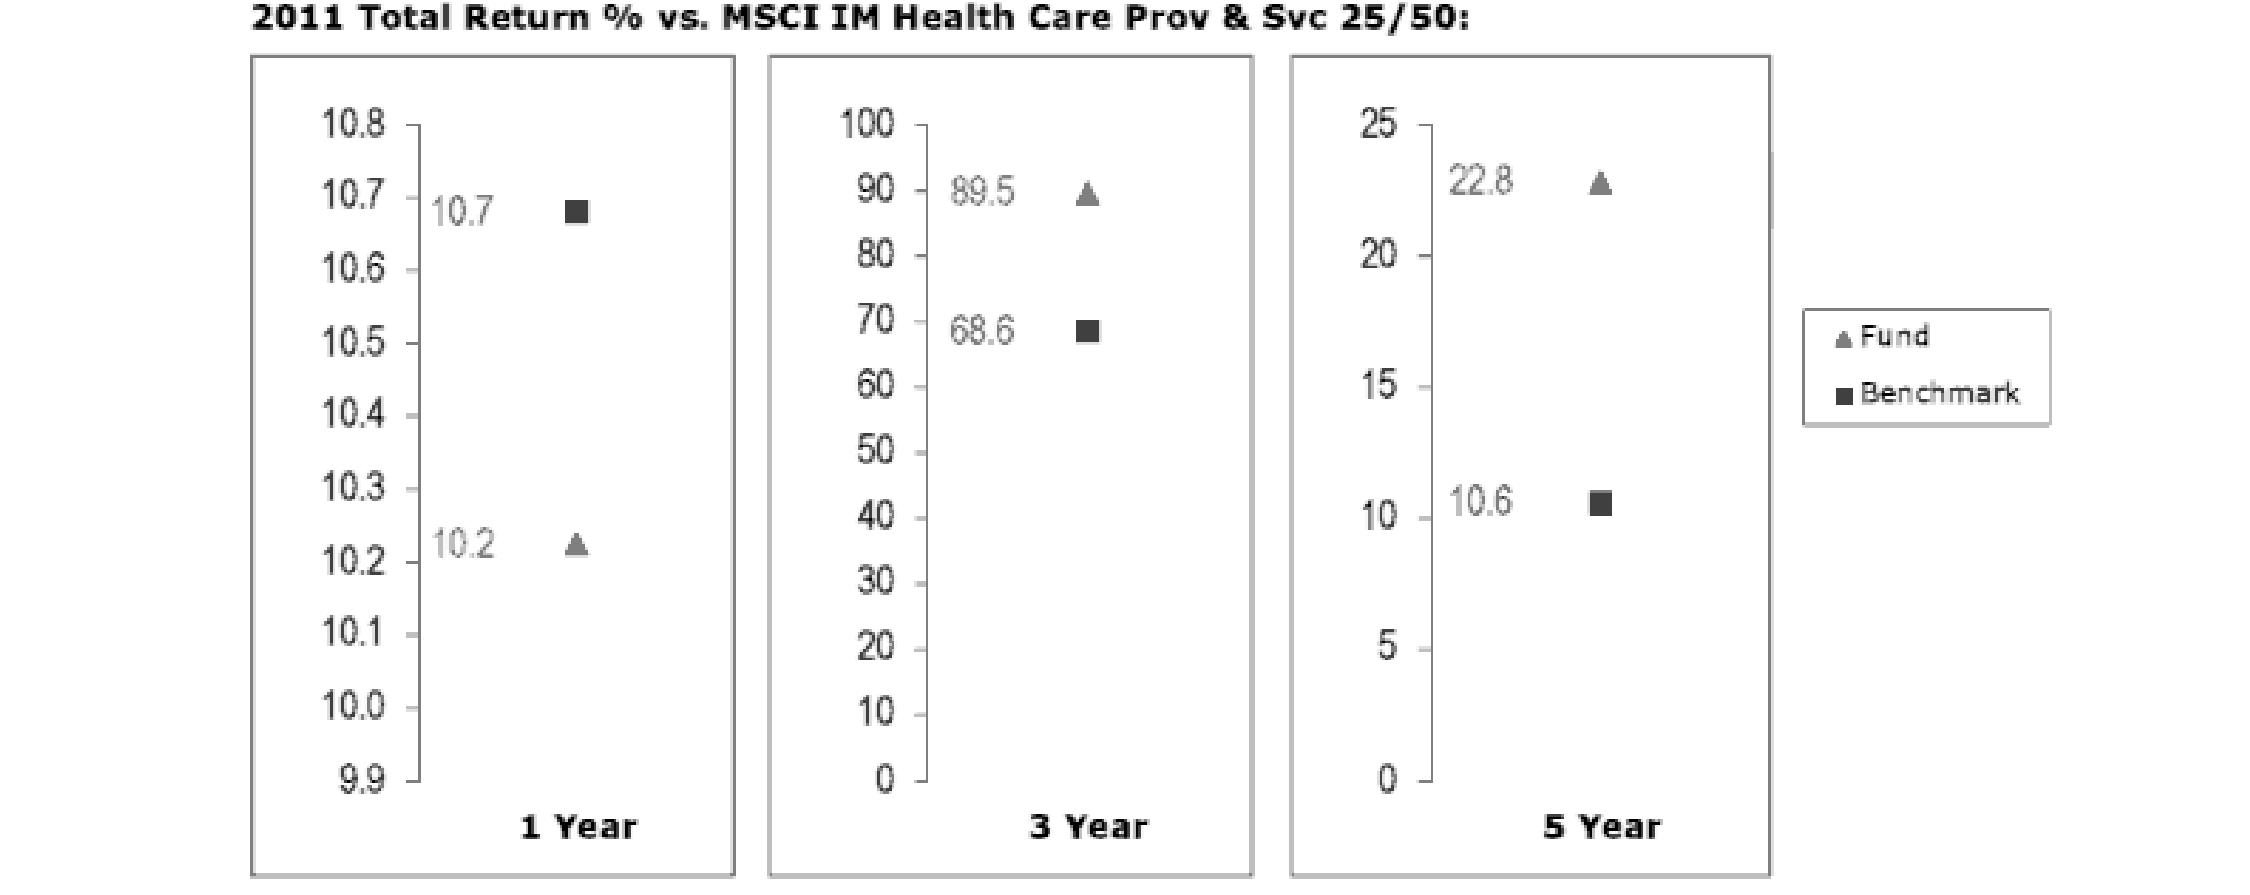
The Board noted that the investment performance of the fund compared favorably to its benchmark for the three- and five-year periods, although the fund's one-year total return was lower than its benchmark. The Board also reviewed the fund's performance since inception as well as performance in the current year.
Semiannual Report
Board Approval of Investment Advisory Contracts and Management Fees - continued
Medical Equipment and Systems Portfolio
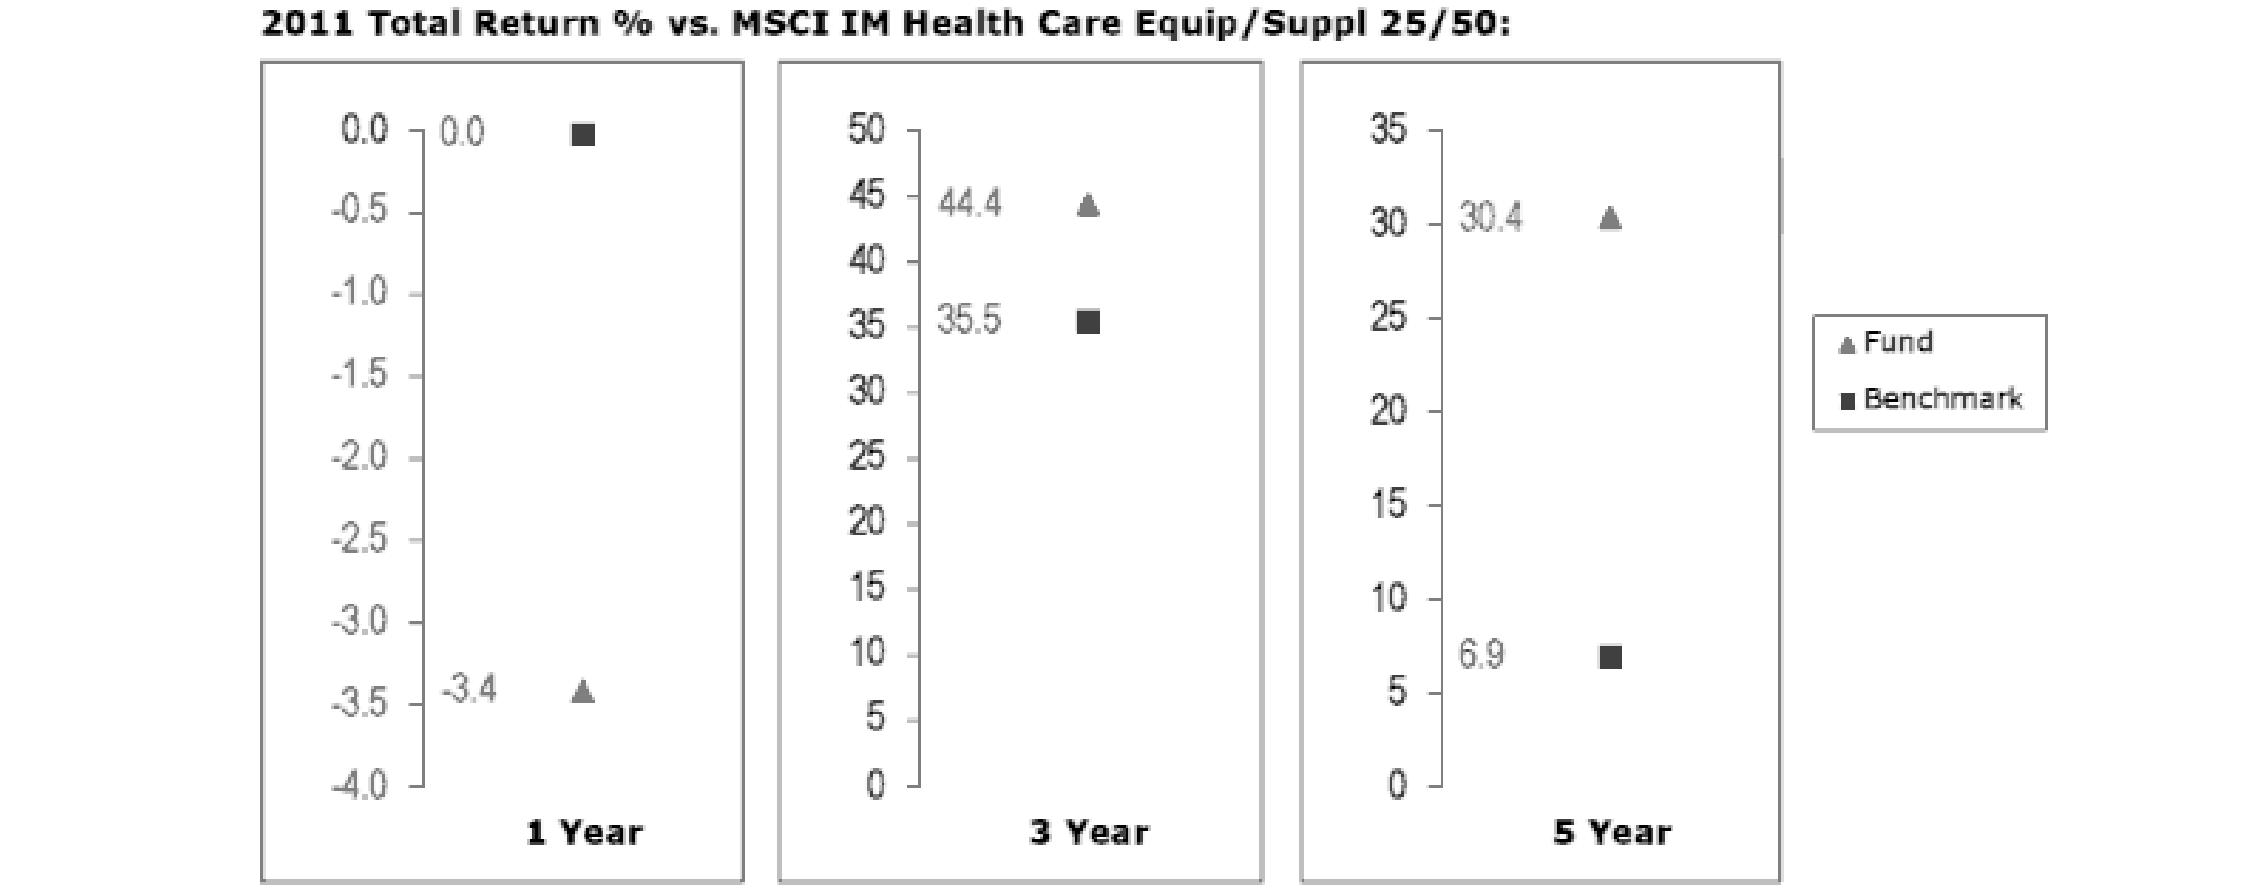
The Board noted that the investment performance of the fund compared favorably to its benchmark for the three- and five-year periods, although the fund's one-year total return was lower than its benchmark. The Board also reviewed the fund's performance since inception as well as performance in the current year.
Pharmaceuticals Portfolio
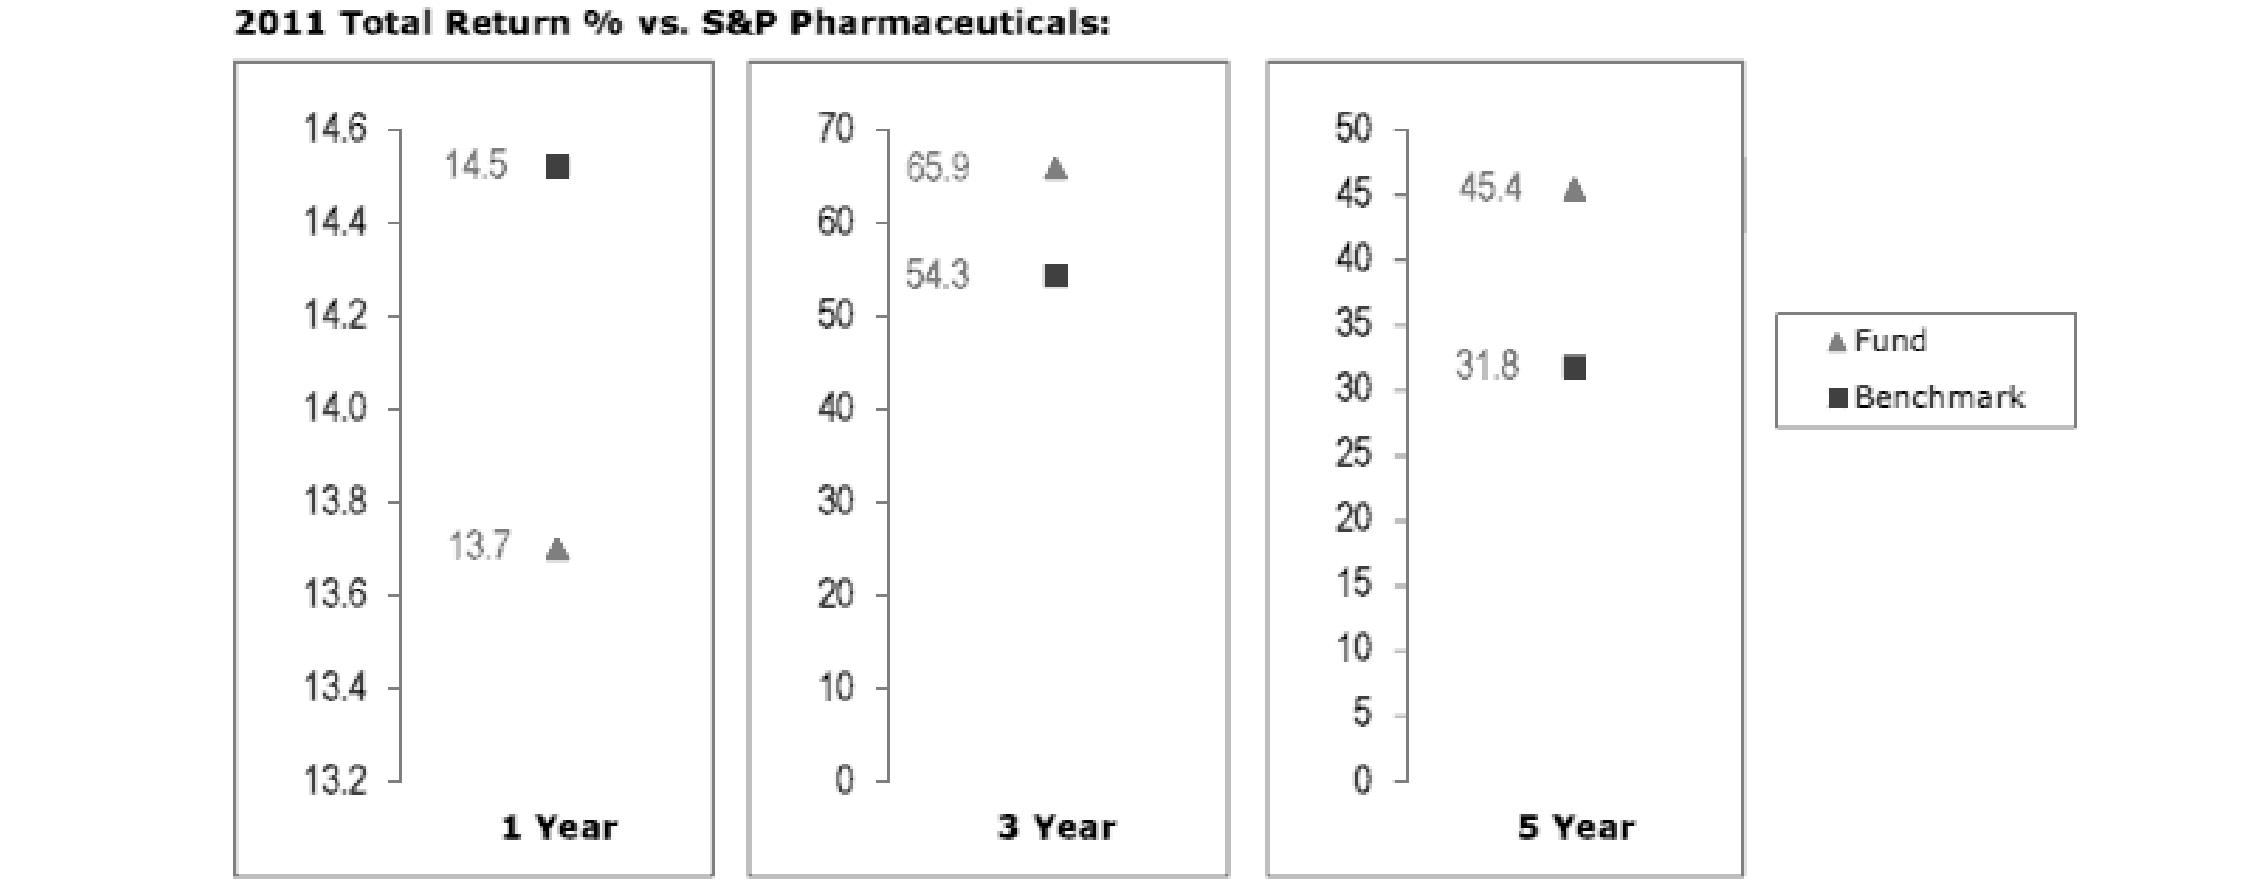
The Board noted that the investment performance of the fund compared favorably to its benchmark for the three- and five-year periods, although the fund's one-year total return was lower than its benchmark. The Board also reviewed the fund's performance since inception as well as performance in the current year.
Based on its review, the Board concluded that the nature, extent, and quality of services provided to each fund under the Advisory Contracts should benefit each fund's shareholders.
Competitiveness of Management Fee and Total Expense Ratio. The Board considered each fund's management fee and total expense ratio compared to "mapped groups" of competitive funds and classes. Fidelity creates "mapped groups" by combining similar Lipper investment objective categories that have comparable management fee characteristics. Combining Lipper investment objective categories aids the Board's management fee and total expense ratio comparisons by broadening the competitive group used for comparison and by reducing the number of universes to which various Fidelity funds are compared.
Semiannual Report
Management Fee. The Board considered two proprietary management fee comparisons for the 12-month periods shown in the charts below. The group of Lipper funds used by the Board for management fee comparisons is referred to below as the "Total Mapped Group." The Total Mapped Group comparison focuses on a fund's standing relative to the total universe of comparable funds available to investors in terms of gross management fees before expense reimbursements or caps. "TMG %" represents the percentage of funds in the Total Mapped Group that had management fees that were lower than a fund's. For example, a TMG % of 6% means that 94% of the funds in the Total Mapped Group had higher management fees than a fund. The "Asset-Size Peer Group" (ASPG) comparison focuses on a fund's standing relative to non-Fidelity funds similar in size to the fund within the Total Mapped Group. The ASPG represents at least 15% of the funds in the Total Mapped Group with comparable asset size and management fee characteristics, subject to a minimum of 50 funds (or all funds in the Total Mapped Group if fewer than 50). Additional information, such as the ASPG quartile in which a fund's management fee ranked, is also included in the charts and considered by the Board.
Biotechnology Portfolio
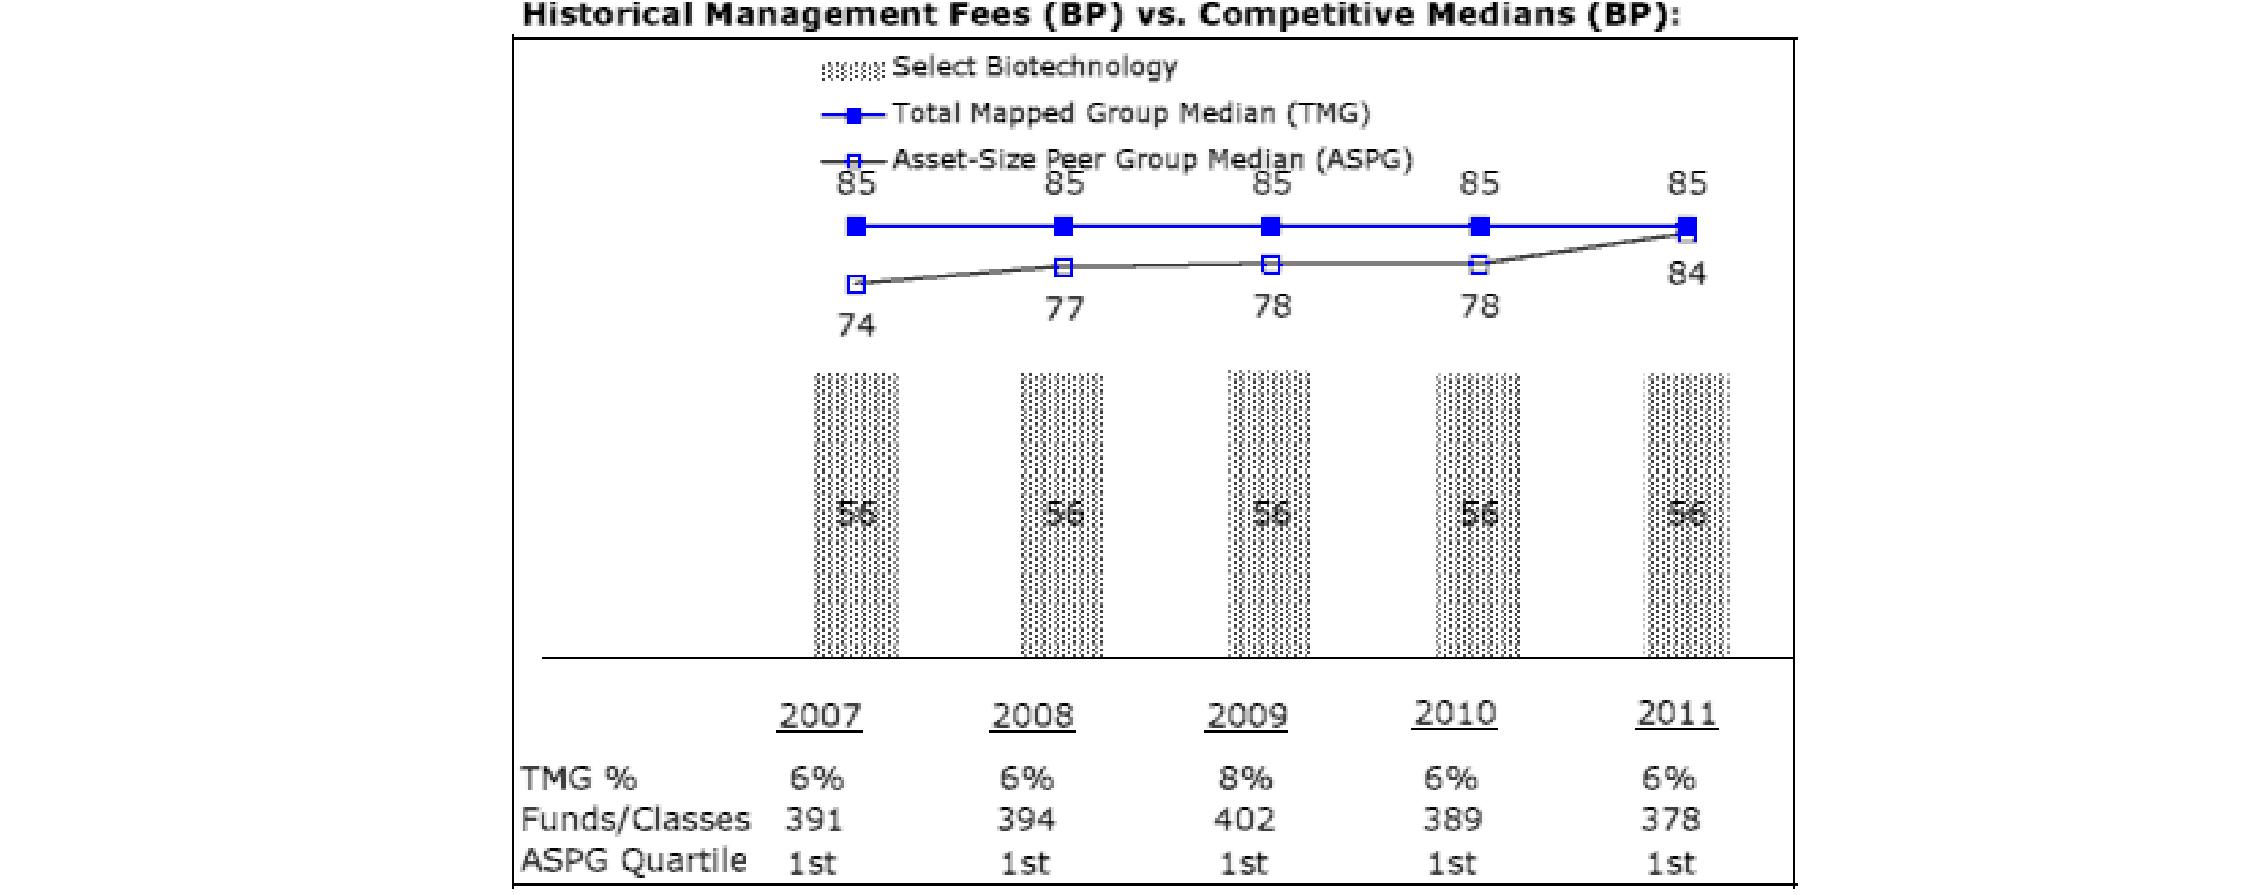
Health Care Portfolio
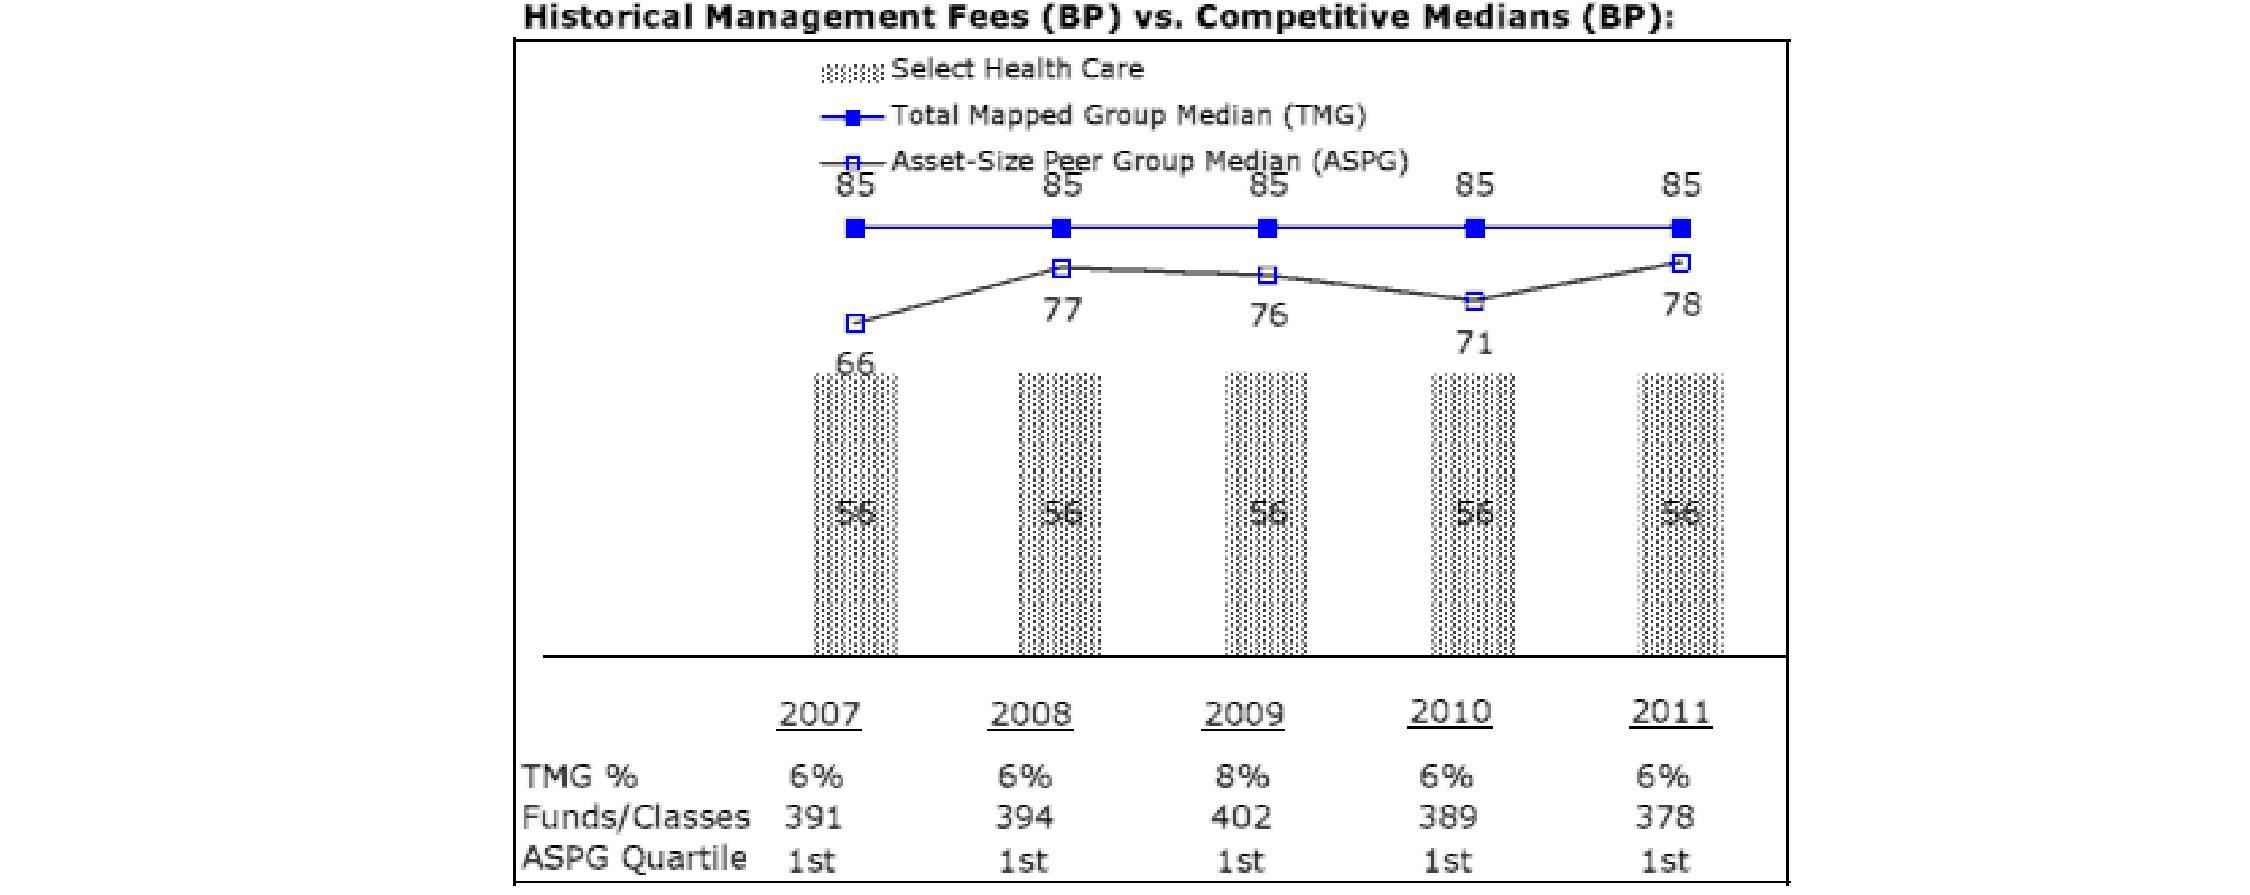
Semiannual Report
Board Approval of Investment Advisory Contracts and Management Fees - continued
Medical Delivery Portfolio
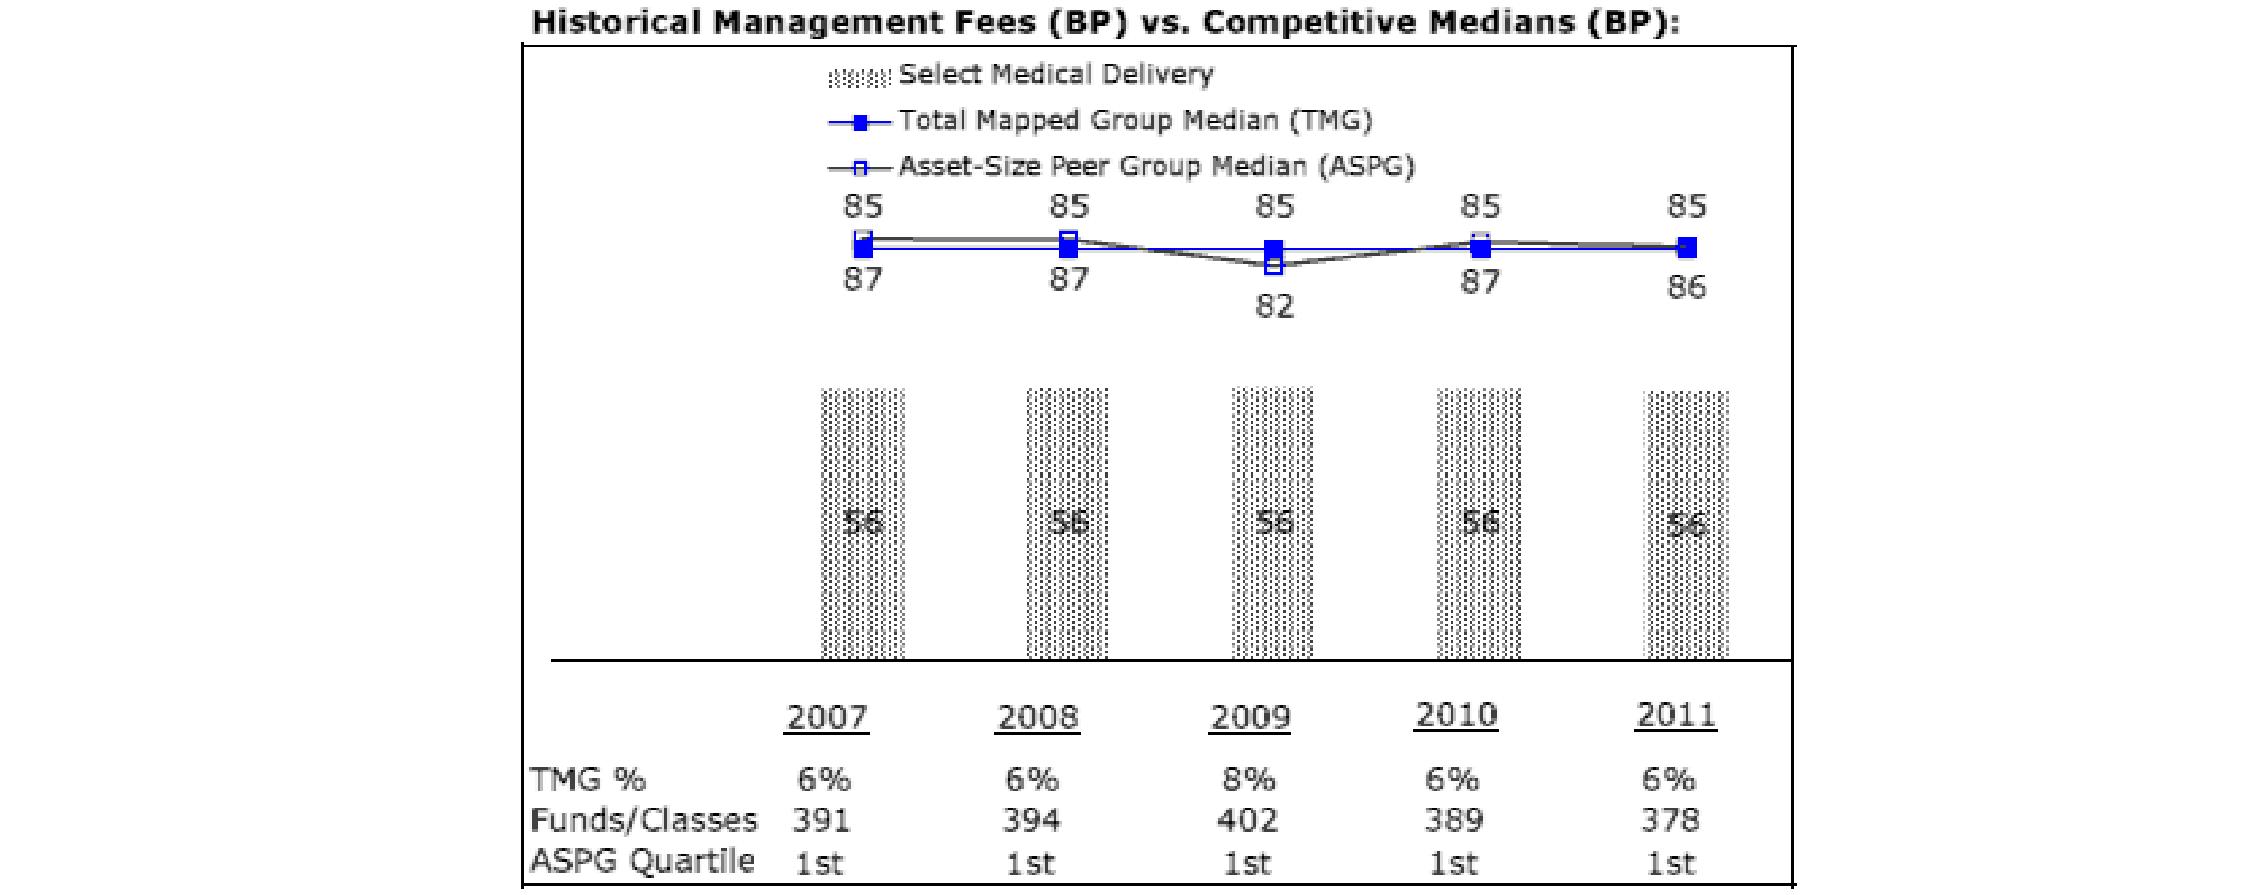
Medical Equipment and Systems Portfolio
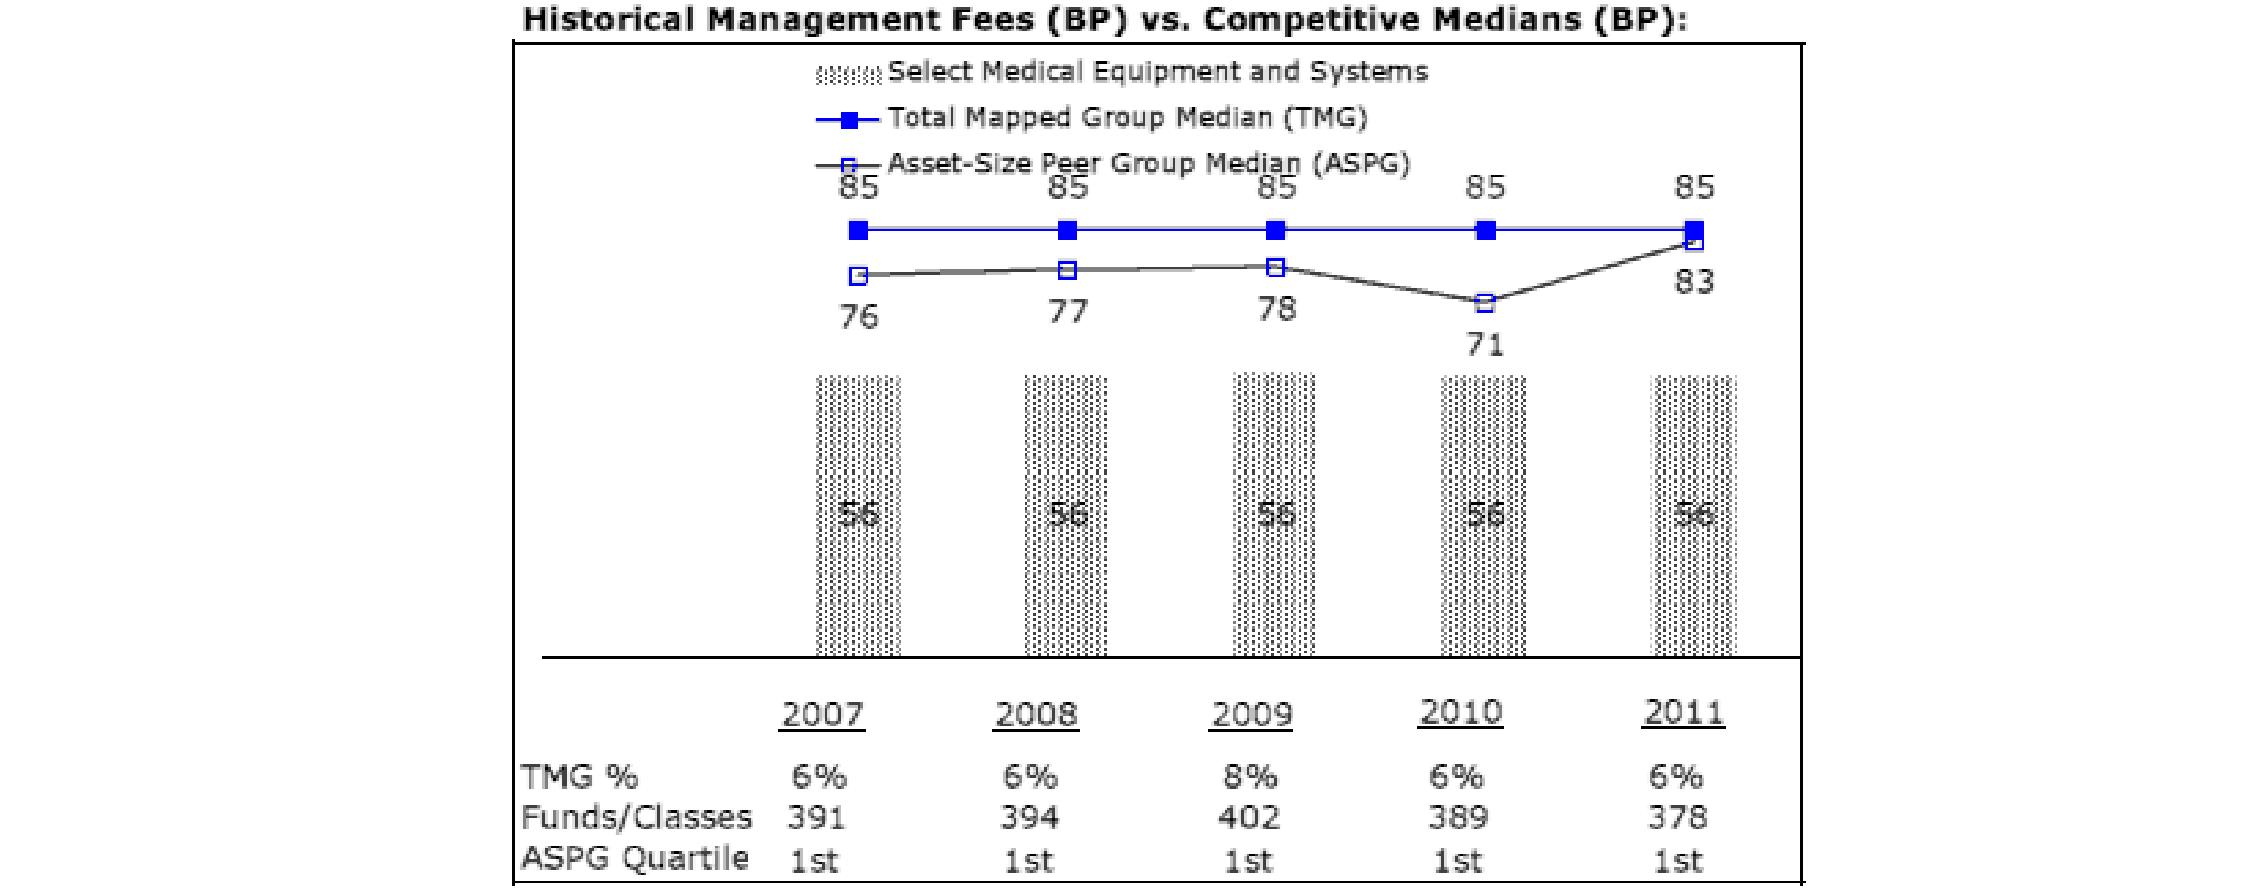
Semiannual Report
Pharmaceuticals Portfolio
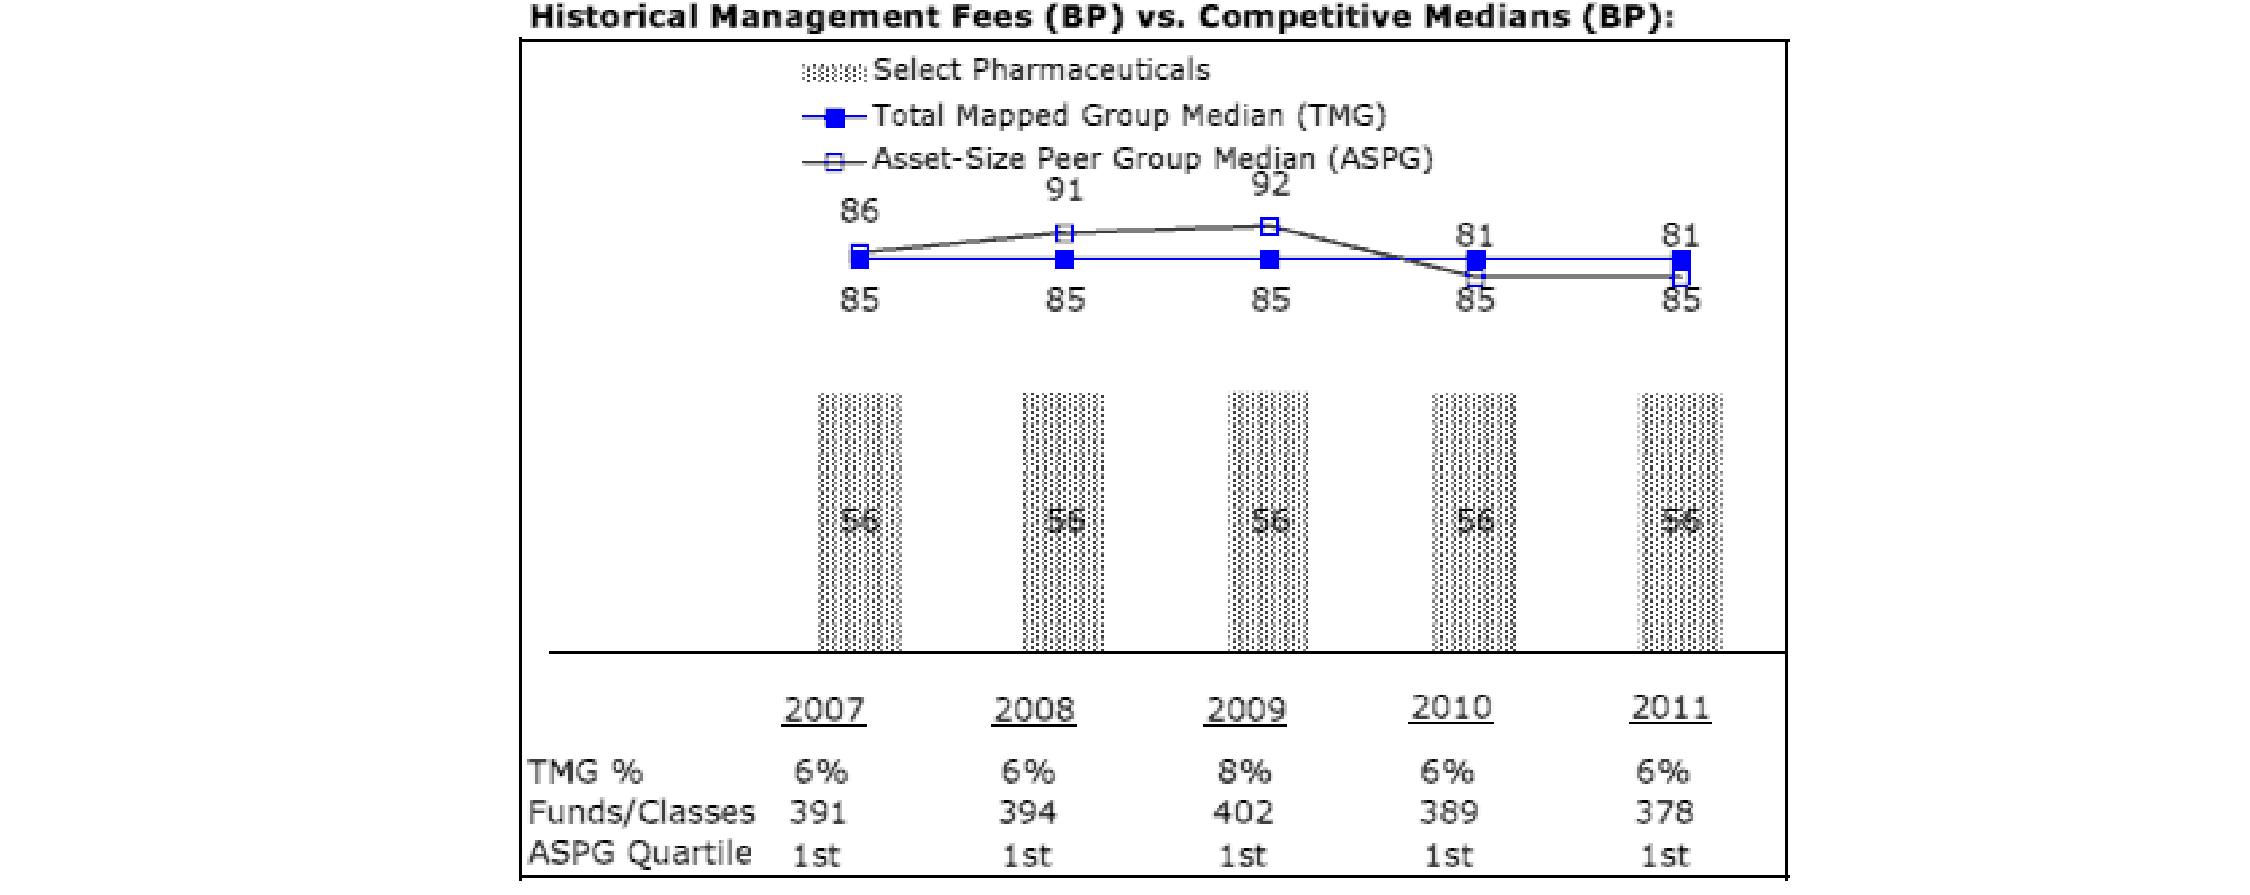
The Board noted that each fund's management fee ranked below the median of its Total Mapped Group and below the median of its ASPG for 2011.
Based on its review, the Board concluded that each fund's management fee is fair and reasonable in light of the services that the fund receives and the other factors considered.
Total Expense Ratio. In its review of each fund's total expense ratio, the Board considered the fund's management fee as well as other fund expenses, such as transfer agent fees, pricing and bookkeeping fees, and custodial, legal, and audit fees. The Board also noted the effects of any waivers and reimbursements on fees and expenses. As part of its review, the Board also considered the current and historical total expense ratios of each fund compared to competitive fund median expenses. Each fund is compared to those funds and classes in the Total Mapped Group (used by the Board for management fee comparisons) that have a similar sales load structure.
The Board noted that each fund's total expense ratio ranked below its competitive median for 2011.
Fees Charged to Other Fidelity Clients. The Board also considered Fidelity fee structures and other information with respect to clients of FMR and its affiliates, such as other mutual funds advised or subadvised by FMR or its affiliates, pension plan clients, and other institutional clients. The Board noted the findings of the 2010 ad hoc joint committee (created with the board of other Fidelity funds), which reviewed and compared Fidelity's institutional investment advisory business with its business of providing services to the Fidelity funds, including the differences in services provided, fees charged, and costs incurred, as well as competition in their respective marketplaces.
Based on its review of total expense ratios and fees charged to other Fidelity clients, the Board concluded that each fund's total expense ratio was reasonable in light of the services that the fund and its shareholders receive and the other factors considered.
Costs of the Services and Profitability. The Board considered the revenues earned and the expenses incurred by Fidelity in conducting the business of developing, marketing, distributing, managing, administering and servicing each fund and its shareholders. The Board also considered the level of Fidelity's profits in respect of all the Fidelity funds.
On an annual basis, FMR presents to the Board Fidelity's profitability for each fund. Fidelity calculates the profitability for each fund, as well as aggregate profitability for groups of Fidelity funds and all Fidelity funds, using a series of detailed revenue and cost allocation methodologies which originate with the books and records of Fidelity on which Fidelity's audited financial statements are based. The Audit Committee of the Board reviews any significant changes from the prior year's methodologies.
PricewaterhouseCoopers LLP (PwC), independent registered public accounting firm and auditor to Fidelity and certain Fidelity funds, has been engaged annually by the Board as part of the Board's assessment of Fidelity's profitability analysis. PwC's engagement includes the review and assessment of Fidelity's methodologies used in determining the revenues and expenses attributable to Fidelity's mutual fund business, and completion of agreed-upon procedures surrounding the mathematical accuracy of fund profitability and its conformity to allocation methodologies. After considering PwC's reports issued under the engagement and information provided by Fidelity, the Board concluded that while other allocation methods may also be reasonable, Fidelity's profitability methodologies are reasonable in all material respects.
Semiannual Report
Board Approval of Investment Advisory Contracts and Management Fees - continued
The Board also reviewed Fidelity's non-fund businesses and fall-out benefits related to the mutual fund business as well as cases where Fidelity's affiliates may benefit from or be related to the funds' business.
The Board considered the costs of the services provided by and the profits realized by Fidelity in connection with the operation of each fund and was satisfied that the profitability was not excessive in the circumstances.
Economies of Scale. The Board considered whether there have been economies of scale in respect of the management of the Fidelity funds, whether the Fidelity funds (including each fund) have appropriately benefited from any such economies of scale, and whether there is potential for realization of any further economies of scale. The Board considered the extent to which each fund will benefit from economies of scale through increased services to the fund, through waivers or reimbursements, or through fee or expense reductions. The Board also noted that in 2009, it and the board of other Fidelity funds created an ad hoc committee (the Economies of Scale Committee) to analyze whether FMR attains economies of scale in respect of the management and servicing of the Fidelity funds, whether the Fidelity funds have appropriately benefited from such economies of scale, and whether there is potential for realization of any further economies of scale.
The Board recognized that each fund's management contract incorporates a "group fee" structure, which provides for lower group fee rates as total fund assets under FMR's management increase, and for higher group fee rates as total fund assets under FMR's management decrease. FMR calculates the group fee rates based on a tiered asset "breakpoint" schedule that varies based on asset class. The Board considered that the group fee is designed to deliver the benefits of economies of scale to fund shareholders when total Fidelity fund assets increase, even if assets of any particular fund are unchanged or have declined, because some portion of Fidelity's costs are attributable to services provided to all Fidelity funds, and all funds benefit if those costs can be allocated among more assets. The Board concluded that, given the group fee structure, fund shareholders will benefit from lower management fees as assets under FMR's management increase at the fund complex level, regardless of whether Fidelity achieves any such economies of scale.
The Board concluded, taking into account the analysis of the Economies of Scale Committee, that economies of scale, if any, are being appropriately shared between fund shareholders and Fidelity.
Additional Information Requested by the Board. In order to develop fully the factual basis for consideration of the Fidelity funds' Advisory Contracts, the Board requested and received additional information on certain topics, including (i) fund performance trends, actions to be taken by FMR to improve certain funds' overall performance, and Fidelity's long-term strategies for certain funds; (ii) the potential to further rationalize the Fidelity fund lineup with the possibility of achieving savings for the funds and Fidelity; (iii) Fidelity's compensation structure for portfolio managers and other key investment personnel; (iv) the amount of the investment that each portfolio manager has made in the Fidelity fund(s) that he or she manages; (v) the realization of fall-out benefits in certain Fidelity business units; (vi) Fidelity's group fee structures, the potential impact of regulatory changes on such structures, and the rationale for the individual fee rates of certain funds; (vii) fund profitability methodology, including Fidelity's cost allocation methodology, and the impact of certain factors on fund profitability results; (viii) trends regarding industry use of performance fee structures and the possibility of implementing performance fee structures for additional funds; and (ix) the impact of net redemptions from the Fidelity funds.
Based on its evaluation of all of the conclusions noted above, and after considering all factors it believed relevant, the Board ultimately concluded that the advisory fee structures are fair and reasonable, and that each fund's Advisory Contracts should be renewed.
Semiannual Report
Investment Adviser
Fidelity Management & Research Company
Boston, MA
Investment Sub-Advisers
FMR Co., Inc.
Fidelity Management & Research
(U.K.) Inc.
Fidelity Management & Research
(Hong Kong) Limited
Fidelity Management & Research
(Japan) Inc.
General Distributor
Fidelity Distributors Corporation
Smithfield, RI
Transfer and Service Agents
Fidelity Investments Institutional Operations Company, Inc.
Boston, MA
Fidelity Service Company, Inc.
Boston, MA
Custodian
Brown Brothers Harriman & Co.
Boston, MA
Corporate Headquarters
82 Devonshire Street
Boston, MA 02109
1-800-544-8888
The Fidelity Telephone Connection
Mutual Fund 24-Hour Service
Exchanges/Redemptions
and Account Assistance 1-800-544-6666
Product Information 1-800-544-8888
Retirement Accounts 1-800-544-4774
(8 a.m. - 9 p.m.)
TDD Service 1-800-544-0118
for the deaf and hearing impaired
(9 a.m. - 9 p.m. Eastern time)
Fidelity Automated Service
Telephone (FAST®)
1-800-544-5555
Automated line for quickest service
SELHC-USAN-1012
1.813643.107
Fidelity®
Select Portfolios®
Financials Sector
Banking Portfolio
Brokerage and Investment Management Portfolio
Consumer Finance Portfolio
Financial Services Portfolio
Insurance Portfolio
Semiannual Report
August 31, 2012
(Fidelity Cover Art)
Contents
To view a fund's proxy voting guidelines and proxy voting record for the 12-month period ended June 30, visit http://www.fidelity.com/proxyvotingresults or visit the Securities and Exchange Commission's (SEC) web site at http://www.sec.gov. You may also call 1-800-544-8544 to request a free copy of the proxy voting guidelines.
Standard & Poor's, S&P and S&P 500 are registered service marks of The McGraw-Hill Companies, Inc. and have been licensed for use by Fidelity Distributors Corporation.
Other third party marks appearing herein are the property of their respective owners.
All other marks appearing herein are registered or unregistered trademarks or service marks of FMR LLC or an affiliated company. © 2012 FMR LLC. All rights reserved.
This report and the financial statements contained herein are submitted for the general information of the shareholders of the funds. This report is not authorized for distribution to prospective investors in the funds unless preceded or accompanied by an effective prospectus.
A fund files its complete schedule of portfolio holdings with the SEC for the first and third quarters of each fiscal year on Form N-Q. Forms N-Q are available on the SEC's web site at http://www.sec.gov. A fund's Forms N-Q may be reviewed and copied at the SEC's Public Reference Room in Washington, DC. Information regarding the operation of the SEC's Public Reference Room may be obtained by calling 1-800-SEC-0330. For a complete list of a fund's portfolio holdings, view the most recent holdings listing, semiannual report, or annual report on Fidelity's web site at http://www.fidelity.com, http://www.advisor.fidelity.com, or http://www.401k.com, as applicable.
NOT FDIC INSURED • MAY LOSE VALUE • NO BANK GUARANTEE
Neither the funds nor Fidelity Distributors Corporation is a bank.
Semiannual Report
As a shareholder of a Fund, you incur two types of costs: (1) transaction costs, including redemption fees and (2) ongoing costs, including management fees and other Fund expenses. This Example is intended to help you understand your ongoing costs (in dollars) of investing in the Funds and to compare these costs with the ongoing costs of investing in other mutual funds.
The Example is based on an investment of $1,000 invested at the beginning of the period and held for the entire period (March 1, 2012 to August 31, 2012).
Actual Expenses
The first line of the accompanying table for each fund provides information about actual account values and actual expenses. You may use the information in this line, together with the amount you invested, to estimate the expenses that you paid over the period. Simply divide your account value by $1,000.00 (for example, an $8,600 account value divided by $1,000.00 = 8.6), then multiply the result by the number in the first line for a fund under the heading entitled "Expenses Paid During Period" to estimate the expenses you paid on your account during this period. A small balance maintenance fee of $12.00 that is charged once a year may apply for certain accounts with a value of less than $2,000. This fee is not included in the table below. If it was, the estimate of expenses you paid during the period would be higher, and your ending account value lower, by this amount. In addition, each Fund, as a shareholder in the underlying Fidelity Central Funds, will indirectly bear its pro-rata share of the fees and expenses incurred by the underlying Fidelity Central Funds. These fees and expenses are not included in the Fund's annualized expense ratio used to calculate the expense estimate in the table below.
Hypothetical Example for Comparison Purposes
The second line of the accompanying table for each fund provides information about hypothetical account values and hypothetical expenses based on a fund's actual expense ratio and an assumed rate of return of 5% per year before expenses, which is not the Fund's actual return. The hypothetical account values and expenses may not be used to estimate the actual ending account balance or expenses you paid for the period. You may use this information to compare the ongoing costs of investing in the Fund and other funds. To do so, compare this 5% hypothetical example with the 5% hypothetical examples that appear in the shareholder reports of the other funds. A small balance maintenance fee of $12.00 that is charged once a year may apply for certain accounts with a value of less than $2,000. This fee is not included in the table below. If it was, the estimate of expenses you paid during the period would be higher, and your ending account value lower, by this amount. In addition, each Fund, as a shareholder in the underlying Fidelity Central Funds, will indirectly bear its pro-rata share of the fees and expenses incurred by the underlying Fidelity Central Funds. These fees and expenses are not included in the Fund's annualized expense ratio used to calculate the expense estimate in the table below.
Please note that the expenses shown in the table are meant to highlight your ongoing costs only and do not reflect any transaction costs. Therefore, the second line of the table is useful in comparing ongoing costs only, and will not help you determine the relative total costs of owning different funds. In addition, if these transactional costs were included, your costs would have been higher.
| Annualized Expense Ratio | Beginning
Account Value
March 1, 2012 | Ending
Account Value
August 31, 2012 | Expenses Paid
During Period*
March 1, 2012
to August 31, 2012 |
Banking Portfolio | .86% | | | |
Actual | | $ 1,000.00 | $ 1,081.10 | $ 4.51 |
HypotheticalA | | $ 1,000.00 | $ 1,020.87 | $ 4.38 |
Brokerage and Investment Management Portfolio | .89% | | | |
Actual | | $ 1,000.00 | $ 971.70 | $ 4.42 |
HypotheticalA | | $ 1,000.00 | $ 1,020.72 | $ 4.53 |
Consumer Finance Portfolio | .91% | | | |
Actual | | $ 1,000.00 | $ 1,097.70 | $ 4.81 |
HypotheticalA | | $ 1,000.00 | $ 1,020.62 | $ 4.63 |
Financial Services Portfolio | .89% | | | |
Actual | | $ 1,000.00 | $ 1,007.80 | $ 4.50 |
HypotheticalA | | $ 1,000.00 | $ 1,020.72 | $ 4.53 |
Insurance Portfolio | .88% | | | |
Actual | | $ 1,000.00 | $ 1,054.00 | $ 4.56 |
HypotheticalA | | $ 1,000.00 | $ 1,020.77 | $ 4.48 |
A 5% return per year before expenses
* Expenses are equal to each Fund's annualized expense ratio, multiplied by the average account value over the period, multiplied by 184/365 (to reflect the one-half year period).
Semiannual Report
Banking Portfolio
Investment Changes (Unaudited)
Top Ten Stocks as of August 31, 2012 |
| % of fund's
net assets | % of fund's net assets
6 months ago |
U.S. Bancorp | 12.7 | 10.2 |
Wells Fargo & Co. | 12.1 | 11.0 |
PNC Financial Services Group, Inc. | 4.0 | 3.7 |
M&T Bank Corp. | 3.9 | 3.1 |
BB&T Corp. | 3.8 | 5.6 |
Comerica, Inc. | 3.5 | 2.5 |
Huntington Bancshares, Inc. | 3.3 | 2.3 |
CIT Group, Inc. | 2.6 | 2.5 |
Bank of the Ozarks, Inc. | 2.5 | 1.7 |
People's United Financial, Inc. | 2.3 | 2.1 |
| 50.7 | |
Top Industries (% of fund's net assets) |
As of August 31, 2012 |
| Commercial Banks | 82.1% | |
| Thrifts & Mortgage Finance | 7.4% | |
| Consumer Finance | 2.2% | |
| Capital Markets | 1.0% | |
| Diversified
Financial Services | 0.8% | |
| All Others* | 6.5% | |

As of February 29, 2012 |
| Commercial Banks | 83.8% | |
| Thrifts & Mortgage Finance | 6.4% | |
| Consumer Finance | 2.3% | |
| Diversified
Financial Services | 2.0% | |
| IT Services | 1.7% | |
| All Others* | 3.8% | |

* Includes short-term investments and net other assets. |
Semiannual Report
Banking Portfolio
Investments August 31, 2012 (Unaudited)
Showing Percentage of Net Assets
Common Stocks - 94.2% |
| Shares | | Value |
CAPITAL MARKETS - 1.0% |
Diversified Capital Markets - 0.6% |
UBS AG (NY Shares) | 238,000 | | $ 2,653,700 |
Investment Banking & Brokerage - 0.4% |
Charles Schwab Corp. | 145,800 | | 1,966,842 |
TOTAL CAPITAL MARKETS | | 4,620,542 |
COMMERCIAL BANKS - 82.1% |
Diversified Banks - 30.6% |
Banco ABC Brasil SA | 471,000 | | 2,895,749 |
Banco ABC Brasil SA (a) | 4,680 | | 27,666 |
BanColombia SA sponsored ADR | 79,700 | | 4,579,562 |
Comerica, Inc. | 531,500 | | 16,322,365 |
Itau Unibanco Banco Multiplo SA sponsored ADR | 207,700 | | 3,283,737 |
U.S. Bancorp | 1,804,800 | | 60,298,367 |
Wells Fargo & Co. | 1,688,592 | | 57,462,786 |
| | 144,870,232 |
Regional Banks - 51.5% |
1st Source Corp. | 218,700 | | 4,992,921 |
Bank of the Ozarks, Inc. | 370,400 | | 11,889,840 |
BB&T Corp. | 573,800 | | 18,097,652 |
BBCN Bancorp, Inc. (a) | 600,812 | | 7,522,166 |
CapitalSource, Inc. | 1,315,900 | | 9,119,187 |
Central Valley Community Bancorp (a) | 133,300 | | 1,093,060 |
CIT Group, Inc. (a) | 321,300 | | 12,132,288 |
City National Corp. | 155,700 | | 7,995,195 |
Commerce Bancshares, Inc. | 240,200 | | 9,663,246 |
Cullen/Frost Bankers, Inc. | 193,000 | | 10,730,800 |
CVB Financial Corp. (d) | 599,600 | | 7,165,220 |
East West Bancorp, Inc. | 384,100 | | 8,427,154 |
Fifth Third Bancorp | 581,600 | | 8,805,424 |
First Republic Bank | 271,300 | | 8,868,797 |
Huntington Bancshares, Inc. | 2,375,451 | | 15,677,977 |
KeyCorp | 415,600 | | 3,503,508 |
M&T Bank Corp. | 214,300 | | 18,622,670 |
Oriental Financial Group, Inc. | 213,180 | | 2,259,708 |
PNC Financial Services Group, Inc. | 306,741 | | 19,067,021 |
Regions Financial Corp. | 683,000 | | 4,753,680 |
SunTrust Banks, Inc. | 325,100 | | 8,182,767 |
Susquehanna Bancshares, Inc. | 668,100 | | 7,021,731 |
SVB Financial Group (a) | 146,865 | | 8,516,701 |
Texas Capital Bancshares, Inc. (a) | 155,800 | | 7,169,916 |
UMB Financial Corp. | 184,175 | | 9,030,100 |
Western Alliance Bancorp. (a) | 709,600 | | 6,606,376 |
Wintrust Financial Corp. | 189,600 | | 7,092,936 |
| | 244,008,041 |
TOTAL COMMERCIAL BANKS | | 388,878,273 |
|
| Shares | | Value |
CONSUMER FINANCE - 2.2% |
Consumer Finance - 2.2% |
Capital One Financial Corp. | 126,100 | | $ 7,128,433 |
SLM Corp. | 210,600 | | 3,316,950 |
| | 10,445,383 |
DIVERSIFIED FINANCIAL SERVICES - 0.8% |
Other Diversified Financial Services - 0.8% |
Citigroup, Inc. | 126,120 | | 3,747,025 |
NBH Holdings Corp. Class A (a)(e) | 13,300 | | 236,075 |
| | 3,983,100 |
IT SERVICES - 0.7% |
Data Processing & Outsourced Services - 0.7% |
Visa, Inc. Class A | 27,500 | | 3,526,875 |
THRIFTS & MORTGAGE FINANCE - 7.4% |
Thrifts & Mortgage Finance - 7.4% |
Flushing Financial Corp. | 213,900 | | 3,259,836 |
Ocwen Financial Corp. (a) | 96,600 | | 2,485,518 |
People's United Financial, Inc. | 904,500 | | 10,826,865 |
Trustco Bank Corp., New York | 1,027,000 | | 5,730,660 |
Washington Federal, Inc. | 494,600 | | 7,963,060 |
WSFS Financial Corp. | 116,100 | | 4,710,177 |
| | 34,976,116 |
TOTAL COMMON STOCKS (Cost $434,341,531) |
446,430,289
|
Money Market Funds - 6.6% |
| | | |
Fidelity Cash Central Fund, 0.17% (b) | 27,012,091 | | 27,012,091 |
Fidelity Securities Lending Cash Central Fund, 0.18% (b)(c) | 3,995,950 | | 3,995,950 |
TOTAL MONEY MARKET FUNDS (Cost $31,008,041) |
31,008,041
|
TOTAL INVESTMENT PORTFOLIO - 100.8% (Cost $465,349,572) | 477,438,330 |
NET OTHER ASSETS (LIABILITIES) - (0.8)% | | (3,661,351) |
NET ASSETS - 100% | $ 473,776,979 |
Legend |
(a) Non-income producing |
(b) Affiliated fund that is available only to investment companies and other accounts managed by Fidelity Investments. The rate quoted is the annualized seven-day yield of the fund at period end. A complete unaudited listing of the fund's holdings as of its most recent quarter end is available upon request. In addition, each Fidelity Central Fund's financial statements are available on the SEC's website or upon request. |
(c) Investment made with cash collateral received from securities on loan. |
(d) Security or a portion of the security is on loan at period end. |
(e) Security exempt from registration under Rule 144A of the Securities Act of 1933. These securities may be resold in transactions exempt from registration, normally to qualified institutional buyers. At the end of the period, the value of these securities amounted to $236,075 or 0.0% of net assets. |
Affiliated Central Funds |
Information regarding fiscal year to date income earned by the Fund from investments in Fidelity Central Funds is as follows: |
Fund | Income earned |
Fidelity Cash Central Fund | $ 14,357 |
Fidelity Securities Lending Cash Central Fund | 5,121 |
Total | $ 19,478 |
Other Information |
The following is a summary of the inputs used, as of August 31, 2012, involving the Fund's assets and liabilities carried at fair value. The inputs or methodology used for valuing securities may not be an indication of the risk associated with investing in those securities. For more information on valuation inputs, and their aggregation into the levels used in the table below, please refer to the Security Valuation section in the accompanying Notes to Financial Statements. |
Valuation Inputs at Reporting Date: |
Description | Total | Level 1 | Level 2 | Level 3 |
Investments in Securities: | | | | |
Common Stocks | $ 446,430,289 | $ 446,194,214 | $ - | $ 236,075 |
Money Market Funds | 31,008,041 | 31,008,041 | - | - |
Total Investments in Securities: | $ 477,438,330 | $ 477,202,255 | $ - | $ 236,075 |
See accompanying notes which are an integral part of the financial statements.
Semiannual Report
Banking Portfolio
Statement of Assets and Liabilities
| August 31, 2012 (Unaudited) |
| | |
Assets | | |
Investment in securities, at value (including securities loaned of $3,898,090) - See accompanying schedule: Unaffiliated issuers (cost $434,341,531) | $ 446,430,289 | |
Fidelity Central Funds (cost $31,008,041) | 31,008,041 | |
Total Investments (cost $465,349,572) | | $ 477,438,330 |
Receivable for investments sold | | 1,173,532 |
Receivable for fund shares sold | | 1,419,622 |
Dividends receivable | | 653,309 |
Distributions receivable from Fidelity Central Funds | | 4,520 |
Other receivables | | 32,793 |
Total assets | | 480,722,106 |
| | |
Liabilities | | |
Payable for investments purchased | $ 2,199,569 | |
Payable for fund shares redeemed | 404,748 | |
Accrued management fee | 218,023 | |
Other affiliated payables | 104,946 | |
Other payables and accrued expenses | 21,891 | |
Collateral on securities loaned, at value | 3,995,950 | |
Total liabilities | | 6,945,127 |
| | |
Net Assets | | $ 473,776,979 |
Net Assets consist of: | | |
Paid in capital | | $ 534,982,102 |
Undistributed net investment income | | 2,744,169 |
Accumulated undistributed net realized gain (loss) on investments and foreign currency transactions | | (76,038,050) |
Net unrealized appreciation (depreciation) on investments | | 12,088,758 |
Net Assets, for 24,604,990 shares outstanding | | $ 473,776,979 |
Net Asset Value, offering price and redemption price per share ($473,776,979 ÷ 24,604,990 shares) | | $ 19.26 |
Statement of Operations
Six months ended August 31, 2012 (Unaudited) |
| | |
Investment Income | | |
Dividends | | $ 4,743,628 |
Income from Fidelity Central Funds | | 19,478 |
Total income | | 4,763,106 |
| | |
Expenses | | |
Management fee | $ 1,299,659 | |
Transfer agent fees | 550,218 | |
Accounting and security lending fees | 91,383 | |
Custodian fees and expenses | 6,562 | |
Independent trustees' compensation | 1,581 | |
Registration fees | 21,612 | |
Audit | 19,875 | |
Legal | 889 | |
Miscellaneous | 1,863 | |
Total expenses before reductions | 1,993,642 | |
Expense reductions | (5,469) | 1,988,173 |
Net investment income (loss) | | 2,774,933 |
Realized and Unrealized Gain (Loss) Net realized gain (loss) on: | | |
Investment securities: | | |
Unaffiliated issuers | 9,728,523 | |
Foreign currency transactions | 4,435 | |
Total net realized gain (loss) | | 9,732,958 |
Change in net unrealized appreciation (depreciation) on investment securities | | 20,211,306 |
Net gain (loss) | | 29,944,264 |
Net increase (decrease) in net assets resulting from operations | | $ 32,719,197 |
See accompanying notes which are an integral part of the financial statements.
Semiannual Report
Banking Portfolio
Financial Statements - continued
Statement of Changes in Net Assets
| Six months ended August 31, 2012 (Unaudited) | Year ended
February 29,
2012 |
Increase (Decrease) in Net Assets | | |
Operations | | |
Net investment income (loss) | $ 2,774,933 | $ 2,165,481 |
Net realized gain (loss) | 9,732,958 | (8,189,625) |
Change in net unrealized appreciation (depreciation) | 20,211,306 | (30,402,176) |
Net increase (decrease) in net assets resulting from operations | 32,719,197 | (36,426,320) |
Distributions to shareholders from net investment income | (419,521) | (1,687,594) |
Share transactions
Proceeds from sales of shares | 103,652,751 | 263,836,043 |
Reinvestment of distributions | 406,966 | 1,634,419 |
Cost of shares redeemed | (92,340,415) | (315,949,436) |
Net increase (decrease) in net assets resulting from share transactions | 11,719,302 | (50,478,974) |
Redemption fees | 11,002 | 22,957 |
Total increase (decrease) in net assets | 44,029,980 | (88,569,931) |
| | |
Net Assets | | |
Beginning of period | 429,746,999 | 518,316,930 |
End of period (including undistributed net investment income of $2,744,169 and undistributed net investment income of $388,757, respectively) | $ 473,776,979 | $ 429,746,999 |
Other Information Shares | | |
Sold | 5,521,094 | 15,627,481 |
Issued in reinvestment of distributions | 22,300 | 104,569 |
Redeemed | (5,039,842) | (19,030,038) |
Net increase (decrease) | 503,552 | (3,297,988) |
Financial Highlights
| Six months ended August 31, 2012 | Years ended February 28, |
| (Unaudited) | 2012 H | 2011 | 2010 | 2009 | 2008 H |
Selected Per-Share Data | | | | | | |
Net asset value, beginning of period | $ 17.83 | $ 18.92 | $ 16.63 | $ 9.04 | $ 22.24 | $ 33.52 |
Income from Investment Operations | | | | | | |
Net investment income (loss) D | .11 | .09 | (.01) | .06 | .67 | .81 |
Net realized and unrealized gain (loss) | 1.34 | (1.11) | 2.31 | 7.74 | (13.32) | (9.57) |
Total from investment operations | 1.45 | (1.02) | 2.30 | 7.80 | (12.65) | (8.76) |
Distributions from net investment income | (.02) | (.07) | (.01) | (.21) | (.51) | (.64) |
Distributions from net realized gain | - | - | - | - | (.05) | (1.88) |
Total distributions | (.02) | (.07) | (.01) | (.21) | (.56) | (2.52) |
Redemption fees added to paid in capital D | - I | - I | - I | - I | .01 | - I |
Net asset value, end of period | $ 19.26 | $ 17.83 | $ 18.92 | $ 16.63 | $ 9.04 | $ 22.24 |
Total Return B,C | 8.11% | (5.31)% | 13.83% | 87.04% | (57.85)% | (27.30)% |
Ratios to Average Net Assets E,G | | | | | | |
Expenses before reductions | .86% A | .88% | .89% | .95% | .93% | .91% |
Expenses net of fee waivers, if any | .86% A | .88% | .89% | .95% | .93% | .91% |
Expenses net of all reductions | .85% A | .87% | .88% | .94% | .93% | .90% |
Net investment income (loss) | 1.19% A | .55% | (.04)% | .46% | 3.86% | 2.75% |
Supplemental Data | | | | | | |
Net assets, end of period (000 omitted) | $ 473,777 | $ 429,747 | $ 518,317 | $ 359,438 | $ 151,158 | $ 293,767 |
Portfolio turnover rate F | 79% A | 91% | 73% | 105% | 199% | 86% |
A Annualized
B Total returns for periods of less than one year are not annualized.
C Total returns would have been lower if certain expenses had not been reduced during the applicable periods shown.
D Calculated based on average shares outstanding during the period.
E Fees and expenses of any underlying Fidelity Central Funds are not included in the Fund's expense ratio. The Fund indirectly bears its proportionate share of the expenses of any underlying Fidelity Central Funds.
F Amount does not include the portfolio activity of any underlying Fidelity Central Funds.
G Expense ratios reflect operating expenses of the Fund. Expenses before reductions do not reflect amounts reimbursed by the investment adviser or reductions from brokerage service arrangements or reductions from other expense offset arrangements and do not represent the amount paid by the Fund during periods when reimbursements or reductions occur. Expenses net of fee waivers reflect expenses after reimbursement by the investment adviser but prior to reductions from brokerage service arrangements or other expense offset arrangements. Expenses net of all reductions represent the net expenses paid by the Fund.
H For the year ended February 29.
I Amount represents less than $.01 per share.
See accompanying notes which are an integral part of the financial statements.
Semiannual Report
Brokerage and Investment Management Portfolio
Investment Changes (Unaudited)
Top Ten Stocks as of August 31, 2012 |
| % of fund's
net assets | % of fund's net assets
6 months ago |
CME Group, Inc. | 7.1 | 0.3 |
Ares Capital Corp. | 5.8 | 4.6 |
Janus Capital Group, Inc. | 4.5 | 3.8 |
Evercore Partners, Inc. Class A | 4.2 | 4.0 |
A.F.P. Provida SA sponsored ADR | 3.7 | 2.8 |
CBOE Holdings, Inc. | 3.3 | 3.3 |
Raymond James Financial, Inc. | 3.1 | 2.0 |
The Blackstone Group LP | 3.0 | 3.7 |
Ameriprise Financial, Inc. | 3.0 | 1.8 |
GFI Group, Inc. | 2.7 | 2.8 |
| 40.4 | |
Top Industries (% of fund's net assets) |
As of August 31, 2012 |
| Capital Markets | 62.8% | |
| Diversified
Financial Services | 16.4% | |
| Commercial Banks | 4.5% | |
| IT Services | 3.7% | |
| Real Estate
Investment Trusts | 2.9% | |
| All Others* | 9.7% | |

As of February 29, 2012 |
| Capital Markets | 64.3% | |
| Diversified Financial Services | 11.6% | |
| Internet Software
& Services | 4.1% | |
| Commercial Banks | 4.0% | |
| Insurance | 2.6% | |
| All Others* | 13.4% | |

* Includes short-term investments and net other assets. |
Semiannual Report
Brokerage and Investment Management Portfolio
Investments August 31, 2012 (Unaudited)
Showing Percentage of Net Assets
Common Stocks - 91.5% |
| Shares | | Value |
AEROSPACE & DEFENSE - 0.0% |
Aerospace & Defense - 0.0% |
BAE Systems PLC | 100 | | $ 506 |
CAPITAL MARKETS - 62.8% |
Asset Management & Custody Banks - 44.7% |
A.F.P. Provida SA sponsored ADR | 148,539 | | 13,361,083 |
Affiliated Managers Group, Inc. (a) | 22,418 | | 2,636,805 |
AllianceBernstein Holding LP | 185,000 | | 2,649,200 |
American Capital Ltd. (a) | 8,800 | | 96,712 |
Ameriprise Financial, Inc. | 195,500 | | 10,734,905 |
Apollo Global Management LLC Class A | 667,832 | | 8,855,452 |
Apollo Investment Corp. | 276,543 | | 2,217,875 |
Ares Capital Corp. | 1,194,005 | | 20,620,466 |
Artio Global Investors, Inc. Class A | 239,385 | | 742,094 |
Bank of New York Mellon Corp. | 395,562 | | 8,915,967 |
Bank Sarasin & Cie AG Series B (Reg.) (a) | 1,380 | | 38,956 |
BlackRock Kelso Capital Corp. | 566,620 | | 5,603,872 |
BlackRock, Inc. Class A | 39,922 | | 7,041,043 |
Calamos Asset Management, Inc. Class A | 30,000 | | 333,900 |
Cetip SA - Mercados Organizado | 485,400 | | 6,241,165 |
Cohen & Steers, Inc. | 100 | | 3,375 |
Eaton Vance Corp. (non-vtg.) | 62,200 | | 1,684,998 |
EFG International (d) | 239,793 | | 1,820,990 |
Federated Investors, Inc. Class B (non-vtg.) | 2,100 | | 44,562 |
Fifth Street Finance Corp. | 300 | | 3,147 |
Fortress Investment Group LLC | 1,018,119 | | 4,001,208 |
Franklin Resources, Inc. | 15,200 | | 1,784,480 |
Invesco Ltd. | 361,272 | | 8,554,921 |
Janus Capital Group, Inc. | 1,865,488 | | 16,267,055 |
Julius Baer Group Ltd. | 980 | | 32,201 |
KKR & Co. LP | 2,600 | | 37,050 |
Legg Mason, Inc. | 196,861 | | 4,838,843 |
Man Group PLC | 20,311 | | 22,995 |
MCG Capital Corp. | 95,707 | | 445,038 |
MVC Capital, Inc. | 17,300 | | 219,883 |
Northern Trust Corp. | 8,300 | | 385,452 |
Oaktree Capital Group LLC | 1,000 | | 37,610 |
Och-Ziff Capital Management Group LLC Class A | 649,449 | | 5,124,153 |
PennantPark Investment Corp. | 359,370 | | 3,902,758 |
Pzena Investment Management, Inc. | 36,849 | | 185,350 |
SEI Investments Co. | 60,090 | | 1,306,958 |
State Street Corp. | 128,200 | | 5,333,120 |
T. Rowe Price Group, Inc. | 1,300 | | 79,872 |
The Blackstone Group LP | 799,094 | | 10,779,778 |
U.S. Global Investments, Inc. Class A | 509,503 | | 2,654,511 |
Waddell & Reed Financial, Inc. Class A | 1,200 | | 35,520 |
WisdomTree Investments, Inc. (a) | 59,000 | | 368,160 |
| | 160,043,483 |
|
| Shares | | Value |
Diversified Capital Markets - 0.8% |
Credit Suisse Group sponsored ADR | 1,500 | | $ 28,890 |
Deutsche Bank AG (NY Shares) | 900 | | 31,896 |
UBS AG | 29,730 | | 331,710 |
UBS AG (NY Shares) | 217,985 | | 2,430,533 |
| | 2,823,029 |
Investment Banking & Brokerage - 17.3% |
BGC Partners, Inc. Class A | 500 | | 2,255 |
Charles Schwab Corp. | 218,600 | | 2,948,914 |
Cowen Group, Inc. Class A (a) | 14,900 | | 38,889 |
Duff & Phelps Corp. Class A | 100 | | 1,325 |
E*TRADE Financial Corp. (a) | 40,800 | | 349,656 |
Evercore Partners, Inc. Class A | 603,815 | | 14,914,231 |
GFI Group, Inc. | 3,377,118 | | 9,455,930 |
Gleacher & Co., Inc. (a) | 50,081 | | 41,567 |
Goldman Sachs Group, Inc. | 50,600 | | 5,349,432 |
Greenhill & Co., Inc. | 1,020 | | 44,523 |
ICAP PLC | 59,200 | | 298,640 |
Investment Technology Group, Inc. (a) | 437,896 | | 3,708,979 |
Jefferies Group, Inc. | 2,849 | | 41,852 |
KBW, Inc. | 53,800 | | 822,602 |
Knight Capital Group, Inc. Class A (a)(d) | 476,759 | | 1,315,855 |
Lazard Ltd. Class A | 1,400 | | 39,886 |
LPL Financial | 122,200 | | 3,503,474 |
Morgan Stanley | 362,075 | | 5,431,125 |
Nomura Holdings, Inc. sponsored ADR | 8,800 | | 29,304 |
Oppenheimer Holdings, Inc. Class A (non-vtg.) | 1,600 | | 23,872 |
Piper Jaffray Companies (a) | 43,943 | | 1,081,437 |
Raymond James Financial, Inc. | 318,567 | | 11,213,558 |
Stifel Financial Corp. (a) | 1,100 | | 35,948 |
SWS Group, Inc. (a) | 205,719 | | 1,228,142 |
TD Ameritrade Holding Corp. | 2,049 | | 35,058 |
| | 61,956,454 |
TOTAL CAPITAL MARKETS | | 224,822,966 |
COMMERCIAL BANKS - 4.5% |
Diversified Banks - 4.2% |
Banco de Chile sponsored ADR | 407 | | 34,294 |
Banco Santander SA (Spain) sponsored ADR | 3,900 | | 27,456 |
Banco Santander SA (Brasil) ADR | 103,400 | | 783,772 |
BanColombia SA sponsored ADR | 83,400 | | 4,792,164 |
Barclays PLC sponsored ADR (d) | 772,162 | | 8,980,244 |
BNP Paribas SA | 1,000 | | 43,463 |
BPI-SGPS SA (a) | 302,300 | | 223,577 |
Comerica, Inc. | 1,506 | | 46,249 |
ICICI Bank Ltd. sponsored ADR | 1,207 | | 39,264 |
Industrial & Commercial Bank of China Ltd. (H Shares) | 214,000 | | 115,885 |
The Toronto-Dominion Bank | 500 | | 40,903 |
Common Stocks - continued |
| Shares | | Value |
COMMERCIAL BANKS - CONTINUED |
Diversified Banks - continued |
UniCredit SpA (a) | 630 | | $ 2,495 |
United Overseas Bank Ltd. | 3,000 | | 45,945 |
| | 15,175,711 |
Regional Banks - 0.3% |
CIT Group, Inc. (a) | 1,200 | | 45,312 |
Fifth Third Bancorp | 2,800 | | 42,392 |
First Interstate Bancsystem, Inc. | 19,337 | | 276,519 |
PNC Financial Services Group, Inc. | 8,400 | | 522,144 |
Regions Financial Corp. | 7,284 | | 50,697 |
SunTrust Banks, Inc. | 2,000 | | 50,340 |
| | 987,404 |
TOTAL COMMERCIAL BANKS | | 16,163,115 |
CONSUMER FINANCE - 0.0% |
Consumer Finance - 0.0% |
SLM Corp. | 2,600 | | 40,950 |
DIVERSIFIED CONSUMER SERVICES - 0.0% |
Specialized Consumer Services - 0.0% |
Sotheby's Class A (Ltd. vtg.) | 1,100 | | 34,386 |
DIVERSIFIED FINANCIAL SERVICES - 16.4% |
Other Diversified Financial Services - 2.0% |
Bank of America Corp. | 4,354 | | 34,788 |
Citigroup, Inc. | 239,010 | | 7,100,987 |
JPMorgan Chase & Co. | 900 | | 33,426 |
| | 7,169,201 |
Specialized Finance - 14.4% |
BM&F Bovespa SA | 301,300 | | 1,595,633 |
Bursa Malaysia Bhd | 151,100 | | 306,503 |
CBOE Holdings, Inc. | 414,300 | | 11,782,692 |
CME Group, Inc. | 465,700 | | 25,566,931 |
Deutsche Boerse AG | 6,500 | | 334,631 |
Hellenic Exchanges Holding SA | 6,800 | | 25,830 |
IntercontinentalExchange, Inc. (a) | 26,426 | | 3,612,434 |
MSCI, Inc. Class A (a) | 2,200 | | 77,176 |
NYSE Euronext | 100 | | 2,505 |
The NASDAQ Stock Market, Inc. | 359,100 | | 8,212,617 |
| | 51,516,952 |
TOTAL DIVERSIFIED FINANCIAL SERVICES | | 58,686,153 |
HOTELS, RESTAURANTS & LEISURE - 0.0% |
Casinos & Gaming - 0.0% |
Boyd Gaming Corp. (a) | 4,900 | | 29,449 |
Las Vegas Sands Corp. | 700 | | 29,673 |
| | 59,122 |
|
| Shares | | Value |
Hotels, Resorts & Cruise Lines - 0.0% |
Starwood Hotels & Resorts Worldwide, Inc. | 700 | | $ 38,591 |
TOTAL HOTELS, RESTAURANTS & LEISURE | | 97,713 |
INSURANCE - 0.3% |
Insurance Brokers - 0.3% |
National Financial Partners Corp. (a) | 57,200 | | 843,128 |
Life & Health Insurance - 0.0% |
AFLAC, Inc. | 800 | | 36,944 |
Multi-Line Insurance - 0.0% |
American International Group, Inc. (a) | 1,400 | | 48,062 |
Genworth Financial, Inc. Class A (a) | 6,300 | | 33,327 |
| | 81,389 |
Property & Casualty Insurance - 0.0% |
Fidelity National Financial, Inc. Class A | 2,487 | | 46,855 |
TOTAL INSURANCE | | 1,008,316 |
INTERNET SOFTWARE & SERVICES - 0.0% |
Internet Software & Services - 0.0% |
China Finance Online Co. Ltd. ADR (a) | 1,600 | | 1,744 |
eBay, Inc. (a) | 1,100 | | 52,217 |
| | 53,961 |
IT SERVICES - 3.7% |
Data Processing & Outsourced Services - 3.7% |
Fidelity National Information Services, Inc. | 2,100 | | 66,150 |
Fiserv, Inc. (a) | 400 | | 28,524 |
Jack Henry & Associates, Inc. | 12,300 | | 454,608 |
MasterCard, Inc. Class A | 100 | | 42,290 |
The Western Union Co. | 488,410 | | 8,600,900 |
Total System Services, Inc. | 177,870 | | 4,123,027 |
| | 13,315,499 |
MEDIA - 0.0% |
Publishing - 0.0% |
Morningstar, Inc. | 700 | | 41,587 |
PROFESSIONAL SERVICES - 0.1% |
Research & Consulting Services - 0.1% |
Equifax, Inc. | 900 | | 41,202 |
IHS, Inc. Class A (a) | 500 | | 57,020 |
| | 98,222 |
REAL ESTATE INVESTMENT TRUSTS - 2.9% |
Mortgage REITs - 2.7% |
American Capital Agency Corp. | 203,500 | | 7,089,940 |
Two Harbors Investment Corp. | 210,700 | | 2,442,013 |
| | 9,531,953 |
Retail REITs - 0.2% |
Federal Realty Investment Trust (SBI) | 6,500 | | 701,415 |
Common Stocks - continued |
| Shares | | Value |
REAL ESTATE INVESTMENT TRUSTS - CONTINUED |
Specialized REITs - 0.0% |
Big Yellow Group PLC | 19,400 | | $ 93,522 |
Strategic Hotel & Resorts, Inc. (a) | 19,100 | | 116,510 |
| | 210,032 |
TOTAL REAL ESTATE INVESTMENT TRUSTS | | 10,443,400 |
REAL ESTATE MANAGEMENT & DEVELOPMENT - 0.1% |
Real Estate Services - 0.1% |
CBRE Group, Inc. (a) | 22,437 | | 388,384 |
Jones Lang LaSalle, Inc. | 500 | | 36,065 |
| | 424,449 |
ROAD & RAIL - 0.0% |
Railroads - 0.0% |
Canadian Pacific | 100 | | 8,271 |
SPECIALTY RETAIL - 0.7% |
Computer & Electronics Retail - 0.7% |
Rent-A-Center, Inc. | 65,400 | | 2,307,312 |
TRADING COMPANIES & DISTRIBUTORS - 0.0% |
Trading Companies & Distributors - 0.0% |
Noble Group Ltd. | 75,000 | | 72,202 |
TOTAL COMMON STOCKS (Cost $361,058,819) |
327,619,008
|
Investment Companies - 0.3% |
| Shares | | Value |
Solar Capital Ltd.
(Cost $355,131) | 47,664 | | $ 1,102,468 |
Money Market Funds - 10.8% |
| | | |
Fidelity Cash Central Fund, 0.17% (b) | 32,768,484 | | 32,768,484 |
Fidelity Securities Lending Cash Central Fund, 0.18% (b)(c) | 5,991,200 | | 5,991,200 |
TOTAL MONEY MARKET FUNDS (Cost $38,759,684) |
38,759,684
|
TOTAL INVESTMENT PORTFOLIO - 102.6% (Cost $400,173,634) | 367,481,160 |
NET OTHER ASSETS (LIABILITIES) - (2.6)% | | (9,285,714) |
NET ASSETS - 100% | $ 358,195,446 |
Legend |
(a) Non-income producing |
(b) Affiliated fund that is available only to investment companies and other accounts managed by Fidelity Investments. The rate quoted is the annualized seven-day yield of the fund at period end. A complete unaudited listing of the fund's holdings as of its most recent quarter end is available upon request. In addition, each Fidelity Central Fund's financial statements are available on the SEC's website or upon request. |
(c) Investment made with cash collateral received from securities on loan. |
(d) Security or a portion of the security is on loan at period end. |
Affiliated Central Funds |
Information regarding fiscal year to date income earned by the Fund from investments in Fidelity Central Funds is as follows: |
Fund | Income earned |
Fidelity Cash Central Fund | $ 23,990 |
Fidelity Securities Lending Cash Central Fund | 15,842 |
Total | $ 39,832 |
Other Information |
The following is a summary of the inputs used, as of August 31, 2012, involving the Fund's assets and liabilities carried at fair value. The inputs or methodology used for valuing securities may not be an indication of the risk associated with investing in those securities. For more information on valuation inputs, and their aggregation into the levels used in the table below, please refer to the Security Valuation section in the accompanying Notes to Financial Statements. |
Valuation Inputs at Reporting Date: |
Description | Total | Level 1 | Level 2 | Level 3 |
Investments in Securities: | | | | |
Common Stocks | $ 327,619,008 | $ 326,980,795 | $ 638,213 | $ - |
Investment Companies | 1,102,468 | 1,102,468 | - | - |
Money Market Funds | 38,759,684 | 38,759,684 | - | - |
Total Investments in Securities: | $ 367,481,160 | $ 366,842,947 | $ 638,213 | $ - |
Distribution of investments by country or territory of incorporation, as a percentage of total net assets, is as follows. (Unaudited) |
United States of America | 85.8% |
Chile | 3.7% |
United Kingdom | 2.6% |
Brazil | 2.5% |
Bermuda | 2.4% |
Colombia | 1.4% |
Switzerland | 1.3% |
Others (Individually Less Than 1%) | 0.3% |
| 100.0% |
See accompanying notes which are an integral part of the financial statements.
Semiannual Report
Brokerage and Investment Management Portfolio
Statement of Assets and Liabilities
| August 31, 2012 (Unaudited) |
| | |
Assets | | |
Investment in securities, at value (including securities loaned of $5,788,036) - See accompanying schedule: Unaffiliated issuers (cost $361,413,950) | $ 328,721,476 | |
Fidelity Central Funds (cost $38,759,684) | 38,759,684 | |
Total Investments (cost $400,173,634) | | $ 367,481,160 |
Receivable for fund shares sold | | 859,020 |
Dividends receivable | | 414,105 |
Distributions receivable from Fidelity Central Funds | | 9,196 |
Other receivables | | 15,117 |
Total assets | | 368,778,598 |
| | |
Liabilities | | |
Payable for investments purchased | $ 4,098,680 | |
Payable for fund shares redeemed | 217,345 | |
Accrued management fee | 163,522 | |
Other affiliated payables | 86,345 | |
Other payables and accrued expenses | 26,060 | |
Collateral on securities loaned, at value | 5,991,200 | |
Total liabilities | | 10,583,152 |
| | |
Net Assets | | $ 358,195,446 |
Net Assets consist of: | | |
Paid in capital | | $ 504,466,252 |
Undistributed net investment income | | 3,397,807 |
Accumulated undistributed net realized gain (loss) on investments and foreign currency transactions | | (116,976,009) |
Net unrealized appreciation (depreciation) on investments and assets and liabilities in foreign currencies | | (32,692,604) |
Net Assets, for 7,797,220 shares outstanding | | $ 358,195,446 |
Net Asset Value, offering price and redemption price per share ($358,195,446 ÷ 7,797,220 shares) | | $ 45.94 |
Statement of Operations
Six months ended August 31, 2012 (Unaudited) |
| | |
Investment Income | | |
Dividends | | $ 6,326,207 |
Interest | | 15 |
Income from Fidelity Central Funds | | 39,832 |
Total income | | 6,366,054 |
| | |
Expenses | | |
Management fee | $ 1,021,342 | |
Transfer agent fees | 473,203 | |
Accounting and security lending fees | 71,668 | |
Custodian fees and expenses | 15,325 | |
Independent trustees' compensation | 1,270 | |
Registration fees | 21,292 | |
Audit | 17,457 | |
Legal | 785 | |
Interest | 234 | |
Miscellaneous | 1,618 | |
Total expenses before reductions | 1,624,194 | |
Expense reductions | (106,346) | 1,517,848 |
Net investment income (loss) | | 4,848,206 |
Realized and Unrealized Gain (Loss) Net realized gain (loss) on: | | |
Investment securities: | | |
Unaffiliated issuers | (12,403,132) | |
Foreign currency transactions | 37,598 | |
Total net realized gain (loss) | | (12,365,534) |
Change in net unrealized appreciation (depreciation) on: Investment securities | (6,577,000) | |
Assets and liabilities in foreign currencies | (616) | |
Total change in net unrealized appreciation (depreciation) | | (6,577,616) |
Net gain (loss) | | (18,943,150) |
Net increase (decrease) in net assets resulting from operations | | $ (14,094,944) |
See accompanying notes which are an integral part of the financial statements.
Semiannual Report
Brokerage and Investment Management Portfolio
Financial Statements - continued
Statement of Changes in Net Assets
| Six months ended August 31, 2012 (Unaudited) | Year ended
February 29,
2012 |
Increase (Decrease) in Net Assets | | |
Operations | | |
Net investment income (loss) | $ 4,848,206 | $ 2,322,577 |
Net realized gain (loss) | (12,365,534) | 6,425,048 |
Change in net unrealized appreciation (depreciation) | (6,577,616) | (74,629,734) |
Net increase (decrease) in net assets resulting from operations | (14,094,944) | (65,882,109) |
Distributions to shareholders from net investment income | - | (4,337,210) |
Share transactions
Proceeds from sales of shares | 44,038,813 | 128,724,945 |
Reinvestment of distributions | - | 4,112,513 |
Cost of shares redeemed | (84,981,591) | (201,372,099) |
Net increase (decrease) in net assets resulting from share transactions | (40,942,778) | (68,534,641) |
Redemption fees | 4,737 | 6,744 |
Total increase (decrease) in net assets | (55,032,985) | (138,747,216) |
| | |
Net Assets | | |
Beginning of period | 413,228,431 | 551,975,647 |
End of period (including undistributed net investment income of $3,397,807 and distributions in excess of net investment income of $1,450,399, respectively) | $ 358,195,446 | $ 413,228,431 |
Other Information Shares | | |
Sold | 949,589 | 2,865,057 |
Issued in reinvestment of distributions | - | 99,867 |
Redeemed | (1,893,280) | (4,424,392) |
Net increase (decrease) | (943,691) | (1,459,468) |
Financial Highlights
| Six months ended August 31, 2012 | Years ended February 28, |
| (Unaudited) | 2012 I | 2011 | 2010 | 2009 | 2008 I |
Selected Per-Share Data | | | | | | |
Net asset value, beginning of period | $ 47.28 | $ 54.11 | $ 47.32 | $ 26.68 | $ 59.56 | $ 73.69 |
Income from Investment Operations | | | | | | |
Net investment income (loss) D | .60 | .26 | .39 | .27 | .78 | 1.01 G |
Net realized and unrealized gain (loss) | (1.94) | (6.56) | 6.71 | 20.62 | (30.23) | (8.50) |
Total from investment operations | (1.34) | (6.30) | 7.10 | 20.89 | (29.45) | (7.49) |
Distributions from net investment income | - | (.53) | (.31) | (.25) | (.93) | (.87) |
Distributions from net realized gain | - | - | - | - | (2.51) | (5.78) |
Total distributions | - | (.53) | (.31) | (.25) | (3.44) | (6.65) |
Redemption fees added to paid in capital D | - J | - J | - J | - J | .01 | .01 |
Net asset value, end of period | $ 45.94 | $ 47.28 | $ 54.11 | $ 47.32 | $ 26.68 | $ 59.56 |
Total Return B,C | (2.83)% | (11.51)% | 15.03% | 78.44% | (51.86)% | (11.16)% |
Ratios to Average Net Assets E,H | | | | | | |
Expenses before reductions | .89% A | .89% | .88% | .93% | .90% | .88% |
Expenses net of fee waivers, if any | .89% A | .89% | .88% | .93% | .90% | .88% |
Expenses net of all reductions | .83% A | .85% | .86% | .89% | .89% | .87% |
Net investment income (loss) | 2.65% A | .57% | .79% | .64% | 1.74% | 1.41% G |
Supplemental Data | | | | | | |
Net assets, end of period (000 omitted) | $ 358,195 | $ 413,228 | $ 551,976 | $ 555,473 | $ 294,618 | $ 699,205 |
Portfolio turnover rate F | 318% A | 294% | 153% | 264% | 351% | 84% |
A Annualized
B Total returns for periods of less than one year are not annualized.
C Total returns would have been lower if certain expenses had not been reduced during the applicable periods shown.
D Calculated based on average shares outstanding during the period.
E Fees and expenses of any underlying Fidelity Central Funds are not included in the Fund's expense ratio. The Fund indirectly bears its proportionate share of the expenses of any underlying Fidelity Central Funds.
F Amount does not include the portfolio activity of any underlying Fidelity Central Funds.
G Investment income per share reflects a large, non-recurring dividend which amounted to $.18 per share. Excluding this non-recurring dividend, the ratio of net investment income (loss) to average net assets would have been 1.15%.
H Expense ratios reflect operating expenses of the Fund. Expenses before reductions do not reflect amounts reimbursed by the investment adviser or reductions from brokerage service arrangements or reductions from other expense offset arrangements and do not represent the amount paid by the Fund during periods when reimbursements or reductions occur. Expenses net of fee waivers reflect expenses after reimbursement by the investment adviser but prior to reductions from brokerage service arrangements or other expense offset arrangements. Expenses net of all reductions represent the net expenses paid by the Fund.
I For the year ended February 29.
J Amount represents less than $.01 per share.
See accompanying notes which are an integral part of the financial statements.
Semiannual Report
Consumer Finance Portfolio
Investment Changes (Unaudited)
Top Ten Stocks as of August 31, 2012 |
| % of fund's
net assets | % of fund's net assets
6 months ago |
Visa, Inc. Class A | 7.3 | 7.0 |
Capital One Financial Corp. | 6.6 | 7.3 |
MasterCard, Inc. Class A | 6.2 | 5.3 |
SLM Corp. | 5.6 | 6.1 |
U.S. Bancorp | 4.8 | 5.1 |
Wells Fargo & Co. | 3.9 | 4.7 |
Discover Financial Services | 3.8 | 3.5 |
Fifth Third Bancorp | 3.4 | 1.7 |
KeyCorp | 3.3 | 3.9 |
American Express Co. | 3.2 | 3.2 |
| 48.1 | |
Top Industries (% of fund's net assets) |
As of August 31, 2012 |
| Commercial Banks | 25.1% | |
| Consumer Finance | 21.0% | |
| IT Services | 17.4% | |
| Real Estate
Investment Trusts | 14.5% | |
| Thrifts & Mortgage Finance | 7.5% | |
| All Others* | 14.5% | |

As of February 29, 2012 |
| Commercial Banks | 22.9% | |
| Consumer Finance | 22.2% | |
| IT Services | 13.4% | |
| Real Estate
Investment Trusts | 13.1% | |
| Diversified
Financial Services | 12.1% | |
| All Others* | 16.3% | |

* Includes short-term investments and net other assets. |
Semiannual Report
Consumer Finance Portfolio
Investments August 31, 2012 (Unaudited)
Showing Percentage of Net Assets
Common Stocks - 94.5% |
| Shares | | Value |
CAPITAL MARKETS - 0.5% |
Investment Banking & Brokerage - 0.5% |
FXCM, Inc. Class A (d) | 150,000 | | $ 1,314,000 |
COMMERCIAL BANKS - 25.1% |
Diversified Banks - 8.7% |
U.S. Bancorp | 400,000 | | 13,364,000 |
Wells Fargo & Co. | 325,000 | | 11,059,750 |
| | 24,423,750 |
Regional Banks - 16.4% |
BankUnited, Inc. | 15,000 | | 378,750 |
BB&T Corp. | 115,000 | | 3,627,100 |
Fifth Third Bancorp | 625,000 | | 9,462,500 |
First Niagara Financial Group, Inc. | 150,000 | | 1,183,500 |
First Republic Bank | 50,000 | | 1,634,500 |
KeyCorp | 1,100,000 | | 9,273,000 |
M&T Bank Corp. | 20,000 | | 1,738,000 |
PNC Financial Services Group, Inc. | 100,000 | | 6,216,000 |
Regions Financial Corp. | 1,000,000 | | 6,960,000 |
SunTrust Banks, Inc. | 222,300 | | 5,595,291 |
| | 46,068,641 |
TOTAL COMMERCIAL BANKS | | 70,492,391 |
COMMERCIAL SERVICES & SUPPLIES - 0.3% |
Diversified Support Services - 0.3% |
Intrum Justitia AB | 63,400 | | 935,845 |
CONSUMER FINANCE - 21.0% |
Consumer Finance - 21.0% |
American Express Co. | 155,000 | | 9,036,500 |
Capital One Financial Corp. | 325,000 | | 18,372,250 |
DFC Global Corp. (a) | 125,000 | | 2,327,500 |
Discover Financial Services | 275,000 | | 10,650,750 |
International Personal Finance PLC | 150,000 | | 689,048 |
Regional Management Corp. (d) | 125,000 | | 2,098,750 |
SLM Corp. | 1,000,000 | | 15,750,000 |
| | 58,924,798 |
DIVERSIFIED FINANCIAL SERVICES - 5.6% |
Other Diversified Financial Services - 4.5% |
Bank of America Corp. | 500,000 | | 3,995,000 |
Citigroup, Inc. | 175,000 | | 5,199,250 |
JPMorgan Chase & Co. | 95,000 | | 3,528,300 |
| | 12,722,550 |
Specialized Finance - 1.1% |
PHH Corp. (a)(d) | 180,000 | | 3,141,000 |
TOTAL DIVERSIFIED FINANCIAL SERVICES | | 15,863,550 |
|
| Shares | | Value |
INSURANCE - 0.7% |
Property & Casualty Insurance - 0.7% |
First American Financial Corp. | 100,000 | | $ 1,927,000 |
INTERNET SOFTWARE & SERVICES - 1.0% |
Internet Software & Services - 1.0% |
Bankrate, Inc. (a)(d) | 75,000 | | 1,288,500 |
eBay, Inc. (a) | 30,000 | | 1,424,100 |
| | 2,712,600 |
IT SERVICES - 17.4% |
Data Processing & Outsourced Services - 17.4% |
CoreLogic, Inc. (a) | 85,000 | | 2,091,000 |
Fidelity National Information Services, Inc. | 80,000 | | 2,520,000 |
Global Payments, Inc. | 60,000 | | 2,499,000 |
MasterCard, Inc. Class A | 41,000 | | 17,338,900 |
The Western Union Co. | 125,000 | | 2,201,250 |
Total System Services, Inc. | 75,000 | | 1,738,500 |
Visa, Inc. Class A | 160,000 | | 20,519,999 |
| | 48,908,649 |
REAL ESTATE INVESTMENT TRUSTS - 14.5% |
Mortgage REITs - 14.5% |
American Capital Agency Corp. | 215,000 | | 7,490,600 |
Annaly Capital Management, Inc. | 300,000 | | 5,193,000 |
Capstead Mortgage Corp. | 200,000 | | 2,868,000 |
Chimera Investment Corp. | 1,700,000 | | 4,318,000 |
Dynex Capital, Inc. | 141,700 | | 1,480,765 |
Invesco Mortgage Capital, Inc. | 300,000 | | 6,147,000 |
MFA Financial, Inc. | 800,000 | | 6,552,000 |
Redwood Trust, Inc. | 300,000 | | 4,299,000 |
Two Harbors Investment Corp. | 200,000 | | 2,318,000 |
| | 40,666,365 |
REAL ESTATE MANAGEMENT & DEVELOPMENT - 0.9% |
Real Estate Services - 0.9% |
Altisource Portfolio Solutions SA (a) | 30,000 | | 2,528,700 |
THRIFTS & MORTGAGE FINANCE - 7.5% |
Thrifts & Mortgage Finance - 7.5% |
Flushing Financial Corp. | 260,000 | | 3,962,400 |
Hudson City Bancorp, Inc. | 300,000 | | 2,157,000 |
MGIC Investment Corp. (a) | 180,000 | | 212,400 |
New York Community Bancorp, Inc. (d) | 200,000 | | 2,652,000 |
Ocwen Financial Corp. (a) | 300,000 | | 7,719,000 |
People's United Financial, Inc. | 115,100 | | 1,377,747 |
Radian Group, Inc. (d) | 125,000 | | 420,000 |
WSFS Financial Corp. | 60,000 | | 2,434,200 |
| | 20,934,747 |
TOTAL COMMON STOCKS (Cost $239,674,133) |
265,208,645
|
Money Market Funds - 6.8% |
| Shares | | Value |
Fidelity Cash Central Fund, 0.17% (b) | 15,771,440 | | $ 15,771,440 |
Fidelity Securities Lending Cash Central Fund, 0.18% (b)(c) | 3,327,252 | | 3,327,252 |
TOTAL MONEY MARKET FUNDS (Cost $19,098,692) |
19,098,692
|
TOTAL INVESTMENT PORTFOLIO - 101.3% (Cost $258,772,825) | 284,307,337 |
NET OTHER ASSETS (LIABILITIES) - (1.3)% | | (3,713,974) |
NET ASSETS - 100% | $ 280,593,363 |
Legend |
(a) Non-income producing |
(b) Affiliated fund that is available only to investment companies and other accounts managed by Fidelity Investments. The rate quoted is the annualized seven-day yield of the fund at period end. A complete unaudited listing of the fund's holdings as of its most recent quarter end is available upon request. In addition, each Fidelity Central Fund's financial statements are available on the SEC's website or upon request. |
(c) Investment made with cash collateral received from securities on loan. |
(d) Security or a portion of the security is on loan at period end. |
Affiliated Central Funds |
Information regarding fiscal year to date income earned by the Fund from investments in Fidelity Central Funds is as follows: |
Fund | Income earned |
Fidelity Cash Central Fund | $ 9,605 |
Fidelity Securities Lending Cash Central Fund | 8,633 |
Total | $ 18,238 |
Other Information |
All investments are categorized as Level 1 under the Fair Value Hierarchy. The inputs or methodology used for valuing securities may not be an indication of the risk associated with investing in those securities. For more information on valuation inputs, please refer to the Security Valuation section in the accompanying Notes to Financial Statements. |
See accompanying notes which are an integral part of the financial statements.
Semiannual Report
Consumer Finance Portfolio
Statement of Assets and Liabilities
| August 31, 2012 (Unaudited) |
| | |
Assets | | |
Investment in securities, at value (including securities loaned of $3,239,652) - See accompanying schedule: Unaffiliated issuers (cost $239,674,133) | $ 265,208,645 | |
Fidelity Central Funds (cost $19,098,692) | 19,098,692 | |
Total Investments (cost $258,772,825) | | $ 284,307,337 |
Receivable for fund shares sold | | 452,627 |
Dividends receivable | | 187,128 |
Distributions receivable from Fidelity Central Funds | | 3,613 |
Other receivables | | 475 |
Total assets | | 284,951,180 |
| | |
Liabilities | | |
Payable for investments purchased | $ 723,388 | |
Payable for fund shares redeemed | 95,056 | |
Accrued management fee | 126,672 | |
Other affiliated payables | 64,846 | |
Other payables and accrued expenses | 20,603 | |
Collateral on securities loaned, at value | 3,327,252 | |
Total liabilities | | 4,357,817 |
| | |
Net Assets | | $ 280,593,363 |
Net Assets consist of: | | |
Paid in capital | | $ 287,976,370 |
Undistributed net investment income | | 1,922,374 |
Accumulated undistributed net realized gain (loss) on investments and foreign currency transactions | | (34,839,893) |
Net unrealized appreciation (depreciation) on investments | | 25,534,512 |
Net Assets, for 20,261,132 shares outstanding | | $ 280,593,363 |
Net Asset Value, offering price and redemption price per share ($280,593,363 ÷ 20,261,132 shares) | | $ 13.85 |
Statement of Operations
Six months ended August 31, 2012 (Unaudited) |
| | |
Investment Income | | |
Dividends | | $ 2,954,268 |
Income from Fidelity Central Funds | | 18,238 |
Total income | | 2,972,506 |
| | |
Expenses | | |
Management fee | $ 629,828 | |
Transfer agent fees | 310,128 | |
Accounting and security lending fees | 44,490 | |
Custodian fees and expenses | 5,599 | |
Independent trustees' compensation | 734 | |
Registration fees | 23,365 | |
Audit | 17,331 | |
Legal | 444 | |
Miscellaneous | 630 | |
Total expenses before reductions | 1,032,549 | |
Expense reductions | (7,440) | 1,025,109 |
Net investment income (loss) | | 1,947,397 |
Realized and Unrealized Gain (Loss) Net realized gain (loss) on: | | |
Investment securities: | | |
Unaffiliated issuers | 2,275,124 | |
Foreign currency transactions | (640) | |
Total net realized gain (loss) | | 2,274,484 |
Change in net unrealized appreciation (depreciation) on investment securities | | 16,148,151 |
Net gain (loss) | | 18,422,635 |
Net increase (decrease) in net assets resulting from operations | | $ 20,370,032 |
See accompanying notes which are an integral part of the financial statements.
Semiannual Report
Statement of Changes in Net Assets
| Six months ended August 31, 2012 (Unaudited) | Year ended
February 29,
2012 |
Increase (Decrease) in Net Assets | | |
Operations | | |
Net investment income (loss) | $ 1,947,397 | $ 2,508,536 |
Net realized gain (loss) | 2,274,484 | 4,579,990 |
Change in net unrealized appreciation (depreciation) | 16,148,151 | 6,126,184 |
Net increase (decrease) in net assets resulting from operations | 20,370,032 | 13,214,710 |
Distributions to shareholders from net investment income | (45,298) | (2,460,438) |
Distributions to shareholders from net realized gain | - | (165,262) |
Total distributions | (45,298) | (2,625,700) |
Share transactions
Proceeds from sales of shares | 142,647,132 | 92,296,814 |
Reinvestment of distributions | 44,408 | 2,566,050 |
Cost of shares redeemed | (48,818,257) | (41,147,880) |
Net increase (decrease) in net assets resulting from share transactions | 93,873,283 | 53,714,984 |
Redemption fees | 4,379 | 5,807 |
Total increase (decrease) in net assets | 114,202,396 | 64,309,801 |
| | |
Net Assets | | |
Beginning of period | 166,390,967 | 102,081,166 |
End of period (including undistributed net investment income of $1,922,374 and undistributed net investment income of $20,275, respectively) | $ 280,593,363 | $ 166,390,967 |
Other Information Shares | | |
Sold | 10,804,760 | 7,998,753 |
Issued in reinvestment of distributions | 3,411 | 231,417 |
Redeemed | (3,730,889) | (3,576,270) |
Net increase (decrease) | 7,077,282 | 4,653,900 |
Financial Highlights
| Six months ended August 31 2012 | Years ended February 28, |
| (Unaudited) | 2012 H | 2011 | 2010 | 2009 | 2008 H |
Selected Per-Share Data | | | | | | |
Net asset value, beginning of period | $ 12.62 | $ 11.97 | $ 11.58 | $ 8.38 | $ 25.83 | $ 48.40 |
Income from Investment Operations | | | | | | |
Net investment income (loss) D | .11 | .22 | .19 | .22 | .75 | .86 |
Net realized and unrealized gain (loss) | 1.12 | .64 | .48 | 3.44 | (17.60) | (20.77) |
Total from investment operations | 1.23 | .86 | .67 | 3.66 | (16.85) | (19.91) |
Distributions from net investment income | - I | (.20) | (.28) | (.46) | (.56) | (.80) |
Distributions from net realized gain | - | (.01) | - | - | (.05) | (1.86) |
Total distributions | - I | (.21) | (.28) | (.46) | (.61) | (2.66) |
Redemption fees added to paid in capital D | - I | - I | - I | - I | .01 | - I |
Net asset value, end of period | $ 13.85 | $ 12.62 | $ 11.97 | $ 11.58 | $ 8.38 | $ 25.83 |
Total Return B,C | 9.77% | 7.41% | 5.83% | 44.74% | (65.96)% | (42.37)% |
Ratios to Average Net Assets E,G | | | | | | |
Expenses before reductions | .91% A | .95% | 1.01% | 1.05% | .99% | .93% |
Expenses net of fee waivers, if any | .91% A | .95% | 1.01% | 1.05% | .99% | .93% |
Expenses net of all reductions | .91% A | .94% | .98% | 1.02% | .99% | .92% |
Net investment income (loss) | 1.72% A | 1.96% | 1.63% | 2.18% | 4.48% | 2.21% |
Supplemental Data | | | | | | |
Net assets, end of period (000 omitted) | $ 280,593 | $ 166,391 | $ 102,081 | $ 85,409 | $ 51,439 | $ 151,202 |
Portfolio turnover rate F | 43% A | 113% | 161% | 153% | 79% | 36% |
A Annualized
B Total returns for periods of less than one year are not annualized.
C Total returns would have been lower if certain expenses had not been reduced during the applicable periods shown.
D Calculated based on average shares outstanding during the period.
E Fees and expenses of any underlying Fidelity Central Funds are not included in the Fund's expense ratio. The Fund indirectly bears its proportionate share of the expenses of any underlying Fidelity Central Funds.
F Amount does not include the portfolio activity of any underlying Fidelity Central Funds.
G Expense ratios reflect operating expenses of the Fund. Expenses before reductions do not reflect amounts reimbursed by the investment adviser or reductions from brokerage service arrangements or reductions from other expense offset arrangements and do not represent the amount paid by the Fund during periods when reimbursements or reductions occur. Expenses net of fee waivers reflect expenses after reimbursement by the investment adviser but prior to reductions from brokerage service arrangements or other expense offset arrangements. Expenses net of all reductions represent the net expenses paid by the Fund.
H For the year ended February 29.
I Amount represents less than $.01 per share.
See accompanying notes which are an integral part of the financial statements.
Semiannual Report
Financial Services Portfolio
Investment Changes (Unaudited)
Top Ten Stocks as of August 31, 2012 |
| % of fund's
net assets | % of fund's net assets
6 months ago |
Citigroup, Inc. | 5.0 | 5.1 |
CME Group, Inc. | 3.7 | 0.0 |
Big Yellow Group PLC | 3.6 | 2.9 |
ACE Ltd. | 3.5 | 3.2 |
HCP, Inc. | 2.8 | 0.7 |
Health Care REIT, Inc. | 2.7 | 0.2 |
The Travelers Companies, Inc. | 2.6 | 0.0 |
The Blackstone Group LP | 2.0 | 1.5 |
PNC Financial Services Group, Inc. | 2.0 | 0.0 |
The Western Union Co. | 2.0 | 0.2 |
| 29.9 | |
Top Industries (% of fund's net assets) |
As of August 31, 2012 |
| Real Estate Investment Trusts | 32.1% | |
| Diversified Financial Services | 14.6% | |
| Commercial Banks | 14.4% | |
| Insurance | 12.8% | |
| Capital Markets | 12.2% | |
| All Others* | 13.9% | |

As of February 29, 2012 |
| Commercial Banks | 19.3% | |
| Capital Markets | 17.8% | |
| Real Estate Investment Trusts | 17.4% | |
| Diversified Financial Services | 13.4% | |
| Insurance | 10.9% | |
| All Others* | 21.2% | |

* Includes short-term investments and net other assets. |
Semiannual Report
Financial Services Portfolio
Investments August 31, 2012 (Unaudited)
Showing Percentage of Net Assets
Common Stocks - 97.8% |
| Shares | | Value |
CAPITAL MARKETS - 12.2% |
Asset Management & Custody Banks - 9.3% |
A.F.P. Provida SA sponsored ADR | 21,400 | | $ 1,924,930 |
Affiliated Managers Group, Inc. (a) | 9,098 | | 1,070,107 |
Ameriprise Financial, Inc. | 800 | | 43,928 |
Apollo Global Management LLC Class A | 432,900 | | 5,740,254 |
Ares Capital Corp. | 294,000 | | 5,077,380 |
Bank of New York Mellon Corp. | 181,279 | | 4,086,029 |
BlackRock, Inc. Class A | 5,293 | | 933,526 |
Cetip SA - Mercados Organizado | 183,500 | | 2,359,402 |
Fortress Investment Group LLC | 201,400 | | 791,502 |
Franklin Resources, Inc. | 9,527 | | 1,118,470 |
Invesco Ltd. | 1,786 | | 42,292 |
Janus Capital Group, Inc. | 610,000 | | 5,319,200 |
Julius Baer Group Ltd. | 910 | | 29,901 |
Legg Mason, Inc. | 2,318 | | 56,976 |
Northern Trust Corp. | 893 | | 41,471 |
State Street Corp. | 24,673 | | 1,026,397 |
The Blackstone Group LP | 615,847 | | 8,307,776 |
| | 37,969,541 |
Diversified Capital Markets - 0.5% |
Credit Suisse Group sponsored ADR | 1,638 | | 31,548 |
HFF, Inc. (a) | 41,200 | | 547,960 |
UBS AG (NY Shares) | 143,437 | | 1,599,323 |
| | 2,178,831 |
Investment Banking & Brokerage - 2.4% |
Charles Schwab Corp. | 2,400 | | 32,376 |
E*TRADE Financial Corp. (a) | 4,464 | | 38,256 |
Evercore Partners, Inc. Class A | 237,913 | | 5,876,451 |
GFI Group, Inc. | 1,115,636 | | 3,123,781 |
Goldman Sachs Group, Inc. | 386 | | 40,808 |
Greenhill & Co., Inc. | 2,000 | | 87,300 |
Investment Technology Group, Inc. (a) | 4,400 | | 37,268 |
Knight Capital Group, Inc. Class A (a) | 148,741 | | 410,525 |
Lazard Ltd. Class A | 1,497 | | 42,650 |
Macquarie Group Ltd. | 1,078 | | 29,915 |
Monex Group, Inc. | 116 | | 20,412 |
Morgan Stanley | 1,258 | | 18,870 |
Nomura Holdings, Inc. sponsored ADR | 9,700 | | 32,301 |
| | 9,790,913 |
TOTAL CAPITAL MARKETS | | 49,939,285 |
COMMERCIAL BANKS - 14.4% |
Diversified Banks - 5.1% |
Banco ABC Brasil SA | 34,600 | | 212,724 |
Banco Bradesco SA (PN) sponsored ADR | 1,900 | | 31,198 |
Banco de Chile sponsored ADR | 425 | | 35,811 |
Banco Macro SA sponsored ADR (a) | 3,700 | | 46,324 |
Banco Pine SA | 570 | | 4,027 |
Banco Pine SA rights 9/12/12 (a) | 72 | | 0 |
Banco Santander Chile sponsored ADR | 400 | | 29,716 |
|
| Shares | | Value |
Banco Santander SA (Spain) sponsored ADR (d) | 6,400 | | $ 45,056 |
Banco Santander SA (Brasil) ADR | 105,710 | | 801,282 |
BanColombia SA sponsored ADR (d) | 114,500 | | 6,579,170 |
Bangkok Bank Public Co. Ltd. (For. Reg.) | 74,200 | | 457,527 |
Bank of Baroda | 23,878 | | 271,721 |
Bank of the Philippine Islands (BPI) | 53,430 | | 95,116 |
Barclays PLC sponsored ADR (d) | 514,544 | | 5,984,147 |
BBVA Banco Frances SA sponsored ADR (a) | 6,900 | | 24,495 |
BNP Paribas SA | 948 | | 41,203 |
China CITIC Bank Corp. Ltd. (H Shares) | 88,000 | | 41,981 |
Comerica, Inc. | 36,061 | | 1,107,433 |
CorpBanca SA sponsored ADR | 1,600 | | 28,304 |
Credicorp Ltd. (NY Shares) | 7,100 | | 855,763 |
Credit Agricole SA (a) | 600 | | 3,500 |
Development Credit Bank Ltd. (a) | 95,718 | | 69,472 |
Grupo Financiero Galicia SA sponsored ADR (a)(d) | 5,400 | | 26,406 |
Guaranty Trust Bank PLC GDR (Reg. S) | 14,800 | | 83,620 |
Hana Financial Group, Inc. | 11,260 | | 336,671 |
Hong Leong Bank Bhd | 12,100 | | 52,169 |
HSBC Holdings PLC sponsored ADR | 1,000 | | 43,630 |
ICICI Bank Ltd. sponsored ADR | 1,400 | | 45,542 |
Industrial & Commercial Bank of China Ltd. (H Shares) | 17,000 | | 9,206 |
Intesa Sanpaolo SpA | 30,559 | | 48,046 |
Itau Unibanco Banco Multiplo SA sponsored ADR | 1,875 | | 29,644 |
KB Financial Group, Inc. | 10,300 | | 335,074 |
Malayan Banking Bhd | 114,087 | | 334,448 |
National Australia Bank Ltd. | 697 | | 18,154 |
Nordea Bank AB | 3,400 | | 31,447 |
PT Bank Bukopin Tbk | 15,446,000 | | 1,036,755 |
PT Bank Central Asia Tbk | 37,000 | | 30,073 |
Raiffeisen International Bank-Holding AG (d) | 3,700 | | 123,723 |
Sberbank (Savings Bank of the Russian Federation) sponsored ADR | 3,100 | | 35,774 |
Standard Chartered PLC (United Kingdom) | 1,911 | | 42,223 |
Sumitomo Mitsui Financial Group, Inc. | 5,900 | | 183,761 |
Swedbank AB (A Shares) | 2,600 | | 45,505 |
The Jammu & Kashmir Bank Ltd. | 20,167 | | 334,077 |
The Toronto-Dominion Bank | 500 | | 40,903 |
U.S. Bancorp | 18,699 | | 624,734 |
UniCredit SpA (a) | 1,710 | | 6,771 |
United Overseas Bank Ltd. | 3,000 | | 45,945 |
Wells Fargo & Co. | 1,194 | | 40,632 |
Yes Bank Ltd. | 6,614 | | 39,160 |
| | 20,790,063 |
Regional Banks - 9.3% |
Alerus Financial Corp. | 1,500 | | 42,000 |
Banco Daycoval SA (PN) | 55,000 | | 281,787 |
Bancorp New Jersey, Inc. | 300 | | 2,880 |
Common Stocks - continued |
| Shares | | Value |
COMMERCIAL BANKS - CONTINUED |
Regional Banks - continued |
BancTrust Financial Group, Inc. (a) | 83,350 | | $ 241,715 |
Bank of Hawaii Corp. | 900 | | 41,607 |
Bank of the Ozarks, Inc. | 30,548 | | 980,591 |
BankUnited, Inc. | 1,500 | | 37,875 |
BB&T Corp. | 2,629 | | 82,919 |
Boston Private Financial Holdings, Inc. | 6,000 | | 56,940 |
Bridge Capital Holdings (a) | 132,440 | | 1,993,222 |
BS Financial Group, Inc. | 206,930 | | 2,153,640 |
Canadian Western Bank, Edmonton (d) | 23,700 | | 676,319 |
Cascade Bancorp (a) | 2,530 | | 13,207 |
CIT Group, Inc. (a) | 32,305 | | 1,219,837 |
Citizens & Northern Corp. | 1,500 | | 28,740 |
City Holding Co. | 1,200 | | 40,944 |
City National Corp. | 872 | | 44,777 |
CNB Financial Corp., Pennsylvania | 2,300 | | 38,111 |
CoBiz, Inc. | 562,293 | | 3,981,034 |
Cullen/Frost Bankers, Inc. | 400 | | 22,240 |
Fifth Third Bancorp | 189,883 | | 2,874,829 |
First Business Finance Services, Inc. | 2,000 | | 46,140 |
First Commonwealth Financial Corp. | 71,700 | | 499,032 |
First Interstate Bancsystem, Inc. | 289,931 | | 4,146,013 |
First Midwest Bancorp, Inc., Delaware | 3,900 | | 46,059 |
First Republic Bank | 12,426 | | 406,206 |
FirstMerit Corp. | 2,700 | | 42,363 |
FNB Corp., Pennsylvania | 4,000 | | 43,800 |
Glacier Bancorp, Inc. | 3,186 | | 49,096 |
Huntington Bancshares, Inc. | 308,837 | | 2,038,324 |
KeyCorp | 4,679 | | 39,444 |
NBT Bancorp, Inc. | 400 | | 8,412 |
Northrim Bancorp, Inc. | 6,100 | | 125,660 |
Pacific Continental Corp. | 92,452 | | 831,143 |
PNC Financial Services Group, Inc. | 132,527 | | 8,237,878 |
PrivateBancorp, Inc. | 3,000 | | 48,900 |
PT Bank Tabungan Negara Tbk | 4,918,000 | | 675,678 |
Regions Financial Corp. | 7,112 | | 49,500 |
Sandy Spring Bancorp, Inc. | 400 | | 7,336 |
Savannah Bancorp, Inc. (a) | 41,015 | | 403,588 |
SCBT Financial Corp. | 2,500 | | 100,525 |
SunTrust Banks, Inc. | 1,698 | | 42,739 |
Susquehanna Bancshares, Inc. | 147,875 | | 1,554,166 |
SVB Financial Group (a) | 698 | | 40,477 |
Synovus Financial Corp. | 82,201 | | 170,978 |
TCF Financial Corp. | 4,073 | | 45,292 |
Texas Capital Bancshares, Inc. (a) | 8,007 | | 368,482 |
UMB Financial Corp. | 10,600 | | 519,718 |
Umpqua Holdings Corp. | 400 | | 5,056 |
Valley National Bancorp | 14,490 | | 140,553 |
Virginia Commerce Bancorp, Inc. (a) | 9,600 | | 77,664 |
Washington Trust Bancorp, Inc. | 25,900 | | 641,284 |
Webster Financial Corp. | 20,700 | | 440,496 |
Westamerica Bancorp. | 100 | | 4,655 |
|
| Shares | | Value |
Western Alliance Bancorp. (a) | 159,961 | | $ 1,489,237 |
Zions Bancorporation | 200 | | 3,850 |
| | 38,244,958 |
TOTAL COMMERCIAL BANKS | | 59,035,021 |
COMMERCIAL SERVICES & SUPPLIES - 0.0% |
Diversified Support Services - 0.0% |
Intrum Justitia AB | 2,600 | | 38,378 |
CONSUMER FINANCE - 1.3% |
Consumer Finance - 1.3% |
American Express Co. | 725 | | 42,268 |
Capital One Financial Corp. | 788 | | 44,546 |
DFC Global Corp. (a) | 7,948 | | 147,992 |
Discover Financial Services | 6,129 | | 237,376 |
EZCORP, Inc. (non-vtg.) Class A (a) | 63,004 | | 1,427,041 |
First Cash Financial Services, Inc. (a) | 16,028 | | 715,169 |
Green Dot Corp. Class A (a) | 1,706 | | 19,534 |
International Personal Finance PLC | 662 | | 3,041 |
Nelnet, Inc. Class A | 1,800 | | 43,110 |
Netspend Holdings, Inc. (a) | 3,724 | | 35,304 |
PT Clipan Finance Indonesia Tbk | 928,000 | | 40,877 |
Regional Management Corp. | 44,400 | | 745,476 |
SLM Corp. | 124,659 | | 1,963,379 |
| | 5,465,113 |
DIVERSIFIED CONSUMER SERVICES - 0.1% |
Specialized Consumer Services - 0.1% |
Sotheby's Class A (Ltd. vtg.) | 6,830 | | 213,506 |
DIVERSIFIED FINANCIAL SERVICES - 14.6% |
Other Diversified Financial Services - 5.3% |
Bank of America Corp. | 5,263 | | 42,051 |
Citigroup, Inc. | 685,650 | | 20,370,657 |
JPMorgan Chase & Co. | 33,056 | | 1,227,700 |
| | 21,640,408 |
Specialized Finance - 9.3% |
BM&F Bovespa SA | 6,400 | | 33,893 |
CBOE Holdings, Inc. | 226,489 | | 6,441,347 |
CME Group, Inc. | 275,022 | | 15,098,708 |
IntercontinentalExchange, Inc. (a) | 13,247 | | 1,810,865 |
MarketAxess Holdings, Inc. | 3,800 | | 123,766 |
Moody's Corp. | 19,927 | | 789,109 |
NYSE Euronext | 1,300 | | 32,565 |
PHH Corp. (a)(d) | 316,487 | | 5,522,698 |
The NASDAQ Stock Market, Inc. | 356,017 | | 8,142,109 |
| | 37,995,060 |
TOTAL DIVERSIFIED FINANCIAL SERVICES | | 59,635,468 |
ENERGY EQUIPMENT & SERVICES - 0.0% |
Oil & Gas Equipment & Services - 0.0% |
SBM Offshore NV (a) | 3,500 | | 49,482 |
Common Stocks - continued |
| Shares | | Value |
HOTELS, RESTAURANTS & LEISURE - 0.5% |
Casinos & Gaming - 0.5% |
Las Vegas Sands Corp. | 1,029 | | $ 43,619 |
MGM Mirage, Inc. (a) | 3,000 | | 29,580 |
Wynn Resorts Ltd. | 19,500 | | 2,011,815 |
| | 2,085,014 |
Hotels, Resorts & Cruise Lines - 0.0% |
Starwood Hotels & Resorts Worldwide, Inc. | 849 | | 46,805 |
TOTAL HOTELS, RESTAURANTS & LEISURE | | 2,131,819 |
HOUSEHOLD DURABLES - 0.0% |
Homebuilding - 0.0% |
M.D.C. Holdings, Inc. | 1,500 | | 52,020 |
PulteGroup, Inc. (a) | 5,200 | | 71,136 |
| | 123,156 |
INDUSTRIAL CONGLOMERATES - 0.0% |
Industrial Conglomerates - 0.0% |
General Electric Co. | 100 | | 2,071 |
Keppel Corp. Ltd. | 4,000 | | 35,909 |
| | 37,980 |
INSURANCE - 12.8% |
Insurance Brokers - 0.5% |
Aon PLC | 900 | | 46,764 |
Brasil Insurance Participacoes e Administracao SA | 52,600 | | 505,296 |
Marsh & McLennan Companies, Inc. | 29,200 | | 997,764 |
National Financial Partners Corp. (a) | 26,900 | | 396,506 |
| | 1,946,330 |
Life & Health Insurance - 1.9% |
AFLAC, Inc. | 1,023 | | 47,242 |
Citizens, Inc. Class A (a) | 5,800 | | 56,666 |
CNO Financial Group, Inc. | 5,900 | | 52,510 |
Delta Lloyd NV | 2,909 | | 40,084 |
FBL Financial Group, Inc. Class A | 800 | | 26,496 |
Lincoln National Corp. | 58,300 | | 1,353,726 |
MetLife, Inc. | 67,918 | | 2,318,041 |
Phoenix Companies, Inc. (a) | 785 | | 24,209 |
Ping An Insurance Group Co. China Ltd. (H Shares) | 10,500 | | 75,813 |
Prudential Financial, Inc. | 60,434 | | 3,294,257 |
Resolution Ltd. | 8,700 | | 29,811 |
StanCorp Financial Group, Inc. | 11,900 | | 371,518 |
Symetra Financial Corp. | 3,000 | | 36,660 |
Torchmark Corp. | 900 | | 46,062 |
Unum Group | 1,900 | | 37,069 |
| | 7,810,164 |
Multi-Line Insurance - 0.9% |
American International Group, Inc. (a) | 18,400 | | 631,672 |
|
| Shares | | Value |
Assurant, Inc. | 35,800 | | $ 1,261,950 |
Fairfax Financial Holdings Ltd. (sub. vtg.) | 579 | | 218,014 |
Genworth Financial, Inc. Class A (a) | 188,554 | | 997,451 |
Hartford Financial Services Group, Inc. | 16,800 | | 301,224 |
Loews Corp. | 9,000 | | 365,850 |
Porto Seguro SA | 6,600 | | 60,931 |
| | 3,837,092 |
Property & Casualty Insurance - 7.6% |
ACE Ltd. | 194,119 | | 14,312,394 |
Allied World Assurance Co. Holdings Ltd. | 5,900 | | 463,327 |
Allstate Corp. | 1,075 | | 40,076 |
Arch Capital Group Ltd. (a) | 37,100 | | 1,480,661 |
Assured Guaranty Ltd. | 2,600 | | 34,320 |
Axis Capital Holdings Ltd. | 35,600 | | 1,212,892 |
Berkshire Hathaway, Inc. Class B (a) | 490 | | 41,327 |
Erie Indemnity Co. Class A | 1,437 | | 91,637 |
Fidelity National Financial, Inc. Class A | 2,538 | | 47,816 |
First American Financial Corp. | 21,400 | | 412,378 |
RLI Corp. | 100 | | 6,336 |
The Travelers Companies, Inc. | 163,685 | | 10,596,967 |
W.R. Berkley Corp. | 11,800 | | 441,084 |
XL Group PLC Class A | 89,312 | | 2,064,893 |
| | 31,246,108 |
Reinsurance - 1.9% |
Everest Re Group Ltd. | 19,500 | | 2,021,370 |
Montpelier Re Holdings Ltd. | 2,100 | | 45,276 |
Platinum Underwriters Holdings Ltd. | 25,904 | | 1,029,425 |
RenaissanceRe Holdings Ltd. | 30,600 | | 2,363,850 |
Swiss Re Ltd. | 648 | | 40,623 |
Validus Holdings Ltd. | 62,307 | | 2,087,908 |
| | 7,588,452 |
TOTAL INSURANCE | | 52,428,146 |
INTERNET SOFTWARE & SERVICES - 0.0% |
Internet Software & Services - 0.0% |
eBay, Inc. (a) | 1,300 | | 61,711 |
IT SERVICES - 7.3% |
Data Processing & Outsourced Services - 7.3% |
Alliance Data Systems Corp. (a) | 400 | | 55,060 |
Cielo SA | 1,560 | | 46,118 |
Fidelity National Information Services, Inc. | 1,800 | | 56,700 |
Fiserv, Inc. (a) | 938 | | 66,889 |
Global Cash Access Holdings, Inc. (a) | 43,300 | | 332,111 |
Jack Henry & Associates, Inc. | 116,169 | | 4,293,606 |
Lender Processing Services, Inc. | 200 | | 5,614 |
MoneyGram International, Inc. (a) | 2,100 | | 33,495 |
Redecard SA | 2,405 | | 39,750 |
The Western Union Co. | 465,723 | | 8,201,382 |
Total System Services, Inc. | 266,028 | | 6,166,529 |
Vantiv, Inc. | 277,600 | | 6,262,656 |
Common Stocks - continued |
| Shares | | Value |
IT SERVICES - CONTINUED |
Data Processing & Outsourced Services - continued |
VeriFone Systems, Inc. (a) | 118,634 | | $ 4,121,345 |
Visa, Inc. Class A | 360 | | 46,170 |
| | 29,727,425 |
IT Consulting & Other Services - 0.0% |
Accenture PLC Class A | 600 | | 36,960 |
Cognizant Technology Solutions Corp. Class A (a) | 578 | | 37,154 |
| | 74,114 |
TOTAL IT SERVICES | | 29,801,539 |
MACHINERY - 0.1% |
Industrial Machinery - 0.1% |
Middleby Corp. (a) | 2,211 | | 254,597 |
MEDIA - 0.0% |
Publishing - 0.0% |
McGraw-Hill Companies, Inc. | 900 | | 46,080 |
PROFESSIONAL SERVICES - 0.0% |
Research & Consulting Services - 0.0% |
Equifax, Inc. | 1,015 | | 46,467 |
IHS, Inc. Class A (a) | 410 | | 46,756 |
| | 93,223 |
REAL ESTATE INVESTMENT TRUSTS - 32.1% |
Diversified REITs - 0.1% |
American Assets Trust, Inc. | 19,200 | | 523,392 |
Vornado Realty Trust | 400 | | 32,468 |
| | 555,860 |
Industrial REITs - 0.9% |
DCT Industrial Trust, Inc. | 140,500 | | 887,960 |
First Potomac Realty Trust | 2,900 | | 37,149 |
Prologis, Inc. | 80,700 | | 2,757,519 |
Stag Industrial, Inc. | 3,000 | | 46,170 |
| | 3,728,798 |
Mortgage REITs - 2.4% |
American Capital Agency Corp. | 154,814 | | 5,393,720 |
American Capital Mortgage Investment Corp. | 4,800 | | 118,704 |
Invesco Mortgage Capital, Inc. | 142,400 | | 2,917,776 |
Pennymac Mortgage Investment Trust | 2,100 | | 45,234 |
Two Harbors Investment Corp. | 103,800 | | 1,203,042 |
| | 9,678,476 |
Office REITs - 5.4% |
Boston Properties, Inc. | 62,600 | | 7,019,338 |
Corporate Office Properties Trust (SBI) | 18,400 | | 411,424 |
Douglas Emmett, Inc. | 260,183 | | 6,241,790 |
Highwoods Properties, Inc. (SBI) | 53,692 | | 1,750,896 |
Kilroy Realty Corp. | 13,100 | | 618,451 |
Lexington Corporate Properties Trust (d) | 587,147 | | 5,507,439 |
|
| Shares | | Value |
MPG Office Trust, Inc. (a) | 14,400 | | $ 50,400 |
SL Green Realty Corp. | 7,012 | | 565,167 |
| | 22,164,905 |
Residential REITs - 7.7% |
American Campus Communities, Inc. | 26,700 | | 1,244,754 |
Apartment Investment & Management Co. Class A | 218,121 | | 5,775,844 |
AvalonBay Communities, Inc. | 29,200 | | 4,132,384 |
BRE Properties, Inc. | 1,400 | | 69,888 |
Camden Property Trust (SBI) | 50,400 | | 3,499,272 |
Campus Crest Communities, Inc. | 3,100 | | 33,480 |
Colonial Properties Trust (SBI) | 132,300 | | 2,900,016 |
Equity Lifestyle Properties, Inc. | 42,300 | | 2,908,548 |
Equity Residential (SBI) | 82,238 | | 4,967,175 |
Essex Property Trust, Inc. | 2,700 | | 410,346 |
Home Properties, Inc. | 25,935 | | 1,655,950 |
Post Properties, Inc. | 51,646 | | 2,636,528 |
UDR, Inc. | 44,579 | | 1,125,620 |
| | 31,359,805 |
Retail REITs - 1.4% |
Federal Realty Investment Trust (SBI) | 8,100 | | 874,071 |
Glimcher Realty Trust | 1,278 | | 13,393 |
Kimco Realty Corp. | 1,800 | | 36,576 |
Realty Income Corp. (d) | 35,700 | | 1,504,041 |
Simon Property Group, Inc. | 20,068 | | 3,184,792 |
Urstadt Biddle Properties, Inc. Class A | 3,900 | | 76,050 |
| | 5,688,923 |
Specialized REITs - 14.2% |
American Tower Corp. | 700 | | 49,280 |
Big Yellow Group PLC | 3,018,002 | | 14,548,920 |
CubeSmart | 3,100 | | 39,990 |
DiamondRock Hospitality Co. | 114,805 | | 1,104,424 |
HCP, Inc. | 253,125 | | 11,608,313 |
Health Care REIT, Inc. | 191,390 | | 11,184,832 |
Host Hotels & Resorts, Inc. | 61,700 | | 944,010 |
National Health Investors, Inc. | 22,300 | | 1,164,952 |
Plum Creek Timber Co., Inc. | 2,300 | | 94,139 |
Potlatch Corp. | 6,000 | | 216,360 |
Public Storage | 28,518 | | 4,151,080 |
Rayonier, Inc. | 53,500 | | 2,620,965 |
Sovran Self Storage, Inc. | 1,500 | | 85,275 |
Strategic Hotel & Resorts, Inc. (a) | 577,067 | | 3,520,109 |
Sunstone Hotel Investors, Inc. (a) | 63,700 | | 664,391 |
Ventas, Inc. | 88,420 | | 5,790,626 |
Weyerhaeuser Co. | 1,800 | | 44,838 |
| | 57,832,504 |
TOTAL REAL ESTATE INVESTMENT TRUSTS | | 131,009,271 |
Common Stocks - continued |
| Shares | | Value |
REAL ESTATE MANAGEMENT & DEVELOPMENT - 1.2% |
Diversified Real Estate Activities - 0.8% |
Tejon Ranch Co. (a) | 23,367 | | $ 653,341 |
The St. Joe Co. (a)(d) | 127,855 | | 2,450,980 |
| | 3,104,321 |
Real Estate Development - 0.0% |
Bukit Sembawang Estates Ltd. | 23,000 | | 89,491 |
Real Estate Operating Companies - 0.1% |
BR Malls Participacoes SA | 1,900 | | 23,681 |
Castellum AB | 2,857 | | 38,203 |
Forest City Enterprises, Inc. Class A (a) | 29,296 | | 441,784 |
Thomas Properties Group, Inc. | 6,200 | | 34,472 |
| | 538,140 |
Real Estate Services - 0.3% |
CBRE Group, Inc. (a) | 55,488 | | 960,497 |
Jones Lang LaSalle, Inc. | 495 | | 35,704 |
Kennedy-Wilson Holdings, Inc. | 6,100 | | 84,424 |
| | 1,080,625 |
TOTAL REAL ESTATE MANAGEMENT & DEVELOPMENT | | 4,812,577 |
SOFTWARE - 0.0% |
Application Software - 0.0% |
EPIQ Systems, Inc. | 1,600 | | 18,752 |
Fair Isaac Corp. | 200 | | 8,542 |
| | 27,294 |
SPECIALTY RETAIL - 1.1% |
Computer & Electronics Retail - 1.1% |
Rent-A-Center, Inc. | 127,178 | | 4,486,840 |
THRIFTS & MORTGAGE FINANCE - 0.1% |
Thrifts & Mortgage Finance - 0.1% |
Brookline Bancorp, Inc., Delaware | 2,200 | | 18,678 |
|
| Shares | | Value |
Cape Bancorp, Inc. (a) | 3,700 | | $ 33,855 |
Cheviot Financial Corp. | 22,986 | | 207,334 |
Eagle Bancorp Montana, Inc. | 1,300 | | 13,130 |
Hudson City Bancorp, Inc. | 2,300 | | 16,537 |
People's United Financial, Inc. | 3,000 | | 35,910 |
| | 325,444 |
TOTAL COMMON STOCKS (Cost $395,301,943) |
400,015,930
|
Money Market Funds - 6.5% |
| | | |
Fidelity Cash Central Fund, 0.17% (b) | 13,281,816 | | 13,281,816 |
Fidelity Securities Lending Cash Central Fund, 0.18% (b)(c) | 13,200,768 | | 13,200,768 |
TOTAL MONEY MARKET FUNDS (Cost $26,482,584) |
26,482,584
|
TOTAL INVESTMENT PORTFOLIO - 104.3% (Cost $421,784,527) | | 426,498,514 |
NET OTHER ASSETS (LIABILITIES) - (4.3)% | | (17,754,813) |
NET ASSETS - 100% | $ 408,743,701 |
Legend |
(a) Non-income producing |
(b) Affiliated fund that is available only to investment companies and other accounts managed by Fidelity Investments. The rate quoted is the annualized seven-day yield of the fund at period end. A complete unaudited listing of the fund's holdings as of its most recent quarter end is available upon request. In addition, each Fidelity Central Fund's financial statements are available on the SEC's website or upon request. |
(c) Investment made with cash collateral received from securities on loan. |
(d) Security or a portion of the security is on loan at period end. |
Affiliated Central Funds |
Information regarding fiscal year to date income earned by the Fund from investments in Fidelity Central Funds is as follows: |
Fund | Income earned |
Fidelity Cash Central Fund | $ 20,801 |
Fidelity Securities Lending Cash Central Fund | 43,899 |
Total | $ 64,700 |
Other Information |
The following is a summary of the inputs used, as of August 31, 2012, involving the Fund's assets and liabilities carried at fair value. The inputs or methodology used for valuing securities may not be an indication of the risk associated with investing in those securities. For more information on valuation inputs, and their aggregation into the levels used in the table below, please refer to the Security Valuation section in the accompanying Notes to Financial Statements. |
Valuation Inputs at Reporting Date: |
Description | Total | Level 1 | Level 2 | Level 3 |
Investments in Securities: | | | | |
Common Stocks | $ 400,015,930 | $ 399,090,066 | $ 925,864 | $ - |
Money Market Funds | 26,482,584 | 26,482,584 | - | - |
Total Investments in Securities: | $ 426,498,514 | $ 425,572,650 | $ 925,864 | $ - |
Distribution of investments by country or territory of incorporation, as a percentage of total net assets, is as follows. (Unaudited) |
United States of America | 82.5% |
United Kingdom | 5.1% |
Switzerland | 4.0% |
Bermuda | 2.8% |
Colombia | 1.6% |
Brazil | 1.1% |
Others (Individually Less Than 1%) | 2.9% |
| 100.0% |
See accompanying notes which are an integral part of the financial statements.
Semiannual Report
Financial Services Portfolio
Statement of Assets and Liabilities
| August 31, 2012 (Unaudited) |
| | |
Assets | | |
Investment in securities, at value (including securities loaned of $12,838,141) - See accompanying schedule: Unaffiliated issuers (cost $395,301,943) | $ 400,015,930 | |
Fidelity Central Funds (cost $26,482,584) | 26,482,584 | |
Total Investments (cost $421,784,527) | | $ 426,498,514 |
Receivable for investments sold | | 176,558 |
Receivable for fund shares sold | | 345,289 |
Dividends receivable | | 230,786 |
Distributions receivable from Fidelity Central Funds | | 5,891 |
Other receivables | | 29,132 |
Total assets | | 427,286,170 |
| | |
Liabilities | | |
Payable for investments purchased | $ 4,752,282 | |
Payable for fund shares redeemed | 268,216 | |
Accrued management fee | 189,790 | |
Other affiliated payables | 97,849 | |
Other payables and accrued expenses | 33,564 | |
Collateral on securities loaned, at value | 13,200,768 | |
Total liabilities | | 18,542,469 |
| | |
Net Assets | | $ 408,743,701 |
Net Assets consist of: | | |
Paid in capital | | $ 519,995,984 |
Undistributed net investment income | | 2,845,158 |
Accumulated undistributed net realized gain (loss) on investments and foreign currency transactions | | (118,811,005) |
Net unrealized appreciation (depreciation) on investments and assets and liabilities in foreign currencies | | 4,713,564 |
Net Assets, for 7,045,241 shares outstanding | | $ 408,743,701 |
Net Asset Value, offering price and redemption price per share ($408,743,701 ÷ 7,045,241 shares) | | $ 58.02 |
Statement of Operations
Six months ended August 31, 2012 (Unaudited) |
| | |
Investment Income | | |
Dividends | | $ 4,698,387 |
Interest | | 71 |
Income from Fidelity Central Funds | | 64,700 |
Total income | | 4,763,158 |
| | |
Expenses | | |
Management fee | $ 1,194,827 | |
Transfer agent fees | 538,563 | |
Accounting and security lending fees | 84,463 | |
Custodian fees and expenses | 33,928 | |
Independent trustees' compensation | 1,477 | |
Registration fees | 24,782 | |
Audit | 22,233 | |
Legal | 886 | |
Miscellaneous | 1,562 | |
Total expenses before reductions | 1,902,721 | |
Expense reductions | (195,197) | 1,707,524 |
Net investment income (loss) | | 3,055,634 |
Realized and Unrealized Gain (Loss) Net realized gain (loss) on: | | |
Investment securities: | | |
Unaffiliated issuers | (5,808,951) | |
Foreign currency transactions | (47,812) | |
Total net realized gain (loss) | | (5,856,763) |
Change in net unrealized appreciation (depreciation) on: Investment securities | 2,531,362 | |
Assets and liabilities in foreign currencies | 2,692 | |
Total change in net unrealized appreciation (depreciation) | | 2,534,054 |
Net gain (loss) | | (3,322,709) |
Net increase (decrease) in net assets resulting from operations | | $ (267,075) |
See accompanying notes which are an integral part of the financial statements.
Semiannual Report
Statement of Changes in Net Assets
| Six months ended August 31, 2012 (Unaudited) | Year ended
February 29,
2012 |
Increase (Decrease) in Net Assets | | |
Operations | | |
Net investment income (loss) | $ 3,055,634 | $ 1,467,379 |
Net realized gain (loss) | (5,856,763) | (20,645,188) |
Change in net unrealized appreciation (depreciation) | 2,534,054 | (12,817,989) |
Net increase (decrease) in net assets resulting from operations | (267,075) | (31,995,798) |
Distributions to shareholders from net investment income | - | (961,766) |
Share transactions
Proceeds from sales of shares | 76,335,231 | 182,517,774 |
Reinvestment of distributions | - | 932,153 |
Cost of shares redeemed | (106,352,103) | (223,738,234) |
Net increase (decrease) in net assets resulting from share transactions | (30,016,872) | (40,288,307) |
Redemption fees | 15,149 | 31,454 |
Total increase (decrease) in net assets | (30,268,798) | (73,214,417) |
| | |
Net Assets | | |
Beginning of period | 439,012,499 | 512,226,916 |
End of period (including undistributed net investment income of $2,845,158 and distributions in excess of net investment income of $210,476, respectively) | $ 408,743,701 | $ 439,012,499 |
Other Information Shares | | |
Sold | 1,303,173 | 3,429,796 |
Issued in reinvestment of distributions | - | 19,762 |
Redeemed | (1,884,112) | (3,978,638) |
Net increase (decrease) | (580,939) | (529,080) |
Financial Highlights
| Six months ended August 31, 2012 | Years ended February 28, |
| (Unaudited) | 2012 H | 2011 | 2010 | 2009 | 2008 H |
Selected Per-Share Data | | | | | | |
Net asset value, beginning of period | $ 57.57 | $ 62.81 | $ 59.32 | $ 33.45 | $ 84.31 | $ 117.33 |
Income from Investment Operations | | | | | | |
Net investment income (loss) D | .41 | .21 | .17 | .37 | 1.58 | 1.73 |
Net realized and unrealized gain (loss) | .04 | (5.31) | 3.49 | 26.14 | (51.12) | (27.77) |
Total from investment operations | .45 | (5.10) | 3.66 | 26.51 | (49.54) | (26.04) |
Distributions from net investment income | - | (.14) | (.18) | (.62) | (1.22) | (1.45) |
Distributions from net realized gain | - | - | - | (.03) | (.13) | (5.54) |
Total distributions | - | (.14) | (.18) | (.65) | (1.35) | (6.99) |
Redemption fees added to paid in capital D | - I | - I | .01 | .01 | .03 | .01 |
Net asset value, end of period | $ 58.02 | $ 57.57 | $ 62.81 | $ 59.32 | $ 33.45 | $ 84.31 |
Total Return B,C | .78% | (8.07) % | 6.21% | 79.56% | (59.22)% | (23.05)% |
Ratios to Average Net Assets E,G | | | | | | |
Expenses before reductions | .89% A | .90% | .92% | .96% | .94% | .90% |
Expenses net of fee waivers, if any | .89% A | .90% | .92% | .96% | .94% | .90% |
Expenses net of all reductions | .80% A | .84% | .88% | .92% | .93% | .89% |
Net investment income (loss) | 1.43% A | .39% | .28% | .70% | 2.57% | 1.57% |
Supplemental Data | | | | | | |
Net assets, end of period (000 omitted) | $ 408,744 | $ 439,012 | $ 512,227 | $ 482,520 | $ 227,344 | $ 382,468 |
Portfolio turnover rate F | 385% A | 384% | 242% | 301% | 129% | 53% |
A Annualized
B Total returns for periods of less than one year are not annualized.
C Total returns would have been lower if certain expenses had not been reduced during the applicable periods shown.
D Calculated based on average shares outstanding during the period.
E Fees and expenses of any underlying Fidelity Central Funds are not included in the Fund's expense ratio. The Fund indirectly bears its proportionate share of the expenses of any underlying Fidelity Central Funds.
F Amount does not include the portfolio activity of any underlying Fidelity Central Funds.
G Expense ratios reflect operating expenses of the Fund. Expenses before reductions do not reflect amounts reimbursed by the investment adviser or reductions from brokerage service arrangements or reductions from other expense offset arrangements and do not represent the amount paid by the Fund during periods when reimbursements or reductions occur. Expenses net of fee waivers reflect expenses after reimbursement by the investment adviser but prior to reductions from brokerage service arrangements or other expense offset arrangements. Expenses net of all reductions represent the net expenses paid by the Fund.
H For the year ended February 29.
I Amount represents less than $.01 per share.
See accompanying notes which are an integral part of the financial statements.
Semiannual Report
Insurance Portfolio
Investment Changes (Unaudited)
Top Ten Stocks as of August 31, 2012 |
| % of fund's
net assets | % of fund's net assets
6 months ago |
Berkshire Hathaway, Inc. Class B | 18.2 | 16.5 |
The Travelers Companies, Inc. | 8.9 | 4.1 |
Prudential Financial, Inc. | 5.9 | 6.1 |
Validus Holdings Ltd. | 5.4 | 5.0 |
MetLife, Inc. | 5.1 | 7.7 |
Axis Capital Holdings Ltd. | 4.7 | 4.9 |
Montpelier Re Holdings Ltd. | 4.6 | 0.0 |
ACE Ltd. | 4.0 | 7.9 |
Beazley PLC | 3.9 | 0.0 |
American International Group, Inc. | 3.4 | 0.0 |
| 64.1 | |
Top Industries (% of fund's net assets) |
As of August 31, 2012 |
| Insurance | 95.6% | |
| Professional
Services | 1.1% | |
 | Capital
Markets | 0.1% | |
| All Others* | 3.2% | |

As of February 29, 2012 |
| Insurance | 96.5% | |
| Professional
Services | 1.3% | |
| IT Services | 0.3% | |
| Capital
Markets | 0.2% | |
| All Others* | 1.7% | |

* Includes short-term investments and net other assets. |
Semiannual Report
Insurance Portfolio
Investments August 31, 2012 (Unaudited)
Showing Percentage of Net Assets
Common Stocks - 96.8% |
| Shares | | Value |
CAPITAL MARKETS - 0.1% |
Asset Management & Custody Banks - 0.1% |
GP Investments Ltd. (depositary receipt) (a) | 115,940 | | $ 254,167 |
INSURANCE - 95.6% |
Insurance Brokers - 7.8% |
Aon PLC | 77,347 | | 4,018,950 |
Arthur J. Gallagher & Co. | 42,100 | | 1,503,812 |
Brasil Insurance Participacoes e Administracao SA | 470,750 | | 4,522,206 |
Brown & Brown, Inc. | 140,100 | | 3,676,224 |
Charles Taylor Consulting PLC | 41,600 | | 115,595 |
Marsh & McLennan Companies, Inc. | 165,900 | | 5,668,803 |
National Financial Partners Corp. (a) | 20,200 | | 297,748 |
| | 19,803,338 |
Life & Health Insurance - 16.3% |
AFLAC, Inc. | 181,200 | | 8,367,816 |
Lincoln National Corp. | 72,500 | | 1,683,450 |
MetLife, Inc. | 378,575 | | 12,920,765 |
Principal Financial Group, Inc. | 10,700 | | 293,608 |
Prudential Financial, Inc. | 274,889 | | 14,984,199 |
Torchmark Corp. | 41,300 | | 2,113,734 |
Unum Group | 69,900 | | 1,363,749 |
| | 41,727,321 |
Multi-Line Insurance - 7.2% |
American International Group, Inc. (a) | 251,200 | | 8,623,696 |
American International Group, Inc. warrants 1/19/21 (a) | 104,469 | | 1,358,097 |
Fairfax Financial Holdings Ltd. (sub. vtg.) | 29 | | 10,920 |
FBD Holdings PLC | 509,100 | | 5,737,500 |
Genworth Financial, Inc. Class A (a) | 105,200 | | 556,508 |
Hartford Financial Services Group, Inc. | 121,300 | | 2,174,909 |
| | 18,461,630 |
Property & Casualty Insurance - 49.1% |
ACE Ltd. | 139,849 | | 10,311,067 |
Allied World Assurance Co. Holdings Ltd. | 98,200 | | 7,711,646 |
Allstate Corp. | 135,900 | | 5,066,352 |
Arch Capital Group Ltd. (a) | 24,300 | | 969,813 |
Assured Guaranty Ltd. | 26,400 | | 348,480 |
Axis Capital Holdings Ltd. | 350,600 | | 11,944,942 |
Beazley PLC | 3,753,340 | | 9,875,291 |
Berkshire Hathaway, Inc. Class B (a) | 551,469 | | 46,510,894 |
Meadowbrook Insurance Group, Inc. | 42,700 | | 324,093 |
|
| Shares | | Value |
ProAssurance Corp. | 22,000 | | $ 1,963,060 |
Progressive Corp. | 115,100 | | 2,247,903 |
The Chubb Corp. | 69,858 | | 5,161,808 |
The Travelers Companies, Inc. | 348,800 | | 22,581,312 |
XL Group PLC Class A | 7,500 | | 173,400 |
| | 125,190,061 |
Reinsurance - 15.2% |
Flagstone Reinsurance Holdings Ltd. | 23,400 | | 199,836 |
Greenlight Capital Re, Ltd. (a) | 163,400 | | 3,967,352 |
Korean Reinsurance Co. | 2,440 | | 23,780 |
Montpelier Re Holdings Ltd. | 544,100 | | 11,730,796 |
Reinsurance Group of America, Inc. | 103,500 | | 6,079,590 |
RenaissanceRe Holdings Ltd. | 39,600 | | 3,059,100 |
Validus Holdings Ltd. | 412,500 | | 13,822,875 |
| | 38,883,329 |
TOTAL INSURANCE | | 244,065,679 |
PROFESSIONAL SERVICES - 1.1% |
Human Resource & Employment Services - 1.1% |
Towers Watson & Co. | 49,600 | | 2,694,272 |
TOTAL COMMON STOCKS (Cost $232,684,053) |
247,014,118
|
Money Market Funds - 3.4% |
| | | |
Fidelity Cash Central Fund, 0.17% (b)
(Cost $8,827,257) | 8,827,257 | |
8,827,257
|
TOTAL INVESTMENT PORTFOLIO - 100.2% (Cost $241,511,310) | | 255,841,375 |
NET OTHER ASSETS (LIABILITIES) - (0.2)% | | (613,032) |
NET ASSETS - 100% | $ 255,228,343 |
Legend |
(a) Non-income producing |
(b) Affiliated fund that is available only to investment companies and other accounts managed by Fidelity Investments. The rate quoted is the annualized seven-day yield of the fund at period end. A complete unaudited listing of the fund's holdings as of its most recent quarter end is available upon request. In addition, each Fidelity Central Fund's financial statements are available on the SEC's website or upon request. |
Affiliated Central Funds |
Information regarding fiscal year to date income earned by the Fund from investments in Fidelity Central Funds is as follows: |
Fund | Income earned |
Fidelity Cash Central Fund | $ 4,148 |
Fidelity Securities Lending Cash Central Fund | 5 |
Total | $ 4,153 |
Other Information |
All investments are categorized as Level 1 under the Fair Value Hierarchy. The inputs or methodology used for valuing securities may not be an indication of the risk associated with investing in those securities. For more information on valuation inputs, please refer to the Security Valuation section in the accompanying Notes to Financial Statements. |
Distribution of investments by country or territory of incorporation, as a percentage of total net assets, is as follows. (Unaudited) |
United States of America | 65.2% |
Bermuda | 16.5% |
Switzerland | 7.0% |
Bailiwick of Jersey | 3.9% |
Ireland | 2.3% |
Brazil | 1.8% |
United Kingdom | 1.7% |
Cayman Islands | 1.5% |
Others (Individually Less Than 1%) | 0.1% |
| 100.0% |
See accompanying notes which are an integral part of the financial statements.
Semiannual Report
Insurance Portfolio
Statement of Assets and Liabilities
| August 31, 2012 (Unaudited) |
| | |
Assets | | |
Investment in securities, at value - See accompanying schedule: Unaffiliated issuers (cost $232,684,053) | $ 247,014,118 | |
Fidelity Central Funds (cost $8,827,257) | 8,827,257 | |
Total Investments (cost $241,511,310) | | $ 255,841,375 |
Foreign currency held at value (cost $25,534) | | 25,534 |
Receivable for investments sold | | 936,145 |
Receivable for fund shares sold | | 31,440 |
Dividends receivable | | 274,783 |
Distributions receivable from Fidelity Central Funds | | 990 |
Other receivables | | 3,662 |
Total assets | | 257,113,929 |
| | |
Liabilities | | |
Payable for investments purchased | $ 1,646,910 | |
Payable for fund shares redeemed | 36,322 | |
Accrued management fee | 115,906 | |
Other affiliated payables | 56,407 | |
Other payables and accrued expenses | 30,041 | |
Total liabilities | | 1,885,586 |
| | |
Net Assets | | $ 255,228,343 |
Net Assets consist of: | | |
Paid in capital | | $ 238,279,189 |
Undistributed net investment income | | 1,108,771 |
Accumulated undistributed net realized gain (loss) on investments and foreign currency transactions | | 1,508,518 |
Net unrealized appreciation (depreciation) on investments and assets and liabilities in foreign currencies | | 14,331,865 |
Net Assets, for 5,095,401 shares outstanding | | $ 255,228,343 |
Net Asset Value, offering price and redemption price per share ($255,228,343 ÷ 5,095,401 shares) | | $ 50.09 |
Statement of Operations
Six months ended August 31, 2012 (Unaudited) |
| | |
Investment Income | | |
Dividends | | $ 2,258,974 |
Income from Fidelity Central Funds | | 4,153 |
Total income | | 2,263,127 |
| | |
Expenses | | |
Management fee | $ 730,624 | |
Transfer agent fees | 315,724 | |
Accounting and security lending fees | 50,974 | |
Custodian fees and expenses | 18,941 | |
Independent trustees' compensation | 897 | |
Registration fees | 15,514 | |
Audit | 17,373 | |
Legal | 527 | |
Interest | 508 | |
Miscellaneous | 1,104 | |
Total expenses before reductions | 1,152,186 | |
Expense reductions | (8,633) | 1,143,553 |
Net investment income (loss) | | 1,119,574 |
Realized and Unrealized Gain (Loss) Net realized gain (loss) on: | | |
Investment securities: | | |
Unaffiliated issuers | 18,519,117 | |
Foreign currency transactions | (13,096) | |
Total net realized gain (loss) | | 18,506,021 |
Change in net unrealized appreciation (depreciation) on: Investment securities | (7,710,031) | |
Assets and liabilities in foreign currencies | 2,329 | |
Total change in net unrealized appreciation (depreciation) | | (7,707,702) |
Net gain (loss) | | 10,798,319 |
Net increase (decrease) in net assets resulting from operations | | $ 11,917,893 |
See accompanying notes which are an integral part of the financial statements.
Semiannual Report
Insurance Portfolio
Financial Statements - continued
Statement of Changes in Net Assets
| Six months ended August 31, 2012 (Unaudited) | Year ended
February 29,
2012 |
Increase (Decrease) in Net Assets | | |
Operations | | |
Net investment income (loss) | $ 1,119,574 | $ 2,287,483 |
Net realized gain (loss) | 18,506,021 | 5,305,470 |
Change in net unrealized appreciation (depreciation) | (7,707,702) | (15,220,844) |
Net increase (decrease) in net assets resulting from operations | 11,917,893 | (7,627,891) |
Distributions to shareholders from net investment income | (214,167) | (2,221,509) |
Share transactions
Proceeds from sales of shares | 18,169,546 | 97,056,869 |
Reinvestment of distributions | 211,163 | 2,151,605 |
Cost of shares redeemed | (45,633,023) | (66,644,402) |
Net increase (decrease) in net assets resulting from share transactions | (27,252,314) | 32,564,072 |
Redemption fees | 756 | 6,573 |
Total increase (decrease) in net assets | (15,547,832) | 22,721,245 |
| | |
Net Assets | | |
Beginning of period | 270,776,175 | 248,054,930 |
End of period (including undistributed net investment income of $1,108,771 and undistributed net investment income of $203,364, respectively) | $ 255,228,343 | $ 270,776,175 |
Other Information Shares | | |
Sold | 371,168 | 2,136,907 |
Issued in reinvestment of distributions | 4,427 | 48,397 |
Redeemed | (973,420) | (1,449,326) |
Net increase (decrease) | (597,825) | 735,978 |
Financial Highlights
| Six months ended August 31, 2012 | Years ended February 28, |
| (Unaudited) | 2012 H | 2011 | 2010 | 2009 | 2008 H |
Selected Per-Share Data | | | | | | |
Net asset value, beginning of period | $ 47.56 | $ 50.04 | $ 41.55 | $ 23.95 | $ 54.02 | $ 69.38 |
Income from Investment Operations | | | | | | |
Net investment income (loss) D | .21 | .43 | .47 | .34 | .51 | .45 |
Net realized and unrealized gain (loss) | 2.36 | (2.52) | 8.36 | 17.60 | (30.02) | (10.95) |
Total from investment operations | 2.57 | (2.09) | 8.83 | 17.94 | (29.51) | (10.50) |
Distributions from net investment income | (.04) | (.39) | (.34) | (.34) | (.54) | (.30) |
Distributions from net realized gain | - | - | - | - | (.02) | (4.56) |
Total distributions | (.04) | (.39) | (.34) | (.34) | (.56) | (4.86) |
Redemption fees added to paid in capital D,I | - | - | - | - | - | - |
Net asset value, end of period | $ 50.09 | $ 47.56 | $ 50.04 | $ 41.55 | $ 23.95 | $ 54.02 |
Total Return B,C | 5.40% | (4.13)% | 21.31% | 74.97% | (54.83)% | (16.04)% |
Ratios to Average Net Assets E,G | | | | | | |
Expenses before reductions | .88% A | .89% | .93% | .99% | .97% | .93% |
Expenses net of fee waivers, if any | .88% A | .89% | .93% | .99% | .97% | .93% |
Expenses net of all reductions | .87% A | .88% | .91% | .97% | .97% | .93% |
Net investment income (loss) | .85% A | .94% | 1.05% | .96% | 1.27% | .65% |
Supplemental Data | | | | | | |
Net assets, end of period (000 omitted) | $ 255,228 | $ 270,776 | $ 248,055 | $ 150,176 | $ 76,580 | $ 154,063 |
Portfolio turnover rate F | 150% A | 153% | 193% | 215% | 426% | 60% |
A Annualized
B Total returns for periods of less than one year are not annualized.
C Total returns would have been lower if certain expenses had not been reduced during the applicable periods shown.
D Calculated based on average shares outstanding during the period.
E Fees and expenses of any underlying Fidelity Central Funds are not included in the Fund's expense ratio. The Fund indirectly bears its proportionate share of the expenses of any underlying Fidelity Central Funds.
F Amount does not include the portfolio activity of any underlying Fidelity Central Funds.
G Expense ratios reflect operating expenses of the Fund. Expenses before reductions do not reflect amounts reimbursed by the investment adviser or reductions from brokerage service arrangements or reductions from other expense offset arrangements and do not represent the amount paid by the Fund during periods when reimbursements or reductions occur. Expenses net of fee waivers reflect expenses after reimbursement by the investment adviser but prior to reductions from brokerage service arrangements or other expense offset arrangements. Expenses net of all reductions represent the net expenses paid by the Fund.
H For the year ended February 29.
I Amount represents less than $.01 per share.
See accompanying notes which are an integral part of the financial statements.
Semiannual Report
Notes to Financial Statements
For the period ended August 31, 2012 (Unaudited)
1. Organization.
Banking Portfolio, Brokerage and Investment Management Portfolio, Consumer Finance Portfolio, Financial Services Portfolio and Insurance Portfolio (the Funds) are funds of Fidelity Select Portfolios (the Trust). The Trust is registered under the Investment Company Act of 1940, as amended (the 1940 Act), as an open-end management investment company organized as a Massachusetts business trust. The Funds are non-diversified with the exception of Banking Portfolio and Financial Services Portfolio. The Funds invest primarily in securities of companies whose principal business activities fall within specific industries. Each Fund is authorized to issue an unlimited number of shares. Brokerage and Investment Management Portfolio's, Financial Services Portfolio's and Insurance Portfolio's investments in emerging markets can be subject to social, economic, regulatory and political uncertainties and can be extremely volatile.
2. Investments in Fidelity Central Funds.
The Funds invest in Fidelity Central Funds, which are open-end investment companies available only to other investment companies and accounts managed by Fidelity Management & Research Company (FMR) and its affiliates. The Funds' Schedules of Investments list each of the Fidelity Central Funds held as of period end, if any, as an investment of each Fund, but do not include the underlying holdings of each Fidelity Central Fund. As an Investing Fund, each Fund indirectly bears its proportionate share of the expenses of the underlying Fidelity Central Funds.
The Money Market Central Funds seek preservation of capital and current income and are managed by Fidelity Investments Money Management, Inc. (FIMM), an affiliate of FMR.
A complete unaudited list of holdings for each Fidelity Central Fund is available upon request or at the Securities and Exchange Commission (the SEC) web site at www.sec.gov. In addition, the financial statements of the Fidelity Central Funds are available on the SEC web site or upon request.
3. Significant Accounting Policies.
The financial statements have been prepared in conformity with accounting principles generally accepted in the United States of America (GAAP), which require management to make certain estimates and assumptions at the date of the financial statements. Actual results could differ from those estimates. Subsequent events, if any, through the date that the financial statements were issued have been evaluated in the preparation of the financial statements. The following summarizes the significant accounting policies of the Funds:
Security Valuation. Investments are valued as of 4:00 p.m. Eastern time on the last calendar day of the period. In accordance with valuation policies and procedures approved by the Board of Trustees (the Board), each Fund attempts to obtain prices from one or more third party pricing vendor or broker to value their investments. When current market prices, quotations or rates are not readily available or reliable, securities will be fair valued in good faith by the FMR Fair Value Committee (the Committee), in accordance with procedures adopted by each Fund's Board. Factors used in determining fair value vary by security type and may include market or security specific events. The frequency with which these procedures are used cannot be predicted and they may be utilized to a significant extent. The Committee oversees each Fund's valuation policies and procedures and is responsible for approving and reporting to the Board all fair value determinations.
Each Fund categorizes the inputs to valuation techniques used to value their investments into a disclosure hierarchy consisting of three levels as shown below:
Level 1 - quoted prices in active markets for identical investments
Level 2 - other significant observable inputs (including quoted prices for similar investments, interest rates, prepayment speeds, etc.)
Level 3 - unobservable inputs (including the Fund's own assumptions based on the best information available)
Valuation techniques used to value each Fund's investments by major category are as follows:
Equity securities, including restricted securities, for which market quotations are readily available, are valued at the last reported sale price or official closing price as reported by a third party pricing vendor on the primary market or exchange on which they are traded and are categorized as Level 1 in the hierarchy. In the event there were no sales during the day or closing prices are not available, securities are valued at the last quoted bid price or may be valued using the last available price and are generally categorized as Level 2 in the hierarchy. For foreign equity securities, when significant market or security specific events arise, comparisons to the valuation of American Depositary Receipts (ADRs), futures contracts, Exchange-Traded Funds (ETFs) and certain indexes as well as quoted prices for similar securities are used and are categorized as Level 2 in the hierarchy. Utilizing these techniques may result in transfers between Level 1 and Level 2.
Investments in open-end mutual funds, including the Fidelity Central Funds, are valued at their closing net asset value each business day and are categorized as Level 1 in the hierarchy.
Changes in valuation techniques may result in transfers in or out of an assigned level within the disclosure hierarchy. The aggregate value of investments by input level, as of August 31, 2012, is included at the end of each Fund's Schedule of Investments.
Semiannual Report
3. Significant Accounting Policies - continued
Foreign Currency Translation. The Funds may use foreign currency contracts to facilitate transactions in foreign-denominated securities. Gains and losses from these transactions may arise from changes in the value of the foreign currency or if the counterparties do not perform under the contracts' terms.
Foreign-denominated assets, including investment securities, and liabilities are translated into U.S. dollars at the exchange rates at period end. Purchases and sales of investment securities, income and dividends received and expenses denominated in foreign currencies are translated into U.S. dollars at the exchange rate in effect on the transaction date.
The effects of exchange rate fluctuations on investments are included with the net realized and unrealized gain (loss) on investment securities. Other foreign currency transactions resulting in realized and unrealized gain (loss) are disclosed separately.
Investment Transactions and Income. For financial reporting purposes, the Funds' investment holdings and NAV include trades executed through the end of the last business day of the period. The NAV per share for processing shareholder transactions is calculated as of the close of business of the New York Stock Exchange (NYSE), normally 4:00 p.m. Eastern time and includes trades executed through the end of the prior business day. Gains and losses on securities sold are determined on the basis of identified cost and may include proceeds received from litigation. Dividend income is recorded on the ex-dividend date, except for certain dividends from foreign securities where the ex-dividend date may have passed, which are recorded as soon as the Funds are informed of the ex-dividend date. Non-cash dividends included in dividend income, if any, are recorded at the fair market value of the securities received. Distributions received on securities that represent a return of capital or capital gain are recorded as a reduction of cost of investments and/or as a realized gain. The Funds estimate the components of distributions received that may be considered return of capital distributions or capital gain distributions. Interest income and distributions from the Fidelity Central Funds are accrued as earned. Interest income includes coupon interest and amortization of premium and accretion of discount on debt securities. Investment income is recorded net of foreign taxes withheld where recovery of such taxes is uncertain.
Expenses. Expenses directly attributable to a fund are charged to that fund. Expenses attributable to more than one fund are allocated among the respective funds on the basis of relative net assets or other appropriate methods. Expense estimates are accrued in the period to which they relate and adjustments are made when actual amounts are known.
Income Tax Information and Distributions to Shareholders. Each year, each Fund intends to qualify as a regulated investment company under Subchapter M of the Internal Revenue Code, including distributing substantially all of its taxable income and realized gains. As a result, no provision for income taxes is required. Each Fund files a U.S. federal tax return, in addition to state and local tax returns as required. A fund's federal income tax returns are subject to examination by the Internal Revenue Service (IRS) for a period of three fiscal years after they are filed. State and local tax returns may be subject to examination for an additional fiscal year depending on the jurisdiction. Foreign taxes are provided for based on each Fund's understanding of the tax rules and rates that exist in the foreign markets in which it invests.
Distributions are declared and recorded on the ex-dividend date. Income and capital gain distributions are determined in accordance with income tax regulations, which may differ from GAAP.
Capital accounts within the financial statements are adjusted for permanent book-tax differences. These adjustments have no impact on net assets or the results of operations. Temporary book-tax differences will reverse in a subsequent period.
Book-tax differences are primarily due to foreign currency transactions, certain foreign taxes, passive foreign investment companies (PFIC), partnerships, deferred trustees compensation, capital loss carryforwards and losses deferred due to wash sales and excise tax regulations.
The federal tax cost of investment securities and unrealized appreciation (depreciation) as of period end were as follows for each Fund:
| Tax cost | Gross unrealized
appreciation | Gross unrealized
depreciation | Net unrealized
appreciation
(depreciation) on
securities and
other investments |
Banking Portfolio | $ 506,022,333 | $ 31,293,566 | $ (59,877,569) | $ (28,584,003) |
Brokerage and Investment Management Portfolio | 412,311,539 | 10,891,476 | (55,721,855) | (44,830,379) |
Consumer Finance Portfolio | 259,898,640 | 35,325,530 | (10,916,833) | 24,408,697 |
Financial Services Portfolio | 431,105,696 | 16,525,561 | (21,132,743) | (4,607,182) |
Insurance Portfolio | 243,918,194 | 16,824,988 | (4,901,807) | 11,923,181 |
Capital loss carryforwards are only available to offset future capital gains of the Funds to the extent provided by regulations and may be limited. Under the Regulated Investment Company Modernization Act of 2010 (the Act), the Funds are permitted to carry forward capital losses incurred in taxable years beginning after December 22, 2010 for an unlimited period and such capital losses are required to be used prior to any losses that expire. At February 29, 2012, capital loss carryforwards were as follows:
Semiannual Report
Notes to Financial Statements (Unaudited) - continued
3. Significant Accounting Policies - continued
Income Tax Information and Distributions to Shareholders - continued
| Fiscal year of expiration | |
| 2017 | 2018 | 2019 | Total with expiration |
Banking Portfolio | $ (16,134,125) | $ (9,935,539) | $ - | $ (26,069,664) |
Brokerage and Investment Management Portfolio | (56,798,891) | (39,892,889) | - | (96,691,780) |
Consumer Finance Portfolio | (97,174,837) | (48,865,995) | (1,011,664) | (147,052,496) |
Financial Services Portfolio | (72,220,809) | (672,925) | - | (72,893,734) |
Insurance Portfolio | - | (13,568,988) | - | (13,568,988) |
| No expiration | | |
| Short-term | Long-term | Total no expiration | Total capital loss
carryfoward |
Banking Portfolio | $ (2,983,382) | $ (11,856,352) | $ (14,839,734) | $ (40,909,398) |
Brokerage and Investment Management Portfolio | - | (938,099) | (938,099) | (97,629,879) |
Consumer Finance Portfolio | - | (2,513,880) | (2,513,880) | (149,566,376) |
Financial Services Portfolio | (7,653,232) | (24,095,806) | (31,749,038) | (104,642,772) |
Insurance Portfolio | - | - | - | (13,568,988) |
Trading (Redemption) Fees. Shares held by investors in the Funds less than 30 days are subject to a redemption fee equal to .75% of the net asset value of shares redeemed. All redemption fees, which reduce the proceeds of the shareholder redemption, are retained by the Funds and accounted for as an addition to paid in capital.
New Accounting Pronouncement. In December 2011, the Financial Accounting Standards Board issued Accounting Standard Update No. 2011-11, Disclosures about Offsetting Assets and Liabilities. The update creates new disclosure requirements requiring entities to disclose both gross and net information for derivatives and other financial instruments that are either offset in the Statement of Assets and Liabilities or subject to an enforceable master netting arrangement or similar agreement. The disclosure requirements are effective for annual reporting periods beginning on or after January 1, 2013, and interim periods within those annual periods. Management is currently evaluating the impact of the update's adoption on the Funds' financial statement disclosures.
4. Operating Policies.
Restricted Securities. The Funds may invest in securities that are subject to legal or contractual restrictions on resale. These securities generally may be resold in transactions exempt from registration or to the public if the securities are registered. Disposal of these securities may involve time-consuming negotiations and expense, and prompt sale at an acceptable price may be difficult. Information regarding restricted securities is included at the end of each applicable Fund's Schedule of Investments.
5. Purchases and Sales of Investments.
Purchases and sales of securities, other than short-term securities, are noted in the table below.
| Purchases ($) | Sales ($) |
Banking Portfolio | 178,185,370 | 179,204,016 |
Brokerage and Investment Management Portfolio | 542,706,891 | 596,190,698 |
Consumer Finance Portfolio | 131,664,497 | 45,899,298 |
Financial Services Portfolio | 787,413,723 | 818,984,788 |
Insurance Portfolio | 192,388,703 | 222,302,163 |
6. Fees and Other Transactions with Affiliates.
Management Fee. FMR and its affiliates provide the Funds with investment management related services for which the Funds pay a monthly management fee. The management fee is the sum of an individual fund fee rate and an annualized group fee rate. The individual fund fee rate is applied to each Fund's average net assets. The group fee rate is based upon the average net assets of all the mutual funds advised by FMR. The group fee rate decreases as assets under management increase and increases as assets under management decrease. For the period, each Fund's annualized management fee rate expressed as a percentage of each Fund's average net assets was as follows:
Semiannual Report
6. Fees and Other Transactions with Affiliates - continued
Management Fee - continued
| Individual Rate | Group Rate | Total |
Banking Portfolio | .30% | .26% | .56% |
Brokerage and Investment Management Portfolio | .30% | .26% | .56% |
Consumer Finance Portfolio | .30% | .26% | .56% |
Financial Services Portfolio | .30% | .26% | .56% |
Insurance Portfolio | .30% | .26% | .56% |
Transfer Agent Fees. Fidelity Investments Institutional Operations Company, Inc. (FIIOC), an affiliate of FMR, is the Funds' transfer, dividend disbursing and shareholder servicing agent. FIIOC receives account fees and asset-based fees that vary according to account size and type of account. FIIOC pays for typesetting, printing and mailing of shareholder reports, except proxy statements. For the period, transfer agent fees were equivalent to the following annualized rates expressed as a percentage of average net assets:
Banking Portfolio | .24% |
Brokerage and Investment Management Portfolio | .26% |
Consumer Finance Portfolio | .27% |
Financial Services Portfolio | .25% |
Insurance Portfolio | .24% |
Accounting and Security Lending Fees. Fidelity Service Company, Inc. (FSC), an affiliate of FMR, maintains each Fund's accounting records. The accounting fee is based on the level of average net assets for each month. Under a separate contract, FSC administers the security lending program. The security lending fee is based on the number and duration of lending transactions.
Brokerage Commissions. Certain Funds placed a portion of their portfolio transactions with brokerage firms which are affiliates of the investment adviser. The commissions paid to these affiliated firms were as follows:
| Amount |
Banking Portfolio | $ 12,700 |
Brokerage and Investment Management Portfolio | 38,038 |
Consumer Finance Portfolio | 10,378 |
Financial Services Portfolio | 52,393 |
Insurance Portfolio | 7,081 |
Interfund Lending Program. Pursuant to an Exemptive Order issued by the SEC, the Funds, along with other registered investment companies having management contracts with FMR, may participate in an interfund lending program. This program provides an alternative credit facility allowing the funds to borrow from, or lend money to, other participating affiliated funds. At period end, there were no interfund loans outstanding. Each applicable fund's activity in this program during the period for which loans were outstanding was as follows:
| Borrower
or Lender | Average Loan
Balance | Weighted Average Interest Rate | Interest
Expense |
Brokerage and Investment Management Portfolio | Borrower | $ 7,032,667 | .40% | $ 234 |
Insurance Portfolio | Borrower | 10,366,500 | .44% | 508 |
7. Committed Line of Credit.
Certain Funds participate with other funds managed by FMR or an affiliate in a $4.25 billion credit facility (the "line of credit") to be utilized for temporary or emergency purposes to fund shareholder redemptions or for other short-term liquidity purposes. The participating funds have agreed to pay commitment fees on their pro-rata portion of the line of credit, which are reflected in Miscellaneous expenses on the Statement of Operations, and are as follows:
Banking Portfolio | $ 634 |
Brokerage and Investment Management Portfolio | 538 |
Consumer Finance Portfolio | 266 |
Financial Services Portfolio | 600 |
Insurance Portfolio | 382 |
During the period, there were no borrowings on this line of credit.
Semiannual Report
Notes to Financial Statements (Unaudited) - continued
8. Security Lending.
Certain Funds lend portfolio securities through a lending agent from time to time in order to earn additional income. For equity securities, a lending agent is used and may loan securities to certain qualified borrowers, including Fidelity Capital Markets (FCM), a broker-dealer affiliated with the Funds. On the settlement date of the loan, each applicable Fund receives collateral (in the form of U.S. Treasury obligations, letters of credit and/or cash) against the loaned securities and maintains collateral in an amount not less than 100% of the market value of the loaned securities during the period of the loan. The market value of the loaned securities is determined at the close of business of the Funds and any additional required collateral is delivered to the Funds on the next business day. If the borrower defaults on its obligation to return the securities loaned because of insolvency or other reasons, a fund could experience delays and costs in recovering the securities loaned or in gaining access to the collateral. Any cash collateral received is invested in the Fidelity Securities Lending Cash Central Fund. The value of loaned securities and cash collateral at period end are disclosed on each applicable Fund's Statement of Assets and Liabilities. At period end, there were no security loans outstanding with FCM. Security lending income represents the income earned on investing cash collateral, less rebates paid to borrowers and any lending agent fees associated with the loan, plus any premium payments received for lending certain types of securities. Security lending income is presented on each applicable Fund's Statement of Operations as a component of income from Fidelity Central Funds. Security lending activity as of and during the period was as follows:
| Total Security
Lending Income | Security Lending
Income From Securities Loaned to FCM |
Banking Portfolio | $ 5,121 | $ - |
Brokerage and Investment Management Portfolio | $ 15,842 | $ - |
Consumer Finance Portfolio | $ 8,633 | $ 1,445 |
Financial Services Portfolio | $ 43,899 | $ 73 |
Insurance Portfolio | $ 5 | $ - |
9. Expense Reductions.
Many of the brokers with whom FMR places trades on behalf of certain Funds provided services to these Funds in addition to trade execution. These services included payments of expenses on behalf of each applicable Fund. In addition, through arrangements with each applicable Fund's custodian, credits realized as a result of uninvested cash balances were used to reduce each applicable Fund's expenses. All of the applicable expense reductions are noted in the table below.
| Brokerage
Service
reduction | Custody
expense
reduction |
Banking Portfolio | $ 5,454 | $ 15 |
Brokerage and Investment Management Portfolio | 106,339 | 7 |
Consumer Finance Portfolio | 7,435 | 5 |
Financial Services Portfolio | 195,197 | - |
Insurance Portfolio | 8,626 | 7 |
10. Other.
The Funds' organizational documents provide former and current trustees and officers with a limited indemnification against liabilities arising in connection with the performance of their duties to the Funds. In the normal course of business, the Funds may also enter into contracts that provide general indemnifications. The Funds' maximum exposure under these arrangements is unknown as this would be dependent on future claims that may be made against the Funds. The risk of material loss from such claims is considered remote.
At the end of the period, Strategic Advisers U.S. Opportunity Fund was the owner of record of approximately 11%, 19% and 21% of the total outstanding shares of Banking Portfolio, Consumer Finance Portfolio and Insurance Portfolio, respectively. Fidelity VIP FundsManager 60% Portfolio was the owner of record of approximately 20%, 13%, 21% and 32% of the total outstanding shares of Banking Portfolio, Consumer Finance Portfolio, Financial Services Portfolio and Insurance Portfolio, respectively. Mutual funds managed by FMR or its affiliates were the owners of record, in the aggregate, of approximately 42%, 36%, 27% and 72% of the total outstanding shares of Banking Portfolio, Consumer Finance Portfolio, Financial Services Portfolio and Insurance Portfolio, respectively.
Semiannual Report
Board Approval of Investment Advisory Contracts and Management Fees
Banking Portfolio
Brokerage and Investment Management Portfolio
Consumer Finance Portfolio
Financial Services Portfolio
Insurance Portfolio
Each year, the Board of Trustees, including the Independent Trustees (together, the Board), votes on the renewal of the management contract and sub-advisory agreements (together, the Advisory Contracts) for each fund. The Board, assisted by the advice of fund counsel and Independent Trustees' counsel, requests and considers a broad range of information relevant to the renewal of the Advisory Contracts throughout the year.
The Board meets regularly and, at each of its meetings, considers factors that are relevant to its annual consideration of the renewal of each fund's Advisory Contracts, including the services and support provided to each fund and its shareholders. The Board has established various standing committees, each composed of and chaired by Independent Trustees with varying backgrounds, to which the Board has assigned specific subject matter responsibilities in order to enhance effective decision-making by the Board. The Board, acting directly and through its Committees, requests and receives information concerning the annual consideration of the renewal of each fund's Advisory Contracts. The Board also meets as needed to consider matters specifically related to the Board's annual consideration of the renewal of Advisory Contracts. Members of the Board may also meet with trustees of other Fidelity funds through ad hoc joint committees to discuss certain matters relevant to the Fidelity funds.
At its July 2012 meeting, the Board of Trustees, including the Independent Trustees, unanimously determined to renew each fund's Advisory Contracts. In reaching its determination, the Board considered all factors it believed relevant, including (i) the nature, extent, and quality of the services to be provided to each fund and its shareholders (including the investment performance of each fund); (ii) the competitiveness of each fund's management fee and total expense ratio relative to peer funds; (iii) the total costs of the services to be provided by and the profits to be realized by Fidelity from its relationship with each fund; (iv) the extent to which economies of scale exist and would be realized as each fund grows; and (v) whether fee levels reflect these economies of scale, if any, for the benefit of fund shareholders.
In considering whether to renew the Advisory Contracts for each fund, the Board reached a determination, with the assistance of fund counsel and Independent Trustees' counsel and through the exercise of its business judgment, that the renewal of the Advisory Contracts is in the best interests of each fund and its shareholders and that the compensation payable under the Advisory Contracts is fair and reasonable. The Board's decision to renew the Advisory Contracts was not based on any single factor, but rather was based on a comprehensive consideration of all the information provided to the Board at its meetings throughout the year. The Board, in reaching its determination to renew the Advisory Contracts, is aware that shareholders in each fund have a broad range of investment choices available to them, including a wide choice among mutual funds offered by Fidelity's competitors, and that each fund's shareholders, who have the opportunity to review and weigh the disclosure provided by the fund in its prospectus and other public disclosures, have chosen to invest in that fund, managed by Fidelity.
Nature, Extent, and Quality of Services Provided. The Board considered the staffing within the investment adviser, FMR, and the sub-advisers (together, the Investment Advisers), including the backgrounds of the funds' investment personnel, and also considered the funds' investment objectives, strategies, and related investment philosophies. The Independent Trustees also had discussions with senior management of Fidelity's investment operations and investment groups. The Board considered the structure of the portfolio manager compensation program and whether this structure provides appropriate incentives to act in the best interests of each fund.
Resources Dedicated to Investment Management and Support Services. The Board and the Fund Oversight and Research Committees reviewed the general qualifications and capabilities of the Investment Advisers' investment staff, including its size, education, experience, and resources, as well as the Investment Advisers' approach to recruiting, training, managing, and compensating investment personnel. The Board also noted that FMR has continued to increase the resources devoted to non-U.S. offices, including expansion of Fidelity's global investment organization. The Board noted that Fidelity's analysts have extensive resources, tools and capabilities that allow them to conduct sophisticated quantitative and fundamental analysis, as well as credit analysis of issuers, counterparties and guarantors. The Board also believes that Fidelity's investment professionals have sufficient access to global information and data so as to provide competitive investment results over time, and that those professionals also have access to sophisticated tools that permit them to assess portfolio construction and risk and performance attribution characteristics continuously, as well as to transmit new information and research conclusions rapidly around the world. Additionally, in its deliberations, the Board considered the Investment Advisers' trading and risk management capabilities and resources, which are an integral part of the investment management process.
Shareholder and Administrative Services. The Board considered (i) the nature, extent, quality, and cost of advisory, administrative, and shareholder services performed by the Investment Advisers and their affiliates under the Advisory Contracts and under separate agreements covering transfer agency, pricing and bookkeeping, and securities lending services for each fund; (ii) the nature and extent of the supervision of third party service providers, principally custodians and subcustodians; and (iii) the resources devoted to, and the record of compliance with, each fund's compliance policies and procedures. The Board also reviewed the allocation of fund brokerage, including allocations to brokers affiliated with the Investment Advisers, the use of brokerage commissions to pay fund expenses, and the use of "soft" commission dollars to pay for research services.
Semiannual Report
The Board noted that the growth of fund assets over time across the complex allows Fidelity to reinvest in the development of services designed to enhance the value or convenience of the Fidelity funds as investment vehicles. These services include 24-hour access to account information and market information through telephone representatives and over the Internet, investor education materials and asset allocation tools, and the expanded availability of Fidelity Investor Centers.
Investment in a Large Fund Family. The Board considered the benefits to shareholders of investing in a Fidelity fund, including the benefits of investing in a fund that is part of a large family of funds offering a variety of investment disciplines and providing a large variety of mutual fund investor services. The Board noted that Fidelity had taken, or had made recommendations that resulted in the Fidelity funds taking, a number of actions over the previous year that benefited particular funds, including (i) continuing to dedicate additional resources to investment research and support of the senior management team that oversees asset management; (ii) persisting in efforts to enhance Fidelity's research capabilities, in particular, international research; (iii) launching new funds and making other enhancements to meet client needs for global and income-oriented solutions; (iv) continuing to launch dedicated lower cost underlying funds to meet investment management's portfolio construction needs related to expanding underlying fund options, specifically for the Freedom Fund product lines; (v) adopting a "Stock Selector" sector neutral investment approach and employing a team of portfolio managers who are sector specialists to manage certain funds; (vi) rationalizing product lines and gaining increased efficiencies through the mergers of several funds into other funds; (vii) strengthening the Spartan Index Fund product line by adding new funds and/or new low-cost institutional share classes, restructuring fund expenses to accommodate new classes, and reducing investment minimums for certain classes of shares; (viii) modifying the eligibility criteria for Institutional Class shares to increase their appeal to government entities and charitable investors; and (ix) reducing certain transfer agent fee rates.
Investment Performance. The Board considered whether each fund has operated in accordance with its investment objective, as well as its record of compliance with its investment restrictions. It also reviewed each fund's absolute investment performance, as well as each fund's relative investment performance measured over multiple periods against a third-party-sponsored index that reflects the market sector in which the fund invests. The Board noted that FMR believes that no meaningful peer group exists for the funds principally because most other funds in each fund's third-party peer group focus on different industries or sectors than the fund. For each fund, the following charts considered by the Board show, over the one-, three-, and five-year periods ended December 31, 2011, the fund's cumulative total returns and the cumulative total returns of a third-party-sponsored index ("benchmark").
Banking Portfolio
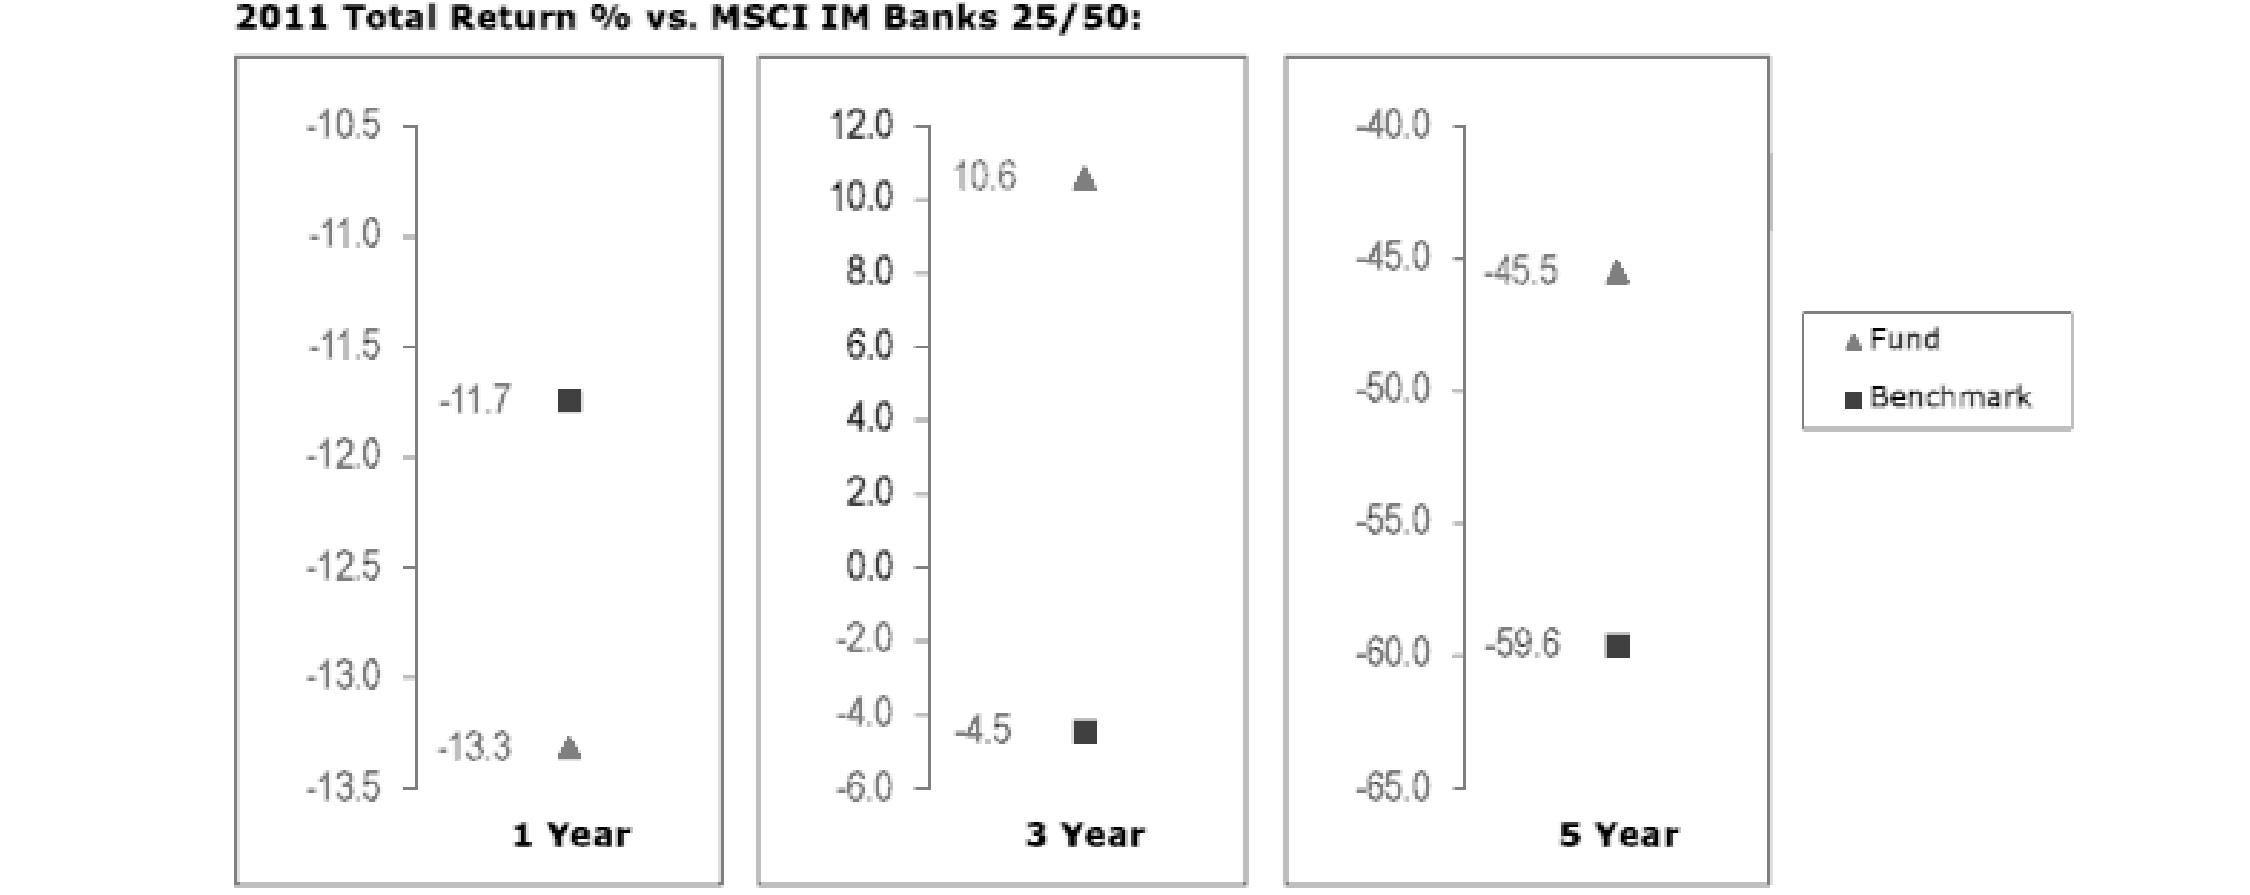
The Board noted that the investment performance of the fund compared favorably to its benchmark for the three- and five-year periods, although the fund's one-year total return was lower than its benchmark. The Board noted that there was a portfolio management change for the fund in January 2012. The Board also reviewed the fund's performance since inception as well as performance in the current year.
Semiannual Report
Board Approval of Investment Advisory Contracts and Management Fees - continued
Brokerage and Investment Management Portfolio
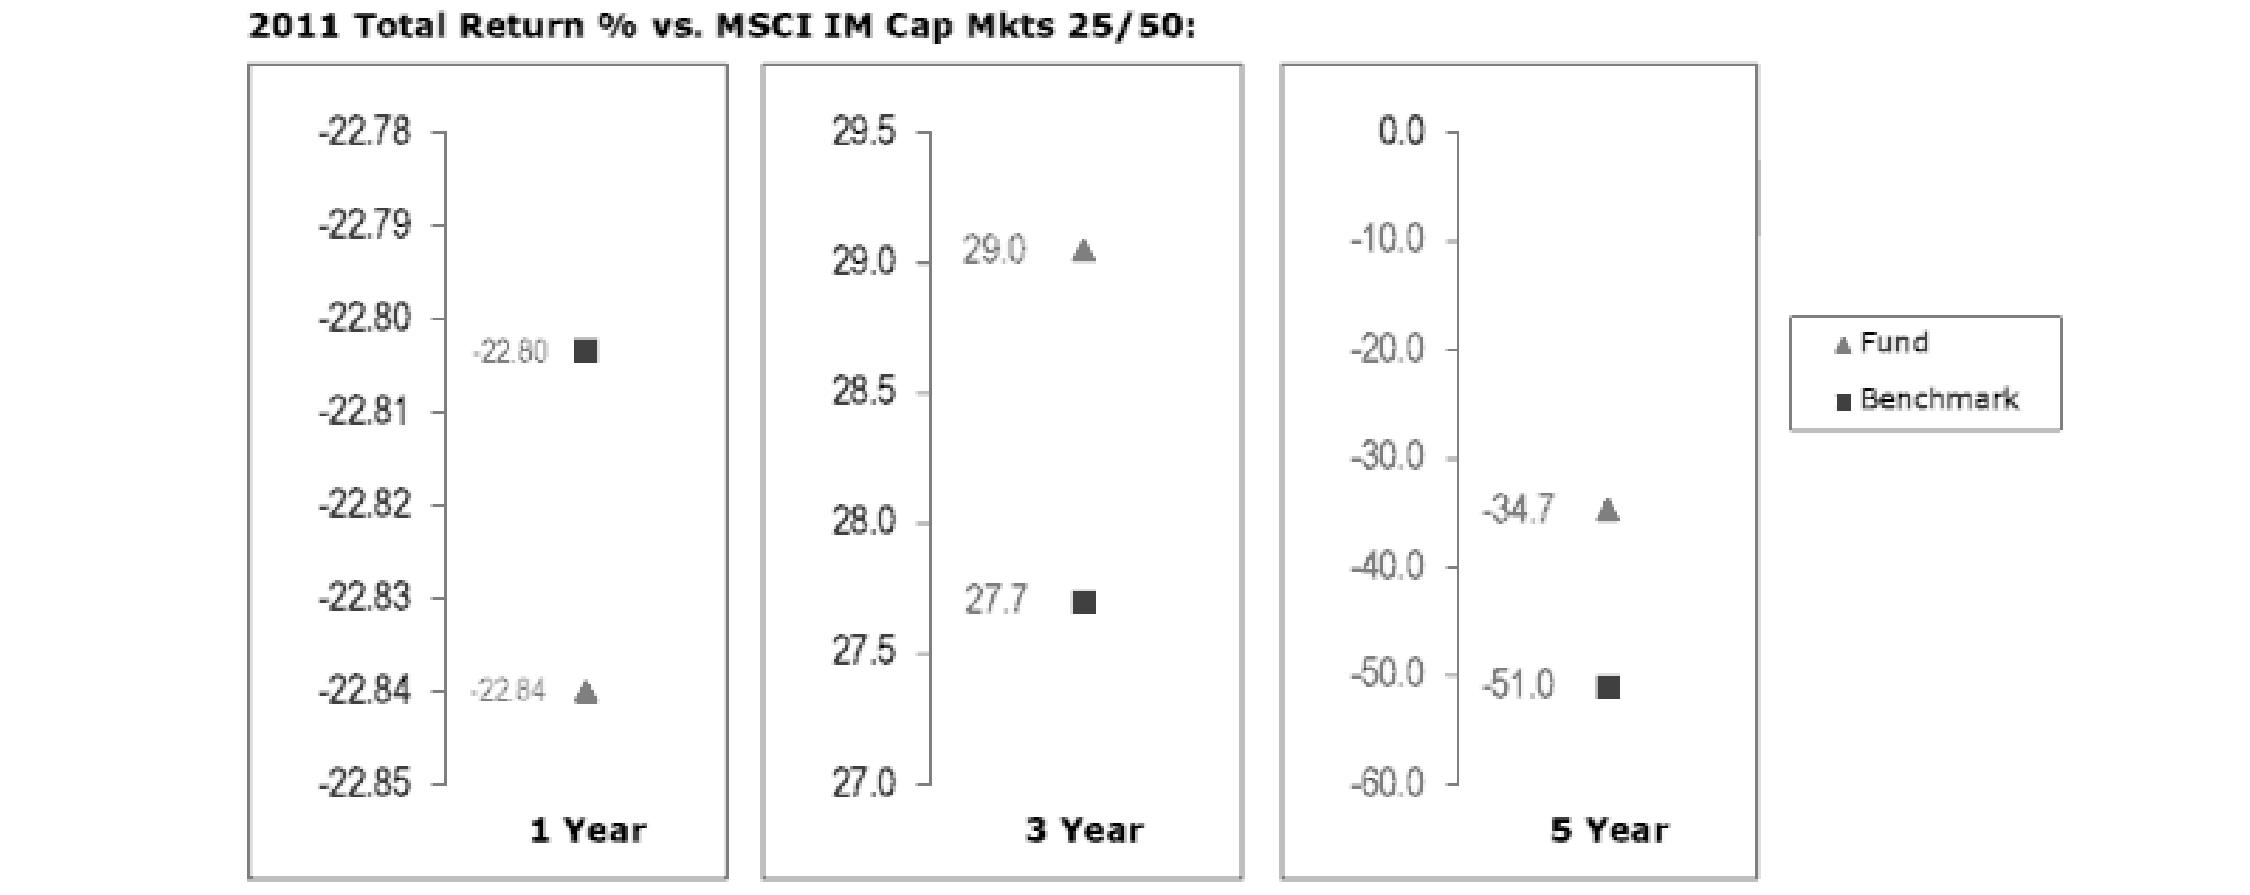
The Board noted that the investment performance of the fund compared favorably to its benchmark for the three- and five-year periods, although the fund's one-year total return was lower than its benchmark. The Board also reviewed the fund's performance since inception as well as performance in the current year.
Consumer Finance Portfolio
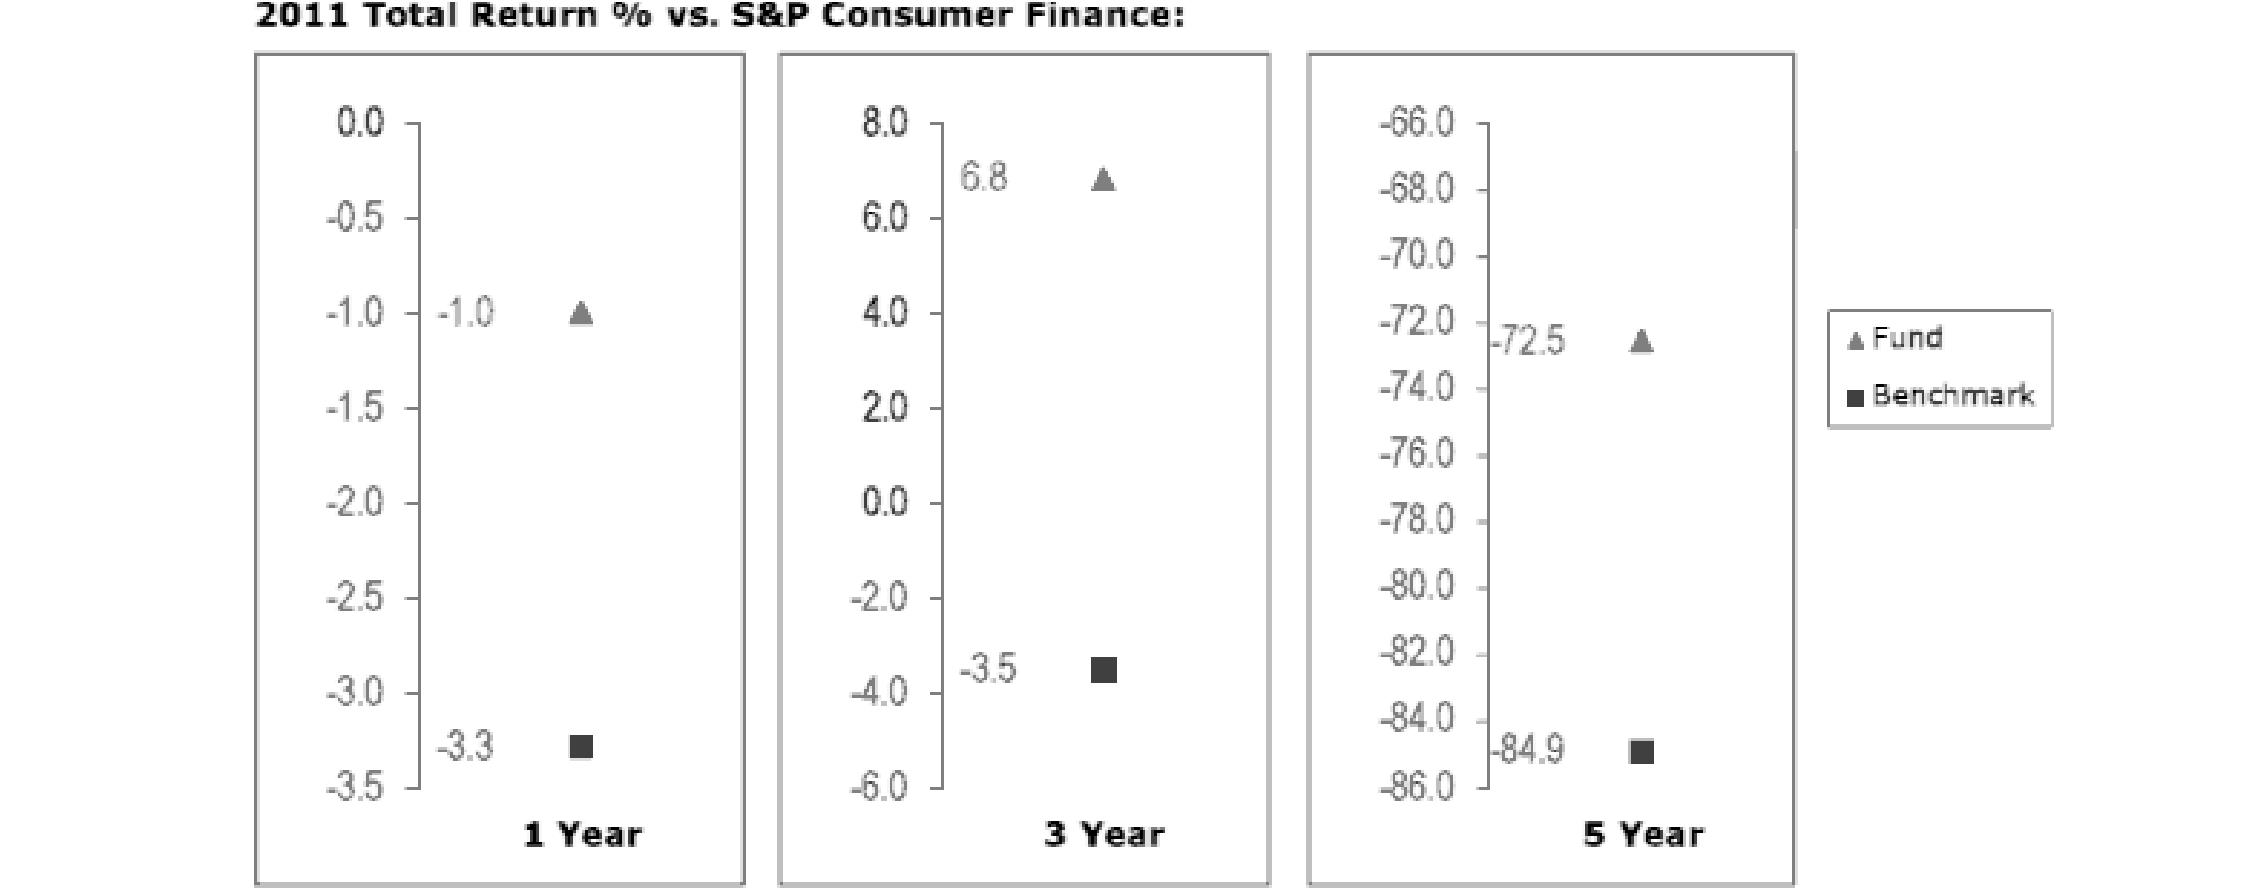
The Board noted that the investment performance of the fund compared favorably to its benchmark for all the periods shown. The Board noted that there was a portfolio management change for the fund in April 2012. The Board also reviewed the fund's performance since inception as well as performance in the current year.
Semiannual Report
Financial Services Portfolio

The Board noted that the investment performance of the fund was lower than its benchmark for all the periods shown. The Board discussed with FMR actions to improve the fund's below-benchmark performance. The Board also reviewed the fund's performance since inception as well as performance in the current year. The Board will continue to closely monitor the performance of the fund in the coming year and discuss with FMR other appropriate actions to address the performance of the fund.
Insurance Portfolio
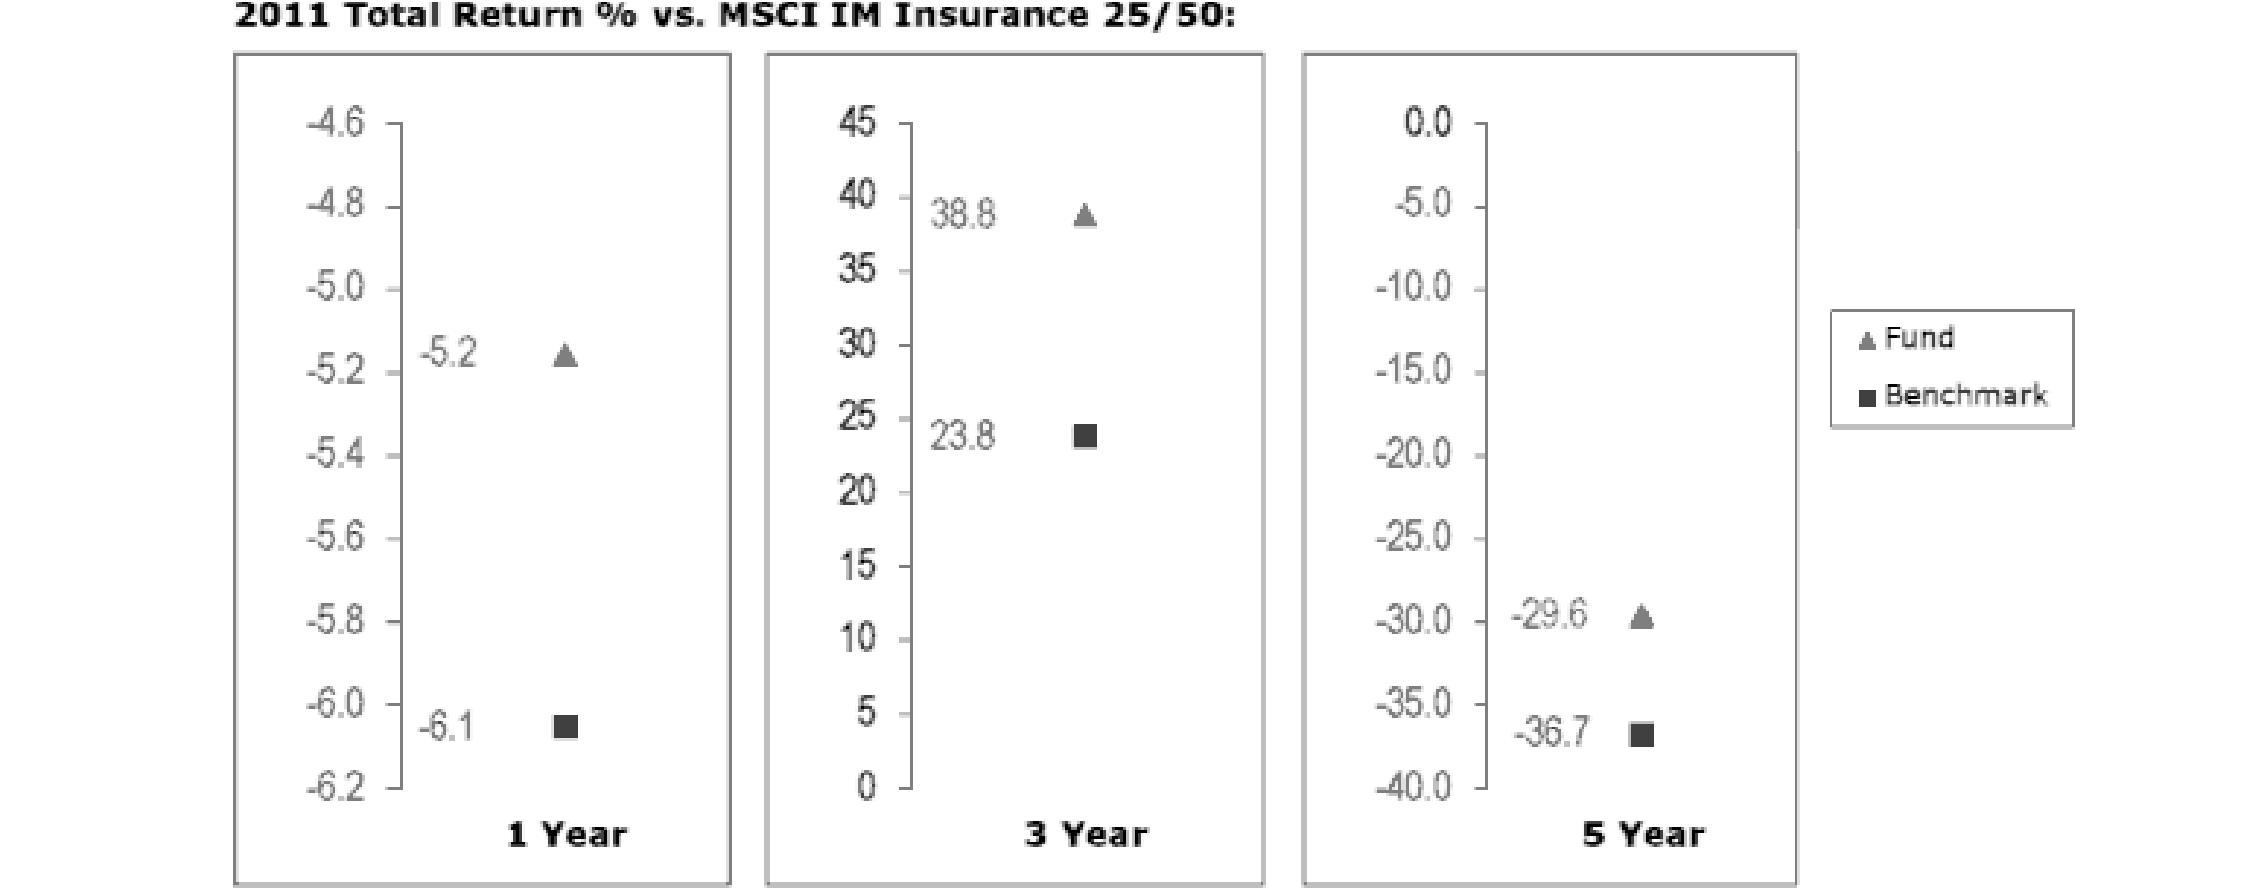
The Board noted that the investment performance of the fund compared favorably to its benchmark for all the periods shown. The Board also reviewed the fund's performance since inception as well as performance in the current year.
Based on its review, the Board concluded that the nature, extent, and quality of services provided to each fund under the Advisory Contracts should benefit each fund's shareholders.
Competitiveness of Management Fee and Total Expense Ratio. The Board considered each fund's management fee and total expense ratio compared to "mapped groups" of competitive funds and classes. Fidelity creates "mapped groups" by combining similar Lipper investment objective categories that have comparable management fee characteristics. Combining Lipper investment objective categories aids the Board's management fee and total expense ratio comparisons by broadening the competitive group used for comparison and by reducing the number of universes to which various Fidelity funds are compared.
Semiannual Report
Board Approval of Investment Advisory Contracts and Management Fees - continued
Management Fee. The Board considered two proprietary management fee comparisons for the 12-month periods shown in the charts below. The group of Lipper funds used by the Board for management fee comparisons is referred to below as the "Total Mapped Group." The Total Mapped Group comparison focuses on a fund's standing relative to the total universe of comparable funds available to investors in terms of gross management fees before expense reimbursements or caps. "TMG %" represents the percentage of funds in the Total Mapped Group that had management fees that were lower than a fund's. For example, a TMG % of 6% means that 94% of the funds in the Total Mapped Group had higher management fees than a fund. The "Asset-Size Peer Group" (ASPG) comparison focuses on a fund's standing relative to non-Fidelity funds similar in size to the fund within the Total Mapped Group. The ASPG represents at least 15% of the funds in the Total Mapped Group with comparable asset size and management fee characteristics, subject to a minimum of 50 funds (or all funds in the Total Mapped Group if fewer than 50). Additional information, such as the ASPG quartile in which a fund's management fee ranked, is also included in the charts and considered by the Board.
Banking Portfolio
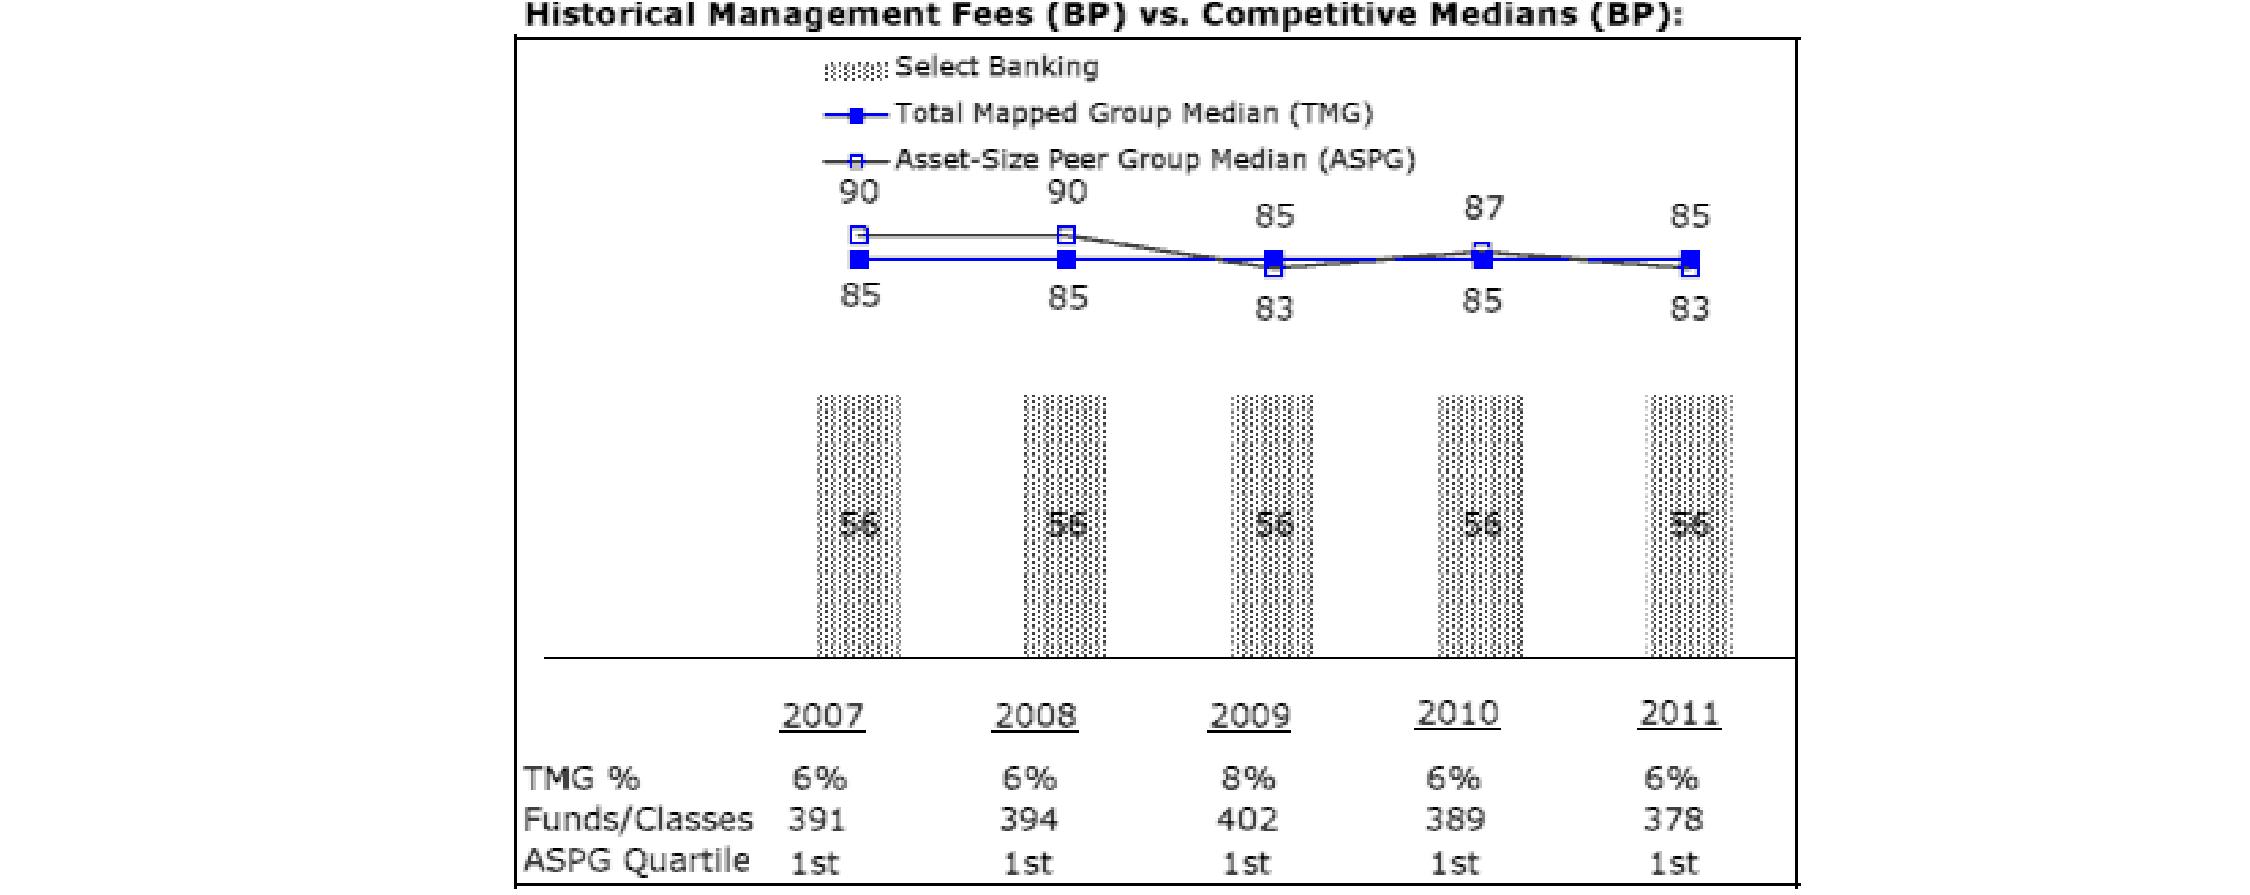
Brokerage and Investment Management Portfolio
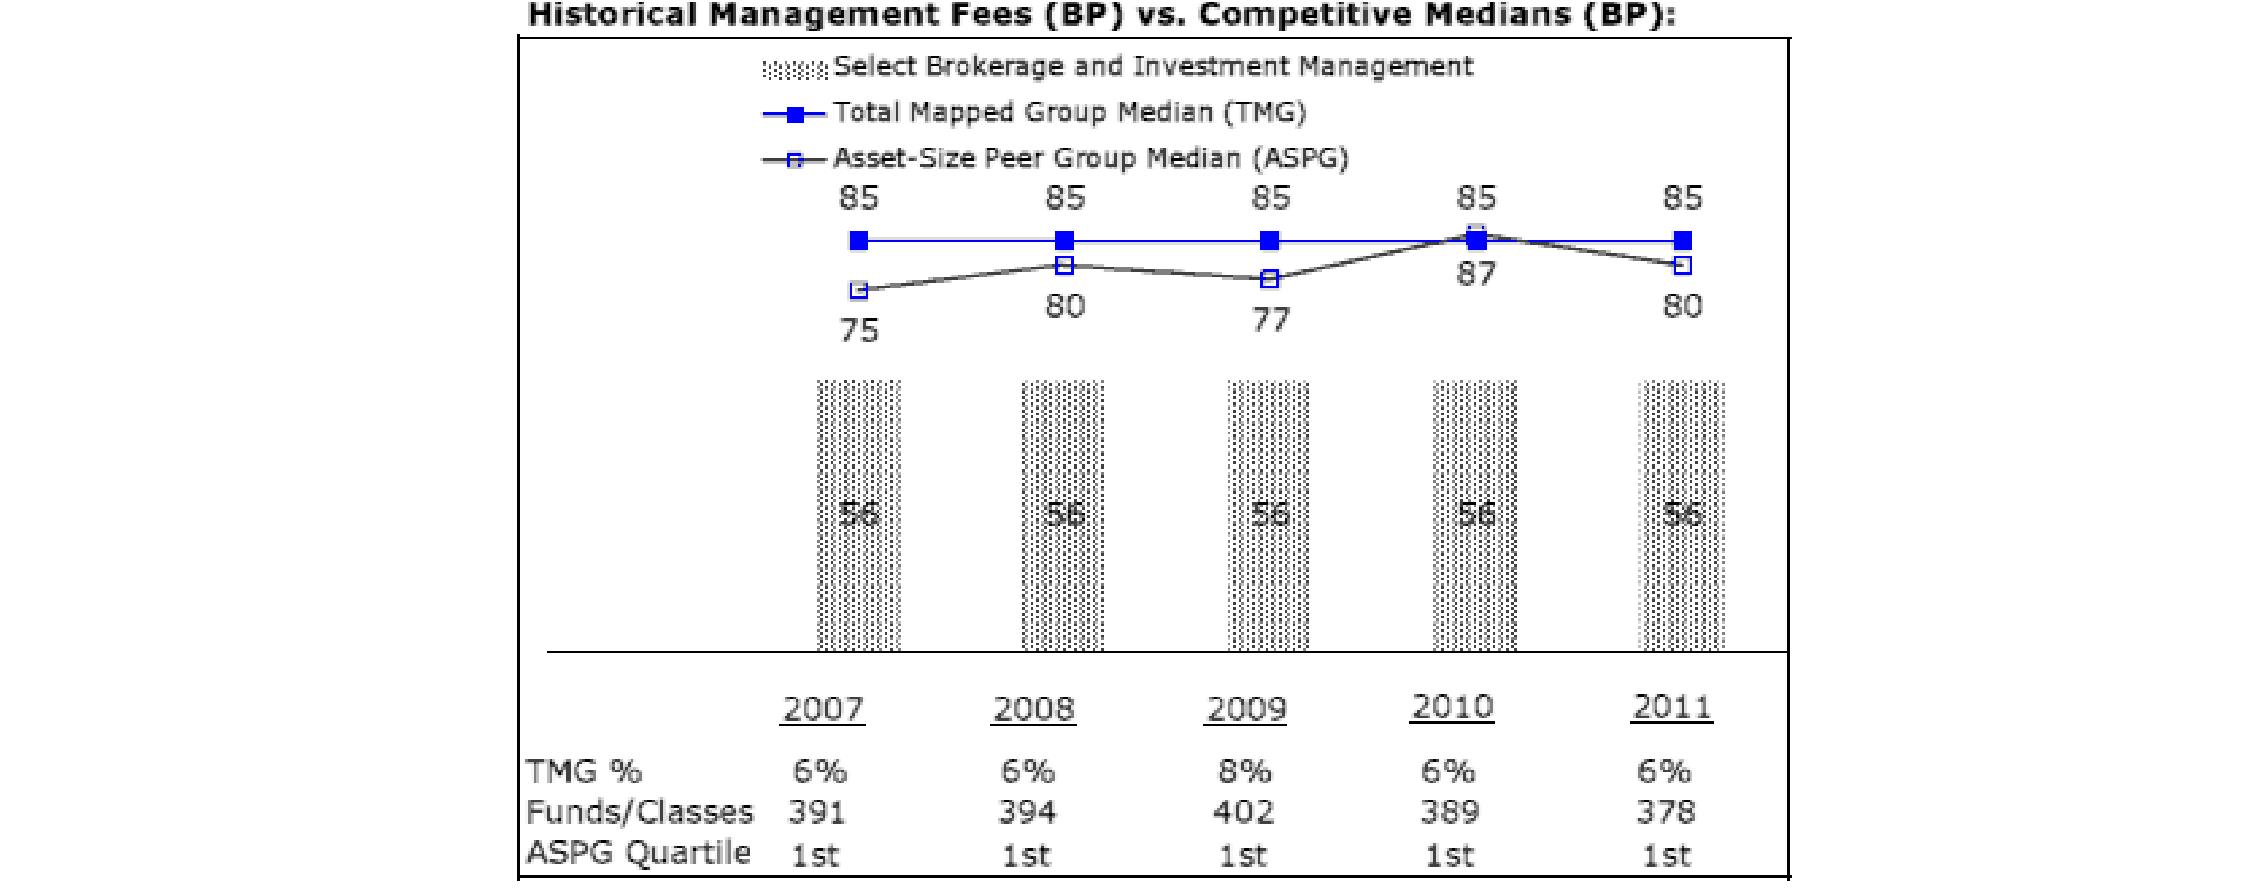
Semiannual Report
Consumer Finance Portfolio
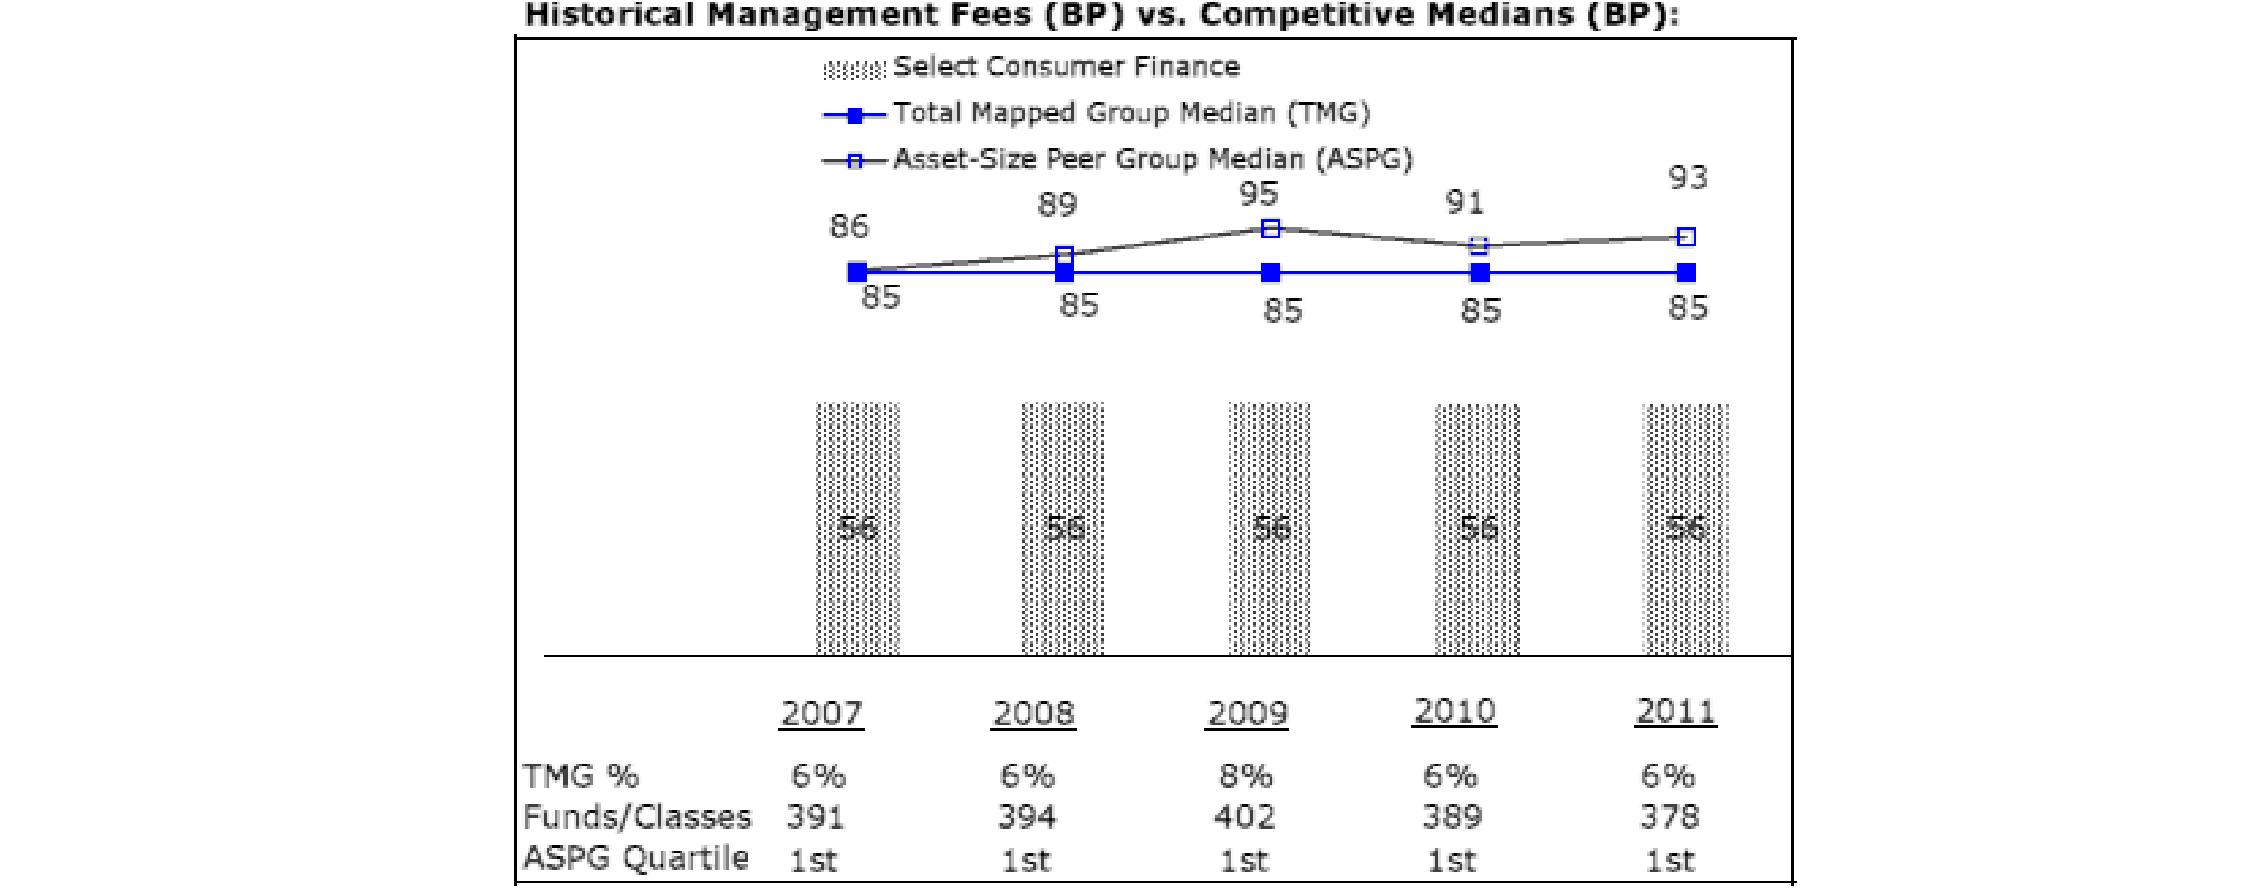
Financial Services Portfolio
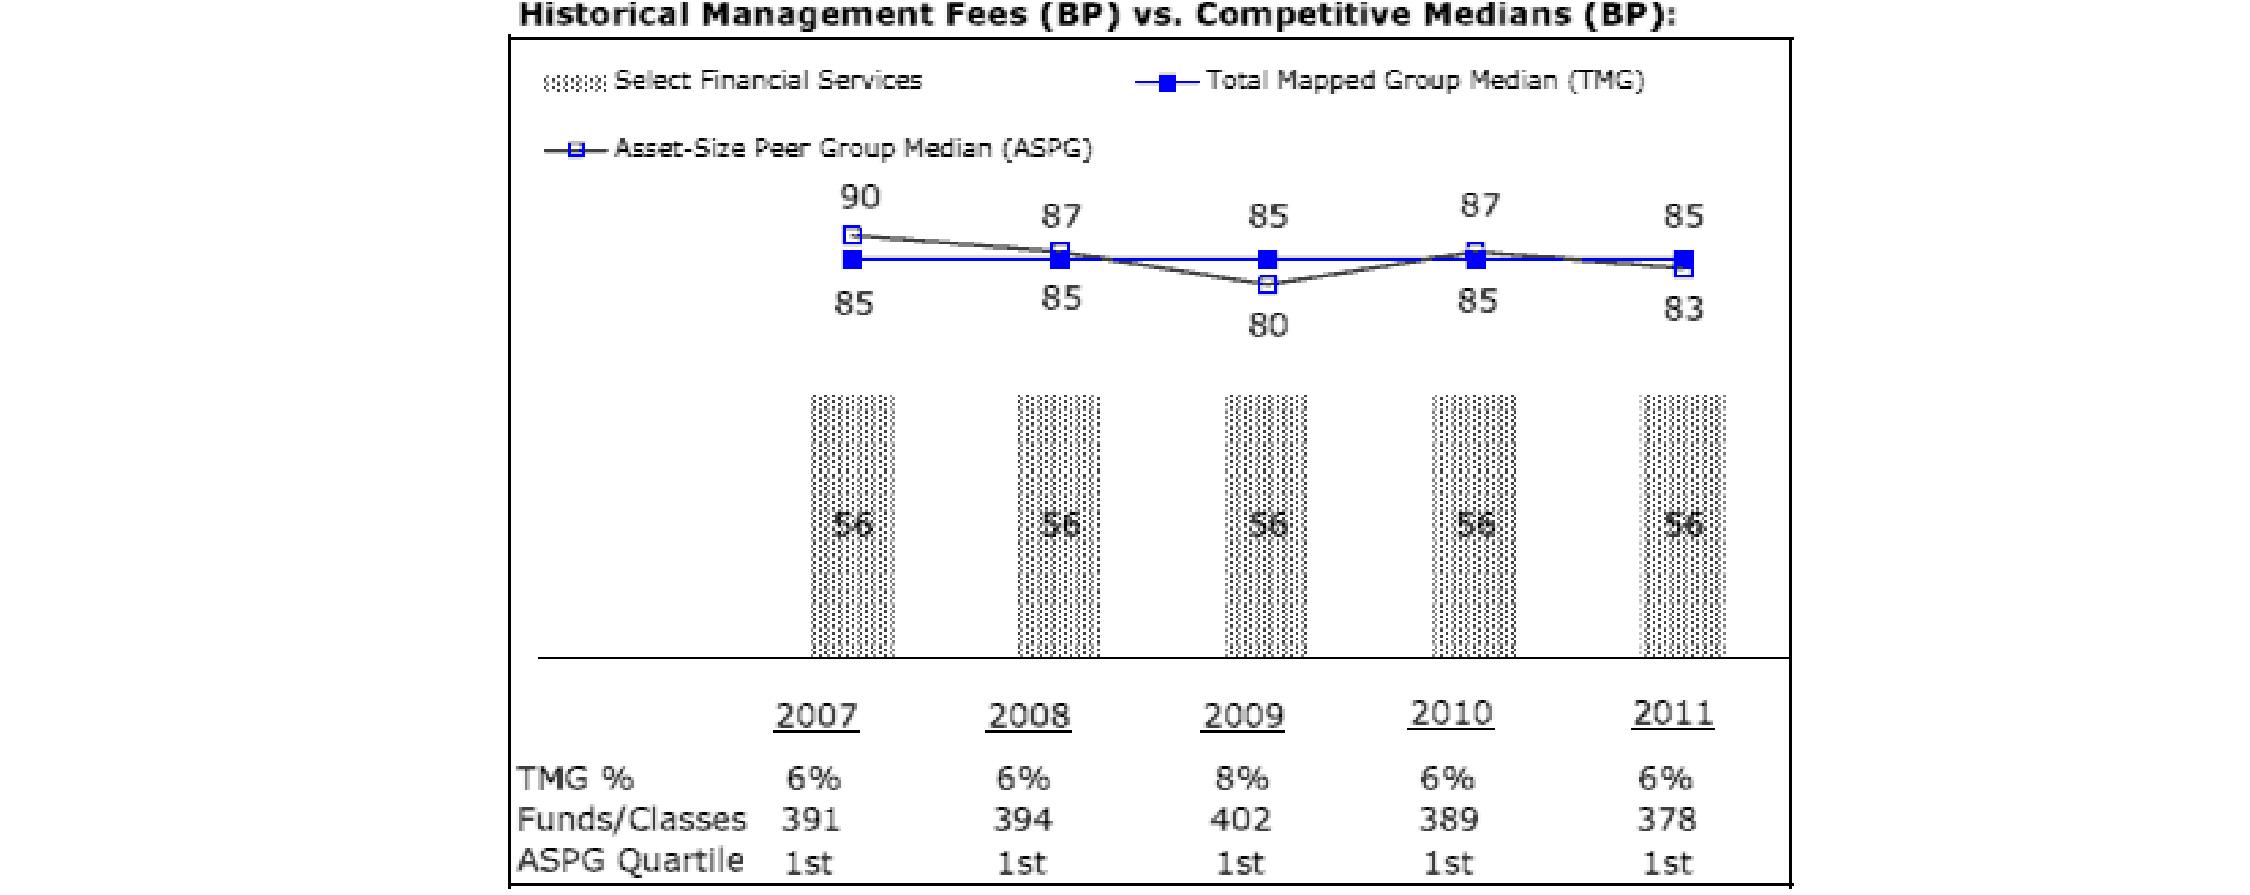
Semiannual Report
Board Approval of Investment Advisory Contracts and Management Fees - continued
Insurance Portfolio
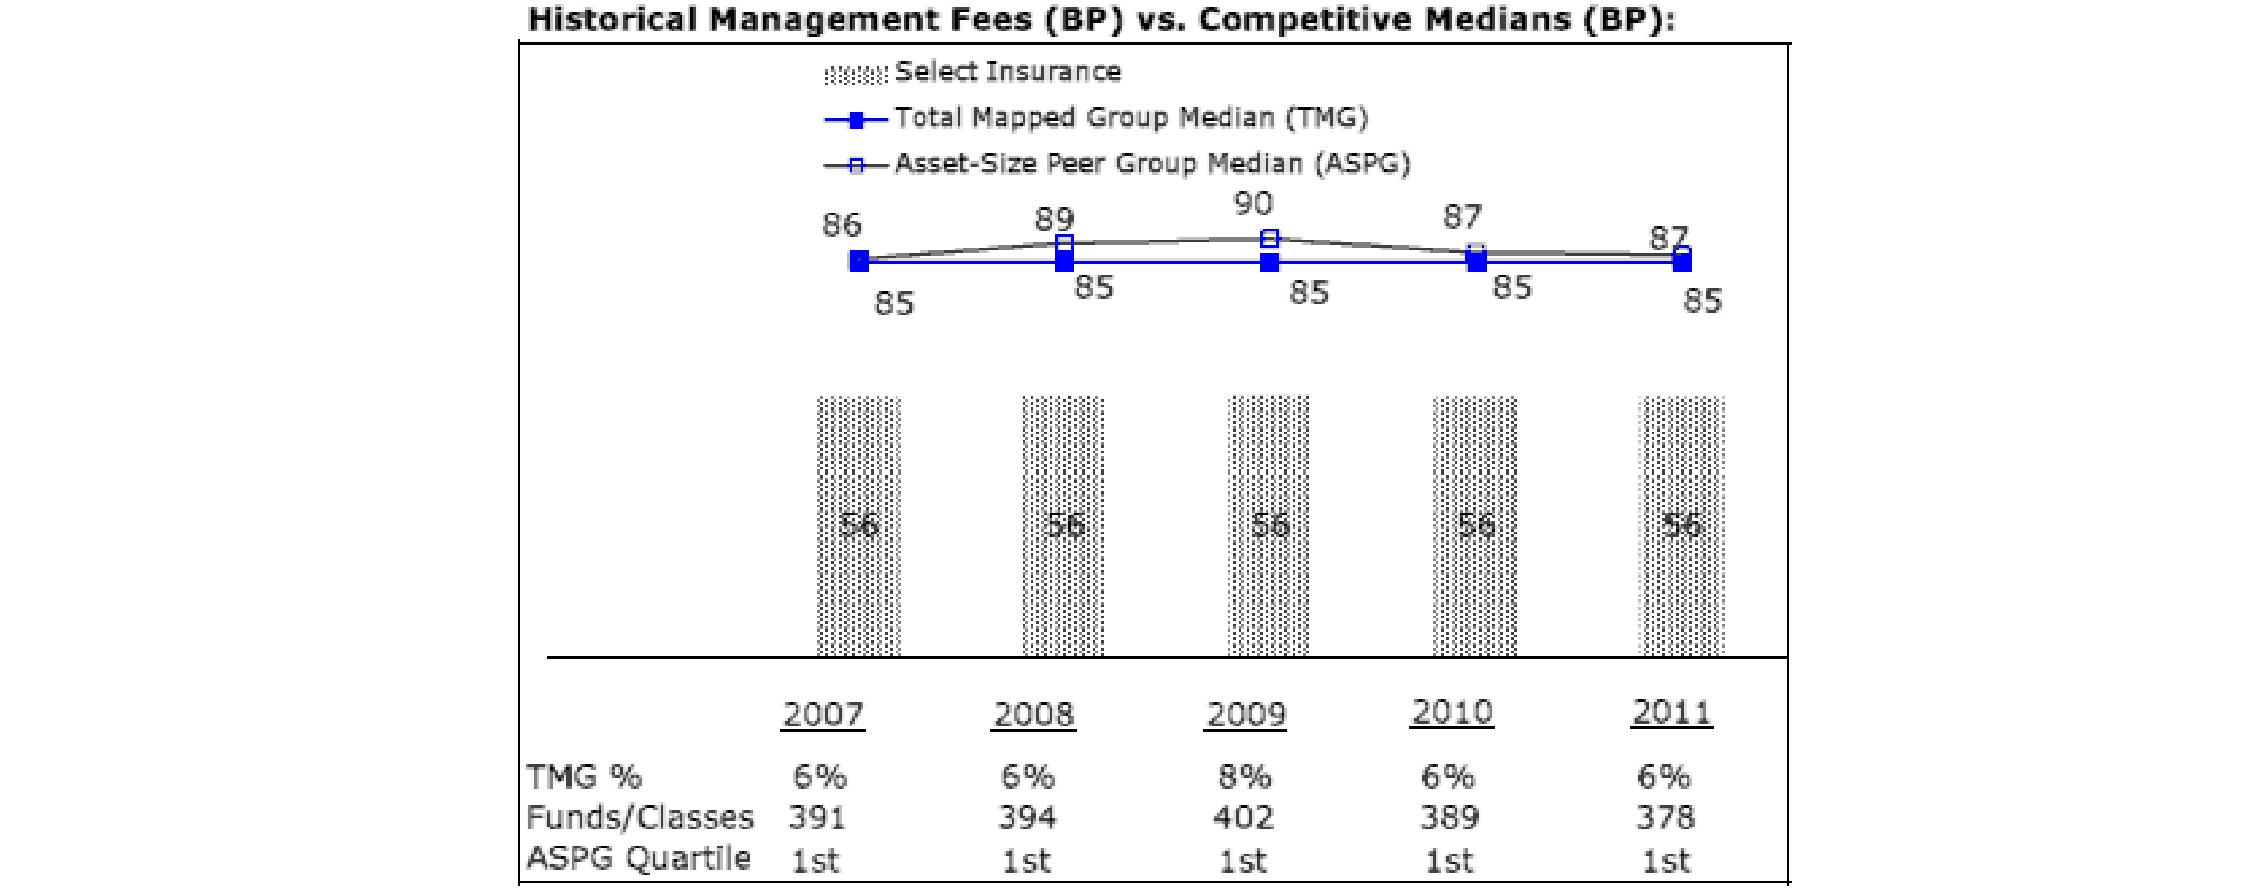
The Board noted that each fund's management fee ranked below the median of its Total Mapped Group and below the median of its ASPG for 2011.
Based on its review, the Board concluded that each fund's management fee is fair and reasonable in light of the services that the fund receives and the other factors considered.
Total Expense Ratio. In its review of each fund's total expense ratio, the Board considered the fund's management fee as well as other fund expenses, such as transfer agent fees, pricing and bookkeeping fees, and custodial, legal, and audit fees. The Board also noted the effects of any waivers and reimbursements on fees and expenses. As part of its review, the Board also considered the current and historical total expense ratios of each fund compared to competitive fund median expenses. Each fund is compared to those funds and classes in the Total Mapped Group (used by the Board for management fee comparisons) that have a similar sales load structure.
The Board noted that each fund's total expense ratio ranked below its competitive median for 2011.
Fees Charged to Other Fidelity Clients. The Board also considered Fidelity fee structures and other information with respect to clients of FMR and its affiliates, such as other mutual funds advised or subadvised by FMR or its affiliates, pension plan clients, and other institutional clients. The Board noted the findings of the 2010 ad hoc joint committee (created with the board of other Fidelity funds), which reviewed and compared Fidelity's institutional investment advisory business with its business of providing services to the Fidelity funds, including the differences in services provided, fees charged, and costs incurred, as well as competition in their respective marketplaces.
Based on its review of total expense ratios and fees charged to other Fidelity clients, the Board concluded that each fund's total expense ratio was reasonable in light of the services that the fund and its shareholders receive and the other factors considered.
Costs of the Services and Profitability. The Board considered the revenues earned and the expenses incurred by Fidelity in conducting the business of developing, marketing, distributing, managing, administering and servicing each fund and its shareholders. The Board also considered the level of Fidelity's profits in respect of all the Fidelity funds.
On an annual basis, FMR presents to the Board Fidelity's profitability for each fund. Fidelity calculates the profitability for each fund, as well as aggregate profitability for groups of Fidelity funds and all Fidelity funds, using a series of detailed revenue and cost allocation methodologies which originate with the books and records of Fidelity on which Fidelity's audited financial statements are based. The Audit Committee of the Board reviews any significant changes from the prior year's methodologies.
PricewaterhouseCoopers LLP (PwC), independent registered public accounting firm and auditor to Fidelity and certain Fidelity funds, has been engaged annually by the Board as part of the Board's assessment of Fidelity's profitability analysis. PwC's engagement includes the review and assessment of Fidelity's methodologies used in determining the revenues and expenses attributable to Fidelity's mutual fund business, and completion of agreed-upon procedures surrounding the mathematical accuracy of fund profitability and its conformity to allocation methodologies. After considering PwC's reports issued under the engagement and information provided by Fidelity, the Board concluded that while other allocation methods may also be reasonable, Fidelity's profitability methodologies are reasonable in all material respects.
Semiannual Report
The Board also reviewed Fidelity's non-fund businesses and fall-out benefits related to the mutual fund business as well as cases where Fidelity's affiliates may benefit from or be related to the funds' business.
The Board considered the costs of the services provided by and the profits realized by Fidelity in connection with the operation of each fund and was satisfied that the profitability was not excessive in the circumstances.
Economies of Scale. The Board considered whether there have been economies of scale in respect of the management of the Fidelity funds, whether the Fidelity funds (including each fund) have appropriately benefited from any such economies of scale, and whether there is potential for realization of any further economies of scale. The Board considered the extent to which each fund will benefit from economies of scale through increased services to the fund, through waivers or reimbursements, or through fee or expense reductions. The Board also noted that in 2009, it and the board of other Fidelity funds created an ad hoc committee (the Economies of Scale Committee) to analyze whether FMR attains economies of scale in respect of the management and servicing of the Fidelity funds, whether the Fidelity funds have appropriately benefited from such economies of scale, and whether there is potential for realization of any further economies of scale.
The Board recognized that each fund's management contract incorporates a "group fee" structure, which provides for lower group fee rates as total fund assets under FMR's management increase, and for higher group fee rates as total fund assets under FMR's management decrease. FMR calculates the group fee rates based on a tiered asset "breakpoint" schedule that varies based on asset class. The Board considered that the group fee is designed to deliver the benefits of economies of scale to fund shareholders when total Fidelity fund assets increase, even if assets of any particular fund are unchanged or have declined, because some portion of Fidelity's costs are attributable to services provided to all Fidelity funds, and all funds benefit if those costs can be allocated among more assets. The Board concluded that, given the group fee structure, fund shareholders will benefit from lower management fees as assets under FMR's management increase at the fund complex level, regardless of whether Fidelity achieves any such economies of scale.
The Board concluded, taking into account the analysis of the Economies of Scale Committee, that economies of scale, if any, are being appropriately shared between fund shareholders and Fidelity.
Additional Information Requested by the Board. In order to develop fully the factual basis for consideration of the Fidelity funds' Advisory Contracts, the Board requested and received additional information on certain topics, including (i) fund performance trends, actions to be taken by FMR to improve certain funds' overall performance, and Fidelity's long-term strategies for certain funds; (ii) the potential to further rationalize the Fidelity fund lineup with the possibility of achieving savings for the funds and Fidelity; (iii) Fidelity's compensation structure for portfolio managers and other key investment personnel; (iv) the amount of the investment that each portfolio manager has made in the Fidelity fund(s) that he or she manages; (v) the realization of fall-out benefits in certain Fidelity business units; (vi) Fidelity's group fee structures, the potential impact of regulatory changes on such structures, and the rationale for the individual fee rates of certain funds; (vii) fund profitability methodology, including Fidelity's cost allocation methodology, and the impact of certain factors on fund profitability results; (viii) trends regarding industry use of performance fee structures and the possibility of implementing performance fee structures for additional funds; and (ix) the impact of net redemptions from the Fidelity funds.
Based on its evaluation of all of the conclusions noted above, and after considering all factors it believed relevant, the Board ultimately concluded that the advisory fee structures are fair and reasonable, and that each fund's Advisory Contracts should be renewed.
Semiannual Report
Semiannual Report
Investment Adviser
Fidelity Management & Research Company
Boston, MA
Investment Sub-Advisers
FMR Co., Inc.
Fidelity Management & Research (U.K.) Inc.
Fidelity Management & Research (Hong Kong) Limited
Fidelity Management & Research (Japan) Inc.
General Distributor
Fidelity Distributors Corporation
Smithfield, RI
Transfer and Service Agents
Fidelity Investments Institutional Operations Company, Inc.
Boston, MA
Fidelity Service Company, Inc.
Boston, MA
Custodian
Brown Brothers Harriman & Co.
Boston, MA
Corporate Headquarters
82 Devonshire Street
Boston, MA 02109
1-800-544-8888
The Fidelity Telephone Connection
Mutual Fund 24-Hour Service
Exchanges/Redemptions
and Account Assistance 1-800-544-6666
Product Information 1-800-544-8888
Retirement Accounts 1-800-544-4774
(8 a.m. - 9 p.m.)
TDD Service 1-800-544-0118
for the deaf and hearing impaired
(9 a.m. - 9 p.m. Eastern time)
Fidelity Automated Service
Telephone (FAST®)
1-800-544-5555
Automated line for quickest service
SELFIN-USAN-1012
1.813665.107
Fidelity®
Select Portfolios®
Consumer Discretionary Sector
Automotive Portfolio
Construction and Housing Portfolio
Consumer Discretionary Portfolio
Leisure Portfolio
Multimedia Portfolio
Retailing Portfolio
Semiannual Report
August 31, 2012
(Fidelity Cover Art)
Contents
To view a fund's proxy voting guidelines and proxy voting record for the 12-month period ended June 30, visit http://www.fidelity.com/proxyvotingresults or visit the Securities and Exchange Commission's (SEC) web site at http://www.sec.gov. You may also call 1-800-544-8544 to request a free copy of the proxy voting guidelines.
Standard & Poor's, S&P and S&P 500 are registered service marks of The McGraw-Hill Companies, Inc. and have been licensed for use by Fidelity Distributors Corporation.
Other third party marks appearing herein are the property of their respective owners.
All other marks appearing herein are registered or unregistered trademarks or service marks of FMR LLC or an affiliated company. © 2012 FMR LLC. All rights reserved.
This report and the financial statements contained herein are submitted for the general information of the shareholders of the funds. This report is not authorized for distribution to prospective investors in the funds unless preceded or accompanied by an effective prospectus.
A fund files its complete schedule of portfolio holdings with the SEC for the first and third quarters of each fiscal year on Form N-Q. Forms N-Q are available on the SEC's web site at http://www.sec.gov. A fund's Forms N-Q may be reviewed and copied at the SEC's Public Reference Room in Washington, DC. Information regarding the operation of the SEC's Public Reference Room may be obtained by calling 1-800-SEC-0330. For a complete list of a fund's portfolio holdings, view the most recent holdings listing, semiannual report, or annual report on Fidelity's web site at http://www.fidelity.com, http://www.advisor.fidelity.com, or http://www.401k.com, as applicable.
NOT FDIC INSURED • MAY LOSE VALUE • NO BANK GUARANTEE
Neither the funds nor Fidelity Distributors Corporation is a bank.
Semiannual Report
As a shareholder of a Fund, you incur two types of costs: (1) transaction costs, including redemption fees and (2) ongoing costs, including management fees and other Fund expenses. This Example is intended to help you understand your ongoing costs (in dollars) of investing in the Funds and to compare these costs with the ongoing costs of investing in other mutual funds.
The Example is based on an investment of $1,000 invested at the beginning of the period and held for the entire period (March 1, 2012 to August 31, 2012).
Actual Expenses
The first line of the accompanying table for each fund provides information about actual account values and actual expenses. You may use the information in this line, together with the amount you invested, to estimate the expenses that you paid over the period. Simply divide your account value by $1,000.00 (for example, an $8,600 account value divided by $1,000.00 = 8.6), then multiply the result by the number in the first line for a fund under the heading entitled "Expenses Paid During Period" to estimate the expenses you paid on your account during this period. A small balance maintenance fee of $12.00 that is charged once a year may apply for certain accounts with a value of less than $2,000. This fee is not included in the table below. If it was, the estimate of expenses you paid during the period would be higher, and your ending account value lower, by this amount. In addition, each Fund, as a shareholder in the underlying Fidelity Central Funds, will indirectly bear its pro-rata share of the fees and expenses incurred by the underlying Fidelity Central Funds. These fees and expenses are not included in the Fund's annualized expense ratio used to calculate the expense estimate in the table below.
Hypothetical Example for Comparison Purposes
The second line of the accompanying table for each fund provides information about hypothetical account values and hypothetical expenses based on a fund's actual expense ratio and an assumed rate of return of 5% per year before expenses, which is not the Fund's actual return. The hypothetical account values and expenses may not be used to estimate the actual ending account balance or expenses you paid for the period. You may use this information to compare the ongoing costs of investing in the Fund and other funds. To do so, compare this 5% hypothetical example with the 5% hypothetical examples that appear in the shareholder reports of the other funds. A small balance maintenance fee of $12.00 that is charged once a year may apply for certain accounts with a value of less than $2,000. This fee is not included in the table below. If it was, the estimate of expenses you paid during the period would be higher, and your ending account value lower, by this amount. In addition, each Fund, as a shareholder in the underlying Fidelity Central Funds, will indirectly bear its pro-rata share of the fees and expenses incurred by the underlying Fidelity Central Funds. These fees and expenses are not included in the Fund's annualized expense ratio used to calculate the expense estimate in the table below.
Please note that the expenses shown in the table are meant to highlight your ongoing costs only and do not reflect any transaction costs. Therefore, the second line of the table is useful in comparing ongoing costs only, and will not help you determine the relative total costs of owning different funds. In addition, if these transactional costs were included, your costs would have been higher.
| Annualized
Expense Ratio | Beginning
Account Value
March 1, 2012 | Ending
Account Value
August 31, 2012 | Expenses Paid
During Period*
March 1, 2012
to August 31, 2012 |
Automotive Portfolio | .93% | | | |
Actual | | $ 1,000.00 | $ 880.70 | $ 4.41 |
HypotheticalA | | $ 1,000.00 | $ 1,020.52 | $ 4.74 |
Construction and Housing Portfolio | .88% | | | |
Actual | | $ 1,000.00 | $ 1,098.50 | $ 4.65 |
HypotheticalA | | $ 1,000.00 | $ 1,020.77 | $ 4.48 |
Consumer Discretionary Portfolio | .86% | | | |
Actual | | $ 1,000.00 | $ 1,042.40 | $ 4.43 |
HypotheticalA | | $ 1,000.00 | $ 1,020.87 | $ 4.38 |
Leisure Portfolio | .86% | | | |
Actual | | $ 1,000.00 | $ 950.80 | $ 4.23 |
HypotheticalA | | $ 1,000.00 | $ 1,020.87 | $ 4.38 |
Multimedia Portfolio | .88% | | | |
Actual | | $ 1,000.00 | $ 1,106.00 | $ 4.67 |
HypotheticalA | | $ 1,000.00 | $ 1,020.77 | $ 4.48 |
Retailing Portfolio | .86% | | | |
Actual | | $ 1,000.00 | $ 1,088.70 | $ 4.53 |
HypotheticalA | | $ 1,000.00 | $ 1,020.87 | $ 4.38 |
A 5% return per year before expenses
* Expenses are equal to each Fund's annualized expense ratio, multiplied by the average account value over the period, multiplied by 184/365 (to reflect the one-half year period).
Semiannual Report
Automotive Portfolio
Investment Changes (Unaudited)
Top Ten Stocks as of August 31, 2012 |
| % of fund's
net assets | % of fund's net assets
6 months ago |
Toyota Motor Corp. sponsored ADR | 15.8 | 12.9 |
Honda Motor Co. Ltd. sponsored ADR | 11.1 | 9.4 |
Ford Motor Co. | 8.3 | 10.2 |
Johnson Controls, Inc. | 5.5 | 5.4 |
TRW Automotive Holdings Corp. | 4.9 | 5.2 |
Delphi Automotive PLC | 4.7 | 3.2 |
General Motors Co. | 4.7 | 5.4 |
BorgWarner, Inc. | 4.1 | 2.7 |
Harley-Davidson, Inc. | 3.7 | 3.2 |
Autoliv, Inc. | 3.3 | 4.7 |
| 66.1 | |
Top Industries (% of fund's net assets) |
As of August 31, 2012 |
 | Auto Components | 47.8% | |
 | Automobiles | 45.2% | |
 | Machinery | 1.9% | |
 | All Others* | 5.1% | |

As of February 29, 2012 |
| Auto Components | 48.9% | |
 | Automobiles | 42.4% | |
 | Machinery | 2.5% | |
 | Household Durables | 0.4% | |
 | Software | 0.4% | |
| All Others* | 5.4% | |

* Includes short-term investments and net other assets. |
Semiannual Report
Automotive Portfolio
Investments August 31, 2012 (Unaudited)
Showing Percentage of Net Assets
Common Stocks - 94.9% |
| Shares | | Value |
AUTO COMPONENTS - 47.8% |
Auto Parts & Equipment - 45.0% |
American Axle & Manufacturing Holdings, Inc. (a) | 120,600 | | $ 1,347,102 |
Amerigon, Inc. | 28,800 | | 341,856 |
Autoliv, Inc. (e) | 55,455 | | 3,287,927 |
BorgWarner, Inc. (a) | 58,800 | | 4,044,264 |
Dana Holding Corp. | 120,700 | | 1,648,762 |
Delphi Automotive PLC | 154,778 | | 4,688,226 |
Dorman Products, Inc. (a) | 19,000 | | 560,120 |
Drew Industries, Inc. (a) | 28,300 | | 819,851 |
Exide Technologies (a) | 164,200 | | 502,452 |
Federal-Mogul Corp. Class A (a) | 58,624 | | 548,721 |
Fuel Systems Solutions, Inc. (a) | 23,800 | | 418,880 |
Gentex Corp. | 127,900 | | 2,240,808 |
Johnson Controls, Inc. | 199,770 | | 5,435,742 |
Lear Corp. | 67,600 | | 2,624,908 |
Linamar Corp. | 38,900 | | 814,108 |
Magna International, Inc. Class A (sub. vtg.) (e) | 71,984 | | 3,106,467 |
Martinrea International, Inc. (a) | 73,700 | | 592,890 |
Modine Manufacturing Co. (a) | 71,100 | | 498,411 |
Motorcar Parts of America, Inc. (a) | 49,000 | | 237,650 |
Spartan Motors, Inc. | 87,600 | | 437,124 |
Standard Motor Products, Inc. | 27,200 | | 479,808 |
Stoneridge, Inc. (a) | 54,789 | | 346,266 |
Tenneco, Inc. (a) | 94,946 | | 2,883,510 |
Tower International, Inc. (a) | 35,400 | | 266,562 |
TRW Automotive Holdings Corp. (a) | 112,000 | | 4,895,520 |
Visteon Corp. (a) | 32,100 | | 1,477,242 |
| | 44,545,177 |
Tires & Rubber - 2.8% |
Cooper Tire & Rubber Co. | 60,800 | | 1,215,392 |
The Goodyear Tire & Rubber Co. (a) | 128,926 | | 1,572,897 |
| | 2,788,289 |
TOTAL AUTO COMPONENTS | | 47,333,466 |
AUTOMOBILES - 45.2% |
Automobile Manufacturers - 41.5% |
Ford Motor Co. | 874,361 | | 8,166,532 |
General Motors Co. (a) | 217,244 | | 4,638,159 |
Honda Motor Co. Ltd. sponsored ADR | 345,700 | | 11,024,373 |
Thor Industries, Inc. | 33,900 | | 1,065,816 |
Toyota Motor Corp. sponsored ADR | 196,900 | | 15,677,177 |
Winnebago Industries, Inc. (a)(e) | 45,300 | | 520,950 |
| | 41,093,007 |
|
| Shares | | Value |
Motorcycle Manufacturers - 3.7% |
Harley-Davidson, Inc. | 87,100 | | $ 3,654,716 |
TOTAL AUTOMOBILES | | 44,747,723 |
MACHINERY - 1.9% |
Construction & Farm Machinery & Heavy Trucks - 1.9% |
Meritor, Inc. (a) | 97,500 | | 435,825 |
Westport Innovations, Inc. (a)(e) | 41,900 | | 1,475,299 |
| | 1,911,124 |
TOTAL COMMON STOCKS (Cost $81,164,957) |
93,992,313
|
Nonconvertible Bonds - 0.0% |
| Principal
Amount | | |
AUTOMOBILES - 0.0% |
Automobile Manufacturers - 0.0% |
General Motors Corp. 6.75% 5/1/28 (d)
(Cost $284,356) | | $ 31,005,000 | |
3
|
Money Market Funds - 11.0% |
| Shares | | |
Fidelity Cash Central Fund, 0.17% (b) | 5,392,605 | | 5,392,605 |
Fidelity Securities Lending Cash Central Fund, 0.18% (b)(c) | 5,495,954 | | 5,495,954 |
TOTAL MONEY MARKET FUNDS (Cost $10,888,559) |
10,888,559
|
TOTAL INVESTMENT PORTFOLIO - 105.9% (Cost $92,337,872) | | 104,880,875 |
NET OTHER ASSETS (LIABILITIES) - (5.9)% | | (5,803,206) |
NET ASSETS - 100% | $ 99,077,669 |
Legend |
(a) Non-income producing |
(b) Affiliated fund that is available only to investment companies and other accounts managed by Fidelity Investments. The rate quoted is the annualized seven-day yield of the fund at period end. A complete unaudited listing of the fund's holdings as of its most recent quarter end is available upon request. In addition, each Fidelity Central Fund's financial statements are available on the SEC's website or upon request. |
(c) Investment made with cash collateral received from securities on loan. |
(d) Non-income producing - Security is in default. |
(e) Security or a portion of the security is on loan at period end. |
Affiliated Central Funds |
Information regarding fiscal year to date income earned by the Fund from investments in Fidelity Central Funds is as follows: |
Fund | Income earned |
Fidelity Cash Central Fund | $ 4,763 |
Fidelity Securities Lending Cash Central Fund | 73,257 |
Total | $ 78,020 |
Other Information |
The following is a summary of the inputs used, as of August 31, 2012, involving the Fund's assets and liabilities carried at fair value. The inputs or methodology used for valuing securities may not be an indication of the risk associated with investing in those securities. For more information on valuation inputs, and their aggregation into the levels used in the table below, please refer to the Security Valuation section in the accompanying Notes to Financial Statements. |
Valuation Inputs at Reporting Date: |
Description | Total | Level 1 | Level 2 | Level 3 |
Investments in Securities: | | | | |
Common Stocks | $ 93,992,313 | $ 93,992,313 | $ - | $ - |
Nonconvertible Bonds | 3 | - | - | 3 |
Money Market Funds | 10,888,559 | 10,888,559 | - | - |
Total Investments in Securities: | $ 104,880,875 | $ 104,880,872 | $ - | $ 3 |
Distribution of investments by country or territory of incorporation, as a percentage of total net assets, is as follows. (Unaudited) |
United States of America | 62.4% |
Japan | 26.9% |
Canada | 6.0% |
Bailiwick of Jersey | 4.7% |
| 100.0% |
See accompanying notes which are an integral part of the financial statements.
Semiannual Report
Automotive Portfolio
Statement of Assets and Liabilities
| August 31, 2012 (Unaudited) |
| | |
Assets | | |
Investment in securities, at value (including securities loaned of $5,377,603) - See accompanying schedule: Unaffiliated issuers (cost $81,449,313) | $ 93,992,316 | |
Fidelity Central Funds (cost $10,888,559) | 10,888,559 | |
Total Investments (cost $92,337,872) | | $ 104,880,875 |
Receivable for fund shares sold | | 55,544 |
Dividends receivable | | 100,715 |
Distributions receivable from Fidelity Central Funds | | 23,292 |
Other receivables | | 3,683 |
Total assets | | 105,064,109 |
| | |
Liabilities | | |
Payable for fund shares redeemed | $ 397,154 | |
Accrued management fee | 46,706 | |
Other affiliated payables | 25,673 | |
Other payables and accrued expenses | 20,953 | |
Collateral on securities loaned, at value | 5,495,954 | |
Total liabilities | | 5,986,440 |
| | |
Net Assets | | $ 99,077,669 |
Net Assets consist of: | | |
Paid in capital | | $ 91,597,693 |
Undistributed net investment income | | 315,698 |
Accumulated undistributed net realized gain (loss) on investments and foreign currency transactions | | (5,377,852) |
Net unrealized appreciation (depreciation) on investments and assets and liabilities in foreign currencies | | 12,542,130 |
Net Assets, for 2,958,689 shares outstanding | | $ 99,077,669 |
Net Asset Value, offering price and redemption price per share ($99,077,669 ÷ 2,958,689 shares) | | $ 33.49 |
Statement of Operations
Six months ended August 31, 2012 (Unaudited) |
| | |
Investment Income | | |
Dividends | | $ 823,222 |
Income from Fidelity Central Funds (including $73,257 from security lending) | | 78,020 |
Total income | | 901,242 |
| | |
Expenses | | |
Management fee | $ 354,574 | |
Transfer agent fees | 161,000 | |
Accounting and security lending fees | 26,700 | |
Custodian fees and expenses | 6,254 | |
Independent trustees' compensation | 445 | |
Registration fees | 19,480 | |
Audit | 17,272 | |
Legal | 277 | |
Miscellaneous | 766 | |
Total expenses before reductions | 586,768 | |
Expense reductions | (1,301) | 585,467 |
Net investment income (loss) | | 315,775 |
Realized and Unrealized Gain (Loss) Net realized gain (loss) on: | | |
Investment securities: | | |
Unaffiliated issuers | (222,536) | |
Foreign currency transactions | 415 | |
Total net realized gain (loss) | | (222,121) |
Change in net unrealized appreciation (depreciation) on: Investment securities | (18,701,322) | |
Assets and liabilities in foreign currencies | (385) | |
Total change in net unrealized appreciation (depreciation) | | (18,701,707) |
Net gain (loss) | | (18,923,828) |
Net increase (decrease) in net assets resulting from operations | | $ (18,608,053) |
See accompanying notes which are an integral part of the financial statements.
Semiannual Report
Statement of Changes in Net Assets
| Six months ended
August 31, 2012
(Unaudited) | Year ended
February 29,
2012 |
Increase (Decrease) in Net Assets | | |
Operations | | |
Net investment income (loss) | $ 315,775 | $ 119,923 |
Net realized gain (loss) | (222,121) | 4,447,404 |
Change in net unrealized appreciation (depreciation) | (18,701,707) | (41,641,844) |
Net increase (decrease) in net assets resulting from operations | (18,608,053) | (37,074,517) |
Distributions to shareholders from net investment income | - | (45,425) |
Distributions to shareholders from net realized gain | (99,971) | (9,238,375) |
Total distributions | (99,971) | (9,283,800) |
Share transactions
Proceeds from sales of shares | 31,722,393 | 130,281,367 |
Reinvestment of distributions | 95,186 | 8,936,839 |
Cost of shares redeemed | (84,057,737) | (296,538,707) |
Net increase (decrease) in net assets resulting from share transactions | (52,240,158) | (157,320,501) |
Redemption fees | 10,082 | 62,990 |
Total increase (decrease) in net assets | (70,938,100) | (203,615,828) |
| | |
Net Assets | | |
Beginning of period | 170,015,769 | 373,631,597 |
End of period (including undistributed net investment income of $315,698 and accumulated net investment loss of $77, respectively) | $ 99,077,669 | $ 170,015,769 |
Other Information Shares | | |
Sold | 862,381 | 3,433,091 |
Issued in reinvestment of distributions | 2,600 | 246,291 |
Redeemed | (2,375,047) | (7,183,045) |
Net increase (decrease) | (1,510,066) | (3,503,663) |
Financial Highlights
| Six months ended
August 31, 2012 | Years ended February 28, |
| (Unaudited) | 2012 H | 2011 | 2010 | 2009 | 2008 H |
Selected Per-Share Data | | | | | | |
Net asset value, beginning of period | $ 38.05 | $ 46.87 | $ 31.63 | $ 10.07 | $ 34.23 | $ 40.24 |
Income from Investment Operations | | | | | | |
Net investment income (loss) D | .09 | .03 | (.08) | (.06) | .42 | .18 |
Net realized and unrealized gain (loss) | (4.63) | (6.45) | 15.94 | 21.67 | (24.30) | (4.98) |
Total from investment operations | (4.54) | (6.42) | 15.86 | 21.61 | (23.88) | (4.80) |
Distributions from net investment income | - | (.02) | - | (.07) | (.28) | (.13) |
Distributions from net realized gain | (.02) | (2.41) | (.63) | - | (.01) | (1.11) |
Total distributions | (.02) | (2.42) J | (.63) | (.07) | (.29) | (1.24) |
Redemption fees added to paid in capital D | - I | .02 | .01 | .02 | .01 | .03 |
Net asset value, end of period | $ 33.49 | $ 38.05 | $ 46.87 | $ 31.63 | $ 10.07 | $ 34.23 |
Total Return B, C | (11.93)% | (13.06)% | 50.90% | 215.39% | (69.99)% | (12.11)% |
Ratios to Average Net Assets E, G | | | | | | |
Expenses before reductions | .93% A | .90% | .91% | .99% | 1.47% | 1.19% |
Expenses net of fee waivers, if any | .93% A | .90% | .91% | .99% | 1.15% | 1.15% |
Expenses net of all reductions | .92% A | .90% | .91% | .97% | 1.15% | 1.15% |
Net investment income (loss) | .50% A | .08% | (.19)% | (.23)% | 1.73% | .44% |
Supplemental Data | | | | | | |
Net assets, end of period (000 omitted) | $ 99,078 | $ 170,016 | $ 373,632 | $ 146,023 | $ 7,581 | $ 25,823 |
Portfolio turnover rate F | 50% A | 49% | 91% | 156% | 156% | 258% |
A Annualized B Total returns for periods of less than one year are not annualized. C Total returns would have been lower if certain expenses had not been reduced during the applicable periods shown. D Calculated based on average shares outstanding during the period. E Fees and expenses of any underlying Fidelity Central Funds are not included in the Fund's expense ratio. The Fund indirectly bears its proportionate share of the expenses of any underlying Fidelity Central Funds. F Amount does not include the portfolio activity of any underlying Fidelity Central Funds. G Expense ratios reflect operating expenses of the Fund. Expenses before reductions do not reflect amounts reimbursed by the investment adviser or reductions from brokerage service arrangements or reductions from other expense offset arrangements and do not represent the amount paid by the Fund during periods when reimbursements or reductions occur. Expenses net of fee waivers reflect expenses after reimbursement by the investment adviser but prior to reductions from brokerage service arrangements or other expense offset arrangements. Expenses net of all reductions represent the net expenses paid by the Fund. H For the year ended February 29. I Amount represents less than $.01 per share. J Total distributions of $2.42 per share is comprised of distributions from net investment income of $0.015 and distributions from net realized gain of $2.408 per share. |
See accompanying notes which are an integral part of the financial statements.
Semiannual Report
Construction and Housing Portfolio
Investment Changes (Unaudited)
Top Ten Stocks as of August 31, 2012 |
| % of fund's
net assets | % of fund's net assets
6 months ago |
Home Depot, Inc. | 23.2 | 19.2 |
Lowe's Companies, Inc. | 10.7 | 16.0 |
Equity Residential (SBI) | 5.6 | 6.4 |
Fluor Corp. | 4.5 | 6.6 |
Toll Brothers, Inc. | 4.2 | 2.5 |
Quanta Services, Inc. | 3.2 | 2.3 |
D.R. Horton, Inc. | 2.9 | 4.5 |
Jacobs Engineering Group, Inc. | 2.9 | 3.1 |
Lennar Corp. Class A | 2.8 | 2.3 |
Vulcan Materials Co. | 2.5 | 0.0 |
| 62.5 | |
Top Industries (% of fund's net assets) |
As of August 31, 2012 |
| Specialty Retail | 33.9% | |
| Real Estate Investment
Trusts | 21.7% | |
| Construction &
Engineering | 15.8% | |
| Household Durables | 13.6% | |
| Building Products | 5.4% | |
| All Others* | 9.6% | |

As of February 29, 2012 |
| Specialty Retail | 35.2% | |
| Construction &
Engineering | 20.3% | |
| Real Estate Investment
Trusts | 20.1% | |
| Household Durables | 12.5% | |
| Building Products | 5.5% | |
| All Others* | 6.4% | |

* Includes short-term investments and net other assets. |
Semiannual Report
Construction and Housing Portfolio
Investments August 31, 2012 (Unaudited)
Showing Percentage of Net Assets
Common Stocks - 98.2% |
| Shares | | Value |
BUILDING PRODUCTS - 5.4% |
Building Products - 5.4% |
American Woodmark Corp. (a) | 17,401 | | $ 336,883 |
Armstrong World Industries, Inc. | 44,250 | | 1,945,673 |
Lennox International, Inc. | 16,900 | | 802,919 |
Masco Corp. | 193,600 | | 2,741,376 |
Owens Corning (a) | 151,169 | | 5,042,998 |
USG Corp. (a)(d) | 126,700 | | 2,604,952 |
| | 13,474,801 |
COMMERCIAL SERVICES & SUPPLIES - 0.6% |
Office Services & Supplies - 0.6% |
Interface, Inc. | 110,480 | | 1,516,890 |
CONSTRUCTION & ENGINEERING - 15.8% |
Construction & Engineering - 15.8% |
AECOM Technology Corp. (a) | 108,900 | | 2,111,571 |
Dycom Industries, Inc. (a) | 146,100 | | 2,121,372 |
Fluor Corp. | 216,800 | | 11,165,200 |
Foster Wheeler AG (a) | 160,600 | | 3,517,140 |
Jacobs Engineering Group, Inc. (a) | 183,600 | | 7,259,544 |
KBR, Inc. | 124,600 | | 3,375,414 |
Quanta Services, Inc. (a) | 332,100 | | 7,970,400 |
URS Corp. | 50,771 | | 1,848,572 |
| | 39,369,213 |
CONSTRUCTION MATERIALS - 4.3% |
Construction Materials - 4.3% |
Eagle Materials, Inc. | 56,100 | | 2,392,665 |
Martin Marietta Materials, Inc. | 27,800 | | 2,123,364 |
Vulcan Materials Co. | 157,900 | | 6,145,468 |
| | 10,661,497 |
ENERGY EQUIPMENT & SERVICES - 0.6% |
Oil & Gas Equipment & Services - 0.6% |
McDermott International, Inc. (a) | 141,600 | | 1,577,424 |
HOUSEHOLD DURABLES - 13.5% |
Homebuilding - 13.5% |
D.R. Horton, Inc. | 386,637 | | 7,342,237 |
Lennar Corp. Class A (d) | 216,478 | | 7,020,382 |
PulteGroup, Inc. (a) | 227,283 | | 3,109,231 |
Ryland Group, Inc. | 210,370 | | 5,640,020 |
Toll Brothers, Inc. (a) | 320,414 | | 10,483,946 |
| | 33,595,816 |
|
| Shares | | Value |
MACHINERY - 0.2% |
Industrial Machinery - 0.2% |
Snap-On, Inc. | 7,700 | | $ 534,534 |
REAL ESTATE INVESTMENT TRUSTS - 21.7% |
Residential REITs - 20.1% |
Apartment Investment & Management Co. Class A | 211,671 | | 5,605,048 |
AvalonBay Communities, Inc. | 35,759 | | 5,060,614 |
BRE Properties, Inc. | 50,800 | | 2,535,936 |
Camden Property Trust (SBI) | 78,000 | | 5,415,540 |
Education Realty Trust, Inc. | 119,695 | | 1,383,674 |
Equity Lifestyle Properties, Inc. | 100 | | 6,876 |
Equity Residential (SBI) | 231,392 | | 13,976,077 |
Essex Property Trust, Inc. | 36,200 | | 5,501,676 |
Home Properties, Inc. | 39,400 | | 2,515,690 |
Mid-America Apartment Communities, Inc. | 11,390 | | 774,520 |
Post Properties, Inc. | 89,000 | | 4,543,450 |
Sun Communities, Inc. | 64,600 | | 2,959,326 |
UDR, Inc. | 38 | | 960 |
| | 50,279,387 |
Retail REITs - 1.6% |
CBL & Associates Properties, Inc. | 187,600 | | 4,009,012 |
TOTAL REAL ESTATE INVESTMENT TRUSTS | | 54,288,399 |
REAL ESTATE MANAGEMENT & DEVELOPMENT - 1.6% |
Real Estate Operating Companies - 1.2% |
Forest City Enterprises, Inc. Class A (a) | 191,200 | | 2,883,296 |
Real Estate Services - 0.4% |
CBRE Group, Inc. (a) | 57,800 | | 1,000,518 |
TOTAL REAL ESTATE MANAGEMENT & DEVELOPMENT | | 3,883,814 |
SPECIALTY RETAIL - 33.9% |
Home Improvement Retail - 33.9% |
Home Depot, Inc. | 1,023,390 | | 58,077,382 |
Lowe's Companies, Inc. | 936,434 | | 26,669,640 |
| | 84,747,022 |
TRADING COMPANIES & DISTRIBUTORS - 0.6% |
Trading Companies & Distributors - 0.6% |
Watsco, Inc. | 20,300 | | 1,531,838 |
TOTAL COMMON STOCKS (Cost $220,356,100) |
245,181,248
|
Nonconvertible Preferred Stocks - 0.1% |
| | | |
HOUSEHOLD DURABLES - 0.1% |
Homebuilding - 0.1% |
M/I Homes, Inc. Series A, 9.75% (a)
(Cost $275,311) | 16,100 | |
289,800
|
Money Market Funds - 4.1% |
| Shares | | Value |
Fidelity Cash Central Fund, 0.17% (b) | 4,885,259 | | $ 4,885,259 |
Fidelity Securities Lending Cash Central Fund, 0.18% (b)(c) | 5,448,125 | | 5,448,125 |
TOTAL MONEY MARKET FUNDS (Cost $10,333,384) |
10,333,384
|
TOTAL INVESTMENT PORTFOLIO - 102.4% (Cost $230,964,795) | | 255,804,432 |
NET OTHER ASSETS (LIABILITIES) - (2.4)% | | (6,001,274) |
NET ASSETS - 100% | $ 249,803,158 |
Legend |
(a) Non-income producing |
(b) Affiliated fund that is available only to investment companies and other accounts managed by Fidelity Investments. The rate quoted is the annualized seven-day yield of the fund at period end. A complete unaudited listing of the fund's holdings as of its most recent quarter end is available upon request. In addition, each Fidelity Central Fund's financial statements are available on the SEC's website or upon request. |
(c) Investment made with cash collateral received from securities on loan. |
(d) Security or a portion of the security is on loan at period end. |
Affiliated Central Funds |
Information regarding fiscal year to date income earned by the Fund from investments in Fidelity Central Funds is as follows: |
Fund | Income earned |
Fidelity Cash Central Fund | $ 4,035 |
Fidelity Securities Lending Cash Central Fund | 21,396 |
Total | $ 25,431 |
Other Information |
All investments are categorized as Level 1 under the Fair Value Hierarchy. The inputs or methodology used for valuing securities may not be an indication of the risk associated with investing in those securities. For more information on valuation inputs, please refer to the Security Valuation section in the accompanying Notes to Financial Statements. |
See accompanying notes which are an integral part of the financial statements.
Semiannual Report
Construction and Housing Portfolio
Statement of Assets and Liabilities
| August 31, 2012 (Unaudited) |
| | |
Assets | | |
Investment in securities, at value (including securities loaned of $5,387,401) - See accompanying schedule: Unaffiliated issuers (cost $220,631,411) | $ 245,471,048 | |
Fidelity Central Funds (cost $10,333,384) | 10,333,384 | |
Total Investments (cost $230,964,795) | | $ 255,804,432 |
Receivable for investments sold | | 1,060,526 |
Receivable for fund shares sold | | 1,006,810 |
Dividends receivable | | 343,901 |
Distributions receivable from Fidelity Central Funds | | 2,767 |
Other receivables | | 596 |
Total assets | | 258,219,032 |
| | |
Liabilities | | |
Payable for investments purchased | $ 2,569,534 | |
Payable for fund shares redeemed | 213,811 | |
Accrued management fee | 110,929 | |
Other affiliated payables | 52,712 | |
Other payables and accrued expenses | 20,763 | |
Collateral on securities loaned, at value | 5,448,125 | |
Total liabilities | | 8,415,874 |
| | |
Net Assets | | $ 249,803,158 |
Net Assets consist of: | | |
Paid in capital | | $ 223,570,718 |
Undistributed net investment income | | 761,576 |
Accumulated undistributed net realized gain (loss) on investments | | 631,227 |
Net unrealized appreciation (depreciation) on investments | | 24,839,637 |
Net Assets, for 5,683,448 shares outstanding | | $ 249,803,158 |
Net Asset Value, offering price and redemption price per share ($249,803,158 ÷ 5,683,448 shares) | | $ 43.95 |
Statement of Operations
Six months ended August 31, 2012 (Unaudited) |
| | |
Investment Income | | |
Dividends | | $ 1,752,612 |
Income from Fidelity Central Funds (including $21,396 from security lending) | | 25,431 |
Total income | | 1,778,043 |
| | |
Expenses | | |
Management fee | $ 608,638 | |
Transfer agent fees | 264,199 | |
Accounting and security lending fees | 43,442 | |
Custodian fees and expenses | 4,769 | |
Independent trustees' compensation | 709 | |
Registration fees | 25,988 | |
Audit | 17,129 | |
Legal | 376 | |
Miscellaneous | 515 | |
Total expenses before reductions | 965,765 | |
Expense reductions | (1,824) | 963,941 |
Net investment income (loss) | | 814,102 |
Realized and Unrealized Gain (Loss) Net realized gain (loss) on: | | |
Investment securities: | | |
Unaffiliated issuers | | 7,819,180 |
Change in net unrealized appreciation (depreciation) on investment securities | | 9,134,919 |
Net gain (loss) | | 16,954,099 |
Net increase (decrease) in net assets resulting from operations | | $ 17,768,201 |
See accompanying notes which are an integral part of the financial statements.
Semiannual Report
Statement of Changes in Net Assets
| Six months ended
August 31, 2012
(Unaudited) | Year ended
February 29,
2012 |
Increase (Decrease) in Net Assets | | |
Operations | | |
Net investment income (loss) | $ 814,102 | $ 595,248 |
Net realized gain (loss) | 7,819,180 | 5,605,883 |
Change in net unrealized appreciation (depreciation) | 9,134,919 | 5,586,759 |
Net increase (decrease) in net assets resulting from operations | 17,768,201 | 11,787,890 |
Distributions to shareholders from net investment income | - | (636,876) |
Share transactions
Proceeds from sales of shares | 130,000,704 | 114,698,637 |
Reinvestment of distributions | - | 621,770 |
Cost of shares redeemed | (69,489,131) | (67,163,181) |
Net increase (decrease) in net assets resulting from share transactions | 60,511,573 | 48,157,226 |
Redemption fees | 9,455 | 5,297 |
Total increase (decrease) in net assets | 78,289,229 | 59,313,537 |
| | |
Net Assets | | |
Beginning of period | 171,513,929 | 112,200,392 |
End of period (including undistributed net investment income of $761,576 and distributions in excess of net investment income of $52,526, respectively) | $ 249,803,158 | $ 171,513,929 |
Other Information Shares | | |
Sold | 3,093,731 | 3,099,736 |
Issued in reinvestment of distributions | - | 17,775 |
Redeemed | (1,696,864) | (1,828,259) |
Net increase (decrease) | 1,396,867 | 1,289,252 |
Financial Highlights
| Six months ended
August 31, 2012 | Years ended February 28, |
| (Unaudited) | 2012 H | 2011 | 2010 | 2009 | 2008 H |
Selected Per-Share Data | | | | | | |
Net asset value, beginning of period | $ 40.01 | $ 37.43 | $ 29.89 | $ 18.01 | $ 33.19 | $ 45.98 |
Income from Investment Operations | | | | | | |
Net investment income (loss) D | .15 | .21 | .18 | .22 | .31 | .26 |
Net realized and unrealized gain (loss) | 3.79 | 2.62 | 7.63 | 11.91 | (14.35) | (8.49) |
Total from investment operations | 3.94 | 2.83 | 7.81 | 12.13 | (14.04) | (8.23) |
Distributions from net investment income | - | (.25) | (.28) | (.25) | (.30) | (.16) |
Distributions from net realized gain | - | - | - | - | (.85) | (4.41) |
Total distributions | - | (.25) | (.28) | (.25) | (1.15) | (4.57) |
Redemption fees added to paid in capital D | - I | - I | .01 | - I | .01 | .01 |
Net asset value, end of period | $ 43.95 | $ 40.01 | $ 37.43 | $ 29.89 | $ 18.01 | $ 33.19 |
Total Return B, C | 9.85% | 7.65% | 26.24% | 67.46% | (43.68)% | (18.11)% |
Ratios to Average Net Assets E, G | | | | | | |
Expenses before reductions | .88% A | .96% | .98% | 1.01% | 1.03% | .98% |
Expenses net of fee waivers, if any | .88% A | .96% | .98% | 1.01% | 1.03% | .98% |
Expenses net of all reductions | .88% A | .96% | .98% | 1.01% | 1.02% | .97% |
Net investment income (loss) | .74% A | .59% | .55% | .84% | 1.14% | .63% |
Supplemental Data | | | | | | |
Net assets, end of period (000 omitted) | $ 249,803 | $ 171,514 | $ 112,200 | $ 99,562 | $ 82,219 | $ 84,685 |
Portfolio turnover rate F | 60% A | 81% | 101% | 82% | 85% | 102% |
A Annualized B Total returns for periods of less than one year are not annualized. C Total returns would have been lower if certain expenses had not been reduced during the applicable periods shown. D Calculated based on average shares outstanding during the period. E Fees and expenses of any underlying Fidelity Central Funds are not included in the Fund's expense ratio. The Fund indirectly bears its proportionate share of the expenses of any underlying Fidelity Central Funds. F Amount does not include the portfolio activity of any underlying Fidelity Central Funds. G Expense ratios reflect operating expenses of the Fund. Expenses before reductions do not reflect amounts reimbursed by the investment adviser or reductions from brokerage service arrangements or reductions from other expense offset arrangements and do not represent the amount paid by the Fund during periods when reimbursements or reductions occur. Expenses net of fee waivers reflect expenses after reimbursement by the investment adviser but prior to reductions from brokerage service arrangements or other expense offset arrangements. Expenses net of all reductions represent the net expenses paid by the Fund. H For the year ended February 29. I Amount represents less than $.01 per share. |
See accompanying notes which are an integral part of the financial statements.
Semiannual Report
Consumer Discretionary Portfolio
Investment Changes (Unaudited)
Top Ten Stocks as of August 31, 2012 |
| % of fund's
net assets | % of fund's net assets
6 months ago |
Comcast Corp. Class A | 7.5 | 4.8 |
The Walt Disney Co. | 6.0 | 6.1 |
News Corp. Class A | 4.4 | 1.5 |
McDonald's Corp. | 4.2 | 6.2 |
Yum! Brands, Inc. | 3.4 | 0.0 |
DIRECTV | 3.2 | 0.3 |
TJX Companies, Inc. | 2.8 | 2.7 |
Time Warner, Inc. | 2.7 | 3.6 |
Target Corp. | 2.7 | 3.1 |
Dollar Tree, Inc. | 2.6 | 1.8 |
| 39.5 | |
Top Industries (% of fund's net assets) |
As of August 31, 2012 |
| Media | 29.2% | |
| Specialty Retail | 26.8% | |
| Hotels, Restaurants & Leisure | 13.4% | |
| Multiline Retail | 7.9% | |
| Textiles, Apparel & Luxury Goods | 5.2% | |
| All Others* | 17.5% | |

As of February 29, 2012 |
| Specialty Retail | 25.2% | |
| Media | 23.4% | |
| Hotels, Restaurants & Leisure | 20.1% | |
| Textiles, Apparel & Luxury Goods | 7.9% | |
| Internet & Catalog Retail | 6.2% | |
| All Others* | 17.2% | |

* Includes short-term investments and net other assets. |
Semiannual Report
Consumer Discretionary Portfolio
Investments August 31, 2012 (Unaudited)
Showing Percentage of Net Assets
Common Stocks - 98.1% |
| Shares | | Value |
AUTO COMPONENTS - 2.1% |
Auto Parts & Equipment - 2.1% |
BorgWarner, Inc. (a) | 60,716 | | $ 4,176,046 |
Delphi Automotive PLC | 78,081 | | 2,365,073 |
| | 6,541,119 |
BUILDING PRODUCTS - 0.9% |
Building Products - 0.9% |
Owens Corning (a) | 81,400 | | 2,715,504 |
COMMERCIAL SERVICES & SUPPLIES - 0.5% |
Office Services & Supplies - 0.5% |
Interface, Inc. | 120,500 | | 1,654,465 |
DISTRIBUTORS - 1.6% |
Distributors - 1.6% |
LKQ Corp. (a) | 135,543 | | 5,115,393 |
HOTELS, RESTAURANTS & LEISURE - 13.4% |
Restaurants - 13.4% |
BJ's Restaurants, Inc. (a) | 8,100 | | 332,505 |
Buffalo Wild Wings, Inc. (a) | 30,300 | | 2,326,434 |
Domino's Pizza, Inc. | 128,700 | | 4,561,128 |
McDonald's Corp. | 147,579 | | 13,206,845 |
Panera Bread Co. Class A (a) | 11,999 | | 1,858,645 |
Starbucks Corp. | 151,361 | | 7,509,019 |
Texas Roadhouse, Inc. Class A | 113,200 | | 1,943,644 |
Yum! Brands, Inc. | 167,278 | | 10,658,954 |
| | 42,397,174 |
HOUSEHOLD DURABLES - 4.7% |
Homebuilding - 2.1% |
Lennar Corp. Class A (d) | 77,189 | | 2,503,239 |
Ryland Group, Inc. | 85,803 | | 2,300,378 |
Toll Brothers, Inc. (a) | 61,700 | | 2,018,824 |
| | 6,822,441 |
Housewares & Specialties - 2.6% |
Jarden Corp. | 135,100 | | 6,529,383 |
Tupperware Brands Corp. | 29,300 | | 1,566,964 |
| | 8,096,347 |
TOTAL HOUSEHOLD DURABLES | | 14,918,788 |
INTERNET & CATALOG RETAIL - 3.9% |
Internet Retail - 3.9% |
Amazon.com, Inc. (a) | 20,935 | | 5,196,695 |
Priceline.com, Inc. (a) | 11,900 | | 7,194,383 |
| | 12,391,078 |
INTERNET SOFTWARE & SERVICES - 0.7% |
Internet Software & Services - 0.7% |
eBay, Inc. (a) | 41,926 | | 1,990,227 |
|
| Shares | | Value |
LEISURE EQUIPMENT & PRODUCTS - 1.2% |
Leisure Products - 1.2% |
Brunswick Corp. | 159,032 | | $ 3,767,468 |
MEDIA - 29.2% |
Broadcasting - 3.2% |
CBS Corp. Class B | 161,632 | | 5,873,707 |
Discovery Communications, Inc. (a) | 76,900 | | 4,217,196 |
| | 10,090,903 |
Cable & Satellite - 12.9% |
Charter Communications, Inc. Class A (a) | 48,742 | | 3,792,128 |
Comcast Corp. Class A | 705,960 | | 23,670,840 |
DIRECTV (a) | 190,303 | | 9,912,883 |
Sirius XM Radio, Inc. (a)(d) | 1,277,277 | | 3,231,511 |
| | 40,607,362 |
Movies & Entertainment - 13.1% |
News Corp. Class A | 601,187 | | 14,061,764 |
The Walt Disney Co. | 380,620 | | 18,829,271 |
Time Warner, Inc. | 208,327 | | 8,655,987 |
| | 41,547,022 |
TOTAL MEDIA | | 92,245,287 |
MULTILINE RETAIL - 7.9% |
General Merchandise Stores - 7.9% |
Dollar General Corp. (a) | 159,036 | | 8,121,969 |
Dollar Tree, Inc. (a) | 172,916 | | 8,329,364 |
Target Corp. | 130,636 | | 8,372,461 |
| | 24,823,794 |
SPECIALTY RETAIL - 26.8% |
Apparel Retail - 7.1% |
Abercrombie & Fitch Co. Class A | 61,580 | | 2,216,264 |
Ascena Retail Group, Inc. (a) | 33,400 | | 661,320 |
Limited Brands, Inc. | 83,640 | | 4,064,904 |
Ross Stores, Inc. | 94,000 | | 6,503,860 |
TJX Companies, Inc. | 194,552 | | 8,908,536 |
| | 22,354,884 |
Automotive Retail - 5.0% |
AutoZone, Inc. (a) | 15,225 | | 5,505,969 |
CarMax, Inc. (a) | 190,363 | | 5,823,204 |
O'Reilly Automotive, Inc. (a) | 52,500 | | 4,459,875 |
| | 15,789,048 |
Home Improvement Retail - 2.1% |
Lowe's Companies, Inc. | 235,180 | | 6,697,926 |
Homefurnishing Retail - 1.4% |
Select Comfort Corp. (a) | 21,600 | | 617,112 |
Williams-Sonoma, Inc. | 94,717 | | 3,885,291 |
| | 4,502,403 |
Specialty Stores - 11.2% |
Cabela's, Inc. Class A (a) | 10,100 | | 484,901 |
Dick's Sporting Goods, Inc. | 145,838 | | 7,256,899 |
Common Stocks - continued |
| Shares | | Value |
SPECIALTY RETAIL - CONTINUED |
Specialty Stores - continued |
Hibbett Sports, Inc. (a) | 52,700 | | $ 3,058,708 |
PetSmart, Inc. | 89,500 | | 6,347,340 |
Sally Beauty Holdings, Inc. (a) | 172,400 | | 4,741,000 |
Tiffany & Co., Inc. | 73,781 | | 4,570,733 |
Tractor Supply Co. | 66,823 | | 6,380,260 |
Vitamin Shoppe, Inc. (a) | 47,173 | | 2,528,945 |
| | 35,368,786 |
TOTAL SPECIALTY RETAIL | | 84,713,047 |
TEXTILES, APPAREL & LUXURY GOODS - 5.2% |
Apparel, Accessories & Luxury Goods - 4.7% |
Hanesbrands, Inc. (a) | 114,100 | | 3,700,263 |
PVH Corp. | 49,285 | | 4,627,862 |
Ralph Lauren Corp. | 5,900 | | 936,035 |
Under Armour, Inc. Class A (sub. vtg.) (a)(d) | 36,614 | | 2,131,301 |
VF Corp. | 23,044 | | 3,518,358 |
| | 14,913,819 |
Footwear - 0.5% |
NIKE, Inc. Class B | 16,400 | | 1,596,704 |
TOTAL TEXTILES, APPAREL & LUXURY GOODS | | 16,510,523 |
TOTAL COMMON STOCKS (Cost $268,901,190) |
309,783,867
|
Nonconvertible Preferred Stocks - 0.6% |
| Shares | | Value |
AUTOMOBILES - 0.6% |
Automobile Manufacturers - 0.6% |
Volkswagen AG
(Cost $1,852,211) | 11,071 | | $ 1,955,085 |
Money Market Funds - 4.0% |
| | | |
Fidelity Cash Central Fund, 0.17% (b) | 4,226,584 | | 4,226,584 |
Fidelity Securities Lending Cash Central Fund, 0.18% (b)(c) | 8,196,725 | | 8,196,725 |
TOTAL MONEY MARKET FUNDS (Cost $12,423,309) |
12,423,309
|
TOTAL INVESTMENT PORTFOLIO - 102.7% (Cost $283,176,710) | | 324,162,261 |
NET OTHER ASSETS (LIABILITIES) - (2.7)% | | (8,414,042) |
NET ASSETS - 100% | $ 315,748,219 |
Legend |
(a) Non-income producing |
(b) Affiliated fund that is available only to investment companies and other accounts managed by Fidelity Investments. The rate quoted is the annualized seven-day yield of the fund at period end. A complete unaudited listing of the fund's holdings as of its most recent quarter end is available upon request. In addition, each Fidelity Central Fund's financial statements are available on the SEC's website or upon request. |
(c) Investment made with cash collateral received from securities on loan. |
(d) Security or a portion of the security is on loan at period end. |
Affiliated Central Funds |
Information regarding fiscal year to date income earned by the Fund from investments in Fidelity Central Funds is as follows: |
Fund | Income earned |
Fidelity Cash Central Fund | $ 2,575 |
Fidelity Securities Lending Cash Central Fund | 55,538 |
Total | $ 58,113 |
Other Information |
All investments are categorized as Level 1 under the Fair Value Hierarchy. The inputs or methodology used for valuing securities may not be an indication of the risk associated with investing in those securities. For more information on valuation inputs, please refer to the Security Valuation section in the accompanying Notes to Financial Statements. |
See accompanying notes which are an integral part of the financial statements.
Semiannual Report
Consumer Discretionary Portfolio
Statement of Assets and Liabilities
| August 31, 2012 (Unaudited) |
| | |
Assets | | |
Investment in securities, at value (including securities loaned of $7,862,155) - See accompanying schedule: Unaffiliated issuers (cost $270,753,401) | $ 311,738,952 | |
Fidelity Central Funds (cost $12,423,309) | 12,423,309 | |
Total Investments (cost $283,176,710) | | $ 324,162,261 |
Receivable for investments sold | | 1,249,034 |
Receivable for fund shares sold | | 90,975 |
Dividends receivable | | 375,860 |
Distributions receivable from Fidelity Central Funds | | 1,142 |
Other receivables | | 6,463 |
Total assets | | 325,885,735 |
| | |
Liabilities | | |
Payable for investments purchased | $ 1,599,250 | |
Payable for fund shares redeemed | 99,897 | |
Accrued management fee | 146,023 | |
Other affiliated payables | 69,110 | |
Other payables and accrued expenses | 26,511 | |
Collateral on securities loaned, at value | 8,196,725 | |
Total liabilities | | 10,137,516 |
| | |
Net Assets | | $ 315,748,219 |
Net Assets consist of: | | |
Paid in capital | | $ 254,811,555 |
Undistributed net investment income | | 356,919 |
Accumulated undistributed net realized gain (loss) on investments and foreign currency transactions | | 19,594,096 |
Net unrealized appreciation (depreciation) on investments and assets and liabilities in foreign currencies | | 40,985,649 |
Net Assets, for 11,673,429 shares outstanding | | $ 315,748,219 |
Net Asset Value, offering price and redemption price per share ($315,748,219 ÷ 11,673,429 shares) | | $ 27.05 |
Statement of Operations
Six months ended August 31, 2012 (Unaudited) |
| | |
Investment Income | | |
Dividends | | $ 1,629,123 |
Income from Fidelity Central Funds (including $55,538 from security lending) | | 58,113 |
Total income | | 1,687,236 |
| | |
Expenses | | |
Management fee | $ 853,726 | |
Transfer agent fees | 351,675 | |
Accounting and security lending fees | 60,532 | |
Custodian fees and expenses | 11,555 | |
Independent trustees' compensation | 1,009 | |
Registration fees | 23,591 | |
Audit | 19,645 | |
Legal | 558 | |
Miscellaneous | 1,170 | |
Total expenses before reductions | 1,323,461 | |
Expense reductions | (13,277) | 1,310,184 |
Net investment income (loss) | | 377,052 |
Realized and Unrealized Gain (Loss) Net realized gain (loss) on: | | |
Investment securities: | | |
Unaffiliated issuers (net of foreign taxes of $10,018) | 22,453,715 | |
Foreign currency transactions | (14,127) | |
Total net realized gain (loss) | | 22,439,588 |
Change in net unrealized appreciation (depreciation) on: Investment securities | (11,204,460) | |
Assets and liabilities in foreign currencies | 98 | |
Total change in net unrealized appreciation (depreciation) | | (11,204,362) |
Net gain (loss) | | 11,235,226 |
Net increase (decrease) in net assets resulting from operations | | $ 11,612,278 |
See accompanying notes which are an integral part of the financial statements.
Semiannual Report
Consumer Discretionary Portfolio
Financial Statements - continued
Statement of Changes in Net Assets
| Six months ended
August 31, 2012
(Unaudited) | Year ended
February 29,
2012 |
Increase (Decrease) in Net Assets | | |
Operations | | |
Net investment income (loss) | $ 377,052 | $ 1,570,752 |
Net realized gain (loss) | 22,439,588 | (1,910,941) |
Change in net unrealized appreciation (depreciation) | (11,204,362) | 19,673,233 |
Net increase (decrease) in net assets resulting from operations | 11,612,278 | 19,333,044 |
Distributions to shareholders from net investment income | (229,061) | (1,192,808) |
Distributions to shareholders from net realized gain | - | (7,465,053) |
Total distributions | (229,061) | (8,657,861) |
Share transactions
Proceeds from sales of shares | 68,322,830 | 134,058,752 |
Reinvestment of distributions | 227,290 | 8,554,881 |
Cost of shares redeemed | (42,711,006) | (77,852,268) |
Net increase (decrease) in net assets resulting from share transactions | 25,839,114 | 64,761,365 |
Redemption fees | 1,849 | 4,336 |
Total increase (decrease) in net assets | 37,224,180 | 75,440,884 |
| | |
Net Assets | | |
Beginning of period | 278,524,039 | 203,083,155 |
End of period (including undistributed net investment income of $356,919 and undistributed net investment income of $208,928, respectively) | $ 315,748,219 | $ 278,524,039 |
Other Information Shares | | |
Sold | 2,575,007 | 5,545,938 |
Issued in reinvestment of distributions | 8,412 | 353,027 |
Redeemed | (1,635,226) | (3,302,815) |
Net increase (decrease) | 948,193 | 2,596,150 |
Financial Highlights
| Six months ended
August 31, 2012 | Years ended February 28, |
| (Unaudited) | 2012 H | 2011 | 2010 | 2009 | 2008 H |
Selected Per-Share Data | | | | | | |
Net asset value, beginning of period | $ 25.97 | $ 24.98 | $ 19.37 | $ 11.67 | $ 19.70 | $ 26.85 |
Income from Investment Operations | | | | | | |
Net investment income (loss) D | .03 | .17 | .05 | .06 | .10 | .01 |
Net realized and unrealized gain (loss) | 1.07 | 1.91 | 5.71 | 7.70 | (8.05) | (3.95) |
Total from investment operations | 1.10 | 2.08 | 5.76 | 7.76 | (7.95) | (3.94) |
Distributions from net investment income | (.02) | (.12) | (.05) | (.06) | (.08) | (.06) |
Distributions from net realized gain | - | (.97) | (.10) | - | (.01) | (3.15) |
Total distributions | (.02) | (1.09) | (.15) | (.06) | (.09) | (3.21) |
Redemption fees added to paid in capital D | - I | - I | - I | - I | .01 | - I |
Net asset value, end of period | $ 27.05 | $ 25.97 | $ 24.98 | $ 19.37 | $ 11.67 | $ 19.70 |
Total Return B, C | 4.24% | 8.67% | 29.75% | 66.54% | (40.37)% | (16.15)% |
Ratios to Average Net Assets E, G | | | | | | |
Expenses before reductions | .86% A | .89% | .96% | 1.10% | 1.19% | 1.12% |
Expenses net of fee waivers, if any | .86% A | .89% | .96% | 1.10% | 1.15% | 1.12% |
Expenses net of all reductions | .86% A | .88% | .95% | 1.08% | 1.15% | 1.12% |
Net investment income (loss) | .25% A | .72% | .23% | .37% | .62% | .03% |
Supplemental Data | | | | | | |
Net assets, end of period (000 omitted) | $ 315,748 | $ 278,524 | $ 203,083 | $ 77,011 | $ 21,325 | $ 24,297 |
Portfolio turnover rate F | 248% A | 174% | 196% | 134% | 71% | 108% |
A Annualized B Total returns for periods of less than one year are not annualized. C Total returns would have been lower if certain expenses had not been reduced during the applicable periods shown. D Calculated based on average shares outstanding during the period. E Fees and expenses of any underlying Fidelity Central Funds are not included in the Fund's expense ratio. The Fund indirectly bears its proportionate share of the expenses of any underlying Fidelity Central Funds. F Amount does not include the portfolio activity of any underlying Fidelity Central Funds. G Expense ratios reflect operating expenses of the Fund. Expenses before reductions do not reflect amounts reimbursed by the investment adviser or reductions from brokerage service arrangements or reductions from other expense offset arrangements and do not represent the amount paid by the Fund during periods when reimbursements or reductions occur. Expenses net of fee waivers reflect expenses after reimbursement by the investment adviser but prior to reductions from brokerage service arrangements or other expense offset arrangements. Expenses net of all reductions represent the net expenses paid by the Fund. H For the year ended February 29. I Amount represents less than $.01 per share. |
See accompanying notes which are an integral part of the financial statements.
Semiannual Report
Leisure Portfolio
Investment Changes (Unaudited)
Top Ten Stocks as of August 31, 2012 |
| % of fund's
net assets | % of fund's net assets
6 months ago |
Starbucks Corp. | 16.7 | 17.5 |
McDonald's Corp. | 15.5 | 15.6 |
Las Vegas Sands Corp. | 11.6 | 9.3 |
Wyndham Worldwide Corp. | 5.7 | 5.8 |
Yum! Brands, Inc. | 5.0 | 4.7 |
Chipotle Mexican Grill, Inc. | 4.6 | 4.8 |
Panera Bread Co. Class A | 4.4 | 3.5 |
Steiner Leisure Ltd. | 3.6 | 1.7 |
Hyatt Hotels Corp. Class A | 2.8 | 0.0 |
Texas Roadhouse, Inc. Class A | 2.7 | 1.7 |
| 72.6 | |
Top Industries (% of fund's net assets) |
As of August 31, 2012 |
| Hotels, Restaurants &
Leisure | 83.7% | |
| Diversified Consumer
Services | 8.3% | |
| Food & Staples Retailing | 1.4% | |
| Textiles, Apparel &
Luxury Goods | 1.4% | |
| Household Durables | 1.0% | |
| All Others* | 4.2% | |

As of February 29, 2012 |
| Hotels, Restaurants &
Leisure | 85.0% | |
| Diversified Consumer
Services | 6.9% | |
| Textiles, Apparel &
Luxury Goods | 2.5% | |
| Household Durables | 1.3% | |
| Leisure Equipment &
Products | 1.1% | |
| All Others* | 3.2% | |

* Includes short-term investments and net other assets. |
Semiannual Report
Leisure Portfolio
Investments August 31, 2012 (Unaudited)
Showing Percentage of Net Assets
Common Stocks - 97.7% |
| Shares | | Value |
DIVERSIFIED CONSUMER SERVICES - 8.3% |
Education Services - 2.6% |
DeVry, Inc. | 137,250 | | $ 2,650,298 |
K12, Inc. (a)(d) | 188,312 | | 3,963,968 |
Strayer Education, Inc. (d) | 38,000 | | 2,461,640 |
| | 9,075,906 |
Specialized Consumer Services - 5.7% |
Hillenbrand, Inc. | 204,900 | | 3,712,788 |
Sotheby's Class A (Ltd. vtg.) | 1,000 | | 31,260 |
Steiner Leisure Ltd. (a) | 272,188 | | 12,722,067 |
Weight Watchers International, Inc. (d) | 77,160 | | 3,685,933 |
| | 20,152,048 |
TOTAL DIVERSIFIED CONSUMER SERVICES | | 29,227,954 |
FOOD & STAPLES RETAILING - 1.4% |
Hypermarkets & Super Centers - 1.4% |
Wal-Mart Stores, Inc. | 65,400 | | 4,748,040 |
HOTELS, RESTAURANTS & LEISURE - 83.6% |
Casinos & Gaming - 16.3% |
International Game Technology | 115,300 | | 1,417,037 |
Las Vegas Sands Corp. | 968,141 | | 41,039,497 |
Melco PBL Entertainment (Macau) Ltd. sponsored ADR (a)(d) | 463,850 | | 5,436,322 |
MGM China Holdings Ltd. | 1,200,000 | | 1,977,321 |
Penn National Gaming, Inc. (a) | 183,312 | | 7,202,328 |
Sands China Ltd. | 100,000 | | 353,277 |
| | 57,425,782 |
Hotels, Resorts & Cruise Lines - 10.2% |
Hyatt Hotels Corp. Class A (a) | 258,087 | | 9,789,240 |
Marriott International, Inc. Class A | 20,409 | | 769,011 |
Starwood Hotels & Resorts Worldwide, Inc. | 99,000 | | 5,457,870 |
Wyndham Worldwide Corp. | 384,200 | | 20,032,188 |
| | 36,048,309 |
Leisure Facilities - 0.4% |
Cedar Fair LP (depository unit) | 46,890 | | 1,504,700 |
Vail Resorts, Inc. | 1,308 | | 67,427 |
| | 1,572,127 |
Restaurants - 56.7% |
BJ's Restaurants, Inc. (a) | 216,500 | | 8,887,325 |
Bloomin' Brands, Inc. | 71,000 | | 921,580 |
Bravo Brio Restaurant Group, Inc. (a) | 109,245 | | 1,766,492 |
Brinker International, Inc. | 212,900 | | 7,336,534 |
CEC Entertainment, Inc. | 45,000 | | 1,336,950 |
Chipotle Mexican Grill, Inc. (a) | 56,929 | | 16,431,987 |
Denny's Corp. (a) | 166,909 | | 816,185 |
McDonald's Corp. | 609,700 | | 54,562,053 |
Panera Bread Co. Class A (a) | 100,500 | | 15,567,450 |
Ruth's Hospitality Group, Inc. (a) | 847,541 | | 5,186,951 |
Spur Corp. Ltd. | 456,636 | | 1,032,498 |
|
| Shares | | Value |
Starbucks Corp. | 1,191,000 | | $ 59,085,510 |
Texas Roadhouse, Inc. Class A | 554,308 | | 9,517,468 |
Yum! Brands, Inc. | 274,800 | | 17,510,256 |
| | 199,959,239 |
TOTAL HOTELS, RESTAURANTS & LEISURE | | 295,005,457 |
HOUSEHOLD DURABLES - 1.0% |
Housewares & Specialties - 1.0% |
Tupperware Brands Corp. | 68,200 | | 3,647,336 |
LEISURE EQUIPMENT & PRODUCTS - 0.1% |
Leisure Products - 0.1% |
Summer Infant, Inc. (a) | 183,534 | | 488,200 |
PERSONAL PRODUCTS - 0.3% |
Personal Products - 0.3% |
Estee Lauder Companies, Inc. Class A | 20,000 | | 1,199,000 |
SOFTWARE - 0.7% |
Application Software - 0.7% |
Intuit, Inc. | 40,500 | | 2,370,870 |
SPECIALTY RETAIL - 0.9% |
Apparel Retail - 0.9% |
Express, Inc. (a) | 210,000 | | 3,278,100 |
TEXTILES, APPAREL & LUXURY GOODS - 1.4% |
Apparel, Accessories & Luxury Goods - 1.4% |
G-III Apparel Group Ltd. (a) | 74,900 | | 2,377,326 |
PVH Corp. | 26,940 | | 2,529,666 |
| | 4,906,992 |
TOTAL COMMON STOCKS (Cost $234,481,272) |
344,871,949
|
Convertible Bonds - 0.1% |
| Principal Amount | | |
HOTELS, RESTAURANTS & LEISURE - 0.1% |
Casinos & Gaming - 0.1% |
MGM Mirage, Inc. 4.25% 4/15/15
(Cost $300,000) | | $ 300,000 | |
303,000
|
Money Market Funds - 4.9% |
| Shares | | Value |
Fidelity Cash Central Fund, 0.17% (b) | 7,844,790 | | $ 7,844,790 |
Fidelity Securities Lending Cash Central Fund, 0.18% (b)(c) | 9,629,502 | | 9,629,502 |
TOTAL MONEY MARKET FUNDS (Cost $17,474,292) |
17,474,292
|
TOTAL INVESTMENT PORTFOLIO - 102.7% (Cost $252,255,564) | | 362,649,241 |
NET OTHER ASSETS (LIABILITIES) - (2.7)% | | (9,676,786) |
NET ASSETS - 100% | $ 352,972,455 |
Legend |
(a) Non-income producing |
(b) Affiliated fund that is available only to investment companies and other accounts managed by Fidelity Investments. The rate quoted is the annualized seven-day yield of the fund at period end. A complete unaudited listing of the fund's holdings as of its most recent quarter end is available upon request. In addition, each Fidelity Central Fund's financial statements are available on the SEC's website or upon request. |
(c) Investment made with cash collateral received from securities on loan. |
(d) Security or a portion of the security is on loan at period end. |
Affiliated Central Funds |
Information regarding fiscal year to date income earned by the Fund from investments in Fidelity Central Funds is as follows: |
Fund | Income earned |
Fidelity Cash Central Fund | $ 4,219 |
Fidelity Securities Lending Cash Central Fund | 248,522 |
Total | $ 252,741 |
Other Information |
The following is a summary of the inputs used, as of August 31, 2012, involving the Fund's assets and liabilities carried at fair value. The inputs or methodology used for valuing securities may not be an indication of the risk associated with investing in those securities. For more information on valuation inputs, and their aggregation into the levels used in the table below, please refer to the Security Valuation section in the accompanying Notes to Financial Statements. |
Valuation Inputs at Reporting Date: |
Description | Total | Level 1 | Level 2 | Level 3 |
Investments in Securities: | | | | |
Common Stocks | $ 344,871,949 | $ 344,871,949 | $ - | $ - |
Convertible Bonds | 303,000 | - | 303,000 | - |
Money Market Funds | 17,474,292 | 17,474,292 | - | - |
Total Investments in Securities: | $ 362,649,241 | $ 362,346,241 | $ 303,000 | $ - |
See accompanying notes which are an integral part of the financial statements.
Semiannual Report
Leisure Portfolio
Statement of Assets and Liabilities
| August 31, 2012 (Unaudited) |
| | |
Assets | | |
Investment in securities, at value (including securities loaned of $9,506,071) - See accompanying schedule: Unaffiliated issuers (cost $234,781,272) | $ 345,174,949 | |
Fidelity Central Funds (cost $17,474,292) | 17,474,292 | |
Total Investments (cost $252,255,564) | | $ 362,649,241 |
Receivable for investments sold | | 1,008,630 |
Receivable for fund shares sold | | 1,105,551 |
Dividends receivable | | 584,295 |
Interest receivable | | 4,817 |
Distributions receivable from Fidelity Central Funds | | 6,503 |
Other receivables | | 2,238 |
Total assets | | 365,361,275 |
| | |
Liabilities | | |
Payable for investments purchased | $ 1,796,143 | |
Payable for fund shares redeemed | 689,146 | |
Accrued management fee | 163,799 | |
Other affiliated payables | 84,770 | |
Other payables and accrued expenses | 25,460 | |
Collateral on securities loaned, at value | 9,629,502 | |
Total liabilities | | 12,388,820 |
| | |
Net Assets | | $ 352,972,455 |
Net Assets consist of: | | |
Paid in capital | | $ 229,451,935 |
Undistributed net investment income | | 1,519,233 |
Accumulated undistributed net realized gain (loss) on investments and foreign currency transactions | | 11,607,566 |
Net unrealized appreciation (depreciation) on investments and assets and liabilities in foreign currencies | | 110,393,721 |
Net Assets, for 3,489,032 shares outstanding | | $ 352,972,455 |
Net Asset Value, offering price and redemption price per share ($352,972,455 ÷ 3,489,032 shares) | | $ 101.17 |
Statement of Operations
Six months ended August 31, 2012 (Unaudited) |
| | |
Investment Income | | |
Dividends | | $ 3,099,101 |
Interest | | 6,410 |
Income from Fidelity Central Funds (including $248,522 from security lending) | | 252,741 |
Total income | | 3,358,252 |
| | |
Expenses | | |
Management fee | $ 1,204,474 | |
Transfer agent fees | 488,666 | |
Accounting and security lending fees | 86,203 | |
Custodian fees and expenses | 12,955 | |
Independent trustees' compensation | 1,505 | |
Registration fees | 32,149 | |
Audit | 17,513 | |
Legal | 886 | |
Interest | 648 | |
Miscellaneous | 1,915 | |
Total expenses before reductions | 1,846,914 | |
Expense reductions | (14,333) | 1,832,581 |
Net investment income (loss) | | 1,525,671 |
Realized and Unrealized Gain (Loss) Net realized gain (loss) on: | | |
Investment securities: | | |
Unaffiliated issuers | 13,974,582 | |
Foreign currency transactions | 754 | |
Total net realized gain (loss) | | 13,975,336 |
Change in net unrealized appreciation (depreciation) on: Investment securities | (41,603,090) | |
Assets and liabilities in foreign currencies | (44) | |
Total change in net unrealized appreciation (depreciation) | | (41,603,134) |
Net gain (loss) | | (27,627,798) |
Net increase (decrease) in net assets resulting from operations | | $ (26,102,127) |
See accompanying notes which are an integral part of the financial statements.
Semiannual Report
Leisure Portfolio
Financial Statements - continued
Statement of Changes in Net Assets
| Six months ended
August 31, 2012
(Unaudited) | Year ended
February 29,
2012 |
Increase (Decrease) in Net Assets | | |
Operations | | |
Net investment income (loss) | $ 1,525,671 | $ 2,610,015 |
Net realized gain (loss) | 13,975,336 | 3,812,173 |
Change in net unrealized appreciation (depreciation) | (41,603,134) | 51,611,340 |
Net increase (decrease) in net assets resulting from operations | (26,102,127) | 58,033,528 |
Distributions to shareholders from net investment income | (605,048) | (358,648) |
Distributions to shareholders from net realized gain | - | (19,922) |
Total distributions | (605,048) | (378,570) |
Share transactions
Proceeds from sales of shares | 122,968,117 | 191,824,059 |
Reinvestment of distributions | 577,441 | 362,956 |
Cost of shares redeemed | (184,391,609) | (220,590,207) |
Net increase (decrease) in net assets resulting from share transactions | (60,846,051) | (28,403,192) |
Redemption fees | 18,250 | 17,007 |
Total increase (decrease) in net assets | (87,534,976) | 29,268,773 |
| | |
Net Assets | | |
Beginning of period | 440,507,431 | 411,238,658 |
End of period (including undistributed net investment income of $1,519,233 and undistributed net investment income of $598,610, respectively) | $ 352,972,455 | $ 440,507,431 |
Other Information Shares | | |
Sold | 1,128,301 | 2,002,224 |
Issued in reinvestment of distributions | 5,079 | 3,903 |
Redeemed | (1,779,333) | (2,377,349) |
Net increase (decrease) | (645,953) | (371,222) |
Financial Highlights
| Six months ended August 31, 2012 | Years ended February 28, |
| (Unaudited) | 2012 H | 2011 | 2010 | 2009 | 2008 H |
Selected Per-Share Data | | | | | | |
Net asset value, beginning of period | $ 106.53 | $ 91.26 | $ 69.99 | $ 46.24 | $ 69.03 | $ 79.61 |
Income from Investment Operations | | | | | | |
Net investment income (loss) D | .37 | .64 | .55 | .43 | .60 | .69 |
Net realized and unrealized gain (loss) | (5.59) | 14.73 | 21.22 | 23.73 | (22.57) | (5.73) |
Total from investment operations | (5.22) | 15.37 | 21.77 | 24.16 | (21.97) | (5.04) |
Distributions from net investment income | (.14) | (.09) | (.52) | (.41) | (.54) | (.55) |
Distributions from net realized gain | - | (.01) | - | - | (.28) | (4.99) |
Total distributions | (.14) | (.10) | (.52) | (.41) | (.82) | (5.54) |
Redemption fees added to paid in capital D | - I | - I | .02 | - I | - I | - I |
Net asset value, end of period | $ 101.17 | $ 106.53 | $ 91.26 | $ 69.99 | $ 46.24 | $ 69.03 |
Total Return B, C | (4.92)% | 16.85% | 31.16% | 52.35% | (32.07)% | (7.09)% |
Ratios to Average Net Assets E, G | | | | | | |
Expenses before reductions | .86% A | .86% | .90% | .94% | .93% | .91% |
Expenses net of fee waivers, if any | .86% A | .86% | .90% | .94% | .93% | .91% |
Expenses net of all reductions | .85% A | .86% | .89% | .93% | .93% | .91% |
Net investment income (loss) | .71% A | .68% | .66% | .70% | 1.00% | .86% |
Supplemental Data | | | | | | |
Net assets, end of period (000 omitted) | $ 352,972 | $ 440,507 | $ 411,239 | $ 224,465 | $ 159,115 | $ 210,424 |
Portfolio turnover rate F | 101% A | 77% | 112% | 99% | 120% | 74% |
A Annualized B Total returns for periods of less than one year are not annualized. C Total returns would have been lower if certain expenses had not been reduced during the applicable periods shown. D Calculated based on average shares outstanding during the period. E Fees and expenses of any underlying Fidelity Central Funds are not included in the Fund's expense ratio. The Fund indirectly bears its proportionate share of the expenses of any underlying Fidelity Central Funds. F Amount does not include the portfolio activity of any underlying Fidelity Central Funds. G Expense ratios reflect operating expenses of the Fund. Expenses before reductions do not reflect amounts reimbursed by the investment adviser or reductions from brokerage service arrangements or reductions from other expense offset arrangements and do not represent the amount paid by the Fund during periods when reimbursements or reductions occur. Expenses net of fee waivers reflect expenses after reimbursement by the investment adviser but prior to reductions from brokerage service arrangements or other expense offset arrangements. Expenses net of all reductions represent the net expenses paid by the Fund. H For the year ended February 29. I Amount represents less than $.01 per share. |
See accompanying notes which are an integral part of the financial statements.
Semiannual Report
Multimedia Portfolio
Investment Changes (Unaudited)
Top Ten Stocks as of August 31, 2012 |
| % of fund's
net assets | % of fund's net assets
6 months ago |
The Walt Disney Co. | 14.7 | 14.2 |
Comcast Corp. Class A | 11.0 | 10.7 |
Time Warner, Inc. | 7.1 | 6.3 |
News Corp. Class A | 6.3 | 6.0 |
DIRECTV | 4.9 | 4.0 |
Viacom, Inc. Class B (non-vtg.) | 4.8 | 3.9 |
CBS Corp. Class B | 4.8 | 4.2 |
Time Warner Cable, Inc. | 4.5 | 5.0 |
Liberty Media Corp. Capital Series A | 3.4 | 3.5 |
McGraw-Hill Companies, Inc. | 2.5 | 2.7 |
| 64.0 | |
Top Industries (% of fund's net assets) |
As of August 31, 2012 |
| Media | 92.3% | |
| Internet Software &
Services | 2.3% | |
 | Software | 0.3% | |
| Internet & Catalog Retail | 0.2% | |
| All Others* | 4.9% | |

As of February 29, 2012 |
| Media | 93.0% | |
| Internet Software &
Services | 1.8% | |
| Software | 1.1% | |
| Internet & Catalog Retail | 0.4% | |
| Wireless
Telecommunication
Services | 0.1% | |
| All Others* | 3.6% | |

* Includes short-term investments and net other assets. |
Semiannual Report
Multimedia Portfolio
Investments August 31, 2012 (Unaudited)
Showing Percentage of Net Assets
Common Stocks - 95.1% |
| Shares | | Value |
INTERNET & CATALOG RETAIL - 0.2% |
Internet Retail - 0.2% |
Rakuten, Inc. | 52,100 | | $ 503,716 |
INTERNET SOFTWARE & SERVICES - 2.3% |
Internet Software & Services - 2.3% |
Active Network, Inc. (a) | 17,100 | | 192,546 |
Baidu.com, Inc. sponsored ADR (a) | 11,400 | | 1,270,416 |
Bankrate, Inc. (a) | 57,500 | | 987,850 |
Demand Media, Inc. (a) | 73,200 | | 742,980 |
Facebook, Inc. Class A | 22,000 | | 397,760 |
Google, Inc. Class A (a) | 2,900 | | 1,986,761 |
Mail.ru Group Ltd. GDR (Reg. S) | 15,400 | | 504,658 |
Yahoo!, Inc. (a) | 15,800 | | 231,470 |
Yandex NV (a) | 51,700 | | 1,091,904 |
| | 7,406,345 |
MEDIA - 92.3% |
Advertising - 4.2% |
Interpublic Group of Companies, Inc. | 322,604 | | 3,432,507 |
Ipsos SA | 19,100 | | 569,128 |
Lamar Advertising Co. Class A (a)(d) | 33,000 | | 1,092,960 |
National CineMedia, Inc. | 24,800 | | 359,600 |
Omnicom Group, Inc. | 127,500 | | 6,549,675 |
ReachLocal, Inc. (a) | 129,400 | | 1,626,558 |
| | 13,630,428 |
Broadcasting - 14.3% |
Belo Corp. Series A | 186,600 | | 1,362,180 |
CBS Corp. Class B | 422,700 | | 15,360,918 |
Discovery Communications, Inc. (a) | 109,050 | | 5,980,302 |
Discovery Communications, Inc. Class C (non-vtg.) (a) | 116,550 | | 6,038,456 |
Entercom Communications Corp.
Class A (a) | 82,700 | | 523,491 |
Liberty Media Corp. Capital Series A (a) | 104,993 | | 10,948,670 |
Scripps Networks Interactive, Inc. Class A | 65,700 | | 3,882,870 |
Sinclair Broadcast Group, Inc. Class A | 173,600 | | 2,006,816 |
| | 46,103,703 |
Cable & Satellite - 33.2% |
AMC Networks, Inc. Class A (a) | 50,400 | | 1,982,736 |
Cablevision Systems Corp. - NY Group Class A | 231,100 | | 3,454,945 |
Charter Communications, Inc. Class A (a) | 29,400 | | 2,287,320 |
Comcast Corp.: | | | |
Class A | 1,064,150 | | 35,680,950 |
Class A (special) (non-vtg.) | 199,700 | | 6,564,139 |
DIRECTV (a) | 303,413 | | 15,804,783 |
DISH Network Corp. Class A | 220,700 | | 7,060,193 |
Liberty Global, Inc.: | | | |
Class A (a) | 59,275 | | 3,276,129 |
Class C (a) | 52,800 | | 2,755,632 |
Sirius XM Radio, Inc. (a)(d) | 2,437,160 | | 6,166,015 |
|
| Shares | | Value |
Time Warner Cable, Inc. | 162,669 | | $ 14,448,261 |
Virgin Media, Inc. (d) | 283,200 | | 7,807,824 |
| | 107,288,927 |
Movies & Entertainment - 36.2% |
Cinemark Holdings, Inc. | 101,700 | | 2,381,814 |
DreamWorks Animation SKG, Inc. Class A (a)(d) | 114,200 | | 1,937,974 |
Lions Gate Entertainment Corp. (a)(d) | 185,300 | | 2,738,734 |
Live Nation Entertainment, Inc. (a) | 55,600 | | 473,712 |
News Corp. Class A | 867,682 | | 20,295,082 |
Regal Entertainment Group
Class A (d) | 147,900 | | 2,055,810 |
The Madison Square Garden Co. Class A (a) | 24,100 | | 1,017,261 |
The Walt Disney Co. | 962,604 | | 47,620,018 |
Time Warner, Inc. | 547,666 | | 22,755,522 |
Viacom, Inc. Class B (non-vtg.) | 312,100 | | 15,608,121 |
| | 116,884,048 |
Publishing - 4.4% |
E.W. Scripps Co. Class A (a) | 110,100 | | 1,141,737 |
Gannett Co., Inc. | 165,100 | | 2,519,426 |
John Wiley & Sons, Inc. Class A | 22,200 | | 1,095,348 |
McGraw-Hill Companies, Inc. | 155,200 | | 7,946,240 |
Meredith Corp. (d) | 25,100 | | 817,256 |
The New York Times Co. Class A (a) | 96,500 | | 886,835 |
| | 14,406,842 |
TOTAL MEDIA | | 298,313,948 |
SOFTWARE - 0.3% |
Home Entertainment Software - 0.3% |
Nexon Co. Ltd. | 48,100 | | 695,348 |
Zynga, Inc. (d) | 122,400 | | 342,720 |
| | 1,038,068 |
TOTAL COMMON STOCKS (Cost $234,615,510) |
307,262,077
|
Money Market Funds - 10.8% |
| | | |
Fidelity Cash Central Fund, 0.17% (b) | 13,960,254 | | 13,960,254 |
Fidelity Securities Lending Cash Central Fund, 0.18% (b)(c) | 20,993,084 | | 20,993,084 |
TOTAL MONEY MARKET FUNDS (Cost $34,953,338) |
34,953,338
|
TOTAL INVESTMENT PORTFOLIO - 105.9% (Cost $269,568,848) | | 342,215,415 |
NET OTHER ASSETS (LIABILITIES) - (5.9)% | | (18,993,150) |
NET ASSETS - 100% | $ 323,222,265 |
Legend |
(a) Non-income producing |
(b) Affiliated fund that is available only to investment companies and other accounts managed by Fidelity Investments. The rate quoted is the annualized seven-day yield of the fund at period end. A complete unaudited listing of the fund's holdings as of its most recent quarter end is available upon request. In addition, each Fidelity Central Fund's financial statements are available on the SEC's website or upon request. |
(c) Investment made with cash collateral received from securities on loan. |
(d) Security or a portion of the security is on loan at period end. |
Affiliated Central Funds |
Information regarding fiscal year to date income earned by the Fund from investments in Fidelity Central Funds is as follows: |
Fund | Income earned |
Fidelity Cash Central Fund | $ 8,336 |
Fidelity Securities Lending Cash Central Fund | 61,493 |
Total | $ 69,829 |
Other Information |
The following is a summary of the inputs used, as of August 31, 2012, involving the Fund's assets and liabilities carried at fair value. The inputs or methodology used for valuing securities may not be an indication of the risk associated with investing in those securities. For more information on valuation inputs, and their aggregation into the levels used in the table below, please refer to the Security Valuation section in the accompanying Notes to Financial Statements. |
Valuation Inputs at Reporting Date: |
Description | Total | Level 1 | Level 2 | Level 3 |
Investments in Securities: | | | | |
Common Stocks | $ 307,262,077 | $ 306,063,013 | $ 1,199,064 | $ - |
Money Market Funds | 34,953,338 | 34,953,338 | - | - |
Total Investments in Securities: | $ 342,215,415 | $ 341,016,351 | $ 1,199,064 | $ - |
See accompanying notes which are an integral part of the financial statements.
Semiannual Report
Multimedia Portfolio
Statement of Assets and Liabilities
| August 31, 2012 (Unaudited) |
| | |
Assets | | |
Investment in securities, at value (including securities loaned of $20,236,121) - See accompanying schedule: Unaffiliated issuers (cost $234,615,510) | $ 307,262,077 | |
Fidelity Central Funds (cost $34,953,338) | 34,953,338 | |
Total Investments (cost $269,568,848) | | $ 342,215,415 |
Receivable for fund shares sold | | 2,255,714 |
Dividends receivable | | 380,305 |
Distributions receivable from Fidelity Central Funds | | 14,653 |
Other receivables | | 1,141 |
Total assets | | 344,867,228 |
| | |
Liabilities | | |
Payable for investments purchased | $ 132,963 | |
Payable for fund shares redeemed | 296,337 | |
Accrued management fee | 138,870 | |
Other affiliated payables | 61,990 | |
Other payables and accrued expenses | 21,719 | |
Collateral on securities loaned, at value | 20,993,084 | |
Total liabilities | | 21,644,963 |
| | |
Net Assets | | $ 323,222,265 |
Net Assets consist of: | | |
Paid in capital | | $ 254,607,973 |
Undistributed net investment income | | 523,384 |
Accumulated undistributed net realized gain (loss) on investments and foreign currency transactions | | (4,555,659) |
Net unrealized appreciation (depreciation) on investments | | 72,646,567 |
Net Assets, for 6,027,773 shares outstanding | | $ 323,222,265 |
Net Asset Value, offering price and redemption price per share ($323,222,265 ÷ 6,027,773 shares) | | $ 53.62 |
Statement of Operations
Six months ended August 31, 2012 (Unaudited) |
| | |
Investment Income | | |
Dividends | | $ 1,500,265 |
Income from Fidelity Central Funds (including $61,493 from security lending) | | 69,829 |
Total income | | 1,570,094 |
| | |
Expenses | | |
Management fee | $ 625,838 | |
Transfer agent fees | 278,182 | |
Accounting and security lending fees | 45,094 | |
Custodian fees and expenses | 6,275 | |
Independent trustees' compensation | 696 | |
Registration fees | 21,417 | |
Audit | 17,395 | |
Legal | 404 | |
Miscellaneous | 978 | |
Total expenses before reductions | 996,279 | |
Expense reductions | (1,768) | 994,511 |
Net investment income (loss) | | 575,583 |
Realized and Unrealized Gain (Loss) Net realized gain (loss) on: | | |
Investment securities: | | |
Unaffiliated issuers | (866,291) | |
Foreign currency transactions | 114 | |
Total net realized gain (loss) | | (866,177) |
Change in net unrealized appreciation (depreciation) on: Investment securities | 24,904,502 | |
Assets and liabilities in foreign currencies | (12) | |
Total change in net unrealized appreciation (depreciation) | | 24,904,490 |
Net gain (loss) | | 24,038,313 |
Net increase (decrease) in net assets resulting from operations | | $ 24,613,896 |
See accompanying notes which are an integral part of the financial statements.
Semiannual Report
Multimedia Portfolio
Financial Statements - continued
Statement of Changes in Net Assets
| Six months ended
August 31, 2012
(Unaudited) | Year ended
February 29,
2012 |
Increase (Decrease) in Net Assets | | |
Operations | | |
Net investment income (loss) | $ 575,583 | $ 1,191,206 |
Net realized gain (loss) | (866,177) | (3,300,816) |
Change in net unrealized appreciation (depreciation) | 24,904,490 | (611,251) |
Net increase (decrease) in net assets resulting from operations | 24,613,896 | (2,720,861) |
Distributions to shareholders from net investment income | - | (1,167,605) |
Distributions to shareholders from net realized gain | - | (1,177,808) |
Total distributions | - | (2,345,413) |
Share transactions
Proceeds from sales of shares | 149,951,205 | 125,782,043 |
Reinvestment of distributions | - | 2,273,089 |
Cost of shares redeemed | (34,502,902) | (145,769,203) |
Net increase (decrease) in net assets resulting from share transactions | 115,448,303 | (17,714,071) |
Redemption fees | 3,426 | 16,532 |
Total increase (decrease) in net assets | 140,065,625 | (22,763,813) |
| | |
Net Assets | | |
Beginning of period | 183,156,640 | 205,920,453 |
End of period (including undistributed net investment income of $523,384 and distributions in excess of net investment income of $52,199, respectively) | $ 323,222,265 | $ 183,156,640 |
Other Information Shares | | |
Sold | 2,933,544 | 2,698,656 |
Issued in reinvestment of distributions | - | 50,831 |
Redeemed | (683,543) | (3,279,398) |
Net increase (decrease) | 2,250,001 | (529,911) |
Financial Highlights
| Six months ended
August 31, 2012 | Years ended February 28, |
| (Unaudited) | 2012 J | 2011 | 2010 | 2009 | 2008 J |
Selected Per-Share Data | | | | | | |
Net asset value, beginning of period | $ 48.48 | $ 47.80 | $ 34.39 | $ 18.27 | $ 35.30 | $ 47.31 |
Income from Investment Operations | | | | | | |
Net investment income (loss) D | .13 | .29 | .14 | .13 G | .06 | .01 |
Net realized and unrealized gain (loss) | 5.01 | .96 H | 13.39 | 16.12 | (16.17) | (5.79) |
Total from investment operations | 5.14 | 1.25 | 13.53 | 16.25 | (16.11) | (5.78) |
Distributions from net investment income | - | (.32) | (.12) | (.13) | (.06) | - |
Distributions from net realized gain | - | (.25) | - | - | (.86) | (6.23) |
Total distributions | - | (.57) | (.12) | (.13) | (.92) | (6.23) |
Redemption fees added to paid in capital D, K | - | - | - | - | - | - |
Net asset value, end of period | $ 53.62 | $ 48.48 | $ 47.80 | $ 34.39 | $ 18.27 | $ 35.30 |
Total Return B, C | 10.60% | 2.73% | 39.37% | 88.96% | (46.75)% | (13.88)% |
Ratios to Average Net Assets E, I | | | | | | |
Expenses before reductions | .88% A | .90% | .94% | 1.08% | 1.07% | .99% |
Expenses net of fee waivers, if any | .88% A | .90% | .94% | 1.08% | 1.07% | .99% |
Expenses net of all reductions | .88% A | .90% | .94% | 1.07% | 1.07% | .98% |
Net investment income (loss) | .51% A | .64% | .37% | .44% G | .22% | .01% |
Supplemental Data | | | | | | |
Net assets, end of period (000 omitted) | $ 323,222 | $ 183,157 | $ 205,920 | $ 76,309 | $ 26,183 | $ 62,141 |
Portfolio turnover rate F | 16% A | 85% | 76% | 40% | 39% | 68% |
A Annualized B Total returns for periods of less than one year are not annualized. C Total returns would have been lower if certain expenses had not been reduced during the applicable periods shown. D Calculated based on average shares outstanding during the period. E Fees and expenses of any underlying Fidelity Central Funds are not included in the Fund's expense ratio. The Fund indirectly bears its proportionate share of the expenses of any underlying Fidelity Central Funds. F Amount does not include the portfolio activity of any underlying Fidelity Central Funds. G Investment income per share reflects a large, non-recurring dividend which amounted to $.10 per share. Excluding this non-recurring dividend, the ratio of net investment income (loss) to average net assets would have been .10%. H The amount shown for a share outstanding does not correspond with the aggregate net gain (loss) on investments for the period due to the timing of sales and repurchases of shares in relation to fluctuating market values of the investments of the Fund. I Expense ratios reflect operating expenses of the Fund. Expenses before reductions do not reflect amounts reimbursed by the investment adviser or reductions from brokerage service arrangements or reductions from other expense offset arrangements and do not represent the amount paid by the Fund during periods when reimbursements or reductions occur. Expenses net of fee waivers reflect expenses after reimbursement by the investment adviser but prior to reductions from brokerage service arrangements or other expense offset arrangements. Expenses net of all reductions represent the net expenses paid by the Fund. J For the year ended February 29. K Amount represents less than $.01 per share. |
See accompanying notes which are an integral part of the financial statements.
Semiannual Report
Retailing Portfolio
Investment Changes (Unaudited)
Top Ten Stocks as of August 31, 2012 |
| % of fund's
net assets | % of fund's net assets
6 months ago |
Home Depot, Inc. | 14.6 | 6.8 |
Amazon.com, Inc. | 14.2 | 11.2 |
TJX Companies, Inc. | 7.1 | 5.7 |
Priceline.com, Inc. | 5.2 | 3.6 |
AutoZone, Inc. | 4.9 | 3.5 |
Limited Brands, Inc. | 4.4 | 5.5 |
O'Reilly Automotive, Inc. | 4.0 | 2.4 |
Wal-Mart Stores, Inc. | 3.7 | 0.0 |
Ross Stores, Inc. | 3.4 | 3.9 |
Lowe's Companies, Inc. | 3.2 | 11.2 |
| 64.7 | |
Top Industries (% of fund's net assets) |
As of August 31, 2012 |
| Specialty Retail | 59.8% | |
| Internet & Catalog Retail | 19.4% | |
| Food & Staples Retailing | 5.4% | |
| Textiles, Apparel &
Luxury Goods | 4.3% | |
| Multiline Retail | 4.1% | |
| All Others* | 7.0% | |

As of February 29, 2012 |
| Specialty Retail | 60.9% | |
| Internet & Catalog Retail | 16.2% | |
| Multiline Retail | 11.8% | |
| Textiles, Apparel &
Luxury Goods | 7.0% | |
| Leisure Equipment &
Products | 1.4% | |
| All Others* | 2.7% | |

* Includes short-term investments and net other assets. |
Semiannual Report
Retailing Portfolio
Investments August 31, 2012 (Unaudited)
Showing Percentage of Net Assets
Common Stocks - 96.4% |
| Shares | | Value |
DISTRIBUTORS - 1.8% |
Distributors - 1.8% |
LKQ Corp. (a) | 265,000 | | $ 10,001,100 |
DIVERSIFIED CONSUMER SERVICES - 0.3% |
Specialized Consumer Services - 0.3% |
Steiner Leisure Ltd. (a) | 34,214 | | 1,599,162 |
FOOD & STAPLES RETAILING - 5.4% |
Food Retail - 0.5% |
Susser Holdings Corp. (a) | 83,579 | | 2,843,358 |
Hypermarkets & Super Centers - 4.9% |
Costco Wholesale Corp. | 68,400 | | 6,694,308 |
Wal-Mart Stores, Inc. | 283,000 | | 20,545,800 |
| | 27,240,108 |
TOTAL FOOD & STAPLES RETAILING | | 30,083,466 |
INTERNET & CATALOG RETAIL - 19.4% |
Internet Retail - 19.4% |
Amazon.com, Inc. (a) | 320,100 | | 79,458,423 |
Priceline.com, Inc. (a) | 48,100 | | 29,079,817 |
| | 108,538,240 |
INTERNET SOFTWARE & SERVICES - 0.5% |
Internet Software & Services - 0.5% |
Google, Inc. Class A (a) | 3,960 | | 2,712,956 |
MULTILINE RETAIL - 4.1% |
Department Stores - 1.0% |
PPR SA | 34,200 | | 5,342,682 |
General Merchandise Stores - 3.1% |
Dollar General Corp. (a) | 126,000 | | 6,434,820 |
Target Corp. | 172,221 | | 11,037,644 |
| | 17,472,464 |
TOTAL MULTILINE RETAIL | | 22,815,146 |
SOFTWARE - 0.8% |
Home Entertainment Software - 0.8% |
Take-Two Interactive Software, Inc. (a) | 454,000 | | 4,653,500 |
SPECIALTY RETAIL - 59.8% |
Apparel Retail - 22.0% |
DSW, Inc. Class A | 122,400 | | 7,897,248 |
Express, Inc. (a) | 1,041,397 | | 16,256,207 |
Fast Retailing Co. Ltd. | 13,700 | | 3,206,886 |
Guess?, Inc. | 99,000 | | 2,579,940 |
|
| Shares | | Value |
Inditex SA | 61,054 | | $ 6,789,333 |
Limited Brands, Inc. | 501,698 | | 24,382,523 |
Ross Stores, Inc. | 273,900 | | 18,951,141 |
The Buckle, Inc. (d) | 64,800 | | 2,950,992 |
TJX Companies, Inc. | 872,400 | | 39,947,196 |
| | 122,961,466 |
Automotive Retail - 10.7% |
Advance Auto Parts, Inc. | 25,881 | | 1,840,657 |
Asbury Automotive Group, Inc. (a) | 303,200 | | 8,395,608 |
AutoZone, Inc. (a) | 75,243 | | 27,210,879 |
O'Reilly Automotive, Inc. (a) | 265,800 | | 22,579,710 |
| | 60,026,854 |
Computer & Electronics Retail - 1.1% |
Best Buy Co., Inc. | 340,279 | | 6,036,549 |
Home Improvement Retail - 17.8% |
Home Depot, Inc. | 1,432,800 | | 81,311,400 |
Lowe's Companies, Inc. | 635,500 | | 18,099,040 |
| | 99,410,440 |
Homefurnishing Retail - 1.4% |
Bed Bath & Beyond, Inc. (a) | 112,100 | | 7,529,757 |
Specialty Stores - 6.8% |
Dick's Sporting Goods, Inc. | 347,000 | | 17,266,720 |
GNC Holdings, Inc. | 201,600 | | 7,832,160 |
Sally Beauty Holdings, Inc. (a) | 369,714 | | 10,167,135 |
Ulta Salon, Cosmetics & Fragrance, Inc. | 31,600 | | 2,970,400 |
| | 38,236,415 |
TOTAL SPECIALTY RETAIL | | 334,201,481 |
TEXTILES, APPAREL & LUXURY GOODS - 4.3% |
Apparel, Accessories & Luxury Goods - 3.5% |
G-III Apparel Group Ltd. (a) | 291,000 | | 9,236,340 |
Hermes International SCA | 6,480 | | 1,866,067 |
Li Ning Co. Ltd. | 100,000 | | 47,963 |
VF Corp. | 55,600 | | 8,489,008 |
| | 19,639,378 |
Footwear - 0.8% |
NIKE, Inc. Class B | 42,700 | | 4,157,272 |
TOTAL TEXTILES, APPAREL & LUXURY GOODS | | 23,796,650 |
TOTAL COMMON STOCKS (Cost $440,143,390) |
538,401,701
|
Convertible Bonds - 0.2% |
| Principal
Amount | | |
SOFTWARE - 0.2% |
Home Entertainment Software - 0.2% |
Take-Two Interactive Software, Inc. 1.75% 12/1/16 (e)
(Cost $1,000,000) | | $ 1,000,000 | |
906,250
|
Money Market Funds - 3.4% |
| Shares | | Value |
Fidelity Cash Central Fund, 0.17% (b) | 17,503,159 | | $ 17,503,159 |
Fidelity Securities Lending Cash Central Fund, 0.18% (b)(c) | 1,606,500 | | 1,606,500 |
TOTAL MONEY MARKET FUNDS (Cost $19,109,659) |
19,109,659
|
TOTAL INVESTMENT PORTFOLIO - 100.0% (Cost $460,253,049) | | 558,417,610 |
NET OTHER ASSETS (LIABILITIES) - 0.0% | | 186,994 |
NET ASSETS - 100% | $ 558,604,604 |
Legend |
(a) Non-income producing |
(b) Affiliated fund that is available only to investment companies and other accounts managed by Fidelity Investments. The rate quoted is the annualized seven-day yield of the fund at period end. A complete unaudited listing of the fund's holdings as of its most recent quarter end is available upon request. In addition, each Fidelity Central Fund's financial statements are available on the SEC's website or upon request. |
(c) Investment made with cash collateral received from securities on loan. |
(d) Security or a portion of the security is on loan at period end. |
(e) Security exempt from registration under Rule 144A of the Securities Act of 1933. These securities may be resold in transactions exempt from registration, normally to qualified institutional buyers. At the end of the period, the value of these securities amounted to $906,250 or 0.2% of net assets. |
Affiliated Central Funds |
Information regarding fiscal year to date income earned by the Fund from investments in Fidelity Central Funds is as follows: |
Fund | Income earned |
Fidelity Cash Central Fund | $ 10,423 |
Fidelity Securities Lending Cash Central Fund | 27,869 |
Total | $ 38,292 |
Other Information |
The following is a summary of the inputs used, as of August 31, 2012, involving the Fund's assets and liabilities carried at fair value. The inputs or methodology used for valuing securities may not be an indication of the risk associated with investing in those securities. For more information on valuation inputs, and their aggregation into the levels used in the table below, please refer to the Security Valuation section in the accompanying Notes to Financial Statements. |
Valuation Inputs at Reporting Date: |
Description | Total | Level 1 | Level 2 | Level 3 |
Investments in Securities: | | | | |
Common Stocks | $ 538,401,701 | $ 535,194,815 | $ 3,206,886 | $ - |
Convertible Bonds | 906,250 | - | 906,250 | - |
Money Market Funds | 19,109,659 | 19,109,659 | - | - |
Total Investments in Securities: | $ 558,417,610 | $ 554,304,474 | $ 4,113,136 | $ - |
See accompanying notes which are an integral part of the financial statements.
Semiannual Report
Retailing Portfolio
Statement of Assets and Liabilities
| August 31, 2012 (Unaudited) |
| | |
Assets | | |
Investment in securities, at value (including securities loaned of $1,548,360) - See accompanying schedule: Unaffiliated issuers (cost $441,143,390) | $ 539,307,951 | |
Fidelity Central Funds (cost $19,109,659) | 19,109,659 | |
Total Investments (cost $460,253,049) | | $ 558,417,610 |
Receivable for investments sold | | 7,539,053 |
Receivable for fund shares sold | | 2,339,599 |
Dividends receivable | | 1,519,425 |
Interest receivable | | 4,375 |
Distributions receivable from Fidelity Central Funds | | 7,049 |
Other receivables | | 9,931 |
Total assets | | 569,837,042 |
| | |
Liabilities | | |
Payable for investments purchased | $ 8,599,199 | |
Payable for fund shares redeemed | 630,207 | |
Accrued management fee | 251,363 | |
Other affiliated payables | 121,290 | |
Other payables and accrued expenses | 23,879 | |
Collateral on securities loaned, at value | 1,606,500 | |
Total liabilities | | 11,232,438 |
| | |
Net Assets | | $ 558,604,604 |
Net Assets consist of: | | |
Paid in capital | | $ 461,055,209 |
Undistributed net investment income | | 1,248,116 |
Accumulated undistributed net realized gain (loss) on investments and foreign currency transactions | | (1,863,343) |
Net unrealized appreciation (depreciation) on investments and assets and liabilities in foreign currencies | | 98,164,622 |
Net Assets, for 8,923,196 shares outstanding | | $ 558,604,604 |
Net Asset Value, offering price and redemption price per share ($558,604,604 ÷ 8,923,196 shares) | | $ 62.60 |
Statement of Operations
Six months ended August 31, 2012 (Unaudited) |
| | |
Investment Income | | |
Dividends | | $ 2,719,661 |
Special dividends | | 640,298 |
Interest | | 8,799 |
Income from Fidelity Central Funds (including $27,869 from security lending) | | 38,292 |
Total income | | 3,407,050 |
| | |
Expenses | | |
Management fee | $ 1,405,423 | |
Transfer agent fees | 591,706 | |
Accounting and security lending fees | 97,428 | |
Custodian fees and expenses | 9,261 | |
Independent trustees' compensation | 1,627 | |
Registration fees | 49,799 | |
Audit | 17,535 | |
Legal | 858 | |
Miscellaneous | 1,257 | |
Total expenses before reductions | 2,174,894 | |
Expense reductions | (19,843) | 2,155,051 |
Net investment income (loss) | | 1,251,999 |
Realized and Unrealized Gain (Loss) Net realized gain (loss) on: | | |
Investment securities: | | |
Unaffiliated issuers | 2,749,760 | |
Foreign currency transactions | (39,737) | |
Total net realized gain (loss) | | 2,710,023 |
Change in net unrealized appreciation (depreciation) on: Investment securities | 30,267,479 | |
Assets and liabilities in foreign currencies | 61 | |
Total change in net unrealized appreciation (depreciation) | | 30,267,540 |
Net gain (loss) | | 32,977,563 |
Net increase (decrease) in net assets resulting from operations | | $ 34,229,562 |
See accompanying notes which are an integral part of the financial statements.
Semiannual Report
Retailing Portfolio
Financial Statements - continued
Statement of Changes in Net Assets
| Six months ended
August 31, 2012
(Unaudited) | Year ended
February 29,
2012 |
Increase (Decrease) in Net Assets | | |
Operations | | |
Net investment income (loss) | $ 1,251,999 | $ 2,294,727 |
Net realized gain (loss) | 2,710,023 | 4,508,981 |
Change in net unrealized appreciation (depreciation) | 30,267,540 | 31,163,378 |
Net increase (decrease) in net assets resulting from operations | 34,229,562 | 37,967,086 |
Distributions to shareholders from net investment income | (63,517) | (1,998,613) |
Distributions to shareholders from net realized gain | (285,828) | (14,569,913) |
Total distributions | (349,345) | (16,568,526) |
Share transactions
Proceeds from sales of shares | 319,585,889 | 358,193,782 |
Reinvestment of distributions | 338,454 | 16,017,682 |
Cost of shares redeemed | (139,985,040) | (218,000,118) |
Net increase (decrease) in net assets resulting from share transactions | 179,939,303 | 156,211,346 |
Redemption fees | 41,798 | 38,912 |
Total increase (decrease) in net assets | 213,861,318 | 177,648,818 |
| | |
Net Assets | | |
Beginning of period | 344,743,286 | 167,094,468 |
End of period (including undistributed net investment income of $1,248,116 and undistributed net investment income of $59,634, respectively) | $ 558,604,604 | $ 344,743,286 |
Other Information Shares | | |
Sold | 5,263,051 | 6,700,769 |
Issued in reinvestment of distributions | 5,529 | 307,489 |
Redeemed | (2,337,238) | (4,129,046) |
Net increase (decrease) | 2,931,342 | 2,879,212 |
Financial Highlights
| Six months ended
August 31, 2012 | Years ended February 28, |
| (Unaudited) | 2012 J | 2011 | 2010 | 2009 | 2008 J |
Selected Per-Share Data | | | | | | |
Net asset value, beginning of period | $ 57.54 | $ 53.68 | $ 45.11 | $ 26.48 | $ 36.57 | $ 54.98 |
Income from Investment Operations | | | | | | |
Net investment income (loss) D | .15 G | .49 H | .09 | .11 | .21 | (.01) |
Net realized and unrealized gain (loss) | 4.95 | 7.46 | 9.81 | 20.74 | (10.11) | (10.59) |
Total from investment operations | 5.10 | 7.95 | 9.90 | 20.85 | (9.90) | (10.60) |
Distributions from net investment income | (.01) | (.34) | (.01) | (.11) | (.20) | (.22) |
Distributions from net realized gain | (.04) | (3.76) | (1.33) | (2.11) | - | (7.60) |
Total distributions | (.04) L | (4.10) | (1.34) | (2.22) | (.20) | (7.82) |
Redemption fees added to paid in capital D | - K | .01 | .01 | - K | .01 | .01 |
Net asset value, end of period | $ 62.60 | $ 57.54 | $ 53.68 | $ 45.11 | $ 26.48 | $ 36.57 |
Total Return B, C | 8.87% | 15.70% | 22.24% | 79.26% | (27.09)% | (21.43)% |
Ratios to Average Net Assets E, I | | | | | | |
Expenses before reductions | .86% A | .90% | .93% | .96% | 1.07% | 1.02% |
Expenses net of fee waivers, if any | .86% A | .90% | .93% | .96% | 1.07% | 1.02% |
Expenses net of all reductions | .85% A | .88% | .93% | .94% | 1.06% | 1.02% |
Net investment income (loss) | .50% A, G | .93% H | .18% | .27% | .63% | (.02)% |
Supplemental Data | | | | | | |
Net assets, end of period (000 omitted) | $ 558,605 | $ 344,743 | $ 167,094 | $ 137,409 | $ 40,335 | $ 48,038 |
Portfolio turnover rate F | 153% A | 217% | 191% | 281% | 504% | 260% |
A Annualized B Total returns for periods of less than one year are not annualized. C Total returns would have been lower if certain expenses had not been reduced during the applicable periods shown. D Calculated based on average shares outstanding during the period. E Fees and expenses of any underlying Fidelity Central Funds are not included in the Fund's expense ratio. The Fund indirectly bears its proportionate share of the expenses of any underlying Fidelity Central Funds. F Amount does not include the portfolio activity of any underlying Fidelity Central Funds. G Investment income per share reflects a large, non-recurring dividend which amounted to $.08 per share. Excluding this non-recurring dividend, the ratio of net investment income (loss) to average net assets would have been .24%. H Investment income per share reflects a large, non-recurring dividend which amounted to $.28 per share. Excluding this non-recurring dividend, the ratio of net investment income (loss) to average net assets would have been .40%. I Expense ratios reflect operating expenses of the Fund. Expenses before reductions do not reflect amounts reimbursed by the investment adviser or reductions from brokerage service arrangements or reductions from other expense offset arrangements and do not represent the amount paid by the Fund during periods when reimbursements or reductions occur. Expenses net of fee waivers reflect expenses after reimbursement by the investment adviser but prior to reductions from brokerage service arrangements or other expense offset arrangements. Expenses net of all reductions represent the net expenses paid by the Fund. J For the year ended February 29. K Amount represents less than $.01 per share. L Total distributions of $.04 per share is comprised of distributions from net investment income of $.008 and distributions from net realized gain of $.0342 per share. |
See accompanying notes which are an integral part of the financial statements.
Semiannual Report
Notes to Financial Statements
For the period ended August 31, 2012 (Unaudited)
1. Organization.
Automotive Portfolio, Construction and Housing Portfolio, Consumer Discretionary Portfolio, Leisure Portfolio, Multimedia Portfolio, and Retailing Portfolio (the Funds) are non-diversified funds of Fidelity Select Portfolios (the Trust). The Trust is registered under the Investment Company Act of 1940, as amended (the 1940 Act), as an open-end management investment company organized as a Massachusetts business trust. The Funds invest primarily in securities of companies whose principal business activities fall within specific industries. Each Fund is authorized to issue an unlimited number of shares. Investments in emerging markets, if applicable, can be subject to social, economic, regulatory, and political uncertainties and can be extremely volatile.
2. Investments in Fidelity Central Funds.
The Funds invest in Fidelity Central Funds, which are open-end investment companies available only to other investment companies and accounts managed by Fidelity Management & Research Company (FMR) and its affiliates. The Funds' Schedules of Investments list each of the Fidelity Central Funds held as of period end, if any, as an investment of each Fund, but do not include the underlying holdings of each Fidelity Central Fund. As an Investing Fund, each Fund indirectly bears its proportionate share of the expenses of the underlying Fidelity Central Funds.
The Money Market Central Funds seek preservation of capital and current income and are managed by Fidelity Investments Money Management, Inc. (FIMM), an affiliate of FMR.
A complete unaudited list of holdings for each Fidelity Central Fund is available upon request or at the Securities and Exchange Commission (the SEC) web site at www.sec.gov. In addition, the financial statements of the Fidelity Central Funds are available on the SEC web site or upon request.
3. Significant Accounting Policies.
The financial statements have been prepared in conformity with accounting principles generally accepted in the United States of America (GAAP), which require management to make certain estimates and assumptions at the date of the financial statements. Actual results could differ from those estimates. Subsequent events, if any, through the date that the financial statements were issued have been evaluated in the preparation of the financial statements. The following summarizes the significant accounting policies of the Funds:
Security Valuation. Investments are valued as of 4:00 p.m. Eastern time on the last calendar day of the period. In accordance with valuation policies and procedures approved by the Board of Trustees (the Board), each Fund attempts to obtain prices from one or more third party pricing vendor or broker to value their investments. When current market prices, quotations or rates are not readily available or reliable, securities will be fair valued in good faith by the FMR Fair Value Committee (the Committee), in accordance with procedures adopted by each Fund's Board. Factors used in determining fair value vary by security type and may include market or security specific events, changes in interest rates and credit quality. The frequency with which these procedures are used cannot be predicted and they may be utilized to a significant extent. The Committee oversees each Fund's valuation policies and procedures and is responsible for approving and reporting to the Board all fair value determinations.
Each Fund categorizes the inputs to valuation techniques used to value their investments into a disclosure hierarchy consisting of three levels as shown below:
Level 1 - quoted prices in active markets for identical investments
Level 2 - other significant observable inputs (including quoted prices for similar investments, interest rates, prepayment speeds, etc.)
Level 3 - unobservable inputs (including the Fund's own assumptions based on the best information available)
Valuation techniques used to value each Fund's investments by major category are as follows:
Equity securities, including restricted securities, for which market quotations are readily available, are valued at the last reported sale price or official closing price as reported by a third party pricing vendor on the primary market or exchange on which they are traded and are categorized as Level 1 in the hierarchy. In the event there were no sales during the day or closing prices are not available, securities are valued at the last quoted bid price or may be valued using the last available price and are generally categorized as Level 2 in the hierarchy. For foreign equity securities, when significant market or security specific events arise, comparisons to the valuation of American Depositary Receipts (ADRs), futures contracts, Exchange-Traded Funds (ETFs) and certain indexes as well as quoted prices for similar securities are used and are categorized as Level 2 in the hierarchy. Utilizing these techniques may result in transfers between Level 1 and Level 2.
Debt securities, including restricted securities, are valued based on evaluated prices received from third party pricing vendors or from brokers who make markets in such securities. For corporate bonds, pricing vendors utilize matrix pricing which considers yield or price of bonds of comparable quality, coupon, maturity and type as well as broker-supplied prices and are generally categorized as Level 2 in the hierarchy. When independent prices are unavailable or unreliable, debt securities may be valued utilizing pricing methodologies which consider similar factors that would be used by third party pricing vendors. These are generally categorized as Level 2 in the hierarchy but may be Level 3 depending on the circumstances.
Semiannual Report
Notes to Financial Statements (Unaudited) - continued
3. Significant Accounting Policies - continued
Security Valuation - continued
Investments in open-end mutual funds, including the Fidelity Central Funds, are valued at their closing net asset value each business day and are categorized as Level 1 in the hierarchy.
Changes in valuation techniques may result in transfers in or out of an assigned level within the disclosure hierarchy. The aggregate value of investments by input level, as of August 31, 2012 is included at the end of each applicable Fund's Schedule of Investments.
Foreign Currency Translation. The Funds may use foreign currency contracts to facilitate transactions in foreign-denominated securities. Gains and losses from these transactions may arise from changes in the value of the foreign currency or if the counterparties do not perform under the contracts' terms.
Foreign-denominated assets, including investment securities, and liabilities are translated into U.S. dollars at the exchange rates at period end. Purchases and sales of investment securities, income and dividends received and expenses denominated in foreign currencies are translated into U.S. dollars at the exchange rate in effect on the transaction date.
The effects of exchange rate fluctuations on investments are included with the net realized and unrealized gain (loss) on investment securities. Other foreign currency transactions resulting in realized and unrealized gain (loss) are disclosed separately.
Investment Transactions and Income. For financial reporting purposes, the Funds' investment holdings and NAV include trades executed through the end of the last business day of the period. The NAV per share for processing shareholder transactions is calculated as of the close of business of the New York Stock Exchange (NYSE), normally 4:00 p.m. Eastern time and includes trades executed through the end of the prior business day. Gains and losses on securities sold are determined on the basis of identified cost and may include proceeds received from litigation. Dividend income is recorded on the ex-dividend date, except for certain dividends from foreign securities where the ex-dividend date may have passed, which are recorded as soon as the Funds are informed of the ex-dividend date. Non-cash dividends included in dividend income, if any, are recorded at the fair market value of the securities received. Distributions received on securities that represent a return of capital or capital gain are recorded as a reduction of cost of investments and/or as a realized gain. The Funds estimate the components of distributions received that may be considered return of capital distributions or capital gain distributions. Large, non-recurring dividends recognized by the Funds are presented separately on the Statement of Operations as "Special Dividends" and the impact of these dividends is presented in the Financial Highlights. Interest income and distributions from the Fidelity Central Funds are accrued as earned. Interest income includes coupon interest and amortization of premium and accretion of discount on debt securities. Investment income is recorded net of foreign taxes withheld where recovery of such taxes is uncertain. Debt obligations may be placed on non-accrual status and related interest income may be reduced by ceasing current accruals and writing off interest receivables when the collection of all or a portion of interest has become doubtful based on consistently applied procedures. A debt obligation is removed from non-accrual status when the issuer resumes interest payments or when collectability of interest is reasonably assured.
Expenses. Expenses directly attributable to a fund are charged to that fund. Expenses attributable to more than one fund are allocated among the respective funds on the basis of relative net assets or other appropriate methods. Expense estimates are accrued in the period to which they relate and adjustments are made when actual amounts are known.
Income Tax Information and Distributions to Shareholders. Each year, each Fund intends to qualify as a regulated investment company under Subchapter M of the Internal Revenue Code, including distributing substantially all of its taxable income and realized gains. As a result, no provision for income taxes is required. Each Fund files a U.S. federal tax return, in addition to state and local tax returns as required. A fund's federal income tax returns are subject to examination by the Internal Revenue Service (IRS) for a period of three fiscal years after they are filed. State and local tax returns may be subject to examination for an additional fiscal year depending on the jurisdiction. Foreign taxes are provided for based on each Fund's understanding of the tax rules and rates that exist in the foreign markets in which it invests.
Distributions are declared and recorded on the ex-dividend date. Income and capital gain distributions are determined in accordance with income tax regulations, which may differ from GAAP.
Capital accounts within the financial statements are adjusted for permanent book-tax differences. These adjustments have no impact on net assets or the results of operations. Temporary book-tax differences will reverse in a subsequent period.
Book-tax differences are primarily due to foreign currency transactions, partnerships, certain foreign taxes, deferred trustees compensation, net operating losses, capital loss carryforwards and losses deferred due to wash sales and excise tax regulations.
Semiannual Report
3. Significant Accounting Policies - continued
Income Tax Information and Distributions to Shareholders - continued
The federal tax cost of investment securities and unrealized appreciation (depreciation) as of period end were as follows for each Fund:
| Tax cost | Gross unrealized
appreciation | Gross unrealized
depreciation | Net unrealized
appreciation
(depreciation)
on securities and
other investments |
Automotive Portfolio | $ 92,795,089 | $ 19,992,034 | $ (7,906,248) | $ 12,085,786 |
Construction and Housing Portfolio | 235,193,757 | 29,975,599 | (9,364,924) | 20,610,675 |
Consumer Discretionary Portfolio | 285,216,336 | 44,921,971 | (5,976,046) | 38,945,925 |
Leisure Portfolio | 256,660,021 | 116,908,104 | (10,918,884) | 105,989,220 |
Multimedia Portfolio | 270,391,145 | 75,295,158 | (3,470,888) | 71,824,270 |
Retailing Portfolio | 462,636,425 | 107,224,556 | (11,443,371) | 95,781,185 |
Capital loss carryforwards are only available to offset future capital gains of the Funds to the extent provided by regulations and may be limited. Under the Regulated Investment Company Modernization Act of 2010 (the Act), the Funds are permitted to carry forward capital losses incurred in taxable years beginning after December 22, 2010 for an unlimited period and such capital losses are required to be used prior to any losses that expire. At February 29, 2012, capital loss carryforwards were as follows:
| Fiscal year
of expiration |
| 2018 |
Construction and Housing Portfolio | $ (2,002,826) |
| | |
| No expiration
Short-term | Total capital
loss carryfoward |
Construction and Housing Portfolio | $ - | $ (2,002,826) |
Consumer Discretionary Portfolio | (1,277,741) | (1,277,741) |
Multimedia Portfolio | (2,894,857) | (2,894,857) |
Certain of the Funds intend to elect to defer to the fiscal year ending February 28, 2013 capital and ordinary losses recognized during the period November 1, 2011 to February 29, 2012. Loss deferrals were as follows:
| Capital losses | Ordinary losses |
Automotive Portfolio | $ (3,996,529) | $ - |
Construction and Housing Portfolio | - | (52,522) |
Leisure Portfolio | (812,452) | - |
Trading (Redemption) Fees. Shares held by investors in the Funds less than 30 days are subject to a redemption fee equal to .75% of the net asset value of shares redeemed. All redemption fees, which reduce the proceeds of the shareholder redemption, are retained by the Funds and accounted for as an addition to paid in capital.
New Accounting Pronouncement. In December 2011, the Financial Accounting Standards Board issued Accounting Standard Update No. 2011-11, Disclosures about Offsetting Assets and Liabilities. The update creates new disclosure requirements requiring entities to disclose both gross and net information for derivatives and other financial instruments that are either offset in the Statement of Assets and Liabilities or subject to an enforceable master netting arrangement or similar agreement. The disclosure requirements are effective for annual reporting periods beginning on or after January 1, 2013, and interim periods within those annual periods. Management is currently evaluating the impact of the update's adoption on the Fund's financial statement disclosures.
4. Operating Policies.
Restricted Securities. The Funds may invest in securities that are subject to legal or contractual restrictions on resale. These securities generally may be resold in transactions exempt from registration or to the public if the securities are registered. Disposal of these securities may involve time-consuming negotiations and expense, and prompt sale at an acceptable price may be difficult. Information regarding restricted securities is included at the end of each applicable Fund's Schedule of Investments.
Semiannual Report
Notes to Financial Statements (Unaudited) - continued
5. Purchases and Sales of Investments.
Purchases and sales of securities other than short-term securities, are noted in the table below.
| Purchases ($) | Sales ($) |
Automotive Portfolio | 30,409,043 | 78,272,984 |
Construction and Housing Portfolio | 124,142,764 | 64,533,327 |
Consumer Discretionary Portfolio | 400,037,707 | 376,368,318 |
Leisure Portfolio | 213,299,923 | 275,351,085 |
Multimedia Portfolio | 124,468,021 | 17,790,853 |
Retailing Portfolio | 538,506,404 | 372,666,144 |
6. Fees and Other Transactions with Affiliates.
Management Fee. FMR and its affiliates provide the Funds with investment management related services for which the Funds pay a monthly management fee. The management fee is the sum of an individual fund fee rate and an annualized group fee rate. The individual fund fee rate is applied to each Fund's average net assets. The group fee rate is based upon the average net assets of all the mutual funds advised by FMR. The group fee rate decreases as assets under management increase and increases as assets under management decrease. For the period, each Fund's annualized management fee rate expressed as a percentage of each Fund's average net assets was as follows:
| Individual Rate | Group Rate | Total |
Automotive Portfolio | .30% | .26% | .56% |
Construction and Housing Portfolio | .30% | .26% | .56% |
Consumer Discretionary Portfolio | .30% | .26% | .56% |
Leisure Portfolio | .30% | .26% | .56% |
Multimedia Portfolio | .30% | .26% | .56% |
Retailing Portfolio | .30% | .26% | .56% |
Transfer Agent Fees. Fidelity Investments Institutional Operations Company, Inc. (FIIOC), an affiliate of FMR, is the Funds' transfer, dividend disbursing and shareholder servicing agent. FIIOC receives account fees and asset-based fees that vary according to account size and type of account. FIIOC pays for typesetting, printing and mailing of shareholder reports, except proxy statements. For the period, transfer agent fees were equivalent to the following annualized rates expressed as a percentage of average net assets:
Automotive Portfolio | .25% |
Construction and Housing Portfolio | .24% |
Consumer Discretionary Portfolio | .23% |
Leisure Portfolio | .23% |
Multimedia Portfolio | .25% |
Retailing Portfolio | .23% |
Accounting and Security Lending Fees. Fidelity Service Company, Inc. (FSC), an affiliate of FMR, maintains each Fund's accounting records. The accounting fee is based on the level of average net assets for each month. Under a separate contract, FSC administers the security lending program. The security lending fee is based on the number and duration of lending transactions.
Brokerage Commissions. Certain Funds placed a portion of their portfolio transactions with brokerage firms which are affiliates of the investment adviser. The commissions paid to these affiliated firms were as follows:
| Amount |
Automotive Portfolio | $ 6,339 |
Construction and Housing Portfolio | 4,775 |
Consumer Discretionary Portfolio | 11,897 |
Leisure Portfolio | 10,238 |
Multimedia Portfolio | 5,962 |
Retailing Portfolio | 9,619 |
Semiannual Report
6. Fees and Other Transactions with Affiliates - continued
Interfund Lending Program. Pursuant to an Exemptive Order issued by the SEC, the Funds, along with other registered investment companies having management contracts with FMR, may participate in an interfund lending program. This program provides an alternative credit facility allowing the funds to borrow from, or lend money to, other participating affiliated funds. At period end, there were no interfund loans outstanding. Each applicable fund's activity in this program during the period for which loans were outstanding was as follows:
| Borrower or
Lender | Average
Loan Balance | Weighted
Average
Interest Rate | Interest
Expense |
Leisure Portfolio | Borrower | $ 5,494,625 | .41% | $ 501 |
7. Committed Line of Credit.
Certain Funds participate with other funds managed by FMR or an affiliate in a $4.25 billion credit facility (the "line of credit") to be utilized for temporary or emergency purposes to fund shareholder redemptions or for other short-term liquidity purposes. The participating funds have agreed to pay commitment fees on their pro-rata portion of the line of credit, which are reflected in Miscellaneous expenses on the Statement of Operations, and are as follows:
Automotive Portfolio | $ 194 |
Construction and Housing Portfolio | 266 |
Consumer Discretionary Portfolio | 401 |
Leisure Portfolio | 637 |
Multimedia Portfolio | 267 |
Retailing Portfolio | 607 |
During the period, there were no borrowings on this line of credit.
8. Security Lending.
Certain Funds lend portfolio securities through a lending agent from time to time in order to earn additional income. For equity securities, a lending agent is used and may loan securities to certain qualified borrowers, including Fidelity Capital Markets (FCM), a broker-dealer affiliated with the Funds. On the settlement date of the loan, each applicable Fund receives collateral (in the form of U.S. Treasury obligations, letters of credit and/or cash) against the loaned securities and maintains collateral in an amount not less than 100% of the market value of the loaned securities during the period of the loan. The market value of the loaned securities is determined at the close of business of the Funds and any additional required collateral is delivered to the Funds on the next business day. If the borrower defaults on its obligation to return the securities loaned because of insolvency or other reasons, a fund could experience delays and costs in recovering the securities loaned or in gaining access to the collateral. Any cash collateral received is invested in the Fidelity Securities Lending Cash Central Fund. The value of loaned securities and cash collateral at period end are disclosed on each applicable Fund's Statement of Assets and Liabilities. Security lending income represents the income earned on investing cash collateral, less rebates paid to borrowers and any lending agent fees associated with the loan, plus any premium payments received for lending certain types of securities. Security lending income is presented on each applicable Fund's Statement of Operations as a component of income from Fidelity Central Funds. FCM activity as of and during the period was as follows:
| Security Lending
Income From Securities
Loaned to FCM | Value of Securities
Loaned to FCM at
Period End |
Automotive Portfolio | $ - | $ - |
Construction and Housing Portfolio | - | - |
Consumer Discretionary Portfolio | - | - |
Leisure Portfolio | - | - |
Multimedia Portfolio | 14,362 | 987,959 |
Retailing Portfolio | 2,446 | - |
Semiannual Report
Notes to Financial Statements (Unaudited) - continued
9. Bank Borrowings.
Each Fund is permitted to have bank borrowings for temporary or emergency purposes to fund shareholder redemptions or for other short-term liquidity requirements. Each Fund has established borrowing arrangements with certain banks. The interest rate on the borrowings is the bank's base rate, as revised from time to time. At period end, there were no bank borrowings outstanding. Each applicable Fund's activity in this program during the period for which loans were outstanding was as follows:
| Average
Loan Balance | Weighted
Average
Interest Rate | Interest
Expense |
Leisure Portfolio | $ 2,001,750 | .66% | $ 147 |
10. Expense Reductions.
Many of the brokers with whom FMR places trades on behalf of certain Funds provided services to these Funds in addition to trade execution. These services included payments of expenses on behalf of each applicable Fund. In addition, through arrangements with each applicable Fund's custodian, credits realized as a result of uninvested cash balances were used to reduce each applicable Fund's expenses. All of the applicable expense reductions are noted in the table below.
| Brokerage
Service
reduction | Custody
expense
reduction |
Automotive Portfolio | $ 1,301 | $ - |
Construction and Housing Portfolio | 1,824 | - |
Consumer Discretionary Portfolio | 13,275 | 2 |
Leisure Portfolio | 14,333 | - |
Multimedia Portfolio | 1,768 | - |
Retailing Portfolio | 19,843 | - |
11. Other.
The Funds' organizational documents provide former and current trustees and officers with a limited indemnification against liabilities arising in connection with the performance of their duties to the Funds. In the normal course of business, the Funds may also enter into contracts that provide general indemnifications. The Funds' maximum exposure under these arrangements is unknown as this would be dependent on future claims that may be made against the Funds. The risk of material loss from such claims is considered remote.
At the end of the period, Fidelity VIP Funds Manager 60% Portfolio was the owner of record of approximately 10%, 17%, 38%, and 10% of the total outstanding shares of Automotive Portfolio, Construction and Housing Portfolio, Consumer Discretionary Portfolio and Multimedia Portfolio, respectively. In addition, at the end of the period, Strategic Advisers U.S. Opportunity Fund was the owner of record of approximately 19%, 14%, and 14% of the total outstanding shares of Consumer Discretionary Portfolio, Multimedia Portfolio, and Retailing Portfolio, respectively. Mutual funds managed by FMR or its affiliates, were the owners of record, in the aggregate, of approximately 35%, 73%, 33%, and 28% of the total outstanding shares of Construction and Housing Portfolio, Consumer Discretionary Portfolio, Multimedia Portfolio, and Retailing Portfolio, respectively.
Semiannual Report
Board Approval of Investment Advisory Contracts and Management Fees
Automotive Portfolio
Construction and Housing Portfolio
Consumer Discretionary Portfolio
Leisure Portfolio
Multimedia Portfolio
Retailing Portfolio
Each year, the Board of Trustees, including the Independent Trustees (together, the Board), votes on the renewal of the management contract and sub-advisory agreements (together, the Advisory Contracts) for each fund. The Board, assisted by the advice of fund counsel and Independent Trustees' counsel, requests and considers a broad range of information relevant to the renewal of the Advisory Contracts throughout the year.
The Board meets regularly and, at each of its meetings, considers factors that are relevant to its annual consideration of the renewal of each fund's Advisory Contracts, including the services and support provided to each fund and its shareholders. The Board has established various standing committees, each composed of and chaired by Independent Trustees with varying backgrounds, to which the Board has assigned specific subject matter responsibilities in order to enhance effective decision-making by the Board. The Board, acting directly and through its Committees, requests and receives information concerning the annual consideration of the renewal of each fund's Advisory Contracts. The Board also meets as needed to consider matters specifically related to the Board's annual consideration of the renewal of Advisory Contracts. Members of the Board may also meet with trustees of other Fidelity funds through ad hoc joint committees to discuss certain matters relevant to the Fidelity funds.
At its July 2012 meeting, the Board of Trustees, including the Independent Trustees, unanimously determined to renew each fund's Advisory Contracts. In reaching its determination, the Board considered all factors it believed relevant, including (i) the nature, extent, and quality of the services to be provided to each fund and its shareholders (including the investment performance of each fund); (ii) the competitiveness of each fund's management fee and total expense ratio relative to peer funds; (iii) the total costs of the services to be provided by and the profits to be realized by Fidelity from its relationship with each fund; (iv) the extent to which economies of scale exist and would be realized as each fund grows; and (v) whether fee levels reflect these economies of scale, if any, for the benefit of fund shareholders.
In considering whether to renew the Advisory Contracts for each fund, the Board reached a determination, with the assistance of fund counsel and Independent Trustees' counsel and through the exercise of its business judgment, that the renewal of the Advisory Contracts is in the best interests of each fund and its shareholders and that the compensation payable under the Advisory Contracts is fair and reasonable. The Board's decision to renew the Advisory Contracts was not based on any single factor, but rather was based on a comprehensive consideration of all the information provided to the Board at its meetings throughout the year. The Board, in reaching its determination to renew the Advisory Contracts, is aware that shareholders in each fund have a broad range of investment choices available to them, including a wide choice among mutual funds offered by Fidelity's competitors, and that each fund's shareholders, who have the opportunity to review and weigh the disclosure provided by the fund in its prospectus and other public disclosures, have chosen to invest in that fund, managed by Fidelity.
Nature, Extent, and Quality of Services Provided. The Board considered the staffing within the investment adviser, FMR, and the sub-advisers (together, the Investment Advisers), including the backgrounds of the funds' investment personnel, and also considered the funds' investment objectives, strategies, and related investment philosophies. The Independent Trustees also had discussions with senior management of Fidelity's investment operations and investment groups. The Board considered the structure of the portfolio manager compensation program and whether this structure provides appropriate incentives to act in the best interests of each fund.
Resources Dedicated to Investment Management and Support Services. The Board and the Fund Oversight and Research Committees reviewed the general qualifications and capabilities of the Investment Advisers' investment staff, including its size, education, experience, and resources, as well as the Investment Advisers' approach to recruiting, training, managing, and compensating investment personnel. The Board also noted that FMR has continued to increase the resources devoted to non-U.S. offices, including expansion of Fidelity's global investment organization. The Board noted that Fidelity's analysts have extensive resources, tools and capabilities that allow them to conduct sophisticated quantitative and fundamental analysis, as well as credit analysis of issuers, counterparties and guarantors. The Board also believes that Fidelity's investment professionals have sufficient access to global information and data so as to provide competitive investment results over time, and that those professionals also have access to sophisticated tools that permit them to assess portfolio construction and risk and performance attribution characteristics continuously, as well as to transmit new information and research conclusions rapidly around the world. Additionally, in its deliberations, the Board considered the Investment Advisers' trading and risk management capabilities and resources, which are an integral part of the investment management process.
Shareholder and Administrative Services. The Board considered (i) the nature, extent, quality, and cost of advisory, administrative, and shareholder services performed by the Investment Advisers and their affiliates under the Advisory Contracts and under separate agreements covering transfer agency, pricing and bookkeeping, and securities lending services for each fund; (ii) the nature and extent of the supervision of third party service providers, principally custodians and subcustodians; and (iii) the resources devoted to, and the record of compliance with, each fund's compliance policies and procedures. The Board also reviewed the allocation of fund brokerage, including allocations to brokers affiliated with the Investment Advisers, the use of brokerage commissions to pay fund expenses, and the use of "soft" commission dollars to pay for research services.
Semiannual Report
The Board noted that the growth of fund assets over time across the complex allows Fidelity to reinvest in the development of services designed to enhance the value or convenience of the Fidelity funds as investment vehicles. These services include 24-hour access to account information and market information through telephone representatives and over the Internet, investor education materials and asset allocation tools, and the expanded availability of Fidelity Investor Centers.
Investment in a Large Fund Family. The Board considered the benefits to shareholders of investing in a Fidelity fund, including the benefits of investing in a fund that is part of a large family of funds offering a variety of investment disciplines and providing a large variety of mutual fund investor services. The Board noted that Fidelity had taken, or had made recommendations that resulted in the Fidelity funds taking, a number of actions over the previous year that benefited particular funds, including (i) continuing to dedicate additional resources to investment research and support of the senior management team that oversees asset management; (ii) persisting in efforts to enhance Fidelity's research capabilities, in particular, international research; (iii) launching new funds and making other enhancements to meet client needs for global and income-oriented solutions; (iv) continuing to launch dedicated lower cost underlying funds to meet investment management's portfolio construction needs related to expanding underlying fund options, specifically for the Freedom Fund product lines; (v) adopting a "Stock Selector" sector neutral investment approach and employing a team of portfolio managers who are sector specialists to manage certain funds; (vi) rationalizing product lines and gaining increased efficiencies through the mergers of several funds into other funds; (vii) strengthening the Spartan Index Fund product line by adding new funds and/or new low-cost institutional share classes, restructuring fund expenses to accommodate new classes, and reducing investment minimums for certain classes of shares; (viii) modifying the eligibility criteria for Institutional Class shares to increase their appeal to government entities and charitable investors; and (ix) reducing certain transfer agent fee rates.
Investment Performance. The Board considered whether each fund has operated in accordance with its investment objective, as well as its record of compliance with its investment restrictions. It also reviewed each fund's absolute investment performance, as well as each fund's relative investment performance measured over multiple periods against a third-party-sponsored index that reflects the market sector in which the fund invests. The Board noted that FMR believes that no meaningful peer group exists for the funds principally because most other funds in each fund's third-party peer group focus on different industries or sectors than the fund. For each fund, the following charts considered by the Board show, over the one-, three-, and five-year periods ended December 31, 2011, the fund's cumulative total returns and the cumulative total returns of a third-party-sponsored index ("benchmark").
Automotive Portfolio
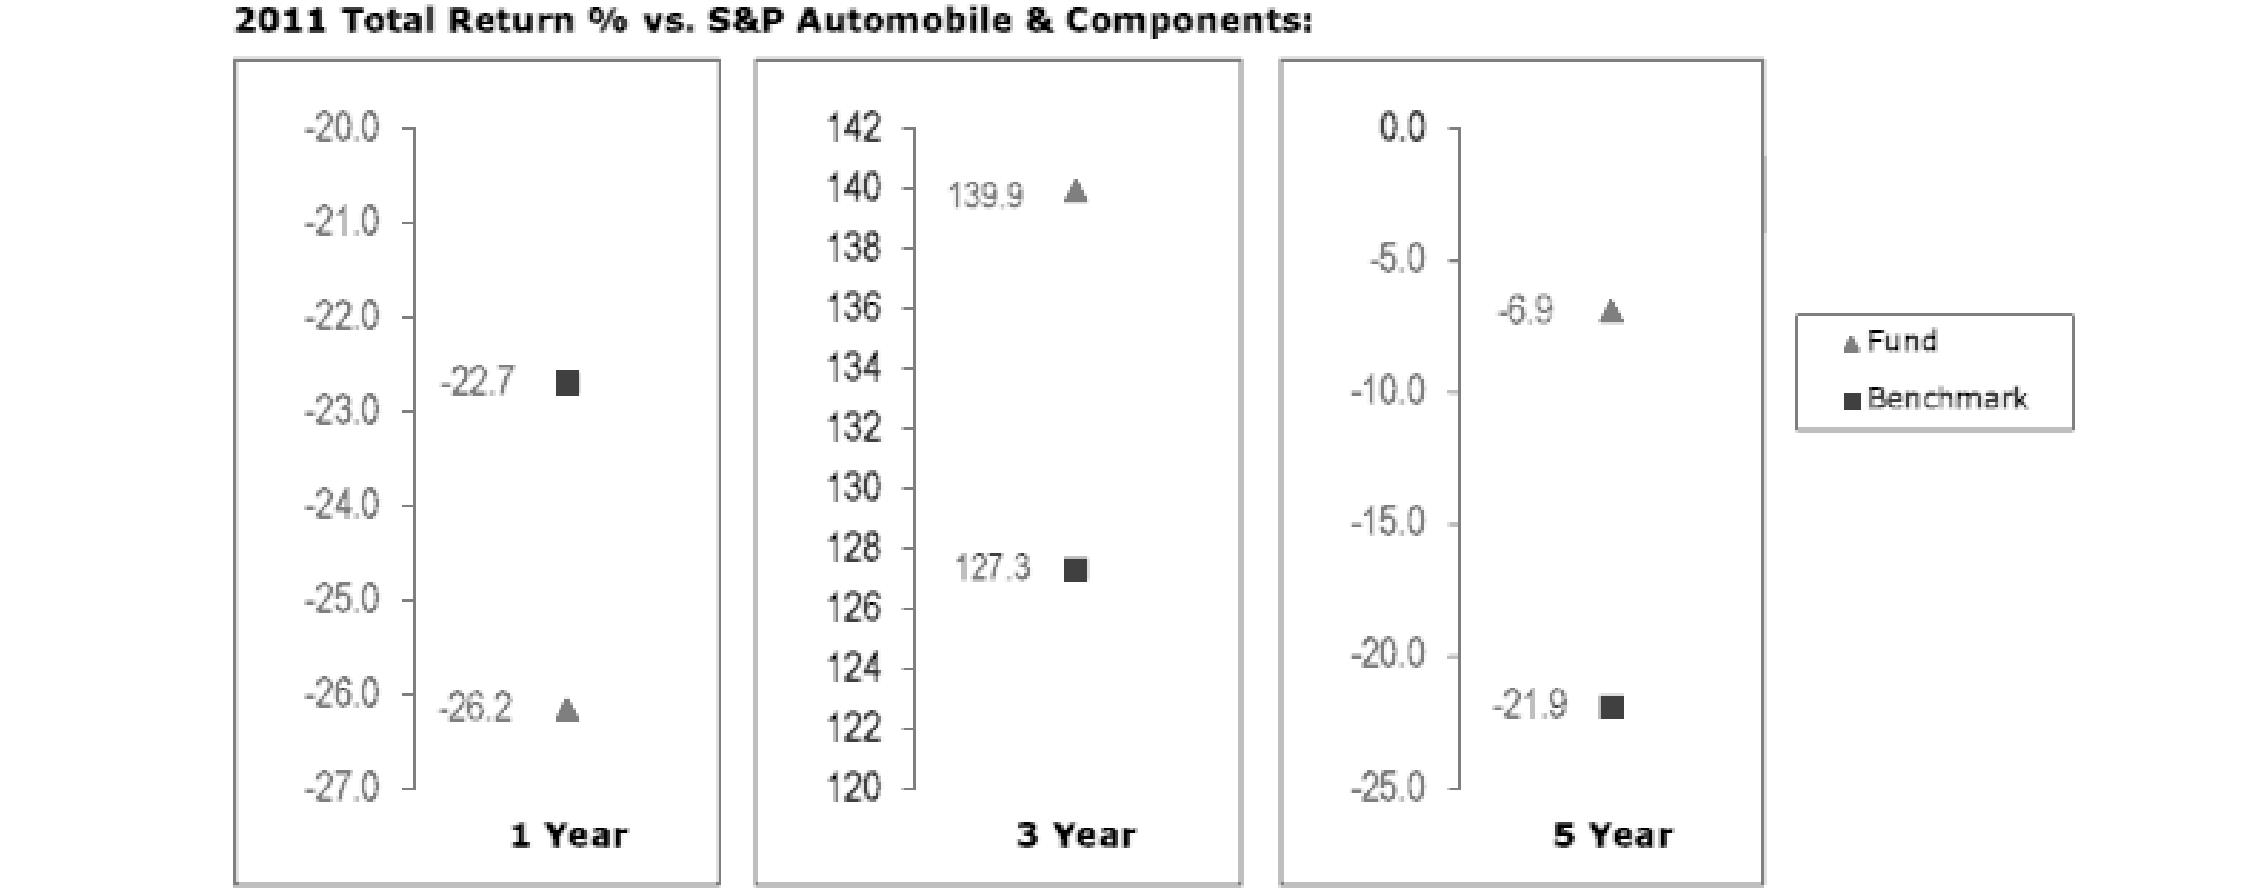
The Board noted that the investment performance of the fund compared favorably to its benchmark for the three- and five-year periods, although the fund's one-year total return was lower than its benchmark. The Board also reviewed the fund's performance since inception as well as performance in the current year.
Semiannual Report
Board Approval of Investment Advisory Contracts and Management Fees - continued
Construction and Housing Portfolio
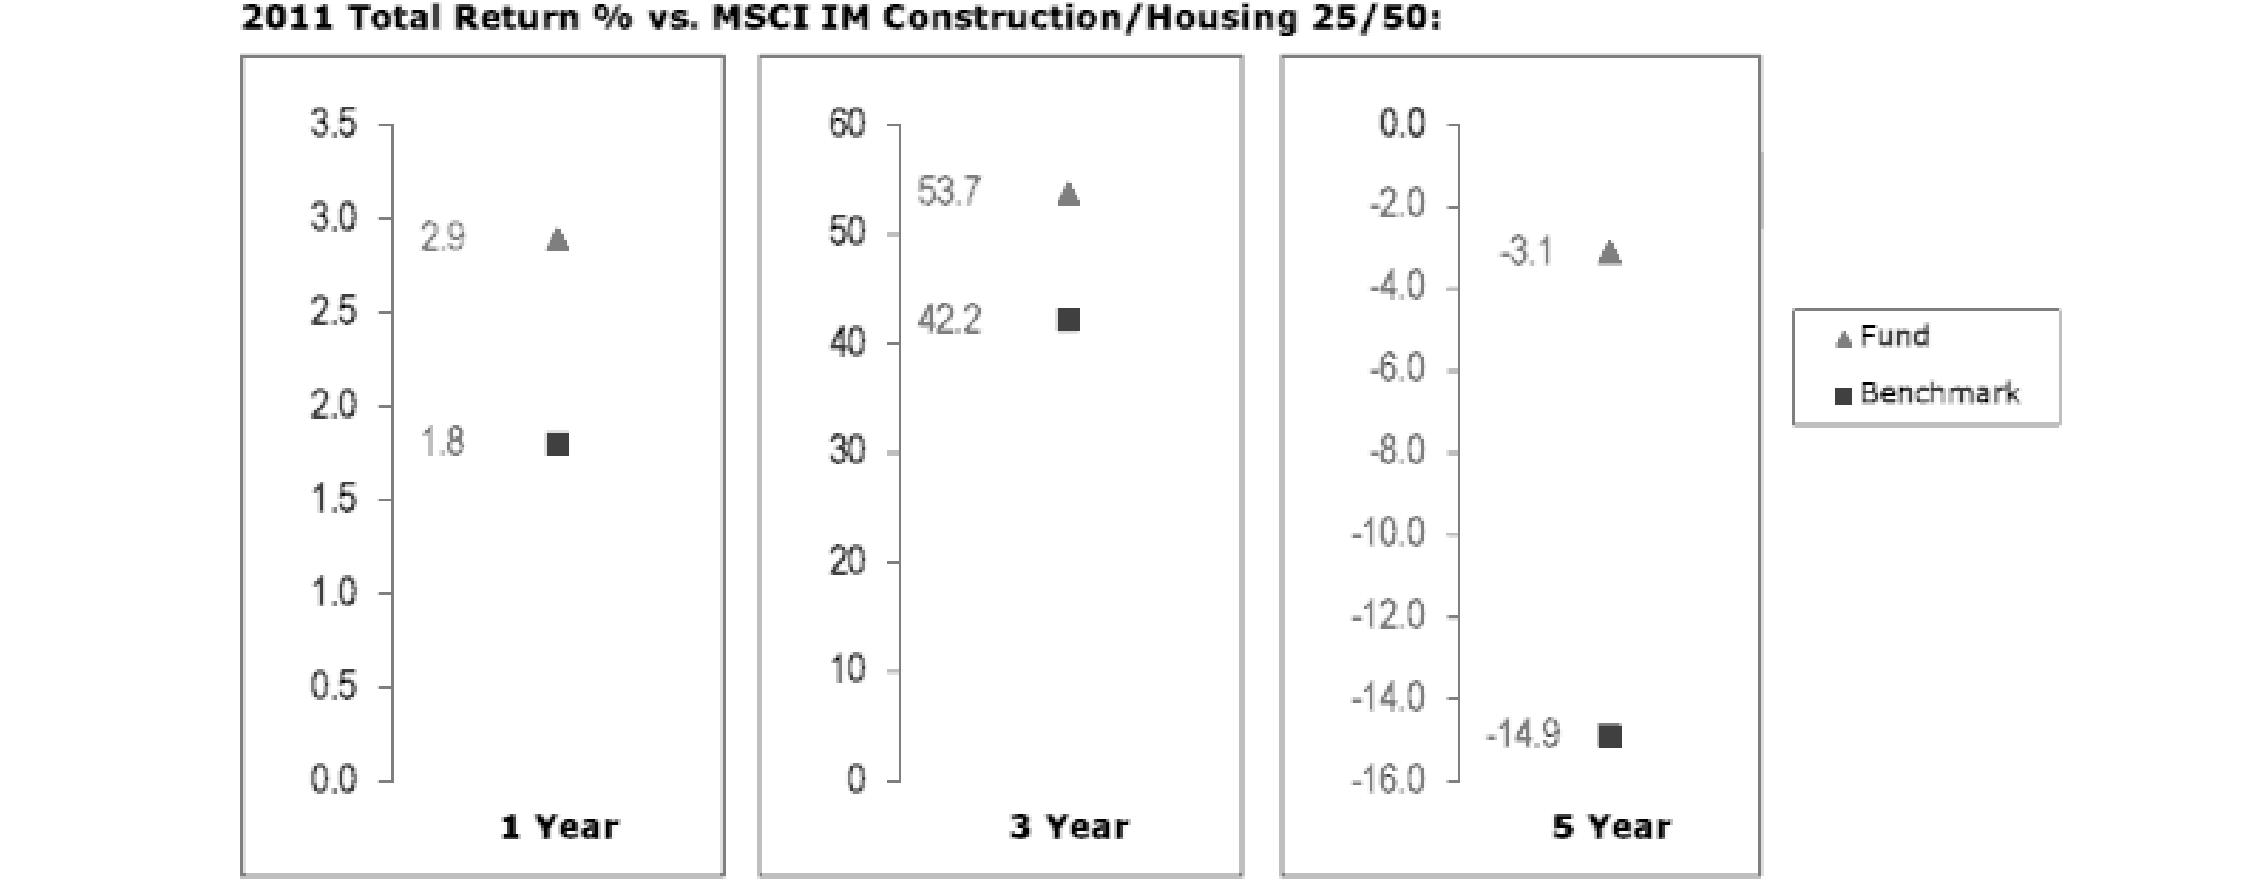
The Board noted that the investment performance of the fund compared favorably to its benchmark for all the periods shown. The Board noted that there was a portfolio management change for the fund in January 2012. The Board also reviewed the fund's performance since inception as well as performance in the current year.
Consumer Discretionary Portfolio
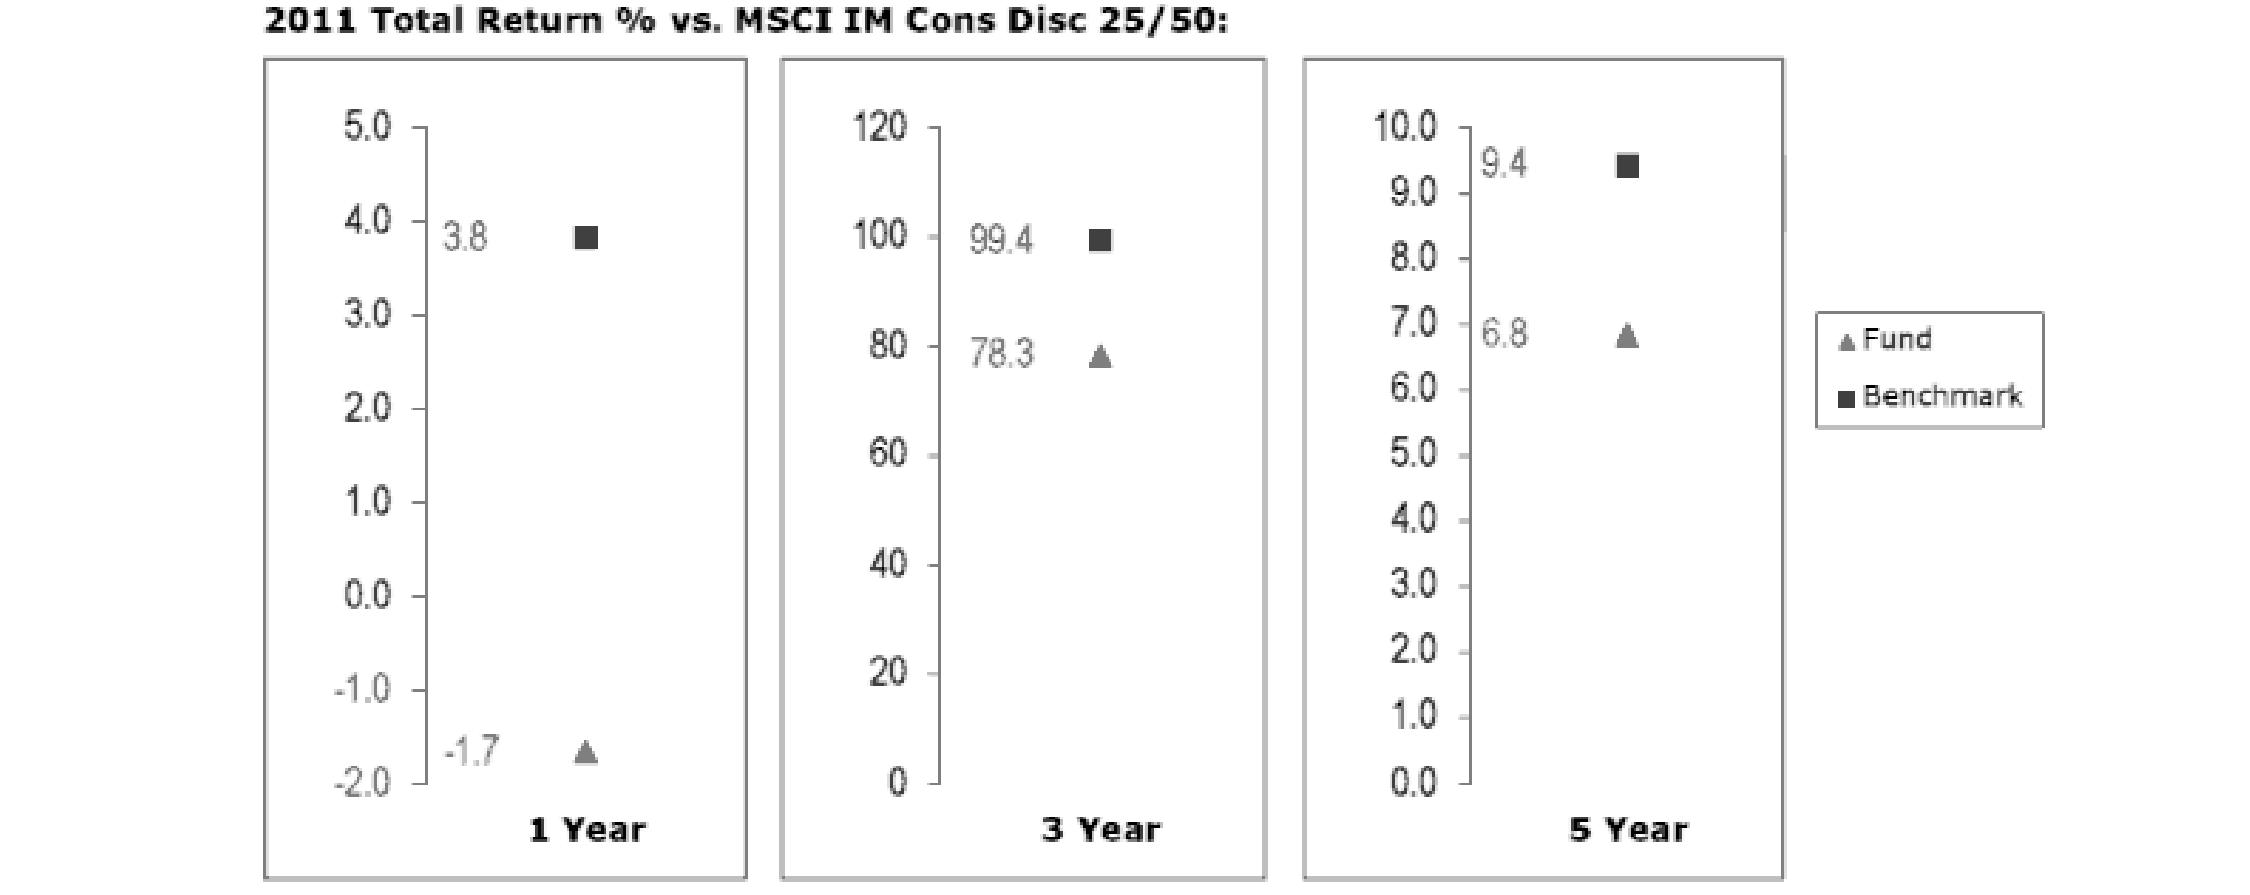
The Board noted that the investment performance of the fund was lower than its benchmark for all the periods shown. The Board discussed with FMR actions to improve the fund's below-benchmark performance. The Board noted that there was a portfolio management change for the fund in April 2012. The Board also reviewed the fund's performance since inception as well as performance in the current year. The Board will continue to closely monitor the performance of the fund in the coming year and discuss with FMR other appropriate actions to address the performance of the fund.
Semiannual Report
Leisure Portfolio
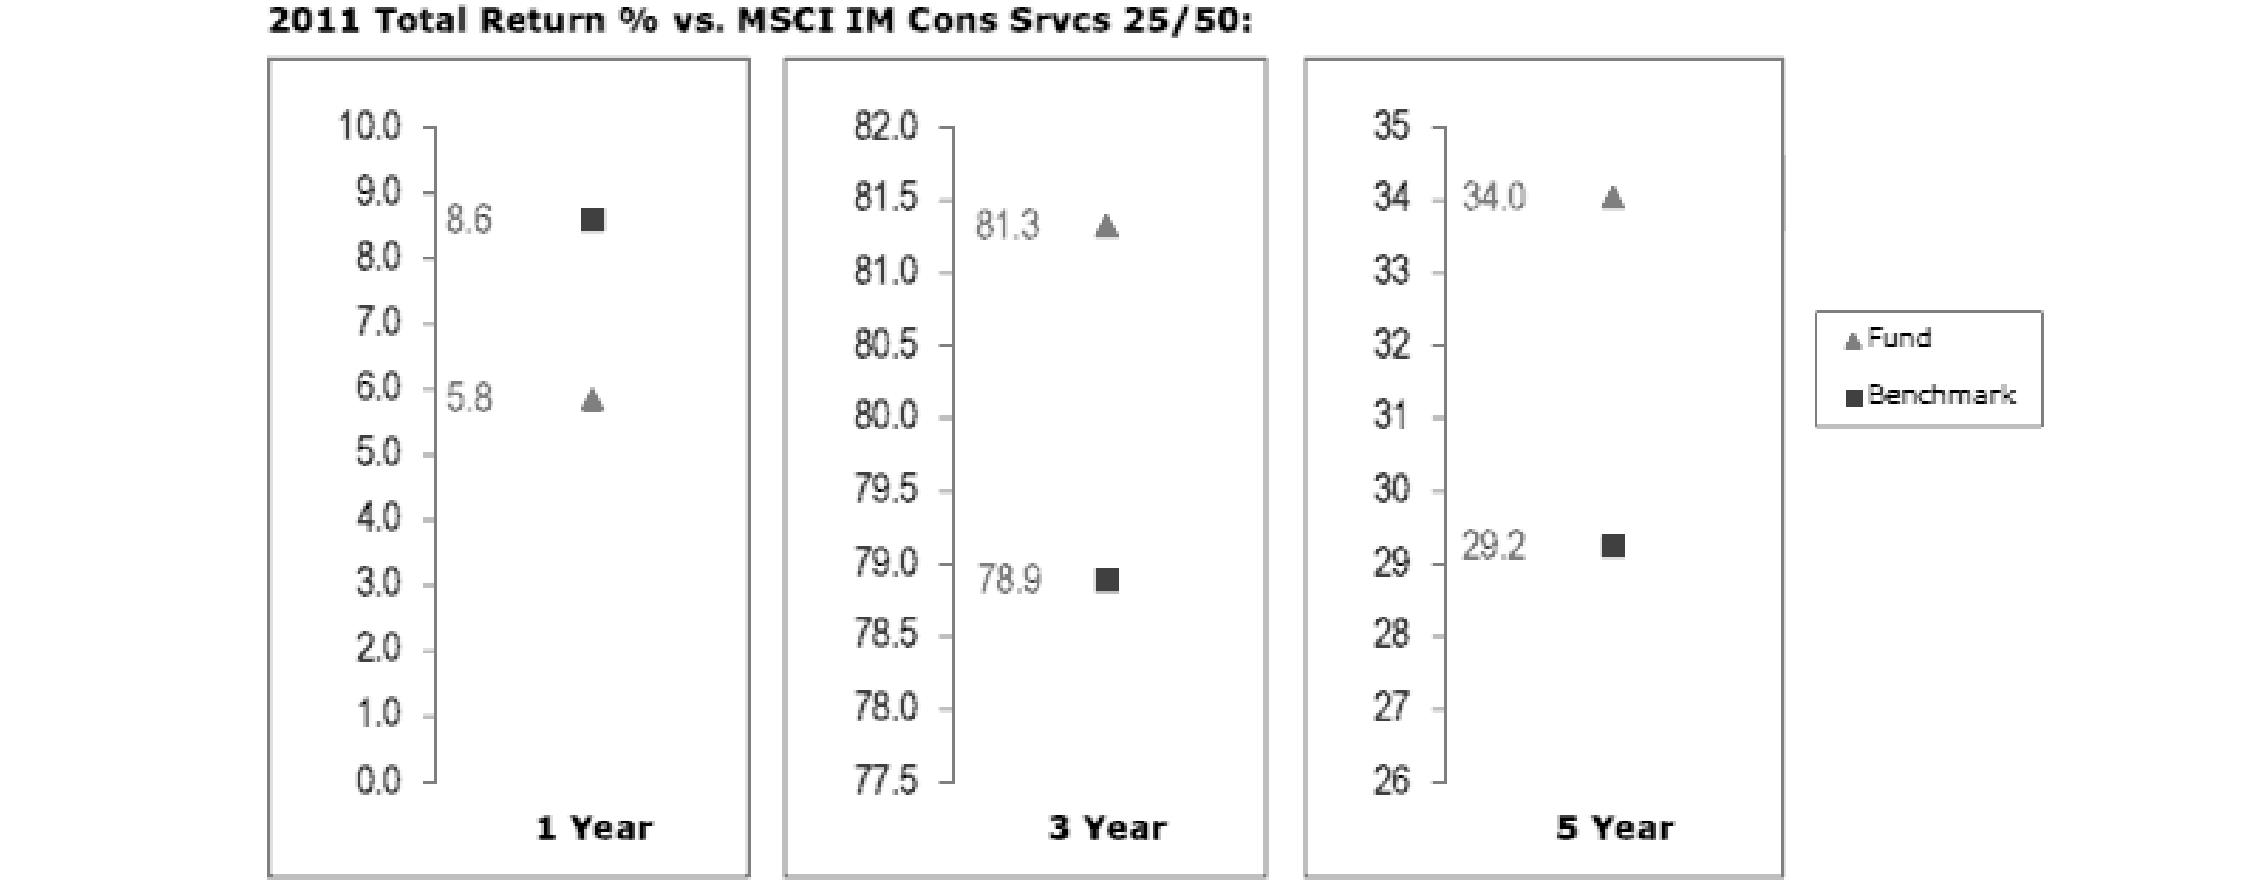
The Board noted that the investment performance of the fund compared favorably to its benchmark for the three- and five-year periods, although the fund's one-year total return was lower than its benchmark. The Board also reviewed the fund's performance since inception as well as performance in the current year.
Multimedia Portfolio
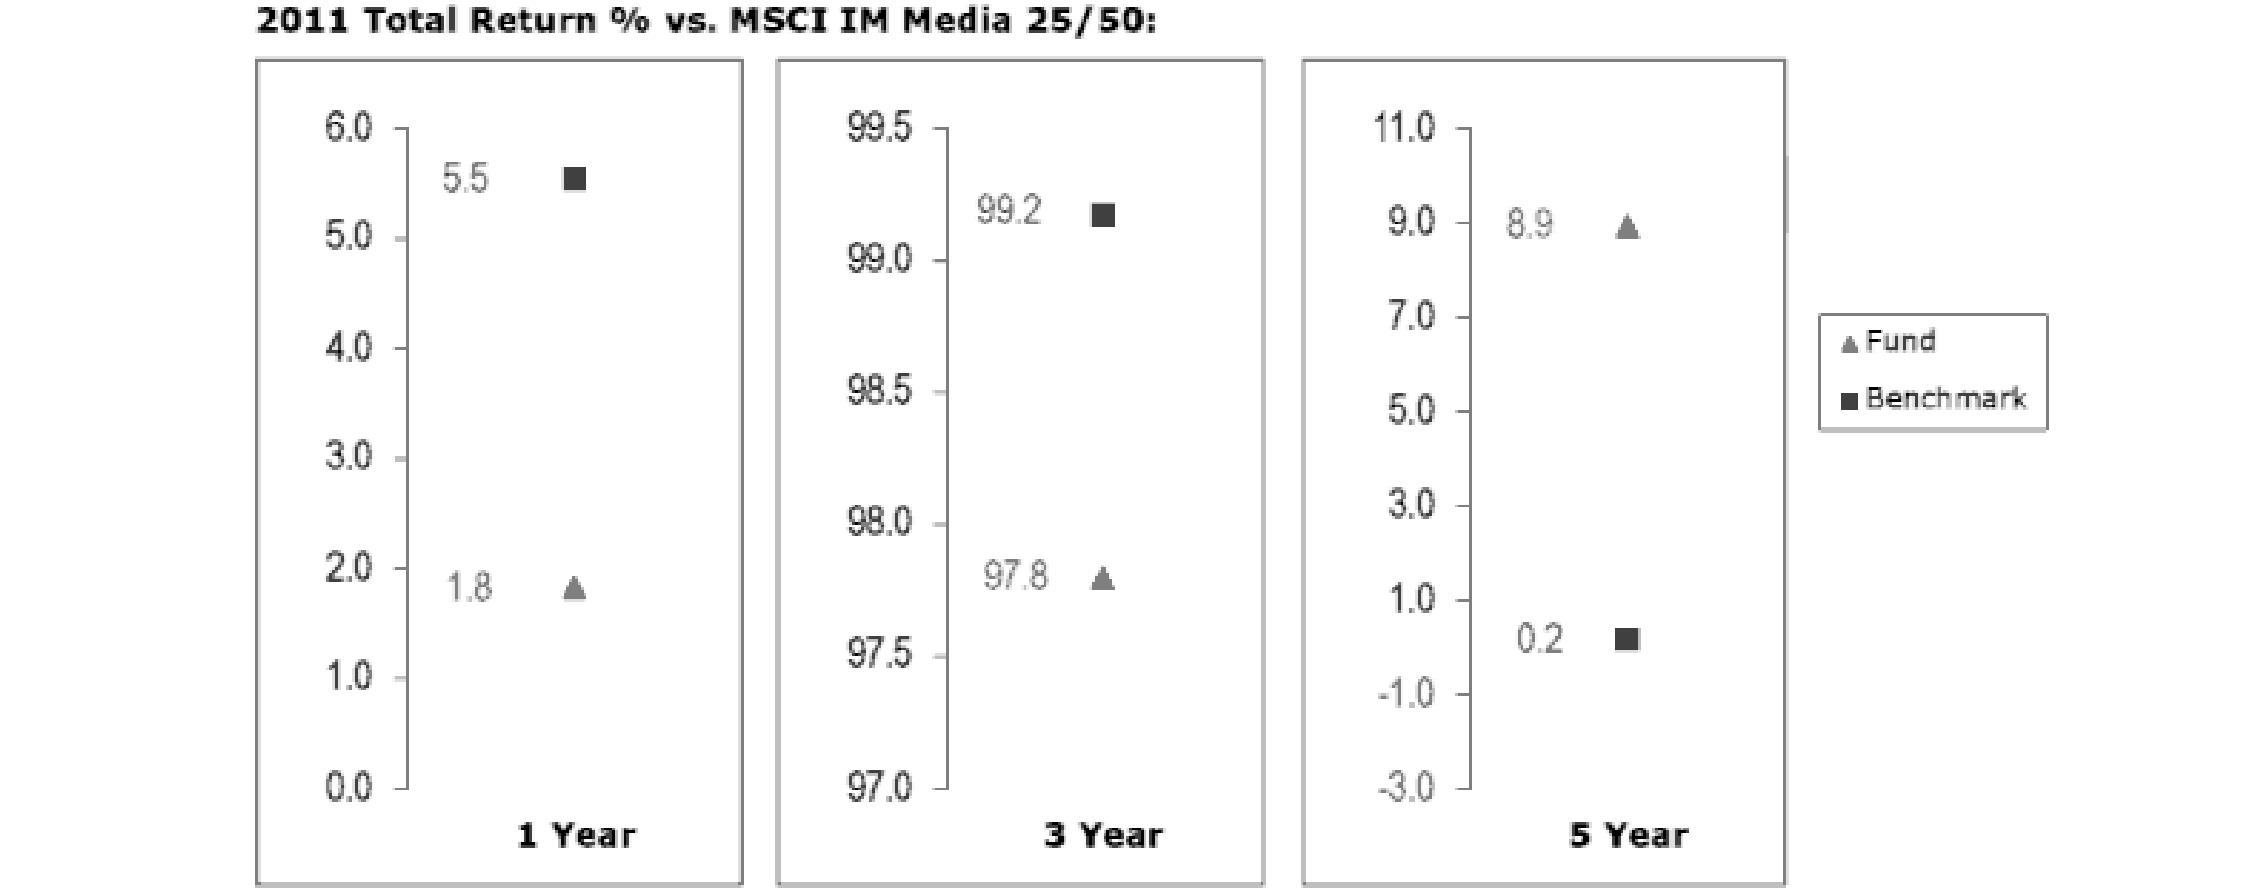
The Board noted that the investment performance of the fund was lower than its benchmark for the one- and three-year periods, although the fund's five-year cumulative total return compared favorably to its benchmark. The Board discussed with FMR actions to improve the fund's below-benchmark performance. The Board also reviewed the fund's performance since inception as well as performance in the current year. The Board will continue to closely monitor the performance of the fund in the coming year and discuss with FMR other appropriate actions to address the performance of the fund.
Semiannual Report
Board Approval of Investment Advisory Contracts and Management Fees - continued
Retailing Portfolio
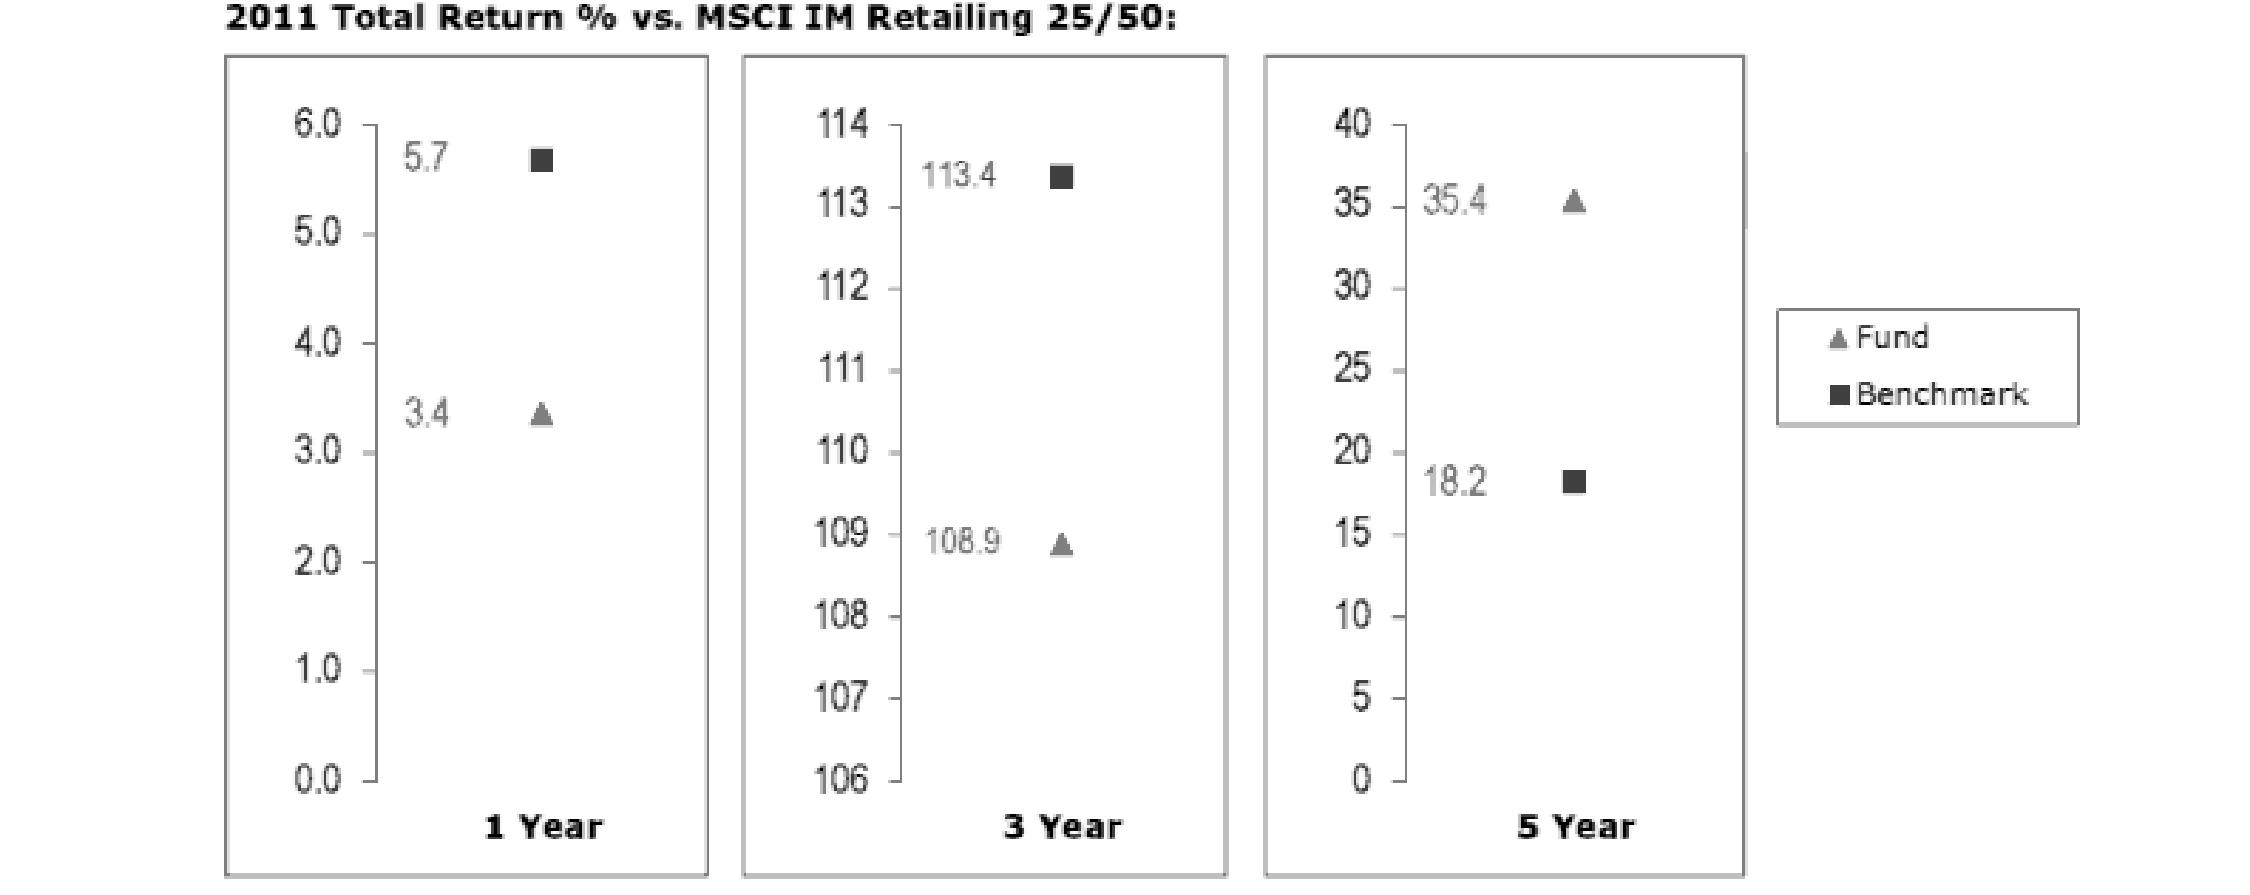
The Board noted that the investment performance of the fund was lower than its benchmark for the one- and three-year periods, although the fund's five-year cumulative total return compared favorably to its benchmark. The Board discussed with FMR actions to improve the fund's below-benchmark performance. The Board noted that there was a change in the fund's portfolio manager in April 2010. The Board also reviewed the fund's performance since inception as well as performance in the current year. The Board will continue to closely monitor the performance of the fund in the coming year and discuss with FMR other appropriate actions to address the performance of the fund.
Based on its review, the Board concluded that the nature, extent, and quality of services provided to each fund under the Advisory Contracts should benefit each fund's shareholders.
Competitiveness of Management Fee and Total Expense Ratio. The Board considered each fund's management fee and total expense ratio compared to "mapped groups" of competitive funds and classes. Fidelity creates "mapped groups" by combining similar Lipper investment objective categories that have comparable management fee characteristics. Combining Lipper investment objective categories aids the Board's management fee and total expense ratio comparisons by broadening the competitive group used for comparison and by reducing the number of universes to which various Fidelity funds are compared.
Management Fee. The Board considered two proprietary management fee comparisons for the 12-month periods shown in the charts below. The group of Lipper funds used by the Board for management fee comparisons is referred to below as the "Total Mapped Group." The Total Mapped Group comparison focuses on a fund's standing relative to the total universe of comparable funds available to investors in terms of gross management fees before expense reimbursements or caps. "TMG %" represents the percentage of funds in the Total Mapped Group that had management fees that were lower than a fund's. For example, a TMG % of 6% means that 94% of the funds in the Total Mapped Group had higher management fees than a fund. The "Asset-Size Peer Group" (ASPG) comparison focuses on a fund's standing relative to non-Fidelity funds similar in size to the fund within the Total Mapped Group. The ASPG represents at least 15% of the funds in the Total Mapped Group with comparable asset size and management fee characteristics, subject to a minimum of 50 funds (or all funds in the Total Mapped Group if fewer than 50). Additional information, such as the ASPG quartile in which a fund's management fee ranked, is also included in the charts and considered by the Board.
Semiannual Report
Automotive Portfolio
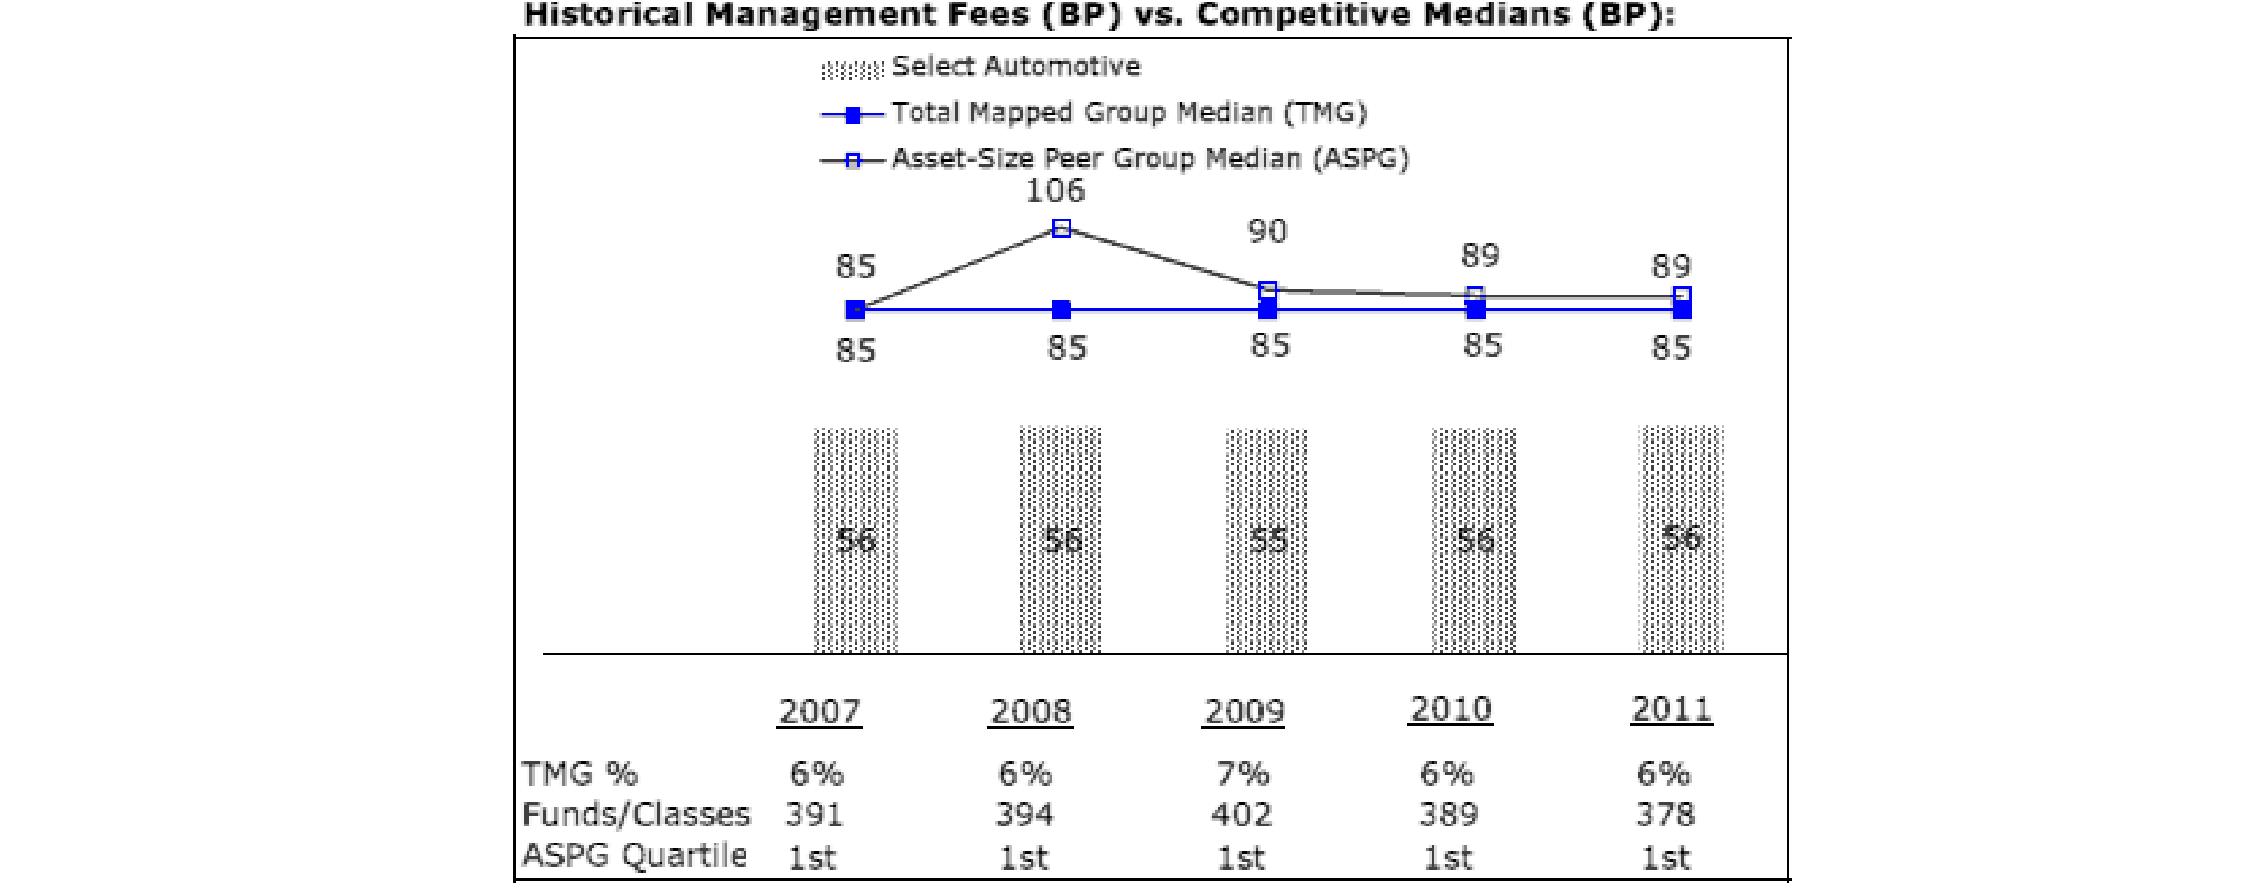
Construction and Housing Portfolio
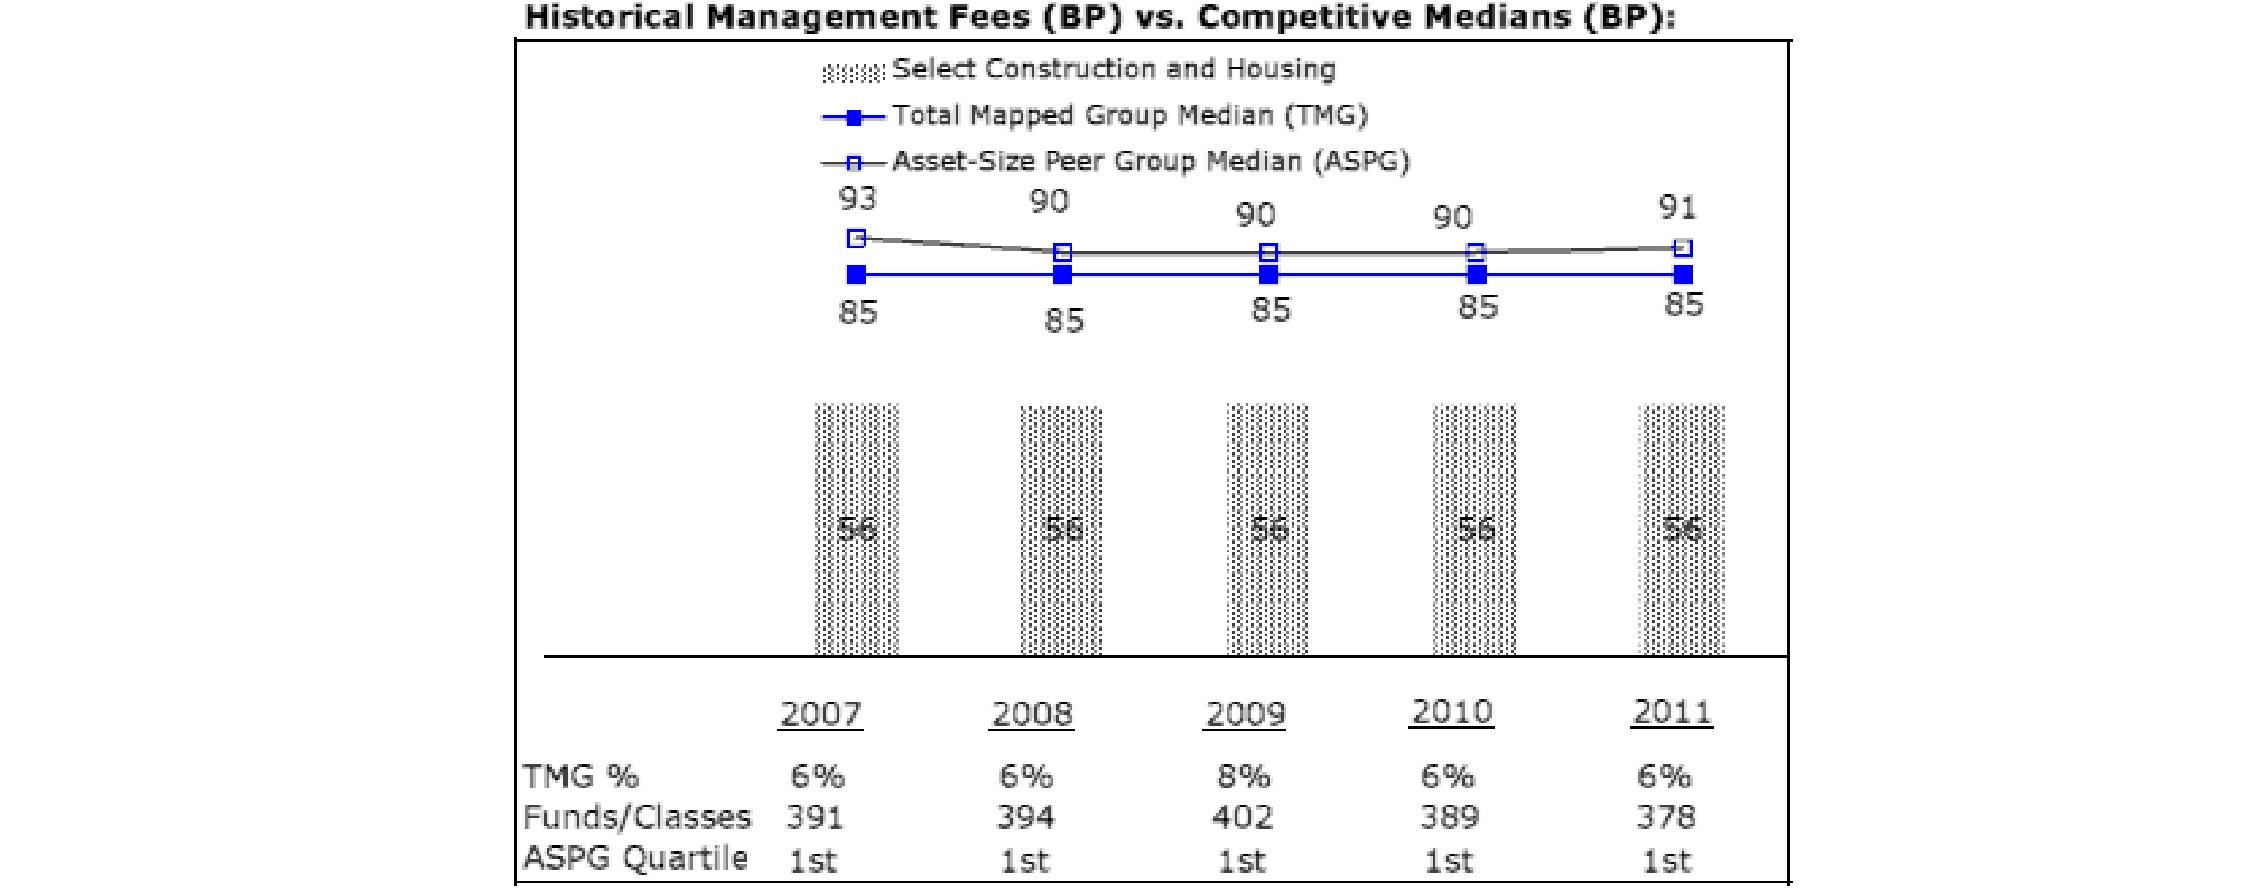
Semiannual Report
Board Approval of Investment Advisory Contracts and Management Fees - continued
Consumer Discretionary Portfolio

Leisure Portfolio

Semiannual Report
Multimedia Portfolio
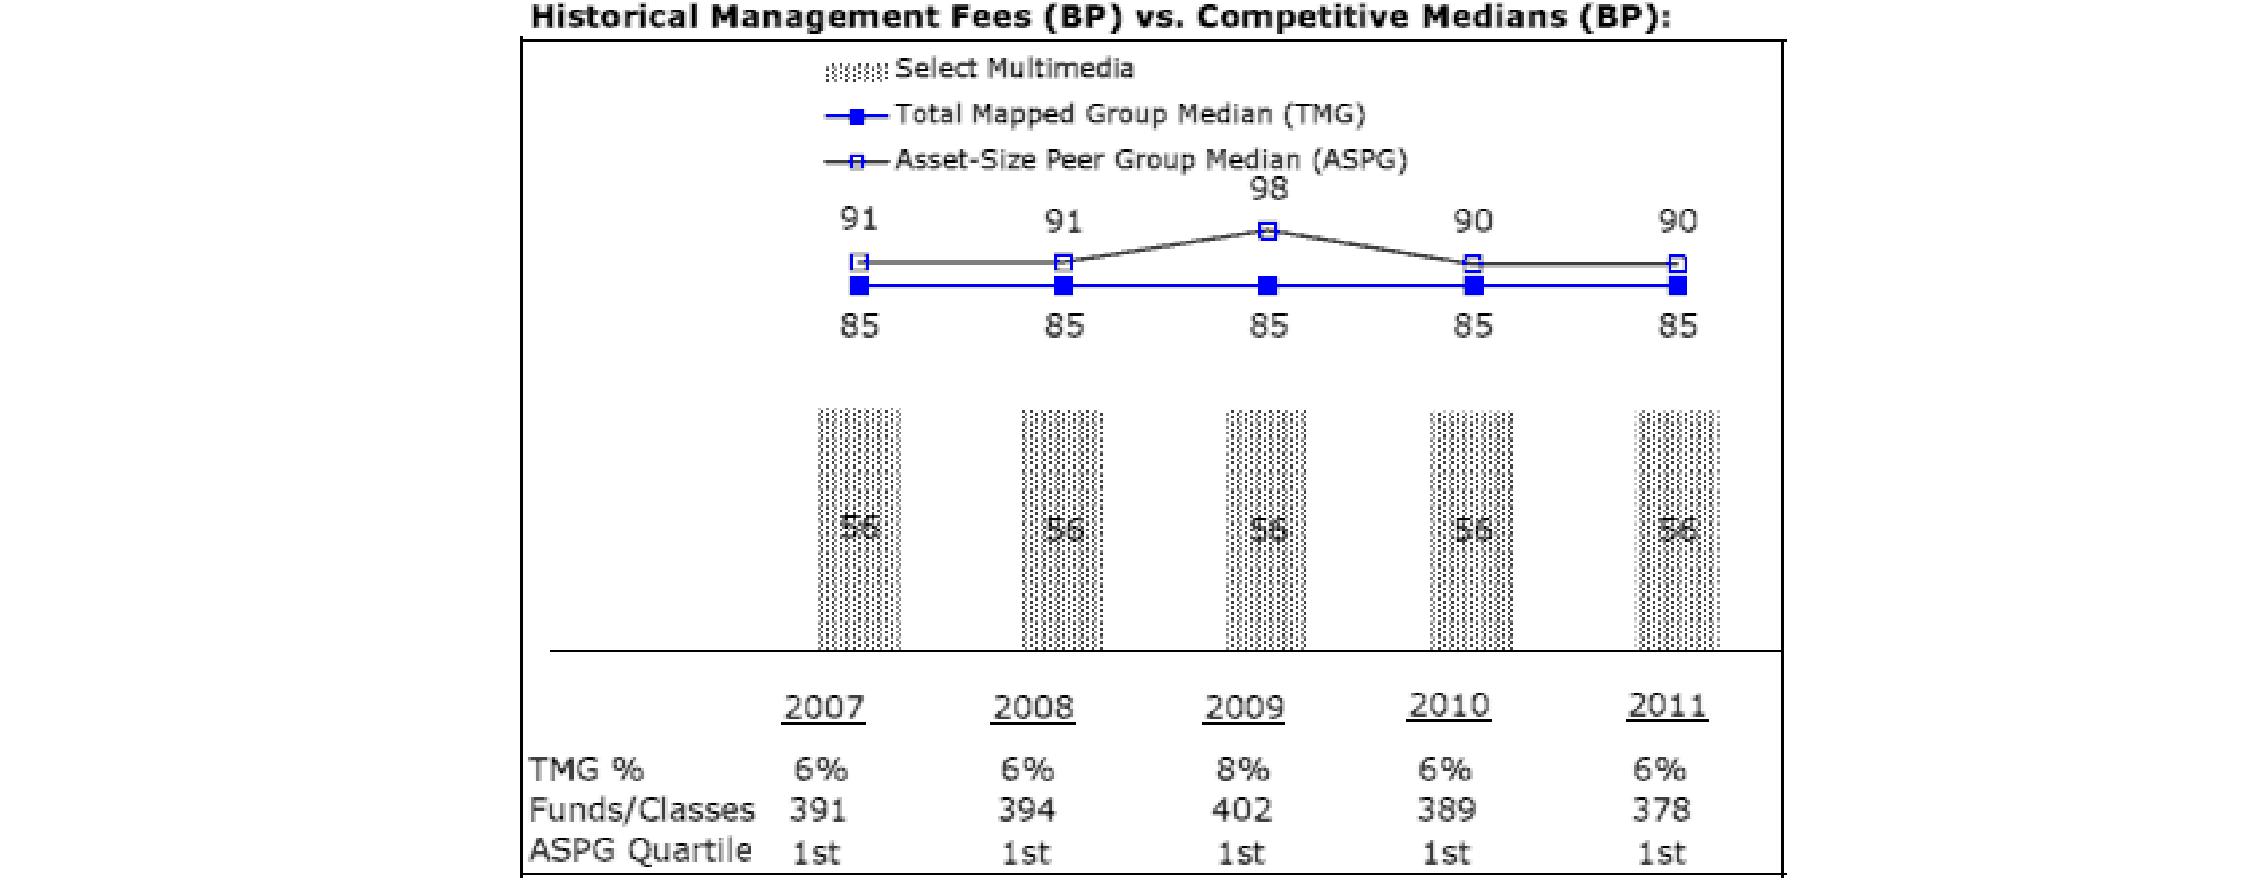
Retailing Portfolio
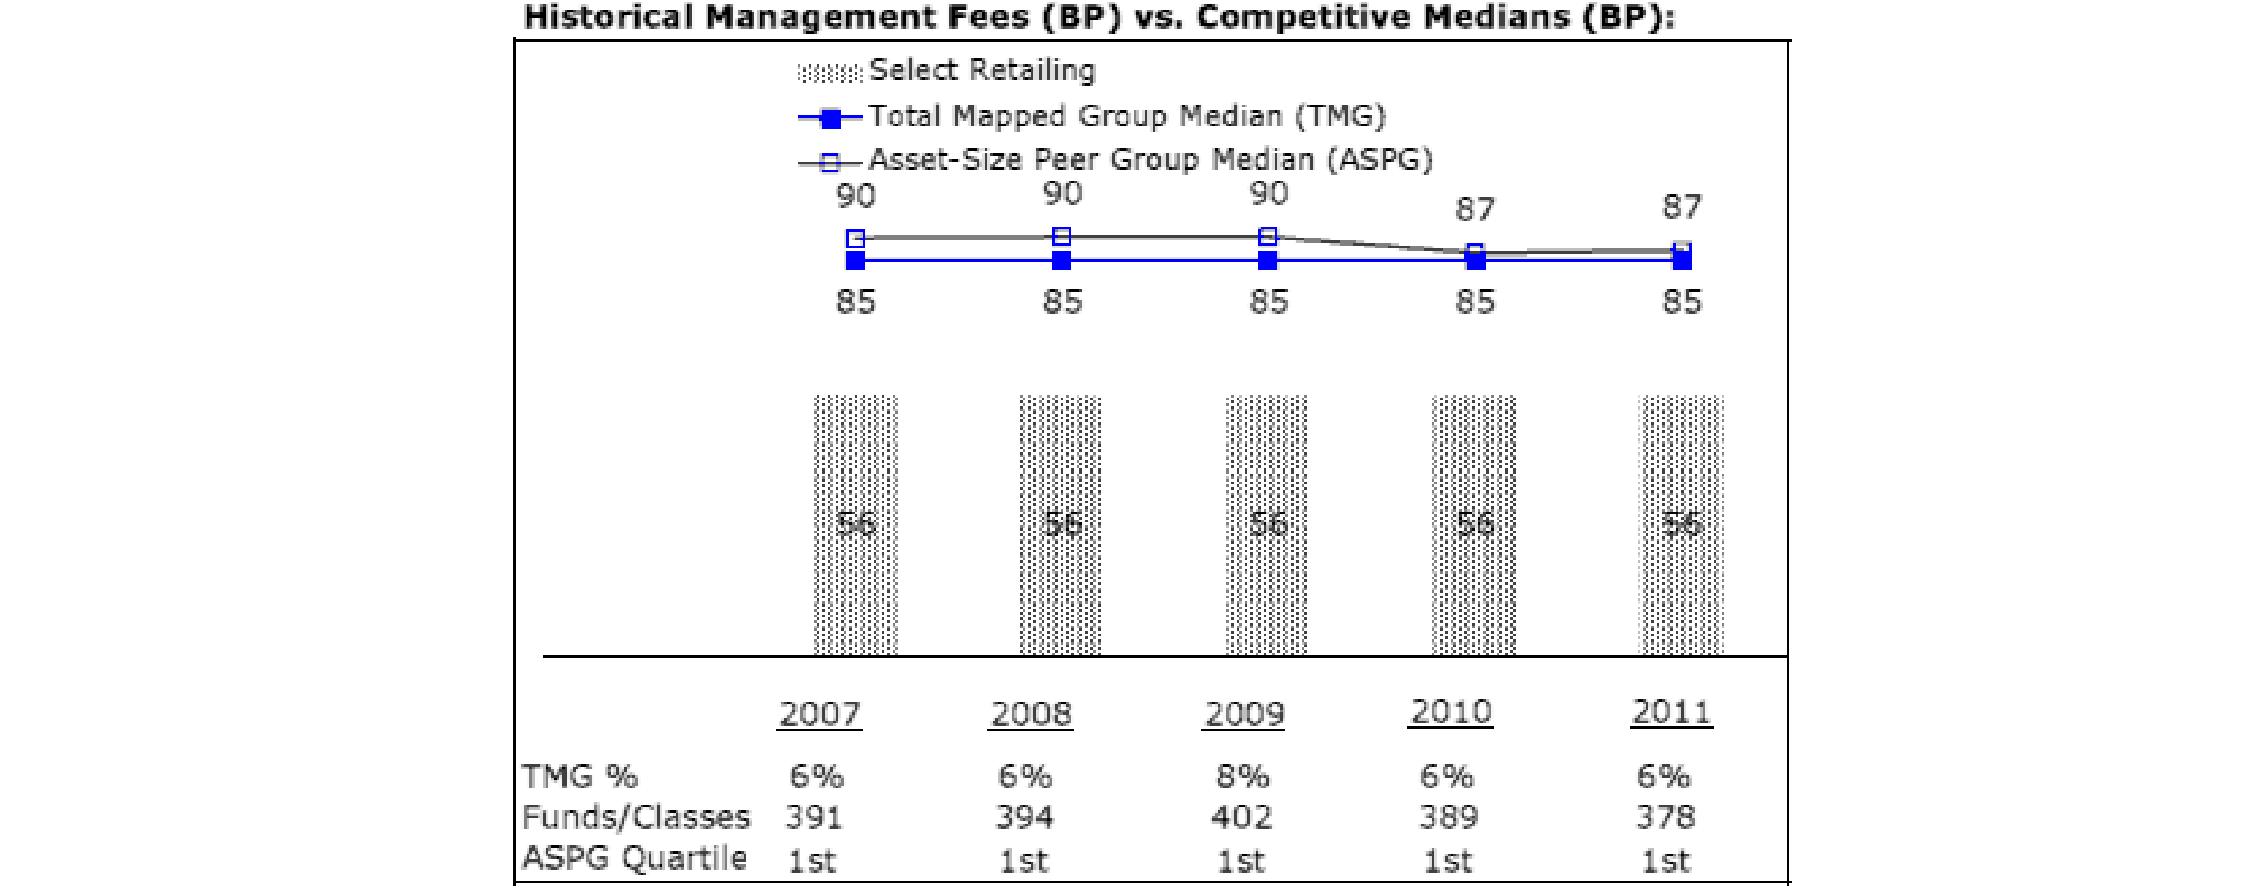
The Board noted that each fund's management fee ranked below the median of its Total Mapped Group and below the median of its ASPG for 2011.
Based on its review, the Board concluded that each fund's management fee is fair and reasonable in light of the services that the fund receives and the other factors considered.
Total Expense Ratio. In its review of each fund's total expense ratio, the Board considered the fund's management fee as well as other fund expenses, such as transfer agent fees, pricing and bookkeeping fees, and custodial, legal, and audit fees. The Board also noted the effects of any waivers and reimbursements on fees and expenses. As part of its review, the Board also considered the current and historical total expense ratios of each fund compared to competitive fund median expenses. Each fund is compared to those funds and classes in the Total Mapped Group (used by the Board for management fee comparisons) that have a similar sales load structure.
The Board noted that each fund's total expense ratio ranked below its competitive median for 2011.
Fees Charged to Other Fidelity Clients. The Board also considered Fidelity fee structures and other information with respect to clients of FMR and its affiliates, such as other mutual funds advised or subadvised by FMR or its affiliates, pension plan clients, and other institutional clients. The Board noted the findings of the 2010 ad hoc joint committee (created with the board of other Fidelity funds), which reviewed and compared Fidelity's institutional investment advisory business with its business of providing services to the Fidelity funds, including the differences in services provided, fees charged, and costs incurred, as well as competition in their respective marketplaces.
Semiannual Report
Board Approval of Investment Advisory Contracts and Management Fees - continued
Based on its review of total expense ratios and fees charged to other Fidelity clients, the Board concluded that each fund's total expense ratio was reasonable in light of the services that the fund and its shareholders receive and the other factors considered.
Costs of the Services and Profitability. The Board considered the revenues earned and the expenses incurred by Fidelity in conducting the business of developing, marketing, distributing, managing, administering and servicing each fund and its shareholders. The Board also considered the level of Fidelity's profits in respect of all the Fidelity funds.
On an annual basis, FMR presents to the Board Fidelity's profitability for each fund. Fidelity calculates the profitability for each fund, as well as aggregate profitability for groups of Fidelity funds and all Fidelity funds, using a series of detailed revenue and cost allocation methodologies which originate with the books and records of Fidelity on which Fidelity's audited financial statements are based. The Audit Committee of the Board reviews any significant changes from the prior year's methodologies.
PricewaterhouseCoopers LLP (PwC), independent registered public accounting firm and auditor to Fidelity and certain Fidelity funds, has been engaged annually by the Board as part of the Board's assessment of Fidelity's profitability analysis. PwC's engagement includes the review and assessment of Fidelity's methodologies used in determining the revenues and expenses attributable to Fidelity's mutual fund business, and completion of agreed-upon procedures surrounding the mathematical accuracy of fund profitability and its conformity to allocation methodologies. After considering PwC's reports issued under the engagement and information provided by Fidelity, the Board concluded that while other allocation methods may also be reasonable, Fidelity's profitability methodologies are reasonable in all material respects.
The Board also reviewed Fidelity's non-fund businesses and fall-out benefits related to the mutual fund business as well as cases where Fidelity's affiliates may benefit from or be related to the funds' business.
The Board considered the costs of the services provided by and the profits realized by Fidelity in connection with the operation of each fund and was satisfied that the profitability was not excessive in the circumstances.
Economies of Scale. The Board considered whether there have been economies of scale in respect of the management of the Fidelity funds, whether the Fidelity funds (including each fund) have appropriately benefited from any such economies of scale, and whether there is potential for realization of any further economies of scale. The Board considered the extent to which each fund will benefit from economies of scale through increased services to the fund, through waivers or reimbursements, or through fee or expense reductions. The Board also noted that in 2009, it and the board of other Fidelity funds created an ad hoc committee (the Economies of Scale Committee) to analyze whether FMR attains economies of scale in respect of the management and servicing of the Fidelity funds, whether the Fidelity funds have appropriately benefited from such economies of scale, and whether there is potential for realization of any further economies of scale.
The Board recognized that each fund's management contract incorporates a "group fee" structure, which provides for lower group fee rates as total fund assets under FMR's management increase, and for higher group fee rates as total fund assets under FMR's management decrease. FMR calculates the group fee rates based on a tiered asset "breakpoint" schedule that varies based on asset class. The Board considered that the group fee is designed to deliver the benefits of economies of scale to fund shareholders when total Fidelity fund assets increase, even if assets of any particular fund are unchanged or have declined, because some portion of Fidelity's costs are attributable to services provided to all Fidelity funds, and all funds benefit if those costs can be allocated among more assets. The Board concluded that, given the group fee structure, fund shareholders will benefit from lower management fees as assets under FMR's management increase at the fund complex level, regardless of whether Fidelity achieves any such economies of scale.
The Board concluded, taking into account the analysis of the Economies of Scale Committee, that economies of scale, if any, are being appropriately shared between fund shareholders and Fidelity.
Additional Information Requested by the Board. In order to develop fully the factual basis for consideration of the Fidelity funds' Advisory Contracts, the Board requested and received additional information on certain topics, including (i) fund performance trends, actions to be taken by FMR to improve certain funds' overall performance, and Fidelity's long-term strategies for certain funds; (ii) the potential to further rationalize the Fidelity fund lineup with the possibility of achieving savings for the funds and Fidelity; (iii) Fidelity's compensation structure for portfolio managers and other key investment personnel; (iv) the amount of the investment that each portfolio manager has made in the Fidelity fund(s) that he or she manages; (v) the realization of fall-out benefits in certain Fidelity business units; (vi) Fidelity's group fee structures, the potential impact of regulatory changes on such structures, and the rationale for the individual fee rates of certain funds; (vii) fund profitability methodology, including Fidelity's cost allocation methodology, and the impact of certain factors on fund profitability results; (viii) trends regarding industry use of performance fee structures and the possibility of implementing performance fee structures for additional funds; and (ix) the impact of net redemptions from the Fidelity funds.
Based on its evaluation of all of the conclusions noted above, and after considering all factors it believed relevant, the Board ultimately concluded that the advisory fee structures are fair and reasonable, and that each fund's Advisory Contracts should be renewed.
Semiannual Report
Investment Adviser
Fidelity Management & Research Company
Boston, MA
Investment Sub-Advisers
FMR Co., Inc.
Fidelity Management & Research
(U.K.) Inc.
Fidelity Management & Research
(Hong Kong) Limited
Fidelity Management & Research
(Japan) Inc.
General Distributor
Fidelity Distributors Corporation
Smithfield, RI
Transfer and Service Agents
Fidelity Investments Institutional Operations Company, Inc.
Boston, MA
Fidelity Service Company, Inc.
Boston, MA
Custodian
Brown Brothers Harriman & Co.
Boston, MA
Corporate Headquarters
82 Devonshire Street
Boston, MA 02109
1-800-544-8888
The Fidelity Telephone Connection
Mutual Fund 24-Hour Service
Exchanges/Redemptions
and Account Assistance 1-800-544-6666
Product Information 1-800-544-8888
Retirement Accounts 1-800-544-4774
(8 a.m. - 9 p.m.)
TDD Service 1-800-544-0118
for the deaf and hearing impaired
(9 a.m. - 9 p.m. Eastern time)
Fidelity Automated Service
Telephone (FAST®)
1-800-544-5555
Automated line for quickest service

SELCON-USAN-1012
1.813636.107
Fidelity®
Select Portfolios®
Materials Sector
Chemicals Portfolio
Gold Portfolio
Materials Portfolio
Semiannual Report
August 31, 2012
(Fidelity Cover Art)
Contents
To view a fund's proxy voting guidelines and proxy voting record for the 12-month period ended June 30, visit http://www.fidelity.com/proxyvotingresults or visit the Securities and Exchange Commission's (SEC) web site at http://www.sec.gov. You may also call 1-800-544-8544 to request a free copy of the proxy voting guidelines.
Standard & Poor's, S&P and S&P 500 are registered service marks of The McGraw-Hill Companies, Inc. and have been licensed for use by Fidelity Distributors Corporation.
Other third party marks appearing herein are the property of their respective owners.
All other marks appearing herein are registered or unregistered trademarks or service marks of FMR LLC or an affiliated company. © 2012 FMR LLC. All rights reserved.
This report and the financial statements contained herein are submitted for the general information of the shareholders of the funds. This report is not authorized for distribution to prospective investors in the funds unless preceded or accompanied by an effective prospectus.
A fund files its complete schedule of portfolio holdings with the SEC for the first and third quarters of each fiscal year on Form N-Q. Forms N-Q are available on the SEC's web site at http://www.sec.gov. A fund's Forms N-Q may be reviewed and copied at the SEC's Public Reference Room in Washington, DC. Information regarding the operation of the SEC's Public Reference Room may be obtained by calling 1-800-SEC-0330. For a complete list of a fund's portfolio holdings, view the most recent holdings listing, semiannual report, or annual report on Fidelity's web site at http://www.fidelity.com, http://www.advisor.fidelity.com, or http://www.401k.com, as applicable.
NOT FDIC INSURED • MAY LOSE VALUE • NO BANK GUARANTEE
Neither the funds nor Fidelity Distributors Corporation is a bank.
Semiannual Report
Chemicals Portfolio
As a shareholder of the Fund, you incur two types of costs: (1) transaction costs, including redemption fees and (2) ongoing costs, including management fees and other Fund expenses. This Example is intended to help you understand your ongoing costs (in dollars) of investing in the Fund and to compare these costs with the ongoing costs of investing in other mutual funds.
The Example is based on an investment of $1,000 invested at the beginning of the period and held for the entire period (March 1, 2012 to August 31, 2012).
Actual Expenses
The first line of the accompanying table provides information about actual account values and actual expenses. You may use the information in this line, together with the amount you invested, to estimate the expenses that you paid over the period. Simply divide your account value by $1,000.00 (for example, an $8,600 account value divided by $1,000.00 = 8.6), then multiply the result by the number in the first line under the heading entitled "Expenses Paid During Period" to estimate the expenses you paid on your account during this period. A small balance maintenance fee of $12.00 that is charged once a year may apply for certain accounts with a value of less than $2,000. This fee is not included in the table below. If it was, the estimate of expenses you paid during the period would be higher, and your ending account value lower, by this amount. In addition, the Fund, as a shareholder in the underlying Fidelity Central Funds, will indirectly bear its pro-rata share of the fees and expenses incurred by the underlying Fidelity Central Funds. These fees and expenses are not included in the Fund's annualized expense ratio used to calculate the expense estimate in the table below.
Hypothetical Example for Comparison Purposes
The second line of the accompanying table provides information about hypothetical account values and hypothetical expenses based on the Fund's actual expense ratio and an assumed rate of return of 5% per year before expenses, which is not the Fund's actual return. The hypothetical account values and expenses may not be used to estimate the actual ending account balance or expenses you paid for the period. You may use this information to compare the ongoing costs of investing in the Fund and other funds. To do so, compare this 5% hypothetical example with the 5% hypothetical examples that appear in the shareholder reports of the other funds. A small balance maintenance fee of $12.00 that is charged once a year may apply for certain accounts with a value of less than $2,000. This fee is not included in the table below. If it was, the estimate of expenses you paid during the period would be higher, and your ending account value lower, by this amount. In addition, the Fund, as a shareholder in the underlying Fidelity Central Funds, will indirectly bear its pro-rata share of the fees and expenses incurred by the underlying Fidelity Central Funds. These fees and expenses are not included in the Fund's annualized expense ratio used to calculate the expense estimate in the table below.
Please note that the expenses shown in the table are meant to highlight your ongoing costs only and do not reflect any transaction costs. Therefore, the second line of the table is useful in comparing ongoing costs only, and will not help you determine the relative total costs of owning different funds. In addition, if these transactional costs were included, your costs would have been higher.
| Annualized
Expense Ratio | Beginning
Account Value
March 1, 2012 | Ending
Account Value
August 31, 2012 | Expenses Paid
During Period*
March 1, 2012
to August 31, 2012 |
Actual | .83% | $ 1,000.00 | $ 1,028.90 | $ 4.24 |
Hypothetical (5% return per year before expenses) | | $ 1,000.00 | $ 1,021.02 | $ 4.23 |
* Expenses are equal to the Fund's annualized expense ratio, multiplied by the average account value over the period, multiplied by 184/365 (to reflect the one-half year period).
Semiannual Report
Chemicals Portfolio
Investment Changes (Unaudited)
Top Ten Stocks as of August 31, 2012 |
| % of fund's
net assets | % of fund's net assets
6 months ago |
Monsanto Co. | 8.7 | 7.6 |
E.I. du Pont de Nemours & Co. | 7.9 | 8.4 |
Praxair, Inc. | 7.9 | 8.3 |
Eastman Chemical Co. | 6.6 | 4.5 |
LyondellBasell Industries NV Class A | 6.6 | 5.2 |
Dow Chemical Co. | 6.5 | 6.2 |
Ecolab, Inc. | 5.0 | 5.7 |
Air Products & Chemicals, Inc. | 5.0 | 4.4 |
Ashland, Inc. | 4.0 | 3.0 |
CF Industries Holdings, Inc. | 3.9 | 5.1 |
| 62.1 | |
Top Industries (% of fund's net assets) |
As of August 31, 2012 |
 | Chemicals | 90.2% | |
 | Energy Equipment &
Services | 1.6% | |
 | Marine | 0.7% | |
 | Commercial Services &
Supplies | 0.2% | |
 | All Others* | 7.3% | |

As of February 29, 2012 |
| Chemicals | 89.7% | |
 | Oil, Gas & Consumable
Fuels | 3.9% | |
 | Marine | 1.4% | |
 | Energy Equipment &
Services | 1.1% | |
| Commercial Services &
Supplies | 0.4% | |
| All Others* | 3.5% | |

* Includes short-term investments and net other assets. |
Semiannual Report
Chemicals Portfolio
Investments August 31, 2012 (Unaudited)
Showing Percentage of Net Assets
Common Stocks - 92.5% |
| Shares | | Value |
CHEMICALS - 90.2% |
Commodity Chemicals - 4.3% |
Arkema SA | 78,200 | | $ 6,657,002 |
PetroLogistics LP | 759,400 | | 9,712,726 |
Westlake Chemical Corp. (d) | 310,585 | | 21,362,036 |
| | 37,731,764 |
Diversified Chemicals - 23.2% |
Dow Chemical Co. | 1,942,038 | | 56,921,134 |
E.I. du Pont de Nemours & Co. | 1,400,000 | | 69,650,000 |
Eastman Chemical Co. | 1,048,600 | | 57,945,636 |
PPG Industries, Inc. | 172,100 | | 18,934,442 |
| | 203,451,212 |
Fertilizers & Agricultural Chemicals - 15.1% |
CF Industries Holdings, Inc. | 167,353 | | 34,643,745 |
Monsanto Co. | 870,640 | | 75,841,450 |
The Mosaic Co. | 374,542 | | 21,689,727 |
| | 132,174,922 |
Industrial Gases - 12.9% |
Air Products & Chemicals, Inc. | 522,700 | | 43,164,566 |
Praxair, Inc. | 657,407 | | 69,356,439 |
| | 112,521,005 |
Specialty Chemicals - 34.7% |
Albemarle Corp. | 280,102 | | 15,329,982 |
Ashland, Inc. | 471,100 | | 34,687,093 |
Celanese Corp. Class A | 93,100 | | 3,562,006 |
Cytec Industries, Inc. | 270,143 | | 18,496,691 |
Ecolab, Inc. | 676,599 | | 43,322,634 |
Innophos Holdings, Inc. | 234,108 | | 11,070,967 |
Innospec, Inc. (a) | 115,746 | | 3,641,369 |
Kraton Performance Polymers, Inc. (a) | 227,496 | | 4,879,789 |
LyondellBasell Industries NV Class A | 1,176,678 | | 57,468,954 |
NewMarket Corp. | 10,000 | | 2,461,200 |
Rockwood Holdings, Inc. | 256,846 | | 12,159,090 |
Sherwin-Williams Co. | 197,700 | | 28,286,916 |
Sigma Aldrich Corp. | 406,400 | | 28,866,592 |
Valspar Corp. | 202,300 | | 10,790,682 |
W.R. Grace & Co. (a) | 491,984 | | 28,416,996 |
| | 303,440,961 |
TOTAL CHEMICALS | | 789,319,864 |
COMMERCIAL SERVICES & SUPPLIES - 0.2% |
Environmental & Facility Services - 0.2% |
Swisher Hygiene, Inc. (a) | 549,240 | | 874,939 |
Swisher Hygiene, Inc. (Canada) (a) | 559,700 | | 990,670 |
| | 1,865,609 |
|
| Shares | | Value |
ENERGY EQUIPMENT & SERVICES - 1.6% |
Oil & Gas Drilling - 1.6% |
Ocean Rig UDW, Inc. (United States) | 540,424 | | $ 9,041,294 |
Seadrill Ltd. | 120,600 | | 4,971,132 |
| | 14,012,426 |
MARINE - 0.5% |
Marine - 0.5% |
DryShips, Inc. (a)(d) | 1,901,920 | | 4,165,205 |
TOTAL COMMON STOCKS (Cost $656,594,723) |
809,363,104
|
Convertible Bonds - 0.2% |
| Principal Amount | | |
MARINE - 0.2% |
Marine - 0.2% |
DryShips, Inc. 5% 12/1/14
(Cost $2,437,149) | | $ 2,790,000 | |
2,172,713
|
Money Market Funds - 9.8% |
| Shares | | |
Fidelity Cash Central Fund, 0.17% (b) | 67,631,997 | | 67,631,997 |
Fidelity Securities Lending Cash Central Fund, 0.18% (b)(c) | 18,044,179 | | 18,044,179 |
TOTAL MONEY MARKET FUNDS (Cost $85,676,176) |
85,676,176
|
TOTAL INVESTMENT PORTFOLIO - 102.5% (Cost $744,708,048) | | 897,211,993 |
NET OTHER ASSETS (LIABILITIES) - (2.5)% | | (22,212,149) |
NET ASSETS - 100% | $ 874,999,844 |
Legend |
(a) Non-income producing |
(b) Affiliated fund that is available only to investment companies and other accounts managed by Fidelity Investments. The rate quoted is the annualized seven-day yield of the fund at period end. A complete unaudited listing of the fund's holdings as of its most recent quarter end is available upon request. In addition, each Fidelity Central Fund's financial statements are available on the SEC's website or upon request. |
(c) Investment made with cash collateral received from securities on loan. |
(d) Security or a portion of the security is on loan at period end. |
Affiliated Central Funds |
Information regarding fiscal year to date income earned by the Fund from investments in Fidelity Central Funds is as follows: |
Fund | Income earned |
Fidelity Cash Central Fund | $ 43,314 |
Fidelity Securities Lending Cash Central Fund | 98,689 |
Total | $ 142,003 |
Other Information |
The following is a summary of the inputs used, as of August 31, 2012, involving the Fund's assets and liabilities carried at fair value. The inputs or methodology used for valuing securities may not be an indication of the risk associated with investing in those securities. For more information on valuation inputs, and their aggregation into the levels used in the table below, please refer to the Security Valuation section in the accompanying Notes to Financial Statements. |
Valuation Inputs at Reporting Date: |
Description | Total | Level 1 | Level 2 | Level 3 |
Investments in Securities: | | | | |
Common Stocks | $ 809,363,104 | $ 808,488,165 | $ 874,939 | $ - |
Convertible Bonds | 2,172,713 | - | 2,172,713 | - |
Money Market Funds | 85,676,176 | 85,676,176 | - | - |
Total Investments in Securities: | $ 897,211,993 | $ 894,164,341 | $ 3,047,652 | $ - |
See accompanying notes which are an integral part of the financial statements.
Semiannual Report
Chemicals Portfolio
Statement of Assets and Liabilities
| August 31, 2012 (Unaudited) |
| | |
Assets | | |
Investment in securities, at value (including securities loaned of $17,742,959) - See accompanying schedule: Unaffiliated issuers (cost $659,031,872) | $ 811,535,817 | |
Fidelity Central Funds (cost $85,676,176) | 85,676,176 | |
Total Investments (cost $744,708,048) | | $ 897,211,993 |
Receivable for investments sold | | 302,061 |
Receivable for fund shares sold | | 595,750 |
Dividends receivable | | 1,516,469 |
Interest receivable | | 34,875 |
Distributions receivable from Fidelity Central Funds | | 15,189 |
Other receivables | | 3,313 |
Total assets | | 899,679,650 |
| | |
Liabilities | | |
Payable for investments purchased | $ 3,516,079 | |
Payable for fund shares redeemed | 2,506,658 | |
Accrued management fee | 407,080 | |
Other affiliated payables | 181,715 | |
Other payables and accrued expenses | 24,095 | |
Collateral on securities loaned, at value | 18,044,179 | |
Total liabilities | | 24,679,806 |
| | |
Net Assets | | $ 874,999,844 |
Net Assets consist of: | | |
Paid in capital | | $ 715,778,494 |
Undistributed net investment income | | 5,030,581 |
Accumulated undistributed net realized gain (loss) on investments and foreign currency transactions | | 1,686,378 |
Net unrealized appreciation (depreciation) on investments and assets and liabilities in foreign currencies | | 152,504,391 |
Net Assets, for 7,754,738 shares outstanding | | $ 874,999,844 |
Net Asset Value, offering price and redemption price per share ($874,999,844 ÷ 7,754,738 shares) | | $ 112.83 |
Statement of Operations
Six months ended August 31, 2012 (Unaudited) |
| | |
Investment Income | | |
Dividends | | $ 8,276,081 |
Interest | | 138,898 |
Income from Fidelity Central Funds | | 142,003 |
Total income | | 8,556,982 |
| | |
Expenses | | |
Management fee | $ 2,376,976 | |
Transfer agent fees | 951,093 | |
Accounting and security lending fees | 147,364 | |
Custodian fees and expenses | 8,300 | |
Independent trustees' compensation | 2,858 | |
Registration fees | 46,475 | |
Audit | 17,760 | |
Legal | 1,610 | |
Miscellaneous | 4,707 | |
Total expenses before reductions | 3,557,143 | |
Expense reductions | (33,936) | 3,523,207 |
Net investment income (loss) | | 5,033,775 |
Realized and Unrealized Gain (Loss) Net realized gain (loss) on: | | |
Investment securities: | | |
Unaffiliated issuers | 15,851,165 | |
Foreign currency transactions | 28,904 | |
Total net realized gain (loss) | | 15,880,069 |
Change in net unrealized appreciation (depreciation) on: Investment securities | 576,643 | |
Assets and liabilities in foreign currencies | (10,081) | |
Total change in net unrealized appreciation (depreciation) | | 566,562 |
Net gain (loss) | | 16,446,631 |
Net increase (decrease) in net assets resulting from operations | | $ 21,480,406 |
See accompanying notes which are an integral part of the financial statements.
Semiannual Report
Chemicals Portfolio
Financial Statements - continued
Statement of Changes in Net Assets
| Six months ended
August 31, 2012
(Unaudited) | Year ended
February 29,
2012 |
Increase (Decrease) in Net Assets | | |
Operations | | |
Net investment income (loss) | $ 5,033,775 | $ 5,722,596 |
Net realized gain (loss) | 15,880,069 | 15,241,817 |
Change in net unrealized appreciation (depreciation) | 566,562 | 35,952,257 |
Net increase (decrease) in net assets resulting from operations | 21,480,406 | 56,916,670 |
Distributions to shareholders from net investment income | (626,746) | (4,429,446) |
Distributions to shareholders from net realized gain | (5,844,599) | - |
Total distributions | (6,471,345) | (4,429,446) |
Share transactions
Proceeds from sales of shares | 180,819,177 | 571,810,704 |
Reinvestment of distributions | 6,285,353 | 4,296,838 |
Cost of shares redeemed | (188,670,287) | (459,470,250) |
Net increase (decrease) in net assets resulting from share transactions | (1,565,757) | 116,637,292 |
Redemption fees | 17,396 | 82,316 |
Total increase (decrease) in net assets | 13,460,700 | 169,206,832 |
| | |
Net Assets | | |
Beginning of period | 861,539,144 | 692,332,312 |
End of period (including undistributed net investment income of $5,030,581 and undistributed net investment income of $623,552, respectively) | $ 874,999,844 | $ 861,539,144 |
Other Information Shares | | |
Sold | 1,637,935 | 5,550,618 |
Issued in reinvestment of distributions | 57,223 | 45,627 |
Redeemed | (1,735,468) | (4,666,200) |
Net increase (decrease) | (40,310) | 930,045 |
Financial Highlights
| Six months ended
August 31, 2012 | Years ended February 28, |
| (Unaudited) | 2012 J | 2011 | 2010 | 2009 | 2008J |
Selected Per-Share Data | | | | | | |
Net asset value, beginning of period | $ 110.52 | $ 100.85 | $ 75.43 | $ 42.74 | $ 81.31 | $ 70.60 |
Income from Investment Operations | | | | | | |
Net investment income (loss)E | .64 | .76 | .69 | 1.00 H | .73 | .85 |
Net realized and unrealized gain (loss) | 2.53 | 9.52 | 27.20 | 32.77 | (38.63) | 12.80 |
Total from investment operations | 3.17 | 10.28 | 27.89 | 33.77 | (37.90) | 13.65 |
Distributions from net investment income | (.08) | (.62) | (.57) | (1.08) | (.68) | (.49) |
Distributions from net realized gain | (.77) | - | (1.91) | - | (.02) | (2.46) |
Total distributions | (.86)L | (.62) | (2.47)M | (1.08) | (.70) | (2.95) |
Redemption fees added to paid in capitalE | -K | .01 | -K | -K | .03 | .01 |
Net asset value, end of period | $ 112.83 | $ 110.52 | $ 100.85 | $ 75.43 | $ 42.74 | $ 81.31 |
Total ReturnB, C, D | 2.89% | 10.31% | 37.74% | 79.15% | (46.68)% | 19.40% |
Ratios to Average Net AssetsF, I | | | | | | |
Expenses before reductions | .83%A | .85% | .90% | .96% | .91% | .93% |
Expenses net of fee waivers, if any | .83%A | .85% | .90% | .96% | .91% | .93% |
Expenses net of all reductions | .83%A | .84% | .89% | .95% | .90% | .93% |
Net investment income (loss) | 1.18%A | .77% | .84% | 1.53%H | 1.05% | 1.08% |
Supplemental Data | | | | | | |
Net assets, end of period (000 omitted) | $ 875,000 | $ 861,539 | $ 692,332 | $ 417,761 | $ 243,144 | $ 320,835 |
Portfolio turnover rateG | 53%A | 119% | 108% | 228% | 201% | 65% |
A Annualized B Total returns for periods of less than one year are not annualized. C Total returns would have been lower if certain expenses had not been reduced during the applicable periods shown. D Total returns do not include the effect of the former sales charges. E Calculated based on average shares outstanding during the period. F Fees and expenses of any underlying Fidelity Central Funds are not included in the Fund's expense ratio. The Fund indirectly bears its proportionate share of the expenses of any underlying Fidelity Central Funds. G Amount does not include the portfolio activity of any underlying Fidelity Central Funds. H Investment income per share reflects a large, non-recurring dividend which amounted to $.18 per share. Excluding this non-recurring dividend, the ratio of net investment income (loss) to average net assets would have been 1.25%. I Expense ratios reflect operating expenses of the Fund. Expenses before reductions do not reflect amounts reimbursed by the investment adviser or reductions from brokerage service arrangements or reductions from other expense offset arrangements and do not represent the amount paid by the Fund during periods when reimbursements or reductions occur. Expenses net of fee waivers reflect expenses after reimbursement by the investment adviser but prior to reductions from brokerage service arrangements or other expense offset arrangements. Expenses net of all reductions represent the net expenses paid by the Fund. J For the year ended February 29. K Amount represents less than $.01 per share. L Total distributions of $.86 per share is comprised of distributions from net investment income of $.083 and distributions from net realized gain of $.774 per share. M Total distributions of $2.47 per share is comprised of distributions from net investment income of $.565 and distributions from net realized gain of $1.905 per share. |
See accompanying notes which are an integral part of the financial statements.
Semiannual Report
Notes to Financial Statements
For the period ended August 31, 2012 (Unaudited)
1. Organization.
Chemicals Portfolio (the Fund) is a non-diversified fund of Fidelity Select Portfolios (the Trust) and is authorized to issue an unlimited number of shares. The Trust is registered under the Investment Company Act of 1940, as amended (the 1940 Act), as an open-end management investment company organized as a Massachusetts business trust. The Fund invests primarily in securities of companies whose principal business activities fall within specific industries.
2. Investments in Fidelity Central Funds.
The Fund invests in Fidelity Central Funds, which are open-end investment companies available only to other investment companies and accounts managed by Fidelity Management & Research Company (FMR) and its affiliates. The Fund's Schedule of Investments lists each of the Fidelity Central Funds held as of period end, if any, as an investment of the Fund, but does not include the underlying holdings of each Fidelity Central Fund. As an Investing Fund, the Fund indirectly bears its proportionate share of the expenses of the underlying Fidelity Central Funds.
The Money Market Central Funds seek preservation of capital and current income and are managed by Fidelity Investments Money Management, Inc. (FIMM), an affiliate of FMR.
A complete unaudited list of holdings for each Fidelity Central Fund is available upon request or at the Securities and Exchange Commission (the SEC) web site at www.sec.gov. In addition, the financial statements of the Fidelity Central Funds are available on the SEC web site or upon request.
3. Significant Accounting Policies.
The financial statements have been prepared in conformity with accounting principles generally accepted in the United States of America (GAAP), which require management to make certain estimates and assumptions at the date of the financial statements. Actual results could differ from those estimates. Subsequent events, if any, through the date that the financial statements were issued have been evaluated in the preparation of the financial statements. The following summarizes the significant accounting policies of the Fund:
Security Valuation. Investments are valued as of 4:00 p.m. Eastern time on the last calendar day of the period. In accordance with valuation policies and procedures approved by the Board of Trustees (the Board), the Fund attempts to obtain prices from one or more third party pricing vendor or broker to value its investments. When current market prices, quotations or rates are not readily available or reliable, securities will be fair valued in good faith by the FMR Fair Value Committee (the Committee), in accordance with procedures adopted by the Fund's Board. Factors used in determining fair value vary by security type and may include market or security specific events, changes in interest rates and credit quality. The frequency with which these procedures are used cannot be predicted and they may be utilized to a significant extent. The Committee oversees the Fund's valuation policies and procedures and is responsible for approving and reporting to the Board all fair value determinations.
The Fund categorizes the inputs to valuation techniques used to value its investments into a disclosure hierarchy consisting of three levels as shown below:
Level 1 - quoted prices in active markets for identical investments
Level 2 - other significant observable inputs (including quoted prices for similar investments, interest rates, prepayment speeds, etc.)
Level 3 - unobservable inputs (including the Fund's own assumptions based on the best information available)
Valuation techniques used to value the Fund's investments by major category are as follows:
Equity securities, including restricted securities, for which market quotations are readily available, are valued at the last reported sale price or official closing price as reported by a third party pricing vendor on the primary market or exchange on which they are traded and are categorized as Level 1 in the hierarchy. In the event there were no sales during the day or closing prices are not available, securities are valued at the last quoted bid price or may be valued using the last available price and are generally categorized as Level 2 in the hierarchy. For foreign equity securities, when significant market or security specific events arise, comparisons to the valuation of American Depositary Receipts (ADRs) futures contracts, Exchange-Traded Funds (ETFs) and certain indexes as well as quoted prices for similar securities are used and are categorized as Level 2 in the hierarchy. Utilizing these techniques may result in transfers between Level 1 and Level 2.
Debt securities, including restricted securities, are valued based on evaluated prices received from third party pricing vendors or from brokers who make markets in such securities. For corporate bonds, pricing vendors utilize matrix pricing which considers yield or price of bonds of comparable quality, coupon, maturity and type as well as broker-supplied prices and are generally categorized as Level 2 in the hierarchy. When independent prices are unavailable or unreliable, debt securities may be valued utilizing pricing methodologies which consider similar factors that would be used by third party pricing vendors. These are generally categorized as Level 2 in the hierarchy but may be Level 3 depending on the circumstances.
Semiannual Report
Notes to Financial Statements (Unaudited) - continued
3. Significant Accounting Policies - continued
Security Valuation - continued
Investments in open-end mutual funds, including the Fidelity Central Funds, are valued at their closing net asset value each business day and are categorized as Level 1 in the hierarchy.
Changes in valuation techniques may result in transfers in or out of an assigned level within the disclosure hierarchy. The aggregate value of investments by input level, as of August 31, 2012, is included at the end of the Fund's Schedule of Investments.
Foreign Currency Translation. The Fund may use foreign currency contracts to facilitate transactions in foreign-denominated securities. Gains and losses from these transactions may arise from changes in the value of the foreign currency or if the counterparties do not perform under the contracts' terms.
Foreign-denominated assets, including investment securities, and liabilities are translated into U.S. dollars at the exchange rates at period end. Purchases and sales of investment securities, income and dividends received and expenses denominated in foreign currencies are translated into U.S. dollars at the exchange rate in effect on the transaction date.
The effects of exchange rate fluctuations on investments are included with the net realized and unrealized gain (loss) on investment securities. Other foreign currency transactions resulting in realized and unrealized gain (loss) are disclosed separately.
Investment Transactions and Income. For financial reporting purposes, the Fund's investment holdings and NAV include trades executed through the end of the last business day of the period. The NAV per share for processing shareholder transactions is calculated as of the close of business of the New York Stock Exchange (NYSE), normally 4:00 p.m. Eastern time and includes trades executed through the end of the prior business day. Gains and losses on securities sold are determined on the basis of identified cost. Dividend income is recorded on the ex-dividend date, except for certain dividends from foreign securities where the ex-dividend date may have passed, which are recorded as soon as the Fund is informed of the ex-dividend date. Non-cash dividends included in dividend income, if any, are recorded at the fair market value of the securities received. Distributions received on securities that represent a return of capital or capital gain are recorded as a reduction of cost of investments and/or as a realized gain. The Fund estimates the components of distributions received that may be considered return of capital distributions or capital gain distributions. Interest income and distributions from the Fidelity Central Funds are accrued as earned. Interest income includes coupon interest and amortization of premium and accretion of discount on debt securities. Investment income is recorded net of foreign taxes withheld where recovery of such taxes is uncertain.
Expenses. Expenses directly attributable to a fund are charged to that fund. Expenses attributable to more than one fund are allocated among the respective funds on the basis of relative net assets or other appropriate methods. Expense estimates are accrued in the period to which they relate and adjustments are made when actual amounts are known.
Income Tax Information and Distributions to Shareholders. Each year, the Fund intends to qualify as a regulated investment company under Subchapter M of the Internal Revenue Code, including distributing substantially all of its taxable income and realized gains. As a result, no provision for income taxes is required. The Fund files a U.S. federal tax return, in addition to state and local tax returns as required. A fund's federal income tax returns are subject to examination by the Internal Revenue Service (IRS) for a period of three fiscal years after they are filed. State and local tax returns may be subject to examination for an additional fiscal year depending on the jurisdiction. Foreign taxes are provided for based on the Fund's understanding of the tax rules and rates that exist in the foreign markets in which it invests.
Distributions are declared and recorded on the ex-dividend date. Income and capital gain distributions are determined in accordance with income tax regulations, which may differ from GAAP.
Capital accounts within the financial statements are adjusted for permanent book-tax differences. These adjustments have no impact on net assets or the results of operations. Temporary book-tax differences will reverse in a subsequent period.
Book-tax differences are primarily due to foreign currency transactions, passive foreign investment companies (PFIC), partnerships, market discount, deferred trustees compensation, capital loss carryforwards and losses deferred due to wash sales and excise tax regulations.
The federal tax cost of investment securities and unrealized appreciation (depreciation) as of period end were as follows:
Gross unrealized appreciation | $ 157,621,903 |
Gross unrealized depreciation | (16,631,825) |
Net unrealized appreciation (depreciation) on securities and other investments | $ 140,990,078 |
| |
Tax cost | $ 756,221,915 |
Semiannual Report
3. Significant Accounting Policies - continued
Trading (Redemption) Fees. Shares held by investors in the Fund less than 30 days are subject to a redemption fee equal to .75% of the net asset value of shares redeemed. All redemption fees, which reduce the proceeds of the shareholder redemption, are retained by the Fund and accounted for as an addition to paid in capital.
New Accounting Pronouncement. In December 2011, the Financial Accounting Standards Board issued Accounting Standard Update No. 2011-11, Disclosures about Offsetting Assets and Liabilities. The update creates new disclosure requirements requiring entities to disclose both gross and net information for derivatives and other financial instruments that are either offset in the Statement of Assets and Liabilities or subject to an enforceable master netting arrangement or similar agreement. The disclosure requirements are effective for annual reporting periods beginning on or after January 1, 2013, and interim periods within those annual periods. Management is currently evaluating the impact of the update's adoption on the Fund's financial statement disclosures.
4. Purchases and Sales of Investments.
Purchases and sales of securities, other than short-term securities, aggregated $212,610,796 and $248,016,435, respectively.
5. Fees and Other Transactions with Affiliates.
Management Fee. FMR and its affiliates provide the Fund with investment management related services for which the Fund pays a monthly management fee. The management fee is the sum of an individual fund fee rate that is based on an annual rate of .30% of the Fund's average net assets and an annualized group fee rate that averaged .26% during the period. The group fee rate is based upon the average net assets of all the mutual funds advised by FMR. The group fee rate decreases as assets under management increase and increases as assets under management decrease. For the period, the total annualized management fee rate was .56% of the Fund's average net assets.
Transfer Agent Fees. Fidelity Investments Institutional Operations Company, Inc. (FIIOC), an affiliate of FMR, is the Fund's transfer, dividend disbursing and shareholder servicing agent. FIIOC receives account fees and asset-based fees that vary according to account size and type of account. FIIOC pays for typesetting, printing and mailing of shareholder reports, except proxy statements. For the period, the transfer agent fees were equivalent to an annualized rate of .22% of average net assets.
Accounting and Security Lending Fees. Fidelity Service Company, Inc. (FSC), an affiliate of FMR, maintains the Fund's accounting records. The accounting fee is based on the level of average net assets for each month. Under a separate contract, FSC administers the security lending program. The security lending fee is based on the number and duration of lending transactions.
Brokerage Commissions. The Fund placed a portion of its portfolio transactions with brokerage firms which are affiliates of the investment adviser. The commissions paid to these affiliated firms were $6,718 for the period.
6. Committed Line of Credit.
The Fund participates with other funds managed by FMR or an affiliate in a $4.25 billion credit facility (the "line of credit") to be utilized for temporary or emergency purposes to fund shareholder redemptions or for other short-term liquidity purposes. The Fund has agreed to pay commitment fees on its pro-rata portion of the line of credit, which amounted to $1,178 and is reflected in Miscellaneous expenses on the Statement of Operations. During the period, there were no borrowings on this line of credit.
7. Security Lending.
The Fund lends portfolio securities through a lending agent from time to time in order to earn additional income. For equity securities, a lending agent is used and may loan securities to certain qualified borrowers, including Fidelity Capital Markets (FCM), a broker-dealer affiliated with the Fund. On the settlement date of the loan, the Fund receives collateral (in the form of U.S. Treasury obligations, letters of credit and/or cash) against the loaned securities and maintains collateral in an amount not less than 100% of the market value of the loaned securities during the period of the loan. The market value of the loaned securities is determined at the close of business of the Fund and any additional required collateral is delivered to the Fund on the next business day. If the borrower defaults on its obligation to return the securities loaned because of insolvency or other reasons, a fund could experience delays and costs in recovering the securities loaned or in gaining access to the collateral. Any cash collateral received is invested in the Fidelity Securities Lending Cash Central Fund. The value of loaned securities and cash collateral at period end are disclosed on the Fund's Statement of Assets and Liabilities. Security lending income represents the income earned on investing cash collateral, less rebates paid to borrowers and any lending agent fees associated with the loan, plus any premium payments received for lending certain types of securities. Security lending income is presented in the Statement of Operations as a component of income from Fidelity Central Funds. Total security lending income during the period amounted to $98,689. During the period, there were no securities loaned to FCM.
Semiannual Report
Notes to Financial Statements (Unaudited) - continued
8. Expense Reductions.
Many of the brokers with whom FMR places trades on behalf of the Fund provided services to the Fund in addition to trade execution. These services included payments of certain expenses on behalf of the Fund totaling $33,879 for the period. In addition, through arrangements with the Fund's custodian, credits realized as a result of uninvested cash balances were used to reduce the Fund's expenses. During the period, these credits reduced the Fund's custody expenses by $57.
9. Other.
The Fund's organizational documents provide former and current trustees and officers with a limited indemnification against liabilities arising in connection with the performance of their duties to the Fund. In the normal course of business, the Fund may also enter into contracts that provide general indemnifications. The Fund's maximum exposure under these arrangements is unknown as this would be dependent on future claims that may be made against the Fund. The risk of material loss from such claims is considered remote.
At the end of the period, Strategic Advisers U.S. Opportunity Fund was the owner of record of approximately 10% of the total outstanding shares of the Fund.
Semiannual Report
Gold Portfolio
As a shareholder of the Fund, you incur two types of costs: (1) transaction costs, including sales charges (loads) on purchase payments or redemption proceeds, redemption fees and (2) ongoing costs, including management fees, distribution and/or service (12b-1) fees and other Fund expenses. This Example is intended to help you understand your ongoing costs (in dollars) of investing in the Fund and to compare these costs with the ongoing costs of investing in other mutual funds.
The Example is based on an investment of $1,000 invested at the beginning of the period and held for the entire period (March 1, 2012 to August 31, 2012).
Actual Expenses
The first line of the accompanying table for each class of the Fund provides information about actual account values and actual expenses. You may use the information in this line, together with the amount you invested, to estimate the expenses that you paid over the period. Simply divide your account value by $1,000.00 (for example, an $8,600 account value divided by $1,000.00 = 8.6), then multiply the result by the number in the first line for a class of the Fund under the heading entitled "Expenses Paid During Period" to estimate the expenses you paid on your account during this period. A small balance maintenance fee of $12.00 that is charged once a year may apply for certain accounts with a value of less than $2,000. This fee is not included in the table below. If it was, the estimate of expenses you paid during the period would be higher, and your ending account value lower, by this amount. In addition, the Fund, as a shareholder in the underlying Fidelity Central Funds, will indirectly bear its pro-rata share of the fees and expenses incurred by the underlying Fidelity Central Funds. These fees and expenses are not included in the Fund's annualized expense ratio used to calculate the expense estimate in the table below.
Hypothetical Example for Comparison Purposes
The second line of the accompanying table for each class of the Fund provides information about hypothetical account values and hypothetical expenses based on a Class' actual expense ratio and an assumed rate of return of 5% per year before expenses, which is not the Class' actual return. The hypothetical account values and expenses may not be used to estimate the actual ending account balance or expenses you paid for the period. You may use this information to compare the ongoing costs of investing in the Fund and other funds. To do so, compare this 5% hypothetical example with the 5% hypothetical examples that appear in the shareholder reports of the other funds. A small balance maintenance fee of $12.00 that is charged once a year may apply for certain accounts with a value of less than $2,000. This fee is not included in the table below. If it was, the estimate of expenses you paid during the period would be higher, and your ending account value lower, by this amount. In addition, the Fund, as a shareholder in the underlying Fidelity Central Funds, will indirectly bear its pro-rata share of the fees and expenses incurred by the underlying Fidelity Central Funds. These fees and expenses are not included in the Fund's annualized expense ratio used to calculate the expense estimate in the table below.
Please note that the expenses shown in the table are meant to highlight your ongoing costs only and do not reflect any transaction costs. Therefore, the second line of the table is useful in comparing ongoing costs only, and will not help you determine the relative total costs of owning different funds. In addition, if these transactional costs were included, your costs would have been higher.
| Annualized
Expense Ratio | Beginning
Account Value
March 1, 2012 | Ending
Account Value
August 31, 2012 | Expenses Paid
During Period*
March 1, 2012
to August 31, 2012 |
Class A | 1.17% | | | |
Actual | | $ 1,000.00 | $ 833.80 | $ 5.41 |
HypotheticalA | | $ 1,000.00 | $ 1,019.31 | $ 5.96 |
Class T | 1.44% | | | |
Actual | | $ 1,000.00 | $ 832.60 | $ 6.65 |
HypotheticalA | | $ 1,000.00 | $ 1,017.95 | $ 7.32 |
Class B | 1.92% | | | |
Actual | | $ 1,000.00 | $ 830.70 | $ 8.86 |
HypotheticalA | | $ 1,000.00 | $ 1,015.53 | $ 9.75 |
Class C | 1.92% | | | |
Actual | | $ 1,000.00 | $ 830.60 | $ 8.86 |
HypotheticalA | | $ 1,000.00 | $ 1,015.53 | $ 9.75 |
Gold | .92% | | | |
Actual | | $ 1,000.00 | $ 834.90 | $ 4.25 |
HypotheticalA | | $ 1,000.00 | $ 1,020.57 | $ 4.69 |
Institutional Class | .83% | | | |
Actual | | $ 1,000.00 | $ 835.20 | $ 3.84 |
HypotheticalA | | $ 1,000.00 | $ 1,021.02 | $ 4.23 |
A 5% return per year before expenses
* Expenses are equal to each Class' annualized expense ratio, multiplied by the average account value over the period, multiplied by 184/365 (to reflect the one-half year period).
Semiannual Report
Gold Portfolio
Investment Changes (Unaudited)
Top Ten Holdings as of August 31, 2012 |
| % of fund's
net assets | % of fund's net assets
6 months ago |
Goldcorp, Inc. | 13.0 | 12.2 |
Barrick Gold Corp. | 11.1 | 11.9 |
Newmont Mining Corp. | 8.1 | 9.0 |
Newcrest Mining Ltd. | 6.9 | 8.4 |
Yamana Gold, Inc. | 4.5 | 3.9 |
AngloGold Ashanti Ltd. sponsored ADR | 4.3 | 5.1 |
Randgold Resources Ltd. sponsored ADR | 4.0 | 3.6 |
Gold Bullion | 3.7 | 1.0 |
Kinross Gold Corp. | 3.6 | 4.0 |
Eldorado Gold Corp. | 3.6 | 2.7 |
| 62.8 | |
Top Industries (% of fund's net assets) |
As of August 31, 2012 |
| Gold | 94.7% | |
| Commodities & Related
Investments** | 3.8% | |
| Precious Metals &
Minerals | 0.7% | |
| Diversified Metals &
Mining | 0.3% | |
| Coal & Consumable Fuels | 0.2% | |
| All Others* | 0.3% | |

As of February 29, 2012 |
| Gold | 97.5% | |
 | Commodities & Related
Investments** | 1.0% | |
| Precious Metals &
Minerals | 0.9% | |
| Diversified Metals &
Mining | 0.2% | |
| Coal & Consumable Fuels | 0.1% | |
| Specialty Stores | 0.0% | |
| All Others* | 0.3% | |

* Includes short-term investments and net other assets. |
** Includes gold bullion and/or silver bullion. |
Geographic Diversification (% of fund's net assets) |
As of August 31, 2012 |
| Canada | 58.4% | |
| United States of America | 15.6% | |
| Australia | 9.9% | |
| South Africa | 8.8% | |
| Bailiwick of Jersey | 4.9% | |
| Peru | 1.2% | |
| United Kingdom | 0.6% | |
 | China | 0.5% | |
| Bermuda | 0.1% | |
| Other | 0.0% | |

Percentages are based on country or territory of incorporation and are adjusted for the effect of futures contracts, if applicable. |
As of February 29, 2012 |
| Canada | 55.8% | |
| United States of America | 12.7% | |
| Australia | 11.5% | |
| South Africa | 10.3% | |
| Bailiwick of Jersey | 4.5% | |
| China | 2.3% | |
| Peru | 2.1% | |
| United Kingdom | 0.8% | |
| Bermuda | 0.0% | |
| Other | 0.0% | |

Percentages are based on country or territory of incorporation and are adjusted for the effect of futures contracts, if applicable. |
Semiannual Report
Gold Portfolio
Consolidated Investments August 31, 2012 (Unaudited)
Showing Percentage of Net Assets
Common Stocks - 95.9% |
| Shares | | Value |
Australia - 9.9% |
METALS & MINING - 9.9% |
Gold - 9.9% |
ABM Resources NL (a) | 2,300,000 | | $ 106,931 |
Alkane Resources Ltd. | 195,000 | | 199,450 |
Ampella Mining Ltd. (a)(d) | 1,230,000 | | 660,803 |
Azumah Resources Ltd. (a) | 843,984 | | 108,995 |
Beadell Resources Ltd. (a) | 2,204,000 | | 1,776,109 |
CGA Mining Ltd.: | | | |
(Australia) (a) | 18,920 | | 40,267 |
(Canada) (a) | 525,000 | | 1,288,866 |
Evolution Mining Ltd. (a) | 2,258,235 | | 3,627,964 |
Focus Minerals Ltd. (a) | 2,300,000 | | 90,297 |
Gold One International Ltd. (a) | 90,277 | | 37,774 |
Gryphon Minerals Ltd. (a) | 2,707,692 | | 1,748,408 |
Integra Mining Ltd. (a) | 1,415,000 | | 687,096 |
Intrepid Mines Ltd.: | | | |
(Australia) (a) | 9,209,798 | | 2,616,653 |
(Canada) (a) | 320,000 | | 97,388 |
Kingsgate Consolidated NL (d) | 2,908,274 | | 12,860,044 |
Kula Gold Ltd. (a) | 31,245 | | 15,172 |
Marengo Mining Ltd. (a) | 560,000 | | 69,428 |
Medusa Mining Ltd. | 2,552,885 | | 13,108,440 |
Newcrest Mining Ltd. | 9,560,792 | | 243,486,101 |
Papillon Resources Ltd. (a)(d) | 130,000 | | 150,427 |
Perseus Mining Ltd.: | | | |
(Australia) (a) | 5,504,308 | | 13,932,601 |
(Canada) (a) | 1,300,000 | | 3,494,801 |
Ramelius Resources Ltd. (a) | 980,000 | | 415,120 |
Red 5 Ltd. (a) | 475,000 | | 679,684 |
Regis Resources Ltd. (a) | 5,143,292 | | 25,187,375 |
Resolute Mining Ltd. (a) | 4,911,661 | | 7,484,862 |
Saracen Mineral Holdings Ltd. (a) | 735,000 | | 265,778 |
Silver Lake Resources Ltd. (a)(d) | 1,061,000 | | 3,255,631 |
St Barbara Ltd. (a)(d) | 5,059,676 | | 7,736,558 |
Tanami Gold NL (a)(d) | 130,000 | | 114,163 |
Troy Resources NL (a)(f) | 734,826 | | 3,265,065 |
| | 348,608,251 |
Bailiwick of Jersey - 4.9% |
METALS & MINING - 4.9% |
Gold - 4.9% |
Centamin PLC (a) | 12,211,900 | | 15,415,579 |
Lydian International Ltd. (a) | 170,000 | | 413,898 |
Polyus Gold International Ltd. sponsored GDR | 5,848,190 | | 17,720,016 |
Randgold Resources Ltd. sponsored ADR | 1,359,067 | | 139,943,129 |
| | 173,492,622 |
|
| Shares | | Value |
Bermuda - 0.1% |
METALS & MINING - 0.1% |
Gold - 0.1% |
Continental Gold Ltd. (a) | 450,100 | | $ 3,433,682 |
G-Resources Group Ltd. (a) | 12,891,000 | | 590,038 |
| | 4,023,720 |
Canada - 58.4% |
METALS & MINING - 58.4% |
Diversified Metals & Mining - 0.3% |
Copper Mountain Mining Corp. (a) | 97,000 | | 257,814 |
East Asia Minerals Corp. (a) | 5,000 | | 812 |
Eastmain Resources, Inc. (a) | 10,000 | | 9,029 |
Kimber Resources, Inc. (a)(e) | 16,100 | | 11,433 |
Kimber Resources, Inc. (a)(e)(f) | 5,832,000 | | 4,141,415 |
NovaCopper, Inc. (a)(d) | 488,333 | | 1,223,619 |
Sabina Gold & Silver Corp. (a) | 465,000 | | 1,551,965 |
Turquoise Hill Resources Ltd. (a) | 350,750 | | 2,818,098 |
| | 10,014,185 |
Gold - 57.5% |
Agnico-Eagle Mines Ltd. (Canada) (d) | 2,135,400 | | 103,136,083 |
Alacer Gold Corp. (a) | 3,409,063 | | 20,473,399 |
Alamos Gold, Inc. | 1,948,800 | | 36,633,288 |
Argonaut Gold, Inc. (a) | 1,084,800 | | 10,014,385 |
ATAC Resources Ltd. (a) | 67,200 | | 175,882 |
Aura Minerals, Inc. (a) | 10,000 | | 4,109 |
AuRico Gold, Inc. (a) | 3,978,563 | | 27,647,128 |
Aurizon Mines Ltd. (a) | 2,366,900 | | 9,628,475 |
Avion Gold Corp. (a) | 5,290,000 | | 3,756,531 |
B2Gold Corp. (a) | 6,022,400 | | 23,032,664 |
Banro Corp. (a) | 3,713,482 | | 15,972,776 |
Barrick Gold Corp. (d) | 10,139,019 | | 390,955,224 |
Belo Sun Mining Corp. (a) | 405,000 | | 480,700 |
Canaco Resources, Inc. (a) | 710,100 | | 252,128 |
Canaco Resources, Inc. (a)(f) | 561,600 | | 199,401 |
Centerra Gold, Inc. | 2,042,200 | | 15,537,915 |
Claude Resources, Inc. (a) | 40,000 | | 28,405 |
Colossus Minerals, Inc. (a) | 1,591,100 | | 7,102,044 |
Detour Gold Corp. (a) | 818,800 | | 20,599,787 |
Detour Gold Corp. (a)(f) | 785,900 | | 19,772,072 |
Eldorado Gold Corp. | 9,506,708 | | 126,241,753 |
Exeter Resource Corp. (a) | 272,300 | | 483,414 |
Franco-Nevada Corp. (d) | 1,689,900 | | 87,670,795 |
Gabriel Resources Ltd. (a) | 725,000 | | 1,698,960 |
Goldcorp, Inc. (d) | 11,229,100 | | 461,011,083 |
Golden Predator Corp. (a) | 5,000 | | 1,725 |
GoldQuest Mining Corp. (a) | 340,000 | | 538,067 |
Gran Colombia Gold Corp. (a) | 1,765,000 | | 599,822 |
Great Basin Gold Ltd. (a)(d) | 1,447,298 | | 278,962 |
Guyana Goldfields, Inc. (a) | 1,176,400 | | 3,126,724 |
Guyana Goldfields, Inc. (a)(f) | 155,000 | | 411,971 |
IAMGOLD Corp. | 4,873,200 | | 63,723,609 |
Common Stocks - continued |
| Shares | | Value |
Canada - continued |
METALS & MINING - CONTINUED |
Gold - continued |
International Minerals Corp.: | | | |
(Canada) (a) | 157,100 | | $ 838,292 |
(Switzerland) (a) | 15,000 | | 78,716 |
International Tower Hill Mines Ltd. (a) | 546,700 | | 1,597,257 |
Keegan Resources, Inc. (a) | 35,000 | | 129,597 |
Kinross Gold Corp. | 14,498,891 | | 128,846,346 |
Kinross Gold Corp. warrants 9/17/14 (a) | 1,192,793 | | 617,118 |
Kirkland Lake Gold, Inc. (a) | 906,000 | | 12,527,294 |
Lake Shore Gold Corp. (a) | 3,961,600 | | 4,018,869 |
Midas Gold Corp. (a) | 15,000 | | 39,564 |
New Gold, Inc. (a) | 6,990,855 | | 77,443,709 |
Novagold Resources, Inc. (a)(d) | 2,930,000 | | 13,672,838 |
OceanaGold Corp. (a) | 1,610,000 | | 4,246,513 |
Orezone Gold Corp. (a)(d) | 312,100 | | 585,732 |
Orvana Minerals Corp. (a)(d) | 10,000 | | 9,029 |
Osisko Mining Corp. (a) | 2,641,500 | | 25,644,591 |
Osisko Mining Corp. (a)(f) | 3,000,000 | | 29,125,032 |
Pilot Gold, Inc. (a) | 131,250 | | 139,805 |
Premier Gold Mines Ltd. (a) | 4,142,500 | | 21,768,349 |
Pretium Resources, Inc. (a) | 200,000 | | 2,960,183 |
Pretium Resources, Inc. (a)(f) | 225,000 | | 3,330,205 |
Pretium Resources, Inc. (a)(g) | 225,000 | | 3,330,205 |
Primero Mining Corp. (a) | 504,300 | | 2,281,692 |
Queenston Mining, Inc. (a) | 659,900 | | 2,202,456 |
Rainy River Resources Ltd. (a) | 1,882,500 | | 8,880,167 |
Richmont Mines, Inc. (a) | 30,000 | | 125,082 |
Romarco Minerals, Inc. (a) | 9,968,000 | | 8,291,920 |
Romarco Minerals, Inc. (a)(f) | 5,900,000 | | 4,907,938 |
Rubicon Minerals Corp. (a) | 2,851,352 | | 9,979,370 |
San Gold Corp. (a) | 4,634,400 | | 3,620,074 |
Seabridge Gold, Inc. (a) | 601,905 | | 10,105,983 |
SEMAFO, Inc. | 4,346,900 | | 16,404,228 |
St. Andrew Goldfields Ltd. (a) | 360,000 | | 158,864 |
Sulliden Gold Corp. Ltd. (a) | 1,700,400 | | 2,380,474 |
Teranga Gold Corp. (a) | 35,000 | | 71,367 |
Teranga Gold Corp. CDI unit (a) | 3,430,974 | | 6,947,633 |
Timmins Gold Corp. (a) | 105,000 | | 264,164 |
Torex Gold Resources, Inc. (a) | 8,097,500 | | 14,786,203 |
Yamana Gold, Inc. | 9,348,100 | | 159,887,361 |
| | 2,033,433,501 |
Precious Metals & Minerals - 0.6% |
Chesapeake Gold Corp. (a) | 6,000 | | 48,085 |
Dalradian Resources, Inc. (a) | 46,000 | | 48,998 |
Kaminak Gold Corp. Class A (a) | 20,000 | | 35,709 |
Pan American Silver Corp. | 563,487 | | 9,894,963 |
|
| Shares | | Value |
Pan American Silver Corp. warrants 12/7/14 (a) | 232,460 | | $ 175,039 |
Silver Wheaton Corp. | 150,700 | | 5,210,100 |
Silvercorp Metals, Inc. | 37,500 | | 220,644 |
Tahoe Resources, Inc. (a) | 225,500 | | 4,108,527 |
| | 19,742,065 |
TOTAL METALS & MINING | | 2,063,189,751 |
Cayman Islands - 0.0% |
METALS & MINING - 0.0% |
Gold - 0.0% |
China Precious Metal Resources Holdings Co. Ltd. (a) | 3,652,000 | | 640,375 |
Endeavour Mining Corp. (a)(d) | 348,000 | | 699,001 |
| | 1,339,376 |
China - 0.5% |
METALS & MINING - 0.5% |
Gold - 0.5% |
Zhaojin Mining Industry Co. Ltd. (H Shares) | 3,099,650 | | 4,100,389 |
Zijin Mining Group Co. Ltd. (H Shares) | 43,164,000 | | 13,523,620 |
| | 17,624,009 |
Netherlands - 0.0% |
METALS & MINING - 0.0% |
Gold - 0.0% |
Nord Gold NV GDR (Reg. S) (a) | 15,000 | | 66,000 |
Peru - 1.2% |
METALS & MINING - 1.2% |
Gold - 1.2% |
Compania de Minas Buenaventura SA sponsored ADR | 1,162,500 | | 40,292,250 |
South Africa - 8.8% |
METALS & MINING - 8.8% |
Gold - 8.8% |
AngloGold Ashanti Ltd. sponsored ADR | 4,802,952 | | 153,214,169 |
Gold Fields Ltd. | 55,000 | | 673,078 |
Gold Fields Ltd. sponsored ADR | 9,021,026 | | 111,139,040 |
Harmony Gold Mining Co. Ltd. | 1,484,000 | | 12,477,370 |
Harmony Gold Mining Co. Ltd. sponsored ADR (d) | 3,881,800 | | 33,150,572 |
| | 310,654,229 |
Sweden - 0.0% |
METALS & MINING - 0.0% |
Gold - 0.0% |
Nordic Mines AB (a) | 20,000 | | 24,161 |
Common Stocks - continued |
| Shares | | Value |
Turkey - 0.0% |
METALS & MINING - 0.0% |
Gold - 0.0% |
Koza Altin Isletmeleri A/S | 5,000 | | $ 98,395 |
United Kingdom - 0.6% |
METALS & MINING - 0.6% |
Gold - 0.6% |
African Barrick Gold Ltd. | 1,338,763 | | 9,440,477 |
Allied Gold Mining PLC (a) | 615,000 | | 1,386,669 |
Patagonia Gold PLC (a)(d) | 260,000 | | 112,499 |
Petropavlovsk PLC | 2,100,929 | | 11,605,805 |
| | 22,545,450 |
United States of America - 11.5% |
METALS & MINING - 11.3% |
Gold - 11.2% |
Allied Nevada Gold Corp. (a) | 1,346,300 | | 43,862,454 |
Allied Nevada Gold Corp. (Canada) (a) | 45,000 | | 1,463,556 |
Gold Resource Corp. (d) | 30,000 | | 568,800 |
Newmont Mining Corp. | 5,646,850 | | 286,182,358 |
Royal Gold, Inc. (d) | 731,313 | | 64,370,170 |
| | 396,447,338 |
Precious Metals & Minerals - 0.1% |
Coeur d'Alene Mines Corp. (a) | 15,000 | | 344,850 |
McEwen Mining, Inc. (a)(d) | 705,100 | | 2,792,196 |
| | 3,137,046 |
TOTAL METALS & MINING | | 399,584,384 |
OIL, GAS & CONSUMABLE FUELS - 0.2% |
Coal & Consumable Fuels - 0.2% |
Alpha Natural Resources, Inc. (a) | 518,000 | | 3,076,920 |
Peabody Energy Corp. | 220,000 | | 4,758,600 |
| | 7,835,520 |
TOTAL UNITED STATES OF AMERICA | | 407,419,904 |
TOTAL COMMON STOCKS (Cost $3,027,884,088) |
3,389,378,118
|
Commodities - 3.8% |
| Troy Ounces | | |
Gold Bullion (a) | 77,500 | | 131,169,525 |
Silver Bullion (a) | 117,000 | | 3,713,580 |
TOTAL COMMODITIES (Cost $113,075,575) |
134,883,105
|
Money Market Funds - 15.5% |
| Shares | | Value |
Fidelity Cash Central Fund, 0.17% (b) | 8,040,203 | | $ 8,040,203 |
Fidelity Securities Lending Cash Central Fund, 0.18% (b)(c) | 539,002,014 | | 539,002,014 |
TOTAL MONEY MARKET FUNDS (Cost $547,042,217) |
547,042,217
|
TOTAL INVESTMENT PORTFOLIO - 115.2% (Cost $3,688,001,880) | | 4,071,303,440 |
NET OTHER ASSETS (LIABILITIES) - (15.2)% | | (538,230,937) |
NET ASSETS - 100% | $ 3,533,072,503 |
Legend |
(a) Non-income producing |
(b) Affiliated fund that is available only to investment companies and other accounts managed by Fidelity Investments. The rate quoted is the annualized seven-day yield of the fund at period end. A complete unaudited listing of the fund's holdings as of its most recent quarter end is available upon request. In addition, each Fidelity Central Fund's financial statements are available on the SEC's website or upon request. |
(c) Investment made with cash collateral received from securities on loan. |
(d) Security or a portion of the security is on loan at period end. |
(e) Affiliated company |
(f) Security exempt from registration under Rule 144A of the Securities Act of 1933. These securities may be resold in transactions exempt from registration, normally to qualified institutional buyers. At the end of the period, the value of these securities amounted to $65,153,099 or 1.8% of net assets. |
(g) Restricted securities - Investment in securities not registered under the Securities Act of 1933 (excluding 144A issues). At the end of the period, the value of restricted securities (excluding 144A issues) amounted to $3,330,205 or 0.1% of net assets. |
Additional information on each restricted holding is as follows: |
Security | Acquisition Date | Acquisition Cost |
Pretium Resources, Inc. | 3/31/11 | $ 2,172,293 |
Affiliated Central Funds |
Information regarding fiscal year to date income earned by the Fund from investments in Fidelity Central Funds is as follows: |
Fund | Income earned |
Fidelity Cash Central Fund | $ 5,626 |
Fidelity Securities Lending Cash Central Fund | 334,629 |
Total | $ 340,255 |
| Value,
beginning of
period | Purchases | Sales
Proceeds | Dividend
Income | Value,
end of
period |
Fidelity Select Gold Cayman Ltd. | $ 43,125,922 | $ 86,850,463 | $ - | $ - | $ 134,852,679 |
Other Affiliated Issuers |
An affiliated company is a company in which the Fund has ownership of at least 5% of the voting securities. Fiscal year to date transactions with companies which are or were affiliates are as follows: |
Affiliate | Value,
beginning of
period | Purchases | Sales
Proceeds | Dividend
Income | Value,
end of
period |
Kimber Resources, Inc. | $ 16,919 | $ - | $ - | $ - | $ 11,433 |
Kimber Resources, Inc. (144A) | 6,128,712 | - | - | - | 4,141,415 |
Total | $ 6,145,631 | $ - | $ - | $ - | $ 4,152,848 |
Other Information |
The following is a summary of the inputs used, as of August 31, 2012, involving the Fund's assets and liabilities carried at fair value. The inputs or methodology used for valuing securities may not be an indication of the risk associated with investing in those securities. For more information on valuation inputs, and their aggregation into the levels used in the table below, please refer to the Security Valuation section in the accompanying Notes to Consolidated Financial Statements. |
Valuation Inputs at Reporting Date: |
Description | Total | Level 1 | Level 2 | Level 3 |
Investments in Securities: | | | | |
Common Stocks | $ 3,389,378,118 | $ 3,376,052,631 | $ 13,325,487 | $ - |
Commodities | 134,883,105 | 134,883,105 | - | - |
Money Market Funds | 547,042,217 | 547,042,217 | - | - |
Total Investments in Securities: | $ 4,071,303,440 | $ 4,057,977,953 | $ 13,325,487 | $ - |
See accompanying notes which are an integral part of the consolidated financial statements.
Semiannual Report
Gold Portfolio
Consolidated Statement of Assets and Liabilities
| August 31, 2012 (Unaudited) |
| | |
Assets | | |
Investment in securities, at value (including securities loaned of $531,798,267) - See accompanying schedule: Unaffiliated issuers (cost $3,022,586,600) | $ 3,385,225,270 | |
Fidelity Central Funds (cost $547,042,217) | 547,042,217 | |
Commodities (cost $113,075,575) | 134,883,105 | |
Other affiliated issuers (cost $5,297,488) | 4,152,848 | |
Total Investments (cost $3,688,001,880) | | $ 4,071,303,440 |
Cash | | 4,946 |
Foreign currency held at value (cost $3) | | 3 |
Receivable for fund shares sold | | 4,841,833 |
Dividends receivable | | 2,712,997 |
Distributions receivable from Fidelity Central Funds | | 63,556 |
Other receivables | | 11,124 |
Total assets | | 4,078,937,899 |
| | |
Liabilities | | |
Payable for fund shares redeemed | $ 4,035,091 | |
Accrued management fee | 1,569,470 | |
Distribution and service plan fees payable | 90,184 | |
Other affiliated payables | 917,284 | |
Other payables and accrued expenses | 251,353 | |
Collateral on securities loaned, at value | 539,002,014 | |
Total liabilities | | 545,865,396 |
| | |
Net Assets | | $ 3,533,072,503 |
Net Assets consist of: | | |
Paid in capital | | $ 3,578,544,855 |
Accumulated net investment loss | | (21,174,752) |
Accumulated undistributed net realized gain (loss) on investments and foreign currency transactions | | (407,604,474) |
Net unrealized appreciation (depreciation) on investments and assets and liabilities in foreign currencies | | 383,306,874 |
Net Assets | | $ 3,533,072,503 |
Consolidated Statement of Assets and Liabilities - continued
| August 31, 2012 (Unaudited) |
| | |
Calculation of Maximum Offering Price Class A:
Net Asset Value and redemption price per share ($126,561,933 ÷ 3,345,457 shares) | | $ 37.83 |
| | |
Maximum offering price per share (100/94.25 of $37.83) | | $ 40.14 |
Class T:
Net Asset Value and redemption price per share ($31,828,989 ÷ 848,774 shares) | | $ 37.50 |
| | |
Maximum offering price per share (100/96.50 of $37.50) | | $ 38.86 |
Class B:
Net Asset Value and offering price per share ($14,241,834 ÷ 387,566 shares)A | | $ 36.75 |
| | |
Class C:
Net Asset Value and offering price per share ($50,719,638 ÷ 1,386,025 shares)A | | $ 36.59 |
| | |
Gold:
Net Asset Value, offering price and redemption price per share ($3,162,334,752 ÷ 82,426,980 shares) | | $ 38.37 |
| | |
Institutional Class:
Net Asset Value, offering price and redemption price per share ($147,385,357 ÷ 3,846,964 shares) | | $ 38.31 |
A Redemption price per share is equal to net asset value less any applicable contingent deferred sales charge.
See accompanying notes which are an integral part of the consolidated financial statements.
Semiannual Report
Gold Portfolio
Consolidated Financial Statements - continued
Consolidated Statement of Operations
Six months ended August 31, 2012 (Unaudited) |
| | |
Investment Income | | |
Dividends | | $ 25,419,413 |
Interest | | 6 |
Income from Fidelity Central Funds | | 340,255 |
Total income | | 25,759,674 |
| | |
Expenses | | |
Management fee | $ 9,864,481 | |
Transfer agent fees | 5,153,104 | |
Distribution and service plan fees | 571,059 | |
Accounting and security lending fees | 739,772 | |
Custodian fees and expenses | 267,648 | |
Independent trustees' compensation | 11,898 | |
Registration fees | 110,314 | |
Audit | 20,966 | |
Legal | 7,351 | |
Interest | 4,841 | |
Miscellaneous | 24,740 | |
Total expenses before reductions | 16,776,174 | |
Expense reductions | (146,638) | 16,629,536 |
Net investment income (loss) | | 9,130,138 |
Realized and Unrealized Gain (Loss) Net realized gain (loss) on: | | |
Investments: | | |
Unaffiliated issuers | (111,301,818) | |
Foreign currency transactions | 41,154 | |
Total net realized gain (loss) | | (111,260,664) |
Change in net unrealized appreciation (depreciation) on: Investments | (631,480,473) | |
Assets and liabilities in foreign currencies | (4,026) | |
Commodities | 5,001,915 | |
Total change in net unrealized appreciation (depreciation) | | (626,482,584) |
Net gain (loss) | | (737,743,248) |
Net increase (decrease) in net assets resulting from operations | | $ (728,613,110) |
Consolidated Statement of Changes in Net Assets
| Six months ended
August 31, 2012
(Unaudited) | Year ended
February 29,
2012 |
Increase (Decrease) in Net Assets | | |
Operations | | |
Net investment income (loss) | $ 9,130,138 | $ (2,911,115) |
Net realized gain (loss) | (111,260,664) | 69,474,908 |
Change in net unrealized appreciation (depreciation) | (626,482,584) | (363,910,363) |
Net increase (decrease) in net assets resulting from operations | (728,613,110) | (297,346,570) |
Distributions to shareholders from net realized gain | - | (238,750,097) |
Share transactions - net increase (decrease) | (113,932,451) | 229,358,064 |
Redemption fees | 108,512 | 461,104 |
Total increase (decrease) in net assets | (842,437,049) | (306,277,499) |
| | |
Net Assets | | |
Beginning of period | 4,375,509,552 | 4,681,787,051 |
End of period (including accumulated net investment loss of $21,174,752 and accumulated net investment loss of $30,304,890, respectively) | $ 3,533,072,503 | $ 4,375,509,552 |
See accompanying notes which are an integral part of the consolidated financial statements.
Semiannual Report
Consolidated Financial Highlights - Class A
| Six months ended
August 31, 2012 | Years ended February 28, |
| (Unaudited) | 2012 I | 2011 | 2010 | 2009 | 2008 I |
Selected Per-Share Data | | | | | | |
Net asset value, beginning of period | $ 45.37 | $ 50.92 | $ 40.50 | $ 30.45 | $ 46.19 | $ 36.53 |
Income from Investment Operations | | | | | | |
Net investment income (loss) E | .06 | (.13) | (.30) | (.25) | (.15) | (.15) |
Net realized and unrealized gain (loss) | (7.60) | (2.83) | 15.28 | 11.00 | (15.44) | 15.00 |
Total from investment operations | (7.54) | (2.96) | 14.98 | 10.75 | (15.59) | 14.85 |
Distributions from net investment income | - | - | - | - | - | (.19) |
Distributions from net realized gain | - | (2.59) | (4.57) | (.71) | (.17) | (5.01) |
Total distributions | - | (2.59) | (4.57) | (.71) | (.17) | (5.20) |
Redemption fees added to paid in capital E | - J | - J | .01 | .01 | .02 | .01 |
Net asset value, end of period | $ 37.83 | $ 45.37 | $ 50.92 | $ 40.50 | $ 30.45 | $ 46.19 |
Total Return B, C, D | (16.62)% | (6.24)% | 36.99% | 35.19% | (33.81)% | 44.59% |
Ratios to Average Net Assets F, H | | | | | | |
Expenses before reductions | 1.18% A | 1.14% | 1.16% | 1.21% | 1.21% | 1.17% |
Expenses net of fee waivers, if any | 1.17% A | 1.14% | 1.15% | 1.19% | 1.19% | 1.17% |
Expenses net of all reductions | 1.17% A | 1.14% | 1.14% | 1.17% | 1.15% | 1.13% |
Net investment income (loss) | .30% A | (.28)% | (.63)% | (.63)% | (.45)% | (.37)% |
Supplemental Data | | | | | | |
Net assets, end of period (000 omitted) | $ 126,562 | $ 152,969 | $ 149,178 | $ 82,413 | $ 39,144 | $ 26,620 |
Portfolio turnover rate G | 16% A | 22% | 35% | 46% | 42% | 55% |
A Annualized B Total returns for periods of less than one year are not annualized. C Total returns would have been lower if certain expenses had not been reduced during the applicable periods shown. D Total returns do not include the effect of the sales charges. E Calculated based on average shares outstanding during the period. F Fees and expenses of any underlying Fidelity Central Funds are not included in the Fund's expense ratio. The Fund indirectly bears its proportionate share of the expenses of any underlying Fidelity Central Funds. G Amount does not include the portfolio activity of any underlying Fidelity Central Funds. H Expense ratios reflect operating expenses of the class. Expenses before reductions do not reflect amounts reimbursed by the investment adviser or reductions from brokerage service arrangements or reductions from other expense offset arrangements and do not represent the amount paid by the class during periods when reimbursements or reductions occur. Expenses net of fee waivers reflect expenses after reimbursement by the investment adviser but prior to reductions from brokerage service arrangements or other expense offset arrangements. Expenses net of all reductions represent the net expenses paid by the class. I For the year ended February 29. J Amount represents less than $.01 per share. |
Consolidated Financial Highlights - Class T
| Six months ended
August 31, 2012 | Years ended February 28, |
| (Unaudited) | 2012 I | 2011 | 2010 | 2009 | 2008 I |
Selected Per-Share Data | | | | | | |
Net asset value, beginning of period | $ 45.04 | $ 50.68 | $ 40.34 | $ 30.36 | $ 46.17 | $ 36.49 |
Income from Investment Operations | | | | | | |
Net investment income (loss) E | .01 | (.27) | (.43) | (.36) | (.24) | (.25) |
Net realized and unrealized gain (loss) | (7.55) | (2.80) | 15.21 | 10.96 | (15.42) | 15.05 |
Total from investment operations | (7.54) | (3.07) | 14.78 | 10.60 | (15.66) | 14.80 |
Distributions from net investment income | - | - | - | - | - | (.16) |
Distributions from net realized gain | - | (2.57) | (4.45) | (.63) | (.17) | (4.97) |
Total distributions | - | (2.57) | (4.45) | (.63) | (.17) | (5.13) |
Redemption fees added to paid in capital E | - J | - J | .01 | .01 | .02 | .01 |
Net asset value, end of period | $ 37.50 | $ 45.04 | $ 50.68 | $ 40.34 | $ 30.36 | $ 46.17 |
Total Return B, C, D | (16.74)% | (6.49)% | 36.62% | 34.79% | (33.98)% | 44.45% |
Ratios to Average Net Assets F, H | | | | | | |
Expenses before reductions | 1.45% A | 1.43% | 1.44% | 1.51% | 1.47% | 1.43% |
Expenses net of fee waivers, if any | 1.44% A | 1.42% | 1.42% | 1.49% | 1.45% | 1.43% |
Expenses net of all reductions | 1.44% A | 1.42% | 1.42% | 1.47% | 1.41% | 1.39% |
Net investment income (loss) | .03% A | (.57)% | (.90)% | (.93)% | (.71)% | (.63)% |
Supplemental Data | | | | | | |
Net assets, end of period (000 omitted) | $ 31,829 | $ 40,664 | $ 45,846 | $ 26,256 | $ 15,284 | $ 11,334 |
Portfolio turnover rate G | 16% A | 22% | 35% | 46% | 42% | 55% |
A Annualized B Total returns for periods of less than one year are not annualized. C Total returns would have been lower if certain expenses had not been reduced during the applicable periods shown. D Total returns do not include the effect of the sales charges. E Calculated based on average shares outstanding during the period. F Fees and expenses of any underlying Fidelity Central Funds are not included in the Fund's expense ratio. The Fund indirectly bears its proportionate share of the expenses of any underlying Fidelity Central Funds. G Amount does not include the portfolio activity of any underlying Fidelity Central Funds. H Expense ratios reflect operating expenses of the class. Expenses before reductions do not reflect amounts reimbursed by the investment adviser or reductions from brokerage service arrangements or reductions from other expense offset arrangements and do not represent the amount paid by the class during periods when reimbursements or reductions occur. Expenses net of fee waivers reflect expenses after reimbursement by the investment adviser but prior to reductions from brokerage service arrangements or other expense offset arrangements. Expenses net of all reductions represent the net expenses paid by the class. I For the year ended February 29. J Amount represents less than $.01 per share. |
See accompanying notes which are an integral part of the consolidated financial statements.
Semiannual Report
Consolidated Financial Highlights - Class B
| Six months ended
August 31, 2012 | Years ended February 28, |
| (Unaudited) | 2012 I | 2011 | 2010 | 2009 | 2008 I |
Selected Per-Share Data | | | | | | |
Net asset value, beginning of period | $ 44.24 | $ 50.02 | $ 39.87 | $ 30.08 | $ 45.97 | $ 36.46 |
Income from Investment Operations | | | | | | |
Net investment income (loss) E | (.08) | (.49) | (.66) | (.55) | (.40) | (.45) |
Net realized and unrealized gain (loss) | (7.41) | (2.76) | 15.02 | 10.84 | (15.34) | 14.95 |
Total from investment operations | (7.49) | (3.25) | 14.36 | 10.29 | (15.74) | 14.50 |
Distributions from net investment income | - | - | - | - | - | (.16) |
Distributions from net realized gain | - | (2.53) | (4.21) | (.51) | (.17) | (4.84) |
Total distributions | - | (2.53) | (4.21) | (.51) | (.17) | (5.00) |
Redemption fees added to paid in capital E | - J | - J | - J | .01 | .02 | .01 |
Net asset value, end of period | $ 36.75 | $ 44.24 | $ 50.02 | $ 39.87 | $ 30.08 | $ 45.97 |
Total Return B, C, D | (16.93)% | (6.95)% | 35.97% | 34.12% | (34.30)% | 43.53% |
Ratios to Average Net Assets F, H | | | | | | |
Expenses before reductions | 1.93% A | 1.90% | 1.93% | 2.00% | 1.97% | 1.93% |
Expenses net of fee waivers, if any | 1.92% A | 1.90% | 1.92% | 1.98% | 1.95% | 1.93% |
Expenses net of all reductions | 1.92% A | 1.90% | 1.91% | 1.96% | 1.89% | 1.90% |
Net investment income (loss) | (.45)% A | (1.04)% | (1.39)% | (1.42)% | (1.20)% | (1.14)% |
Supplemental Data | | | | | | |
Net assets, end of period (000 omitted) | $ 14,242 | $ 20,894 | $ 26,837 | $ 18,340 | $ 8,421 | $ 6,869 |
Portfolio turnover rate G | 16% A | 22% | 35% | 46% | 42% | 55% |
A Annualized B Total returns for periods of less than one year are not annualized. C Total returns would have been lower if certain expenses had not been reduced during the applicable periods shown. D Total returns do not include the effect of the contingent deferred sales charge. E Calculated based on average shares outstanding during the period. F Fees and expenses of any underlying Fidelity Central Funds are not included in the Fund's expense ratio. The Fund indirectly bears its proportionate share of the expenses of any underlying Fidelity Central Funds. G Amount does not include the portfolio activity of any underlying Fidelity Central Funds. H Expense ratios reflect operating expenses of the class. Expenses before reductions do not reflect amounts reimbursed by the investment adviser or reductions from brokerage service arrangements or reductions from other expense offset arrangements and do not represent the amount paid by the class during periods when reimbursements or reductions occur. Expenses net of fee waivers reflect expenses after reimbursement by the investment adviser but prior to reductions from brokerage service arrangements or other expense offset arrangements. Expenses net of all reductions represent the net expenses paid by the class. I For the year ended February 29. J Amount represents less than $.01 per share. |
Consolidated Financial Highlights - Class C
| Six months ended
August 31, 2012 | Years ended February 28, |
| (Unaudited) | 2012 I | 2011 | 2010 | 2009 | 2008 I |
Selected Per-Share Data | | | | | | |
Net asset value, beginning of period | $ 44.05 | $ 49.81 | $ 39.75 | $ 30.00 | $ 45.85 | $ 36.44 |
Income from Investment Operations | | | | | | |
Net investment income (loss) E | (.08) | (.47) | (.64) | (.53) | (.39) | (.45) |
Net realized and unrealized gain (loss) | (7.38) | (2.76) | 14.98 | 10.80 | (15.30) | 14.91 |
Total from investment operations | (7.46) | (3.23) | 14.34 | 10.27 | (15.69) | 14.46 |
Distributions from net investment income | - | - | - | - | - | (.17) |
Distributions from net realized gain | - | (2.53) | (4.28) | (.53) | (.17) | (4.89) |
Total distributions | - | (2.53) | (4.28) | (.53) | (.17) | (5.06) |
Redemption fees added to paid in capital E | - J | - J | - J | .01 | .01 | .01 |
Net asset value, end of period | $ 36.59 | $ 44.05 | $ 49.81 | $ 39.75 | $ 30.00 | $ 45.85 |
Total Return B, C, D | (16.94)% | (6.93)% | 36.01% | 34.15% | (34.30)% | 43.49% |
Ratios to Average Net Assets F, H | | | | | | |
Expenses before reductions | 1.93% A | 1.87% | 1.89% | 1.97% | 1.97% | 1.92% |
Expenses net of fee waivers, if any | 1.92% A | 1.87% | 1.88% | 1.95% | 1.95% | 1.92% |
Expenses net of all reductions | 1.92% A | 1.87% | 1.87% | 1.93% | 1.89% | 1.89% |
Net investment income (loss) | (.45)% A | (1.01)% | (1.35)% | (1.39)% | (1.20)% | (1.12)% |
Supplemental Data | | | | | | |
Net assets, end of period (000 omitted) | $ 50,720 | $ 67,996 | $ 72,431 | $ 38,624 | $ 17,544 | $ 10,835 |
Portfolio turnover rate G | 16% A | 22% | 35% | 46% | 42% | 55% |
A Annualized B Total returns for periods of less than one year are not annualized. C Total returns would have been lower if certain expenses had not been reduced during the applicable periods shown. D Total returns do not include the effect of the contingent deferred sales charge. E Calculated based on average shares outstanding during the period. F Fees and expenses of any underlying Fidelity Central Funds are not included in the Fund's expense ratio. The Fund indirectly bears its proportionate share of the expenses of any underlying Fidelity Central Funds. G Amount does not include the portfolio activity of any underlying Fidelity Central Funds. H Expense ratios reflect operating expenses of the class. Expenses before reductions do not reflect amounts reimbursed by the investment adviser or reductions from brokerage service arrangements or reductions from other expense offset arrangements and do not represent the amount paid by the class during periods when reimbursements or reductions occur. Expenses net of fee waivers reflect expenses after reimbursement by the investment adviser but prior to reductions from brokerage service arrangements or other expense offset arrangements. Expenses net of all reductions represent the net expenses paid by the class. I For the year ended February 29. J Amount represents less than $.01 per share. |
See accompanying notes which are an integral part of the consolidated financial statements.
Semiannual Report
Consolidated Financial Highlights - Gold
| Six months ended
August 31, 2012 | Years ended February 28, |
| (Unaudited) | 2012 H | 2011 | 2010 | 2009 | 2008 H |
Selected Per-Share Data | | | | | | |
Net asset value, beginning of period | $ 45.96 | $ 51.44 | $ 40.85 | $ 30.67 | $ 46.37 | $ 36.54 |
Income from Investment Operations | | | | | | |
Net investment income (loss) D | .10 | (.02) | (.18) | (.16) | (.04) | (.02) |
Net realized and unrealized gain (loss) | (7.69) | (2.85) | 15.43 | 11.10 | (15.51) | 15.05 |
Total from investment operations | (7.59) | (2.87) | 15.25 | 10.94 | (15.55) | 15.03 |
Distributions from net investment income | - | - | - | - | - | (.18) |
Distributions from net realized gain | - | (2.61) | (4.67) | (.77) | (.17) | (5.03) |
Total distributions | - | (2.61) | (4.67) | (.77) | (.17) | (5.21) |
Redemption fees added to paid in capital D | - I | - I | .01 | .01 | .02 | .01 |
Net asset value, end of period | $ 38.37 | $ 45.96 | $ 51.44 | $ 40.85 | $ 30.67 | $ 46.37 |
Total Return B, C | (16.51)% | (6.00)% | 37.35% | 35.52% | (33.59)% | 45.10% |
Ratios to Average Net Assets E, G | | | | | | |
Expenses before reductions | .93% A | .89% | .91% | .98% | .89% | .85% |
Expenses net of fee waivers, if any | .92% A | .89% | .90% | .96% | .87% | .85% |
Expenses net of all reductions | .92% A | .89% | .89% | .94% | .86% | .81% |
Net investment income (loss) | .55% A | (.03)% | (.37)% | (.40)% | (.13)% | (.05)% |
Supplemental Data | | | | | | |
Net assets, end of period (000 omitted) | $ 3,162,335 | $ 3,924,439 | $ 4,250,249 | $ 2,839,664 | $ 1,881,600 | $ 2,381,114 |
Portfolio turnover rate F | 16% A | 22% | 35% | 46% | 42% | 55% |
A Annualized B Total returns for periods of less than one year are not annualized. C Total returns would have been lower if certain expenses had not been reduced during the applicable periods shown. D Calculated based on average shares outstanding during the period. E Fees and expenses of any underlying Fidelity Central Funds are not included in the Fund's expense ratio. The Fund indirectly bears its proportionate share of the expenses of any underlying Fidelity Central Funds. F Amount does not include the portfolio activity of any underlying Fidelity Central Funds. G Expense ratios reflect operating expenses of the class. Expenses before reductions do not reflect amounts reimbursed by the investment adviser or reductions from brokerage service arrangements or reductions from other expense offset arrangements and do not represent the amount paid by the class during periods when reimbursements or reductions occur. Expenses net of fee waivers reflect expenses after reimbursement by the investment adviser but prior to reductions from brokerage service arrangements or other expense offset arrangements. Expenses net of all reductions represent the net expenses paid by the class. H For the year ended February 29. I Amount represents less than $.01 per share. |
Consolidated Financial Highlights - Institutional Class
| Six months ended
August 31, 2012 | Years ended February 28, |
| (Unaudited) | 2012 H | 2011 | 2010 | 2009 | 2008 H |
Selected Per-Share Data | | | | | | |
Net asset value, beginning of period | $ 45.87 | $ 51.32 | $ 40.77 | $ 30.65 | $ 46.34 | $ 36.54 |
Income from Investment Operations | | | | | | |
Net investment income (loss) D | .12 | .02 | (.15) | (.15) | (.05) | (.01) |
Net realized and unrealized gain (loss) | (7.68) | (2.85) | 15.41 | 11.08 | (15.49) | 15.03 |
Total from investment operations | (7.56) | (2.83) | 15.26 | 10.93 | (15.54) | 15.02 |
Distributions from net investment income | - | - | - | - | - | (.19) |
Distributions from net realized gain | - | (2.62) | (4.72) | (.82) | (.17) | (5.04) |
Total distributions | - | (2.62) | (4.72) | (.82) | (.17) | (5.23) |
Redemption fees added to paid in capital D | - I | - I | .01 | .01 | .02 | .01 |
Net asset value, end of period | $ 38.31 | $ 45.87 | $ 51.32 | $ 40.77 | $ 30.65 | $ 46.34 |
Total Return B, C | (16.48)% | (5.94)% | 37.45% | 35.50% | (33.59)% | 45.10% |
Ratios to Average Net Assets E, G | | | | | | |
Expenses before reductions | .84% A | .82% | .85% | .95% | .91% | .83% |
Expenses net of fee waivers, if any | .83% A | .81% | .84% | .93% | .89% | .83% |
Expenses net of all reductions | .83% A | .81% | .83% | .91% | .86% | .79% |
Net investment income (loss) | .64% A | .04% | (.31)% | (.37)% | (.14)% | (.03)% |
Supplemental Data | | | | | | |
Net assets, end of period (000 omitted) | $ 147,385 | $ 168,548 | $ 137,246 | $ 38,037 | $ 6,070 | $ 3,174 |
Portfolio turnover rate F | 16% A | 22% | 35% | 46% | 42% | 55% |
A Annualized B Total returns for periods of less than one year are not annualized. C Total returns would have been lower if certain expenses had not been reduced during the applicable periods shown. D Calculated based on average shares outstanding during the period. E Fees and expenses of any underlying Fidelity Central Funds are not included in the Fund's expense ratio. The Fund indirectly bears its proportionate share of the expenses of any underlying Fidelity Central Funds. F Amount does not include the portfolio activity of any underlying Fidelity Central Funds. G Expense ratios reflect operating expenses of the class. Expenses before reductions do not reflect amounts reimbursed by the investment adviser or reductions from brokerage service arrangements or reductions from other expense offset arrangements and do not represent the amount paid by the class during periods when reimbursements or reductions occur. Expenses net of fee waivers reflect expenses after reimbursement by the investment adviser but prior to reductions from brokerage service arrangements or other expense offset arrangements. Expenses net of all reductions represent the net expenses paid by the class. H For the year ended February 29. I Amount represents less than $.01 per share. |
See accompanying notes which are an integral part of the consolidated financial statements.
Semiannual Report
Notes to Consolidated Financial Statements
For the period ended August 31, 2012 (Unaudited)
1. Organization.
Gold Portfolio (the Fund) is a non-diversified fund of Fidelity Select Portfolios (the Trust) and is authorized to issue an unlimited number of shares. The Trust is registered under the Investment Company Act of 1940, as amended (the 1940 Act), as an open-end management investment company organized as a Massachusetts business trust. The Fund invests primarily in securities of companies whose principal business activities fall within specific industries. The Fund offers Class A, Class T, Class C, Gold and Institutional Class shares, each of which, along with Class B shares, has equal rights as to assets and voting privileges. Effective after the close of business on September 1, 2010, Class B shares were closed to new accounts and additional purchases, except for exchanges and reinvestments. Each class has exclusive voting rights with respect to matters that affect that class. Class B shares will automatically convert to Class A shares after a holding period of seven years from the initial date of purchase. Investment income, realized and unrealized capital gains and losses, the common expenses of the Fund, and certain fund-level expense reductions, if any, are allocated on a pro-rata basis to each class based on the relative net assets of each class to the total net assets of the Fund. Each class differs with respect to transfer agent and distribution and service plan fees incurred. Certain expense reductions may also differ by class.
2. Consolidated Subsidiary
The Fund invests in certain commodity-related investments through Fidelity Select Gold Cayman Ltd., a wholly owned subsidiary (the "Subsidiary"). As of August 31, 2012, the Fund held $134,852,679 in the Subsidiary, representing 3.8% of the Fund's net assets.
The financial statements have been consolidated and include accounts of the Fund and the Subsidiary. Accordingly, all inter-company transactions and balances have been eliminated.
3. Investments in Fidelity Central Funds.
The Fund invests in Fidelity Central Funds, which are open-end investment companies available only to other investment companies and accounts managed by Fidelity Management & Research Company (FMR) and its affiliates. The Fund's Consolidated Schedule of Investments lists each of the Fidelity Central Funds held as of period end, if any, as an investment of the Fund, but does not include the underlying holdings of each Fidelity Central Fund. As an Investing Fund, the Fund indirectly bears its proportionate share of the expenses of the underlying Fidelity Central Funds.
The Money Market Central Funds seek preservation of capital and current income and are managed by Fidelity Investments Money Management, Inc. (FIMM), an affiliate of FMR.
A complete unaudited list of holdings for each Fidelity Central Fund is available upon request or at the Securities and Exchange Commission (the SEC) web site at www.sec.gov. In addition, the financial statements of the Fidelity Central Funds are available on the SEC web site or upon request.
4. Significant Accounting Policies.
The consolidated financial statements have been prepared in conformity with accounting principles generally accepted in the United States of America (GAAP), which require management to make certain estimates and assumptions at the date of the financial statements. Actual results could differ from those estimates. Subsequent events, if any, through the date that the financial statements were issued have been evaluated in the preparation of the financial statements. The following summarizes the significant accounting policies of the Fund:
Security Valuation. Investments are valued as of 4:00 p.m. Eastern time on the last calendar day of the period. In accordance with valuation policies and procedures approved by the Board of Trustees (the Board), the Fund attempts to obtain prices from one or more third party pricing vendor or broker to value its investments. When current market prices, quotations or rates are not readily available or reliable, securities will be fair valued in good faith by the FMR Fair Value Committee (the Committee), in accordance with procedures adopted by the Fund's Board. Factors used in determining fair value vary by security type and may include market or security specific events. The frequency with which these procedures are used cannot be predicted and they may be utilized to a significant extent. The Committee oversees the Fund's valuation policies and procedures and is responsible for approving and reporting to the Board all fair value determinations.
The Fund categorizes the inputs to valuation techniques used to value its investments into a disclosure hierarchy consisting of three levels as shown below:
Level 1 - quoted prices in active markets for identical investments
Level 2 - other significant observable inputs (including quoted prices for similar investments, interest rates, prepayment speeds, etc.)
Level 3 - unobservable inputs (including the Fund's own assumptions based on the best information available)
Valuation techniques used to value the Fund's investments by major category are as follows:
Semiannual Report
Notes to Consolidated Financial Statements (Unaudited) - continued
4. Significant Accounting Policies - continued
Security Valuation - continued
Equity securities, including restricted securities, for which market quotations are readily available, are valued at the last reported sale price or official closing price as reported by a third party pricing vendor on the primary market or exchange on which they are traded and are categorized as Level 1 in the hierarchy. In the event there were no sales during the day or closing prices are not available, securities are valued at the last quoted bid price or may be valued using the last available price and are generally categorized as Level 2 in the hierarchy. For foreign equity securities, when significant market or security specific events arise, comparisons to the valuation of American Depositary Receipts (ADRs), futures contracts, Exchange-Traded Funds (ETFs) and certain indexes as well as quoted prices for similar securities are used and are categorized as Level 2 in the hierarchy. Utilizing these techniques may result in transfers between Level 1 and Level 2. For restricted equity securities and private placements where observable inputs are limited, assumptions about market activity and risk are used and these securities are categorized as Level 3 in the hierarchy.
Investments in commodities are valued at their last traded price at 4:00 p.m. Eastern time each business day and are categorized as Level 1 in the hierarchy. Investments in open-end mutual funds, including the Fidelity Central Funds, are valued at their closing net asset value each business day and are categorized as Level 1 in the hierarchy.
Changes in valuation techniques may result in transfers in or out of an assigned level within the disclosure hierarchy. The aggregate value of investments by input level, as of August 31, 2012, is included at the end of the Fund's Consolidated Schedule of Investments.
Foreign Currency Translation. The Fund may use foreign currency contracts to facilitate transactions in foreign-denominated securities. Gains and losses from these transactions may arise from changes in the value of the foreign currency or if the counterparties do not perform under the contracts' terms.
Foreign-denominated assets, including investment securities, and liabilities are translated into U.S. dollars at the exchange rates at period end. Purchases and sales of investment securities, income and dividends received and expenses denominated in foreign currencies are translated into U.S. dollars at the exchange rate in effect on the transaction date.
The effects of exchange rate fluctuations on investments are included with the net realized and unrealized gain (loss) on investment securities. Other foreign currency transactions resulting in realized and unrealized gain (loss) are disclosed separately.
Investment Transactions and Income. For financial reporting purposes, the Fund's investment holdings and NAV include trades executed through the end of the last business day of the period. The NAV per share for processing shareholder transactions is calculated as of the close of business of the New York Stock Exchange (NYSE), normally 4:00 p.m. Eastern time and includes trades executed through the end of the prior business day. Gains and losses on securities sold are determined on the basis of identified cost. Dividend income is recorded on the ex-dividend date, except for certain dividends from foreign securities where the ex-dividend date may have passed, which are recorded as soon as the Fund is informed of the ex-dividend date. Non-cash dividends included in dividend income, if any, are recorded at the fair market value of the securities received. Distributions received on securities that represent a return of capital or capital gain are recorded as a reduction of cost of investments and/or as a realized gain. The Fund estimates the components of distributions received that may be considered return of capital distributions or capital gain distributions. Interest income and distributions from the Fidelity Central Funds are accrued as earned. Interest income includes coupon interest and amortization of premium and accretion of discount on debt securities. Investment income is recorded net of foreign taxes withheld where recovery of such taxes is uncertain.
Expenses. Expenses directly attributable to a fund are charged to that fund. Expenses attributable to more than one fund are allocated among the respective funds on the basis of relative net assets or other appropriate methods. Expense estimates are accrued in the period to which they relate and adjustments are made when actual amounts are known.
Income Tax Information and Distributions to Shareholders. Each year, the Fund intends to qualify as a regulated investment company under Subchapter M of the Internal Revenue Code, including distributing substantially all of its taxable income and realized gains. As a result, no provision for income taxes is required. The Fund files a U.S. federal tax return, in addition to state and local tax returns as required. A fund's federal income tax returns are subject to examination by the Internal Revenue Service (IRS) for a period of three fiscal years after they are filed. State and local tax returns may be subject to examination for an additional fiscal year depending on the jurisdiction. Foreign taxes are provided for based on the Fund's understanding of the tax rules and rates that exist in the foreign markets in which it invests.
The Subsidiary is classified as a controlled foreign corporation under Subchapter N of the Internal Revenue Code. Therefore, the Fund is required to increase its taxable income by its share of the Subsidiary's income. Net investment losses of the Subsidiary cannot be deducted by the Fund in the current period nor carried forward to offset taxable income in future periods.
Distributions are declared and recorded on the ex-dividend date. Income dividends and capital gain distributions are declared separately for each class. Income and capital gain distributions are determined in accordance with income tax regulations, which may differ from GAAP.
Semiannual Report
4. Significant Accounting Policies - continued
Income Tax Information and Distributions to Shareholders - continued
Capital accounts within the consolidated financial statements are adjusted for permanent book-tax differences. These adjustments have no impact on net assets or the results of operations. Temporary book-tax differences will reverse in a subsequent period.
Book-tax differences are primarily due to foreign currency transactions, passive foreign investment companies (PFIC), controlled foreign corporation, deferred trustees compensation and losses deferred due to wash sales and excise tax regulations.
The federal tax cost of investment securities and unrealized appreciation (depreciation) as of period end on an unconsolidated basis were as follows:
Gross unrealized appreciation | $ 515,696,261 |
Gross unrealized depreciation | (433,498,682) |
Net unrealized appreciation (depreciation) on securities and other investments | $ 82,197,579 |
| |
Tax cost | $ 3,989,075,435 |
Trading (Redemption) Fees. Shares held by investors in the Fund less than 30 days are subject to a redemption fee equal to .75% of the net asset value of shares redeemed. All redemption fees, which reduce the proceeds of the shareholder redemption, are retained by the Fund and accounted for as an addition to paid in capital.
New Accounting Pronouncement. In December 2011, the Financial Accounting Standards Board issued Accounting Standard Update No. 2011-11, Disclosures about Offsetting Assets and Liabilities. The update creates new disclosure requirements requiring entities to disclose both gross and net information for derivatives and other financial instruments that are either offset in the Statement of Assets and Liabilities or subject to an enforceable master netting arrangement or similar agreement. The disclosure requirements are effective for annual reporting periods beginning on or after January 1, 2013, and interim periods within those annual periods. Management is currently evaluating the impact of the update's adoption on the Fund's financial statement disclosures.
5. Operating Policies.
Restricted Securities. The Fund may invest in securities that are subject to legal or contractual restrictions on resale. These securities generally may be resold in transactions exempt from registration or to the public if the securities are registered. Disposal of these securities may involve time-consuming negotiations and expense, and prompt sale at an acceptable price may be difficult. Information regarding restricted securities is included at the end of the Fund's Consolidated Schedule of Investments.
6. Purchases and Sales of Investments.
Purchases and sales of securities, other than short-term securities, aggregated $290,608,518 and $389,268,652, respectively.
7. Fees and Other Transactions with Affiliates.
Management Fee. FMR and its affiliates provide the Fund with investment management related services for which the Fund pays a monthly management fee. The management fee is the sum of an individual fund fee rate that is based on an annual rate of .30% of the Fund's average net assets and an annualized group fee rate that averaged .26% during the period. The group fee rate is based upon the average net assets of all the mutual funds advised by FMR. The group fee rate decreases as assets under management increase and increases as assets under management decrease. For the period, the total annualized management fee rate was .56% of the Fund's average net assets.
FMR and its affiliates also provide investment management related services to the Subsidiary. The Subsidiary pays FMR a monthly management fee at the annual rate of .30% of its net assets. Under the management contract, FMR pays all other expenses of the Subsidiary, except custodian fees.
During the period, FMR waived a portion of its management fee as described in the Expense Reductions note.
Distribution and Service Plan Fees. In accordance with Rule 12b-1 of the 1940 Act, the Fund has adopted separate Distribution and Service Plans for each class of shares. Certain classes pay Fidelity Distributors Corporation (FDC), an affiliate of FMR, separate Distribution and Service Fees, each of which is based on an annual percentage of each class' average net assets. In addition, FDC may pay financial intermediaries for selling shares of the
Semiannual Report
Notes to Consolidated Financial Statements (Unaudited) - continued
7. Fees and Other Transactions with Affiliates - continued
Distribution and Service Plan Fees - continued
Fund and providing shareholder support services. For the period, the Distribution and Service Fee rates, total fees and amounts retained by FDC were as follows:
| Distribution
Fee | Service
Fee | Total Fees | Retained
by FDC |
Class A | -% | .25% | $ 156,314 | $ 1,629 |
Class T | .25% | .25% | 79,192 | - |
Class B | .75% | .25% | 75,203 | 56,402 |
Class C | .75% | .25% | 260,350 | 39,833 |
| | | $ 571,059 | $ 97,864 |
Sales Load. FDC may receive a front-end sales charge of up to 5.75% for selling Class A shares and 3.50% for selling Class T shares, some of which is paid to financial intermediaries for selling shares of the Fund. Depending on the holding period, FDC may receive contingent deferred sales charges levied on Class A, Class T, Class B, and Class C redemptions. The deferred sales charges range from 5.00% to 1.00% for Class B shares, 1.00% for Class C shares, 1.00% for certain purchases of Class A shares and .25% for certain purchases of Class T shares.
For the period, sales charge amounts retained by FDC were as follows:
| Retained
by FDC |
Class A | $ 27,538 |
Class T | 6,049 |
Class B* | 23,856 |
Class C* | 3,522 |
| $ 60,965 |
* When Class B and Class C shares are initially sold, FDC pays commissions from its own resources to financial intermediaries through which the sales are made.
Transfer Agent Fees. Fidelity Investments Institutional Operations Company, Inc. (FIIOC), an affiliate of FMR, is the transfer, dividend disbursing and shareholder servicing agent for each class of the Fund. FIIOC receives account fees and asset-based fees that vary according to the account size and type of account of the shareholders of the respective classes of the Fund. FIIOC pays for typesetting, printing and mailing of shareholder reports, except proxy statements. For the period, transfer agent fees for each class were as follows:
| Amount | % of
Average
Net Assets* |
Class A | $ 186,709 | .30 |
Class T | 50,381 | .32 |
Class B | 22,493 | .30 |
Class C | 76,952 | .30 |
Gold | 4,672,489 | .30 |
Institutional Class | 144,080 | .21 |
| $ 5,153,104 | |
* Annualized
Accounting and Security Lending Fees. Fidelity Service Company, Inc. (FSC), an affiliate of FMR, maintains the Fund's accounting records. The accounting fee is based on the level of average net assets for each month. Under a separate contract, FSC administers the security lending program. The security lending fee is based on the number and duration of lending transactions.
Brokerage Commissions. The Fund placed a portion of its portfolio transactions with brokerage firms which are affiliates of the investment adviser. The commissions paid to these affiliated firms were $1,611 for the period.
Interfund Lending Program. Pursuant to an Exemptive Order issued by the SEC, the Fund, along with other registered investment companies having management contracts with FMR, may participate in an interfund lending program. This program provides an alternative credit facility allowing the
Semiannual Report
7. Fees and Other Transactions with Affiliates - continued
Interfund Lending Program - continued
funds to borrow from, or lend money to, other participating affiliated funds. At period end, there were no interfund loans outstanding. The Fund's activity in this program during the period for which loans were outstanding was as follows:
Borrower or Lender | Average Loan
Balance | Weighted Average
Interest Rate | Interest
Expense |
Borrower | $ 9,128,575 | .41% | $ 4,148 |
8. Committed Line of Credit.
The Fund participates with other funds managed by FMR or an affiliate in a $4.25 billion credit facility (the "line of credit") to be utilized for temporary or emergency purposes to fund shareholder redemptions or for other short-term liquidity purposes. The Fund has agreed to pay commitment fees on its pro-rata portion of the line of credit, which amounted to $5,517 and is reflected in Miscellaneous expenses on the Consolidated Statement of Operations. During the period, there were no borrowings on this line of credit.
9. Security Lending.
The Fund lends portfolio securities through a lending agent from time to time in order to earn additional income. For equity securities, a lending agent is used and may loan securities to certain qualified borrowers, including Fidelity Capital Markets (FCM), a broker-dealer affiliated with the Fund. On the settlement date of the loan, the Fund receives collateral (in the form of U.S. Treasury obligations, letters of credit and/or cash) against the loaned securities and maintains collateral in an amount not less than 100% of the market value of the loaned securities during the period of the loan. The market value of the loaned securities is determined at the close of business of the Fund and any additional required collateral is delivered to the Fund on the next business day. If the borrower defaults on its obligation to return the securities loaned because of insolvency or other reasons, a fund could experience delays and costs in recovering the securities loaned or in gaining access to the collateral. Any cash collateral received is invested in the Fidelity Securities Lending Cash Central Fund. The value of loaned securities and cash collateral at period end are disclosed on the Fund's Consolidated Statement of Assets and Liabilities. The value of securities loaned to FCM at period end was $426,600. Security lending income represents the income earned on investing cash collateral, less rebates paid to borrowers and any lending agent fees associated with the loan, plus any premium payments received for lending certain types of securities. Security lending income is presented in the Consolidated Statement of Operations as a component of income from Fidelity Central Funds. Total security lending income during the period amounted to $334,629, including $15,383 from securities loaned to FCM.
10. Bank Borrowings.
The Fund is permitted to have bank borrowings for temporary or emergency purposes to fund shareholder redemptions or for other short-term liquidity requirements. The Fund has established borrowing arrangements with certain banks. The interest rate on the borrowings is the bank's base rate, as revised from time to time. The average loan balance during the period for which loans were outstanding amounted to $6,452,333. The weighted average interest rate was .64%. The interest expense amounted to $693 under the bank borrowing program. At period end, there were no bank borrowings outstanding.
11. Expense Reductions.
FMR has contractually agreed to waive the Fund's management fee in an amount equal to the management fee of the Subsidiary. During the period, this waiver reduced the Fund's management fee by $120,205. Many of the brokers with whom FMR places trades on behalf of the Fund provided services to the Fund in addition to trade execution. These services included payments of certain expenses on behalf of the Fund totaling $26,120 for the period. In addition, through arrangements with the Fund's custodian, credits realized as a result of uninvested cash balances were used to reduce the Fund's expenses. During the period, these credits reduced the Fund's custody expenses by $313.
Semiannual Report
Notes to Consolidated Financial Statements (Unaudited) - continued
12. Distributions to Shareholders.
Distributions to shareholders of each class were as follows:
| Six months ended
August 31,
2012 | Year ended
February 29,
2012 |
From net realized gain | | |
Class A | $ - | $ 7,834,928 |
Class T | - | 2,382,367 |
Class B | - | 1,303,107 |
Class C | - | 3,798,844 |
Gold | - | 215,607,839 |
Institutional Class | - | 7,823,012 |
Total | $ - | $ 238,750,097 |
13. Share Transactions.
Transactions for each class of shares were as follows:
| Shares | Dollars |
| Six months ended
August 31,
2012 | Year ended
February 29,
2012 | Six months ended
August 31,
2012 | Year ended
February 29,
2012 |
Class A | | | | |
Shares sold | 855,307 | 1,589,102 | $ 32,193,547 | $ 76,690,664 |
Reinvestment of distributions | - | 145,713 | - | 7,265,756 |
Shares redeemed | (881,215) | (1,293,053) | (33,147,004) | (61,867,749) |
Net increase (decrease) | (25,908) | 441,762 | $ (953,457) | $ 22,088,671 |
Class T | | | | |
Shares sold | 125,633 | 326,122 | $ 4,595,848 | $ 15,663,258 |
Reinvestment of distributions | - | 46,446 | - | 2,308,310 |
Shares redeemed | (179,763) | (374,234) | (6,587,924) | (17,626,829) |
Net increase (decrease) | (54,130) | (1,666) | $ (1,992,076) | $ 344,739 |
Class B | | | | |
Shares sold | 9,231 | 55,740 | $ 336,945 | $ 2,638,278 |
Reinvestment of distributions | - | 22,881 | - | 1,122,370 |
Shares redeemed | (93,976) | (142,844) | (3,506,846) | (6,672,300) |
Net increase (decrease) | (84,745) | (64,223) | $ (3,169,901) | $ (2,911,652) |
Class C | | | | |
Shares sold | 142,812 | 510,073 | $ 5,081,885 | $ 24,191,165 |
Reinvestment of distributions | - | 63,636 | - | 3,100,723 |
Shares redeemed | (300,277) | (484,293) | (10,819,907) | (22,585,009) |
Net increase (decrease) | (157,465) | 89,416 | $ (5,738,022) | $ 4,706,879 |
Gold | | | | |
Shares sold | 12,217,076 | 30,555,727 | $ 461,041,057 | $ 1,483,101,053 |
Reinvestment of distributions | - | 4,125,294 | - | 208,463,091 |
Shares redeemed | (15,184,970) | (31,912,749) | (569,825,690) | (1,536,990,789) |
Net increase (decrease) | (2,967,894) | 2,768,272 | $ (108,784,633) | $ 154,573,355 |
Institutional Class | | | | |
Shares sold | 650,993 | 1,664,357 | $ 24,357,064 | $ 81,430,250 |
Reinvestment of distributions | - | 146,226 | - | 7,344,695 |
Shares redeemed | (478,376) | (810,698) | (17,651,426) | (38,218,873) |
Net increase (decrease) | 172,617 | 999,885 | $ 6,705,638 | $ 50,556,072 |
14. Other.
The Fund's organizational documents provide former and current trustees and officers with a limited indemnification against liabilities arising in connection with the performance of their duties to the Fund. In the normal course of business, the Fund may also enter into contracts that provide general indemnifications. The Fund's maximum exposure under these arrangements is unknown as this would be dependent on future claims that may be made against the Fund. The risk of material loss from such claims is considered remote.
Semiannual Report
Materials Portfolio
As a shareholder of the Fund, you incur two types of costs: (1) transaction costs, including sales charges (loads) on purchase payments or redemption proceeds, redemption fees and (2) ongoing costs, including management fees, distribution and/or service (12b-1) fees and other Fund expenses. This Example is intended to help you understand your ongoing costs (in dollars) of investing in the Fund and to compare these costs with the ongoing costs of investing in other mutual funds.
The Example is based on an investment of $1,000 invested at the beginning of the period and held for the entire period (March 1, 2012 to August 31, 2012).
Actual Expenses
The first line of the accompanying table for each class of the Fund provides information about actual account values and actual expenses. You may use the information in this line, together with the amount you invested, to estimate the expenses that you paid over the period. Simply divide your account value by $1,000.00 (for example, an $8,600 account value divided by $1,000.00 = 8.6), then multiply the result by the number in the first line for a class of the Fund under the heading entitled "Expenses Paid During Period" to estimate the expenses you paid on your account during this period. A small balance maintenance fee of $12.00 that is charged once a year may apply for certain accounts with a value of less than $2,000. This fee is not included in the table below. If it was, the estimate of expenses you paid during the period would be higher, and your ending account value lower, by this amount. In addition, the Fund, as a shareholder in the underlying Fidelity Central Funds, will indirectly bear its pro-rata share of the fees and expenses incurred by the underlying Fidelity Central Funds. These fees and expenses are not included in the Fund's annualized expense ratio used to calculate the expense estimate in the table below.
Hypothetical Example for Comparison Purposes
The second line of the accompanying table for each class of the Fund provides information about hypothetical account values and hypothetical expenses based on a Class' actual expense ratio and an assumed rate of return of 5% per year before expenses, which is not the Class' actual return. The hypothetical account values and expenses may not be used to estimate the actual ending account balance or expenses you paid for the period. You may use this information to compare the ongoing costs of investing in the Fund and other funds. To do so, compare this 5% hypothetical example with the 5% hypothetical examples that appear in the shareholder reports of the other funds. A small balance maintenance fee of $12.00 that is charged once a year may apply for certain accounts with a value of less than $2,000. This fee is not included in the table below. If it was, the estimate of expenses you paid during the period would be higher, and your ending account value lower, by this amount. In addition, the Fund, as a shareholder in the underlying Fidelity Central Funds, will indirectly bear its pro-rata share of the fees and expenses incurred by the underlying Fidelity Central Funds. These fees and expenses are not included in the Fund's annualized expense ratio used to calculate the expense estimate in the table below.
Please note that the expenses shown in the table are meant to highlight your ongoing costs only and do not reflect any transaction costs. Therefore, the second line of the table is useful in comparing ongoing costs only, and will not help you determine the relative total costs of owning different funds. In addition, if these transactional costs were included, your costs would have been higher.
| Annualized
Expense Ratio | Beginning
Account Value
March 1, 2012 | Ending
Account Value
August 31, 2012 | Expenses Paid
During Period*
March 1, 2012
to August 31, 2012 |
Class A | 1.13% | | | |
Actual | | $ 1,000.00 | $ 989.70 | $ 5.67 |
HypotheticalA | | $ 1,000.00 | $ 1,019.51 | $ 5.75 |
Class T | 1.42% | | | |
Actual | | $ 1,000.00 | $ 988.30 | $ 7.12 |
HypotheticalA | | $ 1,000.00 | $ 1,018.05 | $ 7.22 |
Class B | 1.91% | | | |
Actual | | $ 1,000.00 | $ 985.90 | $ 9.56 |
HypotheticalA | | $ 1,000.00 | $ 1,015.58 | $ 9.70 |
Class C | 1.89% | | | |
Actual | | $ 1,000.00 | $ 985.80 | $ 9.46 |
HypotheticalA | | $ 1,000.00 | $ 1,015.68 | $ 9.60 |
Materials | .86% | | | |
Actual | | $ 1,000.00 | $ 991.00 | $ 4.32 |
HypotheticalA | | $ 1,000.00 | $ 1,020.87 | $ 4.38 |
Institutional Class | .85% | | | |
Actual | | $ 1,000.00 | $ 991.00 | $ 4.27 |
HypotheticalA | | $ 1,000.00 | $ 1,020.92 | $ 4.33 |
A 5% return per year before expenses
* Expenses are equal to each Class' annualized expense ratio, multiplied by the average account value over the period, multiplied by 184/365 (to reflect the one-half year period).
Semiannual Report
Materials Portfolio
Investment Changes (Unaudited)
Top Ten Stocks as of August 31, 2012 |
| % of fund's
net assets | % of fund's net assets
6 months ago |
E.I. du Pont de Nemours & Co. | 8.3 | 8.1 |
Monsanto Co. | 8.1 | 6.6 |
Air Products & Chemicals, Inc. | 5.7 | 5.2 |
LyondellBasell Industries NV Class A | 4.2 | 3.5 |
Eastman Chemical Co. | 3.8 | 2.2 |
PPG Industries, Inc. | 3.6 | 2.2 |
Ecolab, Inc. | 3.5 | 3.8 |
Sherwin-Williams Co. | 3.2 | 2.4 |
Rock-Tenn Co. Class A | 3.2 | 2.5 |
Freeport-McMoRan Copper & Gold, Inc. | 2.8 | 2.7 |
| 46.4 | |
Top Industries (% of fund's net assets) |
As of August 31, 2012 |
| Chemicals | 62.5% | |
| Metals & Mining | 19.5% | |
| Containers & Packaging | 8.6% | |
| Construction Materials | 1.5% | |
| Paper & Forest Products | 1.2% | |
| All Others* | 6.7% | |

As of February 29, 2012 |
| Chemicals | 65.0% | |
| Metals & Mining | 20.1% | |
| Containers & Packaging | 8.0% | |
| Food Products | 1.0% | |
| Electrical Equipment | 0.6% | |
| All Others* | 5.3% | |

* Includes short-term investments and net other assets. |
Semiannual Report
Materials Portfolio
Investments August 31, 2012 (Unaudited)
Showing Percentage of Net Assets
Common Stocks - 94.0% |
| Shares | | Value |
CHEMICALS - 62.5% |
Commodity Chemicals - 2.5% |
Arkema SA | 81,801 | | $ 6,963,548 |
PetroLogistics LP | 707,262 | | 9,045,881 |
Westlake Chemical Corp. (d) | 266,370 | | 18,320,929 |
| | 34,330,358 |
Diversified Chemicals - 18.6% |
Dow Chemical Co. | 313,213 | | 9,180,273 |
E.I. du Pont de Nemours & Co. | 2,275,817 | | 113,221,891 |
Eastman Chemical Co. | 921,584 | | 50,926,732 |
FMC Corp. | 359,730 | | 19,540,534 |
Lanxess AG | 96,593 | | 7,328,559 |
Olin Corp. | 180,200 | | 3,861,686 |
PPG Industries, Inc. | 446,927 | | 49,170,909 |
| | 253,230,584 |
Fertilizers & Agricultural Chemicals - 11.6% |
CF Industries Holdings, Inc. | 164,937 | | 34,143,608 |
Monsanto Co. | 1,257,799 | | 109,566,871 |
Rentech Nitrogen Partners LP | 409,909 | | 13,924,609 |
| | 157,635,088 |
Industrial Gases - 5.7% |
Air Products & Chemicals, Inc. | 935,857 | | 77,283,071 |
Specialty Chemicals - 24.1% |
Albemarle Corp. | 427,749 | | 23,410,703 |
Ashland, Inc. | 509,786 | | 37,535,543 |
Celanese Corp. Class A | 525,033 | | 20,087,763 |
Cytec Industries, Inc. | 203,146 | | 13,909,407 |
Ecolab, Inc. | 737,482 | | 47,220,972 |
Kraton Performance Polymers, Inc. (a) | 77,900 | | 1,670,955 |
LyondellBasell Industries NV Class A | 1,163,330 | | 56,817,037 |
OMNOVA Solutions, Inc. (a) | 500,291 | | 3,897,267 |
Rockwood Holdings, Inc. | 311,332 | | 14,738,457 |
Sherwin-Williams Co. | 304,547 | | 43,574,585 |
Sigma Aldrich Corp. | 462,244 | | 32,833,191 |
W.R. Grace & Co. (a) | 570,496 | | 32,951,849 |
| | 328,647,729 |
TOTAL CHEMICALS | | 851,126,830 |
COMMERCIAL SERVICES & SUPPLIES - 0.2% |
Environmental & Facility Services - 0.2% |
Swisher Hygiene, Inc. (a) | 262,171 | | 417,639 |
Swisher Hygiene, Inc. (Canada) (a)(d) | 1,553,967 | | 2,750,526 |
| | 3,168,165 |
CONSTRUCTION MATERIALS - 1.5% |
Construction Materials - 1.5% |
Martin Marietta Materials, Inc. (d) | 272,511 | | 20,814,390 |
|
| Shares | | Value |
CONTAINERS & PACKAGING - 8.6% |
Metal & Glass Containers - 5.4% |
Aptargroup, Inc. | 552,400 | | $ 27,979,060 |
Ball Corp. | 795,733 | | 33,556,061 |
Nampak Ltd. | 78,373 | | 252,290 |
Silgan Holdings, Inc. | 285,078 | | 11,953,321 |
| | 73,740,732 |
Paper Packaging - 3.2% |
Rock-Tenn Co. Class A | 649,333 | | 43,355,964 |
TOTAL CONTAINERS & PACKAGING | | 117,096,696 |
METALS & MINING - 19.5% |
Diversified Metals & Mining - 6.5% |
Copper Mountain Mining Corp. (a) | 1,992,200 | | 5,295,018 |
First Quantum Minerals Ltd. | 1,341,300 | | 25,839,500 |
Freeport-McMoRan Copper & Gold, Inc. | 1,052,624 | | 38,010,253 |
HudBay Minerals, Inc. | 408,700 | | 3,495,147 |
Iluka Resources Ltd. | 78,303 | | 744,268 |
Turquoise Hill Resources Ltd. (a)(d) | 1,899,540 | | 15,261,838 |
| | 88,646,024 |
Gold - 6.6% |
Allied Nevada Gold Corp. (a) | 261,472 | | 8,518,758 |
Franco-Nevada Corp. | 207,300 | | 10,754,575 |
Goldcorp, Inc. | 457,700 | | 18,790,889 |
Newmont Mining Corp. | 555,189 | | 28,136,979 |
Royal Gold, Inc. | 267,701 | | 23,563,042 |
| | 89,764,243 |
Steel - 6.4% |
African Minerals Ltd. (a) | 529,923 | | 2,120,424 |
Carpenter Technology Corp. | 386,855 | | 18,282,767 |
Haynes International, Inc. | 232,886 | | 11,353,193 |
Nucor Corp. | 634,535 | | 23,890,243 |
Reliance Steel & Aluminum Co. | 370,602 | | 19,060,061 |
Steel Dynamics, Inc. | 954,009 | | 11,657,990 |
| | 86,364,678 |
TOTAL METALS & MINING | | 264,774,945 |
OIL, GAS & CONSUMABLE FUELS - 0.5% |
Coal & Consumable Fuels - 0.5% |
Peabody Energy Corp. | 297,643 | | 6,438,018 |
PAPER & FOREST PRODUCTS - 1.2% |
Paper Products - 1.2% |
International Paper Co. | 473,440 | | 16,362,086 |
TOTAL COMMON STOCKS (Cost $1,083,584,729) |
1,279,781,130
|
Convertible Bonds - 0.6% |
| Principal
Amount | | Value |
BUILDING PRODUCTS - 0.6% |
Building Products - 0.6% |
Aspen Aerogels, Inc. 8% 6/1/14 (f)
(Cost $7,861,200) | | $ 7,861,200 | | $ 7,861,200 |
U.S. Treasury Obligations - 0.0% |
|
U.S. Treasury Bills, yield at date of purchase 0.1% 11/23/12 (e)
(Cost $669,841) | | 670,000 | |
669,873
|
Money Market Funds - 7.1% |
| Shares | | |
Fidelity Cash Central Fund, 0.17% (b) | 77,412,400 | | 77,412,400 |
Fidelity Securities Lending Cash Central Fund, 0.18% (b)(c) | 19,616,097 | | 19,616,097 |
TOTAL MONEY MARKET FUNDS (Cost $97,028,497) |
97,028,497
|
TOTAL INVESTMENT PORTFOLIO - 101.7% (Cost $1,189,144,267) | |
1,385,340,700
|
NET OTHER ASSETS (LIABILITIES) - (1.7)% | | (23,673,690) |
NET ASSETS - 100% | $ 1,361,667,010 |
Futures Contracts |
| Expiration
Date | | Underlying
Face Amount
at Value | | Unrealized
Appreciation/
(Depreciation) |
Purchased |
Equity Index Contracts |
350 CME E-mini Materials Select Sector Index Contracts | Sept. 2012 | | $ 13,104,000 | | $ 585,925 |
|
The face value of futures purchased as a percentage of net assets is 1% |
Legend |
(a) Non-income producing |
(b) Affiliated fund that is available only to investment companies and other accounts managed by Fidelity Investments. The rate quoted is the annualized seven-day yield of the fund at period end. A complete unaudited listing of the fund's holdings as of its most recent quarter end is available upon request. In addition, each Fidelity Central Fund's financial statements are available on the SEC's website or upon request. |
(c) Investment made with cash collateral received from securities on loan. |
(d) Security or a portion of the security is on loan at period end. |
(e) Security or a portion of the security was pledged to cover margin requirements for futures contracts. At the period end, the value of securities pledged amounted to $669,873. |
(f) Restricted securities - Investment in securities not registered under the Securities Act of 1933 (excluding 144A issues). At the end of the period, the value of restricted securities (excluding 144A issues) amounted to $7,861,200 or 0.6% of net assets. |
Additional information on each restricted holding is as follows: |
Security | Acquisition Date | Acquisition Cost |
Aspen Aerogels, Inc. 8% 6/1/14 | 6/1/11 | $ 7,861,200 |
Affiliated Central Funds |
Information regarding fiscal year to date income earned by the Fund from investments in Fidelity Central Funds is as follows: |
Fund | Income earned |
Fidelity Cash Central Fund | $ 44,504 |
Fidelity Securities Lending Cash Central Fund | 177,206 |
Total | $ 221,710 |
Other Information |
The following is a summary of the inputs used, as of August 31, 2012, involving the Fund's assets and liabilities carried at fair value. The inputs or methodology used for valuing securities may not be an indication of the risk associated with investing in those securities. For more information on valuation inputs, and their aggregation into the levels used in the table below, please refer to the Security Valuation section in the accompanying Notes to Financial Statements. |
Valuation Inputs at Reporting Date: |
Description | Total | Level 1 | Level 2 | Level 3 |
Investments in Securities: | | | | |
Common Stocks | $ 1,279,781,130 | $ 1,279,363,491 | $ 417,639 | $ - |
Convertible Bonds | 7,861,200 | - | - | 7,861,200 |
U.S. Treasury Obligations | 669,873 | - | 669,873 | - |
Money Market Funds | 97,028,497 | 97,028,497 | - | - |
Total Investments in Securities: | $ 1,385,340,700 | $ 1,376,391,988 | $ 1,087,512 | $ 7,861,200 |
Derivative Instruments: | | | | |
Assets | | | | |
Futures Contracts | $ 585,925 | $ 585,925 | $ - | $ - |
Value of Derivative Instruments |
The following table is a summary of the Fund's value of derivative instruments by primary risk exposure as of August 31, 2012. For additional information on derivative instruments, please refer to the Derivative Instruments section in the accompanying Notes to Financial Statements. |
Primary Risk Exposure /
Derivative Type | Value |
| Asset | Liability |
Equity Risk | | |
Futures Contracts (a) | $ 585,925 | $ - |
Total Value of Derivatives | $ 585,925 | $ - |
(a) Reflects cumulative appreciation/(depreciation) on futures contracts as disclosed on the Schedule of Investments. Only the period end variation margin is separately disclosed on the Statement of Assets and Liabilities. |
Distribution of investments by country or territory of incorporation, as a percentage of total net assets, is as follows. (Unaudited) |
United States of America | 88.7% |
Canada | 5.9% |
Netherlands | 4.2% |
Others (Individually Less Than 1%) | 1.2% |
| 100.0% |
See accompanying notes which are an integral part of the financial statements.
Semiannual Report
Materials Portfolio
Statement of Assets and Liabilities
| August 31, 2012 (Unaudited) |
| | |
Assets | | |
Investment in securities, at value (including securities loaned of $19,434,991) - See accompanying schedule: Unaffiliated issuers (cost $1,092,115,770) | $ 1,288,312,203 | |
Fidelity Central Funds (cost $97,028,497) | 97,028,497 | |
Total Investments (cost $1,189,144,267) | | $ 1,385,340,700 |
Receivable for investments sold | | 4,349,682 |
Receivable for fund shares sold | | 1,765,081 |
Dividends receivable | | 2,725,988 |
Interest receivable | | 786,120 |
Distributions receivable from Fidelity Central Funds | | 29,250 |
Receivable for daily variation margin on futures contracts | | 126,001 |
Other receivables | | 13,588 |
Total assets | | 1,395,136,410 |
| | |
Liabilities | | |
Payable for investments purchased | $ 9,732,173 | |
Payable for fund shares redeemed | 3,050,657 | |
Accrued management fee | 627,023 | |
Distribution and service plan fees payable | 100,292 | |
Other affiliated payables | 306,803 | |
Other payables and accrued expenses | 36,355 | |
Collateral on securities loaned, at value | 19,616,097 | |
Total liabilities | | 33,469,400 |
| | |
Net Assets | | $ 1,361,667,010 |
Net Assets consist of: | | |
Paid in capital | | $ 1,157,341,532 |
Undistributed net investment income | | 7,293,497 |
Accumulated undistributed net realized gain (loss) on investments and foreign currency transactions | | 252,393 |
Net unrealized appreciation (depreciation) on investments and assets and liabilities in foreign currencies | | 196,779,588 |
Net Assets | | $ 1,361,667,010 |
Statement of Assets and Liabilities - continued
| August 31, 2012 (Unaudited) |
| | |
Calculation of Maximum Offering Price Class A:
Net Asset Value and redemption price per share ($159,241,924 ÷ 2,337,341 shares) | | $ 68.13 |
| | |
Maximum offering price per share (100/94.25 of $68.13) | | $ 72.29 |
Class T:
Net Asset Value and redemption price per share ($27,882,308 ÷ 411,614 shares) | | $ 67.74 |
| | |
Maximum offering price per share (100/96.50 of $67.74) | | $ 70.20 |
Class B:
Net Asset Value and offering price per share ($9,924,133 ÷ 148,566 shares)A | | $ 66.80 |
| | |
Class C:
Net Asset Value and offering price per share ($57,455,649 ÷ 861,994 shares)A | | $ 66.65 |
| | |
Materials:
Net Asset Value, offering price and redemption price per share ($997,832,433 ÷ 14,593,648 shares) | | $ 68.37 |
| | |
Institutional Class:
Net Asset Value, offering price and redemption price per share ($109,330,563 ÷ 1,600,390 shares) | | $ 68.31 |
A Redemption price per share is equal to net asset value less any applicable contingent deferred sales charge.
See accompanying notes which are an integral part of the financial statements.
Semiannual Report
Statement of Operations
| Six months ended August 31, 2012 (Unaudited) |
| | |
Investment Income | | |
Dividends | | $ 13,109,631 |
Interest | | 316,596 |
Income from Fidelity Central Funds | | 221,710 |
Total income | | 13,647,937 |
| | |
Expenses | | |
Management fee | $ 3,727,331 | |
Transfer agent fees | 1,666,477 | |
Distribution and service plan fees | 595,415 | |
Accounting and security lending fees | 214,646 | |
Custodian fees and expenses | 19,192 | |
Independent trustees' compensation | 4,519 | |
Registration fees | 90,223 | |
Audit | 22,561 | |
Legal | 2,614 | |
Miscellaneous | 8,676 | |
Total expenses before reductions | 6,351,654 | |
Expense reductions | (20,380) | 6,331,274 |
Net investment income (loss) | | 7,316,663 |
Realized and Unrealized Gain (Loss) Net realized gain (loss) on: | | |
Investment securities: | | |
Unaffiliated issuers | 11,592,171 | |
Foreign currency transactions | 9,600 | |
Futures contracts | 165,760 | |
Total net realized gain (loss) | | 11,767,531 |
Change in net unrealized appreciation (depreciation) on: Investment securities | (35,717,709) | |
Assets and liabilities in foreign currencies | (2,770) | |
Futures contracts | (575,410) | |
Total change in net unrealized appreciation (depreciation) | | (36,295,889) |
Net gain (loss) | | (24,528,358) |
Net increase (decrease) in net assets resulting from operations | | $ (17,211,695) |
Statement of Changes in Net Assets
| Six months ended
August 31, 2012
(Unaudited) | Year ended
February 29,
2012 |
Increase (Decrease) in Net Assets | | |
Operations | | |
Net investment income (loss) | $ 7,316,663 | $ 11,168,253 |
Net realized gain (loss) | 11,767,531 | 34,880,798 |
Change in net unrealized appreciation (depreciation) | (36,295,889) | (65,841,883) |
Net increase (decrease) in net assets resulting from operations | (17,211,695) | (19,792,832) |
Distributions to shareholders from net investment income | (820,982) | (9,840,737) |
Distributions to shareholders from net realized gain | (7,338,384) | (7,461,289) |
Total distributions | (8,159,366) | (17,302,026) |
Share transactions - net increase (decrease) | (47,316,017) | (18,941,790) |
Redemption fees | 28,325 | 99,276 |
Total increase (decrease) in net assets | (72,658,753) | (55,937,372) |
| | |
Net Assets | | |
Beginning of period | 1,434,325,763 | 1,490,263,135 |
End of period (including undistributed net investment income of $7,293,497 and undistributed net investment income of $797,816, respectively) | $ 1,361,667,010 | $ 1,434,325,763 |
See accompanying notes which are an integral part of the financial statements.
Semiannual Report
Financial Highlights - Class A
| Six months ended
August 31, 2012 | Years ended February 28, |
| (Unaudited) | 2012 L | 2011 | 2010 | 2009 | 2008 L |
Selected Per-Share Data | | | | | | |
Net asset value, beginning of period | $ 69.23 | $ 69.96 | $ 52.54 | $ 27.65 | $ 57.00 | $ 51.01 |
Income from Investment Operations | | | | | | |
Net investment income (loss) E | .30 | .40 | 1.08 H | .30 I | .22 | .46 |
Net realized and unrealized gain (loss) | (1.02) | (.35) | 17.40 | 24.90 | (29.46) | 8.05 |
Total from investment operations | (.72) | .05 | 18.48 | 25.20 | (29.24) | 8.51 |
Distributions from net investment income | (.02) | (.40) | (1.06) | (.32) | (.12) | (.32) |
Distributions from net realized gain | (.36) | (.38) | (.01) | - | - | (2.21) |
Total distributions | (.38) | (.78) | (1.07) | (.32) | (.12) | (2.53) N |
Redemption fees added to paid in capital E | - M | - M | .01 | .01 | .01 | .01 |
Net asset value, end of period | $ 68.13 | $ 69.23 | $ 69.96 | $ 52.54 | $ 27.65 | $ 57.00 |
Total Return B, C, D | (1.03)% | .21% | 35.33% | 91.25% | (51.30)% | 16.79% |
Ratios to Average Net Assets F, J | | | | | | |
Expenses before reductions | 1.13% A | 1.13% | 1.16% | 1.23% | 1.21% | 1.21% |
Expenses net of fee waivers, if any | 1.13% A | 1.13% | 1.16% | 1.23% | 1.21% | 1.21% |
Expenses net of all reductions | 1.13% A | 1.13% | 1.15% | 1.22% | 1.20% | 1.21% |
Net investment income (loss) | .91% A | .61% | 1.81% H | .65% I | .47% | .83% |
Supplemental Data | | | | | | |
Net assets, end of period (000 omitted) | $ 159,242 | $ 157,781 | $ 124,160 | $ 52,352 | $ 10,796 | $ 12,522 |
Portfolio turnover rate G | 59% A | 94% | 87% | 104% K | 117% | 77% |
A Annualized B Total returns for periods of less than one year are not annualized. C Total returns would have been lower if certain expenses had not been reduced during the applicable periods shown. D Total returns do not include the effect of the sales charges. E Calculated based on average shares outstanding during the period. F Fees and expenses of any underlying Fidelity Central Funds are not included in the Fund's expense ratio. The Fund indirectly bears its proportionate share of the expenses of any underlying Fidelity Central Funds. G Amount does not include the portfolio activity of any underlying Fidelity Central Funds. H Investment income per share reflects a large, non-recurring dividend which amounted to $.83 per share. Excluding this non-recurring dividend, the ratio of net investment income (loss) to average net assets would have been .41%. I Investment income per share reflects a large, non-recurring dividend which amounted to $.10 per share. Excluding this non-recurring dividend, the ratio of net investment income (loss) to average net assets would have been .43%. J Expense ratios reflect operating expenses of the class. Expenses before reductions do not reflect amounts reimbursed by the investment adviser or reductions from brokerage service arrangements or reductions from other expense offset arrangements and do not represent the amount paid by the class during periods when reimbursements or reductions occur. Expenses net of fee waivers reflect expenses after reimbursement by the investment adviser but prior to reductions from brokerage service arrangements or other expense offset arrangements. Expenses net of all reductions represent the net expenses paid by the class. K The portfolio turnover rate does not include the assets acquired in the merger. L For the year ended February 29. M Amount represents less than $.01 per share. N Total distributions of $2.53 per share is comprised of distributions from net investment income of $.322 and distributions from net realized gain of $2.210 per share. |
Financial Highlights - Class T
| Six months ended
August 31, 2012 | Years ended February 28, |
| (Unaudited) | 2012 L | 2011 | 2010 | 2009 | 2008 L |
Selected Per-Share Data | | | | | | |
Net asset value, beginning of period | $ 68.91 | $ 69.68 | $ 52.35 | $ 27.56 | $ 56.80 | $ 50.89 |
Income from Investment Operations | | | | | | |
Net investment income (loss) E | .21 | .21 | .90 H | .16 I | .10 | .32 |
Net realized and unrealized gain (loss) | (1.02) | (.35) | 17.34 | 24.81 | (29.32) | 8.00 |
Total from investment operations | (.81) | (.14) | 18.24 | 24.97 | (29.22) | 8.32 |
Distributions from net investment income | - | (.25) | (.92) | (.19) | (.03) | (.21) |
Distributions from net realized gain | (.36) | (.38) | - | - | - | (2.21) |
Total distributions | (.36) | (.63) | (.92) | (.19) | (.03) | (2.42) N |
Redemption fees added to paid in capital E | - M | - M | .01 | .01 | .01 | .01 |
Net asset value, end of period | $ 67.74 | $ 68.91 | $ 69.68 | $ 52.35 | $ 27.56 | $ 56.80 |
Total Return B, C, D | (1.17)% | (.09)% | 34.98% | 90.70% | (51.43)% | 16.45% |
Ratios to Average Net Assets F, J | | | | | | |
Expenses before reductions | 1.42% A | 1.42% | 1.44% | 1.52% | 1.46% | 1.46% |
Expenses net of fee waivers, if any | 1.42% A | 1.42% | 1.44% | 1.52% | 1.46% | 1.46% |
Expenses net of all reductions | 1.42% A | 1.41% | 1.43% | 1.51% | 1.46% | 1.46% |
Net investment income (loss) | .62% A | .33% | 1.54% H | .35% I | .22% | .57% |
Supplemental Data | | | | | | |
Net assets, end of period (000 omitted) | $ 27,882 | $ 28,290 | $ 25,570 | $ 14,712 | $ 4,944 | $ 6,850 |
Portfolio turnover rate G | 59% A | 94% | 87% | 104% K | 117% | 77% |
A Annualized B Total returns for periods of less than one year are not annualized. C Total returns would have been lower if certain expenses had not been reduced during the applicable periods shown. D Total returns do not include the effect of the sales charges. E Calculated based on average shares outstanding during the period. F Fees and expenses of any underlying Fidelity Central Funds are not included in the Fund's expense ratio. The Fund indirectly bears its proportionate share of the expenses of any underlying Fidelity Central Funds. G Amount does not include the portfolio activity of any underlying Fidelity Central Funds. H Investment income per share reflects a large, non-recurring dividend which amounted to $.83 per share. Excluding this non-recurring dividend, the ratio of net investment income (loss) to average net assets would have been .14%. I Investment income per share reflects a large, non-recurring dividend which amounted to $.10 per share. Excluding this non-recurring dividend, the ratio of net investment income (loss) to average net assets would have been .14%. J Expense ratios reflect operating expenses of the class. Expenses before reductions do not reflect amounts reimbursed by the investment adviser or reductions from brokerage service arrangements or reductions from other expense offset arrangements and do not represent the amount paid by the class during periods when reimbursements or reductions occur. Expenses net of fee waivers reflect expenses after reimbursement by the investment adviser but prior to reductions from brokerage service arrangements or other expense offset arrangements. Expenses net of all reductions represent the net expenses paid by the class. K The portfolio turnover rate does not include the assets acquired in the merger. L For the year ended February 29. M Amount represents less than $.01 per share. N Total distributions of $2.42 per share is comprised of distributions from net investment income of $.207 and distributions from net realized gain of $2.210 per share. |
See accompanying notes which are an integral part of the financial statements.
Semiannual Report
Financial Highlights - Class B
| Six months ended
August 31, 2012 | Years ended February 28, |
| (Unaudited) | 2012 L | 2011 | 2010 | 2009 | 2008 L |
Selected Per-Share Data | | | | | | |
Net asset value, beginning of period | $ 68.13 | $ 68.95 | $ 51.86 | $ 27.35 | $ 56.59 | $ 50.81 |
Income from Investment Operations | | | | | | |
Net investment income (loss) E | .04 | (.11) | .60 H | (.07) I | (.12) | .04 |
Net realized and unrealized gain (loss) | (1.01) | (.33) | 17.13 | 24.61 | (29.13) | 7.98 |
Total from investment operations | (.97) | (.44) | 17.73 | 24.54 | (29.25) | 8.02 |
Distributions from net investment income | - | - | (.65) | (.04) | - | (.04) |
Distributions from net realized gain | (.36) | (.38) | - | - | - | (2.21) |
Total distributions | (.36) | (.38) | (.65) | (.04) | - | (2.25) N |
Redemption fees added to paid in capital E | - M | - M | .01 | .01 | .01 | .01 |
Net asset value, end of period | $ 66.80 | $ 68.13 | $ 68.95 | $ 51.86 | $ 27.35 | $ 56.59 |
Total Return B, C, D | (1.41)% | (.57)% | 34.29% | 89.79% | (51.67)% | 15.89% |
Ratios to Average Net Assets F, J | | | | | | |
Expenses before reductions | 1.91% A | 1.91% | 1.93% | 2.02% | 1.95% | 1.97% |
Expenses net of fee waivers, if any | 1.91% A | 1.91% | 1.93% | 2.02% | 1.95% | 1.97% |
Expenses net of all reductions | 1.91% A | 1.91% | 1.92% | 2.01% | 1.95% | 1.96% |
Net investment income (loss) | .13% A | (.17)% | 1.04% H | (.15)% I | (.27)% | .07% |
Supplemental Data | | | | | | |
Net assets, end of period (000 omitted) | $ 9,924 | $ 11,040 | $ 13,507 | $ 9,538 | $ 2,601 | $ 4,173 |
Portfolio turnover rate G | 59% A | 94% | 87% | 104% K | 117% | 77% |
A Annualized B Total returns for periods of less than one year are not annualized. C Total returns would have been lower if certain expenses had not been reduced during the applicable periods shown. D Total returns do not include the effect of the contingent deferred sales charge. E Calculated based on average shares outstanding during the period. F Fees and expenses of any underlying Fidelity Central Funds are not included in the Fund's expense ratio. The Fund indirectly bears its proportionate share of the expenses of any underlying Fidelity Central Funds. G Amount does not include the portfolio activity of any underlying Fidelity Central Funds. H Investment income per share reflects a large, non-recurring dividend which amounted to $.83 per share. Excluding this non-recurring dividend, the ratio of net investment income (loss) to average net assets would have been (.35)%. I Investment income per share reflects a large, non-recurring dividend which amounted to $.10 per share. Excluding this non-recurring dividend, the ratio of net investment income (loss) to average net assets would have been (.36)%. J Expense ratios reflect operating expenses of the class. Expenses before reductions do not reflect amounts reimbursed by the investment adviser or reductions from brokerage service arrangements or reductions from other expense offset arrangements and do not represent the amount paid by the class during periods when reimbursements or reductions occur. Expenses net of fee waivers reflect expenses after reimbursement by the investment adviser but prior to reductions from brokerage service arrangements or other expense offset arrangements. Expenses net of all reductions represent the net expenses paid by the class. K The portfolio turnover rate does not include the assets acquired in the merger. L For the year ended February 29. M Amount represents less than $.01 per share. N Total distributions of $2.25 per share is comprised of distributions from net investment income of $.043 and distributions from net realized gain of $2.210 per share. |
Financial Highlights - Class C
| Six months ended
August 31, 2012 | Years ended February 28, |
| (Unaudited) | 2012 L | 2011 | 2010 | 2009 | 2008 L |
Selected Per-Share Data | | | | | | |
Net asset value, beginning of period | $ 67.98 | $ 68.78 | $ 51.79 | $ 27.31 | $ 56.50 | $ 50.81 |
Income from Investment Operations | | | | | | |
Net investment income (loss) E | .05 | (.10) | .61 H | (.06) I | (.13) | .04 |
Net realized and unrealized gain (loss) | (1.02) | (.32) | 17.09 | 24.57 | (29.07) | 7.97 |
Total from investment operations | (.97) | (.42) | 17.70 | 24.51 | (29.20) | 8.01 |
Distributions from net investment income | - | - | (.72) | (.04) | - | (.12) |
Distributions from net realized gain | (.36) | (.38) | - | - | - | (2.21) |
Total distributions | (.36) | (.38) | (.72) | (.04) | - | (2.33) N |
Redemption fees added to paid in capital E | - M | - M | .01 | .01 | .01 | .01 |
Net asset value, end of period | $ 66.65 | $ 67.98 | $ 68.78 | $ 51.79 | $ 27.31 | $ 56.50 |
Total Return B, C, D | (1.42)% | (.55)% | 34.29% | 89.82% | (51.66)% | 15.87% |
Ratios to Average Net Assets F, J | | | | | | |
Expenses before reductions | 1.89% A | 1.89% | 1.93% | 2.01% | 1.95% | 1.96% |
Expenses net of fee waivers, if any | 1.89% A | 1.89% | 1.93% | 2.01% | 1.95% | 1.96% |
Expenses net of all reductions | 1.89% A | 1.89% | 1.92% | 2.00% | 1.95% | 1.96% |
Net investment income (loss) | .15% A | (.15)% | 1.04% H | (.13)% I | (.27)% | .07% |
Supplemental Data | | | | | | |
Net assets, end of period (000 omitted) | $ 57,456 | $ 58,296 | $ 46,525 | $ 20,469 | $ 5,509 | $ 8,743 |
Portfolio turnover rate G | 59% A | 94% | 87% | 104% K | 117% | 77% |
A Annualized B Total returns for periods of less than one year are not annualized. C Total returns would have been lower if certain expenses had not been reduced during the applicable periods shown. D Total returns do not include the effect of the contingent deferred sales charge. E Calculated based on average shares outstanding during the period. F Fees and expenses of any underlying Fidelity Central Funds are not included in the Fund's expense ratio. The Fund indirectly bears its proportionate share of the expenses of any underlying Fidelity Central Funds. G Amount does not include the portfolio activity of any underlying Fidelity Central Funds. H Investment income per share reflects a large, non-recurring dividend which amounted to $.83 per share. Excluding this non-recurring dividend, the ratio of net investment income (loss) to average net assets would have been (.35)%. I Investment income per share reflects a large, non-recurring dividend which amounted to $.10 per share. Excluding this non-recurring dividend, the ratio of net investment income (loss) to average net assets would have been (.35)%. J Expense ratios reflect operating expenses of the class. Expenses before reductions do not reflect amounts reimbursed by the investment adviser or reductions from brokerage service arrangements or reductions from other expense offset arrangements and do not represent the amount paid by the class during periods when reimbursements or reductions occur. Expenses net of fee waivers reflect expenses after reimbursement by the investment adviser but prior to reductions from brokerage service arrangements or other expense offset arrangements. Expenses net of all reductions represent the net expenses paid by the class. K The portfolio turnover rate does not include the assets acquired in the merger. L For the year ended February 29. M Amount represents less than $.01 per share. N Total distributions of $2.33 per share is comprised of distributions from net investment income of $.124 and distributions from net realized gain of $2.210 per share. |
See accompanying notes which are an integral part of the financial statements.
Semiannual Report
Financial Highlights - Materials
| Six months ended
August 31, 2012 | Years ended February 28, |
| (Unaudited) | 2012 K | 2011 | 2010 | 2009 | 2008 K |
Selected Per-Share Data | | | | | | |
Net asset value, beginning of period | $ 69.41 | $ 70.11 | $ 52.61 | $ 27.66 | $ 57.01 | $ 50.92 |
Income from Investment Operations | | | | | | |
Net investment income (loss) D | .40 | .60 | 1.25 G | .43 H | .38 | .64 |
Net realized and unrealized gain (loss) | (1.03) | (.37) | 17.43 | 24.91 | (29.54) | 8.01 |
Total from investment operations | (.63) | .23 | 18.68 | 25.34 | (29.16) | 8.65 |
Distributions from net investment income | (.05) | (.55) | (1.16) | (.40) | (.20) | (.36) |
Distributions from net realized gain | (.36) | (.38) | (.03) | - | - | (2.21) |
Total distributions | (.41) | (.93) | (1.19) | (.40) | (.20) | (2.57) M |
Redemption fees added to paid in capital D | - L | - L | .01 | .01 | .01 | .01 |
Net asset value, end of period | $ 68.37 | $ 69.41 | $ 70.11 | $ 52.61 | $ 27.66 | $ 57.01 |
Total Return B, C | (.90)% | .49% | 35.70% | 91.77% | (51.15)% | 17.10% |
Ratios to Average Net Assets E, I | | | | | | |
Expenses before reductions | .86% A | .85% | .88% | .96% | .90% | .91% |
Expenses net of fee waivers, if any | .86% A | .85% | .88% | .96% | .90% | .90% |
Expenses net of all reductions | .85% A | .84% | .87% | .94% | .90% | .89% |
Net investment income (loss) | 1.19% A | .90% | 2.10% G | .92% H | .78% | 1.14% |
Supplemental Data | | | | | | |
Net assets, end of period (000 omitted) | $ 997,832 | $ 1,089,619 | $ 1,195,371 | $ 604,475 | $ 127,551 | $ 353,185 |
Portfolio turnover rate F | 59% A | 94% | 87% | 104% J | 117% | 77% |
A Annualized B Total returns for periods of less than one year are not annualized. C Total returns would have been lower if certain expenses had not been reduced during the applicable periods shown. D Calculated based on average shares outstanding during the period. E Fees and expenses of any underlying Fidelity Central Funds are not included in the Fund's expense ratio. The Fund indirectly bears its proportionate share of the expenses of any underlying Fidelity Central Funds. F Amount does not include the portfolio activity of any underlying Fidelity Central Funds. G Investment income per share reflects a large, non-recurring dividend which amounted to $.83 per share. Excluding this non-recurring dividend, the ratio of net investment income (loss) to average net assets would have been ..70%. H Investment income per share reflects a large, non-recurring dividend which amounted to $.10 per share. Excluding this non-recurring dividend, the ratio of net investment income (loss) to average net assets would have been .70%. I Expense ratios reflect operating expenses of the class. Expenses before reductions do not reflect amounts reimbursed by the investment adviser or reductions from brokerage service arrangements or reductions from other expense offset arrangements and do not represent the amount paid by the class during periods when reimbursements or reductions occur. Expenses net of fee waivers reflect expenses after reimbursement by the investment adviser but prior to reductions from brokerage service arrangements or other expense offset arrangements. Expenses net of all reductions represent the net expenses paid by the class. J The portfolio turnover rate does not include the assets acquired in the merger. K For the year ended February 29. L Amount represents less than $.01 per share. M Total distributions of $2.57 per share is comprised of distributions from net investment income of $.363 and distributions from net realized gain of $2.210 per share. |
Financial Highlights - Institutional Class
| Six months ended
August 31, 2012 | Years ended February 28, |
| (Unaudited) | 2012 K | 2011 | 2010 | 2009 | 2008 K |
Selected Per-Share Data | | | | | | |
Net asset value, beginning of period | $ 69.35 | $ 70.05 | $ 52.58 | $ 27.66 | $ 57.00 | $ 50.91 |
Income from Investment Operations | | | | | | |
Net investment income (loss) D | .40 | .60 | 1.28 G | .46 H | .38 | .64 |
Net realized and unrealized gain (loss) | (1.03) | (.36) | 17.40 | 24.89 | (29.53) | 8.00 |
Total from investment operations | (.63) | .24 | 18.68 | 25.35 | (29.15) | 8.64 |
Distributions from net investment income | (.05) | (.56) | (1.19) | (.44) | (.20) | (.36) |
Distributions from net realized gain | (.36) | (.38) | (.03) | - | - | (2.21) |
Total distributions | (.41) | (.94) | (1.22) | (.44) | (.20) | (2.56) M |
Redemption fees added to paid in capital D | - L | - L | .01 | .01 | .01 | .01 |
Net asset value, end of period | $ 68.31 | $ 69.35 | $ 70.05 | $ 52.58 | $ 27.66 | $ 57.00 |
Total Return B, C | (.90)% | .50% | 35.73% | 91.79% | (51.15)% | 17.08% |
Ratios to Average Net Assets E, I | | | | | | |
Expenses before reductions | .85% A | .84% | .86% | .94% | .90% | .89% |
Expenses net of fee waivers, if any | .85% A | .84% | .86% | .94% | .90% | .89% |
Expenses net of all reductions | .84% A | .83% | .85% | .93% | .90% | .89% |
Net investment income (loss) | 1.20% A | .91% | 2.11% G | .94% H | .78% | 1.14% |
Supplemental Data | | | | | | |
Net assets, end of period (000 omitted) | $ 109,331 | $ 89,299 | $ 85,130 | $ 13,670 | $ 719 | $ 1,820 |
Portfolio turnover rate F | 59% A | 94% | 87% | 104% J | 117% | 77% |
A Annualized B Total returns for periods of less than one year are not annualized. C Total returns would have been lower if certain expenses had not been reduced during the applicable periods shown. D Calculated based on average shares outstanding during the period. E Fees and expenses of any underlying Fidelity Central Funds are not included in the Fund's expense ratio. The Fund indirectly bears its proportionate share of the expenses of any underlying Fidelity Central Funds. F Amount does not include the portfolio activity of any underlying Fidelity Central Funds. G Investment income per share reflects a large, non-recurring dividend which amounted to $.83 per share. Excluding this non-recurring dividend, the ratio of net investment income (loss) to average net assets would have been ..72%. H Investment income per share reflects a large, non-recurring dividend which amounted to $.10 per share. Excluding this non-recurring dividend, the ratio of net investment income (loss) to average net assets would have been .72%. I Expense ratios reflect operating expenses of the class. Expenses before reductions do not reflect amounts reimbursed by the investment adviser or reductions from brokerage service arrangements or reductions from other expense offset arrangements and do not represent the amount paid by the class during periods when reimbursements or reductions occur. Expenses net of fee waivers reflect expenses after reimbursement by the investment adviser but prior to reductions from brokerage service arrangements or other expense offset arrangements. Expenses net of all reductions represent the net expenses paid by the class. J The portfolio turnover rate does not include the assets acquired in the merger. K For the year ended February 29. L Amount represents less than $.01 per share. M Total distributions of $2.56 per share is comprised of distributions from net investment income of $.355 and distributions from net realized gain of $2.210 per share. |
See accompanying notes which are an integral part of the financial statements.
Semiannual Report
Notes to Financial Statements
For the period ended August 31, 2012 (Unaudited)
1. Organization.
Materials Portfolio (the Fund) is a non-diversified fund of Fidelity Select Portfolios (the Trust) and is authorized to issue an unlimited number of shares. The Trust is registered under the Investment Company Act of 1940, as amended (the 1940 Act), as an open-end management investment company organized as a Massachusetts business trust. The Fund invests primarily in securities of companies whose principal business activities fall within specific industries. The Fund offers Class A, Class T, Class C, Materials, and Institutional Class shares, each of which, along with Class B shares, has equal rights as to assets and voting privileges. Effective after the close of business on September 1, 2010, Class B shares were closed to new accounts and additional purchases, except for exchanges and reinvestments. Each class has exclusive voting rights with respect to matters that affect that class. Class B shares will automatically convert to Class A shares after a holding period of seven years from the initial date of purchase. Investment income, realized and unrealized capital gains and losses, the common expenses of the Fund, and certain fund-level expense reductions, if any, are allocated on a pro-rata basis to each class based on the relative net assets of each class to the total net assets of the Fund. Each class differs with respect to transfer agent and distribution and service plan fees incurred. Certain expense reductions may also differ by class.
2. Investments in Fidelity Central Funds.
The Fund invests in Fidelity Central Funds, which are open-end investment companies available only to other investment companies and accounts managed by Fidelity Management & Research Company (FMR) and its affiliates. The Fund's Schedule of Investments lists each of the Fidelity Central Funds held as of period end, if any, as an investment of the Fund, but does not include the underlying holdings of each Fidelity Central Fund. As an Investing Fund, the Fund indirectly bears its proportionate share of the expenses of the underlying Fidelity Central Funds.
The Money Market Central Funds seek preservation of capital and current income and are managed by Fidelity Investments Money Management, Inc. (FIMM), an affiliate of FMR.
A complete unaudited list of holdings for each Fidelity Central Fund is available upon request or at the Securities and Exchange Commission (the SEC) web site at www.sec.gov. In addition, the financial statements of the Fidelity Central Funds are available on the SEC web site or upon request.
3. Significant Accounting Policies.
The financial statements have been prepared in conformity with accounting principles generally accepted in the United States of America (GAAP), which require management to make certain estimates and assumptions at the date of the financial statements. Actual results could differ from those estimates. Subsequent events, if any, through the date that the financial statements were issued have been evaluated in the preparation of the financial statements. The following summarizes the significant accounting policies of the Fund:
Security Valuation. Investments are valued as of 4:00 p.m. Eastern time on the last calendar day of the period. In accordance with valuation policies and procedures approved by the Board of Trustees (the Board), the Fund attempts to obtain prices from one or more third party pricing vendor or broker to value its investments. When current market prices, quotations or rates are not readily available or reliable, securities will be fair valued in good faith by the FMR Fair Value Committee (the Committee), in accordance with procedures adopted by the Fund's Board. Factors used in determining fair value vary by security type and may include market or security specific events, changes in interest rates and credit quality. The frequency with which these procedures are used cannot be predicted and they may be utilized to a significant extent. The Committee oversees the Fund's valuation policies and procedures and is responsible for approving and reporting to the Board all fair value determinations.
The Fund categorizes the inputs to valuation techniques used to value its investments into a disclosure hierarchy consisting of three levels as shown below:
Level 1 - quoted prices in active markets for identical investments
Level 2 - other significant observable inputs (including quoted prices for similar investments, interest rates, prepayment speeds, etc.)
Level 3 - unobservable inputs (including the Fund's own assumptions based on the best information available)
Valuation techniques used to value the Fund's investments by major category are as follows:
Equity securities, including restricted securities, for which market quotations are readily available, are valued at the last reported sale price or official closing price as reported by a third party pricing vendor on the primary market or exchange on which they are traded and are categorized as Level 1 in the hierarchy. In the event there were no sales during the day or closing prices are not available, securities are valued at the last quoted bid price or may be valued using the last available price and are generally categorized as Level 2 in the hierarchy. For foreign equity securities, when significant market or security specific events arise, comparisons to the valuation of American Depositary Receipts (ADRs), futures contracts, Exchange-Traded Funds (ETFs) and certain indexes as well as quoted prices for similar securities are used and are categorized as Level 2 in the hierarchy. Utilizing these techniques may result in transfers between Level 1 and Level 2. For restricted equity securities and private placements where observable inputs are limited, assumptions about market activity and risk are used and these securities are categorized as Level 3 in the hierarchy.
Semiannual Report
3. Significant Accounting Policies - continued
Security Valuation - continued
Debt securities, including restricted securities, are valued based on evaluated prices received from third party pricing vendors or from brokers who make markets in such securities. For corporate bonds and U.S. government and government agency obligations, pricing vendors utilize matrix pricing which considers yield or price of bonds of comparable quality, coupon, maturity and type as well as broker-supplied prices and are generally categorized as Level 2 in the hierarchy. When independent prices are unavailable or unreliable, debt securities may be valued utilizing pricing methodologies which consider similar factors that would be used by third party pricing vendors. These are generally categorized as Level 2 in the hierarchy but may be Level 3 depending on the circumstances.
Futures contracts are valued at the settlement price established each day by the board of trade or exchange on which they are traded and are categorized as Level 1 in the hierarchy. Investments in open-end mutual funds, including the Fidelity Central Funds, are valued at their closing net asset value each business day and are categorized as Level 1 in the hierarchy.
Changes in valuation techniques may result in transfers in or out of an assigned level within the disclosure hierarchy. The aggregate value of investments by input level, as of August 31, 2012, is included at the end of the Fund's Schedule of Investments.
Foreign Currency Translation. The Fund may use foreign currency contracts to facilitate transactions in foreign-denominated securities. Gains and losses from these transactions may arise from changes in the value of the foreign currency or if the counterparties do not perform under the contracts' terms.
Foreign-denominated assets, including investment securities, and liabilities are translated into U.S. dollars at the exchange rates at period end. Purchases and sales of investment securities, income and dividends received and expenses denominated in foreign currencies are translated into U.S. dollars at the exchange rate in effect on the transaction date.
The effects of exchange rate fluctuations on investments are included with the net realized and unrealized gain (loss) on investment securities. Other foreign currency transactions resulting in realized and unrealized gain (loss) are disclosed separately.
Investment Transactions and Income. For financial reporting purposes, the Fund's investment holdings and NAV include trades executed through the end of the last business day of the period. The NAV per share for processing shareholder transactions is calculated as of the close of business of the New York Stock Exchange (NYSE), normally 4:00 p.m. Eastern time and includes trades executed through the end of the prior business day. Gains and losses on securities sold are determined on the basis of identified cost. Dividend income is recorded on the ex-dividend date, except for certain dividends from foreign securities where the ex-dividend date may have passed, which are recorded as soon as the Fund is informed of the ex-dividend date. Non-cash dividends included in dividend income, if any, are recorded at the fair market value of the securities received. Distributions received on securities that represent a return of capital or capital gain are recorded as a reduction of cost of investments and/or as a realized gain. The Fund estimates the components of distributions received that may be considered return of capital distributions or capital gain distributions. Interest income and distributions from the Fidelity Central Funds are accrued as earned. Interest income includes coupon interest and amortization of premium and accretion of discount on debt securities. Investment income is recorded net of foreign taxes withheld where recovery of such taxes is uncertain.
Expenses. Expenses directly attributable to a fund are charged to that fund. Expenses attributable to more than one fund are allocated among the respective funds on the basis of relative net assets or other appropriate methods. Expense estimates are accrued in the period to which they relate and adjustments are made when actual amounts are known.
Income Tax Information and Distributions to Shareholders. Each year, the Fund intends to qualify as a regulated investment company under Subchapter M of the Internal Revenue Code, including distributing substantially all of its taxable income and realized gains. As a result, no provision for income taxes is required. The Fund files a U.S. federal tax return, in addition to state and local tax returns as required. A fund's federal income tax returns are subject to examination by the Internal Revenue Service (IRS) for a period of three fiscal years after they are filed. State and local tax returns may be subject to examination for an additional fiscal year depending on the jurisdiction. Foreign taxes are provided for based on the Fund's understanding of the tax rules and rates that exist in the foreign markets in which it invests.
Distributions are declared and recorded on the ex-dividend date. Income dividends and capital gain distributions are declared separately for each class. Income and capital gain distributions are determined in accordance with income tax regulations, which may differ from GAAP.
Capital accounts within the financial statements are adjusted for permanent book-tax differences. These adjustments have no impact on net assets or the results of operations. Temporary book-tax differences will reverse in a subsequent period.
Book-tax differences are primarily due to foreign currency transactions, partnerships, passive foreign investment companies (PFIC), deferred trustees compensation, futures transactions, capital loss carryforwards and losses deferred due to wash sales and excise tax regulations.
Semiannual Report
Notes to Financial Statements (Unaudited) - continued
3. Significant Accounting Policies - continued
Income Tax Information and Distributions to Shareholders - continued
The federal tax cost of investment securities and unrealized appreciation (depreciation) as of period end were as follows:
Gross unrealized appreciation | $ 243,843,625 |
Gross unrealized depreciation | (51,926,650) |
Net unrealized appreciation (depreciation) on securities and other investments | $ 191,916,975 |
| |
Tax cost | $ 1,193,423,725 |
Capital loss carryforwards are only available to offset future capital gains of the Fund to the extent provided by regulations and may be limited. Under the Regulated Investment Company Modernization Act of 2010 (the Act), the Fund is permitted to carry forward capital losses incurred in taxable years beginning after December 22, 2010 for an unlimited period and such capital losses are required to be used prior to any losses that expire. At February 29, 2012 capital loss carryforwards were as follows:
Fiscal year of expiration | |
2016 | $ (5,392,414) |
2017 | (6,058,499) |
2018 | (1,022,988) |
2019 | (80,787) |
Total with expiration | $ (12,554,688) |
Included in the $12,554,688 of the Fund's capital loss carryforwards are $12,554,688 of capital loss carryforwards that were acquired from Paper and Forest Products Portfolio when it merged into the fund on June 19, 2009 of which $5,392,414, $6,058,499, $1,022,988 and $80,787 will expire in fiscal 2016, 2017, 2018 and 2019, respectively. Under the Internal Revenue Code, the losses acquired from Paper and Forest Products Portfolio that will be available to offset future capital gains of the Fund will be limited. As a result, at least $8,806,047 of the losses acquired from Paper and Forest Products Portfolio will expire unused.
Trading (Redemption) Fees. Shares held by investors in the Fund less than 30 days are subject to a redemption fee equal to .75% of the net asset value of shares redeemed. All redemption fees, which reduce the proceeds of the shareholder redemption, are retained by the Fund and accounted for as an addition to paid in capital.
New Accounting Pronouncement. In December 2011, the Financial Accounting Standards Board issued Accounting Standard Update No. 2011-11, Disclosures about Offsetting Assets and Liabilities. The update creates new disclosure requirements requiring entities to disclose both gross and net information for derivatives and other financial instruments that are either offset in the Statement of Assets and Liabilities or subject to an enforceable master netting arrangement or similar agreement. The disclosure requirements are effective for annual reporting periods beginning on or after January 1, 2013, and interim periods within those annual periods. Management is currently evaluating the impact of the update's adoption on the Fund's financial statement disclosures.
4. Operating Policies.
Restricted Securities. The Fund may invest in securities that are subject to legal or contractual restrictions on resale. These securities generally may be resold in transactions exempt from registration or to the public if the securities are registered. Disposal of these securities may involve time-consuming negotiations and expense, and prompt sale at an acceptable price may be difficult. Information regarding restricted securities is included at the end of the Fund's Schedule of Investments.
5. Derivative Instruments.
Risk Exposures and the Use of Derivative Instruments. The Fund's investment objective allows the Fund to enter into various types of derivative contracts, including futures contracts. Derivatives are investments whose value is primarily derived from underlying assets, indices or reference rates and may be transacted on an exchange or over-the-counter (OTC). Derivatives may involve a future commitment to buy or sell a specified instrument based on specified terms, to exchange future cash flows at periodic intervals based on a notional principal amount, or for one party to make one or more payments upon the occurrence of specified events in exchange for periodic payments from the other party.
The Fund used derivatives to increase returns and to manage exposure to certain risks as defined below. The success of any strategy involving derivatives depends on analysis of numerous economic factors, and if the strategies for investment do not work as intended, the Fund may not achieve its objectives.
Semiannual Report
5. Derivative Instruments - continued
Risk Exposures and the Use of Derivative Instruments - continued
The Fund's use of derivatives increased or decreased its exposure to the following risk:
Equity Risk | Equity risk relates to the fluctuations in the value of financial instruments as a result of changes in market prices (other than those arising from interest rate risk or foreign exchange risk), whether caused by factors specific to an individual investment, its issuer, or all factors affecting all instruments traded in a market or market segment. |
The Fund is also exposed to additional risks from investing in derivatives, such as liquidity risk and counterparty credit risk. Liquidity risk is the risk that the Fund will be unable to close out the derivative in the open market in a timely manner. Counterparty credit risk is the risk that the counterparty will not be able to fulfill its obligation to the Fund. Counterparty credit risk related to exchange-traded futures contracts is minimal because of the protection provided by the exchange on which they trade.
Investing in derivatives may involve greater risks than investing in the underlying assets directly and, to varying degrees, may involve risk of loss in excess of any initial investment and collateral received and amounts recognized in the Statement of Assets and Liabilities. In addition, there may be the risk that the change in value of the derivative contract does not correspond to the change in value of the underlying instrument.
Futures Contracts. A futures contract is an agreement between two parties to buy or sell a specified underlying instrument for a fixed price at a specified future date. The Fund used futures contracts to manage its exposure to the stock market.
Upon entering into a futures contract, a fund is required to deposit either cash or securities (initial margin) with a clearing broker in an amount equal to a certain percentage of the face value of the contract. Futures contracts are marked-to-market daily and subsequent payments (variation margin) are made or received by a fund depending on the daily fluctuations in the value of the futures contracts and are recorded as unrealized appreciation or (depreciation). This receivable and/or payable is included in daily variation margin on futures contracts in the Statement of Assets and Liabilities. Realized gain or (loss) is recorded upon the expiration or closing of a futures contract.
Any open futures contracts at period end are shown in the Schedule of Investments under the caption "Futures Contracts." The underlying face amount at value reflects each contract's exposure to the underlying instrument at period end and is representative of activity for the period. Securities deposited to meet initial margin requirements are identified in the Schedule of Investments.
During the period the Fund recognized net realized gain (loss) of $165,760 and a change in net unrealized appreciation (depreciation) of $(575,410) related to its investment in futures contracts. These amounts are included in the Statement of Operations.
6. Purchases and Sales of Investments.
Purchases and sales of securities, other than short-term securities, aggregated $384,001,026 and $441,362,804, respectively.
7. Fees and Other Transactions with Affiliates.
Management Fee. FMR and its affiliates provide the Fund with investment management related services for which the Fund pays a monthly management fee. The management fee is the sum of an individual fund fee rate that is based on an annual rate of .30% of the Fund's average net assets and an annualized group fee rate that averaged .26% during the period. The group fee rate is based upon the average net assets of all the mutual funds advised by FMR. The group fee rate decreases as assets under management increase and increases as assets under management decrease. For the period, the total annualized management fee rate was .56% of the Fund's average net assets.
Distribution and Service Plan Fees. In accordance with Rule 12b-1 of the 1940 Act, the Fund has adopted separate Distribution and Service Plans for each class of shares. Certain classes pay Fidelity Distributors Corporation (FDC), an affiliate of FMR, separate Distribution and Service Fees, each of which is based on an annual percentage of each class' average net assets. In addition, FDC may pay financial intermediaries for selling shares of the Fund and providing shareholder support services. For the period, the Distribution and Service Fee rates, total fees and amounts retained by FDC were as follows:
| Distribution
Fee | Service
Fee | Total Fees | Retained
by FDC |
Class A | -% | .25% | $ 193,343 | $ 4,157 |
Class T | .25% | .25% | 67,726 | - |
Class B | .75% | .25% | 50,891 | 38,168 |
Class C | .75% | .25% | 283,455 | 75,057 |
| | | $ 595,415 | $ 117,382 |
Semiannual Report
Notes to Financial Statements (Unaudited) - continued
7. Fees and Other Transactions with Affiliates - continued
Sales Load. FDC may receive a front-end sales charge of up to 5.75% for selling Class A shares and 3.50% for selling Class T shares, some of which is paid to financial intermediaries for selling shares of the Fund. Depending on the holding period, FDC may receive contingent deferred sales charges levied on Class A, Class T, Class B and Class C redemptions. The deferred sales charges range from 5.00% to 1.00% for Class B shares, 1.00% for Class C shares, 1.00% for certain purchases of Class A shares and .25% for certain purchases of Class T shares.
For the period, sales charge amounts retained by FDC were as follows:
| Retained
by FDC |
Class A | $ 65,366 |
Class T | 3,956 |
Class B* | 12,477 |
Class C* | 8,069 |
| $ 89,868 |
* When Class B and Class C shares are initially sold, FDC pays commissions from its own resources to financial intermediaries through which the sales are made.
Transfer Agent Fees. Fidelity Investments Institutional Operations Company, Inc. (FIIOC), an affiliate of FMR, is the transfer, dividend disbursing and shareholder servicing agent for each class of the Fund. FIIOC receives account fees and asset-based fees that vary according to the account size and type of account of the shareholders of the respective classes of the Fund. FIIOC pays for typesetting, printing and mailing of shareholder reports, except proxy statements. For the period, transfer agent fees for each class were as follows:
| Amount | % of
Average
Net Assets* |
Class A | $ 209,289 | .27 |
Class T | 41,794 | .31 |
Class B | 15,357 | .30 |
Class C | 79,578 | .28 |
Materials | 1,217,432 | .24 |
Institutional Class | 103,027 | .23 |
| $ 1,666,477 | |
* Annualized
Accounting and Security Lending Fees. Fidelity Service Company, Inc. (FSC), an affiliate of FMR, maintains the Fund's accounting records. The accounting fee is based on the level of average net assets for each month. Under a separate contract, FSC administers the security lending program. The security lending fee is based on the number and duration of lending transactions.
Brokerage Commissions. The Fund placed a portion of its portfolio transactions with brokerage firms which are affiliates of the investment adviser. The commissions paid to these affiliated firms were $6,913 for the period.
8. Committed Line of Credit.
The Fund participates with other funds managed by FMR or an affiliate in a $4.25 billion credit facility (the "line of credit") to be utilized for temporary or emergency purposes to fund shareholder redemptions or for other short-term liquidity purposes. The Fund has agreed to pay commitment fees on its pro-rata portion of the line of credit, which amounted to $1,927 and is reflected in Miscellaneous expenses on the Statement of Operations. During the period, there were no borrowings on this line of credit.
9. Security Lending.
The Fund lends portfolio securities through a lending agent from time to time in order to earn additional income. For equity securities, a lending agent is used and may loan securities to certain qualified borrowers, including Fidelity Capital Markets (FCM), a broker-dealer affiliated with the Fund. On the settlement date of the loan, the Fund receives collateral (in the form of U.S. Treasury obligations, letters of credit and/or cash) against the loaned securities and maintains collateral in an amount not less than 100% of the market value of the loaned securities during the period of the loan. The market value of the loaned securities is determined at the close of business of the Fund and any additional required collateral is delivered to the Fund on the next business day. If the borrower defaults on its obligation to return the securities loaned because of insolvency or other reasons, a fund could experience delays and costs in recovering the securities loaned or in gaining access to the collateral. Any cash collateral received is invested in the Fidelity Securities Lending Cash Central Fund. The value of loaned securities and cash collateral at period end are disclosed on the Fund's Statement of Assets and Liabilities. Security lending income represents the income earned on investing cash collateral, less rebates paid to borrowers and any lending agent fees associated with the loan, plus any premium payments received for lending certain types of securities. Security lending income is presented in the Statement of Operations as a component of income from Fidelity Central Funds. Total security lending income during the period amounted to $177,206. During the period, there were no securities loaned to FCM.
Semiannual Report
10. Expense Reductions.
Many of the brokers with whom FMR places trades on behalf of the Fund provided services to the Fund in addition to trade execution. These services included payments of certain expenses on behalf of the Fund totaling $20,361 for the period. In addition, through arrangements with the Fund's custodian, credits realized as a result of uninvested cash balances were used to reduce the Fund's expenses. During the period, these credits reduced the Fund's custody expenses by $19.
11. Distributions to Shareholders.
Distributions to shareholders of each class were as follows:
| Six months ended
August 31,
2012 | Year ended
February 29,
2012 |
From net investment income | | |
Class A | $ 44,699 | $ 868,107 |
Class T | - | 100,314 |
Materials | 717,326 | 8,266,851 |
Institutional Class | 58,957 | 605,465 |
Total | $ 820,982 | $ 9,840,737 |
From net realized gain | | |
Class A | $ 851,627 | $ 816,536 |
Class T | 148,569 | 151,869 |
Class B | 57,740 | 66,321 |
Class C | 319,952 | 312,224 |
Materials | 5,524,936 | 5,701,275 |
Institutional Class | 435,560 | 413,064 |
Total | $ 7,338,384 | $ 7,461,289 |
12. Share Transactions.
Transactions for each class of shares were as follows:
| Shares | Dollars |
| Six months ended
August 31,
2012 | Year ended
February 29,
2012 | Six months ended
August 31,
2012 | Year ended
February 29,
2012 |
Class A | | | | |
Shares sold | 618,282 | 1,406,389 | $ 41,055,137 | $ 95,285,956 |
Reinvestment of distributions | 11,861 | 23,605 | 796,737 | 1,462,799 |
Shares redeemed | (571,942) | (925,476) | (37,886,137) | (60,145,567) |
Net increase (decrease) | 58,201 | 504,518 | $ 3,965,737 | $ 36,603,188 |
Class T | | | | |
Shares sold | 57,303 | 150,265 | $ 3,768,331 | $ 10,197,019 |
Reinvestment of distributions | 2,151 | 3,964 | 143,789 | 244,682 |
Shares redeemed | (58,360) | (110,682) | (3,814,694) | (7,174,563) |
Net increase (decrease) | 1,094 | 43,547 | $ 97,426 | $ 3,267,138 |
Class B | | | | |
Shares sold | 8,702 | 35,651 | $ 565,370 | $ 2,318,398 |
Reinvestment of distributions | 736 | 909 | 48,582 | 55,554 |
Shares redeemed | (22,911) | (70,403) | (1,487,989) | (4,524,937) |
Net increase (decrease) | (13,473) | (33,843) | $ (874,037) | $ (2,150,985) |
Class C | | | | |
Shares sold | 138,070 | 456,374 | $ 9,089,282 | $ 30,369,453 |
Reinvestment of distributions | 4,035 | 4,184 | 265,885 | 254,995 |
Shares redeemed | (137,723) | (279,339) | (8,907,811) | (17,740,501) |
Net increase (decrease) | 4,382 | 181,219 | $ 447,356 | $ 12,883,947 |
Materials | | | | |
Shares sold | 2,129,932 | 6,950,456 | $ 142,456,070 | $ 471,314,225 |
Reinvestment of distributions | 88,382 | 214,200 | 5,951,604 | 13,299,700 |
Shares redeemed | (3,323,218) | (8,516,169) | (221,239,263) | (562,008,908) |
Net increase (decrease) | (1,104,904) | (1,351,513) | $ (72,831,589) | $ (77,394,983) |
Semiannual Report
Notes to Financial Statements (Unaudited) - continued
12. Share Transactions - continued
| Shares | Dollars |
| Six months ended
August 31,
2012 | Year ended
February 29,
2012 | Six months ended
August 31,
2012 | Year ended
February 29,
2012 |
Institutional Class | | | | |
Shares sold | 890,879 | 1,444,894 | $ 59,941,256 | $ 97,144,756 |
Reinvestment of distributions | 6,215 | 13,291 | 418,157 | 824,595 |
Shares redeemed | (584,398) | (1,385,770) | (38,480,323) | (90,119,446) |
Net increase (decrease) | 312,696 | 72,415 | $ 21,879,090 | $ 7,849,905 |
13. Other.
The Fund's organizational documents provide former and current trustees and officers with a limited indemnification against liabilities arising in connection with the performance of their duties to the Fund. In the normal course of business, the Fund may also enter into contracts that provide general indemnifications. The Fund's maximum exposure under these arrangements is unknown as this would be dependent on future claims that may be made against the Fund. The risk of material loss from such claims is considered remote.
Semiannual Report
Board Approval of Investment Advisory Contracts and Management Fees
Chemicals Portfolio
Gold Portfolio
Materials Portfolio
Each year, the Board of Trustees, including the Independent Trustees (together, the Board), votes on the renewal of the management contract and sub-advisory agreements (together, the Advisory Contracts) for each fund. The Board, assisted by the advice of fund counsel and Independent Trustees' counsel, requests and considers a broad range of information relevant to the renewal of the Advisory Contracts throughout the year.
The Board meets regularly and, at each of its meetings, considers factors that are relevant to its annual consideration of the renewal of each fund's Advisory Contracts, including the services and support provided to each fund and its shareholders. The Board has established various standing committees, each composed of and chaired by Independent Trustees with varying backgrounds, to which the Board has assigned specific subject matter responsibilities in order to enhance effective decision-making by the Board. The Board, acting directly and through its Committees, requests and receives information concerning the annual consideration of the renewal of each fund's Advisory Contracts. The Board also meets as needed to consider matters specifically related to the Board's annual consideration of the renewal of Advisory Contracts. Members of the Board may also meet with trustees of other Fidelity funds through ad hoc joint committees to discuss certain matters relevant to the Fidelity funds.
At its July 2012 meeting, the Board of Trustees, including the Independent Trustees, unanimously determined to renew each fund's Advisory Contracts. In reaching its determination, the Board considered all factors it believed relevant, including (i) the nature, extent, and quality of the services to be provided to each fund and its shareholders (including the investment performance of each fund); (ii) the competitiveness of each fund's management fee and total expense ratio relative to peer funds; (iii) the total costs of the services to be provided by and the profits to be realized by Fidelity from its relationship with each fund; (iv) the extent to which economies of scale exist and would be realized as each fund grows; and (v) whether fee levels reflect these economies of scale, if any, for the benefit of fund shareholders.
In considering whether to renew the Advisory Contracts for each fund, the Board reached a determination, with the assistance of fund counsel and Independent Trustees' counsel and through the exercise of its business judgment, that the renewal of the Advisory Contracts is in the best interests of each fund and its shareholders and that the compensation payable under the Advisory Contracts is fair and reasonable. The Board's decision to renew the Advisory Contracts was not based on any single factor, but rather was based on a comprehensive consideration of all the information provided to the Board at its meetings throughout the year. The Board, in reaching its determination to renew the Advisory Contracts, is aware that shareholders in each fund have a broad range of investment choices available to them, including a wide choice among mutual funds offered by Fidelity's competitors, and that each fund's shareholders, who have the opportunity to review and weigh the disclosure provided by the fund in its prospectus and other public disclosures, have chosen to invest in that fund, managed by Fidelity.
Nature, Extent, and Quality of Services Provided. The Board considered the staffing within the investment adviser, FMR, and the sub-advisers (together, the Investment Advisers), including the backgrounds of the funds' investment personnel, and also considered the funds' investment objectives, strategies, and related investment philosophies. The Independent Trustees also had discussions with senior management of Fidelity's investment operations and investment groups. The Board considered the structure of the portfolio manager compensation program and whether this structure provides appropriate incentives to act in the best interests of each fund.
Resources Dedicated to Investment Management and Support Services. The Board and the Fund Oversight and Research Committees reviewed the general qualifications and capabilities of the Investment Advisers' investment staff, including its size, education, experience, and resources, as well as the Investment Advisers' approach to recruiting, training, managing, and compensating investment personnel. The Board also noted that FMR has continued to increase the resources devoted to non-U.S. offices, including expansion of Fidelity's global investment organization. The Board noted that Fidelity's analysts have extensive resources, tools and capabilities that allow them to conduct sophisticated quantitative and fundamental analysis, as well as credit analysis of issuers, counterparties and guarantors. The Board also believes that Fidelity's investment professionals have sufficient access to global information and data so as to provide competitive investment results over time, and that those professionals also have access to sophisticated tools that permit them to assess portfolio construction and risk and performance attribution characteristics continuously, as well as to transmit new information and research conclusions rapidly around the world. Additionally, in its deliberations, the Board considered the Investment Advisers' trading and risk management capabilities and resources, which are an integral part of the investment management process.
Shareholder and Administrative Services. The Board considered (i) the nature, extent, quality, and cost of advisory, administrative, and shareholder services performed by the Investment Advisers and their affiliates under the Advisory Contracts and under separate agreements covering transfer agency, pricing and bookkeeping, and securities lending services for each fund; (ii) the nature and extent of the supervision of third party service providers, principally custodians and subcustodians; and (iii) the resources devoted to, and the record of compliance with, each fund's compliance policies and procedures. The Board also reviewed the allocation of fund brokerage, including allocations to brokers affiliated with the Investment Advisers, the use of brokerage commissions to pay fund expenses, and the use of "soft" commission dollars to pay for research services.
The Board noted that the growth of fund assets over time across the complex allows Fidelity to reinvest in the development of services designed to enhance the value or convenience of the Fidelity funds as investment vehicles. These services include 24-hour access to account information and market information through telephone representatives and over the Internet, investor education materials and asset allocation tools, and the expanded availability of Fidelity Investor Centers.
Semiannual Report
Board Approval of Investment Advisory Contracts and Management Fees - continued
Investment in a Large Fund Family. The Board considered the benefits to shareholders of investing in a Fidelity fund, including the benefits of investing in a fund that is part of a large family of funds offering a variety of investment disciplines and providing a large variety of mutual fund investor services. The Board noted that Fidelity had taken, or had made recommendations that resulted in the Fidelity funds taking, a number of actions over the previous year that benefited particular funds, including (i) continuing to dedicate additional resources to investment research and support of the senior management team that oversees asset management; (ii) persisting in efforts to enhance Fidelity's research capabilities, in particular, international research; (iii) launching new funds and making other enhancements to meet client needs for global and income-oriented solutions; (iv) continuing to launch dedicated lower cost underlying funds to meet investment management's portfolio construction needs related to expanding underlying fund options, specifically for the Freedom Fund product lines; (v) adopting a "Stock Selector" sector neutral investment approach and employing a team of portfolio managers who are sector specialists to manage certain funds; (vi) rationalizing product lines and gaining increased efficiencies through the mergers of several funds into other funds; (vii) strengthening the Spartan Index Fund product line by adding new funds and/or new low-cost institutional share classes, restructuring fund expenses to accommodate new classes, and reducing investment minimums for certain classes of shares; (viii) modifying the eligibility criteria for Institutional Class shares to increase their appeal to government entities and charitable investors; and (ix) reducing certain transfer agent fee rates.
Investment Performance (Chemicals Portfolio). The Board considered whether the fund has operated in accordance with its investment objective, as well as its record of compliance with its investment restrictions. It also reviewed the fund's absolute investment performance, as well as the fund's relative investment performance measured over multiple periods against a third-party-sponsored index that reflects the market sector in which the fund invests. The Board noted that FMR believes that no meaningful peer group exists for the fund principally because most other funds in the fund's third-party peer group focus on different industries or sectors than the fund. The following charts considered by the Board show, over the one-, three-, and five-year periods ended December 31, 2011, the fund's cumulative total returns and the cumulative total returns of a third-party-sponsored index ("benchmark").
Chemicals Portfolio
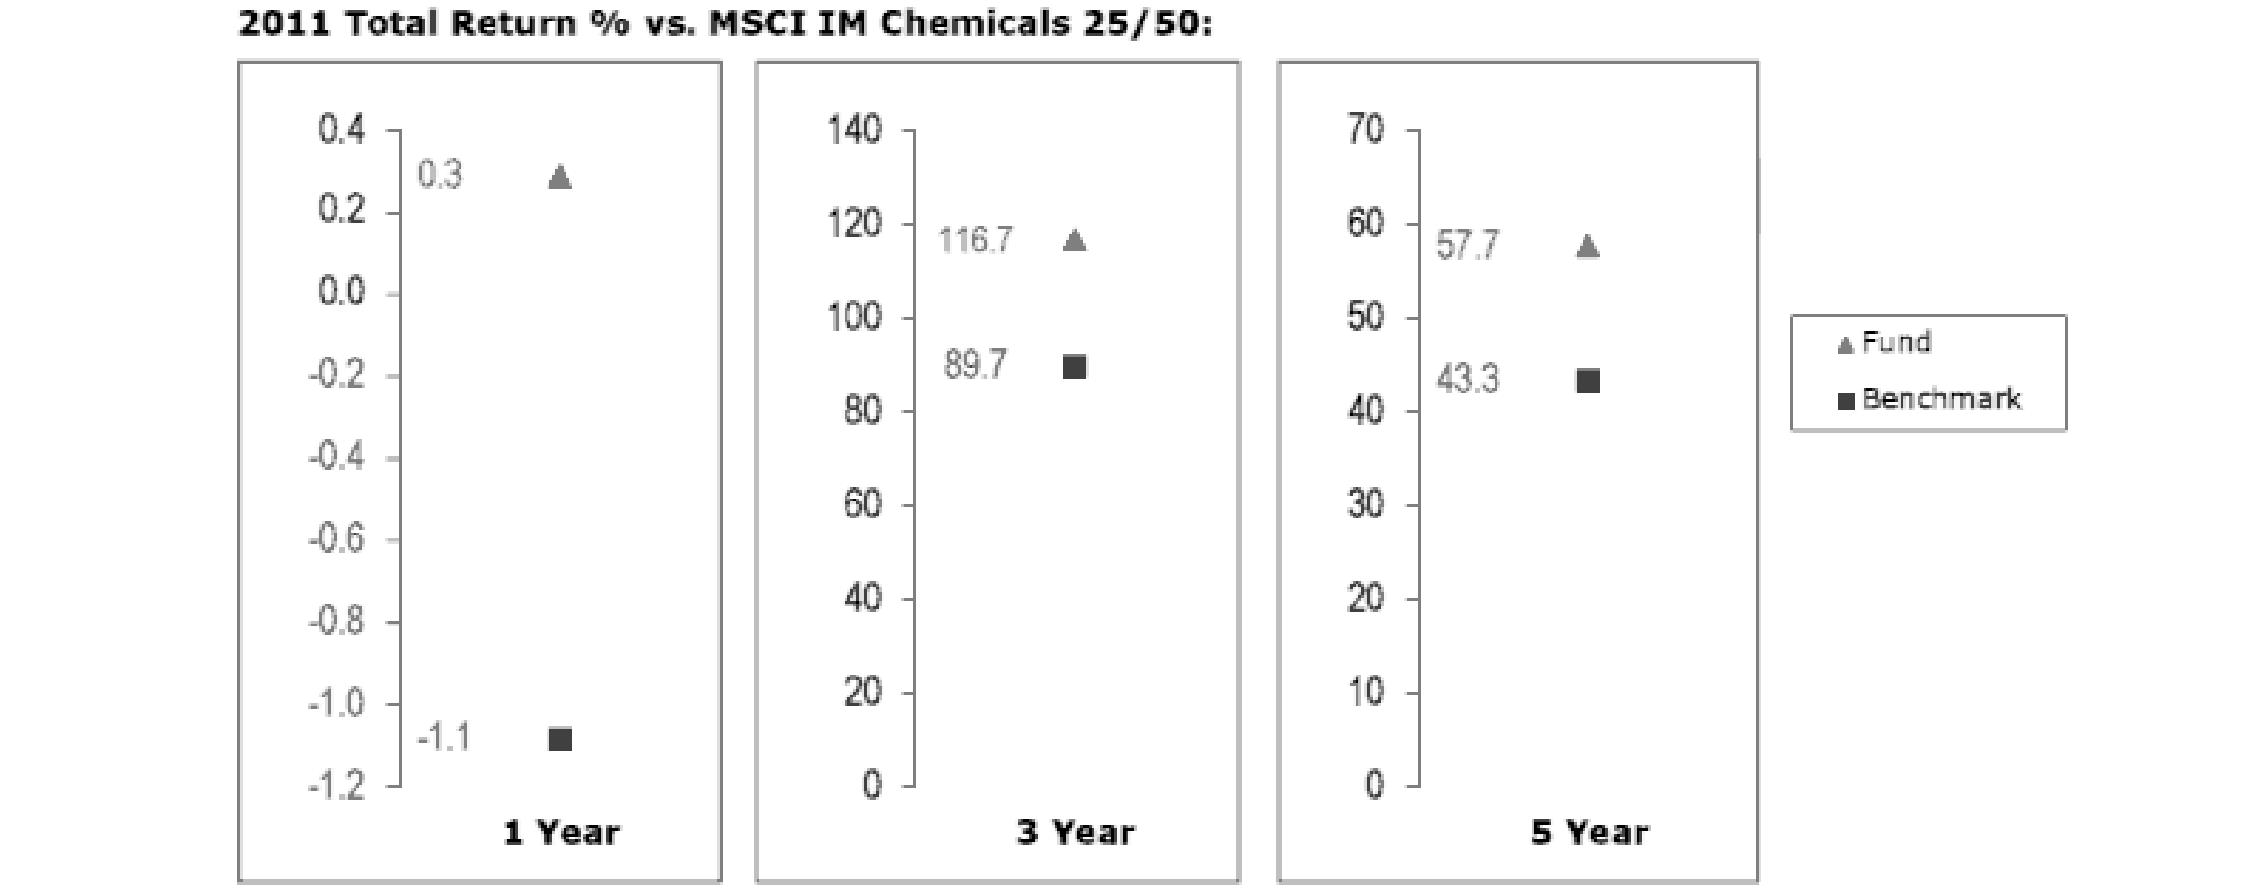
The Board noted that the investment performance of the fund compared favorably to its benchmark for all the periods shown. The Board also reviewed the fund's performance since inception as well as performance in the current year.
Based on its review, the Board concluded that the nature, extent, and quality of services provided to the fund under the Advisory Contracts should benefit the fund's shareholders.
Investment Performance (Gold Portfolio and Materials Portfolio). The Board considered whether each fund has operated in accordance with its investment objective, as well as its record of compliance with its investment restrictions. It also reviewed each fund's absolute investment performance for each class, as well as each fund's relative investment performance for each class measured over multiple periods against a third-party-sponsored index that reflects the market sector in which the fund invests. The Board noted that FMR believes that no meaningful peer group exists for the funds principally because most other funds in each fund's third-party peer group focus on different industries or sectors than the fund.
Semiannual Report
For Gold Portfolio, the following charts considered by the Board show, over the one-, three-, and five-year periods ended December 31, 2011, the cumulative total returns of Institutional Class (Class I) and Class B of the fund, and the cumulative total returns of a third-party-sponsored index ("benchmark"). The returns of Institutional Class (Class I) and Class B show the performance of the highest and lowest performing classes, respectively (based on five-year performance).
For Materials Portfolio, the following charts considered by the Board show, over the one-, three-, and five-year periods ended December 31, 2011, the cumulative total returns of the retail class and Class B of the fund, and the cumulative total returns of a third-party-sponsored index ("benchmark"). The returns of the retail class and Class B show the performance of the highest and lowest performing classes, respectively (based on five-year performance).
Gold Portfolio

The Board noted that the investment performance of Institutional Class (Class I) of the fund compared favorably to its benchmark for all the periods shown. The Board considered that the variations in performance among the fund's classes reflect the variations in class expenses, which result in lower performance for higher expense classes. The Board also reviewed the fund's performance since inception as well as performance in the current year.
Materials Portfolio
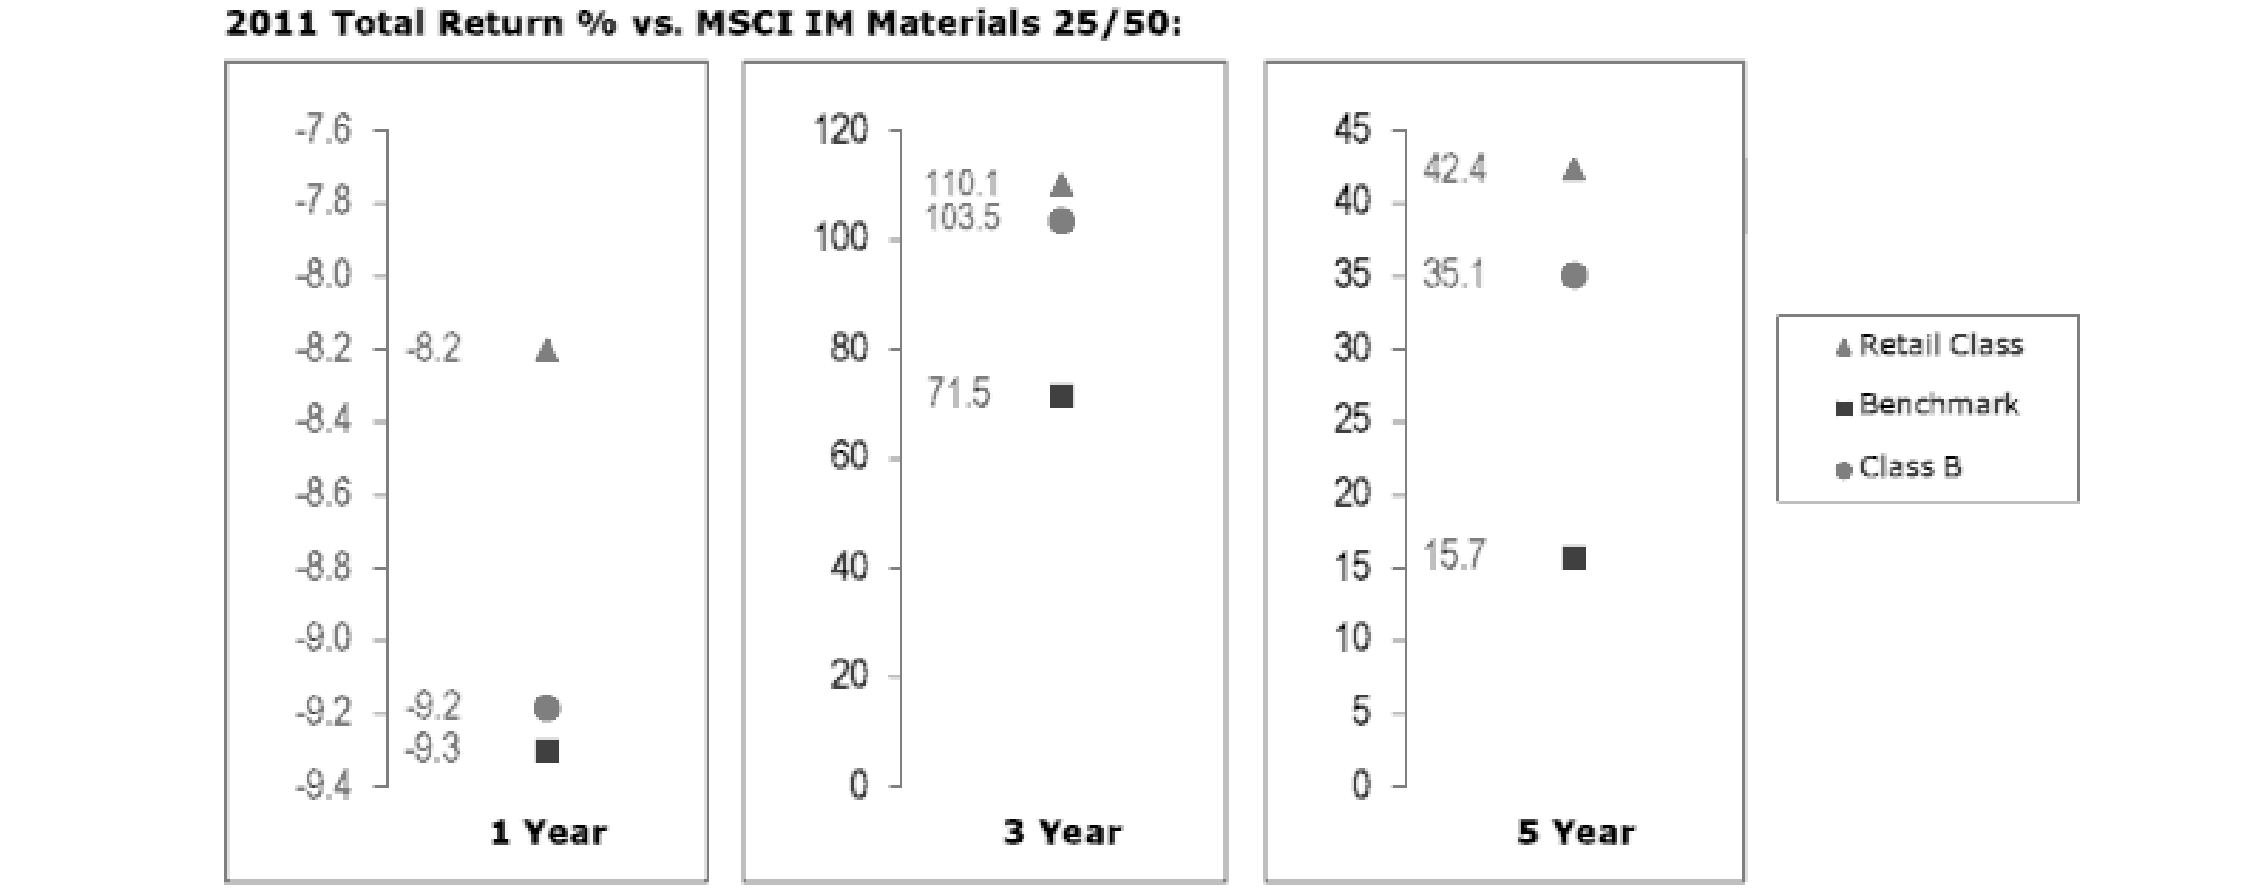
Semiannual Report
Board Approval of Investment Advisory Contracts and Management Fees - continued
The Board noted that the investment performance of the retail class of the fund compared favorably to its benchmark for all the periods shown. The Board considered that the variations in performance among the fund's classes reflect the variations in class expenses, which result in lower performance for higher expense classes. The Board also reviewed the fund's performance since inception as well as performance in the current year.
Based on its review, the Board concluded that the nature, extent, and quality of services provided to each fund under the Advisory Contracts should benefit each fund's shareholders.
Competitiveness of Management Fee and Total Expense Ratio. The Board considered each fund's management fee and total expense ratio compared to "mapped groups" of competitive funds and classes. Fidelity creates "mapped groups" by combining similar Lipper investment objective categories that have comparable management fee characteristics. Combining Lipper investment objective categories aids the Board's management fee and total expense ratio comparisons by broadening the competitive group used for comparison and by reducing the number of universes to which various Fidelity funds are compared.
Management Fee. The Board considered two proprietary management fee comparisons for the 12-month periods shown in the charts below. The group of Lipper funds used by the Board for management fee comparisons is referred to below as the "Total Mapped Group." The Total Mapped Group comparison focuses on a fund's standing relative to the total universe of comparable funds available to investors in terms of gross management fees before expense reimbursements or caps. "TMG %" represents the percentage of funds in the Total Mapped Group that had management fees that were lower than a fund's. For example, a TMG % of 6% means that 94% of the funds in the Total Mapped Group had higher management fees than a fund. The "Asset-Size Peer Group" (ASPG) comparison focuses on a fund's standing relative to non-Fidelity funds similar in size to the fund within the Total Mapped Group. The ASPG represents at least 15% of the funds in the Total Mapped Group with comparable asset size and management fee characteristics, subject to a minimum of 50 funds (or all funds in the Total Mapped Group if fewer than 50). Additional information, such as the ASPG quartile in which a fund's management fee ranked, is also included in the charts and considered by the Board.
Chemicals Portfolio
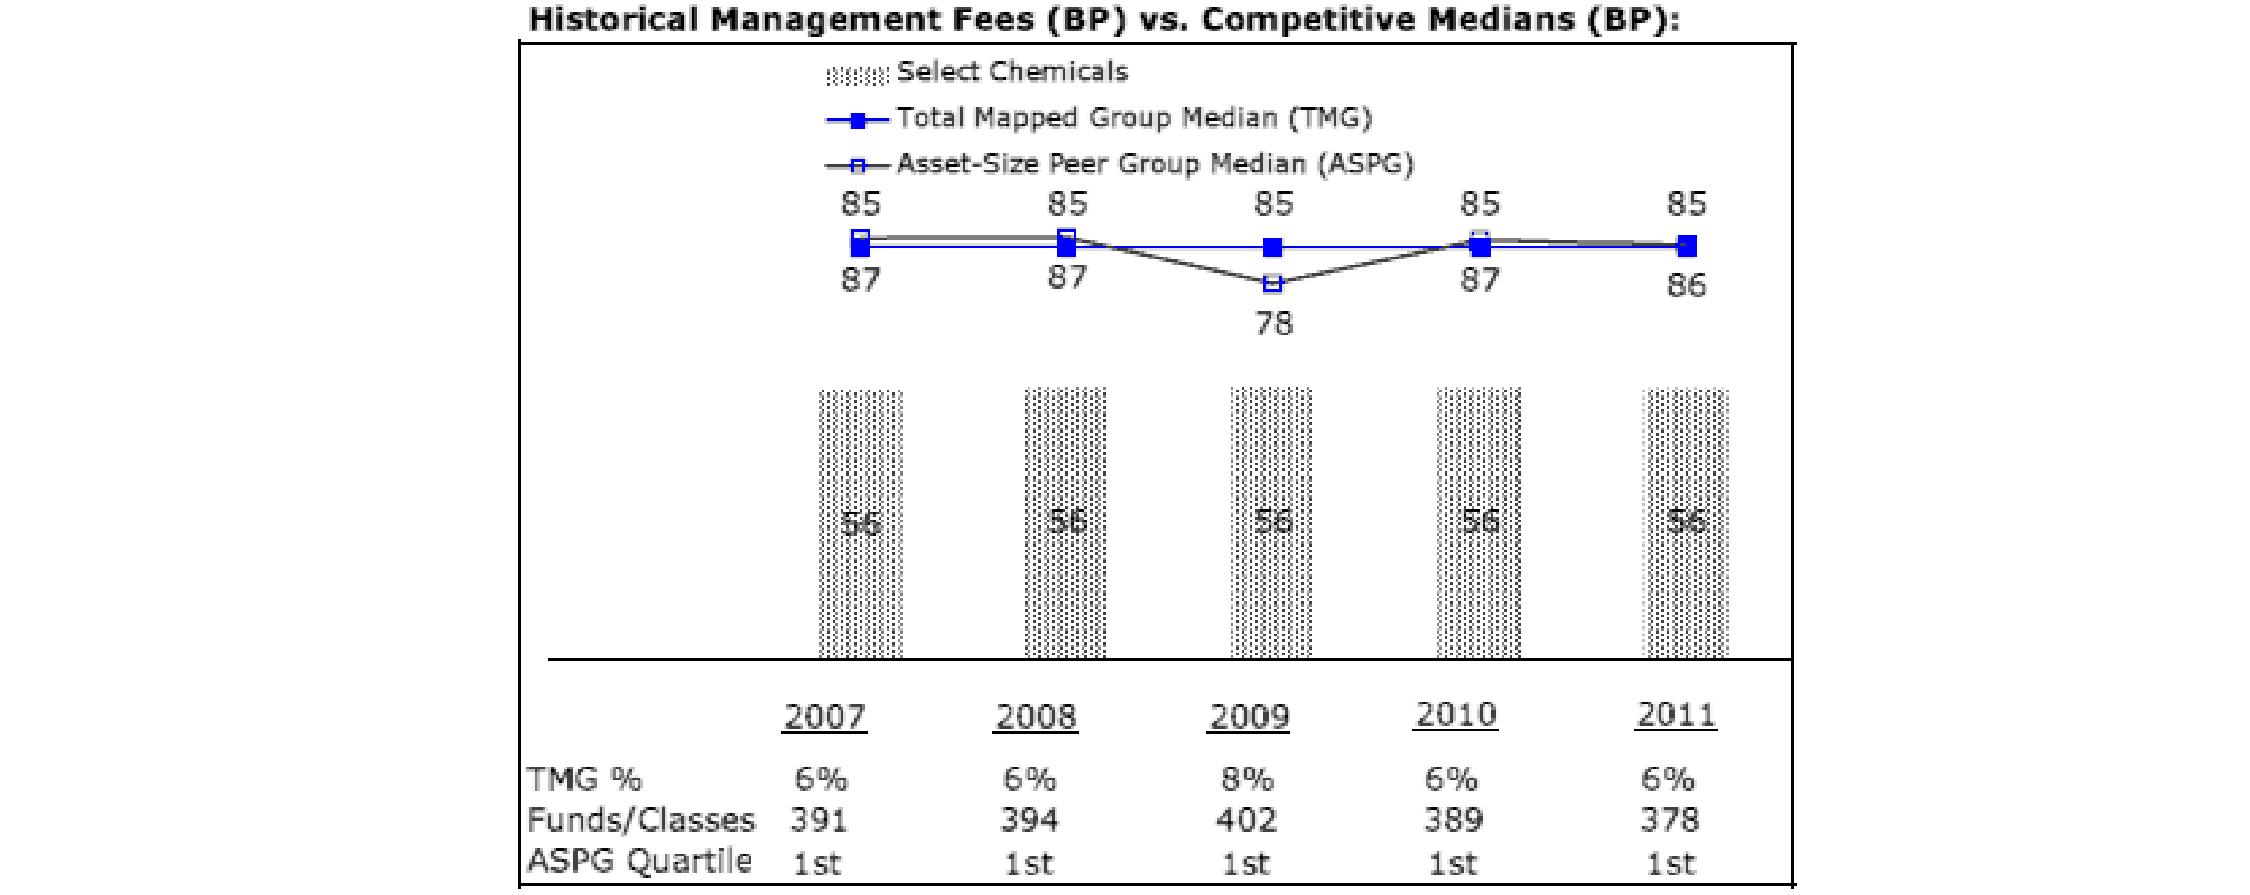
Semiannual Report
Gold Portfolio

Materials Portfolio
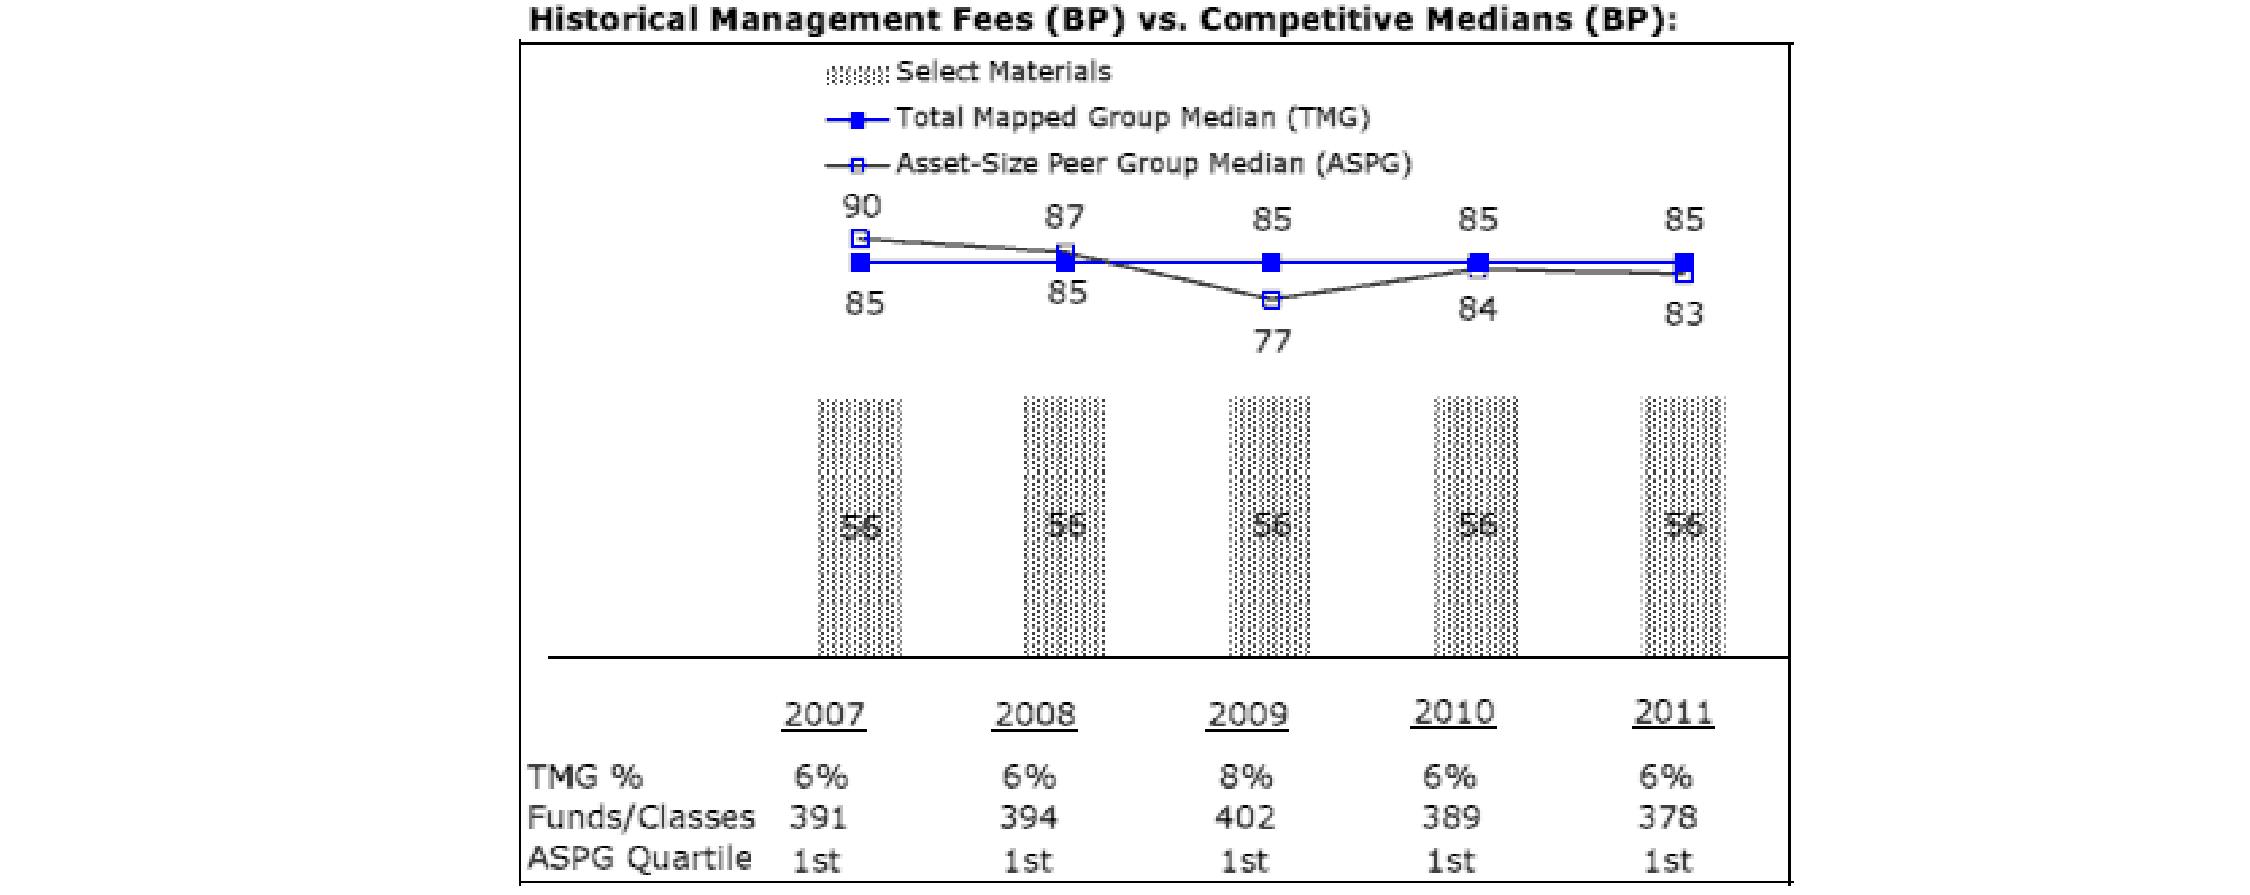
The Board noted that each fund's management fee ranked below the median of its Total Mapped Group and below the median of its ASPG for 2011.
Based on its review, the Board concluded that each fund's management fee is fair and reasonable in light of the services that the fund receives and the other factors considered.
Total Expense Ratio. In its review of Chemicals Portfolio's total expense ratio, the Board considered the fund's management fee as well as other fund expenses, such as transfer agent fees, pricing and bookkeeping fees, and custodial, legal, and audit fees. The Board also noted the effects of any waivers and reimbursements on fees and expenses. As part of its review, the Board also considered the current and historical total expense ratios of the fund compared to competitive fund median expenses. The fund is compared to those funds and classes in the Total Mapped Group (used by the Board for management fee comparisons) that have a similar sales load structure.
In its review of the total expense ratio of each class of Gold Portfolio and Materials Portfolio, the Board considered the fund's management fee as well as other fund or class expenses, as applicable, such as transfer agent fees, pricing and bookkeeping fees, fund-paid 12b-1 fees, and custodial, legal, and audit fees. The Board also noted the effects of any waivers and reimbursements on fees and expenses. As part of its review, the Board also considered the current and historical total expense ratios of each class of each fund compared to competitive fund median expenses. Each class of each fund is compared to those funds and classes in the Total Mapped Group (used by the Board for management fee comparisons) that have a similar sales load structure.
Semiannual Report
Board Approval of Investment Advisory Contracts and Management Fees - continued
The Board noted that Chemicals Portfolio's total expense ratio ranked below its competitive median for 2011.
For each of Gold Portfolio and Materials Portfolio, the Board noted that the total expense ratio of each class ranked below its competitive median for 2011.
Fees Charged to Other Fidelity Clients. The Board also considered Fidelity fee structures and other information with respect to clients of FMR and its affiliates, such as other mutual funds advised or subadvised by FMR or its affiliates, pension plan clients, and other institutional clients. The Board noted the findings of the 2010 ad hoc joint committee (created with the board of other Fidelity funds), which reviewed and compared Fidelity's institutional investment advisory business with its business of providing services to the Fidelity funds, including the differences in services provided, fees charged, and costs incurred, as well as competition in their respective marketplaces.
Based on its review of total expense ratios and fees charged to other Fidelity clients, the Board concluded that the total expense ratio of Chemicals Portfolio and the total expense ratio of each class of Gold Portfolio and Materials Portfolio were reasonable in light of the services that each fund and its shareholders receive and the other factors considered.
Costs of the Services and Profitability. The Board considered the revenues earned and the expenses incurred by Fidelity in conducting the business of developing, marketing, distributing, managing, administering and servicing each fund and its shareholders. The Board also considered the level of Fidelity's profits in respect of all the Fidelity funds.
On an annual basis, FMR presents to the Board Fidelity's profitability for each fund. Fidelity calculates the profitability for each fund, as well as aggregate profitability for groups of Fidelity funds and all Fidelity funds, using a series of detailed revenue and cost allocation methodologies which originate with the books and records of Fidelity on which Fidelity's audited financial statements are based. The Audit Committee of the Board reviews any significant changes from the prior year's methodologies.
PricewaterhouseCoopers LLP (PwC), independent registered public accounting firm and auditor to Fidelity and certain Fidelity funds, has been engaged annually by the Board as part of the Board's assessment of Fidelity's profitability analysis. PwC's engagement includes the review and assessment of Fidelity's methodologies used in determining the revenues and expenses attributable to Fidelity's mutual fund business, and completion of agreed-upon procedures surrounding the mathematical accuracy of fund profitability and its conformity to allocation methodologies. After considering PwC's reports issued under the engagement and information provided by Fidelity, the Board concluded that while other allocation methods may also be reasonable, Fidelity's profitability methodologies are reasonable in all material respects.
The Board also reviewed Fidelity's non-fund businesses and fall-out benefits related to the mutual fund business as well as cases where Fidelity's affiliates may benefit from or be related to the funds' business.
The Board considered the costs of the services provided by and the profits realized by Fidelity in connection with the operation of each fund and was satisfied that the profitability was not excessive in the circumstances.
Economies of Scale. The Board considered whether there have been economies of scale in respect of the management of the Fidelity funds, whether the Fidelity funds (including each fund) have appropriately benefited from any such economies of scale, and whether there is potential for realization of any further economies of scale. The Board considered the extent to which each fund will benefit from economies of scale through increased services to the fund, through waivers or reimbursements, or through fee or expense reductions. The Board also noted that in 2009, it and the board of other Fidelity funds created an ad hoc committee (the Economies of Scale Committee) to analyze whether FMR attains economies of scale in respect of the management and servicing of the Fidelity funds, whether the Fidelity funds have appropriately benefited from such economies of scale, and whether there is potential for realization of any further economies of scale.
The Board recognized that each fund's management contract incorporates a "group fee" structure, which provides for lower group fee rates as total fund assets under FMR's management increase, and for higher group fee rates as total fund assets under FMR's management decrease. FMR calculates the group fee rates based on a tiered asset "breakpoint" schedule that varies based on asset class. The Board considered that the group fee is designed to deliver the benefits of economies of scale to fund shareholders when total Fidelity fund assets increase, even if assets of any particular fund are unchanged or have declined, because some portion of Fidelity's costs are attributable to services provided to all Fidelity funds, and all funds benefit if those costs can be allocated among more assets. The Board concluded that, given the group fee structure, fund shareholders will benefit from lower management fees as assets under FMR's management increase at the fund complex level, regardless of whether Fidelity achieves any such economies of scale.
The Board concluded, taking into account the analysis of the Economies of Scale Committee, that economies of scale, if any, are being appropriately shared between fund shareholders and Fidelity.
Semiannual Report
Additional Information Requested by the Board. In order to develop fully the factual basis for consideration of the Fidelity funds' Advisory Contracts, the Board requested and received additional information on certain topics, including (i) fund performance trends, actions to be taken by FMR to improve certain funds' overall performance, and Fidelity's long-term strategies for certain funds; (ii) the potential to further rationalize the Fidelity fund lineup with the possibility of achieving savings for the funds and Fidelity; (iii) Fidelity's compensation structure for portfolio managers and other key investment personnel; (iv) the amount of the investment that each portfolio manager has made in the Fidelity fund(s) that he or she manages; (v) the realization of fall-out benefits in certain Fidelity business units; (vi) Fidelity's group fee structures, the potential impact of regulatory changes on such structures, and the rationale for the individual fee rates of certain funds; (vii) fund profitability methodology, including Fidelity's cost allocation methodology, and the impact of certain factors on fund profitability results; (viii) trends regarding industry use of performance fee structures and the possibility of implementing performance fee structures for additional funds; and (ix) the impact of net redemptions from the Fidelity funds.
Based on its evaluation of all of the conclusions noted above, and after considering all factors it believed relevant, the Board ultimately concluded that the advisory fee structures are fair and reasonable, and that each fund's Advisory Contracts should be renewed.
Semiannual Report
Semiannual Report
Investment Adviser
Fidelity Management & Research Company
Boston, MA
Investment Sub-Advisers
FMR Co., Inc.
Fidelity Management & Research
(U.K.) Inc.
Fidelity Management & Research
(Japan) Inc.
Fidelity Management & Research
(Hong Kong) Limited
General Distributor
Fidelity Distributors Corporation
Smithfield, RI
Transfer and Service Agents
Fidelity Investments Institutional Operations Company, Inc.
Boston, MA
Fidelity Service Company, Inc.
Boston, MA
Custodian
Brown Brothers Harriman & Co.
Boston, MA
The Fidelity Telephone Connection
Mutual Fund 24-Hour Service
Exchanges/Redemptions
and Account Assistance 1-800-544-6666
Product Information 1-800-544-8888
Retirement Accounts 1-800-544-4774
(8 a.m. - 9 p.m.)
TDD Service 1-800-544-0118
for the deaf and hearing impaired
(9 a.m. - 9 p.m. Eastern time)
Fidelity Automated Service
Telephone (FAST®)
1-800-544-5555
Automated line for quickest service
SELMT-USAN-1012
1.846034.105
Fidelity®
Select Portfolios®
Consumer Staples Sector
Consumer Staples Portfolio
Semiannual Report
August 31, 2012
(Fidelity Cover Art)
Contents
To view a fund's proxy voting guidelines and proxy voting record for the 12-month period ended June 30, visit http://www.fidelity.com/proxyvotingresults or visit the Securities and Exchange Commission's (SEC) web site at http://www.sec.gov. You may also call 1-800-544-8544 to request a free copy of the proxy voting guidelines.
Standard & Poor's, S&P and S&P 500 are registered service marks of The McGraw-Hill Companies, Inc. and have been licensed for use by Fidelity Distributors Corporation.
Other third party marks appearing herein are the property of their respective owners.
All other marks appearing herein are registered or unregistered trademarks or service marks of FMR LLC or an affiliated company. © 2012 FMR LLC. All rights reserved.
This report and the financial statements contained herein are submitted for the general information of the shareholders of the fund. This report is not authorized for distribution to prospective investors in the fund unless preceded or accompanied by an effective prospectus.
A fund files its complete schedule of portfolio holdings with the SEC for the first and third quarters of each fiscal year on Form N-Q. Forms N-Q are available on the SEC's web site at http://www.sec.gov. A fund's Forms N-Q may be reviewed and copied at the SEC's Public Reference Room in Washington, DC. Information regarding the operation of the SEC's Public Reference Room may be obtained by calling 1-800-SEC-0330. For a complete list of a fund's portfolio holdings, view the most recent holdings listing, semiannual report, or annual report on Fidelity's web site at http://www.fidelity.com, http://www.advisor.fidelity.com, or http://www.401k.com, as applicable.
NOT FDIC INSURED • MAY LOSE VALUE • NO BANK GUARANTEE
Neither the fund nor Fidelity Distributors Corporation is a bank.
Semiannual Report
Consumer Staples Portfolio
As a shareholder of the Fund, you incur two types of costs: (1) transaction costs, including sales charges (loads) on purchase payments or redemption proceeds, redemption fees and (2) ongoing costs, including management fees, distribution and/or service (12b-1) fees and other Fund expenses. This Example is intended to help you understand your ongoing costs (in dollars) of investing in the Fund and to compare these costs with the ongoing costs of investing in other mutual funds.
The Example is based on an investment of $1,000 invested at the beginning of the period and held for the entire period (March 1, 2012 to August 31, 2012).
Actual Expenses
The first line of the accompanying table for each class of the Fund provides information about actual account values and actual expenses. You may use the information in this line, together with the amount you invested, to estimate the expenses that you paid over the period. Simply divide your account value by $1,000.00 (for example, an $8,600 account value divided by $1,000.00 = 8.6), then multiply the result by the number in the first line for a class of the Fund under the heading entitled "Expenses Paid During Period" to estimate the expenses you paid on your account during this period. A small balance maintenance fee of $12.00 that is charged once a year may apply for certain accounts with a value of less than $2,000. This fee is not included in the table below. If it was, the estimate of expenses you paid during the period would be higher, and your ending account value lower, by this amount. In addition, the Fund, as a shareholder in the underlying Fidelity Central Funds, will indirectly bear its pro-rata share of the fees and expenses incurred by the underlying Fidelity Central Funds. These fees and expenses are not included in the Fund's annualized expense ratio used to calculate the expense estimate in the table below.
Hypothetical Example for Comparison Purposes
The second line of the accompanying table for each class of the Fund provides information about hypothetical account values and hypothetical expenses based on a Class' actual expense ratio and an assumed rate of return of 5% per year before expenses, which is not the Class' actual return. The hypothetical account values and expenses may not be used to estimate the actual ending account balance or expenses you paid for the period. You may use this information to compare the ongoing costs of investing in the Fund and other funds. To do so, compare this 5% hypothetical example with the 5% hypothetical examples that appear in the shareholder reports of the other funds. A small balance maintenance fee of $12.00 that is charged once a year may apply for certain accounts with a value of less than $2,000. This fee is not included in the table below. If it was, the estimate of expenses you paid during the period would be higher, and your ending account value lower, by this amount. In addition, the Fund, as a shareholder in the underlying Fidelity Central Funds, will indirectly bear its pro-rata share of the fees and expenses incurred by the underlying Fidelity Central Funds. These fees and expenses are not included in the Fund's annualized expense ratio used to calculate the expense estimate in the table below.
Please note that the expenses shown in the table are meant to highlight your ongoing costs only and do not reflect any transaction costs. Therefore, the second line of the table is useful in comparing ongoing costs only, and will not help you determine the relative total costs of owning different funds. In addition, if these transactional costs were included, your costs would have been higher.
| Annualized
Expense Ratio | Beginning
Account Value
March 1, 2012 | Ending
Account Value
August 31, 2012 | Expenses Paid
During Period*
March 1, 2012
to August 31, 2012 |
Class A | 1.09% | | | |
Actual | | $ 1,000.00 | $ 1,072.50 | $ 5.69 |
HypotheticalA | | $ 1,000.00 | $ 1,019.71 | $ 5.55 |
Class T | 1.36% | | | |
Actual | | $ 1,000.00 | $ 1,071.10 | $ 7.10 |
HypotheticalA | | $ 1,000.00 | $ 1,018.35 | $ 6.92 |
Class B | 1.89% | | | |
Actual | | $ 1,000.00 | $ 1,068.30 | $ 9.85 |
HypotheticalA | | $ 1,000.00 | $ 1,015.68 | $ 9.60 |
Class C | 1.83% | | | |
Actual | | $ 1,000.00 | $ 1,068.60 | $ 9.54 |
HypotheticalA | | $ 1,000.00 | $ 1,015.98 | $ 9.30 |
Consumer Staples | .81% | | | |
Actual | | $ 1,000.00 | $ 1,074.10 | $ 4.23 |
HypotheticalA | | $ 1,000.00 | $ 1,021.12 | $ 4.13 |
Institutional Class | .84% | | | |
Actual | | $ 1,000.00 | $ 1,074.00 | $ 4.39 |
HypotheticalA | | $ 1,000.00 | $ 1,020.97 | $ 4.28 |
A 5% return per year before expenses
* Expenses are equal to each Class' annualized expense ratio, multiplied by the average account value over the period, multiplied by 184/365 (to reflect the one-half year period).
Semiannual Report
Consumer Staples Portfolio
Investment Changes (Unaudited)
Top Ten Stocks as of August 31, 2012 |
| % of fund's
net assets | % of fund's net assets
6 months ago |
Procter & Gamble Co. | 14.9 | 16.2 |
British American Tobacco PLC sponsored ADR | 13.8 | 11.9 |
The Coca-Cola Co. | 10.8 | 10.8 |
CVS Caremark Corp. | 7.1 | 6.7 |
Altria Group, Inc. | 4.5 | 4.8 |
Anheuser-Busch InBev SA NV | 3.4 | 3.1 |
Diageo PLC sponsored ADR | 3.1 | 2.8 |
Colgate-Palmolive Co. | 2.9 | 2.3 |
Constellation Brands, Inc. Class A (sub. vtg.) | 2.5 | 2.6 |
Philip Morris International, Inc. | 2.4 | 2.6 |
| 65.4 | |
Top Industries (% of fund's net assets) |
As of August 31, 2012 |
| Beverages | 28.9% | |
| Tobacco | 21.6% | |
| Household Products | 18.4% | |
| Food & Staples Retailing | 12.4% | |
| Food Products | 9.4% | |
| All Others* | 9.3% | |

As of February 29, 2012 |
| Beverages | 31.3% | |
| Tobacco | 20.4% | |
| Household Products | 19.0% | |
| Food & Staples Retailing | 11.1% | |
| Food Products | 10.0% | |
| All Others* | 8.2% | |

* Includes short-term investments and net other assets. |
Semiannual Report
Consumer Staples Portfolio
Investments August 31, 2012 (Unaudited)
Showing Percentage of Net Assets
Common Stocks - 95.3% |
| Shares | | Value |
BEVERAGES - 28.9% |
Brewers - 5.7% |
Anheuser-Busch InBev SA NV | 801,728 | | $ 67,451,302 |
Companhia de Bebidas das Americas (AmBev) (PN) sponsored ADR | 215,485 | | 8,104,391 |
Compania Cervecerias Unidas SA sponsored ADR | 69,900 | | 4,549,791 |
Molson Coors Brewing Co. Class B | 466,328 | | 20,770,249 |
SABMiller PLC | 320,800 | | 14,158,280 |
| | 115,034,013 |
Distillers & Vintners - 8.9% |
Constellation Brands, Inc. Class A (sub. vtg.) (a) | 1,504,820 | | 49,568,771 |
Diageo PLC sponsored ADR | 581,627 | | 63,525,301 |
Pernod Ricard SA | 328,901 | | 35,440,966 |
Remy Cointreau SA | 216,376 | | 24,714,644 |
Thai Beverage PCL | 6,002,000 | | 1,588,977 |
Treasury Wine Estates Ltd. | 770,955 | | 3,767,503 |
| | 178,606,162 |
Soft Drinks - 14.3% |
Britvic PLC | 573,000 | | 2,907,842 |
Coca-Cola Bottling Co. CONSOLIDATED | 94,145 | | 6,462,113 |
Coca-Cola FEMSA SAB de CV sponsored ADR | 41,529 | | 5,068,614 |
Coca-Cola Hellenic Bottling Co. SA sponsored ADR | 270,681 | | 4,964,290 |
Coca-Cola Icecek A/S | 330,842 | | 5,892,305 |
Embotelladora Andina SA: | | | |
ADR | 43,689 | | 1,177,855 |
sponsored ADR | 267,800 | | 8,815,976 |
Fomento Economico Mexicano SAB de CV sponsored ADR | 10,187 | | 860,802 |
PepsiCo, Inc. | 474,871 | | 34,394,907 |
The Coca-Cola Co. | 5,791,184 | | 216,590,282 |
| | 287,134,986 |
TOTAL BEVERAGES | | 580,775,161 |
FOOD & STAPLES RETAILING - 12.4% |
Drug Retail - 9.0% |
CVS Caremark Corp. | 3,134,863 | | 142,793,010 |
Drogasil SA | 521,400 | | 5,514,783 |
Rite Aid Corp. (a) | 1,534,500 | | 1,826,055 |
Walgreen Co. | 836,660 | | 29,918,962 |
| | 180,052,810 |
Food Distributors - 0.1% |
Chefs' Warehouse Holdings (a) | 161,700 | | 2,485,329 |
Food Retail - 1.3% |
Fresh Market, Inc. (a) | 11,800 | | 681,096 |
Kroger Co. | 626,435 | | 13,956,972 |
|
| Shares | | Value |
Susser Holdings Corp. (a) | 144,300 | | $ 4,909,086 |
The Pantry, Inc. (a) | 384,270 | | 5,387,465 |
| | 24,934,619 |
Hypermarkets & Super Centers - 2.0% |
Wal-Mart Stores, Inc. | 564,696 | | 40,996,930 |
TOTAL FOOD & STAPLES RETAILING | | 248,469,688 |
FOOD PRODUCTS - 9.4% |
Agricultural Products - 2.7% |
Archer Daniels Midland Co. | 231,261 | | 6,186,232 |
Bunge Ltd. | 661,987 | | 42,135,473 |
Cosan Ltd. Class A | 40,400 | | 562,772 |
First Resources Ltd. | 1,367,000 | | 2,281,075 |
Ingredion, Inc. | 1,024 | | 55,122 |
SLC Agricola SA | 253,600 | | 2,661,057 |
| | 53,881,731 |
Packaged Foods & Meats - 6.7% |
Annie's, Inc. (d) | 30,587 | | 1,270,890 |
Calavo Growers, Inc. | 81,173 | | 2,146,214 |
Danone SA | 33,400 | | 2,081,621 |
Green Mountain Coffee Roasters, Inc. (a) | 362,037 | | 8,801,119 |
Lindt & Spruengli AG | 121 | | 4,377,647 |
Mead Johnson Nutrition Co. Class A | 460,916 | | 33,798,970 |
Nestle SA | 368,063 | | 22,881,051 |
TreeHouse Foods, Inc. (a) | 102,100 | | 5,304,095 |
Tyson Foods, Inc. Class A | 658,400 | | 10,310,544 |
Unilever NV (NY Reg.) | 1,117,271 | | 38,858,685 |
Want Want China Holdings Ltd. | 3,577,000 | | 4,427,465 |
| | 134,258,301 |
TOTAL FOOD PRODUCTS | | 188,140,032 |
HOUSEHOLD PRODUCTS - 18.4% |
Household Products - 18.4% |
Colgate-Palmolive Co. | 539,871 | | 57,393,686 |
Procter & Gamble Co. | 4,450,558 | | 299,032,991 |
Reckitt Benckiser Group PLC | 85,200 | | 4,816,140 |
Spectrum Brands Holdings, Inc. | 226,147 | | 8,328,994 |
| | 369,571,811 |
PERSONAL PRODUCTS - 2.4% |
Personal Products - 2.4% |
Avon Products, Inc. | 167,400 | | 2,586,330 |
Herbalife Ltd. | 43,690 | | 2,114,159 |
Hypermarcas SA (a) | 239,800 | | 1,539,285 |
L'Oreal SA | 199,400 | | 24,513,712 |
Natura Cosmeticos SA | 113,200 | | 2,838,504 |
Nu Skin Enterprises, Inc. Class A (d) | 367,119 | | 15,231,767 |
| | 48,823,757 |
PHARMACEUTICALS - 2.2% |
Pharmaceuticals - 2.2% |
Johnson & Johnson | 665,460 | | 44,871,968 |
Common Stocks - continued |
| Shares | | Value |
SPECIALTY RETAIL - 0.0% |
Specialty Stores - 0.0% |
Teavana Holdings, Inc. (a) | 66,777 | | $ 734,547 |
TOBACCO - 21.6% |
Tobacco - 21.6% |
Altria Group, Inc. | 2,669,820 | | 90,667,087 |
British American Tobacco PLC sponsored ADR | 2,638,391 | | 276,345,073 |
Japan Tobacco, Inc. | 105,500 | | 3,198,890 |
KT&G Corp. | 25,168 | | 1,906,819 |
Lorillard, Inc. | 52,603 | | 6,602,203 |
Philip Morris International, Inc. | 535,183 | | 47,791,842 |
Souza Cruz SA | 445,200 | | 5,967,728 |
| | 432,479,642 |
TOTAL COMMON STOCKS (Cost $1,474,408,366) |
1,913,866,606
|
Money Market Funds - 5.0% |
| Shares | | Value |
Fidelity Cash Central Fund, 0.17% (b) | 91,956,080 | | $ 91,956,080 |
Fidelity Securities Lending Cash Central Fund, 0.18% (b)(c) | 7,781,175 | | 7,781,175 |
TOTAL MONEY MARKET FUNDS (Cost $99,737,255) |
99,737,255
|
TOTAL INVESTMENT PORTFOLIO - 100.3% (Cost $1,574,145,621) | | 2,013,603,861 |
NET OTHER ASSETS (LIABILITIES) - (0.3)% | | (5,604,927) |
NET ASSETS - 100% | $ 2,007,998,934 |
Legend |
(a) Non-income producing |
(b) Affiliated fund that is available only to investment companies and other accounts managed by Fidelity Investments. The rate quoted is the annualized seven-day yield of the fund at period end. A complete unaudited listing of the fund's holdings as of its most recent quarter end is available upon request. In addition, each Fidelity Central Fund's financial statements are available on the SEC's website or upon request. |
(c) Investment made with cash collateral received from securities on loan. |
(d) Security or a portion of the security is on loan at period end. |
Affiliated Central Funds |
Information regarding fiscal year to date income earned by the Fund from investments in Fidelity Central Funds is as follows: |
Fund | Income earned |
Fidelity Cash Central Fund | $ 51,359 |
Fidelity Securities Lending Cash Central Fund | 344,609 |
Total | $ 395,968 |
Other Information |
The following is a summary of the inputs used, as of August 31, 2012, involving the Fund's assets and liabilities carried at fair value. The inputs or methodology used for valuing securities may not be an indication of the risk associated with investing in those securities. For more information on valuation inputs, and their aggregation into the levels used in the table below, please refer to the Security Valuation section in the accompanying Notes to Financial Statements. |
Valuation Inputs at Reporting Date: |
Description | Total | Level 1 | Level 2 | Level 3 |
Investments in Securities: | | | | |
Common Stocks | $ 1,913,866,606 | $ 1,843,216,414 | $ 70,650,192 | $ - |
Money Market Funds | 99,737,255 | 99,737,255 | - | - |
Total Investments in Securities: | $ 2,013,603,861 | $ 1,942,953,669 | $ 70,650,192 | $ - |
Distribution of investments by country or territory of incorporation, as a percentage of total net assets, is as follows. (Unaudited) |
United States of America | 65.0% |
United Kingdom | 17.9% |
France | 4.3% |
Belgium | 3.4% |
Bermuda | 2.1% |
Netherlands | 1.9% |
Switzerland | 1.4% |
Brazil | 1.4% |
Others (Individually Less Than 1%) | 2.6% |
| 100.0% |
See accompanying notes which are an integral part of the financial statements.
Semiannual Report
Consumer Staples Portfolio
Statement of Assets and Liabilities
| August 31, 2012 (Unaudited) |
| | |
Assets | | |
Investment in securities, at value (including securities loaned of $7,650,604) - See accompanying schedule: Unaffiliated issuers (cost $1,474,408,366) | $ 1,913,866,606 | |
Fidelity Central Funds (cost $99,737,255) | 99,737,255 | |
Total Investments (cost $1,574,145,621) | | $ 2,013,603,861 |
Receivable for investments sold | | 876,470 |
Receivable for fund shares sold | | 2,913,548 |
Dividends receivable | | 6,401,439 |
Distributions receivable from Fidelity Central Funds | | 84,597 |
Other receivables | | 8,642 |
Total assets | | 2,023,888,557 |
| | |
Liabilities | | |
Payable for investments purchased | $ 373,914 | |
Payable for fund shares redeemed | 6,189,422 | |
Accrued management fee | 927,988 | |
Distribution and service plan fees payable | 180,589 | |
Other affiliated payables | 387,229 | |
Other payables and accrued expenses | 49,306 | |
Collateral on securities loaned, at value | 7,781,175 | |
Total liabilities | | 15,889,623 |
| | |
Net Assets | | $ 2,007,998,934 |
Net Assets consist of: | | |
Paid in capital | | $ 1,531,767,644 |
Undistributed net investment income | | 22,806,456 |
Accumulated undistributed net realized gain (loss) on investments and foreign currency transactions | | 13,957,507 |
Net unrealized appreciation (depreciation) on investments and assets and liabilities in foreign currencies | | 439,467,327 |
Net Assets | | $ 2,007,998,934 |
Statement of Assets and Liabilities - continued
| August 31, 2012 (Unaudited) |
| | |
Calculation of Maximum Offering Price Class A:
Net Asset Value and redemption price per share ($236,989,846 ÷ 2,963,833 shares) | | $ 79.96 |
| | |
Maximum offering price per share (100/94.25 of $79.96) | | $ 84.84 |
Class T:
Net Asset Value and redemption price per share ($44,178,924 ÷ 556,085 shares) | | $ 79.45 |
| | |
Maximum offering price per share (100/96.50 of $79.45) | | $ 82.33 |
Class B:
Net Asset Value and offering price per share ($18,982,159 ÷ 240,877 shares)A | | $ 78.80 |
| | |
Class C:
Net Asset Value and offering price per share ($118,686,522 ÷ 1,511,166 shares)A | | $ 78.54 |
| | |
Consumer Staples:
Net Asset Value, offering price and redemption price per share ($1,346,637,604 ÷ 16,736,686 shares) | | $ 80.46 |
| | |
Institutional Class:
Net Asset Value, offering price and redemption price per share ($242,523,879 ÷ 3,020,688 shares) | | $ 80.29 |
A Redemption price per share is equal to net asset value less any applicable contingent deferred sales charge.
See accompanying notes which are an integral part of the financial statements.
Semiannual Report
Consumer Staples Portfolio
Financial Statements - continued
Statement of Operations
Six months ended August 31, 2012 (Unaudited) |
| | |
Investment Income | | |
Dividends | | $ 31,054,949 |
Interest | | 13 |
Income from Fidelity Central Funds | | 395,968 |
Total income | | 31,450,930 |
| | |
Expenses | | |
Management fee | $ 5,154,048 | |
Transfer agent fees | 1,985,358 | |
Distribution and service plan fees | 1,009,871 | |
Accounting and security lending fees | 284,230 | |
Custodian fees and expenses | 39,971 | |
Independent trustees' compensation | 6,078 | |
Registration fees | 92,752 | |
Audit | 20,569 | |
Legal | 3,480 | |
Interest | 887 | |
Miscellaneous | 8,705 | |
Total expenses before reductions | 8,605,949 | |
Expense reductions | (22,003) | 8,583,946 |
Net investment income (loss) | | 22,866,984 |
Realized and Unrealized Gain (Loss) Net realized gain (loss) on: | | |
Investment securities: | | |
Unaffiliated issuers | 21,086,671 | |
Foreign currency transactions | (25,646) | |
Total net realized gain (loss) | | 21,061,025 |
Change in net unrealized appreciation (depreciation) on: Investment securities | 83,775,321 | |
Assets and liabilities in foreign currencies | 764 | |
Total change in net unrealized appreciation (depreciation) | | 83,776,085 |
Net gain (loss) | | 104,837,110 |
Net increase (decrease) in net assets resulting from operations | | $ 127,704,094 |
Statement of Changes in Net Assets
| Six months ended
August 31, 2012
(Unaudited) | Year ended
February 29,
2012 |
Increase (Decrease) in Net Assets | | |
Operations | | |
Net investment income (loss) | $ 22,866,984 | $ 29,195,620 |
Net realized gain (loss) | 21,061,025 | 36,347,219 |
Change in net unrealized appreciation (depreciation) | 83,776,085 | 157,954,804 |
Net increase (decrease) in net assets resulting from operations | 127,704,094 | 223,497,643 |
Distributions to shareholders from net investment income | (3,281,176) | (25,900,882) |
Distributions to shareholders from net realized gain | (5,485,421) | (36,216,657) |
Total distributions | (8,766,597) | (62,117,539) |
Share transactions - net increase (decrease) | 156,512,942 | 162,381,495 |
Redemption fees | 15,203 | 45,851 |
Total increase (decrease) in net assets | 275,465,642 | 323,807,450 |
| | |
Net Assets | | |
Beginning of period | 1,732,533,292 | 1,408,725,842 |
End of period (including undistributed net investment income of $22,806,456 and undistributed net investment income of $3,220,648, respectively) | $ 2,007,998,934 | $ 1,732,533,292 |
See accompanying notes which are an integral part of the financial statements.
Semiannual Report
Financial Highlights - Class A
| Six months ended
August 31, 2012 | Years ended February 28, |
| (Unaudited) | 2012 I | 2011 | 2010 | 2009 | 2008 I |
Selected Per-Share Data | | | | | | |
Net asset value, beginning of period | $ 74.90 | $ 67.65 | $ 61.06 | $ 43.94 | $ 63.13 | $ 58.16 |
Income from Investment Operations | | | | | | |
Net investment income (loss) E | .89 | 1.22 | .98 | .84 | .67 | .53 |
Net realized and unrealized gain (loss) | 4.52 | 8.73 | 7.10 | 17.02 | (19.19) | 7.29 |
Total from investment operations | 5.41 | 9.95 | 8.08 | 17.86 | (18.52) | 7.82 |
Distributions from net investment income | (.12) | (1.06) | (.83) | (.74) | (.66) | (.42) |
Distributions from net realized gain | (.23) | (1.64) | (.66) | - | (.02) | (2.44) |
Total distributions | (.35) | (2.70) | (1.49) | (.74) | (.68) K | (2.86) |
Redemption fees added to paid in capital E | - J | - J | - J | - J | .01 | .01 |
Net asset value, end of period | $ 79.96 | $ 74.90 | $ 67.65 | $ 61.06 | $ 43.94 | $ 63.13 |
Total Return B, C, D | 7.25% | 15.00% | 13.27% | 40.66% | (29.43)% | 13.38% |
Ratios to Average Net Assets F, H | | | | | | |
Expenses before reductions | 1.09% A | 1.10% | 1.11% | 1.13% | 1.19% | 1.19% |
Expenses net of fee waivers, if any | 1.09% A | 1.10% | 1.11% | 1.13% | 1.19% | 1.19% |
Expenses net of all reductions | 1.08% A | 1.09% | 1.11% | 1.13% | 1.18% | 1.19% |
Net investment income (loss) | 2.32% A | 1.74% | 1.53% | 1.51% | 1.27% | .83% |
Supplemental Data | | | | | | |
Net assets, end of period (000 omitted) | $ 236,990 | $ 205,851 | $ 160,526 | $ 162,370 | $ 121,193 | $ 23,796 |
Portfolio turnover rate G | 26% A | 35% | 57% | 69% | 70% | 71% |
A Annualized B Total returns for periods of less than one year are not annualized. C Total returns would have been lower if certain expenses had not been reduced during the applicable periods shown. D Total returns do not include the effect of the sales charges. E Calculated based on average shares outstanding during the period. F Fees and expenses of any underlying Fidelity Central Funds are not included in the Fund's expense ratio. The Fund indirectly bears its proportionate share of the expenses of any underlying Fidelity Central Funds. G Amount does not include the portfolio activity of any underlying Fidelity Central Funds. H Expense ratios reflect operating expenses of the class. Expenses before reductions do not reflect amounts reimbursed by the investment adviser or reductions from brokerage service arrangements or reductions from other expense offset arrangements and do not represent the amount paid by the class during periods when reimbursements or reductions occur. Expenses net of fee waivers reflect expenses after reimbursement by the investment adviser but prior to reductions from brokerage service arrangements or other expense offset arrangements. Expenses net of all reductions represent the net expenses paid by the class. I For the year ended February 29. J Amount represents less than $.01 per share. K Total distributions of $.68 per share is comprised of distributions from net investment income of $.655 and distributions from net realized gain of $.024 per share. |
Financial Highlights - Class T
| Six months ended
August 31, 2012 | Years ended February 28, |
| (Unaudited) | 2012 I | 2011 | 2010 | 2009 | 2008 I |
Selected Per-Share Data | | | | | | |
Net asset value, beginning of period | $ 74.49 | $ 67.30 | $ 60.77 | $ 43.75 | $ 62.93 | $ 58.06 |
Income from Investment Operations | | | | | | |
Net investment income (loss) E | .78 | 1.01 | .79 | .66 | .53 | .36 |
Net realized and unrealized gain (loss) | 4.50 | 8.68 | 7.05 | 16.95 | (19.12) | 7.29 |
Total from investment operations | 5.28 | 9.69 | 7.84 | 17.61 | (18.59) | 7.65 |
Distributions from net investment income | (.09) | (.86) | (.65) | (.59) | (.60) | (.35) |
Distributions from net realized gain | (.23) | (1.64) | (.66) | - | - | (2.44) |
Total distributions | (.32) | (2.50) | (1.31) | (.59) | (.60) K | (2.79) |
Redemption fees added to paid in capital E | - J | - J | - J | - J | .01 | .01 |
Net asset value, end of period | $ 79.45 | $ 74.49 | $ 67.30 | $ 60.77 | $ 43.75 | $ 62.93 |
Total Return B, C, D | 7.11% | 14.67% | 12.93% | 40.24% | (29.61)% | 13.11% |
Ratios to Average Net Assets F, H | | | | | | |
Expenses before reductions | 1.36% A | 1.38% | 1.40% | 1.44% | 1.46% | 1.46% |
Expenses net of fee waivers, if any | 1.36% A | 1.38% | 1.40% | 1.44% | 1.46% | 1.46% |
Expenses net of all reductions | 1.36% A | 1.38% | 1.40% | 1.44% | 1.46% | 1.46% |
Net investment income (loss) | 2.04% A | 1.45% | 1.24% | 1.21% | .99% | .56% |
Supplemental Data | | | | | | |
Net assets, end of period (000 omitted) | $ 44,179 | $ 39,047 | $ 31,496 | $ 29,662 | $ 22,624 | $ 6,298 |
Portfolio turnover rate G | 26% A | 35% | 57% | 69% | 70% | 71% |
A Annualized B Total returns for periods of less than one year are not annualized. C Total returns would have been lower if certain expenses had not been reduced during the applicable periods shown. D Total returns do not include the effect of the sales charges. E Calculated based on average shares outstanding during the period. F Fees and expenses of any underlying Fidelity Central Funds are not included in the Fund's expense ratio. The Fund indirectly bears its proportionate share of the expenses of any underlying Fidelity Central Funds. G Amount does not include the portfolio activity of any underlying Fidelity Central Funds. H Expense ratios reflect operating expenses of the class. Expenses before reductions do not reflect amounts reimbursed by the investment adviser or reductions from brokerage service arrangements or reductions from other expense offset arrangements and do not represent the amount paid by the class during periods when reimbursements or reductions occur. Expenses net of fee waivers reflect expenses after reimbursement by the investment adviser but prior to reductions from brokerage service arrangements or other expense offset arrangements. Expenses net of all reductions represent the net expenses paid by the class. I For the year ended February 29. J Amount represents less than $.01 per share. K Total distributions of $.60 per share is comprised of distributions from net investment income of $.599 and distributions from net realized gain of $.000 per share. |
See accompanying notes which are an integral part of the financial statements.
Semiannual Report
Financial Highlights - Class B
| Six months ended
August 31, 2012 | Years ended February 28, |
| (Unaudited) | 2012 I | 2011 | 2010 | 2009 | 2008 I |
Selected Per-Share Data | | | | | | |
Net asset value, beginning of period | $ 74.01 | $ 66.83 | $ 60.37 | $ 43.53 | $ 62.69 | $ 58.00 |
Income from Investment Operations | | | | | | |
Net investment income (loss) E | .57 | .64 | .46 | .37 | .26 | .04 |
Net realized and unrealized gain (loss) | 4.47 | 8.61 | 6.98 | 16.82 | (19.01) | 7.27 |
Total from investment operations | 5.04 | 9.25 | 7.44 | 17.19 | (18.75) | 7.31 |
Distributions from net investment income | (.02) | (.43) | (.32) | (.35) | (.42) | (.19) |
Distributions from net realized gain | (.23) | (1.64) | (.66) | - | - | (2.44) |
Total distributions | (.25) | (2.07) | (.98) | (.35) | (.42) K | (2.63) |
Redemption fees added to paid in capital E | - J | - J | - J | - J | .01 | .01 |
Net asset value, end of period | $ 78.80 | $ 74.01 | $ 66.83 | $ 60.37 | $ 43.53 | $ 62.69 |
Total Return B, C, D | 6.83% | 14.06% | 12.35% | 39.48% | (29.96)% | 12.53% |
Ratios to Average Net Assets F, H | | | | | | |
Expenses before reductions | 1.89% A | 1.91% | 1.91% | 1.97% | 1.96% | 1.96% |
Expenses net of fee waivers, if any | 1.89% A | 1.91% | 1.91% | 1.97% | 1.96% | 1.96% |
Expenses net of all reductions | 1.89% A | 1.90% | 1.91% | 1.97% | 1.96% | 1.96% |
Net investment income (loss) | 1.51% A | .93% | .73% | .68% | .50% | .06% |
Supplemental Data | | | | | | |
Net assets, end of period (000 omitted) | $ 18,982 | $ 19,330 | $ 20,033 | $ 21,099 | $ 14,929 | $ 4,884 |
Portfolio turnover rate G | 26% A | 35% | 57% | 69% | 70% | 71% |
A Annualized B Total returns for periods of less than one year are not annualized. C Total returns would have been lower if certain expenses had not been reduced during the applicable periods shown. D Total returns do not include the effect of the contingent deferred sales charge. E Calculated based on average shares outstanding during the period. F Fees and expenses of any underlying Fidelity Central Funds are not included in the Fund's expense ratio. The Fund indirectly bears its proportionate share of the expenses of any underlying Fidelity Central Funds. G Amount does not include the portfolio activity of any underlying Fidelity Central Funds. H Expense ratios reflect operating expenses of the class. Expenses before reductions do not reflect amounts reimbursed by the investment adviser or reductions from brokerage service arrangements or reductions from other expense offset arrangements and do not represent the amount paid by the class during periods when reimbursements or reductions occur. Expenses net of fee waivers reflect expenses after reimbursement by the investment adviser but prior to reductions from brokerage service arrangements or other expense offset arrangements. Expenses net of all reductions represent the net expenses paid by the class. I For the year ended February 29. J Amount represents less than $.01 per share. K Total distributions of $.42 per share is comprised of distributions from net investment income of $.418 and distributions from net realized gain of $.000 per share. |
Financial Highlights - Class C
| Six months ended
August 31, 2012 | Years ended February 28, |
| (Unaudited) | 2012 I | 2011 | 2010 | 2009 | 2008 I |
Selected Per-Share Data | | | | | | |
Net asset value, beginning of period | $ 73.75 | $ 66.71 | $ 60.29 | $ 43.46 | $ 62.61 | $ 57.99 |
Income from Investment Operations | | | | | | |
Net investment income (loss) E | .59 | .68 | .49 | .41 | .28 | .06 |
Net realized and unrealized gain (loss) | 4.45 | 8.59 | 7.00 | 16.80 | (19.00) | 7.28 |
Total from investment operations | 5.04 | 9.27 | 7.49 | 17.21 | (18.72) | 7.34 |
Distributions from net investment income | (.02) | (.59) | (.41) | (.38) | (.44) | (.29) |
Distributions from net realized gain | (.23) | (1.64) | (.66) | - | - | (2.44) |
Total distributions | (.25) | (2.23) | (1.07) | (.38) | (.44) K | (2.73) |
Redemption fees added to paid in capital E | - J | - J | - J | - J | .01 | .01 |
Net asset value, end of period | $ 78.54 | $ 73.75 | $ 66.71 | $ 60.29 | $ 43.46 | $ 62.61 |
Total Return B, C, D | 6.86% | 14.14% | 12.44% | 39.59% | (29.94)% | 12.58% |
Ratios to Average Net Assets F, H | | | | | | |
Expenses before reductions | 1.83% A | 1.85% | 1.86% | 1.90% | 1.93% | 1.93% |
Expenses net of fee waivers, if any | 1.83% A | 1.85% | 1.86% | 1.90% | 1.93% | 1.93% |
Expenses net of all reductions | 1.83% A | 1.84% | 1.85% | 1.89% | 1.93% | 1.92% |
Net investment income (loss) | 1.57% A | .99% | .79% | .75% | .52% | .09% |
Supplemental Data | | | | | | |
Net assets, end of period (000 omitted) | $ 118,687 | $ 102,321 | $ 81,239 | $ 73,829 | $ 54,902 | $ 19,791 |
Portfolio turnover rate G | 26% A | 35% | 57% | 69% | 70% | 71% |
A Annualized B Total returns for periods of less than one year are not annualized. C Total returns would have been lower if certain expenses had not been reduced during the applicable periods shown. D Total returns do not include the effect of the contingent deferred sales charge. E Calculated based on average shares outstanding during the period. F Fees and expenses of any underlying Fidelity Central Funds are not included in the Fund's expense ratio. The Fund indirectly bears its proportionate share of the expenses of any underlying Fidelity Central Funds. G Amount does not include the portfolio activity of any underlying Fidelity Central Funds. H Expense ratios reflect operating expenses of the class. Expenses before reductions do not reflect amounts reimbursed by the investment adviser or reductions from brokerage service arrangements or reductions from other expense offset arrangements and do not represent the amount paid by the class during periods when reimbursements or reductions occur. Expenses net of fee waivers reflect expenses after reimbursement by the investment adviser but prior to reductions from brokerage service arrangements or other expense offset arrangements. Expenses net of all reductions represent the net expenses paid by the class. I For the year ended February 29. J Amount represents less than $.01 per share. K Total distributions of $.44 per share is comprised of distributions from net investment income of $.443 and distributions from net realized gain of $.000 per share. |
See accompanying notes which are an integral part of the financial statements.
Semiannual Report
Financial Highlights - Consumer Staples
| Six months ended
August 31, 2012 | Years ended February 28, |
| (Unaudited) | 2012 H | 2011 | 2010 | 2009 | 2008 H |
Selected Per-Share Data | | | | | | |
Net asset value, beginning of period | $ 75.29 | $ 67.98 | $ 61.34 | $ 44.14 | $ 63.25 | $ 58.13 |
Income from Investment Operations | | | | | | |
Net investment income (loss) D | 1.00 | 1.42 | 1.14 | .96 | .88 | .71 |
Net realized and unrealized gain (loss) | 4.55 | 8.76 | 7.14 | 17.11 | (19.31) | 7.30 |
Total from investment operations | 5.55 | 10.18 | 8.28 | 18.07 | (18.43) | 8.01 |
Distributions from net investment income | (.15) | (1.24) | (.98) | (.87) | (.67) | (.46) |
Distributions from net realized gain | (.23) | (1.64) | (.66) | - | (.03) | (2.44) |
Total distributions | (.38) | (2.87) K | (1.64) | (.87) | (.69) J | (2.90) |
Redemption fees added to paid in capital D | - I | - I | - I | - I | .01 | .01 |
Net asset value, end of period | $ 80.46 | $ 75.29 | $ 67.98 | $ 61.34 | $ 44.14 | $ 63.25 |
Total Return B, C | 7.41% | 15.30% | 13.55% | 40.96% | (29.23)% | 13.72% |
Ratios to Average Net Assets E, G | | | | | | |
Expenses before reductions | .81% A | .83% | .86% | .92% | .91% | .91% |
Expenses net of fee waivers, if any | .81% A | .83% | .86% | .92% | .91% | .90% |
Expenses net of all reductions | .81% A | .82% | .86% | .91% | .90% | .90% |
Net investment income (loss) | 2.59% A | 2.01% | 1.78% | 1.73% | 1.55% | 1.12% |
Supplemental Data | | | | | | |
Net assets, end of period (000 omitted) | $ 1,346,638 | $ 1,202,440 | $ 877,548 | $ 946,455 | $ 657,263 | $ 655,224 |
Portfolio turnover rate F | 26% A | 35% | 57% | 69% | 70% | 71% |
A Annualized B Total returns for periods of less than one year are not annualized. C Total returns would have been lower if certain expenses had not been reduced during the applicable periods shown. D Calculated based on average shares outstanding during the period. E Fees and expenses of any underlying Fidelity Central Funds are not included in the Fund's expense ratio. The Fund indirectly bears its proportionate share of the expenses of any underlying Fidelity Central Funds. F Amount does not include the portfolio activity of any underlying Fidelity Central Funds. G Expense ratios reflect operating expenses of the class. Expenses before reductions do not reflect amounts reimbursed by the investment adviser or reductions from brokerage service arrangements or reductions from other expense offset arrangements and do not represent the amount paid by the class during periods when reimbursements or reductions occur. Expenses net of fee waivers reflect expenses after reimbursement by the investment adviser but prior to reductions from brokerage service arrangements or other expense offset arrangements. Expenses net of all reductions represent the net expenses paid by the class. H For the year ended February 29. I Amount represents less than $.01 per share. J Total distributions of $.69 per share is comprised of distributions from net investment income of $.668 and distributions from net realized gain of $.025 per share. K Total distributions of $2.87 per share is comprised of distributions from net investment income of $1.236 and distributions from net realized gain of $1.637 per share. |
Financial Highlights - Institutional Class
| Six months ended August 31, 2012 | Years ended February 28, |
| (Unaudited) | 2012 H | 2011 | 2010 | 2009 | 2008 H |
Selected Per-Share Data | | | | | | |
Net asset value, beginning of period | $ 75.14 | $ 67.84 | $ 61.26 | $ 44.07 | $ 63.22 | $ 58.12 |
Income from Investment Operations | | | | | | |
Net investment income (loss) D | .99 | 1.39 | 1.15 | .98 | .82 | .74 |
Net realized and unrealized gain (loss) | 4.54 | 8.73 | 7.13 | 17.09 | (19.23) | 7.30 |
Total from investment operations | 5.53 | 10.12 | 8.28 | 18.07 | (18.41) | 8.04 |
Distributions from net investment income | (.15) | (1.19) | (1.04) | (.88) | (.73) | (.51) |
Distributions from net realized gain | (.23) | (1.64) | (.66) | - | (.03) | (2.44) |
Total distributions | (.38) | (2.82) K | (1.70) | (.88) | (.75) J | (2.95) |
Redemption fees added to paid in capital D | - I | - I | - I | - I | .01 | .01 |
Net asset value, end of period | $ 80.29 | $ 75.14 | $ 67.84 | $ 61.26 | $ 44.07 | $ 63.22 |
Total Return B,C | 7.40% | 15.24% | 13.57% | 41.03% | (29.22)% | 13.77% |
Ratios to Average Net Assets E, G | | | | | | |
Expenses before reductions | .84% A | .87% | .87% | .86% | .91% | .85% |
Expenses net of fee waivers, if any | .84% A | .87% | .87% | .86% | .91% | .85% |
Expenses net of all reductions | .84% A | .87% | .87% | .86% | .91% | .84% |
Net investment income (loss) | 2.56% A | 1.96% | 1.77% | 1.78% | 1.54% | 1.17% |
Supplemental Data | | | | | | |
Net assets, end of period (000 omitted) | $ 242,524 | $ 163,544 | $ 237,883 | $ 36,152 | $ 30,922 | $ 10,384 |
Portfolio turnover rate F | 26% A | 35% | 57% | 69% | 70% | 71% |
A Annualized B Total returns for periods of less than one year are not annualized. C Total returns would have been lower if certain expenses had not been reduced during the applicable periods shown. D Calculated based on average shares outstanding during the period. E Fees and expenses of any underlying Fidelity Central Funds are not included in the Fund's expense ratio. The Fund indirectly bears its proportionate share of the expenses of any underlying Fidelity Central Funds. F Amount does not include the portfolio activity of any underlying Fidelity Central Funds. G Expense ratios reflect operating expenses of the class. Expenses before reductions do not reflect amounts reimbursed by the investment adviser or reductions from brokerage service arrangements or reductions from other expense offset arrangements and do not represent the amount paid by the class during periods when reimbursements or reductions occur. Expenses net of fee waivers reflect expenses after reimbursement by the investment adviser but prior to reductions from brokerage service arrangements or other expense offset arrangements. Expenses net of all reductions represent the net expenses paid by the class. H For the year ended February 29. I Amount represents less than $.01 per share. J Total distributions of $.75 per share is comprised of distributions from net investment income of $.726 and distributions from net realized gain of $.025 per share. K Total distributions of $2.82 per share is comprised of distributions from net investment income of $1.186 and distributions from net realized gain of $1.637 per share. |
See accompanying notes which are an integral part of the financial statements.
Semiannual Report
Notes to Financial Statements
For the period ended August 31, 2012 (Unaudited)
1. Organization.
Consumer Staples Portfolio (the Fund) is a non-diversified fund of Fidelity Select Portfolios (the Trust) and is authorized to issue an unlimited number of shares. The Trust is registered under the Investment Company Act of 1940, as amended (the 1940 Act), as an open-end management investment company organized as a Massachusetts business trust. The Fund invests primarily in securities of companies whose principal business activities fall within specific industries. The Fund offers Class A, Class T, Class C, Consumer Staples and Institutional Class shares, each of which, along with Class B shares, has equal rights as to assets and voting privileges. Effective after the close of business on September 1, 2010, Class B shares were closed to new accounts and additional purchases, except for exchanges and reinvestments. Each class has exclusive voting rights with respect to matters that affect that class. Class B shares will automatically convert to Class A shares after a holding period of seven years from the initial date of purchase. Investment income, realized and unrealized capital gains and losses, the common expenses of the Fund, and certain fund-level expense reductions, if any, are allocated on a pro-rata basis to each class based on the relative net assets of each class to the total net assets of the Fund. Each class differs with respect to transfer agent and distribution and service plan fees incurred. Certain expense reductions may also differ by class.
2. Investments in Fidelity Central Funds.
The Fund invests in Fidelity Central Funds, which are open-end investment companies available only to other investment companies and accounts managed by Fidelity Management & Research Company (FMR) and its affiliates. The Fund's Schedule of Investments lists each of the Fidelity Central Funds held as of period end, if any, as an investment of the Fund, but does not include the underlying holdings of each Fidelity Central Fund. As an Investing Fund, the Fund indirectly bears its proportionate share of the expenses of the underlying Fidelity Central Funds.
The Money Market Central Funds seek preservation of capital and current income and are managed by Fidelity Investments Money Management, Inc. (FIMM), an affiliate of FMR.
A complete unaudited list of holdings for each Fidelity Central Fund is available upon request or at the Securities and Exchange Commission (the SEC) web site at www.sec.gov. In addition, the financial statements of the Fidelity Central Funds are available on the SEC web site or upon request.
3. Significant Accounting Policies.
The financial statements have been prepared in conformity with accounting principles generally accepted in the United States of America (GAAP), which require management to make certain estimates and assumptions at the date of the financial statements. Actual results could differ from those estimates. Subsequent events, if any, through the date that the financial statements were issued have been evaluated in the preparation of the financial statements. The following summarizes the significant accounting policies of the Fund:
Security Valuation. Investments are valued as of 4:00 p.m. Eastern time on the last calendar day of the period. In accordance with valuation policies and procedures approved by the Board of Trustees (the Board), the Fund attempts to obtain prices from one or more third party pricing vendor or broker to value its investments. When current market prices, quotations or rates are not readily available or reliable, securities will be fair valued in good faith by the FMR Fair Value Committee (the Committee), in accordance with procedures adopted by the Fund's Board. Factors used in determining fair value vary by security type and may include market or security specific events. The frequency with which these procedures are used cannot be predicted and they may be utilized to a significant extent. The Committee oversees the Fund's valuation policies and procedures and is responsible for approving and reporting to the Board all fair value determinations.
The Fund categorizes the inputs to valuation techniques used to value its investments into a disclosure hierarchy consisting of three levels as shown below:
Level 1 - quoted prices in active markets for identical investments
Level 2 - other significant observable inputs (including quoted prices for similar investments, interest rates, prepayment speeds, etc.)
Level 3 - unobservable inputs (including the Fund's own assumptions based on the best information available)
Valuation techniques used to value the Fund's investments by major category are as follows:
Equity securities, including restricted securities, for which market quotations are readily available, are valued at the last reported sale price or official closing price as reported by a third party pricing vendor on the primary market or exchange on which they are traded and are categorized as Level 1 in the hierarchy. In the event there were no sales during the day or closing prices are not available, securities are valued at the last quoted bid price or may be valued using the last available price and are generally categorized as Level 2 in the hierarchy. For foreign equity securities, when significant market or security specific events arise, comparisons to the valuation of American Depositary Receipts (ADRs), futures contracts, Exchange-Traded Funds (ETFs) and certain indexes as well as quoted prices for similar securities are used and are categorized as Level 2 in the hierarchy. Utilizing these techniques may result in transfers between Level 1 and Level 2.
Semiannual Report
Notes to Financial Statements (Unaudited) - continued
3. Significant Accounting Policies - continued
Security Valuation - continued
Investments in open-end mutual funds, including the Fidelity Central Funds, are valued at their closing net asset value each business day and are categorized as Level 1 in the hierarchy.
Changes in valuation techniques may result in transfers in or out of an assigned level within the disclosure hierarchy. The aggregate value of investments by input level, as of August 31, 2012, is included at the end of the Fund's Schedule of Investments.
Foreign Currency Translation. The Fund may use foreign currency contracts to facilitate transactions in foreign-denominated securities. Gains and losses from these transactions may arise from changes in the value of the foreign currency or if the counterparties do not perform under the contracts' terms.
Foreign-denominated assets, including investment securities, and liabilities are translated into U.S. dollars at the exchange rates at period end. Purchases and sales of investment securities, income and dividends received and expenses denominated in foreign currencies are translated into U.S. dollars at the exchange rate in effect on the transaction date.
The effects of exchange rate fluctuations on investments are included with the net realized and unrealized gain (loss) on investment securities. Other foreign currency transactions resulting in realized and unrealized gain (loss) are disclosed separately.
Investment Transactions and Income. For financial reporting purposes, the Fund's investment holdings and NAV include trades executed through the end of the last business day of the period. The NAV per share for processing shareholder transactions is calculated as of the close of business of the New York Stock Exchange (NYSE), normally 4:00 p.m. Eastern time and includes trades executed through the end of the prior business day. Gains and losses on securities sold are determined on the basis of identified cost and may include proceeds received from litigation. Dividend income is recorded on the ex-dividend date, except for certain dividends from foreign securities where the ex-dividend date may have passed, which are recorded as soon as the Fund is informed of the ex-dividend date. Non-cash dividends included in dividend income, if any, are recorded at the fair market value of the securities received. Interest income and distributions from the Fidelity Central Funds are accrued as earned. Interest income includes coupon interest and amortization of premium and accretion of discount on debt securities. Investment income is recorded net of foreign taxes withheld where recovery of such taxes is uncertain.
Expenses. Expenses directly attributable to a fund are charged to that fund. Expenses attributable to more than one fund are allocated among the respective funds on the basis of relative net assets or other appropriate methods. Expense estimates are accrued in the period to which they relate and adjustments are made when actual amounts are known.
Income Tax Information and Distributions to Shareholders. Each year, the Fund intends to qualify as a regulated investment company under Subchapter M of the Internal Revenue Code, including distributing substantially all of its taxable income and realized gains. As a result, no provision for income taxes is required. The Fund files a U.S. federal tax return, in addition to state and local tax returns as required. A fund's federal income tax returns are subject to examination by the Internal Revenue Service (IRS) for a period of three fiscal years after they are filed. State and local tax returns may be subject to examination for an additional fiscal year depending on the jurisdiction. Foreign taxes are provided for based on the Fund's understanding of the tax rules and rates that exist in the foreign markets in which it invests.
Distributions are declared and recorded on the ex-dividend date. Income dividends and capital gain distributions are declared separately for each class. Income and capital gain distributions are determined in accordance with income tax regulations, which may differ from GAAP.
Capital accounts within the financial statements are adjusted for permanent book-tax differences. These adjustments have no impact on net assets or the results of operations. Temporary book-tax differences will reverse in a subsequent period.
Book-tax differences are primarily due to foreign currency transactions, deferred trustees compensation and losses deferred due to wash sales and excise tax regulations.
The federal tax cost of investment securities and unrealized appreciation (depreciation) as of period end were as follows:
Gross unrealized appreciation | $ 449,954,508 |
Gross unrealized depreciation | (13,909,293) |
Net unrealized appreciation (depreciation) on securities and other investments | $ 436,045,215 |
| |
Tax cost | $ 1,577,558,646 |
Semiannual Report
3. Significant Accounting Policies - continued
Trading (Redemption) Fees. Shares held by investors in the Fund less than 30 days are subject to a redemption fee equal to .75% of the net asset value of shares redeemed. All redemption fees, which reduce the proceeds of the shareholder redemption, are retained by the Fund and accounted for as an addition to paid in capital.
New Accounting Pronouncement. In December 2011, the Financial Accounting Standards Board issued Accounting Standard Update No. 2011-11, Disclosures about Offsetting Assets and Liabilities. The update creates new disclosure requirements requiring entities to disclose both gross and net information for derivatives and other financial instruments that are either offset in the Statement of Assets and Liabilities or subject to an enforceable master netting arrangement or similar agreement. The disclosure requirements are effective for annual reporting periods beginning on or after January 1, 2013, and interim periods within those annual periods. Management is currently evaluating the impact of the update's adoption on the Fund's financial statement disclosures.
4. Purchases and Sales of Investments.
Purchases and sales of securities, other than short-term securities, aggregated $356,755,501 and $231,699,991, respectively.
5. Fees and Other Transactions with Affiliates.
Management Fee. FMR and its affiliates provide the Fund with investment management related services for which the Fund pays a monthly management fee. The management fee is the sum of an individual fund fee rate that is based on an annual rate of .30% of the Fund's average net assets and an annualized group fee rate that averaged .26% during the period. The group fee rate is based upon the average net assets of all the mutual funds advised by FMR. The group fee rate decreases as assets under management increase and increases as assets under management decrease. For the period, the total annualized management fee rate was .56% of the Fund's average net assets.
Distribution and Service Plan Fees. In accordance with Rule 12b-1 of the 1940 Act, the Fund has adopted separate Distribution and Service Plans for each class of shares. Certain classes pay Fidelity Distributors Corporation (FDC), an affiliate of FMR, separate Distribution and Service Fees, each of which is based on an annual percentage of each class' average net assets. In addition, FDC may pay financial intermediaries for selling shares of the Fund and providing shareholder support services. For the period, the Distribution and Service Fee rates, total fees and amounts retained by FDC were as follows:
| Distribution
Fee | Service
Fee | Total Fees | Retained
by FDC |
Class A | -% | .25% | $ 270,937 | $ 2,352 |
Class T | .25% | .25% | 102,390 | - |
Class B | .75% | .25% | 94,339 | 70,754 |
Class C | .75% | .25% | 542,205 | 107,255 |
| | | $ 1,009,871 | $ 180,361 |
Sales Load. FDC may receive a front-end sales charge of up to 5.75% for selling Class A shares and 3.50% for selling Class T shares, some of which is paid to financial intermediaries for selling shares of the Fund. Depending on the holding period, FDC may receive contingent deferred sales charges levied on Class A, Class T, Class B, and Class C redemptions. The deferred sales charges range from 5.00% to 1.00% for Class B shares, 1.00% for Class C shares, 1.00% for certain purchases of Class A shares and .25% for certain purchases of Class T shares.
For the period, sales charge amounts retained by FDC were as follows:
| Retained
by FDC |
Class A | $ 84,035 |
Class T | 10,633 |
Class B* | 20,622 |
Class C* | 9,152 |
| $ 124,442 |
* When Class B and Class C shares are initially sold, FDC pays commissions from its own resources to financial intermediaries through which the sales are made.
Transfer Agent Fees. Fidelity Investments Institutional Operations Company, Inc. (FIIOC), an affiliate of FMR, is the transfer, dividend disbursing and shareholder servicing agent for each class of the Fund. FIIOC receives account fees and asset-based fees that vary according to the account size
Semiannual Report
Notes to Financial Statements (Unaudited) - continued
5. Fees and Other Transactions with Affiliates - continued
Transfer Agent Fees - continued
and type of account of the shareholders of the respective classes of the Fund. FIIOC pays for typesetting, printing and mailing of shareholder reports, except proxy statements. For the period, transfer agent fees for each class were as follows:
| Amount | % of
Average
Net Assets* |
Class A | $ 248,375 | .23 |
Class T | 52,988 | .26 |
Class B | 27,048 | .29 |
Class C | 121,555 | .22 |
Consumer Staples | 1,298,635 | .21 |
Institutional Class | 236,757 | .23 |
| $ 1,985,358 | |
* Annualized
Accounting and Security Lending Fees. Fidelity Service Company, Inc. (FSC), an affiliate of FMR, maintains the Fund's accounting records. The accounting fee is based on the level of average net assets for each month. Under a separate contract, FSC administers the security lending program. The security lending fee is based on the number and duration of lending transactions.
Brokerage Commissions. The Fund placed a portion of its portfolio transactions with brokerage firms which are affiliates of the investment adviser. The commissions paid to these affiliated firms were $6,847 for the period.
Interfund Lending Program. Pursuant to an Exemptive Order issued by the SEC, the Fund, along with other registered investment companies having management contracts with FMR, may participate in an interfund lending program. This program provides an alternative credit facility allowing the funds to borrow from, or lend money to, other participating affiliated funds. At period end, there were no interfund loans outstanding. The Fund's activity in this program during the period for which loans were outstanding was as follows:
Borrower or Lender | Average Loan
Balance | Weighted Average
Interest Rate | Interest
Expense |
Borrower | $ 12,984,167 | .41% | $ 887 |
6. Committed Line of Credit.
The Fund participates with other funds managed by FMR or an affiliate in a $4.25 billion credit facility (the "line of credit") to be utilized for temporary or emergency purposes to fund shareholder redemptions or for other short-term liquidity purposes. The Fund has agreed to pay commitment fees on its pro-rata portion of the line of credit, which amounted to $2,500 and is reflected in Miscellaneous expenses on the Statement of Operations. During the period, there were no borrowings on this line of credit.
7. Security Lending.
The Fund lends portfolio securities through a lending agent from time to time in order to earn additional income. For equity securities, a lending agent is used and may loan securities to certain qualified borrowers, including Fidelity Capital Markets (FCM), a broker-dealer affiliated with the Fund. On the settlement date of the loan, the Fund receives collateral (in the form of U.S. Treasury obligations, letters of credit and/or cash) against the loaned securities and maintains collateral in an amount not less than 100% of the market value of the loaned securities during the period of the loan. The market value of the loaned securities is determined at the close of business of the Fund and any additional required collateral is delivered to the Fund on the next business day. If the borrower defaults on its obligation to return the securities loaned because of insolvency or other reasons, a fund could experience delays and costs in recovering the securities loaned or in gaining access to the collateral. Any cash collateral received is invested in the Fidelity Securities Lending Cash Central Fund. The value of loaned securities and cash collateral at period end are disclosed on the Fund's Statement of Assets and Liabilities. Security lending income represents the income earned on investing cash collateral, less rebates paid to borrowers and any lending agent fees associated with the loan, plus any premium payments received for lending certain types of securities. Security lending income is presented in the Statement of Operations as a component of income from Fidelity Central Funds. Total security lending income during the period amounted to $344,609. During the period, there were no securities loaned to FCM.
Semiannual Report
8. Expense Reductions.
Many of the brokers with whom FMR places trades on behalf of the Fund provided services in addition to trade execution. These services included payments of certain expenses on behalf of the Fund totaling $21,953 for the period. In addition, through arrangements with the Fund's custodian, credits realized as a result of uninvested cash balances were used to reduce the Fund's expenses. During the period, these credits reduced the Fund's custody expenses by $50.
9. Distributions to Shareholders.
Distributions to shareholders of each class were as follows:
| Six months ended
August 31,
2012 | Year ended
February 29,
2012 |
From net investment income | | |
Class A | $ 323,577 | $ 2,690,167 |
Class T | 45,344 | 422,197 |
Class B | 4,298 | 114,208 |
Class C | 29,567 | 829,469 |
Consumer Staples | 2,475,321 | 18,061,907 |
Institutional Class | 403,069 | 3,782,934 |
Total | $ 3,281,176 | $ 25,900,882 |
From net realized gain | | |
Class A | $ 630,693 | $ 4,102,363 |
Class T | 121,268 | 795,051 |
Class B | 58,156 | 441,952 |
Class C | 323,833 | 2,213,680 |
Consumer Staples | 3,745,551 | 23,446,773 |
Institutional Class | 605,920 | 5,216,838 |
Total | $ 5,485,421 | $ 36,216,657 |
10. Share Transactions.
Transactions for each class of shares were as follows:
| Shares | Dollars |
| Six months ended
August 31,
2012 | Year ended
February 29,
2012 | Six months ended
August 31,
2012 | Year ended
February 29,
2012 |
Class A | | | | |
Shares sold | 575,336 | 1,107,874 | $ 44,327,963 | $ 77,974,428 |
Reinvestment of distributions | 10,982 | 84,526 | 824,504 | 5,924,948 |
Shares redeemed | (371,007) | (816,686) | (28,336,652) | (57,527,748) |
Net increase (decrease) | 215,311 | 375,714 | $ 16,815,815 | $ 26,371,628 |
Class T | | | | |
Shares sold | 66,759 | 130,126 | $ 5,120,369 | $ 9,133,799 |
Reinvestment of distributions | 2,093 | 16,351 | 156,290 | 1,140,509 |
Shares redeemed | (36,979) | (90,239) | (2,801,960) | (6,276,410) |
Net increase (decrease) | 31,873 | 56,238 | $ 2,474,699 | $ 3,997,898 |
Class B | | | | |
Shares sold | 6,362 | 22,727 | $ 483,566 | $ 1,569,035 |
Reinvestment of distributions | 672 | 6,332 | 49,896 | 439,355 |
Shares redeemed | (27,320) | (67,638) | (2,066,228) | (4,695,265) |
Net increase (decrease) | (20,286) | (38,579) | $ (1,532,766) | $ (2,686,875) |
Class C | | | | |
Shares sold | 247,961 | 536,557 | $ 18,813,434 | $ 37,168,209 |
Reinvestment of distributions | 3,610 | 33,216 | 266,955 | 2,295,907 |
Shares redeemed | (127,849) | (400,115) | (9,590,639) | (28,068,157) |
Net increase (decrease) | 123,722 | 169,658 | $ 9,489,750 | $ 11,395,959 |
Semiannual Report
Notes to Financial Statements (Unaudited) - continued
10. Share Transactions - continued
| Shares | Dollars |
| Six months ended
August 31,
2012 | Year ended
February 29,
2012 | Six months ended
August 31,
2012 | Year ended
February 29,
2012 |
Consumer Staples | | | | |
Shares sold | 3,097,202 | 7,156,716 | $ 239,128,527 | $ 509,488,908 |
Reinvestment of distributions | 79,360 | 566,253 | 5,989,308 | 39,874,596 |
Shares redeemed | (2,410,148) | (4,661,196) | (182,123,770) | (330,401,040) |
Net increase (decrease) | 766,414 | 3,061,773 | $ 62,994,065 | $ 218,962,464 |
Institutional Class | | | | |
Shares sold | 1,388,318 | 2,454,993 | $ 107,435,083 | $ 173,115,499 |
Reinvestment of distributions | 11,821 | 115,398 | 890,360 | 8,111,953 |
Shares redeemed | (555,913) | (3,900,689) | (42,054,064) | (276,887,031) |
Net increase (decrease) | 844,226 | (1,330,298) | $ 66,271,379 | $ (95,659,579) |
11. Other.
The Fund's organizational documents provide former and current trustees and officers with a limited indemnification against liabilities arising in connection with the performance of their duties to the Fund. In the normal course of business, the Fund may also enter into contracts that provide general indemnifications. The Fund's maximum exposure under these arrangements is unknown as this would be dependent on future claims that may be made against the Fund. The risk of material loss from such claims is considered remote.
At the end of the period, Fidelity VIP FundsManager 60% Portfolio was the owner of record of approximately 12% of the total outstanding shares of the Fund. Mutual funds managed by FMR or its affiliates, were the owners of record in aggregate of approximately 25% of the total outstanding shares of the Fund.
Semiannual Report
Board Approval of Investment Advisory Contracts and Management Fees
Consumer Staples Portfolio
Each year, the Board of Trustees, including the Independent Trustees (together, the Board), votes on the renewal of the management contract and sub-advisory agreements (together, the Advisory Contracts) for the fund. The Board, assisted by the advice of fund counsel and Independent Trustees' counsel, requests and considers a broad range of information relevant to the renewal of the Advisory Contracts throughout the year.
The Board meets regularly and, at each of its meetings, considers factors that are relevant to its annual consideration of the renewal of the fund's Advisory Contracts, including the services and support provided to the fund and its shareholders. The Board has established various standing committees, each composed of and chaired by Independent Trustees with varying backgrounds, to which the Board has assigned specific subject matter responsibilities in order to enhance effective decision-making by the Board. The Board, acting directly and through its Committees, requests and receives information concerning the annual consideration of the renewal of the fund's Advisory Contracts. The Board also meets as needed to consider matters specifically related to the Board's annual consideration of the renewal of Advisory Contracts. Members of the Board may also meet with trustees of other Fidelity funds through ad hoc joint committees to discuss certain matters relevant to the Fidelity funds.
At its July 2012 meeting, the Board of Trustees, including the Independent Trustees, unanimously determined to renew the fund's Advisory Contracts. In reaching its determination, the Board considered all factors it believed relevant, including (i) the nature, extent, and quality of the services to be provided to the fund and its shareholders (including the investment performance of the fund); (ii) the competitiveness of the fund's management fee and total expense ratio relative to peer funds; (iii) the total costs of the services to be provided by and the profits to be realized by Fidelity from its relationship with the fund; (iv) the extent to which economies of scale exist and would be realized as the fund grows; and (v) whether fee levels reflect these economies of scale, if any, for the benefit of fund shareholders.
In considering whether to renew the Advisory Contracts for the fund, the Board reached a determination, with the assistance of fund counsel and Independent Trustees' counsel and through the exercise of its business judgment, that the renewal of the Advisory Contracts is in the best interests of the fund and its shareholders and that the compensation payable under the Advisory Contracts is fair and reasonable. The Board's decision to renew the Advisory Contracts was not based on any single factor, but rather was based on a comprehensive consideration of all the information provided to the Board at its meetings throughout the year. The Board, in reaching its determination to renew the Advisory Contracts, is aware that shareholders in the fund have a broad range of investment choices available to them, including a wide choice among mutual funds offered by Fidelity's competitors, and that the fund's shareholders, who have the opportunity to review and weigh the disclosure provided by the fund in its prospectus and other public disclosures, have chosen to invest in this fund, managed by Fidelity.
Nature, Extent, and Quality of Services Provided. The Board considered the staffing within the investment adviser, FMR, and the sub-advisers (together, the Investment Advisers), including the backgrounds of the fund's investment personnel, and also considered the fund's investment objective, strategies, and related investment philosophy. The Independent Trustees also had discussions with senior management of Fidelity's investment operations and investment groups. The Board considered the structure of the portfolio manager compensation program and whether this structure provides appropriate incentives to act in the best interests of the fund.
Resources Dedicated to Investment Management and Support Services. The Board and the Fund Oversight and Research Committees reviewed the general qualifications and capabilities of the Investment Advisers' investment staff, including its size, education, experience, and resources, as well as the Investment Advisers' approach to recruiting, training, managing, and compensating investment personnel. The Board also noted that FMR has continued to increase the resources devoted to non-U.S. offices, including expansion of Fidelity's global investment organization. The Board noted that Fidelity's analysts have extensive resources, tools and capabilities that allow them to conduct sophisticated quantitative and fundamental analysis, as well as credit analysis of issuers, counterparties and guarantors. The Board also believes that Fidelity's investment professionals have sufficient access to global information and data so as to provide competitive investment results over time, and that those professionals also have access to sophisticated tools that permit them to assess portfolio construction and risk and performance attribution characteristics continuously, as well as to transmit new information and research conclusions rapidly around the world. Additionally, in its deliberations, the Board considered the Investment Advisers' trading and risk management capabilities and resources, which are an integral part of the investment management process.
Shareholder and Administrative Services. The Board considered (i) the nature, extent, quality, and cost of advisory, administrative, and shareholder services performed by the Investment Advisers and their affiliates under the Advisory Contracts and under separate agreements covering transfer agency, pricing and bookkeeping, and securities lending services for the fund; (ii) the nature and extent of the supervision of third party service providers, principally custodians and subcustodians; and (iii) the resources devoted to, and the record of compliance with, the fund's compliance policies and procedures. The Board also reviewed the allocation of fund brokerage, including allocations to brokers affiliated with the Investment Advisers, the use of brokerage commissions to pay fund expenses, and the use of "soft" commission dollars to pay for research services.
The Board noted that the growth of fund assets over time across the complex allows Fidelity to reinvest in the development of services designed to enhance the value or convenience of the Fidelity funds as investment vehicles. These services include 24-hour access to account information and market information through telephone representatives and over the Internet, investor education materials and asset allocation tools, and the expanded availability of Fidelity Investor Centers.
Semiannual Report
Investment in a Large Fund Family. The Board considered the benefits to shareholders of investing in a Fidelity fund, including the benefits of investing in a fund that is part of a large family of funds offering a variety of investment disciplines and providing a large variety of mutual fund investor services. The Board noted that Fidelity had taken, or had made recommendations that resulted in the Fidelity funds taking, a number of actions over the previous year that benefited particular funds, including (i) continuing to dedicate additional resources to investment research and support of the senior management team that oversees asset management; (ii) persisting in efforts to enhance Fidelity's research capabilities, in particular, international research; (iii) launching new funds and making other enhancements to meet client needs for global and income-oriented solutions; (iv) continuing to launch dedicated lower cost underlying funds to meet investment management's portfolio construction needs related to expanding underlying fund options, specifically for the Freedom Fund product lines; (v) adopting a "Stock Selector" sector neutral investment approach and employing a team of portfolio managers who are sector specialists to manage certain funds; (vi) rationalizing product lines and gaining increased efficiencies through the mergers of several funds into other funds; (vii) strengthening the Spartan Index Fund product line by adding new funds and/or new low-cost institutional share classes, restructuring fund expenses to accommodate new classes, and reducing investment minimums for certain classes of shares; (viii) modifying the eligibility criteria for Institutional Class shares to increase their appeal to government entities and charitable investors; and (ix) reducing certain transfer agent fee rates.
Investment Performance. The Board considered whether the fund has operated in accordance with its investment objective, as well as its record of compliance with its investment restrictions. It also reviewed the fund's absolute investment performance for each class, as well as the fund's relative investment performance for each class measured over multiple periods against a third-party-sponsored index that reflects the market sector in which the fund invests. The Board noted that FMR believes that no meaningful peer group exists for the fund principally because most other funds in the fund's third-party peer group focus on different industries or sectors than the fund. The following charts considered by the Board show, over the one-, three-, and five-year periods ended December 31, 2011, the cumulative total returns of Institutional Class (Class I) and Class B of the fund and the cumulative total returns of a third-party-sponsored index ("benchmark"). The returns of Institutional Class (Class I) and Class B show the performance of the highest and lowest performing classes, respectively (based on five-year performance).
Consumer Staples Portfolio
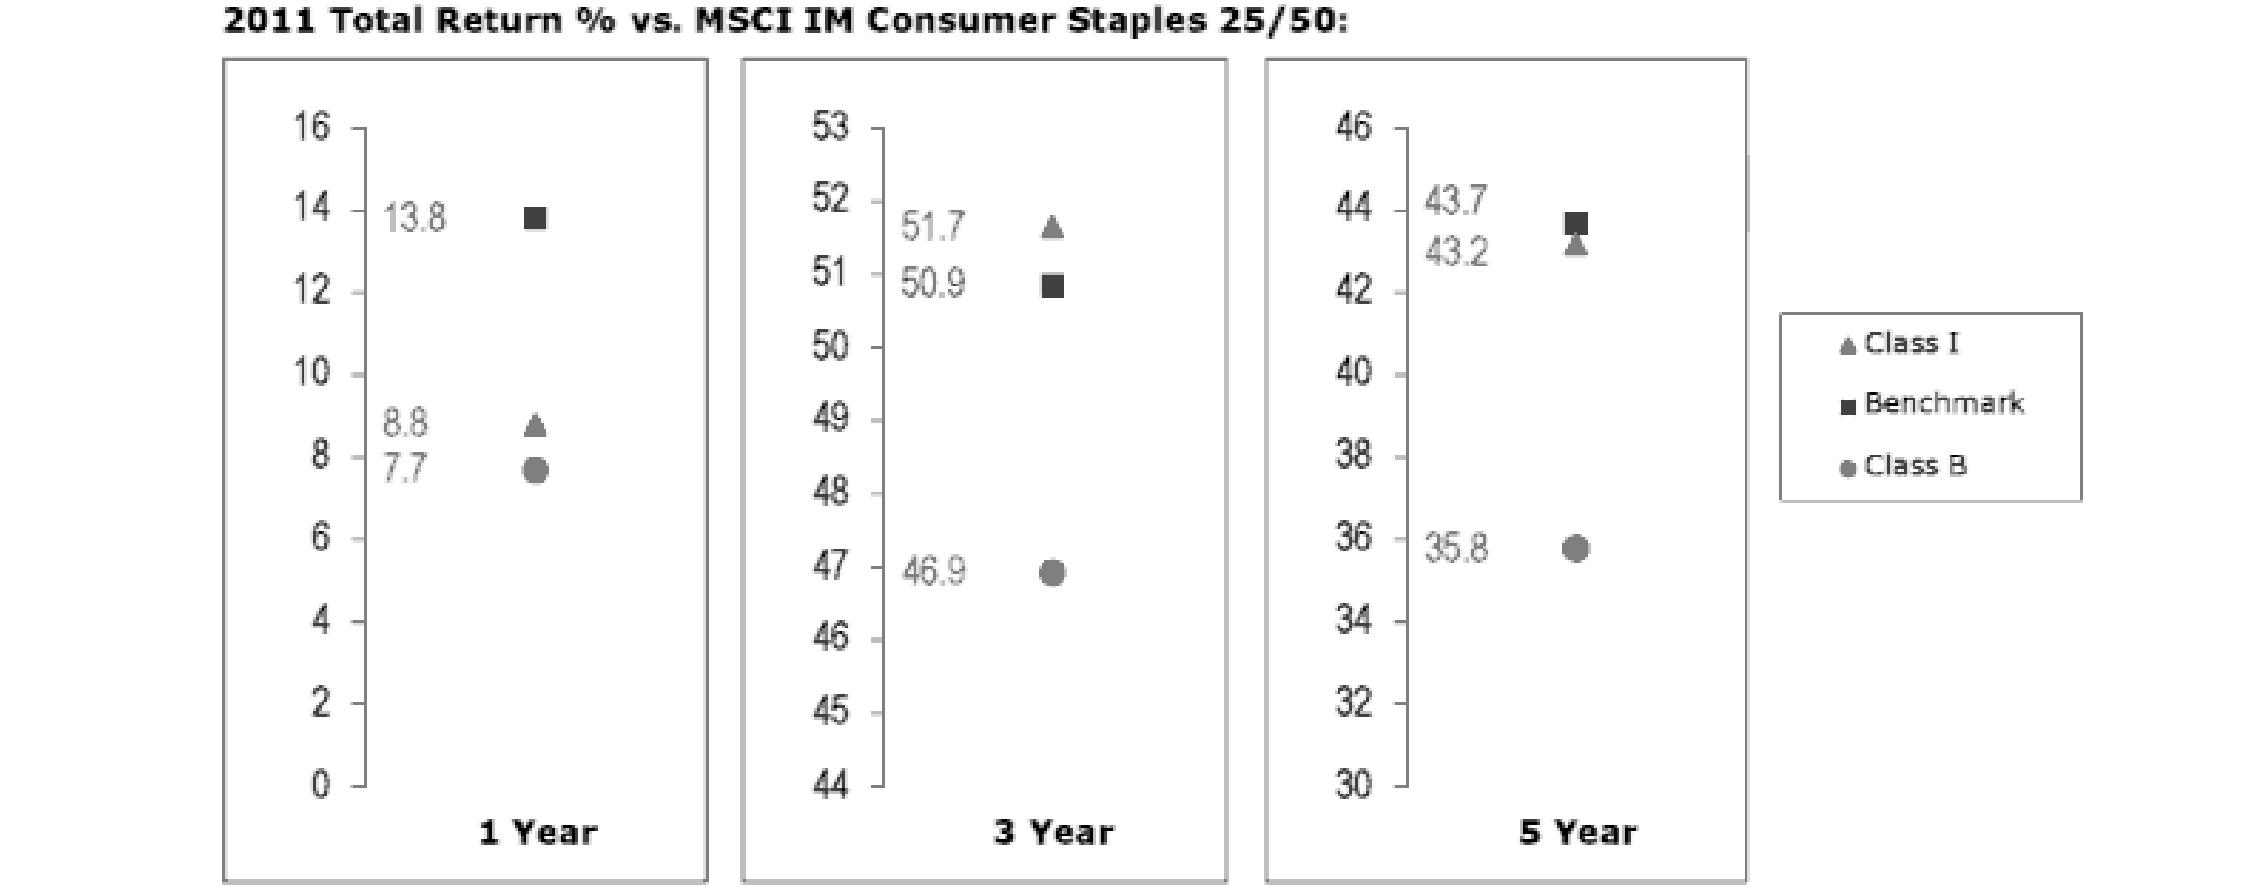
The Board noted that the investment performance of the fund was lower than its benchmark for the one- and five-year periods, although the three-year cumulative total return of Institutional Class (Class I) compared favorably to its benchmark. The Board considered that the variations in performance among the fund's classes reflect the variations in class expenses, which result in lower performance for higher expense classes. The Board also reviewed the fund's performance since inception as well as performance in the current year.
Based on its review, the Board concluded that the nature, extent, and quality of services provided to the fund under the Advisory Contracts should benefit the fund's shareholders.
Competitiveness of Management Fee and Total Expense Ratio. The Board considered the fund's management fee and total expense ratio compared to "mapped groups" of competitive funds and classes. Fidelity creates "mapped groups" by combining similar Lipper investment objective categories that have comparable management fee characteristics. Combining Lipper investment objective categories aids the Board's management fee and total expense ratio comparisons by broadening the competitive group used for comparison and by reducing the number of universes to which various Fidelity funds are compared.
Semiannual Report
Board Approval of Investment Advisory Contracts and Management Fees - continued
Management Fee. The Board considered two proprietary management fee comparisons for the 12-month periods shown in the chart below. The group of Lipper funds used by the Board for management fee comparisons is referred to below as the "Total Mapped Group." The Total Mapped Group comparison focuses on a fund's standing relative to the total universe of comparable funds available to investors in terms of gross management fees before expense reimbursements or caps. "TMG %" represents the percentage of funds in the Total Mapped Group that had management fees that were lower than the fund's. For example, a TMG % of 6% means that 94% of the funds in the Total Mapped Group had higher management fees than the fund. The "Asset-Size Peer Group" (ASPG) comparison focuses on a fund's standing relative to non-Fidelity funds similar in size to the fund within the Total Mapped Group. The ASPG represents at least 15% of the funds in the Total Mapped Group with comparable asset size and management fee characteristics, subject to a minimum of 50 funds (or all funds in the Total Mapped Group if fewer than 50). Additional information, such as the ASPG quartile in which the fund's management fee ranked, is also included in the chart and considered by the Board.
Consumer Staples Portfolio

The Board noted that the fund's management fee ranked below the median of its Total Mapped Group and below the median of its ASPG for 2011.
Based on its review, the Board concluded that the fund's management fee is fair and reasonable in light of the services that the fund receives and the other factors considered.
Total Expense Ratio. In its review of each class's total expense ratio, the Board considered the fund's management fee as well as other fund or class expenses, as applicable, such as transfer agent fees, pricing and bookkeeping fees, fund-paid 12b-1 fees, and custodial, legal, and audit fees. The Board also noted the effects of any waivers and reimbursements on fees and expenses. As part of its review, the Board also considered the current and historical total expense ratios of each class of the fund compared to competitive fund median expenses. Each class of the fund is compared to those funds and classes in the Total Mapped Group (used by the Board for management fee comparisons) that have a similar sales load structure.
The Board noted that the total expense ratio of each class ranked below its competitive median for 2011.
Fees Charged to Other Fidelity Clients. The Board also considered Fidelity fee structures and other information with respect to clients of FMR and its affiliates, such as other mutual funds advised or subadvised by FMR or its affiliates, pension plan clients, and other institutional clients. The Board noted the findings of the 2010 ad hoc joint committee (created with the board of other Fidelity funds), which reviewed and compared Fidelity's institutional investment advisory business with its business of providing services to the Fidelity funds, including the differences in services provided, fees charged, and costs incurred, as well as competition in their respective marketplaces.
Based on its review of total expense ratios and fees charged to other Fidelity clients, the Board concluded that the total expense ratio of each class of the fund was reasonable in light of the services that the fund and its shareholders receive and the other factors considered.
Costs of the Services and Profitability. The Board considered the revenues earned and the expenses incurred by Fidelity in conducting the business of developing, marketing, distributing, managing, administering and servicing the fund and its shareholders. The Board also considered the level of Fidelity's profits in respect of all the Fidelity funds.
On an annual basis, FMR presents to the Board Fidelity's profitability for the fund. Fidelity calculates the profitability for each fund, as well as aggregate profitability for groups of Fidelity funds and all Fidelity funds, using a series of detailed revenue and cost allocation methodologies which originate with the books and records of Fidelity on which Fidelity's audited financial statements are based. The Audit Committee of the Board reviews any significant changes from the prior year's methodologies.
Semiannual Report
PricewaterhouseCoopers LLP (PwC), independent registered public accounting firm and auditor to Fidelity and certain Fidelity funds, has been engaged annually by the Board as part of the Board's assessment of Fidelity's profitability analysis. PwC's engagement includes the review and assessment of Fidelity's methodologies used in determining the revenues and expenses attributable to Fidelity's mutual fund business, and completion of agreed-upon procedures surrounding the mathematical accuracy of fund profitability and its conformity to allocation methodologies. After considering PwC's reports issued under the engagement and information provided by Fidelity, the Board concluded that while other allocation methods may also be reasonable, Fidelity's profitability methodologies are reasonable in all material respects.
The Board also reviewed Fidelity's non-fund businesses and fall-out benefits related to the mutual fund business as well as cases where Fidelity's affiliates may benefit from or be related to the fund's business.
The Board considered the costs of the services provided by and the profits realized by Fidelity in connection with the operation of the fund and was satisfied that the profitability was not excessive in the circumstances.
Economies of Scale. The Board considered whether there have been economies of scale in respect of the management of the Fidelity funds, whether the Fidelity funds (including the fund) have appropriately benefited from any such economies of scale, and whether there is potential for realization of any further economies of scale. The Board considered the extent to which the fund will benefit from economies of scale through increased services to the fund, through waivers or reimbursements, or through fee or expense reductions. The Board also noted that in 2009, it and the board of other Fidelity funds created an ad hoc committee (the Economies of Scale Committee) to analyze whether FMR attains economies of scale in respect of the management and servicing of the Fidelity funds, whether the Fidelity funds have appropriately benefited from such economies of scale, and whether there is potential for realization of any further economies of scale.
The Board recognized that the fund's management contract incorporates a "group fee" structure, which provides for lower group fee rates as total fund assets under FMR's management increase, and for higher group fee rates as total fund assets under FMR's management decrease. FMR calculates the group fee rates based on a tiered asset "breakpoint" schedule that varies based on asset class. The Board considered that the group fee is designed to deliver the benefits of economies of scale to fund shareholders when total Fidelity fund assets increase, even if assets of any particular fund are unchanged or have declined, because some portion of Fidelity's costs are attributable to services provided to all Fidelity funds, and all funds benefit if those costs can be allocated among more assets. The Board concluded that, given the group fee structure, fund shareholders will benefit from lower management fees as assets under FMR's management increase at the fund complex level, regardless of whether Fidelity achieves any such economies of scale.
The Board concluded, taking into account the analysis of the Economies of Scale Committee, that economies of scale, if any, are being appropriately shared between fund shareholders and Fidelity.
Additional Information Requested by the Board. In order to develop fully the factual basis for consideration of the Fidelity funds' Advisory Contracts, the Board requested and received additional information on certain topics, including (i) fund performance trends, actions to be taken by FMR to improve certain funds' overall performance, and Fidelity's long-term strategies for certain funds; (ii) the potential to further rationalize the Fidelity fund lineup with the possibility of achieving savings for the funds and Fidelity; (iii) Fidelity's compensation structure for portfolio managers and other key investment personnel; (iv) the amount of the investment that each portfolio manager has made in the Fidelity fund(s) that he or she manages; (v) the realization of fall-out benefits in certain Fidelity business units; (vi) Fidelity's group fee structures, the potential impact of regulatory changes on such structures, and the rationale for the individual fee rates of certain funds; (vii) fund profitability methodology, including Fidelity's cost allocation methodology, and the impact of certain factors on fund profitability results; (viii) trends regarding industry use of performance fee structures and the possibility of implementing performance fee structures for additional funds; and (ix) the impact of net redemptions from the Fidelity funds.
Based on its evaluation of all of the conclusions noted above, and after considering all factors it believed relevant, the Board ultimately concluded that the advisory fee structures are fair and reasonable, and that the fund's Advisory Contracts should be renewed.
Semiannual Report
Investment Adviser
Fidelity Management & Research Company
Boston, MA
Investment Sub-Advisers
FMR Co., Inc.
Fidelity Management & Research
(U.K.) Inc.
Fidelity Management & Research
(Hong Kong) Limited
Fidelity Management & Research
(Japan) Inc.
General Distributor
Fidelity Distributors Corporation
Smithfield, RI
Transfer and Service Agents
Fidelity Investments Institutional
Operations Company, Inc.
Boston, MA
Fidelity Service Company, Inc.
Boston, MA
Custodian
Brown Brothers Harriman & Co.
Boston, MA
Corporate Headquarters
82 Devonshire Street
Boston, MA 02109
1-800-544-8888
The Fidelity Telephone Connection
Mutual Fund 24-Hour Service
Exchanges/Redemptions
and Account Assistance 1-800-544-6666
Product Information 1-800-544-8888
Retirement Accounts 1-800-544-4774
(8 a.m. - 9 p.m.)
TDD Service 1-800-544-0118
for the deaf and hearing impaired
(9 a.m. - 9 p.m. Eastern time)
Fidelity Automated Service
Telephone (FAST®)
1-800-544-5555
Automated line for quickest service

SELCS-USAN-1012
1.846044.105
Fidelity®
Select Portfolios®
Telecommunications Services Sector
Telecommunications Portfolio
Wireless Portfolio
Semiannual Report
August 31, 2012
(Fidelity Cover Art)
Contents
To view a fund's proxy voting guidelines and proxy voting record for the 12-month period ended June 30, visit http://www.fidelity.com/proxyvotingresults or visit the Securities and Exchange Commission's (SEC) web site at http://www.sec.gov. You may also call 1-800-544-8544 to request a free copy of the proxy voting guidelines.
Standard & Poor's, S&P and S&P 500 are registered service marks of The McGraw-Hill Companies, Inc. and have been licensed for use by Fidelity Distributors Corporation.
Other third party marks appearing herein are the property of their respective owners.
All other marks appearing herein are registered or unregistered trademarks or service marks of FMR LLC or an affiliated company. © 2012 FMR LLC. All rights reserved.
This report and the financial statements contained herein are submitted for the general information of the shareholders of the funds. This report is not authorized for distribution to prospective investors in the funds unless preceded or accompanied by an effective prospectus.
A fund files its complete schedule of portfolio holdings with the SEC for the first and third quarters of each fiscal year on Form N-Q. Forms N-Q are available on the SEC's web site at http://www.sec.gov. A fund's Forms N-Q may be reviewed and copied at the SEC's Public Reference Room in Washington, DC. Information regarding the operation of the SEC's Public Reference Room may be obtained by calling 1-800-SEC-0330. For a complete list of a fund's portfolio holdings, view the most recent holdings listing, semiannual report, or annual report on Fidelity's web site at http://www.fidelity.com, http://www.advisor.fidelity.com, or http://www.401k.com, as applicable.
NOT FDIC INSURED • MAY LOSE VALUE • NO BANK GUARANTEE
Neither the funds nor Fidelity Distributors Corporation is a bank.
Semiannual Report
Telecommunications Portfolio
As a shareholder of the Fund, you incur two types of costs: (1) transaction costs, including sales charges (loads) on purchase payments or redemption proceeds, redemption fees and (2) ongoing costs, including management fees, distribution and/or service (12b-1) fees and other Fund expenses. This Example is intended to help you understand your ongoing costs (in dollars) of investing in the Fund and to compare these costs with the ongoing costs of investing in other mutual funds.
The Example is based on an investment of $1,000 invested at the beginning of the period and held for the entire period (March 1, 2012 to August 31, 2012).
Actual Expenses
The first line of the accompanying table for each class of the Fund provides information about actual account values and actual expenses. You may use the information in this line, together with the amount you invested, to estimate the expenses that you paid over the period. Simply divide your account value by $1,000.00 (for example, an $8,600 account value divided by $1,000.00 = 8.6), then multiply the result by the number in the first line for a class of the Fund under the heading entitled "Expenses Paid During Period" to estimate the expenses you paid on your account during this period. A small balance maintenance fee of $12.00 that is charged once a year may apply for certain accounts with a value of less than $2,000. This fee is not included in the table below. If it was, the estimate of expenses you paid during the period would be higher, and your ending account value lower, by this amount. In addition, the Fund, as a shareholder in the underlying Fidelity Central Funds, will indirectly bear its pro-rata share of the fees and expenses incurred by the underlying Fidelity Central Funds. These fees and expenses are not included in the Fund's annualized expense ratio used to calculate the expense estimate in the table below.
Hypothetical Example for Comparison Purposes
The second line of the accompanying table for each class of the Fund provides information about hypothetical account values and hypothetical expenses based on a Class' actual expense ratio and an assumed rate of return of 5% per year before expenses, which is not the Class' actual return. The hypothetical account values and expenses may not be used to estimate the actual ending account balance or expenses you paid for the period. You may use this information to compare the ongoing costs of investing in the Fund and other funds. To do so, compare this 5% hypothetical example with the 5% hypothetical examples that appear in the shareholder reports of the other funds. A small balance maintenance fee of $12.00 that is charged once a year may apply for certain accounts with a value of less than $2,000. This fee is not included in the table below. If it was, the estimate of expenses you paid during the period would be higher, and your ending account value lower, by this amount. In addition, the Fund, as a shareholder in the underlying Fidelity Central Funds, will indirectly bear its pro-rata share of the fees and expenses incurred by the underlying Fidelity Central Funds. These fees and expenses are not included in the Fund's annualized expense ratio used to calculate the expense estimate in the table below.
Please note that the expenses shown in the table are meant to highlight your ongoing costs only and do not reflect any transaction costs. Therefore, the second line of the table is useful in comparing ongoing costs only, and will not help you determine the relative total costs of owning different funds. In addition, if these transactional costs were included, your costs would have been higher.
| Annualized
Expense Ratio | Beginning
Account Value
March 1, 2012 | Ending
Account Value
August 31, 2012 | Expenses Paid
During Period*
March 1, 2012
to August 31, 2012 |
Class A | 1.18% | | | |
Actual | | $ 1,000.00 | $ 1,086.40 | $ 6.21 |
HypotheticalA | | $ 1,000.00 | $ 1,019.26 | $ 6.01 |
Class T | 1.48% | | | |
Actual | | $ 1,000.00 | $ 1,084.50 | $ 7.78 |
HypotheticalA | | $ 1,000.00 | $ 1,017.74 | $ 7.53 |
Class B | 1.93% | | | |
Actual | | $ 1,000.00 | $ 1,082.20 | $ 10.13 |
HypotheticalA | | $ 1,000.00 | $ 1,015.48 | $ 9.80 |
Class C | 1.91% | | | |
Actual | | $ 1,000.00 | $ 1,082.40 | $ 10.03 |
HypotheticalA | | $ 1,000.00 | $ 1,015.58 | $ 9.70 |
Telecommunications | .88% | | | |
Actual | | $ 1,000.00 | $ 1,087.70 | $ 4.63 |
HypotheticalA | | $ 1,000.00 | $ 1,020.77 | $ 4.48 |
Institutional Class | .88% | | | |
Actual | | $ 1,000.00 | $ 1,087.80 | $ 4.63 |
HypotheticalA | | $ 1,000.00 | $ 1,020.77 | $ 4.48 |
A 5% return per year before expenses
* Expenses are equal to each Class' annualized expense ratio, multiplied by the average account value over the period, multiplied by 184/365 (to reflect the one-half year period).
Semiannual Report
Telecommunications Portfolio
Investment Changes (Unaudited)
Top Ten Stocks as of August 31, 2012 |
| % of fund's
net assets | % of fund's net assets
6 months ago |
AT&T, Inc. | 21.5 | 20.4 |
Verizon Communications, Inc. | 18.1 | 13.4 |
CenturyLink, Inc. | 9.6 | 9.0 |
Sprint Nextel Corp. | 5.1 | 2.8 |
Crown Castle International Corp. | 5.0 | 6.7 |
SBA Communications Corp. Class A | 5.0 | 4.9 |
tw telecom, inc. | 3.8 | 4.4 |
Vodafone Group PLC sponsored ADR | 3.3 | 1.5 |
Telephone & Data Systems, Inc. | 2.9 | 0.0 |
General Communications, Inc. Class A | 2.6 | 2.7 |
| 76.9 | |
Top Industries (% of fund's net assets) |
As of August 31, 2012 |
 | Diversified
Telecommunication
Services | 67.3% | |
 | Wireless
Telecommunication
Services | 27.5% | |
 | Media | 1.7% | |
 | Software | 0.2% | |
 | Communications
Equipment | 0.0% | |
 | All Others* | 3.3% | |

As of February 29, 2012 |
| Diversified
Telecommunication
Services | 64.9% | |
| Wireless
Telecommunication
Services | 28.6% | |
| Media | 2.1% | |
| Software | 0.0%** | |
| Communications
Equipment | 0.0% | |
| All Others* | 4.4% | |

* Includes short-term investments and net other assets. |
** Amount represents less than 0.1%. |
Semiannual Report
Telecommunications Portfolio
Investments August 31, 2012 (Unaudited)
Showing Percentage of Net Assets
Common Stocks - 96.7% |
| Shares | | Value |
COMMUNICATIONS EQUIPMENT - 0.0% |
Communications Equipment - 0.0% |
Nortel Networks Corp. (a) | 8,071 | | $ 0 |
DIVERSIFIED TELECOMMUNICATION SERVICES - 67.3% |
Alternative Carriers - 9.2% |
Cogent Communications Group, Inc. | 438,702 | | 8,598,559 |
Level 3 Communications, Inc. (a) | 525,391 | | 11,322,176 |
tw telecom, inc. (a) | 676,457 | | 17,012,894 |
Vonage Holdings Corp. (a) | 2,164,900 | | 4,632,886 |
| | 41,566,515 |
Integrated Telecommunication Services - 58.1% |
AT&T, Inc. | 2,637,619 | | 96,642,360 |
Atlantic Tele-Network, Inc. | 154,600 | | 5,825,328 |
CenturyLink, Inc. | 1,023,184 | | 43,239,756 |
China Unicom Ltd. sponsored ADR | 288,200 | | 4,570,852 |
Frontier Communications Corp. (d) | 1,136,500 | | 5,250,630 |
General Communications, Inc. Class A (a) | 1,348,300 | | 11,892,006 |
PT Telkomunikasi Indonesia Tbk Series B | 1,388,500 | | 1,355,697 |
PT XL Axiata Tbk | 1,052,500 | | 794,758 |
Telefonica Brasil SA sponsored ADR | 205,163 | | 4,384,333 |
Verizon Communications, Inc. | 1,895,741 | | 81,403,119 |
Windstream Corp. (d) | 583,782 | | 5,761,928 |
| | 261,120,767 |
TOTAL DIVERSIFIED TELECOMMUNICATION SERVICES | | 302,687,282 |
MEDIA - 1.7% |
Cable & Satellite - 1.7% |
Time Warner Cable, Inc. | 14,800 | | 1,314,536 |
Virgin Media, Inc. (d) | 229,900 | | 6,338,343 |
| | 7,652,879 |
SOFTWARE - 0.2% |
Application Software - 0.2% |
Comverse Technology, Inc. (a) | 37 | | 222 |
Synchronoss Technologies, Inc. (a) | 29,003 | | 667,359 |
| | 667,581 |
WIRELESS TELECOMMUNICATION SERVICES - 27.5% |
Wireless Telecommunication Services - 27.5% |
Clearwire Corp. Class A (a)(d) | 4,909,636 | | 7,855,418 |
|
| Shares | | Value |
Crown Castle International Corp. (a) | 353,583 | | $ 22,438,377 |
Leap Wireless International, Inc. (a)(d) | 587,400 | | 3,213,078 |
MetroPCS Communications, Inc. (a) | 705,606 | | 6,865,546 |
Mobile TeleSystems OJSC sponsored ADR | 72,700 | | 1,338,407 |
NII Holdings, Inc. (a)(d) | 492,400 | | 3,072,576 |
NTELOS Holdings Corp. | 15,706 | | 269,672 |
NTT DoCoMo, Inc. | 2,005 | | 3,415,709 |
SBA Communications Corp. Class A (a) | 374,482 | | 22,386,534 |
Sprint Nextel Corp. (a) | 4,685,050 | | 22,722,493 |
Telephone & Data Systems, Inc. | 529,500 | | 12,983,340 |
Turkcell Iletisim Hizmet A/S (a) | 337,000 | | 2,002,265 |
Vodafone Group PLC sponsored ADR | 518,100 | | 14,983,452 |
| | 123,546,867 |
TOTAL COMMON STOCKS (Cost $425,417,388) |
434,554,609
|
Money Market Funds - 7.3% |
| | | |
Fidelity Cash Central Fund, 0.17% (b) | 8,751,193 | | 8,751,193 |
Fidelity Securities Lending Cash Central Fund, 0.18% (b)(c) | 24,229,312 | | 24,229,312 |
TOTAL MONEY MARKET FUNDS (Cost $32,980,505) |
32,980,505
|
TOTAL INVESTMENT PORTFOLIO - 104.0% (Cost $458,397,893) | | 467,535,114 |
NET OTHER ASSETS (LIABILITIES) - (4.0)% | | (18,031,829) |
NET ASSETS - 100% | $ 449,503,285 |
Legend |
(a) Non-income producing |
(b) Affiliated fund that is available only to investment companies and other accounts managed by Fidelity Investments. The rate quoted is the annualized seven-day yield of the fund at period end. A complete unaudited listing of the fund's holdings as of its most recent quarter end is available upon request. In addition, each Fidelity Central Fund's financial statements are available on the SEC's website or upon request. |
(c) Investment made with cash collateral received from securities on loan. |
(d) Security or a portion of the security is on loan at period end. |
Affiliated Central Funds |
Information regarding fiscal year to date income earned by the Fund from investments in Fidelity Central Funds is as follows: |
Fund | Income earned |
Fidelity Cash Central Fund | $ 15,085 |
Fidelity Securities Lending Cash Central Fund | 82,749 |
Total | $ 97,834 |
Other Information |
The following is a summary of the inputs used, as of August 31, 2012, involving the Fund's assets and liabilities carried at fair value. The inputs or methodology used for valuing securities may not be an indication of the risk associated with investing in those securities. For more information on valuation inputs, and their aggregation into the levels used in the table below, please refer to the Security Valuation section in the accompanying Notes to Financial Statements. |
Valuation Inputs at Reporting Date: |
Description | Total | Level 1 | Level 2 | Level 3 |
Investments in Securities: | | | | |
Common Stocks | $ 434,554,609 | $ 427,780,938 | $ 6,773,671 | $ - |
Money Market Funds | 32,980,505 | 32,980,505 | - | - |
Total Investments in Securities: | $ 467,535,114 | $ 460,761,443 | $ 6,773,671 | $ - |
See accompanying notes which are an integral part of the financial statements.
Semiannual Report
Telecommunications Portfolio
Statement of Assets and Liabilities
| August 31, 2012 (Unaudited) |
| | |
Assets | | |
Investment in securities, at value (including securities loaned of $22,849,583) - See accompanying schedule: Unaffiliated issuers (cost $425,417,388) | $ 434,554,609 | |
Fidelity Central Funds (cost $32,980,505) | 32,980,505 | |
Total Investments (cost $458,397,893) | | $ 467,535,114 |
Receivable for investments sold | | 12,122,084 |
Receivable for fund shares sold | | 402,680 |
Dividends receivable | | 52,158 |
Distributions receivable from Fidelity Central Funds | | 30,809 |
Other receivables | | 16,038 |
Total assets | | 480,158,883 |
| | |
Liabilities | | |
Payable for investments purchased | $ 4,675,422 | |
Payable for fund shares redeemed | 1,404,370 | |
Accrued management fee | 213,501 | |
Distribution and service plan fees payable | 6,800 | |
Other affiliated payables | 102,827 | |
Other payables and accrued expenses | 23,366 | |
Collateral on securities loaned, at value | 24,229,312 | |
Total liabilities | | 30,655,598 |
| | |
Net Assets | | $ 449,503,285 |
Net Assets consist of: | | |
Paid in capital | | $ 488,213,240 |
Undistributed net investment income | | 4,690,652 |
Accumulated undistributed net realized gain (loss) on investments and foreign currency transactions | | (52,535,552) |
Net unrealized appreciation (depreciation) on investments and assets and liabilities in foreign currencies | | 9,134,945 |
Net Assets | | $ 449,503,285 |
Statement of Assets and Liabilities - continued
| August 31, 2012 (Unaudited) |
| | |
Calculation of Maximum Offering Price Class A:
Net Asset Value and redemption price per share ($6,614,226 ÷ 132,242 shares) | | $ 50.02 |
| | |
Maximum offering price per share (100/94.25 of $50.02) | | $ 53.07 |
Class T:
Net Asset Value and redemption price per share ($3,875,166 ÷ 77,752 shares) | | $ 49.84 |
| | |
Maximum offering price per share (100/96.50 of $49.84) | | $ 51.65 |
Class B:
Net Asset Value and offering price per share ($745,170 ÷ 14,930 shares)A | | $ 49.91 |
| | |
Class C:
Net Asset Value and offering price per share ($3,953,828 ÷ 79,417 shares)A | | $ 49.79 |
| | |
| | |
Telecommunications:
Net Asset Value, offering price and redemption price per share ($432,830,506 ÷ 8,620,146 shares) | | $ 50.21 |
| | |
Institutional Class:
Net Asset Value, offering price and redemption price per share ($1,484,389 ÷ 29,594 shares) | | $ 50.16 |
A Redemption price per share is equal to net asset value less any applicable contingent deferred sales charge.
See accompanying notes which are an integral part of the financial statements.
Semiannual Report
Telecommunications Portfolio
Financial Statements - continued
Statement of Operations
Six months ended August 31, 2012 (Unaudited) |
| | |
Investment Income | | |
Dividends | | $ 6,349,035 |
Interest | | 72 |
Income from Fidelity Central Funds | | 97,834 |
Total income | | 6,446,941 |
| | |
Expenses | | |
Management fee | $ 1,086,051 | |
Transfer agent fees | 478,909 | |
Distribution and service plan fees | 35,821 | |
Accounting and security lending fees | 76,929 | |
Custodian fees and expenses | 6,486 | |
Independent trustees' compensation | 1,294 | |
Registration fees | 43,700 | |
Audit | 22,396 | |
Legal | 1,552 | |
Miscellaneous | 1,805 | |
Total expenses before reductions | 1,754,943 | |
Expense reductions | (15,528) | 1,739,415 |
Net investment income (loss) | | 4,707,526 |
Realized and Unrealized Gain (Loss) Net realized gain (loss) on: | | |
Investment securities: | | |
Unaffiliated issuers | 5,528,156 | |
Foreign currency transactions | (1,154) | |
Total net realized gain (loss) | | 5,527,002 |
Change in net unrealized appreciation (depreciation) on: Investment securities | 25,626,439 | |
Assets and liabilities in foreign currencies | (859) | |
Total change in net unrealized appreciation (depreciation) | | 25,625,580 |
Net gain (loss) | | 31,152,582 |
Net increase (decrease) in net assets resulting from operations | | $ 35,860,108 |
Statement of Changes in Net Assets
| Six months ended
August 31, 2012
(Unaudited) | Year ended
February 29,
2012 |
Increase (Decrease) in Net Assets | | |
Operations | | |
Net investment income (loss) | $ 4,707,526 | $ 5,541,550 |
Net realized gain (loss) | 5,527,002 | 24,725,843 |
Change in net unrealized appreciation (depreciation) | 25,625,580 | (35,725,245) |
Net increase (decrease) in net assets resulting from operations | 35,860,108 | (5,457,852) |
Distributions to shareholders from net investment income | (747,291) | (4,955,219) |
Share transactions - net increase (decrease) | 59,617,531 | (2,457,615) |
Redemption fees | 834 | 35,055 |
Total increase (decrease) in net assets | 94,731,182 | (12,835,631) |
| | |
Net Assets | | |
Beginning of period | 354,772,103 | 367,607,734 |
End of period (including undistributed net investment income of $4,690,652 and undistributed net investment income of $730,417, respectively) | $ 449,503,285 | $ 354,772,103 |
See accompanying notes which are an integral part of the financial statements.
Semiannual Report
Financial Highlights - Class A
| Six months ended
August 31, 2012 | Years ended February 28, |
| (Unaudited) | 2012 I | 2011 | 2010 | 2009 | 2008 I |
Selected Per-Share Data | | | | | | |
Net asset value, beginning of period | $ 46.12 | $ 46.93 | $ 37.64 | $ 26.66 | $ 42.56 | $ 50.89 |
Income from Investment Operations | | | | | | |
Net investment income (loss) E | .50 | .56 | .57 | .67 | .22 | .26 |
Net realized and unrealized gain (loss) | 3.48 | (.86) | 9.49 | 10.55 | (15.60) | (8.08) |
Total from investment operations | 3.98 | (.30) | 10.06 | 11.22 | (15.38) | (7.82) |
Distributions from net investment income | (.08) | (.51) | (.77) | (.19) | (.35) M | (.51) |
Distributions from net realized gain | - | - | - | (.05) | (.18) M | - |
Total distributions | (.08) | (.51) | (.77) | (.24) L | (.52) K | (.51) |
Redemption fees added to paid in capital E, J | - | - | - | - | - | - |
Net asset value, end of period | $ 50.02 | $ 46.12 | $ 46.93 | $ 37.64 | $ 26.66 | $ 42.56 |
Total Return B, C, D | 8.64% | (.54)% | 26.87% | 42.07% | (36.16)% | (15.55)% |
Ratios to Average Net Assets F, H | | | | | | |
Expenses before reductions | 1.18% A | 1.20% | 1.20% | 1.26% | 1.21% | 1.20% |
Expenses net of fee waivers, if any | 1.18% A | 1.20% | 1.20% | 1.26% | 1.21% | 1.20% |
Expenses net of all reductions | 1.17% A | 1.18% | 1.18% | 1.24% | 1.21% | 1.19% |
Net investment income (loss) | 2.13% A | 1.21% | 1.35% | 1.89% | .61% | .49% |
Supplemental Data | | | | | | |
Net assets, end of period (000 omitted) | $ 6,614 | $ 4,677 | $ 4,305 | $ 3,343 | $ 2,112 | $ 2,791 |
Portfolio turnover rate G | 42% A | 72% | 72% | 90% | 168% | 134% |
A Annualized B Total returns for periods of less than one year are not annualized. C Total returns would have been lower if certain expenses had not been reduced during the applicable periods shown. D Total returns do not include the effect of the sales charges. E Calculated based on average shares outstanding during the period. F Fees and expenses of any underlying Fidelity Central Funds are not included in the Fund's expense ratio. The Fund indirectly bears its proportionate share of the expenses of any underlying Fidelity Central Funds. G Amount does not include the portfolio activity of any underlying Fidelity Central Funds. H Expense ratios reflect operating expenses of the class. Expenses before reductions do not reflect amounts reimbursed by the investment adviser or reductions from brokerage service arrangements or reductions from other expense offset arrangements and do not represent the amount paid by the class during periods when reimbursements or reductions occur. Expenses net of fee waivers reflect expenses after reimbursement by the investment adviser but prior to reductions from brokerage service arrangements or other expense offset arrangements. Expenses net of all reductions represent the net expenses paid by the class. I For the year ended February 29. J Amount represents less than $.01 per share. K Total distributions of $.52 per share is comprised of distributions from net investment income of $.347 and distributions from net realized gain of $.175 per share. L Total distributions of $.24 per share is comprised of distributions from net investment income of $.187 and distributions from net realized gain of $.048 per share. M The amount shown reflects certain reclassifications related to book to tax differences. |
Financial Highlights - Class T
| Six months ended
August 31, 2012 | Years ended February 28, |
| (Unaudited) | 2012 I | 2011 | 2010 | 2009 | 2008 I |
Selected Per-Share Data | | | | | | |
Net asset value, beginning of period | $ 46.01 | $ 46.81 | $ 37.55 | $ 26.68 | $ 42.49 | $ 50.86 |
Income from Investment Operations | | | | | | |
Net investment income (loss) E | .43 | .42 | .45 | .57 | .12 | .12 |
Net realized and unrealized gain (loss) | 3.45 | (.84) | 9.47 | 10.54 | (15.56) | (8.07) |
Total from investment operations | 3.88 | (.42) | 9.92 | 11.11 | (15.44) | (7.95) |
Distributions from net investment income | (.05) | (.38) | (.66) | (.22) | (.24) M | (.42) |
Distributions from net realized gain | - | - | - | (.03) | (.13) M | - |
Total distributions | (.05) | (.38) | (.66) | (.24) L | (.37) K | (.42) |
Redemption fees added to paid in capital E, J | - | - | - | - | - | - |
Net asset value, end of period | $ 49.84 | $ 46.01 | $ 46.81 | $ 37.55 | $ 26.68 | $ 42.49 |
Total Return B, C, D | 8.45% | (.82)% | 26.54% | 41.64% | (36.34)% | (15.78)% |
Ratios to Average Net Assets F, H | | | | | | |
Expenses before reductions | 1.48% A | 1.49% | 1.48% | 1.55% | 1.49% | 1.46% |
Expenses net of fee waivers, if any | 1.48% A | 1.49% | 1.48% | 1.55% | 1.49% | 1.46% |
Expenses net of all reductions | 1.47% A | 1.47% | 1.46% | 1.53% | 1.48% | 1.45% |
Net investment income (loss) | 1.83% A | .92% | 1.06% | 1.60% | .33% | .23% |
Supplemental Data | | | | | | |
Net assets, end of period (000 omitted) | $ 3,875 | $ 2,702 | $ 2,882 | $ 2,051 | $ 620 | $ 1,270 |
Portfolio turnover rate G | 42% A | 72% | 72% | 90% | 168% | 134% |
A Annualized B Total returns for periods of less than one year are not annualized. C Total returns would have been lower if certain expenses had not been reduced during the applicable periods shown. D Total returns do not include the effect of the sales charges. E Calculated based on average shares outstanding during the period. F Fees and expenses of any underlying Fidelity Central Funds are not included in the Fund's expense ratio. The Fund indirectly bears its proportionate share of the expenses of any underlying Fidelity Central Funds. G Amount does not include the portfolio activity of any underlying Fidelity Central Funds. H Expense ratios reflect operating expenses of the class. Expenses before reductions do not reflect amounts reimbursed by the investment adviser or reductions from brokerage service arrangements or reductions from other expense offset arrangements and do not represent the amount paid by the class during periods when reimbursements or reductions occur. Expenses net of fee waivers reflect expenses after reimbursement by the investment adviser but prior to reductions from brokerage service arrangements or other expense offset arrangements. Expenses net of all reductions represent the net expenses paid by the class. I For the year ended February 29. J Amount represents less than $.01 per share. K Total distributions of $.37 per share is comprised of distributions from net investment income of $.244 and distributions from net realized gain of $.127 per share. L Total distributions of $.24 per share is comprised of distributions from net investment income of $.216 and distributions from net realized gain of $.028 per share. M The amount shown reflects certain reclassifications related to book to tax differences. |
See accompanying notes which are an integral part of the financial statements.
Semiannual Report
Financial Highlights - Class B
| Six months ended
August 31, 2012 | Years ended February 28, |
| (Unaudited) | 2012 I | 2011 | 2010 | 2009 | 2008 I |
Selected Per-Share Data | | | | | | |
Net asset value, beginning of period | $ 46.14 | $ 46.93 | $ 37.60 | $ 26.71 | $ 42.42 | $ 50.80 |
Income from Investment Operations | | | | | | |
Net investment income (loss) E | .33 | .21 | .25 | .40 | (.05) | (.14) |
Net realized and unrealized gain (loss) | 3.46 | (.83) | 9.48 | 10.54 | (15.49) | (8.04) |
Total from investment operations | 3.79 | (.62) | 9.73 | 10.94 | (15.54) | (8.18) |
Distributions from net investment income | (.02) | (.17) | (.40) | (.04) | (.11) M | (.20) |
Distributions from net realized gain | - | - | - | (.01) | (.06) M | - |
Total distributions | (.02) | (.17) | (.40) | (.05) L | (.17) K | (.20) |
Redemption fees added to paid in capital E, J | - | - | - | - | - | - |
Net asset value, end of period | $ 49.91 | $ 46.14 | $ 46.93 | $ 37.60 | $ 26.71 | $ 42.42 |
Total Return B, C, D | 8.22% | (1.29)% | 25.96% | 40.97% | (36.64)% | (16.18)% |
Ratios to Average Net Assets F, H | | | | | | |
Expenses before reductions | 1.93% A | 1.95% | 1.95% | 2.01% | 1.97% | 1.95% |
Expenses net of fee waivers, if any | 1.93% A | 1.95% | 1.95% | 2.01% | 1.97% | 1.95% |
Expenses net of all reductions | 1.93% A | 1.93% | 1.93% | 2.00% | 1.96% | 1.94% |
Net investment income (loss) | 1.38% A | .47% | .60% | 1.13% | (.15)% | (.26)% |
Supplemental Data | | | | | | |
Net assets, end of period (000 omitted) | $ 745 | $ 596 | $ 706 | $ 641 | $ 363 | $ 741 |
Portfolio turnover rate G | 42% A | 72% | 72% | 90% | 168% | 134% |
A Annualized B Total returns for periods of less than one year are not annualized. C Total returns would have been lower if certain expenses had not been reduced during the applicable periods shown. D Total returns do not include the effect of the contingent deferred sales charge. E Calculated based on average shares outstanding during the period. F Fees and expenses of any underlying Fidelity Central Funds are not included in the Fund's expense ratio. The Fund indirectly bears its proportionate share of the expenses of any underlying Fidelity Central Funds. G Amount does not include the portfolio activity of any underlying Fidelity Central Funds. H Expense ratios reflect operating expenses of the class. Expenses before reductions do not reflect amounts reimbursed by the investment adviser or reductions from brokerage service arrangements or reductions from other expense offset arrangements and do not represent the amount paid by the class during periods when reimbursements or reductions occur. Expenses net of fee waivers reflect expenses after reimbursement by the investment adviser but prior to reductions from brokerage service arrangements or other expense offset arrangements. Expenses net of all reductions represent the net expenses paid by the class. I For the year ended February 29. J Amount represents less than $.01 per share. K Total distributions of $.17 per share is comprised of distributions from net investment income of $.105 and distributions from net realized gain of $.063 per share. L Total distributions of $.05 per share is comprised of distributions from net investment income of $.044 and distributions from net realized gain of $.009 per share. M The amount shown reflects certain reclassifications related to book to tax differences. |
Financial Highlights - Class C
| Six months ended
August 31, 2012 | Years ended February 28, |
| (Unaudited) | 2012 I | 2011 | 2010 | 2009 | 2008 I |
Selected Per-Share Data | | | | | | |
Net asset value, beginning of period | $ 46.02 | $ 46.89 | $ 37.61 | $ 26.76 | $ 42.42 | $ 50.81 |
Income from Investment Operations | | | | | | |
Net investment income (loss) E | .33 | .22 | .26 | .41 | (.05) | (.14) |
Net realized and unrealized gain (loss) | 3.46 | (.84) | 9.46 | 10.56 | (15.50) | (8.03) |
Total from investment operations | 3.79 | (.62) | 9.72 | 10.97 | (15.55) | (8.17) |
Distributions from net investment income | (.02) | (.25) | (.44) | (.10) | (.07) M | (.22) |
Distributions from net realized gain | - | - | - | (.02) | (.05) M | - |
Total distributions | (.02) | (.25) | (.44) | (.12) L | (.11) K | (.22) |
Redemption fees added to paid in capital E, J | - | - | - | - | - | - |
Net asset value, end of period | $ 49.79 | $ 46.02 | $ 46.89 | $ 37.61 | $ 26.76 | $ 42.42 |
Total Return B, C, D | 8.24% | (1.27)% | 25.95% | 41.00% | (36.64)% | (16.17)% |
Ratios to Average Net Assets F, H | | | | | | |
Expenses before reductions | 1.91% A | 1.93% | 1.94% | 2.01% | 1.97% | 1.95% |
Expenses net of fee waivers, if any | 1.91% A | 1.93% | 1.94% | 2.01% | 1.97% | 1.95% |
Expenses net of all reductions | 1.90% A | 1.91% | 1.92% | 2.00% | 1.96% | 1.94% |
Net investment income (loss) | 1.40% A | .48% | .61% | 1.13% | (.14)% | (.26)% |
Supplemental Data | | | | | | |
Net assets, end of period (000 omitted) | $ 3,954 | $ 3,514 | $ 3,035 | $ 2,151 | $ 371 | $ 902 |
Portfolio turnover rate G | 42% A | 72% | 72% | 90% | 168% | 134% |
A Annualized B Total returns for periods of less than one year are not annualized. C Total returns would have been lower if certain expenses had not been reduced during the applicable periods shown. D Total returns do not include the effect of the contingent deferred sales charge. E Calculated based on average shares outstanding during the period. F Fees and expenses of any underlying Fidelity Central Funds are not included in the Fund's expense ratio. The Fund indirectly bears its proportionate share of the expenses of any underlying Fidelity Central Funds. G Amount does not include the portfolio activity of any underlying Fidelity Central Funds. H Expense ratios reflect operating expenses of the class. Expenses before reductions do not reflect amounts reimbursed by the investment adviser or reductions from brokerage service arrangements or reductions from other expense offset arrangements and do not represent the amount paid by the class during periods when reimbursements or reductions occur. Expenses net of fee waivers reflect expenses after reimbursement by the investment adviser but prior to reductions from brokerage service arrangements or other expense offset arrangements. Expenses net of all reductions represent the net expenses paid by the class. I For the year ended February 29. J Amount represents less than $.01 per share. K Total distributions of $.11 per share is comprised of distributions from net investment income of $.068 and distributions from net realized gain of $.046 per share. L Total distributions of $.12 per share is comprised of distributions from net investment income of $.098 and distributions from net realized gain of $.023 per share. M The amount shown reflects certain reclassifications related to book to tax differences. |
See accompanying notes which are an integral part of the financial statements.
Semiannual Report
Financial Highlights - Telecommunications
| Six months ended
August 31, 2012 | Years ended February 28, |
| (Unaudited) | 2012 H | 2011 | 2010 | 2009 | 2008 H |
Selected Per-Share Data | | | | | | |
Net asset value, beginning of period | $ 46.26 | $ 47.07 | $ 37.73 | $ 26.74 | $ 42.70 | $ 50.91 |
Income from Investment Operations | | | | | | |
Net investment income (loss) D | .58 | .70 | .69 | .76 | .30 | .43 |
Net realized and unrealized gain (loss) | 3.47 | (.86) | 9.52 | 10.59 | (15.65) | (8.12) |
Total from investment operations | 4.05 | (.16) | 10.21 | 11.35 | (15.35) | (7.69) |
Distributions from net investment income | (.10) | (.65) | (.87) | (.31) | (.41) L | (.52) |
Distributions from net realized gain | - | - | - | (.05) | (.20) L | - |
Total distributions | (.10) | (.65) | (.87) | (.36) K | (.61) J | (.52) |
Redemption fees added to paid in capital D, I | - | - | - | - | - | - |
Net asset value, end of period | $ 50.21 | $ 46.26 | $ 47.07 | $ 37.73 | $ 26.74 | $ 42.70 |
Total Return B, C | 8.77% | (.23)% | 27.24% | 42.43% | (36.00)% | (15.30)% |
Ratios to Average Net Assets E, G | | | | | | |
Expenses before reductions | .88% A | .90% | .92% | .99% | .97% | .91% |
Expenses net of fee waivers, if any | .88% A | .90% | .92% | .99% | .97% | .90% |
Expenses net of all reductions | .87% A | .88% | .91% | .98% | .96% | .90% |
Net investment income (loss) | 2.43% A | 1.52% | 1.62% | 2.15% | .85% | .79% |
Supplemental Data | | | | | | |
Net assets, end of period (000 omitted) | $ 432,831 | $ 342,262 | $ 354,938 | $ 279,704 | $ 196,231 | $ 334,565 |
Portfolio turnover rate F | 42% A | 72% | 72% | 90% | 168% | 134% |
A Annualized B Total returns for periods of less than one year are not annualized. C Total returns would have been lower if certain expenses had not been reduced during the applicable periods shown. D Calculated based on average shares outstanding during the period. E Fees and expenses of any underlying Fidelity Central Funds are not included in the Fund's expense ratio. The Fund indirectly bears its proportionate share of the expenses of any underlying Fidelity Central Funds. F Amount does not include the portfolio activity of any underlying Fidelity Central Funds. G Expense ratios reflect operating expenses of the class. Expenses before reductions do not reflect amounts reimbursed by the investment adviser or reductions from brokerage service arrangements or reductions from other expense offset arrangements and do not represent the amount paid by the class during periods when reimbursements or reductions occur. Expenses net of fee waivers reflect expenses after reimbursement by the investment adviser but prior to reductions from brokerage service arrangements or other expense offset arrangements. Expenses net of all reductions represent the net expenses paid by the class. H For the year ended February 29. I Amount represents less than $.01 per share. J Total distributions of $.61 per share is comprised of distributions from net investment income of $.408 and distributions from net realized gain of $.202 per share. K Total distributions of $.36 per share is comprised of distributions from net investment income of $.310 and distributions from net realized gain of $.048 per share. L The amount shown reflects certain reclassifications related to book to tax differences. |
Financial Highlights - Institutional Class
| Six months ended
August 31, 2012 | Years ended February 28, |
| (Unaudited) | 2012 H | 2011 | 2010 | 2009 | 2008 H |
Selected Per-Share Data | | | | | | |
Net asset value, beginning of period | $ 46.20 | $ 47.02 | $ 37.69 | $ 26.73 | $ 42.65 | $ 50.91 |
Income from Investment Operations | | | | | | |
Net investment income (loss) D | .57 | .70 | .71 | .84 | .34 | .45 |
Net realized and unrealized gain (loss) | 3.48 | (.88) | 9.50 | 10.55 | (15.67) | (8.09) |
Total from investment operations | 4.05 | (.18) | 10.21 | 11.39 | (15.33) | (7.64) |
Distributions from net investment income | (.09) | (.64) | (.88) | (.38) | (.40) L | (.62) |
Distributions from net realized gain | - | - | - | (.05) | (.20) L | - |
Total distributions | (.09) | (.64) | (.88) | (.43) K | (.59) J | (.62) |
Redemption fees added to paid in capital D, I | - | - | - | - | - | - |
Net asset value, end of period | $ 50.16 | $ 46.20 | $ 47.02 | $ 37.69 | $ 26.73 | $ 42.65 |
Total Return B, C | 8.78% | (.26)% | 27.27% | 42.59% | (35.99)% | (15.23)% |
Ratios to Average Net Assets E, G | | | | | | |
Expenses before reductions | .88% A | .89% | .91% | .86% | .91% | .83% |
Expenses net of fee waivers, if any | .88% A | .89% | .91% | .86% | .91% | .83% |
Expenses net of all reductions | .88% A | .87% | .89% | .84% | .90% | .83% |
Net investment income (loss) | 2.43% A | 1.52% | 1.64% | 2.29% | .91% | .86% |
Supplemental Data | | | | | | |
Net assets, end of period (000 omitted) | $ 1,484 | $ 1,022 | $ 1,743 | $ 1,101 | $ 68 | $ 256 |
Portfolio turnover rate F | 42% A | 72% | 72% | 90% | 168% | 134% |
A Annualized B Total returns for periods of less than one year are not annualized. C Total returns would have been lower if certain expenses had not been reduced during the applicable periods shown. D Calculated based on average shares outstanding during the period. E Fees and expenses of any underlying Fidelity Central Funds are not included in the Fund's expense ratio. The Fund indirectly bears its proportionate share of the expenses of any underlying Fidelity Central Funds. F Amount does not include the portfolio activity of any underlying Fidelity Central Funds. G Expense ratios reflect operating expenses of the class. Expenses before reductions do not reflect amounts reimbursed by the investment adviser or reductions from brokerage service arrangements or reductions from other expense offset arrangements and do not represent the amount paid by the class during periods when reimbursements or reductions occur. Expenses net of fee waivers reflect expenses after reimbursement by the investment adviser but prior to reductions from brokerage service arrangements or other expense offset arrangements. Expenses net of all reductions represent the net expenses paid by the class. H For the year ended February 29. I Amount represents less than $.01 per share. J Total distributions of $.59 per share is comprised of distributions from net investment income of $.395 and distributions from net realized gain of $.197 per share. K Total distributions of $.43 per share is comprised of distributions from net investment income of $.379 and distributions from net realized gain of $.057 per share. L The amount shown reflects certain reclassifications related to book to tax differences. |
See accompanying notes which are an integral part of the financial statements.
Semiannual Report
Notes to Financial Statements
For the period ended August 31, 2012 (Unaudited)
1. Organization.
Telecommunications Portfolio (the Fund) is a non-diversified fund of Fidelity Select Portfolios (the Trust) and is authorized to issue an unlimited number of shares. The Trust is registered under the Investment Company Act of 1940, as amended (the 1940 Act), as an open-end management investment company organized as a Massachusetts business trust. The Fund invests primarily in securities of companies whose principal business activities fall within specific industries. The Fund offers Class A, Class T, Class C, Telecommunications, and Institutional Class shares, each of which, along with Class B shares, has equal rights as to assets and voting privileges. Effective after the close of business on September 1, 2010, Class B shares were closed to new accounts and additional purchases, except for exchanges and reinvestments. Each class has exclusive voting rights with respect to matters that affect that class. Class B shares will automatically convert to Class A shares after a holding period of seven years from the initial date of purchase. Investment income, realized and unrealized capital gains and losses, the common expenses of the Fund, and certain fund-level expense reductions, if any, are allocated on a pro-rata basis to each class based on the relative net assets of each class to the total net assets of the Fund. Each class differs with respect to transfer agent and distribution and service plan fees incurred. Certain expense reductions may also differ by class. The Fund's investments in emerging markets can be subject to social, economic, regulatory, and political uncertainties and can be extremely volatile.
2. Investments in Fidelity Central Funds.
The Fund invests in Fidelity Central Funds, which are open-end investment companies available only to other investment companies and accounts managed by Fidelity Management & Research Company (FMR) and its affiliates. The Fund's Schedule of Investments lists each of the Fidelity Central Funds held as of period end, if any, as an investment of the Fund, but does not include the underlying holdings of each Fidelity Central Fund. As an Investing Fund, the Fund indirectly bears its proportionate share of the expenses of the underlying Fidelity Central Funds.
The Money Market Central Funds seek preservation of capital and current income and are managed by Fidelity Investments Money Management, Inc. (FIMM), an affiliate of FMR.
A complete unaudited list of holdings for each Fidelity Central Fund is available upon request or at the Securities and Exchange Commission (the SEC) web site at www.sec.gov. In addition, the financial statements of the Fidelity Central Funds are available on the SEC web site or upon request.
3. Significant Accounting Policies.
The financial statements have been prepared in conformity with accounting principles generally accepted in the United States of America (GAAP), which require management to make certain estimates and assumptions at the date of the financial statements. Actual results could differ from those estimates. Subsequent events, if any, through the date that the financial statements were issued have been evaluated in the preparation of the financial statements. The following summarizes the significant accounting policies of the Fund:
Security Valuation. Investments are valued as of 4:00 p.m. Eastern time on the last calendar day of the period. In accordance with valuation policies and procedures approved by the Board of Trustees (the Board), the Fund attempts to obtain prices from one or more third party pricing vendor or broker to value its investments. When current market prices, quotations or rates are not readily available or reliable, securities will be fair valued in good faith by the FMR Fair Value Committee (the Committee), in accordance with procedures adopted by the Fund's Board. Factors used in determining fair value vary by security type and may include market or security specific events. The frequency with which these procedures are used cannot be predicted and they may be utilized to a significant extent. The Committee oversees the Fund's valuation policies and procedures and is responsible for approving and reporting to the Board all fair value determinations.
The Fund categorizes the inputs to valuation techniques used to value its investments into a disclosure hierarchy consisting of three levels as shown below:
Level 1 - quoted prices in active markets for identical investments
Level 2 - other significant observable inputs (including quoted prices for similar investments, interest rates, prepayment speeds, etc.)
Level 3 - unobservable inputs (including the Fund's own assumptions based on the best information available)
Valuation techniques used to value the Fund's investments by major category are as follows:
Equity securities, including restricted securities, for which market quotations are readily available, are valued at the last reported sale price or official closing price as reported by a third party pricing vendor on the primary market or exchange on which they are traded and are categorized as Level 1 in the hierarchy. In the event there were no sales during the day or closing prices are not available, securities are valued at the last quoted bid price or may be valued using the last available price and are generally categorized as Level 2 in the hierarchy. For foreign equity securities, when significant market or security specific events arise, comparisons to the valuation of American Depositary Receipts (ADRs), futures contracts, Exchange-Traded Funds (ETFs) and certain indexes as well as quoted prices for similar securities are used and are categorized as Level 2 in the hierarchy. Utilizing these techniques may result in transfers between Level 1 and Level 2.
Semiannual Report
3. Significant Accounting Policies - continued
Security Valuation - continued
Investments in open-end mutual funds, including the Fidelity Central Funds, are valued at their closing net asset value each business day and are categorized as Level 1 in the hierarchy.
Changes in valuation techniques may result in transfers in or out of an assigned level within the disclosure hierarchy. The aggregate value of investments by input level, as of August 31, 2012 is included at the end of the Fund's Schedule of Investments.
Foreign Currency Translation. The Fund may use foreign currency contracts to facilitate transactions in foreign-denominated securities. Gains and losses from these transactions may arise from changes in the value of the foreign currency or if the counterparties do not perform under the contracts' terms.
Foreign-denominated assets, including investment securities, and liabilities are translated into U.S. dollars at the exchange rates at period end. Purchases and sales of investment securities, income and dividends received and expenses denominated in foreign currencies are translated into U.S. dollars at the exchange rate in effect on the transaction date.
The effects of exchange rate fluctuations on investments are included with the net realized and unrealized gain (loss) on investment securities. Other foreign currency transactions resulting in realized and unrealized gain (loss) are disclosed separately.
Investment Transactions and Income. For financial reporting purposes, the Fund's investment holdings and NAV include trades executed through the end of the last business day of the period. The NAV per share for processing shareholder transactions is calculated as of the close of business of the New York Stock Exchange (NYSE), normally 4:00 p.m. Eastern time and includes trades executed through the end of the prior business day. Gains and losses on securities sold are determined on the basis of identified cost and may include proceeds received from litigation. Dividend income is recorded on the ex-dividend date, except for certain dividends from foreign securities where the ex-dividend date may have passed, which are recorded as soon as the Fund is informed of the ex-dividend date. Non-cash dividends included in dividend income, if any, are recorded at the fair market value of the securities received. Distributions received on securities that represent a return of capital or capital gain are recorded as a reduction of cost of investments and/or as a realized gain. The Fund estimates the components of distributions received that may be considered return of capital distributions or capital gain distributions. Interest income and distributions from the Fidelity Central Funds are accrued as earned. Interest income includes coupon interest and amortization of premium and accretion of discount on debt securities. Investment income is recorded net of foreign taxes withheld where recovery of such taxes is uncertain.
Expenses. Expenses directly attributable to a fund are charged to that fund. Expenses attributable to more than one fund are allocated among the respective funds on the basis of relative net assets or other appropriate methods. Expense estimates are accrued in the period to which they relate and adjustments are made when actual amounts are known.
Income Tax Information and Distributions to Shareholders. Each year, the Fund intends to qualify as a regulated investment company under Subchapter M of the Internal Revenue Code, including distributing substantially all of its taxable income and realized gains. As a result, no provision for income taxes is required. The Fund files a U.S. federal tax return, in addition to state and local tax returns as required. A fund's federal income tax returns are subject to examination by the Internal Revenue Service (IRS) for a period of three fiscal years after they are filed. State and local tax returns may be subject to examination for an additional fiscal year depending on the jurisdiction. Foreign taxes are provided for based on the Fund's understanding of the tax rules and rates that exist in the foreign markets in which it invests.
Distributions are declared and recorded on the ex-dividend date. Income dividends and capital gain distributions are declared separately for each class. Income and capital gain distributions are determined in accordance with income tax regulations, which may differ from GAAP.
Capital accounts within the financial statements are adjusted for permanent book-tax differences. These adjustments have no impact on net assets or the results of operations. Temporary book-tax differences will reverse in a subsequent period.
Book-tax differences are primarily due to foreign currency transactions, deferred trustees compensation, capital loss carryforwards, expiring capital loss carryforwards, and losses deferred due to wash sales and excise tax regulations.
The federal tax cost of investment securities and unrealized appreciation (depreciation) as of period end were as follows:
Gross unrealized appreciation | $ 47,809,069 |
Gross unrealized depreciation | (47,485,236) |
Net unrealized appreciation (depreciation) on securities and other investments | $ 323,833 |
| |
Tax cost | $ 467,211,281 |
Semiannual Report
Notes to Financial Statements (Unaudited) - continued
3. Significant Accounting Policies - continued
Income Tax Information and Distributions to Shareholders - continued
Capital loss carryforwards are only available to offset future capital gains of the Fund to the extent provided by regulations and may be limited. Under the Regulated Investment Company Modernization Act of 2010 (the Act), the Fund is permitted to carry forward capital losses incurred in taxable years beginning after December 22, 2010 for an unlimited period and such capital losses are required to be used prior to any losses that expire. At Feburary 29, 2012, capital loss carryforwards were as follows:
Fiscal year of expiration | |
2017 | $ (31,682,432) |
2018 | (12,541,688) |
Total with expiration | $ (44,224,120) |
The Fund intends to elect to defer to its fiscal year ending February 28, 2013 approximately $4,371,830 of capital losses recognized during the period November 1, 2011 to February 29, 2012.
Trading (Redemption) Fees. Shares held by investors in the Fund less than 30 days are subject to a redemption fee equal to .75% of the net asset value of shares redeemed. All redemption fees, which reduce the proceeds of the shareholder redemption, are retained by the Fund and accounted for as an addition to paid in capital.
New Accounting Pronouncement. In December 2011, the Financial Accounting Standards Board issued Accounting Standard Update No. 2011-11, Disclosures about Offsetting Assets and Liabilities. The update creates new disclosure requirements requiring entities to disclose both gross and net information for derivatives and other financial instruments that are either offset in the Statement of Assets and Liabilities or subject to an enforceable master netting arrangement or similar agreement. The disclosure requirements are effective for annual reporting periods beginning on or after January 1, 2013, and interim periods within those annual periods. Management is currently evaluating the impact of the update's adoption on the Fund's financial statement disclosures.
4. Purchases and Sales of Investments.
Purchases and sales of securities other than short-term securities, aggregated $142,674,054 and $77,682,711, respectively.
5. Fees and Other Transactions with Affiliates.
Management Fee. FMR and its affiliates provide the Fund with investment management related services for which the Fund pays a monthly management fee. The management fee is the sum of an individual fund fee rate that is based on an annual rate of .30% of the Fund's average net assets and an annualized group fee rate that averaged .26% during the period. The group fee rate is based upon the average net assets of all the mutual funds advised by FMR. The group fee rate decreases as assets under management increase and increases as assets under management decrease. For the period, the total annualized management fee rate was .56% of the Fund's average net assets.
Distribution and Service Plan Fees. In accordance with Rule 12b-1 of the 1940 Act, the Fund has adopted separate Distribution and Service Plans for each class of shares. Certain classes pay Fidelity Distributors Corporation (FDC), an affiliate of FMR, separate Distribution and Service Fees, each of which is based on an annual percentage of each class' average net assets. In addition, FDC may pay financial intermediaries for selling shares of the Fund and providing shareholder support services. For the period, the Distribution and Service Fee rates, total fees and amounts retained by FDC were as follows:
| Distribution
Fee | Service
Fee | Total Fees | Retained
by FDC |
Class A | -% | .25% | $ 6,771 | $ 415 |
Class T | .25% | .25% | 7,678 | - |
Class B | .75% | .25% | 3,208 | 2,406 |
Class C | .75% | .25% | 18,164 | 4,499 |
| | | $ 35,821 | $ 7,320 |
Sales Load. FDC may receive a front-end sales charge of up to 5.75% for selling Class A shares and 3.50% for selling Class T shares, some of which is paid to financial intermediaries for selling shares of the Fund. Depending on the holding period, FDC may receive contingent deferred sales charges levied on Class A, Class T, Class B, and Class C redemptions. The deferred sales charges range from 5.00% to 1.00% for Class B shares, 1.00% for Class C shares, 1.00% for certain purchases of Class A shares and .25% for certain purchases of Class T shares.
Semiannual Report
5. Fees and Other Transactions with Affiliates - continued
Sales Load - continued
For the period, sales charge amounts retained by FDC were as follows:
| Retained
by FDC |
Class A | $ 2,179 |
Class T | 1,194 |
Class B* | 457 |
Class C* | 717 |
| $ 4,547 |
* When Class B and Class C shares are initially sold, FDC pays commissions from its own resources to financial intermediaries through which the sales are made.
Transfer Agent Fees. Fidelity Investments Institutional Operations Company, Inc. (FIIOC), an affiliate of FMR, is the transfer, dividend disbursing and shareholder servicing agent for each class of the Fund. FIIOC receives account fees and asset-based fees that vary according to the account size and type of account of the shareholders of the respective classes of the Fund. FIIOC pays for typesetting, printing and mailing of shareholder reports, except proxy statements. For the period, transfer agent fees for each class were as follows:
| Amount | % of
Average
Net Assets* |
Class A | $ 7,987 | .29 |
Class T | 5,308 | .34 |
Class B | 964 | .30 |
Class C | 5,010 | .28 |
Telecommunications | 458,358 | .24 |
Institutional Class | 1,282 | .25 |
| $ 478,909 | |
* Annualized
Accounting and Security Lending Fees. Fidelity Service Company, Inc. (FSC), an affiliate of FMR, maintains the Fund's accounting records. The accounting fee is based on the level of average net assets for each month. Under a separate contract, FSC administers the security lending program. The security lending fee is based on the number and duration of lending transactions.
Brokerage Commissions. The Fund placed a portion of its portfolio transactions with brokerage firms which are affiliates of the investment adviser. The commissions paid to these affiliated firms were $6,788 for the period.
6. Committed Line of Credit.
The Fund participates with other funds managed by FMR or an affiliate in a $4.25 billion credit facility (the "line of credit") to be utilized for temporary or emergency purposes to fund shareholder redemptions or for other short-term liquidity purposes. The Fund has agreed to pay commitment fees on its pro-rata portion of the line of credit, which amounted to $506 and is reflected in Miscellaneous expenses on the Statement of Operations. During the period, there were no borrowings on this line of credit.
7. Security Lending.
The Fund lends portfolio securities through a lending agent from time to time in order to earn additional income. For equity securities, a lending agent is used and may loan securities to certain qualified borrowers, including Fidelity Capital Markets (FCM), a broker-dealer affiliated with the Fund. On the settlement date of the loan, the Fund receives collateral (in the form of U.S. Treasury obligations, letters of credit and/or cash) against the loaned securities and maintains collateral in an amount not less than 100% of the market value of the loaned securities during the period of the loan. The market value of the loaned securities is determined at the close of business of the Fund and any additional required collateral is delivered to the Fund on the next business day. If the borrower defaults on its obligation to return the securities loaned because of insolvency or other reasons, a fund could experience delays and costs in recovering the securities loaned or in gaining access to the collateral. Any cash collateral received is invested in the Fidelity Securities Lending Cash Central Fund. The value of loaned securities and cash collateral at period end are disclosed on the Fund's Statement of Assets and Liabilities. At period end, there were no security loans outstanding with FCM. Security lending income represents the income earned on investing cash collateral, less rebates paid to borrowers and any lending agent fees associated with the loan, plus any premium payments received for
Semiannual Report
Notes to Financial Statements (Unaudited) - continued
7. Security Lending - continued
lending certain types of securities. Security lending income is presented in the Statement of Operations as a component of income from Fidelity Central Funds. Total security lending income during the period amounted to $82,749, including $350 from securities loaned to FCM.
8. Expense Reductions.
Many of the brokers with whom FMR places trades on behalf of the Fund provided services to the Fund in addition to trade execution. These services included payments of certain expenses on behalf of the Fund totaling $15,528 for the period.
9. Distributions to Shareholders.
Distributions to shareholders of each class were as follows:
| Six months ended
August 31,
2012 | Year ended
February 28,
2012 |
From net investment income | | |
Class A | $ 8,492 | $ 54,285 |
Class T | 3,143 | 24,009 |
Class B | 256 | 2,206 |
Class C | 1,681 | 19,099 |
Telecommunications | 731,839 | 4,833,836 |
Institutional Class | 1,880 | 21,784 |
Total | $ 747,291 | $ 4,955,219 |
10. Share Transactions.
Transactions for each class of shares were as follows:
| Shares | Dollars |
| Six months ended
August 31,
2012 | Year ended
February 28,
2012 | Six months ended
August 31,
2012 | Year ended
February 28,
2012 |
Class A | | | | |
Shares sold | 47,204 | 70,128 | $ 2,249,611 | $ 3,321,351 |
Reinvestment of distributions | 147 | 1,116 | 6,669 | 47,447 |
Shares redeemed | (16,505) | (61,569) | (768,026) | (2,787,444) |
Net increase (decrease) | 30,846 | 9,675 | $ 1,488,254 | $ 581,354 |
Class T | | | | |
Shares sold | 25,319 | 24,101 | $ 1,197,182 | $ 1,100,865 |
Reinvestment of distributions | 67 | 557 | 3,054 | 23,555 |
Shares redeemed | (6,360) | (27,493) | (298,541) | (1,235,915) |
Net increase (decrease) | 19,026 | (2,835) | $ 901,695 | $ (111,495) |
Class B | | | | |
Shares sold | 2,740 | 1,659 | $ 128,382 | $ 77,673 |
Reinvestment of distributions | 5 | 46 | 230 | 1,965 |
Shares redeemed | (725) | (3,832) | (33,945) | (176,016) |
Net increase (decrease) | 2,020 | (2,127) | $ 94,667 | $ (96,378) |
Class C | | | | |
Shares sold | 11,345 | 30,950 | $ 534,730 | $ 1,412,876 |
Reinvestment of distributions | 26 | 313 | 1,164 | 13,236 |
Shares redeemed | (8,303) | (19,633) | (390,501) | (879,199) |
Net increase (decrease) | 3,068 | 11,630 | $ 145,393 | $ 546,913 |
Telecommunications | | | | |
Shares sold | 2,633,330 | 3,856,487 | $ 124,473,339 | $ 180,498,933 |
Reinvestment of distributions | 15,557 | 108,713 | 709,072 | 4,652,114 |
Shares redeemed | (1,428,047) | (4,106,690) | (68,578,164) | (188,141,891) |
Net increase (decrease) | 1,220,840 | (141,490) | $ 56,604,247 | $ (2,990,844) |
Semiannual Report
10. Share Transactions - continued
| Shares | Dollars |
| Six months ended
August 31,
2012 | Year ended
February 28,
2012 | Six months ended
August 31,
2012 | Year ended
February 28,
2012 |
Institutional Class | | | | |
Shares sold | 12,743 | 107,857 | $ 633,322 | $ 5,158,491 |
Reinvestment of distributions | 27 | 401 | 1,228 | 17,134 |
Shares redeemed | (5,304) | (123,190) | (251,275) | (5,562,790) |
Net increase (decrease) | 7,466 | (14,932) | $ 383,275 | $ (387,165) |
11. Other.
The Fund's organizational documents provide former and current trustees and officers with a limited indemnification against liabilities arising in connection with the performance of their duties to the Fund. In the normal course of business, the Fund may also enter into contracts that provide general indemnifications. The Fund's maximum exposure under these arrangements is unknown as this would be dependent on future claims that may be made against the Fund. The risk of material loss from such claims is considered remote.
At the end of the period, Fidelity VIP Funds Manager 60% Portfolio was the owner of record of approximately 18% of the total outstanding shares of the fund. In addition, Strategic Advisers U.S. Opportunity Fund was the owner of record of approximately 11% of the total outstanding shares of the fund. Mutual funds managed by FMR or its affiliates were the owners of record, in the aggregate, of approximately 35% of the total outstanding shares of Telecommunications.
Semiannual Report
Wireless Portfolio
As a shareholder of the Fund, you incur two types of costs: (1) transaction costs, including redemption fees and (2) ongoing costs, including management fees and other Fund expenses. This Example is intended to help you understand your ongoing costs (in dollars) of investing in the Fund and to compare these costs with the ongoing costs of investing in other mutual funds.
The Example is based on an investment of $1,000 invested at the beginning of the period and held for the entire period (March 1, 2012 to August 31, 2012).
Actual Expenses
The first line of the accompanying table provides information about actual account values and actual expenses. You may use the information in this line, together with the amount you invested, to estimate the expenses that you paid over the period. Simply divide your account value by $1,000.00 (for example, an $8,600 account value divided by $1,000.00 = 8.6), then multiply the result by the number in the first line under the heading entitled "Expenses Paid During Period" to estimate the expenses you paid on your account during this period. A small balance maintenance fee of $12.00 that is charged once a year may apply for certain accounts with a value of less than $2,000. This fee is not included in the table below. If it was, the estimate of expenses you paid during the period would be higher, and your ending account value lower, by this amount. In addition, the Fund, as a shareholder in the underlying Fidelity Central Funds, will indirectly bear its pro-rata share of the fees and expenses incurred by the underlying Fidelity Central Funds. These fees and expenses are not included in the Fund's annualized expense ratio used to calculate the expense estimate in the table below.
Hypothetical Example for Comparison Purposes
The second line of the accompanying table provides information about hypothetical account values and hypothetical expenses based on the Fund's actual expense ratio and an assumed rate of return of 5% per year before expenses, which is not the Fund's actual return. The hypothetical account values and expenses may not be used to estimate the actual ending account balance or expenses you paid for the period. You may use this information to compare the ongoing costs of investing in the Fund and other funds. To do so, compare this 5% hypothetical example with the 5% hypothetical examples that appear in the shareholder reports of the other funds. A small balance maintenance fee of $12.00 that is charged once a year may apply for certain accounts with a value of less than $2,000. This fee is not included in the table below. If it was, the estimate of expenses you paid during the period would be higher, and your ending account value lower, by this amount. In addition, the Fund, as a shareholder in the underlying Fidelity Central Funds, will indirectly bear its pro-rata share of the fees and expenses incurred by the underlying Fidelity Central Funds. These fees and expenses are not included in the Fund's annualized expense ratio used to calculate the expense estimate in the table below.
Please note that the expenses shown in the table are meant to highlight your ongoing costs only and do not reflect any transaction costs. Therefore, the second line of the table is useful in comparing ongoing costs only, and will not help you determine the relative total costs of owning different funds. In addition, if these transactional costs were included, your costs would have been higher.
| Annualized
Expense Ratio | Beginning
Account Value
March 1, 2012 | Ending
Account Value
August 31, 2012 | Expenses Paid
During Period*
March 1, 2012
to August 31, 2012 |
Actual | .90% | $ 1,000.00 | $ 1,031.30 | $ 4.61 |
Hypothetical (5% return per year before expenses) | | $ 1,000.00 | $ 1,020.67 | $ 4.58 |
* Expenses are equal to the Fund's annualized expense ratio, multiplied by the average account value over the period, multiplied by 184/365 (to reflect the one-half year period).
Semiannual Report
Wireless Portfolio
Investment Changes (Unaudited)
Top Ten Stocks as of August 31, 2012 |
| % of fund's
net assets | % of fund's net assets
6 months ago |
Vodafone Group PLC sponsored ADR | 13.9 | 14.9 |
QUALCOMM, Inc. | 8.7 | 11.4 |
AT&T, Inc. | 5.6 | 0.0 |
Sprint Nextel Corp. | 4.7 | 1.9 |
Verizon Communications, Inc. | 4.6 | 3.7 |
American Tower Corp. | 4.5 | 4.8 |
China Mobile Ltd. sponsored ADR | 3.8 | 5.0 |
SBA Communications Corp. Class A | 3.8 | 3.9 |
Motorola Solutions, Inc. | 3.8 | 5.1 |
Telefonaktiebolaget LM Ericsson (B Shares) sponsored ADR | 3.4 | 2.5 |
| 56.8 | |
Top Industries (% of fund's net assets) |
As of August 31, 2012 |
| Wireless
Telecommunication
Services | 39.8% | |
| Communications
Equipment | 25.3% | |
| Diversified
Telecommunication
Services | 15.0% | |
| Real Estate Investment
Trusts | 4.5% | |
 | Software | 2.8% | |
| All Others* | 12.6% | |

As of February 29, 2012 |
| Wireless
Telecommunication Services | 41.3% | |
| Communications
Equipment | 27.4% | |
| Diversified
Telecommunication
Services | 10.4% | |
| Real Estate Investment
Trusts | 4.8% | |
| Computers &
Peripherals | 3.6% | |
| All Others* | 12.5% | |

* Includes short-term investments and net other assets. |
Semiannual Report
Wireless Portfolio
Investments August 31, 2012 (Unaudited)
Showing Percentage of Net Assets
Common Stocks - 97.9% |
| Shares | | Value |
AEROSPACE & DEFENSE - 0.5% |
Aerospace & Defense - 0.5% |
Kratos Defense & Security Solutions, Inc. (a)(d) | 273,300 | | $ 1,306,374 |
COMMUNICATIONS EQUIPMENT - 25.3% |
Communications Equipment - 25.3% |
Acme Packet, Inc. (a) | 56,000 | | 1,069,040 |
Aruba Networks, Inc. (a)(d) | 206,484 | | 4,057,411 |
Globecomm Systems, Inc. (a) | 8,700 | | 103,617 |
Harris Corp. | 105,000 | | 4,938,150 |
InterDigital, Inc. (d) | 70,500 | | 2,379,375 |
Motorola Solutions, Inc. | 192,868 | | 9,192,089 |
Nokia Corp. sponsored ADR (d) | 1,150,200 | | 3,243,564 |
Polycom, Inc. (a) | 129,200 | | 1,346,264 |
QUALCOMM, Inc. | 344,750 | | 21,188,335 |
Research In Motion Ltd. (a)(d) | 355,600 | | 2,378,965 |
Telefonaktiebolaget LM Ericsson (B Shares) sponsored ADR (d) | 890,800 | | 8,284,440 |
Ubiquiti Networks, Inc. | 18,100 | | 217,562 |
ViaSat, Inc. (a) | 82,000 | | 3,173,400 |
| | 61,572,212 |
COMPUTERS & PERIPHERALS - 2.4% |
Computer Hardware - 2.4% |
Apple, Inc. | 8,900 | | 5,920,636 |
DIVERSIFIED TELECOMMUNICATION SERVICES - 15.0% |
Alternative Carriers - 0.1% |
Iliad SA | 81 | | 12,837 |
Level 3 Communications, Inc. (a) | 15,000 | | 323,250 |
| | 336,087 |
Integrated Telecommunication Services - 14.9% |
AT&T, Inc. | 375,600 | | 13,761,984 |
China Unicom Ltd. sponsored ADR (d) | 402,100 | | 6,377,306 |
Nippon Telegraph & Telephone Corp. | 100 | | 4,637 |
Telefonica SA sponsored ADR (d) | 403,411 | | 5,066,842 |
Verizon Communications, Inc. | 259,200 | | 11,130,048 |
| | 36,340,817 |
TOTAL DIVERSIFIED TELECOMMUNICATION SERVICES | | 36,676,904 |
ELECTRONIC EQUIPMENT & COMPONENTS - 0.1% |
Electronic Manufacturing Services - 0.1% |
Uni-Pixel Inc. (a) | 33,300 | | 200,799 |
INTERNET SOFTWARE & SERVICES - 2.6% |
Internet Software & Services - 2.6% |
Baidu.com, Inc. sponsored ADR (a) | 6,100 | | 679,784 |
|
| Shares | | Value |
Google, Inc. Class A (a) | 6,600 | | $ 4,521,594 |
Web.com Group, Inc. (a) | 74,200 | | 1,235,430 |
| | 6,436,808 |
IT SERVICES - 0.8% |
Data Processing & Outsourced Services - 0.0% |
NeuStar, Inc. Class A (a) | 400 | | 15,028 |
IT Consulting & Other Services - 0.8% |
Cognizant Technology Solutions Corp. Class A (a) | 28,600 | | 1,838,408 |
TOTAL IT SERVICES | | 1,853,436 |
MEDIA - 1.9% |
Cable & Satellite - 1.9% |
DISH Network Corp. Class A | 28,100 | | 898,919 |
Virgin Media, Inc. (d) | 131,150 | | 3,615,806 |
| | 4,514,725 |
REAL ESTATE INVESTMENT TRUSTS - 4.5% |
Specialized REITs - 4.5% |
American Tower Corp. | 155,692 | | 10,960,717 |
SEMICONDUCTORS & SEMICONDUCTOR EQUIPMENT - 2.2% |
Semiconductors - 2.2% |
Analog Devices, Inc. | 7,500 | | 298,050 |
Freescale Semiconductor Holdings I Ltd. (a) | 75,900 | | 759,759 |
NVIDIA Corp. (a) | 550 | | 7,717 |
NXP Semiconductors NV (a) | 48,900 | | 1,140,348 |
RF Micro Devices, Inc. (a) | 845,200 | | 3,169,500 |
| | 5,375,374 |
SOFTWARE - 2.8% |
Application Software - 2.8% |
AsiaInfo-Linkage, Inc. (a) | 54,750 | | 657,000 |
BroadSoft, Inc. (a)(d) | 15,000 | | 543,150 |
Comverse Technology, Inc. (a) | 421,685 | | 2,530,110 |
Gameloft (a) | 386,162 | | 2,292,573 |
Synchronoss Technologies, Inc. (a) | 34,750 | | 799,598 |
| | 6,822,431 |
WIRELESS TELECOMMUNICATION SERVICES - 39.8% |
Wireless Telecommunication Services - 39.8% |
Boingo Wireless, Inc. (a) | 250 | | 1,828 |
China Mobile Ltd. sponsored ADR | 174,400 | | 9,363,536 |
Clearwire Corp. Class A (a)(d) | 1,494,700 | | 2,391,520 |
Crown Castle International Corp. (a) | 122,500 | | 7,773,850 |
Leap Wireless International, Inc. (a)(d) | 268,950 | | 1,471,157 |
MetroPCS Communications, Inc. (a) | 550,650 | | 5,357,825 |
NII Holdings, Inc. (a)(d) | 412,500 | | 2,574,000 |
NTELOS Holdings Corp. | 31,775 | | 545,577 |
NTT DoCoMo, Inc. sponsored ADR (d) | 249,200 | | 4,241,384 |
Rogers Communications, Inc. Class B (non-vtg.) (d) | 131,900 | | 5,321,494 |
SBA Communications Corp. Class A (a) | 153,900 | | 9,200,142 |
Common Stocks - continued |
| Shares | | Value |
WIRELESS TELECOMMUNICATION SERVICES - CONTINUED |
Wireless Telecommunication Services - continued |
Sprint Nextel Corp. (a) | 2,346,031 | | $ 11,378,250 |
Telephone & Data Systems, Inc. | 90,614 | | 2,221,855 |
U.S. Cellular Corp. (a) | 20,000 | | 759,000 |
USA Mobility, Inc. | 36,400 | | 415,324 |
Vodafone Group PLC sponsored ADR | 1,173,900 | | 33,949,184 |
| | 96,965,926 |
TOTAL COMMON STOCKS (Cost $217,346,894) |
238,606,342
|
Money Market Funds - 14.9% |
| | | |
Fidelity Cash Central Fund, 0.17% (b) | 6,391,444 | | 6,391,444 |
Fidelity Securities Lending Cash Central Fund, 0.18% (b)(c) | 29,931,574 | | 29,931,574 |
TOTAL MONEY MARKET FUNDS (Cost $36,323,018) |
36,323,018
|
TOTAL INVESTMENT PORTFOLIO - 112.8% (Cost $253,669,912) | | 274,929,360 |
NET OTHER ASSETS (LIABILITIES) - (12.8)% | | (31,217,024) |
NET ASSETS - 100% | $ 243,712,336 |
Legend |
(a) Non-income producing |
(b) Affiliated fund that is available only to investment companies and other accounts managed by Fidelity Investments. The rate quoted is the annualized seven-day yield of the fund at period end. A complete unaudited listing of the fund's holdings as of its most recent quarter end is available upon request. In addition, each Fidelity Central Fund's financial statements are available on the SEC's website or upon request. |
(c) Investment made with cash collateral received from securities on loan. |
(d) Security or a portion of the security is on loan at period end. |
Affiliated Central Funds |
Information regarding fiscal year to date income earned by the Fund from investments in Fidelity Central Funds is as follows: |
Fund | Income earned |
Fidelity Cash Central Fund | $ 2,382 |
Fidelity Securities Lending Cash Central Fund | 95,505 |
Total | $ 97,887 |
Other Information |
The following is a summary of the inputs used, as of August 31, 2012, involving the Fund's assets and liabilities carried at fair value. The inputs or methodology used for valuing securities may not be an indication of the risk associated with investing in those securities. For more information on valuation inputs, and their aggregation into the levels used in the table below, please refer to the Security Valuation section in the accompanying Notes to Financial Statements. |
Valuation Inputs at Reporting Date: |
Description | Total | Level 1 | Level 2 | Level 3 |
Investments in Securities: | | | | |
Common Stocks | $ 238,606,342 | $ 238,601,705 | $ 4,637 | $ - |
Money Market Funds | 36,323,018 | 36,323,018 | - | - |
Total Investments in Securities: | $ 274,929,360 | $ 274,924,723 | $ 4,637 | $ - |
Distribution of investments by country or territory of incorporation, as a percentage of total net assets, is as follows. (Unaudited) |
United States of America | 65.9% |
United Kingdom | 13.9% |
Hong Kong | 6.4% |
Sweden | 3.4% |
Canada | 3.2% |
Spain | 2.1% |
Japan | 1.7% |
Finland | 1.3% |
France | 1.0% |
Others (Individually Less Than 1%) | 1.1% |
| 100.0% |
See accompanying notes which are an integral part of the financial statements.
Semiannual Report
Wireless Portfolio
Statement of Assets and Liabilities
| August 31, 2012 (Unaudited) |
| | |
Assets | | |
Investment in securities, at value (including securities loaned of $28,794,457) - See accompanying schedule: Unaffiliated issuers (cost $217,346,894) | $ 238,606,342 | |
Fidelity Central Funds (cost $36,323,018) | 36,323,018 | |
Total Investments (cost $253,669,912) | | $ 274,929,360 |
Receivable for fund shares sold | | 134,192 |
Dividends receivable | | 22,843 |
Distributions receivable from Fidelity Central Funds | | 16,625 |
Other receivables | | 21,893 |
Total assets | | 275,124,913 |
| | |
Liabilities | | |
Payable for investments purchased | $ 1,139,315 | |
Payable for fund shares redeemed | 144,254 | |
Accrued management fee | 113,376 | |
Other affiliated payables | 60,496 | |
Other payables and accrued expenses | 23,562 | |
Collateral on securities loaned, at value | 29,931,574 | |
Total liabilities | | 31,412,577 |
| | |
Net Assets | | $ 243,712,336 |
Net Assets consist of: | | |
Paid in capital | | $ 240,669,834 |
Undistributed net investment income | | 2,044,669 |
Accumulated undistributed net realized gain (loss) on investments and foreign currency transactions | | (20,254,390) |
Net unrealized appreciation (depreciation) on investments and assets and liabilities in foreign currencies | | 21,252,223 |
Net Assets, for 30,756,504 shares outstanding | | $ 243,712,336 |
Net Asset Value, offering price and redemption price per share ($243,712,336 ÷ 30,756,504 shares) | | $ 7.92 |
Statement of Operations
Six months ended August 31, 2012 (Unaudited) |
| | |
Investment Income | | |
Dividends | | $ 3,252,906 |
Interest | | 13 |
Income from Fidelity Central Funds | | 97,887 |
Total income | | 3,350,806 |
| | |
Expenses | | |
Management fee | $ 676,117 | |
Transfer agent fees | 325,874 | |
Accounting and security lending fees | 49,876 | |
Custodian fees and expenses | 11,616 | |
Independent trustees' compensation | 822 | |
Registration fees | 13,164 | |
Audit | 17,056 | |
Legal | 503 | |
Miscellaneous | 1,237 | |
Total expenses before reductions | 1,096,265 | |
Expense reductions | (6,888) | 1,089,377 |
Net investment income (loss) | | 2,261,429 |
Realized and Unrealized Gain (Loss) Net realized gain (loss) on: | | |
Investment securities: | | |
Unaffiliated issuers | (2,235,039) | |
Foreign currency transactions | (6,462) | |
Total net realized gain (loss) | | (2,241,501) |
Change in net unrealized appreciation (depreciation) on: Investment securities | 6,789,934 | |
Assets and liabilities in foreign currencies | (3,172) | |
Total change in net unrealized appreciation (depreciation) | | 6,786,762 |
Net gain (loss) | | 4,545,261 |
Net increase (decrease) in net assets resulting from operations | | $ 6,806,690 |
See accompanying notes which are an integral part of the financial statements.
Semiannual Report
Statement of Changes in Net Assets
| Six months ended
August 31, 2012
(Unaudited) | Year ended
February 29,
2012 |
Increase (Decrease) in Net Assets | | |
Operations | | |
Net investment income (loss) | $ 2,261,429 | $ 3,593,386 |
Net realized gain (loss) | (2,241,501) | 7,882,810 |
Change in net unrealized appreciation (depreciation) | 6,786,762 | (21,251,144) |
Net increase (decrease) in net assets resulting from operations | 6,806,690 | (9,774,948) |
Distributions to shareholders from net investment income | - | (2,771,729) |
Distributions to shareholders from net realized gain | - | (10,255,385) |
Total distributions | - | (13,027,114) |
Share transactions
Proceeds from sales of shares | 17,503,442 | 59,170,659 |
Reinvestment of distributions | - | 12,540,423 |
Cost of shares redeemed | (43,297,362) | (147,309,703) |
Net increase (decrease) in net assets resulting from share transactions | (25,793,920) | (75,598,621) |
Redemption fees | 4,061 | 14,005 |
Total increase (decrease) in net assets | (18,983,169) | (98,386,678) |
| | |
Net Assets | | |
Beginning of period | 262,695,505 | 361,082,183 |
End of period (including undistributed net investment income of $2,044,669 and distributions in excess of net investment income of $216,760, respectively) | $ 243,712,336 | $ 262,695,505 |
Other Information Shares | | |
Sold | 2,279,342 | 7,641,356 |
Issued in reinvestment of distributions | - | 1,729,713 |
Redeemed | (5,729,668) | (18,743,667) |
Net increase (decrease) | (3,450,326) | (9,372,598) |
Financial Highlights
| Six months ended
August 31, 2012 | Years ended February 28, |
| (Unaudited) | 2012 J | 2011 | 2010 | 2009 | 2008 J |
Selected Per-Share Data | | | | | | |
Net asset value, beginning of period | $ 7.68 | $ 8.29 | $ 6.47 | $ 4.44 | $ 7.23 | $ 7.13 |
Income from Investment Operations | | | | | | |
Net investment income (loss) D | .07 | .10 G | .08 | .06 | .05 | .03 H |
Net realized and unrealized gain (loss) | .17 | (.33) | 1.82 | 2.03 | (2.78) | .36 |
Total from investment operations | .24 | (.23) | 1.90 | 2.09 | (2.73) | .39 |
Distributions from net investment income | - | (.08) | (.08) | (.06) | (.06) | (.03) |
Distributions from net realized gain | - | (.30) | - | - | - | (.26) |
Total distributions | - | (.38) | (.08) | (.06) | (.06) | (.29) |
Redemption fees added to paid in capital D, K | - | - | - | - | - | - |
Net asset value, end of period | $ 7.92 | $ 7.68 | $ 8.29 | $ 6.47 | $ 4.44 | $ 7.23 |
Total Return B, C | 3.13% | (2.55)% | 29.55% | 47.06% | (37.68)% | 4.71% |
Ratios to Average Net Assets E, I | | | | | | |
Expenses before reductions | .90% A | .90% | .92% | .96% | .95% | .91% |
Expenses net of fee waivers, if any | .90% A | .90% | .92% | .96% | .95% | .91% |
Expenses net of all reductions | .90% A | .89% | .91% | .94% | .94% | .91% |
Net investment income (loss) | 1.86% A | 1.23% G | 1.08% | .90% | .85% | .32% H |
Supplemental Data | | | | | | |
Net assets, end of period (000 omitted) | $ 243,712 | $ 262,696 | $ 361,082 | $ 304,896 | $ 181,114 | $ 434,916 |
Portfolio turnover rate F | 122% A | 114% | 111% | 154% | 191% | 191% |
A Annualized B Total returns for periods of less than one year are not annualized. C Total returns would have been lower if certain expenses had not been reduced during the applicable periods shown. D Calculated based on average shares outstanding during the period. E Fees and expenses of any underlying Fidelity Central Funds are not included in the Fund's expense ratio. The Fund indirectly bears its proportionate share of the expenses of any underlying Fidelity Central Funds. F Amount does not include the portfolio activity of any underlying Fidelity Central Funds. G Investment income per share reflects a large, non-recurring dividend which amounted to $.03 per share. Excluding this non-recurring dividend, the ratio of net investment income (loss) to average net assets would have been .90%. H Investment income per share reflects a large, non-recurring dividend which amounted to $.01 per share. Excluding this non-recurring dividend, the ratio of net investment income (loss) to average net assets would have been .19%. I Expense ratios reflect operating expenses of the Fund. Expenses before reductions do not reflect amounts reimbursed by the investment adviser or reductions from brokerage service arrangements or reductions from other expense offset arrangements and do not represent the amount paid by the Fund during periods when reimbursements or reductions occur. Expenses net of fee waivers reflect expenses after reimbursement by the investment adviser but prior to reductions from brokerage service arrangements or other expense offset arrangements. Expenses net of all reductions represent the net expenses paid by the Fund. J For the year ended February 29. K Amount represents less than $.01 per share. |
See accompanying notes which are an integral part of the financial statements.
Semiannual Report
Notes to Financial Statements
For the period ended August 31, 2012 (Unaudited)
1. Organization.
Wireless Portfolio (the Fund) is a non-diversified fund of Fidelity Select Portfolios (the Trust) and is authorized to issue an unlimited number of shares. The Trust is registered under the Investment Company Act of 1940, as amended (the 1940 Act), as an open-end management investment company organized as a Massachusetts business trust. The Fund invests primarily in securities of companies whose principal business activities fall within specific industries. The Fund's investments in emerging markets can be subject to social, economic, regulatory, and political uncertainties and can be extremely volatile.
2. Investments in Fidelity Central Funds.
The Fund invests in Fidelity Central Funds, which are open-end investment companies available only to other investment companies and accounts managed by Fidelity Management & Research Company (FMR) and its affiliates. The Fund's Schedule of Investments lists each of the Fidelity Central Funds held as of period end, if any, as an investment of the Fund, but does not include the underlying holdings of each Fidelity Central Fund. As an Investing Fund, the Fund indirectly bears its proportionate share of the expenses of the underlying Fidelity Central Funds.
The Money Market Central Funds seek preservation of capital and current income and are managed by Fidelity Investments Money Management, Inc. (FIMM), an affiliate of FMR.
A complete unaudited list of holdings for each Fidelity Central Fund is available upon request or at the Securities and Exchange Commission (the SEC) web site at www.sec.gov. In addition, the financial statements of the Fidelity Central Funds are available on the SEC web site or upon request.
3. Significant Accounting Policies.
The financial statements have been prepared in conformity with accounting principles generally accepted in the United States of America (GAAP), which require management to make certain estimates and assumptions at the date of the financial statements. Actual results could differ from those estimates. Subsequent events, if any, through the date that the financial statements were issued have been evaluated in the preparation of the financial statements. The following summarizes the significant accounting policies of the Fund:
Security Valuation. Investments are valued as of 4:00 p.m. Eastern time on the last calendar day of the period. In accordance with valuation policies and procedures approved by the Board of Trustees (the Board), the Fund attempts to obtain prices from one or more third party pricing vendor or broker to value its investments. When current market prices, quotations or rates are not readily available or reliable, securities will be fair valued in good faith by the FMR Fair Value Committee (the Committee), in accordance with procedures adopted by the Fund's Board. Factors used in determining fair value vary by security type and may include market or security specific events. The frequency with which these procedures are used cannot be predicted and they may be utilized to a significant extent. The Committee oversees the Fund's valuation policies and procedures and is responsible for approving and reporting to the Board all fair value determinations.
The Fund categorizes the inputs to valuation techniques used to value its investments into a disclosure hierarchy consisting of three levels as shown below:
Level 1 - quoted prices in active markets for identical investments
Level 2 - other significant observable inputs (including quoted prices for similar investments, interest rates, prepayment speeds, etc.)
Level 3 - unobservable inputs (including the Fund's own assumptions based on the best information available)
Valuation techniques used to value the Fund's investments by major category are as follows:
Equity securities, including restricted securities, for which market quotations are readily available, are valued at the last reported sale price or official closing price as reported by a third party pricing vendor on the primary market or exchange on which they are traded and are categorized as Level 1 in the hierarchy. In the event there were no sales during the day or closing prices are not available, securities are valued at the last quoted bid price or may be valued using the last available price and are generally categorized as Level 2 in the hierarchy. For foreign equity securities, when significant market or security specific events arise, comparisons to the valuation of American Depositary Receipts (ADRs), futures contracts, Exchange-Traded Funds (ETFs) and certain indexes as well as quoted prices for similar securities are used and are categorized as Level 2 in the hierarchy. Utilizing these techniques may result in transfers between Level 1 and Level 2.
Investments in open-end mutual funds,including the Fidelity Central Funds, are valued at their closing net asset value each business day and are categorized as Level 1 in the hierarchy.
Changes in valuation techniques may result in transfers in or out of an assigned level within the disclosure hierarchy. The aggregate value of investments by input level, as of August 31, 2012, is included at the end of the Fund's Schedule of Investments.
Semiannual Report
3. Significant Accounting Policies - continued
Foreign Currency Translation. The Fund may use foreign currency contracts to facilitate transactions in foreign-denominated securities. Gains and losses from these transactions may arise from changes in the value of the foreign currency or if the counterparties do not perform under the contracts' terms.
Foreign-denominated assets, including investment securities, and liabilities are translated into U.S. dollars at the exchange rates at period end. Purchases and sales of investment securities, income and dividends received and expenses denominated in foreign currencies are translated into U.S. dollars at the exchange rate in effect on the transaction date.
The effects of exchange rate fluctuations on investments are included with the net realized and unrealized gain (loss) on investment securities. Other foreign currency transactions resulting in realized and unrealized gain (loss) are disclosed separately.
Investment Transactions and Income. For financial reporting purposes, the Fund's investment holdings and NAV include trades executed through the end of the last business day of the period. The NAV per share for processing shareholder transactions is calculated as of the close of business of the New York Stock Exchange (NYSE), normally 4:00 p.m. Eastern time and includes trades executed through the end of the prior business day. Gains and losses on securities sold are determined on the basis of identified cost and may include proceeds received from litigation. Dividend income is recorded on the ex-dividend date, except for certain dividends from foreign securities where the ex-dividend date may have passed, which are recorded as soon as the Fund is informed of the ex-dividend date. Non-cash dividends included in dividend income, if any, are recorded at the fair market value of the securities received. Distributions received on securities that represent a return of capital or capital gain are recorded as a reduction of cost of investments and/or as a realized gain. The Fund estimates the components of distributions received that may be considered return of capital distributions or capital gain distributions. Interest income and distributions from the Fidelity Central Funds are accrued as earned. Interest income includes coupon interest and amortization of premium and accretion of discount on debt securities. Investment income is recorded net of foreign taxes withheld where recovery of such taxes is uncertain.
Expenses. Expenses directly attributable to a fund are charged to that fund. Expenses attributable to more than one fund are allocated among the respective funds on the basis of relative net assets or other appropriate methods. Expense estimates are accrued in the period to which they relate and adjustments are made when actual amounts are known.
Income Tax Information and Distributions to Shareholders. Each year, the Fund intends to qualify as a regulated investment company under Subchapter M of the Internal Revenue Code, including distributing substantially all of its taxable income and realized gains. As a result, no provision for income taxes is required. The Fund files a U.S. federal tax return, in addition to state and local tax returns as required. A fund's federal income tax returns are subject to examination by the Internal Revenue Service (IRS) for a period of three fiscal years after they are filed. State and local tax returns may be subject to examination for an additional fiscal year depending on the jurisdiction. Foreign taxes are provided for based on the Fund's understanding of the tax rules and rates that exist in the foreign markets in which it invests.
Distributions are declared and recorded on the ex-dividend date. Income and capital gain distributions are determined in accordance with income tax regulations, which may differ from GAAP.
Capital accounts within the financial statements are adjusted for permanent book-tax differences. These adjustments have no impact on net assets or the results of operations. Temporary book-tax differences will reverse in a subsequent period.
Book-tax differences are primarily due to foreign currency transactions, capital loss carryforwards and losses deferred due to wash sales and excise tax regulations.
The federal tax cost of investment securities and unrealized appreciation (depreciation) as of period end were as follows:
Gross unrealized appreciation | $ 37,422,251 |
Gross unrealized depreciation | (24,714,052) |
Net unrealized appreciation (depreciation) on securities and other investments | $ 12,708,199 |
| |
Tax cost | $ 262,221,161 |
The Fund intends to elect to defer to its fiscal year ending February 28, 2013 approximately $7,781,036 of capital losses recognized during the period November 1, 2011 to February 29, 2012.
Trading (Redemption) Fees. Shares held by investors in the Fund less than 30 days are subject to a redemption fee equal to .75% of the net asset value of shares redeemed. All redemption fees, which reduce the proceeds of the shareholder redemption, are retained by the Fund and accounted for as an addition to paid in capital.
Semiannual Report
Notes to Financial Statements (Unaudited) - continued
3. Significant Accounting Policies - continued
New Accounting Pronouncement. In December 2011, the Financial Accounting Standards Board issued Accounting Standard Update No. 2011-11, Disclosures about Offsetting Assets and Liabilities. The update creates new disclosure requirements requiring entities to disclose both gross and net information for derivatives and other financial instruments that are either offset in the Statement of Assets and Liabilities or subject to an enforceable master netting arrangement or similar agreement. The disclosure requirements are effective for annual reporting periods beginning on or after January 1, 2013, and interim periods within those annual periods. Management is currently evaluating the impact of the update's adoption on the Fund's financial statement disclosures.
4. Purchases and Sales of Investments.
Purchases and sales of securities, other than short-term securities, aggregated $146,653,327 and $167,768,707, respectively.
5. Fees and Other Transactions with Affiliates.
Management Fee. FMR and its affiliates provide the Fund with investment management related services for which the Fund pays a monthly management fee. The management fee is the sum of an individual fund fee rate that is based on an annual rate of .30% of the Fund's average net assets and an annualized group fee rate that averaged .26% during the period. The group fee rate is based upon the average net assets of all the mutual funds advised by FMR. The group fee rate decreases as assets under management increase and increases as assets under management decrease. For the period, the total annualized management fee rate was .56% of the Fund's average net assets.
Transfer Agent Fees. Fidelity Investments Institutional Operations Company, Inc. (FIIOC), an affiliate of FMR, is the Fund's transfer, dividend disbursing and shareholder servicing agent. FIIOC receives account fees and asset-based fees that vary according to account size and type of account. FIIOC pays for typesetting, printing and mailing of shareholder reports, except proxy statements. For the period, the transfer agent fees were equivalent to an annualized rate of .27% of average net assets.
Accounting and Security Lending Fees. Fidelity Service Company, Inc. (FSC), an affiliate of FMR, maintains the Fund's accounting records. The accounting fee is based on the level of average net assets for each month. Under a separate contract, FSC administers the security lending program. The security lending fee is based on the number and duration of lending transactions.
Brokerage Commissions. The Fund placed a portion of its portfolio transactions with brokerage firms which are affiliates of the investment adviser. The commissions paid to these affiliated firms were $13,208 for the period.
6. Committed Line of Credit.
The Fund participates with other funds managed by FMR or an affiliate in a $4.25 billion credit facility (the "line of credit") to be utilized for temporary or emergency purposes to fund shareholder redemptions or for other short-term liquidity purposes. The Fund has agreed to pay commitment fees on its pro-rata portion of the line of credit, which amounted to $360 and is reflected in Miscellaneous expenses on the Statement of Operations. During the period, there were no borrowings on this line of credit.
7. Security Lending.
The Fund lends portfolio securities through a lending agent from time to time in order to earn additional income. For equity securities, a lending agent is used and may loan securities to certain qualified borrowers, including Fidelity Capital Markets (FCM), a broker-dealer affiliated with the Fund. On the settlement date of the loan, the Fund receives collateral (in the form of U.S. Treasury obligations, letters of credit and/or cash) against the loaned securities and maintains collateral in an amount not less than 100% of the market value of the loaned securities during the period of the loan. The market value of the loaned securities is determined at the close of business of the Fund and any additional required collateral is delivered to the Fund on the next business day. If the borrower defaults on its obligation to return the securities loaned because of insolvency or other reasons, a fund could experience delays and costs in recovering the securities loaned or in gaining access to the collateral. Any cash collateral received is invested in the Fidelity Securities Lending Cash Central Fund. The value of loaned securities and cash collateral at period end are disclosed on the Fund's Statement of Assets and Liabilities. Security lending income represents the income earned on investing cash collateral, less rebates paid to borrowers and any lending agent fees associated with the loan, plus any premium payments received for lending certain types of securities. Security lending income is presented in the Statement of Operations as a component of income from Fidelity Central Funds. Total security lending income during the period amounted to $95,505. During the period, there were no securities loaned to FCM.
8. Expense Reductions.
Many of the brokers with whom FMR places trades on behalf of the Fund provided services to the Fund in addition to trade execution. These services included payments of certain expenses on behalf of the Fund totaling $6,888 for the period.
Semiannual Report
9. Other.
The Fund's organizational documents provide former and current trustees and officers with a limited indemnification against liabilities arising in connection with the performance of their duties to the Fund. In the normal course of business, the Fund may also enter into contracts that provide general indemnifications. The Fund's maximum exposure under these arrangements is unknown as this would be dependent on future claims that may be made against the Fund. The risk of material loss from such claims is considered remote.
Semiannual Report
Board Approval of Investment Advisory Contracts and Management Fees
Telecommunications Portfolio
Wireless Portfolio
Each year, the Board of Trustees, including the Independent Trustees (together, the Board), votes on the renewal of the management contract and sub-advisory agreements (together, the Advisory Contracts) for each fund. The Board, assisted by the advice of fund counsel and Independent Trustees' counsel, requests and considers a broad range of information relevant to the renewal of the Advisory Contracts throughout the year.
The Board meets regularly and, at each of its meetings, considers factors that are relevant to its annual consideration of the renewal of each fund's Advisory Contracts, including the services and support provided to each fund and its shareholders. The Board has established various standing committees, each composed of and chaired by Independent Trustees with varying backgrounds, to which the Board has assigned specific subject matter responsibilities in order to enhance effective decision-making by the Board. The Board, acting directly and through its Committees, requests and receives information concerning the annual consideration of the renewal of each fund's Advisory Contracts. The Board also meets as needed to consider matters specifically related to the Board's annual consideration of the renewal of Advisory Contracts. Members of the Board may also meet with trustees of other Fidelity funds through ad hoc joint committees to discuss certain matters relevant to the Fidelity funds.
At its July 2012 meeting, the Board of Trustees, including the Independent Trustees, unanimously determined to renew each fund's Advisory Contracts. In reaching its determination, the Board considered all factors it believed relevant, including (i) the nature, extent, and quality of the services to be provided to each fund and its shareholders (including the investment performance of each fund); (ii) the competitiveness of each fund's management fee and total expense ratio relative to peer funds; (iii) the total costs of the services to be provided by and the profits to be realized by Fidelity from its relationship with each fund; (iv) the extent to which economies of scale exist and would be realized as each fund grows; and (v) whether fee levels reflect these economies of scale, if any, for the benefit of fund shareholders.
In considering whether to renew the Advisory Contracts for each fund, the Board reached a determination, with the assistance of fund counsel and Independent Trustees' counsel and through the exercise of its business judgment, that the renewal of the Advisory Contracts is in the best interests of each fund and its shareholders and that the compensation payable under the Advisory Contracts is fair and reasonable. The Board's decision to renew the Advisory Contracts was not based on any single factor, but rather was based on a comprehensive consideration of all the information provided to the Board at its meetings throughout the year. The Board, in reaching its determination to renew the Advisory Contracts, is aware that shareholders in each fund have a broad range of investment choices available to them, including a wide choice among mutual funds offered by Fidelity's competitors, and that each fund's shareholders, who have the opportunity to review and weigh the disclosure provided by the fund in its prospectus and other public disclosures, have chosen to invest in that fund, managed by Fidelity.
Nature, Extent, and Quality of Services Provided. The Board considered the staffing within the investment adviser, FMR, and the sub-advisers (together, the Investment Advisers), including the backgrounds of the funds' investment personnel, and also considered the funds' investment objectives, strategies, and related investment philosophies. The Independent Trustees also had discussions with senior management of Fidelity's investment operations and investment groups. The Board considered the structure of the portfolio manager compensation program and whether this structure provides appropriate incentives to act in the best interests of each fund.
Resources Dedicated to Investment Management and Support Services. The Board and the Fund Oversight and Research Committees reviewed the general qualifications and capabilities of the Investment Advisers' investment staff, including its size, education, experience, and resources, as well as the Investment Advisers' approach to recruiting, training, managing, and compensating investment personnel. The Board also noted that FMR has continued to increase the resources devoted to non-U.S. offices, including expansion of Fidelity's global investment organization. The Board noted that Fidelity's analysts have extensive resources, tools and capabilities that allow them to conduct sophisticated quantitative and fundamental analysis, as well as credit analysis of issuers, counterparties and guarantors. The Board also believes that Fidelity's investment professionals have sufficient access to global information and data so as to provide competitive investment results over time, and that those professionals also have access to sophisticated tools that permit them to assess portfolio construction and risk and performance attribution characteristics continuously, as well as to transmit new information and research conclusions rapidly around the world. Additionally, in its deliberations, the Board considered the Investment Advisers' trading and risk management capabilities and resources, which are an integral part of the investment management process.
Shareholder and Administrative Services. The Board considered (i) the nature, extent, quality, and cost of advisory, administrative, and shareholder services performed by the Investment Advisers and their affiliates under the Advisory Contracts and under separate agreements covering transfer agency, pricing and bookkeeping, and securities lending services for each fund; (ii) the nature and extent of the supervision of third party service providers, principally custodians and subcustodians; and (iii) the resources devoted to, and the record of compliance with, each fund's compliance policies and procedures. The Board also reviewed the allocation of fund brokerage, including allocations to brokers affiliated with the Investment Advisers, the use of brokerage commissions to pay fund expenses, and the use of "soft" commission dollars to pay for research services.
The Board noted that the growth of fund assets over time across the complex allows Fidelity to reinvest in the development of services designed to enhance the value or convenience of the Fidelity funds as investment vehicles. These services include 24-hour access to account information and market information through telephone representatives and over the Internet, investor education materials and asset allocation tools, and the expanded availability of Fidelity Investor Centers.
Semiannual Report
Board Approval of Investment Advisory Contracts and Management Fees - continued
Investment in a Large Fund Family. The Board considered the benefits to shareholders of investing in a Fidelity fund, including the benefits of investing in a fund that is part of a large family of funds offering a variety of investment disciplines and providing a large variety of mutual fund investor services. The Board noted that Fidelity had taken, or had made recommendations that resulted in the Fidelity funds taking, a number of actions over the previous year that benefited particular funds, including (i) continuing to dedicate additional resources to investment research and support of the senior management team that oversees asset management; (ii) persisting in efforts to enhance Fidelity's research capabilities, in particular, international research; (iii) launching new funds and making other enhancements to meet client needs for global and income-oriented solutions; (iv) continuing to launch dedicated lower cost underlying funds to meet investment management's portfolio construction needs related to expanding underlying fund options, specifically for the Freedom Fund product lines; (v) adopting a "Stock Selector" sector neutral investment approach and employing a team of portfolio managers who are sector specialists to manage certain funds; (vi) rationalizing product lines and gaining increased efficiencies through the mergers of several funds into other funds; (vii) strengthening the Spartan Index Fund product line by adding new funds and/or new low-cost institutional share classes, restructuring fund expenses to accommodate new classes, and reducing investment minimums for certain classes of shares; (viii) modifying the eligibility criteria for Institutional Class shares to increase their appeal to government entities and charitable investors; and (ix) reducing certain transfer agent fee rates.
Investment Performance (Telecommunications Portfolio). The Board considered whether the fund has operated in accordance with its investment objective, as well as its record of compliance with its investment restrictions. It also reviewed the fund's absolute investment performance for each class, as well as the fund's relative investment performance for each class measured over multiple periods against a third-party-sponsored index that reflects the market sector in which the fund invests. The Board noted that FMR believes that no meaningful peer group exists for the fund principally because most other funds in the fund's third-party peer group focus on different industries or sectors than the fund. The following charts considered by the Board show, over the one-, three-, and five-year periods ended December 31, 2011, the cumulative total returns of Institutional Class (Class I) and Class B of the fund and the cumulative total returns of a third-party-sponsored index ("benchmark"). The returns of Institutional Class (Class I) and Class B show the performance of the highest and lowest performing classes, respectively (based on five-year performance).
Telecommunications Portfolio

The Board noted that the investment performance of Institutional Class (Class I) of the fund compared favorably to its benchmark for the three- and five-year periods, although the fund's one-year total return was lower than its benchmark. The Board considered that the variations in performance among the fund's classes reflect the variations in class expenses, which result in lower performance for higher expense classes. The Board noted that there was a portfolio management change for the fund in December 2011. The Board also reviewed the fund's performance since inception as well as performance in the current year.
Based on its review, the Board concluded that the nature, extent, and quality of services provided to the fund under the Advisory Contracts should benefit the fund's shareholders.
Investment Performance (Wireless Portfolio). The Board considered whether the fund has operated in accordance with its investment objective, as well as its record of compliance with its investment restrictions. It also reviewed the fund's absolute investment performance, as well as the fund's relative investment performance measured over multiple periods against a third-party sponsored index that reflects the market sector in which the fund invests. The Board noted that FMR believes that no meaningful peer group exists for the fund principally because most other funds in the fund's third-party peer group focus on different industries or sectors than the fund. The following charts considered by the Board show, over the one-, three-, and five-year periods ended December 31, 2011, the fund's cumulative total returns and the cumulative total returns of a third-party sponsored index ("benchmark").
Semiannual Report
Wireless Portfolio
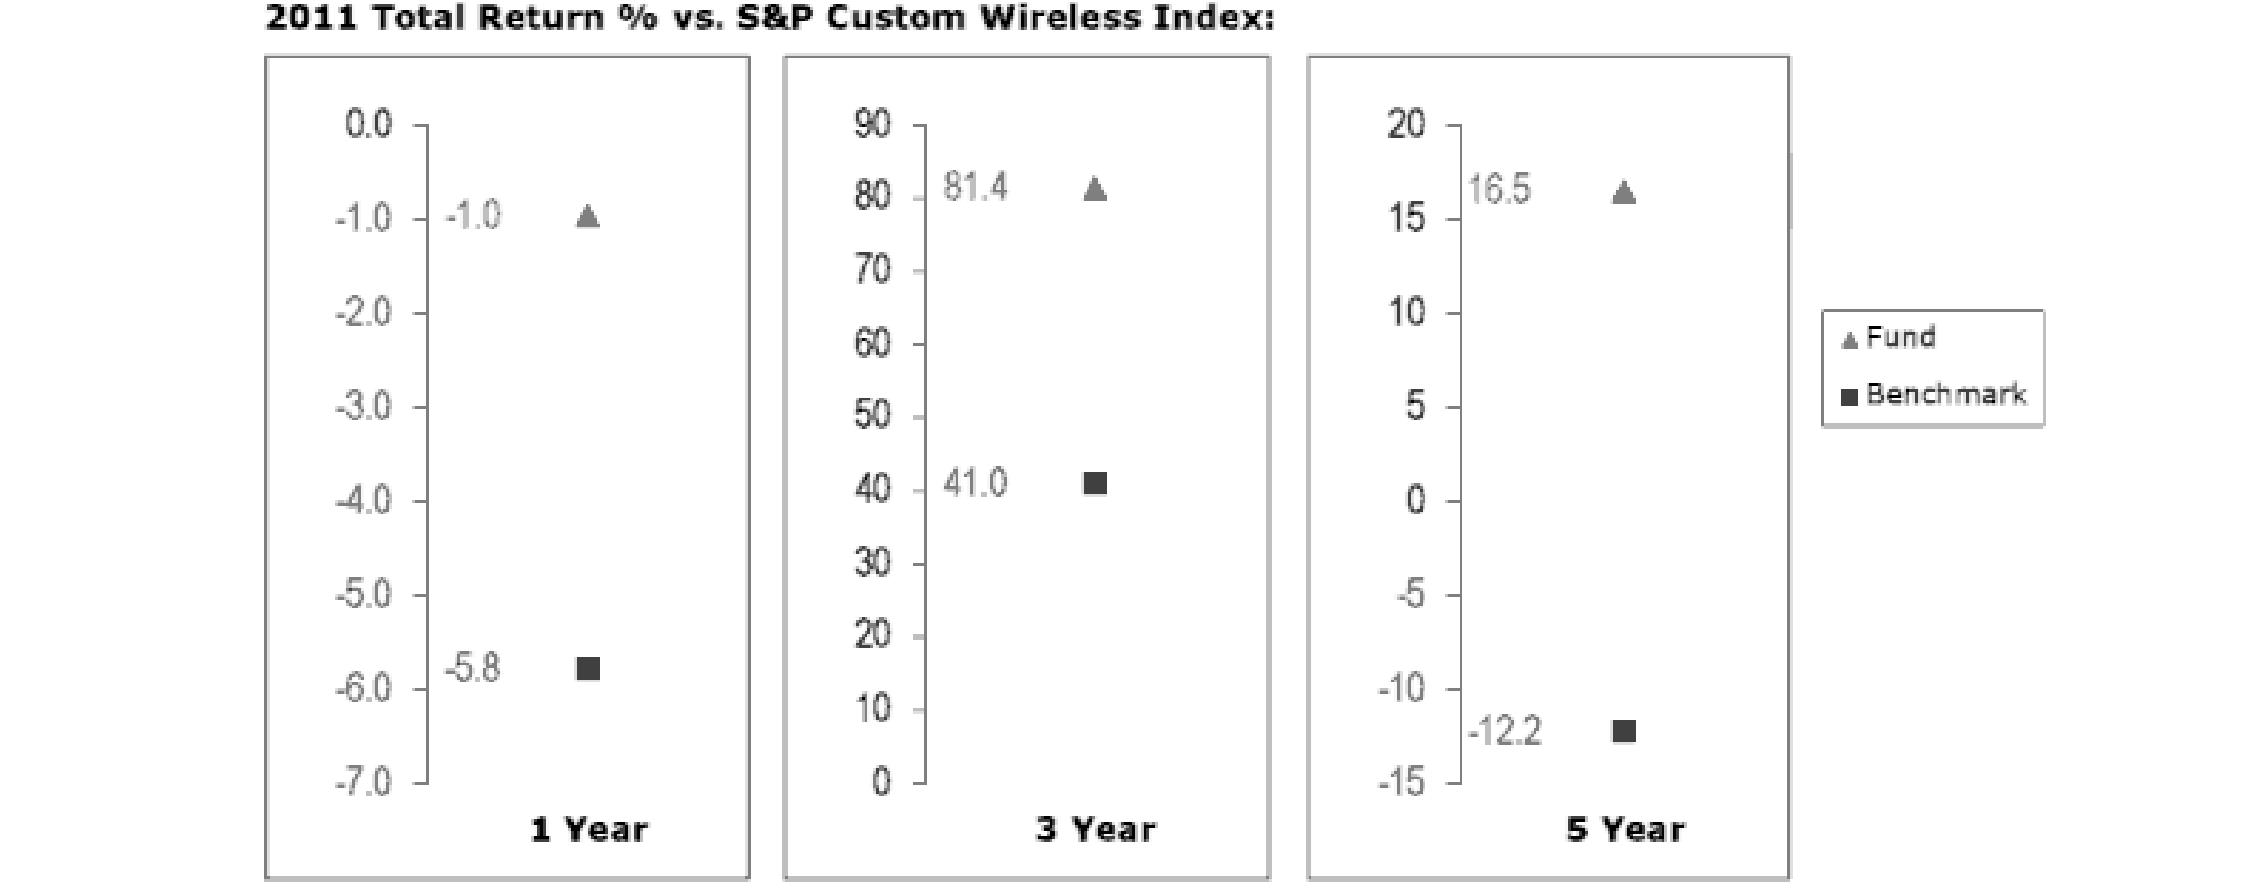
The Board noted that the investment performance of the fund compared favorably to its benchmark for all the periods shown. The Board noted that there was a portfolio management change for the fund in December 2011. The Board also reviewed the fund's performance since inception as well as performance in the current year.
Based on its review, the Board concluded that the nature, extent, and quality of services provided to the fund under the Advisory Contracts should benefit the fund's shareholders.
Competitiveness of Management Fee and Total Expense Ratio. The Board considered each fund's management fee and total expense ratio compared to "mapped groups" of competitive funds and classes. Fidelity creates "mapped groups" by combining similar Lipper investment objective categories that have comparable management fee characteristics. Combining Lipper investment objective categories aids the Board's management fee and total expense ratio comparisons by broadening the competitive group used for comparison and by reducing the number of universes to which various Fidelity funds are compared.
Management Fee. The Board considered two proprietary management fee comparisons for the 12-month periods shown in the charts below. The group of Lipper funds used by the Board for management fee comparisons is referred to below as the "Total Mapped Group." The Total Mapped Group comparison focuses on a fund's standing relative to the total universe of comparable funds available to investors in terms of gross management fees before expense reimbursements or caps. "TMG %" represents the percentage of funds in the Total Mapped Group that had management fees that were lower than a fund's. For example, a TMG % of 6% means that 94% of the funds in the Total Mapped Group had higher management fees than a fund. The "Asset-Size Peer Group" (ASPG) comparison focuses on a fund's standing relative to non-Fidelity funds similar in size to the fund within the Total Mapped Group. The ASPG represents at least 15% of the funds in the Total Mapped Group with comparable asset size and management fee characteristics, subject to a minimum of 50 funds (or all funds in the Total Mapped Group if fewer than 50). Additional information, such as the ASPG quartile in which a fund's management fee ranked, is also included in the charts and considered by the Board.
Semiannual Report
Board Approval of Investment Advisory Contracts and Management Fees - continued
Telecommunications Portfolio

Wireless Portfolio
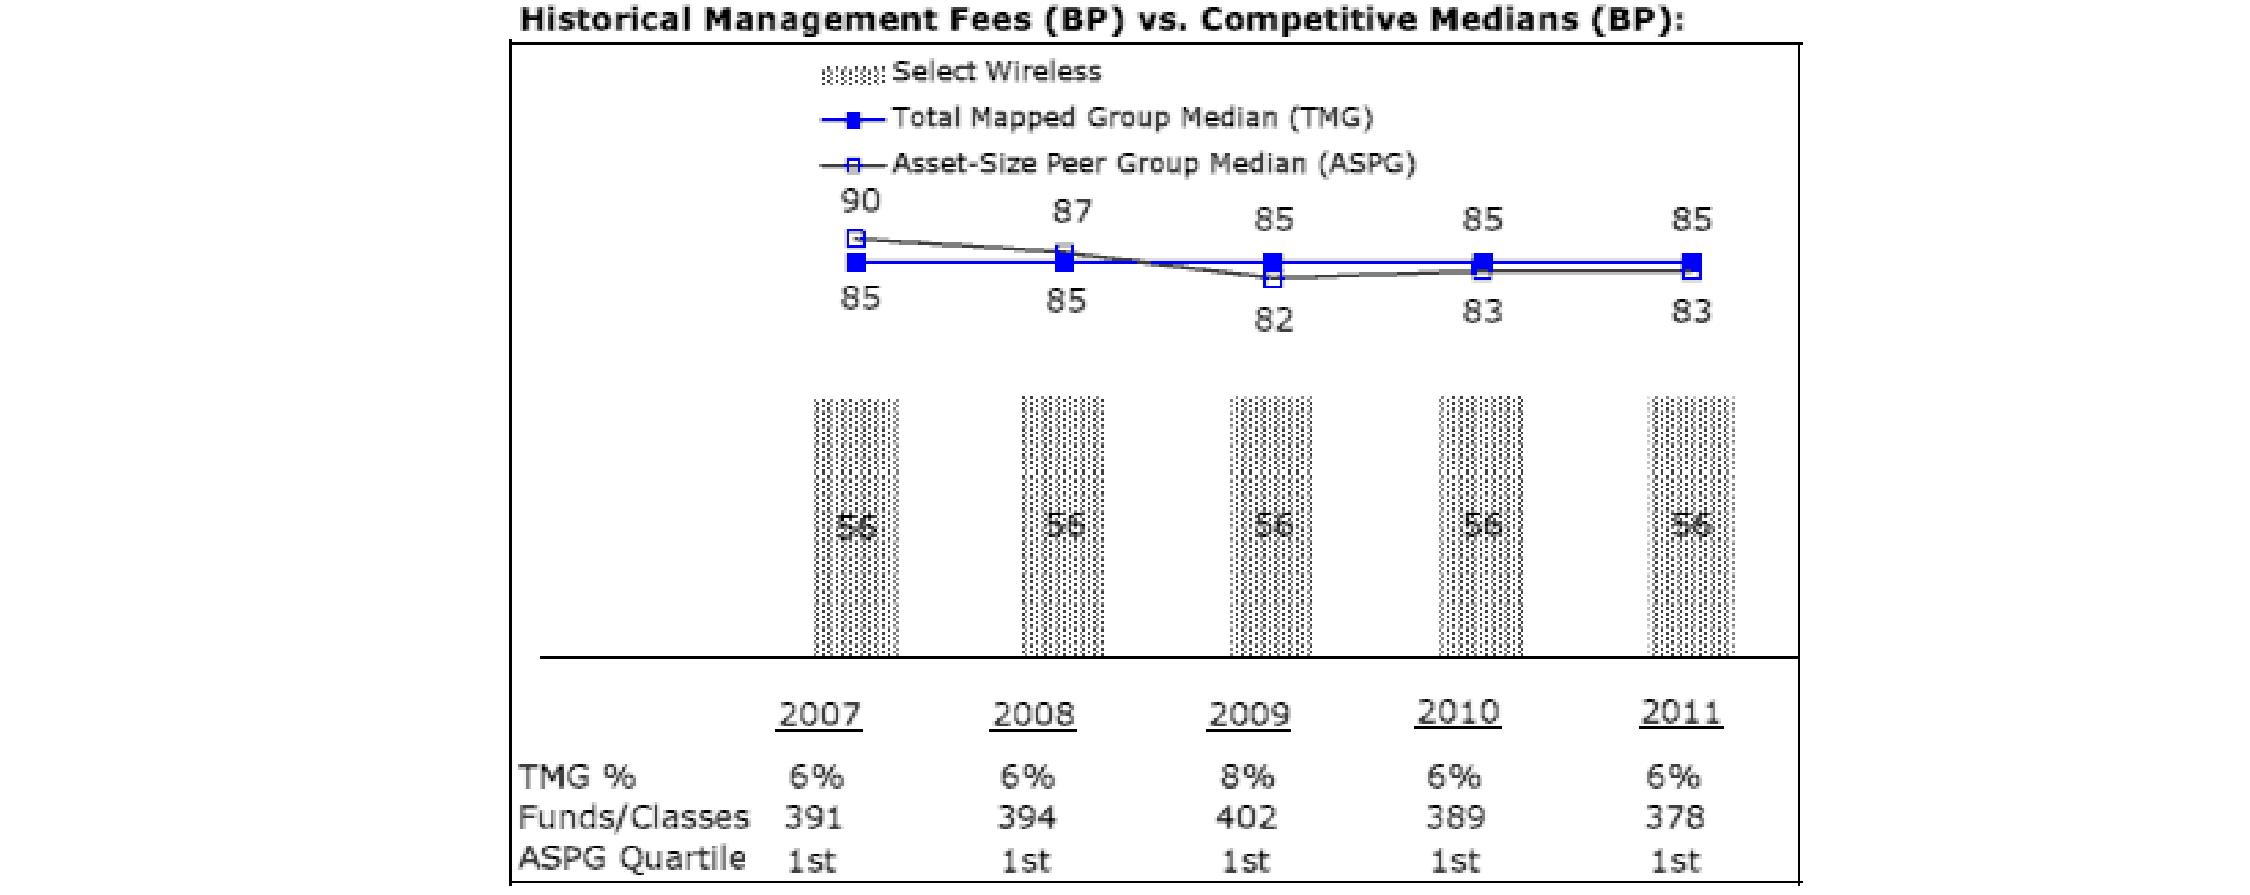
The Board noted that each fund's management fee ranked below the median of its Total Mapped Group and below the median of its ASPG for 2011.
Based on its review, the Board concluded that each fund's management fee is fair and reasonable in light of the services that the fund receives and the other factors considered.
Total Expense Ratio. In its review of the total expense ratio of each class of Telecommunications Portfolio, the Board considered the fund's management fee as well as other fund or class expenses, as applicable, such as transfer agent fees, pricing and bookkeeping fees, fund-paid 12b-1 fees, and custodial, legal, and audit fees. The Board also noted the effects of any waivers and reimbursements on fees and expenses. As part of its review, the Board also considered the current and historical total expense ratios of each class of the fund compared to competitive fund median expenses. Each class of the fund is compared to those funds and classes in the Total Mapped Group (used by the Board for management fee comparisons) that have a similar sales load structure.
In its review of Wireless Portfolio's total expense ratio, the Board considered the fund's management fee as well as other fund expenses, such as transfer agent fees, pricing and bookkeeping fees, and custodial, legal, and audit fees. The Board also noted the effects of any waivers and reimbursements on fees and expenses. As part of its review, the Board also considered the current and historical total expense ratios of the fund compared to competitive fund median expenses. The fund is compared to those funds and classes in the Total Mapped Group (used by the Board for management fee comparisons) that have a similar sales load structure.
Semiannual Report
The Board noted that the total expense ratio of each of Class A, Class B, Class C, Institutional Class, and the retail class of Telecommunications Portfolio ranked below its competitive median for 2011 and the total expense ratio of Class T ranked above its competitive median for 2011. The Board considered that various factors, including 12b-1 fees, positive or negative performance adjustments, and relatively higher other expenses in the case of small fund size, can affect total expense ratios. The Board noted that the total expense ratio of Class T was above the competitive median primarily because of higher 12b-1 fees on Class T. Class T has a higher 12b-1 fee, but a lower front-end sales charge, than traditionally priced front-end sales charge classes. The Board considered that Class T is primarily sold load-waived in the retirement plan market where its 0.50% 12b-1 fee is comparable to competing no-load, higher 12b-1 fee classes designed specifically for retirement plans. The Board noted that the fund offers multiple classes, each of which has a different sales load and 12b-1 fee structure, and that the multiple structures are intended to offer a range of pricing options for the intermediary market. The Board also noted that the total expense ratios of the classes vary primarily by the level of their 12b-1 fees, although differences in transfer agent fees may also cause expenses to vary from class to class.
The Board noted that Wireless Portfolio's total expense ratio ranked below its competitive median for 2011.
Fees Charged to Other Fidelity Clients. The Board also considered Fidelity fee structures and other information with respect to clients of FMR and its affiliates, such as other mutual funds advised or subadvised by FMR or its affiliates, pension plan clients, and other institutional clients. The Board noted the findings of the 2010 ad hoc joint committee (created with the board of other Fidelity funds), which reviewed and compared Fidelity's institutional investment advisory business with its business of providing services to the Fidelity funds, including the differences in services provided, fees charged, and costs incurred, as well as competition in their respective marketplaces.
Based on its review of total expense ratios and fees charged to other Fidelity clients, the Board concluded that the total expense ratio of each class of Telecommunications Portfolio and the total expense ratio of Wireless Portfolio were reasonable, although Class T of Telecommunications Portfolio was above the median of the universe presented for comparison, in light of the services that each fund and its shareholders receive and the other factors considered.
Costs of the Services and Profitability. The Board considered the revenues earned and the expenses incurred by Fidelity in conducting the business of developing, marketing, distributing, managing, administering and servicing each fund and its shareholders. The Board also considered the level of Fidelity's profits in respect of all the Fidelity funds.
On an annual basis, FMR presents to the Board Fidelity's profitability for each fund. Fidelity calculates the profitability for each fund, as well as aggregate profitability for groups of Fidelity funds and all Fidelity funds, using a series of detailed revenue and cost allocation methodologies which originate with the books and records of Fidelity on which Fidelity's audited financial statements are based. The Audit Committee of the Board reviews any significant changes from the prior year's methodologies.
PricewaterhouseCoopers LLP (PwC), independent registered public accounting firm and auditor to Fidelity and certain Fidelity funds, has been engaged annually by the Board as part of the Board's assessment of Fidelity's profitability analysis. PwC's engagement includes the review and assessment of Fidelity's methodologies used in determining the revenues and expenses attributable to Fidelity's mutual fund business, and completion of agreed-upon procedures surrounding the mathematical accuracy of fund profitability and its conformity to allocation methodologies. After considering PwC's reports issued under the engagement and information provided by Fidelity, the Board concluded that while other allocation methods may also be reasonable, Fidelity's profitability methodologies are reasonable in all material respects.
The Board also reviewed Fidelity's non-fund businesses and fall-out benefits related to the mutual fund business as well as cases where Fidelity's affiliates may benefit from or be related to the funds' business.
The Board considered the costs of the services provided by and the profits realized by Fidelity in connection with the operation of each fund and was satisfied that the profitability was not excessive in the circumstances.
Economies of Scale. The Board considered whether there have been economies of scale in respect of the management of the Fidelity funds, whether the Fidelity funds (including each fund) have appropriately benefited from any such economies of scale, and whether there is potential for realization of any further economies of scale. The Board considered the extent to which each fund will benefit from economies of scale through increased services to the fund, through waivers or reimbursements, or through fee or expense reductions. The Board also noted that in 2009, it and the board of other Fidelity funds created an ad hoc committee (the Economies of Scale Committee) to analyze whether FMR attains economies of scale in respect of the management and servicing of the Fidelity funds, whether the Fidelity funds have appropriately benefited from such economies of scale, and whether there is potential for realization of any further economies of scale.
The Board recognized that each fund's management contract incorporates a "group fee" structure, which provides for lower group fee rates as total fund assets under FMR's management increase, and for higher group fee rates as total fund assets under FMR's management decrease. FMR calculates the group fee rates based on a tiered asset "breakpoint" schedule that varies based on asset class. The Board considered that the group fee is designed to deliver the benefits of economies of scale to fund shareholders when total Fidelity fund assets increase, even if assets of any particular fund are unchanged or have declined, because some portion of Fidelity's costs are attributable to services provided to all Fidelity funds, and all funds benefit if those costs can be allocated among more assets. The Board concluded that, given the group fee structure, fund shareholders will benefit from lower management fees as assets under FMR's management increase at the fund complex level, regardless of whether Fidelity achieves any such economies of scale.
Semiannual Report
Board Approval of Investment Advisory Contracts and Management Fees - continued
The Board concluded, taking into account the analysis of the Economies of Scale Committee, that economies of scale, if any, are being appropriately shared between fund shareholders and Fidelity.
Additional Information Requested by the Board. In order to develop fully the factual basis for consideration of the Fidelity funds' Advisory Contracts, the Board requested and received additional information on certain topics, including (i) fund performance trends, actions to be taken by FMR to improve certain funds' overall performance, and Fidelity's long-term strategies for certain funds; (ii) the potential to further rationalize the Fidelity fund lineup with the possibility of achieving savings for the funds and Fidelity; (iii) Fidelity's compensation structure for portfolio managers and other key investment personnel; (iv) the amount of the investment that each portfolio manager has made in the Fidelity fund(s) that he or she manages; (v) the realization of fall-out benefits in certain Fidelity business units; (vi) Fidelity's group fee structures, the potential impact of regulatory changes on such structures, and the rationale for the individual fee rates of certain funds; (vii) fund profitability methodology, including Fidelity's cost allocation methodology, and the impact of certain factors on fund profitability results; (viii) trends regarding industry use of performance fee structures and the possibility of implementing performance fee structures for additional funds; and (ix) the impact of net redemptions from the Fidelity funds.
Based on its evaluation of all of the conclusions noted above, and after considering all factors it believed relevant, the Board ultimately concluded that the advisory fee structures are fair and reasonable, and that each fund's Advisory Contracts should be renewed.
Semiannual Report
Semiannual Report
Investment Adviser
Fidelity Management & Research Company
Boston, MA
Investment Sub-Advisers
FMR Co., Inc.
Fidelity Management & Research
(U.K.) Inc.
Fidelity Management & Research
(Hong Kong) Limited
Fidelity Management & Research
(Japan) Inc.
General Distributor
Fidelity Distributors Corporation
Smithfield, RI
Transfer and Service Agents
Fidelity Investments Institutional Operations Company, Inc.
Boston, MA
Fidelity Service Company, Inc.
Boston, MA
Custodian
Brown Brothers Harriman & Co.
Boston, MA
Corporate Headquarters
82 Devonshire Street
Boston, MA 02109
1-800-544-8888
The Fidelity Telephone Connection
Mutual Fund 24-Hour Service
Exchanges/Redemptions
and Account Assistance 1-800-544-6666
Product Information 1-800-544-8888
Retirement Accounts 1-800-544-4774
(8 a.m. - 9 p.m.)
TDD Service 1-800-544-0118
for the deaf and hearing impaired
(9 a.m. - 9 p.m. Eastern time)
Fidelity Automated Service
Telephone (FAST®)
1-800-544-5555
Automated line for quickest service

SELTS-USAN-1012
1.846052.105

Fidelity Advisor
Focus Funds®
Class A, Class T, Class B and Class C
Fidelity Advisor® Consumer Staples Fund
Fidelity Advisor Gold Fund
Fidelity Advisor Materials Fund
Fidelity Advisor Telecommunications Fund
Each Advisor fund listed above is a class
of the Fidelity® Select Portfolios®.
Semiannual Report
August 31, 2012
(Fidelity Cover Art)
Contents
To view a fund's proxy voting guidelines and proxy voting record for the 12-month period ended June 30, visit http://www.fidelity.com/proxyvotingresults or visit the Securities and Exchange Commission's (SEC) web site at http://www.sec.gov. You may also call 1-877-208-0098 to request a free copy of the proxy voting guidelines.
Standard & Poor's, S&P and S&P 500 are registered service marks of The McGraw-Hill Companies, Inc. and have been licensed for use by Fidelity Distributors Corporation.
Other third party marks appearing herein are the property of their respective owners.
All other marks appearing herein are registered or unregistered trademarks or service marks of FMR LLC or an affiliated company. © 2012 FMR LLC. All rights reserved.
This report and the financial statements contained herein are submitted for the general information of the shareholders of the funds. This report is not authorized for distribution to prospective investors in the funds unless preceded or accompanied by an effective prospectus.
A fund files its complete schedule of portfolio holdings with the SEC for the first and third quarters of each fiscal year on Form N-Q. Forms N-Q are available on the SEC's web site at http://www.sec.gov. A fund's Forms N-Q may be reviewed and copied at the SEC's Public Reference Room in Washington, DC. Information regarding the operation of the SEC's Public Reference Room may be obtained by calling 1-800-SEC-0330. For a complete list of a fund's portfolio holdings, view the most recent holdings listing, semiannual report, or annual report on Fidelity's web site at http://www.fidelity.com, http://www.advisor.fidelity.com, or http://www.401k.com, as applicable.
NOT FDIC INSURED • MAY LOSE VALUE • NO BANK GUARANTEE
Neither the funds nor Fidelity Distributors Corporation is a bank.
Semiannual Report
Consumer Staples Portfolio
As a shareholder of the Fund, you incur two types of costs: (1) transaction costs, including sales charges (loads) on purchase payments or redemption proceeds, redemption fees and (2) ongoing costs, including management fees, distribution and/or service (12b-1) fees and other Fund expenses. This Example is intended to help you understand your ongoing costs (in dollars) of investing in the Fund and to compare these costs with the ongoing costs of investing in other mutual funds.
The Example is based on an investment of $1,000 invested at the beginning of the period and held for the entire period (March 1, 2012 to August 31, 2012).
Actual Expenses
The first line of the accompanying table for each class of the Fund provides information about actual account values and actual expenses. You may use the information in this line, together with the amount you invested, to estimate the expenses that you paid over the period. Simply divide your account value by $1,000.00 (for example, an $8,600 account value divided by $1,000.00 = 8.6), then multiply the result by the number in the first line for a class of the Fund under the heading entitled "Expenses Paid During Period" to estimate the expenses you paid on your account during this period. A small balance maintenance fee of $12.00 that is charged once a year may apply for certain accounts with a value of less than $2,000. This fee is not included in the table below. If it was, the estimate of expenses you paid during the period would be higher, and your ending account value lower, by this amount. In addition, the Fund, as a shareholder in the underlying Fidelity Central Funds, will indirectly bear its pro-rata share of the fees and expenses incurred by the underlying Fidelity Central Funds. These fees and expenses are not included in the Fund's annualized expense ratio used to calculate the expense estimate in the table below.
Hypothetical Example for Comparison Purposes
The second line of the accompanying table for each class of the Fund provides information about hypothetical account values and hypothetical expenses based on a Class' actual expense ratio and an assumed rate of return of 5% per year before expenses, which is not the Class' actual return. The hypothetical account values and expenses may not be used to estimate the actual ending account balance or expenses you paid for the period. You may use this information to compare the ongoing costs of investing in the Fund and other funds. To do so, compare this 5% hypothetical example with the 5% hypothetical examples that appear in the shareholder reports of the other funds. A small balance maintenance fee of $12.00 that is charged once a year may apply for certain accounts with a value of less than $2,000. This fee is not included in the table below. If it was, the estimate of expenses you paid during the period would be higher, and your ending account value lower, by this amount. In addition, the Fund, as a shareholder in the underlying Fidelity Central Funds, will indirectly bear its pro-rata share of the fees and expenses incurred by the underlying Fidelity Central Funds. These fees and expenses are not included in the Fund's annualized expense ratio used to calculate the expense estimate in the table below.
Please note that the expenses shown in the table are meant to highlight your ongoing costs only and do not reflect any transaction costs. Therefore, the second line of the table is useful in comparing ongoing costs only, and will not help you determine the relative total costs of owning different funds. In addition, if these transactional costs were included, your costs would have been higher.
| Annualized
Expense Ratio | Beginning
Account Value
March 1, 2012 | Ending
Account Value
August 31, 2012 | Expenses Paid
During Period*
March 1, 2012
to August 31, 2012 |
Class A | 1.09% | | | |
Actual | | $ 1,000.00 | $ 1,072.50 | $ 5.69 |
HypotheticalA | | $ 1,000.00 | $ 1,019.71 | $ 5.55 |
Class T | 1.36% | | | |
Actual | | $ 1,000.00 | $ 1,071.10 | $ 7.10 |
HypotheticalA | | $ 1,000.00 | $ 1,018.35 | $ 6.92 |
Class B | 1.89% | | | |
Actual | | $ 1,000.00 | $ 1,068.30 | $ 9.85 |
HypotheticalA | | $ 1,000.00 | $ 1,015.68 | $ 9.60 |
Class C | 1.83% | | | |
Actual | | $ 1,000.00 | $ 1,068.60 | $ 9.54 |
HypotheticalA | | $ 1,000.00 | $ 1,015.98 | $ 9.30 |
Consumer Staples | .81% | | | |
Actual | | $ 1,000.00 | $ 1,074.10 | $ 4.23 |
HypotheticalA | | $ 1,000.00 | $ 1,021.12 | $ 4.13 |
Institutional Class | .84% | | | |
Actual | | $ 1,000.00 | $ 1,074.00 | $ 4.39 |
HypotheticalA | | $ 1,000.00 | $ 1,020.97 | $ 4.28 |
A 5% return per year before expenses
* Expenses are equal to each Class' annualized expense ratio, multiplied by the average account value over the period, multiplied by 184/365 (to reflect the one-half year period).
Semiannual Report
Consumer Staples Portfolio
Investment Changes (Unaudited)
Top Ten Stocks as of August 31, 2012 |
| % of fund's
net assets | % of fund's net assets
6 months ago |
Procter & Gamble Co. | 14.9 | 16.2 |
British American Tobacco PLC sponsored ADR | 13.8 | 11.9 |
The Coca-Cola Co. | 10.8 | 10.8 |
CVS Caremark Corp. | 7.1 | 6.7 |
Altria Group, Inc. | 4.5 | 4.8 |
Anheuser-Busch InBev SA NV | 3.4 | 3.1 |
Diageo PLC sponsored ADR | 3.1 | 2.8 |
Colgate-Palmolive Co. | 2.9 | 2.3 |
Constellation Brands, Inc. Class A (sub. vtg.) | 2.5 | 2.6 |
Philip Morris International, Inc. | 2.4 | 2.6 |
| 65.4 | |
Top Industries (% of fund's net assets) |
As of August 31, 2012 |
 | Beverages | 28.9% | |
 | Tobacco | 21.6% | |
 | Household Products | 18.4% | |
 | Food & Staples Retailing | 12.4% | |
 | Food Products | 9.4% | |
 | All Others* | 9.3% | |

As of February 29, 2012 |
| Beverages | 31.3% | |
| Tobacco | 20.4% | |
| Household Products | 19.0% | |
| Food & Staples Retailing | 11.1% | |
| Food Products | 10.0% | |
| All Others* | 8.2% | |

* Includes short-term investments and net other assets. |
Semiannual Report
Consumer Staples Portfolio
Investments August 31, 2012 (Unaudited)
Showing Percentage of Net Assets
Common Stocks - 95.3% |
| Shares | | Value |
BEVERAGES - 28.9% |
Brewers - 5.7% |
Anheuser-Busch InBev SA NV | 801,728 | | $ 67,451,302 |
Companhia de Bebidas das Americas (AmBev) (PN) sponsored ADR | 215,485 | | 8,104,391 |
Compania Cervecerias Unidas SA sponsored ADR | 69,900 | | 4,549,791 |
Molson Coors Brewing Co. Class B | 466,328 | | 20,770,249 |
SABMiller PLC | 320,800 | | 14,158,280 |
| | 115,034,013 |
Distillers & Vintners - 8.9% |
Constellation Brands, Inc. Class A (sub. vtg.) (a) | 1,504,820 | | 49,568,771 |
Diageo PLC sponsored ADR | 581,627 | | 63,525,301 |
Pernod Ricard SA | 328,901 | | 35,440,966 |
Remy Cointreau SA | 216,376 | | 24,714,644 |
Thai Beverage PCL | 6,002,000 | | 1,588,977 |
Treasury Wine Estates Ltd. | 770,955 | | 3,767,503 |
| | 178,606,162 |
Soft Drinks - 14.3% |
Britvic PLC | 573,000 | | 2,907,842 |
Coca-Cola Bottling Co. CONSOLIDATED | 94,145 | | 6,462,113 |
Coca-Cola FEMSA SAB de CV sponsored ADR | 41,529 | | 5,068,614 |
Coca-Cola Hellenic Bottling Co. SA sponsored ADR | 270,681 | | 4,964,290 |
Coca-Cola Icecek A/S | 330,842 | | 5,892,305 |
Embotelladora Andina SA: | | | |
ADR | 43,689 | | 1,177,855 |
sponsored ADR | 267,800 | | 8,815,976 |
Fomento Economico Mexicano SAB de CV sponsored ADR | 10,187 | | 860,802 |
PepsiCo, Inc. | 474,871 | | 34,394,907 |
The Coca-Cola Co. | 5,791,184 | | 216,590,282 |
| | 287,134,986 |
TOTAL BEVERAGES | | 580,775,161 |
FOOD & STAPLES RETAILING - 12.4% |
Drug Retail - 9.0% |
CVS Caremark Corp. | 3,134,863 | | 142,793,010 |
Drogasil SA | 521,400 | | 5,514,783 |
Rite Aid Corp. (a) | 1,534,500 | | 1,826,055 |
Walgreen Co. | 836,660 | | 29,918,962 |
| | 180,052,810 |
Food Distributors - 0.1% |
Chefs' Warehouse Holdings (a) | 161,700 | | 2,485,329 |
Food Retail - 1.3% |
Fresh Market, Inc. (a) | 11,800 | | 681,096 |
Kroger Co. | 626,435 | | 13,956,972 |
|
| Shares | | Value |
Susser Holdings Corp. (a) | 144,300 | | $ 4,909,086 |
The Pantry, Inc. (a) | 384,270 | | 5,387,465 |
| | 24,934,619 |
Hypermarkets & Super Centers - 2.0% |
Wal-Mart Stores, Inc. | 564,696 | | 40,996,930 |
TOTAL FOOD & STAPLES RETAILING | | 248,469,688 |
FOOD PRODUCTS - 9.4% |
Agricultural Products - 2.7% |
Archer Daniels Midland Co. | 231,261 | | 6,186,232 |
Bunge Ltd. | 661,987 | | 42,135,473 |
Cosan Ltd. Class A | 40,400 | | 562,772 |
First Resources Ltd. | 1,367,000 | | 2,281,075 |
Ingredion, Inc. | 1,024 | | 55,122 |
SLC Agricola SA | 253,600 | | 2,661,057 |
| | 53,881,731 |
Packaged Foods & Meats - 6.7% |
Annie's, Inc. (d) | 30,587 | | 1,270,890 |
Calavo Growers, Inc. | 81,173 | | 2,146,214 |
Danone SA | 33,400 | | 2,081,621 |
Green Mountain Coffee Roasters, Inc. (a) | 362,037 | | 8,801,119 |
Lindt & Spruengli AG | 121 | | 4,377,647 |
Mead Johnson Nutrition Co. Class A | 460,916 | | 33,798,970 |
Nestle SA | 368,063 | | 22,881,051 |
TreeHouse Foods, Inc. (a) | 102,100 | | 5,304,095 |
Tyson Foods, Inc. Class A | 658,400 | | 10,310,544 |
Unilever NV (NY Reg.) | 1,117,271 | | 38,858,685 |
Want Want China Holdings Ltd. | 3,577,000 | | 4,427,465 |
| | 134,258,301 |
TOTAL FOOD PRODUCTS | | 188,140,032 |
HOUSEHOLD PRODUCTS - 18.4% |
Household Products - 18.4% |
Colgate-Palmolive Co. | 539,871 | | 57,393,686 |
Procter & Gamble Co. | 4,450,558 | | 299,032,991 |
Reckitt Benckiser Group PLC | 85,200 | | 4,816,140 |
Spectrum Brands Holdings, Inc. | 226,147 | | 8,328,994 |
| | 369,571,811 |
PERSONAL PRODUCTS - 2.4% |
Personal Products - 2.4% |
Avon Products, Inc. | 167,400 | | 2,586,330 |
Herbalife Ltd. | 43,690 | | 2,114,159 |
Hypermarcas SA (a) | 239,800 | | 1,539,285 |
L'Oreal SA | 199,400 | | 24,513,712 |
Natura Cosmeticos SA | 113,200 | | 2,838,504 |
Nu Skin Enterprises, Inc. Class A (d) | 367,119 | | 15,231,767 |
| | 48,823,757 |
PHARMACEUTICALS - 2.2% |
Pharmaceuticals - 2.2% |
Johnson & Johnson | 665,460 | | 44,871,968 |
Common Stocks - continued |
| Shares | | Value |
SPECIALTY RETAIL - 0.0% |
Specialty Stores - 0.0% |
Teavana Holdings, Inc. (a) | 66,777 | | $ 734,547 |
TOBACCO - 21.6% |
Tobacco - 21.6% |
Altria Group, Inc. | 2,669,820 | | 90,667,087 |
British American Tobacco PLC sponsored ADR | 2,638,391 | | 276,345,073 |
Japan Tobacco, Inc. | 105,500 | | 3,198,890 |
KT&G Corp. | 25,168 | | 1,906,819 |
Lorillard, Inc. | 52,603 | | 6,602,203 |
Philip Morris International, Inc. | 535,183 | | 47,791,842 |
Souza Cruz SA | 445,200 | | 5,967,728 |
| | 432,479,642 |
TOTAL COMMON STOCKS (Cost $1,474,408,366) |
1,913,866,606
|
Money Market Funds - 5.0% |
| Shares | | Value |
Fidelity Cash Central Fund, 0.17% (b) | 91,956,080 | | $ 91,956,080 |
Fidelity Securities Lending Cash Central Fund, 0.18% (b)(c) | 7,781,175 | | 7,781,175 |
TOTAL MONEY MARKET FUNDS (Cost $99,737,255) |
99,737,255
|
TOTAL INVESTMENT PORTFOLIO - 100.3% (Cost $1,574,145,621) | | 2,013,603,861 |
NET OTHER ASSETS (LIABILITIES) - (0.3)% | | (5,604,927) |
NET ASSETS - 100% | $ 2,007,998,934 |
Legend |
(a) Non-income producing |
(b) Affiliated fund that is available only to investment companies and other accounts managed by Fidelity Investments. The rate quoted is the annualized seven-day yield of the fund at period end. A complete unaudited listing of the fund's holdings as of its most recent quarter end is available upon request. In addition, each Fidelity Central Fund's financial statements are available on the SEC's website or upon request. |
(c) Investment made with cash collateral received from securities on loan. |
(d) Security or a portion of the security is on loan at period end. |
Affiliated Central Funds |
Information regarding fiscal year to date income earned by the Fund from investments in Fidelity Central Funds is as follows: |
Fund | Income earned |
Fidelity Cash Central Fund | $ 51,359 |
Fidelity Securities Lending Cash Central Fund | 344,609 |
Total | $ 395,968 |
Other Information |
The following is a summary of the inputs used, as of August 31, 2012, involving the Fund's assets and liabilities carried at fair value. The inputs or methodology used for valuing securities may not be an indication of the risk associated with investing in those securities. For more information on valuation inputs, and their aggregation into the levels used in the table below, please refer to the Security Valuation section in the accompanying Notes to Financial Statements. |
Valuation Inputs at Reporting Date: |
Description | Total | Level 1 | Level 2 | Level 3 |
Investments in Securities: | | | | |
Common Stocks | $ 1,913,866,606 | $ 1,843,216,414 | $ 70,650,192 | $ - |
Money Market Funds | 99,737,255 | 99,737,255 | - | - |
Total Investments in Securities: | $ 2,013,603,861 | $ 1,942,953,669 | $ 70,650,192 | $ - |
Distribution of investments by country or territory of incorporation, as a percentage of total net assets, is as follows. (Unaudited) |
United States of America | 65.0% |
United Kingdom | 17.9% |
France | 4.3% |
Belgium | 3.4% |
Bermuda | 2.1% |
Netherlands | 1.9% |
Switzerland | 1.4% |
Brazil | 1.4% |
Others (Individually Less Than 1%) | 2.6% |
| 100.0% |
See accompanying notes which are an integral part of the financial statements.
Semiannual Report
Consumer Staples Portfolio
Statement of Assets and Liabilities
| August 31, 2012 (Unaudited) |
| | |
Assets | | |
Investment in securities, at value (including securities loaned of $7,650,604) - See accompanying schedule: Unaffiliated issuers (cost $1,474,408,366) | $ 1,913,866,606 | |
Fidelity Central Funds (cost $99,737,255) | 99,737,255 | |
Total Investments (cost $1,574,145,621) | | $ 2,013,603,861 |
Receivable for investments sold | | 876,470 |
Receivable for fund shares sold | | 2,913,548 |
Dividends receivable | | 6,401,439 |
Distributions receivable from Fidelity Central Funds | | 84,597 |
Other receivables | | 8,642 |
Total assets | | 2,023,888,557 |
| | |
Liabilities | | |
Payable for investments purchased | $ 373,914 | |
Payable for fund shares redeemed | 6,189,422 | |
Accrued management fee | 927,988 | |
Distribution and service plan fees payable | 180,589 | |
Other affiliated payables | 387,229 | |
Other payables and accrued expenses | 49,306 | |
Collateral on securities loaned, at value | 7,781,175 | |
Total liabilities | | 15,889,623 |
| | |
Net Assets | | $ 2,007,998,934 |
Net Assets consist of: | | |
Paid in capital | | $ 1,531,767,644 |
Undistributed net investment income | | 22,806,456 |
Accumulated undistributed net realized gain (loss) on investments and foreign currency transactions | | 13,957,507 |
Net unrealized appreciation (depreciation) on investments and assets and liabilities in foreign currencies | | 439,467,327 |
Net Assets | | $ 2,007,998,934 |
Statement of Assets and Liabilities - continued
| August 31, 2012 (Unaudited) |
| | |
Calculation of Maximum Offering Price Class A:
Net Asset Value and redemption price per share ($236,989,846 ÷ 2,963,833 shares) | | $ 79.96 |
| | |
Maximum offering price per share (100/94.25 of $79.96) | | $ 84.84 |
Class T:
Net Asset Value and redemption price per share ($44,178,924 ÷ 556,085 shares) | | $ 79.45 |
| | |
Maximum offering price per share (100/96.50 of $79.45) | | $ 82.33 |
Class B:
Net Asset Value and offering price per share ($18,982,159 ÷ 240,877 shares)A | | $ 78.80 |
| | |
Class C:
Net Asset Value and offering price per share ($118,686,522 ÷ 1,511,166 shares)A | | $ 78.54 |
| | |
Consumer Staples:
Net Asset Value, offering price and redemption price per share ($1,346,637,604 ÷ 16,736,686 shares) | | $ 80.46 |
| | |
Institutional Class:
Net Asset Value, offering price and redemption price per share ($242,523,879 ÷ 3,020,688 shares) | | $ 80.29 |
A Redemption price per share is equal to net asset value less any applicable contingent deferred sales charge.
See accompanying notes which are an integral part of the financial statements.
Semiannual Report
Consumer Staples Portfolio
Financial Statements - continued
Statement of Operations
Six months ended August 31, 2012 (Unaudited) |
| | |
Investment Income | | |
Dividends | | $ 31,054,949 |
Interest | | 13 |
Income from Fidelity Central Funds | | 395,968 |
Total income | | 31,450,930 |
| | |
Expenses | | |
Management fee | $ 5,154,048 | |
Transfer agent fees | 1,985,358 | |
Distribution and service plan fees | 1,009,871 | |
Accounting and security lending fees | 284,230 | |
Custodian fees and expenses | 39,971 | |
Independent trustees' compensation | 6,078 | |
Registration fees | 92,752 | |
Audit | 20,569 | |
Legal | 3,480 | |
Interest | 887 | |
Miscellaneous | 8,705 | |
Total expenses before reductions | 8,605,949 | |
Expense reductions | (22,003) | 8,583,946 |
Net investment income (loss) | | 22,866,984 |
Realized and Unrealized Gain (Loss) Net realized gain (loss) on: | | |
Investment securities: | | |
Unaffiliated issuers | 21,086,671 | |
Foreign currency transactions | (25,646) | |
Total net realized gain (loss) | | 21,061,025 |
Change in net unrealized appreciation (depreciation) on: Investment securities | 83,775,321 | |
Assets and liabilities in foreign currencies | 764 | |
Total change in net unrealized appreciation (depreciation) | | 83,776,085 |
Net gain (loss) | | 104,837,110 |
Net increase (decrease) in net assets resulting from operations | | $ 127,704,094 |
Statement of Changes in Net Assets
| Six months ended
August 31, 2012
(Unaudited) | Year ended
February 29,
2012 |
Increase (Decrease) in Net Assets | | |
Operations | | |
Net investment income (loss) | $ 22,866,984 | $ 29,195,620 |
Net realized gain (loss) | 21,061,025 | 36,347,219 |
Change in net unrealized appreciation (depreciation) | 83,776,085 | 157,954,804 |
Net increase (decrease) in net assets resulting from operations | 127,704,094 | 223,497,643 |
Distributions to shareholders from net investment income | (3,281,176) | (25,900,882) |
Distributions to shareholders from net realized gain | (5,485,421) | (36,216,657) |
Total distributions | (8,766,597) | (62,117,539) |
Share transactions - net increase (decrease) | 156,512,942 | 162,381,495 |
Redemption fees | 15,203 | 45,851 |
Total increase (decrease) in net assets | 275,465,642 | 323,807,450 |
| | |
Net Assets | | |
Beginning of period | 1,732,533,292 | 1,408,725,842 |
End of period (including undistributed net investment income of $22,806,456 and undistributed net investment income of $3,220,648, respectively) | $ 2,007,998,934 | $ 1,732,533,292 |
See accompanying notes which are an integral part of the financial statements.
Semiannual Report
Financial Highlights - Class A
| Six months ended
August 31, 2012 | Years ended February 28, |
| (Unaudited) | 2012 I | 2011 | 2010 | 2009 | 2008 I |
Selected Per-Share Data | | | | | | |
Net asset value, beginning of period | $ 74.90 | $ 67.65 | $ 61.06 | $ 43.94 | $ 63.13 | $ 58.16 |
Income from Investment Operations | | | | | | |
Net investment income (loss) E | .89 | 1.22 | .98 | .84 | .67 | .53 |
Net realized and unrealized gain (loss) | 4.52 | 8.73 | 7.10 | 17.02 | (19.19) | 7.29 |
Total from investment operations | 5.41 | 9.95 | 8.08 | 17.86 | (18.52) | 7.82 |
Distributions from net investment income | (.12) | (1.06) | (.83) | (.74) | (.66) | (.42) |
Distributions from net realized gain | (.23) | (1.64) | (.66) | - | (.02) | (2.44) |
Total distributions | (.35) | (2.70) | (1.49) | (.74) | (.68) K | (2.86) |
Redemption fees added to paid in capital E | - J | - J | - J | - J | .01 | .01 |
Net asset value, end of period | $ 79.96 | $ 74.90 | $ 67.65 | $ 61.06 | $ 43.94 | $ 63.13 |
Total Return B, C, D | 7.25% | 15.00% | 13.27% | 40.66% | (29.43)% | 13.38% |
Ratios to Average Net Assets F, H | | | | | | |
Expenses before reductions | 1.09% A | 1.10% | 1.11% | 1.13% | 1.19% | 1.19% |
Expenses net of fee waivers, if any | 1.09% A | 1.10% | 1.11% | 1.13% | 1.19% | 1.19% |
Expenses net of all reductions | 1.08% A | 1.09% | 1.11% | 1.13% | 1.18% | 1.19% |
Net investment income (loss) | 2.32% A | 1.74% | 1.53% | 1.51% | 1.27% | .83% |
Supplemental Data | | | | | | |
Net assets, end of period (000 omitted) | $ 236,990 | $ 205,851 | $ 160,526 | $ 162,370 | $ 121,193 | $ 23,796 |
Portfolio turnover rate G | 26% A | 35% | 57% | 69% | 70% | 71% |
A Annualized B Total returns for periods of less than one year are not annualized. C Total returns would have been lower if certain expenses had not been reduced during the applicable periods shown. D Total returns do not include the effect of the sales charges. E Calculated based on average shares outstanding during the period. F Fees and expenses of any underlying Fidelity Central Funds are not included in the Fund's expense ratio. The Fund indirectly bears its proportionate share of the expenses of any underlying Fidelity Central Funds. G Amount does not include the portfolio activity of any underlying Fidelity Central Funds. H Expense ratios reflect operating expenses of the class. Expenses before reductions do not reflect amounts reimbursed by the investment adviser or reductions from brokerage service arrangements or reductions from other expense offset arrangements and do not represent the amount paid by the class during periods when reimbursements or reductions occur. Expenses net of fee waivers reflect expenses after reimbursement by the investment adviser but prior to reductions from brokerage service arrangements or other expense offset arrangements. Expenses net of all reductions represent the net expenses paid by the class. I For the year ended February 29. J Amount represents less than $.01 per share. K Total distributions of $.68 per share is comprised of distributions from net investment income of $.655 and distributions from net realized gain of $.024 per share. |
Financial Highlights - Class T
| Six months ended
August 31, 2012 | Years ended February 28, |
| (Unaudited) | 2012 I | 2011 | 2010 | 2009 | 2008 I |
Selected Per-Share Data | | | | | | |
Net asset value, beginning of period | $ 74.49 | $ 67.30 | $ 60.77 | $ 43.75 | $ 62.93 | $ 58.06 |
Income from Investment Operations | | | | | | |
Net investment income (loss) E | .78 | 1.01 | .79 | .66 | .53 | .36 |
Net realized and unrealized gain (loss) | 4.50 | 8.68 | 7.05 | 16.95 | (19.12) | 7.29 |
Total from investment operations | 5.28 | 9.69 | 7.84 | 17.61 | (18.59) | 7.65 |
Distributions from net investment income | (.09) | (.86) | (.65) | (.59) | (.60) | (.35) |
Distributions from net realized gain | (.23) | (1.64) | (.66) | - | - | (2.44) |
Total distributions | (.32) | (2.50) | (1.31) | (.59) | (.60) K | (2.79) |
Redemption fees added to paid in capital E | - J | - J | - J | - J | .01 | .01 |
Net asset value, end of period | $ 79.45 | $ 74.49 | $ 67.30 | $ 60.77 | $ 43.75 | $ 62.93 |
Total Return B, C, D | 7.11% | 14.67% | 12.93% | 40.24% | (29.61)% | 13.11% |
Ratios to Average Net Assets F, H | | | | | | |
Expenses before reductions | 1.36% A | 1.38% | 1.40% | 1.44% | 1.46% | 1.46% |
Expenses net of fee waivers, if any | 1.36% A | 1.38% | 1.40% | 1.44% | 1.46% | 1.46% |
Expenses net of all reductions | 1.36% A | 1.38% | 1.40% | 1.44% | 1.46% | 1.46% |
Net investment income (loss) | 2.04% A | 1.45% | 1.24% | 1.21% | .99% | .56% |
Supplemental Data | | | | | | |
Net assets, end of period (000 omitted) | $ 44,179 | $ 39,047 | $ 31,496 | $ 29,662 | $ 22,624 | $ 6,298 |
Portfolio turnover rate G | 26% A | 35% | 57% | 69% | 70% | 71% |
A Annualized B Total returns for periods of less than one year are not annualized. C Total returns would have been lower if certain expenses had not been reduced during the applicable periods shown. D Total returns do not include the effect of the sales charges. E Calculated based on average shares outstanding during the period. F Fees and expenses of any underlying Fidelity Central Funds are not included in the Fund's expense ratio. The Fund indirectly bears its proportionate share of the expenses of any underlying Fidelity Central Funds. G Amount does not include the portfolio activity of any underlying Fidelity Central Funds. H Expense ratios reflect operating expenses of the class. Expenses before reductions do not reflect amounts reimbursed by the investment adviser or reductions from brokerage service arrangements or reductions from other expense offset arrangements and do not represent the amount paid by the class during periods when reimbursements or reductions occur. Expenses net of fee waivers reflect expenses after reimbursement by the investment adviser but prior to reductions from brokerage service arrangements or other expense offset arrangements. Expenses net of all reductions represent the net expenses paid by the class. I For the year ended February 29. J Amount represents less than $.01 per share. K Total distributions of $.60 per share is comprised of distributions from net investment income of $.599 and distributions from net realized gain of $.000 per share. |
See accompanying notes which are an integral part of the financial statements.
Semiannual Report
Financial Highlights - Class B
| Six months ended
August 31, 2012 | Years ended February 28, |
| (Unaudited) | 2012 I | 2011 | 2010 | 2009 | 2008 I |
Selected Per-Share Data | | | | | | |
Net asset value, beginning of period | $ 74.01 | $ 66.83 | $ 60.37 | $ 43.53 | $ 62.69 | $ 58.00 |
Income from Investment Operations | | | | | | |
Net investment income (loss) E | .57 | .64 | .46 | .37 | .26 | .04 |
Net realized and unrealized gain (loss) | 4.47 | 8.61 | 6.98 | 16.82 | (19.01) | 7.27 |
Total from investment operations | 5.04 | 9.25 | 7.44 | 17.19 | (18.75) | 7.31 |
Distributions from net investment income | (.02) | (.43) | (.32) | (.35) | (.42) | (.19) |
Distributions from net realized gain | (.23) | (1.64) | (.66) | - | - | (2.44) |
Total distributions | (.25) | (2.07) | (.98) | (.35) | (.42) K | (2.63) |
Redemption fees added to paid in capital E | - J | - J | - J | - J | .01 | .01 |
Net asset value, end of period | $ 78.80 | $ 74.01 | $ 66.83 | $ 60.37 | $ 43.53 | $ 62.69 |
Total Return B, C, D | 6.83% | 14.06% | 12.35% | 39.48% | (29.96)% | 12.53% |
Ratios to Average Net Assets F, H | | | | | | |
Expenses before reductions | 1.89% A | 1.91% | 1.91% | 1.97% | 1.96% | 1.96% |
Expenses net of fee waivers, if any | 1.89% A | 1.91% | 1.91% | 1.97% | 1.96% | 1.96% |
Expenses net of all reductions | 1.89% A | 1.90% | 1.91% | 1.97% | 1.96% | 1.96% |
Net investment income (loss) | 1.51% A | .93% | .73% | .68% | .50% | .06% |
Supplemental Data | | | | | | |
Net assets, end of period (000 omitted) | $ 18,982 | $ 19,330 | $ 20,033 | $ 21,099 | $ 14,929 | $ 4,884 |
Portfolio turnover rate G | 26% A | 35% | 57% | 69% | 70% | 71% |
A Annualized B Total returns for periods of less than one year are not annualized. C Total returns would have been lower if certain expenses had not been reduced during the applicable periods shown. D Total returns do not include the effect of the contingent deferred sales charge. E Calculated based on average shares outstanding during the period. F Fees and expenses of any underlying Fidelity Central Funds are not included in the Fund's expense ratio. The Fund indirectly bears its proportionate share of the expenses of any underlying Fidelity Central Funds. G Amount does not include the portfolio activity of any underlying Fidelity Central Funds. H Expense ratios reflect operating expenses of the class. Expenses before reductions do not reflect amounts reimbursed by the investment adviser or reductions from brokerage service arrangements or reductions from other expense offset arrangements and do not represent the amount paid by the class during periods when reimbursements or reductions occur. Expenses net of fee waivers reflect expenses after reimbursement by the investment adviser but prior to reductions from brokerage service arrangements or other expense offset arrangements. Expenses net of all reductions represent the net expenses paid by the class. I For the year ended February 29. J Amount represents less than $.01 per share. K Total distributions of $.42 per share is comprised of distributions from net investment income of $.418 and distributions from net realized gain of $.000 per share. |
Financial Highlights - Class C
| Six months ended
August 31, 2012 | Years ended February 28, |
| (Unaudited) | 2012 I | 2011 | 2010 | 2009 | 2008 I |
Selected Per-Share Data | | | | | | |
Net asset value, beginning of period | $ 73.75 | $ 66.71 | $ 60.29 | $ 43.46 | $ 62.61 | $ 57.99 |
Income from Investment Operations | | | | | | |
Net investment income (loss) E | .59 | .68 | .49 | .41 | .28 | .06 |
Net realized and unrealized gain (loss) | 4.45 | 8.59 | 7.00 | 16.80 | (19.00) | 7.28 |
Total from investment operations | 5.04 | 9.27 | 7.49 | 17.21 | (18.72) | 7.34 |
Distributions from net investment income | (.02) | (.59) | (.41) | (.38) | (.44) | (.29) |
Distributions from net realized gain | (.23) | (1.64) | (.66) | - | - | (2.44) |
Total distributions | (.25) | (2.23) | (1.07) | (.38) | (.44) K | (2.73) |
Redemption fees added to paid in capital E | - J | - J | - J | - J | .01 | .01 |
Net asset value, end of period | $ 78.54 | $ 73.75 | $ 66.71 | $ 60.29 | $ 43.46 | $ 62.61 |
Total Return B, C, D | 6.86% | 14.14% | 12.44% | 39.59% | (29.94)% | 12.58% |
Ratios to Average Net Assets F, H | | | | | | |
Expenses before reductions | 1.83% A | 1.85% | 1.86% | 1.90% | 1.93% | 1.93% |
Expenses net of fee waivers, if any | 1.83% A | 1.85% | 1.86% | 1.90% | 1.93% | 1.93% |
Expenses net of all reductions | 1.83% A | 1.84% | 1.85% | 1.89% | 1.93% | 1.92% |
Net investment income (loss) | 1.57% A | .99% | .79% | .75% | .52% | .09% |
Supplemental Data | | | | | | |
Net assets, end of period (000 omitted) | $ 118,687 | $ 102,321 | $ 81,239 | $ 73,829 | $ 54,902 | $ 19,791 |
Portfolio turnover rate G | 26% A | 35% | 57% | 69% | 70% | 71% |
A Annualized B Total returns for periods of less than one year are not annualized. C Total returns would have been lower if certain expenses had not been reduced during the applicable periods shown. D Total returns do not include the effect of the contingent deferred sales charge. E Calculated based on average shares outstanding during the period. F Fees and expenses of any underlying Fidelity Central Funds are not included in the Fund's expense ratio. The Fund indirectly bears its proportionate share of the expenses of any underlying Fidelity Central Funds. G Amount does not include the portfolio activity of any underlying Fidelity Central Funds. H Expense ratios reflect operating expenses of the class. Expenses before reductions do not reflect amounts reimbursed by the investment adviser or reductions from brokerage service arrangements or reductions from other expense offset arrangements and do not represent the amount paid by the class during periods when reimbursements or reductions occur. Expenses net of fee waivers reflect expenses after reimbursement by the investment adviser but prior to reductions from brokerage service arrangements or other expense offset arrangements. Expenses net of all reductions represent the net expenses paid by the class. I For the year ended February 29. J Amount represents less than $.01 per share. K Total distributions of $.44 per share is comprised of distributions from net investment income of $.443 and distributions from net realized gain of $.000 per share. |
See accompanying notes which are an integral part of the financial statements.
Semiannual Report
Financial Highlights - Consumer Staples
| Six months ended
August 31, 2012 | Years ended February 28, |
| (Unaudited) | 2012 H | 2011 | 2010 | 2009 | 2008 H |
Selected Per-Share Data | | | | | | |
Net asset value, beginning of period | $ 75.29 | $ 67.98 | $ 61.34 | $ 44.14 | $ 63.25 | $ 58.13 |
Income from Investment Operations | | | | | | |
Net investment income (loss) D | 1.00 | 1.42 | 1.14 | .96 | .88 | .71 |
Net realized and unrealized gain (loss) | 4.55 | 8.76 | 7.14 | 17.11 | (19.31) | 7.30 |
Total from investment operations | 5.55 | 10.18 | 8.28 | 18.07 | (18.43) | 8.01 |
Distributions from net investment income | (.15) | (1.24) | (.98) | (.87) | (.67) | (.46) |
Distributions from net realized gain | (.23) | (1.64) | (.66) | - | (.03) | (2.44) |
Total distributions | (.38) | (2.87) K | (1.64) | (.87) | (.69) J | (2.90) |
Redemption fees added to paid in capital D | - I | - I | - I | - I | .01 | .01 |
Net asset value, end of period | $ 80.46 | $ 75.29 | $ 67.98 | $ 61.34 | $ 44.14 | $ 63.25 |
Total Return B, C | 7.41% | 15.30% | 13.55% | 40.96% | (29.23)% | 13.72% |
Ratios to Average Net Assets E, G | | | | | | |
Expenses before reductions | .81% A | .83% | .86% | .92% | .91% | .91% |
Expenses net of fee waivers, if any | .81% A | .83% | .86% | .92% | .91% | .90% |
Expenses net of all reductions | .81% A | .82% | .86% | .91% | .90% | .90% |
Net investment income (loss) | 2.59% A | 2.01% | 1.78% | 1.73% | 1.55% | 1.12% |
Supplemental Data | | | | | | |
Net assets, end of period (000 omitted) | $ 1,346,638 | $ 1,202,440 | $ 877,548 | $ 946,455 | $ 657,263 | $ 655,224 |
Portfolio turnover rate F | 26% A | 35% | 57% | 69% | 70% | 71% |
A Annualized B Total returns for periods of less than one year are not annualized. C Total returns would have been lower if certain expenses had not been reduced during the applicable periods shown. D Calculated based on average shares outstanding during the period. E Fees and expenses of any underlying Fidelity Central Funds are not included in the Fund's expense ratio. The Fund indirectly bears its proportionate share of the expenses of any underlying Fidelity Central Funds. F Amount does not include the portfolio activity of any underlying Fidelity Central Funds. G Expense ratios reflect operating expenses of the class. Expenses before reductions do not reflect amounts reimbursed by the investment adviser or reductions from brokerage service arrangements or reductions from other expense offset arrangements and do not represent the amount paid by the class during periods when reimbursements or reductions occur. Expenses net of fee waivers reflect expenses after reimbursement by the investment adviser but prior to reductions from brokerage service arrangements or other expense offset arrangements. Expenses net of all reductions represent the net expenses paid by the class. H For the year ended February 29. I Amount represents less than $.01 per share. J Total distributions of $.69 per share is comprised of distributions from net investment income of $.668 and distributions from net realized gain of $.025 per share. K Total distributions of $2.87 per share is comprised of distributions from net investment income of $1.236 and distributions from net realized gain of $1.637 per share. |
Financial Highlights - Institutional Class
| Six months ended August 31, 2012 | Years ended February 28, |
| (Unaudited) | 2012 H | 2011 | 2010 | 2009 | 2008 H |
Selected Per-Share Data | | | | | | |
Net asset value, beginning of period | $ 75.14 | $ 67.84 | $ 61.26 | $ 44.07 | $ 63.22 | $ 58.12 |
Income from Investment Operations | | | | | | |
Net investment income (loss) D | .99 | 1.39 | 1.15 | .98 | .82 | .74 |
Net realized and unrealized gain (loss) | 4.54 | 8.73 | 7.13 | 17.09 | (19.23) | 7.30 |
Total from investment operations | 5.53 | 10.12 | 8.28 | 18.07 | (18.41) | 8.04 |
Distributions from net investment income | (.15) | (1.19) | (1.04) | (.88) | (.73) | (.51) |
Distributions from net realized gain | (.23) | (1.64) | (.66) | - | (.03) | (2.44) |
Total distributions | (.38) | (2.82) K | (1.70) | (.88) | (.75) J | (2.95) |
Redemption fees added to paid in capital D | - I | - I | - I | - I | .01 | .01 |
Net asset value, end of period | $ 80.29 | $ 75.14 | $ 67.84 | $ 61.26 | $ 44.07 | $ 63.22 |
Total Return B,C | 7.40% | 15.24% | 13.57% | 41.03% | (29.22)% | 13.77% |
Ratios to Average Net Assets E, G | | | | | | |
Expenses before reductions | .84% A | .87% | .87% | .86% | .91% | .85% |
Expenses net of fee waivers, if any | .84% A | .87% | .87% | .86% | .91% | .85% |
Expenses net of all reductions | .84% A | .87% | .87% | .86% | .91% | .84% |
Net investment income (loss) | 2.56% A | 1.96% | 1.77% | 1.78% | 1.54% | 1.17% |
Supplemental Data | | | | | | |
Net assets, end of period (000 omitted) | $ 242,524 | $ 163,544 | $ 237,883 | $ 36,152 | $ 30,922 | $ 10,384 |
Portfolio turnover rate F | 26% A | 35% | 57% | 69% | 70% | 71% |
A Annualized B Total returns for periods of less than one year are not annualized. C Total returns would have been lower if certain expenses had not been reduced during the applicable periods shown. D Calculated based on average shares outstanding during the period. E Fees and expenses of any underlying Fidelity Central Funds are not included in the Fund's expense ratio. The Fund indirectly bears its proportionate share of the expenses of any underlying Fidelity Central Funds. F Amount does not include the portfolio activity of any underlying Fidelity Central Funds. G Expense ratios reflect operating expenses of the class. Expenses before reductions do not reflect amounts reimbursed by the investment adviser or reductions from brokerage service arrangements or reductions from other expense offset arrangements and do not represent the amount paid by the class during periods when reimbursements or reductions occur. Expenses net of fee waivers reflect expenses after reimbursement by the investment adviser but prior to reductions from brokerage service arrangements or other expense offset arrangements. Expenses net of all reductions represent the net expenses paid by the class. H For the year ended February 29. I Amount represents less than $.01 per share. J Total distributions of $.75 per share is comprised of distributions from net investment income of $.726 and distributions from net realized gain of $.025 per share. K Total distributions of $2.82 per share is comprised of distributions from net investment income of $1.186 and distributions from net realized gain of $1.637 per share. |
See accompanying notes which are an integral part of the financial statements.
Semiannual Report
Notes to Financial Statements
For the period ended August 31, 2012 (Unaudited)
1. Organization.
Consumer Staples Portfolio (the Fund) is a non-diversified fund of Fidelity Select Portfolios (the Trust) and is authorized to issue an unlimited number of shares. The Trust is registered under the Investment Company Act of 1940, as amended (the 1940 Act), as an open-end management investment company organized as a Massachusetts business trust. The Fund invests primarily in securities of companies whose principal business activities fall within specific industries. The Fund offers Class A, Class T, Class C, Consumer Staples and Institutional Class shares, each of which, along with Class B shares, has equal rights as to assets and voting privileges. Effective after the close of business on September 1, 2010, Class B shares were closed to new accounts and additional purchases, except for exchanges and reinvestments. Each class has exclusive voting rights with respect to matters that affect that class. Class B shares will automatically convert to Class A shares after a holding period of seven years from the initial date of purchase. Investment income, realized and unrealized capital gains and losses, the common expenses of the Fund, and certain fund-level expense reductions, if any, are allocated on a pro-rata basis to each class based on the relative net assets of each class to the total net assets of the Fund. Each class differs with respect to transfer agent and distribution and service plan fees incurred. Certain expense reductions may also differ by class.
2. Investments in Fidelity Central Funds.
The Fund invests in Fidelity Central Funds, which are open-end investment companies available only to other investment companies and accounts managed by Fidelity Management & Research Company (FMR) and its affiliates. The Fund's Schedule of Investments lists each of the Fidelity Central Funds held as of period end, if any, as an investment of the Fund, but does not include the underlying holdings of each Fidelity Central Fund. As an Investing Fund, the Fund indirectly bears its proportionate share of the expenses of the underlying Fidelity Central Funds.
The Money Market Central Funds seek preservation of capital and current income and are managed by Fidelity Investments Money Management, Inc. (FIMM), an affiliate of FMR.
A complete unaudited list of holdings for each Fidelity Central Fund is available upon request or at the Securities and Exchange Commission (the SEC) web site at www.sec.gov. In addition, the financial statements of the Fidelity Central Funds are available on the SEC web site or upon request.
3. Significant Accounting Policies.
The financial statements have been prepared in conformity with accounting principles generally accepted in the United States of America (GAAP), which require management to make certain estimates and assumptions at the date of the financial statements. Actual results could differ from those estimates. Subsequent events, if any, through the date that the financial statements were issued have been evaluated in the preparation of the financial statements. The following summarizes the significant accounting policies of the Fund:
Security Valuation. Investments are valued as of 4:00 p.m. Eastern time on the last calendar day of the period. In accordance with valuation policies and procedures approved by the Board of Trustees (the Board), the Fund attempts to obtain prices from one or more third party pricing vendor or broker to value its investments. When current market prices, quotations or rates are not readily available or reliable, securities will be fair valued in good faith by the FMR Fair Value Committee (the Committee), in accordance with procedures adopted by the Fund's Board. Factors used in determining fair value vary by security type and may include market or security specific events. The frequency with which these procedures are used cannot be predicted and they may be utilized to a significant extent. The Committee oversees the Fund's valuation policies and procedures and is responsible for approving and reporting to the Board all fair value determinations.
The Fund categorizes the inputs to valuation techniques used to value its investments into a disclosure hierarchy consisting of three levels as shown below:
Level 1 - quoted prices in active markets for identical investments
Level 2 - other significant observable inputs (including quoted prices for similar investments, interest rates, prepayment speeds, etc.)
Level 3 - unobservable inputs (including the Fund's own assumptions based on the best information available)
Valuation techniques used to value the Fund's investments by major category are as follows:
Equity securities, including restricted securities, for which market quotations are readily available, are valued at the last reported sale price or official closing price as reported by a third party pricing vendor on the primary market or exchange on which they are traded and are categorized as Level 1 in the hierarchy. In the event there were no sales during the day or closing prices are not available, securities are valued at the last quoted bid price or may be valued using the last available price and are generally categorized as Level 2 in the hierarchy. For foreign equity securities, when significant market or security specific events arise, comparisons to the valuation of American Depositary Receipts (ADRs), futures contracts, Exchange-Traded Funds (ETFs) and certain indexes as well as quoted prices for similar securities are used and are categorized as Level 2 in the hierarchy. Utilizing these techniques may result in transfers between Level 1 and Level 2.
Semiannual Report
Notes to Financial Statements (Unaudited) - continued
3. Significant Accounting Policies - continued
Security Valuation - continued
Investments in open-end mutual funds, including the Fidelity Central Funds, are valued at their closing net asset value each business day and are categorized as Level 1 in the hierarchy.
Changes in valuation techniques may result in transfers in or out of an assigned level within the disclosure hierarchy. The aggregate value of investments by input level, as of August 31, 2012, is included at the end of the Fund's Schedule of Investments.
Foreign Currency Translation. The Fund may use foreign currency contracts to facilitate transactions in foreign-denominated securities. Gains and losses from these transactions may arise from changes in the value of the foreign currency or if the counterparties do not perform under the contracts' terms.
Foreign-denominated assets, including investment securities, and liabilities are translated into U.S. dollars at the exchange rates at period end. Purchases and sales of investment securities, income and dividends received and expenses denominated in foreign currencies are translated into U.S. dollars at the exchange rate in effect on the transaction date.
The effects of exchange rate fluctuations on investments are included with the net realized and unrealized gain (loss) on investment securities. Other foreign currency transactions resulting in realized and unrealized gain (loss) are disclosed separately.
Investment Transactions and Income. For financial reporting purposes, the Fund's investment holdings and NAV include trades executed through the end of the last business day of the period. The NAV per share for processing shareholder transactions is calculated as of the close of business of the New York Stock Exchange (NYSE), normally 4:00 p.m. Eastern time and includes trades executed through the end of the prior business day. Gains and losses on securities sold are determined on the basis of identified cost and may include proceeds received from litigation. Dividend income is recorded on the ex-dividend date, except for certain dividends from foreign securities where the ex-dividend date may have passed, which are recorded as soon as the Fund is informed of the ex-dividend date. Non-cash dividends included in dividend income, if any, are recorded at the fair market value of the securities received. Interest income and distributions from the Fidelity Central Funds are accrued as earned. Interest income includes coupon interest and amortization of premium and accretion of discount on debt securities. Investment income is recorded net of foreign taxes withheld where recovery of such taxes is uncertain.
Expenses. Expenses directly attributable to a fund are charged to that fund. Expenses attributable to more than one fund are allocated among the respective funds on the basis of relative net assets or other appropriate methods. Expense estimates are accrued in the period to which they relate and adjustments are made when actual amounts are known.
Income Tax Information and Distributions to Shareholders. Each year, the Fund intends to qualify as a regulated investment company under Subchapter M of the Internal Revenue Code, including distributing substantially all of its taxable income and realized gains. As a result, no provision for income taxes is required. The Fund files a U.S. federal tax return, in addition to state and local tax returns as required. A fund's federal income tax returns are subject to examination by the Internal Revenue Service (IRS) for a period of three fiscal years after they are filed. State and local tax returns may be subject to examination for an additional fiscal year depending on the jurisdiction. Foreign taxes are provided for based on the Fund's understanding of the tax rules and rates that exist in the foreign markets in which it invests.
Distributions are declared and recorded on the ex-dividend date. Income dividends and capital gain distributions are declared separately for each class. Income and capital gain distributions are determined in accordance with income tax regulations, which may differ from GAAP.
Capital accounts within the financial statements are adjusted for permanent book-tax differences. These adjustments have no impact on net assets or the results of operations. Temporary book-tax differences will reverse in a subsequent period.
Book-tax differences are primarily due to foreign currency transactions, deferred trustees compensation and losses deferred due to wash sales and excise tax regulations.
The federal tax cost of investment securities and unrealized appreciation (depreciation) as of period end were as follows:
Gross unrealized appreciation | $ 449,954,508 |
Gross unrealized depreciation | (13,909,293) |
Net unrealized appreciation (depreciation) on securities and other investments | $ 436,045,215 |
| |
Tax cost | $ 1,577,558,646 |
Semiannual Report
3. Significant Accounting Policies - continued
Trading (Redemption) Fees. Shares held by investors in the Fund less than 30 days are subject to a redemption fee equal to .75% of the net asset value of shares redeemed. All redemption fees, which reduce the proceeds of the shareholder redemption, are retained by the Fund and accounted for as an addition to paid in capital.
New Accounting Pronouncement. In December 2011, the Financial Accounting Standards Board issued Accounting Standard Update No. 2011-11, Disclosures about Offsetting Assets and Liabilities. The update creates new disclosure requirements requiring entities to disclose both gross and net information for derivatives and other financial instruments that are either offset in the Statement of Assets and Liabilities or subject to an enforceable master netting arrangement or similar agreement. The disclosure requirements are effective for annual reporting periods beginning on or after January 1, 2013, and interim periods within those annual periods. Management is currently evaluating the impact of the update's adoption on the Fund's financial statement disclosures.
4. Purchases and Sales of Investments.
Purchases and sales of securities, other than short-term securities, aggregated $356,755,501 and $231,699,991, respectively.
5. Fees and Other Transactions with Affiliates.
Management Fee. FMR and its affiliates provide the Fund with investment management related services for which the Fund pays a monthly management fee. The management fee is the sum of an individual fund fee rate that is based on an annual rate of .30% of the Fund's average net assets and an annualized group fee rate that averaged .26% during the period. The group fee rate is based upon the average net assets of all the mutual funds advised by FMR. The group fee rate decreases as assets under management increase and increases as assets under management decrease. For the period, the total annualized management fee rate was .56% of the Fund's average net assets.
Distribution and Service Plan Fees. In accordance with Rule 12b-1 of the 1940 Act, the Fund has adopted separate Distribution and Service Plans for each class of shares. Certain classes pay Fidelity Distributors Corporation (FDC), an affiliate of FMR, separate Distribution and Service Fees, each of which is based on an annual percentage of each class' average net assets. In addition, FDC may pay financial intermediaries for selling shares of the Fund and providing shareholder support services. For the period, the Distribution and Service Fee rates, total fees and amounts retained by FDC were as follows:
| Distribution
Fee | Service
Fee | Total Fees | Retained
by FDC |
Class A | -% | .25% | $ 270,937 | $ 2,352 |
Class T | .25% | .25% | 102,390 | - |
Class B | .75% | .25% | 94,339 | 70,754 |
Class C | .75% | .25% | 542,205 | 107,255 |
| | | $ 1,009,871 | $ 180,361 |
Sales Load. FDC may receive a front-end sales charge of up to 5.75% for selling Class A shares and 3.50% for selling Class T shares, some of which is paid to financial intermediaries for selling shares of the Fund. Depending on the holding period, FDC may receive contingent deferred sales charges levied on Class A, Class T, Class B, and Class C redemptions. The deferred sales charges range from 5.00% to 1.00% for Class B shares, 1.00% for Class C shares, 1.00% for certain purchases of Class A shares and .25% for certain purchases of Class T shares.
For the period, sales charge amounts retained by FDC were as follows:
| Retained
by FDC |
Class A | $ 84,035 |
Class T | 10,633 |
Class B* | 20,622 |
Class C* | 9,152 |
| $ 124,442 |
* When Class B and Class C shares are initially sold, FDC pays commissions from its own resources to financial intermediaries through which the sales are made.
Transfer Agent Fees. Fidelity Investments Institutional Operations Company, Inc. (FIIOC), an affiliate of FMR, is the transfer, dividend disbursing and shareholder servicing agent for each class of the Fund. FIIOC receives account fees and asset-based fees that vary according to the account size
Semiannual Report
Notes to Financial Statements (Unaudited) - continued
5. Fees and Other Transactions with Affiliates - continued
Transfer Agent Fees - continued
and type of account of the shareholders of the respective classes of the Fund. FIIOC pays for typesetting, printing and mailing of shareholder reports, except proxy statements. For the period, transfer agent fees for each class were as follows:
| Amount | % of
Average
Net Assets* |
Class A | $ 248,375 | .23 |
Class T | 52,988 | .26 |
Class B | 27,048 | .29 |
Class C | 121,555 | .22 |
Consumer Staples | 1,298,635 | .21 |
Institutional Class | 236,757 | .23 |
| $ 1,985,358 | |
* Annualized
Accounting and Security Lending Fees. Fidelity Service Company, Inc. (FSC), an affiliate of FMR, maintains the Fund's accounting records. The accounting fee is based on the level of average net assets for each month. Under a separate contract, FSC administers the security lending program. The security lending fee is based on the number and duration of lending transactions.
Brokerage Commissions. The Fund placed a portion of its portfolio transactions with brokerage firms which are affiliates of the investment adviser. The commissions paid to these affiliated firms were $6,847 for the period.
Interfund Lending Program. Pursuant to an Exemptive Order issued by the SEC, the Fund, along with other registered investment companies having management contracts with FMR, may participate in an interfund lending program. This program provides an alternative credit facility allowing the funds to borrow from, or lend money to, other participating affiliated funds. At period end, there were no interfund loans outstanding. The Fund's activity in this program during the period for which loans were outstanding was as follows:
Borrower or Lender | Average Loan
Balance | Weighted Average
Interest Rate | Interest
Expense |
Borrower | $ 12,984,167 | .41% | $ 887 |
6. Committed Line of Credit.
The Fund participates with other funds managed by FMR or an affiliate in a $4.25 billion credit facility (the "line of credit") to be utilized for temporary or emergency purposes to fund shareholder redemptions or for other short-term liquidity purposes. The Fund has agreed to pay commitment fees on its pro-rata portion of the line of credit, which amounted to $2,500 and is reflected in Miscellaneous expenses on the Statement of Operations. During the period, there were no borrowings on this line of credit.
7. Security Lending.
The Fund lends portfolio securities through a lending agent from time to time in order to earn additional income. For equity securities, a lending agent is used and may loan securities to certain qualified borrowers, including Fidelity Capital Markets (FCM), a broker-dealer affiliated with the Fund. On the settlement date of the loan, the Fund receives collateral (in the form of U.S. Treasury obligations, letters of credit and/or cash) against the loaned securities and maintains collateral in an amount not less than 100% of the market value of the loaned securities during the period of the loan. The market value of the loaned securities is determined at the close of business of the Fund and any additional required collateral is delivered to the Fund on the next business day. If the borrower defaults on its obligation to return the securities loaned because of insolvency or other reasons, a fund could experience delays and costs in recovering the securities loaned or in gaining access to the collateral. Any cash collateral received is invested in the Fidelity Securities Lending Cash Central Fund. The value of loaned securities and cash collateral at period end are disclosed on the Fund's Statement of Assets and Liabilities. Security lending income represents the income earned on investing cash collateral, less rebates paid to borrowers and any lending agent fees associated with the loan, plus any premium payments received for lending certain types of securities. Security lending income is presented in the Statement of Operations as a component of income from Fidelity Central Funds. Total security lending income during the period amounted to $344,609. During the period, there were no securities loaned to FCM.
Semiannual Report
8. Expense Reductions.
Many of the brokers with whom FMR places trades on behalf of the Fund provided services in addition to trade execution. These services included payments of certain expenses on behalf of the Fund totaling $21,953 for the period. In addition, through arrangements with the Fund's custodian, credits realized as a result of uninvested cash balances were used to reduce the Fund's expenses. During the period, these credits reduced the Fund's custody expenses by $50.
9. Distributions to Shareholders.
Distributions to shareholders of each class were as follows:
| Six months ended
August 31,
2012 | Year ended
February 29,
2012 |
From net investment income | | |
Class A | $ 323,577 | $ 2,690,167 |
Class T | 45,344 | 422,197 |
Class B | 4,298 | 114,208 |
Class C | 29,567 | 829,469 |
Consumer Staples | 2,475,321 | 18,061,907 |
Institutional Class | 403,069 | 3,782,934 |
Total | $ 3,281,176 | $ 25,900,882 |
From net realized gain | | |
Class A | $ 630,693 | $ 4,102,363 |
Class T | 121,268 | 795,051 |
Class B | 58,156 | 441,952 |
Class C | 323,833 | 2,213,680 |
Consumer Staples | 3,745,551 | 23,446,773 |
Institutional Class | 605,920 | 5,216,838 |
Total | $ 5,485,421 | $ 36,216,657 |
10. Share Transactions.
Transactions for each class of shares were as follows:
| Shares | Dollars |
| Six months ended
August 31,
2012 | Year ended
February 29,
2012 | Six months ended
August 31,
2012 | Year ended
February 29,
2012 |
Class A | | | | |
Shares sold | 575,336 | 1,107,874 | $ 44,327,963 | $ 77,974,428 |
Reinvestment of distributions | 10,982 | 84,526 | 824,504 | 5,924,948 |
Shares redeemed | (371,007) | (816,686) | (28,336,652) | (57,527,748) |
Net increase (decrease) | 215,311 | 375,714 | $ 16,815,815 | $ 26,371,628 |
Class T | | | | |
Shares sold | 66,759 | 130,126 | $ 5,120,369 | $ 9,133,799 |
Reinvestment of distributions | 2,093 | 16,351 | 156,290 | 1,140,509 |
Shares redeemed | (36,979) | (90,239) | (2,801,960) | (6,276,410) |
Net increase (decrease) | 31,873 | 56,238 | $ 2,474,699 | $ 3,997,898 |
Class B | | | | |
Shares sold | 6,362 | 22,727 | $ 483,566 | $ 1,569,035 |
Reinvestment of distributions | 672 | 6,332 | 49,896 | 439,355 |
Shares redeemed | (27,320) | (67,638) | (2,066,228) | (4,695,265) |
Net increase (decrease) | (20,286) | (38,579) | $ (1,532,766) | $ (2,686,875) |
Class C | | | | |
Shares sold | 247,961 | 536,557 | $ 18,813,434 | $ 37,168,209 |
Reinvestment of distributions | 3,610 | 33,216 | 266,955 | 2,295,907 |
Shares redeemed | (127,849) | (400,115) | (9,590,639) | (28,068,157) |
Net increase (decrease) | 123,722 | 169,658 | $ 9,489,750 | $ 11,395,959 |
Semiannual Report
Notes to Financial Statements (Unaudited) - continued
10. Share Transactions - continued
| Shares | Dollars |
| Six months ended
August 31,
2012 | Year ended
February 29,
2012 | Six months ended
August 31,
2012 | Year ended
February 29,
2012 |
Consumer Staples | | | | |
Shares sold | 3,097,202 | 7,156,716 | $ 239,128,527 | $ 509,488,908 |
Reinvestment of distributions | 79,360 | 566,253 | 5,989,308 | 39,874,596 |
Shares redeemed | (2,410,148) | (4,661,196) | (182,123,770) | (330,401,040) |
Net increase (decrease) | 766,414 | 3,061,773 | $ 62,994,065 | $ 218,962,464 |
Institutional Class | | | | |
Shares sold | 1,388,318 | 2,454,993 | $ 107,435,083 | $ 173,115,499 |
Reinvestment of distributions | 11,821 | 115,398 | 890,360 | 8,111,953 |
Shares redeemed | (555,913) | (3,900,689) | (42,054,064) | (276,887,031) |
Net increase (decrease) | 844,226 | (1,330,298) | $ 66,271,379 | $ (95,659,579) |
11. Other.
The Fund's organizational documents provide former and current trustees and officers with a limited indemnification against liabilities arising in connection with the performance of their duties to the Fund. In the normal course of business, the Fund may also enter into contracts that provide general indemnifications. The Fund's maximum exposure under these arrangements is unknown as this would be dependent on future claims that may be made against the Fund. The risk of material loss from such claims is considered remote.
At the end of the period, Fidelity VIP FundsManager 60% Portfolio was the owner of record of approximately 12% of the total outstanding shares of the Fund. Mutual funds managed by FMR or its affiliates, were the owners of record in aggregate of approximately 25% of the total outstanding shares of the Fund.
Semiannual Report
Gold Portfolio
As a shareholder of the Fund, you incur two types of costs: (1) transaction costs, including sales charges (loads) on purchase payments or redemption proceeds, redemption fees and (2) ongoing costs, including management fees, distribution and/or service (12b-1) fees and other Fund expenses. This Example is intended to help you understand your ongoing costs (in dollars) of investing in the Fund and to compare these costs with the ongoing costs of investing in other mutual funds.
The Example is based on an investment of $1,000 invested at the beginning of the period and held for the entire period (March 1, 2012 to August 31, 2012).
Actual Expenses
The first line of the accompanying table for each class of the Fund provides information about actual account values and actual expenses. You may use the information in this line, together with the amount you invested, to estimate the expenses that you paid over the period. Simply divide your account value by $1,000.00 (for example, an $8,600 account value divided by $1,000.00 = 8.6), then multiply the result by the number in the first line for a class of the Fund under the heading entitled "Expenses Paid During Period" to estimate the expenses you paid on your account during this period. A small balance maintenance fee of $12.00 that is charged once a year may apply for certain accounts with a value of less than $2,000. This fee is not included in the table below. If it was, the estimate of expenses you paid during the period would be higher, and your ending account value lower, by this amount. In addition, the Fund, as a shareholder in the underlying Fidelity Central Funds, will indirectly bear its pro-rata share of the fees and expenses incurred by the underlying Fidelity Central Funds. These fees and expenses are not included in the Fund's annualized expense ratio used to calculate the expense estimate in the table below.
Hypothetical Example for Comparison Purposes
The second line of the accompanying table for each class of the Fund provides information about hypothetical account values and hypothetical expenses based on a Class' actual expense ratio and an assumed rate of return of 5% per year before expenses, which is not the Class' actual return. The hypothetical account values and expenses may not be used to estimate the actual ending account balance or expenses you paid for the period. You may use this information to compare the ongoing costs of investing in the Fund and other funds. To do so, compare this 5% hypothetical example with the 5% hypothetical examples that appear in the shareholder reports of the other funds. A small balance maintenance fee of $12.00 that is charged once a year may apply for certain accounts with a value of less than $2,000. This fee is not included in the table below. If it was, the estimate of expenses you paid during the period would be higher, and your ending account value lower, by this amount. In addition, the Fund, as a shareholder in the underlying Fidelity Central Funds, will indirectly bear its pro-rata share of the fees and expenses incurred by the underlying Fidelity Central Funds. These fees and expenses are not included in the Fund's annualized expense ratio used to calculate the expense estimate in the table below.
Please note that the expenses shown in the table are meant to highlight your ongoing costs only and do not reflect any transaction costs. Therefore, the second line of the table is useful in comparing ongoing costs only, and will not help you determine the relative total costs of owning different funds. In addition, if these transactional costs were included, your costs would have been higher.
| Annualized
Expense Ratio | Beginning
Account Value
March 1, 2012 | Ending
Account Value
August 31, 2012 | Expenses Paid
During Period*
March 1, 2012
to August 31, 2012 |
Class A | 1.17% | | | |
Actual | | $ 1,000.00 | $ 833.80 | $ 5.41 |
HypotheticalA | | $ 1,000.00 | $ 1,019.31 | $ 5.96 |
Class T | 1.44% | | | |
Actual | | $ 1,000.00 | $ 832.60 | $ 6.65 |
HypotheticalA | | $ 1,000.00 | $ 1,017.95 | $ 7.32 |
Class B | 1.92% | | | |
Actual | | $ 1,000.00 | $ 830.70 | $ 8.86 |
HypotheticalA | | $ 1,000.00 | $ 1,015.53 | $ 9.75 |
Class C | 1.92% | | | |
Actual | | $ 1,000.00 | $ 830.60 | $ 8.86 |
HypotheticalA | | $ 1,000.00 | $ 1,015.53 | $ 9.75 |
Gold | .92% | | | |
Actual | | $ 1,000.00 | $ 834.90 | $ 4.25 |
HypotheticalA | | $ 1,000.00 | $ 1,020.57 | $ 4.69 |
Institutional Class | .83% | | | |
Actual | | $ 1,000.00 | $ 835.20 | $ 3.84 |
HypotheticalA | | $ 1,000.00 | $ 1,021.02 | $ 4.23 |
A 5% return per year before expenses
* Expenses are equal to each Class' annualized expense ratio, multiplied by the average account value over the period, multiplied by 184/365 (to reflect the one-half year period).
Semiannual Report
Gold Portfolio
Investment Changes (Unaudited)
Top Ten Holdings as of August 31, 2012 |
| % of fund's
net assets | % of fund's net assets
6 months ago |
Goldcorp, Inc. | 13.0 | 12.2 |
Barrick Gold Corp. | 11.1 | 11.9 |
Newmont Mining Corp. | 8.1 | 9.0 |
Newcrest Mining Ltd. | 6.9 | 8.4 |
Yamana Gold, Inc. | 4.5 | 3.9 |
AngloGold Ashanti Ltd. sponsored ADR | 4.3 | 5.1 |
Randgold Resources Ltd. sponsored ADR | 4.0 | 3.6 |
Gold Bullion | 3.7 | 1.0 |
Kinross Gold Corp. | 3.6 | 4.0 |
Eldorado Gold Corp. | 3.6 | 2.7 |
| 62.8 | |
Top Industries (% of fund's net assets) |
As of August 31, 2012 |
| Gold | 94.7% | |
| Commodities & Related
Investments** | 3.8% | |
 | Precious Metals &
Minerals | 0.7% | |
 | Diversified Metals &
Mining | 0.3% | |
| Coal & Consumable Fuels | 0.2% | |
| All Others* | 0.3% | |

As of February 29, 2012 |
| Gold | 97.5% | |
 | Commodities & Related
Investments** | 1.0% | |
| Precious Metals &
Minerals | 0.9% | |
| Diversified Metals &
Mining | 0.2% | |
| Coal & Consumable Fuels | 0.1% | |
| Specialty Stores | 0.0% | |
| All Others* | 0.3% | |

* Includes short-term investments and net other assets. |
** Includes gold bullion and/or silver bullion. |
Geographic Diversification (% of fund's net assets) |
As of August 31, 2012 |
| Canada | 58.4% | |
| United States of America | 15.6% | |
| Australia | 9.9% | |
| South Africa | 8.8% | |
| Bailiwick of Jersey | 4.9% | |
| Peru | 1.2% | |
| United Kingdom | 0.6% | |
 | China | 0.5% | |
| Bermuda | 0.1% | |
| Other | 0.0% | |

Percentages are based on country or territory of incorporation and are adjusted for the effect of futures contracts, if applicable. |
As of February 29, 2012 |
| Canada | 55.8% | |
| United States of America | 12.7% | |
| Australia | 11.5% | |
| South Africa | 10.3% | |
| Bailiwick of Jersey | 4.5% | |
| China | 2.3% | |
| Peru | 2.1% | |
| United Kingdom | 0.8% | |
| Bermuda | 0.0% | |
| Other | 0.0% | |

Percentages are based on country or territory of incorporation and are adjusted for the effect of futures contracts, if applicable. |
Semiannual Report
Gold Portfolio
Consolidated Investments August 31, 2012 (Unaudited)
Showing Percentage of Net Assets
Common Stocks - 95.9% |
| Shares | | Value |
Australia - 9.9% |
METALS & MINING - 9.9% |
Gold - 9.9% |
ABM Resources NL (a) | 2,300,000 | | $ 106,931 |
Alkane Resources Ltd. | 195,000 | | 199,450 |
Ampella Mining Ltd. (a)(d) | 1,230,000 | | 660,803 |
Azumah Resources Ltd. (a) | 843,984 | | 108,995 |
Beadell Resources Ltd. (a) | 2,204,000 | | 1,776,109 |
CGA Mining Ltd.: | | | |
(Australia) (a) | 18,920 | | 40,267 |
(Canada) (a) | 525,000 | | 1,288,866 |
Evolution Mining Ltd. (a) | 2,258,235 | | 3,627,964 |
Focus Minerals Ltd. (a) | 2,300,000 | | 90,297 |
Gold One International Ltd. (a) | 90,277 | | 37,774 |
Gryphon Minerals Ltd. (a) | 2,707,692 | | 1,748,408 |
Integra Mining Ltd. (a) | 1,415,000 | | 687,096 |
Intrepid Mines Ltd.: | | | |
(Australia) (a) | 9,209,798 | | 2,616,653 |
(Canada) (a) | 320,000 | | 97,388 |
Kingsgate Consolidated NL (d) | 2,908,274 | | 12,860,044 |
Kula Gold Ltd. (a) | 31,245 | | 15,172 |
Marengo Mining Ltd. (a) | 560,000 | | 69,428 |
Medusa Mining Ltd. | 2,552,885 | | 13,108,440 |
Newcrest Mining Ltd. | 9,560,792 | | 243,486,101 |
Papillon Resources Ltd. (a)(d) | 130,000 | | 150,427 |
Perseus Mining Ltd.: | | | |
(Australia) (a) | 5,504,308 | | 13,932,601 |
(Canada) (a) | 1,300,000 | | 3,494,801 |
Ramelius Resources Ltd. (a) | 980,000 | | 415,120 |
Red 5 Ltd. (a) | 475,000 | | 679,684 |
Regis Resources Ltd. (a) | 5,143,292 | | 25,187,375 |
Resolute Mining Ltd. (a) | 4,911,661 | | 7,484,862 |
Saracen Mineral Holdings Ltd. (a) | 735,000 | | 265,778 |
Silver Lake Resources Ltd. (a)(d) | 1,061,000 | | 3,255,631 |
St Barbara Ltd. (a)(d) | 5,059,676 | | 7,736,558 |
Tanami Gold NL (a)(d) | 130,000 | | 114,163 |
Troy Resources NL (a)(f) | 734,826 | | 3,265,065 |
| | 348,608,251 |
Bailiwick of Jersey - 4.9% |
METALS & MINING - 4.9% |
Gold - 4.9% |
Centamin PLC (a) | 12,211,900 | | 15,415,579 |
Lydian International Ltd. (a) | 170,000 | | 413,898 |
Polyus Gold International Ltd. sponsored GDR | 5,848,190 | | 17,720,016 |
Randgold Resources Ltd. sponsored ADR | 1,359,067 | | 139,943,129 |
| | 173,492,622 |
|
| Shares | | Value |
Bermuda - 0.1% |
METALS & MINING - 0.1% |
Gold - 0.1% |
Continental Gold Ltd. (a) | 450,100 | | $ 3,433,682 |
G-Resources Group Ltd. (a) | 12,891,000 | | 590,038 |
| | 4,023,720 |
Canada - 58.4% |
METALS & MINING - 58.4% |
Diversified Metals & Mining - 0.3% |
Copper Mountain Mining Corp. (a) | 97,000 | | 257,814 |
East Asia Minerals Corp. (a) | 5,000 | | 812 |
Eastmain Resources, Inc. (a) | 10,000 | | 9,029 |
Kimber Resources, Inc. (a)(e) | 16,100 | | 11,433 |
Kimber Resources, Inc. (a)(e)(f) | 5,832,000 | | 4,141,415 |
NovaCopper, Inc. (a)(d) | 488,333 | | 1,223,619 |
Sabina Gold & Silver Corp. (a) | 465,000 | | 1,551,965 |
Turquoise Hill Resources Ltd. (a) | 350,750 | | 2,818,098 |
| | 10,014,185 |
Gold - 57.5% |
Agnico-Eagle Mines Ltd. (Canada) (d) | 2,135,400 | | 103,136,083 |
Alacer Gold Corp. (a) | 3,409,063 | | 20,473,399 |
Alamos Gold, Inc. | 1,948,800 | | 36,633,288 |
Argonaut Gold, Inc. (a) | 1,084,800 | | 10,014,385 |
ATAC Resources Ltd. (a) | 67,200 | | 175,882 |
Aura Minerals, Inc. (a) | 10,000 | | 4,109 |
AuRico Gold, Inc. (a) | 3,978,563 | | 27,647,128 |
Aurizon Mines Ltd. (a) | 2,366,900 | | 9,628,475 |
Avion Gold Corp. (a) | 5,290,000 | | 3,756,531 |
B2Gold Corp. (a) | 6,022,400 | | 23,032,664 |
Banro Corp. (a) | 3,713,482 | | 15,972,776 |
Barrick Gold Corp. (d) | 10,139,019 | | 390,955,224 |
Belo Sun Mining Corp. (a) | 405,000 | | 480,700 |
Canaco Resources, Inc. (a) | 710,100 | | 252,128 |
Canaco Resources, Inc. (a)(f) | 561,600 | | 199,401 |
Centerra Gold, Inc. | 2,042,200 | | 15,537,915 |
Claude Resources, Inc. (a) | 40,000 | | 28,405 |
Colossus Minerals, Inc. (a) | 1,591,100 | | 7,102,044 |
Detour Gold Corp. (a) | 818,800 | | 20,599,787 |
Detour Gold Corp. (a)(f) | 785,900 | | 19,772,072 |
Eldorado Gold Corp. | 9,506,708 | | 126,241,753 |
Exeter Resource Corp. (a) | 272,300 | | 483,414 |
Franco-Nevada Corp. (d) | 1,689,900 | | 87,670,795 |
Gabriel Resources Ltd. (a) | 725,000 | | 1,698,960 |
Goldcorp, Inc. (d) | 11,229,100 | | 461,011,083 |
Golden Predator Corp. (a) | 5,000 | | 1,725 |
GoldQuest Mining Corp. (a) | 340,000 | | 538,067 |
Gran Colombia Gold Corp. (a) | 1,765,000 | | 599,822 |
Great Basin Gold Ltd. (a)(d) | 1,447,298 | | 278,962 |
Guyana Goldfields, Inc. (a) | 1,176,400 | | 3,126,724 |
Guyana Goldfields, Inc. (a)(f) | 155,000 | | 411,971 |
IAMGOLD Corp. | 4,873,200 | | 63,723,609 |
Common Stocks - continued |
| Shares | | Value |
Canada - continued |
METALS & MINING - CONTINUED |
Gold - continued |
International Minerals Corp.: | | | |
(Canada) (a) | 157,100 | | $ 838,292 |
(Switzerland) (a) | 15,000 | | 78,716 |
International Tower Hill Mines Ltd. (a) | 546,700 | | 1,597,257 |
Keegan Resources, Inc. (a) | 35,000 | | 129,597 |
Kinross Gold Corp. | 14,498,891 | | 128,846,346 |
Kinross Gold Corp. warrants 9/17/14 (a) | 1,192,793 | | 617,118 |
Kirkland Lake Gold, Inc. (a) | 906,000 | | 12,527,294 |
Lake Shore Gold Corp. (a) | 3,961,600 | | 4,018,869 |
Midas Gold Corp. (a) | 15,000 | | 39,564 |
New Gold, Inc. (a) | 6,990,855 | | 77,443,709 |
Novagold Resources, Inc. (a)(d) | 2,930,000 | | 13,672,838 |
OceanaGold Corp. (a) | 1,610,000 | | 4,246,513 |
Orezone Gold Corp. (a)(d) | 312,100 | | 585,732 |
Orvana Minerals Corp. (a)(d) | 10,000 | | 9,029 |
Osisko Mining Corp. (a) | 2,641,500 | | 25,644,591 |
Osisko Mining Corp. (a)(f) | 3,000,000 | | 29,125,032 |
Pilot Gold, Inc. (a) | 131,250 | | 139,805 |
Premier Gold Mines Ltd. (a) | 4,142,500 | | 21,768,349 |
Pretium Resources, Inc. (a) | 200,000 | | 2,960,183 |
Pretium Resources, Inc. (a)(f) | 225,000 | | 3,330,205 |
Pretium Resources, Inc. (a)(g) | 225,000 | | 3,330,205 |
Primero Mining Corp. (a) | 504,300 | | 2,281,692 |
Queenston Mining, Inc. (a) | 659,900 | | 2,202,456 |
Rainy River Resources Ltd. (a) | 1,882,500 | | 8,880,167 |
Richmont Mines, Inc. (a) | 30,000 | | 125,082 |
Romarco Minerals, Inc. (a) | 9,968,000 | | 8,291,920 |
Romarco Minerals, Inc. (a)(f) | 5,900,000 | | 4,907,938 |
Rubicon Minerals Corp. (a) | 2,851,352 | | 9,979,370 |
San Gold Corp. (a) | 4,634,400 | | 3,620,074 |
Seabridge Gold, Inc. (a) | 601,905 | | 10,105,983 |
SEMAFO, Inc. | 4,346,900 | | 16,404,228 |
St. Andrew Goldfields Ltd. (a) | 360,000 | | 158,864 |
Sulliden Gold Corp. Ltd. (a) | 1,700,400 | | 2,380,474 |
Teranga Gold Corp. (a) | 35,000 | | 71,367 |
Teranga Gold Corp. CDI unit (a) | 3,430,974 | | 6,947,633 |
Timmins Gold Corp. (a) | 105,000 | | 264,164 |
Torex Gold Resources, Inc. (a) | 8,097,500 | | 14,786,203 |
Yamana Gold, Inc. | 9,348,100 | | 159,887,361 |
| | 2,033,433,501 |
Precious Metals & Minerals - 0.6% |
Chesapeake Gold Corp. (a) | 6,000 | | 48,085 |
Dalradian Resources, Inc. (a) | 46,000 | | 48,998 |
Kaminak Gold Corp. Class A (a) | 20,000 | | 35,709 |
Pan American Silver Corp. | 563,487 | | 9,894,963 |
|
| Shares | | Value |
Pan American Silver Corp. warrants 12/7/14 (a) | 232,460 | | $ 175,039 |
Silver Wheaton Corp. | 150,700 | | 5,210,100 |
Silvercorp Metals, Inc. | 37,500 | | 220,644 |
Tahoe Resources, Inc. (a) | 225,500 | | 4,108,527 |
| | 19,742,065 |
TOTAL METALS & MINING | | 2,063,189,751 |
Cayman Islands - 0.0% |
METALS & MINING - 0.0% |
Gold - 0.0% |
China Precious Metal Resources Holdings Co. Ltd. (a) | 3,652,000 | | 640,375 |
Endeavour Mining Corp. (a)(d) | 348,000 | | 699,001 |
| | 1,339,376 |
China - 0.5% |
METALS & MINING - 0.5% |
Gold - 0.5% |
Zhaojin Mining Industry Co. Ltd. (H Shares) | 3,099,650 | | 4,100,389 |
Zijin Mining Group Co. Ltd. (H Shares) | 43,164,000 | | 13,523,620 |
| | 17,624,009 |
Netherlands - 0.0% |
METALS & MINING - 0.0% |
Gold - 0.0% |
Nord Gold NV GDR (Reg. S) (a) | 15,000 | | 66,000 |
Peru - 1.2% |
METALS & MINING - 1.2% |
Gold - 1.2% |
Compania de Minas Buenaventura SA sponsored ADR | 1,162,500 | | 40,292,250 |
South Africa - 8.8% |
METALS & MINING - 8.8% |
Gold - 8.8% |
AngloGold Ashanti Ltd. sponsored ADR | 4,802,952 | | 153,214,169 |
Gold Fields Ltd. | 55,000 | | 673,078 |
Gold Fields Ltd. sponsored ADR | 9,021,026 | | 111,139,040 |
Harmony Gold Mining Co. Ltd. | 1,484,000 | | 12,477,370 |
Harmony Gold Mining Co. Ltd. sponsored ADR (d) | 3,881,800 | | 33,150,572 |
| | 310,654,229 |
Sweden - 0.0% |
METALS & MINING - 0.0% |
Gold - 0.0% |
Nordic Mines AB (a) | 20,000 | | 24,161 |
Common Stocks - continued |
| Shares | | Value |
Turkey - 0.0% |
METALS & MINING - 0.0% |
Gold - 0.0% |
Koza Altin Isletmeleri A/S | 5,000 | | $ 98,395 |
United Kingdom - 0.6% |
METALS & MINING - 0.6% |
Gold - 0.6% |
African Barrick Gold Ltd. | 1,338,763 | | 9,440,477 |
Allied Gold Mining PLC (a) | 615,000 | | 1,386,669 |
Patagonia Gold PLC (a)(d) | 260,000 | | 112,499 |
Petropavlovsk PLC | 2,100,929 | | 11,605,805 |
| | 22,545,450 |
United States of America - 11.5% |
METALS & MINING - 11.3% |
Gold - 11.2% |
Allied Nevada Gold Corp. (a) | 1,346,300 | | 43,862,454 |
Allied Nevada Gold Corp. (Canada) (a) | 45,000 | | 1,463,556 |
Gold Resource Corp. (d) | 30,000 | | 568,800 |
Newmont Mining Corp. | 5,646,850 | | 286,182,358 |
Royal Gold, Inc. (d) | 731,313 | | 64,370,170 |
| | 396,447,338 |
Precious Metals & Minerals - 0.1% |
Coeur d'Alene Mines Corp. (a) | 15,000 | | 344,850 |
McEwen Mining, Inc. (a)(d) | 705,100 | | 2,792,196 |
| | 3,137,046 |
TOTAL METALS & MINING | | 399,584,384 |
OIL, GAS & CONSUMABLE FUELS - 0.2% |
Coal & Consumable Fuels - 0.2% |
Alpha Natural Resources, Inc. (a) | 518,000 | | 3,076,920 |
Peabody Energy Corp. | 220,000 | | 4,758,600 |
| | 7,835,520 |
TOTAL UNITED STATES OF AMERICA | | 407,419,904 |
TOTAL COMMON STOCKS (Cost $3,027,884,088) |
3,389,378,118
|
Commodities - 3.8% |
| Troy Ounces | | |
Gold Bullion (a) | 77,500 | | 131,169,525 |
Silver Bullion (a) | 117,000 | | 3,713,580 |
TOTAL COMMODITIES (Cost $113,075,575) |
134,883,105
|
Money Market Funds - 15.5% |
| Shares | | Value |
Fidelity Cash Central Fund, 0.17% (b) | 8,040,203 | | $ 8,040,203 |
Fidelity Securities Lending Cash Central Fund, 0.18% (b)(c) | 539,002,014 | | 539,002,014 |
TOTAL MONEY MARKET FUNDS (Cost $547,042,217) |
547,042,217
|
TOTAL INVESTMENT PORTFOLIO - 115.2% (Cost $3,688,001,880) | | 4,071,303,440 |
NET OTHER ASSETS (LIABILITIES) - (15.2)% | | (538,230,937) |
NET ASSETS - 100% | $ 3,533,072,503 |
Legend |
(a) Non-income producing |
(b) Affiliated fund that is available only to investment companies and other accounts managed by Fidelity Investments. The rate quoted is the annualized seven-day yield of the fund at period end. A complete unaudited listing of the fund's holdings as of its most recent quarter end is available upon request. In addition, each Fidelity Central Fund's financial statements are available on the SEC's website or upon request. |
(c) Investment made with cash collateral received from securities on loan. |
(d) Security or a portion of the security is on loan at period end. |
(e) Affiliated company |
(f) Security exempt from registration under Rule 144A of the Securities Act of 1933. These securities may be resold in transactions exempt from registration, normally to qualified institutional buyers. At the end of the period, the value of these securities amounted to $65,153,099 or 1.8% of net assets. |
(g) Restricted securities - Investment in securities not registered under the Securities Act of 1933 (excluding 144A issues). At the end of the period, the value of restricted securities (excluding 144A issues) amounted to $3,330,205 or 0.1% of net assets. |
Additional information on each restricted holding is as follows: |
Security | Acquisition Date | Acquisition Cost |
Pretium Resources, Inc. | 3/31/11 | $ 2,172,293 |
Affiliated Central Funds |
Information regarding fiscal year to date income earned by the Fund from investments in Fidelity Central Funds is as follows: |
Fund | Income earned |
Fidelity Cash Central Fund | $ 5,626 |
Fidelity Securities Lending Cash Central Fund | 334,629 |
Total | $ 340,255 |
| Value,
beginning of
period | Purchases | Sales
Proceeds | Dividend
Income | Value,
end of
period |
Fidelity Select Gold Cayman Ltd. | $ 43,125,922 | $ 86,850,463 | $ - | $ - | $ 134,852,679 |
Other Affiliated Issuers |
An affiliated company is a company in which the Fund has ownership of at least 5% of the voting securities. Fiscal year to date transactions with companies which are or were affiliates are as follows: |
Affiliate | Value,
beginning of
period | Purchases | Sales
Proceeds | Dividend
Income | Value,
end of
period |
Kimber Resources, Inc. | $ 16,919 | $ - | $ - | $ - | $ 11,433 |
Kimber Resources, Inc. (144A) | 6,128,712 | - | - | - | 4,141,415 |
Total | $ 6,145,631 | $ - | $ - | $ - | $ 4,152,848 |
Other Information |
The following is a summary of the inputs used, as of August 31, 2012, involving the Fund's assets and liabilities carried at fair value. The inputs or methodology used for valuing securities may not be an indication of the risk associated with investing in those securities. For more information on valuation inputs, and their aggregation into the levels used in the table below, please refer to the Security Valuation section in the accompanying Notes to Consolidated Financial Statements. |
Valuation Inputs at Reporting Date: |
Description | Total | Level 1 | Level 2 | Level 3 |
Investments in Securities: | | | | |
Common Stocks | $ 3,389,378,118 | $ 3,376,052,631 | $ 13,325,487 | $ - |
Commodities | 134,883,105 | 134,883,105 | - | - |
Money Market Funds | 547,042,217 | 547,042,217 | - | - |
Total Investments in Securities: | $ 4,071,303,440 | $ 4,057,977,953 | $ 13,325,487 | $ - |
See accompanying notes which are an integral part of the consolidated financial statements.
Semiannual Report
Gold Portfolio
Consolidated Statement of Assets and Liabilities
| August 31, 2012 (Unaudited) |
| | |
Assets | | |
Investment in securities, at value (including securities loaned of $531,798,267) - See accompanying schedule: Unaffiliated issuers (cost $3,022,586,600) | $ 3,385,225,270 | |
Fidelity Central Funds (cost $547,042,217) | 547,042,217 | |
Commodities (cost $113,075,575) | 134,883,105 | |
Other affiliated issuers (cost $5,297,488) | 4,152,848 | |
Total Investments (cost $3,688,001,880) | | $ 4,071,303,440 |
Cash | | 4,946 |
Foreign currency held at value (cost $3) | | 3 |
Receivable for fund shares sold | | 4,841,833 |
Dividends receivable | | 2,712,997 |
Distributions receivable from Fidelity Central Funds | | 63,556 |
Other receivables | | 11,124 |
Total assets | | 4,078,937,899 |
| | |
Liabilities | | |
Payable for fund shares redeemed | $ 4,035,091 | |
Accrued management fee | 1,569,470 | |
Distribution and service plan fees payable | 90,184 | |
Other affiliated payables | 917,284 | |
Other payables and accrued expenses | 251,353 | |
Collateral on securities loaned, at value | 539,002,014 | |
Total liabilities | | 545,865,396 |
| | |
Net Assets | | $ 3,533,072,503 |
Net Assets consist of: | | |
Paid in capital | | $ 3,578,544,855 |
Accumulated net investment loss | | (21,174,752) |
Accumulated undistributed net realized gain (loss) on investments and foreign currency transactions | | (407,604,474) |
Net unrealized appreciation (depreciation) on investments and assets and liabilities in foreign currencies | | 383,306,874 |
Net Assets | | $ 3,533,072,503 |
Consolidated Statement of Assets and Liabilities - continued
| August 31, 2012 (Unaudited) |
| | |
Calculation of Maximum Offering Price Class A:
Net Asset Value and redemption price per share ($126,561,933 ÷ 3,345,457 shares) | | $ 37.83 |
| | |
Maximum offering price per share (100/94.25 of $37.83) | | $ 40.14 |
Class T:
Net Asset Value and redemption price per share ($31,828,989 ÷ 848,774 shares) | | $ 37.50 |
| | |
Maximum offering price per share (100/96.50 of $37.50) | | $ 38.86 |
Class B:
Net Asset Value and offering price per share ($14,241,834 ÷ 387,566 shares)A | | $ 36.75 |
| | |
Class C:
Net Asset Value and offering price per share ($50,719,638 ÷ 1,386,025 shares)A | | $ 36.59 |
| | |
Gold:
Net Asset Value, offering price and redemption price per share ($3,162,334,752 ÷ 82,426,980 shares) | | $ 38.37 |
| | |
Institutional Class:
Net Asset Value, offering price and redemption price per share ($147,385,357 ÷ 3,846,964 shares) | | $ 38.31 |
A Redemption price per share is equal to net asset value less any applicable contingent deferred sales charge.
See accompanying notes which are an integral part of the consolidated financial statements.
Semiannual Report
Gold Portfolio
Consolidated Financial Statements - continued
Consolidated Statement of Operations
Six months ended August 31, 2012 (Unaudited) |
| | |
Investment Income | | |
Dividends | | $ 25,419,413 |
Interest | | 6 |
Income from Fidelity Central Funds | | 340,255 |
Total income | | 25,759,674 |
| | |
Expenses | | |
Management fee | $ 9,864,481 | |
Transfer agent fees | 5,153,104 | |
Distribution and service plan fees | 571,059 | |
Accounting and security lending fees | 739,772 | |
Custodian fees and expenses | 267,648 | |
Independent trustees' compensation | 11,898 | |
Registration fees | 110,314 | |
Audit | 20,966 | |
Legal | 7,351 | |
Interest | 4,841 | |
Miscellaneous | 24,740 | |
Total expenses before reductions | 16,776,174 | |
Expense reductions | (146,638) | 16,629,536 |
Net investment income (loss) | | 9,130,138 |
Realized and Unrealized Gain (Loss) Net realized gain (loss) on: | | |
Investments: | | |
Unaffiliated issuers | (111,301,818) | |
Foreign currency transactions | 41,154 | |
Total net realized gain (loss) | | (111,260,664) |
Change in net unrealized appreciation (depreciation) on: Investments | (631,480,473) | |
Assets and liabilities in foreign currencies | (4,026) | |
Commodities | 5,001,915 | |
Total change in net unrealized appreciation (depreciation) | | (626,482,584) |
Net gain (loss) | | (737,743,248) |
Net increase (decrease) in net assets resulting from operations | | $ (728,613,110) |
Consolidated Statement of Changes in Net Assets
| Six months ended
August 31, 2012
(Unaudited) | Year ended
February 29,
2012 |
Increase (Decrease) in Net Assets | | |
Operations | | |
Net investment income (loss) | $ 9,130,138 | $ (2,911,115) |
Net realized gain (loss) | (111,260,664) | 69,474,908 |
Change in net unrealized appreciation (depreciation) | (626,482,584) | (363,910,363) |
Net increase (decrease) in net assets resulting from operations | (728,613,110) | (297,346,570) |
Distributions to shareholders from net realized gain | - | (238,750,097) |
Share transactions - net increase (decrease) | (113,932,451) | 229,358,064 |
Redemption fees | 108,512 | 461,104 |
Total increase (decrease) in net assets | (842,437,049) | (306,277,499) |
| | |
Net Assets | | |
Beginning of period | 4,375,509,552 | 4,681,787,051 |
End of period (including accumulated net investment loss of $21,174,752 and accumulated net investment loss of $30,304,890, respectively) | $ 3,533,072,503 | $ 4,375,509,552 |
See accompanying notes which are an integral part of the consolidated financial statements.
Semiannual Report
Consolidated Financial Highlights - Class A
| Six months ended
August 31, 2012 | Years ended February 28, |
| (Unaudited) | 2012 I | 2011 | 2010 | 2009 | 2008 I |
Selected Per-Share Data | | | | | | |
Net asset value, beginning of period | $ 45.37 | $ 50.92 | $ 40.50 | $ 30.45 | $ 46.19 | $ 36.53 |
Income from Investment Operations | | | | | | |
Net investment income (loss) E | .06 | (.13) | (.30) | (.25) | (.15) | (.15) |
Net realized and unrealized gain (loss) | (7.60) | (2.83) | 15.28 | 11.00 | (15.44) | 15.00 |
Total from investment operations | (7.54) | (2.96) | 14.98 | 10.75 | (15.59) | 14.85 |
Distributions from net investment income | - | - | - | - | - | (.19) |
Distributions from net realized gain | - | (2.59) | (4.57) | (.71) | (.17) | (5.01) |
Total distributions | - | (2.59) | (4.57) | (.71) | (.17) | (5.20) |
Redemption fees added to paid in capital E | - J | - J | .01 | .01 | .02 | .01 |
Net asset value, end of period | $ 37.83 | $ 45.37 | $ 50.92 | $ 40.50 | $ 30.45 | $ 46.19 |
Total Return B, C, D | (16.62)% | (6.24)% | 36.99% | 35.19% | (33.81)% | 44.59% |
Ratios to Average Net Assets F, H | | | | | | |
Expenses before reductions | 1.18% A | 1.14% | 1.16% | 1.21% | 1.21% | 1.17% |
Expenses net of fee waivers, if any | 1.17% A | 1.14% | 1.15% | 1.19% | 1.19% | 1.17% |
Expenses net of all reductions | 1.17% A | 1.14% | 1.14% | 1.17% | 1.15% | 1.13% |
Net investment income (loss) | .30% A | (.28)% | (.63)% | (.63)% | (.45)% | (.37)% |
Supplemental Data | | | | | | |
Net assets, end of period (000 omitted) | $ 126,562 | $ 152,969 | $ 149,178 | $ 82,413 | $ 39,144 | $ 26,620 |
Portfolio turnover rate G | 16% A | 22% | 35% | 46% | 42% | 55% |
A Annualized B Total returns for periods of less than one year are not annualized. C Total returns would have been lower if certain expenses had not been reduced during the applicable periods shown. D Total returns do not include the effect of the sales charges. E Calculated based on average shares outstanding during the period. F Fees and expenses of any underlying Fidelity Central Funds are not included in the Fund's expense ratio. The Fund indirectly bears its proportionate share of the expenses of any underlying Fidelity Central Funds. G Amount does not include the portfolio activity of any underlying Fidelity Central Funds. H Expense ratios reflect operating expenses of the class. Expenses before reductions do not reflect amounts reimbursed by the investment adviser or reductions from brokerage service arrangements or reductions from other expense offset arrangements and do not represent the amount paid by the class during periods when reimbursements or reductions occur. Expenses net of fee waivers reflect expenses after reimbursement by the investment adviser but prior to reductions from brokerage service arrangements or other expense offset arrangements. Expenses net of all reductions represent the net expenses paid by the class. I For the year ended February 29. J Amount represents less than $.01 per share. |
Consolidated Financial Highlights - Class T
| Six months ended
August 31, 2012 | Years ended February 28, |
| (Unaudited) | 2012 I | 2011 | 2010 | 2009 | 2008 I |
Selected Per-Share Data | | | | | | |
Net asset value, beginning of period | $ 45.04 | $ 50.68 | $ 40.34 | $ 30.36 | $ 46.17 | $ 36.49 |
Income from Investment Operations | | | | | | |
Net investment income (loss) E | .01 | (.27) | (.43) | (.36) | (.24) | (.25) |
Net realized and unrealized gain (loss) | (7.55) | (2.80) | 15.21 | 10.96 | (15.42) | 15.05 |
Total from investment operations | (7.54) | (3.07) | 14.78 | 10.60 | (15.66) | 14.80 |
Distributions from net investment income | - | - | - | - | - | (.16) |
Distributions from net realized gain | - | (2.57) | (4.45) | (.63) | (.17) | (4.97) |
Total distributions | - | (2.57) | (4.45) | (.63) | (.17) | (5.13) |
Redemption fees added to paid in capital E | - J | - J | .01 | .01 | .02 | .01 |
Net asset value, end of period | $ 37.50 | $ 45.04 | $ 50.68 | $ 40.34 | $ 30.36 | $ 46.17 |
Total Return B, C, D | (16.74)% | (6.49)% | 36.62% | 34.79% | (33.98)% | 44.45% |
Ratios to Average Net Assets F, H | | | | | | |
Expenses before reductions | 1.45% A | 1.43% | 1.44% | 1.51% | 1.47% | 1.43% |
Expenses net of fee waivers, if any | 1.44% A | 1.42% | 1.42% | 1.49% | 1.45% | 1.43% |
Expenses net of all reductions | 1.44% A | 1.42% | 1.42% | 1.47% | 1.41% | 1.39% |
Net investment income (loss) | .03% A | (.57)% | (.90)% | (.93)% | (.71)% | (.63)% |
Supplemental Data | | | | | | |
Net assets, end of period (000 omitted) | $ 31,829 | $ 40,664 | $ 45,846 | $ 26,256 | $ 15,284 | $ 11,334 |
Portfolio turnover rate G | 16% A | 22% | 35% | 46% | 42% | 55% |
A Annualized B Total returns for periods of less than one year are not annualized. C Total returns would have been lower if certain expenses had not been reduced during the applicable periods shown. D Total returns do not include the effect of the sales charges. E Calculated based on average shares outstanding during the period. F Fees and expenses of any underlying Fidelity Central Funds are not included in the Fund's expense ratio. The Fund indirectly bears its proportionate share of the expenses of any underlying Fidelity Central Funds. G Amount does not include the portfolio activity of any underlying Fidelity Central Funds. H Expense ratios reflect operating expenses of the class. Expenses before reductions do not reflect amounts reimbursed by the investment adviser or reductions from brokerage service arrangements or reductions from other expense offset arrangements and do not represent the amount paid by the class during periods when reimbursements or reductions occur. Expenses net of fee waivers reflect expenses after reimbursement by the investment adviser but prior to reductions from brokerage service arrangements or other expense offset arrangements. Expenses net of all reductions represent the net expenses paid by the class. I For the year ended February 29. J Amount represents less than $.01 per share. |
See accompanying notes which are an integral part of the consolidated financial statements.
Semiannual Report
Consolidated Financial Highlights - Class B
| Six months ended
August 31, 2012 | Years ended February 28, |
| (Unaudited) | 2012 I | 2011 | 2010 | 2009 | 2008 I |
Selected Per-Share Data | | | | | | |
Net asset value, beginning of period | $ 44.24 | $ 50.02 | $ 39.87 | $ 30.08 | $ 45.97 | $ 36.46 |
Income from Investment Operations | | | | | | |
Net investment income (loss) E | (.08) | (.49) | (.66) | (.55) | (.40) | (.45) |
Net realized and unrealized gain (loss) | (7.41) | (2.76) | 15.02 | 10.84 | (15.34) | 14.95 |
Total from investment operations | (7.49) | (3.25) | 14.36 | 10.29 | (15.74) | 14.50 |
Distributions from net investment income | - | - | - | - | - | (.16) |
Distributions from net realized gain | - | (2.53) | (4.21) | (.51) | (.17) | (4.84) |
Total distributions | - | (2.53) | (4.21) | (.51) | (.17) | (5.00) |
Redemption fees added to paid in capital E | - J | - J | - J | .01 | .02 | .01 |
Net asset value, end of period | $ 36.75 | $ 44.24 | $ 50.02 | $ 39.87 | $ 30.08 | $ 45.97 |
Total Return B, C, D | (16.93)% | (6.95)% | 35.97% | 34.12% | (34.30)% | 43.53% |
Ratios to Average Net Assets F, H | | | | | | |
Expenses before reductions | 1.93% A | 1.90% | 1.93% | 2.00% | 1.97% | 1.93% |
Expenses net of fee waivers, if any | 1.92% A | 1.90% | 1.92% | 1.98% | 1.95% | 1.93% |
Expenses net of all reductions | 1.92% A | 1.90% | 1.91% | 1.96% | 1.89% | 1.90% |
Net investment income (loss) | (.45)% A | (1.04)% | (1.39)% | (1.42)% | (1.20)% | (1.14)% |
Supplemental Data | | | | | | |
Net assets, end of period (000 omitted) | $ 14,242 | $ 20,894 | $ 26,837 | $ 18,340 | $ 8,421 | $ 6,869 |
Portfolio turnover rate G | 16% A | 22% | 35% | 46% | 42% | 55% |
A Annualized B Total returns for periods of less than one year are not annualized. C Total returns would have been lower if certain expenses had not been reduced during the applicable periods shown. D Total returns do not include the effect of the contingent deferred sales charge. E Calculated based on average shares outstanding during the period. F Fees and expenses of any underlying Fidelity Central Funds are not included in the Fund's expense ratio. The Fund indirectly bears its proportionate share of the expenses of any underlying Fidelity Central Funds. G Amount does not include the portfolio activity of any underlying Fidelity Central Funds. H Expense ratios reflect operating expenses of the class. Expenses before reductions do not reflect amounts reimbursed by the investment adviser or reductions from brokerage service arrangements or reductions from other expense offset arrangements and do not represent the amount paid by the class during periods when reimbursements or reductions occur. Expenses net of fee waivers reflect expenses after reimbursement by the investment adviser but prior to reductions from brokerage service arrangements or other expense offset arrangements. Expenses net of all reductions represent the net expenses paid by the class. I For the year ended February 29. J Amount represents less than $.01 per share. |
Consolidated Financial Highlights - Class C
| Six months ended
August 31, 2012 | Years ended February 28, |
| (Unaudited) | 2012 I | 2011 | 2010 | 2009 | 2008 I |
Selected Per-Share Data | | | | | | |
Net asset value, beginning of period | $ 44.05 | $ 49.81 | $ 39.75 | $ 30.00 | $ 45.85 | $ 36.44 |
Income from Investment Operations | | | | | | |
Net investment income (loss) E | (.08) | (.47) | (.64) | (.53) | (.39) | (.45) |
Net realized and unrealized gain (loss) | (7.38) | (2.76) | 14.98 | 10.80 | (15.30) | 14.91 |
Total from investment operations | (7.46) | (3.23) | 14.34 | 10.27 | (15.69) | 14.46 |
Distributions from net investment income | - | - | - | - | - | (.17) |
Distributions from net realized gain | - | (2.53) | (4.28) | (.53) | (.17) | (4.89) |
Total distributions | - | (2.53) | (4.28) | (.53) | (.17) | (5.06) |
Redemption fees added to paid in capital E | - J | - J | - J | .01 | .01 | .01 |
Net asset value, end of period | $ 36.59 | $ 44.05 | $ 49.81 | $ 39.75 | $ 30.00 | $ 45.85 |
Total Return B, C, D | (16.94)% | (6.93)% | 36.01% | 34.15% | (34.30)% | 43.49% |
Ratios to Average Net Assets F, H | | | | | | |
Expenses before reductions | 1.93% A | 1.87% | 1.89% | 1.97% | 1.97% | 1.92% |
Expenses net of fee waivers, if any | 1.92% A | 1.87% | 1.88% | 1.95% | 1.95% | 1.92% |
Expenses net of all reductions | 1.92% A | 1.87% | 1.87% | 1.93% | 1.89% | 1.89% |
Net investment income (loss) | (.45)% A | (1.01)% | (1.35)% | (1.39)% | (1.20)% | (1.12)% |
Supplemental Data | | | | | | |
Net assets, end of period (000 omitted) | $ 50,720 | $ 67,996 | $ 72,431 | $ 38,624 | $ 17,544 | $ 10,835 |
Portfolio turnover rate G | 16% A | 22% | 35% | 46% | 42% | 55% |
A Annualized B Total returns for periods of less than one year are not annualized. C Total returns would have been lower if certain expenses had not been reduced during the applicable periods shown. D Total returns do not include the effect of the contingent deferred sales charge. E Calculated based on average shares outstanding during the period. F Fees and expenses of any underlying Fidelity Central Funds are not included in the Fund's expense ratio. The Fund indirectly bears its proportionate share of the expenses of any underlying Fidelity Central Funds. G Amount does not include the portfolio activity of any underlying Fidelity Central Funds. H Expense ratios reflect operating expenses of the class. Expenses before reductions do not reflect amounts reimbursed by the investment adviser or reductions from brokerage service arrangements or reductions from other expense offset arrangements and do not represent the amount paid by the class during periods when reimbursements or reductions occur. Expenses net of fee waivers reflect expenses after reimbursement by the investment adviser but prior to reductions from brokerage service arrangements or other expense offset arrangements. Expenses net of all reductions represent the net expenses paid by the class. I For the year ended February 29. J Amount represents less than $.01 per share. |
See accompanying notes which are an integral part of the consolidated financial statements.
Semiannual Report
Consolidated Financial Highlights - Gold
| Six months ended
August 31, 2012 | Years ended February 28, |
| (Unaudited) | 2012 H | 2011 | 2010 | 2009 | 2008 H |
Selected Per-Share Data | | | | | | |
Net asset value, beginning of period | $ 45.96 | $ 51.44 | $ 40.85 | $ 30.67 | $ 46.37 | $ 36.54 |
Income from Investment Operations | | | | | | |
Net investment income (loss) D | .10 | (.02) | (.18) | (.16) | (.04) | (.02) |
Net realized and unrealized gain (loss) | (7.69) | (2.85) | 15.43 | 11.10 | (15.51) | 15.05 |
Total from investment operations | (7.59) | (2.87) | 15.25 | 10.94 | (15.55) | 15.03 |
Distributions from net investment income | - | - | - | - | - | (.18) |
Distributions from net realized gain | - | (2.61) | (4.67) | (.77) | (.17) | (5.03) |
Total distributions | - | (2.61) | (4.67) | (.77) | (.17) | (5.21) |
Redemption fees added to paid in capital D | - I | - I | .01 | .01 | .02 | .01 |
Net asset value, end of period | $ 38.37 | $ 45.96 | $ 51.44 | $ 40.85 | $ 30.67 | $ 46.37 |
Total Return B, C | (16.51)% | (6.00)% | 37.35% | 35.52% | (33.59)% | 45.10% |
Ratios to Average Net Assets E, G | | | | | | |
Expenses before reductions | .93% A | .89% | .91% | .98% | .89% | .85% |
Expenses net of fee waivers, if any | .92% A | .89% | .90% | .96% | .87% | .85% |
Expenses net of all reductions | .92% A | .89% | .89% | .94% | .86% | .81% |
Net investment income (loss) | .55% A | (.03)% | (.37)% | (.40)% | (.13)% | (.05)% |
Supplemental Data | | | | | | |
Net assets, end of period (000 omitted) | $ 3,162,335 | $ 3,924,439 | $ 4,250,249 | $ 2,839,664 | $ 1,881,600 | $ 2,381,114 |
Portfolio turnover rate F | 16% A | 22% | 35% | 46% | 42% | 55% |
A Annualized B Total returns for periods of less than one year are not annualized. C Total returns would have been lower if certain expenses had not been reduced during the applicable periods shown. D Calculated based on average shares outstanding during the period. E Fees and expenses of any underlying Fidelity Central Funds are not included in the Fund's expense ratio. The Fund indirectly bears its proportionate share of the expenses of any underlying Fidelity Central Funds. F Amount does not include the portfolio activity of any underlying Fidelity Central Funds. G Expense ratios reflect operating expenses of the class. Expenses before reductions do not reflect amounts reimbursed by the investment adviser or reductions from brokerage service arrangements or reductions from other expense offset arrangements and do not represent the amount paid by the class during periods when reimbursements or reductions occur. Expenses net of fee waivers reflect expenses after reimbursement by the investment adviser but prior to reductions from brokerage service arrangements or other expense offset arrangements. Expenses net of all reductions represent the net expenses paid by the class. H For the year ended February 29. I Amount represents less than $.01 per share. |
Consolidated Financial Highlights - Institutional Class
| Six months ended
August 31, 2012 | Years ended February 28, |
| (Unaudited) | 2012 H | 2011 | 2010 | 2009 | 2008 H |
Selected Per-Share Data | | | | | | |
Net asset value, beginning of period | $ 45.87 | $ 51.32 | $ 40.77 | $ 30.65 | $ 46.34 | $ 36.54 |
Income from Investment Operations | | | | | | |
Net investment income (loss) D | .12 | .02 | (.15) | (.15) | (.05) | (.01) |
Net realized and unrealized gain (loss) | (7.68) | (2.85) | 15.41 | 11.08 | (15.49) | 15.03 |
Total from investment operations | (7.56) | (2.83) | 15.26 | 10.93 | (15.54) | 15.02 |
Distributions from net investment income | - | - | - | - | - | (.19) |
Distributions from net realized gain | - | (2.62) | (4.72) | (.82) | (.17) | (5.04) |
Total distributions | - | (2.62) | (4.72) | (.82) | (.17) | (5.23) |
Redemption fees added to paid in capital D | - I | - I | .01 | .01 | .02 | .01 |
Net asset value, end of period | $ 38.31 | $ 45.87 | $ 51.32 | $ 40.77 | $ 30.65 | $ 46.34 |
Total Return B, C | (16.48)% | (5.94)% | 37.45% | 35.50% | (33.59)% | 45.10% |
Ratios to Average Net Assets E, G | | | | | | |
Expenses before reductions | .84% A | .82% | .85% | .95% | .91% | .83% |
Expenses net of fee waivers, if any | .83% A | .81% | .84% | .93% | .89% | .83% |
Expenses net of all reductions | .83% A | .81% | .83% | .91% | .86% | .79% |
Net investment income (loss) | .64% A | .04% | (.31)% | (.37)% | (.14)% | (.03)% |
Supplemental Data | | | | | | |
Net assets, end of period (000 omitted) | $ 147,385 | $ 168,548 | $ 137,246 | $ 38,037 | $ 6,070 | $ 3,174 |
Portfolio turnover rate F | 16% A | 22% | 35% | 46% | 42% | 55% |
A Annualized B Total returns for periods of less than one year are not annualized. C Total returns would have been lower if certain expenses had not been reduced during the applicable periods shown. D Calculated based on average shares outstanding during the period. E Fees and expenses of any underlying Fidelity Central Funds are not included in the Fund's expense ratio. The Fund indirectly bears its proportionate share of the expenses of any underlying Fidelity Central Funds. F Amount does not include the portfolio activity of any underlying Fidelity Central Funds. G Expense ratios reflect operating expenses of the class. Expenses before reductions do not reflect amounts reimbursed by the investment adviser or reductions from brokerage service arrangements or reductions from other expense offset arrangements and do not represent the amount paid by the class during periods when reimbursements or reductions occur. Expenses net of fee waivers reflect expenses after reimbursement by the investment adviser but prior to reductions from brokerage service arrangements or other expense offset arrangements. Expenses net of all reductions represent the net expenses paid by the class. H For the year ended February 29. I Amount represents less than $.01 per share. |
See accompanying notes which are an integral part of the consolidated financial statements.
Semiannual Report
Notes to Consolidated Financial Statements
For the period ended August 31, 2012 (Unaudited)
1. Organization.
Gold Portfolio (the Fund) is a non-diversified fund of Fidelity Select Portfolios (the Trust) and is authorized to issue an unlimited number of shares. The Trust is registered under the Investment Company Act of 1940, as amended (the 1940 Act), as an open-end management investment company organized as a Massachusetts business trust. The Fund invests primarily in securities of companies whose principal business activities fall within specific industries. The Fund offers Class A, Class T, Class C, Gold and Institutional Class shares, each of which, along with Class B shares, has equal rights as to assets and voting privileges. Effective after the close of business on September 1, 2010, Class B shares were closed to new accounts and additional purchases, except for exchanges and reinvestments. Each class has exclusive voting rights with respect to matters that affect that class. Class B shares will automatically convert to Class A shares after a holding period of seven years from the initial date of purchase. Investment income, realized and unrealized capital gains and losses, the common expenses of the Fund, and certain fund-level expense reductions, if any, are allocated on a pro-rata basis to each class based on the relative net assets of each class to the total net assets of the Fund. Each class differs with respect to transfer agent and distribution and service plan fees incurred. Certain expense reductions may also differ by class.
2. Consolidated Subsidiary
The Fund invests in certain commodity-related investments through Fidelity Select Gold Cayman Ltd., a wholly owned subsidiary (the "Subsidiary"). As of August 31, 2012, the Fund held $134,852,679 in the Subsidiary, representing 3.8% of the Fund's net assets.
The financial statements have been consolidated and include accounts of the Fund and the Subsidiary. Accordingly, all inter-company transactions and balances have been eliminated.
3. Investments in Fidelity Central Funds.
The Fund invests in Fidelity Central Funds, which are open-end investment companies available only to other investment companies and accounts managed by Fidelity Management & Research Company (FMR) and its affiliates. The Fund's Consolidated Schedule of Investments lists each of the Fidelity Central Funds held as of period end, if any, as an investment of the Fund, but does not include the underlying holdings of each Fidelity Central Fund. As an Investing Fund, the Fund indirectly bears its proportionate share of the expenses of the underlying Fidelity Central Funds.
The Money Market Central Funds seek preservation of capital and current income and are managed by Fidelity Investments Money Management, Inc. (FIMM), an affiliate of FMR.
A complete unaudited list of holdings for each Fidelity Central Fund is available upon request or at the Securities and Exchange Commission (the SEC) web site at www.sec.gov. In addition, the financial statements of the Fidelity Central Funds are available on the SEC web site or upon request.
4. Significant Accounting Policies.
The consolidated financial statements have been prepared in conformity with accounting principles generally accepted in the United States of America (GAAP), which require management to make certain estimates and assumptions at the date of the financial statements. Actual results could differ from those estimates. Subsequent events, if any, through the date that the financial statements were issued have been evaluated in the preparation of the financial statements. The following summarizes the significant accounting policies of the Fund:
Security Valuation. Investments are valued as of 4:00 p.m. Eastern time on the last calendar day of the period. In accordance with valuation policies and procedures approved by the Board of Trustees (the Board), the Fund attempts to obtain prices from one or more third party pricing vendor or broker to value its investments. When current market prices, quotations or rates are not readily available or reliable, securities will be fair valued in good faith by the FMR Fair Value Committee (the Committee), in accordance with procedures adopted by the Fund's Board. Factors used in determining fair value vary by security type and may include market or security specific events. The frequency with which these procedures are used cannot be predicted and they may be utilized to a significant extent. The Committee oversees the Fund's valuation policies and procedures and is responsible for approving and reporting to the Board all fair value determinations.
The Fund categorizes the inputs to valuation techniques used to value its investments into a disclosure hierarchy consisting of three levels as shown below:
Level 1 - quoted prices in active markets for identical investments
Level 2 - other significant observable inputs (including quoted prices for similar investments, interest rates, prepayment speeds, etc.)
Level 3 - unobservable inputs (including the Fund's own assumptions based on the best information available)
Valuation techniques used to value the Fund's investments by major category are as follows:
Semiannual Report
Notes to Consolidated Financial Statements (Unaudited) - continued
4. Significant Accounting Policies - continued
Security Valuation - continued
Equity securities, including restricted securities, for which market quotations are readily available, are valued at the last reported sale price or official closing price as reported by a third party pricing vendor on the primary market or exchange on which they are traded and are categorized as Level 1 in the hierarchy. In the event there were no sales during the day or closing prices are not available, securities are valued at the last quoted bid price or may be valued using the last available price and are generally categorized as Level 2 in the hierarchy. For foreign equity securities, when significant market or security specific events arise, comparisons to the valuation of American Depositary Receipts (ADRs), futures contracts, Exchange-Traded Funds (ETFs) and certain indexes as well as quoted prices for similar securities are used and are categorized as Level 2 in the hierarchy. Utilizing these techniques may result in transfers between Level 1 and Level 2. For restricted equity securities and private placements where observable inputs are limited, assumptions about market activity and risk are used and these securities are categorized as Level 3 in the hierarchy.
Investments in commodities are valued at their last traded price at 4:00 p.m. Eastern time each business day and are categorized as Level 1 in the hierarchy. Investments in open-end mutual funds, including the Fidelity Central Funds, are valued at their closing net asset value each business day and are categorized as Level 1 in the hierarchy.
Changes in valuation techniques may result in transfers in or out of an assigned level within the disclosure hierarchy. The aggregate value of investments by input level, as of August 31, 2012, is included at the end of the Fund's Consolidated Schedule of Investments.
Foreign Currency Translation. The Fund may use foreign currency contracts to facilitate transactions in foreign-denominated securities. Gains and losses from these transactions may arise from changes in the value of the foreign currency or if the counterparties do not perform under the contracts' terms.
Foreign-denominated assets, including investment securities, and liabilities are translated into U.S. dollars at the exchange rates at period end. Purchases and sales of investment securities, income and dividends received and expenses denominated in foreign currencies are translated into U.S. dollars at the exchange rate in effect on the transaction date.
The effects of exchange rate fluctuations on investments are included with the net realized and unrealized gain (loss) on investment securities. Other foreign currency transactions resulting in realized and unrealized gain (loss) are disclosed separately.
Investment Transactions and Income. For financial reporting purposes, the Fund's investment holdings and NAV include trades executed through the end of the last business day of the period. The NAV per share for processing shareholder transactions is calculated as of the close of business of the New York Stock Exchange (NYSE), normally 4:00 p.m. Eastern time and includes trades executed through the end of the prior business day. Gains and losses on securities sold are determined on the basis of identified cost. Dividend income is recorded on the ex-dividend date, except for certain dividends from foreign securities where the ex-dividend date may have passed, which are recorded as soon as the Fund is informed of the ex-dividend date. Non-cash dividends included in dividend income, if any, are recorded at the fair market value of the securities received. Distributions received on securities that represent a return of capital or capital gain are recorded as a reduction of cost of investments and/or as a realized gain. The Fund estimates the components of distributions received that may be considered return of capital distributions or capital gain distributions. Interest income and distributions from the Fidelity Central Funds are accrued as earned. Interest income includes coupon interest and amortization of premium and accretion of discount on debt securities. Investment income is recorded net of foreign taxes withheld where recovery of such taxes is uncertain.
Expenses. Expenses directly attributable to a fund are charged to that fund. Expenses attributable to more than one fund are allocated among the respective funds on the basis of relative net assets or other appropriate methods. Expense estimates are accrued in the period to which they relate and adjustments are made when actual amounts are known.
Income Tax Information and Distributions to Shareholders. Each year, the Fund intends to qualify as a regulated investment company under Subchapter M of the Internal Revenue Code, including distributing substantially all of its taxable income and realized gains. As a result, no provision for income taxes is required. The Fund files a U.S. federal tax return, in addition to state and local tax returns as required. A fund's federal income tax returns are subject to examination by the Internal Revenue Service (IRS) for a period of three fiscal years after they are filed. State and local tax returns may be subject to examination for an additional fiscal year depending on the jurisdiction. Foreign taxes are provided for based on the Fund's understanding of the tax rules and rates that exist in the foreign markets in which it invests.
The Subsidiary is classified as a controlled foreign corporation under Subchapter N of the Internal Revenue Code. Therefore, the Fund is required to increase its taxable income by its share of the Subsidiary's income. Net investment losses of the Subsidiary cannot be deducted by the Fund in the current period nor carried forward to offset taxable income in future periods.
Distributions are declared and recorded on the ex-dividend date. Income dividends and capital gain distributions are declared separately for each class. Income and capital gain distributions are determined in accordance with income tax regulations, which may differ from GAAP.
Semiannual Report
4. Significant Accounting Policies - continued
Income Tax Information and Distributions to Shareholders - continued
Capital accounts within the consolidated financial statements are adjusted for permanent book-tax differences. These adjustments have no impact on net assets or the results of operations. Temporary book-tax differences will reverse in a subsequent period.
Book-tax differences are primarily due to foreign currency transactions, passive foreign investment companies (PFIC), controlled foreign corporation, deferred trustees compensation and losses deferred due to wash sales and excise tax regulations.
The federal tax cost of investment securities and unrealized appreciation (depreciation) as of period end on an unconsolidated basis were as follows:
Gross unrealized appreciation | $ 515,696,261 |
Gross unrealized depreciation | (433,498,682) |
Net unrealized appreciation (depreciation) on securities and other investments | $ 82,197,579 |
| |
Tax cost | $ 3,989,075,435 |
Trading (Redemption) Fees. Shares held by investors in the Fund less than 30 days are subject to a redemption fee equal to .75% of the net asset value of shares redeemed. All redemption fees, which reduce the proceeds of the shareholder redemption, are retained by the Fund and accounted for as an addition to paid in capital.
New Accounting Pronouncement. In December 2011, the Financial Accounting Standards Board issued Accounting Standard Update No. 2011-11, Disclosures about Offsetting Assets and Liabilities. The update creates new disclosure requirements requiring entities to disclose both gross and net information for derivatives and other financial instruments that are either offset in the Statement of Assets and Liabilities or subject to an enforceable master netting arrangement or similar agreement. The disclosure requirements are effective for annual reporting periods beginning on or after January 1, 2013, and interim periods within those annual periods. Management is currently evaluating the impact of the update's adoption on the Fund's financial statement disclosures.
5. Operating Policies.
Restricted Securities. The Fund may invest in securities that are subject to legal or contractual restrictions on resale. These securities generally may be resold in transactions exempt from registration or to the public if the securities are registered. Disposal of these securities may involve time-consuming negotiations and expense, and prompt sale at an acceptable price may be difficult. Information regarding restricted securities is included at the end of the Fund's Consolidated Schedule of Investments.
6. Purchases and Sales of Investments.
Purchases and sales of securities, other than short-term securities, aggregated $290,608,518 and $389,268,652, respectively.
7. Fees and Other Transactions with Affiliates.
Management Fee. FMR and its affiliates provide the Fund with investment management related services for which the Fund pays a monthly management fee. The management fee is the sum of an individual fund fee rate that is based on an annual rate of .30% of the Fund's average net assets and an annualized group fee rate that averaged .26% during the period. The group fee rate is based upon the average net assets of all the mutual funds advised by FMR. The group fee rate decreases as assets under management increase and increases as assets under management decrease. For the period, the total annualized management fee rate was .56% of the Fund's average net assets.
FMR and its affiliates also provide investment management related services to the Subsidiary. The Subsidiary pays FMR a monthly management fee at the annual rate of .30% of its net assets. Under the management contract, FMR pays all other expenses of the Subsidiary, except custodian fees.
During the period, FMR waived a portion of its management fee as described in the Expense Reductions note.
Distribution and Service Plan Fees. In accordance with Rule 12b-1 of the 1940 Act, the Fund has adopted separate Distribution and Service Plans for each class of shares. Certain classes pay Fidelity Distributors Corporation (FDC), an affiliate of FMR, separate Distribution and Service Fees, each of which is based on an annual percentage of each class' average net assets. In addition, FDC may pay financial intermediaries for selling shares of the
Semiannual Report
Notes to Consolidated Financial Statements (Unaudited) - continued
7. Fees and Other Transactions with Affiliates - continued
Distribution and Service Plan Fees - continued
Fund and providing shareholder support services. For the period, the Distribution and Service Fee rates, total fees and amounts retained by FDC were as follows:
| Distribution
Fee | Service
Fee | Total Fees | Retained
by FDC |
Class A | -% | .25% | $ 156,314 | $ 1,629 |
Class T | .25% | .25% | 79,192 | - |
Class B | .75% | .25% | 75,203 | 56,402 |
Class C | .75% | .25% | 260,350 | 39,833 |
| | | $ 571,059 | $ 97,864 |
Sales Load. FDC may receive a front-end sales charge of up to 5.75% for selling Class A shares and 3.50% for selling Class T shares, some of which is paid to financial intermediaries for selling shares of the Fund. Depending on the holding period, FDC may receive contingent deferred sales charges levied on Class A, Class T, Class B, and Class C redemptions. The deferred sales charges range from 5.00% to 1.00% for Class B shares, 1.00% for Class C shares, 1.00% for certain purchases of Class A shares and .25% for certain purchases of Class T shares.
For the period, sales charge amounts retained by FDC were as follows:
| Retained
by FDC |
Class A | $ 27,538 |
Class T | 6,049 |
Class B* | 23,856 |
Class C* | 3,522 |
| $ 60,965 |
* When Class B and Class C shares are initially sold, FDC pays commissions from its own resources to financial intermediaries through which the sales are made.
Transfer Agent Fees. Fidelity Investments Institutional Operations Company, Inc. (FIIOC), an affiliate of FMR, is the transfer, dividend disbursing and shareholder servicing agent for each class of the Fund. FIIOC receives account fees and asset-based fees that vary according to the account size and type of account of the shareholders of the respective classes of the Fund. FIIOC pays for typesetting, printing and mailing of shareholder reports, except proxy statements. For the period, transfer agent fees for each class were as follows:
| Amount | % of
Average
Net Assets* |
Class A | $ 186,709 | .30 |
Class T | 50,381 | .32 |
Class B | 22,493 | .30 |
Class C | 76,952 | .30 |
Gold | 4,672,489 | .30 |
Institutional Class | 144,080 | .21 |
| $ 5,153,104 | |
* Annualized
Accounting and Security Lending Fees. Fidelity Service Company, Inc. (FSC), an affiliate of FMR, maintains the Fund's accounting records. The accounting fee is based on the level of average net assets for each month. Under a separate contract, FSC administers the security lending program. The security lending fee is based on the number and duration of lending transactions.
Brokerage Commissions. The Fund placed a portion of its portfolio transactions with brokerage firms which are affiliates of the investment adviser. The commissions paid to these affiliated firms were $1,611 for the period.
Interfund Lending Program. Pursuant to an Exemptive Order issued by the SEC, the Fund, along with other registered investment companies having management contracts with FMR, may participate in an interfund lending program. This program provides an alternative credit facility allowing the
Semiannual Report
7. Fees and Other Transactions with Affiliates - continued
Interfund Lending Program - continued
funds to borrow from, or lend money to, other participating affiliated funds. At period end, there were no interfund loans outstanding. The Fund's activity in this program during the period for which loans were outstanding was as follows:
Borrower or Lender | Average Loan
Balance | Weighted Average
Interest Rate | Interest
Expense |
Borrower | $ 9,128,575 | .41% | $ 4,148 |
8. Committed Line of Credit.
The Fund participates with other funds managed by FMR or an affiliate in a $4.25 billion credit facility (the "line of credit") to be utilized for temporary or emergency purposes to fund shareholder redemptions or for other short-term liquidity purposes. The Fund has agreed to pay commitment fees on its pro-rata portion of the line of credit, which amounted to $5,517 and is reflected in Miscellaneous expenses on the Consolidated Statement of Operations. During the period, there were no borrowings on this line of credit.
9. Security Lending.
The Fund lends portfolio securities through a lending agent from time to time in order to earn additional income. For equity securities, a lending agent is used and may loan securities to certain qualified borrowers, including Fidelity Capital Markets (FCM), a broker-dealer affiliated with the Fund. On the settlement date of the loan, the Fund receives collateral (in the form of U.S. Treasury obligations, letters of credit and/or cash) against the loaned securities and maintains collateral in an amount not less than 100% of the market value of the loaned securities during the period of the loan. The market value of the loaned securities is determined at the close of business of the Fund and any additional required collateral is delivered to the Fund on the next business day. If the borrower defaults on its obligation to return the securities loaned because of insolvency or other reasons, a fund could experience delays and costs in recovering the securities loaned or in gaining access to the collateral. Any cash collateral received is invested in the Fidelity Securities Lending Cash Central Fund. The value of loaned securities and cash collateral at period end are disclosed on the Fund's Consolidated Statement of Assets and Liabilities. The value of securities loaned to FCM at period end was $426,600. Security lending income represents the income earned on investing cash collateral, less rebates paid to borrowers and any lending agent fees associated with the loan, plus any premium payments received for lending certain types of securities. Security lending income is presented in the Consolidated Statement of Operations as a component of income from Fidelity Central Funds. Total security lending income during the period amounted to $334,629, including $15,383 from securities loaned to FCM.
10. Bank Borrowings.
The Fund is permitted to have bank borrowings for temporary or emergency purposes to fund shareholder redemptions or for other short-term liquidity requirements. The Fund has established borrowing arrangements with certain banks. The interest rate on the borrowings is the bank's base rate, as revised from time to time. The average loan balance during the period for which loans were outstanding amounted to $6,452,333. The weighted average interest rate was .64%. The interest expense amounted to $693 under the bank borrowing program. At period end, there were no bank borrowings outstanding.
11. Expense Reductions.
FMR has contractually agreed to waive the Fund's management fee in an amount equal to the management fee of the Subsidiary. During the period, this waiver reduced the Fund's management fee by $120,205. Many of the brokers with whom FMR places trades on behalf of the Fund provided services to the Fund in addition to trade execution. These services included payments of certain expenses on behalf of the Fund totaling $26,120 for the period. In addition, through arrangements with the Fund's custodian, credits realized as a result of uninvested cash balances were used to reduce the Fund's expenses. During the period, these credits reduced the Fund's custody expenses by $313.
Semiannual Report
Notes to Consolidated Financial Statements (Unaudited) - continued
12. Distributions to Shareholders.
Distributions to shareholders of each class were as follows:
| Six months ended
August 31,
2012 | Year ended
February 29,
2012 |
From net realized gain | | |
Class A | $ - | $ 7,834,928 |
Class T | - | 2,382,367 |
Class B | - | 1,303,107 |
Class C | - | 3,798,844 |
Gold | - | 215,607,839 |
Institutional Class | - | 7,823,012 |
Total | $ - | $ 238,750,097 |
13. Share Transactions.
Transactions for each class of shares were as follows:
| Shares | Dollars |
| Six months ended
August 31,
2012 | Year ended
February 29,
2012 | Six months ended
August 31,
2012 | Year ended
February 29,
2012 |
Class A | | | | |
Shares sold | 855,307 | 1,589,102 | $ 32,193,547 | $ 76,690,664 |
Reinvestment of distributions | - | 145,713 | - | 7,265,756 |
Shares redeemed | (881,215) | (1,293,053) | (33,147,004) | (61,867,749) |
Net increase (decrease) | (25,908) | 441,762 | $ (953,457) | $ 22,088,671 |
Class T | | | | |
Shares sold | 125,633 | 326,122 | $ 4,595,848 | $ 15,663,258 |
Reinvestment of distributions | - | 46,446 | - | 2,308,310 |
Shares redeemed | (179,763) | (374,234) | (6,587,924) | (17,626,829) |
Net increase (decrease) | (54,130) | (1,666) | $ (1,992,076) | $ 344,739 |
Class B | | | | |
Shares sold | 9,231 | 55,740 | $ 336,945 | $ 2,638,278 |
Reinvestment of distributions | - | 22,881 | - | 1,122,370 |
Shares redeemed | (93,976) | (142,844) | (3,506,846) | (6,672,300) |
Net increase (decrease) | (84,745) | (64,223) | $ (3,169,901) | $ (2,911,652) |
Class C | | | | |
Shares sold | 142,812 | 510,073 | $ 5,081,885 | $ 24,191,165 |
Reinvestment of distributions | - | 63,636 | - | 3,100,723 |
Shares redeemed | (300,277) | (484,293) | (10,819,907) | (22,585,009) |
Net increase (decrease) | (157,465) | 89,416 | $ (5,738,022) | $ 4,706,879 |
Gold | | | | |
Shares sold | 12,217,076 | 30,555,727 | $ 461,041,057 | $ 1,483,101,053 |
Reinvestment of distributions | - | 4,125,294 | - | 208,463,091 |
Shares redeemed | (15,184,970) | (31,912,749) | (569,825,690) | (1,536,990,789) |
Net increase (decrease) | (2,967,894) | 2,768,272 | $ (108,784,633) | $ 154,573,355 |
Institutional Class | | | | |
Shares sold | 650,993 | 1,664,357 | $ 24,357,064 | $ 81,430,250 |
Reinvestment of distributions | - | 146,226 | - | 7,344,695 |
Shares redeemed | (478,376) | (810,698) | (17,651,426) | (38,218,873) |
Net increase (decrease) | 172,617 | 999,885 | $ 6,705,638 | $ 50,556,072 |
14. Other.
The Fund's organizational documents provide former and current trustees and officers with a limited indemnification against liabilities arising in connection with the performance of their duties to the Fund. In the normal course of business, the Fund may also enter into contracts that provide general indemnifications. The Fund's maximum exposure under these arrangements is unknown as this would be dependent on future claims that may be made against the Fund. The risk of material loss from such claims is considered remote.
Semiannual Report
Materials Portfolio
As a shareholder of the Fund, you incur two types of costs: (1) transaction costs, including sales charges (loads) on purchase payments or redemption proceeds, redemption fees and (2) ongoing costs, including management fees, distribution and/or service (12b-1) fees and other Fund expenses. This Example is intended to help you understand your ongoing costs (in dollars) of investing in the Fund and to compare these costs with the ongoing costs of investing in other mutual funds.
The Example is based on an investment of $1,000 invested at the beginning of the period and held for the entire period (March 1, 2012 to August 31, 2012).
Actual Expenses
The first line of the accompanying table for each class of the Fund provides information about actual account values and actual expenses. You may use the information in this line, together with the amount you invested, to estimate the expenses that you paid over the period. Simply divide your account value by $1,000.00 (for example, an $8,600 account value divided by $1,000.00 = 8.6), then multiply the result by the number in the first line for a class of the Fund under the heading entitled "Expenses Paid During Period" to estimate the expenses you paid on your account during this period. A small balance maintenance fee of $12.00 that is charged once a year may apply for certain accounts with a value of less than $2,000. This fee is not included in the table below. If it was, the estimate of expenses you paid during the period would be higher, and your ending account value lower, by this amount. In addition, the Fund, as a shareholder in the underlying Fidelity Central Funds, will indirectly bear its pro-rata share of the fees and expenses incurred by the underlying Fidelity Central Funds. These fees and expenses are not included in the Fund's annualized expense ratio used to calculate the expense estimate in the table below.
Hypothetical Example for Comparison Purposes
The second line of the accompanying table for each class of the Fund provides information about hypothetical account values and hypothetical expenses based on a Class' actual expense ratio and an assumed rate of return of 5% per year before expenses, which is not the Class' actual return. The hypothetical account values and expenses may not be used to estimate the actual ending account balance or expenses you paid for the period. You may use this information to compare the ongoing costs of investing in the Fund and other funds. To do so, compare this 5% hypothetical example with the 5% hypothetical examples that appear in the shareholder reports of the other funds. A small balance maintenance fee of $12.00 that is charged once a year may apply for certain accounts with a value of less than $2,000. This fee is not included in the table below. If it was, the estimate of expenses you paid during the period would be higher, and your ending account value lower, by this amount. In addition, the Fund, as a shareholder in the underlying Fidelity Central Funds, will indirectly bear its pro-rata share of the fees and expenses incurred by the underlying Fidelity Central Funds. These fees and expenses are not included in the Fund's annualized expense ratio used to calculate the expense estimate in the table below.
Please note that the expenses shown in the table are meant to highlight your ongoing costs only and do not reflect any transaction costs. Therefore, the second line of the table is useful in comparing ongoing costs only, and will not help you determine the relative total costs of owning different funds. In addition, if these transactional costs were included, your costs would have been higher.
| Annualized
Expense Ratio | Beginning
Account Value
March 1, 2012 | Ending
Account Value
August 31, 2012 | Expenses Paid
During Period*
March 1, 2012
to August 31, 2012 |
Class A | 1.13% | | | |
Actual | | $ 1,000.00 | $ 989.70 | $ 5.67 |
HypotheticalA | | $ 1,000.00 | $ 1,019.51 | $ 5.75 |
Class T | 1.42% | | | |
Actual | | $ 1,000.00 | $ 988.30 | $ 7.12 |
HypotheticalA | | $ 1,000.00 | $ 1,018.05 | $ 7.22 |
Class B | 1.91% | | | |
Actual | | $ 1,000.00 | $ 985.90 | $ 9.56 |
HypotheticalA | | $ 1,000.00 | $ 1,015.58 | $ 9.70 |
Class C | 1.89% | | | |
Actual | | $ 1,000.00 | $ 985.80 | $ 9.46 |
HypotheticalA | | $ 1,000.00 | $ 1,015.68 | $ 9.60 |
Materials | .86% | | | |
Actual | | $ 1,000.00 | $ 991.00 | $ 4.32 |
HypotheticalA | | $ 1,000.00 | $ 1,020.87 | $ 4.38 |
Institutional Class | .85% | | | |
Actual | | $ 1,000.00 | $ 991.00 | $ 4.27 |
HypotheticalA | | $ 1,000.00 | $ 1,020.92 | $ 4.33 |
A 5% return per year before expenses
* Expenses are equal to each Class' annualized expense ratio, multiplied by the average account value over the period, multiplied by 184/365 (to reflect the one-half year period).
Semiannual Report
Materials Portfolio
Investment Changes (Unaudited)
Top Ten Stocks as of August 31, 2012 |
| % of fund's
net assets | % of fund's net assets
6 months ago |
E.I. du Pont de Nemours & Co. | 8.3 | 8.1 |
Monsanto Co. | 8.1 | 6.6 |
Air Products & Chemicals, Inc. | 5.7 | 5.2 |
LyondellBasell Industries NV Class A | 4.2 | 3.5 |
Eastman Chemical Co. | 3.8 | 2.2 |
PPG Industries, Inc. | 3.6 | 2.2 |
Ecolab, Inc. | 3.5 | 3.8 |
Sherwin-Williams Co. | 3.2 | 2.4 |
Rock-Tenn Co. Class A | 3.2 | 2.5 |
Freeport-McMoRan Copper & Gold, Inc. | 2.8 | 2.7 |
| 46.4 | |
Top Industries (% of fund's net assets) |
As of August 31, 2012 |
| Chemicals | 62.5% | |
| Metals & Mining | 19.5% | |
| Containers & Packaging | 8.6% | |
| Construction Materials | 1.5% | |
| Paper & Forest Products | 1.2% | |
| All Others* | 6.7% | |

As of February 29, 2012 |
| Chemicals | 65.0% | |
| Metals & Mining | 20.1% | |
| Containers & Packaging | 8.0% | |
| Food Products | 1.0% | |
| Electrical Equipment | 0.6% | |
| All Others* | 5.3% | |

* Includes short-term investments and net other assets. |
Semiannual Report
Materials Portfolio
Investments August 31, 2012 (Unaudited)
Showing Percentage of Net Assets
Common Stocks - 94.0% |
| Shares | | Value |
CHEMICALS - 62.5% |
Commodity Chemicals - 2.5% |
Arkema SA | 81,801 | | $ 6,963,548 |
PetroLogistics LP | 707,262 | | 9,045,881 |
Westlake Chemical Corp. (d) | 266,370 | | 18,320,929 |
| | 34,330,358 |
Diversified Chemicals - 18.6% |
Dow Chemical Co. | 313,213 | | 9,180,273 |
E.I. du Pont de Nemours & Co. | 2,275,817 | | 113,221,891 |
Eastman Chemical Co. | 921,584 | | 50,926,732 |
FMC Corp. | 359,730 | | 19,540,534 |
Lanxess AG | 96,593 | | 7,328,559 |
Olin Corp. | 180,200 | | 3,861,686 |
PPG Industries, Inc. | 446,927 | | 49,170,909 |
| | 253,230,584 |
Fertilizers & Agricultural Chemicals - 11.6% |
CF Industries Holdings, Inc. | 164,937 | | 34,143,608 |
Monsanto Co. | 1,257,799 | | 109,566,871 |
Rentech Nitrogen Partners LP | 409,909 | | 13,924,609 |
| | 157,635,088 |
Industrial Gases - 5.7% |
Air Products & Chemicals, Inc. | 935,857 | | 77,283,071 |
Specialty Chemicals - 24.1% |
Albemarle Corp. | 427,749 | | 23,410,703 |
Ashland, Inc. | 509,786 | | 37,535,543 |
Celanese Corp. Class A | 525,033 | | 20,087,763 |
Cytec Industries, Inc. | 203,146 | | 13,909,407 |
Ecolab, Inc. | 737,482 | | 47,220,972 |
Kraton Performance Polymers, Inc. (a) | 77,900 | | 1,670,955 |
LyondellBasell Industries NV Class A | 1,163,330 | | 56,817,037 |
OMNOVA Solutions, Inc. (a) | 500,291 | | 3,897,267 |
Rockwood Holdings, Inc. | 311,332 | | 14,738,457 |
Sherwin-Williams Co. | 304,547 | | 43,574,585 |
Sigma Aldrich Corp. | 462,244 | | 32,833,191 |
W.R. Grace & Co. (a) | 570,496 | | 32,951,849 |
| | 328,647,729 |
TOTAL CHEMICALS | | 851,126,830 |
COMMERCIAL SERVICES & SUPPLIES - 0.2% |
Environmental & Facility Services - 0.2% |
Swisher Hygiene, Inc. (a) | 262,171 | | 417,639 |
Swisher Hygiene, Inc. (Canada) (a)(d) | 1,553,967 | | 2,750,526 |
| | 3,168,165 |
CONSTRUCTION MATERIALS - 1.5% |
Construction Materials - 1.5% |
Martin Marietta Materials, Inc. (d) | 272,511 | | 20,814,390 |
|
| Shares | | Value |
CONTAINERS & PACKAGING - 8.6% |
Metal & Glass Containers - 5.4% |
Aptargroup, Inc. | 552,400 | | $ 27,979,060 |
Ball Corp. | 795,733 | | 33,556,061 |
Nampak Ltd. | 78,373 | | 252,290 |
Silgan Holdings, Inc. | 285,078 | | 11,953,321 |
| | 73,740,732 |
Paper Packaging - 3.2% |
Rock-Tenn Co. Class A | 649,333 | | 43,355,964 |
TOTAL CONTAINERS & PACKAGING | | 117,096,696 |
METALS & MINING - 19.5% |
Diversified Metals & Mining - 6.5% |
Copper Mountain Mining Corp. (a) | 1,992,200 | | 5,295,018 |
First Quantum Minerals Ltd. | 1,341,300 | | 25,839,500 |
Freeport-McMoRan Copper & Gold, Inc. | 1,052,624 | | 38,010,253 |
HudBay Minerals, Inc. | 408,700 | | 3,495,147 |
Iluka Resources Ltd. | 78,303 | | 744,268 |
Turquoise Hill Resources Ltd. (a)(d) | 1,899,540 | | 15,261,838 |
| | 88,646,024 |
Gold - 6.6% |
Allied Nevada Gold Corp. (a) | 261,472 | | 8,518,758 |
Franco-Nevada Corp. | 207,300 | | 10,754,575 |
Goldcorp, Inc. | 457,700 | | 18,790,889 |
Newmont Mining Corp. | 555,189 | | 28,136,979 |
Royal Gold, Inc. | 267,701 | | 23,563,042 |
| | 89,764,243 |
Steel - 6.4% |
African Minerals Ltd. (a) | 529,923 | | 2,120,424 |
Carpenter Technology Corp. | 386,855 | | 18,282,767 |
Haynes International, Inc. | 232,886 | | 11,353,193 |
Nucor Corp. | 634,535 | | 23,890,243 |
Reliance Steel & Aluminum Co. | 370,602 | | 19,060,061 |
Steel Dynamics, Inc. | 954,009 | | 11,657,990 |
| | 86,364,678 |
TOTAL METALS & MINING | | 264,774,945 |
OIL, GAS & CONSUMABLE FUELS - 0.5% |
Coal & Consumable Fuels - 0.5% |
Peabody Energy Corp. | 297,643 | | 6,438,018 |
PAPER & FOREST PRODUCTS - 1.2% |
Paper Products - 1.2% |
International Paper Co. | 473,440 | | 16,362,086 |
TOTAL COMMON STOCKS (Cost $1,083,584,729) |
1,279,781,130
|
Convertible Bonds - 0.6% |
| Principal
Amount | | Value |
BUILDING PRODUCTS - 0.6% |
Building Products - 0.6% |
Aspen Aerogels, Inc. 8% 6/1/14 (f)
(Cost $7,861,200) | | $ 7,861,200 | | $ 7,861,200 |
U.S. Treasury Obligations - 0.0% |
|
U.S. Treasury Bills, yield at date of purchase 0.1% 11/23/12 (e)
(Cost $669,841) | | 670,000 | |
669,873
|
Money Market Funds - 7.1% |
| Shares | | |
Fidelity Cash Central Fund, 0.17% (b) | 77,412,400 | | 77,412,400 |
Fidelity Securities Lending Cash Central Fund, 0.18% (b)(c) | 19,616,097 | | 19,616,097 |
TOTAL MONEY MARKET FUNDS (Cost $97,028,497) |
97,028,497
|
TOTAL INVESTMENT PORTFOLIO - 101.7% (Cost $1,189,144,267) | |
1,385,340,700
|
NET OTHER ASSETS (LIABILITIES) - (1.7)% | | (23,673,690) |
NET ASSETS - 100% | $ 1,361,667,010 |
Futures Contracts |
| Expiration
Date | | Underlying
Face Amount
at Value | | Unrealized
Appreciation/
(Depreciation) |
Purchased |
Equity Index Contracts |
350 CME E-mini Materials Select Sector Index Contracts | Sept. 2012 | | $ 13,104,000 | | $ 585,925 |
|
The face value of futures purchased as a percentage of net assets is 1% |
Legend |
(a) Non-income producing |
(b) Affiliated fund that is available only to investment companies and other accounts managed by Fidelity Investments. The rate quoted is the annualized seven-day yield of the fund at period end. A complete unaudited listing of the fund's holdings as of its most recent quarter end is available upon request. In addition, each Fidelity Central Fund's financial statements are available on the SEC's website or upon request. |
(c) Investment made with cash collateral received from securities on loan. |
(d) Security or a portion of the security is on loan at period end. |
(e) Security or a portion of the security was pledged to cover margin requirements for futures contracts. At the period end, the value of securities pledged amounted to $669,873. |
(f) Restricted securities - Investment in securities not registered under the Securities Act of 1933 (excluding 144A issues). At the end of the period, the value of restricted securities (excluding 144A issues) amounted to $7,861,200 or 0.6% of net assets. |
Additional information on each restricted holding is as follows: |
Security | Acquisition Date | Acquisition Cost |
Aspen Aerogels, Inc. 8% 6/1/14 | 6/1/11 | $ 7,861,200 |
Affiliated Central Funds |
Information regarding fiscal year to date income earned by the Fund from investments in Fidelity Central Funds is as follows: |
Fund | Income earned |
Fidelity Cash Central Fund | $ 44,504 |
Fidelity Securities Lending Cash Central Fund | 177,206 |
Total | $ 221,710 |
Other Information |
The following is a summary of the inputs used, as of August 31, 2012, involving the Fund's assets and liabilities carried at fair value. The inputs or methodology used for valuing securities may not be an indication of the risk associated with investing in those securities. For more information on valuation inputs, and their aggregation into the levels used in the table below, please refer to the Security Valuation section in the accompanying Notes to Financial Statements. |
Valuation Inputs at Reporting Date: |
Description | Total | Level 1 | Level 2 | Level 3 |
Investments in Securities: | | | | |
Common Stocks | $ 1,279,781,130 | $ 1,279,363,491 | $ 417,639 | $ - |
Convertible Bonds | 7,861,200 | - | - | 7,861,200 |
U.S. Treasury Obligations | 669,873 | - | 669,873 | - |
Money Market Funds | 97,028,497 | 97,028,497 | - | - |
Total Investments in Securities: | $ 1,385,340,700 | $ 1,376,391,988 | $ 1,087,512 | $ 7,861,200 |
Derivative Instruments: | | | | |
Assets | | | | |
Futures Contracts | $ 585,925 | $ 585,925 | $ - | $ - |
Value of Derivative Instruments |
The following table is a summary of the Fund's value of derivative instruments by primary risk exposure as of August 31, 2012. For additional information on derivative instruments, please refer to the Derivative Instruments section in the accompanying Notes to Financial Statements. |
Primary Risk Exposure /
Derivative Type | Value |
| Asset | Liability |
Equity Risk | | |
Futures Contracts (a) | $ 585,925 | $ - |
Total Value of Derivatives | $ 585,925 | $ - |
(a) Reflects cumulative appreciation/(depreciation) on futures contracts as disclosed on the Schedule of Investments. Only the period end variation margin is separately disclosed on the Statement of Assets and Liabilities. |
Distribution of investments by country or territory of incorporation, as a percentage of total net assets, is as follows. (Unaudited) |
United States of America | 88.7% |
Canada | 5.9% |
Netherlands | 4.2% |
Others (Individually Less Than 1%) | 1.2% |
| 100.0% |
See accompanying notes which are an integral part of the financial statements.
Semiannual Report
Materials Portfolio
Statement of Assets and Liabilities
| August 31, 2012 (Unaudited) |
| | |
Assets | | |
Investment in securities, at value (including securities loaned of $19,434,991) - See accompanying schedule: Unaffiliated issuers (cost $1,092,115,770) | $ 1,288,312,203 | |
Fidelity Central Funds (cost $97,028,497) | 97,028,497 | |
Total Investments (cost $1,189,144,267) | | $ 1,385,340,700 |
Receivable for investments sold | | 4,349,682 |
Receivable for fund shares sold | | 1,765,081 |
Dividends receivable | | 2,725,988 |
Interest receivable | | 786,120 |
Distributions receivable from Fidelity Central Funds | | 29,250 |
Receivable for daily variation margin on futures contracts | | 126,001 |
Other receivables | | 13,588 |
Total assets | | 1,395,136,410 |
| | |
Liabilities | | |
Payable for investments purchased | $ 9,732,173 | |
Payable for fund shares redeemed | 3,050,657 | |
Accrued management fee | 627,023 | |
Distribution and service plan fees payable | 100,292 | |
Other affiliated payables | 306,803 | |
Other payables and accrued expenses | 36,355 | |
Collateral on securities loaned, at value | 19,616,097 | |
Total liabilities | | 33,469,400 |
| | |
Net Assets | | $ 1,361,667,010 |
Net Assets consist of: | | |
Paid in capital | | $ 1,157,341,532 |
Undistributed net investment income | | 7,293,497 |
Accumulated undistributed net realized gain (loss) on investments and foreign currency transactions | | 252,393 |
Net unrealized appreciation (depreciation) on investments and assets and liabilities in foreign currencies | | 196,779,588 |
Net Assets | | $ 1,361,667,010 |
Statement of Assets and Liabilities - continued
| August 31, 2012 (Unaudited) |
| | |
Calculation of Maximum Offering Price Class A:
Net Asset Value and redemption price per share ($159,241,924 ÷ 2,337,341 shares) | | $ 68.13 |
| | |
Maximum offering price per share (100/94.25 of $68.13) | | $ 72.29 |
Class T:
Net Asset Value and redemption price per share ($27,882,308 ÷ 411,614 shares) | | $ 67.74 |
| | |
Maximum offering price per share (100/96.50 of $67.74) | | $ 70.20 |
Class B:
Net Asset Value and offering price per share ($9,924,133 ÷ 148,566 shares)A | | $ 66.80 |
| | |
Class C:
Net Asset Value and offering price per share ($57,455,649 ÷ 861,994 shares)A | | $ 66.65 |
| | |
Materials:
Net Asset Value, offering price and redemption price per share ($997,832,433 ÷ 14,593,648 shares) | | $ 68.37 |
| | |
Institutional Class:
Net Asset Value, offering price and redemption price per share ($109,330,563 ÷ 1,600,390 shares) | | $ 68.31 |
A Redemption price per share is equal to net asset value less any applicable contingent deferred sales charge.
See accompanying notes which are an integral part of the financial statements.
Semiannual Report
Statement of Operations
| Six months ended August 31, 2012 (Unaudited) |
| | |
Investment Income | | |
Dividends | | $ 13,109,631 |
Interest | | 316,596 |
Income from Fidelity Central Funds | | 221,710 |
Total income | | 13,647,937 |
| | |
Expenses | | |
Management fee | $ 3,727,331 | |
Transfer agent fees | 1,666,477 | |
Distribution and service plan fees | 595,415 | |
Accounting and security lending fees | 214,646 | |
Custodian fees and expenses | 19,192 | |
Independent trustees' compensation | 4,519 | |
Registration fees | 90,223 | |
Audit | 22,561 | |
Legal | 2,614 | |
Miscellaneous | 8,676 | |
Total expenses before reductions | 6,351,654 | |
Expense reductions | (20,380) | 6,331,274 |
Net investment income (loss) | | 7,316,663 |
Realized and Unrealized Gain (Loss) Net realized gain (loss) on: | | |
Investment securities: | | |
Unaffiliated issuers | 11,592,171 | |
Foreign currency transactions | 9,600 | |
Futures contracts | 165,760 | |
Total net realized gain (loss) | | 11,767,531 |
Change in net unrealized appreciation (depreciation) on: Investment securities | (35,717,709) | |
Assets and liabilities in foreign currencies | (2,770) | |
Futures contracts | (575,410) | |
Total change in net unrealized appreciation (depreciation) | | (36,295,889) |
Net gain (loss) | | (24,528,358) |
Net increase (decrease) in net assets resulting from operations | | $ (17,211,695) |
Statement of Changes in Net Assets
| Six months ended
August 31, 2012
(Unaudited) | Year ended
February 29,
2012 |
Increase (Decrease) in Net Assets | | |
Operations | | |
Net investment income (loss) | $ 7,316,663 | $ 11,168,253 |
Net realized gain (loss) | 11,767,531 | 34,880,798 |
Change in net unrealized appreciation (depreciation) | (36,295,889) | (65,841,883) |
Net increase (decrease) in net assets resulting from operations | (17,211,695) | (19,792,832) |
Distributions to shareholders from net investment income | (820,982) | (9,840,737) |
Distributions to shareholders from net realized gain | (7,338,384) | (7,461,289) |
Total distributions | (8,159,366) | (17,302,026) |
Share transactions - net increase (decrease) | (47,316,017) | (18,941,790) |
Redemption fees | 28,325 | 99,276 |
Total increase (decrease) in net assets | (72,658,753) | (55,937,372) |
| | |
Net Assets | | |
Beginning of period | 1,434,325,763 | 1,490,263,135 |
End of period (including undistributed net investment income of $7,293,497 and undistributed net investment income of $797,816, respectively) | $ 1,361,667,010 | $ 1,434,325,763 |
See accompanying notes which are an integral part of the financial statements.
Semiannual Report
Financial Highlights - Class A
| Six months ended
August 31, 2012 | Years ended February 28, |
| (Unaudited) | 2012 L | 2011 | 2010 | 2009 | 2008 L |
Selected Per-Share Data | | | | | | |
Net asset value, beginning of period | $ 69.23 | $ 69.96 | $ 52.54 | $ 27.65 | $ 57.00 | $ 51.01 |
Income from Investment Operations | | | | | | |
Net investment income (loss) E | .30 | .40 | 1.08 H | .30 I | .22 | .46 |
Net realized and unrealized gain (loss) | (1.02) | (.35) | 17.40 | 24.90 | (29.46) | 8.05 |
Total from investment operations | (.72) | .05 | 18.48 | 25.20 | (29.24) | 8.51 |
Distributions from net investment income | (.02) | (.40) | (1.06) | (.32) | (.12) | (.32) |
Distributions from net realized gain | (.36) | (.38) | (.01) | - | - | (2.21) |
Total distributions | (.38) | (.78) | (1.07) | (.32) | (.12) | (2.53) N |
Redemption fees added to paid in capital E | - M | - M | .01 | .01 | .01 | .01 |
Net asset value, end of period | $ 68.13 | $ 69.23 | $ 69.96 | $ 52.54 | $ 27.65 | $ 57.00 |
Total Return B, C, D | (1.03)% | .21% | 35.33% | 91.25% | (51.30)% | 16.79% |
Ratios to Average Net Assets F, J | | | | | | |
Expenses before reductions | 1.13% A | 1.13% | 1.16% | 1.23% | 1.21% | 1.21% |
Expenses net of fee waivers, if any | 1.13% A | 1.13% | 1.16% | 1.23% | 1.21% | 1.21% |
Expenses net of all reductions | 1.13% A | 1.13% | 1.15% | 1.22% | 1.20% | 1.21% |
Net investment income (loss) | .91% A | .61% | 1.81% H | .65% I | .47% | .83% |
Supplemental Data | | | | | | |
Net assets, end of period (000 omitted) | $ 159,242 | $ 157,781 | $ 124,160 | $ 52,352 | $ 10,796 | $ 12,522 |
Portfolio turnover rate G | 59% A | 94% | 87% | 104% K | 117% | 77% |
A Annualized B Total returns for periods of less than one year are not annualized. C Total returns would have been lower if certain expenses had not been reduced during the applicable periods shown. D Total returns do not include the effect of the sales charges. E Calculated based on average shares outstanding during the period. F Fees and expenses of any underlying Fidelity Central Funds are not included in the Fund's expense ratio. The Fund indirectly bears its proportionate share of the expenses of any underlying Fidelity Central Funds. G Amount does not include the portfolio activity of any underlying Fidelity Central Funds. H Investment income per share reflects a large, non-recurring dividend which amounted to $.83 per share. Excluding this non-recurring dividend, the ratio of net investment income (loss) to average net assets would have been .41%. I Investment income per share reflects a large, non-recurring dividend which amounted to $.10 per share. Excluding this non-recurring dividend, the ratio of net investment income (loss) to average net assets would have been .43%. J Expense ratios reflect operating expenses of the class. Expenses before reductions do not reflect amounts reimbursed by the investment adviser or reductions from brokerage service arrangements or reductions from other expense offset arrangements and do not represent the amount paid by the class during periods when reimbursements or reductions occur. Expenses net of fee waivers reflect expenses after reimbursement by the investment adviser but prior to reductions from brokerage service arrangements or other expense offset arrangements. Expenses net of all reductions represent the net expenses paid by the class. K The portfolio turnover rate does not include the assets acquired in the merger. L For the year ended February 29. M Amount represents less than $.01 per share. N Total distributions of $2.53 per share is comprised of distributions from net investment income of $.322 and distributions from net realized gain of $2.210 per share. |
Financial Highlights - Class T
| Six months ended
August 31, 2012 | Years ended February 28, |
| (Unaudited) | 2012 L | 2011 | 2010 | 2009 | 2008 L |
Selected Per-Share Data | | | | | | |
Net asset value, beginning of period | $ 68.91 | $ 69.68 | $ 52.35 | $ 27.56 | $ 56.80 | $ 50.89 |
Income from Investment Operations | | | | | | |
Net investment income (loss) E | .21 | .21 | .90 H | .16 I | .10 | .32 |
Net realized and unrealized gain (loss) | (1.02) | (.35) | 17.34 | 24.81 | (29.32) | 8.00 |
Total from investment operations | (.81) | (.14) | 18.24 | 24.97 | (29.22) | 8.32 |
Distributions from net investment income | - | (.25) | (.92) | (.19) | (.03) | (.21) |
Distributions from net realized gain | (.36) | (.38) | - | - | - | (2.21) |
Total distributions | (.36) | (.63) | (.92) | (.19) | (.03) | (2.42) N |
Redemption fees added to paid in capital E | - M | - M | .01 | .01 | .01 | .01 |
Net asset value, end of period | $ 67.74 | $ 68.91 | $ 69.68 | $ 52.35 | $ 27.56 | $ 56.80 |
Total Return B, C, D | (1.17)% | (.09)% | 34.98% | 90.70% | (51.43)% | 16.45% |
Ratios to Average Net Assets F, J | | | | | | |
Expenses before reductions | 1.42% A | 1.42% | 1.44% | 1.52% | 1.46% | 1.46% |
Expenses net of fee waivers, if any | 1.42% A | 1.42% | 1.44% | 1.52% | 1.46% | 1.46% |
Expenses net of all reductions | 1.42% A | 1.41% | 1.43% | 1.51% | 1.46% | 1.46% |
Net investment income (loss) | .62% A | .33% | 1.54% H | .35% I | .22% | .57% |
Supplemental Data | | | | | | |
Net assets, end of period (000 omitted) | $ 27,882 | $ 28,290 | $ 25,570 | $ 14,712 | $ 4,944 | $ 6,850 |
Portfolio turnover rate G | 59% A | 94% | 87% | 104% K | 117% | 77% |
A Annualized B Total returns for periods of less than one year are not annualized. C Total returns would have been lower if certain expenses had not been reduced during the applicable periods shown. D Total returns do not include the effect of the sales charges. E Calculated based on average shares outstanding during the period. F Fees and expenses of any underlying Fidelity Central Funds are not included in the Fund's expense ratio. The Fund indirectly bears its proportionate share of the expenses of any underlying Fidelity Central Funds. G Amount does not include the portfolio activity of any underlying Fidelity Central Funds. H Investment income per share reflects a large, non-recurring dividend which amounted to $.83 per share. Excluding this non-recurring dividend, the ratio of net investment income (loss) to average net assets would have been .14%. I Investment income per share reflects a large, non-recurring dividend which amounted to $.10 per share. Excluding this non-recurring dividend, the ratio of net investment income (loss) to average net assets would have been .14%. J Expense ratios reflect operating expenses of the class. Expenses before reductions do not reflect amounts reimbursed by the investment adviser or reductions from brokerage service arrangements or reductions from other expense offset arrangements and do not represent the amount paid by the class during periods when reimbursements or reductions occur. Expenses net of fee waivers reflect expenses after reimbursement by the investment adviser but prior to reductions from brokerage service arrangements or other expense offset arrangements. Expenses net of all reductions represent the net expenses paid by the class. K The portfolio turnover rate does not include the assets acquired in the merger. L For the year ended February 29. M Amount represents less than $.01 per share. N Total distributions of $2.42 per share is comprised of distributions from net investment income of $.207 and distributions from net realized gain of $2.210 per share. |
See accompanying notes which are an integral part of the financial statements.
Semiannual Report
Financial Highlights - Class B
| Six months ended
August 31, 2012 | Years ended February 28, |
| (Unaudited) | 2012 L | 2011 | 2010 | 2009 | 2008 L |
Selected Per-Share Data | | | | | | |
Net asset value, beginning of period | $ 68.13 | $ 68.95 | $ 51.86 | $ 27.35 | $ 56.59 | $ 50.81 |
Income from Investment Operations | | | | | | |
Net investment income (loss) E | .04 | (.11) | .60 H | (.07) I | (.12) | .04 |
Net realized and unrealized gain (loss) | (1.01) | (.33) | 17.13 | 24.61 | (29.13) | 7.98 |
Total from investment operations | (.97) | (.44) | 17.73 | 24.54 | (29.25) | 8.02 |
Distributions from net investment income | - | - | (.65) | (.04) | - | (.04) |
Distributions from net realized gain | (.36) | (.38) | - | - | - | (2.21) |
Total distributions | (.36) | (.38) | (.65) | (.04) | - | (2.25) N |
Redemption fees added to paid in capital E | - M | - M | .01 | .01 | .01 | .01 |
Net asset value, end of period | $ 66.80 | $ 68.13 | $ 68.95 | $ 51.86 | $ 27.35 | $ 56.59 |
Total Return B, C, D | (1.41)% | (.57)% | 34.29% | 89.79% | (51.67)% | 15.89% |
Ratios to Average Net Assets F, J | | | | | | |
Expenses before reductions | 1.91% A | 1.91% | 1.93% | 2.02% | 1.95% | 1.97% |
Expenses net of fee waivers, if any | 1.91% A | 1.91% | 1.93% | 2.02% | 1.95% | 1.97% |
Expenses net of all reductions | 1.91% A | 1.91% | 1.92% | 2.01% | 1.95% | 1.96% |
Net investment income (loss) | .13% A | (.17)% | 1.04% H | (.15)% I | (.27)% | .07% |
Supplemental Data | | �� | | | | |
Net assets, end of period (000 omitted) | $ 9,924 | $ 11,040 | $ 13,507 | $ 9,538 | $ 2,601 | $ 4,173 |
Portfolio turnover rate G | 59% A | 94% | 87% | 104% K | 117% | 77% |
A Annualized B Total returns for periods of less than one year are not annualized. C Total returns would have been lower if certain expenses had not been reduced during the applicable periods shown. D Total returns do not include the effect of the contingent deferred sales charge. E Calculated based on average shares outstanding during the period. F Fees and expenses of any underlying Fidelity Central Funds are not included in the Fund's expense ratio. The Fund indirectly bears its proportionate share of the expenses of any underlying Fidelity Central Funds. G Amount does not include the portfolio activity of any underlying Fidelity Central Funds. H Investment income per share reflects a large, non-recurring dividend which amounted to $.83 per share. Excluding this non-recurring dividend, the ratio of net investment income (loss) to average net assets would have been (.35)%. I Investment income per share reflects a large, non-recurring dividend which amounted to $.10 per share. Excluding this non-recurring dividend, the ratio of net investment income (loss) to average net assets would have been (.36)%. J Expense ratios reflect operating expenses of the class. Expenses before reductions do not reflect amounts reimbursed by the investment adviser or reductions from brokerage service arrangements or reductions from other expense offset arrangements and do not represent the amount paid by the class during periods when reimbursements or reductions occur. Expenses net of fee waivers reflect expenses after reimbursement by the investment adviser but prior to reductions from brokerage service arrangements or other expense offset arrangements. Expenses net of all reductions represent the net expenses paid by the class. K The portfolio turnover rate does not include the assets acquired in the merger. L For the year ended February 29. M Amount represents less than $.01 per share. N Total distributions of $2.25 per share is comprised of distributions from net investment income of $.043 and distributions from net realized gain of $2.210 per share. |
Financial Highlights - Class C
| Six months ended
August 31, 2012 | Years ended February 28, |
| (Unaudited) | 2012 L | 2011 | 2010 | 2009 | 2008 L |
Selected Per-Share Data | | | | | | |
Net asset value, beginning of period | $ 67.98 | $ 68.78 | $ 51.79 | $ 27.31 | $ 56.50 | $ 50.81 |
Income from Investment Operations | | | | | | |
Net investment income (loss) E | .05 | (.10) | .61 H | (.06) I | (.13) | .04 |
Net realized and unrealized gain (loss) | (1.02) | (.32) | 17.09 | 24.57 | (29.07) | 7.97 |
Total from investment operations | (.97) | (.42) | 17.70 | 24.51 | (29.20) | 8.01 |
Distributions from net investment income | - | - | (.72) | (.04) | - | (.12) |
Distributions from net realized gain | (.36) | (.38) | - | - | - | (2.21) |
Total distributions | (.36) | (.38) | (.72) | (.04) | - | (2.33) N |
Redemption fees added to paid in capital E | - M | - M | .01 | .01 | .01 | .01 |
Net asset value, end of period | $ 66.65 | $ 67.98 | $ 68.78 | $ 51.79 | $ 27.31 | $ 56.50 |
Total Return B, C, D | (1.42)% | (.55)% | 34.29% | 89.82% | (51.66)% | 15.87% |
Ratios to Average Net Assets F, J | | | | | | |
Expenses before reductions | 1.89% A | 1.89% | 1.93% | 2.01% | 1.95% | 1.96% |
Expenses net of fee waivers, if any | 1.89% A | 1.89% | 1.93% | 2.01% | 1.95% | 1.96% |
Expenses net of all reductions | 1.89% A | 1.89% | 1.92% | 2.00% | 1.95% | 1.96% |
Net investment income (loss) | .15% A | (.15)% | 1.04% H | (.13)% I | (.27)% | .07% |
Supplemental Data | | | | | | |
Net assets, end of period (000 omitted) | $ 57,456 | $ 58,296 | $ 46,525 | $ 20,469 | $ 5,509 | $ 8,743 |
Portfolio turnover rate G | 59% A | 94% | 87% | 104% K | 117% | 77% |
A Annualized B Total returns for periods of less than one year are not annualized. C Total returns would have been lower if certain expenses had not been reduced during the applicable periods shown. D Total returns do not include the effect of the contingent deferred sales charge. E Calculated based on average shares outstanding during the period. F Fees and expenses of any underlying Fidelity Central Funds are not included in the Fund's expense ratio. The Fund indirectly bears its proportionate share of the expenses of any underlying Fidelity Central Funds. G Amount does not include the portfolio activity of any underlying Fidelity Central Funds. H Investment income per share reflects a large, non-recurring dividend which amounted to $.83 per share. Excluding this non-recurring dividend, the ratio of net investment income (loss) to average net assets would have been (.35)%. I Investment income per share reflects a large, non-recurring dividend which amounted to $.10 per share. Excluding this non-recurring dividend, the ratio of net investment income (loss) to average net assets would have been (.35)%. J Expense ratios reflect operating expenses of the class. Expenses before reductions do not reflect amounts reimbursed by the investment adviser or reductions from brokerage service arrangements or reductions from other expense offset arrangements and do not represent the amount paid by the class during periods when reimbursements or reductions occur. Expenses net of fee waivers reflect expenses after reimbursement by the investment adviser but prior to reductions from brokerage service arrangements or other expense offset arrangements. Expenses net of all reductions represent the net expenses paid by the class. K The portfolio turnover rate does not include the assets acquired in the merger. L For the year ended February 29. M Amount represents less than $.01 per share. N Total distributions of $2.33 per share is comprised of distributions from net investment income of $.124 and distributions from net realized gain of $2.210 per share. |
See accompanying notes which are an integral part of the financial statements.
Semiannual Report
Financial Highlights - Materials
| Six months ended
August 31, 2012 | Years ended February 28, |
| (Unaudited) | 2012 K | 2011 | 2010 | 2009 | 2008 K |
Selected Per-Share Data | | | | | | |
Net asset value, beginning of period | $ 69.41 | $ 70.11 | $ 52.61 | $ 27.66 | $ 57.01 | $ 50.92 |
Income from Investment Operations | | | | | | |
Net investment income (loss) D | .40 | .60 | 1.25 G | .43 H | .38 | .64 |
Net realized and unrealized gain (loss) | (1.03) | (.37) | 17.43 | 24.91 | (29.54) | 8.01 |
Total from investment operations | (.63) | .23 | 18.68 | 25.34 | (29.16) | 8.65 |
Distributions from net investment income | (.05) | (.55) | (1.16) | (.40) | (.20) | (.36) |
Distributions from net realized gain | (.36) | (.38) | (.03) | - | - | (2.21) |
Total distributions | (.41) | (.93) | (1.19) | (.40) | (.20) | (2.57) M |
Redemption fees added to paid in capital D | - L | - L | .01 | .01 | .01 | .01 |
Net asset value, end of period | $ 68.37 | $ 69.41 | $ 70.11 | $ 52.61 | $ 27.66 | $ 57.01 |
Total Return B, C | (.90)% | .49% | 35.70% | 91.77% | (51.15)% | 17.10% |
Ratios to Average Net Assets E, I | | | | | | |
Expenses before reductions | .86% A | .85% | .88% | .96% | .90% | .91% |
Expenses net of fee waivers, if any | .86% A | .85% | .88% | .96% | .90% | .90% |
Expenses net of all reductions | .85% A | .84% | .87% | .94% | .90% | .89% |
Net investment income (loss) | 1.19% A | .90% | 2.10% G | .92% H | .78% | 1.14% |
Supplemental Data | | | | | | |
Net assets, end of period (000 omitted) | $ 997,832 | $ 1,089,619 | $ 1,195,371 | $ 604,475 | $ 127,551 | $ 353,185 |
Portfolio turnover rate F | 59% A | 94% | 87% | 104% J | 117% | 77% |
A Annualized B Total returns for periods of less than one year are not annualized. C Total returns would have been lower if certain expenses had not been reduced during the applicable periods shown. D Calculated based on average shares outstanding during the period. E Fees and expenses of any underlying Fidelity Central Funds are not included in the Fund's expense ratio. The Fund indirectly bears its proportionate share of the expenses of any underlying Fidelity Central Funds. F Amount does not include the portfolio activity of any underlying Fidelity Central Funds. G Investment income per share reflects a large, non-recurring dividend which amounted to $.83 per share. Excluding this non-recurring dividend, the ratio of net investment income (loss) to average net assets would have been ..70%. H Investment income per share reflects a large, non-recurring dividend which amounted to $.10 per share. Excluding this non-recurring dividend, the ratio of net investment income (loss) to average net assets would have been .70%. I Expense ratios reflect operating expenses of the class. Expenses before reductions do not reflect amounts reimbursed by the investment adviser or reductions from brokerage service arrangements or reductions from other expense offset arrangements and do not represent the amount paid by the class during periods when reimbursements or reductions occur. Expenses net of fee waivers reflect expenses after reimbursement by the investment adviser but prior to reductions from brokerage service arrangements or other expense offset arrangements. Expenses net of all reductions represent the net expenses paid by the class. J The portfolio turnover rate does not include the assets acquired in the merger. K For the year ended February 29. L Amount represents less than $.01 per share. M Total distributions of $2.57 per share is comprised of distributions from net investment income of $.363 and distributions from net realized gain of $2.210 per share. |
Financial Highlights - Institutional Class
| Six months ended
August 31, 2012 | Years ended February 28, |
| (Unaudited) | 2012 K | 2011 | 2010 | 2009 | 2008 K |
Selected Per-Share Data | | | | | | |
Net asset value, beginning of period | $ 69.35 | $ 70.05 | $ 52.58 | $ 27.66 | $ 57.00 | $ 50.91 |
Income from Investment Operations | | | | | | |
Net investment income (loss) D | .40 | .60 | 1.28 G | .46 H | .38 | .64 |
Net realized and unrealized gain (loss) | (1.03) | (.36) | 17.40 | 24.89 | (29.53) | 8.00 |
Total from investment operations | (.63) | .24 | 18.68 | 25.35 | (29.15) | 8.64 |
Distributions from net investment income | (.05) | (.56) | (1.19) | (.44) | (.20) | (.36) |
Distributions from net realized gain | (.36) | (.38) | (.03) | - | - | (2.21) |
Total distributions | (.41) | (.94) | (1.22) | (.44) | (.20) | (2.56) M |
Redemption fees added to paid in capital D | - L | - L | .01 | .01 | .01 | .01 |
Net asset value, end of period | $ 68.31 | $ 69.35 | $ 70.05 | $ 52.58 | $ 27.66 | $ 57.00 |
Total Return B, C | (.90)% | .50% | 35.73% | 91.79% | (51.15)% | 17.08% |
Ratios to Average Net Assets E, I | | | | | | |
Expenses before reductions | .85% A | .84% | .86% | .94% | .90% | .89% |
Expenses net of fee waivers, if any | .85% A | .84% | .86% | .94% | .90% | .89% |
Expenses net of all reductions | .84% A | .83% | .85% | .93% | .90% | .89% |
Net investment income (loss) | 1.20% A | .91% | 2.11% G | .94% H | .78% | 1.14% |
Supplemental Data | | | | | | |
Net assets, end of period (000 omitted) | $ 109,331 | $ 89,299 | $ 85,130 | $ 13,670 | $ 719 | $ 1,820 |
Portfolio turnover rate F | 59% A | 94% | 87% | 104% J | 117% | 77% |
A Annualized B Total returns for periods of less than one year are not annualized. C Total returns would have been lower if certain expenses had not been reduced during the applicable periods shown. D Calculated based on average shares outstanding during the period. E Fees and expenses of any underlying Fidelity Central Funds are not included in the Fund's expense ratio. The Fund indirectly bears its proportionate share of the expenses of any underlying Fidelity Central Funds. F Amount does not include the portfolio activity of any underlying Fidelity Central Funds. G Investment income per share reflects a large, non-recurring dividend which amounted to $.83 per share. Excluding this non-recurring dividend, the ratio of net investment income (loss) to average net assets would have been ..72%. H Investment income per share reflects a large, non-recurring dividend which amounted to $.10 per share. Excluding this non-recurring dividend, the ratio of net investment income (loss) to average net assets would have been .72%. I Expense ratios reflect operating expenses of the class. Expenses before reductions do not reflect amounts reimbursed by the investment adviser or reductions from brokerage service arrangements or reductions from other expense offset arrangements and do not represent the amount paid by the class during periods when reimbursements or reductions occur. Expenses net of fee waivers reflect expenses after reimbursement by the investment adviser but prior to reductions from brokerage service arrangements or other expense offset arrangements. Expenses net of all reductions represent the net expenses paid by the class. J The portfolio turnover rate does not include the assets acquired in the merger. K For the year ended February 29. L Amount represents less than $.01 per share. M Total distributions of $2.56 per share is comprised of distributions from net investment income of $.355 and distributions from net realized gain of $2.210 per share. |
See accompanying notes which are an integral part of the financial statements.
Semiannual Report
Notes to Financial Statements
For the period ended August 31, 2012 (Unaudited)
1. Organization.
Materials Portfolio (the Fund) is a non-diversified fund of Fidelity Select Portfolios (the Trust) and is authorized to issue an unlimited number of shares. The Trust is registered under the Investment Company Act of 1940, as amended (the 1940 Act), as an open-end management investment company organized as a Massachusetts business trust. The Fund invests primarily in securities of companies whose principal business activities fall within specific industries. The Fund offers Class A, Class T, Class C, Materials, and Institutional Class shares, each of which, along with Class B shares, has equal rights as to assets and voting privileges. Effective after the close of business on September 1, 2010, Class B shares were closed to new accounts and additional purchases, except for exchanges and reinvestments. Each class has exclusive voting rights with respect to matters that affect that class. Class B shares will automatically convert to Class A shares after a holding period of seven years from the initial date of purchase. Investment income, realized and unrealized capital gains and losses, the common expenses of the Fund, and certain fund-level expense reductions, if any, are allocated on a pro-rata basis to each class based on the relative net assets of each class to the total net assets of the Fund. Each class differs with respect to transfer agent and distribution and service plan fees incurred. Certain expense reductions may also differ by class.
2. Investments in Fidelity Central Funds.
The Fund invests in Fidelity Central Funds, which are open-end investment companies available only to other investment companies and accounts managed by Fidelity Management & Research Company (FMR) and its affiliates. The Fund's Schedule of Investments lists each of the Fidelity Central Funds held as of period end, if any, as an investment of the Fund, but does not include the underlying holdings of each Fidelity Central Fund. As an Investing Fund, the Fund indirectly bears its proportionate share of the expenses of the underlying Fidelity Central Funds.
The Money Market Central Funds seek preservation of capital and current income and are managed by Fidelity Investments Money Management, Inc. (FIMM), an affiliate of FMR.
A complete unaudited list of holdings for each Fidelity Central Fund is available upon request or at the Securities and Exchange Commission (the SEC) web site at www.sec.gov. In addition, the financial statements of the Fidelity Central Funds are available on the SEC web site or upon request.
3. Significant Accounting Policies.
The financial statements have been prepared in conformity with accounting principles generally accepted in the United States of America (GAAP), which require management to make certain estimates and assumptions at the date of the financial statements. Actual results could differ from those estimates. Subsequent events, if any, through the date that the financial statements were issued have been evaluated in the preparation of the financial statements. The following summarizes the significant accounting policies of the Fund:
Security Valuation. Investments are valued as of 4:00 p.m. Eastern time on the last calendar day of the period. In accordance with valuation policies and procedures approved by the Board of Trustees (the Board), the Fund attempts to obtain prices from one or more third party pricing vendor or broker to value its investments. When current market prices, quotations or rates are not readily available or reliable, securities will be fair valued in good faith by the FMR Fair Value Committee (the Committee), in accordance with procedures adopted by the Fund's Board. Factors used in determining fair value vary by security type and may include market or security specific events, changes in interest rates and credit quality. The frequency with which these procedures are used cannot be predicted and they may be utilized to a significant extent. The Committee oversees the Fund's valuation policies and procedures and is responsible for approving and reporting to the Board all fair value determinations.
The Fund categorizes the inputs to valuation techniques used to value its investments into a disclosure hierarchy consisting of three levels as shown below:
Level 1 - quoted prices in active markets for identical investments
Level 2 - other significant observable inputs (including quoted prices for similar investments, interest rates, prepayment speeds, etc.)
Level 3 - unobservable inputs (including the Fund's own assumptions based on the best information available)
Valuation techniques used to value the Fund's investments by major category are as follows:
Equity securities, including restricted securities, for which market quotations are readily available, are valued at the last reported sale price or official closing price as reported by a third party pricing vendor on the primary market or exchange on which they are traded and are categorized as Level 1 in the hierarchy. In the event there were no sales during the day or closing prices are not available, securities are valued at the last quoted bid price or may be valued using the last available price and are generally categorized as Level 2 in the hierarchy. For foreign equity securities, when significant market or security specific events arise, comparisons to the valuation of American Depositary Receipts (ADRs), futures contracts, Exchange-Traded Funds (ETFs) and certain indexes as well as quoted prices for similar securities are used and are categorized as Level 2 in the hierarchy. Utilizing these techniques may result in transfers between Level 1 and Level 2. For restricted equity securities and private placements where observable inputs are limited, assumptions about market activity and risk are used and these securities are categorized as Level 3 in the hierarchy.
Semiannual Report
3. Significant Accounting Policies - continued
Security Valuation - continued
Debt securities, including restricted securities, are valued based on evaluated prices received from third party pricing vendors or from brokers who make markets in such securities. For corporate bonds and U.S. government and government agency obligations, pricing vendors utilize matrix pricing which considers yield or price of bonds of comparable quality, coupon, maturity and type as well as broker-supplied prices and are generally categorized as Level 2 in the hierarchy. When independent prices are unavailable or unreliable, debt securities may be valued utilizing pricing methodologies which consider similar factors that would be used by third party pricing vendors. These are generally categorized as Level 2 in the hierarchy but may be Level 3 depending on the circumstances.
Futures contracts are valued at the settlement price established each day by the board of trade or exchange on which they are traded and are categorized as Level 1 in the hierarchy. Investments in open-end mutual funds, including the Fidelity Central Funds, are valued at their closing net asset value each business day and are categorized as Level 1 in the hierarchy.
Changes in valuation techniques may result in transfers in or out of an assigned level within the disclosure hierarchy. The aggregate value of investments by input level, as of August 31, 2012, is included at the end of the Fund's Schedule of Investments.
Foreign Currency Translation. The Fund may use foreign currency contracts to facilitate transactions in foreign-denominated securities. Gains and losses from these transactions may arise from changes in the value of the foreign currency or if the counterparties do not perform under the contracts' terms.
Foreign-denominated assets, including investment securities, and liabilities are translated into U.S. dollars at the exchange rates at period end. Purchases and sales of investment securities, income and dividends received and expenses denominated in foreign currencies are translated into U.S. dollars at the exchange rate in effect on the transaction date.
The effects of exchange rate fluctuations on investments are included with the net realized and unrealized gain (loss) on investment securities. Other foreign currency transactions resulting in realized and unrealized gain (loss) are disclosed separately.
Investment Transactions and Income. For financial reporting purposes, the Fund's investment holdings and NAV include trades executed through the end of the last business day of the period. The NAV per share for processing shareholder transactions is calculated as of the close of business of the New York Stock Exchange (NYSE), normally 4:00 p.m. Eastern time and includes trades executed through the end of the prior business day. Gains and losses on securities sold are determined on the basis of identified cost. Dividend income is recorded on the ex-dividend date, except for certain dividends from foreign securities where the ex-dividend date may have passed, which are recorded as soon as the Fund is informed of the ex-dividend date. Non-cash dividends included in dividend income, if any, are recorded at the fair market value of the securities received. Distributions received on securities that represent a return of capital or capital gain are recorded as a reduction of cost of investments and/or as a realized gain. The Fund estimates the components of distributions received that may be considered return of capital distributions or capital gain distributions. Interest income and distributions from the Fidelity Central Funds are accrued as earned. Interest income includes coupon interest and amortization of premium and accretion of discount on debt securities. Investment income is recorded net of foreign taxes withheld where recovery of such taxes is uncertain.
Expenses. Expenses directly attributable to a fund are charged to that fund. Expenses attributable to more than one fund are allocated among the respective funds on the basis of relative net assets or other appropriate methods. Expense estimates are accrued in the period to which they relate and adjustments are made when actual amounts are known.
Income Tax Information and Distributions to Shareholders. Each year, the Fund intends to qualify as a regulated investment company under Subchapter M of the Internal Revenue Code, including distributing substantially all of its taxable income and realized gains. As a result, no provision for income taxes is required. The Fund files a U.S. federal tax return, in addition to state and local tax returns as required. A fund's federal income tax returns are subject to examination by the Internal Revenue Service (IRS) for a period of three fiscal years after they are filed. State and local tax returns may be subject to examination for an additional fiscal year depending on the jurisdiction. Foreign taxes are provided for based on the Fund's understanding of the tax rules and rates that exist in the foreign markets in which it invests.
Distributions are declared and recorded on the ex-dividend date. Income dividends and capital gain distributions are declared separately for each class. Income and capital gain distributions are determined in accordance with income tax regulations, which may differ from GAAP.
Capital accounts within the financial statements are adjusted for permanent book-tax differences. These adjustments have no impact on net assets or the results of operations. Temporary book-tax differences will reverse in a subsequent period.
Book-tax differences are primarily due to foreign currency transactions, partnerships, passive foreign investment companies (PFIC), deferred trustees compensation, futures transactions, capital loss carryforwards and losses deferred due to wash sales and excise tax regulations.
Semiannual Report
Notes to Financial Statements (Unaudited) - continued
3. Significant Accounting Policies - continued
Income Tax Information and Distributions to Shareholders - continued
The federal tax cost of investment securities and unrealized appreciation (depreciation) as of period end were as follows:
Gross unrealized appreciation | $ 243,843,625 |
Gross unrealized depreciation | (51,926,650) |
Net unrealized appreciation (depreciation) on securities and other investments | $ 191,916,975 |
| |
Tax cost | $ 1,193,423,725 |
Capital loss carryforwards are only available to offset future capital gains of the Fund to the extent provided by regulations and may be limited. Under the Regulated Investment Company Modernization Act of 2010 (the Act), the Fund is permitted to carry forward capital losses incurred in taxable years beginning after December 22, 2010 for an unlimited period and such capital losses are required to be used prior to any losses that expire. At February 29, 2012 capital loss carryforwards were as follows:
Fiscal year of expiration | |
2016 | $ (5,392,414) |
2017 | (6,058,499) |
2018 | (1,022,988) |
2019 | (80,787) |
Total with expiration | $ (12,554,688) |
Included in the $12,554,688 of the Fund's capital loss carryforwards are $12,554,688 of capital loss carryforwards that were acquired from Paper and Forest Products Portfolio when it merged into the fund on June 19, 2009 of which $5,392,414, $6,058,499, $1,022,988 and $80,787 will expire in fiscal 2016, 2017, 2018 and 2019, respectively. Under the Internal Revenue Code, the losses acquired from Paper and Forest Products Portfolio that will be available to offset future capital gains of the Fund will be limited. As a result, at least $8,806,047 of the losses acquired from Paper and Forest Products Portfolio will expire unused.
Trading (Redemption) Fees. Shares held by investors in the Fund less than 30 days are subject to a redemption fee equal to .75% of the net asset value of shares redeemed. All redemption fees, which reduce the proceeds of the shareholder redemption, are retained by the Fund and accounted for as an addition to paid in capital.
New Accounting Pronouncement. In December 2011, the Financial Accounting Standards Board issued Accounting Standard Update No. 2011-11, Disclosures about Offsetting Assets and Liabilities. The update creates new disclosure requirements requiring entities to disclose both gross and net information for derivatives and other financial instruments that are either offset in the Statement of Assets and Liabilities or subject to an enforceable master netting arrangement or similar agreement. The disclosure requirements are effective for annual reporting periods beginning on or after January 1, 2013, and interim periods within those annual periods. Management is currently evaluating the impact of the update's adoption on the Fund's financial statement disclosures.
4. Operating Policies.
Restricted Securities. The Fund may invest in securities that are subject to legal or contractual restrictions on resale. These securities generally may be resold in transactions exempt from registration or to the public if the securities are registered. Disposal of these securities may involve time-consuming negotiations and expense, and prompt sale at an acceptable price may be difficult. Information regarding restricted securities is included at the end of the Fund's Schedule of Investments.
5. Derivative Instruments.
Risk Exposures and the Use of Derivative Instruments. The Fund's investment objective allows the Fund to enter into various types of derivative contracts, including futures contracts. Derivatives are investments whose value is primarily derived from underlying assets, indices or reference rates and may be transacted on an exchange or over-the-counter (OTC). Derivatives may involve a future commitment to buy or sell a specified instrument based on specified terms, to exchange future cash flows at periodic intervals based on a notional principal amount, or for one party to make one or more payments upon the occurrence of specified events in exchange for periodic payments from the other party.
The Fund used derivatives to increase returns and to manage exposure to certain risks as defined below. The success of any strategy involving derivatives depends on analysis of numerous economic factors, and if the strategies for investment do not work as intended, the Fund may not achieve its objectives.
Semiannual Report
5. Derivative Instruments - continued
Risk Exposures and the Use of Derivative Instruments - continued
The Fund's use of derivatives increased or decreased its exposure to the following risk:
Equity Risk | Equity risk relates to the fluctuations in the value of financial instruments as a result of changes in market prices (other than those arising from interest rate risk or foreign exchange risk), whether caused by factors specific to an individual investment, its issuer, or all factors affecting all instruments traded in a market or market segment. |
The Fund is also exposed to additional risks from investing in derivatives, such as liquidity risk and counterparty credit risk. Liquidity risk is the risk that the Fund will be unable to close out the derivative in the open market in a timely manner. Counterparty credit risk is the risk that the counterparty will not be able to fulfill its obligation to the Fund. Counterparty credit risk related to exchange-traded futures contracts is minimal because of the protection provided by the exchange on which they trade.
Investing in derivatives may involve greater risks than investing in the underlying assets directly and, to varying degrees, may involve risk of loss in excess of any initial investment and collateral received and amounts recognized in the Statement of Assets and Liabilities. In addition, there may be the risk that the change in value of the derivative contract does not correspond to the change in value of the underlying instrument.
Futures Contracts. A futures contract is an agreement between two parties to buy or sell a specified underlying instrument for a fixed price at a specified future date. The Fund used futures contracts to manage its exposure to the stock market.
Upon entering into a futures contract, a fund is required to deposit either cash or securities (initial margin) with a clearing broker in an amount equal to a certain percentage of the face value of the contract. Futures contracts are marked-to-market daily and subsequent payments (variation margin) are made or received by a fund depending on the daily fluctuations in the value of the futures contracts and are recorded as unrealized appreciation or (depreciation). This receivable and/or payable is included in daily variation margin on futures contracts in the Statement of Assets and Liabilities. Realized gain or (loss) is recorded upon the expiration or closing of a futures contract.
Any open futures contracts at period end are shown in the Schedule of Investments under the caption "Futures Contracts." The underlying face amount at value reflects each contract's exposure to the underlying instrument at period end and is representative of activity for the period. Securities deposited to meet initial margin requirements are identified in the Schedule of Investments.
During the period the Fund recognized net realized gain (loss) of $165,760 and a change in net unrealized appreciation (depreciation) of $(575,410) related to its investment in futures contracts. These amounts are included in the Statement of Operations.
6. Purchases and Sales of Investments.
Purchases and sales of securities, other than short-term securities, aggregated $384,001,026 and $441,362,804, respectively.
7. Fees and Other Transactions with Affiliates.
Management Fee. FMR and its affiliates provide the Fund with investment management related services for which the Fund pays a monthly management fee. The management fee is the sum of an individual fund fee rate that is based on an annual rate of .30% of the Fund's average net assets and an annualized group fee rate that averaged .26% during the period. The group fee rate is based upon the average net assets of all the mutual funds advised by FMR. The group fee rate decreases as assets under management increase and increases as assets under management decrease. For the period, the total annualized management fee rate was .56% of the Fund's average net assets.
Distribution and Service Plan Fees. In accordance with Rule 12b-1 of the 1940 Act, the Fund has adopted separate Distribution and Service Plans for each class of shares. Certain classes pay Fidelity Distributors Corporation (FDC), an affiliate of FMR, separate Distribution and Service Fees, each of which is based on an annual percentage of each class' average net assets. In addition, FDC may pay financial intermediaries for selling shares of the Fund and providing shareholder support services. For the period, the Distribution and Service Fee rates, total fees and amounts retained by FDC were as follows:
| Distribution
Fee | Service
Fee | Total Fees | Retained
by FDC |
Class A | -% | .25% | $ 193,343 | $ 4,157 |
Class T | .25% | .25% | 67,726 | - |
Class B | .75% | .25% | 50,891 | 38,168 |
Class C | .75% | .25% | 283,455 | 75,057 |
| | | $ 595,415 | $ 117,382 |
Semiannual Report
Notes to Financial Statements (Unaudited) - continued
7. Fees and Other Transactions with Affiliates - continued
Sales Load. FDC may receive a front-end sales charge of up to 5.75% for selling Class A shares and 3.50% for selling Class T shares, some of which is paid to financial intermediaries for selling shares of the Fund. Depending on the holding period, FDC may receive contingent deferred sales charges levied on Class A, Class T, Class B and Class C redemptions. The deferred sales charges range from 5.00% to 1.00% for Class B shares, 1.00% for Class C shares, 1.00% for certain purchases of Class A shares and .25% for certain purchases of Class T shares.
For the period, sales charge amounts retained by FDC were as follows:
| Retained
by FDC |
Class A | $ 65,366 |
Class T | 3,956 |
Class B* | 12,477 |
Class C* | 8,069 |
| $ 89,868 |
* When Class B and Class C shares are initially sold, FDC pays commissions from its own resources to financial intermediaries through which the sales are made.
Transfer Agent Fees. Fidelity Investments Institutional Operations Company, Inc. (FIIOC), an affiliate of FMR, is the transfer, dividend disbursing and shareholder servicing agent for each class of the Fund. FIIOC receives account fees and asset-based fees that vary according to the account size and type of account of the shareholders of the respective classes of the Fund. FIIOC pays for typesetting, printing and mailing of shareholder reports, except proxy statements. For the period, transfer agent fees for each class were as follows:
| Amount | % of
Average
Net Assets* |
Class A | $ 209,289 | .27 |
Class T | 41,794 | .31 |
Class B | 15,357 | .30 |
Class C | 79,578 | .28 |
Materials | 1,217,432 | .24 |
Institutional Class | 103,027 | .23 |
| $ 1,666,477 | |
* Annualized
Accounting and Security Lending Fees. Fidelity Service Company, Inc. (FSC), an affiliate of FMR, maintains the Fund's accounting records. The accounting fee is based on the level of average net assets for each month. Under a separate contract, FSC administers the security lending program. The security lending fee is based on the number and duration of lending transactions.
Brokerage Commissions. The Fund placed a portion of its portfolio transactions with brokerage firms which are affiliates of the investment adviser. The commissions paid to these affiliated firms were $6,913 for the period.
8. Committed Line of Credit.
The Fund participates with other funds managed by FMR or an affiliate in a $4.25 billion credit facility (the "line of credit") to be utilized for temporary or emergency purposes to fund shareholder redemptions or for other short-term liquidity purposes. The Fund has agreed to pay commitment fees on its pro-rata portion of the line of credit, which amounted to $1,927 and is reflected in Miscellaneous expenses on the Statement of Operations. During the period, there were no borrowings on this line of credit.
9. Security Lending.
The Fund lends portfolio securities through a lending agent from time to time in order to earn additional income. For equity securities, a lending agent is used and may loan securities to certain qualified borrowers, including Fidelity Capital Markets (FCM), a broker-dealer affiliated with the Fund. On the settlement date of the loan, the Fund receives collateral (in the form of U.S. Treasury obligations, letters of credit and/or cash) against the loaned securities and maintains collateral in an amount not less than 100% of the market value of the loaned securities during the period of the loan. The market value of the loaned securities is determined at the close of business of the Fund and any additional required collateral is delivered to the Fund on the next business day. If the borrower defaults on its obligation to return the securities loaned because of insolvency or other reasons, a fund could experience delays and costs in recovering the securities loaned or in gaining access to the collateral. Any cash collateral received is invested in the Fidelity Securities Lending Cash Central Fund. The value of loaned securities and cash collateral at period end are disclosed on the Fund's Statement of Assets and Liabilities. Security lending income represents the income earned on investing cash collateral, less rebates paid to borrowers and any lending agent fees associated with the loan, plus any premium payments received for lending certain types of securities. Security lending income is presented in the Statement of Operations as a component of income from Fidelity Central Funds. Total security lending income during the period amounted to $177,206. During the period, there were no securities loaned to FCM.
Semiannual Report
10. Expense Reductions.
Many of the brokers with whom FMR places trades on behalf of the Fund provided services to the Fund in addition to trade execution. These services included payments of certain expenses on behalf of the Fund totaling $20,361 for the period. In addition, through arrangements with the Fund's custodian, credits realized as a result of uninvested cash balances were used to reduce the Fund's expenses. During the period, these credits reduced the Fund's custody expenses by $19.
11. Distributions to Shareholders.
Distributions to shareholders of each class were as follows:
| Six months ended
August 31,
2012 | Year ended
February 29,
2012 |
From net investment income | | |
Class A | $ 44,699 | $ 868,107 |
Class T | - | 100,314 |
Materials | 717,326 | 8,266,851 |
Institutional Class | 58,957 | 605,465 |
Total | $ 820,982 | $ 9,840,737 |
From net realized gain | | |
Class A | $ 851,627 | $ 816,536 |
Class T | 148,569 | 151,869 |
Class B | 57,740 | 66,321 |
Class C | 319,952 | 312,224 |
Materials | 5,524,936 | 5,701,275 |
Institutional Class | 435,560 | 413,064 |
Total | $ 7,338,384 | $ 7,461,289 |
12. Share Transactions.
Transactions for each class of shares were as follows:
| Shares | Dollars |
| Six months ended
August 31,
2012 | Year ended
February 29,
2012 | Six months ended
August 31,
2012 | Year ended
February 29,
2012 |
Class A | | | | |
Shares sold | 618,282 | 1,406,389 | $ 41,055,137 | $ 95,285,956 |
Reinvestment of distributions | 11,861 | 23,605 | 796,737 | 1,462,799 |
Shares redeemed | (571,942) | (925,476) | (37,886,137) | (60,145,567) |
Net increase (decrease) | 58,201 | 504,518 | $ 3,965,737 | $ 36,603,188 |
Class T | | | | |
Shares sold | 57,303 | 150,265 | $ 3,768,331 | $ 10,197,019 |
Reinvestment of distributions | 2,151 | 3,964 | 143,789 | 244,682 |
Shares redeemed | (58,360) | (110,682) | (3,814,694) | (7,174,563) |
Net increase (decrease) | 1,094 | 43,547 | $ 97,426 | $ 3,267,138 |
Class B | | | | |
Shares sold | 8,702 | 35,651 | $ 565,370 | $ 2,318,398 |
Reinvestment of distributions | 736 | 909 | 48,582 | 55,554 |
Shares redeemed | (22,911) | (70,403) | (1,487,989) | (4,524,937) |
Net increase (decrease) | (13,473) | (33,843) | $ (874,037) | $ (2,150,985) |
Class C | | | | |
Shares sold | 138,070 | 456,374 | $ 9,089,282 | $ 30,369,453 |
Reinvestment of distributions | 4,035 | 4,184 | 265,885 | 254,995 |
Shares redeemed | (137,723) | (279,339) | (8,907,811) | (17,740,501) |
Net increase (decrease) | 4,382 | 181,219 | $ 447,356 | $ 12,883,947 |
Materials | | | | |
Shares sold | 2,129,932 | 6,950,456 | $ 142,456,070 | $ 471,314,225 |
Reinvestment of distributions | 88,382 | 214,200 | 5,951,604 | 13,299,700 |
Shares redeemed | (3,323,218) | (8,516,169) | (221,239,263) | (562,008,908) |
Net increase (decrease) | (1,104,904) | (1,351,513) | $ (72,831,589) | $ (77,394,983) |
Semiannual Report
Notes to Financial Statements (Unaudited) - continued
12. Share Transactions - continued
| Shares | Dollars |
| Six months ended
August 31,
2012 | Year ended
February 29,
2012 | Six months ended
August 31,
2012 | Year ended
February 29,
2012 |
Institutional Class | | | | |
Shares sold | 890,879 | 1,444,894 | $ 59,941,256 | $ 97,144,756 |
Reinvestment of distributions | 6,215 | 13,291 | 418,157 | 824,595 |
Shares redeemed | (584,398) | (1,385,770) | (38,480,323) | (90,119,446) |
Net increase (decrease) | 312,696 | 72,415 | $ 21,879,090 | $ 7,849,905 |
13. Other.
The Fund's organizational documents provide former and current trustees and officers with a limited indemnification against liabilities arising in connection with the performance of their duties to the Fund. In the normal course of business, the Fund may also enter into contracts that provide general indemnifications. The Fund's maximum exposure under these arrangements is unknown as this would be dependent on future claims that may be made against the Fund. The risk of material loss from such claims is considered remote.
Semiannual Report
Telecommunications Portfolio
As a shareholder of the Fund, you incur two types of costs: (1) transaction costs, including sales charges (loads) on purchase payments or redemption proceeds, redemption fees and (2) ongoing costs, including management fees, distribution and/or service (12b-1) fees and other Fund expenses. This Example is intended to help you understand your ongoing costs (in dollars) of investing in the Fund and to compare these costs with the ongoing costs of investing in other mutual funds.
The Example is based on an investment of $1,000 invested at the beginning of the period and held for the entire period (March 1, 2012 to August 31, 2012).
Actual Expenses
The first line of the accompanying table for each class of the Fund provides information about actual account values and actual expenses. You may use the information in this line, together with the amount you invested, to estimate the expenses that you paid over the period. Simply divide your account value by $1,000.00 (for example, an $8,600 account value divided by $1,000.00 = 8.6), then multiply the result by the number in the first line for a class of the Fund under the heading entitled "Expenses Paid During Period" to estimate the expenses you paid on your account during this period. A small balance maintenance fee of $12.00 that is charged once a year may apply for certain accounts with a value of less than $2,000. This fee is not included in the table below. If it was, the estimate of expenses you paid during the period would be higher, and your ending account value lower, by this amount. In addition, the Fund, as a shareholder in the underlying Fidelity Central Funds, will indirectly bear its pro-rata share of the fees and expenses incurred by the underlying Fidelity Central Funds. These fees and expenses are not included in the Fund's annualized expense ratio used to calculate the expense estimate in the table below.
Hypothetical Example for Comparison Purposes
The second line of the accompanying table for each class of the Fund provides information about hypothetical account values and hypothetical expenses based on a Class' actual expense ratio and an assumed rate of return of 5% per year before expenses, which is not the Class' actual return. The hypothetical account values and expenses may not be used to estimate the actual ending account balance or expenses you paid for the period. You may use this information to compare the ongoing costs of investing in the Fund and other funds. To do so, compare this 5% hypothetical example with the 5% hypothetical examples that appear in the shareholder reports of the other funds. A small balance maintenance fee of $12.00 that is charged once a year may apply for certain accounts with a value of less than $2,000. This fee is not included in the table below. If it was, the estimate of expenses you paid during the period would be higher, and your ending account value lower, by this amount. In addition, the Fund, as a shareholder in the underlying Fidelity Central Funds, will indirectly bear its pro-rata share of the fees and expenses incurred by the underlying Fidelity Central Funds. These fees and expenses are not included in the Fund's annualized expense ratio used to calculate the expense estimate in the table below.
Please note that the expenses shown in the table are meant to highlight your ongoing costs only and do not reflect any transaction costs. Therefore, the second line of the table is useful in comparing ongoing costs only, and will not help you determine the relative total costs of owning different funds. In addition, if these transactional costs were included, your costs would have been higher.
| Annualized
Expense Ratio | Beginning
Account Value
March 1, 2012 | Ending
Account Value
August 31, 2012 | Expenses Paid
During Period*
March 1, 2012
to August 31, 2012 |
Class A | 1.18% | | | |
Actual | | $ 1,000.00 | $ 1,086.40 | $ 6.21 |
HypotheticalA | | $ 1,000.00 | $ 1,019.26 | $ 6.01 |
Class T | 1.48% | | | |
Actual | | $ 1,000.00 | $ 1,084.50 | $ 7.78 |
HypotheticalA | | $ 1,000.00 | $ 1,017.74 | $ 7.53 |
Class B | 1.93% | | | |
Actual | | $ 1,000.00 | $ 1,082.20 | $ 10.13 |
HypotheticalA | | $ 1,000.00 | $ 1,015.48 | $ 9.80 |
Class C | 1.91% | | | |
Actual | | $ 1,000.00 | $ 1,082.40 | $ 10.03 |
HypotheticalA | | $ 1,000.00 | $ 1,015.58 | $ 9.70 |
Telecommunications | .88% | | | |
Actual | | $ 1,000.00 | $ 1,087.70 | $ 4.63 |
HypotheticalA | | $ 1,000.00 | $ 1,020.77 | $ 4.48 |
Institutional Class | .88% | | | |
Actual | | $ 1,000.00 | $ 1,087.80 | $ 4.63 |
HypotheticalA | | $ 1,000.00 | $ 1,020.77 | $ 4.48 |
A 5% return per year before expenses
* Expenses are equal to each Class' annualized expense ratio, multiplied by the average account value over the period, multiplied by 184/365 (to reflect the one-half year period).
Semiannual Report
Telecommunications Portfolio
Investment Changes (Unaudited)
Top Ten Stocks as of August 31, 2012 |
| % of fund's
net assets | % of fund's net assets
6 months ago |
AT&T, Inc. | 21.5 | 20.4 |
Verizon Communications, Inc. | 18.1 | 13.4 |
CenturyLink, Inc. | 9.6 | 9.0 |
Sprint Nextel Corp. | 5.1 | 2.8 |
Crown Castle International Corp. | 5.0 | 6.7 |
SBA Communications Corp. Class A | 5.0 | 4.9 |
tw telecom, inc. | 3.8 | 4.4 |
Vodafone Group PLC sponsored ADR | 3.3 | 1.5 |
Telephone & Data Systems, Inc. | 2.9 | 0.0 |
General Communications, Inc. Class A | 2.6 | 2.7 |
| 76.9 | |
Top Industries (% of fund's net assets) |
As of August 31, 2012 |
| Diversified
Telecommunication
Services | 67.3% | |
| Wireless
Telecommunication
Services | 27.5% | |
| Media | 1.7% | |
| Software | 0.2% | |
| Communications
Equipment | 0.0% | |
| All Others* | 3.3% | |

As of February 29, 2012 |
| Diversified
Telecommunication
Services | 64.9% | |
| Wireless
Telecommunication
Services | 28.6% | |
| Media | 2.1% | |
| Software | 0.0%** | |
| Communications
Equipment | 0.0% | |
| All Others* | 4.4% | |

* Includes short-term investments and net other assets. |
** Amount represents less than 0.1%. |
Semiannual Report
Telecommunications Portfolio
Investments August 31, 2012 (Unaudited)
Showing Percentage of Net Assets
Common Stocks - 96.7% |
| Shares | | Value |
COMMUNICATIONS EQUIPMENT - 0.0% |
Communications Equipment - 0.0% |
Nortel Networks Corp. (a) | 8,071 | | $ 0 |
DIVERSIFIED TELECOMMUNICATION SERVICES - 67.3% |
Alternative Carriers - 9.2% |
Cogent Communications Group, Inc. | 438,702 | | 8,598,559 |
Level 3 Communications, Inc. (a) | 525,391 | | 11,322,176 |
tw telecom, inc. (a) | 676,457 | | 17,012,894 |
Vonage Holdings Corp. (a) | 2,164,900 | | 4,632,886 |
| | 41,566,515 |
Integrated Telecommunication Services - 58.1% |
AT&T, Inc. | 2,637,619 | | 96,642,360 |
Atlantic Tele-Network, Inc. | 154,600 | | 5,825,328 |
CenturyLink, Inc. | 1,023,184 | | 43,239,756 |
China Unicom Ltd. sponsored ADR | 288,200 | | 4,570,852 |
Frontier Communications Corp. (d) | 1,136,500 | | 5,250,630 |
General Communications, Inc. Class A (a) | 1,348,300 | | 11,892,006 |
PT Telkomunikasi Indonesia Tbk Series B | 1,388,500 | | 1,355,697 |
PT XL Axiata Tbk | 1,052,500 | | 794,758 |
Telefonica Brasil SA sponsored ADR | 205,163 | | 4,384,333 |
Verizon Communications, Inc. | 1,895,741 | | 81,403,119 |
Windstream Corp. (d) | 583,782 | | 5,761,928 |
| | 261,120,767 |
TOTAL DIVERSIFIED TELECOMMUNICATION SERVICES | | 302,687,282 |
MEDIA - 1.7% |
Cable & Satellite - 1.7% |
Time Warner Cable, Inc. | 14,800 | | 1,314,536 |
Virgin Media, Inc. (d) | 229,900 | | 6,338,343 |
| | 7,652,879 |
SOFTWARE - 0.2% |
Application Software - 0.2% |
Comverse Technology, Inc. (a) | 37 | | 222 |
Synchronoss Technologies, Inc. (a) | 29,003 | | 667,359 |
| | 667,581 |
WIRELESS TELECOMMUNICATION SERVICES - 27.5% |
Wireless Telecommunication Services - 27.5% |
Clearwire Corp. Class A (a)(d) | 4,909,636 | | 7,855,418 |
|
| Shares | | Value |
Crown Castle International Corp. (a) | 353,583 | | $ 22,438,377 |
Leap Wireless International, Inc. (a)(d) | 587,400 | | 3,213,078 |
MetroPCS Communications, Inc. (a) | 705,606 | | 6,865,546 |
Mobile TeleSystems OJSC sponsored ADR | 72,700 | | 1,338,407 |
NII Holdings, Inc. (a)(d) | 492,400 | | 3,072,576 |
NTELOS Holdings Corp. | 15,706 | | 269,672 |
NTT DoCoMo, Inc. | 2,005 | | 3,415,709 |
SBA Communications Corp. Class A (a) | 374,482 | | 22,386,534 |
Sprint Nextel Corp. (a) | 4,685,050 | | 22,722,493 |
Telephone & Data Systems, Inc. | 529,500 | | 12,983,340 |
Turkcell Iletisim Hizmet A/S (a) | 337,000 | | 2,002,265 |
Vodafone Group PLC sponsored ADR | 518,100 | | 14,983,452 |
| | 123,546,867 |
TOTAL COMMON STOCKS (Cost $425,417,388) |
434,554,609
|
Money Market Funds - 7.3% |
| | | |
Fidelity Cash Central Fund, 0.17% (b) | 8,751,193 | | 8,751,193 |
Fidelity Securities Lending Cash Central Fund, 0.18% (b)(c) | 24,229,312 | | 24,229,312 |
TOTAL MONEY MARKET FUNDS (Cost $32,980,505) |
32,980,505
|
TOTAL INVESTMENT PORTFOLIO - 104.0% (Cost $458,397,893) | | 467,535,114 |
NET OTHER ASSETS (LIABILITIES) - (4.0)% | | (18,031,829) |
NET ASSETS - 100% | $ 449,503,285 |
Legend |
(a) Non-income producing |
(b) Affiliated fund that is available only to investment companies and other accounts managed by Fidelity Investments. The rate quoted is the annualized seven-day yield of the fund at period end. A complete unaudited listing of the fund's holdings as of its most recent quarter end is available upon request. In addition, each Fidelity Central Fund's financial statements are available on the SEC's website or upon request. |
(c) Investment made with cash collateral received from securities on loan. |
(d) Security or a portion of the security is on loan at period end. |
Affiliated Central Funds |
Information regarding fiscal year to date income earned by the Fund from investments in Fidelity Central Funds is as follows: |
Fund | Income earned |
Fidelity Cash Central Fund | $ 15,085 |
Fidelity Securities Lending Cash Central Fund | 82,749 |
Total | $ 97,834 |
Other Information |
The following is a summary of the inputs used, as of August 31, 2012, involving the Fund's assets and liabilities carried at fair value. The inputs or methodology used for valuing securities may not be an indication of the risk associated with investing in those securities. For more information on valuation inputs, and their aggregation into the levels used in the table below, please refer to the Security Valuation section in the accompanying Notes to Financial Statements. |
Valuation Inputs at Reporting Date: |
Description | Total | Level 1 | Level 2 | Level 3 |
Investments in Securities: | | | | |
Common Stocks | $ 434,554,609 | $ 427,780,938 | $ 6,773,671 | $ - |
Money Market Funds | 32,980,505 | 32,980,505 | - | - |
Total Investments in Securities: | $ 467,535,114 | $ 460,761,443 | $ 6,773,671 | $ - |
See accompanying notes which are an integral part of the financial statements.
Semiannual Report
Telecommunications Portfolio
Statement of Assets and Liabilities
| August 31, 2012 (Unaudited) |
| | |
Assets | | |
Investment in securities, at value (including securities loaned of $22,849,583) - See accompanying schedule: Unaffiliated issuers (cost $425,417,388) | $ 434,554,609 | |
Fidelity Central Funds (cost $32,980,505) | 32,980,505 | |
Total Investments (cost $458,397,893) | | $ 467,535,114 |
Receivable for investments sold | | 12,122,084 |
Receivable for fund shares sold | | 402,680 |
Dividends receivable | | 52,158 |
Distributions receivable from Fidelity Central Funds | | 30,809 |
Other receivables | | 16,038 |
Total assets | | 480,158,883 |
| | |
Liabilities | | |
Payable for investments purchased | $ 4,675,422 | |
Payable for fund shares redeemed | 1,404,370 | |
Accrued management fee | 213,501 | |
Distribution and service plan fees payable | 6,800 | |
Other affiliated payables | 102,827 | |
Other payables and accrued expenses | 23,366 | |
Collateral on securities loaned, at value | 24,229,312 | |
Total liabilities | | 30,655,598 |
| | |
Net Assets | | $ 449,503,285 |
Net Assets consist of: | | |
Paid in capital | | $ 488,213,240 |
Undistributed net investment income | | 4,690,652 |
Accumulated undistributed net realized gain (loss) on investments and foreign currency transactions | | (52,535,552) |
Net unrealized appreciation (depreciation) on investments and assets and liabilities in foreign currencies | | 9,134,945 |
Net Assets | | $ 449,503,285 |
Statement of Assets and Liabilities - continued
| August 31, 2012 (Unaudited) |
| | |
Calculation of Maximum Offering Price Class A:
Net Asset Value and redemption price per share ($6,614,226 ÷ 132,242 shares) | | $ 50.02 |
| | |
Maximum offering price per share (100/94.25 of $50.02) | | $ 53.07 |
Class T:
Net Asset Value and redemption price per share ($3,875,166 ÷ 77,752 shares) | | $ 49.84 |
| | |
Maximum offering price per share (100/96.50 of $49.84) | | $ 51.65 |
Class B:
Net Asset Value and offering price per share ($745,170 ÷ 14,930 shares)A | | $ 49.91 |
| | |
Class C:
Net Asset Value and offering price per share ($3,953,828 ÷ 79,417 shares)A | | $ 49.79 |
| | |
| | |
Telecommunications:
Net Asset Value, offering price and redemption price per share ($432,830,506 ÷ 8,620,146 shares) | | $ 50.21 |
| | |
Institutional Class:
Net Asset Value, offering price and redemption price per share ($1,484,389 ÷ 29,594 shares) | | $ 50.16 |
A Redemption price per share is equal to net asset value less any applicable contingent deferred sales charge.
See accompanying notes which are an integral part of the financial statements.
Semiannual Report
Statement of Operations
Six months ended August 31, 2012 (Unaudited) |
| | |
Investment Income | | |
Dividends | | $ 6,349,035 |
Interest | | 72 |
Income from Fidelity Central Funds | | 97,834 |
Total income | | 6,446,941 |
| | |
Expenses | | |
Management fee | $ 1,086,051 | |
Transfer agent fees | 478,909 | |
Distribution and service plan fees | 35,821 | |
Accounting and security lending fees | 76,929 | |
Custodian fees and expenses | 6,486 | |
Independent trustees' compensation | 1,294 | |
Registration fees | 43,700 | |
Audit | 22,396 | |
Legal | 1,552 | |
Miscellaneous | 1,805 | |
Total expenses before reductions | 1,754,943 | |
Expense reductions | (15,528) | 1,739,415 |
Net investment income (loss) | | 4,707,526 |
Realized and Unrealized Gain (Loss) Net realized gain (loss) on: | | |
Investment securities: | | |
Unaffiliated issuers | 5,528,156 | |
Foreign currency transactions | (1,154) | |
Total net realized gain (loss) | | 5,527,002 |
Change in net unrealized appreciation (depreciation) on: Investment securities | 25,626,439 | |
Assets and liabilities in foreign currencies | (859) | |
Total change in net unrealized appreciation (depreciation) | | 25,625,580 |
Net gain (loss) | | 31,152,582 |
Net increase (decrease) in net assets resulting from operations | | $ 35,860,108 |
Statement of Changes in Net Assets
| Six months ended
August 31, 2012
(Unaudited) | Year ended
February 29,
2012 |
Increase (Decrease) in Net Assets | | |
Operations | | |
Net investment income (loss) | $ 4,707,526 | $ 5,541,550 |
Net realized gain (loss) | 5,527,002 | 24,725,843 |
Change in net unrealized appreciation (depreciation) | 25,625,580 | (35,725,245) |
Net increase (decrease) in net assets resulting from operations | 35,860,108 | (5,457,852) |
Distributions to shareholders from net investment income | (747,291) | (4,955,219) |
Share transactions - net increase (decrease) | 59,617,531 | (2,457,615) |
Redemption fees | 834 | 35,055 |
Total increase (decrease) in net assets | 94,731,182 | (12,835,631) |
| | |
Net Assets | | |
Beginning of period | 354,772,103 | 367,607,734 |
End of period (including undistributed net investment income of $4,690,652 and undistributed net investment income of $730,417, respectively) | $ 449,503,285 | $ 354,772,103 |
See accompanying notes which are an integral part of the financial statements.
Semiannual Report
Financial Highlights - Class A
| Six months ended
August 31, 2012 | Years ended February 28, |
| (Unaudited) | 2012 I | 2011 | 2010 | 2009 | 2008 I |
Selected Per-Share Data | | | | | | |
Net asset value, beginning of period | $ 46.12 | $ 46.93 | $ 37.64 | $ 26.66 | $ 42.56 | $ 50.89 |
Income from Investment Operations | | | | | | |
Net investment income (loss) E | .50 | .56 | .57 | .67 | .22 | .26 |
Net realized and unrealized gain (loss) | 3.48 | (.86) | 9.49 | 10.55 | (15.60) | (8.08) |
Total from investment operations | 3.98 | (.30) | 10.06 | 11.22 | (15.38) | (7.82) |
Distributions from net investment income | (.08) | (.51) | (.77) | (.19) | (.35) M | (.51) |
Distributions from net realized gain | - | - | - | (.05) | (.18) M | - |
Total distributions | (.08) | (.51) | (.77) | (.24) L | (.52) K | (.51) |
Redemption fees added to paid in capital E, J | - | - | - | - | - | - |
Net asset value, end of period | $ 50.02 | $ 46.12 | $ 46.93 | $ 37.64 | $ 26.66 | $ 42.56 |
Total Return B, C, D | 8.64% | (.54)% | 26.87% | 42.07% | (36.16)% | (15.55)% |
Ratios to Average Net Assets F, H | | | | | | |
Expenses before reductions | 1.18% A | 1.20% | 1.20% | 1.26% | 1.21% | 1.20% |
Expenses net of fee waivers, if any | 1.18% A | 1.20% | 1.20% | 1.26% | 1.21% | 1.20% |
Expenses net of all reductions | 1.17% A | 1.18% | 1.18% | 1.24% | 1.21% | 1.19% |
Net investment income (loss) | 2.13% A | 1.21% | 1.35% | 1.89% | .61% | .49% |
Supplemental Data | | | | | | |
Net assets, end of period (000 omitted) | $ 6,614 | $ 4,677 | $ 4,305 | $ 3,343 | $ 2,112 | $ 2,791 |
Portfolio turnover rate G | 42% A | 72% | 72% | 90% | 168% | 134% |
A Annualized B Total returns for periods of less than one year are not annualized. C Total returns would have been lower if certain expenses had not been reduced during the applicable periods shown. D Total returns do not include the effect of the sales charges. E Calculated based on average shares outstanding during the period. F Fees and expenses of any underlying Fidelity Central Funds are not included in the Fund's expense ratio. The Fund indirectly bears its proportionate share of the expenses of any underlying Fidelity Central Funds. G Amount does not include the portfolio activity of any underlying Fidelity Central Funds. H Expense ratios reflect operating expenses of the class. Expenses before reductions do not reflect amounts reimbursed by the investment adviser or reductions from brokerage service arrangements or reductions from other expense offset arrangements and do not represent the amount paid by the class during periods when reimbursements or reductions occur. Expenses net of fee waivers reflect expenses after reimbursement by the investment adviser but prior to reductions from brokerage service arrangements or other expense offset arrangements. Expenses net of all reductions represent the net expenses paid by the class. I For the year ended February 29. J Amount represents less than $.01 per share. K Total distributions of $.52 per share is comprised of distributions from net investment income of $.347 and distributions from net realized gain of $.175 per share. L Total distributions of $.24 per share is comprised of distributions from net investment income of $.187 and distributions from net realized gain of $.048 per share. M The amount shown reflects certain reclassifications related to book to tax differences. |
Financial Highlights - Class T
| Six months ended
August 31, 2012 | Years ended February 28, |
| (Unaudited) | 2012 I | 2011 | 2010 | 2009 | 2008 I |
Selected Per-Share Data | | | | | | |
Net asset value, beginning of period | $ 46.01 | $ 46.81 | $ 37.55 | $ 26.68 | $ 42.49 | $ 50.86 |
Income from Investment Operations | | | | | | |
Net investment income (loss) E | .43 | .42 | .45 | .57 | .12 | .12 |
Net realized and unrealized gain (loss) | 3.45 | (.84) | 9.47 | 10.54 | (15.56) | (8.07) |
Total from investment operations | 3.88 | (.42) | 9.92 | 11.11 | (15.44) | (7.95) |
Distributions from net investment income | (.05) | (.38) | (.66) | (.22) | (.24) M | (.42) |
Distributions from net realized gain | - | - | - | (.03) | (.13) M | - |
Total distributions | (.05) | (.38) | (.66) | (.24) L | (.37) K | (.42) |
Redemption fees added to paid in capital E, J | - | - | - | - | - | - |
Net asset value, end of period | $ 49.84 | $ 46.01 | $ 46.81 | $ 37.55 | $ 26.68 | $ 42.49 |
Total Return B, C, D | 8.45% | (.82)% | 26.54% | 41.64% | (36.34)% | (15.78)% |
Ratios to Average Net Assets F, H | | | | | | |
Expenses before reductions | 1.48% A | 1.49% | 1.48% | 1.55% | 1.49% | 1.46% |
Expenses net of fee waivers, if any | 1.48% A | 1.49% | 1.48% | 1.55% | 1.49% | 1.46% |
Expenses net of all reductions | 1.47% A | 1.47% | 1.46% | 1.53% | 1.48% | 1.45% |
Net investment income (loss) | 1.83% A | .92% | 1.06% | 1.60% | .33% | .23% |
Supplemental Data | | | | | | |
Net assets, end of period (000 omitted) | $ 3,875 | $ 2,702 | $ 2,882 | $ 2,051 | $ 620 | $ 1,270 |
Portfolio turnover rate G | 42% A | 72% | 72% | 90% | 168% | 134% |
A Annualized B Total returns for periods of less than one year are not annualized. C Total returns would have been lower if certain expenses had not been reduced during the applicable periods shown. D Total returns do not include the effect of the sales charges. E Calculated based on average shares outstanding during the period. F Fees and expenses of any underlying Fidelity Central Funds are not included in the Fund's expense ratio. The Fund indirectly bears its proportionate share of the expenses of any underlying Fidelity Central Funds. G Amount does not include the portfolio activity of any underlying Fidelity Central Funds. H Expense ratios reflect operating expenses of the class. Expenses before reductions do not reflect amounts reimbursed by the investment adviser or reductions from brokerage service arrangements or reductions from other expense offset arrangements and do not represent the amount paid by the class during periods when reimbursements or reductions occur. Expenses net of fee waivers reflect expenses after reimbursement by the investment adviser but prior to reductions from brokerage service arrangements or other expense offset arrangements. Expenses net of all reductions represent the net expenses paid by the class. I For the year ended February 29. J Amount represents less than $.01 per share. K Total distributions of $.37 per share is comprised of distributions from net investment income of $.244 and distributions from net realized gain of $.127 per share. L Total distributions of $.24 per share is comprised of distributions from net investment income of $.216 and distributions from net realized gain of $.028 per share. M The amount shown reflects certain reclassifications related to book to tax differences. |
See accompanying notes which are an integral part of the financial statements.
Semiannual Report
Financial Highlights - Class B
| Six months ended
August 31, 2012 | Years ended February 28, |
| (Unaudited) | 2012 I | 2011 | 2010 | 2009 | 2008 I |
Selected Per-Share Data | | | | | | |
Net asset value, beginning of period | $ 46.14 | $ 46.93 | $ 37.60 | $ 26.71 | $ 42.42 | $ 50.80 |
Income from Investment Operations | | | | | | |
Net investment income (loss) E | .33 | .21 | .25 | .40 | (.05) | (.14) |
Net realized and unrealized gain (loss) | 3.46 | (.83) | 9.48 | 10.54 | (15.49) | (8.04) |
Total from investment operations | 3.79 | (.62) | 9.73 | 10.94 | (15.54) | (8.18) |
Distributions from net investment income | (.02) | (.17) | (.40) | (.04) | (.11) M | (.20) |
Distributions from net realized gain | - | - | - | (.01) | (.06) M | - |
Total distributions | (.02) | (.17) | (.40) | (.05) L | (.17) K | (.20) |
Redemption fees added to paid in capital E, J | - | - | - | - | - | - |
Net asset value, end of period | $ 49.91 | $ 46.14 | $ 46.93 | $ 37.60 | $ 26.71 | $ 42.42 |
Total Return B, C, D | 8.22% | (1.29)% | 25.96% | 40.97% | (36.64)% | (16.18)% |
Ratios to Average Net Assets F, H | | | | | | |
Expenses before reductions | 1.93% A | 1.95% | 1.95% | 2.01% | 1.97% | 1.95% |
Expenses net of fee waivers, if any | 1.93% A | 1.95% | 1.95% | 2.01% | 1.97% | 1.95% |
Expenses net of all reductions | 1.93% A | 1.93% | 1.93% | 2.00% | 1.96% | 1.94% |
Net investment income (loss) | 1.38% A | .47% | .60% | 1.13% | (.15)% | (.26)% |
Supplemental Data | | | | | | |
Net assets, end of period (000 omitted) | $ 745 | $ 596 | $ 706 | $ 641 | $ 363 | $ 741 |
Portfolio turnover rate G | 42% A | 72% | 72% | 90% | 168% | 134% |
A Annualized B Total returns for periods of less than one year are not annualized. C Total returns would have been lower if certain expenses had not been reduced during the applicable periods shown. D Total returns do not include the effect of the contingent deferred sales charge. E Calculated based on average shares outstanding during the period. F Fees and expenses of any underlying Fidelity Central Funds are not included in the Fund's expense ratio. The Fund indirectly bears its proportionate share of the expenses of any underlying Fidelity Central Funds. G Amount does not include the portfolio activity of any underlying Fidelity Central Funds. H Expense ratios reflect operating expenses of the class. Expenses before reductions do not reflect amounts reimbursed by the investment adviser or reductions from brokerage service arrangements or reductions from other expense offset arrangements and do not represent the amount paid by the class during periods when reimbursements or reductions occur. Expenses net of fee waivers reflect expenses after reimbursement by the investment adviser but prior to reductions from brokerage service arrangements or other expense offset arrangements. Expenses net of all reductions represent the net expenses paid by the class. I For the year ended February 29. J Amount represents less than $.01 per share. K Total distributions of $.17 per share is comprised of distributions from net investment income of $.105 and distributions from net realized gain of $.063 per share. L Total distributions of $.05 per share is comprised of distributions from net investment income of $.044 and distributions from net realized gain of $.009 per share. M The amount shown reflects certain reclassifications related to book to tax differences. |
Financial Highlights - Class C
| Six months ended
August 31, 2012 | Years ended February 28, |
| (Unaudited) | 2012 I | 2011 | 2010 | 2009 | 2008 I |
Selected Per-Share Data | | | | | | |
Net asset value, beginning of period | $ 46.02 | $ 46.89 | $ 37.61 | $ 26.76 | $ 42.42 | $ 50.81 |
Income from Investment Operations | | | | | | |
Net investment income (loss) E | .33 | .22 | .26 | .41 | (.05) | (.14) |
Net realized and unrealized gain (loss) | 3.46 | (.84) | 9.46 | 10.56 | (15.50) | (8.03) |
Total from investment operations | 3.79 | (.62) | 9.72 | 10.97 | (15.55) | (8.17) |
Distributions from net investment income | (.02) | (.25) | (.44) | (.10) | (.07) M | (.22) |
Distributions from net realized gain | - | - | - | (.02) | (.05) M | - |
Total distributions | (.02) | (.25) | (.44) | (.12) L | (.11) K | (.22) |
Redemption fees added to paid in capital E, J | - | - | - | - | - | - |
Net asset value, end of period | $ 49.79 | $ 46.02 | $ 46.89 | $ 37.61 | $ 26.76 | $ 42.42 |
Total Return B, C, D | 8.24% | (1.27)% | 25.95% | 41.00% | (36.64)% | (16.17)% |
Ratios to Average Net Assets F, H | | | | | | |
Expenses before reductions | 1.91% A | 1.93% | 1.94% | 2.01% | 1.97% | 1.95% |
Expenses net of fee waivers, if any | 1.91% A | 1.93% | 1.94% | 2.01% | 1.97% | 1.95% |
Expenses net of all reductions | 1.90% A | 1.91% | 1.92% | 2.00% | 1.96% | 1.94% |
Net investment income (loss) | 1.40% A | .48% | .61% | 1.13% | (.14)% | (.26)% |
Supplemental Data | | | | | | |
Net assets, end of period (000 omitted) | $ 3,954 | $ 3,514 | $ 3,035 | $ 2,151 | $ 371 | $ 902 |
Portfolio turnover rate G | 42% A | 72% | 72% | 90% | 168% | 134% |
A Annualized B Total returns for periods of less than one year are not annualized. C Total returns would have been lower if certain expenses had not been reduced during the applicable periods shown. D Total returns do not include the effect of the contingent deferred sales charge. E Calculated based on average shares outstanding during the period. F Fees and expenses of any underlying Fidelity Central Funds are not included in the Fund's expense ratio. The Fund indirectly bears its proportionate share of the expenses of any underlying Fidelity Central Funds. G Amount does not include the portfolio activity of any underlying Fidelity Central Funds. H Expense ratios reflect operating expenses of the class. Expenses before reductions do not reflect amounts reimbursed by the investment adviser or reductions from brokerage service arrangements or reductions from other expense offset arrangements and do not represent the amount paid by the class during periods when reimbursements or reductions occur. Expenses net of fee waivers reflect expenses after reimbursement by the investment adviser but prior to reductions from brokerage service arrangements or other expense offset arrangements. Expenses net of all reductions represent the net expenses paid by the class. I For the year ended February 29. J Amount represents less than $.01 per share. K Total distributions of $.11 per share is comprised of distributions from net investment income of $.068 and distributions from net realized gain of $.046 per share. L Total distributions of $.12 per share is comprised of distributions from net investment income of $.098 and distributions from net realized gain of $.023 per share. M The amount shown reflects certain reclassifications related to book to tax differences. |
See accompanying notes which are an integral part of the financial statements.
Semiannual Report
Financial Highlights - Telecommunications
| Six months ended
August 31, 2012 | Years ended February 28, |
| (Unaudited) | 2012 H | 2011 | 2010 | 2009 | 2008 H |
Selected Per-Share Data | | | | | | |
Net asset value, beginning of period | $ 46.26 | $ 47.07 | $ 37.73 | $ 26.74 | $ 42.70 | $ 50.91 |
Income from Investment Operations | | | | | | |
Net investment income (loss) D | .58 | .70 | .69 | .76 | .30 | .43 |
Net realized and unrealized gain (loss) | 3.47 | (.86) | 9.52 | 10.59 | (15.65) | (8.12) |
Total from investment operations | 4.05 | (.16) | 10.21 | 11.35 | (15.35) | (7.69) |
Distributions from net investment income | (.10) | (.65) | (.87) | (.31) | (.41) L | (.52) |
Distributions from net realized gain | - | - | - | (.05) | (.20) L | - |
Total distributions | (.10) | (.65) | (.87) | (.36) K | (.61) J | (.52) |
Redemption fees added to paid in capital D, I | - | - | - | - | - | - |
Net asset value, end of period | $ 50.21 | $ 46.26 | $ 47.07 | $ 37.73 | $ 26.74 | $ 42.70 |
Total Return B, C | 8.77% | (.23)% | 27.24% | 42.43% | (36.00)% | (15.30)% |
Ratios to Average Net Assets E, G | | | | | | |
Expenses before reductions | .88% A | .90% | .92% | .99% | .97% | .91% |
Expenses net of fee waivers, if any | .88% A | .90% | .92% | .99% | .97% | .90% |
Expenses net of all reductions | .87% A | .88% | .91% | .98% | .96% | .90% |
Net investment income (loss) | 2.43% A | 1.52% | 1.62% | 2.15% | .85% | .79% |
Supplemental Data | | | | | | |
Net assets, end of period (000 omitted) | $ 432,831 | $ 342,262 | $ 354,938 | $ 279,704 | $ 196,231 | $ 334,565 |
Portfolio turnover rate F | 42% A | 72% | 72% | 90% | 168% | 134% |
A Annualized B Total returns for periods of less than one year are not annualized. C Total returns would have been lower if certain expenses had not been reduced during the applicable periods shown. D Calculated based on average shares outstanding during the period. E Fees and expenses of any underlying Fidelity Central Funds are not included in the Fund's expense ratio. The Fund indirectly bears its proportionate share of the expenses of any underlying Fidelity Central Funds. F Amount does not include the portfolio activity of any underlying Fidelity Central Funds. G Expense ratios reflect operating expenses of the class. Expenses before reductions do not reflect amounts reimbursed by the investment adviser or reductions from brokerage service arrangements or reductions from other expense offset arrangements and do not represent the amount paid by the class during periods when reimbursements or reductions occur. Expenses net of fee waivers reflect expenses after reimbursement by the investment adviser but prior to reductions from brokerage service arrangements or other expense offset arrangements. Expenses net of all reductions represent the net expenses paid by the class. H For the year ended February 29. I Amount represents less than $.01 per share. J Total distributions of $.61 per share is comprised of distributions from net investment income of $.408 and distributions from net realized gain of $.202 per share. K Total distributions of $.36 per share is comprised of distributions from net investment income of $.310 and distributions from net realized gain of $.048 per share. L The amount shown reflects certain reclassifications related to book to tax differences. |
Financial Highlights - Institutional Class
| Six months ended
August 31, 2012 | Years ended February 28, |
| (Unaudited) | 2012 H | 2011 | 2010 | 2009 | 2008 H |
Selected Per-Share Data | | | | | | |
Net asset value, beginning of period | $ 46.20 | $ 47.02 | $ 37.69 | $ 26.73 | $ 42.65 | $ 50.91 |
Income from Investment Operations | | | | | | |
Net investment income (loss) D | .57 | .70 | .71 | .84 | .34 | .45 |
Net realized and unrealized gain (loss) | 3.48 | (.88) | 9.50 | 10.55 | (15.67) | (8.09) |
Total from investment operations | 4.05 | (.18) | 10.21 | 11.39 | (15.33) | (7.64) |
Distributions from net investment income | (.09) | (.64) | (.88) | (.38) | (.40) L | (.62) |
Distributions from net realized gain | - | - | - | (.05) | (.20) L | - |
Total distributions | (.09) | (.64) | (.88) | (.43) K | (.59) J | (.62) |
Redemption fees added to paid in capital D, I | - | - | - | - | - | - |
Net asset value, end of period | $ 50.16 | $ 46.20 | $ 47.02 | $ 37.69 | $ 26.73 | $ 42.65 |
Total Return B, C | 8.78% | (.26)% | 27.27% | 42.59% | (35.99)% | (15.23)% |
Ratios to Average Net Assets E, G | | | | | | |
Expenses before reductions | .88% A | .89% | .91% | .86% | .91% | .83% |
Expenses net of fee waivers, if any | .88% A | .89% | .91% | .86% | .91% | .83% |
Expenses net of all reductions | .88% A | .87% | .89% | .84% | .90% | .83% |
Net investment income (loss) | 2.43% A | 1.52% | 1.64% | 2.29% | .91% | .86% |
Supplemental Data | | | | | | |
Net assets, end of period (000 omitted) | $ 1,484 | $ 1,022 | $ 1,743 | $ 1,101 | $ 68 | $ 256 |
Portfolio turnover rate F | 42% A | 72% | 72% | 90% | 168% | 134% |
A Annualized B Total returns for periods of less than one year are not annualized. C Total returns would have been lower if certain expenses had not been reduced during the applicable periods shown. D Calculated based on average shares outstanding during the period. E Fees and expenses of any underlying Fidelity Central Funds are not included in the Fund's expense ratio. The Fund indirectly bears its proportionate share of the expenses of any underlying Fidelity Central Funds. F Amount does not include the portfolio activity of any underlying Fidelity Central Funds. G Expense ratios reflect operating expenses of the class. Expenses before reductions do not reflect amounts reimbursed by the investment adviser or reductions from brokerage service arrangements or reductions from other expense offset arrangements and do not represent the amount paid by the class during periods when reimbursements or reductions occur. Expenses net of fee waivers reflect expenses after reimbursement by the investment adviser but prior to reductions from brokerage service arrangements or other expense offset arrangements. Expenses net of all reductions represent the net expenses paid by the class. H For the year ended February 29. I Amount represents less than $.01 per share. J Total distributions of $.59 per share is comprised of distributions from net investment income of $.395 and distributions from net realized gain of $.197 per share. K Total distributions of $.43 per share is comprised of distributions from net investment income of $.379 and distributions from net realized gain of $.057 per share. L The amount shown reflects certain reclassifications related to book to tax differences. |
See accompanying notes which are an integral part of the financial statements.
Semiannual Report
Notes to Financial Statements
For the period ended August 31, 2012 (Unaudited)
1. Organization.
Telecommunications Portfolio (the Fund) is a non-diversified fund of Fidelity Select Portfolios (the Trust) and is authorized to issue an unlimited number of shares. The Trust is registered under the Investment Company Act of 1940, as amended (the 1940 Act), as an open-end management investment company organized as a Massachusetts business trust. The Fund invests primarily in securities of companies whose principal business activities fall within specific industries. The Fund offers Class A, Class T, Class C, Telecommunications, and Institutional Class shares, each of which, along with Class B shares, has equal rights as to assets and voting privileges. Effective after the close of business on September 1, 2010, Class B shares were closed to new accounts and additional purchases, except for exchanges and reinvestments. Each class has exclusive voting rights with respect to matters that affect that class. Class B shares will automatically convert to Class A shares after a holding period of seven years from the initial date of purchase. Investment income, realized and unrealized capital gains and losses, the common expenses of the Fund, and certain fund-level expense reductions, if any, are allocated on a pro-rata basis to each class based on the relative net assets of each class to the total net assets of the Fund. Each class differs with respect to transfer agent and distribution and service plan fees incurred. Certain expense reductions may also differ by class. The Fund's investments in emerging markets can be subject to social, economic, regulatory, and political uncertainties and can be extremely volatile.
2. Investments in Fidelity Central Funds.
The Fund invests in Fidelity Central Funds, which are open-end investment companies available only to other investment companies and accounts managed by Fidelity Management & Research Company (FMR) and its affiliates. The Fund's Schedule of Investments lists each of the Fidelity Central Funds held as of period end, if any, as an investment of the Fund, but does not include the underlying holdings of each Fidelity Central Fund. As an Investing Fund, the Fund indirectly bears its proportionate share of the expenses of the underlying Fidelity Central Funds.
The Money Market Central Funds seek preservation of capital and current income and are managed by Fidelity Investments Money Management, Inc. (FIMM), an affiliate of FMR.
A complete unaudited list of holdings for each Fidelity Central Fund is available upon request or at the Securities and Exchange Commission (the SEC) web site at www.sec.gov. In addition, the financial statements of the Fidelity Central Funds are available on the SEC web site or upon request.
3. Significant Accounting Policies.
The financial statements have been prepared in conformity with accounting principles generally accepted in the United States of America (GAAP), which require management to make certain estimates and assumptions at the date of the financial statements. Actual results could differ from those estimates. Subsequent events, if any, through the date that the financial statements were issued have been evaluated in the preparation of the financial statements. The following summarizes the significant accounting policies of the Fund:
Security Valuation. Investments are valued as of 4:00 p.m. Eastern time on the last calendar day of the period. In accordance with valuation policies and procedures approved by the Board of Trustees (the Board), the Fund attempts to obtain prices from one or more third party pricing vendor or broker to value its investments. When current market prices, quotations or rates are not readily available or reliable, securities will be fair valued in good faith by the FMR Fair Value Committee (the Committee), in accordance with procedures adopted by the Fund's Board. Factors used in determining fair value vary by security type and may include market or security specific events. The frequency with which these procedures are used cannot be predicted and they may be utilized to a significant extent. The Committee oversees the Fund's valuation policies and procedures and is responsible for approving and reporting to the Board all fair value determinations.
The Fund categorizes the inputs to valuation techniques used to value its investments into a disclosure hierarchy consisting of three levels as shown below:
Level 1 - quoted prices in active markets for identical investments
Level 2 - other significant observable inputs (including quoted prices for similar investments, interest rates, prepayment speeds, etc.)
Level 3 - unobservable inputs (including the Fund's own assumptions based on the best information available)
Valuation techniques used to value the Fund's investments by major category are as follows:
Equity securities, including restricted securities, for which market quotations are readily available, are valued at the last reported sale price or official closing price as reported by a third party pricing vendor on the primary market or exchange on which they are traded and are categorized as Level 1 in the hierarchy. In the event there were no sales during the day or closing prices are not available, securities are valued at the last quoted bid price or may be valued using the last available price and are generally categorized as Level 2 in the hierarchy. For foreign equity securities, when significant market or security specific events arise, comparisons to the valuation of American Depositary Receipts (ADRs), futures contracts, Exchange-Traded Funds (ETFs) and certain indexes as well as quoted prices for similar securities are used and are categorized as Level 2 in the hierarchy. Utilizing these techniques may result in transfers between Level 1 and Level 2.
Semiannual Report
Notes to Financial Statements (Unaudited) - continued
3. Significant Accounting Policies - continued
Security Valuation - continued
Investments in open-end mutual funds, including the Fidelity Central Funds, are valued at their closing net asset value each business day and are categorized as Level 1 in the hierarchy.
Changes in valuation techniques may result in transfers in or out of an assigned level within the disclosure hierarchy. The aggregate value of investments by input level, as of August 31, 2012 is included at the end of the Fund's Schedule of Investments.
Foreign Currency Translation. The Fund may use foreign currency contracts to facilitate transactions in foreign-denominated securities. Gains and losses from these transactions may arise from changes in the value of the foreign currency or if the counterparties do not perform under the contracts' terms.
Foreign-denominated assets, including investment securities, and liabilities are translated into U.S. dollars at the exchange rates at period end. Purchases and sales of investment securities, income and dividends received and expenses denominated in foreign currencies are translated into U.S. dollars at the exchange rate in effect on the transaction date.
The effects of exchange rate fluctuations on investments are included with the net realized and unrealized gain (loss) on investment securities. Other foreign currency transactions resulting in realized and unrealized gain (loss) are disclosed separately.
Investment Transactions and Income. For financial reporting purposes, the Fund's investment holdings and NAV include trades executed through the end of the last business day of the period. The NAV per share for processing shareholder transactions is calculated as of the close of business of the New York Stock Exchange (NYSE), normally 4:00 p.m. Eastern time and includes trades executed through the end of the prior business day. Gains and losses on securities sold are determined on the basis of identified cost and may include proceeds received from litigation. Dividend income is recorded on the ex-dividend date, except for certain dividends from foreign securities where the ex-dividend date may have passed, which are recorded as soon as the Fund is informed of the ex-dividend date. Non-cash dividends included in dividend income, if any, are recorded at the fair market value of the securities received. Distributions received on securities that represent a return of capital or capital gain are recorded as a reduction of cost of investments and/or as a realized gain. The Fund estimates the components of distributions received that may be considered return of capital distributions or capital gain distributions. Interest income and distributions from the Fidelity Central Funds are accrued as earned. Interest income includes coupon interest and amortization of premium and accretion of discount on debt securities. Investment income is recorded net of foreign taxes withheld where recovery of such taxes is uncertain.
Expenses. Expenses directly attributable to a fund are charged to that fund. Expenses attributable to more than one fund are allocated among the respective funds on the basis of relative net assets or other appropriate methods. Expense estimates are accrued in the period to which they relate and adjustments are made when actual amounts are known.
Income Tax Information and Distributions to Shareholders. Each year, the Fund intends to qualify as a regulated investment company under Subchapter M of the Internal Revenue Code, including distributing substantially all of its taxable income and realized gains. As a result, no provision for income taxes is required. The Fund files a U.S. federal tax return, in addition to state and local tax returns as required. A fund's federal income tax returns are subject to examination by the Internal Revenue Service (IRS) for a period of three fiscal years after they are filed. State and local tax returns may be subject to examination for an additional fiscal year depending on the jurisdiction. Foreign taxes are provided for based on the Fund's understanding of the tax rules and rates that exist in the foreign markets in which it invests.
Distributions are declared and recorded on the ex-dividend date. Income dividends and capital gain distributions are declared separately for each class. Income and capital gain distributions are determined in accordance with income tax regulations, which may differ from GAAP.
Capital accounts within the financial statements are adjusted for permanent book-tax differences. These adjustments have no impact on net assets or the results of operations. Temporary book-tax differences will reverse in a subsequent period.
Book-tax differences are primarily due to foreign currency transactions, deferred trustees compensation, capital loss carryforwards, expiring capital loss carryforwards, and losses deferred due to wash sales and excise tax regulations.
The federal tax cost of investment securities and unrealized appreciation (depreciation) as of period end were as follows:
Gross unrealized appreciation | $ 47,809,069 |
Gross unrealized depreciation | (47,485,236) |
Net unrealized appreciation (depreciation) on securities and other investments | $ 323,833 |
| |
Tax cost | $ 467,211,281 |
Semiannual Report
3. Significant Accounting Policies - continued
Income Tax Information and Distributions to Shareholders - continued
Capital loss carryforwards are only available to offset future capital gains of the Fund to the extent provided by regulations and may be limited. Under the Regulated Investment Company Modernization Act of 2010 (the Act), the Fund is permitted to carry forward capital losses incurred in taxable years beginning after December 22, 2010 for an unlimited period and such capital losses are required to be used prior to any losses that expire. At Feburary 29, 2012, capital loss carryforwards were as follows:
Fiscal year of expiration | |
2017 | $ (31,682,432) |
2018 | (12,541,688) |
Total with expiration | $ (44,224,120) |
The Fund intends to elect to defer to its fiscal year ending February 28, 2013 approximately $4,371,830 of capital losses recognized during the period November 1, 2011 to February 29, 2012.
Trading (Redemption) Fees. Shares held by investors in the Fund less than 30 days are subject to a redemption fee equal to .75% of the net asset value of shares redeemed. All redemption fees, which reduce the proceeds of the shareholder redemption, are retained by the Fund and accounted for as an addition to paid in capital.
New Accounting Pronouncement. In December 2011, the Financial Accounting Standards Board issued Accounting Standard Update No. 2011-11, Disclosures about Offsetting Assets and Liabilities. The update creates new disclosure requirements requiring entities to disclose both gross and net information for derivatives and other financial instruments that are either offset in the Statement of Assets and Liabilities or subject to an enforceable master netting arrangement or similar agreement. The disclosure requirements are effective for annual reporting periods beginning on or after January 1, 2013, and interim periods within those annual periods. Management is currently evaluating the impact of the update's adoption on the Fund's financial statement disclosures.
4. Purchases and Sales of Investments.
Purchases and sales of securities other than short-term securities, aggregated $142,674,054 and $77,682,711, respectively.
5. Fees and Other Transactions with Affiliates.
Management Fee. FMR and its affiliates provide the Fund with investment management related services for which the Fund pays a monthly management fee. The management fee is the sum of an individual fund fee rate that is based on an annual rate of .30% of the Fund's average net assets and an annualized group fee rate that averaged .26% during the period. The group fee rate is based upon the average net assets of all the mutual funds advised by FMR. The group fee rate decreases as assets under management increase and increases as assets under management decrease. For the period, the total annualized management fee rate was .56% of the Fund's average net assets.
Distribution and Service Plan Fees. In accordance with Rule 12b-1 of the 1940 Act, the Fund has adopted separate Distribution and Service Plans for each class of shares. Certain classes pay Fidelity Distributors Corporation (FDC), an affiliate of FMR, separate Distribution and Service Fees, each of which is based on an annual percentage of each class' average net assets. In addition, FDC may pay financial intermediaries for selling shares of the Fund and providing shareholder support services. For the period, the Distribution and Service Fee rates, total fees and amounts retained by FDC were as follows:
| Distribution
Fee | Service
Fee | Total Fees | Retained
by FDC |
Class A | -% | .25% | $ 6,771 | $ 415 |
Class T | .25% | .25% | 7,678 | - |
Class B | .75% | .25% | 3,208 | 2,406 |
Class C | .75% | .25% | 18,164 | 4,499 |
| | | $ 35,821 | $ 7,320 |
Sales Load. FDC may receive a front-end sales charge of up to 5.75% for selling Class A shares and 3.50% for selling Class T shares, some of which is paid to financial intermediaries for selling shares of the Fund. Depending on the holding period, FDC may receive contingent deferred sales charges levied on Class A, Class T, Class B, and Class C redemptions. The deferred sales charges range from 5.00% to 1.00% for Class B shares, 1.00% for Class C shares, 1.00% for certain purchases of Class A shares and .25% for certain purchases of Class T shares.
Semiannual Report
Notes to Financial Statements (Unaudited) - continued
5. Fees and Other Transactions with Affiliates - continued
Sales Load - continued
For the period, sales charge amounts retained by FDC were as follows:
| Retained
by FDC |
Class A | $ 2,179 |
Class T | 1,194 |
Class B* | 457 |
Class C* | 717 |
| $ 4,547 |
* When Class B and Class C shares are initially sold, FDC pays commissions from its own resources to financial intermediaries through which the sales are made.
Transfer Agent Fees. Fidelity Investments Institutional Operations Company, Inc. (FIIOC), an affiliate of FMR, is the transfer, dividend disbursing and shareholder servicing agent for each class of the Fund. FIIOC receives account fees and asset-based fees that vary according to the account size and type of account of the shareholders of the respective classes of the Fund. FIIOC pays for typesetting, printing and mailing of shareholder reports, except proxy statements. For the period, transfer agent fees for each class were as follows:
| Amount | % of
Average
Net Assets* |
Class A | $ 7,987 | .29 |
Class T | 5,308 | .34 |
Class B | 964 | .30 |
Class C | 5,010 | .28 |
Telecommunications | 458,358 | .24 |
Institutional Class | 1,282 | .25 |
| $ 478,909 | |
* Annualized
Accounting and Security Lending Fees. Fidelity Service Company, Inc. (FSC), an affiliate of FMR, maintains the Fund's accounting records. The accounting fee is based on the level of average net assets for each month. Under a separate contract, FSC administers the security lending program. The security lending fee is based on the number and duration of lending transactions.
Brokerage Commissions. The Fund placed a portion of its portfolio transactions with brokerage firms which are affiliates of the investment adviser. The commissions paid to these affiliated firms were $6,788 for the period.
6. Committed Line of Credit.
The Fund participates with other funds managed by FMR or an affiliate in a $4.25 billion credit facility (the "line of credit") to be utilized for temporary or emergency purposes to fund shareholder redemptions or for other short-term liquidity purposes. The Fund has agreed to pay commitment fees on its pro-rata portion of the line of credit, which amounted to $506 and is reflected in Miscellaneous expenses on the Statement of Operations. During the period, there were no borrowings on this line of credit.
7. Security Lending.
The Fund lends portfolio securities through a lending agent from time to time in order to earn additional income. For equity securities, a lending agent is used and may loan securities to certain qualified borrowers, including Fidelity Capital Markets (FCM), a broker-dealer affiliated with the Fund. On the settlement date of the loan, the Fund receives collateral (in the form of U.S. Treasury obligations, letters of credit and/or cash) against the loaned securities and maintains collateral in an amount not less than 100% of the market value of the loaned securities during the period of the loan. The market value of the loaned securities is determined at the close of business of the Fund and any additional required collateral is delivered to the Fund on the next business day. If the borrower defaults on its obligation to return the securities loaned because of insolvency or other reasons, a fund could experience delays and costs in recovering the securities loaned or in gaining access to the collateral. Any cash collateral received is invested in the Fidelity Securities Lending Cash Central Fund. The value of loaned securities and cash collateral at period end are disclosed on the Fund's Statement of Assets and Liabilities. At period end, there were no security loans outstanding with FCM. Security lending income represents the income earned on investing cash collateral, less rebates paid to borrowers and any lending agent fees associated with the loan, plus any premium payments received for
Semiannual Report
7. Security Lending - continued
lending certain types of securities. Security lending income is presented in the Statement of Operations as a component of income from Fidelity Central Funds. Total security lending income during the period amounted to $82,749, including $350 from securities loaned to FCM.
8. Expense Reductions.
Many of the brokers with whom FMR places trades on behalf of the Fund provided services to the Fund in addition to trade execution. These services included payments of certain expenses on behalf of the Fund totaling $15,528 for the period.
9. Distributions to Shareholders.
Distributions to shareholders of each class were as follows:
| Six months ended
August 31,
2012 | Year ended
February 28,
2012 |
From net investment income | | |
Class A | $ 8,492 | $ 54,285 |
Class T | 3,143 | 24,009 |
Class B | 256 | 2,206 |
Class C | 1,681 | 19,099 |
Telecommunications | 731,839 | 4,833,836 |
Institutional Class | 1,880 | 21,784 |
Total | $ 747,291 | $ 4,955,219 |
10. Share Transactions.
Transactions for each class of shares were as follows:
| Shares | Dollars |
| Six months ended
August 31,
2012 | Year ended
February 28,
2012 | Six months ended
August 31,
2012 | Year ended
February 28,
2012 |
Class A | | | | |
Shares sold | 47,204 | 70,128 | $ 2,249,611 | $ 3,321,351 |
Reinvestment of distributions | 147 | 1,116 | 6,669 | 47,447 |
Shares redeemed | (16,505) | (61,569) | (768,026) | (2,787,444) |
Net increase (decrease) | 30,846 | 9,675 | $ 1,488,254 | $ 581,354 |
Class T | | | | |
Shares sold | 25,319 | 24,101 | $ 1,197,182 | $ 1,100,865 |
Reinvestment of distributions | 67 | 557 | 3,054 | 23,555 |
Shares redeemed | (6,360) | (27,493) | (298,541) | (1,235,915) |
Net increase (decrease) | 19,026 | (2,835) | $ 901,695 | $ (111,495) |
Class B | | | | |
Shares sold | 2,740 | 1,659 | $ 128,382 | $ 77,673 |
Reinvestment of distributions | 5 | 46 | 230 | 1,965 |
Shares redeemed | (725) | (3,832) | (33,945) | (176,016) |
Net increase (decrease) | 2,020 | (2,127) | $ 94,667 | $ (96,378) |
Class C | | | | |
Shares sold | 11,345 | 30,950 | $ 534,730 | $ 1,412,876 |
Reinvestment of distributions | 26 | 313 | 1,164 | 13,236 |
Shares redeemed | (8,303) | (19,633) | (390,501) | (879,199) |
Net increase (decrease) | 3,068 | 11,630 | $ 145,393 | $ 546,913 |
Telecommunications | | | | |
Shares sold | 2,633,330 | 3,856,487 | $ 124,473,339 | $ 180,498,933 |
Reinvestment of distributions | 15,557 | 108,713 | 709,072 | 4,652,114 |
Shares redeemed | (1,428,047) | (4,106,690) | (68,578,164) | (188,141,891) |
Net increase (decrease) | 1,220,840 | (141,490) | $ 56,604,247 | $ (2,990,844) |
Semiannual Report
Notes to Financial Statements (Unaudited) - continued
10. Share Transactions - continued
| Shares | Dollars |
| Six months ended
August 31,
2012 | Year ended
February 28,
2012 | Six months ended
August 31,
2012 | Year ended
February 28,
2012 |
Institutional Class | | | | |
Shares sold | 12,743 | 107,857 | $ 633,322 | $ 5,158,491 |
Reinvestment of distributions | 27 | 401 | 1,228 | 17,134 |
Shares redeemed | (5,304) | (123,190) | (251,275) | (5,562,790) |
Net increase (decrease) | 7,466 | (14,932) | $ 383,275 | $ (387,165) |
11. Other.
The Fund's organizational documents provide former and current trustees and officers with a limited indemnification against liabilities arising in connection with the performance of their duties to the Fund. In the normal course of business, the Fund may also enter into contracts that provide general indemnifications. The Fund's maximum exposure under these arrangements is unknown as this would be dependent on future claims that may be made against the Fund. The risk of material loss from such claims is considered remote.
At the end of the period, Fidelity VIP Funds Manager 60% Portfolio was the owner of record of approximately 18% of the total outstanding shares of the fund. In addition, Strategic Advisers U.S. Opportunity Fund was the owner of record of approximately 11% of the total outstanding shares of the fund. Mutual funds managed by FMR or its affiliates were the owners of record, in the aggregate, of approximately 35% of the total outstanding shares of Telecommunications.
Semiannual Report
Board Approval of Investment Advisory Contracts and Management Fees
Consumer Staples Portfolio
Gold Portfolio
Materials Portfolio
Telecommunications Portfolio
Each year, the Board of Trustees, including the Independent Trustees (together, the Board), votes on the renewal of the management contract and sub-advisory agreements (together, the Advisory Contracts) for each fund. The Board, assisted by the advice of fund counsel and Independent Trustees' counsel, requests and considers a broad range of information relevant to the renewal of the Advisory Contracts throughout the year.
The Board meets regularly and, at each of its meetings, considers factors that are relevant to its annual consideration of the renewal of each fund's Advisory Contracts, including the services and support provided to each fund and its shareholders. The Board has established various standing committees, each composed of and chaired by Independent Trustees with varying backgrounds, to which the Board has assigned specific subject matter responsibilities in order to enhance effective decision-making by the Board. The Board, acting directly and through its Committees, requests and receives information concerning the annual consideration of the renewal of each fund's Advisory Contracts. The Board also meets as needed to consider matters specifically related to the Board's annual consideration of the renewal of Advisory Contracts. Members of the Board may also meet with trustees of other Fidelity funds through ad hoc joint committees to discuss certain matters relevant to the Fidelity funds.
At its July 2012 meeting, the Board of Trustees, including the Independent Trustees, unanimously determined to renew each fund's Advisory Contracts. In reaching its determination, the Board considered all factors it believed relevant, including (i) the nature, extent, and quality of the services to be provided to each fund and its shareholders (including the investment performance of each fund); (ii) the competitiveness of each fund's management fee and total expense ratio relative to peer funds; (iii) the total costs of the services to be provided by and the profits to be realized by Fidelity from its relationship with each fund; (iv) the extent to which economies of scale exist and would be realized as each fund grows; and (v) whether fee levels reflect these economies of scale, if any, for the benefit of fund shareholders.
In considering whether to renew the Advisory Contracts for each fund, the Board reached a determination, with the assistance of fund counsel and Independent Trustees' counsel and through the exercise of its business judgment, that the renewal of the Advisory Contracts is in the best interests of each fund and its shareholders and that the compensation payable under the Advisory Contracts is fair and reasonable. The Board's decision to renew the Advisory Contracts was not based on any single factor, but rather was based on a comprehensive consideration of all the information provided to the Board at its meetings throughout the year. The Board, in reaching its determination to renew the Advisory Contracts, is aware that shareholders in each fund have a broad range of investment choices available to them, including a wide choice among mutual funds offered by Fidelity's competitors, and that each fund's shareholders, who have the opportunity to review and weigh the disclosure provided by the fund in its prospectus and other public disclosures, have chosen to invest in that fund, managed by Fidelity.
Nature, Extent, and Quality of Services Provided. The Board considered the staffing within the investment adviser, FMR, and the sub-advisers (together, the Investment Advisers), including the backgrounds of the funds' investment personnel, and also considered the funds' investment objectives, strategies, and related investment philosophies. The Independent Trustees also had discussions with senior management of Fidelity's investment operations and investment groups. The Board considered the structure of the portfolio manager compensation program and whether this structure provides appropriate incentives to act in the best interests of each fund.
Resources Dedicated to Investment Management and Support Services. The Board and the Fund Oversight and Research Committees reviewed the general qualifications and capabilities of the Investment Advisers' investment staff, including its size, education, experience, and resources, as well as the Investment Advisers' approach to recruiting, training, managing, and compensating investment personnel. The Board also noted that FMR has continued to increase the resources devoted to non-U.S. offices, including expansion of Fidelity's global investment organization. The Board noted that Fidelity's analysts have extensive resources, tools and capabilities that allow them to conduct sophisticated quantitative and fundamental analysis, as well as credit analysis of issuers, counterparties and guarantors. The Board also believes that Fidelity's investment professionals have sufficient access to global information and data so as to provide competitive investment results over time, and that those professionals also have access to sophisticated tools that permit them to assess portfolio construction and risk and performance attribution characteristics continuously, as well as to transmit new information and research conclusions rapidly around the world. Additionally, in its deliberations, the Board considered the Investment Advisers' trading and risk management capabilities and resources, which are an integral part of the investment management process.
Shareholder and Administrative Services. The Board considered (i) the nature, extent, quality, and cost of advisory, administrative, and shareholder services performed by the Investment Advisers and their affiliates under the Advisory Contracts and under separate agreements covering transfer agency, pricing and bookkeeping, and securities lending services for each fund; (ii) the nature and extent of the supervision of third party service providers, principally custodians and subcustodians; and (iii) the resources devoted to, and the record of compliance with, each fund's compliance policies and procedures. The Board also reviewed the allocation of fund brokerage, including allocations to brokers affiliated with the Investment Advisers, the use of brokerage commissions to pay fund expenses, and the use of "soft" commission dollars to pay for research services.
Semiannual Report
The Board noted that the growth of fund assets over time across the complex allows Fidelity to reinvest in the development of services designed to enhance the value or convenience of the Fidelity funds as investment vehicles. These services include 24-hour access to account information and market information through telephone representatives and over the Internet, investor education materials and asset allocation tools, and the expanded availability of Fidelity Investor Centers.
Investment in a Large Fund Family. The Board considered the benefits to shareholders of investing in a Fidelity fund, including the benefits of investing in a fund that is part of a large family of funds offering a variety of investment disciplines and providing a large variety of mutual fund investor services. The Board noted that Fidelity had taken, or had made recommendations that resulted in the Fidelity funds taking, a number of actions over the previous year that benefited particular funds, including (i) continuing to dedicate additional resources to investment research and support of the senior management team that oversees asset management; (ii) persisting in efforts to enhance Fidelity's research capabilities, in particular, international research; (iii) launching new funds and making other enhancements to meet client needs for global and income-oriented solutions; (iv) continuing to launch dedicated lower cost underlying funds to meet investment management's portfolio construction needs related to expanding underlying fund options, specifically for the Freedom Fund product lines; (v) adopting a "Stock Selector" sector neutral investment approach and employing a team of portfolio managers who are sector specialists to manage certain funds; (vi) rationalizing product lines and gaining increased efficiencies through the mergers of several funds into other funds; (vii) strengthening the Spartan Index Fund product line by adding new funds and/or new low-cost institutional share classes, restructuring fund expenses to accommodate new classes, and reducing investment minimums for certain classes of shares; (viii) modifying the eligibility criteria for Institutional Class shares to increase their appeal to government entities and charitable investors; and (ix) reducing certain transfer agent fee rates.
Investment Performance. The Board considered whether each fund has operated in accordance with its investment objective, as well as its record of compliance with its investment restrictions. It also reviewed each fund's absolute investment performance for each class, as well as each fund's relative investment performance for each class measured over multiple periods against a third-party-sponsored index that reflects the market sector in which the fund invests. The Board noted that FMR believes that no meaningful peer group exists for the funds principally because most other funds in each fund's third-party peer group focus on different industries or sectors than the fund.
For each of Consumer Staples Portfolio, Gold Portfolio, and Telecommunications Portfolio, the following charts considered by the Board show, over the one-, three-, and five-year periods ended December 31, 2011, the cumulative total returns of Institutional Class (Class I) and Class B of the fund and the cumulative total returns of a third-party-sponsored index ("benchmark"). The returns of Institutional Class (Class I) and Class B show the performance of the highest and lowest performing classes, respectively (based on five-year performance).
For Materials Portfolio, the following charts considered by the Board show, over the one-, three-, and five-year periods ended December 31, 2011, the cumulative total returns of the retail class and Class B of the fund and the cumulative total returns of a third-party-sponsored index ("benchmark"). The returns of the retail class and Class B show the performance of the highest and lowest performing classes, respectively (based on five-year performance).
Consumer Staples Portfolio

The Board noted that the investment performance of the fund was lower than its benchmark for the one- and five-year periods, although the three-year cumulative total return of Institutional Class (Class I) compared favorably to its benchmark. The Board considered that the variations in performance among the fund's classes reflect the variations in class expenses, which result in lower performance for higher expense classes. The Board also reviewed the fund's performance since inception as well as performance in the current year.
Semiannual Report
Board Approval of Investment Advisory Contracts and Management Fees - continued
Gold Portfolio

The Board noted that the investment performance of Institutional Class (Class I) of the fund compared favorably to its benchmark for all the periods shown. The Board considered that the variations in performance among the fund's classes reflect the variations in class expenses, which result in lower performance for higher expense classes. The Board also reviewed the fund's performance since inception as well as performance in the current year.
Materials Portfolio

The Board noted that the investment performance of the retail class of the fund compared favorably to its benchmark for all the periods shown. The Board considered that the variations in performance among the fund's classes reflect the variations in class expenses, which result in lower performance for higher expense classes. The Board also reviewed the fund's performance since inception as well as performance in the current year.
Semiannual Report
Telecommunications Portfolio

The Board noted that the investment performance of Institutional Class (Class I) of the fund compared favorably to its benchmark for the three- and five-year periods, although the fund's one-year total return was lower than its benchmark. The Board considered that the variations in performance among the fund's classes reflect the variations in class expenses, which result in lower performance for higher expense classes. The Board noted that there was a portfolio management change for the fund in December 2011. The Board also reviewed the fund's performance since inception as well as performance in the current year.
Based on its review, the Board concluded that the nature, extent, and quality of services provided to each fund under the Advisory Contracts should benefit each fund's shareholders.
Competitiveness of Management Fee and Total Expense Ratio. The Board considered each fund's management fee and total expense ratio compared to "mapped groups" of competitive funds and classes. Fidelity creates "mapped groups" by combining similar Lipper investment objective categories that have comparable management fee characteristics. Combining Lipper investment objective categories aids the Board's management fee and total expense ratio comparisons by broadening the competitive group used for comparison and by reducing the number of universes to which various Fidelity funds are compared.
Management Fee. The Board considered two proprietary management fee comparisons for the 12-month periods shown in the charts below. The group of Lipper funds used by the Board for management fee comparisons is referred to below as the "Total Mapped Group." The Total Mapped Group comparison focuses on a fund's standing relative to the total universe of comparable funds available to investors in terms of gross management fees before expense reimbursements or caps. "TMG %" represents the percentage of funds in the Total Mapped Group that had management fees that were lower than a fund's. For example, a TMG % of 6% means that 94% of the funds in the Total Mapped Group had higher management fees than a fund. The "Asset-Size Peer Group" (ASPG) comparison focuses on a fund's standing relative to non-Fidelity funds similar in size to the fund within the Total Mapped Group. The ASPG represents at least 15% of the funds in the Total Mapped Group with comparable asset size and management fee characteristics, subject to a minimum of 50 funds (or all funds in the Total Mapped Group if fewer than 50). Additional information, such as the ASPG quartile in which a fund's management fee ranked, is also included in the charts and considered by the Board.
Semiannual Report
Board Approval of Investment Advisory Contracts and Management Fees - continued
Consumer Staples Portfolio

Gold Portfolio
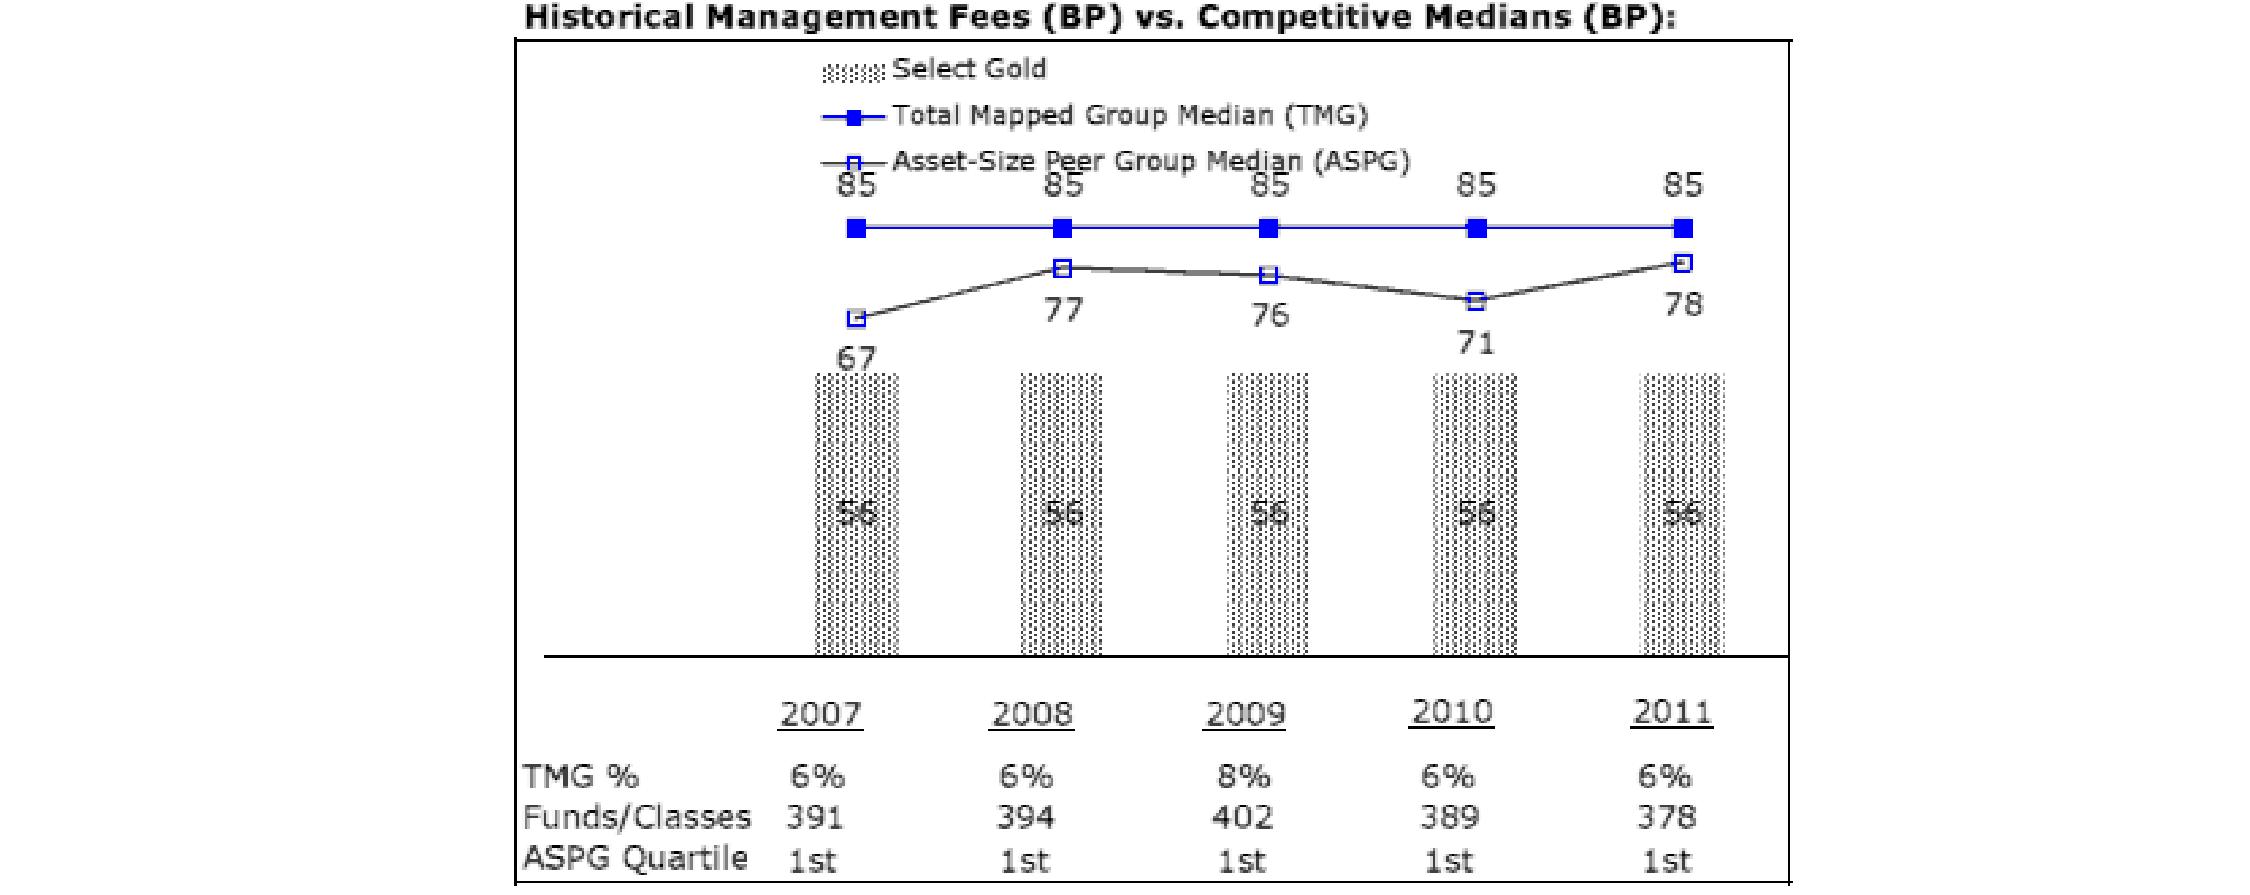
Semiannual Report
Materials Portfolio

Telecommunications Portfolio

The Board noted that each fund's management fee ranked below the median of its Total Mapped Group and below the median of its ASPG for 2011.
Based on its review, the Board concluded that each fund's management fee is fair and reasonable in light of the services that the fund receives and the other factors considered.
Total Expense Ratio. In its review of the total expense ratio of each class of each fund, the Board considered the fund's management fee as well as other fund or class expenses, as applicable, such as transfer agent fees, pricing and bookkeeping fees, fund-paid 12b-1 fees, and custodial, legal, and audit fees. The Board also noted the effects of any waivers and reimbursements on fees and expenses. As part of its review, the Board also considered the current and historical total expense ratios of each class of each fund compared to competitive fund median expenses. Each class of each fund is compared to those funds and classes in the Total Mapped Group (used by the Board for management fee comparisons) that have a similar sales load structure.
The Board noted that the total expense ratio of each class of each of Consumer Staples Portfolio, Gold Portfolio, and Materials Portfolio ranked below its competitive median for 2011.
The Board noted that the total expense ratio of each of Class A, Class B, Class C, Institutional Class, and the retail class of Telecommunications Portfolio ranked below its competitive median for 2011 and the total expense ratio of Class T ranked above its competitive median for 2011. The Board considered that various factors, including 12b-1 fees, positive or negative performance adjustments, and relatively higher other expenses in the case of small fund size, can affect total expense ratios. The Board noted that the total expense ratio of Class T was above the competitive median primarily because of higher 12b-1 fees on Class T. Class T has a higher 12b-1 fee, but a lower front-end sales charge, than traditionally priced front-end sales charge classes. The Board considered that Class T is primarily sold load-waived in the retirement plan market where its 0.50% 12b-1 fee is comparable to competing no-load, higher 12b-1 fee classes designed specifically for retirement plans. The Board noted that the fund offers multiple classes, each of which has a different sales load and 12b-1 fee structure, and that the multiple structures are intended to offer a range of pricing options for the intermediary market. The Board also noted that the total expense ratios of the classes vary primarily by the level of their 12b-1 fees, although differences in transfer agent fees may also cause expenses to vary from class to class.
Semiannual Report
Board Approval of Investment Advisory Contracts and Management Fees - continued
Fees Charged to Other Fidelity Clients. The Board also considered Fidelity fee structures and other information with respect to clients of FMR and its affiliates, such as other mutual funds advised or subadvised by FMR or its affiliates, pension plan clients, and other institutional clients. The Board noted the findings of the 2010 ad hoc joint committee (created with the board of other Fidelity funds), which reviewed and compared Fidelity's institutional investment advisory business with its business of providing services to the Fidelity funds, including the differences in services provided, fees charged, and costs incurred, as well as competition in their respective marketplaces.
Based on its review of total expense ratios and fees charged to other Fidelity clients, the Board concluded that the total expense ratio of each class of each fund was reasonable, although Class T of Telecommunications Portfolio was above the median of the universe presented for comparison, in light of the services that each fund and its shareholders receive and the other factors considered.
Costs of the Services and Profitability. The Board considered the revenues earned and the expenses incurred by Fidelity in conducting the business of developing, marketing, distributing, managing, administering and servicing each fund and its shareholders. The Board also considered the level of Fidelity's profits in respect of all the Fidelity funds.
On an annual basis, FMR presents to the Board Fidelity's profitability for each fund. Fidelity calculates the profitability for each fund, as well as aggregate profitability for groups of Fidelity funds and all Fidelity funds, using a series of detailed revenue and cost allocation methodologies which originate with the books and records of Fidelity on which Fidelity's audited financial statements are based. The Audit Committee of the Board reviews any significant changes from the prior year's methodologies.
PricewaterhouseCoopers LLP (PwC), independent registered public accounting firm and auditor to Fidelity and certain Fidelity funds, has been engaged annually by the Board as part of the Board's assessment of Fidelity's profitability analysis. PwC's engagement includes the review and assessment of Fidelity's methodologies used in determining the revenues and expenses attributable to Fidelity's mutual fund business, and completion of agreed-upon procedures surrounding the mathematical accuracy of fund profitability and its conformity to allocation methodologies. After considering PwC's reports issued under the engagement and information provided by Fidelity, the Board concluded that while other allocation methods may also be reasonable, Fidelity's profitability methodologies are reasonable in all material respects.
The Board also reviewed Fidelity's non-fund businesses and fall-out benefits related to the mutual fund business as well as cases where Fidelity's affiliates may benefit from or be related to the funds' business.
The Board considered the costs of the services provided by and the profits realized by Fidelity in connection with the operation of each fund and was satisfied that the profitability was not excessive in the circumstances.
Economies of Scale. The Board considered whether there have been economies of scale in respect of the management of the Fidelity funds, whether the Fidelity funds (including each fund) have appropriately benefited from any such economies of scale, and whether there is potential for realization of any further economies of scale. The Board considered the extent to which each fund will benefit from economies of scale through increased services to the fund, through waivers or reimbursements, or through fee or expense reductions. The Board also noted that in 2009, it and the board of other Fidelity funds created an ad hoc committee (the Economies of Scale Committee) to analyze whether FMR attains economies of scale in respect of the management and servicing of the Fidelity funds, whether the Fidelity funds have appropriately benefited from such economies of scale, and whether there is potential for realization of any further economies of scale.
The Board recognized that each fund's management contract incorporates a "group fee" structure, which provides for lower group fee rates as total fund assets under FMR's management increase, and for higher group fee rates as total fund assets under FMR's management decrease. FMR calculates the group fee rates based on a tiered asset "breakpoint" schedule that varies based on asset class. The Board considered that the group fee is designed to deliver the benefits of economies of scale to fund shareholders when total Fidelity fund assets increase, even if assets of any particular fund are unchanged or have declined, because some portion of Fidelity's costs are attributable to services provided to all Fidelity funds, and all funds benefit if those costs can be allocated among more assets. The Board concluded that, given the group fee structure, fund shareholders will benefit from lower management fees as assets under FMR's management increase at the fund complex level, regardless of whether Fidelity achieves any such economies of scale.
Semiannual Report
The Board concluded, taking into account the analysis of the Economies of Scale Committee, that economies of scale, if any, are being appropriately shared between fund shareholders and Fidelity.
Additional Information Requested by the Board. In order to develop fully the factual basis for consideration of the Fidelity funds' Advisory Contracts, the Board requested and received additional information on certain topics, including (i) fund performance trends, actions to be taken by FMR to improve certain funds' overall performance, and Fidelity's long-term strategies for certain funds; (ii) the potential to further rationalize the Fidelity fund lineup with the possibility of achieving savings for the funds and Fidelity; (iii) Fidelity's compensation structure for portfolio managers and other key investment personnel; (iv) the amount of the investment that each portfolio manager has made in the Fidelity fund(s) that he or she manages; (v) the realization of fall-out benefits in certain Fidelity business units; (vi) Fidelity's group fee structures, the potential impact of regulatory changes on such structures, and the rationale for the individual fee rates of certain funds; (vii) fund profitability methodology, including Fidelity's cost allocation methodology, and the impact of certain factors on fund profitability results; (viii) trends regarding industry use of performance fee structures and the possibility of implementing performance fee structures for additional funds; and (ix) the impact of net redemptions from the Fidelity funds.
Based on its evaluation of all of the conclusions noted above, and after considering all factors it believed relevant, the Board ultimately concluded that the advisory fee structures are fair and reasonable, and that each fund's Advisory Contracts should be renewed.
Semiannual Report
Investment Adviser
Fidelity Management & Research Company
Boston, MA
Investment Sub-Advisers
FMR Co., Inc.
Fidelity Management & Research
(U.K.) Inc.
Fidelity Management & Research
(Hong Kong) Limited
Fidelity Management & Research
(Japan) Inc.
General Distributor
Fidelity Distributors Corporation
Smithfield, RI
Transfer and Service Agents
Fidelity Investments Institutional
Operations Company, Inc.
Boston, MA
Fidelity Service Company, Inc.
Boston, MA
Custodian
Brown Brothers Harriman & Co.
Boston, MA
(Fidelity Investment logo)(registered trademark)
Corporate Headquarters
82 Devonshire St., Boston, MA 02109
www.fidelity.com
ASGMT-USAN-1012
1.855653.105
Fidelity Advisor
Focus Funds®
Institutional Class
Fidelity Advisor® Consumer Staples Fund
Fidelity Advisor Gold Fund
Fidelity Advisor Materials Fund
Fidelity Advisor Telecommunications Fund
Each Advisor fund listed above is a class
of the Fidelity® Select Portfolios®.
Semiannual Report
August 31, 2012
(Fidelity Cover Art)
Contents
To view a fund's proxy voting guidelines and proxy voting record for the 12-month period ended June 30, visit http://www.fidelity.com/proxyvotingresults or visit the Securities and Exchange Commission's (SEC) web site at http://www.sec.gov. You may also call 1-877-208-0098 to request a free copy of the proxy voting guidelines.
Standard & Poor's, S&P and S&P 500 are registered service marks of The McGraw-Hill Companies, Inc. and have been licensed for use by Fidelity Distributors Corporation.
Other third party marks appearing herein are the property of their respective owners.
All other marks appearing herein are registered or unregistered trademarks or service marks of FMR LLC or an affiliated company. © 2012 FMR LLC. All rights reserved.
This report and the financial statements contained herein are submitted for the general information of the shareholders of the funds. This report is not authorized for distribution to prospective investors in the funds unless preceded or accompanied by an effective prospectus.
A fund files its complete schedule of portfolio holdings with the SEC for the first and third quarters of each fiscal year on Form N-Q. Forms N-Q are available on the SEC's web site at http://www.sec.gov. A fund's Forms N-Q may be reviewed and copied at the SEC's Public Reference Room in Washington, DC. Information regarding the operation of the SEC's Public Reference Room may be obtained by calling 1-800-SEC-0330. For a complete list of a fund's portfolio holdings, view the most recent holdings listing, semiannual report, or annual report on Fidelity's web site at http://www.fidelity.com, http://www.advisor.fidelity.com, or http://www.401k.com, as applicable.
NOT FDIC INSURED • MAY LOSE VALUE • NO BANK GUARANTEE
Neither the funds nor Fidelity Distributors Corporation is a bank.
Semiannual Report
Consumer Staples Portfolio
As a shareholder of the Fund, you incur two types of costs: (1) transaction costs, including sales charges (loads) on purchase payments or redemption proceeds, redemption fees and (2) ongoing costs, including management fees, distribution and/or service (12b-1) fees and other Fund expenses. This Example is intended to help you understand your ongoing costs (in dollars) of investing in the Fund and to compare these costs with the ongoing costs of investing in other mutual funds.
The Example is based on an investment of $1,000 invested at the beginning of the period and held for the entire period (March 1, 2012 to August 31, 2012).
Actual Expenses
The first line of the accompanying table for each class of the Fund provides information about actual account values and actual expenses. You may use the information in this line, together with the amount you invested, to estimate the expenses that you paid over the period. Simply divide your account value by $1,000.00 (for example, an $8,600 account value divided by $1,000.00 = 8.6), then multiply the result by the number in the first line for a class of the Fund under the heading entitled "Expenses Paid During Period" to estimate the expenses you paid on your account during this period. A small balance maintenance fee of $12.00 that is charged once a year may apply for certain accounts with a value of less than $2,000. This fee is not included in the table below. If it was, the estimate of expenses you paid during the period would be higher, and your ending account value lower, by this amount. In addition, the Fund, as a shareholder in the underlying Fidelity Central Funds, will indirectly bear its pro-rata share of the fees and expenses incurred by the underlying Fidelity Central Funds. These fees and expenses are not included in the Fund's annualized expense ratio used to calculate the expense estimate in the table below.
Hypothetical Example for Comparison Purposes
The second line of the accompanying table for each class of the Fund provides information about hypothetical account values and hypothetical expenses based on a Class' actual expense ratio and an assumed rate of return of 5% per year before expenses, which is not the Class' actual return. The hypothetical account values and expenses may not be used to estimate the actual ending account balance or expenses you paid for the period. You may use this information to compare the ongoing costs of investing in the Fund and other funds. To do so, compare this 5% hypothetical example with the 5% hypothetical examples that appear in the shareholder reports of the other funds. A small balance maintenance fee of $12.00 that is charged once a year may apply for certain accounts with a value of less than $2,000. This fee is not included in the table below. If it was, the estimate of expenses you paid during the period would be higher, and your ending account value lower, by this amount. In addition, the Fund, as a shareholder in the underlying Fidelity Central Funds, will indirectly bear its pro-rata share of the fees and expenses incurred by the underlying Fidelity Central Funds. These fees and expenses are not included in the Fund's annualized expense ratio used to calculate the expense estimate in the table below.
Please note that the expenses shown in the table are meant to highlight your ongoing costs only and do not reflect any transaction costs. Therefore, the second line of the table is useful in comparing ongoing costs only, and will not help you determine the relative total costs of owning different funds. In addition, if these transactional costs were included, your costs would have been higher.
| Annualized
Expense Ratio | Beginning
Account Value
March 1, 2012 | Ending
Account Value
August 31, 2012 | Expenses Paid
During Period*
March 1, 2012
to August 31, 2012 |
Class A | 1.09% | | | |
Actual | | $ 1,000.00 | $ 1,072.50 | $ 5.69 |
HypotheticalA | | $ 1,000.00 | $ 1,019.71 | $ 5.55 |
Class T | 1.36% | | | |
Actual | | $ 1,000.00 | $ 1,071.10 | $ 7.10 |
HypotheticalA | | $ 1,000.00 | $ 1,018.35 | $ 6.92 |
Class B | 1.89% | | | |
Actual | | $ 1,000.00 | $ 1,068.30 | $ 9.85 |
HypotheticalA | | $ 1,000.00 | $ 1,015.68 | $ 9.60 |
Class C | 1.83% | | | |
Actual | | $ 1,000.00 | $ 1,068.60 | $ 9.54 |
HypotheticalA | | $ 1,000.00 | $ 1,015.98 | $ 9.30 |
Consumer Staples | .81% | | | |
Actual | | $ 1,000.00 | $ 1,074.10 | $ 4.23 |
HypotheticalA | | $ 1,000.00 | $ 1,021.12 | $ 4.13 |
Institutional Class | .84% | | | |
Actual | | $ 1,000.00 | $ 1,074.00 | $ 4.39 |
HypotheticalA | | $ 1,000.00 | $ 1,020.97 | $ 4.28 |
A 5% return per year before expenses
* Expenses are equal to each Class' annualized expense ratio, multiplied by the average account value over the period, multiplied by 184/365 (to reflect the one-half year period).
Semiannual Report
Consumer Staples Portfolio
Investment Changes (Unaudited)
Top Ten Stocks as of August 31, 2012 |
| % of fund's
net assets | % of fund's net assets
6 months ago |
Procter & Gamble Co. | 14.9 | 16.2 |
British American Tobacco PLC sponsored ADR | 13.8 | 11.9 |
The Coca-Cola Co. | 10.8 | 10.8 |
CVS Caremark Corp. | 7.1 | 6.7 |
Altria Group, Inc. | 4.5 | 4.8 |
Anheuser-Busch InBev SA NV | 3.4 | 3.1 |
Diageo PLC sponsored ADR | 3.1 | 2.8 |
Colgate-Palmolive Co. | 2.9 | 2.3 |
Constellation Brands, Inc. Class A (sub. vtg.) | 2.5 | 2.6 |
Philip Morris International, Inc. | 2.4 | 2.6 |
| 65.4 | |
Top Industries (% of fund's net assets) |
As of August 31, 2012 |
| Beverages | 28.9% | |
| Tobacco | 21.6% | |
| Household Products | 18.4% | |
| Food & Staples Retailing | 12.4% | |
| Food Products | 9.4% | |
| All Others* | 9.3% | |

As of February 29, 2012 |
| Beverages | 31.3% | |
| Tobacco | 20.4% | |
| Household Products | 19.0% | |
| Food & Staples Retailing | 11.1% | |
| Food Products | 10.0% | |
| All Others* | 8.2% | |

* Includes short-term investments and net other assets. |
Semiannual Report
Consumer Staples Portfolio
Investments August 31, 2012 (Unaudited)
Showing Percentage of Net Assets
Common Stocks - 95.3% |
| Shares | | Value |
BEVERAGES - 28.9% |
Brewers - 5.7% |
Anheuser-Busch InBev SA NV | 801,728 | | $ 67,451,302 |
Companhia de Bebidas das Americas (AmBev) (PN) sponsored ADR | 215,485 | | 8,104,391 |
Compania Cervecerias Unidas SA sponsored ADR | 69,900 | | 4,549,791 |
Molson Coors Brewing Co. Class B | 466,328 | | 20,770,249 |
SABMiller PLC | 320,800 | | 14,158,280 |
| | 115,034,013 |
Distillers & Vintners - 8.9% |
Constellation Brands, Inc. Class A (sub. vtg.) (a) | 1,504,820 | | 49,568,771 |
Diageo PLC sponsored ADR | 581,627 | | 63,525,301 |
Pernod Ricard SA | 328,901 | | 35,440,966 |
Remy Cointreau SA | 216,376 | | 24,714,644 |
Thai Beverage PCL | 6,002,000 | | 1,588,977 |
Treasury Wine Estates Ltd. | 770,955 | | 3,767,503 |
| | 178,606,162 |
Soft Drinks - 14.3% |
Britvic PLC | 573,000 | | 2,907,842 |
Coca-Cola Bottling Co. CONSOLIDATED | 94,145 | | 6,462,113 |
Coca-Cola FEMSA SAB de CV sponsored ADR | 41,529 | | 5,068,614 |
Coca-Cola Hellenic Bottling Co. SA sponsored ADR | 270,681 | | 4,964,290 |
Coca-Cola Icecek A/S | 330,842 | | 5,892,305 |
Embotelladora Andina SA: | | | |
ADR | 43,689 | | 1,177,855 |
sponsored ADR | 267,800 | | 8,815,976 |
Fomento Economico Mexicano SAB de CV sponsored ADR | 10,187 | | 860,802 |
PepsiCo, Inc. | 474,871 | | 34,394,907 |
The Coca-Cola Co. | 5,791,184 | | 216,590,282 |
| | 287,134,986 |
TOTAL BEVERAGES | | 580,775,161 |
FOOD & STAPLES RETAILING - 12.4% |
Drug Retail - 9.0% |
CVS Caremark Corp. | 3,134,863 | | 142,793,010 |
Drogasil SA | 521,400 | | 5,514,783 |
Rite Aid Corp. (a) | 1,534,500 | | 1,826,055 |
Walgreen Co. | 836,660 | | 29,918,962 |
| | 180,052,810 |
Food Distributors - 0.1% |
Chefs' Warehouse Holdings (a) | 161,700 | | 2,485,329 |
Food Retail - 1.3% |
Fresh Market, Inc. (a) | 11,800 | | 681,096 |
Kroger Co. | 626,435 | | 13,956,972 |
|
| Shares | | Value |
Susser Holdings Corp. (a) | 144,300 | | $ 4,909,086 |
The Pantry, Inc. (a) | 384,270 | | 5,387,465 |
| | 24,934,619 |
Hypermarkets & Super Centers - 2.0% |
Wal-Mart Stores, Inc. | 564,696 | | 40,996,930 |
TOTAL FOOD & STAPLES RETAILING | | 248,469,688 |
FOOD PRODUCTS - 9.4% |
Agricultural Products - 2.7% |
Archer Daniels Midland Co. | 231,261 | | 6,186,232 |
Bunge Ltd. | 661,987 | | 42,135,473 |
Cosan Ltd. Class A | 40,400 | | 562,772 |
First Resources Ltd. | 1,367,000 | | 2,281,075 |
Ingredion, Inc. | 1,024 | | 55,122 |
SLC Agricola SA | 253,600 | | 2,661,057 |
| | 53,881,731 |
Packaged Foods & Meats - 6.7% |
Annie's, Inc. (d) | 30,587 | | 1,270,890 |
Calavo Growers, Inc. | 81,173 | | 2,146,214 |
Danone SA | 33,400 | | 2,081,621 |
Green Mountain Coffee Roasters, Inc. (a) | 362,037 | | 8,801,119 |
Lindt & Spruengli AG | 121 | | 4,377,647 |
Mead Johnson Nutrition Co. Class A | 460,916 | | 33,798,970 |
Nestle SA | 368,063 | | 22,881,051 |
TreeHouse Foods, Inc. (a) | 102,100 | | 5,304,095 |
Tyson Foods, Inc. Class A | 658,400 | | 10,310,544 |
Unilever NV (NY Reg.) | 1,117,271 | | 38,858,685 |
Want Want China Holdings Ltd. | 3,577,000 | | 4,427,465 |
| | 134,258,301 |
TOTAL FOOD PRODUCTS | | 188,140,032 |
HOUSEHOLD PRODUCTS - 18.4% |
Household Products - 18.4% |
Colgate-Palmolive Co. | 539,871 | | 57,393,686 |
Procter & Gamble Co. | 4,450,558 | | 299,032,991 |
Reckitt Benckiser Group PLC | 85,200 | | 4,816,140 |
Spectrum Brands Holdings, Inc. | 226,147 | | 8,328,994 |
| | 369,571,811 |
PERSONAL PRODUCTS - 2.4% |
Personal Products - 2.4% |
Avon Products, Inc. | 167,400 | | 2,586,330 |
Herbalife Ltd. | 43,690 | | 2,114,159 |
Hypermarcas SA (a) | 239,800 | | 1,539,285 |
L'Oreal SA | 199,400 | | 24,513,712 |
Natura Cosmeticos SA | 113,200 | | 2,838,504 |
Nu Skin Enterprises, Inc. Class A (d) | 367,119 | | 15,231,767 |
| | 48,823,757 |
PHARMACEUTICALS - 2.2% |
Pharmaceuticals - 2.2% |
Johnson & Johnson | 665,460 | | 44,871,968 |
Common Stocks - continued |
| Shares | | Value |
SPECIALTY RETAIL - 0.0% |
Specialty Stores - 0.0% |
Teavana Holdings, Inc. (a) | 66,777 | | $ 734,547 |
TOBACCO - 21.6% |
Tobacco - 21.6% |
Altria Group, Inc. | 2,669,820 | | 90,667,087 |
British American Tobacco PLC sponsored ADR | 2,638,391 | | 276,345,073 |
Japan Tobacco, Inc. | 105,500 | | 3,198,890 |
KT&G Corp. | 25,168 | | 1,906,819 |
Lorillard, Inc. | 52,603 | | 6,602,203 |
Philip Morris International, Inc. | 535,183 | | 47,791,842 |
Souza Cruz SA | 445,200 | | 5,967,728 |
| | 432,479,642 |
TOTAL COMMON STOCKS (Cost $1,474,408,366) |
1,913,866,606
|
Money Market Funds - 5.0% |
| Shares | | Value |
Fidelity Cash Central Fund, 0.17% (b) | 91,956,080 | | $ 91,956,080 |
Fidelity Securities Lending Cash Central Fund, 0.18% (b)(c) | 7,781,175 | | 7,781,175 |
TOTAL MONEY MARKET FUNDS (Cost $99,737,255) |
99,737,255
|
TOTAL INVESTMENT PORTFOLIO - 100.3% (Cost $1,574,145,621) | | 2,013,603,861 |
NET OTHER ASSETS (LIABILITIES) - (0.3)% | | (5,604,927) |
NET ASSETS - 100% | $ 2,007,998,934 |
Legend |
(a) Non-income producing |
(b) Affiliated fund that is available only to investment companies and other accounts managed by Fidelity Investments. The rate quoted is the annualized seven-day yield of the fund at period end. A complete unaudited listing of the fund's holdings as of its most recent quarter end is available upon request. In addition, each Fidelity Central Fund's financial statements are available on the SEC's website or upon request. |
(c) Investment made with cash collateral received from securities on loan. |
(d) Security or a portion of the security is on loan at period end. |
Affiliated Central Funds |
Information regarding fiscal year to date income earned by the Fund from investments in Fidelity Central Funds is as follows: |
Fund | Income earned |
Fidelity Cash Central Fund | $ 51,359 |
Fidelity Securities Lending Cash Central Fund | 344,609 |
Total | $ 395,968 |
Other Information |
The following is a summary of the inputs used, as of August 31, 2012, involving the Fund's assets and liabilities carried at fair value. The inputs or methodology used for valuing securities may not be an indication of the risk associated with investing in those securities. For more information on valuation inputs, and their aggregation into the levels used in the table below, please refer to the Security Valuation section in the accompanying Notes to Financial Statements. |
Valuation Inputs at Reporting Date: |
Description | Total | Level 1 | Level 2 | Level 3 |
Investments in Securities: | | | | |
Common Stocks | $ 1,913,866,606 | $ 1,843,216,414 | $ 70,650,192 | $ - |
Money Market Funds | 99,737,255 | 99,737,255 | - | - |
Total Investments in Securities: | $ 2,013,603,861 | $ 1,942,953,669 | $ 70,650,192 | $ - |
Distribution of investments by country or territory of incorporation, as a percentage of total net assets, is as follows. (Unaudited) |
United States of America | 65.0% |
United Kingdom | 17.9% |
France | 4.3% |
Belgium | 3.4% |
Bermuda | 2.1% |
Netherlands | 1.9% |
Switzerland | 1.4% |
Brazil | 1.4% |
Others (Individually Less Than 1%) | 2.6% |
| 100.0% |
See accompanying notes which are an integral part of the financial statements.
Semiannual Report
Consumer Staples Portfolio
Statement of Assets and Liabilities
| August 31, 2012 (Unaudited) |
| | |
Assets | | |
Investment in securities, at value (including securities loaned of $7,650,604) - See accompanying schedule: Unaffiliated issuers (cost $1,474,408,366) | $ 1,913,866,606 | |
Fidelity Central Funds (cost $99,737,255) | 99,737,255 | |
Total Investments (cost $1,574,145,621) | | $ 2,013,603,861 |
Receivable for investments sold | | 876,470 |
Receivable for fund shares sold | | 2,913,548 |
Dividends receivable | | 6,401,439 |
Distributions receivable from Fidelity Central Funds | | 84,597 |
Other receivables | | 8,642 |
Total assets | | 2,023,888,557 |
| | |
Liabilities | | |
Payable for investments purchased | $ 373,914 | |
Payable for fund shares redeemed | 6,189,422 | |
Accrued management fee | 927,988 | |
Distribution and service plan fees payable | 180,589 | |
Other affiliated payables | 387,229 | |
Other payables and accrued expenses | 49,306 | |
Collateral on securities loaned, at value | 7,781,175 | |
Total liabilities | | 15,889,623 |
| | |
Net Assets | | $ 2,007,998,934 |
Net Assets consist of: | | |
Paid in capital | | $ 1,531,767,644 |
Undistributed net investment income | | 22,806,456 |
Accumulated undistributed net realized gain (loss) on investments and foreign currency transactions | | 13,957,507 |
Net unrealized appreciation (depreciation) on investments and assets and liabilities in foreign currencies | | 439,467,327 |
Net Assets | | $ 2,007,998,934 |
Statement of Assets and Liabilities - continued
| August 31, 2012 (Unaudited) |
| | |
Calculation of Maximum Offering Price Class A:
Net Asset Value and redemption price per share ($236,989,846 ÷ 2,963,833 shares) | | $ 79.96 |
| | |
Maximum offering price per share (100/94.25 of $79.96) | | $ 84.84 |
Class T:
Net Asset Value and redemption price per share ($44,178,924 ÷ 556,085 shares) | | $ 79.45 |
| | |
Maximum offering price per share (100/96.50 of $79.45) | | $ 82.33 |
Class B:
Net Asset Value and offering price per share ($18,982,159 ÷ 240,877 shares)A | | $ 78.80 |
| | |
Class C:
Net Asset Value and offering price per share ($118,686,522 ÷ 1,511,166 shares)A | | $ 78.54 |
| | |
Consumer Staples:
Net Asset Value, offering price and redemption price per share ($1,346,637,604 ÷ 16,736,686 shares) | | $ 80.46 |
| | |
Institutional Class:
Net Asset Value, offering price and redemption price per share ($242,523,879 ÷ 3,020,688 shares) | | $ 80.29 |
A Redemption price per share is equal to net asset value less any applicable contingent deferred sales charge.
See accompanying notes which are an integral part of the financial statements.
Semiannual Report
Consumer Staples Portfolio
Financial Statements - continued
Statement of Operations
Six months ended August 31, 2012 (Unaudited) |
| | |
Investment Income | | |
Dividends | | $ 31,054,949 |
Interest | | 13 |
Income from Fidelity Central Funds | | 395,968 |
Total income | | 31,450,930 |
| | |
Expenses | | |
Management fee | $ 5,154,048 | |
Transfer agent fees | 1,985,358 | |
Distribution and service plan fees | 1,009,871 | |
Accounting and security lending fees | 284,230 | |
Custodian fees and expenses | 39,971 | |
Independent trustees' compensation | 6,078 | |
Registration fees | 92,752 | |
Audit | 20,569 | |
Legal | 3,480 | |
Interest | 887 | |
Miscellaneous | 8,705 | |
Total expenses before reductions | 8,605,949 | |
Expense reductions | (22,003) | 8,583,946 |
Net investment income (loss) | | 22,866,984 |
Realized and Unrealized Gain (Loss) Net realized gain (loss) on: | | |
Investment securities: | | |
Unaffiliated issuers | 21,086,671 | |
Foreign currency transactions | (25,646) | |
Total net realized gain (loss) | | 21,061,025 |
Change in net unrealized appreciation (depreciation) on: Investment securities | 83,775,321 | |
Assets and liabilities in foreign currencies | 764 | |
Total change in net unrealized appreciation (depreciation) | | 83,776,085 |
Net gain (loss) | | 104,837,110 |
Net increase (decrease) in net assets resulting from operations | | $ 127,704,094 |
Statement of Changes in Net Assets
| Six months ended
August 31, 2012
(Unaudited) | Year ended
February 29,
2012 |
Increase (Decrease) in Net Assets | | |
Operations | | |
Net investment income (loss) | $ 22,866,984 | $ 29,195,620 |
Net realized gain (loss) | 21,061,025 | 36,347,219 |
Change in net unrealized appreciation (depreciation) | 83,776,085 | 157,954,804 |
Net increase (decrease) in net assets resulting from operations | 127,704,094 | 223,497,643 |
Distributions to shareholders from net investment income | (3,281,176) | (25,900,882) |
Distributions to shareholders from net realized gain | (5,485,421) | (36,216,657) |
Total distributions | (8,766,597) | (62,117,539) |
Share transactions - net increase (decrease) | 156,512,942 | 162,381,495 |
Redemption fees | 15,203 | 45,851 |
Total increase (decrease) in net assets | 275,465,642 | 323,807,450 |
| | |
Net Assets | | |
Beginning of period | 1,732,533,292 | 1,408,725,842 |
End of period (including undistributed net investment income of $22,806,456 and undistributed net investment income of $3,220,648, respectively) | $ 2,007,998,934 | $ 1,732,533,292 |
See accompanying notes which are an integral part of the financial statements.
Semiannual Report
Financial Highlights - Class A
| Six months ended
August 31, 2012 | Years ended February 28, |
| (Unaudited) | 2012 I | 2011 | 2010 | 2009 | 2008 I |
Selected Per-Share Data | | | | | | |
Net asset value, beginning of period | $ 74.90 | $ 67.65 | $ 61.06 | $ 43.94 | $ 63.13 | $ 58.16 |
Income from Investment Operations | | | | | | |
Net investment income (loss) E | .89 | 1.22 | .98 | .84 | .67 | .53 |
Net realized and unrealized gain (loss) | 4.52 | 8.73 | 7.10 | 17.02 | (19.19) | 7.29 |
Total from investment operations | 5.41 | 9.95 | 8.08 | 17.86 | (18.52) | 7.82 |
Distributions from net investment income | (.12) | (1.06) | (.83) | (.74) | (.66) | (.42) |
Distributions from net realized gain | (.23) | (1.64) | (.66) | - | (.02) | (2.44) |
Total distributions | (.35) | (2.70) | (1.49) | (.74) | (.68) K | (2.86) |
Redemption fees added to paid in capital E | - J | - J | - J | - J | .01 | .01 |
Net asset value, end of period | $ 79.96 | $ 74.90 | $ 67.65 | $ 61.06 | $ 43.94 | $ 63.13 |
Total Return B, C, D | 7.25% | 15.00% | 13.27% | 40.66% | (29.43)% | 13.38% |
Ratios to Average Net Assets F, H | | | | | | |
Expenses before reductions | 1.09% A | 1.10% | 1.11% | 1.13% | 1.19% | 1.19% |
Expenses net of fee waivers, if any | 1.09% A | 1.10% | 1.11% | 1.13% | 1.19% | 1.19% |
Expenses net of all reductions | 1.08% A | 1.09% | 1.11% | 1.13% | 1.18% | 1.19% |
Net investment income (loss) | 2.32% A | 1.74% | 1.53% | 1.51% | 1.27% | .83% |
Supplemental Data | | | | | | |
Net assets, end of period (000 omitted) | $ 236,990 | $ 205,851 | $ 160,526 | $ 162,370 | $ 121,193 | $ 23,796 |
Portfolio turnover rate G | 26% A | 35% | 57% | 69% | 70% | 71% |
A Annualized B Total returns for periods of less than one year are not annualized. C Total returns would have been lower if certain expenses had not been reduced during the applicable periods shown. D Total returns do not include the effect of the sales charges. E Calculated based on average shares outstanding during the period. F Fees and expenses of any underlying Fidelity Central Funds are not included in the Fund's expense ratio. The Fund indirectly bears its proportionate share of the expenses of any underlying Fidelity Central Funds. G Amount does not include the portfolio activity of any underlying Fidelity Central Funds. H Expense ratios reflect operating expenses of the class. Expenses before reductions do not reflect amounts reimbursed by the investment adviser or reductions from brokerage service arrangements or reductions from other expense offset arrangements and do not represent the amount paid by the class during periods when reimbursements or reductions occur. Expenses net of fee waivers reflect expenses after reimbursement by the investment adviser but prior to reductions from brokerage service arrangements or other expense offset arrangements. Expenses net of all reductions represent the net expenses paid by the class. I For the year ended February 29. J Amount represents less than $.01 per share. K Total distributions of $.68 per share is comprised of distributions from net investment income of $.655 and distributions from net realized gain of $.024 per share. |
Financial Highlights - Class T
| Six months ended
August 31, 2012 | Years ended February 28, |
| (Unaudited) | 2012 I | 2011 | 2010 | 2009 | 2008 I |
Selected Per-Share Data | | | | | | |
Net asset value, beginning of period | $ 74.49 | $ 67.30 | $ 60.77 | $ 43.75 | $ 62.93 | $ 58.06 |
Income from Investment Operations | | | | | | |
Net investment income (loss) E | .78 | 1.01 | .79 | .66 | .53 | .36 |
Net realized and unrealized gain (loss) | 4.50 | 8.68 | 7.05 | 16.95 | (19.12) | 7.29 |
Total from investment operations | 5.28 | 9.69 | 7.84 | 17.61 | (18.59) | 7.65 |
Distributions from net investment income | (.09) | (.86) | (.65) | (.59) | (.60) | (.35) |
Distributions from net realized gain | (.23) | (1.64) | (.66) | - | - | (2.44) |
Total distributions | (.32) | (2.50) | (1.31) | (.59) | (.60) K | (2.79) |
Redemption fees added to paid in capital E | - J | - J | - J | - J | .01 | .01 |
Net asset value, end of period | $ 79.45 | $ 74.49 | $ 67.30 | $ 60.77 | $ 43.75 | $ 62.93 |
Total Return B, C, D | 7.11% | 14.67% | 12.93% | 40.24% | (29.61)% | 13.11% |
Ratios to Average Net Assets F, H | | | | | | |
Expenses before reductions | 1.36% A | 1.38% | 1.40% | 1.44% | 1.46% | 1.46% |
Expenses net of fee waivers, if any | 1.36% A | 1.38% | 1.40% | 1.44% | 1.46% | 1.46% |
Expenses net of all reductions | 1.36% A | 1.38% | 1.40% | 1.44% | 1.46% | 1.46% |
Net investment income (loss) | 2.04% A | 1.45% | 1.24% | 1.21% | .99% | .56% |
Supplemental Data | | | | | | |
Net assets, end of period (000 omitted) | $ 44,179 | $ 39,047 | $ 31,496 | $ 29,662 | $ 22,624 | $ 6,298 |
Portfolio turnover rate G | 26% A | 35% | 57% | 69% | 70% | 71% |
A Annualized B Total returns for periods of less than one year are not annualized. C Total returns would have been lower if certain expenses had not been reduced during the applicable periods shown. D Total returns do not include the effect of the sales charges. E Calculated based on average shares outstanding during the period. F Fees and expenses of any underlying Fidelity Central Funds are not included in the Fund's expense ratio. The Fund indirectly bears its proportionate share of the expenses of any underlying Fidelity Central Funds. G Amount does not include the portfolio activity of any underlying Fidelity Central Funds. H Expense ratios reflect operating expenses of the class. Expenses before reductions do not reflect amounts reimbursed by the investment adviser or reductions from brokerage service arrangements or reductions from other expense offset arrangements and do not represent the amount paid by the class during periods when reimbursements or reductions occur. Expenses net of fee waivers reflect expenses after reimbursement by the investment adviser but prior to reductions from brokerage service arrangements or other expense offset arrangements. Expenses net of all reductions represent the net expenses paid by the class. I For the year ended February 29. J Amount represents less than $.01 per share. K Total distributions of $.60 per share is comprised of distributions from net investment income of $.599 and distributions from net realized gain of $.000 per share. |
See accompanying notes which are an integral part of the financial statements.
Semiannual Report
Financial Highlights - Class B
| Six months ended
August 31, 2012 | Years ended February 28, |
| (Unaudited) | 2012 I | 2011 | 2010 | 2009 | 2008 I |
Selected Per-Share Data | | | | | | |
Net asset value, beginning of period | $ 74.01 | $ 66.83 | $ 60.37 | $ 43.53 | $ 62.69 | $ 58.00 |
Income from Investment Operations | | | | | | |
Net investment income (loss) E | .57 | .64 | .46 | .37 | .26 | .04 |
Net realized and unrealized gain (loss) | 4.47 | 8.61 | 6.98 | 16.82 | (19.01) | 7.27 |
Total from investment operations | 5.04 | 9.25 | 7.44 | 17.19 | (18.75) | 7.31 |
Distributions from net investment income | (.02) | (.43) | (.32) | (.35) | (.42) | (.19) |
Distributions from net realized gain | (.23) | (1.64) | (.66) | - | - | (2.44) |
Total distributions | (.25) | (2.07) | (.98) | (.35) | (.42) K | (2.63) |
Redemption fees added to paid in capital E | - J | - J | - J | - J | .01 | .01 |
Net asset value, end of period | $ 78.80 | $ 74.01 | $ 66.83 | $ 60.37 | $ 43.53 | $ 62.69 |
Total Return B, C, D | 6.83% | 14.06% | 12.35% | 39.48% | (29.96)% | 12.53% |
Ratios to Average Net Assets F, H | | | | | | |
Expenses before reductions | 1.89% A | 1.91% | 1.91% | 1.97% | 1.96% | 1.96% |
Expenses net of fee waivers, if any | 1.89% A | 1.91% | 1.91% | 1.97% | 1.96% | 1.96% |
Expenses net of all reductions | 1.89% A | 1.90% | 1.91% | 1.97% | 1.96% | 1.96% |
Net investment income (loss) | 1.51% A | .93% | .73% | .68% | .50% | .06% |
Supplemental Data | | | | | | |
Net assets, end of period (000 omitted) | $ 18,982 | $ 19,330 | $ 20,033 | $ 21,099 | $ 14,929 | $ 4,884 |
Portfolio turnover rate G | 26% A | 35% | 57% | 69% | 70% | 71% |
A Annualized B Total returns for periods of less than one year are not annualized. C Total returns would have been lower if certain expenses had not been reduced during the applicable periods shown. D Total returns do not include the effect of the contingent deferred sales charge. E Calculated based on average shares outstanding during the period. F Fees and expenses of any underlying Fidelity Central Funds are not included in the Fund's expense ratio. The Fund indirectly bears its proportionate share of the expenses of any underlying Fidelity Central Funds. G Amount does not include the portfolio activity of any underlying Fidelity Central Funds. H Expense ratios reflect operating expenses of the class. Expenses before reductions do not reflect amounts reimbursed by the investment adviser or reductions from brokerage service arrangements or reductions from other expense offset arrangements and do not represent the amount paid by the class during periods when reimbursements or reductions occur. Expenses net of fee waivers reflect expenses after reimbursement by the investment adviser but prior to reductions from brokerage service arrangements or other expense offset arrangements. Expenses net of all reductions represent the net expenses paid by the class. I For the year ended February 29. J Amount represents less than $.01 per share. K Total distributions of $.42 per share is comprised of distributions from net investment income of $.418 and distributions from net realized gain of $.000 per share. |
Financial Highlights - Class C
| Six months ended
August 31, 2012 | Years ended February 28, |
| (Unaudited) | 2012 I | 2011 | 2010 | 2009 | 2008 I |
Selected Per-Share Data | | | | | | |
Net asset value, beginning of period | $ 73.75 | $ 66.71 | $ 60.29 | $ 43.46 | $ 62.61 | $ 57.99 |
Income from Investment Operations | | | | | | |
Net investment income (loss) E | .59 | .68 | .49 | .41 | .28 | .06 |
Net realized and unrealized gain (loss) | 4.45 | 8.59 | 7.00 | 16.80 | (19.00) | 7.28 |
Total from investment operations | 5.04 | 9.27 | 7.49 | 17.21 | (18.72) | 7.34 |
Distributions from net investment income | (.02) | (.59) | (.41) | (.38) | (.44) | (.29) |
Distributions from net realized gain | (.23) | (1.64) | (.66) | - | - | (2.44) |
Total distributions | (.25) | (2.23) | (1.07) | (.38) | (.44) K | (2.73) |
Redemption fees added to paid in capital E | - J | - J | - J | - J | .01 | .01 |
Net asset value, end of period | $ 78.54 | $ 73.75 | $ 66.71 | $ 60.29 | $ 43.46 | $ 62.61 |
Total Return B, C, D | 6.86% | 14.14% | 12.44% | 39.59% | (29.94)% | 12.58% |
Ratios to Average Net Assets F, H | | | | | | |
Expenses before reductions | 1.83% A | 1.85% | 1.86% | 1.90% | 1.93% | 1.93% |
Expenses net of fee waivers, if any | 1.83% A | 1.85% | 1.86% | 1.90% | 1.93% | 1.93% |
Expenses net of all reductions | 1.83% A | 1.84% | 1.85% | 1.89% | 1.93% | 1.92% |
Net investment income (loss) | 1.57% A | .99% | .79% | .75% | .52% | .09% |
Supplemental Data | | | | | | |
Net assets, end of period (000 omitted) | $ 118,687 | $ 102,321 | $ 81,239 | $ 73,829 | $ 54,902 | $ 19,791 |
Portfolio turnover rate G | 26% A | 35% | 57% | 69% | 70% | 71% |
A Annualized B Total returns for periods of less than one year are not annualized. C Total returns would have been lower if certain expenses had not been reduced during the applicable periods shown. D Total returns do not include the effect of the contingent deferred sales charge. E Calculated based on average shares outstanding during the period. F Fees and expenses of any underlying Fidelity Central Funds are not included in the Fund's expense ratio. The Fund indirectly bears its proportionate share of the expenses of any underlying Fidelity Central Funds. G Amount does not include the portfolio activity of any underlying Fidelity Central Funds. H Expense ratios reflect operating expenses of the class. Expenses before reductions do not reflect amounts reimbursed by the investment adviser or reductions from brokerage service arrangements or reductions from other expense offset arrangements and do not represent the amount paid by the class during periods when reimbursements or reductions occur. Expenses net of fee waivers reflect expenses after reimbursement by the investment adviser but prior to reductions from brokerage service arrangements or other expense offset arrangements. Expenses net of all reductions represent the net expenses paid by the class. I For the year ended February 29. J Amount represents less than $.01 per share. K Total distributions of $.44 per share is comprised of distributions from net investment income of $.443 and distributions from net realized gain of $.000 per share. |
See accompanying notes which are an integral part of the financial statements.
Semiannual Report
Financial Highlights - Consumer Staples
| Six months ended
August 31, 2012 | Years ended February 28, |
| (Unaudited) | 2012 H | 2011 | 2010 | 2009 | 2008 H |
Selected Per-Share Data | | | | | | |
Net asset value, beginning of period | $ 75.29 | $ 67.98 | $ 61.34 | $ 44.14 | $ 63.25 | $ 58.13 |
Income from Investment Operations | | | | | | |
Net investment income (loss) D | 1.00 | 1.42 | 1.14 | .96 | .88 | .71 |
Net realized and unrealized gain (loss) | 4.55 | 8.76 | 7.14 | 17.11 | (19.31) | 7.30 |
Total from investment operations | 5.55 | 10.18 | 8.28 | 18.07 | (18.43) | 8.01 |
Distributions from net investment income | (.15) | (1.24) | (.98) | (.87) | (.67) | (.46) |
Distributions from net realized gain | (.23) | (1.64) | (.66) | - | (.03) | (2.44) |
Total distributions | (.38) | (2.87) K | (1.64) | (.87) | (.69) J | (2.90) |
Redemption fees added to paid in capital D | - I | - I | - I | - I | .01 | .01 |
Net asset value, end of period | $ 80.46 | $ 75.29 | $ 67.98 | $ 61.34 | $ 44.14 | $ 63.25 |
Total Return B, C | 7.41% | 15.30% | 13.55% | 40.96% | (29.23)% | 13.72% |
Ratios to Average Net Assets E, G | | | | | | |
Expenses before reductions | .81% A | .83% | .86% | .92% | .91% | .91% |
Expenses net of fee waivers, if any | .81% A | .83% | .86% | .92% | .91% | .90% |
Expenses net of all reductions | .81% A | .82% | .86% | .91% | .90% | .90% |
Net investment income (loss) | 2.59% A | 2.01% | 1.78% | 1.73% | 1.55% | 1.12% |
Supplemental Data | | | | | | |
Net assets, end of period (000 omitted) | $ 1,346,638 | $ 1,202,440 | $ 877,548 | $ 946,455 | $ 657,263 | $ 655,224 |
Portfolio turnover rate F | 26% A | 35% | 57% | 69% | 70% | 71% |
A Annualized B Total returns for periods of less than one year are not annualized. C Total returns would have been lower if certain expenses had not been reduced during the applicable periods shown. D Calculated based on average shares outstanding during the period. E Fees and expenses of any underlying Fidelity Central Funds are not included in the Fund's expense ratio. The Fund indirectly bears its proportionate share of the expenses of any underlying Fidelity Central Funds. F Amount does not include the portfolio activity of any underlying Fidelity Central Funds. G Expense ratios reflect operating expenses of the class. Expenses before reductions do not reflect amounts reimbursed by the investment adviser or reductions from brokerage service arrangements or reductions from other expense offset arrangements and do not represent the amount paid by the class during periods when reimbursements or reductions occur. Expenses net of fee waivers reflect expenses after reimbursement by the investment adviser but prior to reductions from brokerage service arrangements or other expense offset arrangements. Expenses net of all reductions represent the net expenses paid by the class. H For the year ended February 29. I Amount represents less than $.01 per share. J Total distributions of $.69 per share is comprised of distributions from net investment income of $.668 and distributions from net realized gain of $.025 per share. K Total distributions of $2.87 per share is comprised of distributions from net investment income of $1.236 and distributions from net realized gain of $1.637 per share. |
Financial Highlights - Institutional Class
| Six months ended August 31, 2012 | Years ended February 28, |
| (Unaudited) | 2012 H | 2011 | 2010 | 2009 | 2008 H |
Selected Per-Share Data | | | | | | |
Net asset value, beginning of period | $ 75.14 | $ 67.84 | $ 61.26 | $ 44.07 | $ 63.22 | $ 58.12 |
Income from Investment Operations | | | | | | |
Net investment income (loss) D | .99 | 1.39 | 1.15 | .98 | .82 | .74 |
Net realized and unrealized gain (loss) | 4.54 | 8.73 | 7.13 | 17.09 | (19.23) | 7.30 |
Total from investment operations | 5.53 | 10.12 | 8.28 | 18.07 | (18.41) | 8.04 |
Distributions from net investment income | (.15) | (1.19) | (1.04) | (.88) | (.73) | (.51) |
Distributions from net realized gain | (.23) | (1.64) | (.66) | - | (.03) | (2.44) |
Total distributions | (.38) | (2.82) K | (1.70) | (.88) | (.75) J | (2.95) |
Redemption fees added to paid in capital D | - I | - I | - I | - I | .01 | .01 |
Net asset value, end of period | $ 80.29 | $ 75.14 | $ 67.84 | $ 61.26 | $ 44.07 | $ 63.22 |
Total Return B,C | 7.40% | 15.24% | 13.57% | 41.03% | (29.22)% | 13.77% |
Ratios to Average Net Assets E, G | | | | | | |
Expenses before reductions | .84% A | .87% | .87% | .86% | .91% | .85% |
Expenses net of fee waivers, if any | .84% A | .87% | .87% | .86% | .91% | .85% |
Expenses net of all reductions | .84% A | .87% | .87% | .86% | .91% | .84% |
Net investment income (loss) | 2.56% A | 1.96% | 1.77% | 1.78% | 1.54% | 1.17% |
Supplemental Data | | | | | | |
Net assets, end of period (000 omitted) | $ 242,524 | $ 163,544 | $ 237,883 | $ 36,152 | $ 30,922 | $ 10,384 |
Portfolio turnover rate F | 26% A | 35% | 57% | 69% | 70% | 71% |
A Annualized B Total returns for periods of less than one year are not annualized. C Total returns would have been lower if certain expenses had not been reduced during the applicable periods shown. D Calculated based on average shares outstanding during the period. E Fees and expenses of any underlying Fidelity Central Funds are not included in the Fund's expense ratio. The Fund indirectly bears its proportionate share of the expenses of any underlying Fidelity Central Funds. F Amount does not include the portfolio activity of any underlying Fidelity Central Funds. G Expense ratios reflect operating expenses of the class. Expenses before reductions do not reflect amounts reimbursed by the investment adviser or reductions from brokerage service arrangements or reductions from other expense offset arrangements and do not represent the amount paid by the class during periods when reimbursements or reductions occur. Expenses net of fee waivers reflect expenses after reimbursement by the investment adviser but prior to reductions from brokerage service arrangements or other expense offset arrangements. Expenses net of all reductions represent the net expenses paid by the class. H For the year ended February 29. I Amount represents less than $.01 per share. J Total distributions of $.75 per share is comprised of distributions from net investment income of $.726 and distributions from net realized gain of $.025 per share. K Total distributions of $2.82 per share is comprised of distributions from net investment income of $1.186 and distributions from net realized gain of $1.637 per share. |
See accompanying notes which are an integral part of the financial statements.
Semiannual Report
Notes to Financial Statements
For the period ended August 31, 2012 (Unaudited)
1. Organization.
Consumer Staples Portfolio (the Fund) is a non-diversified fund of Fidelity Select Portfolios (the Trust) and is authorized to issue an unlimited number of shares. The Trust is registered under the Investment Company Act of 1940, as amended (the 1940 Act), as an open-end management investment company organized as a Massachusetts business trust. The Fund invests primarily in securities of companies whose principal business activities fall within specific industries. The Fund offers Class A, Class T, Class C, Consumer Staples and Institutional Class shares, each of which, along with Class B shares, has equal rights as to assets and voting privileges. Effective after the close of business on September 1, 2010, Class B shares were closed to new accounts and additional purchases, except for exchanges and reinvestments. Each class has exclusive voting rights with respect to matters that affect that class. Class B shares will automatically convert to Class A shares after a holding period of seven years from the initial date of purchase. Investment income, realized and unrealized capital gains and losses, the common expenses of the Fund, and certain fund-level expense reductions, if any, are allocated on a pro-rata basis to each class based on the relative net assets of each class to the total net assets of the Fund. Each class differs with respect to transfer agent and distribution and service plan fees incurred. Certain expense reductions may also differ by class.
2. Investments in Fidelity Central Funds.
The Fund invests in Fidelity Central Funds, which are open-end investment companies available only to other investment companies and accounts managed by Fidelity Management & Research Company (FMR) and its affiliates. The Fund's Schedule of Investments lists each of the Fidelity Central Funds held as of period end, if any, as an investment of the Fund, but does not include the underlying holdings of each Fidelity Central Fund. As an Investing Fund, the Fund indirectly bears its proportionate share of the expenses of the underlying Fidelity Central Funds.
The Money Market Central Funds seek preservation of capital and current income and are managed by Fidelity Investments Money Management, Inc. (FIMM), an affiliate of FMR.
A complete unaudited list of holdings for each Fidelity Central Fund is available upon request or at the Securities and Exchange Commission (the SEC) web site at www.sec.gov. In addition, the financial statements of the Fidelity Central Funds are available on the SEC web site or upon request.
3. Significant Accounting Policies.
The financial statements have been prepared in conformity with accounting principles generally accepted in the United States of America (GAAP), which require management to make certain estimates and assumptions at the date of the financial statements. Actual results could differ from those estimates. Subsequent events, if any, through the date that the financial statements were issued have been evaluated in the preparation of the financial statements. The following summarizes the significant accounting policies of the Fund:
Security Valuation. Investments are valued as of 4:00 p.m. Eastern time on the last calendar day of the period. In accordance with valuation policies and procedures approved by the Board of Trustees (the Board), the Fund attempts to obtain prices from one or more third party pricing vendor or broker to value its investments. When current market prices, quotations or rates are not readily available or reliable, securities will be fair valued in good faith by the FMR Fair Value Committee (the Committee), in accordance with procedures adopted by the Fund's Board. Factors used in determining fair value vary by security type and may include market or security specific events. The frequency with which these procedures are used cannot be predicted and they may be utilized to a significant extent. The Committee oversees the Fund's valuation policies and procedures and is responsible for approving and reporting to the Board all fair value determinations.
The Fund categorizes the inputs to valuation techniques used to value its investments into a disclosure hierarchy consisting of three levels as shown below:
Level 1 - quoted prices in active markets for identical investments
Level 2 - other significant observable inputs (including quoted prices for similar investments, interest rates, prepayment speeds, etc.)
Level 3 - unobservable inputs (including the Fund's own assumptions based on the best information available)
Valuation techniques used to value the Fund's investments by major category are as follows:
Equity securities, including restricted securities, for which market quotations are readily available, are valued at the last reported sale price or official closing price as reported by a third party pricing vendor on the primary market or exchange on which they are traded and are categorized as Level 1 in the hierarchy. In the event there were no sales during the day or closing prices are not available, securities are valued at the last quoted bid price or may be valued using the last available price and are generally categorized as Level 2 in the hierarchy. For foreign equity securities, when significant market or security specific events arise, comparisons to the valuation of American Depositary Receipts (ADRs), futures contracts, Exchange-Traded Funds (ETFs) and certain indexes as well as quoted prices for similar securities are used and are categorized as Level 2 in the hierarchy. Utilizing these techniques may result in transfers between Level 1 and Level 2.
Semiannual Report
Notes to Financial Statements (Unaudited) - continued
3. Significant Accounting Policies - continued
Security Valuation - continued
Investments in open-end mutual funds, including the Fidelity Central Funds, are valued at their closing net asset value each business day and are categorized as Level 1 in the hierarchy.
Changes in valuation techniques may result in transfers in or out of an assigned level within the disclosure hierarchy. The aggregate value of investments by input level, as of August 31, 2012, is included at the end of the Fund's Schedule of Investments.
Foreign Currency Translation. The Fund may use foreign currency contracts to facilitate transactions in foreign-denominated securities. Gains and losses from these transactions may arise from changes in the value of the foreign currency or if the counterparties do not perform under the contracts' terms.
Foreign-denominated assets, including investment securities, and liabilities are translated into U.S. dollars at the exchange rates at period end. Purchases and sales of investment securities, income and dividends received and expenses denominated in foreign currencies are translated into U.S. dollars at the exchange rate in effect on the transaction date.
The effects of exchange rate fluctuations on investments are included with the net realized and unrealized gain (loss) on investment securities. Other foreign currency transactions resulting in realized and unrealized gain (loss) are disclosed separately.
Investment Transactions and Income. For financial reporting purposes, the Fund's investment holdings and NAV include trades executed through the end of the last business day of the period. The NAV per share for processing shareholder transactions is calculated as of the close of business of the New York Stock Exchange (NYSE), normally 4:00 p.m. Eastern time and includes trades executed through the end of the prior business day. Gains and losses on securities sold are determined on the basis of identified cost and may include proceeds received from litigation. Dividend income is recorded on the ex-dividend date, except for certain dividends from foreign securities where the ex-dividend date may have passed, which are recorded as soon as the Fund is informed of the ex-dividend date. Non-cash dividends included in dividend income, if any, are recorded at the fair market value of the securities received. Interest income and distributions from the Fidelity Central Funds are accrued as earned. Interest income includes coupon interest and amortization of premium and accretion of discount on debt securities. Investment income is recorded net of foreign taxes withheld where recovery of such taxes is uncertain.
Expenses. Expenses directly attributable to a fund are charged to that fund. Expenses attributable to more than one fund are allocated among the respective funds on the basis of relative net assets or other appropriate methods. Expense estimates are accrued in the period to which they relate and adjustments are made when actual amounts are known.
Income Tax Information and Distributions to Shareholders. Each year, the Fund intends to qualify as a regulated investment company under Subchapter M of the Internal Revenue Code, including distributing substantially all of its taxable income and realized gains. As a result, no provision for income taxes is required. The Fund files a U.S. federal tax return, in addition to state and local tax returns as required. A fund's federal income tax returns are subject to examination by the Internal Revenue Service (IRS) for a period of three fiscal years after they are filed. State and local tax returns may be subject to examination for an additional fiscal year depending on the jurisdiction. Foreign taxes are provided for based on the Fund's understanding of the tax rules and rates that exist in the foreign markets in which it invests.
Distributions are declared and recorded on the ex-dividend date. Income dividends and capital gain distributions are declared separately for each class. Income and capital gain distributions are determined in accordance with income tax regulations, which may differ from GAAP.
Capital accounts within the financial statements are adjusted for permanent book-tax differences. These adjustments have no impact on net assets or the results of operations. Temporary book-tax differences will reverse in a subsequent period.
Book-tax differences are primarily due to foreign currency transactions, deferred trustees compensation and losses deferred due to wash sales and excise tax regulations.
The federal tax cost of investment securities and unrealized appreciation (depreciation) as of period end were as follows:
Gross unrealized appreciation | $ 449,954,508 |
Gross unrealized depreciation | (13,909,293) |
Net unrealized appreciation (depreciation) on securities and other investments | $ 436,045,215 |
| |
Tax cost | $ 1,577,558,646 |
Semiannual Report
3. Significant Accounting Policies - continued
Trading (Redemption) Fees. Shares held by investors in the Fund less than 30 days are subject to a redemption fee equal to .75% of the net asset value of shares redeemed. All redemption fees, which reduce the proceeds of the shareholder redemption, are retained by the Fund and accounted for as an addition to paid in capital.
New Accounting Pronouncement. In December 2011, the Financial Accounting Standards Board issued Accounting Standard Update No. 2011-11, Disclosures about Offsetting Assets and Liabilities. The update creates new disclosure requirements requiring entities to disclose both gross and net information for derivatives and other financial instruments that are either offset in the Statement of Assets and Liabilities or subject to an enforceable master netting arrangement or similar agreement. The disclosure requirements are effective for annual reporting periods beginning on or after January 1, 2013, and interim periods within those annual periods. Management is currently evaluating the impact of the update's adoption on the Fund's financial statement disclosures.
4. Purchases and Sales of Investments.
Purchases and sales of securities, other than short-term securities, aggregated $356,755,501 and $231,699,991, respectively.
5. Fees and Other Transactions with Affiliates.
Management Fee. FMR and its affiliates provide the Fund with investment management related services for which the Fund pays a monthly management fee. The management fee is the sum of an individual fund fee rate that is based on an annual rate of .30% of the Fund's average net assets and an annualized group fee rate that averaged .26% during the period. The group fee rate is based upon the average net assets of all the mutual funds advised by FMR. The group fee rate decreases as assets under management increase and increases as assets under management decrease. For the period, the total annualized management fee rate was .56% of the Fund's average net assets.
Distribution and Service Plan Fees. In accordance with Rule 12b-1 of the 1940 Act, the Fund has adopted separate Distribution and Service Plans for each class of shares. Certain classes pay Fidelity Distributors Corporation (FDC), an affiliate of FMR, separate Distribution and Service Fees, each of which is based on an annual percentage of each class' average net assets. In addition, FDC may pay financial intermediaries for selling shares of the Fund and providing shareholder support services. For the period, the Distribution and Service Fee rates, total fees and amounts retained by FDC were as follows:
| Distribution
Fee | Service
Fee | Total Fees | Retained
by FDC |
Class A | -% | .25% | $ 270,937 | $ 2,352 |
Class T | .25% | .25% | 102,390 | - |
Class B | .75% | .25% | 94,339 | 70,754 |
Class C | .75% | .25% | 542,205 | 107,255 |
| | | $ 1,009,871 | $ 180,361 |
Sales Load. FDC may receive a front-end sales charge of up to 5.75% for selling Class A shares and 3.50% for selling Class T shares, some of which is paid to financial intermediaries for selling shares of the Fund. Depending on the holding period, FDC may receive contingent deferred sales charges levied on Class A, Class T, Class B, and Class C redemptions. The deferred sales charges range from 5.00% to 1.00% for Class B shares, 1.00% for Class C shares, 1.00% for certain purchases of Class A shares and .25% for certain purchases of Class T shares.
For the period, sales charge amounts retained by FDC were as follows:
| Retained
by FDC |
Class A | $ 84,035 |
Class T | 10,633 |
Class B* | 20,622 |
Class C* | 9,152 |
| $ 124,442 |
* When Class B and Class C shares are initially sold, FDC pays commissions from its own resources to financial intermediaries through which the sales are made.
Transfer Agent Fees. Fidelity Investments Institutional Operations Company, Inc. (FIIOC), an affiliate of FMR, is the transfer, dividend disbursing and shareholder servicing agent for each class of the Fund. FIIOC receives account fees and asset-based fees that vary according to the account size
Semiannual Report
Notes to Financial Statements (Unaudited) - continued
5. Fees and Other Transactions with Affiliates - continued
Transfer Agent Fees - continued
and type of account of the shareholders of the respective classes of the Fund. FIIOC pays for typesetting, printing and mailing of shareholder reports, except proxy statements. For the period, transfer agent fees for each class were as follows:
| Amount | % of
Average
Net Assets* |
Class A | $ 248,375 | .23 |
Class T | 52,988 | .26 |
Class B | 27,048 | .29 |
Class C | 121,555 | .22 |
Consumer Staples | 1,298,635 | .21 |
Institutional Class | 236,757 | .23 |
| $ 1,985,358 | |
* Annualized
Accounting and Security Lending Fees. Fidelity Service Company, Inc. (FSC), an affiliate of FMR, maintains the Fund's accounting records. The accounting fee is based on the level of average net assets for each month. Under a separate contract, FSC administers the security lending program. The security lending fee is based on the number and duration of lending transactions.
Brokerage Commissions. The Fund placed a portion of its portfolio transactions with brokerage firms which are affiliates of the investment adviser. The commissions paid to these affiliated firms were $6,847 for the period.
Interfund Lending Program. Pursuant to an Exemptive Order issued by the SEC, the Fund, along with other registered investment companies having management contracts with FMR, may participate in an interfund lending program. This program provides an alternative credit facility allowing the funds to borrow from, or lend money to, other participating affiliated funds. At period end, there were no interfund loans outstanding. The Fund's activity in this program during the period for which loans were outstanding was as follows:
Borrower or Lender | Average Loan
Balance | Weighted Average
Interest Rate | Interest
Expense |
Borrower | $ 12,984,167 | .41% | $ 887 |
6. Committed Line of Credit.
The Fund participates with other funds managed by FMR or an affiliate in a $4.25 billion credit facility (the "line of credit") to be utilized for temporary or emergency purposes to fund shareholder redemptions or for other short-term liquidity purposes. The Fund has agreed to pay commitment fees on its pro-rata portion of the line of credit, which amounted to $2,500 and is reflected in Miscellaneous expenses on the Statement of Operations. During the period, there were no borrowings on this line of credit.
7. Security Lending.
The Fund lends portfolio securities through a lending agent from time to time in order to earn additional income. For equity securities, a lending agent is used and may loan securities to certain qualified borrowers, including Fidelity Capital Markets (FCM), a broker-dealer affiliated with the Fund. On the settlement date of the loan, the Fund receives collateral (in the form of U.S. Treasury obligations, letters of credit and/or cash) against the loaned securities and maintains collateral in an amount not less than 100% of the market value of the loaned securities during the period of the loan. The market value of the loaned securities is determined at the close of business of the Fund and any additional required collateral is delivered to the Fund on the next business day. If the borrower defaults on its obligation to return the securities loaned because of insolvency or other reasons, a fund could experience delays and costs in recovering the securities loaned or in gaining access to the collateral. Any cash collateral received is invested in the Fidelity Securities Lending Cash Central Fund. The value of loaned securities and cash collateral at period end are disclosed on the Fund's Statement of Assets and Liabilities. Security lending income represents the income earned on investing cash collateral, less rebates paid to borrowers and any lending agent fees associated with the loan, plus any premium payments received for lending certain types of securities. Security lending income is presented in the Statement of Operations as a component of income from Fidelity Central Funds. Total security lending income during the period amounted to $344,609. During the period, there were no securities loaned to FCM.
Semiannual Report
8. Expense Reductions.
Many of the brokers with whom FMR places trades on behalf of the Fund provided services in addition to trade execution. These services included payments of certain expenses on behalf of the Fund totaling $21,953 for the period. In addition, through arrangements with the Fund's custodian, credits realized as a result of uninvested cash balances were used to reduce the Fund's expenses. During the period, these credits reduced the Fund's custody expenses by $50.
9. Distributions to Shareholders.
Distributions to shareholders of each class were as follows:
| Six months ended
August 31,
2012 | Year ended
February 29,
2012 |
From net investment income | | |
Class A | $ 323,577 | $ 2,690,167 |
Class T | 45,344 | 422,197 |
Class B | 4,298 | 114,208 |
Class C | 29,567 | 829,469 |
Consumer Staples | 2,475,321 | 18,061,907 |
Institutional Class | 403,069 | 3,782,934 |
Total | $ 3,281,176 | $ 25,900,882 |
From net realized gain | | |
Class A | $ 630,693 | $ 4,102,363 |
Class T | 121,268 | 795,051 |
Class B | 58,156 | 441,952 |
Class C | 323,833 | 2,213,680 |
Consumer Staples | 3,745,551 | 23,446,773 |
Institutional Class | 605,920 | 5,216,838 |
Total | $ 5,485,421 | $ 36,216,657 |
10. Share Transactions.
Transactions for each class of shares were as follows:
| Shares | Dollars |
| Six months ended
August 31,
2012 | Year ended
February 29,
2012 | Six months ended
August 31,
2012 | Year ended
February 29,
2012 |
Class A | | | | |
Shares sold | 575,336 | 1,107,874 | $ 44,327,963 | $ 77,974,428 |
Reinvestment of distributions | 10,982 | 84,526 | 824,504 | 5,924,948 |
Shares redeemed | (371,007) | (816,686) | (28,336,652) | (57,527,748) |
Net increase (decrease) | 215,311 | 375,714 | $ 16,815,815 | $ 26,371,628 |
Class T | | | | |
Shares sold | 66,759 | 130,126 | $ 5,120,369 | $ 9,133,799 |
Reinvestment of distributions | 2,093 | 16,351 | 156,290 | 1,140,509 |
Shares redeemed | (36,979) | (90,239) | (2,801,960) | (6,276,410) |
Net increase (decrease) | 31,873 | 56,238 | $ 2,474,699 | $ 3,997,898 |
Class B | | | | |
Shares sold | 6,362 | 22,727 | $ 483,566 | $ 1,569,035 |
Reinvestment of distributions | 672 | 6,332 | 49,896 | 439,355 |
Shares redeemed | (27,320) | (67,638) | (2,066,228) | (4,695,265) |
Net increase (decrease) | (20,286) | (38,579) | $ (1,532,766) | $ (2,686,875) |
Class C | | | | |
Shares sold | 247,961 | 536,557 | $ 18,813,434 | $ 37,168,209 |
Reinvestment of distributions | 3,610 | 33,216 | 266,955 | 2,295,907 |
Shares redeemed | (127,849) | (400,115) | (9,590,639) | (28,068,157) |
Net increase (decrease) | 123,722 | 169,658 | $ 9,489,750 | $ 11,395,959 |
Semiannual Report
Notes to Financial Statements (Unaudited) - continued
10. Share Transactions - continued
| Shares | Dollars |
| Six months ended
August 31,
2012 | Year ended
February 29,
2012 | Six months ended
August 31,
2012 | Year ended
February 29,
2012 |
Consumer Staples | | | | |
Shares sold | 3,097,202 | 7,156,716 | $ 239,128,527 | $ 509,488,908 |
Reinvestment of distributions | 79,360 | 566,253 | 5,989,308 | 39,874,596 |
Shares redeemed | (2,410,148) | (4,661,196) | (182,123,770) | (330,401,040) |
Net increase (decrease) | 766,414 | 3,061,773 | $ 62,994,065 | $ 218,962,464 |
Institutional Class | | | | |
Shares sold | 1,388,318 | 2,454,993 | $ 107,435,083 | $ 173,115,499 |
Reinvestment of distributions | 11,821 | 115,398 | 890,360 | 8,111,953 |
Shares redeemed | (555,913) | (3,900,689) | (42,054,064) | (276,887,031) |
Net increase (decrease) | 844,226 | (1,330,298) | $ 66,271,379 | $ (95,659,579) |
11. Other.
The Fund's organizational documents provide former and current trustees and officers with a limited indemnification against liabilities arising in connection with the performance of their duties to the Fund. In the normal course of business, the Fund may also enter into contracts that provide general indemnifications. The Fund's maximum exposure under these arrangements is unknown as this would be dependent on future claims that may be made against the Fund. The risk of material loss from such claims is considered remote.
At the end of the period, Fidelity VIP FundsManager 60% Portfolio was the owner of record of approximately 12% of the total outstanding shares of the Fund. Mutual funds managed by FMR or its affiliates, were the owners of record in aggregate of approximately 25% of the total outstanding shares of the Fund.
Semiannual Report
Gold Portfolio
As a shareholder of the Fund, you incur two types of costs: (1) transaction costs, including sales charges (loads) on purchase payments or redemption proceeds, redemption fees and (2) ongoing costs, including management fees, distribution and/or service (12b-1) fees and other Fund expenses. This Example is intended to help you understand your ongoing costs (in dollars) of investing in the Fund and to compare these costs with the ongoing costs of investing in other mutual funds.
The Example is based on an investment of $1,000 invested at the beginning of the period and held for the entire period (March 1, 2012 to August 31, 2012).
Actual Expenses
The first line of the accompanying table for each class of the Fund provides information about actual account values and actual expenses. You may use the information in this line, together with the amount you invested, to estimate the expenses that you paid over the period. Simply divide your account value by $1,000.00 (for example, an $8,600 account value divided by $1,000.00 = 8.6), then multiply the result by the number in the first line for a class of the Fund under the heading entitled "Expenses Paid During Period" to estimate the expenses you paid on your account during this period. A small balance maintenance fee of $12.00 that is charged once a year may apply for certain accounts with a value of less than $2,000. This fee is not included in the table below. If it was, the estimate of expenses you paid during the period would be higher, and your ending account value lower, by this amount. In addition, the Fund, as a shareholder in the underlying Fidelity Central Funds, will indirectly bear its pro-rata share of the fees and expenses incurred by the underlying Fidelity Central Funds. These fees and expenses are not included in the Fund's annualized expense ratio used to calculate the expense estimate in the table below.
Hypothetical Example for Comparison Purposes
The second line of the accompanying table for each class of the Fund provides information about hypothetical account values and hypothetical expenses based on a Class' actual expense ratio and an assumed rate of return of 5% per year before expenses, which is not the Class' actual return. The hypothetical account values and expenses may not be used to estimate the actual ending account balance or expenses you paid for the period. You may use this information to compare the ongoing costs of investing in the Fund and other funds. To do so, compare this 5% hypothetical example with the 5% hypothetical examples that appear in the shareholder reports of the other funds. A small balance maintenance fee of $12.00 that is charged once a year may apply for certain accounts with a value of less than $2,000. This fee is not included in the table below. If it was, the estimate of expenses you paid during the period would be higher, and your ending account value lower, by this amount. In addition, the Fund, as a shareholder in the underlying Fidelity Central Funds, will indirectly bear its pro-rata share of the fees and expenses incurred by the underlying Fidelity Central Funds. These fees and expenses are not included in the Fund's annualized expense ratio used to calculate the expense estimate in the table below.
Please note that the expenses shown in the table are meant to highlight your ongoing costs only and do not reflect any transaction costs. Therefore, the second line of the table is useful in comparing ongoing costs only, and will not help you determine the relative total costs of owning different funds. In addition, if these transactional costs were included, your costs would have been higher.
| Annualized
Expense Ratio | Beginning
Account Value
March 1, 2012 | Ending
Account Value
August 31, 2012 | Expenses Paid
During Period*
March 1, 2012
to August 31, 2012 |
Class A | 1.17% | | | |
Actual | | $ 1,000.00 | $ 833.80 | $ 5.41 |
HypotheticalA | | $ 1,000.00 | $ 1,019.31 | $ 5.96 |
Class T | 1.44% | | | |
Actual | | $ 1,000.00 | $ 832.60 | $ 6.65 |
HypotheticalA | | $ 1,000.00 | $ 1,017.95 | $ 7.32 |
Class B | 1.92% | | | |
Actual | | $ 1,000.00 | $ 830.70 | $ 8.86 |
HypotheticalA | | $ 1,000.00 | $ 1,015.53 | $ 9.75 |
Class C | 1.92% | | | |
Actual | | $ 1,000.00 | $ 830.60 | $ 8.86 |
HypotheticalA | | $ 1,000.00 | $ 1,015.53 | $ 9.75 |
Gold | .92% | | | |
Actual | | $ 1,000.00 | $ 834.90 | $ 4.25 |
HypotheticalA | | $ 1,000.00 | $ 1,020.57 | $ 4.69 |
Institutional Class | .83% | | | |
Actual | | $ 1,000.00 | $ 835.20 | $ 3.84 |
HypotheticalA | | $ 1,000.00 | $ 1,021.02 | $ 4.23 |
A 5% return per year before expenses
* Expenses are equal to each Class' annualized expense ratio, multiplied by the average account value over the period, multiplied by 184/365 (to reflect the one-half year period).
Semiannual Report
Gold Portfolio
Investment Changes (Unaudited)
Top Ten Holdings as of August 31, 2012 |
| % of fund's
net assets | % of fund's net assets
6 months ago |
Goldcorp, Inc. | 13.0 | 12.2 |
Barrick Gold Corp. | 11.1 | 11.9 |
Newmont Mining Corp. | 8.1 | 9.0 |
Newcrest Mining Ltd. | 6.9 | 8.4 |
Yamana Gold, Inc. | 4.5 | 3.9 |
AngloGold Ashanti Ltd. sponsored ADR | 4.3 | 5.1 |
Randgold Resources Ltd. sponsored ADR | 4.0 | 3.6 |
Gold Bullion | 3.7 | 1.0 |
Kinross Gold Corp. | 3.6 | 4.0 |
Eldorado Gold Corp. | 3.6 | 2.7 |
| 62.8 | |
Top Industries (% of fund's net assets) |
As of August 31, 2012 |
| Gold | 94.7% | |
| Commodities & Related
Investments** | 3.8% | |
| Precious Metals &
Minerals | 0.7% | |
| Diversified Metals &
Mining | 0.3% | |
| Coal & Consumable Fuels | 0.2% | |
| All Others* | 0.3% | |

As of February 29, 2012 |
| Gold | 97.5% | |
| Commodities & Related
Investments** | 1.0% | |
| Precious Metals &
Minerals | 0.9% | |
| Diversified Metals &
Mining | 0.2% | |
| Coal & Consumable Fuels | 0.1% | |
| Specialty Stores | 0.0% | |
| All Others* | 0.3% | |

* Includes short-term investments and net other assets. |
** Includes gold bullion and/or silver bullion. |
Geographic Diversification (% of fund's net assets) |
As of August 31, 2012 |
| Canada | 58.4% | |
| United States of America | 15.6% | |
| Australia | 9.9% | |
| South Africa | 8.8% | |
| Bailiwick of Jersey | 4.9% | |
| Peru | 1.2% | |
| United Kingdom | 0.6% | |
| China | 0.5% | |
| Bermuda | 0.1% | |
| Other | 0.0% | |

Percentages are based on country or territory of incorporation and are adjusted for the effect of futures contracts, if applicable. |
As of February 29, 2012 |
| Canada | 55.8% | |
| United States of America | 12.7% | |
| Australia | 11.5% | |
| South Africa | 10.3% | |
| Bailiwick of Jersey | 4.5% | |
| China | 2.3% | |
| Peru | 2.1% | |
| United Kingdom | 0.8% | |
| Bermuda | 0.0% | |
| Other | 0.0% | |

Percentages are based on country or territory of incorporation and are adjusted for the effect of futures contracts, if applicable. |
Semiannual Report
Gold Portfolio
Consolidated Investments August 31, 2012 (Unaudited)
Showing Percentage of Net Assets
Common Stocks - 95.9% |
| Shares | | Value |
Australia - 9.9% |
METALS & MINING - 9.9% |
Gold - 9.9% |
ABM Resources NL (a) | 2,300,000 | | $ 106,931 |
Alkane Resources Ltd. | 195,000 | | 199,450 |
Ampella Mining Ltd. (a)(d) | 1,230,000 | | 660,803 |
Azumah Resources Ltd. (a) | 843,984 | | 108,995 |
Beadell Resources Ltd. (a) | 2,204,000 | | 1,776,109 |
CGA Mining Ltd.: | | | |
(Australia) (a) | 18,920 | | 40,267 |
(Canada) (a) | 525,000 | | 1,288,866 |
Evolution Mining Ltd. (a) | 2,258,235 | | 3,627,964 |
Focus Minerals Ltd. (a) | 2,300,000 | | 90,297 |
Gold One International Ltd. (a) | 90,277 | | 37,774 |
Gryphon Minerals Ltd. (a) | 2,707,692 | | 1,748,408 |
Integra Mining Ltd. (a) | 1,415,000 | | 687,096 |
Intrepid Mines Ltd.: | | | |
(Australia) (a) | 9,209,798 | | 2,616,653 |
(Canada) (a) | 320,000 | | 97,388 |
Kingsgate Consolidated NL (d) | 2,908,274 | | 12,860,044 |
Kula Gold Ltd. (a) | 31,245 | | 15,172 |
Marengo Mining Ltd. (a) | 560,000 | | 69,428 |
Medusa Mining Ltd. | 2,552,885 | | 13,108,440 |
Newcrest Mining Ltd. | 9,560,792 | | 243,486,101 |
Papillon Resources Ltd. (a)(d) | 130,000 | | 150,427 |
Perseus Mining Ltd.: | | | |
(Australia) (a) | 5,504,308 | | 13,932,601 |
(Canada) (a) | 1,300,000 | | 3,494,801 |
Ramelius Resources Ltd. (a) | 980,000 | | 415,120 |
Red 5 Ltd. (a) | 475,000 | | 679,684 |
Regis Resources Ltd. (a) | 5,143,292 | | 25,187,375 |
Resolute Mining Ltd. (a) | 4,911,661 | | 7,484,862 |
Saracen Mineral Holdings Ltd. (a) | 735,000 | | 265,778 |
Silver Lake Resources Ltd. (a)(d) | 1,061,000 | | 3,255,631 |
St Barbara Ltd. (a)(d) | 5,059,676 | | 7,736,558 |
Tanami Gold NL (a)(d) | 130,000 | | 114,163 |
Troy Resources NL (a)(f) | 734,826 | | 3,265,065 |
| | 348,608,251 |
Bailiwick of Jersey - 4.9% |
METALS & MINING - 4.9% |
Gold - 4.9% |
Centamin PLC (a) | 12,211,900 | | 15,415,579 |
Lydian International Ltd. (a) | 170,000 | | 413,898 |
Polyus Gold International Ltd. sponsored GDR | 5,848,190 | | 17,720,016 |
Randgold Resources Ltd. sponsored ADR | 1,359,067 | | 139,943,129 |
| | 173,492,622 |
|
| Shares | | Value |
Bermuda - 0.1% |
METALS & MINING - 0.1% |
Gold - 0.1% |
Continental Gold Ltd. (a) | 450,100 | | $ 3,433,682 |
G-Resources Group Ltd. (a) | 12,891,000 | | 590,038 |
| | 4,023,720 |
Canada - 58.4% |
METALS & MINING - 58.4% |
Diversified Metals & Mining - 0.3% |
Copper Mountain Mining Corp. (a) | 97,000 | | 257,814 |
East Asia Minerals Corp. (a) | 5,000 | | 812 |
Eastmain Resources, Inc. (a) | 10,000 | | 9,029 |
Kimber Resources, Inc. (a)(e) | 16,100 | | 11,433 |
Kimber Resources, Inc. (a)(e)(f) | 5,832,000 | | 4,141,415 |
NovaCopper, Inc. (a)(d) | 488,333 | | 1,223,619 |
Sabina Gold & Silver Corp. (a) | 465,000 | | 1,551,965 |
Turquoise Hill Resources Ltd. (a) | 350,750 | | 2,818,098 |
| | 10,014,185 |
Gold - 57.5% |
Agnico-Eagle Mines Ltd. (Canada) (d) | 2,135,400 | | 103,136,083 |
Alacer Gold Corp. (a) | 3,409,063 | | 20,473,399 |
Alamos Gold, Inc. | 1,948,800 | | 36,633,288 |
Argonaut Gold, Inc. (a) | 1,084,800 | | 10,014,385 |
ATAC Resources Ltd. (a) | 67,200 | | 175,882 |
Aura Minerals, Inc. (a) | 10,000 | | 4,109 |
AuRico Gold, Inc. (a) | 3,978,563 | | 27,647,128 |
Aurizon Mines Ltd. (a) | 2,366,900 | | 9,628,475 |
Avion Gold Corp. (a) | 5,290,000 | | 3,756,531 |
B2Gold Corp. (a) | 6,022,400 | | 23,032,664 |
Banro Corp. (a) | 3,713,482 | | 15,972,776 |
Barrick Gold Corp. (d) | 10,139,019 | | 390,955,224 |
Belo Sun Mining Corp. (a) | 405,000 | | 480,700 |
Canaco Resources, Inc. (a) | 710,100 | | 252,128 |
Canaco Resources, Inc. (a)(f) | 561,600 | | 199,401 |
Centerra Gold, Inc. | 2,042,200 | | 15,537,915 |
Claude Resources, Inc. (a) | 40,000 | | 28,405 |
Colossus Minerals, Inc. (a) | 1,591,100 | | 7,102,044 |
Detour Gold Corp. (a) | 818,800 | | 20,599,787 |
Detour Gold Corp. (a)(f) | 785,900 | | 19,772,072 |
Eldorado Gold Corp. | 9,506,708 | | 126,241,753 |
Exeter Resource Corp. (a) | 272,300 | | 483,414 |
Franco-Nevada Corp. (d) | 1,689,900 | | 87,670,795 |
Gabriel Resources Ltd. (a) | 725,000 | | 1,698,960 |
Goldcorp, Inc. (d) | 11,229,100 | | 461,011,083 |
Golden Predator Corp. (a) | 5,000 | | 1,725 |
GoldQuest Mining Corp. (a) | 340,000 | | 538,067 |
Gran Colombia Gold Corp. (a) | 1,765,000 | | 599,822 |
Great Basin Gold Ltd. (a)(d) | 1,447,298 | | 278,962 |
Guyana Goldfields, Inc. (a) | 1,176,400 | | 3,126,724 |
Guyana Goldfields, Inc. (a)(f) | 155,000 | | 411,971 |
IAMGOLD Corp. | 4,873,200 | | 63,723,609 |
Common Stocks - continued |
| Shares | | Value |
Canada - continued |
METALS & MINING - CONTINUED |
Gold - continued |
International Minerals Corp.: | | | |
(Canada) (a) | 157,100 | | $ 838,292 |
(Switzerland) (a) | 15,000 | | 78,716 |
International Tower Hill Mines Ltd. (a) | 546,700 | | 1,597,257 |
Keegan Resources, Inc. (a) | 35,000 | | 129,597 |
Kinross Gold Corp. | 14,498,891 | | 128,846,346 |
Kinross Gold Corp. warrants 9/17/14 (a) | 1,192,793 | | 617,118 |
Kirkland Lake Gold, Inc. (a) | 906,000 | | 12,527,294 |
Lake Shore Gold Corp. (a) | 3,961,600 | | 4,018,869 |
Midas Gold Corp. (a) | 15,000 | | 39,564 |
New Gold, Inc. (a) | 6,990,855 | | 77,443,709 |
Novagold Resources, Inc. (a)(d) | 2,930,000 | | 13,672,838 |
OceanaGold Corp. (a) | 1,610,000 | | 4,246,513 |
Orezone Gold Corp. (a)(d) | 312,100 | | 585,732 |
Orvana Minerals Corp. (a)(d) | 10,000 | | 9,029 |
Osisko Mining Corp. (a) | 2,641,500 | | 25,644,591 |
Osisko Mining Corp. (a)(f) | 3,000,000 | | 29,125,032 |
Pilot Gold, Inc. (a) | 131,250 | | 139,805 |
Premier Gold Mines Ltd. (a) | 4,142,500 | | 21,768,349 |
Pretium Resources, Inc. (a) | 200,000 | | 2,960,183 |
Pretium Resources, Inc. (a)(f) | 225,000 | | 3,330,205 |
Pretium Resources, Inc. (a)(g) | 225,000 | | 3,330,205 |
Primero Mining Corp. (a) | 504,300 | | 2,281,692 |
Queenston Mining, Inc. (a) | 659,900 | | 2,202,456 |
Rainy River Resources Ltd. (a) | 1,882,500 | | 8,880,167 |
Richmont Mines, Inc. (a) | 30,000 | | 125,082 |
Romarco Minerals, Inc. (a) | 9,968,000 | | 8,291,920 |
Romarco Minerals, Inc. (a)(f) | 5,900,000 | | 4,907,938 |
Rubicon Minerals Corp. (a) | 2,851,352 | | 9,979,370 |
San Gold Corp. (a) | 4,634,400 | | 3,620,074 |
Seabridge Gold, Inc. (a) | 601,905 | | 10,105,983 |
SEMAFO, Inc. | 4,346,900 | | 16,404,228 |
St. Andrew Goldfields Ltd. (a) | 360,000 | | 158,864 |
Sulliden Gold Corp. Ltd. (a) | 1,700,400 | | 2,380,474 |
Teranga Gold Corp. (a) | 35,000 | | 71,367 |
Teranga Gold Corp. CDI unit (a) | 3,430,974 | | 6,947,633 |
Timmins Gold Corp. (a) | 105,000 | | 264,164 |
Torex Gold Resources, Inc. (a) | 8,097,500 | | 14,786,203 |
Yamana Gold, Inc. | 9,348,100 | | 159,887,361 |
| | 2,033,433,501 |
Precious Metals & Minerals - 0.6% |
Chesapeake Gold Corp. (a) | 6,000 | | 48,085 |
Dalradian Resources, Inc. (a) | 46,000 | | 48,998 |
Kaminak Gold Corp. Class A (a) | 20,000 | | 35,709 |
Pan American Silver Corp. | 563,487 | | 9,894,963 |
|
| Shares | | Value |
Pan American Silver Corp. warrants 12/7/14 (a) | 232,460 | | $ 175,039 |
Silver Wheaton Corp. | 150,700 | | 5,210,100 |
Silvercorp Metals, Inc. | 37,500 | | 220,644 |
Tahoe Resources, Inc. (a) | 225,500 | | 4,108,527 |
| | 19,742,065 |
TOTAL METALS & MINING | | 2,063,189,751 |
Cayman Islands - 0.0% |
METALS & MINING - 0.0% |
Gold - 0.0% |
China Precious Metal Resources Holdings Co. Ltd. (a) | 3,652,000 | | 640,375 |
Endeavour Mining Corp. (a)(d) | 348,000 | | 699,001 |
| | 1,339,376 |
China - 0.5% |
METALS & MINING - 0.5% |
Gold - 0.5% |
Zhaojin Mining Industry Co. Ltd. (H Shares) | 3,099,650 | | 4,100,389 |
Zijin Mining Group Co. Ltd. (H Shares) | 43,164,000 | | 13,523,620 |
| | 17,624,009 |
Netherlands - 0.0% |
METALS & MINING - 0.0% |
Gold - 0.0% |
Nord Gold NV GDR (Reg. S) (a) | 15,000 | | 66,000 |
Peru - 1.2% |
METALS & MINING - 1.2% |
Gold - 1.2% |
Compania de Minas Buenaventura SA sponsored ADR | 1,162,500 | | 40,292,250 |
South Africa - 8.8% |
METALS & MINING - 8.8% |
Gold - 8.8% |
AngloGold Ashanti Ltd. sponsored ADR | 4,802,952 | | 153,214,169 |
Gold Fields Ltd. | 55,000 | | 673,078 |
Gold Fields Ltd. sponsored ADR | 9,021,026 | | 111,139,040 |
Harmony Gold Mining Co. Ltd. | 1,484,000 | | 12,477,370 |
Harmony Gold Mining Co. Ltd. sponsored ADR (d) | 3,881,800 | | 33,150,572 |
| | 310,654,229 |
Sweden - 0.0% |
METALS & MINING - 0.0% |
Gold - 0.0% |
Nordic Mines AB (a) | 20,000 | | 24,161 |
Common Stocks - continued |
| Shares | | Value |
Turkey - 0.0% |
METALS & MINING - 0.0% |
Gold - 0.0% |
Koza Altin Isletmeleri A/S | 5,000 | | $ 98,395 |
United Kingdom - 0.6% |
METALS & MINING - 0.6% |
Gold - 0.6% |
African Barrick Gold Ltd. | 1,338,763 | | 9,440,477 |
Allied Gold Mining PLC (a) | 615,000 | | 1,386,669 |
Patagonia Gold PLC (a)(d) | 260,000 | | 112,499 |
Petropavlovsk PLC | 2,100,929 | | 11,605,805 |
| | 22,545,450 |
United States of America - 11.5% |
METALS & MINING - 11.3% |
Gold - 11.2% |
Allied Nevada Gold Corp. (a) | 1,346,300 | | 43,862,454 |
Allied Nevada Gold Corp. (Canada) (a) | 45,000 | | 1,463,556 |
Gold Resource Corp. (d) | 30,000 | | 568,800 |
Newmont Mining Corp. | 5,646,850 | | 286,182,358 |
Royal Gold, Inc. (d) | 731,313 | | 64,370,170 |
| | 396,447,338 |
Precious Metals & Minerals - 0.1% |
Coeur d'Alene Mines Corp. (a) | 15,000 | | 344,850 |
McEwen Mining, Inc. (a)(d) | 705,100 | | 2,792,196 |
| | 3,137,046 |
TOTAL METALS & MINING | | 399,584,384 |
OIL, GAS & CONSUMABLE FUELS - 0.2% |
Coal & Consumable Fuels - 0.2% |
Alpha Natural Resources, Inc. (a) | 518,000 | | 3,076,920 |
Peabody Energy Corp. | 220,000 | | 4,758,600 |
| | 7,835,520 |
TOTAL UNITED STATES OF AMERICA | | 407,419,904 |
TOTAL COMMON STOCKS (Cost $3,027,884,088) |
3,389,378,118
|
Commodities - 3.8% |
| Troy Ounces | | |
Gold Bullion (a) | 77,500 | | 131,169,525 |
Silver Bullion (a) | 117,000 | | 3,713,580 |
TOTAL COMMODITIES (Cost $113,075,575) |
134,883,105
|
Money Market Funds - 15.5% |
| Shares | | Value |
Fidelity Cash Central Fund, 0.17% (b) | 8,040,203 | | $ 8,040,203 |
Fidelity Securities Lending Cash Central Fund, 0.18% (b)(c) | 539,002,014 | | 539,002,014 |
TOTAL MONEY MARKET FUNDS (Cost $547,042,217) |
547,042,217
|
TOTAL INVESTMENT PORTFOLIO - 115.2% (Cost $3,688,001,880) | | 4,071,303,440 |
NET OTHER ASSETS (LIABILITIES) - (15.2)% | | (538,230,937) |
NET ASSETS - 100% | $ 3,533,072,503 |
Legend |
(a) Non-income producing |
(b) Affiliated fund that is available only to investment companies and other accounts managed by Fidelity Investments. The rate quoted is the annualized seven-day yield of the fund at period end. A complete unaudited listing of the fund's holdings as of its most recent quarter end is available upon request. In addition, each Fidelity Central Fund's financial statements are available on the SEC's website or upon request. |
(c) Investment made with cash collateral received from securities on loan. |
(d) Security or a portion of the security is on loan at period end. |
(e) Affiliated company |
(f) Security exempt from registration under Rule 144A of the Securities Act of 1933. These securities may be resold in transactions exempt from registration, normally to qualified institutional buyers. At the end of the period, the value of these securities amounted to $65,153,099 or 1.8% of net assets. |
(g) Restricted securities - Investment in securities not registered under the Securities Act of 1933 (excluding 144A issues). At the end of the period, the value of restricted securities (excluding 144A issues) amounted to $3,330,205 or 0.1% of net assets. |
Additional information on each restricted holding is as follows: |
Security | Acquisition Date | Acquisition Cost |
Pretium Resources, Inc. | 3/31/11 | $ 2,172,293 |
Affiliated Central Funds |
Information regarding fiscal year to date income earned by the Fund from investments in Fidelity Central Funds is as follows: |
Fund | Income earned |
Fidelity Cash Central Fund | $ 5,626 |
Fidelity Securities Lending Cash Central Fund | 334,629 |
Total | $ 340,255 |
| Value,
beginning of
period | Purchases | Sales
Proceeds | Dividend
Income | Value,
end of
period |
Fidelity Select Gold Cayman Ltd. | $ 43,125,922 | $ 86,850,463 | $ - | $ - | $ 134,852,679 |
Other Affiliated Issuers |
An affiliated company is a company in which the Fund has ownership of at least 5% of the voting securities. Fiscal year to date transactions with companies which are or were affiliates are as follows: |
Affiliate | Value,
beginning of
period | Purchases | Sales
Proceeds | Dividend
Income | Value,
end of
period |
Kimber Resources, Inc. | $ 16,919 | $ - | $ - | $ - | $ 11,433 |
Kimber Resources, Inc. (144A) | 6,128,712 | - | - | - | 4,141,415 |
Total | $ 6,145,631 | $ - | $ - | $ - | $ 4,152,848 |
Other Information |
The following is a summary of the inputs used, as of August 31, 2012, involving the Fund's assets and liabilities carried at fair value. The inputs or methodology used for valuing securities may not be an indication of the risk associated with investing in those securities. For more information on valuation inputs, and their aggregation into the levels used in the table below, please refer to the Security Valuation section in the accompanying Notes to Consolidated Financial Statements. |
Valuation Inputs at Reporting Date: |
Description | Total | Level 1 | Level 2 | Level 3 |
Investments in Securities: | | | | |
Common Stocks | $ 3,389,378,118 | $ 3,376,052,631 | $ 13,325,487 | $ - |
Commodities | 134,883,105 | 134,883,105 | - | - |
Money Market Funds | 547,042,217 | 547,042,217 | - | - |
Total Investments in Securities: | $ 4,071,303,440 | $ 4,057,977,953 | $ 13,325,487 | $ - |
See accompanying notes which are an integral part of the consolidated financial statements.
Semiannual Report
Gold Portfolio
Consolidated Statement of Assets and Liabilities
| August 31, 2012 (Unaudited) |
| | |
Assets | | |
Investment in securities, at value (including securities loaned of $531,798,267) - See accompanying schedule: Unaffiliated issuers (cost $3,022,586,600) | $ 3,385,225,270 | |
Fidelity Central Funds (cost $547,042,217) | 547,042,217 | |
Commodities (cost $113,075,575) | 134,883,105 | |
Other affiliated issuers (cost $5,297,488) | 4,152,848 | |
Total Investments (cost $3,688,001,880) | | $ 4,071,303,440 |
Cash | | 4,946 |
Foreign currency held at value (cost $3) | | 3 |
Receivable for fund shares sold | | 4,841,833 |
Dividends receivable | | 2,712,997 |
Distributions receivable from Fidelity Central Funds | | 63,556 |
Other receivables | | 11,124 |
Total assets | | 4,078,937,899 |
| | |
Liabilities | | |
Payable for fund shares redeemed | $ 4,035,091 | |
Accrued management fee | 1,569,470 | |
Distribution and service plan fees payable | 90,184 | |
Other affiliated payables | 917,284 | |
Other payables and accrued expenses | 251,353 | |
Collateral on securities loaned, at value | 539,002,014 | |
Total liabilities | | 545,865,396 |
| | |
Net Assets | | $ 3,533,072,503 |
Net Assets consist of: | | |
Paid in capital | | $ 3,578,544,855 |
Accumulated net investment loss | | (21,174,752) |
Accumulated undistributed net realized gain (loss) on investments and foreign currency transactions | | (407,604,474) |
Net unrealized appreciation (depreciation) on investments and assets and liabilities in foreign currencies | | 383,306,874 |
Net Assets | | $ 3,533,072,503 |
Consolidated Statement of Assets and Liabilities - continued
| August 31, 2012 (Unaudited) |
| | |
Calculation of Maximum Offering Price Class A:
Net Asset Value and redemption price per share ($126,561,933 ÷ 3,345,457 shares) | | $ 37.83 |
| | |
Maximum offering price per share (100/94.25 of $37.83) | | $ 40.14 |
Class T:
Net Asset Value and redemption price per share ($31,828,989 ÷ 848,774 shares) | | $ 37.50 |
| | |
Maximum offering price per share (100/96.50 of $37.50) | | $ 38.86 |
Class B:
Net Asset Value and offering price per share ($14,241,834 ÷ 387,566 shares)A | | $ 36.75 |
| | |
Class C:
Net Asset Value and offering price per share ($50,719,638 ÷ 1,386,025 shares)A | | $ 36.59 |
| | |
Gold:
Net Asset Value, offering price and redemption price per share ($3,162,334,752 ÷ 82,426,980 shares) | | $ 38.37 |
| | |
Institutional Class:
Net Asset Value, offering price and redemption price per share ($147,385,357 ÷ 3,846,964 shares) | | $ 38.31 |
A Redemption price per share is equal to net asset value less any applicable contingent deferred sales charge.
See accompanying notes which are an integral part of the consolidated financial statements.
Semiannual Report
Gold Portfolio
Consolidated Financial Statements - continued
Consolidated Statement of Operations
Six months ended August 31, 2012 (Unaudited) |
| | |
Investment Income | | |
Dividends | | $ 25,419,413 |
Interest | | 6 |
Income from Fidelity Central Funds | | 340,255 |
Total income | | 25,759,674 |
| | |
Expenses | | |
Management fee | $ 9,864,481 | |
Transfer agent fees | 5,153,104 | |
Distribution and service plan fees | 571,059 | |
Accounting and security lending fees | 739,772 | |
Custodian fees and expenses | 267,648 | |
Independent trustees' compensation | 11,898 | |
Registration fees | 110,314 | |
Audit | 20,966 | |
Legal | 7,351 | |
Interest | 4,841 | |
Miscellaneous | 24,740 | |
Total expenses before reductions | 16,776,174 | |
Expense reductions | (146,638) | 16,629,536 |
Net investment income (loss) | | 9,130,138 |
Realized and Unrealized Gain (Loss) Net realized gain (loss) on: | | |
Investments: | | |
Unaffiliated issuers | (111,301,818) | |
Foreign currency transactions | 41,154 | |
Total net realized gain (loss) | | (111,260,664) |
Change in net unrealized appreciation (depreciation) on: Investments | (631,480,473) | |
Assets and liabilities in foreign currencies | (4,026) | |
Commodities | 5,001,915 | |
Total change in net unrealized appreciation (depreciation) | | (626,482,584) |
Net gain (loss) | | (737,743,248) |
Net increase (decrease) in net assets resulting from operations | | $ (728,613,110) |
Consolidated Statement of Changes in Net Assets
| Six months ended
August 31, 2012
(Unaudited) | Year ended
February 29,
2012 |
Increase (Decrease) in Net Assets | | |
Operations | | |
Net investment income (loss) | $ 9,130,138 | $ (2,911,115) |
Net realized gain (loss) | (111,260,664) | 69,474,908 |
Change in net unrealized appreciation (depreciation) | (626,482,584) | (363,910,363) |
Net increase (decrease) in net assets resulting from operations | (728,613,110) | (297,346,570) |
Distributions to shareholders from net realized gain | - | (238,750,097) |
Share transactions - net increase (decrease) | (113,932,451) | 229,358,064 |
Redemption fees | 108,512 | 461,104 |
Total increase (decrease) in net assets | (842,437,049) | (306,277,499) |
| | |
Net Assets | | |
Beginning of period | 4,375,509,552 | 4,681,787,051 |
End of period (including accumulated net investment loss of $21,174,752 and accumulated net investment loss of $30,304,890, respectively) | $ 3,533,072,503 | $ 4,375,509,552 |
See accompanying notes which are an integral part of the consolidated financial statements.
Semiannual Report
Consolidated Financial Highlights - Class A
| Six months ended
August 31, 2012 | Years ended February 28, |
| (Unaudited) | 2012 I | 2011 | 2010 | 2009 | 2008 I |
Selected Per-Share Data | | | | | | |
Net asset value, beginning of period | $ 45.37 | $ 50.92 | $ 40.50 | $ 30.45 | $ 46.19 | $ 36.53 |
Income from Investment Operations | | | | | | |
Net investment income (loss) E | .06 | (.13) | (.30) | (.25) | (.15) | (.15) |
Net realized and unrealized gain (loss) | (7.60) | (2.83) | 15.28 | 11.00 | (15.44) | 15.00 |
Total from investment operations | (7.54) | (2.96) | 14.98 | 10.75 | (15.59) | 14.85 |
Distributions from net investment income | - | - | - | - | - | (.19) |
Distributions from net realized gain | - | (2.59) | (4.57) | (.71) | (.17) | (5.01) |
Total distributions | - | (2.59) | (4.57) | (.71) | (.17) | (5.20) |
Redemption fees added to paid in capital E | - J | - J | .01 | .01 | .02 | .01 |
Net asset value, end of period | $ 37.83 | $ 45.37 | $ 50.92 | $ 40.50 | $ 30.45 | $ 46.19 |
Total Return B, C, D | (16.62)% | (6.24)% | 36.99% | 35.19% | (33.81)% | 44.59% |
Ratios to Average Net Assets F, H | | | | | | |
Expenses before reductions | 1.18% A | 1.14% | 1.16% | 1.21% | 1.21% | 1.17% |
Expenses net of fee waivers, if any | 1.17% A | 1.14% | 1.15% | 1.19% | 1.19% | 1.17% |
Expenses net of all reductions | 1.17% A | 1.14% | 1.14% | 1.17% | 1.15% | 1.13% |
Net investment income (loss) | .30% A | (.28)% | (.63)% | (.63)% | (.45)% | (.37)% |
Supplemental Data | | | | | | |
Net assets, end of period (000 omitted) | $ 126,562 | $ 152,969 | $ 149,178 | $ 82,413 | $ 39,144 | $ 26,620 |
Portfolio turnover rate G | 16% A | 22% | 35% | 46% | 42% | 55% |
A Annualized B Total returns for periods of less than one year are not annualized. C Total returns would have been lower if certain expenses had not been reduced during the applicable periods shown. D Total returns do not include the effect of the sales charges. E Calculated based on average shares outstanding during the period. F Fees and expenses of any underlying Fidelity Central Funds are not included in the Fund's expense ratio. The Fund indirectly bears its proportionate share of the expenses of any underlying Fidelity Central Funds. G Amount does not include the portfolio activity of any underlying Fidelity Central Funds. H Expense ratios reflect operating expenses of the class. Expenses before reductions do not reflect amounts reimbursed by the investment adviser or reductions from brokerage service arrangements or reductions from other expense offset arrangements and do not represent the amount paid by the class during periods when reimbursements or reductions occur. Expenses net of fee waivers reflect expenses after reimbursement by the investment adviser but prior to reductions from brokerage service arrangements or other expense offset arrangements. Expenses net of all reductions represent the net expenses paid by the class. I For the year ended February 29. J Amount represents less than $.01 per share. |
Consolidated Financial Highlights - Class T
| Six months ended
August 31, 2012 | Years ended February 28, |
| (Unaudited) | 2012 I | 2011 | 2010 | 2009 | 2008 I |
Selected Per-Share Data | | | | | | |
Net asset value, beginning of period | $ 45.04 | $ 50.68 | $ 40.34 | $ 30.36 | $ 46.17 | $ 36.49 |
Income from Investment Operations | | | | | | |
Net investment income (loss) E | .01 | (.27) | (.43) | (.36) | (.24) | (.25) |
Net realized and unrealized gain (loss) | (7.55) | (2.80) | 15.21 | 10.96 | (15.42) | 15.05 |
Total from investment operations | (7.54) | (3.07) | 14.78 | 10.60 | (15.66) | 14.80 |
Distributions from net investment income | - | - | - | - | - | (.16) |
Distributions from net realized gain | - | (2.57) | (4.45) | (.63) | (.17) | (4.97) |
Total distributions | - | (2.57) | (4.45) | (.63) | (.17) | (5.13) |
Redemption fees added to paid in capital E | - J | - J | .01 | .01 | .02 | .01 |
Net asset value, end of period | $ 37.50 | $ 45.04 | $ 50.68 | $ 40.34 | $ 30.36 | $ 46.17 |
Total Return B, C, D | (16.74)% | (6.49)% | 36.62% | 34.79% | (33.98)% | 44.45% |
Ratios to Average Net Assets F, H | | | | | | |
Expenses before reductions | 1.45% A | 1.43% | 1.44% | 1.51% | 1.47% | 1.43% |
Expenses net of fee waivers, if any | 1.44% A | 1.42% | 1.42% | 1.49% | 1.45% | 1.43% |
Expenses net of all reductions | 1.44% A | 1.42% | 1.42% | 1.47% | 1.41% | 1.39% |
Net investment income (loss) | .03% A | (.57)% | (.90)% | (.93)% | (.71)% | (.63)% |
Supplemental Data | | | | | | |
Net assets, end of period (000 omitted) | $ 31,829 | $ 40,664 | $ 45,846 | $ 26,256 | $ 15,284 | $ 11,334 |
Portfolio turnover rate G | 16% A | 22% | 35% | 46% | 42% | 55% |
A Annualized B Total returns for periods of less than one year are not annualized. C Total returns would have been lower if certain expenses had not been reduced during the applicable periods shown. D Total returns do not include the effect of the sales charges. E Calculated based on average shares outstanding during the period. F Fees and expenses of any underlying Fidelity Central Funds are not included in the Fund's expense ratio. The Fund indirectly bears its proportionate share of the expenses of any underlying Fidelity Central Funds. G Amount does not include the portfolio activity of any underlying Fidelity Central Funds. H Expense ratios reflect operating expenses of the class. Expenses before reductions do not reflect amounts reimbursed by the investment adviser or reductions from brokerage service arrangements or reductions from other expense offset arrangements and do not represent the amount paid by the class during periods when reimbursements or reductions occur. Expenses net of fee waivers reflect expenses after reimbursement by the investment adviser but prior to reductions from brokerage service arrangements or other expense offset arrangements. Expenses net of all reductions represent the net expenses paid by the class. I For the year ended February 29. J Amount represents less than $.01 per share. |
See accompanying notes which are an integral part of the consolidated financial statements.
Semiannual Report
Consolidated Financial Highlights - Class B
| Six months ended
August 31, 2012 | Years ended February 28, |
| (Unaudited) | 2012 I | 2011 | 2010 | 2009 | 2008 I |
Selected Per-Share Data | | | | | | |
Net asset value, beginning of period | $ 44.24 | $ 50.02 | $ 39.87 | $ 30.08 | $ 45.97 | $ 36.46 |
Income from Investment Operations | | | | | | |
Net investment income (loss) E | (.08) | (.49) | (.66) | (.55) | (.40) | (.45) |
Net realized and unrealized gain (loss) | (7.41) | (2.76) | 15.02 | 10.84 | (15.34) | 14.95 |
Total from investment operations | (7.49) | (3.25) | 14.36 | 10.29 | (15.74) | 14.50 |
Distributions from net investment income | - | - | - | - | - | (.16) |
Distributions from net realized gain | - | (2.53) | (4.21) | (.51) | (.17) | (4.84) |
Total distributions | - | (2.53) | (4.21) | (.51) | (.17) | (5.00) |
Redemption fees added to paid in capital E | - J | - J | - J | .01 | .02 | .01 |
Net asset value, end of period | $ 36.75 | $ 44.24 | $ 50.02 | $ 39.87 | $ 30.08 | $ 45.97 |
Total Return B, C, D | (16.93)% | (6.95)% | 35.97% | 34.12% | (34.30)% | 43.53% |
Ratios to Average Net Assets F, H | | | | | | |
Expenses before reductions | 1.93% A | 1.90% | 1.93% | 2.00% | 1.97% | 1.93% |
Expenses net of fee waivers, if any | 1.92% A | 1.90% | 1.92% | 1.98% | 1.95% | 1.93% |
Expenses net of all reductions | 1.92% A | 1.90% | 1.91% | 1.96% | 1.89% | 1.90% |
Net investment income (loss) | (.45)% A | (1.04)% | (1.39)% | (1.42)% | (1.20)% | (1.14)% |
Supplemental Data | | | | | | |
Net assets, end of period (000 omitted) | $ 14,242 | $ 20,894 | $ 26,837 | $ 18,340 | $ 8,421 | $ 6,869 |
Portfolio turnover rate G | 16% A | 22% | 35% | 46% | 42% | 55% |
A Annualized B Total returns for periods of less than one year are not annualized. C Total returns would have been lower if certain expenses had not been reduced during the applicable periods shown. D Total returns do not include the effect of the contingent deferred sales charge. E Calculated based on average shares outstanding during the period. F Fees and expenses of any underlying Fidelity Central Funds are not included in the Fund's expense ratio. The Fund indirectly bears its proportionate share of the expenses of any underlying Fidelity Central Funds. G Amount does not include the portfolio activity of any underlying Fidelity Central Funds. H Expense ratios reflect operating expenses of the class. Expenses before reductions do not reflect amounts reimbursed by the investment adviser or reductions from brokerage service arrangements or reductions from other expense offset arrangements and do not represent the amount paid by the class during periods when reimbursements or reductions occur. Expenses net of fee waivers reflect expenses after reimbursement by the investment adviser but prior to reductions from brokerage service arrangements or other expense offset arrangements. Expenses net of all reductions represent the net expenses paid by the class. I For the year ended February 29. J Amount represents less than $.01 per share. |
Consolidated Financial Highlights - Class C
| Six months ended
August 31, 2012 | Years ended February 28, |
| (Unaudited) | 2012 I | 2011 | 2010 | 2009 | 2008 I |
Selected Per-Share Data | | | | | | |
Net asset value, beginning of period | $ 44.05 | $ 49.81 | $ 39.75 | $ 30.00 | $ 45.85 | $ 36.44 |
Income from Investment Operations | | | | | | |
Net investment income (loss) E | (.08) | (.47) | (.64) | (.53) | (.39) | (.45) |
Net realized and unrealized gain (loss) | (7.38) | (2.76) | 14.98 | 10.80 | (15.30) | 14.91 |
Total from investment operations | (7.46) | (3.23) | 14.34 | 10.27 | (15.69) | 14.46 |
Distributions from net investment income | - | - | - | - | - | (.17) |
Distributions from net realized gain | - | (2.53) | (4.28) | (.53) | (.17) | (4.89) |
Total distributions | - | (2.53) | (4.28) | (.53) | (.17) | (5.06) |
Redemption fees added to paid in capital E | - J | - J | - J | .01 | .01 | .01 |
Net asset value, end of period | $ 36.59 | $ 44.05 | $ 49.81 | $ 39.75 | $ 30.00 | $ 45.85 |
Total Return B, C, D | (16.94)% | (6.93)% | 36.01% | 34.15% | (34.30)% | 43.49% |
Ratios to Average Net Assets F, H | | | | | | |
Expenses before reductions | 1.93% A | 1.87% | 1.89% | 1.97% | 1.97% | 1.92% |
Expenses net of fee waivers, if any | 1.92% A | 1.87% | 1.88% | 1.95% | 1.95% | 1.92% |
Expenses net of all reductions | 1.92% A | 1.87% | 1.87% | 1.93% | 1.89% | 1.89% |
Net investment income (loss) | (.45)% A | (1.01)% | (1.35)% | (1.39)% | (1.20)% | (1.12)% |
Supplemental Data | | | | | | |
Net assets, end of period (000 omitted) | $ 50,720 | $ 67,996 | $ 72,431 | $ 38,624 | $ 17,544 | $ 10,835 |
Portfolio turnover rate G | 16% A | 22% | 35% | 46% | 42% | 55% |
A Annualized B Total returns for periods of less than one year are not annualized. C Total returns would have been lower if certain expenses had not been reduced during the applicable periods shown. D Total returns do not include the effect of the contingent deferred sales charge. E Calculated based on average shares outstanding during the period. F Fees and expenses of any underlying Fidelity Central Funds are not included in the Fund's expense ratio. The Fund indirectly bears its proportionate share of the expenses of any underlying Fidelity Central Funds. G Amount does not include the portfolio activity of any underlying Fidelity Central Funds. H Expense ratios reflect operating expenses of the class. Expenses before reductions do not reflect amounts reimbursed by the investment adviser or reductions from brokerage service arrangements or reductions from other expense offset arrangements and do not represent the amount paid by the class during periods when reimbursements or reductions occur. Expenses net of fee waivers reflect expenses after reimbursement by the investment adviser but prior to reductions from brokerage service arrangements or other expense offset arrangements. Expenses net of all reductions represent the net expenses paid by the class. I For the year ended February 29. J Amount represents less than $.01 per share. |
See accompanying notes which are an integral part of the consolidated financial statements.
Semiannual Report
Consolidated Financial Highlights - Gold
| Six months ended
August 31, 2012 | Years ended February 28, |
| (Unaudited) | 2012 H | 2011 | 2010 | 2009 | 2008 H |
Selected Per-Share Data | | | | | | |
Net asset value, beginning of period | $ 45.96 | $ 51.44 | $ 40.85 | $ 30.67 | $ 46.37 | $ 36.54 |
Income from Investment Operations | | | | | | |
Net investment income (loss) D | .10 | (.02) | (.18) | (.16) | (.04) | (.02) |
Net realized and unrealized gain (loss) | (7.69) | (2.85) | 15.43 | 11.10 | (15.51) | 15.05 |
Total from investment operations | (7.59) | (2.87) | 15.25 | 10.94 | (15.55) | 15.03 |
Distributions from net investment income | - | - | - | - | - | (.18) |
Distributions from net realized gain | - | (2.61) | (4.67) | (.77) | (.17) | (5.03) |
Total distributions | - | (2.61) | (4.67) | (.77) | (.17) | (5.21) |
Redemption fees added to paid in capital D | - I | - I | .01 | .01 | .02 | .01 |
Net asset value, end of period | $ 38.37 | $ 45.96 | $ 51.44 | $ 40.85 | $ 30.67 | $ 46.37 |
Total Return B, C | (16.51)% | (6.00)% | 37.35% | 35.52% | (33.59)% | 45.10% |
Ratios to Average Net Assets E, G | | | | | | |
Expenses before reductions | .93% A | .89% | .91% | .98% | .89% | .85% |
Expenses net of fee waivers, if any | .92% A | .89% | .90% | .96% | .87% | .85% |
Expenses net of all reductions | .92% A | .89% | .89% | .94% | .86% | .81% |
Net investment income (loss) | .55% A | (.03)% | (.37)% | (.40)% | (.13)% | (.05)% |
Supplemental Data | | | | | | |
Net assets, end of period (000 omitted) | $ 3,162,335 | $ 3,924,439 | $ 4,250,249 | $ 2,839,664 | $ 1,881,600 | $ 2,381,114 |
Portfolio turnover rate F | 16% A | 22% | 35% | 46% | 42% | 55% |
A Annualized B Total returns for periods of less than one year are not annualized. C Total returns would have been lower if certain expenses had not been reduced during the applicable periods shown. D Calculated based on average shares outstanding during the period. E Fees and expenses of any underlying Fidelity Central Funds are not included in the Fund's expense ratio. The Fund indirectly bears its proportionate share of the expenses of any underlying Fidelity Central Funds. F Amount does not include the portfolio activity of any underlying Fidelity Central Funds. G Expense ratios reflect operating expenses of the class. Expenses before reductions do not reflect amounts reimbursed by the investment adviser or reductions from brokerage service arrangements or reductions from other expense offset arrangements and do not represent the amount paid by the class during periods when reimbursements or reductions occur. Expenses net of fee waivers reflect expenses after reimbursement by the investment adviser but prior to reductions from brokerage service arrangements or other expense offset arrangements. Expenses net of all reductions represent the net expenses paid by the class. H For the year ended February 29. I Amount represents less than $.01 per share. |
Consolidated Financial Highlights - Institutional Class
| Six months ended
August 31, 2012 | Years ended February 28, |
| (Unaudited) | 2012 H | 2011 | 2010 | 2009 | 2008 H |
Selected Per-Share Data | | | | | | |
Net asset value, beginning of period | $ 45.87 | $ 51.32 | $ 40.77 | $ 30.65 | $ 46.34 | $ 36.54 |
Income from Investment Operations | | | | | | |
Net investment income (loss) D | .12 | .02 | (.15) | (.15) | (.05) | (.01) |
Net realized and unrealized gain (loss) | (7.68) | (2.85) | 15.41 | 11.08 | (15.49) | 15.03 |
Total from investment operations | (7.56) | (2.83) | 15.26 | 10.93 | (15.54) | 15.02 |
Distributions from net investment income | - | - | - | - | - | (.19) |
Distributions from net realized gain | - | (2.62) | (4.72) | (.82) | (.17) | (5.04) |
Total distributions | - | (2.62) | (4.72) | (.82) | (.17) | (5.23) |
Redemption fees added to paid in capital D | - I | - I | .01 | .01 | .02 | .01 |
Net asset value, end of period | $ 38.31 | $ 45.87 | $ 51.32 | $ 40.77 | $ 30.65 | $ 46.34 |
Total Return B, C | (16.48)% | (5.94)% | 37.45% | 35.50% | (33.59)% | 45.10% |
Ratios to Average Net Assets E, G | | | | | | |
Expenses before reductions | .84% A | .82% | .85% | .95% | .91% | .83% |
Expenses net of fee waivers, if any | .83% A | .81% | .84% | .93% | .89% | .83% |
Expenses net of all reductions | .83% A | .81% | .83% | .91% | .86% | .79% |
Net investment income (loss) | .64% A | .04% | (.31)% | (.37)% | (.14)% | (.03)% |
Supplemental Data | | | | | | |
Net assets, end of period (000 omitted) | $ 147,385 | $ 168,548 | $ 137,246 | $ 38,037 | $ 6,070 | $ 3,174 |
Portfolio turnover rate F | 16% A | 22% | 35% | 46% | 42% | 55% |
A Annualized B Total returns for periods of less than one year are not annualized. C Total returns would have been lower if certain expenses had not been reduced during the applicable periods shown. D Calculated based on average shares outstanding during the period. E Fees and expenses of any underlying Fidelity Central Funds are not included in the Fund's expense ratio. The Fund indirectly bears its proportionate share of the expenses of any underlying Fidelity Central Funds. F Amount does not include the portfolio activity of any underlying Fidelity Central Funds. G Expense ratios reflect operating expenses of the class. Expenses before reductions do not reflect amounts reimbursed by the investment adviser or reductions from brokerage service arrangements or reductions from other expense offset arrangements and do not represent the amount paid by the class during periods when reimbursements or reductions occur. Expenses net of fee waivers reflect expenses after reimbursement by the investment adviser but prior to reductions from brokerage service arrangements or other expense offset arrangements. Expenses net of all reductions represent the net expenses paid by the class. H For the year ended February 29. I Amount represents less than $.01 per share. |
See accompanying notes which are an integral part of the consolidated financial statements.
Semiannual Report
Notes to Consolidated Financial Statements
For the period ended August 31, 2012 (Unaudited)
1. Organization.
Gold Portfolio (the Fund) is a non-diversified fund of Fidelity Select Portfolios (the Trust) and is authorized to issue an unlimited number of shares. The Trust is registered under the Investment Company Act of 1940, as amended (the 1940 Act), as an open-end management investment company organized as a Massachusetts business trust. The Fund invests primarily in securities of companies whose principal business activities fall within specific industries. The Fund offers Class A, Class T, Class C, Gold and Institutional Class shares, each of which, along with Class B shares, has equal rights as to assets and voting privileges. Effective after the close of business on September 1, 2010, Class B shares were closed to new accounts and additional purchases, except for exchanges and reinvestments. Each class has exclusive voting rights with respect to matters that affect that class. Class B shares will automatically convert to Class A shares after a holding period of seven years from the initial date of purchase. Investment income, realized and unrealized capital gains and losses, the common expenses of the Fund, and certain fund-level expense reductions, if any, are allocated on a pro-rata basis to each class based on the relative net assets of each class to the total net assets of the Fund. Each class differs with respect to transfer agent and distribution and service plan fees incurred. Certain expense reductions may also differ by class.
2. Consolidated Subsidiary
The Fund invests in certain commodity-related investments through Fidelity Select Gold Cayman Ltd., a wholly owned subsidiary (the "Subsidiary"). As of August 31, 2012, the Fund held $134,852,679 in the Subsidiary, representing 3.8% of the Fund's net assets.
The financial statements have been consolidated and include accounts of the Fund and the Subsidiary. Accordingly, all inter-company transactions and balances have been eliminated.
3. Investments in Fidelity Central Funds.
The Fund invests in Fidelity Central Funds, which are open-end investment companies available only to other investment companies and accounts managed by Fidelity Management & Research Company (FMR) and its affiliates. The Fund's Consolidated Schedule of Investments lists each of the Fidelity Central Funds held as of period end, if any, as an investment of the Fund, but does not include the underlying holdings of each Fidelity Central Fund. As an Investing Fund, the Fund indirectly bears its proportionate share of the expenses of the underlying Fidelity Central Funds.
The Money Market Central Funds seek preservation of capital and current income and are managed by Fidelity Investments Money Management, Inc. (FIMM), an affiliate of FMR.
A complete unaudited list of holdings for each Fidelity Central Fund is available upon request or at the Securities and Exchange Commission (the SEC) web site at www.sec.gov. In addition, the financial statements of the Fidelity Central Funds are available on the SEC web site or upon request.
4. Significant Accounting Policies.
The consolidated financial statements have been prepared in conformity with accounting principles generally accepted in the United States of America (GAAP), which require management to make certain estimates and assumptions at the date of the financial statements. Actual results could differ from those estimates. Subsequent events, if any, through the date that the financial statements were issued have been evaluated in the preparation of the financial statements. The following summarizes the significant accounting policies of the Fund:
Security Valuation. Investments are valued as of 4:00 p.m. Eastern time on the last calendar day of the period. In accordance with valuation policies and procedures approved by the Board of Trustees (the Board), the Fund attempts to obtain prices from one or more third party pricing vendor or broker to value its investments. When current market prices, quotations or rates are not readily available or reliable, securities will be fair valued in good faith by the FMR Fair Value Committee (the Committee), in accordance with procedures adopted by the Fund's Board. Factors used in determining fair value vary by security type and may include market or security specific events. The frequency with which these procedures are used cannot be predicted and they may be utilized to a significant extent. The Committee oversees the Fund's valuation policies and procedures and is responsible for approving and reporting to the Board all fair value determinations.
The Fund categorizes the inputs to valuation techniques used to value its investments into a disclosure hierarchy consisting of three levels as shown below:
Level 1 - quoted prices in active markets for identical investments
Level 2 - other significant observable inputs (including quoted prices for similar investments, interest rates, prepayment speeds, etc.)
Level 3 - unobservable inputs (including the Fund's own assumptions based on the best information available)
Valuation techniques used to value the Fund's investments by major category are as follows:
Semiannual Report
Notes to Consolidated Financial Statements (Unaudited) - continued
4. Significant Accounting Policies - continued
Security Valuation - continued
Equity securities, including restricted securities, for which market quotations are readily available, are valued at the last reported sale price or official closing price as reported by a third party pricing vendor on the primary market or exchange on which they are traded and are categorized as Level 1 in the hierarchy. In the event there were no sales during the day or closing prices are not available, securities are valued at the last quoted bid price or may be valued using the last available price and are generally categorized as Level 2 in the hierarchy. For foreign equity securities, when significant market or security specific events arise, comparisons to the valuation of American Depositary Receipts (ADRs), futures contracts, Exchange-Traded Funds (ETFs) and certain indexes as well as quoted prices for similar securities are used and are categorized as Level 2 in the hierarchy. Utilizing these techniques may result in transfers between Level 1 and Level 2. For restricted equity securities and private placements where observable inputs are limited, assumptions about market activity and risk are used and these securities are categorized as Level 3 in the hierarchy.
Investments in commodities are valued at their last traded price at 4:00 p.m. Eastern time each business day and are categorized as Level 1 in the hierarchy. Investments in open-end mutual funds, including the Fidelity Central Funds, are valued at their closing net asset value each business day and are categorized as Level 1 in the hierarchy.
Changes in valuation techniques may result in transfers in or out of an assigned level within the disclosure hierarchy. The aggregate value of investments by input level, as of August 31, 2012, is included at the end of the Fund's Consolidated Schedule of Investments.
Foreign Currency Translation. The Fund may use foreign currency contracts to facilitate transactions in foreign-denominated securities. Gains and losses from these transactions may arise from changes in the value of the foreign currency or if the counterparties do not perform under the contracts' terms.
Foreign-denominated assets, including investment securities, and liabilities are translated into U.S. dollars at the exchange rates at period end. Purchases and sales of investment securities, income and dividends received and expenses denominated in foreign currencies are translated into U.S. dollars at the exchange rate in effect on the transaction date.
The effects of exchange rate fluctuations on investments are included with the net realized and unrealized gain (loss) on investment securities. Other foreign currency transactions resulting in realized and unrealized gain (loss) are disclosed separately.
Investment Transactions and Income. For financial reporting purposes, the Fund's investment holdings and NAV include trades executed through the end of the last business day of the period. The NAV per share for processing shareholder transactions is calculated as of the close of business of the New York Stock Exchange (NYSE), normally 4:00 p.m. Eastern time and includes trades executed through the end of the prior business day. Gains and losses on securities sold are determined on the basis of identified cost. Dividend income is recorded on the ex-dividend date, except for certain dividends from foreign securities where the ex-dividend date may have passed, which are recorded as soon as the Fund is informed of the ex-dividend date. Non-cash dividends included in dividend income, if any, are recorded at the fair market value of the securities received. Distributions received on securities that represent a return of capital or capital gain are recorded as a reduction of cost of investments and/or as a realized gain. The Fund estimates the components of distributions received that may be considered return of capital distributions or capital gain distributions. Interest income and distributions from the Fidelity Central Funds are accrued as earned. Interest income includes coupon interest and amortization of premium and accretion of discount on debt securities. Investment income is recorded net of foreign taxes withheld where recovery of such taxes is uncertain.
Expenses. Expenses directly attributable to a fund are charged to that fund. Expenses attributable to more than one fund are allocated among the respective funds on the basis of relative net assets or other appropriate methods. Expense estimates are accrued in the period to which they relate and adjustments are made when actual amounts are known.
Income Tax Information and Distributions to Shareholders. Each year, the Fund intends to qualify as a regulated investment company under Subchapter M of the Internal Revenue Code, including distributing substantially all of its taxable income and realized gains. As a result, no provision for income taxes is required. The Fund files a U.S. federal tax return, in addition to state and local tax returns as required. A fund's federal income tax returns are subject to examination by the Internal Revenue Service (IRS) for a period of three fiscal years after they are filed. State and local tax returns may be subject to examination for an additional fiscal year depending on the jurisdiction. Foreign taxes are provided for based on the Fund's understanding of the tax rules and rates that exist in the foreign markets in which it invests.
The Subsidiary is classified as a controlled foreign corporation under Subchapter N of the Internal Revenue Code. Therefore, the Fund is required to increase its taxable income by its share of the Subsidiary's income. Net investment losses of the Subsidiary cannot be deducted by the Fund in the current period nor carried forward to offset taxable income in future periods.
Distributions are declared and recorded on the ex-dividend date. Income dividends and capital gain distributions are declared separately for each class. Income and capital gain distributions are determined in accordance with income tax regulations, which may differ from GAAP.
Semiannual Report
4. Significant Accounting Policies - continued
Income Tax Information and Distributions to Shareholders - continued
Capital accounts within the consolidated financial statements are adjusted for permanent book-tax differences. These adjustments have no impact on net assets or the results of operations. Temporary book-tax differences will reverse in a subsequent period.
Book-tax differences are primarily due to foreign currency transactions, passive foreign investment companies (PFIC), controlled foreign corporation, deferred trustees compensation and losses deferred due to wash sales and excise tax regulations.
The federal tax cost of investment securities and unrealized appreciation (depreciation) as of period end on an unconsolidated basis were as follows:
Gross unrealized appreciation | $ 515,696,261 |
Gross unrealized depreciation | (433,498,682) |
Net unrealized appreciation (depreciation) on securities and other investments | $ 82,197,579 |
| |
Tax cost | $ 3,989,075,435 |
Trading (Redemption) Fees. Shares held by investors in the Fund less than 30 days are subject to a redemption fee equal to .75% of the net asset value of shares redeemed. All redemption fees, which reduce the proceeds of the shareholder redemption, are retained by the Fund and accounted for as an addition to paid in capital.
New Accounting Pronouncement. In December 2011, the Financial Accounting Standards Board issued Accounting Standard Update No. 2011-11, Disclosures about Offsetting Assets and Liabilities. The update creates new disclosure requirements requiring entities to disclose both gross and net information for derivatives and other financial instruments that are either offset in the Statement of Assets and Liabilities or subject to an enforceable master netting arrangement or similar agreement. The disclosure requirements are effective for annual reporting periods beginning on or after January 1, 2013, and interim periods within those annual periods. Management is currently evaluating the impact of the update's adoption on the Fund's financial statement disclosures.
5. Operating Policies.
Restricted Securities. The Fund may invest in securities that are subject to legal or contractual restrictions on resale. These securities generally may be resold in transactions exempt from registration or to the public if the securities are registered. Disposal of these securities may involve time-consuming negotiations and expense, and prompt sale at an acceptable price may be difficult. Information regarding restricted securities is included at the end of the Fund's Consolidated Schedule of Investments.
6. Purchases and Sales of Investments.
Purchases and sales of securities, other than short-term securities, aggregated $290,608,518 and $389,268,652, respectively.
7. Fees and Other Transactions with Affiliates.
Management Fee. FMR and its affiliates provide the Fund with investment management related services for which the Fund pays a monthly management fee. The management fee is the sum of an individual fund fee rate that is based on an annual rate of .30% of the Fund's average net assets and an annualized group fee rate that averaged .26% during the period. The group fee rate is based upon the average net assets of all the mutual funds advised by FMR. The group fee rate decreases as assets under management increase and increases as assets under management decrease. For the period, the total annualized management fee rate was .56% of the Fund's average net assets.
FMR and its affiliates also provide investment management related services to the Subsidiary. The Subsidiary pays FMR a monthly management fee at the annual rate of .30% of its net assets. Under the management contract, FMR pays all other expenses of the Subsidiary, except custodian fees.
During the period, FMR waived a portion of its management fee as described in the Expense Reductions note.
Distribution and Service Plan Fees. In accordance with Rule 12b-1 of the 1940 Act, the Fund has adopted separate Distribution and Service Plans for each class of shares. Certain classes pay Fidelity Distributors Corporation (FDC), an affiliate of FMR, separate Distribution and Service Fees, each of which is based on an annual percentage of each class' average net assets. In addition, FDC may pay financial intermediaries for selling shares of the
Semiannual Report
Notes to Consolidated Financial Statements (Unaudited) - continued
7. Fees and Other Transactions with Affiliates - continued
Distribution and Service Plan Fees - continued
Fund and providing shareholder support services. For the period, the Distribution and Service Fee rates, total fees and amounts retained by FDC were as follows:
| Distribution
Fee | Service
Fee | Total Fees | Retained
by FDC |
Class A | -% | .25% | $ 156,314 | $ 1,629 |
Class T | .25% | .25% | 79,192 | - |
Class B | .75% | .25% | 75,203 | 56,402 |
Class C | .75% | .25% | 260,350 | 39,833 |
| | | $ 571,059 | $ 97,864 |
Sales Load. FDC may receive a front-end sales charge of up to 5.75% for selling Class A shares and 3.50% for selling Class T shares, some of which is paid to financial intermediaries for selling shares of the Fund. Depending on the holding period, FDC may receive contingent deferred sales charges levied on Class A, Class T, Class B, and Class C redemptions. The deferred sales charges range from 5.00% to 1.00% for Class B shares, 1.00% for Class C shares, 1.00% for certain purchases of Class A shares and .25% for certain purchases of Class T shares.
For the period, sales charge amounts retained by FDC were as follows:
| Retained
by FDC |
Class A | $ 27,538 |
Class T | 6,049 |
Class B* | 23,856 |
Class C* | 3,522 |
| $ 60,965 |
* When Class B and Class C shares are initially sold, FDC pays commissions from its own resources to financial intermediaries through which the sales are made.
Transfer Agent Fees. Fidelity Investments Institutional Operations Company, Inc. (FIIOC), an affiliate of FMR, is the transfer, dividend disbursing and shareholder servicing agent for each class of the Fund. FIIOC receives account fees and asset-based fees that vary according to the account size and type of account of the shareholders of the respective classes of the Fund. FIIOC pays for typesetting, printing and mailing of shareholder reports, except proxy statements. For the period, transfer agent fees for each class were as follows:
| Amount | % of
Average
Net Assets* |
Class A | $ 186,709 | .30 |
Class T | 50,381 | .32 |
Class B | 22,493 | .30 |
Class C | 76,952 | .30 |
Gold | 4,672,489 | .30 |
Institutional Class | 144,080 | .21 |
| $ 5,153,104 | |
* Annualized
Accounting and Security Lending Fees. Fidelity Service Company, Inc. (FSC), an affiliate of FMR, maintains the Fund's accounting records. The accounting fee is based on the level of average net assets for each month. Under a separate contract, FSC administers the security lending program. The security lending fee is based on the number and duration of lending transactions.
Brokerage Commissions. The Fund placed a portion of its portfolio transactions with brokerage firms which are affiliates of the investment adviser. The commissions paid to these affiliated firms were $1,611 for the period.
Interfund Lending Program. Pursuant to an Exemptive Order issued by the SEC, the Fund, along with other registered investment companies having management contracts with FMR, may participate in an interfund lending program. This program provides an alternative credit facility allowing the
Semiannual Report
7. Fees and Other Transactions with Affiliates - continued
Interfund Lending Program - continued
funds to borrow from, or lend money to, other participating affiliated funds. At period end, there were no interfund loans outstanding. The Fund's activity in this program during the period for which loans were outstanding was as follows:
Borrower or Lender | Average Loan
Balance | Weighted Average
Interest Rate | Interest
Expense |
Borrower | $ 9,128,575 | .41% | $ 4,148 |
8. Committed Line of Credit.
The Fund participates with other funds managed by FMR or an affiliate in a $4.25 billion credit facility (the "line of credit") to be utilized for temporary or emergency purposes to fund shareholder redemptions or for other short-term liquidity purposes. The Fund has agreed to pay commitment fees on its pro-rata portion of the line of credit, which amounted to $5,517 and is reflected in Miscellaneous expenses on the Consolidated Statement of Operations. During the period, there were no borrowings on this line of credit.
9. Security Lending.
The Fund lends portfolio securities through a lending agent from time to time in order to earn additional income. For equity securities, a lending agent is used and may loan securities to certain qualified borrowers, including Fidelity Capital Markets (FCM), a broker-dealer affiliated with the Fund. On the settlement date of the loan, the Fund receives collateral (in the form of U.S. Treasury obligations, letters of credit and/or cash) against the loaned securities and maintains collateral in an amount not less than 100% of the market value of the loaned securities during the period of the loan. The market value of the loaned securities is determined at the close of business of the Fund and any additional required collateral is delivered to the Fund on the next business day. If the borrower defaults on its obligation to return the securities loaned because of insolvency or other reasons, a fund could experience delays and costs in recovering the securities loaned or in gaining access to the collateral. Any cash collateral received is invested in the Fidelity Securities Lending Cash Central Fund. The value of loaned securities and cash collateral at period end are disclosed on the Fund's Consolidated Statement of Assets and Liabilities. The value of securities loaned to FCM at period end was $426,600. Security lending income represents the income earned on investing cash collateral, less rebates paid to borrowers and any lending agent fees associated with the loan, plus any premium payments received for lending certain types of securities. Security lending income is presented in the Consolidated Statement of Operations as a component of income from Fidelity Central Funds. Total security lending income during the period amounted to $334,629, including $15,383 from securities loaned to FCM.
10. Bank Borrowings.
The Fund is permitted to have bank borrowings for temporary or emergency purposes to fund shareholder redemptions or for other short-term liquidity requirements. The Fund has established borrowing arrangements with certain banks. The interest rate on the borrowings is the bank's base rate, as revised from time to time. The average loan balance during the period for which loans were outstanding amounted to $6,452,333. The weighted average interest rate was .64%. The interest expense amounted to $693 under the bank borrowing program. At period end, there were no bank borrowings outstanding.
11. Expense Reductions.
FMR has contractually agreed to waive the Fund's management fee in an amount equal to the management fee of the Subsidiary. During the period, this waiver reduced the Fund's management fee by $120,205. Many of the brokers with whom FMR places trades on behalf of the Fund provided services to the Fund in addition to trade execution. These services included payments of certain expenses on behalf of the Fund totaling $26,120 for the period. In addition, through arrangements with the Fund's custodian, credits realized as a result of uninvested cash balances were used to reduce the Fund's expenses. During the period, these credits reduced the Fund's custody expenses by $313.
Semiannual Report
Notes to Consolidated Financial Statements (Unaudited) - continued
12. Distributions to Shareholders.
Distributions to shareholders of each class were as follows:
| Six months ended
August 31,
2012 | Year ended
February 29,
2012 |
From net realized gain | | |
Class A | $ - | $ 7,834,928 |
Class T | - | 2,382,367 |
Class B | - | 1,303,107 |
Class C | - | 3,798,844 |
Gold | - | 215,607,839 |
Institutional Class | - | 7,823,012 |
Total | $ - | $ 238,750,097 |
13. Share Transactions.
Transactions for each class of shares were as follows:
| Shares | Dollars |
| Six months ended
August 31,
2012 | Year ended
February 29,
2012 | Six months ended
August 31,
2012 | Year ended
February 29,
2012 |
Class A | | | | |
Shares sold | 855,307 | 1,589,102 | $ 32,193,547 | $ 76,690,664 |
Reinvestment of distributions | - | 145,713 | - | 7,265,756 |
Shares redeemed | (881,215) | (1,293,053) | (33,147,004) | (61,867,749) |
Net increase (decrease) | (25,908) | 441,762 | $ (953,457) | $ 22,088,671 |
Class T | | | | |
Shares sold | 125,633 | 326,122 | $ 4,595,848 | $ 15,663,258 |
Reinvestment of distributions | - | 46,446 | - | 2,308,310 |
Shares redeemed | (179,763) | (374,234) | (6,587,924) | (17,626,829) |
Net increase (decrease) | (54,130) | (1,666) | $ (1,992,076) | $ 344,739 |
Class B | | | | |
Shares sold | 9,231 | 55,740 | $ 336,945 | $ 2,638,278 |
Reinvestment of distributions | - | 22,881 | - | 1,122,370 |
Shares redeemed | (93,976) | (142,844) | (3,506,846) | (6,672,300) |
Net increase (decrease) | (84,745) | (64,223) | $ (3,169,901) | $ (2,911,652) |
Class C | | | | |
Shares sold | 142,812 | 510,073 | $ 5,081,885 | $ 24,191,165 |
Reinvestment of distributions | - | 63,636 | - | 3,100,723 |
Shares redeemed | (300,277) | (484,293) | (10,819,907) | (22,585,009) |
Net increase (decrease) | (157,465) | 89,416 | $ (5,738,022) | $ 4,706,879 |
Gold | | | | |
Shares sold | 12,217,076 | 30,555,727 | $ 461,041,057 | $ 1,483,101,053 |
Reinvestment of distributions | - | 4,125,294 | - | 208,463,091 |
Shares redeemed | (15,184,970) | (31,912,749) | (569,825,690) | (1,536,990,789) |
Net increase (decrease) | (2,967,894) | 2,768,272 | $ (108,784,633) | $ 154,573,355 |
Institutional Class | | | | |
Shares sold | 650,993 | 1,664,357 | $ 24,357,064 | $ 81,430,250 |
Reinvestment of distributions | - | 146,226 | - | 7,344,695 |
Shares redeemed | (478,376) | (810,698) | (17,651,426) | (38,218,873) |
Net increase (decrease) | 172,617 | 999,885 | $ 6,705,638 | $ 50,556,072 |
14. Other.
The Fund's organizational documents provide former and current trustees and officers with a limited indemnification against liabilities arising in connection with the performance of their duties to the Fund. In the normal course of business, the Fund may also enter into contracts that provide general indemnifications. The Fund's maximum exposure under these arrangements is unknown as this would be dependent on future claims that may be made against the Fund. The risk of material loss from such claims is considered remote.
Semiannual Report
Materials Portfolio
As a shareholder of the Fund, you incur two types of costs: (1) transaction costs, including sales charges (loads) on purchase payments or redemption proceeds, redemption fees and (2) ongoing costs, including management fees, distribution and/or service (12b-1) fees and other Fund expenses. This Example is intended to help you understand your ongoing costs (in dollars) of investing in the Fund and to compare these costs with the ongoing costs of investing in other mutual funds.
The Example is based on an investment of $1,000 invested at the beginning of the period and held for the entire period (March 1, 2012 to August 31, 2012).
Actual Expenses
The first line of the accompanying table for each class of the Fund provides information about actual account values and actual expenses. You may use the information in this line, together with the amount you invested, to estimate the expenses that you paid over the period. Simply divide your account value by $1,000.00 (for example, an $8,600 account value divided by $1,000.00 = 8.6), then multiply the result by the number in the first line for a class of the Fund under the heading entitled "Expenses Paid During Period" to estimate the expenses you paid on your account during this period. A small balance maintenance fee of $12.00 that is charged once a year may apply for certain accounts with a value of less than $2,000. This fee is not included in the table below. If it was, the estimate of expenses you paid during the period would be higher, and your ending account value lower, by this amount. In addition, the Fund, as a shareholder in the underlying Fidelity Central Funds, will indirectly bear its pro-rata share of the fees and expenses incurred by the underlying Fidelity Central Funds. These fees and expenses are not included in the Fund's annualized expense ratio used to calculate the expense estimate in the table below.
Hypothetical Example for Comparison Purposes
The second line of the accompanying table for each class of the Fund provides information about hypothetical account values and hypothetical expenses based on a Class' actual expense ratio and an assumed rate of return of 5% per year before expenses, which is not the Class' actual return. The hypothetical account values and expenses may not be used to estimate the actual ending account balance or expenses you paid for the period. You may use this information to compare the ongoing costs of investing in the Fund and other funds. To do so, compare this 5% hypothetical example with the 5% hypothetical examples that appear in the shareholder reports of the other funds. A small balance maintenance fee of $12.00 that is charged once a year may apply for certain accounts with a value of less than $2,000. This fee is not included in the table below. If it was, the estimate of expenses you paid during the period would be higher, and your ending account value lower, by this amount. In addition, the Fund, as a shareholder in the underlying Fidelity Central Funds, will indirectly bear its pro-rata share of the fees and expenses incurred by the underlying Fidelity Central Funds. These fees and expenses are not included in the Fund's annualized expense ratio used to calculate the expense estimate in the table below.
Please note that the expenses shown in the table are meant to highlight your ongoing costs only and do not reflect any transaction costs. Therefore, the second line of the table is useful in comparing ongoing costs only, and will not help you determine the relative total costs of owning different funds. In addition, if these transactional costs were included, your costs would have been higher.
| Annualized
Expense Ratio | Beginning
Account Value
March 1, 2012 | Ending
Account Value
August 31, 2012 | Expenses Paid
During Period*
March 1, 2012
to August 31, 2012 |
Class A | 1.13% | | | |
Actual | | $ 1,000.00 | $ 989.70 | $ 5.67 |
HypotheticalA | | $ 1,000.00 | $ 1,019.51 | $ 5.75 |
Class T | 1.42% | | | |
Actual | | $ 1,000.00 | $ 988.30 | $ 7.12 |
HypotheticalA | | $ 1,000.00 | $ 1,018.05 | $ 7.22 |
Class B | 1.91% | | | |
Actual | | $ 1,000.00 | $ 985.90 | $ 9.56 |
HypotheticalA | | $ 1,000.00 | $ 1,015.58 | $ 9.70 |
Class C | 1.89% | | | |
Actual | | $ 1,000.00 | $ 985.80 | $ 9.46 |
HypotheticalA | | $ 1,000.00 | $ 1,015.68 | $ 9.60 |
Materials | .86% | | | |
Actual | | $ 1,000.00 | $ 991.00 | $ 4.32 |
HypotheticalA | | $ 1,000.00 | $ 1,020.87 | $ 4.38 |
Institutional Class | .85% | | | |
Actual | | $ 1,000.00 | $ 991.00 | $ 4.27 |
HypotheticalA | | $ 1,000.00 | $ 1,020.92 | $ 4.33 |
A 5% return per year before expenses
* Expenses are equal to each Class' annualized expense ratio, multiplied by the average account value over the period, multiplied by 184/365 (to reflect the one-half year period).
Semiannual Report
Materials Portfolio
Investment Changes (Unaudited)
Top Ten Stocks as of August 31, 2012 |
| % of fund's
net assets | % of fund's net assets
6 months ago |
E.I. du Pont de Nemours & Co. | 8.3 | 8.1 |
Monsanto Co. | 8.1 | 6.6 |
Air Products & Chemicals, Inc. | 5.7 | 5.2 |
LyondellBasell Industries NV Class A | 4.2 | 3.5 |
Eastman Chemical Co. | 3.8 | 2.2 |
PPG Industries, Inc. | 3.6 | 2.2 |
Ecolab, Inc. | 3.5 | 3.8 |
Sherwin-Williams Co. | 3.2 | 2.4 |
Rock-Tenn Co. Class A | 3.2 | 2.5 |
Freeport-McMoRan Copper & Gold, Inc. | 2.8 | 2.7 |
| 46.4 | |
Top Industries (% of fund's net assets) |
As of August 31, 2012 |
| Chemicals | 62.5% | |
| Metals & Mining | 19.5% | |
| Containers & Packaging | 8.6% | |
| Construction Materials | 1.5% | |
| Paper & Forest Products | 1.2% | |
| All Others* | 6.7% | |

As of February 29, 2012 |
| Chemicals | 65.0% | |
| Metals & Mining | 20.1% | |
| Containers & Packaging | 8.0% | |
| Food Products | 1.0% | |
| Electrical Equipment | 0.6% | |
| All Others* | 5.3% | |

* Includes short-term investments and net other assets. |
Semiannual Report
Materials Portfolio
Investments August 31, 2012 (Unaudited)
Showing Percentage of Net Assets
Common Stocks - 94.0% |
| Shares | | Value |
CHEMICALS - 62.5% |
Commodity Chemicals - 2.5% |
Arkema SA | 81,801 | | $ 6,963,548 |
PetroLogistics LP | 707,262 | | 9,045,881 |
Westlake Chemical Corp. (d) | 266,370 | | 18,320,929 |
| | 34,330,358 |
Diversified Chemicals - 18.6% |
Dow Chemical Co. | 313,213 | | 9,180,273 |
E.I. du Pont de Nemours & Co. | 2,275,817 | | 113,221,891 |
Eastman Chemical Co. | 921,584 | | 50,926,732 |
FMC Corp. | 359,730 | | 19,540,534 |
Lanxess AG | 96,593 | | 7,328,559 |
Olin Corp. | 180,200 | | 3,861,686 |
PPG Industries, Inc. | 446,927 | | 49,170,909 |
| | 253,230,584 |
Fertilizers & Agricultural Chemicals - 11.6% |
CF Industries Holdings, Inc. | 164,937 | | 34,143,608 |
Monsanto Co. | 1,257,799 | | 109,566,871 |
Rentech Nitrogen Partners LP | 409,909 | | 13,924,609 |
| | 157,635,088 |
Industrial Gases - 5.7% |
Air Products & Chemicals, Inc. | 935,857 | | 77,283,071 |
Specialty Chemicals - 24.1% |
Albemarle Corp. | 427,749 | | 23,410,703 |
Ashland, Inc. | 509,786 | | 37,535,543 |
Celanese Corp. Class A | 525,033 | | 20,087,763 |
Cytec Industries, Inc. | 203,146 | | 13,909,407 |
Ecolab, Inc. | 737,482 | | 47,220,972 |
Kraton Performance Polymers, Inc. (a) | 77,900 | | 1,670,955 |
LyondellBasell Industries NV Class A | 1,163,330 | | 56,817,037 |
OMNOVA Solutions, Inc. (a) | 500,291 | | 3,897,267 |
Rockwood Holdings, Inc. | 311,332 | | 14,738,457 |
Sherwin-Williams Co. | 304,547 | | 43,574,585 |
Sigma Aldrich Corp. | 462,244 | | 32,833,191 |
W.R. Grace & Co. (a) | 570,496 | | 32,951,849 |
| | 328,647,729 |
TOTAL CHEMICALS | | 851,126,830 |
COMMERCIAL SERVICES & SUPPLIES - 0.2% |
Environmental & Facility Services - 0.2% |
Swisher Hygiene, Inc. (a) | 262,171 | | 417,639 |
Swisher Hygiene, Inc. (Canada) (a)(d) | 1,553,967 | | 2,750,526 |
| | 3,168,165 |
CONSTRUCTION MATERIALS - 1.5% |
Construction Materials - 1.5% |
Martin Marietta Materials, Inc. (d) | 272,511 | | 20,814,390 |
|
| Shares | | Value |
CONTAINERS & PACKAGING - 8.6% |
Metal & Glass Containers - 5.4% |
Aptargroup, Inc. | 552,400 | | $ 27,979,060 |
Ball Corp. | 795,733 | | 33,556,061 |
Nampak Ltd. | 78,373 | | 252,290 |
Silgan Holdings, Inc. | 285,078 | | 11,953,321 |
| | 73,740,732 |
Paper Packaging - 3.2% |
Rock-Tenn Co. Class A | 649,333 | | 43,355,964 |
TOTAL CONTAINERS & PACKAGING | | 117,096,696 |
METALS & MINING - 19.5% |
Diversified Metals & Mining - 6.5% |
Copper Mountain Mining Corp. (a) | 1,992,200 | | 5,295,018 |
First Quantum Minerals Ltd. | 1,341,300 | | 25,839,500 |
Freeport-McMoRan Copper & Gold, Inc. | 1,052,624 | | 38,010,253 |
HudBay Minerals, Inc. | 408,700 | | 3,495,147 |
Iluka Resources Ltd. | 78,303 | | 744,268 |
Turquoise Hill Resources Ltd. (a)(d) | 1,899,540 | | 15,261,838 |
| | 88,646,024 |
Gold - 6.6% |
Allied Nevada Gold Corp. (a) | 261,472 | | 8,518,758 |
Franco-Nevada Corp. | 207,300 | | 10,754,575 |
Goldcorp, Inc. | 457,700 | | 18,790,889 |
Newmont Mining Corp. | 555,189 | | 28,136,979 |
Royal Gold, Inc. | 267,701 | | 23,563,042 |
| | 89,764,243 |
Steel - 6.4% |
African Minerals Ltd. (a) | 529,923 | | 2,120,424 |
Carpenter Technology Corp. | 386,855 | | 18,282,767 |
Haynes International, Inc. | 232,886 | | 11,353,193 |
Nucor Corp. | 634,535 | | 23,890,243 |
Reliance Steel & Aluminum Co. | 370,602 | | 19,060,061 |
Steel Dynamics, Inc. | 954,009 | | 11,657,990 |
| | 86,364,678 |
TOTAL METALS & MINING | | 264,774,945 |
OIL, GAS & CONSUMABLE FUELS - 0.5% |
Coal & Consumable Fuels - 0.5% |
Peabody Energy Corp. | 297,643 | | 6,438,018 |
PAPER & FOREST PRODUCTS - 1.2% |
Paper Products - 1.2% |
International Paper Co. | 473,440 | | 16,362,086 |
TOTAL COMMON STOCKS (Cost $1,083,584,729) |
1,279,781,130
|
Convertible Bonds - 0.6% |
| Principal
Amount | | Value |
BUILDING PRODUCTS - 0.6% |
Building Products - 0.6% |
Aspen Aerogels, Inc. 8% 6/1/14 (f)
(Cost $7,861,200) | | $ 7,861,200 | | $ 7,861,200 |
U.S. Treasury Obligations - 0.0% |
|
U.S. Treasury Bills, yield at date of purchase 0.1% 11/23/12 (e)
(Cost $669,841) | | 670,000 | |
669,873
|
Money Market Funds - 7.1% |
| Shares | | |
Fidelity Cash Central Fund, 0.17% (b) | 77,412,400 | | 77,412,400 |
Fidelity Securities Lending Cash Central Fund, 0.18% (b)(c) | 19,616,097 | | 19,616,097 |
TOTAL MONEY MARKET FUNDS (Cost $97,028,497) |
97,028,497
|
TOTAL INVESTMENT PORTFOLIO - 101.7% (Cost $1,189,144,267) | |
1,385,340,700
|
NET OTHER ASSETS (LIABILITIES) - (1.7)% | | (23,673,690) |
NET ASSETS - 100% | $ 1,361,667,010 |
Futures Contracts |
| Expiration
Date | | Underlying
Face Amount
at Value | | Unrealized
Appreciation/
(Depreciation) |
Purchased |
Equity Index Contracts |
350 CME E-mini Materials Select Sector Index Contracts | Sept. 2012 | | $ 13,104,000 | | $ 585,925 |
|
The face value of futures purchased as a percentage of net assets is 1% |
Legend |
(a) Non-income producing |
(b) Affiliated fund that is available only to investment companies and other accounts managed by Fidelity Investments. The rate quoted is the annualized seven-day yield of the fund at period end. A complete unaudited listing of the fund's holdings as of its most recent quarter end is available upon request. In addition, each Fidelity Central Fund's financial statements are available on the SEC's website or upon request. |
(c) Investment made with cash collateral received from securities on loan. |
(d) Security or a portion of the security is on loan at period end. |
(e) Security or a portion of the security was pledged to cover margin requirements for futures contracts. At the period end, the value of securities pledged amounted to $669,873. |
(f) Restricted securities - Investment in securities not registered under the Securities Act of 1933 (excluding 144A issues). At the end of the period, the value of restricted securities (excluding 144A issues) amounted to $7,861,200 or 0.6% of net assets. |
Additional information on each restricted holding is as follows: |
Security | Acquisition Date | Acquisition Cost |
Aspen Aerogels, Inc. 8% 6/1/14 | 6/1/11 | $ 7,861,200 |
Affiliated Central Funds |
Information regarding fiscal year to date income earned by the Fund from investments in Fidelity Central Funds is as follows: |
Fund | Income earned |
Fidelity Cash Central Fund | $ 44,504 |
Fidelity Securities Lending Cash Central Fund | 177,206 |
Total | $ 221,710 |
Other Information |
The following is a summary of the inputs used, as of August 31, 2012, involving the Fund's assets and liabilities carried at fair value. The inputs or methodology used for valuing securities may not be an indication of the risk associated with investing in those securities. For more information on valuation inputs, and their aggregation into the levels used in the table below, please refer to the Security Valuation section in the accompanying Notes to Financial Statements. |
Valuation Inputs at Reporting Date: |
Description | Total | Level 1 | Level 2 | Level 3 |
Investments in Securities: | | | | |
Common Stocks | $ 1,279,781,130 | $ 1,279,363,491 | $ 417,639 | $ - |
Convertible Bonds | 7,861,200 | - | - | 7,861,200 |
U.S. Treasury Obligations | 669,873 | - | 669,873 | - |
Money Market Funds | 97,028,497 | 97,028,497 | - | - |
Total Investments in Securities: | $ 1,385,340,700 | $ 1,376,391,988 | $ 1,087,512 | $ 7,861,200 |
Derivative Instruments: | | | | |
Assets | | | | |
Futures Contracts | $ 585,925 | $ 585,925 | $ - | $ - |
Value of Derivative Instruments |
The following table is a summary of the Fund's value of derivative instruments by primary risk exposure as of August 31, 2012. For additional information on derivative instruments, please refer to the Derivative Instruments section in the accompanying Notes to Financial Statements. |
Primary Risk Exposure /
Derivative Type | Value |
| Asset | Liability |
Equity Risk | | |
Futures Contracts (a) | $ 585,925 | $ - |
Total Value of Derivatives | $ 585,925 | $ - |
(a) Reflects cumulative appreciation/(depreciation) on futures contracts as disclosed on the Schedule of Investments. Only the period end variation margin is separately disclosed on the Statement of Assets and Liabilities. |
Distribution of investments by country or territory of incorporation, as a percentage of total net assets, is as follows. (Unaudited) |
United States of America | 88.7% |
Canada | 5.9% |
Netherlands | 4.2% |
Others (Individually Less Than 1%) | 1.2% |
| 100.0% |
See accompanying notes which are an integral part of the financial statements.
Semiannual Report
Materials Portfolio
Statement of Assets and Liabilities
| August 31, 2012 (Unaudited) |
| | |
Assets | | |
Investment in securities, at value (including securities loaned of $19,434,991) - See accompanying schedule: Unaffiliated issuers (cost $1,092,115,770) | $ 1,288,312,203 | |
Fidelity Central Funds (cost $97,028,497) | 97,028,497 | |
Total Investments (cost $1,189,144,267) | | $ 1,385,340,700 |
Receivable for investments sold | | 4,349,682 |
Receivable for fund shares sold | | 1,765,081 |
Dividends receivable | | 2,725,988 |
Interest receivable | | 786,120 |
Distributions receivable from Fidelity Central Funds | | 29,250 |
Receivable for daily variation margin on futures contracts | | 126,001 |
Other receivables | | 13,588 |
Total assets | | 1,395,136,410 |
| | |
Liabilities | | |
Payable for investments purchased | $ 9,732,173 | |
Payable for fund shares redeemed | 3,050,657 | |
Accrued management fee | 627,023 | |
Distribution and service plan fees payable | 100,292 | |
Other affiliated payables | 306,803 | |
Other payables and accrued expenses | 36,355 | |
Collateral on securities loaned, at value | 19,616,097 | |
Total liabilities | | 33,469,400 |
| | |
Net Assets | | $ 1,361,667,010 |
Net Assets consist of: | | |
Paid in capital | | $ 1,157,341,532 |
Undistributed net investment income | | 7,293,497 |
Accumulated undistributed net realized gain (loss) on investments and foreign currency transactions | | 252,393 |
Net unrealized appreciation (depreciation) on investments and assets and liabilities in foreign currencies | | 196,779,588 |
Net Assets | | $ 1,361,667,010 |
Statement of Assets and Liabilities - continued
| August 31, 2012 (Unaudited) |
| | |
Calculation of Maximum Offering Price Class A:
Net Asset Value and redemption price per share ($159,241,924 ÷ 2,337,341 shares) | | $ 68.13 |
| | |
Maximum offering price per share (100/94.25 of $68.13) | | $ 72.29 |
Class T:
Net Asset Value and redemption price per share ($27,882,308 ÷ 411,614 shares) | | $ 67.74 |
| | |
Maximum offering price per share (100/96.50 of $67.74) | | $ 70.20 |
Class B:
Net Asset Value and offering price per share ($9,924,133 ÷ 148,566 shares)A | | $ 66.80 |
| | |
Class C:
Net Asset Value and offering price per share ($57,455,649 ÷ 861,994 shares)A | | $ 66.65 |
| | |
Materials:
Net Asset Value, offering price and redemption price per share ($997,832,433 ÷ 14,593,648 shares) | | $ 68.37 |
| | |
Institutional Class:
Net Asset Value, offering price and redemption price per share ($109,330,563 ÷ 1,600,390 shares) | | $ 68.31 |
A Redemption price per share is equal to net asset value less any applicable contingent deferred sales charge.
See accompanying notes which are an integral part of the financial statements.
Semiannual Report
Statement of Operations
| Six months ended August 31, 2012 (Unaudited) |
| | |
Investment Income | | |
Dividends | | $ 13,109,631 |
Interest | | 316,596 |
Income from Fidelity Central Funds | | 221,710 |
Total income | | 13,647,937 |
| | |
Expenses | | |
Management fee | $ 3,727,331 | |
Transfer agent fees | 1,666,477 | |
Distribution and service plan fees | 595,415 | |
Accounting and security lending fees | 214,646 | |
Custodian fees and expenses | 19,192 | |
Independent trustees' compensation | 4,519 | |
Registration fees | 90,223 | |
Audit | 22,561 | |
Legal | 2,614 | |
Miscellaneous | 8,676 | |
Total expenses before reductions | 6,351,654 | |
Expense reductions | (20,380) | 6,331,274 |
Net investment income (loss) | | 7,316,663 |
Realized and Unrealized Gain (Loss) Net realized gain (loss) on: | | |
Investment securities: | | |
Unaffiliated issuers | 11,592,171 | |
Foreign currency transactions | 9,600 | |
Futures contracts | 165,760 | |
Total net realized gain (loss) | | 11,767,531 |
Change in net unrealized appreciation (depreciation) on: Investment securities | (35,717,709) | |
Assets and liabilities in foreign currencies | (2,770) | |
Futures contracts | (575,410) | |
Total change in net unrealized appreciation (depreciation) | | (36,295,889) |
Net gain (loss) | | (24,528,358) |
Net increase (decrease) in net assets resulting from operations | | $ (17,211,695) |
Statement of Changes in Net Assets
| Six months ended
August 31, 2012
(Unaudited) | Year ended
February 29,
2012 |
Increase (Decrease) in Net Assets | | |
Operations | | |
Net investment income (loss) | $ 7,316,663 | $ 11,168,253 |
Net realized gain (loss) | 11,767,531 | 34,880,798 |
Change in net unrealized appreciation (depreciation) | (36,295,889) | (65,841,883) |
Net increase (decrease) in net assets resulting from operations | (17,211,695) | (19,792,832) |
Distributions to shareholders from net investment income | (820,982) | (9,840,737) |
Distributions to shareholders from net realized gain | (7,338,384) | (7,461,289) |
Total distributions | (8,159,366) | (17,302,026) |
Share transactions - net increase (decrease) | (47,316,017) | (18,941,790) |
Redemption fees | 28,325 | 99,276 |
Total increase (decrease) in net assets | (72,658,753) | (55,937,372) |
| | |
Net Assets | | |
Beginning of period | 1,434,325,763 | 1,490,263,135 |
End of period (including undistributed net investment income of $7,293,497 and undistributed net investment income of $797,816, respectively) | $ 1,361,667,010 | $ 1,434,325,763 |
See accompanying notes which are an integral part of the financial statements.
Semiannual Report
Financial Highlights - Class A
| Six months ended
August 31, 2012 | Years ended February 28, |
| (Unaudited) | 2012 L | 2011 | 2010 | 2009 | 2008 L |
Selected Per-Share Data | | | | | | |
Net asset value, beginning of period | $ 69.23 | $ 69.96 | $ 52.54 | $ 27.65 | $ 57.00 | $ 51.01 |
Income from Investment Operations | | | | | | |
Net investment income (loss) E | .30 | .40 | 1.08 H | .30 I | .22 | .46 |
Net realized and unrealized gain (loss) | (1.02) | (.35) | 17.40 | 24.90 | (29.46) | 8.05 |
Total from investment operations | (.72) | .05 | 18.48 | 25.20 | (29.24) | 8.51 |
Distributions from net investment income | (.02) | (.40) | (1.06) | (.32) | (.12) | (.32) |
Distributions from net realized gain | (.36) | (.38) | (.01) | - | - | (2.21) |
Total distributions | (.38) | (.78) | (1.07) | (.32) | (.12) | (2.53) N |
Redemption fees added to paid in capital E | - M | - M | .01 | .01 | .01 | .01 |
Net asset value, end of period | $ 68.13 | $ 69.23 | $ 69.96 | $ 52.54 | $ 27.65 | $ 57.00 |
Total Return B, C, D | (1.03)% | .21% | 35.33% | 91.25% | (51.30)% | 16.79% |
Ratios to Average Net Assets F, J | | | | | | |
Expenses before reductions | 1.13% A | 1.13% | 1.16% | 1.23% | 1.21% | 1.21% |
Expenses net of fee waivers, if any | 1.13% A | 1.13% | 1.16% | 1.23% | 1.21% | 1.21% |
Expenses net of all reductions | 1.13% A | 1.13% | 1.15% | 1.22% | 1.20% | 1.21% |
Net investment income (loss) | .91% A | .61% | 1.81% H | .65% I | .47% | .83% |
Supplemental Data | | | | | | |
Net assets, end of period (000 omitted) | $ 159,242 | $ 157,781 | $ 124,160 | $ 52,352 | $ 10,796 | $ 12,522 |
Portfolio turnover rate G | 59% A | 94% | 87% | 104% K | 117% | 77% |
A Annualized B Total returns for periods of less than one year are not annualized. C Total returns would have been lower if certain expenses had not been reduced during the applicable periods shown. D Total returns do not include the effect of the sales charges. E Calculated based on average shares outstanding during the period. F Fees and expenses of any underlying Fidelity Central Funds are not included in the Fund's expense ratio. The Fund indirectly bears its proportionate share of the expenses of any underlying Fidelity Central Funds. G Amount does not include the portfolio activity of any underlying Fidelity Central Funds. H Investment income per share reflects a large, non-recurring dividend which amounted to $.83 per share. Excluding this non-recurring dividend, the ratio of net investment income (loss) to average net assets would have been .41%. I Investment income per share reflects a large, non-recurring dividend which amounted to $.10 per share. Excluding this non-recurring dividend, the ratio of net investment income (loss) to average net assets would have been .43%. J Expense ratios reflect operating expenses of the class. Expenses before reductions do not reflect amounts reimbursed by the investment adviser or reductions from brokerage service arrangements or reductions from other expense offset arrangements and do not represent the amount paid by the class during periods when reimbursements or reductions occur. Expenses net of fee waivers reflect expenses after reimbursement by the investment adviser but prior to reductions from brokerage service arrangements or other expense offset arrangements. Expenses net of all reductions represent the net expenses paid by the class. K The portfolio turnover rate does not include the assets acquired in the merger. L For the year ended February 29. M Amount represents less than $.01 per share. N Total distributions of $2.53 per share is comprised of distributions from net investment income of $.322 and distributions from net realized gain of $2.210 per share. |
Financial Highlights - Class T
| Six months ended
August 31, 2012 | Years ended February 28, |
| (Unaudited) | 2012 L | 2011 | 2010 | 2009 | 2008 L |
Selected Per-Share Data | | | | | | |
Net asset value, beginning of period | $ 68.91 | $ 69.68 | $ 52.35 | $ 27.56 | $ 56.80 | $ 50.89 |
Income from Investment Operations | | | | | | |
Net investment income (loss) E | .21 | .21 | .90 H | .16 I | .10 | .32 |
Net realized and unrealized gain (loss) | (1.02) | (.35) | 17.34 | 24.81 | (29.32) | 8.00 |
Total from investment operations | (.81) | (.14) | 18.24 | 24.97 | (29.22) | 8.32 |
Distributions from net investment income | - | (.25) | (.92) | (.19) | (.03) | (.21) |
Distributions from net realized gain | (.36) | (.38) | - | - | - | (2.21) |
Total distributions | (.36) | (.63) | (.92) | (.19) | (.03) | (2.42) N |
Redemption fees added to paid in capital E | - M | - M | .01 | .01 | .01 | .01 |
Net asset value, end of period | $ 67.74 | $ 68.91 | $ 69.68 | $ 52.35 | $ 27.56 | $ 56.80 |
Total Return B, C, D | (1.17)% | (.09)% | 34.98% | 90.70% | (51.43)% | 16.45% |
Ratios to Average Net Assets F, J | | | | | | |
Expenses before reductions | 1.42% A | 1.42% | 1.44% | 1.52% | 1.46% | 1.46% |
Expenses net of fee waivers, if any | 1.42% A | 1.42% | 1.44% | 1.52% | 1.46% | 1.46% |
Expenses net of all reductions | 1.42% A | 1.41% | 1.43% | 1.51% | 1.46% | 1.46% |
Net investment income (loss) | .62% A | .33% | 1.54% H | .35% I | .22% | .57% |
Supplemental Data | | | | | | |
Net assets, end of period (000 omitted) | $ 27,882 | $ 28,290 | $ 25,570 | $ 14,712 | $ 4,944 | $ 6,850 |
Portfolio turnover rate G | 59% A | 94% | 87% | 104% K | 117% | 77% |
A Annualized B Total returns for periods of less than one year are not annualized. C Total returns would have been lower if certain expenses had not been reduced during the applicable periods shown. D Total returns do not include the effect of the sales charges. E Calculated based on average shares outstanding during the period. F Fees and expenses of any underlying Fidelity Central Funds are not included in the Fund's expense ratio. The Fund indirectly bears its proportionate share of the expenses of any underlying Fidelity Central Funds. G Amount does not include the portfolio activity of any underlying Fidelity Central Funds. H Investment income per share reflects a large, non-recurring dividend which amounted to $.83 per share. Excluding this non-recurring dividend, the ratio of net investment income (loss) to average net assets would have been .14%. I Investment income per share reflects a large, non-recurring dividend which amounted to $.10 per share. Excluding this non-recurring dividend, the ratio of net investment income (loss) to average net assets would have been .14%. J Expense ratios reflect operating expenses of the class. Expenses before reductions do not reflect amounts reimbursed by the investment adviser or reductions from brokerage service arrangements or reductions from other expense offset arrangements and do not represent the amount paid by the class during periods when reimbursements or reductions occur. Expenses net of fee waivers reflect expenses after reimbursement by the investment adviser but prior to reductions from brokerage service arrangements or other expense offset arrangements. Expenses net of all reductions represent the net expenses paid by the class. K The portfolio turnover rate does not include the assets acquired in the merger. L For the year ended February 29. M Amount represents less than $.01 per share. N Total distributions of $2.42 per share is comprised of distributions from net investment income of $.207 and distributions from net realized gain of $2.210 per share. |
See accompanying notes which are an integral part of the financial statements.
Semiannual Report
Financial Highlights - Class B
| Six months ended
August 31, 2012 | Years ended February 28, |
| (Unaudited) | 2012 L | 2011 | 2010 | 2009 | 2008 L |
Selected Per-Share Data | | | | | | |
Net asset value, beginning of period | $ 68.13 | $ 68.95 | $ 51.86 | $ 27.35 | $ 56.59 | $ 50.81 |
Income from Investment Operations | | | | | | |
Net investment income (loss) E | .04 | (.11) | .60 H | (.07) I | (.12) | .04 |
Net realized and unrealized gain (loss) | (1.01) | (.33) | 17.13 | 24.61 | (29.13) | 7.98 |
Total from investment operations | (.97) | (.44) | 17.73 | 24.54 | (29.25) | 8.02 |
Distributions from net investment income | - | - | (.65) | (.04) | - | (.04) |
Distributions from net realized gain | (.36) | (.38) | - | - | - | (2.21) |
Total distributions | (.36) | (.38) | (.65) | (.04) | - | (2.25) N |
Redemption fees added to paid in capital E | - M | - M | .01 | .01 | .01 | .01 |
Net asset value, end of period | $ 66.80 | $ 68.13 | $ 68.95 | $ 51.86 | $ 27.35 | $ 56.59 |
Total Return B, C, D | (1.41)% | (.57)% | 34.29% | 89.79% | (51.67)% | 15.89% |
Ratios to Average Net Assets F, J | | | | | | |
Expenses before reductions | 1.91% A | 1.91% | 1.93% | 2.02% | 1.95% | 1.97% |
Expenses net of fee waivers, if any | 1.91% A | 1.91% | 1.93% | 2.02% | 1.95% | 1.97% |
Expenses net of all reductions | 1.91% A | 1.91% | 1.92% | 2.01% | 1.95% | 1.96% |
Net investment income (loss) | .13% A | (.17)% | 1.04% H | (.15)% I | (.27)% | .07% |
Supplemental Data | | | | | | |
Net assets, end of period (000 omitted) | $ 9,924 | $ 11,040 | $ 13,507 | $ 9,538 | $ 2,601 | $ 4,173 |
Portfolio turnover rate G | 59% A | 94% | 87% | 104% K | 117% | 77% |
A Annualized B Total returns for periods of less than one year are not annualized. C Total returns would have been lower if certain expenses had not been reduced during the applicable periods shown. D Total returns do not include the effect of the contingent deferred sales charge. E Calculated based on average shares outstanding during the period. F Fees and expenses of any underlying Fidelity Central Funds are not included in the Fund's expense ratio. The Fund indirectly bears its proportionate share of the expenses of any underlying Fidelity Central Funds. G Amount does not include the portfolio activity of any underlying Fidelity Central Funds. H Investment income per share reflects a large, non-recurring dividend which amounted to $.83 per share. Excluding this non-recurring dividend, the ratio of net investment income (loss) to average net assets would have been (.35)%. I Investment income per share reflects a large, non-recurring dividend which amounted to $.10 per share. Excluding this non-recurring dividend, the ratio of net investment income (loss) to average net assets would have been (.36)%. J Expense ratios reflect operating expenses of the class. Expenses before reductions do not reflect amounts reimbursed by the investment adviser or reductions from brokerage service arrangements or reductions from other expense offset arrangements and do not represent the amount paid by the class during periods when reimbursements or reductions occur. Expenses net of fee waivers reflect expenses after reimbursement by the investment adviser but prior to reductions from brokerage service arrangements or other expense offset arrangements. Expenses net of all reductions represent the net expenses paid by the class. K The portfolio turnover rate does not include the assets acquired in the merger. L For the year ended February 29. M Amount represents less than $.01 per share. N Total distributions of $2.25 per share is comprised of distributions from net investment income of $.043 and distributions from net realized gain of $2.210 per share. |
Financial Highlights - Class C
| Six months ended
August 31, 2012 | Years ended February 28, |
| (Unaudited) | 2012 L | 2011 | 2010 | 2009 | 2008 L |
Selected Per-Share Data | | | | | | |
Net asset value, beginning of period | $ 67.98 | $ 68.78 | $ 51.79 | $ 27.31 | $ 56.50 | $ 50.81 |
Income from Investment Operations | | | | | | |
Net investment income (loss) E | .05 | (.10) | .61 H | (.06) I | (.13) | .04 |
Net realized and unrealized gain (loss) | (1.02) | (.32) | 17.09 | 24.57 | (29.07) | 7.97 |
Total from investment operations | (.97) | (.42) | 17.70 | 24.51 | (29.20) | 8.01 |
Distributions from net investment income | - | - | (.72) | (.04) | - | (.12) |
Distributions from net realized gain | (.36) | (.38) | - | - | - | (2.21) |
Total distributions | (.36) | (.38) | (.72) | (.04) | - | (2.33) N |
Redemption fees added to paid in capital E | - M | - M | .01 | .01 | .01 | .01 |
Net asset value, end of period | $ 66.65 | $ 67.98 | $ 68.78 | $ 51.79 | $ 27.31 | $ 56.50 |
Total Return B, C, D | (1.42)% | (.55)% | 34.29% | 89.82% | (51.66)% | 15.87% |
Ratios to Average Net Assets F, J | | | | | | |
Expenses before reductions | 1.89% A | 1.89% | 1.93% | 2.01% | 1.95% | 1.96% |
Expenses net of fee waivers, if any | 1.89% A | 1.89% | 1.93% | 2.01% | 1.95% | 1.96% |
Expenses net of all reductions | 1.89% A | 1.89% | 1.92% | 2.00% | 1.95% | 1.96% |
Net investment income (loss) | .15% A | (.15)% | 1.04% H | (.13)% I | (.27)% | .07% |
Supplemental Data | | | | | | |
Net assets, end of period (000 omitted) | $ 57,456 | $ 58,296 | $ 46,525 | $ 20,469 | $ 5,509 | $ 8,743 |
Portfolio turnover rate G | 59% A | 94% | 87% | 104% K | 117% | 77% |
A Annualized B Total returns for periods of less than one year are not annualized. C Total returns would have been lower if certain expenses had not been reduced during the applicable periods shown. D Total returns do not include the effect of the contingent deferred sales charge. E Calculated based on average shares outstanding during the period. F Fees and expenses of any underlying Fidelity Central Funds are not included in the Fund's expense ratio. The Fund indirectly bears its proportionate share of the expenses of any underlying Fidelity Central Funds. G Amount does not include the portfolio activity of any underlying Fidelity Central Funds. H Investment income per share reflects a large, non-recurring dividend which amounted to $.83 per share. Excluding this non-recurring dividend, the ratio of net investment income (loss) to average net assets would have been (.35)%. I Investment income per share reflects a large, non-recurring dividend which amounted to $.10 per share. Excluding this non-recurring dividend, the ratio of net investment income (loss) to average net assets would have been (.35)%. J Expense ratios reflect operating expenses of the class. Expenses before reductions do not reflect amounts reimbursed by the investment adviser or reductions from brokerage service arrangements or reductions from other expense offset arrangements and do not represent the amount paid by the class during periods when reimbursements or reductions occur. Expenses net of fee waivers reflect expenses after reimbursement by the investment adviser but prior to reductions from brokerage service arrangements or other expense offset arrangements. Expenses net of all reductions represent the net expenses paid by the class. K The portfolio turnover rate does not include the assets acquired in the merger. L For the year ended February 29. M Amount represents less than $.01 per share. N Total distributions of $2.33 per share is comprised of distributions from net investment income of $.124 and distributions from net realized gain of $2.210 per share. |
See accompanying notes which are an integral part of the financial statements.
Semiannual Report
Financial Highlights - Materials
| Six months ended
August 31, 2012 | Years ended February 28, |
| (Unaudited) | 2012 K | 2011 | 2010 | 2009 | 2008 K |
Selected Per-Share Data | | | | | | |
Net asset value, beginning of period | $ 69.41 | $ 70.11 | $ 52.61 | $ 27.66 | $ 57.01 | $ 50.92 |
Income from Investment Operations | | | | | | |
Net investment income (loss) D | .40 | .60 | 1.25 G | .43 H | .38 | .64 |
Net realized and unrealized gain (loss) | (1.03) | (.37) | 17.43 | 24.91 | (29.54) | 8.01 |
Total from investment operations | (.63) | .23 | 18.68 | 25.34 | (29.16) | 8.65 |
Distributions from net investment income | (.05) | (.55) | (1.16) | (.40) | (.20) | (.36) |
Distributions from net realized gain | (.36) | (.38) | (.03) | - | - | (2.21) |
Total distributions | (.41) | (.93) | (1.19) | (.40) | (.20) | (2.57) M |
Redemption fees added to paid in capital D | - L | - L | .01 | .01 | .01 | .01 |
Net asset value, end of period | $ 68.37 | $ 69.41 | $ 70.11 | $ 52.61 | $ 27.66 | $ 57.01 |
Total Return B, C | (.90)% | .49% | 35.70% | 91.77% | (51.15)% | 17.10% |
Ratios to Average Net Assets E, I | | | | | | |
Expenses before reductions | .86% A | .85% | .88% | .96% | .90% | .91% |
Expenses net of fee waivers, if any | .86% A | .85% | .88% | .96% | .90% | .90% |
Expenses net of all reductions | .85% A | .84% | .87% | .94% | .90% | .89% |
Net investment income (loss) | 1.19% A | .90% | 2.10% G | .92% H | .78% | 1.14% |
Supplemental Data | | | | | | |
Net assets, end of period (000 omitted) | $ 997,832 | $ 1,089,619 | $ 1,195,371 | $ 604,475 | $ 127,551 | $ 353,185 |
Portfolio turnover rate F | 59% A | 94% | 87% | 104% J | 117% | 77% |
A Annualized B Total returns for periods of less than one year are not annualized. C Total returns would have been lower if certain expenses had not been reduced during the applicable periods shown. D Calculated based on average shares outstanding during the period. E Fees and expenses of any underlying Fidelity Central Funds are not included in the Fund's expense ratio. The Fund indirectly bears its proportionate share of the expenses of any underlying Fidelity Central Funds. F Amount does not include the portfolio activity of any underlying Fidelity Central Funds. G Investment income per share reflects a large, non-recurring dividend which amounted to $.83 per share. Excluding this non-recurring dividend, the ratio of net investment income (loss) to average net assets would have been ..70%. H Investment income per share reflects a large, non-recurring dividend which amounted to $.10 per share. Excluding this non-recurring dividend, the ratio of net investment income (loss) to average net assets would have been .70%. I Expense ratios reflect operating expenses of the class. Expenses before reductions do not reflect amounts reimbursed by the investment adviser or reductions from brokerage service arrangements or reductions from other expense offset arrangements and do not represent the amount paid by the class during periods when reimbursements or reductions occur. Expenses net of fee waivers reflect expenses after reimbursement by the investment adviser but prior to reductions from brokerage service arrangements or other expense offset arrangements. Expenses net of all reductions represent the net expenses paid by the class. J The portfolio turnover rate does not include the assets acquired in the merger. K For the year ended February 29. L Amount represents less than $.01 per share. M Total distributions of $2.57 per share is comprised of distributions from net investment income of $.363 and distributions from net realized gain of $2.210 per share. |
Financial Highlights - Institutional Class
| Six months ended
August 31, 2012 | Years ended February 28, |
| (Unaudited) | 2012 K | 2011 | 2010 | 2009 | 2008 K |
Selected Per-Share Data | | | | | | |
Net asset value, beginning of period | $ 69.35 | $ 70.05 | $ 52.58 | $ 27.66 | $ 57.00 | $ 50.91 |
Income from Investment Operations | | | | | | |
Net investment income (loss) D | .40 | .60 | 1.28 G | .46 H | .38 | .64 |
Net realized and unrealized gain (loss) | (1.03) | (.36) | 17.40 | 24.89 | (29.53) | 8.00 |
Total from investment operations | (.63) | .24 | 18.68 | 25.35 | (29.15) | 8.64 |
Distributions from net investment income | (.05) | (.56) | (1.19) | (.44) | (.20) | (.36) |
Distributions from net realized gain | (.36) | (.38) | (.03) | - | - | (2.21) |
Total distributions | (.41) | (.94) | (1.22) | (.44) | (.20) | (2.56) M |
Redemption fees added to paid in capital D | - L | - L | .01 | .01 | .01 | .01 |
Net asset value, end of period | $ 68.31 | $ 69.35 | $ 70.05 | $ 52.58 | $ 27.66 | $ 57.00 |
Total Return B, C | (.90)% | .50% | 35.73% | 91.79% | (51.15)% | 17.08% |
Ratios to Average Net Assets E, I | | | | | | |
Expenses before reductions | .85% A | .84% | .86% | .94% | .90% | .89% |
Expenses net of fee waivers, if any | .85% A | .84% | .86% | .94% | .90% | .89% |
Expenses net of all reductions | .84% A | .83% | .85% | .93% | .90% | .89% |
Net investment income (loss) | 1.20% A | .91% | 2.11% G | .94% H | .78% | 1.14% |
Supplemental Data | | | | | | |
Net assets, end of period (000 omitted) | $ 109,331 | $ 89,299 | $ 85,130 | $ 13,670 | $ 719 | $ 1,820 |
Portfolio turnover rate F | 59% A | 94% | 87% | 104% J | 117% | 77% |
A Annualized B Total returns for periods of less than one year are not annualized. C Total returns would have been lower if certain expenses had not been reduced during the applicable periods shown. D Calculated based on average shares outstanding during the period. E Fees and expenses of any underlying Fidelity Central Funds are not included in the Fund's expense ratio. The Fund indirectly bears its proportionate share of the expenses of any underlying Fidelity Central Funds. F Amount does not include the portfolio activity of any underlying Fidelity Central Funds. G Investment income per share reflects a large, non-recurring dividend which amounted to $.83 per share. Excluding this non-recurring dividend, the ratio of net investment income (loss) to average net assets would have been ..72%. H Investment income per share reflects a large, non-recurring dividend which amounted to $.10 per share. Excluding this non-recurring dividend, the ratio of net investment income (loss) to average net assets would have been .72%. I Expense ratios reflect operating expenses of the class. Expenses before reductions do not reflect amounts reimbursed by the investment adviser or reductions from brokerage service arrangements or reductions from other expense offset arrangements and do not represent the amount paid by the class during periods when reimbursements or reductions occur. Expenses net of fee waivers reflect expenses after reimbursement by the investment adviser but prior to reductions from brokerage service arrangements or other expense offset arrangements. Expenses net of all reductions represent the net expenses paid by the class. J The portfolio turnover rate does not include the assets acquired in the merger. K For the year ended February 29. L Amount represents less than $.01 per share. M Total distributions of $2.56 per share is comprised of distributions from net investment income of $.355 and distributions from net realized gain of $2.210 per share. |
See accompanying notes which are an integral part of the financial statements.
Semiannual Report
Notes to Financial Statements
For the period ended August 31, 2012 (Unaudited)
1. Organization.
Materials Portfolio (the Fund) is a non-diversified fund of Fidelity Select Portfolios (the Trust) and is authorized to issue an unlimited number of shares. The Trust is registered under the Investment Company Act of 1940, as amended (the 1940 Act), as an open-end management investment company organized as a Massachusetts business trust. The Fund invests primarily in securities of companies whose principal business activities fall within specific industries. The Fund offers Class A, Class T, Class C, Materials, and Institutional Class shares, each of which, along with Class B shares, has equal rights as to assets and voting privileges. Effective after the close of business on September 1, 2010, Class B shares were closed to new accounts and additional purchases, except for exchanges and reinvestments. Each class has exclusive voting rights with respect to matters that affect that class. Class B shares will automatically convert to Class A shares after a holding period of seven years from the initial date of purchase. Investment income, realized and unrealized capital gains and losses, the common expenses of the Fund, and certain fund-level expense reductions, if any, are allocated on a pro-rata basis to each class based on the relative net assets of each class to the total net assets of the Fund. Each class differs with respect to transfer agent and distribution and service plan fees incurred. Certain expense reductions may also differ by class.
2. Investments in Fidelity Central Funds.
The Fund invests in Fidelity Central Funds, which are open-end investment companies available only to other investment companies and accounts managed by Fidelity Management & Research Company (FMR) and its affiliates. The Fund's Schedule of Investments lists each of the Fidelity Central Funds held as of period end, if any, as an investment of the Fund, but does not include the underlying holdings of each Fidelity Central Fund. As an Investing Fund, the Fund indirectly bears its proportionate share of the expenses of the underlying Fidelity Central Funds.
The Money Market Central Funds seek preservation of capital and current income and are managed by Fidelity Investments Money Management, Inc. (FIMM), an affiliate of FMR.
A complete unaudited list of holdings for each Fidelity Central Fund is available upon request or at the Securities and Exchange Commission (the SEC) web site at www.sec.gov. In addition, the financial statements of the Fidelity Central Funds are available on the SEC web site or upon request.
3. Significant Accounting Policies.
The financial statements have been prepared in conformity with accounting principles generally accepted in the United States of America (GAAP), which require management to make certain estimates and assumptions at the date of the financial statements. Actual results could differ from those estimates. Subsequent events, if any, through the date that the financial statements were issued have been evaluated in the preparation of the financial statements. The following summarizes the significant accounting policies of the Fund:
Security Valuation. Investments are valued as of 4:00 p.m. Eastern time on the last calendar day of the period. In accordance with valuation policies and procedures approved by the Board of Trustees (the Board), the Fund attempts to obtain prices from one or more third party pricing vendor or broker to value its investments. When current market prices, quotations or rates are not readily available or reliable, securities will be fair valued in good faith by the FMR Fair Value Committee (the Committee), in accordance with procedures adopted by the Fund's Board. Factors used in determining fair value vary by security type and may include market or security specific events, changes in interest rates and credit quality. The frequency with which these procedures are used cannot be predicted and they may be utilized to a significant extent. The Committee oversees the Fund's valuation policies and procedures and is responsible for approving and reporting to the Board all fair value determinations.
The Fund categorizes the inputs to valuation techniques used to value its investments into a disclosure hierarchy consisting of three levels as shown below:
Level 1 - quoted prices in active markets for identical investments
Level 2 - other significant observable inputs (including quoted prices for similar investments, interest rates, prepayment speeds, etc.)
Level 3 - unobservable inputs (including the Fund's own assumptions based on the best information available)
Valuation techniques used to value the Fund's investments by major category are as follows:
Equity securities, including restricted securities, for which market quotations are readily available, are valued at the last reported sale price or official closing price as reported by a third party pricing vendor on the primary market or exchange on which they are traded and are categorized as Level 1 in the hierarchy. In the event there were no sales during the day or closing prices are not available, securities are valued at the last quoted bid price or may be valued using the last available price and are generally categorized as Level 2 in the hierarchy. For foreign equity securities, when significant market or security specific events arise, comparisons to the valuation of American Depositary Receipts (ADRs), futures contracts, Exchange-Traded Funds (ETFs) and certain indexes as well as quoted prices for similar securities are used and are categorized as Level 2 in the hierarchy. Utilizing these techniques may result in transfers between Level 1 and Level 2. For restricted equity securities and private placements where observable inputs are limited, assumptions about market activity and risk are used and these securities are categorized as Level 3 in the hierarchy.
Semiannual Report
3. Significant Accounting Policies - continued
Security Valuation - continued
Debt securities, including restricted securities, are valued based on evaluated prices received from third party pricing vendors or from brokers who make markets in such securities. For corporate bonds and U.S. government and government agency obligations, pricing vendors utilize matrix pricing which considers yield or price of bonds of comparable quality, coupon, maturity and type as well as broker-supplied prices and are generally categorized as Level 2 in the hierarchy. When independent prices are unavailable or unreliable, debt securities may be valued utilizing pricing methodologies which consider similar factors that would be used by third party pricing vendors. These are generally categorized as Level 2 in the hierarchy but may be Level 3 depending on the circumstances.
Futures contracts are valued at the settlement price established each day by the board of trade or exchange on which they are traded and are categorized as Level 1 in the hierarchy. Investments in open-end mutual funds, including the Fidelity Central Funds, are valued at their closing net asset value each business day and are categorized as Level 1 in the hierarchy.
Changes in valuation techniques may result in transfers in or out of an assigned level within the disclosure hierarchy. The aggregate value of investments by input level, as of August 31, 2012, is included at the end of the Fund's Schedule of Investments.
Foreign Currency Translation. The Fund may use foreign currency contracts to facilitate transactions in foreign-denominated securities. Gains and losses from these transactions may arise from changes in the value of the foreign currency or if the counterparties do not perform under the contracts' terms.
Foreign-denominated assets, including investment securities, and liabilities are translated into U.S. dollars at the exchange rates at period end. Purchases and sales of investment securities, income and dividends received and expenses denominated in foreign currencies are translated into U.S. dollars at the exchange rate in effect on the transaction date.
The effects of exchange rate fluctuations on investments are included with the net realized and unrealized gain (loss) on investment securities. Other foreign currency transactions resulting in realized and unrealized gain (loss) are disclosed separately.
Investment Transactions and Income. For financial reporting purposes, the Fund's investment holdings and NAV include trades executed through the end of the last business day of the period. The NAV per share for processing shareholder transactions is calculated as of the close of business of the New York Stock Exchange (NYSE), normally 4:00 p.m. Eastern time and includes trades executed through the end of the prior business day. Gains and losses on securities sold are determined on the basis of identified cost. Dividend income is recorded on the ex-dividend date, except for certain dividends from foreign securities where the ex-dividend date may have passed, which are recorded as soon as the Fund is informed of the ex-dividend date. Non-cash dividends included in dividend income, if any, are recorded at the fair market value of the securities received. Distributions received on securities that represent a return of capital or capital gain are recorded as a reduction of cost of investments and/or as a realized gain. The Fund estimates the components of distributions received that may be considered return of capital distributions or capital gain distributions. Interest income and distributions from the Fidelity Central Funds are accrued as earned. Interest income includes coupon interest and amortization of premium and accretion of discount on debt securities. Investment income is recorded net of foreign taxes withheld where recovery of such taxes is uncertain.
Expenses. Expenses directly attributable to a fund are charged to that fund. Expenses attributable to more than one fund are allocated among the respective funds on the basis of relative net assets or other appropriate methods. Expense estimates are accrued in the period to which they relate and adjustments are made when actual amounts are known.
Income Tax Information and Distributions to Shareholders. Each year, the Fund intends to qualify as a regulated investment company under Subchapter M of the Internal Revenue Code, including distributing substantially all of its taxable income and realized gains. As a result, no provision for income taxes is required. The Fund files a U.S. federal tax return, in addition to state and local tax returns as required. A fund's federal income tax returns are subject to examination by the Internal Revenue Service (IRS) for a period of three fiscal years after they are filed. State and local tax returns may be subject to examination for an additional fiscal year depending on the jurisdiction. Foreign taxes are provided for based on the Fund's understanding of the tax rules and rates that exist in the foreign markets in which it invests.
Distributions are declared and recorded on the ex-dividend date. Income dividends and capital gain distributions are declared separately for each class. Income and capital gain distributions are determined in accordance with income tax regulations, which may differ from GAAP.
Capital accounts within the financial statements are adjusted for permanent book-tax differences. These adjustments have no impact on net assets or the results of operations. Temporary book-tax differences will reverse in a subsequent period.
Book-tax differences are primarily due to foreign currency transactions, partnerships, passive foreign investment companies (PFIC), deferred trustees compensation, futures transactions, capital loss carryforwards and losses deferred due to wash sales and excise tax regulations.
Semiannual Report
Notes to Financial Statements (Unaudited) - continued
3. Significant Accounting Policies - continued
Income Tax Information and Distributions to Shareholders - continued
The federal tax cost of investment securities and unrealized appreciation (depreciation) as of period end were as follows:
Gross unrealized appreciation | $ 243,843,625 |
Gross unrealized depreciation | (51,926,650) |
Net unrealized appreciation (depreciation) on securities and other investments | $ 191,916,975 |
| |
Tax cost | $ 1,193,423,725 |
Capital loss carryforwards are only available to offset future capital gains of the Fund to the extent provided by regulations and may be limited. Under the Regulated Investment Company Modernization Act of 2010 (the Act), the Fund is permitted to carry forward capital losses incurred in taxable years beginning after December 22, 2010 for an unlimited period and such capital losses are required to be used prior to any losses that expire. At February 29, 2012 capital loss carryforwards were as follows:
Fiscal year of expiration | |
2016 | $ (5,392,414) |
2017 | (6,058,499) |
2018 | (1,022,988) |
2019 | (80,787) |
Total with expiration | $ (12,554,688) |
Included in the $12,554,688 of the Fund's capital loss carryforwards are $12,554,688 of capital loss carryforwards that were acquired from Paper and Forest Products Portfolio when it merged into the fund on June 19, 2009 of which $5,392,414, $6,058,499, $1,022,988 and $80,787 will expire in fiscal 2016, 2017, 2018 and 2019, respectively. Under the Internal Revenue Code, the losses acquired from Paper and Forest Products Portfolio that will be available to offset future capital gains of the Fund will be limited. As a result, at least $8,806,047 of the losses acquired from Paper and Forest Products Portfolio will expire unused.
Trading (Redemption) Fees. Shares held by investors in the Fund less than 30 days are subject to a redemption fee equal to .75% of the net asset value of shares redeemed. All redemption fees, which reduce the proceeds of the shareholder redemption, are retained by the Fund and accounted for as an addition to paid in capital.
New Accounting Pronouncement. In December 2011, the Financial Accounting Standards Board issued Accounting Standard Update No. 2011-11, Disclosures about Offsetting Assets and Liabilities. The update creates new disclosure requirements requiring entities to disclose both gross and net information for derivatives and other financial instruments that are either offset in the Statement of Assets and Liabilities or subject to an enforceable master netting arrangement or similar agreement. The disclosure requirements are effective for annual reporting periods beginning on or after January 1, 2013, and interim periods within those annual periods. Management is currently evaluating the impact of the update's adoption on the Fund's financial statement disclosures.
4. Operating Policies.
Restricted Securities. The Fund may invest in securities that are subject to legal or contractual restrictions on resale. These securities generally may be resold in transactions exempt from registration or to the public if the securities are registered. Disposal of these securities may involve time-consuming negotiations and expense, and prompt sale at an acceptable price may be difficult. Information regarding restricted securities is included at the end of the Fund's Schedule of Investments.
5. Derivative Instruments.
Risk Exposures and the Use of Derivative Instruments. The Fund's investment objective allows the Fund to enter into various types of derivative contracts, including futures contracts. Derivatives are investments whose value is primarily derived from underlying assets, indices or reference rates and may be transacted on an exchange or over-the-counter (OTC). Derivatives may involve a future commitment to buy or sell a specified instrument based on specified terms, to exchange future cash flows at periodic intervals based on a notional principal amount, or for one party to make one or more payments upon the occurrence of specified events in exchange for periodic payments from the other party.
The Fund used derivatives to increase returns and to manage exposure to certain risks as defined below. The success of any strategy involving derivatives depends on analysis of numerous economic factors, and if the strategies for investment do not work as intended, the Fund may not achieve its objectives.
Semiannual Report
5. Derivative Instruments - continued
Risk Exposures and the Use of Derivative Instruments - continued
The Fund's use of derivatives increased or decreased its exposure to the following risk:
Equity Risk | Equity risk relates to the fluctuations in the value of financial instruments as a result of changes in market prices (other than those arising from interest rate risk or foreign exchange risk), whether caused by factors specific to an individual investment, its issuer, or all factors affecting all instruments traded in a market or market segment. |
The Fund is also exposed to additional risks from investing in derivatives, such as liquidity risk and counterparty credit risk. Liquidity risk is the risk that the Fund will be unable to close out the derivative in the open market in a timely manner. Counterparty credit risk is the risk that the counterparty will not be able to fulfill its obligation to the Fund. Counterparty credit risk related to exchange-traded futures contracts is minimal because of the protection provided by the exchange on which they trade.
Investing in derivatives may involve greater risks than investing in the underlying assets directly and, to varying degrees, may involve risk of loss in excess of any initial investment and collateral received and amounts recognized in the Statement of Assets and Liabilities. In addition, there may be the risk that the change in value of the derivative contract does not correspond to the change in value of the underlying instrument.
Futures Contracts. A futures contract is an agreement between two parties to buy or sell a specified underlying instrument for a fixed price at a specified future date. The Fund used futures contracts to manage its exposure to the stock market.
Upon entering into a futures contract, a fund is required to deposit either cash or securities (initial margin) with a clearing broker in an amount equal to a certain percentage of the face value of the contract. Futures contracts are marked-to-market daily and subsequent payments (variation margin) are made or received by a fund depending on the daily fluctuations in the value of the futures contracts and are recorded as unrealized appreciation or (depreciation). This receivable and/or payable is included in daily variation margin on futures contracts in the Statement of Assets and Liabilities. Realized gain or (loss) is recorded upon the expiration or closing of a futures contract.
Any open futures contracts at period end are shown in the Schedule of Investments under the caption "Futures Contracts." The underlying face amount at value reflects each contract's exposure to the underlying instrument at period end and is representative of activity for the period. Securities deposited to meet initial margin requirements are identified in the Schedule of Investments.
During the period the Fund recognized net realized gain (loss) of $165,760 and a change in net unrealized appreciation (depreciation) of $(575,410) related to its investment in futures contracts. These amounts are included in the Statement of Operations.
6. Purchases and Sales of Investments.
Purchases and sales of securities, other than short-term securities, aggregated $384,001,026 and $441,362,804, respectively.
7. Fees and Other Transactions with Affiliates.
Management Fee. FMR and its affiliates provide the Fund with investment management related services for which the Fund pays a monthly management fee. The management fee is the sum of an individual fund fee rate that is based on an annual rate of .30% of the Fund's average net assets and an annualized group fee rate that averaged .26% during the period. The group fee rate is based upon the average net assets of all the mutual funds advised by FMR. The group fee rate decreases as assets under management increase and increases as assets under management decrease. For the period, the total annualized management fee rate was .56% of the Fund's average net assets.
Distribution and Service Plan Fees. In accordance with Rule 12b-1 of the 1940 Act, the Fund has adopted separate Distribution and Service Plans for each class of shares. Certain classes pay Fidelity Distributors Corporation (FDC), an affiliate of FMR, separate Distribution and Service Fees, each of which is based on an annual percentage of each class' average net assets. In addition, FDC may pay financial intermediaries for selling shares of the Fund and providing shareholder support services. For the period, the Distribution and Service Fee rates, total fees and amounts retained by FDC were as follows:
| Distribution
Fee | Service
Fee | Total Fees | Retained
by FDC |
Class A | -% | .25% | $ 193,343 | $ 4,157 |
Class T | .25% | .25% | 67,726 | - |
Class B | .75% | .25% | 50,891 | 38,168 |
Class C | .75% | .25% | 283,455 | 75,057 |
| | | $ 595,415 | $ 117,382 |
Semiannual Report
Notes to Financial Statements (Unaudited) - continued
7. Fees and Other Transactions with Affiliates - continued
Sales Load. FDC may receive a front-end sales charge of up to 5.75% for selling Class A shares and 3.50% for selling Class T shares, some of which is paid to financial intermediaries for selling shares of the Fund. Depending on the holding period, FDC may receive contingent deferred sales charges levied on Class A, Class T, Class B and Class C redemptions. The deferred sales charges range from 5.00% to 1.00% for Class B shares, 1.00% for Class C shares, 1.00% for certain purchases of Class A shares and .25% for certain purchases of Class T shares.
For the period, sales charge amounts retained by FDC were as follows:
| Retained
by FDC |
Class A | $ 65,366 |
Class T | 3,956 |
Class B* | 12,477 |
Class C* | 8,069 |
| $ 89,868 |
* When Class B and Class C shares are initially sold, FDC pays commissions from its own resources to financial intermediaries through which the sales are made.
Transfer Agent Fees. Fidelity Investments Institutional Operations Company, Inc. (FIIOC), an affiliate of FMR, is the transfer, dividend disbursing and shareholder servicing agent for each class of the Fund. FIIOC receives account fees and asset-based fees that vary according to the account size and type of account of the shareholders of the respective classes of the Fund. FIIOC pays for typesetting, printing and mailing of shareholder reports, except proxy statements. For the period, transfer agent fees for each class were as follows:
| Amount | % of
Average
Net Assets* |
Class A | $ 209,289 | .27 |
Class T | 41,794 | .31 |
Class B | 15,357 | .30 |
Class C | 79,578 | .28 |
Materials | 1,217,432 | .24 |
Institutional Class | 103,027 | .23 |
| $ 1,666,477 | |
* Annualized
Accounting and Security Lending Fees. Fidelity Service Company, Inc. (FSC), an affiliate of FMR, maintains the Fund's accounting records. The accounting fee is based on the level of average net assets for each month. Under a separate contract, FSC administers the security lending program. The security lending fee is based on the number and duration of lending transactions.
Brokerage Commissions. The Fund placed a portion of its portfolio transactions with brokerage firms which are affiliates of the investment adviser. The commissions paid to these affiliated firms were $6,913 for the period.
8. Committed Line of Credit.
The Fund participates with other funds managed by FMR or an affiliate in a $4.25 billion credit facility (the "line of credit") to be utilized for temporary or emergency purposes to fund shareholder redemptions or for other short-term liquidity purposes. The Fund has agreed to pay commitment fees on its pro-rata portion of the line of credit, which amounted to $1,927 and is reflected in Miscellaneous expenses on the Statement of Operations. During the period, there were no borrowings on this line of credit.
9. Security Lending.
The Fund lends portfolio securities through a lending agent from time to time in order to earn additional income. For equity securities, a lending agent is used and may loan securities to certain qualified borrowers, including Fidelity Capital Markets (FCM), a broker-dealer affiliated with the Fund. On the settlement date of the loan, the Fund receives collateral (in the form of U.S. Treasury obligations, letters of credit and/or cash) against the loaned securities and maintains collateral in an amount not less than 100% of the market value of the loaned securities during the period of the loan. The market value of the loaned securities is determined at the close of business of the Fund and any additional required collateral is delivered to the Fund on the next business day. If the borrower defaults on its obligation to return the securities loaned because of insolvency or other reasons, a fund could experience delays and costs in recovering the securities loaned or in gaining access to the collateral. Any cash collateral received is invested in the Fidelity Securities Lending Cash Central Fund. The value of loaned securities and cash collateral at period end are disclosed on the Fund's Statement of Assets and Liabilities. Security lending income represents the income earned on investing cash collateral, less rebates paid to borrowers and any lending agent fees associated with the loan, plus any premium payments received for lending certain types of securities. Security lending income is presented in the Statement of Operations as a component of income from Fidelity Central Funds. Total security lending income during the period amounted to $177,206. During the period, there were no securities loaned to FCM.
Semiannual Report
10. Expense Reductions.
Many of the brokers with whom FMR places trades on behalf of the Fund provided services to the Fund in addition to trade execution. These services included payments of certain expenses on behalf of the Fund totaling $20,361 for the period. In addition, through arrangements with the Fund's custodian, credits realized as a result of uninvested cash balances were used to reduce the Fund's expenses. During the period, these credits reduced the Fund's custody expenses by $19.
11. Distributions to Shareholders.
Distributions to shareholders of each class were as follows:
| Six months ended
August 31,
2012 | Year ended
February 29,
2012 |
From net investment income | | |
Class A | $ 44,699 | $ 868,107 |
Class T | - | 100,314 |
Materials | 717,326 | 8,266,851 |
Institutional Class | 58,957 | 605,465 |
Total | $ 820,982 | $ 9,840,737 |
From net realized gain | | |
Class A | $ 851,627 | $ 816,536 |
Class T | 148,569 | 151,869 |
Class B | 57,740 | 66,321 |
Class C | 319,952 | 312,224 |
Materials | 5,524,936 | 5,701,275 |
Institutional Class | 435,560 | 413,064 |
Total | $ 7,338,384 | $ 7,461,289 |
12. Share Transactions.
Transactions for each class of shares were as follows:
| Shares | Dollars |
| Six months ended
August 31,
2012 | Year ended
February 29,
2012 | Six months ended
August 31,
2012 | Year ended
February 29,
2012 |
Class A | | | | |
Shares sold | 618,282 | 1,406,389 | $ 41,055,137 | $ 95,285,956 |
Reinvestment of distributions | 11,861 | 23,605 | 796,737 | 1,462,799 |
Shares redeemed | (571,942) | (925,476) | (37,886,137) | (60,145,567) |
Net increase (decrease) | 58,201 | 504,518 | $ 3,965,737 | $ 36,603,188 |
Class T | | | | |
Shares sold | 57,303 | 150,265 | $ 3,768,331 | $ 10,197,019 |
Reinvestment of distributions | 2,151 | 3,964 | 143,789 | 244,682 |
Shares redeemed | (58,360) | (110,682) | (3,814,694) | (7,174,563) |
Net increase (decrease) | 1,094 | 43,547 | $ 97,426 | $ 3,267,138 |
Class B | | | | |
Shares sold | 8,702 | 35,651 | $ 565,370 | $ 2,318,398 |
Reinvestment of distributions | 736 | 909 | 48,582 | 55,554 |
Shares redeemed | (22,911) | (70,403) | (1,487,989) | (4,524,937) |
Net increase (decrease) | (13,473) | (33,843) | $ (874,037) | $ (2,150,985) |
Class C | | | | |
Shares sold | 138,070 | 456,374 | $ 9,089,282 | $ 30,369,453 |
Reinvestment of distributions | 4,035 | 4,184 | 265,885 | 254,995 |
Shares redeemed | (137,723) | (279,339) | (8,907,811) | (17,740,501) |
Net increase (decrease) | 4,382 | 181,219 | $ 447,356 | $ 12,883,947 |
Materials | | | | |
Shares sold | 2,129,932 | 6,950,456 | $ 142,456,070 | $ 471,314,225 |
Reinvestment of distributions | 88,382 | 214,200 | 5,951,604 | 13,299,700 |
Shares redeemed | (3,323,218) | (8,516,169) | (221,239,263) | (562,008,908) |
Net increase (decrease) | (1,104,904) | (1,351,513) | $ (72,831,589) | $ (77,394,983) |
Semiannual Report
Notes to Financial Statements (Unaudited) - continued
12. Share Transactions - continued
| Shares | Dollars |
| Six months ended
August 31,
2012 | Year ended
February 29,
2012 | Six months ended
August 31,
2012 | Year ended
February 29,
2012 |
Institutional Class | | | | |
Shares sold | 890,879 | 1,444,894 | $ 59,941,256 | $ 97,144,756 |
Reinvestment of distributions | 6,215 | 13,291 | 418,157 | 824,595 |
Shares redeemed | (584,398) | (1,385,770) | (38,480,323) | (90,119,446) |
Net increase (decrease) | 312,696 | 72,415 | $ 21,879,090 | $ 7,849,905 |
13. Other.
The Fund's organizational documents provide former and current trustees and officers with a limited indemnification against liabilities arising in connection with the performance of their duties to the Fund. In the normal course of business, the Fund may also enter into contracts that provide general indemnifications. The Fund's maximum exposure under these arrangements is unknown as this would be dependent on future claims that may be made against the Fund. The risk of material loss from such claims is considered remote.
Semiannual Report
Telecommunications Portfolio
As a shareholder of the Fund, you incur two types of costs: (1) transaction costs, including sales charges (loads) on purchase payments or redemption proceeds, redemption fees and (2) ongoing costs, including management fees, distribution and/or service (12b-1) fees and other Fund expenses. This Example is intended to help you understand your ongoing costs (in dollars) of investing in the Fund and to compare these costs with the ongoing costs of investing in other mutual funds.
The Example is based on an investment of $1,000 invested at the beginning of the period and held for the entire period (March 1, 2012 to August 31, 2012).
Actual Expenses
The first line of the accompanying table for each class of the Fund provides information about actual account values and actual expenses. You may use the information in this line, together with the amount you invested, to estimate the expenses that you paid over the period. Simply divide your account value by $1,000.00 (for example, an $8,600 account value divided by $1,000.00 = 8.6), then multiply the result by the number in the first line for a class of the Fund under the heading entitled "Expenses Paid During Period" to estimate the expenses you paid on your account during this period. A small balance maintenance fee of $12.00 that is charged once a year may apply for certain accounts with a value of less than $2,000. This fee is not included in the table below. If it was, the estimate of expenses you paid during the period would be higher, and your ending account value lower, by this amount. In addition, the Fund, as a shareholder in the underlying Fidelity Central Funds, will indirectly bear its pro-rata share of the fees and expenses incurred by the underlying Fidelity Central Funds. These fees and expenses are not included in the Fund's annualized expense ratio used to calculate the expense estimate in the table below.
Hypothetical Example for Comparison Purposes
The second line of the accompanying table for each class of the Fund provides information about hypothetical account values and hypothetical expenses based on a Class' actual expense ratio and an assumed rate of return of 5% per year before expenses, which is not the Class' actual return. The hypothetical account values and expenses may not be used to estimate the actual ending account balance or expenses you paid for the period. You may use this information to compare the ongoing costs of investing in the Fund and other funds. To do so, compare this 5% hypothetical example with the 5% hypothetical examples that appear in the shareholder reports of the other funds. A small balance maintenance fee of $12.00 that is charged once a year may apply for certain accounts with a value of less than $2,000. This fee is not included in the table below. If it was, the estimate of expenses you paid during the period would be higher, and your ending account value lower, by this amount. In addition, the Fund, as a shareholder in the underlying Fidelity Central Funds, will indirectly bear its pro-rata share of the fees and expenses incurred by the underlying Fidelity Central Funds. These fees and expenses are not included in the Fund's annualized expense ratio used to calculate the expense estimate in the table below.
Please note that the expenses shown in the table are meant to highlight your ongoing costs only and do not reflect any transaction costs. Therefore, the second line of the table is useful in comparing ongoing costs only, and will not help you determine the relative total costs of owning different funds. In addition, if these transactional costs were included, your costs would have been higher.
| Annualized
Expense Ratio | Beginning
Account Value
March 1, 2012 | Ending
Account Value
August 31, 2012 | Expenses Paid
During Period*
March 1, 2012
to August 31, 2012 |
Class A | 1.18% | | | |
Actual | | $ 1,000.00 | $ 1,086.40 | $ 6.21 |
HypotheticalA | | $ 1,000.00 | $ 1,019.26 | $ 6.01 |
Class T | 1.48% | | | |
Actual | | $ 1,000.00 | $ 1,084.50 | $ 7.78 |
HypotheticalA | | $ 1,000.00 | $ 1,017.74 | $ 7.53 |
Class B | 1.93% | | | |
Actual | | $ 1,000.00 | $ 1,082.20 | $ 10.13 |
HypotheticalA | | $ 1,000.00 | $ 1,015.48 | $ 9.80 |
Class C | 1.91% | | | |
Actual | | $ 1,000.00 | $ 1,082.40 | $ 10.03 |
HypotheticalA | | $ 1,000.00 | $ 1,015.58 | $ 9.70 |
Telecommunications | .88% | | | |
Actual | | $ 1,000.00 | $ 1,087.70 | $ 4.63 |
HypotheticalA | | $ 1,000.00 | $ 1,020.77 | $ 4.48 |
Institutional Class | .88% | | | |
Actual | | $ 1,000.00 | $ 1,087.80 | $ 4.63 |
HypotheticalA | | $ 1,000.00 | $ 1,020.77 | $ 4.48 |
A 5% return per year before expenses
* Expenses are equal to each Class' annualized expense ratio, multiplied by the average account value over the period, multiplied by 184/365 (to reflect the one-half year period).
Semiannual Report
Telecommunications Portfolio
Investment Changes (Unaudited)
Top Ten Stocks as of August 31, 2012 |
| % of fund's
net assets | % of fund's net assets
6 months ago |
AT&T, Inc. | 21.5 | 20.4 |
Verizon Communications, Inc. | 18.1 | 13.4 |
CenturyLink, Inc. | 9.6 | 9.0 |
Sprint Nextel Corp. | 5.1 | 2.8 |
Crown Castle International Corp. | 5.0 | 6.7 |
SBA Communications Corp. Class A | 5.0 | 4.9 |
tw telecom, inc. | 3.8 | 4.4 |
Vodafone Group PLC sponsored ADR | 3.3 | 1.5 |
Telephone & Data Systems, Inc. | 2.9 | 0.0 |
General Communications, Inc. Class A | 2.6 | 2.7 |
| 76.9 | |
Top Industries (% of fund's net assets) |
As of August 31, 2012 |
| Diversified
Telecommunication
Services | 67.3% | |
| Wireless
Telecommunication
Services | 27.5% | |
| Media | 1.7% | |
| Software | 0.2% | |
| Communications
Equipment | 0.0% | |
| All Others* | 3.3% | |

As of February 29, 2012 |
| Diversified
Telecommunication
Services | 64.9% | |
| Wireless
Telecommunication
Services | 28.6% | |
| Media | 2.1% | |
| Software | 0.0%** | |
| Communications
Equipment | 0.0% | |
| All Others* | 4.4% | |

* Includes short-term investments and net other assets. |
** Amount represents less than 0.1%. |
Semiannual Report
Telecommunications Portfolio
Investments August 31, 2012 (Unaudited)
Showing Percentage of Net Assets
Common Stocks - 96.7% |
| Shares | | Value |
COMMUNICATIONS EQUIPMENT - 0.0% |
Communications Equipment - 0.0% |
Nortel Networks Corp. (a) | 8,071 | | $ 0 |
DIVERSIFIED TELECOMMUNICATION SERVICES - 67.3% |
Alternative Carriers - 9.2% |
Cogent Communications Group, Inc. | 438,702 | | 8,598,559 |
Level 3 Communications, Inc. (a) | 525,391 | | 11,322,176 |
tw telecom, inc. (a) | 676,457 | | 17,012,894 |
Vonage Holdings Corp. (a) | 2,164,900 | | 4,632,886 |
| | 41,566,515 |
Integrated Telecommunication Services - 58.1% |
AT&T, Inc. | 2,637,619 | | 96,642,360 |
Atlantic Tele-Network, Inc. | 154,600 | | 5,825,328 |
CenturyLink, Inc. | 1,023,184 | | 43,239,756 |
China Unicom Ltd. sponsored ADR | 288,200 | | 4,570,852 |
Frontier Communications Corp. (d) | 1,136,500 | | 5,250,630 |
General Communications, Inc. Class A (a) | 1,348,300 | | 11,892,006 |
PT Telkomunikasi Indonesia Tbk Series B | 1,388,500 | | 1,355,697 |
PT XL Axiata Tbk | 1,052,500 | | 794,758 |
Telefonica Brasil SA sponsored ADR | 205,163 | | 4,384,333 |
Verizon Communications, Inc. | 1,895,741 | | 81,403,119 |
Windstream Corp. (d) | 583,782 | | 5,761,928 |
| | 261,120,767 |
TOTAL DIVERSIFIED TELECOMMUNICATION SERVICES | | 302,687,282 |
MEDIA - 1.7% |
Cable & Satellite - 1.7% |
Time Warner Cable, Inc. | 14,800 | | 1,314,536 |
Virgin Media, Inc. (d) | 229,900 | | 6,338,343 |
| | 7,652,879 |
SOFTWARE - 0.2% |
Application Software - 0.2% |
Comverse Technology, Inc. (a) | 37 | | 222 |
Synchronoss Technologies, Inc. (a) | 29,003 | | 667,359 |
| | 667,581 |
WIRELESS TELECOMMUNICATION SERVICES - 27.5% |
Wireless Telecommunication Services - 27.5% |
Clearwire Corp. Class A (a)(d) | 4,909,636 | | 7,855,418 |
|
| Shares | | Value |
Crown Castle International Corp. (a) | 353,583 | | $ 22,438,377 |
Leap Wireless International, Inc. (a)(d) | 587,400 | | 3,213,078 |
MetroPCS Communications, Inc. (a) | 705,606 | | 6,865,546 |
Mobile TeleSystems OJSC sponsored ADR | 72,700 | | 1,338,407 |
NII Holdings, Inc. (a)(d) | 492,400 | | 3,072,576 |
NTELOS Holdings Corp. | 15,706 | | 269,672 |
NTT DoCoMo, Inc. | 2,005 | | 3,415,709 |
SBA Communications Corp. Class A (a) | 374,482 | | 22,386,534 |
Sprint Nextel Corp. (a) | 4,685,050 | | 22,722,493 |
Telephone & Data Systems, Inc. | 529,500 | | 12,983,340 |
Turkcell Iletisim Hizmet A/S (a) | 337,000 | | 2,002,265 |
Vodafone Group PLC sponsored ADR | 518,100 | | 14,983,452 |
| | 123,546,867 |
TOTAL COMMON STOCKS (Cost $425,417,388) |
434,554,609
|
Money Market Funds - 7.3% |
| | | |
Fidelity Cash Central Fund, 0.17% (b) | 8,751,193 | | 8,751,193 |
Fidelity Securities Lending Cash Central Fund, 0.18% (b)(c) | 24,229,312 | | 24,229,312 |
TOTAL MONEY MARKET FUNDS (Cost $32,980,505) |
32,980,505
|
TOTAL INVESTMENT PORTFOLIO - 104.0% (Cost $458,397,893) | | 467,535,114 |
NET OTHER ASSETS (LIABILITIES) - (4.0)% | | (18,031,829) |
NET ASSETS - 100% | $ 449,503,285 |
Legend |
(a) Non-income producing |
(b) Affiliated fund that is available only to investment companies and other accounts managed by Fidelity Investments. The rate quoted is the annualized seven-day yield of the fund at period end. A complete unaudited listing of the fund's holdings as of its most recent quarter end is available upon request. In addition, each Fidelity Central Fund's financial statements are available on the SEC's website or upon request. |
(c) Investment made with cash collateral received from securities on loan. |
(d) Security or a portion of the security is on loan at period end. |
Affiliated Central Funds |
Information regarding fiscal year to date income earned by the Fund from investments in Fidelity Central Funds is as follows: |
Fund | Income earned |
Fidelity Cash Central Fund | $ 15,085 |
Fidelity Securities Lending Cash Central Fund | 82,749 |
Total | $ 97,834 |
Other Information |
The following is a summary of the inputs used, as of August 31, 2012, involving the Fund's assets and liabilities carried at fair value. The inputs or methodology used for valuing securities may not be an indication of the risk associated with investing in those securities. For more information on valuation inputs, and their aggregation into the levels used in the table below, please refer to the Security Valuation section in the accompanying Notes to Financial Statements. |
Valuation Inputs at Reporting Date: |
Description | Total | Level 1 | Level 2 | Level 3 |
Investments in Securities: | | | | |
Common Stocks | $ 434,554,609 | $ 427,780,938 | $ 6,773,671 | $ - |
Money Market Funds | 32,980,505 | 32,980,505 | - | - |
Total Investments in Securities: | $ 467,535,114 | $ 460,761,443 | $ 6,773,671 | $ - |
See accompanying notes which are an integral part of the financial statements.
Semiannual Report
Telecommunications Portfolio
Statement of Assets and Liabilities
| August 31, 2012 (Unaudited) |
| | |
Assets | | |
Investment in securities, at value (including securities loaned of $22,849,583) - See accompanying schedule: Unaffiliated issuers (cost $425,417,388) | $ 434,554,609 | |
Fidelity Central Funds (cost $32,980,505) | 32,980,505 | |
Total Investments (cost $458,397,893) | | $ 467,535,114 |
Receivable for investments sold | | 12,122,084 |
Receivable for fund shares sold | | 402,680 |
Dividends receivable | | 52,158 |
Distributions receivable from Fidelity Central Funds | | 30,809 |
Other receivables | | 16,038 |
Total assets | | 480,158,883 |
| | |
Liabilities | | |
Payable for investments purchased | $ 4,675,422 | |
Payable for fund shares redeemed | 1,404,370 | |
Accrued management fee | 213,501 | |
Distribution and service plan fees payable | 6,800 | |
Other affiliated payables | 102,827 | |
Other payables and accrued expenses | 23,366 | |
Collateral on securities loaned, at value | 24,229,312 | |
Total liabilities | | 30,655,598 |
| | |
Net Assets | | $ 449,503,285 |
Net Assets consist of: | | |
Paid in capital | | $ 488,213,240 |
Undistributed net investment income | | 4,690,652 |
Accumulated undistributed net realized gain (loss) on investments and foreign currency transactions | | (52,535,552) |
Net unrealized appreciation (depreciation) on investments and assets and liabilities in foreign currencies | | 9,134,945 |
Net Assets | | $ 449,503,285 |
Statement of Assets and Liabilities - continued
| August 31, 2012 (Unaudited) |
| | |
Calculation of Maximum Offering Price Class A:
Net Asset Value and redemption price per share ($6,614,226 ÷ 132,242 shares) | | $ 50.02 |
| | |
Maximum offering price per share (100/94.25 of $50.02) | | $ 53.07 |
Class T:
Net Asset Value and redemption price per share ($3,875,166 ÷ 77,752 shares) | | $ 49.84 |
| | |
Maximum offering price per share (100/96.50 of $49.84) | | $ 51.65 |
Class B:
Net Asset Value and offering price per share ($745,170 ÷ 14,930 shares)A | | $ 49.91 |
| | |
Class C:
Net Asset Value and offering price per share ($3,953,828 ÷ 79,417 shares)A | | $ 49.79 |
| | |
| | |
Telecommunications:
Net Asset Value, offering price and redemption price per share ($432,830,506 ÷ 8,620,146 shares) | | $ 50.21 |
| | |
Institutional Class:
Net Asset Value, offering price and redemption price per share ($1,484,389 ÷ 29,594 shares) | | $ 50.16 |
A Redemption price per share is equal to net asset value less any applicable contingent deferred sales charge.
See accompanying notes which are an integral part of the financial statements.
Semiannual Report
Statement of Operations
Six months ended August 31, 2012 (Unaudited) |
| | |
Investment Income | | |
Dividends | | $ 6,349,035 |
Interest | | 72 |
Income from Fidelity Central Funds | | 97,834 |
Total income | | 6,446,941 |
| | |
Expenses | | |
Management fee | $ 1,086,051 | |
Transfer agent fees | 478,909 | |
Distribution and service plan fees | 35,821 | |
Accounting and security lending fees | 76,929 | |
Custodian fees and expenses | 6,486 | |
Independent trustees' compensation | 1,294 | |
Registration fees | 43,700 | |
Audit | 22,396 | |
Legal | 1,552 | |
Miscellaneous | 1,805 | |
Total expenses before reductions | 1,754,943 | |
Expense reductions | (15,528) | 1,739,415 |
Net investment income (loss) | | 4,707,526 |
Realized and Unrealized Gain (Loss) Net realized gain (loss) on: | | |
Investment securities: | | |
Unaffiliated issuers | 5,528,156 | |
Foreign currency transactions | (1,154) | |
Total net realized gain (loss) | | 5,527,002 |
Change in net unrealized appreciation (depreciation) on: Investment securities | 25,626,439 | |
Assets and liabilities in foreign currencies | (859) | |
Total change in net unrealized appreciation (depreciation) | | 25,625,580 |
Net gain (loss) | | 31,152,582 |
Net increase (decrease) in net assets resulting from operations | | $ 35,860,108 |
Statement of Changes in Net Assets
| Six months ended
August 31, 2012
(Unaudited) | Year ended
February 29,
2012 |
Increase (Decrease) in Net Assets | | |
Operations | | |
Net investment income (loss) | $ 4,707,526 | $ 5,541,550 |
Net realized gain (loss) | 5,527,002 | 24,725,843 |
Change in net unrealized appreciation (depreciation) | 25,625,580 | (35,725,245) |
Net increase (decrease) in net assets resulting from operations | 35,860,108 | (5,457,852) |
Distributions to shareholders from net investment income | (747,291) | (4,955,219) |
Share transactions - net increase (decrease) | 59,617,531 | (2,457,615) |
Redemption fees | 834 | 35,055 |
Total increase (decrease) in net assets | 94,731,182 | (12,835,631) |
| | |
Net Assets | | |
Beginning of period | 354,772,103 | 367,607,734 |
End of period (including undistributed net investment income of $4,690,652 and undistributed net investment income of $730,417, respectively) | $ 449,503,285 | $ 354,772,103 |
See accompanying notes which are an integral part of the financial statements.
Semiannual Report
Financial Highlights - Class A
| Six months ended
August 31, 2012 | Years ended February 28, |
| (Unaudited) | 2012 I | 2011 | 2010 | 2009 | 2008 I |
Selected Per-Share Data | | | | | | |
Net asset value, beginning of period | $ 46.12 | $ 46.93 | $ 37.64 | $ 26.66 | $ 42.56 | $ 50.89 |
Income from Investment Operations | | | | | | |
Net investment income (loss) E | .50 | .56 | .57 | .67 | .22 | .26 |
Net realized and unrealized gain (loss) | 3.48 | (.86) | 9.49 | 10.55 | (15.60) | (8.08) |
Total from investment operations | 3.98 | (.30) | 10.06 | 11.22 | (15.38) | (7.82) |
Distributions from net investment income | (.08) | (.51) | (.77) | (.19) | (.35) M | (.51) |
Distributions from net realized gain | - | - | - | (.05) | (.18) M | - |
Total distributions | (.08) | (.51) | (.77) | (.24) L | (.52) K | (.51) |
Redemption fees added to paid in capital E, J | - | - | - | - | - | - |
Net asset value, end of period | $ 50.02 | $ 46.12 | $ 46.93 | $ 37.64 | $ 26.66 | $ 42.56 |
Total Return B, C, D | 8.64% | (.54)% | 26.87% | 42.07% | (36.16)% | (15.55)% |
Ratios to Average Net Assets F, H | | | | | | |
Expenses before reductions | 1.18% A | 1.20% | 1.20% | 1.26% | 1.21% | 1.20% |
Expenses net of fee waivers, if any | 1.18% A | 1.20% | 1.20% | 1.26% | 1.21% | 1.20% |
Expenses net of all reductions | 1.17% A | 1.18% | 1.18% | 1.24% | 1.21% | 1.19% |
Net investment income (loss) | 2.13% A | 1.21% | 1.35% | 1.89% | .61% | .49% |
Supplemental Data | | | | | | |
Net assets, end of period (000 omitted) | $ 6,614 | $ 4,677 | $ 4,305 | $ 3,343 | $ 2,112 | $ 2,791 |
Portfolio turnover rate G | 42% A | 72% | 72% | 90% | 168% | 134% |
A Annualized B Total returns for periods of less than one year are not annualized. C Total returns would have been lower if certain expenses had not been reduced during the applicable periods shown. D Total returns do not include the effect of the sales charges. E Calculated based on average shares outstanding during the period. F Fees and expenses of any underlying Fidelity Central Funds are not included in the Fund's expense ratio. The Fund indirectly bears its proportionate share of the expenses of any underlying Fidelity Central Funds. G Amount does not include the portfolio activity of any underlying Fidelity Central Funds. H Expense ratios reflect operating expenses of the class. Expenses before reductions do not reflect amounts reimbursed by the investment adviser or reductions from brokerage service arrangements or reductions from other expense offset arrangements and do not represent the amount paid by the class during periods when reimbursements or reductions occur. Expenses net of fee waivers reflect expenses after reimbursement by the investment adviser but prior to reductions from brokerage service arrangements or other expense offset arrangements. Expenses net of all reductions represent the net expenses paid by the class. I For the year ended February 29. J Amount represents less than $.01 per share. K Total distributions of $.52 per share is comprised of distributions from net investment income of $.347 and distributions from net realized gain of $.175 per share. L Total distributions of $.24 per share is comprised of distributions from net investment income of $.187 and distributions from net realized gain of $.048 per share. M The amount shown reflects certain reclassifications related to book to tax differences. |
Financial Highlights - Class T
| Six months ended
August 31, 2012 | Years ended February 28, |
| (Unaudited) | 2012 I | 2011 | 2010 | 2009 | 2008 I |
Selected Per-Share Data | | | | | | |
Net asset value, beginning of period | $ 46.01 | $ 46.81 | $ 37.55 | $ 26.68 | $ 42.49 | $ 50.86 |
Income from Investment Operations | | | | | | |
Net investment income (loss) E | .43 | .42 | .45 | .57 | .12 | .12 |
Net realized and unrealized gain (loss) | 3.45 | (.84) | 9.47 | 10.54 | (15.56) | (8.07) |
Total from investment operations | 3.88 | (.42) | 9.92 | 11.11 | (15.44) | (7.95) |
Distributions from net investment income | (.05) | (.38) | (.66) | (.22) | (.24) M | (.42) |
Distributions from net realized gain | - | - | - | (.03) | (.13) M | - |
Total distributions | (.05) | (.38) | (.66) | (.24) L | (.37) K | (.42) |
Redemption fees added to paid in capital E, J | - | - | - | - | - | - |
Net asset value, end of period | $ 49.84 | $ 46.01 | $ 46.81 | $ 37.55 | $ 26.68 | $ 42.49 |
Total Return B, C, D | 8.45% | (.82)% | 26.54% | 41.64% | (36.34)% | (15.78)% |
Ratios to Average Net Assets F, H | | | | | | |
Expenses before reductions | 1.48% A | 1.49% | 1.48% | 1.55% | 1.49% | 1.46% |
Expenses net of fee waivers, if any | 1.48% A | 1.49% | 1.48% | 1.55% | 1.49% | 1.46% |
Expenses net of all reductions | 1.47% A | 1.47% | 1.46% | 1.53% | 1.48% | 1.45% |
Net investment income (loss) | 1.83% A | .92% | 1.06% | 1.60% | .33% | .23% |
Supplemental Data | | | | | | |
Net assets, end of period (000 omitted) | $ 3,875 | $ 2,702 | $ 2,882 | $ 2,051 | $ 620 | $ 1,270 |
Portfolio turnover rate G | 42% A | 72% | 72% | 90% | 168% | 134% |
A Annualized B Total returns for periods of less than one year are not annualized. C Total returns would have been lower if certain expenses had not been reduced during the applicable periods shown. D Total returns do not include the effect of the sales charges. E Calculated based on average shares outstanding during the period. F Fees and expenses of any underlying Fidelity Central Funds are not included in the Fund's expense ratio. The Fund indirectly bears its proportionate share of the expenses of any underlying Fidelity Central Funds. G Amount does not include the portfolio activity of any underlying Fidelity Central Funds. H Expense ratios reflect operating expenses of the class. Expenses before reductions do not reflect amounts reimbursed by the investment adviser or reductions from brokerage service arrangements or reductions from other expense offset arrangements and do not represent the amount paid by the class during periods when reimbursements or reductions occur. Expenses net of fee waivers reflect expenses after reimbursement by the investment adviser but prior to reductions from brokerage service arrangements or other expense offset arrangements. Expenses net of all reductions represent the net expenses paid by the class. I For the year ended February 29. J Amount represents less than $.01 per share. K Total distributions of $.37 per share is comprised of distributions from net investment income of $.244 and distributions from net realized gain of $.127 per share. L Total distributions of $.24 per share is comprised of distributions from net investment income of $.216 and distributions from net realized gain of $.028 per share. M The amount shown reflects certain reclassifications related to book to tax differences. |
See accompanying notes which are an integral part of the financial statements.
Semiannual Report
Financial Highlights - Class B
| Six months ended
August 31, 2012 | Years ended February 28, |
| (Unaudited) | 2012 I | 2011 | 2010 | 2009 | 2008 I |
Selected Per-Share Data | | | | | | |
Net asset value, beginning of period | $ 46.14 | $ 46.93 | $ 37.60 | $ 26.71 | $ 42.42 | $ 50.80 |
Income from Investment Operations | | | | | | |
Net investment income (loss) E | .33 | .21 | .25 | .40 | (.05) | (.14) |
Net realized and unrealized gain (loss) | 3.46 | (.83) | 9.48 | 10.54 | (15.49) | (8.04) |
Total from investment operations | 3.79 | (.62) | 9.73 | 10.94 | (15.54) | (8.18) |
Distributions from net investment income | (.02) | (.17) | (.40) | (.04) | (.11) M | (.20) |
Distributions from net realized gain | - | - | - | (.01) | (.06) M | - |
Total distributions | (.02) | (.17) | (.40) | (.05) L | (.17) K | (.20) |
Redemption fees added to paid in capital E, J | - | - | - | - | - | - |
Net asset value, end of period | $ 49.91 | $ 46.14 | $ 46.93 | $ 37.60 | $ 26.71 | $ 42.42 |
Total Return B, C, D | 8.22% | (1.29)% | 25.96% | 40.97% | (36.64)% | (16.18)% |
Ratios to Average Net Assets F, H | | | | | | |
Expenses before reductions | 1.93% A | 1.95% | 1.95% | 2.01% | 1.97% | 1.95% |
Expenses net of fee waivers, if any | 1.93% A | 1.95% | 1.95% | 2.01% | 1.97% | 1.95% |
Expenses net of all reductions | 1.93% A | 1.93% | 1.93% | 2.00% | 1.96% | 1.94% |
Net investment income (loss) | 1.38% A | .47% | .60% | 1.13% | (.15)% | (.26)% |
Supplemental Data | | | | | | |
Net assets, end of period (000 omitted) | $ 745 | $ 596 | $ 706 | $ 641 | $ 363 | $ 741 |
Portfolio turnover rate G | 42% A | 72% | 72% | 90% | 168% | 134% |
A Annualized B Total returns for periods of less than one year are not annualized. C Total returns would have been lower if certain expenses had not been reduced during the applicable periods shown. D Total returns do not include the effect of the contingent deferred sales charge. E Calculated based on average shares outstanding during the period. F Fees and expenses of any underlying Fidelity Central Funds are not included in the Fund's expense ratio. The Fund indirectly bears its proportionate share of the expenses of any underlying Fidelity Central Funds. G Amount does not include the portfolio activity of any underlying Fidelity Central Funds. H Expense ratios reflect operating expenses of the class. Expenses before reductions do not reflect amounts reimbursed by the investment adviser or reductions from brokerage service arrangements or reductions from other expense offset arrangements and do not represent the amount paid by the class during periods when reimbursements or reductions occur. Expenses net of fee waivers reflect expenses after reimbursement by the investment adviser but prior to reductions from brokerage service arrangements or other expense offset arrangements. Expenses net of all reductions represent the net expenses paid by the class. I For the year ended February 29. J Amount represents less than $.01 per share. K Total distributions of $.17 per share is comprised of distributions from net investment income of $.105 and distributions from net realized gain of $.063 per share. L Total distributions of $.05 per share is comprised of distributions from net investment income of $.044 and distributions from net realized gain of $.009 per share. M The amount shown reflects certain reclassifications related to book to tax differences. |
Financial Highlights - Class C
| Six months ended
August 31, 2012 | Years ended February 28, |
| (Unaudited) | 2012 I | 2011 | 2010 | 2009 | 2008 I |
Selected Per-Share Data | | | | | | |
Net asset value, beginning of period | $ 46.02 | $ 46.89 | $ 37.61 | $ 26.76 | $ 42.42 | $ 50.81 |
Income from Investment Operations | | | | | | |
Net investment income (loss) E | .33 | .22 | .26 | .41 | (.05) | (.14) |
Net realized and unrealized gain (loss) | 3.46 | (.84) | 9.46 | 10.56 | (15.50) | (8.03) |
Total from investment operations | 3.79 | (.62) | 9.72 | 10.97 | (15.55) | (8.17) |
Distributions from net investment income | (.02) | (.25) | (.44) | (.10) | (.07) M | (.22) |
Distributions from net realized gain | - | - | - | (.02) | (.05) M | - |
Total distributions | (.02) | (.25) | (.44) | (.12) L | (.11) K | (.22) |
Redemption fees added to paid in capital E, J | - | - | - | - | - | - |
Net asset value, end of period | $ 49.79 | $ 46.02 | $ 46.89 | $ 37.61 | $ 26.76 | $ 42.42 |
Total Return B, C, D | 8.24% | (1.27)% | 25.95% | 41.00% | (36.64)% | (16.17)% |
Ratios to Average Net Assets F, H | | | | | | |
Expenses before reductions | 1.91% A | 1.93% | 1.94% | 2.01% | 1.97% | 1.95% |
Expenses net of fee waivers, if any | 1.91% A | 1.93% | 1.94% | 2.01% | 1.97% | 1.95% |
Expenses net of all reductions | 1.90% A | 1.91% | 1.92% | 2.00% | 1.96% | 1.94% |
Net investment income (loss) | 1.40% A | .48% | .61% | 1.13% | (.14)% | (.26)% |
Supplemental Data | | | | | | |
Net assets, end of period (000 omitted) | $ 3,954 | $ 3,514 | $ 3,035 | $ 2,151 | $ 371 | $ 902 |
Portfolio turnover rate G | 42% A | 72% | 72% | 90% | 168% | 134% |
A Annualized B Total returns for periods of less than one year are not annualized. C Total returns would have been lower if certain expenses had not been reduced during the applicable periods shown. D Total returns do not include the effect of the contingent deferred sales charge. E Calculated based on average shares outstanding during the period. F Fees and expenses of any underlying Fidelity Central Funds are not included in the Fund's expense ratio. The Fund indirectly bears its proportionate share of the expenses of any underlying Fidelity Central Funds. G Amount does not include the portfolio activity of any underlying Fidelity Central Funds. H Expense ratios reflect operating expenses of the class. Expenses before reductions do not reflect amounts reimbursed by the investment adviser or reductions from brokerage service arrangements or reductions from other expense offset arrangements and do not represent the amount paid by the class during periods when reimbursements or reductions occur. Expenses net of fee waivers reflect expenses after reimbursement by the investment adviser but prior to reductions from brokerage service arrangements or other expense offset arrangements. Expenses net of all reductions represent the net expenses paid by the class. I For the year ended February 29. J Amount represents less than $.01 per share. K Total distributions of $.11 per share is comprised of distributions from net investment income of $.068 and distributions from net realized gain of $.046 per share. L Total distributions of $.12 per share is comprised of distributions from net investment income of $.098 and distributions from net realized gain of $.023 per share. M The amount shown reflects certain reclassifications related to book to tax differences. |
See accompanying notes which are an integral part of the financial statements.
Semiannual Report
Financial Highlights - Telecommunications
| Six months ended
August 31, 2012 | Years ended February 28, |
| (Unaudited) | 2012 H | 2011 | 2010 | 2009 | 2008 H |
Selected Per-Share Data | | | | | | |
Net asset value, beginning of period | $ 46.26 | $ 47.07 | $ 37.73 | $ 26.74 | $ 42.70 | $ 50.91 |
Income from Investment Operations | | | | | | |
Net investment income (loss) D | .58 | .70 | .69 | .76 | .30 | .43 |
Net realized and unrealized gain (loss) | 3.47 | (.86) | 9.52 | 10.59 | (15.65) | (8.12) |
Total from investment operations | 4.05 | (.16) | 10.21 | 11.35 | (15.35) | (7.69) |
Distributions from net investment income | (.10) | (.65) | (.87) | (.31) | (.41) L | (.52) |
Distributions from net realized gain | - | - | - | (.05) | (.20) L | - |
Total distributions | (.10) | (.65) | (.87) | (.36) K | (.61) J | (.52) |
Redemption fees added to paid in capital D, I | - | - | - | - | - | - |
Net asset value, end of period | $ 50.21 | $ 46.26 | $ 47.07 | $ 37.73 | $ 26.74 | $ 42.70 |
Total Return B, C | 8.77% | (.23)% | 27.24% | 42.43% | (36.00)% | (15.30)% |
Ratios to Average Net Assets E, G | | | | | | |
Expenses before reductions | .88% A | .90% | .92% | .99% | .97% | .91% |
Expenses net of fee waivers, if any | .88% A | .90% | .92% | .99% | .97% | .90% |
Expenses net of all reductions | .87% A | .88% | .91% | .98% | .96% | .90% |
Net investment income (loss) | 2.43% A | 1.52% | 1.62% | 2.15% | .85% | .79% |
Supplemental Data | | | | | | |
Net assets, end of period (000 omitted) | $ 432,831 | $ 342,262 | $ 354,938 | $ 279,704 | $ 196,231 | $ 334,565 |
Portfolio turnover rate F | 42% A | 72% | 72% | 90% | 168% | 134% |
A Annualized B Total returns for periods of less than one year are not annualized. C Total returns would have been lower if certain expenses had not been reduced during the applicable periods shown. D Calculated based on average shares outstanding during the period. E Fees and expenses of any underlying Fidelity Central Funds are not included in the Fund's expense ratio. The Fund indirectly bears its proportionate share of the expenses of any underlying Fidelity Central Funds. F Amount does not include the portfolio activity of any underlying Fidelity Central Funds. G Expense ratios reflect operating expenses of the class. Expenses before reductions do not reflect amounts reimbursed by the investment adviser or reductions from brokerage service arrangements or reductions from other expense offset arrangements and do not represent the amount paid by the class during periods when reimbursements or reductions occur. Expenses net of fee waivers reflect expenses after reimbursement by the investment adviser but prior to reductions from brokerage service arrangements or other expense offset arrangements. Expenses net of all reductions represent the net expenses paid by the class. H For the year ended February 29. I Amount represents less than $.01 per share. J Total distributions of $.61 per share is comprised of distributions from net investment income of $.408 and distributions from net realized gain of $.202 per share. K Total distributions of $.36 per share is comprised of distributions from net investment income of $.310 and distributions from net realized gain of $.048 per share. L The amount shown reflects certain reclassifications related to book to tax differences. |
Financial Highlights - Institutional Class
| Six months ended
August 31, 2012 | Years ended February 28, |
| (Unaudited) | 2012 H | 2011 | 2010 | 2009 | 2008 H |
Selected Per-Share Data | | | | | | |
Net asset value, beginning of period | $ 46.20 | $ 47.02 | $ 37.69 | $ 26.73 | $ 42.65 | $ 50.91 |
Income from Investment Operations | | | | | | |
Net investment income (loss) D | .57 | .70 | .71 | .84 | .34 | .45 |
Net realized and unrealized gain (loss) | 3.48 | (.88) | 9.50 | 10.55 | (15.67) | (8.09) |
Total from investment operations | 4.05 | (.18) | 10.21 | 11.39 | (15.33) | (7.64) |
Distributions from net investment income | (.09) | (.64) | (.88) | (.38) | (.40) L | (.62) |
Distributions from net realized gain | - | - | - | (.05) | (.20) L | - |
Total distributions | (.09) | (.64) | (.88) | (.43) K | (.59) J | (.62) |
Redemption fees added to paid in capital D, I | - | - | - | - | - | - |
Net asset value, end of period | $ 50.16 | $ 46.20 | $ 47.02 | $ 37.69 | $ 26.73 | $ 42.65 |
Total Return B, C | 8.78% | (.26)% | 27.27% | 42.59% | (35.99)% | (15.23)% |
Ratios to Average Net Assets E, G | | | | | | |
Expenses before reductions | .88% A | .89% | .91% | .86% | .91% | .83% |
Expenses net of fee waivers, if any | .88% A | .89% | .91% | .86% | .91% | .83% |
Expenses net of all reductions | .88% A | .87% | .89% | .84% | .90% | .83% |
Net investment income (loss) | 2.43% A | 1.52% | 1.64% | 2.29% | .91% | .86% |
Supplemental Data | | | | | | |
Net assets, end of period (000 omitted) | $ 1,484 | $ 1,022 | $ 1,743 | $ 1,101 | $ 68 | $ 256 |
Portfolio turnover rate F | 42% A | 72% | 72% | 90% | 168% | 134% |
A Annualized B Total returns for periods of less than one year are not annualized. C Total returns would have been lower if certain expenses had not been reduced during the applicable periods shown. D Calculated based on average shares outstanding during the period. E Fees and expenses of any underlying Fidelity Central Funds are not included in the Fund's expense ratio. The Fund indirectly bears its proportionate share of the expenses of any underlying Fidelity Central Funds. F Amount does not include the portfolio activity of any underlying Fidelity Central Funds. G Expense ratios reflect operating expenses of the class. Expenses before reductions do not reflect amounts reimbursed by the investment adviser or reductions from brokerage service arrangements or reductions from other expense offset arrangements and do not represent the amount paid by the class during periods when reimbursements or reductions occur. Expenses net of fee waivers reflect expenses after reimbursement by the investment adviser but prior to reductions from brokerage service arrangements or other expense offset arrangements. Expenses net of all reductions represent the net expenses paid by the class. H For the year ended February 29. I Amount represents less than $.01 per share. J Total distributions of $.59 per share is comprised of distributions from net investment income of $.395 and distributions from net realized gain of $.197 per share. K Total distributions of $.43 per share is comprised of distributions from net investment income of $.379 and distributions from net realized gain of $.057 per share. L The amount shown reflects certain reclassifications related to book to tax differences. |
See accompanying notes which are an integral part of the financial statements.
Semiannual Report
Notes to Financial Statements
For the period ended August 31, 2012 (Unaudited)
1. Organization.
Telecommunications Portfolio (the Fund) is a non-diversified fund of Fidelity Select Portfolios (the Trust) and is authorized to issue an unlimited number of shares. The Trust is registered under the Investment Company Act of 1940, as amended (the 1940 Act), as an open-end management investment company organized as a Massachusetts business trust. The Fund invests primarily in securities of companies whose principal business activities fall within specific industries. The Fund offers Class A, Class T, Class C, Telecommunications, and Institutional Class shares, each of which, along with Class B shares, has equal rights as to assets and voting privileges. Effective after the close of business on September 1, 2010, Class B shares were closed to new accounts and additional purchases, except for exchanges and reinvestments. Each class has exclusive voting rights with respect to matters that affect that class. Class B shares will automatically convert to Class A shares after a holding period of seven years from the initial date of purchase. Investment income, realized and unrealized capital gains and losses, the common expenses of the Fund, and certain fund-level expense reductions, if any, are allocated on a pro-rata basis to each class based on the relative net assets of each class to the total net assets of the Fund. Each class differs with respect to transfer agent and distribution and service plan fees incurred. Certain expense reductions may also differ by class. The Fund's investments in emerging markets can be subject to social, economic, regulatory, and political uncertainties and can be extremely volatile.
2. Investments in Fidelity Central Funds.
The Fund invests in Fidelity Central Funds, which are open-end investment companies available only to other investment companies and accounts managed by Fidelity Management & Research Company (FMR) and its affiliates. The Fund's Schedule of Investments lists each of the Fidelity Central Funds held as of period end, if any, as an investment of the Fund, but does not include the underlying holdings of each Fidelity Central Fund. As an Investing Fund, the Fund indirectly bears its proportionate share of the expenses of the underlying Fidelity Central Funds.
The Money Market Central Funds seek preservation of capital and current income and are managed by Fidelity Investments Money Management, Inc. (FIMM), an affiliate of FMR.
A complete unaudited list of holdings for each Fidelity Central Fund is available upon request or at the Securities and Exchange Commission (the SEC) web site at www.sec.gov. In addition, the financial statements of the Fidelity Central Funds are available on the SEC web site or upon request.
3. Significant Accounting Policies.
The financial statements have been prepared in conformity with accounting principles generally accepted in the United States of America (GAAP), which require management to make certain estimates and assumptions at the date of the financial statements. Actual results could differ from those estimates. Subsequent events, if any, through the date that the financial statements were issued have been evaluated in the preparation of the financial statements. The following summarizes the significant accounting policies of the Fund:
Security Valuation. Investments are valued as of 4:00 p.m. Eastern time on the last calendar day of the period. In accordance with valuation policies and procedures approved by the Board of Trustees (the Board), the Fund attempts to obtain prices from one or more third party pricing vendor or broker to value its investments. When current market prices, quotations or rates are not readily available or reliable, securities will be fair valued in good faith by the FMR Fair Value Committee (the Committee), in accordance with procedures adopted by the Fund's Board. Factors used in determining fair value vary by security type and may include market or security specific events. The frequency with which these procedures are used cannot be predicted and they may be utilized to a significant extent. The Committee oversees the Fund's valuation policies and procedures and is responsible for approving and reporting to the Board all fair value determinations.
The Fund categorizes the inputs to valuation techniques used to value its investments into a disclosure hierarchy consisting of three levels as shown below:
Level 1 - quoted prices in active markets for identical investments
Level 2 - other significant observable inputs (including quoted prices for similar investments, interest rates, prepayment speeds, etc.)
Level 3 - unobservable inputs (including the Fund's own assumptions based on the best information available)
Valuation techniques used to value the Fund's investments by major category are as follows:
Equity securities, including restricted securities, for which market quotations are readily available, are valued at the last reported sale price or official closing price as reported by a third party pricing vendor on the primary market or exchange on which they are traded and are categorized as Level 1 in the hierarchy. In the event there were no sales during the day or closing prices are not available, securities are valued at the last quoted bid price or may be valued using the last available price and are generally categorized as Level 2 in the hierarchy. For foreign equity securities, when significant market or security specific events arise, comparisons to the valuation of American Depositary Receipts (ADRs), futures contracts, Exchange-Traded Funds (ETFs) and certain indexes as well as quoted prices for similar securities are used and are categorized as Level 2 in the hierarchy. Utilizing these techniques may result in transfers between Level 1 and Level 2.
Semiannual Report
Notes to Financial Statements (Unaudited) - continued
3. Significant Accounting Policies - continued
Security Valuation - continued
Investments in open-end mutual funds, including the Fidelity Central Funds, are valued at their closing net asset value each business day and are categorized as Level 1 in the hierarchy.
Changes in valuation techniques may result in transfers in or out of an assigned level within the disclosure hierarchy. The aggregate value of investments by input level, as of August 31, 2012 is included at the end of the Fund's Schedule of Investments.
Foreign Currency Translation. The Fund may use foreign currency contracts to facilitate transactions in foreign-denominated securities. Gains and losses from these transactions may arise from changes in the value of the foreign currency or if the counterparties do not perform under the contracts' terms.
Foreign-denominated assets, including investment securities, and liabilities are translated into U.S. dollars at the exchange rates at period end. Purchases and sales of investment securities, income and dividends received and expenses denominated in foreign currencies are translated into U.S. dollars at the exchange rate in effect on the transaction date.
The effects of exchange rate fluctuations on investments are included with the net realized and unrealized gain (loss) on investment securities. Other foreign currency transactions resulting in realized and unrealized gain (loss) are disclosed separately.
Investment Transactions and Income. For financial reporting purposes, the Fund's investment holdings and NAV include trades executed through the end of the last business day of the period. The NAV per share for processing shareholder transactions is calculated as of the close of business of the New York Stock Exchange (NYSE), normally 4:00 p.m. Eastern time and includes trades executed through the end of the prior business day. Gains and losses on securities sold are determined on the basis of identified cost and may include proceeds received from litigation. Dividend income is recorded on the ex-dividend date, except for certain dividends from foreign securities where the ex-dividend date may have passed, which are recorded as soon as the Fund is informed of the ex-dividend date. Non-cash dividends included in dividend income, if any, are recorded at the fair market value of the securities received. Distributions received on securities that represent a return of capital or capital gain are recorded as a reduction of cost of investments and/or as a realized gain. The Fund estimates the components of distributions received that may be considered return of capital distributions or capital gain distributions. Interest income and distributions from the Fidelity Central Funds are accrued as earned. Interest income includes coupon interest and amortization of premium and accretion of discount on debt securities. Investment income is recorded net of foreign taxes withheld where recovery of such taxes is uncertain.
Expenses. Expenses directly attributable to a fund are charged to that fund. Expenses attributable to more than one fund are allocated among the respective funds on the basis of relative net assets or other appropriate methods. Expense estimates are accrued in the period to which they relate and adjustments are made when actual amounts are known.
Income Tax Information and Distributions to Shareholders. Each year, the Fund intends to qualify as a regulated investment company under Subchapter M of the Internal Revenue Code, including distributing substantially all of its taxable income and realized gains. As a result, no provision for income taxes is required. The Fund files a U.S. federal tax return, in addition to state and local tax returns as required. A fund's federal income tax returns are subject to examination by the Internal Revenue Service (IRS) for a period of three fiscal years after they are filed. State and local tax returns may be subject to examination for an additional fiscal year depending on the jurisdiction. Foreign taxes are provided for based on the Fund's understanding of the tax rules and rates that exist in the foreign markets in which it invests.
Distributions are declared and recorded on the ex-dividend date. Income dividends and capital gain distributions are declared separately for each class. Income and capital gain distributions are determined in accordance with income tax regulations, which may differ from GAAP.
Capital accounts within the financial statements are adjusted for permanent book-tax differences. These adjustments have no impact on net assets or the results of operations. Temporary book-tax differences will reverse in a subsequent period.
Book-tax differences are primarily due to foreign currency transactions, deferred trustees compensation, capital loss carryforwards, expiring capital loss carryforwards, and losses deferred due to wash sales and excise tax regulations.
The federal tax cost of investment securities and unrealized appreciation (depreciation) as of period end were as follows:
Gross unrealized appreciation | $ 47,809,069 |
Gross unrealized depreciation | (47,485,236) |
Net unrealized appreciation (depreciation) on securities and other investments | $ 323,833 |
| |
Tax cost | $ 467,211,281 |
Semiannual Report
3. Significant Accounting Policies - continued
Income Tax Information and Distributions to Shareholders - continued
Capital loss carryforwards are only available to offset future capital gains of the Fund to the extent provided by regulations and may be limited. Under the Regulated Investment Company Modernization Act of 2010 (the Act), the Fund is permitted to carry forward capital losses incurred in taxable years beginning after December 22, 2010 for an unlimited period and such capital losses are required to be used prior to any losses that expire. At Feburary 29, 2012, capital loss carryforwards were as follows:
Fiscal year of expiration | |
2017 | $ (31,682,432) |
2018 | (12,541,688) |
Total with expiration | $ (44,224,120) |
The Fund intends to elect to defer to its fiscal year ending February 28, 2013 approximately $4,371,830 of capital losses recognized during the period November 1, 2011 to February 29, 2012.
Trading (Redemption) Fees. Shares held by investors in the Fund less than 30 days are subject to a redemption fee equal to .75% of the net asset value of shares redeemed. All redemption fees, which reduce the proceeds of the shareholder redemption, are retained by the Fund and accounted for as an addition to paid in capital.
New Accounting Pronouncement. In December 2011, the Financial Accounting Standards Board issued Accounting Standard Update No. 2011-11, Disclosures about Offsetting Assets and Liabilities. The update creates new disclosure requirements requiring entities to disclose both gross and net information for derivatives and other financial instruments that are either offset in the Statement of Assets and Liabilities or subject to an enforceable master netting arrangement or similar agreement. The disclosure requirements are effective for annual reporting periods beginning on or after January 1, 2013, and interim periods within those annual periods. Management is currently evaluating the impact of the update's adoption on the Fund's financial statement disclosures.
4. Purchases and Sales of Investments.
Purchases and sales of securities other than short-term securities, aggregated $142,674,054 and $77,682,711, respectively.
5. Fees and Other Transactions with Affiliates.
Management Fee. FMR and its affiliates provide the Fund with investment management related services for which the Fund pays a monthly management fee. The management fee is the sum of an individual fund fee rate that is based on an annual rate of .30% of the Fund's average net assets and an annualized group fee rate that averaged .26% during the period. The group fee rate is based upon the average net assets of all the mutual funds advised by FMR. The group fee rate decreases as assets under management increase and increases as assets under management decrease. For the period, the total annualized management fee rate was .56% of the Fund's average net assets.
Distribution and Service Plan Fees. In accordance with Rule 12b-1 of the 1940 Act, the Fund has adopted separate Distribution and Service Plans for each class of shares. Certain classes pay Fidelity Distributors Corporation (FDC), an affiliate of FMR, separate Distribution and Service Fees, each of which is based on an annual percentage of each class' average net assets. In addition, FDC may pay financial intermediaries for selling shares of the Fund and providing shareholder support services. For the period, the Distribution and Service Fee rates, total fees and amounts retained by FDC were as follows:
| Distribution
Fee | Service
Fee | Total Fees | Retained
by FDC |
Class A | -% | .25% | $ 6,771 | $ 415 |
Class T | .25% | .25% | 7,678 | - |
Class B | .75% | .25% | 3,208 | 2,406 |
Class C | .75% | .25% | 18,164 | 4,499 |
| | | $ 35,821 | $ 7,320 |
Sales Load. FDC may receive a front-end sales charge of up to 5.75% for selling Class A shares and 3.50% for selling Class T shares, some of which is paid to financial intermediaries for selling shares of the Fund. Depending on the holding period, FDC may receive contingent deferred sales charges levied on Class A, Class T, Class B, and Class C redemptions. The deferred sales charges range from 5.00% to 1.00% for Class B shares, 1.00% for Class C shares, 1.00% for certain purchases of Class A shares and .25% for certain purchases of Class T shares.
Semiannual Report
Notes to Financial Statements (Unaudited) - continued
5. Fees and Other Transactions with Affiliates - continued
Sales Load - continued
For the period, sales charge amounts retained by FDC were as follows:
| Retained
by FDC |
Class A | $ 2,179 |
Class T | 1,194 |
Class B* | 457 |
Class C* | 717 |
| $ 4,547 |
* When Class B and Class C shares are initially sold, FDC pays commissions from its own resources to financial intermediaries through which the sales are made.
Transfer Agent Fees. Fidelity Investments Institutional Operations Company, Inc. (FIIOC), an affiliate of FMR, is the transfer, dividend disbursing and shareholder servicing agent for each class of the Fund. FIIOC receives account fees and asset-based fees that vary according to the account size and type of account of the shareholders of the respective classes of the Fund. FIIOC pays for typesetting, printing and mailing of shareholder reports, except proxy statements. For the period, transfer agent fees for each class were as follows:
| Amount | % of
Average
Net Assets* |
Class A | $ 7,987 | .29 |
Class T | 5,308 | .34 |
Class B | 964 | .30 |
Class C | 5,010 | .28 |
Telecommunications | 458,358 | .24 |
Institutional Class | 1,282 | .25 |
| $ 478,909 | |
* Annualized
Accounting and Security Lending Fees. Fidelity Service Company, Inc. (FSC), an affiliate of FMR, maintains the Fund's accounting records. The accounting fee is based on the level of average net assets for each month. Under a separate contract, FSC administers the security lending program. The security lending fee is based on the number and duration of lending transactions.
Brokerage Commissions. The Fund placed a portion of its portfolio transactions with brokerage firms which are affiliates of the investment adviser. The commissions paid to these affiliated firms were $6,788 for the period.
6. Committed Line of Credit.
The Fund participates with other funds managed by FMR or an affiliate in a $4.25 billion credit facility (the "line of credit") to be utilized for temporary or emergency purposes to fund shareholder redemptions or for other short-term liquidity purposes. The Fund has agreed to pay commitment fees on its pro-rata portion of the line of credit, which amounted to $506 and is reflected in Miscellaneous expenses on the Statement of Operations. During the period, there were no borrowings on this line of credit.
7. Security Lending.
The Fund lends portfolio securities through a lending agent from time to time in order to earn additional income. For equity securities, a lending agent is used and may loan securities to certain qualified borrowers, including Fidelity Capital Markets (FCM), a broker-dealer affiliated with the Fund. On the settlement date of the loan, the Fund receives collateral (in the form of U.S. Treasury obligations, letters of credit and/or cash) against the loaned securities and maintains collateral in an amount not less than 100% of the market value of the loaned securities during the period of the loan. The market value of the loaned securities is determined at the close of business of the Fund and any additional required collateral is delivered to the Fund on the next business day. If the borrower defaults on its obligation to return the securities loaned because of insolvency or other reasons, a fund could experience delays and costs in recovering the securities loaned or in gaining access to the collateral. Any cash collateral received is invested in the Fidelity Securities Lending Cash Central Fund. The value of loaned securities and cash collateral at period end are disclosed on the Fund's Statement of Assets and Liabilities. At period end, there were no security loans outstanding with FCM. Security lending income represents the income earned on investing cash collateral, less rebates paid to borrowers and any lending agent fees associated with the loan, plus any premium payments received for
Semiannual Report
7. Security Lending - continued
lending certain types of securities. Security lending income is presented in the Statement of Operations as a component of income from Fidelity Central Funds. Total security lending income during the period amounted to $82,749, including $350 from securities loaned to FCM.
8. Expense Reductions.
Many of the brokers with whom FMR places trades on behalf of the Fund provided services to the Fund in addition to trade execution. These services included payments of certain expenses on behalf of the Fund totaling $15,528 for the period.
9. Distributions to Shareholders.
Distributions to shareholders of each class were as follows:
| Six months ended
August 31,
2012 | Year ended
February 28,
2012 |
From net investment income | | |
Class A | $ 8,492 | $ 54,285 |
Class T | 3,143 | 24,009 |
Class B | 256 | 2,206 |
Class C | 1,681 | 19,099 |
Telecommunications | 731,839 | 4,833,836 |
Institutional Class | 1,880 | 21,784 |
Total | $ 747,291 | $ 4,955,219 |
10. Share Transactions.
Transactions for each class of shares were as follows:
| Shares | Dollars |
| Six months ended
August 31,
2012 | Year ended
February 28,
2012 | Six months ended
August 31,
2012 | Year ended
February 28,
2012 |
Class A | | | | |
Shares sold | 47,204 | 70,128 | $ 2,249,611 | $ 3,321,351 |
Reinvestment of distributions | 147 | 1,116 | 6,669 | 47,447 |
Shares redeemed | (16,505) | (61,569) | (768,026) | (2,787,444) |
Net increase (decrease) | 30,846 | 9,675 | $ 1,488,254 | $ 581,354 |
Class T | | | | |
Shares sold | 25,319 | 24,101 | $ 1,197,182 | $ 1,100,865 |
Reinvestment of distributions | 67 | 557 | 3,054 | 23,555 |
Shares redeemed | (6,360) | (27,493) | (298,541) | (1,235,915) |
Net increase (decrease) | 19,026 | (2,835) | $ 901,695 | $ (111,495) |
Class B | | | | |
Shares sold | 2,740 | 1,659 | $ 128,382 | $ 77,673 |
Reinvestment of distributions | 5 | 46 | 230 | 1,965 |
Shares redeemed | (725) | (3,832) | (33,945) | (176,016) |
Net increase (decrease) | 2,020 | (2,127) | $ 94,667 | $ (96,378) |
Class C | | | | |
Shares sold | 11,345 | 30,950 | $ 534,730 | $ 1,412,876 |
Reinvestment of distributions | 26 | 313 | 1,164 | 13,236 |
Shares redeemed | (8,303) | (19,633) | (390,501) | (879,199) |
Net increase (decrease) | 3,068 | 11,630 | $ 145,393 | $ 546,913 |
Telecommunications | | | | |
Shares sold | 2,633,330 | 3,856,487 | $ 124,473,339 | $ 180,498,933 |
Reinvestment of distributions | 15,557 | 108,713 | 709,072 | 4,652,114 |
Shares redeemed | (1,428,047) | (4,106,690) | (68,578,164) | (188,141,891) |
Net increase (decrease) | 1,220,840 | (141,490) | $ 56,604,247 | $ (2,990,844) |
Semiannual Report
Notes to Financial Statements (Unaudited) - continued
10. Share Transactions - continued
| Shares | Dollars |
| Six months ended
August 31,
2012 | Year ended
February 28,
2012 | Six months ended
August 31,
2012 | Year ended
February 28,
2012 |
Institutional Class | | | | |
Shares sold | 12,743 | 107,857 | $ 633,322 | $ 5,158,491 |
Reinvestment of distributions | 27 | 401 | 1,228 | 17,134 |
Shares redeemed | (5,304) | (123,190) | (251,275) | (5,562,790) |
Net increase (decrease) | 7,466 | (14,932) | $ 383,275 | $ (387,165) |
11. Other.
The Fund's organizational documents provide former and current trustees and officers with a limited indemnification against liabilities arising in connection with the performance of their duties to the Fund. In the normal course of business, the Fund may also enter into contracts that provide general indemnifications. The Fund's maximum exposure under these arrangements is unknown as this would be dependent on future claims that may be made against the Fund. The risk of material loss from such claims is considered remote.
At the end of the period, Fidelity VIP Funds Manager 60% Portfolio was the owner of record of approximately 18% of the total outstanding shares of the fund. In addition, Strategic Advisers U.S. Opportunity Fund was the owner of record of approximately 11% of the total outstanding shares of the fund. Mutual funds managed by FMR or its affiliates were the owners of record, in the aggregate, of approximately 35% of the total outstanding shares of Telecommunications.
Semiannual Report
Board Approval of Investment Advisory Contracts and Management Fees
Consumer Staples Portfolio
Gold Portfolio
Materials Portfolio
Telecommunications Portfolio
Each year, the Board of Trustees, including the Independent Trustees (together, the Board), votes on the renewal of the management contract and sub-advisory agreements (together, the Advisory Contracts) for each fund. The Board, assisted by the advice of fund counsel and Independent Trustees' counsel, requests and considers a broad range of information relevant to the renewal of the Advisory Contracts throughout the year.
The Board meets regularly and, at each of its meetings, considers factors that are relevant to its annual consideration of the renewal of each fund's Advisory Contracts, including the services and support provided to each fund and its shareholders. The Board has established various standing committees, each composed of and chaired by Independent Trustees with varying backgrounds, to which the Board has assigned specific subject matter responsibilities in order to enhance effective decision-making by the Board. The Board, acting directly and through its Committees, requests and receives information concerning the annual consideration of the renewal of each fund's Advisory Contracts. The Board also meets as needed to consider matters specifically related to the Board's annual consideration of the renewal of Advisory Contracts. Members of the Board may also meet with trustees of other Fidelity funds through ad hoc joint committees to discuss certain matters relevant to the Fidelity funds.
At its July 2012 meeting, the Board of Trustees, including the Independent Trustees, unanimously determined to renew each fund's Advisory Contracts. In reaching its determination, the Board considered all factors it believed relevant, including (i) the nature, extent, and quality of the services to be provided to each fund and its shareholders (including the investment performance of each fund); (ii) the competitiveness of each fund's management fee and total expense ratio relative to peer funds; (iii) the total costs of the services to be provided by and the profits to be realized by Fidelity from its relationship with each fund; (iv) the extent to which economies of scale exist and would be realized as each fund grows; and (v) whether fee levels reflect these economies of scale, if any, for the benefit of fund shareholders.
In considering whether to renew the Advisory Contracts for each fund, the Board reached a determination, with the assistance of fund counsel and Independent Trustees' counsel and through the exercise of its business judgment, that the renewal of the Advisory Contracts is in the best interests of each fund and its shareholders and that the compensation payable under the Advisory Contracts is fair and reasonable. The Board's decision to renew the Advisory Contracts was not based on any single factor, but rather was based on a comprehensive consideration of all the information provided to the Board at its meetings throughout the year. The Board, in reaching its determination to renew the Advisory Contracts, is aware that shareholders in each fund have a broad range of investment choices available to them, including a wide choice among mutual funds offered by Fidelity's competitors, and that each fund's shareholders, who have the opportunity to review and weigh the disclosure provided by the fund in its prospectus and other public disclosures, have chosen to invest in that fund, managed by Fidelity.
Nature, Extent, and Quality of Services Provided. The Board considered the staffing within the investment adviser, FMR, and the sub-advisers (together, the Investment Advisers), including the backgrounds of the funds' investment personnel, and also considered the funds' investment objectives, strategies, and related investment philosophies. The Independent Trustees also had discussions with senior management of Fidelity's investment operations and investment groups. The Board considered the structure of the portfolio manager compensation program and whether this structure provides appropriate incentives to act in the best interests of each fund.
Resources Dedicated to Investment Management and Support Services. The Board and the Fund Oversight and Research Committees reviewed the general qualifications and capabilities of the Investment Advisers' investment staff, including its size, education, experience, and resources, as well as the Investment Advisers' approach to recruiting, training, managing, and compensating investment personnel. The Board also noted that FMR has continued to increase the resources devoted to non-U.S. offices, including expansion of Fidelity's global investment organization. The Board noted that Fidelity's analysts have extensive resources, tools and capabilities that allow them to conduct sophisticated quantitative and fundamental analysis, as well as credit analysis of issuers, counterparties and guarantors. The Board also believes that Fidelity's investment professionals have sufficient access to global information and data so as to provide competitive investment results over time, and that those professionals also have access to sophisticated tools that permit them to assess portfolio construction and risk and performance attribution characteristics continuously, as well as to transmit new information and research conclusions rapidly around the world. Additionally, in its deliberations, the Board considered the Investment Advisers' trading and risk management capabilities and resources, which are an integral part of the investment management process.
Shareholder and Administrative Services. The Board considered (i) the nature, extent, quality, and cost of advisory, administrative, and shareholder services performed by the Investment Advisers and their affiliates under the Advisory Contracts and under separate agreements covering transfer agency, pricing and bookkeeping, and securities lending services for each fund; (ii) the nature and extent of the supervision of third party service providers, principally custodians and subcustodians; and (iii) the resources devoted to, and the record of compliance with, each fund's compliance policies and procedures. The Board also reviewed the allocation of fund brokerage, including allocations to brokers affiliated with the Investment Advisers, the use of brokerage commissions to pay fund expenses, and the use of "soft" commission dollars to pay for research services.
Semiannual Report
The Board noted that the growth of fund assets over time across the complex allows Fidelity to reinvest in the development of services designed to enhance the value or convenience of the Fidelity funds as investment vehicles. These services include 24-hour access to account information and market information through telephone representatives and over the Internet, investor education materials and asset allocation tools, and the expanded availability of Fidelity Investor Centers.
Investment in a Large Fund Family. The Board considered the benefits to shareholders of investing in a Fidelity fund, including the benefits of investing in a fund that is part of a large family of funds offering a variety of investment disciplines and providing a large variety of mutual fund investor services. The Board noted that Fidelity had taken, or had made recommendations that resulted in the Fidelity funds taking, a number of actions over the previous year that benefited particular funds, including (i) continuing to dedicate additional resources to investment research and support of the senior management team that oversees asset management; (ii) persisting in efforts to enhance Fidelity's research capabilities, in particular, international research; (iii) launching new funds and making other enhancements to meet client needs for global and income-oriented solutions; (iv) continuing to launch dedicated lower cost underlying funds to meet investment management's portfolio construction needs related to expanding underlying fund options, specifically for the Freedom Fund product lines; (v) adopting a "Stock Selector" sector neutral investment approach and employing a team of portfolio managers who are sector specialists to manage certain funds; (vi) rationalizing product lines and gaining increased efficiencies through the mergers of several funds into other funds; (vii) strengthening the Spartan Index Fund product line by adding new funds and/or new low-cost institutional share classes, restructuring fund expenses to accommodate new classes, and reducing investment minimums for certain classes of shares; (viii) modifying the eligibility criteria for Institutional Class shares to increase their appeal to government entities and charitable investors; and (ix) reducing certain transfer agent fee rates.
Investment Performance. The Board considered whether each fund has operated in accordance with its investment objective, as well as its record of compliance with its investment restrictions. It also reviewed each fund's absolute investment performance for each class, as well as each fund's relative investment performance for each class measured over multiple periods against a third-party-sponsored index that reflects the market sector in which the fund invests. The Board noted that FMR believes that no meaningful peer group exists for the funds principally because most other funds in each fund's third-party peer group focus on different industries or sectors than the fund.
For each of Consumer Staples Portfolio, Gold Portfolio, and Telecommunications Portfolio, the following charts considered by the Board show, over the one-, three-, and five-year periods ended December 31, 2011, the cumulative total returns of Institutional Class (Class I) and Class B of the fund and the cumulative total returns of a third-party-sponsored index ("benchmark"). The returns of Institutional Class (Class I) and Class B show the performance of the highest and lowest performing classes, respectively (based on five-year performance).
For Materials Portfolio, the following charts considered by the Board show, over the one-, three-, and five-year periods ended December 31, 2011, the cumulative total returns of the retail class and Class B of the fund and the cumulative total returns of a third-party-sponsored index ("benchmark"). The returns of the retail class and Class B show the performance of the highest and lowest performing classes, respectively (based on five-year performance).
Consumer Staples Portfolio

The Board noted that the investment performance of the fund was lower than its benchmark for the one- and five-year periods, although the three-year cumulative total return of Institutional Class (Class I) compared favorably to its benchmark. The Board considered that the variations in performance among the fund's classes reflect the variations in class expenses, which result in lower performance for higher expense classes. The Board also reviewed the fund's performance since inception as well as performance in the current year.
Semiannual Report
Board Approval of Investment Advisory Contracts and Management Fees - continued
Gold Portfolio
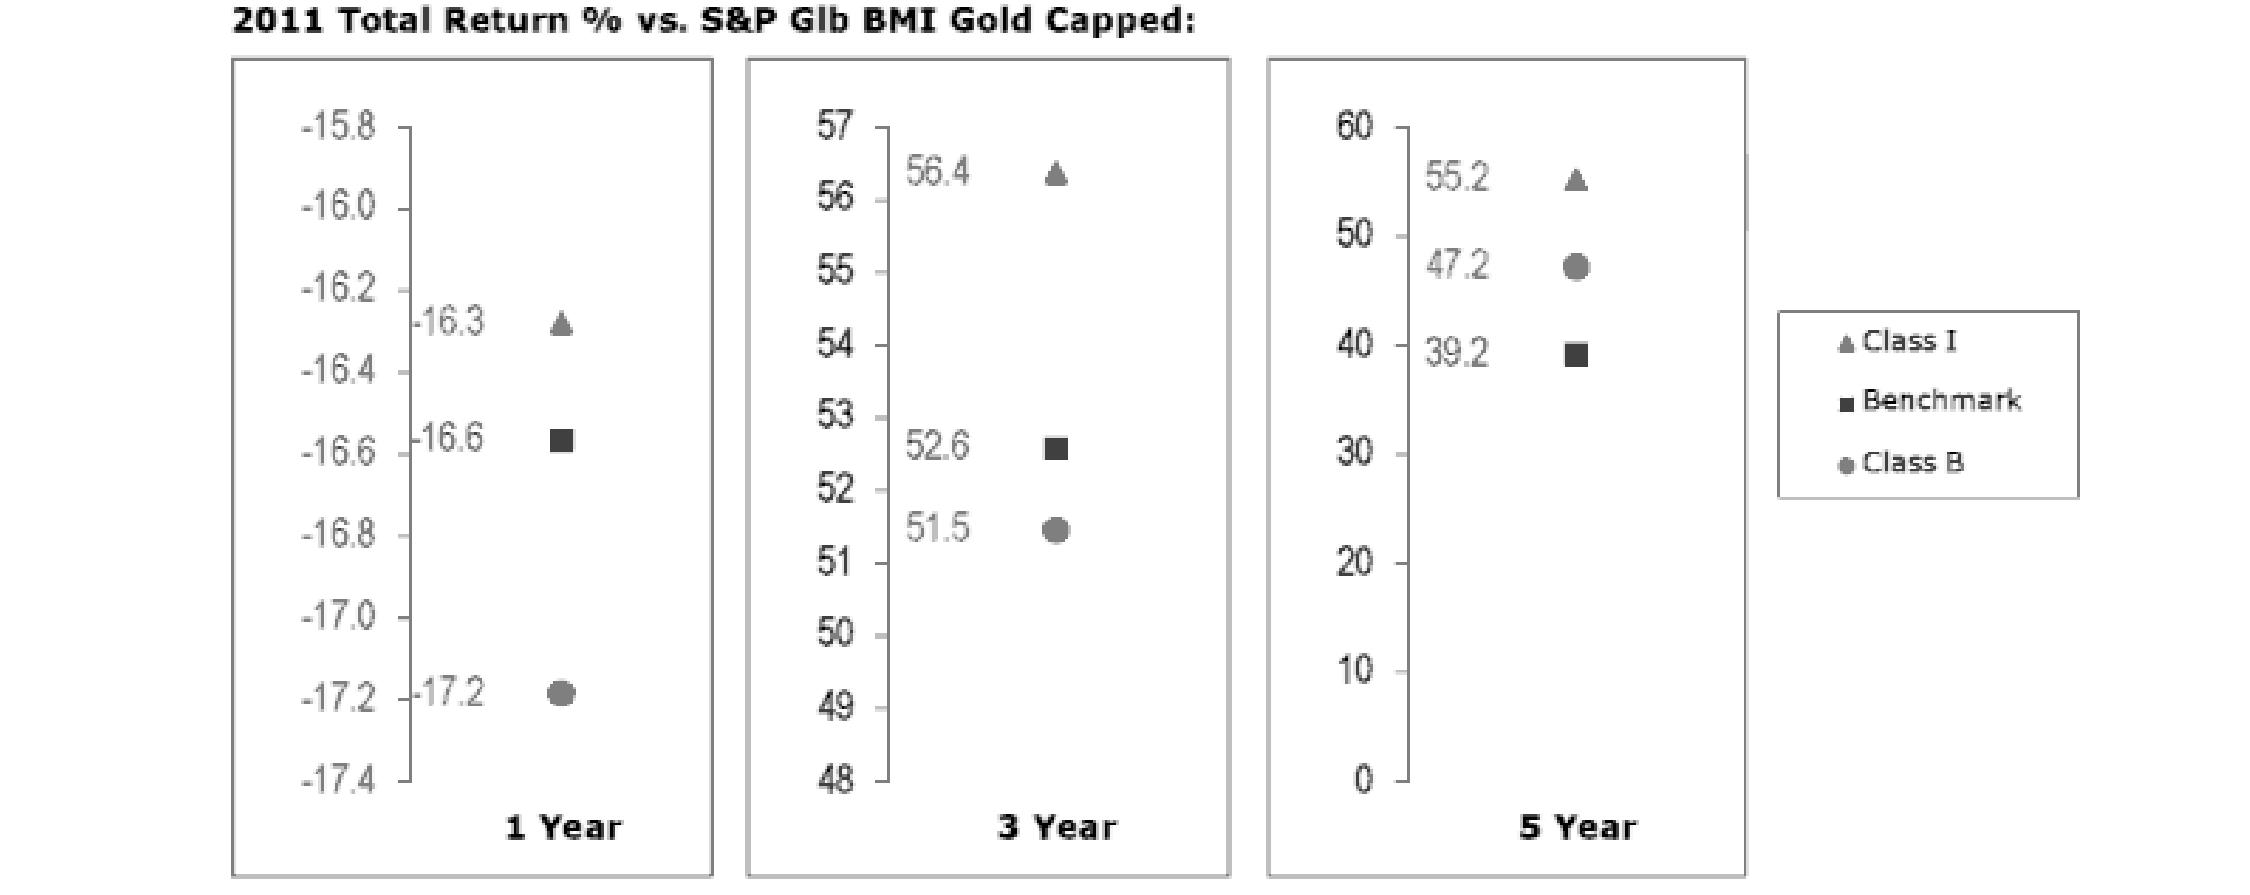
The Board noted that the investment performance of Institutional Class (Class I) of the fund compared favorably to its benchmark for all the periods shown. The Board considered that the variations in performance among the fund's classes reflect the variations in class expenses, which result in lower performance for higher expense classes. The Board also reviewed the fund's performance since inception as well as performance in the current year.
Materials Portfolio

The Board noted that the investment performance of the retail class of the fund compared favorably to its benchmark for all the periods shown. The Board considered that the variations in performance among the fund's classes reflect the variations in class expenses, which result in lower performance for higher expense classes. The Board also reviewed the fund's performance since inception as well as performance in the current year.
Semiannual Report
Telecommunications Portfolio
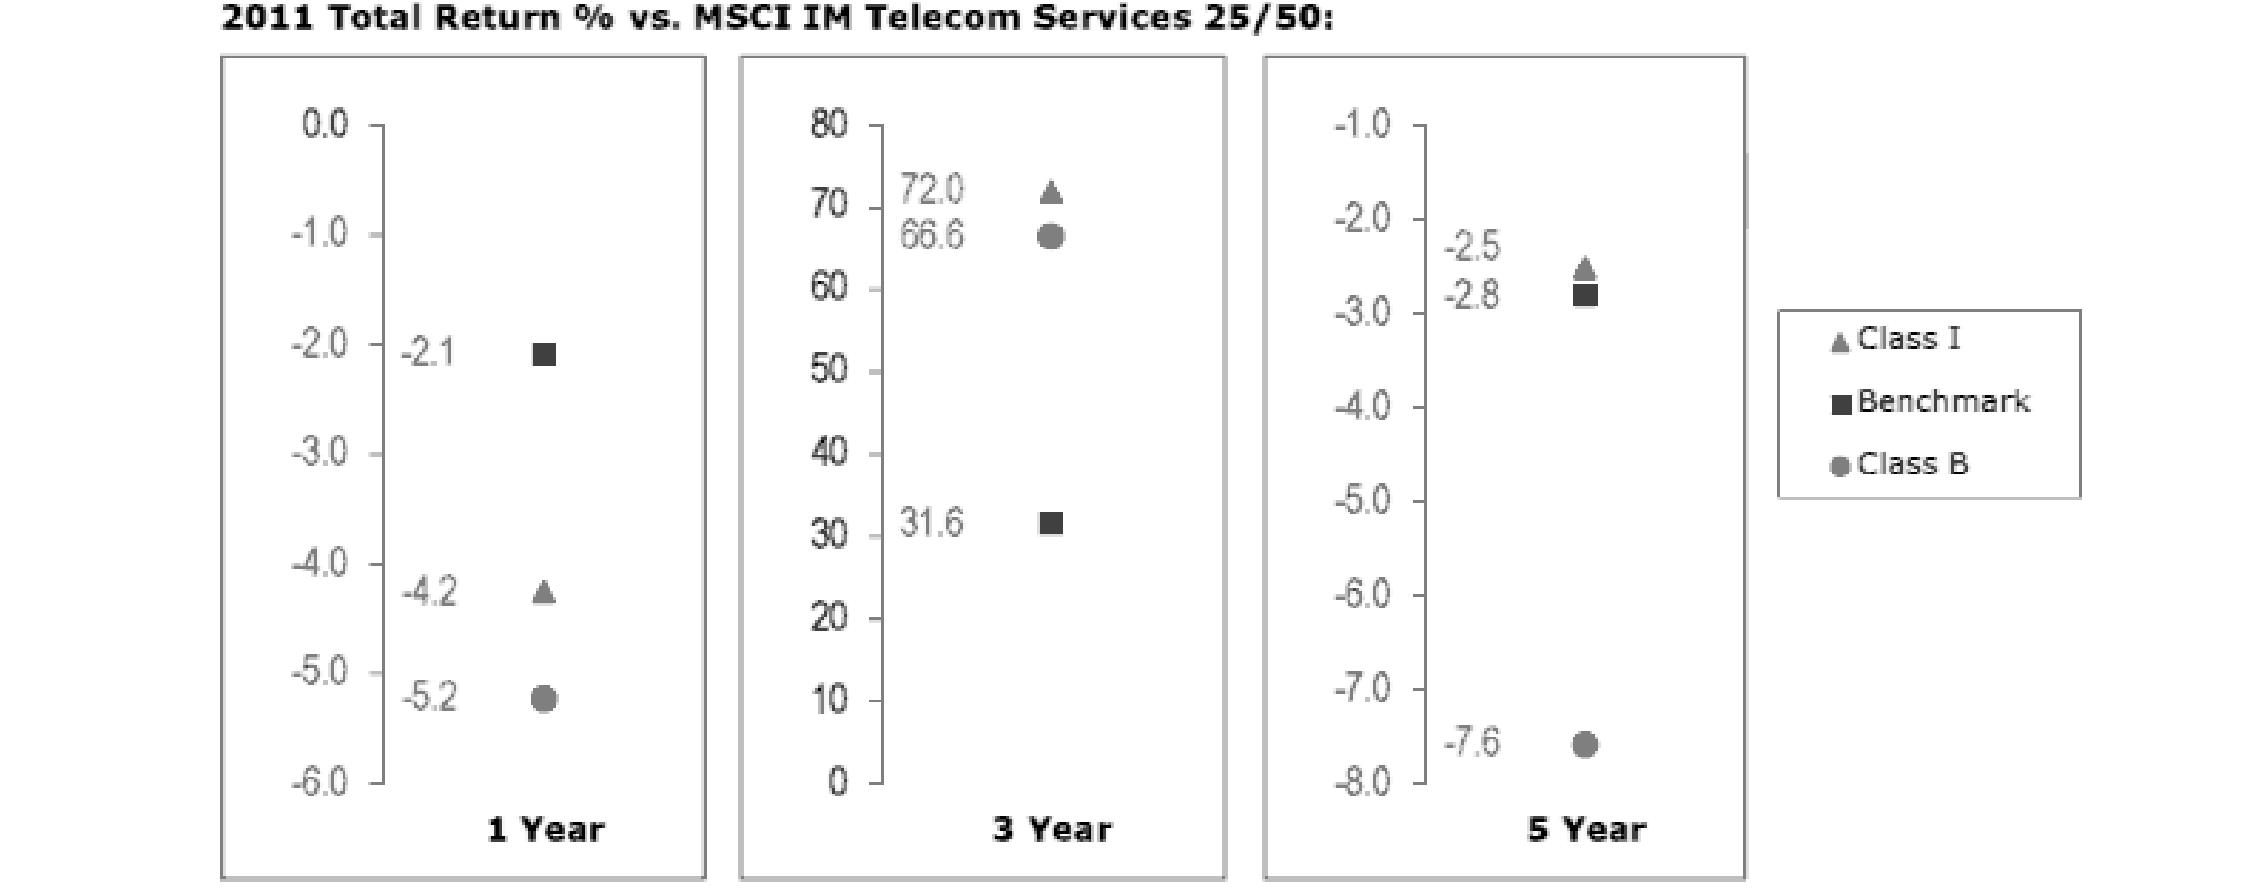
The Board noted that the investment performance of Institutional Class (Class I) of the fund compared favorably to its benchmark for the three- and five-year periods, although the fund's one-year total return was lower than its benchmark. The Board considered that the variations in performance among the fund's classes reflect the variations in class expenses, which result in lower performance for higher expense classes. The Board noted that there was a portfolio management change for the fund in December 2011. The Board also reviewed the fund's performance since inception as well as performance in the current year.
Based on its review, the Board concluded that the nature, extent, and quality of services provided to each fund under the Advisory Contracts should benefit each fund's shareholders.
Competitiveness of Management Fee and Total Expense Ratio. The Board considered each fund's management fee and total expense ratio compared to "mapped groups" of competitive funds and classes. Fidelity creates "mapped groups" by combining similar Lipper investment objective categories that have comparable management fee characteristics. Combining Lipper investment objective categories aids the Board's management fee and total expense ratio comparisons by broadening the competitive group used for comparison and by reducing the number of universes to which various Fidelity funds are compared.
Management Fee. The Board considered two proprietary management fee comparisons for the 12-month periods shown in the charts below. The group of Lipper funds used by the Board for management fee comparisons is referred to below as the "Total Mapped Group." The Total Mapped Group comparison focuses on a fund's standing relative to the total universe of comparable funds available to investors in terms of gross management fees before expense reimbursements or caps. "TMG %" represents the percentage of funds in the Total Mapped Group that had management fees that were lower than a fund's. For example, a TMG % of 6% means that 94% of the funds in the Total Mapped Group had higher management fees than a fund. The "Asset-Size Peer Group" (ASPG) comparison focuses on a fund's standing relative to non-Fidelity funds similar in size to the fund within the Total Mapped Group. The ASPG represents at least 15% of the funds in the Total Mapped Group with comparable asset size and management fee characteristics, subject to a minimum of 50 funds (or all funds in the Total Mapped Group if fewer than 50). Additional information, such as the ASPG quartile in which a fund's management fee ranked, is also included in the charts and considered by the Board.
Semiannual Report
Board Approval of Investment Advisory Contracts and Management Fees - continued
Consumer Staples Portfolio
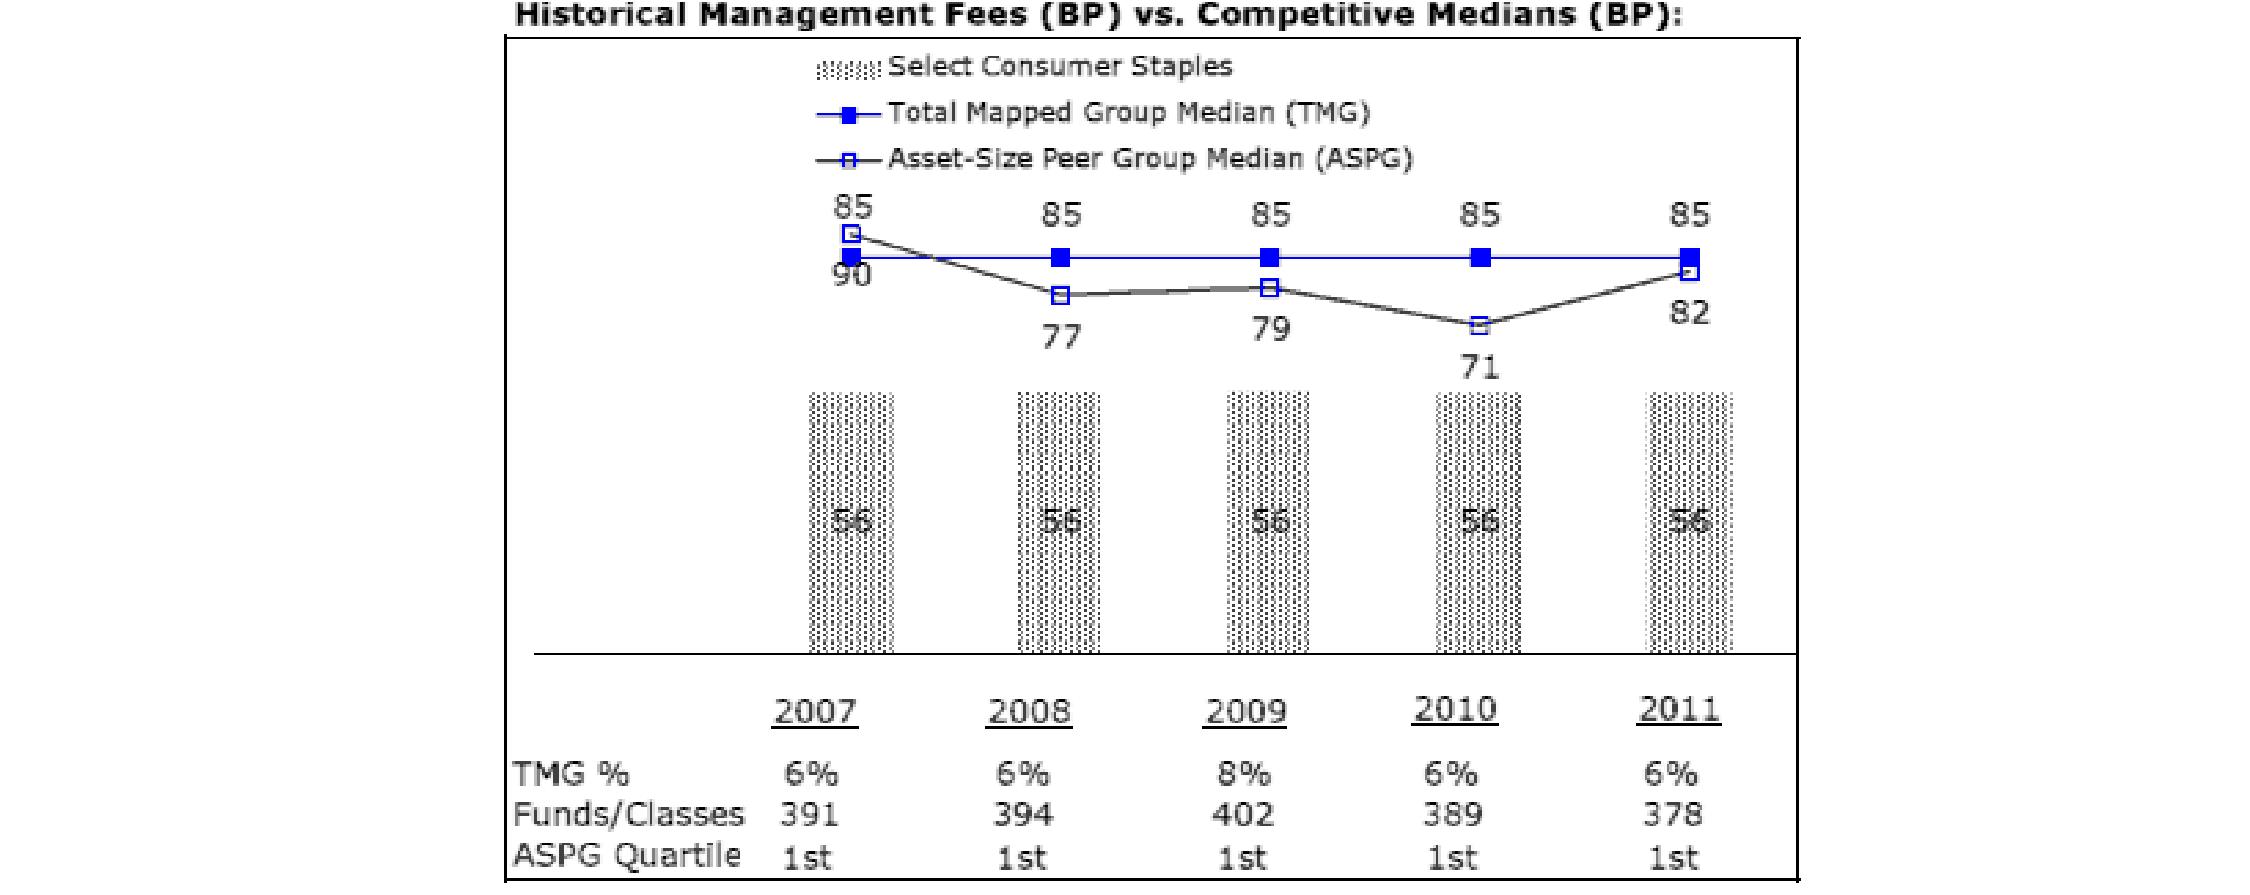
Gold Portfolio

Semiannual Report
Materials Portfolio

Telecommunications Portfolio

The Board noted that each fund's management fee ranked below the median of its Total Mapped Group and below the median of its ASPG for 2011.
Based on its review, the Board concluded that each fund's management fee is fair and reasonable in light of the services that the fund receives and the other factors considered.
Total Expense Ratio. In its review of the total expense ratio of each class of each fund, the Board considered the fund's management fee as well as other fund or class expenses, as applicable, such as transfer agent fees, pricing and bookkeeping fees, fund-paid 12b-1 fees, and custodial, legal, and audit fees. The Board also noted the effects of any waivers and reimbursements on fees and expenses. As part of its review, the Board also considered the current and historical total expense ratios of each class of each fund compared to competitive fund median expenses. Each class of each fund is compared to those funds and classes in the Total Mapped Group (used by the Board for management fee comparisons) that have a similar sales load structure.
The Board noted that the total expense ratio of each class of each of Consumer Staples Portfolio, Gold Portfolio, and Materials Portfolio ranked below its competitive median for 2011.
The Board noted that the total expense ratio of each of Class A, Class B, Class C, Institutional Class, and the retail class of Telecommunications Portfolio ranked below its competitive median for 2011 and the total expense ratio of Class T ranked above its competitive median for 2011. The Board considered that various factors, including 12b-1 fees, positive or negative performance adjustments, and relatively higher other expenses in the case of small fund size, can affect total expense ratios. The Board noted that the total expense ratio of Class T was above the competitive median primarily because of higher 12b-1 fees on Class T. Class T has a higher 12b-1 fee, but a lower front-end sales charge, than traditionally priced front-end sales charge classes. The Board considered that Class T is primarily sold load-waived in the retirement plan market where its 0.50% 12b-1 fee is comparable to competing no-load, higher 12b-1 fee classes designed specifically for retirement plans. The Board noted that the fund offers multiple classes, each of which has a different sales load and 12b-1 fee structure, and that the multiple structures are intended to offer a range of pricing options for the intermediary market. The Board also noted that the total expense ratios of the classes vary primarily by the level of their 12b-1 fees, although differences in transfer agent fees may also cause expenses to vary from class to class.
Semiannual Report
Board Approval of Investment Advisory Contracts and Management Fees - continued
Fees Charged to Other Fidelity Clients. The Board also considered Fidelity fee structures and other information with respect to clients of FMR and its affiliates, such as other mutual funds advised or subadvised by FMR or its affiliates, pension plan clients, and other institutional clients. The Board noted the findings of the 2010 ad hoc joint committee (created with the board of other Fidelity funds), which reviewed and compared Fidelity's institutional investment advisory business with its business of providing services to the Fidelity funds, including the differences in services provided, fees charged, and costs incurred, as well as competition in their respective marketplaces.
Based on its review of total expense ratios and fees charged to other Fidelity clients, the Board concluded that the total expense ratio of each class of each fund was reasonable, although Class T of Telecommunications Portfolio was above the median of the universe presented for comparison, in light of the services that each fund and its shareholders receive and the other factors considered.
Costs of the Services and Profitability. The Board considered the revenues earned and the expenses incurred by Fidelity in conducting the business of developing, marketing, distributing, managing, administering and servicing each fund and its shareholders. The Board also considered the level of Fidelity's profits in respect of all the Fidelity funds.
On an annual basis, FMR presents to the Board Fidelity's profitability for each fund. Fidelity calculates the profitability for each fund, as well as aggregate profitability for groups of Fidelity funds and all Fidelity funds, using a series of detailed revenue and cost allocation methodologies which originate with the books and records of Fidelity on which Fidelity's audited financial statements are based. The Audit Committee of the Board reviews any significant changes from the prior year's methodologies.
PricewaterhouseCoopers LLP (PwC), independent registered public accounting firm and auditor to Fidelity and certain Fidelity funds, has been engaged annually by the Board as part of the Board's assessment of Fidelity's profitability analysis. PwC's engagement includes the review and assessment of Fidelity's methodologies used in determining the revenues and expenses attributable to Fidelity's mutual fund business, and completion of agreed-upon procedures surrounding the mathematical accuracy of fund profitability and its conformity to allocation methodologies. After considering PwC's reports issued under the engagement and information provided by Fidelity, the Board concluded that while other allocation methods may also be reasonable, Fidelity's profitability methodologies are reasonable in all material respects.
The Board also reviewed Fidelity's non-fund businesses and fall-out benefits related to the mutual fund business as well as cases where Fidelity's affiliates may benefit from or be related to the funds' business.
The Board considered the costs of the services provided by and the profits realized by Fidelity in connection with the operation of each fund and was satisfied that the profitability was not excessive in the circumstances.
Economies of Scale. The Board considered whether there have been economies of scale in respect of the management of the Fidelity funds, whether the Fidelity funds (including each fund) have appropriately benefited from any such economies of scale, and whether there is potential for realization of any further economies of scale. The Board considered the extent to which each fund will benefit from economies of scale through increased services to the fund, through waivers or reimbursements, or through fee or expense reductions. The Board also noted that in 2009, it and the board of other Fidelity funds created an ad hoc committee (the Economies of Scale Committee) to analyze whether FMR attains economies of scale in respect of the management and servicing of the Fidelity funds, whether the Fidelity funds have appropriately benefited from such economies of scale, and whether there is potential for realization of any further economies of scale.
The Board recognized that each fund's management contract incorporates a "group fee" structure, which provides for lower group fee rates as total fund assets under FMR's management increase, and for higher group fee rates as total fund assets under FMR's management decrease. FMR calculates the group fee rates based on a tiered asset "breakpoint" schedule that varies based on asset class. The Board considered that the group fee is designed to deliver the benefits of economies of scale to fund shareholders when total Fidelity fund assets increase, even if assets of any particular fund are unchanged or have declined, because some portion of Fidelity's costs are attributable to services provided to all Fidelity funds, and all funds benefit if those costs can be allocated among more assets. The Board concluded that, given the group fee structure, fund shareholders will benefit from lower management fees as assets under FMR's management increase at the fund complex level, regardless of whether Fidelity achieves any such economies of scale.
Semiannual Report
The Board concluded, taking into account the analysis of the Economies of Scale Committee, that economies of scale, if any, are being appropriately shared between fund shareholders and Fidelity.
Additional Information Requested by the Board. In order to develop fully the factual basis for consideration of the Fidelity funds' Advisory Contracts, the Board requested and received additional information on certain topics, including (i) fund performance trends, actions to be taken by FMR to improve certain funds' overall performance, and Fidelity's long-term strategies for certain funds; (ii) the potential to further rationalize the Fidelity fund lineup with the possibility of achieving savings for the funds and Fidelity; (iii) Fidelity's compensation structure for portfolio managers and other key investment personnel; (iv) the amount of the investment that each portfolio manager has made in the Fidelity fund(s) that he or she manages; (v) the realization of fall-out benefits in certain Fidelity business units; (vi) Fidelity's group fee structures, the potential impact of regulatory changes on such structures, and the rationale for the individual fee rates of certain funds; (vii) fund profitability methodology, including Fidelity's cost allocation methodology, and the impact of certain factors on fund profitability results; (viii) trends regarding industry use of performance fee structures and the possibility of implementing performance fee structures for additional funds; and (ix) the impact of net redemptions from the Fidelity funds.
Based on its evaluation of all of the conclusions noted above, and after considering all factors it believed relevant, the Board ultimately concluded that the advisory fee structures are fair and reasonable, and that each fund's Advisory Contracts should be renewed.
Semiannual Report
Investment Adviser
Fidelity Management & Research Company
Boston, MA
Investment Sub-Advisers
FMR Co., Inc.
Fidelity Management & Research
(U.K.) Inc.
Fidelity Management & Research
(Hong Kong) Limited
Fidelity Management & Research
(Japan) Inc.
General Distributor
Fidelity Distributors Corporation
Smithfield, RI
Transfer and Service Agents
Fidelity Investments Institutional
Operations Company, Inc.
Boston, MA
Fidelity Service Company, Inc.
Boston, MA
Custodian
Brown Brothers Harriman & Co.
Boston, MA
(Fidelity Investment logo)(registered trademark)
Corporate Headquarters
82 Devonshire St., Boston, MA 02109
www.fidelity.com
ASGMTI-USAN-1012
1.855656.105
Item 2. Code of Ethics
Not applicable.
Item 3. Audit Committee Financial Expert
Not applicable.
Item 4. Principal Accountant Fees and Services
Not applicable.
Item 5. Audit Committee of Listed Registrants
Not applicable.
Item 6. Investments
(a) Not applicable.
(b) Not applicable
Item 7. Disclosure of Proxy Voting Policies and Procedures for Closed-End Management Investment Companies
Not applicable.
Item 8. Portfolio Managers of Closed-End Management Investment Companies
Not applicable.
Item 9. Purchase of Equity Securities by Closed-End Management Investment Company and Affiliated Purchasers
Not applicable.
Item 10. Submission of Matters to a Vote of Security Holders
There were no material changes to the procedures by which shareholders may recommend nominees to the Fidelity Select Portfolios's Board of Trustees.
Item 11. Controls and Procedures
(a)(i) The President and Treasurer and the Chief Financial Officer have concluded that the Fidelity Select Portfolios's (the "Trust") disclosure controls and procedures (as defined in Rule 30a-3(c) under the Investment Company Act) provide reasonable assurances that material information relating to the Trust is made known to them by the appropriate persons, based on their evaluation of these controls and procedures as of a date within 90 days of the filing date of this report.
(a)(ii) There was no change in the Trust's internal control over financial reporting (as defined in Rule 30a-3(d) under the Investment Company Act) that occurred during the second fiscal quarter of the period covered by this report that has materially affected, or is reasonably likely to materially affect, the Trust's internal control over financial reporting.
Item 12. Exhibits
(a) | (1) | Not applicable. |
(a) | (2) | Certification pursuant to Rule 30a-2(a) under the Investment Company Act of 1940 (17 CFR 270.30a-2(a)) is filed and attached hereto as Exhibit 99.CERT. |
(a) | (3) | Not applicable. |
(b) | | Certification pursuant to Rule 30a-2(b) under the Investment Company Act of 1940 (17 CFR 270.30a-2(b)) is furnished and attached hereto as Exhibit 99.906CERT. |
SIGNATURES
Pursuant to the requirements of the Securities Exchange Act of 1934 and the Investment Company Act of 1940, the registrant has duly caused this report to be signed on its behalf by the undersigned, thereunto duly authorized.
Fidelity Select Portfolios
By: | /s/Kenneth B. Robins |
| Kenneth B. Robins |
| President and Treasurer |
| |
Date: | October 26, 2012 |
Pursuant to the requirements of the Securities Exchange Act of 1934 and the Investment Company Act of 1940, this report has been signed below by the following persons on behalf of the registrant and in the capacities and on the dates indicated.
By: | /s/Kenneth B. Robins |
| Kenneth B. Robins |
| President and Treasurer |
| |
Date: | October 26, 2012 |
By: | /s/Christine Reynolds |
| Christine Reynolds |
| Chief Financial Officer |
| |
Date: | October 26, 2012 |