UNITED STATES
SECURITIES AND EXCHANGE COMMISSION
Washington, D.C. 20549
FORM N-CSR
CERTIFIED SHAREHOLDER REPORT OF REGISTERED
MANAGEMENT INVESTMENT COMPANIES
Investment Company Act file number 811-3114
Fidelity Select Portfolios
(Exact name of registrant as specified in charter)
245 Summer St., Boston, Massachusetts 02210
(Address of principal executive offices) (Zip code)
Marc Bryant, Secretary
245 Summer St.
Boston, Massachusetts 02210
(Name and address of agent for service)
Registrant's telephone number, including area code:
617-563-7000
| |
Date of fiscal year end: | July 31 |
|
|
Date of reporting period: | July 31, 2015 |
Item 1.
Reports to Stockholders
Fidelity® International Real Estate Fund Class A, Class T, Class B and Class C
Annual Report July 31, 2015 Class A, Class T, Class B and Class C are classes of Fidelity® International Real Estate Fund |
 |
Contents
This report and the financial statements contained herein are submitted for the general information of the shareholders of the Fund. This report is not authorized for distribution to prospective investors in the Fund unless preceded or accompanied by an effective prospectus.
A fund files its complete schedule of portfolio holdings with the SEC for the first and third quarters of each fiscal year on Form N-Q. Forms N-Q are available on the SEC’s web site at http://www.sec.gov. A fund's Forms N-Q may be reviewed and copied at the SEC’s Public Reference Room in Washington, DC. Information regarding the operation of the SEC's Public Reference Room may be obtained by calling 1-800-SEC-0330.
For a complete list of a fund's portfolio holdings, view the most recent holdings listing, semiannual report, or annual report on Fidelity's web site at http://www.fidelity.com, http://www.advisor.fidelity.com, or http://www.401k.com, as applicable.
NOT FDIC INSURED •MAY LOSE VALUE •NO BANK GUARANTEE
Neither the Fund nor Fidelity Distributors Corporation is a bank.
To view a fund's proxy voting guidelines and proxy voting record for the 12-month period ended June 30, visit http://www.fidelity.com/proxyvotingresults or visit the Securities and Exchange Commission's (SEC) web site at http://www.sec.gov.
You may also call1-877-208-0098 to request a free copy of the proxy voting guidelines.
Standard & Poor's, S&P and S&P 500 are registered service marks of The McGraw-Hill Companies, Inc. and have been licensed for use by Fidelity Distributors Corporation.
Other third-party marks appearing herein are the property of their respective owners.
All other marks appearing herein are registered or unregistered trademarks or service marks of FMR LLC or an affiliated company. © 2015 FMR LLC. All rights reserved.
Performance: The Bottom Line
Average annual total return reflects the change in the value of an investment, assuming reinvestment of distributions from dividend income and capital gains (the profits earned upon the sale of securities that have grown in value, if any) and assuming a constant rate of performance each year.
The hypothetical investment and the average annual total returns do not reflect the deduction of taxes that a shareholder would pay on fund distributions or the redemption of fund shares.
During periods of reimbursement by Fidelity, a fund’s total return will be greater than it would be had the reimbursement not occurred.
How a fund did yesterday is no guarantee of how it will do tomorrow.
Returns reflect the conversion of Class B shares to Class A shares after a maximum of seven years.
Average Annual Total Returns
| For the periods ended July 31, 2015 | Past 1 year | Past 5 years | Past 10 years |
| Class A (incl. 5.75% sales charge) | (4.18)% | 8.80% | 3.77% |
| Class T (incl. 3.50% sales charge) | (2.06)% | 9.03% | 3.79% |
| Class B (incl. contingent deferred sales charge) | (3.92)% | 8.99% | 3.84% |
| Class C (incl. contingent deferred sales charge) | (0.01)% | 9.30% | 3.73% |
Class A shares bear a 0.25% 12b-1 fee. The initial offering of Class A shares took place on April 4, 2007. Returns prior to April 4, 2007, are those of Fidelity® International Real Estate Fund, the original class of the fund, which has no 12b-1 fee. Had Class A's 12b-1 fee been reflected, returns prior to April 4, 2007, would have been lower.
Class T shares bear a 0.50% 12b-1 fee. The initial offering of Class T shares took place on April 4, 2007. Returns prior to April 4, 2007, are those of Fidelity® International Real Estate Fund, the original class of the fund, which has no 12b-1 fee. Had Class T's 12b-1 fee been reflected, returns prior to April 4, 2007, would have been lower.
Class B shares bear a 1.00% 12b-1 fee. The initial offering of Class B shares took place on April 4, 2007. Returns prior to April 4, 2007, are those of Fidelity® International Real Estate Fund, the original class of the fund, which has no 12b-1 fee. Had Class B's 12b-1 fee been reflected, returns prior to April 4, 2007, would have been lower.
Class B shares' contingent deferred sales charges included in the past one year, past five years and past ten years total return figures are 5%, 2% and 0%, respectively.
Class C shares bear a 1.00% 12b-1 fee. The initial offering of Class C shares took place on April 4, 2007. Returns prior to April 4, 2007, are those of Fidelity® International Real Estate Fund, the original class of the fund, which has no 12b-1 fee. Had Class C's 12b-1 fee been reflected, returns prior to April 4, 2007, would have been lower.
Class C shares' contingent deferred sales charges included in the past one year, past five years and past ten years total return figures are 1%, 0% and 0%, respectively.
$10,000 Over 10 Years
Let's say hypothetically that $10,000 was invested in Fidelity Advisor® International Real Estate Fund - Class A on July 31, 2005, and the current 5.75% sales charge was paid.
The chart shows how the value of your investment would have changed, and also shows how the MSCI EAFE Index performed over the same period.
See previous page for additional information regarding the performance of Class A.
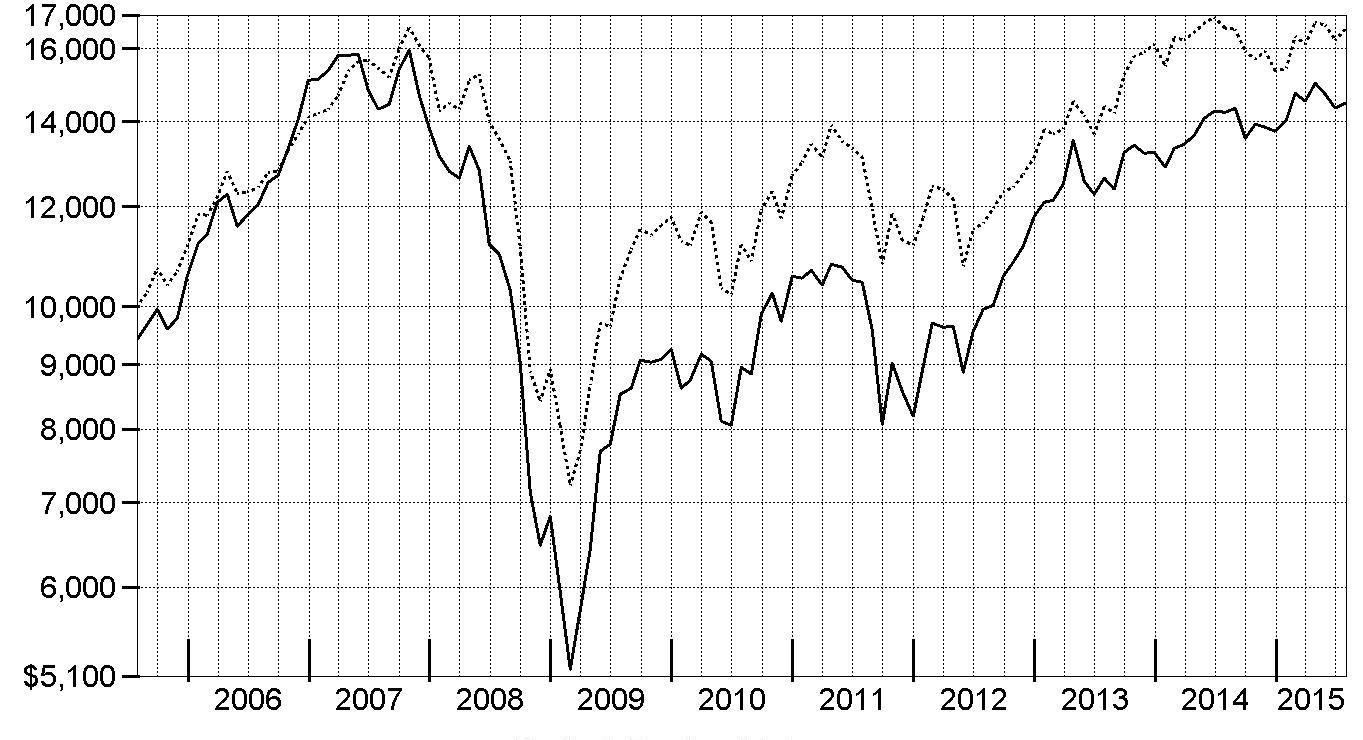
| Period Ending Values |
| $14,477 | Fidelity Advisor® International Real Estate Fund - Class A |
| $16,562 | MSCI EAFE Index |
Management's Discussion of Fund Performance
Market Recap: International real estate securities ran a turbulent course for the 12 months ending July 31, 2015. As measured by the FTSE
® EPRA℠/NAREIT
® Developed ex North America Index, international property stocks returned -1.69%, compared with the 11.29% result for the Dow Jones U.S. Select Real Estate Securities Index℠, a proxy for the U.S. market. Geopolitical risks – including conflict between Russia and Ukraine, pro-democracy protests in Hong Kong, persistent turmoil in the Middle East, ongoing debt drama for Greece, and slowing growth in China – continued to threaten markets. These factors, combined with currency fluctuations and a steep decline in the price of commodities, drove investors toward perceived safer-haven areas, curtailing results for international real estate investment trusts (REITs). Among the FTSE index’s country components, the best results came from the U.K. (+18%), which continued to see strong demand, and the rest of Europe (+1%), where returns were driven by continued quantitative easing. Asia-Pacific ex Japan (-3%) was held back by Singapore, amid impending interest rate hikes and declining distribution-per-unit growth there. Japan (-11%) saw the most dramatic regional decline. Despite a surge in late October on stimulus measures, an increasingly cautious outlook on Japan’s property market caused that market to plunge.
Comments from Portfolio Manager Guillermo de las Casas: For the year, the fund’s share classes outperformed the benchmark FTSE
® EPRA℠/NAREIT
® Developed ex North America Index.
(For specific class-level results, please see the Performance section of this report.) Versus the index, security selection and market allocation fueled the fund’s result. In terms of geography, picks in Europe and Japan helped the most. An overweighting in Germany-based Gagfah was the fund’s top individual contributor. Competitor and fund holding Deutsche Annington Immobilien – Europe’s second largest property company by market cap as well as Germany’s largest residential investment company – offered to buy Gagfah in December. The deal created Europe’s second-largest real estate company. Gagfah was sold from the fund by period end. U.K.’s self-storage providers Safestore Holdings, a mid-cap firm that lagged last year, and Big Yellow Group - the industry leader in that region - also were big contributors. Both stocks were propelled by an increase in occupancy rates in the spring. On the flip side, avoiding two large U.K.-based index components, both of which are commercial property development companies – Land Securities Group, the biggest developer in the region, and British Land - weighed on the fund’s relative result as these stocks outperformed.
The views expressed above reflect those of the portfolio manager(s) only through the end of the period as stated on the cover of this report and do not necessarily represent the views of Fidelity or any other person in the Fidelity organization. Any such views are subject to change at any time based upon market or other conditions and Fidelity disclaims any responsibility to update such views. These views may not be relied on as investment advice and, because investment decisions for a Fidelity fund are based on numerous factors, may not be relied on as an indication of trading intent on behalf of any Fidelity fund.Investment Summary (Unaudited)
Top Ten Stocks as of July 31, 2015
| | % of fund's net assets | % of fund's net assets 6 months ago |
| Mitsubishi Estate Co. Ltd. | 5.5 | 6.6 |
| Mitsui Fudosan Co. Ltd. | 5.3 | 4.8 |
| Sun Hung Kai Properties Ltd. | 5.2 | 5.2 |
| Westfield Corp. unit | 3.8 | 3.3 |
| Deutsche Annington Immobilien SE | 3.7 | 0.0 |
| Wing Tai Holdings Ltd. | 2.9 | 3.0 |
| Sumitomo Realty & Development Co. Ltd. | 2.9 | 1.3 |
| UOL Group Ltd. | 2.8 | 3.4 |
| LEG Immobilien AG | 2.8 | 3.9 |
| Safestore Holdings PLC | 2.7 | 2.4 |
| | 37.6 | |
Top Five Countries as of July 31, 2015
| (excluding cash equivalents) | % of fund's net assets | % of fund's net assets 6 months ago |
| Japan | 20.4 | 21.2 |
| United Kingdom | 14.1 | 15.3 |
| Hong Kong | 10.3 | 10.8 |
| Germany | 8.9 | 4.9 |
| Singapore | 8.8 | 10.6 |
Top Five REIT Sectors as of July 31, 2015
| | % of fund's net assets | % of fund's net assets 6 months ago |
| REITs - Management/Investment | 12.6 | 16.2 |
| REITs - Warehouse/Industrial | 5.7 | 5.4 |
| REITs - Health Care | 3.3 | 2.3 |
| REITs - Office Property | 2.7 | 4.2 |
| REITs - Apartments | 1.9 | 2.2 |
Asset Allocation (% of fund's net assets)
| As of July 31, 2015 * |
| | Stocks | 93.8% |
| | Short-Term Investments and Net Other Assets (Liabilities) | 6.2% |

* Foreign investments - 93.8%
| As of January 31, 2015 * |
| | Stocks | 94.8% |
| | Short-Term Investments and Net Other Assets (Liabilities) | 5.2% |

* Foreign investments - 94.8%
Investments July 31, 2015
Showing Percentage of Net Assets
| Common Stocks - 93.8% | | | |
| | | Shares | Value |
| Australia - 8.5% | | | |
| 360 Capital Group Ltd. unit | | 1,151,768 | $883,979 |
| Abacus Property Group unit | | 2,239,684 | 5,091,372 |
| ALE Property Group | | 325,000 | 867,089 |
| APN Property Group Ltd. | | 2,812,372 | 770,889 |
| Ardent Leisure Group unit | | 575,000 | 1,017,117 |
| Charter Hall Group unit | | 539,587 | 1,865,565 |
| Hotel Property Investments unit | | 497,270 | 955,951 |
| Ingenia Communities Group unit | | 2,858,228 | 981,934 |
| Mirvac Group unit | | 4,062,126 | 5,611,809 |
| National Storage (REIT) unit | | 642,411 | 786,530 |
| Westfield Corp. unit | | 2,055,802 | 15,071,965 |
|
| TOTAL AUSTRALIA | | | 33,904,200 |
|
| Austria - 1.7% | | | |
| Buwog-Gemeinnuetzige Wohnung (a) | | 332,618 | 6,710,519 |
| Belgium - 1.7% | | | |
| Warehouses de Pauw | | 84,409 | 6,668,068 |
| Bermuda - 5.3% | | | |
| Great Eagle Holdings Ltd. | | 2,208,385 | 7,691,446 |
| Hongkong Land Holdings Ltd. | | 1,333,100 | 10,264,870 |
| Tai Cheung Holdings Ltd. | | 3,382,000 | 2,979,640 |
|
| TOTAL BERMUDA | | | 20,935,956 |
|
| France - 3.3% | | | |
| Accor SA | | 59,342 | 2,911,575 |
| Altarea | | 20,546 | 3,497,520 |
| Societe Fonciere Lyonnaise SA | | 131,558 | 5,923,827 |
| Terreis | | 34,300 | 1,000,515 |
|
| TOTAL FRANCE | | | 13,333,437 |
|
| Germany - 8.9% | | | |
| alstria office REIT-AG (a) | | 402,000 | 5,551,819 |
| Deutsche Annington Immobilien SE | | 467,490 | 14,581,153 |
| DIC Asset AG | | 471,700 | 4,125,189 |
| LEG Immobilien AG | | 150,777 | 10,963,770 |
|
| TOTAL GERMANY | | | 35,221,931 |
|
| Greece - 0.2% | | | |
| Grivalia Properties REIC | | 129,339 | 996,856 |
| Hong Kong - 10.3% | | | |
| Cheung Kong Property Holdings Ltd. (b) | | 273,500 | 2,279,078 |
| Hysan Development Co. Ltd. | | 2,160,703 | 9,253,427 |
| Magnificent Estates Ltd. | | 54,693,000 | 1,940,144 |
| Shun Ho Technology Holdings Ltd. (b) | | 830,065 | 291,240 |
| Sino Land Ltd. | | 3,570,348 | 5,545,063 |
| Sun Hung Kai Properties Ltd. | | 1,354,044 | 20,802,425 |
| Wheelock and Co. Ltd. | | 190,000 | 984,031 |
|
| TOTAL HONG KONG | | | 41,095,408 |
|
| Ireland - 0.1% | | | |
| Hibernia (REIT) PLC | | 300,000 | 433,260 |
| Israel - 0.8% | | | |
| Azrieli Group | | 74,700 | 3,096,455 |
| Italy - 0.9% | | | |
| Beni Stabili SpA SIIQ | | 2,480,262 | 1,961,242 |
| Immobiliare Grande Distribuzione SpA | | 1,771,488 | 1,645,924 |
|
| TOTAL ITALY | | | 3,607,166 |
|
| Japan - 20.4% | | | |
| Advance Residence Investment Corp. | | 3,374 | 7,364,078 |
| Fukuoka (REIT) Investment Fund | | 3,881 | 6,529,136 |
| Goldcrest Co. Ltd. | | 47,000 | 963,247 |
| Ichigo, Inc. (a) | | 639,800 | 1,579,689 |
| Kenedix, Inc. | | 527,000 | 2,062,331 |
| Mitsubishi Estate Co. Ltd. | | 982,000 | 21,829,264 |
| Mitsui Fudosan Co. Ltd. | | 738,000 | 21,011,280 |
| Open House Co. Ltd. | | 30,000 | 497,922 |
| Ship Healthcare Holdings, Inc. | | 81,600 | 1,730,959 |
| Sumitomo Realty & Development Co. Ltd. | | 324,000 | 11,369,476 |
| Sundrug Co. Ltd. | | 7,000 | 408,359 |
| The Sumitomo Warehouse Co. Ltd. | | 177,000 | 956,873 |
| Tokyu Fudosan Holdings Corp. | | 361,700 | 2,731,684 |
| Uchiyama Holdings Co. Ltd. | | 481,300 | 1,980,579 |
|
| TOTAL JAPAN | | | 81,014,877 |
|
| Netherlands - 1.2% | | | |
| VastNed Retail NV | | 101,749 | 4,629,071 |
| Norway - 1.7% | | | |
| Olav Thon Eiendomsselskap A/S | | 239,300 | 4,321,107 |
| Selvaag Bolig ASA (a)(b) | | 756,200 | 2,406,968 |
|
| TOTAL NORWAY | | | 6,728,075 |
|
| Singapore - 8.8% | | | |
| Keppel DC (REIT) | | 2,479,900 | 1,961,360 |
| Parkway Life REIT | | 5,793,400 | 10,262,027 |
| UOL Group Ltd. | | 2,293,936 | 11,203,390 |
| Wing Tai Holdings Ltd. | | 8,275,181 | 11,370,570 |
|
| TOTAL SINGAPORE | | | 34,797,347 |
|
| Spain - 1.5% | | | |
| Inmobiliaria Colonial SA (a)(b) | | 5,333,700 | 3,965,687 |
| Melia Hotels International SA (a) | | 136,900 | 1,971,094 |
|
| TOTAL SPAIN | | | 5,936,781 |
|
| Sweden - 3.5% | | | |
| Castellum AB | | 265,000 | 3,778,364 |
| Hufvudstaden AB Series A | | 308,350 | 3,988,972 |
| Kungsleden AB | | 436,700 | 2,923,398 |
| Wallenstam AB (B Shares) | | 432,600 | 3,131,639 |
|
| TOTAL SWEDEN | | | 13,822,373 |
|
| Switzerland - 0.9% | | | |
| PSP Swiss Property AG | | 39,500 | 3,546,130 |
| United Kingdom - 14.1% | | | |
| Assura PLC | | 1,637,252 | 1,393,464 |
| Big Yellow Group PLC | | 672,100 | 7,394,326 |
| Derwent London PLC | | 142,123 | 8,067,751 |
| Development Securities PLC | | 315,000 | 1,322,034 |
| Hansteen Holdings PLC (a) | | 1,550,000 | 2,948,239 |
| Helical Bar PLC | | 1,437,427 | 9,545,833 |
| Primary Health Properties PLC | | 172,675 | 1,099,530 |
| Safestore Holdings PLC | | 2,316,500 | 10,906,950 |
| Segro PLC | | 773,486 | 5,421,120 |
| St. Modwen Properties PLC | | 442,925 | 3,293,846 |
| Unite Group PLC | | 476,790 | 4,698,294 |
|
| TOTAL UNITED KINGDOM | | | 56,091,387 |
|
| TOTAL COMMON STOCKS | | | |
| (Cost $374,870,484) | | | 372,569,297 |
|
| Money Market Funds - 7.5% | | | |
| Fidelity Cash Central Fund, 0.17% (c) | | 23,508,834 | 23,508,834 |
| Fidelity Securities Lending Cash Central Fund, 0.18% (c)(d) | | 6,438,255 | 6,438,255 |
| TOTAL MONEY MARKET FUNDS | | | |
| (Cost $29,947,089) | | | 29,947,089 |
| TOTAL INVESTMENT PORTFOLIO - 101.3% | | | |
| (Cost $404,817,573) | | | 402,516,386 |
| NET OTHER ASSETS (LIABILITIES) - (1.3)% | | | (5,345,444) |
| NET ASSETS - 100% | | | $397,170,942 |
Categorizations in the Schedule of Investments are based on country or territory of incorporation.
Legend
(a) Security or a portion of the security is on loan at period end.
(b) Non-income producing
(c) Affiliated fund that is generally available only to investment companies and other accounts managed by Fidelity Investments. The rate quoted is the annualized seven-day yield of the fund at period end. A complete unaudited listing of the fund's holdings as of its most recent quarter end is available upon request. In addition, each Fidelity Central Fund's financial statements, which are not covered by the Fund's Report of Independent Registered Public Accounting Firm, are available on the SEC's website or upon request.
(d) Investment made with cash collateral received from securities on loan.
Affiliated Central Funds
Information regarding fiscal year to date income earned by the Fund from investments in Fidelity Central Funds is as follows:
| Fund | Income earned |
| Fidelity Cash Central Fund | $30,349 |
| Fidelity Securities Lending Cash Central Fund | 50,462 |
| Total | $80,811 |
Investment Valuation
The following is a summary of the inputs used, as of July 31, 2015, involving the Fund's assets and liabilities carried at fair value. The inputs or methodology used for valuing securities may not be an indication of the risk associated with investing in those securities. For more information on valuation inputs, and their aggregation into the levels used below, please refer to the Investment Valuation section in the accompanying Notes to Financial Statements.
| | Valuation Inputs at Reporting Date: |
| Description | Total | Level 1 | Level 2 | Level 3 |
| Investments in Securities: | | | | |
| Equities: | | | | |
| Consumer Discretionary | $8,131,170 | $8,131,170 | $-- | $-- |
| Consumer Staples | 408,359 | 408,359 | -- | -- |
| Financials | 359,361,357 | 358,364,501 | -- | 996,856 |
| Health Care | 3,711,538 | 3,711,538 | -- | -- |
| Industrials | 956,873 | 956,873 | -- | -- |
| Money Market Funds | 29,947,089 | 29,947,089 | -- | -- |
| Total Investments in Securities: | $402,516,386 | $401,519,530 | $-- | $996,856 |
The following is a summary of transfers between Level 1 and Level 2 for the period ended July 31, 2015. Transfers are assumed to have occurred at the beginning of the period, and are primarily attributable to the valuation techniques used for foreign equity securities, as discussed in the accompanying Notes to Financial Statements:
| Transfers | Total |
| Level 1 to Level 2 | $0 |
| Level 2 to Level 1 | $193,149,286 |
See accompanying notes which are an integral part of the financial statements.
Financial Statements
Statement of Assets and Liabilities
| | | July 31, 2015 |
| Assets | | |
Investment in securities, at value (including securities loaned of $6,182,323) — See accompanying schedule:
Unaffiliated issuers (cost $374,870,484) | $372,569,297 | |
| Fidelity Central Funds (cost $29,947,089) | 29,947,089 | |
| Total Investments (cost $404,817,573) | | $402,516,386 |
| Foreign currency held at value (cost $141,923) | | 141,919 |
| Receivable for fund shares sold | | 1,040,802 |
| Dividends receivable | | 854,800 |
| Distributions receivable from Fidelity Central Funds | | 8,360 |
| Other receivables | | 8,164 |
| Total assets | | 404,570,431 |
| Liabilities | | |
| Payable for fund shares redeemed | $506,903 | |
| Accrued management fee | 228,781 | |
| Distribution and service plan fees payable | 11,095 | |
| Other affiliated payables | 112,286 | |
| Other payables and accrued expenses | 102,169 | |
| Collateral on securities loaned, at value | 6,438,255 | |
| Total liabilities | | 7,399,489 |
| Net Assets | | $397,170,942 |
| Net Assets consist of: | | |
| Paid in capital | | $658,443,472 |
| Undistributed net investment income | | 4,972,026 |
| Accumulated undistributed net realized gain (loss) on investments and foreign currency transactions | | (263,915,393) |
| Net unrealized appreciation (depreciation) on investments and assets and liabilities in foreign currencies | | (2,329,163) |
| Net Assets | | $397,170,942 |
| Calculation of Maximum Offering Price | | |
| Class A: | | |
| Net Asset Value and redemption price per share ($17,162,355 ÷ 1,624,787 shares) | | $10.56 |
| Maximum offering price per share (100/94.25 of $10.56) | | $11.20 |
| Class T: | | |
| Net Asset Value and redemption price per share ($4,938,940 ÷ 471,047 shares) | | $10.49 |
| Maximum offering price per share (100/96.50 of $10.49) | | $10.87 |
| Class B: | | |
| Net Asset Value and offering price per share ($185,954 ÷ 17,919 shares)(a) | | $10.38 |
| Class C: | | |
| Net Asset Value and offering price per share ($6,547,695 ÷ 634,518 shares)(a) | | $10.32 |
| International Real Estate: | | |
| Net Asset Value, offering price and redemption price per share ($330,909,846 ÷ 30,985,398 shares) | | $10.68 |
| Class I: | | |
| Net Asset Value, offering price and redemption price per share ($37,426,152 ÷ 3,517,543 shares) | | $10.64 |
(a) Redemption price per share is equal to net asset value less any applicable contingent deferred sales charge.
See accompanying notes which are an integral part of the financial statements.
Statement of Operations
| | | Year ended July 31, 2015 |
| Investment Income | | |
| Dividends | | $9,937,021 |
| Special dividends | | 4,858,262 |
| Interest | | 8 |
| Income from Fidelity Central Funds | | 80,811 |
| Income before foreign taxes withheld | | 14,876,102 |
| Less foreign taxes withheld | | (668,855) |
| Total income | | 14,207,247 |
| Expenses | | |
| Management fee | $2,621,594 | |
| Transfer agent fees | 1,111,178 | |
| Distribution and service plan fees | 126,032 | |
| Accounting and security lending fees | 195,111 | |
| Custodian fees and expenses | 85,015 | |
| Independent trustees' compensation | 6,544 | |
| Registration fees | 92,189 | |
| Audit | 63,527 | |
| Legal | 4,476 | |
| Miscellaneous | 4,591 | |
| Total expenses before reductions | 4,310,257 | |
| Expense reductions | (20,000) | 4,290,257 |
| Net investment income (loss) | | 9,916,990 |
Realized and Unrealized Gain (Loss)
Net realized gain (loss) on: | | |
| Investment securities: | | |
| Unaffiliated issuers | 18,820,595 | |
| Foreign currency transactions | (20,412) | |
| Total net realized gain (loss) | | 18,800,183 |
Change in net unrealized appreciation (depreciation) on:
Investment securities | (22,775,467) | |
| Assets and liabilities in foreign currencies | (19,074) | |
| Total change in net unrealized appreciation (depreciation) | | (22,794,541) |
| Net gain (loss) | | (3,994,358) |
| Net increase (decrease) in net assets resulting from operations | | $5,922,632 |
See accompanying notes which are an integral part of the financial statements.
Statement of Changes in Net Assets
| | Year ended July 31, 2015 | Year ended July 31, 2014 |
| Increase (Decrease) in Net Assets | | |
| Operations | | |
| Net investment income (loss) | $9,916,990 | $6,793,871 |
| Net realized gain (loss) | 18,800,183 | 29,767,981 |
| Change in net unrealized appreciation (depreciation) | (22,794,541) | 10,181,937 |
| Net increase (decrease) in net assets resulting from operations | 5,922,632 | 46,743,789 |
| Distributions to shareholders from net investment income | (5,351,966) | (6,758,423) |
| Distributions to shareholders from net realized gain | (10,638,166) | (13,002,325) |
| Total distributions | (15,990,132) | (19,760,748) |
| Share transactions - net increase (decrease) | 30,504,182 | (53,161,192) |
| Redemption fees | 66,458 | 90,758 |
| Total increase (decrease) in net assets | 20,503,140 | (26,087,393) |
| Net Assets | | |
| Beginning of period | 376,667,802 | 402,755,195 |
| End of period (including undistributed net investment income of $4,972,026 and undistributed net investment income of $4,396,784, respectively) | $397,170,942 | $376,667,802 |
See accompanying notes which are an integral part of the financial statements.
Fidelity International Real Estate Fund Class A
| | | | | | |
| Years ended July 31, | 2015 | 2014 | 2013 | 2012 | 2011 |
| Selected Per–Share Data | | | | | |
| Net asset value, beginning of period | $10.85 | $10.11 | $8.37 | $9.21 | $8.46 |
| Income from Investment Operations | | | | | |
| Net investment income (loss)A | .26B | .16 | .14 | .16 | .34C |
| Net realized and unrealized gain (loss) | (.10)D | 1.09 | 2.03 | (.65) | 1.04 |
| Total from investment operations | .16 | 1.25 | 2.17 | (.49) | 1.38 |
| Distributions from net investment income | (.14) | (.16) | (.17) | (.17) | (.33) |
| Distributions from net realized gain | (.31) | (.35) | (.27) | (.18) | (.29) |
| Total distributions | (.45) | (.51) | (.44) | (.35) | (.63)E |
| Redemption fees added to paid in capitalA | –F | –F | .01 | –F | –F |
| Net asset value, end of period | $10.56 | $10.85 | $10.11 | $8.37 | $9.21 |
| Total ReturnG,H | 1.67%D | 12.85% | 26.94% | (4.88)% | 16.76% |
| Ratios to Average Net AssetsI,J | | | | | |
| Expenses before reductions | 1.34% | 1.38% | 1.40% | 1.44% | 1.42% |
| Expenses net of fee waivers, if any | 1.34% | 1.38% | 1.40% | 1.44% | 1.42% |
| Expenses net of all reductions | 1.34% | 1.38% | 1.39% | 1.37% | 1.36% |
| Net investment income (loss) | 2.45%B | 1.57% | 1.51% | 2.09% | 3.67%C |
| Supplemental Data | | | | | |
| Net assets, end of period (000 omitted) | $17,162 | $13,933 | $13,173 | $7,117 | $7,047 |
| Portfolio turnover rateK | 82% | 59% | 78% | 138% | 131% |
A Calculated based on average shares outstanding during the period.
B Investment income per share reflects a large, non-recurring dividend which amounted to $.14 per share. Excluding this non-recurring dividend, the ratio of net investment income (loss) to average net assets would have been 1.15%.
C Investment income per share reflects a large, non-recurring dividend which amounted to $.19 per share. Excluding this non-recurring dividend, the ratio of net investment income (loss) to average net assets would have been 1.64%.
D Amount includes a reimbursement from the investment adviser for an operational error which amounted to less than $.01 per share. Excluding this reimbursement, the total return would have been 1.64%.
E Total distributions of $.63 per share is comprised of distributions from net investment income of $.333 and distributions from net realized gain of $.294 per share.
F Amount represents less than $.01 per share.
G Total returns would have been lower if certain expenses had not been reduced during the applicable periods shown.
H Total returns do not include the effect of the sales charges.
I Fees and expenses of any underlying Fidelity Central Funds are not included in the Fund's expense ratio. The Fund indirectly bears its proportionate share of the expenses of any underlying Fidelity Central Funds.
J Expense ratios reflect operating expenses of the class. Expenses before reductions do not reflect amounts reimbursed by the investment adviser or reductions from brokerage service arrangements or reductions from other expense offset arrangements and do not represent the amount paid by the class during periods when reimbursements or reductions occur. Expenses net of fee waivers reflect expenses after reimbursement by the investment adviser but prior to reductions from brokerage service arrangements or other expense offset arrangements. Expenses net of all reductions represent the net expenses paid by the class.
K Amount does not include the portfolio activity of any underlying Fidelity Central Funds.
See accompanying notes which are an integral part of the financial statements.
Fidelity International Real Estate Fund Class T
| | | | | | |
| Years ended July 31, | 2015 | 2014 | 2013 | 2012 | 2011 |
| Selected Per–Share Data | | | | | |
| Net asset value, beginning of period | $10.76 | $10.04 | $8.32 | $9.16 | $8.41 |
| Income from Investment Operations | | | | | |
| Net investment income (loss)A | .22B | .13 | .12 | .14 | .31C |
| Net realized and unrealized gain (loss) | (.08)D | 1.07 | 2.01 | (.66) | 1.04 |
| Total from investment operations | .14 | 1.20 | 2.13 | (.52) | 1.35 |
| Distributions from net investment income | (.10) | (.14) | (.15) | (.14) | (.31) |
| Distributions from net realized gain | (.31) | (.35) | (.27) | (.18) | (.29) |
| Total distributions | (.41) | (.48)E | (.42) | (.32) | (.60) |
| Redemption fees added to paid in capitalA | –F | –F | .01 | –F | –F |
| Net asset value, end of period | $10.49 | $10.76 | $10.04 | $8.32 | $9.16 |
| Total ReturnG,H | 1.49%D | 12.50% | 26.62% | (5.23)% | 16.54% |
| Ratios to Average Net AssetsI,J | | | | | |
| Expenses before reductions | 1.64% | 1.66% | 1.68% | 1.72% | 1.69% |
| Expenses net of fee waivers, if any | 1.64% | 1.66% | 1.68% | 1.70% | 1.69% |
| Expenses net of all reductions | 1.63% | 1.65% | 1.66% | 1.63% | 1.63% |
| Net investment income (loss) | 2.15%B | 1.30% | 1.23% | 1.83% | 3.41%C |
| Supplemental Data | | | | | |
| Net assets, end of period (000 omitted) | $4,939 | $5,563 | $5,081 | $2,570 | $2,496 |
| Portfolio turnover rateK | 82% | 59% | 78% | 138% | 131% |
A Calculated based on average shares outstanding during the period.
B Investment income per share reflects a large, non-recurring dividends which amounted to $.14 per share. Excluding this non-recurring dividends, the ratio of net investment income (loss) to average net assets would have been .86%.
C Investment income per share reflects a large, non-recurring dividend which amounted to $.19 per share. Excluding this non-recurring dividends, the ratio of net investment income (loss) to average net assets would have been 1.38%.
D Amount includes a reimbursement from the investment adviser for an operational error which amounted to less than $.01 per share. Excluding this reimbursement, the total return would have been 1.46%.
E Total distributions of $.48 per share is comprised of distributions from net investment income of $.136 and distributions from net realized gain of $.348 per share.
F Amount represents less than $.01 per share.
G Total returns would have been lower if certain expenses had not been reduced during the applicable periods shown.
H Total returns do not include the effect of the sales charges.
I Fees and expenses of any underlying Fidelity Central Funds are not included in the Fund's expense ratio. The Fund indirectly bears its proportionate share of the expenses of any underlying Fidelity Central Funds.
J Expense ratios reflect operating expenses of the class. Expenses before reductions do not reflect amounts reimbursed by the investment adviser or reductions from brokerage service arrangements or reductions from other expense offset arrangements and do not represent the amount paid by the class during periods when reimbursements or reductions occur. Expenses net of fee waivers reflect expenses after reimbursement by the investment adviser but prior to reductions from brokerage service arrangements or other expense offset arrangements. Expenses net of all reductions represent the net expenses paid by the class.
K Amount does not include the portfolio activity of any underlying Fidelity Central Funds.
See accompanying notes which are an integral part of the financial statements.
Fidelity International Real Estate Fund Class B
| | | | | | |
| Years ended July 31, | 2015 | 2014 | 2013 | 2012 | 2011 |
| Selected Per–Share Data | | | | | |
| Net asset value, beginning of period | $10.67 | $9.94 | $8.24 | $9.05 | $8.32 |
| Income from Investment Operations | | | | | |
| Net investment income (loss)A | .17B | .08 | .07 | .10 | .26C |
| Net realized and unrealized gain (loss) | (.08)D | 1.08 | 1.99 | (.64) | 1.03 |
| Total from investment operations | .09 | 1.16 | 2.06 | (.54) | 1.29 |
| Distributions from net investment income | (.08) | (.08) | (.10) | (.09) | (.27) |
| Distributions from net realized gain | (.30) | (.35) | (.27) | (.18) | (.29) |
| Total distributions | (.38) | (.43) | (.37) | (.27) | (.56) |
| Redemption fees added to paid in capitalA | –E | –E | .01 | –E | –E |
| Net asset value, end of period | $10.38 | $10.67 | $9.94 | $8.24 | $9.05 |
| Total ReturnF,G | .95%D | 12.08% | 25.87% | (5.61)% | 15.90% |
| Ratios to Average Net AssetsH,I | | | | | |
| Expenses before reductions | 2.12% | 2.14% | 2.16% | 2.19% | 2.17% |
| Expenses net of fee waivers, if any | 2.12% | 2.14% | 2.16% | 2.19% | 2.17% |
| Expenses net of all reductions | 2.12% | 2.13% | 2.14% | 2.12% | 2.11% |
| Net investment income (loss) | 1.67%B | .82% | .76% | 1.34% | 2.92%C |
| Supplemental Data | | | | | |
| Net assets, end of period (000 omitted) | $186 | $373 | $456 | $457 | $570 |
| Portfolio turnover rateJ | 82% | 59% | 78% | 138% | 131% |
A Calculated based on average shares outstanding during the period.
B Investment income per share reflects a large, non-recurring dividend which amounted to $.13 per share. Excluding this non-recurring dividend, the ratio of net investment income (loss) to average net assets would have been .37%.
C Investment income per share reflects a large, non-recurring dividend which amounted to $.18 per share. Excluding this non-recurring dividend, the ratio of net investment income (loss) to average net assets would have been .90%.
D Amount includes a reimbursement from the investment adviser for an operational error which amounted to less than $.01 per share. Excluding this reimbursement, the total return would have been .92%.
E Amount represents less than $.01 per share.
F Total returns would have been lower if certain expenses had not been reduced during the applicable periods shown.
G Total returns do not include the effect of the contingent deferred sales charge.
H Fees and expenses of any underlying Fidelity Central Funds are not included in the Fund's expense ratio. The Fund indirectly bears its proportionate share of the expenses of any underlying Fidelity Central Funds.
I Expense ratios reflect operating expenses of the class. Expenses before reductions do not reflect amounts reimbursed by the investment adviser or reductions from brokerage service arrangements or reductions from other expense offset arrangements and do not represent the amount paid by the class during periods when reimbursements or reductions occur. Expenses net of fee waivers reflect expenses after reimbursement by the investment adviser but prior to reductions from brokerage service arrangements or other expense offset arrangements. Expenses net of all reductions represent the net expenses paid by the class.
J Amount does not include the portfolio activity of any underlying Fidelity Central Funds.
See accompanying notes which are an integral part of the financial statements.
Fidelity International Real Estate Fund Class C
| | | | | | |
| Years ended July 31, | 2015 | 2014 | 2013 | 2012 | 2011 |
| Selected Per–Share Data | | | | | |
| Net asset value, beginning of period | $10.60 | $9.89 | $8.21 | $9.03 | $8.30 |
| Income from Investment Operations | | | | | |
| Net investment income (loss)A | .17B | .08 | .07 | .10 | .26C |
| Net realized and unrealized gain (loss) | (.08)D | 1.07 | 1.99 | (.64) | 1.04 |
| Total from investment operations | .09 | 1.15 | 2.06 | (.54) | 1.30 |
| Distributions from net investment income | (.07) | (.09) | (.12) | (.10) | (.28) |
| Distributions from net realized gain | (.30) | (.35) | (.27) | (.18) | (.29) |
| Total distributions | (.37) | (.44) | (.39) | (.28) | (.57) |
| Redemption fees added to paid in capitalA | –E | –E | .01 | –E | –E |
| Net asset value, end of period | $10.32 | $10.60 | $9.89 | $8.21 | $9.03 |
| Total ReturnF,G | .97%D | 12.04% | 25.96% | (5.68)% | 16.07% |
| Ratios to Average Net AssetsH,I | | | | | |
| Expenses before reductions | 2.09% | 2.13% | 2.16% | 2.19% | 2.17% |
| Expenses net of fee waivers, if any | 2.09% | 2.13% | 2.16% | 2.19% | 2.17% |
| Expenses net of all reductions | 2.09% | 2.13% | 2.14% | 2.12% | 2.11% |
| Net investment income (loss) | 1.70%B | .82% | .76% | 1.34% | 2.92%C |
| Supplemental Data | | | | | |
| Net assets, end of period (000 omitted) | $6,548 | $6,504 | $6,872 | $3,164 | $3,208 |
| Portfolio turnover rateJ | 82% | 59% | 78% | 138% | 131% |
A Calculated based on average shares outstanding during the period.
B Investment income per share reflects a large, non-recurring dividend which amounted to $.13 per share. Excluding this non-recurring dividend, the ratio of net investment income (loss) to average net assets would have been .41%.
C Investment income per share reflects a large, non-recurring dividend which amounted to $.18 per share. Excluding this non-recurring dividend, the ratio of net investment income (loss) to average net assets would have been .89%.
D Amount includes a reimbursement from the investment adviser for an operational error which amounted to less than $.01 per share. Excluding this reimbursement, the total return would have been .94%.
E Amount represents less than $.01 per share.
F Total returns would have been lower if certain expenses had not been reduced during the applicable periods shown.
G Total returns do not include the effect of the contingent deferred sales charge.
H Fees and expenses of any underlying Fidelity Central Funds are not included in the Fund's expense ratio. The Fund indirectly bears its proportionate share of the expenses of any underlying Fidelity Central Funds.
I Expense ratios reflect operating expenses of the class. Expenses before reductions do not reflect amounts reimbursed by the investment adviser or reductions from brokerage service arrangements or reductions from other expense offset arrangements and do not represent the amount paid by the class during periods when reimbursements or reductions occur. Expenses net of fee waivers reflect expenses after reimbursement by the investment adviser but prior to reductions from brokerage service arrangements or other expense offset arrangements. Expenses net of all reductions represent the net expenses paid by the class.
J Amount does not include the portfolio activity of any underlying Fidelity Central Funds.
See accompanying notes which are an integral part of the financial statements.
Financial Highlights — Fidelity International Real Estate Fund
| | | | | | |
| Years ended July 31, | 2015 | 2014 | 2013 | 2012 | 2011 |
| Selected Per–Share Data | | | | | |
| Net asset value, beginning of period | $10.96 | $10.21 | $8.44 | $9.30 | $8.53 |
| Income from Investment Operations | | | | | |
| Net investment income (loss)A | .28B | .19 | .17 | .18 | .36C |
| Net realized and unrealized gain (loss) | (.09)D | 1.09 | 2.05 | (.67) | 1.06 |
| Total from investment operations | .19 | 1.28 | 2.22 | (.49) | 1.42 |
| Distributions from net investment income | (.16) | (.18) | (.19) | (.19) | (.35) |
| Distributions from net realized gain | (.31) | (.35) | (.27) | (.18) | (.29) |
| Total distributions | (.47) | (.53) | (.46) | (.37) | (.65)E |
| Redemption fees added to paid in capitalA | –F | –F | .01 | –F | –F |
| Net asset value, end of period | $10.68 | $10.96 | $10.21 | $8.44 | $9.30 |
| Total ReturnG | 1.95%D | 13.12% | 27.31% | (4.76)% | 17.15% |
| Ratios to Average Net AssetsH,I | | | | | |
| Expenses before reductions | 1.12% | 1.13% | 1.16% | 1.19% | 1.17% |
| Expenses net of fee waivers, if any | 1.12% | 1.13% | 1.16% | 1.19% | 1.17% |
| Expenses net of all reductions | 1.12% | 1.13% | 1.14% | 1.12% | 1.11% |
| Net investment income (loss) | 2.67%B | 1.82% | 1.76% | 2.34% | 3.92%C |
| Supplemental Data | | | | | |
| Net assets, end of period (000 omitted) | $330,910 | $342,960 | $367,269 | $251,543 | $322,045 |
| Portfolio turnover rateJ | 82% | 59% | 78% | 138% | 131% |
A Calculated based on average shares outstanding during the period.
B Investment income per share reflects a large, non-recurring dividend which amounted to $.14 per share. Excluding this non-recurring dividend, the ratio of net investment income (loss) to average net assets would have been 1.38%.
C Investment income per share reflects a large, non-recurring dividend which amounted to $.19 per share. Excluding this non-recurring dividend, the ratio of net investment income (loss) to average net assets would have been 1.90%.
D Amount includes a reimbursement from the investment adviser for an operational error which amounted to less than $.01 per share. Excluding this reimbursement, the total return would have been 1.92%.
E Total distributions of $.65 per share is comprised of distributions from net investment income of $.354 and distributions from net realized gain of $.294 per share.
F Amount represents less than $.01 per share.
G Total returns would have been lower if certain expenses had not been reduced during the applicable periods shown.
H Fees and expenses of any underlying Fidelity Central Funds are not included in the Fund's expense ratio. The Fund indirectly bears its proportionate share of the expenses of any underlying Fidelity Central Funds.
I Expense ratios reflect operating expenses of the class. Expenses before reductions do not reflect amounts reimbursed by the investment adviser or reductions from brokerage service arrangements or reductions from other expense offset arrangements and do not represent the amount paid by the class during periods when reimbursements or reductions occur. Expenses net of fee waivers reflect expenses after reimbursement by the investment adviser but prior to reductions from brokerage service arrangements or other expense offset arrangements. Expenses net of all reductions represent the net expenses paid by the class.
J Amount does not include the portfolio activity of any underlying Fidelity Central Funds.
See accompanying notes which are an integral part of the financial statements.
Financial Highlights — Fidelity International Real Estate Fund Class I
| | | | | | |
| Years ended July 31, | 2015 | 2014 | 2013 | 2012 | 2011 |
| Selected Per–Share Data | | | | | |
| Net asset value, beginning of period | $10.92 | $10.18 | $8.42 | $9.28 | $8.51 |
| Income from Investment Operations | | | | | |
| Net investment income (loss)A | .29B | .19 | .18 | .18 | .36C |
| Net realized and unrealized gain (loss) | (.09)D | 1.09 | 2.03 | (.67) | 1.06 |
| Total from investment operations | .20 | 1.28 | 2.21 | (.49) | 1.42 |
| Distributions from net investment income | (.17) | (.19) | (.19) | (.20) | (.35) |
| Distributions from net realized gain | (.31) | (.35) | (.27) | (.18) | (.29) |
| Total distributions | (.48) | (.54) | (.46) | (.37)E | (.65)F |
| Redemption fees added to paid in capitalA | –G | –G | .01 | –G | –G |
| Net asset value, end of period | $10.64 | $10.92 | $10.18 | $8.42 | $9.28 |
| Total ReturnH | 2.01%D | 13.16% | 27.33% | (4.73)% | 17.18% |
| Ratios to Average Net AssetsI,J | | | | | |
| Expenses before reductions | 1.03% | 1.12% | 1.10% | 1.19% | 1.17% |
| Expenses net of fee waivers, if any | 1.03% | 1.12% | 1.10% | 1.19% | 1.17% |
| Expenses net of all reductions | 1.03% | 1.12% | 1.09% | 1.12% | 1.11% |
| Net investment income (loss) | 2.76%B | 1.84% | 1.81% | 2.34% | 3.92%C |
| Supplemental Data | | | | | |
| Net assets, end of period (000 omitted) | $37,426 | $7,336 | $9,905 | $1,947 | $1,785 |
| Portfolio turnover rateK | 82% | 59% | 78% | 138% | 131% |
A Calculated based on average shares outstanding during the period.
B Investment income per share reflects a large, non-recurring dividend which amounted to $.14 per share. Excluding this non-recurring dividend, the ratio of net investment income (loss) to average net assets would have been 1.46%.
C Investment income per share reflects a large, non-recurring dividend which amounted to $.19 per share. Excluding this non-recurring dividend, the ratio of net investment income (loss) to average net assets would have been 1.90%.
D Amount includes a reimbursement from the investment adviser for an operational error which amounted to less than $.01 per share. Excluding this reimbursement, the total return would have been 1.98%.
E Total distributions of $.37 per share is comprised of distributions from net investment income of $.195 and distributions from net realized gain of $.178 per share.
F Total distributions of $.65 per share is comprised of distributions from net investment income of $.354 and distributions from net realized gain of $.294 per share.
G Amount represents less than $.01 per share.
H Total returns would have been lower if certain expenses had not been reduced during the applicable periods shown.
I Fees and expenses of any underlying Fidelity Central Funds are not included in the Fund's expense ratio. The Fund indirectly bears its proportionate share of the expenses of any underlying Fidelity Central Funds.
J Expense ratios reflect operating expenses of the class. Expenses before reductions do not reflect amounts reimbursed by the investment adviser or reductions from brokerage service arrangements or reductions from other expense offset arrangements and do not represent the amount paid by the class during periods when reimbursements or reductions occur. Expenses net of fee waivers reflect expenses after reimbursement by the investment adviser but prior to reductions from brokerage service arrangements or other expense offset arrangements. Expenses net of all reductions represent the net expenses paid by the class.
K Amount does not include the portfolio activity of any underlying Fidelity Central Funds.
See accompanying notes which are an integral part of the financial statements.
Notes to Financial Statements
For the period ended July 31, 2015
1. Organization.
Fidelity International Real Estate Fund (the Fund) is a non-diversified fund of Fidelity Select Portfolios (the Trust) and is authorized to issue an unlimited number of shares. The Trust is registered under the Investment Company Act of 1940, as amended (the 1940 Act), as an open-end management investment company organized as a Massachusetts business trust. The Fund offers Class A, Class T, Class C, International Real Estate and Class I (formerly Institutional Class) shares, each of which, along with Class B shares, has equal rights as to assets and voting privileges. Class B shares are closed to new accounts and additional purchases, except for exchanges and reinvestments. Each class has exclusive voting rights with respect to matters that affect that class. Class B shares will automatically convert to Class A shares after a holding period of seven years from the initial date of purchase.
2. Investments in Fidelity Central Funds.
The Fund invests in Fidelity Central Funds, which are open-end investment companies generally available only to other investment companies and accounts managed by the investment adviser and its affiliates. The Fund's Schedule of Investments lists each of the Fidelity Central Funds held as of period end, if any, as an investment of the Fund, but does not include the underlying holdings of each Fidelity Central Fund. As an Investing Fund, the Fund indirectly bears its proportionate share of the expenses of the underlying Fidelity Central Funds.
The Money Market Central Funds seek preservation of capital and current income and are managed by Fidelity Investments Money Management, Inc. (FIMM), an affiliate of the investment adviser. Annualized expenses of the Money Market Central Funds as of their most recent shareholder report date are less than .01%.
A complete unaudited list of holdings for each Fidelity Central Fund is available upon request or at the Securities and Exchange Commission (the SEC) website at www.sec.gov. In addition, the financial statements of the Fidelity Central Funds, which are not covered by the Fund's Report of Independent Registered Public Accounting Firm, are available on the SEC website or upon request.
3. Significant Accounting Policies.
The financial statements have been prepared in conformity with accounting principles generally accepted in the United States of America (GAAP), which require management to make certain estimates and assumptions at the date of the financial statements. Actual results could differ from those estimates. Subsequent events, if any, through the date that the financial statements were issued have been evaluated in the preparation of the financial statements. The following summarizes the significant accounting policies of the Fund:
Investment Valuation. Investments are valued as of 4:00 p.m. Eastern time on the last calendar day of the period. The Board of Trustees (the Board) has delegated the day to day responsibility for the valuation of the Fund's investments to the Fidelity SelectCo, LLC (SelectCo) Fair Value Committee (the Committee). In accordance with valuation policies and procedures approved by the Board, the Fund attempts to obtain prices from one or more third party pricing vendors or brokers to value its investments. When current market prices, quotations or currency exchange rates are not readily available or reliable, investments will be fair valued in good faith by the Committee, in accordance with procedures adopted by the Board. Factors used in determining fair value vary by investment type and may include market or investment specific events. The frequency with which these procedures are used cannot be predicted and they may be utilized to a significant extent. The Committee oversees the Fund's valuation policies and procedures and reports to the Board on the Committee's activities and fair value determinations. The Board monitors the appropriateness of the procedures used in valuing the Fund's investments and ratifies the fair value determinations of the Committee.
The Fund categorizes the inputs to valuation techniques used to value its investments into a disclosure hierarchy consisting of three levels as shown below:
- Level 1 – quoted prices in active markets for identical investments
- Level 2 – other significant observable inputs (including quoted prices for similar investments, interest rates, prepayment speeds, etc.)
- Level 3 – unobservable inputs (including the Fund's own assumptions based on the best information available)
Valuation techniques used to value the Fund's investments by major category are as follows:
Equity securities, including restricted securities, for which market quotations are readily available, are valued at the last reported sale price or official closing price as reported by a third party pricing vendor on the primary market or exchange on which they are traded and are categorized as Level 1 in the hierarchy. In the event there were no sales during the day or closing prices are not available, securities are valued at the last quoted bid price or may be valued using the last available price and are generally categorized as Level 2 in the hierarchy. For foreign equity securities, when market or security specific events arise, comparisons to the valuation of American Depositary Receipts (ADRs), futures contracts, Exchange-Traded Funds (ETFs) and certain indexes as well as quoted prices for similar securities may be used and would be categorized as Level 2 in the hierarchy. Utilizing these techniques may result in transfers between Level 1 and Level 2. For equity securities, including restricted securities, where observable inputs are limited, assumptions about market activity and risk are used and these securities may be categorized as Level 3 in the hierarchy.
Investments in open-end mutual funds, including the Fidelity Central Funds, are valued at their closing net asset value (NAV) each business day and are categorized as Level 1 in the hierarchy.
Changes in valuation techniques may result in transfers in or out of an assigned level within the disclosure hierarchy. The aggregate value of investments by input level as of July 31, 2015, including information on transfers between Levels 1 and 2, is included at the end of the Fund's Schedule of Investments.
Foreign Currency. The Fund may use foreign currency contracts to facilitate transactions in foreign-denominated securities. Gains and losses from these transactions may arise from changes in the value of the foreign currency or if the counterparties do not perform under the contracts' terms.
Foreign-denominated assets, including investment securities, and liabilities are translated into U.S. dollars at the exchange rates at period end. Purchases and sales of investment securities, income and dividends received and expenses denominated in foreign currencies are translated into U.S. dollars at the exchange rate in effect on the transaction date.
The effects of exchange rate fluctuations on investments are included with the net realized and unrealized gain (loss) on investment securities. Other foreign currency transactions resulting in realized and unrealized gain (loss) are disclosed separately.
Investment Transactions and Income. For financial reporting purposes, the Fund's investment holdings and NAV include trades executed through the end of the last business day of the period. The NAV per share for processing shareholder transactions is calculated as of the close of business of the New York Stock Exchange (NYSE), normally 4:00 p.m. Eastern time and includes trades executed through the end of the prior business day. Gains and losses on securities sold are determined on the basis of identified cost. Dividend income is recorded on the ex-dividend date, except for certain dividends from foreign securities where the ex-dividend date may have passed, which are recorded as soon as the Fund is informed of the ex-dividend date. Non-cash dividends included in dividend income, if any, are recorded at the fair market value of the securities received. Income and capital gain distributions from Fidelity Central Funds, if any, are recorded on the ex-dividend date. Large, non-recurring dividends recognized by the Fund are presented separately on the Statement of Operations as "Special Dividends" and the impact of these dividends is presented in the Financial Highlights. Interest income is accrued as earned and includes coupon interest and amortization of premium and accretion of discount on debt securities as applicable. Investment income is recorded net of foreign taxes withheld where recovery of such taxes is uncertain.
Class Allocations and Expenses. Investment income, realized and unrealized capital gains and losses, common expenses of the Fund, and certain fund-level expense reductions, if any, are allocated daily on a pro-rata basis to each class based on the relative net assets of each class to the total net assets of the Fund. Each class differs with respect to transfer agent and distribution and service plan fees incurred. Certain expense reductions may also differ by class. For the reporting period, the allocated portion of income and expenses to each class as a percent of its average net assets may vary due to the timing of recording these transactions in relation to fluctuating net assets of the classes. Expenses directly attributable to a fund are charged to that fund. Expenses attributable to more than one fund are allocated among the respective funds on the basis of relative net assets or other appropriate methods. Expense estimates are accrued in the period to which they relate and adjustments are made when actual amounts are known.
Income Tax Information and Distributions to Shareholders. Each year, the Fund intends to qualify as a regulated investment company under Subchapter M of the Internal Revenue Code, including distributing substantially all of its taxable income and realized gains. As a result, no provision for U.S. Federal income taxes is required. As of July 31, 2015, the Fund did not have any unrecognized tax benefits in the financial statements; nor is the Fund aware of any tax positions for which it is reasonably possible that the total amounts of unrecognized tax benefits will significantly change in the next twelve months. The Fund files a U.S. federal tax return, in addition to state and local tax returns as required. The Fund's federal income tax returns are subject to examination by the Internal Revenue Service (IRS) for a period of three fiscal years after they are filed. State and local tax returns may be subject to examination for an additional fiscal year depending on the jurisdiction. Foreign taxes are provided for based on the Fund's understanding of the tax rules and rates that exist in the foreign markets in which it invests.
Distributions are declared and recorded on the ex-dividend date. Income dividends and capital gain distributions are declared separately for each class. Income and capital gain distributions are determined in accordance with income tax regulations, which may differ from GAAP.
Capital accounts within the financial statements are adjusted for permanent book-tax differences. These adjustments have no impact on net assets or the results of operations. Capital accounts are not adjusted for temporary book-tax differences which will reverse in a subsequent period.
Book-tax differences are primarily due to foreign currency transactions, passive foreign investment companies (PFIC), capital loss carryforwards and losses deferred due to wash sales and excise tax regulations.
The federal tax cost of investment securities and unrealized appreciation (depreciation) as of period end were as follows:
| Gross unrealized appreciation | $17,307,736 |
| Gross unrealized depreciation | (22,669,419) |
| Net unrealized appreciation (depreciation) on securities | $(5,361,683) |
| Tax Cost | $407,878,069 |
The tax-based components of distributable earnings as of period end were as follows:
| Undistributed ordinary income | $9,561,844 |
| Capital loss carryforward | $(260,441,503) |
| Net unrealized appreciation (depreciation) on securities and other investments | $(5,389,659) |
Capital loss carryforwards are only available to offset future capital gains of the Fund to the extent provided by regulations and may be limited. Under the Regulated Investment Company Modernization Act of 2010 (the Act), the Fund is permitted to carry forward capital losses incurred in taxable years beginning after December 22, 2010 for an unlimited period and such capital losses are required to be used prior to any losses that expire. The capital loss carryforward information presented below, including any applicable limitation, is estimated as of fiscal period end and is subject to adjustment.
| Fiscal year of expiration | |
| 2017 | $(123,841,971) |
| 2018 | (136,599,532) |
| Total with expiration | $(260,441,503) |
The Fund intends to elect to defer to its next fiscal year $5,003,212 of capital losses recognized during the period November 1, 2014 to July 31, 2015.
The tax character of distributions paid was as follows:
| | July 31, 2015 | July 31, 2014 |
| Ordinary Income | $ 15,990,132 | $ 19,760,748 |
Short-Term Trading (Redemption) Fees. Shares held by investors in the Fund less than 90 days may have been subject to a redemption fee equal to 1.50% of the NAV of shares redeemed. All redemption fees, which reduce the proceeds of the shareholder redemption, are retained by the Fund and accounted for as an addition to paid in capital.
4. Purchases and Sales of Investments.
Purchases and sales of securities, other than short-term securities, aggregated $288,764,035 and $298,002,141, respectively.
5. Fees and Other Transactions with Affiliates.
Management Fee. Fidelity SelectCo, LLC (the investment adviser) and its affiliates provide the Fund with investment management related services for which the Fund pays a monthly management fee. The management fee is the sum of an individual fund fee rate that is based on an annual rate of .45% of the Fund's average net assets and an annualized group fee rate that averaged .25% during the period. The group fee rate is based upon the average net assets of all the mutual funds advised by Fidelity Management & Research Company (FMR) and the investment adviser. The group fee rate decreases as assets under management increase and increases as assets under management decrease. For the reporting period, the total annual management fee rate was .70% of the Fund's average net assets.
Distribution and Service Plan Fees. In accordance with Rule 12b-1 of the 1940 Act, the Fund has adopted separate Distribution and Service Plans for each class of shares. Certain classes pay Fidelity Distributors Corporation (FDC), an affiliate of the investment adviser, separate Distribution and Service Fees, each of which is based on an annual percentage of each class' average net assets. In addition, FDC may pay financial intermediaries for selling shares of the Fund and providing shareholder support services. For the period, the Distribution and Service Fee rates, total fees and amounts retained by FDC were as follows:
| | Distribution
Fee | Service
Fee | Total Fees | Retained
by FDC |
| Class A | –% | .25% | $35,975 | $262 |
| Class T | .25% | .25% | 25,098 | 16 |
| Class B | .75% | .25% | 2,675 | 2,007 |
| Class C | .75% | .25% | 62,284 | 13,937 |
| | | | $126,032 | $16,222 |
Sales Load. FDC may receive a front-end sales charge of up to 5.75% for selling Class A shares and 3.50% for selling Class T shares, some of which is paid to financial intermediaries for selling shares of the Fund. Depending on the holding period, FDC may receive contingent deferred sales charges levied on Class A, Class T, Class B and Class C redemptions. The deferred sales charges range from 5.00% to 1.00% for Class B shares, 1.00% for Class C shares, 1.00% for certain purchases of Class A shares and .25% for certain purchases of Class T shares.
For the period, sales charge amounts retained by FDC were as follows:
| | Retained
by FDC |
| Class A | $8,704 |
| Class T | 1,620 |
| Class B* | 38 |
| Class C* | 1,701 |
| | $12,063 |
* When Class B and Class C shares are initially sold, FDC pays commissions from its own resources to financial intermediaries through which the sales are made.
Transfer Agent Fees. Fidelity Investments Institutional Operations Company, Inc., (FIIOC), an affiliate of the investment adviser, is the transfer, dividend disbursing and shareholder servicing agent for each class of the Fund. FIIOC receives account fees and asset-based fees that vary according to the account size and type of account of the shareholders of the respective classes of the Fund. FIIOC pays for typesetting, printing and mailing of shareholder reports, except proxy statements.
For the period, transfer agent fees for each class were as follows:
| | Amount | % of
Class-Level Average
Net Assets |
| Class A | $39,714 | .28 |
| Class T | 16,001 | .32 |
| Class B | 804 | .30 |
| Class C | 17,077 | .27 |
| International Real Estate | 997,303 | .30 |
| Class I | 40,279 | .21 |
| | $1,111,178 | |
Accounting and Security Lending Fees. Fidelity Service Company, Inc. (FSC), an affiliate of the investment adviser, maintains the Fund's accounting records. The accounting fee is based on the level of average net assets for each month. Under a separate contract, FSC administers the security lending program. The security lending fee is based on the number and duration of lending transactions.
Brokerage Commissions. The Fund placed a portion of its portfolio transactions with brokerage firms which are affiliates of the investment adviser. Brokerage commissions are included in net realized gain (loss) and change in net unrealized appreciation (depreciation) in the Statement of Operations. The commissions paid to these affiliated firms were $193 for the period.
Other. During the period, the investment adviser reimbursed the Fund $97,302 for an operational error which is included in Net Realized Gain (Loss) in the accompanying Statement of Operations.
6. Committed Line of Credit.
The Fund participates with other funds managed by the investment adviser or an affiliate in a $4.25 billion credit facility (the "line of credit") to be utilized for temporary or emergency purposes to fund shareholder redemptions or for other short-term liquidity purposes. The Fund has agreed to pay commitment fees on its pro-rata portion of the line of credit, which amounted to $540 and is reflected in Miscellaneous expenses on the Statement of Operations. During the period, the Fund did not borrow on this line of credit.
7. Security Lending.
The Fund lends portfolio securities through a lending agent from time to time in order to earn additional income. On the settlement date of the loan, the Fund receives collateral (in the form of U.S. Treasury obligations, letters of credit and/or cash) against the loaned securities and maintains collateral in an amount not less than 100% of the market value of the loaned securities during the period of the loan. The market value of the loaned securities is determined at the close of business of the Fund and any additional required collateral is delivered to the Fund on the next business day. If the borrower defaults on its obligation to return the securities loaned because of insolvency or other reasons, the Fund may apply collateral received from the borrower against the obligation. The Fund may experience delays and costs in recovering the securities loaned. Any cash collateral received is invested in the Fidelity Securities Lending Cash Central Fund. The value of loaned securities and cash collateral at period end are disclosed on the Fund's Statement of Assets and Liabilities. Security lending income represents the income earned on investing cash collateral, less rebates paid to borrowers and any lending agent fees associated with the loan, plus any premium payments received for lending certain types of securities. Security lending income is presented in the Statement of Operations as a component of income from Fidelity Central Funds. Total security lending income during the period amounted to $50,462.
8. Expense Reductions.
Commissions paid to certain brokers with whom the investment adviser, or its affiliates, places trades on behalf of the Fund include an amount in addition to trade execution, which may be rebated back to the Fund to offset certain expenses. This amount totaled $16,886 for the period. In addition, through arrangements with the Fund's custodian, credits realized as a result of uninvested cash balances were used to reduce the Fund's expenses. During the period, these credits reduced the Fund's custody expenses by $9.
In addition, during the period the investment adviser reimbursed/waived a portion of fund-level operating expenses in the amount of $1,581 and a portion of class-level operating expenses as follows:
| | Amount |
| Class A | $205 |
| Class T | 11 |
| Class C | 93 |
| International Real Estate | 1,021 |
| Class I | 194 |
| | $1,524 |
9. Distributions to Shareholders.
Distributions to shareholders of each class were as follows:
| Years ended July 31, | 2015 | 2014 |
| From net investment income | | |
| Class A | $181,420 | $187,181 |
| Class T | 50,433 | 65,518 |
| Class B | 2,573 | 3,710 |
| Class C | 43,291 | 59,254 |
| International Real Estate | 4,923,960 | 6,296,631 |
| Class I | 150,289 | 146,129 |
| Total | $5,351,966 | $6,758,423 |
| From net realized gain | | |
| Class A | $396,004 | $414,914 |
| Class T | 151,630 | 167,858 |
| Class B | 8,904 | 16,133 |
| Class C | 181,835 | 231,539 |
| International Real Estate | 9,576,263 | 11,906,952 |
| Class I | 323,530 | 264,929 |
| Total | $10,638,166 | $13,002,325 |
10. Share Transactions.
Share transactions for each class were as follows and may contain automatic conversions between classes or exchanges between funds:
| | Shares | Shares | Dollars | Dollars |
| Years ended July 31, | 2015 | 2014 | 2015 | 2014 |
| Class A | | | | |
| Shares sold | 673,844 | 587,302 | $7,190,291 | $6,069,117 |
| Reinvestment of distributions | 53,260 | 52,782 | 545,527 | 523,247 |
| Shares redeemed | (386,439) | (659,545) | (4,035,124) | (6,744,761) |
| Net increase (decrease) | 340,665 | (19,461) | $3,700,694 | $(152,397) |
| Class T | | | | |
| Shares sold | 95,352 | 116,161 | $1,006,443 | $1,193,650 |
| Reinvestment of distributions | 18,282 | 21,965 | 185,991 | 216,331 |
| Shares redeemed | (159,356) | (127,651) | (1,656,253) | (1,309,222) |
| Net increase (decrease) | (45,722) | 10,475 | $(463,819) | $100,759 |
| Class B | | | | |
| Shares sold | 491 | 2,791 | $5,118 | $27,886 |
| Reinvestment of distributions | 1,032 | 1,850 | 10,413 | 18,115 |
| Shares redeemed | (18,524) | (15,540) | (192,621) | (158,043) |
| Net increase (decrease) | (17,001) | (10,899) | $(177,090) | $(112,042) |
| Class C | | | | |
| Shares sold | 250,748 | 208,940 | $2,602,917 | $2,102,127 |
| Reinvestment of distributions | 19,920 | 27,197 | 199,577 | 264,712 |
| Shares redeemed | (249,625) | (317,554) | (2,534,026) | (3,194,650) |
| Net increase (decrease) | 21,043 | (81,417) | $268,468 | $(827,811) |
| International Real Estate | | | | |
| Shares sold | 6,483,374 | 7,089,024 | $69,046,559 | $73,687,897 |
| Reinvestment of distributions | 1,337,840 | 1,734,141 | 13,829,911 | 17,353,365 |
| Shares redeemed | (8,123,208) | (13,521,464) | (85,913,965) | (140,085,115) |
| Net increase (decrease) | (301,994) | (4,698,299) | $(3,037,495) | $(49,043,853) |
| Class I | | | | |
| Shares sold | 3,546,789 | 435,461 | $37,608,644 | $4,524,767 |
| Reinvestment of distributions | 33,956 | 34,703 | 349,358 | 345,746 |
| Shares redeemed | (734,873) | (771,815) | (7,744,578) | (7,996,361) |
| Net increase (decrease) | 2,845,872 | (301,651) | $30,213,424 | $(3,125,848) |
11. Other.
The Fund's organizational documents provide former and current trustees and officers with a limited indemnification against liabilities arising in connection with the performance of their duties to the Fund. In the normal course of business, the Fund may also enter into contracts that provide general indemnifications. The Fund's maximum exposure under these arrangements is unknown as this would be dependent on future claims that may be made against the Fund. The risk of material loss from such claims is considered remote.
At the end of the period, the investment adviser or its affiliates were the owners of record of 14% of the total outstanding shares of the Fund.
Report of Independent Registered Public Accounting Firm
To the Trustees of Fidelity Select Portfolios and Shareholders of Fidelity® International Real Estate Fund:
We have audited the accompanying statement of assets and liabilities of Fidelity® International Real Estate Fund (the Fund), a fund of Fidelity Select Portfolios, including the schedule of investments, as of July 31, 2015, and the related statement of operations for the year then ended, and the statement of changes in net assets and financial highlights for each of the two years in the period then ended. These financial statements and financial highlights are the responsibility of the Fund's management. Our responsibility is to express an opinion on these financial statements and financial highlights based on our audits. The financial highlights for the year ended July 31, 2013 and all prior periods presented were audited by other auditors whose report dated September 16, 2013, expressed an unqualified opinion on those financial highlights.
We conducted our audits in accordance with the standards of the Public Company Accounting Oversight Board (United States). Those standards require that we plan and perform the audit to obtain reasonable assurance about whether the financial statements and financial highlights are free of material misstatement. The Fund is not required to have, nor were we engaged to perform, an audit of its internal controls over financial reporting. Our audits included consideration of internal control over financial reporting as a basis for designing audit procedures that are appropriate in the circumstances, but not for the purpose of expressing an opinion on the effectiveness of the Fund's internal control over financial reporting. Accordingly, we express no such opinion. An audit also includes examining, on a test basis, evidence supporting the amounts and disclosures in the financial statements, assessing the accounting principles used and significant estimates made by management, as well as evaluating the overall financial statement presentation. Our procedures included confirmation of securities owned as of July 31, 2015, by correspondence with the custodians and brokers; when replies were not received from brokers, we performed other auditing procedures. We believe our audits provide a reasonable basis for our opinion.
In our opinion, such financial statements and financial highlights referred to above present fairly, in all material respects, the financial position of Fidelity® International Real Estate Fund as of July 31, 2015, the results of its operations for the year then ended, and the changes in its net assets and the financial highlights for each of the two years in the period then ended in conformity with accounting principles generally accepted in the United States of America.
DELOITTE & TOUCHE LLP
Boston, Massachusetts
September 18, 2015
Trustees and Officers
The Trustees, Members of the Advisory Board (if any), and officers of the trust and fund, as applicable, are listed below. The Board of Trustees governs the fund and is responsible for protecting the interests of shareholders. The Trustees are experienced executives who meet periodically throughout the year to oversee the fund's activities, review contractual arrangements with companies that provide services to the fund, oversee management of the risks associated with such activities and contractual arrangements, and review the fund's performance. Each of the Trustees oversees 75 funds.
The Trustees hold office without limit in time except that (a) any Trustee may resign; (b) any Trustee may be removed by written instrument, signed by at least two-thirds of the number of Trustees prior to such removal; (c) any Trustee who requests to be retired or who has become incapacitated by illness or injury may be retired by written instrument signed by a majority of the other Trustees; and (d) any Trustee may be removed at any special meeting of shareholders by a two-thirds vote of the outstanding voting securities of the trust. Officers and Advisory Board Members hold office without limit in time, except that any officer or Advisory Board Member may resign or may be removed by a vote of a majority of the Trustees at any regular meeting or any special meeting of the Trustees. Except as indicated, each individual has held the office shown or other offices in the same company for the past five years.
Each Trustee who is not an interested person (as defined in the 1940 Act) of the trust and the fund is referred to herein as an Independent Trustee.
The fund’s Statement of Additional Information (SAI) includes more information about the Trustees. To request a free copy, call Fidelity at 1-877-208-0098.
Experience, Skills, Attributes, and Qualifications of the Trustees. The Governance and Nominating Committee has adopted a statement of policy that describes the experience, qualifications, attributes, and skills that are necessary and desirable for potential Independent Trustee candidates (Statement of Policy). The Board believes that each Trustee satisfied at the time he or she was initially elected or appointed a Trustee, and continues to satisfy, the standards contemplated by the Statement of Policy. The Governance and Nominating Committee also engages professional search firms to help identify potential Independent Trustee candidates who have the experience, qualifications, attributes, and skills consistent with the Statement of Policy. From time to time, additional criteria based on the composition and skills of the current Independent Trustees, as well as experience or skills that may be appropriate in light of future changes to board composition, business conditions, and regulatory or other developments, have also been considered by the professional search firms and the Governance and Nominating Committee. In addition, the Board takes into account the Trustees' commitment and participation in Board and committee meetings, as well as their leadership of standing and ad hoc committees throughout their tenure.
In determining that a particular Trustee was and continues to be qualified to serve as a Trustee, the Board has considered a variety of criteria, none of which, in isolation, was controlling. The Board believes that, collectively, the Trustees have balanced and diverse experience, qualifications, attributes, and skills, which allow the Board to operate effectively in governing the fund and protecting the interests of shareholders. Information about the specific experience, skills, attributes, and qualifications of each Trustee, which in each case led to the Board's conclusion that the Trustee should serve (or continue to serve) as a trustee of the fund, is provided below.
Board Structure and Oversight Function. Brian B. Hogan is an interested person and currently serves as Chairman. The Trustees have determined that an interested Chairman is appropriate and benefits shareholders because an interested Chairman has a personal and professional stake in the quality and continuity of services provided to the fund. Independent Trustees exercise their informed business judgment to appoint an individual of their choosing to serve as Chairman, regardless of whether the Trustee happens to be independent or a member of management. The Independent Trustees have determined that they can act independently and effectively without having an Independent Trustee serve as Chairman and that a key structural component for assuring that they are in a position to do so is for the Independent Trustees to constitute a substantial majority for the Board. The Independent Trustees also regularly meet in executive session. Michael E. Wiley serves as Chairman of the Independent Trustees and as such (i) acts as a liaison between the Independent Trustees and management with respect to matters important to the Independent Trustees and (ii) with management prepares agendas for Board meetings.
Fidelity® funds are overseen by different Boards of Trustees. The fund's Board oversees Fidelity's sector portfolios. Other Boards oversee Fidelity's equity and high income funds, and Fidelity's investment grade bond, money market, and asset allocation funds. The use of separate Boards, each with its own committee structure, allows the Trustees of each group of Fidelity® funds to focus on the unique issues of the funds they oversee, including common research, investment, and operational issues. On occasion, the separate Boards establish joint committees to address issues of overlapping consequences for the Fidelity® funds overseen by each Board.
The Trustees operate using a system of committees to facilitate the timely and efficient consideration of all matters of importance to the Trustees, the fund, and fund shareholders and to facilitate compliance with legal and regulatory requirements and oversight of the fund's activities and associated risks. The Board, acting through its committees, has charged SelectCo and its affiliates with (i) identifying events or circumstances the occurrence of which could have demonstrably adverse effects on the fund's business and/or reputation; (ii) implementing processes and controls to lessen the possibility that such events or circumstances occur or to mitigate the effects of such events or circumstances if they do occur; and (iii) creating and maintaining a system designed to evaluate continuously business and market conditions in order to facilitate the identification and implementation processes described in (i) and (ii) above. Because the day-to-day operations and activities of the fund are carried out by or through SelectCo, its affiliates, and other service providers, the fund's exposure to risks is mitigated but not eliminated by the processes overseen by the Trustees. While each of the Board's committees has responsibility for overseeing different aspects of the fund's activities, oversight is exercised primarily through the Operations and Audit Committees. Appropriate personnel, including but not limited to the fund's Chief Compliance Officer (CCO), SelectCo's internal auditor, the independent accountants, the fund's Treasurer and portfolio management personnel, make periodic reports to the Board's committees, as appropriate. The responsibilities of each standing committee, including their oversight responsibilities, are described further under "Standing Committees of the Trustees."
Interested Trustees*:
Correspondence intended for a Trustee who is an interested person may be sent to Fidelity Investments, 245 Summer Street, Boston, Massachusetts 02210.
Name, Year of Birth; Principal Occupations and Other Relevant Experience+
Brian B. Hogan (1964)
Year of Election or Appointment: 2014
Trustee
Chairman of the Board of Trustees
Mr. Hogan also serves as Trustee or Vice President of other funds. Mr. Hogan serves as a Director of Fidelity SelectCo, LLC (investment adviser firm, 2014-present) and President of the Equity Division of FMR (investment adviser firm, 2009-present). Previously, Mr. Hogan served as Senior Vice President, Equity Research of FMR (2006-2009) and as a portfolio manager.
* Determined to be an "Interested Trustee" by virtue of, among other things, his or her affiliation with the trust or various entities under common control with SelectCo.
+ The information includes the Trustee's principal occupation during the last five years and other information relating to the experience, attributes, and skills relevant to the Trustee's qualifications to serve as a Trustee, which led to the conclusion that the Trustee should serve as a Trustee for the fund.
Independent Trustees:
Correspondence intended for an Independent Trustee may be sent to Fidelity Investments, P.O. Box 55235, Boston, Massachusetts 02205-5235.
Name, Year of Birth; Principal Occupations and Other Relevant Experience+
David A. Rosow (1942)
Year of Election or Appointment: 2013
Trustee
Mr. Rosow also serves as Trustee of other Fidelity® funds. Prior to his retirement in 2006, Mr. Rosow was the Chief Executive Officer, owner and operator of a number of private companies, which encompassed oil refining, drilling and marketing of petroleum products (including specialty petroleum products), the recreation industry, and real estate development. Previously, Mr. Rosow served as Lead Director and Chairman of the Audit Committee of Hudson United Bancorp (1996-2006), Chairman of the Board of Westport Bank and Trust (1992-1996), and as a Director of TD Banknorth (2006-2007). In addition, Mr. Rosow served as a member (2008-2014) and President (2009-2014) of the Town Council of Palm Beach, Florida. Mr. Rosow also served as a Member of the Advisory Board of other Fidelity® funds (2012-2013).
Garnett A. Smith (1947)
Year of Election or Appointment: 2013
Trustee
Mr. Smith also serves as Trustee of other Fidelity® funds. Prior to Mr. Smith's retirement, he served as Chairman and Chief Executive Officer of Inbrand Corp. (manufacturer of personal absorbent products, 1990-1997). He also served as President (1986-1990) of Inbrand Corp. Prior to his employment with Inbrand Corp., he was employed by a retail fabric chain and North Carolina National Bank. In addition, Mr. Smith served as a Member of the Advisory Board of other Fidelity® funds (2012-2013) and as a board member of the Jackson Hole Land Trust (2009-2012).
Michael E. Wiley (1950)
Year of Election or Appointment: 2008
Trustee
Chairman of the Independent Trustees
Mr. Wiley also serves as Trustee of other Fidelity® funds. Mr. Wiley serves as a Director of Tesoro Corporation (independent oil refiner and marketer, 2005-present), and a Director of Bill Barrett Corporation (exploration and production, 2005-present). In addition, Mr. Wiley also serves as a Director of Post Oak Bank (privately-held bank, 2004-present). Previously, Mr. Wiley served as a Trustee of other Fidelity® funds (2008-2013), as a Director of Asia Pacific Exploration Consolidated (international oil and gas exploration and production, 2008-2013), as a member of the Board of Trustees of the University of Tulsa (2000-2006; 2007-2010), as a Senior Energy Advisor of Katzenbach Partners, LLC (consulting, 2006-2007), as an Advisory Director of Riverstone Holdings (private investment), Chairman, President, and CEO of Baker Hughes, Inc. (oilfield services, 2000-2004), and as Director of Spinnaker Exploration Company (exploration and production, 2001-2005).
+ The information includes the Trustee's principal occupation during the last five years and other information relating to the experience, attributes, and skills relevant to the Trustee's qualifications to serve as a Trustee, which led to the conclusion that the Trustee should serve as a Trustee for the fund.
Advisory Board Members and Officers:
Except for Anthony R. Rochte, correspondence intended for an officer may be sent to Fidelity Investments, 245 Summer Street, Boston, Massachusetts 02210. Correspondence intended for Mr. Rochte may be sent to SelectCo, 1225 17th Street, Denver, Colorado 80202-5541. Officers appear below in alphabetical order.
Name, Year of Birth; Principal Occupation
Christopher S. Bartel (1971)
Year of Election or Appointment: 2009
Vice President
Mr. Bartel also serves as Vice President of other funds. Mr. Bartel serves as a Director, President, and Chief Executive Officer of Fidelity Management & Research (Japan) Limited (investment adviser firm, 2012-present), a Director of Fidelity Management & Research (Hong Kong) (investment adviser firm, 2012-present), and Senior Vice President of Global Equity Research (2010-present). Previously, Mr. Bartel served as Senior Vice President of Equity Research (2009-2010), Managing Director of Research (2006-2009), and an analyst and portfolio manager (2000-2006).
Elizabeth Paige Baumann (1968)
Year of Election or Appointment: 2012
Anti-Money Laundering (AML) Officer
Ms. Baumann also serves as AML Officer of other funds. She is Chief AML Officer of FMR LLC (diversified financial services company, 2012-present) and is an employee of Fidelity Investments. Previously, Ms. Baumann served as Vice President and Deputy Anti-Money Laundering Officer (2007-2012).
Marc Bryant (1966)
Year of Election or Appointment: 2013
Secretary and Chief Legal Officer (CLO)
Mr. Bryant also serves as Secretary and Chief Legal Officer (CLO) of other funds. He is Senior Vice President and Deputy General Counsel of FMR LLC (diversified financial services company). Previously, Mr. Bryant served as Secretary and Chief Legal Officer of Fidelity Rutland Square Trust II (2010-2014) and Assistant Secretary of Fidelity's Fixed Income and Asset Allocation Funds (2013-2015). Prior to joining Fidelity Investments, Mr. Bryant served as a Senior Vice President and the Head of Global Retail Legal for AllianceBernstein L.P. (2006-2010), and as the General Counsel for ProFund Advisors LLC (2001-2006).
William C. Coffey (1969)
Year of Election or Appointment: 2009
Assistant Secretary
Mr. Coffey also serves as Assistant Secretary of other funds. He is Senior Vice President and Deputy General Counsel of FMR LLC (diversified financial services company, 2010-present), and is an employee of Fidelity Investments. Previously, Mr. Coffey served as Vice President and Associate General Counsel of FMR LLC (2005-2009).
Jonathan Davis (1968)
Year of Election or Appointment: 2010
Assistant Treasurer
Mr. Davis also serves as Assistant Treasurer of other funds. Mr. Davis is an employee of Fidelity Investments. Previously, Mr. Davis served as Vice President and Associate General Counsel of FMR LLC (diversified financial services company, 2003-2010).
Adrien E. Deberghes (1967)
Year of Election or Appointment: 2013
President and Treasurer
Mr. Deberghes also serves as an officer of other funds. He is an employee of Fidelity Investments (2008-present). Prior to joining Fidelity Investments, Mr. Deberghes was Senior Vice President of Mutual Fund Administration at State Street Corporation (2007-2008), Senior Director of Mutual Fund Administration at Investors Bank & Trust (2005-2007), and Director of Finance for Dunkin' Brands (2000-2005).
Joseph DeSantis (1959)
Year of Election or Appointment: 2015
Vice President
Mr. DeSantis also serves as Vice President of other funds. Mr. DeSantis serves as Group Chief Investment Officer, Equities (2010-present) and is an employee of Fidelity Investments.
Stephanie J. Dorsey (1969)
Year of Election or Appointment: 2010
Assistant Treasurer
Ms. Dorsey also serves as an officer of other funds. She is an employee of Fidelity Investments (2008-present) and has served in other fund officer roles. Prior to joining Fidelity Investments, Ms. Dorsey served as Treasurer (2004-2008) of the JPMorgan Mutual Funds and Vice President (2004-2008) of JPMorgan Chase Bank.
Howard J. Galligan III (1966)
Year of Election or Appointment: 2014
Chief Financial Officer
Mr. Galligan also serves as Chief Financial Officer of other funds. Mr. Galligan serves as President of Fidelity Pricing and Cash Management Services (FPCMS) (2014-present) and as a Director of Strategic Advisers, Inc. (investment adviser firm, 2008-present). Previously, Mr. Galligan served as Chief Administrative Officer of Asset Management (2011-2014) and Chief Operating Officer and Senior Vice President of Investment Support for Strategic Advisers, Inc. (2003-2011).
James D. Gryglewicz (1972)
Year of Election or Appointment: 2014
Chief Compliance Officer
Mr. Gryglewicz also serves as Chief Compliance Officer of other funds. Mr. Gryglewicz serves as Compliance Officer of Fidelity SelectCo, LLC (investment adviser firm, 2014-present), Vice President of Asset Management Compliance (2009-present), and is an employee of Fidelity Investments (2004-present).
Brian B. Hogan (1964)
Year of Election or Appointment: 2009
Vice President
Mr. Hogan also serves as Trustee or Vice President of other funds. Mr. Hogan serves as a Director of Fidelity SelectCo, LLC (investment adviser firm, 2014-present) and President of the Equity Division of FMR (investment adviser firm, 2009-present). Previously, Mr. Hogan served as Senior Vice President, Equity Research of FMR (2006-2009) and as a portfolio manager.
Chris Maher (1972)
Year of Election or Appointment: 2013
Assistant Treasurer
Mr. Maher serves as Assistant Treasurer of other funds. Mr. Maher is Vice President of Valuation Oversight and is an employee of Fidelity Investments. Previously, Mr. Maher served as Vice President of Asset Management Compliance (2013), Vice President of the Program Management Group of FMR (investment adviser firm, 2010-2013), and Vice President of Valuation Oversight (2008-2010).
Kenneth B. Robins (1969)
Year of Election or Appointment: 2013
Deputy Treasurer
Mr. Robins also serves as an officer of other funds. Mr. Robins serves as Executive Vice President of Fidelity Investments Money Management, Inc. (FIMM) (investment adviser firm, 2013-present) and is an employee of Fidelity Investments (2004-present). Previously, Mr. Robins served in other fund officer roles.
Anthony R. Rochte (1968)
Year of Election or Appointment: 2013
Vice President
Mr. Rochte also serves as Vice President of other funds. Mr. Rochte serves as President of Fidelity SelectCo, LLC (investment adviser firm, 2012-present) and is an employee of Fidelity Investments (2012-present). Prior to joining Fidelity Investments, Mr. Rochte served as Senior Managing Director and head of State Street Global Advisors' North American Intermediary Business Group (2006-2012).
Stacie M. Smith (1974)
Year of Election or Appointment: 2013
Assistant Treasurer
Ms. Smith also serves as an officer of other funds. She is an employee of Fidelity Investments (2009-present) and has served in other fund officer roles. Prior to joining Fidelity Investments, Ms. Smith served as Senior Audit Manager of Ernst & Young LLP (1996-2009).
Renee Stagnone (1975)
Year of Election or Appointment: 2013
Deputy Treasurer
Ms. Stagnone also serves as Deputy Treasurer of other funds. Ms. Stagnone is an employee of Fidelity Investments.
Joseph F. Zambello (1957)
Year of Election or Appointment: 2011
Deputy Treasurer
Mr. Zambello also serves as Deputy Treasurer of other funds. Mr. Zambello is an employee of Fidelity Investments. Previously, Mr. Zambello served as Vice President of the Program Management Group of FMR (investment adviser firm, 2009-2011) and Vice President of the Transfer Agent Oversight Group (2005-2009).
Shareholder Expense Example
As a shareholder of a Fund, you incur two types of costs: (1) transaction costs, including sales charges (loads) on purchase payments or redemption proceeds, redemption fees and (2) ongoing costs, including management fees, distribution and/or service (12b-1) fees and other Fund expenses. This Example is intended to help you understand your ongoing costs (in dollars) of investing in the Funds and to compare these costs with the ongoing costs of investing in other mutual funds.
The Example is based on an investment of $1,000 invested at the beginning of the period and held for the entire period (February 1, 2015 to July 31, 2015).
Actual Expenses
The first line of the accompanying table for each class of the Fund provides information about actual account values and actual expenses. You may use the information in this line, together with the amount you invested, to estimate the expenses that you paid over the period. Simply divide your account value by $1,000.00 (for example, an $8,600 account value divided by $1,000.00 = 8.6), then multiply the result by the number in the first line for a class of the Fund under the heading entitled "Expenses Paid During Period" to estimate the expenses you paid on your account during this period. A small balance maintenance fee of $12.00 that is charged once a year may apply for certain accounts with a value of less than $2,000. This fee is not included in the table below. If it was, the estimate of expenses you paid during the period would be higher, and your ending account value lower, by this amount. In addition, the Fund, as a shareholder in the underlying Fidelity Central Funds, will indirectly bear its pro-rata share of the fees and expenses incurred by the underlying Fidelity Central Funds. These fees and expenses are not included in the Fund's annualized expense ratio used to calculate the expense estimate in the table below.
Hypothetical Example for Comparison Purposes
The second line of the accompanying table for each class of the Fund provides information about hypothetical account values and hypothetical expenses based on a Class' actual expense ratio and an assumed rate of return of 5% per year before expenses, which is not the Class' actual return. The hypothetical account values and expenses may not be used to estimate the actual ending account balance or expenses you paid for the period. You may use this information to compare the ongoing costs of investing in the Fund and other funds. To do so, compare this 5% hypothetical example with the 5% hypothetical examples that appear in the shareholder reports of the other funds. A small balance maintenance fee of $12.00 that is charged once a year may apply for certain accounts with a value of less than $2,000. This fee is not included in the table below. If it was, the estimate of expenses you paid during the period would be higher, and your ending account value lower, by this amount. In addition, the Fund, as a shareholder in the underlying Fidelity Central Funds, will indirectly bear its pro-rata share of the fees and expenses incurred by the underlying Fidelity Central Funds. These fees and expenses are not included in the Fund's annualized expense ratio used to calculate the expense estimate in the table below.
Please note that the expenses shown in the table are meant to highlight your ongoing costs only and do not reflect any transaction costs. Therefore, the second line of the table is useful in comparing ongoing costs only, and will not help you determine the relative total costs of owning different funds. In addition, if these transactional costs were included, your costs would have been higher.
| | Annualized Expense Ratio-A | Beginning
Account Value
February 1, 2015 | Ending
Account Value
July 31, 2015 | Expenses Paid
During Period-B
February 1, 2015
to July 31, 2015 |
| Class A | 1.33% | | | |
| Actual | | $1,000.00 | $1,031.30 | $6.70 |
| Hypothetical-C | | $1,000.00 | $1,018.20 | $6.66 |
| Class T | 1.63% | | | |
| Actual | | $1,000.00 | $1,030.50 | $8.21 |
| Hypothetical-C | | $1,000.00 | $1,016.71 | $8.15 |
| Class B | 2.12% | | | |
| Actual | | $1,000.00 | $1,027.70 | $10.66 |
| Hypothetical-C | | $1,000.00 | $1,014.28 | $10.59 |
| Class C | 2.07% | | | |
| Actual | | $1,000.00 | $1,027.90 | $10.41 |
| Hypothetical-C | | $1,000.00 | $1,014.53 | $10.34 |
| International Real Estate | 1.12% | | | |
| Actual | | $1,000.00 | $1,032.90 | $5.65 |
| Hypothetical-C | | $1,000.00 | $1,019.24 | $5.61 |
| Class I | 1.01% | | | |
| Actual | | $1,000.00 | $1,033.00 | $5.09 |
| Hypothetical-C | | $1,000.00 | $1,019.79 | $5.06 |
A Annualized expense ratio reflects expenses net of applicable fee waivers.
B Expenses are equal to each Class' annualized expense ratio, multiplied by the average account value over the period, multiplied by 181/365 (to reflect the one-half year period).
C 5% return per year before expenses.
Distributions (Unaudited)
The Board of Trustees of Fidelity Advisor International Real Estate Fund voted to pay to shareholders of record at the opening of business on record date, the following distributions per share derived from capital gains realized from sales of portfolio securities, and dividends derived from net investment income:
| | Pay Date | Record Date | Dividends | Capital Gains |
| Class A | 09/14/15 | 09/11/15 | $0.117 | $0.121 |
| | | | | |
| Class T | 09/14/15 | 09/11/15 | $0.097 | $0.121 |
| | | | | |
| Class B | 09/14/15 | 09/11/15 | $0.000 | $0.117 |
| | | | | |
| Class C | 09/14/15 | 09/11/15 | $0.074 | $0.121 |
| | | | | |
Class A designates 41% and 9%; Class T designates 47% and 9%; Class B designates 50% and 10%; and Class C designates 54% and 10%; of the dividends distributed in September and December, respectively during the fiscal year as amounts which may be taken into account as a dividend for the purposes of the maximum rate under section 1(h)(11) of the Internal Revenue Code.
The amounts per share which represent income derived from sources within, and taxes paid to, foreign countries or possessions of the United States are as follows:
| | Pay Date | Income | Taxes | |
| Class A | 09/15/2014 | $0.2102 | $0.0172 | |
| | 12/22/2014 | $0.0606 | $0.0015 | |
| Class T | 09/15/2014 | $0.1842 | $0.0172 | |
| | 12/22/2014 | $0.0576 | $0.0015 | |
| Class B | 09/15/2014 | $0.1702 | $0.0172 | |
| | 12/22/2014 | $0.0525 | $0.0015 | |
| Class C | 09/15/2014 | $0.1582 | $0.0172 | |
| | 12/22/2014 | $0.0531 | $0.0015 | |
The fund will notify shareholders in January 2016 of amounts for use in preparing 2015 income tax returns.

AIRE-ANN-0915
1.843179.108
Fidelity® International Real Estate Fund
Annual Report July 31, 2015 |
|
Contents
This report and the financial statements contained herein are submitted for the general information of the shareholders of the Fund. This report is not authorized for distribution to prospective investors in the Fund unless preceded or accompanied by an effective prospectus.
A fund files its complete schedule of portfolio holdings with the SEC for the first and third quarters of each fiscal year on Form N-Q. Forms N-Q are available on the SEC’s web site at http://www.sec.gov. A fund's Forms N-Q may be reviewed and copied at the SEC’s Public Reference Room in Washington, DC. Information regarding the operation of the SEC's Public Reference Room may be obtained by calling 1-800-SEC-0330.
For a complete list of a fund's portfolio holdings, view the most recent holdings listing, semiannual report, or annual report on Fidelity's web site at http://www.fidelity.com, http://www.advisor.fidelity.com, or http://www.401k.com, as applicable.
NOT FDIC INSURED •MAY LOSE VALUE •NO BANK GUARANTEE
Neither the Fund nor Fidelity Distributors Corporation is a bank.
To view a fund's proxy voting guidelines and proxy voting record for the 12-month period ended June 30, visit http://www.fidelity.com/proxyvotingresults or visit the Securities and Exchange Commission's (SEC) web site at http://www.sec.gov.
You may also call 1-800-544-8544 to request a free copy of the proxy voting guidelines.
Standard & Poor's, S&P and S&P 500 are registered service marks of The McGraw-Hill Companies, Inc. and have been licensed for use by Fidelity Distributors Corporation.
Other third-party marks appearing herein are the property of their respective owners.
All other marks appearing herein are registered or unregistered trademarks or service marks of FMR LLC or an affiliated company. © 2015 FMR LLC. All rights reserved.
Performance: The Bottom Line
Average annual total return reflects the change in the value of an investment, assuming reinvestment of distributions from dividend income and capital gains (the profits earned upon the sale of securities that have grown in value, if any) and assuming a constant rate of performance each year.
The hypothetical investment and the average annual total returns do not reflect the deduction of taxes that a shareholder would pay on fund distributions or the redemption of fund shares.
During periods of reimbursement by Fidelity, a fund’s total return will be greater than it would be had the reimbursement not occurred.
How a fund did yesterday is no guarantee of how it will do tomorrow.
Average Annual Total Returns
| For the periods ended July 31, 2015 | Past 1 year | Past 5 years | Past 10 years |
| Fidelity® International Real Estate Fund | 1.95% | 10.37% | 4.61% |
$10,000 Over 10 Years
Let's say hypothetically that $10,000 was invested in Fidelity® International Real Estate Fund, a class of the fund, on July 31, 2005.
The chart shows how the value of your investment would have changed, and also shows how the MSCI EAFE Index performed over the same period.
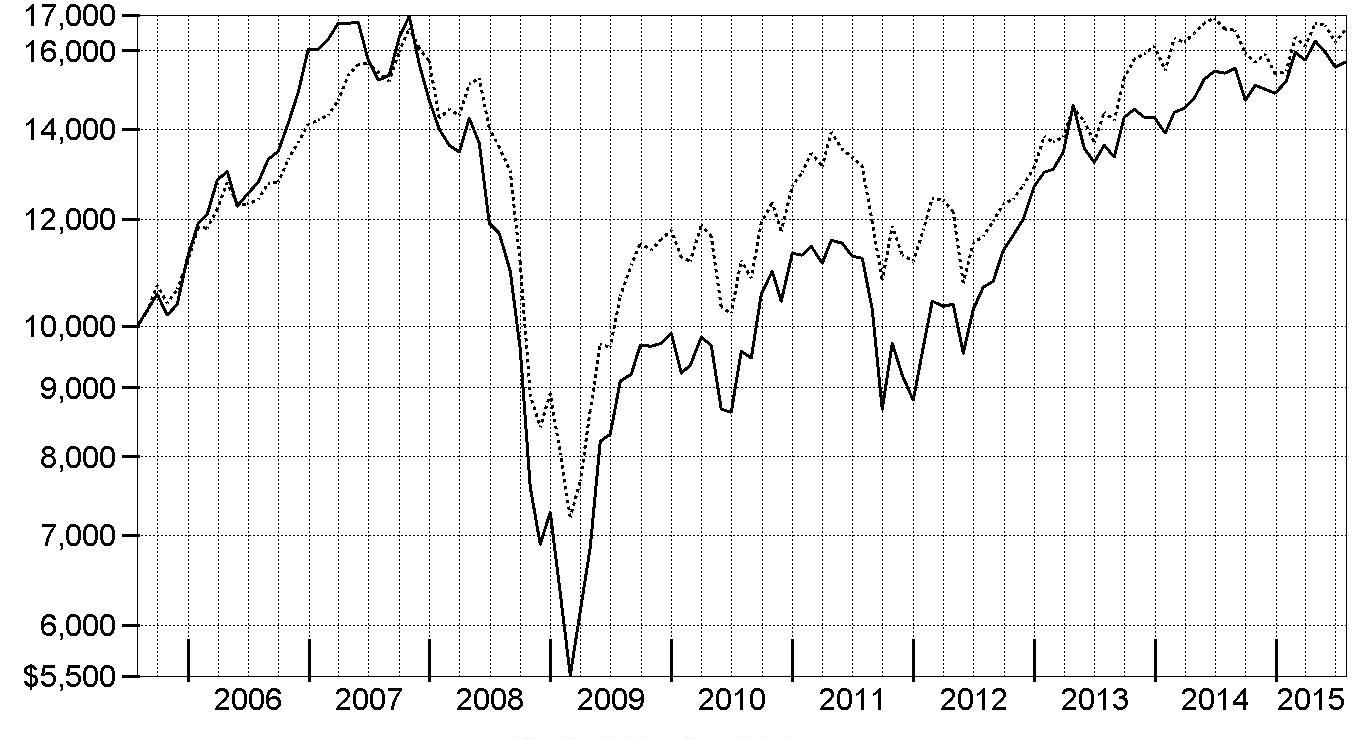
| Period Ending Values |
| $15,692 | Fidelity® International Real Estate Fund |
| $16,562 | MSCI EAFE Index |
Management's Discussion of Fund Performance
Market Recap: International real estate securities ran a turbulent course for the 12 months ending July 31, 2015. As measured by the FTSE
® EPRA℠/NAREIT
® Developed ex North America Index, international property stocks returned -1.69%, compared with the 11.29% result for the Dow Jones U.S. Select Real Estate Securities Index℠, a proxy for the U.S. market. Geopolitical risks – including conflict between Russia and Ukraine, pro-democracy protests in Hong Kong, persistent turmoil in the Middle East, ongoing debt drama for Greece, and slowing growth in China – continued to threaten markets. These factors, combined with currency fluctuations and a steep decline in the price of commodities, drove investors toward perceived safer-haven areas, curtailing results for international real estate investment trusts (REITs). Among the FTSE index’s country components, the best results came from the U.K. (+18%), which continued to see strong demand, and the rest of Europe (+1%), where returns were driven by continued quantitative easing. Asia-Pacific ex Japan (-3%) was held back by Singapore, amid impending interest rate hikes and declining distribution-per-unit growth there. Japan (-11%) saw the most dramatic regional decline. Despite a surge in late October on stimulus measures, an increasingly cautious outlook on Japan’s property market caused that market to plunge.
Comments from Portfolio Manager Guillermo de las Casas: For the year, the fund’s share classes outperformed the benchmark FTSE
® EPRA℠/NAREIT
® Developed ex North America Index.
(For specific class-level results, please see the Performance section of this report.) Versus the index, security selection and market allocation fueled the fund’s result. In terms of geography, picks in Europe and Japan helped the most. An overweighting in Germany-based Gagfah was the fund’s top individual contributor. Competitor and fund holding Deutsche Annington Immobilien – Europe’s second largest property company by market cap as well as Germany’s largest residential investment company – offered to buy Gagfah in December. The deal created Europe’s second-largest real estate company. Gagfah was sold from the fund by period end. U.K.’s self-storage providers Safestore Holdings, a mid-cap firm that lagged last year, and Big Yellow Group - the industry leader in that region - also were big contributors. Both stocks were propelled by an increase in occupancy rates in the spring. On the flip side, avoiding two large U.K.-based index components, both of which are commercial property development companies – Land Securities Group, the biggest developer in the region, and British Land - weighed on the fund’s relative result as these stocks outperformed.
The views expressed above reflect those of the portfolio manager(s) only through the end of the period as stated on the cover of this report and do not necessarily represent the views of Fidelity or any other person in the Fidelity organization. Any such views are subject to change at any time based upon market or other conditions and Fidelity disclaims any responsibility to update such views. These views may not be relied on as investment advice and, because investment decisions for a Fidelity fund are based on numerous factors, may not be relied on as an indication of trading intent on behalf of any Fidelity fund.Investment Summary (Unaudited)
Top Ten Stocks as of July 31, 2015
| | % of fund's net assets | % of fund's net assets 6 months ago |
| Mitsubishi Estate Co. Ltd. | 5.5 | 6.6 |
| Mitsui Fudosan Co. Ltd. | 5.3 | 4.8 |
| Sun Hung Kai Properties Ltd. | 5.2 | 5.2 |
| Westfield Corp. unit | 3.8 | 3.3 |
| Deutsche Annington Immobilien SE | 3.7 | 0.0 |
| Wing Tai Holdings Ltd. | 2.9 | 3.0 |
| Sumitomo Realty & Development Co. Ltd. | 2.9 | 1.3 |
| UOL Group Ltd. | 2.8 | 3.4 |
| LEG Immobilien AG | 2.8 | 3.9 |
| Safestore Holdings PLC | 2.7 | 2.4 |
| | 37.6 | |
Top Five Countries as of July 31, 2015
| (excluding cash equivalents) | % of fund's net assets | % of fund's net assets 6 months ago |
| Japan | 20.4 | 21.2 |
| United Kingdom | 14.1 | 15.3 |
| Hong Kong | 10.3 | 10.8 |
| Germany | 8.9 | 4.9 |
| Singapore | 8.8 | 10.6 |
Top Five REIT Sectors as of July 31, 2015
| | % of fund's net assets | % of fund's net assets 6 months ago |
| REITs - Management/Investment | 12.6 | 16.2 |
| REITs - Warehouse/Industrial | 5.7 | 5.4 |
| REITs - Health Care | 3.3 | 2.3 |
| REITs - Office Property | 2.7 | 4.2 |
| REITs - Apartments | 1.9 | 2.2 |
Asset Allocation (% of fund's net assets)
| As of July 31, 2015* |
| | Stocks | 93.8% |
| | Short-Term Investments and Net Other Assets (Liabilities) | 6.2% |

* Foreign investments - 93.8%
| As of January 31, 2015* |
| | Stocks | 94.8% |
| | Short-Term Investments and Net Other Assets (Liabilities) | 5.2% |

* Foreign investments - 94.8%
Investments July 31, 2015
Showing Percentage of Net Assets
| Common Stocks - 93.8% | | | |
| | | Shares | Value |
| Australia - 8.5% | | | |
| 360 Capital Group Ltd. unit | | 1,151,768 | $883,979 |
| Abacus Property Group unit | | 2,239,684 | 5,091,372 |
| ALE Property Group | | 325,000 | 867,089 |
| APN Property Group Ltd. | | 2,812,372 | 770,889 |
| Ardent Leisure Group unit | | 575,000 | 1,017,117 |
| Charter Hall Group unit | | 539,587 | 1,865,565 |
| Hotel Property Investments unit | | 497,270 | 955,951 |
| Ingenia Communities Group unit | | 2,858,228 | 981,934 |
| Mirvac Group unit | | 4,062,126 | 5,611,809 |
| National Storage (REIT) unit | | 642,411 | 786,530 |
| Westfield Corp. unit | | 2,055,802 | 15,071,965 |
|
| TOTAL AUSTRALIA | | | 33,904,200 |
|
| Austria - 1.7% | | | |
| Buwog-Gemeinnuetzige Wohnung (a) | | 332,618 | 6,710,519 |
| Belgium - 1.7% | | | |
| Warehouses de Pauw | | 84,409 | 6,668,068 |
| Bermuda - 5.3% | | | |
| Great Eagle Holdings Ltd. | | 2,208,385 | 7,691,446 |
| Hongkong Land Holdings Ltd. | | 1,333,100 | 10,264,870 |
| Tai Cheung Holdings Ltd. | | 3,382,000 | 2,979,640 |
|
| TOTAL BERMUDA | | | 20,935,956 |
|
| France - 3.3% | | | |
| Accor SA | | 59,342 | 2,911,575 |
| Altarea | | 20,546 | 3,497,520 |
| Societe Fonciere Lyonnaise SA | | 131,558 | 5,923,827 |
| Terreis | | 34,300 | 1,000,515 |
|
| TOTAL FRANCE | | | 13,333,437 |
|
| Germany - 8.9% | | | |
| alstria office REIT-AG (a) | | 402,000 | 5,551,819 |
| Deutsche Annington Immobilien SE | | 467,490 | 14,581,153 |
| DIC Asset AG | | 471,700 | 4,125,189 |
| LEG Immobilien AG | | 150,777 | 10,963,770 |
|
| TOTAL GERMANY | | | 35,221,931 |
|
| Greece - 0.2% | | | |
| Grivalia Properties REIC | | 129,339 | 996,856 |
| Hong Kong - 10.3% | | | |
| Cheung Kong Property Holdings Ltd. (b) | | 273,500 | 2,279,078 |
| Hysan Development Co. Ltd. | | 2,160,703 | 9,253,427 |
| Magnificent Estates Ltd. | | 54,693,000 | 1,940,144 |
| Shun Ho Technology Holdings Ltd. (b) | | 830,065 | 291,240 |
| Sino Land Ltd. | | 3,570,348 | 5,545,063 |
| Sun Hung Kai Properties Ltd. | | 1,354,044 | 20,802,425 |
| Wheelock and Co. Ltd. | | 190,000 | 984,031 |
|
| TOTAL HONG KONG | | | 41,095,408 |
|
| Ireland - 0.1% | | | |
| Hibernia (REIT) PLC | | 300,000 | 433,260 |
| Israel - 0.8% | | | |
| Azrieli Group | | 74,700 | 3,096,455 |
| Italy - 0.9% | | | |
| Beni Stabili SpA SIIQ | | 2,480,262 | 1,961,242 |
| Immobiliare Grande Distribuzione SpA | | 1,771,488 | 1,645,924 |
|
| TOTAL ITALY | | | 3,607,166 |
|
| Japan - 20.4% | | | |
| Advance Residence Investment Corp. | | 3,374 | 7,364,078 |
| Fukuoka (REIT) Investment Fund | | 3,881 | 6,529,136 |
| Goldcrest Co. Ltd. | | 47,000 | 963,247 |
| Ichigo, Inc. (a) | | 639,800 | 1,579,689 |
| Kenedix, Inc. | | 527,000 | 2,062,331 |
| Mitsubishi Estate Co. Ltd. | | 982,000 | 21,829,264 |
| Mitsui Fudosan Co. Ltd. | | 738,000 | 21,011,280 |
| Open House Co. Ltd. | | 30,000 | 497,922 |
| Ship Healthcare Holdings, Inc. | | 81,600 | 1,730,959 |
| Sumitomo Realty & Development Co. Ltd. | | 324,000 | 11,369,476 |
| Sundrug Co. Ltd. | | 7,000 | 408,359 |
| The Sumitomo Warehouse Co. Ltd. | | 177,000 | 956,873 |
| Tokyu Fudosan Holdings Corp. | | 361,700 | 2,731,684 |
| Uchiyama Holdings Co. Ltd. | | 481,300 | 1,980,579 |
|
| TOTAL JAPAN | | | 81,014,877 |
|
| Netherlands - 1.2% | | | |
| VastNed Retail NV | | 101,749 | 4,629,071 |
| Norway - 1.7% | | | |
| Olav Thon Eiendomsselskap A/S | | 239,300 | 4,321,107 |
| Selvaag Bolig ASA (a)(b) | | 756,200 | 2,406,968 |
|
| TOTAL NORWAY | | | 6,728,075 |
|
| Singapore - 8.8% | | | |
| Keppel DC (REIT) | | 2,479,900 | 1,961,360 |
| Parkway Life REIT | | 5,793,400 | 10,262,027 |
| UOL Group Ltd. | | 2,293,936 | 11,203,390 |
| Wing Tai Holdings Ltd. | | 8,275,181 | 11,370,570 |
|
| TOTAL SINGAPORE | | | 34,797,347 |
|
| Spain - 1.5% | | | |
| Inmobiliaria Colonial SA (a)(b) | | 5,333,700 | 3,965,687 |
| Melia Hotels International SA (a) | | 136,900 | 1,971,094 |
|
| TOTAL SPAIN | | | 5,936,781 |
|
| Sweden - 3.5% | | | |
| Castellum AB | | 265,000 | 3,778,364 |
| Hufvudstaden AB Series A | | 308,350 | 3,988,972 |
| Kungsleden AB | | 436,700 | 2,923,398 |
| Wallenstam AB (B Shares) | | 432,600 | 3,131,639 |
|
| TOTAL SWEDEN | | | 13,822,373 |
|
| Switzerland - 0.9% | | | |
| PSP Swiss Property AG | | 39,500 | 3,546,130 |
| United Kingdom - 14.1% | | | |
| Assura PLC | | 1,637,252 | 1,393,464 |
| Big Yellow Group PLC | | 672,100 | 7,394,326 |
| Derwent London PLC | | 142,123 | 8,067,751 |
| Development Securities PLC | | 315,000 | 1,322,034 |
| Hansteen Holdings PLC (a) | | 1,550,000 | 2,948,239 |
| Helical Bar PLC | | 1,437,427 | 9,545,833 |
| Primary Health Properties PLC | | 172,675 | 1,099,530 |
| Safestore Holdings PLC | | 2,316,500 | 10,906,950 |
| Segro PLC | | 773,486 | 5,421,120 |
| St. Modwen Properties PLC | | 442,925 | 3,293,846 |
| Unite Group PLC | | 476,790 | 4,698,294 |
|
| TOTAL UNITED KINGDOM | | | 56,091,387 |
|
| TOTAL COMMON STOCKS | | | |
| (Cost $374,870,484) | | | 372,569,297 |
|
| Money Market Funds - 7.5% | | | |
| Fidelity Cash Central Fund, 0.17% (c) | | 23,508,834 | 23,508,834 |
| Fidelity Securities Lending Cash Central Fund, 0.18% (c)(d) | | 6,438,255 | 6,438,255 |
| TOTAL MONEY MARKET FUNDS | | | |
| (Cost $29,947,089) | | | 29,947,089 |
| TOTAL INVESTMENT PORTFOLIO - 101.3% | | | |
| (Cost $404,817,573) | | | 402,516,386 |
| NET OTHER ASSETS (LIABILITIES) - (1.3)% | | | (5,345,444) |
| NET ASSETS - 100% | | | $397,170,942 |
Categorizations in the Schedule of Investments are based on country or territory of incorporation.
Legend
(a) Security or a portion of the security is on loan at period end.
(b) Non-income producing
(c) Affiliated fund that is generally available only to investment companies and other accounts managed by Fidelity Investments. The rate quoted is the annualized seven-day yield of the fund at period end. A complete unaudited listing of the fund's holdings as of its most recent quarter end is available upon request. In addition, each Fidelity Central Fund's financial statements, which are not covered by the Fund's Report of Independent Registered Public Accounting Firm, are available on the SEC's website or upon request.
(d) Investment made with cash collateral received from securities on loan.
Affiliated Central Funds
Information regarding fiscal year to date income earned by the Fund from investments in Fidelity Central Funds is as follows:
| Fund | Income earned |
| Fidelity Cash Central Fund | $30,349 |
| Fidelity Securities Lending Cash Central Fund | 50,462 |
| Total | $80,811 |
Investment Valuation
The following is a summary of the inputs used, as of July 31, 2015, involving the Fund's assets and liabilities carried at fair value. The inputs or methodology used for valuing securities may not be an indication of the risk associated with investing in those securities. For more information on valuation inputs, and their aggregation into the levels used below, please refer to the Investment Valuation section in the accompanying Notes to Financial Statements.
| | Valuation Inputs at Reporting Date: |
| Description | Total | Level 1 | Level 2 | Level 3 |
| Investments in Securities: | | | | |
| Equities: | | | | |
| Consumer Discretionary | $8,131,170 | $8,131,170 | $-- | $-- |
| Consumer Staples | 408,359 | 408,359 | -- | -- |
| Financials | 359,361,357 | 358,364,501 | -- | 996,856 |
| Health Care | 3,711,538 | 3,711,538 | -- | -- |
| Industrials | 956,873 | 956,873 | -- | -- |
| Money Market Funds | 29,947,089 | 29,947,089 | -- | -- |
| Total Investments in Securities: | $402,516,386 | $401,519,530 | $-- | $996,856 |
The following is a summary of transfers between Level 1 and Level 2 for the period ended July 31, 2015. Transfers are assumed to have occurred at the beginning of the period, and are primarily attributable to the valuation techniques used for foreign equity securities, as discussed in the accompanying Notes to Financial Statements:
| Transfers | Total |
| Level 1 to Level 2 | $0 |
| Level 2 to Level 1 | $193,149,286 |
See accompanying notes which are an integral part of the financial statements.
Financial Statements
Statement of Assets and Liabilities
| | | July 31, 2015 |
| Assets | | |
Investment in securities, at value (including securities loaned of $6,182,323) — See accompanying schedule:
Unaffiliated issuers (cost $374,870,484) | $372,569,297 | |
| Fidelity Central Funds (cost $29,947,089) | 29,947,089 | |
| Total Investments (cost $404,817,573) | | $402,516,386 |
| Foreign currency held at value (cost $141,923) | | 141,919 |
| Receivable for fund shares sold | | 1,040,802 |
| Dividends receivable | | 854,800 |
| Distributions receivable from Fidelity Central Funds | | 8,360 |
| Other receivables | | 8,164 |
| Total assets | | 404,570,431 |
| Liabilities | | |
| Payable for fund shares redeemed | $506,903 | |
| Accrued management fee | 228,781 | |
| Distribution and service plan fees payable | 11,095 | |
| Other affiliated payables | 112,286 | |
| Other payables and accrued expenses | 102,169 | |
| Collateral on securities loaned, at value | 6,438,255 | |
| Total liabilities | | 7,399,489 |
| Net Assets | | $397,170,942 |
| Net Assets consist of: | | |
| Paid in capital | | $658,443,472 |
| Undistributed net investment income | | 4,972,026 |
| Accumulated undistributed net realized gain (loss) on investments and foreign currency transactions | | (263,915,393) |
| Net unrealized appreciation (depreciation) on investments and assets and liabilities in foreign currencies | | (2,329,163) |
| Net Assets | | $397,170,942 |
| Calculation of Maximum Offering Price | | |
| Class A: | | |
| Net Asset Value and redemption price per share ($17,162,355 ÷ 1,624,787 shares) | | $10.56 |
| Maximum offering price per share (100/94.25 of $10.56) | | $11.20 |
| Class T: | | |
| Net Asset Value and redemption price per share ($4,938,940 ÷ 471,047 shares) | | $10.49 |
| Maximum offering price per share (100/96.50 of $10.49) | | $10.87 |
| Class B: | | |
| Net Asset Value and offering price per share ($185,954 ÷ 17,919 shares)(a) | | $10.38 |
| Class C: | | |
| Net Asset Value and offering price per share ($6,547,695 ÷ 634,518 shares)(a) | | $10.32 |
| International Real Estate: | | |
| Net Asset Value, offering price and redemption price per share ($330,909,846 ÷ 30,985,398 shares) | | $10.68 |
| Class I: | | |
| Net Asset Value, offering price and redemption price per share ($37,426,152 ÷ 3,517,543 shares) | | $10.64 |
(a) Redemption price per share is equal to net asset value less any applicable contingent deferred sales charge.
See accompanying notes which are an integral part of the financial statements.
Statement of Operations
| | | Year ended July 31, 2015 |
| Investment Income | | |
| Dividends | | $9,937,021 |
| Special dividends | | 4,858,262 |
| Interest | | 8 |
| Income from Fidelity Central Funds | | 80,811 |
| Income before foreign taxes withheld | | 14,876,102 |
| Less foreign taxes withheld | | (668,855) |
| Total income | | 14,207,247 |
| Expenses | | |
| Management fee | $2,621,594 | |
| Transfer agent fees | 1,111,178 | |
| Distribution and service plan fees | 126,032 | |
| Accounting and security lending fees | 195,111 | |
| Custodian fees and expenses | 85,015 | |
| Independent trustees' compensation | 6,544 | |
| Registration fees | 92,189 | |
| Audit | 63,527 | |
| Legal | 4,476 | |
| Miscellaneous | 4,591 | |
| Total expenses before reductions | 4,310,257 | |
| Expense reductions | (20,000) | 4,290,257 |
| Net investment income (loss) | | 9,916,990 |
Realized and Unrealized Gain (Loss)
Net realized gain (loss) on: | | |
| Investment securities: | | |
| Unaffiliated issuers | 18,820,595 | |
| Foreign currency transactions | (20,412) | |
| Total net realized gain (loss) | | 18,800,183 |
Change in net unrealized appreciation (depreciation) on:
Investment securities | (22,775,467) | |
| Assets and liabilities in foreign currencies | (19,074) | |
| Total change in net unrealized appreciation (depreciation) | | (22,794,541) |
| Net gain (loss) | | (3,994,358) |
| Net increase (decrease) in net assets resulting from operations | | $5,922,632 |
See accompanying notes which are an integral part of the financial statements.
Statement of Changes in Net Assets
| | Year ended July 31, 2015 | Year ended July 31, 2014 |
| Increase (Decrease) in Net Assets | | |
| Operations | | |
| Net investment income (loss) | $9,916,990 | $6,793,871 |
| Net realized gain (loss) | 18,800,183 | 29,767,981 |
| Change in net unrealized appreciation (depreciation) | (22,794,541) | 10,181,937 |
| Net increase (decrease) in net assets resulting from operations | 5,922,632 | 46,743,789 |
| Distributions to shareholders from net investment income | (5,351,966) | (6,758,423) |
| Distributions to shareholders from net realized gain | (10,638,166) | (13,002,325) |
| Total distributions | (15,990,132) | (19,760,748) |
| Share transactions - net increase (decrease) | 30,504,182 | (53,161,192) |
| Redemption fees | 66,458 | 90,758 |
| Total increase (decrease) in net assets | 20,503,140 | (26,087,393) |
| Net Assets | | |
| Beginning of period | 376,667,802 | 402,755,195 |
| End of period (including undistributed net investment income of $4,972,026 and undistributed net investment income of $4,396,784, respectively) | $397,170,942 | $376,667,802 |
See accompanying notes which are an integral part of the financial statements.
Fidelity International Real Estate Fund Class A
| | | | | | |
| Years ended July 31, | 2015 | 2014 | 2013 | 2012 | 2011 |
| Selected Per–Share Data | | | | | |
| Net asset value, beginning of period | $10.85 | $10.11 | $8.37 | $9.21 | $8.46 |
| Income from Investment Operations | | | | | |
| Net investment income (loss)A | .26B | .16 | .14 | .16 | .34C |
| Net realized and unrealized gain (loss) | (.10)D | 1.09 | 2.03 | (.65) | 1.04 |
| Total from investment operations | .16 | 1.25 | 2.17 | (.49) | 1.38 |
| Distributions from net investment income | (.14) | (.16) | (.17) | (.17) | (.33) |
| Distributions from net realized gain | (.31) | (.35) | (.27) | (.18) | (.29) |
| Total distributions | (.45) | (.51) | (.44) | (.35) | (.63)E |
| Redemption fees added to paid in capitalA | –F | –F | .01 | –F | –F |
| Net asset value, end of period | $10.56 | $10.85 | $10.11 | $8.37 | $9.21 |
| Total ReturnG,H | 1.67%D | 12.85% | 26.94% | (4.88)% | 16.76% |
| Ratios to Average Net AssetsI,J | | | | | |
| Expenses before reductions | 1.34% | 1.38% | 1.40% | 1.44% | 1.42% |
| Expenses net of fee waivers, if any | 1.34% | 1.38% | 1.40% | 1.44% | 1.42% |
| Expenses net of all reductions | 1.34% | 1.38% | 1.39% | 1.37% | 1.36% |
| Net investment income (loss) | 2.45%B | 1.57% | 1.51% | 2.09% | 3.67%C |
| Supplemental Data | | | | | |
| Net assets, end of period (000 omitted) | $17,162 | $13,933 | $13,173 | $7,117 | $7,047 |
| Portfolio turnover rateK | 82% | 59% | 78% | 138% | 131% |
A Calculated based on average shares outstanding during the period.
B Investment income per share reflects a large, non-recurring dividend which amounted to $.14 per share. Excluding this non-recurring dividend, the ratio of net investment income (loss) to average net assets would have been 1.15%.
C Investment income per share reflects a large, non-recurring dividend which amounted to $.19 per share. Excluding this non-recurring dividend, the ratio of net investment income (loss) to average net assets would have been 1.64%.
D Amount includes a reimbursement from the investment adviser for an operational error which amounted to less than $.01 per share. Excluding this reimbursement, the total return would have been 1.64%.
E Total distributions of $.63 per share is comprised of distributions from net investment income of $.333 and distributions from net realized gain of $.294 per share.
F Amount represents less than $.01 per share.
G Total returns would have been lower if certain expenses had not been reduced during the applicable periods shown.
H Total returns do not include the effect of the sales charges.
I Fees and expenses of any underlying Fidelity Central Funds are not included in the Fund's expense ratio. The Fund indirectly bears its proportionate share of the expenses of any underlying Fidelity Central Funds.
J Expense ratios reflect operating expenses of the class. Expenses before reductions do not reflect amounts reimbursed by the investment adviser or reductions from brokerage service arrangements or reductions from other expense offset arrangements and do not represent the amount paid by the class during periods when reimbursements or reductions occur. Expenses net of fee waivers reflect expenses after reimbursement by the investment adviser but prior to reductions from brokerage service arrangements or other expense offset arrangements. Expenses net of all reductions represent the net expenses paid by the class.
K Amount does not include the portfolio activity of any underlying Fidelity Central Funds.
See accompanying notes which are an integral part of the financial statements.
Fidelity International Real Estate Fund Class T
| | | | | | |
| Years ended July 31, | 2015 | 2014 | 2013 | 2012 | 2011 |
| Selected Per–Share Data | | | | | |
| Net asset value, beginning of period | $10.76 | $10.04 | $8.32 | $9.16 | $8.41 |
| Income from Investment Operations | | | | | |
| Net investment income (loss)A | .22B | .13 | .12 | .14 | .31C |
| Net realized and unrealized gain (loss) | (.08)D | 1.07 | 2.01 | (.66) | 1.04 |
| Total from investment operations | .14 | 1.20 | 2.13 | (.52) | 1.35 |
| Distributions from net investment income | (.10) | (.14) | (.15) | (.14) | (.31) |
| Distributions from net realized gain | (.31) | (.35) | (.27) | (.18) | (.29) |
| Total distributions | (.41) | (.48)E | (.42) | (.32) | (.60) |
| Redemption fees added to paid in capitalA | –F | –F | .01 | –F | –F |
| Net asset value, end of period | $10.49 | $10.76 | $10.04 | $8.32 | $9.16 |
| Total ReturnG,H | 1.49%D | 12.50% | 26.62% | (5.23)% | 16.54% |
| Ratios to Average Net AssetsI,J | | | | | |
| Expenses before reductions | 1.64% | 1.66%�� | 1.68% | 1.72% | 1.69% |
| Expenses net of fee waivers, if any | 1.64% | 1.66% | 1.68% | 1.70% | 1.69% |
| Expenses net of all reductions | 1.63% | 1.65% | 1.66% | 1.63% | 1.63% |
| Net investment income (loss) | 2.15%B | 1.30% | 1.23% | 1.83% | 3.41%C |
| Supplemental Data | | | | | |
| Net assets, end of period (000 omitted) | $4,939 | $5,563 | $5,081 | $2,570 | $2,496 |
| Portfolio turnover rateK | 82% | 59% | 78% | 138% | 131% |
A Calculated based on average shares outstanding during the period.
B Investment income per share reflects a large, non-recurring dividends which amounted to $.14 per share. Excluding this non-recurring dividends, the ratio of net investment income (loss) to average net assets would have been .86%.
C Investment income per share reflects a large, non-recurring dividend which amounted to $.19 per share. Excluding this non-recurring dividends, the ratio of net investment income (loss) to average net assets would have been 1.38%.
D Amount includes a reimbursement from the investment adviser for an operational error which amounted to less than $.01 per share. Excluding this reimbursement, the total return would have been 1.46%.
E Total distributions of $.48 per share is comprised of distributions from net investment income of $.136 and distributions from net realized gain of $.348 per share.
F Amount represents less than $.01 per share.
G Total returns would have been lower if certain expenses had not been reduced during the applicable periods shown.
H Total returns do not include the effect of the sales charges.
I Fees and expenses of any underlying Fidelity Central Funds are not included in the Fund's expense ratio. The Fund indirectly bears its proportionate share of the expenses of any underlying Fidelity Central Funds.
J Expense ratios reflect operating expenses of the class. Expenses before reductions do not reflect amounts reimbursed by the investment adviser or reductions from brokerage service arrangements or reductions from other expense offset arrangements and do not represent the amount paid by the class during periods when reimbursements or reductions occur. Expenses net of fee waivers reflect expenses after reimbursement by the investment adviser but prior to reductions from brokerage service arrangements or other expense offset arrangements. Expenses net of all reductions represent the net expenses paid by the class.
K Amount does not include the portfolio activity of any underlying Fidelity Central Funds.
See accompanying notes which are an integral part of the financial statements.
Fidelity International Real Estate Fund Class B
| | | | | | |
| Years ended July 31, | 2015 | 2014 | 2013 | 2012 | 2011 |
| Selected Per–Share Data | | | | | |
| Net asset value, beginning of period | $10.67 | $9.94 | $8.24 | $9.05 | $8.32 |
| Income from Investment Operations | | | | | |
| Net investment income (loss)A | .17B | .08 | .07 | .10 | .26C |
| Net realized and unrealized gain (loss) | (.08)D | 1.08 | 1.99 | (.64) | 1.03 |
| Total from investment operations | .09 | 1.16 | 2.06 | (.54) | 1.29 |
| Distributions from net investment income | (.08) | (.08) | (.10) | (.09) | (.27) |
| Distributions from net realized gain | (.30) | (.35) | (.27) | (.18) | (.29) |
| Total distributions | (.38) | (.43) | (.37) | (.27) | (.56) |
| Redemption fees added to paid in capitalA | –E | –E | .01 | –E | –E |
| Net asset value, end of period | $10.38 | $10.67 | $9.94 | $8.24 | $9.05 |
| Total ReturnF,G | .95%D | 12.08% | 25.87% | (5.61)% | 15.90% |
| Ratios to Average Net AssetsH,I | | | | | |
| Expenses before reductions | 2.12% | 2.14% | 2.16% | 2.19% | 2.17% |
| Expenses net of fee waivers, if any | 2.12% | 2.14% | 2.16% | 2.19% | 2.17% |
| Expenses net of all reductions | 2.12% | 2.13% | 2.14% | 2.12% | 2.11% |
| Net investment income (loss) | 1.67%B | .82% | .76% | 1.34% | 2.92%C |
| Supplemental Data | | | | | |
| Net assets, end of period (000 omitted) | $186 | $373 | $456 | $457 | $570 |
| Portfolio turnover rateJ | 82% | 59% | 78% | 138% | 131% |
A Calculated based on average shares outstanding during the period.
B Investment income per share reflects a large, non-recurring dividend which amounted to $.13 per share. Excluding this non-recurring dividend, the ratio of net investment income (loss) to average net assets would have been .37%.
C Investment income per share reflects a large, non-recurring dividend which amounted to $.18 per share. Excluding this non-recurring dividend, the ratio of net investment income (loss) to average net assets would have been .90%.
D Amount includes a reimbursement from the investment adviser for an operational error which amounted to less than $.01 per share. Excluding this reimbursement, the total return would have been .92%.
E Amount represents less than $.01 per share.
F Total returns would have been lower if certain expenses had not been reduced during the applicable periods shown.
G Total returns do not include the effect of the contingent deferred sales charge.
H Fees and expenses of any underlying Fidelity Central Funds are not included in the Fund's expense ratio. The Fund indirectly bears its proportionate share of the expenses of any underlying Fidelity Central Funds.
I Expense ratios reflect operating expenses of the class. Expenses before reductions do not reflect amounts reimbursed by the investment adviser or reductions from brokerage service arrangements or reductions from other expense offset arrangements and do not represent the amount paid by the class during periods when reimbursements or reductions occur. Expenses net of fee waivers reflect expenses after reimbursement by the investment adviser but prior to reductions from brokerage service arrangements or other expense offset arrangements. Expenses net of all reductions represent the net expenses paid by the class.
J Amount does not include the portfolio activity of any underlying Fidelity Central Funds.
See accompanying notes which are an integral part of the financial statements.
Fidelity International Real Estate Fund Class C
| | | | | | |
| Years ended July 31, | 2015 | 2014 | 2013 | 2012 | 2011 |
| Selected Per–Share Data | | | | | |
| Net asset value, beginning of period | $10.60 | $9.89 | $8.21 | $9.03 | $8.30 |
| Income from Investment Operations | | | | | |
| Net investment income (loss)A | .17B | .08 | .07 | .10 | .26C |
| Net realized and unrealized gain (loss) | (.08)D | 1.07 | 1.99 | (.64) | 1.04 |
| Total from investment operations | .09 | 1.15 | 2.06 | (.54) | 1.30 |
| Distributions from net investment income | (.07) | (.09) | (.12) | (.10) | (.28) |
| Distributions from net realized gain | (.30) | (.35) | (.27) | (.18) | (.29) |
| Total distributions | (.37) | (.44) | (.39) | (.28) | (.57) |
| Redemption fees added to paid in capitalA | –E | –E | .01 | –E | –E |
| Net asset value, end of period | $10.32 | $10.60 | $9.89 | $8.21 | $9.03 |
| Total ReturnF,G | .97%D | 12.04% | 25.96% | (5.68)% | 16.07% |
| Ratios to Average Net AssetsH,I | | | | | |
| Expenses before reductions | 2.09% | 2.13% | 2.16% | 2.19% | 2.17% |
| Expenses net of fee waivers, if any | 2.09% | 2.13% | 2.16% | 2.19% | 2.17% |
| Expenses net of all reductions | 2.09% | 2.13% | 2.14% | 2.12% | 2.11% |
| Net investment income (loss) | 1.70%B | .82% | .76% | 1.34% | 2.92%C |
| Supplemental Data | | | | | |
| Net assets, end of period (000 omitted) | $6,548 | $6,504 | $6,872 | $3,164 | $3,208 |
| Portfolio turnover rateJ | 82% | 59% | 78% | 138% | 131% |
A Calculated based on average shares outstanding during the period.
B Investment income per share reflects a large, non-recurring dividend which amounted to $.13 per share. Excluding this non-recurring dividend, the ratio of net investment income (loss) to average net assets would have been .41%.
C Investment income per share reflects a large, non-recurring dividend which amounted to $.18 per share. Excluding this non-recurring dividend, the ratio of net investment income (loss) to average net assets would have been .89%.
D Amount includes a reimbursement from the investment adviser for an operational error which amounted to less than $.01 per share. Excluding this reimbursement, the total return would have been .94%.
E Amount represents less than $.01 per share.
F Total returns would have been lower if certain expenses had not been reduced during the applicable periods shown.
G Total returns do not include the effect of the contingent deferred sales charge.
H Fees and expenses of any underlying Fidelity Central Funds are not included in the Fund's expense ratio. The Fund indirectly bears its proportionate share of the expenses of any underlying Fidelity Central Funds.
I Expense ratios reflect operating expenses of the class. Expenses before reductions do not reflect amounts reimbursed by the investment adviser or reductions from brokerage service arrangements or reductions from other expense offset arrangements and do not represent the amount paid by the class during periods when reimbursements or reductions occur. Expenses net of fee waivers reflect expenses after reimbursement by the investment adviser but prior to reductions from brokerage service arrangements or other expense offset arrangements. Expenses net of all reductions represent the net expenses paid by the class.
J Amount does not include the portfolio activity of any underlying Fidelity Central Funds.
See accompanying notes which are an integral part of the financial statements.
Financial Highlights — Fidelity International Real Estate Fund
| | | | | | |
| Years ended July 31, | 2015 | 2014 | 2013 | 2012 | 2011 |
| Selected Per–Share Data | | | | | |
| Net asset value, beginning of period | $10.96 | $10.21 | $8.44 | $9.30 | $8.53 |
| Income from Investment Operations | | | | | |
| Net investment income (loss)A | .28B | .19 | .17 | .18 | .36C |
| Net realized and unrealized gain (loss) | (.09)D | 1.09 | 2.05 | (.67) | 1.06 |
| Total from investment operations | .19 | 1.28 | 2.22 | (.49) | 1.42 |
| Distributions from net investment income | (.16) | (.18) | (.19) | (.19) | (.35) |
| Distributions from net realized gain | (.31) | (.35) | (.27) | (.18) | (.29) |
| Total distributions | (.47) | (.53) | (.46) | (.37) | (.65)E |
| Redemption fees added to paid in capitalA | –F | –F | .01 | –F | –F |
| Net asset value, end of period | $10.68 | $10.96 | $10.21 | $8.44 | $9.30 |
| Total ReturnG | 1.95%D | 13.12% | 27.31% | (4.76)% | 17.15% |
| Ratios to Average Net AssetsH,I | | | | | |
| Expenses before reductions | 1.12% | 1.13% | 1.16% | 1.19% | 1.17% |
| Expenses net of fee waivers, if any | 1.12% | 1.13% | 1.16% | 1.19% | 1.17% |
| Expenses net of all reductions | 1.12% | 1.13% | 1.14% | 1.12% | 1.11% |
| Net investment income (loss) | 2.67%B | 1.82% | 1.76% | 2.34% | 3.92%C |
| Supplemental Data | | | | | |
| Net assets, end of period (000 omitted) | $330,910 | $342,960 | $367,269 | $251,543 | $322,045 |
| Portfolio turnover rateJ | 82% | 59% | 78% | 138% | 131% |
A Calculated based on average shares outstanding during the period.
B Investment income per share reflects a large, non-recurring dividend which amounted to $.14 per share. Excluding this non-recurring dividend, the ratio of net investment income (loss) to average net assets would have been 1.38%.
C Investment income per share reflects a large, non-recurring dividend which amounted to $.19 per share. Excluding this non-recurring dividend, the ratio of net investment income (loss) to average net assets would have been 1.90%.
D Amount includes a reimbursement from the investment adviser for an operational error which amounted to less than $.01 per share. Excluding this reimbursement, the total return would have been 1.92%.
E Total distributions of $.65 per share is comprised of distributions from net investment income of $.354 and distributions from net realized gain of $.294 per share.
F Amount represents less than $.01 per share.
G Total returns would have been lower if certain expenses had not been reduced during the applicable periods shown.
H Fees and expenses of any underlying Fidelity Central Funds are not included in the Fund's expense ratio. The Fund indirectly bears its proportionate share of the expenses of any underlying Fidelity Central Funds.
I Expense ratios reflect operating expenses of the class. Expenses before reductions do not reflect amounts reimbursed by the investment adviser or reductions from brokerage service arrangements or reductions from other expense offset arrangements and do not represent the amount paid by the class during periods when reimbursements or reductions occur. Expenses net of fee waivers reflect expenses after reimbursement by the investment adviser but prior to reductions from brokerage service arrangements or other expense offset arrangements. Expenses net of all reductions represent the net expenses paid by the class.
J Amount does not include the portfolio activity of any underlying Fidelity Central Funds.
See accompanying notes which are an integral part of the financial statements.
Financial Highlights — Fidelity International Real Estate Fund Class I
| | | | | | |
| Years ended July 31, | 2015 | 2014 | 2013 | 2012 | 2011 |
| Selected Per–Share Data | | | | | |
| Net asset value, beginning of period | $10.92 | $10.18 | $8.42 | $9.28 | $8.51 |
| Income from Investment Operations | | | | | |
| Net investment income (loss)A | .29B | .19 | .18 | .18 | .36C |
| Net realized and unrealized gain (loss) | (.09)D | 1.09 | 2.03 | (.67) | 1.06 |
| Total from investment operations | .20 | 1.28 | 2.21 | (.49) | 1.42 |
| Distributions from net investment income | (.17) | (.19) | (.19) | (.20) | (.35) |
| Distributions from net realized gain | (.31) | (.35) | (.27) | (.18) | (.29) |
| Total distributions | (.48) | (.54) | (.46) | (.37)E | (.65)F |
| Redemption fees added to paid in capitalA | –G | –G | .01 | –G | –G |
| Net asset value, end of period | $10.64 | $10.92 | $10.18 | $8.42 | $9.28 |
| Total ReturnH | 2.01%D | 13.16% | 27.33% | (4.73)% | 17.18% |
| Ratios to Average Net AssetsI,J | | | | | |
| Expenses before reductions | 1.03% | 1.12% | 1.10% | 1.19% | 1.17% |
| Expenses net of fee waivers, if any | 1.03% | 1.12% | 1.10% | 1.19% | 1.17% |
| Expenses net of all reductions | 1.03% | 1.12% | 1.09% | 1.12% | 1.11% |
| Net investment income (loss) | 2.76%B | 1.84% | 1.81% | 2.34% | 3.92%C |
| Supplemental Data | | | | | |
| Net assets, end of period (000 omitted) | $37,426 | $7,336 | $9,905 | $1,947 | $1,785 |
| Portfolio turnover rateK | 82% | 59% | 78% | 138% | 131% |
A Calculated based on average shares outstanding during the period.
B Investment income per share reflects a large, non-recurring dividend which amounted to $.14 per share. Excluding this non-recurring dividend, the ratio of net investment income (loss) to average net assets would have been 1.46%.
C Investment income per share reflects a large, non-recurring dividend which amounted to $.19 per share. Excluding this non-recurring dividend, the ratio of net investment income (loss) to average net assets would have been 1.90%.
D Amount includes a reimbursement from the investment adviser for an operational error which amounted to less than $.01 per share. Excluding this reimbursement, the total return would have been 1.98%.
E Total distributions of $.37 per share is comprised of distributions from net investment income of $.195 and distributions from net realized gain of $.178 per share.
F Total distributions of $.65 per share is comprised of distributions from net investment income of $.354 and distributions from net realized gain of $.294 per share.
G Amount represents less than $.01 per share.
H Total returns would have been lower if certain expenses had not been reduced during the applicable periods shown.
I Fees and expenses of any underlying Fidelity Central Funds are not included in the Fund's expense ratio. The Fund indirectly bears its proportionate share of the expenses of any underlying Fidelity Central Funds.
J Expense ratios reflect operating expenses of the class. Expenses before reductions do not reflect amounts reimbursed by the investment adviser or reductions from brokerage service arrangements or reductions from other expense offset arrangements and do not represent the amount paid by the class during periods when reimbursements or reductions occur. Expenses net of fee waivers reflect expenses after reimbursement by the investment adviser but prior to reductions from brokerage service arrangements or other expense offset arrangements. Expenses net of all reductions represent the net expenses paid by the class.
K Amount does not include the portfolio activity of any underlying Fidelity Central Funds.
See accompanying notes which are an integral part of the financial statements.
Notes to Financial Statements
For the period ended July 31, 2015
1. Organization.
Fidelity International Real Estate Fund (the Fund) is a non-diversified fund of Fidelity Select Portfolios (the Trust) and is authorized to issue an unlimited number of shares. The Trust is registered under the Investment Company Act of 1940, as amended (the 1940 Act), as an open-end management investment company organized as a Massachusetts business trust. The Fund offers Class A, Class T, Class C, International Real Estate and Class I (formerly Institutional Class) shares, each of which, along with Class B shares, has equal rights as to assets and voting privileges. Class B shares are closed to new accounts and additional purchases, except for exchanges and reinvestments. Each class has exclusive voting rights with respect to matters that affect that class. Class B shares will automatically convert to Class A shares after a holding period of seven years from the initial date of purchase.
2. Investments in Fidelity Central Funds.
The Fund invests in Fidelity Central Funds, which are open-end investment companies generally available only to other investment companies and accounts managed by the investment adviser and its affiliates. The Fund's Schedule of Investments lists each of the Fidelity Central Funds held as of period end, if any, as an investment of the Fund, but does not include the underlying holdings of each Fidelity Central Fund. As an Investing Fund, the Fund indirectly bears its proportionate share of the expenses of the underlying Fidelity Central Funds.
The Money Market Central Funds seek preservation of capital and current income and are managed by Fidelity Investments Money Management, Inc. (FIMM), an affiliate of the investment adviser. Annualized expenses of the Money Market Central Funds as of their most recent shareholder report date are less than .01%.
A complete unaudited list of holdings for each Fidelity Central Fund is available upon request or at the Securities and Exchange Commission (the SEC) website at www.sec.gov. In addition, the financial statements of the Fidelity Central Funds, which are not covered by the Fund's Report of Independent Registered Public Accounting Firm, are available on the SEC website or upon request.
3. Significant Accounting Policies.
The financial statements have been prepared in conformity with accounting principles generally accepted in the United States of America (GAAP), which require management to make certain estimates and assumptions at the date of the financial statements. Actual results could differ from those estimates. Subsequent events, if any, through the date that the financial statements were issued have been evaluated in the preparation of the financial statements. The following summarizes the significant accounting policies of the Fund:
Investment Valuation. Investments are valued as of 4:00 p.m. Eastern time on the last calendar day of the period. The Board of Trustees (the Board) has delegated the day to day responsibility for the valuation of the Fund's investments to the Fidelity SelectCo, LLC (SelectCo) Fair Value Committee (the Committee). In accordance with valuation policies and procedures approved by the Board, the Fund attempts to obtain prices from one or more third party pricing vendors or brokers to value its investments. When current market prices, quotations or currency exchange rates are not readily available or reliable, investments will be fair valued in good faith by the Committee, in accordance with procedures adopted by the Board. Factors used in determining fair value vary by investment type and may include market or investment specific events. The frequency with which these procedures are used cannot be predicted and they may be utilized to a significant extent. The Committee oversees the Fund's valuation policies and procedures and reports to the Board on the Committee's activities and fair value determinations. The Board monitors the appropriateness of the procedures used in valuing the Fund's investments and ratifies the fair value determinations of the Committee.
The Fund categorizes the inputs to valuation techniques used to value its investments into a disclosure hierarchy consisting of three levels as shown below:
- Level 1 – quoted prices in active markets for identical investments
- Level 2 – other significant observable inputs (including quoted prices for similar investments, interest rates, prepayment speeds, etc.)
- Level 3 – unobservable inputs (including the Fund's own assumptions based on the best information available)
Valuation techniques used to value the Fund's investments by major category are as follows:
Equity securities, including restricted securities, for which market quotations are readily available, are valued at the last reported sale price or official closing price as reported by a third party pricing vendor on the primary market or exchange on which they are traded and are categorized as Level 1 in the hierarchy. In the event there were no sales during the day or closing prices are not available, securities are valued at the last quoted bid price or may be valued using the last available price and are generally categorized as Level 2 in the hierarchy. For foreign equity securities, when market or security specific events arise, comparisons to the valuation of American Depositary Receipts (ADRs), futures contracts, Exchange-Traded Funds (ETFs) and certain indexes as well as quoted prices for similar securities may be used and would be categorized as Level 2 in the hierarchy. Utilizing these techniques may result in transfers between Level 1 and Level 2. For equity securities, including restricted securities, where observable inputs are limited, assumptions about market activity and risk are used and these securities may be categorized as Level 3 in the hierarchy.
Investments in open-end mutual funds, including the Fidelity Central Funds, are valued at their closing net asset value (NAV) each business day and are categorized as Level 1 in the hierarchy.
Changes in valuation techniques may result in transfers in or out of an assigned level within the disclosure hierarchy. The aggregate value of investments by input level as of July 31, 2015, including information on transfers between Levels 1 and 2, is included at the end of the Fund's Schedule of Investments.
Foreign Currency. The Fund may use foreign currency contracts to facilitate transactions in foreign-denominated securities. Gains and losses from these transactions may arise from changes in the value of the foreign currency or if the counterparties do not perform under the contracts' terms.
Foreign-denominated assets, including investment securities, and liabilities are translated into U.S. dollars at the exchange rates at period end. Purchases and sales of investment securities, income and dividends received and expenses denominated in foreign currencies are translated into U.S. dollars at the exchange rate in effect on the transaction date.
The effects of exchange rate fluctuations on investments are included with the net realized and unrealized gain (loss) on investment securities. Other foreign currency transactions resulting in realized and unrealized gain (loss) are disclosed separately.
Investment Transactions and Income. For financial reporting purposes, the Fund's investment holdings and NAV include trades executed through the end of the last business day of the period. The NAV per share for processing shareholder transactions is calculated as of the close of business of the New York Stock Exchange (NYSE), normally 4:00 p.m. Eastern time and includes trades executed through the end of the prior business day. Gains and losses on securities sold are determined on the basis of identified cost. Dividend income is recorded on the ex-dividend date, except for certain dividends from foreign securities where the ex-dividend date may have passed, which are recorded as soon as the Fund is informed of the ex-dividend date. Non-cash dividends included in dividend income, if any, are recorded at the fair market value of the securities received. Income and capital gain distributions from Fidelity Central Funds, if any, are recorded on the ex-dividend date. Large, non-recurring dividends recognized by the Fund are presented separately on the Statement of Operations as "Special Dividends" and the impact of these dividends is presented in the Financial Highlights. Interest income is accrued as earned and includes coupon interest and amortization of premium and accretion of discount on debt securities as applicable. Investment income is recorded net of foreign taxes withheld where recovery of such taxes is uncertain.
Class Allocations and Expenses. Investment income, realized and unrealized capital gains and losses, common expenses of the Fund, and certain fund-level expense reductions, if any, are allocated daily on a pro-rata basis to each class based on the relative net assets of each class to the total net assets of the Fund. Each class differs with respect to transfer agent and distribution and service plan fees incurred. Certain expense reductions may also differ by class. For the reporting period, the allocated portion of income and expenses to each class as a percent of its average net assets may vary due to the timing of recording these transactions in relation to fluctuating net assets of the classes. Expenses directly attributable to a fund are charged to that fund. Expenses attributable to more than one fund are allocated among the respective funds on the basis of relative net assets or other appropriate methods. Expense estimates are accrued in the period to which they relate and adjustments are made when actual amounts are known.
Income Tax Information and Distributions to Shareholders. Each year, the Fund intends to qualify as a regulated investment company under Subchapter M of the Internal Revenue Code, including distributing substantially all of its taxable income and realized gains. As a result, no provision for U.S. Federal income taxes is required. As of July 31, 2015, the Fund did not have any unrecognized tax benefits in the financial statements; nor is the Fund aware of any tax positions for which it is reasonably possible that the total amounts of unrecognized tax benefits will significantly change in the next twelve months. The Fund files a U.S. federal tax return, in addition to state and local tax returns as required. The Fund's federal income tax returns are subject to examination by the Internal Revenue Service (IRS) for a period of three fiscal years after they are filed. State and local tax returns may be subject to examination for an additional fiscal year depending on the jurisdiction. Foreign taxes are provided for based on the Fund's understanding of the tax rules and rates that exist in the foreign markets in which it invests.
Distributions are declared and recorded on the ex-dividend date. Income dividends and capital gain distributions are declared separately for each class. Income and capital gain distributions are determined in accordance with income tax regulations, which may differ from GAAP.
Capital accounts within the financial statements are adjusted for permanent book-tax differences. These adjustments have no impact on net assets or the results of operations. Capital accounts are not adjusted for temporary book-tax differences which will reverse in a subsequent period.
Book-tax differences are primarily due to foreign currency transactions, passive foreign investment companies (PFIC), capital loss carryforwards and losses deferred due to wash sales and excise tax regulations.
The federal tax cost of investment securities and unrealized appreciation (depreciation) as of period end were as follows:
| Gross unrealized appreciation | $17,307,736 |
| Gross unrealized depreciation | (22,669,419) |
| Net unrealized appreciation (depreciation) on securities | $(5,361,683) |
| Tax Cost | $407,878,069 |
The tax-based components of distributable earnings as of period end were as follows:
| Undistributed ordinary income | $9,561,844 |
| Capital loss carryforward | $(260,441,503) |
| Net unrealized appreciation (depreciation) on securities and other investments | $(5,389,659) |
Capital loss carryforwards are only available to offset future capital gains of the Fund to the extent provided by regulations and may be limited. Under the Regulated Investment Company Modernization Act of 2010 (the Act), the Fund is permitted to carry forward capital losses incurred in taxable years beginning after December 22, 2010 for an unlimited period and such capital losses are required to be used prior to any losses that expire. The capital loss carryforward information presented below, including any applicable limitation, is estimated as of fiscal period end and is subject to adjustment.
| Fiscal year of expiration | |
| 2017 | $(123,841,971) |
| 2018 | (136,599,532) |
| Total with expiration | $(260,441,503) |
The Fund intends to elect to defer to its next fiscal year $5,003,212 of capital losses recognized during the period November 1, 2014 to July 31, 2015.
The tax character of distributions paid was as follows:
| | July 31, 2015 | July 31, 2014 |
| Ordinary Income | $ 15,990,132 | $ 19,760,748 |
Short-Term Trading (Redemption) Fees. Shares held by investors in the Fund less than 90 days may have been subject to a redemption fee equal to 1.50% of the NAV of shares redeemed. All redemption fees, which reduce the proceeds of the shareholder redemption, are retained by the Fund and accounted for as an addition to paid in capital.
4. Purchases and Sales of Investments.
Purchases and sales of securities, other than short-term securities, aggregated $288,764,035 and $298,002,141, respectively.
5. Fees and Other Transactions with Affiliates.
Management Fee. Fidelity SelectCo, LLC (the investment adviser) and its affiliates provide the Fund with investment management related services for which the Fund pays a monthly management fee. The management fee is the sum of an individual fund fee rate that is based on an annual rate of .45% of the Fund's average net assets and an annualized group fee rate that averaged .25% during the period. The group fee rate is based upon the average net assets of all the mutual funds advised by Fidelity Management & Research Company (FMR) and the investment adviser. The group fee rate decreases as assets under management increase and increases as assets under management decrease. For the reporting period, the total annual management fee rate was .70% of the Fund's average net assets.
Distribution and Service Plan Fees. In accordance with Rule 12b-1 of the 1940 Act, the Fund has adopted separate Distribution and Service Plans for each class of shares. Certain classes pay Fidelity Distributors Corporation (FDC), an affiliate of the investment adviser, separate Distribution and Service Fees, each of which is based on an annual percentage of each class' average net assets. In addition, FDC may pay financial intermediaries for selling shares of the Fund and providing shareholder support services. For the period, the Distribution and Service Fee rates, total fees and amounts retained by FDC were as follows:
| | Distribution
Fee | Service
Fee | Total Fees | Retained
by FDC |
| Class A | –% | .25% | $35,975 | $262 |
| Class T | .25% | .25% | 25,098 | 16 |
| Class B | .75% | .25% | 2,675 | 2,007 |
| Class C | .75% | .25% | 62,284 | 13,937 |
| | | | $126,032 | $16,222 |
Sales Load. FDC may receive a front-end sales charge of up to 5.75% for selling Class A shares and 3.50% for selling Class T shares, some of which is paid to financial intermediaries for selling shares of the Fund. Depending on the holding period, FDC may receive contingent deferred sales charges levied on Class A, Class T, Class B and Class C redemptions. The deferred sales charges range from 5.00% to 1.00% for Class B shares, 1.00% for Class C shares, 1.00% for certain purchases of Class A shares and .25% for certain purchases of Class T shares.
For the period, sales charge amounts retained by FDC were as follows:
| | Retained
by FDC |
| Class A | $8,704 |
| Class T | 1,620 |
| Class B* | 38 |
| Class C* | 1,701 |
| | $12,063 |
* When Class B and Class C shares are initially sold, FDC pays commissions from its own resources to financial intermediaries through which the sales are made.
Transfer Agent Fees. Fidelity Investments Institutional Operations Company, Inc., (FIIOC), an affiliate of the investment adviser, is the transfer, dividend disbursing and shareholder servicing agent for each class of the Fund. FIIOC receives account fees and asset-based fees that vary according to the account size and type of account of the shareholders of the respective classes of the Fund. FIIOC pays for typesetting, printing and mailing of shareholder reports, except proxy statements.
For the period, transfer agent fees for each class were as follows:
| | Amount | % of
Class-Level Average
Net Assets |
| Class A | $39,714 | .28 |
| Class T | 16,001 | .32 |
| Class B | 804 | .30 |
| Class C | 17,077 | .27 |
| International Real Estate | 997,303 | .30 |
| Class I | 40,279 | .21 |
| | $1,111,178 | |
Accounting and Security Lending Fees. Fidelity Service Company, Inc. (FSC), an affiliate of the investment adviser, maintains the Fund's accounting records. The accounting fee is based on the level of average net assets for each month. Under a separate contract, FSC administers the security lending program. The security lending fee is based on the number and duration of lending transactions.
Brokerage Commissions. The Fund placed a portion of its portfolio transactions with brokerage firms which are affiliates of the investment adviser. Brokerage commissions are included in net realized gain (loss) and change in net unrealized appreciation (depreciation) in the Statement of Operations. The commissions paid to these affiliated firms were $193 for the period.
Other. During the period, the investment adviser reimbursed the Fund $97,302 for an operational error which is included in Net Realized Gain (Loss) in the accompanying Statement of Operations.
6. Committed Line of Credit.
The Fund participates with other funds managed by the investment adviser or an affiliate in a $4.25 billion credit facility (the "line of credit") to be utilized for temporary or emergency purposes to fund shareholder redemptions or for other short-term liquidity purposes. The Fund has agreed to pay commitment fees on its pro-rata portion of the line of credit, which amounted to $540 and is reflected in Miscellaneous expenses on the Statement of Operations. During the period, the Fund did not borrow on this line of credit.
7. Security Lending.
The Fund lends portfolio securities through a lending agent from time to time in order to earn additional income. On the settlement date of the loan, the Fund receives collateral (in the form of U.S. Treasury obligations, letters of credit and/or cash) against the loaned securities and maintains collateral in an amount not less than 100% of the market value of the loaned securities during the period of the loan. The market value of the loaned securities is determined at the close of business of the Fund and any additional required collateral is delivered to the Fund on the next business day. If the borrower defaults on its obligation to return the securities loaned because of insolvency or other reasons, the Fund may apply collateral received from the borrower against the obligation. The Fund may experience delays and costs in recovering the securities loaned. Any cash collateral received is invested in the Fidelity Securities Lending Cash Central Fund. The value of loaned securities and cash collateral at period end are disclosed on the Fund's Statement of Assets and Liabilities. Security lending income represents the income earned on investing cash collateral, less rebates paid to borrowers and any lending agent fees associated with the loan, plus any premium payments received for lending certain types of securities. Security lending income is presented in the Statement of Operations as a component of income from Fidelity Central Funds. Total security lending income during the period amounted to $50,462.
8. Expense Reductions.
Commissions paid to certain brokers with whom the investment adviser, or its affiliates, places trades on behalf of the Fund include an amount in addition to trade execution, which may be rebated back to the Fund to offset certain expenses. This amount totaled $16,886 for the period. In addition, through arrangements with the Fund's custodian, credits realized as a result of uninvested cash balances were used to reduce the Fund's expenses. During the period, these credits reduced the Fund's custody expenses by $9.
In addition, during the period the investment adviser reimbursed/waived a portion of fund-level operating expenses in the amount of $1,581 and a portion of class-level operating expenses as follows:
| | Amount |
| Class A | $ 205 |
| Class T | 11 |
| Class C | 93 |
| International Real Estate | 1,021 |
| Class I | 194 |
| | $1,524 |
9. Distributions to Shareholders.
Distributions to shareholders of each class were as follows:
| Years ended July 31, | 2015 | 2014 |
| From net investment income | | |
| Class A | $181,420 | $187,181 |
| Class T | 50,433 | 65,518 |
| Class B | 2,573 | 3,710 |
| Class C | 43,291 | 59,254 |
| International Real Estate | 4,923,960 | 6,296,631 |
| Class I | 150,289 | 146,129 |
| Total | $5,351,966 | $6,758,423 |
| From net realized gain | | |
| Class A | $396,004 | $414,914 |
| Class T | 151,630 | 167,858 |
| Class B | 8,904 | 16,133 |
| Class C | 181,835 | 231,539 |
| International Real Estate | 9,576,263 | 11,906,952 |
| Class I | 323,530 | 264,929 |
| Total | $10,638,166 | $13,002,325 |
10. Share Transactions.
Share transactions for each class were as follows and may contain automatic conversions between classes or exchanges between funds:
| | Shares | Shares | Dollars | Dollars |
| Years ended July 31, | 2015 | 2014 | 2015 | 2014 |
| Class A | | | | |
| Shares sold | 673,844 | 587,302 | $7,190,291 | $6,069,117 |
| Reinvestment of distributions | 53,260 | 52,782 | 545,527 | 523,247 |
| Shares redeemed | (386,439) | (659,545) | (4,035,124) | (6,744,761) |
| Net increase (decrease) | 340,665 | (19,461) | $3,700,694 | $(152,397) |
| Class T | | | | |
| Shares sold | 95,352 | 116,161 | $1,006,443 | $1,193,650 |
| Reinvestment of distributions | 18,282 | 21,965 | 185,991 | 216,331 |
| Shares redeemed | (159,356) | (127,651) | (1,656,253) | (1,309,222) |
| Net increase (decrease) | (45,722) | 10,475 | $(463,819) | $100,759 |
| Class B | | | | |
| Shares sold | 491 | 2,791 | $5,118 | $27,886 |
| Reinvestment of distributions | 1,032 | 1,850 | 10,413 | 18,115 |
| Shares redeemed | (18,524) | (15,540) | (192,621) | (158,043) |
| Net increase (decrease) | (17,001) | (10,899) | $(177,090) | $(112,042) |
| Class C | | | | |
| Shares sold | 250,748 | 208,940 | $2,602,917 | $2,102,127 |
| Reinvestment of distributions | 19,920 | 27,197 | 199,577 | 264,712 |
| Shares redeemed | (249,625) | (317,554) | (2,534,026) | (3,194,650) |
| Net increase (decrease) | 21,043 | (81,417) | $268,468 | $(827,811) |
| International Real Estate | | | | |
| Shares sold | 6,483,374 | 7,089,024 | $69,046,559 | $73,687,897 |
| Reinvestment of distributions | 1,337,840 | 1,734,141 | 13,829,911 | 17,353,365 |
| Shares redeemed | (8,123,208) | (13,521,464) | (85,913,965) | (140,085,115) |
| Net increase (decrease) | (301,994) | (4,698,299) | $(3,037,495) | $(49,043,853) |
| Class I | | | | |
| Shares sold | 3,546,789 | 435,461 | $37,608,644 | $4,524,767 |
| Reinvestment of distributions | 33,956 | 34,703 | 349,358 | 345,746 |
| Shares redeemed | (734,873) | (771,815) | (7,744,578) | (7,996,361) |
| Net increase (decrease) | 2,845,872 | (301,651) | $30,213,424 | $(3,125,848) |
11. Other.
The Fund's organizational documents provide former and current trustees and officers with a limited indemnification against liabilities arising in connection with the performance of their duties to the Fund. In the normal course of business, the Fund may also enter into contracts that provide general indemnifications. The Fund's maximum exposure under these arrangements is unknown as this would be dependent on future claims that may be made against the Fund. The risk of material loss from such claims is considered remote.
At the end of the period, the investment adviser or its affiliates were the owners of record of 14% of the total outstanding shares of the Fund.
Report of Independent Registered Public Accounting Firm
To the Trustees of Fidelity Select Portfolios and Shareholders of Fidelity® International Real Estate Fund:
We have audited the accompanying statement of assets and liabilities of Fidelity® International Real Estate Fund (the Fund), a fund of Fidelity Select Portfolios, including the schedule of investments, as of July 31, 2015, and the related statement of operations for the year then ended, and the statement of changes in net assets and financial highlights for each of the two years in the period then ended. These financial statements and financial highlights are the responsibility of the Fund's management. Our responsibility is to express an opinion on these financial statements and financial highlights based on our audits. The financial highlights for the year ended July 31, 2013 and all prior periods presented were audited by other auditors whose report dated September 16, 2013 expressed an unqualified opinion on those financial highlights.
We conducted our audits in accordance with the standards of the Public Company Accounting Oversight Board (United States). Those standards require that we plan and perform the audit to obtain reasonable assurance about whether the financial statements and financial highlights are free of material misstatement. The Fund is not required to have, nor were we engaged to perform, an audit of its internal controls over financial reporting. Our audits included consideration of internal control over financial reporting as a basis for designing audit procedures that are appropriate in the circumstances, but not for the purpose of expressing an opinion on the effectiveness of the Fund's internal control over financial reporting. Accordingly, we express no such opinion. An audit also includes examining, on a test basis, evidence supporting the amounts and disclosures in the financial statements, assessing the accounting principles used and significant estimates made by management, as well as evaluating the overall financial statement presentation. Our procedures included confirmation of securities owned as of July 31, 2015, by correspondence with the custodians and brokers; when replies were not received from brokers, we performed other auditing procedures. We believe our audits provide a reasonable basis for our opinion.
In our opinion, such financial statements and financial highlights referred to above present fairly, in all material respects, the financial position of Fidelity® International Real Estate Fund as of July 31, 2015, the results of its operations for the year then ended, and the changes in its net assets and the financial highlights for each of the two years in the period then ended in conformity with accounting principles generally accepted in the United States of America.
DELOITTE & TOUCHE LLP
Boston, Massachusetts
September 18, 2015
Trustees and Officers
The Trustees, Members of the Advisory Board (if any), and officers of the trust and fund, as applicable, are listed below. The Board of Trustees governs the fund and is responsible for protecting the interests of shareholders. The Trustees are experienced executives who meet periodically throughout the year to oversee the fund's activities, review contractual arrangements with companies that provide services to the fund, oversee management of the risks associated with such activities and contractual arrangements, and review the fund's performance. Each of the Trustees oversees 75 funds.
The Trustees hold office without limit in time except that (a) any Trustee may resign; (b) any Trustee may be removed by written instrument, signed by at least two-thirds of the number of Trustees prior to such removal; (c) any Trustee who requests to be retired or who has become incapacitated by illness or injury may be retired by written instrument signed by a majority of the other Trustees; and (d) any Trustee may be removed at any special meeting of shareholders by a two-thirds vote of the outstanding voting securities of the trust. Officers and Advisory Board Members hold office without limit in time, except that any officer or Advisory Board Member may resign or may be removed by a vote of a majority of the Trustees at any regular meeting or any special meeting of the Trustees. Except as indicated, each individual has held the office shown or other offices in the same company for the past five years.
Each Trustee who is not an interested person (as defined in the 1940 Act) of the trust and the fund is referred to herein as an Independent Trustee.
The fund’s Statement of Additional Information (SAI) includes more information about the Trustees. To request a free copy, call Fidelity at 1-800-544-8544.
Experience, Skills, Attributes, and Qualifications of the Trustees. The Governance and Nominating Committee has adopted a statement of policy that describes the experience, qualifications, attributes, and skills that are necessary and desirable for potential Independent Trustee candidates (Statement of Policy). The Board believes that each Trustee satisfied at the time he or she was initially elected or appointed a Trustee, and continues to satisfy, the standards contemplated by the Statement of Policy. The Governance and Nominating Committee also engages professional search firms to help identify potential Independent Trustee candidates who have the experience, qualifications, attributes, and skills consistent with the Statement of Policy. From time to time, additional criteria based on the composition and skills of the current Independent Trustees, as well as experience or skills that may be appropriate in light of future changes to board composition, business conditions, and regulatory or other developments, have also been considered by the professional search firms and the Governance and Nominating Committee. In addition, the Board takes into account the Trustees' commitment and participation in Board and committee meetings, as well as their leadership of standing and ad hoc committees throughout their tenure.
In determining that a particular Trustee was and continues to be qualified to serve as a Trustee, the Board has considered a variety of criteria, none of which, in isolation, was controlling. The Board believes that, collectively, the Trustees have balanced and diverse experience, qualifications, attributes, and skills, which allow the Board to operate effectively in governing the fund and protecting the interests of shareholders. Information about the specific experience, skills, attributes, and qualifications of each Trustee, which in each case led to the Board's conclusion that the Trustee should serve (or continue to serve) as a trustee of the fund, is provided below.
Board Structure and Oversight Function. Brian B. Hogan is an interested person and currently serves as Chairman. The Trustees have determined that an interested Chairman is appropriate and benefits shareholders because an interested Chairman has a personal and professional stake in the quality and continuity of services provided to the fund. Independent Trustees exercise their informed business judgment to appoint an individual of their choosing to serve as Chairman, regardless of whether the Trustee happens to be independent or a member of management. The Independent Trustees have determined that they can act independently and effectively without having an Independent Trustee serve as Chairman and that a key structural component for assuring that they are in a position to do so is for the Independent Trustees to constitute a substantial majority for the Board. The Independent Trustees also regularly meet in executive session. Michael E. Wiley serves as Chairman of the Independent Trustees and as such (i) acts as a liaison between the Independent Trustees and management with respect to matters important to the Independent Trustees and (ii) with management prepares agendas for Board meetings.
Fidelity® funds are overseen by different Boards of Trustees. The fund's Board oversees Fidelity's sector portfolios. Other Boards oversee Fidelity's equity and high income funds, and Fidelity's investment grade bond, money market, and asset allocation funds. The use of separate Boards, each with its own committee structure, allows the Trustees of each group of Fidelity® funds to focus on the unique issues of the funds they oversee, including common research, investment, and operational issues. On occasion, the separate Boards establish joint committees to address issues of overlapping consequences for the Fidelity® funds overseen by each Board.
The Trustees operate using a system of committees to facilitate the timely and efficient consideration of all matters of importance to the Trustees, the fund, and fund shareholders and to facilitate compliance with legal and regulatory requirements and oversight of the fund's activities and associated risks. The Board, acting through its committees, has charged SelectCo and its affiliates with (i) identifying events or circumstances the occurrence of which could have demonstrably adverse effects on the fund's business and/or reputation; (ii) implementing processes and controls to lessen the possibility that such events or circumstances occur or to mitigate the effects of such events or circumstances if they do occur; and (iii) creating and maintaining a system designed to evaluate continuously business and market conditions in order to facilitate the identification and implementation processes described in (i) and (ii) above. Because the day-to-day operations and activities of the fund are carried out by or through SelectCo, its affiliates, and other service providers, the fund's exposure to risks is mitigated but not eliminated by the processes overseen by the Trustees. While each of the Board's committees has responsibility for overseeing different aspects of the fund's activities, oversight is exercised primarily through the Operations and Audit Committees. Appropriate personnel, including but not limited to the fund's Chief Compliance Officer (CCO), SelectCo's internal auditor, the independent accountants, the fund's Treasurer and portfolio management personnel, make periodic reports to the Board's committees, as appropriate. The responsibilities of each standing committee, including their oversight responsibilities, are described further under "Standing Committees of the Trustees."
Interested Trustees*:
Correspondence intended for a Trustee who is an interested person may be sent to Fidelity Investments, 245 Summer Street, Boston, Massachusetts 02210.
Name, Year of Birth; Principal Occupations and Other Relevant Experience+
Brian B. Hogan (1964)
Year of Election or Appointment: 2014
Trustee
Chairman of the Board of Trustees
Mr. Hogan also serves as Trustee or Vice President of other funds. Mr. Hogan serves as a Director of Fidelity SelectCo, LLC (investment adviser firm, 2014-present) and President of the Equity Division of FMR (investment adviser firm, 2009-present). Previously, Mr. Hogan served as Senior Vice President, Equity Research of FMR (2006-2009) and as a portfolio manager.
* Determined to be an "Interested Trustee" by virtue of, among other things, his or her affiliation with the trust or various entities under common control with SelectCo.
+ The information includes the Trustee's principal occupation during the last five years and other information relating to the experience, attributes, and skills relevant to the Trustee's qualifications to serve as a Trustee, which led to the conclusion that the Trustee should serve as a Trustee for the fund.
Independent Trustees:
Correspondence intended for an Independent Trustee may be sent to Fidelity Investments, P.O. Box 55235, Boston, Massachusetts 02205-5235.
Name, Year of Birth; Principal Occupations and Other Relevant Experience+
David A. Rosow (1942)
Year of Election or Appointment: 2013
Trustee
Mr. Rosow also serves as Trustee of other Fidelity® funds. Prior to his retirement in 2006, Mr. Rosow was the Chief Executive Officer, owner and operator of a number of private companies, which encompassed oil refining, drilling and marketing of petroleum products (including specialty petroleum products), the recreation industry, and real estate development. Previously, Mr. Rosow served as Lead Director and Chairman of the Audit Committee of Hudson United Bancorp (1996-2006), Chairman of the Board of Westport Bank and Trust (1992-1996), and as a Director of TD Banknorth (2006-2007). In addition, Mr. Rosow served as a member (2008-2014) and President (2009-2014) of the Town Council of Palm Beach, Florida. Mr. Rosow also served as a Member of the Advisory Board of other Fidelity® funds (2012-2013).
Garnett A. Smith (1947)
Year of Election or Appointment: 2013
Trustee
Mr. Smith also serves as Trustee of other Fidelity® funds. Prior to Mr. Smith's retirement, he served as Chairman and Chief Executive Officer of Inbrand Corp. (manufacturer of personal absorbent products, 1990-1997). He also served as President (1986-1990) of Inbrand Corp. Prior to his employment with Inbrand Corp., he was employed by a retail fabric chain and North Carolina National Bank. In addition, Mr. Smith served as a Member of the Advisory Board of other Fidelity® funds (2012-2013) and as a board member of the Jackson Hole Land Trust (2009-2012).
Michael E. Wiley (1950)
Year of Election or Appointment: 2008
Trustee
Chairman of the Independent Trustees
Mr. Wiley also serves as Trustee of other Fidelity® funds. Mr. Wiley serves as a Director of Tesoro Corporation (independent oil refiner and marketer, 2005-present), and a Director of Bill Barrett Corporation (exploration and production, 2005-present). In addition, Mr. Wiley also serves as a Director of Post Oak Bank (privately-held bank, 2004-present). Previously, Mr. Wiley served as a Trustee of other Fidelity® funds (2008-2013), as a Director of Asia Pacific Exploration Consolidated (international oil and gas exploration and production, 2008-2013), as a member of the Board of Trustees of the University of Tulsa (2000-2006; 2007-2010), as a Senior Energy Advisor of Katzenbach Partners, LLC (consulting, 2006-2007), as an Advisory Director of Riverstone Holdings (private investment), Chairman, President, and CEO of Baker Hughes, Inc. (oilfield services, 2000-2004), and as Director of Spinnaker Exploration Company (exploration and production, 2001-2005).
+ The information includes the Trustee's principal occupation during the last five years and other information relating to the experience, attributes, and skills relevant to the Trustee's qualifications to serve as a Trustee, which led to the conclusion that the Trustee should serve as a Trustee for the fund.
Advisory Board Members and Officers:
Except for Anthony R. Rochte, correspondence intended for an officer may be sent to Fidelity Investments, 245 Summer Street, Boston, Massachusetts 02210. Correspondence intended for Mr. Rochte may be sent to SelectCo, 1225 17th Street, Denver, Colorado 80202-5541. Officers appear below in alphabetical order.
Name, Year of Birth; Principal Occupation
Christopher S. Bartel (1971)
Year of Election or Appointment: 2009
Vice President
Mr. Bartel also serves as Vice President of other funds. Mr. Bartel serves as a Director, President, and Chief Executive Officer of Fidelity Management & Research (Japan) Limited (investment adviser firm, 2012-present), a Director of Fidelity Management & Research (Hong Kong) (investment adviser firm, 2012-present), and Senior Vice President of Global Equity Research (2010-present). Previously, Mr. Bartel served as Senior Vice President of Equity Research (2009-2010), Managing Director of Research (2006-2009), and an analyst and portfolio manager (2000-2006).
Elizabeth Paige Baumann (1968)
Year of Election or Appointment: 2012
Anti-Money Laundering (AML) Officer
Ms. Baumann also serves as AML Officer of other funds. She is Chief AML Officer of FMR LLC (diversified financial services company, 2012-present) and is an employee of Fidelity Investments. Previously, Ms. Baumann served as Vice President and Deputy Anti-Money Laundering Officer (2007-2012).
Marc Bryant (1966)
Year of Election or Appointment: 2013
Secretary and Chief Legal Officer (CLO)
Mr. Bryant also serves as Secretary and Chief Legal Officer (CLO) of other funds. He is Senior Vice President and Deputy General Counsel of FMR LLC (diversified financial services company). Previously, Mr. Bryant served as Secretary and Chief Legal Officer of Fidelity Rutland Square Trust II (2010-2014) and Assistant Secretary of Fidelity's Fixed Income and Asset Allocation Funds (2013-2015). Prior to joining Fidelity Investments, Mr. Bryant served as a Senior Vice President and the Head of Global Retail Legal for AllianceBernstein L.P. (2006-2010), and as the General Counsel for ProFund Advisors LLC (2001-2006).
William C. Coffey (1969)
Year of Election or Appointment: 2009
Assistant Secretary
Mr. Coffey also serves as Assistant Secretary of other funds. He is Senior Vice President and Deputy General Counsel of FMR LLC (diversified financial services company, 2010-present), and is an employee of Fidelity Investments. Previously, Mr. Coffey served as Vice President and Associate General Counsel of FMR LLC (2005-2009).
Jonathan Davis (1968)
Year of Election or Appointment: 2010
Assistant Treasurer
Mr. Davis also serves as Assistant Treasurer of other funds. Mr. Davis is an employee of Fidelity Investments. Previously, Mr. Davis served as Vice President and Associate General Counsel of FMR LLC (diversified financial services company, 2003-2010).
Adrien E. Deberghes (1967)
Year of Election or Appointment: 2013
President and Treasurer
Mr. Deberghes also serves as an officer of other funds. He is an employee of Fidelity Investments (2008-present). Prior to joining Fidelity Investments, Mr. Deberghes was Senior Vice President of Mutual Fund Administration at State Street Corporation (2007-2008), Senior Director of Mutual Fund Administration at Investors Bank & Trust (2005-2007), and Director of Finance for Dunkin' Brands (2000-2005).
Joseph DeSantis (1959)
Year of Election or Appointment: 2015
Vice President
Mr. DeSantis also serves as Vice President of other funds. Mr. DeSantis serves as Group Chief Investment Officer, Equities (2010-present) and is an employee of Fidelity Investments.
Stephanie J. Dorsey (1969)
Year of Election or Appointment: 2010
Assistant Treasurer
Ms. Dorsey also serves as an officer of other funds. She is an employee of Fidelity Investments (2008-present) and has served in other fund officer roles. Prior to joining Fidelity Investments, Ms. Dorsey served as Treasurer (2004-2008) of the JPMorgan Mutual Funds and Vice President (2004-2008) of JPMorgan Chase Bank.
Howard J. Galligan III (1966)
Year of Election or Appointment: 2014
Chief Financial Officer
Mr. Galligan also serves as Chief Financial Officer of other funds. Mr. Galligan serves as President of Fidelity Pricing and Cash Management Services (FPCMS) (2014-present) and as a Director of Strategic Advisers, Inc. (investment adviser firm, 2008-present). Previously, Mr. Galligan served as Chief Administrative Officer of Asset Management (2011-2014) and Chief Operating Officer and Senior Vice President of Investment Support for Strategic Advisers, Inc. (2003-2011).
James D. Gryglewicz (1972)
Year of Election or Appointment: 2014
Chief Compliance Officer
Mr. Gryglewicz also serves as Chief Compliance Officer of other funds. Mr. Gryglewicz serves as Compliance Officer of Fidelity SelectCo, LLC (investment adviser firm, 2014-present), Vice President of Asset Management Compliance (2009-present), and is an employee of Fidelity Investments (2004-present).
Brian B. Hogan (1964)
Year of Election or Appointment: 2009
Vice President
Mr. Hogan also serves as Trustee or Vice President of other funds. Mr. Hogan serves as a Director of Fidelity SelectCo, LLC (investment adviser firm, 2014-present) and President of the Equity Division of FMR (investment adviser firm, 2009-present). Previously, Mr. Hogan served as Senior Vice President, Equity Research of FMR (2006-2009) and as a portfolio manager.
Chris Maher (1972)
Year of Election or Appointment: 2013
Assistant Treasurer
Mr. Maher serves as Assistant Treasurer of other funds. Mr. Maher is Vice President of Valuation Oversight and is an employee of Fidelity Investments. Previously, Mr. Maher served as Vice President of Asset Management Compliance (2013), Vice President of the Program Management Group of FMR (investment adviser firm, 2010-2013), and Vice President of Valuation Oversight (2008-2010).
Kenneth B. Robins (1969)
Year of Election or Appointment: 2013
Deputy Treasurer
Mr. Robins also serves as an officer of other funds. Mr. Robins serves as Executive Vice President of Fidelity Investments Money Management, Inc. (FIMM) (investment adviser firm, 2013-present) and is an employee of Fidelity Investments (2004-present). Previously, Mr. Robins served in other fund officer roles.
Anthony R. Rochte (1968)
Year of Election or Appointment: 2013
Vice President
Mr. Rochte also serves as Vice President of other funds. Mr. Rochte serves as President of Fidelity SelectCo, LLC (investment adviser firm, 2012-present) and is an employee of Fidelity Investments (2012-present). Prior to joining Fidelity Investments, Mr. Rochte served as Senior Managing Director and head of State Street Global Advisors' North American Intermediary Business Group (2006-2012).
Stacie M. Smith (1974)
Year of Election or Appointment: 2013
Assistant Treasurer
Ms. Smith also serves as an officer of other funds. She is an employee of Fidelity Investments (2009-present) and has served in other fund officer roles. Prior to joining Fidelity Investments, Ms. Smith served as Senior Audit Manager of Ernst & Young LLP (1996-2009).
Renee Stagnone (1975)
Year of Election or Appointment: 2013
Deputy Treasurer
Ms. Stagnone also serves as Deputy Treasurer of other funds. Ms. Stagnone is an employee of Fidelity Investments.
Joseph F. Zambello (1957)
Year of Election or Appointment: 2011
Deputy Treasurer
Mr. Zambello also serves as Deputy Treasurer of other funds. Mr. Zambello is an employee of Fidelity Investments. Previously, Mr. Zambello served as Vice President of the Program Management Group of FMR (investment adviser firm, 2009-2011) and Vice President of the Transfer Agent Oversight Group (2005-2009).
Shareholder Expense Example
As a shareholder of a Fund, you incur two types of costs: (1) transaction costs, including sales charges (loads) on purchase payments or redemption proceeds, redemption fees and (2) ongoing costs, including management fees, distribution and/or service (12b-1) fees and other Fund expenses. This Example is intended to help you understand your ongoing costs (in dollars) of investing in the Funds and to compare these costs with the ongoing costs of investing in other mutual funds.
The Example is based on an investment of $1,000 invested at the beginning of the period and held for the entire period (February 1, 2015 to July 31, 2015).
Actual Expenses
The first line of the accompanying table for each class of the Fund provides information about actual account values and actual expenses. You may use the information in this line, together with the amount you invested, to estimate the expenses that you paid over the period. Simply divide your account value by $1,000.00 (for example, an $8,600 account value divided by $1,000.00 = 8.6), then multiply the result by the number in the first line for a class of the Fund under the heading entitled "Expenses Paid During Period" to estimate the expenses you paid on your account during this period. A small balance maintenance fee of $12.00 that is charged once a year may apply for certain accounts with a value of less than $2,000. This fee is not included in the table below. If it was, the estimate of expenses you paid during the period would be higher, and your ending account value lower, by this amount. In addition, the Fund, as a shareholder in the underlying Fidelity Central Funds, will indirectly bear its pro-rata share of the fees and expenses incurred by the underlying Fidelity Central Funds. These fees and expenses are not included in the Fund's annualized expense ratio used to calculate the expense estimate in the table below.
Hypothetical Example for Comparison Purposes
The second line of the accompanying table for each class of the Fund provides information about hypothetical account values and hypothetical expenses based on a Class' actual expense ratio and an assumed rate of return of 5% per year before expenses, which is not the Class' actual return. The hypothetical account values and expenses may not be used to estimate the actual ending account balance or expenses you paid for the period. You may use this information to compare the ongoing costs of investing in the Fund and other funds. To do so, compare this 5% hypothetical example with the 5% hypothetical examples that appear in the shareholder reports of the other funds. A small balance maintenance fee of $12.00 that is charged once a year may apply for certain accounts with a value of less than $2,000. This fee is not included in the table below. If it was, the estimate of expenses you paid during the period would be higher, and your ending account value lower, by this amount. In addition, the Fund, as a shareholder in the underlying Fidelity Central Funds, will indirectly bear its pro-rata share of the fees and expenses incurred by the underlying Fidelity Central Funds. These fees and expenses are not included in the Fund's annualized expense ratio used to calculate the expense estimate in the table below.
Please note that the expenses shown in the table are meant to highlight your ongoing costs only and do not reflect any transaction costs. Therefore, the second line of the table is useful in comparing ongoing costs only, and will not help you determine the relative total costs of owning different funds. In addition, if these transactional costs were included, your costs would have been higher.
| | Annualized Expense Ratio-A | Beginning
Account Value
February 1, 2015 | Ending
Account Value
July 31, 2015 | Expenses Paid
During Period-B
February 1, 2015
to July 31, 2015 |
| Class A | 1.33% | | | |
| Actual | | $1,000.00 | $1,031.30 | $6.70 |
| Hypothetical-C | | $1,000.00 | $1,018.20 | $6.66 |
| Class T | 1.63% | | | |
| Actual | | $1,000.00 | $1,030.50 | $8.21 |
| Hypothetical-C | | $1,000.00 | $1,016.71 | $8.15 |
| Class B | 2.12% | | | |
| Actual | | $1,000.00 | $1,027.70 | $10.66 |
| Hypothetical-C | | $1,000.00 | $1,014.28 | $10.59 |
| Class C | 2.07% | | | |
| Actual | | $1,000.00 | $1,027.90 | $10.41 |
| Hypothetical-C | | $1,000.00 | $1,014.53 | $10.34 |
| International Real Estate | 1.12% | | | |
| Actual | | $1,000.00 | $1,032.90 | $5.65 |
| Hypothetical-C | | $1,000.00 | $1,019.24 | $5.61 |
| Class I | 1.01% | | | |
| Actual | | $1,000.00 | $1,033.00 | $5.09 |
| Hypothetical-C | | $1,000.00 | $1,019.79 | $5.06 |
A Annualized expense ratio reflects expenses net of applicable fee waivers.
B Expenses are equal to each Class' annualized expense ratio, multiplied by the average account value over the period, multiplied by 181/365 (to reflect the one-half year period).
C 5% return per year before expenses.
Distributions (Unaudited)
The Board of Trustees of Fidelity International Real Estate Fund voted to pay on September 14, 2015, to shareholders of record at the opening of business on September 11, 2015, a distribution of $0.121 per share derived from capital gains realized from sales of portfolio securities, and a dividend of $0.129 per share from net investment income.
International Real Estate designates 39% and 8% of the dividends distributed in September and December, respectively during the fiscal year as amounts which may be taken into account as a dividend for the purposes of the maximum rate under section 1(h)(11) of the Internal Revenue Code.
The amounts per share which represent income derived from sources within, and taxes paid to, foreign countries or possessions of the United States are as follows:
| | Pay Date | Income | Taxes |
| Retail | 09/15/2014 | $0.2192 | $0.0172 |
| | 12/22/2014 | $0.0632 | $0.0015 |
The fund will notify shareholders in January 2016 of amounts for use in preparing 2015 income tax returns.
Corporate Headquarters
245 Summer St.
Boston, MA 02210
www.fidelity.com
IRE-ANN-0915
1.801328.110
Fidelity® International Real Estate Fund Class I (formerly Institutional Class)
Annual Report July 31, 2015 Class I is a class of Fidelity® International Real Estate Fund |
|
Contents
This report and the financial statements contained herein are submitted for the general information of the shareholders of the Fund. This report is not authorized for distribution to prospective investors in the Fund unless preceded or accompanied by an effective prospectus.
A fund files its complete schedule of portfolio holdings with the SEC for the first and third quarters of each fiscal year on Form N-Q. Forms N-Q are available on the SEC’s web site at http://www.sec.gov. A fund's Forms N-Q may be reviewed and copied at the SEC’s Public Reference Room in Washington, DC. Information regarding the operation of the SEC's Public Reference Room may be obtained by calling 1-800-SEC-0330.
For a complete list of a fund's portfolio holdings, view the most recent holdings listing, semiannual report, or annual report on Fidelity's web site at http://www.fidelity.com, http://www.advisor.fidelity.com, or http://www.401k.com, as applicable.
NOT FDIC INSURED •MAY LOSE VALUE •NO BANK GUARANTEE
Neither the Fund nor Fidelity Distributors Corporation is a bank.
To view a fund's proxy voting guidelines and proxy voting record for the 12-month period ended June 30, visit http://www.fidelity.com/proxyvotingresults or visit the Securities and Exchange Commission's (SEC) web site at http://www.sec.gov.
You may also call1-877-208-0098 to request a free copy of the proxy voting guidelines.
Standard & Poor's, S&P and S&P 500 are registered service marks of The McGraw-Hill Companies, Inc. and have been licensed for use by Fidelity Distributors Corporation.
Other third-party marks appearing herein are the property of their respective owners.
All other marks appearing herein are registered or unregistered trademarks or service marks of FMR LLC or an affiliated company. © 2015 FMR LLC. All rights reserved.
Performance: The Bottom Line
Average annual total return reflects the change in the value of an investment, assuming reinvestment of distributions from dividend income and capital gains (the profits earned upon the sale of securities that have grown in value, if any) and assuming a constant rate of performance each year.
The hypothetical investment and the average annual total returns do not reflect the deduction of taxes that a shareholder would pay on fund distributions or the redemption of fund shares.
During periods of reimbursement by Fidelity, a fund’s total return will be greater than it would be had the reimbursement not occurred.
How a fund did yesterday is no guarantee of how it will do tomorrow.
Average Annual Total Returns
| For the periods ended July 31, 2015 | Past 1 year | Past 5 years | Past 10 years |
| Class I | 2.01% | 10.41% | 4.62% |
The initial offering of Class I shares took place on April 4, 2007. Returns prior to April 4, 2007 are those of Fidelity® International Real Estate Fund, the original class of the fund.
$10,000 Over 10 Years
Let's say hypothetically that $10,000 was invested in Fidelity Advisor® International Real Estate Fund - Class I on July 31, 2005.
The chart shows how the value of your investment would have changed, and also shows how the MSCI EAFE Index performed over the same period.
See above for additional information regarding the performance of Class I.

| Period Ending Values |
| $15,709 | Fidelity Advisor® International Real Estate Fund - Class I |
| $16,562 | MSCI EAFE Index |
Management's Discussion of Fund Performance
Market Recap: International real estate securities ran a turbulent course for the 12 months ending July 31, 2015. As measured by the FTSE
® EPRA℠/NAREIT
® Developed ex North America Index, international property stocks returned -1.69%, compared with the 11.29% result for the Dow Jones U.S. Select Real Estate Securities Index℠, a proxy for the U.S. market. Geopolitical risks – including conflict between Russia and Ukraine, pro-democracy protests in Hong Kong, persistent turmoil in the Middle East, ongoing debt drama for Greece, and slowing growth in China – continued to threaten markets. These factors, combined with currency fluctuations and a steep decline in the price of commodities, drove investors toward perceived safer-haven areas, curtailing results for international real estate investment trusts (REITs). Among the FTSE index’s country components, the best results came from the U.K. (+18%), which continued to see strong demand, and the rest of Europe (+1%), where returns were driven by continued quantitative easing. Asia-Pacific ex Japan (-3%) was held back by Singapore, amid impending interest rate hikes and declining distribution-per-unit growth there. Japan (-11%) saw the most dramatic regional decline. Despite a surge in late October on stimulus measures, an increasingly cautious outlook on Japan’s property market caused that market to plunge.
Comments from Portfolio Manager Guillermo de las Casas: For the year, the fund’s share classes outperformed the benchmark FTSE
® EPRA℠/NAREIT
® Developed ex North America Index.
(For specific class-level results, please see the Performance section of this report.) Versus the index, security selection and market allocation fueled the fund’s result. In terms of geography, picks in Europe and Japan helped the most. An overweighting in Germany-based Gagfah was the fund’s top individual contributor. Competitor and fund holding Deutsche Annington Immobilien – Europe’s second largest property company by market cap as well as Germany’s largest residential investment company – offered to buy Gagfah in December. The deal created Europe’s second-largest real estate company. Gagfah was sold from the fund by period end. U.K.’s self-storage providers Safestore Holdings, a mid-cap firm that lagged last year, and Big Yellow Group - the industry leader in that region - also were big contributors. Both stocks were propelled by an increase in occupancy rates in the spring. On the flip side, avoiding two large U.K.-based index components, both of which are commercial property development companies – Land Securities Group, the biggest developer in the region, and British Land - weighed on the fund’s relative result as these stocks outperformed.
The views expressed above reflect those of the portfolio manager(s) only through the end of the period as stated on the cover of this report and do not necessarily represent the views of Fidelity or any other person in the Fidelity organization. Any such views are subject to change at any time based upon market or other conditions and Fidelity disclaims any responsibility to update such views. These views may not be relied on as investment advice and, because investment decisions for a Fidelity fund are based on numerous factors, may not be relied on as an indication of trading intent on behalf of any Fidelity fund.Investment Summary (Unaudited)
Top Ten Stocks as of July 31, 2015
| | % of fund's net assets | % of fund's net assets 6 months ago |
| Mitsubishi Estate Co. Ltd. | 5.5 | 6.6 |
| Mitsui Fudosan Co. Ltd. | 5.3 | 4.8 |
| Sun Hung Kai Properties Ltd. | 5.2 | 5.2 |
| Westfield Corp. unit | 3.8 | 3.3 |
| Deutsche Annington Immobilien SE | 3.7 | 0.0 |
| Wing Tai Holdings Ltd. | 2.9 | 3.0 |
| Sumitomo Realty & Development Co. Ltd. | 2.9 | 1.3 |
| UOL Group Ltd. | 2.8 | 3.4 |
| LEG Immobilien AG | 2.8 | 3.9 |
| Safestore Holdings PLC | 2.7 | 2.4 |
| | 37.6 | |
Top Five Countries as of July 31, 2015
| (excluding cash equivalents) | % of fund's net assets | % of fund's net assets 6 months ago |
| Japan | 20.4 | 21.2 |
| United Kingdom | 14.1 | 15.3 |
| Hong Kong | 10.3 | 10.8 |
| Germany | 8.9 | 4.9 |
| Singapore | 8.8 | 10.6 |
Top Five REIT Sectors as of July 31, 2015
| | % of fund's net assets | % of fund's net assets 6 months ago |
| REITs - Management/Investment | 12.6 | 16.2 |
| REITs - Warehouse/Industrial | 5.7 | 5.4 |
| REITs - Health Care | 3.3 | 2.3 |
| REITs - Office Property | 2.7 | 4.2 |
| REITs - Apartments | 1.9 | 2.2 |
Asset Allocation (% of fund's net assets)
| As of July 31, 2015* |
| | Stocks | 93.8% |
| | Short-Term Investments and Net Other Assets (Liabilities) | 6.2% |

* Foreign investments - 93.8%
| As of January 31, 2015* |
| | Stocks | 94.8% |
| | Short-Term Investments and Net Other Assets (Liabilities) | 5.2% |

* Foreign investments - 94.8%
Investments July 31, 2015
Showing Percentage of Net Assets
| Common Stocks - 93.8% | | | |
| | | Shares | Value |
| Australia - 8.5% | | | |
| 360 Capital Group Ltd. unit | | 1,151,768 | $883,979 |
| Abacus Property Group unit | | 2,239,684 | 5,091,372 |
| ALE Property Group | | 325,000 | 867,089 |
| APN Property Group Ltd. | | 2,812,372 | 770,889 |
| Ardent Leisure Group unit | | 575,000 | 1,017,117 |
| Charter Hall Group unit | | 539,587 | 1,865,565 |
| Hotel Property Investments unit | | 497,270 | 955,951 |
| Ingenia Communities Group unit | | 2,858,228 | 981,934 |
| Mirvac Group unit | | 4,062,126 | 5,611,809 |
| National Storage (REIT) unit | | 642,411 | 786,530 |
| Westfield Corp. unit | | 2,055,802 | 15,071,965 |
|
| TOTAL AUSTRALIA | | | 33,904,200 |
|
| Austria - 1.7% | | | |
| Buwog-Gemeinnuetzige Wohnung (a) | | 332,618 | 6,710,519 |
| Belgium - 1.7% | | | |
| Warehouses de Pauw | | 84,409 | 6,668,068 |
| Bermuda - 5.3% | | | |
| Great Eagle Holdings Ltd. | | 2,208,385 | 7,691,446 |
| Hongkong Land Holdings Ltd. | | 1,333,100 | 10,264,870 |
| Tai Cheung Holdings Ltd. | | 3,382,000 | 2,979,640 |
|
| TOTAL BERMUDA | | | 20,935,956 |
|
| France - 3.3% | | | |
| Accor SA | | 59,342 | 2,911,575 |
| Altarea | | 20,546 | 3,497,520 |
| Societe Fonciere Lyonnaise SA | | 131,558 | 5,923,827 |
| Terreis | | 34,300 | 1,000,515 |
|
| TOTAL FRANCE | | | 13,333,437 |
|
| Germany - 8.9% | | | |
| alstria office REIT-AG (a) | | 402,000 | 5,551,819 |
| Deutsche Annington Immobilien SE | | 467,490 | 14,581,153 |
| DIC Asset AG | | 471,700 | 4,125,189 |
| LEG Immobilien AG | | 150,777 | 10,963,770 |
|
| TOTAL GERMANY | | | 35,221,931 |
|
| Greece - 0.2% | | | |
| Grivalia Properties REIC | | 129,339 | 996,856 |
| Hong Kong - 10.3% | | | |
| Cheung Kong Property Holdings Ltd. (b) | | 273,500 | 2,279,078 |
| Hysan Development Co. Ltd. | | 2,160,703 | 9,253,427 |
| Magnificent Estates Ltd. | | 54,693,000 | 1,940,144 |
| Shun Ho Technology Holdings Ltd. (b) | | 830,065 | 291,240 |
| Sino Land Ltd. | | 3,570,348 | 5,545,063 |
| Sun Hung Kai Properties Ltd. | | 1,354,044 | 20,802,425 |
| Wheelock and Co. Ltd. | | 190,000 | 984,031 |
|
| TOTAL HONG KONG | | | 41,095,408 |
|
| Ireland - 0.1% | | | |
| Hibernia (REIT) PLC | | 300,000 | 433,260 |
| Israel - 0.8% | | | |
| Azrieli Group | | 74,700 | 3,096,455 |
| Italy - 0.9% | | | |
| Beni Stabili SpA SIIQ | | 2,480,262 | 1,961,242 |
| Immobiliare Grande Distribuzione SpA | | 1,771,488 | 1,645,924 |
|
| TOTAL ITALY | | | 3,607,166 |
|
| Japan - 20.4% | | | |
| Advance Residence Investment Corp. | | 3,374 | 7,364,078 |
| Fukuoka (REIT) Investment Fund | | 3,881 | 6,529,136 |
| Goldcrest Co. Ltd. | | 47,000 | 963,247 |
| Ichigo, Inc. (a) | | 639,800 | 1,579,689 |
| Kenedix, Inc. | | 527,000 | 2,062,331 |
| Mitsubishi Estate Co. Ltd. | | 982,000 | 21,829,264 |
| Mitsui Fudosan Co. Ltd. | | 738,000 | 21,011,280 |
| Open House Co. Ltd. | | 30,000 | 497,922 |
| Ship Healthcare Holdings, Inc. | | 81,600 | 1,730,959 |
| Sumitomo Realty & Development Co. Ltd. | | 324,000 | 11,369,476 |
| Sundrug Co. Ltd. | | 7,000 | 408,359 |
| The Sumitomo Warehouse Co. Ltd. | | 177,000 | 956,873 |
| Tokyu Fudosan Holdings Corp. | | 361,700 | 2,731,684 |
| Uchiyama Holdings Co. Ltd. | | 481,300 | 1,980,579 |
|
| TOTAL JAPAN | | | 81,014,877 |
|
| Netherlands - 1.2% | | | |
| VastNed Retail NV | | 101,749 | 4,629,071 |
| Norway - 1.7% | | | |
| Olav Thon Eiendomsselskap A/S | | 239,300 | 4,321,107 |
| Selvaag Bolig ASA (a)(b) | | 756,200 | 2,406,968 |
|
| TOTAL NORWAY | | | 6,728,075 |
|
| Singapore - 8.8% | | | |
| Keppel DC (REIT) | | 2,479,900 | 1,961,360 |
| Parkway Life REIT | | 5,793,400 | 10,262,027 |
| UOL Group Ltd. | | 2,293,936 | 11,203,390 |
| Wing Tai Holdings Ltd. | | 8,275,181 | 11,370,570 |
|
| TOTAL SINGAPORE | | | 34,797,347 |
|
| Spain - 1.5% | | | |
| Inmobiliaria Colonial SA (a)(b) | | 5,333,700 | 3,965,687 |
| Melia Hotels International SA (a) | | 136,900 | 1,971,094 |
|
| TOTAL SPAIN | | | 5,936,781 |
|
| Sweden - 3.5% | | | |
| Castellum AB | | 265,000 | 3,778,364 |
| Hufvudstaden AB Series A | | 308,350 | 3,988,972 |
| Kungsleden AB | | 436,700 | 2,923,398 |
| Wallenstam AB (B Shares) | | 432,600 | 3,131,639 |
|
| TOTAL SWEDEN | | | 13,822,373 |
|
| Switzerland - 0.9% | | | |
| PSP Swiss Property AG | | 39,500 | 3,546,130 |
| United Kingdom - 14.1% | | | |
| Assura PLC | | 1,637,252 | 1,393,464 |
| Big Yellow Group PLC | | 672,100 | 7,394,326 |
| Derwent London PLC | | 142,123 | 8,067,751 |
| Development Securities PLC | | 315,000 | 1,322,034 |
| Hansteen Holdings PLC (a) | | 1,550,000 | 2,948,239 |
| Helical Bar PLC | | 1,437,427 | 9,545,833 |
| Primary Health Properties PLC | | 172,675 | 1,099,530 |
| Safestore Holdings PLC | | 2,316,500 | 10,906,950 |
| Segro PLC | | 773,486 | 5,421,120 |
| St. Modwen Properties PLC | | 442,925 | 3,293,846 |
| Unite Group PLC | | 476,790 | 4,698,294 |
|
| TOTAL UNITED KINGDOM | | | 56,091,387 |
|
| TOTAL COMMON STOCKS | | | |
| (Cost $374,870,484) | | | 372,569,297 |
|
| Money Market Funds - 7.5% | | | |
| Fidelity Cash Central Fund, 0.17% (c) | | 23,508,834 | 23,508,834 |
| Fidelity Securities Lending Cash Central Fund, 0.18% (c)(d) | | 6,438,255 | 6,438,255 |
| TOTAL MONEY MARKET FUNDS | | | |
| (Cost $29,947,089) | | | 29,947,089 |
| TOTAL INVESTMENT PORTFOLIO - 101.3% | | | |
| (Cost $404,817,573) | | | 402,516,386 |
| NET OTHER ASSETS (LIABILITIES) - (1.3)% | | | (5,345,444) |
| NET ASSETS - 100% | | | $397,170,942 |
Categorizations in the Schedule of Investments are based on country or territory of incorporation.
Legend
(a) Security or a portion of the security is on loan at period end.
(b) Non-income producing
(c) Affiliated fund that is generally available only to investment companies and other accounts managed by Fidelity Investments. The rate quoted is the annualized seven-day yield of the fund at period end. A complete unaudited listing of the fund's holdings as of its most recent quarter end is available upon request. In addition, each Fidelity Central Fund's financial statements, which are not covered by the Fund's Report of Independent Registered Public Accounting Firm, are available on the SEC's website or upon request.
(d) Investment made with cash collateral received from securities on loan.
Affiliated Central Funds
Information regarding fiscal year to date income earned by the Fund from investments in Fidelity Central Funds is as follows:
| Fund | Income earned |
| Fidelity Cash Central Fund | $30,349 |
| Fidelity Securities Lending Cash Central Fund | 50,462 |
| Total | $80,811 |
Investment Valuation
The following is a summary of the inputs used, as of July 31, 2015, involving the Fund's assets and liabilities carried at fair value. The inputs or methodology used for valuing securities may not be an indication of the risk associated with investing in those securities. For more information on valuation inputs, and their aggregation into the levels used below, please refer to the Investment Valuation section in the accompanying Notes to Financial Statements.
| | Valuation Inputs at Reporting Date: |
| Description | Total | Level 1 | Level 2 | Level 3 |
| Investments in Securities: | | | | |
| Equities: | | | | |
| Consumer Discretionary | $8,131,170 | $8,131,170 | $-- | $-- |
| Consumer Staples | 408,359 | 408,359 | -- | -- |
| Financials | 359,361,357 | 358,364,501 | -- | 996,856 |
| Health Care | 3,711,538 | 3,711,538 | -- | -- |
| Industrials | 956,873 | 956,873 | -- | -- |
| Money Market Funds | 29,947,089 | 29,947,089 | -- | -- |
| Total Investments in Securities: | $402,516,386 | $401,519,530 | $-- | $996,856 |
The following is a summary of transfers between Level 1 and Level 2 for the period ended July 31, 2015. Transfers are assumed to have occurred at the beginning of the period, and are primarily attributable to the valuation techniques used for foreign equity securities, as discussed in the accompanying Notes to Financial Statements:
| Transfers | Total |
| Level 1 to Level 2 | $0 |
| Level 2 to Level 1 | $193,149,286 |
See accompanying notes which are an integral part of the financial statements.
Financial Statements
Statement of Assets and Liabilities
| | | July 31, 2015 |
| Assets | | |
Investment in securities, at value (including securities loaned of $6,182,323) — See accompanying schedule:
Unaffiliated issuers (cost $374,870,484) | $372,569,297 | |
| Fidelity Central Funds (cost $29,947,089) | 29,947,089 | |
| Total Investments (cost $404,817,573) | | $402,516,386 |
| Foreign currency held at value (cost $141,923) | | 141,919 |
| Receivable for fund shares sold | | 1,040,802 |
| Dividends receivable | | 854,800 |
| Distributions receivable from Fidelity Central Funds | | 8,360 |
| Other receivables | | 8,164 |
| Total assets | | 404,570,431 |
| Liabilities | | |
| Payable for fund shares redeemed | $506,903 | |
| Accrued management fee | 228,781 | |
| Distribution and service plan fees payable | 11,095 | |
| Other affiliated payables | 112,286 | |
| Other payables and accrued expenses | 102,169 | |
| Collateral on securities loaned, at value | 6,438,255 | |
| Total liabilities | | 7,399,489 |
| Net Assets | | $397,170,942 |
| Net Assets consist of: | | |
| Paid in capital | | $658,443,472 |
| Undistributed net investment income | | 4,972,026 |
| Accumulated undistributed net realized gain (loss) on investments and foreign currency transactions | | (263,915,393) |
| Net unrealized appreciation (depreciation) on investments and assets and liabilities in foreign currencies | | (2,329,163) |
| Net Assets | | $397,170,942 |
| Calculation of Maximum Offering Price | | |
| Class A: | | |
| Net Asset Value and redemption price per share ($17,162,355 ÷ 1,624,787 shares) | | $10.56 |
| Maximum offering price per share (100/94.25 of $10.56) | | $11.20 |
| Class T: | | |
| Net Asset Value and redemption price per share ($4,938,940 ÷ 471,047 shares) | | $10.49 |
| Maximum offering price per share (100/96.50 of $10.49) | | $10.87 |
| Class B: | | |
| Net Asset Value and offering price per share ($185,954 ÷ 17,919 shares)(a) | | $10.38 |
| Class C: | | |
| Net Asset Value and offering price per share ($6,547,695 ÷ 634,518 shares)(a) | | $10.32 |
| International Real Estate: | | |
| Net Asset Value, offering price and redemption price per share ($330,909,846 ÷ 30,985,398 shares) | | $10.68 |
| Class I: | | |
| Net Asset Value, offering price and redemption price per share ($37,426,152 ÷ 3,517,543 shares) | | $10.64 |
(a) Redemption price per share is equal to net asset value less any applicable contingent deferred sales charge.
See accompanying notes which are an integral part of the financial statements.
Statement of Operations
| | | Year ended July 31, 2015 |
| Investment Income | | |
| Dividends | | $9,937,021 |
| Special dividends | | 4,858,262 |
| Interest | | 8 |
| Income from Fidelity Central Funds | | 80,811 |
| Income before foreign taxes withheld | | 14,876,102 |
| Less foreign taxes withheld | | (668,855) |
| Total income | | 14,207,247 |
| Expenses | | |
| Management fee | $2,621,594 | |
| Transfer agent fees | 1,111,178 | |
| Distribution and service plan fees | 126,032 | |
| Accounting and security lending fees | 195,111 | |
| Custodian fees and expenses | 85,015 | |
| Independent trustees' compensation | 6,544 | |
| Registration fees | 92,189 | |
| Audit | 63,527 | |
| Legal | 4,476 | |
| Miscellaneous | 4,591 | |
| Total expenses before reductions | 4,310,257 | |
| Expense reductions | (20,000) | 4,290,257 |
| Net investment income (loss) | | 9,916,990 |
Realized and Unrealized Gain (Loss)
Net realized gain (loss) on: | | |
| Investment securities: | | |
| Unaffiliated issuers | 18,820,595 | |
| Foreign currency transactions | (20,412) | |
| Total net realized gain (loss) | | 18,800,183 |
Change in net unrealized appreciation (depreciation) on:
Investment securities | (22,775,467) | |
| Assets and liabilities in foreign currencies | (19,074) | |
| Total change in net unrealized appreciation (depreciation) | | (22,794,541) |
| Net gain (loss) | | (3,994,358) |
| Net increase (decrease) in net assets resulting from operations | | $5,922,632 |
See accompanying notes which are an integral part of the financial statements.
Statement of Changes in Net Assets
| | Year ended July 31, 2015 | Year ended July 31, 2014 |
| Increase (Decrease) in Net Assets | | |
| Operations | | |
| Net investment income (loss) | $9,916,990 | $6,793,871 |
| Net realized gain (loss) | 18,800,183 | 29,767,981 |
| Change in net unrealized appreciation (depreciation) | (22,794,541) | 10,181,937 |
| Net increase (decrease) in net assets resulting from operations | 5,922,632 | 46,743,789 |
| Distributions to shareholders from net investment income | (5,351,966) | (6,758,423) |
| Distributions to shareholders from net realized gain | (10,638,166) | (13,002,325) |
| Total distributions | (15,990,132) | (19,760,748) |
| Share transactions - net increase (decrease) | 30,504,182 | (53,161,192) |
| Redemption fees | 66,458 | 90,758 |
| Total increase (decrease) in net assets | 20,503,140 | (26,087,393) |
| Net Assets | | |
| Beginning of period | 376,667,802 | 402,755,195 |
| End of period (including undistributed net investment income of $4,972,026 and undistributed net investment income of $4,396,784, respectively) | $397,170,942 | $376,667,802 |
See accompanying notes which are an integral part of the financial statements.
Fidelity International Real Estate Fund Class A
| | | | | | |
| Years ended July 31, | 2015 | 2014 | 2013 | 2012 | 2011 |
| Selected Per–Share Data | | | | | |
| Net asset value, beginning of period | $10.85 | $10.11 | $8.37 | $9.21 | $8.46 |
| Income from Investment Operations | | | | | |
| Net investment income (loss)A | .26B | .16 | .14 | .16 | .34C |
| Net realized and unrealized gain (loss) | (.10)D | 1.09 | 2.03 | (.65) | 1.04 |
| Total from investment operations | .16 | 1.25 | 2.17 | (.49) | 1.38 |
| Distributions from net investment income | (.14) | (.16) | (.17) | (.17) | (.33) |
| Distributions from net realized gain | (.31) | (.35) | (.27) | (.18) | (.29) |
| Total distributions | (.45) | (.51) | (.44) | (.35) | (.63)E |
| Redemption fees added to paid in capitalA | –F | –F | .01 | –F | –F |
| Net asset value, end of period | $10.56 | $10.85 | $10.11 | $8.37 | $9.21 |
| Total ReturnG,H | 1.67%D | 12.85% | 26.94% | (4.88)% | 16.76% |
| Ratios to Average Net AssetsI,J | | | | | |
| Expenses before reductions | 1.34% | 1.38% | 1.40% | 1.44% | 1.42% |
| Expenses net of fee waivers, if any | 1.34% | 1.38% | 1.40% | 1.44% | 1.42% |
| Expenses net of all reductions | 1.34% | 1.38% | 1.39% | 1.37% | 1.36% |
| Net investment income (loss) | 2.45%B | 1.57% | 1.51% | 2.09% | 3.67%C |
| Supplemental Data | | | | | |
| Net assets, end of period (000 omitted) | $17,162 | $13,933 | $13,173 | $7,117 | $7,047 |
| Portfolio turnover rateK | 82% | 59% | 78% | 138% | 131% |
A Calculated based on average shares outstanding during the period.
B Investment income per share reflects a large, non-recurring dividend which amounted to $.14 per share. Excluding this non-recurring dividend, the ratio of net investment income (loss) to average net assets would have been 1.15%.
C Investment income per share reflects a large, non-recurring dividend which amounted to $.19 per share. Excluding this non-recurring dividend, the ratio of net investment income (loss) to average net assets would have been 1.64%.
D Amount includes a reimbursement from the investment adviser for an operational error which amounted to less than $.01 per share. Excluding this reimbursement, the total return would have been 1.64%.
E Total distributions of $.63 per share is comprised of distributions from net investment income of $.333 and distributions from net realized gain of $.294 per share.
F Amount represents less than $.01 per share.
G Total returns would have been lower if certain expenses had not been reduced during the applicable periods shown.
H Total returns do not include the effect of the sales charges.
I Fees and expenses of any underlying Fidelity Central Funds are not included in the Fund's expense ratio. The Fund indirectly bears its proportionate share of the expenses of any underlying Fidelity Central Funds.
J Expense ratios reflect operating expenses of the class. Expenses before reductions do not reflect amounts reimbursed by the investment adviser or reductions from brokerage service arrangements or reductions from other expense offset arrangements and do not represent the amount paid by the class during periods when reimbursements or reductions occur. Expenses net of fee waivers reflect expenses after reimbursement by the investment adviser but prior to reductions from brokerage service arrangements or other expense offset arrangements. Expenses net of all reductions represent the net expenses paid by the class.
K Amount does not include the portfolio activity of any underlying Fidelity Central Funds.
See accompanying notes which are an integral part of the financial statements.
Fidelity International Real Estate Fund Class T
| | | | | | |
| Years ended July 31, | 2015 | 2014 | 2013 | 2012 | 2011 |
| Selected Per–Share Data | | | | | |
| Net asset value, beginning of period | $10.76 | $10.04 | $8.32 | $9.16 | $8.41 |
| Income from Investment Operations | | | | | |
| Net investment income (loss)A | .22B | .13 | .12 | .14 | .31C |
| Net realized and unrealized gain (loss) | (.08)D | 1.07 | 2.01 | (.66) | 1.04 |
| Total from investment operations | .14 | 1.20 | 2.13 | (.52) | 1.35 |
| Distributions from net investment income | (.10) | (.14) | (.15) | (.14) | (.31) |
| Distributions from net realized gain | (.31) | (.35) | (.27) | (.18) | (.29) |
| Total distributions | (.41) | (.48)E | (.42) | (.32) | (.60) |
| Redemption fees added to paid in capitalA | –F | –F | .01 | –F | –F |
| Net asset value, end of period | $10.49 | $10.76 | $10.04 | $8.32 | $9.16 |
| Total ReturnG,H | 1.49%D | 12.50% | 26.62% | (5.23)% | 16.54% |
| Ratios to Average Net AssetsI,J | | | | | |
| Expenses before reductions | 1.64% | 1.66% | 1.68% | 1.72% | 1.69% |
| Expenses net of fee waivers, if any | 1.64% | 1.66% | 1.68% | 1.70% | 1.69% |
| Expenses net of all reductions | 1.63% | 1.65% | 1.66% | 1.63% | 1.63% |
| Net investment income (loss) | 2.15%B | 1.30% | 1.23% | 1.83% | 3.41%C |
| Supplemental Data | | | | | |
| Net assets, end of period (000 omitted) | $4,939 | $5,563 | $5,081 | $2,570 | $2,496 |
| Portfolio turnover rateK | 82% | 59% | 78% | 138% | 131% |
A Calculated based on average shares outstanding during the period.
B Investment income per share reflects a large, non-recurring dividends which amounted to $.14 per share. Excluding this non-recurring dividends, the ratio of net investment income (loss) to average net assets would have been .86%.
C Investment income per share reflects a large, non-recurring dividend which amounted to $.19 per share. Excluding this non-recurring dividends, the ratio of net investment income (loss) to average net assets would have been 1.38%.
D Amount includes a reimbursement from the investment adviser for an operational error which amounted to less than $.01 per share. Excluding this reimbursement, the total return would have been 1.46%.
E Total distributions of $.48 per share is comprised of distributions from net investment income of $.136 and distributions from net realized gain of $.348 per share.
F Amount represents less than $.01 per share.
G Total returns would have been lower if certain expenses had not been reduced during the applicable periods shown.
H Total returns do not include the effect of the sales charges.
I Fees and expenses of any underlying Fidelity Central Funds are not included in the Fund's expense ratio. The Fund indirectly bears its proportionate share of the expenses of any underlying Fidelity Central Funds.
J Expense ratios reflect operating expenses of the class. Expenses before reductions do not reflect amounts reimbursed by the investment adviser or reductions from brokerage service arrangements or reductions from other expense offset arrangements and do not represent the amount paid by the class during periods when reimbursements or reductions occur. Expenses net of fee waivers reflect expenses after reimbursement by the investment adviser but prior to reductions from brokerage service arrangements or other expense offset arrangements. Expenses net of all reductions represent the net expenses paid by the class.
K Amount does not include the portfolio activity of any underlying Fidelity Central Funds.
See accompanying notes which are an integral part of the financial statements.
Fidelity International Real Estate Fund Class B
| | | | | | |
| Years ended July 31, | 2015 | 2014 | 2013 | 2012 | 2011 |
| Selected Per–Share Data | | | | | |
| Net asset value, beginning of period | $10.67 | $9.94 | $8.24 | $9.05 | $8.32 |
| Income from Investment Operations | | | | | |
| Net investment income (loss)A | .17B | .08 | .07 | .10 | .26C |
| Net realized and unrealized gain (loss) | (.08)D | 1.08 | 1.99 | (.64) | 1.03 |
| Total from investment operations | .09 | 1.16 | 2.06 | (.54) | 1.29 |
| Distributions from net investment income | (.08) | (.08) | (.10) | (.09) | (.27) |
| Distributions from net realized gain | (.30) | (.35) | (.27) | (.18) | (.29) |
| Total distributions | (.38) | (.43) | (.37) | (.27) | (.56) |
| Redemption fees added to paid in capitalA | –E | –E | .01 | –E | –E |
| Net asset value, end of period | $10.38 | $10.67 | $9.94 | $8.24 | $9.05 |
| Total ReturnF,G | .95%D | 12.08% | 25.87% | (5.61)% | 15.90% |
| Ratios to Average Net AssetsH,I | | | | | |
| Expenses before reductions | 2.12% | 2.14% | 2.16% | 2.19% | 2.17% |
| Expenses net of fee waivers, if any | 2.12% | 2.14% | 2.16% | 2.19% | 2.17% |
| Expenses net of all reductions | 2.12% | 2.13% | 2.14% | 2.12% | 2.11% |
| Net investment income (loss) | 1.67%B | .82% | .76% | 1.34% | 2.92%C |
| Supplemental Data | | | | | |
| Net assets, end of period (000 omitted) | $186 | $373 | $456 | $457 | $570 |
| Portfolio turnover rateJ | 82% | 59% | 78% | 138% | 131% |
A Calculated based on average shares outstanding during the period.
B Investment income per share reflects a large, non-recurring dividend which amounted to $.13 per share. Excluding this non-recurring dividend, the ratio of net investment income (loss) to average net assets would have been .37%.
C Investment income per share reflects a large, non-recurring dividend which amounted to $.18 per share. Excluding this non-recurring dividend, the ratio of net investment income (loss) to average net assets would have been .90%.
D Amount includes a reimbursement from the investment adviser for an operational error which amounted to less than $.01 per share. Excluding this reimbursement, the total return would have been .92%.
E Amount represents less than $.01 per share.
F Total returns would have been lower if certain expenses had not been reduced during the applicable periods shown.
G Total returns do not include the effect of the contingent deferred sales charge.
H Fees and expenses of any underlying Fidelity Central Funds are not included in the Fund's expense ratio. The Fund indirectly bears its proportionate share of the expenses of any underlying Fidelity Central Funds.
I Expense ratios reflect operating expenses of the class. Expenses before reductions do not reflect amounts reimbursed by the investment adviser or reductions from brokerage service arrangements or reductions from other expense offset arrangements and do not represent the amount paid by the class during periods when reimbursements or reductions occur. Expenses net of fee waivers reflect expenses after reimbursement by the investment adviser but prior to reductions from brokerage service arrangements or other expense offset arrangements. Expenses net of all reductions represent the net expenses paid by the class.
J Amount does not include the portfolio activity of any underlying Fidelity Central Funds.
See accompanying notes which are an integral part of the financial statements.
Fidelity International Real Estate Fund Class C
| | | | | | |
| Years ended July 31, | 2015 | 2014 | 2013 | 2012 | 2011 |
| Selected Per–Share Data | | | | | |
| Net asset value, beginning of period | $10.60 | $9.89 | $8.21 | $9.03 | $8.30 |
| Income from Investment Operations | | | | | |
| Net investment income (loss)A | .17B | .08 | .07 | .10 | .26C |
| Net realized and unrealized gain (loss) | (.08)D | 1.07 | 1.99 | (.64) | 1.04 |
| Total from investment operations | .09 | 1.15 | 2.06 | (.54) | 1.30 |
| Distributions from net investment income | (.07) | (.09) | (.12) | (.10) | (.28) |
| Distributions from net realized gain | (.30) | (.35) | (.27) | (.18) | (.29) |
| Total distributions | (.37) | (.44) | (.39) | (.28) | (.57) |
| Redemption fees added to paid in capitalA | –E | –E | .01 | –E | –E |
| Net asset value, end of period | $10.32 | $10.60 | $9.89 | $8.21 | $9.03 |
| Total ReturnF,G | .97%D | 12.04% | 25.96% | (5.68)% | 16.07% |
| Ratios to Average Net AssetsH,I | | | | | |
| Expenses before reductions | 2.09% | 2.13% | 2.16% | 2.19% | 2.17% |
| Expenses net of fee waivers, if any | 2.09% | 2.13% | 2.16% | 2.19% | 2.17% |
| Expenses net of all reductions | 2.09% | 2.13% | 2.14% | 2.12% | 2.11% |
| Net investment income (loss) | 1.70%B | .82% | .76% | 1.34% | 2.92%C |
| Supplemental Data | | | | | |
| Net assets, end of period (000 omitted) | $6,548 | $6,504 | $6,872 | $3,164 | $3,208 |
| Portfolio turnover rateJ | 82% | 59% | 78% | 138% | 131% |
A Calculated based on average shares outstanding during the period.
B Investment income per share reflects a large, non-recurring dividend which amounted to $.13 per share. Excluding this non-recurring dividend, the ratio of net investment income (loss) to average net assets would have been .41%.
C Investment income per share reflects a large, non-recurring dividend which amounted to $.18 per share. Excluding this non-recurring dividend, the ratio of net investment income (loss) to average net assets would have been .89%.
D Amount includes a reimbursement from the investment adviser for an operational error which amounted to less than $.01 per share. Excluding this reimbursement, the total return would have been .94%.
E Amount represents less than $.01 per share.
F Total returns would have been lower if certain expenses had not been reduced during the applicable periods shown.
G Total returns do not include the effect of the contingent deferred sales charge.
H Fees and expenses of any underlying Fidelity Central Funds are not included in the Fund's expense ratio. The Fund indirectly bears its proportionate share of the expenses of any underlying Fidelity Central Funds.
I Expense ratios reflect operating expenses of the class. Expenses before reductions do not reflect amounts reimbursed by the investment adviser or reductions from brokerage service arrangements or reductions from other expense offset arrangements and do not represent the amount paid by the class during periods when reimbursements or reductions occur. Expenses net of fee waivers reflect expenses after reimbursement by the investment adviser but prior to reductions from brokerage service arrangements or other expense offset arrangements. Expenses net of all reductions represent the net expenses paid by the class.
J Amount does not include the portfolio activity of any underlying Fidelity Central Funds.
See accompanying notes which are an integral part of the financial statements.
Financial Highlights — Fidelity International Real Estate Fund
| | | | | | |
| Years ended July 31, | 2015 | 2014 | 2013 | 2012 | 2011 |
| Selected Per–Share Data | | | | | |
| Net asset value, beginning of period | $10.96 | $10.21 | $8.44 | $9.30 | $8.53 |
| Income from Investment Operations | | | | | |
| Net investment income (loss)A | .28B | .19 | .17 | .18 | .36C |
| Net realized and unrealized gain (loss) | (.09)D | 1.09 | 2.05 | (.67) | 1.06 |
| Total from investment operations | .19 | 1.28 | 2.22 | (.49) | 1.42 |
| Distributions from net investment income | (.16) | (.18) | (.19) | (.19) | (.35) |
| Distributions from net realized gain | (.31) | (.35) | (.27) | (.18) | (.29) |
| Total distributions | (.47) | (.53) | (.46) | (.37) | (.65)E |
| Redemption fees added to paid in capitalA | –F | –F | .01 | –F | –F |
| Net asset value, end of period | $10.68 | $10.96 | $10.21 | $8.44 | $9.30 |
| Total ReturnG | 1.95%D | 13.12% | 27.31% | (4.76)% | 17.15% |
| Ratios to Average Net AssetsH,I | | | | | |
| Expenses before reductions | 1.12% | 1.13% | 1.16% | 1.19% | 1.17% |
| Expenses net of fee waivers, if any | 1.12% | 1.13% | 1.16% | 1.19% | 1.17% |
| Expenses net of all reductions | 1.12% | 1.13% | 1.14% | 1.12% | 1.11% |
| Net investment income (loss) | 2.67%B | 1.82% | 1.76% | 2.34% | 3.92%C |
| Supplemental Data | | | | | |
| Net assets, end of period (000 omitted) | $330,910 | $342,960 | $367,269 | $251,543 | $322,045 |
| Portfolio turnover rateJ | 82% | 59% | 78% | 138% | 131% |
A Calculated based on average shares outstanding during the period.
B Investment income per share reflects a large, non-recurring dividend which amounted to $.14 per share. Excluding this non-recurring dividend, the ratio of net investment income (loss) to average net assets would have been 1.38%.
C Investment income per share reflects a large, non-recurring dividend which amounted to $.19 per share. Excluding this non-recurring dividend, the ratio of net investment income (loss) to average net assets would have been 1.90%.
D Amount includes a reimbursement from the investment adviser for an operational error which amounted to less than $.01 per share. Excluding this reimbursement, the total return would have been 1.92%.
E Total distributions of $.65 per share is comprised of distributions from net investment income of $.354 and distributions from net realized gain of $.294 per share.
F Amount represents less than $.01 per share.
G Total returns would have been lower if certain expenses had not been reduced during the applicable periods shown.
H Fees and expenses of any underlying Fidelity Central Funds are not included in the Fund's expense ratio. The Fund indirectly bears its proportionate share of the expenses of any underlying Fidelity Central Funds.
I Expense ratios reflect operating expenses of the class. Expenses before reductions do not reflect amounts reimbursed by the investment adviser or reductions from brokerage service arrangements or reductions from other expense offset arrangements and do not represent the amount paid by the class during periods when reimbursements or reductions occur. Expenses net of fee waivers reflect expenses after reimbursement by the investment adviser but prior to reductions from brokerage service arrangements or other expense offset arrangements. Expenses net of all reductions represent the net expenses paid by the class.
J Amount does not include the portfolio activity of any underlying Fidelity Central Funds.
See accompanying notes which are an integral part of the financial statements.
Financial Highlights — Fidelity International Real Estate Fund Class I
| | | | | | |
| Years ended July 31, | 2015 | 2014 | 2013 | 2012 | 2011 |
| Selected Per–Share Data | | | | | |
| Net asset value, beginning of period | $10.92 | $10.18 | $8.42 | $9.28 | $8.51 |
| Income from Investment Operations | | | | | |
| Net investment income (loss)A | .29B | .19 | .18 | .18 | .36C |
| Net realized and unrealized gain (loss) | (.09)D | 1.09 | 2.03 | (.67) | 1.06 |
| Total from investment operations | .20 | 1.28 | 2.21 | (.49) | 1.42 |
| Distributions from net investment income | (.17) | (.19) | (.19) | (.20) | (.35) |
| Distributions from net realized gain | (.31) | (.35) | (.27) | (.18) | (.29) |
| Total distributions | (.48) | (.54) | (.46) | (.37)E | (.65)F |
| Redemption fees added to paid in capitalA | –G | –G | .01 | –G | –G |
| Net asset value, end of period | $10.64 | $10.92 | $10.18 | $8.42 | $9.28 |
| Total ReturnH | 2.01%D | 13.16% | 27.33% | (4.73)% | 17.18% |
| Ratios to Average Net AssetsI,J | | | | | |
| Expenses before reductions | 1.03% | 1.12% | 1.10% | 1.19% | 1.17% |
| Expenses net of fee waivers, if any | 1.03% | 1.12% | 1.10% | 1.19% | 1.17% |
| Expenses net of all reductions | 1.03% | 1.12% | 1.09% | 1.12% | 1.11% |
| Net investment income (loss) | 2.76%B | 1.84% | 1.81% | 2.34% | 3.92%C |
| Supplemental Data | | | | | |
| Net assets, end of period (000 omitted) | $37,426 | $7,336 | $9,905 | $1,947 | $1,785 |
| Portfolio turnover rateK | 82% | 59% | 78% | 138% | 131% |
A Calculated based on average shares outstanding during the period.
B Investment income per share reflects a large, non-recurring dividend which amounted to $.14 per share. Excluding this non-recurring dividend, the ratio of net investment income (loss) to average net assets would have been 1.46%.
C Investment income per share reflects a large, non-recurring dividend which amounted to $.19 per share. Excluding this non-recurring dividend, the ratio of net investment income (loss) to average net assets would have been 1.90%.
D Amount includes a reimbursement from the investment adviser for an operational error which amounted to less than $.01 per share. Excluding this reimbursement, the total return would have been 1.98%.
E Total distributions of $.37 per share is comprised of distributions from net investment income of $.195 and distributions from net realized gain of $.178 per share.
F Total distributions of $.65 per share is comprised of distributions from net investment income of $.354 and distributions from net realized gain of $.294 per share.
G Amount represents less than $.01 per share.
H Total returns would have been lower if certain expenses had not been reduced during the applicable periods shown.
I Fees and expenses of any underlying Fidelity Central Funds are not included in the Fund's expense ratio. The Fund indirectly bears its proportionate share of the expenses of any underlying Fidelity Central Funds.
J Expense ratios reflect operating expenses of the class. Expenses before reductions do not reflect amounts reimbursed by the investment adviser or reductions from brokerage service arrangements or reductions from other expense offset arrangements and do not represent the amount paid by the class during periods when reimbursements or reductions occur. Expenses net of fee waivers reflect expenses after reimbursement by the investment adviser but prior to reductions from brokerage service arrangements or other expense offset arrangements. Expenses net of all reductions represent the net expenses paid by the class.
K Amount does not include the portfolio activity of any underlying Fidelity Central Funds.
See accompanying notes which are an integral part of the financial statements.
Notes to Financial Statements
For the period ended July 31, 2015
1. Organization.
Fidelity International Real Estate Fund (the Fund) is a non-diversified fund of Fidelity Select Portfolios (the Trust) and is authorized to issue an unlimited number of shares. The Trust is registered under the Investment Company Act of 1940, as amended (the 1940 Act), as an open-end management investment company organized as a Massachusetts business trust. The Fund offers Class A, Class T, Class C, International Real Estate and Class I (formerly Institutional Class) shares, each of which, along with Class B shares, has equal rights as to assets and voting privileges. Class B shares are closed to new accounts and additional purchases, except for exchanges and reinvestments. Each class has exclusive voting rights with respect to matters that affect that class. Class B shares will automatically convert to Class A shares after a holding period of seven years from the initial date of purchase.
2. Investments in Fidelity Central Funds.
The Fund invests in Fidelity Central Funds, which are open-end investment companies generally available only to other investment companies and accounts managed by the investment adviser and its affiliates. The Fund's Schedule of Investments lists each of the Fidelity Central Funds held as of period end, if any, as an investment of the Fund, but does not include the underlying holdings of each Fidelity Central Fund. As an Investing Fund, the Fund indirectly bears its proportionate share of the expenses of the underlying Fidelity Central Funds.
The Money Market Central Funds seek preservation of capital and current income and are managed by Fidelity Investments Money Management, Inc. (FIMM), an affiliate of the investment adviser. Annualized expenses of the Money Market Central Funds as of their most recent shareholder report date are less than .01%.
A complete unaudited list of holdings for each Fidelity Central Fund is available upon request or at the Securities and Exchange Commission (the SEC) website at www.sec.gov. In addition, the financial statements of the Fidelity Central Funds, which are not covered by the Fund's Report of Independent Registered Public Accounting Firm, are available on the SEC website or upon request.
3. Significant Accounting Policies.
The financial statements have been prepared in conformity with accounting principles generally accepted in the United States of America (GAAP), which require management to make certain estimates and assumptions at the date of the financial statements. Actual results could differ from those estimates. Subsequent events, if any, through the date that the financial statements were issued have been evaluated in the preparation of the financial statements. The following summarizes the significant accounting policies of the Fund:
Investment Valuation. Investments are valued as of 4:00 p.m. Eastern time on the last calendar day of the period. The Board of Trustees (the Board) has delegated the day to day responsibility for the valuation of the Fund's investments to the Fidelity SelectCo, LLC (SelectCo) Fair Value Committee (the Committee). In accordance with valuation policies and procedures approved by the Board, the Fund attempts to obtain prices from one or more third party pricing vendors or brokers to value its investments. When current market prices, quotations or currency exchange rates are not readily available or reliable, investments will be fair valued in good faith by the Committee, in accordance with procedures adopted by the Board. Factors used in determining fair value vary by investment type and may include market or investment specific events. The frequency with which these procedures are used cannot be predicted and they may be utilized to a significant extent. The Committee oversees the Fund's valuation policies and procedures and reports to the Board on the Committee's activities and fair value determinations. The Board monitors the appropriateness of the procedures used in valuing the Fund's investments and ratifies the fair value determinations of the Committee.
The Fund categorizes the inputs to valuation techniques used to value its investments into a disclosure hierarchy consisting of three levels as shown below:
- Level 1 – quoted prices in active markets for identical investments
- Level 2 – other significant observable inputs (including quoted prices for similar investments, interest rates, prepayment speeds, etc.)
- Level 3 – unobservable inputs (including the Fund's own assumptions based on the best information available)
Valuation techniques used to value the Fund's investments by major category are as follows:
Equity securities, including restricted securities, for which market quotations are readily available, are valued at the last reported sale price or official closing price as reported by a third party pricing vendor on the primary market or exchange on which they are traded and are categorized as Level 1 in the hierarchy. In the event there were no sales during the day or closing prices are not available, securities are valued at the last quoted bid price or may be valued using the last available price and are generally categorized as Level 2 in the hierarchy. For foreign equity securities, when market or security specific events arise, comparisons to the valuation of American Depositary Receipts (ADRs), futures contracts, Exchange-Traded Funds (ETFs) and certain indexes as well as quoted prices for similar securities may be used and would be categorized as Level 2 in the hierarchy. Utilizing these techniques may result in transfers between Level 1 and Level 2. For equity securities, including restricted securities, where observable inputs are limited, assumptions about market activity and risk are used and these securities may be categorized as Level 3 in the hierarchy.
Investments in open-end mutual funds, including the Fidelity Central Funds, are valued at their closing net asset value (NAV) each business day and are categorized as Level 1 in the hierarchy.
Changes in valuation techniques may result in transfers in or out of an assigned level within the disclosure hierarchy. The aggregate value of investments by input level as of July 31, 2015, including information on transfers between Levels 1 and 2, is included at the end of the Fund's Schedule of Investments.
Foreign Currency. The Fund may use foreign currency contracts to facilitate transactions in foreign-denominated securities. Gains and losses from these transactions may arise from changes in the value of the foreign currency or if the counterparties do not perform under the contracts' terms.
Foreign-denominated assets, including investment securities, and liabilities are translated into U.S. dollars at the exchange rates at period end. Purchases and sales of investment securities, income and dividends received and expenses denominated in foreign currencies are translated into U.S. dollars at the exchange rate in effect on the transaction date.
The effects of exchange rate fluctuations on investments are included with the net realized and unrealized gain (loss) on investment securities. Other foreign currency transactions resulting in realized and unrealized gain (loss) are disclosed separately.
Investment Transactions and Income. For financial reporting purposes, the Fund's investment holdings and NAV include trades executed through the end of the last business day of the period. The NAV per share for processing shareholder transactions is calculated as of the close of business of the New York Stock Exchange (NYSE), normally 4:00 p.m. Eastern time and includes trades executed through the end of the prior business day. Gains and losses on securities sold are determined on the basis of identified cost. Dividend income is recorded on the ex-dividend date, except for certain dividends from foreign securities where the ex-dividend date may have passed, which are recorded as soon as the Fund is informed of the ex-dividend date. Non-cash dividends included in dividend income, if any, are recorded at the fair market value of the securities received. Income and capital gain distributions from Fidelity Central Funds, if any, are recorded on the ex-dividend date. Large, non-recurring dividends recognized by the Fund are presented separately on the Statement of Operations as "Special Dividends" and the impact of these dividends is presented in the Financial Highlights. Interest income is accrued as earned and includes coupon interest and amortization of premium and accretion of discount on debt securities as applicable. Investment income is recorded net of foreign taxes withheld where recovery of such taxes is uncertain.
Class Allocations and Expenses. Investment income, realized and unrealized capital gains and losses, common expenses of the Fund, and certain fund-level expense reductions, if any, are allocated daily on a pro-rata basis to each class based on the relative net assets of each class to the total net assets of the Fund. Each class differs with respect to transfer agent and distribution and service plan fees incurred. Certain expense reductions may also differ by class. For the reporting period, the allocated portion of income and expenses to each class as a percent of its average net assets may vary due to the timing of recording these transactions in relation to fluctuating net assets of the classes. Expenses directly attributable to a fund are charged to that fund. Expenses attributable to more than one fund are allocated among the respective funds on the basis of relative net assets or other appropriate methods. Expense estimates are accrued in the period to which they relate and adjustments are made when actual amounts are known.
Income Tax Information and Distributions to Shareholders. Each year, the Fund intends to qualify as a regulated investment company under Subchapter M of the Internal Revenue Code, including distributing substantially all of its taxable income and realized gains. As a result, no provision for U.S. Federal income taxes is required. As of July 31, 2015, the Fund did not have any unrecognized tax benefits in the financial statements; nor is the Fund aware of any tax positions for which it is reasonably possible that the total amounts of unrecognized tax benefits will significantly change in the next twelve months. The Fund files a U.S. federal tax return, in addition to state and local tax returns as required. The Fund's federal income tax returns are subject to examination by the Internal Revenue Service (IRS) for a period of three fiscal years after they are filed. State and local tax returns may be subject to examination for an additional fiscal year depending on the jurisdiction. Foreign taxes are provided for based on the Fund's understanding of the tax rules and rates that exist in the foreign markets in which it invests.
Distributions are declared and recorded on the ex-dividend date. Income dividends and capital gain distributions are declared separately for each class. Income and capital gain distributions are determined in accordance with income tax regulations, which may differ from GAAP.
Capital accounts within the financial statements are adjusted for permanent book-tax differences. These adjustments have no impact on net assets or the results of operations. Capital accounts are not adjusted for temporary book-tax differences which will reverse in a subsequent period.
Book-tax differences are primarily due to foreign currency transactions, passive foreign investment companies (PFIC), capital loss carryforwards and losses deferred due to wash sales and excise tax regulations.
The federal tax cost of investment securities and unrealized appreciation (depreciation) as of period end were as follows:
| Gross unrealized appreciation | $17,307,736 |
| Gross unrealized depreciation | (22,669,419) |
| Net unrealized appreciation (depreciation) on securities | $(5,361,683) |
| Tax Cost | $407,878,069 |
The tax-based components of distributable earnings as of period end were as follows:
| Undistributed ordinary income | $9,561,844 |
| Capital loss carryforward | $(260,441,503) |
| Net unrealized appreciation (depreciation) on securities and other investments | $(5,389,659) |
Capital loss carryforwards are only available to offset future capital gains of the Fund to the extent provided by regulations and may be limited. Under the Regulated Investment Company Modernization Act of 2010 (the Act), the Fund is permitted to carry forward capital losses incurred in taxable years beginning after December 22, 2010 for an unlimited period and such capital losses are required to be used prior to any losses that expire. The capital loss carryforward information presented below, including any applicable limitation, is estimated as of fiscal period end and is subject to adjustment.
| Fiscal year of expiration | |
| 2017 | $(123,841,971) |
| 2018 | (136,599,532) |
| Total with expiration | $(260,441,503) |
The Fund intends to elect to defer to its next fiscal year $5,003,212 of capital losses recognized during the period November 1, 2014 to July 31, 2015.
The tax character of distributions paid was as follows:
| | July 31, 2015 | July 31, 2014 |
| Ordinary Income | $ 15,990,132 | $ 19,760,748 |
Short-Term Trading (Redemption) Fees. Shares held by investors in the Fund less than 90 days may have been subject to a redemption fee equal to 1.50% of the NAV of shares redeemed. All redemption fees, which reduce the proceeds of the shareholder redemption, are retained by the Fund and accounted for as an addition to paid in capital.
4. Purchases and Sales of Investments.
Purchases and sales of securities, other than short-term securities, aggregated $288,764,035 and $298,002,141, respectively.
5. Fees and Other Transactions with Affiliates.
Management Fee. Fidelity SelectCo, LLC (the investment adviser) and its affiliates provide the Fund with investment management related services for which the Fund pays a monthly management fee. The management fee is the sum of an individual fund fee rate that is based on an annual rate of .45% of the Fund's average net assets and an annualized group fee rate that averaged .25% during the period. The group fee rate is based upon the average net assets of all the mutual funds advised by Fidelity Management & Research Company (FMR) and the investment adviser. The group fee rate decreases as assets under management increase and increases as assets under management decrease. For the reporting period, the total annual management fee rate was .70% of the Fund's average net assets.
Distribution and Service Plan Fees. In accordance with Rule 12b-1 of the 1940 Act, the Fund has adopted separate Distribution and Service Plans for each class of shares. Certain classes pay Fidelity Distributors Corporation (FDC), an affiliate of the investment adviser, separate Distribution and Service Fees, each of which is based on an annual percentage of each class' average net assets. In addition, FDC may pay financial intermediaries for selling shares of the Fund and providing shareholder support services. For the period, the Distribution and Service Fee rates, total fees and amounts retained by FDC were as follows:
| | Distribution
Fee | Service
Fee | Total Fees | Retained
by FDC |
| Class A | –% | .25% | $35,975 | $262 |
| Class T | .25% | .25% | 25,098 | 16 |
| Class B | .75% | .25% | 2,675 | 2,007 |
| Class C | .75% | .25% | 62,284 | 13,937 |
| | | | $126,032 | $16,222 |
Sales Load. FDC may receive a front-end sales charge of up to 5.75% for selling Class A shares and 3.50% for selling Class T shares, some of which is paid to financial intermediaries for selling shares of the Fund. Depending on the holding period, FDC may receive contingent deferred sales charges levied on Class A, Class T, Class B and Class C redemptions. The deferred sales charges range from 5.00% to 1.00% for Class B shares, 1.00% for Class C shares, 1.00% for certain purchases of Class A shares and .25% for certain purchases of Class T shares.
For the period, sales charge amounts retained by FDC were as follows:
| | Retained
by FDC |
| Class A | $8,704 |
| Class T | 1,620 |
| Class B* | 38 |
| Class C* | 1,701 |
| | $12,063 |
* When Class B and Class C shares are initially sold, FDC pays commissions from its own resources to financial intermediaries through which the sales are made.
Transfer Agent Fees. Fidelity Investments Institutional Operations Company, Inc., (FIIOC), an affiliate of the investment adviser, is the transfer, dividend disbursing and shareholder servicing agent for each class of the Fund. FIIOC receives account fees and asset-based fees that vary according to the account size and type of account of the shareholders of the respective classes of the Fund. FIIOC pays for typesetting, printing and mailing of shareholder reports, except proxy statements.
For the period, transfer agent fees for each class were as follows:
| | Amount | % of
Class-Level Average
Net Assets |
| Class A | $39,714 | .28 |
| Class T | 16,001 | .32 |
| Class B | 804 | .30 |
| Class C | 17,077 | .27 |
| International Real Estate | 997,303 | .30 |
| Class I | 40,279 | .21 |
| | $1,111,178 | |
Accounting and Security Lending Fees. Fidelity Service Company, Inc. (FSC), an affiliate of the investment adviser, maintains the Fund's accounting records. The accounting fee is based on the level of average net assets for each month. Under a separate contract, FSC administers the security lending program. The security lending fee is based on the number and duration of lending transactions.
Brokerage Commissions. The Fund placed a portion of its portfolio transactions with brokerage firms which are affiliates of the investment adviser. Brokerage commissions are included in net realized gain (loss) and change in net unrealized appreciation (depreciation) in the Statement of Operations. The commissions paid to these affiliated firms were $193 for the period.
Other. During the period, the investment adviser reimbursed the Fund $97,302 for an operational error which is included in Net Realized Gain (Loss) in the accompanying Statement of Operations.
6. Committed Line of Credit.
The Fund participates with other funds managed by the investment adviser or an affiliate in a $4.25 billion credit facility (the "line of credit") to be utilized for temporary or emergency purposes to fund shareholder redemptions or for other short-term liquidity purposes. The Fund has agreed to pay commitment fees on its pro-rata portion of the line of credit, which amounted to $540 and is reflected in Miscellaneous expenses on the Statement of Operations. During the period, the Fund did not borrow on this line of credit.
7. Security Lending.
The Fund lends portfolio securities through a lending agent from time to time in order to earn additional income. On the settlement date of the loan, the Fund receives collateral (in the form of U.S. Treasury obligations, letters of credit and/or cash) against the loaned securities and maintains collateral in an amount not less than 100% of the market value of the loaned securities during the period of the loan. The market value of the loaned securities is determined at the close of business of the Fund and any additional required collateral is delivered to the Fund on the next business day. If the borrower defaults on its obligation to return the securities loaned because of insolvency or other reasons, the Fund may apply collateral received from the borrower against the obligation. The Fund may experience delays and costs in recovering the securities loaned. Any cash collateral received is invested in the Fidelity Securities Lending Cash Central Fund. The value of loaned securities and cash collateral at period end are disclosed on the Fund's Statement of Assets and Liabilities. Security lending income represents the income earned on investing cash collateral, less rebates paid to borrowers and any lending agent fees associated with the loan, plus any premium payments received for lending certain types of securities. Security lending income is presented in the Statement of Operations as a component of income from Fidelity Central Funds. Total security lending income during the period amounted to $50,462.
8. Expense Reductions.
Commissions paid to certain brokers with whom the investment adviser, or its affiliates, places trades on behalf of the Fund include an amount in addition to trade execution, which may be rebated back to the Fund to offset certain expenses. This amount totaled $16,886 for the period. In addition, through arrangements with the Fund's custodian, credits realized as a result of uninvested cash balances were used to reduce the Fund's expenses. During the period, these credits reduced the Fund's custody expenses by $9.
In addition, during the period the investment adviser reimbursed/waived a portion of fund-level operating expenses in the amount of $1,581 and a portion of class-level operating expenses as follows:
| | Amount |
| Class A | $ 205 |
| Class T | 11 |
| Class C | 93 |
| International Real Estate | 1,021 |
| Class I | 194 |
| | $1,524 |
9. Distributions to Shareholders.
Distributions to shareholders of each class were as follows:
| Years ended July 31, | 2015 | 2014 |
| From net investment income | | |
| Class A | $181,420 | $187,181 |
| Class T | 50,433 | 65,518 |
| Class B | 2,573 | 3,710 |
| Class C | 43,291 | 59,254 |
| International Real Estate | 4,923,960 | 6,296,631 |
| Class I | 150,289 | 146,129 |
| Total | $5,351,966 | $6,758,423 |
| From net realized gain | | |
| Class A | $396,004 | $414,914 |
| Class T | 151,630 | 167,858 |
| Class B | 8,904 | 16,133 |
| Class C | 181,835 | 231,539 |
| International Real Estate | 9,576,263 | 11,906,952 |
| Class I | 323,530 | 264,929 |
| Total | $10,638,166 | $13,002,325 |
10. Share Transactions.
Share transactions for each class were as follows and may contain automatic conversions between classes or exchanges between funds:
| | Shares | Shares | Dollars | Dollars |
| Years ended July 31, | 2015 | 2014 | 2015 | 2014 |
| Class A | | | | |
| Shares sold | 673,844 | 587,302 | $7,190,291 | $6,069,117 |
| Reinvestment of distributions | 53,260 | 52,782 | 545,527 | 523,247 |
| Shares redeemed | (386,439) | (659,545) | (4,035,124) | (6,744,761) |
| Net increase (decrease) | 340,665 | (19,461) | $3,700,694 | $(152,397) |
| Class T | | | | |
| Shares sold | 95,352 | 116,161 | $1,006,443 | $1,193,650 |
| Reinvestment of distributions | 18,282 | 21,965 | 185,991 | 216,331 |
| Shares redeemed | (159,356) | (127,651) | (1,656,253) | (1,309,222) |
| Net increase (decrease) | (45,722) | 10,475 | $(463,819) | $100,759 |
| Class B | | | | |
| Shares sold | 491 | 2,791 | $5,118 | $27,886 |
| Reinvestment of distributions | 1,032 | 1,850 | 10,413 | 18,115 |
| Shares redeemed | (18,524) | (15,540) | (192,621) | (158,043) |
| Net increase (decrease) | (17,001) | (10,899) | $(177,090) | $(112,042) |
| Class C | | | | |
| Shares sold | 250,748 | 208,940 | $2,602,917 | $2,102,127 |
| Reinvestment of distributions | 19,920 | 27,197 | 199,577 | 264,712 |
| Shares redeemed | (249,625) | (317,554) | (2,534,026) | (3,194,650) |
| Net increase (decrease) | 21,043 | (81,417) | $268,468 | $(827,811) |
| International Real Estate | | | | |
| Shares sold | 6,483,374 | 7,089,024 | $69,046,559 | $73,687,897 |
| Reinvestment of distributions | 1,337,840 | 1,734,141 | 13,829,911 | 17,353,365 |
| Shares redeemed | (8,123,208) | (13,521,464) | (85,913,965) | (140,085,115) |
| Net increase (decrease) | (301,994) | (4,698,299) | $(3,037,495) | $(49,043,853) |
| Class I | | | | |
| Shares sold | 3,546,789 | 435,461 | $37,608,644 | $4,524,767 |
| Reinvestment of distributions | 33,956 | 34,703 | 349,358 | 345,746 |
| Shares redeemed | (734,873) | (771,815) | (7,744,578) | (7,996,361) |
| Net increase (decrease) | 2,845,872 | (301,651) | $30,213,424 | $(3,125,848) |
11. Other.
The Fund's organizational documents provide former and current trustees and officers with a limited indemnification against liabilities arising in connection with the performance of their duties to the Fund. In the normal course of business, the Fund may also enter into contracts that provide general indemnifications. The Fund's maximum exposure under these arrangements is unknown as this would be dependent on future claims that may be made against the Fund. The risk of material loss from such claims is considered remote.
At the end of the period, the investment adviser or its affiliates were the owners of record of 14% of the total outstanding shares of the Fund.
Report of Independent Registered Public Accounting Firm
To the Trustees of Fidelity Select Portfolios and Shareholders of Fidelity® International Real Estate Fund:
We have audited the accompanying statement of assets and liabilities of Fidelity® International Real Estate Fund (the Fund), a fund of Fidelity Select Portfolios, including the schedule of investments, as of July 31, 2015, and the related statement of operations for the year then ended, and the statement of changes in net assets and financial highlights for each of the two years in the period then ended. These financial statements and financial highlights are the responsibility of the Fund's management. Our responsibility is to express an opinion on these financial statements and financial highlights based on our audits.The financial highlights for the year ended July 31, 2013 and all prior periods presented were audited by other auditors whose report dated September 16, 2013 expressed an unqualified opinion on those financial highlights.
We conducted our audits in accordance with the standards of the Public Company Accounting Oversight Board (United States). Those standards require that we plan and perform the audit to obtain reasonable assurance about whether the financial statements and financial highlights are free of material misstatement. The Fund is not required to have, nor were we engaged to perform, an audit of its internal controls over financial reporting. Our audits included consideration of internal control over financial reporting as a basis for designing audit procedures that are appropriate in the circumstances, but not for the purpose of expressing an opinion on the effectiveness of the Fund's internal control over financial reporting. Accordingly, we express no such opinion. An audit also includes examining, on a test basis, evidence supporting the amounts and disclosures in the financial statements, assessing the accounting principles used and significant estimates made by management, as well as evaluating the overall financial statement presentation. Our procedures included confirmation of securities owned as of July 31, 2015, by correspondence with the custodians and brokers; when replies were not received from brokers, we performed other auditing procedures. We believe our audits provide a reasonable basis for our opinion.
In our opinion, such financial statements and financial highlights referred to above present fairly, in all material respects, the financial position of Fidelity® International Real Estate Fund as of July 31, 2015, the results of its operations for the year then ended, and the changes in its net assets and the financial highlights for each of the two years in the period then ended in conformity with accounting principles generally accepted in the United States of America.
DELOITTE & TOUCHE LLP
Boston, Massachusetts
September 18, 2015
Trustees and Officers
The Trustees, Members of the Advisory Board (if any), and officers of the trust and fund, as applicable, are listed below. The Board of Trustees governs the fund and is responsible for protecting the interests of shareholders. The Trustees are experienced executives who meet periodically throughout the year to oversee the fund's activities, review contractual arrangements with companies that provide services to the fund, oversee management of the risks associated with such activities and contractual arrangements, and review the fund's performance. Each of the Trustees oversees 75 funds.
The Trustees hold office without limit in time except that (a) any Trustee may resign; (b) any Trustee may be removed by written instrument, signed by at least two-thirds of the number of Trustees prior to such removal; (c) any Trustee who requests to be retired or who has become incapacitated by illness or injury may be retired by written instrument signed by a majority of the other Trustees; and (d) any Trustee may be removed at any special meeting of shareholders by a two-thirds vote of the outstanding voting securities of the trust. Officers and Advisory Board Members hold office without limit in time, except that any officer or Advisory Board Member may resign or may be removed by a vote of a majority of the Trustees at any regular meeting or any special meeting of the Trustees. Except as indicated, each individual has held the office shown or other offices in the same company for the past five years.
Each Trustee who is not an interested person (as defined in the 1940 Act) of the trust and the fund is referred to herein as an Independent Trustee.
The fund’s Statement of Additional Information (SAI) includes more information about the Trustees. To request a free copy, call Fidelity at 1-877-208-0098.
Experience, Skills, Attributes, and Qualifications of the Trustees. The Governance and Nominating Committee has adopted a statement of policy that describes the experience, qualifications, attributes, and skills that are necessary and desirable for potential Independent Trustee candidates (Statement of Policy). The Board believes that each Trustee satisfied at the time he or she was initially elected or appointed a Trustee, and continues to satisfy, the standards contemplated by the Statement of Policy. The Governance and Nominating Committee also engages professional search firms to help identify potential Independent Trustee candidates who have the experience, qualifications, attributes, and skills consistent with the Statement of Policy. From time to time, additional criteria based on the composition and skills of the current Independent Trustees, as well as experience or skills that may be appropriate in light of future changes to board composition, business conditions, and regulatory or other developments, have also been considered by the professional search firms and the Governance and Nominating Committee. In addition, the Board takes into account the Trustees' commitment and participation in Board and committee meetings, as well as their leadership of standing and ad hoc committees throughout their tenure.
In determining that a particular Trustee was and continues to be qualified to serve as a Trustee, the Board has considered a variety of criteria, none of which, in isolation, was controlling. The Board believes that, collectively, the Trustees have balanced and diverse experience, qualifications, attributes, and skills, which allow the Board to operate effectively in governing the fund and protecting the interests of shareholders. Information about the specific experience, skills, attributes, and qualifications of each Trustee, which in each case led to the Board's conclusion that the Trustee should serve (or continue to serve) as a trustee of the fund, is provided below.
Board Structure and Oversight Function. Brian B. Hogan is an interested person and currently serves as Chairman. The Trustees have determined that an interested Chairman is appropriate and benefits shareholders because an interested Chairman has a personal and professional stake in the quality and continuity of services provided to the fund. Independent Trustees exercise their informed business judgment to appoint an individual of their choosing to serve as Chairman, regardless of whether the Trustee happens to be independent or a member of management. The Independent Trustees have determined that they can act independently and effectively without having an Independent Trustee serve as Chairman and that a key structural component for assuring that they are in a position to do so is for the Independent Trustees to constitute a substantial majority for the Board. The Independent Trustees also regularly meet in executive session. Michael E. Wiley serves as Chairman of the Independent Trustees and as such (i) acts as a liaison between the Independent Trustees and management with respect to matters important to the Independent Trustees and (ii) with management prepares agendas for Board meetings.
Fidelity® funds are overseen by different Boards of Trustees. The fund's Board oversees Fidelity's sector portfolios. Other Boards oversee Fidelity's equity and high income funds, and Fidelity's investment grade bond, money market, and asset allocation funds. The use of separate Boards, each with its own committee structure, allows the Trustees of each group of Fidelity® funds to focus on the unique issues of the funds they oversee, including common research, investment, and operational issues. On occasion, the separate Boards establish joint committees to address issues of overlapping consequences for the Fidelity® funds overseen by each Board.
The Trustees operate using a system of committees to facilitate the timely and efficient consideration of all matters of importance to the Trustees, the fund, and fund shareholders and to facilitate compliance with legal and regulatory requirements and oversight of the fund's activities and associated risks. The Board, acting through its committees, has charged SelectCo and its affiliates with (i) identifying events or circumstances the occurrence of which could have demonstrably adverse effects on the fund's business and/or reputation; (ii) implementing processes and controls to lessen the possibility that such events or circumstances occur or to mitigate the effects of such events or circumstances if they do occur; and (iii) creating and maintaining a system designed to evaluate continuously business and market conditions in order to facilitate the identification and implementation processes described in (i) and (ii) above. Because the day-to-day operations and activities of the fund are carried out by or through SelectCo, its affiliates, and other service providers, the fund's exposure to risks is mitigated but not eliminated by the processes overseen by the Trustees. While each of the Board's committees has responsibility for overseeing different aspects of the fund's activities, oversight is exercised primarily through the Operations and Audit Committees. Appropriate personnel, including but not limited to the fund's Chief Compliance Officer (CCO), SelectCo's internal auditor, the independent accountants, the fund's Treasurer and portfolio management personnel, make periodic reports to the Board's committees, as appropriate. The responsibilities of each standing committee, including their oversight responsibilities, are described further under "Standing Committees of the Trustees."
Interested Trustees*:
Correspondence intended for a Trustee who is an interested person may be sent to Fidelity Investments, 245 Summer Street, Boston, Massachusetts 02210.
Name, Year of Birth; Principal Occupations and Other Relevant Experience+
Brian B. Hogan (1964)
Year of Election or Appointment: 2014
Trustee
Chairman of the Board of Trustees
Mr. Hogan also serves as Trustee or Vice President of other funds. Mr. Hogan serves as a Director of Fidelity SelectCo, LLC (investment adviser firm, 2014-present) and President of the Equity Division of FMR (investment adviser firm, 2009-present). Previously, Mr. Hogan served as Senior Vice President, Equity Research of FMR (2006-2009) and as a portfolio manager.
* Determined to be an "Interested Trustee" by virtue of, among other things, his or her affiliation with the trust or various entities under common control with SelectCo.
+ The information includes the Trustee's principal occupation during the last five years and other information relating to the experience, attributes, and skills relevant to the Trustee's qualifications to serve as a Trustee, which led to the conclusion that the Trustee should serve as a Trustee for the fund.
Independent Trustees:
Correspondence intended for an Independent Trustee may be sent to Fidelity Investments, P.O. Box 55235, Boston, Massachusetts 02205-5235.
Name, Year of Birth; Principal Occupations and Other Relevant Experience+
David A. Rosow (1942)
Year of Election or Appointment: 2013
Trustee
Mr. Rosow also serves as Trustee of other Fidelity® funds. Prior to his retirement in 2006, Mr. Rosow was the Chief Executive Officer, owner and operator of a number of private companies, which encompassed oil refining, drilling and marketing of petroleum products (including specialty petroleum products), the recreation industry, and real estate development. Previously, Mr. Rosow served as Lead Director and Chairman of the Audit Committee of Hudson United Bancorp (1996-2006), Chairman of the Board of Westport Bank and Trust (1992-1996), and as a Director of TD Banknorth (2006-2007). In addition, Mr. Rosow served as a member (2008-2014) and President (2009-2014) of the Town Council of Palm Beach, Florida. Mr. Rosow also served as a Member of the Advisory Board of other Fidelity® funds (2012-2013).
Garnett A. Smith (1947)
Year of Election or Appointment: 2013
Trustee
Mr. Smith also serves as Trustee of other Fidelity® funds. Prior to Mr. Smith's retirement, he served as Chairman and Chief Executive Officer of Inbrand Corp. (manufacturer of personal absorbent products, 1990-1997). He also served as President (1986-1990) of Inbrand Corp. Prior to his employment with Inbrand Corp., he was employed by a retail fabric chain and North Carolina National Bank. In addition, Mr. Smith served as a Member of the Advisory Board of other Fidelity® funds (2012-2013) and as a board member of the Jackson Hole Land Trust (2009-2012).
Michael E. Wiley (1950)
Year of Election or Appointment: 2008
Trustee
Chairman of the Independent Trustees
Mr. Wiley also serves as Trustee of other Fidelity® funds. Mr. Wiley serves as a Director of Tesoro Corporation (independent oil refiner and marketer, 2005-present), and a Director of Bill Barrett Corporation (exploration and production, 2005-present). In addition, Mr. Wiley also serves as a Director of Post Oak Bank (privately-held bank, 2004-present). Previously, Mr. Wiley served as a Trustee of other Fidelity® funds (2008-2013), as a Director of Asia Pacific Exploration Consolidated (international oil and gas exploration and production, 2008-2013), as a member of the Board of Trustees of the University of Tulsa (2000-2006; 2007-2010), as a Senior Energy Advisor of Katzenbach Partners, LLC (consulting, 2006-2007), as an Advisory Director of Riverstone Holdings (private investment), Chairman, President, and CEO of Baker Hughes, Inc. (oilfield services, 2000-2004), and as Director of Spinnaker Exploration Company (exploration and production, 2001-2005).
+ The information includes the Trustee's principal occupation during the last five years and other information relating to the experience, attributes, and skills relevant to the Trustee's qualifications to serve as a Trustee, which led to the conclusion that the Trustee should serve as a Trustee for the fund.
Advisory Board Members and Officers:
Except for Anthony R. Rochte, correspondence intended for an officer may be sent to Fidelity Investments, 245 Summer Street, Boston, Massachusetts 02210. Correspondence intended for Mr. Rochte may be sent to SelectCo, 1225 17th Street, Denver, Colorado 80202-5541. Officers appear below in alphabetical order.
Name, Year of Birth; Principal Occupation
Christopher S. Bartel (1971)
Year of Election or Appointment: 2009
Vice President
Mr. Bartel also serves as Vice President of other funds. Mr. Bartel serves as a Director, President, and Chief Executive Officer of Fidelity Management & Research (Japan) Limited (investment adviser firm, 2012-present), a Director of Fidelity Management & Research (Hong Kong) (investment adviser firm, 2012-present), and Senior Vice President of Global Equity Research (2010-present). Previously, Mr. Bartel served as Senior Vice President of Equity Research (2009-2010), Managing Director of Research (2006-2009), and an analyst and portfolio manager (2000-2006).
Elizabeth Paige Baumann (1968)
Year of Election or Appointment: 2012
Anti-Money Laundering (AML) Officer
Ms. Baumann also serves as AML Officer of other funds. She is Chief AML Officer of FMR LLC (diversified financial services company, 2012-present) and is an employee of Fidelity Investments. Previously, Ms. Baumann served as Vice President and Deputy Anti-Money Laundering Officer (2007-2012).
Marc Bryant (1966)
Year of Election or Appointment: 2013
Secretary and Chief Legal Officer (CLO)
Mr. Bryant also serves as Secretary and Chief Legal Officer (CLO) of other funds. He is Senior Vice President and Deputy General Counsel of FMR LLC (diversified financial services company). Previously, Mr. Bryant served as Secretary and Chief Legal Officer of Fidelity Rutland Square Trust II (2010-2014) and Assistant Secretary of Fidelity's Fixed Income and Asset Allocation Funds (2013-2015). Prior to joining Fidelity Investments, Mr. Bryant served as a Senior Vice President and the Head of Global Retail Legal for AllianceBernstein L.P. (2006-2010), and as the General Counsel for ProFund Advisors LLC (2001-2006).
William C. Coffey (1969)
Year of Election or Appointment: 2009
Assistant Secretary
Mr. Coffey also serves as Assistant Secretary of other funds. He is Senior Vice President and Deputy General Counsel of FMR LLC (diversified financial services company, 2010-present), and is an employee of Fidelity Investments. Previously, Mr. Coffey served as Vice President and Associate General Counsel of FMR LLC (2005-2009).
Jonathan Davis (1968)
Year of Election or Appointment: 2010
Assistant Treasurer
Mr. Davis also serves as Assistant Treasurer of other funds. Mr. Davis is an employee of Fidelity Investments. Previously, Mr. Davis served as Vice President and Associate General Counsel of FMR LLC (diversified financial services company, 2003-2010).
Adrien E. Deberghes (1967)
Year of Election or Appointment: 2013
President and Treasurer
Mr. Deberghes also serves as an officer of other funds. He is an employee of Fidelity Investments (2008-present). Prior to joining Fidelity Investments, Mr. Deberghes was Senior Vice President of Mutual Fund Administration at State Street Corporation (2007-2008), Senior Director of Mutual Fund Administration at Investors Bank & Trust (2005-2007), and Director of Finance for Dunkin' Brands (2000-2005).
Joseph DeSantis (1959)
Year of Election or Appointment: 2015
Vice President
Mr. DeSantis also serves as Vice President of other funds. Mr. DeSantis serves as Group Chief Investment Officer, Equities (2010-present) and is an employee of Fidelity Investments.
Stephanie J. Dorsey (1969)
Year of Election or Appointment: 2010
Assistant Treasurer
Ms. Dorsey also serves as an officer of other funds. She is an employee of Fidelity Investments (2008-present) and has served in other fund officer roles. Prior to joining Fidelity Investments, Ms. Dorsey served as Treasurer (2004-2008) of the JPMorgan Mutual Funds and Vice President (2004-2008) of JPMorgan Chase Bank.
Howard J. Galligan III (1966)
Year of Election or Appointment: 2014
Chief Financial Officer
Mr. Galligan also serves as Chief Financial Officer of other funds. Mr. Galligan serves as President of Fidelity Pricing and Cash Management Services (FPCMS) (2014-present) and as a Director of Strategic Advisers, Inc. (investment adviser firm, 2008-present). Previously, Mr. Galligan served as Chief Administrative Officer of Asset Management (2011-2014) and Chief Operating Officer and Senior Vice President of Investment Support for Strategic Advisers, Inc. (2003-2011).
James D. Gryglewicz (1972)
Year of Election or Appointment: 2014
Chief Compliance Officer
Mr. Gryglewicz also serves as Chief Compliance Officer of other funds. Mr. Gryglewicz serves as Compliance Officer of Fidelity SelectCo, LLC (investment adviser firm, 2014-present), Vice President of Asset Management Compliance (2009-present), and is an employee of Fidelity Investments (2004-present).
Brian B. Hogan (1964)
Year of Election or Appointment: 2009
Vice President
Mr. Hogan also serves as Trustee or Vice President of other funds. Mr. Hogan serves as a Director of Fidelity SelectCo, LLC (investment adviser firm, 2014-present) and President of the Equity Division of FMR (investment adviser firm, 2009-present). Previously, Mr. Hogan served as Senior Vice President, Equity Research of FMR (2006-2009) and as a portfolio manager.
Chris Maher (1972)
Year of Election or Appointment: 2013
Assistant Treasurer
Mr. Maher serves as Assistant Treasurer of other funds. Mr. Maher is Vice President of Valuation Oversight and is an employee of Fidelity Investments. Previously, Mr. Maher served as Vice President of Asset Management Compliance (2013), Vice President of the Program Management Group of FMR (investment adviser firm, 2010-2013), and Vice President of Valuation Oversight (2008-2010).
Kenneth B. Robins (1969)
Year of Election or Appointment: 2013
Deputy Treasurer
Mr. Robins also serves as an officer of other funds. Mr. Robins serves as Executive Vice President of Fidelity Investments Money Management, Inc. (FIMM) (investment adviser firm, 2013-present) and is an employee of Fidelity Investments (2004-present). Previously, Mr. Robins served in other fund officer roles.
Anthony R. Rochte (1968)
Year of Election or Appointment: 2013
Vice President
Mr. Rochte also serves as Vice President of other funds. Mr. Rochte serves as President of Fidelity SelectCo, LLC (investment adviser firm, 2012-present) and is an employee of Fidelity Investments (2012-present). Prior to joining Fidelity Investments, Mr. Rochte served as Senior Managing Director and head of State Street Global Advisors' North American Intermediary Business Group (2006-2012).
Stacie M. Smith (1974)
Year of Election or Appointment: 2013
Assistant Treasurer
Ms. Smith also serves as an officer of other funds. She is an employee of Fidelity Investments (2009-present) and has served in other fund officer roles. Prior to joining Fidelity Investments, Ms. Smith served as Senior Audit Manager of Ernst & Young LLP (1996-2009).
Renee Stagnone (1975)
Year of Election or Appointment: 2013
Deputy Treasurer
Ms. Stagnone also serves as Deputy Treasurer of other funds. Ms. Stagnone is an employee of Fidelity Investments.
Joseph F. Zambello (1957)
Year of Election or Appointment: 2011
Deputy Treasurer
Mr. Zambello also serves as Deputy Treasurer of other funds. Mr. Zambello is an employee of Fidelity Investments. Previously, Mr. Zambello served as Vice President of the Program Management Group of FMR (investment adviser firm, 2009-2011) and Vice President of the Transfer Agent Oversight Group (2005-2009).
Shareholder Expense Example
As a shareholder of a Fund, you incur two types of costs: (1) transaction costs, including sales charges (loads) on purchase payments or redemption proceeds, redemption fees and (2) ongoing costs, including management fees, distribution and/or service (12b-1) fees and other Fund expenses. This Example is intended to help you understand your ongoing costs (in dollars) of investing in the Funds and to compare these costs with the ongoing costs of investing in other mutual funds.
The Example is based on an investment of $1,000 invested at the beginning of the period and held for the entire period (February 1, 2015 to July 31, 2015).
Actual Expenses
The first line of the accompanying table for each class of the Fund provides information about actual account values and actual expenses. You may use the information in this line, together with the amount you invested, to estimate the expenses that you paid over the period. Simply divide your account value by $1,000.00 (for example, an $8,600 account value divided by $1,000.00 = 8.6), then multiply the result by the number in the first line for a class of the Fund under the heading entitled "Expenses Paid During Period" to estimate the expenses you paid on your account during this period. A small balance maintenance fee of $12.00 that is charged once a year may apply for certain accounts with a value of less than $2,000. This fee is not included in the table below. If it was, the estimate of expenses you paid during the period would be higher, and your ending account value lower, by this amount. In addition, the Fund, as a shareholder in the underlying Fidelity Central Funds, will indirectly bear its pro-rata share of the fees and expenses incurred by the underlying Fidelity Central Funds. These fees and expenses are not included in the Fund's annualized expense ratio used to calculate the expense estimate in the table below.
Hypothetical Example for Comparison Purposes
The second line of the accompanying table for each class of the Fund provides information about hypothetical account values and hypothetical expenses based on a Class' actual expense ratio and an assumed rate of return of 5% per year before expenses, which is not the Class' actual return. The hypothetical account values and expenses may not be used to estimate the actual ending account balance or expenses you paid for the period. You may use this information to compare the ongoing costs of investing in the Fund and other funds. To do so, compare this 5% hypothetical example with the 5% hypothetical examples that appear in the shareholder reports of the other funds. A small balance maintenance fee of $12.00 that is charged once a year may apply for certain accounts with a value of less than $2,000. This fee is not included in the table below. If it was, the estimate of expenses you paid during the period would be higher, and your ending account value lower, by this amount. In addition, the Fund, as a shareholder in the underlying Fidelity Central Funds, will indirectly bear its pro-rata share of the fees and expenses incurred by the underlying Fidelity Central Funds. These fees and expenses are not included in the Fund's annualized expense ratio used to calculate the expense estimate in the table below.
Please note that the expenses shown in the table are meant to highlight your ongoing costs only and do not reflect any transaction costs. Therefore, the second line of the table is useful in comparing ongoing costs only, and will not help you determine the relative total costs of owning different funds. In addition, if these transactional costs were included, your costs would have been higher.
| | Annualized Expense Ratio-A | Beginning
Account Value
February 1, 2015 | Ending
Account Value
July 31, 2015 | Expenses Paid
During Period-B
February 1, 2015
to July 31, 2015 |
| Class A | 1.33% | | | |
| Actual | | $1,000.00 | $1,031.30 | $6.70 |
| Hypothetical-C | | $1,000.00 | $1,018.20 | $6.66 |
| Class T | 1.63% | | | |
| Actual | | $1,000.00 | $1,030.50 | $8.21 |
| Hypothetical-C | | $1,000.00 | $1,016.71 | $8.15 |
| Class B | 2.12% | | | |
| Actual | | $1,000.00 | $1,027.70 | $10.66 |
| Hypothetical-C | | $1,000.00 | $1,014.28 | $10.59 |
| Class C | 2.07% | | | |
| Actual | | $1,000.00 | $1,027.90 | $10.41 |
| Hypothetical-C | | $1,000.00 | $1,014.53 | $10.34 |
| International Real Estate | 1.12% | | | |
| Actual | | $1,000.00 | $1,032.90 | $5.65 |
| Hypothetical-C | | $1,000.00 | $1,019.24 | $5.61 |
| Class I | 1.01% | | | |
| Actual | | $1,000.00 | $1,033.00 | $5.09 |
| Hypothetical-C | | $1,000.00 | $1,019.79 | $5.06 |
A Annualized expense ratio reflects expenses net of applicable fee waivers.
B Expenses are equal to each Class' annualized expense ratio, multiplied by the average account value over the period, multiplied by 181/365 (to reflect the one-half year period).
C 5% return per year before expenses.
Distributions (Unaudited)
The Board of Trustees of Fidelity Advisor International Real Estate Fund voted to pay to shareholders of record at the opening of business on record date, the following distributions per share derived from capital gains realized from sales of portfolio securities, and dividends derived from net investment income:
| | Pay Date | Record Date | Dividends | Capital Gains |
| Class I | 09/14/15 | 09/11/15 | $0.142 | $0.121 |
Class I designates 39% and 8% of the dividends distributed in September and December, respectively during the fiscal year as amounts which may be taken into account as a dividend for the purposes of the maximum rate under section 1(h)(11) of the Internal Revenue Code.
The amounts per share which represent income derived from sources within, and taxes paid to, foreign countries or possessions of the United States are as follows:
| | Pay Date | Income | Taxes |
| Class I | 09/15/2014 | $0.2222 | $0.0172 |
| | 12/22/2014 | $0.0638 | $0.0015 |
The fund will notify shareholders in January 2016 of amounts for use in preparing 2015 income tax returns.
AIREI-ANN-0915
1.843172.108
Fidelity® Real Estate Investment Portfolio
Annual Report July 31, 2015 |
|
Contents
This report and the financial statements contained herein are submitted for the general information of the shareholders of the Fund. This report is not authorized for distribution to prospective investors in the Fund unless preceded or accompanied by an effective prospectus.
A fund files its complete schedule of portfolio holdings with the SEC for the first and third quarters of each fiscal year on Form N-Q. Forms N-Q are available on the SEC’s web site at http://www.sec.gov. A fund's Forms N-Q may be reviewed and copied at the SEC’s Public Reference Room in Washington, DC. Information regarding the operation of the SEC's Public Reference Room may be obtained by calling 1-800-SEC-0330.
For a complete list of a fund's portfolio holdings, view the most recent holdings listing, semiannual report, or annual report on Fidelity's web site at http://www.fidelity.com, http://www.advisor.fidelity.com, or http://www.401k.com, as applicable.
NOT FDIC INSURED •MAY LOSE VALUE •NO BANK GUARANTEE
Neither the Fund nor Fidelity Distributors Corporation is a bank.
To view a fund's proxy voting guidelines and proxy voting record for the 12-month period ended June 30, visit http://www.fidelity.com/proxyvotingresults or visit the Securities and Exchange Commission's (SEC) web site at http://www.sec.gov.
You may also call 1-800-544-8544 to request a free copy of the proxy voting guidelines.
Standard & Poor's, S&P and S&P 500 are registered service marks of The McGraw-Hill Companies, Inc. and have been licensed for use by Fidelity Distributors Corporation.
Other third-party marks appearing herein are the property of their respective owners.
All other marks appearing herein are registered or unregistered trademarks or service marks of FMR LLC or an affiliated company. © 2015 FMR LLC. All rights reserved.
Performance: The Bottom Line
Average annual total return reflects the change in the value of an investment, assuming reinvestment of distributions from dividend income and capital gains (the profits earned upon the sale of securities that have grown in value, if any) and assuming a constant rate of performance each year.
The hypothetical investment and the average annual total returns do not reflect the deduction of taxes that a shareholder would pay on fund distributions or the redemption of fund shares.
During periods of reimbursement by Fidelity, a fund’s total return will be greater than it would be had the reimbursement not occurred.
How a fund did yesterday is no guarantee of how it will do tomorrow.
Average Annual Total Returns
| For the periods ended July 31, 2015 | Past 1 year | Past 5 years | Past 10 years |
| Fidelity® Real Estate Investment Portfolio | 10.34% | 13.49% | 6.53% |
$10,000 Over 10 Years
Let's say hypothetically that $10,000 was invested in Fidelity® Real Estate Investment Portfolio on July 31, 2005.
The chart shows how the value of your investment would have changed, and also shows how the S&P 500® Index performed over the same period.
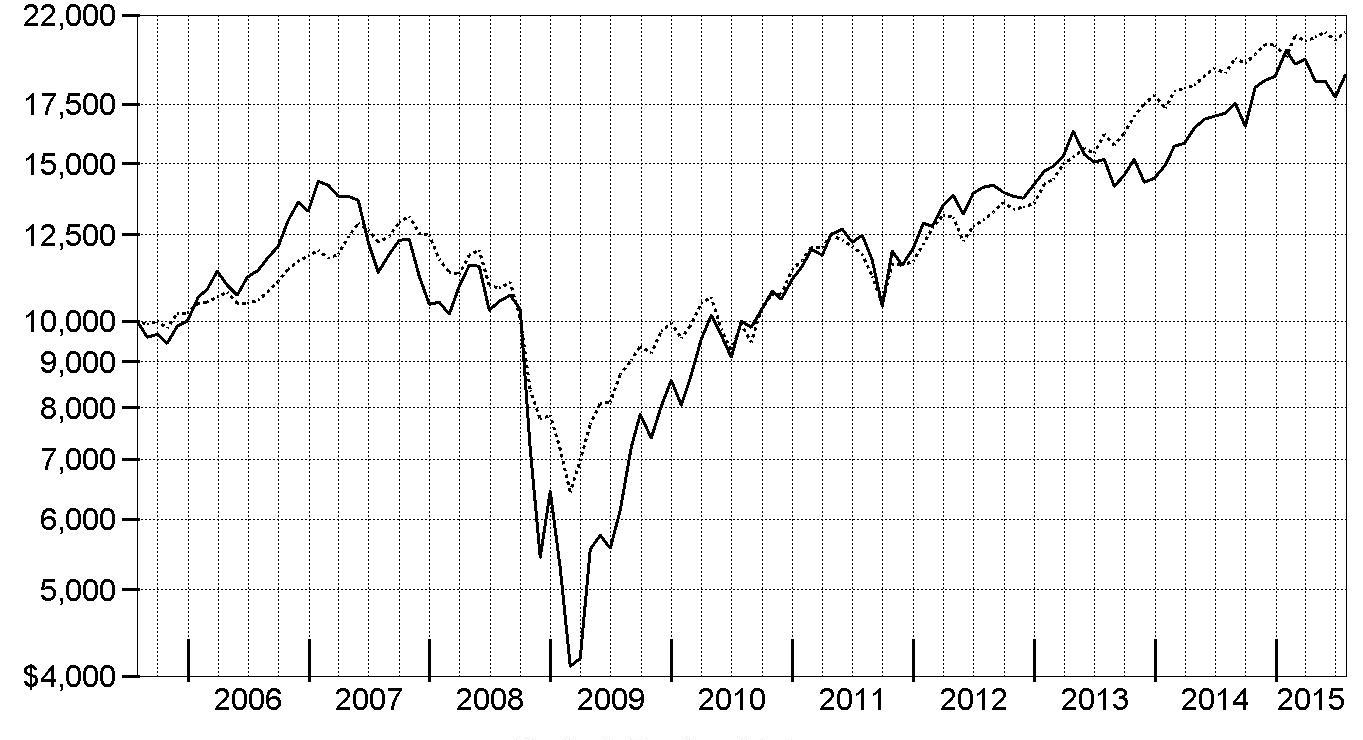
| Period Ending Values |
| $18,822 | Fidelity® Real Estate Investment Portfolio |
| $21,043 | S&P 500® Index |
Management's Discussion of Fund Performance
Market Recap: The U.S. equity market gained strongly for the 12 months ending July 31, 2015, as stocks recovered from volatility in late 2014 and early 2015, supported by a still-positive economic backdrop. The S&P 500
® Index returned 11.21%, with growth stocks in the index far outpacing value-oriented names on prospects for continued U.S. economic growth. As a result, the growth-oriented Nasdaq Composite Index
® rose 18.71%, outpacing the broader S&P 500
®, as well as the 12.03% advance of the smaller-cap Russell 2000
® Index. Within the S&P 500
®, seven of 10 sectors notched a gain, with significant performance variation. Health care (+27%) led the way, aided by merger activity. Consumer discretionary (+24%) benefited from spending linked to a seven-year low in unemployment. Strong first halves for consumer staples and the real estate segment of the financials sector yielded above-market returns (19% and 12%, respectively) for the full-year period. Conversely, energy (-26%) significantly lagged, due to a roughly 55% decline for U.S. crude-oil prices. Materials (-4%) also lost ground. At period end, investors remained focused on the slowing rate of U.S. earnings growth, the possible effect of a relatively stronger U.S. dollar on exports and inflation, and whether an economic slowdown in China would create ripples for the global economy.
Comments from Portfolio Manager Steven Buller: For the year, the fund fell short of our sector benchmark, the Dow Jones U.S. Select Real Estate Securities Index
SM, which gained 11.29%.
(For specific results, please see the Performance section of this report.) The relative result was hurt by subpar stock picking, especially in the retail subsector. Here, the fund’s biggest detractor was DDR, whose shares returned roughly -4% for the 12 months, partly because of the market’s uncertainty about a change in company management. Several other retail-oriented REITs hurt results, as well, including General Growth Properties (GGP). The biggest individual detractor was a position in Host Hotels & Resorts. Hotel owners struggled this period as the rate of revenue growth per available room declined. In contrast, the biggest positive impact came from an overweighting in self-storage REITs, the best-performing category in the Dow Jones Index. Within this group, overweightings in Extra Space Storage and Public Storage were positives; the companies’ shares rose 47% and about 23%, respectively. Another relative contributor was Senior Housing Properties Trust, an operator of senior health care facilities. We had minimal exposure to this index constituent – none, in fact, at period end – and this positioning was helpful, given the stock’s roughly -19% return.
The views expressed above reflect those of the portfolio manager(s) only through the end of the period as stated on the cover of this report and do not necessarily represent the views of Fidelity or any other person in the Fidelity organization. Any such views are subject to change at any time based upon market or other conditions and Fidelity disclaims any responsibility to update such views. These views may not be relied on as investment advice and, because investment decisions for a Fidelity fund are based on numerous factors, may not be relied on as an indication of trading intent on behalf of any Fidelity fund.
Investment Summary (Unaudited)
Top Ten Stocks as of July 31, 2015
| | % of fund's net assets | % of fund's net assets 6 months ago |
| Public Storage | 8.0 | 6.4 |
| Simon Property Group, Inc. | 6.9 | 10.3 |
| Host Hotels & Resorts, Inc. | 4.7 | 4.5 |
| Digital Realty Trust, Inc. | 4.5 | 4.1 |
| General Growth Properties, Inc. | 4.5 | 1.7 |
| Boston Properties, Inc. | 4.2 | 4.3 |
| Prologis, Inc. | 3.8 | 2.7 |
| HCP, Inc. | 3.6 | 4.1 |
| Duke Realty LP | 3.5 | 3.0 |
| DDR Corp. | 3.3 | 3.4 |
| | 47.0 | |
Top Five REIT Sectors as of July 31, 2015
| | % of fund's net assets | % of fund's net assets 6 months ago |
| REITs - Apartments | 17.9 | 17.1 |
| REITs - Regional Malls | 14.7 | 13.2 |
| REITs - Office Property | 11.7 | 12.1 |
| REITs - Storage | 10.9 | 8.3 |
| REITs - Diversified | 9.9 | 10.4 |
Asset Allocation (% of fund's net assets)
| As of July 31, 2015 |
| | Stocks | 99.2% |
| | Short-Term Investments and Net Other Assets (Liabilities) | 0.8% |

| As of January 31, 2015 |
| | Stocks | 96.5% |
| | Short-Term Investments and Net Other Assets (Liabilities) | 3.5% |

Investments July 31, 2015
Showing Percentage of Net Assets
| Common Stocks - 99.2% | | | |
| | | Shares | Value (000s) |
| Health Care Providers & Services - 0.1% | | | |
| Health Care Facilities - 0.1% | | | |
| Capital Senior Living Corp. (a) | | 210,000 | $4,681 |
| Real Estate Investment Trusts - 97.5% | | | |
| REITs - Apartments - 17.9% | | | |
| American Campus Communities, Inc. | | 2,468,603 | 92,128 |
| Apartment Investment & Management Co. Class A | | 1,968,374 | 76,924 |
| AvalonBay Communities, Inc. | | 393,200 | 67,764 |
| Camden Property Trust (SBI) | | 1,083,600 | 86,287 |
| Equity Residential (SBI) | | 1,926,800 | 144,144 |
| Essex Property Trust, Inc. | | 581,900 | 130,875 |
| Post Properties, Inc. | | 747,300 | 42,551 |
| UDR, Inc. | | 4,303,241 | 145,493 |
| | | | 786,166 |
| REITs - Diversified - 9.9% | | | |
| Cousins Properties, Inc. | | 4,540,000 | 47,125 |
| Digital Realty Trust, Inc. (b) | | 3,111,000 | 199,944 |
| Duke Realty LP | | 7,570,600 | 152,699 |
| DuPont Fabros Technology, Inc. | | 1,136,000 | 34,250 |
| | | | 434,018 |
| REITs - Health Care - 6.9% | | | |
| HCP, Inc. | | 4,078,500 | 157,593 |
| Ventas, Inc. | | 2,137,754 | 143,422 |
| | | | 301,015 |
| REITs - Hotels - 6.0% | | | |
| Ashford Hospitality Prime, Inc. | | 351,667 | 5,120 |
| DiamondRock Hospitality Co. | | 3,218,200 | 40,582 |
| Host Hotels & Resorts, Inc. | | 10,498,405 | 203,459 |
| RLJ Lodging Trust | | 451,300 | 13,462 |
| | | | 262,623 |
| REITs - Manufactured Homes - 3.8% | | | |
| Equity Lifestyle Properties, Inc. | | 1,798,687 | 104,108 |
| Sun Communities, Inc. | | 914,363 | 63,557 |
| | | | 167,665 |
| REITs - Office Property - 11.7% | | | |
| Alexandria Real Estate Equities, Inc. | | 426,000 | 39,494 |
| Boston Properties, Inc. | | 1,477,200 | 182,109 |
| Brandywine Realty Trust (SBI) | | 1,882,100 | 25,917 |
| Douglas Emmett, Inc. | | 1,647,000 | 48,274 |
| Highwoods Properties, Inc. (SBI) | | 903,123 | 38,229 |
| Hudson Pacific Properties, Inc. | | 190,000 | 5,848 |
| New York (REIT), Inc. | | 3,825,203 | 39,629 |
| Piedmont Office Realty Trust, Inc. Class A | | 1,220,600 | 22,227 |
| SL Green Realty Corp. | | 945,946 | 108,916 |
| | | | 510,643 |
| REITs - Regional Malls - 14.7% | | | |
| General Growth Properties, Inc. | | 7,344,200 | 199,322 |
| Simon Property Group, Inc. | | 1,604,772 | 300,445 |
| Tanger Factory Outlet Centers, Inc. | | 1,511,300 | 49,087 |
| The Macerich Co. | | 1,199,200 | 94,929 |
| | | | 643,783 |
| REITs - Shopping Centers - 9.1% | | | |
| Acadia Realty Trust (SBI) | | 1,059,000 | 33,867 |
| Cedar Shopping Centers, Inc. | | 1,128,305 | 7,560 |
| DDR Corp. | | 9,004,867 | 146,779 |
| Kimco Realty Corp. | | 5,226,600 | 129,149 |
| Kite Realty Group Trust | | 1,837,150 | 48,501 |
| Ramco-Gershenson Properties Trust (SBI) | | 1,949,124 | 33,018 |
| | | | 398,874 |
| REITs - Storage - 10.9% | | | |
| Extra Space Storage, Inc. | | 1,702,600 | 125,175 |
| Public Storage | | 1,708,200 | 350,490 |
| | | | 475,665 |
| REITs - Warehouse/Industrial - 6.6% | | | |
| Chambers Street Properties | | 3,561,566 | 26,427 |
| DCT Industrial Trust, Inc. | | 2,307,873 | 80,222 |
| Prologis, Inc. | | 4,145,400 | 168,345 |
| Terreno Realty Corp. | | 728,361 | 15,274 |
| | | | 290,268 |
|
| TOTAL REAL ESTATE INVESTMENT TRUSTS | | | 4,270,720 |
|
| Real Estate Management & Development - 1.6% | | | |
| Real Estate Operating Companies - 1.6% | | | |
| Forest City Enterprises, Inc. Class A (a) | | 2,997,700 | 69,996 |
| TOTAL COMMON STOCKS | | | |
| (Cost $3,328,335) | | | 4,345,397 |
|
| Money Market Funds - 1.3% | | | |
| Fidelity Cash Central Fund, 0.17% (c) | | 35,117,138 | 35,117 |
| Fidelity Securities Lending Cash Central Fund, 0.18% (c)(d) | | 22,176,000 | 22,176 |
| TOTAL MONEY MARKET FUNDS | | | |
| (Cost $57,293) | | | 57,293 |
| TOTAL INVESTMENT PORTFOLIO - 100.5% | | | |
| (Cost $3,385,628) | | | 4,402,690 |
| NET OTHER ASSETS (LIABILITIES) - (0.5)% | | | (20,957) |
| NET ASSETS - 100% | | | $4,381,733 |
Legend
(a) Non-income producing
(b) Security or a portion of the security is on loan at period end.
(c) Affiliated fund that is generally available only to investment companies and other accounts managed by Fidelity Investments. The rate quoted is the annualized seven-day yield of the fund at period end. A complete unaudited listing of the fund's holdings as of its most recent quarter end is available upon request. In addition, each Fidelity Central Fund's financial statements, which are not covered by the Fund's Report of Independent Registered Public Accounting Firm, are available on the SEC's website or upon request.
(d) Investment made with cash collateral received from securities on loan.
Affiliated Central Funds
Information regarding fiscal year to date income earned by the Fund from investments in Fidelity Central Funds is as follows:
| Fund | Income earned |
| | (Amounts in thousands) |
| Fidelity Cash Central Fund | $74 |
| Fidelity Securities Lending Cash Central Fund | 163 |
| Total | $237 |
Investment Valuation
All investments are categorized as Level 1 under the Fair Value Hierarchy. The inputs or methodology used for valuing securities may not be an indication of the risk associated with investing in those securities. For more information on valuation inputs please refer to the Investment Valuation section in the accompanying Notes to Financial Statements.
See accompanying notes which are an integral part of the financial statements.
Financial Statements
Statement of Assets and Liabilities
| Amounts in thousands (except per-share amount) | | July 31, 2015 |
| Assets | | |
Investment in securities, at value (including securities loaned of $21,595) — See accompanying schedule:
Unaffiliated issuers (cost $3,328,335) | $4,345,397 | |
| Fidelity Central Funds (cost $57,293) | 57,293 | |
| Total Investments (cost $3,385,628) | | $4,402,690 |
| Receivable for investments sold | | 21,732 |
| Receivable for fund shares sold | | 2,300 |
| Dividends receivable | | 591 |
| Distributions receivable from Fidelity Central Funds | | 12 |
| Other receivables | | 155 |
| Total assets | | 4,427,480 |
| Liabilities | | |
| Payable for investments purchased | $12,419 | |
| Payable for fund shares redeemed | 8,186 | |
| Accrued management fee | 1,996 | |
| Other affiliated payables | 838 | |
| Other payables and accrued expenses | 132 | |
| Collateral on securities loaned, at value | 22,176 | |
| Total liabilities | | 45,747 |
| Net Assets | | $4,381,733 |
| Net Assets consist of: | | |
| Paid in capital | | $3,236,912 |
| Undistributed net investment income | | 13,584 |
| Accumulated undistributed net realized gain (loss) on investments and foreign currency transactions | | 114,175 |
| Net unrealized appreciation (depreciation) on investments | | 1,017,062 |
| Net Assets, for 107,400 shares outstanding | | $4,381,733 |
| Net Asset Value, offering price and redemption price per share ($4,381,733 ÷ 107,400 shares) | | $40.80 |
See accompanying notes which are an integral part of the financial statements.
Statement of Operations
| Amounts in thousands | | Year ended July 31, 2015 |
| Investment Income | | |
| Dividends | | $109,959 |
| Income from Fidelity Central Funds | | 237 |
| Total income | | 110,196 |
| Expenses | | |
| Management fee | $24,835 | |
| Transfer agent fees | 9,129 | |
| Accounting and security lending fees | 1,074 | |
| Custodian fees and expenses | 55 | |
| Independent trustees' compensation | 79 | |
| Registration fees | 114 | |
| Audit | 59 | |
| Legal | 53 | |
| Miscellaneous | 49 | |
| Total expenses before reductions | 35,447 | |
| Expense reductions | (290) | 35,157 |
| Net investment income (loss) | | 75,039 |
Realized and Unrealized Gain (Loss)
Net realized gain (loss) on: | | |
| Investment securities: | | |
| Unaffiliated issuers | 203,425 | |
| Total net realized gain (loss) | | 203,425 |
| Change in net unrealized appreciation (depreciation) on investment securities | | 123,115 |
| Net gain (loss) | | 326,540 |
| Net increase (decrease) in net assets resulting from operations | | $401,579 |
See accompanying notes which are an integral part of the financial statements.
Statement of Changes in Net Assets
| Amounts in thousands | Year ended July 31, 2015 | Year ended July 31, 2014 |
| Increase (Decrease) in Net Assets | | |
| Operations | | |
| Net investment income (loss) | $75,039 | $65,571 |
| Net realized gain (loss) | 203,425 | 66,238 |
| Change in net unrealized appreciation (depreciation) | 123,115 | 290,661 |
| Net increase (decrease) in net assets resulting from operations | 401,579 | 422,470 |
| Distributions to shareholders from net investment income | (69,332) | (69,055) |
| Distributions to shareholders from net realized gain | – | (2,117) |
| Total distributions | (69,332) | (71,172) |
| Share transactions | | |
| Proceeds from sales of shares | 1,073,115 | 708,676 |
| Reinvestment of distributions | 63,235 | 64,818 |
| Cost of shares redeemed | (1,123,146) | (1,049,208) |
| Net increase (decrease) in net assets resulting from share transactions | 13,204 | (275,714) |
| Redemption fees | 659 | 349 |
| Total increase (decrease) in net assets | 346,110 | 75,933 |
| Net Assets | | |
| Beginning of period | 4,035,623 | 3,959,690 |
| End of period (including undistributed net investment income of $13,584 and undistributed net investment income of $9,580, respectively) | $4,381,733 | $4,035,623 |
Other Information
Shares | | |
| Sold | 26,155 | 20,292 |
| Issued in reinvestment of distributions | 1,576 | 1,984 |
| Redeemed | (27,772) | (31,199) |
| Net increase (decrease) | (41) | (8,923) |
See accompanying notes which are an integral part of the financial statements.
Financial Highlights
| | | July 31, | | | |
| Years ended July 31, | 2015 | 2014 | 2013 | 2012 | 2011 |
| Selected Per–Share Data | | | | | |
| Net asset value, beginning of period | $37.56 | $34.03 | $32.18 | $28.76 | $23.32 |
| Income from Investment Operations | | | | | |
| Net investment income (loss)A | .67 | .61 | .56 | .36 | .24 |
| Net realized and unrealized gain (loss) | 3.19 | 3.58 | 1.76 | 3.41 | 5.47 |
| Total from investment operations | 3.86 | 4.19 | 2.32 | 3.77 | 5.71 |
| Distributions from net investment income | (.63) | (.64) | (.47) | (.35) | (.27) |
| Distributions from net realized gain | – | (.02) | – | – | – |
| Total distributions | (.63) | (.66) | (.47) | (.35) | (.27) |
| Redemption fees added to paid in capitalA | .01 | –B | –B | –B | –B |
| Net asset value, end of period | $40.80 | $37.56 | $34.03 | $32.18 | $28.76 |
| Total ReturnC | 10.34% | 12.61% | 7.28% | 13.31% | 24.67% |
| Ratios to Average Net AssetsD,E | | | | | |
| Expenses before reductions | .78% | .80% | .81% | .84% | .85% |
| Expenses net of fee waivers, if any | .78% | .80% | .81% | .84% | .85% |
| Expenses net of all reductions | .78% | .80% | .80% | .84% | .85% |
| Net investment income (loss) | 1.66% | 1.78% | 1.69% | 1.28% | .90% |
| Supplemental Data | | | | | |
| Net assets, end of period (in millions) | $4,382 | $4,036 | $3,960 | $3,690 | $3,542 |
| Portfolio turnover rateF | 34% | 24% | 26% | 26% | 25% |
A Calculated based on average shares outstanding during the period.
B Amount represents less than $.01 per share.
C Total returns would have been lower if certain expenses had not been reduced during the applicable periods shown.
D Fees and expenses of any underlying Fidelity Central Funds are not included in the Fund's expense ratio. The Fund indirectly bears its proportionate share of the expenses of any underlying Fidelity Central Funds.
E Expense ratios reflect operating expenses of the Fund. Expenses before reductions do not reflect amounts reimbursed by the investment adviser or reductions from brokerage service arrangements or reductions from other expense offset arrangements and do not represent the amount paid by the Fund during periods when reimbursements or reductions occur. Expenses net of fee waivers reflect expenses after reimbursement by the investment adviser but prior to reductions from brokerage service arrangements or other expense offset arrangements. Expenses net of all reductions represent the net expenses paid by the Fund.
F Amount does not include the portfolio activity of any underlying Fidelity Central Funds.
See accompanying notes which are an integral part of the financial statements.
Notes to Financial Statements
For the period ended July 31, 2015
(Amounts in thousands except percentages)
1. Organization.
Fidelity Real Estate Investment Portfolio (the Fund) is a non-diversified fund of Fidelity Select Portfolios (the Trust) and is authorized to issue an unlimited number of shares. Share transactions on the Statement of Changes in Net Assets may contain exchanges between funds. The Trust is registered under the Investment Company Act of 1940, as amended (the 1940 Act), as an open-end management investment company organized as a Massachusetts business trust.
2. Investments in Fidelity Central Funds.
The Fund invests in Fidelity Central Funds, which are open-end investment companies generally available only to other investment companies and accounts managed by the investment adviser and its affiliates. The Fund's Schedule of Investments lists each of the Fidelity Central Funds held as of period end, if any, as an investment of the Fund, but does not include the underlying holdings of each Fidelity Central Fund. As an Investing Fund, the Fund indirectly bears its proportionate share of the expenses of the underlying Fidelity Central Funds.
The Money Market Central Funds seek preservation of capital and current income and are managed by Fidelity Investments Money Management, Inc. (FIMM), an affiliate of the investment adviser. Annualized expenses of the Money Market Central Funds as of their most recent shareholder report date are less than .01%.
A complete unaudited list of holdings for each Fidelity Central Fund is available upon request or at the Securities and Exchange Commission (the SEC) website at www.sec.gov. In addition, the financial statements of the Fidelity Central Funds, which are not covered by the Fund's Report of Independent Registered Public Accounting Firm, are available on the SEC website or upon request.
3. Significant Accounting Policies.
The financial statements have been prepared in conformity with accounting principles generally accepted in the United States of America (GAAP), which require management to make certain estimates and assumptions at the date of the financial statements. Actual results could differ from those estimates. Subsequent events, if any, through the date that the financial statements were issued have been evaluated in the preparation of the financial statements. The following summarizes the significant accounting policies of the Fund:
Investment Valuation. Investments are valued as of 4:00 p.m. Eastern time on the last calendar day of the period. The Board of Trustees (the Board) has delegated the day to day responsibility for the valuation of the Fund's investments to the Fidelity SelectCo, LLC (SelectCo) Fair Value Committee (the Committee). In accordance with valuation policies and procedures approved by the Board, the Fund attempts to obtain prices from one or more third party pricing vendors or brokers to value its investments. When current market prices, quotations or currency exchange rates are not readily available or reliable, investments will be fair valued in good faith by the Committee, in accordance with procedures adopted by the Board. Factors used in determining fair value vary by investment type and may include market or investment specific events. The frequency with which these procedures are used cannot be predicted and they may be utilized to a significant extent. The Committee oversees the Fund's valuation policies and procedures and reports to the Board on the Committee's activities and fair value determinations. The Board monitors the appropriateness of the procedures used in valuing the Fund's investments and ratifies the fair value determinations of the Committee.
The Fund categorizes the inputs to valuation techniques used to value its investments into a disclosure hierarchy consisting of three levels as shown below:
- Level 1 – quoted prices in active markets for identical investments
- Level 2 – other significant observable inputs (including quoted prices for similar investments, interest rates, prepayment speeds, etc.)
- Level 3 – unobservable inputs (including the Fund's own assumptions based on the best information available)
Valuation techniques used to value the Fund's investments by major category are as follows:
Equity securities, including restricted securities, for which market quotations are readily available, are valued at the last reported sale price or official closing price as reported by a third party pricing vendor on the primary market or exchange on which they are traded and are categorized as Level 1 in the hierarchy. In the event there were no sales during the day or closing prices are not available, securities are valued at the last quoted bid price or may be valued using the last available price and are generally categorized as Level 2 in the hierarchy. For foreign equity securities, when market or security specific events arise, comparisons to the valuation of American Depositary Receipts (ADRs), futures contracts, Exchange-Traded Funds (ETFs) and certain indexes as well as quoted prices for similar securities may be used and would be categorized as Level 2 in the hierarchy. Utilizing these techniques may result in transfers between Level 1 and Level 2. For equity securities, including restricted securities, where observable inputs are limited, assumptions about market activity and risk are used and these securities may be categorized as Level 3 in the hierarchy.
Investments in open-end mutual funds, including the Fidelity Central Funds, are valued at their closing net asset value (NAV) each business day and are categorized as Level 1 in the hierarchy.
Changes in valuation techniques may result in transfers in or out of an assigned level within the disclosure hierarchy.
Foreign Currency. The Fund may use foreign currency contracts to facilitate transactions in foreign-denominated securities. Gains and losses from these transactions may arise from changes in the value of the foreign currency or if the counterparties do not perform under the contracts' terms.
Foreign-denominated assets, including investment securities, and liabilities are translated into U.S. dollars at the exchange rates at period end. Purchases and sales of investment securities, income and dividends received and expenses denominated in foreign currencies are translated into U.S. dollars at the exchange rate in effect on the transaction date.
The effects of exchange rate fluctuations on investments are included with the net realized and unrealized gain (loss) on investment securities. Other foreign currency transactions resulting in realized and unrealized gain (loss) are disclosed separately.
Investment Transactions and Income. For financial reporting purposes, the Fund's investment holdings and NAV include trades executed through the end of the last business day of the period. The NAV per share for processing shareholder transactions is calculated as of the close of business of the New York Stock Exchange (NYSE), normally 4:00 p.m. Eastern time and includes trades executed through the end of the prior business day. Gains and losses on securities sold are determined on the basis of identified cost. Dividend income is recorded on the ex-dividend date, except for certain dividends from foreign securities where the ex-dividend date may have passed, which are recorded as soon as the Fund is informed of the ex-dividend date. Non-cash dividends included in dividend income, if any, are recorded at the fair market value of the securities received. Income and capital gain distributions from Fidelity Central Funds, if any, are recorded on the ex-dividend date. Distributions received on securities that represent a return of capital or capital gain are recorded as a reduction of cost of investments and/or as a realized gain. Subsequent to ex-dividend date the Fund determines the components of these distributions, based upon receipt of tax filings or other correspondence relating to the underlying investment. Investment income is recorded net of foreign taxes withheld where recovery of such taxes is uncertain.
Expenses. Expenses directly attributable to a fund are charged to that fund. Expenses attributable to more than one fund are allocated among the respective funds on the basis of relative net assets or other appropriate methods. Expense estimates are accrued in the period to which they relate and adjustments are made when actual amounts are known.
Deferred Trustee Compensation. Under a Deferred Compensation Plan (the Plan), independent Trustees may elect to defer receipt of a portion of their annual compensation. Deferred amounts are invested in a cross-section of Fidelity funds, are marked-to-market and remain in the Fund until distributed in accordance with the Plan. The investment of deferred amounts and the offsetting payable to the Trustees are included in the accompanying Statement of Assets and Liabilities.
Income Tax Information and Distributions to Shareholders. Each year, the Fund intends to qualify as a regulated investment company under Subchapter M of the Internal Revenue Code, including distributing substantially all of its taxable income and realized gains. As a result, no provision for U.S. Federal income taxes is required. As of July 31, 2015, the Fund did not have any unrecognized tax benefits in the financial statements; nor is the Fund aware of any tax positions for which it is reasonably possible that the total amounts of unrecognized tax benefits will significantly change in the next twelve months. The Fund files a U.S. federal tax return, in addition to state and local tax returns as required. The Fund's federal income tax returns are subject to examination by the Internal Revenue Service (IRS) for a period of three fiscal years after they are filed. State and local tax returns may be subject to examination for an additional fiscal year depending on the jurisdiction. Foreign taxes are provided for based on the Fund's understanding of the tax rules and rates that exist in the foreign markets in which it invests.
Distributions are declared and recorded on the ex-dividend date. Income and capital gain distributions are determined in accordance with income tax regulations, which may differ from GAAP. In addition, the Fund claimed a portion of the payment made to redeeming shareholders as a distribution for income tax purposes.
Capital accounts within the financial statements are adjusted for permanent book-tax differences. These adjustments have no impact on net assets or the results of operations. Capital accounts are not adjusted for temporary book-tax differences which will reverse in a subsequent period.
Book-tax differences are primarily due to foreign currency transactions, deferred trustees compensation and losses deferred due to wash sales and excise tax regulations.
The federal tax cost of investment securities and unrealized appreciation (depreciation) as of period end were as follows:
| Gross unrealized appreciation | $1,124,742 |
| Gross unrealized depreciation | (144,971) |
| Net unrealized appreciation (depreciation) on securities | $979,771 |
| Tax Cost | $3,422,919 |
The tax-based components of distributable earnings as of period end were as follows:
| Undistributed ordinary income | $13,667 |
| Undistributed long-term capital gain | $151,466 |
| Net unrealized appreciation (depreciation) on securities and other investments | $979,771 |
The tax character of distributions paid was as follows:
| | July 31, 2015 | July 31, 2015 |
| Ordinary Income | $69,332 | $ 69,055 |
| Long-term Capital Gains | – | 2,117 |
| Total | $69,332 | $ 71,172 |
Short-Term Trading (Redemption) Fees. Shares held by investors in the Fund less than 90 days may have been subject to a redemption fee equal to .75% of the NAV of shares redeemed. All redemption fees, which reduce the proceeds of the shareholder redemption, are retained by the Fund and accounted for as an addition to paid in capital.
4. Purchases and Sales of Investments.
Purchases and sales of securities, other than short-term securities, aggregated $1,571,570 and $1,513,985, respectively.
5. Fees and Other Transactions with Affiliates.
Management Fee. Fidelity SelectCo, LLC (the investment adviser) and its affiliates provide the Fund with investment management related services for which the Fund pays a monthly management fee. The management fee is the sum of an individual fund fee rate that is based on an annual rate of .30% of the Fund's average net assets and an annualized group fee rate that averaged .25% during the period. The group fee rate is based upon the average net assets of all the mutual funds advised by Fidelity Management & Research Company (FMR) and the investment adviser. The group fee rate decreases as assets under management increase and increases as assets under management decrease. For the reporting period, the total annual management fee rate was .55% of the Fund's average net assets.
Transfer Agent Fees. Fidelity Investments Institutional Operations Company, Inc. (FIIOC), an affiliate of the investment adviser, is the Fund's transfer, dividend disbursing and shareholder servicing agent. FIIOC receives account fees and asset-based fees that vary according to account size and type of account. FIIOC pays for typesetting, printing and mailing of shareholder reports, except proxy statements. For the period, the transfer agent fees were equivalent to an annual rate of .20% of average net assets.
Accounting and Security Lending Fees. Fidelity Service Company, Inc. (FSC), an affiliate of the investment adviser, maintains the Fund's accounting records. The accounting fee is based on the level of average net assets for each month. Under a separate contract, FSC administers the security lending program. The security lending fee is based on the number and duration of lending transactions.
Brokerage Commissions. The Fund placed a portion of its portfolio transactions with brokerage firms which are affiliates of the investment adviser. Brokerage commissions are included in net realized gain (loss) and change in net unrealized appreciation (depreciation) in the Statement of Operations. The commissions paid to these affiliated firms were $25 for the period.
6. Committed Line of Credit.
The Fund participates with other funds managed by the investment adviser or an affiliate in a $4.25 billion credit facility (the "line of credit") to be utilized for temporary or emergency purposes to fund shareholder redemptions or for other short-term liquidity purposes. The Fund has agreed to pay commitment fees on its pro-rata portion of the line of credit, which amounted to $7 and is reflected in Miscellaneous expenses on the Statement of Operations. During the period, the Fund did not borrow on this line of credit.
7. Security Lending.
The Fund lends portfolio securities through a lending agent from time to time in order to earn additional income. On the settlement date of the loan, the Fund receives collateral (in the form of U.S. Treasury obligations, letters of credit and/or cash) against the loaned securities and maintains collateral in an amount not less than 100% of the market value of the loaned securities during the period of the loan. The market value of the loaned securities is determined at the close of business of the Fund and any additional required collateral is delivered to the Fund on the next business day. If the borrower defaults on its obligation to return the securities loaned because of insolvency or other reasons, the Fund may apply collateral received from the borrower against the obligation. The Fund may experience delays and costs in recovering the securities loaned. Any cash collateral received is invested in the Fidelity Securities Lending Cash Central Fund. The value of loaned securities and cash collateral at period end are disclosed on the Fund's Statement of Assets and Liabilities. Security lending income represents the income earned on investing cash collateral, less rebates paid to borrowers and any lending agent fees associated with the loan, plus any premium payments received for lending certain types of securities. Security lending income is presented in the Statement of Operations as a component of income from Fidelity Central Funds. Total security lending income during the period amounted to $163.
8. Expense Reductions.
Commissions paid to certain brokers with whom the investment adviser, or its affiliates, places trades on behalf of the Fund include an amount in addition to trade execution, which may be rebated back to the Fund to offset certain expenses. This amount totaled $171 for the period. In addition, through arrangements with the Fund's custodian, credits realized as a result of uninvested cash balances were used to reduce the Fund's expenses. During the period, these credits reduced the Fund's custody expenses in the amount of less than five hundred dollars.
In addition, during the period the investment adviser reimbursed/waived a portion of fund-level operating expenses in the amount of $17 and a portion of class-level operating expenses in the amount of $102.
9. Other.
The Fund's organizational documents provide former and current trustees and officers with a limited indemnification against liabilities arising in connection with the performance of their duties to the Fund. In the normal course of business, the Fund may also enter into contracts that provide general indemnifications. The Fund's maximum exposure under these arrangements is unknown as this would be dependent on future claims that may be made against the Fund. The risk of material loss from such claims is considered remote.
Report of Independent Registered Public Accounting Firm
To the Trustees of Fidelity Select Portfolios and Shareholders of Fidelity® Real Estate Investment Portfolio:
We have audited the accompanying statement of assets and liabilities of Fidelity® Real Estate Investment Portfolio (the Fund), a fund of Fidelity Select Portfolios, including the schedule of investments, as of July 31, 2015, and the related statement of operations for the year then ended, and the statement of changes in net assets and the financial highlights for each of the two years in the period then ended. These financial statements and financial highlights are the responsibility of the Fund's management. Our responsibility is to express an opinion on these financial statements and financial highlights based on our audits. The financial highlights for the year ended July 31, 2013 and all prior periods presented were audited by other auditors whose report dated September 13, 2013, expressed an unqualified opinion on those financial highlights.
We conducted our audit in accordance with the standards of the Public Company Accounting Oversight Board (United States). Those standards require that we plan and perform the audit to obtain reasonable assurance about whether the financial statements and financial highlights are free of material misstatement. The Fund is not required to have, nor were we engaged to perform, an audit of its internal controls over financial reporting. Our audits included consideration of internal control over financial reporting as a basis for designing audit procedures that are appropriate in the circumstances, but not for the purpose of expressing an opinion on the effectiveness of the Fund's internal control over financial reporting. Accordingly, we express no such opinion. An audit also includes examining, on a test basis, evidence supporting the amounts and disclosures in the financial statements, assessing the accounting principles used and significant estimates made by management, as well as evaluating the overall financial statement presentation. Our procedures included confirmation of securities owned as of July 31, 2015, by correspondence with the custodians and brokers; when replies were not received from brokers, we performed other auditing procedures. We believe our audits provide a reasonable basis for our opinion.
In our opinion, such financial statements and financial highlights referred to above present fairly, in all material respects, the financial position of Fidelity® Real Estate Investment Portfolio as of July 31, 2015, the results of its operations for the year then ended, and the changes in its net assets and the financial highlights for each of the two years in the period then ended, in conformity with accounting principles generally accepted in the United States of America.
DELOITTE & TOUCHE LLP
Boston, Massachusetts
September 18, 2015
Trustees and Officers
The Trustees, Members of the Advisory Board (if any), and officers of the trust and fund, as applicable, are listed below. The Board of Trustees governs the fund and is responsible for protecting the interests of shareholders. The Trustees are experienced executives who meet periodically throughout the year to oversee the fund's activities, review contractual arrangements with companies that provide services to the fund, oversee management of the risks associated with such activities and contractual arrangements, and review the fund's performance. Each of the Trustees oversees 75 funds.
The Trustees hold office without limit in time except that (a) any Trustee may resign; (b) any Trustee may be removed by written instrument, signed by at least two-thirds of the number of Trustees prior to such removal; (c) any Trustee who requests to be retired or who has become incapacitated by illness or injury may be retired by written instrument signed by a majority of the other Trustees; and (d) any Trustee may be removed at any special meeting of shareholders by a two-thirds vote of the outstanding voting securities of the trust. Officers and Advisory Board Members hold office without limit in time, except that any officer or Advisory Board Member may resign or may be removed by a vote of a majority of the Trustees at any regular meeting or any special meeting of the Trustees. Except as indicated, each individual has held the office shown or other offices in the same company for the past five years.
Each Trustee who is not an interested person (as defined in the 1940 Act) of the trust and the fund is referred to herein as an Independent Trustee.
The fund’s Statement of Additional Information (SAI) includes more information about the Trustees. To request a free copy, call Fidelity at 1-800-544-8544.
Experience, Skills, Attributes, and Qualifications of the Trustees. The Governance and Nominating Committee has adopted a statement of policy that describes the experience, qualifications, attributes, and skills that are necessary and desirable for potential Independent Trustee candidates (Statement of Policy). The Board believes that each Trustee satisfied at the time he or she was initially elected or appointed a Trustee, and continues to satisfy, the standards contemplated by the Statement of Policy. The Governance and Nominating Committee also engages professional search firms to help identify potential Independent Trustee candidates who have the experience, qualifications, attributes, and skills consistent with the Statement of Policy. From time to time, additional criteria based on the composition and skills of the current Independent Trustees, as well as experience or skills that may be appropriate in light of future changes to board composition, business conditions, and regulatory or other developments, have also been considered by the professional search firms and the Governance and Nominating Committee. In addition, the Board takes into account the Trustees' commitment and participation in Board and committee meetings, as well as their leadership of standing and ad hoc committees throughout their tenure.
In determining that a particular Trustee was and continues to be qualified to serve as a Trustee, the Board has considered a variety of criteria, none of which, in isolation, was controlling. The Board believes that, collectively, the Trustees have balanced and diverse experience, qualifications, attributes, and skills, which allow the Board to operate effectively in governing the fund and protecting the interests of shareholders. Information about the specific experience, skills, attributes, and qualifications of each Trustee, which in each case led to the Board's conclusion that the Trustee should serve (or continue to serve) as a trustee of the fund, is provided below.
Board Structure and Oversight Function. Brian B. Hogan is an interested person and currently serves as Chairman. The Trustees have determined that an interested Chairman is appropriate and benefits shareholders because an interested Chairman has a personal and professional stake in the quality and continuity of services provided to the fund. Independent Trustees exercise their informed business judgment to appoint an individual of their choosing to serve as Chairman, regardless of whether the Trustee happens to be independent or a member of management. The Independent Trustees have determined that they can act independently and effectively without having an Independent Trustee serve as Chairman and that a key structural component for assuring that they are in a position to do so is for the Independent Trustees to constitute a substantial majority for the Board. The Independent Trustees also regularly meet in executive session. Michael E. Wiley serves as Chairman of the Independent Trustees and as such (i) acts as a liaison between the Independent Trustees and management with respect to matters important to the Independent Trustees and (ii) with management prepares agendas for Board meetings.
Fidelity® funds are overseen by different Boards of Trustees. The fund's Board oversees Fidelity's sector portfolios. Other Boards oversee Fidelity's equity and high income funds, and Fidelity's investment grade bond, money market, and asset allocation funds. The use of separate Boards, each with its own committee structure, allows the Trustees of each group of Fidelity® funds to focus on the unique issues of the funds they oversee, including common research, investment, and operational issues. On occasion, the separate Boards establish joint committees to address issues of overlapping consequences for the Fidelity® funds overseen by each Board.
The Trustees operate using a system of committees to facilitate the timely and efficient consideration of all matters of importance to the Trustees, the fund, and fund shareholders and to facilitate compliance with legal and regulatory requirements and oversight of the fund's activities and associated risks. The Board, acting through its committees, has charged SelectCo and its affiliates with (i) identifying events or circumstances the occurrence of which could have demonstrably adverse effects on the fund's business and/or reputation; (ii) implementing processes and controls to lessen the possibility that such events or circumstances occur or to mitigate the effects of such events or circumstances if they do occur; and (iii) creating and maintaining a system designed to evaluate continuously business and market conditions in order to facilitate the identification and implementation processes described in (i) and (ii) above. Because the day-to-day operations and activities of the fund are carried out by or through SelectCo, its affiliates, and other service providers, the fund's exposure to risks is mitigated but not eliminated by the processes overseen by the Trustees. While each of the Board's committees has responsibility for overseeing different aspects of the fund's activities, oversight is exercised primarily through the Operations and Audit Committees. Appropriate personnel, including but not limited to the fund's Chief Compliance Officer (CCO), SelectCo's internal auditor, the independent accountants, the fund's Treasurer and portfolio management personnel, make periodic reports to the Board's committees, as appropriate. The responsibilities of each standing committee, including their oversight responsibilities, are described further under "Standing Committees of the Trustees."
Interested Trustees*:
Correspondence intended for a Trustee who is an interested person may be sent to Fidelity Investments, 245 Summer Street, Boston, Massachusetts 02210.
Name, Year of Birth; Principal Occupations and Other Relevant Experience+
Brian B. Hogan (1964)
Year of Election or Appointment: 2014
Trustee
Chairman of the Board of Trustees
Mr. Hogan also serves as Trustee or Vice President of other funds. Mr. Hogan serves as a Director of Fidelity SelectCo, LLC (investment adviser firm, 2014-present) and President of the Equity Division of FMR (investment adviser firm, 2009-present). Previously, Mr. Hogan served as Senior Vice President, Equity Research of FMR (2006-2009) and as a portfolio manager.
* Determined to be an "Interested Trustee" by virtue of, among other things, his or her affiliation with the trust or various entities under common control with SelectCo.
+ The information includes the Trustee's principal occupation during the last five years and other information relating to the experience, attributes, and skills relevant to the Trustee's qualifications to serve as a Trustee, which led to the conclusion that the Trustee should serve as a Trustee for the fund.
Independent Trustees:
Correspondence intended for an Independent Trustee may be sent to Fidelity Investments, P.O. Box 55235, Boston, Massachusetts 02205-5235.
Name, Year of Birth; Principal Occupations and Other Relevant Experience+
David A. Rosow (1942)
Year of Election or Appointment: 2013
Trustee
Mr. Rosow also serves as Trustee of other Fidelity® funds. Prior to his retirement in 2006, Mr. Rosow was the Chief Executive Officer, owner and operator of a number of private companies, which encompassed oil refining, drilling and marketing of petroleum products (including specialty petroleum products), the recreation industry, and real estate development. Previously, Mr. Rosow served as Lead Director and Chairman of the Audit Committee of Hudson United Bancorp (1996-2006), Chairman of the Board of Westport Bank and Trust (1992-1996), and as a Director of TD Banknorth (2006-2007). In addition, Mr. Rosow served as a member (2008-2014) and President (2009-2014) of the Town Council of Palm Beach, Florida. Mr. Rosow also served as a Member of the Advisory Board of other Fidelity® funds (2012-2013).
Garnett A. Smith (1947)
Year of Election or Appointment: 2013
Trustee
Mr. Smith also serves as Trustee of other Fidelity® funds. Prior to Mr. Smith's retirement, he served as Chairman and Chief Executive Officer of Inbrand Corp. (manufacturer of personal absorbent products, 1990-1997). He also served as President (1986-1990) of Inbrand Corp. Prior to his employment with Inbrand Corp., he was employed by a retail fabric chain and North Carolina National Bank. In addition, Mr. Smith served as a Member of the Advisory Board of other Fidelity® funds (2012-2013) and as a board member of the Jackson Hole Land Trust (2009-2012).
Michael E. Wiley (1950)
Year of Election or Appointment: 2008
Trustee
Chairman of the Independent Trustees
Mr. Wiley also serves as Trustee of other Fidelity® funds. Mr. Wiley serves as a Director of Tesoro Corporation (independent oil refiner and marketer, 2005-present), and a Director of Bill Barrett Corporation (exploration and production, 2005-present). In addition, Mr. Wiley also serves as a Director of Post Oak Bank (privately-held bank, 2004-present). Previously, Mr. Wiley served as a Trustee of other Fidelity® funds (2008-2013), as a Director of Asia Pacific Exploration Consolidated (international oil and gas exploration and production, 2008-2013), as a member of the Board of Trustees of the University of Tulsa (2000-2006; 2007-2010), as a Senior Energy Advisor of Katzenbach Partners, LLC (consulting, 2006-2007), as an Advisory Director of Riverstone Holdings (private investment), Chairman, President, and CEO of Baker Hughes, Inc. (oilfield services, 2000-2004), and as Director of Spinnaker Exploration Company (exploration and production, 2001-2005).
+ The information includes the Trustee's principal occupation during the last five years and other information relating to the experience, attributes, and skills relevant to the Trustee's qualifications to serve as a Trustee, which led to the conclusion that the Trustee should serve as a Trustee for the fund.
Advisory Board Members and Officers:
Except for Anthony R. Rochte, correspondence intended for an officer may be sent to Fidelity Investments, 245 Summer Street, Boston, Massachusetts 02210. Correspondence intended for Mr. Rochte may be sent to SelectCo, 1225 17th Street, Denver, Colorado 80202-5541. Officers appear below in alphabetical order.
Name, Year of Birth; Principal Occupation
Christopher S. Bartel (1971)
Year of Election or Appointment: 2009
Vice President
Mr. Bartel also serves as Vice President of other funds. Mr. Bartel serves as a Director, President, and Chief Executive Officer of Fidelity Management & Research (Japan) Limited (investment adviser firm, 2012-present), a Director of Fidelity Management & Research (Hong Kong) (investment adviser firm, 2012-present), and Senior Vice President of Global Equity Research (2010-present). Previously, Mr. Bartel served as Senior Vice President of Equity Research (2009-2010), Managing Director of Research (2006-2009), and an analyst and portfolio manager (2000-2006).
Elizabeth Paige Baumann (1968)
Year of Election or Appointment: 2012
Anti-Money Laundering (AML) Officer
Ms. Baumann also serves as AML Officer of other funds. She is Chief AML Officer of FMR LLC (diversified financial services company, 2012-present) and is an employee of Fidelity Investments. Previously, Ms. Baumann served as Vice President and Deputy Anti-Money Laundering Officer (2007-2012).
Marc Bryant (1966)
Year of Election or Appointment: 2013
Secretary and Chief Legal Officer (CLO)
Mr. Bryant also serves as Secretary and Chief Legal Officer (CLO) of other funds. He is Senior Vice President and Deputy General Counsel of FMR LLC (diversified financial services company). Previously, Mr. Bryant served as Secretary and Chief Legal Officer of Fidelity Rutland Square Trust II (2010-2014) and Assistant Secretary of Fidelity's Fixed Income and Asset Allocation Funds (2013-2015). Prior to joining Fidelity Investments, Mr. Bryant served as a Senior Vice President and the Head of Global Retail Legal for AllianceBernstein L.P. (2006-2010), and as the General Counsel for ProFund Advisors LLC (2001-2006).
William C. Coffey (1969)
Year of Election or Appointment: 2009
Assistant Secretary
Mr. Coffey also serves as Assistant Secretary of other funds. He is Senior Vice President and Deputy General Counsel of FMR LLC (diversified financial services company, 2010-present), and is an employee of Fidelity Investments. Previously, Mr. Coffey served as Vice President and Associate General Counsel of FMR LLC (2005-2009).
Jonathan Davis (1968)
Year of Election or Appointment: 2010
Assistant Treasurer
Mr. Davis also serves as Assistant Treasurer of other funds. Mr. Davis is an employee of Fidelity Investments. Previously, Mr. Davis served as Vice President and Associate General Counsel of FMR LLC (diversified financial services company, 2003-2010).
Adrien E. Deberghes (1967)
Year of Election or Appointment: 2013
President and Treasurer
Mr. Deberghes also serves as an officer of other funds. He is an employee of Fidelity Investments (2008-present). Prior to joining Fidelity Investments, Mr. Deberghes was Senior Vice President of Mutual Fund Administration at State Street Corporation (2007-2008), Senior Director of Mutual Fund Administration at Investors Bank & Trust (2005-2007), and Director of Finance for Dunkin' Brands (2000-2005).
Joseph DeSantis (1959)
Year of Election or Appointment: 2015
Vice President
Mr. DeSantis also serves as Vice President of other funds. Mr. DeSantis serves as Group Chief Investment Officer, Equities (2010-present) and is an employee of Fidelity Investments.
Stephanie J. Dorsey (1969)
Year of Election or Appointment: 2010
Assistant Treasurer
Ms. Dorsey also serves as an officer of other funds. She is an employee of Fidelity Investments (2008-present) and has served in other fund officer roles. Prior to joining Fidelity Investments, Ms. Dorsey served as Treasurer (2004-2008) of the JPMorgan Mutual Funds and Vice President (2004-2008) of JPMorgan Chase Bank.
Howard J. Galligan III (1966)
Year of Election or Appointment: 2014
Chief Financial Officer
Mr. Galligan also serves as Chief Financial Officer of other funds. Mr. Galligan serves as President of Fidelity Pricing and Cash Management Services (FPCMS) (2014-present) and as a Director of Strategic Advisers, Inc. (investment adviser firm, 2008-present). Previously, Mr. Galligan served as Chief Administrative Officer of Asset Management (2011-2014) and Chief Operating Officer and Senior Vice President of Investment Support for Strategic Advisers, Inc. (2003-2011).
James D. Gryglewicz (1972)
Year of Election or Appointment: 2014
Chief Compliance Officer
Mr. Gryglewicz also serves as Chief Compliance Officer of other funds. Mr. Gryglewicz serves as Compliance Officer of Fidelity SelectCo, LLC (investment adviser firm, 2014-present), Vice President of Asset Management Compliance (2009-present), and is an employee of Fidelity Investments (2004-present).
Brian B. Hogan (1964)
Year of Election or Appointment: 2009
Vice President
Mr. Hogan also serves as Trustee or Vice President of other funds. Mr. Hogan serves as a Director of Fidelity SelectCo, LLC (investment adviser firm, 2014-present) and President of the Equity Division of FMR (investment adviser firm, 2009-present). Previously, Mr. Hogan served as Senior Vice President, Equity Research of FMR (2006-2009) and as a portfolio manager.
Chris Maher (1972)
Year of Election or Appointment: 2013
Assistant Treasurer
Mr. Maher serves as Assistant Treasurer of other funds. Mr. Maher is Vice President of Valuation Oversight and is an employee of Fidelity Investments. Previously, Mr. Maher served as Vice President of Asset Management Compliance (2013), Vice President of the Program Management Group of FMR (investment adviser firm, 2010-2013), and Vice President of Valuation Oversight (2008-2010).
Kenneth B. Robins (1969)
Year of Election or Appointment: 2013
Deputy Treasurer
Mr. Robins also serves as an officer of other funds. Mr. Robins serves as Executive Vice President of Fidelity Investments Money Management, Inc. (FIMM) (investment adviser firm, 2013-present) and is an employee of Fidelity Investments (2004-present). Previously, Mr. Robins served in other fund officer roles.
Anthony R. Rochte (1968)
Year of Election or Appointment: 2013
Vice President
Mr. Rochte also serves as Vice President of other funds. Mr. Rochte serves as President of Fidelity SelectCo, LLC (investment adviser firm, 2012-present) and is an employee of Fidelity Investments (2012-present). Prior to joining Fidelity Investments, Mr. Rochte served as Senior Managing Director and head of State Street Global Advisors' North American Intermediary Business Group (2006-2012).
Stacie M. Smith (1974)
Year of Election or Appointment: 2013
Assistant Treasurer
Ms. Smith also serves as an officer of other funds. She is an employee of Fidelity Investments (2009-present) and has served in other fund officer roles. Prior to joining Fidelity Investments, Ms. Smith served as Senior Audit Manager of Ernst & Young LLP (1996-2009).
Renee Stagnone (1975)
Year of Election or Appointment: 2013
Deputy Treasurer
Ms. Stagnone also serves as Deputy Treasurer of other funds. Ms. Stagnone is an employee of Fidelity Investments.
Joseph F. Zambello (1957)
Year of Election or Appointment: 2011
Deputy Treasurer
Mr. Zambello also serves as Deputy Treasurer of other funds. Mr. Zambello is an employee of Fidelity Investments. Previously, Mr. Zambello served as Vice President of the Program Management Group of FMR (investment adviser firm, 2009-2011) and Vice President of the Transfer Agent Oversight Group (2005-2009).
Shareholder Expense Example
As a shareholder of the Fund, you incur two types of costs: (1) transaction costs, including redemption fees and (2) ongoing costs, including management fees and other Fund expenses. This Example is intended to help you understand your ongoing costs (in dollars) of investing in the Fund and to compare these costs with the ongoing costs of investing in other mutual funds.
The Example is based on an investment of $1,000 invested at the beginning of the period and held for the entire period (January 1, 2015 to June 30, 2015).
Actual Expenses
The first line of the accompanying table provides information about actual account values and actual expenses. You may use the information in this line, together with the amount you invested, to estimate the expenses that you paid over the period. Simply divide your account value by $1,000.00 (for example, an $8,600 account value divided by $1,000.00 = 8.6), then multiply the result by the number in the first line under the heading entitled "Expenses Paid During Period" to estimate the expenses you paid on your account during this period. A small balance maintenance fee of $12.00 that is charged once a year may apply for certain accounts with a value of less than $2,000. This fee is not included in the table below. If it was, the estimate of expenses you paid during the period would be higher, and your ending account value lower, by this amount. In addition, the Fund, as a shareholder in the underlying Fidelity Central Funds, will indirectly bear its pro-rata share of the fees and expenses incurred by the underlying Fidelity Central Funds. These fees and expenses are not included in the Fund's annualized expense ratio used to calculate the expense estimate in the table below.
Hypothetical Example for Comparison Purposes
The second line of the accompanying table provides information about hypothetical account values and hypothetical expenses based on the Fund's actual expense ratio and an assumed rate of return of 5% per year before expenses, which is not the Fund's actual return. The hypothetical account values and expenses may not be used to estimate the actual ending account balance or expenses you paid for the period. You may use this information to compare the ongoing costs of investing in the Fund and other funds. To do so, compare this 5% hypothetical example with the 5% hypothetical examples that appear in the shareholder reports of the other funds. A small balance maintenance fee of $12.00 that is charged once a year may apply for certain accounts with a value of less than $2,000. This fee is not included in the table below. If it was, the estimate of expenses you paid during the period would be higher, and your ending account value lower, by this amount. In addition, the Fund, as a shareholder in the underlying Fidelity Central Funds, will indirectly bear its pro-rata share of the fees and expenses incurred by the underlying Fidelity Central Funds. These fees and expenses are not included in the Fund's annualized expense ratio used to calculate the expense estimate in the table below.
Please note that the expenses shown in the table are meant to highlight your ongoing costs only and do not reflect any transaction costs. Therefore, the second line of the table is useful in comparing ongoing costs only, and will not help you determine the relative total costs of owning different funds. In addition, if these transactional costs were included, your costs would have been higher.
| | Annualized Expense Ratio-A | Beginning
Account Value
February 1, 2015 | Ending
Account Value
July 31, 2015 | Expenses Paid
During Period-B
February 1, 2015
to July 31, 2015 |
| Actual | .78% | $1,000.00 | $936.20 | $3.74 |
| Hypothetical-C | | $1,000.00 | $1,020.93 | $3.91 |
A Annualized expense ratio reflects expenses net of applicable fee waivers.
B Expenses are equal to the Fund's annualized expense ratio, multiplied by the average account value over the period, multiplied by 181/365 (to reflect the one-half year period).
C 5% return per year before expenses.
Distributions (Unaudited)
The Board of Trustees of Fidelity Real Estate Investment Portfolio voted to pay on September 14, 2015 to shareholders of record at the opening of business on September 11, 2015, a distribution of $1.430 per share derived from capital gains realized from sales of portfolio securities and a dividend of $0.175 per share from net investment income.
The fund hereby designates as a capital gain dividend with respect to the taxable year ended July 31, 2015, $156,333,925, or, if subsequently determined to be different, the net capital gain of such year.
A total of 0.01% of the dividends distributed during the fiscal year was derived from interest on U.S. Government securities which is generally exempt from state income tax.
The fund will notify shareholders in January 2016 of amounts for use in preparing 2015 income tax returns.
Corporate Headquarters
245 Summer St.
Boston, MA 02210
www.fidelity.com
REA-ANN-0915
1.700141.118
Item 2.
Code of Ethics
As of the end of the period, July 31, 2015, Fidelity Select Portfolios (the trust) has adopted a code of ethics, as defined in Item 2 of Form N-CSR, that applies to its President and Treasurer and its Chief Financial Officer. A copy of the code of ethics is filed as an exhibit to this Form N-CSR.
Item 3.
Audit Committee Financial Expert
The Board of Trustees of the trust has determined that David A. Rosow is an audit committee financial expert, as defined in Item 3 of Form N-CSR. Mr. Rosow is independent for purposes of Item 3 of Form N-CSR.
Item 4.
Principal Accountant Fees and Services
Fees and Services
The following table presents fees billed by Deloitte & Touche LLP, the member firms of Deloitte Touche Tohmatsu, and their respective affiliates (collectively, “Deloitte Entities”) in each of the last two fiscal years for services rendered to Fidelity International Real Estate Fund and Fidelity Real Estate Investment Portfolio (the “Funds”):
Services Billed by Deloitte Entities
July 31, 2015 FeesA
| | | | |
| Audit Fees | Audit-Related Fees | Tax Fees | All Other Fees |
Fidelity International Real Estate Fund | $48,000 | $- | $6,000 | $700 |
Fidelity Real Estate Investment Portfolio | $43,000 | $- | $5,800 | $1,600 |
| | | | |
| Audit Fees | Audit-Related Fees | Tax Fees | All Other Fees |
Fidelity International Real Estate Fund | $51,000 | $- | $6,100 | $900 |
Fidelity Real Estate Investment Portfolio | $50,000 | $- | $5,900 | $1,700 |
A Amounts may reflect rounding.
The following table presents fees billed by Deloitte Entities that were required to be approved by the Audit Committee for services that relate directly to the operations and financial reporting of the Funds and that are rendered on behalf of Fidelity SelectCo, LLC (“SelectCo”) and entities controlling, controlled by, or under common control with SelectCo (not including any sub-adviser whose role is primarily portfolio management and is subcontracted with or overseen by another investment adviser) that provide ongoing services to the Funds (“Fund Service Providers”):
Services Billed by Deloitte Entities
| | |
| July 31, 2015A | July 31, 2014A |
Audit-Related Fees | $- | $355,000 |
Tax Fees | $- | $- |
All Other Fees | $175,000 | $745,000 |
A Amounts may reflect rounding.
“Audit-Related Fees” represent fees billed for assurance and related services that are reasonably related to the performance of the fund audit or the review of the fund's financial statements and that are not reported under Audit Fees.
“Tax Fees” represent fees billed for tax compliance, tax advice or tax planning that relate directly to the operations and financial reporting of the fund.
“All Other Fees” represent fees billed for services provided to the fund or Fund Service Provider, a significant portion of which are assurance related, that relate directly to the operations and financial reporting of the fund, excluding those services that are reported under Audit Fees, Audit-Related Fees or Tax Fees.
Assurance services must be performed by an independent public accountant.
* * *
The aggregate non-audit fees billed by Deloitte Entities for services rendered to the Funds, SelectCo (not including any sub-adviser whose role is primarily portfolio management and is subcontracted with or overseen by another investment adviser), and any Fund Service Provider for each of the last two fiscal years of the Funds are as follows:
| | |
Billed By | July 31, 2015 A | July 31, 2014 A |
Deloitte Entities | $550,000 | $1,950,000 |
A Amounts may reflect rounding.
The trust's Audit Committee has considered non-audit services that were not pre-approved that were provided by Deloitte Entities to Fund Service Providers to be compatible with maintaining the independence of Deloitte Entities in its audit of the Funds, taking into account representations from Deloitte Entities, in accordance with Public Company Accounting Oversight Board rules, regarding its independence from the Funds and its related entities and SelectCo’s review of the appropriateness and permissibility under applicable law of such non-audit services prior to their provision to the Fund Service Providers.
Audit Committee Pre-Approval Policies and Procedures
The trust’s Audit Committee must pre-approve all audit and non-audit services provided by a fund’s independent registered public accounting firm relating to the operations or financial reporting of the fund. Prior to the commencement of any audit or non-audit services to a fund, the Audit Committee reviews the services to determine whether they are appropriate and permissible under applicable law.
The Audit Committee has adopted policies and procedures to, among other purposes, provide a framework for the Committee’s consideration of non-audit services by the audit firms that audit the Fidelity funds. The policies and procedures require that any non-audit service provided by a fund audit firm to a Fidelity fund and any non-audit service provided by a fund auditor to a Fund Service Provider that relates directly to the operations and financial reporting of a Fidelity fund (“Covered Service”) are subject to approval by the Audit Committee before such service is provided.
All Covered Services must be approved in advance of provision of the service either: (i) by formal resolution of the Audit Committee, or (ii) by oral or written approval of the service by the Chair of the Audit Committee (or if the Chair is unavailable, such other member of the Audit Committee as may be designated by the Chair to act in the Chair’s absence). The approval contemplated by (ii) above is permitted where the Treasurer determines that action on such an engagement is necessary before the next meeting of the Audit Committee.
Non-audit services provided by a fund audit firm to a Fund Service Provider that do not relate directly to the operations and financial reporting of a Fidelity fund are reported to the Audit Committee on a periodic basis.
Non-Audit Services Approved Pursuant to Rule 2-01(c)(7)(i)(C) and (ii) of Regulation S-X (“De Minimis Exception”)
There were no non-audit services approved or required to be approved by the Audit Committee pursuant to the De Minimis Exception during the Funds’ last two fiscal years relating to services provided to (i) the Funds or (ii) any Fund Service Provider that relate directly to the operations and financial reporting of the Funds.
Item 5.
Audit Committee of Listed Registrants
Not applicable.
Item 6.
Investments
(a)
Not applicable.
(b)
Not applicable
Item 7.
Disclosure of Proxy Voting Policies and Procedures for Closed-End Management Investment Companies
Not applicable.
Item 8.
Portfolio Managers of Closed-End Management Investment Companies
Not applicable.
Item 9.
Purchase of Equity Securities by Closed-End Management Investment Company and Affiliated Purchasers
Not applicable.
Item 10.
Submission of Matters to a Vote of Security Holders
There were no material changes to the procedures by which shareholders may recommend nominees to the trust’s Board of Trustees.
Item 11.
Controls and Procedures
(a)(i) The President and Treasurer and the Chief Financial Officer have concluded that the trust’s disclosure controls and procedures (as defined in Rule 30a-3(c) under the Investment Company Act) provide reasonable assurances that material information relating to the trust is made known to them by the appropriate persons, based on their evaluation of these controls and procedures as of a date within 90 days of the filing date of this report.
(a)(ii) There was no change in the trust’s internal control over financial reporting (as defined in Rule 30a-3(d) under the Investment Company Act) that occurred during the second fiscal quarter of the period covered by this report that has materially affected, or is reasonably likely to materially affect, the trust’s internal control over financial reporting.
Item 12.
Exhibits
| | |
(a) | (1) | Code of Ethics pursuant to Item 2 of Form N-CSR is filed and attached hereto as EX-99.CODE ETH. |
(a) | (2) | Certification pursuant to Rule 30a-2(a) under the Investment Company Act of 1940 (17 CFR 270.30a-2(a)) is filed and attached hereto as Exhibit 99.CERT. |
(a) | (3) | Not applicable. |
(b) | | Certification pursuant to Rule 30a-2(b) under the Investment Company Act of 1940 (17 CFR 270.30a-2(b)) is furnished and attached hereto as Exhibit 99.906CERT. |
SIGNATURES
Pursuant to the requirements of the Securities Exchange Act of 1934 and the Investment Company Act of 1940, the registrant has duly caused this report to be signed on its behalf by the undersigned, thereunto duly authorized.
Fidelity Select Portfolios
| |
By: | /s/Adrien E. Deberghes |
| Adrien E. Deberghes |
| President and Treasurer |
| |
Date: | September 25, 2015 |
Pursuant to the requirements of the Securities Exchange Act of 1934 and the Investment Company Act of 1940, this report has been signed below by the following persons on behalf of the registrant and in the capacities and on the dates indicated.
| |
By: | /s/ Adrien E. Deberghes |
| Adrien E. Deberghes |
| President and Treasurer |
| |
Date: | September 25, 2015 |
| |
By: | /s/Howard J. Galligan III |
| Howard J. Galligan III |
| Chief Financial Officer |
| |
Date: | September 25, 2015 |