UNITED STATES
SECURITIES AND EXCHANGE COMMISSION
Washington, D.C. 20549
FORM N-CSR
CERTIFIED SHAREHOLDER REPORT OF REGISTERED
MANAGEMENT INVESTMENT COMPANIES
Investment Company Act file number 811-3114
Fidelity Select Portfolios
(Exact name of registrant as specified in charter)
245 Summer St., Boston, MA 02210
(Address of principal executive offices) (Zip code)
Marc Bryant, Secretary
245 Summer St.
Boston, Massachusetts 02210
(Name and address of agent for service)
Registrant's telephone number, including area code:
617-563-7000
| |
Date of fiscal year end: | February 28 |
|
|
Date of reporting period: | August 31, 2017 |
Item 1.
Reports to Stockholders
Fidelity® Select Portfolios®
Information Technology Sector Communications Equipment Portfolio
Computers Portfolio
IT Services Portfolio
Semiconductors Portfolio
Software and IT Services Portfolio
Technology Portfolio
Semi-Annual Report August 31, 2017 |
 |
Contents
To view a fund's proxy voting guidelines and proxy voting record for the 12-month period ended June 30, visit http://www.fidelity.com/proxyvotingresults or visit the Securities and Exchange Commission's (SEC) web site at http://www.sec.gov.
You may also call 1-800-544-8544 to request a free copy of the proxy voting guidelines.
Standard & Poor's, S&P and S&P 500 are registered service marks of The McGraw-Hill Companies, Inc. and have been licensed for use by Fidelity Distributors Corporation.
Other third-party marks appearing herein are the property of their respective owners.
All other marks appearing herein are registered or unregistered trademarks or service marks of FMR LLC or an affiliated company. © 2017 FMR LLC. All rights reserved.
This report and the financial statements contained herein are submitted for the general information of the shareholders of the Funds. This report is not authorized for distribution to prospective investors in the Funds unless preceded or accompanied by an effective prospectus.
A fund files its complete schedule of portfolio holdings with the SEC for the first and third quarters of each fiscal year on Form N-Q. Forms N-Q are available on the SEC’s web site at http://www.sec.gov. A fund's Forms N-Q may be reviewed and copied at the SEC’s Public Reference Room in Washington, DC. Information regarding the operation of the SEC's Public Reference Room may be obtained by calling 1-800-SEC-0330.
For a complete list of a fund's portfolio holdings, view the most recent holdings listing, semiannual report, or annual report on Fidelity's web site at http://www.fidelity.com, http://www.institutional.fidelity.com, or http://www.401k.com, as applicable.
NOT FDIC INSURED •MAY LOSE VALUE •NO BANK GUARANTEE
Neither the Funds nor Fidelity Distributors Corporation is a bank.
Communications Equipment Portfolio
Investment Summary (Unaudited)
Top Ten Stocks as of August 31, 2017
| | % of fund's net assets | % of fund's net assets 6 months ago |
| Cisco Systems, Inc. | 24.4 | 24.4 |
| Nokia Corp. sponsored ADR | 8.3 | 4.4 |
| Harris Corp. | 6.9 | 4.9 |
| CommScope Holding Co., Inc. | 6.3 | 6.1 |
| F5 Networks, Inc. | 4.9 | 4.6 |
| Juniper Networks, Inc. | 4.8 | 4.3 |
| Telefonaktiebolaget LM Ericsson (B Shares) sponsored ADR | 4.5 | 4.9 |
| Brocade Communications Systems, Inc. | 2.7 | 2.2 |
| Palo Alto Networks, Inc. | 2.4 | 2.1 |
| Finisar Corp. | 2.2 | 2.4 |
| | 67.4 | |
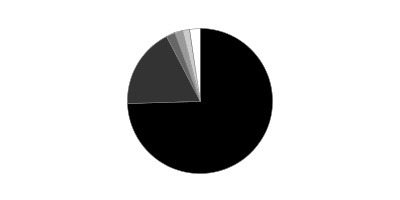
Top Industries (% of fund's net assets)
| As of August 31, 2017 |
| | Communications Equipment | 88.3% |
| | Semiconductors & Semiconductor Equipment | 4.1% |
| | Electronic Equipment & Components | 2.2% |
| | Internet Software & Services | 2.0% |
| | Technology Hardware, Storage & Peripherals | 0.8% |
| | All Others* | 2.6% |

* Includes Short-Term investments and Net Other Assets (Liabilities).
| As of February 28, 2017 |
| | Communications Equipment | 74.4% |
| | Semiconductors & Semiconductor Equipment | 18.0% |
| | Technology Hardware, Storage & Peripherals | 2.0% |
| | Electronic Equipment & Components | 1.7% |
| | Internet Software & Services | 1.7% |
| | All Others* | 2.2% |
* Includes Short-Term investments and Net Other Assets (Liabilities).
Communications Equipment Portfolio
Investments August 31, 2017 (Unaudited)
Showing Percentage of Net Assets
| Common Stocks - 99.3% | | | |
| | | Shares | Value |
| Communications Equipment - 88.3% | | | |
| Communications Equipment - 88.3% | | | |
| ADTRAN, Inc. | | 121,800 | $2,691,780 |
| Arista Networks, Inc. (a) | | 14,800 | 2,607,020 |
| Arris International PLC (a) | | 111,841 | 3,115,890 |
| Brocade Communications Systems, Inc. | | 403,250 | 4,992,235 |
| Calix Networks, Inc. (a) | | 300,521 | 1,472,553 |
| Ciena Corp. (a) | | 15,600 | 337,116 |
| Cisco Systems, Inc. | | 1,395,299 | 44,942,580 |
| CommScope Holding Co., Inc. (a) | | 352,371 | 11,649,385 |
| Comtech Telecommunications Corp. | | 25,300 | 495,121 |
| EchoStar Holding Corp. Class A (a) | | 23,000 | 1,386,900 |
| F5 Networks, Inc. (a) | | 76,235 | 9,100,934 |
| Finisar Corp. (a) | | 170,100 | 4,107,915 |
| Harmonic, Inc. (a) | | 31,400 | 102,050 |
| Harris Corp. | | 103,400 | 12,707,860 |
| Infinera Corp. (a) | | 139,614 | 1,181,134 |
| InterDigital, Inc. | | 39,900 | 2,846,865 |
| Juniper Networks, Inc. | | 322,112 | 8,932,166 |
| Lumentum Holdings, Inc. (a) | | 47,520 | 2,701,512 |
| Mitel Networks Corp. (a) | | 164,300 | 1,337,402 |
| Motorola Solutions, Inc. | | 36,259 | 3,195,143 |
| NETGEAR, Inc. (a) | | 24,650 | 1,183,200 |
| NetScout Systems, Inc. (a) | | 55,900 | 1,830,725 |
| Nokia Corp. sponsored ADR (b) | | 2,481,003 | 15,332,599 |
| Oclaro, Inc. (a)(b) | | 122,300 | 1,028,543 |
| Palo Alto Networks, Inc. (a) | | 33,100 | 4,392,039 |
| Plantronics, Inc. | | 27,534 | 1,173,774 |
| Radware Ltd. (a) | | 47,991 | 845,122 |
| Sandvine Corp. (U.K.) | | 552,000 | 1,931,724 |
| ShoreTel, Inc. (a) | | 236,500 | 1,761,925 |
| Sierra Wireless, Inc. (a) | | 2,300 | 50,964 |
| Sonus Networks, Inc. (a) | | 185,960 | 1,284,984 |
| Telefonaktiebolaget LM Ericsson (B Shares) sponsored ADR | | 1,429,680 | 8,335,034 |
| ViaSat, Inc. (a)(b) | | 7,900 | 502,519 |
| Viavi Solutions, Inc. (a) | | 344,200 | 3,455,768 |
| | | | 163,012,481 |
| Diversified Financial Services - 0.4% | | | |
| Other Diversified Financial Services - 0.4% | | | |
| Quantenna Communications, Inc. | | 37,000 | 687,460 |
| Electronic Equipment & Components - 2.2% | | | |
| Electronic Manufacturing Services - 1.3% | | | |
| Fabrinet (a) | | 20,400 | 792,336 |
| Jabil, Inc. | | 35,800 | 1,122,330 |
| TE Connectivity Ltd. | | 4,600 | 366,160 |
| | | | 2,280,826 |
| Technology Distributors - 0.9% | | | |
| CDW Corp. | | 14,500 | 919,590 |
| Dell Technologies, Inc. | | 10,159 | 761,214 |
| | | | 1,680,804 |
|
| TOTAL ELECTRONIC EQUIPMENT & COMPONENTS | | | 3,961,630 |
|
| Internet Software & Services - 2.0% | | | |
| Internet Software & Services - 2.0% | | | |
| Akamai Technologies, Inc. (a) | | 4,000 | 188,600 |
| Alphabet, Inc.: | | | |
| Class A (a) | | 1,580 | 1,509,279 |
| Class C (a) | | 1,405 | 1,319,759 |
| LogMeIn, Inc. | | 4,008 | 458,515 |
| Web.com Group, Inc. (a) | | 5,900 | 149,270 |
| | | | 3,625,423 |
| IT Services - 0.7% | | | |
| IT Consulting & Other Services - 0.7% | | | |
| Cognizant Technology Solutions Corp. Class A | | 7,250 | 513,083 |
| Presidio, Inc. (b) | | 60,000 | 834,600 |
| | | | 1,347,683 |
| Semiconductors & Semiconductor Equipment - 4.1% | | | |
| Semiconductors - 4.1% | | | |
| Acacia Communications, Inc. (a)(b) | | 26,800 | 1,308,644 |
| Broadcom Ltd. | | 3,573 | 900,646 |
| Maxim Integrated Products, Inc. | | 19,800 | 923,868 |
| NXP Semiconductors NV (a) | | 350 | 39,536 |
| ON Semiconductor Corp. (a) | | 59,500 | 1,016,260 |
| Qualcomm, Inc. | | 65,419 | 3,419,451 |
| | | | 7,608,405 |
| Software - 0.8% | | | |
| Systems Software - 0.8% | | | |
| Check Point Software Technologies Ltd. (a) | | 12,600 | 1,409,562 |
| Technology Hardware, Storage & Peripherals - 0.8% | | | |
| Technology Hardware, Storage & Peripherals - 0.8% | | | |
| HP, Inc. | | 34,211 | 652,746 |
| Samsung Electronics Co. Ltd. | | 432 | 889,949 |
| | | | 1,542,695 |
| TOTAL COMMON STOCKS | | | |
| (Cost $148,134,715) | | | 183,195,339 |
|
| Money Market Funds - 3.1% | | | |
| Fidelity Cash Central Fund, 1.11% (c) | | 973,939 | 974,134 |
| Fidelity Securities Lending Cash Central Fund 1.11% (c)(d) | | 4,831,792 | 4,832,275 |
| TOTAL MONEY MARKET FUNDS | | | |
| (Cost $5,806,214) | | | 5,806,409 |
| TOTAL INVESTMENT IN SECURITIES - 102.4% | | | |
| (Cost $153,940,929) | | | 189,001,748 |
| NET OTHER ASSETS (LIABILITIES) - (2.4)% | | | (4,471,420) |
| NET ASSETS - 100% | | | $184,530,328 |
Legend
(a) Non-income producing
(b) Security or a portion of the security is on loan at period end.
(c) Affiliated fund that is generally available only to investment companies and other accounts managed by Fidelity Investments. The rate quoted is the annualized seven-day yield of the fund at period end. A complete unaudited listing of the fund's holdings as of its most recent quarter end is available upon request. In addition, each Fidelity Central Fund's financial statements are available on the SEC's website or upon request.
(d) Investment made with cash collateral received from securities on loan.
Affiliated Central Funds
Information regarding fiscal year to date income earned by the Fund from investments in Fidelity Central Funds is as follows:
| Fund | Income earned |
| Fidelity Cash Central Fund | $6,205 |
| Fidelity Securities Lending Cash Central Fund | 82,617 |
| Total | $88,822 |
Investment Valuation
All investments are categorized as Level 1 under the Fair Value Hierarchy. The inputs or methodology used for valuing securities may not be an indication of the risk associated with investing in those securities. For more information on valuation inputs please refer to the Investment Valuation section in the accompanying Notes to Financial Statements.
Other Information
Distribution of investments by country or territory of incorporation, as a percentage of Total Net Assets, is as follows (Unaudited):
| United States of America | 80.8% |
| Finland | 8.3% |
| Sweden | 4.5% |
| Canada | 1.7% |
| United Kingdom | 1.7% |
| Israel | 1.3% |
| Others (Individually Less Than 1%) | 1.7% |
| | 100.0% |
See accompanying notes which are an integral part of the financial statements.
Communications Equipment Portfolio
Financial Statements
Statement of Assets and Liabilities
| | | August 31, 2017 (Unaudited) |
| Assets | | |
Investment in securities, at value (including securities loaned of $4,666,621) — See accompanying schedule:
Unaffiliated issuers (cost $148,134,715) | $183,195,339 | |
| Fidelity Central Funds (cost $5,806,214) | 5,806,409 | |
| Total Investment in Securities (cost $153,940,929) | | $189,001,748 |
| Receivable for investments sold | | 1,288,313 |
| Receivable for fund shares sold | | 9,607 |
| Dividends receivable | | 88,742 |
| Distributions receivable from Fidelity Central Funds | | 11,975 |
| Other receivables | | 915 |
| Total assets | | 190,401,300 |
| Liabilities | | |
| Payable for investments purchased | $788,523 | |
| Payable for fund shares redeemed | 105,655 | |
| Accrued management fee | 83,658 | |
| Other affiliated payables | 42,557 | |
| Other payables and accrued expenses | 19,079 | |
| Collateral on securities loaned | 4,831,500 | |
| Total liabilities | | 5,870,972 |
| Net Assets | | $184,530,328 |
| Net Assets consist of: | | |
| Paid in capital | | $151,852,584 |
| Undistributed net investment income | | 1,056,237 |
| Accumulated undistributed net realized gain (loss) on investments and foreign currency transactions | | (3,439,203) |
| Net unrealized appreciation (depreciation) on investments and assets and liabilities in foreign currencies | | 35,060,710 |
| Net Assets, for 5,419,480 shares outstanding | | $184,530,328 |
| Net Asset Value, offering price and redemption price per share ($184,530,328 ÷ 5,419,480 shares) | | $34.05 |
See accompanying notes which are an integral part of the financial statements.
Statement of Operations
| | | Six months ended August 31, 2017 (Unaudited) |
| Investment Income | | |
| Dividends | | $1,802,545 |
| Income from Fidelity Central Funds (including $82,617 from security lending) | | 88,822 |
| Total income | | 1,891,367 |
| Expenses | | |
| Management fee | $531,077 | |
| Transfer agent fees | 223,699 | |
| Accounting and security lending fees | 38,989 | |
| Custodian fees and expenses | 776 | |
| Independent trustees' fees and expenses | 2,288 | |
| Registration fees | 16,255 | |
| Audit | 18,704 | |
| Legal | 1,511 | |
| Miscellaneous | 1,176 | |
| Total expenses before reductions | 834,475 | |
| Expense reductions | (4,666) | 829,809 |
| Net investment income (loss) | | 1,061,558 |
| Realized and Unrealized Gain (Loss) | | |
| Net realized gain (loss) on: | | |
| Investment securities: | | |
| Unaffiliated issuers | (1,277,522) | |
| Fidelity Central Funds | 228 | |
| Foreign currency transactions | 2,465 | |
| Total net realized gain (loss) | | (1,274,829) |
| Change in net unrealized appreciation (depreciation) on: | | |
| Investment securities: | | |
| Unaffiliated issuers | 1,196,099 | |
| Fidelity Central Funds | (910) | |
| Assets and liabilities in foreign currencies | (553) | |
| Total change in net unrealized appreciation (depreciation) | | 1,194,636 |
| Net gain (loss) | | (80,193) |
| Net increase (decrease) in net assets resulting from operations | | $981,365 |
See accompanying notes which are an integral part of the financial statements.
Statement of Changes in Net Assets
| | Six months ended August 31, 2017 (Unaudited) | Year ended February 28, 2017 |
| Increase (Decrease) in Net Assets | | |
| Operations | | |
| Net investment income (loss) | $1,061,558 | $2,383,352 |
| Net realized gain (loss) | (1,274,829) | 2,028,153 |
| Change in net unrealized appreciation (depreciation) | 1,194,636 | 43,260,949 |
| Net increase (decrease) in net assets resulting from operations | 981,365 | 47,672,454 |
| Distributions to shareholders from net investment income | (461,209) | (2,293,875) |
| Distributions to shareholders from net realized gain | (804,161) | – |
| Total distributions | (1,265,370) | (2,293,875) |
| Share transactions | | |
| Proceeds from sales of shares | 3,700,799 | 35,416,799 |
| Reinvestment of distributions | 1,171,270 | 2,137,643 |
| Cost of shares redeemed | (24,708,830) | (47,739,292) |
| Net increase (decrease) in net assets resulting from share transactions | (19,836,761) | (10,184,850) |
| Redemption fees | 321 | 2,519 |
| Total increase (decrease) in net assets | (20,120,446) | 35,196,248 |
| Net Assets | | |
| Beginning of period | 204,650,774 | 169,454,526 |
| End of period | $184,530,328 | $204,650,774 |
| Other Information | | |
| Undistributed net investment income end of period | $1,056,237 | $455,888 |
| Shares | | |
| Sold | 107,894 | 1,146,264 |
| Issued in reinvestment of distributions | 35,332 | 68,971 |
| Redeemed | (721,530) | (1,562,158) |
| Net increase (decrease) | (578,304) | (346,923) |
See accompanying notes which are an integral part of the financial statements.
Financial Highlights — Communications Equipment Portfolio
| | Six months ended (Unaudited) August 31, | Years ended February 28, | | | | |
| | 2017 | 2017 | 2016A | 2015 | 2014 | 2013 |
| Selected Per–Share Data | | | | | | |
| Net asset value, beginning of period | $34.12 | $26.71 | $32.99 | $31.24 | $24.31 | $24.50 |
| Income from Investment Operations | | | | | | |
| Net investment income (loss)B | .19 | .38 | .31 | .28 | .18 | .14C |
| Net realized and unrealized gain (loss) | (.05)D | 7.39 | (5.64) | 3.52 | 6.95 | (.14)E |
| Total from investment operations | .14 | 7.77 | (5.33) | 3.80 | 7.13 | – |
| Distributions from net investment income | (.08) | (.36) | (.30) | (.30) | (.20) | (.17) |
| Distributions from net realized gain | (.14) | – | (.65) | (1.75) | – | – |
| Tax return of capital | – | – | – | – | – | (.02) |
| Total distributions | (.21)F | (.36) | (.95) | (2.05) | (.20) | (.19) |
| Redemption fees added to paid in capitalB | –G | –G | –G | –G | –G | –G |
| Net asset value, end of period | $34.05 | $34.12 | $26.71 | $32.99 | $31.24 | $24.31 |
| Total ReturnH,I | .44%D | 29.24% | (16.38)% | 12.49% | 29.41% | .07%E |
| Ratios to Average Net AssetsJ,K | | | | | | |
| Expenses before reductions | .86%L | .88% | .90% | .89% | .92% | .93% |
| Expenses net of fee waivers, if any | .86%L | .88% | .89% | .89% | .92% | .93% |
| Expenses net of all reductions | .85%L | .88% | .89% | .89% | .90% | .89% |
| Net investment income (loss) | 1.09%L | 1.27% | 1.04% | .89% | .69% | .61%C |
| Supplemental Data | | | | | | |
| Net assets, end of period (000 omitted) | $184,530 | $204,651 | $169,455 | $263,631 | $347,345 | $316,012 |
| Portfolio turnover rateM | 47%L | 38% | 30% | 42% | 65% | 54% |
A For the year ended February 29.
B Calculated based on average shares outstanding during the period.
C Net Investment income per share reflects a large, non-recurring dividend which amounted to $.10 per share. Excluding this non-recurring dividend, the ratio of net investment income (loss) to average net assets would have been .18%.
D Net realized and unrealized gain (loss) per share reflects proceeds received from litigation which amounted to $.01 per share. Excluding these litigation proceeds, the total return would have been 0.40%.
E Net realized and unrealized gain (loss) per share reflects proceeds received from litigation which amounted to $.06 per share. Excluding these litigation proceeds, the total return would have been (.19)%.
F Total distributions of $.21 per share is comprised of distributions from net investment income of $.078 and distributions from net realized gain of $.136 per share.
G Amount represents less than $.005 per share.
H Total returns for periods of less than one year are not annualized.
I Total returns would have been lower if certain expenses had not been reduced during the applicable periods shown.
J Fees and expenses of any underlying Fidelity Central Funds are not included in the Fund's expense ratio. The Fund indirectly bears its proportionate share of the expenses of any underlying Fidelity Central Funds.
K Expense ratios reflect operating expenses of the Fund. Expenses before reductions do not reflect amounts reimbursed by the investment adviser or reductions from brokerage service arrangements or reductions from other expense offset arrangements and do not represent the amount paid by the Fund during periods when reimbursements or reductions occur. Expenses net of fee waivers reflect expenses after reimbursement by the investment adviser but prior to reductions from brokerage service arrangements or other expense offset arrangements. Expenses net of all reductions represent the net expenses paid by the Fund.
L Annualized
M Amount does not include the portfolio activity of any underlying Fidelity Central Funds.
See accompanying notes which are an integral part of the financial statements.
Computers Portfolio
Investment Summary (Unaudited)
Top Ten Stocks as of August 31, 2017
| | % of fund's net assets | % of fund's net assets 6 months ago |
| Apple, Inc. | 24.8 | 23.1 |
| Samsung Electronics Co. Ltd. | 12.8 | 4.0 |
| Sony Corp. | 11.9 | 0.0 |
| Dell Technologies, Inc. | 5.0 | 3.2 |
| HP, Inc. | 4.8 | 10.3 |
| Facebook, Inc. Class A | 4.8 | 4.7 |
| Western Digital Corp. | 4.2 | 8.6 |
| Quanta Computer, Inc. | 4.1 | 0.0 |
| NetApp, Inc. | 4.0 | 2.6 |
| Alphabet, Inc. Class A | 4.0 | 4.3 |
| | 80.4 | |
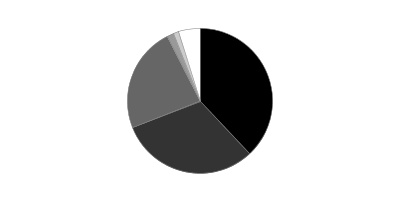
Top Industries (% of fund's net assets)
| As of August 31, 2017 |
| | Technology Hardware, Storage & Peripherals | 61.3% |
| | Household Durables | 11.9% |
| | Internet Software & Services | 9.1% |
| | Semiconductors & Semiconductor Equipment | 6.3% |
| | Electronic Equipment & Components | 5.0% |
| | All Others* | 6.4% |

* Includes Short-Term investments and Net Other Assets (Liabilities).
| As of February 28, 2017 |
| | Technology Hardware, Storage & Peripherals | 77.9% |
| | Internet Software & Services | 9.3% |
| | IT Services | 4.7% |
| | Electronic Equipment & Components | 3.2% |
| | Semiconductors & Semiconductor Equipment | 1.7% |
| | All Others* | 3.2% |

* Includes Short-Term investments and Net Other Assets (Liabilities).
Percentages shown as 0.0% may reflect amounts less than 0.05%.
Computers Portfolio
Investments August 31, 2017 (Unaudited)
Showing Percentage of Net Assets
| Common Stocks - 97.4% | | | |
| | | Shares | Value |
| Electronic Equipment & Components - 5.0% | | | |
| Technology Distributors - 5.0% | | | |
| Dell Technologies, Inc. | | 348,001 | $26,075,715 |
| Household Durables - 11.9% | | | |
| Consumer Electronics - 11.9% | | | |
| Sony Corp. | | 1,573,765 | 62,271,263 |
| Internet Software & Services - 9.1% | | | |
| Internet Software & Services - 9.1% | | | |
| Alphabet, Inc.: | | | |
| Class A (a) | | 21,600 | 20,633,184 |
| Class C (a) | | 1,957 | 1,838,269 |
| Facebook, Inc. Class A (a) | | 145,211 | 24,971,936 |
| | | | 47,443,389 |
| IT Services - 3.8% | | | |
| Data Processing & Outsourced Services - 3.8% | | | |
| MasterCard, Inc. Class A | | 36,500 | 4,865,450 |
| PayPal Holdings, Inc. (a) | | 128,722 | 7,939,573 |
| Visa, Inc. Class A | | 67,200 | 6,956,544 |
| | | | 19,761,567 |
| Semiconductors & Semiconductor Equipment - 6.3% | | | |
| Semiconductor Equipment - 1.5% | | | |
| ASML Holding NV | | 48,966 | 7,653,875 |
| Semiconductors - 4.8% | | | |
| Mellanox Technologies Ltd. (a) | | 145,721 | 6,841,601 |
| Qorvo, Inc. (a) | | 34,375 | 2,516,938 |
| Qualcomm, Inc. | | 300,069 | 15,684,607 |
| | | | 25,043,146 |
|
| TOTAL SEMICONDUCTORS & SEMICONDUCTOR EQUIPMENT | | | 32,697,021 |
|
| Technology Hardware, Storage & Peripherals - 61.3% | | | |
| Technology Hardware, Storage & Peripherals - 61.3% | | | |
| Apple, Inc. | | 788,918 | 129,382,551 |
| Canon, Inc. | | 145,600 | 5,103,534 |
| Cray, Inc. (a) | | 32,729 | 616,942 |
| Eastman Kodak Co. (a)(b) | | 877,562 | 6,801,106 |
| Fujifilm Holdings Corp. | | 37,100 | 1,458,555 |
| Hewlett Packard Enterprise Co. | | 207,505 | 3,747,540 |
| HP, Inc. | | 1,312,442 | 25,041,393 |
| Lenovo Group Ltd. | | 2,016,000 | 1,102,575 |
| NCR Corp. (a) | | 124,104 | 4,533,519 |
| NetApp, Inc. | | 535,624 | 20,707,224 |
| Quanta Computer, Inc. | | 9,390,000 | 21,405,704 |
| Samsung Electronics Co. Ltd. | | 32,488 | 66,927,473 |
| Seagate Technology LLC | | 188,041 | 5,928,933 |
| Western Digital Corp. | | 248,205 | 21,909,055 |
| Xerox Corp. | | 160,869 | 5,191,243 |
| | | | 319,857,347 |
| TOTAL COMMON STOCKS | | | |
| (Cost $337,014,193) | | | 508,106,302 |
|
| Money Market Funds - 1.1% | | | |
| Fidelity Cash Central Fund, 1.11% (c) | | 3,956,243 | 3,957,034 |
| Fidelity Securities Lending Cash Central Fund 1.11% (c)(d) | | 2,026,681 | 2,026,884 |
| TOTAL MONEY MARKET FUNDS | | | |
| (Cost $5,983,792) | | | 5,983,918 |
| TOTAL INVESTMENT IN SECURITIES - 98.5% | | | |
| (Cost $342,997,985) | | | 514,090,220 |
| NET OTHER ASSETS (LIABILITIES) - 1.5% | | | 7,838,020 |
| NET ASSETS - 100% | | | $521,928,240 |
Legend
(a) Non-income producing
(b) Security or a portion of the security is on loan at period end.
(c) Affiliated fund that is generally available only to investment companies and other accounts managed by Fidelity Investments. The rate quoted is the annualized seven-day yield of the fund at period end. A complete unaudited listing of the fund's holdings as of its most recent quarter end is available upon request. In addition, each Fidelity Central Fund's financial statements are available on the SEC's website or upon request.
(d) Investment made with cash collateral received from securities on loan.
Affiliated Central Funds
Information regarding fiscal year to date income earned by the Fund from investments in Fidelity Central Funds is as follows:
| Fund | Income earned |
| Fidelity Cash Central Fund | $35,872 |
| Fidelity Securities Lending Cash Central Fund | 66,220 |
| Total | $102,092 |
Investment Valuation
All investments are categorized as Level 1 under the Fair Value Hierarchy. The inputs or methodology used for valuing securities may not be an indication of the risk associated with investing in those securities. For more information on valuation inputs please refer to the Investment Valuation section in the accompanying Notes to Financial Statements.
Other Information
Distribution of investments by country or territory of incorporation, as a percentage of Total Net Assets, is as follows (Unaudited):
| United States of America | 65.8% |
| Japan | 13.2% |
| Korea (South) | 12.8% |
| Taiwan | 4.1% |
| Netherlands | 1.5% |
| Israel | 1.3% |
| Ireland | 1.1% |
| Others (Individually Less Than 1%) | 0.2% |
| | 100.0% |
See accompanying notes which are an integral part of the financial statements.
Computers Portfolio
Financial Statements
Statement of Assets and Liabilities
| | | August 31, 2017 (Unaudited) |
| Assets | | |
Investment in securities, at value (including securities loaned of $2,028,175) — See accompanying schedule:
Unaffiliated issuers (cost $337,014,193) | $508,106,302 | |
| Fidelity Central Funds (cost $5,983,792) | 5,983,918 | |
| Total Investment in Securities (cost $342,997,985) | | $514,090,220 |
| Receivable for investments sold | | 10,296,848 |
| Receivable for fund shares sold | | 288,749 |
| Dividends receivable | | 435,436 |
| Distributions receivable from Fidelity Central Funds | | 881 |
| Other receivables | | 177,638 |
| Total assets | | 525,289,772 |
| Liabilities | | |
| Payable for fund shares redeemed | $948,755 | |
| Accrued management fee | 234,910 | |
| Other affiliated payables | 94,344 | |
| Other payables and accrued expenses | 55,348 | |
| Collateral on securities loaned | 2,028,175 | |
| Total liabilities | | 3,361,532 |
| Net Assets | | $521,928,240 |
| Net Assets consist of: | | |
| Paid in capital | | $308,847,975 |
| Undistributed net investment income | | 3,068,621 |
| Accumulated undistributed net realized gain (loss) on investments and foreign currency transactions | | 39,001,143 |
| Net unrealized appreciation (depreciation) on investments and assets and liabilities in foreign currencies | | 171,010,501 |
| Net Assets, for 5,846,104 shares outstanding | | $521,928,240 |
| Net Asset Value, offering price and redemption price per share ($521,928,240 ÷ 5,846,104 shares) | | $89.28 |
See accompanying notes which are an integral part of the financial statements.
Statement of Operations
| | | Six months ended August 31, 2017 (Unaudited) |
| Investment Income | | |
| Dividends | | $5,073,443 |
| Income from Fidelity Central Funds (including $66,220 from security lending) | | 102,092 |
| Total income | | 5,175,535 |
| Expenses | | |
| Management fee | $1,441,436 | |
| Transfer agent fees | 477,059 | |
| Accounting and security lending fees | 103,156 | |
| Custodian fees and expenses | 15,225 | |
| Independent trustees' fees and expenses | 5,975 | |
| Registration fees | 32,889 | |
| Audit | 19,068 | |
| Legal | 3,482 | |
| Interest | 4,973 | |
| Miscellaneous | 2,672 | |
| Total expenses before reductions | 2,105,935 | |
| Expense reductions | (28,255) | 2,077,680 |
| Net investment income (loss) | | 3,097,855 |
| Realized and Unrealized Gain (Loss) | | |
| Net realized gain (loss) on: | | |
| Investment securities: | | |
| Unaffiliated issuers | 40,815,379 | |
| Fidelity Central Funds | (1,499) | |
| Foreign currency transactions | (58,447) | |
| Total net realized gain (loss) | | 40,755,433 |
| Change in net unrealized appreciation (depreciation) on: | | |
| Investment securities: | | |
| Unaffiliated issuers | 3,910,903 | |
| Fidelity Central Funds | (556) | |
| Assets and liabilities in foreign currencies | 11,507 | |
| Total change in net unrealized appreciation (depreciation) | | 3,921,854 |
| Net gain (loss) | | 44,677,287 |
| Net increase (decrease) in net assets resulting from operations | | $47,775,142 |
See accompanying notes which are an integral part of the financial statements.
Statement of Changes in Net Assets
| | Six months ended August 31, 2017 (Unaudited) | Year ended February 28, 2017 |
| Increase (Decrease) in Net Assets | | |
| Operations | | |
| Net investment income (loss) | $3,097,855 | $4,166,033 |
| Net realized gain (loss) | 40,755,433 | 38,339,496 |
| Change in net unrealized appreciation (depreciation) | 3,921,854 | 99,919,551 |
| Net increase (decrease) in net assets resulting from operations | 47,775,142 | 142,425,080 |
| Distributions to shareholders from net investment income | (125,075) | (4,760,421) |
| Distributions to shareholders from net realized gain | (10,556,265) | (21,241,452) |
| Total distributions | (10,681,340) | (26,001,873) |
| Share transactions | | |
| Proceeds from sales of shares | 104,971,969 | 69,348,882 |
| Reinvestment of distributions | 10,233,606 | 24,823,963 |
| Cost of shares redeemed | (103,123,462) | (126,405,898) |
| Net increase (decrease) in net assets resulting from share transactions | 12,082,113 | (32,233,053) |
| Redemption fees | 7,061 | 1,604 |
| Total increase (decrease) in net assets | 49,182,976 | 84,191,758 |
| Net Assets | | |
| Beginning of period | 472,745,264 | 388,553,506 |
| End of period | $521,928,240 | $472,745,264 |
| Other Information | | |
| Undistributed net investment income end of period | $3,068,621 | $95,841 |
| Shares | | |
| Sold | 1,227,636 | 914,204 |
| Issued in reinvestment of distributions | 122,720 | 331,793 |
| Redeemed | (1,199,311) | (1,771,351) |
| Net increase (decrease) | 151,045 | (525,354) |
See accompanying notes which are an integral part of the financial statements.
Financial Highlights — Computers Portfolio
| | Six months ended (Unaudited) August 31, | Years ended February 28, | | | | |
| | 2017 | 2017 | 2016A | 2015 | 2014 | 2013 |
| Selected Per–Share Data | | | | | | |
| Net asset value, beginning of period | $83.01 | $62.46 | $83.28 | $75.46 | $64.51 | $64.89 |
| Income from Investment Operations | | | | | | |
| Net investment income (loss)B | .51 | .73 | .69 | .45 | .59 | .18 |
| Net realized and unrealized gain (loss) | 7.47 | 24.69 | (18.42) | 9.61 | 15.76 | (.43) |
| Total from investment operations | 7.98 | 25.42 | (17.73) | 10.06 | 16.35 | (.25) |
| Distributions from net investment income | (.02) | (.88) | (.80) | (.47) | (.53) | (.13) |
| Distributions from net realized gain | (1.69) | (4.00) | (2.29) | (1.77) | (4.87) | – |
| Total distributions | (1.71) | (4.87)C | (3.09) | (2.24) | (5.40) | (.13) |
| Redemption fees added to paid in capitalB,D | – | – | – | – | – | – |
| Net asset value, end of period | $89.28 | $83.01 | $62.46 | $83.28 | $75.46 | $64.51 |
| Total ReturnE,F | 9.76% | 41.57% | (21.56)% | 13.36% | 27.13% | (.38)% |
| Ratios to Average Net AssetsG,H | | | | | | |
| Expenses before reductions | .80%I | .81% | .80% | .80% | .82% | .85% |
| Expenses net of fee waivers, if any | .80%I | .81% | .80% | .80% | .82% | .85% |
| Expenses net of all reductions | .79%I | .81% | .79% | .80% | .82% | .82% |
| Net investment income (loss) | 1.17%I | 1.01% | .91% | .57% | .86% | .29% |
| Supplemental Data | | | | | | |
| Net assets, end of period (000 omitted) | $521,934 | $472,745 | $388,554 | $808,852 | $679,323 | $687,105 |
| Portfolio turnover rateJ | 105%I | 49% | 31% | 46% | 35% | 184% |
A For the year ended February 29.
B Calculated based on average shares outstanding during the period.
C Total distributions of 4.87 per share is comprised of distributions from net investment income of $.879 and distributions from net realized gain of $3.995 per share.
D Amount represents less than $.005 per share.
E Total returns for periods of less than one year are not annualized.
F Total returns would have been lower if certain expenses had not been reduced during the applicable periods shown.
G Fees and expenses of any underlying Fidelity Central Funds are not included in the Fund's expense ratio. The Fund indirectly bears its proportionate share of the expenses of any underlying Fidelity Central Funds.
H Expense ratios reflect operating expenses of the Fund. Expenses before reductions do not reflect amounts reimbursed by the investment adviser or reductions from brokerage service arrangements or reductions from other expense offset arrangements and do not represent the amount paid by the Fund during periods when reimbursements or reductions occur. Expenses net of fee waivers reflect expenses after reimbursement by the investment adviser but prior to reductions from brokerage service arrangements or other expense offset arrangements. Expenses net of all reductions represent the net expenses paid by the Fund.
I Annualized
J Amount does not include the portfolio activity of any underlying Fidelity Central Funds.
See accompanying notes which are an integral part of the financial statements.
IT Services Portfolio
Investment Summary (Unaudited)
Top Ten Stocks as of August 31, 2017
| | % of fund's net assets | % of fund's net assets 6 months ago |
| Visa, Inc. Class A | 18.9 | 17.5 |
| MasterCard, Inc. Class A | 11.8 | 10.9 |
| Cognizant Technology Solutions Corp. Class A | 8.4 | 7.2 |
| PayPal Holdings, Inc. | 6.7 | 4.3 |
| Accenture PLC Class A | 4.9 | 5.5 |
| IBM Corp. | 4.8 | 5.2 |
| Fidelity National Information Services, Inc. | 4.1 | 3.8 |
| EPAM Systems, Inc. | 3.2 | 3.9 |
| Alliance Data Systems Corp. | 2.9 | 4.6 |
| FleetCor Technologies, Inc. | 2.7 | 2.0 |
| | 68.4 | |
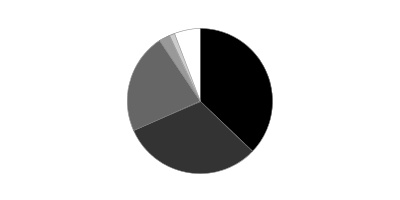
Top Industries (% of fund's net assets)
| As of August 31, 2017 |
| | IT Services | 93.3% |
| | Internet Software & Services | 3.5% |
| | Software | 1.3% |
| | Electronic Equipment & Components | 0.4% |
| | Professional Services | 0.4% |
| | All Others* | 1.1% |

* Includes Short-Term investments and Net Other Assets (Liabilities).
| As of February 28, 2017 |
| | IT Services | 95.9% |
| | Internet Software & Services | 2.5% |
| | Electronic Equipment & Components | 0.5% |
| | Software | 0.3% |
| | All Others* | 0.8% |

* Includes Short-Term investments and Net Other Assets (Liabilities).
IT Services Portfolio
Investments August 31, 2017 (Unaudited)
Showing Percentage of Net Assets
| Common Stocks - 98.9% | | | |
| | | Shares | Value |
| Electronic Equipment & Components - 0.4% | | | |
| Electronic Manufacturing Services - 0.4% | | | |
| Cardtronics PLC (a) | | 265,400 | $6,895,092 |
| Internet Software & Services - 3.5% | | | |
| Internet Software & Services - 3.5% | | | |
| Endurance International Group Holdings, Inc. (a)(b) | | 1,651,458 | 12,716,227 |
| GoDaddy, Inc. (a) | | 1,018,427 | 45,645,898 |
| Wix.com Ltd. (a) | | 89,817 | 5,847,087 |
| | | | 64,209,212 |
| IT Services - 93.3% | | | |
| Data Processing & Outsourced Services - 61.5% | | | |
| Alliance Data Systems Corp. | | 234,048 | 52,777,824 |
| Amadeus IT Holding SA Class A | | 800 | 49,589 |
| Automatic Data Processing, Inc. | | 229,900 | 24,477,453 |
| Convergys Corp. | | 8,200 | 192,700 |
| CoreLogic, Inc. (a) | | 2,700 | 126,819 |
| DST Systems, Inc. | | 400 | 20,532 |
| Euronet Worldwide, Inc. (a) | | 187,000 | 18,376,490 |
| EVERTEC, Inc. | | 13,800 | 253,920 |
| ExlService Holdings, Inc. (a) | | 282,270 | 15,886,156 |
| Fidelity National Information Services, Inc. | | 802,600 | 74,577,592 |
| First Data Corp. Class A (a) | | 296,200 | 5,453,042 |
| Fiserv, Inc. (a) | | 227,900 | 28,193,509 |
| FleetCor Technologies, Inc. (a) | | 347,600 | 49,974,452 |
| Genpact Ltd. | | 207,500 | 5,903,375 |
| Global Payments, Inc. | | 438,981 | 41,918,296 |
| Jack Henry & Associates, Inc. | | 1,600 | 164,912 |
| MasterCard, Inc. Class A | | 1,606,900 | 214,199,770 |
| Paychex, Inc. | | 286,400 | 16,333,392 |
| PayPal Holdings, Inc. (a) | | 1,979,900 | 122,120,232 |
| Syntel, Inc. | | 7,700 | 139,062 |
| Teletech Holdings, Inc. | | 2,000 | 79,400 |
| The Western Union Co. | | 5,000 | 94,600 |
| Total System Services, Inc. | | 499,100 | 34,497,792 |
| Travelport Worldwide Ltd. | | 705,324 | 10,678,605 |
| Vantiv, Inc. (a) | | 235,000 | 16,612,150 |
| Visa, Inc. Class A | | 3,323,748 | 344,074,391 |
| WEX, Inc. (a) | | 43,400 | 4,736,676 |
| WNS Holdings Ltd. sponsored ADR (a) | | 1,094,392 | 38,303,720 |
| | | | 1,120,216,451 |
| IT Consulting & Other Services - 31.8% | | | |
| Accenture PLC Class A | | 688,080 | 89,973,341 |
| Acxiom Corp. (a) | | 6,100 | 142,069 |
| Booz Allen Hamilton Holding Corp. Class A | | 842,400 | 28,734,264 |
| Capgemini SA | | 256,600 | 28,448,372 |
| Cognizant Technology Solutions Corp. Class A | | 2,171,732 | 153,693,474 |
| DXC Technology Co. | | 495,300 | 42,100,500 |
| EPAM Systems, Inc. (a) | | 708,700 | 57,638,571 |
| Forrester Research, Inc. | | 4,500 | 183,375 |
| IBM Corp. (b) | | 615,950 | 88,099,329 |
| Leidos Holdings, Inc. | | 138,825 | 8,096,274 |
| Luxoft Holding, Inc. (a) | | 679,450 | 34,414,143 |
| Science Applications International Corp. | | 800 | 59,104 |
| Teradata Corp. (a) | | 3,500 | 111,720 |
| Virtusa Corp. (a) | | 1,279,151 | 46,458,764 |
| | | | 578,153,300 |
|
| TOTAL IT SERVICES | | | 1,698,369,751 |
|
| Professional Services - 0.4% | | | |
| Research & Consulting Services - 0.4% | | | |
| ICF International, Inc. (a) | | 135,611 | 6,516,109 |
| Software - 1.3% | | | |
| Application Software - 1.3% | | | |
| Adobe Systems, Inc. (a) | | 73,969 | 11,477,030 |
| Globant SA (a)(b) | | 86,771 | 3,374,524 |
| Intuit, Inc. | | 64,100 | 9,066,945 |
| | | | 23,918,499 |
| TOTAL COMMON STOCKS | | | |
| (Cost $1,127,213,981) | | | 1,799,908,663 |
|
| Money Market Funds - 1.0% | | | |
| Fidelity Cash Central Fund, 1.11% (c) | | 14,469,774 | 14,472,668 |
| Fidelity Securities Lending Cash Central Fund 1.11% (c)(d) | | 4,185,208 | 4,185,626 |
| TOTAL MONEY MARKET FUNDS | | | |
| (Cost $18,658,004) | | | 18,658,294 |
| TOTAL INVESTMENT IN SECURITIES - 99.9% | | | |
| (Cost $1,145,871,985) | | | 1,818,566,957 |
| NET OTHER ASSETS (LIABILITIES) - 0.1% | | | 2,064,941 |
| NET ASSETS - 100% | | | $1,820,631,898 |
Legend
(a) Non-income producing
(b) Security or a portion of the security is on loan at period end.
(c) Affiliated fund that is generally available only to investment companies and other accounts managed by Fidelity Investments. The rate quoted is the annualized seven-day yield of the fund at period end. A complete unaudited listing of the fund's holdings as of its most recent quarter end is available upon request. In addition, each Fidelity Central Fund's financial statements are available on the SEC's website or upon request.
(d) Investment made with cash collateral received from securities on loan.
Affiliated Central Funds
Information regarding fiscal year to date income earned by the Fund from investments in Fidelity Central Funds is as follows:
| Fund | Income earned |
| Fidelity Cash Central Fund | $56,636 |
| Fidelity Securities Lending Cash Central Fund | 19,025 |
| Total | $75,661 |
Investment Valuation
All investments are categorized as Level 1 under the Fair Value Hierarchy. The inputs or methodology used for valuing securities may not be an indication of the risk associated with investing in those securities. For more information on valuation inputs please refer to the Investment Valuation section in the accompanying Notes to Financial Statements.
Other Information
Distribution of investments by country or territory of incorporation, as a percentage of Total Net Assets, is as follows (Unaudited):
| United States of America | 87.7% |
| Ireland | 4.9% |
| Bailiwick of Jersey | 2.1% |
| British Virgin Islands | 1.9% |
| France | 1.6% |
| Others (Individually Less Than 1%) | 1.8% |
| | 100.0% |
See accompanying notes which are an integral part of the financial statements.
IT Services Portfolio
Financial Statements
Statement of Assets and Liabilities
| | | August 31, 2017 (Unaudited) |
| Assets | | |
Investment in securities, at value (including securities loaned of $4,093,874) — See accompanying schedule:
Unaffiliated issuers (cost $1,127,213,981) | $1,799,908,663 | |
| Fidelity Central Funds (cost $18,658,004) | 18,658,294 | |
| Total Investment in Securities (cost $1,145,871,985) | | $1,818,566,957 |
| Receivable for investments sold | | 6,874,493 |
| Receivable for fund shares sold | | 1,670,348 |
| Dividends receivable | | 1,538,449 |
| Distributions receivable from Fidelity Central Funds | | 12,190 |
| Other receivables | | 24,083 |
| Total assets | | 1,828,686,520 |
| Liabilities | | |
| Payable to custodian bank | $1 | |
| Payable for investments purchased | 506,065 | |
| Payable for fund shares redeemed | 2,218,455 | |
| Accrued management fee | 816,230 | |
| Other affiliated payables | 320,576 | |
| Other payables and accrued expenses | 11,201 | |
| Collateral on securities loaned | 4,182,094 | |
| Total liabilities | | 8,054,622 |
| Net Assets | | $1,820,631,898 |
| Net Assets consist of: | | |
| Paid in capital | | $1,100,901,702 |
| Undistributed net investment income | | 984,228 |
| Accumulated undistributed net realized gain (loss) on investments and foreign currency transactions | | 46,057,948 |
| Net unrealized appreciation (depreciation) on investments and assets and liabilities in foreign currencies | | 672,688,020 |
| Net Assets, for 36,303,516 shares outstanding | | $1,820,631,898 |
| Net Asset Value, offering price and redemption price per share ($1,820,631,898 ÷ 36,303,516 shares) | | $50.15 |
See accompanying notes which are an integral part of the financial statements.
Statement of Operations
| | | Six months ended August 31, 2017 (Unaudited) |
| Investment Income | | |
| Dividends | | $7,650,651 |
| Income from Fidelity Central Funds (including $19,025 from security lending) | | 75,661 |
| Total income | | 7,726,312 |
| Expenses | | |
| Management fee | $4,681,436 | |
| Transfer agent fees | 1,622,151 | |
| Accounting and security lending fees | 266,916 | |
| Custodian fees and expenses | 12,306 | |
| Independent trustees' fees and expenses | 19,375 | |
| Registration fees | 23,383 | |
| Audit | 26,219 | |
| Legal | 12,189 | |
| Miscellaneous | 13,541 | |
| Total expenses before reductions | 6,677,516 | |
| Expense reductions | (28,681) | 6,648,835 |
| Net investment income (loss) | | 1,077,477 |
| Realized and Unrealized Gain (Loss) | | |
| Net realized gain (loss) on: | | |
| Investment securities: | | |
| Unaffiliated issuers | 48,010,540 | |
| Fidelity Central Funds | 621 | |
| Foreign currency transactions | (4,580) | |
| Total net realized gain (loss) | | 48,006,581 |
| Change in net unrealized appreciation (depreciation) on: | | |
| Investment securities: | | |
| Unaffiliated issuers | 158,209,640 | |
| Fidelity Central Funds | (2,390) | |
| Assets and liabilities in foreign currencies | 831 | |
| Total change in net unrealized appreciation (depreciation) | | 158,208,081 |
| Net gain (loss) | | 206,214,662 |
| Net increase (decrease) in net assets resulting from operations | | $207,292,139 |
See accompanying notes which are an integral part of the financial statements.
Statement of Changes in Net Assets
| | Six months ended August 31, 2017 (Unaudited) | Year ended February 28, 2017 |
| Increase (Decrease) in Net Assets | | |
| Operations | | |
| Net investment income (loss) | $1,077,477 | $6,007,288 |
| Net realized gain (loss) | 48,006,581 | 44,116,665 |
| Change in net unrealized appreciation (depreciation) | 158,208,081 | 293,487,758 |
| Net increase (decrease) in net assets resulting from operations | 207,292,139 | 343,611,711 |
| Distributions to shareholders from net investment income | – | (5,197,978) |
| Distributions to shareholders from net realized gain | (13,090,079) | – |
| Total distributions | (13,090,079) | (5,197,978) |
| Share transactions | | |
| Proceeds from sales of shares | 130,986,834 | 375,114,434 |
| Reinvestment of distributions | 12,515,795 | 4,954,736 |
| Cost of shares redeemed | (180,874,383) | (948,883,745) |
| Net increase (decrease) in net assets resulting from share transactions | (37,371,754) | (568,814,575) |
| Redemption fees | – | 27,362 |
| Total increase (decrease) in net assets | 156,830,306 | (230,373,480) |
| Net Assets | | |
| Beginning of period | 1,663,801,592 | 1,894,175,072 |
| End of period | $1,820,631,898 | $1,663,801,592 |
| Other Information | | |
| Undistributed net investment income end of period | $984,228 | $– |
| Accumulated net investment loss end of period | $– | $(93,249) |
| Shares | | |
| Sold | 2,775,339 | 9,254,539 |
| Issued in reinvestment of distributions | 284,192 | 117,858 |
| Redeemed | (3,864,129) | (23,235,605) |
| Net increase (decrease) | (804,598) | (13,863,208) |
See accompanying notes which are an integral part of the financial statements.
Financial Highlights — IT Services Portfolio
| | Six months ended (Unaudited) August 31, | Years ended February 28, | | | | |
| | 2017 | 2017 | 2016A | 2015 | 2014 | 2013 |
| Selected Per–Share Data | | | | | | |
| Net asset value, beginning of period | $44.84 | $37.16 | $38.88 | $37.86 | $27.53 | $23.77 |
| Income from Investment Operations | | | | | | |
| Net investment income (loss)B | .03 | .13C | (.02) | (.03) | (.03) | (.02)D |
| Net realized and unrealized gain (loss) | 5.64 | 7.68 | (.15) | 4.06 | 11.42 | 4.08 |
| Total from investment operations | 5.67 | 7.81 | (.17) | 4.03 | 11.39 | 4.06 |
| Distributions from net investment income | – | (.13) | – | (.01) | – | – |
| Distributions from net realized gain | (.36) | – | (1.55) | (3.01) | (1.06) | (.30) |
| Total distributions | (.36) | (.13) | (1.55) | (3.01) | (1.06) | (.30) |
| Redemption fees added to paid in capitalB | – | –E | –E | –E | –E | –E |
| Net asset value, end of period | $50.15 | $44.84 | $37.16 | $38.88 | $37.86 | $27.53 |
| Total ReturnF,G,H | 12.75% | 21.05% | (.59)% | 11.16% | 41.66% | 17.22% |
| Ratios to Average Net AssetsI,J | | | | | | |
| Expenses before reductions | .78%K | .79% | .81% | .81% | .84% | .86% |
| Expenses net of fee waivers, if any | .78%K | .79% | .81% | .81% | .84% | .86% |
| Expenses net of all reductions | .77%K | .79% | .80% | .81% | .83% | .85% |
| Net investment income (loss) | .13%K | .33%C | (.06)% | (.07)% | (.09)% | (.09)%D |
| Supplemental Data | | | | | | |
| Net assets, end of period (000 omitted) | $1,820,632 | $1,663,802 | $1,894,175 | $941,998 | $1,653,572 | $470,962 |
| Portfolio turnover rateL | 28%K | 27% | 24% | 56% | 74% | 107% |
A For the year ended February 29.
B Calculated based on average shares outstanding during the period.
C Net Investment income per share reflects a large, non-recurring dividend which amounted to $.13 per share. Excluding this non-recurring dividend, the ratio of net investment income (loss) to average net assets would have been .02%.
D Net Investment income per share reflects a large, non-recurring dividend which amounted to $.02 per share. Excluding this non-recurring dividend, the ratio of net investment income (loss) to average net assets would have been (.19) %.
E Amount represents less than $.005 per share.
F Total returns for periods of less than one year are not annualized.
G Total returns would have been lower if certain expenses had not been reduced during the applicable periods shown.
H Total distributions of $3.01 per share is comprised of distributions from net investment income of $.005 and distributions from net realized gain of $3.009 per share.
I Fees and expenses of any underlying Fidelity Central Funds are not included in the Fund's expense ratio. The Fund indirectly bears its proportionate share of the expenses of any underlying Fidelity Central Funds.
J Expense ratios reflect operating expenses of the Fund. Expenses before reductions do not reflect amounts reimbursed by the investment adviser or reductions from brokerage service arrangements or reductions from other expense offset arrangements and do not represent the amount paid by the Fund during periods when reimbursements or reductions occur. Expenses net of fee waivers reflect expenses after reimbursement by the investment adviser but prior to reductions from brokerage service arrangements or other expense offset arrangements. Expenses net of all reductions represent the net expenses paid by the Fund.
K Annualized
L Amount does not include the portfolio activity of any underlying Fidelity Central Funds.
See accompanying notes which are an integral part of the financial statements.
Semiconductors Portfolio
Investment Summary (Unaudited)
Top Ten Stocks as of August 31, 2017
| | % of fund's net assets | % of fund's net assets 6 months ago |
| Intel Corp. | 16.1 | 22.4 |
| Qualcomm, Inc. | 13.8 | 14.3 |
| Broadcom Ltd. | 11.2 | 8.0 |
| Analog Devices, Inc. | 6.2 | 4.9 |
| Micron Technology, Inc. | 4.9 | 4.5 |
| ON Semiconductor Corp. | 4.6 | 3.0 |
| Maxim Integrated Products, Inc. | 3.3 | 2.7 |
| NVIDIA Corp. | 3.1 | 1.7 |
| Cypress Semiconductor Corp. | 2.5 | 0.3 |
| Marvell Technology Group Ltd. | 2.3 | 3.4 |
| | 68.0 | |
Top Industries (% of fund's net assets)
| As of August 31, 2017 |
| | Semiconductors & Semiconductor Equipment | 86.2% |
| | Electronic Equipment & Components | 5.0% |
| | Internet Software & Services | 3.0% |
| | Communications Equipment | 1.0% |
| | Technology Hardware, Storage & Peripherals | 0.9% |
| | All Others* | 3.9% |

* Includes Short-Term investments and Net Other Assets (Liabilities).
| As of February 28, 2017 |
| | Semiconductors & Semiconductor Equipment | 88.0% |
| | Electronic Equipment & Components | 3.8% |
| | Internet Software & Services | 2.1% |
| | Technology Hardware, Storage & Peripherals | 1.4% |
| | Commercial Services & Supplies | 0.6% |
| | All Others* | 4.1% |

* Includes Short-Term investments and Net Other Assets (Liabilities).
Semiconductors Portfolio
Investments August 31, 2017 (Unaudited)
Showing Percentage of Net Assets
| Common Stocks - 96.7% | | | |
| | | Shares | Value |
| Communications Equipment - 1.0% | | | |
| Communications Equipment - 1.0% | | | |
| CommScope Holding Co., Inc. (a) | | 403,900 | $13,352,934 |
| F5 Networks, Inc. (a) | | 72,200 | 8,619,236 |
| Finisar Corp. (a) | | 265,300 | 6,406,995 |
| | | | 28,379,165 |
| Diversified Financial Services - 0.3% | | | |
| Other Diversified Financial Services - 0.3% | | | |
| Quantenna Communications, Inc. | | 486,356 | 9,036,494 |
| Electronic Equipment & Components - 5.0% | | | |
| Electronic Manufacturing Services - 3.0% | | | |
| Flextronics International Ltd. (a) | | 1,341,300 | 21,822,951 |
| Jabil, Inc. | | 1,003,237 | 31,451,480 |
| Park Electrochemical Corp. | | 181,033 | 3,287,559 |
| Plexus Corp. (a) | | 227,300 | 11,837,784 |
| TTM Technologies, Inc. (a) | | 1,397,500 | 19,900,400 |
| | | | 88,300,174 |
| Technology Distributors - 2.0% | | | |
| Avnet, Inc. | | 1,586,400 | 61,187,448 |
|
| TOTAL ELECTRONIC EQUIPMENT & COMPONENTS | | | 149,487,622 |
|
| Internet Software & Services - 3.0% | | | |
| Internet Software & Services - 3.0% | | | |
| Akamai Technologies, Inc. (a) | | 440,000 | 20,746,000 |
| Alphabet, Inc. Class A (a) | | 68,450 | 65,386,178 |
| SecureWorks Corp. (a) | | 253,313 | 2,591,392 |
| | | | 88,723,570 |
| IT Services - 0.3% | | | |
| IT Consulting & Other Services - 0.3% | | | |
| IBM Corp. | | 62,600 | 8,953,678 |
| Semiconductors & Semiconductor Equipment - 86.2% | | | |
| Semiconductor Equipment - 1.1% | | | |
| Applied Materials, Inc. | | 236,600 | 10,675,392 |
| Lam Research Corp. | | 55,273 | 9,174,213 |
| PDF Solutions, Inc. (a) | | 816,320 | 12,399,901 |
| Xcerra Corp. (a) | | 188,248 | 1,848,595 |
| | | | 34,098,101 |
| Semiconductors - 85.1% | | | |
| Acacia Communications, Inc. (a)(b) | | 395,400 | 19,307,382 |
| Ambarella, Inc. (a) | | 40,200 | 2,186,880 |
| Analog Devices, Inc. | | 2,197,006 | 183,823,492 |
| Broadcom Ltd. | | 1,320,200 | 332,782,814 |
| Cavium, Inc. (a) | | 834,300 | 52,819,533 |
| Cree, Inc. (a) | | 2,528,972 | 61,529,889 |
| Cypress Semiconductor Corp. (b) | | 5,532,500 | 75,739,925 |
| Dialog Semiconductor PLC (a) | | 132,500 | 6,023,097 |
| Diodes, Inc. (a) | | 10,920 | 307,289 |
| Inphi Corp. (a)(b) | | 1,764,549 | 67,564,581 |
| Integrated Device Technology, Inc. (a) | | 2,217,967 | 54,805,965 |
| Intel Corp. | | 13,676,871 | 479,647,865 |
| Lattice Semiconductor Corp. (a) | | 1,006,859 | 5,688,753 |
| Marvell Technology Group Ltd. | | 3,819,096 | 68,400,009 |
| Maxim Integrated Products, Inc. | | 2,110,925 | 98,495,761 |
| MaxLinear, Inc. Class A (a) | | 250,100 | 5,402,160 |
| Mellanox Technologies Ltd. (a) | | 805,400 | 37,813,530 |
| Microchip Technology, Inc. | | 270,900 | 23,514,120 |
| Micron Technology, Inc. (a) | | 4,556,840 | 145,682,175 |
| Microsemi Corp. (a) | | 121,200 | 6,106,056 |
| NVIDIA Corp. | | 546,492 | 92,597,604 |
| ON Semiconductor Corp. (a) | | 8,069,346 | 137,824,430 |
| Qorvo, Inc. (a) | | 593,328 | 43,443,476 |
| Qualcomm, Inc. | | 7,874,084 | 411,578,371 |
| Renesas Electronics Corp. (a) | | 229,900 | 2,319,180 |
| Sanken Electric Co. Ltd. | | 1,552,000 | 7,919,880 |
| Semtech Corp. (a) | | 1,368,936 | 51,471,994 |
| Silicon Motion Technology Corp. sponsored ADR (b) | | 147,200 | 6,713,792 |
| SMART Global Holdings, Inc. | | 387,062 | 7,690,922 |
| Synaptics, Inc. (a)(b) | | 172,200 | 7,158,354 |
| Texas Instruments, Inc. | | 252,800 | 20,936,896 |
| United Microelectronics Corp. sponsored ADR (b) | | 2,133,200 | 5,333,000 |
| Xilinx, Inc. | | 199,500 | 13,178,970 |
| | | | 2,535,808,145 |
|
| TOTAL SEMICONDUCTORS & SEMICONDUCTOR EQUIPMENT | | | 2,569,906,246 |
|
| Technology Hardware, Storage & Peripherals - 0.9% | | | |
| Technology Hardware, Storage & Peripherals - 0.9% | | | |
| Lenovo Group Ltd. | | 7,298,000 | 3,991,367 |
| Samsung Electronics Co. Ltd. | | 5,068 | 10,440,422 |
| Western Digital Corp. | | 146,700 | 12,949,209 |
| | | | 27,380,998 |
| TOTAL COMMON STOCKS | | | |
| (Cost $2,375,787,445) | | | 2,881,867,773 |
|
| Money Market Funds - 6.6% | | | |
| Fidelity Cash Central Fund, 1.11% (c) | | 94,166,797 | 94,185,630 |
| Fidelity Securities Lending Cash Central Fund 1.11% (c)(d) | | 104,250,671 | 104,261,096 |
| TOTAL MONEY MARKET FUNDS | | | |
| (Cost $198,433,896) | | | 198,446,726 |
| TOTAL INVESTMENT IN SECURITIES - 103.3% | | | |
| (Cost $2,574,221,341) | | | 3,080,314,499 |
| NET OTHER ASSETS (LIABILITIES) - (3.3)% | | | (99,753,908) |
| NET ASSETS - 100% | | | $2,980,560,591 |
Legend
(a) Non-income producing
(b) Security or a portion of the security is on loan at period end.
(c) Affiliated fund that is generally available only to investment companies and other accounts managed by Fidelity Investments. The rate quoted is the annualized seven-day yield of the fund at period end. A complete unaudited listing of the fund's holdings as of its most recent quarter end is available upon request. In addition, each Fidelity Central Fund's financial statements are available on the SEC's website or upon request.
(d) Investment made with cash collateral received from securities on loan.
Affiliated Central Funds
Information regarding fiscal year to date income earned by the Fund from investments in Fidelity Central Funds is as follows:
| Fund | Income earned |
| Fidelity Cash Central Fund | $473,676 |
| Fidelity Securities Lending Cash Central Fund | 1,159,546 |
| Total | $1,633,222 |
Investment Valuation
All investments are categorized as Level 1 under the Fair Value Hierarchy. The inputs or methodology used for valuing securities may not be an indication of the risk associated with investing in those securities. For more information on valuation inputs please refer to the Investment Valuation section in the accompanying Notes to Financial Statements.
Other Information
Distribution of investments by country or territory of incorporation, as a percentage of Total Net Assets, is as follows (Unaudited):
| United States of America | 82.9% |
| Singapore | 11.9% |
| Bermuda | 2.3% |
| Israel | 1.3% |
| Others (Individually Less Than 1%) | 1.6% |
| | 100.0% |
See accompanying notes which are an integral part of the financial statements.
Semiconductors Portfolio
Financial Statements
Statement of Assets and Liabilities
| | | August 31, 2017 (Unaudited) |
| Assets | | |
Investment in securities, at value (including securities loaned of $102,291,482) — See accompanying schedule:
Unaffiliated issuers (cost $2,375,787,445) | $2,881,867,773 | |
| Fidelity Central Funds (cost $198,433,896) | 198,446,726 | |
| Total Investment in Securities (cost $2,574,221,341) | | $3,080,314,499 |
| Receivable for investments sold | | 47,363,975 |
| Receivable for fund shares sold | | 2,087,213 |
| Dividends receivable | | 9,650,688 |
| Distributions receivable from Fidelity Central Funds | | 290,621 |
| Other receivables | | 195,650 |
| Total assets | | 3,139,902,646 |
| Liabilities | | |
| Payable to custodian bank | $1,702,152 | |
| Payable for investments purchased | 45,753,055 | |
| Payable for fund shares redeemed | 5,650,646 | |
| Accrued management fee | 1,338,157 | |
| Other affiliated payables | 484,157 | |
| Other payables and accrued expenses | 156,488 | |
| Collateral on securities loaned | 104,257,400 | |
| Total liabilities | | 159,342,055 |
| Net Assets | | $2,980,560,591 |
| Net Assets consist of: | | |
| Paid in capital | | $2,216,457,769 |
| Undistributed net investment income | | 16,933,290 |
| Accumulated undistributed net realized gain (loss) on investments and foreign currency transactions | | 241,076,053 |
| Net unrealized appreciation (depreciation) on investments and assets and liabilities in foreign currencies | | 506,093,479 |
| Net Assets, for 27,793,365 shares outstanding | | $2,980,560,591 |
| Net Asset Value, offering price and redemption price per share ($2,980,560,591 ÷ 27,793,365 shares) | | $107.24 |
See accompanying notes which are an integral part of the financial statements.
Statement of Operations
| | | Six months ended August 31, 2017 (Unaudited) |
| Investment Income | | |
| Dividends | | $26,917,125 |
| Income from Fidelity Central Funds (including $1,159,546 from security lending) | | 1,633,222 |
| Total income | | 28,550,347 |
| Expenses | | |
| Management fee | $8,425,018 | |
| Transfer agent fees | 2,543,954 | |
| Accounting and security lending fees | 459,450 | |
| Custodian fees and expenses | 43,938 | |
| Independent trustees' fees and expenses | 35,361 | |
| Appreciation in deferred trustee compensation account | 76 | |
| Registration fees | 97,566 | |
| Audit | 18,748 | |
| Legal | 21,088 | |
| Miscellaneous | 14,258 | |
| Total expenses before reductions | 11,659,457 | |
| Expense reductions | (173,476) | 11,485,981 |
| Net investment income (loss) | | 17,064,366 |
| Realized and Unrealized Gain (Loss) | | |
| Net realized gain (loss) on: | | |
| Investment securities: | | |
| Unaffiliated issuers | 267,574,030 | |
| Fidelity Central Funds | (3,449) | |
| Foreign currency transactions | (77,017) | |
| Total net realized gain (loss) | | 267,493,564 |
| Change in net unrealized appreciation (depreciation) on: | | |
| Investment securities: | | |
| Unaffiliated issuers | (4,354,209) | |
| Fidelity Central Funds | (1,922) | |
| Assets and liabilities in foreign currencies | 4,715 | |
| Total change in net unrealized appreciation (depreciation) | | (4,351,416) |
| Net gain (loss) | | 263,142,148 |
| Net increase (decrease) in net assets resulting from operations | | $280,206,514 |
See accompanying notes which are an integral part of the financial statements.
Statement of Changes in Net Assets
| | Six months ended August 31, 2017 (Unaudited) | Year ended February 28, 2017 |
| Increase (Decrease) in Net Assets | | |
| Operations | | |
| Net investment income (loss) | $17,064,366 | $23,461,992 |
| Net realized gain (loss) | 267,493,564 | 153,404,162 |
| Change in net unrealized appreciation (depreciation) | (4,351,416) | 608,450,143 |
| Net increase (decrease) in net assets resulting from operations | 280,206,514 | 785,316,297 |
| Distributions to shareholders from net investment income | (7,257,080) | (16,885,913) |
| Distributions to shareholders from net realized gain | (97,244,896) | (60,751,043) |
| Total distributions | (104,501,976) | (77,636,956) |
| Share transactions | | |
| Proceeds from sales of shares | 467,838,339 | 1,421,320,708 |
| Reinvestment of distributions | 100,395,495 | 74,398,178 |
| Cost of shares redeemed | (775,815,477) | (529,318,580) |
| Net increase (decrease) in net assets resulting from share transactions | (207,581,643) | 966,400,306 |
| Redemption fees | 66,178 | 116,895 |
| Total increase (decrease) in net assets | (31,810,927) | 1,674,196,542 |
| Net Assets | | |
| Beginning of period | 3,012,371,518 | 1,338,174,976 |
| End of period | $2,980,560,591 | $3,012,371,518 |
| Other Information | | |
| Undistributed net investment income end of period | $16,933,290 | $7,126,004 |
| Shares | | |
| Sold | 4,505,877 | 15,698,643 |
| Issued in reinvestment of distributions | 1,031,071 | 948,917 |
| Redeemed | (7,498,682) | (6,043,951) |
| Net increase (decrease) | (1,961,734) | 10,603,609 |
See accompanying notes which are an integral part of the financial statements.
Financial Highlights — Semiconductors Portfolio
| | Six months ended (Unaudited) August 31, | Years ended February 28, | | | | |
| | 2017 | 2017 | 2016A | 2015 | 2014 | 2013 |
| Selected Per–Share Data | | | | | | |
| Net asset value, beginning of period | $101.24 | $69.87 | $89.46 | $68.32 | $49.82 | $53.29 |
| Income from Investment Operations | | | | | | |
| Net investment income (loss)B | .59 | 1.03 | .70 | .47 | .36 | .17 |
| Net realized and unrealized gain (loss) | 8.87 | 33.98 | (8.79) | 23.21 | 18.53 | (3.49) |
| Total from investment operations | 9.46 | 35.01 | (8.09) | 23.68 | 18.89 | (3.32) |
| Distributions from net investment income | (.24) | (.68) | (.83) | (.45) | (.32) | (.15) |
| Distributions from net realized gain | (3.22) | (2.98) | (10.68) | (2.10) | (.06) | – |
| Total distributions | (3.46) | (3.65)C | (11.50)D | (2.55) | (.39)E | (.15) |
| Redemption fees added to paid in capitalB | –F | .01 | –F | .01 | –F | –F |
| Net asset value, end of period | $107.24 | $101.24 | $69.87 | $89.46 | $68.32 | $49.82 |
| Total ReturnG,H | 9.69% | 51.79% | (10.44)% | 34.91% | 38.01% | (6.20)% |
| Ratios to Average Net AssetsI,J,K | | | | | | |
| Expenses before reductions | .75%L | .77% | .77% | .78% | .82% | .84% |
| Expenses net of fee waivers, if any | .75%L | .77% | .77% | .78% | .82% | .84% |
| Expenses net of all reductions | .74%L | .75% | .74% | .77% | .79% | .82% |
| Net investment income (loss) | 1.15%L | 1.19% | .88% | .61% | .63% | .36% |
| Supplemental Data | | | | | | |
| Net assets, end of period (000 omitted) | $2,980,561 | $3,012,372 | $1,338,175 | $2,395,039 | $1,253,853 | $953,784 |
| Portfolio turnover rateJ | 94%L | 110% | 179% | 132%M | 186% | 118% |
A A For the year ended February 29.
B Calculated based on average shares outstanding during the period.
C Total distributions of $3.65 per share is comprised of distributions from net investment income of $.676 and distributions from net realized gain of $2.975 per share.
D Total distributions of $11.50 per share is comprised of distributions from net investment income of $.825 and distributions from net realized gain of $10.678 per share.
E Total distributions of $.39 per share is comprised of distributions from net investment income of $.322 and distributions from net realized gain of $.064 per share.
F Amount represents less than $.005 per share.
G Total returns for periods of less than one year are not annualized.
H Total returns would have been lower if certain expenses had not been reduced during the applicable periods shown.
I Fees and expenses of any underlying Fidelity Central Funds are not included in the Fund's expense ratio. The Fund indirectly bears its proportionate share of the expenses of any underlying Fidelity Central Funds.
J Amount does not include the portfolio activity of any underlying Fidelity Central Funds.
K Expense ratios reflect operating expenses of the Fund. Expenses before reductions do not reflect amounts reimbursed by the investment adviser or reductions from brokerage service arrangements or reductions from other expense offset arrangements and do not represent the amount paid by the Fund during periods when reimbursements or reductions occur. Expenses net of fee waivers reflect expenses after reimbursement by the investment adviser but prior to reductions from brokerage service arrangements or other expense offset arrangements. Expenses net of all reductions represent the net expenses paid by the Fund.
L Annualized
M Portfolio turnover rate excludes securities received or delivered in-kind.
See accompanying notes which are an integral part of the financial statements.
Software and IT Services Portfolio
Investment Summary (Unaudited)
Top Ten Stocks as of August 31, 2017
| | % of fund's net assets | % of fund's net assets 6 months ago |
| Microsoft Corp. | 14.1 | 12.7 |
| Facebook, Inc. Class A | 12.4 | 11.6 |
| Alphabet, Inc. Class C | 10.8 | 10.4 |
| Alphabet, Inc. Class A | 8.4 | 9.1 |
| Visa, Inc. Class A | 4.9 | 5.8 |
| Adobe Systems, Inc. | 4.3 | 3.7 |
| Salesforce.com, Inc. | 3.6 | 3.0 |
| MasterCard, Inc. Class A | 3.1 | 3.9 |
| Akamai Technologies, Inc. | 2.7 | 2.0 |
| PayPal Holdings, Inc. | 2.7 | 2.1 |
| | 67.0 | |
Top Industries (% of fund's net assets)
| As of August 31, 2017 |
| | Internet Software & Services | 38.0% |
| | Software | 31.0% |
| | IT Services | 23.5% |
| | Internet & Direct Marketing Retail | 1.5% |
| | Semiconductors & Semiconductor Equipment | 1.2% |
| | All Others* | 4.8% |
* Includes Short-Term investments and Net Other Assets (Liabilities).
| As of February 28, 2017 |
| | Internet Software & Services | 37.1% |
| | Software | 31.2% |
| | IT Services | 22.3% |
| | Internet & Direct Marketing Retail | 2.4% |
| | Electronic Equipment & Components | 1.2% |
| | All Others* | 5.8% |
* Includes Short-Term investments and Net Other Assets (Liabilities).
Software and IT Services Portfolio
Investments August 31, 2017 (Unaudited)
Showing Percentage of Net Assets
| Common Stocks - 97.0% | | | |
| | | Shares | Value |
| Communications Equipment - 0.7% | | | |
| Communications Equipment - 0.7% | | | |
| Cisco Systems, Inc. | | 324,000 | $10,436,040 |
| F5 Networks, Inc. (a) | | 162,600 | 19,411,188 |
| | | | 29,847,228 |
| Electronic Equipment & Components - 0.9% | | | |
| Technology Distributors - 0.9% | | | |
| Dell Technologies, Inc. | | 549,000 | 41,136,570 |
| Health Care Technology - 0.2% | | | |
| Health Care Technology - 0.2% | | | |
| Inovalon Holdings, Inc. Class A (a)(b) | | 678,300 | 9,190,965 |
| Internet & Direct Marketing Retail - 1.5% | | | |
| Internet & Direct Marketing Retail - 1.5% | | | |
| Amazon.com, Inc. (a) | | 37,200 | 36,478,320 |
| TripAdvisor, Inc. (a)(b) | | 758,000 | 32,389,340 |
| | | | 68,867,660 |
| Internet Software & Services - 38.0% | | | |
| Internet Software & Services - 38.0% | | | |
| Actua Corp. (a) | | 345,589 | 4,423,539 |
| Akamai Technologies, Inc. (a) | | 2,580,800 | 121,684,720 |
| Alphabet, Inc.: | | | |
| Class A (a) | | 400,700 | 382,764,668 |
| Class C (a) | | 520,860 | 489,259,424 |
| Bazaarvoice, Inc. (a) | | 1,417,100 | 6,731,225 |
| Facebook, Inc. Class A (a) | | 3,263,200 | 561,172,504 |
| Mix Telematics Ltd. | | 27,823,896 | 10,620,926 |
| New Relic, Inc. (a) | | 358,000 | 17,148,200 |
| NIC, Inc. | | 1,768,000 | 28,906,800 |
| Pandora Media, Inc. (a)(b) | | 1,595,600 | 13,482,820 |
| SecureWorks Corp. (a)(b) | | 470,411 | 4,812,305 |
| Shutterstock, Inc. (a)(b) | | 915,500 | 30,742,490 |
| SPS Commerce, Inc. (a) | | 339,100 | 20,657,972 |
| Twilio, Inc. Class A (a)(b) | | 556,800 | 16,303,104 |
| Twitter, Inc. (a) | | 893,700 | 15,112,467 |
| | | | 1,723,823,164 |
| IT Services - 23.5% | | | |
| Data Processing & Outsourced Services - 17.7% | | | |
| Alliance Data Systems Corp. | | 262,500 | 59,193,750 |
| EVERTEC, Inc. | | 418,700 | 7,704,080 |
| Fidelity National Information Services, Inc. | | 513,100 | 47,677,252 |
| FleetCor Technologies, Inc. (a) | | 546,100 | 78,512,797 |
| Global Payments, Inc. | | 332,700 | 31,769,523 |
| MasterCard, Inc. Class A | | 1,057,200 | 140,924,760 |
| PayPal Holdings, Inc. (a) | | 1,955,400 | 120,609,072 |
| Sabre Corp. | | 1,021,000 | 18,827,240 |
| The Western Union Co. | | 931,100 | 17,616,412 |
| Total System Services, Inc. | | 856,100 | 59,173,632 |
| Visa, Inc. Class A | | 2,135,120 | 221,027,622 |
| | | | 803,036,140 |
| IT Consulting & Other Services - 5.8% | | | |
| Accenture PLC Class A | | 234,400 | 30,650,144 |
| Cognizant Technology Solutions Corp. Class A | | 1,672,000 | 118,327,440 |
| CSRA, Inc. | | 654,300 | 20,616,993 |
| IBM Corp. | | 658,700 | 94,213,861 |
| | | | 263,808,438 |
|
| TOTAL IT SERVICES | | | 1,066,844,578 |
|
| Semiconductors & Semiconductor Equipment - 1.2% | | | |
| Semiconductors - 1.2% | | | |
| Qualcomm, Inc. | | 1,059,200 | 55,364,384 |
| Software - 31.0% | | | |
| Application Software - 13.6% | | | |
| Adobe Systems, Inc. (a) | | 1,248,700 | 193,748,292 |
| Autodesk, Inc. (a) | | 355,800 | 40,724,868 |
| Citrix Systems, Inc. (a) | | 300,600 | 23,509,926 |
| Deem, Inc. (a)(c)(d) | | 124,895 | 23,730 |
| MobileIron, Inc. (a) | | 717,511 | 2,726,542 |
| Monotype Imaging Holdings, Inc. | | 1,478,300 | 26,978,975 |
| Paylocity Holding Corp. (a) | | 404,600 | 19,882,044 |
| RingCentral, Inc. (a) | | 132,900 | 5,628,315 |
| Salesforce.com, Inc. (a) | | 1,709,626 | 163,252,187 |
| Ultimate Software Group, Inc. (a)(b) | | 231,800 | 46,568,620 |
| Workday, Inc. Class A (a) | | 719,100 | 78,878,079 |
| Zendesk, Inc. (a) | | 604,800 | 16,571,520 |
| | | | 618,493,098 |
| Home Entertainment Software - 1.3% | | | |
| Activision Blizzard, Inc. | | 324,700 | 21,287,332 |
| Electronic Arts, Inc. (a) | | 289,900 | 35,222,850 |
| | | | 56,510,182 |
| Systems Software - 16.1% | | | |
| Microsoft Corp. | | 8,565,200 | 640,420,002 |
| Red Hat, Inc. (a) | | 455,700 | 48,987,750 |
| Tableau Software, Inc. (a) | | 536,600 | 38,892,768 |
| | | | 728,300,520 |
|
| TOTAL SOFTWARE | | | 1,403,303,800 |
|
| TOTAL COMMON STOCKS | | | |
| (Cost $2,543,058,713) | | | 4,398,378,349 |
|
| Money Market Funds - 5.0% | | | |
| Fidelity Cash Central Fund, 1.11% (e) | | 131,603,669 | 131,629,990 |
| Fidelity Securities Lending Cash Central Fund 1.11% (e)(f) | | 94,913,327 | 94,922,819 |
| TOTAL MONEY MARKET FUNDS | | | |
| (Cost $226,538,938) | | | 226,552,809 |
| TOTAL INVESTMENT IN SECURITIES - 102.0% | | | |
| (Cost $2,769,597,651) | | | 4,624,931,158 |
| NET OTHER ASSETS (LIABILITIES) - (2.0)% | | | (92,596,909) |
| NET ASSETS - 100% | | | $4,532,334,249 |
Legend
(a) Non-income producing
(b) Security or a portion of the security is on loan at period end.
(c) Restricted securities - Investment in securities not registered under the Securities Act of 1933 (excluding 144A issues). At the end of the period, the value of restricted securities (excluding 144A issues) amounted to $23,730 or 0.0% of net assets.
(d) Level 3 instrument
(e) Affiliated fund that is generally available only to investment companies and other accounts managed by Fidelity Investments. The rate quoted is the annualized seven-day yield of the fund at period end. A complete unaudited listing of the fund's holdings as of its most recent quarter end is available upon request. In addition, each Fidelity Central Fund's financial statements are available on the SEC's website or upon request.
(f) Investment made with cash collateral received from securities on loan.
Affiliated Central Funds
Information regarding fiscal year to date income earned by the Fund from investments in Fidelity Central Funds is as follows:
| Fund | Income earned |
| Fidelity Cash Central Fund | $614,295 |
| Fidelity Securities Lending Cash Central Fund | 367,368 |
| Total | $981,663 |
Investment Valuation
The following is a summary of the inputs used, as of August 31, 2017, involving the Fund's assets and liabilities carried at fair value. The inputs or methodology used for valuing securities may not be an indication of the risk associated with investing in those securities. For more information on valuation inputs, and their aggregation into the levels used below, please refer to the Investment Valuation section in the accompanying Notes to Financial Statements.
| | Valuation Inputs at Reporting Date: |
| Description | Total | Level 1 | Level 2 | Level 3 |
| Investments in Securities: | | | | |
| Common Stocks | $4,398,378,349 | $4,387,733,693 | $10,620,926 | $23,730 |
| Money Market Funds | 226,552,809 | 226,552,809 | -- | -- |
| Total Investments in Securities: | $4,624,931,158 | $4,614,286,502 | $10,620,926 | $23,730 |
See accompanying notes which are an integral part of the financial statements.
Software and IT Services Portfolio
Financial Statements
Statement of Assets and Liabilities
| | | August 31, 2017 (Unaudited) |
| Assets | | |
Investment in securities, at value (including securities loaned of $94,417,863) — See accompanying schedule:
Unaffiliated issuers (cost $2,543,058,713) | $4,398,378,350 | |
| Fidelity Central Funds (cost $226,538,938) | 226,552,808 | |
| Total Investment in Securities (cost $2,769,597,651) | | $4,624,931,158 |
| Receivable for investments sold | | 90,168 |
| Receivable for fund shares sold | | 4,269,030 |
| Dividends receivable | | 5,458,041 |
| Distributions receivable from Fidelity Central Funds | | 177,386 |
| Other receivables | | 326,160 |
| Total assets | | 4,635,251,943 |
| Liabilities | | |
| Payable for fund shares redeemed | 5,123,539 | |
| Accrued management fee | 2,012,828 | |
| Other affiliated payables | 675,250 | |
| Other payables and accrued expenses | 185,677 | |
| Collateral on securities loaned | 94,920,400 | |
| Total liabilities | | 102,917,694 |
| Net Assets | | $4,532,334,249 |
| Net Assets consist of: | | |
| Paid in capital | | $2,489,239,350 |
| Accumulated net investment loss | | (1,498,135) |
| Accumulated undistributed net realized gain (loss) on investments and foreign currency transactions | | 189,331,467 |
| Net unrealized appreciation (depreciation) on investments and assets and liabilities in foreign currencies | | 1,855,261,567 |
| Net Assets, for 28,657,731 shares outstanding | | $4,532,334,249 |
| Net Asset Value, offering price and redemption price per share ($4,532,334,249 ÷ 28,657,731 shares) | | $158.15 |
See accompanying notes which are an integral part of the financial statements.
Statement of Operations
| | | Six months ended August 31, 2017 (Unaudited) |
| Investment Income | | |
| Dividends | | $13,498,921 |
| Income from Fidelity Central Funds (including $367,368 from security lending) | | 981,663 |
| Total income | | 14,480,584 |
| Expenses | | |
| Management fee | $11,678,623 | |
| Transfer agent fees | 3,450,717 | |
| Accounting and security lending fees | 531,665 | |
| Custodian fees and expenses | 24,008 | |
| Independent trustees' fees and expenses | 48,712 | |
| Registration fees | 72,731 | |
| Audit | 25,721 | |
| Legal | 30,838 | |
| Miscellaneous | 26,590 | |
| Total expenses before reductions | 15,889,605 | |
| Expense reductions | (53,197) | 15,836,408 |
| Net investment income (loss) | | (1,355,824) |
| Realized and Unrealized Gain (Loss) | | |
| Net realized gain (loss) on: | | |
| Investment securities: | | |
| Unaffiliated issuers | 192,059,019 | |
| Fidelity Central Funds | 2,108 | |
| Foreign currency transactions | (2,720) | |
| Total net realized gain (loss) | | 192,058,407 |
| Change in net unrealized appreciation (depreciation) on: | | |
| Investment securities: | | |
| Unaffiliated issuers | 413,297,708 | |
| Fidelity Central Funds | (7,607) | |
| Assets and liabilities in foreign currencies | 6,034 | |
| Total change in net unrealized appreciation (depreciation) | | 413,296,135 |
| Net gain (loss) | | 605,354,542 |
| Net increase (decrease) in net assets resulting from operations | | $603,998,718 |
See accompanying notes which are an integral part of the financial statements.
Statement of Changes in Net Assets
| | Six months ended August 31, 2017 (Unaudited) | Year ended February 28, 2017 |
| Increase (Decrease) in Net Assets | | |
| Operations | | |
| Net investment income (loss) | $(1,355,824) | $(4,060,383) |
| Net realized gain (loss) | 192,058,407 | 254,286,047 |
| Change in net unrealized appreciation (depreciation) | 413,296,135 | 730,057,967 |
| Net increase (decrease) in net assets resulting from operations | 603,998,718 | 980,283,631 |
| Distributions to shareholders from net investment income | – | (1,211,235) |
| Distributions to shareholders from net realized gain | (103,704,113) | (146,887,357) |
| Total distributions | (103,704,113) | (148,098,592) |
| Share transactions | | |
| Proceeds from sales of shares | 413,763,947 | 1,075,769,868 |
| Reinvestment of distributions | 98,803,889 | 141,773,881 |
| Cost of shares redeemed | (635,962,967) | (865,722,579) |
| Net increase (decrease) in net assets resulting from share transactions | (123,395,131) | 351,821,170 |
| Redemption fees | – | 59,005 |
| Total increase (decrease) in net assets | 376,899,474 | 1,184,065,214 |
| Net Assets | | |
| Beginning of period | 4,155,434,775 | 2,971,369,561 |
| End of period | $4,532,334,249 | $4,155,434,775 |
| Other Information | | |
| Accumulated net investment loss end of period | $(1,498,135) | $(142,311) |
| Shares | | |
| Sold | 2,777,173 | 8,292,367 |
| Issued in reinvestment of distributions | 714,675 | 1,094,880 |
| Redeemed | (4,335,368) | (6,629,721) |
| Net increase (decrease) | (843,520) | 2,757,526 |
See accompanying notes which are an integral part of the financial statements.
Financial Highlights — Software and IT Services Portfolio
| | Six months ended (Unaudited) August 31, | Years ended February 28, | | | | |
| | 2017 | 2017 | 2016A | 2015 | 2014 | 2013 |
| Selected Per–Share Data | | | | | | |
| Net asset value, beginning of period | $140.86 | $111.11 | $119.38 | $124.38 | $87.97 | $89.96 |
| Income from Investment Operations | | | | | | |
| Net investment income (loss)B | (.05) | (.14) | .12 | (.17) | .06 | .04 |
| Net realized and unrealized gain (loss) | 21.01 | 35.02 | (2.05) | 7.26 | 41.95 | 7.25 |
| Total from investment operations | 20.96 | 34.88 | (1.93) | 7.09 | 42.01 | 7.29 |
| Distributions from net investment income | – | (.05) | (.05) | – | – | (.78)C |
| Distributions from net realized gain | (3.67) | (5.08) | (6.29) | (12.09) | (5.60) | (8.50)C |
| Total distributions | (3.67) | (5.13) | (6.34) | (12.09) | (5.60) | (9.28) |
| Redemption fees added to paid in capitalB | – | –D | –D | –D | –D | –D |
| Net asset value, end of period | $158.15 | $140.86 | $111.11 | $119.38 | $124.38 | $87.97 |
| Total ReturnE,F | 15.25% | 31.83% | (1.84)% | 6.33% | 48.18% | 8.85% |
| Ratios to Average Net AssetsG,H | | | | | | |
| Expenses before reductions | .74%I | .76% | .77% | .77% | .79% | .82% |
| Expenses net of fee waivers, if any | .74%I | .76% | .76% | .77% | .79% | .82% |
| Expenses net of all reductions | .74%I | .75% | .76% | .77% | .78% | .80% |
| Net investment income (loss) | (.06)%I | (.11)% | .10% | (.15)% | .06% | .04% |
| Supplemental Data | | | | | | |
| Net assets, end of period (000 omitted) | $4,532,334 | $4,155,435 | $2,971,370 | $3,012,792 | $3,844,505 | $2,027,731 |
| Portfolio turnover rateJ | 28%I | 44% | 36% | 53% | 87% | 96% |
A For the year ended February 29.
B Calculated based on average shares outstanding during the period.
C The amounts shown reflect certain reclassifications related to book to tax differences that were made in the year shown.
D Amount represents less than $.005 per share.
E Total returns for periods of less than one year are not annualized.
F Total returns would have been lower if certain expenses had not been reduced during the applicable periods shown.
G Fees and expenses of any underlying Fidelity Central Funds are not included in the Fund's expense ratio. The Fund indirectly bears its proportionate share of the expenses of any underlying Fidelity Central Funds.
H Expense ratios reflect operating expenses of the Fund. Expenses before reductions do not reflect amounts reimbursed by the investment adviser or reductions from brokerage service arrangements or reductions from other expense offset arrangements and do not represent the amount paid by the Fund during periods when reimbursements or reductions occur. Expenses net of fee waivers reflect expenses after reimbursement by the investment adviser but prior to reductions from brokerage service arrangements or other expense offset arrangements. Expenses net of all reductions represent the net expenses paid by the Fund.
I Annualized
J Amount does not include the portfolio activity of any underlying Fidelity Central Funds.
See accompanying notes which are an integral part of the financial statements.
Technology Portfolio
Investment Summary (Unaudited)
Top Ten Stocks as of August 31, 2017
| | % of fund's net assets | % of fund's net assets 6 months ago |
| Apple, Inc. | 10.1 | 11.1 |
| Facebook, Inc. Class A | 6.9 | 5.2 |
| Tesla, Inc. | 4.9 | 3.4 |
| Alphabet, Inc. Class C | 4.9 | 5.3 |
| Alphabet, Inc. Class A | 4.9 | 5.1 |
| Microsoft Corp. | 4.5 | 4.4 |
| Autodesk, Inc. | 3.6 | 3.4 |
| Alibaba Group Holding Ltd. sponsored ADR | 2.9 | 0.0 |
| Cognizant Technology Solutions Corp. Class A | 1.9 | 0.5 |
| Electronic Arts, Inc. | 1.5 | 1.0 |
| | 46.1 | |
Top Industries (% of fund's net assets)
| As of August 31, 2017 |
| | Internet Software & Services | 25.7% |
| | Software | 19.9% |
| | Semiconductors & Semiconductor Equipment | 16.0% |
| | Technology Hardware, Storage & Peripherals | 10.1% |
| | Electronic Equipment & Components | 7.1% |
| | All Others* | 21.2% |
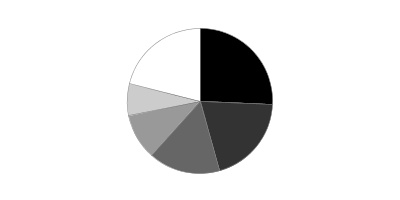
* Includes Short-Term investments and Net Other Assets (Liabilities).
| As of February 28, 2017 |
| | Internet Software & Services | 21.7% |
| | Semiconductors & Semiconductor Equipment | 18.0% |
| | Software | 15.7% |
| | Technology Hardware, Storage & Peripherals | 11.3% |
| | Electronic Equipment & Components | 10.4% |
| | All Others* | 22.9% |
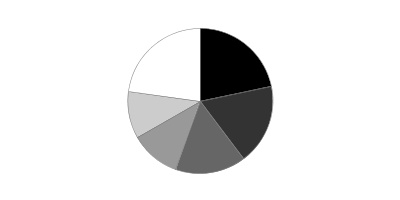
* Includes Short-Term investments and Net Other Assets (Liabilities).
Percentages shown as 0.0% may reflect amounts less than 0.05%.
Technology Portfolio
Investments August 31, 2017 (Unaudited)
Showing Percentage of Net Assets
| Common Stocks - 96.1% | | | |
| | | Shares | Value |
| Automobiles - 4.9% | | | |
| Automobile Manufacturers - 4.9% | | | |
| Tesla, Inc. (a)(b) | | 832,156 | $296,164,320 |
| Biotechnology - 0.1% | | | |
| Biotechnology - 0.1% | | | |
| BeiGene Ltd. ADR (a) | | 107,300 | 7,395,116 |
| Chemicals - 0.6% | | | |
| Industrial Gases - 0.1% | | | |
| SK Materials Co., Ltd. | | 43,112 | 7,002,318 |
| Specialty Chemicals - 0.5% | | | |
| Duk San Neolux Co. Ltd. | | 728,408 | 16,197,859 |
| Soulbrain Co. Ltd. | | 171,081 | 9,815,318 |
| | | | 26,013,177 |
|
| TOTAL CHEMICALS | | | 33,015,495 |
|
| Communications Equipment - 0.4% | | | |
| Communications Equipment - 0.4% | | | |
| Cisco Systems, Inc. | | 682,300 | 21,976,883 |
| Diversified Consumer Services - 1.7% | | | |
| Education Services - 1.7% | | | |
| China Online Education Group sponsored ADR (a)(b) | | 7,115 | 96,053 |
| New Oriental Education & Technology Group, Inc. sponsored ADR | | 496,795 | 40,612,991 |
| TAL Education Group ADR | | 1,969,884 | 59,943,570 |
| | | | 100,652,614 |
| Diversified Financial Services - 0.1% | | | |
| Other Diversified Financial Services - 0.1% | | | |
| GDS Holdings Ltd. ADR | | 787,800 | 7,365,930 |
| Diversified Telecommunication Services - 0.1% | | | |
| Integrated Telecommunication Services - 0.1% | | | |
| Bharti Infratel Ltd. | | 951,441 | 5,583,494 |
| Electrical Equipment - 0.2% | | | |
| Electrical Components & Equipment - 0.2% | | | |
| Rockwell Automation, Inc. | | 65,000 | 10,663,900 |
| Electronic Equipment & Components - 7.1% | | | |
| Electronic Components - 2.5% | | | |
| Genius Electronic Optical Co. Ltd. (a) | | 456,000 | 7,535,314 |
| Largan Precision Co. Ltd. | | 113,000 | 21,860,203 |
| Ledlink Optics, Inc. | | 1,728,624 | 2,913,878 |
| Lens Technology Co. Ltd. Class A | | 3,393,960 | 16,640,442 |
| Sunny Optical Technology Group Co. Ltd. | | 4,710,000 | 67,528,607 |
| TDK Corp. | | 220,800 | 14,802,347 |
| Universal Display Corp. | | 144,544 | 18,371,542 |
| | | | 149,652,333 |
| Electronic Equipment & Instruments - 3.7% | | | |
| Chroma ATE, Inc. | | 14,500,644 | 49,800,629 |
| Cognex Corp. | | 232,700 | 25,357,319 |
| Hexagon AB (B Shares) | | 295,900 | 14,519,889 |
| National Instruments Corp. | | 265,400 | 10,719,506 |
| Topcon Corp. | | 1,784,400 | 31,505,166 |
| Trimble, Inc. (a) | | 2,369,921 | 91,668,544 |
| | | | 223,571,053 |
| Electronic Manufacturing Services - 0.3% | | | |
| Merry Electronics Co. Ltd. | | 2,463,000 | 19,369,568 |
| Technology Distributors - 0.6% | | | |
| Dell Technologies, Inc. | | 444,052 | 33,272,816 |
|
| TOTAL ELECTRONIC EQUIPMENT & COMPONENTS | | | 425,865,770 |
|
| Health Care Technology - 0.3% | | | |
| Health Care Technology - 0.3% | | | |
| athenahealth, Inc. (a) | | 138,126 | 19,466,097 |
| Household Durables - 0.9% | | | |
| Consumer Electronics - 0.9% | | | |
| Sony Corp. | | 710,500 | 28,113,303 |
| Sony Corp. sponsored ADR | | 588,100 | 23,306,403 |
| | | | 51,419,706 |
| Internet & Direct Marketing Retail - 1.0% | | | |
| Internet & Direct Marketing Retail - 1.0% | | | |
| Amazon.com, Inc. (a) | | 34,900 | 34,222,940 |
| China Internet Plus Holdings Ltd. Class B (c)(d) | | 759,582 | 4,413,171 |
| Cogobuy Group | | 547,000 | 370,457 |
| JD.com, Inc. sponsored ADR (a) | | 465,000 | 19,488,150 |
| | | | 58,494,718 |
| Internet Software & Services - 25.3% | | | |
| Internet Software & Services - 25.3% | | | |
| 58.com, Inc. ADR (a) | | 857,636 | 53,713,743 |
| Akamai Technologies, Inc. (a) | | 679,300 | 32,028,995 |
| Alibaba Group Holding Ltd. sponsored ADR (a) | | 1,017,600 | 174,762,624 |
| Alphabet, Inc.: | | | |
| Class A (a) | | 304,403 | 290,777,922 |
| Class C (a) | | 313,868 | 294,825,628 |
| Benefitfocus, Inc. (a) | | 93,600 | 2,887,560 |
| CoStar Group, Inc. (a) | | 52,000 | 14,904,240 |
| Endurance International Group Holdings, Inc. (a) | | 1,193,620 | 9,190,874 |
| Envestnet, Inc. (a) | | 434 | 19,291 |
| Facebook, Inc. Class A (a) | | 2,416,274 | 415,526,640 |
| GoDaddy, Inc. (a) | | 438,300 | 19,644,606 |
| Hortonworks, Inc. (a) | | 409,500 | 6,957,405 |
| LogMeIn, Inc. | | 527,469 | 60,342,454 |
| NetEase, Inc. ADR | | 133,100 | 36,714,304 |
| New Relic, Inc. (a) | | 251,000 | 12,022,900 |
| Nutanix, Inc. Class B (e) | | 72,872 | 1,603,184 |
| Pandora Media, Inc. (a) | | 312,300 | 2,638,935 |
| Shopify, Inc. | | 6,256 | 693,916 |
| Shopify, Inc. Class A (a) | | 64,300 | 7,105,826 |
| SMS Co., Ltd. | | 1,011,900 | 32,722,104 |
| Tencent Holdings Ltd. | | 795,000 | 33,453,342 |
| Xunlei Ltd. sponsored ADR (a)(b) | | 1,303,205 | 5,525,589 |
| Yandex NV Series A (a) | | 303,800 | 9,117,038 |
| | | | 1,517,179,120 |
| IT Services - 5.7% | | | |
| Data Processing & Outsourced Services - 3.0% | | | |
| Fidelity National Information Services, Inc. | | 220,268 | 20,467,303 |
| Fiserv, Inc. (a) | | 153,900 | 19,038,969 |
| FleetCor Technologies, Inc. (a) | | 281,100 | 40,413,747 |
| Global Payments, Inc. | | 223,300 | 21,322,917 |
| PayPal Holdings, Inc. (a) | | 679,100 | 41,886,888 |
| Paysafe Group PLC (a) | | 2,576,735 | 19,525,379 |
| Total System Services, Inc. | | 124,799 | 8,626,107 |
| WEX, Inc. (a) | | 71,000 | 7,748,940 |
| | | | 179,030,250 |
| IT Consulting & Other Services - 2.7% | | | |
| Cognizant Technology Solutions Corp. Class A | | 1,661,412 | 117,578,127 |
| CSRA, Inc. | | 125,400 | 3,951,354 |
| DXC Technology Co. | | 487,900 | 41,471,500 |
| | | | 163,000,981 |
|
| TOTAL IT SERVICES | | | 342,031,231 |
|
| Life Sciences Tools & Services - 0.0% | | | |
| Life Sciences Tools & Services - 0.0% | | | |
| JHL Biotech, Inc. (a) | | 1,015,442 | 1,946,546 |
| Machinery - 1.6% | | | |
| Industrial Machinery - 1.6% | | | |
| HIWIN Technologies Corp. | | 2,049,180 | 18,189,095 |
| Minebea Mitsumi, Inc. | | 4,678,819 | 76,905,680 |
| | | | 95,094,775 |
| Media - 0.0% | | | |
| Advertising - 0.0% | | | |
| iCar Asia Ltd. (a) | | 3,611,616 | 660,342 |
| Professional Services - 0.1% | | | |
| Human Resource & Employment Services - 0.1% | | | |
| WageWorks, Inc. (a) | | 87,200 | 5,140,440 |
| Research & Consulting Services - 0.0% | | | |
| ICF International, Inc. (a) | | 61,300 | 2,945,465 |
|
| TOTAL PROFESSIONAL SERVICES | | | 8,085,905 |
|
| Semiconductors & Semiconductor Equipment - 16.0% | | | |
| Semiconductor Equipment - 4.8% | | | |
| ASM Pacific Technology Ltd. | | 6,619,800 | 81,883,096 |
| GlobalWafers Co. Ltd. | | 8,804,200 | 69,968,507 |
| Lam Research Corp. | | 398,400 | 66,126,432 |
| Siltronic AG (a) | | 291,052 | 28,415,059 |
| Sino-American Silicon Products, Inc. | | 6,991,000 | 12,480,407 |
| SolarEdge Technologies, Inc. (a) | | 112,700 | 3,014,725 |
| Sumco Corp. | | 1,864,300 | 27,404,455 |
| | | | 289,292,681 |
| Semiconductors - 11.2% | | | |
| Acacia Communications, Inc. (a)(b) | | 104,200 | 5,088,086 |
| Advanced Micro Devices, Inc. (a)(b) | | 3,273,100 | 42,550,300 |
| ams AG | | 732,209 | 52,723,324 |
| Analog Devices, Inc. | | 152,500 | 12,759,675 |
| ASPEED Tech, Inc. | | 399,000 | 8,844,159 |
| Broadcom Ltd. | | 277,000 | 69,823,390 |
| Cavium, Inc. (a) | | 129,700 | 8,211,307 |
| ChipMOS TECHNOLOGIES, Inc. sponsored ADR (b) | | 401,467 | 7,286,626 |
| Cirrus Logic, Inc. (a) | | 41,000 | 2,377,180 |
| Cree, Inc. (a) | | 532,184 | 12,948,037 |
| Cypress Semiconductor Corp. | | 612,000 | 8,378,280 |
| Dialog Semiconductor PLC (a) | | 208,500 | 9,477,854 |
| Himax Technologies, Inc. sponsored ADR (b) | | 2,845,291 | 27,940,758 |
| Inphi Corp. (a)(b) | | 472,914 | 18,107,877 |
| Integrated Device Technology, Inc. (a) | | 220,600 | 5,451,026 |
| Marvell Technology Group Ltd. | | 1,353,254 | 24,236,779 |
| Mellanox Technologies Ltd. (a) | | 833,754 | 39,144,750 |
| Micron Technology, Inc. (a) | | 2,673,100 | 85,459,007 |
| Monolithic Power Systems, Inc. | | 167,995 | 17,021,253 |
| NVIDIA Corp. | | 511,750 | 86,710,920 |
| ON Semiconductor Corp. (a) | | 489,300 | 8,357,244 |
| Qualcomm, Inc. | | 901,000 | 47,095,270 |
| Renesas Electronics Corp. (a) | | 395,800 | 3,992,743 |
| Semtech Corp. (a) | | 599,476 | 22,540,298 |
| Silergy Corp. | | 233,000 | 5,203,292 |
| Silicon Laboratories, Inc. (a) | | 141,200 | 10,717,080 |
| Silicon Motion Technology Corp. sponsored ADR (b) | | 416,500 | 18,996,565 |
| Win Semiconductors Corp. | | 1,511,000 | 8,724,105 |
| | | | 670,167,185 |
|
| TOTAL SEMICONDUCTORS & SEMICONDUCTOR EQUIPMENT | | | 959,459,866 |
|
| Software - 19.9% | | | |
| Application Software - 9.8% | | | |
| Adobe Systems, Inc. (a) | | 376,439 | 58,408,275 |
| Aspen Technology, Inc. (a) | | 68,900 | 4,357,925 |
| Autodesk, Inc. (a) | | 1,883,600 | 215,596,856 |
| Callidus Software, Inc. (a) | | 586,428 | 15,100,521 |
| Ellie Mae, Inc. (a) | | 334,400 | 27,748,512 |
| HubSpot, Inc. (a) | | 20,100 | 1,474,335 |
| iFlytek Co. Ltd. | | 833,018 | 7,206,537 |
| Intuit, Inc. | | 180,300 | 25,503,435 |
| Parametric Technology Corp. (a) | | 957,000 | 53,592,000 |
| Paylocity Holding Corp. (a) | | 66,028 | 3,244,616 |
| RealPage, Inc. (a) | | 16,400 | 706,840 |
| Salesforce.com, Inc. (a) | | 778,192 | 74,309,554 |
| Snap, Inc. Class A (a)(b) | | 617,600 | 8,961,376 |
| SS&C Technologies Holdings, Inc. | | 266,600 | 10,320,086 |
| Ultimate Software Group, Inc. (a) | | 277,617 | 55,773,255 |
| Workday, Inc. Class A (a) | | 49,500 | 5,429,655 |
| Zendesk, Inc. (a) | | 758,275 | 20,776,735 |
| | | | 588,510,513 |
| Home Entertainment Software - 4.7% | | | |
| Activision Blizzard, Inc. | | 1,251,400 | 82,041,784 |
| Electronic Arts, Inc. (a) | | 757,400 | 92,024,100 |
| Nintendo Co. Ltd. | | 177,600 | 59,234,878 |
| Nintendo Co. Ltd. ADR (b) | | 412,200 | 17,159,886 |
| Take-Two Interactive Software, Inc. (a) | | 319,100 | 31,204,789 |
| | | | 281,665,437 |
| Systems Software - 5.4% | | | |
| Microsoft Corp. | | 3,615,440 | 270,326,449 |
| Tableau Software, Inc. (a) | | 672,600 | 48,750,048 |
| | | | 319,076,497 |
|
| TOTAL SOFTWARE | | | 1,189,252,447 |
|
| Technology Hardware, Storage & Peripherals - 10.1% | | | |
| Technology Hardware, Storage & Peripherals - 10.1% | | | |
| Apple, Inc. | | 3,696,797 | 606,274,711 |
| TOTAL COMMON STOCKS | | | |
| (Cost $3,852,885,980) | | | 5,758,048,986 |
|
| Convertible Preferred Stocks - 1.1% | | | |
| Internet & Direct Marketing Retail - 0.7% | | | |
| Internet & Direct Marketing Retail - 0.7% | | | |
| China Internet Plus Holdings Ltd.: | | | |
| Series A-11 (a)(c)(d) | | 2,802,162 | 16,280,561 |
| Series B (a)(c)(d) | | 3,918,573 | 22,766,909 |
| | | | 39,047,470 |
| Internet Software & Services - 0.4% | | | |
| Internet Software & Services - 0.4% | | | |
| Uber Technologies, Inc. Series D, 8.00% (a)(c)(d) | | 515,696 | 25,151,643 |
| TOTAL CONVERTIBLE PREFERRED STOCKS | | | |
| (Cost $31,985,667) | | | 64,199,113 |
|
| Money Market Funds - 9.0% | | | |
| Fidelity Cash Central Fund, 1.11% (f) | | 164,361,308 | 164,394,180 |
| Fidelity Securities Lending Cash Central Fund 1.11% (f)(g) | | 376,684,007 | 376,721,675 |
| TOTAL MONEY MARKET FUNDS | | | |
| (Cost $541,111,945) | | | 541,115,855 |
| TOTAL INVESTMENT IN SECURITIES - 106.2% | | | |
| (Cost $4,425,983,592) | | | 6,363,363,954 |
| NET OTHER ASSETS (LIABILITIES) - (6.2)% | | | (372,890,127) |
| NET ASSETS - 100% | | | $5,990,473,827 |
Legend
(a) Non-income producing
(b) Security or a portion of the security is on loan at period end.
(c) Level 3 instrument
(d) Restricted securities - Investment in securities not registered under the Securities Act of 1933 (excluding 144A issues). At the end of the period, the value of restricted securities (excluding 144A issues) amounted to $68,612,284 or 1.1% of net assets.
(e) Security exempt from registration under Rule 144A of the Securities Act of 1933. These securities may be resold in transactions exempt from registration, normally to qualified institutional buyers. At the end of the period, the value of these securities amounted to $1,603,184 or 0.0% of net assets.
(f) Affiliated fund that is generally available only to investment companies and other accounts managed by Fidelity Investments. The rate quoted is the annualized seven-day yield of the fund at period end. A complete unaudited listing of the fund's holdings as of its most recent quarter end is available upon request. In addition, each Fidelity Central Fund's financial statements are available on the SEC's website or upon request.
(g) Investment made with cash collateral received from securities on loan.
Additional information on each restricted holding is as follows:
| Security | Acquisition Date | Acquisition Cost |
| China Internet Plus Holdings Ltd. Class B | 11/16/16 | $2,140,730 |
| China Internet Plus Holdings Ltd. Series A-11 | 1/26/15 | $8,857,214 |
| China Internet Plus Holdings Ltd. Series B | 12/11/15 | $15,128,435 |
| Uber Technologies, Inc. Series D, 8.00% | 6/6/14 | $8,000,018 |
Affiliated Central Funds
Information regarding fiscal year to date income earned by the Fund from investments in Fidelity Central Funds is as follows:
| Fund | Income earned |
| Fidelity Cash Central Fund | $474,007 |
| Fidelity Securities Lending Cash Central Fund | 1,151,465 |
| Total | $1,625,472 |
Investment Valuation
The following is a summary of the inputs used, as of August 31, 2017, involving the Fund's assets and liabilities carried at fair value. The inputs or methodology used for valuing securities may not be an indication of the risk associated with investing in those securities. For more information on valuation inputs, and their aggregation into the levels used below, please refer to the Investment Valuation section in the accompanying Notes to Financial Statements.
| | Valuation Inputs at Reporting Date: |
| Description | Total | Level 1 | Level 2 | Level 3 |
| Investments in Securities: | | | | |
| Common Stocks | $5,758,048,986 | $5,632,834,292 | $120,801,523 | $4,413,171 |
| Convertible Preferred Stocks | 64,199,113 | -- | -- | 64,199,113 |
| Money Market Funds | 541,115,855 | 541,115,855 | -- | -- |
| Total Investments in Securities: | $6,363,363,954 | $6,173,950,147 | $120,801,523 | $68,612,284 |
The following is a reconciliation of Investments in Securities and Derivative Instruments for which Level 3 inputs were used in determining value:
| Investments in Securities: | |
| Convertible Preferred Stocks | |
| Beginning Balance | $55,642,687 |
| Total Realized Gain (Loss) | -- |
| Total Unrealized Gain (Loss) | 8,556,426 |
| Cost of Purchases | -- |
| Proceeds of Sales | -- |
| Amortization/Accretion | -- |
| Transfers in to Level 3 | -- |
| Transfers out of Level 3 | -- |
| Ending Balance | $64,199,113 |
| The change in unrealized gain (loss) for the period attributable to Level 3 securities held at August 31, 2017 | $8,556,426 |
| Other Investments in Securities | |
| Beginning Balance | $3,344,212 |
| Total Realized Gain (Loss) | -- |
| Total Unrealized Gain (Loss) | 1,068,959 |
| Cost of Purchases | -- |
| Proceeds of Sales | -- |
| Amortization/Accretion | -- |
| Transfers in to Level 3 | -- |
| Transfers out of Level 3 | -- |
| Ending Balance | $4,413,171 |
| The change in unrealized gain (loss) for the period attributable to Level 3 securities held at August 31, 2017 | $1,068,959 |
The information used in the above reconciliation represents fiscal year to date activity for any Investments in Securities identified as using Level 3 inputs at either the beginning or the end of the current fiscal period. Transfers in or out of Level 3 represent the beginning value of any Security or Instrument where a change in the pricing level occurred from the beginning to the end of the period. The cost of purchases and the proceeds of sales may include securities received or delivered through corporate actions or exchanges.
Other Information
Distribution of investments by country or territory of incorporation, as a percentage of Total Net Assets, is as follows (Unaudited):
| United States of America | 73.8% |
| Cayman Islands | 11.4% |
| Japan | 5.2% |
| Taiwan | 3.7% |
| Singapore | 1.2% |
| Others (Individually Less Than 1%) | 4.7% |
| | 100.0% |
See accompanying notes which are an integral part of the financial statements.
Technology Portfolio
Financial Statements
Statement of Assets and Liabilities
| | | August 31, 2017 (Unaudited) |
| Assets | | |
Investment in securities, at value (including securities loaned of $373,293,815) — See accompanying schedule:
Unaffiliated issuers (cost $3,884,871,647) | $5,822,248,099 | |
| Fidelity Central Funds (cost $541,111,945) | 541,115,855 | |
| Total Investment in Securities (cost $4,425,983,592) | | $6,363,363,954 |
| Foreign currency held at value (cost $2,531,865) | | 2,530,894 |
| Receivable for fund shares sold | | 8,907,169 |
| Dividends receivable | | 2,782,263 |
| Distributions receivable from Fidelity Central Funds | | 304,610 |
| Other receivables | | 233,140 |
| Total assets | | 6,378,122,030 |
| Liabilities | | |
| Payable for investments purchased | $1,140,922 | |
| Payable for fund shares redeemed | 5,852,503 | |
| Accrued management fee | 2,632,561 | |
| Other affiliated payables | 834,448 | |
| Other payables and accrued expenses | 459,319 | |
| Collateral on securities loaned | 376,728,450 | |
| Total liabilities | | 387,648,203 |
| Net Assets | | $5,990,473,827 |
| Net Assets consist of: | | |
| Paid in capital | | $3,874,628,920 |
| Undistributed net investment income | | 5,234,500 |
| Accumulated undistributed net realized gain (loss) on investments and foreign currency transactions | | 173,221,868 |
| Net unrealized appreciation (depreciation) on investments and assets and liabilities in foreign currencies | | 1,937,388,539 |
| Net Assets, for 34,085,859 shares outstanding | | $5,990,473,827 |
| Net Asset Value, offering price and redemption price per share ($5,990,473,827 ÷ 34,085,859 shares) | | $175.75 |
See accompanying notes which are an integral part of the financial statements.
Statement of Operations
| | | Six months ended August 31, 2017 (Unaudited) |
| Investment Income | | |
| Dividends | | $23,144,105 |
| Income from Fidelity Central Funds (including $1,151,465 from security lending) | | 1,625,472 |
| Total income | | 24,769,577 |
| Expenses | | |
| Management fee | $14,091,750 | |
| Transfer agent fees | 4,163,963 | |
| Accounting and security lending fees | 571,782 | |
| Custodian fees and expenses | 433,111 | |
| Independent trustees' fees and expenses | 55,574 | |
| Registration fees | 148,817 | |
| Audit | 26,115 | |
| Legal | 31,265 | |
| Interest | 2,096 | |
| Miscellaneous | 24,803 | |
| Total expenses before reductions | 19,549,276 | |
| Expense reductions | (135,661) | 19,413,615 |
| Net investment income (loss) | | 5,355,962 |
| Realized and Unrealized Gain (Loss) | | |
| Net realized gain (loss) on: | | |
| Investment securities: | | |
| Unaffiliated issuers | 178,301,226 | |
| Fidelity Central Funds | (11,109) | |
| Foreign currency transactions | (3,830) | |
| Total net realized gain (loss) | | 178,286,287 |
| Change in net unrealized appreciation (depreciation) on: | | |
| Investment securities: | | |
| Unaffiliated issuers | 885,650,360 | |
| Fidelity Central Funds | (20,166) | |
| Assets and liabilities in foreign currencies | (49,175) | |
| Total change in net unrealized appreciation (depreciation) | | 885,581,019 |
| Net gain (loss) | | 1,063,867,306 |
| Net increase (decrease) in net assets resulting from operations | | $1,069,223,268 |
See accompanying notes which are an integral part of the financial statements.
Statement of Changes in Net Assets
| | Six months ended August 31, 2017 (Unaudited) | Year ended February 28, 2017 |
| Increase (Decrease) in Net Assets | | |
| Operations | | |
| Net investment income (loss) | $5,355,962 | $3,650,721 |
| Net realized gain (loss) | 178,286,287 | 261,066,743 |
| Change in net unrealized appreciation (depreciation) | 885,581,019 | 806,087,128 |
| Net increase (decrease) in net assets resulting from operations | 1,069,223,268 | 1,070,804,592 |
| Distributions to shareholders from net investment income | – | (1,878,708) |
| Distributions to shareholders from net realized gain | (144,844,067) | (51,148,484) |
| Total distributions | (144,844,067) | (53,027,192) |
| Share transactions | | |
| Proceeds from sales of shares | 1,444,672,060 | 875,621,785 |
| Reinvestment of distributions | 139,363,396 | 50,893,756 |
| Cost of shares redeemed | (637,429,654) | (602,177,811) |
| Net increase (decrease) in net assets resulting from share transactions | 946,605,802 | 324,337,730 |
| Redemption fees | – | 28,097 |
| Total increase (decrease) in net assets | 1,870,985,003 | 1,342,143,227 |
| Net Assets | | |
| Beginning of period | 4,119,488,824 | 2,777,345,597 |
| End of period | $5,990,473,827 | $4,119,488,824 |
| Other Information | | |
| Undistributed net investment income end of period | $5,234,500 | $– |
| Distributions in excess of net investment income end of period | $– | $(121,462) |
| Shares | | |
| Sold | 9,033,833 | 6,614,908 |
| Issued in reinvestment of distributions | 952,456 | 402,895 |
| Redeemed | (3,932,779) | (4,756,350) |
| Net increase (decrease) | 6,053,510 | 2,261,453 |
See accompanying notes which are an integral part of the financial statements.
Financial Highlights — Technology Portfolio
| | Six months ended (Unaudited) August 31, | Years ended February 28, | | | | |
| | 2017 | 2017 | 2016 A | 2015 | 2014 | 2013 |
| Selected Per–Share Data | | | | | | |
| Net asset value, beginning of period | $146.95 | $107.77 | $120.85 | $130.70 | $104.11 | $101.57 |
| Income from Investment Operations | | | | | | |
| Net investment income (loss)B | .17 | .14 | .13 | .16 | .06 | .01 |
| Net realized and unrealized gain (loss) | 33.51 | 41.04 | (8.26) | 10.26 | 36.34 | 2.53 |
| Total from investment operations | 33.68 | 41.18 | (8.13) | 10.42 | 36.40 | 2.54 |
| Distributions from net investment income | – | (.07) | (.10) | (.17) | (.09)C | – |
| Distributions from net realized gain | (4.88) | (1.93) | (4.85) | (20.10) | (9.72)C | – |
| Total distributions | (4.88) | (2.00) | (4.95) | (20.27) | (9.81) | – |
| Redemption fees added to paid in capitalB | – | –D | –D | –D | –D | –D |
| Net asset value, end of period | $175.75 | $146.95 | $107.77 | $120.85 | $130.70 | $104.11 |
| Total ReturnE,F | 23.59% | 38.52% | (7.16)% | 9.97% | 36.20% | 2.50% |
| Ratios to Average Net AssetsG,H | | | | | | |
| Expenses before reductions | .75%I | .77% | .78% | .78% | .80% | .81% |
| Expenses net of fee waivers, if any | .75%I | .77% | .77% | .78% | .80% | .81% |
| Expenses net of all reductions | .75%I | .76% | .76% | .78% | .77% | .79% |
| Net investment income (loss) | .21%I | .11% | .11% | .13% | .05% | .01% |
| Supplemental Data | | | | | | |
| Net assets, end of period (000 omitted) | $5,990,474 | $4,119,489 | $2,777,346 | $2,824,848 | $2,411,391 | $2,028,324 |
| Portfolio turnover rateJ | 50%I | 82% | 130% | 144% | 181% | 140% |
A For the year ended February 29.
B Calculated based on average shares outstanding during the period.
C The amounts shown reflect certain reclassifications related to book to tax differences that were made in the year shown.
D Amount represents less than $.005 per share.
E Total returns for periods of less than one year are not annualized.
F Total returns would have been lower if certain expenses had not been reduced during the applicable periods shown.
G Fees and expenses of any underlying Fidelity Central Funds are not included in the Fund's expense ratio. The Fund indirectly bears its proportionate share of the expenses of any underlying Fidelity Central Funds.
H Expense ratios reflect operating expenses of the Fund. Expenses before reductions do not reflect amounts reimbursed by the investment adviser or reductions from brokerage service arrangements or reductions from other expense offset arrangements and do not represent the amount paid by the Fund during periods when reimbursements or reductions occur. Expenses net of fee waivers reflect expenses after reimbursement by the investment adviser but prior to reductions from brokerage service arrangements or other expense offset arrangements. Expenses net of all reductions represent the net expenses paid by the Fund.
I Annualized
J Amount does not include the portfolio activity of any underlying Fidelity Central Funds.
See accompanying notes which are an integral part of the financial statements.
Notes to Financial Statements (Unaudited)
For the period ended August 31, 2017
1. Organization.
Communications Equipment Portfolio, Computers Portfolio, IT Services Portfolio, Semiconductors Portfolio, Software and IT Services Portfolio, and Technology Portfolio (the Funds) are non-diversified funds of Fidelity Select Portfolios (the Trust). The Trust is registered under the Investment Company Act of 1940, as amended (the 1940 Act), as an open-end management investment company organized as a Massachusetts business trust. The Funds invest primarily in securities of companies whose principal business activities fall within specific industries. Each Fund is authorized to issue an unlimited number of shares. Share transactions on the Statement of Changes in Net Assets may contain exchanges between affiliated funds. Certain Funds investments in emerging markets can be subject to social, economic, regulatory, and political uncertainties and can be extremely volatile.
2. Investments in Fidelity Central Funds.
The Funds invest in Fidelity Central Funds, which are open-end investment companies generally available only to other investment companies and accounts managed by the investment adviser and its affiliates. The Funds' Schedules of Investments list each of the Fidelity Central Funds held as of period end, if any, as an investment of each Fund, but does not include the underlying holdings of each Fidelity Central Fund. As an Investing Fund, each Fund indirectly bears its proportionate share of the expenses of the underlying Fidelity Central Funds.
The Money Market Central Funds seek preservation of capital and current income and are managed by Fidelity Investments Money Management, Inc. (FIMM), an affiliate of the investment adviser. Annualized expenses of the Money Market Central Funds as of their most recent shareholder report date are less than .005%.
A complete unaudited list of holdings for each Fidelity Central Fund is available upon request or at the Securities and Exchange Commission (the SEC) website at www.sec.gov. In addition, the financial statements of the Fidelity Central Funds are available on the SEC website or upon request.
3. Significant Accounting Policies.
Each Fund is an investment company and applies the accounting and reporting guidance of the Financial Accounting Standards Board (FASB) Accounting Standards Codification Topic 946 Financial Services – Investments Companies. The financial statements have been prepared in conformity with accounting principles generally accepted in the United States of America (GAAP), which require management to make certain estimates and assumptions at the date of the financial statements. Actual results could differ from those estimates. Subsequent events, if any, through the date that the financial statements were issued have been evaluated in the preparation of the financial statements. The following summarizes the significant accounting policies of the Funds:
Investment Valuation. Investments are valued as of 4:00 p.m. Eastern time on the last calendar day of the period. The Board of Trustees (the Board) has delegated the day to day responsibility for the valuation of each Fund's investments to the Fair Value Committee (the Committee) established by each Fund's investment adviser. In accordance with valuation policies and procedures approved by the Board, each Fund attempts to obtain prices from one or more third party pricing vendors or brokers to value its investments. When current market prices, quotations or currency exchange rates are not readily available or reliable, investments will be fair valued in good faith by the Committee, in accordance with procedures adopted by the Board. Factors used in determining fair value vary by investment type and may include market or investment specific events. The frequency with which these procedures are used cannot be predicted and they may be utilized to a significant extent. The Committee oversees each Fund's valuation policies and procedures and reports to the Board on the Committee's activities and fair value determinations. The Board monitors the appropriateness of the procedures used in valuing each Fund's investments and ratifies the fair value determinations of the Committee.
Each Fund categorizes the inputs to valuation techniques used to value its investments into a disclosure hierarchy consisting of three levels as shown below:
- Level 1 – quoted prices in active markets for identical investments
- Level 2 – other significant observable inputs (including quoted prices for similar investments, interest rates, prepayment speeds, etc.)
- Level 3 – unobservable inputs (including the Fund's own assumptions based on the best information available)
Valuation techniques used to value each Fund's investments by major category are as follows:
Equity securities, including restricted securities, for which market quotations are readily available, are valued at the last reported sale price or official closing price as reported by a third party pricing vendor on the primary market or exchange on which they are traded and are categorized as Level 1 in the hierarchy. In the event there were no sales during the day or closing prices are not available, securities are valued at the last quoted bid price or may be valued using the last available price and are generally categorized as Level 2 in the hierarchy. For foreign equity securities, when market or security specific events arise, comparisons to the valuation of American Depositary Receipts (ADRs), futures contracts, Exchange-Traded Funds (ETFs) and certain indexes as well as quoted prices for similar securities may be used and would be categorized as Level 2 in the hierarchy. Utilizing these techniques may result in transfers between Level 1 and Level 2. For equity securities, including restricted securities, where observable inputs are limited, assumptions about market activity and risk are used and these securities may be categorized as Level 3 in the hierarchy. Equity securities, including restricted securities, for which observable inputs are not available are valued using alternate valuation approaches, including the market approach and the income approach and are categorized as Level 3 in the hierarchy. The market approach generally consists of using comparable market transactions while the income approach generally consists of using the net present value of estimated future cash flows, adjusted as appropriate for liquidity, credit, market and/or other risk factors.
Investments in open-end mutual funds, including the Fidelity Central Funds, are valued at their closing net asset value (NAV) each business day and are categorized as Level 1 in the hierarchy.
The following provides information on Level 3 securities held by Technology fund that were valued at period end based on unobservable inputs. These amounts exclude valuations provided by a broker.
| Asset Type | Fair Value | Valuation Technique(s) | Unobservable Input | Amount or Range/Weighted Average | Impact to Valuation from an Increase in Input(a) |
| Equities | $68,612,284 | Market approach | Transaction price | $48.77 | Increase |
| | | Market comparable | Discount rate | 2.3% | Decrease |
| | | | Enterprise value/Gross profit multiple (EV/GP) | 12.2 | Increase |
| | | | Discount for lack of marketability | 15.0% | Decrease |
(a) Represents the expected directional change in the fair value of the Level 3 investments that would result from an increase in the corresponding input. A decrease to the unobservable input would have the opposite effect. Significant changes in these inputs could result in significantly higher or lower fair value measurements.
Changes in valuation techniques may result in transfers in or out of an assigned level within the disclosure hierarchy. The aggregate value of investments by input level as of August 31, 2017, as well as a roll forward of Level 3 investments, is included at the end of each applicable Fund's Schedule of Investments.
Foreign Currency. The Funds may use foreign currency contracts to facilitate transactions in foreign-denominated securities. Gains and losses from these transactions may arise from changes in the value of the foreign currency or if the counterparties do not perform under the contracts' terms.
Foreign-denominated assets, including investment securities, and liabilities are translated into U.S. dollars at the exchange rates at period end. Purchases and sales of investment securities, income and dividends received and expenses denominated in foreign currencies are translated into U.S. dollars at the exchange rate in effect on the transaction date.
The effects of exchange rate fluctuations on investments are included with the net realized and unrealized gain (loss) on investment securities. Other foreign currency transactions resulting in realized and unrealized gain (loss) are disclosed separately.
Investment Transactions and Income. For financial reporting purposes, the Funds' investment holdings and NAV include trades executed through the end of the last business day of the period. The NAV per share for processing shareholder transactions is calculated as of the close of business of the New York Stock Exchange (NYSE), normally 4:00 p.m. Eastern time and includes trades executed through the end of the prior business day. Gains and losses on securities sold are determined on the basis of identified cost and may include proceeds received from litigation. Dividend income is recorded on the ex-dividend date, except for certain dividends from foreign securities where the ex-dividend date may have passed, which are recorded as soon as the Funds are informed of the ex-dividend date. Non-cash dividends included in dividend income, if any, are recorded at the fair market value of the securities received. Income and capital gain distributions from Fidelity Central Funds, if any, are recorded on the ex-dividend date. Certain distributions received by the Funds represent a return of capital or capital gain. The Funds determine the components of these distributions subsequent to the ex-dividend date, based upon receipt of tax filings or other correspondence relating to the underlying investment. These distributions are recorded as a reduction of cost of investments and/or as a realized gain. Investment income is recorded net of foreign taxes withheld where recovery of such taxes is uncertain.
Expenses. Expenses directly attributable to a fund are charged to that fund. Expenses attributable to more than one fund are allocated among the respective funds on the basis of relative net assets or other appropriate methods. Expense estimates are accrued in the period to which they relate and adjustments are made when actual amounts are known.
Deferred Trustee Compensation. Under a Deferred Compensation Plan (the Plan) for Computers Portfolio, Semiconductors Portfolio, Software and IT Services Portfolio and Technology Portfolio, independent Trustees may elect to defer receipt of a portion of their annual compensation. Deferred amounts are invested in a cross-section of Fidelity funds, are marked-to-market and remain in the Fund until distributed in accordance with the Plan. The investment of deferred amounts and the offsetting payable to the Trustees are included in the accompanying Statement of Assets and Liabilities.
Income Tax Information and Distributions to Shareholders. Each year, each Fund intends to qualify as a regulated investment company under Subchapter M of the Internal Revenue Code, including distributing substantially all of its taxable income and realized gains. As a result, no provision for U.S. Federal income taxes is required. Each Fund files a U.S. federal tax return, in addition to state and local tax returns as required. Each Fund's federal income tax returns are subject to examination by the Internal Revenue Service (IRS) for a period of three fiscal years after they are filed. State and local tax returns may be subject to examination for an additional fiscal year depending on the jurisdiction. Foreign taxes are provided for based on each Fund's understanding of the tax rules and rates that exist in the foreign markets in which it invests.
Distributions are declared and recorded on the ex-dividend date. Income and capital gain distributions are determined in accordance with income tax regulations, which may differ from GAAP.
Capital accounts within the financial statements are adjusted for permanent book-tax differences. These adjustments have no impact on net assets or the results of operations. Capital accounts are not adjusted for temporary book-tax differences which will reverse in a subsequent period.
Book-tax differences are primarily due to foreign currency transactions, certain foreign taxes, passive foreign investment companies (PFIC), market discount, deferred trustees compensation, net operating losses, capital loss carryforwards and losses deferred due to wash sales and excise tax regulations.
As of period end, the cost and unrealized appreciation (depreciation) in securities, and derivatives if applicable, for federal income tax purposes were as follows for each Fund:
| | Tax cost | Gross unrealized appreciation | Gross unrealized depreciation | Net unrealized appreciation (depreciation) |
| Communications Equipment Portfolio | $155,816,370 | $39,340,025 | $(6,154,647) | $33,185,378 |
| Computers Portfolio | 343,108,209 | 178,842,133 | (7,860,122) | 170,982,011 |
| IT Services Portfolio | 1,147,592,286 | 696,570,237 | (25,595,566) | 670,974,671 |
| Semiconductors Portfolio | 2,590,419,030 | 541,461,094 | (51,565,625) | 489,895,469 |
| Software and IT Services Portfolio | 2,771,997,075 | 1,933,543,454 | (80,609,371) | 1,852,934,083 |
| Technology Portfolio | 4,427,635,794 | 1,979,248,860 | (43,520,700) | 1,935,728,160 |
Certain of the Funds elected to defer to the next fiscal year capital losses recognized during the period November 1, 2016 to February 28, 2017, and ordinary losses recognized during the period January 1, 2017 to February 28, 2017. Loss deferrals were as follows:
| | Ordinary losses |
| IT Services Portfolio | $(93,249) |
Trading (Redemption) Fees. Shares held by investors in the Communications Equipment Portfolio, Computers Portfolio, and Semiconductors Portfolio less than 30 days may be subject to a redemption fee equal to .75% of the NAV of shares redeemed. All redemption fees, which reduce the proceeds of the shareholder redemption, are retained by the Funds and accounted for as an addition to paid in capital.
Restricted Securities. The Funds may invest in securities that are subject to legal or contractual restrictions on resale. These securities generally may be resold in transactions exempt from registration or to the public if the securities are registered. Disposal of these securities may involve time-consuming negotiations and expense, and prompt sale at an acceptable price may be difficult. Information regarding restricted securities is included at the end of each applicable Fund's Schedule of Investments.
4. Purchases and Sales of Investments.
Purchases and sales of securities, other than short-term securities, are noted in the table below.
| | Purchases ($) | Sales ($) |
| Communications Equipment Portfolio | 45,875,757 | 61,951,200 |
| Computers Portfolio | 276,160,194 | 270,393,866 |
| IT Services Portfolio | 237,114,878 | 294,617,552 |
| Semiconductors Portfolio | 1,402,211,816 | 1,697,926,574 |
| Software and IT Services Portfolio | 579,298,914 | 769,454,517 |
| Technology Portfolio | 1,995,139,773 | 1,258,449,817 |
5. Fees and Other Transactions with Affiliates.
Management Fee. Fidelity SelectCo, LLC (the investment adviser) and its affiliates provide the Funds with investment management related services for which the Funds pay a monthly management fee. The management fee is the sum of an individual fund fee rate and an annualized group fee rate. The individual fund fee rate is applied to each Fund's average net assets. The group fee rate is based upon the average net assets of all the mutual funds advised by Fidelity Management & Research Company (FMR) and the investment adviser. The group fee rate decreases as assets under management increase and increases as assets under management decrease. For the reporting period, each Fund's annualized management fee rate expressed as a percentage of each Fund's average net assets was as follows:
| | Individual Rate | Group Rate | Total |
| Communications Equipment Portfolio | .30% | .25% | .55% |
| Computers Portfolio | .30% | .25% | .55% |
| IT Services Portfolio | .30% | .25% | .55% |
| Semiconductors Portfolio | .30% | .25% | .55% |
| Software and IT Services Portfolio | .30% | .25% | .55% |
| Technology Portfolio | .30% | .25% | .55% |
Transfer Agent Fees. Fidelity Investments Institutional Operations Company, Inc. (FIIOC), an affiliate of the investment adviser, is the Funds' transfer, dividend disbursing and shareholder servicing agent. FIIOC receives account fees and asset-based fees that vary according to account size and type of account. FIIOC pays for typesetting, printing and mailing of shareholder reports, except proxy statements. For the period, transfer agent fees were equivalent to the following annualized rates expressed as a percentage of average net assets:
| Communications Equipment Portfolio | .23% |
| Computers Portfolio | .18% |
| IT Services Portfolio | .19% |
| Semiconductors Portfolio | .16% |
| Software and IT Services Portfolio | .16% |
| Technology Portfolio | .16% |
Accounting and Security Lending Fees. Fidelity Service Company, Inc. (FSC), an affiliate of the investment adviser, maintains each Fund's accounting records. The accounting fee is based on the level of average net assets for each month. Under a separate contract, FSC administers the security lending program. The security lending fee is based on the number and duration of lending transactions.
Brokerage Commissions. Certain Funds placed a portion of their portfolio transactions with brokerage firms which are affiliates of the investment adviser. Brokerage commissions are included in net realized gain (loss) and change in net unrealized appreciation (depreciation) in the Statement of Operations. The commissions paid to these affiliated firms were as follows:
| | Amount |
| Communications Equipment Portfolio | $4,497 |
| Computers Portfolio | 7,777 |
| IT Services Portfolio | 6,135 |
| Semiconductors Portfolio | 75,464 |
| Software and IT Services Portfolio | 23,422 |
| Technology Portfolio | 50,220 |
Interfund Lending Program. Pursuant to an Exemptive Order issued by the SEC, the Funds, along with other registered investment companies having management contracts with Fidelity Management & Research Company (FMR) or other affiliated entities of FMR, may participate in an interfund lending program. This program provides an alternative credit facility allowing the funds to borrow from, or lend money to, other participating affiliated funds. Each applicable fund's activity in this program during the period for which loans were outstanding was as follows:
| | Borrower or Lender | Average Loan Balance | Weighted Average Interest Rate | Interest Expense |
| Computer Portfolio | Borrower | $9,728,714 | 1.31% | $4,973 |
| Technology Portfolio | Borrower | 14,133,000 | 1.34% | 2,097 |
Interfund Trades. The Funds may purchase from or sell securities to other Fidelity Funds under procedures adopted by the Board. The procedures have been designed to ensure these interfund trades are executed in accordance with Rule 17a-7 of the 1940 Act. Interfund trades are included within the respective purchases and sales amounts shown in the Purchases and Sales of Investments note.
6. Committed Line of Credit.
Certain Funds participate with other funds managed by the investment adviser or an affiliate in a $4.25 billion credit facility (the "line of credit") to be utilized for temporary or emergency purposes to fund shareholder redemptions or for other short-term liquidity purposes. The participating funds have agreed to pay commitment fees on their pro-rata portion of the line of credit, which are reflected in Miscellaneous expenses on the Statement of Operations, and are as follows:
| Communications Equipment Portfolio | $326 |
| Computers Portfolio | 803 |
| IT Services Portfolio | 2,728 |
| Semiconductors Portfolio | 4,917 |
| Software and IT Services Portfolio | 6,827 |
| Technology Portfolio | 7,254 |
During the period, the Funds did not borrow on this line of credit.
7. Security Lending.
Certain Funds lend portfolio securities through a lending agent from time to time in order to earn additional income. On the settlement date of the loan, each applicable Fund receives collateral (in the form of U.S. Treasury obligations, letters of credit and/or cash) against the loaned securities and maintains collateral in an amount not less than 100% of the market value of the loaned securities during the period of the loan. The market value of the loaned securities is determined at the close of business of the Funds and any additional required collateral is delivered to the Funds on the next business day. The Funds or borrower may terminate the loan at any time, and if the borrower defaults on its obligation to return the securities loaned because of insolvency or other reasons, the Funds may apply collateral received from the borrower against the obligation. The Funds may experience delays and costs in recovering the securities loaned. Any cash collateral received is invested in the Fidelity Securities Lending Cash Central Fund. The value of loaned securities and cash collateral at period end are disclosed on each applicable Fund's Statement of Assets and Liabilities. Security lending income represents the income earned on investing cash collateral, less rebates paid to borrowers and any lending agent fees associated with the loan, plus any premium payments received for lending certain types of securities. Security lending income is presented on each applicable Fund's Statement of Operations as a component of income from Fidelity Central Funds
8. Expense Reductions.
Commissions paid to certain brokers with whom the investment adviser, or its affiliates, places trades on behalf of Certain Funds include an amount in addition to trade execution, which may be rebated back to the Funds to offset certain expenses. In addition, through arrangements with each applicable Fund's custodian, credits realized as a result of certain uninvested cash balances were used to reduce each applicable Fund's expenses. All of the applicable expense reductions are noted in the table below.
| | Brokerage Service reduction | Custody
expense
reduction |
| Communications Equipment Portfolio | $3,624 | $– |
| Computers Portfolio | 26,149 | – |
| IT Services Portfolio | 20,447 | – |
| Semiconductors Portfolio | 160,652 | 217 |
| Software and IT Services Portfolio | 32,952 | 613 |
| Technology Portfolio | 117,571 | 618 |
In addition, during the period the investment adviser reimbursed and/or waived a portion of operating expenses as follows:
| | Amount |
| Communications Equipment Portfolio | $1,042 |
| Computers Portfolio | 2,106 |
| IT Services Portfolio | 8,234 |
| Semiconductors Portfolio | 12,607 |
| Software and IT Services Portfolio | 19,632 |
| Technology Portfolio | 17,472 |
9. Other.
The Funds' organizational documents provide former and current trustees and officers with a limited indemnification against liabilities arising in connection with the performance of their duties to the Funds. In the normal course of business, the Funds may also enter into contracts that provide general indemnifications. The Funds' maximum exposure under these arrangements is unknown as this would be dependent on future claims that may be made against the Funds. The risk of material loss from such claims is considered remote.
| | VIP FundsManager% |
| | 60% Portfolio |
| Technology Portfolio | 11% |
Mutual funds managed by the investment adviser or its affiliates, in aggregate, were the owners of record of more than 20% of the total outstanding shares of the following Funds.
| | % of shares held |
| Technology Portfolio | 25% |
Shareholder Expense Example
As a shareholder of a Fund, you incur two types of costs: (1) transaction costs, including redemption fees and (2) ongoing costs, including management fees and other Fund expenses. This Example is intended to help you understand your ongoing costs (in dollars) of investing in the Funds and to compare these costs with the ongoing costs of investing in other mutual funds.
The Example is based on an investment of $1,000 invested at the beginning of the period and held for the entire period (March 1, 2017 to August 31, 2017).
Actual Expenses
The first line of the accompanying table provides information about actual account values and actual expenses. You may use the information in this line, together with the amount you invested, to estimate the expenses that you paid over the period. Simply divide your account value by $1,000.00 (for example, an $8,600 account value divided by $1,000.00 = 8.6), then multiply the result by the number in the first line under the heading entitled "Expenses Paid During Period" to estimate the expenses you paid on your account during this period. A small balance maintenance fee of $12.00 that is charged once a year may apply for certain accounts with a value of less than $2,000. This fee is not included in the table below. If it was, the estimate of expenses you paid during the period would be higher, and your ending account value lower, by this amount. In addition, the Fund, as a shareholder in the underlying Fidelity Central Funds, will indirectly bear its pro-rata share of the fees and expenses incurred by the underlying Fidelity Central Funds. These fees and expenses are not included in the Fund's annualized expense ratio used to calculate the expense estimate in the table below.
Hypothetical Example for Comparison Purposes
The second line of the accompanying table provides information about hypothetical account values and hypothetical expenses based on the Fund's actual expense ratio and an assumed rate of return of 5% per year before expenses, which is not the Fund's actual return. The hypothetical account values and expenses may not be used to estimate the actual ending account balance or expenses you paid for the period. You may use this information to compare the ongoing costs of investing in the Fund and other funds. To do so, compare this 5% hypothetical example with the 5% hypothetical examples that appear in the shareholder reports of the other funds. A small balance maintenance fee of $12.00 that is charged once a year may apply for certain accounts with a value of less than $2,000. This fee is not included in the table below. If it was, the estimate of expenses you paid during the period would be higher, and your ending account value lower, by this amount. In addition, the Fund, as a shareholder in the underlying Fidelity Central Funds, will indirectly bear its pro-rata share of the fees and expenses incurred by the underlying Fidelity Central Funds. These fees and expenses are not included in the Fund's annualized expense ratio used to calculate the expense estimate in the table below.
Please note that the expenses shown in the table are meant to highlight your ongoing costs only and do not reflect any transaction costs. Therefore, the second line of the table is useful in comparing ongoing costs only, and will not help you determine the relative total costs of owning different funds. In addition, if these transactional costs were included, your costs would have been higher.
| | Annualized Expense Ratio-A | Beginning
Account Value
March 1, 2017 | Ending
Account Value
August 31, 2017 | Expenses Paid
During Period-B
March 1, 2017
to August 31, 2017 |
| Communications Equipment Portfolio | .86% | | | |
| Actual | | $1,000.00 | $1,004.40 | $4.34 |
| Hypothetical-C | | $1,000.00 | $1,020.87 | $4.38 |
| Computers Portfolio | .80% | | | |
| Actual | | $1,000.00 | $1,097.60 | $4.23 |
| Hypothetical-C | | $1,000.00 | $1,021.17 | $4.08 |
| IT Services Portfolio | .78% | | | |
| Actual | | $1,000.00 | $1,127.50 | $4.18 |
| Hypothetical-C | | $1,000.00 | $1,021.27 | $3.97 |
| Semiconductors Portfolio | .75% | | | |
| Actual | | $1,000.00 | $1,096.90 | $3.96 |
| Hypothetical-C | | $1,000.00 | $1,021.42 | $3.82 |
| Software and IT Services Portfolio | .74% | | | |
| Actual | | $1,000.00 | $1,152.50 | $4.01 |
| Hypothetical-C | | $1,000.00 | $1,021.48 | $3.77 |
| Technology Portfolio | .75% | | | |
| Actual | | $1,000.00 | $1,235.90 | $4.23 |
| Hypothetical-C | | $1,000.00 | $1,021.42 | $3.82 |
A Annualized expense ratio reflects expenses net of applicable fee waivers.
B Expenses are equal to each Fund's annualized expense ratio, multiplied by the average account value over the period, multiplied by 184/ 365 (to reflect the one-half year period).
C 5% return per year before expenses

SELTEC-SANN-1017
1.813673.112
Fidelity® Select Portfolios®
Health Care Sector Biotechnology Portfolio
Health Care Portfolio
Health Care Services Portfolio
Medical Equipment and Systems Portfolio
Pharmaceuticals Portfolio
Semi-Annual Report August 31, 2017 |
|
Contents
To view a fund's proxy voting guidelines and proxy voting record for the 12-month period ended June 30, visit http://www.fidelity.com/proxyvotingresults or visit the Securities and Exchange Commission's (SEC) web site at http://www.sec.gov.
You may also call 1-800-544-8544 to request a free copy of the proxy voting guidelines.
Standard & Poor's, S&P and S&P 500 are registered service marks of The McGraw-Hill Companies, Inc. and have been licensed for use by Fidelity Distributors Corporation.
Other third-party marks appearing herein are the property of their respective owners.
All other marks appearing herein are registered or unregistered trademarks or service marks of FMR LLC or an affiliated company. © 2017 FMR LLC. All rights reserved.
This report and the financial statements contained herein are submitted for the general information of the shareholders of the Funds. This report is not authorized for distribution to prospective investors in the Funds unless preceded or accompanied by an effective prospectus.
A fund files its complete schedule of portfolio holdings with the SEC for the first and third quarters of each fiscal year on Form N-Q. Forms N-Q are available on the SEC’s web site at http://www.sec.gov. A fund's Forms N-Q may be reviewed and copied at the SEC’s Public Reference Room in Washington, DC. Information regarding the operation of the SEC's Public Reference Room may be obtained by calling 1-800-SEC-0330.
For a complete list of a fund's portfolio holdings, view the most recent holdings listing, semiannual report, or annual report on Fidelity's web site at http://www.fidelity.com, http://www.institutional.fidelity.com, or http://www.401k.com, as applicable.
NOT FDIC INSURED •MAY LOSE VALUE •NO BANK GUARANTEE
Neither the Funds nor Fidelity Distributors Corporation is a bank.
Biotechnology Portfolio
Investment Summary (Unaudited)
Top Ten Stocks as of August 31, 2017
| | % of fund's net assets | % of fund's net assets 6 months ago |
| Amgen, Inc. | 9.6 | 9.9 |
| Celgene Corp. | 6.1 | 5.5 |
| Regeneron Pharmaceuticals, Inc. | 5.3 | 4.7 |
| Vertex Pharmaceuticals, Inc. | 4.7 | 2.7 |
| Alexion Pharmaceuticals, Inc. | 4.6 | 5.9 |
| Biogen, Inc. | 4.0 | 4.1 |
| Incyte Corp. | 2.2 | 2.5 |
| Gilead Sciences, Inc. | 1.7 | 0.8 |
| Portola Pharmaceuticals, Inc. | 1.7 | 1.0 |
| BioMarin Pharmaceutical, Inc. | 1.7 | 1.9 |
| | 41.6 | |
Top Industries (% of fund's net assets)
| As of August 31, 2017 |
| | Biotechnology | 91.8% |
| | Pharmaceuticals | 6.8% |
| | Health Care Providers & Services | 0.4% |
| | Health Care Equipment & Supplies | 0.3% |
| | Health Care Technology | 0.1% |
| | All Others* | 0.6% |

| As of February 28, 2017 |
| | Biotechnology | 89.1% |
| | Pharmaceuticals | 9.4% |
| | Health Care Equipment & Supplies | 0.3% |
| | Health Care Technology | 0.1% |
| | Health Care Providers & Services | 0.1% |
| | All Others* | 1.0% |

* Includes Short-Term investments and Net Other Assets (Liabilities).
Biotechnology Portfolio
Investments August 31, 2017 (Unaudited)
Showing Percentage of Net Assets
| Common Stocks - 97.6% | | | |
| | | Shares | Value |
| Biotechnology - 90.2% | | | |
| Biotechnology - 90.2% | | | |
| AbbVie, Inc. | | 397,440 | $29,927,232 |
| AC Immune SA | | 949,214 | 7,441,838 |
| ACADIA Pharmaceuticals, Inc. (a)(b) | | 3,737,580 | 133,095,224 |
| Acceleron Pharma, Inc. (a)(c) | | 2,693,805 | 104,411,882 |
| Achaogen, Inc. (a)(b) | | 1,553,725 | 29,116,807 |
| Achillion Pharmaceuticals, Inc. (a) | | 1,171,620 | 5,986,978 |
| Acorda Therapeutics, Inc. (a) | | 2,148,911 | 44,697,349 |
| Adamas Pharmaceuticals, Inc. (a)(b)(c) | | 1,442,133 | 30,198,265 |
| Adaptimmune Therapeutics PLC sponsored ADR (a)(b) | | 1,814,225 | 12,699,575 |
| ADMA Biologics, Inc. (a)(b) | | 333,300 | 1,149,885 |
| Aduro Biotech, Inc. (a)(b) | | 1,678,515 | 20,393,957 |
| Advanced Accelerator Applications SA sponsored ADR (a) | | 301,947 | 14,786,345 |
| Advaxis, Inc. (a) | | 570,752 | 3,886,821 |
| Adverum Biotechnologies, Inc. (a) | | 623,457 | 1,714,507 |
| Agenus, Inc. (a)(b) | | 1,183,718 | 4,367,919 |
| Agenus, Inc. warrants 1/9/18 (a) | | 1,548,000 | 15 |
| Agios Pharmaceuticals, Inc. (a) | | 349,890 | 22,134,041 |
| Aimmune Therapeutics, Inc. (a)(b) | | 1,596,271 | 34,319,827 |
| Akebia Therapeutics, Inc. (a) | | 859,578 | 14,389,336 |
| Alder Biopharmaceuticals, Inc. (a) | | 1,429,634 | 14,010,413 |
| Aldeyra Therapeutics, Inc. (a)(c) | | 1,084,252 | 4,499,646 |
| Alexion Pharmaceuticals, Inc. (a) | | 3,216,755 | 458,098,080 |
| Alkermes PLC (a) | | 2,249,011 | 114,204,779 |
| Alnylam Pharmaceuticals, Inc. (a) | | 1,811,378 | 155,289,436 |
| AMAG Pharmaceuticals, Inc. (a) | | 687,477 | 11,480,866 |
| Amarin Corp. PLC ADR (a) | | 1,403,031 | 4,756,275 |
| Amgen, Inc. | | 5,324,258 | 946,493,337 |
| Amicus Therapeutics, Inc. (a)(b) | | 3,953,862 | 55,116,836 |
| Applied Genetic Technologies Corp. (a) | | 295,794 | 1,360,652 |
| Aptevo Therapeutics, Inc. (a) | | 101,833 | 135,438 |
| AquaBounty Technologies, Inc. (a)(b) | | 7,555 | 54,547 |
| Ardelyx, Inc. (a) | | 1,835,888 | 9,454,823 |
| Arena Pharmaceuticals, Inc. (a)(c) | | 2,267,082 | 52,550,961 |
| Argenx SE ADR | | 590,392 | 12,173,883 |
| Array BioPharma, Inc. (a)(b) | | 6,019,603 | 58,269,757 |
| Ascendis Pharma A/S sponsored ADR (a) | | 142,632 | 3,987,991 |
| Asterias Biotherapeutics, Inc. (a)(b) | | 596,713 | 2,058,660 |
| Asterias Biotherapeutics, Inc. warrants 9/29/17 (a)(b) | | 119,342 | 27,449 |
| Atara Biotherapeutics, Inc. (a)(b) | | 1,423,883 | 22,426,157 |
| aTyr Pharma, Inc. (a)(b) | | 201,820 | 615,551 |
| aTyr Pharma, Inc. (a)(d) | | 675,659 | 2,060,760 |
| Audentes Therapeutics, Inc. (a) | | 689,847 | 14,479,889 |
| Axovant Sciences Ltd. (a) | | 1,101,769 | 22,035,380 |
| Bellicum Pharmaceuticals, Inc. (a)(b)(c) | | 2,029,817 | 21,982,918 |
| BioCryst Pharmaceuticals, Inc. (a) | | 2,302,753 | 11,744,040 |
| Biogen, Inc. (a) | | 1,232,983 | 390,313,098 |
| Biohaven Pharmaceutical Holding Co. Ltd. | | 751,723 | 26,874,097 |
| BioMarin Pharmaceutical, Inc. (a) | | 1,871,634 | 168,802,670 |
| BioTime, Inc. warrants 10/1/18 (a) | | 30,113 | 6,318 |
| Bioverativ, Inc. | | 833,785 | 47,267,272 |
| bluebird bio, Inc. (a) | | 360,019 | 44,948,372 |
| Blueprint Medicines Corp. (a)(c) | | 1,982,011 | 107,464,636 |
| Calithera Biosciences, Inc. (a) | | 839,161 | 13,762,240 |
| Cara Therapeutics, Inc. (a)(b) | | 973,275 | 13,947,031 |
| Catalyst Pharmaceutical Partners, Inc. (a) | | 282,100 | 775,775 |
| Celgene Corp. (a) | | 4,306,430 | 598,292,320 |
| Celldex Therapeutics, Inc. (a)(b) | | 4,298,566 | 10,574,472 |
| Chiasma, Inc. (a)(b)(c) | | 1,564,599 | 3,442,118 |
| Chiasma, Inc. warrants (a)(c) | | 382,683 | 171,828 |
| Chimerix, Inc. (a) | | 1,871,867 | 8,910,087 |
| Cidara Therapeutics, Inc. (a)(c) | | 146,000 | 1,007,400 |
| Cidara Therapeutics, Inc. (a)(c)(d) | | 1,066,786 | 7,360,823 |
| Clovis Oncology, Inc. (a) | | 1,000,233 | 76,087,724 |
| Corbus Pharmaceuticals Holdings, Inc. (a)(b) | | 568,800 | 4,408,200 |
| Corvus Pharmaceuticals, Inc. (a)(b) | | 674,548 | 10,907,441 |
| Cytokinetics, Inc. (a) | | 1,765,958 | 26,224,476 |
| CytomX Therapeutics, Inc. (a)(d) | | 287,485 | 4,967,741 |
| DBV Technologies SA sponsored ADR (a) | | 461,100 | 20,362,176 |
| Dicerna Pharmaceuticals, Inc. (a)(b) | | 683,098 | 2,384,012 |
| Dynavax Technologies Corp. (a)(b) | | 1,102,187 | 19,784,257 |
| Eagle Pharmaceuticals, Inc. (a)(b) | | 253,208 | 13,815,028 |
| Edge Therapeutics, Inc. (a)(b) | | 39,243 | 414,014 |
| Editas Medicine, Inc. (a)(b) | | 851,718 | 17,979,767 |
| Emergent BioSolutions, Inc. (a) | | 117,467 | 4,385,043 |
| Enanta Pharmaceuticals, Inc. (a) | | 236,928 | 10,154,734 |
| Epizyme, Inc. (a)(b)(c) | | 4,317,622 | 74,910,742 |
| Esperion Therapeutics, Inc. (a)(b) | | 1,062,872 | 52,527,134 |
| Exact Sciences Corp. (a)(b) | | 1,647,700 | 69,022,153 |
| Exelixis, Inc. (a) | | 4,822,440 | 141,008,146 |
| Fate Therapeutics, Inc. (a) | | 1,760,366 | 6,654,183 |
| Fibrocell Science, Inc. (a) | | 707,977 | 1,897,378 |
| FibroGen, Inc. (a) | | 1,522,611 | 73,389,850 |
| Five Prime Therapeutics, Inc. (a) | | 461,000 | 15,637,120 |
| Foundation Medicine, Inc. (a)(b) | | 71,300 | 2,873,390 |
| Galapagos Genomics NV sponsored ADR (a) | | 867,388 | 80,224,716 |
| Genmab A/S (a) | | 240,971 | 56,237,560 |
| Genocea Biosciences, Inc. (a) | | 21,563 | 105,012 |
| Genomic Health, Inc. (a) | | 209,128 | 6,629,358 |
| GenSight Biologics SA (a) | | 446,320 | 2,661,921 |
| Geron Corp. (a)(b)(c) | | 15,808,751 | 34,304,990 |
| Gilead Sciences, Inc. | | 2,022,781 | 169,326,998 |
| Global Blood Therapeutics, Inc. (a)(b) | | 1,698,705 | 51,640,632 |
| Halozyme Therapeutics, Inc. (a)(b) | | 3,985,950 | 51,857,210 |
| Heron Therapeutics, Inc. (a) | | 929,179 | 15,331,454 |
| Histogenics Corp. (a)(b)(c) | | 1,132,386 | 2,083,590 |
| Idera Pharmaceuticals, Inc. (a)(b) | | 2,582,662 | 5,113,671 |
| Ignyta, Inc. (a) | | 316,959 | 3,645,029 |
| Immune Design Corp. (a)(b) | | 415,057 | 4,503,368 |
| ImmunoGen, Inc. (a)(b) | | 3,576,147 | 29,896,589 |
| Immunomedics, Inc. (a)(b) | | 4,176,597 | 52,792,186 |
| Incyte Corp. (a) | | 1,578,559 | 216,909,792 |
| Insys Therapeutics, Inc. (a)(b) | | 174,390 | 1,593,925 |
| Intellia Therapeutics, Inc. (a)(b) | | 594,861 | 12,509,927 |
| Intercept Pharmaceuticals, Inc. (a)(b) | | 869,868 | 101,435,307 |
| Intrexon Corp. (a)(b) | | 227,753 | 4,493,567 |
| Ionis Pharmaceuticals, Inc. (a)(b) | | 2,570,377 | 137,823,615 |
| Iovance Biotherapeutics, Inc.(a) | | 1,167,382 | 6,712,447 |
| Ironwood Pharmaceuticals, Inc. Class A (a)(b) | | 3,857,710 | 61,530,475 |
| Jounce Therapeutics, Inc. (b)(c) | | 1,817,177 | 30,873,837 |
| Juno Therapeutics, Inc. (a) | | 1,332,327 | 54,985,135 |
| Karyopharm Therapeutics, Inc. (a)(c) | | 2,961,111 | 30,262,554 |
| Keryx Biopharmaceuticals, Inc. (a)(b) | | 1,888,425 | 13,615,544 |
| Kura Oncology, Inc. (a)(b)(c) | | 1,708,717 | 12,302,762 |
| La Jolla Pharmaceutical Co. (a)(b)(c) | | 1,189,798 | 40,631,602 |
| Lexicon Pharmaceuticals, Inc. (a)(b) | | 2,173,504 | 32,906,851 |
| Ligand Pharmaceuticals, Inc. Class B (a)(b) | | 341,601 | 44,022,121 |
| Loxo Oncology, Inc. (a)(b) | | 1,407,136 | 117,355,142 |
| Macrogenics, Inc. (a)(c) | | 2,940,497 | 55,604,798 |
| MediciNova, Inc. (a)(b) | | 794,520 | 4,306,298 |
| Merrimack Pharmaceuticals, Inc. (b) | | 2,833,462 | 3,853,508 |
| MiMedx Group, Inc. (a)(b) | | 45,164 | 734,818 |
| Minerva Neurosciences, Inc. (a)(b)(c) | | 3,851,214 | 23,299,845 |
| Miragen Therapeutics, Inc. (a)(b)(c) | | 2,466,347 | 22,197,123 |
| Molecular Templates, Inc. (a)(b) | | 33,358 | 192,142 |
| Momenta Pharmaceuticals, Inc. (a) | | 1,203,956 | 20,286,659 |
| NantKwest, Inc. (a)(b) | | 314,343 | 1,958,357 |
| Neurocrine Biosciences, Inc. (a) | | 2,310,351 | 130,765,867 |
| NewLink Genetics Corp. (a)(b) | | 540,264 | 4,386,944 |
| Novavax, Inc. (a)(b) | | 6,114,921 | 6,420,667 |
| Novelion Therapeutics, Inc. (a) | | 462,707 | 3,289,847 |
| Opko Health, Inc. (a)(b) | | 1,011,167 | 6,471,469 |
| Oragenics, Inc. (a) | | 1,558,058 | 498,579 |
| Osiris Therapeutics, Inc. (a)(b) | | 62,695 | 388,709 |
| OvaScience, Inc. (a) | | 666,191 | 932,667 |
| Ovid Therapeutics, Inc. | | 495,000 | 4,662,900 |
| Ovid Therapeutics, Inc. | | 483,349 | 4,325,490 |
| Portola Pharmaceuticals, Inc. (a) | | 2,663,375 | 168,991,144 |
| Progenics Pharmaceuticals, Inc. (a)(b) | | 1,999,848 | 13,458,977 |
| Protagonist Therapeutics, Inc. | | 572,963 | 9,356,486 |
| Proteostasis Therapeutics, Inc. (a) | | 674,200 | 1,463,014 |
| Prothena Corp. PLC (a) | | 769,935 | 47,304,806 |
| PTC Therapeutics, Inc. (a)(b) | | 897,445 | 18,621,984 |
| Puma Biotechnology, Inc. (a)(b) | | 1,086,225 | 100,475,813 |
| Radius Health, Inc. (a)(b)(c) | | 2,603,915 | 97,985,321 |
| Regeneron Pharmaceuticals, Inc. (a) | | 1,056,563 | 525,006,155 |
| REGENXBIO, Inc. (a) | | 1,321,108 | 30,055,207 |
| Regulus Therapeutics, Inc. (a)(b) | | 4,440,151 | 4,440,151 |
| Repligen Corp. (a) | | 950,386 | 41,503,357 |
| Retrophin, Inc. (a) | | 1,465,503 | 35,758,273 |
| Sage Therapeutics, Inc. (a)(b) | | 1,122,593 | 92,333,274 |
| Sangamo Therapeutics, Inc. (a) | | 1,373,531 | 18,336,639 |
| Sarepta Therapeutics, Inc. (a)(b) | | 838,586 | 33,786,630 |
| Seattle Genetics, Inc. (a) | | 2,173,190 | 114,157,671 |
| Selecta Biosciences, Inc. (a)(b) | | 226,900 | 4,050,165 |
| Seres Therapeutics, Inc. (a)(c) | | 1,028,440 | 14,429,013 |
| Seres Therapeutics, Inc. (a)(c)(d) | | 1,292,035 | 18,127,251 |
| Sienna Biopharmaceuticals, Inc. | | 187,284 | 4,685,846 |
| Spark Therapeutics, Inc. (a) | | 1,446,320 | 119,075,526 |
| Spectrum Pharmaceuticals, Inc. (a) | | 1,158,000 | 11,302,080 |
| Stemline Therapeutics, Inc. (a)(c) | | 2,032,699 | 18,395,926 |
| Syndax Pharmaceuticals, Inc. (a) | | 910,945 | 10,566,962 |
| Synlogic, Inc. (a) | | 15,000 | 192,000 |
| Syros Pharmaceuticals, Inc. (a)(b) | | 557,661 | 10,913,426 |
| Syros Pharmaceuticals, Inc. (d) | | 303,621 | 5,941,863 |
| TESARO, Inc. (a)(b) | | 935,107 | 120,759,718 |
| TG Therapeutics, Inc. (a)(b)(c) | | 5,049,511 | 64,128,790 |
| Tocagen, Inc. (b) | | 616,400 | 8,574,124 |
| Trevena, Inc. (a) | | 1,105,549 | 2,653,318 |
| Ultragenyx Pharmaceutical, Inc. (a)(b) | | 1,624,821 | 92,712,286 |
| United Therapeutics Corp. (a) | | 308,125 | 40,302,750 |
| Vanda Pharmaceuticals, Inc. (a) | | 1,146,692 | 19,723,102 |
| Versartis, Inc. (a)(c) | | 2,288,570 | 43,482,830 |
| Vertex Pharmaceuticals, Inc. (a) | | 2,876,008 | 461,714,324 |
| Vical, Inc. (a) | | 484,784 | 1,144,090 |
| Vital Therapies, Inc. (a)(b)(c) | | 2,369,791 | 7,109,373 |
| Voyager Therapeutics, Inc. (a)(c) | | 2,422,574 | 23,353,613 |
| Xencor, Inc. (a) | | 1,784,543 | 38,581,820 |
| Zafgen, Inc. (a)(c) | | 2,712,346 | 9,791,569 |
| Zealand Pharma A/S (a)(b) | | 400,644 | 7,631,498 |
| Zealand Pharma A/S sponsored ADR (b) | | 120,146 | 2,258,745 |
| | | | 8,903,334,077 |
| Capital Markets - 0.1% | | | |
| Asset Management & Custody Banks - 0.1% | | | |
| RPI International Holdings LP (a)(e)(f) | | 54,958 | 7,441,588 |
| Health Care Equipment & Supplies - 0.3% | | | |
| Health Care Equipment - 0.3% | | | |
| Bellerophon Therapeutics, Inc. (a)(b) | | 876,970 | 964,667 |
| Novocure Ltd. (a)(b) | | 413,389 | 8,474,475 |
| Novocure Ltd. (a)(d) | | 701,713 | 14,385,117 |
| Vermillion, Inc. (a)(b)(c) | | 4,260,663 | 5,411,042 |
| Zosano Pharma Corp. (a)(b) | | 1,158,216 | 972,901 |
| | | | 30,208,202 |
| Health Care Providers & Services - 0.2% | | | |
| Health Care Services - 0.2% | | | |
| G1 Therapeutics, Inc. | | 840,300 | 15,831,252 |
| Health Care Technology - 0.0% | | | |
| Health Care Technology - 0.0% | | | |
| NantHealth, Inc. (a)(b) | | 107,400 | 297,498 |
| Personal Products - 0.0% | | | |
| Personal Products - 0.0% | | | |
| MYOS Corp. (a) | | 33,334 | 41,668 |
| Pharmaceuticals - 6.8% | | | |
| Pharmaceuticals - 6.8% | | | |
| Adimab LLC (a)(e)(f)(g) | | 1,954,526 | 66,962,061 |
| Afferent Pharmaceuticals, Inc. rights 12/31/24 (f) | | 8,274,568 | 8,274,568 |
| Akcea Therapeutics, Inc. | | 399,467 | 7,450,060 |
| Aradigm Corp. (a)(b) | | 11,945 | 16,006 |
| Aradigm Corp. (a) | | 148,009 | 198,332 |
| Avexis, Inc. (a) | | 864,181 | 80,671,296 |
| Axsome Therapeutics, Inc. (a)(b) | | 864,552 | 4,409,215 |
| Cempra, Inc. (a)(b)(c) | | 3,933,074 | 11,995,876 |
| Clementia Pharmaceuticals, Inc. | | 390,500 | 6,376,865 |
| Corcept Therapeutics, Inc. (a) | | 185,022 | 3,084,317 |
| Dermira, Inc. (a)(b) | | 1,482,491 | 34,971,963 |
| Dova Pharmaceuticals, Inc. (b) | | 1,203,845 | 29,734,972 |
| Egalet Corp. (a)(b) | | 1,207,531 | 1,461,113 |
| GW Pharmaceuticals PLC ADR (a)(b) | | 566,898 | 59,989,146 |
| Horizon Pharma PLC (a) | | 437,240 | 5,981,443 |
| Intra-Cellular Therapies, Inc. (a) | | 529,782 | 9,774,478 |
| Jazz Pharmaceuticals PLC (a) | | 345,713 | 51,635,694 |
| Kala Pharmaceuticals, Inc. | | 468,500 | 11,853,050 |
| Kolltan Pharmaceuticals, Inc. rights (f) | | 10,639,609 | 1,276,753 |
| MyoKardia, Inc. (a) | | 1,273,154 | 55,191,226 |
| Nektar Therapeutics (a) | | 87,871 | 1,847,927 |
| NeurogesX, Inc. (a)(c)(f) | | 2,550,000 | 26 |
| Ocular Therapeutix, Inc. (a)(b) | | 1,061,528 | 6,645,165 |
| Pacira Pharmaceuticals, Inc. (a) | | 332,435 | 12,665,774 |
| Paratek Pharmaceuticals, Inc. (a) | | 1,028,132 | 28,993,322 |
| Reata Pharmaceuticals, Inc. (a) | | 343,197 | 10,381,709 |
| Repros Therapeutics, Inc. (a)(b) | | 913,890 | 270,329 |
| Stemcentrx, Inc. rights 12/31/21 (f) | | 876,163 | 2,575,919 |
| Tetraphase Pharmaceuticals, Inc. (a) | | 962,603 | 6,718,969 |
| The Medicines Company (a)(b) | | 1,176,508 | 43,166,079 |
| TherapeuticsMD, Inc. (a) | | 4,758,642 | 28,551,852 |
| Theravance Biopharma, Inc. (a)(b) | | 786,100 | 25,681,887 |
| UroGen Pharma Ltd. (c) | | 602,330 | 14,365,571 |
| WAVE Life Sciences (a)(b) | | 1,174,761 | 27,606,884 |
| Zogenix, Inc. (a)(b) | | 752,013 | 8,911,354 |
| | | | 669,691,201 |
| Software - 0.0% | | | |
| Application Software - 0.0% | | | |
| Precipio, Inc. (e) | | 7,883 | 17,973 |
| TOTAL COMMON STOCKS | | | |
| (Cost $6,323,274,339) | | | 9,626,863,459 |
|
| Preferred Stocks - 1.9% | | | |
| Convertible Preferred Stocks - 1.8% | | | |
| Biotechnology - 1.5% | | | |
| Biotechnology - 1.5% | | | |
| 23andMe, Inc. Series E (a)(e)(f) | | 1,505,457 | 20,902,066 |
| Axcella Health, Inc. Series C (a)(e)(f) | | 1,642,272 | 16,554,102 |
| Immunocore Ltd. Series A (a)(e)(f) | | 73,318 | 24,860,424 |
| Moderna Therapeutics, Inc.: | | | |
| Series D (e)(f) | | 2,074,940 | 14,960,317 |
| Series E (e)(f) | | 2,698,970 | 19,459,574 |
| Scholar Rock LLC Series B (a)(e)(f) | | 4,276,340 | 13,812,578 |
| Translate Bio Series B (a)(e)(f) | | 5,634,091 | 16,169,841 |
| Twist Bioscience Corp.: | | | |
| Series C (a)(e)(f) | | 8,133,875 | 17,452,856 |
| Series D (a)(e)(f) | | 1,976,343 | 4,240,639 |
| | | | 148,412,397 |
| Health Care Providers & Services - 0.2% | | | |
| Health Care Services - 0.2% | | | |
| Allena Pharmaceuticals, Inc. Series C (a)(e)(f) | | 6,041,631 | 16,312,404 |
| Health Care Technology - 0.1% | | | |
| Health Care Technology - 0.1% | | | |
| Codiak Biosciences, Inc.: | | | |
| Series A (a)(e)(f) | | 856,366 | 2,826,008 |
| Series B (a)(e)(f) | | 2,783,187 | 9,184,517 |
| | | | 12,010,525 |
| Pharmaceuticals - 0.0% | | | |
| Pharmaceuticals - 0.0% | | | |
| Afferent Pharmaceuticals, Inc. Series C (a)(e)(f) | | 8,274,568 | 3,971,793 |
|
| TOTAL CONVERTIBLE PREFERRED STOCKS | | | 180,707,119 |
|
| Nonconvertible Preferred Stocks - 0.1% | | | |
| Biotechnology - 0.1% | | | |
| Biotechnology - 0.1% | | | |
| Yumanity Holdings LLC Class A (a)(e)(f) | | 588,700 | 6,581,666 |
| TOTAL PREFERRED STOCKS | | | |
| (Cost $135,994,537) | | | 187,288,785 |
|
| Money Market Funds - 10.8% | | | |
| Fidelity Cash Central Fund, 1.11% (h) | | 43,392,732 | 43,401,410 |
| Fidelity Securities Lending Cash Central Fund 1.11% (h)(i) | | 1,021,576,783 | 1,021,678,941 |
| TOTAL MONEY MARKET FUNDS | | | |
| (Cost $1,064,983,574) | | | 1,065,080,351 |
| TOTAL INVESTMENT IN SECURITIES - 110.3% | | | |
| (Cost $7,524,252,450) | | | 10,879,232,595 |
| NET OTHER ASSETS (LIABILITIES) - (10.3)% | | | (1,012,263,557) |
| NET ASSETS - 100% | | | $9,866,969,038 |
Legend
(a) Non-income producing
(b) Security or a portion of the security is on loan at period end.
(c) Affiliated company
(d) Security exempt from registration under Rule 144A of the Securities Act of 1933. These securities may be resold in transactions exempt from registration, normally to qualified institutional buyers. At the end of the period, the value of these securities amounted to $52,843,555 or 0.5% of net assets.
(e) Restricted securities - Investment in securities not registered under the Securities Act of 1933 (excluding 144A issues). At the end of the period, the value of restricted securities (excluding 144A issues) amounted to $261,710,407 or 2.7% of net assets.
(f) Level 3 instrument
(g) Investment is owned by a wholly-owned subsidiary (Subsidiary) that is treated as a corporation for U.S. tax purposes.
(h) Affiliated fund that is generally available only to investment companies and other accounts managed by Fidelity Investments. The rate quoted is the annualized seven-day yield of the fund at period end. A complete unaudited listing of the fund's holdings as of its most recent quarter end is available upon request. In addition, each Fidelity Central Fund's financial statements are available on the SEC's website or upon request.
(i) Investment made with cash collateral received from securities on loan.
Additional information on each restricted holding is as follows:
| Security | Acquisition Date | Acquisition Cost |
| 23andMe, Inc. Series E | 6/18/15 | $16,299,991 |
| Adimab LLC | 9/17/14 - 6/5/15 | $31,094,459 |
| Afferent Pharmaceuticals, Inc. Series C | 7/1/15 | $3,723,556 |
| Allena Pharmaceuticals, Inc. Series C | 11/25/15 | $16,010,322 |
| Axcella Health, Inc. Series C | 1/30/15 | $16,554,102 |
| Codiak Biosciences, Inc. Series A | 11/12/15 | $856,366 |
| Codiak Biosciences, Inc. Series B | 11/12/15 | $8,349,561 |
| Immunocore Ltd. Series A | 7/27/15 | $13,796,921 |
| Moderna Therapeutics, Inc. Series D | 11/6/13 | $9,158,071 |
| Moderna Therapeutics, Inc. Series E | 12/18/14 | $11,912,324 |
| Precipio, Inc. | 2/3/12 | $2,828,200 |
| RPI International Holdings LP | 5/21/15 | $6,479,548 |
| Scholar Rock LLC Series B | 12/17/15 | $12,829,020 |
| Translate Bio Series B | 7/17/15 | $6,084,818 |
| Twist Bioscience Corp. Series C | 5/29/15 | $12,199,999 |
| Twist Bioscience Corp. Series D | 1/8/16 | $4,240,639 |
| Yumanity Holdings LLC Class A | 2/8/16 | $3,978,847 |
Affiliated Central Funds
Information regarding fiscal year to date income earned by the Fund from investments in Fidelity Central Funds is as follows:
| Fund | Income earned |
| Fidelity Cash Central Fund | $225,103 |
| Fidelity Securities Lending Cash Central Fund | 5,469,595 |
| Total | $5,694,698 |
Other Affiliated Issuers
An affiliated company is a company in which the Fund has ownership of at least 5% of the voting securities. Fiscal year to date transactions with companies which are or were affiliates are as follows:
| Affiliate | Value, beginning of period | Purchases | Sales Proceeds | Dividend Income | Realized Gain (loss) | Change in Unrealized appreciation (depreciation) | Value, end of period |
| Acceleron Pharma, Inc. | $98,051,765 | $-- | $33,053,739 | $-- | $(10,172,465) | $49,586,320 | $104,411,882 |
| Acorda Therapeutics, Inc. | 62,530,736 | -- | 5,488,014 | -- | (1,617,371) | (10,728,002) | -- |
| Adamas Pharmaceuticals, Inc. | 32,978,322 | -- | 5,945,750 | -- | (727,498) | 3,893,191 | 30,198,265 |
| Alder Biopharmaceuticals, Inc. | 67,312,513 | 3,848,000 | 23,207,985 | -- | (40,788,872) | 6,846,758 | -- |
| Aldeyra Therapeutics, Inc. | 5,663,057 | -- | 275,178 | -- | (203,221) | (685,012) | 4,499,646 |
| Arena Pharmaceuticals, Inc. | -- | 57,852,519 | -- | -- | -- | (5,301,558) | 52,550,961 |
| Atara Biotherapeutics, Inc. | 28,569,877 | -- | 7,752,326 | -- | (12,411,501) | 14,020,107 | -- |
| Avexis, Inc. | 89,004,815 | -- | 46,314,182 | -- | 25,913,948 | 12,066,716 | -- |
| Axsome Therapeutics, Inc. | 6,093,929 | -- | 2,292,706 | -- | (1,980,251) | 2,588,243 | -- |
| Bellicum Pharmaceuticals, Inc. | 12,222,396 | 13,883,147 | 285,696 | -- | (485,197) | (3,351,732) | 21,982,918 |
| Blueprint Medicines Corp. | 55,635,200 | 20,993,071 | -- | -- | -- | 30,836,366 | 107,464,636 |
| Cempra, Inc. | 14,107,872 | -- | 778,040 | -- | (6,638,553) | 5,304,597 | 11,995,876 |
| Chiasma, Inc. | 2,641,278 | -- | 136,949 | -- | (1,671,809) | 2,609,598 | 3,442,118 |
| Chiasma, Inc. warrants | 105,173 | -- | -- | -- | -- | 66,656 | 171,828 |
| Cidara Therapeutics, Inc. | 1,051,200 | -- | -- | -- | -- | (43,800) | 1,007,400 |
| Cidara Therapeutics, Inc. | 7,680,859 | -- | -- | -- | -- | (320,036) | 7,360,823 |
| Cytokinetics, Inc. | 23,813,727 | 3,369,062 | 15,552,012 | -- | 4,461,994 | 10,131,706 | -- |
| Cytokinetics, Inc. warrants 6/25/17 | 3,409,874 | -- | -- | -- | -- | (3,409,874) | -- |
| Egalet Corp. | 10,675,696 | -- | 4,421,617 | -- | (7,507,095) | 2,714,130 | -- |
| Epizyme, Inc. | 81,256,291 | -- | 22,095,994 | -- | (23,386,790) | 39,137,235 | 74,910,742 |
| Fibrocell Science, Inc. | -- | -- | 313,811 | -- | (456,969) | (3,412,442) | -- |
| Fibrocell Science, Inc. | 1,702,568 | -- | -- | -- | -- | 4,378,032 | -- |
| Geron Corp. | 33,988,815 | -- | -- | -- | -- | 316,175 | 34,304,990 |
| Global Blood Therapeutics, Inc. | 68,660,137 | -- | 22,645,080 | -- | 15,936,892 | (10,311,317) | -- |
| Histogenics Corp. | 1,891,085 | -- | -- | -- | -- | 192,506 | 2,083,590 |
| Jounce Therapeutics, Inc. | -- | -- | 1,766,090 | -- | 517,681 | 15,719,665 | 30,873,837 |
| Jounce Therapeutics, Inc. | 35,864,035 | -- | -- | -- | -- | (19,461,455) | -- |
| Karyopharm Therapeutics, Inc. | 32,829,502 | -- | 1,796,934 | -- | (5,734,966) | 4,964,953 | 30,262,554 |
| Kura Oncology, Inc. | 15,816,712 | -- | 1,685,213 | -- | 201,213 | (2,029,950) | 12,302,762 |
| La Jolla Pharmaceutical Co. | 38,332,223 | 1,652,643 | -- | -- | -- | 646,736 | 40,631,602 |
| Loxo Oncology, Inc. | 86,708,884 | 140,955 | 41,396,772 | -- | 25,817,986 | 46,084,090 | -- |
| Macrogenics, Inc. | 62,162,107 | -- | -- | -- | -- | (6,557,308) | 55,604,798 |
| Minerva Neurosciences, Inc. | 29,051,873 | 4,115,250 | -- | -- | -- | (9,867,278) | 23,299,845 |
| Miragen Therapeutics, Inc. | 32,333,809 | -- | -- | -- | -- | (10,136,686) | 22,197,123 |
| MyoKardia, Inc. | 32,129,339 | -- | 18,593,273 | -- | 4,576,251 | 37,078,910 | -- |
| NeurogesX, Inc. | 26 | -- | -- | -- | -- | -- | 26 |
| Paratek Pharmaceuticals, Inc. | 19,671,688 | -- | 6,570,991 | -- | 3,254,981 | 12,637,644 | -- |
| Radius Health, Inc. | 133,725,306 | -- | 24,471,960 | -- | (1,312,132) | (9,955,893) | 97,985,321 |
| Seres Therapeutics, Inc. | 9,955,299 | -- | -- | -- | -- | 4,473,714 | 14,429,013 |
| Seres Therapeutics, Inc. | 12,506,899 | -- | -- | -- | -- | 5,620,352 | 18,127,251 |
| Stemline Therapeutics, Inc. | 14,228,893 | -- | -- | -- | -- | 4,167,033 | 18,395,926 |
| Syndax Pharmaceuticals, Inc. | 11,352,881 | 930,086 | 1,876,944 | -- | (268,640) | 429,578 | -- |
| TG Therapeutics, Inc. | 16,717,918 | 21,596,708 | -- | -- | -- | 25,814,164 | 64,128,790 |
| UroGen Pharma Ltd. | -- | 7,830,290 | -- | -- | -- | 6,535,281 | 14,365,571 |
| Vermillion, Inc. | 9,842,132 | -- | -- | -- | -- | (4,431,090) | 5,411,042 |
| Versartis, Inc. | 58,725,590 | -- | 7,515,206 | -- | (4,868,732) | (2,858,821) | 43,482,830 |
| Vital Therapies, Inc. | 5,541,828 | 4,712,000 | -- | -- | -- | (3,144,455) | 7,109,373 |
| Voyager Therapeutics, Inc. | 34,640,913 | -- | 2,741,529 | -- | (803,488) | (7,742,283) | 23,353,613 |
| WAVE Life Sciences | 42,795,006 | -- | 4,504,147 | -- | 552,147 | (11,236,123) | -- |
| Zafgen, Inc. | 10,768,014 | -- | -- | -- | -- | (976,445) | 9,791,569 |
| Zosano Pharma Corp. | 3,155,743 | -- | 16,129 | -- | (196,171) | (1,970,541) | -- |
| Total | $1,457,903,805 | $140,923,731 | $303,494,267 | $-- | $(39,998,628) | $220,928,355 | $988,138,521 |
Investment Valuation
The following is a summary of the inputs used, as of August 31, 2017, involving the Fund's assets and liabilities carried at fair value. The inputs or methodology used for valuing securities may not be an indication of the risk associated with investing in those securities. For more information on valuation inputs, and their aggregation into the levels used below, please refer to the Investment Valuation section in the accompanying Notes to Financial Statements.
| | Valuation Inputs at Reporting Date: |
| Description | Total | Level 1 | Level 2 | Level 3 |
| Investments in Securities: | | | | |
| Common Stocks | $9,626,863,459 | $9,535,835,211 | $4,497,333 | $86,530,915 |
| Preferred Stocks | 187,288,785 | -- | -- | 187,288,785 |
| Money Market Funds | 1,065,080,351 | 1,065,080,351 | -- | -- |
| Total Investments in Securities: | $10,879,232,595 | $10,600,915,562 | $4,497,333 | $273,819,700 |
The following is a reconciliation of Investments in Securities for which Level 3 inputs were used in determining value:
| Investments in Securities: | |
| Other Investments in Securities | |
| Beginning Balance | $67,962,514 |
| Total Realized Gain (Loss) | -- |
| Total Unrealized Gain (Loss) | 18,587,059 |
| Cost of Purchases | -- |
| Proceeds of Sales | (18,658) |
| Amortization/Accretion | -- |
| Transfers in to Level 3 | -- |
| Transfers out of Level 3 | -- |
| Ending Balance | $86,530,915 |
| The change in unrealized gain (loss) for the period attributable to Level 3 securities held at August 31, 2017 | $18,587,059 |
| Preferred Stocks | |
| Beginning Balance | $178,837,945 |
| Total Realized Gain (Loss) | -- |
| Total Unrealized Gain (Loss) | 14,925,062 |
| Cost of Purchases | -- |
| Proceeds of Sales | (6,474,222) |
| Amortization/Accretion | -- |
| Transfers in to Level 3 | -- |
| Transfers out of Level 3 | -- |
| Ending Balance | $187,288,785 |
| The change in unrealized gain (loss) for the period attributable to Level 3 securities held at August 31, 2017 | $15,465,447 |
The information used in the above reconciliations represents fiscal year to date activity for any Investments in Securities identified as using Level 3 inputs at either the beginning or the end of the current fiscal period. Transfers in or out of Level 3 represent the beginning value of any Security or Instrument where a change in the pricing level occurred from the beginning to the end of the period. The cost of purchases and the proceeds of sales may include securities received or delivered through corporate actions or exchanges. Realized and unrealized gains (losses) disclosed in the reconciliations are included in Net Gain (Loss) on the Fund's Statement of Operations.
See accompanying notes which are an integral part of the financial statements.
Biotechnology Portfolio
Financial Statements
Statement of Assets and Liabilities
| | | August 31, 2017 (Unaudited) |
| Assets | | |
Investment in securities, at value (including securities loaned of $1,017,423,315) — See accompanying schedule:
Unaffiliated issuers (cost $5,351,035,235) | $8,826,013,723 | |
| Fidelity Central Funds (cost $1,064,983,574) | 1,065,080,351 | |
| Other affiliated issuers (cost $1,108,233,641) | 988,138,521 | |
| Total Investment in Securities (cost $7,524,252,450) | | $10,879,232,595 |
| Cash | | 37,242 |
| Receivable for investments sold | | 23,186,327 |
| Receivable for fund shares sold | | 9,677,867 |
| Dividends receivable | | 6,243,865 |
| Distributions receivable from Fidelity Central Funds | | 1,042,615 |
| Other receivables | | 614,060 |
| Total assets | | 10,920,034,571 |
| Liabilities | | |
| Payable for investments purchased | $987,762 | |
| Payable for fund shares redeemed | 24,305,639 | |
| Accrued management fee | 4,217,066 | |
| Other affiliated payables | 1,438,529 | |
| Other payables and accrued expenses | 564,407 | |
| Collateral on securities loaned | 1,021,552,130 | |
| Total liabilities | | 1,053,065,533 |
| Net Assets | | $9,866,969,038 |
| Net Assets consist of: | | |
| Paid in capital | | $6,582,447,960 |
| Accumulated net investment loss | | (13,353,253) |
| Accumulated undistributed net realized gain (loss) on investments and foreign currency transactions | | (57,112,633) |
| Net unrealized appreciation (depreciation) on investments and assets and liabilities in foreign currencies | | 3,354,986,964 |
| Net Assets, for 43,227,443 shares outstanding | | $9,866,969,038 |
| Net Asset Value, offering price and redemption price per share ($9,866,969,038 ÷ 43,227,443 shares) | | $228.26 |
See accompanying notes which are an integral part of the financial statements.
Statement of Operations
| | | Six months ended August 31, 2017 (Unaudited) |
| Investment Income | | |
| Dividends | | $18,591,443 |
| Income from Fidelity Central Funds (including $5,469,595 from security lending) | | 5,694,698 |
| Total income | | 24,286,141 |
| Expenses | | |
| Management fee | $25,277,493 | |
| Transfer agent fees | 7,946,035 | |
| Accounting and security lending fees | 759,354 | |
| Custodian fees and expenses | 113,810 | |
| Independent trustees' fees and expenses | 106,729 | |
| Registration fees | 68,806 | |
| Audit | 41,492 | |
| Legal | 70,330 | |
| Miscellaneous | 73,676 | |
| Total expenses before reductions | 34,457,725 | |
| Expense reductions | (219,207) | 34,238,518 |
| Net investment income (loss) | | (9,952,377) |
| Realized and Unrealized Gain (Loss) | | |
| Net realized gain (loss) on: | | |
| Investment securities: | | |
| Unaffiliated issuers | 172,114,094 | |
| Fidelity Central Funds | 1,425 | |
| Other affiliated issuers | (39,998,628) | |
| Foreign currency transactions | 25,323 | |
| Total net realized gain (loss) | | 132,142,214 |
| Change in net unrealized appreciation (depreciation) on: | | |
| Investment securities: | | |
| Unaffiliated issuers | 736,297,601 | |
| Fidelity Central Funds | (108,008) | |
| Other Affiliated issuers | 220,928,355 | |
| Assets and liabilities in foreign currencies | (6,887) | |
| Total change in net unrealized appreciation (depreciation) | | 957,111,061 |
| Net gain (loss) | | 1,089,253,275 |
| Net increase (decrease) in net assets resulting from operations | | $1,079,300,898 |
See accompanying notes which are an integral part of the financial statements.
Statement of Changes in Net Assets
| | Six months ended August 31, 2017 (Unaudited) | Year ended February 28, 2017 |
| Increase (Decrease) in Net Assets | | |
| Operations | | |
| Net investment income (loss) | $(9,952,377) | $(42,688,123) |
| Net realized gain (loss) | 132,142,214 | (142,401,947) |
| Change in net unrealized appreciation (depreciation) | 957,111,061 | 2,691,756,572 |
| Net increase (decrease) in net assets resulting from operations | 1,079,300,898 | 2,506,666,502 |
| Distributions to shareholders from net realized gain | – | (351,244,588) |
| Share transactions | | |
| Proceeds from sales of shares | 593,072,525 | 1,517,002,797 |
| Reinvestment of distributions | – | 335,307,225 |
| Cost of shares redeemed | (1,379,085,133) | (4,158,007,769) |
| Net increase (decrease) in net assets resulting from share transactions | (786,012,608) | (2,305,697,747) |
| Redemption fees | – | 358,003 |
| Total increase (decrease) in net assets | 293,288,290 | (149,917,830) |
| Net Assets | | |
| Beginning of period | 9,573,680,748 | 9,723,598,578 |
| End of period | $9,866,969,038 | $9,573,680,748 |
| Other Information | | |
| Accumulated net investment loss end of period | $(13,353,253) | $(3,400,876) |
| Shares | | |
| Sold | 2,846,394 | 8,341,359 |
| Issued in reinvestment of distributions | – | 1,903,424 |
| Redeemed | (6,731,248) | (23,151,337) |
| Net increase (decrease) | (3,884,854) | (12,906,554) |
See accompanying notes which are an integral part of the financial statements.
Financial Highlights — Biotechnology Portfolio
| | Six months ended (Unaudited) August 31, | Years ended February 28, | | | | |
| | 2017 | 2017 | 2016 A | 2015 | 2014 | 2013 |
| Selected Per–Share Data | | | | | | |
| Net asset value, beginning of period | $203.21 | $162.01 | $248.00 | $221.45 | $120.51 | $97.78 |
| Income from Investment Operations | | | | | | |
| Net investment income (loss)B | (.22) | (.78) | (.95) | (.87) | (.54) | (.16) |
| Net realized and unrealized gain (loss) | 25.27 | 47.93 | (69.22) | 51.24 | 101.91 | 29.36 |
| Total from investment operations | 25.05 | 47.15 | (70.17) | 50.37 | 101.37 | 29.20 |
| Distributions from net realized gain | – | (5.96) | (15.84) | (23.84) | (.46) | (6.48) |
| Total distributions | – | (5.96) | (15.84) | (23.84) | (.46) | (6.48) |
| Redemption fees added to paid in capitalB | – | .01 | .02 | .02 | .03 | .01 |
| Net asset value, end of period | $228.26 | $203.21 | $162.01 | $248.00 | $221.45 | $120.51 |
| Total ReturnC,D | 12.33% | 29.67% | (30.35)% | 24.21% | 84.25% | 31.78% |
| Ratios to Average Net AssetsE,F | | | | | | |
| Expenses before reductions | .74%G | .75% | .73% | .74% | .76% | .81% |
| Expenses net of fee waivers, if any | .74%G | .75% | .73% | .74% | .76% | .80% |
| Expenses net of all reductions | .74%G | .74% | .73% | .74% | .75% | .79% |
| Net investment income (loss) | (.21)%G | (.43)% | (.39)% | (.41)% | (.32)% | (.15)% |
| Supplemental Data | | | | | | |
| Net assets, end of period (000 omitted) | $9,866,969 | $9,573,681 | $9,723,599 | $13,277,052 | $11,033,313 | $3,450,725 |
| Portfolio turnover rateH | 22%G | 28% | 35% | 61% | 35% | 42% |
A For the year ended February 29.
B Calculated based on average shares outstanding during the period.
C Total returns for periods of less than one year are not annualized.
D Total returns would have been lower if certain expenses had not been reduced during the applicable periods shown.
E Fees and expenses of any underlying Fidelity Central Funds are not included in the Fund's expense ratio. The Fund indirectly bears its proportionate share of the expenses of any underlying Fidelity Central Funds.
F Expense ratios reflect operating expenses of the Fund. Expenses before reductions do not reflect amounts reimbursed by the investment adviser or reductions from brokerage service arrangements or reductions from other expense offset arrangements and do not represent the amount paid by the Fund during periods when reimbursements or reductions occur. Expenses net of fee waivers reflect expenses after reimbursement by the investment adviser but prior to reductions from brokerage service arrangements or other expense offset arrangements. Expenses net of all reductions represent the net expenses paid by the Fund.
G Annualized
H Amount does not include the portfolio activity of any underlying Fidelity Central Funds.
See accompanying notes which are an integral part of the financial statements.
Health Care Portfolio
Investment Summary (Unaudited)
Top Ten Stocks as of August 31, 2017
| | % of fund's net assets | % of fund's net assets 6 months ago |
| Amgen, Inc. | 9.5 | 9.1 |
| UnitedHealth Group, Inc. | 7.6 | 5.2 |
| Allergan PLC | 7.0 | 7.5 |
| Boston Scientific Corp. | 5.3 | 5.2 |
| Becton, Dickinson & Co. | 4.6 | 0.0 |
| Intuitive Surgical, Inc. | 3.5 | 2.5 |
| Cigna Corp. | 3.3 | 2.0 |
| Medtronic PLC | 2.8 | 7.1 |
| Humana, Inc. | 2.6 | 2.5 |
| CVS Health Corp. | 2.2 | 0.0 |
| | 48.4 | |
Top Industries (% of fund's net assets)
| As of August 31, 2017 |
| | Biotechnology | 29.0% |
| | Health Care Equipment & Supplies | 22.9% |
| | Health Care Providers & Services | 21.3% |
| | Pharmaceuticals | 17.2% |
| | Health Care Technology | 3.4% |
| | All Others* | 6.2% |
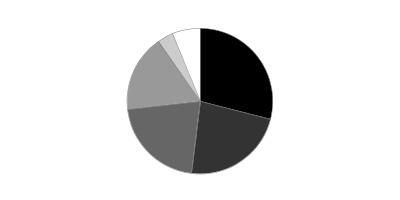
* Includes Short-Term investments and Net Other Assets (Liabilities).
| As of February 28, 2017 |
| | Biotechnology | 30.2% |
| | Health Care Equipment & Supplies | 23.2% |
| | Health Care Providers & Services | 20.5% |
| | Pharmaceuticals | 18.6% |
| | Health Care Technology | 3.0% |
| | All Others* | 4.5% |
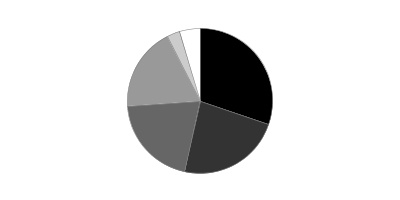
* Includes Short-Term investments and Net Other Assets (Liabilities).
Percentages shown as 0.0% may reflect amounts less than 0.05%.
Health Care Portfolio
Investments August 31, 2017 (Unaudited)
Showing Percentage of Net Assets
| Common Stocks - 98.1% | | | |
| | | Shares | Value |
| Biotechnology - 28.8% | | | |
| Biotechnology - 28.8% | | | |
| Ablynx NV (a)(b) | | 2,200,000 | $31,427,880 |
| AC Immune SA (b) | | 800,000 | 6,272,000 |
| Acorda Therapeutics, Inc. (a) | | 1,399,700 | 29,113,760 |
| Advanced Accelerator Applications SA sponsored ADR (a) | | 506,500 | 24,803,305 |
| Advaxis, Inc. (a)(b) | | 1,800,000 | 12,258,000 |
| Alexion Pharmaceuticals, Inc. (a) | | 628,000 | 89,433,480 |
| Alnylam Pharmaceuticals, Inc. (a) | | 611,783 | 52,448,157 |
| Amgen, Inc. | | 3,700,000 | 657,749,000 |
| Amicus Therapeutics, Inc. (a)(b) | | 4,215,500 | 58,764,070 |
| AnaptysBio, Inc. | | 309,134 | 8,646,478 |
| Ascendis Pharma A/S sponsored ADR (a) | | 671,696 | 18,780,620 |
| Audentes Therapeutics, Inc. (a) | | 317,000 | 6,653,830 |
| BeiGene Ltd. ADR (a) | | 292,757 | 20,176,812 |
| Biogen, Inc. (a) | | 372,000 | 117,760,320 |
| BioMarin Pharmaceutical, Inc. (a) | | 800,000 | 72,152,000 |
| Bioverativ, Inc. | | 1,200,000 | 68,028,000 |
| bluebird bio, Inc. (a) | | 217,400 | 27,142,390 |
| Blueprint Medicines Corp. (a) | | 915,594 | 49,643,507 |
| Calithera Biosciences, Inc. (a) | | 720,000 | 11,808,000 |
| Cellectis SA sponsored ADR (a)(b) | | 684,600 | 19,689,096 |
| Curis, Inc. (a) | | 2,600,000 | 5,304,000 |
| Cytokinetics, Inc. (a) | | 900,000 | 13,365,000 |
| CytomX Therapeutics, Inc. (a) | | 428,977 | 7,412,723 |
| Five Prime Therapeutics, Inc. (a) | | 357,600 | 12,129,792 |
| Heron Therapeutics, Inc. (a)(b) | | 694,643 | 11,461,610 |
| Insmed, Inc. (a) | | 2,640,000 | 32,788,800 |
| Intercept Pharmaceuticals, Inc. (a) | | 287,485 | 33,523,626 |
| La Jolla Pharmaceutical Co. (a) | | 331,617 | 11,324,721 |
| Loxo Oncology, Inc. (a) | | 500,000 | 41,700,000 |
| Momenta Pharmaceuticals, Inc. (a) | | 45,932 | 773,954 |
| Neurocrine Biosciences, Inc. (a) | | 972,449 | 55,040,613 |
| Proteostasis Therapeutics, Inc. (a) | | 305,964 | 663,942 |
| Prothena Corp. PLC (a) | | 418,350 | 25,703,424 |
| Puma Biotechnology, Inc. (a)(b) | | 350,000 | 32,375,000 |
| Regeneron Pharmaceuticals, Inc. (a) | | 90,000 | 44,721,000 |
| Spark Therapeutics, Inc. (a) | | 524,126 | 43,151,294 |
| TESARO, Inc. (a)(b) | | 800,000 | 103,312,000 |
| Vertex Pharmaceuticals, Inc. (a) | | 728,000 | 116,873,120 |
| Xencor, Inc. (a) | | 1,078,212 | 23,310,943 |
| | | | 1,997,686,267 |
| Capital Markets - 0.4% | | | |
| Asset Management & Custody Banks - 0.4% | | | |
| RPI International Holdings LP (a)(c)(d) | | 199,753 | 27,047,555 |
| Diversified Consumer Services - 0.3% | | | |
| Specialized Consumer Services - 0.3% | | | |
| Carriage Services, Inc. | | 736,300 | 18,031,987 |
| Food & Staples Retailing - 2.2% | | | |
| Drug Retail - 2.2% | | | |
| CVS Health Corp. | | 2,000,000 | 154,680,000 |
| Health Care Equipment & Supplies - 22.9% | | | |
| Health Care Equipment - 22.9% | | | |
| Atricure, Inc. (a) | | 1,630,000 | 36,560,900 |
| Becton, Dickinson & Co. | | 1,600,000 | 319,104,000 |
| Boston Scientific Corp. (a) | | 13,400,000 | 369,170,000 |
| DexCom, Inc. (a) | | 1,500,000 | 111,915,000 |
| Genmark Diagnostics, Inc. (a) | | 2,697,037 | 26,269,140 |
| Insulet Corp. (a) | | 1,237,817 | 71,867,655 |
| Integra LifeSciences Holdings Corp. (a) | | 1,120,000 | 57,108,800 |
| Intuitive Surgical, Inc. (a) | | 244,000 | 245,139,480 |
| Medtronic PLC | | 2,400,000 | 193,488,000 |
| Penumbra, Inc. (a)(b) | | 900,000 | 77,400,000 |
| Wright Medical Group NV (a) | | 2,900,000 | 85,840,000 |
| | | | 1,593,862,975 |
| Health Care Providers & Services - 21.2% | | | |
| Health Care Distributors & Services - 0.9% | | | |
| Amplifon SpA | | 1,600,000 | 23,142,348 |
| EBOS Group Ltd. | | 3,060,000 | 37,833,718 |
| | | | 60,976,066 |
| Health Care Facilities - 2.3% | | | |
| HCA Holdings, Inc. (a) | | 800,000 | 62,928,000 |
| Tenet Healthcare Corp. (a) | | 1,672,000 | 28,708,240 |
| Universal Health Services, Inc. Class B | | 600,000 | 64,878,000 |
| | | | 156,514,240 |
| Health Care Services - 2.2% | | | |
| American Renal Associates Holdings, Inc. (a) | | 800,000 | 11,464,000 |
| Premier, Inc. (a) | | 720,000 | 24,120,000 |
| Teladoc, Inc. (a)(b) | | 2,635,330 | 88,415,322 |
| United Drug PLC (United Kingdom) | | 2,700,000 | 29,222,767 |
| | | | 153,222,089 |
| Managed Health Care - 15.8% | | | |
| Aetna, Inc. | | 860,000 | 135,622,000 |
| Anthem, Inc. | | 128,000 | 25,093,120 |
| Cigna Corp. | | 1,280,000 | 233,036,800 |
| Humana, Inc. | | 700,000 | 180,334,000 |
| UnitedHealth Group, Inc. | | 2,650,000 | 527,085,000 |
| | | | 1,101,170,920 |
|
| TOTAL HEALTH CARE PROVIDERS & SERVICES | | | 1,471,883,315 |
|
| Health Care Technology - 3.4% | | | |
| Health Care Technology - 3.4% | | | |
| athenahealth, Inc. (a)(b) | | 691,528 | 97,457,041 |
| Castlight Health, Inc. (a) | | 1,875,650 | 7,315,035 |
| Castlight Health, Inc. Class B (a)(b) | | 2,862,066 | 11,162,057 |
| Cerner Corp. (a) | | 624,977 | 42,360,941 |
| Evolent Health, Inc. (a)(b) | | 1,850,000 | 30,895,000 |
| HealthStream, Inc. (a) | | 670,000 | 15,738,300 |
| Medidata Solutions, Inc. (a) | | 430,000 | 32,232,800 |
| | | | 237,161,174 |
| Internet Software & Services - 0.8% | | | |
| Internet Software & Services - 0.8% | | | |
| Benefitfocus, Inc. (a)(b)(e) | | 1,780,000 | 54,913,000 |
| Life Sciences Tools & Services - 0.9% | | | |
| Life Sciences Tools & Services - 0.9% | | | |
| Agilent Technologies, Inc. | | 1,000,000 | 64,720,000 |
| Pharmaceuticals - 17.2% | | | |
| Pharmaceuticals - 17.2% | | | |
| Aclaris Therapeutics, Inc. (a) | | 190,000 | 4,926,700 |
| Allergan PLC | | 2,120,000 | 486,497,600 |
| AstraZeneca PLC (United Kingdom) | | 400,000 | 23,451,129 |
| Avexis, Inc. (a) | | 64,800 | 6,049,080 |
| Bristol-Myers Squibb Co. | | 1,770,000 | 107,049,600 |
| Dechra Pharmaceuticals PLC | | 2,028,000 | 50,166,642 |
| Eisai Co. Ltd. | | 700,000 | 36,255,969 |
| GlaxoSmithKline PLC | | 4,000,000 | 79,359,055 |
| Jazz Pharmaceuticals PLC (a) | | 550,000 | 82,148,000 |
| Jiangsu Hengrui Medicine Co. Ltd. (A Shares) | | 5,280,000 | 43,378,382 |
| Mallinckrodt PLC (a) | | 720,000 | 29,577,600 |
| Merck & Co., Inc. | | 1,000,000 | 63,860,000 |
| Sanofi SA | | 650,000 | 63,375,222 |
| The Medicines Company (a)(b) | | 960,690 | 35,247,716 |
| TherapeuticsMD, Inc. (a)(b) | | 6,900,000 | 41,400,000 |
| Theravance Biopharma, Inc. (a)(b) | | 1,285,735 | 42,004,962 |
| | | | 1,194,747,657 |
| TOTAL COMMON STOCKS | | | |
| (Cost $5,080,487,272) | | | 6,814,733,930 |
|
| Convertible Preferred Stocks - 0.6% | | | |
| Biotechnology - 0.2% | | | |
| Biotechnology - 0.2% | | | |
| 10X Genomics, Inc. Series C (a)(c)(d) | | 2,958,778 | 13,250,000 |
| Health Care Providers & Services - 0.1% | | | |
| Health Care Services - 0.1% | | | |
| 1Life Healthcare, Inc. Series G (a)(c)(d) | | 1,639,892 | 11,840,020 |
| Software - 0.3% | | | |
| Application Software - 0.3% | | | |
| Outset Medical, Inc. Series B (a)(c)(d) | | 8,159,125 | 21,144,372 |
| TOTAL CONVERTIBLE PREFERRED STOCKS | | | |
| (Cost $42,550,001) | | | 46,234,392 |
|
| Money Market Funds - 4.8% | | | |
| Fidelity Cash Central Fund, 1.11% (f) | | 89,378,227 | 89,396,103 |
| Fidelity Securities Lending Cash Central Fund 1.11% (f)(g) | | 244,882,918 | 244,907,406 |
| TOTAL MONEY MARKET FUNDS | | | |
| (Cost $334,291,947) | | | 334,303,509 |
| TOTAL INVESTMENT IN SECURITIES - 103.5% | | | |
| (Cost $5,457,329,220) | | | 7,195,271,831 |
| NET OTHER ASSETS (LIABILITIES) - (3.5)% | | | (246,363,393) |
| NET ASSETS - 100% | | | $6,948,908,438 |
Legend
(a) Non-income producing
(b) Security or a portion of the security is on loan at period end.
(c) Level 3 instrument
(d) Restricted securities - Investment in securities not registered under the Securities Act of 1933 (excluding 144A issues). At the end of the period, the value of restricted securities (excluding 144A issues) amounted to $73,281,947 or 1.1% of net assets.
(e) Affiliated company
(f) Affiliated fund that is generally available only to investment companies and other accounts managed by Fidelity Investments. The rate quoted is the annualized seven-day yield of the fund at period end. A complete unaudited listing of the fund's holdings as of its most recent quarter end is available upon request. In addition, each Fidelity Central Fund's financial statements are available on the SEC's website or upon request.
(g) Investment made with cash collateral received from securities on loan.
Additional information on each restricted holding is as follows:
| Security | Acquisition Date | Acquisition Cost |
| 10X Genomics, Inc. Series C | 2/23/16 - 4/3/17 | $13,250,000 |
| 1Life Healthcare, Inc. Series G | 4/10/14 | $10,800,001 |
| Outset Medical, Inc. Series B | 5/5/15 | $18,500,000 |
| RPI International Holdings LP | 5/21/15 - 3/23/16 | $26,504,031 |
Affiliated Central Funds
Information regarding fiscal year to date income earned by the Fund from investments in Fidelity Central Funds is as follows:
| Fund | Income earned |
| Fidelity Cash Central Fund | $283,266 |
| Fidelity Securities Lending Cash Central Fund | 1,667,183 |
| Total | $1,950,449 |
Other Affiliated Issuers
An affiliated company is a company in which the Fund has ownership of at least 5% of the voting securities. Fiscal year to date transactions with companies which are or were affiliates are as follows:
| Affiliate | Value, beginning of period | Purchases | Sales Proceeds | Dividend Income | Realized Gain (loss) | Change in Unrealized appreciation (depreciation) | Value, end of period |
| Benefitfocus, Inc. | $26,550,000 | $23,366,028 | $-- | $-- | $-- | $4,996,972 | $54,913,000 |
| Genmark Diagnostics, Inc. | 28,300,000 | 2,299,259 | -- | -- | -- | (4,330,118) | -- |
| Total | $54,850,000 | $25,665,287 | $-- | $-- | $-- | $666,854 | $54,913,000 |
Investment Valuation
The following is a summary of the inputs used, as of August 31, 2017, involving the Fund's assets and liabilities carried at fair value. The inputs or methodology used for valuing securities may not be an indication of the risk associated with investing in those securities. For more information on valuation inputs, and their aggregation into the levels used below, please refer to the Investment Valuation section in the accompanying Notes to Financial Statements.
| | Valuation Inputs at Reporting Date: |
| Description | Total | Level 1 | Level 2 | Level 3 |
| Investments in Securities: | | | | |
| Common Stocks | $6,814,733,930 | $6,621,500,969 | $166,185,406 | $27,047,555 |
| Convertible Preferred Stocks | 46,234,392 | -- | -- | 46,234,392 |
| Money Market Funds | 334,303,509 | 334,303,509 | -- | -- |
| Total Investments in Securities: | $7,195,271,831 | $6,955,804,478 | $166,185,406 | $73,281,947 |
The following is a reconciliation of Investments in Securities for which Level 3 inputs were used in determining value:
| Investments in Securities: | |
| Beginning Balance | $67,022,431 |
| Total Realized Gain (Loss) | -- |
| Total Unrealized Gain (Loss) | 3,009,516 |
| Cost of Purchases | 3,250,000 |
| Proceeds of Sales | -- |
| Amortization/Accretion | -- |
| Transfers in to Level 3 | -- |
| Transfers out of Level 3 | -- |
| Ending Balance | $73,281,947 |
| The change in unrealized gain (loss) for the period attributable to Level 3 securities held at August 31, 2017 | $3,009,516 |
The information used in the above reconciliation represents fiscal year to date activity for any Investments in Securities identified as using Level 3 inputs at either the beginning or the end of the current fiscal period. Transfers in or out of Level 3 represent the beginning value of any Security or Instrument where a change in the pricing level occurred from the beginning to the end of the period. The cost of purchases and the proceeds of sales may include securities received or delivered through corporate actions or exchanges. Realized and unrealized gains (losses) disclosed in the reconciliations are included in Net Gain (Loss) on the Fund's Statement of Operations.
Other Information
Distribution of investments by country or territory of incorporation, as a percentage of Total Net Assets, is as follows (Unaudited):
| United States of America | 79.1% |
| Ireland | 12.2% |
| United Kingdom | 2.2% |
| France | 1.5% |
| Netherlands | 1.3% |
| Others (Individually Less Than 1%) | 3.7% |
| | 100.0% |
See accompanying notes which are an integral part of the financial statements.
Health Care Portfolio
Financial Statements
Statement of Assets and Liabilities
| | | August 31, 2017 (Unaudited) |
| Assets | | |
Investment in securities, at value (including securities loaned of $239,717,698) — See accompanying schedule:
Unaffiliated issuers (cost $5,071,422,796) | $6,806,055,322 | |
| Fidelity Central Funds (cost $334,291,947) | 334,303,509 | |
| Other affiliated issuers (cost $51,614,477) | 54,913,000 | |
| Total Investment in Securities (cost $5,457,329,220) | | $7,195,271,831 |
| Receivable for investments sold | | 32,132,024 |
| Receivable for fund shares sold | | 5,160,720 |
| Dividends receivable | | 7,419,535 |
| Distributions receivable from Fidelity Central Funds | | 373,103 |
| Other receivables | | 473,710 |
| Total assets | | 7,240,830,923 |
| Liabilities | | |
| Payable for investments purchased | $33,650,960 | |
| Payable for fund shares redeemed | 8,857,191 | |
| Accrued management fee | 3,077,030 | |
| Other affiliated payables | 1,007,084 | |
| Other payables and accrued expenses | 441,659 | |
| Collateral on securities loaned | 244,888,561 | |
| Total liabilities | | 291,922,485 |
| Net Assets | | $6,948,908,438 |
| Net Assets consist of: | | |
| Paid in capital | | $5,090,796,934 |
| Undistributed net investment income | | 8,405,946 |
| Accumulated undistributed net realized gain (loss) on investments and foreign currency transactions | | 111,767,043 |
| Net unrealized appreciation (depreciation) on investments and assets and liabilities in foreign currencies | | 1,737,938,515 |
| Net Assets, for 30,267,208 shares outstanding | | $6,948,908,438 |
| Net Asset Value, offering price and redemption price per share ($6,948,908,438 ÷ 30,267,208 shares) | | $229.59 |
See accompanying notes which are an integral part of the financial statements.
Statement of Operations
| | | Six months ended August 31, 2017 (Unaudited) |
| Investment Income | | |
| Dividends | | $31,125,469 |
| Income from Fidelity Central Funds (including $1,667,183 from security lending) | | 1,950,449 |
| Total income | | 33,075,918 |
| Expenses | | |
| Management fee | $18,156,387 | |
| Transfer agent fees | 5,367,494 | |
| Accounting and security lending fees | 595,139 | |
| Custodian fees and expenses | 77,868 | |
| Independent trustees' fees and expenses | 75,692 | |
| Appreciation in deferred trustee compensation account | 546 | |
| Registration fees | 64,871 | |
| Audit | 30,763 | |
| Legal | 48,581 | |
| Interest | 2,252 | |
| Miscellaneous | 54,218 | |
| Total expenses before reductions | 24,473,811 | |
| Expense reductions | (157,749) | 24,316,062 |
| Net investment income (loss) | | 8,759,856 |
| Realized and Unrealized Gain (Loss) | | |
| Net realized gain (loss) on: | | |
| Investment securities: | | |
| Unaffiliated issuers | 251,268,019 | |
| Fidelity Central Funds | (317) | |
| Foreign currency transactions | (47,201) | |
| Total net realized gain (loss) | | 251,220,501 |
| Change in net unrealized appreciation (depreciation) on: | | |
| Investment securities: | | |
| Unaffiliated issuers | 364,797,699 | |
| Fidelity Central Funds | (11,562) | |
| Other Affiliated issuers | 666,854 | |
| Assets and liabilities in foreign currencies | 9,286 | |
| Total change in net unrealized appreciation (depreciation) | | 365,462,277 |
| Net gain (loss) | | 616,682,778 |
| Net increase (decrease) in net assets resulting from operations | | $625,442,634 |
See accompanying notes which are an integral part of the financial statements.
Statement of Changes in Net Assets
| | Six months ended August 31, 2017 (Unaudited) | Year ended February 28, 2017 |
| Increase (Decrease) in Net Assets | | |
| Operations | | |
| Net investment income (loss) | $8,759,856 | $8,645,658 |
| Net realized gain (loss) | 251,220,501 | 4,497,783 |
| Change in net unrealized appreciation (depreciation) | 365,462,277 | 1,003,557,704 |
| Net increase (decrease) in net assets resulting from operations | 625,442,634 | 1,016,701,145 |
| Distributions to shareholders from net investment income | – | (7,826,452) |
| Distributions to shareholders from net realized gain | – | (36,346,185) |
| Total distributions | – | (44,172,637) |
| Share transactions | | |
| Proceeds from sales of shares | 439,637,171 | 982,508,524 |
| Reinvestment of distributions | – | 41,828,930 |
| Cost of shares redeemed | (745,053,025) | (2,807,128,925) |
| Net increase (decrease) in net assets resulting from share transactions | (305,415,854) | (1,782,791,471) |
| Redemption fees | – | 59,517 |
| Total increase (decrease) in net assets | 320,026,780 | (810,203,446) |
| Net Assets | | |
| Beginning of period | 6,628,881,658 | 7,439,085,104 |
| End of period | $6,948,908,438 | $6,628,881,658 |
| Other Information | | |
| Undistributed net investment income end of period | $8,405,946 | $– |
| Accumulated net investment loss end of period | $– | $(353,910) |
| Shares | | |
| Sold | 2,001,188 | 5,048,731 |
| Issued in reinvestment of distributions | – | 224,110 |
| Redeemed | (3,464,276) | (14,749,861) |
| Net increase (decrease) | (1,463,088) | (9,477,020) |
See accompanying notes which are an integral part of the financial statements.
Financial Highlights — Health Care Portfolio
| | Six months ended (Unaudited) August 31, | Years ended February 28, | | | | |
| | 2017 | 2017 | 2016 A | 2015 | 2014 | 2013 |
| Selected Per–Share Data | | | | | | |
| Net asset value, beginning of period | $208.91 | $180.53 | $236.43 | $216.88 | $144.20 | $133.07 |
| Income from Investment Operations | | | | | | |
| Net investment income (loss)B | .28 | .23 | (.07) | (.38) | (.20) | .50 |
| Net realized and unrealized gain (loss) | 20.40 | 29.29 | (31.64) | 50.00 | 92.44 | 24.74 |
| Total from investment operations | 20.68 | 29.52 | (31.71) | 49.62 | 92.24 | 25.24 |
| Distributions from net investment income | – | (.23) | – | – | (.03) | (.44) |
| Distributions from net realized gain | – | (.90) | (24.20) | (30.08) | (19.53) | (13.67) |
| Total distributions | – | (1.14)C | (24.20) | (30.08) | (19.57)D | (14.11) |
| Redemption fees added to paid in capitalB | – | –E | .01 | .01 | .01 | –E |
| Net asset value, end of period | $229.59 | $208.91 | $180.53 | $236.43 | $216.88 | $144.20 |
| Total ReturnF,G | 9.90% | 16.43% | (14.90)% | 25.44% | 67.13% | 20.07% |
| Ratios to Average Net AssetsH,I | | | | | | |
| Expenses before reductions | .73%J | .74% | .73% | .74% | .77% | .79% |
| Expenses net of fee waivers, if any | .73%J | .73% | .73% | .74% | .77% | .79% |
| Expenses net of all reductions | .73%J | .73% | .72% | .74% | .76% | .78% |
| Net investment income (loss) | .26%J | .12% | (.03)% | (.18)% | (.11)% | .36% |
| Supplemental Data | | | | | | |
| Net assets, end of period (000 omitted) | $6,948,908 | $6,628,882 | $7,439,085 | $9,831,808 | $6,180,280 | $2,724,341 |
| Portfolio turnover rateK | 69%J | 49%L | 76% | 98%L | 99% | 95% |
A For the year ended February 29.
B Calculated based on average shares outstanding during the period.
C Total distributions of $1.14 per share is comprised of distributions from net investment income of $.234 and distributions from net realized gain of $.904 per share.
D Total distributions of $19.57 per share is comprised of distributions from net investment income of $.034 and distributions from net realized gain of $19.532 per share.
E Amount represents less than $.005 per share.
F Total returns for periods of less than one year are not annualized.
G Total returns would have been lower if certain expenses had not been reduced during the applicable periods shown.
H Fees and expenses of any underlying Fidelity Central Funds are not included in the Fund's expense ratio. The Fund indirectly bears its proportionate share of the expenses of any underlying Fidelity Central Funds.
I Expense ratios reflect operating expenses of the Fund. Expenses before reductions do not reflect amounts reimbursed by the investment adviser or reductions from brokerage service arrangements or reductions from other expense offset arrangements and do not represent the amount paid by the Fund during periods when reimbursements or reductions occur. Expenses net of fee waivers reflect expenses after reimbursement by the investment adviser but prior to reductions from brokerage service arrangements or other expense offset arrangements. Expenses net of all reductions represent the net expenses paid by the Fund.
J Annualized
K Amount does not include the portfolio activity of any underlying Fidelity Central Funds.
L Portfolio turnover rate excludes securities received or delivered in-kind.
See accompanying notes which are an integral part of the financial statements.
Health Care Services Portfolio
Investment Summary (Unaudited)
Top Ten Stocks as of August 31, 2017
| | % of fund's net assets | % of fund's net assets 6 months ago |
| UnitedHealth Group, Inc. | 24.2 | 25.0 |
| Anthem, Inc. | 9.5 | 8.6 |
| Cigna Corp. | 9.2 | 6.6 |
| Humana, Inc. | 6.3 | 6.9 |
| McKesson Corp. | 4.8 | 4.6 |
| Universal Health Services, Inc. Class B | 4.8 | 4.3 |
| Aetna, Inc. | 4.2 | 4.9 |
| Laboratory Corp. of America Holdings | 4.2 | 3.8 |
| Teladoc, Inc. | 2.1 | 1.0 |
| Cardinal Health, Inc. | 2.0 | 2.5 |
| | 71.3 | |
Top Industries (% of fund's net assets)
| As of August 31, 2017 |
| | Health Care Providers & Services | 93.9% |
| | Health Care Technology | 0.7% |
| | Professional Services | 0.6% |
| | Health Care Equipment & Supplies | 0.5% |
| | Equity Real Estate Investment Trusts (Reits) | 0.2% |
| | All Others* | 4.1% |

* Includes Short-Term investments and Net Other Assets (Liabilities).
| As of February 28, 2017 |
| | Health Care Providers & Services | 97.4% |
| | Professional Services | 0.9% |
| | Pharmaceuticals | 0.5% |
| | Equity Real Estate Investment Trusts (Reits) | 0.3% |
| | All Others* | 0.9% |

* Includes Short-Term investments and Net Other Assets (Liabilities).
Health Care Services Portfolio
Investments August 31, 2017 (Unaudited)
Showing Percentage of Net Assets
| Common Stocks - 96.1% | | | |
| | | Shares | Value |
| Equity Real Estate Investment Trusts (REITs) - 0.2% | | | |
| Health Care REITs - 0.2% | | | |
| Medical Properties Trust, Inc. | | 164,500 | $2,164,820 |
| Health Care Equipment & Supplies - 0.5% | | | |
| Health Care Supplies - 0.5% | | | |
| Sartorius Stedim Biotech | | 52,700 | 3,861,445 |
| Health Care Providers & Services - 93.9% | | | |
| Health Care Distributors & Services - 8.7% | | | |
| AmerisourceBergen Corp. | | 58,700 | 4,710,675 |
| Cardinal Health, Inc. | | 246,400 | 16,622,144 |
| Henry Schein, Inc. (a) | | 59,500 | 10,333,960 |
| McKesson Corp. | | 266,115 | 39,733,631 |
| | | | 71,400,410 |
| Health Care Facilities - 13.3% | | | |
| Acadia Healthcare Co., Inc. (a)(b) | | 352,300 | 16,536,962 |
| Brookdale Senior Living, Inc. (a) | | 610,800 | 7,409,004 |
| HCA Holdings, Inc. (a) | | 174,700 | 13,741,902 |
| HealthSouth Corp. | | 129,100 | 5,906,325 |
| Kindred Healthcare, Inc. | | 604,200 | 4,894,020 |
| Surgery Partners, Inc. (a) | | 569,226 | 5,549,954 |
| Tenet Healthcare Corp. (a)(b) | | 576,400 | 9,896,788 |
| U.S. Physical Therapy, Inc. | | 100,000 | 5,990,000 |
| Universal Health Services, Inc. Class B | | 362,700 | 39,218,751 |
| | | | 109,143,706 |
| Health Care Services - 16.9% | | | |
| Almost Family, Inc. (a) | | 183,400 | 8,931,580 |
| Amedisys, Inc. (a) | | 145,400 | 7,595,696 |
| American Renal Associates Holdings, Inc. (a)(b) | | 617,071 | 8,842,627 |
| Chemed Corp. | | 30,800 | 6,076,532 |
| Envision Healthcare Corp. | | 125,700 | 6,587,937 |
| Express Scripts Holding Co. (a) | | 251,800 | 15,818,076 |
| Laboratory Corp. of America Holdings (a) | | 217,600 | 34,134,912 |
| LHC Group, Inc. (a) | | 64,700 | 4,221,675 |
| Premier, Inc. (a) | | 363,900 | 12,190,650 |
| Providence Service Corp. (a) | | 105,000 | 5,442,150 |
| Quest Diagnostics, Inc. | | 103,800 | 11,246,730 |
| Teladoc, Inc. (a)(b) | | 525,455 | 17,629,015 |
| | | | 138,717,580 |
| Managed Health Care - 55.0% | | | |
| Aetna, Inc. | | 220,700 | 34,804,390 |
| Anthem, Inc. | | 399,302 | 78,279,164 |
| Cigna Corp. | | 415,900 | 75,718,754 |
| Humana, Inc. | | 200,400 | 51,627,048 |
| Molina Healthcare, Inc. (a)(b) | | 208,300 | 13,331,200 |
| UnitedHealth Group, Inc. | | 997,800 | 198,462,420 |
| | | | 452,222,976 |
|
| TOTAL HEALTH CARE PROVIDERS & SERVICES | | | 771,484,672 |
|
| Health Care Technology - 0.7% | | | |
| Health Care Technology - 0.7% | | | |
| Castlight Health, Inc. Class B (a) | | 31,500 | 122,850 |
| Evolent Health, Inc. (a)(b) | | 324,300 | 5,415,810 |
| | | | 5,538,660 |
| Professional Services - 0.6% | | | |
| Human Resource & Employment Services - 0.6% | | | |
| WageWorks, Inc. (a) | | 92,100 | 5,429,295 |
| Textiles, Apparel & Luxury Goods - 0.2% | | | |
| Textiles - 0.2% | | | |
| PetIQ, Inc. Class A | | 55,900 | 1,400,854 |
| TOTAL COMMON STOCKS | | | |
| (Cost $475,871,748) | | | 789,879,746 |
|
| Money Market Funds - 10.1% | | | |
| Fidelity Cash Central Fund, 1.11% (c) | | 21,713,524 | 21,717,867 |
| Fidelity Securities Lending Cash Central Fund 1.11% (c)(d) | | 60,898,819 | 60,904,909 |
| TOTAL MONEY MARKET FUNDS | | | |
| (Cost $82,621,932) | | | 82,622,776 |
| TOTAL INVESTMENT IN SECURITIES - 106.2% | | | |
| (Cost $558,493,680) | | | 872,502,522 |
| NET OTHER ASSETS (LIABILITIES) - (6.2)% | | | (50,678,854) |
| NET ASSETS - 100% | | | $821,823,668 |
Legend
(a) Non-income producing
(b) Security or a portion of the security is on loan at period end.
(c) Affiliated fund that is generally available only to investment companies and other accounts managed by Fidelity Investments. The rate quoted is the annualized seven-day yield of the fund at period end. A complete unaudited listing of the fund's holdings as of its most recent quarter end is available upon request. In addition, each Fidelity Central Fund's financial statements are available on the SEC's website or upon request.
(d) Investment made with cash collateral received from securities on loan.
Affiliated Central Funds
Information regarding fiscal year to date income earned by the Fund from investments in Fidelity Central Funds is as follows:
| Fund | Income earned |
| Fidelity Cash Central Fund | $76,578 |
| Fidelity Securities Lending Cash Central Fund | 96,970 |
| Total | $173,548 |
Investment Valuation
All investments are categorized as Level 1 under the Fair Value Hierarchy. The inputs or methodology used for valuing securities may not be an indication of the risk associated with investing in those securities. For more information on valuation inputs please refer to the Investment Valuation section in the accompanying Notes to Financial Statements.
See accompanying notes which are an integral part of the financial statements.
Health Care Services Portfolio
Financial Statements
Statement of Assets and Liabilities
| | | August 31, 2017 (Unaudited) |
| Assets | | |
Investment in securities, at value (including securities loaned of $60,680,888) — See accompanying schedule:
Unaffiliated issuers (cost $475,871,748) | $789,879,746 | |
| Fidelity Central Funds (cost $82,621,932) | 82,622,776 | |
| Total Investment in Securities (cost $558,493,680) | | $872,502,522 |
| Receivable for investments sold | | 14,553,083 |
| Receivable for fund shares sold | | 843,334 |
| Dividends receivable | | 178,600 |
| Distributions receivable from Fidelity Central Funds | | 46,753 |
| Other receivables | | 49,710 |
| Total assets | | 888,174,002 |
| Liabilities | | |
| Payable for investments purchased | $3,280,525 | |
| Payable for fund shares redeemed | 1,590,455 | |
| Accrued management fee | 370,470 | |
| Other affiliated payables | 143,307 | |
| Other payables and accrued expenses | 60,674 | |
| Collateral on securities loaned | 60,904,903 | |
| Total liabilities | | 66,350,334 |
| Net Assets | | $821,823,668 |
| Net Assets consist of: | | |
| Paid in capital | | $437,304,341 |
| Undistributed net investment income | | 65,826 |
| Accumulated undistributed net realized gain (loss) on investments and foreign currency transactions | | 70,445,655 |
| Net unrealized appreciation (depreciation) on investments and assets and liabilities in foreign currencies | | 314,007,846 |
| Net Assets, for 8,967,752 shares outstanding | | $821,823,668 |
| Net Asset Value, offering price and redemption price per share ($821,823,668 ÷ 8,967,752 shares) | | $91.64 |
See accompanying notes which are an integral part of the financial statements.
Statement of Operations
| | | Six months ended August 31, 2017 (Unaudited) |
| Investment Income | | |
| Dividends | | $3,340,066 |
| Income from Fidelity Central Funds (including $96,970 from security lending) | | 173,548 |
| Total income | | 3,513,614 |
| Expenses | | |
| Management fee | $2,132,104 | |
| Transfer agent fees | 684,527 | |
| Accounting and security lending fees | 139,947 | |
| Custodian fees and expenses | 5,692 | |
| Independent trustees' fees and expenses | 8,890 | |
| Registration fees | 21,125 | |
| Audit | 18,493 | |
| Legal | 5,804 | |
| Miscellaneous | 6,348 | |
| Total expenses before reductions | 3,022,930 | |
| Expense reductions | (12,760) | 3,010,170 |
| Net investment income (loss) | | 503,444 |
| Realized and Unrealized Gain (Loss) | | |
| Net realized gain (loss) on: | | |
| Investment securities: | | |
| Unaffiliated issuers | 73,493,785 | |
| Fidelity Central Funds | (1,171) | |
| Foreign currency transactions | 1,997 | |
| Total net realized gain (loss) | | 73,494,611 |
| Change in net unrealized appreciation (depreciation) on: | | |
| Investment securities: | | |
| Unaffiliated issuers | (21,608,560) | |
| Fidelity Central Funds | (1,326) | |
| Assets and liabilities in foreign currencies | 659 | |
| Total change in net unrealized appreciation (depreciation) | | (21,609,227) |
| Net gain (loss) | | 51,885,384 |
| Net increase (decrease) in net assets resulting from operations | | $52,388,828 |
See accompanying notes which are an integral part of the financial statements.
Statement of Changes in Net Assets
| | Six months ended August 31, 2017 (Unaudited) | Year ended February 28, 2017 |
| Increase (Decrease) in Net Assets | | |
| Operations | | |
| Net investment income (loss) | $503,444 | $1,200,397 |
| Net realized gain (loss) | 73,494,611 | 67,674,608 |
| Change in net unrealized appreciation (depreciation) | (21,609,227) | 71,121,457 |
| Net increase (decrease) in net assets resulting from operations | 52,388,828 | 139,996,462 |
| Distributions to shareholders from net investment income | – | (1,101,426) |
| Distributions to shareholders from net realized gain | (36,757,903) | (32,459,112) |
| Total distributions | (36,757,903) | (33,560,538) |
| Share transactions | | |
| Proceeds from sales of shares | 97,149,900 | 98,741,730 |
| Reinvestment of distributions | 34,919,677 | 31,971,028 |
| Cost of shares redeemed | (85,993,389) | (314,570,674) |
| Net increase (decrease) in net assets resulting from share transactions | 46,076,188 | (183,857,916) |
| Redemption fees | 8,880 | 11,242 |
| Total increase (decrease) in net assets | 61,715,993 | (77,410,750) |
| Net Assets | | |
| Beginning of period | 760,107,675 | 837,518,425 |
| End of period | $821,823,668 | $760,107,675 |
| Other Information | | |
| Undistributed net investment income end of period | $65,826 | $– |
| Accumulated net investment loss end of period | $– | $(437,618) |
| Shares | | |
| Sold | 1,068,360 | 1,169,971 |
| Issued in reinvestment of distributions | 412,567 | 384,552 |
| Redeemed | (965,288) | (3,759,703) |
| Net increase (decrease) | 515,639 | (2,205,180) |
See accompanying notes which are an integral part of the financial statements.
Financial Highlights — Health Care Services Portfolio
| | Six months ended (Unaudited) August 31, | Years ended February 28, | | | | |
| | 2017 | 2017 | 2016 A | 2015 | 2014 | 2013 |
| Selected Per–Share Data | | | | | | |
| Net asset value, beginning of period | $89.93 | $78.59 | $87.26 | $75.55 | $59.90 | $61.26 |
| Income from Investment Operations | | | | | | |
| Net investment income (loss)B | .06 | .12 | (.03) | (.09) | (.07) | .06 |
| Net realized and unrealized gain (loss) | 6.02 | 15.03 | (5.21) | 19.25 | 20.08 | 1.77 |
| Total from investment operations | 6.08 | 15.15 | (5.24) | 19.16 | 20.01 | 1.83 |
| Distributions from net investment income | – | (.13) | (.02) | – | – | (.03) |
| Distributions from net realized gain | (4.37) | (3.68) | (3.41) | (7.45) | (4.36) | (3.16) |
| Total distributions | (4.37) | (3.81) | (3.43) | (7.45) | (4.36) | (3.19) |
| Redemption fees added to paid in capitalB,C | – | – | – | – | – | – |
| Net asset value, end of period | $91.64 | $89.93 | $78.59 | $87.26 | $75.55 | $59.90 |
| Total ReturnD,E | 7.17% | 19.71% | (6.30)% | 26.88% | 34.22% | 3.17% |
| Ratios to Average Net AssetsF,G | | | | | | |
| Expenses before reductions | .77%H | .78% | .77% | .79% | .82% | .84% |
| Expenses net of fee waivers, if any | .77%H | .78% | .77% | .79% | .82% | .84% |
| Expenses net of all reductions | .77%H | .78% | .77% | .79% | .82% | .83% |
| Net investment income (loss) | .13%H | .15% | (.03)% | (.12)% | (.10)% | .10% |
| Supplemental Data | | | | | | |
| Net assets, end of period (000 omitted) | $821,824 | $760,108 | $837,518 | $878,416 | $692,486 | $562,949 |
| Portfolio turnover rateI | 59%H | 26% | 39% | 44% | 65% | 96% |
A For the year ended February 29.
B Calculated based on average shares outstanding during the period.
C Amount represents less than $.005 per share.
D Total returns for periods of less than one year are not annualized.
E Total returns would have been lower if certain expenses had not been reduced during the applicable periods shown.
F Fees and expenses of any underlying Fidelity Central Funds are not included in the Fund's expense ratio. The Fund indirectly bears its proportionate share of the expenses of any underlying Fidelity Central Funds.
G Expense ratios reflect operating expenses of the Fund. Expenses before reductions do not reflect amounts reimbursed by the investment adviser or reductions from brokerage service arrangements or reductions from other expense offset arrangements and do not represent the amount paid by the Fund during periods when reimbursements or reductions occur. Expenses net of fee waivers reflect expenses after reimbursement by the investment adviser but prior to reductions from brokerage service arrangements or other expense offset arrangements. Expenses net of all reductions represent the net expenses paid by the Fund.
H Annualized
I Amount does not include the portfolio activity of any underlying Fidelity Central Funds.
See accompanying notes which are an integral part of the financial statements.
Medical Equipment and Systems Portfolio
Investment Summary (Unaudited)
Top Ten Stocks as of August 31, 2017
| | % of fund's net assets | % of fund's net assets 6 months ago |
| Medtronic PLC | 14.9 | 21.2 |
| Boston Scientific Corp. | 11.4 | 11.2 |
| Becton, Dickinson & Co. | 10.7 | 0.3 |
| Intuitive Surgical, Inc. | 7.9 | 6.8 |
| Danaher Corp. | 4.9 | 3.8 |
| Stryker Corp. | 4.0 | 4.1 |
| Amgen, Inc. | 3.4 | 2.5 |
| DexCom, Inc. | 3.3 | 2.7 |
| Allergan PLC | 2.8 | 2.1 |
| Wright Medical Group NV | 2.7 | 2.6 |
| | 66.0 | |
Top Industries (% of fund's net assets)
| As of August 31, 2017 |
| | Health Care Equipment & Supplies | 79.9% |
| | Health Care Providers & Services | 4.7% |
| | Biotechnology | 3.6% |
| | Health Care Technology | 3.5% |
| | Life Sciences Tools & Services | 2.8% |
| | All Others* | 5.5% |

* Includes Short-Term investments and Net Other Assets (Liabilities).
| As of February 28, 2017 |
| | Health Care Equipment & Supplies | 80.2% |
| | Biotechnology | 5.9% |
| | Pharmaceuticals | 3.0% |
| | Health Care Providers & Services | 2.9% |
| | Health Care Technology | 2.4% |
| | All Others* | 5.6% |

* Includes Short-Term investments and Net Other Assets (Liabilities).
Medical Equipment and Systems Portfolio
Investments August 31, 2017 (Unaudited)
Showing Percentage of Net Assets
| Common Stocks - 97.7% | | | |
| | | Shares | Value |
| Biotechnology - 3.6% | | | |
| Biotechnology - 3.6% | | | |
| Amgen, Inc. | | 780,000 | $138,660,600 |
| Calyxt, Inc. | | 416,090 | 6,324,568 |
| | | | 144,985,168 |
| Food & Staples Retailing - 1.2% | | | |
| Drug Retail - 1.2% | | | |
| CVS Health Corp. | | 650,000 | 50,271,000 |
| Health Care Equipment & Supplies - 78.4% | | | |
| Health Care Equipment - 77.6% | | | |
| Abbott Laboratories | | 1,770,000 | 90,163,800 |
| Angiodynamics, Inc. (a) | | 800,000 | 13,624,000 |
| Atricure, Inc. (a)(b) | | 1,920,000 | 43,065,600 |
| AxoGen, Inc. (a) | | 144,429 | 2,541,950 |
| Becton, Dickinson & Co. | | 2,172,000 | 433,183,680 |
| Boston Scientific Corp. (a) | | 16,900,000 | 465,595,000 |
| Danaher Corp. | | 2,400,000 | 200,208,000 |
| DexCom, Inc. (a)(c) | | 1,825,339 | 136,188,543 |
| Edwards Lifesciences Corp. (a) | | 290,000 | 32,961,400 |
| Fisher & Paykel Healthcare Corp. | | 3,500,000 | 29,578,010 |
| Genmark Diagnostics, Inc. (a) | | 1,965,510 | 19,144,067 |
| Inogen, Inc. (a) | | 250,000 | 23,950,000 |
| Insulet Corp. (a) | | 1,200,000 | 69,672,000 |
| Integra LifeSciences Holdings Corp. (a) | | 1,720,000 | 87,702,800 |
| Intuitive Surgical, Inc. (a) | | 318,000 | 319,485,060 |
| LivaNova PLC (a) | | 132,000 | 8,260,560 |
| Medtronic PLC | | 7,500,000 | 604,650,001 |
| Nakanishi, Inc. | | 405,500 | 17,520,580 |
| Nevro Corp. (a) | | 128,000 | 11,031,040 |
| Penumbra, Inc. (a) | | 414,125 | 35,614,750 |
| ResMed, Inc. (c) | | 1,200,000 | 93,096,000 |
| Steris PLC | | 720,000 | 62,755,200 |
| Stryker Corp. | | 1,140,000 | 161,161,800 |
| Teleflex, Inc. | | 4,000 | 847,000 |
| Varian Medical Systems, Inc. (a) | | 640,000 | 68,000,000 |
| Wright Medical Group NV (a) | | 3,700,000 | 109,520,000 |
| Zimmer Biomet Holdings, Inc. | | 128,000 | 14,626,560 |
| | | | 3,154,147,401 |
| Health Care Supplies - 0.8% | | | |
| Nanosonics Ltd. (a) | | 1,738,853 | 3,607,806 |
| Sartorius Stedim Biotech | | 325,000 | 23,813,464 |
| The Cooper Companies, Inc. | | 17,000 | 4,264,110 |
| | | | 31,685,380 |
|
| TOTAL HEALTH CARE EQUIPMENT & SUPPLIES | | | 3,185,832,781 |
|
| Health Care Providers & Services - 4.6% | | | |
| Health Care Services - 1.5% | | | |
| Premier, Inc. (a) | | 360,000 | 12,060,000 |
| Teladoc, Inc. (a) | | 1,424,975 | 47,807,911 |
| | | | 59,867,911 |
| Managed Health Care - 3.1% | | | |
| Cigna Corp. | | 172,000 | 31,314,320 |
| UnitedHealth Group, Inc. | | 472,000 | 93,880,800 |
| | | | 125,195,120 |
|
| TOTAL HEALTH CARE PROVIDERS & SERVICES | | | 185,063,031 |
|
| Health Care Technology - 3.5% | | | |
| Health Care Technology - 3.5% | | | |
| athenahealth, Inc. (a) | | 163,547 | 23,048,679 |
| Castlight Health, Inc. (a) | | 999,300 | 3,897,270 |
| Castlight Health, Inc. Class B (a) | | 1,191,502 | 4,646,858 |
| Cerner Corp. (a) | | 899,650 | 60,978,277 |
| Evolent Health, Inc. (a)(c) | | 1,140,000 | 19,038,000 |
| HealthStream, Inc. (a) | | 500,000 | 11,745,000 |
| HTG Molecular Diagnostics (a)(b)(c) | | 673,461 | 1,117,945 |
| Medidata Solutions, Inc. (a) | | 240,000 | 17,990,400 |
| | | | 142,462,429 |
| Internet Software & Services - 0.8% | | | |
| Internet Software & Services - 0.8% | | | |
| Benefitfocus, Inc. (a)(c) | | 1,089,394 | 33,607,805 |
| Life Sciences Tools & Services - 2.8% | | | |
| Life Sciences Tools & Services - 2.8% | | | |
| Agilent Technologies, Inc. | | 770,000 | 49,834,400 |
| Bruker Corp. | | 1,400,000 | 40,726,000 |
| Lonza Group AG | | 90,000 | 22,787,424 |
| | | | 113,347,824 |
| Pharmaceuticals - 2.8% | | | |
| Pharmaceuticals - 2.8% | | | |
| Allergan PLC | | 490,000 | 112,445,200 |
| TOTAL COMMON STOCKS | | | |
| (Cost $3,105,237,241) | | | 3,968,015,238 |
|
| Preferred Stocks - 1.8% | | | |
| Convertible Preferred Stocks - 0.3% | | | |
| Health Care Providers & Services - 0.1% | | | |
| Health Care Services - 0.1% | | | |
| 1Life Healthcare, Inc. Series G (a)(d)(e) | | 455,526 | 3,288,898 |
| Software - 0.2% | | | |
| Application Software - 0.2% | | | |
| Outset Medical, Inc. Series B (a)(d)(e) | | 3,307,754 | 8,572,044 |
|
| TOTAL CONVERTIBLE PREFERRED STOCKS | | | 11,860,942 |
|
| Nonconvertible Preferred Stocks - 1.5% | | | |
| Health Care Equipment & Supplies - 1.5% | | | |
| Health Care Equipment - 1.5% | | | |
| Sartorius AG (non-vtg.) | | 630,000 | 62,578,623 |
| TOTAL PREFERRED STOCKS | | | |
| (Cost $47,829,976) | | | 74,439,565 |
|
| Money Market Funds - 2.8% | | | |
| Fidelity Cash Central Fund, 1.11% (f) | | 38,474,692 | 38,482,387 |
| Fidelity Securities Lending Cash Central Fund 1.11% (f)(g) | | 75,155,812 | 75,163,327 |
| TOTAL MONEY MARKET FUNDS | | | |
| (Cost $113,644,413) | | | 113,645,714 |
| TOTAL INVESTMENT IN SECURITIES - 102.3% | | | |
| (Cost $3,266,711,630) | | | 4,156,100,517 |
| NET OTHER ASSETS (LIABILITIES) - (2.3)% | | | (91,925,332) |
| NET ASSETS - 100% | | | $4,064,175,185 |
Legend
(a) Non-income producing
(b) Affiliated company
(c) Security or a portion of the security is on loan at period end.
(d) Level 3 instrument
(e) Restricted securities - Investment in securities not registered under the Securities Act of 1933 (excluding 144A issues). At the end of the period, the value of restricted securities (excluding 144A issues) amounted to $11,860,942 or 0.3% of net assets.
(f) Affiliated fund that is generally available only to investment companies and other accounts managed by Fidelity Investments. The rate quoted is the annualized seven-day yield of the fund at period end. A complete unaudited listing of the fund's holdings as of its most recent quarter end is available upon request. In addition, each Fidelity Central Fund's financial statements are available on the SEC's website or upon request.
(g) Investment made with cash collateral received from securities on loan.
Additional information on each restricted holding is as follows:
| Security | Acquisition Date | Acquisition Cost |
| 1Life Healthcare, Inc. Series G | 4/10/14 | $3,000,003 |
| Outset Medical, Inc. Series B | 5/5/15 - 6/5/15 | $7,500,001 |
Affiliated Central Funds
Information regarding fiscal year to date income earned by the Fund from investments in Fidelity Central Funds is as follows:
| Fund | Income earned |
| Fidelity Cash Central Fund | $189,983 |
| Fidelity Securities Lending Cash Central Fund | 371,726 |
| Total | $561,709 |
Other Affiliated Issuers
An affiliated company is a company in which the Fund has ownership of at least 5% of the voting securities. Fiscal year to date transactions with companies which are or were affiliates are as follows:
| Affiliate | Value, beginning of period | Purchases | Sales Proceeds | Dividend Income | Realized Gain (loss) | Change in Unrealized appreciation (depreciation) | Value, end of period |
| Atricure, Inc. | $27,375,000 | $8,813,714 | $-- | $-- | $-- | $6,876,886 | $43,065,600 |
| Avinger, Inc. | 3,570,000 | -- | 1,157,059 | -- | (5,486,292) | 3,073,351 | -- |
| HTG Molecular Diagnostics | 1,838,549 | -- | -- | -- | -- | (720,604) | 1,117,945 |
| Total | $32,783,549 | $8,813,714 | $1,157,059 | $-- | $(5,486,292) | $9,229,633 | $44,183,545 |
Investment Valuation
The following is a summary of the inputs used, as of August 31, 2017, involving the Fund's assets and liabilities carried at fair value. The inputs or methodology used for valuing securities may not be an indication of the risk associated with investing in those securities. For more information on valuation inputs, and their aggregation into the levels used below, please refer to the Investment Valuation section in the accompanying Notes to Financial Statements.
| | Valuation Inputs at Reporting Date: |
| Description | Total | Level 1 | Level 2 | Level 3 |
| Investments in Securities: | | | | |
| Common Stocks | $3,968,015,238 | $3,968,015,238 | $-- | $-- |
| Preferred Stocks | 74,439,565 | 62,578,623 | -- | 11,860,942 |
| Money Market Funds | 113,645,714 | 113,645,714 | -- | -- |
| Total Investments in Securities: | $4,156,100,517 | $4,144,239,575 | $-- | $11,860,942 |
Other Information
Distribution of investments by country or territory of incorporation, as a percentage of Total Net Assets, is as follows (Unaudited):
| United States of America | 74.0% |
| Ireland | 17.7% |
| Netherlands | 2.7% |
| United Kingdom | 1.7% |
| Germany | 1.5% |
| Others (Individually Less Than 1%) | 2.4% |
| | 100.0% |
See accompanying notes which are an integral part of the financial statements.
Medical Equipment and Systems Portfolio
Financial Statements
Statement of Assets and Liabilities
| | | August 31, 2017 (Unaudited) |
| Assets | | |
Investment in securities, at value (including securities loaned of $74,070,225) — See accompanying schedule:
Unaffiliated issuers (cost $3,113,340,081) | $3,998,271,258 | |
| Fidelity Central Funds (cost $113,644,413) | 113,645,714 | |
| Other affiliated issuers (cost $39,727,136) | 44,183,545 | |
| Total Investment in Securities (cost $3,266,711,630) | | $4,156,100,517 |
| Receivable for investments sold | | 7,931,910 |
| Receivable for fund shares sold | | 6,051,035 |
| Dividends receivable | | 2,060,157 |
| Distributions receivable from Fidelity Central Funds | | 101,638 |
| Other receivables | | 151,029 |
| Total assets | | 4,172,396,286 |
| Liabilities | | |
| Payable for investments purchased | $23,901,699 | |
| Payable for fund shares redeemed | 6,559,498 | |
| Accrued management fee | 1,811,896 | |
| Other affiliated payables | 664,497 | |
| Other payables and accrued expenses | 130,061 | |
| Collateral on securities loaned | 75,153,450 | |
| Total liabilities | | 108,221,101 |
| Net Assets | | $4,064,175,185 |
| Net Assets consist of: | | |
| Paid in capital | | $2,932,567,927 |
| Undistributed net investment income | | 2,804,341 |
| Accumulated undistributed net realized gain (loss) on investments and foreign currency transactions | | 239,409,885 |
| Net unrealized appreciation (depreciation) on investments and assets and liabilities in foreign currencies | | 889,393,032 |
| Net Assets, for 87,851,338 shares outstanding | | $4,064,175,185 |
| Net Asset Value, offering price and redemption price per share ($4,064,175,185 ÷ 87,851,338 shares) | | $46.26 |
See accompanying notes which are an integral part of the financial statements.
Statement of Operations
| | | Six months ended August 31, 2017 (Unaudited) |
| Investment Income | | |
| Dividends | | $16,219,212 |
| Income from Fidelity Central Funds (including $371,726 from security lending) | | 561,709 |
| Total income | | 16,780,921 |
| Expenses | | |
| Management fee | $10,010,992 | |
| Transfer agent fees | 3,205,425 | |
| Accounting and security lending fees | 511,154 | |
| Custodian fees and expenses | 32,081 | |
| Independent trustees' fees and expenses | 39,992 | |
| Registration fees | 134,491 | |
| Audit | 18,616 | |
| Legal | 22,631 | |
| Interest | 204 | |
| Miscellaneous | 19,833 | |
| Total expenses before reductions | 13,995,419 | |
| Expense reductions | (108,013) | 13,887,406 |
| Net investment income (loss) | | 2,893,515 |
| Realized and Unrealized Gain (Loss) | | |
| Net realized gain (loss) on: | | |
| Investment securities: | | |
| Unaffiliated issuers | 251,197,658 | |
| Fidelity Central Funds | 3,319 | |
| Other affiliated issuers | (5,486,292) | |
| Foreign currency transactions | 86,579 | |
| Total net realized gain (loss) | | 245,801,264 |
| Change in net unrealized appreciation (depreciation) on: | | |
| Investment securities: | | |
| Unaffiliated issuers | 150,141,344 | |
| Fidelity Central Funds | (12,329) | |
| Other Affiliated issuers | 9,229,633 | |
| Assets and liabilities in foreign currencies | 1,675 | |
| Total change in net unrealized appreciation (depreciation) | | 159,360,323 |
| Net gain (loss) | | 405,161,587 |
| Net increase (decrease) in net assets resulting from operations | | $408,055,102 |
See accompanying notes which are an integral part of the financial statements.
Statement of Changes in Net Assets
| | Six months ended August 31, 2017 (Unaudited) | Year ended February 28, 2017 |
| Increase (Decrease) in Net Assets | | |
| Operations | | |
| Net investment income (loss) | $2,893,515 | $357,634 |
| Net realized gain (loss) | 245,801,264 | 168,649,269 |
| Change in net unrealized appreciation (depreciation) | 159,360,323 | 424,009,904 |
| Net increase (decrease) in net assets resulting from operations | 408,055,102 | 593,016,807 |
| Distributions to shareholders from net realized gain | (15,478,713) | (146,067,746) |
| Share transactions | | |
| Proceeds from sales of shares | 1,064,314,400 | 1,466,793,197 |
| Reinvestment of distributions | 14,866,512 | 140,204,873 |
| Cost of shares redeemed | (541,958,226) | (835,443,267) |
| Net increase (decrease) in net assets resulting from share transactions | 537,222,686 | 771,554,803 |
| Redemption fees | – | 100,741 |
| Total increase (decrease) in net assets | 929,799,075 | 1,218,604,605 |
| Net Assets | | |
| Beginning of period | 3,134,376,110 | 1,915,771,505 |
| End of period | $4,064,175,185 | $3,134,376,110 |
| Other Information | | |
| Undistributed net investment income end of period | $2,804,341 | $– |
| Distributions in excess of net investment income end of period | $– | $(89,174) |
| Shares | | |
| Sold | 24,145,275 | 36,297,550 |
| Issued in reinvestment of distributions | 356,515 | 3,801,155 |
| Redeemed | (12,210,690) | (21,308,013) |
| Net increase (decrease) | 12,291,100 | 18,790,692 |
See accompanying notes which are an integral part of the financial statements.
Financial Highlights — Medical Equipment and Systems Portfolio
| | Six months ended (Unaudited) August 31, | Years ended February 28, | | | | |
| | 2017 | 2017 | 2016 A | 2015 | 2014 | 2013 |
| Selected Per–Share Data | | | | | | |
| Net asset value, beginning of period | $41.48 | $33.75 | $41.90 | $38.03 | $30.60 | $28.02 |
| Income from Investment Operations | | | | | | |
| Net investment income (loss)B | .03 | .01 | (.03) | .04 | .01 | .04 |
| Net realized and unrealized gain (loss) | 4.95 | 9.87 | (2.25) | 9.86 | 10.94 | 3.77 |
| Total from investment operations | 4.98 | 9.88 | (2.28) | 9.90 | 10.95 | 3.81 |
| Distributions from net investment income | – | – | (.01) | (.05) | – | (.05) |
| Distributions from net realized gain | (.20) | (2.15) | (5.86) | (5.98) | (3.52) | (1.18) |
| Total distributions | (.20) | (2.15) | (5.87) | (6.03) | (3.52) | (1.23) |
| Redemption fees added to paid in capitalB | – | –C | –C | –C | –C | –C |
| Net asset value, end of period | $46.26 | $41.48 | $33.75 | $41.90 | $38.03 | $30.60 |
| Total ReturnD,E | 12.06% | 30.13% | (6.63)% | 28.52% | 37.03% | 14.09% |
| Ratios to Average Net AssetsF,G | | | | | | |
| Expenses before reductions | .76%H | .76% | .76% | .77% | .80% | .83% |
| Expenses net of fee waivers, if any | .76%H | .76% | .76% | .77% | .80% | .83% |
| Expenses net of all reductions | .76%H | .76% | .75% | .77% | .79% | .82% |
| Net investment income (loss) | .16%H | .01% | (.09)% | .11% | .04% | .13% |
| Supplemental Data | | | | | | |
| Net assets, end of period (000 omitted) | $4,064,175 | $3,134,376 | $1,915,772 | $2,107,515 | $1,720,317 | $1,404,437 |
| Portfolio turnover rateI | 62%H | 55% | 46% | 106% | 75% | 69% |
A For the year ended February 29.
B Calculated based on average shares outstanding during the period.
C Amount represents less than $.005 per share.
D Total returns for periods of less than one year are not annualized.
E Total returns would have been lower if certain expenses had not been reduced during the applicable periods shown.
F Fees and expenses of any underlying Fidelity Central Funds are not included in the Fund's expense ratio. The Fund indirectly bears its proportionate share of the expenses of any underlying Fidelity Central Funds.
G Expense ratios reflect operating expenses of the Fund. Expenses before reductions do not reflect amounts reimbursed by the investment adviser or reductions from brokerage service arrangements or reductions from other expense offset arrangements and do not represent the amount paid by the Fund during periods when reimbursements or reductions occur. Expenses net of fee waivers reflect expenses after reimbursement by the investment adviser but prior to reductions from brokerage service arrangements or other expense offset arrangements. Expenses net of all reductions represent the net expenses paid by the Fund.
H Annualized
I Amount does not include the portfolio activity of any underlying Fidelity Central Funds.
See accompanying notes which are an integral part of the financial statements.
Pharmaceuticals Portfolio
Investment Summary (Unaudited)
Top Ten Stocks as of August 31, 2017
| | % of fund's net assets | % of fund's net assets 6 months ago |
| Johnson & Johnson | 12.9 | 5.4 |
| Sanofi SA sponsored ADR | 8.8 | 7.9 |
| Allergan PLC | 8.1 | 5.7 |
| GlaxoSmithKline PLC sponsored ADR | 7.4 | 8.0 |
| Pfizer, Inc. | 6.3 | 4.1 |
| Novartis AG sponsored ADR | 5.4 | 4.2 |
| Merck & Co., Inc. | 4.6 | 3.9 |
| Bristol-Myers Squibb Co. | 4.5 | 5.6 |
| AstraZeneca PLC sponsored ADR | 3.5 | 4.9 |
| Amgen, Inc. | 2.7 | 2.2 |
| | 64.2 | |
Top Industries (% of fund's net assets)
| As of August 31, 2017 |
| | Pharmaceuticals | 82.8% |
| | Biotechnology | 9.5% |
| | Health Care Providers & Services | 3.2% |
| | Health Care Equipment & Supplies | 2.5% |
| | Household Products | 0.8% |
| | All Others* | 1.2% |

* Includes Short-Term investments and Net Other Assets (Liabilities).
| As of February 28, 2017 |
| | Pharmaceuticals | 76.8% |
| | Biotechnology | 15.1% |
| | Health Care Providers & Services | 2.8% |
| | Health Care Equipment & Supplies | 2.5% |
| | Life Sciences Tools & Services | 1.0% |
| | All Others* | 1.8% |

* Includes Short-Term investments and Net Other Assets (Liabilities).
Pharmaceuticals Portfolio
Investments August 31, 2017 (Unaudited)
Showing Percentage of Net Assets
| Common Stocks - 98.8% | | | |
| | | Shares | Value |
| Biotechnology - 9.5% | | | |
| Biotechnology - 9.5% | | | |
| Ablynx NV (a)(b) | | 263,300 | $3,761,346 |
| AC Immune SA (b) | | 142,200 | 1,114,848 |
| Advanced Accelerator Applications SA sponsored ADR (a) | | 80,600 | 3,946,982 |
| Advaxis, Inc. (a) | | 180,600 | 1,229,886 |
| Alnylam Pharmaceuticals, Inc. (a) | | 38,500 | 3,300,605 |
| Amgen, Inc. | | 135,600 | 24,105,612 |
| Amicus Therapeutics, Inc. (a) | | 72,258 | 1,007,277 |
| Biogen, Inc. (a) | | 48,500 | 15,353,160 |
| Cytokinetics, Inc. (a) | | 134,100 | 1,991,385 |
| Olivo Labs (c)(d) | | 6,851 | 3,220 |
| Ovid Therapeutics, Inc. | | 172,500 | 1,624,950 |
| Repligen Corp. (a) | | 122,500 | 5,349,575 |
| Shire PLC sponsored ADR | | 59,900 | 8,948,461 |
| Spark Therapeutics, Inc. (a) | | 3,400 | 279,922 |
| TESARO, Inc. (a) | | 28,741 | 3,711,613 |
| uniQure B.V. (a) | | 290,618 | 2,342,381 |
| Vertex Pharmaceuticals, Inc. (a) | | 26,400 | 4,238,256 |
| Xencor, Inc. (a) | | 146,268 | 3,162,314 |
| | | | 85,471,793 |
| Chemicals - 0.7% | | | |
| Specialty Chemicals - 0.7% | | | |
| Codexis, Inc. (a) | | 1,127,829 | 6,259,451 |
| Health Care Equipment & Supplies - 1.8% | | | |
| Health Care Equipment - 1.8% | | | |
| Becton, Dickinson & Co. | | 52,900 | 10,550,376 |
| Insulet Corp. (a) | | 93,900 | 5,451,834 |
| | | | 16,002,210 |
| Health Care Providers & Services - 3.2% | | | |
| Managed Health Care - 3.2% | | | |
| Aetna, Inc. | | 53,700 | 8,468,490 |
| Humana, Inc. | | 27,900 | 7,187,598 |
| UnitedHealth Group, Inc. | | 64,800 | 12,888,720 |
| | | | 28,544,808 |
| Household Products - 0.8% | | | |
| Household Products - 0.8% | | | |
| Reckitt Benckiser Group PLC | | 76,562 | 7,260,263 |
| Personal Products - 0.0% | | | |
| Personal Products - 0.0% | | | |
| MYOS Corp. (a) | | 40,000 | 50,000 |
| Pharmaceuticals - 82.8% | | | |
| Pharmaceuticals - 82.8% | | | |
| Aclaris Therapeutics, Inc. (a)(b) | | 335,300 | 8,694,329 |
| Aerie Pharmaceuticals, Inc. (a) | | 88,400 | 5,069,740 |
| Allergan PLC | | 319,738 | 73,373,476 |
| AstraZeneca PLC sponsored ADR | | 1,059,400 | 31,601,902 |
| Bayer AG | | 127,900 | 16,367,795 |
| Bristol-Myers Squibb Co. | | 673,410 | 40,727,837 |
| Dermira, Inc. (a)(b) | | 11,100 | 261,849 |
| GlaxoSmithKline PLC sponsored ADR | | 1,666,500 | 67,043,295 |
| Horizon Pharma PLC (a) | | 114,500 | 1,566,360 |
| Impax Laboratories, Inc. (a) | | 272,500 | 5,899,625 |
| Innoviva, Inc. (a) | | 524,600 | 7,365,384 |
| Jazz Pharmaceuticals PLC (a) | | 101,000 | 15,085,360 |
| Jiangsu Hengrui Medicine Co. Ltd. (A Shares) | | 1,211,999 | 9,957,302 |
| Johnson & Johnson | | 877,000 | 116,088,489 |
| Lannett Co., Inc. (a)(b) | | 82,200 | 1,442,610 |
| Mallinckrodt PLC (a) | | 461,000 | 18,937,880 |
| Merck & Co., Inc. | | 651,736 | 41,619,861 |
| MyoKardia, Inc. (a) | | 220,000 | 9,537,000 |
| Nektar Therapeutics (a) | | 422,400 | 8,883,072 |
| Novartis AG sponsored ADR | | 577,098 | 48,643,590 |
| Novo Nordisk A/S Series B sponsored ADR | | 223,400 | 10,638,308 |
| Pfizer, Inc. | | 1,666,388 | 56,523,881 |
| Prestige Brands Holdings, Inc. (a) | | 40,500 | 2,053,755 |
| Reata Pharmaceuticals, Inc. (a) | | 137,600 | 4,162,400 |
| Revance Therapeutics, Inc. (a)(b) | | 303,100 | 7,441,105 |
| Roche Holding AG (participation certificate) | | 84,689 | 21,517,001 |
| Sanofi SA sponsored ADR | | 1,616,722 | 78,960,702 |
| Sosei Group Corp. (a)(b) | | 19,500 | 1,610,588 |
| Supernus Pharmaceuticals, Inc. (a) | | 104,100 | 4,767,780 |
| Teligent, Inc. (a)(b) | | 715,100 | 4,941,341 |
| Teva Pharmaceutical Industries Ltd. sponsored ADR | | 375,900 | 5,961,774 |
| The Medicines Company (a)(b) | | 176,884 | 6,489,874 |
| Theravance Biopharma, Inc. (a)(b) | | 299,297 | 9,778,033 |
| Valeant Pharmaceuticals International, Inc. (Canada) (a) | | 190,600 | 2,557,853 |
| | | | 745,571,151 |
| TOTAL COMMON STOCKS | | | |
| (Cost $708,543,797) | | | 889,159,676 |
|
| Nonconvertible Preferred Stocks - 0.7% | | | |
| Health Care Equipment & Supplies - 0.7% | | | |
| Health Care Equipment - 0.7% | | | |
| Sartorius AG (non-vtg.) | | | |
| (Cost $5,042,530) | | 68,600 | 6,814,117 |
|
| Money Market Funds - 3.8% | | | |
| Fidelity Cash Central Fund, 1.11% (e) | | 1,334,879 | 1,335,145 |
| Fidelity Securities Lending Cash Central Fund 1.11% (e)(f) | | 32,510,391 | 32,513,642 |
| TOTAL MONEY MARKET FUNDS | | | |
| (Cost $33,845,714) | | | 33,848,787 |
| TOTAL INVESTMENT IN SECURITIES - 103.3% | | | |
| (Cost $747,432,041) | | | 929,822,580 |
| NET OTHER ASSETS (LIABILITIES) - (3.3)% | | | (29,912,620) |
| NET ASSETS - 100% | | | $899,909,960 |
Legend
(a) Non-income producing
(b) Security or a portion of the security is on loan at period end.
(c) Level 3 instrument
(d) Restricted securities - Investment in securities not registered under the Securities Act of 1933 (excluding 144A issues). At the end of the period, the value of restricted securities (excluding 144A issues) amounted to $3,220 or 0.0% of net assets.
(e) Affiliated fund that is generally available only to investment companies and other accounts managed by Fidelity Investments. The rate quoted is the annualized seven-day yield of the fund at period end. A complete unaudited listing of the fund's holdings as of its most recent quarter end is available upon request. In addition, each Fidelity Central Fund's financial statements are available on the SEC's website or upon request.
(f) Investment made with cash collateral received from securities on loan.
Additional information on each restricted holding is as follows:
| Security | Acquisition Date | Acquisition Cost |
| Olivo Labs | 2/8/17 | $8,290 |
Affiliated Central Funds
Information regarding fiscal year to date income earned by the Fund from investments in Fidelity Central Funds is as follows:
| Fund | Income earned |
| Fidelity Cash Central Fund | $12,756 |
| Fidelity Securities Lending Cash Central Fund | 403,669 |
| Total | $416,425 |
Investment Valuation
The following is a summary of the inputs used, as of August 31, 2017, involving the Fund's assets and liabilities carried at fair value. The inputs or methodology used for valuing securities may not be an indication of the risk associated with investing in those securities. For more information on valuation inputs, and their aggregation into the levels used below, please refer to the Investment Valuation section in the accompanying Notes to Financial Statements.
| | Valuation Inputs at Reporting Date: |
| Description | Total | Level 1 | Level 2 | Level 3 |
| Investments in Securities: | | | | |
| Common Stocks | $889,159,676 | $860,379,192 | $28,777,264 | $3,220 |
| Nonconvertible Preferred Stocks | 6,814,117 | 6,814,117 | -- | -- |
| Money Market Funds | 33,848,787 | 33,848,787 | -- | -- |
| Total Investments in Securities: | $929,822,580 | $901,042,096 | $28,777,264 | $3,220 |
Other Information
Distribution of investments by country or territory of incorporation, as a percentage of Total Net Assets, is as follows (Unaudited):
| United States of America | 50.3% |
| Ireland | 12.1% |
| United Kingdom | 11.7% |
| France | 9.2% |
| Switzerland | 7.9% |
| Germany | 2.5% |
| Denmark | 1.2% |
| China | 1.1% |
| Cayman Islands | 1.1% |
| Bailiwick of Jersey | 1.0% |
| Others (Individually Less Than 1%) | 1.9% |
| | 100.0% |
See accompanying notes which are an integral part of the financial statements.
Pharmaceuticals Portfolio
Financial Statements
Statement of Assets and Liabilities
| | | August 31, 2017 (Unaudited) |
| Assets | | |
Investment in securities, at value (including securities loaned of $32,381,048) — See accompanying schedule:
Unaffiliated issuers (cost $713,586,327) | $895,973,793 | |
| Fidelity Central Funds (cost $33,845,714) | 33,848,787 | |
| Total Investment in Securities (cost $747,432,041) | | $929,822,580 |
| Receivable for investments sold | | 1,786,305 |
| Receivable for fund shares sold | | 183,820 |
| Dividends receivable | | 3,848,632 |
| Distributions receivable from Fidelity Central Funds | | 38,839 |
| Other receivables | | 90,629 |
| Total assets | | 935,770,805 |
| Liabilities | | |
| Payable for investments purchased | $8,346 | |
| Payable for fund shares redeemed | 2,646,978 | |
| Accrued management fee | 406,376 | |
| Other affiliated payables | 189,554 | |
| Other payables and accrued expenses | 105,541 | |
| Collateral on securities loaned | 32,504,050 | |
| Total liabilities | | 35,860,845 |
| Net Assets | | $899,909,960 |
| Net Assets consist of: | | |
| Paid in capital | | $776,542,793 |
| Undistributed net investment income | | 8,304,774 |
| Accumulated undistributed net realized gain (loss) on investments and foreign currency transactions | | (67,319,666) |
| Net unrealized appreciation (depreciation) on investments and assets and liabilities in foreign currencies | | 182,382,059 |
| Net Assets, for 47,155,323 shares outstanding | | $899,909,960 |
| Net Asset Value, offering price and redemption price per share ($899,909,960 ÷ 47,155,323 shares) | | $19.08 |
See accompanying notes which are an integral part of the financial statements.
Statement of Operations
| | | Six months ended August 31, 2017 (Unaudited) |
| Investment Income | | |
| Dividends | | $11,860,606 |
| Income from Fidelity Central Funds (including $403,669 from security lending) | | 416,425 |
| Total income | | 12,277,031 |
| Expenses | | |
| Management fee | $2,593,493 | |
| Transfer agent fees | 1,007,273 | |
| Accounting and security lending fees | 166,658 | |
| Custodian fees and expenses | 18,906 | |
| Independent trustees' fees and expenses | 11,110 | |
| Registration fees | 32,580 | |
| Audit | 18,449 | |
| Legal | 9,122 | |
| Interest | 1,970 | |
| Miscellaneous | 10,444 | |
| Total expenses before reductions | 3,870,005 | |
| Expense reductions | (20,579) | 3,849,426 |
| Net investment income (loss) | | 8,427,605 |
| Realized and Unrealized Gain (Loss) | | |
| Net realized gain (loss) on: | | |
| Investment securities: | | |
| Unaffiliated issuers | 32,390,515 | |
| Fidelity Central Funds | (2,834) | |
| Foreign currency transactions | (66,437) | |
| Total net realized gain (loss) | | 32,321,244 |
| Change in net unrealized appreciation (depreciation) on: | | |
| Investment securities: | | |
| Unaffiliated issuers | 10,183,268 | |
| Fidelity Central Funds | (3,306) | |
| Assets and liabilities in foreign currencies | 31,238 | |
| Total change in net unrealized appreciation (depreciation) | | 10,211,200 |
| Net gain (loss) | | 42,532,444 |
| Net increase (decrease) in net assets resulting from operations | | $50,960,049 |
See accompanying notes which are an integral part of the financial statements.
Statement of Changes in Net Assets
| | Six months ended August 31, 2017 (Unaudited) | Year ended February 28, 2017 |
| Increase (Decrease) in Net Assets | | |
| Operations | | |
| Net investment income (loss) | $8,427,605 | $16,034,717 |
| Net realized gain (loss) | 32,321,244 | (64,388,903) |
| Change in net unrealized appreciation (depreciation) | 10,211,200 | 57,674,163 |
| Net increase (decrease) in net assets resulting from operations | 50,960,049 | 9,319,977 |
| Distributions to shareholders from net investment income | (1,229,213) | (11,379,757) |
| Share transactions | | |
| Proceeds from sales of shares | 33,220,116 | 159,355,203 |
| Reinvestment of distributions | 1,173,303 | 10,875,085 |
| Cost of shares redeemed | (185,151,485) | (860,669,026) |
| Net increase (decrease) in net assets resulting from share transactions | (150,758,066) | (690,438,738) |
| Redemption fees | – | 25,672 |
| Total increase (decrease) in net assets | (101,027,230) | (692,472,846) |
| Net Assets | | |
| Beginning of period | 1,000,937,190 | 1,693,410,036 |
| End of period | $899,909,960 | $1,000,937,190 |
| Other Information | | |
| Undistributed net investment income end of period | $8,304,774 | $1,106,382 |
| Shares | | |
| Sold | 1,786,200 | 8,712,351 |
| Issued in reinvestment of distributions | 64,574 | 637,835 |
| Redeemed | (9,979,316) | (47,134,152) |
| Net increase (decrease) | (8,128,542) | (37,783,966) |
See accompanying notes which are an integral part of the financial statements.
Financial Highlights — Pharmaceuticals Portfolio
| | Six months ended (Unaudited) August 31, | Years ended February 28, | | | | |
| | 2017 | 2017 | 2016 A | 2015 | 2014 | 2013 |
| Selected Per–Share Data | | | | | | |
| Net asset value, beginning of period | $18.11 | $18.20 | $23.08 | $21.39 | $16.13 | $14.11 |
| Income from Investment Operations | | | | | | |
| Net investment income (loss)B | .16 | .22 | .24 | .14 | .26 | .23 |
| Net realized and unrealized gain (loss) | .83 | (.13) | (2.52) | 3.76 | 6.96 | 2.26 |
| Total from investment operations | .99 | .09 | (2.28) | 3.90 | 7.22 | 2.49 |
| Distributions from net investment income | (.02) | (.18) | (.17) | (.18) | (.18) | (.20) |
| Distributions from net realized gain | – | – | (2.43) | (2.03) | (1.77) | (.27) |
| Total distributions | (.02) | (.18) | (2.60) | (2.21) | (1.96)C | (.47) |
| Redemption fees added to paid in capitalB | – | –D | –D | –D | –D | –D |
| Net asset value, end of period | $19.08 | $18.11 | $18.20 | $23.08 | $21.39 | $16.13 |
| Total ReturnE,F | 5.49% | .57% | (11.33)% | 20.04% | 46.77% | 17.93% |
| Ratios to Average Net AssetsG,H | | | | | | |
| Expenses before reductions | .81%I | .80% | .78% | .79% | .82% | .85% |
| Expenses net of fee waivers, if any | .81%I | .80% | .78% | .79% | .81% | .85% |
| Expenses net of all reductions | .81%I | .79% | .77% | .79% | .81% | .84% |
| Net investment income (loss) | 1.77%I | 1.16% | 1.09% | .66% | 1.39% | 1.54% |
| Supplemental Data | | | | | | |
| Net assets, end of period (000 omitted) | $899,910 | $1,000,937 | $1,693,410 | $1,892,865 | $1,634,743 | $911,064 |
| Portfolio turnover rateJ | 88%I | 77% | 77% | 72%K | 95% | 54% |
A For the year ended February 29.
B Calculated based on average shares outstanding during the period.
C Total distributions of $1.96 per share is comprised of distributions from net investment income of $.182 and distributions from net realized gain of $1.773 per share.
D Amount represents less than $.005 per share.
E Total returns for periods of less than one year are not annualized.
F Total returns would have been lower if certain expenses had not been reduced during the applicable periods shown.
G Fees and expenses of any underlying Fidelity Central Funds are not included in the Fund's expense ratio. The Fund indirectly bears its proportionate share of the expenses of any underlying Fidelity Central Funds.
H Expense ratios reflect operating expenses of the Fund. Expenses before reductions do not reflect amounts reimbursed by the investment adviser or reductions from brokerage service arrangements or reductions from other expense offset arrangements and do not represent the amount paid by the Fund during periods when reimbursements or reductions occur. Expenses net of fee waivers reflect expenses after reimbursement by the investment adviser but prior to reductions from brokerage service arrangements or other expense offset arrangements. Expenses net of all reductions represent the net expenses paid by the Fund.
I Annualized
J Amount does not include the portfolio activity of any underlying Fidelity Central Funds.
K Portfolio turnover rate excludes securities received or delivered in-kind.
See accompanying notes which are an integral part of the financial statements.
Notes to Financial Statements (Unaudited)
For the period ended August 31, 2017
1. Organization.
Biotechnology Portfolio, Health Care Portfolio, Health Care Services Portfolio, Medical Equipment and Systems Portfolio, and Pharmaceuticals Portfolio (the Funds) are non-diversified funds of Fidelity Select Portfolios (the Trust). The Trust is registered under the Investment Company Act of 1940, as amended (the 1940 Act), as an open-end management investment company organized as a Massachusetts business trust. The Funds invest primarily in securities of companies whose principal business activities fall within specific industries. Each Fund is authorized to issue an unlimited number of shares. Share transactions on the Statement of Changes in Net Assets may contain exchanges between affiliated funds.
Pending shareholder approval of a change in its fundamental concentration policy, Medical Equipment and Systems Portfolio will be renamed Medical Technology and Devices Portfolio.
2. Investments in Fidelity Central Funds.
The Funds invest in Fidelity Central Funds, which are open-end investment companies generally available only to other investment companies and accounts managed by the investment adviser and its affiliates. The Funds' Schedules of Investments list each of the Fidelity Central Funds held as of period end, if any, as an investment of each Fund, but do not include the underlying holdings of each Fidelity Central Fund. As an Investing Fund, each Fund indirectly bears its proportionate share of the expenses of the underlying Fidelity Central Funds.
The Money Market Central Funds seek preservation of capital and current income and are managed by Fidelity Investments Money Management, Inc. (FIMM), an affiliate of the investment adviser. Annualized expenses of the Money Market Central Funds as of their most recent shareholder report date are less than .005%.
A complete unaudited list of holdings for each Fidelity Central Fund is available upon request or at the Securities and Exchange Commission (the SEC) website at www.sec.gov. In addition, the financial statements of the Fidelity Central Funds are available on the SEC website or upon request.
3. Significant Accounting Policies.
Each Fund is an investment company and applies the accounting and reporting guidance of the Financial Accounting Standards Board (FASB) Accounting Standards Codification Topic 946 Financial Services – Investments Companies. The financial statements have been prepared in conformity with accounting principles generally accepted in the United States of America (GAAP), which require management to make certain estimates and assumptions at the date of the financial statements. Actual results could differ from those estimates. Subsequent events, if any, through the date that the financial statements were issued have been evaluated in the preparation of the financial statements. The following summarizes the significant accounting policies of the Funds:
Investment Valuation. Investments are valued as of 4:00 p.m. Eastern time on the last calendar day of the period. The Board of Trustees (the Board) has delegated the day to day responsibility for the valuation of each Fund's investments to the Fair Value Committee (the Committee) established by each Fund's investment adviser. In accordance with valuation policies and procedures approved by the Board, each Fund attempts to obtain prices from one or more third party pricing vendors or brokers to value its investments. When current market prices, quotations or currency exchange rates are not readily available or reliable, investments will be fair valued in good faith by the Committee, in accordance with procedures adopted by the Board. Factors used in determining fair value vary by investment type and may include market or investment specific events. The frequency with which these procedures are used cannot be predicted and they may be utilized to a significant extent. The Committee oversees each Fund's valuation policies and procedures and reports to the Board on the Committee's activities and fair value determinations. The Board monitors the appropriateness of the procedures used in valuing each Fund's investments and ratifies the fair value determinations of the Committee.
Each Fund categorizes the inputs to valuation techniques used to value its investments into a disclosure hierarchy consisting of three levels as shown below:
- Level 1 – quoted prices in active markets for identical investments
- Level 2 – other significant observable inputs (including quoted prices for similar investments, interest rates, prepayment speeds, etc.)
- Level 3 – unobservable inputs (including the Fund's own assumptions based on the best information available)
Valuation techniques used to value each Fund's investments by major category are as follows:
Equity securities, including restricted securities, for which market quotations are readily available, are valued at the last reported sale price or official closing price as reported by a third party pricing vendor on the primary market or exchange on which they are traded and are categorized as Level 1 in the hierarchy. In the event there were no sales during the day or closing prices are not available, securities are valued at the last quoted bid price or may be valued using the last available price and are generally categorized as Level 2 in the hierarchy. For foreign equity securities, when market or security specific events arise, comparisons to the valuation of American Depositary Receipts (ADRs), futures contracts, Exchange-Traded Funds (ETFs) and certain indexes as well as quoted prices for similar securities may be used and would be categorized as Level 2 in the hierarchy. Utilizing these techniques may result in transfers between Level 1 and Level 2. For equity securities, including restricted securities, where observable inputs are limited, assumptions about market activity and risk are used and these securities may be categorized as Level 3 in the hierarchy. Equity securities, including restricted securities, for which observable inputs are not available are valued using alternate valuation approaches, including the market approach and the income approach and are categorized as Level 3 in the hierarchy. The market approach generally consists of using comparable market transactions while the income approach generally consists of using the net present value of estimated future cash flows, adjusted as appropriate for liquidity, credit, market and/or other risk factors.
Investments in open-end mutual funds, including Fidelity Central Funds, are valued at their closing net asset value (NAV) each business day and are categorized as Level 1 in the hierarchy.
The following provides information on Level 3 securities held by Biotechnology Portfolio and Health Care Portfolio that were valued at period end based on unobservable inputs. These amounts exclude valuations provided by a broker.
Biotechnology Portfolio:
| Asset Type | Fair Value | Valuation Technique(s) | Unobservable Input | Amount or Range/Weighted Average | Impact to Valuation from an Increase in Input(a) |
| Equities | $273,819,700 | Recovery value | Recovery value | 0.0% | Increase |
| | | Market approach | Transaction price | $2.15 - $13.88 / $7.91 | Increase |
| | | Market comparable | Transaction price | $1.98 - $150.00 / $30.49 | Increase |
| | | | Premium rate | 15.0% | Increase |
| | | | Proxy premium | 1.9% - 76.0% / 28.4% | Increase |
| | | Discount cash flow | Discount rate | 8.0% - 12.2% / 10.7% | Decrease |
| | | | Discount for lack of marketability | 10.0% | Decrease |
| | | | Probability rate | 6.3% - 69.0% / 7.5% | Increase |
(a) Represents the expected directional change in the fair value of the Level 3 investments that would result from an increase in the corresponding input. A decrease to the unobservable input would have the opposite effect. Significant changes in these inputs could result in significantly higher or lower fair value measurements.
Health Care Portfolio:
| Asset Type | Fair Value | Valuation Technique(s) | Unobservable Input | Amount or Range/Weighted Average | Impact to Valuation from an Increase in Input(a) |
| Equities | $73,281,947 | Market approach | Transaction price | $2.59 - $4.48 / $3.32 | Increase |
| | | Market comparable | Enterprise value / Sales multiple (EV/S) | 3.2 | Increase |
| | | | Discount rate | 75.0% | Decrease |
| | | | Premium rate | 86.5% | Increase |
| | | Discount cash flow | Discount rate | 8.0% | Decrease |
(a) Represents the expected directional change in the fair value of the Level 3 investments that would result from an increase in the corresponding input. A decrease to the unobservable input would have the opposite effect. Significant changes in these inputs could result in significantly higher or lower fair value measurements.
Changes in valuation techniques may result in transfers in or out of an assigned level within the disclosure hierarchy. The aggregate value of investments by input level as of August 31, 2017, as well as a roll forward of Level 3 investments, is included at the end of each applicable Fund's Schedule of Investments
Foreign Currency. The Funds may use foreign currency contracts to facilitate transactions in foreign-denominated securities. Gains and losses from these transactions may arise from changes in the value of the foreign currency or if the counterparties do not perform under the contracts' terms.
Foreign-denominated assets, including investment securities, and liabilities are translated into U.S. dollars at the exchange rates at period end. Purchases and sales of investment securities, income and dividends received and expenses denominated in foreign currencies are translated into U.S. dollars at the exchange rate in effect on the transaction date.
The effects of exchange rate fluctuations on investments are included with the net realized and unrealized gain (loss) on investment securities. Other foreign currency transactions resulting in realized and unrealized gain (loss) are disclosed separately.
Investment Transactions and Income. For financial reporting purposes, the Funds' investment holdings and NAV include trades executed through the end of the last business day of the period. The NAV per share for processing shareholder transactions is calculated as of the close of business of the New York Stock Exchange (NYSE), normally 4:00 p.m. Eastern time and includes trades executed through the end of the prior business day. Gains and losses on securities sold are determined on the basis of identified cost and may include proceeds received from litigation. Dividend income is recorded on the ex-dividend date, except for certain dividends from foreign securities where the ex-dividend date may have passed, which are recorded as soon as the Funds are informed of the ex-dividend date. Non-cash dividends included in dividend income, if any, are recorded at the fair market value of the securities received. Income and capital gain distributions from Fidelity Central Funds, if any, are recorded on the ex-dividend date. Certain distributions received by the Funds represent a return of capital or capital gain. The Funds determine the components of these distributions subsequent to the ex-dividend date, based upon receipt of tax filings or other correspondence relating to the underlying investment. These distributions are recorded as a reduction of cost of investments and/or as a realized gain. Investment income is recorded net of foreign taxes withheld where recovery of such taxes is uncertain.
Expenses. Expenses directly attributable to a fund are charged to that fund. Expenses attributable to more than one fund are allocated among the respective funds on the basis of relative net assets or other appropriate methods. Expense estimates are accrued in the period to which they relate and adjustments are made when actual amounts are known.
Deferred Trustee Compensation. Under a Deferred Compensation Plan (the Plan) for the Funds, independent Trustees may elect to defer receipt of a portion of their annual compensation. Deferred amounts are invested in a cross-section of Fidelity funds, are marked-to-market and remain in the Fund until distributed in accordance with the Plan. The investment of deferred amounts and the offsetting payable to the Trustees are included in the accompanying Statement of Assets and Liabilities.
Income Tax Information and Distributions to Shareholders. Each year, each Fund intends to qualify as a regulated investment company under Subchapter M of the Internal Revenue Code, including distributing substantially all of its taxable income and realized gains. As a result, no provision for U.S. Federal income taxes is required. Each Fund files a U.S. federal tax return, in addition to state and local tax returns as required. Each Fund's federal income tax returns are subject to examination by the Internal Revenue Service (IRS) for a period of three fiscal years after they are filed. State and local tax returns may be subject to examination for an additional fiscal year depending on the jurisdiction. Foreign taxes are provided for based on each Fund's understanding of the tax rules and rates that exist in the foreign markets in which it invests.
Distributions are declared and recorded on the ex-dividend date. Income and capital gain distributions are determined in accordance with income tax regulations, which may differ from GAAP.
Capital accounts within the financial statements are adjusted for permanent book-tax differences. These adjustments have no impact on net assets or the results of operations. Capital accounts are not adjusted for temporary book-tax differences which will reverse in a subsequent period.
Book-tax differences are primarily due to foreign currency transactions, passive foreign investment companies (PFIC), redemptions in kind, partnerships, deferred trustees compensation, net operating losses, capital loss carryforwards and losses deferred due to wash sales and excise tax regulations.
As of period end, the cost and unrealized appreciation (depreciation) in securities, and derivatives if applicable, for federal income tax purposes were as follows for each Fund:
| | Tax cost | Gross unrealized appreciation | Gross unrealized depreciation | Net unrealized appreciation (depreciation) |
| Biotechnology Portfolio | $7,546,767,921 | $4,070,724,226 | $(738,259,552) | $3,332,464,674 |
| Health Care Portfolio | 5,469,840,415 | 1,845,382,621 | (119,951,205) | 1,725,431,416 |
| Health Care Services Portfolio | 560,136,773 | 333,462,468 | (21,096,719) | 312,365,749 |
| Medical Equipment and Systems Portfolio | 3,271,401,341 | 918,526,726 | (33,827,550) | 884,699,176 |
| Pharmaceuticals Portfolio | 750,399,706 | 199,090,106 | (19,667,232) | 179,422,874 |
Capital loss carryforwards are only available to offset future capital gains of the Funds to the extent provided by regulations and may be limited. Under the Regulated Investment Company Modernization Act of 2010 (the Act), the Funds are permitted to carry forward capital losses incurred in taxable years beginning after December 22, 2010 for an unlimited period and such capital losses are required to be used prior to any losses that expire. The capital loss carryforward information presented below, including any applicable limitation, is estimated as of prior fiscal period end and is subject to adjustment.
| | No expiration | | | |
| | Short-term | Long-term | Total no expiration | Total capital loss carryforward |
| Biotechnology Portfolio | $(165,997,617) | $-– | $(165,997,617) | $(165,997,617) |
| Health Care Portfolio | (113,174,584) | -– | (113,174,584) | (113,174,584) |
| Pharmaceuticals Portfolio | (90,254,422) | (2,477,811) | (92,732,233) | (92,732,233) |
Certain of the Funds elected to defer to the next fiscal year ordinary losses recognized during the period January 1, 2017 to February 28, 2017. Loss deferrals were as follows:
| Biotechnology Portfolio | $2,936,860 |
| Health Care Services Portfolio | 401,429 |
Trading (Redemption) Fees. Shares held by investors in Health Care Services Portfolio less than 30 days may be subject to a redemption fee equal to .75% of the NAV of shares redeemed. All redemption fees, which reduce the proceeds of the shareholder redemption, are retained by the Funds and accounted for as an addition to paid in capital.
Restricted Securities. The Funds may invest in securities that are subject to legal or contractual restrictions on resale. These securities generally may be resold in transactions exempt from registration or to the public if the securities are registered. Disposal of these securities may involve time-consuming negotiations and expense, and prompt sale at an acceptable price may be difficult. Information regarding restricted securities is included at the end of each applicable Fund's Schedule of Investments.
Consolidated Subsidiary. Biotechnology Portfolio invests in certain investments through a wholly-owned subsidiary ("Subsidiary"), which may be subject to federal and state taxes upon disposition.
As of period end, Biotechnology Portfolio held an investment of $66,962,061 in this Subsidiary, representing .68% of the Fund's net assets. The financial statements have been consolidated and include accounts of the Fund and the Subsidiary. Accordingly, all inter-company transactions and balances have been eliminated.
4. Purchases and Sales of Investments.
Purchases and sales of securities, other than short-term securities, are noted in the table below.
| | Purchases ($) | Sales ($) |
| Biotechnology Portfolio | 1,005,483,260 | 1,765,622,514 |
| Health Care Portfolio | 2,293,159,599 | 2,624,960,986 |
| Health Care Services Portfolio | 226,095,217 | 241,415,402 |
| Medical Equipment and Systems Portfolio | 1,695,779,510 | 1,123,468,696 |
| Pharmaceuticals Portfolio | 415,764,553 | 553,816,657 |
5. Fees and Other Transactions with Affiliates.
Management Fee. Fidelity SelectCo, LLC (the investment adviser) and its affiliates provide the Funds with investment management related services for which the Funds pay a monthly management fee. The management fee is the sum of an individual fund fee rate and an annualized group fee rate. The individual fund fee rate is applied to each Fund's average net assets. The group fee rate is based upon the average net assets of all the mutual funds advised by Fidelity Management & Research Company (FMR) and the investment adviser. The group fee rate decreases as assets under management increase and increases as assets under management decrease. For the reporting period, each Fund's annualized management fee rate expressed as a percentage of each Fund's average net assets was as follows:
| | Individual Rate | Group Rate | Total |
| Biotechnology Portfolio | .30% | .25% | .54% |
| Health Care Portfolio | .30% | .25% | .54% |
| Health Care Services Portfolio | .30% | .25% | .54% |
| Medical Equipment and Systems Portfolio | .30% | .25% | .54% |
| Pharmaceuticals Portfolio | .30% | .25% | .54% |
Transfer Agent Fees. Fidelity Investments Institutional Operations Company, Inc. (FIIOC), an affiliate of the investment adviser, is the Funds' transfer, dividend disbursing and shareholder servicing agent. FIIOC receives account fees and asset-based fees that vary according to account size and type of account. FIIOC pays for typesetting, printing and mailing of shareholder reports, except proxy statements. For the period, transfer agent fees were equivalent to the following annualized rates expressed as a percentage of average net assets:
| Biotechnology Portfolio | .17% |
| Health Care Portfolio | .16% |
| Health Care Services Portfolio | .17% |
| Medical Equipment and Systems Portfolio | .17% |
| Pharmaceuticals Portfolio | .21% |
Accounting and Security Lending Fees. Fidelity Service Company, Inc. (FSC), an affiliate of the investment adviser, maintains each Fund's accounting records. The accounting fee is based on the level of average net assets for each month. Under a separate contract, FSC administers the security lending program. The security lending fee is based on the number and duration of lending transactions.
Brokerage Commissions. Certain Funds placed a portion of their portfolio transactions with brokerage firms which are affiliates of the investment adviser. Brokerage commissions are included in net realized gain (loss) and change in net unrealized appreciation (depreciation) in the Statement of Operations. The commissions paid to these affiliated firms were as follows:
| | Amount |
| Biotechnology Portfolio | $87,702 |
| Health Care Portfolio | 47,400 |
| Health Care Services Portfolio | 5,567 |
| Medical Equipment and Systems Portfolio | 22,869 |
| Pharmaceuticals Portfolio | 27,451 |
Interfund Lending Program. Pursuant to an Exemptive Order issued by the SEC, the Funds, along with other registered investment companies having management contracts with FMR or other affiliated entities of FMR, may participate in an interfund lending program. This program provides an alternative credit facility allowing the funds to borrow from, or lend money to, other participating affiliated funds. At period end, there were no interfund loans outstanding. Each applicable fund's activity in this program during the period for which loans were outstanding was as follows:
| | Borrower or Lender | Average Loan Balance | Weighted Average Interest Rate | Interest Expense |
| Health Care Portfolio | Borrower | $9,338,125 | 1.09% | $2,252 |
| Medical Equipment and Systems Portfolio | Borrower | $5,493,000 | 1.34% | $204 |
| Pharmaceuticals Portfolio | Borrower | $8,670,714 | 1.17% | $1,970 |
Interfund Trades. The Funds may purchase from or sell securities to other Fidelity Funds under procedures adopted by the Board. The procedures have been designed to ensure these interfund trades are executed in accordance with Rule 17a-7 of the 1940 Act. Interfund trades are included within the respective purchases and sales amounts shown in the Purchases and Sales of Investments note.
Prior Fiscal Year Redemptions In-Kind. During the prior period, 1,587,958 shares of Health Care Portfolio held by an affiliated entity were redeemed in-kind for investments and cash with a value of $284,244,539. The Fund had a net realized gain of $90,840,956 on investments delivered through in-kind redemptions. The amount of in-kind redemptions is included in share transactions in the accompanying Statement of Changes in Net Assets. Health Care Portfolio recognized no gain or loss for federal income tax purposes.
6. Committed Line of Credit.
Certain Funds participate with other funds managed by the investment adviser or an affiliate in a $4.25 billion credit facility (the "line of credit") to be utilized for temporary or emergency purposes to fund shareholder redemptions or for other short-term liquidity purposes. The participating funds have agreed to pay commitment fees on their pro-rata portion of the line of credit, which are reflected in Miscellaneous expenses on the Statement of Operations, and are as follows:
| Biotechnology Portfolio | $14,856 |
| Health Care Portfolio | 10,579 |
| Health Care Services Portfolio | 1,227 |
| Medical Equipment and Systems Portfolio | 5,288 |
| Pharmaceuticals Portfolio | 1,607 |
During the period, the Funds did not borrow on this line of credit.
7. Security Lending.
Certain Funds lend portfolio securities through a lending agent from time to time in order to earn additional income. On the settlement date of the loan, each applicable Fund receives collateral (in the form of U.S. Treasury obligations, letters of credit and/or cash) against the loaned securities and maintains collateral in an amount not less than 100% of the market value of the loaned securities during the period of the loan. The market value of the loaned securities is determined at the close of business of the Funds and any additional required collateral is delivered to the Funds on the next business day. The Funds or borrower may terminate the loan at any time, and if the borrower defaults on its obligation to return the securities loaned because of insolvency or other reasons, the Funds may apply collateral received from the borrower against the obligation. The Funds may experience delays and costs in recovering the securities loaned. Any cash collateral received is invested in the Fidelity Securities Lending Cash Central Fund. The value of loaned securities and cash collateral at period end are disclosed on each applicable Fund's Statement of Assets and Liabilities. Security lending income represents the income earned on investing cash collateral, less rebates paid to borrowers and any lending agent fees associated with the loan, plus any premium payments received for lending certain types of securities. Security lending income is presented on each applicable Fund's Statement of Operations as a component of income from Fidelity Central Funds.
8. Expense Reductions.
Commissions paid to certain brokers with whom the investment adviser, or its affiliates, places trades on behalf of certain Funds include an amount in addition to trade execution, which may be rebated back to the Funds to offset certain expenses. In addition, through arrangements with each applicable Fund's custodian, credits realized as a result of certain uninvested cash balances were used to reduce each applicable Fund's expenses. All of the applicable expense reductions are noted in the table below.
| | Brokerage Service reduction | Custody
expense
reduction |
| Biotechnology Portfolio | $172,954 | $616 |
| Health Care Portfolio | 126,375 | 336 |
| Health Care Services Portfolio | 9,140 | 8 |
| Medical Equipment and Systems Portfolio | 94,611 | – |
| Pharmaceuticals Portfolio | 15,243 | – |
In addition, during the period the investment adviser reimbursed and/or waived a portion of operating expenses as follows:
| | Amount |
| Biotechnology Portfolio | $45,637 |
| Health Care Portfolio | 31,038 |
| Health Care Services Portfolio | 3,612 |
| Medical Equipment and Systems Portfolio | 13,402 |
| Pharmaceuticals Portfolio | 5,336 |
9. Other.
The Funds' organizational documents provide former and current trustees and officers with a limited indemnification against liabilities arising in connection with the performance of their duties to the Funds. In the normal course of business, the Funds may also enter into contracts that provide general indemnifications. The Funds' maximum exposure under these arrangements is unknown as this would be dependent on future claims that may be made against the Funds. The risk of material loss from such claims is considered remote.
Shareholder Expense Example
As a shareholder of a Fund, you incur two types of costs: (1) transaction costs, including redemption fees and (2) ongoing costs, including management fees and other Fund expenses. This Example is intended to help you understand your ongoing costs (in dollars) of investing in the Funds and to compare these costs with the ongoing costs of investing in other mutual funds.
The Example is based on an investment of $1,000 invested at the beginning of the period and held for the entire period (March 1, 2017 to August 31, 2017).
Actual Expenses
The first line of the accompanying table for each fund provides information about actual account values and actual expenses. You may use the information in this line, together with the amount you invested, to estimate the expenses that you paid over the period. Simply divide your account value by $1,000.00 (for example, an $8,600 account value divided by $1,000.00 = 8.6), then multiply the result by the number in the first line for a fund under the heading entitled "Expenses Paid During Period" to estimate the expenses you paid on your account during this period. A small balance maintenance fee of $12.00 that is charged once a year may apply for certain accounts with a value of less than $2,000. This fee is not included in the table below. If it was, the estimate of expenses you paid during the period would be higher, and your ending account value lower, by this amount. In addition, each Fund, as a shareholder in the underlying Fidelity Central Funds, will indirectly bear its pro-rata share of the fees and expenses incurred by the underlying Fidelity Central Funds. These fees and expenses are not included in the Fund’s annualized expense ratio used to calculate the expense estimate in the table below.
Hypothetical Example for Comparison Purposes
The second line of the accompanying table for each fund provides information about hypothetical account values and hypothetical expenses based on a fund's actual expense ratio and an assumed rate of return of 5% per year before expenses, which is not the Fund's actual return. The hypothetical account values and expenses may not be used to estimate the actual ending account balance or expenses you paid for the period. You may use this information to compare the ongoing costs of investing in the Fund and other funds. To do so, compare this 5% hypothetical example with the 5% hypothetical examples that appear in the shareholder reports of the other funds. A small balance maintenance fee of $12.00 that is charged once a year may apply for certain accounts with a value of less than $2,000. This fee is not included in the table below. If it was, the estimate of expenses you paid during the period would be higher, and your ending account value lower, by this amount. In addition, each Fund, as a shareholder in the underlying Fidelity Central Funds, will indirectly bear its pro-rata share of the fees and expenses incurred by the underlying Fidelity Central Funds. These fees and expenses are not included in the Fund’s annualized expense ratio used to calculate the expense estimate in the table below.
Please note that the expenses shown in the table are meant to highlight your ongoing costs only and do not reflect any transaction costs. Therefore, the second line of the table is useful in comparing ongoing costs only, and will not help you determine the relative total costs of owning different funds. In addition, if these transactional costs were included, your costs would have been higher.
| | Annualized Expense Ratio-A | Beginning
Account Value
March 1, 2017 | Ending
Account Value
August 31, 2017 | Expenses Paid
During Period-B
March 1, 2017
to August 31, 2017 |
| Biotechnology Portfolio | .74% | | | |
| Actual | | $1,000.00 | $1,123.30 | $3.96 |
| Hypothetical-C | | $1,000.00 | $1,021.48 | $3.77 |
| Health Care Portfolio | .73% | | | |
| Actual | | $1,000.00 | $1,099.00 | $3.86 |
| Hypothetical-C | | $1,000.00 | $1,021.53 | $3.72 |
| Health Care Services Portfolio | .77% | | | |
| Actual | | $1,000.00 | $1,071.70 | $4.02 |
| Hypothetical-C | | $1,000.00 | $1,021.32 | $3.92 |
| Medical Equipment and Systems Portfolio | .76% | | | |
| Actual | | $1,000.00 | $1,120.60 | $4.06 |
| Hypothetical-C | | $1,000.00 | $1,021.37 | $3.87 |
| Pharmaceuticals Portfolio | .81% | | | |
| Actual | | $1,000.00 | $1,054.90 | $4.20 |
| Hypothetical-C | | $1,000.00 | $1,021.12 | $4.13 |
A Annualized expense ratio reflects expenses net of applicable fee waivers.
B Expenses are equal to each Fund's annualized expense ratio, multiplied by the average account value over the period, multiplied by 184/ 365 (to reflect the one-half year period).
C 5% return per year before expenses
SELHC-SANN-1017
1.813645.112
Fidelity® Select Portfolios®
Financials Sector Banking Portfolio
Brokerage and Investment Management Portfolio
Consumer Finance Portfolio
Financial Services Portfolio
Insurance Portfolio
Semi-Annual Report August 31, 2017 |
|
Contents
To view a fund's proxy voting guidelines and proxy voting record for the 12-month period ended June 30, visit http://www.fidelity.com/proxyvotingresults or visit the Securities and Exchange Commission's (SEC) web site at http://www.sec.gov.
You may also call 1-800-544-8544 to request a free copy of the proxy voting guidelines.
Standard & Poor's, S&P and S&P 500 are registered service marks of The McGraw-Hill Companies, Inc. and have been licensed for use by Fidelity Distributors Corporation.
Other third-party marks appearing herein are the property of their respective owners.
All other marks appearing herein are registered or unregistered trademarks or service marks of FMR LLC or an affiliated company. © 2017 FMR LLC. All rights reserved.
This report and the financial statements contained herein are submitted for the general information of the shareholders of the Funds. This report is not authorized for distribution to prospective investors in the Funds unless preceded or accompanied by an effective prospectus.
A fund files its complete schedule of portfolio holdings with the SEC for the first and third quarters of each fiscal year on Form N-Q. Forms N-Q are available on the SEC’s web site at http://www.sec.gov. A fund's Forms N-Q may be reviewed and copied at the SEC’s Public Reference Room in Washington, DC. Information regarding the operation of the SEC's Public Reference Room may be obtained by calling 1-800-SEC-0330.
For a complete list of a fund's portfolio holdings, view the most recent holdings listing, semiannual report, or annual report on Fidelity's web site at http://www.fidelity.com, http://www.institutional.fidelity.com, or http://www.401k.com, as applicable.
NOT FDIC INSURED •MAY LOSE VALUE •NO BANK GUARANTEE
Neither the Funds nor Fidelity Distributors Corporation is a bank.
Banking Portfolio
Investment Summary (Unaudited)
Top Ten Stocks as of August 31, 2017
| | % of fund's net assets | % of fund's net assets 6 months ago |
| Wells Fargo & Co. | 6.8 | 5.8 |
| Bank of America Corp. | 6.5 | 5.1 |
| Huntington Bancshares, Inc. | 5.8 | 5.1 |
| Citigroup, Inc. | 5.4 | 4.9 |
| U.S. Bancorp | 5.4 | 4.9 |
| PNC Financial Services Group, Inc. | 5.3 | 5.0 |
| JPMorgan Chase & Co. | 4.0 | 5.0 |
| Bank of the Ozarks, Inc. | 3.6 | 4.3 |
| SunTrust Banks, Inc. | 3.2 | 3.2 |
| Capital One Financial Corp. | 3.0 | 3.5 |
| | 49.0 | |
Top Industries (% of fund's net assets)
| As of August 31, 2017 |
| | Banks | 83.7% |
| | Consumer Finance | 4.9% |
| | Thrifts & Mortgage Finance | 4.2% |
| | Capital Markets | 4.0% |
| | Insurance | 1.3% |
| | All Others* | 1.9% |

* Includes Short-Term investments and Net Other Assets (Liabilities).
| As of February 28, 2017 |
| | Banks | 82.5% |
| | Consumer Finance | 6.7% |
| | Capital Markets | 3.5% |
| | Thrifts & Mortgage Finance | 3.2% |
| | Insurance | 1.2% |
| | All Others* | 2.9% |

* Includes Short-Term investments and Net Other Assets (Liabilities).
Banking Portfolio
Investments August 31, 2017 (Unaudited)
Showing Percentage of Net Assets
| Common Stocks - 99.1% | | | |
| | | Shares | Value |
| Banks - 83.7% | | | |
| Diversified Banks - 29.1% | | | |
| Bank of America Corp. | | 2,558,776 | $61,129,159 |
| Citigroup, Inc. | | 740,100 | 50,349,003 |
| JPMorgan Chase & Co. | | 414,000 | 37,628,460 |
| The Bank of NT Butterfield & Son Ltd. | | 288,800 | 9,495,744 |
| U.S. Bancorp | | 980,700 | 50,260,875 |
| Wells Fargo & Co. | | 1,258,192 | 64,255,865 |
| | | | 273,119,106 |
| Regional Banks - 54.6% | | | |
| 1st Source Corp. | | 243,560 | 11,366,945 |
| Bank of the Ozarks, Inc. | | 786,900 | 33,805,224 |
| BB&T Corp. | | 494,800 | 22,805,332 |
| Camden National Corp. | | 96,332 | 3,756,948 |
| CIT Group, Inc. | | 379,800 | 17,034,030 |
| Comerica, Inc. | | 200 | 13,650 |
| Commerce Bancshares, Inc. | | 212,526 | 11,686,805 |
| Community Trust Bancorp, Inc. | | 231,150 | 9,835,433 |
| ConnectOne Bancorp, Inc. | | 186,100 | 4,243,080 |
| Cullen/Frost Bankers, Inc. | | 151,600 | 12,764,720 |
| CVB Financial Corp. | | 551,800 | 11,422,260 |
| East West Bancorp, Inc. | | 364,100 | 20,160,217 |
| First Citizen Bancshares, Inc. | | 51,300 | 17,468,163 |
| First Hawaiian, Inc. | | 283,000 | 7,666,470 |
| Hanmi Financial Corp. | | 299,100 | 7,985,970 |
| Hilltop Holdings, Inc. | | 318,700 | 7,543,629 |
| Hope Bancorp, Inc. | | 847,220 | 13,674,131 |
| Huntington Bancshares, Inc. | | 4,321,300 | 54,405,167 |
| Investors Bancorp, Inc. | | 1,079,900 | 14,135,891 |
| Lakeland Financial Corp. | | 185,100 | 8,044,446 |
| M&T Bank Corp. | | 19,790 | 2,926,149 |
| Northrim Bancorp, Inc. | | 44,500 | 1,328,325 |
| PacWest Bancorp | | 372,636 | 16,824,515 |
| PNC Financial Services Group, Inc. | | 397,091 | 49,799,182 |
| Popular, Inc. | | 269,737 | 10,765,204 |
| Preferred Bank, Los Angeles | | 89,300 | 4,804,340 |
| Prosperity Bancshares, Inc. | | 186,900 | 11,167,275 |
| Regions Financial Corp. | | 1,364,100 | 19,247,451 |
| Signature Bank (a) | | 147,800 | 18,968,652 |
| SunTrust Banks, Inc. | | 547,300 | 30,156,230 |
| SVB Financial Group (a) | | 87,800 | 14,868,052 |
| Univest Corp. of Pennsylvania | | 185,000 | 5,392,750 |
| Valley National Bancorp | | 892,800 | 9,990,432 |
| WesBanco, Inc. | | 348,600 | 13,239,828 |
| Zions Bancorporation | | 321,450 | 14,034,507 |
| | | | 513,331,403 |
|
| TOTAL BANKS | | | 786,450,509 |
|
| Capital Markets - 4.0% | | | |
| Asset Management & Custody Banks - 3.2% | | | |
| Brookfield Asset Management, Inc. Class A (b) | | 126,700 | 5,011,182 |
| Northern Trust Corp. | | 103,500 | 9,159,750 |
| State Street Corp. | | 121,300 | 11,219,037 |
| The Blackstone Group LP | | 147,800 | 4,837,494 |
| | | | 30,227,463 |
| Investment Banking & Brokerage - 0.8% | | | |
| Goldman Sachs Group, Inc. | | 31,900 | 7,137,306 |
|
| TOTAL CAPITAL MARKETS | | | 37,364,769 |
|
| Consumer Finance - 4.9% | | | |
| Consumer Finance - 4.9% | | | |
| Capital One Financial Corp. | | 350,000 | 27,863,500 |
| Discover Financial Services | | 95,800 | 5,647,410 |
| Synchrony Financial | | 399,400 | 12,297,526 |
| | | | 45,808,436 |
| Insurance - 1.3% | | | |
| Property & Casualty Insurance - 1.3% | | | |
| First American Financial Corp. | | 123,800 | 6,073,628 |
| FNF Group | | 136,100 | 6,565,464 |
| | | | 12,639,092 |
| Textiles, Apparel & Luxury Goods - 0.3% | | | |
| Textiles - 0.3% | | | |
| Cadence Bancorp (b) | | 117,900 | 2,457,036 |
| Thrifts & Mortgage Finance - 4.2% | | | |
| Thrifts & Mortgage Finance - 4.2% | | | |
| Beneficial Bancorp, Inc. | | 625,100 | 9,345,245 |
| Essent Group Ltd. (a) | | 64,700 | 2,528,476 |
| Meridian Bancorp, Inc. Maryland | | 538,165 | 9,471,704 |
| NMI Holdings, Inc. (a) | | 672,726 | 7,299,077 |
| TFS Financial Corp. | | 726,400 | 11,172,032 |
| | | | 39,816,534 |
| Trading Companies & Distributors - 0.7% | | | |
| Trading Companies & Distributors - 0.7% | | | |
| AerCap Holdings NV (a) | | 125,600 | 6,317,680 |
| TOTAL COMMON STOCKS | | | |
| (Cost $742,139,633) | | | 930,854,056 |
|
| Money Market Funds - 1.5% | | | |
| Fidelity Cash Central Fund, 1.11% (c) | | 7,799,151 | 7,800,711 |
| Fidelity Securities Lending Cash Central Fund 1.11% (c)(d) | | 6,385,296 | 6,385,934 |
| TOTAL MONEY MARKET FUNDS | | | |
| (Cost $14,186,645) | | | 14,186,645 |
| TOTAL INVESTMENT IN SECURITIES - 100.6% | | | |
| (Cost $756,326,278) | | | 945,040,701 |
| NET OTHER ASSETS (LIABILITIES) - (0.6)% | | | (6,087,258) |
| NET ASSETS - 100% | | | $938,953,443 |
Legend
(a) Non-income producing
(b) Security or a portion of the security is on loan at period end.
(c) Affiliated fund that is generally available only to investment companies and other accounts managed by Fidelity Investments. The rate quoted is the annualized seven-day yield of the fund at period end. A complete unaudited listing of the fund's holdings as of its most recent quarter end is available upon request. In addition, each Fidelity Central Fund's financial statements are available on the SEC's website or upon request.
(d) Investment made with cash collateral received from securities on loan.
Affiliated Central Funds
Information regarding fiscal year to date income earned by the Fund from investments in Fidelity Central Funds is as follows:
| Fund | Income earned |
| Fidelity Cash Central Fund | $44,293 |
| Fidelity Securities Lending Cash Central Fund | 7,298 |
| Total | $51,591 |
Investment Valuation
All investments are categorized as Level 1 under the Fair Value Hierarchy. The inputs or methodology used for valuing securities may not be an indication of the risk associated with investing in those securities. For more information on valuation inputs please refer to the Investment Valuation section in the accompanying Notes to Financial Statements.
See accompanying notes which are an integral part of the financial statements.
Banking Portfolio
Financial Statements
Statement of Assets and Liabilities
| | | August 31, 2017 (Unaudited) |
| Assets | | |
Investment in securities, at value (including securities loaned of $6,118,359) — See accompanying schedule:
Unaffiliated issuers (cost $742,139,633) | $930,854,056 | |
| Fidelity Central Funds (cost $14,186,645) | 14,186,645 | |
| Total Investment in Securities (cost $756,326,278) | | $945,040,701 |
| Receivable for investments sold | | 3,013,326 |
| Receivable for fund shares sold | | 623,873 |
| Dividends receivable | | 1,509,853 |
| Distributions receivable from Fidelity Central Funds | | 7,065 |
| Other receivables | | 6,561 |
| Total assets | | 950,201,379 |
| Liabilities | | |
| Payable to custodian bank | $735 | |
| Payable for investments purchased | 954,889 | |
| Payable for fund shares redeemed | 3,271,809 | |
| Accrued management fee | 440,393 | |
| Other affiliated payables | 176,863 | |
| Other payables and accrued expenses | 15,047 | |
| Collateral on securities loaned | 6,388,200 | |
| Total liabilities | | 11,247,936 |
| Net Assets | | $938,953,443 |
| Net Assets consist of: | | |
| Paid in capital | | $735,405,404 |
| Undistributed net investment income | | 6,927,020 |
| Accumulated undistributed net realized gain (loss) on investments and foreign currency transactions | | 7,906,554 |
| Net unrealized appreciation (depreciation) on investments and assets and liabilities in foreign currencies | | 188,714,465 |
| Net Assets, for 29,615,608 shares outstanding | | $938,953,443 |
| Net Asset Value, offering price and redemption price per share ($938,953,443 ÷ 29,615,608 shares) | | $31.70 |
See accompanying notes which are an integral part of the financial statements.
Statement of Operations
| | | Six months ended August 31, 2017 (Unaudited) |
| Investment Income | | |
| Dividends | | $11,106,728 |
| Income from Fidelity Central Funds | | 51,591 |
| Total income | | 11,158,319 |
| Expenses | | |
| Management fee | $2,922,785 | |
| Transfer agent fees | 970,462 | |
| Accounting and security lending fees | 176,593 | |
| Custodian fees and expenses | 10,385 | |
| Independent trustees' fees and expenses | 12,835 | |
| Registration fees | 54,752 | |
| Audit | 18,596 | |
| Legal | 14,674 | |
| Interest | 867 | |
| Miscellaneous | 5,292 | |
| Total expenses before reductions | 4,187,241 | |
| Expense reductions | (30,428) | 4,156,813 |
| Net investment income (loss) | | 7,001,506 |
| Realized and Unrealized Gain (Loss) | | |
| Net realized gain (loss) on: | | |
| Investment securities: | | |
| Unaffiliated issuers | 26,500,189 | |
| Fidelity Central Funds | (452) | |
| Foreign currency transactions | 22,556 | |
| Total net realized gain (loss) | | 26,522,293 |
| Change in net unrealized appreciation (depreciation) on: | | |
| Investment securities: | | |
| Unaffiliated issuers | (111,625,000) | |
| Fidelity Central Funds | (1,600) | |
| Assets and liabilities in foreign currencies | (18,479) | |
| Total change in net unrealized appreciation (depreciation) | | (111,645,079) |
| Net gain (loss) | | (85,122,786) |
| Net increase (decrease) in net assets resulting from operations | | $(78,121,280) |
See accompanying notes which are an integral part of the financial statements.
Statement of Changes in Net Assets
| | Six months ended August 31, 2017 (Unaudited) | Year ended February 28, 2017 |
| Increase (Decrease) in Net Assets | | |
| Operations | | |
| Net investment income (loss) | $7,001,506 | $8,899,856 |
| Net realized gain (loss) | 26,522,293 | 950,718 |
| Change in net unrealized appreciation (depreciation) | (111,645,079) | 316,502,560 |
| Net increase (decrease) in net assets resulting from operations | (78,121,280) | 326,353,134 |
| Distributions to shareholders from net investment income | (226,244) | (7,718,086) |
| Share transactions | | |
| Proceeds from sales of shares | 214,301,364 | 644,775,316 |
| Reinvestment of distributions | 217,124 | 7,448,757 |
| Cost of shares redeemed | (459,110,010) | (274,527,992) |
| Net increase (decrease) in net assets resulting from share transactions | (244,591,522) | 377,696,081 |
| Redemption fees | 33,301 | 49,199 |
| Total increase (decrease) in net assets | (322,905,745) | 696,380,328 |
| Net Assets | | |
| Beginning of period | 1,261,859,188 | 565,478,860 |
| End of period | $938,953,443 | $1,261,859,188 |
| Other Information | | |
| Undistributed net investment income end of period | $6,927,020 | $151,758 |
| Shares | | |
| Sold | 6,511,484 | 21,208,450 |
| Issued in reinvestment of distributions | 6,841 | 232,556 |
| Redeemed | (14,430,121) | (9,972,925) |
| Net increase (decrease) | (7,911,796) | 11,468,081 |
See accompanying notes which are an integral part of the financial statements.
Financial Highlights — Banking Portfolio
| | Six months ended (Unaudited) August 31, | Years ended February 28, | | | | |
| | 2017 | 2017 | 2016 A | 2015 | 2014 | 2013 |
| Selected Per–Share Data | | | | | | |
| Net asset value, beginning of period | $33.63 | $21.70 | $26.24 | $26.11 | $20.58 | $17.83 |
| Income from Investment Operations | | | | | | |
| Net investment income (loss)B | .21 | .33 | .33 | .30 | .29 | .26 |
| Net realized and unrealized gain (loss) | (2.13) | 11.85 | (3.43) | 1.04 | 5.97 | 2.73 |
| Total from investment operations | (1.92) | 12.18 | (3.10) | 1.34 | 6.26 | 2.99 |
| Distributions from net investment income | (.01) | (.25) | (.28) | (.34) | (.20) | (.24) |
| Distributions from net realized gain | – | – | (1.16) | (.87) | (.53) | – |
| Total distributions | (.01) | (.25) | (1.44) | (1.21) | (.73) | (.24) |
| Redemption fees added to paid in capitalB,C | – | – | – | – | – | – |
| Net asset value, end of period | $31.70 | $33.63 | $21.70 | $26.24 | $26.11 | $20.58 |
| Total ReturnD,E | (5.72)% | 56.16% | (12.57)% | 5.30% | 30.48% | 16.86% |
| Ratios to Average Net AssetsF,G | | | | | | |
| Expenses before reductions | .78%H | .79% | .79% | .80% | .81% | .85% |
| Expenses net of fee waivers, if any | .78%H | .79% | .79% | .80% | .81% | .85% |
| Expenses net of all reductions | .78%H | .79% | .79% | .79% | .80% | .83% |
| Net investment income (loss) | 1.31%H | 1.20% | 1.27% | 1.14% | 1.22% | 1.37% |
| Supplemental Data | | | | | | |
| Net assets, end of period (000 omitted) | $938,953 | $1,261,859 | $565,479 | $584,635 | $809,980 | $530,562 |
| Portfolio turnover rateI | 36%H | 34% | 63% | 65% | 91% | 69% |
A For the year ended February 29.
B Calculated based on average shares outstanding during the period.
C Amount represents less than $.005 per share.
D Total returns for periods of less than one year are not annualized.
E Total returns would have been lower if certain expenses had not been reduced during the applicable periods shown.
F Fees and expenses of any underlying Fidelity Central Funds are not included in the Fund's expense ratio. The Fund indirectly bears its proportionate share of the expenses of any underlying Fidelity Central Funds.
G Expense ratios reflect operating expenses of the Fund. Expenses before reductions do not reflect amounts reimbursed by the investment adviser or reductions from brokerage service arrangements or reductions from other expense offset arrangements and do not represent the amount paid by the Fund during periods when reimbursements or reductions occur. Expenses net of fee waivers reflect expenses after reimbursement by the investment adviser but prior to reductions from brokerage service arrangements or other expense offset arrangements. Expenses net of all reductions represent the net expenses paid by the Fund.
H Annualized
I Amount does not include the portfolio activity of any underlying Fidelity Central Funds.
See accompanying notes which are an integral part of the financial statements.
Brokerage and Investment Management Portfolio
Investment Summary (Unaudited)
Top Ten Stocks as of August 31, 2017
| | % of fund's net assets | % of fund's net assets 6 months ago |
| CBOE Holdings, Inc. | 6.7 | 4.8 |
| BlackRock, Inc. Class A | 5.8 | 6.0 |
| S&P Global, Inc. | 5.6 | 5.2 |
| Morgan Stanley | 5.3 | 6.0 |
| State Street Corp. | 4.9 | 2.2 |
| IntercontinentalExchange, Inc. | 4.9 | 1.9 |
| TD Ameritrade Holding Corp. | 4.8 | 4.0 |
| CME Group, Inc. | 4.6 | 4.7 |
| Invesco Ltd. | 4.1 | 3.1 |
| Charles Schwab Corp. | 4.1 | 4.6 |
| | 50.8 | |
Top Industries (% of fund's net assets)
| As of August 31, 2017 |
| | Capital Markets | 98.4% |
| | Diversified Financial Services | 1.6% |

| As of February 28, 2017 |
| | Capital Markets | 95.8% |
| | Diversified Financial Services | 0.9% |
| | Real Estate Management & Development | 0.3% |
| | All Others* | 3.0% |

* Includes Short-Term investments and Net Other Assets (Liabilities).
Brokerage and Investment Management Portfolio
Investments August 31, 2017 (Unaudited)
Showing Percentage of Net Assets
| Common Stocks - 100.0% | | | |
| | | Shares | Value |
| Capital Markets - 98.4% | | | |
| Asset Management & Custody Banks - 39.4% | | | |
| Affiliated Managers Group, Inc. | | 90,400 | $15,972,776 |
| Apollo Global Management LLC Class A | | 448,200 | 13,235,346 |
| Bank of New York Mellon Corp. | | 329,100 | 17,205,348 |
| BlackRock, Inc. Class A | | 62,700 | 26,271,927 |
| Cohen & Steers, Inc. | | 107,400 | 4,064,016 |
| Diamond Hill Investment Group, Inc. | | 12,591 | 2,471,991 |
| Eaton Vance Corp. (non-vtg.) | | 328,100 | 15,610,998 |
| Invesco Ltd. | | 571,400 | 18,730,492 |
| Legg Mason, Inc. | | 356,642 | 13,620,158 |
| Northern Trust Corp. | | 151,200 | 13,381,200 |
| Pzena Investment Management, Inc. | | 466,400 | 4,617,360 |
| State Street Corp. | | 240,100 | 22,206,849 |
| The Blackstone Group LP | | 185,500 | 6,071,415 |
| Virtus Investment Partners, Inc. | | 24,700 | 2,618,200 |
| WisdomTree Investments, Inc. (a) | | 248,800 | 2,281,496 |
| | | | 178,359,572 |
| Financial Exchanges & Data - 29.2% | | | |
| CBOE Holdings, Inc. | | 299,038 | 30,169,943 |
| CME Group, Inc. | | 164,300 | 20,668,940 |
| Deutsche Borse AG | | 90,300 | 9,652,213 |
| IntercontinentalExchange, Inc. | | 340,900 | 22,046,003 |
| MarketAxess Holdings, Inc. | | 33,100 | 6,386,645 |
| Moody's Corp. | | 77,400 | 10,373,922 |
| MSCI, Inc. | | 64,400 | 7,380,884 |
| S&P Global, Inc. | | 163,100 | 25,171,223 |
| | | | 131,849,773 |
| Investment Banking & Brokerage - 29.8% | | | |
| BGC Partners, Inc. Class A | | 871,600 | 11,322,084 |
| Charles Schwab Corp. | | 467,900 | 18,669,210 |
| E*TRADE Financial Corp. (b) | | 65,900 | 2,702,559 |
| Houlihan Lokey | | 243,100 | 8,763,755 |
| Investment Technology Group, Inc. | | 148,300 | 2,979,347 |
| Lazard Ltd. Class A | | 99,100 | 4,250,399 |
| LPL Financial | | 149,400 | 6,997,896 |
| Morgan Stanley | | 530,900 | 24,155,950 |
| PJT Partners, Inc. | | 264,612 | 10,229,900 |
| Raymond James Financial, Inc. | | 30,900 | 2,420,088 |
| Stifel Financial Corp. | | 232,100 | 11,082,775 |
| TD Ameritrade Holding Corp. | | 501,100 | 21,707,652 |
| Tullett Prebon PLC | | 513,100 | 3,274,985 |
| Virtu Financial, Inc. Class A (a) | | 359,100 | 6,445,845 |
| | | | 135,002,445 |
|
| TOTAL CAPITAL MARKETS | | | 445,211,790 |
|
| Diversified Financial Services - 1.6% | | | |
| Other Diversified Financial Services - 1.6% | | | |
| NEX Group PLC | | 814,774 | 6,985,264 |
| TOTAL COMMON STOCKS | | | |
| (Cost $386,816,011) | | | 452,197,054 |
|
| Money Market Funds - 1.5% | | | |
| Fidelity Cash Central Fund, 1.11% (c) | | 367,508 | 367,581 |
| Fidelity Securities Lending Cash Central Fund 1.11% (c)(d) | | 6,623,330 | 6,623,992 |
| TOTAL MONEY MARKET FUNDS | | | |
| (Cost $6,991,343) | | | 6,991,573 |
| TOTAL INVESTMENT IN SECURITIES - 101.5% | | | |
| (Cost $393,807,354) | | | 459,188,627 |
| NET OTHER ASSETS (LIABILITIES) - (1.5)% | | | (6,864,330) |
| NET ASSETS - 100% | | | $452,324,297 |
Legend
(a) Security or a portion of the security is on loan at period end.
(b) Non-income producing
(c) Affiliated fund that is generally available only to investment companies and other accounts managed by Fidelity Investments. The rate quoted is the annualized seven-day yield of the fund at period end. A complete unaudited listing of the fund's holdings as of its most recent quarter end is available upon request. In addition, each Fidelity Central Fund's financial statements are available on the SEC's website or upon request.
(d) Investment made with cash collateral received from securities on loan.
Affiliated Central Funds
Information regarding fiscal year to date income earned by the Fund from investments in Fidelity Central Funds is as follows:
| Fund | Income earned |
| Fidelity Cash Central Fund | $25,831 |
| Fidelity Securities Lending Cash Central Fund | 25,670 |
| Total | $51,501 |
Investment Valuation
All investments are categorized as Level 1 under the Fair Value Hierarchy. The inputs or methodology used for valuing securities may not be an indication of the risk associated with investing in those securities. For more information on valuation inputs please refer to the Investment Valuation section in the accompanying Notes to Financial Statements.
See accompanying notes which are an integral part of the financial statements.
Brokerage and Investment Management Portfolio
Financial Statements
Statement of Assets and Liabilities
| | | August 31, 2017 (Unaudited) |
| Assets | | |
Investment in securities, at value (including securities loaned of $6,514,822) — See accompanying schedule:
Unaffiliated issuers (cost $386,816,011) | $452,197,054 | |
| Fidelity Central Funds (cost $6,991,343) | 6,991,573 | |
| Total Investment in Securities (cost $393,807,354) | | $459,188,627 |
| Cash | | 31,598 |
| Receivable for fund shares sold | | 198,866 |
| Dividends receivable | | 818,351 |
| Distributions receivable from Fidelity Central Funds | | 10,418 |
| Other receivables | | 37,582 |
| Total assets | | 460,285,442 |
| Liabilities | | |
| Payable for fund shares redeemed | $1,001,321 | |
| Accrued management fee | 206,849 | |
| Other affiliated payables | 81,851 | |
| Other payables and accrued expenses | 46,040 | |
| Collateral on securities loaned | 6,625,084 | |
| Total liabilities | | 7,961,145 |
| Net Assets | | $452,324,297 |
| Net Assets consist of: | | |
| Paid in capital | | $367,777,611 |
| Undistributed net investment income | | 3,502,067 |
| Accumulated undistributed net realized gain (loss) on investments and foreign currency transactions | | 15,661,737 |
| Net unrealized appreciation (depreciation) on investments and assets and liabilities in foreign currencies | | 65,382,882 |
| Net Assets, for 6,033,544 shares outstanding | | $452,324,297 |
| Net Asset Value, offering price and redemption price per share ($452,324,297 ÷ 6,033,544 shares) | | $74.97 |
See accompanying notes which are an integral part of the financial statements.
Statement of Operations
| | | Six months ended August 31, 2017 (Unaudited) |
| Investment Income | | |
| Dividends | | $5,114,639 |
| Income from Fidelity Central Funds | | 51,501 |
| Total income | | 5,166,140 |
| Expenses | | |
| Management fee | $1,139,061 | |
| Transfer agent fees | 381,533 | |
| Accounting and security lending fees | 82,180 | |
| Custodian fees and expenses | 3,840 | |
| Independent trustees' fees and expenses | 4,672 | |
| Registration fees | 21,053 | |
| Audit | 18,824 | |
| Legal | 4,484 | |
| Miscellaneous | 2,130 | |
| Total expenses before reductions | 1,657,777 | |
| Expense reductions | (22,130) | 1,635,647 |
| Net investment income (loss) | | 3,530,493 |
| Realized and Unrealized Gain (Loss) | | |
| Net realized gain (loss) on: | | |
| Investment securities: | | |
| Unaffiliated issuers | 17,144,648 | |
| Fidelity Central Funds | (393) | |
| Foreign currency transactions | 7,327 | |
| Total net realized gain (loss) | | 17,151,582 |
| Change in net unrealized appreciation (depreciation) on: | | |
| Investment securities: | | |
| Unaffiliated issuers | 7,693,391 | |
| Fidelity Central Funds | (505) | |
| Assets and liabilities in foreign currencies | 1,609 | |
| Total change in net unrealized appreciation (depreciation) | | 7,694,495 |
| Net gain (loss) | | 24,846,077 |
| Net increase (decrease) in net assets resulting from operations | | $28,376,570 |
See accompanying notes which are an integral part of the financial statements.
Statement of Changes in Net Assets
| | Six months ended August 31, 2017 (Unaudited) | Year ended February 28, 2017 |
| Increase (Decrease) in Net Assets | | |
| Operations | | |
| Net investment income (loss) | $3,530,493 | $4,812,904 |
| Net realized gain (loss) | 17,151,582 | 13,312,025 |
| Change in net unrealized appreciation (depreciation) | 7,694,495 | 74,061,176 |
| Net increase (decrease) in net assets resulting from operations | 28,376,570 | 92,186,105 |
| Distributions to shareholders from net investment income | (112,188) | (4,381,249) |
| Distributions to shareholders from net realized gain | (6,871,523) | (73,811) |
| Total distributions | (6,983,711) | (4,455,060) |
| Share transactions | | |
| Proceeds from sales of shares | 64,037,425 | 79,591,297 |
| Reinvestment of distributions | 6,656,315 | 4,230,142 |
| Cost of shares redeemed | (45,046,831) | (76,843,261) |
| Net increase (decrease) in net assets resulting from share transactions | 25,646,909 | 6,978,178 |
| Redemption fees | 1,671 | 3,550 |
| Total increase (decrease) in net assets | 47,041,439 | 94,712,773 |
| Net Assets | | |
| Beginning of period | 405,282,858 | 310,570,085 |
| End of period | $452,324,297 | $405,282,858 |
| Other Information | | |
| Undistributed net investment income end of period | $3,502,067 | $83,762 |
| Shares | | |
| Sold | 867,564 | 1,190,777 |
| Issued in reinvestment of distributions | 97,229 | 61,844 |
| Redeemed | (628,808) | (1,237,856) |
| Net increase (decrease) | 335,985 | 14,765 |
See accompanying notes which are an integral part of the financial statements.
Financial Highlights — Brokerage and Investment Management Portfolio
| | Six months ended (Unaudited) August 31, | Years ended February 28, | | | | |
| | 2017 | 2017 | 2016 A | 2015 | 2014 | 2013 |
| Selected Per–Share Data | | | | | | |
| Net asset value, beginning of period | $71.13 | $54.65 | $74.78 | $71.99 | $55.99 | $47.28 |
| Income from Investment Operations | | | | | | |
| Net investment income (loss)B | .61 | .89 | .72 | .96 | .99 | 1.31 |
| Net realized and unrealized gain (loss) | 4.48 | 16.44 | (16.77) | 4.39 | 15.41 | 8.52 |
| Total from investment operations | 5.09 | 17.33 | (16.05) | 5.35 | 16.40 | 9.83 |
| Distributions from net investment income | (.02) | (.83) | (.74) | (.83) | (.39) | (1.12) |
| Distributions from net realized gain | (1.23) | (.01) | (3.34) | (1.73) | (.02) | – |
| Total distributions | (1.25) | (.85)C | (4.08) | (2.56) | (.40)D | (1.12) |
| Redemption fees added to paid in capitalB,E | – | – | – | – | – | – |
| Net asset value, end of period | $74.97 | $71.13 | $54.65 | $74.78 | $71.99 | $55.99 |
| Total ReturnF,G | 7.32% | 31.76% | (22.23)% | 7.43% | 29.29% | 21.08% |
| Ratios to Average Net AssetsH,I | | | | | | |
| Expenses before reductions | .79%J | .82% | .79% | .79% | .82% | .87% |
| Expenses net of fee waivers, if any | .79%J | .82% | .79% | .79% | .82% | .87% |
| Expenses net of all reductions | .78%J | .80% | .78% | .79% | .80% | .78% |
| Net investment income (loss) | 1.69%J | 1.43% | 1.02% | 1.32% | 1.52% | 2.72% |
| Supplemental Data | | | | | | |
| Net assets, end of period (000 omitted) | $452,324 | $405,283 | $310,570 | $577,953 | $834,222 | $604,773 |
| Portfolio turnover rateK | 70%J | 146% | 67% | 31% | 182% | 308% |
A For the year ended February 29.
B Calculated based on average shares outstanding during the period.
C Total distributions of $.85 per share is comprised of distributions from net investment income of $.831 and distributions from net realized gain of $.014 per share.
D Total distributions of $.40 per share is comprised of distributions from net investment income of $.388 and distributions from net realized gain of $.016 per share.
E Amount represents less than $.005 per share.
F Total returns for periods of less than one year are not annualized.
G Total returns would have been lower if certain expenses had not been reduced during the applicable periods shown.
H Fees and expenses of any underlying Fidelity Central Funds are not included in the Fund's expense ratio. The Fund indirectly bears its proportionate share of the expenses of any underlying Fidelity Central Funds.
I Expense ratios reflect operating expenses of the Fund. Expenses before reductions do not reflect amounts reimbursed by the investment adviser or reductions from brokerage service arrangements or reductions from other expense offset arrangements and do not represent the amount paid by the Fund during periods when reimbursements or reductions occur. Expenses net of fee waivers reflect expenses after reimbursement by the investment adviser but prior to reductions from brokerage service arrangements or other expense offset arrangements. Expenses net of all reductions represent the net expenses paid by the Fund.
J Annualized
K Amount does not include the portfolio activity of any underlying Fidelity Central Funds.
See accompanying notes which are an integral part of the financial statements.
Consumer Finance Portfolio
Investment Summary (Unaudited)
Top Ten Stocks as of August 31, 2017
| | % of fund's net assets | % of fund's net assets 6 months ago |
| Visa, Inc. Class A | 7.4 | 6.3 |
| Capital One Financial Corp. | 7.4 | 6.6 |
| Synchrony Financial | 7.0 | 7.1 |
| MasterCard, Inc. Class A | 5.9 | 5.5 |
| Ally Financial, Inc. | 5.8 | 4.5 |
| AGNC Investment Corp. | 5.3 | 2.2 |
| New Residential Investment Corp. | 3.5 | 1.5 |
| American Express Co. | 3.1 | 2.5 |
| TFS Financial Corp. | 3.1 | 2.7 |
| Discover Financial Services | 2.8 | 4.9 |
| | 51.3 | |
Top Industries (% of fund's net assets)
| As of August 31, 2017 |
| | Consumer Finance | 38.8% |
| | IT Services | 22.7% |
| | Thrifts & Mortgage Finance | 18.0% |
| | Mortgage Real Estate Investment Trusts | 16.5% |
| | Banks | 2.7% |
| | All Others* | 1.3% |
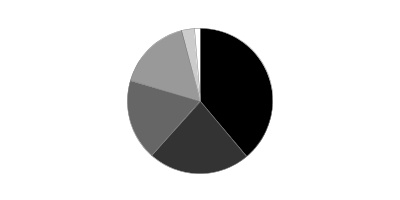
* Includes Short-Term investments and Net Other Assets (Liabilities).
| As of February 28, 2017 |
| | Consumer Finance | 40.4% |
| | Thrifts & Mortgage Finance | 22.3% |
| | IT Services | 20.6% |
| | Mortgage Real Estate Investment Trusts | 11.5% |
| | Banks | 4.1% |
| | All Others* | 1.1% |

* Includes Short-Term investments and Net Other Assets (Liabilities).
Consumer Finance Portfolio
Investments August 31, 2017 (Unaudited)
Showing Percentage of Net Assets
| Common Stocks - 99.5% | | | |
| | | Shares | Value |
| Banks - 2.7% | | | |
| Diversified Banks - 1.7% | | | |
| Wells Fargo & Co. | | 31,400 | $1,603,598 |
| Regional Banks - 1.0% | | | |
| Huntington Bancshares, Inc. | | 36,500 | 459,535 |
| SVB Financial Group (a) | | 2,700 | 457,218 |
| | | | 916,753 |
|
| TOTAL BANKS | | | 2,520,351 |
|
| Consumer Finance - 38.8% | | | |
| Consumer Finance - 38.8% | | | |
| Ally Financial, Inc. | | 239,200 | 5,405,920 |
| American Express Co. | | 33,400 | 2,875,740 |
| Capital One Financial Corp. | | 86,600 | 6,894,226 |
| Credit Acceptance Corp. (a)(b) | | 7,275 | 1,980,983 |
| Discover Financial Services | | 44,900 | 2,646,855 |
| First Cash Financial Services, Inc. | | 4,811 | 282,406 |
| LendingClub Corp. (a) | | 80,800 | 500,152 |
| Navient Corp. | | 166,500 | 2,197,800 |
| Nelnet, Inc. Class A | | 7,400 | 350,982 |
| OneMain Holdings, Inc. (a) | | 79,000 | 2,162,230 |
| Santander Consumer U.S.A. Holdings, Inc. (a) | | 135,100 | 1,929,228 |
| SLM Corp. (a) | | 249,900 | 2,541,483 |
| Synchrony Financial | | 212,000 | 6,527,480 |
| | | | 36,295,485 |
| IT Services - 22.7% | | | |
| Data Processing & Outsourced Services - 22.7% | | | |
| Blackhawk Network Holdings, Inc. (a) | | 11,600 | 519,680 |
| FleetCor Technologies, Inc. (a) | | 12,000 | 1,725,240 |
| Global Payments, Inc. | | 21,600 | 2,062,584 |
| MasterCard, Inc. Class A | | 41,500 | 5,531,950 |
| PayPal Holdings, Inc. (a) | | 40,700 | 2,510,376 |
| Square, Inc. (a) | | 15,700 | 409,927 |
| Total System Services, Inc. | | 13,600 | 940,032 |
| Vantiv, Inc. (a) | | 8,100 | 572,589 |
| Visa, Inc. Class A | | 67,036 | 6,939,564 |
| | | | 21,211,942 |
| Mortgage Real Estate Investment Trusts - 16.5% | | | |
| Mortgage REITs - 16.5% | | | |
| AGNC Investment Corp. | | 228,500 | 4,921,890 |
| Annaly Capital Management, Inc. | | 174,815 | 2,185,188 |
| Capstead Mortgage Corp. | | 100 | 967 |
| Chimera Investment Corp. | | 39,700 | 757,079 |
| Invesco Mortgage Capital, Inc. | | 113,257 | 1,923,104 |
| MFA Financial, Inc. | | 114,700 | 1,007,066 |
| New Residential Investment Corp. | | 202,050 | 3,329,784 |
| Redwood Trust, Inc. | | 82,500 | 1,376,100 |
| | | | 15,501,178 |
| Professional Services - 0.8% | | | |
| Research & Consulting Services - 0.8% | | | |
| Equifax, Inc. | | 5,100 | 726,597 |
| Thrifts & Mortgage Finance - 18.0% | | | |
| Thrifts & Mortgage Finance - 18.0% | | | |
| Astoria Financial Corp. | | 37,200 | 728,748 |
| BofI Holding, Inc. (a)(b) | | 25,600 | 678,656 |
| Capitol Federal Financial, Inc. | | 70,500 | 967,260 |
| Flagstar Bancorp, Inc. (a) | | 13,900 | 456,198 |
| Meridian Bancorp, Inc. Maryland | | 18,100 | 318,560 |
| MGIC Investment Corp. (a) | | 170,928 | 1,957,126 |
| Nationstar Mortgage Holdings, Inc. (a)(b) | | 63,100 | 1,086,582 |
| New York Community Bancorp, Inc. | | 200,100 | 2,411,205 |
| Northwest Bancshares, Inc. | | 38,600 | 595,598 |
| PHH Corp. (a) | | 18,000 | 255,600 |
| Provident Financial Services, Inc. | | 33,600 | 834,960 |
| Radian Group, Inc. | | 91,365 | 1,598,888 |
| TFS Financial Corp. | | 186,600 | 2,869,908 |
| Washington Federal, Inc. | | 40,400 | 1,262,500 |
| WSFS Financial Corp. | | 19,400 | 867,180 |
| | | | 16,888,969 |
| TOTAL COMMON STOCKS | | | |
| (Cost $70,515,266) | | | 93,144,522 |
|
| Money Market Funds - 3.3% | | | |
| Fidelity Securities Lending Cash Central Fund 1.11% (c)(d) | | | |
| (Cost $3,098,475) | | 3,098,299 | 3,098,609 |
| TOTAL INVESTMENT IN SECURITIES - 102.8% | | | |
| (Cost $73,613,741) | | | 96,243,131 |
| NET OTHER ASSETS (LIABILITIES) - (2.8)% | | | (2,655,018) |
| NET ASSETS - 100% | | | $93,588,113 |
Legend
(a) Non-income producing
(b) Security or a portion of the security is on loan at period end.
(c) Investment made with cash collateral received from securities on loan.
(d) Affiliated fund that is generally available only to investment companies and other accounts managed by Fidelity Investments. The rate quoted is the annualized seven-day yield of the fund at period end. A complete unaudited listing of the fund's holdings as of its most recent quarter end is available upon request. In addition, each Fidelity Central Fund's financial statements are available on the SEC's website or upon request.
Affiliated Central Funds
Information regarding fiscal year to date income earned by the Fund from investments in Fidelity Central Funds is as follows:
| Fund | Income earned |
| Fidelity Cash Central Fund | $2,102 |
| Fidelity Securities Lending Cash Central Fund | 35,846 |
| Total | $37,948 |
Investment Valuation
All investments are categorized as Level 1 under the Fair Value Hierarchy. The inputs or methodology used for valuing securities may not be an indication of the risk associated with investing in those securities. For more information on valuation inputs please refer to the Investment Valuation section in the accompanying Notes to Financial Statements.
See accompanying notes which are an integral part of the financial statements.
Consumer Finance Portfolio
Financial Statements
Statement of Assets and Liabilities
| | | August 31, 2017 (Unaudited) |
| Assets | | |
Investment in securities, at value (including securities loaned of $3,062,416) — See accompanying schedule:
Unaffiliated issuers (cost $70,515,266) | $93,144,522 | |
| Fidelity Central Funds (cost $3,098,475) | 3,098,609 | |
| Total Investment in Securities (cost $73,613,741) | | $96,243,131 |
| Receivable for investments sold | | 520,794 |
| Receivable for fund shares sold | | 81,464 |
| Dividends receivable | | 110,645 |
| Distributions receivable from Fidelity Central Funds | | 3,549 |
| Other receivables | | 2,866 |
| Total assets | | 96,962,449 |
| Liabilities | | |
| Payable to custodian bank | $86,732 | |
| Payable for fund shares redeemed | 105,322 | |
| Accrued management fee | 42,735 | |
| Other affiliated payables | 22,263 | |
| Other payables and accrued expenses | 18,841 | |
| Collateral on securities loaned | 3,098,443 | |
| Total liabilities | | 3,374,336 |
| Net Assets | | $93,588,113 |
| Net Assets consist of: | | |
| Paid in capital | | $76,485,084 |
| Undistributed net investment income | | 865,849 |
| Accumulated undistributed net realized gain (loss) on investments | | (6,392,210) |
| Net unrealized appreciation (depreciation) on investments | | 22,629,390 |
| Net Assets, for 6,463,222 shares outstanding | | $93,588,113 |
| Net Asset Value, offering price and redemption price per share ($93,588,113 ÷ 6,463,222 shares) | | $14.48 |
See accompanying notes which are an integral part of the financial statements.
Statement of Operations
| | | Six months ended August 31, 2017 (Unaudited) |
| Investment Income | | |
| Dividends | | $1,264,553 |
| Income from Fidelity Central Funds | | 37,948 |
| Total income | | 1,302,501 |
| Expenses | | |
| Management fee | $259,485 | |
| Transfer agent fees | 116,791 | |
| Accounting and security lending fees | 18,936 | |
| Custodian fees and expenses | (2,352) | |
| Independent trustees' fees and expenses | 1,117 | |
| Registration fees | 14,699 | |
| Audit | 19,865 | |
| Legal | 2,830 | |
| Miscellaneous | 590 | |
| Total expenses before reductions | 431,961 | |
| Expense reductions | (7,932) | 424,029 |
| Net investment income (loss) | | 878,472 |
| Realized and Unrealized Gain (Loss) | | |
| Net realized gain (loss) on: | | |
| Investment securities: | | |
| Unaffiliated issuers | 5,644,929 | |
| Fidelity Central Funds | (143) | |
| Total net realized gain (loss) | | 5,644,786 |
| Change in net unrealized appreciation (depreciation) on: | | |
| Investment securities: | | |
| Unaffiliated issuers | (3,514,362) | |
| Fidelity Central Funds | (395) | |
| Total change in net unrealized appreciation (depreciation) | | (3,514,757) |
| Net gain (loss) | | 2,130,029 |
| Net increase (decrease) in net assets resulting from operations | | $3,008,501 |
See accompanying notes which are an integral part of the financial statements.
Statement of Changes in Net Assets
| | Six months ended August 31, 2017 (Unaudited) | Year ended February 28, 2017 |
| Increase (Decrease) in Net Assets | | |
| Operations | | |
| Net investment income (loss) | $878,472 | $1,593,348 |
| Net realized gain (loss) | 5,644,786 | 376,285 |
| Change in net unrealized appreciation (depreciation) | (3,514,757) | 24,444,332 |
| Net increase (decrease) in net assets resulting from operations | 3,008,501 | 26,413,965 |
| Distributions to shareholders from net investment income | (112,163) | (1,693,811) |
| Distributions to shareholders from net realized gain | – | (2,140,248) |
| Total distributions | (112,163) | (3,834,059) |
| Share transactions | | |
| Proceeds from sales of shares | 5,889,314 | 24,529,703 |
| Reinvestment of distributions | 108,027 | 3,691,039 |
| Cost of shares redeemed | (17,129,323) | (35,623,808) |
| Net increase (decrease) in net assets resulting from share transactions | (11,131,982) | (7,403,066) |
| Redemption fees | 792 | 3,187 |
| Total increase (decrease) in net assets | (8,234,852) | 15,180,027 |
| Net Assets | | |
| Beginning of period | 101,822,965 | 86,642,938 |
| End of period | $93,588,113 | $101,822,965 |
| Other Information | | |
| Undistributed net investment income end of period | $865,849 | $99,540 |
| Shares | | |
| Sold | 419,709 | 1,911,163 |
| Issued in reinvestment of distributions | 8,044 | 300,993 |
| Redeemed | (1,228,945) | (2,869,642) |
| Net increase (decrease) | (801,192) | (657,486) |
See accompanying notes which are an integral part of the financial statements.
Financial Highlights — Consumer Finance Portfolio
| | Six months ended (Unaudited) August 31, | Years ended February 28, | | | | |
| | 2017 | 2017 | 2016 A | 2015 | 2014 | 2013 |
| Selected Per–Share Data | | | | | | |
| Net asset value, beginning of period | $14.02 | $10.94 | $14.01 | $16.16 | $15.37 | $12.62 |
| Income from Investment Operations | | | | | | |
| Net investment income (loss)B | .13 | .21 | .20 | .22 | .34 | .28 |
| Net realized and unrealized gain (loss) | .35C | 3.38 | (1.99) | .95 | 3.18 | 2.72 |
| Total from investment operations | .48 | 3.59 | (1.79) | 1.17 | 3.52 | 3.00 |
| Distributions from net investment income | (.02) | (.23) | (.20) | (.30) | (.40) | (.24) |
| Distributions from net realized gain | – | (.28) | (1.08) | (3.03) | (2.33) | (.01) |
| Total distributions | (.02) | (.51) | (1.28) | (3.32)D | (2.73) | (.25) |
| Redemption fees added to paid in capitalB,E | – | – | – | – | – | – |
| Net asset value, end of period | $14.48 | $14.02 | $10.94 | $14.01 | $16.16 | $15.37 |
| Total ReturnF,G | 3.40%C | 33.57% | (14.01)% | 7.69% | 24.31% | 23.92% |
| Ratios to Average Net AssetsH,I | | | | | | |
| Expenses before reductions | .91%J | .94% | .90% | .88% | .85% | .89% |
| Expenses net of fee waivers, if any | .91%J | .94% | .89% | .88% | .85% | .89% |
| Expenses net of all reductions | .89%J | .93% | .89% | .88% | .83% | .86% |
| Net investment income (loss) | 1.84%J | 1.72% | 1.53% | 1.45% | 2.07% | 1.98% |
| Supplemental Data | | | | | | |
| Net assets, end of period (000 omitted) | $93,588 | $101,823 | $86,643 | $134,569 | $250,222 | $303,556 |
| Portfolio turnover rateK | 45%J | 44% | 48% | 71% | 89% | 79% |
A For the year ended February 29.
B Calculated based on average shares outstanding during the period.
C Net realized and unrealized gain (loss) per share reflects proceeds received from litigation which amounted to $.26 per share. Excluding these litigation proceeds, the total return would have been 1.55%.
D Total distributions of $3.32 per share is comprised of distributions from net investment income of $.296 and distributions from net realized gain of $3.026 per share.
E Amount represents less than $.005 per share.
F Total returns for periods of less than one year are not annualized.
G Total returns would have been lower if certain expenses had not been reduced during the applicable periods shown.
H Fees and expenses of any underlying Fidelity Central Funds are not included in the Fund's expense ratio. The Fund indirectly bears its proportionate share of the expenses of any underlying Fidelity Central Funds.
I Expense ratios reflect operating expenses of the Fund. Expenses before reductions do not reflect amounts reimbursed by the investment adviser or reductions from brokerage service arrangements or reductions from other expense offset arrangements and do not represent the amount paid by the Fund during periods when reimbursements or reductions occur. Expenses net of fee waivers reflect expenses after reimbursement by the investment adviser but prior to reductions from brokerage service arrangements or other expense offset arrangements. Expenses net of all reductions represent the net expenses paid by the Fund.
J Annualized
K Amount does not include the portfolio activity of any underlying Fidelity Central Funds.
See accompanying notes which are an integral part of the financial statements.
Financial Services Portfolio
Investment Summary (Unaudited)
Top Ten Stocks as of August 31, 2017
| | % of fund's net assets | % of fund's net assets 6 months ago |
| Capital One Financial Corp. | 5.5 | 5.3 |
| Berkshire Hathaway, Inc. Class B | 5.4 | 6.0 |
| Citigroup, Inc. | 5.4 | 5.0 |
| Bank of America Corp. | 5.0 | 5.1 |
| Huntington Bancshares, Inc. | 4.7 | 3.4 |
| Goldman Sachs Group, Inc. | 4.6 | 4.9 |
| TD Ameritrade Holding Corp. | 4.1 | 1.4 |
| Chubb Ltd. | 3.9 | 2.9 |
| The Travelers Companies, Inc. | 3.7 | 2.8 |
| JPMorgan Chase & Co. | 3.6 | 3.5 |
| | 45.9 | |
Top Industries (% of fund's net assets)
| As of August 31, 2017 |
| | Banks | 32.8% |
| | Capital Markets | 26.7% |
| | Insurance | 21.5% |
| | Consumer Finance | 8.4% |
| | Diversified Financial Services | 5.4% |
| | All Others* | 5.2% |
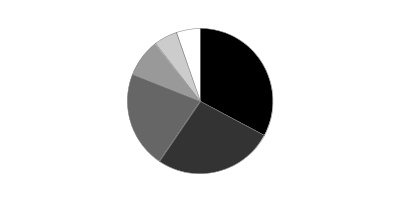
* Includes Short-Term investments and Net Other Assets (Liabilities).
| As of February 28, 2017 |
| | Banks | 38.1% |
| | Insurance | 20.1% |
| | Capital Markets | 19.9% |
| | Consumer Finance | 10.1% |
| | Diversified Financial Services | 6.5% |
| | All Others* | 5.3% |
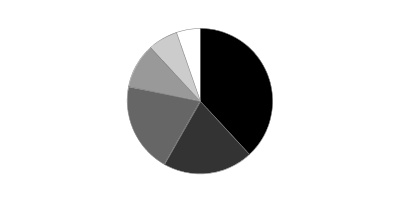
* Includes Short-Term investments and Net Other Assets (Liabilities).
Financial Services Portfolio
Investments August 31, 2017 (Unaudited)
Showing Percentage of Net Assets
| Common Stocks - 98.3% | | | |
| | | Shares | Value |
| Banks - 32.8% | | | |
| Diversified Banks - 17.0% | | | |
| Allied Irish Banks PLC | | 102,138 | $608,680 |
| Bank of America Corp. | | 2,242,000 | 53,561,380 |
| Citigroup, Inc. | | 847,490 | 57,654,745 |
| JPMorgan Chase & Co. | | 424,400 | 38,573,716 |
| Wells Fargo & Co. | | 629,000 | 32,123,030 |
| | | | 182,521,551 |
| Regional Banks - 15.8% | | | |
| Bank of the Ozarks, Inc. | | 269,700 | 11,586,312 |
| CIT Group, Inc. | | 150,000 | 6,727,500 |
| CoBiz, Inc. | | 398,300 | 6,791,015 |
| East West Bancorp, Inc. | | 150,000 | 8,305,500 |
| First Republic Bank | | 106,200 | 10,306,710 |
| Huntington Bancshares, Inc. | | 3,991,400 | 50,251,726 |
| PNC Financial Services Group, Inc. | | 295,400 | 37,046,114 |
| Popular, Inc. | | 257,170 | 10,263,655 |
| Preferred Bank, Los Angeles | | 40,000 | 2,152,000 |
| Regions Financial Corp. | | 400,000 | 5,644,000 |
| Signature Bank (a) | | 10,000 | 1,283,400 |
| SunTrust Banks, Inc. | | 274,300 | 15,113,930 |
| SVB Financial Group (a) | | 20,000 | 3,386,800 |
| | | | 168,858,662 |
|
| TOTAL BANKS | | | 351,380,213 |
|
| Capital Markets - 26.7% | | | |
| Asset Management & Custody Banks - 8.4% | | | |
| Affiliated Managers Group, Inc. | | 91,600 | 16,184,804 |
| BlackRock, Inc. Class A | | 53,000 | 22,207,530 |
| Brighthouse Financial, Inc. | | 27,272 | 1,556,413 |
| Invesco Ltd. | | 483,500 | 15,849,130 |
| Northern Trust Corp. | | 328,300 | 29,054,550 |
| State Street Corp. | | 50,000 | 4,624,500 |
| | | | 89,476,927 |
| Financial Exchanges & Data - 5.8% | | | |
| CBOE Holdings, Inc. | | 308,900 | 31,164,921 |
| Deutsche Borse AG | | 75,000 | 8,016,788 |
| IntercontinentalExchange, Inc. | | 356,200 | 23,035,454 |
| | | | 62,217,163 |
| Investment Banking & Brokerage - 12.5% | | | |
| E*TRADE Financial Corp. (a) | | 872,100 | 35,764,821 |
| Goldman Sachs Group, Inc. | | 218,400 | 48,864,816 |
| Investment Technology Group, Inc. | | 270,000 | 5,424,300 |
| TD Ameritrade Holding Corp. | | 1,005,600 | 43,562,592 |
| | | | 133,616,529 |
|
| TOTAL CAPITAL MARKETS | | | 285,310,619 |
|
| Consumer Finance - 8.4% | | | |
| Consumer Finance - 8.4% | | | |
| Capital One Financial Corp. | | 741,700 | 59,046,736 |
| Synchrony Financial | | 1,019,900 | 31,402,721 |
| | | | 90,449,457 |
| Diversified Financial Services - 5.4% | | | |
| Multi-Sector Holdings - 5.4% | | | |
| Berkshire Hathaway, Inc. Class B (a) | | 318,500 | 57,699,460 |
| Insurance - 21.5% | | | |
| Insurance Brokers - 1.1% | | | |
| Willis Group Holdings PLC | | 81,200 | 12,055,764 |
| Life & Health Insurance - 3.7% | | | |
| MetLife, Inc. | | 356,200 | 16,680,846 |
| Torchmark Corp. | | 291,400 | 22,429,058 |
| | | | 39,109,904 |
| Multi-Line Insurance - 2.6% | | | |
| Hartford Financial Services Group, Inc. | | 519,400 | 28,083,958 |
| Property & Casualty Insurance - 12.3% | | | |
| Allstate Corp. | | 305,500 | 27,647,750 |
| Chubb Ltd. | | 298,100 | 42,157,302 |
| FNF Group | | 458,000 | 22,093,920 |
| The Travelers Companies, Inc. | | 326,800 | 39,601,624 |
| | | | 131,500,596 |
| Reinsurance - 1.8% | | | |
| Reinsurance Group of America, Inc. | | 141,600 | 19,038,120 |
|
| TOTAL INSURANCE | | | 229,788,342 |
|
| IT Services - 2.9% | | | |
| Data Processing & Outsourced Services - 2.9% | | | |
| Visa, Inc. Class A | | 127,200 | 13,167,744 |
| WEX, Inc. (a) | | 160,100 | 17,473,314 |
| | | | 30,641,058 |
| Thrifts & Mortgage Finance - 0.6% | | | |
| Thrifts & Mortgage Finance - 0.6% | | | |
| MGIC Investment Corp. (a) | | 392,800 | 4,497,560 |
| Radian Group, Inc. | | 144,100 | 2,521,750 |
| | | | 7,019,310 |
| TOTAL COMMON STOCKS | | | |
| (Cost $876,458,840) | | | 1,052,288,459 |
|
| Money Market Funds - 1.5% | | | |
| Fidelity Cash Central Fund, 1.11% (b) | | | |
| (Cost $15,419,752) | | 15,416,668 | 15,419,752 |
| TOTAL INVESTMENT IN SECURITIES - 99.8% | | | |
| (Cost $891,878,592) | | | 1,067,708,211 |
| NET OTHER ASSETS (LIABILITIES) - 0.2% | | | 2,488,834 |
| NET ASSETS - 100% | | | $1,070,197,045 |
Legend
(a) Non-income producing
(b) Affiliated fund that is generally available only to investment companies and other accounts managed by Fidelity Investments. The rate quoted is the annualized seven-day yield of the fund at period end. A complete unaudited listing of the fund's holdings as of its most recent quarter end is available upon request. In addition, each Fidelity Central Fund's financial statements are available on the SEC's website or upon request.
Affiliated Central Funds
Information regarding fiscal year to date income earned by the Fund from investments in Fidelity Central Funds is as follows:
| Fund | Income earned |
| Fidelity Cash Central Fund | $82,046 |
| Fidelity Securities Lending Cash Central Fund | 2,651 |
| Total | $84,697 |
Investment Valuation
All investments are categorized as Level 1 under the Fair Value Hierarchy. The inputs or methodology used for valuing securities may not be an indication of the risk associated with investing in those securities. For more information on valuation inputs please refer to the Investment Valuation section in the accompanying Notes to Financial Statements.
See accompanying notes which are an integral part of the financial statements.
Financial Services Portfolio
Financial Statements
Statement of Assets and Liabilities
| | | August 31, 2017 (Unaudited) |
| Assets | | |
Investment in securities, at value — See accompanying schedule:
Unaffiliated issuers (cost $876,458,840) | $1,052,288,459 | |
| Fidelity Central Funds (cost $15,419,752) | 15,419,752 | |
| Total Investment in Securities (cost $891,878,592) | | $1,067,708,211 |
| Receivable for fund shares sold | | 4,965,039 |
| Dividends receivable | | 1,684,235 |
| Distributions receivable from Fidelity Central Funds | | 15,598 |
| Other receivables | | 8,004 |
| Total assets | | 1,074,381,087 |
| Liabilities | | |
| Payable for investments purchased | $1,928,571 | |
| Payable for fund shares redeemed | 1,573,887 | |
| Accrued management fee | 482,262 | |
| Other affiliated payables | 184,288 | |
| Other payables and accrued expenses | 15,034 | |
| Total liabilities | | 4,184,042 |
| Net Assets | | $1,070,197,045 |
| Net Assets consist of: | | |
| Paid in capital | | $862,818,395 |
| Undistributed net investment income | | 5,002,152 |
| Accumulated undistributed net realized gain (loss) on investments and foreign currency transactions | | 26,547,652 |
| Net unrealized appreciation (depreciation) on investments and assets and liabilities in foreign currencies | | 175,828,846 |
| Net Assets, for 10,426,835 shares outstanding | | $1,070,197,045 |
| Net Asset Value, offering price and redemption price per share ($1,070,197,045 ÷ 10,426,835 shares) | | $102.64 |
See accompanying notes which are an integral part of the financial statements.
Statement of Operations
| | | Six months ended August 31, 2017 (Unaudited) |
| Investment Income | | |
| Dividends | | $8,753,994 |
| Income from Fidelity Central Funds | | 84,697 |
| Total income | | 8,838,691 |
| Expenses | | |
| Management fee | $2,702,505 | |
| Transfer agent fees | 892,995 | |
| Accounting and security lending fees | 165,139 | |
| Custodian fees and expenses | 6,466 | |
| Independent trustees' fees and expenses | 11,257 | |
| Registration fees | 39,338 | |
| Audit | 24,037 | |
| Legal | 8,646 | |
| Miscellaneous | 7,659 | |
| Total expenses before reductions | 3,858,042 | |
| Expense reductions | (22,402) | 3,835,640 |
| Net investment income (loss) | | 5,003,051 |
| Realized and Unrealized Gain (Loss) | | |
| Net realized gain (loss) on: | | |
| Investment securities: | | |
| Unaffiliated issuers | 29,161,466 | |
| Fidelity Central Funds | (1,435) | |
| Foreign currency transactions | (917) | |
| Total net realized gain (loss) | | 29,159,114 |
| Change in net unrealized appreciation (depreciation) on: | | |
| Investment securities: | | |
| Unaffiliated issuers | (26,395,289) | |
| Assets and liabilities in foreign currencies | 75 | |
| Total change in net unrealized appreciation (depreciation) | | (26,395,214) |
| Net gain (loss) | | 2,763,900 |
| Net increase (decrease) in net assets resulting from operations | | $7,766,951 |
See accompanying notes which are an integral part of the financial statements.
Statement of Changes in Net Assets
| | Six months ended August 31, 2017 (Unaudited) | Year ended February 28, 2017 |
| Increase (Decrease) in Net Assets | | |
| Operations | | |
| Net investment income (loss) | $5,003,051 | $11,209,051 |
| Net realized gain (loss) | 29,159,114 | 79,390,901 |
| Change in net unrealized appreciation (depreciation) | (26,395,214) | 210,318,275 |
| Net increase (decrease) in net assets resulting from operations | 7,766,951 | 300,918,227 |
| Distributions to shareholders from net investment income | (426,314) | (9,666,149) |
| Distributions to shareholders from net realized gain | (13,729,261) | – |
| Total distributions | (14,155,575) | (9,666,149) |
| Share transactions | | |
| Proceeds from sales of shares | 254,049,186 | 369,367,686 |
| Reinvestment of distributions | 13,794,334 | 9,404,400 |
| Cost of shares redeemed | (210,913,555) | (693,953,459) |
| Net increase (decrease) in net assets resulting from share transactions | 56,929,965 | (315,181,373) |
| Redemption fees | – | 11,423 |
| Total increase (decrease) in net assets | 50,541,341 | (23,917,872) |
| Net Assets | | |
| Beginning of period | 1,019,655,704 | 1,043,573,576 |
| End of period | $1,070,197,045 | $1,019,655,704 |
| Other Information | | |
| Undistributed net investment income end of period | $5,002,152 | $425,415 |
| Shares | | |
| Sold | 2,496,986 | 3,895,979 |
| Issued in reinvestment of distributions | 141,046 | 95,090 |
| Redeemed | (2,105,599) | (8,010,907) |
| Net increase (decrease) | 532,433 | (4,019,838) |
See accompanying notes which are an integral part of the financial statements.
Financial Highlights — Financial Services Portfolio
| | Six months ended (Unaudited) August 31, | Years ended February 28, | | | | |
| | 2017 | 2017 | 2016 A | 2015 | 2014 | 2013 |
| Selected Per–Share Data | | | | | | |
| Net asset value, beginning of period | $103.05 | $75.00 | $88.84 | $80.90 | $65.56 | $57.57 |
| Income from Investment Operations | | | | | | |
| Net investment income (loss)B | .51 | .95 | .87 | .84 | 1.06 | .99 |
| Net realized and unrealized gain (loss) | .54 | 28.09 | (13.34) | 8.75 | 15.03 | 7.75 |
| Total from investment operations | 1.05 | 29.04 | (12.47) | 9.59 | 16.09 | 8.74 |
| Distributions from net investment income | (.04) | (.99) | (.78) | (.89) | (.75) | (.75) |
| Distributions from net realized gain | (1.42) | – | (.59) | (.76) | – | – |
| Total distributions | (1.46) | (.99) | (1.37) | (1.65) | (.75) | (.75) |
| Redemption fees added to paid in capitalB | – | –C | –C | –C | –C | –C |
| Net asset value, end of period | $102.64 | $103.05 | $75.00 | $88.84 | $80.90 | $65.56 |
| Total ReturnD,E | 1.09% | 38.78% | (14.18)% | 11.87% | 24.56% | 15.26% |
| Ratios to Average Net AssetsF,G | | | | | | |
| Expenses before reductions | .78%H | .77% | .76% | .78% | .83% | .87% |
| Expenses net of fee waivers, if any | .78%H | .77% | .76% | .78% | .83% | .87% |
| Expenses net of all reductions | .77%H | .76% | .75% | .78% | .81% | .78% |
| Net investment income (loss) | 1.01%H | 1.10% | 1.01% | .99% | 1.43% | 1.66% |
| Supplemental Data | | | | | | |
| Net assets, end of period (000 omitted) | $1,070,197 | $1,019,656 | $1,043,574 | $1,385,490 | $779,524 | $616,059 |
| Portfolio turnover rateI | 68%H | 84%J | 55% | 42%J | 197% | 271% |
A For the year ended February 29.
B Calculated based on average shares outstanding during the period.
C Amount represents less than $.005 per share.
D Total returns for periods of less than one year are not annualized.
E Total returns would have been lower if certain expenses had not been reduced during the applicable periods shown.
F Fees and expenses of any underlying Fidelity Central Funds are not included in the Fund's expense ratio. The Fund indirectly bears its proportionate share of the expenses of any underlying Fidelity Central Funds.
G Expense ratios reflect operating expenses of the Fund. Expenses before reductions do not reflect amounts reimbursed by the investment adviser or reductions from brokerage service arrangements or reductions from other expense offset arrangements and do not represent the amount paid by the Fund during periods when reimbursements or reductions occur. Expenses net of fee waivers reflect expenses after reimbursement by the investment adviser but prior to reductions from brokerage service arrangements or other expense offset arrangements. Expenses net of all reductions represent the net expenses paid by the Fund.
H Annualized
I Amount does not include the portfolio activity of any underlying Fidelity Central Funds.
J Portfolio turnover rate excludes securities received or delivered in-kind.
See accompanying notes which are an integral part of the financial statements.
Insurance Portfolio
Investment Summary (Unaudited)
Top Ten Stocks as of August 31, 2017
| | % of fund's net assets | % of fund's net assets 6 months ago |
| Chubb Ltd. | 13.0 | 10.0 |
| American International Group, Inc. | 10.5 | 10.0 |
| The Travelers Companies, Inc. | 7.8 | 5.9 |
| MetLife, Inc. | 5.3 | 6.5 |
| Berkshire Hathaway, Inc. Class B | 5.3 | 2.6 |
| Marsh & McLennan Companies, Inc. | 5.3 | 5.3 |
| Reinsurance Group of America, Inc. | 4.6 | 1.9 |
| Principal Financial Group, Inc. | 3.2 | 3.9 |
| Allstate Corp. | 3.0 | 4.2 |
| AFLAC, Inc. | 2.9 | 4.5 |
| | 60.9 | |
Top Industries (% of fund's net assets)
| As of August 31, 2017 |
| | Insurance | 87.4% |
| | Diversified Financial Services | 7.1% |
| | Capital Markets | 2.5% |
| | Consumer Finance | 0.2% |
| | All Others* | 2.8% |

* Includes Short-Term investments and Net Other Assets (Liabilities).
| As of February 28, 2017 |
| | Insurance | 92.5% |
| | Diversified Financial Services | 3.0% |
| | Capital Markets | 1.2% |
| | Banks | 0.3% |
| | Consumer Finance | 0.1% |
| | All Others* | 2.9% |

* Includes Short-Term investments and Net Other Assets (Liabilities).
Insurance Portfolio
Investments August 31, 2017 (Unaudited)
Showing Percentage of Net Assets
| Common Stocks - 97.2% | | | |
| | | Shares | Value |
| Banks - 0.0% | | | |
| Regional Banks - 0.0% | | | |
| Hilltop Holdings, Inc. | | 500 | $11,835 |
| Capital Markets - 2.5% | | | |
| Asset Management & Custody Banks - 2.5% | | | |
| Apollo Global Management LLC Class A | | 127,644 | 3,769,327 |
| Ares Management LP | | 309,014 | 5,608,604 |
| Brighthouse Financial, Inc. | | 51,706 | 2,950,861 |
| | | | 12,328,792 |
| Consumer Finance - 0.2% | | | |
| Consumer Finance - 0.2% | | | |
| J.G. Wentworth Co. (a)(b) | | 179,100 | 35,820 |
| OneMain Holdings, Inc. (a) | | 29,000 | 793,730 |
| | | | 829,550 |
| Diversified Financial Services - 7.1% | | | |
| Multi-Sector Holdings - 5.3% | | | |
| Berkshire Hathaway, Inc. Class B (a) | | 141,700 | 25,670,372 |
| Other Diversified Financial Services - 1.8% | | | |
| Voya Financial, Inc. | | 233,700 | 8,934,351 |
|
| TOTAL DIVERSIFIED FINANCIAL SERVICES | | | 34,604,723 |
|
| Insurance - 87.4% | | | |
| Insurance Brokers - 13.7% | | | |
| Aon PLC | | 88,700 | 12,343,492 |
| Arthur J. Gallagher & Co. | | 198,900 | 11,516,310 |
| Brown & Brown, Inc. | | 211,800 | 9,522,528 |
| Marsh & McLennan Companies, Inc. | | 327,600 | 25,579,008 |
| Willis Group Holdings PLC | | 50,628 | 7,516,739 |
| | | | 66,478,077 |
| Life & Health Insurance - 21.4% | | | |
| AFLAC, Inc. | | 171,200 | 14,132,560 |
| CNO Financial Group, Inc. | | 218,900 | 4,892,415 |
| FBL Financial Group, Inc. Class A | | 300 | 20,400 |
| Genworth Financial, Inc. Class A (a) | | 444,100 | 1,523,263 |
| MetLife, Inc. | | 556,775 | 26,073,773 |
| Primerica, Inc. | | 49,300 | 3,773,915 |
| Principal Financial Group, Inc. | | 249,700 | 15,611,244 |
| Prudential Financial, Inc. | | 118,589 | 12,105,565 |
| Sony Financial Holdings, Inc. | | 518,000 | 8,208,087 |
| Torchmark Corp. | | 100,200 | 7,712,394 |
| Unum Group | | 217,661 | 10,486,907 |
| | | | 104,540,523 |
| Multi-Line Insurance - 14.7% | | | |
| American International Group, Inc. | | 845,400 | 51,129,792 |
| Fairfax Financial Holdings Ltd. | | 4,217 | 2,180,189 |
| Hartford Financial Services Group, Inc. | | 232,900 | 12,592,903 |
| Loews Corp. | | 104,000 | 4,844,320 |
| Zurich Insurance Group AG | | 3,616 | 1,081,840 |
| | | | 71,829,044 |
| Property & Casualty Insurance - 32.0% | | | |
| Allstate Corp. | | 164,100 | 14,851,050 |
| AmTrust Financial Services, Inc. (b) | | 87,900 | 1,089,960 |
| Arch Capital Group Ltd. (a) | | 67,800 | 6,599,652 |
| Argo Group International Holdings, Ltd. | | 16,681 | 1,004,196 |
| Aspen Insurance Holdings Ltd. | | 103,400 | 4,673,680 |
| Assured Guaranty Ltd. | | 107,200 | 4,560,288 |
| Axis Capital Holdings Ltd. | | 14,700 | 885,528 |
| Chubb Ltd. | | 449,505 | 63,568,999 |
| First American Financial Corp. | | 69,300 | 3,399,858 |
| FNF Group | | 109,600 | 5,287,104 |
| FNFV Group (a) | | 21,299 | 358,888 |
| Hanover Insurance Group, Inc. | | 44,000 | 4,319,920 |
| Markel Corp. (a) | | 4,900 | 5,154,751 |
| MBIA, Inc. (a) | | 92,900 | 934,574 |
| Mercury General Corp. | | 200 | 11,494 |
| OneBeacon Insurance Group Ltd. | | 77,420 | 1,410,592 |
| The Travelers Companies, Inc. | | 314,900 | 38,159,582 |
| | | | 156,270,116 |
| Reinsurance - 5.6% | | | |
| Maiden Holdings Ltd. | | 700 | 5,075 |
| Muenchener Rueckversicherungs AG | | 20,600 | 4,252,335 |
| Reinsurance Group of America, Inc. | | 165,933 | 22,309,692 |
| Third Point Reinsurance Ltd. (a) | | 46,300 | 650,515 |
| | | | 27,217,617 |
|
| TOTAL INSURANCE | | | 426,335,377 |
|
| TOTAL COMMON STOCKS | | | |
| (Cost $310,993,284) | | | 474,110,277 |
|
| Nonconvertible Preferred Stocks - 0.0% | | | |
| Insurance - 0.0% | | | |
| Life & Health Insurance - 0.0% | | | |
| Torchmark Corp. 6.125% | | | |
| (Cost $76,079) | | 3,059 | 82,715 |
|
| Money Market Funds - 2.6% | | | |
| Fidelity Cash Central Fund, 1.11% (c) | | 11,948,077 | 11,950,467 |
| Fidelity Securities Lending Cash Central Fund 1.11% (c)(d) | | 869,026 | 869,113 |
| TOTAL MONEY MARKET FUNDS | | | |
| (Cost $12,818,195) | | | 12,819,580 |
| TOTAL INVESTMENT IN SECURITIES - 99.8% | | | |
| (Cost $323,887,558) | | | 487,012,572 |
| NET OTHER ASSETS (LIABILITIES) - 0.2% | | | 1,039,677 |
| NET ASSETS - 100% | | | $488,052,249 |
Legend
(a) Non-income producing
(b) Security or a portion of the security is on loan at period end.
(c) Affiliated fund that is generally available only to investment companies and other accounts managed by Fidelity Investments. The rate quoted is the annualized seven-day yield of the fund at period end. A complete unaudited listing of the fund's holdings as of its most recent quarter end is available upon request. In addition, each Fidelity Central Fund's financial statements are available on the SEC's website or upon request.
(d) Investment made with cash collateral received from securities on loan.
Affiliated Central Funds
Information regarding fiscal year to date income earned by the Fund from investments in Fidelity Central Funds is as follows:
| Fund | Income earned |
| Fidelity Cash Central Fund | $88,592 |
| Fidelity Securities Lending Cash Central Fund | 747 |
| Total | $89,339 |
Investment Valuation
All investments are categorized as Level 1 under the Fair Value Hierarchy. The inputs or methodology used for valuing securities may not be an indication of the risk associated with investing in those securities. For more information on valuation inputs please refer to the Investment Valuation section in the accompanying Notes to Financial Statements.
Other Information
Distribution of investments by country or territory of incorporation, as a percentage of Total Net Assets, is as follows (Unaudited):
| United States of America | 77.3% |
| Switzerland | 13.2% |
| Bermuda | 4.0% |
| United Kingdom | 2.5% |
| Japan | 1.7% |
| Others (Individually Less Than 1%) | 1.3% |
| | 100.0% |
See accompanying notes which are an integral part of the financial statements.
Insurance Portfolio
Financial Statements
Statement of Assets and Liabilities
| | | August 31, 2017 (Unaudited) |
| Assets | | |
Investment in securities, at value (including securities loaned of $819,640) — See accompanying schedule:
Unaffiliated issuers (cost $311,069,363) | $474,192,992 | |
| Fidelity Central Funds (cost $12,818,195) | 12,819,580 | |
| Total Investment in Securities (cost $323,887,558) | | $487,012,572 |
| Cash | | 8,999 |
| Receivable for investments sold | | 2,954,630 |
| Receivable for fund shares sold | | 556,601 |
| Dividends receivable | | 842,834 |
| Distributions receivable from Fidelity Central Funds | | 13,340 |
| Receivable from affiliate | | 9,697 |
| Other receivables | | 2,092 |
| Total assets | | 491,400,765 |
| Liabilities | | |
| Payable for fund shares redeemed | $2,134,442 | |
| Accrued management fee | 229,525 | |
| Other affiliated payables | 97,436 | |
| Other payables and accrued expenses | 18,013 | |
| Collateral on securities loaned | 869,100 | |
| Total liabilities | | 3,348,516 |
| Net Assets | | $488,052,249 |
| Net Assets consist of: | | |
| Paid in capital | | $266,833,733 |
| Undistributed net investment income | | 4,398,384 |
| Accumulated undistributed net realized gain (loss) on investments and foreign currency transactions | | 53,693,001 |
| Net unrealized appreciation (depreciation) on investments and assets and liabilities in foreign currencies | | 163,127,131 |
| Net Assets, for 5,880,671 shares outstanding | | $488,052,249 |
| Net Asset Value, offering price and redemption price per share ($488,052,249 ÷ 5,880,671 shares) | | $82.99 |
See accompanying notes which are an integral part of the financial statements.
Statement of Operations
| | | Six months ended August 31, 2017 (Unaudited) |
| Investment Income | | |
| Dividends | | $6,541,164 |
| Income from Fidelity Central Funds | | 89,339 |
| Total income | | 6,630,503 |
| Expenses | | |
| Management fee | $1,544,918 | |
| Transfer agent fees | 523,352 | |
| Accounting and security lending fees | 106,517 | |
| Custodian fees and expenses | 5,256 | |
| Independent trustees' fees and expenses | 6,788 | |
| Registration fees | 26,283 | |
| Audit | 18,813 | |
| Legal | 4,752 | |
| Miscellaneous | 4,173 | |
| Total expenses before reductions | 2,240,852 | |
| Expense reductions | (8,823) | 2,232,029 |
| Net investment income (loss) | | 4,398,474 |
| Realized and Unrealized Gain (Loss) | | |
| Net realized gain (loss) on: | | |
| Investment securities: | | |
| Unaffiliated issuers | 55,294,816 | |
| Fidelity Central Funds | 319 | |
| Foreign currency transactions | (13,776) | |
| Total net realized gain (loss) | | 55,281,359 |
| Change in net unrealized appreciation (depreciation) on: | | |
| Investment securities: | | |
| Unaffiliated issuers | (40,205,871) | |
| Fidelity Central Funds | (306) | |
| Assets and liabilities in foreign currencies | 2,719 | |
| Total change in net unrealized appreciation (depreciation) | | (40,203,458) |
| Net gain (loss) | | 15,077,901 |
| Net increase (decrease) in net assets resulting from operations | | $19,476,375 |
See accompanying notes which are an integral part of the financial statements.
Statement of Changes in Net Assets
| | Six months ended August 31, 2017 (Unaudited) | Year ended February 28, 2017 |
| Increase (Decrease) in Net Assets | | |
| Operations | | |
| Net investment income (loss) | $4,398,474 | $7,889,074 |
| Net realized gain (loss) | 55,281,359 | 4,129,500 |
| Change in net unrealized appreciation (depreciation) | (40,203,458) | 143,124,773 |
| Net increase (decrease) in net assets resulting from operations | 19,476,375 | 155,143,347 |
| Distributions to shareholders from net investment income | (985,294) | (7,613,475) |
| Distributions to shareholders from net realized gain | (2,384,262) | (9,708,827) |
| Total distributions | (3,369,556) | (17,322,302) |
| Share transactions | | |
| Proceeds from sales of shares | 64,663,582 | 240,670,672 |
| Reinvestment of distributions | 3,251,922 | 16,799,725 |
| Cost of shares redeemed | (243,762,755) | (207,368,304) |
| Net increase (decrease) in net assets resulting from share transactions | (175,847,251) | 50,102,093 |
| Redemption fees | 5,539 | 9,719 |
| Total increase (decrease) in net assets | (159,734,893) | 187,932,857 |
| Net Assets | | |
| Beginning of period | 647,787,142 | 459,854,285 |
| End of period | $488,052,249 | $647,787,142 |
| Other Information | | |
| Undistributed net investment income end of period | $4,398,384 | $985,204 |
| Shares | | |
| Sold | 788,939 | 3,320,634 |
| Issued in reinvestment of distributions | 41,127 | 236,373 |
| Redeemed | (2,986,569) | (2,802,254) |
| Net increase (decrease) | (2,156,503) | 754,753 |
See accompanying notes which are an integral part of the financial statements.
Financial Highlights — Insurance Portfolio
| | Six months ended (Unaudited) August 31, | Years ended February 28, | | | | |
| | 2017 | 2017 | 2016 A | 2015 | 2014 | 2013 |
| Selected Per–Share Data | | | | | | |
| Net asset value, beginning of period | $80.60 | $63.15 | $66.87 | $66.08 | $56.81 | $47.56 |
| Income from Investment Operations | | | | | | |
| Net investment income (loss)B | .63 | .99 | .89 | .96 | .75 | .68 |
| Net realized and unrealized gain (loss) | 2.21 | 18.64 | (2.50) | 7.13 | 13.75 | 10.06 |
| Total from investment operations | 2.84 | 19.63 | (1.61) | 8.09 | 14.50 | 10.74 |
| Distributions from net investment income | (.13) | (.89) | (.74) | (.96) | (.61) | (.52) |
| Distributions from net realized gain | (.32) | (1.29) | (1.37) | (6.34) | (4.62) | (.97) |
| Total distributions | (.45) | (2.18) | (2.11) | (7.30) | (5.23) | (1.49) |
| Redemption fees added to paid in capitalB,C | – | – | – | – | – | – |
| Net asset value, end of period | $82.99 | $80.60 | $63.15 | $66.87 | $66.08 | $56.81 |
| Total ReturnD,E | 3.55% | 31.60% | (2.54)% | 13.01% | 25.82% | 22.91% |
| Ratios to Average Net AssetsF,G | | | | | | |
| Expenses before reductions | .79%H | .80% | .80% | .81% | .83% | .87% |
| Expenses net of fee waivers, if any | .79%H | .79% | .80% | .81% | .83% | .87% |
| Expenses net of all reductions | .79%H | .79% | .80% | .81% | .82% | .85% |
| Net investment income (loss) | 1.55%H | 1.37% | 1.32% | 1.44% | 1.17% | 1.35% |
| Supplemental Data | | | | | | |
| Net assets, end of period (000 omitted) | $488,052 | $647,787 | $459,854 | $401,818 | $430,482 | $307,071 |
| Portfolio turnover rateI | 29%H | 16% | 25% | 26% | 126% | 157% |
A For the year ended February 29.
B Calculated based on average shares outstanding during the period.
C Amount represents less than $.005 per share.
D Total returns for periods of less than one year are not annualized.
E Total returns would have been lower if certain expenses had not been reduced during the applicable periods shown.
F Fees and expenses of any underlying Fidelity Central Funds are not included in the Fund's expense ratio. The Fund indirectly bears its proportionate share of the expenses of any underlying Fidelity Central Funds.
G Expense ratios reflect operating expenses of the Fund. Expenses before reductions do not reflect amounts reimbursed by the investment adviser or reductions from brokerage service arrangements or reductions from other expense offset arrangements and do not represent the amount paid by the Fund during periods when reimbursements or reductions occur. Expenses net of fee waivers reflect expenses after reimbursement by the investment adviser but prior to reductions from brokerage service arrangements or other expense offset arrangements. Expenses net of all reductions represent the net expenses paid by the Fund.
H Annualized
I Amount does not include the portfolio activity of any underlying Fidelity Central Funds.
See accompanying notes which are an integral part of the financial statements.
Notes to Financial Statements (Unaudited)
For the period ended August 31, 2017
1. Organization.
Banking Portfolio, Brokerage and Investment Management Portfolio, Consumer Finance Portfolio, Financial Services Portfolio, and Insurance Portfolio (the Funds) are funds of Fidelity Select Portfolios (the Trust). The Trust is registered under the Investment Company Act of 1940, as amended (the 1940 Act), as an open-end management investment company organized as a Massachusetts business trust. The Funds are non-diversified with the exception of Financial Services Portfolio and Banking Portfolio. The Funds invest primarily in securities of companies whose principal business activities fall within specific industries. Each Fund is authorized to issue an unlimited number of shares. Share transactions on the Statement of Changes in Net Assets may contain exchanges between affiliated funds.
2. Investments in Fidelity Central Funds.
The Funds invest in Fidelity Central Funds, which are open-end investment companies generally available only to other investment companies and accounts managed by the investment adviser and its affiliates. The Funds' Schedules of Investments list each of the Fidelity Central Funds held as of period end, if any, as an investment of each Fund, but does not include the underlying holdings of each Fidelity Central Fund. As an Investing Fund, each Fund indirectly bears its proportionate share of the expenses of the underlying Fidelity Central Funds.
The Money Market Central Funds seek preservation of capital and current income and are managed by Fidelity Investments Money Management, Inc. (FIMM), an affiliate of the investment adviser. Annualized expenses of the Money Market Central Funds as of their most recent shareholder report date are less than .005%.
A complete unaudited list of holdings for each Fidelity Central Fund is available upon request or at the Securities and Exchange Commission (the SEC) website at www.sec.gov. In addition, the financial statements of the Fidelity Central Funds are available on the SEC website or upon request.
3. Significant Accounting Policies.
Each Fund is an investment company and applies the accounting and reporting guidance of the Financial Accounting Standards Board (FASB) Accounting Standards Codification Topic 946 Financial Services – Investments Companies. The financial statements have been prepared in conformity with accounting principles generally accepted in the United States of America (GAAP), which require management to make certain estimates and assumptions at the date of the financial statements. Actual results could differ from those estimates. Subsequent events, if any, through the date that the financial statements were issued have been evaluated in the preparation of the financial statements. The following summarizes the significant accounting policies of the Funds:
Investment Valuation. Investments are valued as of 4:00 p.m. Eastern time on the last calendar day of the period. The Board of Trustees (the Board) has delegated the day to day responsibility for the valuation of each Fund's investments to the Fair Value Committee (the Committee) established by each Fund's investment adviser. In accordance with valuation policies and procedures approved by the Board, each Fund attempts to obtain prices from one or more third party pricing vendors or brokers to value its investments. When current market prices, quotations or currency exchange rates are not readily available or reliable, investments will be fair valued in good faith by the Committee, in accordance with procedures adopted by the Board. Factors used in determining fair value vary by investment type and may include market or investment specific events. The frequency with which these procedures are used cannot be predicted and they may be utilized to a significant extent. The Committee oversees each Fund's valuation policies and procedures and reports to the Board on the Committee's activities and fair value determinations. The Board monitors the appropriateness of the procedures used in valuing each Fund's investments and ratifies the fair value determinations of the Committee.
Each Fund categorizes the inputs to valuation techniques used to value its investments into a disclosure hierarchy consisting of three levels as shown below:
- Level 1 – quoted prices in active markets for identical investments
- Level 2 – other significant observable inputs (including quoted prices for similar investments, interest rates, prepayment speeds, etc.)
- Level 3 – unobservable inputs (including the Fund's own assumptions based on the best information available)
Valuation techniques used to value each Fund's investments by major category are as follows:
Equity securities, including restricted securities, for which market quotations are readily available, are valued at the last reported sale price or official closing price as reported by a third party pricing vendor on the primary market or exchange on which they are traded and are categorized as Level 1 in the hierarchy. In the event there were no sales during the day or closing prices are not available, securities are valued at the last quoted bid price or may be valued using the last available price and are generally categorized as Level 2 in the hierarchy. For foreign equity securities, when market or security specific events arise, comparisons to the valuation of American Depositary Receipts (ADRs), futures contracts, Exchange-Traded Funds (ETFs) and certain indexes as well as quoted prices for similar securities may be used and would be categorized as Level 2 in the hierarchy. Utilizing these techniques may result in transfers between Level 1 and Level 2. For equity securities, including restricted securities, where observable inputs are limited, assumptions about market activity and risk are used and these securities may be categorized as Level 3 in the hierarchy.
Investments in open-end mutual funds, including the Fidelity Central Funds, are valued at their closing net asset value (NAV) each business day and are categorized as Level 1 in the hierarchy.
Changes in valuation techniques may result in transfers in or out of an assigned level within the disclosure hierarchy. The aggregate value of investments by input level as of August 31, 2017 is included at the end of each applicable Fund's Schedule of Investments.
Foreign Currency. The Funds may use foreign currency contracts to facilitate transactions in foreign-denominated securities. Gains and losses from these transactions may arise from changes in the value of the foreign currency or if the counterparties do not perform under the contracts' terms.
Foreign-denominated assets, including investment securities, and liabilities are translated into U.S. dollars at the exchange rates at period end. Purchases and sales of investment securities, income and dividends received and expenses denominated in foreign currencies are translated into U.S. dollars at the exchange rate in effect on the transaction date.
The effects of exchange rate fluctuations on investments are included with the net realized and unrealized gain (loss) on investment securities. Other foreign currency transactions resulting in realized and unrealized gain (loss) are disclosed separately.
Investment Transactions and Income. For financial reporting purposes, the Funds' investment holdings and NAV include trades executed through the end of the last business day of the period. The NAV per share for processing shareholder transactions is calculated as of the close of business of the New York Stock Exchange (NYSE), normally 4:00 p.m. Eastern time and includes trades executed through the end of the prior business day. Gains and losses on securities sold are determined on the basis of identified cost and may include proceeds received from litigation. Dividend income is recorded on the ex-dividend date, except for certain dividends from foreign securities where the ex-dividend date may have passed, which are recorded as soon as the Funds are informed of the ex-dividend date. Non-cash dividends included in dividend income, if any, are recorded at the fair market value of the securities received. Income and capital gain distributions from Fidelity Central Funds, if any, are recorded on the ex-dividend date. Certain distributions received by the Funds represent a return of capital or capital gain. The Funds determine the components of these distributions subsequent to the ex-dividend date, based upon receipt of tax filings or other correspondence relating to the underlying investment. These distributions are recorded as a reduction of cost of investments and/or as a realized gain. Investment income is recorded net of foreign taxes withheld where recovery of such taxes is uncertain.
Expenses. Expenses directly attributable to a fund are charged to that fund. Expenses attributable to more than one fund are allocated among the respective funds on the basis of relative net assets or other appropriate methods. Expense estimates are accrued in the period to which they relate and adjustments are made when actual amounts are known.
Deferred Trustee Compensation. Under a Deferred Compensation Plan (the Plan) for Brokerage and Investment Management Portfolio, independent Trustees may elect to defer receipt of a portion of their annual compensation. Deferred amounts are invested in a cross-section of Fidelity funds, are marked-to-market and remain in the Fund until distributed in accordance with the Plan. The investment of deferred amounts and the offsetting payable to the Trustees are included in the accompanying Statement of Assets and Liabilities.
Income Tax Information and Distributions to Shareholders. Each year, each Fund intends to qualify as a regulated investment company under Subchapter M of the Internal Revenue Code, including distributing substantially all of its taxable income and realized gains. As a result, no provision for U.S. Federal income taxes is required. Each Fund files a U.S. federal tax return, in addition to state and local tax returns as required. Each Fund's federal income tax returns are subject to examination by the Internal Revenue Service (IRS) for a period of three fiscal years after they are filed. State and local tax returns may be subject to examination for an additional fiscal year depending on the jurisdiction. Foreign taxes are provided for based on each Fund's understanding of the tax rules and rates that exist in the foreign markets in which it invests.
Distributions are declared and recorded on the ex-dividend date. Income and capital gain distributions are determined in accordance with income tax regulations, which may differ from GAAP.
Capital accounts within the financial statements are adjusted for permanent book-tax differences. These adjustments have no impact on net assets or the results of operations. Capital accounts are not adjusted for temporary book-tax differences which will reverse in a subsequent period.
Book-tax differences are primarily due to foreign currency transactions, equity-debt classifications, redemptions in kind, partnerships, deferred trustees' compensation, capital loss carryforwards, expiring capital loss carryforwards and losses deferred due to wash sales and excise tax regulations.
As of period end, the cost and unrealized appreciation (depreciation) in securities, and derivatives if applicable, for federal income tax purposes were as follows for each Fund:
| | Tax cost | Gross unrealized appreciation | Gross unrealized depreciation | Net unrealized appreciation (depreciation) |
| Banking Portfolio | $758,198,774 | $206,084,502 | $(19,242,575) | $186,841,927 |
| Brokerage and Investment Management Portfolio | 395,031,724 | 68,946,403 | (4,789,500) | 64,156,903 |
| Consumer Finance Portfolio | 73,966,858 | 23,857,528 | (1,581,255) | 22,276,273 |
| Financial Services Portfolio | 895,516,609 | 184,061,841 | (11,870,239) | 172,191,602 |
| Insurance Portfolio | 325,541,327 | 164,156,020 | (2,684,775) | 161,471,245 |
Capital loss carryforwards are only available to offset future capital gains of the Funds to the extent provided by regulations and may be limited. Under the Regulated Investment Company Modernization Act of 2010 (the Act), the Funds are permitted to carry forward capital losses incurred in taxable years beginning after December 22, 2010 for an unlimited period and such capital losses are required to be used prior to any losses that expire. The capital loss carryforward information presented below, including any applicable limitation, is estimated as of prior fiscal period end and is subject to adjustment.
| | Fiscal year of expiration | | |
| | 2018 | 2019 | Total with expiration |
| Consumer Finance Portfolio | $(10,657,800) | $(1,011,664) | $(11,669,464) |
| | No expiration | | | |
| | Short-term | Long-term | Total no expiration | Total capital loss carryforward |
| Banking Portfolio | $(11,016,532) | $(5,087,108) | $(16,103,640) | $(16,103,640) |
| Consumer Finance Portfolio | – | – | – | (11,669,464) |
Due to large subscriptions in a prior period, $11,669,464 of capital losses that will be available to offset future capital gains of the Consumer Finance Portfolio will be limited to approximately $5,418,625 per year.
Trading (Redemption) Fees. Shares held by investors in Banking Portfolio, Brokerage and Investment Management Portfolio, Consumer Finance Portfolio, and Insurance Portfolio less than 30 days may be subject to a redemption fee equal to .75% of the NAV of shares redeemed. All redemption fees, which reduce the proceeds of the shareholder redemption, are retained by the applicable fund and accounted for as an addition to paid in capital.
4. Purchases and Sales of Investments.
Purchases and sales of securities, other than short-term securities, are noted in the table below.
| | Purchases ($) | Sales ($) |
| Banking Portfolio | 188,950,522 | 408,334,431 |
| Brokerage and Investment Management Portfolio | 178,834,218 | 144,530,148 |
| Consumer Finance Portfolio | 21,480,188 | 28,919,634 |
| Financial Services Portfolio | 387,242,229 | 334,581,451 |
| Insurance Portfolio | 78,378,910 | 241,749,806 |
5. Fees and Other Transactions with Affiliates.
Management Fee. Fidelity SelectCo, LLC (the investment adviser) and its affiliates provide the Funds with investment management related services for which the Funds pay a monthly management fee. The management fee is the sum of an individual fund fee rate and an annualized group fee rate. The individual fund fee rate is applied to each Fund's average net assets. The group fee rate is based upon the average net assets of all the mutual funds advised by Fidelity Management & Research Company (FMR) and the investment adviser. The group fee rate decreases as assets under management increase and increases as assets under management decrease. For the reporting period, each Fund's annualized management fee rate expressed as a percentage of each Fund's average net assets was as follows:
| | Individual Rate | Group Rate | Total |
| Banking Portfolio | .30% | .25% | .54% |
| Brokerage and Investment Management Portfolio | .30% | .25% | .54% |
| Consumer Finance Portfolio | .30% | .25% | .54% |
| Financial Services Portfolio | .30% | .25% | .54% |
| Insurance Portfolio | .30% | .25% | .54% |
Transfer Agent Fees. Fidelity Investments Institutional Operations Company, Inc. (FIIOC), an affiliate of the investment adviser, is the Funds' transfer, dividend disbursing and shareholder servicing agent. FIIOC receives account fees and asset-based fees that vary according to account size and type of account. FIIOC pays for typesetting, printing and mailing of shareholder reports, except proxy statements. For the period, transfer agent fees were equivalent to the following annualized rates expressed as a percentage of average net assets:
| Banking Portfolio | .18% |
| Brokerage and Investment Management Portfolio | .18% |
| Consumer Finance Portfolio | .25% |
| Financial Services Portfolio | .18% |
| Insurance Portfolio | .18% |
Accounting and Security Lending Fees. Fidelity Service Company, Inc. (FSC), an affiliate of the investment adviser, maintains each Fund's accounting records. The accounting fee is based on the level of average net assets for each month. Under a separate contract, FSC administers the security lending program. The security lending fee is based on the number and duration of lending transactions.
Brokerage Commissions. Certain Funds placed a portion of their portfolio transactions with brokerage firms which are affiliates of the investment adviser. Brokerage commissions are included in net realized gain (loss) and change in net unrealized appreciation (depreciation) in the Statement of Operations. The commissions paid to these affiliated firms were as follows:
| | Amount |
| Banking Portfolio | $8,558 |
| Brokerage and Investment Management Portfolio | 2,709 |
| Consumer Finance Portfolio | 1,784 |
| Financial Services Portfolio | 5,854 |
| Insurance Portfolio | 1,478 |
Interfund Lending Program. Pursuant to an Exemptive Order issued by the SEC, the Funds, along with other registered investment companies having management contracts with FMR or other affiliated entities of FMR, may participate in an interfund lending program. This program provides an alternative credit facility allowing the funds to borrow from, or lend money to, other participating affiliated funds. At period end, there were no interfund loans outstanding. Each applicable fund's activity in this program during the period for which loans were outstanding was as follows:
| | Borrower or Lender | Average Loan Balance | Weighted Average Interest Rate | Interest Expense |
| Banking Portfolio | Borrower | $4,743,667 | 1.10% | $867 |
Interfund Trades. The Funds may purchase from or sell securities to other Fidelity Funds under procedures adopted by the Board. The procedures have been designed to ensure these interfund trades are executed in accordance with Rule 17a-7 of the 1940 Act. Interfund trades are included within the respective purchases and sales amounts shown in the Purchases and Sales of Investments note.
Prior Fiscal Year Redemptions In-Kind. During the prior period, 3,248,246 shares of Financial Services Portfolio held by an affiliated entity were redeemed in-kind for investments and cash with a value of $276,003,424. The Fund had a net realized gain of $46,242,607 on investments delivered through in-kind redemptions. The amount of in-kind redemptions is included in share transactions in the accompanying Statement of Changes in Net Assets. Financial Services Portfolio recognized no gain or loss for federal income tax purposes.
Other. During the period, Insurance Portfolio recorded a reimbursement of $9,697 for an Operational error. This amount is included in Share Transactions in the accompanying Statement of Changes in Net Assets, and will settle subsequent to period end.
6. Committed Line of Credit.
Certain Funds participate with other funds managed by the investment adviser or an affiliate in a $4.25 billion credit facility (the "line of credit") to be utilized for temporary or emergency purposes to fund shareholder redemptions or for other short-term liquidity purposes. The participating funds have agreed to pay commitment fees on their pro-rata portion of the line of credit, which are reflected in Miscellaneous expenses on the Statement of Operations, and are as follows:
| Banking Portfolio | $1,863 |
| Brokerage and Investment Management Portfolio | 645 |
| Consumer Finance Portfolio | 160 |
| Financial Services Portfolio | 1,574 |
| Insurance Portfolio | 1,020 |
During the period, the Funds did not borrow on this line of credit.
7. Security Lending.
Certain Funds lend portfolio securities through a lending agent from time to time in order to earn additional income. On the settlement date of the loan, each applicable Fund receives collateral (in the form of U.S. Treasury obligations, letters of credit and/or cash) against the loaned securities and maintains collateral in an amount not less than 100% of the market value of the loaned securities during the period of the loan. The market value of the loaned securities is determined at the close of business of the Funds and any additional required collateral is delivered to the Funds on the next business day. The Funds or borrower may terminate the loan at any time, and if the borrower defaults on its obligation to return the securities loaned because of insolvency or other reasons, the Funds may apply collateral received from the borrower against the obligation. The Funds may experience delays and costs in recovering the securities loaned. Any cash collateral received is invested in the Fidelity Securities Lending Cash Central Fund. The value of loaned securities and cash collateral at period end are disclosed on each applicable Fund's Statement of Assets and Liabilities. Security lending income represents the income earned on investing cash collateral, less rebates paid to borrowers and any lending agent fees associated with the loan, plus any premium payments received for lending certain types of securities. Security lending income is presented on each applicable Fund's Statement of Operations as a component of income from Fidelity Central Funds. Security lending activity was as follows:
| | Total Security Lending Income |
| Banking Portfolio | $7,298 |
| Brokerage and Investment Management Portfolio | 25,670 |
| Consumer Finance Portfolio | 35,846 |
| Financial Services Portfolio | 2,651 |
| Insurance Portfolio | 747 |
8. Expense Reductions.
Commissions paid to certain brokers with whom the investment adviser, or its affiliates, places trades on behalf of Certain Funds include an amount in addition to trade execution, which may be rebated back to the Funds to offset certain expenses. In addition, through arrangements with each applicable Fund's custodian, credits realized as a result of certain uninvested cash balances were used to reduce each applicable Fund's expenses. All of the applicable expense reductions are noted in the table below.
| | Brokerage Service reduction | Custody
expense
reduction |
| Banking Portfolio | $25,414 | $– |
| Brokerage and Investment Management Portfolio | 20,260 | 49 |
| Consumer Finance Portfolio | 7,444 | – |
| Financial Services Portfolio | 17,590 | – |
| Insurance Portfolio | 5,410 | 7 |
In addition, during the period the investment adviser reimbursed and/or waived a portion of operating expenses as follows:
| | Amount |
| Banking Portfolio | $5,014 |
| Brokerage and Investment Management Portfolio | 1,821 |
| Consumer Finance Portfolio | 488 |
| Financial Services Portfolio | 4,812 |
| Insurance Portfolio | 3,406 |
9. Other.
The Funds' organizational documents provide former and current trustees and officers with a limited indemnification against liabilities arising in connection with the performance of their duties to the Funds. In the normal course of business, the Funds may also enter into contracts that provide general indemnifications. The Funds' maximum exposure under these arrangements is unknown as this would be dependent on future claims that may be made against the Funds. The risk of material loss from such claims is considered remote.
At the end of the period, the following mutual funds managed by the investment adviser or its affiliates were the owners of record of 10% or more of the total outstanding shares of the following Funds.
| | VIP FundsManager 50% Portfolio | VIP FundsManager 60% Portfolio |
| Banking Portfolio | 11% | 16% |
| Financial Services Portfolio | 16% | 18% |
| Insurance Portfolio | 12% | 15% |
Mutual funds managed by the investment adviser or its affiliates, in aggregate, were the owners of record of more than 20% of the total outstanding shares of the following Funds.
| | % of shares held |
| Banking Portfolio | 31% |
| Financial Services Portfolio | 41% |
| Insurance Portfolio | 33% |
Shareholder Expense Example
As a shareholder of the Fund, you incur two types of costs: (1) transaction costs, including redemption fees and (2) ongoing costs, including management fees and other Fund expenses. This Example is intended to help you understand your ongoing costs (in dollars) of investing in the Fund and to compare these costs with the ongoing costs of investing in other mutual funds.
The Example is based on an investment of $1,000 invested at the beginning of the period and held for the entire period (March 1, 2017 to August 31, 2017).
Actual Expenses
The first line of the accompanying table provides information about actual account values and actual expenses. You may use the information in this line, together with the amount you invested, to estimate the expenses that you paid over the period. Simply divide your account value by $1,000.00 (for example, an $8,600 account value divided by $1,000.00 = 8.6), then multiply the result by the number in the first line under the heading entitled "Expenses Paid During Period" to estimate the expenses you paid on your account during this period. A small balance maintenance fee of $12.00 that is charged once a year may apply for certain accounts with a value of less than $2,000. This fee is not included in the table below. If it was, the estimate of expenses you paid during the period would be higher, and your ending account value lower, by this amount. In addition, the Fund, as a shareholder in the underlying Fidelity Central Funds, will indirectly bear its pro-rata share of the fees and expenses incurred by the underlying Fidelity Central Funds. These fees and expenses are not included in the Fund's annualized expense ratio used to calculate the expense estimate in the table below.
Hypothetical Example for Comparison Purposes
The second line of the accompanying table provides information about hypothetical account values and hypothetical expenses based on the Fund's actual expense ratio and an assumed rate of return of 5% per year before expenses, which is not the Fund's actual return. The hypothetical account values and expenses may not be used to estimate the actual ending account balance or expenses you paid for the period. You may use this information to compare the ongoing costs of investing in the Fund and other funds. To do so, compare this 5% hypothetical example with the 5% hypothetical examples that appear in the shareholder reports of the other funds. A small balance maintenance fee of $12.00 that is charged once a year may apply for certain accounts with a value of less than $2,000. This fee is not included in the table below. If it was, the estimate of expenses you paid during the period would be higher, and your ending account value lower, by this amount. In addition, the Fund, as a shareholder in the underlying Fidelity Central Funds, will indirectly bear its pro-rata share of the fees and expenses incurred by the underlying Fidelity Central Funds. These fees and expenses are not included in the Fund's annualized expense ratio used to calculate the expense estimate in the table below.
Please note that the expenses shown in the table are meant to highlight your ongoing costs only and do not reflect any transaction costs. Therefore, the second line of the table is useful in comparing ongoing costs only, and will not help you determine the relative total costs of owning different funds. In addition, if these transactional costs were included, your costs would have been higher.
| | Annualized Expense RatioA | Beginning
Account Value
March 1, 2017 | Ending
Account Value
August 31, 2017 | Expenses Paid
During Period-B
March 1, 2017
to August 31, 2017 |
| Banking Portfolio | .78% | | | |
| Actual | | $1,000.00 | $942.80 | $3.82 |
| Hypothetical-C | | $1,000.00 | $1,021.27 | $3.97 |
| Brokerage and Investment Management Portfolio | .79% | | | |
| Actual | | $1,000.00 | $1,073.20 | $4.13 |
| Hypothetical-C | | $1,000.00 | $1,021.22 | $4.02 |
| Consumer Finance Portfolio | .91% | | | |
| Actual | | $1,000.00 | $1,034.00 | $4.67 |
| Hypothetical-C | | $1,000.00 | $1,020.62 | $4.63 |
| Financial Services Portfolio | .78% | | | |
| Actual | | $1,000.00 | $1,010.90 | $3.95 |
| Hypothetical-C | | $1,000.00 | $1,021.27 | $3.97 |
| Insurance Portfolio | .79% | | | |
| Actual | | $1,000.00 | 1,035.50 | $4.05 |
| Hypothetical-C | | $1,000.00 | $1,021.22 | $4.02 |
A Annualized expense ratio reflects expenses net of applicable fee waivers.
B Expenses are equal to each Fund's annualized expense ratio, multiplied by the average account value over the period, multiplied by 184/ 365 (to reflect the one-half year period).
C 5% return per year before expenses
SELFIN-SANN-1017
1.813666.112
Fidelity® Select Portfolios®
Consumer Staples Sector Consumer Staples Portfolio
Semi-Annual Report August 31, 2017 |
|
Contents
To view a fund's proxy voting guidelines and proxy voting record for the 12-month period ended June 30, visit http://www.fidelity.com/proxyvotingresults or visit the Securities and Exchange Commission's (SEC) web site at http://www.sec.gov.
You may also call 1-800-544-8544 to request a free copy of the proxy voting guidelines.
Standard & Poor's, S&P and S&P 500 are registered service marks of The McGraw-Hill Companies, Inc. and have been licensed for use by Fidelity Distributors Corporation.
Other third-party marks appearing herein are the property of their respective owners.
All other marks appearing herein are registered or unregistered trademarks or service marks of FMR LLC or an affiliated company. © 2017 FMR LLC. All rights reserved.
This report and the financial statements contained herein are submitted for the general information of the shareholders of the Fund. This report is not authorized for distribution to prospective investors in the Fund unless preceded or accompanied by an effective prospectus.
A fund files its complete schedule of portfolio holdings with the SEC for the first and third quarters of each fiscal year on Form N-Q. Forms N-Q are available on the SEC’s web site at http://www.sec.gov. A fund's Forms N-Q may be reviewed and copied at the SEC’s Public Reference Room in Washington, DC. Information regarding the operation of the SEC's Public Reference Room may be obtained by calling 1-800-SEC-0330.
For a complete list of a fund's portfolio holdings, view the most recent holdings listing, semiannual report, or annual report on Fidelity's web site at http://www.fidelity.com, http://www.institutional.fidelity.com, or http://www.401k.com, as applicable.
NOT FDIC INSURED •MAY LOSE VALUE •NO BANK GUARANTEE
Neither the Fund nor Fidelity Distributors Corporation is a bank.
Investment Summary (Unaudited)
Top Ten Stocks as of August 31, 2017
| | % of fund's net assets | % of fund's net assets 6 months ago |
| British American Tobacco PLC sponsored ADR | 14.2 | 11.6 |
| Philip Morris International, Inc. | 14.1 | 11.7 |
| CVS Health Corp. | 9.2 | 8.4 |
| Kroger Co. | 5.4 | 6.0 |
| The Coca-Cola Co. | 5.3 | 4.9 |
| Colgate-Palmolive Co. | 4.8 | 3.8 |
| Estee Lauder Companies, Inc. Class A | 4.8 | 4.8 |
| Monster Beverage Corp. | 3.8 | 3.1 |
| Procter & Gamble Co. | 3.1 | 3.9 |
| Anheuser-Busch InBev SA NV | 2.9 | 2.5 |
| | 67.6 | |
Top Industries (% of fund's net assets)
| As of August 31, 2017 |
| | Tobacco | 31.1% |
| | Food & Staples Retailing | 18.5% |
| | Beverages | 17.7% |
| | Food Products | 11.3% |
| | Personal Products | 10.2% |
| | All Others* | 11.2% |

* Includes Short-Term investments and Net Other Assets (Liabilities).
| As of February 28, 2017 |
| | Tobacco | 33.8% |
| | Food & Staples Retailing | 17.6% |
| | Beverages | 16.6% |
| | Food Products | 10.4% |
| | Personal Products | 9.7% |
| | All Others* | 11.9% |

* Includes Short-Term investments and Net Other Assets (Liabilities).
Investments August 31, 2017 (Unaudited)
Showing Percentage of Net Assets
| Common Stocks - 99.2% | | | |
| | | Shares | Value |
| Beverages - 17.5% | | | |
| Brewers - 3.9% | | | |
| Anheuser-Busch InBev SA NV | | 640,690 | $75,877,560 |
| China Resources Beer Holdings Co. Ltd. | | 2,798,000 | 7,022,039 |
| Molson Coors Brewing Co. Class B | | 244,200 | 21,916,950 |
| | | | 104,816,549 |
| Distillers & Vintners - 2.7% | | | |
| Constellation Brands, Inc. Class A (sub. vtg.) | | 203,300 | 40,680,330 |
| Kweichow Moutai Co. Ltd. (A Shares) | | 105,853 | 7,889,300 |
| Pernod Ricard SA | | 111,076 | 15,180,053 |
| Wuliangye Yibin Co. Ltd. Class A | | 867,109 | 7,301,458 |
| | | | 71,051,141 |
| Soft Drinks - 10.9% | | | |
| Britvic PLC | | 1,513,964 | 14,790,475 |
| Coca-Cola Bottling Co. Consolidated | | 75,144 | 16,050,007 |
| Coca-Cola FEMSA S.A.B. de CV sponsored ADR | | 64,529 | 5,280,408 |
| Coca-Cola Icecek Sanayi A/S | | 402,162 | 4,674,190 |
| Embotelladora Andina SA Series A sponsored ADR Series A | | 216,511 | 5,202,759 |
| Monster Beverage Corp. (a) | | 1,798,702 | 100,403,546 |
| The Coca-Cola Co. | | 3,103,718 | 141,374,355 |
| | | | 287,775,740 |
|
| TOTAL BEVERAGES | | | 463,643,430 |
|
| Diversified Financial Services - 0.2% | | | |
| Other Diversified Financial Services - 0.2% | | | |
| The Simply Good Foods Co. | | 360,100 | 4,267,185 |
| Food & Staples Retailing - 18.5% | | | |
| Drug Retail - 13.1% | | | |
| CVS Health Corp. | | 3,140,703 | 242,901,970 |
| Drogasil SA | | 328,600 | 7,239,357 |
| Rite Aid Corp. (a) | | 9,452,063 | 22,873,992 |
| Walgreens Boots Alliance, Inc. | | 893,324 | 72,805,906 |
| | | | 345,821,225 |
| Food Retail - 5.4% | | | |
| Kroger Co. | | 6,592,770 | 144,183,880 |
|
| TOTAL FOOD & STAPLES RETAILING | | | 490,005,105 |
|
| Food Products - 11.3% | | | |
| Agricultural Products - 2.7% | | | |
| Bunge Ltd. | | 952,135 | 71,057,835 |
| Packaged Foods & Meats - 8.6% | | | |
| Amplify Snack Brands, Inc. (a)(b) | | 1,342,368 | 9,678,473 |
| Blue Buffalo Pet Products, Inc. (a) | | 680,771 | 17,536,661 |
| Dean Foods Co. | | 1,808,400 | 19,892,400 |
| Mondelez International, Inc. | | 1,472,558 | 59,874,208 |
| Nestle SA (Reg. S) | | 165,250 | 14,009,225 |
| The Hain Celestial Group, Inc. (a) | | 623,766 | 25,087,869 |
| The J.M. Smucker Co. | | 234,500 | 24,566,220 |
| TreeHouse Foods, Inc. (a)(b) | | 837,059 | 56,074,582 |
| | | | 226,719,638 |
|
| TOTAL FOOD PRODUCTS | | | 297,777,473 |
|
| Hotels, Restaurants & Leisure - 0.6% | | | |
| Restaurants - 0.6% | | | |
| U.S. Foods Holding Corp. (a) | | 526,416 | 14,450,119 |
| Household Products - 9.8% | | | |
| Household Products - 9.8% | | | |
| Colgate-Palmolive Co. | | 1,781,080 | 127,596,571 |
| Kimberly-Clark Corp. | | 136,454 | 16,823,414 |
| Procter & Gamble Co. | | 895,350 | 82,613,945 |
| Spectrum Brands Holdings, Inc. | | 287,905 | 31,658,034 |
| | | | 258,691,964 |
| Personal Products - 10.2% | | | |
| Personal Products - 10.2% | | | |
| Avon Products, Inc. (a) | | 12,927,767 | 32,190,140 |
| Coty, Inc. Class A | | 3,440,797 | 57,048,414 |
| Edgewell Personal Care Co. (a) | | 103,600 | 7,867,384 |
| Estee Lauder Companies, Inc. Class A | | 1,184,339 | 126,712,430 |
| Herbalife Ltd. (a)(b) | | 257,910 | 17,798,369 |
| L'Oreal SA | | 33,600 | 7,098,354 |
| Unilever NV (Certificaten Van Aandelen) (Bearer) | | 254,300 | 15,139,557 |
| Unilever PLC sponsored ADR | | 108,400 | 6,309,964 |
| | | | 270,164,612 |
| Tobacco - 31.1% | | | |
| Tobacco - 31.1% | | | |
| Altria Group, Inc. | | 1,084,045 | 68,728,453 |
| British American Tobacco PLC sponsored ADR | | 6,048,226 | 375,715,799 |
| ITC Ltd. | | 1,547,202 | 6,830,340 |
| Philip Morris International, Inc. | | 3,179,491 | 371,777,883 |
| | | | 823,052,475 |
| TOTAL COMMON STOCKS | | | |
| (Cost $2,090,242,953) | | | 2,622,052,363 |
|
| Nonconvertible Preferred Stocks - 0.2% | | | |
| Beverages - 0.2% | | | |
| Brewers - 0.2% | | | |
| Ambev SA sponsored ADR | | | |
| (Cost $3,965,278) | | 1,022,310 | 6,399,661 |
|
| Money Market Funds - 0.7% | | | |
| Fidelity Cash Central Fund, 1.11% (c) | | 8,513,602 | 8,515,305 |
| Fidelity Securities Lending Cash Central Fund 1.11% (c)(d) | | 8,525,328 | 8,526,180 |
| TOTAL MONEY MARKET FUNDS | | | |
| (Cost $17,041,042) | | | 17,041,485 |
| TOTAL INVESTMENT IN SECURITIES - 100.1% | | | |
| (Cost $2,111,249,273) | | | 2,645,493,509 |
| NET OTHER ASSETS (LIABILITIES) - (0.1)% | | | (2,535,928) |
| NET ASSETS - 100% | | | $2,642,957,581 |
Legend
(a) Non-income producing
(b) Security or a portion of the security is on loan at period end.
(c) Affiliated fund that is generally available only to investment companies and other accounts managed by Fidelity Investments. The rate quoted is the annualized seven-day yield of the fund at period end. A complete unaudited listing of the fund's holdings as of its most recent quarter end is available upon request. In addition, each Fidelity Central Fund's financial statements are available on the SEC's website or upon request.
(d) Investment made with cash collateral received from securities on loan.
Affiliated Central Funds
Information regarding fiscal year to date income earned by the Fund from investments in Fidelity Central Funds is as follows:
| Fund | Income earned |
| Fidelity Cash Central Fund | $310,941 |
| Fidelity Securities Lending Cash Central Fund | 4,312,502 |
| Total | $4,623,443 |
Investment Valuation
The following is a summary of the inputs used, as of August 31, 2017, involving the Fund's assets and liabilities carried at fair value. The inputs or methodology used for valuing securities may not be an indication of the risk associated with investing in those securities. For more information on valuation inputs, and their aggregation into the levels used below, please refer to the Investment Valuation section in the accompanying Notes to Financial Statements.
| | Valuation Inputs at Reporting Date: |
| Description | Total | Level 1 | Level 2 | Level 3 |
| Investments in Securities: | | | | |
| Common Stocks | $2,622,052,363 | $2,509,927,667 | $112,124,696 | $-- |
| Nonconvertible Preferred Stocks | 6,399,661 | 6,399,661 | -- | -- |
| Money Market Funds | 17,041,485 | 17,041,485 | -- | -- |
| Total Investments in Securities: | $2,645,493,509 | $2,533,368,813 | $112,124,696 | $-- |
Other Information
Distribution of investments by country or territory of incorporation, as a percentage of Total Net Assets, is as follows (Unaudited):
| United States of America | 88.8% |
| Belgium | 2.9% |
| Bermuda | 2.7% |
| Others (Individually Less Than 1%) | 5.6% |
| | 100.0% |
See accompanying notes which are an integral part of the financial statements.
Financial Statements
Statement of Assets and Liabilities
| | | August 31, 2017 (Unaudited) |
| Assets | | |
Investment in securities, at value (including securities loaned of $8,373,419) — See accompanying schedule:
Unaffiliated issuers (cost $2,094,208,231) | $2,628,452,024 | |
| Fidelity Central Funds (cost $17,041,042) | 17,041,485 | |
| Total Investment in Securities (cost $2,111,249,273) | | $2,645,493,509 |
| Receivable for investments sold | | 5,536,361 |
| Receivable for fund shares sold | | 1,444,159 |
| Dividends receivable | | 8,565,508 |
| Distributions receivable from Fidelity Central Funds | | 80,717 |
| Other receivables | | 171,782 |
| Total assets | | 2,661,292,036 |
| Liabilities | | |
| Payable for investments purchased | $2,521,744 | |
| Payable for fund shares redeemed | 5,015,374 | |
| Accrued management fee | 1,221,479 | |
| Distribution and service plan fees payable | 357,575 | |
| Other affiliated payables | 492,601 | |
| Other payables and accrued expenses | 176,907 | |
| Collateral on securities loaned | 8,548,775 | |
| Total liabilities | | 18,334,455 |
| Net Assets | | $2,642,957,581 |
| Net Assets consist of: | | |
| Paid in capital | | $1,951,128,702 |
| Undistributed net investment income | | 32,848,790 |
| Accumulated undistributed net realized gain (loss) on investments and foreign currency transactions | | 124,702,159 |
| Net unrealized appreciation (depreciation) on investments and assets and liabilities in foreign currencies | | 534,277,930 |
| Net Assets | | $2,642,957,581 |
| Calculation of Maximum Offering Price | | |
| Class A: | | |
| Net Asset Value and redemption price per share ($357,988,757 ÷ 3,738,308 shares) | | $95.76 |
| Maximum offering price per share (100/94.25 of $95.76) | | $101.60 |
| Class M: | | |
| Net Asset Value and redemption price per share ($87,937,030 ÷ 926,814 shares) | | $94.88 |
| Maximum offering price per share (100/96.50 of $94.88) | | $98.32 |
| Class C: | | |
| Net Asset Value and offering price per share ($288,178,074 ÷ 3,092,318 shares)(a) | | $93.19 |
| Consumer Staples: | | |
| Net Asset Value, offering price and redemption price per share ($1,550,420,314 ÷ 16,039,578 shares) | | $96.66 |
| Class I: | | |
| Net Asset Value, offering price and redemption price per share ($358,433,406 ÷ 3,715,946 shares) | | $96.46 |
(a) Redemption price per share is equal to net asset value less any applicable contingent deferred sales charge.
See accompanying notes which are an integral part of the financial statements.
Statement of Operations
| | | Six months ended August 31, 2017 (Unaudited) |
| Investment Income | | |
| Dividends | | $41,648,001 |
| Income from Fidelity Central Funds (including $4,312,502 from security lending) | | 4,623,443 |
| Total income | | 46,271,444 |
| Expenses | | |
| Management fee | $7,766,230 | |
| Transfer agent fees | 2,623,106 | |
| Distribution and service plan fees | 2,243,713 | |
| Accounting and security lending fees | 445,431 | |
| Custodian fees and expenses | 35,866 | |
| Independent trustees' fees and expenses | 32,924 | |
| Registration fees | 97,548 | |
| Audit | 35,247 | |
| Legal | 21,418 | |
| Miscellaneous | 24,264 | |
| Total expenses before reductions | 13,325,747 | |
| Expense reductions | (76,627) | 13,249,120 |
| Net investment income (loss) | | 33,022,324 |
| Realized and Unrealized Gain (Loss) | | |
| Net realized gain (loss) on: | | |
| Investment securities: | | |
| Unaffiliated issuers | 130,040,418 | |
| Fidelity Central Funds | (13,734) | |
| Foreign currency transactions | (7,142) | |
| Total net realized gain (loss) | | 130,019,542 |
| Change in net unrealized appreciation (depreciation) on: | | |
| Unaffiliated issuers (net of decrease in deferred foreign taxes of $618,798) | (126,686,719) | |
| Fidelity Central Funds | (29,147) | |
| Assets and liabilities in foreign currencies | 80,389 | |
| Total change in net unrealized appreciation (depreciation) | | (126,635,477) |
| Net gain (loss) | | 3,384,065 |
| Net increase (decrease) in net assets resulting from operations | | $36,406,389 |
See accompanying notes which are an integral part of the financial statements.
Statement of Changes in Net Assets
| | Six months ended August 31, 2017 (Unaudited) | Year ended February 28, 2017 |
| Increase (Decrease) in Net Assets | | |
| Operations | | |
| Net investment income (loss) | $33,022,324 | $47,285,744 |
| Net realized gain (loss) | 130,019,542 | 217,332,500 |
| Change in net unrealized appreciation (depreciation) | (126,635,477) | 57,308,049 |
| Net increase (decrease) in net assets resulting from operations | 36,406,389 | 321,926,293 |
| Distributions to shareholders from net investment income | (4,974,935) | (44,327,157) |
| Distributions to shareholders from net realized gain | (39,438,066) | (82,139,579) |
| Total distributions | (44,413,001) | (126,466,736) |
| Share transactions - net increase (decrease) | (210,545,204) | (395,070,237) |
| Redemption fees | – | 44,026 |
| Total increase (decrease) in net assets | (218,551,816) | (199,566,654) |
| Net Assets | | |
| Beginning of period | 2,861,509,397 | 3,061,076,051 |
| End of period | $2,642,957,581 | $2,861,509,397 |
| Other Information | | |
| Undistributed net investment income end of period | $32,848,790 | $4,801,401 |
See accompanying notes which are an integral part of the financial statements.
Financial Highlights — Consumer Staples Portfolio Class A
| | Six months ended (Unaudited) August 31, | Years ended February 28, | | | | |
| | 2017 | 2017 | 2016 A | 2015 | 2014 | 2013 |
| Selected Per–Share Data | | | | | | |
| Net asset value, beginning of period | $96.18 | $89.78 | $101.33 | $87.93 | $85.67 | $74.90 |
| Income from Investment Operations | | | | | | |
| Net investment income (loss)B | 1.08 | 1.28 | 1.34 | 1.37 | 1.43 | 1.26 |
| Net realized and unrealized gain (loss) | (.03)C | 9.12 | (4.86) | 17.28 | 7.51 | 11.73 |
| Total from investment operations | 1.05 | 10.40 | (3.52) | 18.65 | 8.94 | 12.99 |
| Distributions from net investment income | (.13) | (1.37) | (1.31) | (1.28) | (1.44) | (1.08) |
| Distributions from net realized gain | (1.34) | (2.64) | (6.72) | (3.98) | (5.24) | (1.14) |
| Total distributions | (1.47) | (4.00)D | (8.03) | (5.25)E | (6.68) | (2.22) |
| Redemption fees added to paid in capitalB | – | –F | –F | –F | –F | –F |
| Net asset value, end of period | $95.76 | $96.18 | $89.78 | $101.33 | $87.93 | $85.67 |
| Total ReturnG,H,I | 1.07% | 11.91% | (3.51)% | 21.95% | 10.53% | 17.60% |
| Ratios to Average Net AssetsJ,K | | | | | | |
| Expenses before reductions | 1.05%L | 1.04% | 1.04% | 1.05% | 1.06% | 1.08% |
| Expenses net of fee waivers, if any | 1.05%L | 1.04% | 1.04% | 1.05% | 1.06% | 1.08% |
| Expenses net of all reductions | 1.05%L | 1.03% | 1.04% | 1.05% | 1.06% | 1.08% |
| Net investment income (loss) | 2.20%L | 1.37% | 1.45% | 1.45% | 1.61% | 1.58% |
| Supplemental Data | | | | | | |
| Net assets, end of period (000 omitted) | $357,989 | $522,014 | $470,249 | $414,151 | $329,459 | $277,329 |
| Portfolio turnover rateM | 44%L | 56%N | 63% | 42%N | 31% | 28% |
A For the year ended February 29.
B Calculated based on average shares outstanding during the period.
C The amount shown for a share outstanding does not correspond with the aggregate net gain (loss) on investments for the period due to the timing of sales and repurchases of shares in relation to fluctuating market values of the investments of the Fund.
D Total distributions of $4.00 per share is comprised of distributions from net investment income of $1.365 and distributions from net realized gain of $2.636 per share.
E Total distributions of $5.25 per share is comprised of distributions from net investment income of $1.275 and distributions from net realized gain of $3.976 per share.
F Amount represents less than $.005 per share.
G Total returns for periods of less than one year are not annualized.
H Total returns would have been lower if certain expenses had not been reduced during the applicable periods shown.
I Total returns do not include the effect of the sales charges.
J Fees and expenses of any underlying Fidelity Central Funds are not included in the Fund's expense ratio. The Fund indirectly bears its proportionate share of the expenses of any underlying Fidelity Central Funds.
K Expense ratios reflect operating expenses of the class. Expenses before reductions do not reflect amounts reimbursed by the investment adviser or reductions from brokerage service arrangements or reductions from other expense offset arrangements and do not represent the amount paid by the class during periods when reimbursements or reductions occur. Expenses net of fee waivers reflect expenses after reimbursement by the investment adviser but prior to reductions from brokerage service arrangements or other expense offset arrangements. Expenses net of all reductions represent the net expenses paid by the class.
L Annualized
M Amount does not include the portfolio activity of any underlying Fidelity Central Funds.
N Portfolio turnover rate excludes securities received or delivered in-kind.
See accompanying notes which are an integral part of the financial statements.
Financial Highlights — Consumer Staples Portfolio Class M
| | Six months ended (Unaudited) August 31, | Years ended February 28, | | | | |
| | 2017 | 2017 | 2016 A | 2015 | 2014 | 2013 |
| Selected Per–Share Data | | | | | | |
| Net asset value, beginning of period | $95.42 | $89.10 | $100.61 | $87.37 | $85.18 | $74.49 |
| Income from Investment Operations | | | | | | |
| Net investment income (loss)B | .94 | 1.01 | 1.08 | 1.10 | 1.18 | 1.03 |
| Net realized and unrealized gain (loss) | (.03)C | 9.07 | (4.83) | 17.15 | 7.46 | 11.68 |
| Total from investment operations | .91 | 10.08 | (3.75) | 18.25 | 8.64 | 12.71 |
| Distributions from net investment income | (.11) | (1.12) | (1.04) | (1.04) | (1.21) | (.88) |
| Distributions from net realized gain | (1.34) | (2.64) | (6.72) | (3.98) | (5.24) | (1.14) |
| Total distributions | (1.45) | (3.76) | (7.76) | (5.01)D | (6.45) | (2.02) |
| Redemption fees added to paid in capitalB | – | –E | –E | –E | –E | –E |
| Net asset value, end of period | $94.88 | $95.42 | $89.10 | $100.61 | $87.37 | $85.18 |
| Total ReturnF,G,H | .93% | 11.61% | (3.78)% | 21.60% | 10.23% | 17.29% |
| Ratios to Average Net AssetsI,J | | | | | | |
| Expenses before reductions | 1.32%K | 1.32% | 1.32% | 1.32% | 1.33% | 1.36% |
| Expenses net of fee waivers, if any | 1.32%K | 1.32% | 1.32% | 1.32% | 1.33% | 1.36% |
| Expenses net of all reductions | 1.31%K | 1.31% | 1.31% | 1.32% | 1.33% | 1.35% |
| Net investment income (loss) | 1.93%K | 1.09% | 1.17% | 1.18% | 1.34% | 1.30% |
| Supplemental Data | | | | | | |
| Net assets, end of period (000 omitted) | $87,937 | $89,925 | $76,586 | $81,489 | $61,421 | $52,024 |
| Portfolio turnover rateL | 44%K | 56%M | 63% | 42%M | 31% | 28% |
A For the year ended February 29.
B Calculated based on average shares outstanding during the period.
C The amount shown for a share outstanding does not correspond with the aggregate net gain (loss) on investments for the period due to the timing of sales and repurchases of shares in relation to fluctuating market values of the investments of the Fund.
D Total distributions of $5.01 per share is comprised of distributions from net investment income of $1.036 and distributions from net realized gain of $3.976 per share.
E Amount represents less than $.005 per share.
F Total returns for periods of less than one year are not annualized.
G Total returns would have been lower if certain expenses had not been reduced during the applicable periods shown.
H Total returns do not include the effect of the sales charges.
I Fees and expenses of any underlying Fidelity Central Funds are not included in the Fund's expense ratio. The Fund indirectly bears its proportionate share of the expenses of any underlying Fidelity Central Funds.
J Expense ratios reflect operating expenses of the class. Expenses before reductions do not reflect amounts reimbursed by the investment adviser or reductions from brokerage service arrangements or reductions from other expense offset arrangements and do not represent the amount paid by the class during periods when reimbursements or reductions occur. Expenses net of fee waivers reflect expenses after reimbursement by the investment adviser but prior to reductions from brokerage service arrangements or other expense offset arrangements. Expenses net of all reductions represent the net expenses paid by the class.
K Annualized
L Amount does not include the portfolio activity of any underlying Fidelity Central Funds.
M Portfolio turnover rate excludes securities received or delivered in-kind.
See accompanying notes which are an integral part of the financial statements.
Financial Highlights — Consumer Staples Portfolio Class C
| | Six months ended (Unaudited) August 31, | Years ended February 28, | | | | |
| | 2017 | 2017 | 2016 A | 2015 | 2014 | 2013 |
| Selected Per–Share Data | | | | | | |
| Net asset value, beginning of period | $93.89 | $87.77 | $99.27 | $86.32 | $84.28 | $73.75 |
| Income from Investment Operations | | | | | | |
| Net investment income (loss)B | .70 | .56 | .63 | .65 | .75 | .65 |
| Net realized and unrealized gain (loss) | (.03)C | 8.92 | (4.75) | 16.93 | 7.36 | 11.55 |
| Total from investment operations | .67 | 9.48 | (4.12) | 17.58 | 8.11 | 12.20 |
| Distributions from net investment income | (.03) | (.73) | (.65) | (.65) | (.84) | (.53) |
| Distributions from net realized gain | (1.34) | (2.64) | (6.72) | (3.98) | (5.24) | (1.14) |
| Total distributions | (1.37) | (3.36)D | (7.38)E | (4.63) | (6.07)F | (1.67) |
| Redemption fees added to paid in capitalB | – | –G | –G | –G | –G | –G |
| Net asset value, end of period | $93.19 | $93.89 | $87.77 | $99.27 | $86.32 | $84.28 |
| Total ReturnH,I,J | .70% | 11.07% | (4.23)% | 21.03% | 9.70% | 16.73% |
| Ratios to Average Net AssetsK,L | | | | | | |
| Expenses before reductions | 1.79%M | 1.80% | 1.80% | 1.80% | 1.82% | 1.83% |
| Expenses net of fee waivers, if any | 1.79%M | 1.79% | 1.80% | 1.80% | 1.82% | 1.83% |
| Expenses net of all reductions | 1.79%M | 1.79% | 1.79% | 1.80% | 1.81% | 1.82% |
| Net investment income (loss) | 1.46%M | .61% | .69% | .70% | .85% | .83% |
| Supplemental Data | | | | | | |
| Net assets, end of period (000 omitted) | $288,178 | $308,350 | $250,576 | $228,151 | $164,669 | $134,966 |
| Portfolio turnover rateN | 44%M | 56%O | 63% | 42%O | 31% | 28% |
A For the year ended February 29.
B Calculated based on average shares outstanding during the period.
C The amount shown for a share outstanding does not correspond with the aggregate net gain (loss) on investments for the period due to the timing of sales and repurchases of shares in relation to fluctuating market values of the investments of the Fund.
D Total distributions of $3.36 per share is comprised of distributions from net investment income of $.726 and distributions from net realized gain of $2.636 per share.
E Total distributions of $7.38 per share is comprised of distributions from net investment income of $.651 and distributions from net realized gain of $6.724 per share.
F Total distributions of $6.07 per share is comprised of distributions from net investment income of $.837 and distributions from net realized gain of $5.237 per share.
G Amount represents less than $.005 per share.
H Total returns for periods of less than one year are not annualized.
I Total returns would have been lower if certain expenses had not been reduced during the applicable periods shown.
J Total returns do not include the effect of the contingent deferred sales charge.
K Fees and expenses of any underlying Fidelity Central Funds are not included in the Fund's expense ratio. The Fund indirectly bears its proportionate share of the expenses of any underlying Fidelity Central Funds.
L Expense ratios reflect operating expenses of the class. Expenses before reductions do not reflect amounts reimbursed by the investment adviser or reductions from brokerage service arrangements or reductions from other expense offset arrangements and do not represent the amount paid by the class during periods when reimbursements or reductions occur. Expenses net of fee waivers reflect expenses after reimbursement by the investment adviser but prior to reductions from brokerage service arrangements or other expense offset arrangements. Expenses net of all reductions represent the net expenses paid by the class.
M Annualized
N Amount does not include the portfolio activity of any underlying Fidelity Central Funds.
O Portfolio turnover rate excludes securities received or delivered in-kind.
See accompanying notes which are an integral part of the financial statements.
Financial Highlights — Consumer Staples Portfolio
| | Six months ended (Unaudited) August 31, | Years ended February 28, | | | | |
| | 2017 | 2017 | 2016 A | 2015 | 2014 | 2013 |
| Selected Per–Share Data | | | | | | |
| Net asset value, beginning of period | $97.01 | $90.48 | $102.03 | $88.51 | $86.17 | $75.29 |
| Income from Investment Operations | | | | | | |
| Net investment income (loss)B | 1.23 | 1.56 | 1.61 | 1.64 | 1.69 | 1.48 |
| Net realized and unrealized gain (loss) | (.04)C | 9.20 | (4.89) | 17.40 | 7.55 | 11.82 |
| Total from investment operations | 1.19 | 10.76 | (3.28) | 19.04 | 9.24 | 13.30 |
| Distributions from net investment income | (.20) | (1.60) | (1.55) | (1.54) | (1.66) | (1.28) |
| Distributions from net realized gain | (1.34) | (2.64) | (6.72) | (3.98) | (5.24) | (1.14) |
| Total distributions | (1.54) | (4.23)D | (8.27) | (5.52) | (6.90) | (2.42) |
| Redemption fees added to paid in capitalB | – | –E | –E | –E | –E | –E |
| Net asset value, end of period | $96.66 | $97.01 | $90.48 | $102.03 | $88.51 | $86.17 |
| Total ReturnF,G | 1.21% | 12.24% | (3.25)% | 22.27% | 10.82% | 17.94% |
| Ratios to Average Net AssetsH,I | | | | | | |
| Expenses before reductions | .77%J | .76% | .77% | .77% | .79% | .81% |
| Expenses net of fee waivers, if any | .77%J | .76% | .77% | .77% | .79% | .81% |
| Expenses net of all reductions | .76%J | .76% | .76% | .77% | .79% | .80% |
| Net investment income (loss) | 2.49%J | 1.64% | 1.72% | 1.73% | 1.88% | 1.85% |
| Supplemental Data | | | | | | |
| Net assets, end of period (000 omitted) | $1,550,420 | $1,665,604 | $2,039,983 | $2,173,970 | $1,328,594 | $1,425,055 |
| Portfolio turnover rateK | 44%J | 56%L | 63% | 42%L | 31% | 28% |
A For the year ended February 29.
B Calculated based on average shares outstanding during the period.
C The amount shown for a share outstanding does not correspond with the aggregate net gain (loss) on investments for the period due to the timing of sales and repurchases of shares in relation to fluctuating market values of the investments of the Fund.
D Total distributions of $4.23 per share is comprised of distributions from net investment income of $1.596 and distributions from net realized gain of $2.636 per share.
E Amount represents less than $.005 per share.
F Total returns for periods of less than one year are not annualized.
G Total returns would have been lower if certain expenses had not been reduced during the applicable periods shown.
H Fees and expenses of any underlying Fidelity Central Funds are not included in the Fund's expense ratio. The Fund indirectly bears its proportionate share of the expenses of any underlying Fidelity Central Funds.
I Expense ratios reflect operating expenses of the class. Expenses before reductions do not reflect amounts reimbursed by the investment adviser or reductions from brokerage service arrangements or reductions from other expense offset arrangements and do not represent the amount paid by the class during periods when reimbursements or reductions occur. Expenses net of fee waivers reflect expenses after reimbursement by the investment adviser but prior to reductions from brokerage service arrangements or other expense offset arrangements. Expenses net of all reductions represent the net expenses paid by the class.
J Annualized
K Amount does not include the portfolio activity of any underlying Fidelity Central Funds.
L Portfolio turnover rate excludes securities received or delivered in-kind.
See accompanying notes which are an integral part of the financial statements.
Financial Highlights — Consumer Staples Portfolio Class I
| | Six months ended (Unaudited) August 31, | Years ended February 28, | | | | |
| | 2017 | 2017 | 2016 A | 2015 | 2014 | 2013 |
| Selected Per–Share Data | | | | | | |
| Net asset value, beginning of period | $96.82 | $90.34 | $101.91 | $88.33 | $85.92 | $75.14 |
| Income from Investment Operations | | | | | | |
| Net investment income (loss)B | 1.22 | 1.54 | 1.60 | 1.59 | 1.66 | 1.45 |
| Net realized and unrealized gain (loss) | (.04)C | 9.19 | (4.89) | 17.40 | 7.53 | 11.79 |
| Total from investment operations | 1.18 | 10.73 | (3.29) | 18.99 | 9.19 | 13.24 |
| Distributions from net investment income | (.20) | (1.61) | (1.55) | (1.44) | (1.54) | (1.32) |
| Distributions from net realized gain | (1.34) | (2.64) | (6.72) | (3.98) | (5.24) | (1.14) |
| Total distributions | (1.54) | (4.25) | (8.28)D | (5.41)E | (6.78) | (2.46) |
| Redemption fees added to paid in capitalB | – | –F | –F | –F | –F | –F |
| Net asset value, end of period | $96.46 | $96.82 | $90.34 | $101.91 | $88.33 | $85.92 |
| Total ReturnG,H | 1.21% | 12.22% | (3.26)% | 22.26% | 10.80% | 17.90% |
| Ratios to Average Net AssetsI,J | | | | | | |
| Expenses before reductions | .78%K | .78% | .78% | .80% | .82% | .85% |
| Expenses net of fee waivers, if any | .78%K | .78% | .77% | .80% | .82% | .85% |
| Expenses net of all reductions | .77%K | .77% | .77% | .80% | .82% | .84% |
| Net investment income (loss) | 2.48%K | 1.63% | 1.71% | 1.70% | 1.85% | 1.81% |
| Supplemental Data | | | | | | |
| Net assets, end of period (000 omitted) | $358,433 | $275,616 | $216,836 | $198,538 | $154,271 | $378,731 |
| Portfolio turnover rateL | 44%K | 56%M | 63% | 42%M | 31% | 28% |
A For the year ended February 29.
B Calculated based on average shares outstanding during the period.
C The amount shown for a share outstanding does not correspond with the aggregate net gain (loss) on investments for the period due to the timing of sales and repurchases of shares in relation to fluctuating market values of the investments of the Fund.
D Total distributions of $8.28 per share is comprised of distributions from net investment income of $1.553 and distributions from net realized gain of $6.724 per share.
E Total distributions of $5.41 per share is comprised of distributions from net investment income of $1.436 and distributions from net realized gain of $3.976 per share.
F Amount represents less than $.005 per share.
G Total returns for periods of less than one year are not annualized.
H Total returns would have been lower if certain expenses had not been reduced during the applicable periods shown.
I Fees and expenses of any underlying Fidelity Central Funds are not included in the Fund's expense ratio. The Fund indirectly bears its proportionate share of the expenses of any underlying Fidelity Central Funds.
J Expense ratios reflect operating expenses of the class. Expenses before reductions do not reflect amounts reimbursed by the investment adviser or reductions from brokerage service arrangements or reductions from other expense offset arrangements and do not represent the amount paid by the class during periods when reimbursements or reductions occur. Expenses net of fee waivers reflect expenses after reimbursement by the investment adviser but prior to reductions from brokerage service arrangements or other expense offset arrangements. Expenses net of all reductions represent the net expenses paid by the class.
K Annualized
L Amount does not include the portfolio activity of any underlying Fidelity Central Funds.
M Portfolio turnover rate excludes securities received or delivered in-kind.
See accompanying notes which are an integral part of the financial statements.
Notes to Financial Statements (Unaudited)
For the period ended August 31, 2017
1. Organization.
Consumer Staples Portfolio (the Fund) is a non-diversified fund of Fidelity Select Portfolios (the Trust) and is authorized to issue an unlimited number of shares. The Trust is registered under the Investment Company Act of 1940, as amended (the 1940 Act), as an open-end management investment company organized as a Massachusetts business trust. The Fund invests primarily in securities of companies whose principal business activities fall within specific industries. The Fund offers Class A, Class M (formerly Class T), Class C, Consumer Staples and Class I shares, each of which has equal rights as to assets and voting privileges. Each class has exclusive voting rights with respect to matters that affect that class.
After the close of business on June 24, 2016, all outstanding Class B shares were converted to Class A shares. All prior fiscal period dollar and share amounts for Class B presented in the Notes to Financial Statements are for the period March 1, 2016 through June 24, 2016.
2. Investments in Fidelity Central Funds.
The Fund invests in Fidelity Central Funds, which are open-end investment companies generally available only to other investment companies and accounts managed by the investment adviser and its affiliates. The Fund's Schedule of Investments lists each of the Fidelity Central Funds held as of period end, if any, as an investment of the Fund, but does not include the underlying holdings of each Fidelity Central Fund. As an Investing Fund, the Fund indirectly bears its proportionate share of the expenses of the underlying Fidelity Central Funds.
The Money Market Central Funds seek preservation of capital and current income and are managed by Fidelity Investments Money Management, Inc. (FIMM), an affiliate of the investment adviser. Annualized expenses of the Money Market Central Funds as of their most recent shareholder report date are less than .005%.
A complete unaudited list of holdings for each Fidelity Central Fund is available upon request or at the Securities and Exchange Commission (the SEC) website at www.sec.gov. In addition, the financial statements of the Fidelity Central Funds are available on the SEC website or upon request.
3. Significant Accounting Policies.
The Fund is an investment company and applies the accounting and reporting guidance of the Financial Accounting Standards Board (FASB) Accounting Standards Codification Topic 946 Financial Services – Investments Companies. The financial statements have been prepared in conformity with accounting principles generally accepted in the United States of America (GAAP), which require management to make certain estimates and assumptions at the date of the financial statements. Actual results could differ from those estimates. Subsequent events, if any, through the date that the financial statements were issued have been evaluated in the preparation of the financial statements. The following summarizes the significant accounting policies of the Fund:
Investment Valuation. Investments are valued as of 4:00 p.m. Eastern time on the last calendar day of the period. The Board of Trustees (the Board) has delegated the day to day responsibility for the valuation of the Fund's investments to the Fair Value Committee (the Committee) established by the Fund's investment adviser. In accordance with valuation policies and procedures approved by the Board, the Fund attempts to obtain prices from one or more third party pricing vendors or brokers to value its investments. When current market prices, quotations or currency exchange rates are not readily available or reliable, investments will be fair valued in good faith by the Committee, in accordance with procedures adopted by the Board. Factors used in determining fair value vary by investment type and may include market or investment specific events. The frequency with which these procedures are used cannot be predicted and they may be utilized to a significant extent. The Committee oversees the Fund's valuation policies and procedures and reports to the Board on the Committee's activities and fair value determinations. The Board monitors the appropriateness of the procedures used in valuing the Fund's investments and ratifies the fair value determinations of the Committee.
The Fund categorizes the inputs to valuation techniques used to value its investments into a disclosure hierarchy consisting of three levels as shown below:
- Level 1 – quoted prices in active markets for identical investments
- Level 2 – other significant observable inputs (including quoted prices for similar investments, interest rates, prepayment speeds, etc.)
- Level 3 – unobservable inputs (including the Fund's own assumptions based on the best information available)
Valuation techniques used to value the Fund's investments by major category are as follows:
Equity securities, including restricted securities, for which market quotations are readily available, are valued at the last reported sale price or official closing price as reported by a third party pricing vendor on the primary market or exchange on which they are traded and are categorized as Level 1 in the hierarchy. In the event there were no sales during the day or closing prices are not available, securities are valued at the last quoted bid price or may be valued using the last available price and are generally categorized as Level 2 in the hierarchy. For foreign equity securities, when market or security specific events arise, comparisons to the valuation of American Depositary Receipts (ADRs), futures contracts, Exchange-Traded Funds (ETFs) and certain indexes as well as quoted prices for similar securities may be used and would be categorized as Level 2 in the hierarchy. Utilizing these techniques may result in transfers between Level 1 and Level 2. For equity securities, including restricted securities, where observable inputs are limited, assumptions about market activity and risk are used and these securities may be categorized as Level 3 in the hierarchy.
Investments in open-end mutual funds, including the Fidelity Central Funds, are valued at their closing net asset value (NAV) each business day and are categorized as Level 1 in the hierarchy.
Changes in valuation techniques may result in transfers in or out of an assigned level within the disclosure hierarchy. The aggregate value of investments by input level as of August 31, 2017 is included at the end of the Fund's Schedule of Investments.
Foreign Currency. The Fund may use foreign currency contracts to facilitate transactions in foreign-denominated securities. Gains and losses from these transactions may arise from changes in the value of the foreign currency or if the counterparties do not perform under the contracts' terms.
Foreign-denominated assets, including investment securities, and liabilities are translated into U.S. dollars at the exchange rates at period end. Purchases and sales of investment securities, income and dividends received and expenses denominated in foreign currencies are translated into U.S. dollars at the exchange rate in effect on the transaction date.
The effects of exchange rate fluctuations on investments are included with the net realized and unrealized gain (loss) on investment securities. Other foreign currency transactions resulting in realized and unrealized gain (loss) are disclosed separately.
Investment Transactions and Income. For financial reporting purposes, the Fund's investment holdings and NAV include trades executed through the end of the last business day of the period. The NAV per share for processing shareholder transactions is calculated as of the close of business of the New York Stock Exchange (NYSE), normally 4:00 p.m. Eastern time and includes trades executed through the end of the prior business day. Gains and losses on securities sold are determined on the basis of identified cost and may include proceeds received from litigation. Dividend income is recorded on the ex-dividend date, except for certain dividends from foreign securities where the ex-dividend date may have passed, which are recorded as soon as the Fund is informed of the ex-dividend date. Non-cash dividends included in dividend income, if any, are recorded at the fair market value of the securities received. Income and capital gain distributions from Fidelity Central Funds, if any, are recorded on the ex-dividend date. Certain distributions received by the Fund represent a return of capital or capital gain. The Fund determines the components of these distributions subsequent to the ex-dividend date, based upon receipt of tax filings or other correspondence relating to the underlying investment. These distributions are recorded as a reduction of cost of investments and/or as a realized gain. Investment income is recorded net of foreign taxes withheld where recovery of such taxes is uncertain.
Class Allocations and Expenses. Investment income, realized and unrealized capital gains and losses, common expenses of the Fund, and certain fund-level expense reductions, if any, are allocated daily on a pro-rata basis to each class based on the relative net assets of each class to the total net assets of the Fund. Each class differs with respect to transfer agent and distribution and service plan fees incurred. Certain expense reductions may also differ by class. For the reporting period, the allocated portion of income and expenses to each class as a percent of its average net assets may vary due to the timing of recording these transactions in relation to fluctuating net assets of the classes. Expenses directly attributable to a fund are charged to that fund. Expenses attributable to more than one fund are allocated among the respective funds on the basis of relative net assets or other appropriate methods. Expense estimates are accrued in the period to which they relate and adjustments are made when actual amounts are known.
Deferred Trustee Compensation. Under a Deferred Compensation Plan (the Plan), independent Trustees may elect to defer receipt of a portion of their annual compensation. Deferred amounts are invested in a cross-section of Fidelity funds, are marked-to-market and remain in the Fund until distributed in accordance with the Plan. The investment of deferred amounts and the offsetting payable to the Trustees are included in the accompanying Statement of Assets and Liabilities.
Income Tax Information and Distributions to Shareholders. Each year, the Fund intends to qualify as a regulated investment company under Subchapter M of the Internal Revenue Code, including distributing substantially all of its taxable income and realized gains. As a result, no provision for U.S. Federal income taxes is required. The Fund files a U.S. federal tax return, in addition to state and local tax returns as required. The Fund's federal income tax returns are subject to examination by the Internal Revenue Service (IRS) for a period of three fiscal years after they are filed. State and local tax returns may be subject to examination for an additional fiscal year depending on the jurisdiction. Foreign taxes are provided for based on the Fund's understanding of the tax rules and rates that exist in the foreign markets in which it invests.
Distributions are declared and recorded on the ex-dividend date. Income dividends and capital gain distributions are declared separately for each class. Income and capital gain distributions are determined in accordance with income tax regulations, which may differ from GAAP.
Capital accounts within the financial statements are adjusted for permanent book-tax differences. These adjustments have no impact on net assets or the results of operations. Capital accounts are not adjusted for temporary book-tax differences which will reverse in a subsequent period.
Book-tax differences are primarily due to foreign currency transactions, deferred trustees compensation, and losses deferred due to wash sales.
As of period end, the cost and unrealized appreciation (depreciation) in securities, and derivatives if applicable, for federal income tax purposes were as follows:
| Gross unrealized appreciation | $636,748,550 |
| Gross unrealized depreciation | (112,378,851) |
| Net unrealized appreciation (depreciation) | $524,369,699 |
| Tax cost | $2,121,123,810 |
4. Purchases and Sales of Investments.
Purchases and sales of securities, other than short-term securities, aggregated $607,927,606 and $784,519,326, respectively.
5. Fees and Other Transactions with Affiliates.
Management Fee. Fidelity SelectCo, LLC (the investment adviser) and its affiliates provide the Fund with investment management related services for which the Fund pays a monthly management fee. The management fee is the sum of an individual fund fee rate that is based on an annual rate of .30% of the Fund's average net assets and an annualized group fee rate that averaged .25% during the period. The group fee rate is based upon the average net assets of all the mutual funds advised by Fidelity Management & Research Company (FMR) and the investment adviser. The group fee rate decreases as assets under management increase and increases as assets under management decrease. For the reporting period, the total annualized management fee rate was .55% of the Fund's average net assets.
Distribution and Service Plan Fees. In accordance with Rule 12b-1 of the 1940 Act, the Fund has adopted separate Distribution and Service Plans for each class of shares. Certain classes pay Fidelity Distributors Corporation (FDC), an affiliate of the investment adviser, separate Distribution and Service Fees, each of which is based on an annual percentage of each class' average net assets. In addition, FDC may pay financial intermediaries for selling shares of the Fund and providing shareholder support services. For the period, the Distribution and Service Fee rates, total fees and amounts retained by FDC were as follows:
| | Distribution
Fee | Service
Fee | Total Fees | Retained
by FDC |
| Class A | -% | .25% | $484,738 | $– |
| Class M | .25% | .25% | 227,998 | – |
| Class C | .75% | .25% | 1,530,977 | 251,882 |
| | | | $2,243,713 | $251,882 |
Sales Load. FDC may receive a front-end sales charge of up to 5.75% for selling Class A shares and 3.50% for selling Class M shares, some of which is paid to financial intermediaries for selling shares of the Fund. Depending on the holding period, FDC may receive contingent deferred sales charges levied on Class A, Class M and Class C redemptions. The deferred sales charges are 1.00% for Class C shares, 1.00% for certain purchases of Class A shares and .25% for certain purchases of Class M shares.
For the period, sales charge amounts retained by FDC were as follows:
| | Retained
by FDC |
| Class A | $121,378 |
| Class M | 14,227 |
| Class C(a) | 32,344 |
| | $167,949 |
(a) When Class C shares are initially sold, FDC pays commissions from its own resources to financial intermediaries through which the sales are made.
Transfer Agent Fees. Fidelity Investments Institutional Operations Company, Inc., (FIIOC), an affiliate of the investment adviser, is the transfer, dividend disbursing and shareholder servicing agent for each class of the Fund. FIIOC receives account fees and asset-based fees that vary according to the account size and type of account of the shareholders of the respective classes of the Fund. FIIOC pays for typesetting, printing and mailing of shareholder reports, except proxy statements.
For the period, transfer agent fees for each class were as follows:
| | Amount | % of
Class-Level Average
Net Assets(a) |
| Class A | $402,176 | .21 |
| Class M | 102,505 | .22 |
| Class C | 305,148 | .20 |
| Consumer Staples | 1,441,186 | .17 |
| Class I | 372,091 | .18 |
| | $2,623,106 | |
(a) Annualized
Accounting and Security Lending Fees. Fidelity Service Company, Inc. (FSC), an affiliate of the investment adviser, maintains the Fund's accounting records. The accounting fee is based on the level of average net assets for each month. Under a separate contract, FSC administers the security lending program. The security lending fee is based on the number and duration of lending transactions.
Brokerage Commissions. The Fund placed a portion of its portfolio transactions with brokerage firms which are affiliates of the investment adviser. Brokerage commissions are included in net realized gain (loss) and change in net unrealized appreciation (depreciation) in the Statement of Operations. The commissions paid to these affiliated firms were $16,195 for the period.
Interfund Trades. The Funds may purchase from or sell securities to other Fidelity Funds under procedures adopted by the Board. The procedures have been designed to ensure these interfund trades are executed in accordance with Rule 17a-7 of the 1940 Act. Interfund trades are included within the respective purchases and sales amounts shown in the Purchases and Sales of Investments note.
Prior Fiscal Year Redemptions In-Kind. During the prior period, 2,230,314 shares of the Fund held by an affiliated entity were redeemed in-kind for investments and cash with a value of $205,991,818. The Fund had a net realized gain of $85,065,706 on investments delivered through the in-kind redemptions. The amount of the in-kind redemptions is included in share transactions in the accompanying Statement of Changes in Net Assets as well as the Notes to Financial Statements. The Fund recognized no gain or loss for federal income tax purposes.
Other. During the period, the investment adviser reimbursed the Fund for certain losses in the amount of $7,646.
6. Committed Line of Credit.
The Fund participates with other funds managed by the investment adviser or an affiliate in a $4.25 billion credit facility (the "line of credit") to be utilized for temporary or emergency purposes to fund shareholder redemptions or for other short-term liquidity purposes. The Fund has agreed to pay commitment fees on its pro-rata portion of the line of credit, which amounted to $4,658 and is reflected in Miscellaneous expenses on the Statement of Operations. During the period, the Fund did not borrow on this line of credit.
7. Security Lending.
The Fund lends portfolio securities through a lending agent from time to time in order to earn additional income. On the settlement date of the loan, the Fund receives collateral (in the form of U.S. Treasury obligations, letters of credit and/or cash) against the loaned securities and maintains collateral in an amount not less than 100% of the market value of the loaned securities during the period of the loan. The market value of the loaned securities is determined at the close of business of the Fund and any additional required collateral is delivered to the Fund on the next business day. The Fund or borrower may terminate the loan at any time, and if the borrower defaults on its obligation to return the securities loaned because of insolvency or other reasons, the Fund may apply collateral received from the borrower against the obligation. The Fund may experience delays and costs in recovering the securities loaned. Any cash collateral received is invested in the Fidelity Securities Lending Cash Central Fund. The value of loaned securities and cash collateral at period end are disclosed on the Fund's Statement of Assets and Liabilities. Security lending income represents the income earned on investing cash collateral, less rebates paid to borrowers and any lending agent fees associated with the loan, plus any premium payments received for lending certain types of securities. Security lending income is presented in the Statement of Operations as a component of income from Fidelity Central Funds.
8. Expense Reductions.
Commissions paid to certain brokers with whom the investment adviser, or its affiliates, places trades on behalf of the Fund include an amount in addition to trade execution, which may be rebated back to the Fund to offset certain expenses. This amount totaled $62,534 for the period. Through arrangements with the Fund's custodian, credits realized as a result of certain uninvested cash balances were used to reduce the Fund's expenses. During the period, these credits reduced the Fund's custody expense by $143.
In addition, during the period the investment adviser reimbursed and/or waived a portion of fund-level operating expenses in the amount of $13,950.
9. Distributions to Shareholders.
Distributions to shareholders of each class were as follows:
| | Six months ended
August 31, 2017 | Year ended February 28, 2017 |
| From net investment income | | |
| Class A | $511,554 | $7,577,410 |
| Class M | 101,980 | 1,043,893 |
| Class C | 109,620 | 2,453,649 |
| Consumer Staples | 3,382,754 | 28,450,076 |
| Class I | 869,027 | 4,802,129 |
| Total | $4,974,935 | $44,327,157 |
| From net realized gain | | |
| Class A | $5,341,726 | $14,585,099 |
| Class M | 1,250,852 | 2,440,856 |
| Class B | – | 38,559 |
| Class C | 4,310,637 | 8,724,413 |
| Consumer Staples | 22,839,321 | 48,589,839 |
| Class I | 5,695,530 | 7,760,813 |
| Total | $39,438,066 | $82,139,579 |
10. Share Transactions.
Share transactions for each class were as follows and may contain automatic conversions between classes or exchanges between affiliated funds:
| | Shares | Shares | Dollars | Dollars |
| | Six months ended
August 31, 2017 | Year ended February 28, 2017 | Six months ended
August 31, 2017 | Year ended February 28, 2017 |
| Class A | | | | |
| Shares sold | 444,732 | 2,074,631 | $43,579,322 | $195,949,659 |
| Reinvestment of distributions | 59,428 | 237,892 | 5,744,829 | 21,465,950 |
| Shares redeemed | (2,193,084) | (2,123,267) | (212,515,389) | (197,828,865) |
| Net increase (decrease) | (1,688,924) | 189,256 | $(163,191,238) | $19,586,744 |
| Class M | | | | |
| Shares sold | 67,367 | 258,361 | $6,527,508 | $24,169,768 |
| Reinvestment of distributions | 14,044 | 37,389 | 1,346,502 | 3,349,216 |
| Shares redeemed | (97,015) | (212,844) | (9,392,746) | (19,792,973) |
| Net increase (decrease) | (15,604) | 82,906 | $(1,518,736) | $7,726,011 |
| Class B | | | | |
| Shares sold | – | 1,629 | $– | $151,958 |
| Reinvestment of distributions | – | 379 | – | 35,399 |
| Shares redeemed | – | (78,913) | – | (7,397,851) |
| Net increase (decrease) | – | (76,905) | $– | $(7,210,494) |
| Class C | | | | |
| Shares sold | 227,445 | 1,245,446 | $21,693,368 | $115,155,143 |
| Reinvestment of distributions | 43,923 | 115,157 | 4,143,666 | 10,152,865 |
| Shares redeemed | (463,146) | (931,585) | (44,125,499) | (84,513,838) |
| Net increase (decrease) | (191,778) | 429,018 | $(18,288,465) | $40,794,170 |
| Consumer Staples | | | | |
| Shares sold | 1,112,057 | 4,086,473 | $109,978,272 | $389,479,615 |
| Reinvestment of distributions | 254,563 | 801,941 | 24,812,185 | 73,103,322 |
| Shares redeemed | (2,497,051) | (10,263,589)(a) | (245,989,625) | (963,924,332)(a) |
| Net increase (decrease) | (1,130,431) | (5,375,175) | $(111,199,168) | $(501,341,395) |
| Class I | | | | |
| Shares sold | 2,116,133 | 2,282,645 | $206,372,922 | $217,344,361 |
| Reinvestment of distributions | 63,184 | 121,641 | 6,146,528 | 11,031,386 |
| Shares redeemed | (1,310,154) | (1,957,632) | (128,867,047) | (183,001,020) |
| Net increase (decrease) | 869,163 | 446,654 | $83,652,403 | $45,374,727 |
(a) Amount includes in-kind redemptions (see the Prior Year Redemptions In-Kind note for additional details)
11. Other.
The Fund's organizational documents provide former and current trustees and officers with a limited indemnification against liabilities arising in connection with the performance of their duties to the Fund. In the normal course of business, the Fund may also enter into contracts that provide general indemnifications. The Fund's maximum exposure under these arrangements is unknown as this would be dependent on future claims that may be made against the Fund. The risk of material loss from such claims is considered remote.
Shareholder Expense Example
As a shareholder of the Fund, you incur two types of costs: (1) transaction costs, including sales charges (loads) on purchase payments or redemption proceeds, and (2) ongoing costs, including management fees, distribution and/or service (12b-1) fees and other Fund expenses. This Example is intended to help you understand your ongoing costs (in dollars) of investing in the Fund and to compare these costs with the ongoing costs of investing in other mutual funds.
The Example is based on an investment of $1,000 invested at the beginning of the period and held for the entire period (March 1, 2017 to August 31, 2017).
Actual Expenses
The first line of the accompanying table for each class of the Fund provides information about actual account values and actual expenses. You may use the information in this line, together with the amount you invested, to estimate the expenses that you paid over the period. Simply divide your account value by $1,000.00 (for example, an $8,600 account value divided by $1,000.00 = 8.6), then multiply the result by the number in the first line for a class of the Fund under the heading entitled "Expenses Paid During Period" to estimate the expenses you paid on your account during this period. A small balance maintenance fee of $12.00 that is charged once a year may apply for certain accounts with a value of less than $2,000. This fee is not included in the table below. If it was, the estimate of expenses you paid during the period would be higher, and your ending account value lower, by this amount. In addition, the Fund, as a shareholder in the underlying Fidelity Central Funds, will indirectly bear its pro-rata share of the fees and expenses incurred by the underlying Fidelity Central Funds. These fees and expenses are not included in the Fund's annualized expense ratio used to calculate the expense estimate in the table below.
Hypothetical Example for Comparison Purposes
The second line of the accompanying table for each class of the Fund provides information about hypothetical account values and hypothetical expenses based on a Class' actual expense ratio and an assumed rate of return of 5% per year before expenses, which is not the Class' actual return. The hypothetical account values and expenses may not be used to estimate the actual ending account balance or expenses you paid for the period. You may use this information to compare the ongoing costs of investing in the Fund and other funds. To do so, compare this 5% hypothetical example with the 5% hypothetical examples that appear in the shareholder reports of the other funds. A small balance maintenance fee of $12.00 that is charged once a year may apply for certain accounts with a value of less than $2,000. This fee is not included in the table below. If it was, the estimate of expenses you paid during the period would be higher, and your ending account value lower, by this amount. In addition, the Fund, as a shareholder in the underlying Fidelity Central Funds, will indirectly bear its pro-rata share of the fees and expenses incurred by the underlying Fidelity Central Funds. These fees and expenses are not included in the Fund's annualized expense ratio used to calculate the expense estimate in the table below.
Please note that the expenses shown in the table are meant to highlight your ongoing costs only and do not reflect any transaction costs. Therefore, the second line of the table is useful in comparing ongoing costs only, and will not help you determine the relative total costs of owning different funds. In addition, if these transactional costs were included, your costs would have been higher.
| | Annualized Expense Ratio-A | Beginning
Account Value
March 1, 2017 | Ending
Account Value
August 31, 2017 | Expenses Paid
During Period-B
March 1, 2017
to August 31, 2017 |
| Class A | 1.05% | | | |
| Actual | | $1,000.00 | $1,010.70 | $5.32 |
| Hypothetical-C | | $1,000.00 | $1,019.91 | $5.35 |
| Class M | 1.32% | | | |
| Actual | | $1,000.00 | $1,009.30 | $6.69 |
| Hypothetical-C | | $1,000.00 | $1,018.55 | $6.72 |
| Class C | 1.79% | | | |
| Actual | | $1,000.00 | $1,007.00 | $9.06 |
| Hypothetical-C | | $1,000.00 | $1,016.18 | $9.10 |
| Consumer Staples | .77% | | | |
| Actual | | $1,000.00 | $1,012.10 | $3.91 |
| Hypothetical-C | | $1,000.00 | $1,021.32 | $3.92 |
| Class I | .78% | | | |
| Actual | | $1,000.00 | $1,012.10 | $3.96 |
| Hypothetical-C | | $1,000.00 | $1,021.27 | $3.97 |
A Annualized expense ratio reflects expenses net of applicable fee waivers.
B Expenses are equal to each Class' annualized expense ratio, multiplied by the average account value over the period, multiplied by 184/365 (to reflect the one-half year period).
C 5% return per year before expenses
SELCS-SANN-1017
1.846045.110
Fidelity® Select Portfolios®
Telecommunications Services Sector Telecommunications Portfolio
Wireless Portfolio
Semi-Annual Report August 31, 2017 |
|
Contents
To view a fund's proxy voting guidelines and proxy voting record for the 12-month period ended June 30, visit http://www.fidelity.com/proxyvotingresults or visit the Securities and Exchange Commission's (SEC) web site at http://www.sec.gov.
You may also call 1-800-544-8544 to request a free copy of the proxy voting guidelines.
Standard & Poor's, S&P and S&P 500 are registered service marks of The McGraw-Hill Companies, Inc. and have been licensed for use by Fidelity Distributors Corporation.
Other third-party marks appearing herein are the property of their respective owners.
All other marks appearing herein are registered or unregistered trademarks or service marks of FMR LLC or an affiliated company. © 2017 FMR LLC. All rights reserved.
This report and the financial statements contained herein are submitted for the general information of the shareholders of the Funds. This report is not authorized for distribution to prospective investors in the Funds unless preceded or accompanied by an effective prospectus.
A fund files its complete schedule of portfolio holdings with the SEC for the first and third quarters of each fiscal year on Form N-Q. Forms N-Q are available on the SEC’s web site at http://www.sec.gov. A fund's Forms N-Q may be reviewed and copied at the SEC’s Public Reference Room in Washington, DC. Information regarding the operation of the SEC's Public Reference Room may be obtained by calling 1-800-SEC-0330.
For a complete list of a fund's portfolio holdings, view the most recent holdings listing, semiannual report, or annual report on Fidelity's web site at http://www.fidelity.com, http://www.institutional.fidelity.com, or http://www.401k.com, as applicable.
NOT FDIC INSURED •MAY LOSE VALUE •NO BANK GUARANTEE
Neither the Funds nor Fidelity Distributors Corporation is a bank.
Telecommunications Portfolio
Investment Summary (Unaudited)
Top Ten Stocks as of August 31, 2017
| | % of fund's net assets | % of fund's net assets 6 months ago |
| Verizon Communications, Inc. | 24.3 | 19.3 |
| AT&T, Inc. | 11.1 | 15.2 |
| T-Mobile U.S., Inc. | 6.9 | 8.1 |
| Level 3 Communications, Inc. | 4.4 | 4.6 |
| Cogent Communications Group, Inc. | 3.5 | 2.5 |
| Liberty Global PLC Class C | 3.4 | 1.9 |
| General Communications, Inc. Class A | 3.4 | 1.3 |
| Iridium Communications, Inc. | 3.3 | 2.4 |
| Vonage Holdings Corp. | 2.8 | 1.6 |
| CenturyLink, Inc. | 2.7 | 3.5 |
| | 65.8 | |
Top Industries (% of fund's net assets)
| As of August 31, 2017 |
| | Diversified Telecommunication Services | 67.7% |
| | Wireless Telecommunication Services | 15.2% |
| | Media | 10.3% |
| | Equity Real Estate Investment Trusts (Reits) | 2.2% |
| | Internet Software & Services | 1.9% |
| | All Others* | 2.7% |

* Includes Short-Term investments and Net Other Assets (Liabilities).
| As of February 28, 2017 |
| | Diversified Telecommunication Services | 68.1% |
| | Wireless Telecommunication Services | 15.5% |
| | Media | 8.7% |
| | Equity Real Estate Investment Trusts (Reits) | 3.8% |
| | Semiconductors & Semiconductor Equipment | 1.2% |
| | All Others* | 2.7% |

* Includes Short-Term investments and Net Other Assets (Liabilities).
Telecommunications Portfolio
Investments August 31, 2017 (Unaudited)
Showing Percentage of Net Assets
| Common Stocks - 99.6% | | | |
| | | Shares | Value |
| Construction & Engineering - 0.8% | | | |
| Construction & Engineering - 0.8% | | | |
| Dycom Industries, Inc. (a) | | 43,500 | $3,509,580 |
| Diversified Telecommunication Services - 67.7% | | | |
| Alternative Carriers - 19.6% | | | |
| Cogent Communications Group, Inc. | | 314,639 | 14,662,177 |
| Globalstar, Inc. (a)(b) | | 2,806,748 | 5,388,956 |
| Iliad SA | | 5,585 | 1,442,427 |
| Iridium Communications, Inc. (a)(b) | | 1,244,311 | 13,811,852 |
| Level 3 Communications, Inc. (a) | | 342,767 | 18,656,808 |
| Lumos Networks Corp. (a) | | 244,578 | 4,397,512 |
| ORBCOMM, Inc. (a) | | 238,449 | 2,637,246 |
| Vonage Holdings Corp. (a) | | 1,416,571 | 11,757,539 |
| Zayo Group Holdings, Inc. (a) | | 284,300 | 9,714,531 |
| | | | 82,469,048 |
| Integrated Telecommunication Services - 48.1% | | | |
| AT&T, Inc. | | 1,247,720 | 46,739,591 |
| Atlantic Tele-Network, Inc. | | 121,200 | 7,341,084 |
| CenturyLink, Inc. (b) | | 573,178 | 11,303,070 |
| Cincinnati Bell, Inc. (a) | | 491,402 | 10,344,012 |
| Consolidated Communications Holdings, Inc. (b) | | 221,900 | 4,094,055 |
| Frontier Communications Corp. (b) | | 261,375 | 3,520,721 |
| General Communications, Inc. Class A (a) | | 327,143 | 14,109,678 |
| Verizon Communications, Inc. | | 2,122,197 | 101,801,792 |
| Windstream Holdings, Inc. (b) | | 1,176,630 | 2,435,624 |
| | | | 201,689,627 |
|
| TOTAL DIVERSIFIED TELECOMMUNICATION SERVICES | | | 284,158,675 |
|
| Equity Real Estate Investment Trusts (REITs) - 2.2% | | | |
| Specialized REITs - 2.2% | | | |
| American Tower Corp. | | 62,690 | 9,281,255 |
| Internet Software & Services - 1.9% | | | |
| Internet Software & Services - 1.9% | | | |
| Akamai Technologies, Inc. (a) | | 77,000 | 3,630,550 |
| Gogo, Inc. (a)(b) | | 296,147 | 4,149,019 |
| | | | 7,779,569 |
| Media - 10.3% | | | |
| Broadcasting - 1.0% | | | |
| CBS Corp. Class B | | 32,500 | 2,081,950 |
| Nexstar Broadcasting Group, Inc. Class A | | 36,800 | 2,215,360 |
| | | | 4,297,310 |
| Cable & Satellite - 8.7% | | | |
| Altice NV Class A (a) | | 149,381 | 3,444,579 |
| Comcast Corp. Class A | | 57,100 | 2,318,831 |
| DISH Network Corp. Class A (a) | | 50,200 | 2,875,958 |
| Liberty Broadband Corp. Class A (a) | | 89,400 | 9,067,842 |
| Liberty Global PLC: | | | |
| Class A (a) | | 43,400 | 1,475,600 |
| Class C (a) | | 428,636 | 14,157,847 |
| LiLAC Class C (a) | | 53,034 | 1,367,747 |
| Megacable Holdings S.A.B. de CV unit | | 402,500 | 1,742,664 |
| | | | 36,451,068 |
| Movies & Entertainment - 0.6% | | | |
| Lions Gate Entertainment Corp. Class B | | 12,603 | 353,766 |
| The Walt Disney Co. | | 20,500 | 2,074,600 |
| | | | 2,428,366 |
|
| TOTAL MEDIA | | | 43,176,744 |
|
| Semiconductors & Semiconductor Equipment - 0.7% | | | |
| Semiconductors - 0.7% | | | |
| Qorvo, Inc. (a) | | 39,000 | 2,855,580 |
| Technology Hardware, Storage & Peripherals - 0.8% | | | |
| Technology Hardware, Storage & Peripherals - 0.8% | | | |
| Apple, Inc. | | 21,200 | 3,476,800 |
| Wireless Telecommunication Services - 15.2% | | | |
| Wireless Telecommunication Services - 15.2% | | | |
| Millicom International Cellular SA | | 26,600 | 1,641,486 |
| NII Holdings, Inc. (a)(b) | | 898,526 | 596,621 |
| Shenandoah Telecommunications Co. | | 172,067 | 6,203,015 |
| Sprint Corp. (a)(b) | | 1,329,785 | 10,970,726 |
| T-Mobile U.S., Inc. (a) | | 449,697 | 29,099,893 |
| Telephone & Data Systems, Inc. | | 351,264 | 10,295,548 |
| U.S. Cellular Corp. (a) | | 125,200 | 4,842,737 |
| | | | 63,650,026 |
| TOTAL COMMON STOCKS | | | |
| (Cost $337,755,824) | | | 417,888,229 |
|
| Money Market Funds - 12.0% | | | |
| Fidelity Cash Central Fund, 1.11% (c) | | 1,207,346 | 1,207,588 |
| Fidelity Securities Lending Cash Central Fund 1.11% (c)(d) | | 49,285,105 | 49,290,033 |
| TOTAL MONEY MARKET FUNDS | | | |
| (Cost $50,493,552) | | | 50,497,621 |
| TOTAL INVESTMENT IN SECURITIES - 111.6% | | | |
| (Cost $388,249,376) | | | 468,385,850 |
| NET OTHER ASSETS (LIABILITIES) - (11.6)% | | | (48,834,796) |
| NET ASSETS - 100% | | | $419,551,054 |
Legend
(a) Non-income producing
(b) Security or a portion of the security is on loan at period end.
(c) Affiliated fund that is generally available only to investment companies and other accounts managed by Fidelity Investments. The rate quoted is the annualized seven-day yield of the fund at period end. A complete unaudited listing of the fund's holdings as of its most recent quarter end is available upon request. In addition, each Fidelity Central Fund's financial statements are available on the SEC's website or upon request.
(d) Investment made with cash collateral received from securities on loan.
Affiliated Central Funds
Information regarding fiscal year to date income earned by the Fund from investments in Fidelity Central Funds is as follows:
| Fund | Income earned |
| Fidelity Cash Central Fund | $3,867 |
| Fidelity Securities Lending Cash Central Fund | 671,906 |
| Total | $675,773 |
Investment Valuation
All investments are categorized as Level 1 under the Fair Value Hierarchy. The inputs or methodology used for valuing securities may not be an indication of the risk associated with investing in those securities. For more information on valuation inputs please refer to the Investment Valuation section in the accompanying Notes to Financial Statements.
See accompanying notes which are an integral part of the financial statements.
Telecommunications Portfolio
Financial Statements
Statement of Assets and Liabilities
| | | August 31, 2017 (Unaudited) |
| Assets | | |
Investment in securities, at value (including securities loaned of $47,550,610) — See accompanying schedule:
Unaffiliated issuers (cost $337,755,824) | $417,888,229 | |
| Fidelity Central Funds (cost $50,493,552) | 50,497,621 | |
| Total Investment in Securities (cost $388,249,376) | | $468,385,850 |
| Receivable for investments sold | | 2,364,891 |
| Receivable for fund shares sold | | 29,074 |
| Dividends receivable | | 456,166 |
| Distributions receivable from Fidelity Central Funds | | 97,788 |
| Other receivables | | 18,925 |
| Total assets | | 471,352,694 |
| Liabilities | | |
| Payable for investments purchased | $1,345,085 | |
| Payable for fund shares redeemed | 855,560 | |
| Accrued management fee | 193,108 | |
| Distribution and service plan fees payable | 16,424 | |
| Other affiliated payables | 86,628 | |
| Other payables and accrued expenses | 23,716 | |
| Collateral on securities loaned | 49,281,119 | |
| Total liabilities | | 51,801,640 |
| Net Assets | | $419,551,054 |
| Net Assets consist of: | | |
| Paid in capital | | $292,314,377 |
| Undistributed net investment income | | 5,500,435 |
| Accumulated undistributed net realized gain (loss) on investments and foreign currency transactions | | 41,603,149 |
| Net unrealized appreciation (depreciation) on investments and assets and liabilities in foreign currencies | | 80,133,093 |
| Net Assets | | $419,551,054 |
| Calculation of Maximum Offering Price | | |
| Class A: | | |
| Net Asset Value and redemption price per share ($22,224,250 ÷ 322,447 shares) | | $68.92 |
| Maximum offering price per share (100/94.25 of $68.92) | | $73.12 |
| Class M: | | |
| Net Asset Value and redemption price per share ($5,618,855 ÷ 81,955 shares) | | $68.56 |
| Maximum offering price per share (100/96.50 of $68.56) | | $71.05 |
| Class C: | | |
| Net Asset Value and offering price per share ($10,792,274 ÷ 157,793 shares)(a) | | $68.40 |
| Telecommunications: | | |
| Net Asset Value, offering price and redemption price per share ($369,458,852 ÷ 5,326,959 shares) | | $69.36 |
| Class I: | | |
| Net Asset Value, offering price and redemption price per share ($11,456,823 ÷ 165,550 shares) | | $69.20 |
(a) Redemption price per share is equal to net asset value less any applicable contingent deferred sales charge.
See accompanying notes which are an integral part of the financial statements.
Statement of Operations
| | | Six months ended August 31, 2017 (Unaudited) |
| Investment Income | | |
| Dividends | | $7,199,569 |
| Income from Fidelity Central Funds (including $671,906 from security lending) | | 675,773 |
| Total income | | 7,875,342 |
| Expenses | | |
| Management fee | $1,534,353 | |
| Transfer agent fees | 540,373 | |
| Distribution and service plan fees | 106,574 | |
| Accounting and security lending fees | 112,555 | |
| Custodian fees and expenses | 11,955 | |
| Independent trustees' fees and expenses | 7,200 | |
| Registration fees | 54,928 | |
| Audit | 38,653 | |
| Legal | 5,318 | |
| Interest | 11,274 | |
| Miscellaneous | 6,716 | |
| Total expenses before reductions | 2,429,899 | |
| Expense reductions | (58,013) | 2,371,886 |
| Net investment income (loss) | | 5,503,456 |
| Realized and Unrealized Gain (Loss) | | |
| Net realized gain (loss) on: | | |
| Investment securities: | | |
| Unaffiliated issuers | 48,757,948 | |
| Fidelity Central Funds | (2,638) | |
| Foreign currency transactions | (9,080) | |
| Total net realized gain (loss) | | 48,746,230 |
| Change in net unrealized appreciation (depreciation) on: | | |
| Investment securities: | | |
| Unaffiliated issuers | (51,108,942) | |
| Fidelity Central Funds | (6,588) | |
| Assets and liabilities in foreign currencies | 48 | |
| Total change in net unrealized appreciation (depreciation) | | (51,115,482) |
| Net gain (loss) | | (2,369,252) |
| Net increase (decrease) in net assets resulting from operations | | $3,134,204 |
See accompanying notes which are an integral part of the financial statements.
Statement of Changes in Net Assets
| | Six months ended August 31, 2017 (Unaudited) | Year ended February 28, 2017 |
| Increase (Decrease) in Net Assets | | |
| Operations | | |
| Net investment income (loss) | $5,503,456 | $13,937,211 |
| Net realized gain (loss) | 48,746,230 | 61,532,842 |
| Change in net unrealized appreciation (depreciation) | (51,115,482) | 57,549,557 |
| Net increase (decrease) in net assets resulting from operations | 3,134,204 | 133,019,610 |
| Distributions to shareholders from net investment income | (2,154,816) | (13,294,404) |
| Distributions to shareholders from net realized gain | (13,743,561) | (31,675,318) |
| Total distributions | (15,898,377) | (44,969,722) |
| Share transactions - net increase (decrease) | (325,382,612) | (55,515,132) |
| Redemption fees | – | 54,102 |
| Total increase (decrease) in net assets | (338,146,785) | 32,588,858 |
| Net Assets | | |
| Beginning of period | 757,697,839 | 725,108,981 |
| End of period | $419,551,054 | $757,697,839 |
| Other Information | | |
| Undistributed net investment income end of period | $5,500,435 | $2,151,795 |
See accompanying notes which are an integral part of the financial statements.
Financial Highlights — Telecommunications Portfolio Class A
| | Six months ended (Unaudited) August 31, | Years ended February 28, | | | | |
| | 2017 | 2017 | 2016 A | 2015 | 2014 | 2013 |
| Selected Per–Share Data | | | | | | |
| Net asset value, beginning of period | $69.61 | $62.32 | $63.26 | $58.71 | $51.58 | $46.12 |
| Income from Investment Operations | | | | | | |
| Net investment income (loss)B | .57 | .88 | .81 | .76 | 1.76C | .99 |
| Net realized and unrealized gain (loss) | .36D | 10.68 | (.76) | 5.83 | 6.48 | 5.43 |
| Total from investment operations | .93 | 11.56 | .05 | 6.59 | 8.24 | 6.42 |
| Distributions from net investment income | (.19) | (1.11) | (.54) | (2.04) | (1.11) | (.96) |
| Distributions from net realized gain | (1.43) | (3.16) | (.45) | – | (.01) | – |
| Total distributions | (1.62) | (4.27) | (.99) | (2.04) | (1.11)E | (.96) |
| Redemption fees added to paid in capitalB | – | –F | –F | –F | –F | –F |
| Net asset value, end of period | $68.92 | $69.61 | $62.32 | $63.26 | $58.71 | $51.58 |
| Total ReturnG,H,I | 1.32% | 18.65% | .16% | 11.54% | 16.00% | 13.97% |
| Ratios to Average Net AssetsJ,K | | | | | | |
| Expenses before reductions | 1.14%L | 1.14% | 1.15% | 1.15% | 1.18% | 1.18% |
| Expenses net of fee waivers, if any | 1.14%L | 1.14% | 1.15% | 1.15% | 1.18% | 1.18% |
| Expenses net of all reductions | 1.12%L | 1.12% | 1.15% | 1.15% | 1.15% | 1.17% |
| Net investment income (loss) | 1.68%L | 1.28% | 1.33% | 1.26% | 3.08%C | 2.01% |
| Supplemental Data | | | | | | |
| Net assets, end of period (000 omitted) | $22,224 | $31,966 | $13,032 | $11,052 | $7,712 | $6,449 |
| Portfolio turnover rateM | 63%L | 105%N | 51% | 94%N | 111% | 76% |
A For the year ended February 29.
B Calculated based on average shares outstanding during the period.
C Net Investment income per share reflects a large, non-recurring dividend which amounted to $.95 per share. Excluding this non-recurring dividend, the ratio of net investment income (loss) to average net assets would have been 1.43%.
D The amount shown for a share outstanding does not correspond with the aggregate net gain (loss) on investments for the period due to the timing of sales and repurchases of shares in relation to fluctuating market values of the investments of the Fund.
E Total distributions of $1.11 per share is comprised of distributions from net investment income of $1.106 and distributions from net realized gain of $.005 per share.
F Amount represents less than $.005 per share.
G Total returns for periods of less than one year are not annualized.
H Total returns would have been lower if certain expenses had not been reduced during the applicable periods shown.
I Total returns do not include the effect of the sales charges.
J Fees and expenses of any underlying Fidelity Central Funds are not included in the Fund's expense ratio. The Fund indirectly bears its proportionate share of the expenses of any underlying Fidelity Central Funds.
K Expense ratios reflect operating expenses of the class. Expenses before reductions do not reflect amounts reimbursed by the investment adviser or reductions from brokerage service arrangements or reductions from other expense offset arrangements and do not represent the amount paid by the class during periods when reimbursements or reductions occur. Expenses net of fee waivers reflect expenses after reimbursement by the investment adviser but prior to reductions from brokerage service arrangements or other expense offset arrangements. Expenses net of all reductions represent the net expenses paid by the class.
L Annualized
M Amount does not include the portfolio activity of any underlying Fidelity Central Funds.
N Portfolio turnover rate excludes securities received or delivered in-kind.
See accompanying notes which are an integral part of the financial statements.
Financial Highlights — Telecommunications Portfolio Class M
| | Six months ended (Unaudited) August 31, | Years ended February 28, | | | | |
| | 2017 | 2017 | 2016 A | 2015 | 2014 | 2013 |
| Selected Per–Share Data | | | | | | |
| Net asset value, beginning of period | $69.33 | $61.95 | $63.04 | $58.50 | $51.41 | $46.01 |
| Income from Investment Operations | | | | | | |
| Net investment income (loss)B | .45 | .65 | .61 | .57 | 1.59C | .85 |
| Net realized and unrealized gain (loss) | .36D | 10.62 | (.76) | 5.81 | 6.44 | 5.39 |
| Total from investment operations | .81 | 11.27 | (.15) | 6.38 | 8.03 | 6.24 |
| Distributions from net investment income | (.14) | (.73) | (.49) | (1.84) | (.94) | (.84) |
| Distributions from net realized gain | (1.43) | (3.16) | (.45) | – | (.01) | – |
| Total distributions | (1.58)E | (3.89) | (.94) | (1.84) | (.94)F | (.84) |
| Redemption fees added to paid in capitalB | – | –G | –G | –G | –G | –G |
| Net asset value, end of period | $68.56 | $69.33 | $61.95 | $63.04 | $58.50 | $51.41 |
| Total ReturnH,I,J | 1.15% | 18.26% | (.16)% | 11.19% | 15.64% | 13.61% |
| Ratios to Average Net AssetsK,L | | | | | | |
| Expenses before reductions | 1.49%M | 1.46% | 1.47% | 1.47% | 1.48% | 1.48% |
| Expenses net of fee waivers, if any | 1.49%M | 1.46% | 1.47% | 1.47% | 1.48% | 1.48% |
| Expenses net of all reductions | 1.47%M | 1.44% | 1.46% | 1.46% | 1.45% | 1.46% |
| Net investment income (loss) | 1.33%M | .96% | 1.01% | .94% | 2.78%C | 1.72% |
| Supplemental Data | | | | | | |
| Net assets, end of period (000 omitted) | $5,619 | $6,933 | $8,280 | $5,095 | $4,344 | $4,237 |
| Portfolio turnover rateN | 63%M | 105%O | 51% | 94%O | 111% | 76% |
A For the year ended February 29.
B Calculated based on average shares outstanding during the period.
C Net Investment income per share reflects a large, non-recurring dividend which amounted to $.94 per share. Excluding this non-recurring dividend, the ratio of net investment income (loss) to average net assets would have been 1.13%.
D The amount shown for a share outstanding does not correspond with the aggregate net gain (loss) on investments for the period due to the timing of sales and repurchases of shares in relation to fluctuating market values of the investments of the Fund.
E Total distributions of $1.58 per share is comprised of distributions from net investment income of $.144 and distributions from net realized gain of $1.434 per share.
F Total distributions of $.94 per share is comprised of distributions from net investment income of $.939 and distributions from net realized gain of $.005 per share.
G Amount represents less than $.005 per share.
H Total returns for periods of less than one year are not annualized.
I Total returns would have been lower if certain expenses had not been reduced during the applicable periods shown.
J Total returns do not include the effect of the sales charges.
K Fees and expenses of any underlying Fidelity Central Funds are not included in the Fund's expense ratio. The Fund indirectly bears its proportionate share of the expenses of any underlying Fidelity Central Funds.
L Expense ratios reflect operating expenses of the class. Expenses before reductions do not reflect amounts reimbursed by the investment adviser or reductions from brokerage service arrangements or reductions from other expense offset arrangements and do not represent the amount paid by the class during periods when reimbursements or reductions occur. Expenses net of fee waivers reflect expenses after reimbursement by the investment adviser but prior to reductions from brokerage service arrangements or other expense offset arrangements. Expenses net of all reductions represent the net expenses paid by the class.
M Annualized
N Amount does not include the portfolio activity of any underlying Fidelity Central Funds.
O Portfolio turnover rate excludes securities received or delivered in-kind.
See accompanying notes which are an integral part of the financial statements.
Financial Highlights — Telecommunications Portfolio Class C
| | Six months ended (Unaudited) August 31, | Years ended February 28, | | | | |
| | 2017 | 2017 | 2016 A | 2015 | 2014 | 2013 |
| Selected Per–Share Data | | | | | | |
| Net asset value, beginning of period | $69.24 | $62.10 | $63.04 | $58.54 | $51.47 | $46.02 |
| Income from Investment Operations | | | | | | |
| Net investment income (loss)B | .32 | .37 | .36 | .34 | 1.36C | .63 |
| Net realized and unrealized gain (loss) | .37D | 10.62 | (.75) | 5.80 | 6.46 | 5.41 |
| Total from investment operations | .69 | 10.99 | (.39) | 6.14 | 7.82 | 6.04 |
| Distributions from net investment income | (.09) | (.69) | (.10) | (1.64) | (.74) | (.59) |
| Distributions from net realized gain | (1.43) | (3.16) | (.45) | – | (.01) | – |
| Total distributions | (1.53)E | (3.85) | (.55) | (1.64) | (.75) | (.59) |
| Redemption fees added to paid in capitalB | – | –F | –F | –F | –F | –F |
| Net asset value, end of period | $68.40 | $69.24 | $62.10 | $63.04 | $58.54 | $51.47 |
| Total ReturnG,H,I | .97% | 17.77% | (.57)% | 10.75% | 15.20% | 13.14% |
| Ratios to Average Net AssetsJ,K | | | | | | |
| Expenses before reductions | 1.87%L | 1.88% | 1.89% | 1.85% | 1.88% | 1.90% |
| Expenses net of fee waivers, if any | 1.87%L | 1.88% | 1.89% | 1.85% | 1.88% | 1.90% |
| Expenses net of all reductions | 1.85%L | 1.86% | 1.88% | 1.85% | 1.85% | 1.89% |
| Net investment income (loss) | .95%L | .54% | .60% | .56% | 2.38%C | 1.29% |
| Supplemental Data | | | | | | |
| Net assets, end of period (000 omitted) | $10,792 | $13,528 | $7,735 | $7,074 | $5,523 | $4,353 |
| Portfolio turnover rateM | 63%L | 105%N | 51% | 94%N | 111% | 76% |
A For the year ended February 29.
B Calculated based on average shares outstanding during the period.
C Net Investment income per share reflects a large, non-recurring dividend which amounted to $.94 per share. Excluding this non-recurring dividend, the ratio of net investment income (loss) to average net assets would have been .73%.
D The amount shown for a share outstanding does not correspond with the aggregate net gain (loss) on investments for the period due to the timing of sales and repurchases of shares in relation to fluctuating market values of the investments of the Fund.
E Total distributions of $1.53 per share is comprised of distributions from net investment income of $.092 and distributions from net realized gain of $1.434 per share.
F Amount represents less than $.005 per share.
G Total returns for periods of less than one year are not annualized.
H Total returns would have been lower if certain expenses had not been reduced during the applicable periods shown.
I Total returns do not include the effect of the contingent deferred sales charge.
J Fees and expenses of any underlying Fidelity Central Funds are not included in the Fund's expense ratio. The Fund indirectly bears its proportionate share of the expenses of any underlying Fidelity Central Funds.
K Expense ratios reflect operating expenses of the class. Expenses before reductions do not reflect amounts reimbursed by the investment adviser or reductions from brokerage service arrangements or reductions from other expense offset arrangements and do not represent the amount paid by the class during periods when reimbursements or reductions occur. Expenses net of fee waivers reflect expenses after reimbursement by the investment adviser but prior to reductions from brokerage service arrangements or other expense offset arrangements. Expenses net of all reductions represent the net expenses paid by the class.
L Annualized
M Amount does not include the portfolio activity of any underlying Fidelity Central Funds.
N Portfolio turnover rate excludes securities received or delivered in-kind.
See accompanying notes which are an integral part of the financial statements.
Financial Highlights — Telecommunications Portfolio
| | Six months ended (Unaudited) August 31, | Years ended February 28, | | | | |
| | 2017 | 2017 | 2016 A | 2015 | 2014 | 2013 |
| Selected Per–Share Data | | | | | | |
| Net asset value, beginning of period | $69.97 | $62.58 | $63.54 | $58.94 | $51.75 | $46.26 |
| Income from Investment Operations | | | | | | |
| Net investment income (loss)B | .69 | 1.12 | 1.02 | .96 | 1.96C | 1.15 |
| Net realized and unrealized gain (loss) | .36D | 10.74 | (.77) | 5.85 | 6.51 | 5.43 |
| Total from investment operations | 1.05 | 11.86 | .25 | 6.81 | 8.47 | 6.58 |
| Distributions from net investment income | (.23) | (1.31) | (.76) | (2.21) | (1.28) | (1.09) |
| Distributions from net realized gain | (1.43) | (3.16) | (.45) | – | (.01) | – |
| Total distributions | (1.66) | (4.47) | (1.21) | (2.21) | (1.28)E | (1.09) |
| Redemption fees added to paid in capitalB | – | –F | –F | –F | –F | –F |
| Net asset value, end of period | $69.36 | $69.97 | $62.58 | $63.54 | $58.94 | $51.75 |
| Total ReturnG,H | 1.49% | 19.06% | .49% | 11.90% | 16.40% | 14.30% |
| Ratios to Average Net AssetsI,J | | | | | | |
| Expenses before reductions | .82%K | .80% | .82% | .83% | .85% | .87% |
| Expenses net of fee waivers, if any | .82%K | .80% | .81% | .83% | .85% | .87% |
| Expenses net of all reductions | .80%K | .78% | .81% | .82% | .82% | .85% |
| Net investment income (loss) | 2.00%K | 1.62% | 1.67% | 1.58% | 3.41%C | 2.33% |
| Supplemental Data | | | | | | |
| Net assets, end of period (000 omitted) | $369,459 | $690,720 | $689,600 | $346,174 | $343,548 | $377,841 |
| Portfolio turnover rateL | 63%K | 105%M | 51% | 94%M | 111% | 76% |
A For the year ended February 29.
B Calculated based on average shares outstanding during the period.
C Net Investment income per share reflects a large, non-recurring dividend which amounted to $.95 per share. Excluding this non-recurring dividend, the ratio of net investment income (loss) to average net assets would have been 1.76%.
D The amount shown for a share outstanding does not correspond with the aggregate net gain (loss) on investments for the period due to the timing of sales and repurchases of shares in relation to fluctuating market values of the investments of the Fund.
E Total distributions of $1.28 per share is comprised of distributions from net investment income of $1.275 and distributions from net realized gain of $.005 per share.
F Amount represents less than $.005 per share.
G Total returns for periods of less than one year are not annualized.
H Total returns would have been lower if certain expenses had not been reduced during the applicable periods shown.
I Fees and expenses of any underlying Fidelity Central Funds are not included in the Fund's expense ratio. The Fund indirectly bears its proportionate share of the expenses of any underlying Fidelity Central Funds.
J Expense ratios reflect operating expenses of the class. Expenses before reductions do not reflect amounts reimbursed by the investment adviser or reductions from brokerage service arrangements or reductions from other expense offset arrangements and do not represent the amount paid by the class during periods when reimbursements or reductions occur. Expenses net of fee waivers reflect expenses after reimbursement by the investment adviser but prior to reductions from brokerage service arrangements or other expense offset arrangements. Expenses net of all reductions represent the net expenses paid by the class.
K Annualized
L Amount does not include the portfolio activity of any underlying Fidelity Central Funds.
M Portfolio turnover rate excludes securities received or delivered in-kind.
See accompanying notes which are an integral part of the financial statements.
Financial Highlights — Telecommunications Portfolio Class I
| | Six months ended (Unaudited) August 31, | Years ended February 28, | | | | |
| | 2017 | 2017 | 2016 A | 2015 | 2014 | 2013 |
| Selected Per–Share Data | | | | | | |
| Net asset value, beginning of period | $69.82 | $62.46 | $63.38 | $58.80 | $51.65 | $46.20 |
| Income from Investment Operations | | | | | | |
| Net investment income (loss)B | .68 | 1.12 | 1.02 | .94 | 1.93C | 1.17 |
| Net realized and unrealized gain (loss) | .37D | 10.70 | (.76) | 5.83 | 6.48 | 5.42 |
| Total from investment operations | 1.05 | 11.82 | .26 | 6.77 | 8.41 | 6.59 |
| Distributions from net investment income | (.23) | (1.30) | (.73) | (2.19) | (1.25) | (1.14) |
| Distributions from net realized gain | (1.43) | (3.16) | (.45) | – | (.01) | – |
| Total distributions | (1.67)E | (4.46) | (1.18) | (2.19) | (1.26) | (1.14) |
| Redemption fees added to paid in capitalB | – | –F | –F | –F | –F | –F |
| Net asset value, end of period | $69.20 | $69.82 | $62.46 | $63.38 | $58.80 | $51.65 |
| Total ReturnG,H | 1.49% | 19.03% | .51% | 11.85% | 16.30% | 14.33% |
| Ratios to Average Net AssetsI,J | | | | | | |
| Expenses before reductions | .82%K | .80% | .82% | .86% | .91% | .85% |
| Expenses net of fee waivers, if any | .82%K | .80% | .82% | .86% | .91% | .85% |
| Expenses net of all reductions | .80%K | .78% | .81% | .85% | .88% | .83% |
| Net investment income (loss) | 2.00%K | 1.62% | 1.67% | 1.55% | 3.35%C | 2.35% |
| Supplemental Data | | | | | | |
| Net assets, end of period (000 omitted) | $11,457 | $14,550 | $6,197 | $2,505 | $1,604 | $2,641 |
| Portfolio turnover rateL | 63%K | 105%M | 51% | 94%M | 111% | 76% |
A For the year ended February 29.
B Calculated based on average shares outstanding during the period.
C Net Investment income per share reflects a large, non-recurring dividend which amounted to $.95 per share. Excluding this non-recurring dividend, the ratio of net investment income (loss) to average net assets would have been 1.70%.
D The amount shown for a share outstanding does not correspond with the aggregate net gain (loss) on investments for the period due to the timing of sales and repurchases of shares in relation to fluctuating market values of the investments of the Fund.
E Total distributions of $1.67 per share is comprised of distributions from net investment income of $.232 and distributions from net realized gain of $1.434 per share.
F Amount represents less than $.005 per share.
G Total returns for periods of less than one year are not annualized.
H Total returns would have been lower if certain expenses had not been reduced during the applicable periods shown.
I Fees and expenses of any underlying Fidelity Central Funds are not included in the Fund's expense ratio. The Fund indirectly bears its proportionate share of the expenses of any underlying Fidelity Central Funds.
J Expense ratios reflect operating expenses of the class. Expenses before reductions do not reflect amounts reimbursed by the investment adviser or reductions from brokerage service arrangements or reductions from other expense offset arrangements and do not represent the amount paid by the class during periods when reimbursements or reductions occur. Expenses net of fee waivers reflect expenses after reimbursement by the investment adviser but prior to reductions from brokerage service arrangements or other expense offset arrangements. Expenses net of all reductions represent the net expenses paid by the class.
K Annualized
L Amount does not include the portfolio activity of any underlying Fidelity Central Funds.
M Portfolio turnover rate excludes securities received or delivered in-kind.
See accompanying notes which are an integral part of the financial statements.
Notes to Financial Statements (Unaudited)
For the period ended August 31, 2017
1. Organization.
Telecommunications Portfolio (the Fund) is a non-diversified fund of Fidelity Select Portfolios (the Trust) and is authorized to issue an unlimited number of shares. The Trust is registered under the Investment Company Act of 1940, as amended (the 1940 Act), as an open-end management investment company organized as a Massachusetts business trust. The Fund invests primarily in securities of companies whose principal business activities fall within specific industries. The Fund offers Class A, Class M (formerly Class T), Class C, Telecommunications and Class I shares, each of which has equal rights as to assets and voting privileges. Each class has exclusive voting rights with respect to matters that affect that class.
After the close of business on June 24, 2016, all outstanding Class B shares were converted to Class A shares. All prior fiscal period dollar and share amounts for Class B presented in the Notes to Financial Statements are for the period March 1, 2016 through June 24, 2016.
2. Investments in Fidelity Central Funds.
The Fund invests in Fidelity Central Funds, which are open-end investment companies generally available only to other investment companies and accounts managed by the investment adviser and its affiliates. The Fund's Schedule of Investments lists each of the Fidelity Central Funds held as of period end, if any, as an investment of the Fund, but does not include the underlying holdings of each Fidelity Central Fund. As an Investing Fund, the Fund indirectly bears its proportionate share of the expenses of the underlying Fidelity Central Funds.
The Money Market Central Funds seek preservation of capital and current income and are managed by Fidelity Investments Money Management, Inc. (FIMM), an affiliate of the investment adviser. Annualized expenses of the Money Market Central Funds as of their most recent shareholder report date are less than .005%.
A complete unaudited list of holdings for each Fidelity Central Fund is available upon request or at the Securities and Exchange Commission (the SEC) website at www.sec.gov. In addition, the financial statements of the Fidelity Central Funds are available on the SEC website or upon request.
3. Significant Accounting Policies.
The Fund is an investment company and applies the accounting and reporting guidance of the Financial Accounting Standards Board (FASB) Accounting Standards Codification Topic 946 Financial Services – Investments Companies. The financial statements have been prepared in conformity with accounting principles generally accepted in the United States of America (GAAP), which require management to make certain estimates and assumptions at the date of the financial statements. Actual results could differ from those estimates. Subsequent events, if any, through the date that the financial statements were issued have been evaluated in the preparation of the financial statements. The following summarizes the significant accounting policies of the Fund:
Investment Valuation. Investments are valued as of 4:00 p.m. Eastern time on the last calendar day of the period. The Board of Trustees (the Board) has delegated the day to day responsibility for the valuation of the Fund's investments to the Fair Value Committee (the Committee) established by the Fund's investment adviser. In accordance with valuation policies and procedures approved by the Board, the Fund attempts to obtain prices from one or more third party pricing vendors or brokers to value its investments. When current market prices, quotations or currency exchange rates are not readily available or reliable, investments will be fair valued in good faith by the Committee, in accordance with procedures adopted by the Board. Factors used in determining fair value vary by investment type and may include market or investment specific events. The frequency with which these procedures are used cannot be predicted and they may be utilized to a significant extent. The Committee oversees the Fund's valuation policies and procedures and reports to the Board on the Committee's activities and fair value determinations. The Board monitors the appropriateness of the procedures used in valuing the Fund's investments and ratifies the fair value determinations of the Committee.
The Fund categorizes the inputs to valuation techniques used to value its investments into a disclosure hierarchy consisting of three levels as shown below:
- Level 1 – quoted prices in active markets for identical investments
- Level 2 – other significant observable inputs (including quoted prices for similar investments, interest rates, prepayment speeds, etc.)
- Level 3 – unobservable inputs (including the Fund's own assumptions based on the best information available)
Valuation techniques used to value the Fund's investments by major category are as follows:
Equity securities, including restricted securities, for which market quotations are readily available, are valued at the last reported sale price or official closing price as reported by a third party pricing vendor on the primary market or exchange on which they are traded and are categorized as Level 1 in the hierarchy. In the event there were no sales during the day or closing prices are not available, securities are valued at the last quoted bid price or may be valued using the last available price and are generally categorized as Level 2 in the hierarchy. For foreign equity securities, when market or security specific events arise, comparisons to the valuation of American Depositary Receipts (ADRs), futures contracts, Exchange-Traded Funds (ETFs)and certain indexes as well as quoted prices for similar securities may be used and would be categorized as Level 2 in the hierarchy. Utilizing these techniques may result in transfers between Level 1 and Level 2. For equity securities, including restricted securities, where observable inputs are limited, assumptions about market activity and risk are used and these securities may be categorized as Level 3 in the hierarchy.
Investments in open-end mutual funds ,including the Fidelity Central Funds, are valued at their closing net asset value (NAV) each business day and are categorized as Level 1 in the hierarchy.
Changes in valuation techniques may result in transfers in or out of an assigned level within the disclosure hierarchy.
Foreign Currency. The Fund may use foreign currency contracts to facilitate transactions in foreign-denominated securities. Gains and losses from these transactions may arise from changes in the value of the foreign currency or if the counterparties do not perform under the contracts' terms.
Foreign-denominated assets, including investment securities, and liabilities are translated into U.S. dollars at the exchange rates at period end. Purchases and sales of investment securities, income and dividends received and expenses denominated in foreign currencies are translated into U.S. dollars at the exchange rate in effect on the transaction date.
The effects of exchange rate fluctuations on investments are included with the net realized and unrealized gain (loss) on investment securities. Other foreign currency transactions resulting in realized and unrealized gain (loss) are disclosed separately.
Investment Transactions and Income. For financial reporting purposes, the Fund's investment holdings and NAV include trades executed through the end of the last business day of the period. The NAV per share for processing shareholder transactions is calculated as of the close of business of the New York Stock Exchange (NYSE), normally 4:00 p.m. Eastern time and includes trades executed through the end of the prior business day. Gains and losses on securities sold are determined on the basis of identified cost and may include proceeds received from litigation. Dividend income is recorded on the ex-dividend date, except for certain dividends from foreign securities where the ex-dividend date may have passed, which are recorded as soon as the Fund is informed of the ex-dividend date. Non-cash dividends included in dividend income, if any, are recorded at the fair market value of the securities received. Income and capital gain distributions from Fidelity Central Funds, if any, are recorded on the ex-dividend date. Certain distributions received by the Fund represent a return of capital or capital gain. The Fund determines the components of these distributions subsequent to the ex-dividend date, based upon receipt of tax filings or other correspondence relating to the underlying investment. These distributions are recorded as a reduction of cost of investments and/or as a realized gain. Investment income is recorded net of foreign taxes withheld where recovery of such taxes is uncertain.
Class Allocations and Expenses. Investment income, realized and unrealized capital gains and losses, common expenses of the Fund, and certain fund-level expense reductions, if any, are allocated daily on a pro-rata basis to each class based on the relative net assets of each class to the total net assets of the Fund. Each class differs with respect to transfer agent and distribution and service plan fees incurred. Certain expense reductions may also differ by class. For the reporting period, the allocated portion of income and expenses to each class as a percent of its average net assets may vary due to the timing of recording these transactions in relation to fluctuating net assets of the classes. Expenses directly attributable to a fund are charged to that fund. Expenses attributable to more than one fund are allocated among the respective funds on the basis of relative net assets or other appropriate methods. Expense estimates are accrued in the period to which they relate and adjustments are made when actual amounts are known.
Income Tax Information and Distributions to Shareholders. Each year, the Fund intends to qualify as a regulated investment company under Subchapter M of the Internal Revenue Code, including distributing substantially all of its taxable income and realized gains. As a result, no provision for U.S. Federal income taxes is required. The Fund files a U.S. federal tax return, in addition to state and local tax returns as required. The Fund's federal income tax returns are subject to examination by the Internal Revenue Service (IRS) for a period of three fiscal years after they are filed. State and local tax returns may be subject to examination for an additional fiscal year depending on the jurisdiction. Foreign taxes are provided for based on the Fund's understanding of the tax rules and rates that exist in the foreign markets in which it invests.
Distributions are declared and recorded on the ex-dividend date. Income dividends and capital gain distributions are declared separately for each class. Income and capital gain distributions are determined in accordance with income tax regulations, which may differ from GAAP.
Capital accounts within the financial statements are adjusted for permanent book-tax differences. These adjustments have no impact on net assets or the results of operations. Capital accounts are not adjusted for temporary book-tax differences which will reverse in a subsequent period.
Book-tax differences are primarily due to foreign currency transactions, redemptions in kind, deferred trustees compensation and losses deferred due to wash sales and excise tax regulations.
As of period end, the cost and unrealized appreciation (depreciation) in securities, and derivatives if applicable, for federal income tax purposes were as follows:
| Gross unrealized appreciation | $104,528,264 |
| Gross unrealized depreciation | (26,389,865) |
| Net unrealized appreciation (depreciation) | $78,138,399 |
| Tax cost | $390,247,451 |
4. Purchases and Sales of Investments.
Purchases and sales of securities, other than short-term securities, aggregated $177,798,036 and $512,124,010, respectively.
5. Fees and Other Transactions with Affiliates.
Management Fee. Fidelity SelectCo, LLC (the investment adviser) and its affiliates provide the Fund with investment management related services for which the Fund pays a monthly management fee. The management fee is the sum of an individual fund fee rate that is based on an annual rate of .30% of the Fund's average net assets and an annualized group fee rate that averaged .25% during the period. The group fee rate is based upon the average net assets of all the mutual funds advised by Fidelity Management & Research Company (FMR) and the investment adviser. The group fee rate decreases as assets under management increase and increases as assets under management decrease. For the reporting period, the total annualized management fee rate was .55% of the Fund's average net assets.
Distribution and Service Plan Fees. In accordance with Rule 12b-1 of the 1940 Act, the Fund has adopted separate Distribution and Service Plans for each class of shares. Certain classes pay Fidelity Distributors Corporation (FDC), an affiliate of the investment adviser, separate Distribution and Service Fees, each of which is based on an annual percentage of each class' average net assets. In addition, FDC may pay financial intermediaries for selling shares of the Fund and providing shareholder support services. For the period, the Distribution and Service Fee rates, total fees and amounts retained by FDC were as follows:
| | Distribution
Fee | Service
Fee | Total Fees | Retained
by FDC |
| Class A | -% | .25% | $31,517 | $– |
| Class M | .25% | .25% | 15,696 | – |
| Class C | .75% | .25% | 59,361 | 12,455 |
| | | | $106,574 | $12,455 |
Sales Load. FDC may receive a front-end sales charge of up to 5.75% for selling Class A shares and 3.50% for selling Class M shares, some of which is paid to financial intermediaries for selling shares of the Fund. Depending on the holding period, FDC may receive contingent deferred sales charges levied on Class A, Class M and Class C redemptions. The deferred sales charges are 1.00% for Class C shares, 1.00% for certain purchases of Class A shares and .25% for certain purchases of Class M shares.
For the period, sales charge amounts retained by FDC were as follows:
| | Retained
by FDC |
| Class A | $8,866 |
| Class M | 1,127 |
| Class C(a) | 4,252 |
| | $14,245 |
(a) When Class C shares are initially sold, FDC pays commissions from its own resources to financial intermediaries through which the sales are made.
Transfer Agent Fees. Fidelity Investments Institutional Operations Company, Inc., (FIIOC), an affiliate of the investment adviser, is the transfer, dividend disbursing and shareholder servicing agent for each class of the Fund. FIIOC receives account fees and asset-based fees that vary according to the account size and type of account of the shareholders of the respective classes of the Fund. FIIOC pays for typesetting, printing and mailing of shareholder reports, except proxy statements.
For the period, transfer agent fees for each class were as follows:
| | Amount | % of
Class-Level Average
Net Assets(a) |
| Class A | $32,614 | .26 |
| Class M | 11,247 | .36 |
| Class C | 13,945 | .23 |
| Telecommunications | 470,564 | .19 |
| Class I | 12,003 | .19 |
| | $540,373 | |
(a) Annualized
Accounting and Security Lending Fees. Fidelity Service Company, Inc. (FSC), an affiliate of the investment adviser, maintains the Fund's accounting records. The accounting fee is based on the level of average net assets for each month. Under a separate contract, FSC administers the security lending program. The security lending fee is based on the number and duration of lending transactions.
Brokerage Commissions. The Fund placed a portion of its portfolio transactions with brokerage firms which are affiliates of the investment adviser. Brokerage commissions are included in net realized gain (loss) and change in net unrealized appreciation (depreciation) in the Statement of Operations. The commissions paid to these affiliated firms were $22,354 for the period.
Interfund Lending Program. Pursuant to an Exemptive Order issued by the SEC, the Fund, along with other registered investment companies having management contracts with FMR or other affiliated entities of FMR, may participate in an interfund lending program. This program provides an alternative credit facility allowing the funds to borrow from, or lend money to, other participating affiliated funds. At period end, there were no interfund loans outstanding. The Fund's activity in this program during the period for which loans were outstanding was as follows:
| Borrower or Lender | Average Loan Balance | Weighted Average Interest Rate | Interest Expense |
| Borrower | $6,749,957 | 1.15% | $10,093 |
Interfund Trades. The Fund may purchase from or sell securities to other Fidelity Funds under procedures adopted by the Board. The procedures have been designed to ensure these interfund trades are executed in accordance with Rule 17a-7 of the 1940 Act. Interfund trades are included within the respective purchases and sales amounts shown in the Purchases and Sales of Investments note.
Prior Fiscal Year Redemptions In-Kind. During the prior period, 805,095 shares of the Fund held by an affiliated entity were redeemed in-kind for investments and cash with a value of $53,345,591. The Fund had a net realized gain of $12,655,696 on investments delivered through the in-kind redemptions. The amount of the in-kind redemptions is included in share transactions in the accompanying Statement of Changes in Net Assets as well as the Notes to Financial Statements. The Fund recognized no gain or loss for federal income tax purposes.
6. Committed Line of Credit.
The Fund participates with other funds managed by the investment adviser or an affiliate in a $4.25 billion credit facility (the "line of credit") to be utilized for temporary or emergency purposes to fund shareholder redemptions or for other short-term liquidity purposes. The Fund has agreed to pay commitment fees on its pro-rata portion of the line of credit, which amounted to $1,141 and is reflected in Miscellaneous expenses on the Statement of Operations. During the period, the Fund did not borrow on this line of credit.
7. Security Lending.
The Fund lends portfolio securities through a lending agent from time to time in order to earn additional income. On the settlement date of the loan, the Fund receives collateral (in the form of U.S. Treasury obligations, letters of credit and/or cash) against the loaned securities and maintains collateral in an amount not less than 100% of the market value of the loaned securities during the period of the loan. The market value of the loaned securities is determined at the close of business of the Fund and any additional required collateral is delivered to the Fund on the next business day. The Fund or borrower may terminate the loan at any time, and if the borrower defaults on its obligation to return the securities loaned because of insolvency or other reasons, the Fund may apply collateral received from the borrower against the obligation. The Fund may experience delays and costs in recovering the securities loaned. Any cash collateral received is invested in the Fidelity Securities Lending Cash Central Fund. The value of loaned securities and cash collateral at period end are disclosed on the Fund's Statement of Assets and Liabilities. Security lending income represents the income earned on investing cash collateral, less rebates paid to borrowers and any lending agent fees associated with the loan, plus any premium payments received for lending certain types of securities. Security lending income is presented in the Statement of Operations as a component of income from Fidelity Central Funds.
8. Bank Borrowings.
The Fund is permitted to have bank borrowings for temporary or emergency purposes to fund shareholder redemptions or for other short-term liquidity requirements. The Fund has established borrowing arrangements with certain banks. The interest rate on the borrowings is the bank's base rate, as revised from time to time. The average loan balance during the period for which loans were outstanding amounted to $3,895,111. The weighted average interest rate was 1.21%. The interest expense amounted to $1,181 under the bank borrowing program. At period end, there were no bank borrowings outstanding.
9. Expense Reductions.
Commissions paid to certain brokers with whom the investment adviser, or its affiliates, places trades on behalf of the Fund include an amount in addition to trade execution, which may be rebated back to the Fund to offset certain expenses. This amount totaled $54,354 for the period.
In addition, during the period the investment adviser reimbursed and/or waived a portion of fund-level operating expenses in the amount of $3,659.
10. Distributions to Shareholders.
Distributions to shareholders of each class were as follows:
| | Six months ended
August 31, 2017 | Year ended February 28, 2017 |
| From net investment income | | |
| Class A | $70,858 | $455,173 |
| Class M | 13,588 | 67,280 |
| Class C | 16,681 | 124,522 |
| Telecommunications | 2,010,238 | 12,452,745 |
| Class I | 43,451 | 194,684 |
| Total | $2,154,816 | $13,294,404 |
| From net realized gain | | |
| Class A | $546,287 | $1,308,078 |
| Class M | 135,310 | 287,783 |
| Class C | 260,002 | 572,522 |
| Telecommunications | 12,533,393 | 29,029,256 |
| Class I | 268,569 | 477,679 |
| Total | $13,743,561 | $31,675,318 |
11. Share Transactions.
Share transactions for each class were as follows and may contain automatic conversions between classes or exchanges between affiliated funds:
| | Shares | Shares | Dollars | Dollars |
| | Six months ended
August 31, 2017 | Year ended February 28, 2017 | Six months ended
August 31, 2017 | Year ended February 28, 2017 |
| Class A | | | | |
| Shares sold | 40,883 | 521,786 | $2,800,759 | $35,388,038 |
| Reinvestment of distributions | 8,681 | 24,324 | 602,094 | 1,671,796 |
| Shares redeemed | (186,335) | (296,004) | (12,774,640) | (20,518,786) |
| Net increase (decrease) | (136,771) | 250,106 | $(9,371,787) | $16,541,048 |
| Class M | | | | |
| Shares sold | 15,187 | 82,122 | $1,046,682 | $5,468,018 |
| Reinvestment of distributions | 2,151 | 5,039 | 148,633 | 345,400 |
| Shares redeemed | (35,390) | (120,797) | (2,416,248) | (8,187,323) |
| Net increase (decrease) | (18,052) | (33,636) | $(1,220,933) | $(2,373,905) |
| Class B | | | | |
| Shares sold | – | 975 | $– | $64,042 |
| Shares redeemed | – | (5,216) | – | (349,278) |
| Net increase (decrease) | – | (4,241) | $– | $(285,236) |
| Class C | | | | |
| Shares sold | 18,841 | 135,768 | $1,284,909 | $9,283,679 |
| Reinvestment of distributions | 3,602 | 8,829 | 248,620 | 604,885 |
| Shares redeemed | (60,028) | (73,776) | (4,077,668) | (5,085,863) |
| Net increase (decrease) | (37,585) | 70,821 | $(2,544,139) | $4,802,701 |
| Telecommunications | | | | |
| Shares sold | 445,173 | 6,206,062 | $30,748,858 | $424,943,213 |
| Reinvestment of distributions | 201,643 | 578,869 | 14,056,517 | 39,940,628 |
| Shares redeemed | (5,191,889) | (7,931,924)(a) | (354,133,506) | (546,713,599)(a) |
| Net increase (decrease) | (4,545,073) | (1,146,993) | $(309,328,131) | $(81,829,758) |
| Class I | | | | |
| Shares sold | 122,562 | 536,498 | $8,529,582 | $37,085,732 |
| Reinvestment of distributions | 3,946 | 8,128 | 274,462 | 559,963 |
| Shares redeemed | (169,352) | (435,454) | (11,721,666) | (30,015,677) |
| Net increase (decrease) | (42,844) | 109,172 | $(2,917,622) | $7,630,018 |
(a) Amount includes in-kind redemptions (see the Prior Fiscal Year Redemptions In-Kind note for additional details).
12. Other.
The Fund's organizational documents provide former and current trustees and officers with a limited indemnification against liabilities arising in connection with the performance of their duties to the Fund. In the normal course of business, the Fund may also enter into contracts that provide general indemnifications. The Fund's maximum exposure under these arrangements is unknown as this would be dependent on future claims that may be made against the Fund. The risk of material loss from such claims is considered remote.
Wireless Portfolio
Investment Summary (Unaudited)
Top Ten Stocks as of August 31, 2017
| | % of fund's net assets | % of fund's net assets 6 months ago |
| Apple, Inc. | 20.1 | 24.6 |
| Verizon Communications, Inc. | 11.5 | 5.8 |
| T-Mobile U.S., Inc. | 5.1 | 7.0 |
| Qualcomm, Inc. | 4.8 | 4.8 |
| AT&T, Inc. | 4.7 | 1.3 |
| American Tower Corp. | 4.5 | 6.4 |
| Liberty Global PLC Class A | 3.7 | 1.5 |
| Vodafone Group PLC sponsored ADR | 3.0 | 3.7 |
| Masmovil Ibercom SA | 2.7 | 2.0 |
| China Mobile Ltd. sponsored ADR | 2.5 | 2.0 |
| | 62.6 | |
Top Industries (% of fund's net assets)
| As of August 31, 2017 |
| | Diversified Telecommunication Services | 38.0% |
| | Technology Hardware, Storage & Peripherals | 21.7% |
| | Wireless Telecommunication Services | 12.5% |
| | Semiconductors & Semiconductor Equipment | 8.9% |
| | Media | 6.2% |
| | All Others* | 12.7% |

* Includes Short-Term investments and Net Other Assets (Liabilities).
| As of February 28, 2017 |
| | Diversified Telecommunication Services | 29.0% |
| | Technology Hardware, Storage & Peripherals | 25.8% |
| | Wireless Telecommunication Services | 14.7% |
| | Semiconductors & Semiconductor Equipment | 8.9% |
| | Equity Real Estate Investment Trusts (Reits) | 6.4% |
| | All Others* | 15.2% |
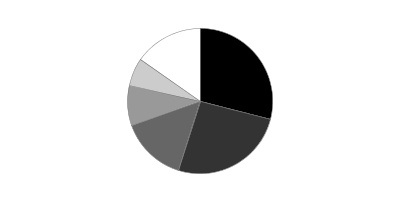
* Includes Short-Term investments and Net Other Assets (Liabilities).
Wireless Portfolio
Investments August 31, 2017 (Unaudited)
Showing Percentage of Net Assets
| Common Stocks - 96.5% | | | |
| | | Shares | Value |
| Communications Equipment - 3.6% | | | |
| Communications Equipment - 3.6% | | | |
| CommScope Holding Co., Inc. (a) | | 64,400 | $2,129,064 |
| Harris Corp. | | 20,500 | 2,519,450 |
| Motorola Solutions, Inc. | | 11,368 | 1,001,748 |
| NETGEAR, Inc. (a) | | 17,000 | 816,000 |
| Nokia Corp. sponsored ADR | | 126,800 | 783,624 |
| Telefonaktiebolaget LM Ericsson (B Shares) sponsored ADR | | 487,700 | 2,843,291 |
| ViaSat, Inc. (a) | | 1 | 64 |
| | | | 10,093,241 |
| Diversified Telecommunication Services - 36.6% | | | |
| Alternative Carriers - 0.4% | | | |
| Iliad SA | | 3,344 | 863,649 |
| ORBCOMM, Inc. (a) | | 37,000 | 409,220 |
| | | | 1,272,869 |
| Integrated Telecommunication Services - 36.2% | | | |
| AT&T, Inc. | | 349,900 | 13,107,254 |
| BCE, Inc. | | 91,700 | 4,364,883 |
| BT Group PLC sponsored ADR (b) | | 297,500 | 5,682,250 |
| Chunghwa Telecom Co. Ltd. sponsored ADR (b) | | 48,200 | 1,668,202 |
| Deutsche Telekom AG | | 126,400 | 2,285,937 |
| Euskaltel, S.A. | | 333,000 | 3,393,750 |
| Masmovil Ibercom SA (a)(b) | | 103,674 | 7,651,960 |
| Nippon Telegraph & Telephone Corp. sponsored ADR | | 125,400 | 6,237,396 |
| Orange SA (a) | | 287,300 | 4,877,963 |
| SFR Group SA (a) | | 106,800 | 4,373,618 |
| TDC A/S | | 343,098 | 2,044,084 |
| Telecom Italia SpA (a) | | 3,433,900 | 3,295,139 |
| Telecom Italia SpA sponsored ADR (a)(b) | | 25,400 | 246,380 |
| Telefonica Deutschland Holding AG | | 908,571 | 4,916,992 |
| Telefonica SA sponsored ADR (b) | | 491,697 | 5,295,577 |
| Verizon Communications, Inc. | | 676,201 | 32,437,362 |
| | | | 101,878,747 |
|
| TOTAL DIVERSIFIED TELECOMMUNICATION SERVICES | | | 103,151,616 |
|
| Equity Real Estate Investment Trusts (REITs) - 5.8% | | | |
| Specialized REITs - 5.8% | | | |
| American Tower Corp. | | 86,292 | 12,775,531 |
| Crown Castle International Corp. | | 1 | 108 |
| SBA Communications Corp. Class A (a) | | 23,400 | 3,593,070 |
| | | | 16,368,709 |
| Internet Software & Services - 1.3% | | | |
| Internet Software & Services - 1.3% | | | |
| Akamai Technologies, Inc. (a) | | 26,100 | 1,230,615 |
| Alphabet, Inc. Class C (a) | | 2,652 | 2,491,103 |
| | | | 3,721,718 |
| Media - 6.2% | | | |
| Cable & Satellite - 6.2% | | | |
| Altice NV: | | | |
| Class A (a) | | 121,206 | 2,794,891 |
| Class B (a) | | 181,574 | 4,198,806 |
| Liberty Global PLC Class A (a) | | 307,000 | 10,438,000 |
| | | | 17,431,697 |
| Semiconductors & Semiconductor Equipment - 8.9% | | | |
| Semiconductors - 8.9% | | | |
| Integrated Device Technology, Inc. (a) | | 61,100 | 1,509,781 |
| Marvell Technology Group Ltd. | | 119,400 | 2,138,454 |
| Qorvo, Inc. (a) | | 61,625 | 4,512,183 |
| Qualcomm, Inc. | | 258,350 | 13,503,955 |
| Skyworks Solutions, Inc. | | 28,100 | 2,960,616 |
| STMicroelectronics NV (NY Shares) unit | | 31,200 | 544,128 |
| | | | 25,169,117 |
| Software - 0.8% | | | |
| Application Software - 0.8% | | | |
| RingCentral, Inc. (a) | | 50,600 | 2,142,910 |
| Technology Hardware, Storage & Peripherals - 21.7% | | | |
| Technology Hardware, Storage & Peripherals - 21.7% | | | |
| Apple, Inc. | | 344,805 | 56,548,019 |
| BlackBerry Ltd. (a) | | 76,201 | 706,022 |
| Samsung Electronics Co. Ltd. | | 1,805 | 3,718,422 |
| | | | 60,972,463 |
| Wireless Telecommunication Services - 11.6% | | | |
| Wireless Telecommunication Services - 11.6% | | | |
| China Mobile Ltd. sponsored ADR | | 132,100 | 7,011,868 |
| Millicom International Cellular SA | | 24,100 | 1,487,211 |
| NTT DOCOMO, Inc. sponsored ADR | | 1,400 | 32,564 |
| Rogers Communications, Inc. Class B (non-vtg.) | | 6,900 | 360,209 |
| Spok Holdings, Inc. | | 1 | 17 |
| Sprint Corp. (a) | | 32 | 264 |
| T-Mobile U.S., Inc. (a) | | 222,075 | 14,370,473 |
| Telephone & Data Systems, Inc. | | 27,614 | 809,366 |
| U.S. Cellular Corp. (a) | | 5,800 | 224,344 |
| Vodafone Group PLC sponsored ADR | | 289,381 | 8,400,730 |
| | | | 32,697,046 |
| TOTAL COMMON STOCKS | | | |
| (Cost $215,693,149) | | | 271,748,517 |
|
| Nonconvertible Preferred Stocks - 2.3% | | | |
| Diversified Telecommunication Services - 1.4% | | | |
| Integrated Telecommunication Services - 1.4% | | | |
| Telefonica Brasil SA | | 242,900 | 3,768,679 |
| Wireless Telecommunication Services - 0.9% | | | |
| Wireless Telecommunication Services - 0.9% | | | |
| TIM Participacoes SA sponsored ADR | | 141,700 | 2,523,677 |
| TOTAL NONCONVERTIBLE PREFERRED STOCKS | | | |
| (Cost $5,349,446) | | | 6,292,356 |
|
| Money Market Funds - 1.9% | | | |
| Fidelity Cash Central Fund, 1.11% (c) | | 1,230,415 | 1,230,662 |
| Fidelity Securities Lending Cash Central Fund 1.11% (c)(d) | | 4,135,039 | 4,135,452 |
| TOTAL MONEY MARKET FUNDS | | | |
| (Cost $5,366,061) | | | 5,366,114 |
| TOTAL INVESTMENT IN SECURITIES - 100.7% | | | |
| (Cost $226,408,656) | | | 283,406,987 |
| NET OTHER ASSETS (LIABILITIES) - (0.7)% | | | (1,876,551) |
| NET ASSETS - 100% | | | $281,530,436 |
Legend
(a) Non-income producing
(b) Security or a portion of the security is on loan at period end.
(c) Affiliated fund that is generally available only to investment companies and other accounts managed by Fidelity Investments. The rate quoted is the annualized seven-day yield of the fund at period end. A complete unaudited listing of the fund's holdings as of its most recent quarter end is available upon request. In addition, each Fidelity Central Fund's financial statements are available on the SEC's website or upon request.
(d) Investment made with cash collateral received from securities on loan.
Affiliated Central Funds
Information regarding fiscal year to date income earned by the Fund from investments in Fidelity Central Funds is as follows:
| Fund | Income earned |
| Fidelity Cash Central Fund | $19,624 |
| Fidelity Securities Lending Cash Central Fund | 67,827 |
| Total | $87,451 |
Investment Valuation
The following is a summary of the inputs used, as of August 31, 2017, involving the Fund's assets and liabilities carried at fair value. The inputs or methodology used for valuing securities may not be an indication of the risk associated with investing in those securities. For more information on valuation inputs, and their aggregation into the levels used below, please refer to the Investment Valuation section in the accompanying Notes to Financial Statements.
| | Valuation Inputs at Reporting Date: |
| Description | Total | Level 1 | Level 2 | Level 3 |
| Investments in Securities: | | | | |
| Common Stocks | $271,748,517 | $261,289,478 | $10,459,039 | $-- |
| Nonconvertible Preferred Stocks | 6,292,356 | 6,292,356 | -- | -- |
| Money Market Funds | 5,366,114 | 5,366,114 | -- | -- |
| Total Investments in Securities: | $283,406,987 | $272,947,948 | $10,459,039 | $-- |
The following is a summary of transfers between Level 1 and Level 2 for the period ended August 31, 2017. Transfers are assumed to have occurred at the beginning of the period, and are primarily attributable to the valuation techniques used for foreign equity securities, as discussed in the accompanying Notes to Financial Statements:
| Transfers | Total |
| Level 1 to Level 2 | $0 |
| Level 2 to Level 1 | $3,150,787 |
Other Information
Distribution of investments by country or territory of incorporation, as a percentage of Total Net Assets, is as follows (Unaudited):
| United States of America | 61.2% |
| United Kingdom | 8.7% |
| Spain | 5.8% |
| France | 3.6% |
| Netherlands | 2.7% |
| Germany | 2.5% |
| Hong Kong | 2.5% |
| Brazil | 2.3% |
| Japan | 2.2% |
| Canada | 2.0% |
| Korea (South) | 1.3% |
| Italy | 1.3% |
| Sweden | 1.0% |
| Others (Individually Less Than 1%) | 2.9% |
| | 100.0% |
See accompanying notes which are an integral part of the financial statements.
Wireless Portfolio
Financial Statements
Statement of Assets and Liabilities
| | | August 31, 2017 (Unaudited) |
| Assets | | |
Investment in securities, at value (including securities loaned of $4,044,887) — See accompanying schedule:
Unaffiliated issuers (cost $221,042,595) | $278,040,873 | |
| Fidelity Central Funds (cost $5,366,061) | 5,366,114 | |
| Total Investment in Securities (cost $226,408,656) | | $283,406,987 |
| Receivable for investments sold | | 2,537,260 |
| Receivable for fund shares sold | | 668,583 |
| Dividends receivable | | 1,038,214 |
| Distributions receivable from Fidelity Central Funds | | 5,085 |
| Other receivables | | 21,901 |
| Total assets | | 287,678,030 |
| Liabilities | | |
| Payable for fund shares redeemed | $1,802,555 | |
| Accrued management fee | 128,335 | |
| Other affiliated payables | 59,986 | |
| Other payables and accrued expenses | 23,318 | |
| Collateral on securities loaned | 4,133,400 | |
| Total liabilities | | 6,147,594 |
| Net Assets | | $281,530,436 |
| Net Assets consist of: | | |
| Paid in capital | | $220,136,337 |
| Undistributed net investment income | | 3,406,251 |
| Accumulated undistributed net realized gain (loss) on investments and foreign currency transactions | | 985,642 |
| Net unrealized appreciation (depreciation) on investments and assets and liabilities in foreign currencies | | 57,002,206 |
| Net Assets, for 27,909,376 shares outstanding | | $281,530,436 |
| Net Asset Value, offering price and redemption price per share ($281,530,436 ÷ 27,909,376 shares) | | $10.09 |
See accompanying notes which are an integral part of the financial statements.
Statement of Operations
| | | Six months ended August 31, 2017 (Unaudited) |
| Investment Income | | |
| Dividends | | $4,549,667 |
| Income from Fidelity Central Funds | | 87,451 |
| Total income | | 4,637,118 |
| Expenses | | |
| Management fee | $788,297 | |
| Transfer agent fees | 293,706 | |
| Accounting and security lending fees | 56,956 | |
| Custodian fees and expenses | 14,601 | |
| Independent trustees' fees and expenses | 3,188 | |
| Registration fees | 42,693 | |
| Audit | 29,333 | |
| Legal | 1,713 | |
| Interest | 498 | |
| Miscellaneous | 1,429 | |
| Total expenses before reductions | 1,232,414 | |
| Expense reductions | (26,634) | 1,205,780 |
| Net investment income (loss) | | 3,431,338 |
| Realized and Unrealized Gain (Loss) | | |
| Net realized gain (loss) on: | | |
| Investment securities: | | |
| Unaffiliated issuers | 3,506,986 | |
| Fidelity Central Funds | 452 | |
| Foreign currency transactions | (19,923) | |
| Total net realized gain (loss) | | 3,487,515 |
| Change in net unrealized appreciation (depreciation) on: | | |
| Investment securities: | | |
| Unaffiliated issuers | 20,551,632 | |
| Fidelity Central Funds | (1,005) | |
| Assets and liabilities in foreign currencies | 3,029 | |
| Total change in net unrealized appreciation (depreciation) | | 20,553,656 |
| Net gain (loss) | | 24,041,171 |
| Net increase (decrease) in net assets resulting from operations | | $27,472,509 |
See accompanying notes which are an integral part of the financial statements.
Statement of Changes in Net Assets
| | Six months ended August 31, 2017 (Unaudited) | Year ended February 28, 2017 |
| Increase (Decrease) in Net Assets | | |
| Operations | | |
| Net investment income (loss) | $3,431,338 | $2,634,675 |
| Net realized gain (loss) | 3,487,515 | 17,033,169 |
| Change in net unrealized appreciation (depreciation) | 20,553,656 | 26,589,316 |
| Net increase (decrease) in net assets resulting from operations | 27,472,509 | 46,257,160 |
| Distributions to shareholders from net investment income | (272,447) | (2,089,084) |
| Distributions to shareholders from net realized gain | (953,566) | (11,015,171) |
| Total distributions | (1,226,013) | (13,104,255) |
| Share transactions | | |
| Proceeds from sales of shares | 141,869,390 | 45,389,529 |
| Reinvestment of distributions | 1,170,249 | 12,510,630 |
| Cost of shares redeemed | (127,120,765) | (59,190,184) |
| Net increase (decrease) in net assets resulting from share transactions | 15,918,874 | (1,290,025) |
| Redemption fees | 6,138 | 4,168 |
| Total increase (decrease) in net assets | 42,171,508 | 31,867,048 |
| Net Assets | | |
| Beginning of period | 239,358,928 | 207,491,880 |
| End of period | $281,530,436 | $239,358,928 |
| Other Information | | |
| Undistributed net investment income end of period | $3,406,251 | $247,360 |
| Shares | | |
| Sold | 14,612,769 | 5,182,631 |
| Issued in reinvestment of distributions | 125,563 | 1,569,715 |
| Redeemed | (13,104,548) | (6,898,091) |
| Net increase (decrease) | 1,633,784 | (145,745) |
See accompanying notes which are an integral part of the financial statements.
Financial Highlights — Wireless Portfolio
| | Six months ended (Unaudited) August 31, | Years ended February 28, | | | | |
| | 2017 | 2017 | 2016 A | 2015 | 2014 | 2013 |
| Selected Per–Share Data | | | | | | |
| Net asset value, beginning of period | $9.11 | $7.85 | $9.54 | $10.57 | $8.60 | $7.68 |
| Income from Investment Operations | | | | | | |
| Net investment income (loss)B | .11 | .10 | .11 | .17 | .56C | .12 |
| Net realized and unrealized gain (loss) | .92 | 1.71 | (1.11) | .48 | 1.51 | .94 |
| Total from investment operations | 1.03 | 1.81 | (1.00) | .65 | 2.07 | 1.06 |
| Distributions from net investment income | (.01) | (.09) | (.12) | (.62) | (.10) | (.14) |
| Distributions from net realized gain | (.04) | (.46) | (.57) | (1.06) | – | – |
| Total distributions | (.05) | (.55) | (.69) | (1.68) | (.10) | (.14) |
| Redemption fees added to paid in capitalB,D | – | – | – | – | – | – |
| Net asset value, end of period | $10.09 | $9.11 | $7.85 | $9.54 | $10.57 | $8.60 |
| Total ReturnE,F | 11.29% | 24.09% | (11.07)% | 7.55% | 24.11% | 13.89% |
| Ratios to Average Net AssetsG,H | | | | | | |
| Expenses before reductions | .85%I | .87% | .86% | .86% | .88% | .90% |
| Expenses net of fee waivers, if any | .85%I | .87% | .86% | .86% | .88% | .90% |
| Expenses net of all reductions | .83%I | .86% | .85% | .85% | .86% | .87% |
| Net investment income (loss) | 2.37%I | 1.23% | 1.23% | 1.76% | 5.91%C | 1.50% |
| Supplemental Data | | | | | | |
| Net assets, end of period (000 omitted) | $281,530 | $239,359 | $207,492 | $270,449 | $290,057 | $253,794 |
| Portfolio turnover rateJ | 101%I | 98% | 78% | 48% | 120% | 100% |
A For the year ended February 29.
B Calculated based on average shares outstanding during the period.
C Net Investment income per share reflects a large, non-recurring dividend which amounted to $.45 per share. Excluding this non-recurring dividend, the ratio of net investment income (loss) to average net assets would have been 1.23%.
D Amount represents less than $.005 per share.
E Total returns for periods of less than one year are not annualized.
F Total returns would have been lower if certain expenses had not been reduced during the applicable periods shown.
G Fees and expenses of any underlying Fidelity Central Funds are not included in the Fund's expense ratio. The Fund indirectly bears its proportionate share of the expenses of any underlying Fidelity Central Funds.
H Expense ratios reflect operating expenses of the Fund. Expenses before reductions do not reflect amounts reimbursed by the investment adviser or reductions from brokerage service arrangements or reductions from other expense offset arrangements and do not represent the amount paid by the Fund during periods when reimbursements or reductions occur. Expenses net of fee waivers reflect expenses after reimbursement by the investment adviser but prior to reductions from brokerage service arrangements or other expense offset arrangements. Expenses net of all reductions represent the net expenses paid by the Fund.
I Annualized
J Amount does not include the portfolio activity of any underlying Fidelity Central Funds.
See accompanying notes which are an integral part of the financial statements.
Notes to Financial Statements (Unaudited)
For the period ended August 31, 2017
1. Organization.
Wireless Portfolio (the Fund) is a non-diversified fund of Fidelity Select Portfolios (the Trust) and is authorized to issue an unlimited number of shares. Share transactions on the Statement of Changes in Net Assets may contain exchanges between affiliated funds. The Trust is registered under the Investment Company Act of 1940, as amended (the 1940 Act), as an open-end management investment company organized as a Massachusetts business trust. The Fund invests primarily in securities of companies whose principal business activities fall within specific industries.
2. Investments in Fidelity Central Funds.
The Fund invests in Fidelity Central Funds, which are open-end investment companies generally available only to other investment companies and accounts managed by the investment adviser and its affiliates. The Fund's Schedule of Investments lists each of the Fidelity Central Funds held as of period end, if any, as an investment of the Fund, but does not include the underlying holdings of each Fidelity Central Fund. As an Investing Fund, the Fund indirectly bears its proportionate share of the expenses of the underlying Fidelity Central Funds.
The Money Market Central Funds seek preservation of capital and current income and are managed by Fidelity Investments Money Management, Inc. (FIMM), an affiliate of the investment adviser. Annualized expenses of the Money Market Central Funds as of their most recent shareholder report date are less than .005%.
A complete unaudited list of holdings for each Fidelity Central Fund is available upon request or at the Securities and Exchange Commission (the SEC) website at www.sec.gov. In addition, the financial statements of the Fidelity Central Funds are available on the SEC website or upon request.
3. Significant Accounting Policies.
The Fund is an investment company and applies the accounting and reporting guidance of the Financial Accounting Standards Board (FASB) Accounting Standards Codification Topic 946 Financial Services – Investments Companies. The financial statements have been prepared in conformity with accounting principles generally accepted in the United States of America (GAAP), which require management to make certain estimates and assumptions at the date of the financial statements. Actual results could differ from those estimates. Subsequent events, if any, through the date that the financial statements were issued have been evaluated in the preparation of the financial statements. The following summarizes the significant accounting policies of the Fund:
Investment Valuation. Investments are valued as of 4:00 p.m. Eastern time on the last calendar day of the period. The Board of Trustees (the Board) has delegated the day to day responsibility for the valuation of the Fund's investments to the Fair Value Committee (the Committee) established by the Fund's investment adviser. In accordance with valuation policies and procedures approved by the Board, the Fund attempts to obtain prices from one or more third party pricing vendors or brokers to value its investments. When current market prices, quotations or currency exchange rates are not readily available or reliable, investments will be fair valued in good faith by the Committee, in accordance with procedures adopted by the Board. Factors used in determining fair value vary by investment type and may include market or investment specific events. The frequency with which these procedures are used cannot be predicted and they may be utilized to a significant extent. The Committee oversees the Fund's valuation policies and procedures and reports to the Board on the Committee's activities and fair value determinations. The Board monitors the appropriateness of the procedures used in valuing the Fund's investments and ratifies the fair value determinations of the Committee.
The Fund categorizes the inputs to valuation techniques used to value its investments into a disclosure hierarchy consisting of three levels as shown below:
- Level 1 – quoted prices in active markets for identical investments
- Level 2 – other significant observable inputs (including quoted prices for similar investments, interest rates, prepayment speeds, etc.)
- Level 3 – unobservable inputs (including the Fund's own assumptions based on the best information available)
Valuation techniques used to value the Fund's investments by major category are as follows:
Equity securities, including restricted securities, for which market quotations are readily available, are valued at the last reported sale price or official closing price as reported by a third party pricing vendor on the primary market or exchange on which they are traded and are categorized as Level 1 in the hierarchy. In the event there were no sales during the day or closing prices are not available, securities are valued at the last quoted bid price or may be valued using the last available price and are generally categorized as Level 2 in the hierarchy. For foreign equity securities, when market or security specific events arise, comparisons to the valuation of American Depositary Receipts (ADRs), futures contracts, Exchange-Traded Funds (ETFs) and certain indexes as well as quoted prices for similar securities may be used and would be categorized as Level 2 in the hierarchy. Utilizing these techniques may result in transfers between Level 1 and Level 2. For equity securities, including restricted securities, where observable inputs are limited, assumptions about market activity and risk are used and these securities may be categorized as Level 3 in the hierarchy.
Investments in open-end mutual funds, including the Fidelity Central Funds, are valued at their closing net asset value (NAV) each business day and are categorized as Level 1 in the hierarchy.
Changes in valuation techniques may result in transfers in or out of an assigned level within the disclosure hierarchy. The aggregate value of investments by input level as of August 31, 2017, including information on transfers between Levels 1 and 2 is included at the end of the Fund's Schedule of Investments.
Foreign Currency. The Fund may use foreign currency contracts to facilitate transactions in foreign-denominated securities. Gains and losses from these transactions may arise from changes in the value of the foreign currency or if the counterparties do not perform under the contracts' terms.
Foreign-denominated assets, including investment securities, and liabilities are translated into U.S. dollars at the exchange rates at period end. Purchases and sales of investment securities, income and dividends received and expenses denominated in foreign currencies are translated into U.S. dollars at the exchange rate in effect on the transaction date.
The effects of exchange rate fluctuations on investments are included with the net realized and unrealized gain (loss) on investment securities. Other foreign currency transactions resulting in realized and unrealized gain (loss) are disclosed separately.
Investment Transactions and Income. For financial reporting purposes, the Fund's investment holdings and NAV include trades executed through the end of the last business day of the period. The NAV per share for processing shareholder transactions is calculated as of the close of business of the New York Stock Exchange (NYSE), normally 4:00 p.m. Eastern time and includes trades executed through the end of the prior business day. Gains and losses on securities sold are determined on the basis of identified cost and may include proceeds received from litigation. Dividend income is recorded on the ex-dividend date, except for certain dividends from foreign securities where the ex-dividend date may have passed, which are recorded as soon as the Fund is informed of the ex-dividend date. Non-cash dividends included in dividend income, if any, are recorded at the fair market value of the securities received. Income and capital gain distributions from Fidelity Central Funds, if any, are recorded on the ex-dividend date. Certain distributions received by the Fund represent a return of capital or capital gain. The Fund determines the components of these distributions subsequent to the ex-dividend date, based upon receipt of tax filings or other correspondence relating to the underlying investment. These distributions are recorded as a reduction of cost of investments and/or as a realized gain. Investment income is recorded net of foreign taxes withheld where recovery of such taxes is uncertain.
Expenses. Expenses directly attributable to a fund are charged to that fund. Expenses attributable to more than one fund are allocated among the respective funds on the basis of relative net assets or other appropriate methods. Expense estimates are accrued in the period to which they relate and adjustments are made when actual amounts are known.
Income Tax Information and Distributions to Shareholders. Each year, the Fund intends to qualify as a regulated investment company under Subchapter M of the Internal Revenue Code, including distributing substantially all of its taxable income and realized gains. As a result, no provision for U.S. Federal income taxes is required. The Fund files a U.S. federal tax return, in addition to state and local tax returns as required. The Fund's federal income tax returns are subject to examination by the Internal Revenue Service (IRS) for a period of three fiscal years after they are filed. State and local tax returns may be subject to examination for an additional fiscal year depending on the jurisdiction. Foreign taxes are provided for based on the Fund's understanding of the tax rules and rates that exist in the foreign markets in which it invests.
Distributions are declared and recorded on the ex-dividend date. Income and capital gain distributions are determined in accordance with income tax regulations, which may differ from GAAP.
Capital accounts within the financial statements are adjusted for permanent book-tax differences. These adjustments have no impact on net assets or the results of operations. Capital accounts are not adjusted for temporary book-tax differences which will reverse in a subsequent period.
Book-tax differences are primarily due to foreign currency transactions and losses deferred due to wash sales and excise tax regulations.
As of period end, the cost and unrealized appreciation (depreciation) in securities, and derivatives if applicable, for federal income tax purposes were as follows:
| Gross unrealized appreciation | $62,273,569 |
| Gross unrealized depreciation | (7,167,863) |
| Net unrealized appreciation (depreciation) | $55,105,706 |
| Tax cost | $228,301,281 |
Trading (Redemption) Fees. Shares held by investors in the Fund less than 30 days may be subject to a redemption fee equal to .75% of the NAV of shares redeemed. All redemption fees, which reduce the proceeds of the shareholder redemption, are retained by the Fund and accounted for as an addition to paid in capital.
4. Purchases and Sales of Investments.
Purchases and sales of securities, other than short-term securities, aggregated $162,733,899 and $142,191,636, respectively.
5. Fees and Other Transactions with Affiliates.
Management Fee. Fidelity SelectCo, LLC (the investment adviser) and its affiliates provide the Fund with investment management related services for which the Fund pays a monthly management fee. The management fee is the sum of an individual fund fee rate that is based on an annual rate of .30% of the Fund's average net assets and an annualized group fee rate that averaged .25% during the period. The group fee rate is based upon the average net assets of all the mutual funds advised by Fidelity Management & Research Company (FMR) and the investment adviser. The group fee rate decreases as assets under management increase and increases as assets under management decrease. For the reporting period, the total annualized management fee rate was .55% of the Fund's average net assets.
Transfer Agent Fees. Fidelity Investments Institutional Operations Company, Inc. (FIIOC), an affiliate of the investment adviser, is the Fund's transfer, dividend disbursing and shareholder servicing agent. FIIOC receives account fees and asset-based fees that vary according to account size and type of account. FIIOC pays for typesetting, printing and mailing of shareholder reports, except proxy statements. For the period, the transfer agent fees were equivalent to an annualized rate of .20% of average net assets.
Accounting and Security Lending Fees. Fidelity Service Company, Inc. (FSC), an affiliate of the investment adviser, maintains the Fund's accounting records. The accounting fee is based on the level of average net assets for each month. Under a separate contract, FSC administers the security lending program. The security lending fee is based on the number and duration of lending transactions.
Brokerage Commissions. The Fund placed a portion of its portfolio transactions with brokerage firms which are affiliates of the investment adviser. Brokerage commissions are included in net realized gain (loss) and change in net unrealized appreciation (depreciation) in the Statement of Operations. The commissions paid to these affiliated firms were $2,836 for the period.
Interfund Lending Program. Pursuant to an Exemptive Order issued by the SEC, the Fund, along with other registered investment companies having management contracts with Fidelity Management & Research Company (FMR) or other affiliated entities of FMR, may participate in an interfund lending program. This program provides an alternative credit facility allowing the funds to borrow from, or lend money to, other participating affiliated funds. The Fund's activity in this program during the period for which loans were outstanding was as follows:
| Borrower or Lender | Average Loan Balance | Weighted Average Interest Rate | Interest Expense |
| Borrower | $3,354,000 | 1.34% | $498 |
Interfund Trades. The Fund may purchase from or sell securities to other Fidelity Funds under procedures adopted by the Board. The procedures have been designed to ensure these interfund trades are executed in accordance with Rule 17a-7 of the 1940 Act. Interfund trades are included within the respective purchases and sales amounts shown in the Purchases and Sales of Investments note.
6. Committed Line of Credit.
The Fund participates with other funds managed by the investment adviser or an affiliate in a $4.25 billion credit facility (the "line of credit") to be utilized for temporary or emergency purposes to fund shareholder redemptions or for other short-term liquidity purposes. The Fund has agreed to pay commitment fees on its pro-rata portion of the line of credit, which amounted to $418 and is reflected in Miscellaneous expenses on the Statement of Operations. During the period, the Fund did not borrow on this line of credit.
7. Security Lending.
The Fund lends portfolio securities through a lending agent from time to time in order to earn additional income. On the settlement date of the loan, the Fund receives collateral (in the form of U.S. Treasury obligations, letters of credit and/or cash) against the loaned securities and maintains collateral in an amount not less than 100% of the market value of the loaned securities during the period of the loan. The market value of the loaned securities is determined at the close of business of the Fund and any additional required collateral is delivered to the Fund on the next business day. The Fund or borrower may terminate the loan at any time, and if the borrower defaults on its obligation to return the securities loaned because of insolvency or other reasons, the Fund may apply collateral received from the borrower against the obligation. The Fund may experience delays and costs in recovering the securities loaned. Any cash collateral received is invested in the Fidelity Securities Lending Cash Central Fund. The value of loaned securities and cash collateral at period end are disclosed on the Fund's Statement of Assets and Liabilities. Security lending income represents the income earned on investing cash collateral, less rebates paid to borrowers and any lending agent fees associated with the loan, plus any premium payments received for lending certain types of securities. Security lending income is presented in the Statement of Operations as a component of income from Fidelity Central Funds. Total security lending income during the period amounted to $67,827.
8. Expense Reductions.
Commissions paid to certain brokers with whom the investment adviser, or its affiliates, places trades on behalf of the Fund include an amount in addition to trade execution, which may be rebated back to the Fund to offset certain expenses. This amount totaled $25,592 for the period.
In addition, during the period the investment adviser reimbursed and/or waived a portion of operating expenses in the amount of $1,042.
9. Other.
The Fund's organizational documents provide former and current trustees and officers with a limited indemnification against liabilities arising in connection with the performance of their duties to the Fund. In the normal course of business, the Fund may also enter into contracts that provide general indemnifications. The Fund's maximum exposure under these arrangements is unknown as this would be dependent on future claims that may be made against the Fund. The risk of material loss from such claims is considered remote.
Shareholder Expense Example
As a shareholder of a Fund, you incur two types of costs: (1) transaction costs, including sales charges (loads) on purchase payments or redemption proceeds, and (2) ongoing costs, including management fees, distribution and/or service (12b-1) fees and other Fund expenses. This Example is intended to help you understand your ongoing costs (in dollars) of investing in the Fund and to compare these costs with the ongoing costs of investing in other mutual funds.
The Example is based on an investment of $1,000 invested at the beginning of the period and held for the entire period (March 1, 2017 to August 31, 2017).
Actual Expenses
The first line of the accompanying table for each Class of each fund provides information about actual account values and actual expenses. You may use the information in this line, together with the amount you invested, to estimate the expenses that you paid over the period. Simply divide your account value by $1,000.00 (for example, an $8,600 account value divided by $1,000.00 = 8.6), then multiply the result by the number in the first line for a Class of the fund under the heading entitled "Expenses Paid During Period" to estimate the expenses you paid on your account during this period. A small balance maintenance fee of $12.00 that is charged once a year may apply for certain accounts with a value of less than $2,000. This fee is not included in the table below. If it was, the estimate of expenses you paid during the period would be higher, and your ending account value lower, by this amount. In addition, each Fund, as a shareholder in the underlying Fidelity Central Funds, will indirectly bear its pro-rata share of the fees and expenses incurred by the underlying Fidelity Central Funds. These fees and expenses are not included in the Fund's annualized expense ratio used to calculate the expense estimate in the table below.
Hypothetical Example for Comparison Purposes
The second line of the accompanying table for each Class of each fund provides information about hypothetical account values and hypothetical expenses based on a Class' actual expense ratio and an assumed rate of return of 5% per year before expenses, which is not the Class' actual return. The hypothetical account values and expenses may not be used to estimate the actual ending account balance or expenses you paid for the period. You may use this information to compare the ongoing costs of investing in the Fund and other funds. To do so, compare this 5% hypothetical example with the 5% hypothetical examples that appear in the shareholder reports of the other funds. A small balance maintenance fee of $12.00 that is charged once a year may apply for certain accounts with a value of less than $2,000. This fee is not included in the table below. If it was, the estimate of expenses you paid during the period would be higher, and your ending account value lower, by this amount. In addition, each Fund, as a shareholder in the underlying Fidelity Central Funds, will indirectly bear its pro-rata share of the fees and expenses incurred by the underlying Fidelity Central Funds. These fees and expenses are not included in the Fund's annualized expense ratio used to calculate the expense estimate in the table below.
Please note that the expenses shown in the table are meant to highlight your ongoing costs only and do not reflect any transaction costs. Therefore, the second line of the table is useful in comparing ongoing costs only, and will not help you determine the relative total costs of owning different funds. In addition, if these transactional costs were included, your costs would have been higher.
| | Annualized Expense RatioA | Beginning
Account Value
March 1, 2017 | Ending
Account Value
August 31, 2017 | Expenses Paid
During Period-B
March 1, 2017
to August 31, 2017 |
| Telecommunications Portfolio | | | | |
| Class A | 1.14% | | | |
| Actual | | $1,000.00 | $1,013.20 | $5.78 |
| Hypothetical-C | | $1,000.00 | $1,019.46 | $5.80 |
| Class M | 1.49% | | | |
| Actual | | $1,000.00 | $1,011.50 | $7.55 |
| Hypothetical-C | | $1,000.00 | $1,017.69 | $7.58 |
| Class C | 1.87% | | | |
| Actual | | $1,000.00 | $1,009.70 | $9.47 |
| Hypothetical-C | | $1,000.00 | $1,015.78 | $9.50 |
| Telecommunications | .82% | | | |
| Actual | | $1,000.00 | $1,014.90 | $4.16 |
| Hypothetical-C | | $1,000.00 | $1,021.07 | $4.18 |
| Class I | .82% | | | |
| Actual | | $1,000.00 | $1,014.90 | $4.16 |
| Hypothetical-C | | $1,000.00 | $1,021.07 | $4.18 |
| Wireless Portfolio | .85% | | | |
| Actual | | $1,000.00 | $1,112.90 | $4.53 |
| Hypothetical-C | | $1,000.00 | $1,020.92 | $4.33 |
A Annualized expense ratio reflects expenses net of applicable fee waivers.
B Expenses are equal to each Fund's annualized expense ratio, multiplied by the average account value over the period, multiplied by 184/ 365 (to reflect the one-half year period).
C 5% return per year before expenses
SELTS-SANN-1017
1.846053.110
Fidelity® Select Portfolios®
Utilities Sector Utilities Portfolio
Semi-Annual Report August 31, 2017 |
|
Contents
To view a fund's proxy voting guidelines and proxy voting record for the 12-month period ended June 30, visit http://www.fidelity.com/proxyvotingresults or visit the Securities and Exchange Commission's (SEC) web site at http://www.sec.gov.
You may also call 1-800-544-8544 to request a free copy of the proxy voting guidelines.
Standard & Poor's, S&P and S&P 500 are registered service marks of The McGraw-Hill Companies, Inc. and have been licensed for use by Fidelity Distributors Corporation.
Other third-party marks appearing herein are the property of their respective owners.
All other marks appearing herein are registered or unregistered trademarks or service marks of FMR LLC or an affiliated company. © 2017 FMR LLC. All rights reserved.
This report and the financial statements contained herein are submitted for the general information of the shareholders of the Fund. This report is not authorized for distribution to prospective investors in the Fund unless preceded or accompanied by an effective prospectus.
A fund files its complete schedule of portfolio holdings with the SEC for the first and third quarters of each fiscal year on Form N-Q. Forms N-Q are available on the SEC’s web site at http://www.sec.gov. A fund's Forms N-Q may be reviewed and copied at the SEC’s Public Reference Room in Washington, DC. Information regarding the operation of the SEC's Public Reference Room may be obtained by calling 1-800-SEC-0330.
For a complete list of a fund's portfolio holdings, view the most recent holdings listing, semiannual report, or annual report on Fidelity's web site at http://www.fidelity.com, http://www.institutional.fidelity.com, or http://www.401k.com, as applicable.
NOT FDIC INSURED •MAY LOSE VALUE •NO BANK GUARANTEE
Neither the Fund nor Fidelity Distributors Corporation is a bank.
Investment Summary (Unaudited)
Top Ten Stocks as of August 31, 2017
| | % of fund's net assets | % of fund's net assets 6 months ago |
| NextEra Energy, Inc. | 17.6 | 16.9 |
| Sempra Energy | 12.3 | 12.7 |
| PG&E Corp. | 8.1 | 8.7 |
| Avangrid, Inc. | 4.9 | 4.9 |
| Exelon Corp. | 4.8 | 4.9 |
| Great Plains Energy, Inc. | 4.8 | 4.4 |
| DTE Energy Co. | 4.6 | 4.8 |
| NRG Energy, Inc. | 4.0 | 2.1 |
| FirstEnergy Corp. | 3.9 | 4.2 |
| Dominion Resources, Inc. | 3.5 | 6.3 |
| | 68.5 | |
Top Industries (% of fund's net assets)
| As of August 31, 2017 |
| | Electric Utilities | 46.7% |
| | Multi-Utilities | 35.4% |
| | Independent Power and Renewable Electricity Producers | 11.3% |
| | Oil, Gas & Consumable Fuels | 2.0% |
| | Gas Utilities | 1.0% |
| | All Others* | 3.6% |

* Includes Short-Term investments and Net Other Assets (Liabilities).
| As of February 28, 2017 |
| | Electric Utilities | 46.6% |
| | Multi-Utilities | 38.6% |
| | Independent Power and Renewable Electricity Producers | 9.9% |
| | Media | 1.2% |
| | Oil, Gas & Consumable Fuels | 1.1% |
| | All Others* | 2.6% |
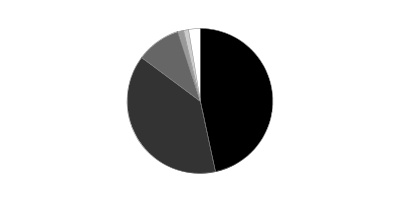
* Includes Short-Term investments and Net Other Assets (Liabilities).
Investments August 31, 2017 (Unaudited)
Showing Percentage of Net Assets
| Common Stocks - 96.7% | | | |
| | | Shares | Value |
| Electric Utilities - 46.7% | | | |
| Electric Utilities - 46.7% | | | |
| Exelon Corp. | | 970,592 | $36,756,319 |
| FirstEnergy Corp. | | 929,400 | 30,279,852 |
| Great Plains Energy, Inc. | | 1,196,968 | 36,734,948 |
| NextEra Energy, Inc. | | 899,385 | 135,366,439 |
| OGE Energy Corp. | | 431,685 | 15,419,788 |
| PG&E Corp. | | 890,904 | 62,701,824 |
| PNM Resources, Inc. | | 251,866 | 10,679,118 |
| Vistra Energy Corp. | | 941,107 | 16,657,594 |
| Westar Energy, Inc. | | 297,608 | 15,270,266 |
| | | | 359,866,148 |
| Equity Real Estate Investment Trusts (REITs) - 0.3% | | | |
| Specialized REITs - 0.3% | | | |
| InfraReit, Inc. | | 97,070 | 2,183,104 |
| Gas Utilities - 1.0% | | | |
| Gas Utilities - 1.0% | | | |
| South Jersey Industries, Inc. | | 212,495 | 7,624,321 |
| Independent Power and Renewable Electricity Producers - 11.3% | | | |
| Independent Power Producers & Energy Traders - 8.2% | | | |
| Calpine Corp. (a) | | 570,065 | 8,379,956 |
| Dynegy, Inc. (a) | | 400,328 | 3,771,090 |
| NRG Energy, Inc. | | 1,233,302 | 30,721,553 |
| NRG Yield, Inc. Class C | | 744,034 | 13,764,629 |
| The AES Corp. | | 580,504 | 6,408,764 |
| | | | 63,045,992 |
| Renewable Electricity - 3.1% | | | |
| NextEra Energy Partners LP | | 571,753 | 23,704,879 |
|
| TOTAL INDEPENDENT POWER AND RENEWABLE ELECTRICITY PRODUCERS | | | 86,750,871 |
|
| Multi-Utilities - 35.4% | | | |
| Multi-Utilities - 35.4% | | | |
| Avangrid, Inc. | | 768,761 | 37,530,912 |
| Black Hills Corp. (b) | | 282,528 | 19,884,321 |
| CenterPoint Energy, Inc. | | 864,226 | 25,598,374 |
| CMS Energy Corp. | | 92,800 | 4,504,512 |
| Dominion Resources, Inc. | | 343,968 | 27,094,359 |
| DTE Energy Co. | | 312,570 | 35,107,862 |
| Public Service Enterprise Group, Inc. | | 160,300 | 7,508,452 |
| SCANA Corp. | | 335,759 | 20,273,128 |
| Sempra Energy | | 803,927 | 94,807,111 |
| | | | 272,309,031 |
| Oil, Gas & Consumable Fuels - 2.0% | | | |
| Oil & Gas Storage & Transport - 2.0% | | | |
| Cheniere Energy Partners LP Holdings LLC | | 323,342 | 8,125,584 |
| Cheniere Energy, Inc. (a) | | 177,389 | 7,590,475 |
| | | | 15,716,059 |
| TOTAL COMMON STOCKS | | | |
| (Cost $560,175,546) | | | 744,449,534 |
|
| Money Market Funds - 4.1% | | | |
| Fidelity Cash Central Fund, 1.11% (c) | | 24,769,471 | 24,774,425 |
| Fidelity Securities Lending Cash Central Fund 1.11% (c)(d) | | 6,791,893 | 6,792,572 |
| TOTAL MONEY MARKET FUNDS | | | |
| (Cost $31,566,997) | | | 31,566,997 |
| TOTAL INVESTMENT IN SECURITIES - 100.8% | | | |
| (Cost $591,742,543) | | | 776,016,531 |
| NET OTHER ASSETS (LIABILITIES) - (0.8)% | | | (6,476,226) |
| NET ASSETS - 100% | | | $769,540,305 |
Legend
(a) Non-income producing
(b) Security or a portion of the security is on loan at period end.
(c) Affiliated fund that is generally available only to investment companies and other accounts managed by Fidelity Investments. The rate quoted is the annualized seven-day yield of the fund at period end. A complete unaudited listing of the fund's holdings as of its most recent quarter end is available upon request. In addition, each Fidelity Central Fund's financial statements are available on the SEC's website or upon request.
(d) Investment made with cash collateral received from securities on loan.
Affiliated Central Funds
Information regarding fiscal year to date income earned by the Fund from investments in Fidelity Central Funds is as follows:
| Fund | Income earned |
| Fidelity Cash Central Fund | $56,244 |
| Fidelity Securities Lending Cash Central Fund | 1,587 |
| Total | $57,831 |
Investment Valuation
All investments are categorized as Level 1 under the Fair Value Hierarchy. The inputs or methodology used for valuing securities may not be an indication of the risk associated with investing in those securities. For more information on valuation inputs please refer to the Investment Valuation section in the accompanying Notes to Financial Statements.
See accompanying notes which are an integral part of the financial statements.
Financial Statements
Statement of Assets and Liabilities
| | | August 31, 2017 (Unaudited) |
| Assets | | |
Investment in securities, at value (including securities loaned of $6,686,100) — See accompanying schedule:
Unaffiliated issuers (cost $560,175,546) | $744,449,534 | |
| Fidelity Central Funds (cost $31,566,997) | 31,566,997 | |
| Total Investment in Securities (cost $591,742,543) | | $776,016,531 |
| Receivable for fund shares sold | | 1,021,452 |
| Dividends receivable | | 2,661,770 |
| Distributions receivable from Fidelity Central Funds | | 15,694 |
| Other receivables | | 11,963 |
| Total assets | | 779,727,410 |
| Liabilities | | |
| Payable for investments purchased | $1,687,373 | |
| Payable for fund shares redeemed | 1,221,340 | |
| Accrued management fee | 337,375 | |
| Other affiliated payables | 132,550 | |
| Other payables and accrued expenses | 15,967 | |
| Collateral on securities loaned | 6,792,500 | |
| Total liabilities | | 10,187,105 |
| Net Assets | | $769,540,305 |
| Net Assets consist of: | | |
| Paid in capital | | $567,501,973 |
| Undistributed net investment income | | 7,788,577 |
| Accumulated undistributed net realized gain (loss) on investments | | 9,975,767 |
| Net unrealized appreciation (depreciation) on investments | | 184,273,988 |
| Net Assets, for 9,020,379 shares outstanding | | $769,540,305 |
| Net Asset Value, offering price and redemption price per share ($769,540,305 ÷ 9,020,379 shares) | | $85.31 |
See accompanying notes which are an integral part of the financial statements.
Statement of Operations
| | | Six months ended August 31, 2017 (Unaudited) |
| Investment Income | | |
| Dividends | | $10,499,735 |
| Income from Fidelity Central Funds | | 57,831 |
| Total income | | 10,557,566 |
| Expenses | | |
| Management fee | $1,932,076 | |
| Transfer agent fees | 664,328 | |
| Accounting and security lending fees | 126,135 | |
| Custodian fees and expenses | 566 | |
| Independent trustees' fees and expenses | 8,087 | |
| Registration fees | 32,173 | |
| Audit | 23,585 | |
| Legal | 6,262 | |
| Miscellaneous | 6,935 | |
| Total expenses before reductions | 2,800,147 | |
| Expense reductions | (31,842) | 2,768,305 |
| Net investment income (loss) | | 7,789,261 |
| Realized and Unrealized Gain (Loss) | | |
| Net realized gain (loss) on: | | |
| Investment securities: | | |
| Unaffiliated issuers | 17,697,207 | |
| Fidelity Central Funds | 73 | |
| Total net realized gain (loss) | | 17,697,280 |
| Change in net unrealized appreciation (depreciation) on investment securities | | 46,242,459 |
| Net gain (loss) | | 63,939,739 |
| Net increase (decrease) in net assets resulting from operations | | $71,729,000 |
See accompanying notes which are an integral part of the financial statements.
Statement of Changes in Net Assets
| | Six months ended August 31, 2017 (Unaudited) | Year ended February 28, 2017 |
| Increase (Decrease) in Net Assets | | |
| Operations | | |
| Net investment income (loss) | $7,789,261 | $18,373,129 |
| Net realized gain (loss) | 17,697,280 | 31,127,434 |
| Change in net unrealized appreciation (depreciation) | 46,242,459 | 75,669,341 |
| Net increase (decrease) in net assets resulting from operations | 71,729,000 | 125,169,904 |
| Distributions to shareholders from net investment income | – | (17,560,259) |
| Distributions to shareholders from net realized gain | – | (256,435) |
| Total distributions | – | (17,816,694) |
| Share transactions | | |
| Proceeds from sales of shares | 128,055,269 | 384,948,279 |
| Reinvestment of distributions | – | 17,007,314 |
| Cost of shares redeemed | (126,381,999) | (621,442,544) |
| Net increase (decrease) in net assets resulting from share transactions | 1,673,270 | (219,486,951) |
| Redemption fees | – | 36,967 |
| Total increase (decrease) in net assets | 73,402,270 | (112,096,774) |
| Net Assets | | |
| Beginning of period | 696,138,035 | 808,234,809 |
| End of period | $769,540,305 | $696,138,035 |
| Other Information | | |
| Undistributed net investment income end of period | $7,788,577 | $– |
| Distributions in excess of net investment income end of period | $– | $(684) |
| Shares | | |
| Sold | 1,581,110 | 5,289,786 |
| Issued in reinvestment of distributions | – | 247,779 |
| Redeemed | (1,595,928) | (8,587,083) |
| Net increase (decrease) | (14,818) | (3,049,518) |
See accompanying notes which are an integral part of the financial statements.
Financial Highlights — Utilities Portfolio
| | Six months ended (Unaudited) August 31, | Years ended February 28, | | | | |
| | 2017 | 2017 | 2016 A | 2015 | 2014 | 2013 |
| Selected Per–Share Data | | | | | | |
| Net asset value, beginning of period | $77.05 | $66.88 | $72.85 | $70.64 | $61.04 | $52.56 |
| Income from Investment Operations | | | | | | |
| Net investment income (loss)B | .88 | 1.52 | 1.39 | 1.41 | 1.49 | 1.41 |
| Net realized and unrealized gain (loss) | 7.38 | 10.44 | (4.49) | 6.40 | 9.80 | 7.70 |
| Total from investment operations | 8.26 | 11.96 | (3.10) | 7.81 | 11.29 | 9.11 |
| Distributions from net investment income | – | (1.77) | (1.60) | (1.20) | (1.07) | (.63) |
| Distributions from net realized gain | – | (.02) | (1.27) | (4.42) | (.62) | – |
| Total distributions | – | (1.79) | (2.87) | (5.61)C | (1.69) | (.63) |
| Redemption fees added to paid in capitalB | – | –D | –D | .01 | –D | –D |
| Net asset value, end of period | $85.31 | $77.05 | $66.88 | $72.85 | $70.64 | $61.04 |
| Total ReturnE,F | 10.72% | 18.21% | (4.19)% | 11.22% | 18.71% | 17.46% |
| Ratios to Average Net AssetsG,H | | | | | | |
| Expenses before reductions | .79%I | .79% | .80% | .80% | .82% | .83% |
| Expenses net of fee waivers, if any | .79%I | .79% | .79% | .80% | .82% | .83% |
| Expenses net of all reductions | .78%I | .78% | .78% | .80% | .80% | .79% |
| Net investment income (loss) | 2.19%I | 2.09% | 2.05% | 1.89% | 2.28% | 2.49% |
| Supplemental Data | | | | | | |
| Net assets, end of period (000 omitted) | $769,540 | $696,138 | $808,235 | $988,426 | $695,932 | $532,382 |
| Portfolio turnover rateJ | 40%I | 70%K | 74% | 129%K | 160% | 158% |
A For the year ended February 29.
B Calculated based on average shares outstanding during the period.
C Total distributions of $5.61 per share is comprised of distributions from net investment income of $1.199 and distributions from net realized gain of $4.415 per share.
D Amount represents less than $.005 per share.
E Total returns for periods of less than one year are not annualized.
F Total returns would have been lower if certain expenses had not been reduced during the applicable periods shown.
G Fees and expenses of any underlying Fidelity Central Funds are not included in the Fund's expense ratio. The Fund indirectly bears its proportionate share of the expenses of any underlying Fidelity Central Funds.
H Expense ratios reflect operating expenses of the Fund. Expenses before reductions do not reflect amounts reimbursed by the investment adviser or reductions from brokerage service arrangements or reductions from other expense offset arrangements and do not represent the amount paid by the Fund during periods when reimbursements or reductions occur. Expenses net of fee waivers reflect expenses after reimbursement by the investment adviser but prior to reductions from brokerage service arrangements or other expense offset arrangements. Expenses net of all reductions represent the net expenses paid by the Fund.
I Annualized
J Amount does not include the portfolio activity of any underlying Fidelity Central Funds.
K Portfolio turnover rate excludes securities received or delivered in-kind.
See accompanying notes which are an integral part of the financial statements.
Notes to Financial Statements (Unaudited)
For the period ended August 31, 2017
1. Organization.
Utilities Portfolio (the Fund) is a non-diversified fund of Fidelity Select Portfolios (the Trust) and is authorized to issue an unlimited number of shares. Share transactions on the Statement of Changes in Net Assets may contain exchanges between affiliated funds. The Trust is registered under the Investment Company Act of 1940, as amended (the 1940 Act), as an open-end management investment company organized as a Massachusetts business trust. The Fund invests primarily in securities of companies whose principal business activities fall within specific industries.
2. Investments in Fidelity Central Funds.
The Fund invests in Fidelity Central Funds, which are open-end investment companies generally available only to other investment companies and accounts managed by the investment adviser and its affiliates. The Fund's Schedule of Investments lists each of the Fidelity Central Funds held as of period end, if any, as an investment of the Fund, but does not include the underlying holdings of each Fidelity Central Fund. As an Investing Fund, the Fund indirectly bears its proportionate share of the expenses of the underlying Fidelity Central Funds.
The Money Market Central Funds seek preservation of capital and current income and are managed by Fidelity Investments Money Management, Inc. (FIMM), an affiliate of the investment adviser. Annualized expenses of the Money Market Central Funds as of their most recent shareholder report date are less than .005%.
A complete unaudited list of holdings for each Fidelity Central Fund is available upon request or at the Securities and Exchange Commission (the SEC) website at www.sec.gov. In addition, the financial statements of the Fidelity Central Funds are available on the SEC website or upon request.
3. Significant Accounting Policies.
The Fund is an investment company and applies the accounting and reporting guidance of the Financial Accounting Standards Board (FASB) Accounting Standards Codification Topic 946 Financial Services – Investments Companies. The financial statements have been prepared in conformity with accounting principles generally accepted in the United States of America (GAAP), which require management to make certain estimates and assumptions at the date of the financial statements. Actual results could differ from those estimates. Subsequent events, if any, through the date that the financial statements were issued have been evaluated in the preparation of the financial statements. The following summarizes the significant accounting policies of the Fund:
Investment Valuation. Investments are valued as of 4:00 p.m. Eastern time on the last calendar day of the period. The Board of Trustees (the Board) has delegated the day to day responsibility for the valuation of the Fund's investments to the Fair Value Committee (the Committee) established by the Fund's investment adviser. In accordance with valuation policies and procedures approved by the Board, the Fund attempts to obtain prices from one or more third party pricing vendors or brokers to value its investments. When current market prices, quotations or currency exchange rates are not readily available or reliable, investments will be fair valued in good faith by the Committee, in accordance with procedures adopted by the Board. Factors used in determining fair value vary by investment type and may include market or investment specific events. The frequency with which these procedures are used cannot be predicted and they may be utilized to a significant extent. The Committee oversees the Fund's valuation policies and procedures and reports to the Board on the Committee's activities and fair value determinations. The Board monitors the appropriateness of the procedures used in valuing the Fund's investments and ratifies the fair value determinations of the Committee.
The Fund categorizes the inputs to valuation techniques used to value its investments into a disclosure hierarchy consisting of three levels as shown below:
- Level 1 – quoted prices in active markets for identical investments
- Level 2 – other significant observable inputs (including quoted prices for similar investments, interest rates, prepayment speeds, etc.)
- Level 3 – unobservable inputs (including the Fund's own assumptions based on the best information available)
Valuation techniques used to value the Fund's investments by major category are as follows:
Equity securities, including restricted securities, for which market quotations are readily available, are valued at the last reported sale price or official closing price as reported by a third party pricing vendor on the primary market or exchange on which they are traded and are categorized as Level 1 in the hierarchy. In the event there were no sales during the day or closing prices are not available, securities are valued at the last quoted bid price or may be valued using the last available price and are generally categorized as Level 2 in the hierarchy. For foreign equity securities, when market or security specific events arise, comparisons to the valuation of American Depositary Receipts (ADRs), futures contracts, Exchange-Traded Funds (ETFs) and certain indexes as well as quoted prices for similar securities may be used and would be categorized as Level 2 in the hierarchy. Utilizing these techniques may result in transfers between Level 1 and Level 2. For equity securities, including restricted securities, where observable inputs are limited, assumptions about market activity and risk are used and these securities may be categorized as Level 3 in the hierarchy.
Investments in open-end mutual funds, including the Fidelity Central Funds, are valued at their closing net asset value (NAV) each business day and are categorized as Level 1 in the hierarchy.
Changes in valuation techniques may result in transfers in or out of an assigned level within the disclosure hierarchy.
Investment Transactions and Income. For financial reporting purposes, the Fund's investment holdings and NAV include trades executed through the end of the last business day of the period. The NAV per share for processing shareholder transactions is calculated as of the close of business of the New York Stock Exchange (NYSE), normally 4:00 p.m. Eastern time and includes trades executed through the end of the prior business day. Gains and losses on securities sold are determined on the basis of identified cost and may include proceeds received from litigation. Dividend income is recorded on the ex-dividend date, except for certain dividends from foreign securities where the ex-dividend date may have passed, which are recorded as soon as the Fund is informed of the ex-dividend date. Non-cash dividends included in dividend income, if any, are recorded at the fair market value of the securities received. Income and capital gain distributions from Fidelity Central Funds, if any, are recorded on the ex-dividend date. Certain distributions received by the Fund represent a return of capital or capital gain. The Fund determines the components of these distributions subsequent to the ex-dividend date, based upon receipt of tax filings or other correspondence relating to the underlying investment. These distributions are recorded as a reduction of cost of investments and/or as a realized gain.
Expenses. Expenses directly attributable to a fund are charged to that fund. Expenses attributable to more than one fund are allocated among the respective funds on the basis of relative net assets or other appropriate methods. Expense estimates are accrued in the period to which they relate and adjustments are made when actual amounts are known.
Income Tax Information and Distributions to Shareholders. Each year, the Fund intends to qualify as a regulated investment company under Subchapter M of the Internal Revenue Code, including distributing substantially all of its taxable income and realized gains. As a result, no provision for U.S. Federal income taxes is required. The Fund files a U.S. federal tax return, in addition to state and local tax returns as required. The Fund's federal income tax returns are subject to examination by the Internal Revenue Service (IRS) for a period of three fiscal years after they are filed. State and local tax returns may be subject to examination for an additional fiscal year depending on the jurisdiction.
Distributions are declared and recorded on the ex-dividend date. Income and capital gain distributions are determined in accordance with income tax regulations, which may differ from GAAP.
Capital accounts within the financial statements are adjusted for permanent book-tax differences. These adjustments have no impact on net assets or the results of operations. Capital accounts are not adjusted for temporary book-tax differences which will reverse in a subsequent period.
Book-tax differences are primarily due to foreign currency transactions, redemptions in kind, deferred trustees compensation, capital loss carryforwards and losses deferred due to wash sales.
As of period end, the cost and unrealized appreciation (depreciation) in securities, and derivatives if applicable, for federal income tax purposes were as follows:
| Gross unrealized appreciation | $190,490,323 |
| Gross unrealized depreciation | (8,295,480) |
| Net unrealized appreciation (depreciation) | $182,194,843 |
| Tax cost | $593,821,688 |
Capital loss carryforwards are only available to offset future capital gains of the Fund to the extent provided by regulations and may be limited. Under the Regulated Investment Company Modernization Act of 2010 (the Act), the Fund is permitted to carry forward capital losses incurred in taxable years beginning after December 22, 2010 for an unlimited period and such capital losses are required to be used prior to any losses that expire. The capital loss carryforward information presented below, including any applicable limitation, is estimated as of prior fiscal period end and is subject to adjustment.
| No expiration | |
| Short-term | $(6,327,931) |
4. Purchases and Sales of Investments.
Purchases and sales of securities, other than short-term securities, aggregated $139,430,965 and $143,579,403, respectively.
5. Fees and Other Transactions with Affiliates.
Management Fee. Fidelity SelectCo, LLC (the investment adviser) and its affiliates provide the Fund with investment management related services for which the Fund pays a monthly management fee. The management fee is the sum of an individual fund fee rate that is based on an annual rate of .30% of the Fund's average net assets and an annualized group fee rate that averaged .25% during the period. The group fee rate is based upon the average net assets of all the mutual funds advised by Fidelity Management & Research Company (FMR) and the investment adviser. The group fee rate decreases as assets under management increase and increases as assets under management decrease. For the reporting period, the total annualized management fee rate was .54% of the Fund's average net assets.
Transfer Agent Fees. Fidelity Investments Institutional Operations Company, Inc. (FIIOC), an affiliate of the investment adviser, is the Fund's transfer, dividend disbursing and shareholder servicing agent. FIIOC receives account fees and asset-based fees that vary according to account size and type of account. FIIOC pays for typesetting, printing and mailing of shareholder reports, except proxy statements. For the period, the transfer agent fees were equivalent to an annualized rate of .19% of average net assets.
Accounting and Security Lending Fees. Fidelity Service Company, Inc. (FSC), an affiliate of the investment adviser, maintains the Fund's accounting records. The accounting fee is based on the level of average net assets for each month. Under a separate contract, FSC administers the security lending program. The security lending fee is based on the number and duration of lending transactions.
Brokerage Commissions. The Fund placed a portion of its portfolio transactions with brokerage firms which are affiliates of the investment adviser. Brokerage commissions are included in net realized gain (loss) and change in net unrealized appreciation (depreciation) in the Statement of Operations. The commissions paid to these affiliated firms were $4,082 for the period.
Interfund Trades. The Fund may purchase from or sell securities to other Fidelity Funds under procedures adopted by the Board. The procedures have been designed to ensure these interfund trades are executed in accordance with Rule 17a-7 of the 1940 Act. Interfund trades are included within the respective purchases and sales amounts shown in the Purchases and Sales of Investments note.
Prior Fiscal Year Redemptions In-Kind. During the prior period, 950,668 shares of the Fund held by an affiliated entity were redeemed in-kind for investments and cash with a value of $68,267,475. The Fund had a net realized gain of $14,595,449 on investments delivered through in-kind redemptions. The amount of in-kind redemptions is included in share transactions in the accompanying Statement of Changes in Net Assets. The Fund recognized no gain or loss for federal income tax purposes.
6. Committed Line of Credit.
The Fund participates with other funds managed by the investment adviser or an affiliate in a $4.25 billion credit facility (the "line of credit") to be utilized for temporary or emergency purposes to fund shareholder redemptions or for other short-term liquidity purposes. The Fund has agreed to pay commitment fees on its pro-rata portion of the line of credit, which amounted to $1,129 and is reflected in Miscellaneous expenses on the Statement of Operations. During the period, the Fund did not borrow on this line of credit.
7. Security Lending.
The Fund lends portfolio securities through a lending agent from time to time in order to earn additional income. On the settlement date of the loan, the Fund receives collateral (in the form of U.S. Treasury obligations, letters of credit and/or cash) against the loaned securities and maintains collateral in an amount not less than 100% of the market value of the loaned securities during the period of the loan. The market value of the loaned securities is determined at the close of business of the Fund and any additional required collateral is delivered to the Fund on the next business day. The Fund or borrower may terminate the loan at any time, and if the borrower defaults on its obligation to return the securities loaned because of insolvency or other reasons, the Fund may apply collateral received from the borrower against the obligation. The Fund may experience delays and costs in recovering the securities loaned. Any cash collateral received is invested in the Fidelity Securities Lending Cash Central Fund. The value of loaned securities and cash collateral at period end are disclosed on the Fund's Statement of Assets and Liabilities. Security lending income represents the income earned on investing cash collateral, less rebates paid to borrowers and any lending agent fees associated with the loan, plus any premium payments received for lending certain types of securities. Security lending income is presented in the Statement of Operations as a component of income from Fidelity Central Funds. Total security lending income during the period amounted to $1,587.
8. Expense Reductions.
Commissions paid to certain brokers with whom the investment adviser, or its affiliates, places trades on behalf of the Fund include an amount in addition to trade execution, which may be rebated back to the Fund to offset certain expenses. This amount totaled $28,390 for the period.
In addition, during the period the investment adviser reimbursed and/or waived a portion of operating expenses in the amount of $3,452.
9. Other.
The Fund's organizational documents provide former and current trustees and officers with a limited indemnification against liabilities arising in connection with the performance of their duties to the Fund. In the normal course of business, the Fund may also enter into contracts that provide general indemnifications. The Fund's maximum exposure under these arrangements is unknown as this would be dependent on future claims that may be made against the Fund. The risk of material loss from such claims is considered remote.
Shareholder Expense Example
As a shareholder of the Fund, you incur two types of costs: (1) transaction costs and (2) ongoing costs, including management fees and other Fund expenses. This Example is intended to help you understand your ongoing costs (in dollars) of investing in the Fund and to compare these costs with the ongoing costs of investing in other mutual funds.
The Example is based on an investment of $1,000 invested at the beginning of the period and held for the entire period (March 1, 2017 to August 31, 2017).
Actual Expenses
The first line of the accompanying table provides information about actual account values and actual expenses. You may use the information in this line, together with the amount you invested, to estimate the expenses that you paid over the period. Simply divide your account value by $1,000.00 (for example, an $8,600 account value divided by $1,000.00 = 8.6), then multiply the result by the number in the first line under the heading entitled "Expenses Paid During Period" to estimate the expenses you paid on your account during this period. A small balance maintenance fee of $12.00 that is charged once a year may apply for certain accounts with a value of less than $2,000. This fee is not included in the table below. If it was, the estimate of expenses you paid during the period would be higher, and your ending account value lower, by this amount. In addition, the Fund, as a shareholder in the underlying Fidelity Central Funds, will indirectly bear its pro-rata share of the fees and expenses incurred by the underlying Fidelity Central Funds. These fees and expenses are not included in the Fund's annualized expense ratio used to calculate the expense estimate in the table below.
Hypothetical Example for Comparison Purposes
The second line of the accompanying table provides information about hypothetical account values and hypothetical expenses based on the Fund's actual expense ratio and an assumed rate of return of 5% per year before expenses, which is not the Fund's actual return. The hypothetical account values and expenses may not be used to estimate the actual ending account balance or expenses you paid for the period. You may use this information to compare the ongoing costs of investing in the Fund and other funds. To do so, compare this 5% hypothetical example with the 5% hypothetical examples that appear in the shareholder reports of the other funds. A small balance maintenance fee of $12.00 that is charged once a year may apply for certain accounts with a value of less than $2,000. This fee is not included in the table below. If it was, the estimate of expenses you paid during the period would be higher, and your ending account value lower, by this amount. In addition, the Fund, as a shareholder in the underlying Fidelity Central Funds, will indirectly bear its pro-rata share of the fees and expenses incurred by the underlying Fidelity Central Funds. These fees and expenses are not included in the Fund's annualized expense ratio used to calculate the expense estimate in the table below.
Please note that the expenses shown in the table are meant to highlight your ongoing costs only and do not reflect any transaction costs. Therefore, the second line of the table is useful in comparing ongoing costs only, and will not help you determine the relative total costs of owning different funds. In addition, if these transactional costs were included, your costs would have been higher.
| | Annualized Expense Ratio-A | Beginning
Account Value
March 1, 2017 | Ending
Account Value
August 31, 2017 | Expenses Paid
During Period-B
March 1, 2017
to August 31, 2017 |
| Actual | .79% | $1,000.00 | $1,107.20 | $4.20 |
| Hypothetical-C | | $1,000.00 | $1,021.22 | $4.02 |
A Annualized expense ratio reflects expenses net of applicable fee waivers.
B Expenses are equal to the Fund's annualized expense ratio, multiplied by the average account value over the period, multiplied by 184/365 (to reflect the one-half year period).
C 5% return per year before expenses
SELUTL-SANN-1017
1.813630.112
Fidelity® Select Portfolios®
Energy Sector Energy Portfolio
Energy Service Portfolio
Natural Gas Portfolio
Natural Resources Portfolio
Semi-Annual Report August 31, 2017 |
|
Contents
To view a fund's proxy voting guidelines and proxy voting record for the 12-month period ended June 30, visit http://www.fidelity.com/proxyvotingresults or visit the Securities and Exchange Commission's (SEC) web site at http://www.sec.gov.
You may also call 1-800-544-8544 to request a free copy of the proxy voting guidelines.
Standard & Poor's, S&P and S&P 500 are registered service marks of The McGraw-Hill Companies, Inc. and have been licensed for use by Fidelity Distributors Corporation.
Other third-party marks appearing herein are the property of their respective owners.
All other marks appearing herein are registered or unregistered trademarks or service marks of FMR LLC or an affiliated company. © 2017 FMR LLC. All rights reserved.
This report and the financial statements contained herein are submitted for the general information of the shareholders of the Funds. This report is not authorized for distribution to prospective investors in the Funds unless preceded or accompanied by an effective prospectus.
A fund files its complete schedule of portfolio holdings with the SEC for the first and third quarters of each fiscal year on Form N-Q. Forms N-Q are available on the SEC’s web site at http://www.sec.gov. A fund's Forms N-Q may be reviewed and copied at the SEC’s Public Reference Room in Washington, DC. Information regarding the operation of the SEC's Public Reference Room may be obtained by calling 1-800-SEC-0330.
For a complete list of a fund's portfolio holdings, view the most recent holdings listing, semiannual report, or annual report on Fidelity's web site at http://www.fidelity.com, http://www.institutional.fidelity.com, or http://www.401k.com, as applicable.
NOT FDIC INSURED •MAY LOSE VALUE •NO BANK GUARANTEE
Neither the Funds nor Fidelity Distributors Corporation is a bank.
Energy Portfolio
Investment Summary (Unaudited)
Top Ten Stocks as of August 31, 2017
| | % of fund's net assets | % of fund's net assets 6 months ago |
| Chevron Corp. | 7.7 | 6.3 |
| EOG Resources, Inc. | 7.1 | 5.8 |
| Pioneer Natural Resources Co. | 5.5 | 4.4 |
| Diamondback Energy, Inc. | 5.4 | 3.4 |
| Exxon Mobil Corp. | 4.6 | 7.0 |
| Halliburton Co. | 4.2 | 3.6 |
| Phillips 66 Co. | 3.1 | 1.9 |
| The Williams Companies, Inc. | 3.1 | 1.3 |
| Parsley Energy, Inc. Class A | 3.1 | 1.8 |
| RSP Permian, Inc. | 2.9 | 1.8 |
| | 46.7 | |
Top Industries (% of fund's net assets)
| As of August 31, 2017 |
| | Oil, Gas & Consumable Fuels | 81.9% |
| | Energy Equipment & Services | 14.4% |
| | Chemicals | 1.9% |
| | Gas Utilities | 0.5% |
| | Machinery | 0.2% |
| | All Others* | 1.1% |

* Includes Short-Term investments and Net Other Assets (Liabilities).
| As of February 28, 2017 |
| | Oil, Gas & Consumable Fuels | 78.7% |
| | Energy Equipment & Services | 18.3% |
| | Chemicals | 0.7% |
| | Metals & Mining | 0.5% |
| | Independent Power and Renewable Electricity Producers | 0.5% |
| | All Others* | 1.3% |

* Includes Short-Term investments and Net Other Assets (Liabilities).
Energy Portfolio
Investments August 31, 2017 (Unaudited)
Showing Percentage of Net Assets
| Common Stocks - 99.0% | | | |
| | | Shares | Value |
| Chemicals - 1.9% | | | |
| Commodity Chemicals - 1.9% | | | |
| LG Chemical Ltd. | | 16,193 | $5,458,954 |
| LyondellBasell Industries NV Class A | | 316,700 | 28,689,853 |
| | | | 34,148,807 |
| Energy Equipment & Services - 14.4% | | | |
| Oil & Gas Drilling - 1.7% | | | |
| Nabors Industries Ltd. | | 564,900 | 3,700,095 |
| Odfjell Drilling A/S (a) | | 1,434,080 | 4,399,500 |
| Shelf Drilling Ltd. | | 1,791,500 | 14,317,313 |
| Trinidad Drilling Ltd. (a) | | 2,361,600 | 3,158,256 |
| Xtreme Drilling & Coil Services Corp. (a) | | 2,470,200 | 3,956,276 |
| | | | 29,531,440 |
| Oil & Gas Equipment & Services - 12.7% | | | |
| Baker Hughes, a GE Co. Class A | | 728,300 | 24,689,370 |
| C&J Energy Services, Inc. | | 124,100 | 3,134,766 |
| Dril-Quip, Inc. (a) | | 346,753 | 13,020,575 |
| Frank's International NV (b) | | 938,000 | 5,890,640 |
| Halliburton Co. | | 1,924,600 | 75,001,662 |
| National Oilwell Varco, Inc. | | 547,400 | 16,788,758 |
| NCS Multistage Holdings, Inc. | | 289,000 | 5,710,640 |
| Newpark Resources, Inc. (a) | | 1,803,902 | 14,521,411 |
| Oceaneering International, Inc. | | 530,827 | 11,970,149 |
| RigNet, Inc. (a) | | 579,471 | 9,271,536 |
| Schlumberger Ltd. | | 604,558 | 38,395,479 |
| Smart Sand, Inc. | | 287,100 | 1,713,987 |
| Tesco Corp. (a) | | 410,200 | 1,804,880 |
| TETRA Technologies, Inc. (a) | | 1,066,000 | 2,195,960 |
| Total Energy Services, Inc. | | 94,100 | 919,335 |
| | | | 225,029,148 |
|
| TOTAL ENERGY EQUIPMENT & SERVICES | | | 254,560,588 |
|
| Gas Utilities - 0.5% | | | |
| Gas Utilities - 0.5% | | | |
| Indraprastha Gas Ltd. | | 418,546 | 8,350,626 |
| Independent Power and Renewable Electricity Producers - 0.1% | | | |
| Renewable Electricity - 0.1% | | | |
| NextEra Energy Partners LP | | 47,500 | 1,969,350 |
| Machinery - 0.2% | | | |
| Industrial Machinery - 0.2% | | | |
| ProPetro Holding Corp. (b) | | 312,500 | 3,596,875 |
| Oil, Gas & Consumable Fuels - 81.9% | | | |
| Integrated Oil & Gas - 15.0% | | | |
| Chevron Corp. | | 1,260,023 | 135,603,676 |
| Exxon Mobil Corp. | | 1,076,548 | 82,172,909 |
| Occidental Petroleum Corp. | | 506,800 | 30,255,960 |
| Suncor Energy, Inc. | | 534,400 | 16,745,603 |
| | | | 264,778,148 |
| Oil & Gas Exploration & Production - 51.0% | | | |
| Anadarko Petroleum Corp. | | 858,215 | 35,126,740 |
| Cabot Oil & Gas Corp. | | 1,248,300 | 31,894,065 |
| Callon Petroleum Co. (a) | | 3,095,700 | 32,071,452 |
| Centennial Resource Development, Inc.: | | | |
| Class A | | 115,200 | 1,991,808 |
| Class A (b) | | 703,400 | 12,161,786 |
| Cimarex Energy Co. | | 428,245 | 42,691,744 |
| Concho Resources, Inc. (a) | | 306,900 | 34,056,693 |
| ConocoPhillips Co. | | 388,000 | 16,940,080 |
| Continental Resources, Inc. (a) | | 964,700 | 32,722,624 |
| Devon Energy Corp. | | 1,259,500 | 39,548,300 |
| Diamondback Energy, Inc. (a) | | 1,058,300 | 96,083,057 |
| Encana Corp. | | 3,014,600 | 28,124,196 |
| EOG Resources, Inc. | | 1,467,464 | 124,719,765 |
| Extraction Oil & Gas, Inc. (b) | | 888,382 | 11,673,339 |
| Hess Corp. | | 269,200 | 10,471,880 |
| Jagged Peak Energy, Inc. (b) | | 149,300 | 1,912,533 |
| Jones Energy, Inc. | | 1 | 1 |
| Marathon Oil Corp. | | 575,700 | 6,401,784 |
| Matador Resources Co. (a)(b) | | 613,400 | 14,463,972 |
| Murphy Oil Corp. | | 183,100 | 4,149,046 |
| Newfield Exploration Co. (a) | | 1,467,200 | 38,337,936 |
| Parsley Energy, Inc. Class A (a) | | 2,170,900 | 54,381,045 |
| PDC Energy, Inc. (a) | | 470,351 | 18,498,905 |
| Pioneer Natural Resources Co. | | 746,699 | 96,809,525 |
| Range Resources Corp. | | 216,600 | 3,760,176 |
| Resolute Energy Corp. (a)(b) | | 262,160 | 7,746,828 |
| Ring Energy, Inc. (a) | | 600,522 | 7,158,222 |
| RSP Permian, Inc. (a) | | 1,612,900 | 50,612,802 |
| Seven Generations Energy Ltd. (a) | | 1,126,600 | 17,150,483 |
| Viper Energy Partners LP | | 740,400 | 12,512,760 |
| WPX Energy, Inc. (a) | | 1,842,300 | 18,404,577 |
| | | | 902,578,124 |
| Oil & Gas Refining & Marketing - 7.8% | | | |
| Andeavor | | 192,400 | 19,268,860 |
| Bharat Petroleum Corp. Ltd. | | 1,092,128 | 9,036,298 |
| Delek U.S. Holdings, Inc. | | 1,489,855 | 36,829,216 |
| Phillips 66 Co. | | 661,973 | 55,479,957 |
| Pilipinas Shell Petroleum Corp. | | 3,398,110 | 4,382,622 |
| Reliance Industries Ltd. | | 474,220 | 11,826,758 |
| World Fuel Services Corp. | | 24,855 | 858,492 |
| | | | 137,682,203 |
| Oil & Gas Storage & Transport - 8.1% | | | |
| Cheniere Energy, Inc. (a) | | 267,000 | 11,424,930 |
| Enterprise Products Partners LP | | 871,300 | 22,714,791 |
| GasLog Partners LP | | 267,500 | 6,072,250 |
| Gener8 Maritime, Inc. (a) | | 2,567,090 | 11,551,905 |
| Golar LNG Ltd. (b) | | 424,400 | 9,200,992 |
| Noble Midstream Partners LP | | 304,127 | 14,649,798 |
| Noble Midstream Partners LP (c) | | 101,027 | 4,623,147 |
| Plains GP Holdings LP Class A | | 217,600 | 4,891,648 |
| Teekay LNG Partners LP | | 163,000 | 2,771,000 |
| The Williams Companies, Inc. | | 1,865,800 | 55,470,234 |
| | | | 143,370,695 |
|
| TOTAL OIL, GAS & CONSUMABLE FUELS | | | 1,448,409,170 |
|
| TOTAL COMMON STOCKS | | | |
| (Cost $1,747,319,672) | | | 1,751,035,416 |
|
| Money Market Funds - 3.3% | | | |
| Fidelity Cash Central Fund, 1.11% (d) | | 8,671,378 | 8,673,112 |
| Fidelity Securities Lending Cash Central Fund 1.11% (d)(e) | | 49,314,367 | 49,319,299 |
| TOTAL MONEY MARKET FUNDS | | | |
| (Cost $57,990,352) | | | 57,992,411 |
| TOTAL INVESTMENT IN SECURITIES - 102.3% | | | |
| (Cost $1,805,310,024) | | | 1,809,027,827 |
| NET OTHER ASSETS (LIABILITIES) - (2.3)% | | | (39,871,148) |
| NET ASSETS - 100% | | | $1,769,156,679 |
Legend
(a) Non-income producing
(b) Security or a portion of the security is on loan at period end.
(c) Restricted securities - Investment in securities not registered under the Securities Act of 1933 (excluding 144A issues). At the end of the period, the value of restricted securities (excluding 144A issues) amounted to $4,623,147 or 0.3% of net assets.
(d) Affiliated fund that is generally available only to investment companies and other accounts managed by Fidelity Investments. The rate quoted is the annualized seven-day yield of the fund at period end. A complete unaudited listing of the fund's holdings as of its most recent quarter end is available upon request. In addition, each Fidelity Central Fund's financial statements are available on the SEC's website or upon request.
(e) Investment made with cash collateral received from securities on loan.
Additional information on each restricted holding is as follows:
| Security | Acquisition Date | Acquisition Cost |
| Noble Midstream Partners LP | 6/21/17 | $4,086,542 |
Affiliated Central Funds
Information regarding fiscal year to date income earned by the Fund from investments in Fidelity Central Funds is as follows:
| Fund | Income earned |
| Fidelity Cash Central Fund | $59,715 |
| Fidelity Securities Lending Cash Central Fund | 189,366 |
| Total | $249,081 |
Investment Valuation
The following is a summary of the inputs used, as of August 31, 2017, involving the Fund's assets and liabilities carried at fair value. The inputs or methodology used for valuing securities may not be an indication of the risk associated with investing in those securities. For more information on valuation inputs, and their aggregation into the levels used below, please refer to the Investment Valuation section in the accompanying Notes to Financial Statements.
| | Valuation Inputs at Reporting Date: |
| Description | Total | Level 1 | Level 2 | Level 3 |
| Investments in Securities: | | | | |
| Common Stocks | $1,751,035,416 | $1,746,412,269 | $4,623,147 | $-- |
| Money Market Funds | 57,992,411 | 57,992,411 | -- | -- |
| Total Investments in Securities: | $1,809,027,827 | $1,804,404,680 | $4,623,147 | $-- |
Other Information
Distribution of investments by country or territory of incorporation, as a percentage of Total Net Assets, is as follows (Unaudited):
| United States of America | 86.5% |
| Canada | 4.2% |
| Curacao | 2.2% |
| Netherlands | 1.9% |
| India | 1.7% |
| Marshall Islands | 1.2% |
| Others (Individually Less Than 1%) | 2.3% |
| | 100.0% |
See accompanying notes which are an integral part of the financial statements.
Energy Portfolio
Financial Statements
Statement of Assets and Liabilities
| | | August 31, 2017 (Unaudited) |
| Assets | | |
Investment in securities, at value (including securities loaned of $49,467,741) — See accompanying schedule:
Unaffiliated issuers (cost $1,747,319,672) | $1,751,035,416 | |
| Fidelity Central Funds (cost $57,990,352) | 57,992,411 | |
| Total Investment in Securities (cost $1,805,310,024) | | $1,809,027,827 |
| Receivable for investments sold | | 9,759,013 |
| Receivable for fund shares sold | | 1,853,060 |
| Dividends receivable | | 3,518,854 |
| Distributions receivable from Fidelity Central Funds | | 32,980 |
| Other receivables | | 173,771 |
| Total assets | | 1,824,365,505 |
| Liabilities | | |
| Payable for investments purchased | $9,236 | |
| Payable for fund shares redeemed | 3,556,437 | |
| Accrued management fee | 809,692 | |
| Other affiliated payables | 376,392 | |
| Other payables and accrued expenses | 1,143,244 | |
| Collateral on securities loaned | 49,313,825 | |
| Total liabilities | | 55,208,826 |
| Net Assets | | $1,769,156,679 |
| Net Assets consist of: | | |
| Paid in capital | | $2,088,960,818 |
| Undistributed net investment income | | 23,411,000 |
| Accumulated undistributed net realized gain (loss) on investments and foreign currency transactions | | (345,932,505) |
| Net unrealized appreciation (depreciation) on investments and assets and liabilities in foreign currencies | | 2,717,366 |
| Net Assets, for 47,495,178 shares outstanding | | $1,769,156,679 |
| Net Asset Value, offering price and redemption price per share ($1,769,156,679 ÷ 47,495,178 shares) | | $37.25 |
See accompanying notes which are an integral part of the financial statements.
Statement of Operations
| | | Six months ended August 31, 2017 (Unaudited) |
| Investment Income | | |
| Dividends | | $13,781,973 |
| Special dividends | | 22,615,250 |
| Income from Fidelity Central Funds (including $189,366 from security lending) | | 249,081 |
| Total income | | 36,646,304 |
| Expenses | | |
| Management fee | $5,404,251 | |
| Transfer agent fees | 2,058,819 | |
| Accounting and security lending fees | 305,342 | |
| Custodian fees and expenses | 28,710 | |
| Independent trustees' fees and expenses | 24,040 | |
| Registration fees | 39,555 | |
| Audit | 33,110 | |
| Legal | 18,510 | |
| Interest | 731 | |
| Miscellaneous | 17,117 | |
| Total expenses before reductions | 7,930,185 | |
| Expense reductions | (182,012) | 7,748,173 |
| Net investment income (loss) | | 28,898,131 |
| Realized and Unrealized Gain (Loss) | | |
| Net realized gain (loss) on: | | |
| Investment securities: | | |
| Unaffiliated issuers (net of foreign taxes of $37,583) | 4,409,028 | |
| Fidelity Central Funds | 1,658 | |
| Foreign currency transactions | (39,328) | |
| Total net realized gain (loss) | | 4,371,358 |
| Change in net unrealized appreciation (depreciation) on: | | |
| Unaffiliated issuers (net of increase in deferred foreign taxes of $809,306) | (365,521,525) | |
| Fidelity Central Funds | (5,264) | |
| Assets and liabilities in foreign currencies | 2,452 | |
| Total change in net unrealized appreciation (depreciation) | | (365,524,337) |
| Net gain (loss) | | (361,152,979) |
| Net increase (decrease) in net assets resulting from operations | | $(332,254,848) |
See accompanying notes which are an integral part of the financial statements.
Statement of Changes in Net Assets
| | Six months ended August 31, 2017 (Unaudited) | Year ended February 28, 2017 |
| Increase (Decrease) in Net Assets | | |
| Operations | | |
| Net investment income (loss) | $28,898,131 | $10,465,618 |
| Net realized gain (loss) | 4,371,358 | 120,379,476 |
| Change in net unrealized appreciation (depreciation) | (365,524,337) | 542,954,194 |
| Net increase (decrease) in net assets resulting from operations | (332,254,848) | 673,799,288 |
| Distributions to shareholders from net investment income | – | (13,079,637) |
| Distributions to shareholders from net realized gain | (5,042,802) | (3,147,768) |
| Total distributions | (5,042,802) | (16,227,405) |
| Share transactions | | |
| Proceeds from sales of shares | 204,020,874 | 898,918,597 |
| Reinvestment of distributions | 4,846,433 | 15,617,735 |
| Cost of shares redeemed | (391,762,754) | (1,211,768,502) |
| Net increase (decrease) in net assets resulting from share transactions | (182,895,447) | (297,232,170) |
| Redemption fees | – | 112,786 |
| Total increase (decrease) in net assets | (520,193,097) | 360,452,499 |
| Net Assets | | |
| Beginning of period | 2,289,349,776 | 1,928,897,277 |
| End of period | $1,769,156,679 | $2,289,349,776 |
| Other Information | | |
| Undistributed net investment income end of period | $23,411,000 | $– |
| Distributions in excess of net investment income end of period | $– | $(5,487,131) |
| Shares | | |
| Sold | 5,076,572 | 21,107,325 |
| Issued in reinvestment of distributions | 110,978 | 360,628 |
| Redeemed | (9,603,012) | (28,669,318) |
| Net increase (decrease) | (4,415,462) | (7,201,365) |
See accompanying notes which are an integral part of the financial statements.
Financial Highlights — Energy Portfolio
| | Six months ended (Unaudited) August 31, | Years ended February 28, | | | | |
| | 2017 | 2017 | 2016 A | 2015 | 2014 | 2013 |
| Selected Per–Share Data | | | | | | |
| Net asset value, beginning of period | $44.10 | $32.63 | $45.64 | $56.25 | $54.81 | $55.14 |
| Income from Investment Operations | | | | | | |
| Net investment income (loss)B | .59C | .18 | .42 | .46 | .44 | .53 |
| Net realized and unrealized gain (loss) | (7.34) | 11.58 | (12.98) | (6.37) | 7.86 | (.04) |
| Total from investment operations | (6.75) | 11.76 | (12.56) | (5.91) | 8.30 | .49 |
| Distributions from net investment income | – | (.24) | (.39) | (.46) | (.46) | (.47) |
| Distributions from net realized gain | (.10) | (.05) | (.07) | (4.23) | (6.40) | (.35) |
| Total distributions | (.10) | (.29) | (.45)D | (4.70)E | (6.86) | (.82) |
| Redemption fees added to paid in capitalB | – | –F | –F | –F | –F | –F |
| Net asset value, end of period | $37.25 | $44.10 | $32.63 | $45.64 | $56.25 | $54.81 |
| Total ReturnG,H | (15.34)% | 36.05% | (27.61)% | (11.25)% | 15.43% | 1.00% |
| Ratios to Average Net AssetsI,J | | | | | | |
| Expenses before reductions | .80%K | .79% | .80% | .79% | .80% | .82% |
| Expenses net of fee waivers, if any | .80%K | .79% | .80% | .79% | .80% | .82% |
| Expenses net of all reductions | .78%K | .78% | .79% | .79% | .80% | .81% |
| Net investment income (loss) | 1.77%C,K | .44% | 1.03% | .85% | .76% | 1.04% |
| Supplemental Data | | | | | | |
| Net assets, end of period (000 omitted) | $1,769,157 | $2,289,350 | $1,928,897 | $2,179,828 | $1,995,808 | $2,126,992 |
| Portfolio turnover rateL | 84%K | 93%M | 79% | 73%M | 98% | 80% |
A For the year ended February 29.
B Calculated based on average shares outstanding during the period.
C Net Investment income per share reflects a large, non-recurring dividend which amounted to $.46 per share. This dividend is not annualized in the ratio of net investment income (loss) to average net assets. Excluding this non-recurring dividend, the ratio of net investment income (loss) to average net assets would have been .63%.
D Total distributions of $.45 per share is comprised of distributions from net investment income of $.387 and distributions from net realized gain of $.066 per share.
E Total distributions of $4.70 per share is comprised of distributions from net investment income of $.463 and distributions from net realized gain of $4.233 per share.
F Amount represents less than $.005 per share.
G Total returns for periods of less than one year are not annualized.
H Total returns would have been lower if certain expenses had not been reduced during the applicable periods shown.
I Fees and expenses of any underlying Fidelity Central Funds are not included in the Fund's expense ratio. The Fund indirectly bears its proportionate share of the expenses of any underlying Fidelity Central Funds.
J Expense ratios reflect operating expenses of the Fund. Expenses before reductions do not reflect amounts reimbursed by the investment adviser or reductions from brokerage service arrangements or reductions from other expense offset arrangements and do not represent the amount paid by the Fund during periods when reimbursements or reductions occur. Expenses net of fee waivers reflect expenses after reimbursement by the investment adviser but prior to reductions from brokerage service arrangements or other expense offset arrangements. Expenses net of all reductions represent the net expenses paid by the Fund.
K Annualized
L Amount does not include the portfolio activity of any underlying Fidelity Central Funds.
M Portfolio turnover rate excludes securities received or delivered in-kind.
See accompanying notes which are an integral part of the financial statements.
Energy Service Portfolio
Investment Summary (Unaudited)
Top Ten Stocks as of August 31, 2017
| | % of fund's net assets | % of fund's net assets 6 months ago |
| Schlumberger Ltd. | 16.3 | 17.0 |
| Halliburton Co. | 13.6 | 8.7 |
| Baker Hughes, a GE Co. Class A | 5.7 | 13.6 |
| Oceaneering International, Inc. | 5.0 | 3.8 |
| TETRA Technologies, Inc. | 4.8 | 4.6 |
| RigNet, Inc. | 3.8 | 3.8 |
| Dril-Quip, Inc. | 3.6 | 4.0 |
| Odfjell Drilling A/S | 3.6 | 1.5 |
| Borr Drilling Ltd. | 3.5 | 3.2 |
| Tesco Corp. | 3.4 | 3.1 |
| | 63.3 | |
Top Industries (% of fund's net assets)
| As of August 31, 2017 |
| | Energy Equipment & Services | 96.2% |
| | Oil, Gas & Consumable Fuels | 2.3% |
| | Water Utilities | 0.5% |
| | Textiles, Apparel & Luxury Goods | 0.5% |
| | Construction & Engineering | 0.3% |
| | All Others* | 0.2% |

* Includes Short-Term investments and Net Other Assets (Liabilities).
| As of February 28, 2017 |
| | Energy Equipment & Services | 97.1% |
| | Oil, Gas & Consumable Fuels | 2.8% |
| | Construction & Engineering | 0.2% |
| | All Others*,** | (0.1)% |

* Includes Short-Term investments and Net Other Assets (Liabilities).
** Not included in the pie chart
Energy Service Portfolio
Investments August 31, 2017 (Unaudited)
Showing Percentage of Net Assets
| Common Stocks - 99.9% | | | |
| | | Shares | Value |
| Construction & Engineering - 0.3% | | | |
| Construction & Engineering - 0.3% | | | |
| Enterprise Group, Inc. (a)(b) | | 5,565,237 | $1,359,277 |
| Energy Equipment & Services - 96.2% | | | |
| Oil & Gas Drilling - 18.4% | | | |
| Borr Drilling Ltd. | | 4,307,283 | 16,212,100 |
| Helmerich & Payne, Inc. | | 7,600 | 321,784 |
| Independence Contract Drilling, Inc. (a) | | 1,535,913 | 4,945,640 |
| Nabors Industries Ltd. | | 1,424,000 | 9,327,200 |
| Odfjell Drilling A/S (a) | | 5,418,521 | 16,623,051 |
| Parker Drilling Co. (a)(b) | | 7,772,993 | 8,550,292 |
| Pioneer Energy Services Corp. (a) | | 875,713 | 1,488,712 |
| Shelf Drilling Ltd. | | 1,115,203 | 8,912,482 |
| Trinidad Drilling Ltd. (a) | | 8,427,700 | 11,270,678 |
| Xtreme Drilling & Coil Services Corp. (a)(b) | | 4,820,116 | 7,719,906 |
| | | | 85,371,845 |
| Oil & Gas Equipment & Services - 77.8% | | | |
| Baker Hughes, a GE Co. Class A | | 781,973 | 26,508,885 |
| BW Offshore Ltd. (a)(c) | | 2,293,814 | 7,539,654 |
| C&J Energy Services, Inc. | | 438,200 | 11,068,932 |
| CSI Compressco LP | | 1,483,977 | 6,959,852 |
| Dril-Quip, Inc. (a)(c) | | 448,900 | 16,856,195 |
| Fairmount Santrol Holidings, Inc. (a)(c) | | 378,500 | 1,158,210 |
| Frank's International NV (c) | | 2,005,532 | 12,594,741 |
| Halliburton Co. | | 1,617,534 | 63,035,300 |
| Helix Energy Solutions Group, Inc. (a) | | 1,293,329 | 8,109,173 |
| Key Energy Services, Inc. (c) | | 51,600 | 656,868 |
| McCoy Global, Inc. (a) | | 1,049,550 | 1,596,913 |
| National Oilwell Varco, Inc. | | 299,062 | 9,172,232 |
| Newpark Resources, Inc. (a) | | 963,852 | 7,759,009 |
| Oceaneering International, Inc. | | 1,022,194 | 23,050,475 |
| Oil States International, Inc. (a) | | 15,100 | 328,425 |
| RigNet, Inc. (a)(b)(c) | | 1,093,486 | 17,495,776 |
| Schlumberger Ltd. | | 1,188,211 | 75,463,279 |
| Smart Sand, Inc. (c) | | 1,239,300 | 7,398,621 |
| Spectrum ASA (a) | | 1,030,013 | 5,045,211 |
| Superior Drilling Products, Inc. (a)(b)(c) | | 2,409,569 | 1,614,652 |
| Superior Energy Services, Inc. (a) | | 224,700 | 1,851,528 |
| TechnipFMC PLC | | 206,362 | 5,330,330 |
| TechnipFMC PLC (France) | | 51,232 | 1,313,706 |
| Tesco Corp. (a)(b) | | 3,605,104 | 15,862,458 |
| TETRA Technologies, Inc. (a)(b) | | 10,796,594 | 22,240,984 |
| TETRA Technologies, Inc. warrants 12/14/21 (a)(b) | | 300,100 | 93,931 |
| Weatherford International PLC | | 2,677,966 | 10,256,610 |
| | | | 360,361,950 |
|
| TOTAL ENERGY EQUIPMENT & SERVICES | | | 445,733,795 |
|
| Marine - 0.1% | | | |
| Marine - 0.1% | | | |
| Hapag-Lloyd AG (a) | | 7,488 | 323,849 |
| Oil, Gas & Consumable Fuels - 2.3% | | | |
| Oil & Gas Storage & Transport - 2.3% | | | |
| Golar LNG Ltd. | | 87,533 | 1,897,715 |
| StealthGas, Inc. (a)(b) | | 2,310,091 | 7,438,493 |
| Teekay LNG Partners LP | | 77,900 | 1,324,300 |
| | | | 10,660,508 |
| Textiles, Apparel & Luxury Goods - 0.5% | | | |
| Textiles - 0.5% | | | |
| Ranger Energy Services, Inc. Class A (c) | | 146,900 | 2,085,980 |
| Water Utilities - 0.5% | | | |
| Water Utilities - 0.5% | | | |
| Select Energy Services, Inc. Class A | | 177,012 | 2,495,869 |
| TOTAL COMMON STOCKS | | | |
| (Cost $591,201,940) | | | 462,659,278 |
|
| Money Market Funds - 4.1% | | | |
| Fidelity Cash Central Fund, 1.11% (d) | | 562,904 | 563,017 |
| Fidelity Securities Lending Cash Central Fund 1.11% (d)(e) | | 18,760,612 | 18,762,488 |
| TOTAL MONEY MARKET FUNDS | | | |
| (Cost $19,324,342) | | | 19,325,505 |
| TOTAL INVESTMENT IN SECURITIES - 104.0% | | | |
| (Cost $610,526,282) | | | 481,984,783 |
| NET OTHER ASSETS (LIABILITIES) - (4.0)% | | | (18,755,573) |
| NET ASSETS - 100% | | | $463,229,210 |
Legend
(a) Non-income producing
(b) Affiliated company
(c) Security or a portion of the security is on loan at period end.
(d) Affiliated fund that is generally available only to investment companies and other accounts managed by Fidelity Investments. The rate quoted is the annualized seven-day yield of the fund at period end. A complete unaudited listing of the fund's holdings as of its most recent quarter end is available upon request. In addition, each Fidelity Central Fund's financial statements are available on the SEC's website or upon request.
(e) Investment made with cash collateral received from securities on loan.
Affiliated Central Funds
Information regarding fiscal year to date income earned by the Fund from investments in Fidelity Central Funds is as follows:
| Fund | Income earned |
| Fidelity Cash Central Fund | $3,392 |
| Fidelity Securities Lending Cash Central Fund | 240,572 |
| Total | $243,964 |
Other Affiliated Issuers
An affiliated company is a company in which the Fund has ownership of at least 5% of the voting securities. Fiscal year to date transactions with companies which are or were affiliates are as follows:
| Affiliate | Value, beginning of period | Purchases | Sales Proceeds | Dividend Income | Realized Gain (loss) | Change in Unrealized appreciation (depreciation) | Value, end of period |
| Borr Drilling Ltd. | $23,110,873 | $-- | $7,507,575 | $-- | $3,637,774 | $(3,028,971) | $-- |
| Enterprise Group, Inc. | 1,340,819 | -- | -- | -- | -- | 18,458 | 1,359,277 |
| Forbes Energy Services Ltd. | 62,930 | -- | 16,345 | -- | (4,734,595) | 4,688,010 | -- |
| Parker Drilling Co. | 10,581,966 | 4,199,763 | 779,581 | -- | (292,788) | (5,159,069) | 8,550,292 |
| RigNet, Inc. | 27,747,812 | 1,339,717 | 10,933,847 | -- | 1,999,294 | (2,657,199) | 17,495,776 |
| StealthGas, Inc. | 10,668,491 | -- | 488,777 | -- | (677,461) | (2,063,759) | 7,438,493 |
| Superior Drilling Products, Inc. | 2,481,856 | -- | -- | -- | -- | (867,204) | 1,614,652 |
| Tesco Corp. | 22,842,845 | 5,339,566 | 1,094,702 | -- | (71,032) | (11,154,218) | 15,862,458 |
| TETRA Technologies, Inc. | 33,925,982 | 11,361,508 | 2,257,199 | -- | (1,062,403) | (19,726,905) | 22,240,984 |
| TETRA Technologies, Inc. warrants 12/14/21 | 435,145 | -- | -- | -- | -- | (341,214) | 93,931 |
| Xtreme Drilling & Coil Services Corp. | 10,443,266 | 379,993 | 2,034,098 | -- | (2,176,797) | 1,107,542 | 7,719,906 |
| Total | $143,641,985 | $22,620,547 | $25,112,124 | $-- | $(3,378,008) | $(39,184,529) | $82,375,769 |
Investment Valuation
The following is a summary of the inputs used, as of August 31, 2017, involving the Fund's assets and liabilities carried at fair value. The inputs or methodology used for valuing securities may not be an indication of the risk associated with investing in those securities. For more information on valuation inputs, and their aggregation into the levels used below, please refer to the Investment Valuation section in the accompanying Notes to Financial Statements.
| | Valuation Inputs at Reporting Date: |
| Description | Total | Level 1 | Level 2 | Level 3 |
| Investments in Securities: | | | | |
| Common Stocks | $462,659,278 | $462,565,347 | $93,931 | $-- |
| Money Market Funds | 19,325,505 | 19,325,505 | -- | -- |
| Total Investments in Securities: | $481,984,783 | $481,890,852 | $93,931 | $-- |
Other Information
Distribution of investments by country or territory of incorporation, as a percentage of Total Net Assets, is as follows (Unaudited):
| United States of America | 53.1% |
| Curacao | 16.3% |
| Canada | 8.1% |
| Bermuda | 7.5% |
| Norway | 4.7% |
| Netherlands | 2.7% |
| Ireland | 2.2% |
| Cayman Islands | 1.9% |
| Marshall Islands | 1.9% |
| United Kingdom | 1.5% |
| Others (Individually Less Than 1%) | 0.1% |
| | 100.0% |
See accompanying notes which are an integral part of the financial statements.
Energy Service Portfolio
Financial Statements
Statement of Assets and Liabilities
| | | August 31, 2017 (Unaudited) |
| Assets | | |
Investment in securities, at value (including securities loaned of $18,052,212) — See accompanying schedule:
Unaffiliated issuers (cost $443,073,641) | $380,283,509 | |
| Fidelity Central Funds (cost $19,324,342) | 19,325,505 | |
| Other affiliated issuers (cost $148,128,299) | 82,375,769 | |
| Total Investment in Securities (cost $610,526,282) | | $481,984,783 |
| Cash | | 197,125 |
| Receivable for investments sold | | 2,966,057 |
| Receivable for fund shares sold | | 383,502 |
| Dividends receivable | | 294,186 |
| Distributions receivable from Fidelity Central Funds | | 25,660 |
| Other receivables | | 51,949 |
| Total assets | | 485,903,262 |
| Liabilities | | |
| Payable for investments purchased | $2,275,617 | |
| Payable for fund shares redeemed | 1,244,966 | |
| Accrued management fee | 213,831 | |
| Other affiliated payables | 113,400 | |
| Other payables and accrued expenses | 64,755 | |
| Collateral on securities loaned | 18,761,483 | |
| Total liabilities | | 22,674,052 |
| Net Assets | | $463,229,210 |
| Net Assets consist of: | | |
| Paid in capital | | $630,596,236 |
| Undistributed net investment income | | 14,796,913 |
| Accumulated undistributed net realized gain (loss) on investments and foreign currency transactions | | (53,616,457) |
| Net unrealized appreciation (depreciation) on investments and assets and liabilities in foreign currencies | | (128,547,482) |
| Net Assets, for 11,209,660 shares outstanding | | $463,229,210 |
| Net Asset Value, offering price and redemption price per share ($463,229,210 ÷ 11,209,660 shares) | | $41.32 |
See accompanying notes which are an integral part of the financial statements.
Statement of Operations
| | | Six months ended August 31, 2017 (Unaudited) |
| Investment Income | | |
| Dividends | | $2,458,566 |
| Special dividends | | 14,759,028 |
| Income from Fidelity Central Funds (including $240,572 from security lending) | | 243,964 |
| Total income | | 17,461,558 |
| Expenses | | |
| Management fee | $1,523,129 | |
| Transfer agent fees | 627,683 | |
| Accounting and security lending fees | 107,894 | |
| Custodian fees and expenses | 18,088 | |
| Independent trustees' fees and expenses | 6,995 | |
| Registration fees | 28,294 | |
| Audit | 26,541 | |
| Legal | 4,857 | |
| Interest | 3,017 | |
| Miscellaneous | 3,900 | |
| Total expenses before reductions | 2,350,398 | |
| Expense reductions | (79,059) | 2,271,339 |
| Net investment income (loss) | | 15,190,219 |
| Realized and Unrealized Gain (Loss) | | |
| Net realized gain (loss) on: | | |
| Investment securities: | | |
| Unaffiliated issuers | (16,490,424) | |
| Fidelity Central Funds | (1,642) | |
| Other affiliated issuers | (3,378,008) | |
| Foreign currency transactions | 38,883 | |
| Total net realized gain (loss) | | (19,831,191) |
| Change in net unrealized appreciation (depreciation) on: | | |
| Investment securities: | | |
| Unaffiliated issuers | (116,323,096) | |
| Fidelity Central Funds | (1,164) | |
| Other Affiliated issuers | (39,184,529) | |
| Assets and liabilities in foreign currencies | (2,514) | |
| Total change in net unrealized appreciation (depreciation) | | (155,511,303) |
| Net gain (loss) | | (175,342,494) |
| Net increase (decrease) in net assets resulting from operations | | $(160,152,275) |
See accompanying notes which are an integral part of the financial statements.
Statement of Changes in Net Assets
| | Six months ended August 31, 2017 (Unaudited) | Year ended February 28, 2017 |
| Increase (Decrease) in Net Assets | | |
| Operations | | |
| Net investment income (loss) | $15,190,219 | $1,984,380 |
| Net realized gain (loss) | (19,831,191) | (19,224,046) |
| Change in net unrealized appreciation (depreciation) | (155,511,303) | 205,013,343 |
| Net increase (decrease) in net assets resulting from operations | (160,152,275) | 187,773,677 |
| Distributions to shareholders from net investment income | – | (2,569,509) |
| Share transactions | | |
| Proceeds from sales of shares | 59,932,327 | 347,580,414 |
| Reinvestment of distributions | – | 2,440,107 |
| Cost of shares redeemed | (170,659,835) | (236,538,737) |
| Net increase (decrease) in net assets resulting from share transactions | (110,727,508) | 113,481,784 |
| Redemption fees | 17,524 | 30,328 |
| Total increase (decrease) in net assets | (270,862,259) | 298,716,280 |
| Net Assets | | |
| Beginning of period | 734,091,469 | 435,375,189 |
| End of period | $463,229,210 | $734,091,469 |
| Other Information | | |
| Undistributed net investment income end of period | $14,796,913 | $– |
| Distributions in excess of net investment income end of period | $– | $(393,306) |
| Shares | | |
| Sold | 1,266,973 | 6,670,683 |
| Issued in reinvestment of distributions | – | 46,274 |
| Redeemed | (3,476,423) | (4,895,393) |
| Net increase (decrease) | (2,209,450) | 1,821,564 |
See accompanying notes which are an integral part of the financial statements.
Financial Highlights — Energy Service Portfolio
| | Six months ended (Unaudited) August 31, | Years ended February 28, | | | | |
| | 2017 | 2017 | 2016 A | 2015 | 2014 | 2013 |
| Selected Per–Share Data | | | | | | |
| Net asset value, beginning of period | $54.70 | $37.54 | $54.34 | $86.13 | $74.01 | $73.01 |
| Income from Investment Operations | | | | | | |
| Net investment income (loss)B | 1.29C | .17 | .45 | .45 | .21 | –D |
| Net realized and unrealized gain (loss) | (14.67) | 17.22 | (16.85) | (23.10) | 12.09 | 1.00 |
| Total from investment operations | (13.38) | 17.39 | (16.40) | (22.65) | 12.30 | 1.00 |
| Distributions from net investment income | – | (.23) | (.40) | (.39) | (.18) | – |
| Distributions from net realized gain | – | – | – | (8.75) | – | – |
| Total distributions | – | (.23) | (.40) | (9.14) | (.18) | – |
| Redemption fees added to paid in capitalB,D | – | – | – | – | – | – |
| Net asset value, end of period | $41.32 | $54.70 | $37.54 | $54.34 | $86.13 | $74.01 |
| Total ReturnE,F | (24.46)% | 46.36% | (30.30)% | (27.82)% | 16.62% | 1.37% |
| Ratios to Average Net AssetsG,H | | | | | | |
| Expenses before reductions | .84%I | .85% | .85% | .79% | .80% | .82% |
| Expenses net of fee waivers, if any | .84%I | .85% | .84% | .79% | .80% | .82% |
| Expenses net of all reductions | .81%I | .84% | .81% | .79% | .80% | .81% |
| Net investment income (loss) | 2.79%C,I | .36% | .92% | .56% | .26% | .01% |
| Supplemental Data | | | | | | |
| Net assets, end of period (000 omitted) | $463,229 | $734,091 | $435,375 | $698,803 | $1,047,980 | $1,236,403 |
| Portfolio turnover rateJ | 52%I | 96% | 58% | 55% | 34% | 49% |
A For the year ended February 29.
B Calculated based on average shares outstanding during the period.
C Net Investment income per share reflects a large, non-recurring dividend which amounted to $1.25 per share. This dividend is not annualized in the ratio of net investment income (loss) to average net assets. Excluding this non-recurring dividend, the ratio of net investment income (loss) to average net assets would have been .15%.
D Amount represents less than $.005 per share.
E Total returns for periods of less than one year are not annualized.
F Total returns would have been lower if certain expenses had not been reduced during the applicable periods shown.
G Fees and expenses of any underlying Fidelity Central Funds are not included in the Fund's expense ratio. The Fund indirectly bears its proportionate share of the expenses of any underlying Fidelity Central Funds.
H Expense ratios reflect operating expenses of the Fund. Expenses before reductions do not reflect amounts reimbursed by the investment adviser or reductions from brokerage service arrangements or reductions from other expense offset arrangements and do not represent the amount paid by the Fund during periods when reimbursements or reductions occur. Expenses net of fee waivers reflect expenses after reimbursement by the investment adviser but prior to reductions from brokerage service arrangements or other expense offset arrangements. Expenses net of all reductions represent the net expenses paid by the Fund.
I Annualized
J Amount does not include the portfolio activity of any underlying Fidelity Central Funds.
See accompanying notes which are an integral part of the financial statements.
Natural Gas Portfolio
Investment Summary (Unaudited)
Top Ten Stocks as of August 31, 2017
| | % of fund's net assets | % of fund's net assets 6 months ago |
| ConocoPhillips Co. | 9.0 | 6.5 |
| Kinder Morgan, Inc. | 6.4 | 0.0 |
| Schlumberger Ltd. | 6.4 | 7.8 |
| Anadarko Petroleum Corp. | 6.3 | 7.8 |
| Baker Hughes, a GE Co. Class A | 5.3 | 9.9 |
| EOG Resources, Inc. | 3.5 | 0.0 |
| Encana Corp. | 3.4 | 3.8 |
| Boardwalk Pipeline Partners, LP | 3.4 | 4.2 |
| Cimarex Energy Co. | 2.9 | 0.3 |
| Spire, Inc. | 2.9 | 1.1 |
| | 49.5 | |
Top Industries (% of fund's net assets)
| As of August 31, 2017 |
| | Oil, Gas & Consumable Fuels | 65.1% |
| | Energy Equipment & Services | 22.7% |
| | Gas Utilities | 9.5% |
| | Multi-Utilities | 1.5% |
| | All Others* | 1.2% |

* Includes Short-Term investments and Net Other Assets (Liabilities).
| As of February 28, 2017 |
| | Oil, Gas & Consumable Fuels | 57.0% |
| | Energy Equipment & Services | 39.7% |
| | Gas Utilities | 2.8% |
| | All Others* | 0.5% |

* Includes Short-Term investments and Net Other Assets (Liabilities).
Percentages shown as 0.0% may reflect amounts less than 0.05%.
Natural Gas Portfolio
Investments August 31, 2017 (Unaudited)
Showing Percentage of Net Assets
| Common Stocks - 98.8% | | | |
| | | Shares | Value |
| Energy Equipment & Services - 22.7% | | | |
| Oil & Gas Drilling - 2.8% | | | |
| Ensco PLC Class A | | 317,100 | $1,347,675 |
| Nabors Industries Ltd. | | 352,700 | 2,310,185 |
| Patterson-UTI Energy, Inc. | | 172,200 | 2,750,034 |
| Precision Drilling Corp. (a) | | 717,000 | 1,820,132 |
| | | | 8,228,026 |
| Oil & Gas Equipment & Services - 19.9% | | | |
| Baker Hughes, a GE Co. Class A | | 453,400 | 15,370,260 |
| Era Group, Inc. (a) | | 210,900 | 1,858,029 |
| Exterran Corp. (a) | | 168,600 | 4,676,964 |
| Halliburton Co. | | 64,100 | 2,497,977 |
| National Oilwell Varco, Inc. | | 146,100 | 4,480,887 |
| Pason Systems, Inc. | | 113,100 | 1,621,213 |
| Schlumberger Ltd. | | 288,332 | 18,311,965 |
| U.S. Silica Holdings, Inc. (b) | | 123,500 | 3,360,435 |
| Weatherford International PLC | | 1,280,100 | 4,902,783 |
| | | | 57,080,513 |
|
| TOTAL ENERGY EQUIPMENT & SERVICES | | | 65,308,539 |
|
| Gas Utilities - 9.5% | | | |
| Gas Utilities - 9.5% | | | |
| Atmos Energy Corp. | | 74,598 | 6,567,608 |
| Southwest Gas Holdings, Inc. | | 102,500 | 8,150,800 |
| Spire, Inc. | | 107,500 | 8,223,750 |
| Valener, Inc. | | 232,200 | 4,250,724 |
| | | | 27,192,882 |
| Multi-Utilities - 1.5% | | | |
| Multi-Utilities - 1.5% | | | |
| NiSource, Inc. | | 162,000 | 4,352,940 |
| Oil, Gas & Consumable Fuels - 65.1% | | | |
| Integrated Oil & Gas - 3.0% | | | |
| Occidental Petroleum Corp. | | 65,700 | 3,922,290 |
| Suncor Energy, Inc. | | 151,900 | 4,759,837 |
| | | | 8,682,127 |
| Oil & Gas Exploration & Production - 45.6% | | | |
| Advantage Oil & Gas Ltd. (a) | | 816,900 | 5,207,226 |
| Anadarko Petroleum Corp. | | 439,700 | 17,996,921 |
| Cimarex Energy Co. | | 84,600 | 8,433,774 |
| Concho Resources, Inc. (a) | | 16,400 | 1,819,908 |
| ConocoPhillips Co. | | 593,300 | 25,903,478 |
| Crew Energy, Inc. (a) | | 1,090,700 | 3,642,217 |
| Crown Point Energy, Inc. (a)(c) | | 181,658 | 6,546 |
| Devon Energy Corp. | | 19,046 | 598,044 |
| Encana Corp. | | 1,061,800 | 9,905,882 |
| EOG Resources, Inc. | | 117,800 | 10,011,822 |
| Gulfport Energy Corp. (a) | | 243,200 | 3,047,296 |
| Lekoil Ltd. (a) | | 6,233,200 | 1,470,978 |
| Marathon Oil Corp. | | 498,300 | 5,541,096 |
| Noble Energy, Inc. | | 263,100 | 6,253,887 |
| Northern Blizzard Resources, Inc. (b) | | 1,006,700 | 1,620,394 |
| Parsley Energy, Inc. Class A (a) | | 257,200 | 6,442,860 |
| PDC Energy, Inc. (a) | | 131,800 | 5,183,694 |
| Pioneer Natural Resources Co. | | 27,700 | 3,591,305 |
| Range Resources Corp. | | 216,700 | 3,761,912 |
| Rice Energy, Inc. (a) | | 55,700 | 1,523,952 |
| Savannah Petroleum PLC (a)(d) | | 4,767,600 | 2,134,626 |
| Surge Energy, Inc. (b) | | 1,558,200 | 2,483,138 |
| Whiting Petroleum Corp. (a)(b) | | 264,200 | 1,180,974 |
| WPX Energy, Inc. (a) | | 338,500 | 3,381,615 |
| | | | 131,143,545 |
| Oil & Gas Refining & Marketing - 1.0% | | | |
| Keyera Corp. | | 97,200 | 2,820,843 |
| Oil & Gas Storage & Transport - 15.5% | | | |
| Boardwalk Pipeline Partners, LP | | 642,500 | 9,708,175 |
| Enbridge, Inc. | | 173,500 | 6,935,832 |
| Kinder Morgan, Inc. | | 953,600 | 18,433,088 |
| Sunoco Logistics Partners LP | | 160,950 | 3,059,660 |
| The Williams Companies, Inc. | | 29,800 | 885,954 |
| TransCanada Corp. | | 106,000 | 5,382,551 |
| | | | 44,405,260 |
|
| TOTAL OIL, GAS & CONSUMABLE FUELS | | | 187,051,775 |
|
| TOTAL COMMON STOCKS | | | |
| (Cost $420,371,959) | | | 283,906,136 |
|
| Money Market Funds - 3.7% | | | |
| Fidelity Cash Central Fund, 1.11% (e) | | 3,793,056 | 3,793,815 |
| Fidelity Securities Lending Cash Central Fund 1.11% (e)(f) | | 6,866,517 | 6,867,204 |
| TOTAL MONEY MARKET FUNDS | | | |
| (Cost $10,661,305) | | | 10,661,019 |
| TOTAL INVESTMENT IN SECURITIES - 102.5% | | | |
| (Cost $431,033,264) | | | 294,567,155 |
| NET OTHER ASSETS (LIABILITIES) - (2.5)% | | | (7,301,039) |
| NET ASSETS - 100% | | | $287,266,116 |
Legend
(a) Non-income producing
(b) Security or a portion of the security is on loan at period end.
(c) Security exempt from registration under Rule 144A of the Securities Act of 1933. These securities may be resold in transactions exempt from registration, normally to qualified institutional buyers. At the end of the period, the value of these securities amounted to $6,546 or 0.0% of net assets.
(d) Level 3 instrument
(e) Affiliated fund that is generally available only to investment companies and other accounts managed by Fidelity Investments. The rate quoted is the annualized seven-day yield of the fund at period end. A complete unaudited listing of the fund's holdings as of its most recent quarter end is available upon request. In addition, each Fidelity Central Fund's financial statements are available on the SEC's website or upon request.
(f) Investment made with cash collateral received from securities on loan.
Affiliated Central Funds
Information regarding fiscal year to date income earned by the Fund from investments in Fidelity Central Funds is as follows:
| Fund | Income earned |
| Fidelity Cash Central Fund | $16,233 |
| Fidelity Securities Lending Cash Central Fund | 49,346 |
| Total | $65,579 |
Investment Valuation
The following is a summary of the inputs used, as of August 31, 2017, involving the Fund's assets and liabilities carried at fair value. The inputs or methodology used for valuing securities may not be an indication of the risk associated with investing in those securities. For more information on valuation inputs, and their aggregation into the levels used below, please refer to the Investment Valuation section in the accompanying Notes to Financial Statements.
| | Valuation Inputs at Reporting Date: |
| Description | Total | Level 1 | Level 2 | Level 3 |
| Investments in Securities: | | | | |
| Common Stocks | $283,906,136 | $281,771,510 | $-- | $2,134,626 |
| Money Market Funds | 10,661,019 | 10,661,019 | -- | -- |
| Total Investments in Securities: | $294,567,155 | $292,432,529 | $-- | $2,134,626 |
Other Information
Distribution of investments by country or territory of incorporation, as a percentage of Total Net Assets, is as follows (Unaudited):
| United States of America | 71.8% |
| Canada | 17.6% |
| Curacao | 6.4% |
| Ireland | 1.7% |
| United Kingdom | 1.2% |
| Others (Individually Less Than 1%) | 1.3% |
| | 100.0% |
See accompanying notes which are an integral part of the financial statements.
Natural Gas Portfolio
Financial Statements
Statement of Assets and Liabilities
| | | August 31, 2017 (Unaudited) |
| Assets | | |
Investment in securities, at value (including securities loaned of $6,677,665) — See accompanying schedule:
Unaffiliated issuers (cost $420,371,959) | $283,906,136 | |
| Fidelity Central Funds (cost $10,661,305) | 10,661,019 | |
| Total Investment in Securities (cost $431,033,264) | | $294,567,155 |
| Receivable for fund shares sold | | 394,216 |
| Dividends receivable | | 391,545 |
| Distributions receivable from Fidelity Central Funds | | 8,490 |
| Other receivables | | 61,836 |
| Total assets | | 295,423,242 |
| Liabilities | | |
| Payable for fund shares redeemed | 1,029,287 | |
| Accrued management fee | 132,674 | |
| Other affiliated payables | 79,825 | |
| Other payables and accrued expenses | 50,652 | |
| Collateral on securities loaned | 6,864,688 | |
| Total liabilities | | 8,157,126 |
| Net Assets | | $287,266,116 |
| Net Assets consist of: | | |
| Paid in capital | | $901,508,843 |
| Undistributed net investment income | | 3,120,813 |
| Accumulated undistributed net realized gain (loss) on investments and foreign currency transactions | | (480,898,632) |
| Net unrealized appreciation (depreciation) on investments and assets and liabilities in foreign currencies | | (136,464,908) |
| Net Assets, for 12,958,207 shares outstanding | | $287,266,116 |
| Net Asset Value, offering price and redemption price per share ($287,266,116 ÷ 12,958,207 shares) | | $22.17 |
See accompanying notes which are an integral part of the financial statements.
Statement of Operations
| | | Six months ended August 31, 2017 (Unaudited) |
| Investment Income | | |
| Dividends | | $2,592,195 |
| Special dividends | | 5,815,250 |
| Income from Fidelity Central Funds (including $49,346 from security lending) | | 65,579 |
| Total income | | 8,473,024 |
| Expenses | | |
| Management fee | $900,159 | |
| Transfer agent fees | 435,079 | |
| Accounting and security lending fees | 65,978 | |
| Custodian fees and expenses | 10,304 | |
| Independent trustees' fees and expenses | 4,301 | |
| Registration fees | 29,701 | |
| Audit | 18,465 | |
| Legal | 3,403 | |
| Interest | 1,169 | |
| Miscellaneous | 2,630 | |
| Total expenses before reductions | 1,471,189 | |
| Expense reductions | (34,304) | 1,436,885 |
| Net investment income (loss) | | 7,036,139 |
| Realized and Unrealized Gain (Loss) | | |
| Net realized gain (loss) on: | | |
| Investment securities: | | |
| Unaffiliated issuers | (36,203,023) | |
| Fidelity Central Funds | (873) | |
| Foreign currency transactions | (18,213) | |
| Total net realized gain (loss) | | (36,222,109) |
| Change in net unrealized appreciation (depreciation) on: | | |
| Investment securities: | | |
| Unaffiliated issuers | (46,136,673) | |
| Fidelity Central Funds | (286) | |
| Assets and liabilities in foreign currencies | 3,245 | |
| Total change in net unrealized appreciation (depreciation) | | (46,133,714) |
| Net gain (loss) | | (82,355,823) |
| Net increase (decrease) in net assets resulting from operations | | $(75,319,684) |
See accompanying notes which are an integral part of the financial statements.
Statement of Changes in Net Assets
| | Six months ended August 31, 2017 (Unaudited) | Year ended February 28, 2017 |
| Increase (Decrease) in Net Assets | | |
| Operations | | |
| Net investment income (loss) | $7,036,139 | $2,134,122 |
| Net realized gain (loss) | (36,222,109) | (14,597,072) |
| Change in net unrealized appreciation (depreciation) | (46,133,714) | 159,311,552 |
| Net increase (decrease) in net assets resulting from operations | (75,319,684) | 146,848,602 |
| Distributions to shareholders from net investment income | – | (2,707,349) |
| Distributions to shareholders from net realized gain | (1,322,540) | (399,401) |
| Total distributions | (1,322,540) | (3,106,750) |
| Share transactions | | |
| Proceeds from sales of shares | 48,275,057 | 363,264,746 |
| Reinvestment of distributions | 1,248,166 | 2,868,753 |
| Cost of shares redeemed | (165,501,496) | (286,062,132) |
| Net increase (decrease) in net assets resulting from share transactions | (115,978,273) | 80,071,367 |
| Redemption fees | 7,505 | 75,698 |
| Total increase (decrease) in net assets | (192,612,992) | 223,888,917 |
| Net Assets | | |
| Beginning of period | 479,879,108 | 255,990,191 |
| End of period | $287,266,116 | $479,879,108 |
| Other Information | | |
| Undistributed net investment income end of period | $3,120,813 | $– |
| Distributions in excess of net investment income end of period | $– | $(3,915,326) |
| Shares | | |
| Sold | 2,016,755 | 13,555,828 |
| Issued in reinvestment of distributions | 45,454 | 106,018 |
| Redeemed | (6,391,961) | (10,729,732) |
| Net increase (decrease) | (4,329,752) | 2,932,114 |
See accompanying notes which are an integral part of the financial statements.
Financial Highlights — Natural Gas Portfolio
| | Six months ended (Unaudited) August 31, | Years ended February 28, | | | | |
| | 2017 | 2017 | 2016 A | 2015 | 2014 | 2013 |
| Selected Per–Share Data | | | | | | |
| Net asset value, beginning of period | $27.76 | $17.83 | $32.05 | $39.16 | $32.86 | $32.91 |
| Income from Investment Operations | | | | | | |
| Net investment income (loss)B | .53C | .13 | .33 | .34 | .35 | .30 |
| Net realized and unrealized gain (loss) | (6.02) | 9.98 | (14.16) | (7.03) | 6.61 | (.03)D |
| Total from investment operations | (5.49) | 10.11 | (13.83) | (6.69) | 6.96 | .27 |
| Distributions from net investment income | – | (.15) | (.39) | (.38) | (.33) | (.27) |
| Distributions from net realized gain | (.10) | (.03) | – | (.04) | (.32) | (.05) |
| Total distributions | (.10) | (.18) | (.39) | (.42) | (.66)E | (.32) |
| Redemption fees added to paid in capitalB,F | – | – | – | – | – | – |
| Net asset value, end of period | $22.17 | $27.76 | $17.83 | $32.05 | $39.16 | $32.86 |
| Total ReturnG,H | (19.85)% | 56.75% | (43.29)% | (17.15)% | 21.28% | .86%D |
| Ratios to Average Net AssetsI,J | | | | | | |
| Expenses before reductions | .89%K | .87% | .89% | .82% | .84% | .87% |
| Expenses net of fee waivers, if any | .89%K | .87% | .88% | .82% | .84% | .87% |
| Expenses net of all reductions | .87%K | .87% | .88% | .82% | .84% | .86% |
| Net investment income (loss) | 2.49%C,K | .50% | 1.24% | .84% | .98% | .96% |
| Supplemental Data | | | | | | |
| Net assets, end of period (000 omitted) | $287,266 | $479,879 | $255,990 | $530,285 | $840,514 | $650,073 |
| Portfolio turnover rateL | 90%K | 76% | 62% | 147%M | 135% | 107% |
A For the year ended February 29.
B Calculated based on average shares outstanding during the period.
C Net Investment income per share reflects a large, non-recurring dividend which amounted to $.44 per share. This dividend is not annualized in the ratio of net investment income (loss) to average net assets. Excluding this non-recurring dividend, the ratio of net investment income (loss) to average net assets would have been .74%.
D Net realized and unrealized gain (loss) per share reflects proceeds received from litigation which amounted to $.03 per share. Excluding these litigation proceeds, the total return would have been .75%.
E Total distributions of $.66 per share is comprised of distributions from net investment income of $.332 and distributions from net realized gain of $.324 per share.
F Amount represents less than $.005 per share.
G Total returns for periods of less than one year are not annualized.
H Total returns would have been lower if certain expenses had not been reduced during the applicable periods shown.
I Fees and expenses of any underlying Fidelity Central Funds are not included in the Fund's expense ratio. The Fund indirectly bears its proportionate share of the expenses of any underlying Fidelity Central Funds.
J Expense ratios reflect operating expenses of the Fund. Expenses before reductions do not reflect amounts reimbursed by the investment adviser or reductions from brokerage service arrangements or reductions from other expense offset arrangements and do not represent the amount paid by the Fund during periods when reimbursements or reductions occur. Expenses net of fee waivers reflect expenses after reimbursement by the investment adviser but prior to reductions from brokerage service arrangements or other expense offset arrangements. Expenses net of all reductions represent the net expenses paid by the Fund.
K Annualized
L Amount does not include the portfolio activity of any underlying Fidelity Central Funds.
M Portfolio turnover rate excludes securities received or delivered in-kind.
See accompanying notes which are an integral part of the financial statements.
Natural Resources Portfolio
Investment Summary (Unaudited)
Top Ten Stocks as of August 31, 2017
| | % of fund's net assets | % of fund's net assets 6 months ago |
| EOG Resources, Inc. | 7.2 | 6.0 |
| Diamondback Energy, Inc. | 5.2 | 3.5 |
| Halliburton Co. | 4.5 | 3.8 |
| Pioneer Natural Resources Co. | 4.2 | 3.5 |
| Chevron Corp. | 4.0 | 3.4 |
| Phillips 66 Co. | 3.4 | 1.9 |
| The Williams Companies, Inc. | 3.3 | 1.3 |
| Parsley Energy, Inc. Class A | 2.8 | 1.8 |
| RSP Permian, Inc. | 2.6 | 1.8 |
| Schlumberger Ltd. | 2.6 | 3.7 |
| | 39.8 | |
Top Industries (% of fund's net assets)
| As of August 31, 2017 |
| | Oil, Gas & Consumable Fuels | 70.1% |
| | Energy Equipment & Services | 14.2% |
| | Containers & Packaging | 6.3% |
| | Metals & Mining | 5.3% |
| | Chemicals | 2.2% |
| | All Others* | 1.9% |

* Includes Short-Term investments and Net Other Assets (Liabilities).
| As of February 28, 2017 |
| | Oil, Gas & Consumable Fuels | 69.0% |
| | Energy Equipment & Services | 18.3% |
| | Metals & Mining | 5.1% |
| | Containers & Packaging | 5.0% |
| | Chemicals | 1.2% |
| | All Others* | 1.4% |

* Includes Short-Term investments and Net Other Assets (Liabilities).
Natural Resources Portfolio
Investments August 31, 2017 (Unaudited)
Showing Percentage of Net Assets
| Common Stocks - 98.8% | | | |
| | | Shares | Value |
| Chemicals - 2.2% | | | |
| Commodity Chemicals - 2.2% | | | |
| LG Chemical Ltd. | | 6,054 | $2,040,913 |
| LyondellBasell Industries NV Class A | | 184,800 | 16,741,032 |
| | | | 18,781,945 |
| Containers & Packaging - 6.3% | | | |
| Metal & Glass Containers - 2.2% | | | |
| Ball Corp. | | 329,200 | 13,164,708 |
| Berry Global Group, Inc. (a) | | 96,000 | 5,399,040 |
| | | | 18,563,748 |
| Paper Packaging - 4.1% | | | |
| Graphic Packaging Holding Co. | | 423,800 | 5,530,590 |
| Packaging Corp. of America | | 125,300 | 14,084,973 |
| WestRock Co. | | 254,500 | 14,483,595 |
| | | | 34,099,158 |
|
| TOTAL CONTAINERS & PACKAGING | | | 52,662,906 |
|
| Energy Equipment & Services - 14.2% | | | |
| Oil & Gas Drilling - 1.5% | | | |
| Nabors Industries Ltd. | | 261,400 | 1,712,170 |
| Odfjell Drilling A/S (a) | | 590,700 | 1,812,162 |
| Shelf Drilling Ltd. | | 759,800 | 6,072,171 |
| Trinidad Drilling Ltd. (a) | | 856,400 | 1,145,296 |
| Xtreme Drilling & Coil Services Corp. (a) | | 1,059,900 | 1,697,538 |
| | | | 12,439,337 |
| Oil & Gas Equipment & Services - 12.7% | | | |
| Baker Hughes, a GE Co. Class A | | 439,400 | 14,895,660 |
| C&J Energy Services, Inc. | | 40,500 | 1,023,030 |
| Dril-Quip, Inc. (a) | | 113,925 | 4,277,884 |
| Frank's International NV (b) | | 264,100 | 1,658,548 |
| Halliburton Co. | | 965,100 | 37,609,947 |
| National Oilwell Varco, Inc. | | 209,400 | 6,422,298 |
| NCS Multistage Holdings, Inc. | | 122,500 | 2,420,600 |
| Newpark Resources, Inc. (a) | | 790,200 | 6,361,110 |
| Oceaneering International, Inc. | | 187,200 | 4,221,360 |
| RigNet, Inc. (a) | | 216,596 | 3,465,536 |
| Schlumberger Ltd. | | 340,465 | 21,622,932 |
| Smart Sand, Inc. | | 117,300 | 700,281 |
| Tesco Corp. (a) | | 139,000 | 611,600 |
| TETRA Technologies, Inc. (a) | | 408,600 | 841,716 |
| Total Energy Services, Inc. | | 100,600 | 982,839 |
| | | | 107,115,341 |
|
| TOTAL ENERGY EQUIPMENT & SERVICES | | | 119,554,678 |
|
| Gas Utilities - 0.4% | | | |
| Gas Utilities - 0.4% | | | |
| Indraprastha Gas Ltd. | | 188,519 | 3,761,239 |
| Independent Power and Renewable Electricity Producers - 0.1% | | | |
| Renewable Electricity - 0.1% | | | |
| NextEra Energy Partners LP | | 20,700 | 858,222 |
| Machinery - 0.2% | | | |
| Industrial Machinery - 0.2% | | | |
| ProPetro Holding Corp. | | 108,200 | 1,245,382 |
| Metals & Mining - 5.3% | | | |
| Gold - 3.8% | | | |
| B2Gold Corp. (a) | | 999,000 | 2,744,000 |
| Franco-Nevada Corp. | | 24,200 | 1,979,797 |
| New Gold, Inc. (a) | | 2,414,800 | 9,030,724 |
| Randgold Resources Ltd. sponsored ADR (b) | | 141,973 | 14,550,813 |
| Tahoe Resources, Inc. | | 876,900 | 4,185,244 |
| | | | 32,490,578 |
| Silver - 1.5% | | | |
| Wheaton Precious Metals Corp. | | 599,200 | 12,447,045 |
|
| TOTAL METALS & MINING | | | 44,937,623 |
|
| Oil, Gas & Consumable Fuels - 70.1% | | | |
| Integrated Oil & Gas - 8.0% | | | |
| Chevron Corp. | | 315,300 | 33,932,586 |
| Occidental Petroleum Corp. | | 213,800 | 12,763,860 |
| Suncor Energy, Inc. | | 667,800 | 20,925,737 |
| | | | 67,622,183 |
| Oil & Gas Exploration & Production - 45.3% | | | |
| Anadarko Petroleum Corp. | | 262,900 | 10,760,497 |
| Cabot Oil & Gas Corp. | | 554,700 | 14,172,585 |
| Callon Petroleum Co. (a) | | 1,179,000 | 12,214,440 |
| Centennial Resource Development, Inc.: | | | |
| Class A | | 38,300 | 662,207 |
| Class A (b) | | 338,800 | 5,857,852 |
| Cimarex Energy Co. | | 211,400 | 21,074,466 |
| Concho Resources, Inc. (a) | | 170,500 | 18,920,385 |
| Continental Resources, Inc. (a)(b) | | 508,600 | 17,251,712 |
| Devon Energy Corp. | | 554,500 | 17,411,300 |
| Diamondback Energy, Inc. (a) | | 486,400 | 44,160,256 |
| Encana Corp. | | 1,666,600 | 15,548,260 |
| EOG Resources, Inc. | | 712,600 | 60,563,875 |
| Extraction Oil & Gas, Inc. (b) | | 421,256 | 5,535,304 |
| Jagged Peak Energy, Inc. (b) | | 65,000 | 832,650 |
| Marathon Oil Corp. | | 174,700 | 1,942,664 |
| Matador Resources Co. (a)(b) | | 197,700 | 4,661,766 |
| Murphy Oil Corp. | | 67,700 | 1,534,082 |
| Newfield Exploration Co. (a) | | 535,900 | 14,003,067 |
| Parsley Energy, Inc. Class A (a) | | 943,900 | 23,644,695 |
| PDC Energy, Inc. (a) | | 135,300 | 5,321,349 |
| Pioneer Natural Resources Co. | | 275,000 | 35,653,750 |
| PrairieSky Royalty Ltd. | | 8,038 | 188,857 |
| Range Resources Corp. | | 80,800 | 1,402,688 |
| Resolute Energy Corp. (a)(b) | | 112,757 | 3,331,969 |
| Ring Energy, Inc. (a) | | 246,000 | 2,932,320 |
| RSP Permian, Inc. (a) | | 693,800 | 21,771,444 |
| Seven Generations Energy Ltd. (a) | | 384,400 | 5,851,807 |
| Viper Energy Partners LP | | 330,500 | 5,585,450 |
| WPX Energy, Inc. (a) | | 894,400 | 8,935,056 |
| | | | 381,726,753 |
| Oil & Gas Refining & Marketing - 8.1% | | | |
| Andeavor | | 121,800 | 12,198,270 |
| Bharat Petroleum Corp. Ltd. | | 530,985 | 4,393,385 |
| Delek U.S. Holdings, Inc. | | 679,504 | 16,797,339 |
| Phillips 66 Co. | | 346,416 | 29,033,125 |
| Reliance Industries Ltd. | | 223,643 | 5,577,520 |
| | | | 67,999,639 |
| Oil & Gas Storage & Transport - 8.7% | | | |
| Cheniere Energy, Inc. (a) | | 259,400 | 11,099,726 |
| Enterprise Products Partners LP | | 521,400 | 13,592,898 |
| GasLog Partners LP | | 93,200 | 2,115,640 |
| Gener8 Maritime, Inc. (a) | | 1,176,326 | 5,293,467 |
| Golar LNG Ltd. (b) | | 185,400 | 4,019,472 |
| Noble Midstream Partners LP | | 139,437 | 6,716,680 |
| Noble Midstream Partners LP (c) | | 43,718 | 2,000,601 |
| Teekay LNG Partners LP | | 50,500 | 858,500 |
| The Williams Companies, Inc. | | 930,900 | 27,675,657 |
| | | | 73,372,641 |
|
| TOTAL OIL, GAS & CONSUMABLE FUELS | | | 590,721,216 |
|
| TOTAL COMMON STOCKS | | | |
| (Cost $849,511,385) | | | 832,523,211 |
|
| Money Market Funds - 5.7% | | | |
| Fidelity Cash Central Fund, 1.11% (d) | | 10,583,954 | 10,586,071 |
| Fidelity Securities Lending Cash Central Fund 1.11% (d)(e) | | 37,432,310 | 37,436,053 |
| TOTAL MONEY MARKET FUNDS | | | |
| (Cost $48,020,087) | | | 48,022,124 |
| TOTAL INVESTMENT IN SECURITIES - 104.5% | | | |
| (Cost $897,531,472) | | | 880,545,335 |
| NET OTHER ASSETS (LIABILITIES) - (4.5)% | | | (37,992,669) |
| NET ASSETS - 100% | | | $842,552,666 |
Legend
(a) Non-income producing
(b) Security or a portion of the security is on loan at period end.
(c) Restricted securities - Investment in securities not registered under the Securities Act of 1933 (excluding 144A issues). At the end of the period, the value of restricted securities (excluding 144A issues) amounted to $2,000,601 or 0.2% of net assets.
(d) Affiliated fund that is generally available only to investment companies and other accounts managed by Fidelity Investments. The rate quoted is the annualized seven-day yield of the fund at period end. A complete unaudited listing of the fund's holdings as of its most recent quarter end is available upon request. In addition, each Fidelity Central Fund's financial statements are available on the SEC's website or upon request.
(e) Investment made with cash collateral received from securities on loan.
Additional information on each restricted holding is as follows:
| Security | Acquisition Date | Acquisition Cost |
| Noble Midstream Partners LP | 6/21/17 | $1,768,393 |
Affiliated Central Funds
Information regarding fiscal year to date income earned by the Fund from investments in Fidelity Central Funds is as follows:
| Fund | Income earned |
| Fidelity Cash Central Fund | $46,664 |
| Fidelity Securities Lending Cash Central Fund | 104,099 |
| Total | $150,763 |
Investment Valuation
The following is a summary of the inputs used, as of August 31, 2017, involving the Fund's assets and liabilities carried at fair value. The inputs or methodology used for valuing securities may not be an indication of the risk associated with investing in those securities. For more information on valuation inputs, and their aggregation into the levels used below, please refer to the Investment Valuation section in the accompanying Notes to Financial Statements.
| | Valuation Inputs at Reporting Date: |
| Description | Total | Level 1 | Level 2 | Level 3 |
| Investments in Securities: | | | | |
| Common Stocks | $832,523,211 | $830,522,610 | $2,000,601 | $-- |
| Money Market Funds | 48,022,124 | 48,022,124 | -- | -- |
| Total Investments in Securities: | $880,545,335 | $878,544,734 | $2,000,601 | $-- |
Other Information
Distribution of investments by country or territory of incorporation, as a percentage of Total Net Assets, is as follows (Unaudited):
| United States of America | 79.9% |
| Canada | 9.2% |
| Curacao | 2.6% |
| Netherlands | 2.2% |
| Bailiwick of Jersey | 1.7% |
| India | 1.6% |
| Marshall Islands | 1.0% |
| Others (Individually Less Than 1%) | 1.8% |
| | 100.0% |
See accompanying notes which are an integral part of the financial statements.
Natural Resources Portfolio
Financial Statements
Statement of Assets and Liabilities
| | | August 31, 2017 (Unaudited) |
| Assets | | |
Investment in securities, at value (including securities loaned of $37,439,433) — See accompanying schedule:
Unaffiliated issuers (cost $849,511,385) | $832,523,211 | |
| Fidelity Central Funds (cost $48,020,087) | 48,022,124 | |
| Total Investment in Securities (cost $897,531,472) | | $880,545,335 |
| Receivable for fund shares sold | | 631,880 |
| Dividends receivable | | 1,080,323 |
| Distributions receivable from Fidelity Central Funds | | 26,409 |
| Other receivables | | 75,234 |
| Total assets | | 882,359,181 |
| Liabilities | | |
| Payable for investments purchased | $6,178 | |
| Payable for fund shares redeemed | 1,322,137 | |
| Accrued management fee | 374,661 | |
| Other affiliated payables | 184,669 | |
| Other payables and accrued expenses | 488,970 | |
| Collateral on securities loaned | 37,429,900 | |
| Total liabilities | | 39,806,515 |
| Net Assets | | $842,552,666 |
| Net Assets consist of: | | |
| Paid in capital | | $1,033,988,001 |
| Undistributed net investment income | | 11,774,655 |
| Accumulated undistributed net realized gain (loss) on investments and foreign currency transactions | | (185,802,741) |
| Net unrealized appreciation (depreciation) on investments and assets and liabilities in foreign currencies | | (17,407,249) |
| Net Assets, for 33,280,059 shares outstanding | | $842,552,666 |
| Net Asset Value, offering price and redemption price per share ($842,552,666 ÷ 33,280,059 shares) | | $25.32 |
See accompanying notes which are an integral part of the financial statements.
Statement of Operations
| | | Six months ended August 31, 2017 (Unaudited) |
| Investment Income | | |
| Dividends | | $5,733,770 |
| Special dividends | | 10,141,250 |
| Income from Fidelity Central Funds (including $104,099 from security lending) | | 150,763 |
| Total income | | 16,025,783 |
| Expenses | | |
| Management fee | $2,325,975 | |
| Transfer agent fees | 984,895 | |
| Accounting and security lending fees | 149,643 | |
| Custodian fees and expenses | 18,919 | |
| Independent trustees' fees and expenses | 10,064 | |
| Registration fees | 23,606 | |
| Audit | 27,056 | |
| Legal | 8,018 | |
| Miscellaneous | 5,954 | |
| Total expenses before reductions | 3,554,130 | |
| Expense reductions | (75,688) | 3,478,442 |
| Net investment income (loss) | | 12,547,341 |
| Realized and Unrealized Gain (Loss) | | |
| Net realized gain (loss) on: | | |
| Investment securities: | | |
| Unaffiliated issuers | (4,683,480) | |
| Fidelity Central Funds | (112) | |
| Foreign currency transactions | (8,521) | |
| Total net realized gain (loss) | | (4,692,113) |
| Change in net unrealized appreciation (depreciation) on: | | |
| Unaffiliated issuers (net of increase in deferred foreign taxes of $357,818) | (127,463,702) | |
| Fidelity Central Funds | (3,124) | |
| Assets and liabilities in foreign currencies | 775 | |
| Total change in net unrealized appreciation (depreciation) | | (127,466,051) |
| Net gain (loss) | | (132,158,164) |
| Net increase (decrease) in net assets resulting from operations | | $(119,610,823) |
See accompanying notes which are an integral part of the financial statements.
Statement of Changes in Net Assets
| | Six months ended August 31, 2017 (Unaudited) | Year ended February 28, 2017 |
| Increase (Decrease) in Net Assets | | |
| Operations | | |
| Net investment income (loss) | $12,547,341 | $2,893,695 |
| Net realized gain (loss) | (4,692,113) | 18,115,373 |
| Change in net unrealized appreciation (depreciation) | (127,466,051) | 176,626,416 |
| Net increase (decrease) in net assets resulting from operations | (119,610,823) | 197,635,484 |
| Distributions to shareholders from net investment income | – | (3,359,511) |
| Distributions to shareholders from net realized gain | (719,107) | (2,074,553) |
| Total distributions | (719,107) | (5,434,064) |
| Share transactions | | |
| Proceeds from sales of shares | 162,892,107 | 495,662,532 |
| Reinvestment of distributions | 694,195 | 5,196,216 |
| Cost of shares redeemed | (112,802,418) | (243,885,913) |
| Net increase (decrease) in net assets resulting from share transactions | 50,783,884 | 256,972,835 |
| Redemption fees | 9,116 | 46,019 |
| Total increase (decrease) in net assets | (69,536,930) | 449,220,274 |
| Net Assets | | |
| Beginning of period | 912,089,596 | 462,869,322 |
| End of period | $842,552,666 | $912,089,596 |
| Other Information | | |
| Undistributed net investment income end of period | $11,774,655 | $– |
| Distributions in excess of net investment income end of period | $– | $(772,686) |
| Shares | | |
| Sold | 6,084,801 | 18,462,591 |
| Issued in reinvestment of distributions | 23,979 | 185,868 |
| Redeemed | (4,144,663) | (8,562,319) |
| Net increase (decrease) | 1,964,117 | 10,086,140 |
See accompanying notes which are an integral part of the financial statements.
Financial Highlights — Natural Resources Portfolio
| | Six months ended (Unaudited) August 31, | Years ended February 28, | | | | |
| | 2017 | 2017 | 2016 A | 2015 | 2014 | 2013 |
| Selected Per–Share Data | | | | | | |
| Net asset value, beginning of period | $29.13 | $21.80 | $31.49 | $37.85 | $34.10 | $35.36 |
| Income from Investment Operations | | | | | | |
| Net investment income (loss)B | .40C | .10 | .18 | .21 | .20 | .28 |
| Net realized and unrealized gain (loss) | (4.19) | 7.42 | (9.69) | (4.55) | 4.52 | (1.45) |
| Total from investment operations | (3.79) | 7.52 | (9.51) | (4.34) | 4.72 | (1.17) |
| Distributions from net investment income | – | (.11) | (.18) | (.15) | (.10) | (.09) |
| Distributions from net realized gain | (.02) | (.08) | – | (1.87) | (.88) | – |
| Total distributions | (.02) | (.19) | (.18) | (2.02) | (.97)D | (.09) |
| Redemption fees added to paid in capitalB,E | – | – | – | – | – | – |
| Net asset value, end of period | $25.32 | $29.13 | $21.80 | $31.49 | $37.85 | $34.10 |
| Total ReturnF,G | (13.01)% | 34.54% | (30.22)% | (11.45)% | 13.97% | (3.30)% |
| Ratios to Average Net AssetsH,I | | | | | | |
| Expenses before reductions | .83%J | .84% | .86% | .82% | .84% | .86% |
| Expenses net of fee waivers, if any | .83%J | .84% | .86% | .82% | .84% | .85% |
| Expenses net of all reductions | .81%J | .83% | .85% | .82% | .83% | .84% |
| Net investment income (loss) | 1.75%C,J | .35% | .66% | .55% | .54% | .89% |
| Supplemental Data | | | | | | |
| Net assets, end of period (000 omitted) | $842,553 | $912,090 | $462,869 | $761,078 | $949,394 | $1,054,528 |
| Portfolio turnover rateK | 84%J | 84% | 78% | 87% | 99% | 76% |
A For the year ended February 29.
B Calculated based on average shares outstanding during the period.
C Net Investment income per share reflects a large, non-recurring dividend which amounted to $.32 per share. This dividend is not annualized in the ratio of net investment income (loss) to average net assets. Excluding this non-recurring dividend, the ratio of net investment income (loss) to average net assets would have been .56%.
D Total distributions of $.97 per share is comprised of distributions from net investment income of $.095 and distributions from net realized gain of $.877 per share.
E Amount represents less than $.005 per share.
F Total returns for periods of less than one year are not annualized.
G Total returns would have been lower if certain expenses had not been reduced during the applicable periods shown.
H Fees and expenses of any underlying Fidelity Central Funds are not included in the Fund's expense ratio. The Fund indirectly bears its proportionate share of the expenses of any underlying Fidelity Central Funds.
I Expense ratios reflect operating expenses of the Fund. Expenses before reductions do not reflect amounts reimbursed by the investment adviser or reductions from brokerage service arrangements or reductions from other expense offset arrangements and do not represent the amount paid by the Fund during periods when reimbursements or reductions occur. Expenses net of fee waivers reflect expenses after reimbursement by the investment adviser but prior to reductions from brokerage service arrangements or other expense offset arrangements. Expenses net of all reductions represent the net expenses paid by the Fund.
J Annualized
K Amount does not include the portfolio activity of any underlying Fidelity Central Funds.
See accompanying notes which are an integral part of the financial statements.
Notes to Financial Statements (Unaudited)
For the period ended August 31, 2017
1. Organization.
Energy Portfolio, Energy Service Portfolio, Natural Gas Portfolio, and Natural Resources Portfolio (the Funds) are funds of Fidelity Select Portfolios (the Trust). Energy Portfolio, Energy Service Portfolio and Natural Gas Portfolio are non-diversified funds. The Trust is registered under the Investment Company Act of 1940, as amended (the 1940 Act), as an open-end management investment company organized as a Massachusetts business trust. The Funds invest primarily in securities of companies whose principal business activities fall within specific industries. Each Fund is authorized to issue an unlimited number of shares. Share transactions on the Statement of Changes in Net Assets may contain exchanges between affiliated funds. The Natural Resources Portfolio may also invest in certain precious metals. Certain Funds investments in emerging markets can be subject to social, economic, regulatory, and political uncertainties and can be extremely volatile.
2. Investments in Fidelity Central Funds.
The Funds invest in Fidelity Central Funds, which are open-end investment companies generally available only to other investment companies and accounts managed by the investment adviser and its affiliates. The Funds' Schedules of Investments list each of the Fidelity Central Funds held as of period end, if any, as an investment of each Fund, but do not include the underlying holdings of each Fidelity Central Fund. As an Investing Fund, each Fund indirectly bears its proportionate share of the expenses of the underlying Fidelity Central Funds.
The Money Market Central Funds seek preservation of capital and current income and are managed by Fidelity Investments Money Management, Inc. (FIMM), an affiliate of the investment adviser. Annualized expenses of the Money Market Central Funds as of their most recent shareholder report date are less than .005%.
A complete unaudited list of holdings for each Fidelity Central Fund is available upon request or at the Securities and Exchange Commission (the SEC) website at www.sec.gov. In addition, the financial statements of the Fidelity Central Funds are available on the SEC website or upon request.
3. Significant Accounting Policies.
Each Fund is an investment company and applies the accounting and reporting guidance of the Financial Accounting Standards Board (FASB) Accounting Standards Codification Topic 946 Financial Services – Investments Companies. The financial statements have been prepared in conformity with accounting principles generally accepted in the United States of America (GAAP), which require management to make certain estimates and assumptions at the date of the financial statements. Actual results could differ from those estimates. Subsequent events, if any, through the date that the financial statements were issued have been evaluated in the preparation of the financial statements. The following summarizes the significant accounting policies of the Funds:
Investment Valuation. Investments are valued as of 4:00 p.m. Eastern time on the last calendar day of the period. The Board of Trustees (the Board) has delegated the day to day responsibility for the valuation of each Fund's investments to the Fair Value Committee (the Committee) established by each Fund's investment adviser. In accordance with valuation policies and procedures approved by the Board, each Fund attempts to obtain prices from one or more third party pricing vendors or brokers to value its investments. When current market prices, quotations or currency exchange rates are not readily available or reliable, investments will be fair valued in good faith by the Committee, in accordance with procedures adopted by the Board. Factors used in determining fair value vary by investment type and may include market or investment specific events. The frequency with which these procedures are used cannot be predicted and they may be utilized to a significant extent. The Committee oversees each Fund's valuation policies and procedures and reports to the Board on the Committee's activities and fair value determinations. The Board monitors the appropriateness of the procedures used in valuing each Fund's investments and ratifies the fair value determinations of the Committee.
Each Fund categorizes the inputs to valuation techniques used to value its investments into a disclosure hierarchy consisting of three levels as shown below:
- Level 1 – quoted prices in active markets for identical investments
- Level 2 – other significant observable inputs (including quoted prices for similar investments, interest rates, prepayment speeds, etc.)
- Level 3 – unobservable inputs (including the Fund's own assumptions based on the best information available)
Valuation techniques used to value each Fund's investments by major category are as follows:
Equity securities, including restricted securities, for which market quotations are readily available, are valued at the last reported sale price or official closing price as reported by a third party pricing vendor on the primary market or exchange on which they are traded and are categorized as Level 1 in the hierarchy. In the event there were no sales during the day or closing prices are not available, securities are valued at the last quoted bid price or may be valued using the last available price and are generally categorized as Level 2 in the hierarchy. For foreign equity securities, when market or security specific events arise, comparisons to the valuation of American Depositary Receipts (ADRs), futures contracts, Exchange-Traded Funds (ETFs) and certain indexes as well as quoted prices for similar securities may be used and would be categorized as Level 2 in the hierarchy. Utilizing these techniques may result in transfers between Level 1 and Level 2. For equity securities, including restricted securities, where observable inputs are limited, assumptions about market activity and risk are used and these securities may be categorized as Level 3 in the hierarchy.
Investments in open-end mutual funds, including the Fidelity Central Funds, are valued at their closing net asset value (NAV) each business day and are categorized as Level 1 in the hierarchy.
Changes in valuation techniques may result in transfers in or out of an assigned level within the disclosure hierarchy. The aggregate value of investments by input level as of August 31, 2017 is included at the end of each Fund's Schedule of Investments.
Foreign Currency. The Funds may use foreign currency contracts to facilitate transactions in foreign-denominated securities. Gains and losses from these transactions may arise from changes in the value of the foreign currency or if the counterparties do not perform under the contracts' terms.
Foreign-denominated assets, including investment securities, and liabilities are translated into U.S. dollars at the exchange rates at period end. Purchases and sales of investment securities, income and dividends received and expenses denominated in foreign currencies are translated into U.S. dollars at the exchange rate in effect on the transaction date.
The effects of exchange rate fluctuations on investments are included with the net realized and unrealized gain (loss) on investment securities. Other foreign currency transactions resulting in realized and unrealized gain (loss) are disclosed separately.
Investment Transactions and Income. For financial reporting purposes, the Funds' investment holdings and NAV include trades executed through the end of the last business day of the period. The NAV per share for processing shareholder transactions is calculated as of the close of business of the New York Stock Exchange (NYSE), normally 4:00 p.m. Eastern time and includes trades executed through the end of the prior business day. Gains and losses on securities sold are determined on the basis of identified cost and may include proceeds received from litigation. Dividend income is recorded on the ex-dividend date, except for certain dividends from foreign securities where the ex-dividend date may have passed, which are recorded as soon as the Funds are informed of the ex-dividend date. Non-cash dividends included in dividend income, if any, are recorded at the fair market value of the securities received. Income and capital gain distributions from Fidelity Central Funds, if any, are recorded on the ex-dividend date. Certain distributions received by the Funds represent a return of capital or capital gain. The Funds determine the components of these distributions subsequent to the ex-dividend date, based upon receipt of tax filings or other correspondence relating to the underlying investment. These distributions are recorded as a reduction of cost of investments and/or as a realized gain. Large, non-recurring dividends recognized by the Funds are presented separately on the Statement of Operations as "Special Dividends" and the impact of these dividends is presented in the Financial Highlights. Investment income is recorded net of foreign taxes withheld where recovery of such taxes is uncertain.
Expenses. Expenses directly attributable to a fund are charged to that fund. Expenses attributable to more than one fund are allocated among the respective funds on the basis of relative net assets or other appropriate methods. Expense estimates are accrued in the period to which they relate and adjustments are made when actual amounts are known.
Deferred Trustee Compensation. Under a Deferred Compensation Plan (the Plan) for the Funds, independent Trustees may elect to defer receipt of a portion of their annual compensation. Deferred amounts are invested in a cross-section of Fidelity funds, are marked-to-market and remain in the Fund until distributed in accordance with the Plan. The investment of deferred amounts and the offsetting payable to the Trustees are included in the accompanying Statement of Assets and Liabilities.
Income Tax Information and Distributions to Shareholders. Each year, each Fund intends to qualify as a regulated investment company under Subchapter M of the Internal Revenue Code, including distributing substantially all of its taxable income and realized gains. As a result, no provision for U.S. Federal income taxes is required. Each Fund files a U.S. federal tax return, in addition to state and local tax returns as required. Each Fund's federal income tax returns are subject to examination by the Internal Revenue Service (IRS) for a period of three fiscal years after they are filed. State and local tax returns may be subject to examination for an additional fiscal year depending on the jurisdiction. Foreign taxes are provided for based on each Fund's understanding of the tax rules and rates that exist in the foreign markets in which it invests. An estimated deferred tax liability for net unrealized appreciation on the applicable securities is included in Other payables and accrued expenses on each applicable Fund's Statement of Assets & Liabilities.
Distributions are declared and recorded on the ex-dividend date. Income and capital gain distributions are determined in accordance with income tax regulations, which may differ from GAAP.
Capital accounts within the financial statements are adjusted for permanent book-tax differences. These adjustments have no impact on net assets or the results of operations. Capital accounts are not adjusted for temporary book-tax differences which will reverse in a subsequent period.
Book-tax differences are primarily due to foreign currency transactions, passive foreign investment companies (PFIC), partnerships, deferred trustees compensation, redemptions in-kind, capital loss carryforwards, and losses deferred due to wash sales and excise tax regulations.
As of period end, the cost and unrealized appreciation (depreciation) in securities, and derivatives if applicable, for federal income tax purposes were as follows for each Fund:
| | Tax cost | Gross unrealized appreciation | Gross unrealized depreciation | Net unrealized appreciation (depreciation) |
| Energy Portfolio | $1,815,314,402 | $193,576,934 | $(199,863,509) | $(6,286,575) |
| Energy Service Portfolio | 617,889,178 | 48,390,958 | (184,295,353) | (135,904,395) |
| Natural Gas Portfolio | 434,536,740 | 4,787,795 | (144,757,380) | (139,969,585) |
| Natural Resources Portfolio | 903,335,401 | 83,197,418 | (105,987,484) | (22,790,066) |
Capital loss carryforwards are only available to offset future capital gains of the Funds to the extent provided by regulations and may be limited. Under the Regulated Investment Company Modernization Act of 2010 (the Act), the Funds are permitted to carry forward capital losses incurred in taxable years beginning after December 22, 2010 for an unlimited period and such capital losses are required to be used prior to any losses that expire. The capital loss carryforward information presented below, including any applicable limitation, is estimated as of prior fiscal period end and is subject to adjustment.
| | Fiscal year of expiration | | |
| | 2018 | 2019 | Total with expiration |
| Natural Gas Portfolio | $(60,545,261) | $(215,752,708) | $(276,297,969) |
| | No expiration | | | |
| | Short-term | Long-term | Total no expiration | Total capital loss carryforward |
| Energy Portfolio | $(184,858,560) | $(144,954,023) | $(329,812,583) | $(329,812,583) |
| Energy Service Portfolio | -– | (28,813,113) | (28,813,113) | (28,813,113) |
| Natural Gas Portfolio | (48,906,799) | (120,503,170) | (169,409,969) | (445,707,938) |
| Natural Resources Portfolio | (70,283,311) | (103,693,036) | (173,976,347) | (173,976,347) |
At the prior fiscal period end, the Energy Services Portfolio elected to defer to the next fiscal year $35,306 of ordinary losses recognized during the period January 1, 2017 to February 28, 2017.
Trading (Redemption) Fees. Shares held by investors in the Energy Service Portfolio, Natural Gas Portfolio, and Natural Resources Portfolio less than 30 days may be subject to a redemption fee equal to .75% of the NAV of shares redeemed. All redemption fees, which reduce the proceeds of the shareholder redemption, are retained by the Funds and accounted for as an addition to paid in capital.
Restricted Securities. The Funds may invest in securities that are subject to legal or contractual restrictions on resale. These securities generally may be resold in transactions exempt from registration or to the public if the securities are registered. Disposal of these securities may involve time-consuming negotiations and expense, and prompt sale at an acceptable price may be difficult. Information regarding restricted securities is included at the end of each applicable Fund's Schedule of Investments.
4. Purchases and Sales of Investments.
Purchases and sales of securities, other than short-term securities, are noted in the table below.
| | Purchases ($) | Sales ($) |
| Energy Portfolio | 829,898,961 | 984,104,583 |
| Energy Service Portfolio | 149,407,802 | 245,991,107 |
| Natural Gas Portfolio | 152,422,485 | 263,193,827 |
| Natural Resources Portfolio | 417,108,631 | 359,167,596 |
5. Fees and Other Transactions with Affiliates.
Management Fee. Fidelity SelectCo, LLC (the investment adviser) and its affiliates provide the Funds with investment management related services for which the Funds pay a monthly management fee. The management fee is the sum of an individual fund fee rate and an annualized group fee rate. The individual fund fee rate is applied to each Fund's average net assets. The group fee rate is based upon the average net assets of all the mutual funds advised by Fidelity Management & Research Company (FMR) and the investment adviser. The group fee rate decreases as assets under management increase and increases as assets under management decrease. For the reporting period, each Fund's annualized management fee rate expressed as a percentage of each Fund's average net assets was as follows:
| | Individual Rate | Group Rate | Total |
| Energy Portfolio | .30% | .25% | .55% |
| Energy Service Portfolio | .30% | .25% | .55% |
| Natural Gas Portfolio | .30% | .25% | .54% |
| Natural Resources Portfolio | .30% | .25% | .54% |
Transfer Agent Fees. Fidelity Investments Institutional Operations Company, Inc. (FIIOC), an affiliate of the investment adviser, is the Funds' transfer, dividend disbursing and shareholder servicing agent. FIIOC receives account fees and asset-based fees that vary according to account size and type of account. FIIOC pays for typesetting, printing and mailing of shareholder reports, except proxy statements. For the period, transfer agent fees were equivalent to the following annualized rates expressed as a percentage of average net assets:
| Energy Portfolio | .21% |
| Energy Service Portfolio | .22% |
| Natural Gas Portfolio | .26% |
| Natural Resources Portfolio | .23% |
Accounting and Security Lending Fees. Fidelity Service Company, Inc. (FSC), an affiliate of the investment adviser, maintains each Fund's accounting records. The accounting fee is based on the level of average net assets for each month. Under a separate contract, FSC administers the security lending program. The security lending fee is based on the number and duration of lending transactions.
Brokerage Commissions. Certain Funds placed a portion of their portfolio transactions with brokerage firms which are affiliates of the investment adviser. Brokerage commissions are included in net realized gain (loss) and change in net unrealized appreciation (depreciation) in the Statement of Operations. The commissions paid to these affiliated firms were as follows:
| | | | Amount |
| Energy Portfolio | | | $32,466 |
| Energy Service Portfolio | | | 11,091 |
| Natural Gas Portfolio | | | 17,262 |
| Natural Resources Portfolio | | | 14,960 |
Interfund Lending Program. Pursuant to an Exemptive Order issued by the SEC, the Funds, along with other registered investment companies having management contracts with Fidelity Management & Research Company (FMR) or other affiliated entities of FMR, may participate in an interfund lending program. This program provides an alternative credit facility allowing the funds to borrow from, or lend money to, other participating affiliated funds. At period end, there were no interfund loans outstanding. Each applicable fund's activity in this program during the period for which loans were outstanding was as follows:
| | Borrower or Lender | Average Loan Balance | Weighted Average Interest Rate | Interest Expense |
| Energy Portfolio | Borrower | $5,278,833 | .83% | $731 |
| Energy Service Portfolio | Borrower | 7,018,222 | .86% | 3,017 |
| Natural Gas Portfolio | Borrower | 5,457,375 | .96% | 1,169 |
Interfund Trades. The Funds may purchase from or sell securities to other Fidelity Funds under procedures adopted by the Board. The procedures have been designed to ensure these interfund trades are executed in accordance with Rule 17a-7 of the 1940 Act. Interfund trades are included within the respective purchases and sales amounts shown in the Purchases and Sales of Investments note.
Prior Fiscal Year Redemptions In-Kind. During the prior period, 3,526,343 shares of Energy Portfolio held by an affiliated entity were redeemed in-kind for investments and cash with a value of $146,061,109. The Fund had a net realized gain of $45,915,372 on investments delivered through in-kind redemptions. The amount of in-kind redemptions is included in share transactions in the accompanying Statement of Changes in Net Assets. Energy Portfolio recognized no gain or loss for federal income tax purposes.
6. Committed Line of Credit.
Certain Funds participate with other funds managed by the investment adviser or an affiliate in a $4.25 billion credit facility (the "line of credit") to be utilized for temporary or emergency purposes to fund shareholder redemptions or for other short-term liquidity purposes. The participating funds have agreed to pay commitment fees on their pro-rata portion of the line of credit, which are reflected in Miscellaneous expenses on the Statement of Operations, and are as follows:
| | Amount |
| Energy Portfolio | $3,674 |
| Energy Service Portfolio | 1,097 |
| Natural Gas Portfolio | 728 |
| Natural Resources Portfolio | 1,489 |
During the period, the Funds did not borrow on this line of credit.
7. Security Lending.
Certain Funds lend portfolio securities through a lending agent from time to time in order to earn additional income. On the settlement date of the loan, each applicable Fund receives collateral (in the form of U.S. Treasury obligations, letters of credit and/or cash) against the loaned securities and maintains collateral in an amount not less than 100% of the market value of the loaned securities during the period of the loan. The market value of the loaned securities is determined at the close of business of the Funds and any additional required collateral is delivered to the Funds on the next business day. The Funds or borrower may terminate the loan at any time, and if the borrower defaults on its obligation to return the securities loaned because of insolvency or other reasons, the Funds may apply collateral received from the borrower against the obligation. The Funds may experience delays and costs in recovering the securities loaned. Any cash collateral received is invested in the Fidelity Securities Lending Cash Central Fund. The value of loaned securities and cash collateral at period end are disclosed on each applicable Fund's Statement of Assets and Liabilities. Security lending income represents the income earned on investing cash collateral, less rebates paid to borrowers and any lending agent fees associated with the loan, plus any premium payments received for lending certain types of securities. Security lending income is presented on each applicable Fund's Statement of Operations as a component of income from Fidelity Central Funds.
8. Expense Reductions.
Commissions paid to certain brokers with whom the investment adviser, or its affiliates, places trades on behalf of Certain Funds include an amount in addition to trade execution, which may be rebated back to the Funds to offset certain expenses. In addition, through arrangements with each applicable Fund's custodian, credits realized as a result of certain uninvested cash balances were used to reduce each applicable Fund's expenses. All of the applicable expense reductions are noted in the table below.
| | Brokerage Service reduction |
| Energy Portfolio | $169,050 |
| Energy Service Portfolio | 75,875 |
| Natural Gas Portfolio | 31,605 |
| Natural Resources Portfolio | 70,780 |
In addition, during the period the investment adviser reimbursed and/or waived a portion of operating expenses as follows:
| | Amount |
| Energy Portfolio | $12,962 |
| Energy Service Portfolio | 3,184 |
| Natural Gas Portfolio | 2,699 |
| Natural Resources Portfolio | 4,908 |
9. Other.
The Funds' organizational documents provide former and current trustees and officers with a limited indemnification against liabilities arising in connection with the performance of their duties to the Funds. In the normal course of business, the Funds may also enter into contracts that provide general indemnifications. The Funds' maximum exposure under these arrangements is unknown as this would be dependent on future claims that may be made against the Funds. The risk of material loss from such claims is considered remote.
Mutual Funds managed by the investment adviser or its affiliates, in aggregate, were owners of record of more than 20% of the outstanding shares of the following Fund:
| Fund | % of shares held |
| Energy Portfolio | 22% |
Shareholder Expense Example
As a shareholder of a Fund, you incur two types of costs: (1) transaction costs, including redemption fees and (2) ongoing costs, including management fees and other Fund expenses. This Example is intended to help you understand your ongoing costs (in dollars) of investing in the Funds and to compare these costs with the ongoing costs of investing in other mutual funds.
The Example is based on an investment of $1,000 invested at the beginning of the period and held for the entire period (March 1, 2017 to August 31, 2017).
Actual Expenses
The first line of the accompanying table for each fund provides information about actual account values and actual expenses. You may use the information in this line, together with the amount you invested, to estimate the expenses that you paid over the period. Simply divide your account value by $1,000.00 (for example, an $8,600 account value divided by $1,000.00 = 8.6), then multiply the result by the number in the first line for a fund under the heading entitled "Expenses Paid During Period" to estimate the expenses you paid on your account during this period. A small balance maintenance fee of $12.00 that is charged once a year may apply for certain accounts with a value of less than $2,000. This fee is not included in the table below. If it was, the estimate of expenses you paid during the period would be higher, and your ending account value lower, by this amount. In addition, each Fund, as a shareholder in the underlying Fidelity Central Funds, will indirectly bear its pro-rata share of the fees and expenses incurred by the underlying Fidelity Central Funds. These fees and expenses are not included in the Fund's annualized expense ratio used to calculate the expense estimate in the table below.
Hypothetical Example for Comparison Purposes
The second line of the accompanying table for each fund provides information about hypothetical account values and hypothetical expenses based on a fund's actual expense ratio and an assumed rate of return of 5% per year before expenses, which is not the Fund's actual return. The hypothetical account values and expenses may not be used to estimate the actual ending account balance or expenses you paid for the period. You may use this information to compare the ongoing costs of investing in the Fund and other funds. To do so, compare this 5% hypothetical example with the 5% hypothetical examples that appear in the shareholder reports of the other funds. A small balance maintenance fee of $12.00 that is charged once a year may apply for certain accounts with a value of less than $2,000. This fee is not included in the table below. If it was, the estimate of expenses you paid during the period would be higher, and your ending account value lower, by this amount. In addition, each Fund, as a shareholder in the underlying Fidelity Central Funds, will indirectly bear its pro-rata share of the fees and expenses incurred by the underlying Fidelity Central Funds. These fees and expenses are not included in the Fund's annualized expense ratio used to calculate the expense estimate in the table below.
Please note that the expenses shown in the table are meant to highlight your ongoing costs only and do not reflect any transaction costs. Therefore, the second line of the table is useful in comparing ongoing costs only, and will not help you determine the relative total costs of owning different funds. In addition, if these transactional costs were included, your costs would have been higher.
| | Annualized Expense RatioA | Beginning
Account Value
March 1, 2017 | Ending
Account Value
August 31, 2017 | Expenses Paid
During Period-B
March 1, 2017
to August 31, 2017 |
| Energy Portfolio | .80% | | | |
| Actual | | $1,000.00 | $846.60 | $3.72 |
| Hypothetical-C | | $1,000.00 | $1,021.17 | $4.08 |
| Energy Service Portfolio | .84% | | | |
| Actual | | 1,000.00 | 755.40 | $3.72 |
| Hypothetical-C | | $1,000.00 | $1,020.97 | $4.28 |
| Natural Gas Portfolio | .89% | | | |
| Actual | | $1,000.00 | $801.50 | $4.04 |
| Hypothetical-C | | $1,000.00 | $1,020.72 | $4.53 |
| Natural Resources Portfolio | .83% | | | |
| Actual | | $1,000.00 | $869.90 | $3.91 |
| Hypothetical-C | | $1,000.00 | $1,021.02 | $4.23 |
A Annualized expense ratio reflects expenses net of applicable fee waivers.
B Expenses are equal to each Fund's annualized expense ratio, multiplied by the average account value over the period, multiplied by 184/ 365 (to reflect the one-half year period).
C 5% return per year before expenses
SELNR-SANN-1017
1.813654.112
Fidelity® Select Portfolios®
Industrials Sector Air Transportation Portfolio
Defense and Aerospace Portfolio
Environment and Alternative Energy Portfolio
Industrial Equipment Portfolio
Industrials Portfolio
Transportation Portfolio
Semi-Annual Report August 31, 2017 |
|
Contents
To view a fund's proxy voting guidelines and proxy voting record for the 12-month period ended June 30, visit http://www.fidelity.com/proxyvotingresults or visit the Securities and Exchange Commission's (SEC) web site at http://www.sec.gov.
You may also call 1-800-544-8544 to request a free copy of the proxy voting guidelines.
Standard & Poor's, S&P and S&P 500 are registered service marks of The McGraw-Hill Companies, Inc. and have been licensed for use by Fidelity Distributors Corporation.
Other third-party marks appearing herein are the property of their respective owners.
All other marks appearing herein are registered or unregistered trademarks or service marks of FMR LLC or an affiliated company. © 2017 FMR LLC. All rights reserved.
This report and the financial statements contained herein are submitted for the general information of the shareholders of the Funds. This report is not authorized for distribution to prospective investors in the Funds unless preceded or accompanied by an effective prospectus.
A fund files its complete schedule of portfolio holdings with the SEC for the first and third quarters of each fiscal year on Form N-Q. Forms N-Q are available on the SEC’s web site at http://www.sec.gov. A fund's Forms N-Q may be reviewed and copied at the SEC’s Public Reference Room in Washington, DC. Information regarding the operation of the SEC's Public Reference Room may be obtained by calling 1-800-SEC-0330.
For a complete list of a fund's portfolio holdings, view the most recent holdings listing, semiannual report, or annual report on Fidelity's web site at http://www.fidelity.com, http://www.institutional.fidelity.com, or http://www.401k.com, as applicable.
NOT FDIC INSURED •MAY LOSE VALUE •NO BANK GUARANTEE
Neither the Funds nor Fidelity Distributors Corporation is a bank.
Air Transportation Portfolio
Investment Summary (Unaudited)
Top Ten Stocks as of August 31, 2017
| | % of fund's net assets | % of fund's net assets 6 months ago |
| United Parcel Service, Inc. Class B | 11.1 | 10.3 |
| Delta Air Lines, Inc. | 8.9 | 6.1 |
| Southwest Airlines Co. | 7.9 | 4.3 |
| Rockwell Collins, Inc. | 6.6 | 3.9 |
| United Technologies Corp. | 6.3 | 0.0 |
| Expeditors International of Washington, Inc. | 5.8 | 5.0 |
| Spirit AeroSystems Holdings, Inc. Class A | 4.8 | 3.7 |
| Alaska Air Group, Inc. | 4.2 | 5.3 |
| Air Canada | 3.8 | 0.9 |
| American Airlines Group, Inc. | 3.4 | 7.0 |
| | 62.8 | |
Top Industries (% of fund's net assets)
| As of August 31, 2017 |
| | Airlines | 33.2% |
| | Aerospace & Defense | 31.2% |
| | Air Freight & Logistics | 26.9% |
| | Road & Rail | 4.0% |
| | Internet Software & Services | 1.2% |
| | All Others* | 3.5% |
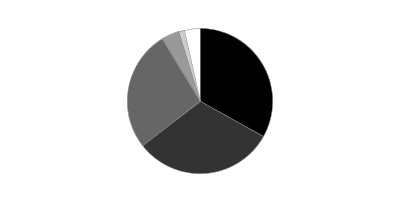
| As of February 28, 2017 |
| | Airlines | 38.8% |
| | Air Freight & Logistics | 29.4% |
| | Aerospace & Defense | 25.3% |
| | Road & Rail | 1.9% |
| | Machinery | 1.0% |
| | All Others* | 3.6% |

* Includes short-term investments and net other assets (liabilities).
Percentages shown as 0.0% may reflect amounts less than 0.05%.
Air Transportation Portfolio
Investments August 31, 2017 (Unaudited)
Showing Percentage of Net Assets
| Common Stocks - 96.9% | | | |
| | | Shares | Value |
| Aerospace & Defense - 31.2% | | | |
| Aerospace & Defense - 31.2% | | | |
| Astronics Corp. (a) | | 118,000 | $3,102,220 |
| Astronics Corp. Class B | | 4,755 | 124,581 |
| CAE, Inc. | | 196,600 | 3,244,786 |
| Hexcel Corp. | | 194,100 | 10,436,757 |
| Moog, Inc. Class A (a) | | 173,300 | 13,302,508 |
| Rockwell Collins, Inc. | | 206,500 | 27,061,825 |
| Spirit AeroSystems Holdings, Inc. Class A | | 265,000 | 19,742,500 |
| Textron, Inc. | | 71,000 | 3,485,390 |
| The Boeing Co. | | 38,000 | 9,107,080 |
| TransDigm Group, Inc. | | 49,600 | 12,928,736 |
| United Technologies Corp. | | 216,500 | 25,919,380 |
| | | | 128,455,763 |
| Air Freight & Logistics - 26.9% | | | |
| Air Freight & Logistics - 26.9% | | | |
| Air Transport Services Group, Inc. (a) | | 323,100 | 7,418,376 |
| Atlas Air Worldwide Holdings, Inc. (a) | | 114,600 | 7,655,280 |
| C.H. Robinson Worldwide, Inc. (b) | | 102,600 | 7,246,638 |
| Expeditors International of Washington, Inc. | | 424,100 | 23,792,010 |
| FedEx Corp. | | 57,500 | 12,326,850 |
| Forward Air Corp. | | 118,150 | 6,140,256 |
| United Parcel Service, Inc. Class B | | 400,600 | 45,812,615 |
| | | | 110,392,025 |
| Airlines - 33.2% | | | |
| Airlines - 33.2% | | | |
| Air Canada (a) | | 834,400 | 15,595,512 |
| Alaska Air Group, Inc. | | 228,800 | 17,082,208 |
| Allegiant Travel Co. | | 5,000 | 590,000 |
| American Airlines Group, Inc. | | 315,100 | 14,097,574 |
| Dart Group PLC | | 107,586 | 718,552 |
| Delta Air Lines, Inc. | | 778,302 | 36,728,071 |
| Hawaiian Holdings, Inc. (a) | | 138,200 | 5,921,870 |
| SkyWest, Inc. | | 292,300 | 10,142,810 |
| Southwest Airlines Co. | | 623,500 | 32,509,290 |
| Spirit Airlines, Inc. (a) | | 32,200 | 1,096,410 |
| United Continental Holdings, Inc. (a) | | 34,400 | 2,131,424 |
| | | | 136,613,721 |
| Internet Software & Services - 1.2% | | | |
| Internet Software & Services - 1.2% | | | |
| Gogo, Inc. (a) | | 169,800 | 2,378,898 |
| Stamps.com, Inc. (a) | | 13,300 | 2,543,625 |
| | | | 4,922,523 |
| Machinery - 0.4% | | | |
| Industrial Machinery - 0.4% | | | |
| Global Brass & Copper Holdings, Inc. | | 29,587 | 883,172 |
| Park-Ohio Holdings Corp. | | 19,390 | 772,692 |
| | | | 1,655,864 |
| Road & Rail - 4.0% | | | |
| Railroads - 4.0% | | | |
| Genesee & Wyoming, Inc. Class A (a) | | 48,200 | 3,304,592 |
| Norfolk Southern Corp. | | 38,300 | 4,615,916 |
| Union Pacific Corp. | | 79,700 | 8,392,410 |
| | | | 16,312,918 |
| TOTAL COMMON STOCKS | | | |
| (Cost $308,007,900) | | | 398,352,814 |
|
| Money Market Funds - 3.6% | | | |
| Fidelity Cash Central Fund, 1.11% (c) | | 9,872,703 | 9,874,678 |
| Fidelity Securities Lending Cash Central Fund 1.11% (c)(d) | | 5,000,204 | 5,000,704 |
| TOTAL MONEY MARKET FUNDS | | | |
| (Cost $14,874,809) | | | 14,875,382 |
| TOTAL INVESTMENT IN SECURITIES - 100.5% | | | |
| (Cost $322,882,709) | | | 413,228,196 |
| NET OTHER ASSETS (LIABILITIES) - (0.5)% | | | (2,154,383) |
| NET ASSETS - 100% | | | $411,073,813 |
Legend
(a) Non-income producing
(b) Security or a portion of the security is on loan at period end.
(c) Affiliated fund that is generally available only to investment companies and other accounts managed by Fidelity Investments. The rate quoted is the annualized seven-day yield of the fund at period end. A complete unaudited listing of the fund's holdings as of its most recent quarter end is available upon request. In addition, each Fidelity Central Fund's financial statements are available on the SEC's website or upon request.
(d) Investment made with cash collateral received from securities on loan.
Affiliated Central Funds
Information regarding fiscal year to date income earned by the Fund from investments in Fidelity Central Funds is as follows:
| Fund | Income earned |
| Fidelity Cash Central Fund | $57,170 |
| Fidelity Securities Lending Cash Central Fund | 4,559 |
| Total | $61,729 |
Investment Valuation
All investments are categorized as Level 1 under the Fair Value Hierarchy. The inputs or methodology used for valuing securities may not be an indication of the risk associated with investing in those securities. For more information on valuation inputs please refer to the Investment Valuation section in the accompanying Notes to Financial Statements.
See accompanying notes which are an integral part of the financial statements.
Air Transportation Portfolio
Financial Statements
Statement of Assets and Liabilities
| | | August 31, 2017 (Unaudited) |
| Assets | | |
Investment in securities, at value (including securities loaned of $4,725,147) — See accompanying schedule:
Unaffiliated issuers (cost $308,007,900) | $398,352,814 | |
| Fidelity Central Funds (cost $14,874,809) | 14,875,382 | |
| Total Investment in Securities (cost $322,882,709) | | $413,228,196 |
| Receivable for investments sold | | 17,682,700 |
| Receivable for fund shares sold | | 956,047 |
| Dividends receivable | | 1,892,750 |
| Distributions receivable from Fidelity Central Funds | | 12,174 |
| Other receivables | | 1,655 |
| Total assets | | 433,773,522 |
| Liabilities | | |
| Payable for investments purchased | $15,733,144 | |
| Payable for fund shares redeemed | 1,678,678 | |
| Accrued management fee | 185,169 | |
| Other affiliated payables | 83,978 | |
| Other payables and accrued expenses | 17,965 | |
| Collateral on securities loaned | 5,000,775 | |
| Total liabilities | | 22,699,709 |
| Net Assets | | $411,073,813 |
| Net Assets consist of: | | |
| Paid in capital | | $288,505,078 |
| Undistributed net investment income | | 2,390,656 |
| Accumulated undistributed net realized gain (loss) on investments and foreign currency transactions | | 29,832,592 |
| Net unrealized appreciation (depreciation) on investments | | 90,345,487 |
| Net Assets, for 5,086,792 shares outstanding | | $411,073,813 |
| Net Asset Value, offering price and redemption price per share ($411,073,813 ÷ 5,086,792 shares) | | $80.81 |
See accompanying notes which are an integral part of the financial statements.
Statement of Operations
| | | Six months ended August 31, 2017 (Unaudited) |
| Investment Income | | |
| Dividends | | $2,860,847 |
| Special dividends | | 1,091,200 |
| Income from Fidelity Central Funds | | 61,729 |
| Total income | | 4,013,776 |
| Expenses | | |
| Management fee | $1,070,054 | |
| Transfer agent fees | 414,811 | |
| Accounting and security lending fees | 76,748 | |
| Custodian fees and expenses | 13,065 | |
| Independent trustees' fees and expenses | 4,456 | |
| Registration fees | 28,311 | |
| Audit | 18,843 | |
| Legal | 2,735 | |
| Miscellaneous | 2,071 | |
| Total expenses before reductions | 1,631,094 | |
| Expense reductions | (12,892) | 1,618,202 |
| Net investment income (loss) | | 2,395,574 |
| Realized and Unrealized Gain (Loss) | | |
| Net realized gain (loss) on: | | |
| Investment securities: | | |
| Unaffiliated issuers | 30,868,021 | |
| Fidelity Central Funds | 926 | |
| Foreign currency transactions | 2,534 | |
| Total net realized gain (loss) | | 30,871,481 |
| Change in net unrealized appreciation (depreciation) on: | | |
| Investment securities: | | |
| Unaffiliated issuers | (4,807,007) | |
| Fidelity Central Funds | (542) | |
| Assets and liabilities in foreign currencies | (266) | |
| Total change in net unrealized appreciation (depreciation) | | (4,807,815) |
| Net gain (loss) | | 26,063,666 |
| Net increase (decrease) in net assets resulting from operations | | $28,459,240 |
See accompanying notes which are an integral part of the financial statements.
Statement of Changes in Net Assets
| | Six months ended August 31, 2017 (Unaudited) | Year ended February 28, 2017 |
| Increase (Decrease) in Net Assets | | |
| Operations | | |
| Net investment income (loss) | $2,395,574 | $1,569,033 |
| Net realized gain (loss) | 30,871,481 | 15,925,983 |
| Change in net unrealized appreciation (depreciation) | (4,807,815) | 53,078,643 |
| Net increase (decrease) in net assets resulting from operations | 28,459,240 | 70,573,659 |
| Distributions to shareholders from net investment income | (340,407) | (1,185,421) |
| Distributions to shareholders from net realized gain | (4,531,980) | (1,110,453) |
| Total distributions | (4,872,387) | (2,295,874) |
| Share transactions | | |
| Proceeds from sales of shares | 67,956,896 | 189,705,911 |
| Reinvestment of distributions | 4,700,350 | 2,204,136 |
| Cost of shares redeemed | (79,318,429) | (191,690,596) |
| Net increase (decrease) in net assets resulting from share transactions | (6,661,183) | 219,451 |
| Redemption fees | 5,499 | 15,263 |
| Total increase (decrease) in net assets | 16,931,169 | 68,512,499 |
| Net Assets | | |
| Beginning of period | 394,142,644 | 325,630,145 |
| End of period | $411,073,813 | $394,142,644 |
| Other Information | | |
| Undistributed net investment income end of period | $2,390,656 | $335,489 |
| Shares | | |
| Sold | 868,244 | 2,678,190 |
| Issued in reinvestment of distributions | 64,618 | 29,373 |
| Redeemed | (1,029,333) | (2,897,377) |
| Net increase (decrease) | (96,471) | (189,814) |
See accompanying notes which are an integral part of the financial statements.
Financial Highlights — Air Transportation Portfolio
| | Six months ended (Unaudited) August 31, | Years ended February 28, | | | | |
| | 2017 | 2017 | 2016 A | 2015 | 2014 | 2013 |
| Selected Per–Share Data | | | | | | |
| Net asset value, beginning of period | $76.04 | $60.60 | $73.09 | $61.02 | $43.97 | $38.12 |
| Income from Investment Operations | | | | | | |
| Net investment income (loss)B | .47C | .32 | .18 | .20D | .12 | .21E |
| Net realized and unrealized gain (loss) | 5.26 | 15.61 | (6.82) | 13.09 | 18.28 | 6.44 |
| Total from investment operations | 5.73 | 15.93 | (6.64) | 13.29 | 18.40 | 6.65 |
| Distributions from net investment income | (.07) | (.25) | (.17) | (.08) | (.06) | (.15) |
| Distributions from net realized gain | (.89) | (.24) | (5.68) | (1.14) | (1.30) | (.66) |
| Total distributions | (.96) | (.49) | (5.85) | (1.23)F | (1.36) | (.80)G |
| Redemption fees added to paid in capitalB | –H | –H | –H | .01 | .01 | –H |
| Net asset value, end of period | $80.81 | $76.04 | $60.60 | $73.09 | $61.02 | $43.97 |
| Total ReturnI,J | 7.67% | 26.30% | (9.24)% | 21.93% | 42.26% | 17.62% |
| Ratios to Average Net AssetsK,L | | | | | | |
| Expenses before reductions | .83%M | .85% | .83% | .83% | .87% | .94% |
| Expenses net of fee waivers, if any | .83%M | .85% | .83% | .83% | .87% | .94% |
| Expenses net of all reductions | .82%M | .84% | .82% | .83% | .86% | .92% |
| Net investment income (loss) | .94%C,M | .48% | .27% | .30%D | .22% | .54%E |
| Supplemental Data | | | | | | |
| Net assets, end of period (000 omitted) | $411,074 | $394,143 | $325,630 | $715,925 | $350,960 | $90,837 |
| Portfolio turnover rateN | 130%M | 106% | 97% | 65%O | 125% | 74% |
A For the year ended February 29.
B Calculated based on average shares outstanding during the period.
C Net Investment income per share reflects a large, non-recurring dividend which amounted to $.21 per share. This dividend is not annualized in the ratio of net investment income (loss) to average net assets. Excluding this dividend the ratio would have been .66%.
D Net Investment income per share reflects a large, non-recurring dividend which amounted to $.22 per share. Excluding this non-recurring dividend, the ratio of net investment income (loss) to average net assets would have been (.04) %.
E Net Investment income per share reflects a large, non-recurring dividend which amounted to $.07 per share. Excluding this non-recurring dividend, the ratio of net investment income (loss) to average net assets would have been .35%.
F Total distributions of $1.23 per share is comprised of distributions from net investment income of $.084 and distributions from net realized gain of $1.144 per share.
G Total distributions of $.80 per share is comprised of distributions from net investment income of $.147 and distributions from net realized gain of $.655 per share.
H Amount represents less than $.005 per share.
I Total returns for periods of less than one year are not annualized.
J Total returns would have been lower if certain expenses had not been reduced during the applicable periods shown.
K Fees and expenses of any underlying Fidelity Central Funds are not included in the Fund's expense ratio. The Fund indirectly bears its proportionate share of the expenses of any underlying Fidelity Central Funds.
L Expense ratios reflect operating expenses of the Fund. Expenses before reductions do not reflect amounts reimbursed by the investment adviser or reductions from brokerage service arrangements or reductions from other expense offset arrangements and do not represent the amount paid by the Fund during periods when reimbursements or reductions occur. Expenses net of fee waivers reflect expenses after reimbursement by the investment adviser but prior to reductions from brokerage service arrangements or other expense offset arrangements. Expenses net of all reductions represent the net expenses paid by the Fund.
M Annualized
N Amount does not include the portfolio activity of any underlying Fidelity Central Funds.
O Portfolio turnover rate excludes securities received or delivered in-kind.
See accompanying notes which are an integral part of the financial statements.
Defense and Aerospace Portfolio
Investment Summary (Unaudited)
Top Ten Stocks as of August 31, 2017
| | % of fund's net assets | % of fund's net assets 6 months ago |
| Northrop Grumman Corp. | 10.5 | 10.7 |
| The Boeing Co. | 10.4 | 6.6 |
| Rockwell Collins, Inc. | 9.3 | 5.5 |
| General Dynamics Corp. | 8.7 | 9.7 |
| TransDigm Group, Inc. | 5.2 | 5.0 |
| Huntington Ingalls Industries, Inc. | 5.0 | 4.6 |
| Teledyne Technologies, Inc. | 4.9 | 3.3 |
| Raytheon Co. | 4.9 | 4.4 |
| United Technologies Corp. | 4.7 | 9.4 |
| Orbital ATK, Inc. | 3.4 | 3.4 |
| | 67.0 | |
Top Industries (% of fund's net assets)
| As of August 31, 2017 |
| | Aerospace & Defense | 93.6% |
| | IT Services | 2.3% |
| | Trading Companies & Distributors | 0.6% |
| | Construction & Engineering | 0.2% |
| | Diversified Telecommunication Services | 0.2% |
| | All Others* | 3.1% |

| As of February 28, 2017 |
| | Aerospace & Defense | 92.4% |
| | IT Services | 1.5% |
| | Trading Companies & Distributors | 0.6% |
| | Industrial Conglomerates | 0.5% |
| | Containers & Packaging | 0.4% |
| | All Others* | 4.6% |

* Includes short-term investments and net other assets (liabilities).
Defense and Aerospace Portfolio
Investments August 31, 2017 (Unaudited)
Showing Percentage of Net Assets
| Common Stocks - 96.0% | | | |
| | | Shares | Value |
| Aerospace & Defense - 92.6% | | | |
| Aerospace & Defense - 92.6% | | | |
| Airbus Group NV | | 102,400 | $8,624,026 |
| Arconic, Inc. | | 102,400 | 2,608,128 |
| Astronics Corp. (a) | | 1,249,053 | 32,837,603 |
| Astronics Corp. Class B | | 113,234 | 2,966,731 |
| Axon Enterprise, Inc. (a)(b) | | 1,100,521 | 23,892,311 |
| BAE Systems PLC | | 4,326,500 | 33,999,590 |
| BWX Technologies, Inc. | | 19,901 | 1,088,983 |
| Elbit Systems Ltd. | | 346,435 | 47,873,853 |
| Elbit Systems Ltd. (Israel) (b) | | 30,000 | 4,130,859 |
| Engility Holdings, Inc. (a) | | 1,153,877 | 35,850,958 |
| General Dynamics Corp. | | 916,900 | 184,617,815 |
| HEICO Corp. | | 461,558 | 39,587,830 |
| HEICO Corp. Class A | | 872,996 | 63,423,159 |
| Hexcel Corp. | | 1,263,100 | 67,916,887 |
| Huntington Ingalls Industries, Inc. | | 493,874 | 105,669,281 |
| KEYW Holding Corp. (a) | | 247,582 | 1,770,211 |
| KLX, Inc. (a) | | 321,291 | 15,402,691 |
| Lockheed Martin Corp. | | 195,515 | 59,708,326 |
| Moog, Inc. Class A (a) | | 617,587 | 47,405,978 |
| Northrop Grumman Corp. | | 820,450 | 223,334,693 |
| Orbital ATK, Inc. | | 653,730 | 72,943,193 |
| Raytheon Co. | | 568,026 | 103,386,412 |
| Rockwell Collins, Inc. | | 1,510,870 | 197,999,514 |
| Senior Engineering Group PLC | | 1,173,000 | 4,165,150 |
| Sparton Corp. (a) | | 275,693 | 6,387,807 |
| Spirit AeroSystems Holdings, Inc. Class A | | 165,550 | 12,333,475 |
| Teledyne Technologies, Inc. (a) | | 689,201 | 103,421,502 |
| Textron, Inc. | | 592,231�� | 29,072,620 |
| The Boeing Co. | | 924,919 | 221,666,088 |
| TransDigm Group, Inc. (b) | | 426,476 | 111,165,234 |
| United Technologies Corp. | | 826,901 | 98,996,588 |
| | | | 1,964,247,496 |
| Construction & Engineering - 0.2% | | | |
| Construction & Engineering - 0.2% | | | |
| KBR, Inc. | | 284,400 | 4,627,188 |
| Diversified Telecommunication Services - 0.2% | | | |
| Alternative Carriers - 0.2% | | | |
| Iridium Communications, Inc. (a)(b) | | 321,150 | 3,564,765 |
| IT Services - 2.3% | | | |
| IT Consulting & Other Services - 2.3% | | | |
| CSRA, Inc. | | 670,220 | 21,118,632 |
| Leidos Holdings, Inc. | | 456,130 | 26,601,502 |
| | | | 47,720,134 |
| Metals & Mining - 0.1% | | | |
| Steel - 0.1% | | | |
| Carpenter Technology Corp. | | 43,800 | 1,775,214 |
| Trading Companies & Distributors - 0.6% | | | |
| Trading Companies & Distributors - 0.6% | | | |
| Air Lease Corp. Class A | | 327,120 | 13,294,157 |
| TOTAL COMMON STOCKS | | | |
| (Cost $1,433,128,615) | | | 2,035,228,954 |
|
| Nonconvertible Preferred Stocks - 1.0% | | | |
| Aerospace & Defense - 1.0% | | | |
| Aerospace & Defense - 1.0% | | | |
| Embraer SA sponsored ADR | | | |
| (Cost $20,932,285) | | 953,150 | 21,636,506 |
|
| Money Market Funds - 6.0% | | | |
| Fidelity Cash Central Fund, 1.11% (c) | | 63,420,784 | 63,433,467 |
| Fidelity Securities Lending Cash Central Fund 1.11% (c)(d) | | 64,091,814 | 64,098,224 |
| TOTAL MONEY MARKET FUNDS | | | |
| (Cost $127,527,029) | | | 127,531,691 |
| TOTAL INVESTMENT IN SECURITIES - 103.0% | | | |
| (Cost $1,581,587,929) | | | 2,184,397,151 |
| NET OTHER ASSETS (LIABILITIES) - (3.0)% | | | (62,663,059) |
| NET ASSETS - 100% | | | $2,121,734,092 |
Legend
(a) Non-income producing
(b) Security or a portion of the security is on loan at period end.
(c) Affiliated fund that is generally available only to investment companies and other accounts managed by Fidelity Investments. The rate quoted is the annualized seven-day yield of the fund at period end. A complete unaudited listing of the fund's holdings as of its most recent quarter end is available upon request. In addition, each Fidelity Central Fund's financial statements are available on the SEC's website or upon request.
(d) Investment made with cash collateral received from securities on loan.
Affiliated Central Funds
Information regarding fiscal year to date income earned by the Fund from investments in Fidelity Central Funds is as follows:
| Fund | Income earned |
| Fidelity Cash Central Fund | $290,759 |
| Fidelity Securities Lending Cash Central Fund | 111,288 |
| Total | $402,047 |
Investment Valuation
The following is a summary of the inputs used, as of August 31, 2017, involving the Fund's assets and liabilities carried at fair value. The inputs or methodology used for valuing securities may not be an indication of the risk associated with investing in those securities. For more information on valuation inputs, and their aggregation into the levels used below, please refer to the Investment Valuation section in the accompanying Notes to Financial Statements.
| | Valuation Inputs at Reporting Date: |
| Description | Total | Level 1 | Level 2 | Level 3 |
| Investments in Securities: | | | | |
| Common Stocks | $2,035,228,954 | $1,992,605,338 | $42,623,616 | $-- |
| Nonconvertible Preferred Stocks | 21,636,505 | 21,636,505 | -- | -- |
| Money Market Funds | 127,531,692 | 127,531,692 | -- | -- |
| Total Investments in Securities: | $2,184,397,151 | $2,141,773,535 | $42,623,616 | $-- |
See accompanying notes which are an integral part of the financial statements.
Defense and Aerospace Portfolio
Financial Statements
Statement of Assets and Liabilities
| | | August 31, 2017 (Unaudited) |
| Assets | | |
Investment in securities, at value (including securities loaned of $60,532,539) — See accompanying schedule:
Unaffiliated issuers (cost $1,454,060,900) | $2,056,865,460 | |
| Fidelity Central Funds (cost $127,527,029) | 127,531,691 | |
| Total Investment in Securities (cost $1,581,587,929) | | $2,184,397,151 |
| Receivable for investments sold | | 2,109,624 |
| Receivable for fund shares sold | | 6,696,380 |
| Dividends receivable | | 13,275,361 |
| Distributions receivable from Fidelity Central Funds | | 73,994 |
| Other receivables | | 63,966 |
| Total assets | | 2,206,616,476 |
| Liabilities | | |
| Payable for investments purchased | $14,491,263 | |
| Payable for fund shares redeemed | 4,960,163 | |
| Accrued management fee | 924,469 | |
| Other affiliated payables | 336,968 | |
| Other payables and accrued expenses | 68,771 | |
| Collateral on securities loaned | 64,100,750 | |
| Total liabilities | | 84,882,384 |
| Net Assets | | $2,121,734,092 |
| Net Assets consist of: | | |
| Paid in capital | | $1,459,997,768 |
| Undistributed net investment income | | 15,738,005 |
| Accumulated undistributed net realized gain (loss) on investments and foreign currency transactions | | 43,189,097 |
| Net unrealized appreciation (depreciation) on investments | | 602,809,222 |
| Net Assets, for 13,725,227 shares outstanding | | $2,121,734,092 |
| Net Asset Value, offering price and redemption price per share ($2,121,734,092 ÷ 13,725,227 shares) | | $154.59 |
See accompanying notes which are an integral part of the financial statements.
Statement of Operations
| | | Six months ended August 31, 2017 (Unaudited) |
| Investment Income | | |
| Dividends | | $12,890,173 |
| Special dividends | | 9,382,472 |
| Income from Fidelity Central Funds | | 402,047 |
| Total income | | 22,674,692 |
| Expenses | | |
| Management fee | $4,875,270 | |
| Transfer agent fees | 1,614,139 | |
| Accounting and security lending fees | 281,894 | |
| Custodian fees and expenses | 16,243 | |
| Independent trustees' fees and expenses | 19,445 | |
| Registration fees | 61,820 | |
| Audit | 18,735 | |
| Legal | 11,898 | |
| Miscellaneous | 8,405 | |
| Total expenses before reductions | 6,907,849 | |
| Expense reductions | (20,096) | 6,887,753 |
| Net investment income (loss) | | 15,786,939 |
| Realized and Unrealized Gain (Loss) | | |
| Net realized gain (loss) on: | | |
| Investment securities: | | |
| Unaffiliated issuers | 43,635,830 | |
| Fidelity Central Funds | (1,836) | |
| Foreign currency transactions | (4,436) | |
| Total net realized gain (loss) | | 43,629,558 |
| Change in net unrealized appreciation (depreciation) on: | | |
| Investment securities: | | |
| Unaffiliated issuers | 162,922,460 | |
| Fidelity Central Funds | (440) | |
| Total change in net unrealized appreciation (depreciation) | | 162,922,020 |
| Net gain (loss) | | 206,551,578 |
| Net increase (decrease) in net assets resulting from operations | | $222,338,517 |
See accompanying notes which are an integral part of the financial statements.
Statement of Changes in Net Assets
| | Six months ended August 31, 2017 (Unaudited) | Year ended February 28, 2017 |
| Increase (Decrease) in Net Assets | | |
| Operations | | |
| Net investment income (loss) | $15,786,939 | $11,596,929 |
| Net realized gain (loss) | 43,629,558 | 64,001,438 |
| Change in net unrealized appreciation (depreciation) | 162,922,020 | 254,946,544 |
| Net increase (decrease) in net assets resulting from operations | 222,338,517 | 330,544,911 |
| Distributions to shareholders from net investment income | (1,322,859) | (11,758,000) |
| Distributions to shareholders from net realized gain | (9,915,864) | (53,922,271) |
| Total distributions | (11,238,723) | (65,680,271) |
| Share transactions | | |
| Proceeds from sales of shares | 492,466,001 | 698,805,364 |
| Reinvestment of distributions | 10,730,133 | 62,788,633 |
| Cost of shares redeemed | (194,029,635) | (310,408,871) |
| Net increase (decrease) in net assets resulting from share transactions | 309,166,499 | 451,185,126 |
| Redemption fees | – | 19,875 |
| Total increase (decrease) in net assets | 520,266,293 | 716,069,641 |
| Net Assets | | |
| Beginning of period | 1,601,467,799 | 885,398,158 |
| End of period | $2,121,734,092 | $1,601,467,799 |
| Other Information | | |
| Undistributed net investment income end of period | $15,738,005 | $1,273,925 |
| Shares | | |
| Sold | 3,439,990 | 5,346,927 |
| Issued in reinvestment of distributions | 79,808 | 492,405 |
| Redeemed | (1,371,421) | (2,454,187) |
| Net increase (decrease) | 2,148,377 | 3,385,145 |
See accompanying notes which are an integral part of the financial statements.
Financial Highlights — Defense and Aerospace Portfolio
| | Six months ended (Unaudited) August 31, | Years ended February 28, | | | | |
| | 2017 | 2017 | 2016 A | 2015 | 2014 | 2013 |
| Selected Per–Share Data | | | | | | |
| Net asset value, beginning of period | $138.33 | $108.08 | $128.97 | $122.55 | $91.73 | $86.02 |
| Income from Investment Operations | | | | | | |
| Net investment income (loss)B | 1.25C | 1.28D | 1.08 | 1.06E | .77 | 1.17F |
| Net realized and unrealized gain (loss) | 15.95 | 35.26 | (14.72) | 13.14 | 36.34 | 5.94 |
| Total from investment operations | 17.20 | 36.54 | (13.64) | 14.20 | 37.11 | 7.11 |
| Distributions from net investment income | (.11) | (1.15) | (1.01) | (.97) | (.64) | (1.21) |
| Distributions from net realized gain | (.83) | (5.14) | (6.24) | (6.81) | (5.65) | (.19) |
| Total distributions | (.94) | (6.29) | (7.25) | (7.78) | (6.29) | (1.40) |
| Redemption fees added to paid in capitalB | – | –G | –G | –G | –G | –G |
| Net asset value, end of period | $154.59 | $138.33 | $108.08 | $128.97 | $122.55 | $91.73 |
| Total ReturnH,I | 12.54% | 34.36% | (11.08)% | 12.53% | 40.85% | 8.37% |
| Ratios to Average Net AssetsJ,K | | | | | | |
| Expenses before reductions | .77%L | .79% | .80% | .79% | .81% | .84% |
| Expenses net of fee waivers, if any | .77%L | .79% | .79% | .79% | .81% | .84% |
| Expenses net of all reductions | .77%L | .79% | .79% | .79% | .81% | .83% |
| Net investment income (loss) | 1.24%C,L | 1.03%D | .92% | .90%E | .70% | 1.39%F |
| Supplemental Data | | | | | | |
| Net assets, end of period (000 omitted) | $2,121,734 | $1,601,468 | $885,398 | $948,156 | $1,023,393 | $606,859 |
| Portfolio turnover rateM | 22%L | 24% | 52% | 20% | 48% | 56% |
A For the year ended February 29.
B Calculated based on average shares outstanding during the period.
C Net Investment income per share reflects a large, non-recurring dividend which amounted to $.75 per share. This dividend is not annualized in the ratio of net investment income (loss) to average net assets. Excluding this dividend the ratio would have been .71%.
D Net Investment income per share reflects a large, non-recurring dividend which amounted to $.49 per share. Excluding this non-recurring dividend, the ratio of net investment income (loss) to average net assets would have been .64%.
E Net Investment income per share reflects a large, non-recurring dividend which amounted to $.66 per share. Excluding this non-recurring dividend, the ratio of net investment income (loss) to average net assets would have been .34%.
F Net Investment income per share reflects a large, non-recurring dividend which amounted to $.34 per share. Excluding this non-recurring dividend, the ratio of net investment income (loss) to average net assets would have been .99%.
G Amount represents less than $.005 per share.
H Total returns for periods of less than one year are not annualized.
I Total returns would have been lower if certain expenses had not been reduced during the applicable periods shown.
J Fees and expenses of any underlying Fidelity Central Funds are not included in the Fund's expense ratio. The Fund indirectly bears its proportionate share of the expenses of any underlying Fidelity Central Funds.
K Expense ratios reflect operating expenses of the Fund. Expenses before reductions do not reflect amounts reimbursed by the investment adviser or reductions from brokerage service arrangements or reductions from other expense offset arrangements and do not represent the amount paid by the Fund during periods when reimbursements or reductions occur. Expenses net of fee waivers reflect expenses after reimbursement by the investment adviser but prior to reductions from brokerage service arrangements or other expense offset arrangements. Expenses net of all reductions represent the net expenses paid by the Fund.
L Annualized
M Amount does not include the portfolio activity of any underlying Fidelity Central Funds.
See accompanying notes which are an integral part of the financial statements.
Environment and Alternative Energy Portfolio
Investment Summary (Unaudited)
Top Ten Stocks as of August 31, 2017
| | % of fund's net assets | % of fund's net assets 6 months ago |
| 3M Co. | 10.9 | 10.5 |
| Honeywell International, Inc. | 8.5 | 8.1 |
| Danaher Corp. | 4.5 | 2.5 |
| Ingersoll-Rand PLC | 4.1 | 3.6 |
| Iberdrola SA | 3.7 | 3.4 |
| Deere & Co. | 3.3 | 4.3 |
| Owens Corning | 3.1 | 2.1 |
| Andritz AG | 3.1 | 3.1 |
| Cummins, Inc. | 3.1 | 2.5 |
| TE Connectivity Ltd. | 2.6 | 0.0 |
| | 46.9 | |
Top Industries (% of fund's net assets)
| As of August 31, 2017 |
| | Energy Efficiency | 32.6% |
| | Renewable & Alternative Energy | 29.7% |
| | Environmental Support Services | 10.9% |
| | Food Agriculture and Forestry | 7.5% |
| | Pollution Control | 6.5% |
| | All Others* | 12.8% |
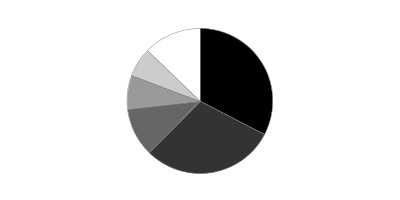
| As of February 28, 2017 |
| | Energy Efficiency | 30.4% |
| | Renewable & Alternative Energy | 23.8% |
| | Environmental Support Services | 12.7% |
| | Food Agriculture and Forestry | 11.3% |
| | Pollution Control | 5.5% |
| | All Others* | 16.3% |
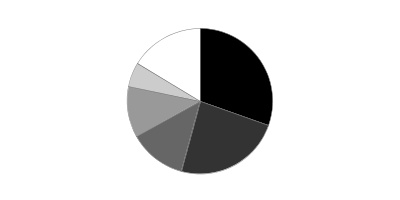
* Includes short-term investments and net other assets (liabilities).
Percentages shown as 0.0% may reflect amounts less than 0.05%.
Environment and Alternative Energy Portfolio
Investments August 31, 2017 (Unaudited)
Showing Percentage of Net Assets
| Common Stocks - 99.1% | | | |
| | | Shares | Value |
| Energy Efficiency - 32.6% | | | |
| Buildings Energy Efficiency - 16.4% | | | |
| A.O. Smith Corp. | | 23,882 | $1,329,989 |
| Apogee Enterprises, Inc. | | 79,150 | 3,458,855 |
| Carlisle Companies, Inc. | | 35,585 | 3,369,544 |
| Comfort Systems U.S.A., Inc. | | 82,470 | 2,808,104 |
| Ingersoll-Rand PLC | | 81,360 | 6,947,330 |
| Lennox International, Inc. | | 24,121 | 3,997,573 |
| Owens Corning | | 71,440 | 5,295,847 |
| Trex Co., Inc. (a) | | 11,090 | 842,840 |
| | | | 28,050,082 |
| Diversified Energy Efficiency - 8.5% | | | |
| Honeywell International, Inc. | | 105,667 | 14,610,576 |
| Industrial Energy Efficiency - 4.0% | | | |
| EMCOR Group, Inc. | | 30,258 | 1,998,238 |
| EnerSys | | 18,390 | 1,178,799 |
| Minerals Technologies, Inc. | | 20,890 | 1,336,960 |
| Regal Beloit Corp. | | 31,184 | 2,351,274 |
| | | | 6,865,271 |
| Transport Energy Efficiency - 3.7% | | | |
| Hexcel Corp. | | 49,140 | 2,642,258 |
| Innospec, Inc. | | 67,777 | 3,761,624 |
| | | | 6,403,882 |
|
| TOTAL ENERGY EFFICIENCY | | | 55,929,811 |
|
| Environmental Support Services - 10.9% | | | |
| Diversified Environmental - 10.9% | | | |
| 3M Co. | | 90,772 | 18,546,534 |
| Food Agriculture & Forestry - 7.5% | | | |
| Logistics, Food Safety and Packing - 4.2% | | | |
| Bemis Co., Inc. | | 60,310 | 2,569,809 |
| Bunge Ltd. | | 15,930 | 1,188,856 |
| Sealed Air Corp. | | 75,810 | 3,364,448 |
| | | | 7,123,113 |
| Sustainable and Efficient Agriculture - 3.3% | | | |
| Deere & Co. | | 48,668 | 5,642,081 |
|
| TOTAL FOOD AGRICULTURE & FORESTRY | | | 12,765,194 |
|
| Miscellaneous Environmental - 3.8% | | | |
| Other Environmental - 3.8% | | | |
| IBM Corp. | | 10,845 | 1,551,160 |
| Johnson & Johnson | | 13,130 | 1,738,018 |
| Philips Lighting NV | | 46,880 | 1,730,057 |
| Whirlpool Corp. | | 9,410 | 1,614,944 |
| | | | 6,634,179 |
| Pollution Control - 6.5% | | | |
| Environmental Testing and Gas Sensing - 0.9% | | | |
| PerkinElmer, Inc. | | 22,410 | 1,501,246 |
| Pollution Control Solutions - 5.6% | | | |
| Cummins, Inc. | | 32,892 | 5,242,327 |
| Entegris, Inc. (a) | | 4,900 | 124,705 |
| Tenneco, Inc. | | 77,548 | 4,203,102 |
| | | | 9,570,134 |
|
| TOTAL POLLUTION CONTROL | | | 11,071,380 |
|
| Renewable & Alternative Energy - 29.7% | | | |
| Biofuels - 0.7% | | | |
| Cosan SA Industria e Comercio | | 100,540 | 1,232,536 |
| Other Renewables Equipment - 3.1% | | | |
| Andritz AG | | 97,032 | 5,280,042 |
| Renewable Energy Developers and Independent Power Producers - 23.3% | | | |
| Centrais Eletricas Brasileiras SA (Electrobras) (a) | | 114,980 | 643,597 |
| China Power Intl Development Ltd. | | 1,335,730 | 455,726 |
| Companhia Paranaense de Energia-Copel (a) | | 55,970 | 403,970 |
| Danaher Corp. | | 91,390 | 7,623,754 |
| Electric Power Development Co. Ltd. | | 30,740 | 841,656 |
| Empresa Nacional de Electricidad SA | | 355,303 | 302,325 |
| Empresa Nacional de Electricidad SA sponsored ADR (b) | | 41,190 | 1,037,576 |
| Enel Chile Sa | | 7,283,247 | 862,026 |
| Energias de Portugal SA | | 346,377 | 1,329,811 |
| Enersis SA | | 3,192,969 | 691,629 |
| Enersis SA sponsored | | 225,120 | 2,417,789 |
| ENGIE Brasil Energia SA | | 230,940 | 2,648,453 |
| Graphic Packaging Holding Co. | | 287,170 | 3,747,569 |
| Grupo Acciona SA | | 12,940 | 1,105,884 |
| Hollysys Automation Technologies Ltd. | | 74,071 | 1,506,604 |
| Iberdrola SA | | 764,550 | 6,244,598 |
| NHPC Ltd. | | 1,192,643 | 541,898 |
| PNOC Energy Development Corp. | | 4,341,010 | 575,575 |
| Portland General Electric Co. | | 42,931 | 2,039,652 |
| TE Connectivity Ltd. | | 55,830 | 4,444,068 |
| | | | 39,464,160 |
| Wind Power Generation Equipment - 2.6% | | | |
| Gamesa Corporacion Tecnologica SA | | 27,310 | 407,853 |
| Nordex Se (a)(b) | | 44,300 | 615,440 |
| Vestas Wind Systems A/S | | 36,720 | 3,344,407 |
| | | | 4,367,700 |
|
| TOTAL RENEWABLE & ALTERNATIVE ENERGY | | | 50,344,438 |
|
| Waste Management & Technologies - 4.7% | | | |
| Recycling and Value Added Waste Processing - 4.7% | | | |
| Copart, Inc. (a) | | 70,128 | 2,292,484 |
| Darling International, Inc. (a) | | 61,150 | 1,064,010 |
| Interface, Inc. | | 146,773 | 2,788,687 |
| Steel Dynamics, Inc. | | 57,650 | 1,986,043 |
| | | | 8,131,224 |
| Water Infrastructure & Technologies - 3.4% | | | |
| Water Infrastructure - 3.4% | | | |
| Crane Co. | | 55,207 | 4,098,016 |
| HD Supply Holdings, Inc. (a) | | 53,760 | 1,790,208 |
| | | | 5,888,224 |
| TOTAL COMMON STOCKS | | | |
| (Cost $149,938,359) | | | 169,310,984 |
|
| Cash Equivalents - 1.4% | | | |
| Fidelity Cash Central Fund, 1.11% (c) | | 1,120,008 | 1,120,232 |
| Fidelity Securities Lending Cash Central Fund 1.11% (c)(d) | | 1,291,540 | 1,291,669 |
| TOTAL CASH EQUIVALENTS | | | |
| (Cost $2,411,922) | | | 2,411,901 |
| TOTAL INVESTMENT IN SECURITIES - 100.5% | | | |
| (Cost $152,350,281) | | | 171,722,885 |
| NET OTHER ASSETS (LIABILITIES) - (0.5)% | | | (774,402) |
| NET ASSETS - 100% | | | $170,948,483 |
Legend
(a) Non-income producing
(b) Security or a portion of the security is on loan at period end.
(c) Affiliated fund that is generally available only to investment companies and other accounts managed by Fidelity Investments. The rate quoted is the annualized seven-day yield of the fund at period end. A complete unaudited listing of the fund's holdings as of its most recent quarter end is available upon request. In addition, each Fidelity Central Fund's financial statements are available on the SEC's website or upon request.
(d) Investment made with cash collateral received from securities on loan.
Affiliated Central Funds
Information regarding fiscal year to date income earned by the Fund from investments in Fidelity Central Funds is as follows:
| Fund | Income earned |
| Fidelity Cash Central Fund | $15,880 |
| Fidelity Securities Lending Cash Central Fund | 18,240 |
| Total | $34,120 |
Investment Valuation
All investments are categorized as Level 1 under the Fair Value Hierarchy. The inputs or methodology used for valuing securities may not be an indication of the risk associated with investing in those securities. For more information on valuation inputs please refer to the Investment Valuation section in the accompanying Notes to Financial Statements.
The following is a summary of transfers between Level 1 and Level 2 for the period ended August 31, 2017. Transfers are assumed to have occurred at the beginning of the period, and are primarily attributable to the valuation techniques used for foreign equity securities, as discussed in the accompanying Notes to Financial Statements:
| Transfers | Total |
| Level 1 to Level 2 | $0 |
| Level 2 to Level 1 | $3,349,088 |
Other Information
Distribution of investments by country or territory of incorporation, as a percentage of Total Net Assets, is as follows (Unaudited):
| United States of America | 72.4% |
| Spain | 4.6% |
| Ireland | 4.1% |
| Chile | 3.1% |
| Austria | 3.1% |
| Brazil | 2.9% |
| Switzerland | 2.6% |
| Denmark | 2.0% |
| Netherlands | 1.0% |
| Others (Individually Less Than 1%) | 4.2% |
| | 100.0% |
See accompanying notes which are an integral part of the financial statements.
Environment and Alternative Energy Portfolio
Financial Statements
Statement of Assets and Liabilities
| | | August 31, 2017 (Unaudited) |
| Assets | | |
Investment in securities, at value (including securities loaned of $1,263,033) — See accompanying schedule:
Unaffiliated issuers (cost $149,938,359) | $169,310,984 | |
| Fidelity Central Funds (cost $2,411,922) | 2,411,901 | |
| Total Investment in Securities (cost $152,350,281) | | $171,722,885 |
| Receivable for investments sold | | 971,320 |
| Receivable for fund shares sold | | 336,907 |
| Dividends receivable | | 505,223 |
| Distributions receivable from Fidelity Central Funds | | 6,503 |
| Other receivables | | 1,060 |
| Total assets | | 173,543,898 |
| Liabilities | | |
| Payable for fund shares redeemed | $1,154,983 | |
| Accrued management fee | 79,246 | |
| Other affiliated payables | 37,804 | |
| Other payables and accrued expenses | 31,617 | |
| Collateral on securities loaned | 1,291,765 | |
| Total liabilities | | 2,595,415 |
| Net Assets | | $170,948,483 |
| Net Assets consist of: | | |
| Paid in capital | | $144,919,138 |
| Undistributed net investment income | | 1,170,024 |
| Accumulated undistributed net realized gain (loss) on investments and foreign currency transactions | | 5,478,058 |
| Net unrealized appreciation (depreciation) on investments and assets and liabilities in foreign currencies | | 19,381,263 |
| Net Assets, for 6,982,108 shares outstanding | | $170,948,483 |
| Net Asset Value, offering price and redemption price per share ($170,948,483 ÷ 6,982,108 shares) | | $24.48 |
See accompanying notes which are an integral part of the financial statements.
Statement of Operations
| | | Six months ended August 31, 2017 (Unaudited) |
| Investment Income | | |
| Dividends | | $1,717,575 |
| Non-Cash dividends | | 133,154 |
| Income from Fidelity Central Funds | | 34,120 |
| Total income | | 1,884,849 |
| Expenses | | |
| Management fee | $440,530 | |
| Transfer agent fees | 176,170 | |
| Accounting and security lending fees | 31,642 | |
| Custodian fees and expenses | 10,907 | |
| Independent trustees' fees and expenses | 1,777 | |
| Registration fees | 27,604 | |
| Audit | 27,139 | |
| Legal | 991 | |
| Miscellaneous | 645 | |
| Total expenses before reductions | 717,405 | |
| Expense reductions | (3,150) | 714,255 |
| Net investment income (loss) | | 1,170,594 |
| Realized and Unrealized Gain (Loss) | | |
| Net realized gain (loss) on: | | |
| Investment securities: | | |
| Unaffiliated issuers | 5,691,081 | |
| Fidelity Central Funds | 531 | |
| Foreign currency transactions | 570 | |
| Total net realized gain (loss) | | 5,692,182 |
| Change in net unrealized appreciation (depreciation) on: | | |
| Unaffiliated issuers (net of decrease in deferred foreign taxes of $17,803) | 1,311,864 | |
| Fidelity Central Funds | (627) | |
| Assets and liabilities in foreign currencies | 5,633 | |
| Total change in net unrealized appreciation (depreciation) | | 1,316,870 |
| Net gain (loss) | | 7,009,052 |
| Net increase (decrease) in net assets resulting from operations | | $8,179,646 |
See accompanying notes which are an integral part of the financial statements.
Statement of Changes in Net Assets
| | Six months ended August 31, 2017 (Unaudited) | Year ended February 28, 2017 |
| Increase (Decrease) in Net Assets | | |
| Operations | | |
| Net investment income (loss) | $1,170,594 | $930,588 |
| Net realized gain (loss) | 5,692,182 | 5,955,658 |
| Change in net unrealized appreciation (depreciation) | 1,316,870 | 21,441,835 |
| Net increase (decrease) in net assets resulting from operations | 8,179,646 | 28,328,081 |
| Distributions to shareholders from net investment income | (280,127) | (790,016) |
| Distributions to shareholders from net realized gain | (4,488,262) | (676,548) |
| Total distributions | (4,768,389) | (1,466,564) |
| Share transactions | | |
| Proceeds from sales of shares | 63,735,657 | 66,656,121 |
| Reinvestment of distributions | 4,405,978 | 1,399,954 |
| Cost of shares redeemed | (38,283,242) | (30,686,349) |
| Net increase (decrease) in net assets resulting from share transactions | 29,858,393 | 37,369,726 |
| Redemption fees | 5,316 | 10,066 |
| Total increase (decrease) in net assets | 33,274,966 | 64,241,309 |
| Net Assets | | |
| Beginning of period | 137,673,517 | 73,432,208 |
| End of period | $170,948,483 | $137,673,517 |
| Other Information | | |
| Undistributed net investment income end of period | $1,170,024 | $279,557 |
| Shares | | |
| Sold | 2,601,833 | 3,101,751 |
| Issued in reinvestment of distributions | 189,179 | 64,231 |
| Redeemed | (1,571,998) | (1,437,873) |
| Net increase (decrease) | 1,219,014 | 1,728,109 |
See accompanying notes which are an integral part of the financial statements.
Financial Highlights — Environment and Alternative Energy Portfolio
| | Six months ended (Unaudited) August 31, | Years ended February 28, | | | | |
| | 2017 | 2017 | 2016 A | 2015 | 2014 | 2013 |
| Selected Per–Share Data | | | | | | |
| Net asset value, beginning of period | $23.89 | $18.20 | $20.94 | $23.36 | $18.12 | $16.32 |
| Income from Investment Operations | | | | | | |
| Net investment income (loss)B | .18 | .20 | .17 | .16 | .14 | .18 |
| Net realized and unrealized gain (loss) | 1.18 | 5.78 | (2.34) | .31 | 5.27 | 1.77 |
| Total from investment operations | 1.36 | 5.98 | (2.17) | .47 | 5.41 | 1.95 |
| Distributions from net investment income | (.05) | (.16) | (.13) | (.14) | (.17) | (.15) |
| Distributions from net realized gain | (.72) | (.13) | (.44) | (2.75) | – | – |
| Total distributions | (.77) | (.29) | (.57) | (2.89) | (.17) | (.15) |
| Redemption fees added to paid in capitalB,C | – | – | – | – | – | – |
| Net asset value, end of period | $24.48 | $23.89 | $18.20 | $20.94 | $23.36 | $18.12 |
| Total ReturnD,E | 5.84% | 33.02% | (10.63)% | 2.19% | 29.97% | 12.02% |
| Ratios to Average Net AssetsF,G | | | | | | |
| Expenses before reductions | .89%H | .94% | .95% | .92% | .97% | .99% |
| Expenses net of fee waivers, if any | .89%H | .94% | .95% | .92% | .97% | .99% |
| Expenses net of all reductions | .88%H | .94% | .95% | .92% | .97% | .97% |
| Net investment income (loss) | 1.45%H | .94% | .86% | .71% | .70% | 1.10% |
| Supplemental Data | | | | | | |
| Net assets, end of period (000 omitted) | $170,948 | $137,674 | $73,432 | $88,573 | $102,869 | $82,018 |
| Portfolio turnover rateI | 51%H | 82% | 20% | 160% | 28% | 54% |
A For the year ended February 29.
B Calculated based on average shares outstanding during the period.
C Amount represents less than $.005 per share.
D Total returns for periods of less than one year are not annualized.
E Total returns would have been lower if certain expenses had not been reduced during the applicable periods shown.
F Fees and expenses of any underlying Fidelity Central Funds are not included in the Fund's expense ratio. The Fund indirectly bears its proportionate share of the expenses of any underlying Fidelity Central Funds.
G Expense ratios reflect operating expenses of the Fund. Expenses before reductions do not reflect amounts reimbursed by the investment adviser or reductions from brokerage service arrangements or reductions from other expense offset arrangements and do not represent the amount paid by the Fund during periods when reimbursements or reductions occur. Expenses net of fee waivers reflect expenses after reimbursement by the investment adviser but prior to reductions from brokerage service arrangements or other expense offset arrangements. Expenses net of all reductions represent the net expenses paid by the Fund.
H Annualized
I Amount does not include the portfolio activity of any underlying Fidelity Central Funds.
See accompanying notes which are an integral part of the financial statements.
Industrial Equipment Portfolio
Investment Summary (Unaudited)
Top Ten Stocks as of August 31, 2017
| | % of fund's net assets | % of fund's net assets 6 months ago |
| General Electric Co. | 7.6 | 11.6 |
| AMETEK, Inc. | 7.2 | 5.8 |
| The Boeing Co. | 7.1 | 4.8 |
| Honeywell International, Inc. | 5.4 | 5.2 |
| Lockheed Martin Corp. | 4.6 | 1.2 |
| Raytheon Co. | 4.5 | 2.3 |
| HD Supply Holdings, Inc. | 4.3 | 5.1 |
| Roper Technologies, Inc. | 4.2 | 1.7 |
| Fortive Corp. | 4.0 | 2.2 |
| General Dynamics Corp. | 3.7 | 4.7 |
| | 52.6 | |
Top Industries (% of fund's net assets)
| As of August 31, 2017 |
| | Aerospace & Defense | 33.8% |
| | Machinery | 24.3% |
| | Industrial Conglomerates | 20.2% |
| | Electrical Equipment | 13.1% |
| | Trading Companies & Distributors | 5.1% |
| | All Others* | 3.5% |
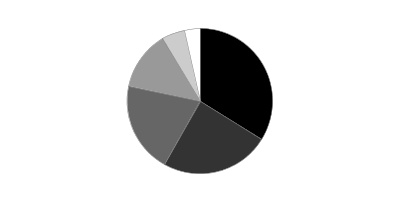
| As of February 28, 2017 |
| | Machinery | 30.9% |
| | Aerospace & Defense | 22.3% |
| | Industrial Conglomerates | 20.2% |
| | Electrical Equipment | 14.3% |
| | Trading Companies & Distributors | 8.3% |
| | All Others* | 4.0% |
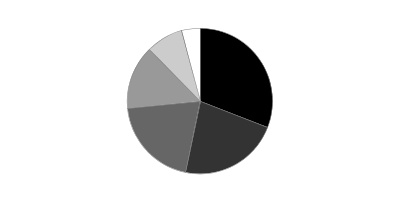
* Includes short-term investments and net other assets (liabilities).
Industrial Equipment Portfolio
Investments August 31, 2017 (Unaudited)
Showing Percentage of Net Assets
| Common Stocks - 99.6% | | | |
| | | Shares | Value |
| Aerospace & Defense - 33.8% | | | |
| Aerospace & Defense - 33.8% | | | |
| Elbit Systems Ltd. | | 5,300 | $732,407 |
| General Dynamics Corp. | | 28,800 | 5,798,880 |
| HEICO Corp. Class A | | 19,800 | 1,438,470 |
| Huntington Ingalls Industries, Inc. | | 4,000 | 855,840 |
| L3 Technologies, Inc. | | 8,100 | 1,469,988 |
| Lockheed Martin Corp. | | 23,600 | 7,207,204 |
| Northrop Grumman Corp. | | 19,900 | 5,416,979 |
| Raytheon Co. | | 39,000 | 7,098,390 |
| Rockwell Collins, Inc. | | 41,600 | 5,451,680 |
| Teledyne Technologies, Inc. (a) | | 2,500 | 375,150 |
| The Boeing Co. | | 46,800 | 11,216,088 |
| TransDigm Group, Inc. | | 2,900 | 755,914 |
| United Technologies Corp. | | 44,700 | 5,351,484 |
| | | | 53,168,474 |
| Building Products - 1.3% | | | |
| Building Products - 1.3% | | | |
| Allegion PLC | | 14,600 | 1,149,166 |
| Fortune Brands Home & Security, Inc. | | 15,200 | 950,456 |
| | | | 2,099,622 |
| Chemicals - 0.0% | | | |
| Diversified Chemicals - 0.0% | | | |
| AdvanSix, Inc. | | 1 | 32 |
| Construction & Engineering - 0.8% | | | |
| Construction & Engineering - 0.8% | | | |
| AECOM (a) | | 15,093 | 505,616 |
| Dycom Industries, Inc. (a) | | 2,600 | 209,768 |
| Quanta Services, Inc. (a) | | 16,500 | 592,845 |
| | | | 1,308,229 |
| Electrical Equipment - 13.1% | | | |
| Electrical Components & Equipment - 13.1% | | | |
| Acuity Brands, Inc. (b) | | 2,400 | 424,296 |
| AMETEK, Inc. | | 180,000 | 11,385,000 |
| Eaton Corp. PLC | | 34,500 | 2,475,720 |
| Fortive Corp. | | 96,800 | 6,289,096 |
| | | | 20,574,112 |
| Electronic Equipment & Components - 1.0% | | | |
| Electronic Equipment & Instruments - 1.0% | | | |
| Cognex Corp. | | 15,000 | 1,634,550 |
| Industrial Conglomerates - 20.2% | | | |
| Industrial Conglomerates - 20.2% | | | |
| 3M Co. | | 23,100 | 4,719,792 |
| General Electric Co. | | 486,255 | 11,937,560 |
| Honeywell International, Inc. | | 61,400 | 8,489,778 |
| Roper Technologies, Inc. | | 28,600 | 6,596,876 |
| | | | 31,744,006 |
| Machinery - 24.3% | | | |
| Agricultural & Farm Machinery - 1.5% | | | |
| Deere & Co. | | 20,700 | 2,399,751 |
| Construction Machinery & Heavy Trucks - 7.7% | | | |
| Allison Transmission Holdings, Inc. | | 500 | 17,365 |
| Caterpillar, Inc. | | 47,600 | 5,592,524 |
| Cummins, Inc. | | 13,300 | 2,119,754 |
| Wabtec Corp. (b) | | 62,600 | 4,417,682 |
| | | | 12,147,325 |
| Industrial Machinery - 15.1% | | | |
| Colfax Corp. (a) | | 15,900 | 634,092 |
| Flowserve Corp. | | 59,808 | 2,349,258 |
| IDEX Corp. | | 30,600 | 3,597,948 |
| Parker Hannifin Corp. | | 24,600 | 3,957,894 |
| Pentair PLC | | 88,715 | 5,504,766 |
| Rexnord Corp. (a) | | 100,714 | 2,405,050 |
| SPX Flow, Inc. (a) | | 200 | 6,694 |
| Xylem, Inc. | | 85,400 | 5,300,778 |
| | | | 23,756,480 |
|
| TOTAL MACHINERY | | | 38,303,556 |
|
| Trading Companies & Distributors - 5.1% | | | |
| Trading Companies & Distributors - 5.1% | | | |
| HD Supply Holdings, Inc. (a) | | 201,300 | 6,703,290 |
| MRC Global, Inc. (a) | | 83,800 | 1,321,526 |
| | | | 8,024,816 |
| TOTAL COMMON STOCKS | | | |
| (Cost $126,262,970) | | | 156,857,397 |
|
| Money Market Funds - 2.8% | | | |
| Fidelity Cash Central Fund, 1.11% (c) | | 503,560 | 503,661 |
| Fidelity Securities Lending Cash Central Fund 1.11% (c)(d) | | 3,915,131 | 3,915,522 |
| TOTAL MONEY MARKET FUNDS | | | |
| (Cost $4,419,183) | | | 4,419,183 |
| TOTAL INVESTMENT IN SECURITIES - 102.4% | | | |
| (Cost $130,682,153) | | | 161,276,580 |
| NET OTHER ASSETS (LIABILITIES) - (2.4)% | | | (3,782,032) |
| NET ASSETS - 100% | | | $157,494,548 |
Legend
(a) Non-income producing
(b) Security or a portion of the security is on loan at period end.
(c) Affiliated fund that is generally available only to investment companies and other accounts managed by Fidelity Investments. The rate quoted is the annualized seven-day yield of the fund at period end. A complete unaudited listing of the fund's holdings as of its most recent quarter end is available upon request. In addition, each Fidelity Central Fund's financial statements are available on the SEC's website or upon request.
(d) Investment made with cash collateral received from securities on loan.
Affiliated Central Funds
Information regarding fiscal year to date income earned by the Fund from investments in Fidelity Central Funds is as follows:
| Fund | Income earned |
| Fidelity Cash Central Fund | $2,758 |
| Fidelity Securities Lending Cash Central Fund | 6,673 |
| Total | $9,431 |
Investment Valuation
All investments are categorized as Level 1 under the Fair Value Hierarchy. The inputs or methodology used for valuing securities may not be an indication of the risk associated with investing in those securities. For more information on valuation inputs please refer to the Investment Valuation section in the accompanying Notes to Financial Statements.
See accompanying notes which are an integral part of the financial statements.
Industrial Equipment Portfolio
Financial Statements
Statement of Assets and Liabilities
| | | August 31, 2017 (Unaudited) |
| Assets | | |
Investment in securities, at value (including securities loaned of $3,843,376) — See accompanying schedule:
Unaffiliated issuers (cost $126,262,970) | $156,857,397 | |
| Fidelity Central Funds (cost $4,419,183) | 4,419,183 | |
| Total Investment in Securities (cost $130,682,153) | | $161,276,580 |
| Receivable for investments sold | | 299,590 |
| Receivable for fund shares sold | | 72,782 |
| Dividends receivable | | 373,182 |
| Distributions receivable from Fidelity Central Funds | | 1,540 |
| Other receivables | | 1,034 |
| Total assets | | 162,024,708 |
| Liabilities | | |
| Payable for investments purchased | $381,565 | |
| Payable for fund shares redeemed | 110,677 | |
| Accrued management fee | 71,203 | |
| Other affiliated payables | 29,809 | |
| Other payables and accrued expenses | 21,106 | |
| Collateral on securities loaned | 3,915,800 | |
| Total liabilities | | 4,530,160 |
| Net Assets | | $157,494,548 |
| Net Assets consist of: | | |
| Paid in capital | | $126,362,117 |
| Undistributed net investment income | | 647,763 |
| Accumulated undistributed net realized gain (loss) on investments | | (109,769) |
| Net unrealized appreciation (depreciation) on investments and assets and liabilities in foreign currencies | | 30,594,437 |
| Net Assets, for 3,883,074 shares outstanding | | $157,494,548 |
| Net Asset Value, offering price and redemption price per share ($157,494,548 ÷ 3,883,074 shares) | | $40.56 |
See accompanying notes which are an integral part of the financial statements.
Statement of Operations
| | | Six months ended August 31, 2017 (Unaudited) |
| Investment Income | | |
| Dividends | | $1,325,735 |
| Income from Fidelity Central Funds | | 9,431 |
| Total income | | 1,335,166 |
| Expenses | | |
| Management fee | $452,480 | |
| Transfer agent fees | 154,976 | |
| Accounting and security lending fees | 32,761 | |
| Custodian fees and expenses | (236) | |
| Independent trustees' fees and expenses | 1,972 | |
| Registration fees | 17,031 | |
| Audit | 26,440 | |
| Legal | 1,858 | |
| Miscellaneous | 1,210 | |
| Total expenses before reductions | 688,492 | |
| Expense reductions | (4,224) | 684,268 |
| Net investment income (loss) | | 650,898 |
| Realized and Unrealized Gain (Loss) | | |
| Net realized gain (loss) on: | | |
| Investment securities: | | |
| Unaffiliated issuers | 346,104 | |
| Fidelity Central Funds | (278) | |
| Total net realized gain (loss) | | 345,826 |
| Change in net unrealized appreciation (depreciation) on: | | |
| Investment securities: | | |
| Unaffiliated issuers | 5,202,076 | |
| Assets and liabilities in foreign currencies | 10 | |
| Total change in net unrealized appreciation (depreciation) | | 5,202,086 |
| Net gain (loss) | | 5,547,912 |
| Net increase (decrease) in net assets resulting from operations | | $6,198,810 |
See accompanying notes which are an integral part of the financial statements.
Statement of Changes in Net Assets
| | Six months ended August 31, 2017 (Unaudited) | Year ended February 28, 2017 |
| Increase (Decrease) in Net Assets | | |
| Operations | | |
| Net investment income (loss) | $650,898 | $1,776,251 |
| Net realized gain (loss) | 345,826 | 18,031,016 |
| Change in net unrealized appreciation (depreciation) | 5,202,086 | 14,714,578 |
| Net increase (decrease) in net assets resulting from operations | 6,198,810 | 34,521,845 |
| Distributions to shareholders from net investment income | (365,784) | (1,294,923) |
| Distributions to shareholders from net realized gain | (6,141,762) | (8,371,263) |
| Total distributions | (6,507,546) | (9,666,186) |
| Share transactions | | |
| Proceeds from sales of shares | 5,777,906 | 66,086,044 |
| Reinvestment of distributions | 6,343,972 | 9,433,524 |
| Cost of shares redeemed | (39,474,471) | (72,725,165) |
| Net increase (decrease) in net assets resulting from share transactions | (27,352,593) | 2,794,403 |
| Redemption fees | 125 | 4,026 |
| Total increase (decrease) in net assets | (27,661,204) | 27,654,088 |
| Net Assets | | |
| Beginning of period | 185,155,752 | 157,501,664 |
| End of period | $157,494,548 | $185,155,752 |
| Other Information | | |
| Undistributed net investment income end of period | $647,763 | $362,649 |
| Shares | | |
| Sold | 143,809 | 1,702,493 |
| Issued in reinvestment of distributions | 165,165 | 240,651 |
| Redeemed | (985,308) | (1,851,754) |
| Net increase (decrease) | (676,334) | 91,390 |
See accompanying notes which are an integral part of the financial statements.
Financial Highlights — Industrial Equipment Portfolio
| | Six months ended (Unaudited) August 31, | Years ended February 28, | | | | |
| | 2017 | 2017 | 2016 A | 2015 | 2014 | 2013 |
| Selected Per–Share Data | | | | | | |
| Net asset value, beginning of period | $40.61 | $35.25 | $38.86 | $46.03 | $39.59 | $36.37 |
| Income from Investment Operations | | | | | | |
| Net investment income (loss)B | .16 | .37 | .33 | .32 | .37 | .45 |
| Net realized and unrealized gain (loss) | 1.32 | 7.00 | (1.87) | .75 | 9.19 | 3.22 |
| Total from investment operations | 1.48 | 7.37 | (1.54) | 1.07 | 9.56 | 3.67 |
| Distributions from net investment income | (.09) | (.27) | (.19) | (.36) | (.32) | (.45) |
| Distributions from net realized gain | (1.44) | (1.74) | (1.88) | (7.88) | (2.80) | – |
| Total distributions | (1.53) | (2.01) | (2.07) | (8.24) | (3.12) | (.45) |
| Redemption fees added to paid in capitalB,C | – | – | – | – | – | – |
| Net asset value, end of period | $40.56 | $40.61 | $35.25 | $38.86 | $46.03 | $39.59 |
| Total ReturnD,E | 3.86% | 21.11% | (4.20)% | 3.36% | 24.37% | 10.19% |
| Ratios to Average Net AssetsF,G | | | | | | |
| Expenses before reductions | .83%H | .83% | .83% | .77% | .79% | .82% |
| Expenses net of fee waivers, if any | .83%H | .83% | .83% | .77% | .78% | .82% |
| Expenses net of all reductions | .82%H | .83% | .82% | .77% | .78% | .81% |
| Net investment income (loss) | .78%H | .94% | .90% | .76% | .87% | 1.25% |
| Supplemental Data | | | | | | |
| Net assets, end of period (000 omitted) | $157,495 | $185,156 | $157,502 | $228,311 | $425,386 | $369,951 |
| Portfolio turnover rateI | 70%H | 166% | 72%J | 53% | 100% | 69% |
A For the year ended February 29.
B Calculated based on average shares outstanding during the period.
C Amount represents less than $.005 per share.
D Total returns for periods of less than one year are not annualized.
E Total returns would have been lower if certain expenses had not been reduced during the applicable periods shown.
F Fees and expenses of any underlying Fidelity Central Funds are not included in the Fund's expense ratio. The Fund indirectly bears its proportionate share of the expenses of any underlying Fidelity Central Funds.
G Expense ratios reflect operating expenses of the Fund. Expenses before reductions do not reflect amounts reimbursed by the investment adviser or reductions from brokerage service arrangements or reductions from other expense offset arrangements and do not represent the amount paid by the Fund during periods when reimbursements or reductions occur. Expenses net of fee waivers reflect expenses after reimbursement by the investment adviser but prior to reductions from brokerage service arrangements or other expense offset arrangements. Expenses net of all reductions represent the net expenses paid by the Fund.
H Annualized
I Amount does not include the portfolio activity of any underlying Fidelity Central Funds.
J Portfolio turnover rate excludes securities received or delivered in-kind.
See accompanying notes which are an integral part of the financial statements.
Industrials Portfolio
Investment Summary (Unaudited)
Top Ten Stocks as of August 31, 2017
| | % of fund's net assets | % of fund's net assets 6 months ago |
| United Technologies Corp. | 5.7 | 4.8 |
| Honeywell International, Inc. | 5.5 | 4.8 |
| Caterpillar, Inc. | 5.4 | 3.6 |
| General Electric Co. | 5.3 | 10.4 |
| Northrop Grumman Corp. | 4.6 | 3.7 |
| General Dynamics Corp. | 4.2 | 4.3 |
| Union Pacific Corp. | 3.9 | 0.0 |
| Raytheon Co. | 3.1 | 1.9 |
| Fortive Corp. | 2.7 | 2.1 |
| The Boeing Co. | 2.5 | 0.0 |
| | 42.9 | |
Top Industries (% of fund's net assets)
| As of August 31, 2017 |
| | Aerospace & Defense | 27.5% |
| | Machinery | 22.9% |
| | Industrial Conglomerates | 11.3% |
| | Road & Rail | 8.5% |
| | Electrical Equipment | 7.5% |
| | All Others* | 22.3% |
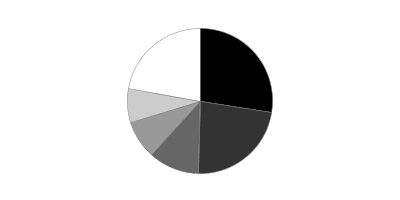
| As of February 28, 2017 |
| | Aerospace & Defense | 21.2% |
| | Machinery | 17.6% |
| | Industrial Conglomerates | 16.5% |
| | Road & Rail | 9.4% |
| | Electrical Equipment | 7.9% |
| | All Others* | 27.4% |
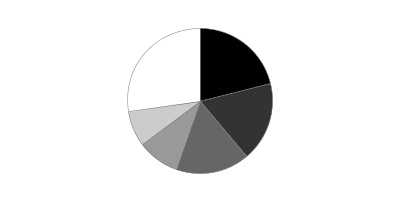
* Includes short-term investments and net other assets (liabilities).
Percentages shown as 0.0% may reflect amounts less than 0.05%.
Industrials Portfolio
Investments August 31, 2017 (Unaudited)
Showing Percentage of Net Assets
| Common Stocks - 99.3% | | | |
| | | Shares | Value |
| Aerospace & Defense - 27.5% | | | |
| Aerospace & Defense - 27.5% | | | |
| Astronics Corp. (a) | | 101,317 | $2,663,624 |
| Astronics Corp. Class B | | 8,732 | 228,778 |
| Axon Enterprise, Inc. (a) | | 193,500 | 4,200,885 |
| Elbit Systems Ltd. | | 28,100 | 3,883,139 |
| General Dynamics Corp. | | 170,397 | 34,309,436 |
| Huntington Ingalls Industries, Inc. | | 33,100 | 7,082,076 |
| Northrop Grumman Corp. | | 139,900 | 38,082,179 |
| Raytheon Co. | | 138,800 | 25,262,988 |
| Rockwell Collins, Inc. | | 128,100 | 16,787,505 |
| Teledyne Technologies, Inc. (a) | | 93,340 | 14,006,600 |
| The Boeing Co. | | 86,900 | 20,826,454 |
| TransDigm Group, Inc. | | 46,600 | 12,146,756 |
| United Technologies Corp. | | 392,371 | 46,974,657 |
| | | | 226,455,077 |
| Air Freight & Logistics - 1.3% | | | |
| Air Freight & Logistics - 1.3% | | | |
| XPO Logistics, Inc. (a) | | 175,600 | 10,746,720 |
| Airlines - 2.5% | | | |
| Airlines - 2.5% | | | |
| Ryanair Holdings PLC sponsored ADR (a) | | 34,700 | 3,945,390 |
| Southwest Airlines Co. | | 325,000 | 16,945,500 |
| | | | 20,890,890 |
| Building Products - 3.7% | | | |
| Building Products - 3.7% | | | |
| A.O. Smith Corp. | | 202,878 | 11,298,276 |
| Fortune Brands Home & Security, Inc. | | 143,500 | 8,973,055 |
| Masco Corp. | | 289,100 | 10,630,207 |
| | | | 30,901,538 |
| Commercial Services & Supplies - 4.0% | | | |
| Diversified Support Services - 2.8% | | | |
| Cintas Corp. | | 90,000 | 12,150,900 |
| KAR Auction Services, Inc. | | 238,600 | 10,758,474 |
| | | | 22,909,374 |
| Environmental & Facility Services - 1.2% | | | |
| Waste Connection, Inc. (United States) | | 146,900 | 9,796,761 |
|
| TOTAL COMMERCIAL SERVICES & SUPPLIES | | | 32,706,135 |
|
| Construction & Engineering - 4.3% | | | |
| Construction & Engineering - 4.3% | | | |
| AECOM (a) | | 619,198 | 20,743,133 |
| Dycom Industries, Inc. (a) | | 61,200 | 4,937,616 |
| KBR, Inc. | | 591,600 | 9,625,332 |
| | | | 35,306,081 |
| Electrical Equipment - 7.5% | | | |
| Electrical Components & Equipment - 6.7% | | | |
| AMETEK, Inc. | | 260,354 | 16,467,391 |
| Eaton Corp. PLC | | 226,300 | 16,239,288 |
| Fortive Corp. | | 350,610 | 22,779,132 |
| | | | 55,485,811 |
| Heavy Electrical Equipment - 0.8% | | | |
| TPI Composites, Inc. (a) | | 331,657 | 6,745,903 |
|
| TOTAL ELECTRICAL EQUIPMENT | | | 62,231,714 |
|
| Industrial Conglomerates - 11.3% | | | |
| Industrial Conglomerates - 11.3% | | | |
| 3M Co. | | 20,600 | 4,208,992 |
| General Electric Co. | | 1,771,684 | 43,494,842 |
| Honeywell International, Inc. | | 325,759 | 45,042,697 |
| | | | 92,746,531 |
| Machinery - 22.9% | | | |
| Construction Machinery & Heavy Trucks - 11.1% | | | |
| Allison Transmission Holdings, Inc. | | 442,400 | 15,364,552 |
| Caterpillar, Inc. | | 377,700 | 44,375,973 |
| PACCAR, Inc. | | 126,000 | 8,357,580 |
| WABCO Holdings, Inc. (a) | | 121,300 | 17,421,106 |
| Wabtec Corp. (b) | | 85,200 | 6,012,564 |
| | | | 91,531,775 |
| Industrial Machinery - 11.8% | | | |
| CIRCOR International, Inc. | | 17,300 | 830,746 |
| Flowserve Corp. | | 148,200 | 5,821,296 |
| Gardner Denver Holdings, Inc. | | 188,500 | 4,427,865 |
| IDEX Corp. | | 103,798 | 12,204,569 |
| Ingersoll-Rand PLC | | 193,500 | 16,522,965 |
| Lincoln Electric Holdings, Inc. | | 65,500 | 5,688,020 |
| Nordson Corp. | | 54,200 | 5,924,060 |
| Parker Hannifin Corp. | | 80,000 | 12,871,200 |
| Pentair PLC | | 152,035 | 9,433,772 |
| Rexnord Corp. (a) | | 324,692 | 7,753,645 |
| Snap-On, Inc. (b) | | 102,100 | 15,066,897 |
| Xylem, Inc. | | 6,600 | 409,662 |
| | | | 96,954,697 |
|
| TOTAL MACHINERY | | | 188,486,472 |
|
| Professional Services - 2.4% | | | |
| Human Resource & Employment Services - 0.7% | | | |
| Robert Half International, Inc. | | 129,600 | 5,870,880 |
| Research & Consulting Services - 1.7% | | | |
| IHS Markit Ltd. (a) | | 293,600 | 13,752,224 |
|
| TOTAL PROFESSIONAL SERVICES | | | 19,623,104 |
|
| Road & Rail - 8.5% | | | |
| Railroads - 6.9% | | | |
| Genesee & Wyoming, Inc. Class A (a) | | 80,400 | 5,512,224 |
| Norfolk Southern Corp. | | 156,300 | 18,837,276 |
| Union Pacific Corp. | | 309,100 | 32,548,230 |
| | | | 56,897,730 |
| Trucking - 1.6% | | | |
| J.B. Hunt Transport Services, Inc. | | 72,120 | 7,131,947 |
| Old Dominion Freight Lines, Inc. | | 63,100 | 6,303,690 |
| | | | 13,435,637 |
|
| TOTAL ROAD & RAIL | | | 70,333,367 |
|
| Trading Companies & Distributors - 2.7% | | | |
| Trading Companies & Distributors - 2.7% | | | |
| HD Supply Holdings, Inc. (a) | | 198,648 | 6,614,978 |
| MSC Industrial Direct Co., Inc. Class A | | 73,600 | 5,069,568 |
| Univar, Inc. (a) | | 373,500 | 10,536,435 |
| | | | 22,220,981 |
| Water Utilities - 0.7% | | | |
| Water Utilities - 0.7% | | | |
| AquaVenture Holdings Ltd. (b) | | 365,500 | 5,540,979 |
| TOTAL COMMON STOCKS | | | |
| (Cost $655,004,141) | | | 818,189,589 |
|
| Money Market Funds - 0.9% | | | |
| Fidelity Cash Central Fund, 1.11% (c) | | 4,227,454 | 4,228,299 |
| Fidelity Securities Lending Cash Central Fund 1.11% (c)(d) | | 2,663,307 | 2,663,574 |
| TOTAL MONEY MARKET FUNDS | | | |
| (Cost $6,891,872) | | | 6,891,873 |
| TOTAL INVESTMENT IN SECURITIES - 100.2% | | | |
| (Cost $661,896,013) | | | 825,081,462 |
| NET OTHER ASSETS (LIABILITIES) - (0.2)% | | | (1,427,926) |
| NET ASSETS - 100% | | | $823,653,536 |
Legend
(a) Non-income producing
(b) Security or a portion of the security is on loan at period end.
(c) Affiliated fund that is generally available only to investment companies and other accounts managed by Fidelity Investments. The rate quoted is the annualized seven-day yield of the fund at period end. A complete unaudited listing of the fund's holdings as of its most recent quarter end is available upon request. In addition, each Fidelity Central Fund's financial statements are available on the SEC's website or upon request.
(d) Investment made with cash collateral received from securities on loan.
Affiliated Central Funds
Information regarding fiscal year to date income earned by the Fund from investments in Fidelity Central Funds is as follows:
| Fund | Income earned |
| Fidelity Cash Central Fund | $25,546 |
| Fidelity Securities Lending Cash Central Fund | 25,164 |
| Total | $50,710 |
Investment Valuation
All investments are categorized as Level 1 under the Fair Value Hierarchy. The inputs or methodology used for valuing securities may not be an indication of the risk associated with investing in those securities. For more information on valuation inputs please refer to the Investment Valuation section in the accompanying Notes to Financial Statements.
See accompanying notes which are an integral part of the financial statements.
Industrials Portfolio
Financial Statements
Statement of Assets and Liabilities
| | | August 31, 2017 (Unaudited) |
| Assets | | |
Investment in securities, at value (including securities loaned of $2,580,376) — See accompanying schedule:
Unaffiliated issuers (cost $655,004,141) | $818,189,589 | |
| Fidelity Central Funds (cost $6,891,872) | 6,891,873 | |
| Total Investment in Securities (cost $661,896,013) | | $825,081,462 |
| Receivable for investments sold | | 8,830,098 |
| Receivable for fund shares sold | | 684,143 |
| Dividends receivable | | 2,436,279 |
| Distributions receivable from Fidelity Central Funds | | 4,981 |
| Other receivables | | 72,085 |
| Total assets | | 837,109,048 |
| Liabilities | | |
| Payable for investments purchased | $4,508,185 | |
| Payable for fund shares redeemed | 5,664,725 | |
| Accrued management fee | 386,067 | |
| Other affiliated payables | 154,486 | |
| Other payables and accrued expenses | 78,349 | |
| Collateral on securities loaned | 2,663,700 | |
| Total liabilities | | 13,455,512 |
| Net Assets | | $823,653,536 |
| Net Assets consist of: | | |
| Paid in capital | | $637,039,774 |
| Undistributed net investment income | | 3,962,486 |
| Accumulated undistributed net realized gain (loss) on investments and foreign currency transactions | | 19,465,827 |
| Net unrealized appreciation (depreciation) on investments | | 163,185,449 |
| Net Assets, for 24,494,304 shares outstanding | | $823,653,536 |
| Net Asset Value, offering price and redemption price per share ($823,653,536 ÷ 24,494,304 shares) | | $33.63 |
See accompanying notes which are an integral part of the financial statements.
Statement of Operations
| | | Six months ended August 31, 2017 (Unaudited) |
| Investment Income | | |
| Dividends | | $7,492,251 |
| Income from Fidelity Central Funds | | 50,710 |
| Total income | | 7,542,961 |
| Expenses | | |
| Management fee | $2,497,332 | |
| Transfer agent fees | 816,972 | |
| Accounting and security lending fees | 156,495 | |
| Custodian fees and expenses | 10,232 | |
| Independent trustees' fees and expenses | 10,753 | |
| Registration fees | 29,490 | |
| Audit | 27,830 | |
| Legal | 7,524 | |
| Interest | 1,978 | |
| Miscellaneous | 7,721 | |
| Total expenses before reductions | 3,566,327 | |
| Expense reductions | (37,964) | 3,528,363 |
| Net investment income (loss) | | 4,014,598 |
| Realized and Unrealized Gain (Loss) | | |
| Net realized gain (loss) on: | | |
| Investment securities: | | |
| Unaffiliated issuers | 21,022,764 | |
| Fidelity Central Funds | 1,708 | |
| Foreign currency transactions | (412) | |
| Total net realized gain (loss) | | 21,024,060 |
| Change in net unrealized appreciation (depreciation) on: | | |
| Investment securities: | | |
| Unaffiliated issuers | (11,588,917) | |
| Fidelity Central Funds | (205) | |
| Total change in net unrealized appreciation (depreciation) | | (11,589,122) |
| Net gain (loss) | | 9,434,938 |
| Net increase (decrease) in net assets resulting from operations | | $13,449,536 |
See accompanying notes which are an integral part of the financial statements.
Statement of Changes in Net Assets
| | Six months ended August 31, 2017 (Unaudited) | Year ended February 28, 2017 |
| Increase (Decrease) in Net Assets | | |
| Operations | | |
| Net investment income (loss) | $4,014,598 | $8,475,623 |
| Net realized gain (loss) | 21,024,060 | 113,517,493 |
| Change in net unrealized appreciation (depreciation) | (11,589,122) | 81,799,219 |
| Net increase (decrease) in net assets resulting from operations | 13,449,536 | 203,792,335 |
| Distributions to shareholders from net investment income | (1,675,122) | (5,098,193) |
| Distributions to shareholders from net realized gain | (16,041,432) | (33,247,891) |
| Total distributions | (17,716,554) | (38,346,084) |
| Share transactions | | |
| Proceeds from sales of shares | 87,042,987 | 405,686,354 |
| Reinvestment of distributions | 17,107,340 | 37,026,695 |
| Cost of shares redeemed | (282,650,159) | (580,294,997) |
| Net increase (decrease) in net assets resulting from share transactions | (178,499,832) | (137,581,948) |
| Redemption fees | – | 6,151 |
| Total increase (decrease) in net assets | (182,766,850) | 27,870,454 |
| Net Assets | | |
| Beginning of period | 1,006,420,386 | 978,549,932 |
| End of period | $823,653,536 | $1,006,420,386 |
| Other Information | | |
| Undistributed net investment income end of period | $3,962,486 | $1,623,010 |
| Shares | | |
| Sold | 2,594,119 | 12,627,592 |
| Issued in reinvestment of distributions | 528,494 | 1,142,094 |
| Redeemed | (8,475,955) | (18,750,051) |
| Net increase (decrease) | (5,353,342) | (4,980,365) |
See accompanying notes which are an integral part of the financial statements.
Financial Highlights — Industrials Portfolio
| | Six months ended (Unaudited) August 31, | Years ended February 28, | | | | |
| | 2017 | 2017 | 2016 A | 2015 | 2014 | 2013 |
| Selected Per–Share Data | | | | | | |
| Net asset value, beginning of period | $33.72 | $28.10 | $32.69 | $33.69 | $28.04 | $24.69 |
| Income from Investment Operations | | | | | | |
| Net investment income (loss)B | .15 | .26 | .24 | .22 | .23 | .28 |
| Net realized and unrealized gain (loss) | .38 | 6.76 | (2.90) | 2.44 | 7.36 | 3.54 |
| Total from investment operations | .53 | 7.02 | (2.66) | 2.66 | 7.59 | 3.82 |
| Distributions from net investment income | (.06) | (.19) | (.20) | (.23) | (.20) | (.26) |
| Distributions from net realized gain | (.57) | (1.21) | (1.73) | (3.43) | (1.74) | (.21) |
| Total distributions | (.62)C | (1.40) | (1.93) | (3.66) | (1.94) | (.47) |
| Redemption fees added to paid in capitalB | – | –D | –D | –D | –D | –D |
| Net asset value, end of period | $33.63 | $33.72 | $28.10 | $32.69 | $33.69 | $28.04 |
| Total ReturnE,F | 1.66% | 25.18% | (8.29)% | 8.74% | 27.80% | 15.71% |
| Ratios to Average Net AssetsG,H | | | | | | |
| Expenses before reductions | .78%I | .77% | .77% | .78% | .81% | .85% |
| Expenses net of fee waivers, if any | .78%I | .77% | .76% | .78% | .81% | .85% |
| Expenses net of all reductions | .77%I | .77% | .76% | .78% | .81% | .84% |
| Net investment income (loss) | .88%I | .83% | .79% | .68% | .74% | 1.13% |
| Supplemental Data | | | | | | |
| Net assets, end of period (000 omitted) | $823,654 | $1,006,420 | $978,550 | $1,142,689 | $1,217,117 | $873,266 |
| Portfolio turnover rateJ | 56%I | 62%K | 75%K | 72%K | 58% | 75% |
A For the year ended February 29.
B Calculated based on average shares outstanding during the period.
C Total distributions of $.62 per share is comprised of distributions from net investment income of $.059 and distributions from net realized gain of $.565 per share.
D Amount represents less than $.005 per share.
E Total returns for periods of less than one year are not annualized.
F Total returns would have been lower if certain expenses had not been reduced during the applicable periods shown.
G Fees and expenses of any underlying Fidelity Central Funds are not included in the Fund's expense ratio. The Fund indirectly bears its proportionate share of the expenses of any underlying Fidelity Central Funds.
H Expense ratios reflect operating expenses of the Fund. Expenses before reductions do not reflect amounts reimbursed by the investment adviser or reductions from brokerage service arrangements or reductions from other expense offset arrangements and do not represent the amount paid by the Fund during periods when reimbursements or reductions occur. Expenses net of fee waivers reflect expenses after reimbursement by the investment adviser but prior to reductions from brokerage service arrangements or other expense offset arrangements. Expenses net of all reductions represent the net expenses paid by the Fund.
I Annualized
J Amount does not include the portfolio activity of any underlying Fidelity Central Funds.
K Portfolio turnover rate excludes securities received or delivered in-kind.
See accompanying notes which are an integral part of the financial statements.
Transportation Portfolio
Investment Summary (Unaudited)
Top Ten Stocks as of August 31, 2017
| | % of fund's net assets | % of fund's net assets 6 months ago |
| Union Pacific Corp. | 17.3 | 11.6 |
| United Parcel Service, Inc. Class B | 14.0 | 14.5 |
| FedEx Corp. | 6.6 | 9.4 |
| CSX Corp. | 6.3 | 8.1 |
| Norfolk Southern Corp. | 5.7 | 4.9 |
| Delta Air Lines, Inc. | 4.4 | 4.7 |
| Genesee & Wyoming, Inc. Class A | 3.9 | 4.4 |
| Expeditors International of Washington, Inc. | 3.7 | 4.2 |
| Southwest Airlines Co. | 3.1 | 3.3 |
| C.H. Robinson Worldwide, Inc. | 3.1 | 0.3 |
| | 68.1 | |
Top Industries (% of fund's net assets)
| As of August 31, 2017 |
| | Road & Rail | 44.8% |
| | Air Freight & Logistics | 32.2% |
| | Airlines | 16.3% |
| | Transportation Infrastructure | 1.6% |
| | Machinery | 1.3% |
| | All Others* | 3.8% |
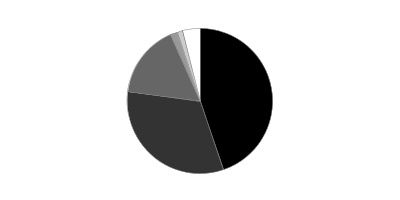
| As of February 28, 2017 |
| | Road & Rail | 38.6% |
| | Air Freight & Logistics | 30.6% |
| | Airlines | 25.7% |
| | Machinery | 1.4% |
| | Transportation Infrastructure | 0.6% |
| | All Others* | 3.1% |

* Includes short-term investments and net other assets (liabilities).
Transportation Portfolio
Investments August 31, 2017 (Unaudited)
Showing Percentage of Net Assets
| Common Stocks - 96.8% | | | |
| | | Shares | Value |
| Aerospace & Defense - 0.1% | | | |
| Aerospace & Defense - 0.1% | | | |
| Rockwell Collins, Inc. | | 4,300 | $563,515 |
| Air Freight & Logistics - 32.2% | | | |
| Air Freight & Logistics - 32.2% | | | |
| Air Transport Services Group, Inc. (a) | | 189,200 | 4,344,032 |
| Atlas Air Worldwide Holdings, Inc. (a) | | 76,200 | 5,090,160 |
| C.H. Robinson Worldwide, Inc. (b) | | 226,296 | 15,983,286 |
| Expeditors International of Washington, Inc. | | 336,700 | 18,888,870 |
| FedEx Corp. | | 157,700 | 33,807,726 |
| Forward Air Corp. | | 105,144 | 5,464,334 |
| United Parcel Service, Inc. Class B | | 629,300 | 71,966,748 |
| XPO Logistics, Inc. (a) | | 162,700 | 9,957,240 |
| | | | 165,502,396 |
| Airlines - 16.3% | | | |
| Airlines - 16.3% | | | |
| Alaska Air Group, Inc. | | 174,800 | 13,050,568 |
| Allegiant Travel Co. | | 15,500 | 1,829,000 |
| American Airlines Group, Inc. | | 320,800 | 14,352,592 |
| Delta Air Lines, Inc. | | 483,602 | 22,821,178 |
| Hawaiian Holdings, Inc. (a) | | 103,700 | 4,443,545 |
| SkyWest, Inc. | | 323,700 | 11,232,390 |
| Southwest Airlines Co. | | 307,700 | 16,043,478 |
| | | | 83,772,751 |
| Internet Software & Services - 0.1% | | | |
| Internet Software & Services - 0.1% | | | |
| Stamps.com, Inc. (a) | | 2,600 | 497,250 |
| Machinery - 1.3% | | | |
| Construction Machinery & Heavy Trucks - 0.8% | | | |
| Allison Transmission Holdings, Inc. | | 113,800 | 3,952,274 |
| Industrial Machinery - 0.5% | | | |
| Global Brass & Copper Holdings, Inc. | | 21,600 | 644,760 |
| Park-Ohio Holdings Corp. | | 52,070 | 2,074,990 |
| | | | 2,719,750 |
|
| TOTAL MACHINERY | | | 6,672,024 |
|
| Marine - 0.4% | | | |
| Marine - 0.4% | | | |
| Matson, Inc. | | 80,600 | 2,079,480 |
| Road & Rail - 44.8% | | | |
| Railroads - 35.0% | | | |
| CSX Corp. | | 643,519 | 32,304,654 |
| Genesee & Wyoming, Inc. Class A (a) | | 293,000 | 20,088,080 |
| Kansas City Southern | | 88,100 | 9,112,183 |
| Norfolk Southern Corp. | | 245,300 | 29,563,556 |
| Union Pacific Corp. | | 845,995 | 89,083,274 |
| | | | 180,151,747 |
| Trucking - 9.8% | | | |
| AMERCO | | 2,800 | 1,044,988 |
| Avis Budget Group, Inc. (a)(b) | | 176,400 | 6,390,972 |
| Celadon Group, Inc. (b) | | 830,600 | 4,153,000 |
| J.B. Hunt Transport Services, Inc. | | 153,700 | 15,199,393 |
| Landstar System, Inc. | | 18,000 | 1,680,300 |
| Marten Transport Ltd. | | 209,600 | 3,594,640 |
| Roadrunner Transportation Systems, Inc. (a) | | 441,600 | 3,298,752 |
| Ryder System, Inc. | | 46,900 | 3,639,440 |
| Saia, Inc. (a) | | 108,688 | 6,146,306 |
| Schneider National, Inc. Class B | | 51,200 | 1,139,200 |
| Universal Logistics Holdings, Inc. | | 64,390 | 1,068,874 |
| YRC Worldwide, Inc. (a) | | 230,800 | 3,090,412 |
| | | | 50,446,277 |
|
| TOTAL ROAD & RAIL | | | 230,598,024 |
|
| Transportation Infrastructure - 1.6% | | | |
| Airport Services - 1.6% | | | |
| Macquarie Infrastructure Co. LLC | | 109,900 | 8,185,352 |
| TOTAL COMMON STOCKS | | | |
| (Cost $348,559,228) | | | 497,870,792 |
|
| Money Market Funds - 6.2% | | | |
| Fidelity Cash Central Fund, 1.11% (c) | | 13,812,954 | 13,815,717 |
| Fidelity Securities Lending Cash Central Fund 1.11% (c)(d) | | 18,375,042 | 18,376,879 |
| TOTAL MONEY MARKET FUNDS | | | |
| (Cost $32,192,596) | | | 32,192,596 |
| TOTAL INVESTMENT IN SECURITIES - 103.0% | | | |
| (Cost $380,751,824) | | | 530,063,388 |
| NET OTHER ASSETS (LIABILITIES) - (3.0)% | | | (15,584,655) |
| NET ASSETS - 100% | | | $514,478,733 |
Legend
(a) Non-income producing
(b) Security or a portion of the security is on loan at period end.
(c) Affiliated fund that is generally available only to investment companies and other accounts managed by Fidelity Investments. The rate quoted is the annualized seven-day yield of the fund at period end. A complete unaudited listing of the fund's holdings as of its most recent quarter end is available upon request. In addition, each Fidelity Central Fund's financial statements are available on the SEC's website or upon request.
(d) Investment made with cash collateral received from securities on loan.
Affiliated Central Funds
Information regarding fiscal year to date income earned by the Fund from investments in Fidelity Central Funds is as follows:
| Fund | Income earned |
| Fidelity Cash Central Fund | $61,952 |
| Fidelity Securities Lending Cash Central Fund | 13,559 |
| Total | $75,511 |
Investment Valuation
All investments are categorized as Level 1 under the Fair Value Hierarchy. The inputs or methodology used for valuing securities may not be an indication of the risk associated with investing in those securities. For more information on valuation inputs please refer to the Investment Valuation section in the accompanying Notes to Financial Statements.
See accompanying notes which are an integral part of the financial statements.
Transportation Portfolio
Financial Statements
Statement of Assets and Liabilities
| | | August 31, 2017 (Unaudited) |
| Assets | | |
Investment in securities, at value (including securities loaned of $17,946,047) — See accompanying schedule:
Unaffiliated issuers (cost $348,559,228) | $497,870,792 | |
| Fidelity Central Funds (cost $32,192,596) | 32,192,596 | |
| Total Investment in Securities (cost $380,751,824) | | $530,063,388 |
| Receivable for investments sold | | 2,787,259 |
| Receivable for fund shares sold | | 230,854 |
| Dividends receivable | | 1,216,656 |
| Distributions receivable from Fidelity Central Funds | | 20,480 |
| Other receivables | | 4,793 |
| Total assets | | 534,323,430 |
| Liabilities | | |
| Payable for fund shares redeemed | $1,102,768 | |
| Accrued management fee | 238,712 | |
| Other affiliated payables | 108,906 | |
| Other payables and accrued expenses | 16,661 | |
| Collateral on securities loaned | 18,377,650 | |
| Total liabilities | | 19,844,697 |
| Net Assets | | $514,478,733 |
| Net Assets consist of: | | |
| Paid in capital | | $338,161,551 |
| Undistributed net investment income | | 2,500,686 |
| Accumulated undistributed net realized gain (loss) on investments | | 24,504,932 |
| Net unrealized appreciation (depreciation) on investments | | 149,311,564 |
| Net Assets, for 5,457,634 shares outstanding | | $514,478,733 |
| Net Asset Value, offering price and redemption price per share ($514,478,733 ÷ 5,457,634 shares) | | $94.27 |
See accompanying notes which are an integral part of the financial statements.
Statement of Operations
| | | Six months ended August 31, 2017 (Unaudited) |
| Investment Income | | |
| Dividends | | $4,668,006 |
| Income from Fidelity Central Funds | | 75,511 |
| Total income | | 4,743,517 |
| Expenses | | |
| Management fee | $1,518,710 | |
| Transfer agent fees | 560,463 | |
| Accounting and security lending fees | 105,474 | |
| Custodian fees and expenses | 5,233 | |
| Independent trustees' fees and expenses | 6,656 | |
| Registration fees | 34,505 | |
| Audit | 26,052 | |
| Legal | 4,394 | |
| Miscellaneous | 2,924 | |
| Total expenses before reductions | 2,264,411 | |
| Expense reductions | (22,908) | 2,241,503 |
| Net investment income (loss) | | 2,502,014 |
| Realized and Unrealized Gain (Loss) | | |
| Net realized gain (loss) on: | | |
| Investment securities: | | |
| Unaffiliated issuers | 27,223,636 | |
| Fidelity Central Funds | 685 | |
| Total net realized gain (loss) | | 27,224,321 |
| Change in net unrealized appreciation (depreciation) on: | | |
| Investment securities: | | |
| Unaffiliated issuers | (20,669,825) | |
| Fidelity Central Funds | (1,456) | |
| Total change in net unrealized appreciation (depreciation) | | (20,671,281) |
| Net gain (loss) | | 6,553,040 |
| Net increase (decrease) in net assets resulting from operations | | $9,055,054 |
See accompanying notes which are an integral part of the financial statements.
Statement of Changes in Net Assets
| | Six months ended August 31, 2017 (Unaudited) | Year ended February 28, 2017 |
| Increase (Decrease) in Net Assets | | |
| Operations | | |
| Net investment income (loss) | $2,502,014 | $3,560,984 |
| Net realized gain (loss) | 27,224,321 | 25,777,009 |
| Change in net unrealized appreciation (depreciation) | (20,671,281) | 86,525,869 |
| Net increase (decrease) in net assets resulting from operations | 9,055,054 | 115,863,862 |
| Distributions to shareholders from net investment income | (886,528) | (2,471,329) |
| Distributions to shareholders from net realized gain | (4,231,438) | (9,022,622) |
| Total distributions | (5,117,966) | (11,493,951) |
| Share transactions | | |
| Proceeds from sales of shares | 48,279,275 | 345,780,616 |
| Reinvestment of distributions | 4,905,993 | 11,028,020 |
| Cost of shares redeemed | (185,718,854) | (226,311,294) |
| Net increase (decrease) in net assets resulting from share transactions | (132,533,586) | 130,497,342 |
| Redemption fees | 7,928 | 29,312 |
| Total increase (decrease) in net assets | (128,588,570) | 234,896,565 |
| Net Assets | | |
| Beginning of period | 643,067,303 | 408,170,738 |
| End of period | $514,478,733 | $643,067,303 |
| Other Information | | |
| Undistributed net investment income end of period | $2,500,686 | $885,200 |
| Shares | | |
| Sold | 517,242 | 3,926,788 |
| Issued in reinvestment of distributions | 55,941 | 120,921 |
| Redeemed | (2,031,917) | (2,703,847) |
| Net increase (decrease) | (1,458,734) | 1,343,862 |
See accompanying notes which are an integral part of the financial statements.
Financial Highlights — Transportation Portfolio
| | Six months ended (Unaudited) August 31, | Years ended February 28, | | | | |
| | 2017 | 2017 | 2016 A | 2015 | 2014 | 2013 |
| Selected Per–Share Data | | | | | | |
| Net asset value, beginning of period | $92.98 | $73.25 | $94.04 | $76.28 | $57.75 | $53.02 |
| Income from Investment Operations | | | | | | |
| Net investment income (loss)B | .41 | .63 | .50 | .46 | .45 | .51 |
| Net realized and unrealized gain (loss) | 1.69 | 20.86 | (15.81) | 19.67 | 20.44 | 7.59 |
| Total from investment operations | 2.10 | 21.49 | (15.31) | 20.13 | 20.89 | 8.10 |
| Distributions from net investment income | (.14) | (.38) | (.52) | (.34) | (.27) | (.41) |
| Distributions from net realized gain | (.67) | (1.39) | (4.95) | (2.04) | (2.09) | (2.96) |
| Total distributions | (.81) | (1.77) | (5.48)C | (2.38) | (2.36) | (3.37) |
| Redemption fees added to paid in capitalB | –D | .01 | –D | .01 | –D | –D |
| Net asset value, end of period | $94.27 | $92.98 | $73.25 | $94.04 | $76.28 | $57.75 |
| Total ReturnE,F | 2.33% | 29.40% | (16.28)% | 26.80% | 36.60% | 16.10% |
| Ratios to Average Net AssetsG,H | | | | | | |
| Expenses before reductions | .81%I | .83% | .81% | .81% | .85% | .89% |
| Expenses net of fee waivers, if any | .81%I | .83% | .81% | .81% | .85% | .89% |
| Expenses net of all reductions | .80%I | .82% | .80% | .81% | .84% | .86% |
| Net investment income (loss) | .90%I | .76% | .60% | .53% | .68% | .98% |
| Supplemental Data | | | | | | |
| Net assets, end of period (000 omitted) | $514,479 | $643,067 | $408,171 | $1,146,633 | $450,237 | $212,956 |
| Portfolio turnover rateJ | 53%I | 104% | 80% | 72%K | 78% | 47% |
A For the year ended February 29.
B Calculated based on average shares outstanding during the period.
C Total distributions of $5.48 per share is comprised of distributions from net investment income of $.521 and distributions from net realized gain of $4.954 per share.
D Amount represents less than $.005 per share.
E Total returns for periods of less than one year are not annualized.
F Total returns would have been lower if certain expenses had not been reduced during the applicable periods shown.
G Fees and expenses of any underlying Fidelity Central Funds are not included in the Fund's expense ratio. The Fund indirectly bears its proportionate share of the expenses of any underlying Fidelity Central Funds.
H Expense ratios reflect operating expenses of the Fund. Expenses before reductions do not reflect amounts reimbursed by the investment adviser or reductions from brokerage service arrangements or reductions from other expense offset arrangements and do not represent the amount paid by the Fund during periods when reimbursements or reductions occur. Expenses net of fee waivers reflect expenses after reimbursement by the investment adviser but prior to reductions from brokerage service arrangements or other expense offset arrangements. Expenses net of all reductions represent the net expenses paid by the Fund.
I Annualized
J Amount does not include the portfolio activity of any underlying Fidelity Central Funds.
K Portfolio turnover rate excludes securities received or delivered in-kind.
See accompanying notes which are an integral part of the financial statements.
Notes to Financial Statements (Unaudited)
For the period ended August 31, 2017
1. Organization.
Air Transportation Portfolio, Defense and Aerospace Portfolio, Environment and Alternative Energy Portfolio, Industrial Equipment Portfolio, Industrials Portfolio, and Transportation Portfolio (the Funds) are non-diversified funds of Fidelity Select Portfolios (the Trust). The Trust is registered under the Investment Company Act of 1940, as amended (the 1940 Act), as an open-end management investment company organized as a Massachusetts business trust. The Funds invest primarily in securities of companies whose principal business activities fall within specific industries. Each Fund is authorized to issue an unlimited number of shares. Share transactions on the Statement of Changes in Net Assets may contain exchanges between affiliated funds.
2. Investments in Fidelity Central Funds.
The Funds invest in Fidelity Central Funds, which are open-end investment companies generally available only to other investment companies and accounts managed by the investment adviser and its affiliates. The Funds' Schedules of Investments list each of the Fidelity Central Funds held as of period end, if any, as an investment of each Fund, but do not include the underlying holdings of each Fidelity Central Fund. As an Investing Fund, each Fund indirectly bears its proportionate share of the expenses of the underlying Fidelity Central Funds.
The Money Market Central Funds seek preservation of capital and current income and are managed by Fidelity Investments Money Management, Inc. (FIMM), an affiliate of the investment adviser. Annualized expenses of the Money Market Central Funds as of their most recent shareholder report date are less than .005%.
A complete unaudited list of holdings for each Fidelity Central Fund is available upon request or at the Securities and Exchange Commission (the SEC) website at www.sec.gov. In addition, the financial statements of the Fidelity Central Funds are available on the SEC website or upon request.
3. Significant Accounting Policies.
Each Fund is an investment company and applies the accounting and reporting guidance of the Financial Accounting Standards Board (FASB) Accounting Standards Codification Topic 946 Financial Services – Investments Companies. The financial statements have been prepared in conformity with accounting principles generally accepted in the United States of America (GAAP), which require management to make certain estimates and assumptions at the date of the financial statements. Actual results could differ from those estimates. Subsequent events, if any, through the date that the financial statements were issued have been evaluated in the preparation of the financial statements. The following summarizes the significant accounting policies of the Funds:
Investment Valuation. Investments are valued as of 4:00 p.m. Eastern time on the last calendar day of the period. The Board of Trustees (the Board) has delegated the day to day responsibility for the valuation of each Fund's investments to the Fair Value Committee (the Committee) established by each Fund's investment adviser. In accordance with valuation policies and procedures approved by the Board, each Fund attempts to obtain prices from one or more third party pricing vendors or brokers to value its investments. When current market prices, quotations or currency exchange rates are not readily available or reliable, investments will be fair valued in good faith by the Committee, in accordance with procedures adopted by the Board. Factors used in determining fair value vary by investment type and may include market or investment specific events. The frequency with which these procedures are used cannot be predicted and they may be utilized to a significant extent. The Committee oversees each Fund's valuation policies and procedures and reports to the Board on the Committee's activities and fair value determinations. The Board monitors the appropriateness of the procedures used in valuing each Fund's investments and ratifies the fair value determinations of the Committee.
Each Fund categorizes the inputs to valuation techniques used to value its investments into a disclosure hierarchy consisting of three levels as shown below:
- Level 1 – quoted prices in active markets for identical investments
- Level 2 – other significant observable inputs (including quoted prices for similar investments, interest rates, prepayment speeds, etc.)
- Level 3 – unobservable inputs (including the Fund's own assumptions based on the best information available)
Valuation techniques used to value each Fund's investments by major category are as follows:
Equity securities, including restricted securities, for which market quotations are readily available, are valued at the last reported sale price or official closing price as reported by a third party pricing vendor on the primary market or exchange on which they are traded and are categorized as Level 1 in the hierarchy. In the event there were no sales during the day or closing prices are not available, securities are valued at the last quoted bid price or may be valued using the last available price and are generally categorized as Level 2 in the hierarchy. For foreign equity securities, when market or security specific events arise, comparisons to the valuation of American Depositary Receipts (ADRs), futures contracts, Exchange-Traded Funds (ETFs) and certain indexes as well as quoted prices for similar securities may be used and would be categorized as Level 2 in the hierarchy. Utilizing these techniques may result in transfers between Level 1 and Level 2. For equity securities, including restricted securities, where observable inputs are limited, assumptions about market activity and risk are used and these securities may be categorized as Level 3 in the hierarchy.
Investments in open-end mutual funds ,including the Fidelity Central Funds, are valued at their closing net asset value (NAV) each business day and are categorized as Level 1 in the hierarchy.
Changes in valuation techniques may result in transfers in or out of an assigned level within the disclosure hierarchy. The aggregate value of investments by input level as of August 31, 2017, including information on transfers between Levels 1 and 2, is included at the end of each applicable Fund's Schedule of Investments.
Foreign Currency. The Funds may use foreign currency contracts to facilitate transactions in foreign-denominated securities. Gains and losses from these transactions may arise from changes in the value of the foreign currency or if the counterparties do not perform under the contracts' terms.
Foreign-denominated assets, including investment securities, and liabilities are translated into U.S. dollars at the exchange rates at period end. Purchases and sales of investment securities, income and dividends received and expenses denominated in foreign currencies are translated into U.S. dollars at the exchange rate in effect on the transaction date.
The effects of exchange rate fluctuations on investments are included with the net realized and unrealized gain (loss) on investment securities. Other foreign currency transactions resulting in realized and unrealized gain (loss) are disclosed separately.
Investment Transactions and Income. For financial reporting purposes, the Funds' investment holdings and NAV include trades executed through the end of the last business day of the period. The NAV per share for processing shareholder transactions is calculated as of the close of business of the New York Stock Exchange (NYSE), normally 4:00 p.m. Eastern time and includes trades executed through the end of the prior business day. Gains and losses on securities sold are determined on the basis of identified cost. Dividend income is recorded on the ex-dividend date, except for certain dividends from foreign securities where the ex-dividend date may have passed, which are recorded as soon as the Funds are informed of the ex-dividend date. Non-cash dividends included in dividend income, if any, are recorded at the fair market value of the securities received. Income and capital gain distributions from Fidelity Central Funds, if any, are recorded on the ex-dividend date. Certain distributions received by the Funds represent a return of capital or capital gain. The Funds determine the components of these distributions subsequent to the ex-dividend date, based upon receipt of tax filings or other correspondence relating to the underlying investment. These distributions are recorded as a reduction of cost of investments and/or as a realized gain. Large, non-recurring dividends recognized by the Funds are presented separately on the Statement of Operations as "Special Dividends" and the impact of these dividends is presented in the Financial Highlights. Investment income is recorded net of foreign taxes withheld where recovery of such taxes is uncertain.
Expenses. Expenses directly attributable to a fund are charged to that fund. Expenses attributable to more than one fund are allocated among the respective funds on the basis of relative net assets or other appropriate methods. Expense estimates are accrued in the period to which they relate and adjustments are made when actual amounts are known.
Deferred Trustee Compensation. Under a Deferred Compensation Plan (the Plan) for Defense and Aerospace Portfolio and Industrials Portfolio, independent Trustees may elect to defer receipt of a portion of their annual compensation. Deferred amounts are invested in a cross-section of Fidelity funds, are marked-to-market and remain in the Fund until distributed in accordance with the Plan. The investment of deferred amounts and the offsetting payable to the Trustees are included in the accompanying Statement of Assets and Liabilities.
Income Tax Information and Distributions to Shareholders. Each year, each Fund intends to qualify as a regulated investment company under Subchapter M of the Internal Revenue Code, including distributing substantially all of its taxable income and realized gains. As a result, no provision for U.S. Federal income taxes is required. Each Fund files a U.S. federal tax return, in addition to state and local tax returns as required. Each Fund's federal income tax returns are subject to examination by the Internal Revenue Service (IRS) for a period of three fiscal years after they are filed. State and local tax returns may be subject to examination for an additional fiscal year depending on the jurisdiction. Foreign taxes are provided for based on each Fund's understanding of the tax rules and rates that exist in the foreign markets in which it invests.
Distributions are declared and recorded on the ex-dividend date. Income and capital gain distributions are determined in accordance with income tax regulations, which may differ from GAAP.
Capital accounts within the financial statements are adjusted for permanent book-tax differences. These adjustments have no impact on net assets or the results of operations. Capital accounts are not adjusted for temporary book-tax differences which will reverse in a subsequent period.
Book-tax differences are primarily due to foreign currency transactions, certain foreign taxes, redemptions in kind, deferred trustees compensation, losses deferred due to wash sales and excise tax regulations.
As of period end, the cost and unrealized appreciation (depreciation) in securities, and derivatives if applicable, for federal income tax purposes were as follows for each Fund:
| | Tax cost | Gross unrealized appreciation | Gross unrealized depreciation | Net unrealized appreciation (depreciation) |
| Air Transportation Portfolio | $323,389,753 | $93,909,788 | $(4,071,345) | $89,838,443 |
| Defense and Aerospace Portfolio | 1,581,963,071 | 619,660,633 | (17,226,553) | 602,434,080 |
| Environment and Alternative Energy Portfolio | 152,626,925 | 22,702,972 | (3,607,012) | 19,095,960 |
| Industrial Equipment Portfolio | 130,788,966 | 31,747,556 | (1,259,942) | 30,487,614 |
| Industrials Portfolio | 663,109,851 | 176,077,612 | (14,106,001) | 161,971,611 |
| Transportation Portfolio | 382,302,544 | 152,221,634 | (4,460,790) | 147,760,844 |
Trading (Redemption) Fees. Shares held by investors in the Air Transportation Portfolio, Environment and Alternative Energy Portfolio, Industrial Equipment Portfolio, Transportation Portfolio for less than 30 days may be subject to a redemption fee equal to .75% of the NAV of shares redeemed. All redemption fees, which reduce the proceeds of the shareholder redemption, are retained by the Funds and accounted for as an addition to paid in capital.
4. Purchases and Sales of Investments.
Purchases and sales of securities, other than short-term securities, are noted in the table below.
| | Purchases ($) | Sales ($) |
| Air Transportation Portfolio | 245,741,935 | 254,502,429 |
| Defense and Aerospace Portfolio | 508,938,432 | 191,452,812 |
| Environment and Alternative Energy Portfolio | 69,980,321 | 40,049,951 |
| Industrial Equipment Portfolio | 58,205,009 | 90,279,350 |
| Industrials Portfolio | 252,414,443 | 432,214,328 |
| Transportation Portfolio | 145,093,850 | 281,897,236 |
5. Fees and Other Transactions with Affiliates.
Management Fee. Fidelity SelectCo, LLC (the investment adviser) and its affiliates provide the Funds with investment management related services for which the Funds pay a monthly management fee. The management fee is the sum of an individual fund fee rate and an annualized group fee rate. The individual fund fee rate is applied to each Fund's average net assets. The group fee rate is based upon the average net assets of all the mutual funds advised by Fidelity Management & Research Company (FMR) and the investment adviser. The group fee rate decreases as assets under management increase and increases as assets under management decrease. For the reporting period, each Fund's annualized management fee rate expressed as a percentage of each Fund's average net assets was as follows:
| | Individual Rate | Group Rate | Total |
| Air Transportation Portfolio | .30% | .25% | .54% |
| Defense and Aerospace Portfolio | .30% | .25% | .54% |
| Environment and Alternative Energy Portfolio | .30% | .25% | .55% |
| Industrial Equipment Portfolio | .30% | .25% | .54% |
| Industrials Portfolio | .30% | .25% | .55% |
| Transportation Portfolio | .30% | .25% | .54% |
Transfer Agent Fees. Fidelity Investments Institutional Operations Company, Inc. (FIIOC), an affiliate of the investment adviser, is the Funds' transfer, dividend disbursing and shareholder servicing agent. FIIOC receives account fees and asset-based fees that vary according to account size and type of account. FIIOC pays for typesetting, printing and mailing of shareholder reports, except proxy statements. For the period, transfer agent fees were equivalent to the following annualized rates expressed as a percentage of average net assets:
| Air Transportation Portfolio | .21% |
| Defense and Aerospace Portfolio | .18% |
| Environment and Alternative Energy Portfolio | .22% |
| Industrial Equipment Portfolio | .19% |
| Industrials Portfolio | .18% |
| Transportation Portfolio | .20% |
Accounting and Security Lending Fees. Fidelity Service Company, Inc. (FSC), an affiliate of the investment adviser, maintains each Fund's accounting records. The accounting fee is based on the level of average net assets for each month. Under a separate contract, FSC administers the security lending program. The security lending fee is based on the number and duration of lending transactions.
Brokerage Commissions. Certain Funds placed a portion of their portfolio transactions with brokerage firms which are affiliates of the investment adviser. Brokerage commissions are included in net realized gain (loss) and change in net unrealized appreciation (depreciation) in the Statement of Operations. The commissions paid to these affiliated firms were as follows:
| | Amount |
| Air Transportation Portfolio | $5,269 |
| Defense and Aerospace Portfolio | 8,468 |
| Environment and Alternative Energy Portfolio | 790 |
| Industrial Equipment Portfolio | 1,895 |
| Industrials Portfolio | 11,481 |
| Transportation Portfolio | 5,736 |
Interfund Lending Program. Pursuant to an Exemptive Order issued by the SEC, the Funds, along with other registered investment companies having management contracts with FMR or other affiliated entities of FMR, may participate in an interfund lending program. This program provides an alternative credit facility allowing the funds to borrow from, or lend money to, other participating affiliated funds. At period end, there were no interfund loans outstanding. Each applicable fund's activity in this program during the period for which loans were outstanding was as follows:
| | Borrower or Lender | Average Loan Balance | Weighted Average Interest Rate | Interest Expense |
| Industrials Portfolio | Borrower | $6,988,750 | 1.09% | $1,691 |
Interfund Trades. The Funds may purchase from or sell securities to other Fidelity Funds under procedures adopted by the Board. The procedures have been designed to ensure these interfund trades are executed in accordance with Rule 17a-7 of the 1940 Act. Interfund trades are included within the respective purchases and sales amounts shown in the Purchases and Sales of Investments note.
Prior Fiscal Year Redemptions In-Kind. During the prior period, 6,790,326 shares of Industrials Portfolio held by an affiliated entity were redeemed in-kind for investments and cash with a value of $203,573,978. The Fund had net realized gain of $45,579,937 on investments delivered through in-kind redemptions. The amount of in-kind redemptions is included in share transactions in the accompanying Statement of Changes in Net Assets. Industrials Portfolio recognized no gain or loss for federal income tax purposes.
6. Committed Line of Credit.
Certain Funds participate with other funds managed by the investment adviser or an affiliate in a $4.25 billion credit facility (the "line of credit") to be utilized for temporary or emergency purposes to fund shareholder redemptions or for other short-term liquidity purposes. The participating funds have agreed to pay commitment fees on their pro-rata portion of the line of credit, which are reflected in Miscellaneous expenses on the Statement of Operations, and are as follows:
| Air Transportation Portfolio | $627 |
| Defense and Aerospace Portfolio | 2,630 |
| Environment and Alternative Energy Portfolio | 234 |
| Industrial Equipment Portfolio | 294 |
| Industrials Portfolio | 1,549 |
| Transportation Portfolio | 988 |
During the period, the Funds did not borrow on this line of credit.
7. Security Lending.
Certain Funds lend portfolio securities through a lending agent from time to time in order to earn additional income. On the settlement date of the loan, each applicable Fund receives collateral (in the form of U.S. Treasury obligations, letters of credit and/or cash) against the loaned securities and maintains collateral in an amount not less than 100% of the market value of the loaned securities during the period of the loan. The market value of the loaned securities is determined at the close of business of the Funds and any additional required collateral is delivered to the Funds on the next business day. The Funds or borrower may terminate the loan at any time, and if the borrower defaults on its obligation to return the securities loaned because of insolvency or other reasons, the Funds may apply collateral received from the borrower against the obligation. The Funds may experience delays and costs in recovering the securities loaned. Any cash collateral received is invested in the Fidelity Securities Lending Cash Central Fund. The value of loaned securities and cash collateral at period end are disclosed on each applicable Fund's Statement of Assets and Liabilities. Security lending income represents the income earned on investing cash collateral, less rebates paid to borrowers and any lending agent fees associated with the loan, plus any premium payments received for lending certain types of securities. Security lending income is presented on each applicable Fund's Statement of Operations as a component of income from Fidelity Central Funds. Security lending activity was as follows:
| | Total Security Lending Income |
| Air Transportation Portfolio | $4,559 |
| Defense and Aerospace Portfolio | 111,288 |
| Environment and Alternative Energy Portfolio | 18,240 |
| Industrial Equipment Portfolio | 6,673 |
| Industrials Portfolio | 25,164 |
| Transportation Portfolio | 13,559 |
8. Bank Borrowings.
Each Fund is permitted to have bank borrowings for temporary or emergency purposes to fund shareholder redemptions or for other short-term liquidity requirements. Each Fund has established borrowing arrangements with certain banks. The interest rate on the borrowings is the bank's base rate, as revised from time to time. At period end, there were no bank borrowings outstanding. Each applicable Fund's activity in this program during the period for which loans were outstanding was as follows:
| | Average Loan Balance | Weighted Average Interest Rate | Interest Expense |
| Industrials Portfolio | $7,324,000 | 1.41% | $287 |
9. Expense Reductions.
Commissions paid to certain brokers with whom the investment adviser, or its affiliates, places trades on behalf of Certain Funds include an amount in addition to trade execution, which may be rebated back to the Funds to offset certain expenses. In addition, through arrangements with each applicable Fund's custodian, credits realized as a result of certain uninvested cash balances were used to reduce each applicable Fund's expenses. All of the applicable expense reductions are noted in the table below.
| | Brokerage Service reduction | Custody
expense
reduction |
| Air Transportation Portfolio | $11,054 | $80 |
| Defense and Aerospace Portfolio | 11,465 | 1,371 |
| Environment and Alternative Energy Portfolio | 2,539 | 8 |
| Industrial Equipment Portfolio | 3,226 | – |
| Industrials Portfolio | 33,341 | – |
| Transportation Portfolio | 19,894 | 50 |
In addition, during the period the investment adviser reimbursed and/or waived a portion of operating expenses as follows:
| | Amount |
| Air Transportation Portfolio | $1,758 |
| Defense and Aerospace Portfolio | 7,260 |
| Environment and Alternative Energy Portfolio | 603 |
| Industrial Equipment Portfolio | 998 |
| Industrials Portfolio | 4,623 |
| Transportation Portfolio | 2,964 |
10. Proposed Reorganization.
The Board of Trustees of Fidelity Select Portfolios approved an Agreement and Plan of Reorganization (the Agreement) between Industrial Equipment Portfolio and Industrials Portfolio. The Agreement provides for the transfer of all the assets and the assumption of all the liabilities of Industrial Equipment Portfolio in exchange for shares of Industrials Portfolio equal in value to the net assets of Industrial Equipment Portfolio on the day the reorganization is effective.
A meeting of shareholders of Industrial Equipment Portfolio is expected to be held during the 4th quarter of 2017 to vote on the reorganization. If approved by shareholders, the reorganization is expected to become effective on or about January 26, 2018. The reorganization is expected to qualify as a tax-free transaction for federal income tax purposes with no gain or loss recognized by the funds or their shareholders.
11. Other.
The Funds' organizational documents provide former and current trustees and officers with a limited indemnification against liabilities arising in connection with the performance of their duties to the Funds. In the normal course of business, the Funds may also enter into contracts that provide general indemnifications. The Funds' maximum exposure under these arrangements is unknown as this would be dependent on future claims that may be made against the Funds. The risk of material loss from such claims is considered remote.
At the end of the period, the following mutual funds managed by the investment adviser or its affiliates were the owners of record of 10% or more of the total outstanding shares of the following Funds.
| | VIP FundsManager 50% Portfolio | VIP FundsManager 60% Portfolio |
| Industrial Equipment Portfolio | 22% | 26% |
Mutual funds managed by the investment adviser or its affiliates, in aggregate, were the owners of record of more than 20% of the total outstanding shares of the following Funds.
| Fund | % of shares held |
| Industrial Equipment Portfolio | 56% |
| Industrials Portfolio | 21% |
Shareholder Expense Example
As a shareholder of a Fund, you incur two types of costs: (1) transaction costs, including redemption fees and (2) ongoing costs, including management fees and other Fund expenses. This Example is intended to help you understand your ongoing costs (in dollars) of investing in the Funds and to compare these costs with the ongoing costs of investing in other mutual funds.
The Example is based on an investment of $1,000 invested at the beginning of the period and held for the entire period (March 1, 2017 to August 31, 2017).
Actual Expenses
The first line of the accompanying table for each fund provides information about actual account values and actual expenses. You may use the information in this line, together with the amount you invested, to estimate the expenses that you paid over the period. Simply divide your account value by $1,000.00 (for example, an $8,600 account value divided by $1,000.00 = 8.6), then multiply the result by the number in the first line for a fund under the heading entitled "Expenses Paid During Period" to estimate the expenses you paid on your account during this period. A small balance maintenance fee of $12.00 that is charged once a year may apply for certain accounts with a value of less than $2,000. This fee is not included in the table below. If it was, the estimate of expenses you paid during the period would be higher, and your ending account value lower, by this amount. In addition, each Fund, as a shareholder in the underlying Fidelity Central Funds, will indirectly bear its pro-rata share of the fees and expenses incurred by the underlying Fidelity Central Funds. These fees and expenses are not included in the Fund's annualized expense ratio used to calculate the expense estimate in the table below.
Hypothetical Example for Comparison Purposes
The second line of the accompanying table for each fund provides information about hypothetical account values and hypothetical expenses based on a fund's actual expense ratio and an assumed rate of return of 5% per year before expenses, which is not the Fund's actual return. The hypothetical account values and expenses may not be used to estimate the actual ending account balance or expenses you paid for the period. You may use this information to compare the ongoing costs of investing in the Fund and other funds. To do so, compare this 5% hypothetical example with the 5% hypothetical examples that appear in the shareholder reports of the other funds. A small balance maintenance fee of $12.00 that is charged once a year may apply for certain accounts with a value of less than $2,000. This fee is not included in the table below. If it was, the estimate of expenses you paid during the period would be higher, and your ending account value lower, by this amount. In addition, each Fund, as a shareholder in the underlying Fidelity Central Funds, will indirectly bear its pro-rata share of the fees and expenses incurred by the underlying Fidelity Central Funds. These fees and expenses are not included in the Fund's annualized expense ratio used to calculate the expense estimate in the table below.
Please note that the expenses shown in the table are meant to highlight your ongoing costs only and do not reflect any transaction costs. Therefore, the second line of the table is useful in comparing ongoing costs only, and will not help you determine the relative total costs of owning different funds. In addition, if these transactional costs were included, your costs would have been higher.
| | Annualized Expense RatioA | Beginning
Account Value
March 1, 2017 | Ending
Account Value
August 31, 2017 | Expenses Paid
During Period-B
March 1, 2017
to August 31, 2017 |
| Air Transportation Portfolio | .83% | | | |
| Actual | | $1,000.00 | $1,076.70 | $4.34 |
| Hypothetical-C | | $1,000.00 | $1,021.02 | $4.23 |
| Defense and Aerospace Portfolio | .77% | | | |
| Actual | | $1,000.00 | $1,125.30 | $4.12 |
| Hypothetical-C | | $1,000.00 | $1,021.32 | $3.92 |
| Environment and Alternative Energy Portfolio | .89% | | | |
| Actual | | $1,000.00 | $1,058.40 | $4.62 |
| Hypothetical-C | | $1,000.00 | $1,020.72 | $4.53 |
| Industrial Equipment Portfolio | .83% | | | |
| Actual | | $1,000.00 | $1,038.60 | $4.26 |
| Hypothetical-C | | $1,000.00 | $1,021.02 | $4.23 |
| Industrials Portfolio | .78% | | | |
| Actual | | $1,000.00 | $1,016.60 | $3.96 |
| Hypothetical-C | | $1,000.00 | $1,021.27 | $3.97 |
| Transportation Portfolio | .81% | | | |
| Actual | | $1,000.00 | $1,023.30 | $4.13 |
| Hypothetical-C | | $1,000.00 | $1,021.12 | $4.13 |
A Annualized expense ratio reflects expenses net of applicable fee waivers.
B Expenses are equal to each Fund's annualized expense ratio, multiplied by the average account value over the period, multiplied by 184/ 365 (to reflect the one-half year period).
C 5% return per year before expenses
SELCI-SANN-1017
1.813660.112
Fidelity Advisor Focus Funds®
Class A, Class M (formerly Class T), Class C and Class I Fidelity Advisor® Consumer Staples Fund
Fidelity Advisor® Gold Fund
Fidelity Advisor® Materials Fund
Fidelity Advisor® Telecommunications Fund
Semi-Annual Report August 31, 2017 Each Advisor fund listed above is a class of the Fidelity® Select Portfolios® |
|
Contents
To view a fund's proxy voting guidelines and proxy voting record for the 12-month period ended June 30, visit http://www.fidelity.com/proxyvotingresults or visit the Securities and Exchange Commission's (SEC) web site at http://www.sec.gov.
You may also call 1-877-208-0098 to request a free copy of the proxy voting guidelines.
Standard & Poor's, S&P and S&P 500 are registered service marks of The McGraw-Hill Companies, Inc. and have been licensed for use by Fidelity Distributors Corporation.
Other third-party marks appearing herein are the property of their respective owners.
All other marks appearing herein are registered or unregistered trademarks or service marks of FMR LLC or an affiliated company. © 2017 FMR LLC. All rights reserved.
This report and the financial statements contained herein are submitted for the general information of the shareholders of the Funds. This report is not authorized for distribution to prospective investors in the Funds unless preceded or accompanied by an effective prospectus.
A fund files its complete schedule of portfolio holdings with the SEC for the first and third quarters of each fiscal year on Form N-Q. Forms N-Q are available on the SEC’s web site at http://www.sec.gov. A fund's Forms N-Q may be reviewed and copied at the SEC’s Public Reference Room in Washington, DC. Information regarding the operation of the SEC's Public Reference Room may be obtained by calling 1-800-SEC-0330.
For a complete list of a fund's portfolio holdings, view the most recent holdings listing, semiannual report, or annual report on Fidelity's web site at http://www.fidelity.com, http://www.institutional.fidelity.com, or http://www.401k.com, as applicable.
NOT FDIC INSURED •MAY LOSE VALUE •NO BANK GUARANTEE
Neither the Funds nor Fidelity Distributors Corporation is a bank.
Consumer Staples Portfolio
Investment Summary (Unaudited)
Top Ten Stocks as of August 31, 2017
| | % of fund's net assets | % of fund's net assets 6 months ago |
| British American Tobacco PLC sponsored ADR | 14.2 | 11.6 |
| Philip Morris International, Inc. | 14.1 | 11.7 |
| CVS Health Corp. | 9.2 | 8.4 |
| Kroger Co. | 5.4 | 6.0 |
| The Coca-Cola Co. | 5.3 | 4.9 |
| Colgate-Palmolive Co. | 4.8 | 3.8 |
| Estee Lauder Companies, Inc. Class A | 4.8 | 4.8 |
| Monster Beverage Corp. | 3.8 | 3.1 |
| Procter & Gamble Co. | 3.1 | 3.9 |
| Anheuser-Busch InBev SA NV | 2.9 | 2.5 |
| | 67.6 | |
Top Industries (% of fund's net assets)
| As of August 31, 2017 |
| | Tobacco | 31.1% |
| | Food & Staples Retailing | 18.5% |
| | Beverages | 17.7% |
| | Food Products | 11.3% |
| | Personal Products | 10.2% |
| | All Others* | 11.2% |
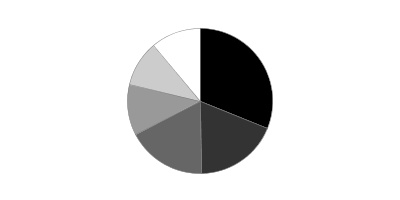
* Includes Short-Term investments and Net Other Assets (Liabilities).
| As of February 28, 2017 |
| | Tobacco | 33.8% |
| | Food & Staples Retailing | 17.6% |
| | Beverages | 16.6% |
| | Food Products | 10.4% |
| | Personal Products | 9.7% |
| | All Others* | 11.9% |
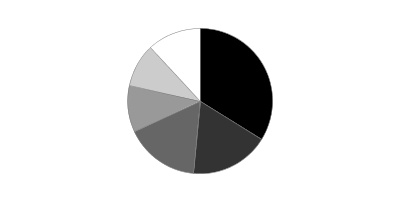
* Includes Short-Term investments and Net Other Assets (Liabilities).
Consumer Staples Portfolio
Investments August 31, 2017 (Unaudited)
Showing Percentage of Net Assets
| Common Stocks - 99.2% | | | |
| | | Shares | Value |
| Beverages - 17.5% | | | |
| Brewers - 3.9% | | | |
| Anheuser-Busch InBev SA NV | | 640,690 | $75,877,560 |
| China Resources Beer Holdings Co. Ltd. | | 2,798,000 | 7,022,039 |
| Molson Coors Brewing Co. Class B | | 244,200 | 21,916,950 |
| | | | 104,816,549 |
| Distillers & Vintners - 2.7% | | | |
| Constellation Brands, Inc. Class A (sub. vtg.) | | 203,300 | 40,680,330 |
| Kweichow Moutai Co. Ltd. (A Shares) | | 105,853 | 7,889,300 |
| Pernod Ricard SA | | 111,076 | 15,180,053 |
| Wuliangye Yibin Co. Ltd. Class A | | 867,109 | 7,301,458 |
| | | | 71,051,141 |
| Soft Drinks - 10.9% | | | |
| Britvic PLC | | 1,513,964 | 14,790,475 |
| Coca-Cola Bottling Co. Consolidated | | 75,144 | 16,050,007 |
| Coca-Cola FEMSA S.A.B. de CV sponsored ADR | | 64,529 | 5,280,408 |
| Coca-Cola Icecek Sanayi A/S | | 402,162 | 4,674,190 |
| Embotelladora Andina SA Series A sponsored ADR Series A | | 216,511 | 5,202,759 |
| Monster Beverage Corp. (a) | | 1,798,702 | 100,403,546 |
| The Coca-Cola Co. | | 3,103,718 | 141,374,355 |
| | | | 287,775,740 |
|
| TOTAL BEVERAGES | | | 463,643,430 |
|
| Diversified Financial Services - 0.2% | | | |
| Other Diversified Financial Services - 0.2% | | | |
| The Simply Good Foods Co. | | 360,100 | 4,267,185 |
| Food & Staples Retailing - 18.5% | | | |
| Drug Retail - 13.1% | | | |
| CVS Health Corp. | | 3,140,703 | 242,901,970 |
| Drogasil SA | | 328,600 | 7,239,357 |
| Rite Aid Corp. (a) | | 9,452,063 | 22,873,992 |
| Walgreens Boots Alliance, Inc. | | 893,324 | 72,805,906 |
| | | | 345,821,225 |
| Food Retail - 5.4% | | | |
| Kroger Co. | | 6,592,770 | 144,183,880 |
|
| TOTAL FOOD & STAPLES RETAILING | | | 490,005,105 |
|
| Food Products - 11.3% | | | |
| Agricultural Products - 2.7% | | | |
| Bunge Ltd. | | 952,135 | 71,057,835 |
| Packaged Foods & Meats - 8.6% | | | |
| Amplify Snack Brands, Inc. (a)(b) | | 1,342,368 | 9,678,473 |
| Blue Buffalo Pet Products, Inc. (a) | | 680,771 | 17,536,661 |
| Dean Foods Co. | | 1,808,400 | 19,892,400 |
| Mondelez International, Inc. | | 1,472,558 | 59,874,208 |
| Nestle SA (Reg. S) | | 165,250 | 14,009,225 |
| The Hain Celestial Group, Inc. (a) | | 623,766 | 25,087,869 |
| The J.M. Smucker Co. | | 234,500 | 24,566,220 |
| TreeHouse Foods, Inc. (a)(b) | | 837,059 | 56,074,582 |
| | | | 226,719,638 |
|
| TOTAL FOOD PRODUCTS | | | 297,777,473 |
|
| Hotels, Restaurants & Leisure - 0.6% | | | |
| Restaurants - 0.6% | | | |
| U.S. Foods Holding Corp. (a) | | 526,416 | 14,450,119 |
| Household Products - 9.8% | | | |
| Household Products - 9.8% | | | |
| Colgate-Palmolive Co. | | 1,781,080 | 127,596,571 |
| Kimberly-Clark Corp. | | 136,454 | 16,823,414 |
| Procter & Gamble Co. | | 895,350 | 82,613,945 |
| Spectrum Brands Holdings, Inc. | | 287,905 | 31,658,034 |
| | | | 258,691,964 |
| Personal Products - 10.2% | | | |
| Personal Products - 10.2% | | | |
| Avon Products, Inc. (a) | | 12,927,767 | 32,190,140 |
| Coty, Inc. Class A | | 3,440,797 | 57,048,414 |
| Edgewell Personal Care Co. (a) | | 103,600 | 7,867,384 |
| Estee Lauder Companies, Inc. Class A | | 1,184,339 | 126,712,430 |
| Herbalife Ltd. (a)(b) | | 257,910 | 17,798,369 |
| L'Oreal SA | | 33,600 | 7,098,354 |
| Unilever NV (Certificaten Van Aandelen) (Bearer) | | 254,300 | 15,139,557 |
| Unilever PLC sponsored ADR | | 108,400 | 6,309,964 |
| | | | 270,164,612 |
| Tobacco - 31.1% | | | |
| Tobacco - 31.1% | | | |
| Altria Group, Inc. | | 1,084,045 | 68,728,453 |
| British American Tobacco PLC sponsored ADR | | 6,048,226 | 375,715,799 |
| ITC Ltd. | | 1,547,202 | 6,830,340 |
| Philip Morris International, Inc. | | 3,179,491 | 371,777,883 |
| | | | 823,052,475 |
| TOTAL COMMON STOCKS | | | |
| (Cost $2,090,242,953) | | | 2,622,052,363 |
|
| Nonconvertible Preferred Stocks - 0.2% | | | |
| Beverages - 0.2% | | | |
| Brewers - 0.2% | | | |
| Ambev SA sponsored ADR | | | |
| (Cost $3,965,278) | | 1,022,310 | 6,399,661 |
|
| Money Market Funds - 0.7% | | | |
| Fidelity Cash Central Fund, 1.11% (c) | | 8,513,602 | 8,515,305 |
| Fidelity Securities Lending Cash Central Fund 1.11% (c)(d) | | 8,525,328 | 8,526,180 |
| TOTAL MONEY MARKET FUNDS | | | |
| (Cost $17,041,042) | | | 17,041,485 |
| TOTAL INVESTMENT IN SECURITIES - 100.1% | | | |
| (Cost $2,111,249,273) | | | 2,645,493,509 |
| NET OTHER ASSETS (LIABILITIES) - (0.1)% | | | (2,535,928) |
| NET ASSETS - 100% | | | $2,642,957,581 |
Legend
(a) Non-income producing
(b) Security or a portion of the security is on loan at period end.
(c) Affiliated fund that is generally available only to investment companies and other accounts managed by Fidelity Investments. The rate quoted is the annualized seven-day yield of the fund at period end. A complete unaudited listing of the fund's holdings as of its most recent quarter end is available upon request. In addition, each Fidelity Central Fund's financial statements are available on the SEC's website or upon request.
(d) Investment made with cash collateral received from securities on loan.
Affiliated Central Funds
Information regarding fiscal year to date income earned by the Fund from investments in Fidelity Central Funds is as follows:
| Fund | Income earned |
| Fidelity Cash Central Fund | $310,941 |
| Fidelity Securities Lending Cash Central Fund | 4,312,502 |
| Total | $4,623,443 |
Investment Valuation
The following is a summary of the inputs used, as of August 31, 2017, involving the Fund's assets and liabilities carried at fair value. The inputs or methodology used for valuing securities may not be an indication of the risk associated with investing in those securities. For more information on valuation inputs, and their aggregation into the levels used below, please refer to the Investment Valuation section in the accompanying Notes to Financial Statements.
| | Valuation Inputs at Reporting Date: |
| Description | Total | Level 1 | Level 2 | Level 3 |
| Investments in Securities: | | | | |
| Common Stocks | $2,622,052,363 | $2,509,927,667 | $112,124,696 | $-- |
| Nonconvertible Preferred Stocks | 6,399,661 | 6,399,661 | -- | -- |
| Money Market Funds | 17,041,485 | 17,041,485 | -- | -- |
| Total Investments in Securities: | $2,645,493,509 | $2,533,368,813 | $112,124,696 | $-- |
Other Information
Distribution of investments by country or territory of incorporation, as a percentage of Total Net Assets, is as follows (Unaudited):
| United States of America | 88.8% |
| Belgium | 2.9% |
| Bermuda | 2.7% |
| Others (Individually Less Than 1%) | 5.6% |
| | 100.0% |
See accompanying notes which are an integral part of the financial statements.
Consumer Staples Portfolio
Financial Statements
Statement of Assets and Liabilities
| | | August 31, 2017 (Unaudited) |
| Assets | | |
Investment in securities, at value (including securities loaned of $8,373,419) — See accompanying schedule:
Unaffiliated issuers (cost $2,094,208,231) | $2,628,452,024 | |
| Fidelity Central Funds (cost $17,041,042) | 17,041,485 | |
| Total Investment in Securities (cost $2,111,249,273) | | $2,645,493,509 |
| Receivable for investments sold | | 5,536,361 |
| Receivable for fund shares sold | | 1,444,159 |
| Dividends receivable | | 8,565,508 |
| Distributions receivable from Fidelity Central Funds | | 80,717 |
| Other receivables | | 171,782 |
| Total assets | | 2,661,292,036 |
| Liabilities | | |
| Payable for investments purchased | $2,521,744 | |
| Payable for fund shares redeemed | 5,015,374 | |
| Accrued management fee | 1,221,479 | |
| Distribution and service plan fees payable | 357,575 | |
| Other affiliated payables | 492,601 | |
| Other payables and accrued expenses | 176,907 | |
| Collateral on securities loaned | 8,548,775 | |
| Total liabilities | | 18,334,455 |
| Net Assets | | $2,642,957,581 |
| Net Assets consist of: | | |
| Paid in capital | | $1,951,128,702 |
| Undistributed net investment income | | 32,848,790 |
| Accumulated undistributed net realized gain (loss) on investments and foreign currency transactions | | 124,702,159 |
| Net unrealized appreciation (depreciation) on investments and assets and liabilities in foreign currencies | | 534,277,930 |
| Net Assets | | $2,642,957,581 |
| Calculation of Maximum Offering Price | | |
| Class A: | | |
| Net Asset Value and redemption price per share ($357,988,757 ÷ 3,738,308 shares) | | $95.76 |
| Maximum offering price per share (100/94.25 of $95.76) | | $101.60 |
| Class M: | | |
| Net Asset Value and redemption price per share ($87,937,030 ÷ 926,814 shares) | | $94.88 |
| Maximum offering price per share (100/96.50 of $94.88) | | $98.32 |
| Class C: | | |
| Net Asset Value and offering price per share ($288,178,074 ÷ 3,092,318 shares)(a) | | $93.19 |
| Consumer Staples: | | |
| Net Asset Value, offering price and redemption price per share ($1,550,420,314 ÷ 16,039,578 shares) | | $96.66 |
| Class I: | | |
| Net Asset Value, offering price and redemption price per share ($358,433,406 ÷ 3,715,946 shares) | | $96.46 |
(a) Redemption price per share is equal to net asset value less any applicable contingent deferred sales charge.
See accompanying notes which are an integral part of the financial statements.
Statement of Operations
| | | Six months ended August 31, 2017 (Unaudited) |
| Investment Income | | |
| Dividends | | $41,648,001 |
| Income from Fidelity Central Funds (including $4,312,502 from security lending) | | 4,623,443 |
| Total income | | 46,271,444 |
| Expenses | | |
| Management fee | $7,766,230 | |
| Transfer agent fees | 2,623,106 | |
| Distribution and service plan fees | 2,243,713 | |
| Accounting and security lending fees | 445,431 | |
| Custodian fees and expenses | 35,866 | |
| Independent trustees' fees and expenses | 32,924 | |
| Registration fees | 97,548 | |
| Audit | 35,247 | |
| Legal | 21,418 | |
| Miscellaneous | 24,264 | |
| Total expenses before reductions | 13,325,747 | |
| Expense reductions | (76,627) | 13,249,120 |
| Net investment income (loss) | | 33,022,324 |
| Realized and Unrealized Gain (Loss) | | |
| Net realized gain (loss) on: | | |
| Investment securities: | | |
| Unaffiliated issuers | 130,040,418 | |
| Fidelity Central Funds | (13,734) | |
| Foreign currency transactions | (7,142) | |
| Total net realized gain (loss) | | 130,019,542 |
| Change in net unrealized appreciation (depreciation) on: | | |
| Unaffiliated issuers (net of decrease in deferred foreign taxes of $618,798) | (126,686,719) | |
| Fidelity Central Funds | (29,147) | |
| Assets and liabilities in foreign currencies | 80,389 | |
| Total change in net unrealized appreciation (depreciation) | | (126,635,477) |
| Net gain (loss) | | 3,384,065 |
| Net increase (decrease) in net assets resulting from operations | | $36,406,389 |
See accompanying notes which are an integral part of the financial statements.
Statement of Changes in Net Assets
| | Six months ended August 31, 2017 (Unaudited) | Year ended February 28, 2017 |
| Increase (Decrease) in Net Assets | | |
| Operations | | |
| Net investment income (loss) | $33,022,324 | $47,285,744 |
| Net realized gain (loss) | 130,019,542 | 217,332,500 |
| Change in net unrealized appreciation (depreciation) | (126,635,477) | 57,308,049 |
| Net increase (decrease) in net assets resulting from operations | 36,406,389 | 321,926,293 |
| Distributions to shareholders from net investment income | (4,974,935) | (44,327,157) |
| Distributions to shareholders from net realized gain | (39,438,066) | (82,139,579) |
| Total distributions | (44,413,001) | (126,466,736) |
| Share transactions - net increase (decrease) | (210,545,204) | (395,070,237) |
| Redemption fees | – | 44,026 |
| Total increase (decrease) in net assets | (218,551,816) | (199,566,654) |
| Net Assets | | |
| Beginning of period | 2,861,509,397 | 3,061,076,051 |
| End of period | $2,642,957,581 | $2,861,509,397 |
| Other Information | | |
| Undistributed net investment income end of period | $32,848,790 | $4,801,401 |
See accompanying notes which are an integral part of the financial statements.
Financial Highlights — Consumer Staples Portfolio Class A
| | Six months ended (Unaudited) August 31, | Years ended February 28, | | | | |
| | 2017 | 2017 | 2016 A | 2015 | 2014 | 2013 |
| Selected Per–Share Data | | | | | | |
| Net asset value, beginning of period | $96.18 | $89.78 | $101.33 | $87.93 | $85.67 | $74.90 |
| Income from Investment Operations | | | | | | |
| Net investment income (loss)B | 1.08 | 1.28 | 1.34 | 1.37 | 1.43 | 1.26 |
| Net realized and unrealized gain (loss) | (.03)C | 9.12 | (4.86) | 17.28 | 7.51 | 11.73 |
| Total from investment operations | 1.05 | 10.40 | (3.52) | 18.65 | 8.94 | 12.99 |
| Distributions from net investment income | (.13) | (1.37) | (1.31) | (1.28) | (1.44) | (1.08) |
| Distributions from net realized gain | (1.34) | (2.64) | (6.72) | (3.98) | (5.24) | (1.14) |
| Total distributions | (1.47) | (4.00)D | (8.03) | (5.25)E | (6.68) | (2.22) |
| Redemption fees added to paid in capitalB | – | –F | –F | –F | –F | –F |
| Net asset value, end of period | $95.76 | $96.18 | $89.78 | $101.33 | $87.93 | $85.67 |
| Total ReturnG,H,I | 1.07% | 11.91% | (3.51)% | 21.95% | 10.53% | 17.60% |
| Ratios to Average Net AssetsJ,K | | | | | | |
| Expenses before reductions | 1.05%L | 1.04% | 1.04% | 1.05% | 1.06% | 1.08% |
| Expenses net of fee waivers, if any | 1.05%L | 1.04% | 1.04% | 1.05% | 1.06% | 1.08% |
| Expenses net of all reductions | 1.05%L | 1.03% | 1.04% | 1.05% | 1.06% | 1.08% |
| Net investment income (loss) | 2.20%L | 1.37% | 1.45% | 1.45% | 1.61% | 1.58% |
| Supplemental Data | | | | | | |
| Net assets, end of period (000 omitted) | $357,989 | $522,014 | $470,249 | $414,151 | $329,459 | $277,329 |
| Portfolio turnover rateM | 44%L | 56%N | 63% | 42%N | 31% | 28% |
A For the year ended February 29.
B Calculated based on average shares outstanding during the period.
C The amount shown for a share outstanding does not correspond with the aggregate net gain (loss) on investments for the period due to the timing of sales and repurchases of shares in relation to fluctuating market values of the investments of the Fund.
D Total distributions of $4.00 per share is comprised of distributions from net investment income of $1.365 and distributions from net realized gain of $2.636 per share.
E Total distributions of $5.25 per share is comprised of distributions from net investment income of $1.275 and distributions from net realized gain of $3.976 per share.
F Amount represents less than $.005 per share.
G Total returns for periods of less than one year are not annualized.
H Total returns would have been lower if certain expenses had not been reduced during the applicable periods shown.
I Total returns do not include the effect of the sales charges.
J Fees and expenses of any underlying Fidelity Central Funds are not included in the Fund's expense ratio. The Fund indirectly bears its proportionate share of the expenses of any underlying Fidelity Central Funds.
K Expense ratios reflect operating expenses of the class. Expenses before reductions do not reflect amounts reimbursed by the investment adviser or reductions from brokerage service arrangements or reductions from other expense offset arrangements and do not represent the amount paid by the class during periods when reimbursements or reductions occur. Expenses net of fee waivers reflect expenses after reimbursement by the investment adviser but prior to reductions from brokerage service arrangements or other expense offset arrangements. Expenses net of all reductions represent the net expenses paid by the class.
L Annualized
M Amount does not include the portfolio activity of any underlying Fidelity Central Funds.
N Portfolio turnover rate excludes securities received or delivered in-kind.
See accompanying notes which are an integral part of the financial statements.
Financial Highlights — Consumer Staples Portfolio Class M
| | Six months ended (Unaudited) August 31, | Years ended February 28, | | | | |
| | 2017 | 2017 | 2016 A | 2015 | 2014 | 2013 |
| Selected Per–Share Data | | | | | | |
| Net asset value, beginning of period | $95.42 | $89.10 | $100.61 | $87.37 | $85.18 | $74.49 |
| Income from Investment Operations | | | | | | |
| Net investment income (loss)B | .94 | 1.01 | 1.08 | 1.10 | 1.18 | 1.03 |
| Net realized and unrealized gain (loss) | (.03)C | 9.07 | (4.83) | 17.15 | 7.46 | 11.68 |
| Total from investment operations | .91 | 10.08 | (3.75) | 18.25 | 8.64 | 12.71 |
| Distributions from net investment income | (.11) | (1.12) | (1.04) | (1.04) | (1.21) | (.88) |
| Distributions from net realized gain | (1.34) | (2.64) | (6.72) | (3.98) | (5.24) | (1.14) |
| Total distributions | (1.45) | (3.76) | (7.76) | (5.01)D | (6.45) | (2.02) |
| Redemption fees added to paid in capitalB | – | –E | –E | –E | –E | –E |
| Net asset value, end of period | $94.88 | $95.42 | $89.10 | $100.61 | $87.37 | $85.18 |
| Total ReturnF,G,H | .93% | 11.61% | (3.78)% | 21.60% | 10.23% | 17.29% |
| Ratios to Average Net AssetsI,J | | | | | | |
| Expenses before reductions | 1.32%K | 1.32% | 1.32% | 1.32% | 1.33% | 1.36% |
| Expenses net of fee waivers, if any | 1.32%K | 1.32% | 1.32% | 1.32% | 1.33% | 1.36% |
| Expenses net of all reductions | 1.31%K | 1.31% | 1.31% | 1.32% | 1.33% | 1.35% |
| Net investment income (loss) | 1.93%K | 1.09% | 1.17% | 1.18% | 1.34% | 1.30% |
| Supplemental Data | | | | | | |
| Net assets, end of period (000 omitted) | $87,937 | $89,925 | $76,586 | $81,489 | $61,421 | $52,024 |
| Portfolio turnover rateL | 44%K | 56%M | 63% | 42%M | 31% | 28% |
A For the year ended February 29.
B Calculated based on average shares outstanding during the period.
C The amount shown for a share outstanding does not correspond with the aggregate net gain (loss) on investments for the period due to the timing of sales and repurchases of shares in relation to fluctuating market values of the investments of the Fund.
D Total distributions of $5.01 per share is comprised of distributions from net investment income of $1.036 and distributions from net realized gain of $3.976 per share.
E Amount represents less than $.005 per share.
F Total returns for periods of less than one year are not annualized.
G Total returns would have been lower if certain expenses had not been reduced during the applicable periods shown.
H Total returns do not include the effect of the sales charges.
I Fees and expenses of any underlying Fidelity Central Funds are not included in the Fund's expense ratio. The Fund indirectly bears its proportionate share of the expenses of any underlying Fidelity Central Funds.
J Expense ratios reflect operating expenses of the class. Expenses before reductions do not reflect amounts reimbursed by the investment adviser or reductions from brokerage service arrangements or reductions from other expense offset arrangements and do not represent the amount paid by the class during periods when reimbursements or reductions occur. Expenses net of fee waivers reflect expenses after reimbursement by the investment adviser but prior to reductions from brokerage service arrangements or other expense offset arrangements. Expenses net of all reductions represent the net expenses paid by the class.
K Annualized
L Amount does not include the portfolio activity of any underlying Fidelity Central Funds.
M Portfolio turnover rate excludes securities received or delivered in-kind.
See accompanying notes which are an integral part of the financial statements.
Financial Highlights — Consumer Staples Portfolio Class C
| | Six months ended (Unaudited) August 31, | Years ended February 28, | | | | |
| | 2017 | 2017 | 2016 A | 2015 | 2014 | 2013 |
| Selected Per–Share Data | | | | | | |
| Net asset value, beginning of period | $93.89 | $87.77 | $99.27 | $86.32 | $84.28 | $73.75 |
| Income from Investment Operations | | | | | | |
| Net investment income (loss)B | .70 | .56 | .63 | .65 | .75 | .65 |
| Net realized and unrealized gain (loss) | (.03)C | 8.92 | (4.75) | 16.93 | 7.36 | 11.55 |
| Total from investment operations | .67 | 9.48 | (4.12) | 17.58 | 8.11 | 12.20 |
| Distributions from net investment income | (.03) | (.73) | (.65) | (.65) | (.84) | (.53) |
| Distributions from net realized gain | (1.34) | (2.64) | (6.72) | (3.98) | (5.24) | (1.14) |
| Total distributions | (1.37) | (3.36)D | (7.38)E | (4.63) | (6.07)F | (1.67) |
| Redemption fees added to paid in capitalB | – | –G | –G | –G | –G | –G |
| Net asset value, end of period | $93.19 | $93.89 | $87.77 | $99.27 | $86.32 | $84.28 |
| Total ReturnH,I,J | .70% | 11.07% | (4.23)% | 21.03% | 9.70% | 16.73% |
| Ratios to Average Net AssetsK,L | | | | | | |
| Expenses before reductions | 1.79%M | 1.80% | 1.80% | 1.80% | 1.82% | 1.83% |
| Expenses net of fee waivers, if any | 1.79%M | 1.79% | 1.80% | 1.80% | 1.82% | 1.83% |
| Expenses net of all reductions | 1.79%M | 1.79% | 1.79% | 1.80% | 1.81% | 1.82% |
| Net investment income (loss) | 1.46%M | .61% | .69% | .70% | .85% | .83% |
| Supplemental Data | | | | | | |
| Net assets, end of period (000 omitted) | $288,178 | $308,350 | $250,576 | $228,151 | $164,669 | $134,966 |
| Portfolio turnover rateN | 44%M | 56%O | 63% | 42%O | 31% | 28% |
A For the year ended February 29.
B Calculated based on average shares outstanding during the period.
C The amount shown for a share outstanding does not correspond with the aggregate net gain (loss) on investments for the period due to the timing of sales and repurchases of shares in relation to fluctuating market values of the investments of the Fund.
D Total distributions of $3.36 per share is comprised of distributions from net investment income of $.726 and distributions from net realized gain of $2.636 per share.
E Total distributions of $7.38 per share is comprised of distributions from net investment income of $.651 and distributions from net realized gain of $6.724 per share.
F Total distributions of $6.07 per share is comprised of distributions from net investment income of $.837 and distributions from net realized gain of $5.237 per share.
G Amount represents less than $.005 per share.
H Total returns for periods of less than one year are not annualized.
I Total returns would have been lower if certain expenses had not been reduced during the applicable periods shown.
J Total returns do not include the effect of the contingent deferred sales charge.
K Fees and expenses of any underlying Fidelity Central Funds are not included in the Fund's expense ratio. The Fund indirectly bears its proportionate share of the expenses of any underlying Fidelity Central Funds.
L Expense ratios reflect operating expenses of the class. Expenses before reductions do not reflect amounts reimbursed by the investment adviser or reductions from brokerage service arrangements or reductions from other expense offset arrangements and do not represent the amount paid by the class during periods when reimbursements or reductions occur. Expenses net of fee waivers reflect expenses after reimbursement by the investment adviser but prior to reductions from brokerage service arrangements or other expense offset arrangements. Expenses net of all reductions represent the net expenses paid by the class.
M Annualized
N Amount does not include the portfolio activity of any underlying Fidelity Central Funds.
O Portfolio turnover rate excludes securities received or delivered in-kind.
See accompanying notes which are an integral part of the financial statements.
Financial Highlights — Consumer Staples Portfolio
| | Six months ended (Unaudited) August 31, | Years ended February 28, | | | | |
| | 2017 | 2017 | 2016 A | 2015 | 2014 | 2013 |
| Selected Per–Share Data | | | | | | |
| Net asset value, beginning of period | $97.01 | $90.48 | $102.03 | $88.51 | $86.17 | $75.29 |
| Income from Investment Operations | | | | | | |
| Net investment income (loss)B | 1.23 | 1.56 | 1.61 | 1.64 | 1.69 | 1.48 |
| Net realized and unrealized gain (loss) | (.04)C | 9.20 | (4.89) | 17.40 | 7.55 | 11.82 |
| Total from investment operations | 1.19 | 10.76 | (3.28) | 19.04 | 9.24 | 13.30 |
| Distributions from net investment income | (.20) | (1.60) | (1.55) | (1.54) | (1.66) | (1.28) |
| Distributions from net realized gain | (1.34) | (2.64) | (6.72) | (3.98) | (5.24) | (1.14) |
| Total distributions | (1.54) | (4.23)D | (8.27) | (5.52) | (6.90) | (2.42) |
| Redemption fees added to paid in capitalB | – | –E | –E | –E | –E | –E |
| Net asset value, end of period | $96.66 | $97.01 | $90.48 | $102.03 | $88.51 | $86.17 |
| Total ReturnF,G | 1.21% | 12.24% | (3.25)% | 22.27% | 10.82% | 17.94% |
| Ratios to Average Net AssetsH,I | | | | | | |
| Expenses before reductions | .77%J | .76% | .77% | .77% | .79% | .81% |
| Expenses net of fee waivers, if any | .77%J | .76% | .77% | .77% | .79% | .81% |
| Expenses net of all reductions | .76%J | .76% | .76% | .77% | .79% | .80% |
| Net investment income (loss) | 2.49%J | 1.64% | 1.72% | 1.73% | 1.88% | 1.85% |
| Supplemental Data | | | | | | |
| Net assets, end of period (000 omitted) | $1,550,420 | $1,665,604 | $2,039,983 | $2,173,970 | $1,328,594 | $1,425,055 |
| Portfolio turnover rateK | 44%J | 56%L | 63% | 42%L | 31% | 28% |
A For the year ended February 29.
B Calculated based on average shares outstanding during the period.
C The amount shown for a share outstanding does not correspond with the aggregate net gain (loss) on investments for the period due to the timing of sales and repurchases of shares in relation to fluctuating market values of the investments of the Fund.
D Total distributions of $4.23 per share is comprised of distributions from net investment income of $1.596 and distributions from net realized gain of $2.636 per share.
E Amount represents less than $.005 per share.
F Total returns for periods of less than one year are not annualized.
G Total returns would have been lower if certain expenses had not been reduced during the applicable periods shown.
H Fees and expenses of any underlying Fidelity Central Funds are not included in the Fund's expense ratio. The Fund indirectly bears its proportionate share of the expenses of any underlying Fidelity Central Funds.
I Expense ratios reflect operating expenses of the class. Expenses before reductions do not reflect amounts reimbursed by the investment adviser or reductions from brokerage service arrangements or reductions from other expense offset arrangements and do not represent the amount paid by the class during periods when reimbursements or reductions occur. Expenses net of fee waivers reflect expenses after reimbursement by the investment adviser but prior to reductions from brokerage service arrangements or other expense offset arrangements. Expenses net of all reductions represent the net expenses paid by the class.
J Annualized
K Amount does not include the portfolio activity of any underlying Fidelity Central Funds.
L Portfolio turnover rate excludes securities received or delivered in-kind.
See accompanying notes which are an integral part of the financial statements.
Financial Highlights — Consumer Staples Portfolio Class I
| | Six months ended (Unaudited) August 31, | Years ended February 28, | | | | |
| | 2017 | 2017 | 2016 A | 2015 | 2014 | 2013 |
| Selected Per–Share Data | | | | | | |
| Net asset value, beginning of period | $96.82 | $90.34 | $101.91 | $88.33 | $85.92 | $75.14 |
| Income from Investment Operations | | | | | | |
| Net investment income (loss)B | 1.22 | 1.54 | 1.60 | 1.59 | 1.66 | 1.45 |
| Net realized and unrealized gain (loss) | (.04)C | 9.19 | (4.89) | 17.40 | 7.53 | 11.79 |
| Total from investment operations | 1.18 | 10.73 | (3.29) | 18.99 | 9.19 | 13.24 |
| Distributions from net investment income | (.20) | (1.61) | (1.55) | (1.44) | (1.54) | (1.32) |
| Distributions from net realized gain | (1.34) | (2.64) | (6.72) | (3.98) | (5.24) | (1.14) |
| Total distributions | (1.54) | (4.25) | (8.28)D | (5.41)E | (6.78) | (2.46) |
| Redemption fees added to paid in capitalB | – | –F | –F | –F | –F | –F |
| Net asset value, end of period | $96.46 | $96.82 | $90.34 | $101.91 | $88.33 | $85.92 |
| Total ReturnG,H | 1.21% | 12.22% | (3.26)% | 22.26% | 10.80% | 17.90% |
| Ratios to Average Net AssetsI,J | | | | | | |
| Expenses before reductions | .78%K | .78% | .78% | .80% | .82% | .85% |
| Expenses net of fee waivers, if any | .78%K | .78% | .77% | .80% | .82% | .85% |
| Expenses net of all reductions | .77%K | .77% | .77% | .80% | .82% | .84% |
| Net investment income (loss) | 2.48%K | 1.63% | 1.71% | 1.70% | 1.85% | 1.81% |
| Supplemental Data | | | | | | |
| Net assets, end of period (000 omitted) | $358,433 | $275,616 | $216,836 | $198,538 | $154,271 | $378,731 |
| Portfolio turnover rateL | 44%K | 56%M | 63% | 42%M | 31% | 28% |
A For the year ended February 29.
B Calculated based on average shares outstanding during the period.
C The amount shown for a share outstanding does not correspond with the aggregate net gain (loss) on investments for the period due to the timing of sales and repurchases of shares in relation to fluctuating market values of the investments of the Fund.
D Total distributions of $8.28 per share is comprised of distributions from net investment income of $1.553 and distributions from net realized gain of $6.724 per share.
E Total distributions of $5.41 per share is comprised of distributions from net investment income of $1.436 and distributions from net realized gain of $3.976 per share.
F Amount represents less than $.005 per share.
G Total returns for periods of less than one year are not annualized.
H Total returns would have been lower if certain expenses had not been reduced during the applicable periods shown.
I Fees and expenses of any underlying Fidelity Central Funds are not included in the Fund's expense ratio. The Fund indirectly bears its proportionate share of the expenses of any underlying Fidelity Central Funds.
J Expense ratios reflect operating expenses of the class. Expenses before reductions do not reflect amounts reimbursed by the investment adviser or reductions from brokerage service arrangements or reductions from other expense offset arrangements and do not represent the amount paid by the class during periods when reimbursements or reductions occur. Expenses net of fee waivers reflect expenses after reimbursement by the investment adviser but prior to reductions from brokerage service arrangements or other expense offset arrangements. Expenses net of all reductions represent the net expenses paid by the class.
K Annualized
L Amount does not include the portfolio activity of any underlying Fidelity Central Funds.
M Portfolio turnover rate excludes securities received or delivered in-kind.
See accompanying notes which are an integral part of the financial statements.
Notes to Financial Statements (Unaudited)
For the period ended August 31, 2017
1. Organization.
Consumer Staples Portfolio (the Fund) is a non-diversified fund of Fidelity Select Portfolios (the Trust) and is authorized to issue an unlimited number of shares. The Trust is registered under the Investment Company Act of 1940, as amended (the 1940 Act), as an open-end management investment company organized as a Massachusetts business trust. The Fund invests primarily in securities of companies whose principal business activities fall within specific industries. The Fund offers Class A, Class M (formerly Class T), Class C, Consumer Staples and Class I shares, each of which has equal rights as to assets and voting privileges. Each class has exclusive voting rights with respect to matters that affect that class.
After the close of business on June 24, 2016, all outstanding Class B shares were converted to Class A shares. All prior fiscal period dollar and share amounts for Class B presented in the Notes to Financial Statements are for the period March 1, 2016 through June 24, 2016.
2. Investments in Fidelity Central Funds.
The Fund invests in Fidelity Central Funds, which are open-end investment companies generally available only to other investment companies and accounts managed by the investment adviser and its affiliates. The Fund's Schedule of Investments lists each of the Fidelity Central Funds held as of period end, if any, as an investment of the Fund, but does not include the underlying holdings of each Fidelity Central Fund. As an Investing Fund, the Fund indirectly bears its proportionate share of the expenses of the underlying Fidelity Central Funds.
The Money Market Central Funds seek preservation of capital and current income and are managed by Fidelity Investments Money Management, Inc. (FIMM), an affiliate of the investment adviser. Annualized expenses of the Money Market Central Funds as of their most recent shareholder report date are less than .005%.
A complete unaudited list of holdings for each Fidelity Central Fund is available upon request or at the Securities and Exchange Commission (the SEC) website at www.sec.gov. In addition, the financial statements of the Fidelity Central Funds are available on the SEC website or upon request.
3. Significant Accounting Policies.
The Fund is an investment company and applies the accounting and reporting guidance of the Financial Accounting Standards Board (FASB) Accounting Standards Codification Topic 946 Financial Services – Investments Companies. The financial statements have been prepared in conformity with accounting principles generally accepted in the United States of America (GAAP), which require management to make certain estimates and assumptions at the date of the financial statements. Actual results could differ from those estimates. Subsequent events, if any, through the date that the financial statements were issued have been evaluated in the preparation of the financial statements. The following summarizes the significant accounting policies of the Fund:
Investment Valuation. Investments are valued as of 4:00 p.m. Eastern time on the last calendar day of the period. The Board of Trustees (the Board) has delegated the day to day responsibility for the valuation of the Fund's investments to the Fair Value Committee (the Committee) established by the Fund's investment adviser. In accordance with valuation policies and procedures approved by the Board, the Fund attempts to obtain prices from one or more third party pricing vendors or brokers to value its investments. When current market prices, quotations or currency exchange rates are not readily available or reliable, investments will be fair valued in good faith by the Committee, in accordance with procedures adopted by the Board. Factors used in determining fair value vary by investment type and may include market or investment specific events. The frequency with which these procedures are used cannot be predicted and they may be utilized to a significant extent. The Committee oversees the Fund's valuation policies and procedures and reports to the Board on the Committee's activities and fair value determinations. The Board monitors the appropriateness of the procedures used in valuing the Fund's investments and ratifies the fair value determinations of the Committee.
The Fund categorizes the inputs to valuation techniques used to value its investments into a disclosure hierarchy consisting of three levels as shown below:
- Level 1 – quoted prices in active markets for identical investments
- Level 2 – other significant observable inputs (including quoted prices for similar investments, interest rates, prepayment speeds, etc.)
- Level 3 – unobservable inputs (including the Fund's own assumptions based on the best information available)
Valuation techniques used to value the Fund's investments by major category are as follows:
Equity securities, including restricted securities, for which market quotations are readily available, are valued at the last reported sale price or official closing price as reported by a third party pricing vendor on the primary market or exchange on which they are traded and are categorized as Level 1 in the hierarchy. In the event there were no sales during the day or closing prices are not available, securities are valued at the last quoted bid price or may be valued using the last available price and are generally categorized as Level 2 in the hierarchy. For foreign equity securities, when market or security specific events arise, comparisons to the valuation of American Depositary Receipts (ADRs), futures contracts, Exchange-Traded Funds (ETFs) and certain indexes as well as quoted prices for similar securities may be used and would be categorized as Level 2 in the hierarchy. Utilizing these techniques may result in transfers between Level 1 and Level 2. For equity securities, including restricted securities, where observable inputs are limited, assumptions about market activity and risk are used and these securities may be categorized as Level 3 in the hierarchy.
Investments in open-end mutual funds, including the Fidelity Central Funds, are valued at their closing net asset value (NAV) each business day and are categorized as Level 1 in the hierarchy.
Changes in valuation techniques may result in transfers in or out of an assigned level within the disclosure hierarchy. The aggregate value of investments by input level as of August 31, 2017 is included at the end of the Fund's Schedule of Investments.
Foreign Currency. The Fund may use foreign currency contracts to facilitate transactions in foreign-denominated securities. Gains and losses from these transactions may arise from changes in the value of the foreign currency or if the counterparties do not perform under the contracts' terms.
Foreign-denominated assets, including investment securities, and liabilities are translated into U.S. dollars at the exchange rates at period end. Purchases and sales of investment securities, income and dividends received and expenses denominated in foreign currencies are translated into U.S. dollars at the exchange rate in effect on the transaction date.
The effects of exchange rate fluctuations on investments are included with the net realized and unrealized gain (loss) on investment securities. Other foreign currency transactions resulting in realized and unrealized gain (loss) are disclosed separately.
Investment Transactions and Income. For financial reporting purposes, the Fund's investment holdings and NAV include trades executed through the end of the last business day of the period. The NAV per share for processing shareholder transactions is calculated as of the close of business of the New York Stock Exchange (NYSE), normally 4:00 p.m. Eastern time and includes trades executed through the end of the prior business day. Gains and losses on securities sold are determined on the basis of identified cost and may include proceeds received from litigation. Dividend income is recorded on the ex-dividend date, except for certain dividends from foreign securities where the ex-dividend date may have passed, which are recorded as soon as the Fund is informed of the ex-dividend date. Non-cash dividends included in dividend income, if any, are recorded at the fair market value of the securities received. Income and capital gain distributions from Fidelity Central Funds, if any, are recorded on the ex-dividend date. Certain distributions received by the Fund represent a return of capital or capital gain. The Fund determines the components of these distributions subsequent to the ex-dividend date, based upon receipt of tax filings or other correspondence relating to the underlying investment. These distributions are recorded as a reduction of cost of investments and/or as a realized gain. Investment income is recorded net of foreign taxes withheld where recovery of such taxes is uncertain.
Class Allocations and Expenses. Investment income, realized and unrealized capital gains and losses, common expenses of the Fund, and certain fund-level expense reductions, if any, are allocated daily on a pro-rata basis to each class based on the relative net assets of each class to the total net assets of the Fund. Each class differs with respect to transfer agent and distribution and service plan fees incurred. Certain expense reductions may also differ by class. For the reporting period, the allocated portion of income and expenses to each class as a percent of its average net assets may vary due to the timing of recording these transactions in relation to fluctuating net assets of the classes. Expenses directly attributable to a fund are charged to that fund. Expenses attributable to more than one fund are allocated among the respective funds on the basis of relative net assets or other appropriate methods. Expense estimates are accrued in the period to which they relate and adjustments are made when actual amounts are known.
Deferred Trustee Compensation. Under a Deferred Compensation Plan (the Plan), independent Trustees may elect to defer receipt of a portion of their annual compensation. Deferred amounts are invested in a cross-section of Fidelity funds, are marked-to-market and remain in the Fund until distributed in accordance with the Plan. The investment of deferred amounts and the offsetting payable to the Trustees are included in the accompanying Statement of Assets and Liabilities.
Income Tax Information and Distributions to Shareholders. Each year, the Fund intends to qualify as a regulated investment company under Subchapter M of the Internal Revenue Code, including distributing substantially all of its taxable income and realized gains. As a result, no provision for U.S. Federal income taxes is required. The Fund files a U.S. federal tax return, in addition to state and local tax returns as required. The Fund's federal income tax returns are subject to examination by the Internal Revenue Service (IRS) for a period of three fiscal years after they are filed. State and local tax returns may be subject to examination for an additional fiscal year depending on the jurisdiction. Foreign taxes are provided for based on the Fund's understanding of the tax rules and rates that exist in the foreign markets in which it invests.
Distributions are declared and recorded on the ex-dividend date. Income dividends and capital gain distributions are declared separately for each class. Income and capital gain distributions are determined in accordance with income tax regulations, which may differ from GAAP.
Capital accounts within the financial statements are adjusted for permanent book-tax differences. These adjustments have no impact on net assets or the results of operations. Capital accounts are not adjusted for temporary book-tax differences which will reverse in a subsequent period.
Book-tax differences are primarily due to foreign currency transactions, deferred trustees compensation, and losses deferred due to wash sales.
As of period end, the cost and unrealized appreciation (depreciation) in securities, and derivatives if applicable, for federal income tax purposes were as follows:
| Gross unrealized appreciation | $636,748,550 |
| Gross unrealized depreciation | (112,378,851) |
| Net unrealized appreciation (depreciation) | $524,369,699 |
| Tax cost | $2,121,123,810 |
4. Purchases and Sales of Investments.
Purchases and sales of securities, other than short-term securities, aggregated $607,927,606 and $784,519,326, respectively.
5. Fees and Other Transactions with Affiliates.
Management Fee. Fidelity SelectCo, LLC (the investment adviser) and its affiliates provide the Fund with investment management related services for which the Fund pays a monthly management fee. The management fee is the sum of an individual fund fee rate that is based on an annual rate of .30% of the Fund's average net assets and an annualized group fee rate that averaged .25% during the period. The group fee rate is based upon the average net assets of all the mutual funds advised by Fidelity Management & Research Company (FMR) and the investment adviser. The group fee rate decreases as assets under management increase and increases as assets under management decrease. For the reporting period, the total annualized management fee rate was .55% of the Fund's average net assets.
Distribution and Service Plan Fees. In accordance with Rule 12b-1 of the 1940 Act, the Fund has adopted separate Distribution and Service Plans for each class of shares. Certain classes pay Fidelity Distributors Corporation (FDC), an affiliate of the investment adviser, separate Distribution and Service Fees, each of which is based on an annual percentage of each class' average net assets. In addition, FDC may pay financial intermediaries for selling shares of the Fund and providing shareholder support services. For the period, the Distribution and Service Fee rates, total fees and amounts retained by FDC were as follows:
| | Distribution
Fee | Service
Fee | Total Fees | Retained
by FDC |
| Class A | -% | .25% | $484,738 | $– |
| Class M | .25% | .25% | 227,998 | – |
| Class C | .75% | .25% | 1,530,977 | 251,882 |
| | | | $2,243,713 | $251,882 |
Sales Load. FDC may receive a front-end sales charge of up to 5.75% for selling Class A shares and 3.50% for selling Class M shares, some of which is paid to financial intermediaries for selling shares of the Fund. Depending on the holding period, FDC may receive contingent deferred sales charges levied on Class A, Class M and Class C redemptions. The deferred sales charges are 1.00% for Class C shares, 1.00% for certain purchases of Class A shares and .25% for certain purchases of Class M shares.
For the period, sales charge amounts retained by FDC were as follows:
| | Retained
by FDC |
| Class A | $121,378 |
| Class M | 14,227 |
| Class C(a) | 32,344 |
| | $167,949 |
(a) When Class C shares are initially sold, FDC pays commissions from its own resources to financial intermediaries through which the sales are made.
Transfer Agent Fees. Fidelity Investments Institutional Operations Company, Inc., (FIIOC), an affiliate of the investment adviser, is the transfer, dividend disbursing and shareholder servicing agent for each class of the Fund. FIIOC receives account fees and asset-based fees that vary according to the account size and type of account of the shareholders of the respective classes of the Fund. FIIOC pays for typesetting, printing and mailing of shareholder reports, except proxy statements.
For the period, transfer agent fees for each class were as follows:
| | Amount | % of
Class-Level Average
Net Assets(a) |
| Class A | $402,176 | .21 |
| Class M | 102,505 | .22 |
| Class C | 305,148 | .20 |
| Consumer Staples | 1,441,186 | .17 |
| Class I | 372,091 | .18 |
| | $2,623,106 | |
(a) Annualized
Accounting and Security Lending Fees. Fidelity Service Company, Inc. (FSC), an affiliate of the investment adviser, maintains the Fund's accounting records. The accounting fee is based on the level of average net assets for each month. Under a separate contract, FSC administers the security lending program. The security lending fee is based on the number and duration of lending transactions.
Brokerage Commissions. The Fund placed a portion of its portfolio transactions with brokerage firms which are affiliates of the investment adviser. Brokerage commissions are included in net realized gain (loss) and change in net unrealized appreciation (depreciation) in the Statement of Operations. The commissions paid to these affiliated firms were $16,195 for the period.
Interfund Trades. The Funds may purchase from or sell securities to other Fidelity Funds under procedures adopted by the Board. The procedures have been designed to ensure these interfund trades are executed in accordance with Rule 17a-7 of the 1940 Act. Interfund trades are included within the respective purchases and sales amounts shown in the Purchases and Sales of Investments note.
Prior Fiscal Year Redemptions In-Kind. During the prior period, 2,230,314 shares of the Fund held by an affiliated entity were redeemed in-kind for investments and cash with a value of $205,991,818. The Fund had a net realized gain of $85,065,706 on investments delivered through the in-kind redemptions. The amount of the in-kind redemptions is included in share transactions in the accompanying Statement of Changes in Net Assets as well as the Notes to Financial Statements. The Fund recognized no gain or loss for federal income tax purposes.
Other. During the period, the investment adviser reimbursed the Fund for certain losses in the amount of $7,646.
6. Committed Line of Credit.
The Fund participates with other funds managed by the investment adviser or an affiliate in a $4.25 billion credit facility (the "line of credit") to be utilized for temporary or emergency purposes to fund shareholder redemptions or for other short-term liquidity purposes. The Fund has agreed to pay commitment fees on its pro-rata portion of the line of credit, which amounted to $4,658 and is reflected in Miscellaneous expenses on the Statement of Operations. During the period, the Fund did not borrow on this line of credit.
7. Security Lending.
The Fund lends portfolio securities through a lending agent from time to time in order to earn additional income. On the settlement date of the loan, the Fund receives collateral (in the form of U.S. Treasury obligations, letters of credit and/or cash) against the loaned securities and maintains collateral in an amount not less than 100% of the market value of the loaned securities during the period of the loan. The market value of the loaned securities is determined at the close of business of the Fund and any additional required collateral is delivered to the Fund on the next business day. The Fund or borrower may terminate the loan at any time, and if the borrower defaults on its obligation to return the securities loaned because of insolvency or other reasons, the Fund may apply collateral received from the borrower against the obligation. The Fund may experience delays and costs in recovering the securities loaned. Any cash collateral received is invested in the Fidelity Securities Lending Cash Central Fund. The value of loaned securities and cash collateral at period end are disclosed on the Fund's Statement of Assets and Liabilities. Security lending income represents the income earned on investing cash collateral, less rebates paid to borrowers and any lending agent fees associated with the loan, plus any premium payments received for lending certain types of securities. Security lending income is presented in the Statement of Operations as a component of income from Fidelity Central Funds.
8. Expense Reductions.
Commissions paid to certain brokers with whom the investment adviser, or its affiliates, places trades on behalf of the Fund include an amount in addition to trade execution, which may be rebated back to the Fund to offset certain expenses. This amount totaled $62,534 for the period. Through arrangements with the Fund's custodian, credits realized as a result of certain uninvested cash balances were used to reduce the Fund's expenses. During the period, these credits reduced the Fund's custody expense by $143.
In addition, during the period the investment adviser reimbursed and/or waived a portion of fund-level operating expenses in the amount of $13,950.
9. Distributions to Shareholders.
Distributions to shareholders of each class were as follows:
| | Six months ended
August 31, 2017 | Year ended February 28, 2017 |
| From net investment income | | |
| Class A | $511,554 | $7,577,410 |
| Class M | 101,980 | 1,043,893 |
| Class C | 109,620 | 2,453,649 |
| Consumer Staples | 3,382,754 | 28,450,076 |
| Class I | 869,027 | 4,802,129 |
| Total | $4,974,935 | $44,327,157 |
| From net realized gain | | |
| Class A | $5,341,726 | $14,585,099 |
| Class M | 1,250,852 | 2,440,856 |
| Class B | – | 38,559 |
| Class C | 4,310,637 | 8,724,413 |
| Consumer Staples | 22,839,321 | 48,589,839 |
| Class I | 5,695,530 | 7,760,813 |
| Total | $39,438,066 | $82,139,579 |
10. Share Transactions.
Share transactions for each class were as follows and may contain automatic conversions between classes or exchanges between affiliated funds:
| | Shares | Shares | Dollars | Dollars |
| | Six months ended
August 31, 2017 | Year ended February 28, 2017 | Six months ended
August 31, 2017 | Year ended February 28, 2017 |
| Class A | | | | |
| Shares sold | 444,732 | 2,074,631 | $43,579,322 | $195,949,659 |
| Reinvestment of distributions | 59,428 | 237,892 | 5,744,829 | 21,465,950 |
| Shares redeemed | (2,193,084) | (2,123,267) | (212,515,389) | (197,828,865) |
| Net increase (decrease) | (1,688,924) | 189,256 | $(163,191,238) | $19,586,744 |
| Class M | | | | |
| Shares sold | 67,367 | 258,361 | $6,527,508 | $24,169,768 |
| Reinvestment of distributions | 14,044 | 37,389 | 1,346,502 | 3,349,216 |
| Shares redeemed | (97,015) | (212,844) | (9,392,746) | (19,792,973) |
| Net increase (decrease) | (15,604) | 82,906 | $(1,518,736) | $7,726,011 |
| Class B | | | | |
| Shares sold | – | 1,629 | $– | $151,958 |
| Reinvestment of distributions | – | 379 | – | 35,399 |
| Shares redeemed | – | (78,913) | – | (7,397,851) |
| Net increase (decrease) | – | (76,905) | $– | $(7,210,494) |
| Class C | | | | |
| Shares sold | 227,445 | 1,245,446 | $21,693,368 | $115,155,143 |
| Reinvestment of distributions | 43,923 | 115,157 | 4,143,666 | 10,152,865 |
| Shares redeemed | (463,146) | (931,585) | (44,125,499) | (84,513,838) |
| Net increase (decrease) | (191,778) | 429,018 | $(18,288,465) | $40,794,170 |
| Consumer Staples | | | | |
| Shares sold | 1,112,057 | 4,086,473 | $109,978,272 | $389,479,615 |
| Reinvestment of distributions | 254,563 | 801,941 | 24,812,185 | 73,103,322 |
| Shares redeemed | (2,497,051) | (10,263,589)(a) | (245,989,625) | (963,924,332)(a) |
| Net increase (decrease) | (1,130,431) | (5,375,175) | $(111,199,168) | $(501,341,395) |
| Class I | | | | |
| Shares sold | 2,116,133 | 2,282,645 | $206,372,922 | $217,344,361 |
| Reinvestment of distributions | 63,184 | 121,641 | 6,146,528 | 11,031,386 |
| Shares redeemed | (1,310,154) | (1,957,632) | (128,867,047) | (183,001,020) |
| Net increase (decrease) | 869,163 | 446,654 | $83,652,403 | $45,374,727 |
(a) Amount includes in-kind redemptions (see the Prior Year Redemptions In-Kind note for additional details)
11. Other.
The Fund's organizational documents provide former and current trustees and officers with a limited indemnification against liabilities arising in connection with the performance of their duties to the Fund. In the normal course of business, the Fund may also enter into contracts that provide general indemnifications. The Fund's maximum exposure under these arrangements is unknown as this would be dependent on future claims that may be made against the Fund. The risk of material loss from such claims is considered remote.
Gold Portfolio
Consolidated Investment Summary (Unaudited)
The information in the following tables is based on the consolidated investments of the Fund.
Top Ten Holdings as of August 31, 2017
| | % of fund's net assets | % of fund's net assets 6 months ago |
| Newmont Mining Corp. | 8.3 | 6.9 |
| Randgold Resources Ltd. sponsored ADR | 7.6 | 8.2 |
| Barrick Gold Corp. | 7.1 | 7.6 |
| Agnico Eagle Mines Ltd. (Canada) | 5.6 | 6.0 |
| B2Gold Corp. | 5.1 | 5.7 |
| Franco-Nevada Corp. | 4.9 | 5.3 |
| Silver Bullion | 4.7 | 4.0 |
| Royal Gold, Inc. | 3.9 | 2.8 |
| Premier Gold Mines Ltd. | 3.3 | 1.9 |
| Newcrest Mining Ltd. | 3.1 | 4.5 |
| | 53.6 | |
Top Industries (% of fund's net assets)
| As of August 31, 2017 |
| | Gold | 90.1% |
| | Commodities & Related Investments* | 5.7% |
| | Silver | 1.2% |
| | Precious Metals & Minerals | 0.9% |
| | Diversified Metals & Mining | 0.8% |
| | Copper | 0.6% |
| | All Others** | 0.7% |

* Includes gold bullion and/or silver bullion.
** Includes Short-Term investments and Net Other Assets (Liabilities).
| As of February 28, 2017 |
| | Gold | 90.5% |
| | Commodities & Related Investments* | 5.7% |
| | Precious Metals & Minerals | 1.0% |
| | Silver | 1.0% |
| | Diversified Metals & Mining | 0.8% |
| | Copper | 0.3% |
| | All Others** | 0.7% |

* Includes gold bullion and/or silver bullion.
** Includes Short-Term investments and Net Other Assets (Liabilities).
Geographic Diversification (% of fund's net assets)
| As of August 31, 2017 |
| | Canada | 60.8% |
| | United States of America* | 18.8% |
| | Bailiwick of Jersey | 7.6% |
| | Australia | 4.7% |
| | South Africa | 4.3% |
| | Peru | 1.4% |
| | Cayman Islands | 1.3% |
| | United Kingdom | 0.8% |
| | China | 0.3% |

* Includes Short-Term investments and Net Other Assets (Liabilities).
| As of February 28, 2017 |
| | Canada | 59.8% |
| | United States of America* | 16.3% |
| | Bailiwick of Jersey | 8.3% |
| | Australia | 6.2% |
| | South Africa | 4.8% |
| | United Kingdom | 2.1% |
| | Cayman Islands | 1.2% |
| | Peru | 1.0% |
| | China | 0.3% |

* Includes Short-Term investments and Net Other Assets (Liabilities).
Percentages are based on country or territory of incorporation and are adjusted for the effect of futures contracts, if applicable.
Gold Portfolio
Consolidated Investments August 31, 2017 (Unaudited)
Showing Percentage of Net Assets
| Common Stocks - 93.6% | | | |
| | | Shares | Value |
| Australia - 4.7% | | | |
| Metals & Mining - 4.7% | | | |
| Gold - 4.7% | | | |
| Dacian Gold Ltd. | | 40,000 | $70,910 |
| Evolution Mining Ltd. | | 3,631,243 | 6,985,709 |
| Gold Road Resources Ltd. (a) | | 1,080,000 | 626,739 |
| Newcrest Mining Ltd. | | 2,629,162 | 47,757,696 |
| Northern Star Resources Ltd. | | 818,118 | 3,388,391 |
| Perseus Mining Ltd.: | | | |
| (Australia) (a) | | 1,717,134 | 409,511 |
| (Canada) (a) | | 1,300,000 | 322,723 |
| Resolute Mng Ltd. | | 3,935,161 | 3,785,190 |
| Saracen Mineral Holdings Ltd. (a) | | 5,187,787 | 5,629,303 |
| Silver Lake Resources Ltd. (a) | | 2,840,985 | 993,714 |
| St Barbara Ltd. | | 1,317,257 | 2,952,973 |
| | | | 72,922,859 |
| Bailiwick of Jersey - 7.6% | | | |
| Metals & Mining - 7.6% | | | |
| Gold - 7.6% | | | |
| Randgold Resources Ltd. sponsored ADR | | 1,160,795 | 118,969,880 |
| Canada - 60.8% | | | |
| Metals & Mining - 60.8% | | | |
| Copper - 0.6% | | | |
| First Quantum Minerals Ltd. | | 832,200 | 10,029,718 |
| Diversified Metals & Mining - 0.8% | | | |
| Arizona Mining, Inc. (a)(b) | | 1,255,600 | 3,147,170 |
| Ivanhoe Mines Ltd. (a) | | 2,600,800 | 9,434,734 |
| Sabina Gold & Silver Corp. (a) | | 65,500 | 126,935 |
| | | | 12,708,839 |
| Gold - 57.5% | | | |
| Agnico Eagle Mines Ltd. (Canada) | | 1,691,201 | 86,689,711 |
| Alacer Gold Corp. (a) | | 2,554,063 | 4,479,198 |
| Alamos Gold, Inc. | | 3,726,787 | 31,037,906 |
| Alio Gold Corp. (a) | | 37,150 | 158,269 |
| Argonaut Gold, Inc. (a) | | 6,106,462 | 13,741,068 |
| B2Gold Corp. (a) | | 28,695,793 | 78,820,076 |
| Barrick Gold Corp. | | 6,121,469 | 110,247,718 |
| Belo Sun Mining Corp. (a)(b) | | 160,800 | 84,987 |
| Centerra Gold, Inc. | | 512,500 | 3,078,078 |
| Continental Gold, Inc. (a) | | 9,366,700 | 25,952,979 |
| Detour Gold Corp. (a) | | 2,619,800 | 36,671,955 |
| Detour Gold Corp. (a)(c) | | 785,900 | 11,001,027 |
| Eldorado Gold Corp. | | 9,350,935 | 19,244,767 |
| Franco-Nevada Corp. | | 937,900 | 76,729,421 |
| Goldcorp, Inc. | | 3,017,100 | 41,460,209 |
| Guyana Goldfields, Inc. (a) | | 4,666,400 | 18,684,284 |
| Guyana Goldfields, Inc. (a)(c) | | 155,000 | 620,621 |
| IAMGOLD Corp. (a) | | 1,424,000 | 9,453,421 |
| Kinross Gold Corp. (a) | | 3,400,391 | 15,494,074 |
| Kirkland Lake Gold Ltd. | | 838,019 | 10,918,574 |
| Klondex Mines Ltd. (a) | | 1,904,478 | 6,405,452 |
| Liberty Gold Corp. (a) | | 1,418,150 | 539,436 |
| Lundin Gold, Inc. (a) | | 13,800 | 58,129 |
| New Gold, Inc. (a) | | 7,391,375 | 27,641,819 |
| Novagold Resources, Inc. (a) | | 2,027,500 | 8,816,276 |
| OceanaGold Corp. | | 9,921,932 | 30,828,505 |
| Osisko Gold Royalties Ltd. | | 1,242,893 | 17,378,108 |
| Premier Gold Mines Ltd. (a)(d) | | 16,645,522 | 52,252,610 |
| Pretium Resources, Inc. (a) | | 1,752,683 | 14,540,777 |
| Pretium Resources, Inc. (a)(c) | | 225,000 | 1,866,667 |
| Primero Mining Corp. (a) | | 1,387,100 | 122,187 |
| Richmont Mines, Inc. (a) | | 1,041,643 | 9,567,684 |
| Rubicon Minerals Corp. (a) | | 1,000 | 1,273 |
| Sandstorm Gold Ltd. (a) | | 1,820,475 | 8,644,978 |
| Seabridge Gold, Inc. (a) | | 1,419,090 | 17,383,855 |
| SEMAFO, Inc. (a) | | 7,675,000 | 21,634,434 |
| Ssr Mining, Inc. (a) | | 1,323,700 | 13,845,907 |
| Tahoe Resources, Inc. | | 3,474,438 | 16,582,703 |
| Teranga Gold Corp. (a) | | 471,000 | 1,342,751 |
| Teranga Gold Corp. CDI unit (a) | | 667,614 | 1,820,369 |
| TMAC Resources, Inc. (a) | | 6,300 | 44,649 |
| Torex Gold Resources, Inc. (a) | | 2,518,700 | 42,517,875 |
| Yamana Gold, Inc. | | 2,755,620 | 8,142,733 |
| | | | 896,547,520 |
| Precious Metals & Minerals - 0.7% | | | |
| Dalradian Resources, Inc. (a) | | 729,500 | 946,378 |
| Gold Standard Ventures Corp. (a) | | 2,970,300 | 5,287,146 |
| Osisko Mining, Inc. (a)(b) | | 1,018,400 | 3,865,638 |
| | | | 10,099,162 |
| Silver - 1.2% | | | |
| MAG Silver Corp. (a) | | 448,200 | 5,627,849 |
| Wheaton Precious Metals Corp. | | 636,900 | 13,230,179 |
| | | | 18,858,028 |
| TOTAL METALS & MINING | | | 948,243,267 |
| Cayman Islands - 1.3% | | | |
| Metals & Mining - 1.3% | | | |
| Gold - 1.3% | | | |
| Endeavour Mining Corp. (a) | | 1,030,040 | 20,456,450 |
| China - 0.3% | | | |
| Metals & Mining - 0.3% | | | |
| Gold - 0.3% | | | |
| Zijin Mng Group Co. Ltd. (H Shares) | | 10,858,000 | 3,982,041 |
| Peru - 1.4% | | | |
| Metals & Mining - 1.4% | | | |
| Gold - 1.4% | | | |
| Compania de Minas Buenaventura SA sponsored ADR | | 1,658,997 | 22,280,330 |
| South Africa - 4.3% | | | |
| Metals & Mining - 4.3% | | | |
| Gold - 4.3% | | | |
| AngloGold Ashanti Ltd. sponsored ADR | | 3,524,508 | 35,738,511 |
| DRDGOLD Ltd. sponsored ADR | | 1,000 | 3,450 |
| Gold Fields Ltd. sponsored ADR | | 3,614,426 | 16,120,340 |
| Harmony Gold Mining Co. Ltd. | | 1,484,000 | 2,994,258 |
| Harmony Gold Mining Co. Ltd. sponsored ADR | | 1,460,400 | 3,008,424 |
| Sibanye Gold Ltd. ADR | | 1,320,306 | 8,449,958 |
| | | | 66,314,941 |
| United Kingdom - 0.8% | | | |
| Metals & Mining - 0.8% | | | |
| Gold - 0.6% | | | |
| Acacia Mining PLC | | 2,736,536 | 7,162,156 |
| Pan African Resources PLC | | 550,000 | 103,125 |
| Solgold PLC (a)(b) | | 3,320,331 | 1,556,401 |
| | | | 8,821,682 |
| Precious Metals & Minerals - 0.2% | | | |
| Fresnillo PLC | | 150,200 | 3,138,654 |
| TOTAL METALS & MINING | | | 11,960,336 |
| United States of America - 12.4% | | | |
| Metals & Mining - 12.4% | | | |
| Gold - 12.4% | | | |
| McEwen Mining, Inc. | | 1,096,410 | 2,817,774 |
| Newmont Mining Corp. | | 3,368,678 | 129,155,108 |
| Royal Gold, Inc. | | 659,313 | 61,500,717 |
| | | | 193,473,599 |
| TOTAL COMMON STOCKS | | | |
| (Cost $1,278,906,548) | | | 1,458,603,703 |
| | | Troy Ounces | |
|
| Commodities - 5.7% | | | |
| Gold Bullion (a) | | 11,510 | 15,225,428 |
| Silver Bullion (a) | | 4,172,000 | 73,500,210 |
| TOTAL COMMODITIES | | | |
| (Cost $81,866,785) | | | 88,725,638 |
| | | Shares | |
|
| Money Market Funds - 0.9% | | | |
| Fidelity Cash Central Fund, 1.11% (e) | | 12,988,126 | 12,990,724 |
| Fidelity Securities Lending Cash Central Fund 1.11% (e)(f) | | 1,265,624 | 1,265,751 |
| TOTAL MONEY MARKET FUNDS | | | |
| (Cost $14,256,469) | | | 14,256,475 |
| TOTAL INVESTMENT IN SECURITIES - 100.2% | | | |
| (Cost $1,375,029,802) | | | 1,561,585,816 |
| NET OTHER ASSETS (LIABILITIES) - (0.2)% | | | (2,965,301) |
| NET ASSETS - 100% | | | $1,558,620,515 |
Legend
(a) Non-income producing
(b) Security or a portion of the security is on loan at period end.
(c) Security exempt from registration under Rule 144A of the Securities Act of 1933. These securities may be resold in transactions exempt from registration, normally to qualified institutional buyers. At the end of the period, the value of these securities amounted to $13,488,315 or 0.9% of net assets.
(d) Affiliated company
(e) Affiliated fund that is generally available only to investment companies and other accounts managed by Fidelity Investments. The rate quoted is the annualized seven-day yield of the fund at period end. A complete unaudited listing of the fund's holdings as of its most recent quarter end is available upon request. In addition, each Fidelity Central Fund's financial statements are available on the SEC's website or upon request.
(f) Investment made with cash collateral received from securities on loan.
Affiliated Central Funds
Information regarding fiscal year to date income earned by the Fund from investments in Fidelity Central Funds is as follows:
| Fund | Income earned |
| Fidelity Cash Central Fund | $27,252 |
| Fidelity Securities Lending Cash Central Fund | 23,389 |
| Total | $50,641 |
Consolidated Subsidiary
| Affiliate | Value, beginning of period | Purchases | Sales Proceeds | Dividend Income | Realized Gain (loss) | Change in Unrealized appreciation (depreciation) | Value, end of period |
| FIdelity Select Cayman Gold Ltd. | $87,787,763 | $14,344,719 | $12,181,500 | $- | $(256,190) | $(1,013,927) | $88,680,865 |
Other Affiliated Issuers
An affiliated company is a company in which the Fund has ownership of at least 5% of the voting securities. Fiscal year to date transactions with companies which are or were affiliates are as follows:
| Affiliate | Value, beginning of period | Purchases | Sales Proceeds | Dividend Income | Realized Gain (loss) | Change in Unrealized appreciation (depreciation) | Value, end of period |
| Continental Gold, Inc. | $26,033,941 | $4,080,231 | $-- | $-- | $-- | $(4,161,194) | $-- |
| Premier Gold Mines Ltd. | 29,885,078 | 2,666,090 | 72,855 | -- | (70,838) | 19,845,135 | 52,252,610 |
| Total | $55,919,019 | $6,746,321 | $72,855 | $-- | $(70,838) | $15,683,941 | $52,252,610 |
Investment Valuation
The following is a summary of the inputs used, as of August 31, 2017, involving the Fund's assets and liabilities carried at fair value. The inputs or methodology used for valuing securities may not be an indication of the risk associated with investing in those securities. For more information on valuation inputs, and their aggregation into the levels used below, please refer to the Investment Valuation section in the accompanying Notes to Consolidated Financial Statements.
| | Valuation Inputs at Reporting Date: |
| Description | Total | Level 1 | Level 2 | Level 3 |
| Investments in Securities: | | | | |
| Common Stocks | $1,458,603,703 | $1,455,609,445 | $2,994,258 | $-- |
| Commodities | 88,725,638 | 88,725,638 | -- | -- |
| Money Market Funds | 14,256,475 | 14,256,475 | -- | -- |
| Total Investments in Securities: | $1,561,585,816 | $1,558,591,558 | $2,994,258 | $-- |
See accompanying notes which are an integral part of the consolidated financial statements.
Gold Portfolio
Consolidated Financial Statements
Consolidated Statement of Assets and Liabilities
| | | August 31, 2017 (Unaudited) |
| Assets | | |
Investment in securities, at value (including securities loaned of $1,196,904) — See accompanying schedule:
Unaffiliated issuers (cost $1,233,803,316) | $1,406,351,093 | |
| Fidelity Central Funds (cost $14,256,469) | 14,256,475 | |
| Commodities (cost $81,866,785) | 88,725,638 | |
| Other affiliated issuers (cost $45,103,232) | 52,252,610 | |
| Total Investment in Securities (cost $1,375,029,802) | | $1,561,585,816 |
| Cash | | 22,103 |
| Foreign currency held at value (cost $120,719) | | 121,285 |
| Receivable for investments sold | | 1,052,368 |
| Receivable for fund shares sold | | 2,145,597 |
| Dividends receivable | | 525,368 |
| Distributions receivable from Fidelity Central Funds | | 15,155 |
| Other receivables | | 82,461 |
| Total assets | | 1,565,550,153 |
| Liabilities | | |
| Payable for investments purchased | $138,712 | |
| Payable for fund shares redeemed | 4,264,178 | |
| Accrued management fee | 661,093 | |
| Distribution and service plan fees payable | 111,781 | |
| Other affiliated payables | 318,982 | |
| Other payables and accrued expenses | 169,069 | |
| Collateral on securities loaned | 1,265,823 | |
| Total liabilities | | 6,929,638 |
| Net Assets | | $1,558,620,515 |
| Net Assets consist of: | | |
| Paid in capital | | $2,760,993,415 |
| Accumulated net investment loss | | (1,335,947) |
| Accumulated undistributed net realized gain (loss) on investments and foreign currency transactions | | (1,387,593,739) |
| Net unrealized appreciation (depreciation) on investments and assets and liabilities in foreign currencies | | 186,556,786 |
| Net Assets | | $1,558,620,515 |
| Calculation of Maximum Offering Price | | |
| Class A: | | |
| Net Asset Value and redemption price per share ($78,013,298 ÷ 3,605,791 shares) | | $21.64 |
| Maximum offering price per share (100/94.25 of $21.64) | | $22.96 |
| Class M: | | |
| Net Asset Value and redemption price per share ($25,535,044 ÷ 1,201,798 shares) | | $21.25 |
| Maximum offering price per share (100/96.50 of $21.25) | | $22.02 |
| Class C: | | |
| Net Asset Value and offering price per share ($111,122,082 ÷ 5,463,556 shares)(a) | | $20.34 |
| Gold: | | |
| Net Asset Value, offering price and redemption price per share ($1,271,324,594 ÷ 57,357,370 shares) | | $22.16 |
| Class I: | | |
| Net Asset Value, offering price and redemption price per share ($72,625,497 ÷ 3,277,270 shares) | | $22.16 |
(a) Redemption price per share is equal to net asset value less any applicable contingent deferred sales charge.
See accompanying notes which are an integral part of the consolidated financial statements.
Consolidated Statement of Operations
| | | Six months ended August 31, 2017 (Unaudited) |
| Investment Income | | |
| Dividends | | $6,094,201 |
| Income from Fidelity Central Funds | | 50,641 |
| Income before foreign taxes withheld | | 6,144,842 |
| Less foreign taxes withheld | | (491,360) |
| Total income | | 5,653,482 |
| Expenses | | |
| Management fee | $4,139,644 | |
| Transfer agent fees | 1,646,207 | |
| Distribution and service plan fees | 666,693 | |
| Accounting and security lending fees | 332,190 | |
| Custodian fees and expenses | 140,937 | |
| Independent trustees' fees and expenses | 17,323 | |
| Registration fees | 78,615 | |
| Audit | 31,701 | |
| Legal | 10,739 | |
| Miscellaneous | 13,800 | |
| Total expenses before reductions | 7,077,849 | |
| Expense reductions | (138,092) | 6,939,757 |
| Net investment income (loss) | | (1,286,275) |
| Realized and Unrealized Gain (Loss) | | |
| Net realized gain (loss) on: | | |
| Investments: | | |
| Unaffiliated issuers | (25,833,810) | |
| Fidelity Central Funds | (78) | |
| Other affiliated issuers | (70,838) | |
| Commodities | (159,200) | |
| Foreign currency transactions | 7,995 | |
| Total net realized gain (loss) | | (26,055,931) |
| Change in net unrealized appreciation (depreciation) on: | | |
| Investments: | | |
| Investments | 91,894,697 | |
| Fidelity Central Funds | (6) | |
| Other Affiliated issuers | 15,683,941 | |
| Assets and liabilities in foreign currencies | 2,204 | |
| Commodities | (902,889) | |
| Total change in net unrealized appreciation (depreciation) | | 106,677,947 |
| Net gain (loss) | | 80,622,016 |
| Net increase (decrease) in net assets resulting from operations | | $79,335,741 |
See accompanying notes which are an integral part of the consolidated financial statements.
Consolidated Statement of Changes in Net Assets
| | Six months ended August 31, 2017 (Unaudited) | Year ended February 28, 2017 |
| Increase (Decrease) in Net Assets | | |
| Operations | | |
| Net investment income (loss) | $(1,286,275) | $(8,049,958) |
| Net realized gain (loss) | (26,055,931) | (56,558,933) |
| Change in net unrealized appreciation (depreciation) | 106,677,947 | 282,432,875 |
| Net increase (decrease) in net assets resulting from operations | 79,335,741 | 217,823,984 |
| Distributions to shareholders from net realized gain | (3,130,280) | (47,051,891) |
| Share transactions - net increase (decrease) | (57,689,283) | 114,767,885 |
| Redemption fees | – | 402,160 |
| Total increase (decrease) in net assets | 18,516,178 | 285,942,138 |
| Net Assets | | |
| Beginning of period | 1,540,104,337 | 1,254,162,199 |
| End of period | $1,558,620,515 | $1,540,104,337 |
| Other Information | | |
| Accumulated net investment loss end of period | $(1,335,947) | $(49,672) |
See accompanying notes which are an integral part of the consolidated financial statements.
Consolidated Financial Highlights — Gold Portfolio Class A
| | Six months ended (Unaudited) August 31, | Years ended February 28, | | | | |
| | 2017 | 2017 | 2016A | 2015 | 2014 | 2013 |
| Selected Per–Share Data | | | | | | |
| Net asset value, beginning of period | $20.54 | $17.70 | $18.11 | $22.01 | $30.25 | $45.37 |
| Income from Investment Operations | | | | | | |
| Net investment income (loss)B | (.04) | (.16) | (.06) | (.10) | –C | .07 |
| Net realized and unrealized gain (loss) | 1.17 | 3.59 | (.35) | (3.80) | (8.25) | (15.19) |
| Total from investment operations | 1.13 | 3.43 | (.41) | (3.90) | (8.25) | (15.12) |
| Distributions from net realized gain | (.03) | (.60) | – | – | – | – |
| Total distributions | (.03) | (.60) | – | – | – | – |
| Redemption fees added to paid in capitalB | – | .01 | –C | –C | .01 | –C |
| Net asset value, end of period | $21.64 | $20.54 | $17.70 | $18.11 | $22.01 | $30.25 |
| Total ReturnD,E,F | 5.52% | 19.97% | (2.26)% | (17.72)% | (27.24)% | (33.33)% |
| Ratios to Average Net AssetsG,H | | | | | | |
| Expenses before reductions | 1.18%I | 1.19% | 1.23% | 1.23% | 1.21% | 1.18% |
| Expenses net of fee waivers, if any | 1.16%I | 1.16% | 1.20% | 1.19% | 1.19% | 1.17% |
| Expenses net of all reductions | 1.16%I | 1.16% | 1.20% | 1.19% | 1.18% | 1.17% |
| Net investment income (loss) | (.40)%I | (.71)% | (.44)% | (.51)% | - %J | .18% |
| Supplemental Data | | | | | | |
| Net assets, end of period (000 omitted) | $78,013 | $83,589 | $53,509 | $46,898 | $60,270 | $101,202 |
| Portfolio turnover rateK | 19%I | 28% | 20% | 20% | 56% | 18% |
A For the year ended February 29.
B Calculated based on average shares outstanding during the period.
C Amount represents less than $.005 per share.
D Total returns for periods of less than one year are not annualized.
E Total returns would have been lower if certain expenses had not been reduced during the applicable periods shown.
F Total returns do not include the effect of the sales charges.
G Fees and expenses of any underlying Fidelity Central Funds are not included in the Fund's expense ratio. The Fund indirectly bears its proportionate share of the expenses of any underlying Fidelity Central Funds.
H Expense ratios reflect operating expenses of the class. Expenses before reductions do not reflect amounts reimbursed by the investment adviser or reductions from brokerage service arrangements or reductions from other expense offset arrangements and do not represent the amount paid by the class during periods when reimbursements or reductions occur. Expenses net of fee waivers reflect expenses after reimbursement by the investment adviser but prior to reductions from brokerage service arrangements or other expense offset arrangements. Expenses net of all reductions represent the net expenses paid by the class.
I Annualized
J Amount represents less than .005%.
K Amount does not include the portfolio activity of any underlying Fidelity Central Funds.
See accompanying notes which are an integral part of the consolidated financial statements.
Consolidated Financial Highlights — Gold Portfolio Class M
| | Six months ended (Unaudited) August 31, | Years ended February 28, | | | | |
| | 2017 | 2017 | 2016A | 2015 | 2014 | 2013 |
| Selected Per–Share Data | | | | | | |
| Net asset value, beginning of period | $20.19 | $17.37 | $17.83 | $21.73 | $29.95 | $45.04 |
| Income from Investment Operations | | | | | | |
| Net investment income (loss)B | (.07) | (.22) | (.11) | (.15) | (.06) | (.03) |
| Net realized and unrealized gain (loss) | 1.16 | 3.54 | (.35) | (3.75) | (8.17) | (15.06) |
| Total from investment operations | 1.09 | 3.32 | (.46) | (3.90) | (8.23) | (15.09) |
| Distributions from net realized gain | (.03) | (.51) | – | – | – | – |
| Total distributions | (.03) | (.51) | – | – | – | – |
| Redemption fees added to paid in capitalB | – | .01 | –C | –C | .01 | –C |
| Net asset value, end of period | $21.25 | $20.19 | $17.37 | $17.83 | $21.73 | $29.95 |
| Total ReturnD,E,F | 5.38% | 19.62% | (2.58)% | (17.95)% | (27.45)% | (33.50)% |
| Ratios to Average Net AssetsG,H | | | | | | |
| Expenses before reductions | 1.48%I | 1.49% | 1.52% | 1.50% | 1.49% | 1.45% |
| Expenses net of fee waivers, if any | 1.46%I | 1.46% | 1.48% | 1.46% | 1.47% | 1.44% |
| Expenses net of all reductions | 1.46%I | 1.46% | 1.48% | 1.46% | 1.46% | 1.44% |
| Net investment income (loss) | (.70)%I | (1.01)% | (.72)% | (.79)% | (.28)% | (.09)% |
| Supplemental Data | | | | | | |
| Net assets, end of period (000 omitted) | $25,535 | $25,170 | $17,720 | $16,200 | $18,402 | $24,913 |
| Portfolio turnover rateJ | 19%I | 28% | 20% | 20% | 56% | 18% |
A For the year ended February 29.
B Calculated based on average shares outstanding during the period.
C Amount represents less than $.005 per share.
D Total returns for periods of less than one year are not annualized.
E Total returns would have been lower if certain expenses had not been reduced during the applicable periods shown.
F Total returns do not include the effect of the sales charges.
G Fees and expenses of any underlying Fidelity Central Funds are not included in the Fund's expense ratio. The Fund indirectly bears its proportionate share of the expenses of any underlying Fidelity Central Funds.
H Expense ratios reflect operating expenses of the class. Expenses before reductions do not reflect amounts reimbursed by the investment adviser or reductions from brokerage service arrangements or reductions from other expense offset arrangements and do not represent the amount paid by the class during periods when reimbursements or reductions occur. Expenses net of fee waivers reflect expenses after reimbursement by the investment adviser but prior to reductions from brokerage service arrangements or other expense offset arrangements. Expenses net of all reductions represent the net expenses paid by the class.
I Annualized
J Amount does not include the portfolio activity of any underlying Fidelity Central Funds.
See accompanying notes which are an integral part of the consolidated financial statements.
Consolidated Financial Highlights — Gold Portfolio Class C
| | Six months ended (Unaudited) August 31, | Years ended February 28, | | | | |
| | 2017 | 2017 | 2016A | 2015 | 2014 | 2013 |
| Selected Per–Share Data | | | | | | |
| Net asset value, beginning of period | $19.36 | $16.68 | $17.20 | $21.06 | $29.15 | $44.05 |
| Income from Investment Operations | | | | | | |
| Net investment income (loss)B | (.10) | (.29) | (.16) | (.23) | (.16) | (.20) |
| Net realized and unrealized gain (loss) | 1.10 | 3.42 | (.36) | (3.63) | (7.94) | (14.70) |
| Total from investment operations | 1.00 | 3.13 | (.52) | (3.86) | (8.10) | (14.90) |
| Distributions from net realized gain | (.02) | (.45) | – | – | – | – |
| Total distributions | (.02) | (.45) | – | – | – | – |
| Redemption fees added to paid in capitalB | – | –C | –C | –C | .01 | –C |
| Net asset value, end of period | $20.34 | $19.36 | $16.68 | $17.20 | $21.06 | $29.15 |
| Total ReturnD,E,F | 5.14% | 19.19% | (3.02)% | (18.33)% | (27.75)% | (33.83)% |
| Ratios to Average Net AssetsG,H | | | | | | |
| Expenses before reductions | 1.85%I | 1.88% | 1.97% | 1.96% | 1.96% | 1.93% |
| Expenses net of fee waivers, if any | 1.83%I | 1.85% | 1.93% | 1.92% | 1.94% | 1.92% |
| Expenses net of all reductions | 1.83%I | 1.84% | 1.93% | 1.92% | 1.93% | 1.91% |
| Net investment income (loss) | (1.07)%I | (1.40)% | (1.17)% | (1.25)% | (.76)% | (.57)% |
| Supplemental Data | | | | | | |
| Net assets, end of period (000 omitted) | $111,122 | $101,215 | $52,732 | $39,429 | $33,811 | $37,787 |
| Portfolio turnover rateJ | 19%I | 28% | 20% | 20% | 56% | 18% |
A For the year ended February 29.
B Calculated based on average shares outstanding during the period.
C Amount represents less than $.005 per share.
D Total returns for periods of less than one year are not annualized.
E Total returns would have been lower if certain expenses had not been reduced during the applicable periods shown.
F Total returns do not include the effect of the contingent deferred sales charge.
G Fees and expenses of any underlying Fidelity Central Funds are not included in the Fund's expense ratio. The Fund indirectly bears its proportionate share of the expenses of any underlying Fidelity Central Funds.
H Expense ratios reflect operating expenses of the class. Expenses before reductions do not reflect amounts reimbursed by the investment adviser or reductions from brokerage service arrangements or reductions from other expense offset arrangements and do not represent the amount paid by the class during periods when reimbursements or reductions occur. Expenses net of fee waivers reflect expenses after reimbursement by the investment adviser but prior to reductions from brokerage service arrangements or other expense offset arrangements. Expenses net of all reductions represent the net expenses paid by the class.
I Annualized
J Amount does not include the portfolio activity of any underlying Fidelity Central Funds.
See accompanying notes which are an integral part of the consolidated financial statements.
Consolidated Financial Highlights — Gold Portfolio
| | Six months ended (Unaudited) August 31, | Years ended February 28, | | | | |
| | 2017 | 2017 | 2016A | 2015 | 2014 | 2013 |
| Selected Per–Share Data | | | | | | |
| Net asset value, beginning of period | $21.02 | $18.12 | $18.50 | $22.41 | $30.72 | $45.96 |
| Income from Investment Operations | | | | | | |
| Net investment income (loss)B | (.01) | (.09) | (.03) | (.04) | .06 | .16 |
| Net realized and unrealized gain (loss) | 1.20 | 3.66 | (.35) | (3.87) | (8.38) | (15.40) |
| Total from investment operations | 1.19 | 3.57 | (.38) | (3.91) | (8.32) | (15.24) |
| Distributions from net realized gain | (.05) | (.68) | – | – | – | – |
| Total distributions | (.05) | (.68) | – | – | – | – |
| Redemption fees added to paid in capitalB | – | .01 | –C | –C | .01 | –C |
| Net asset value, end of period | $22.16 | $21.02 | $18.12 | $18.50 | $22.41 | $30.72 |
| Total ReturnD,E | 5.64% | 20.38% | (2.05)% | (17.45)% | (27.05)% | (33.16)% |
| Ratios to Average Net AssetsF,G | | | | | | |
| Expenses before reductions | .86%H | .87% | .97% | .94% | .94% | .93% |
| Expenses net of fee waivers, if any | .85%H | .84% | .93% | .90% | .92% | .92% |
| Expenses net of all reductions | .85%H | .84% | .93% | .90% | .91% | .92% |
| Net investment income (loss) | (.08)%H | (.39)% | (.17)% | (.22)% | .27% | .43% |
| Supplemental Data | | | | | | |
| Net assets, end of period (000 omitted) | $1,271,325 | $1,271,458 | $1,076,206 | $992,944 | $1,275,913 | $2,301,019 |
| Portfolio turnover rateI | 19%H | 28% | 20% | 20% | 56% | 18% |
A For the year ended February 29.
B Calculated based on average shares outstanding during the period.
C Amount represents less than $.005 per share.
D Total returns for periods of less than one year are not annualized.
E Total returns would have been lower if certain expenses had not been reduced during the applicable periods shown.
F Fees and expenses of any underlying Fidelity Central Funds are not included in the Fund's expense ratio. The Fund indirectly bears its proportionate share of the expenses of any underlying Fidelity Central Funds.
G Expense ratios reflect operating expenses of the class. Expenses before reductions do not reflect amounts reimbursed by the investment adviser or reductions from brokerage service arrangements or reductions from other expense offset arrangements and do not represent the amount paid by the class during periods when reimbursements or reductions occur. Expenses net of fee waivers reflect expenses after reimbursement by the investment adviser but prior to reductions from brokerage service arrangements or other expense offset arrangements. Expenses net of all reductions represent the net expenses paid by the class.
H Annualized
I Amount does not include the portfolio activity of any underlying Fidelity Central Funds.
See accompanying notes which are an integral part of the consolidated financial statements.
Consolidated Financial Highlights — Gold Portfolio Class I
| | Six months ended (Unaudited) August 31, | Years ended February 28, | | | | |
| | 2017 | 2017 | 2016A | 2015 | 2014 | 2013 |
| Selected Per–Share Data | | | | | | |
| Net asset value, beginning of period | $21.02 | $18.13 | $18.50 | $22.41 | $30.69 | $45.87 |
| Income from Investment Operations | | | | | | |
| Net investment income (loss)B | (.01) | (.09) | (.02) | (.04) | .07 | .20 |
| Net realized and unrealized gain (loss) | 1.20 | 3.67 | (.35) | (3.87) | (8.36) | (15.38) |
| Total from investment operations | 1.19 | 3.58 | (.37) | (3.91) | (8.29) | (15.18) |
| Distributions from net realized gain | (.05) | (.70) | – | – | – | – |
| Total distributions | (.05) | (.70) | – | – | – | – |
| Redemption fees added to paid in capitalB | – | .01 | –C | –C | .01 | –C |
| Net asset value, end of period | $22.16 | $21.02 | $18.13 | $18.50 | $22.41 | $30.69 |
| Total ReturnD,E | 5.65% | 20.41% | (2.00)% | (17.45)% | (26.98)% | (33.09)% |
| Ratios to Average Net AssetsF,G | | | | | | |
| Expenses before reductions | .85%H | .87% | .92% | .90% | .87% | .84% |
| Expenses net of fee waivers, if any | .83%H | .84% | .88% | .86% | .85% | .83% |
| Expenses net of all reductions | .83%H | .84% | .88% | .86% | .84% | .82% |
| Net investment income (loss) | (.06)%H | (.39)% | (.12)% | (.18)% | .34% | .52% |
| Supplemental Data | | | | | | |
| Net assets, end of period (000 omitted) | $72,625 | $58,673 | $52,607 | $23,667 | $107,830 | $128,262 |
| Portfolio turnover rateI | 19%H | 28% | 20% | 20% | 56% | 18% |
A For the year ended February 29.
B Calculated based on average shares outstanding during the period.
C Amount represents less than $.005 per share.
D Total returns for periods of less than one year are not annualized.
E Total returns would have been lower if certain expenses had not been reduced during the applicable periods shown.
F Fees and expenses of any underlying Fidelity Central Funds are not included in the Fund's expense ratio. The Fund indirectly bears its proportionate share of the expenses of any underlying Fidelity Central Funds.
G Expense ratios reflect operating expenses of the class. Expenses before reductions do not reflect amounts reimbursed by the investment adviser or reductions from brokerage service arrangements or reductions from other expense offset arrangements and do not represent the amount paid by the class during periods when reimbursements or reductions occur. Expenses net of fee waivers reflect expenses after reimbursement by the investment adviser but prior to reductions from brokerage service arrangements or other expense offset arrangements. Expenses net of all reductions represent the net expenses paid by the class.
H Annualized
I Amount does not include the portfolio activity of any underlying Fidelity Central Funds.
See accompanying notes which are an integral part of the consolidated financial statements.
Notes to Consolidated Financial Statements (Unaudited)
For the period ended August 31, 2017
1. Organization.
Gold Portfolio (the Fund) is a non-diversified fund of Fidelity Select Portfolios (the Trust) and is authorized to issue an unlimited number of shares. The Trust is registered under the Investment Company Act of 1940, as amended (the 1940 Act), as an open-end management investment company organized as a Massachusetts business trust. The Fund invests primarily in securities of companies whose principal business activities fall within specific industries. The Fund offers Class A, Class M (formerly Class T), Class C, Gold and Class I shares, each of which has equal rights as to assets and voting privileges. Each class has exclusive voting rights with respect to matters that affect that class.
After the close of business on June 24, 2016, all outstanding Class B shares were converted to Class A shares. All prior fiscal period dollar and share amounts for Class B presented in the Notes to Financial Statements are for the period March 1, 2016 through June 24, 2016.
2. Consolidated Subsidiary.
The Fund invests in certain commodity-related investments through Fidelity Select Gold Cayman Ltd, a wholly owned subsidiary (the "Subsidiary"). As of period end, the Fund held an investment of $88,680,865 in the Subsidiary, representing 5.7% of the Fund's net assets.
The financial statements have been consolidated and include accounts of the Fund and the Subsidiary. Accordingly, all inter-company transactions and balances have been eliminated.
3. Investments in Fidelity Central Funds.
The Fund invests in Fidelity Central Funds, which are open-end investment companies generally available only to other investment companies and accounts managed by the investment adviser and its affiliates. The Fund's Consolidated Schedule of Investments lists each of the Fidelity Central Funds held as of period end, if any, as an investment of the Fund, but does not include the underlying holdings of each Fidelity Central Fund. As an Investing Fund, the Fund indirectly bears its proportionate share of the expenses of the underlying Fidelity Central Funds.
The Money Market Central Funds seek preservation of capital and current income and are managed by Fidelity Investments Money Management, Inc. (FIMM), an affiliate of the investment adviser. Annualized expenses of the Money Market Central Funds as of their most recent shareholder report date are less than .005%.
A complete unaudited list of holdings for each Fidelity Central Fund is available upon request or at the Securities and Exchange Commission (the SEC) website at www.sec.gov. In addition, the financial statements of the Fidelity Central Funds are available on the SEC website or upon request.
4. Significant Accounting Policies.
The Fund is an investment company and applies the accounting and reporting guidance of the Financial Accounting Standards Board (FASB) Accounting Standards Codification Topic 946 Financial Services – Investments Companies. The consolidated financial statements have been prepared in conformity with accounting principles generally accepted in the United States of America (GAAP), which require management to make certain estimates and assumptions at the date of the financial statements. Actual results could differ from those estimates. Subsequent events, if any, through the date that the financial statements were issued have been evaluated in the preparation of the financial statements. The following summarizes the significant accounting policies of the Fund:
Investment Valuation. Investments are valued as of 4:00 p.m. Eastern time on the last calendar day of the period. The Board of Trustees (the Board) has delegated the day to day responsibility for the valuation of the Fund's investments to the Fair Value Committee (the Committee) established by the Fund's investment adviser. In accordance with valuation policies and procedures approved by the Board, the Fund attempts to obtain prices from one or more third party pricing vendors or brokers to value its investments. When current market prices, quotations or currency exchange rates are not readily available or reliable, investments will be fair valued in good faith by the Committee, in accordance with procedures adopted by the Board. Factors used in determining fair value vary by investment type and may include market or investment specific events. The frequency with which these procedures are used cannot be predicted and they may be utilized to a significant extent. The Committee oversees the Fund's valuation policies and procedures and reports to the Board on the Committee's activities and fair value determinations. The Board monitors the appropriateness of the procedures used in valuing the Fund's investments and ratifies the fair value determinations of the Committee.
The Fund categorizes the inputs to valuation techniques used to value its investments into a disclosure hierarchy consisting of three levels as shown below:
- Level 1 – quoted prices in active markets for identical investments
- Level 2 – other significant observable inputs (including quoted prices for similar investments, interest rates, prepayment speeds, etc.)
- Level 3 – unobservable inputs (including the Fund's own assumptions based on the best information available)
Valuation techniques used to value the Fund's investments by major category are as follows:
Equity securities, including restricted securities, for which market quotations are readily available, are valued at the last reported sale price or official closing price as reported by a third party pricing vendor on the primary market or exchange on which they are traded and are categorized as Level 1 in the hierarchy. In the event there were no sales during the day or closing prices are not available, securities are valued at the last quoted bid price or may be valued using the last available price and are generally categorized as Level 2 in the hierarchy. For foreign equity securities, when market or security specific events arise, comparisons to the valuation of American Depositary Receipts (ADRs), futures contracts, Exchange-Traded Funds (ETFs) and certain indexes as well as quoted prices for similar securities may be used and would be categorized as Level 2 in the hierarchy. Utilizing these techniques may result in transfers between Level 1 and Level 2. For equity securities, including restricted securities, where observable inputs are limited, assumptions about market activity and risk are used and these securities may be categorized as Level 3 in the hierarchy.
Investments in commodities are valued at their last traded price at 4:00 p.m. Eastern time each business day and are categorized as Level 1 in the hierarchy. Investments in open-end mutual funds, including the Fidelity Central Funds, are valued at their closing net asset value (NAV) each business day and are categorized as Level 1 in the hierarchy.
Changes in valuation techniques may result in transfers in or out of an assigned level within the disclosure hierarchy. The aggregate value of investments by input level as of August 31, 2017 is included at the end the Fund's Consolidated Schedule of Investments.
Foreign Currency. The Fund may use foreign currency contracts to facilitate transactions in foreign-denominated securities. Gains and losses from these transactions may arise from changes in the value of the foreign currency or if the counterparties do not perform under the contracts' terms.
Foreign-denominated assets, including investment securities, and liabilities are translated into U.S. dollars at the exchange rates at period end. Purchases and sales of investment securities, income and dividends received and expenses denominated in foreign currencies are translated into U.S. dollars at the exchange rate in effect on the transaction date.
The effects of exchange rate fluctuations on investments are included with the net realized and unrealized gain (loss) on investment securities. Other foreign currency transactions resulting in realized and unrealized gain (loss) are disclosed separately.
Investment Transactions and Income. For financial reporting purposes, the Fund's investment holdings and NAV include trades executed through the end of the last business day of the period. The NAV per share for processing shareholder transactions is calculated as of the close of business of the New York Stock Exchange (NYSE), normally 4:00 p.m. Eastern time and includes trades executed through the end of the prior business day. Gains and losses on securities sold are determined on the basis of identified cost and may include proceeds received from litigation. Dividend income is recorded on the ex-dividend date, except for certain dividends from foreign securities where the ex-dividend date may have passed, which are recorded as soon as the Fund is informed of the ex-dividend date. Non-cash dividends included in dividend income, if any, are recorded at the fair market value of the securities received. Income and capital gain distributions from Fidelity Central Funds, if any, are recorded on the ex-dividend date. Certain distributions received by the Fund represent a return of capital or capital gain. The Fund determines the components of these distributions subsequent to the ex-dividend date, based upon receipt of tax filings or other correspondence relating to the underlying investment. These distributions are recorded as a reduction of cost of investments and/or as a realized gain. Investment income is recorded net of foreign taxes withheld where recovery of such taxes is uncertain.
Class Allocations and Expenses. Investment income, realized and unrealized capital gains and losses, common expenses of the Fund, and certain fund-level expense reductions, if any, are allocated daily on a pro-rata basis to each class based on the relative net assets of each class to the total net assets of the Fund. Each class differs with respect to transfer agent and distribution and service plan fees incurred. Certain expense reductions may also differ by class. For the reporting period, the allocated portion of income and expenses to each class as a percent of its average net assets may vary due to the timing of recording these transactions in relation to fluctuating net assets of the classes. Expenses directly attributable to a fund are charged to that fund. Expenses attributable to more than one fund are allocated among the respective funds on the basis of relative net assets or other appropriate methods. Expense estimates are accrued in the period to which they relate and adjustments are made when actual amounts are known.
Deferred Trustee Compensation. Under a Deferred Compensation Plan (the Plan), independent Trustees may elect to defer receipt of a portion of their annual compensation. Deferred amounts are invested in a cross-section of Fidelity funds, are marked-to-market and remain in the Fund until distributed in accordance with the Plan. The investment of deferred amounts and the offsetting payable to the Trustees are included in the accompanying Statement of Assets and Liabilities.
Income Tax Information and Distributions to Shareholders. Each year, the Fund intends to qualify as a regulated investment company under Subchapter M of the Internal Revenue Code, including distributing substantially all of its taxable income and realized gains. As a result, no provision for U.S. Federal income taxes is required. The Fund files a U.S. federal tax return, in addition to state and local tax returns as required. The Fund's federal income tax returns are subject to examination by the Internal Revenue Service (IRS) for a period of three fiscal years after they are filed. State and local tax returns may be subject to examination for an additional fiscal year depending on the jurisdiction. Foreign taxes are provided for based on the Fund's understanding of the tax rules and rates that exist in the foreign markets in which it invests.
The Subsidiary is classified as a controlled foreign corporation under Subchapter N of the Internal Revenue Code. Therefore, the Fund is required to increase its taxable income by its share of the Subsidiary's income. Net investment losses of the Subsidiary cannot be deducted by the Fund in the current period nor carried forward to offset taxable income in future periods.
Distributions are declared and recorded on the ex-dividend date. Income dividends and capital gain distributions are declared separately for each class. Income and capital gain distributions are determined in accordance with income tax regulations, which may differ from GAAP.
Capital accounts within the consolidated financial statements are adjusted for permanent book-tax differences. These adjustments have no impact on net assets or the results of operations. Capital accounts are not adjusted for temporary book-tax differences which will reverse in a subsequent period.
Book-tax differences are primarily due to foreign currency transactions, passive foreign investment companies (PFIC), controlled foreign corporations, deferred trustees compensation, capital loss carryforwards, and losses deferred due to wash sales.
As of period end, the cost and unrealized appreciation (depreciation) in securities, and derivatives if applicable, for federal income tax purposes on an unconsolidated basis were as follows:
| Gross unrealized appreciation | $381,059,966 |
| Gross unrealized depreciation | (356,383,362) |
| Net unrealized appreciation (depreciation) | $24,676,604 |
| Tax cost | $1,536,864,439 |
Capital loss carryforwards are only available to offset future capital gains of the Fund to the extent provided by regulations and may be limited. Under the Regulated Investment Company Modernization Act of 2010 (the Act), the Fund is permitted to carry forward capital losses incurred in taxable years beginning after December 22, 2010 for an unlimited period and such capital losses are required to be used prior to any losses that expire. The capital loss carryforward information presented below, including any applicable limitation, is estimated as of prior fiscal period end and is subject to adjustment.
| No expiration | |
| Short-term | $(140,407,726) |
| Long-term | (1,077,593,342) |
| Total capital loss carryforward | $(1,218,001,068) |
Restricted Securities. The Fund may invest in securities that are subject to legal or contractual restrictions on resale. These securities generally may be resold in transactions exempt from registration or to the public if the securities are registered. Disposal of these securities may involve time-consuming negotiations and expense, and prompt sale at an acceptable price may be difficult. Information regarding restricted securities is included at the end of the Fund's Consolidated Schedule of Investments.
5. Purchases and Sales of Investments.
Purchases and sales of securities, other than short-term securities, aggregated $138,248,523 and $199,944,314, respectively.
6. Fees and Other Transactions with Affiliates.
Management Fee. Fidelity SelectCo, LLC (the investment adviser) and its affiliates provide the Fund with investment management related services for which the Fund pays a monthly management fee. The management fee is the sum of an individual fund fee rate that is based on an annual rate of .30% of the Fund's average net assets and an annualized group fee rate that averaged .25% during the period. The group fee rate is based upon the average net assets of all the mutual funds advised by Fidelity Management & Research Company (FMR) and the investment adviser. The group fee rate decreases as assets under management increase and increases as assets under management decrease.
FMR, either through itself or through an affiliate provides investment management related services to the Subsidiary for which the Subsidiary pays a monthly management fee at the annual rate of .30% of its net assets. Under the management contract with the subsidiary, FMR pays all other expenses of the Subsidiary, except custodian fees.
For the reporting period, the total consolidated annual management fee rate which includes the management fee of the Fund and the Subsidiary was .56% of the Fund's average net assets.
During the period, the investment adviser waived a portion of the Fund's management fee representing the amount of the management fee paid by the Subsidiary to FMR as described in the Expense Reductions note.
Distribution and Service Plan Fees. In accordance with Rule 12b-1 of the 1940 Act, the Fund has adopted separate Distribution and Service Plans for each class of shares. Certain classes pay Fidelity Distributors Corporation (FDC), an affiliate of the investment adviser, separate Distribution and Service Fees, each of which is based on an annual percentage of each class' average net assets. In addition, FDC may pay financial intermediaries for selling shares of the Fund and providing shareholder support services. For the period, the Distribution and Service Fee rates, total fees and amounts retained by FDC were as follows:
| | Distribution
Fee | Service
Fee | Total Fees | Retained
by FDC |
| Class A | -% | .25% | $94,092 | $2,057 |
| Class M | .25% | .25% | 60,670 | – |
| Class C | .75% | .25% | 511,931 | 149,970 |
| | | | $666,693 | $152,027 |
Sales Load. FDC may receive a front-end sales charge of up to 5.75% for selling Class A shares and 3.50% for selling Class M shares, some of which is paid to financial intermediaries for selling shares of the Fund. Depending on the holding period, FDC may receive contingent deferred sales charges levied on Class A, Class M and Class C redemptions. The deferred sales charges are 1.00% for Class C shares, 1.00% for certain purchases of Class A shares and .25% for certain purchases of Class M shares.
For the period, sales charge amounts retained by FDC were as follows:
| | Retained
by FDC |
| Class A | $19,052 |
| Class M | 3,996 |
| Class C(a) | 8,211 |
| | $31,259 |
(a) When Class C shares are initially sold, FDC pays commissions from its own resources to financial intermediaries through which the sales are made.
Transfer Agent Fees. Fidelity Investments Institutional Operations Company, Inc., (FIIOC), an affiliate of the investment adviser, is the transfer, dividend disbursing and shareholder servicing agent for each class of the Fund. FIIOC receives account fees and asset-based fees that vary according to the account size and type of account of the shareholders of the respective classes of the Fund. FIIOC pays for typesetting, printing and mailing of shareholder reports, except proxy statements.
For the period, transfer agent fees for each class were as follows:
| | Amount | % of
Class-Level Average
Net Assets(a) |
| Class A | $107,027 | .28 |
| Class M | 40,726 | .34 |
| Class C | 105,836 | .21 |
| Gold | 1,326,472 | .22 |
| Class I | 66,146 | .20 |
| | $1,646,207 | |
(a) Annualized
Accounting and Security Lending Fees. Fidelity Service Company, Inc. (FSC), an affiliate of the investment adviser, maintains the Fund's accounting records. The accounting fee is based on the level of average net assets for each month. Under a separate contract, FSC administers the security lending program. The security lending fee is based on the number and duration of lending transactions.
Brokerage Commissions. The Fund placed a portion of its portfolio transactions with brokerage firms which are affiliates of the investment adviser. Brokerage commissions are included in net realized gain (loss) and change in net unrealized appreciation (depreciation) in the Statement of Operations. The commissions paid to these affiliated firms were $5,179 for the period.
Interfund Trades. The Fund may purchase from or sell securities to other Fidelity Funds under procedures adopted by the Board. The procedures have been designed to ensure these interfund trades are executed in accordance with Rule 17a-7 of the 1940 Act. Interfund trades are included within the respective purchases and sales amounts shown in the Purchases and Sales of Investments note.
Other. During the period, the investment adviser reimbursed the Fund for certain losses in the amount of $1,500.
7. Committed Line of Credit.
The Fund participates with other funds managed by the investment adviser or an affiliate in a $4.25 billion credit facility (the "line of credit") to be utilized for temporary or emergency purposes to fund shareholder redemptions or for other short-term liquidity purposes. The Fund has agreed to pay commitment fees on its pro-rata portion of the line of credit, which amounted to $2,367 and is reflected in Miscellaneous expenses on the Consolidated Statement of Operations. During the period, the Fund did not borrow on this line of credit.
8. Security Lending.
The Fund lends portfolio securities through a lending agent from time to time in order to earn additional income. On the settlement date of the loan, the Fund receives collateral (in the form of U.S. Treasury obligations, letters of credit and/or cash) against the loaned securities and maintains collateral in an amount not less than 100% of the market value of the loaned securities during the period of the loan. The market value of the loaned securities is determined at the close of business of the Fund and any additional required collateral is delivered to the Fund on the next business day. The Fund or borrower may terminate the loan at any time, and if the borrower defaults on its obligation to return the securities loaned because of insolvency or other reasons, the Fund may apply collateral received from the borrower against the obligation. The Fund may experience delays and costs in recovering the securities loaned. Any cash collateral received is invested in the Fidelity Securities Lending Cash Central Fund. The value of loaned securities and cash collateral at period end are disclosed on the Fund's Consolidated Statement of Assets and Liabilities. Security lending income represents the income earned on investing cash collateral, less rebates paid to borrowers and any lending agent fees associated with the loan, plus any premium payments received for lending certain types of securities. Security lending income is presented in the Consolidated Statement of Operations as a component of income from Fidelity Central Funds. Total security lending income during the period amounted to $23,389.
9. Expense Reductions.
The investment adviser has contractually agreed to waive the Fund's management fee in an amount equal to the management fee paid by the Subsidiary to FMR. During the period, this waiver reduced the Fund's management fee by $118,759.
Commissions paid to certain brokers with whom the investment adviser, or its affiliates, places trades on behalf of the Fund include an amount in addition to trade execution, which may be rebated back to the Fund to offset certain expenses. This amount totaled $12,774 for the period.
In addition, during the period the investment adviser reimbursed and/or waived a portion of fund-level operating expenses in the amount of $6,559.
10. Distributions to Shareholders.
Distributions to shareholders of each class were as follows:
| | Six months ended
August 31, 2017 | Year ended February 28, 2017 |
| From net realized gain | | |
| Class A | $127,654 | $2,221,326 |
| Class M | 32,220 | 587,030 |
| Class C | 80,825 | 2,039,868 |
| Gold | 2,740,284 | 40,224,766 |
| Class I | 149,297 | 1,978,901 |
| Total | $3,130,280 | $47,051,891 |
11. Share Transactions.
Share transactions for each class were as follows and may contain automatic conversions between classes or exchanges between affiliated funds:
| | Shares | Shares | Dollars | Dollars |
| | Six months ended
August 31, 2017 | Year ended February 28, 2017 | Six months ended
August 31, 2017 | Year ended February 28, 2017 |
| Class A | | | | |
| Shares sold | 582,290 | 3,164,607 | $11,642,181 | $69,537,871 |
| Reinvestment of distributions | 5,732 | 120,564 | 125,534 | 2,146,978 |
| Shares redeemed | (1,051,845) | (2,238,855) | (21,020,473) | (48,377,613) |
| Net increase (decrease) | (463,823) | 1,046,316 | $(9,252,758) | $23,307,236 |
| Class M | | | | |
| Shares sold | 150,921 | 712,177 | $3,003,369 | $15,561,760 |
| Reinvestment of distributions | 1,488 | 32,071 | 32,029 | 560,038 |
| Shares redeemed | (196,977) | (517,783) | (3,878,428) | (11,004,318) |
| Net increase (decrease) | (44,568) | 226,465 | $(843,030) | $5,117,480 |
| Class B | | | | |
| Shares sold | – | 7,043 | $– | $134,526 |
| Shares redeemed | – | (89,908) | – | (1,923,575) |
| Net increase (decrease) | – | (82,865) | $– | $(1,789,049) |
| Class C | | | | |
| Shares sold | 744,696 | 3,277,150 | $14,167,937 | $68,100,712 |
| Reinvestment of distributions | 3,724 | 115,019 | 76,867 | 1,909,405 |
| Shares redeemed | (513,570) | (1,324,351) | (9,742,860) | (26,570,952) |
| Net increase (decrease) | 234,850 | 2,067,818 | $4,501,944 | $43,439,165 |
| Gold | | | | |
| Shares sold | 9,265,178 | 44,152,495 | $191,799,344 | $998,832,934 |
| Reinvestment of distributions | 117,013 | 2,098,203 | 2,622,272 | 38,476,693 |
| Shares redeemed | (12,513,844) | (45,146,079) | (256,491,430) | (990,273,602) |
| Net increase (decrease) | (3,131,653) | 1,104,619 | $(62,069,814) | $47,036,025 |
| Class I | | | | |
| Shares sold | 998,901 | 2,033,849 | $20,504,790 | $45,606,027 |
| Reinvestment of distributions | 6,152 | 97,474 | 137,796 | 1,788,422 |
| Shares redeemed | (519,717) | (2,240,667) | (10,668,211) | (49,737,421) |
| Net increase (decrease) | 485,336 | (109,344) | $9,974,375 | $(2,342,972) |
12. Other.
The Fund's organizational documents provide former and current trustees and officers with a limited indemnification against liabilities arising in connection with the performance of their duties to the Fund. In the normal course of business, the Fund may also enter into contracts that provide general indemnifications. The Fund's maximum exposure under these arrangements is unknown as this would be dependent on future claims that may be made against the Fund. The risk of material loss from such claims is considered remote.
Materials Portfolio
Investment Summary (Unaudited)
Top Ten Stocks as of August 31, 2017
| | % of fund's net assets | % of fund's net assets 6 months ago |
| E.I. du Pont de Nemours & Co. | 16.0 | 15.3 |
| LyondellBasell Industries NV Class A | 5.8 | 5.5 |
| Sherwin-Williams Co. | 5.1 | 2.9 |
| The Dow Chemical Co. | 4.7 | 4.6 |
| Ball Corp. | 4.7 | 4.6 |
| WestRock Co. | 4.4 | 6.4 |
| Graphic Packaging Holding Co. | 3.6 | 4.8 |
| Monsanto Co. | 3.5 | 6.1 |
| Ecolab, Inc. | 3.4 | 3.9 |
| PPG Industries, Inc. | 3.4 | 4.4 |
| | 54.6 | |
Top Industries (% of fund's net assets)
| As of August 31, 2017 |
| | Chemicals | 63.6% |
| | Containers & Packaging | 17.2% |
| | Metals & Mining | 13.2% |
| | Construction Materials | 3.6% |
| | Trading Companies & Distributors | 1.4% |
| | All Others* | 1.0% |

* Includes Short-Term investments and Net Other Assets (Liabilities).
| As of February 28, 2017 |
| | Chemicals | 67.7% |
| | Containers & Packaging | 16.6% |
| | Metals & Mining | 9.4% |
| | Construction Materials | 3.3% |
| | Trading Companies & Distributors | 2.0% |
| | All Others* | 1.0% |

* Includes Short-Term investments and Net Other Assets (Liabilities).
Materials Portfolio
Investments August 31, 2017 (Unaudited)
Showing Percentage of Net Assets
| Common Stocks - 99.0% | | | |
| | | Shares | Value |
| Chemicals - 63.6% | | | |
| Commodity Chemicals - 8.2% | | | |
| LyondellBasell Industries NV Class A | | 1,039,196 | $94,140,766 |
| Tronox Ltd. Class A | | 746,803 | 15,451,354 |
| Westlake Chemical Corp. | | 293,100 | 22,542,321 |
| | | | 132,134,441 |
| Diversified Chemicals - 25.0% | | | |
| E.I. du Pont de Nemours & Co. | | 3,065,900 | 257,320,986 |
| Eastman Chemical Co. | | 378,748 | 32,648,078 |
| The Chemours Co. LLC | | 768,600 | 37,715,202 |
| The Dow Chemical Co. | | 1,134,900 | 75,641,085 |
| | | | 403,325,351 |
| Fertilizers & Agricultural Chemicals - 9.1% | | | |
| Agrium, Inc. | | 168,300 | 16,507,214 |
| CF Industries Holdings, Inc. | | 584,810 | 16,953,642 |
| FMC Corp. | | 303,900 | 26,202,258 |
| Monsanto Co. | | 475,730 | 55,755,556 |
| The Scotts Miracle-Gro Co. Class A | | 332,731 | 31,805,756 |
| | | | 147,224,426 |
| Industrial Gases - 3.0% | | | |
| Air Products & Chemicals, Inc. | | 334,800 | 48,669,876 |
| Specialty Chemicals - 18.3% | | | |
| Axalta Coating Systems (a) | | 699,100 | 20,637,432 |
| Ecolab, Inc. | | 417,520 | 55,655,416 |
| Frutarom Industries Ltd. | | 171,096 | 13,137,729 |
| Platform Specialty Products Corp. (a) | | 1,882,200 | 21,984,096 |
| PPG Industries, Inc. | | 519,700 | 54,215,104 |
| Sherwin-Williams Co. | | 240,200 | 81,492,654 |
| W.R. Grace & Co. | | 663,640 | 47,436,987 |
| | | | 294,559,418 |
|
| TOTAL CHEMICALS | | | 1,025,913,512 |
|
| Construction Materials - 3.6% | | | |
| Construction Materials - 3.6% | | | |
| Eagle Materials, Inc. | | 446,615 | 43,433,309 |
| Summit Materials, Inc. | | 482,400 | 14,250,096 |
| | | | 57,683,405 |
| Containers & Packaging - 17.2% | | | |
| Metal & Glass Containers - 6.5% | | | |
| Aptargroup, Inc. | | 166,000 | 13,879,260 |
| Ball Corp. | | 1,883,061 | 75,303,609 |
| Berry Global Group, Inc. (a) | | 284,200 | 15,983,408 |
| | | | 105,166,277 |
| Paper Packaging - 10.7% | | | |
| Avery Dennison Corp. | | 210,500 | 19,841,730 |
| Graphic Packaging Holding Co. | | 4,514,395 | 58,912,855 |
| Packaging Corp. of America | | 209,100 | 23,504,931 |
| WestRock Co. | | 1,248,719 | 71,064,598 |
| | | | 173,324,114 |
|
| TOTAL CONTAINERS & PACKAGING | | | 278,490,391 |
|
| Metals & Mining - 13.2% | | | |
| Copper - 2.6% | | | |
| Freeport-McMoRan, Inc. (a) | | 2,872,800 | 42,459,984 |
| Diversified Metals & Mining - 2.4% | | | |
| Alcoa Corp. | | 407,400 | 17,876,712 |
| Glencore Xstrata PLC | | 3,540,237 | 16,457,480 |
| Ivanhoe Mines Ltd. (a) | | 1,027,400 | 3,727,025 |
| | | | 38,061,217 |
| Gold - 4.6% | | | |
| Franco-Nevada Corp. | | 143,600 | 11,747,889 |
| Newmont Mining Corp. | | 1,197,000 | 45,892,980 |
| Randgold Resources Ltd. sponsored ADR (b) | | 166,000 | 17,013,340 |
| | | | 74,654,209 |
| Steel - 3.6% | | | |
| JFE Holdings, Inc. | | 240,100 | 4,743,687 |
| Reliance Steel & Aluminum Co. | | 235,800 | 17,076,636 |
| Steel Dynamics, Inc. | | 1,043,300 | 35,941,685 |
| | | | 57,762,008 |
|
| TOTAL METALS & MINING | | | 212,937,418 |
|
| Trading Companies & Distributors - 1.4% | | | |
| Trading Companies & Distributors - 1.4% | | | |
| Univar, Inc. (a) | | 794,300 | 22,407,203 |
| TOTAL COMMON STOCKS | | | |
| (Cost $1,225,458,078) | | | 1,597,431,929 |
|
| Money Market Funds - 2.2% | | | |
| Fidelity Cash Central Fund, 1.11% (c) | | 17,592,420 | 17,595,939 |
| Fidelity Securities Lending Cash Central Fund 1.11% (c)(d) | | 17,265,939 | 17,267,665 |
| TOTAL MONEY MARKET FUNDS | | | |
| (Cost $34,862,744) | | | 34,863,604 |
| TOTAL INVESTMENT IN SECURITIES - 101.2% | | | |
| (Cost $1,260,320,822) | | | 1,632,295,533 |
| NET OTHER ASSETS (LIABILITIES) - (1.2)% | | | (18,828,365) |
| NET ASSETS - 100% | | | $1,613,467,168 |
Legend
(a) Non-income producing
(b) Security or a portion of the security is on loan at period end.
(c) Affiliated fund that is generally available only to investment companies and other accounts managed by Fidelity Investments. The rate quoted is the annualized seven-day yield of the fund at period end. A complete unaudited listing of the fund's holdings as of its most recent quarter end is available upon request. In addition, each Fidelity Central Fund's financial statements are available on the SEC's website or upon request.
(d) Investment made with cash collateral received from securities on loan.
Affiliated Central Funds
Information regarding fiscal year to date income earned by the Fund from investments in Fidelity Central Funds is as follows:
| Fund | Income earned |
| Fidelity Cash Central Fund | $57,142 |
| Fidelity Securities Lending Cash Central Fund | 42,894 |
| Total | $100,036 |
Investment Valuation
All investments are categorized as Level 1 under the Fair Value Hierarchy. The inputs or methodology used for valuing securities may not be an indication of the risk associated with investing in those securities. For more information on valuation inputs please refer to the Investment Valuation section in the accompanying Notes to Financial Statements.
Other Information
Distribution of investments by country or territory of incorporation, as a percentage of Total Net Assets, is as follows (Unaudited):
| United States of America | 88.0% |
| Netherlands | 5.8% |
| Bailiwick of Jersey | 2.1% |
| Canada | 2.0% |
| Australia | 1.0% |
| Others (Individually Less Than 1%) | 1.1% |
| | 100.0% |
See accompanying notes which are an integral part of the financial statements.
Materials Portfolio
Financial Statements
Statement of Assets and Liabilities
| | | August 31, 2017 (Unaudited) |
| Assets | | |
Investment in securities, at value (including securities loaned of $17,013,340) — See accompanying schedule:
Unaffiliated issuers (cost $1,225,460,078) | $1,597,431,929 | |
| Fidelity Central Funds (cost $34,862,744) | 34,863,604 | |
| Total Investment in Securities (cost $1,260,322,822) | | $1,632,295,533 |
| Foreign currency held at value (cost $20,307) | | 20,622 |
| Receivable for fund shares sold | | 1,320,032 |
| Dividends receivable | | 2,885,278 |
| Distributions receivable from Fidelity Central Funds | | 20,599 |
| Other receivables | | 111,986 |
| Total assets | | 1,636,654,050 |
| Liabilities | | |
| Payable for investments purchased | $2,379,628 | |
| Payable for fund shares redeemed | 2,274,063 | |
| Accrued management fee | 719,781 | |
| Distribution and service plan fees payable | 121,583 | |
| Other affiliated payables | 312,611 | |
| Other payables and accrued expenses | 115,216 | |
| Collateral on securities loaned | 17,264,000 | |
| Total liabilities | | 23,186,882 |
| Net Assets | | $1,613,467,168 |
| Net Assets consist of: | | |
| Paid in capital | | $1,189,007,405 |
| Undistributed net investment income | | 7,030,550 |
| Accumulated undistributed net realized gain (loss) on investments and foreign currency transactions | | 45,456,187 |
| Net unrealized appreciation (depreciation) on investments and assets and liabilities in foreign currencies | | 371,973,026 |
| Net Assets | | $1,613,467,168 |
| Calculation of Maximum Offering Price | | |
| Class A: | | |
| Net Asset Value and redemption price per share ($189,385,356 ÷ 2,222,102 shares) | | $85.23 |
| Maximum offering price per share (100/94.25 of $85.23) | | $90.43 |
| Class M: | | |
| Net Asset Value and redemption price per share ($36,186,506 ÷ 428,341 shares) | | $84.48 |
| Maximum offering price per share (100/96.50 of $84.48) | | $87.54 |
| Class C: | | |
| Net Asset Value and offering price per share ($82,067,428 ÷ 997,161 shares)(a) | | $82.30 |
| Materials: | | |
| Net Asset Value, offering price and redemption price per share ($881,380,293 ÷ 10,285,371 shares) | | $85.69 |
| Class I: | | |
| Net Asset Value, offering price and redemption price per share ($424,447,585 ÷ 4,962,363 shares) | | $85.53 |
(a) Redemption price per share is equal to net asset value less any applicable contingent deferred sales charge.
See accompanying notes which are an integral part of the financial statements.
Statement of Operations
| | | Six months ended August 31, 2017 (Unaudited) |
| Investment Income | | |
| Dividends | | $14,074,146 |
| Income from Fidelity Central Funds | | 100,036 |
| Total income | | 14,174,182 |
| Expenses | | |
| Management fee | $4,284,426 | |
| Transfer agent fees | 1,628,285 | |
| Distribution and service plan fees | 748,422 | |
| Accounting and security lending fees | 246,736 | |
| Custodian fees and expenses | 13,537 | |
| Independent trustees' fees and expenses | 17,939 | |
| Registration fees | 91,499 | |
| Audit | 26,939 | |
| Legal | 11,127 | |
| Interest | 570 | |
| Miscellaneous | 10,692 | |
| Total expenses before reductions | 7,080,172 | |
| Expense reductions | (38,825) | 7,041,347 |
| Net investment income (loss) | | 7,132,835 |
| Realized and Unrealized Gain (Loss) | | |
| Net realized gain (loss) on: | | |
| Investment securities: | | |
| Unaffiliated issuers | 51,393,911 | |
| Fidelity Central Funds | 147 | |
| Foreign currency transactions | 1,825 | |
| Total net realized gain (loss) | | 51,395,883 |
| Change in net unrealized appreciation (depreciation) on: | | |
| Investment securities: | | |
| Unaffiliated issuers | 35,519,935 | |
| Fidelity Central Funds | (1,638) | |
| Assets and liabilities in foreign currencies | 10,004 | |
| Total change in net unrealized appreciation (depreciation) | | 35,528,301 |
| Net gain (loss) | | 86,924,184 |
| Net increase (decrease) in net assets resulting from operations | | $94,057,019 |
See accompanying notes which are an integral part of the financial statements.
Statement of Changes in Net Assets
| | Six months ended August 31, 2017 (Unaudited) | Year ended February 28, 2017 |
| Increase (Decrease) in Net Assets | | |
| Operations | | |
| Net investment income (loss) | $7,132,835 | $16,237,847 |
| Net realized gain (loss) | 51,395,883 | 64,095,613 |
| Change in net unrealized appreciation (depreciation) | 35,528,301 | 293,420,932 |
| Net increase (decrease) in net assets resulting from operations | 94,057,019 | 373,754,392 |
| Distributions to shareholders from net investment income | (2,594,339) | (13,547,763) |
| Distributions to shareholders from net realized gain | (15,363,271) | – |
| Total distributions | (17,957,610) | (13,547,763) |
| Share transactions - net increase (decrease) | (30,507,050) | (113,259,980) |
| Redemption fees | – | 17,097 |
| Total increase (decrease) in net assets | 45,592,359 | 246,963,746 |
| Net Assets | | |
| Beginning of period | 1,567,874,809 | 1,320,911,063 |
| End of period | $1,613,467,168 | $1,567,874,809 |
| Other Information | | |
| Undistributed net investment income end of period | $7,030,550 | $2,492,054 |
See accompanying notes which are an integral part of the financial statements.
Financial Highlights — Materials Portfolio Class A
| | Six months ended (Unaudited) August 31, | Years ended February 28, | | | | |
| | 2017 | 2017 | 2016 A | 2015 | 2014 | 2013 |
| Selected Per–Share Data | | | | | | |
| Net asset value, beginning of period | $81.27 | $62.94 | $80.43 | $86.46 | $73.44 | $69.23 |
| Income from Investment Operations | | | | | | |
| Net investment income (loss)B | .30 | .70 | .79 | .51 | .36 | .70 |
| Net realized and unrealized gain (loss) | 4.56 | 18.26 | (16.80) | 1.05 | 14.56 | 5.69 |
| Total from investment operations | 4.86 | 18.96 | (16.01) | 1.56 | 14.92 | 6.39 |
| Distributions from net investment income | (.10) | (.63) | (.58) | (.43) | (.30) | (.63) |
| Distributions from net realized gain | (.80) | – | (.91) | (7.17) | (1.60) | (1.55) |
| Total distributions | (.90) | (.63) | (1.48)C | (7.59)D | (1.90) | (2.18) |
| Redemption fees added to paid in capitalB | – | –E | –E | –E | –E | –E |
| Net asset value, end of period | $85.23 | $81.27 | $62.94 | $80.43 | $86.46 | $73.44 |
| Total ReturnF,G,H | 6.07% | 30.18% | (20.01)% | 2.20% | 20.46% | 9.40% |
| Ratios to Average Net AssetsI,J | | | | | | |
| Expenses before reductions | 1.07%K | 1.08% | 1.06% | 1.06% | 1.10% | 1.13% |
| Expenses net of fee waivers, if any | 1.07%K | 1.08% | 1.06% | 1.06% | 1.10% | 1.13% |
| Expenses net of all reductions | 1.07%K | 1.07% | 1.06% | 1.06% | 1.09% | 1.12% |
| Net investment income (loss) | .73%K | .96% | 1.09% | .61% | .45% | 1.02% |
| Supplemental Data | | | | | | |
| Net assets, end of period (000 omitted) | $189,385 | $229,086 | $202,747 | $319,740 | $336,777 | $219,627 |
| Portfolio turnover rateL | 48%K | 49%M | 64% | 76%M | 53% | 61% |
A For the year ended February 29.
B Calculated based on average shares outstanding during the period.
C Total distributions of $1.48 per share is comprised of distributions from net investment income of $.575 and distributions from net realized gain of $.906 per share.
D Total distributions of $7.59 per share is comprised of distributions from net investment income of $.425 and distributions from net realized gain of $7.167 per share.
E Amount represents less than $.005 per share.
F Total returns for periods of less than one year are not annualized.
G Total returns would have been lower if certain expenses had not been reduced during the applicable periods shown.
H Total returns do not include the effect of the sales charges.
I Fees and expenses of any underlying Fidelity Central Funds are not included in the Fund's expense ratio. The Fund indirectly bears its proportionate share of the expenses of any underlying Fidelity Central Funds.
J Expense ratios reflect operating expenses of the class. Expenses before reductions do not reflect amounts reimbursed by the investment adviser or reductions from brokerage service arrangements or reductions from other expense offset arrangements and do not represent the amount paid by the class during periods when reimbursements or reductions occur. Expenses net of fee waivers reflect expenses after reimbursement by the investment adviser but prior to reductions from brokerage service arrangements or other expense offset arrangements. Expenses net of all reductions represent the net expenses paid by the class.
K Annualized
L Amount does not include the portfolio activity of any underlying Fidelity Central Funds.
M Portfolio turnover rate excludes securities received or delivered in-kind.
See accompanying notes which are an integral part of the financial statements.
Financial Highlights — Materials Portfolio Class M
| | Six months ended (Unaudited) August 31, | Years ended February 28, | | | | |
| | 2017 | 2017 | 2016 A | 2015 | 2014 | 2013 |
| Selected Per–Share Data | | | | | | |
| Net asset value, beginning of period | $80.66 | $62.52 | $79.95 | $85.99 | $73.05 | $68.91 |
| Income from Investment Operations | | | | | | |
| Net investment income (loss)B | .18 | .47 | .56 | .25 | .12 | .50 |
| Net realized and unrealized gain (loss) | 4.52 | 18.12 | (16.69) | 1.06 | 14.48 | 5.66 |
| Total from investment operations | 4.70 | 18.59 | (16.13) | 1.31 | 14.60 | 6.16 |
| Distributions from net investment income | (.08) | (.45) | (.40) | (.18) | (.06) | (.46) |
| Distributions from net realized gain | (.80) | – | (.91) | (7.17) | (1.60) | (1.55) |
| Total distributions | (.88) | (.45) | (1.30)C | (7.35) | (1.66) | (2.02)D |
| Redemption fees added to paid in capitalB | – | –E | –E | –E | –E | –E |
| Net asset value, end of period | $84.48 | $80.66 | $62.52 | $79.95 | $85.99 | $73.05 |
| Total ReturnF,G,H | 5.91% | 29.78% | (20.27)% | 1.90% | 20.10% | 9.10% |
| Ratios to Average Net AssetsI,J | | | | | | |
| Expenses before reductions | 1.36%K | 1.39% | 1.38% | 1.37% | 1.40% | 1.42% |
| Expenses net of fee waivers, if any | 1.36%K | 1.39% | 1.37% | 1.37% | 1.40% | 1.42% |
| Expenses net of all reductions | 1.36%K | 1.38% | 1.37% | 1.37% | 1.39% | 1.41% |
| Net investment income (loss) | .44%K | .65% | .77% | .31% | .15% | .73% |
| Supplemental Data | | | | | | |
| Net assets, end of period (000 omitted) | $36,187 | $40,935 | $30,118 | $45,252 | $45,223 | $37,860 |
| Portfolio turnover rateL | 48%K | 49%M | 64% | 76%M | 53% | 61% |
A For the year ended February 29.
B Calculated based on average shares outstanding during the period.
C Total distributions of $1.30 per share is comprised of distributions from net investment income of $.395 and distributions from net realized gain of $.906 per share.
D Total distributions of $2.02 per share is comprised of distributions from net investment income of $.463 and distributions from net realized gain of $1.552 per share.
E Amount represents less than $.005 per share.
F Total returns for periods of less than one year are not annualized.
G Total returns would have been lower if certain expenses had not been reduced during the applicable periods shown.
H Total returns do not include the effect of the sales charges.
I Fees and expenses of any underlying Fidelity Central Funds are not included in the Fund's expense ratio. The Fund indirectly bears its proportionate share of the expenses of any underlying Fidelity Central Funds.
J Expense ratios reflect operating expenses of the class. Expenses before reductions do not reflect amounts reimbursed by the investment adviser or reductions from brokerage service arrangements or reductions from other expense offset arrangements and do not represent the amount paid by the class during periods when reimbursements or reductions occur. Expenses net of fee waivers reflect expenses after reimbursement by the investment adviser but prior to reductions from brokerage service arrangements or other expense offset arrangements. Expenses net of all reductions represent the net expenses paid by the class.
K Annualized
L Amount does not include the portfolio activity of any underlying Fidelity Central Funds.
M Portfolio turnover rate excludes securities received or delivered in-kind.
See accompanying notes which are an integral part of the financial statements.
Financial Highlights — Materials Portfolio Class C
| | Six months ended (Unaudited) August 31, | Years ended February 28, | | | | |
| | 2017 | 2017 | 2016 A | 2015 | 2014 | 2013 |
| Selected Per–Share Data | | | | | | |
| Net asset value, beginning of period | $78.72 | $61.09 | $78.12 | $84.38 | $71.96 | $67.98 |
| Income from Investment Operations | | | | | | |
| Net investment income (loss)B | (.01) | .15 | .24 | (.12) | (.23) | .18 |
| Net realized and unrealized gain (loss) | 4.41 | 17.68 | (16.28) | 1.03 | 14.23 | 5.55 |
| Total from investment operations | 4.40 | 17.83 | (16.04) | .91 | 14.00 | 5.73 |
| Distributions from net investment income | (.02) | (.20) | (.08) | – | – | (.20) |
| Distributions from net realized gain | (.80) | – | (.91) | (7.17) | (1.58) | (1.55) |
| Total distributions | (.82) | (.20) | (.99) | (7.17) | (1.58) | (1.75) |
| Redemption fees added to paid in capitalB | – | –C | –C | –C | –C | –C |
| Net asset value, end of period | $82.30 | $78.72 | $61.09 | $78.12 | $84.38 | $71.96 |
| Total ReturnD,E,F | 5.66% | 29.21% | (20.61)% | 1.43% | 19.56% | 8.58% |
| Ratios to Average Net AssetsG,H | | | | | | |
| Expenses before reductions | 1.82%I | 1.83% | 1.81% | 1.82% | 1.85% | 1.89% |
| Expenses net of fee waivers, if any | 1.82%I | 1.82% | 1.81% | 1.82% | 1.85% | 1.89% |
| Expenses net of all reductions | 1.82%I | 1.82% | 1.81% | 1.82% | 1.84% | 1.88% |
| Net investment income (loss) | (.02)%I | .21% | .34% | (.14)% | (.30)% | .26% |
| Supplemental Data | | | | | | |
| Net assets, end of period (000 omitted) | $82,067 | $80,225 | $66,896 | $107,697 | $106,879 | $75,007 |
| Portfolio turnover rateJ | 48%I | 49%K | 64% | 76%K | 53% | 61% |
A For the year ended February 29.
B Calculated based on average shares outstanding during the period.
C Amount represents less than $.005 per share.
D Total returns for periods of less than one year are not annualized.
E Total returns would have been lower if certain expenses had not been reduced during the applicable periods shown.
F Total returns do not include the effect of the contingent deferred sales charge.
G Fees and expenses of any underlying Fidelity Central Funds are not included in the Fund's expense ratio. The Fund indirectly bears its proportionate share of the expenses of any underlying Fidelity Central Funds.
H Expense ratios reflect operating expenses of the class. Expenses before reductions do not reflect amounts reimbursed by the investment adviser or reductions from brokerage service arrangements or reductions from other expense offset arrangements and do not represent the amount paid by the class during periods when reimbursements or reductions occur. Expenses net of fee waivers reflect expenses after reimbursement by the investment adviser but prior to reductions from brokerage service arrangements or other expense offset arrangements. Expenses net of all reductions represent the net expenses paid by the class.
I Annualized
J Amount does not include the portfolio activity of any underlying Fidelity Central Funds.
K Portfolio turnover rate excludes securities received or delivered in-kind.
See accompanying notes which are an integral part of the financial statements.
Financial Highlights — Materials Portfolio
| | Six months ended (Unaudited) August 31, | Years ended February 28, | | | | |
| | 2017 | 2017 | 2016 A | 2015 | 2014 | 2013 |
| Selected Per–Share Data | | | | | | |
| Net asset value, beginning of period | $81.64 | $63.20 | $80.77 | $86.81 | $73.68 | $69.41 |
| Income from Investment Operations | | | | | | |
| Net investment income (loss)B | .41 | .90 | .98 | .73 | .58 | .90 |
| Net realized and unrealized gain (loss) | 4.59 | 18.34 | (16.89) | 1.05 | 14.63 | 5.71 |
| Total from investment operations | 5.00 | 19.24 | (15.91) | 1.78 | 15.21 | 6.61 |
| Distributions from net investment income | (.15) | (.80) | (.76) | (.65) | (.48) | (.79) |
| Distributions from net realized gain | (.80) | – | (.91) | (7.17) | (1.60) | (1.55) |
| Total distributions | (.95) | (.80) | (1.66)C | (7.82) | (2.08) | (2.34) |
| Redemption fees added to paid in capitalB | – | –D | –D | –D | –D | –D |
| Net asset value, end of period | $85.69 | $81.64 | $63.20 | $80.77 | $86.81 | $73.68 |
| Total ReturnE,F | 6.21% | 30.52% | (19.81)% | 2.46% | 20.80% | 9.71% |
| Ratios to Average Net AssetsG,H | | | | | | |
| Expenses before reductions | .80%I | .81% | .81% | .80% | .82% | .85% |
| Expenses net of fee waivers, if any | .80%I | .81% | .81% | .80% | .82% | .85% |
| Expenses net of all reductions | .80%I | .81% | .80% | .80% | .82% | .84% |
| Net investment income (loss) | 1.01%I | 1.22% | 1.34% | .87% | .73% | 1.30% |
| Supplemental Data | | | | | | |
| Net assets, end of period (000 omitted) | $881,380 | $882,504 | $711,985 | $1,107,689 | $1,231,942 | $1,146,782 |
| Portfolio turnover rateJ | 48%I | 49%K | 64% | 76%K | 53% | 61% |
A For the year ended February 29.
B Calculated based on average shares outstanding during the period.
C Total distributions of $1.66 per share is comprised of distributions from net investment income of $.756 and distributions from net realized gain of $.906 per share.
D Amount represents less than $.005 per share.
E Total returns for periods of less than one year are not annualized.
F Total returns would have been lower if certain expenses had not been reduced during the applicable periods shown.
G Fees and expenses of any underlying Fidelity Central Funds are not included in the Fund's expense ratio. The Fund indirectly bears its proportionate share of the expenses of any underlying Fidelity Central Funds.
H Expense ratios reflect operating expenses of the class. Expenses before reductions do not reflect amounts reimbursed by the investment adviser or reductions from brokerage service arrangements or reductions from other expense offset arrangements and do not represent the amount paid by the class during periods when reimbursements or reductions occur. Expenses net of fee waivers reflect expenses after reimbursement by the investment adviser but prior to reductions from brokerage service arrangements or other expense offset arrangements. Expenses net of all reductions represent the net expenses paid by the class.
I Annualized
J Amount does not include the portfolio activity of any underlying Fidelity Central Funds.
K Portfolio turnover rate excludes securities received or delivered in-kind.
See accompanying notes which are an integral part of the financial statements.
Financial Highlights — Materials Portfolio Class I
| | Six months ended (Unaudited) August 31, | Years ended February 28, | | | | |
| | 2017 | 2017 | 2016 A | 2015 | 2014 | 2013 |
| Selected Per–Share Data | | | | | | |
| Net asset value, beginning of period | $81.49 | $63.07 | $80.60 | $86.66 | $73.57 | $69.35 |
| Income from Investment Operations | | | | | | |
| Net investment income (loss)B | .42 | .91 | 1.00 | .74 | .59 | .90 |
| Net realized and unrealized gain (loss) | 4.57 | 18.31 | (16.86) | 1.05 | 14.60 | 5.70 |
| Total from investment operations | 4.99 | 19.22 | (15.86) | 1.79 | 15.19 | 6.60 |
| Distributions from net investment income | (.15) | (.80) | (.77) | (.68) | (.50) | (.83) |
| Distributions from net realized gain | (.80) | – | (.91) | (7.17) | (1.60) | (1.55) |
| Total distributions | (.95) | (.80) | (1.67)C | (7.85) | (2.10) | (2.38) |
| Redemption fees added to paid in capitalB | – | –D | –D | –D | –D | –D |
| Net asset value, end of period | $85.53 | $81.49 | $63.07 | $80.60 | $86.66 | $73.57 |
| Total ReturnE,F | 6.22% | 30.55% | (19.79)% | 2.49% | 20.81% | 9.71% |
| Ratios to Average Net AssetsG,H | | | | | | |
| Expenses before reductions | .79%I | .79% | .78% | .78% | .81% | .85% |
| Expenses net of fee waivers, if any | .79%I | .79% | .78% | .78% | .81% | .85% |
| Expenses net of all reductions | .79%I | .78% | .78% | .78% | .81% | .84% |
| Net investment income (loss) | 1.01%I | 1.25% | 1.37% | .89% | .74% | 1.30% |
| Supplemental Data | | | | | | |
| Net assets, end of period (000 omitted) | $424,448 | $335,124 | $306,145 | $468,371 | $333,963 | $246,696 |
| Portfolio turnover rateJ | 48%I | 49%K | 64% | 76%K | 53% | 61% |
A For the year ended February 29.
B Calculated based on average shares outstanding during the period.
C Total distributions of $1.67 per share is comprised of distributions from net investment income of $.767 and distributions from net realized gain of $.906 per share.
D Amount represents less than $.005 per share.
E Total returns for periods of less than one year are not annualized.
F Total returns would have been lower if certain expenses had not been reduced during the applicable periods shown.
G Fees and expenses of any underlying Fidelity Central Funds are not included in the Fund's expense ratio. The Fund indirectly bears its proportionate share of the expenses of any underlying Fidelity Central Funds.
H Expense ratios reflect operating expenses of the class. Expenses before reductions do not reflect amounts reimbursed by the investment adviser or reductions from brokerage service arrangements or reductions from other expense offset arrangements and do not represent the amount paid by the class during periods when reimbursements or reductions occur. Expenses net of fee waivers reflect expenses after reimbursement by the investment adviser but prior to reductions from brokerage service arrangements or other expense offset arrangements. Expenses net of all reductions represent the net expenses paid by the class.
I Annualized
J Amount does not include the portfolio activity of any underlying Fidelity Central Funds.
K Portfolio turnover rate excludes securities received or delivered in-kind.
See accompanying notes which are an integral part of the financial statements.
Notes to Financial Statements (Unaudited)
For the period ended August 31, 2017
1. Organization.
Materials Portfolio (the Fund) is a non-diversified fund of Fidelity Select Portfolios (the Trust) and is authorized to issue an unlimited number of shares. The Trust is registered under the Investment Company Act of 1940, as amended (the 1940 Act), as an open-end management investment company organized as a Massachusetts business trust. The Fund invests primarily in securities of companies whose principal business activities fall within specific industries. The Fund offers Class A, Class M (formerly Class T), Class C, Materials and Class I shares, each of which has equal rights as to assets and voting privileges. Each class has exclusive voting rights with respect to matters that affect that class.
After the close of business on June 24, 2016, all outstanding Class B shares were converted to Class A shares. All prior fiscal period dollar and share amounts for Class B presented in the Notes to Financial Statements are for the period March 1, 2016 through June 24, 2016.
2. Investments in Fidelity Central Funds.
The Fund invests in Fidelity Central Funds, which are open-end investment companies generally available only to other investment companies and accounts managed by the investment adviser and its affiliates. The Fund's Schedule of Investments lists each of the Fidelity Central Funds held as of period end, if any, as an investment of the Fund, but does not include the underlying holdings of each Fidelity Central Fund. As an Investing Fund, the Fund indirectly bears its proportionate share of the expenses of the underlying Fidelity Central Funds.
The Money Market Central Funds seek preservation of capital and current income and are managed by Fidelity Investments Money Management, Inc. (FIMM), an affiliate of the investment adviser. Annualized expenses of the Money Market Central Funds as of their most recent shareholder report date are less than .005%.
A complete unaudited list of holdings for each Fidelity Central Fund is available upon request or at the Securities and Exchange Commission (the SEC) website at www.sec.gov. In addition, the financial statements of the Fidelity Central Funds are available on the SEC website or upon request.
3. Significant Accounting Policies.
The Fund is an investment company and applies the accounting and reporting guidance of the Financial Accounting Standards Board (FASB) Accounting Standards Codification Topic 946 Financial Services – Investments Companies. The financial statements have been prepared in conformity with accounting principles generally accepted in the United States of America (GAAP), which require management to make certain estimates and assumptions at the date of the financial statements. Actual results could differ from those estimates. Subsequent events, if any, through the date that the financial statements were issued have been evaluated in the preparation of the financial statements. The following summarizes the significant accounting policies of the Fund:
Investment Valuation. Investments are valued as of 4:00 p.m. Eastern time on the last calendar day of the period. The Board of Trustees (the Board) has delegated the day to day responsibility for the valuation of the Fund's investments to the Fair Value Committee (the Committee) established by the Fund's investment adviser. In accordance with valuation policies and procedures approved by the Board, the Fund attempts to obtain prices from one or more third party pricing vendors or brokers to value its investments. When current market prices, quotations or currency exchange rates are not readily available or reliable, investments will be fair valued in good faith by the Committee, in accordance with procedures adopted by the Board. Factors used in determining fair value vary by investment type and may include market or investment specific events. The frequency with which these procedures are used cannot be predicted and they may be utilized to a significant extent. The Committee oversees the Fund's valuation policies and procedures and reports to the Board on the Committee's activities and fair value determinations. The Board monitors the appropriateness of the procedures used in valuing the Fund's investments and ratifies the fair value determinations of the Committee.
The Fund categorizes the inputs to valuation techniques used to value its investments into a disclosure hierarchy consisting of three levels as shown below:
- Level 1 – quoted prices in active markets for identical investments
- Level 2 – other significant observable inputs (including quoted prices for similar investments, interest rates, prepayment speeds, etc.)
- Level 3 – unobservable inputs (including the Fund's own assumptions based on the best information available)
Valuation techniques used to value the Fund's investments by major category are as follows:
Equity securities, including restricted securities, for which market quotations are readily available, are valued at the last reported sale price or official closing price as reported by a third party pricing vendor on the primary market or exchange on which they are traded and are categorized as Level 1 in the hierarchy. In the event there were no sales during the day or closing prices are not available, securities are valued at the last quoted bid price or may be valued using the last available price and are generally categorized as Level 2 in the hierarchy. For foreign equity securities, when market or security specific events arise, comparisons to the valuation of American Depositary Receipts (ADRs), futures contracts, Exchange-Traded Funds (ETFs) and certain indexes as well as quoted prices for similar securities may be used and would be categorized as Level 2 in the hierarchy. Utilizing these techniques may result in transfers between Level 1 and Level 2. For equity securities, including restricted securities, where observable inputs are limited, assumptions about market activity and risk are used and these securities may be categorized as Level 3 in the hierarchy.
Investments in open-end mutual funds, including the Fidelity Central Funds, are valued at their closing net asset value (NAV) each business day and are categorized as Level 1 in the hierarchy.
Changes in valuation techniques may result in transfers in or out of an assigned level within the disclosure hierarchy.
Foreign Currency. The Fund may use foreign currency contracts to facilitate transactions in foreign-denominated securities. Gains and losses from these transactions may arise from changes in the value of the foreign currency or if the counterparties do not perform under the contracts' terms.
Foreign-denominated assets, including investment securities, and liabilities are translated into U.S. dollars at the exchange rates at period end. Purchases and sales of investment securities, income and dividends received and expenses denominated in foreign currencies are translated into U.S. dollars at the exchange rate in effect on the transaction date.
The effects of exchange rate fluctuations on investments are included with the net realized and unrealized gain (loss) on investment securities. Other foreign currency transactions resulting in realized and unrealized gain (loss) are disclosed separately.
Investment Transactions and Income. For financial reporting purposes, the Fund's investment holdings and NAV include trades executed through the end of the last business day of the period. The NAV per share for processing shareholder transactions is calculated as of the close of business of the New York Stock Exchange (NYSE), normally 4:00 p.m. Eastern time and includes trades executed through the end of the prior business day. Gains and losses on securities sold are determined on the basis of identified cost and may include proceeds received from litigation. Dividend income is recorded on the ex-dividend date, except for certain dividends from foreign securities where the ex-dividend date may have passed, which are recorded as soon as the Fund is informed of the ex-dividend date. Non-cash dividends included in dividend income, if any, are recorded at the fair market value of the securities received. Income and capital gain distributions from Fidelity Central Funds, if any, are recorded on the ex-dividend date. Certain distributions received by the Fund represent a return of capital or capital gain. The Fund determines the components of these distributions subsequent to the ex-dividend date, based upon receipt of tax filings or other correspondence relating to the underlying investment. These distributions are recorded as a reduction of cost of investments and/or as a realized gain. Investment income is recorded net of foreign taxes withheld where recovery of such taxes is uncertain.
Class Allocations and Expenses. Investment income, realized and unrealized capital gains and losses, common expenses of the Fund, and certain fund-level expense reductions, if any, are allocated daily on a pro-rata basis to each class based on the relative net assets of each class to the total net assets of the Fund. Each class differs with respect to transfer agent and distribution and service plan fees incurred. Certain expense reductions may also differ by class. For the reporting period, the allocated portion of income and expenses to each class as a percent of its average net assets may vary due to the timing of recording these transactions in relation to fluctuating net assets of the classes. Expenses directly attributable to a fund are charged to that fund. Expenses attributable to more than one fund are allocated among the respective funds on the basis of relative net assets or other appropriate methods. Expense estimates are accrued in the period to which they relate and adjustments are made when actual amounts are known.
Deferred Trustee Compensation. Under a Deferred Compensation Plan (the Plan), independent Trustees may elect to defer receipt of a portion of their annual compensation. Deferred amounts are invested in a cross-section of Fidelity funds, are marked-to-market and remain in the Fund until distributed in accordance with the Plan. The investment of deferred amounts and the offsetting payable to the Trustees are included in the accompanying Statement of Assets and Liabilities.
Income Tax Information and Distributions to Shareholders. Each year, the Fund intends to qualify as a regulated investment company under Subchapter M of the Internal Revenue Code, including distributing substantially all of its taxable income and realized gains. As a result, no provision for U.S. Federal income taxes is required. The Fund files a U.S. federal tax return, in addition to state and local tax returns as required. The Fund's federal income tax returns are subject to examination by the Internal Revenue Service (IRS) for a period of three fiscal years after they are filed. State and local tax returns may be subject to examination for an additional fiscal year depending on the jurisdiction. Foreign taxes are provided for based on the Fund's understanding of the tax rules and rates that exist in the foreign markets in which it invests.
Distributions are declared and recorded on the ex-dividend date. Income dividends and capital gain distributions are declared separately for each class. Income and capital gain distributions are determined in accordance with income tax regulations, which may differ from GAAP.
Capital accounts within the financial statements are adjusted for permanent book-tax differences. These adjustments have no impact on net assets or the results of operations. Capital accounts are not adjusted for temporary book-tax differences which will reverse in a subsequent period.
Book-tax differences are primarily due to in-kind transactions, foreign currency transactions, deferred trustees compensation, capital loss carryforwards and losses deferred due to wash sales and excise tax regulations.
As of period end, the cost and unrealized appreciation (depreciation) in securities, and derivatives if applicable, for federal income tax purposes were as follows:
| Gross unrealized appreciation | $381,555,886 |
| Gross unrealized depreciation | (10,848,625) |
| Net unrealized appreciation (depreciation) | $370,707,261 |
| Tax cost | $1,261,588,272 |
Capital loss carryforwards are only available to offset future capital gains of the Fund to the extent provided by regulations and may be limited. Under the Regulated Investment Company Modernization Act of 2010 (the Act), the Fund is permitted to carry forward capital losses incurred in taxable years beginning after December 22, 2010 for an unlimited period and such capital losses are required to be used prior to any losses that expire. The capital loss carryforward information presented below, including any applicable limitation, is estimated as of fiscal period end and is subject to adjustment.
| Fiscal year of expiration | |
| 2018 | $(611,309) |
| 2019 | (80,787) |
| Total with expiration | $(692,096) |
The Fund acquired $692,096 of its capital loss carryforward as part of a merger in a prior period. The losses acquired that will be available to offset future capital gains of the Fund will be limited to approximately $611,309 per year.
4. Purchases and Sales of Investments.
Purchases and sales of securities, other than short-term securities, aggregated $376,858,242 and $418,129,637, respectively.
5. Fees and Other Transactions with Affiliates.
Management Fee. Fidelity SelectCo, LLC (the investment adviser) and its affiliates provide the Fund with investment management related services for which the Fund pays a monthly management fee. The management fee is the sum of an individual fund fee rate that is based on an annual rate of .30% of the Fund's average net assets and an annualized group fee rate that averaged .25% during the period. The group fee rate is based upon the average net assets of all the mutual funds advised by Fidelity Management & Research Company (FMR) and the investment adviser. The group fee rate decreases as assets under management increase and increases as assets under management decrease. For the reporting period, the total annualized management fee rate was .54% of the Fund's average net assets.
Distribution and Service Plan Fees. In accordance with Rule 12b-1 of the 1940 Act, the Fund has adopted separate Distribution and Service Plans for each class of shares. Certain classes pay Fidelity Distributors Corporation (FDC), an affiliate of the investment adviser, separate Distribution and Service Fees, each of which is based on an annual percentage of each class' average net assets. In addition, FDC may pay financial intermediaries for selling shares of the Fund and providing shareholder support services. For the period, the Distribution and Service Fee rates, total fees and amounts retained by FDC were as follows:
| | Distribution
Fee | Service
Fee | Total Fees | Retained
by FDC |
| Class A | -% | .25% | $243,537 | $– |
| Class M | .25% | .25% | 98,574 | – |
| Class C | .75% | .25% | 406,311 | 46,835 |
| | | | $748,422 | $46,835 |
Sales Load. FDC may receive a front-end sales charge of up to 5.75% for selling Class A shares and 3.50% for selling Class M shares, some of which is paid to financial intermediaries for selling shares of the Fund. Depending on the holding period, FDC may receive contingent deferred sales charges levied on Class A, Class M and Class C redemptions. The deferred sales charges are 1.00% for Class C shares, 1.00% for certain purchases of Class A shares and .25% for certain purchases of Class M shares.
For the period, sales charge amounts retained by FDC were as follows:
| | Retained
by FDC |
| Class A | $41,394 |
| Class M | 3,776 |
| Class C(a) | 4,301 |
| | $49,471 |
(a) When Class C shares are initially sold, FDC pays commissions from its own resources to financial intermediaries through which the sales are made.
Transfer Agent Fees. Fidelity Investments Institutional Operations Company, Inc., (FIIOC), an affiliate of the investment adviser, is the transfer, dividend disbursing and shareholder servicing agent for each class of the Fund. FIIOC receives account fees and asset-based fees that vary according to the account size and type of account of the shareholders of the respective classes of the Fund. FIIOC pays for typesetting, printing and mailing of shareholder reports, except proxy statements.
For the period, transfer agent fees for each class were as follows:
| | Amount | % of
Class-Level Average
Net Assets(a) |
| Class A | $218,546 | .22 |
| Class M | 52,341 | .27 |
| Class C | 91,657 | .23 |
| Materials | 879,179 | .20 |
| Class I | 386,562 | .20 |
| | $1,628,285 | |
(a) Annualized
Accounting and Security Lending Fees. Fidelity Service Company, Inc. (FSC), an affiliate of the investment adviser, maintains the Fund's accounting records. The accounting fee is based on the level of average net assets for each month. Under a separate contract, FSC administers the security lending program. The security lending fee is based on the number and duration of lending transactions.
Brokerage Commissions. The Fund placed a portion of its portfolio transactions with brokerage firms which are affiliates of the investment adviser. Brokerage commissions are included in net realized gain (loss) and change in net unrealized appreciation (depreciation) in the Statement of Operations. The commissions paid to these affiliated firms were $10,316 for the period.
Interfund Lending Program. Pursuant to an Exemptive Order issued by the SEC, the Fund, along with other registered investment companies having management contracts with FMR or other affiliated entities of FMR, may participate in an interfund lending program. This program provides an alternative credit facility allowing the funds to borrow from, or lend money to, other participating affiliated funds. At period end, there were no interfund loans outstanding. The Fund's activity in this program during the period for which loans were outstanding was as follows:
| Borrower or Lender | Average Loan Balance | Weighted Average Interest Rate | Interest Expense |
| Borrower | $7,691,000 | 1.34% | $570 |
Interfund Trades. The Fund may purchase from or sell securities to other Fidelity Funds under procedures adopted by the Board. The procedures have been designed to ensure these interfund trades are executed in accordance with Rule 17a-7 of the 1940 Act. Interfund trades are included within the respective purchases and sales amounts shown in the Purchases and Sales of Investments note.
Prior Fiscal Year Redemptions In-Kind. During the prior period, 845,013 shares of the Fund held by an affiliated entity were redeemed in-kind for investments and cash with a value of $60,325,459. The Fund had a net realized gain of $17,720,821 on investments delivered through in-kind redemptions. The amount of the in-kind redemptions is included in share transactions in the accompanying Statement of Changes in Net Assets as well as the Notes to Financial Statements. The Fund recognized no gain or loss for federal income tax purposes.
6. Committed Line of Credit.
The Fund participates with other funds managed by the investment adviser or an affiliate in a $4.25 billion credit facility (the "line of credit") to be utilized for temporary or emergency purposes to fund shareholder redemptions or for other short-term liquidity purposes. The Fund has agreed to pay commitment fees on its pro-rata portion of the line of credit, which amounted to $2,512 and is reflected in Miscellaneous expenses on the Statement of Operations. During the period, the Fund did not borrow on this line of credit.
7. Security Lending.
The Fund lends portfolio securities through a lending agent from time to time in order to earn additional income. On the settlement date of the loan, the Fund receives collateral (in the form of U.S. Treasury obligations, letters of credit and/or cash) against the loaned securities and maintains collateral in an amount not less than 100% of the market value of the loaned securities during the period of the loan. The market value of the loaned securities is determined at the close of business of the Fund and any additional required collateral is delivered to the Fund on the next business day. The Fund or borrower may terminate the loan at any time, and if the borrower defaults on its obligation to return the securities loaned because of insolvency or other reasons, the Fund may apply collateral received from the borrower against the obligation. The Fund may experience delays and costs in recovering the securities loaned. Any cash collateral received is invested in the Fidelity Securities Lending Cash Central Fund. The value of loaned securities and cash collateral at period end are disclosed on the Fund's Statement of Assets and Liabilities. Security lending income represents the income earned on investing cash collateral, less rebates paid to borrowers and any lending agent fees associated with the loan, plus any premium payments received for lending certain types of securities. Security lending income is presented in the Statement of Operations as a component of income from Fidelity Central Funds. Total security lending income during the period amounted to $42,894.
8. Expense Reductions.
Commissions paid to certain brokers with whom the investment adviser, or its affiliates, places trades on behalf of the Fund include an amount in addition to trade execution, which may be rebated back to the Fund to offset certain expenses. This amount totaled $31,677 for the period
In addition, during the period the investment adviser reimbursed and/or waived a portion of fund-level operating expenses in the amount of $7,148.
9. Distributions to Shareholders.
Distributions to shareholders of each class were as follows:
| | Six months ended
August 31, 2017 | Year ended February 28, 2017 |
| From net investment income | | |
| Class A | $251,830 | $1,672,756 |
| Class M | 41,120 | 205,222 |
| Class C | 21,712 | 195,843 |
| Materials | 1,551,064 | 8,304,133 |
| Class I | 728,613 | 3,169,809 |
| Total | $2,594,339 | $13,547,763 |
| From net realized gain | | |
| Class A | $1,932,857 | $– |
| Class M | 410,177 | – |
| Class C | 825,070 | – |
| Materials | 8,419,630 | – |
| Class I | 3,775,537 | – |
| Total | $15,363,271 | $– |
10. Share Transactions.
Share transactions for each class were as follows and may contain automatic conversions between classes or exchanges between affiliated funds:
| | Shares | Shares | Dollars | Dollars |
| | Six months ended
August 31, 2017 | Year ended February 28, 2017 | Six months ended
August 31, 2017 | Year ended February 28, 2017 |
| Class A | | | | |
| Shares sold | 360,126 | 902,923 | $29,389,353 | $67,495,419 |
| Reinvestment of distributions | 26,448 | 20,549 | 2,095,242 | 1,575,920 |
| Shares redeemed | (983,377) | (1,326,009) | (80,641,332) | (96,308,599) |
| Net increase (decrease) | (596,803) | (402,537) | $(49,156,737) | $(27,237,260) |
| Class M | | | | |
| Shares sold | 130,996 | 158,674 | $10,589,239 | $11,939,333 |
| Reinvestment of distributions | 5,733 | 2,663 | 450,680 | 202,830 |
| Shares redeemed | (215,919) | (135,543) | (17,511,909) | (9,849,995) |
| Net increase (decrease) | (79,190) | 25,794 | $(6,471,990) | $2,292,168 |
| Class B | | | | |
| Shares sold | – | 325 | $– | $22,444 |
| Shares redeemed | – | (49,632) | – | (3,403,614) |
| Net increase (decrease) | – | (49,307) | $– | $(3,381,170) |
| Class C | | | | |
| Shares sold | 97,906 | 197,093 | $7,719,298 | $14,487,205 |
| Reinvestment of distributions | 10,428 | 2,419 | 800,052 | 179,992 |
| Shares redeemed | (130,332) | (275,454) | (10,327,170) | (19,415,602) |
| Net increase (decrease) | (21,998) | (75,942) | $(1,807,820) | $(4,748,405) |
| Materials | | | | |
| Shares sold | 807,375 | 2,367,980 | $66,920,266 | $176,958,165 |
| Reinvestment of distributions | 117,439 | 100,563 | 9,344,603 | 7,743,369 |
| Shares redeemed | (1,449,071) | (2,924,430) | (119,003,042) | (214,559,584) |
| Net increase (decrease) | (524,257) | (455,887) | $(42,738,173) | $(29,858,050) |
| Class I | | | | |
| Shares sold | 1,437,469 | 1,754,029 | $118,140,685 | $130,244,335 |
| Reinvestment of distributions | 53,154 | 37,780 | 4,221,464 | 2,903,738 |
| Shares redeemed | (640,489) | (2,533,375)(a) | (52,694,479) | (183,475,336)(a) |
| Net increase (decrease) | 850,134 | (741,566) | $69,667,670 | $(50,327,263) |
(a) Amount includes in-kind redemptions (see the Prior Fiscal Year Redemptions In-Kind note for additional details).
11. Other.
The Fund's organizational documents provide former and current trustees and officers with a limited indemnification against liabilities arising in connection with the performance of their duties to the Fund. In the normal course of business, the Fund may also enter into contracts that provide general indemnifications. The Fund's maximum exposure under these arrangements is unknown as this would be dependent on future claims that may be made against the Fund. The risk of material loss from such claims is considered remote.
Telecommunications Portfolio
Investment Summary (Unaudited)
Top Ten Stocks as of August 31, 2017
| | % of fund's net assets | % of fund's net assets 6 months ago |
| Verizon Communications, Inc. | 24.3 | 19.3 |
| AT&T, Inc. | 11.1 | 15.2 |
| T-Mobile U.S., Inc. | 6.9 | 8.1 |
| Level 3 Communications, Inc. | 4.4 | 4.6 |
| Cogent Communications Group, Inc. | 3.5 | 2.5 |
| Liberty Global PLC Class C | 3.4 | 1.9 |
| General Communications, Inc. Class A | 3.4 | 1.3 |
| Iridium Communications, Inc. | 3.3 | 2.4 |
| Vonage Holdings Corp. | 2.8 | 1.6 |
| CenturyLink, Inc. | 2.7 | 3.5 |
| | 65.8 | |
Top Industries (% of fund's net assets)
| As of August 31, 2017 |
| | Diversified Telecommunication Services | 67.7% |
| | Wireless Telecommunication Services | 15.2% |
| | Media | 10.3% |
| | Equity Real Estate Investment Trusts (Reits) | 2.2% |
| | Internet Software & Services | 1.9% |
| | All Others* | 2.7% |

* Includes Short-Term investments and Net Other Assets (Liabilities).
| As of February 28, 2017 |
| | Diversified Telecommunication Services | 68.1% |
| | Wireless Telecommunication Services | 15.5% |
| | Media | 8.7% |
| | Equity Real Estate Investment Trusts (Reits) | 3.8% |
| | Semiconductors & Semiconductor Equipment | 1.2% |
| | All Others* | 2.7% |

* Includes Short-Term investments and Net Other Assets (Liabilities).
Telecommunications Portfolio
Investments August 31, 2017 (Unaudited)
Showing Percentage of Net Assets
| Common Stocks - 99.6% | | | |
| | | Shares | Value |
| Construction & Engineering - 0.8% | | | |
| Construction & Engineering - 0.8% | | | |
| Dycom Industries, Inc. (a) | | 43,500 | $3,509,580 |
| Diversified Telecommunication Services - 67.7% | | | |
| Alternative Carriers - 19.6% | | | |
| Cogent Communications Group, Inc. | | 314,639 | 14,662,177 |
| Globalstar, Inc. (a)(b) | | 2,806,748 | 5,388,956 |
| Iliad SA | | 5,585 | 1,442,427 |
| Iridium Communications, Inc. (a)(b) | | 1,244,311 | 13,811,852 |
| Level 3 Communications, Inc. (a) | | 342,767 | 18,656,808 |
| Lumos Networks Corp. (a) | | 244,578 | 4,397,512 |
| ORBCOMM, Inc. (a) | | 238,449 | 2,637,246 |
| Vonage Holdings Corp. (a) | | 1,416,571 | 11,757,539 |
| Zayo Group Holdings, Inc. (a) | | 284,300 | 9,714,531 |
| | | | 82,469,048 |
| Integrated Telecommunication Services - 48.1% | | | |
| AT&T, Inc. | | 1,247,720 | 46,739,591 |
| Atlantic Tele-Network, Inc. | | 121,200 | 7,341,084 |
| CenturyLink, Inc. (b) | | 573,178 | 11,303,070 |
| Cincinnati Bell, Inc. (a) | | 491,402 | 10,344,012 |
| Consolidated Communications Holdings, Inc. (b) | | 221,900 | 4,094,055 |
| Frontier Communications Corp. (b) | | 261,375 | 3,520,721 |
| General Communications, Inc. Class A (a) | | 327,143 | 14,109,678 |
| Verizon Communications, Inc. | | 2,122,197 | 101,801,792 |
| Windstream Holdings, Inc. (b) | | 1,176,630 | 2,435,624 |
| | | | 201,689,627 |
|
| TOTAL DIVERSIFIED TELECOMMUNICATION SERVICES | | | 284,158,675 |
|
| Equity Real Estate Investment Trusts (REITs) - 2.2% | | | |
| Specialized REITs - 2.2% | | | |
| American Tower Corp. | | 62,690 | 9,281,255 |
| Internet Software & Services - 1.9% | | | |
| Internet Software & Services - 1.9% | | | |
| Akamai Technologies, Inc. (a) | | 77,000 | 3,630,550 |
| Gogo, Inc. (a)(b) | | 296,147 | 4,149,019 |
| | | | 7,779,569 |
| Media - 10.3% | | | |
| Broadcasting - 1.0% | | | |
| CBS Corp. Class B | | 32,500 | 2,081,950 |
| Nexstar Broadcasting Group, Inc. Class A | | 36,800 | 2,215,360 |
| | | | 4,297,310 |
| Cable & Satellite - 8.7% | | | |
| Altice NV Class A (a) | | 149,381 | 3,444,579 |
| Comcast Corp. Class A | | 57,100 | 2,318,831 |
| DISH Network Corp. Class A (a) | | 50,200 | 2,875,958 |
| Liberty Broadband Corp. Class A (a) | | 89,400 | 9,067,842 |
| Liberty Global PLC: | | | |
| Class A (a) | | 43,400 | 1,475,600 |
| Class C (a) | | 428,636 | 14,157,847 |
| LiLAC Class C (a) | | 53,034 | 1,367,747 |
| Megacable Holdings S.A.B. de CV unit | | 402,500 | 1,742,664 |
| | | | 36,451,068 |
| Movies & Entertainment - 0.6% | | | |
| Lions Gate Entertainment Corp. Class B | | 12,603 | 353,766 |
| The Walt Disney Co. | | 20,500 | 2,074,600 |
| | | | 2,428,366 |
|
| TOTAL MEDIA | | | 43,176,744 |
|
| Semiconductors & Semiconductor Equipment - 0.7% | | | |
| Semiconductors - 0.7% | | | |
| Qorvo, Inc. (a) | | 39,000 | 2,855,580 |
| Technology Hardware, Storage & Peripherals - 0.8% | | | |
| Technology Hardware, Storage & Peripherals - 0.8% | | | |
| Apple, Inc. | | 21,200 | 3,476,800 |
| Wireless Telecommunication Services - 15.2% | | | |
| Wireless Telecommunication Services - 15.2% | | | |
| Millicom International Cellular SA | | 26,600 | 1,641,486 |
| NII Holdings, Inc. (a)(b) | | 898,526 | 596,621 |
| Shenandoah Telecommunications Co. | | 172,067 | 6,203,015 |
| Sprint Corp. (a)(b) | | 1,329,785 | 10,970,726 |
| T-Mobile U.S., Inc. (a) | | 449,697 | 29,099,893 |
| Telephone & Data Systems, Inc. | | 351,264 | 10,295,548 |
| U.S. Cellular Corp. (a) | | 125,200 | 4,842,737 |
| | | | 63,650,026 |
| TOTAL COMMON STOCKS | | | |
| (Cost $337,755,824) | | | 417,888,229 |
|
| Money Market Funds - 12.0% | | | |
| Fidelity Cash Central Fund, 1.11% (c) | | 1,207,346 | 1,207,588 |
| Fidelity Securities Lending Cash Central Fund 1.11% (c)(d) | | 49,285,105 | 49,290,033 |
| TOTAL MONEY MARKET FUNDS | | | |
| (Cost $50,493,552) | | | 50,497,621 |
| TOTAL INVESTMENT IN SECURITIES - 111.6% | | | |
| (Cost $388,249,376) | | | 468,385,850 |
| NET OTHER ASSETS (LIABILITIES) - (11.6)% | | | (48,834,796) |
| NET ASSETS - 100% | | | $419,551,054 |
Legend
(a) Non-income producing
(b) Security or a portion of the security is on loan at period end.
(c) Affiliated fund that is generally available only to investment companies and other accounts managed by Fidelity Investments. The rate quoted is the annualized seven-day yield of the fund at period end. A complete unaudited listing of the fund's holdings as of its most recent quarter end is available upon request. In addition, each Fidelity Central Fund's financial statements are available on the SEC's website or upon request.
(d) Investment made with cash collateral received from securities on loan.
Affiliated Central Funds
Information regarding fiscal year to date income earned by the Fund from investments in Fidelity Central Funds is as follows:
| Fund | Income earned |
| Fidelity Cash Central Fund | $3,867 |
| Fidelity Securities Lending Cash Central Fund | 671,906 |
| Total | $675,773 |
Investment Valuation
All investments are categorized as Level 1 under the Fair Value Hierarchy. The inputs or methodology used for valuing securities may not be an indication of the risk associated with investing in those securities. For more information on valuation inputs please refer to the Investment Valuation section in the accompanying Notes to Financial Statements.
See accompanying notes which are an integral part of the financial statements.
Telecommunications Portfolio
Financial Statements
Statement of Assets and Liabilities
| | | August 31, 2017 (Unaudited) |
| Assets | | |
Investment in securities, at value (including securities loaned of $47,550,610) — See accompanying schedule:
Unaffiliated issuers (cost $337,755,824) | $417,888,229 | |
| Fidelity Central Funds (cost $50,493,552) | 50,497,621 | |
| Total Investment in Securities (cost $388,249,376) | | $468,385,850 |
| Receivable for investments sold | | 2,364,891 |
| Receivable for fund shares sold | | 29,074 |
| Dividends receivable | | 456,166 |
| Distributions receivable from Fidelity Central Funds | | 97,788 |
| Other receivables | | 18,925 |
| Total assets | | 471,352,694 |
| Liabilities | | |
| Payable for investments purchased | $1,345,085 | |
| Payable for fund shares redeemed | 855,560 | |
| Accrued management fee | 193,108 | |
| Distribution and service plan fees payable | 16,424 | |
| Other affiliated payables | 86,628 | |
| Other payables and accrued expenses | 23,716 | |
| Collateral on securities loaned | 49,281,119 | |
| Total liabilities | | 51,801,640 |
| Net Assets | | $419,551,054 |
| Net Assets consist of: | | |
| Paid in capital | | $292,314,377 |
| Undistributed net investment income | | 5,500,435 |
| Accumulated undistributed net realized gain (loss) on investments and foreign currency transactions | | 41,603,149 |
| Net unrealized appreciation (depreciation) on investments and assets and liabilities in foreign currencies | | 80,133,093 |
| Net Assets | | $419,551,054 |
| Calculation of Maximum Offering Price | | |
| Class A: | | |
| Net Asset Value and redemption price per share ($22,224,250 ÷ 322,447 shares) | | $68.92 |
| Maximum offering price per share (100/94.25 of $68.92) | | $73.12 |
| Class M: | | |
| Net Asset Value and redemption price per share ($5,618,855 ÷ 81,955 shares) | | $68.56 |
| Maximum offering price per share (100/96.50 of $68.56) | | $71.05 |
| Class C: | | |
| Net Asset Value and offering price per share ($10,792,274 ÷ 157,793 shares)(a) | | $68.40 |
| Telecommunications: | | |
| Net Asset Value, offering price and redemption price per share ($369,458,852 ÷ 5,326,959 shares) | | $69.36 |
| Class I: | | |
| Net Asset Value, offering price and redemption price per share ($11,456,823 ÷ 165,550 shares) | | $69.20 |
(a) Redemption price per share is equal to net asset value less any applicable contingent deferred sales charge.
See accompanying notes which are an integral part of the financial statements.
Statement of Operations
| | | Six months ended August 31, 2017 (Unaudited) |
| Investment Income | | |
| Dividends | | $7,199,569 |
| Income from Fidelity Central Funds (including $671,906 from security lending) | | 675,773 |
| Total income | | 7,875,342 |
| Expenses | | |
| Management fee | $1,534,353 | |
| Transfer agent fees | 540,373 | |
| Distribution and service plan fees | 106,574 | |
| Accounting and security lending fees | 112,555 | |
| Custodian fees and expenses | 11,955 | |
| Independent trustees' fees and expenses | 7,200 | |
| Registration fees | 54,928 | |
| Audit | 38,653 | |
| Legal | 5,318 | |
| Interest | 11,274 | |
| Miscellaneous | 6,716 | |
| Total expenses before reductions | 2,429,899 | |
| Expense reductions | (58,013) | 2,371,886 |
| Net investment income (loss) | | 5,503,456 |
| Realized and Unrealized Gain (Loss) | | |
| Net realized gain (loss) on: | | |
| Investment securities: | | |
| Unaffiliated issuers | 48,757,948 | |
| Fidelity Central Funds | (2,638) | |
| Foreign currency transactions | (9,080) | |
| Total net realized gain (loss) | | 48,746,230 |
| Change in net unrealized appreciation (depreciation) on: | | |
| Investment securities: | | |
| Unaffiliated issuers | (51,108,942) | |
| Fidelity Central Funds | (6,588) | |
| Assets and liabilities in foreign currencies | 48 | |
| Total change in net unrealized appreciation (depreciation) | | (51,115,482) |
| Net gain (loss) | | (2,369,252) |
| Net increase (decrease) in net assets resulting from operations | | $3,134,204 |
See accompanying notes which are an integral part of the financial statements.
Statement of Changes in Net Assets
| | Six months ended August 31, 2017 (Unaudited) | Year ended February 28, 2017 |
| Increase (Decrease) in Net Assets | | |
| Operations | | |
| Net investment income (loss) | $5,503,456 | $13,937,211 |
| Net realized gain (loss) | 48,746,230 | 61,532,842 |
| Change in net unrealized appreciation (depreciation) | (51,115,482) | 57,549,557 |
| Net increase (decrease) in net assets resulting from operations | 3,134,204 | 133,019,610 |
| Distributions to shareholders from net investment income | (2,154,816) | (13,294,404) |
| Distributions to shareholders from net realized gain | (13,743,561) | (31,675,318) |
| Total distributions | (15,898,377) | (44,969,722) |
| Share transactions - net increase (decrease) | (325,382,612) | (55,515,132) |
| Redemption fees | – | 54,102 |
| Total increase (decrease) in net assets | (338,146,785) | 32,588,858 |
| Net Assets | | |
| Beginning of period | 757,697,839 | 725,108,981 |
| End of period | $419,551,054 | $757,697,839 |
| Other Information | | |
| Undistributed net investment income end of period | $5,500,435 | $2,151,795 |
See accompanying notes which are an integral part of the financial statements.
Financial Highlights — Telecommunications Portfolio Class A
| | Six months ended (Unaudited) August 31, | Years ended February 28, | | | | |
| | 2017 | 2017 | 2016 A | 2015 | 2014 | 2013 |
| Selected Per–Share Data | | | | | | |
| Net asset value, beginning of period | $69.61 | $62.32 | $63.26 | $58.71 | $51.58 | $46.12 |
| Income from Investment Operations | | | | | | |
| Net investment income (loss)B | .57 | .88 | .81 | .76 | 1.76C | .99 |
| Net realized and unrealized gain (loss) | .36D | 10.68 | (.76) | 5.83 | 6.48 | 5.43 |
| Total from investment operations | .93 | 11.56 | .05 | 6.59 | 8.24 | 6.42 |
| Distributions from net investment income | (.19) | (1.11) | (.54) | (2.04) | (1.11) | (.96) |
| Distributions from net realized gain | (1.43) | (3.16) | (.45) | – | (.01) | – |
| Total distributions | (1.62) | (4.27) | (.99) | (2.04) | (1.11)E | (.96) |
| Redemption fees added to paid in capitalB | – | –F | –F | –F | –F | –F |
| Net asset value, end of period | $68.92 | $69.61 | $62.32 | $63.26 | $58.71 | $51.58 |
| Total ReturnG,H,I | 1.32% | 18.65% | .16% | 11.54% | 16.00% | 13.97% |
| Ratios to Average Net AssetsJ,K | | | | | | |
| Expenses before reductions | 1.14%L | 1.14% | 1.15% | 1.15% | 1.18% | 1.18% |
| Expenses net of fee waivers, if any | 1.14%L | 1.14% | 1.15% | 1.15% | 1.18% | 1.18% |
| Expenses net of all reductions | 1.12%L | 1.12% | 1.15% | 1.15% | 1.15% | 1.17% |
| Net investment income (loss) | 1.68%L | 1.28% | 1.33% | 1.26% | 3.08%C | 2.01% |
| Supplemental Data | | | | | | |
| Net assets, end of period (000 omitted) | $22,224 | $31,966 | $13,032 | $11,052 | $7,712 | $6,449 |
| Portfolio turnover rateM | 63%L | 105%N | 51% | 94%N | 111% | 76% |
A For the year ended February 29.
B Calculated based on average shares outstanding during the period.
C Net Investment income per share reflects a large, non-recurring dividend which amounted to $.95 per share. Excluding this non-recurring dividend, the ratio of net investment income (loss) to average net assets would have been 1.43%.
D The amount shown for a share outstanding does not correspond with the aggregate net gain (loss) on investments for the period due to the timing of sales and repurchases of shares in relation to fluctuating market values of the investments of the Fund.
E Total distributions of $1.11 per share is comprised of distributions from net investment income of $1.106 and distributions from net realized gain of $.005 per share.
F Amount represents less than $.005 per share.
G Total returns for periods of less than one year are not annualized.
H Total returns would have been lower if certain expenses had not been reduced during the applicable periods shown.
I Total returns do not include the effect of the sales charges.
J Fees and expenses of any underlying Fidelity Central Funds are not included in the Fund's expense ratio. The Fund indirectly bears its proportionate share of the expenses of any underlying Fidelity Central Funds.
K Expense ratios reflect operating expenses of the class. Expenses before reductions do not reflect amounts reimbursed by the investment adviser or reductions from brokerage service arrangements or reductions from other expense offset arrangements and do not represent the amount paid by the class during periods when reimbursements or reductions occur. Expenses net of fee waivers reflect expenses after reimbursement by the investment adviser but prior to reductions from brokerage service arrangements or other expense offset arrangements. Expenses net of all reductions represent the net expenses paid by the class.
L Annualized
M Amount does not include the portfolio activity of any underlying Fidelity Central Funds.
N Portfolio turnover rate excludes securities received or delivered in-kind.
See accompanying notes which are an integral part of the financial statements.
Financial Highlights — Telecommunications Portfolio Class M
| | Six months ended (Unaudited) August 31, | Years ended February 28, | | | | |
| | 2017 | 2017 | 2016 A | 2015 | 2014 | 2013 |
| Selected Per–Share Data | | | | | | |
| Net asset value, beginning of period | $69.33 | $61.95 | $63.04 | $58.50 | $51.41 | $46.01 |
| Income from Investment Operations | | | | | | |
| Net investment income (loss)B | .45 | .65 | .61 | .57 | 1.59C | .85 |
| Net realized and unrealized gain (loss) | .36D | 10.62 | (.76) | 5.81 | 6.44 | 5.39 |
| Total from investment operations | .81 | 11.27 | (.15) | 6.38 | 8.03 | 6.24 |
| Distributions from net investment income | (.14) | (.73) | (.49) | (1.84) | (.94) | (.84) |
| Distributions from net realized gain | (1.43) | (3.16) | (.45) | – | (.01) | – |
| Total distributions | (1.58)E | (3.89) | (.94) | (1.84) | (.94)F | (.84) |
| Redemption fees added to paid in capitalB | – | –G | –G | –G | –G | –G |
| Net asset value, end of period | $68.56 | $69.33 | $61.95 | $63.04 | $58.50 | $51.41 |
| Total ReturnH,I,J | 1.15% | 18.26% | (.16)% | 11.19% | 15.64% | 13.61% |
| Ratios to Average Net AssetsK,L | | | | | | |
| Expenses before reductions | 1.49%M | 1.46% | 1.47% | 1.47% | 1.48% | 1.48% |
| Expenses net of fee waivers, if any | 1.49%M | 1.46% | 1.47% | 1.47% | 1.48% | 1.48% |
| Expenses net of all reductions | 1.47%M | 1.44% | 1.46% | 1.46% | 1.45% | 1.46% |
| Net investment income (loss) | 1.33%M | .96% | 1.01% | .94% | 2.78%C | 1.72% |
| Supplemental Data | | | | | | |
| Net assets, end of period (000 omitted) | $5,619 | $6,933 | $8,280 | $5,095 | $4,344 | $4,237 |
| Portfolio turnover rateN | 63%M | 105%O | 51% | 94%O | 111% | 76% |
A For the year ended February 29.
B Calculated based on average shares outstanding during the period.
C Net Investment income per share reflects a large, non-recurring dividend which amounted to $.94 per share. Excluding this non-recurring dividend, the ratio of net investment income (loss) to average net assets would have been 1.13%.
D The amount shown for a share outstanding does not correspond with the aggregate net gain (loss) on investments for the period due to the timing of sales and repurchases of shares in relation to fluctuating market values of the investments of the Fund.
E Total distributions of $1.58 per share is comprised of distributions from net investment income of $.144 and distributions from net realized gain of $1.434 per share.
F Total distributions of $.94 per share is comprised of distributions from net investment income of $.939 and distributions from net realized gain of $.005 per share.
G Amount represents less than $.005 per share.
H Total returns for periods of less than one year are not annualized.
I Total returns would have been lower if certain expenses had not been reduced during the applicable periods shown.
J Total returns do not include the effect of the sales charges.
K Fees and expenses of any underlying Fidelity Central Funds are not included in the Fund's expense ratio. The Fund indirectly bears its proportionate share of the expenses of any underlying Fidelity Central Funds.
L Expense ratios reflect operating expenses of the class. Expenses before reductions do not reflect amounts reimbursed by the investment adviser or reductions from brokerage service arrangements or reductions from other expense offset arrangements and do not represent the amount paid by the class during periods when reimbursements or reductions occur. Expenses net of fee waivers reflect expenses after reimbursement by the investment adviser but prior to reductions from brokerage service arrangements or other expense offset arrangements. Expenses net of all reductions represent the net expenses paid by the class.
M Annualized
N Amount does not include the portfolio activity of any underlying Fidelity Central Funds.
O Portfolio turnover rate excludes securities received or delivered in-kind.
See accompanying notes which are an integral part of the financial statements.
Financial Highlights — Telecommunications Portfolio Class C
| | Six months ended (Unaudited) August 31, | Years ended February 28, | | | | |
| | 2017 | 2017 | 2016 A | 2015 | 2014 | 2013 |
| Selected Per–Share Data | | | | | | |
| Net asset value, beginning of period | $69.24 | $62.10 | $63.04 | $58.54 | $51.47 | $46.02 |
| Income from Investment Operations | | | | | | |
| Net investment income (loss)B | .32 | .37 | .36 | .34 | 1.36C | .63 |
| Net realized and unrealized gain (loss) | .37D | 10.62 | (.75) | 5.80 | 6.46 | 5.41 |
| Total from investment operations | .69 | 10.99 | (.39) | 6.14 | 7.82 | 6.04 |
| Distributions from net investment income | (.09) | (.69) | (.10) | (1.64) | (.74) | (.59) |
| Distributions from net realized gain | (1.43) | (3.16) | (.45) | – | (.01) | – |
| Total distributions | (1.53)E | (3.85) | (.55) | (1.64) | (.75) | (.59) |
| Redemption fees added to paid in capitalB | – | –F | –F | –F | –F | –F |
| Net asset value, end of period | $68.40 | $69.24 | $62.10 | $63.04 | $58.54 | $51.47 |
| Total ReturnG,H,I | .97% | 17.77% | (.57)% | 10.75% | 15.20% | 13.14% |
| Ratios to Average Net AssetsJ,K | | | | | | |
| Expenses before reductions | 1.87%L | 1.88% | 1.89% | 1.85% | 1.88% | 1.90% |
| Expenses net of fee waivers, if any | 1.87%L | 1.88% | 1.89% | 1.85% | 1.88% | 1.90% |
| Expenses net of all reductions | 1.85%L | 1.86% | 1.88% | 1.85% | 1.85% | 1.89% |
| Net investment income (loss) | .95%L | .54% | .60% | .56% | 2.38%C | 1.29% |
| Supplemental Data | | | | | | |
| Net assets, end of period (000 omitted) | $10,792 | $13,528 | $7,735 | $7,074 | $5,523 | $4,353 |
| Portfolio turnover rateM | 63%L | 105%N | 51% | 94%N | 111% | 76% |
A For the year ended February 29.
B Calculated based on average shares outstanding during the period.
C Net Investment income per share reflects a large, non-recurring dividend which amounted to $.94 per share. Excluding this non-recurring dividend, the ratio of net investment income (loss) to average net assets would have been .73%.
D The amount shown for a share outstanding does not correspond with the aggregate net gain (loss) on investments for the period due to the timing of sales and repurchases of shares in relation to fluctuating market values of the investments of the Fund.
E Total distributions of $1.53 per share is comprised of distributions from net investment income of $.092 and distributions from net realized gain of $1.434 per share.
F Amount represents less than $.005 per share.
G Total returns for periods of less than one year are not annualized.
H Total returns would have been lower if certain expenses had not been reduced during the applicable periods shown.
I Total returns do not include the effect of the contingent deferred sales charge.
J Fees and expenses of any underlying Fidelity Central Funds are not included in the Fund's expense ratio. The Fund indirectly bears its proportionate share of the expenses of any underlying Fidelity Central Funds.
K Expense ratios reflect operating expenses of the class. Expenses before reductions do not reflect amounts reimbursed by the investment adviser or reductions from brokerage service arrangements or reductions from other expense offset arrangements and do not represent the amount paid by the class during periods when reimbursements or reductions occur. Expenses net of fee waivers reflect expenses after reimbursement by the investment adviser but prior to reductions from brokerage service arrangements or other expense offset arrangements. Expenses net of all reductions represent the net expenses paid by the class.
L Annualized
M Amount does not include the portfolio activity of any underlying Fidelity Central Funds.
N Portfolio turnover rate excludes securities received or delivered in-kind.
See accompanying notes which are an integral part of the financial statements.
Financial Highlights — Telecommunications Portfolio
| | Six months ended (Unaudited) August 31, | Years ended February 28, | | | | |
| | 2017 | 2017 | 2016 A | 2015 | 2014 | 2013 |
| Selected Per–Share Data | | | | | | |
| Net asset value, beginning of period | $69.97 | $62.58 | $63.54 | $58.94 | $51.75 | $46.26 |
| Income from Investment Operations | | | | | | |
| Net investment income (loss)B | .69 | 1.12 | 1.02 | .96 | 1.96C | 1.15 |
| Net realized and unrealized gain (loss) | .36D | 10.74 | (.77) | 5.85 | 6.51 | 5.43 |
| Total from investment operations | 1.05 | 11.86 | .25 | 6.81 | 8.47 | 6.58 |
| Distributions from net investment income | (.23) | (1.31) | (.76) | (2.21) | (1.28) | (1.09) |
| Distributions from net realized gain | (1.43) | (3.16) | (.45) | – | (.01) | – |
| Total distributions | (1.66) | (4.47) | (1.21) | (2.21) | (1.28)E | (1.09) |
| Redemption fees added to paid in capitalB | – | –F | –F | –F | –F | –F |
| Net asset value, end of period | $69.36 | $69.97 | $62.58 | $63.54 | $58.94 | $51.75 |
| Total ReturnG,H | 1.49% | 19.06% | .49% | 11.90% | 16.40% | 14.30% |
| Ratios to Average Net AssetsI,J | | | | | | |
| Expenses before reductions | .82%K | .80% | .82% | .83% | .85% | .87% |
| Expenses net of fee waivers, if any | .82%K | .80% | .81% | .83% | .85% | .87% |
| Expenses net of all reductions | .80%K | .78% | .81% | .82% | .82% | .85% |
| Net investment income (loss) | 2.00%K | 1.62% | 1.67% | 1.58% | 3.41%C | 2.33% |
| Supplemental Data | | | | | | |
| Net assets, end of period (000 omitted) | $369,459 | $690,720 | $689,600 | $346,174 | $343,548 | $377,841 |
| Portfolio turnover rateL | 63%K | 105%M | 51% | 94%M | 111% | 76% |
A For the year ended February 29.
B Calculated based on average shares outstanding during the period.
C Net Investment income per share reflects a large, non-recurring dividend which amounted to $.95 per share. Excluding this non-recurring dividend, the ratio of net investment income (loss) to average net assets would have been 1.76%.
D The amount shown for a share outstanding does not correspond with the aggregate net gain (loss) on investments for the period due to the timing of sales and repurchases of shares in relation to fluctuating market values of the investments of the Fund.
E Total distributions of $1.28 per share is comprised of distributions from net investment income of $1.275 and distributions from net realized gain of $.005 per share.
F Amount represents less than $.005 per share.
G Total returns for periods of less than one year are not annualized.
H Total returns would have been lower if certain expenses had not been reduced during the applicable periods shown.
I Fees and expenses of any underlying Fidelity Central Funds are not included in the Fund's expense ratio. The Fund indirectly bears its proportionate share of the expenses of any underlying Fidelity Central Funds.
J Expense ratios reflect operating expenses of the class. Expenses before reductions do not reflect amounts reimbursed by the investment adviser or reductions from brokerage service arrangements or reductions from other expense offset arrangements and do not represent the amount paid by the class during periods when reimbursements or reductions occur. Expenses net of fee waivers reflect expenses after reimbursement by the investment adviser but prior to reductions from brokerage service arrangements or other expense offset arrangements. Expenses net of all reductions represent the net expenses paid by the class.
K Annualized
L Amount does not include the portfolio activity of any underlying Fidelity Central Funds.
M Portfolio turnover rate excludes securities received or delivered in-kind.
See accompanying notes which are an integral part of the financial statements.
Financial Highlights — Telecommunications Portfolio Class I
| | Six months ended (Unaudited) August 31, | Years ended February 28, | | | | |
| | 2017 | 2017 | 2016 A | 2015 | 2014 | 2013 |
| Selected Per–Share Data | | | | | | |
| Net asset value, beginning of period | $69.82 | $62.46 | $63.38 | $58.80 | $51.65 | $46.20 |
| Income from Investment Operations | | | | | | |
| Net investment income (loss)B | .68 | 1.12 | 1.02 | .94 | 1.93C | 1.17 |
| Net realized and unrealized gain (loss) | .37D | 10.70 | (.76) | 5.83 | 6.48 | 5.42 |
| Total from investment operations | 1.05 | 11.82 | .26 | 6.77 | 8.41 | 6.59 |
| Distributions from net investment income | (.23) | (1.30) | (.73) | (2.19) | (1.25) | (1.14) |
| Distributions from net realized gain | (1.43) | (3.16) | (.45) | – | (.01) | – |
| Total distributions | (1.67)E | (4.46) | (1.18) | (2.19) | (1.26) | (1.14) |
| Redemption fees added to paid in capitalB | – | –F | –F | –F | –F | –F |
| Net asset value, end of period | $69.20 | $69.82 | $62.46 | $63.38 | $58.80 | $51.65 |
| Total ReturnG,H | 1.49% | 19.03% | .51% | 11.85% | 16.30% | 14.33% |
| Ratios to Average Net AssetsI,J | | | | | | |
| Expenses before reductions | .82%K | .80% | .82% | .86% | .91% | .85% |
| Expenses net of fee waivers, if any | .82%K | .80% | .82% | .86% | .91% | .85% |
| Expenses net of all reductions | .80%K | .78% | .81% | .85% | .88% | .83% |
| Net investment income (loss) | 2.00%K | 1.62% | 1.67% | 1.55% | 3.35%C | 2.35% |
| Supplemental Data | | | | | | |
| Net assets, end of period (000 omitted) | $11,457 | $14,550 | $6,197 | $2,505 | $1,604 | $2,641 |
| Portfolio turnover rateL | 63%K | 105%M | 51% | 94%M | 111% | 76% |
A For the year ended February 29.
B Calculated based on average shares outstanding during the period.
C Net Investment income per share reflects a large, non-recurring dividend which amounted to $.95 per share. Excluding this non-recurring dividend, the ratio of net investment income (loss) to average net assets would have been 1.70%.
D The amount shown for a share outstanding does not correspond with the aggregate net gain (loss) on investments for the period due to the timing of sales and repurchases of shares in relation to fluctuating market values of the investments of the Fund.
E Total distributions of $1.67 per share is comprised of distributions from net investment income of $.232 and distributions from net realized gain of $1.434 per share.
F Amount represents less than $.005 per share.
G Total returns for periods of less than one year are not annualized.
H Total returns would have been lower if certain expenses had not been reduced during the applicable periods shown.
I Fees and expenses of any underlying Fidelity Central Funds are not included in the Fund's expense ratio. The Fund indirectly bears its proportionate share of the expenses of any underlying Fidelity Central Funds.
J Expense ratios reflect operating expenses of the class. Expenses before reductions do not reflect amounts reimbursed by the investment adviser or reductions from brokerage service arrangements or reductions from other expense offset arrangements and do not represent the amount paid by the class during periods when reimbursements or reductions occur. Expenses net of fee waivers reflect expenses after reimbursement by the investment adviser but prior to reductions from brokerage service arrangements or other expense offset arrangements. Expenses net of all reductions represent the net expenses paid by the class.
K Annualized
L Amount does not include the portfolio activity of any underlying Fidelity Central Funds.
M Portfolio turnover rate excludes securities received or delivered in-kind.
See accompanying notes which are an integral part of the financial statements.
Notes to Financial Statements (Unaudited)
For the period ended August 31, 2017
1. Organization.
Telecommunications Portfolio (the Fund) is a non-diversified fund of Fidelity Select Portfolios (the Trust) and is authorized to issue an unlimited number of shares. The Trust is registered under the Investment Company Act of 1940, as amended (the 1940 Act), as an open-end management investment company organized as a Massachusetts business trust. The Fund invests primarily in securities of companies whose principal business activities fall within specific industries. The Fund offers Class A, Class M (formerly Class T), Class C, Telecommunications and Class I shares, each of which has equal rights as to assets and voting privileges. Each class has exclusive voting rights with respect to matters that affect that class.
After the close of business on June 24, 2016, all outstanding Class B shares were converted to Class A shares. All prior fiscal period dollar and share amounts for Class B presented in the Notes to Financial Statements are for the period March 1, 2016 through June 24, 2016.
2. Investments in Fidelity Central Funds.
The Fund invests in Fidelity Central Funds, which are open-end investment companies generally available only to other investment companies and accounts managed by the investment adviser and its affiliates. The Fund's Schedule of Investments lists each of the Fidelity Central Funds held as of period end, if any, as an investment of the Fund, but does not include the underlying holdings of each Fidelity Central Fund. As an Investing Fund, the Fund indirectly bears its proportionate share of the expenses of the underlying Fidelity Central Funds.
The Money Market Central Funds seek preservation of capital and current income and are managed by Fidelity Investments Money Management, Inc. (FIMM), an affiliate of the investment adviser. Annualized expenses of the Money Market Central Funds as of their most recent shareholder report date are less than .005%.
A complete unaudited list of holdings for each Fidelity Central Fund is available upon request or at the Securities and Exchange Commission (the SEC) website at www.sec.gov. In addition, the financial statements of the Fidelity Central Funds are available on the SEC website or upon request.
3. Significant Accounting Policies.
The Fund is an investment company and applies the accounting and reporting guidance of the Financial Accounting Standards Board (FASB) Accounting Standards Codification Topic 946 Financial Services – Investments Companies. The financial statements have been prepared in conformity with accounting principles generally accepted in the United States of America (GAAP), which require management to make certain estimates and assumptions at the date of the financial statements. Actual results could differ from those estimates. Subsequent events, if any, through the date that the financial statements were issued have been evaluated in the preparation of the financial statements. The following summarizes the significant accounting policies of the Fund:
Investment Valuation. Investments are valued as of 4:00 p.m. Eastern time on the last calendar day of the period. The Board of Trustees (the Board) has delegated the day to day responsibility for the valuation of the Fund's investments to the Fair Value Committee (the Committee) established by the Fund's investment adviser. In accordance with valuation policies and procedures approved by the Board, the Fund attempts to obtain prices from one or more third party pricing vendors or brokers to value its investments. When current market prices, quotations or currency exchange rates are not readily available or reliable, investments will be fair valued in good faith by the Committee, in accordance with procedures adopted by the Board. Factors used in determining fair value vary by investment type and may include market or investment specific events. The frequency with which these procedures are used cannot be predicted and they may be utilized to a significant extent. The Committee oversees the Fund's valuation policies and procedures and reports to the Board on the Committee's activities and fair value determinations. The Board monitors the appropriateness of the procedures used in valuing the Fund's investments and ratifies the fair value determinations of the Committee.
The Fund categorizes the inputs to valuation techniques used to value its investments into a disclosure hierarchy consisting of three levels as shown below:
- Level 1 – quoted prices in active markets for identical investments
- Level 2 – other significant observable inputs (including quoted prices for similar investments, interest rates, prepayment speeds, etc.)
- Level 3 – unobservable inputs (including the Fund's own assumptions based on the best information available)
Valuation techniques used to value the Fund's investments by major category are as follows:
Equity securities, including restricted securities, for which market quotations are readily available, are valued at the last reported sale price or official closing price as reported by a third party pricing vendor on the primary market or exchange on which they are traded and are categorized as Level 1 in the hierarchy. In the event there were no sales during the day or closing prices are not available, securities are valued at the last quoted bid price or may be valued using the last available price and are generally categorized as Level 2 in the hierarchy. For foreign equity securities, when market or security specific events arise, comparisons to the valuation of American Depositary Receipts (ADRs), futures contracts, Exchange-Traded Funds (ETFs)and certain indexes as well as quoted prices for similar securities may be used and would be categorized as Level 2 in the hierarchy. Utilizing these techniques may result in transfers between Level 1 and Level 2. For equity securities, including restricted securities, where observable inputs are limited, assumptions about market activity and risk are used and these securities may be categorized as Level 3 in the hierarchy.
Investments in open-end mutual funds ,including the Fidelity Central Funds, are valued at their closing net asset value (NAV) each business day and are categorized as Level 1 in the hierarchy.
Changes in valuation techniques may result in transfers in or out of an assigned level within the disclosure hierarchy.
Foreign Currency. The Fund may use foreign currency contracts to facilitate transactions in foreign-denominated securities. Gains and losses from these transactions may arise from changes in the value of the foreign currency or if the counterparties do not perform under the contracts' terms.
Foreign-denominated assets, including investment securities, and liabilities are translated into U.S. dollars at the exchange rates at period end. Purchases and sales of investment securities, income and dividends received and expenses denominated in foreign currencies are translated into U.S. dollars at the exchange rate in effect on the transaction date.
The effects of exchange rate fluctuations on investments are included with the net realized and unrealized gain (loss) on investment securities. Other foreign currency transactions resulting in realized and unrealized gain (loss) are disclosed separately.
Investment Transactions and Income. For financial reporting purposes, the Fund's investment holdings and NAV include trades executed through the end of the last business day of the period. The NAV per share for processing shareholder transactions is calculated as of the close of business of the New York Stock Exchange (NYSE), normally 4:00 p.m. Eastern time and includes trades executed through the end of the prior business day. Gains and losses on securities sold are determined on the basis of identified cost and may include proceeds received from litigation. Dividend income is recorded on the ex-dividend date, except for certain dividends from foreign securities where the ex-dividend date may have passed, which are recorded as soon as the Fund is informed of the ex-dividend date. Non-cash dividends included in dividend income, if any, are recorded at the fair market value of the securities received. Income and capital gain distributions from Fidelity Central Funds, if any, are recorded on the ex-dividend date. Certain distributions received by the Fund represent a return of capital or capital gain. The Fund determines the components of these distributions subsequent to the ex-dividend date, based upon receipt of tax filings or other correspondence relating to the underlying investment. These distributions are recorded as a reduction of cost of investments and/or as a realized gain. Investment income is recorded net of foreign taxes withheld where recovery of such taxes is uncertain.
Class Allocations and Expenses. Investment income, realized and unrealized capital gains and losses, common expenses of the Fund, and certain fund-level expense reductions, if any, are allocated daily on a pro-rata basis to each class based on the relative net assets of each class to the total net assets of the Fund. Each class differs with respect to transfer agent and distribution and service plan fees incurred. Certain expense reductions may also differ by class. For the reporting period, the allocated portion of income and expenses to each class as a percent of its average net assets may vary due to the timing of recording these transactions in relation to fluctuating net assets of the classes. Expenses directly attributable to a fund are charged to that fund. Expenses attributable to more than one fund are allocated among the respective funds on the basis of relative net assets or other appropriate methods. Expense estimates are accrued in the period to which they relate and adjustments are made when actual amounts are known.
Income Tax Information and Distributions to Shareholders. Each year, the Fund intends to qualify as a regulated investment company under Subchapter M of the Internal Revenue Code, including distributing substantially all of its taxable income and realized gains. As a result, no provision for U.S. Federal income taxes is required. The Fund files a U.S. federal tax return, in addition to state and local tax returns as required. The Fund's federal income tax returns are subject to examination by the Internal Revenue Service (IRS) for a period of three fiscal years after they are filed. State and local tax returns may be subject to examination for an additional fiscal year depending on the jurisdiction. Foreign taxes are provided for based on the Fund's understanding of the tax rules and rates that exist in the foreign markets in which it invests.
Distributions are declared and recorded on the ex-dividend date. Income dividends and capital gain distributions are declared separately for each class. Income and capital gain distributions are determined in accordance with income tax regulations, which may differ from GAAP.
Capital accounts within the financial statements are adjusted for permanent book-tax differences. These adjustments have no impact on net assets or the results of operations. Capital accounts are not adjusted for temporary book-tax differences which will reverse in a subsequent period.
Book-tax differences are primarily due to foreign currency transactions, redemptions in kind, deferred trustees compensation and losses deferred due to wash sales and excise tax regulations.
As of period end, the cost and unrealized appreciation (depreciation) in securities, and derivatives if applicable, for federal income tax purposes were as follows:
| Gross unrealized appreciation | $104,528,264 |
| Gross unrealized depreciation | (26,389,865) |
| Net unrealized appreciation (depreciation) | $78,138,399 |
| Tax cost | $390,247,451 |
4. Purchases and Sales of Investments.
Purchases and sales of securities, other than short-term securities, aggregated $177,798,036 and $512,124,010, respectively.
5. Fees and Other Transactions with Affiliates.
Management Fee. Fidelity SelectCo, LLC (the investment adviser) and its affiliates provide the Fund with investment management related services for which the Fund pays a monthly management fee. The management fee is the sum of an individual fund fee rate that is based on an annual rate of .30% of the Fund's average net assets and an annualized group fee rate that averaged .25% during the period. The group fee rate is based upon the average net assets of all the mutual funds advised by Fidelity Management & Research Company (FMR) and the investment adviser. The group fee rate decreases as assets under management increase and increases as assets under management decrease. For the reporting period, the total annualized management fee rate was .55% of the Fund's average net assets.
Distribution and Service Plan Fees. In accordance with Rule 12b-1 of the 1940 Act, the Fund has adopted separate Distribution and Service Plans for each class of shares. Certain classes pay Fidelity Distributors Corporation (FDC), an affiliate of the investment adviser, separate Distribution and Service Fees, each of which is based on an annual percentage of each class' average net assets. In addition, FDC may pay financial intermediaries for selling shares of the Fund and providing shareholder support services. For the period, the Distribution and Service Fee rates, total fees and amounts retained by FDC were as follows:
| | Distribution
Fee | Service
Fee | Total Fees | Retained
by FDC |
| Class A | -% | .25% | $31,517 | $– |
| Class M | .25% | .25% | 15,696 | – |
| Class C | .75% | .25% | 59,361 | 12,455 |
| | | | $106,574 | $12,455 |
Sales Load. FDC may receive a front-end sales charge of up to 5.75% for selling Class A shares and 3.50% for selling Class M shares, some of which is paid to financial intermediaries for selling shares of the Fund. Depending on the holding period, FDC may receive contingent deferred sales charges levied on Class A, Class M and Class C redemptions. The deferred sales charges are 1.00% for Class C shares, 1.00% for certain purchases of Class A shares and .25% for certain purchases of Class M shares.
For the period, sales charge amounts retained by FDC were as follows:
| | Retained
by FDC |
| Class A | $8,866 |
| Class M | 1,127 |
| Class C(a) | 4,252 |
| | $14,245 |
(a) When Class C shares are initially sold, FDC pays commissions from its own resources to financial intermediaries through which the sales are made.
Transfer Agent Fees. Fidelity Investments Institutional Operations Company, Inc., (FIIOC), an affiliate of the investment adviser, is the transfer, dividend disbursing and shareholder servicing agent for each class of the Fund. FIIOC receives account fees and asset-based fees that vary according to the account size and type of account of the shareholders of the respective classes of the Fund. FIIOC pays for typesetting, printing and mailing of shareholder reports, except proxy statements.
For the period, transfer agent fees for each class were as follows:
| | Amount | % of
Class-Level Average
Net Assets(a) |
| Class A | $32,614 | .26 |
| Class M | 11,247 | .36 |
| Class C | 13,945 | .23 |
| Telecommunications | 470,564 | .19 |
| Class I | 12,003 | .19 |
| | $540,373 | |
(a) Annualized
Accounting and Security Lending Fees. Fidelity Service Company, Inc. (FSC), an affiliate of the investment adviser, maintains the Fund's accounting records. The accounting fee is based on the level of average net assets for each month. Under a separate contract, FSC administers the security lending program. The security lending fee is based on the number and duration of lending transactions.
Brokerage Commissions. The Fund placed a portion of its portfolio transactions with brokerage firms which are affiliates of the investment adviser. Brokerage commissions are included in net realized gain (loss) and change in net unrealized appreciation (depreciation) in the Statement of Operations. The commissions paid to these affiliated firms were $22,354 for the period.
Interfund Lending Program. Pursuant to an Exemptive Order issued by the SEC, the Fund, along with other registered investment companies having management contracts with FMR or other affiliated entities of FMR, may participate in an interfund lending program. This program provides an alternative credit facility allowing the funds to borrow from, or lend money to, other participating affiliated funds. At period end, there were no interfund loans outstanding. The Fund's activity in this program during the period for which loans were outstanding was as follows:
| Borrower or Lender | Average Loan Balance | Weighted Average Interest Rate | Interest Expense |
| Borrower | $6,749,957 | 1.15% | $10,093 |
Interfund Trades. The Fund may purchase from or sell securities to other Fidelity Funds under procedures adopted by the Board. The procedures have been designed to ensure these interfund trades are executed in accordance with Rule 17a-7 of the 1940 Act. Interfund trades are included within the respective purchases and sales amounts shown in the Purchases and Sales of Investments note.
Prior Fiscal Year Redemptions In-Kind. During the prior period, 805,095 shares of the Fund held by an affiliated entity were redeemed in-kind for investments and cash with a value of $53,345,591. The Fund had a net realized gain of $12,655,696 on investments delivered through the in-kind redemptions. The amount of the in-kind redemptions is included in share transactions in the accompanying Statement of Changes in Net Assets as well as the Notes to Financial Statements. The Fund recognized no gain or loss for federal income tax purposes.
6. Committed Line of Credit.
The Fund participates with other funds managed by the investment adviser or an affiliate in a $4.25 billion credit facility (the "line of credit") to be utilized for temporary or emergency purposes to fund shareholder redemptions or for other short-term liquidity purposes. The Fund has agreed to pay commitment fees on its pro-rata portion of the line of credit, which amounted to $1,141 and is reflected in Miscellaneous expenses on the Statement of Operations. During the period, the Fund did not borrow on this line of credit.
7. Security Lending.
The Fund lends portfolio securities through a lending agent from time to time in order to earn additional income. On the settlement date of the loan, the Fund receives collateral (in the form of U.S. Treasury obligations, letters of credit and/or cash) against the loaned securities and maintains collateral in an amount not less than 100% of the market value of the loaned securities during the period of the loan. The market value of the loaned securities is determined at the close of business of the Fund and any additional required collateral is delivered to the Fund on the next business day. The Fund or borrower may terminate the loan at any time, and if the borrower defaults on its obligation to return the securities loaned because of insolvency or other reasons, the Fund may apply collateral received from the borrower against the obligation. The Fund may experience delays and costs in recovering the securities loaned. Any cash collateral received is invested in the Fidelity Securities Lending Cash Central Fund. The value of loaned securities and cash collateral at period end are disclosed on the Fund's Statement of Assets and Liabilities. Security lending income represents the income earned on investing cash collateral, less rebates paid to borrowers and any lending agent fees associated with the loan, plus any premium payments received for lending certain types of securities. Security lending income is presented in the Statement of Operations as a component of income from Fidelity Central Funds.
8. Bank Borrowings.
The Fund is permitted to have bank borrowings for temporary or emergency purposes to fund shareholder redemptions or for other short-term liquidity requirements. The Fund has established borrowing arrangements with certain banks. The interest rate on the borrowings is the bank's base rate, as revised from time to time. The average loan balance during the period for which loans were outstanding amounted to $3,895,111. The weighted average interest rate was 1.21%. The interest expense amounted to $1,181 under the bank borrowing program. At period end, there were no bank borrowings outstanding.
9. Expense Reductions.
Commissions paid to certain brokers with whom the investment adviser, or its affiliates, places trades on behalf of the Fund include an amount in addition to trade execution, which may be rebated back to the Fund to offset certain expenses. This amount totaled $54,354 for the period.
In addition, during the period the investment adviser reimbursed and/or waived a portion of fund-level operating expenses in the amount of $3,659.
10. Distributions to Shareholders.
Distributions to shareholders of each class were as follows:
| | Six months ended
August 31, 2017 | Year ended February 28, 2017 |
| From net investment income | | |
| Class A | $70,858 | $455,173 |
| Class M | 13,588 | 67,280 |
| Class C | 16,681 | 124,522 |
| Telecommunications | 2,010,238 | 12,452,745 |
| Class I | 43,451 | 194,684 |
| Total | $2,154,816 | $13,294,404 |
| From net realized gain | | |
| Class A | $546,287 | $1,308,078 |
| Class M | 135,310 | 287,783 |
| Class C | 260,002 | 572,522 |
| Telecommunications | 12,533,393 | 29,029,256 |
| Class I | 268,569 | 477,679 |
| Total | $13,743,561 | $31,675,318 |
11. Share Transactions.
Share transactions for each class were as follows and may contain automatic conversions between classes or exchanges between affiliated funds:
| | Shares | Shares | Dollars | Dollars |
| | Six months ended
August 31, 2017 | Year ended February 28, 2017 | Six months ended
August 31, 2017 | Year ended February 28, 2017 |
| Class A | | | | |
| Shares sold | 40,883 | 521,786 | $2,800,759 | $35,388,038 |
| Reinvestment of distributions | 8,681 | 24,324 | 602,094 | 1,671,796 |
| Shares redeemed | (186,335) | (296,004) | (12,774,640) | (20,518,786) |
| Net increase (decrease) | (136,771) | 250,106 | $(9,371,787) | $16,541,048 |
| Class M | | | | |
| Shares sold | 15,187 | 82,122 | $1,046,682 | $5,468,018 |
| Reinvestment of distributions | 2,151 | 5,039 | 148,633 | 345,400 |
| Shares redeemed | (35,390) | (120,797) | (2,416,248) | (8,187,323) |
| Net increase (decrease) | (18,052) | (33,636) | $(1,220,933) | $(2,373,905) |
| Class B | | | | |
| Shares sold | – | 975 | $– | $64,042 |
| Shares redeemed | – | (5,216) | – | (349,278) |
| Net increase (decrease) | – | (4,241) | $– | $(285,236) |
| Class C | | | | |
| Shares sold | 18,841 | 135,768 | $1,284,909 | $9,283,679 |
| Reinvestment of distributions | 3,602 | 8,829 | 248,620 | 604,885 |
| Shares redeemed | (60,028) | (73,776) | (4,077,668) | (5,085,863) |
| Net increase (decrease) | (37,585) | 70,821 | $(2,544,139) | $4,802,701 |
| Telecommunications | | | | |
| Shares sold | 445,173 | 6,206,062 | $30,748,858 | $424,943,213 |
| Reinvestment of distributions | 201,643 | 578,869 | 14,056,517 | 39,940,628 |
| Shares redeemed | (5,191,889) | (7,931,924)(a) | (354,133,506) | (546,713,599)(a) |
| Net increase (decrease) | (4,545,073) | (1,146,993) | $(309,328,131) | $(81,829,758) |
| Class I | | | | |
| Shares sold | 122,562 | 536,498 | $8,529,582 | $37,085,732 |
| Reinvestment of distributions | 3,946 | 8,128 | 274,462 | 559,963 |
| Shares redeemed | (169,352) | (435,454) | (11,721,666) | (30,015,677) |
| Net increase (decrease) | (42,844) | 109,172 | $(2,917,622) | $7,630,018 |
(a) Amount includes in-kind redemptions (see the Prior Fiscal Year Redemptions In-Kind note for additional details).
12. Other.
The Fund's organizational documents provide former and current trustees and officers with a limited indemnification against liabilities arising in connection with the performance of their duties to the Fund. In the normal course of business, the Fund may also enter into contracts that provide general indemnifications. The Fund's maximum exposure under these arrangements is unknown as this would be dependent on future claims that may be made against the Fund. The risk of material loss from such claims is considered remote.
Shareholder Expense Example
As a shareholder of a Fund, you incur two types of costs: (1) transaction costs, including sales charges (loads) on purchase payments or redemption proceeds, and (2) ongoing costs, including management fees, distribution and/or service (12b-1) fees and other Fund expenses. This Example is intended to help you understand your ongoing costs (in dollars) of investing in the Fund and to compare these costs with the ongoing costs of investing in other mutual funds.
The Example is based on an investment of $1,000 invested at the beginning of the period and held for the entire period (March 1, 2017 to August 31, 2017).
Actual Expenses
The first line of the accompanying table for each Class of each fund provides information about actual account values and actual expenses. You may use the information in this line, together with the amount you invested, to estimate the expenses that you paid over the period. Simply divide your account value by $1,000.00 (for example, an $8,600 account value divided by $1,000.00 = 8.6), then multiply the result by the number in the first line for a Class of the fund under the heading entitled "Expenses Paid During Period" to estimate the expenses you paid on your account during this period. A small balance maintenance fee of $12.00 that is charged once a year may apply for certain accounts with a value of less than $2,000. This fee is not included in the table below. If it was, the estimate of expenses you paid during the period would be higher, and your ending account value lower, by this amount. In addition, each Fund, as a shareholder in the underlying Fidelity Central Funds, will indirectly bear its pro-rata share of the fees and expenses incurred by the underlying Fidelity Central Funds. These fees and expenses are not included in the Fund's annualized expense ratio used to calculate the expense estimate in the table below.
Hypothetical Example for Comparison Purposes
The second line of the accompanying table for each Class of each fund provides information about hypothetical account values and hypothetical expenses based on a Class' actual expense ratio and an assumed rate of return of 5% per year before expenses, which is not the Class' actual return. The hypothetical account values and expenses may not be used to estimate the actual ending account balance or expenses you paid for the period. You may use this information to compare the ongoing costs of investing in the Fund and other funds. To do so, compare this 5% hypothetical example with the 5% hypothetical examples that appear in the shareholder reports of the other funds. A small balance maintenance fee of $12.00 that is charged once a year may apply for certain accounts with a value of less than $2,000. This fee is not included in the table below. If it was, the estimate of expenses you paid during the period would be higher, and your ending account value lower, by this amount. In addition, each Fund, as a shareholder in the underlying Fidelity Central Funds, will indirectly bear its pro-rata share of the fees and expenses incurred by the underlying Fidelity Central Funds. These fees and expenses are not included in the Fund's annualized expense ratio used to calculate the expense estimate in the table below.
Please note that the expenses shown in the table are meant to highlight your ongoing costs only and do not reflect any transaction costs. Therefore, the second line of the table is useful in comparing ongoing costs only, and will not help you determine the relative total costs of owning different funds. In addition, if these transactional costs were included, your costs would have been higher.
| | Annualized Expense Ratio-A | Beginning
Account Value
March 1, 2017 | Ending
Account Value
August 31, 2017 | Expenses Paid
During Period-B
March 1, 2017
to August 31, 2017 |
| Consumer Staples Portfolio | | | | |
| Class A | 1.05% | | | |
| Actual | | $1,000.00 | $1,010.70 | $5.32 |
| Hypothetical-C | | $1,000.00 | $1,019.91 | $5.35 |
| Class M | 1.32% | | | |
| Actual | | $1,000.00 | $1,009.30 | $6.69 |
| Hypothetical-C | | $1,000.00 | $1,018.55 | $6.72 |
| Class C | 1.79% | | | |
| Actual | | $1,000.00 | $1,007.00 | $9.06 |
| Hypothetical-C | | $1,000.00 | $1,016.18 | $9.10 |
| Consumer Staples | .77% | | | |
| Actual | | $1,000.00 | $1,012.10 | $3.91 |
| Hypothetical-C | | $1,000.00 | $1,021.32 | $3.92 |
| Class I | .78% | | | |
| Actual | | $1,000.00 | $1,012.10 | $3.96 |
| Hypothetical-C | | $1,000.00 | $1,021.27 | $3.97 |
| Gold Portfolio | | | | |
| Class A | 1.16% | | | |
| Actual | | $1,000.00 | $1,055.20 | $6.01 |
| Hypothetical-C | | $1,000.00 | $1,019.36 | $5.90 |
| Class M | 1.46% | | | |
| Actual | | $1,000.00 | $1,053.80 | $7.56 |
| Hypothetical-C | | $1,000.00 | $1,017.85 | $7.43 |
| Class C | 1.83% | | | |
| Actual | | $1,000.00 | $1,051.40 | $9.46 |
| Hypothetical-C | | $1,000.00 | $1,015.98 | $9.30 |
| Gold | .85% | | | |
| Actual | | $1,000.00 | $1,056.40 | $4.41 |
| Hypothetical-C | | $1,000.00 | $1,020.92 | $4.33 |
| Class I | .83% | | | |
| Actual | | $1,000.00 | $1,056.50 | $4.30 |
| Hypothetical-C | | $1,000.00 | $1,021.02 | $4.23 |
| Materials Portfolio | | | | |
| Class A | 1.07% | | | |
| Actual | | $1,000.00 | $1,060.70 | $5.56 |
| Hypothetical-C | | $1,000.00 | $1,019.81 | $5.45 |
| Class M | 1.36% | | | |
| Actual | | $1,000.00 | $1,059.10 | $7.06 |
| Hypothetical-C | | $1,000.00 | $1,018.35 | $6.92 |
| Class C | 1.82% | | | |
| Actual | | $1,000.00 | $1,056.60 | $9.43 |
| Hypothetical-C | | $1,000.00 | $1,016.03 | $9.25 |
| Materials | .80% | | | |
| Actual | | $1,000.00 | $1,062.10 | $4.16 |
| Hypothetical-C | | $1,000.00 | $1,021.17 | $4.08 |
| Class I | .79% | | | |
| Actual | | $1,000.00 | $1,062.20 | $4.11 |
| Hypothetical-C | | $1,000.00 | $1,021.22 | $4.02 |
| Telecommunications Portfolio | | | | |
| Class A | 1.14% | | | |
| Actual | | $1,000.00 | $1,013.20 | $5.78 |
| Hypothetical-C | | $1,000.00 | $1,019.46 | $5.80 |
| Class M | 1.49% | | | |
| Actual | | $1,000.00 | $1,011.50 | $7.55 |
| Hypothetical-C | | $1,000.00 | $1,017.69 | $7.58 |
| Class C | 1.87% | | | |
| Actual | | $1,000.00 | $1,009.70 | $9.47 |
| Hypothetical-C | | $1,000.00 | $1,015.78 | $9.50 |
| Telecommunications | .82% | | | |
| Actual | | $1,000.00 | $1,014.90 | $4.16 |
| Hypothetical-C | | $1,000.00 | $1,021.07 | $4.18 |
| Class I | .82% | | | |
| Actual | | $1,000.00 | $1,014.90 | $4.16 |
| Hypothetical-C | | $1,000.00 | $1,021.07 | $4.18 |
A Annualized expense ratio reflects expenses net of applicable fee waivers.
B Expenses are equal to each Class' annualized expense ratio, multiplied by the average account value over the period, multiplied by 184/365 (to reflect the one-half year period).
C 5% return per year before expenses
ASGMT-SANN-1017
1.855654.110
Fidelity® Select Portfolios®
Materials Sector Chemicals Portfolio
Gold Portfolio
Materials Portfolio
Semi-Annual Report August 31, 2017 |
|
Contents
To view a fund's proxy voting guidelines and proxy voting record for the 12-month period ended June 30, visit http://www.fidelity.com/proxyvotingresults or visit the Securities and Exchange Commission's (SEC) web site at http://www.sec.gov.
You may also call 1-800-544-8544 to request a free copy of the proxy voting guidelines.
Standard & Poor's, S&P and S&P 500 are registered service marks of The McGraw-Hill Companies, Inc. and have been licensed for use by Fidelity Distributors Corporation.
Other third-party marks appearing herein are the property of their respective owners.
All other marks appearing herein are registered or unregistered trademarks or service marks of FMR LLC or an affiliated company. © 2017 FMR LLC. All rights reserved.
This report and the financial statements contained herein are submitted for the general information of the shareholders of the Funds. This report is not authorized for distribution to prospective investors in the Funds unless preceded or accompanied by an effective prospectus.
A fund files its complete schedule of portfolio holdings with the SEC for the first and third quarters of each fiscal year on Form N-Q. Forms N-Q are available on the SEC’s web site at http://www.sec.gov. A fund's Forms N-Q may be reviewed and copied at the SEC’s Public Reference Room in Washington, DC. Information regarding the operation of the SEC's Public Reference Room may be obtained by calling 1-800-SEC-0330.
For a complete list of a fund's portfolio holdings, view the most recent holdings listing, semiannual report, or annual report on Fidelity's web site at http://www.fidelity.com, http://www.institutional.fidelity.com, or http://www.401k.com, as applicable.
NOT FDIC INSURED •MAY LOSE VALUE •NO BANK GUARANTEE
Neither the Funds nor Fidelity Distributors Corporation is a bank.
Chemicals Portfolio
Investment Summary (Unaudited)
Top Ten Stocks as of August 31, 2017
| | % of fund's net assets | % of fund's net assets 6 months ago |
| E.I. du Pont de Nemours & Co. | 17.2 | 17.8 |
| The Dow Chemical Co. | 12.7 | 12.3 |
| LyondellBasell Industries NV Class A | 11.0 | 11.1 |
| Monsanto Co. | 8.5 | 7.4 |
| The Chemours Co. LLC | 4.7 | 3.7 |
| Sherwin-Williams Co. | 4.5 | 4.4 |
| Linde AG | 3.6 | 0.0 |
| FMC Corp. | 3.5 | 0.0 |
| Univar, Inc. | 3.3 | 3.2 |
| Tronox Ltd. Class A | 3.3 | 0.6 |
| | 72.3 | |
Top Industries (% of fund's net assets)
| As of August 31, 2017 |
| | Chemicals | 95.0% |
| | Trading Companies & Distributors | 3.3% |
| | Building Products | 0.4% |
| | Biotechnology | 0.1% |
| | All Others* | 1.2% |

* Includes Short-Term investments and Net Other Assets (Liabilities).
| As of February 28, 2017 |
| | Chemicals | 95.3% |
| | Trading Companies & Distributors | 3.2% |
| | All Others* | 1.5% |

* Includes Short-Term investments and Net Other Assets (Liabilities).
Percentages shown as 0.0% may reflect amounts less than 0.05%.
Chemicals Portfolio
Investments August 31, 2017 (Unaudited)
Showing Percentage of Net Assets
| Common Stocks - 98.3% | | | |
| | | Shares | Value |
| Biotechnology - 0.1% | | | |
| Biotechnology - 0.1% | | | |
| Calyxt, Inc. | | 128,500 | $1,953,200 |
| Building Products - 0.4% | | | |
| Building Products - 0.4% | | | |
| GCP Applied Technologies, Inc. (a) | | 282,600 | 7,983,450 |
| Chemicals - 94.5% | | | |
| Commodity Chemicals - 20.9% | | | |
| Ciner Resources LP | | 301,818 | 7,240,614 |
| LyondellBasell Industries NV Class A | | 2,181,522 | 197,624,078 |
| Olin Corp. | | 1,627,911 | 52,467,572 |
| Trinseo SA | | 170,646 | 11,416,217 |
| Tronox Ltd. Class A | | 2,838,700 | 58,732,703 |
| Valvoline, Inc. | | 529,705 | 11,277,419 |
| Westlake Chemical Corp. | | 492,646 | 37,889,404 |
| | | | 376,648,007 |
| Diversified Chemicals - 39.0% | | | |
| Ashland Global Holdings, Inc. | | 219,806 | 13,638,962 |
| E.I. du Pont de Nemours & Co. | | 3,678,129 | 308,705,368 |
| Eastman Chemical Co. | | 518,957 | 44,734,093 |
| Huntsman Corp. | | 684,100 | 18,176,537 |
| LSB Industries, Inc. (a)(b) | | 315,200 | 1,922,720 |
| The Chemours Co. LLC | | 1,730,000 | 84,891,100 |
| The Dow Chemical Co. | | 3,425,794 | 228,329,170 |
| | | | 700,397,950 |
| Fertilizers & Agricultural Chemicals - 13.9% | | | |
| AgroFresh Solutions, Inc. (a)(b) | | 463,776 | 3,302,085 |
| CF Industries Holdings, Inc. | | 452,600 | 13,120,874 |
| CVR Partners LP | | 1,058,200 | 2,761,902 |
| FMC Corp. | | 721,700 | 62,224,974 |
| Monsanto Co. | | 1,310,993 | 153,648,380 |
| The Scotts Miracle-Gro Co. Class A | | 162,712 | 15,553,640 |
| | | | 250,611,855 |
| Industrial Gases - 3.8% | | | |
| Air Products & Chemicals, Inc. | | 19,508 | 2,835,878 |
| Linde AG | | 337,600 | 64,821,028 |
| | | | 67,656,906 |
| Specialty Chemicals - 16.9% | | | |
| Axalta Coating Systems (a) | | 465,000 | 13,726,800 |
| Celanese Corp. Class A | | 556,600 | 54,001,332 |
| Ecolab, Inc. | | 218,430 | 29,116,719 |
| Evonik Industries AG | | 249,200 | 8,078,056 |
| Kraton Performance Polymers, Inc. (a) | | 535,080 | 17,566,676 |
| Platform Specialty Products Corp. (a) | | 2,421,190 | 28,279,499 |
| PolyOne Corp. | | 313,500 | 11,329,890 |
| PPG Industries, Inc. | | 401,500 | 41,884,480 |
| Sherwin-Williams Co. | | 240,653 | 81,646,343 |
| W.R. Grace & Co. | | 248,300 | 17,748,484 |
| | | | 303,378,279 |
|
| TOTAL CHEMICALS | | | 1,698,692,997 |
|
| Trading Companies & Distributors - 3.3% | | | |
| Trading Companies & Distributors - 3.3% | | | |
| Univar, Inc. (a) | | 2,096,098 | 59,130,925 |
| TOTAL COMMON STOCKS | | | |
| (Cost $1,283,834,653) | | | 1,767,760,572 |
|
| Nonconvertible Preferred Stocks - 0.5% | | | |
| Chemicals - 0.5% | | | |
| Commodity Chemicals - 0.5% | | | |
| Braskem SA (PN-A) | | | |
| (Cost $7,601,751) | | 730,600 | 8,845,137 |
|
| Money Market Funds - 0.9% | | | |
| Fidelity Cash Central Fund, 1.11% (c) | | 14,383,462 | 14,386,339 |
| Fidelity Securities Lending Cash Central Fund 1.11% (c)(d) | | 1,664,726 | 1,664,892 |
| TOTAL MONEY MARKET FUNDS | | | |
| (Cost $16,051,139) | | | 16,051,231 |
| TOTAL INVESTMENT IN SECURITIES - 99.7% | | | |
| (Cost $1,307,487,543) | | | 1,792,656,940 |
| NET OTHER ASSETS (LIABILITIES) - 0.3% | | | 4,978,569 |
| NET ASSETS - 100% | | | $1,797,635,509 |
Legend
(a) Non-income producing
(b) Security or a portion of the security is on loan at period end.
(c) Affiliated fund that is generally available only to investment companies and other accounts managed by Fidelity Investments. The rate quoted is the annualized seven-day yield of the fund at period end. A complete unaudited listing of the fund's holdings as of its most recent quarter end is available upon request. In addition, each Fidelity Central Fund's financial statements are available on the SEC's website or upon request.
(d) Investment made with cash collateral received from securities on loan.
Affiliated Central Funds
Information regarding fiscal year to date income earned by the Fund from investments in Fidelity Central Funds is as follows:
| Fund | Income earned |
| Fidelity Cash Central Fund | $91,859 |
| Fidelity Securities Lending Cash Central Fund | 20,679 |
| Total | $112,538 |
Investment Valuation
The following is a summary of the inputs used, as of August 31, 2017, involving the Fund's assets and liabilities carried at fair value. The inputs or methodology used for valuing securities may not be an indication of the risk associated with investing in those securities. For more information on valuation inputs, and their aggregation into the levels used below, please refer to the Investment Valuation section in the accompanying Notes to Financial Statements.
| | Valuation Inputs at Reporting Date: |
| Description | Total | Level 1 | Level 2 | Level 3 |
| Investments in Securities: | | | | |
| Common Stocks | $1,767,760,572 | $1,702,939,544 | $64,821,028 | $-- |
| Nonconvertible Preferred Stocks | 8,845,137 | 8,845,137 | -- | -- |
| Money Market Funds | 16,051,231 | 16,051,231 | -- | -- |
| Total Investments in Securities: | $1,792,656,940 | $1,727,835,912 | $64,821,028 | $-- |
Other Information
Distribution of investments by country or territory of incorporation, as a percentage of Total Net Assets, is as follows (Unaudited):
| United States of America | 80.5% |
| Netherlands | 11.0% |
| Germany | 4.1% |
| Australia | 3.3% |
| Others (Individually Less Than 1%) | 1.1% |
| | 100.0% |
See accompanying notes which are an integral part of the financial statements.
Chemicals Portfolio
Financial Statements
Statement of Assets and Liabilities
| | | August 31, 2017 (Unaudited) |
| Assets | | |
Investment in securities, at value (including securities loaned of $1,627,160) — See accompanying schedule:
Unaffiliated issuers (cost $1,291,436,404) | $1,776,605,709 | |
| Fidelity Central Funds (cost $16,051,139) | 16,051,231 | |
| Total Investment in Securities (cost $1,307,487,543) | | $1,792,656,940 |
| Receivable for investments sold | | 4,213,562 |
| Receivable for fund shares sold | | 2,422,657 |
| Dividends receivable | | 4,134,621 |
| Distributions receivable from Fidelity Central Funds | | 17,313 |
| Other receivables | | 82,963 |
| Total assets | | 1,803,528,056 |
| Liabilities | | |
| Payable for fund shares redeemed | $3,022,616 | |
| Accrued management fee | 801,412 | |
| Other affiliated payables | 311,014 | |
| Other payables and accrued expenses | 91,505 | |
| Collateral on securities loaned | 1,666,000 | |
| Total liabilities | | 5,892,547 |
| Net Assets | | $1,797,635,509 |
| Net Assets consist of: | | |
| Paid in capital | | $1,260,749,282 |
| Undistributed net investment income | | 10,782,262 |
| Accumulated undistributed net realized gain (loss) on investments and foreign currency transactions | | 40,929,915 |
| Net unrealized appreciation (depreciation) on investments and assets and liabilities in foreign currencies | | 485,174,050 |
| Net Assets, for 10,765,302 shares outstanding | | $1,797,635,509 |
| Net Asset Value, offering price and redemption price per share ($1,797,635,509 ÷ 10,765,302 shares) | | $166.98 |
See accompanying notes which are an integral part of the financial statements.
Statement of Operations
| | | Six months ended August 31, 2017 (Unaudited) |
| Investment Income | | |
| Dividends | | $17,235,685 |
| Income from Fidelity Central Funds | | 112,538 |
| Total income | | 17,348,223 |
| Expenses | | |
| Management fee | $4,549,203 | |
| Transfer agent fees | 1,570,432 | |
| Accounting and security lending fees | 258,564 | |
| Custodian fees and expenses | 11,595 | |
| Independent trustees' fees and expenses | 18,815 | |
| Registration fees | 62,764 | |
| Audit | 26,201 | |
| Legal | 11,626 | |
| Miscellaneous | 9,768 | |
| Total expenses before reductions | 6,518,968 | |
| Expense reductions | (17,691) | 6,501,277 |
| Net investment income (loss) | | 10,846,946 |
| Realized and Unrealized Gain (Loss) | | |
| Net realized gain (loss) on: | | |
| Investment securities: | | |
| Unaffiliated issuers | 44,193,997 | |
| Fidelity Central Funds | 1,122 | |
| Foreign currency transactions | (152,428) | |
| Total net realized gain (loss) | | 44,042,691 |
| Change in net unrealized appreciation (depreciation) on: | | |
| Investment securities: | | |
| Unaffiliated issuers | 55,237,970 | |
| Fidelity Central Funds | (1,201) | |
| Assets and liabilities in foreign currencies | 4,653 | |
| Total change in net unrealized appreciation (depreciation) | | 55,241,422 |
| Net gain (loss) | | 99,284,113 |
| Net increase (decrease) in net assets resulting from operations | | $110,131,059 |
See accompanying notes which are an integral part of the financial statements.
Statement of Changes in Net Assets
| | Six months ended August 31, 2017 (Unaudited) | Year ended February 28, 2017 |
| Increase (Decrease) in Net Assets | | |
| Operations | | |
| Net investment income (loss) | $10,846,946 | $16,769,365 |
| Net realized gain (loss) | 44,042,691 | 137,965,075 |
| Change in net unrealized appreciation (depreciation) | 55,241,422 | 267,026,378 |
| Net increase (decrease) in net assets resulting from operations | 110,131,059 | 421,760,818 |
| Distributions to shareholders from net investment income | (826,577) | (15,876,012) |
| Distributions to shareholders from net realized gain | (63,115,675) | (50,330,730) |
| Total distributions | (63,942,252) | (66,206,742) |
| Share transactions | | |
| Proceeds from sales of shares | 370,487,024 | 556,232,815 |
| Reinvestment of distributions | 61,229,162 | 63,676,065 |
| Cost of shares redeemed | (306,911,754) | (395,662,133) |
| Net increase (decrease) in net assets resulting from share transactions | 124,804,432 | 224,246,747 |
| Redemption fees | – | 14,379 |
| Total increase (decrease) in net assets | 170,993,239 | 579,815,202 |
| Net Assets | | |
| Beginning of period | 1,626,642,270 | 1,046,827,068 |
| End of period | $1,797,635,509 | $1,626,642,270 |
| Other Information | | |
| Undistributed net investment income end of period | $10,782,262 | $761,893 |
| Shares | | |
| Sold | 2,269,406 | 3,811,949 |
| Issued in reinvestment of distributions | 393,681 | 426,812 |
| Redeemed | (1,913,665) | (2,719,518) |
| Net increase (decrease) | 749,422 | 1,519,243 |
See accompanying notes which are an integral part of the financial statements.
Financial Highlights — Chemicals Portfolio
| | Six months ended (Unaudited) August 31, | Years ended February 28, | | | | |
| | 2017 | 2017 | 2016 A | 2015 | 2014 | 2013 |
| Selected Per–Share Data | | | | | | |
| Net asset value, beginning of period | $162.41 | $123.20 | $153.34 | $148.23 | $122.98 | $110.52 |
| Income from Investment Operations | | | | | | |
| Net investment income (loss)B | 1.05 | 1.82 | 1.87 | 1.64 | 1.23 | 1.84C |
| Net realized and unrealized gain (loss) | 9.79 | 44.40 | (23.41) | 9.09 | 32.11 | 15.10 |
| Total from investment operations | 10.84 | 46.22 | (21.54) | 10.73 | 33.34 | 16.94 |
| Distributions from net investment income | (.08) | (1.68) | (1.81) | (1.42) | (1.18) | (1.55) |
| Distributions from net realized gain | (6.19) | (5.33) | (6.80) | (4.20) | (6.92) | (2.95) |
| Total distributions | (6.27) | (7.01) | (8.60)D | (5.62) | (8.10) | (4.49)E |
| Redemption fees added to paid in capitalB | – | –F | –F | –F | .01 | .01 |
| Net asset value, end of period | $166.98 | $162.41 | $123.20 | $153.34 | $148.23 | $122.98 |
| Total ReturnG,H | 6.96% | 38.02% | (14.46)% | 7.52% | 27.77% | 15.61% |
| Ratios to Average Net AssetsI,J | | | | | | |
| Expenses before reductions | .78%K | .80% | .80% | .79% | .81% | .83% |
| Expenses net of fee waivers, if any | .78%K | .80% | .80% | .79% | .81% | .83% |
| Expenses net of all reductions | .78%K | .79% | .79% | .79% | .80% | .81% |
| Net investment income (loss) | 1.30%K | 1.26% | 1.36% | 1.10% | .91% | 1.62%C |
| Supplemental Data | | | | | | |
| Net assets, end of period (000 omitted) | $1,797,636 | $1,626,642 | $1,046,827 | $1,625,067 | $1,429,434 | $1,134,777 |
| Portfolio turnover rateL | 49%K | 85% | 79% | 80%M | 109% | 60% |
A For the year ended February 29.
B Calculated based on average shares outstanding during the period.
C Net Investment income per share reflects a large, non-recurring dividend which amounted to $.30 per share. Excluding this non-recurring dividend, the ratio of net investment income (loss) to average net assets would have been 1.35%.
D Total distributions of $8.60 per share is comprised of distributions from net investment income of $1.806 and distributions from net realized gain of $6.795 per share.
E Total distributions of $4.49 per share is comprised of distributions from net investment income of $1.547 and distributions from net realized gain of $2.947 per share.
F Amount represents less than $.005 per share.
G Total returns for periods of less than one year are not annualized.
H Total returns would have been lower if certain expenses had not been reduced during the applicable periods shown.
I Fees and expenses of any underlying Fidelity Central Funds are not included in the Fund's expense ratio. The Fund indirectly bears its proportionate share of the expenses of any underlying Fidelity Central Funds.
J Expense ratios reflect operating expenses of the Fund. Expenses before reductions do not reflect amounts reimbursed by the investment adviser or reductions from brokerage service arrangements or reductions from other expense offset arrangements and do not represent the amount paid by the Fund during periods when reimbursements or reductions occur. Expenses net of fee waivers reflect expenses after reimbursement by the investment adviser but prior to reductions from brokerage service arrangements or other expense offset arrangements. Expenses net of all reductions represent the net expenses paid by the Fund.
K Annualized
L Amount does not include the portfolio activity of any underlying Fidelity Central Funds.
M Portfolio turnover rate excludes securities received or delivered in-kind.
See accompanying notes which are an integral part of the financial statements.
Notes to Financial Statements (Unaudited)
For the period ended August 31, 2017
1. Organization.
Chemicals Portfolio (the Fund) is a non-diversified fund of Fidelity Select Portfolios (the Trust) and is authorized to issue an unlimited number of shares. Share transactions on the Statement of Changes in Net Assets may contain exchanges between affiliated funds. The Trust is registered under the Investment Company Act of 1940, as amended (the 1940 Act), as an open-end management investment company organized as a Massachusetts business trust. The Fund invests primarily in securities of companies whose principal business activities fall within specific industries.
2. Investments in Fidelity Central Funds.
The Fund invests in Fidelity Central Funds, which are open-end investment companies generally available only to other investment companies and accounts managed by the investment adviser and its affiliates. The Fund's Schedule of Investments lists each of the Fidelity Central Funds held as of period end, if any, as an investment of the Fund, but does not include the underlying holdings of each Fidelity Central Fund. As an Investing Fund, the Fund indirectly bears its proportionate share of the expenses of the underlying Fidelity Central Funds.
The Money Market Central Funds seek preservation of capital and current income and are managed by Fidelity Investments Money Management, Inc. (FIMM), an affiliate of the investment adviser. Annualized expenses of the Money Market Central Funds as of their most recent shareholder report date are less than .005%.
A complete unaudited list of holdings for each Fidelity Central Fund is available upon request or at the Securities and Exchange Commission (the SEC) website at www.sec.gov. In addition, the financial statements of the Fidelity Central Funds are available on the SEC website or upon request.
3. Significant Accounting Policies.
The Fund is an investment company and applies the accounting and reporting guidance of the Financial Accounting Standards Board (FASB) Accounting Standards Codification Topic 946 Financial Services – Investments Companies. The financial statements have been prepared in conformity with accounting principles generally accepted in the United States of America (GAAP), which require management to make certain estimates and assumptions at the date of the financial statements. Actual results could differ from those estimates. Subsequent events, if any, through the date that the financial statements were issued have been evaluated in the preparation of the financial statements. The following summarizes the significant accounting policies of the Fund:
Investment Valuation. Investments are valued as of 4:00 p.m. Eastern time on the last calendar day of the period. The Board of Trustees (the Board) has delegated the day to day responsibility for the valuation of the Fund's investments to the Fair Value Committee (the Committee) established by the Fund's investment adviser. In accordance with valuation policies and procedures approved by the Board, the Fund attempts to obtain prices from one or more third party pricing vendors or brokers to value its investments. When current market prices, quotations or currency exchange rates are not readily available or reliable, investments will be fair valued in good faith by the Committee, in accordance with procedures adopted by the Board. Factors used in determining fair value vary by investment type and may include market or investment specific events. The frequency with which these procedures are used cannot be predicted and they may be utilized to a significant extent. The Committee oversees the Fund's valuation policies and procedures and reports to the Board on the Committee's activities and fair value determinations. The Board monitors the appropriateness of the procedures used in valuing the Fund's investments and ratifies the fair value determinations of the Committee.
The Fund categorizes the inputs to valuation techniques used to value its investments into a disclosure hierarchy consisting of three levels as shown below:
- Level 1 – quoted prices in active markets for identical investments
- Level 2 – other significant observable inputs (including quoted prices for similar investments, interest rates, prepayment speeds, etc.)
- Level 3 – unobservable inputs (including the Fund's own assumptions based on the best information available)
Valuation techniques used to value the Fund's investments by major category are as follows:
Equity securities, including restricted securities, for which market quotations are readily available, are valued at the last reported sale price or official closing price as reported by a third party pricing vendor on the primary market or exchange on which they are traded and are categorized as Level 1 in the hierarchy. In the event there were no sales during the day or closing prices are not available, securities are valued at the last quoted bid price or may be valued using the last available price and are generally categorized as Level 2 in the hierarchy. For foreign equity securities, when market or security specific events arise, comparisons to the valuation of American Depositary Receipts (ADRs), futures contracts, Exchange-Traded Funds (ETFs) and certain indexes as well as quoted prices for similar securities may be used and would be categorized as Level 2 in the hierarchy. Utilizing these techniques may result in transfers between Level 1 and Level 2. For equity securities, including restricted securities, where observable inputs are limited, assumptions about market activity and risk are used and these securities may be categorized as Level 3 in the hierarchy.
Investments in open-end mutual funds, including the Fidelity Central Funds, are valued at their closing net asset value (NAV) each business day and are categorized as Level 1 in the hierarchy.
Changes in valuation techniques may result in transfers in or out of an assigned level within the disclosure hierarchy. The aggregate value of investments by input level as of August 31, 2017 is included at the end of the Fund's Schedule of Investments.
Foreign Currency. The Fund may use foreign currency contracts to facilitate transactions in foreign-denominated securities. Gains and losses from these transactions may arise from changes in the value of the foreign currency or if the counterparties do not perform under the contracts' terms.
Foreign-denominated assets, including investment securities, and liabilities are translated into U.S. dollars at the exchange rates at period end. Purchases and sales of investment securities, income and dividends received and expenses denominated in foreign currencies are translated into U.S. dollars at the exchange rate in effect on the transaction date.
The effects of exchange rate fluctuations on investments are included with the net realized and unrealized gain (loss) on investment securities. Other foreign currency transactions resulting in realized and unrealized gain (loss) are disclosed separately.
Investment Transactions and Income. For financial reporting purposes, the Fund's investment holdings and NAV include trades executed through the end of the last business day of the period. The NAV per share for processing shareholder transactions is calculated as of the close of business of the New York Stock Exchange (NYSE), normally 4:00 p.m. Eastern time and includes trades executed through the end of the prior business day. Gains and losses on securities sold are determined on the basis of identified cost. Dividend income is recorded on the ex-dividend date, except for certain dividends from foreign securities where the ex-dividend date may have passed, which are recorded as soon as the Fund is informed of the ex-dividend date. Non-cash dividends included in dividend income, if any, are recorded at the fair market value of the securities received. Income and capital gain distributions from Fidelity Central Funds, if any, are recorded on the ex-dividend date. Certain distributions received by the Fund represent a return of capital or capital gain. The Fund determines the components of these distributions subsequent to the ex-dividend date, based upon receipt of tax filings or other correspondence relating to the underlying investment. These distributions are recorded as a reduction of cost of investments and/or as a realized gain. Investment income is recorded net of foreign taxes withheld where recovery of such taxes is uncertain.
Expenses. Expenses directly attributable to a fund are charged to that fund. Expenses attributable to more than one fund are allocated among the respective funds on the basis of relative net assets or other appropriate methods. Expense estimates are accrued in the period to which they relate and adjustments are made when actual amounts are known.
Deferred Trustee Compensation. Under a Deferred Compensation Plan (the Plan), independent Trustees may elect to defer receipt of a portion of their annual compensation. Deferred amounts are invested in a cross-section of Fidelity funds, are marked-to-market and remain in the Fund until distributed in accordance with the Plan. The investment of deferred amounts and the offsetting payable to the Trustees are included in the accompanying Statement of Assets and Liabilities.
Income Tax Information and Distributions to Shareholders. Each year, the Fund intends to qualify as a regulated investment company under Subchapter M of the Internal Revenue Code, including distributing substantially all of its taxable income and realized gains. As a result, no provision for U.S. Federal income taxes is required. The Fund files a U.S. federal tax return, in addition to state and local tax returns as required. The Fund's federal income tax returns are subject to examination by the Internal Revenue Service (IRS) for a period of three fiscal years after they are filed. State and local tax returns may be subject to examination for an additional fiscal year depending on the jurisdiction. Foreign taxes are provided for based on the Fund's understanding of the tax rules and rates that exist in the foreign markets in which it invests.
Distributions are declared and recorded on the ex-dividend date. Income and capital gain distributions are determined in accordance with income tax regulations, which may differ from GAAP.
Capital accounts within the financial statements are adjusted for permanent book-tax differences. These adjustments have no impact on net assets or the results of operations. Capital accounts are not adjusted for temporary book-tax differences which will reverse in a subsequent period.
Book-tax differences are primarily due to foreign currency transactions, partnerships, deferred trustees compensation and losses deferred due to wash sales and excise tax regulations.
As of period end, the cost and unrealized appreciation (depreciation) in securities, and derivatives if applicable, for federal income tax purposes were as follows:
| Gross unrealized appreciation | $493,567,413 |
| Gross unrealized depreciation | (11,717,720) |
| Net unrealized appreciation (depreciation) | $481,849,693 |
| Tax cost | $1,310,807,247 |
4. Purchases and Sales of Investments.
Purchases and sales of securities, other than short-term securities, aggregated $486,099,519 and $410,599,075, respectively.
5. Fees and Other Transactions with Affiliates.
Management Fee. Fidelity SelectCo, LLC (the investment adviser) and its affiliates provide the Fund with investment management related services for which the Fund pays a monthly management fee. The management fee is the sum of an individual fund fee rate that is based on an annual rate of .30% of the Fund's average net assets and an annualized group fee rate that averaged .25% during the period. The group fee rate is based upon the average net assets of all the mutual funds advised by Fidelity Management & Research Company (FMR) and the investment adviser. The group fee rate decreases as assets under management increase and increases as assets under management decrease. For the reporting period, the total annualized management fee rate was .54% of the Fund's average net assets.
Transfer Agent Fees. Fidelity Investments Institutional Operations Company, Inc. (FIIOC), an affiliate of the investment adviser, is the Fund's transfer, dividend disbursing and shareholder servicing agent. FIIOC receives account fees and asset-based fees that vary according to account size and type of account. FIIOC pays for typesetting, printing and mailing of shareholder reports, except proxy statements. For the period, the transfer agent fees were equivalent to an annualized rate of .19% of average net assets.
Accounting and Security Lending Fees. Fidelity Service Company, Inc. (FSC), an affiliate of the investment adviser, maintains the Fund's accounting records. The accounting fee is based on the level of average net assets for each month. Under a separate contract, FSC administers the security lending program. The security lending fee is based on the number and duration of lending transactions.
Brokerage Commissions. The Fund placed a portion of its portfolio transactions with brokerage firms which are affiliates of the investment adviser. Brokerage commissions are included in net realized gain (loss) and change in net unrealized appreciation (depreciation) in the Statement of Operations. The commissions paid to these affiliated firms were $14,617 for the period.
Interfund Trades. The Fund may purchase from or sell securities to other Fidelity Funds under procedures adopted by the Board. The procedures have been designed to ensure these interfund trades are executed in accordance with Rule 17a-7 of the 1940 Act. Interfund trades are included within the respective purchases and sales amounts shown in the Purchases and Sales of Investments note.
6. Committed Line of Credit.
The Fund participates with other funds managed by the investment adviser or an affiliate in a $4.25 billion credit facility (the "line of credit") to be utilized for temporary or emergency purposes to fund shareholder redemptions or for other short-term liquidity purposes. The Fund has agreed to pay commitment fees on its pro-rata portion of the line of credit, which amounted to $2,596 and is reflected in Miscellaneous expenses on the Statement of Operations. During the period, the Fund did not borrow on this line of credit.
7. Security Lending.
The Fund lends portfolio securities through a lending agent from time to time in order to earn additional income. On the settlement date of the loan, the Fund receives collateral (in the form of U.S. Treasury obligations, letters of credit and/or cash) against the loaned securities and maintains collateral in an amount not less than 100% of the market value of the loaned securities during the period of the loan. The market value of the loaned securities is determined at the close of business of the Fund and any additional required collateral is delivered to the Fund on the next business day. The Fund or borrower may terminate the loan at any time, and if the borrower defaults on its obligation to return the securities loaned because of insolvency or other reasons, the Fund may apply collateral received from the borrower against the obligation. The Fund may experience delays and costs in recovering the securities loaned. Any cash collateral received is invested in the Fidelity Securities Lending Cash Central Fund. The value of loaned securities and cash collateral at period end are disclosed on the Fund's Statement of Assets and Liabilities. Security lending income represents the income earned on investing cash collateral, less rebates paid to borrowers and any lending agent fees associated with the loan, plus any premium payments received for lending certain types of securities. Security lending income is presented in the Statement of Operations as a component of income from Fidelity Central Funds. Total security lending income during the period amounted to $20,679.
8. Expense Reductions.
Commissions paid to certain brokers with whom the investment adviser, or its affiliates, places trades on behalf of the Fund include an amount in addition to trade execution, which may be rebated back to the Fund to offset certain expenses. This amount totaled $10,374 for the period.
In addition, during the period the investment adviser reimbursed and/or waived a portion of operating expenses in the amount of $7,317.
9. Other.
The Fund's organizational documents provide former and current trustees and officers with a limited indemnification against liabilities arising in connection with the performance of their duties to the Fund. In the normal course of business, the Fund may also enter into contracts that provide general indemnifications. The Fund's maximum exposure under these arrangements is unknown as this would be dependent on future claims that may be made against the Fund. The risk of material loss from such claims is considered remote.
Gold Portfolio
Consolidated Investment Summary (Unaudited)
The information in the following tables is based on the consolidated investments of the Fund.
Top Ten Holdings as of August 31, 2017
| | % of fund's net assets | % of fund's net assets 6 months ago |
| Newmont Mining Corp. | 8.3 | 6.9 |
| Randgold Resources Ltd. sponsored ADR | 7.6 | 8.2 |
| Barrick Gold Corp. | 7.1 | 7.6 |
| Agnico Eagle Mines Ltd. (Canada) | 5.6 | 6.0 |
| B2Gold Corp. | 5.1 | 5.7 |
| Franco-Nevada Corp. | 4.9 | 5.3 |
| Silver Bullion | 4.7 | 4.0 |
| Royal Gold, Inc. | 3.9 | 2.8 |
| Premier Gold Mines Ltd. | 3.3 | 1.9 |
| Newcrest Mining Ltd. | 3.1 | 4.5 |
| | 53.6 | |
Top Industries (% of fund's net assets)
| As of August 31, 2017 |
| | Gold | 90.1% |
| | Commodities & Related Investments* | 5.7% |
| | Silver | 1.2% |
| | Precious Metals & Minerals | 0.9% |
| | Diversified Metals & Mining | 0.8% |
| | Copper | 0.6% |
| | All Others** | 0.7% |

* Includes gold bullion and/or silver bullion.
** Includes Short-Term investments and Net Other Assets (Liabilities).
| As of February 28, 2017 |
| | Gold | 90.5% |
| | Commodities & Related Investments* | 5.7% |
| | Precious Metals & Minerals | 1.0% |
| | Silver | 1.0% |
| | Diversified Metals & Mining | 0.8% |
| | Copper | 0.3% |
| | All Others** | 0.7% |

* Includes gold bullion and/or silver bullion.
** Includes Short-Term investments and Net Other Assets (Liabilities).
Geographic Diversification (% of fund's net assets)
| As of August 31, 2017 |
| | Canada | 60.8% |
| | United States of America* | 18.8% |
| | Bailiwick of Jersey | 7.6% |
| | Australia | 4.7% |
| | South Africa | 4.3% |
| | Peru | 1.4% |
| | Cayman Islands | 1.3% |
| | United Kingdom | 0.8% |
| | China | 0.3% |

* Includes Short-Term investments and Net Other Assets (Liabilities).
| As of February 28, 2017 |
| | Canada | 59.8% |
| | United States of America* | 16.3% |
| | Bailiwick of Jersey | 8.3% |
| | Australia | 6.2% |
| | South Africa | 4.8% |
| | United Kingdom | 2.1% |
| | Cayman Islands | 1.2% |
| | Peru | 1.0% |
| | China | 0.3% |

* Includes Short-Term investments and Net Other Assets (Liabilities).
Percentages are based on country or territory of incorporation and are adjusted for the effect of futures contracts, if applicable.
Gold Portfolio
Consolidated Investments August 31, 2017 (Unaudited)
Showing Percentage of Net Assets
| Common Stocks - 93.6% | | | |
| | | Shares | Value |
| Australia - 4.7% | | | |
| Metals & Mining - 4.7% | | | |
| Gold - 4.7% | | | |
| Dacian Gold Ltd. | | 40,000 | $70,910 |
| Evolution Mining Ltd. | | 3,631,243 | 6,985,709 |
| Gold Road Resources Ltd. (a) | | 1,080,000 | 626,739 |
| Newcrest Mining Ltd. | | 2,629,162 | 47,757,696 |
| Northern Star Resources Ltd. | | 818,118 | 3,388,391 |
| Perseus Mining Ltd.: | | | |
| (Australia) (a) | | 1,717,134 | 409,511 |
| (Canada) (a) | | 1,300,000 | 322,723 |
| Resolute Mng Ltd. | | 3,935,161 | 3,785,190 |
| Saracen Mineral Holdings Ltd. (a) | | 5,187,787 | 5,629,303 |
| Silver Lake Resources Ltd. (a) | | 2,840,985 | 993,714 |
| St Barbara Ltd. | | 1,317,257 | 2,952,973 |
| | | | 72,922,859 |
| Bailiwick of Jersey - 7.6% | | | |
| Metals & Mining - 7.6% | | | |
| Gold - 7.6% | | | |
| Randgold Resources Ltd. sponsored ADR | | 1,160,795 | 118,969,880 |
| Canada - 60.8% | | | |
| Metals & Mining - 60.8% | | | |
| Copper - 0.6% | | | |
| First Quantum Minerals Ltd. | | 832,200 | 10,029,718 |
| Diversified Metals & Mining - 0.8% | | | |
| Arizona Mining, Inc. (a)(b) | | 1,255,600 | 3,147,170 |
| Ivanhoe Mines Ltd. (a) | | 2,600,800 | 9,434,734 |
| Sabina Gold & Silver Corp. (a) | | 65,500 | 126,935 |
| | | | 12,708,839 |
| Gold - 57.5% | | | |
| Agnico Eagle Mines Ltd. (Canada) | | 1,691,201 | 86,689,711 |
| Alacer Gold Corp. (a) | | 2,554,063 | 4,479,198 |
| Alamos Gold, Inc. | | 3,726,787 | 31,037,906 |
| Alio Gold Corp. (a) | | 37,150 | 158,269 |
| Argonaut Gold, Inc. (a) | | 6,106,462 | 13,741,068 |
| B2Gold Corp. (a) | | 28,695,793 | 78,820,076 |
| Barrick Gold Corp. | | 6,121,469 | 110,247,718 |
| Belo Sun Mining Corp. (a)(b) | | 160,800 | 84,987 |
| Centerra Gold, Inc. | | 512,500 | 3,078,078 |
| Continental Gold, Inc. (a) | | 9,366,700 | 25,952,979 |
| Detour Gold Corp. (a) | | 2,619,800 | 36,671,955 |
| Detour Gold Corp. (a)(c) | | 785,900 | 11,001,027 |
| Eldorado Gold Corp. | | 9,350,935 | 19,244,767 |
| Franco-Nevada Corp. | | 937,900 | 76,729,421 |
| Goldcorp, Inc. | | 3,017,100 | 41,460,209 |
| Guyana Goldfields, Inc. (a) | | 4,666,400 | 18,684,284 |
| Guyana Goldfields, Inc. (a)(c) | | 155,000 | 620,621 |
| IAMGOLD Corp. (a) | | 1,424,000 | 9,453,421 |
| Kinross Gold Corp. (a) | | 3,400,391 | 15,494,074 |
| Kirkland Lake Gold Ltd. | | 838,019 | 10,918,574 |
| Klondex Mines Ltd. (a) | | 1,904,478 | 6,405,452 |
| Liberty Gold Corp. (a) | | 1,418,150 | 539,436 |
| Lundin Gold, Inc. (a) | | 13,800 | 58,129 |
| New Gold, Inc. (a) | | 7,391,375 | 27,641,819 |
| Novagold Resources, Inc. (a) | | 2,027,500 | 8,816,276 |
| OceanaGold Corp. | | 9,921,932 | 30,828,505 |
| Osisko Gold Royalties Ltd. | | 1,242,893 | 17,378,108 |
| Premier Gold Mines Ltd. (a)(d) | | 16,645,522 | 52,252,610 |
| Pretium Resources, Inc. (a) | | 1,752,683 | 14,540,777 |
| Pretium Resources, Inc. (a)(c) | | 225,000 | 1,866,667 |
| Primero Mining Corp. (a) | | 1,387,100 | 122,187 |
| Richmont Mines, Inc. (a) | | 1,041,643 | 9,567,684 |
| Rubicon Minerals Corp. (a) | | 1,000 | 1,273 |
| Sandstorm Gold Ltd. (a) | | 1,820,475 | 8,644,978 |
| Seabridge Gold, Inc. (a) | | 1,419,090 | 17,383,855 |
| SEMAFO, Inc. (a) | | 7,675,000 | 21,634,434 |
| Ssr Mining, Inc. (a) | | 1,323,700 | 13,845,907 |
| Tahoe Resources, Inc. | | 3,474,438 | 16,582,703 |
| Teranga Gold Corp. (a) | | 471,000 | 1,342,751 |
| Teranga Gold Corp. CDI unit (a) | | 667,614 | 1,820,369 |
| TMAC Resources, Inc. (a) | | 6,300 | 44,649 |
| Torex Gold Resources, Inc. (a) | | 2,518,700 | 42,517,875 |
| Yamana Gold, Inc. | | 2,755,620 | 8,142,733 |
| | | | 896,547,520 |
| Precious Metals & Minerals - 0.7% | | | |
| Dalradian Resources, Inc. (a) | | 729,500 | 946,378 |
| Gold Standard Ventures Corp. (a) | | 2,970,300 | 5,287,146 |
| Osisko Mining, Inc. (a)(b) | | 1,018,400 | 3,865,638 |
| | | | 10,099,162 |
| Silver - 1.2% | | | |
| MAG Silver Corp. (a) | | 448,200 | 5,627,849 |
| Wheaton Precious Metals Corp. | | 636,900 | 13,230,179 |
| | | | 18,858,028 |
| TOTAL METALS & MINING | | | 948,243,267 |
| Cayman Islands - 1.3% | | | |
| Metals & Mining - 1.3% | | | |
| Gold - 1.3% | | | |
| Endeavour Mining Corp. (a) | | 1,030,040 | 20,456,450 |
| China - 0.3% | | | |
| Metals & Mining - 0.3% | | | |
| Gold - 0.3% | | | |
| Zijin Mng Group Co. Ltd. (H Shares) | | 10,858,000 | 3,982,041 |
| Peru - 1.4% | | | |
| Metals & Mining - 1.4% | | | |
| Gold - 1.4% | | | |
| Compania de Minas Buenaventura SA sponsored ADR | | 1,658,997 | 22,280,330 |
| South Africa - 4.3% | | | |
| Metals & Mining - 4.3% | | | |
| Gold - 4.3% | | | |
| AngloGold Ashanti Ltd. sponsored ADR | | 3,524,508 | 35,738,511 |
| DRDGOLD Ltd. sponsored ADR | | 1,000 | 3,450 |
| Gold Fields Ltd. sponsored ADR | | 3,614,426 | 16,120,340 |
| Harmony Gold Mining Co. Ltd. | | 1,484,000 | 2,994,258 |
| Harmony Gold Mining Co. Ltd. sponsored ADR | | 1,460,400 | 3,008,424 |
| Sibanye Gold Ltd. ADR | | 1,320,306 | 8,449,958 |
| | | | 66,314,941 |
| United Kingdom - 0.8% | | | |
| Metals & Mining - 0.8% | | | |
| Gold - 0.6% | | | |
| Acacia Mining PLC | | 2,736,536 | 7,162,156 |
| Pan African Resources PLC | | 550,000 | 103,125 |
| Solgold PLC (a)(b) | | 3,320,331 | 1,556,401 |
| | | | 8,821,682 |
| Precious Metals & Minerals - 0.2% | | | |
| Fresnillo PLC | | 150,200 | 3,138,654 |
| TOTAL METALS & MINING | | | 11,960,336 |
| United States of America - 12.4% | | | |
| Metals & Mining - 12.4% | | | |
| Gold - 12.4% | | | |
| McEwen Mining, Inc. | | 1,096,410 | 2,817,774 |
| Newmont Mining Corp. | | 3,368,678 | 129,155,108 |
| Royal Gold, Inc. | | 659,313 | 61,500,717 |
| | | | 193,473,599 |
| TOTAL COMMON STOCKS | | | |
| (Cost $1,278,906,548) | | | 1,458,603,703 |
| | | Troy Ounces | |
|
| Commodities - 5.7% | | | |
| Gold Bullion (a) | | 11,510 | 15,225,428 |
| Silver Bullion (a) | | 4,172,000 | 73,500,210 |
| TOTAL COMMODITIES | | | |
| (Cost $81,866,785) | | | 88,725,638 |
| | | Shares | |
|
| Money Market Funds - 0.9% | | | |
| Fidelity Cash Central Fund, 1.11% (e) | | 12,988,126 | 12,990,724 |
| Fidelity Securities Lending Cash Central Fund 1.11% (e)(f) | | 1,265,624 | 1,265,751 |
| TOTAL MONEY MARKET FUNDS | | | |
| (Cost $14,256,469) | | | 14,256,475 |
| TOTAL INVESTMENT IN SECURITIES - 100.2% | | | |
| (Cost $1,375,029,802) | | | 1,561,585,816 |
| NET OTHER ASSETS (LIABILITIES) - (0.2)% | | | (2,965,301) |
| NET ASSETS - 100% | | | $1,558,620,515 |
Legend
(a) Non-income producing
(b) Security or a portion of the security is on loan at period end.
(c) Security exempt from registration under Rule 144A of the Securities Act of 1933. These securities may be resold in transactions exempt from registration, normally to qualified institutional buyers. At the end of the period, the value of these securities amounted to $13,488,315 or 0.9% of net assets.
(d) Affiliated company
(e) Affiliated fund that is generally available only to investment companies and other accounts managed by Fidelity Investments. The rate quoted is the annualized seven-day yield of the fund at period end. A complete unaudited listing of the fund's holdings as of its most recent quarter end is available upon request. In addition, each Fidelity Central Fund's financial statements are available on the SEC's website or upon request.
(f) Investment made with cash collateral received from securities on loan.
Affiliated Central Funds
Information regarding fiscal year to date income earned by the Fund from investments in Fidelity Central Funds is as follows:
| Fund | Income earned |
| Fidelity Cash Central Fund | $27,252 |
| Fidelity Securities Lending Cash Central Fund | 23,389 |
| Total | $50,641 |
Consolidated Subsidiary
| Affiliate | Value, beginning of period | Purchases | Sales Proceeds | Dividend Income | Realized Gain (loss) | Change in Unrealized appreciation (depreciation) | Value, end of period |
| FIdelity Select Cayman Gold Ltd. | $87,787,763 | $14,344,719 | $12,181,500 | $- | $(256,190) | $(1,013,927) | $88,680,865 |
Other Affiliated Issuers
An affiliated company is a company in which the Fund has ownership of at least 5% of the voting securities. Fiscal year to date transactions with companies which are or were affiliates are as follows:
| Affiliate | Value, beginning of period | Purchases | Sales Proceeds | Dividend Income | Realized Gain (loss) | Change in Unrealized appreciation (depreciation) | Value, end of period |
| Continental Gold, Inc. | $26,033,941 | $4,080,231 | $-- | $-- | $-- | $(4,161,194) | $-- |
| Premier Gold Mines Ltd. | 29,885,078 | 2,666,090 | 72,855 | -- | (70,838) | 19,845,135 | 52,252,610 |
| Total | $55,919,019 | $6,746,321 | $72,855 | $-- | $(70,838) | $15,683,941 | $52,252,610 |
Investment Valuation
The following is a summary of the inputs used, as of August 31, 2017, involving the Fund's assets and liabilities carried at fair value. The inputs or methodology used for valuing securities may not be an indication of the risk associated with investing in those securities. For more information on valuation inputs, and their aggregation into the levels used below, please refer to the Investment Valuation section in the accompanying Notes to Consolidated Financial Statements.
| | Valuation Inputs at Reporting Date: |
| Description | Total | Level 1 | Level 2 | Level 3 |
| Investments in Securities: | | | | |
| Common Stocks | $1,458,603,703 | $1,455,609,445 | $2,994,258 | $-- |
| Commodities | 88,725,638 | 88,725,638 | -- | -- |
| Money Market Funds | 14,256,475 | 14,256,475 | -- | -- |
| Total Investments in Securities: | $1,561,585,816 | $1,558,591,558 | $2,994,258 | $-- |
See accompanying notes which are an integral part of the consolidated financial statements.
Gold Portfolio
Consolidated Financial Statements
Consolidated Statement of Assets and Liabilities
| | | August 31, 2017 (Unaudited) |
| Assets | | |
Investment in securities, at value (including securities loaned of $1,196,904) — See accompanying schedule:
Unaffiliated issuers (cost $1,233,803,316) | $1,406,351,093 | |
| Fidelity Central Funds (cost $14,256,469) | 14,256,475�� | |
| Commodities (cost $81,866,785) | 88,725,638 | |
| Other affiliated issuers (cost $45,103,232) | 52,252,610 | |
| Total Investment in Securities (cost $1,375,029,802) | | $1,561,585,816 |
| Cash | | 22,103 |
| Foreign currency held at value (cost $120,719) | | 121,285 |
| Receivable for investments sold | | 1,052,368 |
| Receivable for fund shares sold | | 2,145,597 |
| Dividends receivable | | 525,368 |
| Distributions receivable from Fidelity Central Funds | | 15,155 |
| Other receivables | | 82,461 |
| Total assets | | 1,565,550,153 |
| Liabilities | | |
| Payable for investments purchased | $138,712 | |
| Payable for fund shares redeemed | 4,264,178 | |
| Accrued management fee | 661,093 | |
| Distribution and service plan fees payable | 111,781 | |
| Other affiliated payables | 318,982 | |
| Other payables and accrued expenses | 169,069 | |
| Collateral on securities loaned | 1,265,823 | |
| Total liabilities | | 6,929,638 |
| Net Assets | | $1,558,620,515 |
| Net Assets consist of: | | |
| Paid in capital | | $2,760,993,415 |
| Accumulated net investment loss | | (1,335,947) |
| Accumulated undistributed net realized gain (loss) on investments and foreign currency transactions | | (1,387,593,739) |
| Net unrealized appreciation (depreciation) on investments and assets and liabilities in foreign currencies | | 186,556,786 |
| Net Assets | | $1,558,620,515 |
| Calculation of Maximum Offering Price | | |
| Class A: | | |
| Net Asset Value and redemption price per share ($78,013,298 ÷ 3,605,791 shares) | | $21.64 |
| Maximum offering price per share (100/94.25 of $21.64) | | $22.96 |
| Class M: | | |
| Net Asset Value and redemption price per share ($25,535,044 ÷ 1,201,798 shares) | | $21.25 |
| Maximum offering price per share (100/96.50 of $21.25) | | $22.02 |
| Class C: | | |
| Net Asset Value and offering price per share ($111,122,082 ÷ 5,463,556 shares)(a) | | $20.34 |
| Gold: | | |
| Net Asset Value, offering price and redemption price per share ($1,271,324,594 ÷ 57,357,370 shares) | | $22.16 |
| Class I: | | |
| Net Asset Value, offering price and redemption price per share ($72,625,497 ÷ 3,277,270 shares) | | $22.16 |
(a) Redemption price per share is equal to net asset value less any applicable contingent deferred sales charge.
See accompanying notes which are an integral part of the consolidated financial statements.
Consolidated Statement of Operations
| | | Six months ended August 31, 2017 (Unaudited) |
| Investment Income | | |
| Dividends | | $6,094,201 |
| Income from Fidelity Central Funds | | 50,641 |
| Income before foreign taxes withheld | | 6,144,842 |
| Less foreign taxes withheld | | (491,360) |
| Total income | | 5,653,482 |
| Expenses | | |
| Management fee | $4,139,644 | |
| Transfer agent fees | 1,646,207 | |
| Distribution and service plan fees | 666,693 | |
| Accounting and security lending fees | 332,190 | |
| Custodian fees and expenses | 140,937 | |
| Independent trustees' fees and expenses | 17,323 | |
| Registration fees | 78,615 | |
| Audit | 31,701 | |
| Legal | 10,739 | |
| Miscellaneous | 13,800 | |
| Total expenses before reductions | 7,077,849 | |
| Expense reductions | (138,092) | 6,939,757 |
| Net investment income (loss) | | (1,286,275) |
| Realized and Unrealized Gain (Loss) | | |
| Net realized gain (loss) on: | | |
| Investments: | | |
| Unaffiliated issuers | (25,833,810) | |
| Fidelity Central Funds | (78) | |
| Other affiliated issuers | (70,838) | |
| Commodities | (159,200) | |
| Foreign currency transactions | 7,995 | |
| Total net realized gain (loss) | | (26,055,931) |
| Change in net unrealized appreciation (depreciation) on: | | |
| Investments: | | |
| Investments | 91,894,697 | |
| Fidelity Central Funds | (6) | |
| Other Affiliated issuers | 15,683,941 | |
| Assets and liabilities in foreign currencies | 2,204 | |
| Commodities | (902,889) | |
| Total change in net unrealized appreciation (depreciation) | | 106,677,947 |
| Net gain (loss) | | 80,622,016 |
| Net increase (decrease) in net assets resulting from operations | | $79,335,741 |
See accompanying notes which are an integral part of the consolidated financial statements.
Consolidated Statement of Changes in Net Assets
| | Six months ended August 31, 2017 (Unaudited) | Year ended February 28, 2017 |
| Increase (Decrease) in Net Assets | | |
| Operations | | |
| Net investment income (loss) | $(1,286,275) | $(8,049,958) |
| Net realized gain (loss) | (26,055,931) | (56,558,933) |
| Change in net unrealized appreciation (depreciation) | 106,677,947 | 282,432,875 |
| Net increase (decrease) in net assets resulting from operations | 79,335,741 | 217,823,984 |
| Distributions to shareholders from net realized gain | (3,130,280) | (47,051,891) |
| Share transactions - net increase (decrease) | (57,689,283) | 114,767,885 |
| Redemption fees | – | 402,160 |
| Total increase (decrease) in net assets | 18,516,178 | 285,942,138 |
| Net Assets | | |
| Beginning of period | 1,540,104,337 | 1,254,162,199 |
| End of period | $1,558,620,515 | $1,540,104,337 |
| Other Information | | |
| Accumulated net investment loss end of period | $(1,335,947) | $(49,672) |
See accompanying notes which are an integral part of the consolidated financial statements.
Consolidated Financial Highlights — Gold Portfolio Class A
| | Six months ended (Unaudited) August 31, | Years ended February 28, | | | | |
| | 2017 | 2017 | 2016A | 2015 | 2014 | 2013 |
| Selected Per–Share Data | | | | | | |
| Net asset value, beginning of period | $20.54 | $17.70 | $18.11 | $22.01 | $30.25 | $45.37 |
| Income from Investment Operations | | | | | | |
| Net investment income (loss)B | (.04) | (.16) | (.06) | (.10) | –C | .07 |
| Net realized and unrealized gain (loss) | 1.17 | 3.59 | (.35) | (3.80) | (8.25) | (15.19) |
| Total from investment operations | 1.13 | 3.43 | (.41) | (3.90) | (8.25) | (15.12) |
| Distributions from net realized gain | (.03) | (.60) | – | – | – | – |
| Total distributions | (.03) | (.60) | – | – | – | – |
| Redemption fees added to paid in capitalB | – | .01 | –C | –C | .01 | –C |
| Net asset value, end of period | $21.64 | $20.54 | $17.70 | $18.11 | $22.01 | $30.25 |
| Total ReturnD,E,F | 5.52% | 19.97% | (2.26)% | (17.72)% | (27.24)% | (33.33)% |
| Ratios to Average Net AssetsG,H | | | | | | |
| Expenses before reductions | 1.18%I | 1.19% | 1.23% | 1.23% | 1.21% | 1.18% |
| Expenses net of fee waivers, if any | 1.16%I | 1.16% | 1.20% | 1.19% | 1.19% | 1.17% |
| Expenses net of all reductions | 1.16%I | 1.16% | 1.20% | 1.19% | 1.18% | 1.17% |
| Net investment income (loss) | (.40)%I | (.71)% | (.44)% | (.51)% | - %J | .18% |
| Supplemental Data | | | | | | |
| Net assets, end of period (000 omitted) | $78,013 | $83,589 | $53,509 | $46,898 | $60,270 | $101,202 |
| Portfolio turnover rateK | 19%I | 28% | 20% | 20% | 56% | 18% |
A For the year ended February 29.
B Calculated based on average shares outstanding during the period.
C Amount represents less than $.005 per share.
D Total returns for periods of less than one year are not annualized.
E Total returns would have been lower if certain expenses had not been reduced during the applicable periods shown.
F Total returns do not include the effect of the sales charges.
G Fees and expenses of any underlying Fidelity Central Funds are not included in the Fund's expense ratio. The Fund indirectly bears its proportionate share of the expenses of any underlying Fidelity Central Funds.
H Expense ratios reflect operating expenses of the class. Expenses before reductions do not reflect amounts reimbursed by the investment adviser or reductions from brokerage service arrangements or reductions from other expense offset arrangements and do not represent the amount paid by the class during periods when reimbursements or reductions occur. Expenses net of fee waivers reflect expenses after reimbursement by the investment adviser but prior to reductions from brokerage service arrangements or other expense offset arrangements. Expenses net of all reductions represent the net expenses paid by the class.
I Annualized
J Amount represents less than .005%.
K Amount does not include the portfolio activity of any underlying Fidelity Central Funds.
See accompanying notes which are an integral part of the consolidated financial statements.
Consolidated Financial Highlights — Gold Portfolio Class M
| | Six months ended (Unaudited) August 31, | Years ended February 28, | | | | |
| | 2017 | 2017 | 2016A | 2015 | 2014 | 2013 |
| Selected Per–Share Data | | | | | | |
| Net asset value, beginning of period | $20.19 | $17.37 | $17.83 | $21.73 | $29.95 | $45.04 |
| Income from Investment Operations | | | | | | |
| Net investment income (loss)B | (.07) | (.22) | (.11) | (.15) | (.06) | (.03) |
| Net realized and unrealized gain (loss) | 1.16 | 3.54 | (.35) | (3.75) | (8.17) | (15.06) |
| Total from investment operations | 1.09 | 3.32 | (.46) | (3.90) | (8.23) | (15.09) |
| Distributions from net realized gain | (.03) | (.51) | – | – | – | – |
| Total distributions | (.03) | (.51) | – | – | – | – |
| Redemption fees added to paid in capitalB | – | .01 | –C | –C | .01 | –C |
| Net asset value, end of period | $21.25 | $20.19 | $17.37 | $17.83 | $21.73 | $29.95 |
| Total ReturnD,E,F | 5.38% | 19.62% | (2.58)% | (17.95)% | (27.45)% | (33.50)% |
| Ratios to Average Net AssetsG,H | | | | | | |
| Expenses before reductions | 1.48%I | 1.49% | 1.52% | 1.50% | 1.49% | 1.45% |
| Expenses net of fee waivers, if any | 1.46%I | 1.46% | 1.48% | 1.46% | 1.47% | 1.44% |
| Expenses net of all reductions | 1.46%I | 1.46% | 1.48% | 1.46% | 1.46% | 1.44% |
| Net investment income (loss) | (.70)%I | (1.01)% | (.72)% | (.79)% | (.28)% | (.09)% |
| Supplemental Data | | | | | | |
| Net assets, end of period (000 omitted) | $25,535 | $25,170 | $17,720 | $16,200 | $18,402 | $24,913 |
| Portfolio turnover rateJ | 19%I | 28% | 20% | 20% | 56% | 18% |
A For the year ended February 29.
B Calculated based on average shares outstanding during the period.
C Amount represents less than $.005 per share.
D Total returns for periods of less than one year are not annualized.
E Total returns would have been lower if certain expenses had not been reduced during the applicable periods shown.
F Total returns do not include the effect of the sales charges.
G Fees and expenses of any underlying Fidelity Central Funds are not included in the Fund's expense ratio. The Fund indirectly bears its proportionate share of the expenses of any underlying Fidelity Central Funds.
H Expense ratios reflect operating expenses of the class. Expenses before reductions do not reflect amounts reimbursed by the investment adviser or reductions from brokerage service arrangements or reductions from other expense offset arrangements and do not represent the amount paid by the class during periods when reimbursements or reductions occur. Expenses net of fee waivers reflect expenses after reimbursement by the investment adviser but prior to reductions from brokerage service arrangements or other expense offset arrangements. Expenses net of all reductions represent the net expenses paid by the class.
I Annualized
J Amount does not include the portfolio activity of any underlying Fidelity Central Funds.
See accompanying notes which are an integral part of the consolidated financial statements.
Consolidated Financial Highlights — Gold Portfolio Class C
| | Six months ended (Unaudited) August 31, | Years ended February 28, | | | | |
| | 2017 | 2017 | 2016A | 2015 | 2014 | 2013 |
| Selected Per–Share Data | | | | | | |
| Net asset value, beginning of period | $19.36 | $16.68 | $17.20 | $21.06 | $29.15 | $44.05 |
| Income from Investment Operations | | | | | | |
| Net investment income (loss)B | (.10) | (.29) | (.16) | (.23) | (.16) | (.20) |
| Net realized and unrealized gain (loss) | 1.10 | 3.42 | (.36) | (3.63) | (7.94) | (14.70) |
| Total from investment operations | 1.00 | 3.13 | (.52) | (3.86) | (8.10) | (14.90) |
| Distributions from net realized gain | (.02) | (.45) | – | – | – | – |
| Total distributions | (.02) | (.45) | – | – | – | – |
| Redemption fees added to paid in capitalB | – | –C | –C | –C | .01 | –C |
| Net asset value, end of period | $20.34 | $19.36 | $16.68 | $17.20 | $21.06 | $29.15 |
| Total ReturnD,E,F | 5.14% | 19.19% | (3.02)% | (18.33)% | (27.75)% | (33.83)% |
| Ratios to Average Net AssetsG,H | | | | | | |
| Expenses before reductions | 1.85%I | 1.88% | 1.97% | 1.96% | 1.96% | 1.93% |
| Expenses net of fee waivers, if any | 1.83%I | 1.85% | 1.93% | 1.92% | 1.94% | 1.92% |
| Expenses net of all reductions | 1.83%I | 1.84% | 1.93% | 1.92% | 1.93% | 1.91% |
| Net investment income (loss) | (1.07)%I | (1.40)% | (1.17)% | (1.25)% | (.76)% | (.57)% |
| Supplemental Data | | | | | | |
| Net assets, end of period (000 omitted) | $111,122 | $101,215 | $52,732 | $39,429 | $33,811 | $37,787 |
| Portfolio turnover rateJ | 19%I | 28% | 20% | 20% | 56% | 18% |
A For the year ended February 29.
B Calculated based on average shares outstanding during the period.
C Amount represents less than $.005 per share.
D Total returns for periods of less than one year are not annualized.
E Total returns would have been lower if certain expenses had not been reduced during the applicable periods shown.
F Total returns do not include the effect of the contingent deferred sales charge.
G Fees and expenses of any underlying Fidelity Central Funds are not included in the Fund's expense ratio. The Fund indirectly bears its proportionate share of the expenses of any underlying Fidelity Central Funds.
H Expense ratios reflect operating expenses of the class. Expenses before reductions do not reflect amounts reimbursed by the investment adviser or reductions from brokerage service arrangements or reductions from other expense offset arrangements and do not represent the amount paid by the class during periods when reimbursements or reductions occur. Expenses net of fee waivers reflect expenses after reimbursement by the investment adviser but prior to reductions from brokerage service arrangements or other expense offset arrangements. Expenses net of all reductions represent the net expenses paid by the class.
I Annualized
J Amount does not include the portfolio activity of any underlying Fidelity Central Funds.
See accompanying notes which are an integral part of the consolidated financial statements.
Consolidated Financial Highlights — Gold Portfolio
| | Six months ended (Unaudited) August 31, | Years ended February 28, | | | | |
| | 2017 | 2017 | 2016A | 2015 | 2014 | 2013 |
| Selected Per–Share Data | | | | | | |
| Net asset value, beginning of period | $21.02 | $18.12 | $18.50 | $22.41 | $30.72 | $45.96 |
| Income from Investment Operations | | | | | | |
| Net investment income (loss)B | (.01) | (.09) | (.03) | (.04) | .06 | .16 |
| Net realized and unrealized gain (loss) | 1.20 | 3.66 | (.35) | (3.87) | (8.38) | (15.40) |
| Total from investment operations | 1.19 | 3.57 | (.38) | (3.91) | (8.32) | (15.24) |
| Distributions from net realized gain | (.05) | (.68) | – | – | – | – |
| Total distributions | (.05) | (.68) | – | – | – | – |
| Redemption fees added to paid in capitalB | – | .01 | –C | –C | .01 | –C |
| Net asset value, end of period | $22.16 | $21.02 | $18.12 | $18.50 | $22.41 | $30.72 |
| Total ReturnD,E | 5.64% | 20.38% | (2.05)% | (17.45)% | (27.05)% | (33.16)% |
| Ratios to Average Net AssetsF,G | | | | | | |
| Expenses before reductions | .86%H | .87% | .97% | .94% | .94% | .93% |
| Expenses net of fee waivers, if any | .85%H | .84% | .93% | .90% | .92% | .92% |
| Expenses net of all reductions | .85%H | .84% | .93% | .90% | .91% | .92% |
| Net investment income (loss) | (.08)%H | (.39)% | (.17)% | (.22)% | .27% | .43% |
| Supplemental Data | | | | | | |
| Net assets, end of period (000 omitted) | $1,271,325 | $1,271,458 | $1,076,206 | $992,944 | $1,275,913 | $2,301,019 |
| Portfolio turnover rateI | 19%H | 28% | 20% | 20% | 56% | 18% |
A For the year ended February 29.
B Calculated based on average shares outstanding during the period.
C Amount represents less than $.005 per share.
D Total returns for periods of less than one year are not annualized.
E Total returns would have been lower if certain expenses had not been reduced during the applicable periods shown.
F Fees and expenses of any underlying Fidelity Central Funds are not included in the Fund's expense ratio. The Fund indirectly bears its proportionate share of the expenses of any underlying Fidelity Central Funds.
G Expense ratios reflect operating expenses of the class. Expenses before reductions do not reflect amounts reimbursed by the investment adviser or reductions from brokerage service arrangements or reductions from other expense offset arrangements and do not represent the amount paid by the class during periods when reimbursements or reductions occur. Expenses net of fee waivers reflect expenses after reimbursement by the investment adviser but prior to reductions from brokerage service arrangements or other expense offset arrangements. Expenses net of all reductions represent the net expenses paid by the class.
H Annualized
I Amount does not include the portfolio activity of any underlying Fidelity Central Funds.
See accompanying notes which are an integral part of the consolidated financial statements.
Consolidated Financial Highlights — Gold Portfolio Class I
| | Six months ended (Unaudited) August 31, | Years ended February 28, | | | | |
| | 2017 | 2017 | 2016A | 2015 | 2014 | 2013 |
| Selected Per–Share Data | | | | | | |
| Net asset value, beginning of period | $21.02 | $18.13 | $18.50 | $22.41 | $30.69 | $45.87 |
| Income from Investment Operations | | | | | | |
| Net investment income (loss)B | (.01) | (.09) | (.02) | (.04) | .07 | .20 |
| Net realized and unrealized gain (loss) | 1.20 | 3.67 | (.35) | (3.87) | (8.36) | (15.38) |
| Total from investment operations | 1.19 | 3.58 | (.37) | (3.91) | (8.29) | (15.18) |
| Distributions from net realized gain | (.05) | (.70) | – | – | – | – |
| Total distributions | (.05) | (.70) | – | – | – | – |
| Redemption fees added to paid in capitalB | – | .01 | –C | –C | .01 | –C |
| Net asset value, end of period | $22.16 | $21.02 | $18.13 | $18.50 | $22.41 | $30.69 |
| Total ReturnD,E | 5.65% | 20.41% | (2.00)% | (17.45)% | (26.98)% | (33.09)% |
| Ratios to Average Net AssetsF,G | | | | | | |
| Expenses before reductions | .85%H | .87% | .92% | .90% | .87% | .84% |
| Expenses net of fee waivers, if any | .83%H | .84% | .88% | .86% | .85% | .83% |
| Expenses net of all reductions | .83%H | .84% | .88% | .86% | .84% | .82% |
| Net investment income (loss) | (.06)%H | (.39)% | (.12)% | (.18)% | .34% | .52% |
| Supplemental Data | | | | | | |
| Net assets, end of period (000 omitted) | $72,625 | $58,673 | $52,607 | $23,667 | $107,830 | $128,262 |
| Portfolio turnover rateI | 19%H | 28% | 20% | 20% | 56% | 18% |
A For the year ended February 29.
B Calculated based on average shares outstanding during the period.
C Amount represents less than $.005 per share.
D Total returns for periods of less than one year are not annualized.
E Total returns would have been lower if certain expenses had not been reduced during the applicable periods shown.
F Fees and expenses of any underlying Fidelity Central Funds are not included in the Fund's expense ratio. The Fund indirectly bears its proportionate share of the expenses of any underlying Fidelity Central Funds.
G Expense ratios reflect operating expenses of the class. Expenses before reductions do not reflect amounts reimbursed by the investment adviser or reductions from brokerage service arrangements or reductions from other expense offset arrangements and do not represent the amount paid by the class during periods when reimbursements or reductions occur. Expenses net of fee waivers reflect expenses after reimbursement by the investment adviser but prior to reductions from brokerage service arrangements or other expense offset arrangements. Expenses net of all reductions represent the net expenses paid by the class.
H Annualized
I Amount does not include the portfolio activity of any underlying Fidelity Central Funds.
See accompanying notes which are an integral part of the consolidated financial statements.
Notes to Consolidated Financial Statements (Unaudited)
For the period ended August 31, 2017
1. Organization.
Gold Portfolio (the Fund) is a non-diversified fund of Fidelity Select Portfolios (the Trust) and is authorized to issue an unlimited number of shares. The Trust is registered under the Investment Company Act of 1940, as amended (the 1940 Act), as an open-end management investment company organized as a Massachusetts business trust. The Fund invests primarily in securities of companies whose principal business activities fall within specific industries. The Fund offers Class A, Class M (formerly Class T), Class C, Gold and Class I shares, each of which has equal rights as to assets and voting privileges. Each class has exclusive voting rights with respect to matters that affect that class.
After the close of business on June 24, 2016, all outstanding Class B shares were converted to Class A shares. All prior fiscal period dollar and share amounts for Class B presented in the Notes to Financial Statements are for the period March 1, 2016 through June 24, 2016.
2. Consolidated Subsidiary.
The Fund invests in certain commodity-related investments through Fidelity Select Gold Cayman Ltd, a wholly owned subsidiary (the "Subsidiary"). As of period end, the Fund held an investment of $88,680,865 in the Subsidiary, representing 5.7% of the Fund's net assets.
The financial statements have been consolidated and include accounts of the Fund and the Subsidiary. Accordingly, all inter-company transactions and balances have been eliminated.
3. Investments in Fidelity Central Funds.
The Fund invests in Fidelity Central Funds, which are open-end investment companies generally available only to other investment companies and accounts managed by the investment adviser and its affiliates. The Fund's Consolidated Schedule of Investments lists each of the Fidelity Central Funds held as of period end, if any, as an investment of the Fund, but does not include the underlying holdings of each Fidelity Central Fund. As an Investing Fund, the Fund indirectly bears its proportionate share of the expenses of the underlying Fidelity Central Funds.
The Money Market Central Funds seek preservation of capital and current income and are managed by Fidelity Investments Money Management, Inc. (FIMM), an affiliate of the investment adviser. Annualized expenses of the Money Market Central Funds as of their most recent shareholder report date are less than .005%.
A complete unaudited list of holdings for each Fidelity Central Fund is available upon request or at the Securities and Exchange Commission (the SEC) website at www.sec.gov. In addition, the financial statements of the Fidelity Central Funds are available on the SEC website or upon request.
4. Significant Accounting Policies.
The Fund is an investment company and applies the accounting and reporting guidance of the Financial Accounting Standards Board (FASB) Accounting Standards Codification Topic 946 Financial Services – Investments Companies. The consolidated financial statements have been prepared in conformity with accounting principles generally accepted in the United States of America (GAAP), which require management to make certain estimates and assumptions at the date of the financial statements. Actual results could differ from those estimates. Subsequent events, if any, through the date that the financial statements were issued have been evaluated in the preparation of the financial statements. The following summarizes the significant accounting policies of the Fund:
Investment Valuation. Investments are valued as of 4:00 p.m. Eastern time on the last calendar day of the period. The Board of Trustees (the Board) has delegated the day to day responsibility for the valuation of the Fund's investments to the Fair Value Committee (the Committee) established by the Fund's investment adviser. In accordance with valuation policies and procedures approved by the Board, the Fund attempts to obtain prices from one or more third party pricing vendors or brokers to value its investments. When current market prices, quotations or currency exchange rates are not readily available or reliable, investments will be fair valued in good faith by the Committee, in accordance with procedures adopted by the Board. Factors used in determining fair value vary by investment type and may include market or investment specific events. The frequency with which these procedures are used cannot be predicted and they may be utilized to a significant extent. The Committee oversees the Fund's valuation policies and procedures and reports to the Board on the Committee's activities and fair value determinations. The Board monitors the appropriateness of the procedures used in valuing the Fund's investments and ratifies the fair value determinations of the Committee.
The Fund categorizes the inputs to valuation techniques used to value its investments into a disclosure hierarchy consisting of three levels as shown below:
- Level 1 – quoted prices in active markets for identical investments
- Level 2 – other significant observable inputs (including quoted prices for similar investments, interest rates, prepayment speeds, etc.)
- Level 3 – unobservable inputs (including the Fund's own assumptions based on the best information available)
Valuation techniques used to value the Fund's investments by major category are as follows:
Equity securities, including restricted securities, for which market quotations are readily available, are valued at the last reported sale price or official closing price as reported by a third party pricing vendor on the primary market or exchange on which they are traded and are categorized as Level 1 in the hierarchy. In the event there were no sales during the day or closing prices are not available, securities are valued at the last quoted bid price or may be valued using the last available price and are generally categorized as Level 2 in the hierarchy. For foreign equity securities, when market or security specific events arise, comparisons to the valuation of American Depositary Receipts (ADRs), futures contracts, Exchange-Traded Funds (ETFs) and certain indexes as well as quoted prices for similar securities may be used and would be categorized as Level 2 in the hierarchy. Utilizing these techniques may result in transfers between Level 1 and Level 2. For equity securities, including restricted securities, where observable inputs are limited, assumptions about market activity and risk are used and these securities may be categorized as Level 3 in the hierarchy.
Investments in commodities are valued at their last traded price at 4:00 p.m. Eastern time each business day and are categorized as Level 1 in the hierarchy. Investments in open-end mutual funds, including the Fidelity Central Funds, are valued at their closing net asset value (NAV) each business day and are categorized as Level 1 in the hierarchy.
Changes in valuation techniques may result in transfers in or out of an assigned level within the disclosure hierarchy. The aggregate value of investments by input level as of August 31, 2017 is included at the end the Fund's Consolidated Schedule of Investments.
Foreign Currency. The Fund may use foreign currency contracts to facilitate transactions in foreign-denominated securities. Gains and losses from these transactions may arise from changes in the value of the foreign currency or if the counterparties do not perform under the contracts' terms.
Foreign-denominated assets, including investment securities, and liabilities are translated into U.S. dollars at the exchange rates at period end. Purchases and sales of investment securities, income and dividends received and expenses denominated in foreign currencies are translated into U.S. dollars at the exchange rate in effect on the transaction date.
The effects of exchange rate fluctuations on investments are included with the net realized and unrealized gain (loss) on investment securities. Other foreign currency transactions resulting in realized and unrealized gain (loss) are disclosed separately.
Investment Transactions and Income. For financial reporting purposes, the Fund's investment holdings and NAV include trades executed through the end of the last business day of the period. The NAV per share for processing shareholder transactions is calculated as of the close of business of the New York Stock Exchange (NYSE), normally 4:00 p.m. Eastern time and includes trades executed through the end of the prior business day. Gains and losses on securities sold are determined on the basis of identified cost and may include proceeds received from litigation. Dividend income is recorded on the ex-dividend date, except for certain dividends from foreign securities where the ex-dividend date may have passed, which are recorded as soon as the Fund is informed of the ex-dividend date. Non-cash dividends included in dividend income, if any, are recorded at the fair market value of the securities received. Income and capital gain distributions from Fidelity Central Funds, if any, are recorded on the ex-dividend date. Certain distributions received by the Fund represent a return of capital or capital gain. The Fund determines the components of these distributions subsequent to the ex-dividend date, based upon receipt of tax filings or other correspondence relating to the underlying investment. These distributions are recorded as a reduction of cost of investments and/or as a realized gain. Investment income is recorded net of foreign taxes withheld where recovery of such taxes is uncertain.
Class Allocations and Expenses. Investment income, realized and unrealized capital gains and losses, common expenses of the Fund, and certain fund-level expense reductions, if any, are allocated daily on a pro-rata basis to each class based on the relative net assets of each class to the total net assets of the Fund. Each class differs with respect to transfer agent and distribution and service plan fees incurred. Certain expense reductions may also differ by class. For the reporting period, the allocated portion of income and expenses to each class as a percent of its average net assets may vary due to the timing of recording these transactions in relation to fluctuating net assets of the classes. Expenses directly attributable to a fund are charged to that fund. Expenses attributable to more than one fund are allocated among the respective funds on the basis of relative net assets or other appropriate methods. Expense estimates are accrued in the period to which they relate and adjustments are made when actual amounts are known.
Deferred Trustee Compensation. Under a Deferred Compensation Plan (the Plan), independent Trustees may elect to defer receipt of a portion of their annual compensation. Deferred amounts are invested in a cross-section of Fidelity funds, are marked-to-market and remain in the Fund until distributed in accordance with the Plan. The investment of deferred amounts and the offsetting payable to the Trustees are included in the accompanying Statement of Assets and Liabilities.
Income Tax Information and Distributions to Shareholders. Each year, the Fund intends to qualify as a regulated investment company under Subchapter M of the Internal Revenue Code, including distributing substantially all of its taxable income and realized gains. As a result, no provision for U.S. Federal income taxes is required. The Fund files a U.S. federal tax return, in addition to state and local tax returns as required. The Fund's federal income tax returns are subject to examination by the Internal Revenue Service (IRS) for a period of three fiscal years after they are filed. State and local tax returns may be subject to examination for an additional fiscal year depending on the jurisdiction. Foreign taxes are provided for based on the Fund's understanding of the tax rules and rates that exist in the foreign markets in which it invests.
The Subsidiary is classified as a controlled foreign corporation under Subchapter N of the Internal Revenue Code. Therefore, the Fund is required to increase its taxable income by its share of the Subsidiary's income. Net investment losses of the Subsidiary cannot be deducted by the Fund in the current period nor carried forward to offset taxable income in future periods.
Distributions are declared and recorded on the ex-dividend date. Income dividends and capital gain distributions are declared separately for each class. Income and capital gain distributions are determined in accordance with income tax regulations, which may differ from GAAP.
Capital accounts within the consolidated financial statements are adjusted for permanent book-tax differences. These adjustments have no impact on net assets or the results of operations. Capital accounts are not adjusted for temporary book-tax differences which will reverse in a subsequent period.
Book-tax differences are primarily due to foreign currency transactions, passive foreign investment companies (PFIC), controlled foreign corporations, deferred trustees compensation, capital loss carryforwards, and losses deferred due to wash sales.
As of period end, the cost and unrealized appreciation (depreciation) in securities, and derivatives if applicable, for federal income tax purposes on an unconsolidated basis were as follows:
| Gross unrealized appreciation | $381,059,966 |
| Gross unrealized depreciation | (356,383,362) |
| Net unrealized appreciation (depreciation) | $24,676,604 |
| Tax cost | $1,536,864,439 |
Capital loss carryforwards are only available to offset future capital gains of the Fund to the extent provided by regulations and may be limited. Under the Regulated Investment Company Modernization Act of 2010 (the Act), the Fund is permitted to carry forward capital losses incurred in taxable years beginning after December 22, 2010 for an unlimited period and such capital losses are required to be used prior to any losses that expire. The capital loss carryforward information presented below, including any applicable limitation, is estimated as of prior fiscal period end and is subject to adjustment.
| No expiration | |
| Short-term | $(140,407,726) |
| Long-term | (1,077,593,342) |
| Total capital loss carryforward | $(1,218,001,068) |
Restricted Securities. The Fund may invest in securities that are subject to legal or contractual restrictions on resale. These securities generally may be resold in transactions exempt from registration or to the public if the securities are registered. Disposal of these securities may involve time-consuming negotiations and expense, and prompt sale at an acceptable price may be difficult. Information regarding restricted securities is included at the end of the Fund's Consolidated Schedule of Investments.
5. Purchases and Sales of Investments.
Purchases and sales of securities, other than short-term securities, aggregated $138,248,523 and $199,944,314, respectively.
6. Fees and Other Transactions with Affiliates.
Management Fee. Fidelity SelectCo, LLC (the investment adviser) and its affiliates provide the Fund with investment management related services for which the Fund pays a monthly management fee. The management fee is the sum of an individual fund fee rate that is based on an annual rate of .30% of the Fund's average net assets and an annualized group fee rate that averaged .25% during the period. The group fee rate is based upon the average net assets of all the mutual funds advised by Fidelity Management & Research Company (FMR) and the investment adviser. The group fee rate decreases as assets under management increase and increases as assets under management decrease.
FMR, either through itself or through an affiliate provides investment management related services to the Subsidiary for which the Subsidiary pays a monthly management fee at the annual rate of .30% of its net assets. Under the management contract with the subsidiary, FMR pays all other expenses of the Subsidiary, except custodian fees.
For the reporting period, the total consolidated annual management fee rate which includes the management fee of the Fund and the Subsidiary was .56% of the Fund's average net assets.
During the period, the investment adviser waived a portion of the Fund's management fee representing the amount of the management fee paid by the Subsidiary to FMR as described in the Expense Reductions note.
Distribution and Service Plan Fees. In accordance with Rule 12b-1 of the 1940 Act, the Fund has adopted separate Distribution and Service Plans for each class of shares. Certain classes pay Fidelity Distributors Corporation (FDC), an affiliate of the investment adviser, separate Distribution and Service Fees, each of which is based on an annual percentage of each class' average net assets. In addition, FDC may pay financial intermediaries for selling shares of the Fund and providing shareholder support services. For the period, the Distribution and Service Fee rates, total fees and amounts retained by FDC were as follows:
| | Distribution
Fee | Service
Fee | Total Fees | Retained
by FDC |
| Class A | -% | .25% | $94,092 | $2,057 |
| Class M | .25% | .25% | 60,670 | – |
| Class C | .75% | .25% | 511,931 | 149,970 |
| | | | $666,693 | $152,027 |
Sales Load. FDC may receive a front-end sales charge of up to 5.75% for selling Class A shares and 3.50% for selling Class M shares, some of which is paid to financial intermediaries for selling shares of the Fund. Depending on the holding period, FDC may receive contingent deferred sales charges levied on Class A, Class M and Class C redemptions. The deferred sales charges are 1.00% for Class C shares, 1.00% for certain purchases of Class A shares and .25% for certain purchases of Class M shares.
For the period, sales charge amounts retained by FDC were as follows:
| | Retained
by FDC |
| Class A | $19,052 |
| Class M | 3,996 |
| Class C(a) | 8,211 |
| | $31,259 |
(a) When Class C shares are initially sold, FDC pays commissions from its own resources to financial intermediaries through which the sales are made.
Transfer Agent Fees. Fidelity Investments Institutional Operations Company, Inc., (FIIOC), an affiliate of the investment adviser, is the transfer, dividend disbursing and shareholder servicing agent for each class of the Fund. FIIOC receives account fees and asset-based fees that vary according to the account size and type of account of the shareholders of the respective classes of the Fund. FIIOC pays for typesetting, printing and mailing of shareholder reports, except proxy statements.
For the period, transfer agent fees for each class were as follows:
| | Amount | % of
Class-Level Average
Net Assets(a) |
| Class A | $107,027 | .28 |
| Class M | 40,726 | .34 |
| Class C | 105,836 | .21 |
| Gold | 1,326,472 | .22 |
| Class I | 66,146 | .20 |
| | $1,646,207 | |
(a) Annualized
Accounting and Security Lending Fees. Fidelity Service Company, Inc. (FSC), an affiliate of the investment adviser, maintains the Fund's accounting records. The accounting fee is based on the level of average net assets for each month. Under a separate contract, FSC administers the security lending program. The security lending fee is based on the number and duration of lending transactions.
Brokerage Commissions. The Fund placed a portion of its portfolio transactions with brokerage firms which are affiliates of the investment adviser. Brokerage commissions are included in net realized gain (loss) and change in net unrealized appreciation (depreciation) in the Statement of Operations. The commissions paid to these affiliated firms were $5,179 for the period.
Interfund Trades. The Fund may purchase from or sell securities to other Fidelity Funds under procedures adopted by the Board. The procedures have been designed to ensure these interfund trades are executed in accordance with Rule 17a-7 of the 1940 Act. Interfund trades are included within the respective purchases and sales amounts shown in the Purchases and Sales of Investments note.
Other. During the period, the investment adviser reimbursed the Fund for certain losses in the amount of $1,500.
7. Committed Line of Credit.
The Fund participates with other funds managed by the investment adviser or an affiliate in a $4.25 billion credit facility (the "line of credit") to be utilized for temporary or emergency purposes to fund shareholder redemptions or for other short-term liquidity purposes. The Fund has agreed to pay commitment fees on its pro-rata portion of the line of credit, which amounted to $2,367 and is reflected in Miscellaneous expenses on the Consolidated Statement of Operations. During the period, the Fund did not borrow on this line of credit.
8. Security Lending.
The Fund lends portfolio securities through a lending agent from time to time in order to earn additional income. On the settlement date of the loan, the Fund receives collateral (in the form of U.S. Treasury obligations, letters of credit and/or cash) against the loaned securities and maintains collateral in an amount not less than 100% of the market value of the loaned securities during the period of the loan. The market value of the loaned securities is determined at the close of business of the Fund and any additional required collateral is delivered to the Fund on the next business day. The Fund or borrower may terminate the loan at any time, and if the borrower defaults on its obligation to return the securities loaned because of insolvency or other reasons, the Fund may apply collateral received from the borrower against the obligation. The Fund may experience delays and costs in recovering the securities loaned. Any cash collateral received is invested in the Fidelity Securities Lending Cash Central Fund. The value of loaned securities and cash collateral at period end are disclosed on the Fund's Consolidated Statement of Assets and Liabilities. Security lending income represents the income earned on investing cash collateral, less rebates paid to borrowers and any lending agent fees associated with the loan, plus any premium payments received for lending certain types of securities. Security lending income is presented in the Consolidated Statement of Operations as a component of income from Fidelity Central Funds. Total security lending income during the period amounted to $23,389.
9. Expense Reductions.
The investment adviser has contractually agreed to waive the Fund's management fee in an amount equal to the management fee paid by the Subsidiary to FMR. During the period, this waiver reduced the Fund's management fee by $118,759.
Commissions paid to certain brokers with whom the investment adviser, or its affiliates, places trades on behalf of the Fund include an amount in addition to trade execution, which may be rebated back to the Fund to offset certain expenses. This amount totaled $12,774 for the period.
In addition, during the period the investment adviser reimbursed and/or waived a portion of fund-level operating expenses in the amount of $6,559.
10. Distributions to Shareholders.
Distributions to shareholders of each class were as follows:
| | Six months ended
August 31, 2017 | Year ended February 28, 2017 |
| From net realized gain | | |
| Class A | $127,654 | $2,221,326 |
| Class M | 32,220 | 587,030 |
| Class C | 80,825 | 2,039,868 |
| Gold | 2,740,284 | 40,224,766 |
| Class I | 149,297 | 1,978,901 |
| Total | $3,130,280 | $47,051,891 |
11. Share Transactions.
Share transactions for each class were as follows and may contain automatic conversions between classes or exchanges between affiliated funds:
| | Shares | Shares | Dollars | Dollars |
| | Six months ended
August 31, 2017 | Year ended February 28, 2017 | Six months ended
August 31, 2017 | Year ended February 28, 2017 |
| Class A | | | | |
| Shares sold | 582,290 | 3,164,607 | $11,642,181 | $69,537,871 |
| Reinvestment of distributions | 5,732 | 120,564 | 125,534 | 2,146,978 |
| Shares redeemed | (1,051,845) | (2,238,855) | (21,020,473) | (48,377,613) |
| Net increase (decrease) | (463,823) | 1,046,316 | $(9,252,758) | $23,307,236 |
| Class M | | | | |
| Shares sold | 150,921 | 712,177 | $3,003,369 | $15,561,760 |
| Reinvestment of distributions | 1,488 | 32,071 | 32,029 | 560,038 |
| Shares redeemed | (196,977) | (517,783) | (3,878,428) | (11,004,318) |
| Net increase (decrease) | (44,568) | 226,465 | $(843,030) | $5,117,480 |
| Class B | | | | |
| Shares sold | – | 7,043 | $– | $134,526 |
| Shares redeemed | – | (89,908) | – | (1,923,575) |
| Net increase (decrease) | – | (82,865) | $– | $(1,789,049) |
| Class C | | | | |
| Shares sold | 744,696 | 3,277,150 | $14,167,937 | $68,100,712 |
| Reinvestment of distributions | 3,724 | 115,019 | 76,867 | 1,909,405 |
| Shares redeemed | (513,570) | (1,324,351) | (9,742,860) | (26,570,952) |
| Net increase (decrease) | 234,850 | 2,067,818 | $4,501,944 | $43,439,165 |
| Gold | | | | |
| Shares sold | 9,265,178 | 44,152,495 | $191,799,344 | $998,832,934 |
| Reinvestment of distributions | 117,013 | 2,098,203 | 2,622,272 | 38,476,693 |
| Shares redeemed | (12,513,844) | (45,146,079) | (256,491,430) | (990,273,602) |
| Net increase (decrease) | (3,131,653) | 1,104,619 | $(62,069,814) | $47,036,025 |
| Class I | | | | |
| Shares sold | 998,901 | 2,033,849 | $20,504,790 | $45,606,027 |
| Reinvestment of distributions | 6,152 | 97,474 | 137,796 | 1,788,422 |
| Shares redeemed | (519,717) | (2,240,667) | (10,668,211) | (49,737,421) |
| Net increase (decrease) | 485,336 | (109,344) | $9,974,375 | $(2,342,972) |
12. Other.
The Fund's organizational documents provide former and current trustees and officers with a limited indemnification against liabilities arising in connection with the performance of their duties to the Fund. In the normal course of business, the Fund may also enter into contracts that provide general indemnifications. The Fund's maximum exposure under these arrangements is unknown as this would be dependent on future claims that may be made against the Fund. The risk of material loss from such claims is considered remote.
Materials Portfolio
Investment Summary (Unaudited)
Top Ten Stocks as of August 31, 2017
| | % of fund's net assets | % of fund's net assets 6 months ago |
| E.I. du Pont de Nemours & Co. | 16.0 | 15.3 |
| LyondellBasell Industries NV Class A | 5.8 | 5.5 |
| Sherwin-Williams Co. | 5.1 | 2.9 |
| The Dow Chemical Co. | 4.7 | 4.6 |
| Ball Corp.�� | 4.7 | 4.6 |
| WestRock Co. | 4.4 | 6.4 |
| Graphic Packaging Holding Co. | 3.6 | 4.8 |
| Monsanto Co. | 3.5 | 6.1 |
| Ecolab, Inc. | 3.4 | 3.9 |
| PPG Industries, Inc. | 3.4 | 4.4 |
| | 54.6 | |
Top Industries (% of fund's net assets)
| As of August 31, 2017 |
| | Chemicals | 63.6% |
| | Containers & Packaging | 17.2% |
| | Metals & Mining | 13.2% |
| | Construction Materials | 3.6% |
| | Trading Companies & Distributors | 1.4% |
| | All Others* | 1.0% |

* Includes Short-Term investments and Net Other Assets (Liabilities).
| As of February 28, 2017 |
| | Chemicals | 67.7% |
| | Containers & Packaging | 16.6% |
| | Metals & Mining | 9.4% |
| | Construction Materials | 3.3% |
| | Trading Companies & Distributors | 2.0% |
| | All Others* | 1.0% |

* Includes Short-Term investments and Net Other Assets (Liabilities).
Materials Portfolio
Investments August 31, 2017 (Unaudited)
Showing Percentage of Net Assets
| Common Stocks - 99.0% | | | |
| | | Shares | Value |
| Chemicals - 63.6% | | | |
| Commodity Chemicals - 8.2% | | | |
| LyondellBasell Industries NV Class A | | 1,039,196 | $94,140,766 |
| Tronox Ltd. Class A | | 746,803 | 15,451,354 |
| Westlake Chemical Corp. | | 293,100 | 22,542,321 |
| | | | 132,134,441 |
| Diversified Chemicals - 25.0% | | | |
| E.I. du Pont de Nemours & Co. | | 3,065,900 | 257,320,986 |
| Eastman Chemical Co. | | 378,748 | 32,648,078 |
| The Chemours Co. LLC | | 768,600 | 37,715,202 |
| The Dow Chemical Co. | | 1,134,900 | 75,641,085 |
| | | | 403,325,351 |
| Fertilizers & Agricultural Chemicals - 9.1% | | | |
| Agrium, Inc. | | 168,300 | 16,507,214 |
| CF Industries Holdings, Inc. | | 584,810 | 16,953,642 |
| FMC Corp. | | 303,900 | 26,202,258 |
| Monsanto Co. | | 475,730 | 55,755,556 |
| The Scotts Miracle-Gro Co. Class A | | 332,731 | 31,805,756 |
| | | | 147,224,426 |
| Industrial Gases - 3.0% | | | |
| Air Products & Chemicals, Inc. | | 334,800 | 48,669,876 |
| Specialty Chemicals - 18.3% | | | |
| Axalta Coating Systems (a) | | 699,100 | 20,637,432 |
| Ecolab, Inc. | | 417,520 | 55,655,416 |
| Frutarom Industries Ltd. | | 171,096 | 13,137,729 |
| Platform Specialty Products Corp. (a) | | 1,882,200 | 21,984,096 |
| PPG Industries, Inc. | | 519,700 | 54,215,104 |
| Sherwin-Williams Co. | | 240,200 | 81,492,654 |
| W.R. Grace & Co. | | 663,640 | 47,436,987 |
| | | | 294,559,418 |
|
| TOTAL CHEMICALS | | | 1,025,913,512 |
|
| Construction Materials - 3.6% | | | |
| Construction Materials - 3.6% | | | |
| Eagle Materials, Inc. | | 446,615 | 43,433,309 |
| Summit Materials, Inc. | | 482,400 | 14,250,096 |
| | | | 57,683,405 |
| Containers & Packaging - 17.2% | | | |
| Metal & Glass Containers - 6.5% | | | |
| Aptargroup, Inc. | | 166,000 | 13,879,260 |
| Ball Corp. | | 1,883,061 | 75,303,609 |
| Berry Global Group, Inc. (a) | | 284,200 | 15,983,408 |
| | | | 105,166,277 |
| Paper Packaging - 10.7% | | | |
| Avery Dennison Corp. | | 210,500 | 19,841,730 |
| Graphic Packaging Holding Co. | | 4,514,395 | 58,912,855 |
| Packaging Corp. of America | | 209,100 | 23,504,931 |
| WestRock Co. | | 1,248,719 | 71,064,598 |
| | | | 173,324,114 |
|
| TOTAL CONTAINERS & PACKAGING | | | 278,490,391 |
|
| Metals & Mining - 13.2% | | | |
| Copper - 2.6% | | | |
| Freeport-McMoRan, Inc. (a) | | 2,872,800 | 42,459,984 |
| Diversified Metals & Mining - 2.4% | | | |
| Alcoa Corp. | | 407,400 | 17,876,712 |
| Glencore Xstrata PLC | | 3,540,237 | 16,457,480 |
| Ivanhoe Mines Ltd. (a) | | 1,027,400 | 3,727,025 |
| | | | 38,061,217 |
| Gold - 4.6% | | | |
| Franco-Nevada Corp. | | 143,600 | 11,747,889 |
| Newmont Mining Corp. | | 1,197,000 | 45,892,980 |
| Randgold Resources Ltd. sponsored ADR (b) | | 166,000 | 17,013,340 |
| | | | 74,654,209 |
| Steel - 3.6% | | | |
| JFE Holdings, Inc. | | 240,100 | 4,743,687 |
| Reliance Steel & Aluminum Co. | | 235,800 | 17,076,636 |
| Steel Dynamics, Inc. | | 1,043,300 | 35,941,685 |
| | | | 57,762,008 |
|
| TOTAL METALS & MINING | | | 212,937,418 |
|
| Trading Companies & Distributors - 1.4% | | | |
| Trading Companies & Distributors - 1.4% | | | |
| Univar, Inc. (a) | | 794,300 | 22,407,203 |
| TOTAL COMMON STOCKS | | | |
| (Cost $1,225,458,078) | | | 1,597,431,929 |
|
| Money Market Funds - 2.2% | | | |
| Fidelity Cash Central Fund, 1.11% (c) | | 17,592,420 | 17,595,939 |
| Fidelity Securities Lending Cash Central Fund 1.11% (c)(d) | | 17,265,939 | 17,267,665 |
| TOTAL MONEY MARKET FUNDS | | | |
| (Cost $34,862,744) | | | 34,863,604 |
| TOTAL INVESTMENT IN SECURITIES - 101.2% | | | |
| (Cost $1,260,320,822) | | | 1,632,295,533 |
| NET OTHER ASSETS (LIABILITIES) - (1.2)% | | | (18,828,365) |
| NET ASSETS - 100% | | | $1,613,467,168 |
Legend
(a) Non-income producing
(b) Security or a portion of the security is on loan at period end.
(c) Affiliated fund that is generally available only to investment companies and other accounts managed by Fidelity Investments. The rate quoted is the annualized seven-day yield of the fund at period end. A complete unaudited listing of the fund's holdings as of its most recent quarter end is available upon request. In addition, each Fidelity Central Fund's financial statements are available on the SEC's website or upon request.
(d) Investment made with cash collateral received from securities on loan.
Affiliated Central Funds
Information regarding fiscal year to date income earned by the Fund from investments in Fidelity Central Funds is as follows:
| Fund | Income earned |
| Fidelity Cash Central Fund | $57,142 |
| Fidelity Securities Lending Cash Central Fund | 42,894 |
| Total | $100,036 |
Investment Valuation
All investments are categorized as Level 1 under the Fair Value Hierarchy. The inputs or methodology used for valuing securities may not be an indication of the risk associated with investing in those securities. For more information on valuation inputs please refer to the Investment Valuation section in the accompanying Notes to Financial Statements.
Other Information
Distribution of investments by country or territory of incorporation, as a percentage of Total Net Assets, is as follows (Unaudited):
| United States of America | 88.0% |
| Netherlands | 5.8% |
| Bailiwick of Jersey | 2.1% |
| Canada | 2.0% |
| Australia | 1.0% |
| Others (Individually Less Than 1%) | 1.1% |
| | 100.0% |
See accompanying notes which are an integral part of the financial statements.
Materials Portfolio
Financial Statements
Statement of Assets and Liabilities
| | | August 31, 2017 (Unaudited) |
| Assets | | |
Investment in securities, at value (including securities loaned of $17,013,340) — See accompanying schedule:
Unaffiliated issuers (cost $1,225,460,078) | $1,597,431,929 | |
| Fidelity Central Funds (cost $34,862,744) | 34,863,604 | |
| Total Investment in Securities (cost $1,260,322,822) | | $1,632,295,533 |
| Foreign currency held at value (cost $20,307) | | 20,622 |
| Receivable for fund shares sold | | 1,320,032 |
| Dividends receivable | | 2,885,278 |
| Distributions receivable from Fidelity Central Funds | | 20,599 |
| Other receivables | | 111,986 |
| Total assets | | 1,636,654,050 |
| Liabilities | | |
| Payable for investments purchased | $2,379,628 | |
| Payable for fund shares redeemed | 2,274,063 | |
| Accrued management fee | 719,781 | |
| Distribution and service plan fees payable | 121,583 | |
| Other affiliated payables | 312,611 | |
| Other payables and accrued expenses | 115,216 | |
| Collateral on securities loaned | 17,264,000 | |
| Total liabilities | | 23,186,882 |
| Net Assets | | $1,613,467,168 |
| Net Assets consist of: | | |
| Paid in capital | | $1,189,007,405 |
| Undistributed net investment income | | 7,030,550 |
| Accumulated undistributed net realized gain (loss) on investments and foreign currency transactions | | 45,456,187 |
| Net unrealized appreciation (depreciation) on investments and assets and liabilities in foreign currencies | | 371,973,026 |
| Net Assets | | $1,613,467,168 |
| Calculation of Maximum Offering Price | | |
| Class A: | | |
| Net Asset Value and redemption price per share ($189,385,356 ÷ 2,222,102 shares) | | $85.23 |
| Maximum offering price per share (100/94.25 of $85.23) | | $90.43 |
| Class M: | | |
| Net Asset Value and redemption price per share ($36,186,506 ÷ 428,341 shares) | | $84.48 |
| Maximum offering price per share (100/96.50 of $84.48) | | $87.54 |
| Class C: | | |
| Net Asset Value and offering price per share ($82,067,428 ÷ 997,161 shares)(a) | | $82.30 |
| Materials: | | |
| Net Asset Value, offering price and redemption price per share ($881,380,293 ÷ 10,285,371 shares) | | $85.69 |
| Class I: | | |
| Net Asset Value, offering price and redemption price per share ($424,447,585 ÷ 4,962,363 shares) | | $85.53 |
(a) Redemption price per share is equal to net asset value less any applicable contingent deferred sales charge.
See accompanying notes which are an integral part of the financial statements.
Statement of Operations
| | | Six months ended August 31, 2017 (Unaudited) |
| Investment Income | | |
| Dividends | | $14,074,146 |
| Income from Fidelity Central Funds | | 100,036 |
| Total income | | 14,174,182 |
| Expenses | | |
| Management fee | $4,284,426 | |
| Transfer agent fees | 1,628,285 | |
| Distribution and service plan fees | 748,422 | |
| Accounting and security lending fees | 246,736 | |
| Custodian fees and expenses | 13,537 | |
| Independent trustees' fees and expenses | 17,939 | |
| Registration fees | 91,499 | |
| Audit | 26,939 | |
| Legal | 11,127 | |
| Interest | 570 | |
| Miscellaneous | 10,692 | |
| Total expenses before reductions | 7,080,172 | |
| Expense reductions | (38,825) | 7,041,347 |
| Net investment income (loss) | | 7,132,835 |
| Realized and Unrealized Gain (Loss) | | |
| Net realized gain (loss) on: | | |
| Investment securities: | | |
| Unaffiliated issuers | 51,393,911 | |
| Fidelity Central Funds | 147 | |
| Foreign currency transactions | 1,825 | |
| Total net realized gain (loss) | | 51,395,883 |
| Change in net unrealized appreciation (depreciation) on: | | |
| Investment securities: | | |
| Unaffiliated issuers | 35,519,935 | |
| Fidelity Central Funds | (1,638) | |
| Assets and liabilities in foreign currencies | 10,004 | |
| Total change in net unrealized appreciation (depreciation) | | 35,528,301 |
| Net gain (loss) | | 86,924,184 |
| Net increase (decrease) in net assets resulting from operations | | $94,057,019 |
See accompanying notes which are an integral part of the financial statements.
Statement of Changes in Net Assets
| | Six months ended August 31, 2017 (Unaudited) | Year ended February 28, 2017 |
| Increase (Decrease) in Net Assets | | |
| Operations | | |
| Net investment income (loss) | $7,132,835 | $16,237,847 |
| Net realized gain (loss) | 51,395,883 | 64,095,613 |
| Change in net unrealized appreciation (depreciation) | 35,528,301 | 293,420,932 |
| Net increase (decrease) in net assets resulting from operations | 94,057,019 | 373,754,392 |
| Distributions to shareholders from net investment income | (2,594,339) | (13,547,763) |
| Distributions to shareholders from net realized gain | (15,363,271) | – |
| Total distributions | (17,957,610) | (13,547,763) |
| Share transactions - net increase (decrease) | (30,507,050) | (113,259,980) |
| Redemption fees | – | 17,097 |
| Total increase (decrease) in net assets | 45,592,359 | 246,963,746 |
| Net Assets | | |
| Beginning of period | 1,567,874,809 | 1,320,911,063 |
| End of period | $1,613,467,168 | $1,567,874,809 |
| Other Information | | |
| Undistributed net investment income end of period | $7,030,550 | $2,492,054 |
See accompanying notes which are an integral part of the financial statements.
Financial Highlights — Materials Portfolio Class A
| | Six months ended (Unaudited) August 31, | Years ended February 28, | | | | |
| | 2017 | 2017 | 2016 A | 2015 | 2014 | 2013 |
| Selected Per–Share Data | | | | | | |
| Net asset value, beginning of period | $81.27 | $62.94 | $80.43 | $86.46 | $73.44 | $69.23 |
| Income from Investment Operations | | | | | | |
| Net investment income (loss)B | .30 | .70 | .79 | .51 | .36 | .70 |
| Net realized and unrealized gain (loss) | 4.56 | 18.26 | (16.80) | 1.05 | 14.56 | 5.69 |
| Total from investment operations | 4.86 | 18.96 | (16.01) | 1.56 | 14.92 | 6.39 |
| Distributions from net investment income | (.10) | (.63) | (.58) | (.43) | (.30) | (.63) |
| Distributions from net realized gain | (.80) | – | (.91) | (7.17) | (1.60) | (1.55) |
| Total distributions | (.90) | (.63) | (1.48)C | (7.59)D | (1.90) | (2.18) |
| Redemption fees added to paid in capitalB | – | –E | –E | –E | –E | –E |
| Net asset value, end of period | $85.23 | $81.27 | $62.94 | $80.43 | $86.46 | $73.44 |
| Total ReturnF,G,H | 6.07% | 30.18% | (20.01)% | 2.20% | 20.46% | 9.40% |
| Ratios to Average Net AssetsI,J | | | | | | |
| Expenses before reductions | 1.07%K | 1.08% | 1.06% | 1.06% | 1.10% | 1.13% |
| Expenses net of fee waivers, if any | 1.07%K | 1.08% | 1.06% | 1.06% | 1.10% | 1.13% |
| Expenses net of all reductions | 1.07%K | 1.07% | 1.06% | 1.06% | 1.09% | 1.12% |
| Net investment income (loss) | .73%K | .96% | 1.09% | .61% | .45% | 1.02% |
| Supplemental Data | | | | | | |
| Net assets, end of period (000 omitted) | $189,385 | $229,086 | $202,747 | $319,740 | $336,777 | $219,627 |
| Portfolio turnover rateL | 48%K | 49%M | 64% | 76%M | 53% | 61% |
A For the year ended February 29.
B Calculated based on average shares outstanding during the period.
C Total distributions of $1.48 per share is comprised of distributions from net investment income of $.575 and distributions from net realized gain of $.906 per share.
D Total distributions of $7.59 per share is comprised of distributions from net investment income of $.425 and distributions from net realized gain of $7.167 per share.
E Amount represents less than $.005 per share.
F Total returns for periods of less than one year are not annualized.
G Total returns would have been lower if certain expenses had not been reduced during the applicable periods shown.
H Total returns do not include the effect of the sales charges.
I Fees and expenses of any underlying Fidelity Central Funds are not included in the Fund's expense ratio. The Fund indirectly bears its proportionate share of the expenses of any underlying Fidelity Central Funds.
J Expense ratios reflect operating expenses of the class. Expenses before reductions do not reflect amounts reimbursed by the investment adviser or reductions from brokerage service arrangements or reductions from other expense offset arrangements and do not represent the amount paid by the class during periods when reimbursements or reductions occur. Expenses net of fee waivers reflect expenses after reimbursement by the investment adviser but prior to reductions from brokerage service arrangements or other expense offset arrangements. Expenses net of all reductions represent the net expenses paid by the class.
K Annualized
L Amount does not include the portfolio activity of any underlying Fidelity Central Funds.
M Portfolio turnover rate excludes securities received or delivered in-kind.
See accompanying notes which are an integral part of the financial statements.
Financial Highlights — Materials Portfolio Class M
| | Six months ended (Unaudited) August 31, | Years ended February 28, | | | | |
| | 2017 | 2017 | 2016 A | 2015 | 2014 | 2013 |
| Selected Per–Share Data | | | | | | |
| Net asset value, beginning of period | $80.66 | $62.52 | $79.95 | $85.99 | $73.05 | $68.91 |
| Income from Investment Operations | | | | | | |
| Net investment income (loss)B | .18 | .47 | .56 | .25 | .12 | .50 |
| Net realized and unrealized gain (loss) | 4.52 | 18.12 | (16.69) | 1.06 | 14.48 | 5.66 |
| Total from investment operations | 4.70 | 18.59 | (16.13) | 1.31 | 14.60 | 6.16 |
| Distributions from net investment income | (.08) | (.45) | (.40) | (.18) | (.06) | (.46) |
| Distributions from net realized gain | (.80) | – | (.91) | (7.17) | (1.60) | (1.55) |
| Total distributions | (.88) | (.45) | (1.30)C | (7.35) | (1.66) | (2.02)D |
| Redemption fees added to paid in capitalB | – | –E | –E | –E | –E | –E |
| Net asset value, end of period | $84.48 | $80.66 | $62.52 | $79.95 | $85.99 | $73.05 |
| Total ReturnF,G,H | 5.91% | 29.78% | (20.27)% | 1.90% | 20.10% | 9.10% |
| Ratios to Average Net AssetsI,J | | | | | | |
| Expenses before reductions | 1.36%K | 1.39% | 1.38% | 1.37% | 1.40% | 1.42% |
| Expenses net of fee waivers, if any | 1.36%K | 1.39% | 1.37% | 1.37% | 1.40% | 1.42% |
| Expenses net of all reductions | 1.36%K | 1.38% | 1.37% | 1.37% | 1.39% | 1.41% |
| Net investment income (loss) | .44%K | .65% | .77% | .31% | .15% | .73% |
| Supplemental Data | | | | | | |
| Net assets, end of period (000 omitted) | $36,187 | $40,935 | $30,118 | $45,252 | $45,223 | $37,860 |
| Portfolio turnover rateL | 48%K | 49%M | 64% | 76%M | 53% | 61% |
A For the year ended February 29.
B Calculated based on average shares outstanding during the period.
C Total distributions of $1.30 per share is comprised of distributions from net investment income of $.395 and distributions from net realized gain of $.906 per share.
D Total distributions of $2.02 per share is comprised of distributions from net investment income of $.463 and distributions from net realized gain of $1.552 per share.
E Amount represents less than $.005 per share.
F Total returns for periods of less than one year are not annualized.
G Total returns would have been lower if certain expenses had not been reduced during the applicable periods shown.
H Total returns do not include the effect of the sales charges.
I Fees and expenses of any underlying Fidelity Central Funds are not included in the Fund's expense ratio. The Fund indirectly bears its proportionate share of the expenses of any underlying Fidelity Central Funds.
J Expense ratios reflect operating expenses of the class. Expenses before reductions do not reflect amounts reimbursed by the investment adviser or reductions from brokerage service arrangements or reductions from other expense offset arrangements and do not represent the amount paid by the class during periods when reimbursements or reductions occur. Expenses net of fee waivers reflect expenses after reimbursement by the investment adviser but prior to reductions from brokerage service arrangements or other expense offset arrangements. Expenses net of all reductions represent the net expenses paid by the class.
K Annualized
L Amount does not include the portfolio activity of any underlying Fidelity Central Funds.
M Portfolio turnover rate excludes securities received or delivered in-kind.
See accompanying notes which are an integral part of the financial statements.
Financial Highlights — Materials Portfolio Class C
| | Six months ended (Unaudited) August 31, | Years ended February 28, | | | | |
| | 2017 | 2017 | 2016 A | 2015 | 2014 | 2013 |
| Selected Per–Share Data | | | | | | |
| Net asset value, beginning of period | $78.72 | $61.09 | $78.12 | $84.38 | $71.96 | $67.98 |
| Income from Investment Operations | | | | | | |
| Net investment income (loss)B | (.01) | .15 | .24 | (.12) | (.23) | .18 |
| Net realized and unrealized gain (loss) | 4.41 | 17.68 | (16.28) | 1.03 | 14.23 | 5.55 |
| Total from investment operations | 4.40 | 17.83 | (16.04) | .91 | 14.00 | 5.73 |
| Distributions from net investment income | (.02) | (.20) | (.08) | – | – | (.20) |
| Distributions from net realized gain | (.80) | – | (.91) | (7.17) | (1.58) | (1.55) |
| Total distributions | (.82) | (.20) | (.99) | (7.17) | (1.58) | (1.75) |
| Redemption fees added to paid in capitalB | – | –C | –C | –C | –C | –C |
| Net asset value, end of period | $82.30 | $78.72 | $61.09 | $78.12 | $84.38 | $71.96 |
| Total ReturnD,E,F | 5.66% | 29.21% | (20.61)% | 1.43% | 19.56% | 8.58% |
| Ratios to Average Net AssetsG,H | | | | | | |
| Expenses before reductions | 1.82%I | 1.83% | 1.81% | 1.82% | 1.85% | 1.89% |
| Expenses net of fee waivers, if any | 1.82%I | 1.82% | 1.81% | 1.82% | 1.85% | 1.89% |
| Expenses net of all reductions | 1.82%I | 1.82% | 1.81% | 1.82% | 1.84% | 1.88% |
| Net investment income (loss) | (.02)%I | .21% | .34% | (.14)% | (.30)% | .26% |
| Supplemental Data | | | | | | |
| Net assets, end of period (000 omitted) | $82,067 | $80,225 | $66,896 | $107,697 | $106,879 | $75,007 |
| Portfolio turnover rateJ | 48%I | 49%K | 64% | 76%K | 53% | 61% |
A For the year ended February 29.
B Calculated based on average shares outstanding during the period.
C Amount represents less than $.005 per share.
D Total returns for periods of less than one year are not annualized.
E Total returns would have been lower if certain expenses had not been reduced during the applicable periods shown.
F Total returns do not include the effect of the contingent deferred sales charge.
G Fees and expenses of any underlying Fidelity Central Funds are not included in the Fund's expense ratio. The Fund indirectly bears its proportionate share of the expenses of any underlying Fidelity Central Funds.
H Expense ratios reflect operating expenses of the class. Expenses before reductions do not reflect amounts reimbursed by the investment adviser or reductions from brokerage service arrangements or reductions from other expense offset arrangements and do not represent the amount paid by the class during periods when reimbursements or reductions occur. Expenses net of fee waivers reflect expenses after reimbursement by the investment adviser but prior to reductions from brokerage service arrangements or other expense offset arrangements. Expenses net of all reductions represent the net expenses paid by the class.
I Annualized
J Amount does not include the portfolio activity of any underlying Fidelity Central Funds.
K Portfolio turnover rate excludes securities received or delivered in-kind.
See accompanying notes which are an integral part of the financial statements.
Financial Highlights — Materials Portfolio
| | Six months ended (Unaudited) August 31, | Years ended February 28, | | | | |
| | 2017 | 2017 | 2016 A | 2015 | 2014 | 2013 |
| Selected Per–Share Data | | | | | | |
| Net asset value, beginning of period | $81.64 | $63.20 | $80.77 | $86.81 | $73.68 | $69.41 |
| Income from Investment Operations | | | | | | |
| Net investment income (loss)B | .41 | .90 | .98 | .73 | .58 | .90 |
| Net realized and unrealized gain (loss) | 4.59 | 18.34 | (16.89) | 1.05 | 14.63 | 5.71 |
| Total from investment operations | 5.00 | 19.24 | (15.91) | 1.78 | 15.21 | 6.61 |
| Distributions from net investment income | (.15) | (.80) | (.76) | (.65) | (.48) | (.79) |
| Distributions from net realized gain | (.80) | – | (.91) | (7.17) | (1.60) | (1.55) |
| Total distributions | (.95) | (.80) | (1.66)C | (7.82) | (2.08) | (2.34) |
| Redemption fees added to paid in capitalB | – | –D | –D | –D | –D | –D |
| Net asset value, end of period | $85.69 | $81.64 | $63.20 | $80.77 | $86.81 | $73.68 |
| Total ReturnE,F | 6.21% | 30.52% | (19.81)% | 2.46% | 20.80% | 9.71% |
| Ratios to Average Net AssetsG,H | | | | | | |
| Expenses before reductions | .80%I | .81% | .81% | .80% | .82% | .85% |
| Expenses net of fee waivers, if any | .80%I | .81% | .81% | .80% | .82% | .85% |
| Expenses net of all reductions | .80%I | .81% | .80% | .80% | .82% | .84% |
| Net investment income (loss) | 1.01%I | 1.22% | 1.34% | .87% | .73% | 1.30% |
| Supplemental Data | | | | | | |
| Net assets, end of period (000 omitted) | $881,380 | $882,504 | $711,985 | $1,107,689 | $1,231,942 | $1,146,782 |
| Portfolio turnover rateJ | 48%I | 49%K | 64% | 76%K | 53% | 61% |
A For the year ended February 29.
B Calculated based on average shares outstanding during the period.
C Total distributions of $1.66 per share is comprised of distributions from net investment income of $.756 and distributions from net realized gain of $.906 per share.
D Amount represents less than $.005 per share.
E Total returns for periods of less than one year are not annualized.
F Total returns would have been lower if certain expenses had not been reduced during the applicable periods shown.
G Fees and expenses of any underlying Fidelity Central Funds are not included in the Fund's expense ratio. The Fund indirectly bears its proportionate share of the expenses of any underlying Fidelity Central Funds.
H Expense ratios reflect operating expenses of the class. Expenses before reductions do not reflect amounts reimbursed by the investment adviser or reductions from brokerage service arrangements or reductions from other expense offset arrangements and do not represent the amount paid by the class during periods when reimbursements or reductions occur. Expenses net of fee waivers reflect expenses after reimbursement by the investment adviser but prior to reductions from brokerage service arrangements or other expense offset arrangements. Expenses net of all reductions represent the net expenses paid by the class.
I Annualized
J Amount does not include the portfolio activity of any underlying Fidelity Central Funds.
K Portfolio turnover rate excludes securities received or delivered in-kind.
See accompanying notes which are an integral part of the financial statements.
Financial Highlights — Materials Portfolio Class I
| | Six months ended (Unaudited) August 31, | Years ended February 28, | | | | |
| | 2017 | 2017 | 2016 A | 2015 | 2014 | 2013 |
| Selected Per–Share Data | | | | | | |
| Net asset value, beginning of period | $81.49 | $63.07 | $80.60 | $86.66 | $73.57 | $69.35 |
| Income from Investment Operations | | | | | | |
| Net investment income (loss)B | .42 | .91 | 1.00 | .74 | .59 | .90 |
| Net realized and unrealized gain (loss) | 4.57 | 18.31 | (16.86) | 1.05 | 14.60 | 5.70 |
| Total from investment operations | 4.99 | 19.22 | (15.86) | 1.79 | 15.19 | 6.60 |
| Distributions from net investment income | (.15) | (.80) | (.77) | (.68) | (.50) | (.83) |
| Distributions from net realized gain | (.80) | – | (.91) | (7.17) | (1.60) | (1.55) |
| Total distributions | (.95) | (.80) | (1.67)C | (7.85) | (2.10) | (2.38) |
| Redemption fees added to paid in capitalB | – | –D | –D | –D | –D | –D |
| Net asset value, end of period | $85.53 | $81.49 | $63.07 | $80.60 | $86.66 | $73.57 |
| Total ReturnE,F | 6.22% | 30.55% | (19.79)% | 2.49% | 20.81% | 9.71% |
| Ratios to Average Net AssetsG,H | | | | | | |
| Expenses before reductions | .79%I | .79% | .78% | .78% | .81% | .85% |
| Expenses net of fee waivers, if any | .79%I | .79% | .78% | .78% | .81% | .85% |
| Expenses net of all reductions | .79%I | .78% | .78% | .78% | .81% | .84% |
| Net investment income (loss) | 1.01%I | 1.25% | 1.37% | .89% | .74% | 1.30% |
| Supplemental Data | | | | | | |
| Net assets, end of period (000 omitted) | $424,448 | $335,124 | $306,145 | $468,371 | $333,963 | $246,696 |
| Portfolio turnover rateJ | 48%I | 49%K | 64% | 76%K | 53% | 61% |
A For the year ended February 29.
B Calculated based on average shares outstanding during the period.
C Total distributions of $1.67 per share is comprised of distributions from net investment income of $.767 and distributions from net realized gain of $.906 per share.
D Amount represents less than $.005 per share.
E Total returns for periods of less than one year are not annualized.
F Total returns would have been lower if certain expenses had not been reduced during the applicable periods shown.
G Fees and expenses of any underlying Fidelity Central Funds are not included in the Fund's expense ratio. The Fund indirectly bears its proportionate share of the expenses of any underlying Fidelity Central Funds.
H Expense ratios reflect operating expenses of the class. Expenses before reductions do not reflect amounts reimbursed by the investment adviser or reductions from brokerage service arrangements or reductions from other expense offset arrangements and do not represent the amount paid by the class during periods when reimbursements or reductions occur. Expenses net of fee waivers reflect expenses after reimbursement by the investment adviser but prior to reductions from brokerage service arrangements or other expense offset arrangements. Expenses net of all reductions represent the net expenses paid by the class.
I Annualized
J Amount does not include the portfolio activity of any underlying Fidelity Central Funds.
K Portfolio turnover rate excludes securities received or delivered in-kind.
See accompanying notes which are an integral part of the financial statements.
Notes to Financial Statements (Unaudited)
For the period ended August 31, 2017
1. Organization.
Materials Portfolio (the Fund) is a non-diversified fund of Fidelity Select Portfolios (the Trust) and is authorized to issue an unlimited number of shares. The Trust is registered under the Investment Company Act of 1940, as amended (the 1940 Act), as an open-end management investment company organized as a Massachusetts business trust. The Fund invests primarily in securities of companies whose principal business activities fall within specific industries. The Fund offers Class A, Class M (formerly Class T), Class C, Materials and Class I shares, each of which has equal rights as to assets and voting privileges. Each class has exclusive voting rights with respect to matters that affect that class.
After the close of business on June 24, 2016, all outstanding Class B shares were converted to Class A shares. All prior fiscal period dollar and share amounts for Class B presented in the Notes to Financial Statements are for the period March 1, 2016 through June 24, 2016.
2. Investments in Fidelity Central Funds.
The Fund invests in Fidelity Central Funds, which are open-end investment companies generally available only to other investment companies and accounts managed by the investment adviser and its affiliates. The Fund's Schedule of Investments lists each of the Fidelity Central Funds held as of period end, if any, as an investment of the Fund, but does not include the underlying holdings of each Fidelity Central Fund. As an Investing Fund, the Fund indirectly bears its proportionate share of the expenses of the underlying Fidelity Central Funds.
The Money Market Central Funds seek preservation of capital and current income and are managed by Fidelity Investments Money Management, Inc. (FIMM), an affiliate of the investment adviser. Annualized expenses of the Money Market Central Funds as of their most recent shareholder report date are less than .005%.
A complete unaudited list of holdings for each Fidelity Central Fund is available upon request or at the Securities and Exchange Commission (the SEC) website at www.sec.gov. In addition, the financial statements of the Fidelity Central Funds are available on the SEC website or upon request.
3. Significant Accounting Policies.
The Fund is an investment company and applies the accounting and reporting guidance of the Financial Accounting Standards Board (FASB) Accounting Standards Codification Topic 946 Financial Services – Investments Companies. The financial statements have been prepared in conformity with accounting principles generally accepted in the United States of America (GAAP), which require management to make certain estimates and assumptions at the date of the financial statements. Actual results could differ from those estimates. Subsequent events, if any, through the date that the financial statements were issued have been evaluated in the preparation of the financial statements. The following summarizes the significant accounting policies of the Fund:
Investment Valuation. Investments are valued as of 4:00 p.m. Eastern time on the last calendar day of the period. The Board of Trustees (the Board) has delegated the day to day responsibility for the valuation of the Fund's investments to the Fair Value Committee (the Committee) established by the Fund's investment adviser. In accordance with valuation policies and procedures approved by the Board, the Fund attempts to obtain prices from one or more third party pricing vendors or brokers to value its investments. When current market prices, quotations or currency exchange rates are not readily available or reliable, investments will be fair valued in good faith by the Committee, in accordance with procedures adopted by the Board. Factors used in determining fair value vary by investment type and may include market or investment specific events. The frequency with which these procedures are used cannot be predicted and they may be utilized to a significant extent. The Committee oversees the Fund's valuation policies and procedures and reports to the Board on the Committee's activities and fair value determinations. The Board monitors the appropriateness of the procedures used in valuing the Fund's investments and ratifies the fair value determinations of the Committee.
The Fund categorizes the inputs to valuation techniques used to value its investments into a disclosure hierarchy consisting of three levels as shown below:
- Level 1 – quoted prices in active markets for identical investments
- Level 2 – other significant observable inputs (including quoted prices for similar investments, interest rates, prepayment speeds, etc.)
- Level 3 – unobservable inputs (including the Fund's own assumptions based on the best information available)
Valuation techniques used to value the Fund's investments by major category are as follows:
Equity securities, including restricted securities, for which market quotations are readily available, are valued at the last reported sale price or official closing price as reported by a third party pricing vendor on the primary market or exchange on which they are traded and are categorized as Level 1 in the hierarchy. In the event there were no sales during the day or closing prices are not available, securities are valued at the last quoted bid price or may be valued using the last available price and are generally categorized as Level 2 in the hierarchy. For foreign equity securities, when market or security specific events arise, comparisons to the valuation of American Depositary Receipts (ADRs), futures contracts, Exchange-Traded Funds (ETFs) and certain indexes as well as quoted prices for similar securities may be used and would be categorized as Level 2 in the hierarchy. Utilizing these techniques may result in transfers between Level 1 and Level 2. For equity securities, including restricted securities, where observable inputs are limited, assumptions about market activity and risk are used and these securities may be categorized as Level 3 in the hierarchy.
Investments in open-end mutual funds, including the Fidelity Central Funds, are valued at their closing net asset value (NAV) each business day and are categorized as Level 1 in the hierarchy.
Changes in valuation techniques may result in transfers in or out of an assigned level within the disclosure hierarchy.
Foreign Currency. The Fund may use foreign currency contracts to facilitate transactions in foreign-denominated securities. Gains and losses from these transactions may arise from changes in the value of the foreign currency or if the counterparties do not perform under the contracts' terms.
Foreign-denominated assets, including investment securities, and liabilities are translated into U.S. dollars at the exchange rates at period end. Purchases and sales of investment securities, income and dividends received and expenses denominated in foreign currencies are translated into U.S. dollars at the exchange rate in effect on the transaction date.
The effects of exchange rate fluctuations on investments are included with the net realized and unrealized gain (loss) on investment securities. Other foreign currency transactions resulting in realized and unrealized gain (loss) are disclosed separately.
Investment Transactions and Income. For financial reporting purposes, the Fund's investment holdings and NAV include trades executed through the end of the last business day of the period. The NAV per share for processing shareholder transactions is calculated as of the close of business of the New York Stock Exchange (NYSE), normally 4:00 p.m. Eastern time and includes trades executed through the end of the prior business day. Gains and losses on securities sold are determined on the basis of identified cost and may include proceeds received from litigation. Dividend income is recorded on the ex-dividend date, except for certain dividends from foreign securities where the ex-dividend date may have passed, which are recorded as soon as the Fund is informed of the ex-dividend date. Non-cash dividends included in dividend income, if any, are recorded at the fair market value of the securities received. Income and capital gain distributions from Fidelity Central Funds, if any, are recorded on the ex-dividend date. Certain distributions received by the Fund represent a return of capital or capital gain. The Fund determines the components of these distributions subsequent to the ex-dividend date, based upon receipt of tax filings or other correspondence relating to the underlying investment. These distributions are recorded as a reduction of cost of investments and/or as a realized gain. Investment income is recorded net of foreign taxes withheld where recovery of such taxes is uncertain.
Class Allocations and Expenses. Investment income, realized and unrealized capital gains and losses, common expenses of the Fund, and certain fund-level expense reductions, if any, are allocated daily on a pro-rata basis to each class based on the relative net assets of each class to the total net assets of the Fund. Each class differs with respect to transfer agent and distribution and service plan fees incurred. Certain expense reductions may also differ by class. For the reporting period, the allocated portion of income and expenses to each class as a percent of its average net assets may vary due to the timing of recording these transactions in relation to fluctuating net assets of the classes. Expenses directly attributable to a fund are charged to that fund. Expenses attributable to more than one fund are allocated among the respective funds on the basis of relative net assets or other appropriate methods. Expense estimates are accrued in the period to which they relate and adjustments are made when actual amounts are known.
Deferred Trustee Compensation. Under a Deferred Compensation Plan (the Plan), independent Trustees may elect to defer receipt of a portion of their annual compensation. Deferred amounts are invested in a cross-section of Fidelity funds, are marked-to-market and remain in the Fund until distributed in accordance with the Plan. The investment of deferred amounts and the offsetting payable to the Trustees are included in the accompanying Statement of Assets and Liabilities.
Income Tax Information and Distributions to Shareholders. Each year, the Fund intends to qualify as a regulated investment company under Subchapter M of the Internal Revenue Code, including distributing substantially all of its taxable income and realized gains. As a result, no provision for U.S. Federal income taxes is required. The Fund files a U.S. federal tax return, in addition to state and local tax returns as required. The Fund's federal income tax returns are subject to examination by the Internal Revenue Service (IRS) for a period of three fiscal years after they are filed. State and local tax returns may be subject to examination for an additional fiscal year depending on the jurisdiction. Foreign taxes are provided for based on the Fund's understanding of the tax rules and rates that exist in the foreign markets in which it invests.
Distributions are declared and recorded on the ex-dividend date. Income dividends and capital gain distributions are declared separately for each class. Income and capital gain distributions are determined in accordance with income tax regulations, which may differ from GAAP.
Capital accounts within the financial statements are adjusted for permanent book-tax differences. These adjustments have no impact on net assets or the results of operations. Capital accounts are not adjusted for temporary book-tax differences which will reverse in a subsequent period.
Book-tax differences are primarily due to in-kind transactions, foreign currency transactions, deferred trustees compensation, capital loss carryforwards and losses deferred due to wash sales and excise tax regulations.
As of period end, the cost and unrealized appreciation (depreciation) in securities, and derivatives if applicable, for federal income tax purposes were as follows:
| Gross unrealized appreciation | $381,555,886 |
| Gross unrealized depreciation | (10,848,625) |
| Net unrealized appreciation (depreciation) | $370,707,261 |
| Tax cost | $1,261,588,272 |
Capital loss carryforwards are only available to offset future capital gains of the Fund to the extent provided by regulations and may be limited. Under the Regulated Investment Company Modernization Act of 2010 (the Act), the Fund is permitted to carry forward capital losses incurred in taxable years beginning after December 22, 2010 for an unlimited period and such capital losses are required to be used prior to any losses that expire. The capital loss carryforward information presented below, including any applicable limitation, is estimated as of fiscal period end and is subject to adjustment.
| Fiscal year of expiration | |
| 2018 | $(611,309) |
| 2019 | (80,787) |
| Total with expiration | $(692,096) |
The Fund acquired $692,096 of its capital loss carryforward as part of a merger in a prior period. The losses acquired that will be available to offset future capital gains of the Fund will be limited to approximately $611,309 per year.
4. Purchases and Sales of Investments.
Purchases and sales of securities, other than short-term securities, aggregated $376,858,242 and $418,129,637, respectively.
5. Fees and Other Transactions with Affiliates.
Management Fee. Fidelity SelectCo, LLC (the investment adviser) and its affiliates provide the Fund with investment management related services for which the Fund pays a monthly management fee. The management fee is the sum of an individual fund fee rate that is based on an annual rate of .30% of the Fund's average net assets and an annualized group fee rate that averaged .25% during the period. The group fee rate is based upon the average net assets of all the mutual funds advised by Fidelity Management & Research Company (FMR) and the investment adviser. The group fee rate decreases as assets under management increase and increases as assets under management decrease. For the reporting period, the total annualized management fee rate was .54% of the Fund's average net assets.
Distribution and Service Plan Fees. In accordance with Rule 12b-1 of the 1940 Act, the Fund has adopted separate Distribution and Service Plans for each class of shares. Certain classes pay Fidelity Distributors Corporation (FDC), an affiliate of the investment adviser, separate Distribution and Service Fees, each of which is based on an annual percentage of each class' average net assets. In addition, FDC may pay financial intermediaries for selling shares of the Fund and providing shareholder support services. For the period, the Distribution and Service Fee rates, total fees and amounts retained by FDC were as follows:
| | Distribution
Fee | Service
Fee | Total Fees | Retained
by FDC |
| Class A | -% | .25% | $243,537 | $– |
| Class M | .25% | .25% | 98,574 | – |
| Class C | .75% | .25% | 406,311 | 46,835 |
| | | | $748,422 | $46,835 |
Sales Load. FDC may receive a front-end sales charge of up to 5.75% for selling Class A shares and 3.50% for selling Class M shares, some of which is paid to financial intermediaries for selling shares of the Fund. Depending on the holding period, FDC may receive contingent deferred sales charges levied on Class A, Class M and Class C redemptions. The deferred sales charges are 1.00% for Class C shares, 1.00% for certain purchases of Class A shares and .25% for certain purchases of Class M shares.
For the period, sales charge amounts retained by FDC were as follows:
| | Retained
by FDC |
| Class A | $41,394 |
| Class M | 3,776 |
| Class C(a) | 4,301 |
| | $49,471 |
(a) When Class C shares are initially sold, FDC pays commissions from its own resources to financial intermediaries through which the sales are made.
Transfer Agent Fees. Fidelity Investments Institutional Operations Company, Inc., (FIIOC), an affiliate of the investment adviser, is the transfer, dividend disbursing and shareholder servicing agent for each class of the Fund. FIIOC receives account fees and asset-based fees that vary according to the account size and type of account of the shareholders of the respective classes of the Fund. FIIOC pays for typesetting, printing and mailing of shareholder reports, except proxy statements.
For the period, transfer agent fees for each class were as follows:
| | Amount | % of
Class-Level Average
Net Assets(a) |
| Class A | $218,546 | .22 |
| Class M | 52,341 | .27 |
| Class C | 91,657 | .23 |
| Materials | 879,179 | .20 |
| Class I | 386,562 | .20 |
| | $1,628,285 | |
(a) Annualized
Accounting and Security Lending Fees. Fidelity Service Company, Inc. (FSC), an affiliate of the investment adviser, maintains the Fund's accounting records. The accounting fee is based on the level of average net assets for each month. Under a separate contract, FSC administers the security lending program. The security lending fee is based on the number and duration of lending transactions.
Brokerage Commissions. The Fund placed a portion of its portfolio transactions with brokerage firms which are affiliates of the investment adviser. Brokerage commissions are included in net realized gain (loss) and change in net unrealized appreciation (depreciation) in the Statement of Operations. The commissions paid to these affiliated firms were $10,316 for the period.
Interfund Lending Program. Pursuant to an Exemptive Order issued by the SEC, the Fund, along with other registered investment companies having management contracts with FMR or other affiliated entities of FMR, may participate in an interfund lending program. This program provides an alternative credit facility allowing the funds to borrow from, or lend money to, other participating affiliated funds. At period end, there were no interfund loans outstanding. The Fund's activity in this program during the period for which loans were outstanding was as follows:
| Borrower or Lender | Average Loan Balance | Weighted Average Interest Rate | Interest Expense |
| Borrower | $7,691,000 | 1.34% | $570 |
Interfund Trades. The Fund may purchase from or sell securities to other Fidelity Funds under procedures adopted by the Board. The procedures have been designed to ensure these interfund trades are executed in accordance with Rule 17a-7 of the 1940 Act. Interfund trades are included within the respective purchases and sales amounts shown in the Purchases and Sales of Investments note.
Prior Fiscal Year Redemptions In-Kind. During the prior period, 845,013 shares of the Fund held by an affiliated entity were redeemed in-kind for investments and cash with a value of $60,325,459. The Fund had a net realized gain of $17,720,821 on investments delivered through in-kind redemptions. The amount of the in-kind redemptions is included in share transactions in the accompanying Statement of Changes in Net Assets as well as the Notes to Financial Statements. The Fund recognized no gain or loss for federal income tax purposes.
6. Committed Line of Credit.
The Fund participates with other funds managed by the investment adviser or an affiliate in a $4.25 billion credit facility (the "line of credit") to be utilized for temporary or emergency purposes to fund shareholder redemptions or for other short-term liquidity purposes. The Fund has agreed to pay commitment fees on its pro-rata portion of the line of credit, which amounted to $2,512 and is reflected in Miscellaneous expenses on the Statement of Operations. During the period, the Fund did not borrow on this line of credit.
7. Security Lending.
The Fund lends portfolio securities through a lending agent from time to time in order to earn additional income. On the settlement date of the loan, the Fund receives collateral (in the form of U.S. Treasury obligations, letters of credit and/or cash) against the loaned securities and maintains collateral in an amount not less than 100% of the market value of the loaned securities during the period of the loan. The market value of the loaned securities is determined at the close of business of the Fund and any additional required collateral is delivered to the Fund on the next business day. The Fund or borrower may terminate the loan at any time, and if the borrower defaults on its obligation to return the securities loaned because of insolvency or other reasons, the Fund may apply collateral received from the borrower against the obligation. The Fund may experience delays and costs in recovering the securities loaned. Any cash collateral received is invested in the Fidelity Securities Lending Cash Central Fund. The value of loaned securities and cash collateral at period end are disclosed on the Fund's Statement of Assets and Liabilities. Security lending income represents the income earned on investing cash collateral, less rebates paid to borrowers and any lending agent fees associated with the loan, plus any premium payments received for lending certain types of securities. Security lending income is presented in the Statement of Operations as a component of income from Fidelity Central Funds. Total security lending income during the period amounted to $42,894.
8. Expense Reductions.
Commissions paid to certain brokers with whom the investment adviser, or its affiliates, places trades on behalf of the Fund include an amount in addition to trade execution, which may be rebated back to the Fund to offset certain expenses. This amount totaled $31,677 for the period
In addition, during the period the investment adviser reimbursed and/or waived a portion of fund-level operating expenses in the amount of $7,148.
9. Distributions to Shareholders.
Distributions to shareholders of each class were as follows:
| | Six months ended
August 31, 2017 | Year ended February 28, 2017 |
| From net investment income | | |
| Class A | $251,830 | $1,672,756 |
| Class M | 41,120 | 205,222 |
| Class C | 21,712 | 195,843 |
| Materials | 1,551,064 | 8,304,133 |
| Class I | 728,613 | 3,169,809 |
| Total | $2,594,339 | $13,547,763 |
| From net realized gain | | |
| Class A | $1,932,857 | $– |
| Class M | 410,177 | – |
| Class C | 825,070 | – |
| Materials | 8,419,630 | – |
| Class I | 3,775,537 | – |
| Total | $15,363,271 | $– |
10. Share Transactions.
Share transactions for each class were as follows and may contain automatic conversions between classes or exchanges between affiliated funds:
| | Shares | Shares | Dollars | Dollars |
| | Six months ended
August 31, 2017 | Year ended February 28, 2017 | Six months ended
August 31, 2017 | Year ended February 28, 2017 |
| Class A | | | | |
| Shares sold | 360,126 | 902,923 | $29,389,353 | $67,495,419 |
| Reinvestment of distributions | 26,448 | 20,549 | 2,095,242 | 1,575,920 |
| Shares redeemed | (983,377) | (1,326,009) | (80,641,332) | (96,308,599) |
| Net increase (decrease) | (596,803) | (402,537) | $(49,156,737) | $(27,237,260) |
| Class M | | | | |
| Shares sold | 130,996 | 158,674 | $10,589,239 | $11,939,333 |
| Reinvestment of distributions | 5,733 | 2,663 | 450,680 | 202,830 |
| Shares redeemed | (215,919) | (135,543) | (17,511,909) | (9,849,995) |
| Net increase (decrease) | (79,190) | 25,794 | $(6,471,990) | $2,292,168 |
| Class B | | | | |
| Shares sold | – | 325 | $– | $22,444 |
| Shares redeemed | – | (49,632) | – | (3,403,614) |
| Net increase (decrease) | – | (49,307) | $– | $(3,381,170) |
| Class C | | | | |
| Shares sold | 97,906 | 197,093 | $7,719,298 | $14,487,205 |
| Reinvestment of distributions | 10,428 | 2,419 | 800,052 | 179,992 |
| Shares redeemed | (130,332) | (275,454) | (10,327,170) | (19,415,602) |
| Net increase (decrease) | (21,998) | (75,942) | $(1,807,820) | $(4,748,405) |
| Materials | | | | |
| Shares sold | 807,375 | 2,367,980 | $66,920,266 | $176,958,165 |
| Reinvestment of distributions | 117,439 | 100,563 | 9,344,603 | 7,743,369 |
| Shares redeemed | (1,449,071) | (2,924,430) | (119,003,042) | (214,559,584) |
| Net increase (decrease) | (524,257) | (455,887) | $(42,738,173) | $(29,858,050) |
| Class I | | | | |
| Shares sold | 1,437,469 | 1,754,029 | $118,140,685 | $130,244,335 |
| Reinvestment of distributions | 53,154 | 37,780 | 4,221,464 | 2,903,738 |
| Shares redeemed | (640,489) | (2,533,375)(a) | (52,694,479) | (183,475,336)(a) |
| Net increase (decrease) | 850,134 | (741,566) | $69,667,670 | $(50,327,263) |
(a) Amount includes in-kind redemptions (see the Prior Fiscal Year Redemptions In-Kind note for additional details).
11. Other.
The Fund's organizational documents provide former and current trustees and officers with a limited indemnification against liabilities arising in connection with the performance of their duties to the Fund. In the normal course of business, the Fund may also enter into contracts that provide general indemnifications. The Fund's maximum exposure under these arrangements is unknown as this would be dependent on future claims that may be made against the Fund. The risk of material loss from such claims is considered remote.
Shareholder Expense Example
As a shareholder of a Fund, you incur two types of costs: (1) transaction costs, including sales charges (loads) on purchase payments or redemption proceeds and (2) ongoing costs, including management fees, distribution and/or service (12b-1) fees and other Fund expenses. This Example is intended to help you understand your ongoing costs (in dollars) of investing in the Fund and to compare these costs with the ongoing costs of investing in other mutual funds.
The Example is based on an investment of $1,000 invested at the beginning of the period and held for the entire period (March 1, 2017 to August 31, 2017).
Actual Expenses
The first line of the accompanying table for each Class of each fund provides information about actual account values and actual expenses. You may use the information in this line, together with the amount you invested, to estimate the expenses that you paid over the period. Simply divide your account value by $1,000.00 (for example, an $8,600 account value divided by $1,000.00 = 8.6), then multiply the result by the number in the first line for a Class of the fund under the heading entitled "Expenses Paid During Period" to estimate the expenses you paid on your account during this period. A small balance maintenance fee of $12.00 that is charged once a year may apply for certain accounts with a value of less than $2,000. This fee is not included in the table below. If it was, the estimate of expenses you paid during the period would be higher, and your ending account value lower, by this amount. In addition, each Fund, as a shareholder in the underlying Fidelity Central Funds, will indirectly bear its pro-rata share of the fees and expenses incurred by the underlying Fidelity Central Funds. These fees and expenses are not included in the Fund's annualized expense ratio used to calculate the expense estimate in the table below.
Hypothetical Example for Comparison Purposes
The second line of the accompanying table for each Class of each fund provides information about hypothetical account values and hypothetical expenses based on a Class' actual expense ratio and an assumed rate of return of 5% per year before expenses, which is not the Class' actual return. The hypothetical account values and expenses may not be used to estimate the actual ending account balance or expenses you paid for the period. You may use this information to compare the ongoing costs of investing in the Fund and other funds. To do so, compare this 5% hypothetical example with the 5% hypothetical examples that appear in the shareholder reports of the other funds. A small balance maintenance fee of $12.00 that is charged once a year may apply for certain accounts with a value of less than $2,000. This fee is not included in the table below. If it was, the estimate of expenses you paid during the period would be higher, and your ending account value lower, by this amount. In addition, each Fund, as a shareholder in the underlying Fidelity Central Funds, will indirectly bear its pro-rata share of the fees and expenses incurred by the underlying Fidelity Central Funds. These fees and expenses are not included in the Fund's annualized expense ratio used to calculate the expense estimate in the table below.
Please note that the expenses shown in the table are meant to highlight your ongoing costs only and do not reflect any transaction costs. Therefore, the second line of the table is useful in comparing ongoing costs only, and will not help you determine the relative total costs of owning different funds. In addition, if these transactional costs were included, your costs would have been higher.
| | Annualized Expense Ratio-A | Beginning
Account Value
March 1, 2017 | Ending
Account Value
August 31, 2017 | Expenses Paid
During Period-B
March 1, 2017
to August 31, 2017 |
| Chemicals Portfolio | .78% | | | |
| Actual | | $1,000.00 | $1,069.60 | $4.07 |
| Hypothetical-C | | $1,000.00 | $1,021.27 | $3.97 |
| Gold Portfolio | | | | |
| Class A | 1.16% | | | |
| Actual | | $1,000.00 | $1,055.20 | $6.01 |
| Hypothetical-C | | $1,000.00 | $1,019.36 | $5.90 |
| Class M | 1.46% | | | |
| Actual | | $1,000.00 | $1,053.80 | $7.56 |
| Hypothetical-C | | $1,000.00 | $1,017.85 | $7.43 |
| Class C | 1.83% | | | |
| Actual | | $1,000.00 | $1,051.40 | $9.46 |
| Hypothetical-C | | $1,000.00 | $1,015.98 | $9.30 |
| Gold | .85% | | | |
| Actual | | $1,000.00 | $1,056.40 | $4.41 |
| Hypothetical-C | | $1,000.00 | $1,020.92 | $4.33 |
| Class I | .83% | | | |
| Actual | | $1,000.00 | $1,056.50 | $4.30 |
| Hypothetical-C | | $1,000.00 | $1,021.02 | $4.23 |
| Materials Portfolio | | | | |
| Class A | 1.07% | | | |
| Actual | | $1,000.00 | $1,060.70 | $5.56 |
| Hypothetical-C | | $1,000.00 | $1,019.81 | $5.45 |
| Class M | 1.36% | | | |
| Actual | | $1,000.00 | $1,059.10 | $7.06 |
| Hypothetical- C | | $1,000.00 | $1,018.35 | $6.92 |
| Class C | 1.82% | | | |
| Actual | | $1,000.00 | $1,056.60 | $9.43 |
| Hypothetical-C | | $1,000.00 | $1,016.03 | $9.25 |
| Materials | .80% | | | |
| Actual | | $1,000.00 | $1,062.10 | $4.16 |
| Hypothetical-C | | $1,000.00 | $1,021.17 | $4.08 |
| Class I | .79% | | | |
| Actual | | $1,000.00 | $1,062.20 | $4.11 |
| Hypothetical-C | | $1,000.00 | $1,021.22 | $4.02 |
A Annualized expense ratio reflects expenses net of applicable fee waivers.
B Expenses are equal to each Fund's annualized expense ratio, multiplied by the average account value over the period, multiplied by 184/ 365 (to reflect the one-half year period).
C 5% return per year before expenses
SELMT-SANN-1017
1.846035.110
Fidelity® Select Portfolios®
Consumer Discretionary Sector Automotive Portfolio
Construction and Housing Portfolio
Consumer Discretionary Portfolio
Leisure Portfolio
Multimedia Portfolio
Retailing Portfolio
Semi-Annual Report August 31, 2017 |
|
Contents
To view a fund's proxy voting guidelines and proxy voting record for the 12-month period ended June 30, visit http://www.fidelity.com/proxyvotingresults or visit the Securities and Exchange Commission's (SEC) web site at http://www.sec.gov.
You may also call 1-800-544-8544 to request a free copy of the proxy voting guidelines.
Standard & Poor's, S&P and S&P 500 are registered service marks of The McGraw-Hill Companies, Inc. and have been licensed for use by Fidelity Distributors Corporation.
Other third-party marks appearing herein are the property of their respective owners.
All other marks appearing herein are registered or unregistered trademarks or service marks of FMR LLC or an affiliated company. © 2017 FMR LLC. All rights reserved.
This report and the financial statements contained herein are submitted for the general information of the shareholders of the Funds. This report is not authorized for distribution to prospective investors in the Funds unless preceded or accompanied by an effective prospectus.
A fund files its complete schedule of portfolio holdings with the SEC for the first and third quarters of each fiscal year on Form N-Q. Forms N-Q are available on the SEC’s web site at http://www.sec.gov. A fund's Forms N-Q may be reviewed and copied at the SEC’s Public Reference Room in Washington, DC. Information regarding the operation of the SEC's Public Reference Room may be obtained by calling 1-800-SEC-0330.
For a complete list of a fund's portfolio holdings, view the most recent holdings listing, semiannual report, or annual report on Fidelity's web site at http://www.fidelity.com, http://www.institutional.fidelity.com, or http://www.401k.com, as applicable.
NOT FDIC INSURED •MAY LOSE VALUE •NO BANK GUARANTEE
Neither the Funds nor Fidelity Distributors Corporation is a bank.
Automotive Portfolio
Investment Summary (Unaudited)
Top Ten Stocks as of August 31, 2017
| | % of fund's net assets | % of fund's net assets 6 months ago |
| Tesla, Inc. | 10.1 | 9.8 |
| General Motors Co. | 9.4 | 5.8 |
| Toyota Motor Corp. sponsored ADR | 9.3 | 11.9 |
| Ford Motor Co. | 7.8 | 5.3 |
| Honda Motor Co. Ltd. sponsored ADR | 7.3 | 4.1 |
| Delphi Automotive PLC | 5.5 | 3.1 |
| CarMax, Inc. | 4.4 | 0.0 |
| AutoZone, Inc. | 4.1 | 2.1 |
| O'Reilly Automotive, Inc. | 3.9 | 0.0 |
| KAR Auction Services, Inc. | 3.9 | 4.3 |
| | 65.7 | |
Top Industries (% of fund's net assets)
| As of August 31, 2017 |
| | Automobiles | 53.0% |
| | Auto Components | 19.7% |
| | Specialty Retail | 13.3% |
| | Commercial Services & Supplies | 6.2% |
| | Distributors | 3.7% |
| | All Others* | 4.1% |

| As of February 28, 2017 |
| | Automobiles | 50.6% |
| | Auto Components | 25.1% |
| | Machinery | 6.5% |
| | Commercial Services & Supplies | 4.3% |
| | Distributors | 4.1% |
| | All Others* | 9.4% |

Percentages shown as 0.0% may reflect amounts less than 0.05%.
* Includes Short-Term investments and Net Other Assets (Liabilities).
Automotive Portfolio
Investments August 31, 2017 (Unaudited)
Showing Percentage of Net Assets
| Common Stocks - 99.0% | | | |
| | | Shares | Value |
| Auto Components - 19.7% | | | |
| Auto Parts & Equipment - 18.9% | | | |
| Adient PLC | | 12,400 | $876,432 |
| Autoliv, Inc. (a) | | 3,900 | 423,618 |
| BorgWarner, Inc. | | 9,600 | 445,536 |
| Dana Holding Corp. | | 45,200 | 1,087,964 |
| Delphi Automotive PLC | | 26,458 | 2,550,551 |
| Gentex Corp. | | 3,600 | 65,772 |
| Lear Corp. | | 2,000 | 299,080 |
| Magna International, Inc. Class A (sub. vtg.) | | 20,900 | 1,005,711 |
| Stoneridge, Inc. (b) | | 23,140 | 383,198 |
| Tenneco, Inc. | | 13,106 | 710,345 |
| Valeo SA | | 6,200 | 414,653 |
| Visteon Corp. (b) | | 5,040 | 581,818 |
| | | | 8,844,678 |
| Tires & Rubber - 0.8% | | | |
| The Goodyear Tire & Rubber Co. | | 11,500 | 348,450 |
|
| TOTAL AUTO COMPONENTS | | | 9,193,128 |
|
| Automobiles - 52.0% | | | |
| Automobile Manufacturers - 51.6% | | | |
| EDAG Engineering Group AG | | 400 | 5,564 |
| Ferrari NV | | 12,400 | 1,419,676 |
| Fiat Chrysler Automobiles NV(b) | | 104,000 | 1,573,520 |
| Ford Motor Co. | | 332,731 | 3,670,023 |
| General Motors Co. | | 120,114 | 4,388,966 |
| Honda Motor Co. Ltd. sponsored ADR | | 121,295 | 3,408,390 |
| Subaru Corp. | | 17,400 | 610,310 |
| Tata Motors Ltd. sponsored ADR | | 40 | 1,194 |
| Tesla, Inc. (a)(b) | | 13,300 | 4,733,469 |
| Toyota Motor Corp. sponsored ADR (a) | | 38,317 | 4,329,055 |
| | | | 24,140,167 |
| Motorcycle Manufacturers - 0.4% | | | |
| Harley-Davidson, Inc. (a) | | 3,800 | 178,638 |
|
| TOTAL AUTOMOBILES | | | 24,318,805 |
|
| Commercial Services & Supplies - 6.2% | | | |
| Diversified Support Services - 6.2% | | | |
| Copart, Inc. (b) | | 33,000 | 1,078,770 |
| KAR Auction Services, Inc. | | 39,980 | 1,802,698 |
| | | | 2,881,468 |
| Distributors - 3.7% | | | |
| Distributors - 3.7% | | | |
| Genuine Parts Co. | | 5,900 | 488,697 |
| LKQ Corp. (b) | | 35,400 | 1,226,610 |
| | | | 1,715,307 |
| Household Durables - 0.8% | | | |
| Consumer Electronics - 0.8% | | | |
| Panasonic Corp. | | 27,600 | 367,914 |
| Machinery - 2.2% | | | |
| Construction Machinery & Heavy Trucks - 2.2% | | | |
| Allison Transmission Holdings, Inc. | | 29,700 | 1,031,481 |
| Specialty Retail - 13.3% | | | |
| Automotive Retail - 13.3% | | | |
| Advance Auto Parts, Inc. | | 4,100 | 401,390 |
| AutoZone, Inc. (b) | | 3,664 | 1,936,204 |
| CarMax, Inc. (b) | | 30,700 | 2,061,505 |
| O'Reilly Automotive, Inc. (b) | | 9,400 | 1,843,622 |
| | | | 6,242,721 |
| Trading Companies & Distributors - 1.1% | | | |
| Trading Companies & Distributors - 1.1% | | | |
| Rush Enterprises, Inc. Class A (b) | | 12,500 | 512,375 |
| TOTAL COMMON STOCKS | | | |
| (Cost $35,762,623) | | | 46,263,199 |
|
| Nonconvertible Preferred Stocks - 1.0% | | | |
| Automobiles - 1.0% | | | |
| Automobile Manufacturers - 1.0% | | | |
| Volkswagen AG | | | |
| (Cost $437,983) | | 3,200 | 477,513 |
|
| Money Market Funds - 17.3% | | | |
| Fidelity Cash Central Fund, 1.11% (c) | | 219,801 | 219,845 |
| Fidelity Securities Lending Cash Central Fund 1.11% (c)(d) | | 7,846,987 | 7,847,772 |
| TOTAL MONEY MARKET FUNDS | | | |
| (Cost $8,067,586) | | | 8,067,617 |
| TOTAL INVESTMENT IN SECURITIES - 117.3% | | | |
| (Cost $44,268,192) | | | 54,808,329 |
| NET OTHER ASSETS (LIABILITIES) - (17.3)% | | | (8,073,624) |
| NET ASSETS - 100% | | | $46,734,705 |
Legend
(a) Security or a portion of the security is on loan at period end.
(b) Non-income producing
(c) Affiliated fund that is generally available only to investment companies and other accounts managed by Fidelity Investments. The rate quoted is the annualized seven-day yield of the fund at period end. A complete unaudited listing of the fund's holdings as of its most recent quarter end is available upon request. In addition, each Fidelity Central Fund's financial statements are available on the SEC's website or upon request.
(d) Investment made with cash collateral received from securities on loan.
Affiliated Central Funds
Information regarding fiscal year to date income earned by the Fund from investments in Fidelity Central Funds is as follows:
| Fund | Income earned |
| Fidelity Cash Central Fund | $2,797 |
| Fidelity Securities Lending Cash Central Fund | 31,832 |
| Total | $34,629 |
Investment Valuation
The following is a summary of the inputs used, as of August 31, 2017, involving the Fund's assets and liabilities carried at fair value. The inputs or methodology used for valuing securities may not be an indication of the risk associated with investing in those securities. For more information on valuation inputs, and their aggregation into the levels used below, please refer to the Investment Valuation section in the accompanying Notes to Financial Statements.
| | Valuation Inputs at Reporting Date: |
| Description | Total | Level 1 | Level 2 | Level 3 |
| Investments in Securities: | | | | |
| Common Stocks | $46,263,199 | $45,895,285 | $367,914 | $-- |
| Nonconvertible Preferred Stocks | 477,513 | 477,513 | -- | -- |
| Money Market Funds | 8,067,617 | 8,067,617 | -- | -- |
| Total Investments in Securities: | $54,808,329 | $54,440,415 | $367,914 | $-- |
Other Information
Distribution of investments by country or territory of incorporation, as a percentage of Total Net Assets, is as follows (Unaudited):
| United States of America | 63.4% |
| Japan | 18.7% |
| Netherlands | 6.4% |
| Bailiwick of Jersey | 5.5% |
| Canada | 2.2% |
| Ireland | 1.9% |
| Germany | 1.0% |
| Others (Individually Less Than 1%) | 0.9% |
| | 100.0% |
See accompanying notes which are an integral part of the financial statements.
Automotive Portfolio
Financial Statements
Statement of Assets and Liabilities
| | | August 31, 2017 (Unaudited) |
| Assets | | |
Investment in securities, at value (including securities loaned of $7,741,387) — See accompanying schedule:
Unaffiliated issuers (cost $36,200,606) | $46,740,712 | |
| Fidelity Central Funds (cost $8,067,586) | 8,067,617 | |
| Total Investment in Securities (cost $44,268,192) | | $54,808,329 |
| Cash | | 16,915 |
| Receivable for investments sold | | 117,492 |
| Receivable for fund shares sold | | 126,941 |
| Dividends receivable | | 94,276 |
| Distributions receivable from Fidelity Central Funds | | 4,377 |
| Other receivables | | 3,127 |
| Total assets | | 55,171,457 |
| Liabilities | | |
| Payable for investments purchased | $115,241 | |
| Payable for fund shares redeemed | 421,192 | |
| Accrued management fee | 20,885 | |
| Other affiliated payables | 11,137 | |
| Other payables and accrued expenses | 20,324 | |
| Collateral on securities loaned | 7,847,973 | |
| Total liabilities | | 8,436,752 |
| Net Assets | | $46,734,705 |
| Net Assets consist of: | | |
| Paid in capital | | $29,958,606 |
| Undistributed net investment income | | 259,213 |
| Accumulated undistributed net realized gain (loss) on investments and foreign currency transactions | | 5,977,844 |
| Net unrealized appreciation (depreciation) on investments and assets and liabilities in foreign currencies | | 10,539,042 |
| Net Assets, for 1,293,002 shares outstanding | | $46,734,705 |
| Net Asset Value, offering price and redemption price per share ($46,734,705 ÷ 1,293,002 shares) | | $36.14 |
See accompanying notes which are an integral part of the financial statements.
Statement of Operations
| | | Six months ended August 31, 2017 (Unaudited) |
| Investment Income | | |
| Dividends | | $552,621 |
| Income from Fidelity Central Funds (including $31,832 from security lending) | | 34,629 |
| Total income | | 587,250 |
| Expenses | | |
| Management fee | $135,090 | |
| Transfer agent fees | 60,086 | |
| Accounting and security lending fees | 10,528 | |
| Custodian fees and expenses | 4,407 | |
| Independent trustees' fees and expenses | 593 | |
| Registration fees | 15,995 | |
| Audit | 18,571 | |
| Legal | 395 | |
| Miscellaneous | 454 | |
| Total expenses before reductions | 246,119 | |
| Expense reductions | (270) | 245,849 |
| Net investment income (loss) | | 341,401 |
| Realized and Unrealized Gain (Loss) | | |
| Net realized gain (loss) on: | | |
| Investment securities: | | |
| Unaffiliated issuers | 6,277,404 | |
| Fidelity Central Funds | (1,490) | |
| Foreign currency transactions | (6,148) | |
| Total net realized gain (loss) | | 6,269,766 |
| Change in net unrealized appreciation (depreciation) on: | | |
| Investment securities: | | |
| Unaffiliated issuers | (4,189,660) | |
| Fidelity Central Funds | (103) | |
| Assets and liabilities in foreign currencies | 762 | |
| Total change in net unrealized appreciation (depreciation) | | (4,189,001) |
| Net gain (loss) | | 2,080,765 |
| Net increase (decrease) in net assets resulting from operations | | $2,422,166 |
See accompanying notes which are an integral part of the financial statements.
Statement of Changes in Net Assets
| | Six months ended August 31, 2017 (Unaudited) | Year ended February 28, 2017 |
| Increase (Decrease) in Net Assets | | |
| Operations | | |
| Net investment income (loss) | $341,401 | $554,402 |
| Net realized gain (loss) | 6,269,766 | 7,164,534 |
| Change in net unrealized appreciation (depreciation) | (4,189,001) | 1,447,014 |
| Net increase (decrease) in net assets resulting from operations | 2,422,166 | 9,165,950 |
| Distributions to shareholders from net investment income | – | (804,065) |
| Distributions to shareholders from net realized gain | (3,308,933) | (3,128,021) |
| Total distributions | (3,308,933) | (3,932,086) |
| Share transactions | | |
| Proceeds from sales of shares | 4,282,218 | 20,368,287 |
| Reinvestment of distributions | 3,180,295 | 3,717,039 |
| Cost of shares redeemed | (13,910,767) | (40,996,727) |
| Net increase (decrease) in net assets resulting from share transactions | (6,448,254) | (16,911,401) |
| Redemption fees | 564 | 1,913 |
| Total increase (decrease) in net assets | (7,334,457) | (11,675,624) |
| Net Assets | | |
| Beginning of period | 54,069,162 | 65,744,786 |
| End of period | $46,734,705 | $54,069,162 |
| Other Information | | |
| Undistributed net investment income end of period | $259,213 | $– |
| Distributions in excess of net investment income end of period | $– | $(82,188) |
| Shares | | |
| Sold | 121,646 | 560,082 |
| Issued in reinvestment of distributions | 93,953 | 104,277 |
| Redeemed | (392,744) | (1,143,684) |
| Net increase (decrease) | (177,145) | (479,325) |
See accompanying notes which are an integral part of the financial statements.
Financial Highlights — Automotive Portfolio
| | Six months ended (Unaudited) August 31, | Years ended February 28, | | | | |
| | 2017 | 2017 | 2016 A | 2015 | 2014 | 2013 |
| Selected Per–Share Data | | | | | | |
| Net asset value, beginning of period | $36.78 | $33.72 | $48.82 | $56.95 | $40.65 | $38.05 |
| Income from Investment Operations | | | | | | |
| Net investment income (loss)B | .24 | .33 | .65 | .42 | .22 | .24 |
| Net realized and unrealized gain (loss) | 1.48 | 5.22 | (9.37) | 3.05 | 16.96 | 2.65 |
| Total from investment operations | 1.72 | 5.55 | (8.72) | 3.47 | 17.18 | 2.89 |
| Distributions from net investment income | – | (.52) | (.45) | (.38) | (.15) | (.26) |
| Distributions from net realized gain | (2.36) | (1.98) | (5.93) | (11.22) | (.73) | (.02) |
| Total distributions | (2.36) | (2.49)C | (6.38) | (11.60) | (.88) | (.29)D |
| Redemption fees added to paid in capitalB,E | – | – | – | – | – | – |
| Net asset value, end of period | $36.14 | $36.78 | $33.72 | $48.82 | $56.95 | $40.65 |
| Total ReturnF,G | 5.10% | 16.80% | (20.00)% | 8.04% | 42.33% | 7.64% |
| Ratios to Average Net AssetsH,I | | | | | | |
| Expenses before reductions | .99%J | .96% | .87% | .85% | .84% | .91% |
| Expenses net of fee waivers, if any | .99%J | .96% | .87% | .85% | .84% | .91% |
| Expenses net of all reductions | .99%J | .95% | .86% | .85% | .83% | .89% |
| Net investment income (loss) | 1.38%J | .92% | 1.49% | .82% | .43% | .66% |
| Supplemental Data | | | | | | |
| Net assets, end of period (000 omitted) | $46,735 | $54,069 | $65,745 | $137,877 | $214,227 | $142,959 |
| Portfolio turnover rateK | 123%J | 83% | 80% | 71% | 148% | 72% |
A For the year ended February 29.
B Calculated based on average shares outstanding during the period.
C Total distributions of $2.49 per share is comprised of distributions from net investment income of $.515 and distributions from net realized gain of $1.975 per share.
D Total distributions of $.29 per share is comprised of distributions from net investment income of $.261 and distributions from net realized gain of $.024 per share.
E Amount represents less than $.005 per share.
F Total returns for periods of less than one year are not annualized.
G Total returns would have been lower if certain expenses had not been reduced during the applicable periods shown.
H Fees and expenses of any underlying Fidelity Central Funds are not included in the Fund's expense ratio. The Fund indirectly bears its proportionate share of the expenses of any underlying Fidelity Central Funds.
I Expense ratios reflect operating expenses of the Fund. Expenses before reductions do not reflect amounts reimbursed by the investment adviser or reductions from brokerage service arrangements or reductions from other expense offset arrangements and do not represent the amount paid by the Fund during periods when reimbursements or reductions occur. Expenses net of fee waivers reflect expenses after reimbursement by the investment adviser but prior to reductions from brokerage service arrangements or other expense offset arrangements. Expenses net of all reductions represent the net expenses paid by the Fund.
J Annualized
K Amount does not include the portfolio activity of any underlying Fidelity Central Funds.
See accompanying notes which are an integral part of the financial statements.
Construction and Housing Portfolio
Investment Summary (Unaudited)
Top Ten Stocks as of August 31, 2017
| | % of fund's net assets | % of fund's net assets 6 months ago |
| Home Depot, Inc. | 18.5 | 24.1 |
| Lowe's Companies, Inc. | 11.0 | 8.3 |
| AvalonBay Communities, Inc. | 6.5 | 6.2 |
| UDR, Inc. | 3.8 | 0.0 |
| Vulcan Materials Co. | 3.4 | 2.5 |
| Camden Property Trust (SBI) | 3.1 | 3.3 |
| Fortune Brands Home & Security, Inc. | 3.0 | 2.9 |
| Martin Marietta Materials, Inc. | 2.9 | 3.3 |
| Owens Corning | 2.9 | 2.4 |
| Lennar Corp. Class A | 2.7 | 2.7 |
| | 57.8 | |
Top Industries (% of fund's net assets)
| As of August 31, 2017 |
| | Specialty Retail | 29.5% |
| | Equity Real Estate Investment Trusts (Reits) | 21.6% |
| | Building Products | 16.1% |
| | Household Durables | 12.9% |
| | Construction & Engineering | 8.3% |
| | All Others* | 11.6% |
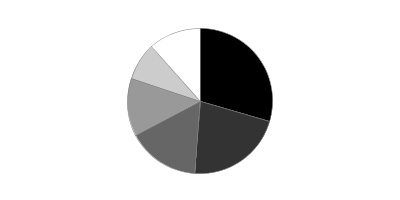
| As of February 28, 2017 |
| | Specialty Retail | 32.4% |
| | Equity Real Estate Investment Trusts (Reits) | 20.6% |
| | Building Products | 17.0% |
| | Household Durables | 11.5% |
| | Construction & Engineering | 8.8% |
| | All Others* | 9.7% |
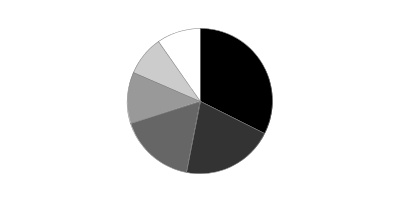
Percentages shown as 0.0% may reflect amounts less than 0.05%.
* Includes Short-Term investments and Net Other Assets (Liabilities).
Construction and Housing Portfolio
Investments August 31, 2017 (Unaudited)
Showing Percentage of Net Assets
| Common Stocks - 97.8% | | | |
| | | Shares | Value |
| Building Products - 16.1% | | | |
| Building Products - 16.1% | | | |
| A.O. Smith Corp. | | 113,384 | $6,314,355 |
| Allegion PLC | | 21,800 | 1,715,878 |
| Apogee Enterprises, Inc. | | 54,300 | 2,372,910 |
| Builders FirstSource, Inc. (a) | | 118,608 | 1,930,938 |
| Continental Building Products, Inc. (a) | | 81,173 | 1,976,563 |
| Fortune Brands Home & Security, Inc. | | 158,684 | 9,922,511 |
| Johnson Controls International PLC | | 191,054 | 7,563,828 |
| Masco Corp. | | 24,600 | 904,542 |
| Masonite International Corp. (a) | | 59,400 | 3,760,020 |
| Owens Corning | | 126,443 | 9,373,220 |
| Patrick Industries, Inc. (a) | | 39,000 | 2,886,000 |
| Simpson Manufacturing Co. Ltd. | | 46,700 | 2,044,526 |
| Trex Co., Inc. (a) | | 29,200 | 2,219,200 |
| | | | 52,984,491 |
| Construction & Engineering - 8.3% | | | |
| Construction & Engineering - 8.3% | | | |
| EMCOR Group, Inc. | | 67,328 | 4,446,341 |
| Fluor Corp. | | 124 | 4,783 |
| Granite Construction, Inc. | | 57,900 | 3,197,817 |
| Jacobs Engineering Group, Inc. | | 92,502 | 5,040,434 |
| KBR, Inc. | | 240,154 | 3,907,306 |
| MasTec, Inc. (a) | | 62,100 | 2,533,680 |
| Quanta Services, Inc. (a) | | 128,500 | 4,617,005 |
| Valmont Industries, Inc. | | 25,800 | 3,703,590 |
| | | | 27,450,956 |
| Construction Materials - 7.2% | | | |
| Construction Materials - 7.2% | | | |
| Martin Marietta Materials, Inc. | | 44,444 | 9,421,684 |
| Summit Materials, Inc. | | 107,410 | 3,172,891 |
| Vulcan Materials Co. | | 91,831 | 11,135,427 |
| | | | 23,730,002 |
| Equity Real Estate Investment Trusts (REITs) - 21.6% | | | |
| Residential REITs - 19.7% | | | |
| American Homes 4 Rent Class A | | 264,369 | 5,858,417 |
| AvalonBay Communities, Inc. | | 114,798 | 21,551,029 |
| Camden Property Trust (SBI) | | 115,922 | 10,372,701 |
| Equity Lifestyle Properties, Inc. | | 95,700 | 8,531,655 |
| Equity Residential (SBI) | | 34,450 | 2,313,318 |
| Invitation Homes, Inc. (b) | | 167,700 | 3,880,578 |
| UDR, Inc. | | 318,300 | 12,356,406 |
| | | | 64,864,104 |
| Specialized REITs - 1.9% | | | |
| Extra Space Storage, Inc. | | 78,282 | 6,077,032 |
|
| TOTAL EQUITY REAL ESTATE INVESTMENT TRUSTS (REITS) | | | 70,941,136 |
|
| Household Durables - 12.9% | | | |
| Home Furnishings - 1.6% | | | |
| Mohawk Industries, Inc. (a) | | 20,953 | 5,303,623 |
| Homebuilding - 11.3% | | | |
| CalAtlantic Group, Inc. | | 78,677 | 2,734,026 |
| Lennar Corp. Class A | | 168,610 | 8,727,254 |
| M/I Homes, Inc. | | 58,800 | 1,446,480 |
| NVR, Inc. (a) | | 2,652 | 7,215,694 |
| PulteGroup, Inc. | | 68,100 | 1,758,342 |
| Taylor Morrison Home Corp. (a) | | 190,415 | 3,850,191 |
| Toll Brothers, Inc. | | 170,875 | 6,657,290 |
| TopBuild Corp. (a) | | 81,100 | 4,813,285 |
| | | | 37,202,562 |
|
| TOTAL HOUSEHOLD DURABLES | | | 42,506,185 |
|
| Real Estate Management & Development - 1.6% | | | |
| Real Estate Development - 1.1% | | | |
| Howard Hughes Corp. (a) | | 29,292 | 3,437,416 |
| Real Estate Operating Companies - 0.5% | | | |
| The RMR Group, Inc. | | 32,415 | 1,674,235 |
|
| TOTAL REAL ESTATE MANAGEMENT & DEVELOPMENT | | | 5,111,651 |
|
| Specialty Retail - 29.5% | | | |
| Home Improvement Retail - 29.5% | | | |
| Home Depot, Inc. | | 405,560 | 60,781,274 |
| Lowe's Companies, Inc. | | 489,570 | 36,174,327 |
| | | | 96,955,601 |
| Trading Companies & Distributors - 0.6% | | | |
| Trading Companies & Distributors - 0.6% | | | |
| HD Supply Holdings, Inc. (a) | | 57,600 | 1,918,080 |
| TOTAL COMMON STOCKS | | | |
| (Cost $223,009,515) | | | 321,598,102 |
|
| Convertible Preferred Stocks - 0.0% | | | |
| Household Durables - 0.0% | | | |
| Homebuilding - 0.0% | | | |
| Blu Homes, Inc. Series A, 5.00% (a)(c)(d) | | | |
| (Cost $4,000,001) | | 865,801 | 8,658 |
|
| Money Market Funds - 2.9% | | | |
| Fidelity Cash Central Fund, 1.11% (e) | | 5,506,694 | 5,507,795 |
| Fidelity Securities Lending Cash Central Fund 1.11% (e)(f) | | 3,937,931 | 3,938,325 |
| TOTAL MONEY MARKET FUNDS | | | |
| (Cost $9,446,488) | | | 9,446,120 |
| TOTAL INVESTMENT IN SECURITIES - 100.7% | | | |
| (Cost $236,456,004) | | | 331,052,880 |
| NET OTHER ASSETS (LIABILITIES) - (0.7)% | | | (2,286,284) |
| NET ASSETS - 100% | | | $328,766,596 |
Legend
(a) Non-income producing
(b) Security or a portion of the security is on loan at period end.
(c) Restricted securities - Investment in securities not registered under the Securities Act of 1933 (excluding 144A issues). At the end of the period, the value of restricted securities (excluding 144A issues) amounted to $8,658 or 0.0% of net assets.
(d) Level 3 instrument
(e) Affiliated fund that is generally available only to investment companies and other accounts managed by Fidelity Investments. The rate quoted is the annualized seven-day yield of the fund at period end. A complete unaudited listing of the fund's holdings as of its most recent quarter end is available upon request. In addition, each Fidelity Central Fund's financial statements are available on the SEC's website or upon request.
(f) Investment made with cash collateral received from securities on loan.
Additional information on each restricted holding is as follows:
| Security | Acquisition Date | Acquisition Cost |
| Blu Homes, Inc. Series A, 5.00% | 6/10/13 | $4,000,001 |
Affiliated Central Funds
Information regarding fiscal year to date income earned by the Fund from investments in Fidelity Central Funds is as follows:
| Fund | Income earned |
| Fidelity Cash Central Fund | $13,440 |
| Fidelity Securities Lending Cash Central Fund | 3,036 |
| Total | $16,476 |
Investment Valuation
The following is a summary of the inputs used, as of August 31, 2017, involving the Fund's assets and liabilities carried at fair value. The inputs or methodology used for valuing securities may not be an indication of the risk associated with investing in those securities. For more information on valuation inputs, and their aggregation into the levels used below, please refer to the Investment Valuation section in the accompanying Notes to Financial Statements.
| | Valuation Inputs at Reporting Date: |
| Description | Total | Level 1 | Level 2 | Level 3 |
| Investments in Securities: | | | | |
| Common Stocks | $321,598,102 | $321,598,102 | $-- | $-- |
| Convertible Preferred Stocks | 8,658 | -- | -- | 8,658 |
| Money Market Funds | 9,446,120 | 9,446,120 | -- | -- |
| Total Investments in Securities: | $331,052,880 | $331,044,222 | $-- | $8,658 |
See accompanying notes which are an integral part of the financial statements.
Construction and Housing Portfolio
Financial Statements
Statement of Assets and Liabilities
| | | August 31, 2017 (Unaudited) |
| Assets | | |
Investment in securities, at value (including securities loaned of $3,878,264) — See accompanying schedule:
Unaffiliated issuers (cost $227,009,516) | $321,606,760 | |
| Fidelity Central Funds (cost $9,446,488) | 9,446,120 | |
| Total Investment in Securities (cost $236,456,004) | | $331,052,880 |
| Receivable for investments sold | | 9,941,683 |
| Receivable for fund shares sold | | 1,496,586 |
| Dividends receivable | | 450,648 |
| Distributions receivable from Fidelity Central Funds | | 3,094 |
| Other receivables | | 4,499 |
| Total assets | | 342,949,390 |
| Liabilities | | |
| Payable for investments purchased | $8,240,005 | |
| Payable for fund shares redeemed | 1,762,605 | |
| Accrued management fee | 151,596 | |
| Other affiliated payables | 71,658 | |
| Other payables and accrued expenses | 18,330 | |
| Collateral on securities loaned | 3,938,600 | |
| Total liabilities | | 14,182,794 |
| Net Assets | | $328,766,596 |
| Net Assets consist of: | | |
| Paid in capital | | $196,757,591 |
| Undistributed net investment income | | 1,521,027 |
| Accumulated undistributed net realized gain (loss) on investments | | 35,891,102 |
| Net unrealized appreciation (depreciation) on investments | | 94,596,876 |
| Net Assets, for 5,295,628 shares outstanding | | $328,766,596 |
| Net Asset Value, offering price and redemption price per share ($328,766,596 ÷ 5,295,628 shares) | | $62.08 |
See accompanying notes which are an integral part of the financial statements.
Statement of Operations
| | | Six months ended August 31, 2017 (Unaudited) |
| Investment Income | | |
| Dividends | | $3,189,157 |
| Income from Fidelity Central Funds (including $3,036 from security lending) | | 16,476 |
| Total income | | 3,205,633 |
| Expenses | | |
| Management fee | $1,095,011 | |
| Transfer agent fees | 380,321 | |
| Accounting and security lending fees | 78,248 | |
| Custodian fees and expenses | 3,863 | |
| Independent trustees' fees and expenses | 4,723 | |
| Registration fees | 25,403 | |
| Audit | 18,330 | |
| Legal | 3,931 | |
| Interest | 420 | |
| Miscellaneous | 3,197 | |
| Total expenses before reductions | 1,613,447 | |
| Expense reductions | (12,997) | 1,600,450 |
| Net investment income (loss) | | 1,605,183 |
| Realized and Unrealized Gain (Loss) | | |
| Net realized gain (loss) on: | | |
| Investment securities: | | |
| Unaffiliated issuers | 36,389,950 | |
| Fidelity Central Funds | 92 | |
| Total net realized gain (loss) | | 36,390,042 |
| Change in net unrealized appreciation (depreciation) on: | | |
| Investment securities: | | |
| Unaffiliated issuers | (22,617,748) | |
| Fidelity Central Funds | (368) | |
| Total change in net unrealized appreciation (depreciation) | | (22,618,116) |
| Net gain (loss) | | 13,771,926 |
| Net increase (decrease) in net assets resulting from operations | | $15,377,109 |
See accompanying notes which are an integral part of the financial statements.
Statement of Changes in Net Assets
| | Six months ended August 31, 2017 (Unaudited) | Year ended February 28, 2017 |
| Increase (Decrease) in Net Assets | | |
| Operations | | |
| Net investment income (loss) | $1,605,183 | $2,871,772 |
| Net realized gain (loss) | 36,390,042 | 45,337,281 |
| Change in net unrealized appreciation (depreciation) | (22,618,116) | 31,572,029 |
| Net increase (decrease) in net assets resulting from operations | 15,377,109 | 79,781,082 |
| Distributions to shareholders from net investment income | – | (2,958,507) |
| Distributions to shareholders from net realized gain | (12,640,420) | (10,930,766) |
| Total distributions | (12,640,420) | (13,889,273) |
| Share transactions | | |
| Proceeds from sales of shares | 51,979,947 | 139,679,030 |
| Reinvestment of distributions | 12,128,737 | 13,323,889 |
| Cost of shares redeemed | (142,606,861) | (263,677,954) |
| Net increase (decrease) in net assets resulting from share transactions | (78,498,177) | (110,675,035) |
| Redemption fees | 2,292 | 5,822 |
| Total increase (decrease) in net assets | (75,759,196) | (44,777,404) |
| Net Assets | | |
| Beginning of period | 404,525,792 | 449,303,196 |
| End of period | $328,766,596 | $404,525,792 |
| Other Information | | |
| Undistributed net investment income end of period | $1,521,027 | $– |
| Distributions in excess of net investment income end of period | $– | $(84,156) |
| Shares | | |
| Sold | 831,434 | 2,347,435 |
| Issued in reinvestment of distributions | 199,191 | 225,218 |
| Redeemed | (2,290,922) | (4,467,875) |
| Net increase (decrease) | (1,260,297) | (1,895,222) |
See accompanying notes which are an integral part of the financial statements.
Financial Highlights — Construction and Housing Portfolio
| | Six months ended (Unaudited) August 31, | Years ended February 28, | | | | |
| | 2017 | 2017 | 2016 A | 2015 | 2014 | 2013 |
| Selected Per–Share Data | | | | | | |
| Net asset value, beginning of period | $61.70 | $53.16 | $59.74 | $57.48 | $52.01 | $40.01 |
| Income from Investment Operations | | | | | | |
| Net investment income (loss)B | .25 | .37 | .33 | .29 | .26 | .19 |
| Net realized and unrealized gain (loss) | 2.06 | 10.29 | (5.02) | 8.53 | 9.65 | 12.47 |
| Total from investment operations | 2.31 | 10.66 | (4.69) | 8.82 | 9.91 | 12.66 |
| Distributions from net investment income | – | (.45) | (.23) | (.29) | (.30) | (.14) |
| Distributions from net realized gain | (1.93) | (1.67) | (1.66) | (6.28) | (4.14) | (.53) |
| Total distributions | (1.93) | (2.12) | (1.89) | (6.56)C | (4.44) | (.67) |
| Redemption fees added to paid in capitalB | –D | –D | –D | –D | –D | .01 |
| Net asset value, end of period | $62.08 | $61.70 | $53.16 | $59.74 | $57.48 | $52.01 |
| Total ReturnE,F | 3.80% | 20.23% | (8.11)% | 16.99% | 19.84% | 31.79% |
| Ratios to Average Net AssetsG,H | | | | | | |
| Expenses before reductions | .80%I | .80% | .81% | .82% | .81% | .86% |
| Expenses net of fee waivers, if any | .80%I | .80% | .80% | .82% | .81% | .86% |
| Expenses net of all reductions | .80%I | .79% | .80% | .82% | .81% | .86% |
| Net investment income (loss) | .80%I | .62% | .57% | .52% | .47% | .42% |
| Supplemental Data | | | | | | |
| Net assets, end of period (000 omitted) | $328,767 | $404,526 | $449,303 | $419,479 | $376,750 | $781,007 |
| Portfolio turnover rateJ | 48%I | 87% | 80% | 71% | 53% | 47% |
A For the year ended February 29.
B Calculated based on average shares outstanding during the period.
C Total distributions of $6.56 per share is comprised of distributions from net investment income of $.287 and distributions from net realized gain of $6.276 per share.
D Amount represents less than $.005 per share.
E Total returns for periods of less than one year are not annualized.
F Total returns would have been lower if certain expenses had not been reduced during the applicable periods shown.
G Fees and expenses of any underlying Fidelity Central Funds are not included in the Fund's expense ratio. The Fund indirectly bears its proportionate share of the expenses of any underlying Fidelity Central Funds.
H Expense ratios reflect operating expenses of the Fund. Expenses before reductions do not reflect amounts reimbursed by the investment adviser or reductions from brokerage service arrangements or reductions from other expense offset arrangements and do not represent the amount paid by the Fund during periods when reimbursements or reductions occur. Expenses net of fee waivers reflect expenses after reimbursement by the investment adviser but prior to reductions from brokerage service arrangements or other expense offset arrangements. Expenses net of all reductions represent the net expenses paid by the Fund.
I Annualized
J Amount does not include the portfolio activity of any underlying Fidelity Central Funds.
See accompanying notes which are an integral part of the financial statements.
Consumer Discretionary Portfolio
Investment Summary (Unaudited)
Top Ten Stocks as of August 31, 2017
| | % of fund's net assets | % of fund's net assets 6 months ago |
| Amazon.com, Inc. | 15.9 | 14.9 |
| Home Depot, Inc. | 9.3 | 9.7 |
| The Walt Disney Co. | 7.1 | 9.6 |
| Charter Communications, Inc. Class A | 7.0 | 7.0 |
| Comcast Corp. Class A | 4.3 | 3.3 |
| Starbucks Corp. | 3.9 | 1.8 |
| Dollar Tree, Inc. | 3.8 | 4.4 |
| NIKE, Inc. Class B | 3.8 | 6.4 |
| Tesla, Inc. | 2.4 | 0.0 |
| Las Vegas Sands Corp. | 2.0 | 1.2 |
| | 59.5 | |
Top Industries (% of fund's net assets)
| As of August 31, 2017 |
| | Hotels, Restaurants & Leisure | 23.7% |
| | Internet & Direct Marketing Retail | 19.5% |
| | Media | 19.0% |
| | Specialty Retail | 17.7% |
| | Textiles, Apparel & Luxury Goods | 6.1% |
| | All Others* | 14.0% |
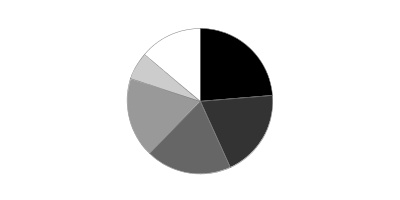
| As of February 28, 2017 |
| | Media | 27.0% |
| | Specialty Retail | 20.4% |
| | Internet & Direct Marketing Retail | 17.2% |
| | Hotels, Restaurants & Leisure | 12.7% |
| | Textiles, Apparel & Luxury Goods | 8.0% |
| | All Others* | 14.7% |
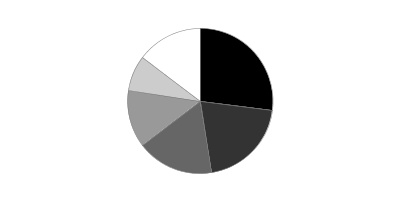
Percentages shown as 0.0% may reflect amounts less than 0.05%.
* Includes Short-Term investments and Net Other Assets (Liabilities).
Consumer Discretionary Portfolio
Investments August 31, 2017 (Unaudited)
Showing Percentage of Net Assets
| Common Stocks - 99.9% | | | |
| | | Shares | Value |
| Auto Components - 0.0% | | | |
| Auto Parts & Equipment - 0.0% | | | |
| Tenneco, Inc. | | 1,000 | $54,200 |
| Automobiles - 2.7% | | | |
| Automobile Manufacturers - 2.7% | | | |
| Ferrari NV | | 12,600 | 1,442,574 |
| Tesla, Inc. (a)(b) | | 46,600 | 16,584,940 |
| Thor Industries, Inc. | | 3,500 | 380,240 |
| | | | 18,407,754 |
| Beverages - 1.0% | | | |
| Distillers & Vintners - 0.9% | | | |
| Constellation Brands, Inc. Class A (sub. vtg.) | | 28,500 | 5,702,850 |
| Soft Drinks - 0.1% | | | |
| Monster Beverage Corp. (b) | | 16,720 | 933,310 |
|
| TOTAL BEVERAGES | | | 6,636,160 |
|
| Distributors - 0.8% | | | |
| Distributors - 0.8% | | | |
| LKQ Corp. (b) | | 113,800 | 3,943,170 |
| Pool Corp. | | 12,100 | 1,206,249 |
| | | | 5,149,419 |
| Diversified Consumer Services - 0.3% | | | |
| Education Services - 0.1% | | | |
| New Oriental Education & Technology Group, Inc. sponsored ADR | | 9,300 | 760,275 |
| Specialized Consumer Services - 0.2% | | | |
| Service Corp. International | | 10,600 | 374,604 |
| ServiceMaster Global Holdings, Inc. (b) | | 23,100 | 1,088,472 |
| | | | 1,463,076 |
|
| TOTAL DIVERSIFIED CONSUMER SERVICES | | | 2,223,351 |
|
| Food & Staples Retailing - 1.1% | | | |
| Food Distributors - 0.8% | | | |
| Performance Food Group Co. (b) | | 188,500 | 5,240,300 |
| Hypermarkets & Super Centers - 0.3% | | | |
| Costco Wholesale Corp. | | 16,100 | 2,523,514 |
|
| TOTAL FOOD & STAPLES RETAILING | | | 7,763,814 |
|
| Hotels, Restaurants & Leisure - 23.7% | | | |
| Casinos & Gaming - 4.2% | | | |
| Churchill Downs, Inc. | | 12,700 | 2,481,580 |
| Eldorado Resorts, Inc. (b) | | 12,500 | 287,500 |
| Las Vegas Sands Corp. | | 215,170 | 13,385,726 |
| Melco Crown Entertainment Ltd. sponsored ADR | | 84,900 | 1,863,555 |
| MGM Mirage, Inc. | | 223,000 | 7,350,080 |
| Penn National Gaming, Inc. (b) | | 34,035 | 755,237 |
| Wynn Resorts Ltd. | | 15,300 | 2,126,547 |
| | | | 28,250,225 |
| Hotels, Resorts & Cruise Lines - 6.8% | | | |
| Hilton Grand Vacations, Inc. | | 33,887 | 1,228,404 |
| Hilton, Inc. | | 201,600 | 12,968,928 |
| Marriott International, Inc. Class A | | 58,433 | 6,052,490 |
| Marriott Vacations Worldwide Corp. | | 25,400 | 2,955,544 |
| Royal Caribbean Cruises Ltd. | | 95,100 | 11,836,146 |
| Wyndham Worldwide Corp. | | 109,500 | 10,914,960 |
| | | | 45,956,472 |
| Leisure Facilities - 1.4% | | | |
| Cedar Fair LP (depositary unit) | | 6,700 | 464,846 |
| Vail Resorts, Inc. | | 39,089 | 8,910,338 |
| | | | 9,375,184 |
| Restaurants - 11.3% | | | |
| ARAMARK Holdings Corp. | | 65,900 | 2,681,471 |
| Chipotle Mexican Grill, Inc. (b) | | 7,300 | 2,311,983 |
| Darden Restaurants, Inc. | | 27,500 | 2,257,475 |
| Dave & Buster's Entertainment, Inc. (b) | | 76,100 | 4,448,806 |
| Del Taco Restaurants, Inc. (b) | | 164,028 | 2,309,514 |
| Domino's Pizza, Inc. | | 5,400 | 984,204 |
| Dunkin' Brands Group, Inc. | | 28,900 | 1,490,084 |
| Jack in the Box, Inc. | | 69,001 | 6,459,874 |
| McDonald's Corp. | | 48,700 | 7,790,539 |
| Papa John's International, Inc. | | 63,600 | 4,756,644 |
| Restaurant Brands International, Inc. | | 16,500 | 1,007,243 |
| Ruth's Hospitality Group, Inc. | | 78,400 | 1,532,720 |
| Shake Shack, Inc. Class A (b) | | 22,600 | 698,792 |
| Starbucks Corp. | | 481,500 | 26,415,090 |
| Texas Roadhouse, Inc. Class A | | 42,400 | 2,011,880 |
| U.S. Foods Holding Corp. (b) | | 174,967 | 4,802,844 |
| Wingstop, Inc. | | 24,100 | 781,081 |
| Yum! Brands, Inc. | | 51,100 | 3,925,502 |
| | | | 76,665,746 |
|
| TOTAL HOTELS, RESTAURANTS & LEISURE | | | 160,247,627 |
|
| Household Durables - 0.8% | | | |
| Homebuilding - 0.7% | | | |
| D.R. Horton, Inc. | | 72,100 | 2,606,415 |
| Lennar Corp. Class A | | 35,800 | 1,853,008 |
| | | | 4,459,423 |
| Household Appliances - 0.1% | | | |
| Techtronic Industries Co. Ltd. | | 191,000 | 988,468 |
|
| TOTAL HOUSEHOLD DURABLES | | | 5,447,891 |
|
| Household Products - 0.3% | | | |
| Household Products - 0.3% | | | |
| Spectrum Brands Holdings, Inc. | | 21,602 | 2,375,356 |
| Internet & Direct Marketing Retail - 19.5% | | | |
| Internet & Direct Marketing Retail - 19.5% | | | |
| Amazon.com, Inc. (b) | | 109,500 | 107,375,699 |
| Boohoo.Com PLC (b) | | 392,600 | 1,152,413 |
| Liberty Interactive Corp. QVC Group Series A (b) | | 201,810 | 4,464,037 |
| Netflix, Inc. (b) | | 57,079 | 9,972,272 |
| Priceline Group, Inc. (b) | | 4,840 | 8,964,067 |
| Wayfair LLC Class A (b) | | 2,600 | 184,626 |
| | | | 132,113,114 |
| Internet Software & Services - 0.8% | | | |
| Internet Software & Services - 0.8% | | | |
| Alphabet, Inc. Class A (b) | | 3,400 | 3,247,816 |
| Facebook, Inc. Class A (b) | | 12,900 | 2,218,413 |
| | | | 5,466,229 |
| IT Services - 0.2% | | | |
| Data Processing & Outsourced Services - 0.2% | | | |
| Global Payments, Inc. | | 10,800 | 1,031,292 |
| Leisure Products - 0.7% | | | |
| Leisure Products - 0.7% | | | |
| Mattel, Inc. (a) | | 271,800 | 4,408,596 |
| Media - 19.0% | | | |
| Cable & Satellite - 11.8% | | | |
| Charter Communications, Inc. Class A (b) | | 118,869 | 47,374,051 |
| Comcast Corp. Class A | | 720,400 | 29,255,444 |
| DISH Network Corp. Class A (b) | | 21,800 | 1,248,922 |
| Naspers Ltd. Class N | | 8,300 | 1,876,433 |
| | | | 79,754,850 |
| Movies & Entertainment - 7.2% | | | |
| Liberty SiriusXM Liberty Formula One Group Series C (b) | | 20,200 | 793,860 |
| The Walt Disney Co. | | 471,847 | 47,750,916 |
| | | | 48,544,776 |
|
| TOTAL MEDIA | | | 128,299,626 |
|
| Multiline Retail - 4.5% | | | |
| General Merchandise Stores - 4.5% | | | |
| B&M European Value Retail S.A. | | 436,486 | 2,101,900 |
| Dollar General Corp. | | 36,700 | 2,662,952 |
| Dollar Tree, Inc. (b) | | 325,921 | 25,956,348 |
| | | | 30,721,200 |
| Personal Products - 0.2% | | | |
| Personal Products - 0.2% | | | |
| Herbalife Ltd. (b) | | 17,900 | 1,235,279 |
| Real Estate Management & Development - 0.0% | | | |
| Real Estate Services - 0.0% | | | |
| Redfin Corp. | | 1,200 | 26,748 |
| Specialty Retail - 17.7% | | | |
| Apparel Retail - 5.3% | | | |
| Burlington Stores, Inc. (b) | | 55,000 | 4,792,150 |
| Foot Locker, Inc. | | 19,600 | 690,508 |
| Inditex SA | | 64,573 | 2,456,249 |
| L Brands, Inc. | | 41,225 | 1,493,170 |
| Ross Stores, Inc. | | 228,459 | 13,353,429 |
| TJX Companies, Inc. | | 177,809 | 12,855,591 |
| | | | 35,641,097 |
| Automotive Retail - 2.4% | | | |
| AutoZone, Inc. (b) | | 11,800 | 6,235,592 |
| O'Reilly Automotive, Inc. (b) | | 50,398 | 9,884,560 |
| | | | 16,120,152 |
| Home Improvement Retail - 9.6% | | | |
| Home Depot, Inc. | | 422,800 | 63,365,036 |
| Lowe's Companies, Inc. | | 24,800 | 1,832,472 |
| | | | 65,197,508 |
| Specialty Stores - 0.4% | | | |
| Ulta Beauty, Inc. | | 11,000 | 2,431,110 |
|
| TOTAL SPECIALTY RETAIL | | | 119,389,867 |
|
| Technology Hardware, Storage & Peripherals - 0.5% | | | |
| Technology Hardware, Storage & Peripherals - 0.5% | | | |
| Apple, Inc. | | 20,800 | 3,411,200 |
| Textiles, Apparel & Luxury Goods - 6.1% | | | |
| Apparel, Accessories & Luxury Goods - 2.3% | | | |
| adidas AG | | 14,107 | 3,166,448 |
| Carter's, Inc. | | 24,300 | 2,107,053 |
| Coach, Inc. | | 32,900 | 1,371,930 |
| G-III Apparel Group Ltd. (b) | | 29,800 | 819,500 |
| LVMH Moet Hennessy - Louis Vuitton SA | | 8,932 | 2,346,166 |
| PVH Corp. | | 48,200 | 6,067,898 |
| | | | 15,878,995 |
| Footwear - 3.8% | | | |
| NIKE, Inc. Class B | | 483,150 | 25,515,152 |
|
| TOTAL TEXTILES, APPAREL & LUXURY GOODS | | | 41,394,147 |
|
| TOTAL COMMON STOCKS | | | |
| (Cost $529,979,385) | | | 675,802,870 |
|
| Money Market Funds - 2.9% | | | |
| Fidelity Cash Central Fund, 1.11% (c) | | 2,237,097 | 2,237,544 |
| Fidelity Securities Lending Cash Central Fund 1.11% (c)(d) | | 17,022,505 | 17,024,207 |
| TOTAL MONEY MARKET FUNDS | | | |
| (Cost $19,261,083) | | | 19,261,751 |
| TOTAL INVESTMENT IN SECURITIES - 102.8% | | | |
| (Cost $549,240,468) | | | 695,064,621 |
| NET OTHER ASSETS (LIABILITIES) - (2.8)% | | | (18,707,104) |
| NET ASSETS - 100% | | | $676,357,517 |
Legend
(a) Security or a portion of the security is on loan at period end.
(b) Non-income producing
(c) Affiliated fund that is generally available only to investment companies and other accounts managed by Fidelity Investments. The rate quoted is the annualized seven-day yield of the fund at period end. A complete unaudited listing of the fund's holdings as of its most recent quarter end is available upon request. In addition, each Fidelity Central Fund's financial statements are available on the SEC's website or upon request.
(d) Investment made with cash collateral received from securities on loan.
Affiliated Central Funds
Information regarding fiscal year to date income earned by the Fund from investments in Fidelity Central Funds is as follows:
| Fund | Income earned |
| Fidelity Cash Central Fund | $20,918 |
| Fidelity Securities Lending Cash Central Fund | 132,495 |
| Total | $153,413 |
Investment Valuation
The following is a summary of the inputs used, as of August 31, 2017, involving the Fund's assets and liabilities carried at fair value. The inputs or methodology used for valuing securities may not be an indication of the risk associated with investing in those securities. For more information on valuation inputs, and their aggregation into the levels used below, please refer to the Investment Valuation section in the accompanying Notes to Financial Statements.
| | Valuation Inputs at Reporting Date: |
| Description | Total | Level 1 | Level 2 | Level 3 |
| Investments in Securities: | | | | |
| Common Stocks | $675,802,870 | $671,000,455 | $4,802,415 | $-- |
| Money Market Funds | 19,261,751 | 19,261,751 | -- | -- |
| Total Investments in Securities: | $695,064,621 | $690,262,206 | $4,802,415 | $-- |
See accompanying notes which are an integral part of the financial statements.
Consumer Discretionary Portfolio
Financial Statements
Statement of Assets and Liabilities
| | | August 31, 2017 (Unaudited) |
| Assets | | |
Investment in securities, at value (including securities loaned of $16,813,736) — See accompanying schedule:
Unaffiliated issuers (cost $529,979,385) | $675,802,870 | |
| Fidelity Central Funds (cost $19,261,083) | 19,261,751 | |
| Total Investment in Securities (cost $549,240,468) | | $695,064,621 |
| Receivable for investments sold | | 1,322,143 |
| Receivable for fund shares sold | | 492,081 |
| Dividends receivable | | 933,486 |
| Distributions receivable from Fidelity Central Funds | | 13,430 |
| Other receivables | | 25,090 |
| Total assets | | 697,850,851 |
| Liabilities | | |
| Payable for investments purchased | $3,174,464 | |
| Payable for fund shares redeemed | 844,924 | |
| Accrued management fee | 308,791 | |
| Other affiliated payables | 124,571 | |
| Other payables and accrued expenses | 20,009 | |
| Collateral on securities loaned | 17,020,575 | |
| Total liabilities | | 21,493,334 |
| Net Assets | | $676,357,517 |
| Net Assets consist of: | | |
| Paid in capital | | $508,051,407 |
| Undistributed net investment income | | 2,284,961 |
| Accumulated undistributed net realized gain (loss) on investments and foreign currency transactions | | 20,199,434 |
| Net unrealized appreciation (depreciation) on investments and assets and liabilities in foreign currencies | | 145,821,715 |
| Net Assets, for 17,568,609 shares outstanding | | $676,357,517 |
| Net Asset Value, offering price and redemption price per share ($676,357,517 ÷ 17,568,609 shares) | | $38.50 |
See accompanying notes which are an integral part of the financial statements.
Statement of Operations
| | | Six months ended August 31, 2017 (Unaudited) |
| Investment Income | | |
| Dividends | | $5,352,743 |
| Interest | | 42,091 |
| Income from Fidelity Central Funds (including $132,495 from security lending) | | 153,413 |
| Total income | | 5,548,247 |
| Expenses | | |
| Management fee | $2,055,804 | |
| Transfer agent fees | 674,846 | |
| Accounting and security lending fees | 134,259 | |
| Custodian fees and expenses | 14,081 | |
| Independent trustees' fees and expenses | 9,001 | |
| Registration fees | 23,669 | |
| Audit | 27,930 | |
| Legal | 6,678 | |
| Interest | 4,246 | |
| Miscellaneous | 7,615 | |
| Total expenses before reductions | 2,958,129 | |
| Expense reductions | (23,953) | 2,934,176 |
| Net investment income (loss) | | 2,614,071 |
| Realized and Unrealized Gain (Loss) | | |
| Net realized gain (loss) on: | | |
| Investment securities: | | |
| Unaffiliated issuers | 22,068,643 | |
| Fidelity Central Funds | 3,862 | |
| Foreign currency transactions | 22,445 | |
| Total net realized gain (loss) | | 22,094,950 |
| Change in net unrealized appreciation (depreciation) on: | | |
| Investment securities: | | |
| Unaffiliated issuers | 7,529,827 | |
| Fidelity Central Funds | (5,698) | |
| Assets and liabilities in foreign currencies | 3,736 | |
| Total change in net unrealized appreciation (depreciation) | | 7,527,865 |
| Net gain (loss) | | 29,622,815 |
| Net increase (decrease) in net assets resulting from operations | | $32,236,886 |
See accompanying notes which are an integral part of the financial statements.
Statement of Changes in Net Assets
| | Six months ended August 31, 2017 (Unaudited) | Year ended February 28, 2017 |
| Increase (Decrease) in Net Assets | | |
| Operations | | |
| Net investment income (loss) | $2,614,071 | $6,092,738 |
| Net realized gain (loss) | 22,094,950 | 106,936,943 |
| Change in net unrealized appreciation (depreciation) | 7,527,865 | 18,937,528 |
| Net increase (decrease) in net assets resulting from operations | 32,236,886 | 131,967,209 |
| Distributions to shareholders from net investment income | – | (7,587,944) |
| Share transactions | | |
| Proceeds from sales of shares | 37,119,256 | 189,032,213 |
| Reinvestment of distributions | – | 7,429,891 |
| Cost of shares redeemed | (221,990,569) | (610,875,058) |
| Net increase (decrease) in net assets resulting from share transactions | (184,871,313) | (414,412,954) |
| Redemption fees | – | 4,452 |
| Total increase (decrease) in net assets | (152,634,427) | (290,029,237) |
| Net Assets | | |
| Beginning of period | 828,991,944 | 1,119,021,181 |
| End of period | $676,357,517 | $828,991,944 |
| Other Information | | |
| Undistributed net investment income end of period | $2,284,961 | $– |
| Distributions in excess of net investment income end of period | $– | $(329,110) |
| Shares | | |
| Sold | 967,327 | 5,346,026 |
| Issued in reinvestment of distributions | – | 208,347 |
| Redeemed | (5,801,452) | (17,715,321) |
| Net increase (decrease) | (4,834,125) | (12,160,948) |
See accompanying notes which are an integral part of the financial statements.
Financial Highlights — Consumer Discretionary Portfolio
| | Six months ended (Unaudited) August 31, | Years ended February 28, | | | | |
| | 2017 | 2017 | 2016 A | 2015 | 2014 | 2013 |
| Selected Per–Share Data | | | | | | |
| Net asset value, beginning of period | $37.00 | $32.38 | $35.23 | $33.30 | $27.40 | $25.97 |
| Income from Investment Operations | | | | | | |
| Net investment income (loss)B | .13 | .21 | .24 | .15 | .04 | .11 |
| Net realized and unrealized gain (loss) | 1.37 | 4.73 | (1.79) | 4.39 | 8.67 | 3.70 |
| Total from investment operations | 1.50 | 4.94 | (1.55) | 4.54 | 8.71 | 3.81 |
| Distributions from net investment income | – | (.32) | (.18) | (.11) | (.03) | (.11) |
| Distributions from net realized gain | – | – | (1.13) | (2.51) | (2.77) | (2.27) |
| Total distributions | – | (.32) | (1.30)C | (2.61)D | (2.81)E | (2.38) |
| Redemption fees added to paid in capitalB | – | –F | –F | –F | –F | –F |
| Net asset value, end of period | $38.50 | $37.00 | $32.38 | $35.23 | $33.30 | $27.40 |
| Total ReturnG,H | 4.05% | 15.29% | (4.60)% | 14.79% | 32.17% | 15.38% |
| Ratios to Average Net AssetsI,J | | | | | | |
| Expenses before reductions | .78%K | .76% | .77% | .79% | .82% | .86% |
| Expenses net of fee waivers, if any | .78%K | .76% | .77% | .79% | .82% | .86% |
| Expenses net of all reductions | .78%K | .76% | .76% | .79% | .81% | .84% |
| Net investment income (loss) | .69%K | .60% | .71% | .46% | .14% | .43% |
| Supplemental Data | | | | | | |
| Net assets, end of period (000 omitted) | $676,358 | $828,992 | $1,119,021 | $1,078,988 | $557,868 | $397,925 |
| Portfolio turnover rateL | 96%K | 39%M | 69% | 109%M | 138% | 170% |
A For the year ended February 29.
B Calculated based on average shares outstanding during the period.
C Total distributions of $1.30 per share is comprised of distributions from net investment income of $.175 and distributions from net realized gain of $1.126 per share.
D Total distributions of $2.61 per share is comprised of distributions from net investment income of $.105 and distributions from net realized gain of $2.508 per share.
E Total distributions of $2.81 per share is comprised of distributions from net investment income of $.034 and distributions from net realized gain of $2.772 per share.
F Amount represents less than $.005 per share.
G Total returns for periods of less than one year are not annualized.
H Total returns would have been lower if certain expenses had not been reduced during the applicable periods shown.
I Fees and expenses of any underlying Fidelity Central Funds are not included in the Fund's expense ratio. The Fund indirectly bears its proportionate share of the expenses of any underlying Fidelity Central Funds.
J Expense ratios reflect operating expenses of the Fund. Expenses before reductions do not reflect amounts reimbursed by the investment adviser or reductions from brokerage service arrangements or reductions from other expense offset arrangements and do not represent the amount paid by the Fund during periods when reimbursements or reductions occur. Expenses net of fee waivers reflect expenses after reimbursement by the investment adviser but prior to reductions from brokerage service arrangements or other expense offset arrangements. Expenses net of all reductions represent the net expenses paid by the Fund.
K Annualized
L Amount does not include the portfolio activity of any underlying Fidelity Central Funds.
M Portfolio turnover rate excludes securities received or delivered in-kind.
See accompanying notes which are an integral part of the financial statements.
Leisure Portfolio
Investment Summary (Unaudited)
Top Ten Stocks as of August 31, 2017
| | % of fund's net assets | % of fund's net assets 6 months ago |
| McDonald's Corp. | 20.2 | 11.5 |
| Starbucks Corp. | 15.2 | 19.4 |
| Marriott International, Inc. Class A | 7.1 | 6.0 |
| Las Vegas Sands Corp. | 5.8 | 6.7 |
| Royal Caribbean Cruises Ltd. | 5.1 | 1.7 |
| Yum! Brands, Inc. | 5.0 | 5.6 |
| Wyndham Worldwide Corp. | 4.0 | 3.4 |
| MGM Mirage, Inc. | 3.6 | 3.1 |
| Hilton, Inc. | 2.9 | 2.9 |
| Vail Resorts, Inc. | 2.5 | 3.3 |
| | 71.4 | |
Top Industries (% of fund's net assets)
| As of August 31, 2017 |
| | Hotels, Restaurants & Leisure | 89.8% |
| | Multiline Retail | 2.3% |
| | Diversified Consumer Services | 2.1% |
| | Internet Software & Services | 1.6% |
| | Internet & Direct Marketing Retail | 1.1% |
| | All Others* | 3.1% |

| As of February 28, 2017 |
| | Hotels, Restaurants & Leisure | 87.0% |
| | Diversified Consumer Services | 2.7% |
| | Specialty Retail | 1.5% |
| | Internet Software & Services | 1.3% |
| | Internet & Direct Marketing Retail | 0.9% |
| | All Others* | 6.6% |

* Includes Short-Term investments and Net Other Assets (Liabilities).
Leisure Portfolio
Investments August 31, 2017 (Unaudited)
Showing Percentage of Net Assets
| Common Stocks - 99.9% | | | |
| | | Shares | Value |
| Distributors - 0.1% | | | |
| Distributors - 0.1% | | | |
| Pool Corp. | | 5,200 | $518,388 |
| Diversified Consumer Services - 2.1% | | | |
| Education Services - 0.1% | | | |
| New Oriental Education & Technology Group, Inc. sponsored ADR | | 6,600 | 539,550 |
| Specialized Consumer Services - 2.0% | | | |
| Service Corp. International | | 152,200 | 5,378,748 |
| ServiceMaster Global Holdings, Inc. (a) | | 112,134 | 5,283,754 |
| | | | 10,662,502 |
|
| TOTAL DIVERSIFIED CONSUMER SERVICES | | | 11,202,052 |
|
| Food & Staples Retailing - 0.9% | | | |
| Food Distributors - 0.9% | | | |
| Performance Food Group Co. (a) | | 170,800 | 4,748,240 |
| Hotels, Restaurants & Leisure - 89.8% | | | |
| Casinos & Gaming - 11.0% | | | |
| Boyd Gaming Corp. | | 73,200 | 1,935,408 |
| Caesars Entertainment Corp. (a)(b) | | 137,800 | 1,598,480 |
| Churchill Downs, Inc. | | 7,423 | 1,450,454 |
| Eldorado Resorts, Inc. (a) | | 9,600 | 220,800 |
| Las Vegas Sands Corp. | | 491,408 | 30,570,492 |
| MGM Mirage, Inc. | | 567,900 | 18,717,984 |
| Penn National Gaming, Inc. (a) | | 136,649 | 3,032,241 |
| | | | 57,525,859 |
| Hotels, Resorts & Cruise Lines - 21.5% | | | |
| Carnival Corp. | | 76,600 | 5,322,168 |
| Hilton Grand Vacations, Inc. | | 15,012 | 544,185 |
| Hilton, Inc. | | 231,697 | 14,905,068 |
| Marriott International, Inc. Class A | | 360,493 | 37,339,865 |
| Marriott Vacations Worldwide Corp. | | 57,997 | 6,748,531 |
| Royal Caribbean Cruises Ltd. | | 212,490 | 26,446,505 |
| Wyndham Worldwide Corp. | | 211,814 | 21,113,620 |
| | | | 112,419,942 |
| Leisure Facilities - 3.2% | | | |
| Cedar Fair LP (depositary unit) | | 52,043 | 3,610,743 |
| Vail Resorts, Inc. | | 59,178 | 13,489,625 |
| | | | 17,100,368 |
| Restaurants - 54.1% | | | |
| ARAMARK Holdings Corp. | | 79,300 | 3,226,717 |
| Chipotle Mexican Grill, Inc. (a)(b) | | 28,572 | 9,049,038 |
| Darden Restaurants, Inc. | | 77,900 | 6,394,811 |
| Dave & Buster's Entertainment, Inc. (a) | | 66,914 | 3,911,792 |
| Del Taco Restaurants, Inc. (a) | | 190,949 | 2,688,562 |
| Domino's Pizza, Inc. | | 23,400 | 4,264,884 |
| Dunkin' Brands Group, Inc. | | 124,400 | 6,414,064 |
| Habit Restaurants, Inc. Class A (a)(b) | | 12,200 | 158,600 |
| Jack in the Box, Inc. | | 116,080 | 10,867,410 |
| McDonald's Corp. | | 659,558 | 105,509,493 |
| Papa John's International, Inc. (b) | | 78,743 | 5,889,189 |
| Red Robin Gourmet Burgers, Inc. (a) | | 200 | 11,400 |
| Restaurant Brands International, Inc. | | 36,300 | 2,215,935 |
| Ruth's Hospitality Group, Inc. | | 59,823 | 1,169,540 |
| Shake Shack, Inc. Class A (a)(b) | | 21,000 | 649,320 |
| Starbucks Corp. | | 1,444,200 | 79,228,812 |
| Texas Roadhouse, Inc. Class A | | 152,200 | 7,221,890 |
| U.S. Foods Holding Corp. (a) | | 167,833 | 4,607,016 |
| Wingstop, Inc. (b) | | 108,539 | 3,517,749 |
| Yum! Brands, Inc. | | 336,836 | 25,875,742 |
| | | | 282,871,964 |
|
| TOTAL HOTELS, RESTAURANTS & LEISURE | | | 469,918,133 |
|
| Household Durables - 0.1% | | | |
| Household Appliances - 0.1% | | | |
| Helen of Troy Ltd. (a) | | 4,500 | 406,350 |
| Internet & Direct Marketing Retail - 1.1% | | | |
| Internet & Direct Marketing Retail - 1.1% | | | |
| Amazon.com, Inc. (a) | | 2,400 | 2,353,440 |
| Liberty Interactive Corp. QVC Group Series A (a) | | 33,300 | 736,596 |
| Netflix, Inc. (a) | | 1,800 | 314,478 |
| Priceline Group, Inc. (a) | | 1,300 | 2,407,704 |
| | | | 5,812,218 |
| Internet Software & Services - 1.6% | | | |
| Internet Software & Services - 1.6% | | | |
| 2U, Inc. (a) | | 71,924 | 3,603,392 |
| Alphabet, Inc. Class A (a) | | 2,400 | 2,292,576 |
| Facebook, Inc. Class A (a) | | 14,200 | 2,441,974 |
| | | | 8,337,942 |
| IT Services - 0.6% | | | |
| Data Processing & Outsourced Services - 0.6% | | | |
| Global Payments, Inc. | | 15,700 | 1,499,193 |
| Visa, Inc. Class A | | 13,200 | 1,366,464 |
| | | | 2,865,657 |
| Media - 0.3% | | | |
| Cable & Satellite - 0.2% | | | |
| Charter Communications, Inc. Class A (a) | | 2,588 | 1,031,422 |
| Movies & Entertainment - 0.1% | | | |
| Liberty Media Corp. Liberty Formula One Group Series C (a) | | 13,400 | 526,620 |
|
| TOTAL MEDIA | | | 1,558,042 |
|
| Multiline Retail - 2.3% | | | |
| General Merchandise Stores - 2.3% | | | |
| Dollar Tree, Inc. (a) | | 147,400 | 11,738,936 |
| Personal Products - 0.1% | | | |
| Personal Products - 0.1% | | | |
| Herbalife Ltd. (a) | | 10,400 | 717,704 |
| Real Estate Management & Development - 0.0% | | | |
| Real Estate Services - 0.0% | | | |
| Redfin Corp. | | 1,000 | 22,290 |
| Specialty Retail - 0.3% | | | |
| Apparel Retail - 0.3% | | | |
| Burlington Stores, Inc. (a) | | 20,300 | 1,768,739 |
| Technology Hardware, Storage & Peripherals - 0.3% | | | |
| Technology Hardware, Storage & Peripherals - 0.3% | | | |
| Apple, Inc. | | 10,100 | 1,656,400 |
| Textiles, Apparel & Luxury Goods - 0.3% | | | |
| Apparel, Accessories & Luxury Goods - 0.3% | | | |
| LVMH Moet Hennessy - Louis Vuitton SA | | 5,005 | 1,314,662 |
| TOTAL COMMON STOCKS | | | |
| (Cost $324,332,229) | | | 522,585,753 |
|
| Money Market Funds - 3.1% | | | |
| Fidelity Cash Central Fund, 1.11% (c) | | 171,571 | 171,605 |
| Fidelity Securities Lending Cash Central Fund 1.11% (c)(d) | | 16,013,919 | 16,015,521 |
| TOTAL MONEY MARKET FUNDS | | | |
| (Cost $16,186,985) | | | 16,187,126 |
| TOTAL INVESTMENT IN SECURITIES - 103.0% | | | |
| (Cost $340,519,214) | | | 538,772,879 |
| NET OTHER ASSETS (LIABILITIES) - (3.0)% | | | (15,616,372) |
| NET ASSETS - 100% | | | $523,156,507 |
Legend
(a) Non-income producing
(b) Security or a portion of the security is on loan at period end.
(c) Affiliated fund that is generally available only to investment companies and other accounts managed by Fidelity Investments. The rate quoted is the annualized seven-day yield of the fund at period end. A complete unaudited listing of the fund's holdings as of its most recent quarter end is available upon request. In addition, each Fidelity Central Fund's financial statements are available on the SEC's website or upon request.
(d) Investment made with cash collateral received from securities on loan.
Affiliated Central Funds
Information regarding fiscal year to date income earned by the Fund from investments in Fidelity Central Funds is as follows:
| Fund | Income earned |
| Fidelity Cash Central Fund | $29,768 |
| Fidelity Securities Lending Cash Central Fund | 33,291 |
| Total | $63,059 |
Investment Valuation
The following is a summary of the inputs used, as of August 31, 2017, involving the Fund's assets and liabilities carried at fair value. The inputs or methodology used for valuing securities may not be an indication of the risk associated with investing in those securities. For more information on valuation inputs, and their aggregation into the levels used below, please refer to the Investment Valuation section in the accompanying Notes to Financial Statements.
| | Valuation Inputs at Reporting Date: |
| Description | Total | Level 1 | Level 2 | Level 3 |
| Investments in Securities: | | | | |
| Common Stocks | $522,585,753 | $521,271,091 | $1,314,662 | $-- |
| Money Market Funds | 16,187,126 | 16,187,126 | -- | -- |
| Total Investments in Securities: | $538,772,879 | $537,458,217 | $1,314,662 | $-- |
See accompanying notes which are an integral part of the financial statements.
Leisure Portfolio
Financial Statements
Statement of Assets and Liabilities
| | | August 31, 2017 (Unaudited) |
| Assets | | |
Investment in securities, at value (including securities loaned of $15,779,491) — See accompanying schedule:
Unaffiliated issuers (cost $324,332,229) | $522,585,753 | |
| Fidelity Central Funds (cost $16,186,985) | 16,187,126 | |
| Total Investment in Securities (cost $340,519,214) | | $538,772,879 |
| Receivable for investments sold | | 3,130,674 |
| Receivable for fund shares sold | | 335,815 |
| Dividends receivable | | 996,849 |
| Distributions receivable from Fidelity Central Funds | | 10,154 |
| Other receivables | | 3,441 |
| Total assets | | 543,249,812 |
| Liabilities | | |
| Payable for investments purchased | $3,080,590 | |
| Payable for fund shares redeemed | 658,185 | |
| Accrued management fee | 234,833 | |
| Other affiliated payables | 93,882 | |
| Other payables and accrued expenses | 16,965 | |
| Collateral on securities loaned | 16,008,850 | |
| Total liabilities | | 20,093,305 |
| Net Assets | | $523,156,507 |
| Net Assets consist of: | | |
| Paid in capital | | $306,741,986 |
| Undistributed net investment income | | 2,493,269 |
| Accumulated undistributed net realized gain (loss) on investments and foreign currency transactions | | 15,667,587 |
| Net unrealized appreciation (depreciation) on investments | | 198,253,665 |
| Net Assets, for 3,270,425 shares outstanding | | $523,156,507 |
| Net Asset Value, offering price and redemption price per share ($523,156,507 ÷ 3,270,425 shares) | | $159.97 |
See accompanying notes which are an integral part of the financial statements.
Statement of Operations
| | | Six months ended August 31, 2017 (Unaudited) |
| Investment Income | | |
| Dividends | | $4,664,530 |
| Income from Fidelity Central Funds (including $33,291 from security lending) | | 63,059 |
| Total income | | 4,727,589 |
| Expenses | | |
| Management fee | $1,321,384 | |
| Transfer agent fees | 415,860 | |
| Accounting and security lending fees | 94,456 | |
| Custodian fees and expenses | 4,901 | |
| Independent trustees' fees and expenses | 5,352 | |
| Registration fees | 26,209 | |
| Audit | 18,814 | |
| Legal | 2,990 | |
| Interest | 1,595 | |
| Miscellaneous | 2,662 | |
| Total expenses before reductions | 1,894,223 | |
| Expense reductions | (8,961) | 1,885,262 |
| Net investment income (loss) | | 2,842,327 |
| Realized and Unrealized Gain (Loss) | | |
| Net realized gain (loss) on: | | |
| Investment securities: | | |
| Unaffiliated issuers | 21,398,027 | |
| Fidelity Central Funds | 241 | |
| Foreign currency transactions | (1,213) | |
| Total net realized gain (loss) | | 21,397,055 |
| Change in net unrealized appreciation (depreciation) on: | | |
| Investment securities: | | |
| Unaffiliated issuers | 26,920,952 | |
| Fidelity Central Funds | (261) | |
| Total change in net unrealized appreciation (depreciation) | | 26,920,691 |
| Net gain (loss) | | 48,317,746 |
| Net increase (decrease) in net assets resulting from operations | | $51,160,073 |
See accompanying notes which are an integral part of the financial statements.
Statement of Changes in Net Assets
| | Six months ended August 31, 2017 (Unaudited) | Year ended February 28, 2017 |
| Increase (Decrease) in Net Assets | | |
| Operations | | |
| Net investment income (loss) | $2,842,327 | $4,724,283 |
| Net realized gain (loss) | 21,397,055 | 4,111,071 |
| Change in net unrealized appreciation (depreciation) | 26,920,691 | 33,169,030 |
| Net increase (decrease) in net assets resulting from operations | 51,160,073 | 42,004,384 |
| Distributions to shareholders from net investment income | (403,808) | (3,947,620) |
| Share transactions | | |
| Proceeds from sales of shares | 174,138,703 | 56,175,802 |
| Reinvestment of distributions | 378,995 | 3,699,415 |
| Cost of shares redeemed | (105,064,242) | (111,769,338) |
| Net increase (decrease) in net assets resulting from share transactions | 69,453,456 | (51,894,121) |
| Redemption fees | 6,204 | 6,683 |
| Total increase (decrease) in net assets | 120,215,925 | (13,830,674) |
| Net Assets | | |
| Beginning of period | 402,940,582 | 416,771,256 |
| End of period | $523,156,507 | $402,940,582 |
| Other Information | | |
| Undistributed net investment income end of period | $2,493,269 | $54,750 |
| Shares | | |
| Sold | 1,096,681 | 417,493 |
| Issued in reinvestment of distributions | 2,597 | 26,364 |
| Redeemed | (679,177) | (841,666) |
| Net increase (decrease) | 420,101 | (397,809) |
See accompanying notes which are an integral part of the financial statements.
Financial Highlights — Leisure Portfolio
| | Six months ended (Unaudited) August 31, | Years ended February 28, | | | | |
| | 2017 | 2017 | 2016 A | 2015 | 2014 | 2013 |
| Selected Per–Share Data | | | | | | |
| Net asset value, beginning of period | $141.37 | $128.31 | $140.13 | $135.06 | $108.30 | $106.53 |
| Income from Investment Operations | | | | | | |
| Net investment income (loss)B | .90 | 1.56 | 1.47 | 1.31 | 1.40C | 1.40D |
| Net realized and unrealized gain (loss) | 17.84 | 12.88 | (6.24) | 14.80 | 35.09 | 6.22 |
| Total from investment operations | 18.74 | 14.44 | (4.77) | 16.11 | 36.49 | 7.62 |
| Distributions from net investment income | (.14) | (1.38) | (1.30) | (1.47) | (1.01) | (1.36) |
| Distributions from net realized gain | – | – | (5.75) | (9.57) | (8.72) | (4.50) |
| Total distributions | (.14) | (1.38) | (7.05) | (11.04) | (9.73) | (5.86) |
| Redemption fees added to paid in capitalB | –E | –E | –E | –E | –E | .01 |
| Net asset value, end of period | $159.97 | $141.37 | $128.31 | $140.13 | $135.06 | $108.30 |
| Total ReturnF,G | 13.27% | 11.26% | (3.48)% | 12.91% | 34.71% | 7.52% |
| Ratios to Average Net AssetsH,I | | | | | | |
| Expenses before reductions | .78%J | .80% | .79% | .80% | .82% | .85% |
| Expenses net of fee waivers, if any | .78%J | .79% | .79% | .80% | .82% | .85% |
| Expenses net of all reductions | .78%J | .79% | .78% | .80% | .81% | .83% |
| Net investment income (loss) | 1.17%J | 1.17% | 1.08% | 1.00% | 1.13%C | 1.33%D |
| Supplemental Data | | | | | | |
| Net assets, end of period (000 omitted) | $523,157 | $402,941 | $416,771 | $445,296 | $568,149 | $347,701 |
| Portfolio turnover rateK | 50%J | 23% | 48% | 32%L | 65% | 90% |
A For the year ended February 29.
B Calculated based on average shares outstanding during the period.
C Net Investment income per share reflects a large, non-recurring dividend which amounted to $.43 per share. Excluding this non-recurring dividend, the ratio of net investment income (loss) to average net assets would have been .79%.
D Net Investment income per share reflects a large, non-recurring dividend which amounted to $.53 per share. Excluding this non-recurring dividend, the ratio of net investment income (loss) to average net assets would have been .82%.
E Amount represents less than $.005 per share.
F Total returns for periods of less than one year are not annualized.
G Total returns would have been lower if certain expenses had not been reduced during the applicable periods shown.
H Fees and expenses of any underlying Fidelity Central Funds are not included in the Fund's expense ratio. The Fund indirectly bears its proportionate share of the expenses of any underlying Fidelity Central Funds.
I Expense ratios reflect operating expenses of the Fund. Expenses before reductions do not reflect amounts reimbursed by the investment adviser or reductions from brokerage service arrangements or reductions from other expense offset arrangements and do not represent the amount paid by the Fund during periods when reimbursements or reductions occur. Expenses net of fee waivers reflect expenses after reimbursement by the investment adviser but prior to reductions from brokerage service arrangements or other expense offset arrangements. Expenses net of all reductions represent the net expenses paid by the Fund.
J Annualized
K Amount does not include the portfolio activity of any underlying Fidelity Central Funds.
L Portfolio turnover rate excludes securities received or delivered in-kind.
See accompanying notes which are an integral part of the financial statements.
Multimedia Portfolio
Investment Summary (Unaudited)
Top Ten Stocks as of August 31, 2017
| | % of fund's net assets | % of fund's net assets 6 months ago |
| Comcast Corp. Class A | 21.9 | 18.1 |
| The Walt Disney Co. | 18.8 | 17.7 |
| Charter Communications, Inc. Class A | 8.8 | 8.2 |
| Time Warner, Inc. | 3.5 | 5.0 |
| Facebook, Inc. Class A | 3.5 | 3.1 |
| Lions Gate Entertainment Corp. Class B | 3.1 | 2.7 |
| Twenty-First Century Fox, Inc. Class A | 3.1 | 3.3 |
| Sirius XM Holdings, Inc. | 3.0 | 2.5 |
| Liberty Global PLC Class C | 2.8 | 4.7 |
| Apple, Inc. | 2.6 | 2.0 |
| | 71.1 | |
Top Industries (% of fund's net assets)
| As of August 31, 2017 |
| | Media | 85.1% |
| | Internet Software & Services | 6.5% |
| | Internet & Direct Marketing Retail | 4.6% |
| | Technology Hardware, Storage & Peripherals | 2.6% |
| | All Others* | 1.2% |

| As of February 28, 2017 |
| | Media | 87.6% |
| | Internet Software & Services | 5.6% |
| | Technology Hardware, Storage & Peripherals | 2.0% |
| | Internet & Direct Marketing Retail | 1.9% |
| | All Others* | 2.9% |

*Includes Short-Term investments and Net Other Assets (Liabilities).
Multimedia Portfolio
Investments August 31, 2017 (Unaudited)
Showing Percentage of Net Assets
| Common Stocks - 98.8% | | | |
| | | Shares | Value |
| Internet & Direct Marketing Retail - 4.6% | | | |
| Internet & Direct Marketing Retail - 4.6% | | | |
| Netflix, Inc. (a) | | 85,500 | $14,937,705 |
| Priceline Group, Inc. (a) | | 8,000 | 14,816,640 |
| | | | 29,754,345 |
| Internet Software & Services - 6.5% | | | |
| Internet Software & Services - 6.5% | | | |
| Alphabet, Inc.: | | | |
| Class A (a) | | 10,200 | 9,743,448 |
| Class C (a) | | 10,414 | 9,782,183 |
| Facebook, Inc. Class A (a) | | 131,000 | 22,528,070 |
| | | | 42,053,701 |
| Media - 85.1% | | | |
| Advertising - 1.3% | | | |
| Interpublic Group of Companies, Inc. | | 145,900 | 2,938,426 |
| Omnicom Group, Inc. | | 79,000 | 5,718,020 |
| | | | 8,656,446 |
| Broadcasting - 2.5% | | | |
| CBS Corp. Class B | | 249,800 | 16,002,188 |
| Cumulus Media, Inc. Class A (a) | | 26 | 10 |
| Discovery Communications, Inc. Class A (a) | | 450 | 9,995 |
| Entercom Communications Corp. Class A (b) | | 3,053 | 31,446 |
| | | | 16,043,639 |
| Cable & Satellite - 42.3% | | | |
| Charter Communications, Inc. Class A (a) | | 143,471 | 57,178,932 |
| Comcast Corp. Class A | | 3,488,100 | 141,651,742 |
| DISH Network Corp. Class A (a) | | 188,700 | 10,810,623 |
| Liberty Broadband Corp.: | | | |
| Class A (a) | | 156,923 | 15,916,700 |
| Class C (a) | | 93,640 | 9,507,269 |
| Liberty Global PLC: | | | |
| Class A (a) | | 17,338 | 589,492 |
| Class C (a) | | 542,147 | 17,907,115 |
| Sirius XM Holdings, Inc. (b) | | 3,356,900 | 19,302,175 |
| | | | 272,864,048 |
| Movies & Entertainment - 39.0% | | | |
| Cinemark Holdings, Inc. | | 301,100 | 10,023,619 |
| Liberty Media Corp.: | | | |
| Liberty Media Class A (a)(b) | | 350,662 | 13,300,610 |
| Liberty SiriusXM Series A (a) | | 63,500 | 2,838,450 |
| Liberty SiriusXM Series C (a) | | 213,786 | 9,536,993 |
| Lions Gate Entertainment Corp. Class B | | 720,934 | 20,236,617 |
| Live Nation Entertainment, Inc. (a) | | 382,500 | 15,284,700 |
| The Madison Square Garden Co. (a) | | 52,099 | 11,071,558 |
| The Walt Disney Co. | | 1,197,004 | 121,136,805 |
| Time Warner, Inc. | | 223,382 | 22,583,920 |
| Twenty-First Century Fox, Inc.: | | | |
| Class A | | 731,307 | 20,176,760 |
| Class B | | 197,700 | 5,357,670 |
| | | | 251,547,702 |
| Publishing - 0.0% | | | |
| Gannett Co., Inc. | | 6,937 | 58,895 |
|
| TOTAL MEDIA | | | 549,170,730 |
|
| Technology Hardware, Storage & Peripherals - 2.6% | | | |
| Technology Hardware, Storage & Peripherals - 2.6% | | | |
| Apple, Inc. | | 101,100 | 16,580,400 |
| TOTAL COMMON STOCKS | | | |
| (Cost $336,434,144) | | | 637,559,176 |
|
| Money Market Funds - 4.7% | | | |
| Fidelity Cash Central Fund, 1.11% (c) | | 9,152,488 | 9,154,319 |
| Fidelity Securities Lending Cash Central Fund 1.11% (c)(d) | | 21,151,302 | 21,153,417 |
| TOTAL MONEY MARKET FUNDS | | | |
| (Cost $30,307,023) | | | 30,307,736 |
| TOTAL INVESTMENT IN SECURITIES - 103.5% | | | |
| (Cost $366,741,167) | | | 667,866,912 |
| NET OTHER ASSETS (LIABILITIES) - (3.5)% | | | (22,467,599) |
| NET ASSETS - 100% | | | $645,399,313 |
Legend
(a) Non-income producing
(b) Security or a portion of the security is on loan at period end.
(c) Affiliated fund that is generally available only to investment companies and other accounts managed by Fidelity Investments. The rate quoted is the annualized seven-day yield of the fund at period end. A complete unaudited listing of the fund's holdings as of its most recent quarter end is available upon request. In addition, each Fidelity Central Fund's financial statements are available on the SEC's website or upon request.
(d) Investment made with cash collateral received from securities on loan.
Affiliated Central Funds
Information regarding fiscal year to date income earned by the Fund from investments in Fidelity Central Funds is as follows:
| Fund | Income earned |
| Fidelity Cash Central Fund | $18,318 |
| Fidelity Securities Lending Cash Central Fund | 225,198 |
| Total | $243,516 |
Investment Valuation
All investments are categorized as Level 1 under the Fair Value Hierarchy. The inputs or methodology used for valuing securities may not be an indication of the risk associated with investing in those securities. For more information on valuation inputs please refer to the Investment Valuation section in the accompanying Notes to Financial Statements.
See accompanying notes which are an integral part of the financial statements.
Multimedia Portfolio
Financial Statements
Statement of Assets and Liabilities
| | | August 31, 2017 (Unaudited) |
| Assets | | |
Investment in securities, at value (including securities loaned of $20,302,854) — See accompanying schedule:
Unaffiliated issuers (cost $336,434,144) | $637,559,176 | |
| Fidelity Central Funds (cost $30,307,023) | 30,307,736 | |
| Total Investment in Securities (cost $366,741,167) | | $667,866,912 |
| Receivable for fund shares sold | | 211,198 |
| Dividends receivable | | 114,920 |
| Distributions receivable from Fidelity Central Funds | | 46,171 |
| Other receivables | | 19,460 |
| Total assets | | 668,258,661 |
| Liabilities | | |
| Payable for fund shares redeemed | $1,273,644 | |
| Accrued management fee | 294,124 | |
| Other affiliated payables | 125,118 | |
| Other payables and accrued expenses | 15,712 | |
| Collateral on securities loaned | 21,150,750 | |
| Total liabilities | | 22,859,348 |
| Net Assets | | $645,399,313 |
| Net Assets consist of: | | |
| Paid in capital | | $327,343,292 |
| Undistributed net investment income | | 751,301 |
| Accumulated undistributed net realized gain (loss) on investments | | 16,178,975 |
| Net unrealized appreciation (depreciation) on investments | | 301,125,745 |
| Net Assets, for 7,761,555 shares outstanding | | $645,399,313 |
| Net Asset Value, offering price and redemption price per share ($645,399,313 ÷ 7,761,555 shares) | | $83.15 |
See accompanying notes which are an integral part of the financial statements.
Statement of Operations
| | | Six months ended August 31, 2017 (Unaudited) |
| Investment Income | | |
| Dividends | | $3,254,767 |
| Income from Fidelity Central Funds (including $225,198 from security lending) | | 243,516 |
| Total income | | 3,498,283 |
| Expenses | | |
| Management fee | $1,794,482 | |
| Transfer agent fees | 655,945 | |
| Accounting and security lending fees | 121,500 | |
| Custodian fees and expenses | 3,747 | |
| Independent trustees' fees and expenses | 7,610 | |
| Registration fees | 25,277 | |
| Audit | 19,193 | |
| Legal | 5,013 | |
| Interest | 873 | |
| Miscellaneous | 4,376 | |
| Total expenses before reductions | 2,638,016 | |
| Expense reductions | (58,936) | 2,579,080 |
| Net investment income (loss) | | 919,203 |
| Realized and Unrealized Gain (Loss) | | |
| Net realized gain (loss) on: | | |
| Investment securities: | | |
| Unaffiliated issuers | 20,346,374 | |
| Fidelity Central Funds | (1,253) | |
| Total net realized gain (loss) | | 20,345,121 |
| Change in net unrealized appreciation (depreciation) on: | | |
| Investment securities: | | |
| Unaffiliated issuers | 5,708,190 | |
| Fidelity Central Funds | (1,273) | |
| Total change in net unrealized appreciation (depreciation) | | 5,706,917 |
| Net gain (loss) | | 26,052,038 |
| Net increase (decrease) in net assets resulting from operations | | $26,971,241 |
See accompanying notes which are an integral part of the financial statements.
Statement of Changes in Net Assets
| | Six months ended August 31, 2017 (Unaudited) | Year ended February 28, 2017 |
| Increase (Decrease) in Net Assets | | |
| Operations | | |
| Net investment income (loss) | $919,203 | $1,721,308 |
| Net realized gain (loss) | 20,345,121 | 33,248,436 |
| Change in net unrealized appreciation (depreciation) | 5,706,917 | 102,417,983 |
| Net increase (decrease) in net assets resulting from operations | 26,971,241 | 137,387,727 |
| Distributions to shareholders from net investment income | – | (2,410,179) |
| Distributions to shareholders from net realized gain | (8,605,595) | (39,255,107) |
| Total distributions | (8,605,595) | (41,665,286) |
| Share transactions | | |
| Proceeds from sales of shares | 41,216,508 | 142,629,475 |
| Reinvestment of distributions | 8,307,911 | 40,020,773 |
| Cost of shares redeemed | (102,886,670) | (174,102,382) |
| Net increase (decrease) in net assets resulting from share transactions | (53,362,251) | 8,547,866 |
| Redemption fees | 4,168 | 3,008 |
| Total increase (decrease) in net assets | (34,992,437) | 104,273,315 |
| Net Assets | | |
| Beginning of period | 680,391,750 | 576,118,435 |
| End of period | $645,399,313 | $680,391,750 |
| Other Information | | |
| Undistributed net investment income end of period | $751,301 | $– |
| Distributions in excess of net investment income end of period | $– | $(167,902) |
| Shares | | |
| Sold | 504,536 | 1,849,202 |
| Issued in reinvestment of distributions | 102,302 | 546,111 |
| Redeemed | (1,270,731) | (2,369,431) |
| Net increase (decrease) | (663,893) | 25,882 |
See accompanying notes which are an integral part of the financial statements.
Financial Highlights — Multimedia Portfolio
| | Six months ended (Unaudited) August 31, | Years ended February 28, | | | | |
| | 2017 | 2017 | 2016 A | 2015 | 2014 | 2013 |
| Selected Per–Share Data | | | | | | |
| Net asset value, beginning of period | $80.75 | $68.59 | $82.48 | $81.74 | $61.55 | $48.48 |
| Income from Investment Operations | | | | | | |
| Net investment income (loss)B | .11 | .22 | .27 | .22 | .20 | .53C |
| Net realized and unrealized gain (loss) | 3.33 | 17.53 | (8.82) | 7.62 | 22.46 | 12.96 |
| Total from investment operations | 3.44 | 17.75 | (8.55) | 7.84 | 22.66 | 13.49 |
| Distributions from net investment income | – | (.33) | (.23) | (.20) | (.19) | (.43) |
| Distributions from net realized gain | (1.04) | (5.26) | (5.12) | (6.89) | (2.30) | – |
| Total distributions | (1.04) | (5.59) | (5.34)D | (7.10)E | (2.48)F | (.43) |
| Redemption fees added to paid in capitalB | –G | –G | –G | –G | .01 | .01 |
| Net asset value, end of period | $83.15 | $80.75 | $68.59 | $82.48 | $81.74 | $61.55 |
| Total ReturnH,I | 4.29% | 26.85% | (10.88)% | 10.16% | 37.01% | 27.91% |
| Ratios to Average Net AssetsJ,K | | | | | | |
| Expenses before reductions | .80%L | .82% | .81% | .81% | .81% | .88% |
| Expenses net of fee waivers, if any | .80%L | .82% | .81% | .81% | .81% | .88% |
| Expenses net of all reductions | .78%L | .82% | .80% | .81% | .80% | .88% |
| Net investment income (loss) | .28%L | .30% | .34% | .27% | .27% | .97%C |
| Supplemental Data | | | | | | |
| Net assets, end of period (000 omitted) | $645,399 | $680,392 | $576,118 | $802,988 | $1,008,988 | $657,366 |
| Portfolio turnover rateM | 40%L | 33% | 42% | 55% | 111% | 30% |
A For the year ended February 29.
B Calculated based on average shares outstanding during the period.
C Net Investment income per share reflects a large, non-recurring dividend which amounted to $.12 per share. Excluding this non-recurring dividend, the ratio of net investment income (loss) to average net assets would have been .76%.
D Total distributions of $5.34 per share is comprised of distributions from net investment income of $.227 and distributions from net realized gain of $5.115 per share.
E Total distributions of $7.10 per share is comprised of distributions from net investment income of $.204 and distributions from net realized gain of $6.892 per share.
F Total distributions of $2.48 per share is comprised of distributions from net investment income of $.187 and distributions from net realized gain of $2.295 per share.
G Amount represents less than $.005 per share.
H Total returns for periods of less than one year are not annualized.
I Total returns would have been lower if certain expenses had not been reduced during the applicable periods shown.
J Fees and expenses of any underlying Fidelity Central Funds are not included in the Fund's expense ratio. The Fund indirectly bears its proportionate share of the expenses of any underlying Fidelity Central Funds.
K Expense ratios reflect operating expenses of the Fund. Expenses before reductions do not reflect amounts reimbursed by the investment adviser or reductions from brokerage service arrangements or reductions from other expense offset arrangements and do not represent the amount paid by the Fund during periods when reimbursements or reductions occur. Expenses net of fee waivers reflect expenses after reimbursement by the investment adviser but prior to reductions from brokerage service arrangements or other expense offset arrangements. Expenses net of all reductions represent the net expenses paid by the Fund.
L Annualized
M Amount does not include the portfolio activity of any underlying Fidelity Central Funds.
See accompanying notes which are an integral part of the financial statements.
Retailing Portfolio
Investment Summary (Unaudited)
Top Ten Stocks as of August 31, 2017
| | % of fund's net assets | % of fund's net assets 6 months ago |
| Amazon.com, Inc. | 22.5 | 24.4 |
| Home Depot, Inc. | 20.7 | 19.2 |
| Priceline Group, Inc. | 7.1 | 5.9 |
| Netflix, Inc. | 4.9 | 4.9 |
| TJX Companies, Inc. | 4.8 | 4.9 |
| AutoZone, Inc. | 3.4 | 4.5 |
| Dollar General Corp. | 3.3 | 3.2 |
| Ross Stores, Inc. | 3.0 | 3.2 |
| O'Reilly Automotive, Inc. | 2.9 | 4.3 |
| Tiffany & Co., Inc. | 1.8 | 1.8 |
| | 74.4 | |
Top Industries (% of fund's net assets)
| As of August 31, 2017 |
| | Specialty Retail | 44.5% |
| | Internet & Direct Marketing Retail | 37.9% |
| | Multiline Retail | 6.2% |
| | Textiles, Apparel & Luxury Goods | 2.5% |
| | Hotels, Restaurants & Leisure | 1.7% |
| | All Others* | 7.2% |

| As of February 28, 2017 |
| | Specialty Retail | 46.7% |
| | Internet & Direct Marketing Retail | 36.7% |
| | Multiline Retail | 6.3% |
| | Textiles, Apparel & Luxury Goods | 2.2% |
| | Food & Staples Retailing | 0.9% |
| | All Others* | 7.2% |

* Includes Short-Term investments and Net Other Assets (Liabilities).
Retailing Portfolio
Investments August 31, 2017 (Unaudited)
Showing Percentage of Net Assets
| Common Stocks - 97.1% | | | |
| | | Shares | Value |
| Distributors - 1.1% | | | |
| Distributors - 1.1% | | | |
| LKQ Corp. (a) | | 578,900 | $20,058,885 |
| Food & Staples Retailing - 1.0% | | | |
| Hypermarkets & Super Centers - 1.0% | | | |
| Costco Wholesale Corp. | | 114,043 | 17,875,100 |
| Health Care Providers & Services - 0.3% | | | |
| Health Care Facilities - 0.3% | | | |
| Ryman Healthcare Group Ltd. | | 941,196 | 6,136,071 |
| Hotels, Restaurants & Leisure - 1.7% | | | |
| Leisure Facilities - 0.4% | | | |
| Cedar Fair LP (depositary unit) | | 93,700 | 6,500,906 |
| Restaurants - 1.3% | | | |
| Dave & Buster's Entertainment, Inc. (a) | | 213,000 | 12,451,980 |
| U.S. Foods Holding Corp. (a) | | 377,900 | 10,373,355 |
| | | | 22,825,335 |
|
| TOTAL HOTELS, RESTAURANTS & LEISURE | | | 29,326,241 |
|
| Household Durables - 0.7% | | | |
| Household Appliances - 0.7% | | | |
| Techtronic Industries Co. Ltd. | | 2,257,000 | 11,680,478 |
| Internet & Direct Marketing Retail - 37.9% | | | |
| Internet & Direct Marketing Retail - 37.9% | | | |
| Amazon.com, Inc. (a) | | 400,430 | 392,661,658 |
| Expedia, Inc. | | 212,700 | 31,556,172 |
| Liberty Interactive Corp. QVC Group Series A (a) | | 1,270,700 | 28,107,884 |
| Netflix, Inc. (a) | | 488,700 | 85,380,777 |
| Priceline Group, Inc. (a) | | 66,320 | 122,829,946 |
| | | | 660,536,437 |
| Leisure Products - 0.3% | | | |
| Leisure Products - 0.3% | | | |
| Mattel, Inc. | | 377,600 | 6,124,672 |
| Multiline Retail - 6.2% | | | |
| Department Stores - 1.0% | | | |
| Macy's, Inc. | | 816,500 | 16,958,705 |
| General Merchandise Stores - 5.2% | | | |
| B&M European Value Retail S.A. | | 2,233,396 | 10,754,928 |
| Dollar General Corp. | | 791,600 | 57,438,496 |
| Dollar Tree, Inc. (a) | | 279,000 | 22,219,560 |
| | | | 90,412,984 |
|
| TOTAL MULTILINE RETAIL | | | 107,371,689 |
|
| Personal Products - 0.5% | | | |
| Personal Products - 0.5% | | | |
| Coty, Inc. Class A | | 527,600 | 8,747,608 |
| Specialty Retail - 44.5% | | | |
| Apparel Retail - 10.2% | | | |
| Inditex SA | | 498,570 | 18,964,768 |
| L Brands, Inc. | | 650,683 | 23,567,738 |
| Ross Stores, Inc. | | 885,900 | 51,780,855 |
| TJX Companies, Inc. | | 1,158,300 | 83,745,090 |
| | | | 178,058,451 |
| Automotive Retail - 6.3% | | | |
| AutoZone, Inc. (a) | | 113,263 | 59,852,700 |
| O'Reilly Automotive, Inc. (a) | | 256,586 | 50,324,212 |
| | | | 110,176,912 |
| Home Improvement Retail - 21.9% | | | |
| Home Depot, Inc. | | 2,408,900 | 361,021,843 |
| Lowe's Companies, Inc. | | 282,000 | 20,836,980 |
| | | | 381,858,823 |
| Specialty Stores - 6.1% | | | |
| Sally Beauty Holdings, Inc. (a) | | 376,100 | 6,991,699 |
| Signet Jewelers Ltd. (b) | | 278,100 | 17,539,767 |
| Tiffany & Co., Inc. | | 347,400 | 31,752,360 |
| Tractor Supply Co. | | 338,600 | 20,150,086 |
| Ulta Beauty, Inc. | | 136,200 | 30,101,562 |
| | | | 106,535,474 |
|
| TOTAL SPECIALTY RETAIL | | | 776,629,660 |
|
| Technology Hardware, Storage & Peripherals - 0.4% | | | |
| Technology Hardware, Storage & Peripherals - 0.4% | | | |
| Apple, Inc. | | 42,800 | 7,019,200 |
| Textiles, Apparel & Luxury Goods - 2.5% | | | |
| Apparel, Accessories & Luxury Goods - 1.8% | | | |
| G-III Apparel Group Ltd. (a) | | 132,726 | 3,649,965 |
| lululemon athletica, Inc. (a) | | 90,157 | 5,188,535 |
| Luxottica Group SpA | | 149,700 | 8,616,471 |
| Prada SpA | | 3,874,600 | 14,085,854 |
| | | | 31,540,825 |
| Footwear - 0.7% | | | |
| NIKE, Inc. Class B | | 217,840 | 11,504,130 |
|
| TOTAL TEXTILES, APPAREL & LUXURY GOODS | | | 43,044,955 |
|
| TOTAL COMMON STOCKS | | | |
| (Cost $1,061,495,006) | | | 1,694,550,996 |
|
| Money Market Funds - 0.8% | | | |
| Fidelity Securities Lending Cash Central Fund 1.11% (c)(d) | | | |
| (Cost $14,132,565) | | 14,131,430 | 14,132,843 |
| TOTAL INVESTMENT IN SECURITIES - 97.9% | | | |
| (Cost $1,075,627,571) | | | 1,708,683,839 |
| NET OTHER ASSETS (LIABILITIES) - 2.1% | | | 35,814,292 |
| NET ASSETS - 100% | | | $1,744,498,131 |
Legend
(a) Non-income producing
(b) Security or a portion of the security is on loan at period end.
(c) Investment made with cash collateral received from securities on loan.
(d) Affiliated fund that is generally available only to investment companies and other accounts managed by Fidelity Investments. The rate quoted is the annualized seven-day yield of the fund at period end. A complete unaudited listing of the fund's holdings as of its most recent quarter end is available upon request. In addition, each Fidelity Central Fund's financial statements are available on the SEC's website or upon request.
Affiliated Central Funds
Information regarding fiscal year to date income earned by the Fund from investments in Fidelity Central Funds is as follows:
| Fund | Income earned |
| Fidelity Cash Central Fund | $145,445 |
| Fidelity Securities Lending Cash Central Fund | 156,936 |
| Total | $302,381 |
Investment Valuation
The following is a summary of the inputs used, as of August 31, 2017, involving the Fund's assets and liabilities carried at fair value. The inputs or methodology used for valuing securities may not be an indication of the risk associated with investing in those securities. For more information on valuation inputs, and their aggregation into the levels used below, please refer to the Investment Valuation section in the accompanying Notes to Financial Statements.
| | Valuation Inputs at Reporting Date: |
| Description | Total | Level 1 | Level 2 | Level 3 |
| Investments in Securities: | | | | |
| Common Stocks | $1,694,550,996 | $1,675,586,228 | $18,964,768 | $-- |
| Money Market Funds | 14,132,843 | 14,132,843 | -- | -- |
| Total Investments in Securities: | $1,708,683,839 | $1,689,719,071 | $18,964,768 | $-- |
See accompanying notes which are an integral part of the financial statements.
Retailing Portfolio
Financial Statements
Statement of Assets and Liabilities
| | | August 31, 2017 (Unaudited) |
| Assets | | |
Investment in securities, at value (including securities loaned of $13,875,400) — See accompanying schedule:
Unaffiliated issuers (cost $1,061,495,006) | $1,694,550,996 | |
| Fidelity Central Funds (cost $14,132,565) | 14,132,843 | |
| Total Investment in Securities (cost $1,075,627,571) | | $1,708,683,839 |
| Cash | | 49 |
| Receivable for investments sold | | 51,803,269 |
| Receivable for fund shares sold | | 1,132,676 |
| Dividends receivable | | 3,012,609 |
| Distributions receivable from Fidelity Central Funds | | 10,657 |
| Other receivables | | 2,950 |
| Total assets | | 1,764,646,049 |
| Liabilities | | |
| Payable for fund shares redeemed | $4,291,578 | |
| Accrued management fee | 806,209 | |
| Notes payable | 563,000 | |
| Other affiliated payables | 339,397 | |
| Other payables and accrued expenses | 12,734 | |
| Collateral on securities loaned | 14,135,000 | |
| Total liabilities | | 20,147,918 |
| Net Assets | | $1,744,498,131 |
| Net Assets consist of: | | |
| Paid in capital | | $1,044,980,815 |
| Undistributed net investment income | | 4,463,870 |
| Accumulated undistributed net realized gain (loss) on investments and foreign currency transactions | | 61,999,301 |
| Net unrealized appreciation (depreciation) on investments and assets and liabilities in foreign currencies | | 633,054,145 |
| Net Assets, for 14,829,160 shares outstanding | | $1,744,498,131 |
| Net Asset Value, offering price and redemption price per share ($1,744,498,131 ÷ 14,829,160 shares) | | $117.64 |
See accompanying notes which are an integral part of the financial statements.
Statement of Operations
| | | Six months ended August 31, 2017 (Unaudited) |
| Investment Income | | |
| Dividends | | $12,814,733 |
| Income from Fidelity Central Funds (including $156,936 from security lending) | | 302,381 |
| Total income | | 13,117,114 |
| Expenses | | |
| Management fee | $5,156,763 | |
| Transfer agent fees | 1,808,149 | |
| Accounting and security lending fees | 290,284 | |
| Custodian fees and expenses | 12,943 | |
| Independent trustees' fees and expenses | 21,988 | |
| Registration fees | 46,264 | |
| Audit | 18,735 | |
| Legal | 14,349 | |
| Interest | 2,430 | |
| Miscellaneous | 14,722 | |
| Total expenses before reductions | 7,386,627 | |
| Expense reductions | (12,932) | 7,373,695 |
| Net investment income (loss) | | 5,743,419 |
| Realized and Unrealized Gain (Loss) | | |
| Net realized gain (loss) on: | | |
| Investment securities: | | |
| Unaffiliated issuers | 81,933,615 | |
| Fidelity Central Funds | (4,269) | |
| Foreign currency transactions | 1,295 | |
| Total net realized gain (loss) | | 81,930,641 |
| Change in net unrealized appreciation (depreciation) on: | | |
| Investment securities: | | |
| Unaffiliated issuers | (53,171,812) | |
| Fidelity Central Funds | (520) | |
| Assets and liabilities in foreign currencies | 4,239 | |
| Total change in net unrealized appreciation (depreciation) | | (53,168,093) |
| Net gain (loss) | | 28,762,548 |
| Net increase (decrease) in net assets resulting from operations | | $34,505,967 |
See accompanying notes which are an integral part of the financial statements.
Statement of Changes in Net Assets
| | Six months ended August 31, 2017 (Unaudited) | Year ended February 28, 2017 |
| Increase (Decrease) in Net Assets | | |
| Operations | | |
| Net investment income (loss) | $5,743,419 | $1,397,815 |
| Net realized gain (loss) | 81,930,641 | 18,197,857 |
| Change in net unrealized appreciation (depreciation) | (53,168,093) | 289,174,021 |
| Net increase (decrease) in net assets resulting from operations | 34,505,967 | 308,769,693 |
| Distributions to shareholders from net investment income | – | (2,743,328) |
| Share transactions | | |
| Proceeds from sales of shares | 166,627,731 | 851,900,058 |
| Reinvestment of distributions | – | 2,631,909 |
| Cost of shares redeemed | (381,038,241) | (1,086,215,468) |
| Net increase (decrease) in net assets resulting from share transactions | (214,410,510) | (231,683,501) |
| Redemption fees | – | 64,279 |
| Total increase (decrease) in net assets | (179,904,543) | 74,407,143 |
| Net Assets | | |
| Beginning of period | 1,924,402,674 | 1,849,995,531 |
| End of period | $1,744,498,131 | $1,924,402,674 |
| Other Information | | |
| Undistributed net investment income end of period | $4,463,870 | $– |
| Distributions in excess of net investment income end of period | $– | $(1,279,549) |
| Shares | | |
| Sold | 1,397,936 | 7,963,159 |
| Issued in reinvestment of distributions | – | 23,719 |
| Redeemed | (3,212,106) | (10,069,012) |
| Net increase (decrease) | (1,814,170) | (2,082,134) |
See accompanying notes which are an integral part of the financial statements.
Financial Highlights — Retailing Portfolio
| | Six months ended (Unaudited) August 31, | Years ended February 28, | | | | |
| | 2017 | 2017 | 2016 A | 2015 | 2014 | 2013 |
| Selected Per–Share Data | | | | | | |
| Net asset value, beginning of period | $115.63 | $98.80 | $95.26 | $88.40 | $66.59 | $57.54 |
| Income from Investment Operations | | | | | | |
| Net investment income (loss)B | .36 | .08 | .13C | .31D | .15E | .52F |
| Net realized and unrealized gain (loss) | 1.65 | 16.90 | 4.69 | 13.72 | 23.64 | 10.27 |
| Total from investment operations | 2.01 | 16.98 | 4.82 | 14.03 | 23.79 | 10.79 |
| Distributions from net investment income | – | (.15) | (.18) | (.17) | (.12) | (.38) |
| Distributions from net realized gain | – | – | (1.10) | (7.01) | (1.86) | (1.36) |
| Total distributions | – | (.15) | (1.29)G | (7.17)H | (1.99)I | (1.75)J |
| Redemption fees added to paid in capitalB | – | –K | .01 | –K | .01 | .01 |
| Net asset value, end of period | $117.64 | $115.63 | $98.80 | $95.26 | $88.40 | $66.59 |
| Total ReturnL,M | 1.74% | 17.20% | 5.11% | 17.29% | 35.82% | 18.98% |
| Ratios to Average Net AssetsN,O | | | | | | |
| Expenses before reductions | .78%P | .78% | .81% | .81% | .83% | .86% |
| Expenses net of fee waivers, if any | .78%P | .78% | .80% | .81% | .83% | .86% |
| Expenses net of all reductions | .78%P | .78% | .80% | .81% | .82% | .84% |
| Net investment income (loss) | .61%P | .07% | .14%C | .36%D | .18%E | .83%F |
| Supplemental Data | | | | | | |
| Net assets, end of period (000 omitted) | $1,744,498 | $1,924,403 | $1,849,996 | $915,177 | $1,063,920 | $643,082 |
| Portfolio turnover rateQ | 18%P | 17% | 11% | 31% | 72% | 119% |
A For the year ended February 29.
B Calculated based on average shares outstanding during the period.
C Net Investment income per share reflects a large, non-recurring dividend which amounted to $.12 per share. Excluding this non-recurring dividend, the ratio of net investment income (loss) to average net assets would have been .02%.
D Net Investment income per share reflects a large, non-recurring dividend which amounted to $.13 per share. Excluding this non-recurring dividend, the ratio of net investment income (loss) to average net assets would have been .22%.
E Net Investment income per share reflects a large, non-recurring dividend which amounted to $.08 per share. Excluding this non-recurring dividend, the ratio of net investment income (loss) to average net assets would have been .08%.
F Net Investment income per share reflects a large, non-recurring dividend which amounted to $.19 per share. Excluding this non-recurring dividend, the ratio of net investment income (loss) to average net assets would have been .53%.
G Total distributions of $1.29 per share is comprised of distributions from net investment income of $.182 and distributions from net realized gain of $1.103 per share.
H Total distributions of $7.17per share is comprised of distributions from net investment income of $.166 and distributions from net realized gain of $7.006 per share.
I Total distributions of $1.99 per share is comprised of distributions from net investment income of $.124 and distributions from net realized gain of $1.861 per share.
J Total distributions of $1.75 per share is comprised of distributions from net investment income of $.383 and distributions from net realized gain of $1.364 per share.
K Amount represents less than $.005 per share.
L Total returns for periods of less than one year are not annualized.
M Total returns would have been lower if certain expenses had not been reduced during the applicable periods shown.
N Fees and expenses of any underlying Fidelity Central Funds are not included in the Fund's expense ratio. The Fund indirectly bears its proportionate share of the expenses of any underlying Fidelity Central Funds.
O Expense ratios reflect operating expenses of the Fund. Expenses before reductions do not reflect amounts reimbursed by the investment adviser or reductions from brokerage service arrangements or reductions from other expense offset arrangements and do not represent the amount paid by the Fund during periods when reimbursements or reductions occur. Expenses net of fee waivers reflect expenses after reimbursement by the investment adviser but prior to reductions from brokerage service arrangements or other expense offset arrangements. Expenses net of all reductions represent the net expenses paid by the Fund.
P Annualized
Q Amount does not include the portfolio activity of any underlying Fidelity Central Funds.
See accompanying notes which are an integral part of the financial statements.
Notes to Financial Statements (Unaudited)
For the period ended August 31, 2017
1. Organization.
Automotive Portfolio, Construction and Housing Portfolio, Consumer Discretionary Portfolio, Leisure Portfolio, Multimedia Portfolio, and Retailing Portfolio (the Funds) are non-diversified funds of Fidelity Select Portfolios (the Trust). The Trust is registered under the Investment Company Act of 1940, as amended (the 1940 Act), as an open-end management investment company organized as a Massachusetts business trust. The Funds invest primarily in securities of companies whose principal business activities fall within specific industries. Each Fund is authorized to issue an unlimited number of shares. Share transactions on the Statement of Changes in Net Assets may contain exchanges between affiliated funds.
2. Investments in Fidelity Central Funds.
The Funds invest in Fidelity Central Funds, which are open-end investment companies generally available only to other investment companies and accounts managed by the investment adviser and its affiliates. The Funds' Schedules of Investments list each of the Fidelity Central Funds held as of period end, if any, as an investment of each Fund, but do not include the underlying holdings of each Fidelity Central Fund. As an Investing Fund, each Fund indirectly bears its proportionate share of the expenses of the underlying Fidelity Central Funds.
The Money Market Central Funds seek preservation of capital and current income and are managed by Fidelity Investments Money Management, Inc. (FIMM), an affiliate of the investment adviser. Annualized expenses of the Money Market Central Funds as of their most recent shareholder report date are less than .005%.
A complete unaudited list of holdings for each Fidelity Central Fund is available upon request or at the Securities and Exchange Commission (the SEC) website at www.sec.gov. In addition, the financial statements of the Fidelity Central Funds are available on the SEC website or upon request.
3. Significant Accounting Policies.
Each Fund is an investment company and applies the accounting and reporting guidance of the Financial Accounting Standards Board (FASB) Accounting Standards Codification Topic 946 Financial Services – Investments Companies. The financial statements have been prepared in conformity with accounting principles generally accepted in the United States of America (GAAP), which require management to make certain estimates and assumptions at the date of the financial statements. Actual results could differ from those estimates. Subsequent events, if any, through the date that the financial statements were issued have been evaluated in the preparation of the financial statements. The following summarizes the significant accounting policies of the Funds.
Investment Valuation. Investments are valued as of 4:00 p.m. Eastern time on the last calendar day of the period. The Board of Trustees (the Board) has delegated the day to day responsibility for the valuation of each Fund's investments to the Fair Value Committee (the Committee) established by each Fund's investment adviser. In accordance with valuation policies and procedures approved by the Board, each Fund attempts to obtain prices from one or more third party pricing vendors or brokers to value its investments. When current market prices, quotations or currency exchange rates are not readily available or reliable, investments will be fair valued in good faith by the Committee, in accordance with procedures adopted by the Board. Factors used in determining fair value vary by investment type and may include market or investment specific events. The frequency with which these procedures are used cannot be predicted and they may be utilized to a significant extent. The Committee oversees each Fund's valuation policies and procedures and reports to the Board on the Committee's activities and fair value determinations. The Board monitors the appropriateness of the procedures used in valuing each Fund's investments and ratifies the fair value determinations of the Committee.
Each Fund categorizes the inputs to valuation techniques used to value its investments into a disclosure hierarchy consisting of three levels as shown below:
- Level 1 – quoted prices in active markets for identical investments
- Level 2 – other significant observable inputs (including quoted prices for similar investments, interest rates, prepayment speeds, etc.)
- Level 3 – unobservable inputs (including the Fund's own assumptions based on the best information available)
Valuation techniques used to value each Fund's investments by major category are as follows:
Equity securities, including restricted securities, for which market quotations are readily available, are valued at the last reported sale price or official closing price as reported by a third party pricing vendor on the primary market or exchange on which they are traded and are categorized as Level 1 in the hierarchy. In the event there were no sales during the day or closing prices are not available, securities are valued at the last quoted bid price or may be valued using the last available price and are generally categorized as Level 2 in the hierarchy. For foreign equity securities, when market or security specific events arise, comparisons to the valuation of American Depositary Receipts (ADRs), futures contracts, Exchange-Traded Funds (ETFs) and certain indexes as well as quoted prices for similar securities may be used and would be categorized as Level 2 in the hierarchy. Utilizing these techniques may result in transfers between Level 1 and Level 2. For equity securities, including restricted securities, where observable inputs are limited, assumptions about market activity and risk are used and these securities may be categorized as Level 3 in the hierarchy.
Investments in open-end mutual funds, including the Fidelity Central Funds, are valued at their closing net asset value (NAV) each business day and are categorized as Level 1 in the hierarchy
Changes in valuation techniques may result in transfers in or out of an assigned level within the disclosure hierarchy. The aggregate value of investments by input level as of August 31, 2017 is included at the end of each applicable Fund's Schedule of Investments.
Foreign Currency. The Funds may use foreign currency contracts to facilitate transactions in foreign-denominated securities. Gains and losses from these transactions may arise from changes in the value of the foreign currency or if the counterparties do not perform under the contracts' terms.
Foreign-denominated assets, including investment securities, and liabilities are translated into U.S. dollars at the exchange rates at period end. Purchases and sales of investment securities, income and dividends received and expenses denominated in foreign currencies are translated into U.S. dollars at the exchange rate in effect on the transaction date.
The effects of exchange rate fluctuations on investments are included with the net realized and unrealized gain (loss) on investment securities. Other foreign currency transactions resulting in realized and unrealized gain (loss) are disclosed separately.
Investment Transactions and Income. For financial reporting purposes, the Funds' investment holdings and NAV include trades executed through the end of the last business day of the period. The NAV per share for processing shareholder transactions is calculated as of the close of business of the New York Stock Exchange (NYSE), normally 4:00 p.m. Eastern time and includes trades executed through the end of the prior business day. Gains and losses on securities sold are determined on the basis of identified cost and may include proceeds received from litigation. Dividend income is recorded on the ex-dividend date, except for certain dividends from foreign securities where the ex-dividend date may have passed, which are recorded as soon as the Funds are informed of the ex-dividend date. Non-cash dividends included in dividend income, if any, are recorded at the fair market value of the securities received. Income and capital gain distributions from Fidelity Central Funds, if any, are recorded on the ex-dividend date. Certain distributions received by the Funds represent a return of capital or capital gain. The Funds determine the components of these distributions subsequent to the ex-dividend date, based upon receipt of tax filings or other correspondence relating to the underlying investment. These distributions are recorded as a reduction of cost of investments and/or as a realized gain. Interest income is accrued as earned and includes coupon interest and amortization of premium and accretion of discount on debt securities as applicable. Investment income is recorded net of foreign taxes withheld where recovery of such taxes is uncertain.
Expenses. Expenses directly attributable to a fund are charged to that fund. Expenses attributable to more than one fund are allocated among the respective funds on the basis of relative net assets or other appropriate methods. Expense estimates are accrued in the period to which they relate and adjustments are made when actual amounts are known.
Income Tax Information and Distributions to Shareholders. Each year, each Fund intends to qualify as a regulated investment company under Subchapter M of the Internal Revenue Code, including distributing substantially all of its taxable income and realized gains. As a result, no provision for U.S. Federal income taxes is required. Each Fund files a U.S. federal tax return, in addition to state and local tax returns as required. Each Fund's federal income tax returns are subject to examination by the Internal Revenue Service (IRS) for a period of three fiscal years after they are filed. State and local tax returns may be subject to examination for an additional fiscal year depending on the jurisdiction. Foreign taxes are provided for based on each Fund's understanding of the tax rules and rates that exist in the foreign markets in which it invests.
Distributions are declared and recorded on the ex-dividend date. Income and capital gain distributions are determined in accordance with income tax regulations, which may differ from GAAP.
Capital accounts within the financial statements are adjusted for permanent book-tax differences. These adjustments have no impact on net assets or the results of operations. Capital accounts are not adjusted for temporary book-tax differences which will reverse in a subsequent period.
Book-tax differences are primarily due to in-kind transactions, foreign currency transactions, certain foreign taxes, partnerships, deferred trustees compensation, capital loss carryforwards, security level mergers and exchanges and losses deferred due to wash sales and excise tax regulations.
As of period end, the cost and unrealized appreciation (depreciation) in securities and derivatives if applicable, for federal income tax purposes were as follows for each Fund:
| | Tax cost | Gross unrealized appreciation | Gross unrealized depreciation | Net unrealized appreciation (depreciation) |
| Automotive Portfolio | $44,481,766 | $12,324,383 | $(1,997,820) | $10,326,563 |
| Construction and Housing Portfolio | 236,723,635 | 99,818,193 | (5,488,948) | 94,329,245 |
| Consumer Discretionary Portfolio | 550,333,063 | 155,386,358 | (10,654,800) | 144,731,558 |
| Leisure Portfolio | 344,680,537 | 199,486,071 | (5,393,729) | 194,092,342 |
| Multimedia Portfolio | 371,073,658 | 301,561,000 | (4,767,746) | 296,793,254 |
| Retailing Portfolio | 1,076,291,774 | 705,614,923 | (73,222,858) | 632,392,065 |
Capital loss carryforwards are only available to offset future capital gains of the Funds to the extent provided by regulations and may be limited. Under the Regulated Investment Company Modernization Act of 2010 (the Act), the Funds are permitted to carry forward capital losses incurred in taxable years beginning after December 22, 2010 for an unlimited period and such capital losses are required to be used prior to any losses that expire. The capital loss carryforward information presented below, including any applicable limitation, is estimated as of prior fiscal period end and is subject to adjustment.
| | No expiration | | | |
| | Short-term | Long-term | Total no expiration | Total capital loss carryforward |
| Consumer Discretionary Portfolio | $(1,700,132) | $– | $(1,700,132) | $(1,700,132) |
| Leisure Portfolio | (1,470,861) | – | (1,470,861) | (1,470,861) |
| Retailing Portfolio | (19,255,988) | – | (19,255,988) | (19,255,988) |
Certain of the Funds elected to defer to the next fiscal year ordinary losses recognized during the period January 1, 2017 to February 28, 2017. Loss deferrals were as follows:
| | Ordinary losses |
| Automotive Portfolio | $(82,061) |
| Construction and Housing Portfolio | (84,156) |
| Consumer Discretionary Portfolio | (329,108) |
| Multimedia Portfolio | (167,899) |
| Retailing Portfolio | (1,279,212) |
Trading (Redemption) Fees. Shares held by investors in the Automotive Portfolio, Construction and Housing Portfolio, Leisure Portfolio and Multimedia Portfolio for less than 30 days may be subject to a redemption fee equal to .75% of the NAV of shares redeemed. All redemption fees, which reduce the proceeds of the shareholder redemption, are retained by the Funds and accounted for as an addition to paid in capital.
Restricted Securities. The Funds may invest in securities that are subject to legal or contractual restrictions on resale. These securities generally may be resold in transactions exempt from registration or to the public if the securities are registered. Disposal of these securities may involve time-consuming negotiations and expense, and prompt sale at an acceptable price may be difficult. Information regarding restricted securities is included at the end of each applicable Fund's Schedule of Investments.
4. Purchases and Sales of Investments.
Purchases and sales of securities, other than short-term securities, are noted in the table below.
| | Purchases ($) | Sales ($) |
| Automotive Portfolio | 30,313,477 | 39,042,910 |
| Construction and Housing Portfolio | 94,567,011 | 187,404,423 |
| Consumer Discretionary Portfolio | 359,885,551 | 538,060,505 |
| Leisure Portfolio | 199,107,390 | 120,926,775 |
| Multimedia Portfolio | 131,626,412 | 181,160,270 |
| Retailing Portfolio | 166,447,442 | 336,264,870 |
5. Fees and Other Transactions with Affiliates.
Management Fee. Fidelity SelectCo, LLC (the investment adviser) and its affiliates provide the Funds with investment management related services for which the Funds pay a monthly management fee. The management fee is the sum of an individual fund fee rate and an annualized group fee rate. The individual fund fee rate is applied to each Fund's average net assets. The group fee rate is based upon the average net assets of all the mutual funds advised by Fidelity Management & Research Company (FMR) and the investment adviser. The group fee rate decreases as assets under management increase and increases as assets under management decrease. For the reporting period, each Fund's annualized management fee rate expressed as a percentage of each Fund's average net assets was as follows:
| | Individual Rate | Group Rate | Total |
| Automotive Portfolio | .30% | .25% | .54% |
| Construction and Housing Portfolio | .30% | .25% | .55% |
| Consumer Discretionary Portfolio | .30% | .25% | .54% |
| Leisure Portfolio | .30% | .25% | .54% |
| Multimedia Portfolio | .30% | .25% | .54% |
| Retailing Portfolio | .30% | .25% | .55% |
Transfer Agent Fees. Fidelity Investments Institutional Operations Company, Inc. (FIIOC), an affiliate of the investment adviser, is the Funds' transfer, dividend disbursing and shareholder servicing agent. FIIOC receives account fees and asset-based fees that vary according to account size and type of account. FIIOC pays for typesetting, printing and mailing of shareholder reports, except proxy statements. For the period, transfer agent fees were equivalent to the following annualized rates expressed as a percentage of average net assets:
| Automotive Portfolio | .24% |
| Construction and Housing Portfolio | .19% |
| Consumer Discretionary Portfolio | .18% |
| Leisure Portfolio | .17% |
| Multimedia Portfolio | .20% |
| Retailing Portfolio | .19% |
Accounting and Security Lending Fees. Fidelity Service Company, Inc. (FSC), an affiliate of the investment adviser, maintains each Fund's accounting records. The accounting fee is based on the level of average net assets for each month. Under a separate contract, FSC administers the security lending program. The security lending fee is based on the number and duration of lending transactions.
Brokerage Commissions. Certain Funds placed a portion of their portfolio transactions with brokerage firms which are affiliates of the investment adviser. Brokerage commissions are included in net realized gain (loss) and change in net unrealized appreciation (depreciation) in the Statement of Operations. The commissions paid to these affiliated firms were as follows:
| | Amount |
| Automotive Portfolio | $711 |
| Construction and Housing Portfolio | 4,057 |
| Consumer Discretionary Portfolio | 9,794 |
| Leisure Portfolio | 3,742 |
| Multimedia Portfolio | 4,862 |
| Retailing Portfolio | 2,768 |
Interfund Lending Program. Pursuant to an Exemptive Order issued by the SEC, the Funds, along with other registered investment companies having management contracts with Fidelity Management & Research Company (FMR) or other affiliated entities of FMR, may participate in an interfund lending program. This program provides an alternative credit facility allowing the funds to borrow from, or lend money to, other participating affiliated funds. At period end, there were no interfund loans outstanding. Each applicable fund's activity in this program during the period for which loans were outstanding was as follows:
| | Borrower or Lender | Average Loan Balance | Weighted Average Interest Rate | Interest Expense |
| Construction and Housing Portfolio | Borrower | $5,651,500 | 1.34% | $420 |
| Consumer Discretionary Portfolio | Borrower | 27,816,600 | 1.10% | $4,246 |
| Leisure Portfolio | Borrower | 8,599,800 | 1.34% | $1,595 |
| Multimedia Portfolio | Borrower | 5,795,000 | 1.09% | $873 |
| Retailing Portfolio | Borrower | 2,708,800 | 1.35% | $1,013 |
Interfund Trades. The Funds may purchase from or sell securities to other Fidelity Funds under procedures adopted by the Board. The procedures have been designed to ensure these interfund trades are executed in accordance with Rule 17a-7 of the 1940 Act. Interfund trades are included within the respective purchases and sales amounts shown in the Purchases and Sales of Investments note.
Prior Fiscal Year Redemptions In-Kind. During the prior period, 7,597,094 shares of Consumer Discretionary Portfolio held by an affiliated entity were redeemed in-kind for investments and cash with a value of $255,946,088. The Fund had a net realized gain of $63,305,455 on investments delivered through in-kind redemptions. The amount of in-kind redemptions is included in share transactions in the accompanying Statement of Changes in Net Assets. Consumer Discretionary Portfolio recognized no gain or loss for federal income tax purposes.
6. Committed Line of Credit.
Certain Funds participate with other funds managed by the investment adviser or an affiliate in a $4.25 billion credit facility (the "line of credit") to be utilized for temporary or emergency purposes to fund shareholder redemptions or for other short-term liquidity purposes. The participating funds have agreed to pay commitment fees on their pro-rata portion of the line of credit, which are reflected in Miscellaneous expenses on the Statement of Operations, and are as follows:
| Automotive Portfolio | $87 |
| Construction and Housing Portfolio | 668 |
| Consumer Discretionary Portfolio | 1,327 |
| Leisure Portfolio | 718 |
| Multimedia Portfolio | 1,075 |
| Retailing Portfolio | 3,160 |
During the period, the Funds did not borrow on this line of credit.
7. Security Lending.
Certain Funds lend portfolio securities through a lending agent from time to time in order to earn additional income. On the settlement date of the loan, each applicable Fund receives collateral (in the form of U.S. Treasury obligations, letters of credit and/or cash) against the loaned securities and maintains collateral in an amount not less than 100% of the market value of the loaned securities during the period of the loan. The market value of the loaned securities is determined at the close of business of the Funds and any additional required collateral is delivered to the Funds on the next business day. The Funds or borrower may terminate the loan at any time, and if the borrower defaults on its obligation to return the securities loaned because of insolvency or other reasons, the Funds may apply collateral received from the borrower against the obligation. The Funds may experience delays and costs in recovering the securities loaned. Any cash collateral received is invested in the Fidelity Securities Lending Cash Central Fund. The value of loaned securities and cash collateral at period end are disclosed on each applicable Fund's Statement of Assets and Liabilities. Security lending income represents the income earned on investing cash collateral, less rebates paid to borrowers and any lending agent fees associated with the loan, plus any premium payments received for lending certain types of securities. Security lending income is presented on each applicable Fund's Statement of Operations as a component of income from Fidelity Central Funds.
8. Bank Borrowings.
Each Fund is permitted to have bank borrowings for temporary or emergency purposes to fund shareholder redemptions or for other short-term liquidity requirements. Each Fund has established borrowing arrangements with certain banks. The interest rate on the borrowings is the bank's base rate, as revised from time to time. At period end, there were no bank borrowings outstanding. Each applicable Fund's activity in this program during the period for which loans were outstanding was as follows:
| | Average Loan Balance | Weighted Average Interest Rate | Interest Expense |
| Retailing Portfolio | $2,794,273 | 1.66% | $1,417 |
9. Expense Reductions.
Commissions paid to certain brokers with whom the investment adviser, or its affiliates, places trades on behalf of Certain Funds include an amount in addition to trade execution, which may be rebated back to the Funds to offset certain expenses. In addition, through arrangements with each applicable Fund's custodian, credits realized as a result of certain invested cash balances were used to reduce each applicable Fund's expenses. All of the applicable expense reductions are noted in the table below.
| | Brokerage Service reduction | Custody
expense
reduction |
| Construction and Housing Portfolio | $10,967 | $34 |
| Consumer Discretionary Portfolio | 19,896 | – |
| Leisure Portfolio | 6,940 | – |
| Multimedia Portfolio | 56,106 | 36 |
| Retailing Portfolio | 2,976 | – |
In addition, during the period the investment adviser reimbursed and/or waived a portion of operating expenses as follows:
| | Amount |
| Automotive Portfolio | $270 |
| Construction and Housing Portfolio | 1,996 |
| Consumer Discretionary Portfolio | 4,057 |
| Leisure Portfolio | 2,021 |
| Multimedia Portfolio | 2,794 |
| Retailing Portfolio | 9,956 |
10. Other.
The Funds' organizational documents provide former and current trustees and officers with a limited indemnification against liabilities arising in connection with the performance of their duties to the Funds. In the normal course of business, the Funds may also enter into contracts that provide general indemnifications. The Funds' maximum exposure under these arrangements is unknown as this would be dependent on future claims that may be made against the Funds. The risk of material loss from such claims is considered remote.
At the end of the period, the following mutual funds managed by the investment adviser or its affiliates were the owners of record of 10% or more of the total outstanding shares of the following Fund.
| | VIP FundsManager 50% Portfolio | VIP FundsManager 60% Portfolio |
| Consumer Discretionary Portfolio | 21% | 26% |
Mutual funds managed by the investment adviser or its affiliates, in aggregate, were the owners of record of more than 20% of the total outstanding shares of the following Fund.
| | % of shares held |
| Consumer Discretionary Portfolio | 57% |
Shareholder Expense Example
As a shareholder of the Fund, you incur two types of costs: (1) transaction costs, including redemption fees and (2) ongoing costs, including management fees and other Fund expenses. This Example is intended to help you understand your ongoing costs (in dollars) of investing in the Fund and to compare these costs with the ongoing costs of investing in other mutual funds.
The Example is based on an investment of $1,000 invested at the beginning of the period and held for the entire period (March 1, 2017 to August 31, 2017).
Actual Expenses
The first line of the accompanying table for each fund provides information about actual account values and actual expenses. You may use the information in this line, together with the amount you invested, to estimate the expenses that you paid over the period. Simply divide your account value by $1,000.00 (for example, an $8,600 account value divided by $1,000.00 = 8.6), then multiply the result by the number in the first line for a fund under the heading entitled "Expenses Paid During Period" to estimate the expenses you paid on your account during this period. A small balance maintenance fee of $12.00 that is charged once a year may apply for certain accounts with a value of less than $2,000. This fee is not included in the table below. If it was, the estimate of expenses you paid during the period would be higher, and your ending account value lower, by this amount. In addition, each Fund, as a shareholder in the underlying Fidelity Central Funds, will indirectly bear its pro-rata share of the fees and expenses incurred by the underlying Fidelity Central Funds. These fees and expenses are not included in the Fund's annualized expense ratio used to calculate the expense estimate in the table below.
Hypothetical Example for Comparison Purposes
The second line of the accompanying table for each fund provides information about hypothetical account values and hypothetical expenses based on a fund's actual expense ratio and an assumed rate of return of 5% per year before expenses, which is not the Fund's actual return. The hypothetical account values and expenses may not be used to estimate the actual ending account balance or expenses you paid for the period. You may use this information to compare the ongoing costs of investing in the Fund and other funds. To do so, compare this 5% hypothetical example with the 5% hypothetical examples that appear in the shareholder reports of the other funds. A small balance maintenance fee of $12.00 that is charged once a year may apply for certain accounts with a value of less than $2,000. This fee is not included in the table below. If it was, the estimate of expenses you paid during the period would be higher, and your ending account value lower, by this amount. In addition, each Fund, as a shareholder in the underlying Fidelity Central Funds, will indirectly bear its pro-rata share of the fees and expenses incurred by the underlying Fidelity Central Funds. These fees and expenses are not included in the Fund's annualized expense ratio used to calculate the expense estimate in the table below.
Please note that the expenses shown in the table are meant to highlight your ongoing costs only and do not reflect any transaction costs. Therefore, the second line of the table is useful in comparing ongoing costs only, and will not help you determine the relative total costs of owning different funds. In addition, if these transactional costs were included, your costs would have been higher.
| | Annualized Expense Ratio-A | Beginning
Account Value
March 1, 2017 | Ending
Account Value
August 31, 2017 | Expenses Paid
During Period-B
March 1, 2017
to August 31, 2017 |
| Automotive Portfolio | .99% | | | |
| Actual | | $1,000.00 | $1,051.00 | $5.12 |
| Hypothetical-C | | $1,000.00 | $1,020.21 | $5.04 |
| Construction and Housing Portfolio | .80% | | | |
| Actual | | $1,000.00 | $1,038.00 | $4.11 |
| Hypothetical-C | | $1,000.00 | $1,021.17 | $4.08 |
| Consumer Discretionary Portfolio | .78% | | | |
| Actual | | $1,000.00 | $1,040.50 | $4.01 |
| Hypothetical-C | | $1,000.00 | $1,021.27 | $3.97 |
| Leisure Portfolio | .78% | | | |
| Actual | | $1,000.00 | $1,132.70 | $4.19 |
| Hypothetical-C | | $1,000.00 | $1,021.27 | $3.97 |
| Multimedia Portfolio | .80% | | | |
| Actual | | $1,000.00 | $1,042.90 | $4.12 |
| Hypothetical-C | | $1,000.00 | $1,021.17 | $4.08 |
| Retailing Portfolio | .78% | | | |
| Actual | | $1,000.00 | $1,017.40 | $3.97 |
| Hypothetical-C | | $1,000.00 | $1,021.27 | $3.97 |
A Annualized expense ratio reflects expenses net of applicable fee waivers.
B Expenses are equal to each Fund's annualized expense ratio, multiplied by the average account value over the period, multiplied by 184/ 365 (to reflect the one-half year period).
C 5% return per year before expenses
SELCON-SANN-1017
1.813637.112
Item 2.
Code of Ethics
Not applicable.
Item 3.
Audit Committee Financial Expert
Not applicable.
Item 4.
Principal Accountant Fees and Services
Not applicable.
Item 5.
Audit Committee of Listed Registrants
Not applicable.
Item 6.
Investments
(a)
Not applicable.
(b)
Not applicable
Item 7.
Disclosure of Proxy Voting Policies and Procedures for Closed-End Management Investment Companies
Not applicable.
Item 8.
Portfolio Managers of Closed-End Management Investment Companies
Not applicable.
Item 9.
Purchase of Equity Securities by Closed-End Management Investment Company and Affiliated Purchasers
Not applicable.
Item 10.
Submission of Matters to a Vote of Security Holders
There were no material changes to the procedures by which shareholders may recommend nominees to the Fidelity Select Portfolios’s Board of Trustees.
Item 11.
Controls and Procedures
(a)(i) The President and Treasurer and the Chief Financial Officer have concluded that the Fidelity Select Portfolios’s (the “Trust”) disclosure controls and procedures (as
defined in Rule 30a-3(c) under the Investment Company Act) provide reasonable assurances that material information relating to the Trust is made known to them by the appropriate persons, based on their evaluation of these controls and procedures as of a date within 90 days of the filing date of this report.
(a)(ii) There was no change in the Trust’s internal control over financial reporting (as defined in Rule 30a-3(d) under the Investment Company Act) that occurred during the second fiscal quarter of the period covered by this report that has materially affected, or is reasonably likely to materially affect, the Trust’s internal control over financial reporting.
Item 12.
Exhibits
| | |
(a) | (1) | Not applicable. |
(a) | (2) | Certification pursuant to Rule 30a-2(a) under the Investment Company Act of 1940 (17 CFR 270.30a-2(a)) is filed and attached hereto as Exhibit 99.CERT. |
(a) | (3) | Not applicable. |
(b) |
| Certification pursuant to Rule 30a-2(b) under the Investment Company Act of 1940 (17 CFR 270.30a-2(b)) is furnished and attached hereto as Exhibit 99.906CERT. |
SIGNATURES
Pursuant to the requirements of the Securities Exchange Act of 1934 and the Investment Company Act of 1940, the registrant has duly caused this report to be signed on its behalf by the undersigned, thereunto duly authorized.
Fidelity Select Portfolios
| |
By: | /s/Adrien E. Deberghes |
| Adrien E. Deberghes |
| President and Treasurer |
|
|
Date: | October 25, 2017 |
Pursuant to the requirements of the Securities Exchange Act of 1934 and the Investment Company Act of 1940, this report has been signed below by the following persons on behalf of the registrant and in the capacities and on the dates indicated.
| |
By: | /s/Adrien E. Deberghes |
| Adrien E. Deberghes |
| President and Treasurer |
|
|
Date: | October 25, 2017 |
| |
By: | /s/Howard J. Galligan III |
| Howard J. Galligan III |
| Chief Financial Officer |
|
|
Date: | October 25, 2017 |