United States
Securities and Exchange Commission
Washington, D.C. 20549
Form 10-K
(Mark One)
x Annual report pursuant to Section 13 or 15(d) of the Securities
Exchange Act of 1934 for the fiscal year ended September 29, 2012 or
¨ Transition report pursuant to Section 13 or 15(d) of the
Securities Exchange Act of 1934 for the transition period from to
Commission file number: 0-10815
Unified Grocers, Inc.
(Exact name of registrant as specified in its charter)
California
(State or other jurisdiction of incorporation or organization)
| | |
I.R.S. Employer Identification No.: 95-0615250 |
5200 Sheila Street, Commerce, CA | | 90040 |
(Address of principal executive offices) | | (Zip Code) |
Registrant’s telephone number, including area code: (323) 264-5200
Securities registered pursuant to Section 12(b) of the Act: None
Securities registered pursuant to Section 12(g) of the Act:
| | |
| Title of each class | | |
Class A Shares | | |
Class B Shares | | |
Class E Shares | | |
Indicate by check mark if the registrant is a well-known seasoned issuer, as defined in Rule 405 of the Securities Act. Yes ¨ No x
Indicate by check mark if the registrant is not required to file reports pursuant to Section 13 or Section 15(d) of the Act. Yes ¨ No x
Indicate by check mark whether the registrant (1) has filed all reports required to be filed by Section 13 or 15(d) of the Securities Exchange Act of 1934 during the preceding 12 months (or for such shorter period that the registrant was required to file such reports), and (2) has been subject to such filing requirements for the past 90 days. Yes x No ¨
Indicate by check mark whether the registrant has submitted electronically and posted on its corporate Web site, if any, every Interactive Data File required to be submitted and posted pursuant to Rule 405 of Regulation S-T (§232.405 of this chapter) during the preceding 12 months (or for such shorter period that the registrant was required to submit and post such files). Yes x No ¨
Indicate by check mark if disclosure of delinquent filers pursuant to Item 405 of Regulation S-K (§229.405) is not contained herein, and will not be contained, to the best of registrant’s knowledge, in definitive proxy or information statements incorporated by reference in Part III of this Form 10-K or any amendment to this Form 10-K. x
Indicate by check mark whether the registrant is a large accelerated filer, an accelerated filer, a non-accelerated filer, or a smaller reporting company. See definitions of “large accelerated filer,” “accelerated filer” and “smaller reporting company” in Rule 12b-2 of the Exchange Act. (Check one):
| | | | | | |
| Large accelerated filer ¨ | | Accelerated filer ¨ | | Non-accelerated filer x | | Smaller reporting company ¨ |
| | | | (Do not check if a smaller reporting company) |
Indicate by check mark whether the registrant is a shell company (as defined in Rule 12b-2 of the Exchange Act). Yes ¨ No x
State the aggregate market value of the voting and non-voting common equity held by non-affiliates computed by reference to the price at which the common equity was last sold, or the average bid and asked price of such common equity, as of the last business day of the registrant’s most recently completed second fiscal quarter. There is no public market for the Company’s voting and non-voting common equity.
The number of shares outstanding of each of the registrant’s classes of common stock, as of December 14, 2012, was as follows:
| | | | | | |
| Class A: 147,000 shares | | Class B: 434,598 shares | | Class C: 15 shares | | Class E: 251,808 shares |
Documents Incorporated By Reference: Portions of the proxy statement for the 2013 annual meeting, which will be filed within 120 days of the end of the fiscal year, are incorporated by reference into Part III of this Form 10-K.
Table of Contents
Part I
Item 1. BUSINESS
Business Overview
Unified Grocers, Inc. (referred to in this Form 10-K, together with its consolidated subsidiaries, as “Unified,” “the Company,” “we,” “us,” or “our”) is a California corporation organized in 1922 and incorporated in 1925. We are a retailer-owned, grocery wholesale cooperative serving supermarket, specialty and convenience store operators located primarily in the western United States and the Pacific Rim. We sell a wide variety of products typically found in supermarkets, including dry grocery, frozen food, deli, ethnic, gourmet, specialty foods, natural and organic, general merchandise, health and beauty care, service deli, service bakery, meat, eggs, produce, bakery and dairy products. We also provide insurance and financing services to our customers, as well as various support services, including merchandising, retail pricing, advertising, promotional planning, retail technology, equipment purchasing and real estate services. The availability of specific products and services may vary by geographic region. We have three separate geographical and marketing regions: Southern California, Northern California and the Pacific Northwest.
Our customers include our owners (“Members”) and non-owners (“Non-Members”). We do business primarily with those customers that have been accepted as Members. Our Members operate supermarket companies that range in size from single store operators to regional supermarket chains. Store sizes range from neighborhood stores of less than 10,000 square feet to large box format stores of over 80,000 square feet. Members are required to meet specific requirements, which include ownership of our capital shares and may include required cash deposits. Customers who purchase less than $1 million annually from us would not generally be considered for membership, while customers who purchase over $3 million annually are typically required to become Members. In addition, each Member must meet purchase requirements that may be modified at the discretion of the Company’s Board of Directors (the “Board”).
We distribute the earnings from patronage activities conducted by us, excluding our subsidiaries, with our Members (“Patronage Business”), in the form of patronage dividends. An entity that does not meet Member purchase requirements may conduct business with us as a Non-Member customer. We may also grant an entity that meets our Member purchase requirements the ability to conduct business with us as a Non-Member customer. We retain the earnings from our subsidiaries and from business conducted with Non-Members (collectively, “Non-Patronage Business”).
Company Structure and Organization
Overview
Our business includes the following two reportable segments:
| | · | | Wholesale Distribution segment—Our Wholesale Distribution business includes the sale of perishable and non-perishable food and non-food products to both Members and Non-Members. Our Wholesale Distribution business provided approximately 99% of our consolidated net sales and approximately 85%, 87% and 89% of our consolidated operating income for each of fiscal 2012, 2011 and 2010, and represented approximately 84% of our consolidated total assets for each of these three fiscal years. The Wholesale Distribution business offers a broad range of branded and corporate brand products in nearly all product categories found in a typical supermarket. In addition, this business segment provides certain retail support services to our customers, including merchandising, retail pricing, advertising, promotional planning, retail technology, equipment purchasing and real estate services. |
| | · | | Insurance segment—Our Insurance business includes two insurance subsidiaries that provide insurance and insurance-related products, including workers’ compensation and liability insurance policies, to both us and our customers and one insurance agency subsidiary that places business with insurance carriers, including our insurance subsidiaries. |
We also have other support businesses, consisting primarily of our financing subsidiary that provides financing services to our Members.
1
The following table presents percentages of net sales by type of similar product, as classified by the Company:
| | | | | | | | | | | | |
| | | Percent of Consolidated Net Sales | |
| | | Fiscal Years Ended | |
| | | September 29,
2012 | | | October 1,
2011 | | | October 2,
2010 | |
Wholesale Distribution: | | | | | | | | | | | | |
Non-perishable products(1) | | | 68 | % | | | 70 | % | | | 71 | % |
Perishable products(2) | | | 31 | % | | | 29 | % | | | 28 | % |
| |
Total Wholesale Distribution net sales | | | 99 | % | | | 99 | % | | | 99 | % |
| |
Insurance and Other(3) | | | 1 | % | | | 1 | % | | | 1 | % |
| |
Total consolidated net sales | | | 100 | % | | | 100 | % | | | 100 | % |
| |
| (1) | | Consists primarily of dry grocery, frozen food, deli, ethnic, gourmet, specialty foods, natural and organic, general merchandise and health and beauty care products. Also includes (a) retail support services and (b) products and shipping services provided to Non-Member customers. |
| (2) | | Consists primarily of service deli, service bakery, meat, eggs, produce, bakery and dairy products. |
| (3) | | Consists primarily of revenues from our Insurance segment and All Other support business activities. |
In the last few years, we have seen a modest shift in sales mix in the Wholesale Distribution segment towards perishable products as sales of perishable products have increased. As our non-perishable products tend to have higher margins than our perishable products, the shift in sales mix towards perishable products has resulted in a lower overall margin and negatively impacted our net earnings.
Wholesale Distribution Business
Overview
Our Wholesale Distribution business provides products and services through the following divisions and subsidiaries:
| | · | | Cooperative Division: Products sold through the Cooperative Division include dry grocery, frozen food, deli, meat, eggs, produce, bakery, service bakery, service deli, general merchandise and health and beauty care. We also provide retail support services including merchandising, retail pricing, advertising, promotional planning, technology support services, equipment purchasing services and real estate services. We have divided our Cooperative Division into three marketing regions to better serve the product and service needs of our customers: Southern California, Northern California and Pacific Northwest. |
| | · | | Southern California Dairy Division: The Southern California Dairy Division operates a milk processing plant in Los Angeles, California. Raw milk that is pasteurized and bottled at the plant is purchased from a third party dairy cooperative based in California. The Southern California Dairy also bottles water and various fruit punch drinks. |
| | · | | Pacific Northwest Dairy Division: The Pacific Northwest Dairy Division generates earnings from sales of dairy and related products manufactured by third parties. Dairy and related products are distributed by our Milwaukie, Oregon and Seattle, Washington distribution facilities and by third parties directly to our customers in the Pacific Northwest region. |
| | · | | Market Centre: We sell food products such as Hispanic, other ethnic, gourmet, natural, organic and other specialty foods through our Market Centre subsidiary. We also sell products carried in the Cooperative Division to small Non-Member customers through our Market Centre subsidiary. |
| | · | | Unified International, Inc.: We sell products and provide shipping services to Non-Member customers through our Unified International, Inc. subsidiary. |
Earnings from business conducted with Members in our Cooperative, Southern California Dairy and Pacific Northwest Dairy divisions are distributed in the form of patronage dividends. We retain the earnings from business
2
conducted with Non-Members in our Cooperative, Southern California Dairy, and Pacific Northwest Dairy divisions. We also retain the earnings from all business, with both Member and Non-Member, conducted by our subsidiaries, including Market Centre and Unified International, Inc.
Supply Agreements
During the normal course of business, we may enter into supply agreements with customers. These agreements typically require that a customer purchase a specified amount of its merchandise requirements from us and obligate us to supply such merchandise pursuant to agreed-upon terms and conditions relating to matters such as pricing (i.e., mark-up) and delivery. We may also enter into supply agreements with customers under which we make a loan or provide upfront money or other benefits to the customer, including to fund store acquisitions or renovations, or provide more favorable pricing based on the customer’s purchasing volume commitments. The supply agreements vary with respect to terms and length. Approximately 54% of our net sales in the Wholesale Distribution segment in fiscal 2012 were to customers pursuant to the terms of a supply agreement, of which 11% were attributable to sales with Members subject to five-year supply agreements executed at the time of our purchase of certain assets and assumption of certain liabilities of Associated Grocers, Incorporated in fiscal 2008.
Products
National Brands
We supply more than 100,000 national and regional brand items, which represented approximately 88.7% of our net sales in the Wholesale Distribution segment in fiscal 2012. We believe that national and regional brands are attractive to chain accounts and other customers seeking consistent product availability throughout their operations. Our national brand strategy is to foster close relationships with many national suppliers, which provide us with important sales and marketing support.
Corporate Brands
We sell an extensive line of food and non-food items under various corporate brands. Our two-tier corporate brand strategy emphasizes certain premium corporate brands as a direct alternative to national brand items and other value-oriented corporate brands as an alternative to lower cost regional labels. These corporate brands enable us to offer our customers an exclusive line of product alternatives across a wide range of price points. Sales of our corporate brand products represented approximately 11.3% of net sales in the Wholesale Distribution segment in fiscal 2012.
We currently offer over 5,300 corporate brand products in the following categories: dry grocery, frozen, delicatessen, general merchandise, ice cream, fluid milk and bakery. These products are sold under the premium corporate brands of Western Family, Springfield, Cottage Hearth and Natural Directions and the value-oriented corporate brands of Special Value and Golden Crème. Western Family and Natural Directions products are acquired from Western Family Holding Company, of which we hold a partial ownership interest. We operate a bakery manufacturing facility and a milk, water and juice processing plant in Los Angeles, California and sell such products under the Springfield, Golden Crème and Cottage Hearth corporate brands. With the exception of certain bakery, milk, water and juice products, all of our corporate brand products are manufactured by third parties.
Facilities and Transportation
As of September 29, 2012, we operated approximately 5.0 million square feet of warehouse and manufacturing space throughout our marketing area.
| | · | | Southern California: We own and operate a dry grocery warehouse in Commerce and a combined frozen foods/refrigerated warehouse in Santa Fe Springs. We also lease a perishable foods warehouse in Los Angeles. These facilities serve our customers in Southern California, Southern Nevada, Arizona, New Mexico, Texas and the Pacific Rim. We own and operate a bakery manufacturing facility and a milk, water and juice processing plant, both in Los Angeles. |
| | · | | Northern California: We own a dry grocery and a combined frozen foods/refrigerated warehouse in Stockton. The Stockton facility provides dry grocery, frozen and refrigerated foods primarily to our customers in Northern California, Hawaii, Northern Nevada and the Pacific Rim. The Stockton facility also supplies gourmet, specialty, and natural and organic foods to all three of our marketing regions. |
3
Historically we distributed general merchandise and health and beauty care products to customers throughout California, Nevada, Hawaii, Arizona, New Mexico, Texas and the Pacific Rim through a leased dry warehouse in Fresno. We allowed the lease on this facility to expire and in the first quarter of fiscal 2013, we ceased distribution from this facility and consolidated distribution of these products into our facilities in Southern and Northern California.
| | · | | Pacific Northwest: We own and operate a facility in Milwaukie, Oregon that provides dry grocery, frozen and refrigerated foods, as well as general merchandise and health and beauty care products. We also lease and operate a dry grocery, frozen and refrigerated warehouse in Seattle, Washington. During fiscal 2012, we extended our lease on our current Seattle location through April 30, 2018. These facilities serve our Pacific Northwest region, which includes Alaska, Oregon, Washington, Idaho, California and the Pacific Rim. |
We believe that our properties are generally in good condition, well maintained and suitable and adequate to carry on our business as presently conducted.
One of our competitive strengths lies in our ability to provide the many different items our customers need to compete across multiple retail formats. Rather than continuing to build the additional warehouse space necessary to store and distribute duplicate items in all regions, we have focused on extending the reach of our current facilities. This strategy enables us to be selective about which items are duplicated in more than one region. Our specialty food subsidiary, Market Centre, provides an example of where we have been successful in reducing the duplication of items across multiple warehouses. Market Centre warehouses a portion of its products exclusively in our facility in Stockton, California and provides gourmet, specialty and natural and organic foods to all three of our marketing regions, eliminating the need to buy, store and manage inventories in multiple locations. By extending the reach of our facilities, we are also able to operate our business in a manner which minimizes our inventory-carrying requirement.
Our customers may choose either of two delivery options for the distribution of our products: have us deliver orders to their stores or warehouses or pick up their orders from our distribution centers. We operate a fleet of 320 tractors and 1,094 trailers that we use to distribute products to our customers. Approximately 48% of our sales are delivered to customers by our own fleet of tractors and trailers. This percentage has been on a relatively steady decline from 60% or more in 2008 and earlier years as customers have increasingly utilized their own fleets or turned to third-party carriers. Continuation of this trend may have a negative impact on our fleet efficiencies.
Insurance Business
Our Insurance business includes two insurance subsidiaries that provide insurance and insurance-related products to both us and our customers in most of the states in which we do business. It also includes an insurance agency subsidiary that places business with insurance carriers, including our insurance subsidiaries. The insurance and insurance-related products provided by our insurance subsidiaries include workers’ compensation and liability insurance policies, representing approximately 85% and 15%, respectively, of our total Insurance segment revenues in fiscal 2012.
Our Insurance segment generated 88% of policy revenues from sales in California, 4% from sales in Oregon and 8% from sales in other states in fiscal 2012. Our insurance subsidiaries compete with both national and regional insurance carriers. Our Insurance segment represented approximately 1% of our consolidated net sales and approximately 14%, 13% and 11%, respectively, of consolidated operating income and 13%, 12% and 12%, respectively, of our consolidated total assets for fiscal 2012, 2011 and 2010. While contributing only a small percentage of our consolidated net sales, the results of our Insurance segment can often have a more significant impact on our operating income due to the higher margins of this segment.
Our insurance subsidiaries are subject to the insurance laws and regulations of each of the states or jurisdictions in which they do business. These insurance laws and regulations are frequently amended. These regulatory agencies perform statutory accounting, financial, “Market Conduct” and/or “Claims Practice” examinations to ensure that our rating, underwriting and claims practices are in compliance with state regulations. We primarily use subscriptions, reporting services and direct communications from the states to monitor and maintain compliance within this changing environment.
4
Other Support Businesses
Our other support businesses, consisting primarily of a financing entity, collectively accounted for less than 1% of our consolidated net sales and consolidated operating income and 3% of our consolidated total assets for each of fiscal 2012, 2011 and 2010.
Employees
As of September 29, 2012, we employed approximately 2,700 employees, of whom approximately 60% are represented by labor unions under 23 collective bargaining agreements. The International Brotherhood of Teamsters represents a significant majority of employees covered by labor contracts. Collective bargaining agreements affecting our employees have various expiration dates ranging from 2013 through 2016. We believe our labor relations with the various local unions are good.
Industry Overview and the Company’s Operating Environment
Competition
The grocery industry, including the wholesale food distribution business, is highly competitive and characterized by high volume and low profit margins. As a result of this competition, the grocery industry has trended towards both vertical and horizontal integration, an increasing number of competitive format grocery stores that are adding square footage devoted to food and non-food products (including warehouse club stores, supercenters and other alternate formats) and mergers and acquisitions among competing organizations. When independent retailers are acquired by large chains with self-distribution capacity, are driven from business by larger grocery chains, or become large enough to purchase directly from manufacturers or develop their own self-distribution capabilities, we may lose business. In addition, as a higher percentage of our sales go to larger customers, our margins tend to be adversely affected as these larger customers typically receive discounts for the higher volume of their purchases, which may adversely impact our profitability.
We believe these trends in industry competition and consolidation will continue and that adapting our organization to them is essential to continuing to achieve our strategic and financial objectives. For example, one of the primary drivers of mergers and acquisitions in the grocery industry is the need to consolidate to increase economies of scale that reduce costs, including increased buying power and resource sharing. We have participated in such consolidation in the past, including our purchase of certain assets and assumption of certain liabilities of Associated Grocers, Incorporated (“AG”) and its subsidiaries, a retailer-owned grocery cooperative headquartered in Seattle, Washington (the “Acquisition”), in early fiscal 2008, which expanded our capacity to serve retailers throughout Washington, Oregon, Alaska and the Pacific Rim while enabling us to reduce costs through economies of scale.
We compete in the wholesale grocery industry with regional and national food wholesalers such as C&S Wholesale Grocers, Inc. and Supervalu, Inc. We also compete with many local and regional meat, produce, grocery, specialty, general food, bakery and dairy wholesalers and distributors.
Our customers include grocery retailers with a broad range of store sizes and types targeting a diverse range of consumers. Depending on the nature of their stores and consumer focus, our customers may compete directly with vertically integrated regional and national chains, such as Albertsons (owned by Supervalu, Inc.), Kroger Co., Safeway Inc., and WinCo Foods, which operate traditional format full-service grocery stores. They may also compete with warehouse club stores and supercenters such as Costco Wholesale Corp., Sam’s Club and Wal-Mart Stores, Inc., discount, drug and alternative format stores such as CVS Caremark Corporation, Target Corp., and the various “dollar” stores, stores focused on upscale and natural and organic products such as Trader Joe’s and Whole Foods Market Inc., and various convenience stores. Certain of our customers also serve niche markets such as the Hispanic and Asian communities. The marketplace in which our customers compete continues to evolve and present challenges. These challenges include such recent trends as the continued proliferation of discount stores, supercenters and warehouse club stores and the efforts of many of the non-traditional format stores to expand their offerings of product to cover a greater range of the products offered by the traditional format full-service grocery store. The success of our customers in attracting consumers to shop at their stores, as opposed to the traditional and non-traditional format stores of their competitors, has a direct and significant impact on our sales and earnings. For more information about the competitive environment we and our customers face, please refer to Item 1A,“Risk Factors.”
5
In helping our customers remain competitive, whether they operate a traditional full-service grocery store or a non-traditional format store targeting particular consumers, we emphasize providing a diverse line of high quality products, competitive pricing and timely and reliable deliveries. We also provide a wide range of other services, such as merchandising, retail pricing support, advertising, financing and insurance, to further support our customers’ businesses.
Consumers
Our strategy to help our customers effectively compete in the marketplace includes a focus on helping our customers understand consumer trends. The ongoing challenging economic climate continues to cause consumers to place a higher emphasis on lower prices. Job losses have also caused a significant shift in consumers’ eating and living habits. To effectively adjust to these conditions, many of our customers have focused on, among other things, enhancing the use of our corporate brand offerings to give consumers a lower-priced alternative to nationally branded products. This includes a corporate brand health and wellness offering to satisfy consumers’ desire for products that support a healthy lifestyle but at a lower price. Differentiation strategies in specialty and ethnic products and items on the perimeter of the store such as produce, service deli, service bakery and meat categories also continue to be an important part of our strategy.
One of our sales initiatives is to continue our development of programs and services designed with consumers in mind. The retail store is becoming a more important source of information for consumers about the products that are available to them. To provide this information, we offer customers tools to educate consumers about the products we offer through a variety of methods including social media, websites and mobile devices as well as in-store displays. We also promote value and savings through event marketing and everyday low price campaigns.
Economic Factors
Economic factors such as low consumer confidence and high unemployment continue to persist in many of our operating markets. Higher food price inflation and fuel costs during calendar 2011 placed more pressure on consumer discretionary income, and these trends have continued during 2012, though to a lesser extent during our third and fourth fiscal quarters ending June 30 and September 29, 2012, respectively. Severe to extreme drought conditions currently prevailing in approximately one-third of the U.S. are expected to result in higher prices on certain food products; however, the timing and degree of any such impact is uncertain at this time. Consumers continue to be highly price sensitive and seek lower-cost alternatives in their grocery purchases, continuing to put pressure on profit margins in an industry already characterized by low profit margins. Job losses have also caused greater demographic shifts that have changed the composition of consumers and their related product focus in a given marketplace.
We are impacted by changes in the overall economic environment. An inflationary or deflationary economic period could impact our operating income in a variety of areas, including, but not limited to, sales, cost of sales, employee wages and benefits, workers’ compensation insurance and energy and fuel costs. We typically experience significant volatility in the cost of certain commodities, the cost of ingredients for our manufactured breads and processed fluid milk, and the cost of packaged goods purchased from other manufacturers. Our operating programs are designed to give us the flexibility to pass on these costs to our customers; however, we may not always be able to pass on such increases to customers on a timely basis. Any delay may result in our recovering less than all of a price increase. It is also difficult to predict the effect that possible future purchased or manufactured product cost decreases might have on our profitability. The effect of deflation in purchased or manufactured product costs would depend on the extent to which we had to lower selling prices of our products to respond to sales price competition in the market. Additionally, we are impacted by changes in prevailing interest rates or interest rates that have been negotiated in conjunction with our credit facilities. A lower interest rate (used, for example, to discount our pension and postretirement unfunded obligations) may increase certain expenses, particularly pension and postretirement benefit costs, while decreasing potential interest expense for our credit facilities. An increase in interest rates may have the opposite impact. Consequently, it is difficult for us to accurately predict the impact that inflation, deflation or changes in interest rates might have on our operations.
The majority of our investments (approximately 85%) are held by two of our insurance subsidiaries, and include obligations of U.S. government corporations and agencies, high quality investment grade corporate bonds, U.S. government treasury securities, U.S. state and municipal securities and common equity securities. The
6
investments held by our insurance subsidiaries, excluding the common equity securities, are generally not actively traded and are valued based upon inputs including quoted prices for identical or similar assets. Collectively, the estimated fair value or market value of these investments continued to exceed their cost during fiscal 2012. Approximately 10% of our investments are held by our Wholesale Distribution segment, which consists primarily of Western Family Holding Company (“Western Family”) common stock. Western Family is a private cooperative located in Oregon from which we purchase food and general merchandise products. Approximately 5% of our investments are held by our other support businesses and consist primarily of an investment by our wholly-owned finance subsidiary in National Consumer Cooperative Bank (“NCB”). NCB operates as a cooperative and therefore its borrowers are required to own its Class B common stock.
We invest in life insurance policies (reported at cash surrender value) and various publicly-traded mutual funds (reported at estimated fair value based on quoted market prices) to fund obligations pursuant to our Executive Salary Protection Plan and deferred compensation plan (see Note 11 ofNotes to Consolidated Financial Statementsin Item 8,“Financial Statements and Supplementary Data”for additional discussion). Life insurance and mutual fund assets with values tied to the equity markets are impacted by overall market conditions. In fiscal 2012, net earnings and net comprehensive earnings experienced an increase corresponding to the increase in life insurance and mutual fund assets, respectively.
External factors continue to drive volatility in our costs associated with fuel. Our pricing includes a fuel surcharge on product shipments to recover fuel costs over a specified index. When fuel costs differ from a specified index, pricing adjustments are passed on to our customers. The surcharge is reviewed monthly and adjusted when appropriate.
We are subject to recurring wage and benefit increases as a result of negotiated labor contracts with our represented employees and compensation and benefit adjustments for non-represented employees. We continually focus attention on initiatives aimed at improving operating efficiencies throughout the organization to offset the impact of these increases.
Technology
Technology has played a significant role in shaping the grocery industry as companies continue to use technology to improve efficiency and reduce costs. Technological improvements have been an important part of our strategy to improve service to our customers and lower costs. As supermarket chains increase in size and alternative format grocery stores gain market share, independent grocers are further challenged to compete. Our customers benefit from our substantial investment in supply-chain technology, including improvements in our vendor management activities through new item introductions, promotions management and payment support activities. We also provide our customers with network connectivity, data exchange and a portfolio of retail automation applications. Most of these offerings are provided under a subscription model allowing our retailers to utilize these systems without high up-front costs. We fully support these products, eliminating the need for our customers to manage these systems. We continue to invest in technology solutions that offer value to the supply chain and bring our customers closer to the consumer.
Suppliers and Raw Materials Sources
The products we sell to our customers and the raw materials we use in our manufacturing operations are purchased from a number of sources. No single source of supply exceeds 5% in any part of our business. We believe that alternative suppliers are available for substantially all of our products and that the loss of any one supplier would not have a material adverse effect on our business. We also believe the products and raw materials are generally available in sufficient supply to adequately meet customer demand.
Seasonality and Backlog
Our business is not subject to significant seasonal fluctuations in demand. We do not typically experience a material backlog in sales orders or the fulfillment of customer orders.
7
Environmental Regulation
We own and operate various facilities for the manufacture, warehousing and distribution of products to our customers. Accordingly, we are subject to increasingly stringent federal, state and local laws, regulations and ordinances that (1) govern activities or operations that may have adverse environmental effects, such as discharges to air and water, as well as handling and disposal practices for solid and hazardous wastes and (2) impose liability for the costs of cleaning up, and certain damages resulting from past spills, disposals or other releases of hazardous materials. In particular, under applicable environmental laws, we may be responsible for remediation of environmental conditions and may be subject to associated liabilities (including liabilities resulting from lawsuits brought by private litigants) relating to our facilities and the land on which our facilities are situated, regardless of whether we lease or own the facilities or land in question and regardless of whether such environmental conditions were created by us or by a prior owner or tenant. We believe we are in compliance with all such laws and regulations and have established reserves for known and anticipated costs of remediation.
Customers
Approximately 58% of our net sales are conducted with Members on a patronage basis. Earnings resulting from our patronage sales are distributed in the form of patronage dividends. Approximately 20% of our net sales are conducted with Members on a non-patronage basis, and 22% of our net sales are conducted with Non-Members. We retain earnings from all business activities transacted with Non-Members and non-patronage business activities transacted with Members. Our Member and Non-Member customers are typically retail grocery store operators ranging in size from single store operators to regional supermarket chains.
Our largest customer, Smart & Final, Inc., a Non-Member customer, accounted for 13%, 12% and 11% of our total net sales, and our ten largest customers (including Smart & Final, Inc.), taken together, accounted for 46%, 45% and 44% of our total net sales, for the fiscal years ended September 29, 2012, October 1, 2011 and October 2, 2010, respectively.
Our ten customers with the largest accounts receivable balances accounted for approximately 39% and 37% of total accounts receivable at September 29, 2012 and October 1, 2011, respectively.
During fiscal 2012, the following changes to our membership base have occurred as indicated in the following table:
| | | | |
| Membership Activity | | Number of
Members | |
Membership count as of October 1, 2011 | | | 445 | |
New Members | | | 4 | |
Members who converted to Non-Member status | | | (9 | ) |
Members who sold to other continuing Members | | | (10 | ) |
Members discontinued | | | (11 | ) |
| |
Membership count as of September 29, 2012 | | | 419 | |
| |
Since the beginning of our equity enhancement initiative (see Item 7,“Management’s Discussion and Analysis of Financial Condition and Results of Operations—“Equity Enhancement”), a number of smaller-volume retailers have decided to conduct business with us as Non-Members rather than as Members. While the pricing program for these Non-Members is higher than that for Members, the benefit to such retailers is that the change eliminates their need to own our Class A and Class B Shares (see“Capital Shares” below). Conducting business with us as a Non-Member allows a customer to maintain access to the broad product selection we offer that helps them stay competitive.
8
Competitive Strengths
We believe we have the following competitive strengths:
Full service provider of products for supermarkets
We provide nearly all product categories typically found in supermarkets, including dry grocery, frozen food, deli, ethnic, gourmet, specialty food, natural and organic, general merchandise, health and beauty care, service deli, service bakery, meat, eggs, produce, bakery and dairy products. Through our strategically located warehouses in Northern and Southern California and the Pacific Northwest and our extensive fleet of tractors and trailers, we are able to sell and/or deliver product to supermarkets, specialty grocery stores and convenience stores located in the Western United States and the Pacific Rim. As a full service provider, we offer retailers the ability to centralize their purchasing and simplify their logistics. We emphasize providing a diverse line of high quality products, and are constantly seeking to expand and adjust our product offerings to help our customers remain competitive and meet shifts in consumer demand.
Large and diverse customer base enables competitive pricing and range of offerings
Our large and diverse customer base gives us the buying power, and enables us to maintain a scale of operations, necessary to purchase a diverse range of products from vendors at favorable prices and, in turn, sell and/or deliver such products to customers at competitive prices. Our scale also allows us to offer our customers access to vendor support, including promotional offerings, new items and other information, to help them be competitive and meet consumer demands. Further, we participate in buying consortiums with other non-competing wholesalers to help ensure that our retailers are given the necessary vendor support to help them be competitive with larger national chains.
Broad range of services to help retailers compete
We provide insurance and financing services to our customers, as well as various support services, including merchandising, retail pricing, advertising, promotional planning, retail technology, equipment purchasing and real estate services, to help our retailers compete. We also gather and disseminate industry information to keep our customers updated on consumer trends, regulations and products, assisting them to identify and focus on opportunities for success. Our various services help our customers concentrate on their core business and give them essential business tools to compete against larger national chains.
Competitive Strategy
Our strategy is to provide our customers with the tools they need to be successful in serving consumers at the retail level. First and foremost, we are focused on continuing to provide a broad range of high quality products and services, at competitive prices, to enable our customers’ stores to attract and satisfy consumers. As consumer demands shift (such as recent trends toward natural, organic and ethnic products) or technology creates new ways for retailers to reach consumers (such as data collection to provide targeted promotional offers), we seek to be at the forefront of providing the new products and services our customers need to make the most of emerging market opportunities. In addition, we seek to increase sales outside of the traditional supermarket channel, such as to neighborhood and ethnic markets, carnicerias (meat markets) and restaurants, expand our sales and service offerings into other geographic areas, including through partnerships with other regional wholesale distribution companies, and seize other business opportunities, such as logistics, warehousing and transportation services, that leverage our assets.
Member Requirements
Our Members are both owners and customers of our company. A Member must (1) own 350 Class A Shares and a number of Class B Shares based upon the amount of such Member’s average weekly purchases of product from us, or as otherwise specified by the Board (see“—Capital Shares”); (2) be of approved financial standing; (3) be engaged in selling grocery and related products at retail or wholesale; (4) purchase products from us in amounts and in a manner that is established by the Board; (5) make application in such form as is prescribed by us; and (6) be accepted as a Member by Board action.
9
Our Members are typically required to satisfy a minimum purchase requirement of $1 million in annual purchases from us. This requirement may be modified from time to time by the Board, having been most recently changed in April 2008. Members at the time of this change, or who were shareholders or customers of AG who became Members in connection with the AG Acquisition, remain subject to the earlier requirement of $5,000 per week in purchases from us. Exceptions to the minimum purchase requirements may be granted by the Board.
A customer that does not meet the requirements to be a Member, or does not desire to become a Member, may conduct business with us as a Non-Member. However, any customer that purchases more than $3 million of product from us annually is typically required to be a Member.
Capital Shares
Ownership and Exchange of Shares
There is no established public trading market for our shares. Our Class A and Class B Shares are issued by us to our Members, and repurchased by us from our Members, a process we refer to as the exchange of shares, in accordance with our share purchase requirements and at a price (the “Exchange Value Per Share”) based on a formula approved by the Board. The Exchange Value Per Share, as currently calculated, is equal to Book Value (as defined below) divided by the number of Class A and Class B Shares outstanding at the end of the fiscal year, excluding shares tendered for redemption. “Book Value” is computed based on (1) the fiscal year end balance of Class A and Class B Shares, excluding the redemption value of unredeemed shares tendered for redemption, plus (2) retained earnings, excluding non-allocated retained earnings.
The Exchange Value Per Share does not necessarily reflect the amount for which our net assets could be sold. If the Board decides in any year to retain a portion of our earnings from our Non-Patronage Business, and not to allocate those earnings to the Exchange Value Per Share, the redemption price of Class A and Class B Shares that are repurchased in the year of such retention and in future years will be reduced. See Part II, Item 5.“MARKET FOR REGISTRANT’S COMMON EQUITY, RELATED STOCKHOLDER MATTERS AND ISSUER PURCHASES OF EQUITY SECURITIES” and Part II, Item 6.“SELECTED FINANCIAL DATA” for additional information on the calculation of the Exchange Value Per Share. Our Class C and Class E Shares are exchanged with our directors and Members, respectively, at a fixed stated value. See “—Classes of Shares—Class C Shares” and “—Classes of Shares—Class E Shares.”
Classes of Shares
Class A Shares
Our Bylaws require that each Member own 350 Class A Shares. The Board may accept an affiliate of a Member without such affiliate holding any Class A Shares where the owners of the affiliate are the same, or sufficiently the same, as those of the Member, and the Member already holds the required number of Class A Shares. Holders of Class A Shares are entitled to one vote per share on all matters to be voted upon by the shareholders, and the holders of the Class A Shares are entitled to elect 80% of our authorized number of directors. If a person holding Class A Shares ceases to be a Member, the Class A Shares held by such outgoing Member are subject to redemption. See “—Redemption of Class A, Class B and Class E Shares.”
Class B Shares
Our Bylaws require that each Member own such amount of Class B Shares as may be established by the Board. The holders of Class B Shares have the right to elect 20% of our authorized number of directors. Except as provided above or by California law, the holders of Class B Shares do not have any other voting rights. Any Class B Shares held by an outgoing Member or which are held by a Member in an amount in excess of that required by the Board are subject to redemption. See “—Redemption of Class A, Class B and Class E Shares.”
Our Board currently requires each Member to hold Class B Shares having an issuance value equal to approximately twice the Member’s average weekly purchases from the Cooperative Division, except that as to meat and produce purchases the requirement is approximately one times the Member’s average weekly purchases from the Cooperative Division (the “Class B Share Requirement”). If purchases are not made weekly, the average weekly
10
purchases are based on the number of weeks in which purchases were actually made. For purposes of determining whether a Member holds Class B Shares having an issuance value satisfying the Class B Share Requirement, the issuance value of each Class B Share held by the Member is deemed to be the Exchange Value Per Share in effect at the close of the fiscal year end prior to the issuance of such Class B Share.
One of the ways in which Members may acquire Class B Shares is through our payment of Cooperative Division patronage dividends at the end of our fiscal year. If a Member, at the time a patronage dividend is declared, does not satisfy its Class B Share Requirement, we may issue Class B Shares to such Member as a portion of the Cooperative Division patronage dividends paid. As Class B Shares are issued as part of a Member’s patronage dividend distribution, the issuance value of such Class B Shares add to the amount of Class B Shares held by such Member for purposes of satisfying the Class B Share Requirement.
The Class B Share Requirement is determined twice a year, at the end of our second and fourth fiscal quarters, based on a Member’s purchases from the Cooperative Division during the preceding four quarters. If at the end of the our second fiscal quarter, after giving effect to the value of Class B Shares estimated to be issued as part of the next Cooperative Division patronage dividend, a Member does not hold Class B Shares with a combined issuance value equal to the required amount of Class B Shares, we will typically require the Member to make a subordinated deposit (a “Required Deposit”) which may, at our option, be paid over a 26-week period. If at the end of our fourth fiscal quarter, after accounting for the issuance of Class B Shares as part of the Cooperative Division patronage dividend distribution declared for such fiscal year after the first year as a Member, a Member does not hold Class B Shares with a combined issuance value equal to the required amount of Class B Shares, then additional Class B Shares must be purchased by the Member in an amount sufficient to satisfy the requirement. The additional Class B Shares may be paid for by our charging the Member’s deposit fund in an amount equal to the issuance value of the additional Class B Shares or by direct purchase by the Member, which may be paid over a 26-week period. For those Members who otherwise would have been required to purchase additional Class B Shares from cash in their deposit fund at the end of fiscal 2010, the Board waived such requirement only as to fiscal 2010. The Board may increase or otherwise change the Class B Share Requirement at its discretion.
In September 1999, we completed a merger (the “Merger”) with United Grocers, Inc. (“United”), a grocery cooperative headquartered in Milwaukie, Oregon. In October 2007, we purchased certain assets and assumed certain liabilities of AG and its subsidiaries. Certain Members, including former shareholders of United and AG, also may elect to satisfy their Class B Share Requirement with respect to stores owned at the time of admission as a Member solely from their patronage dividend distributions by electing to receive Class B Shares in lieu of 80% of the Cooperative Division qualified cash patronage dividends the Member otherwise would receive in the future until the Class B Share Requirement is satisfied. In order to make the election to satisfy their Class B Share Requirement solely from patronage dividend distributions, former shareholders of AG were required to enter into supply agreements with us. During the build-up of its Class B Share Requirement, such a Member is not required to provide a Required Deposit with respect to stores owned at the time of admission as a Member. Satisfaction of the Class B Share Requirement of such Members relating to new stores or growth in the sales of existing stores may not be satisfied solely from their patronage dividend distributions, but is subject to the same payment requirements that apply to other Members.
New Members typically must satisfy their Class B Share Requirement in one of two ways: (1) the purchase of Class B Shares at the time of their admission as a Member such that the required amount is held at that time; or (2) the acquisition of Class B Shares over a five-year period commencing at the start of our first fiscal year after the Member’s admission, at the rate of 20% of the required amount per fiscal year, such that by the start of our sixth full fiscal year after the Member’s admission, the required amount is held. If a new Member elects to satisfy the Class B Share Requirement through the acquisition of shares over a five-year period, it is typically required to make a Required Deposit with us for the full required amount during the five-year build-up of the Class B Share Requirement. The Required Deposit may generally be paid either in full upon acceptance as a Member or 75% upon acceptance and the balance paid over a 26-week period.
Required Deposits for new stores, replacement stores or growth in the sales of existing stores can be paid either in full or with a 50% down payment and the balance paid over a 26-week period.
We may make modifications to the requirements as to the timing of the purchase of Class B Shares and the timing and amount of the Required Deposit on a case-by-case basis, based on the particular circumstances of a Member.
11
A reduced investment option in lieu of the standard Class B Share Requirement (“SBI”) described above is available if certain qualifications are met. A Member may apply for a reduced Class B Share requirement (“RBI”), which requires the Member to pay for its purchases electronically on the statement due date and demonstrate credit worthiness. The purpose of the RBI is to encourage Member growth by offering a reduced requirement if the qualifications are met and to provide a cap on the investment requirement at certain volume levels. The RBI is based on a sliding scale such that additional purchase volume marginally reduces the requirement as a percentage of purchase volume. Members who do not apply for the RBI remain on the SBI. However, once a Member has elected the RBI option, it must notify us in writing if it wishes to change its election. Generally, changes can only be made at the time of the second quarter recalculation of the Class B Share Requirement in March.
Class C Shares
Certain of our directors hold Class C Shares. Each of such directors purchased one Class C Share for its stated value. Class C Shares are non-voting director qualifying shares, with no rights as to dividends or other distributions, and share in liquidation at their stated value of $10 per share.
Class E Shares
We issued Class E Shares as a portion of the Cooperative Division patronage dividends in fiscal years 2003 through 2009, and may issue them as a portion of the Cooperative Division patronage dividends in future periods, as determined annually at the discretion of the Board (see Part II, Item 7, “Management’s Discussion and Analysis of Financial Condition and Results of Operations—Equity Enhancement”). The Class E Shares have a stated value of $100 per share and, unless required by law, are non-voting equity securities. Ordinary dividends on Class E Shares may be declared and may be payable in unique circumstances solely at the discretion of the Board. Class E Shares are transferable only with our consent, which will normally be withheld except in connection with the transfer of a Member’s business to an existing or new Member for continuation of such business. Class E Shares become eligible for redemption ten years after their date of issuance. Our redemption policy provides that Class E Shares will not be repurchased for at least ten years from their date of issuance unless approved by the Board or upon sale or liquidation of the Company. See “—Redemption of Class A, Class B and Class E Shares.”
Redemption of Class A, Class B and Class E Shares
Our Articles of Incorporation and Bylaws provide that the Board has the absolute discretion to repurchase, or not repurchase, any Class A, Class B or Class E Shares of any outgoing Member regardless of when the membership terminated, and any Class B Shares in excess of the Class B Share Requirement (“Excess Class B Shares”) held by a current Member, whether or not the shares have been tendered for repurchase and regardless of when the shares were tendered. The Board considers the redemption of eligible Class A Shares at each board meeting. All other shares eligible for redemption are considered by the Board on an annual basis, usually in December. Class E Shares will only be redeemed upon approval of the Board or upon sale or liquidation of the Company. The Class E Shares, when redeemed, will be redeemed at stated value.
Excess Class B Shares may be redeemed at the sole discretion of the Board. If the Member tendering the shares for repurchase is current on all obligations owing to us, and no grounds exist for termination of membership, such redemption may be effected by paying cash to the Member or crediting the redemption price to the Member’s account. The redemption price for such shares shall be the same as would be provided on a termination of membership as of the date the shares were tendered for redemption. If the Member tendering the shares for repurchase is not current on all obligations owing to us, and no grounds exist for termination of membership, we may redeem such Excess Class B Shares and apply the proceeds against all amounts owing to us.
The right to deduct any amounts owing to us against the total redemption price for shares is solely at our option. Shareholders may not offset or recoup any obligations to us or otherwise refuse to pay any amounts owed to us.
Subject to the Board’s determination and approval to redeem shares, any repurchase of shares will be on the terms, and subject to the limitations and restrictions, if any, set forth in the following:
| | · | | The California General Corporation Law; |
| | · | | Our Articles of Incorporation and Bylaws; |
12
| | · | | Our redemption policy; and |
| | · | | Any credit agreements to which we are a party. |
California General Corporation Law
We are subject to the restrictions imposed by the California General Corporation Law (the “CGCL”). Section 501 of the CGCL prohibits any distribution that would be likely to result in a corporation being unable to meet its liabilities as they mature. In addition, Section 500 of the CGCL prohibits any distribution to shareholders for the purchase or redemption of shares unless the board has determined in good faith that either (a) the amount of retained earnings immediately prior thereto equals or exceeds the sum of (1) the amount of the proposed distribution plus (2) any preferential dividend arrears that must be paid in respect of any other class of shares prior to the proposed distribution, or (b) immediately after the proposed distribution, the value of the corporation’s assets would equal or exceed the sum of (1) its liabilities plus (2) the preferential rights of other classes of shares that would be required to be paid upon dissolution to holders of such shares prior to any distribution to the class of shares as to which the proposed distribution is being made. While we have generally maintained sufficient retained earnings for each fiscal year to accomplish our share repurchase program, there can be no assurance in the future that we will be able to redeem all shares tendered to us given the restrictions of the CGCL.
Articles of Incorporation and Bylaws
Our Articles of Incorporation and Bylaws contain certain restrictions on the redemption of our shares. In addition, our Bylaws contain our redemption policy (see below). The Board has the right to amend the redemption policy in our Bylaws at any time, including, but not limited to, changing the order in which repurchases will be made or suspending or further limiting the number of shares repurchased, except as otherwise may be expressly provided in the Articles of Incorporation.
Redemption Policy
The Board has the discretion to modify our redemption policy from time to time. All redemptions occur solely at the discretion of the Board. Our redemption policy currently provides that (1) Class A and Class B Shares held by a shareholder that is no longer a qualified or active Member and (2) Excess Class B Shares, may be redeemed at the Exchange Value Per Share at the close of the last fiscal year end prior to (A) termination of Member status or (B) the date of redemption, as applicable.
Our redemption policy currently provides that the number of Class B Shares that we may redeem in any fiscal year is limited to no more than 5% of the sum of:
| | · | | The number of Class B Shares outstanding at the close of the preceding fiscal year end; and |
| | · | | The number of Class B Shares issuable as a part of the patronage dividend distribution for the preceding fiscal year. |
In connection with the closing of fiscal 2012, we will redeem 8,867 Class B Shares, leaving 69,442 Class B Shares, or 16.0% of our outstanding Class B Shares, that have been tendered for redemption but not yet redeemed. This percentage has steadily increased in recent years, from 14.8% and 11.9% of our outstanding Class B Shares at the close of fiscal 2011 and 2010, respectively, as we have had an increase in the number of shares our Members have sought to redeem and we have redeemed less than the 5% limit in fiscal 2012, 2011 and 2010. Based on the current level of redemption as compared to the number of shares tendered for redemption, Members seeking to redeem shares may be required to wait a number of years. Members may have even less liquidity with respect to shares in Unified should the Board, in its discretion, cease redemptions of stock.
There is no assurance that our financial condition will enable us to redeem shares tendered for redemption. Even if redemption is permitted by legal requirements, it is possible under our redemption policy that a Member’s Class B Shares will not be fully, or even partially, redeemed in the year in which they are tendered for redemption. If we are not able to redeem all shares eligible for redemption in a given year, then the shares redeemed will be determined on a pro rata basis. See Item 1A, “Risk Factors—The requirement that Members invest in our shares and/or make Required Deposits, and the lack of liquidity with respect to such investments and Required Deposits, may make attracting new Members difficult and may cause existing Members to withdraw from membership,” Item 5,“Market
13
For Registrant’s Common Equity, Related Shareholder Matters and Issuer Purchases of Equity Securities,”Part II, Item 8,“Financial Statements and Supplementary Data—Notes 10 and 18” for recent redemption activity and the number of outstanding shares tendered for redemption but which have not yet been redeemed.
The Board has the absolute discretion to redeem Excess Class B Shares or to redeem Class A, Class B or Class E Shares of any outgoing Member regardless of when the membership terminated or the Class B Shares were tendered. The Board also has the right to elect to redeem Excess Class B Shares or Class E Shares even though such redemption has not been requested and without regard to each year’s five percent limit or any other provision of the redemption policy.
Credit Agreements
We are a party to credit agreements which provide that during any period where we are in breach of, or an event of default has occurred under, such credit agreements, we will be prohibited from redeeming Class A, Class B and Class E Shares.
Patronage Dividends
We distribute patronage dividends to our Members based upon our patronage earnings during a fiscal year. Non-Member customers are not entitled to receive patronage dividends. The Board approves the payment of dividends and the form of such payment for our three patronage-earning divisions: the Southern California Dairy Division, the Pacific Northwest Dairy Division and the Cooperative Division. We track the volume of qualifying patronage sales in each of these patronage-earning divisions on an individual Member basis to determine each such Member’s share of such patronage dividends. Patronage dividends for each patronage-earning division are paid solely to Members who purchase products from such division.
| | · | | Cooperative Division. Patronage earnings attributable to the Cooperative Division are derived from all patronage activities of Unified, other than the Southern California and Pacific Northwest Dairy Divisions discussed below, regardless of geographic location. Patronage dividends for this division are paid based on the qualified patronage purchases of the following types of products: dry grocery, deli, health and beauty care, tobacco, general merchandise, frozen food, ice cream, meat, produce and bakery. |
| | · | | Southern California Dairy Division. Patronage earnings attributable to the Southern California Dairy Division are derived primarily from sales of products manufactured at a milk, water and juice bottling plant located in Los Angeles, California. |
| | · | | Pacific Northwest Dairy Division. Patronage earnings attributable to the Pacific Northwest Dairy Division are derived from sales of dairy products manufactured by third party suppliers located in Oregon and Washington. |
The following table summarizes the patronage dividends distributed by us during the past three fiscal years.
| | | | | | | | | | | | |
| (dollars in thousands) | | | | | | | | | |
| Division | | 2012 | | | 2011 | | | 2010 | |
Cooperative Division | | $ | — | | | $ | 301 | | | $ | 407 | |
Southern California Dairy Division | | | 9,676 | | | | 10,710 | | | | 11,974 | |
Pacific Northwest Dairy Division | | | 1,111 | | | | 1,420 | | | | 1,657 | |
| |
Total | | $ | 10,787 | | | $ | 12,431 | | | $ | 14,038 | |
| |
Patronage dividends have been both positively and negatively impacted by a variety of activities. A summary of these activities in fiscal 2012 and 2011 is as follows:
| | · | | During the 2012 Period, we experienced lower earnings in the Southern California and Pacific Northwest Dairy Divisions due to a decline in Member sales volume. Our earnings for the Cooperative Division declined to a loss due to lower net sales and lower inventory holding gains, partially offset by lower distribution, selling and administrative expenses due to continued cost containment efforts. |
| | · | | During the 2011 Period, we experienced lower earnings in the Southern California and Pacific Northwest Dairy Divisions due to a decline in Member sales volume. Our earnings for the Cooperative Division were |
14
| | consistent with the prior year. Lower overall distribution, selling and administrative expenses offset reduced patronage earnings due primarily to lower sales, along with higher insurance expenses driven by lower investment performance and higher medical expenses. |
See additional discussion in Part II, Item 7, “Management’s Discussion and Analysis of Financial Condition and Results of Operations—Wholesale Distribution Segment.” Total patronage earnings are based on the combined results of the Southern California Dairy Division, the Pacific Northwest Dairy Division and the Cooperative Division. In the event of a loss in one division, the Board will make an equitable decision with respect to the treatment of the loss. During the 2012 Period, the Cooperative Division experienced a loss that was recognized in net earnings, thereby reducing our Exchange Value Per Share.
Our Bylaws provide that patronage dividends may be distributed in cash or in any other form that constitutes a written notice of allocation under Section 1388 of the Internal Revenue Code. Section 1388 defines the term “written notice of allocation” to mean any capital share, revolving fund certificate, retain certificate, certificate of indebtedness, letter of advice, or other written notice, that discloses to the recipient the stated dollar amount allocated to the recipient by Unified and the portion thereof, if any, which constitutes a patronage dividend. Written notices of allocation may be in the form of qualified written notices of allocation or non-qualified written notices of allocation. To constitute a qualified written notice of allocation, a patronage dividend must be paid at least 20% in cash and the balance in a form which constitutes a written notice of allocation and which the recipient has agreed to take into income for tax purposes in the year of receipt. If at least 20% of the patronage dividend is not paid in cash, the entire amount of the distribution not paid in cash, whether in the form of share, subordinated patronage dividend certificates or other debt instrument, constitutes a non-qualified written notice of allocation.
Patronage dividends for the Cooperative Division are calculated annually and distributed to Members following each fiscal year in proportion to the qualified patronage sales during such fiscal year. The following describes the manner of distribution of such Cooperative Division patronage dividends for the past three fiscal years:
| | · | | For fiscal 2012, there were no Cooperative Division patronage earnings available for distribution. |
| | · | | For fiscal 2011 and 2010, the entire patronage dividend was distributed in cash. |
Patronage dividends for our dairy divisions are calculated quarterly and have been historically distributed to Members in cash on a quarterly basis in proportion to the qualified patronage sales during the quarter.
Customer Deposits
Each of our customers may be required to maintain a deposit fund with us, which may include one or both of the following:
| | · | | Required Deposit. Members who do not satisfy the Class B Share Requirement solely from their holdings of Class B Shares are generally required to make a Required Deposit with us. See “—Capital Shares—Classes of Shares—Class B Shares.” |
| | · | | Credit Deposit. Member and Non-Member customers may be required to provide us a Credit Deposit in order to purchase products on credit terms established by us. “Credit Deposit” means any non-subordinated deposit that is required to be maintained by a Member or Non-Member customer in accordance with levels established by our credit office from time to time in excess of the amount of the Required Deposit set by the Board. |
We do not pay interest on Required Deposits or Credit Deposits; however, interest is paid at the prime rate for deposits in excess of a Member’s Required Deposit or Credit Deposit (an “Excess Deposit”).
At any given time, our required cash deposits may be less than otherwise would be required (referred to as a “Deposit Fund Deficiency”) as a result of Members having been approved to build deposits in their deposit fund over time or in cases where their Required Deposits are waived. Deposit Fund Deficiencies typically occur when Members do not maintain sufficient Required Deposits to meet the Class B Share Requirement. The Deposit Fund Deficiency was approximately $2.9 million, $1.5 million and $2.3 million at September 29, 2012, October 1, 2011 and October 2, 2010, respectively, consisting of approximately $2.5 million, $1.1 million and $1.8 million,
15
respectively, due to Members that were approved to build deposit fund requirements over time and approximately $0.4 million, $0.4 million and $0.5 million, respectively, due to former United members that elected to assign at least 80% of the Cooperative Division qualified cash patronage dividends to fulfill deposit fund requirements.
Required Deposits of Members are contractually subordinated and subject to the prior payment in full of certain of our senior indebtedness. As a condition of becoming a Member, each Member is required to execute a subordination agreement providing for the subordination of the Member’s Required Deposits. Generally, the subordination is such that no payment can be made by us with respect to the Required Deposits in the event of an uncured default by us with respect to our senior indebtedness, or in the event of our dissolution, liquidation or insolvency or other similar proceedings, until all of our senior indebtedness has been paid in full.
If membership status is terminated, upon request, we will return the amount in a Member’s deposit fund that is an Excess Deposit, less any amounts owed to us, provided that the Member is not in default on any other of its obligations to us. The return of a Member’s Required Deposit is governed by, and will be returned only to the extent permitted by, the subordination agreement executed by the Member. We do not permit a Member to offset any obligations owing to us against the Required Deposit.
Pledge of Shares and Guarantees
We require our Members to pledge to us, as collateral, all Class A, Class B and Class E Shares, all other shares and securities issued from time to time to Members by us, all deposits and deposit accounts with us and all distributions thereon and products and proceeds thereof, to secure their obligations to us. Such security is also pledged to us to secure the prohibition against the transfer of their collateral and to secure our rights to repurchase any of our shares held by them. Upon termination of membership of a Member or any affiliate of a Member, or default by a Member or any affiliate of a Member of any agreement with us, we are under no obligation to return any collateral pledged to us, or any proceeds thereof, so long as there are any matured or unmatured, contingent or unliquidated amounts owed by the Member to, or obligations that remain to be performed by the Member for the benefit of, us. We do not permit a Member to offset or recoup any obligations owing to us or otherwise refuse to pay any amounts owed to us. However, we retain all rights of offset and recoupment and furthermore, the 2008 form of pledge agreement provides that we have the right to offset and recoup any obligations owed by a Member to us.
As part of the credit evaluation process, individual shareholders of corporate Members, including those who became Members from AG, may be required to guarantee the obligations of the corporate Member, except that former shareholders of United who were, at the date of the Merger, in compliance with their obligations to United are not required to provide individual guarantees in the absence of financing transactions.
Tax Matters
We are a California corporation operating on a cooperative basis. We are subject to federal, state, franchise and other taxes applicable to corporations, such as sales, excise, real and personal property taxes. We file consolidated annual income tax returns with our subsidiaries.
As a corporation operating on a cooperative basis, we are subject to Subchapter T of the Internal Revenue Code and regulations promulgated thereunder. Under Subchapter T, we generally must distribute patronage dividends to our Members. In order to qualify as a patronage dividend, distributions are made on the basis of the relative value of the business done with or for Members, under a pre-existing obligation to make such payment, and with reference to the net earnings from business done with or for the cooperative’s Members. Patronage dividends are paid in cash or in any form that constitutes a written notice of allocation. A written notice of allocation is distributed to the Member and provides notice of the amount allocated to the Member by Unified and the portion thereof which constitutes a patronage dividend.
Under Subchapter T regulations, we may deduct for the fiscal year to which they relate the amount of patronage dividends paid in cash and qualified written notices of allocation or other property (except a nonqualified written notice of allocation) within 8-1/2 months after the end of the fiscal year to which the patronage dividends relate. A written notice of allocation will be qualified if we pay at least 20% of the patronage dividend in cash, and the
16
Member consents to take the stated dollar amount of the written notice into income in the year in which it is received. Members sign a consent form at the time of membership to satisfy the consent requirement. Members are required to consent to include in their gross income, in the year received, all cash as well as the stated dollar amount of all qualified written notices of allocation, including the Exchange Value Per Share of the Class B Shares distributed to them as part of the qualified written notices of allocation. Class B Shares distributed as part of the qualified written notices of allocation may also be subject to state income taxes.
We are subject to federal income tax and various state taxes on the net earnings of the business with or for Members that are not distributed as qualified written notices of allocation and on the net earnings derived from Non-Patronage Business. In fiscal 2002, as part of our equity enhancement initiative, we issued nonqualified written notices of allocation in the form of Class B Shares and subordinated patronage dividend certificates. In fiscal 2003 through 2005, we issued nonqualified written notices of allocation in the form of Class B and Class E Shares. In fiscal 2006 through 2009, we issued qualified and nonqualified written notices of allocation in the form of Class B and Class E Shares, respectively. For fiscal 2010 through 2012, we distributed 100% of the patronage dividend in cash. The Member does not include a nonqualified written notice of allocation, whether in Class B Shares, Class E Shares or subordinated patronage dividend certificates, as taxable income in the year of receipt, and we are not entitled to an income tax deduction in the year of issuance. When the nonqualified written notice of allocation is redeemed for cash or property, the Member will have ordinary taxable income and we will have an income tax deduction to the extent that the stated dollar amount of such written notice of allocation exceeds its basis.
Members are urged to consult their tax advisors with respect to the applicability of U.S. federal income, state or local tax rules on the ownership and disposition of Class A, Class B and Class E Shares and the receipt of subordinated patronage dividend certificates with respect to their own tax status.
Availability of SEC Filings
We make available, free of charge, through our website (http://www.unifiedgrocers.com) our Forms 10-K, 10-Q and 8-K, as well as our registration statements, proxy statements and all amendments to those reports, as soon as reasonably practicable after those reports are filed electronically with the Securities and Exchange Commission (the “SEC”). A copy of any of the reports filed with the SEC can be obtained from the SEC’s Public Reference Room at 100 F Street, N.E., Washington, D.C. 20549. A copy may also be obtained by calling the SEC at 1-800-SEC-0330. All reports filed electronically with the SEC are available on the SEC’s website at http://www.sec.gov.
Item 1A. RISK FACTORS
The risks and uncertainties described below are those that we believe are the material risks related to our business. If any of the following risks occur, our business, prospects, financial condition, operating results and cash flows could be adversely affected in amounts that could be material.
The markets in which we operate are highly competitive, characterized by high volume, low profit margins and industry consolidation, and many of our competitors have greater financial resources than us which could place us at a competitive disadvantage and adversely affect our financial performance. The grocery distribution business is generally characterized by a relatively high volume of sales with relatively low profit margins. Price competition among food wholesalers is intense. In addition, we compete with such food wholesalers with regard to quality, variety and availability of products offered, strength of corporate brand labels offered, schedule and reliability of deliveries and the range and quality of services provided.
Some of our competitors, including C&S Wholesale Grocers, Inc. and Supervalu, Inc., are significantly larger and have greater financial resources than us. In addition, industry consolidation has in the past increased, and may continue in the future to increase, the number of large competitors that we face. These large national distributors have the resources to compete aggressively on price and may be able to offer customers a wider range of products and services and a wider area of distribution than we are. We also face intense competition from regional or specialized distributors and, from time to time, new entrants in various niche markets, with such competitors often able to compete very aggressively in such niches with unique or highly tailored products and services.
17
To compete effectively, we must keep our costs down to maintain margins while simultaneously increasing sales by offering the right products and services at competitive prices, with the expected quality, variety and availability, to appeal to consumers. If we are unable to compete effectively in our highly competitive industry, we may suffer reduced net sales and/or reduced margins and profitability, or suffer a loss, and our business, financial condition and results of operations could suffer.
We may experience reduced sales and earnings if Members continue to lose market share to larger, often fully integrated traditional full-service grocery store chains or to warehouse club stores, supercenters and discount stores, many of which have greater financial resources than our Members or us. Our Members continue to face intense competition from large, often fully integrated traditional full-service grocery store chains. Most of these store chains have greater resources than our Members and us and benefit from local or national brand name recognition and efficiencies of scale from a fully integrated distribution network, standardization across stores, concentrated buying power and shared overhead costs. In addition, traditional format full-service grocery stores, which include most of our customers, have in recent years faced intense competition from, and lost market share to, non-traditional format stores, including warehouse club stores, supercenters, discount stores and stores focused on upscale and natural and organic products. Many of these non-traditional format stores are very large, with considerable resources, national brand names and economies of scale. This competition from non-traditional format stores has been particularly intense, and significant market share has been lost, with respect to categories of non-perishable products that we sell. Traditional format grocery stores, including our customers, have tended to move to expand their offerings and sales of perishable products, which generally have lower margins for us than non-perishable products. A continued decline in our sales of non-perishable products may adversely affect our profitability.
The market share of non-traditional format stores may grow in the future, potentially resulting in continued losses of sales volume and reduced earnings for our Members and, in turn, for us. Continued losses of market share by our Members, whether to other traditional full-service grocery store chains or to non-traditional format stores, could reduce our net sales, margins and profitability, or cause us to incur losses. As a result, our business, financial condition and results of operations could suffer.
We have an increasingly concentrated customer base, which has in the past reduced, and may continue in the future to reduce, our margins and expose us to an increase in risk concentration, including in the areas of credit risk and the sudden loss of significant customer business. Our operating results are highly dependent upon maintaining or growing our sales to our customers. Our largest customer, Smart & Final, Inc., a Non-Member customer, constituted approximately 13% of our total net sales for fiscal 2012. In recent years, we have seen our sales become increasingly concentrated with our large customers, with our top ten customers having increased from 42% of our total net sales in fiscal 2008 to 46% of our total net sales in fiscal 2012. A significant loss in membership or volume by one of our larger customers could have a sudden and material adverse effect on our operating results. For example, in the third quarter of fiscal 2011, we lost one of our top ten customers who represented $144.9 million in net sales for the fifty-two weeks immediately preceding the date they ceased purchasing from us. Between fiscal 2011 and fiscal 2012, this resulted in a loss of $87.2 million in annual net sales, or 2% of total net sales in fiscal 2012. Any other such loss of a large customer, or the loss of a number of smaller customers, could have a material and adverse effect on our net sales. In addition, to the extent we have suffered and may in the future suffer a decline in net sales, our margins and profitability have been and will be further negatively impacted to the extent we are unable to correspondingly reduce our fixed costs, such as warehouses, equipment and headcount. As it is difficult to quickly make significant reductions in fixed costs, if we were to suffer a significant and rapid decline in our net sales, such as from the loss of one or more significant customers, our margins and profitability may be adversely impacted, we may incur losses and our business, financial condition and results of operations could suffer.
We will continue to be subject to the risks associated with consolidation within the grocery industry. When independent retailers are acquired by large chains with self-distribution capacity, are driven from business by larger grocery chains, or become large enough to purchase directly from manufacturers or develop their own self-distribution capabilities, we will lose distribution volume. Members may also select other wholesale providers. Reduced volume is normally injurious to profitable operations since fixed costs must be spread over a lower sales volume if the volume cannot be replaced. In addition, as a higher percentage of our sales go to larger customers, our margins tend to be adversely affected as these larger customers typically receive discounts for the higher volume of their purchases, which may adversely impact our profitability.
18
We are also exposed to concentrations of credit risk related primarily to trade receivables, notes receivable and lease guarantees for certain Members. Our ten customers with the largest accounts receivable balances accounted for approximately 39% and 37% of total accounts receivable at September 29, 2012 and October 1, 2011, respectively. These concentrations of credit risk may be affected by changes in economic or other conditions affecting the western United States, particularly Arizona, California, Nevada, Oregon and Washington. We could suffer losses as a result of our concentrated credit risk in the event of a significant adverse change in economic or other conditions.
We may experience reduced sales if Members purchase directly from manufacturers or decide to self-distribute. Increased industry competitive pressure is causing some of our Members that can qualify to purchase directly from manufacturers to increase their level of direct purchases from manufacturers and expand their self-distribution activities. Our operating results could be adversely affected if a significant reduction in distribution volume occurred in the future as a result of such a shift to direct purchases and self-distribution by our customers.
We are vulnerable to changes in general economic conditions. We are affected by certain economic factors that are beyond our control, including changes in the overall economic environment. In recent periods, we have experienced significant volatility in the cost of certain commodities, the cost of ingredients for our manufactured breads and processed fluid milk and the cost of packaged goods purchased from other manufacturers. An inflationary economic period could impact our operating expenses in a variety of areas, including, but not limited to, employee wages and benefits, workers’ compensation insurance and energy and fuel costs. A portion of the risk related to employee wages and benefits is mitigated by bargaining agreements that contractually determine the amount of inflationary increases. General economic conditions also impact our pension plan liabilities, as the assets funding or supporting these liabilities are invested in securities that are subject to interest rate and stock market fluctuations. A portion of our debt is at floating interest rates and an inflationary economic cycle typically results in higher interest costs. We operate in a highly competitive marketplace and passing on such cost increases to customers could be difficult. It is also difficult to predict the effect that possible future purchased or manufactured product cost decreases might have on our profitability. A lack of inflation in the cost of food products may also adversely impact our margins when we are unable to take advantage of forward buying opportunities whereby we purchase product at a lower price and, by the time we sell the product, the market price and the price at which we are able to sell the product has risen to a higher price as a result of inflation. The effect of deflation in purchased or manufactured product costs would depend on the extent to which we had to lower selling prices of our products to respond to sales price competition in the market. Consequently, it is difficult for us to accurately predict the impact that inflation or deflation might have on our operations. To the extent we are unable to mitigate increasing costs, or retain the benefits from decreases in costs, patronage dividends may be reduced and/or the Exchange Value Per Share of our Class A and Class B Shares may decrease.
Changes in the economic environment could adversely affect our customers’ ability to meet certain obligations to us or leave us exposed for obligations we have guaranteed. Loans to Members, trade receivables and lease guarantees could be at risk in a sustained economic downturn. We establish reserves for notes receivable, trade receivables and lease commitments for which the customer may be at risk for default. Under certain circumstances, we would be required to foreclose on assets provided as collateral or assume payments for leased locations for which we have guaranteed payment. Although we believe our reserves to be adequate, our operating results could be adversely affected in the event that actual losses exceed available reserves.
We may on occasion hold investments in the common and/or preferred stock of Members and suppliers. These investments are generally held at cost or the equity method and are periodically evaluated for impairment. As a result, changes in the economic environment that adversely affect the business of these Members and suppliers could result in the write-down of these investments. This risk is unique to a cooperative form of business in that investments are made to support Members’ businesses, and those economic conditions that adversely affect the Members can also reduce the value of our investment, and hence the Exchange Value Per Share of our Class A and Class B Shares. We do not currently hold any equity investments in our Members.
The United States economy and financial markets have declined and experienced volatility due to uncertainties related to energy prices, availability of credit, difficulties in the banking and financial services sectors, the decline in the housing market, diminished market liquidity, falling consumer confidence and high unemployment rates. As a result, consumers may be more cautious. This may lead to additional reductions in consumer spending, to
19
consumers trading down to a less expensive mix of products or to consumers trading down to discounters for grocery and non-food items, all of which may affect our financial condition and results of operations. We are unable to predict when the economy will improve. If the economy does not improve, our business, results of operations and financial condition may be adversely affected.
Litigation could lead to unexpected losses. During the normal course of carrying on our business, we may become involved in litigation. In the event that management determines that the likelihood of an adverse judgment in a pending litigation is probable and that the exposure can be reasonably estimated, appropriate reserves are recorded at that time pursuant to FASB’s Accounting Standards Codification (“ASC”) Topic 450, “Contingencies.” The final outcome of any litigation could adversely affect operating results if the actual settlement amount exceeds established reserves and insurance coverage.
We are subject to environmental laws and regulations. We own and operate various facilities and equipment for the manufacture, warehousing and distribution of products to our customers. Accordingly, we are subject to increasingly stringent federal, state and local laws, regulations and ordinances that (1) govern activities or operations that may have adverse environmental effects, such as discharges to air and water, as well as handling and disposal practices for solid and hazardous wastes and (2) impose liability for the costs of cleaning up, and certain damages resulting from, past or present spills, disposals or other releases of hazardous materials. In particular, under applicable environmental laws, we may be responsible for remediation of environmental conditions and may be subject to associated liabilities (including liabilities resulting from lawsuits brought by private litigants) relating to our facilities and the land on which our facilities are situated, regardless of whether we lease or own the facilities or land in question and regardless of whether such environmental conditions were created by us or by a prior owner or tenant. In addition, we may be subject to pending federal and state legislation that if ultimately passed, may require us to incur costs to improve facilities and equipment to reduce emissions in order to comply with regulatory limits or to mitigate the financial consequences of a “cap and trade” regime. We are unable to predict the ultimate outcome of such legislation; however, should such legislation require us to incur significant expenditures, our business, results of operations and financial condition may be adversely affected.
We are exposed to potential product liability claims and potential negative publicity surrounding any assertion that our products caused illness or injury. The packaging, marketing and distribution of food products purchased from others involve an inherent risk of product liability, product recall and adverse publicity. Such products may contain contaminants that may be inadvertently redistributed by us. These contaminants may result in illness, injury or death if such contaminants are not eliminated. Product liability claims in excess of insurance coverage, as well as the negative publicity surrounding any assertion that our products caused illness, injury or death could have a material adverse effect on our reputation, business, financial condition and results of operations.
Our insurance reserves may be inadequate if unexpected losses occur. Our insurance subsidiaries are subject to the rules and regulations promulgated by various regulatory agencies, including, but not limited to, the State of California and the Commonwealth of Bermuda. Insurance reserves are recorded based on estimates made by management and validated by third party actuaries to ensure such estimates are within acceptable ranges. Actuarial estimates are based on detailed analyses of health care cost trends, claims history, demographics, industry trends and federal and state law. As a result, the amount of reserve and related expense is significantly affected by the outcome of these studies. Significant and adverse changes in the experience of claims settlement and other underlying assumptions could negatively impact our operating results.
We may not have adequate financial resources to fund our operations. We rely primarily upon cash flow from our operations and Member investments to fund our operating activities. In the event that these sources of cash are not sufficient to meet our requirements, additional sources of cash are expected to be obtained from our credit facilities to fund our daily operating activities. Our revolving credit agreement, which expires on October 8, 2015, and our senior secured notes, which expire on January 1, 2016 and November 1, 2019, require compliance with certain financial covenants, including minimum tangible net worth, fixed charge coverage ratio and total funded debt to earnings before interest, taxes, depreciation, amortization and patronage dividends (“EBITDAP”). See Note 5 of Notes to Consolidated Financial Statements in Part II, Item 8“Financial Statements and Supplementary Data”for additional information. While we are currently in compliance with all required covenants and expect to remain in compliance, this does not guarantee we will remain in compliance in future periods.
20
As of September 29, 2012, we believe we have sufficient cash flow from operations and availability under the revolving credit agreement to meet our operating needs, capital spending requirements and required debt repayments through October 8, 2015. However, if access to operating cash or to the revolving credit agreement becomes restricted, we may be compelled to seek alternate sources of cash. We cannot assure that alternate sources will provide cash on terms favorable to us or at all. Consequently, the inability to access alternate sources of cash on terms similar to our existing agreement could adversely affect our operations.
The value of our benefit plan assets and liabilities is based on estimates and assumptions, which may prove inaccurate. Our non-union employees participate in a Company sponsored defined benefit pension plan and Company sponsored postretirement benefit plans. Certain eligible union and non-union employees participate in separate plans providing payouts for unused sick leave. Our officers also participate in a Company sponsored Executive Salary Protection Plan (“ESPP”), which provides additional post-termination retirement income based on each participant’s salary and years of service as an officer of the Company. The postretirement plans provide medical benefits for retired non-union employees, life insurance benefits for retired non-union employees for which active non-union employees are no longer eligible and lump-sum payouts for unused sick days covering certain eligible union and non-union employees. Liabilities for the ESPP and postretirement plans are not funded. We account for these benefit plans in accordance with ASC Topic 715, “Compensation—Retirement Benefits” and ASC Topic 712, “Compensation—Nonretirement PostemploymentBenefits,” which require us to make actuarial assumptions that are used to calculate the carrying value of the related assets, where applicable, and liabilities and the amount of expenses to be recorded in our consolidated financial statements. Assumptions include the expected return on plan assets, discount rates, health care cost trend rate, projected life expectancies of plan participants and anticipated salary increases. While we believe the underlying assumptions are appropriate, the carrying value of the related assets and liabilities and the amount of expenses recorded in the consolidated financial statements could differ if other assumptions are used. See Note 11 of Notes to Consolidated Financial Statements in Part II, Item 8“Financial Statements and Supplementary Data”for additional information.
The credit and liquidity crisis in the United States and throughout the global financial system triggered substantial volatility in the world financial markets and banking system. As a result, the investment portfolios of the Unified Cash Balance Plan incurred a significant decline in fair value during fiscal 2008. While the values of the investment portfolios of our defined benefit pension plans increased during fiscal 2009 and 2010, they declined in fiscal 2011 and reflected improvement in fiscal 2012, as the values of the plans’ individual investments have and will fluctuate in response to changing market conditions, and the amount of gains or losses that will be recognized in subsequent periods, if any, cannot be determined.
Authoritative accounting guidance may necessitate companies who issue and redeem shares based on book value to redefine the method used to value their shares. Authoritative accounting guidance that requires adjustments to shareholders’ equity has the potential to impact companies whose equity securities are issued and redeemed at book value (“book value companies”) disproportionately more than companies whose share values are market-based (“publicly traded”). While valuations of publicly traded companies are primarily driven by their income statement and cash flows, the traded value of the shares of book value companies, however, may be immediately impacted by adjustments affecting shareholders’ equity upon implementation. Therefore, such guidance may necessitate companies who issue and redeem shares based on book value to redefine the method used to value their shares. As such, we modified our Exchange Value Per Share calculation to exclude accumulated other comprehensive earnings (loss) from Book Value (see Part II, Item 6.“Selected Financial Data” for additional information on the calculation of the Exchange Value Per Share), thereby excluding the potentially volatile impact that (1) ASC Topic 715-20, “Compensation—Retirement Benefits—Defined Benefit Plans—General” and (2) changes in unrealized gains and losses, net of taxes, on available for sale investments would have on shareholders’ equity and Exchange Value Per Share.
A system failure or breach of system or network security could delay or interrupt services to our customers or subject us to significant liability. We have implemented security measures such as firewalls, virus protection, intrusion detection and access controls to address the risk of computer viruses and unauthorized access. A business continuity plan has been developed focusing on the offsite restoration of computer hardware and software applications. We have also developed business resumption plans, which include procedures to ensure the continuation of business operations in response to the risk of damage from energy blackouts, natural disasters, terrorism, war and telecommunication failures, and we have implemented change management procedures and
21
quality assurance controls designed to ensure that new or upgraded business management systems operate as intended. However, there can be no assurances that any of these efforts will be adequate to prevent a system failure, accident or security breach, any of which could result in a material disruption to our business. In addition, substantial costs may be incurred to remedy the damages caused by any such disruptions.
Our success depends on our retention of our executive officers and senior management, and our ability to hire and retain additional key personnel. Our success depends on the skills, experience and performance of our executive officers, senior management and other key personnel. The loss of service of one or more of our executive officers, senior management or other key employees could have a material adverse effect on our business, prospects, financial condition, operating results and cash flows. Our future success also depends on our continuing ability to attract and retain highly qualified technical, sales and managerial personnel. Competition for these personnel is intense, and there can be no assurance that we can retain our key employees or that we can attract, assimilate or retain other highly qualified technical, sales and managerial personnel in the future.
We depend on third parties for the supply of products and raw materials and for marketing and promotional programs. We depend upon third parties for the supply of products, including corporate brand products, and raw materials. Any disruption in the services provided by any of these suppliers, or any failure by them to handle current or higher volumes of activity, could have a material adverse effect on our business, prospects, financial condition, operating results and cash flows.
We participate in various marketing and promotional programs to increase sales volume and reduce merchandise costs. Failure to continue these relationships on terms that are acceptable to us, or to obtain adequate marketing relationships, could have a material adverse effect on our business, prospects, financial condition, operating results and cash flows.
Increased electricity, diesel fuel and gasoline costs could reduce our profitability. Our operations require and are dependent upon the continued availability of substantial amounts of electricity, diesel fuel and gasoline to manufacture, store and transport products. Our trucking operations are extensive and diesel fuel storage capacity represents approximately two weeks average usage. The prices of electricity, diesel fuel and gasoline fluctuate significantly over time. Given the competitive nature of the grocery industry, we may not be able to pass on increased costs of production, storage and transportation to our customers. As a result, either a shortage or significant increase in the cost of electricity, diesel fuel or gasoline could disrupt distribution activities and negatively impact our business and results of operations.
A strike or work stoppage by employees could disrupt our business and/or we could face increased operating costs from higher wages or benefits we must pay our employees. Approximately 60% of our employees are covered by collective bargaining agreements, which have various expiration dates ranging from 2013 through 2016. If we are unable to negotiate acceptable contracts with labor unions representing our unionized employees, we may be subject to a strike or work stoppage that disrupts our business and/or increased operating costs resulting from higher wages or benefits paid to union members or replacement workers. Any such outcome could have a material adverse effect on our operations and financial results.
If we fail to maintain an effective system of internal controls, we may not be able to detect fraud or report our financial results accurately, which could harm our business and subject us to regulatory scrutiny. Pursuant to Section 404 of theSarbanes-Oxley Act of 2002, we perform an annual evaluation of our internal controls over financial reporting. In July 2010, theDodd-Frank Wall Street Reform and Consumer Protection Act (the “Reform Act”) became law. The Reform Act includes a provision that indefinitely exempts companies that qualify as either a non-accelerated filer or smaller reporting company from the auditor attestation requirement of Section 404(b) of theSarbanes-Oxley Act of 2002. For our fiscal 2012 and subsequent foreseeable fiscal years, we expect to be exempt from such requirement. Although we believe our internal controls are operating effectively, we cannot guarantee that we will not have any material weaknesses in the future. In addition, any failure to implement required new or improved controls, or difficulties encountered in their implementation, could harm our operating results or cause us to fail to meet our reporting obligations.
A loss of our cooperative tax status could increase tax liability. Subchapter T of the Internal Revenue Code sets forth rules for the tax treatment of cooperatives. As a cooperative, we are allowed to offset patronage earnings with patronage dividends that are paid in cash or through qualified written notices of allocation. However, we are taxed
22
as a typical corporation on the remainder of our earnings from our Member business and on earnings from our Non-Member business. If we are not entitled to be taxed as a cooperative under Subchapter T, our revenues would be taxed when earned by us and the Members would be taxed when dividends are distributed. The Internal Revenue Service can challenge the tax status of cooperatives. The Internal Revenue Service has not challenged our tax status, and we would vigorously defend any such challenge. However, if we were not entitled to be taxed as a cooperative, taxation at both the Company and the Member level could have a material adverse impact on us and our Members.
Each method used to meet the Class B Share Requirement has its own tax consequences. Class B Shares required to be held by a new Member may be purchased directly at the time of admission as a Member or may be acquired over the five consecutive fiscal years commencing with the first year after admission as a Member at the rate of 20% per year. In addition, certain Members, including former shareholders of United Grocers, Inc. or Associated Grocers, Incorporated, may elect to satisfy their Class B Share Requirement only with respect to stores owned at the time of admission as a Member solely from their patronage dividend distributions. Each of these purchase alternatives may have tax consequences which are different from those applicable to other purchase alternatives. Members and prospective Members are urged to consult their tax advisers with respect to the application of U.S. federal income, state or local tax rules to the purchase method selected.
Members’ Class A, Class B and Class E Shares are subject to risk of loss. Class A and Class B Shares are purchased and sold at purchase prices equal to the Exchange Value Per Share at the close of the last fiscal year end prior to the date the shares are purchased or tendered for redemption. Class E Shares are purchased and sold at a value of $100 per share. If a Member were to sell shares at a price that is less than the price at which the shares were purchased, the Member would lose all or a portion of its investment in the Class A, Class B or Class E Shares. See “OFFERING OF CLASS A, CLASS B AND CLASS E SHARES” in our Amendment No. 2 to Registration Statement on Form S-1 filed on April 19, 2012, with respect to our offering of Class A, Class B and Class E Shares for further information.
If the Board decides in any year to retain a portion of our earnings from our Non-Patronage Business, and not to allocate those earnings to the Exchange Value Per Share, the redemption price of Class A and Class B Shares that are repurchased in the year of such retention and in future years will be reduced.
The requirement that Members invest in our shares and/or make Required Deposits, and the lack of liquidity with respect to such investments and Required Deposits, may make attracting new Members difficult and may cause existing Members to withdraw from membership. Members are required to meet specific requirements, which include ownership of our capital shares and may include required cash deposits. These investments by Members are a principal source of our capital, and in fiscal 2012, approximately 78% of our net sales were to Members. We compete with other wholesale suppliers who are not structured as cooperatives and therefore have no investment requirements for customers. Our requirements to purchase shares or maintain cash deposits may become an obstacle to retaining existing business and attracting new business. For a discussion of required Member equity investments and deposits, see Item 1,“Business—Capital Shares” and Item 1,“Business—Customer Deposits.”
Our Bylaws give the Board complete discretion with respect to the redemption of shares held by terminated Members and excess shares held by Members. Our redemption policy currently provides that the number of Class B Shares that we may redeem in any fiscal year is limited to no more than 5% of the outstanding Class B Shares (after patronage dividends payable in Class B Shares). In connection with the closing of fiscal 2012, we will redeem 8,867 Class B Shares, leaving 69,442 Class B Shares, or 16.0% of our outstanding Class B Shares, that have been tendered for redemption but not yet redeemed. This percentage has steadily increased in recent years, from 14.8% and 11.9% of our outstanding Class B Shares at the close of fiscal 2011 and 2010, respectively, as we have had an increase in the number of shares our Members have sought to redeem and we have redeemed less than the 5% limit in fiscal 2012, 2011 and 2010. Based on the current level of redemption as compared to the number of shares tendered for redemption, Members seeking to redeem shares may be required to wait a number of years. Members may have even less liquidity with respect to shares in Unified should the Board, in its discretion, cease redemptions of stock. See Part II, Item 8.“Financial Statements and Supplementary Data—Notes 10 and 18” for recent redemption activity and the number of outstanding shares tendered for redemption but which have not yet been redeemed. Furthermore, required cash deposits are contractually subordinated and subject to the prior payment in full of our senior indebtedness. For a discussion of the limitations on the redemption of capital shares and the subordination of cash deposits, see Item 1,“Business—Capital Shares—Redemption of Class A, Class B
23
and Class E Shares,” Item 1,“Business—Customer Deposits” andItem 1,“Business—Pledge of Shares and Guarantees.”These limitations on our obligation to redeem capital shares or repay the cash deposits of Members may cause Members to withdraw from membership or potential Members to not become Members.
Severe weather, natural disasters and adverse climate changes may adversely affect our financial condition and results of operations. Severe weather conditions, such as hurricanes or tornadoes, or natural disasters, such as earthquakes or fires, in areas in which we have distribution facilities, in which customers’ stores are located or from which we obtain products may adversely affect our results of operations. Such conditions may cause physical damage to our properties, closure of one or more of our distribution facilities, closure of customers’ stores, lack of an adequate work force in a market, temporary disruption in the supply of products, disruption in the transport of goods, delays in the delivery of goods to our distribution centers or customer stores or a reduction in the availability of products we offer. In addition, adverse climate conditions and adverse weather patterns, such as droughts and floods, impact growing conditions and the quantity and quality of crops yielded by food producers and may adversely affect the availability or cost of certain products within the grocery supply chain. Our business resumption plans may not be effective in a timely manner and a significant disruption to our business could occur in the event of a natural disaster, terrorism or war. In addition, while we carry insurance to cover business interruption and damage to buildings and equipment, some of the insurance carries high deductibles. Any of these factors may disrupt our business and adversely affect our financial condition and results of operations.
Item 1B. UNRESOLVED STAFF COMMENTS
Not applicable.
Item 2. PROPERTIES
Our corporate offices, warehouses and manufacturing facilities as of September 29, 2012 are as follows:
| | | | | | | | |
| | | Approximate Square Footage | |
| Description | | Owned | | | Leased | |
Corporate offices(1) | | | 73,567 | | | | 285,367 | |
Dry warehouses | | | 2,165,123 | | | | 1,038,391 | |
Refrigerated warehouses | | | 744,336 | | | | 408,471 | |
Manufacturing facilities | | | 181,206 | | | | — | |
| (1) | | Includes corporate offices for both our Wholesale Distribution and Insurance segments. |
These properties are located in California, Oregon and Washington. We consider our properties to be generally in good condition, well maintained, and suitable and adequate to carry on our business as presently conducted. Certain of our real and personal property is pledged as collateral to secure our senior secured notes to certain insurance companies and pension funds under a note purchase agreement dated September 29, 1999 (as amended, the “Senior Note Agreement”) as amended and restated effective January 6, 2006 and further amended on November 3, 2009. See Note 5 of Notes to Consolidated Financial Statements in Part II, Item 8“Financial Statements and Supplementary Data”for additional information.
Item 3. LEGAL PROCEEDINGS
We are a party to various litigation, claims and disputes, some of which are for substantial amounts, arising in the ordinary course of business. While the ultimate effect of such actions cannot be predicted with certainty, we believe the outcome of these matters will not have a material adverse effect on our financial condition or results of operations.
Item 4. MINE SAFETY DISCLOSURES
Not applicable.
Additional Item. EXECUTIVE OFFICERS OF THE REGISTRANT
Please refer to the information under Part III, Item 10,“Directors and Executive Officers of the Registrant” for information regarding the executive officers of the Registrant.
24
Part II
Item 5. MARKET FOR REGISTRANT’S COMMON EQUITY, RELATED STOCKHOLDER MATTERS AND ISSUER PURCHASES OF EQUITY SECURITIES
There is no established public trading market for our Class A, Class B, Class C or Class E Shares. As of December 14, 2012, our Class A Shares (147,000 shares outstanding) were held of record by 420 shareholders, Class B Shares (434,598 shares outstanding) were held of record by 527 shareholders, Class C Shares were held of record, one share each, by 15 directors of Unified, and our Class E Shares (251,808 shares outstanding) were held of record by 735 shareholders.
Company Purchases of Equity Securities
| | | | | | | | |
| Period | | Total Number of Shares
Purchased | | | Average
Price Paid
Per Share | |
July 1, 2012 – July 28, 2012 | | | — | | | | — | |
July 29, 2012 – August 25, 2012 | | | — | | | | — | |
August 26, 2012 – September 29, 2012 (Class A Shares) | | | 1,750 | | | $ | 312.31 | |
| |
Total | | | 1,750 | | | $ | 312.31 | |
| |
The repurchase of Class A, Class B or Class E Shares is solely at the discretion of the Board.
Dividends
Cash dividends are not generally paid by us and may be declared in unique circumstances solely at the discretion of the Board. See Note 10 of Notes to Consolidated Financial Statements in Part II, Item 8“Financial Statements and Supplementary Data”for additional information.
Performance Graph
The following graph sets forth the five-year cumulative total shareholder return on our shares as compared to the cumulative total shareholder return for the same period of our Peer Group and the S&P 500 Index. Our Peer Group consists of Nash Finch Company, Spartan Stores, Inc. and Supervalu, Inc. These companies were selected on the basis that the companies, although unlike Unified in that they are not structured as cooperative organizations, have certain operational characteristics that are similar to Unified. For example, each of the companies is a full-line distributor of grocery products. While all shares of the companies included in the Peer Group are publicly traded, our shares are privately held. We exchange our Class A and Class B Shares with our Members at Exchange Value Per Share (see Item 1,“Business—Capital Shares”). The Exchange Value Per Share, as currently calculated, is equal to Book Value (as defined below) divided by the number of Class A and Class B Shares outstanding at the end of the fiscal year, excluding shares tendered for redemption. “Book Value” is computed based on (1) the fiscal year end balance of Class A and Class B Shares, excluding the redemption value of unredeemed shares tendered for redemption, plus (2) retained earnings excluding non-allocated retained earnings.
Prior to February 23, 2010, we computed Exchange Value Per Share of the Class A and Class B Shares as Book Value divided by the number of Class A and Class B Shares outstanding at the end of the fiscal year. For purposes of such earlier calculation, “Book Value” was computed based on the sum of the fiscal year end balances of Class A and Class B Shares, plus retained earnings. At our annual meeting of shareholders held on February 23, 2010, the shareholders authorized the Board, in its sole discretion, to retain a portion of our annual earnings from our Non-Patronage Business and not allocate those earnings to the Exchange Value Per Share. Additionally, on February 23, 2010, we modified our Exchange Value Per Share computation, effective for fiscal year end 2010, to exclude from Book Value non-allocated retained earnings (loss) and the redemption value of unredeemed shares tendered for redemption, and to exclude the number of shares tendered for redemption from the outstanding number of Class A and Class B Shares.
25
The graphical presentation of the cumulative total return of the companies included in the Peer Group reflects the incremental change in book value of the shares of those companies. The book value of the members of the Peer Group have been computed based on total equity, less other accumulated comprehensive income, divided by the number of outstanding shares for the years 2008 through 2012.
��
The comparison assumes $100 was invested on September 30, 2008 in the shares of the Company, the shares of the Peer Group and in the foregoing index through September 29, 2012. The historical cost performance on the following graph is not necessarily indicative of future cost performance.
This graph shall not be deemed incorporated by reference by any general statement incorporating by reference this Annual Report on Form 10-K into any filing under the Securities Act of 1933 or the Securities Exchange Act of 1934, except to the extent that we specifically incorporate this information by reference, and shall not otherwise be deemed filed under such Acts.
Comparison of Five Year* Cumulative Total Return
Among Unified Grocers, Inc., S&P 500 Index and Peer Group
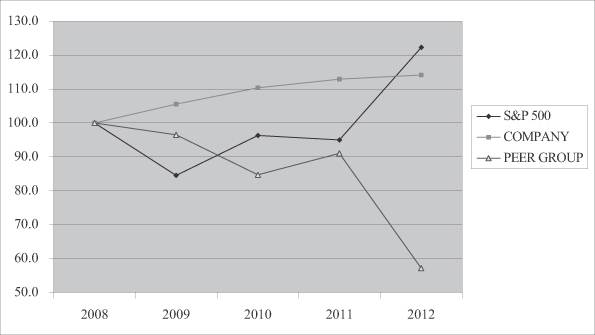
| * | | Fiscal years ended September 27, 2008, October 3, 2009, October 2, 2010, October 1, 2011 and September 29, 2012. |
26
Item 6. SELECTED FINANCIAL DATA
The selected financial information below has been compiled from the audited consolidated financial statements of Unified for the fiscal years ended September 29, 2012, October 1, 2011, October 2, 2010, October 3, 2009 and September 27, 2008. The following selected consolidated financial data should be read in conjunction with our consolidated financial statements and the notes thereto (see Part II, Item 8.“Financial Statements and Supplementary Data”)and the information contained in Item 7,“Management’s Discussion and Analysis of Financial Condition and Results of Operations.” Historical results are not necessarily indicative of future results.
| | | | | | | | | | | | | | | | | | | | |
| (dollars in thousands, except Exchange Value Per Share) | |
| Fiscal Year Ended†(a) | | September 29,
2012 (52 Weeks) | | | October 1,
2011 (52 Weeks) | | | October 2,
2010 (52 Weeks) | | | October 3,
2009 (53 Weeks)(b) | | | September 27,
2008 (52 Weeks) | |
Net sales | | $ | 3,796,272 | | | $ | 3,847,775 | | | $ | 3,921,059 | | | $ | 4,050,678 | | | $ | 4,104,775 | |
Operating income | | | 25,119 | | | | 37,433 | | | | 42,650 | | | | 51,018 | | | | 64,432 | |
Earnings before patronage dividends and income taxes | | | 12,547 | | | | 25,091 | | | | 31,139 | | | | 39,335 | | | | 48,611 | |
Patronage dividends | | | 10,787 | | | | 12,431 | | | | 14,038 | | | | 16,723 | | | | 22,059 | |
Net earnings | | | 1,953 | | | | 7,387 | | | | 10,978 | | | | 14,755 | | | | 17,369 | |
Total assets | | | 920,975 | | | | 923,678 | | | | 927,688 | | | | 915,553 | | | | 903,282 | |
Long-term notes payable | | | 196,484 | | | | 226,162 | | | | 224,926 | | | | 228,422 | | | | 254,089 | |
Exchange Value Per Share(c) | | | 316.11 | | | | 312.31 | | | | 304.48 | | | | 290.37 | | | | 273.97 | |
| |
| † | | Our fiscal year ends on the Saturday nearest September 30. |
| (a) | | The following items are not included within Selected Financial Data because they are not applicable to our operations: income from continuing operations per common share, redeemable preferred stock (within long-term obligations), and cash dividends per common share. |
| (b) | | The fiscal year ended October 3, 2009 had 53 weeks while the other fiscal years presented in Selected Financial Data had 52 weeks. This additional week resulted in an additional $79.0 million of net sales being recorded in the fiscal year ended October 3, 2009 compared to the fiscal year ended September 27, 2008. |
| (c) | | We exchange our Class A and Class B Shares with our Members at the Exchange Value Per Share (see Item 1, “Business—Capital Shares”). The Exchange Value Per Share, as currently calculated, is equal to Book Value (as defined below) divided by the number of Class A and Class B Shares outstanding at the end of the fiscal year, excluding shares tendered for redemption. “Book Value” is computed based on (1) the fiscal year end balance of Class A and Class B Shares, excluding the redemption value of unredeemed shares tendered for redemption, plus (2) retained earnings, excluding non-allocated retained earnings. |
Prior to February 23, 2010, we computed the Exchange Value Per Share of the Class A and Class B Shares as Book Value divided by the number of Class A and Class B Shares outstanding at the end of the fiscal year. For purposes of such earlier calculation, “Book Value” was computed based on the sum of the fiscal year end balances of Class A and Class B Shares, plus retained earnings. At our annual meeting of shareholders held on February 23, 2010, the shareholders authorized the Board, in its sole discretion, to retain a portion of our annual earnings from our Non-Patronage Business and not allocate those earnings to the Exchange Value Per Share. Additionally, on February 23, 2010, we modified our Exchange Value Per Share computation, effective for fiscal year end 2010, to exclude from Book Value non-allocated retained earnings (loss) and the redemption value of unredeemed shares tendered for redemption, and to exclude the number of shares tendered for redemption from the outstanding number of Class A and Class B Shares.
Exchange Value Per Share does not necessarily reflect the amount for which our net assets could be sold or the dollar amount that would be required to replace them.
27
Item 7. MANAGEMENT’S DISCUSSION AND ANALYSIS OF FINANCIAL CONDITION AND RESULTS OF OPERATIONS
Forward-Looking Information
This report contains “forward-looking statements” within the meaning of the Private Securities Litigation Reform Act of 1995. These statements relate to expectations concerning matters that (a) are not historical facts, (b) predict or forecast future events or results, or (c) embody assumptions that may prove to have been inaccurate. These forward-looking statements involve risks, uncertainties and assumptions. When we use words such as “believe,” “expect,” “anticipate” or similar expressions, we are making forward-looking statements. Although we believe that the expectations reflected in such forward-looking statements are reasonable, we cannot give readers any assurance that such expectations will prove correct. The actual results may differ materially from those anticipated in the forward-looking statements as a result of numerous factors, many of which are beyond our control. Important factors that could cause actual results to differ materially from our expectations include, but are not limited to, the factors discussed in the sections entitled Item 1A, “Risk Factors” and “Critical Accounting Policies and Estimates” within “Management’s Discussion and Analysis of Financial Condition and Results of Operations.” All forward-looking statements attributable to us are expressly qualified in their entirety by the factors that may cause actual results to differ materially from anticipated results. Readers are cautioned not to place undue reliance on these forward-looking statements, which reflect management’s opinion only as of the date hereof. We undertake no duty or obligation to revise or publicly release the results of any revision to these forward-looking statements. Readers should carefully review the risk factors described in this document as well as in other documents we file from time to time with the SEC.
Company Overview
About the Company
Unified, a California corporation organized in 1922 and incorporated in 1925, is a retailer-owned, grocery wholesale cooperative serving supermarket, specialty and convenience store operators primarily located in the western United States and the Pacific Rim. Our customers range in size from single store operators to regional supermarket chains. We operate our business in two reportable business segments: (1) Wholesale Distribution; and (2) Insurance. All remaining business activities are grouped into All Other (see Note 14 of Notes to Consolidated Financial Statements in Item 8,“Financial Statements and Supplementary Data”).
We sell a wide variety of products typically found in supermarkets, as well as a variety of specialty products, through the Cooperative and Dairy Divisions of Unified, our specialty food subsidiary and our international sales subsidiary. We report all product sales in our Wholesale Distribution segment, which represents approximately 99% of our total net sales. Our customers include our Members and Non-Members. We also provide support services to our customers, including insurance, financing, merchandising, retail pricing, advertising, promotional planning, retail technology, equipment purchasing and real estate services. Support services, other than insurance and financing, are reported in our Wholesale Distribution segment. Insurance activities account for approximately 1% of total net sales and are reported in our Insurance segment, while finance activities are grouped with our All Other business activities. The availability of specific products and services may vary by geographic region. We have three separate geographical and marketing regions: Southern California, Northern California and the Pacific Northwest.
Sales and Earnings Highlights—Fiscal 2012
Our net sales were $3.796 billion for the fiscal year ended September 29, 2012 (“2012 Period”) as compared to net sales of $3.848 billion in the fiscal year ended October 1, 2011 (“2011 Period”), a decrease of $51.5 million, or 1.3%. Despite achieving higher sales to our continuing customers, those sales improvements were offset by the loss of sales due to store closures and lost customers, including the loss of one of our top ten customers to a competitor in the third quarter of the 2011 Period. Our net sales have been negatively impacted by aggressive competition at two levels: competition we face from other wholesale distribution companies for sales to retail customers, and competition faced by our retail customers. Our net sales have also been adversely affected as a result of the challenging economic environment, including high unemployment and low consumer confidence, in which consumers continue to be highly price sensitive and seek lower-cost alternatives in their grocery purchases, as well as a shift in consumer buying habits in recent years towards non-traditional format stores that has adversely impacted our sales to many of our retail customers.
28
The following table presents details as to the distribution of changes in our net sales during the 2012 Period among our customer base:
| | | | |
| (dollars in millions) | | | |
| Key Net Sales Changes | | (Decrease)
Increase | |
Increase in net sales to continuing customers | | $ | 96.5 | |
Loss of significant Member in May 2011 | | | (87.2 | ) |
Other lost customers, net | | | (21.3 | ) |
Store closures | | | (39.5 | ) |
Change in net sales | | $ | (51.5 | ) |
| |
Our net earnings in the 2012 Period were $2.0 million, as compared to net earnings of $7.4 million in the 2011 Period, a decline of $5.4 million, or 0.2% of total net sales, primarily due to lower net sales, a change in sales mix due to a decrease in sales of higher margin products and decreased inventory holding gains, partially offset by a decline in distribution, selling and administrative expenses resulting from cost containment efforts. As a percentage of our net sales, sales of our perishable and specialty products increased, while sales of our other non-perishable products decreased. We believe this change is in part due to the considerable competition our customers face from non-traditional format stores in the sale of non-perishable products. As our non-perishable products tend to have higher margins than our perishable products, this decline in sales of non-perishable products resulted in a lower overall margin and negatively impacted our net earnings. In addition, we continued to see a shift in sales mix towards sales to large customers that tend to have reduced margins resulting from their higher purchase volume. Lower food price inflation in the 2012 Period as compared to the 2011 Period was the cause of the decrease in inventory holding gains as we were less able to take advantage of forward buying opportunities. Our continued focus on cost containment has helped to partially mitigate the impact of lower net sales. We anticipate that we will continue to experience similar market conditions, including significant competitive pressure, low consumer confidence and high unemployment, during our next fiscal year, as well as somewhat higher food price inflation, primarily due to the impacts of the drought.
Industry Overview and the Economic Environment
We were impacted by the continued weak overall economic environment during the 2012 Period, including price volatility associated with the costs of certain commodities, ingredients used in our manufactured products and packaged goods purchased from suppliers. See Item 1,“Business—Industry Overview and the Company’s Operating Environment—Economic Factors,” for a discussion of how we are impacted by changes in overall economic conditions. We were also impacted by the continued highly competitive nature of the grocery industry, including the typically high volume and low profit margins and trends towards both vertical and horizontal integration, an increasing number of competitive format grocery stores that are adding square footage devoted to food and non-food products (including warehouse club stores, supercenters, discount stores and other alternate format stores) and mergers and acquisitions among competing organizations. See Item 1, “Business—Industry Overview and the Company’s Operating Environment—Competition,” for a discussion of the highly competitive nature of the grocery industry.
The ongoing challenging economic climate during the 2012 Period, combined with continuing uncertainties related to energy prices and limited availability of credit, the depressed housing market, diminished market liquidity and high unemployment rates, have negatively impacted consumer confidence and spending and resulted in consumers continuing to behave more cautiously than in years prior to the current economic downturn and place a high emphasis on low prices. Job losses in recent years have also caused demographic shifts that change the composition of consumers and their related product focus in any given marketplace. These challenging economic conditions have contributed to continued low levels of consumer spending and a shift in consumer buying patterns, including increased purchases from grocery discounters and other non-traditional format stores for grocery products. We anticipate these same conditions may continue during our next fiscal year.
29
Results of Operations
The following discussion of our financial condition and results of operations should be read in conjunction with Item 6, “Selected Consolidated Financial Data” and Item 8, “Financial Statements and Supplementary Data,” specifically Note 14 of Notes to Consolidated Financial Statements, “Segment Reporting.” Certain statements in the following discussion are not historical in nature and should be considered to be forward-looking statements that are inherently uncertain.
The following table sets forth our selected consolidated financial data expressed as a percentage of net sales for the periods indicated below:
| | | | | | | | | | | | |
| Fiscal Year Ended | | September 29,
2012 | | | October 1,
2011 | | | October 2,
2010 | |
Net sales | | | 100.0 | % | | | 100.0 | % | | | 100.0 | % |
Cost of sales | | | 91.6 | | | | 91.1 | | | | 90.9 | |
Distribution, selling and administrative expenses | | | 7.7 | | | | 7.9 | | | | 8.0 | |
| |
Operating income | | | 0.7 | | | | 1.0 | | | | 1.1 | |
Interest expense | | | 0.3 | | | | 0.3 | | | | 0.3 | |
Patronage dividends | | | 0.3 | | | | 0.3 | | | | 0.4 | |
Income taxes | | | — | | | | 0.2 | | | | 0.2 | |
| |
Net earnings | | | 0.1 | % | | | 0.2 | % | | | 0.2 | % |
| |
Fiscal Year Ended September 29, 2012 (“2012 Period”) Compared to Fiscal Year Ended October 1, 2011 (“2011 Period”)
Overview of the 2012 Period. Our consolidated operating income decreased by $12.3 million to $25.1 million in the 2012 Period compared to $37.4 million in the 2011 Period.
The overall decrease in operating income is summarized in our operating segments and other business activities as follows:
| | · | | Wholesale Distribution Segment: The Wholesale Distribution segment’s operating income was $21.3 million in the 2012 Period compared to $32.6 million in the 2011 Period. The $11.3 million decrease in operating income was due, in large part, to the general decline in net sales and lower inventory holding gains. These declines in operating income were partially offset by lower distribution, selling and administrative expenses related to continued cost containment efforts. |
| | · | | Insurance Segment: Operating income decreased $1.3 million in our Insurance segment to $3.5 million in the 2012 Period compared to $4.8 million in the 2011 Period. This decrease was primarily due to a reduction in investment income. |
| | · | | All Other: All Other business activities primarily consist of our wholly-owned finance subsidiary. Operating income was $0.3 million for the 2012 Period compared to marginal income for the 2011 Period. |
The following tables summarize the performance of each business segment for the 2012 and 2011 Periods.
Wholesale Distribution Segment
| | | | | | | | | | | | |
| (dollars in thousands) | | | | | | | | | |
| | | 2012 | | | 2011 | | | Difference | |
Net sales | | $ | 3,776,173 | | | $ | 3,832,477 | | | $ | (56,304 | ) |
Cost of sales | | | 3,468,414 | | | | 3,503,445 | | | | (35,031 | ) |
Distribution, selling and administrative expenses | | | 286,441 | | | | 296,445 | | | | (10,004 | ) |
| |
Operating income | | $ | 21,318 | | | $ | 32,587 | | | $ | (11,269 | ) |
| |
30
Insurance Segment
| | | | | | | | | | | | |
| (dollars in thousands) | | | | | | | | | |
| | | 2012 | | | 2011 | | | Difference | |
Gross sales—premiums earned and investment income | | $ | 30,404 | | | $ | 27,280 | | | $ | 3,124 | |
Inter-segment eliminations | | | (11,452 | ) | | | (12,796 | ) | | | 1,344 | |
| |
Net sales—premiums earned and investment income | | | 18,952 | | | | 14,484 | | | | 4,468 | |
Cost of sales (including underwriting expenses) | | | 8,201 | | | | 2,343 | | | | 5,858 | |
Selling and administrative expenses | | | 7,286 | | | | 7,350 | | | | (64 | ) |
| |
Operating income | | $ | 3,465 | | | $ | 4,791 | | | $ | (1,326 | ) |
| |
All Other | | | | | | | | | |
| (dollars in thousands) | | | | | | | | | |
| | | 2012 | | | 2011 | | | Difference | |
Gross sales | | $ | 1,280 | | | $ | 1,034 | | | $ | 246 | |
Inter-segment eliminations | | | (133 | ) | | | (220 | ) | | | 87 | |
| |
Net sales | | | 1,147 | | | | 814 | | | | 333 | |
Selling and administrative expenses | | | 811 | | | | 759 | | | | 52 | |
| |
Operating income | | $ | 336 | | | $ | 55 | | | $ | 281 | |
| |
Net sales. Consolidated net sales decreased $51.5 million, or 1.3%, to $3.796 billion in the 2012 Period compared to $3.848 billion for the 2011 Period. Factors impacting net sales are as follows:
| | · | | Wholesale Distribution Segment: Wholesale Distribution net sales decreased $56.3 million to $3.776 billion in the 2012 Period compared to $3.832 billion for the 2011 Period. The table below illustrates the key changes in net sales from the 2011 Period to the 2012 Period: |
| | | | |
| (dollars in millions) | | | |
| Key Net Sales Changes | | Increase (Decrease) | |
Increase in net sales to continuing customers | | $ | 91.7 | |
Loss of significant Member in May 2011 | | | (87.2 | ) |
Other lost customers, net | | | (21.3 | ) |
Store closures | | | (39.5 | ) |
Change in net sales | | $ | (56.3 | ) |
| |
| | · | | Insurance Segment: Net sales, consisting principally of premium revenues and investment income, increased $4.5 million to $19.0 million in the 2012 Period compared to $14.5 million in the 2011 Period. The increase is primarily related to an increase in workers’ compensation premium revenue resulting from the addition of new policyholders and increased renewal premium rates. The increase in premium revenue was partially offset by lower investment income. |
| | · | | All Other: Net sales increased $0.3 million to $1.1 million in the 2012 Period compared to $0.8 million for the 2011 Period. |
Cost of sales (including underwriting expenses). Consolidated cost of sales decreased $29.1 million to $3.477 billion for the 2012 Period compared to $3.505 billion for the 2011 Period and comprised 91.6% and 91.1% of consolidated net sales for the 2012 and 2011 Periods, respectively. Factors impacting cost of sales are as follows:
| | · | | Wholesale Distribution Segment: Cost of sales decreased by $35.0 million to $3.468 billion in the 2012 Period compared to $3.503 billion in the 2011 Period. As a percentage of Wholesale Distribution net sales, cost of sales was 91.8% and 91.4% for the 2012 and 2011 Periods, respectively. |
| | · | | The change in product mix between perishable and non-perishable products and growth in sales to our larger customers resulted in a 0.2% increase in cost of sales as a percent of Wholesale Distribution net sales in the 2012 Period compared to the 2011 Period. |
31
| | · | | Vendor related activity contributed to a 0.2% increase in cost of sales as a percent of Wholesale Distribution net sales in the 2012 Period compared to the 2011 Period. This change was primarily driven by a decrease in inventory holding gains (realized upon sale) due to a lack of vendor price increases as well as changes in vendor marketing activity. |
| | · | | Insurance Segment: Cost of sales primarily consists of claims loss and loss adjustment expenses, underwriting expenses, commissions, premium taxes and regulatory fees. Cost of sales increased $5.9 million to $8.2 million in the 2012 Period compared to $2.3 million in the 2011 Period. The increase in cost of sales in the 2012 Period is due primarily to additional claims exposure related to new workers’ compensation policies written during the 2012 Period. The cost of insurance and the sufficiency of loss reserves are also impacted by actuarial estimates based on a detailed analysis of health care cost trends, claims history, demographics and industry trends. As a result, the amount of loss reserves and future expenses is significantly affected by these variables and may significantly change, depending on the cost of providing benefits and the results of further legislative action. See additional discussion related to insurance reserves under “Risk Factors”—“Our insurance reserves may be inadequate if unexpected losses occur.” |
Distribution, selling and administrative expenses. Consolidated distribution, selling and administrative expenses decreased $10.1 million to $294.5 million for the 2012 Period compared to $304.6 million for the 2011 Period and comprised 7.7% and 7.9% of consolidated net sales for the 2012 and 2011 Periods, respectively. Factors impacting distribution, selling and administrative expenses are as follows:
| | · | | Wholesale Distribution Segment: Distribution, selling and administrative expenses decreased $10.0 million to $286.4 million in the 2012 Period compared to $296.4 million in the 2011 Period. These expenses comprised 7.6% and 7.7% of Wholesale Distribution net sales for the 2012 and 2011 Periods, respectively. Factors impacting distribution, selling and administrative expenses are as follows: |
| | · | | Member Settlement: During the 2012 Period, distribution, selling and administrative expenses increased $3.4 million, or 0.1% as a percent of Wholesale Distribution net sales, resulting from settlement proceeds recorded during the 2011 Period due to the loss of a significant Member. See“Company Overview—Sales Highlights and Other Information—Fiscal 2011” discussed in Part II, Item 7.“Management’s Discussion and Analysis of Financial Condition and Results of Operations” of our Annual Report on Form 10-K for the year ended October 1, 2011 for additional information. |
| | · | | Insurance Expense (other than Workers’ Compensation): During the 2012 Period, we experienced net insurance expense decreases of $2.5 million, or 0.1% as a percent of Wholesale Distribution net sales. This net decrease in expense is primarily due to the increase in the cash surrender value of our life insurance policy assets, which are held in a rabbi trust to support post-termination retirement benefits and are not available for general corporate purposes. The changes in our policy assets are a result of changes in the fair value of the underlying securities, which are highly concentrated in U.S. equity markets and priced based on readily determinable market values. |
| | · | | Other Expense Changes: General expenses decreased $10.9 million, or 0.1% as a percent of Wholesale Distribution net sales, due primarily to our continued focus on cost containment and lower expenses related to annual employee incentive plans. |
| | · | | Insurance Segment: Selling and administrative expenses for the Insurance segment remained constant at $7.3 million for the 2012 Period compared to the 2011 Period. |
| | · | | All Other: Selling and administrative expenses for our All Other business activities were $0.8 million for both the 2012 and 2011 Periods. |
Interest. Interest expense increased $0.3 million to $12.6 million in the 2012 Period compared to $12.3 million in the 2011 Period and comprised 0.3% of consolidated net sales for both the 2012 and 2011 Periods. Factors contributing to the increase in interest expense are as follows:
| | · | | Interest expense on our primary debt instruments was $11.8 million and $11.3 million for the 2012 and 2011 Periods, respectively, an increase of $0.5 million. |
| | · | | Interest Rates: Interest expense increased $0.4 million over the 2011 Period due to an increase in our effective borrowing rate. Our effective borrowing rate for the combined primary debt, made up of |
32
| | the revolving lines of credit for Unified and Grocers Capital Company (“GCC”), and senior secured notes, was 4.6% and 4.4% for the 2012 and 2011 Periods, respectively. The rate increase was due to a higher effective rate on Unified’s revolving line of credit. |
| | · | | Weighted Average Borrowings: Interest expense increased by $0.1 million from the 2011 Period as a result of a $1.5 million increase in weighted average borrowings. |
Borrowings on Unified’s revolving credit agreement are subject to market rate fluctuations. A 25 basis point change in the market rate of interest over the 2012 Period would result in a $0.4 million increase or decrease in corresponding interest expense.
| | · | | Interest expense on all our other outstanding debt instruments was $0.8 million and $1.0 million in the 2012 and 2011 Periods, respectively. |
Patronage dividends. Patronage dividends for the 2012 Period were $10.8 million, compared to $12.4 million in the 2011 Period, a decrease of 12.9%. Patronage dividends for the 2011 Period consisted of the patronage earnings from our three patronage earning divisions: the Southern California Dairy Division, the Pacific Northwest Dairy Division and the Cooperative Division, while patronage dividends for the 2012 Period consisted of patronage earnings from the Southern California Dairy Division and the Pacific Northwest Dairy Division. For the 2012 and 2011 Periods, respectively, we had patronage earnings of $9.7 million and $10.7 million in the Southern California Dairy Division, $1.1 million and $1.4 million in the Pacific Northwest Dairy Division, and we incurred a $3.6 million loss in the Cooperative Division compared to $0.3 million of earnings. The decrease in the Southern California and Pacific Northwest Dairy Divisions’ patronage earnings was due to a decrease in Member sales volume. Cooperative Division patronage earnings declined to a loss due to lower net sales and lower inventory holding gains, partially offset by lower distribution, selling and administrative expenses due to continued cost containment efforts. This loss was recognized in net earnings, thereby reducing our Exchange Value Per Share.
Income taxes. Income taxes reflected a $0.2 million benefit for the 2012 Period compared to $5.3 million of expense for the 2011 Period. Our effective income tax rate was (11%) for the 2012 Period compared to 41.7% for the 2011 Period. The lower than statutory rate in the 2012 Period reflects favorable adjustments due to non-taxable gains on life insurance.
Other Comprehensive (Loss) Earnings, Net of Income Taxes (“OCI”). Our OCI net loss was $23.8 million in the 2012 Period compared to a net loss of $8.7 million in the 2011 Period (see Note 1 to“Notes to Consolidated Financial Statements” in Part II, Item 8,“Financial Statements and Supplementary Data”). OCI is excluded from the calculation of Exchange Value Per Share (see Note 10 to“Notes to Consolidated Financial Statements” in Part II, Item 8,“Financial Statements and Supplementary Data”).
| | · | | Unrealized Net Holding Gain (loss) on Investments: Our investments are primarily made up of bonds in our insurance segment portfolio. We experienced an unrealized gain of $1.2 million in the 2012 Period compared to an unrealized loss of $2.8 million in the 2011 Period. |
| | · | | Defined Benefit Pension Plans and Other Postretirement Benefit Plans: This component of OCI primarily represents the non-cash amount to record the ultimate future liability for pension obligations net of the value of our pension fund assets pursuant to ASC Topic 715-20, “Compensation—Retirement Benefits—Defined Benefits Plans—General.” We experienced a $25.0 million loss in the 2012 Period compared to a $5.9 million loss in the 2011 Period, due primarily to a decrease in interest rates used to discount the liabilities for pension and other postretirement benefits. See Note 11“Benefit Plans” and Note 12“Postretirement Benefit Plans Other Than Pensions” of Notes to Consolidated Financial Statements in Item 8,“Financial Statements and Supplementary Data”for more information. |
Fiscal Year Ended October 1, 2011 (“2011 Period”) Compared to Fiscal Year Ended October 2, 2010 (“2010 Period”)
Overview of the 2011 Period. Our consolidated operating income decreased by $5.2 million to $37.4 million in the 2011 Period compared to $42.6 million in the 2010 Period.
33
The overall decrease in operating income is summarized in our operating segments and other business activities as follows:
| | · | | Wholesale Distribution Segment: The Wholesale Distribution segment’s operating income was $32.6 million in the 2011 Period compared to $38.1 million in the 2010 Period. The $5.5 million decrease in operating income was due, in large part, to the general decline in net sales, along with higher insurance expenses driven by lower investment performance and higher fuel and medical expenses, partially offset by lower overall distribution, selling and administrative expenses. |
| | · | | Insurance Segment: Operating income increased $0.2 million in our Insurance segment to $4.8 million in the 2011 Period compared to $4.6 million in the 2010 Period. This increase was primarily due to our recording an estimated loss reserve for a customer’s fire-related claim in the 2010 Period and a reduction of loss reserves in the 2011 Period. |
| | · | | All Other: All Other business activities primarily consist of our wholly-owned finance subsidiary. Operating income was marginal for the 2011 Period as compared to a marginal loss for the 2010 Period. |
The following tables summarize the performance of each business segment for the 2011 and 2010 Periods.
Wholesale Distribution Segment
| | | | | | | | | | | | |
| (dollars in thousands) | | | | | | | | | |
| | | 2011 | | | 2010 | | | Difference | |
Net sales | | $ | 3,832,477 | | | $ | 3,904,102 | | | $ | (71,625 | ) |
Cost of sales | | | 3,503,445 | | | | 3,561,415 | | | | (57,970 | ) |
Distribution, selling and administrative expenses | | | 296,445 | | | | 304,565 | | | | (8,120 | ) |
| |
Operating income | | $ | 32,587 | | | $ | 38,122 | | | $ | (5,535 | ) |
| |
Insurance Segment
| | | | | | | | | | | | |
| (dollars in thousands) | | | | | | | | | |
| | | 2011 | | | 2010 | | | Difference | |
Gross sales—premiums earned and investment income | | $ | 27,280 | | | $ | 29,794 | | | $ | (2,514 | ) |
Inter-segment eliminations | | | (12,796 | ) | | | (13,538 | ) | | | 742 | |
| |
Net sales—premiums earned and investment income | | | 14,484 | | | | 16,256 | | | | (1,772 | ) |
Cost of sales (including underwriting expenses) | | | 2,343 | | | | 4,805 | | | | (2,462 | ) |
Selling and administrative expenses | | | 7,350 | | | | 6,834 | | | | 516 | |
| |
Operating income | | $ | 4,791 | | | $ | 4,617 | | | $ | 174 | |
| |
All Other
| | | | | | | | | | | | |
| (dollars in thousands) | | | | | | | | | |
| | | 2011 | | | 2010 | | | Difference | |
Gross sales | | $ | 1,034 | | | $ | 974 | | | $ | 60 | |
Inter-segment eliminations | | | (220 | ) | | | (273 | ) | | | 53 | |
| |
Net sales | | | 814 | | | | 701 | | | | 113 | |
Selling and administrative expenses | | | 759 | | | | 790 | | | | (31 | ) |
| |
Operating income (loss) | | $ | 55 | | | $ | (89 | ) | | $ | 144 | |
| |
34
Net sales. Consolidated net sales decreased $73.3 million, or 1.9%, to $3.848 billion in the 2011 Period compared to $3.921 billion for the 2010 Period. Factors impacting net sales are as follows:
| | · | | Wholesale Distribution Segment: Wholesale Distribution net sales decreased $71.6 million to $3.832 billion in the 2011 Period compared to $3.904 billion for the 2010 Period. The table below illustrates the key changes in net sales from the 2010 Period to the 2011 Period: |
| | | | |
| (dollars in millions) | | | |
| Key Net Sales Changes | | Increase (Decrease) | |
Increase in net sales to continuing customers | | $ | 51.3 | |
Net new customers added in the 2011 Period | | | 11.6 | |
Loss of significant Member | | | (62.8 | ) |
Store closures | | | (71.7 | ) |
| |
Change in net sales | | $ | (71.6 | ) |
| |
| | · | | Insurance Segment: Net sales, consisting principally of premium revenues and investment income, decreased $1.8 million to $14.5 million in the 2011 Period compared to $16.3 million in the 2010 Period. The decrease is primarily related to a reduction in workers’ compensation premium revenue and lower investment income. |
| | · | | All Other: Net sales increased $0.1 million to $0.8 million in the 2011 Period compared to $0.7 million for the 2010 Period. |
Cost of sales (including underwriting expenses). Consolidated cost of sales decreased $60.4 million to $3.505 billion for the 2011 Period compared to $3.566 billion for the 2010 Period and comprised 91.1% and 90.9% of consolidated net sales for the 2011 and 2010 Periods, respectively. Factors impacting cost of sales are as follows:
| | · | | Wholesale Distribution Segment: Cost of sales decreased by $57.9 million to $3.503 billion in the 2011 Period compared to $3.561 billion in the 2010 Period. As a percentage of Wholesale Distribution net sales, cost of sales was 91.4% and 91.2% for the 2011 and 2010 Periods, respectively. |
| | · | | The change in product and customer sales mix resulted in a 0.4% increase in cost of sales as a percent of Wholesale Distribution net sales in the 2011 Period compared to the 2010 Period. |
| | · | | Vendor related activity contributed to a 0.2% decrease in cost of sales as a percent of Wholesale Distribution net sales in the 2011 Period compared to the 2010 Period. This change was primarily driven by an increase in inventory holding gains (realized upon sale) due to vendor price increases as well as changes in vendor marketing activity. |
| | · | | Insurance Segment: Cost of sales primarily consists of claims loss and loss adjustment expenses, underwriting expenses, commissions, premium taxes and regulatory fees. Cost of sales decreased $2.5 million to $2.3 million in the 2011 Period compared to $4.8 million in the 2010 Period. The decrease in cost of sales in the 2011 Period is due primarily to (1) a non-recurring increase in reserves in the 2010 Period for an insurance claim by a customer related to a fire loss estimated at $1.1 million, and (2) reduced exposure to claims losses resulting from a decline in workers’ compensation premium revenue during the 2011 Period. Additionally, the cost of insurance and the sufficiency of loss reserves are also impacted by actuarial estimates based on a detailed analysis of health care cost trends, claims history, demographics and industry trends. As a result, the amount of loss reserves and future expenses is significantly affected by these variables and may significantly change, depending on the cost of providing benefits and the results of further legislative action. See additional discussion related to insurance reserves under “Risk Factors”—“Our insurance reserves may be inadequate if unexpected losses occur.” |
35
Distribution, selling and administrative expenses. Consolidated distribution, selling and administrative expenses decreased $7.6 million to $304.6 million for the 2011 Period compared to $312.2 million for the 2010 Period and comprised 7.9% and 8.0% of consolidated net sales for the 2011 and 2010 Periods, respectively. Factors impacting distribution, selling and administrative expenses are as follows:
| | · | | Wholesale Distribution Segment: Distribution, selling and administrative expenses decreased $8.1 million to $296.4 million in the 2011 Period compared to $304.5 million in the 2010 Period. These expenses comprised 7.7% and 7.8% of Wholesale Distribution net sales for the 2011 and 2010 Periods, respectively. Factors impacting distribution, selling and administrative expenses are as follows: |
| | · | | Member Settlement: During the 2011 Period, distribution, selling and administrative expenses decreased $3.4 million, or 0.1% as a percent of Wholesale Distribution net sales, resulting from the Member Settlement. |
| | · | | Insurance Expense (other than Workers’ Compensation): During the 2011 Period, we experienced net insurance expense increases of $1.7 million, or 0.1% as a percent of Wholesale Distribution net sales. This net increase in expense is primarily due to the decrease in the cash surrender value of our life insurance policy assets, which are held in a rabbi trust to support post-termination retirement benefits and are not available for general corporate purposes. The changes in our policy assets are a result of changes in the fair value of the underlying securities, which are highly concentrated in U.S. equity markets and priced based on readily determinable market values. |
| | · | | Fuel Expense: During the 2011 Period, we experienced diesel fuel expense increases of $1.8 million, or 0.1% as a percent of Wholesale Distribution net sales. This increase is primarily due to the rising cost of oil. |
| | · | | Non-Union Medical Benefits: During the 2011 Period, we experienced expense increases of $1.6 million, or 0.1% as a percent of Wholesale Distribution net sales, primarily due to the increased cost of medical benefits. |
| | · | | Other Expense Changes: General expenses decreased $9.8 million, or 0.3% as a percent of Wholesale Distribution net sales, due primarily to our continued focus on cost containment. |
| | · | | Insurance Segment: Selling and administrative expenses for the Insurance segment increased $0.5 million to $7.3 million for the 2011 Period compared to $6.8 million for the 2010 Period. The increase in expense is primarily due to on-going software maintenance and depreciation costs associated with a new policy management system implemented during the 2010 Period. |
| | · | | All Other: Selling and administrative expenses for our All Other business activities were $0.8 million for both the 2011 and 2010 Periods. |
Interest. Interest expense increased $0.8 million to $12.3 million in the 2011 Period compared to $11.5 million in the 2010 Period and comprised 0.3% of consolidated net sales for both the 2011 and 2010 Periods. Factors contributing to the increase in interest expense are as follows:
| | · | | Interest expense on our primary debt instruments was $11.3 million and $10.4 million for the 2011 and 2010 Periods, respectively, an increase of $0.9 million. |
| | · | | Interest Rates: Interest expense increased $0.4 million over the 2010 Period due to an increase in our effective borrowing rate. Our effective borrowing rate for the combined primary debt, made up of the revolving lines of credit for Unified and Grocers Capital Company (“GCC”), and senior secured notes, was 4.4% and 4.3% for the 2011 and 2010 Periods, respectively. The rate increase was due to a higher effective rate on Unified’s revolving line of credit. On October 8, 2010, we entered into a new revolving credit agreement with Wells Fargo Bank, National Association, as Administrative Agent (see“Credit Facilities” and the Company’s Current Report on Form 8-K filed on October 13, 2010 for additional information). |
| | · | | Weighted Average Borrowings: Interest expense increased by $0.5 million from the 2010 Period as a result of higher outstanding debt. Weighted average borrowings increased by $12.9 million primarily due to increased inventory levels during the 2011 Period. |
36
Borrowings on Unified’s revolving credit agreement are subject to market rate fluctuations. A 25 basis point change in the market rate of interest over the 2011 Period would result in a $0.4 million increase or decrease in corresponding interest expense.
| | · | | Interest expense on all our other outstanding debt instruments was $1.0 million and $1.1 million in the 2011 and 2010 Periods, respectively. |
Patronage dividends. Patronage dividends for the 2011 Period were $12.4 million, compared to $14.0 million in the 2010 Period, a decrease of 10.9%. Patronage dividends for the 2011 and 2010 Periods consisted of the patronage earnings from our three patronage earning divisions: the Southern California Dairy Division, the Pacific Northwest Dairy Division and the Cooperative Division. For the 2011 and 2010 Periods, respectively, we had patronage earnings of $10.7 million and $11.9 million in the Southern California Dairy Division, $1.4 million and $1.7 million in the Pacific Northwest Dairy Division and $0.3 million and $0.4 million in the Cooperative Division. The decrease in the Southern California and Pacific Northwest Dairy Divisions’ patronage earnings was due to a decrease in Member sales volume. Cooperative Division patronage earnings were consistent from the 2010 Period to the 2011 Period. Lower overall distribution, selling and administrative expenses partially offset reduced patronage earnings due to lower sales and higher insurance and medical expenses.
Income taxes. Income tax expense was $5.3 million for the 2011 Period compared to $6.1 million for the 2010 Period. Our effective income tax rate was 41.7% for the 2011 Period compared to 35.8% for the 2010 Period. The higher than statutory rate in the 2011 Period reflects unfavorable adjustments due to non-deductible losses on life insurance.
Other Comprehensive (Loss) Earnings, Net of Income Taxes (“OCI”). Our OCI net loss was $8.7 million in the 2011 Period compared to a net loss of $3.5 million in the 2010 Period (see Note 1 to“Notes to Consolidated Financial Statements” in Part II, Item 8,“Financial Statements and Supplementary Data”). OCI is excluded from the calculation of Exchange Value Per Share (see Note 10 to“Notes to Consolidated Financial Statements” in Part II, Item 8,“Financial Statements and Supplementary Data”).
| | · | | Unrealized Net Holding Gain (loss) on Investments: Our investments are primarily made up of bonds in our insurance segment portfolio. We experienced an unrealized loss of $2.8 million in the 2011 Period compared to an unrealized gain of $0.7 million in the 2010 Period. |
| | · | | Defined Benefit Pension Plans and Other Postretirement Benefit Plans: This component of OCI primarily represents the non-cash amount to record the ultimate future liability for pension obligations net of the value of our pension fund assets pursuant to ASC Topic 715-20, “Compensation—Retirement Benefits—Defined Benefits Plans—General.” We experienced a $5.9 million loss in the 2011 Period compared to a $4.2 million loss in the 2010 Period. |
Liquidity and Capital Resources
We finance our capital needs through a combination of internal and external sources. These sources include cash from operations, Member capital and other Member investments, bank borrowings, various types of long-term debt and lease financing.
The acquisition, holding and redemption of our shares and making of deposits, including Required Deposits, by our Members, and our policies with respect to such matters, can significantly affect our liquidity and capital resources. Our obligations to repay a Member’s Required Deposit on termination of Member status (once the Member’s obligations to us have been satisfied) is reported as a long-term liability within “Members and Non-Members’ deposits” on our consolidated balance sheets. Excess Deposits are not subordinated to our other obligations and are reported as short-term liabilities within “Members’ deposits and declared patronage dividends” on our consolidated balance sheets. At September 29, 2012, we had $0.8 million of tendered Class A Shares and $23.8 million of tendered Class B Shares pending redemption, whose redemption is subject to final approval by the Board, and in the case of Class B Shares, subject to the 5% limitation on redemptions contained in our redemption policy. At September 29, 2012 and October 1, 2011, we had $7.5 million and $6.0 million, respectively, in “Members and Non-Members’ deposits” and $12.1 million and $13.4 million, respectively, in “Members’ deposits and declared patronage dividends” (of which $10.7 million and $10.8 million, respectively, represented deposits in
37
excess of the Required Deposits and Credit Deposits). See Item 1,“Business—Capital Shares,” Item 1,“Business—Patronage Dividends,” Item 1,“Business—Customer Deposits,” and Note 18 of Notes to Consolidated Financial Statements in Item 8,“Financial Statements and Supplementary Data.”
We believe that the combination of cash flows from operations, current cash balances, and available lines of credit, will be sufficient to service our debt, redeem Members’ capital shares, make income tax payments and meet our anticipated needs for working capital and capital expenditures (including facility expansion and/or replacement projects under consideration as discussed in Part I, Item 1,“Business—Facilities and Transportation”) through at least the next three fiscal years.
Cash Flow
We generated positive cash flow from operating activities during the 2012 Period. Cash from operations was used for investing and financing activities, including redemption of Members’ capital shares and investing in our infrastructure. We also reinvested proceeds from maturing investments.
As a result of these activities, net cash, consisting of cash and cash equivalents, increased by $6.0 million to $11.1 million as of September 29, 2012, compared to $5.1 million as of October 1, 2011.
The following table summarizes the impact of operating, investing and financing activities on our cash flows for the 2012 and 2011 Periods:
| | | | | | | | | | | | |
| (dollars in thousands) | | | | | | | | | |
| Summary of Net Increase (Decrease) in Total Cash and Cash Equivalents | | 2012 | | | 2011 | | | Difference | |
Cash provided by operating activities | | $ | 67,849 | | | $ | 24,902 | | | $ | 42,947 | |
Cash utilized by investing activities | | | (27,997 | ) | | | (16,603 | ) | | | (11,394 | ) |
Cash utilized by financing activities | | | (33,800 | ) | | | (9,083 | ) | | | (24,717 | ) |
| |
Total increase (decrease) in cash and cash equivalents | | $ | 6,052 | | | $ | (784 | ) | | $ | 6,836 | |
| |
Net cash from operating, investing and financing activities increased by $6.8 million to an increase of $6.0 million for the 2012 Period compared to a decrease of $0.8 million for the 2011 Period. The increase in net cash for the 2012 Period consisted of cash provided by operating activities of $67.8 million offset by cash used in investing activities of $28.0 million and financing activities of $33.8 million. The primary factors contributing to the changes in cash flow are discussed below. Working capital was $163.1 million and $193.0 million, and the current ratio was 1.5 and 1.7 at September 29, 2012 and October 1, 2011, respectively.
Operating Activities: Net cash provided by operating activities increased by $42.9 million to $67.8 million provided in the 2012 Period compared to $24.9 million provided in the 2011 Period. The increase in cash provided by operating activities compared to the 2011 Period was attributable primarily to (1) an increase between the periods in net cash flows related to decreased inventories of $34.3 million, (2) a decrease in cash used to fund pension plan contributions of $1.9 million, (3) a decrease between the periods in cash used to pay accounts payable and accrued liabilities of $15.7 million and (4) an increase in long-term liabilities, other between the periods of $5.8 million that was primarily attributable to an increase in pension and postretirement liabilities. The foregoing increases of $57.7 million in cash provided were partially offset by (1) a decrease between the periods in cash provided of $9.0 million in accounts receivable, (2) an increase in prepaid expenses during the 2012 Period compared to a decrease in the 2011 Period, resulting in a decrease in cash provided between the periods of $4.2 million, and (3) a decrease between the periods in net cash provided by other operating activities of $1.6 million.
Investing Activities: Net cash used by investing activities increased by $11.4 million to $28.0 million for the 2012 Period compared to $16.6 million in the 2011 Period. The increase in cash used by investing activities during the 2012 Period as compared to the 2011 Period was due mainly to (1) an increase in capital expenditures between the periods of $3.9 million as a result of the purchase of a warehouse adjacent to our Stockton facility, (2) an increase of $1.8 million in net investment activities by our insurance subsidiaries, consisting of the purchase and sale of securities to replace maturing investments in their portfolios and (3) an increase in other assets between the periods of $9.3 million, primarily related to the change in value between the periods of our
38
mutual fund and life insurance policy assets. The foregoing increases of $15.0 million in cash used were partially offset by an increase in cash provided by net notes receivable activities of $3.6 million, reflecting normal fluctuation in loan activity to Members for their inventory and equipment financing. Spending on investing activities is expected to be funded by existing cash balances, cash generated from operations or additional borrowings.
Financing Activities: Net cash used by financing activities was $33.8 million for the 2012 Period compared to $9.1 million used in the 2011 Period. The net increase of $24.7 million in cash used by financing activities for the 2012 Period as compared to the 2011 Period was due primarily to an increase in cash used of $29.8 million related to changes in our long-term and short-term notes payable and deferred financing fees. See“Outstanding Debt and Other Financing Arrangements” for further discussion regarding our credit facilities and financing arrangements. The net increase in cash used for repayments under our secured revolving credit agreements was partially offset by decreased cash used by Member investment and share activity of $5.1 million. Future cash used by financing activities to meet capital spending requirements is expected to be funded by our continuing operating cash flow or additional borrowings.
Equity Enhancement
In fiscal 2003, we introduced a new class of capital share, denominated “Class E Shares,” as part of an equity enhancement initiative designed to build equity in the Company for future investment in the business and other infrastructure improvements. This initiative contemplated issuing Class E Shares as part of the patronage dividends issued in fiscal years 2003 through 2007 for the Cooperative Division, and this was successfully completed in fiscal 2007. In fiscal 2009 and 2008, 30% of the Cooperative Division patronage dividend was issued in Class E Shares. Class E Shares are available to be issued in future years at the discretion of the Board.
Credit Facilities
On October 8, 2010, we entered into a Credit Agreement (the “Agreement”), among the Company, the lenders party thereto, and Wells Fargo Bank, National Association, as Administrative Agent. The Agreement replaced our previous revolving credit agreement, with substantially the same parties, terms and conditions.
The Agreement provides for a revolving credit facility with total commitments in the principal amount of $275 million. Borrowings under the Agreement may be made as revolving loans, swing line loans or letters of credit. The aggregate commitments under the Agreement may be increased from time to time, either through any of the existing lenders increasing its commitment or by means of the addition of new lenders, up to a maximum commitment of $400 million. While the consent of the lenders as a group is not required to permit any such increase, no individual lender is required to increase its own commitment to the Agreement. The Agreement expires on October 8, 2015, and it refinanced existing indebtedness and finances capital expenditures, working capital needs, potential acquisitions and general corporate purposes.
Our obligations under the Agreement are guaranteed by certain of our subsidiaries, excluding our finance and insurance subsidiaries, and are secured by grants of security interests in our (excluding certain of our subsidiaries’) accounts receivable and inventory (subject to exceptions). The obligations are also senior to the rights of Members with respect to partially subordinated patrons’ deposit accounts.
The Agreement provides for loans which bear interest at either the Base Rate or the Eurodollar Rate, in each case plus a margin based upon the Consolidated Total Funded Debt (as defined in the Agreement) to earnings before interest, taxes, depreciation, amortization and patronage dividends (“EBITDAP”) Ratio. Eurodollar Rate Loans will bear interest margins (and letters of credit issued under the Agreement will bear letter of credit fees) of between 1.00% per annum and 2.00% per annum, based upon the Consolidated Total Funded Debt to EBITDAP Ratio of the Company. Base Rate Loans will bear interest margins of between 0.00% per annum and 1.00% per annum, dependent upon our Consolidated Total Funded Debt to EBITDAP Ratio. Undrawn portions of the commitments under the Agreement bear commitment fees at rates of between 0.20% per annum and 0.30% per annum, also dependent upon our Consolidated Total Funded Debt to EBITDAP Ratio.
39
On June 19, 2012, we entered into the second amendment (the “Second Amendment”) of the Agreement. The Second Amendment raises the Consolidated Total Funded Debt to EBITDAP ratio (as defined) of the Company allowed by the financial covenants to be no higher than 4.0 to 1 for the fiscal quarters ended June 30 and September 29, 2012, after which it returns to 3.5 to 1, and sets forth a 0.5% increase in the interest rates to be charged if the ratio is greater than 3.5 to 1. The changes were pursued to provide flexibility due to the volatility and uncertainty associated with the prevailing economic environment.
A copy of the Second Amendment was filed as Exhibit 10.1 to the Company’s Quarterly Report on Form 10-Q for the quarter ended June 30, 2012. The foregoing description of the Second Amendment does not purport to be complete and is qualified in its entirety by reference to the exhibit.
Our outstanding borrowings under the Agreement decreased to $90.0 million (Eurodollar and Base Rate Loans at a blended average rate of 2.25% per annum) at September 29, 2012 from $108.3 million (Eurodollar and Base Rate Loans at a blended average rate of 1.89% per annum) at October 1, 2011, with access to approximately $185.0 million of additional capital available under the Agreement (based on the amounts indicated above) to fund our continuing operations and capital spending requirements for the foreseeable future.
Our amended and restated Senior Note Agreement with John Hancock Life Insurance Company (“Hancock”) (see“Outstanding Debt and Other Financing Arrangements” herein) provided $111.0 million of financing through notes that mature on January 1, 2016 and November 1, 2019. We had a total of $104.8 million and $108.5 million outstanding at September 29, 2012 and October 1, 2011, respectively, under the Senior Note Agreement.
On September 24, 2010, our wholly-owned finance subsidiary entered into a loan and security agreement (“Loan Agreement”) providing total commitments in the principal amount of $15.0 million. As of September 29, 2012 and October 1, 2011, we had $5.5 million and $13.0 million, respectively, outstanding under the Loan Agreement. See“Outstanding Debt and Other Financing Arrangements—Member Financing” for further discussion.
As of September 29, 2012, we are in compliance with all applicable covenants of the Agreement, Senior Note Agreement and Loan Agreement.
Pension and Postretirement Benefit Plans
We sponsor a cash balance plan (the “Unified Cash Balance Plan”). The Unified Cash Balance Plan is a noncontributory defined benefit pension plan covering substantially all our employees who are not subject to a collective bargaining agreement. Under the Unified Cash Balance Plan, participants are credited with an annual accrual based on their years of service with us. Effective January 1, 2009, all of our qualifying employees who are not subject to a collective bargaining agreement accrue benefits pursuant to the Unified Cash Balance Plan. We also sponsor an Executive Salary Protection Plan (“ESPP”) for our executive officers that provides supplemental post-termination retirement income based on each participant’s salary and years of service as an officer with us. Funds are held in a rabbi trust for the ESPP consisting primarily of life insurance policies tied to underlying investments in the equity market (reported at cash surrender value) and mutual fund assets consisting of various publicly-traded mutual funds (reported at estimated fair value based on quoted market prices). See Note 11“Benefit Plans” of Notes to Consolidated Financial Statements in Item 8,“Financial Statements and Supplementary Data”for additional discussion.
Our net periodic benefit cost for our combined pension and other postretirement benefits was approximately $15.7 million for fiscal 2012 compared to $16.1 million for fiscal 2011.
We contributed $10.9 million to the Unified Cash Balance Plan during fiscal 2012, which is comprised of $3.9 million for the 2012 plan year and $7.0 million for the 2011 plan year. At this time, we expect to make estimated minimum contributions to the Unified Cash Balance Plan totaling $7.4 million during fiscal 2013, which is comprised of $3.6 million for the 2013 plan year and $3.8 million for the 2012 plan year. At our discretion, we may contribute in excess of these amounts. Additional contributions, if any, will be based, in part, on future actuarial
40
funding calculations and the performance of plan investments. Additional contributions, if any, for the 2012 plan year will be due by September 15, 2013, while contributions for the 2013 plan year will be due by September 15, 2014.
During July 2012, legislation to provide pension funding relief was enacted as part of the 2012 student loan and transportation legislation titled “Moving Ahead for Progress in the 21st Century” (“MAP-21”). Funding relief is to be achieved through changes in the methodology employed to determine interest rates used to calculate required funding contributions. The funding relief applies to Employee Retirement Income Security Act (“ERISA”) single-employer plans that base pension liability calculations on interest rates determined pursuant to the Pension Protection Act of 2006 and was predicted to reduce 2012 contribution requirements for typical plans. As a result of MAP-21, we were able to reduce our contributions to the Unified Cash Balance Plan for fiscal year 2012 by $2.0 million, and we anticipate our fiscal year 2013 contributions will be reduced by approximately $7.9 million from our originally estimated amounts.
We also made contributions of $13.8 million and $14.9 million for fiscal years 2012 and 2011, respectively, to collectively bargained, multi-employer defined benefit pension plans in accordance with the provisions of negotiated labor contracts.
In addition, we contributed $0.7 million to the ESPP during fiscal 2012 to fund benefit payments to participants. At this time, we expect to contribute $0.7 million to the ESPP to fund projected benefit payments to participants in fiscal 2013.
Assuming a long-term rate of return on plan assets of 8.25%, a discount rate of 4.00% for the Unified Cash Balance Plan, a discount rate of 3.25% for the ESPP, and certain other assumptions, we estimate that our combined pension expense for the Unified Cash Balance Plan and ESPP for fiscal 2013 will be approximately $13.9 million. Future pension expense will be affected by future investment performance, discount rates and other variables such as expected rate of compensation increases and mortality rates relating to plan participants. Decreasing only the discount rate assumption by 0.5% would increase our projected fiscal 2013 pension expense for the Unified Cash Balance Plan by approximately $1.6 million. Decreasing only the discount rate assumption by 0.5% would increase our projected fiscal 2013 pension expense for the ESPP by approximately $0.4 million. Lowering the expected long-term rate of return on our plan assets (for the Unified Cash Balance Plan) by 0.50% from 8.50% to 8.00% would have increased our pension expense for fiscal 2012 by approximately $0.7 million. Similarly, lowering the expected long-term rate of return on our plan assets (for the Unified Cash Balance Plan) by 0.50% (from 8.25% to 7.75%) would increase our projected fiscal 2013 pension expense by approximately $0.9 million.
The credit and liquidity crisis in the United States and throughout the global financial system triggered substantial volatility in the world financial markets and banking system. As a result, the investment portfolios of the Unified Cash Balance Plan incurred a significant decline in fair value during fiscal 2008. While the values of the investment portfolios increased during fiscal 2009 and 2010, they declined in fiscal 2011 and reflected improvement in fiscal 2012, as the values of the plan’s individual investments have and will fluctuate in response to changing market conditions, and the amount of gains or losses that will be recognized in subsequent periods, if any, cannot be determined.
We sponsor postretirement benefit plans that provide: (1) certain medical coverage to retired non-union employees, (2) certain medical coverage to officers who are at least 55 years of age and have seven years of service with us as an officer pursuant to our Officer Retirement Medical Plan, which includes our Executive Medical Reimbursement Plan, following termination of employment, (3) life insurance benefits for a certain group of retired non-union employees (for which active non-union employees are no longer eligible), and (4) lump-sum payouts for unused sick days covering certain eligible union and non-union employees. See Note 12,“Postretirement Benefit Plans Other Than Pensions,” of Notes to Consolidated Financial Statements in Item 8,“Financial Statements and Supplementary Data”for additional information.
Assuming a discount rate of 4.00% and certain other assumptions, we estimate that postretirement expense for fiscal 2013 will be approximately $4.3 million. Future postretirement expense will be affected by discount rates and other variables such as expected rate of compensation increases and projected health care trend rates.
41
During fiscal year 2010, comprehensive health care reform legislation under thePatient Protection and Affordable Care Act(HR 3590) and theHealth Care Education and Affordability Reconciliation Act (HR 4872) (collectively, the “Acts”) was passed and signed into law. The Acts contain provisions that could impact our accounting for retiree medical benefits in future periods. However, the extent of that impact, if any, cannot be determined until regulations are promulgated under the Acts and additional interpretations of the Acts become available. On June 28, 2012, the U.S. Supreme Court generally upheld the constitutionality of the Acts; however, provisions in the Acts requiring each state to expand its Medicaid program or lose all federal Medicaid funds were struck down. The U.S. Supreme Court did not invalidate the Acts’ expansion of Medicaid for states that voluntarily participate; it only held that a state’s entire Medicaid funding cannot be withheld due to its failure to participate in the expansion. We will continue to assess the accounting implications of the Acts as related regulations and interpretations of the Acts become available. In addition, we may consider plan amendments in future periods that may have accounting implications. See Note 12“Postretirement Benefit Plans Other Than Pensions” of Notes to Consolidated Financial Statements in Item 8,“Financial Statements and Supplementary Data”for additional discussion.
Off-Balance Sheet Arrangements
As of the date of this report, we do not participate in transactions that generate relationships with unconsolidated entities or financial partnerships, such as entities often referred to as structured finance or special purpose entities, which would have been established for the purpose of facilitating off-balance sheet arrangements or other contractual, narrow or limited purposes.
Contractual Obligations and Commercial Commitments
At September 29, 2012, we were contingently liable with respect to three lease guarantees for certain Members with commitments expiring through 2017. We believe the locations underlying these leases are marketable and, accordingly, that we will be able to recover a substantial portion of the guaranteed amounts in the event we are required to satisfy our obligations under the guarantees. In addition to the lease guarantees, we also guarantee standby letters of credit to certain beneficiaries. We would be obligated under the standby letters of credit to the extent of any amount utilized by the beneficiaries.
Our contractual obligations and commercial commitments at September 29, 2012 are summarized as follows:
| | | | | | | | | | | | | | | | | | | | |
| (dollars in thousands) | | | |
| | | Payments due by period | |
| Contractual Obligations | | Total | | | Less than
1 year | | | 1-3 years | | | 4-5 years | | | More than
5 years | |
Senior secured notes | | $ | 104,843 | | | $ | 3,859 | | | $ | 8,543 | | | $ | 67,441 | | | $ | 25,000 | |
Revolving lines of credits | | | 95,500 | | | | — | | | | — | | | | 95,500 | | | | — | |
Operating lease obligations | | | 90,225 | | | | 21,475 | | | | 34,870 | | | | 17,763 | | | | 16,117 | |
Capital lease obligations | | | 19 | | | | 19 | | | | — | | | | — | | | | — | |
Self-Insurance reserves | | | 51,124 | | | | 15,000 | | | | 20,940 | | | | 8,027 | | | | 7,157 | |
Projected interest on contractual obligations | | | 47,357 | | | | 10,580 | | | | 22,598 | | | | 10,627 | | | | 3,552 | |
| |
Total contractual obligations | | $ | 389,068 | | | $ | 50,933 | | | $ | 86,951 | | | $ | 199,358 | | | $ | 51,826 | |
| |
| | | | | | | | | | | | | | | | | | | | |
| (dollars in thousands) | | | |
| | | Payments due by period | |
| Other Commercial Commitments | | Total | | | Less than
1 year | | | 1-3 years | | | 4-5 years | | | More than
5 years | |
Standby letters of credit | | $ | 500 | | | $ | 500 | | | $ | — | | | $ | — | | | $ | — | |
Lease guarantees | | | 4,469 | | | | 1,929 | | | | 1,696 | | | | 844 | | | | — | |
Loan commitments | | | 325 | | | | 325 | | | | — | | | | — | | | | — | |
| |
Total commercial commitments | | $ | 5,294 | | | $ | 2,754 | | | $ | 1,696 | | | $ | 844 | | | $ | — | |
| |
42
We have incorporated additional disclosure regarding projected disbursements pursuant to self-insurance reserves maintained by our Insurance segment. These amounts are our estimate at this time based upon actuarial projections of the timing of anticipated disbursements and may not reflect actual amounts ultimately disbursed. Additionally, this disclosure assumes no additional reserves being established for future activity, which would replace claims that are closed.
The following items have been excluded from the foregoing tables:
| | · | | Projected funding obligations for the Unified Cash Balance Plan and ESPP ($7.4 million and $0.7 million, respectively, projected through fiscal 2013); and |
| | · | | Long-term liabilities for asset retirement obligations ($1.7 million at September 29, 2012). |
The items above have been excluded from the foregoing tables based on the following:
| | · | | Projected pension funding obligations—a reasonably reliable estimate of the timing and amount of future funding obligations cannot be determined beyond fiscal 2013 due to the uncertainty and variability of actuarial assumptions upon which the determination of such amounts is dependent. |
| | · | | Long-term liabilities for asset retirement obligations—a reasonably reliable estimate of the timing of future asset retirements and related incurrence of expense cannot be determined. |
Obligations under our Unified Cash Balance Plan and ESPP are disclosed in Note 11 of Notes to Consolidated Financial Statements in Item 8,“Financial Statements and Supplementary Data.”Asset retirement obligations are included in long-term liabilities, other in the accompanying consolidated balance sheets as of September 29, 2012 and October 1, 2011.
The projected interest component on our contractual obligations was estimated based on the prevailing or contractual interest rates for the respective obligations over the period of the agreements (see Note 5 of Notes to Consolidated Financial Statements in Item 8,“Financial Statements and Supplementary Data”).
In addition, we also have $0.5 million in standby letters of credit outstanding at September 29, 2012 to secure various bank, insurance and vendor obligations.
Outstanding Debt and Other Financing Arrangements
Our notes payable and scheduled maturities are summarized as follows:
| | | | | | | | |
| (dollars in thousands) | | | | | | |
| | | September 29,
2012 | | | October 1,
2011 | |
Senior secured notes | | $ | 104,843 | | | $ | 108,450 | |
Secured revolving credit agreements | | | 95,500 | | | | 121,300 | |
Obligations under capital leases | | | 19 | | | | 160 | |
| |
Total notes payable | | | 200,362 | | | | 229,910 | |
Less portion due within one year | | | 3,878 | | | | 3,748 | |
| |
| | $ | 196,484 | | | $ | 226,162 | |
| |
Senior Secured Notes
We had a total of $104.8 million and $108.5 million outstanding at September 29, 2012 and October 1, 2011, respectively, in senior secured notes to certain insurance companies and pension funds (referred to collectively as “John Hancock Life Insurance Company” or “Hancock”) under a note purchase agreement dated September 29, 1999 (as amended, the “Senior Note Agreement”) as amended and restated effective January 6, 2006 and further amended on November 3, 2009.
43
On June 29, 2012, we entered into the fourth amendment (the “Fourth Amendment”) to the Senior Note Agreement. The Fourth Amendment (1) amends the covenant on Indebtedness to Consolidated EBITDAP ratio (as defined) to allow for a ratio of 4.0 to 1 for the fiscal quarters ended June 30 and September 29, 2012, after which it is reduced to 3.75 to 1 for the fiscal quarters ended December 29, 2012 and March 30, 2013, 3.5 to 1 for the fiscal quarter ended June 29, 2013 and 3.25 to 1 for all fiscal quarters thereafter, (2) sets forth the increase in the interest rates to be charged based on the Indebtedness to Consolidated EBITDAP ratio (0.5% if the ratio is greater than 3.5 to 1 but less than 3.75 to 1, and 1.5% if the ratio is equal to or greater than 3.75 to 1), (3) amends the debt-to-capital covenant to permit a ratio of Consolidated Adjusted Indebtedness to Consolidated Adjusted Indebtedness plus Consolidated Tangible Net Worth (as defined) of no higher than 65% from the beginning of the third fiscal quarter of the Company’s fiscal 2012 through the end of the first fiscal quarter of the Company’s fiscal 2014, after which the ratio returns to 60%, and (4) adds an additional covenant providing that the Company’s Consolidated Lease Expense (as defined) for the fiscal quarter ended September 29, 2012 and subsequent fiscal quarters may not exceed $7.5 million for the quarter.
A copy of the Fourth Amendment was filed as Exhibit 10.2 to the Company’s Quarterly Report on Form 10-Q for the quarter ended June 30, 2012. The foregoing description of the Fourth Amendment does not purport to be complete and is qualified in its entirety by reference to the exhibit.
The Senior Note Agreement is comprised of three tranches of $46.0 million, $40.0 million and $25.0 million with interest rates of 6.421%, 7.157% and 6.82%, respectively. The $46.0 million and $40.0 million tranches mature on January 1, 2016 and the $25.0 million tranche matures on November 1, 2019. The Senior Note Agreement calls for interest only payments for the first five years of the term, and then starting on the 61st payment, approximately $0.8 million principal plus interest on $86.0 million of notes. At the January 1, 2016 maturity date, a balloon payment of $66.3 million is due. Additionally, at the November 1, 2019 maturity date, a balloon payment of $25.0 million is due. During fiscal 2011, principal payments of $2.5 million were made. During fiscal 2012, principal payments of $3.6 million were made.
The notes continue to be secured by certain of our personal and real property and contain customary covenants, default provisions (including acceleration of the debt in the event of an uncured default), and prepayment penalties similar to those included in the original note purchase agreement.
Secured Revolving Credit Agreement
On October 8, 2010, we entered into a Credit Agreement (the “Agreement”) with the lenders party thereto and Wells Fargo Bank, National Association, as Administrative Agent. The Agreement replaced our previous revolving credit agreement, dated as of December 5, 2006, with substantially the same parties, terms and conditions. See“Credit Facilities” for additional discussion.
We had $90.0 million and $108.3 million (Eurodollar and Base Rate Loans at a blended average rate of 2.25% and 1.89% per annum) outstanding under the Agreement at September 29, 2012 and October 1, 2011, respectively.
The Agreement and the Senior Note Agreement each contain customary representations, warranties, financial covenants and default and pre-payment provisions for these types of financing. Obligations under these credit agreements are senior to the rights of Members with respect to Required Deposits and subordinated notes. Both the Agreement and the Senior Note Agreement limit the incurrence of additional funded debt and the incurrence of liens except permitted liens. Examples of default conditions include the failure to pay an installment of principal or interest under the agreements, the making of false representations and warranties, and non-compliance with one or more financial covenants (minimum tangible net worth, fixed charge coverage ratio and funded debt to EBITDAP ratio). The Agreement and the Senior Note Agreement both limit distributions to shareholders (including the repurchase of shares) to designated permitted redemptions, and prohibit all distributions and payments when an event of default has occurred and is continuing. In the event we are not in compliance with the financial covenants of the Agreement and the Senior Note Agreement, the continued availability of loan funds or the terms upon which such loans would be available could be negatively impacted, and the impact to us could be material. As of September 29, 2012, we were in compliance with all applicable covenants in the Agreement and Senior Note Agreement. While we are currently in compliance with all required covenants and expect to remain in compliance, this does not guarantee that we will remain in compliance in future periods.
44
Member Financing Arrangement
On September 24, 2010, our wholly-owned finance subsidiary, GCC, entered into a Loan and Security Agreement (the “GCC Loan Agreement”), by and among GCC, the lenders signatory thereto, and California Bank & Trust, as Arranger and Administrative Agent (the “Agent”). The GCC Loan Agreement provides for a revolving credit facility with total commitments in the principal amount of $15 million. Borrowings under the GCC Loan Agreement may not exceed 80% of GCC’s eligible notes receivable (certain notes receivable restricted to 50%), less any reserves as may be established by the Agent. The GCC Loan Agreement matures on September 24, 2013, and the proceeds therefrom will be used to fund loans to our customers and for GCC’s general corporate purposes, including customary financing and operating activities.
The GCC Loan Agreement provides for revolving loans and term loans. At the election of GCC, revolving loans shall bear interest at either the LIBOR Rate or the Base Rate, and term loans shall bear interest at either the LIBOR/Swap Rate or the Base Rate, in each case plus an interest rate margin. The interest rate margin for LIBOR Rate loans is 3.00% per annum. The interest rate margin for Base Rate loans is 0.75% per annum. The interest rate margin for LIBOR/Swap Rate loans is 3.25% per annum. Notwithstanding the foregoing, all loans will be subject to daily interest rate floors. For term loans that bear interest at a LIBOR/Swap Rate, the daily minimum rate is based on a 5.75% per annum rate. For all other loans, the daily minimum rate is based on a 4.00% per annum rate. Undrawn portions of the commitments under the GCC Loan Agreement bear commitment fees at the rate of 0.25% per annum. GCC had revolving loan borrowings of $5.5 million and $13.0 million bearing an interest rate of 4.00% (3.25% prime plus 0.75% interest rate margin), outstanding at September 29, 2012 and October 1, 2011, respectively. GCC’s revolving loan borrowings are included under the caption“Secured revolving credit agreements” in the foregoing contractual obligations table. There were no term loan borrowings outstanding at September 29, 2012 and October 1, 2011. As of September 29, 2012, we were in compliance with all applicable covenants in the GCC Loan Agreement. While we are currently in compliance with all required covenants and expect to remain in compliance, this does not guarantee that we will remain in compliance in future periods.
Critical Accounting Policies and Estimates
The preparation of our consolidated financial statements in conformity with accounting principles generally accepted in the United States of America requires us to make estimates, assumptions and judgments that affect the amount of assets and liabilities reported in the consolidated financial statements, the disclosure of contingent assets and liabilities as of the date of the consolidated financial statements and reported amounts of revenues and expenses during the year. We believe our estimates and assumptions to be reasonable; however, future results could differ from those estimates under different assumptions or conditions.
We believe the following discussion addresses our most critical accounting policies, which are those that are most important to the portrayal of our financial condition and results and requires management’s most difficult, subjective and complex judgments, often as a result of the need to make estimates about the effect of matters that are inherently uncertain. Our critical accounting policies and important accounting practices are described below.
Insurance Reserves. Our insurance subsidiaries provide various types of insurance products to its Members including workers’ compensation, general liability and auto. Certain of our insurance subsidiaries are regulated by the State of California and are subject to the rules and regulations promulgated by the appropriate state regulatory agencies. There are many factors that contribute to the variability in estimating insurance loss reserves and related costs. Changes in state regulations may have a direct impact on workers’ compensation cost and reserve requirements. The cost of insurance and the sufficiency of loss reserves are also impacted by actuarial estimates based on a detailed analysis of health care cost trends, claims history, demographics and industry trends. As a result, the amount of the loss reserve and the related expense is significantly affected by these variables, as well as the periodic changes in state and federal law. We regularly assess the sufficiency of our loss reserves, which represent potential future claims and settlements to policyholders. Insurance reserves are recorded based on estimates and assumptions made by management using data available at the valuation date and are validated by third party actuaries to ensure such estimates are within acceptable ranges. Effective September 1, 2010 and continuing, for losses with injury dates on or after September 1, 2010, one of the Company’s insurance subsidiaries, Springfield Insurance Company, retains up to $250,000 per incident. Another insurance subsidiary,
45
Springfield Insurance Company, Limited, participates with outside carriers on losses that exceed $250,000 up to $2,000,000 per incident, with a maximum share of $137,500 for losses with injury dates on or after September 1, 2011 and $212,500 for losses with injury dates on or after September 1, 2010. Excess coverage for workers’ compensation claims above $2,000,000 is provided through a third party. We maintain appropriate reserves to cover anticipated payments up to the excess coverage amount. Insurance reserves maintained by our insurance subsidiaries and our reserve for projected payouts totaled approximately $51.1 million as of September 29, 2012 and $47.8 million as of October 1, 2011.
Allowance for Uncollectible Accounts and Notes Receivable. The preparation of our consolidated financial statements requires management to make estimates of the collectibility of its accounts and notes receivable. Our trade and short-term notes receivable, net was approximately $187.1 million and $191.7 million (including approximately $7.3 million and $6.0 million of short-term notes receivable) at September 29, 2012 and October 1, 2011, respectively. Our long-term notes receivable, net was approximately $16.7 million and $17.8 million at September 29, 2012 and October 1, 2011, respectively. We regularly analyze our accounts and notes receivable for changes in the credit-worthiness of customers, economic trends and other variables that may affect the adequacy of recorded reserves for potential bad debt. In determining the appropriate level of reserves to establish, we utilize several techniques including specific account identification, percentage of aged receivables and historical collection and write-off trends. In addition, we consider in our reserve calculations collateral such as Member shareholdings, cash deposits and personal guarantees. A bankruptcy or financial loss associated with a major customer could have a material adverse effect on our sales and operating results. Our allowance for doubtful accounts for trade and short-term notes receivable was approximately $2.9 million and $2.3 million at September 29, 2012 and October 1, 2011, respectively, and $0.9 million and $0.6 million for long-term notes receivable at September 29, 2012 and October 1, 2011, respectively.
Lease Loss Reserves. We have historically subleased store sites to independent retailers who meet certain credit requirements, at rates that are at least as high as the rent paid by us. Under the terms of the original lease agreements, we remain primarily liable for any financial commitments a retailer may no longer be able to satisfy. Should a retailer be unable to perform under the terms of the sublease, we would record a charge to earnings for the cost of the remaining term of the lease, less any expected sublease income, at net present value. We are also contingently liable for certain subleased facilities. Variables affecting the level of lease reserves recorded include the remaining lease term, vacancy rates of leased property, the state of the economy, property taxes, common area maintenance costs and the time required to sublease the property. Favorable changes in economic conditions, leading to shorter vacancy periods or higher than expected sublease rental commitments, could result in a reduction of the required reserves. Our lease reserves for all leased locations were approximately $0.8 million and $1.1 million as of September 29, 2012 and October 1, 2011, respectively.
Goodwill and Intangible Assets. Our operating results are highly dependent upon either maintaining or growing our distribution volume to our customers. Our top ten customers constituted approximately 46% of total net sales at September 29, 2012. A significant loss in membership or volume could adversely affect our operating results. The Merger with United and the Acquisition of AG resulted in the recording of goodwill, representing the excess of the purchase price over the fair value of the net assets of the acquired businesses. The carrying value of the goodwill was approximately $39.0 million at September 29, 2012. Although the sales volume and customer base of the combined entity remains strong, significant reductions in our distribution volume in the future could potentially impair the carrying amount of goodwill, necessitating a write-down of this asset.
We evaluate our goodwill and intangible assets for impairment pursuant to ASC Topic 350-20 “Intangibles— Goodwill and other—Goodwill” (“ASC Topic 350-20”) which provides that goodwill and other intangible assets with indefinite lives are not amortized but tested for impairment annually, or more frequently if circumstances indicate potential impairment. For the annual impairment test, entities have the option of first performing a qualitative assessment to test goodwill for impairment on a reporting-unit-by-reporting-unit basis. If after performing the qualitative assessment, an entity concludes that it is more likely than not that the fair value of a reporting unit is less than its carrying amount, the entity would perform the two-step goodwill impairment test described in ASC Topic 350-20. An entity that does not elect to use the qualitative analysis and proceeds directly to step one would not need to evaluate the qualitative factors as part of the annual impairment analysis. The two-step impairment test process consists of the following: (1) a reporting unit’s fair value is compared to its carrying value; if the fair value is less than its carrying value, impairment is indicated; and (2) if impairment is indicated in the first step, it is
46
measured by comparing the implied fair value of goodwill to its carrying value at the reporting unit level. In determining fair value, we use the discounted cash flow method, which assumes a certain growth rate projected over a period of time in the future, and this result is then discounted to net present value using our estimated cost of capital. We evaluate our goodwill for impairment at the end of the third quarter for each fiscal year. Accordingly, we tested our goodwill and noted no impairment for the fiscal quarter ended June 30, 2012. In addition to the annual impairment test required under ASC Topic 350-20, during fiscal 2012 and 2011, we assessed whether events or circumstances occurred that potentially indicate that the carrying amount of these assets may not be recoverable. We concluded that there were no such events or changes in circumstances during fiscal 2012 and 2011 and determined that the fair value of our reporting units was in excess of its carrying value as of September 29, 2012 and October 1, 2011. Consequently, no impairment charges were recorded in fiscal 2012 and 2011.
Long-lived Asset Groups. In accordance with ASC Topic 360-10 “Property, Plant and Equipment—Overall” (“ASC Topic 360-10”) we assess the impairment of long-lived asset groups when events or changes in circumstances indicate that the carrying value may not be recoverable. An asset group is the unit of accounting for a long-lived asset or assets to be held and used, which represents the lowest level for which identifiable cash flows are largely independent of the cash flows of other groups of assets and liabilities. Recoverability is measured by comparing the carrying amount of an asset group to expected future net cash flows generated by the asset group. If the carrying amount of an asset group exceeds its estimated future undiscounted cash flows, an impairment charge is recognized to the extent of the difference between fair value as determined by discounting cash flows at an appropriate discount rate and the carrying value. ASC Topic 360-10 requires companies to separately report discontinued operations, including components of an entity that either have been disposed of (by sale, abandonment or in a distribution to owners) or classified as held for sale. Asset groups to be disposed of are reported at the lower of the carrying amount or fair value less costs to sell.
Factors that we consider important which could individually or in combination trigger an impairment review include the following:
| | · | | Significant underperformance relative to expected historical or projected future operating results; |
| | · | | Significant changes in our business strategies, legal factors and/or negative industry or economic trend; |
| | · | | Significant decreases in the market price of the long-lived asset group; |
| | · | | Significant adverse change in the extent or manner in which a long-lived asset group is being used or in its physical condition; and |
| | · | | Expectation that, more likely than not, a long-lived asset group will be sold or otherwise disposed of significantly before the end of its previously estimated useful life. |
If we determine that the carrying value of long-lived asset groups may not be recoverable based upon the existence of one or more of the above indicators of impairment, we will measure any impairment based on a projected discounted cash flow method using a discount rate commensurate with the risks associated with the estimated cash flows of the asset groups.
On a quarterly basis, we assess whether events or changes in circumstances occur that potentially indicate the carrying value of long-lived asset groups may not be recoverable. We concluded that there were no material events or significant changes in circumstances that led to impairment during fiscal 2012 and 2011.
Tax Valuation Allowances. We account for income taxes in accordance with ASC Topic 740, “Income Taxes” (“ASC Topic 740”), which requires that deferred tax assets and liabilities be recognized using enacted tax rates for the effect of temporary differences between the book and tax bases of recorded assets and liabilities. ASC Topic 740 also requires that deferred tax assets be reduced by a valuation allowance if it is more likely than not that some portion or all of the net deferred tax asset will not be realized. We had approximately $57.9 million and $46.0 million in net deferred tax assets at September 29, 2012 and October 1, 2011, respectively. We evaluated the available positive and negative evidence in assessing our ability to realize the benefits of the net deferred tax assets at September 29, 2012 and October 1, 2011 and concluded it is more likely than not that we do not require a tax valuation allowance. The net deferred tax assets should be realized through future operating results,
47
tax planning and the reversal of temporary differences. Of the net deferred tax assets, $5.2 million and $8.4 million are classified as current assets in deferred income taxes and $52.7 million and $37.6 million are included in other assets in the accompanying consolidated balance sheets (see Item 8,“Financial Statements and Supplementary Data”) as of September 29, 2012 and October 1, 2011, respectively.
Pension and Postretirement Benefit Plans. Our non-union employees participate in Company sponsored defined benefit pension and postretirement benefit plans. Certain eligible union and non-union employees participate in separate plans providing payouts for unused sick leave. Officers of the Company also participate in a Company sponsored ESPP, which provides supplemental post-termination retirement income based on each participant’s salary and years of service as an officer of the Company. We account for these benefit plans in accordance with ASC Topic 715, “Compensation—Retirement Benefits” and ASC Topic 712, “Compensation—Nonretirement Postemployment Benefits” and ASC Topic 715-20, “Compensation—Retirement Benefits—Defined Benefits Plans—General”, which require the Company to make actuarial assumptions that are used to calculate the carrying value of the related assets and liabilities and the amount of expenses to be recorded in our consolidated financial statements. Assumptions include the expected return on plan assets, discount rates, projected life expectancies of plan participants, anticipated salary increases and health care cost trends. The assumptions are regularly evaluated by management in consultation with outside actuaries. While we believe the underlying assumptions are appropriate, the carrying value of the related liabilities and the amount of expenses recorded in the consolidated financial statements could differ if other assumptions are used.
Pursuant to ASC Topic 715-20, “Compensation—Retirement Benefits—Defined Benefits Plans—General” (“ASC Topic 715-20”), the Company (1) recognizes the funded status of pension and other postretirement benefit plans on its balance sheet and (2) measures plan assets and obligations at the Company’s year-end balance sheet date.
We contribute to collectively-bargained, multi-employer defined benefit pension plans in accordance with the provisions of negotiated labor contracts. The amount of the Company’s contribution is determined according to provisions of collective bargaining agreements.
Vendor Funds. We receive funds from many of the vendors whose products we buy for resale to our Members. These vendor funds are provided to increase the sell-through of the related products. We receive funds for a variety of merchandising activities: placement of vendors’ products in the Members’ advertising; placement of vendors’ products in prominent locations in the Members’ stores; introduction of new products into our distribution system and Members’ stores; exclusivity rights in certain categories that have slower-turning products; and to compensate for temporary price reductions offered to customers on products held for sale at Members’ stores.
Vendor funds are reflected as a reduction of inventory costs or as an offset to cost incurred on behalf of the vendor for which we are being reimbursed in accordance with ASC Topic 605, “Revenue Recognition,” Amounts due from vendors upon achievement of certain milestones, such as minimum purchase volumes, are accrued prior to the achievement of the milestone if we believe it is probable the milestone will be achieved, and the amounts to be received are reasonably estimable.
We adhere to ASC Topic 605, “Revenue Recognition,” which requires manufacturers’ sales incentives offered directly to consumers that do not meet certain criteria to be reflected as a reduction of revenue in the financial statements of a reseller. Accordingly, certain discounts and allowances negotiated by us on behalf of our Members are classified as a reduction in cost of sales with a corresponding reduction in net sales. Vendor funds that offset costs incurred on behalf of the vendor are classified as a reduction in distribution, selling and administrative expenses.
Recently Adopted and Recently Issued Authoritative Accounting Guidance
See Note 1 of Notes to Consolidated Financial Statements in Item 8,“Financial Statements and Supplementary Data” for information regarding the Company’s adoption of new and recently issued authoritative accounting guidance.
48
Item 7A. QUANTITATIVE AND QUALITATIVE DISCLOSURES ABOUT MARKET RISK
The following discussion of the market risks we face contains forward-looking statements. Forward-looking statements are subject to risks and uncertainties. Actual results could differ materially from those discussed in the forward-looking statements.
We are subject to interest rate changes on certain of our notes payable under our credit agreements that may affect the fair value of the notes payable, as well as cash flow and earnings. Based on the notes payable outstanding at September 29, 2012 and the current market conditions, a one percent change in the applicable interest rates would impact our annual cash flow and pretax earnings by approximately $1.0 million. See Note 16 ofNotes to Consolidated Financial Statementsin Item 8,“Financial Statements and Supplementary Data” for additional discussion regarding the fair value of notes payable.
We are exposed to credit risk on accounts receivable through the ordinary course of business and we perform ongoing credit evaluations. Concentration of credit risk with respect to accounts receivable is limited due to the nature of our customer base (i.e., primarily Members). We currently believe our allowance for doubtful accounts to be sufficient to cover customer credit risks.
The majority of our investments are held by two of our insurance subsidiaries, and include obligations of U.S. government corporations and agencies, high quality investment grade corporate bonds, U.S. government treasury securities, U.S. state and municipal securities, and common equity securities. The investments held by our insurance subsidiaries, excluding the common equity securities, are generally not actively traded and are valued based upon inputs including quoted prices for identical or similar assets. Collectively, the estimated fair value or market value of these investments continued to exceed their cost during fiscal 2012.
Investments held by our Wholesale Distribution segment consist primarily of Western Family Holding Company (“Western Family”) common stock. Western Family is a private cooperative located in Oregon from which we purchase food and general merchandise products. Investments held by our other support businesses consist primarily of an investment by our wholly-owned finance subsidiary in National Consumer Cooperative Bank (“NCB”). NCB operates as a cooperative and therefore its borrowers are required to own its Class B common stock.
Life insurance and mutual fund assets with values tied to the equity markets are impacted by overall market conditions. In fiscal 2012, net earnings and net comprehensive earnings experienced an increase corresponding to the increase in life insurance and mutual fund assets, respectively.
49
Item 8. FINANCIAL STATEMENTS AND SUPPLEMENTARY DATA
Report of Independent Registered Public Accounting Firm
To the Shareholders and Board of Directors of
Unified Grocers, Inc.
We have audited the accompanying consolidated balance sheets of Unified Grocers, Inc. and subsidiaries (the “Company”) as of September 29, 2012 and October 1, 2011, and the related consolidated statements of earnings, comprehensive (loss) earnings, shareholders’ equity, and cash flows for each of the three years ended September 29, 2012, October 1, 2011 and October 2, 2010. Our audits also included the consolidated financial statement schedule listed in the index at Item 15(a)(2). These financial statements and the financial statement schedule are the responsibility of the Company’s management. Our responsibility is to express an opinion on these financial statements and the financial statement schedule based on our audits.
We conducted our audits in accordance with standards of the Public Company Accounting Oversight Board (United States). Those standards require that we plan and perform the audit to obtain reasonable assurance about whether the financial statements are free of material misstatement. The Company is not required to have, nor were we engaged to perform, an audit of its internal control over financial reporting. Our audits included consideration of internal control over financial reporting as a basis for designing audit procedures that are appropriate in the circumstances, but not for the purpose of expressing an opinion on the effectiveness of the Company’s internal control over financial reporting. Accordingly, we express no such opinion. An audit also includes examining, on a test basis, evidence supporting the amounts and disclosures in the financial statements, assessing the accounting principles used and significant estimates made by management, as well as evaluating the overall financial statement presentation. We believe that our audits provide a reasonable basis for our opinion.
In our opinion, such consolidated financial statements present fairly, in all material respects, the financial position of Unified Grocers, Inc. and subsidiaries as of September 29, 2012 and October 1, 2011, and the results of their operations and their cash flows for each of the three years ended September 29, 2012, October 1, 2011 and October 2, 2010, in conformity with accounting principles generally accepted in the United States of America. Also, in our opinion, such financial statement schedule, when considered in relation to the basic consolidated financial statements taken as a whole, presents fairly in all material respects the information set forth therein.
/s/ DELOITTE & TOUCHE LLP
Los Angeles, California
December 14, 2012
50
Unified Grocers, Inc. and Subsidiaries
Consolidated Balance Sheets
(dollars in thousands)
| | | | | | | | |
| | | September 29, 2012 | | | October 1, 2011 | |
Assets | | | | | | | | |
| | |
Current Assets: | | | | | | | | |
Cash and cash equivalents | | $ | 11,169 | | | $ | 5,117 | |
Accounts and current portion of notes receivable, net of allowances of $2,930 and $2,302 at September 29, 2012 and October 1, 2011, respectively | | | 187,126 | | | | 191,684 | |
Inventories | | | 247,267 | | | | 267,745 | |
Prepaid expenses and other current assets | | | 11,023 | | | | 9,118 | |
Deferred income taxes | | | 5,165 | | | | 8,445 | |
| |
Total current assets | | | 461,750 | | | | 482,109 | |
Properties and equipment, net | | | 176,338 | | | | 179,811 | |
Investments | | | 88,991 | | | | 88,599 | |
Notes receivable, less current portion and net of allowances of $877 and $581 at September 29, 2012 and October 1, 2011, respectively | | | 16,693 | | | | 17,809 | |
Goodwill | | | 38,997 | | | | 38,997 | |
Other assets, net | | | 138,206 | | | | 116,353 | |
| |
Total Assets | | $ | 920,975 | | | $ | 923,678 | |
| |
| | |
Liabilities and Shareholders’ Equity | | | | | | | | |
| | |
Current Liabilities: | | | | | | | | |
Accounts payable | | $ | 218,404 | | | $ | 209,886 | |
Accrued liabilities | | | 64,285 | | | | 62,047 | |
Current portion of notes payable | | | 3,878 | | | | 3,748 | |
Members’ deposits and declared patronage dividends | | | 12,109 | | | | 13,398 | |
| |
Total current liabilities | | | 298,676 | | | | 289,079 | |
Notes payable, less current portion | | | 196,484 | | | | 226,162 | |
Long-term liabilities, other | | | 263,411 | | | | 221,773 | |
Members’ and Non-Members’ deposits | | | 7,475 | | | | 5,959 | |
Commitments and contingencies | | | | | | | | |
| | |
Shareholders’ equity: | | | | | | | | |
Class A Shares: 500,000 shares authorized, 149,450 and 158,550 shares outstanding at September 29, 2012 and October 1, 2011, respectively | | | 27,922 | | | | 29,531 | |
Class B Shares: 2,000,000 shares authorized, 434,598 and 440,273 shares outstanding at September 29, 2012 and October 1, 2011, respectively | | | 78,411 | | | | 78,465 | |
Class E Shares: 2,000,000 shares authorized, 251,808 shares outstanding at September 29, 2012 and October 1, 2011 | | | 25,181 | | | | 25,181 | |
Retained earnings, after elimination of accumulated deficit of $26,976 effective September 28, 2002 – allocated | | | 77,365 | | | | 78,183 | |
Retained earnings – non-allocated | | | 6,864 | | | | 6,864 | |
| |
Total retained earnings | | | 84,229 | | | | 85,047 | |
Receivable from sale of Class A Shares to Members | | | (661 | ) | | | (1,179 | ) |
Accumulated other comprehensive loss | | | (60,153 | ) | | | (36,340 | ) |
| |
Total shareholders’ equity | | | 154,929 | | | | 180,705 | |
| |
Total Liabilities and Shareholders’ Equity | | $ | 920,975 | | | $ | 923,678 | |
| |
The accompanying notes are an integral part of these statements.
51
Unified Grocers, Inc. and Subsidiaries
Consolidated Statements of Earnings
(dollars in thousands)
| | | | | | | | | | | | |
| | | Fiscal Years Ended | |
| | | September 29,
2012 (52 weeks) | | | October 1,
2011 (52 weeks) | | | October 2,
2010 (52 weeks) | |
Net sales | | $ | 3,796,272 | | | $ | 3,847,775 | | | $ | 3,921,059 | |
Cost of sales | | | 3,476,615 | | | | 3,505,788 | | | | 3,566,220 | |
Distribution, selling and administrative expenses | | | 294,538 | | | | 304,554 | | | | 312,189 | |
| |
Operating income | | | 25,119 | | | | 37,433 | | | | 42,650 | |
Interest expense | | | (12,572 | ) | | | (12,342 | ) | | | (11,511 | ) |
| |
Earnings before patronage dividends and income taxes | | | 12,547 | | | | 25,091 | | | | 31,139 | |
Patronage dividends | | | (10,787 | ) | | | (12,431 | ) | | | (14,038 | ) |
| |
Earnings before income taxes | | | 1,760 | | | | 12,660 | | | | 17,101 | |
Income tax benefit (provision) | | | 193 | | | | (5,273 | ) | | | (6,123 | ) |
| |
Net earnings | | $ | 1,953 | | | $ | 7,387 | | | $ | 10,978 | |
| |
The accompanying notes are an integral part of these statements.
52
Unified Grocers, Inc. and Subsidiaries
Consolidated Statements of Comprehensive (Loss) Earnings
(dollars in thousands)
| | | | | | | | | | | | |
| | | Fiscal Years Ended | |
| | | September 29,
2012 (52 weeks) | | | October 1,
2011 (52 weeks) | | | October 2,
2010 (52 weeks) | |
Net earnings | | $ | 1,953 | | | $ | 7,387 | | | $ | 10,978 | |
| |
Other comprehensive (loss) earnings, net of income taxes: | | | | | | | | | | | | |
Unrealized net holding gain (loss) on investments, net of income tax expense (benefit) of $655, $(1,534) and $421 for fiscal year ended September 29, 2012, October 1, 2011 and October 2, 2010, respectively | | | 1,220 | | | | (2,747 | ) | | | 713 | |
Defined benefit pension plans and other postretirement benefit plans: Unrecognized prior service cost and loss arising during the period, net of income tax benefit of $11,812, $2,697 and $2,437 for fiscal year ended September 29, 2012, October 1, 2011 and October 2, 2010, respectively | | | (25,033 | ) | | | (5,906 | ) | | | (4,242 | ) |
| |
Comprehensive (loss) earnings | | $ | (21,860 | ) | | $ | (1,266 | ) | | $ | 7,449 | |
| |
The accompanying notes are an integral part of these statements.
53
Unified Grocers, Inc. and Subsidiaries
Consolidated Statements of Shareholders’ Equity
(dollars in thousands)
| | | | | | | | | | | | | | | | | | | | | | | | | | | | | | | | | | | | | | | | |
For the fiscal years ended September 29,
2012, October 1, 2011 and October 2,
2010 | | Class A | | | Class B | | | Class E | | | Retained
Earnings | | | Receivable
from sale
of Class A
Shares | | | Accumulated
Other
Comprehensive
Earnings (Loss) | | | Total | |
| | Shares | | | Amount | | | Shares | | | Amount | | | Shares | | | Amount | | | | | |
Balance, October 3, 2009 | | | 177,100 | | | $ | 32,670 | | | | 469,053 | | | $ | 81,774 | | | | 251,808 | | | $ | 25,181 | | | $ | 73,182 | | | ($ | 2,577 | ) | | ($ | 24,158 | ) | | $ | 186,072 | |
Class A Shares issued | | | 1,750 | | | | 508 | | | | | | | | | | | | | | | | | | | | | | | | | | | | | | | | 508 | |
Class A Shares redeemed | | | (10,500 | ) | | | (1,978 | ) | | | | | | | | | | | | | | | | | | | (1,024 | ) | | | | | | | | | | | (3,002 | ) |
Class B Shares redeemed | | | | | | | | | | | (17,339 | ) | | | (3,087 | ) | | | | | | | | | | | (1,303 | ) | | | | | | | | | | | (4,390 | ) |
Net earnings – allocated | | | | | | | | | | | | | | | | | | | | | | | | | | | 7,258 | | | | | | | | | | | | 7,258 | |
Net earnings – non-allocated | | | | | | | | | | | | | | | | | | | | | | | | | | | 3,720 | | | | | | | | | | | | 3,720 | |
Decrease in receivable due to payment for Class A Shares by members | | | | | | | | | | | | | | | | | | | | | | | | | | | | | | | 833 | | | | | | | | 833 | |
Net unrealized gain on appreciation of investments (net of deferred tax liability of $421) | | | | | | | | | | | | | | | | | | | | | | | | | | | | | | | | | | | 713 | | | | 713 | |
Defined benefit pension plans and other postretirement benefit plans: Net unrecognized prior service cost and loss arising during period (net of deferred tax asset of $2,437) | | | | | | | | | | | | | | | | | | | | | | | | | | | | | | | | | | | (4,242 | ) | | | (4,242 | ) |
| |
Balance, October 2, 2010 | | | 168,350 | | | | 31,200 | | | | 451,714 | | | | 78,687 | | | | 251,808 | | | | 25,181 | | | | 81,833 | | | | (1,744 | ) | | | (27,687 | ) | | | 187,470 | |
Class A Shares issued | | | 1,400 | | | | 426 | | | | | | | | | | | | | | | | | | | | | | | | | | | | | | | | 426 | |
Class A Shares redeemed | | | (11,200 | ) | | | (2,095 | ) | | | | | | | | | | | | | | | | | | | (1,275 | ) | | | | | | | | | | | (3,370 | ) |
Class B Shares issued | | | | | | | | | | | 10,864 | | | | 3,363 | | | | | | | | | | | | | | | | | | | | | | | | 3,363 | |
Class B Shares redeemed | | | | | | | | | | | (22,305 | ) | | | (3,585 | ) | | | | | | | | | | | (2,898 | ) | | | | | | | | | | | (6,483 | ) |
Net earnings – allocated | | | | | | | | | | | | | | | | | | | | | | | | | | | 4,243 | | | | | | | | | | | | 4,243 | |
Net earnings – non-allocated | | | | | | | | | | | | | | | | | | | | | | | | | | | 3,144 | | | | | | | | | | | | 3,144 | |
Decrease in receivable due to payment for Class A Shares by members | | | | | | | | | | | | | | | | | | | | | | | | | | | | | | | 565 | | | | | | | | 565 | |
Net unrealized loss on depreciation of investments (net of deferred tax asset of $1,534) | | | | | | | | | | | | | | | | | | | | | | | | | | | | | | | | | | | (2,747 | ) | | | (2,747 | ) |
Defined benefit pension plans and other postretirement benefit plans: Net unrecognized prior service cost and loss arising during period (net of deferred tax asset of $2,697) | | | | | | | | | | | | | | | | | | | | | | | | | | | | | | | | | | | (5,906 | ) | | | (5,906 | ) |
| |
Balance, October 1, 2011 | | | 158,550 | | | | 29,531 | | | | 440,273 | | | | 78,465 | | | | 251,808 | | | | 25,181 | | | | 85,047 | | | | (1,179 | ) | | | (36,340 | ) | | | 180,705 | |
Class A Shares issued | | | 1,400 | | | | 437 | | | | | | | | | | | | | | | | | | | | | | | | | | | | | | | | 437 | |
Class A Shares redeemed | | | (10,500 | ) | | | (2,046 | ) | | | | | | | | | | | | | | | | | | | (1,211 | ) | | | | | | | | | | | (3,257 | ) |
Class B Shares issued | | | | | | | | | | | 5,883 | | | | 1,852 | | | | | | | | | | | | | | | | | | | | | | | | 1,852 | |
Class B Shares redeemed | | | | | | | | | | | (11,558 | ) | | | (1,906 | ) | | | | | | | | | | | (1,560 | ) | | | | | | | | | | | (3,466 | ) |
Net earnings – allocated | | | | | | | | | | | | | | | | | | | | | | | | | | | 1,953 | | | | | | | | | | | | 1,953 | |
Decrease in receivable due to payment for Class A Shares by members | | | | | | | | | | | | | | | | | | | | | | | | | | | | | | | 518 | | | | | | | | 518 | |
Net unrealized gain on appreciation of investments (net of deferred tax liability of $655) | | | | | | | | | | | | | | | | | | | | | | | | | | | | | | | | | | | 1,220 | | | | 1,220 | |
Defined benefit pension plans and other postretirement benefit plans: Net unrecognized prior service cost and loss arising during period (net of deferred tax asset of $11,812) | | | | | | | | | | | | | | | | | | | | | | | | | | | | | | | | | | | (25,033 | ) | | | (25,033 | ) |
| |
Balance, September 29, 2012 | | | 149,450 | | | $ | 27,922 | | | | 434,598 | | | $ | 78,411 | | | | 251,808 | | | $ | 25,181 | | | $ | 84,229 | | | ($ | 661 | ) | | ($ | 60,153 | ) | | $ | 154,929 | |
| |
The accompanying notes are an integral part of these statements.
54
Unified Grocers, Inc. and Subsidiaries
Consolidated Statements of Cash Flows
(dollars in thousands)
| | | | | | | | | | | | |
| | | Fiscal Years Ended | |
| | | September 29,
2012 (52 weeks) | | | October 1, 2011 (52 weeks) | | | October 2,
2010 (52 weeks) | |
Cash flows from operating activities: | | | | | | | | | | | | |
Net earnings | | $ | 1,953 | | | $ | 7,387 | | | $ | 10,978 | |
Adjustments to reconcile net earnings to net cash provided by operating activities: | | | | | | | | | | | | |
Depreciation and amortization | | | 26,079 | | | | 23,239 | | | | 25,444 | |
Provision for doubtful accounts | | | 1,778 | | | | 390 | | | | 150 | |
(Gain) loss on sale of properties and equipment | | | (295 | ) | | | (307 | ) | | | 75 | |
Deferred income taxes | | | (672 | ) | | | (255 | ) | | | (7,131 | ) |
Pension contributions | | | (10,941 | ) | | | (12,858 | ) | | | (6,389 | ) |
(Increase) decrease in assets: | | | | | | | | | | | | |
Accounts receivable | | | 2,757 | | | | 11,712 | | | | (9,362 | ) |
Inventories | | | 20,478 | | | | (13,813 | ) | | | 4,015 | |
Prepaid expenses and other current assets | | | (1,905 | ) | | | 2,342 | | | | (407 | ) |
Increase (decrease) in liabilities: | | | | | | | | | | | | |
Accounts payable | | | 8,323 | | | | (1,157 | ) | | | (3,108 | ) |
Accrued liabilities | | | 678 | | | | (5,600 | ) | | | 1,953 | |
Long-term liabilities, other | | | 19,616 | | | | 13,822 | | | | 15,206 | |
| |
Net cash provided by operating activities | | | 67,849 | | | | 24,902 | | | | 31,424 | |
| |
Cash flows from investing activities: | | | | | | | | | | | | |
Purchases of properties and equipment | | | (12,799 | ) | | | (8,940 | ) | | | (7,773 | ) |
Purchases of securities and other investments | | | (56,722 | ) | | | (72,707 | ) | | | (37,355 | ) |
Proceeds from maturities or sales of securities and other investments | | | 58,521 | | | | 76,264 | | | | 29,654 | |
Origination of notes receivable | | | (4,732 | ) | | | (8,915 | ) | | | (5,751 | ) |
Collection of notes receivable | | | 5,871 | | | | 6,488 | | | | 4,590 | |
Proceeds from sales of properties and equipment | | | 454 | | | | 393 | | | | 73 | |
Increase in other assets | | | (18,590 | ) | | | (9,186 | ) | | | (12,493 | ) |
| |
Net cash utilized by investing activities | | | (27,997 | ) | | | (16,603 | ) | | | (29,055 | ) |
| |
Cash flows from financing activities: | | | | | | | | | | | | |
Net (repayments) borrowings under secured revolving credit agreements | | | (25,800 | ) | | | 5,000 | | | | (25,700 | ) |
Borrowings of notes payable | | | — | | | | — | | | | 25,000 | |
Repayments of notes payable | | | (3,748 | ) | | | (2,722 | ) | | | (1,138 | ) |
Payment of deferred financing fees | | | (563 | ) | | | (2,602 | ) | | | (354 | ) |
Decrease in Members’ deposits and declared patronage dividends | | | (1,289 | ) | | | (864 | ) | | | (2,194 | ) |
Increase (decrease) in Members and Non-Members’ deposits | | | 1,516 | | | | (2,396 | ) | | | 3,027 | |
Decrease in receivable from sale of Class A Shares to Members, net | | | 518 | | | | 565 | | | | 833 | |
Repurchase of shares from Members | | | (6,723 | ) | | | (9,853 | ) | | | (7,392 | ) |
Issuance of shares to Members | | | 2,289 | | | | 3,789 | | | | 508 | |
| |
Net cash utilized by financing activities | | | (33,800 | ) | | | (9,083 | ) | | | (7,410 | ) |
| |
Net increase (decrease) in cash and cash equivalents | | | 6,052 | | | | (784 | ) | | | (5,041 | ) |
Cash and cash equivalents at beginning of year | | | 5,117 | | | | 5,901 | | | | 10,942 | |
| |
Cash and cash equivalents at end of year | | $ | 11,169 | | | $ | 5,117 | | | $ | 5,901 | |
| |
Supplemental disclosure of cash flow information: | | | | | | | | | | | | |
Cash paid during the year for: | | | | | | | | | | | | |
Interest | | $ | 11,552 | | | $ | 11,540 | | | $ | 11,048 | |
Income taxes | | $ | 2,676 | | | $ | 3,335 | | | $ | 12,263 | |
| |
Supplemental disclosure of non-cash items: | | | | | | | | | | | | |
Capital leases | | $ | — | | | $ | — | | | $ | 68 | |
| |
The accompanying notes are an integral part of these statements.
55
Notes to Consolidated Financial Statements
Fiscal Years Ended September 29, 2012, October 1, 2011 and October 2, 2010
1. Basis of Presentation and Summary of Significant Accounting Policies
Nature of Business. Unified Grocers, Inc. (“Unified” or the “Company”) is a retailer-owned, grocery wholesale cooperative serving supermarket, specialty and convenience store operators located primarily in the western United States and the Pacific Rim. The Company’s customers range in size from single store operators to regional supermarket chains. The Company sells a wide variety of products typically found in supermarkets. The Company’s customers include its owners (“Members”) and non-owners (“Non-Members”). The Company sells products through Unified or through its specialty food subsidiary (Market Centre) and international sales subsidiary (Unified International, Inc.). The Company reports all product sales in its Wholesale Distribution segment. The Company also provides support services to its customers through the Wholesale Distribution segment, including promotional planning, retail technology, equipment purchasing services and real estate services, and through separate subsidiaries, including insurance and financing. Insurance activities are reported in Unified’s Insurance segment while finance activities are grouped within Unified’s All Other business activities. The availability of specific products and services may vary by geographic region. Members affiliated with directors of the Company purchase groceries and related products and services from the Company in the ordinary course of business pursuant to published terms or according to the provisions of individually negotiated supply agreements.
Principles of Consolidation. The consolidated financial statements include the accounts of the Company and all of its subsidiaries required to be consolidated in accordance with accounting principles generally accepted in the United States of America (“U.S. GAAP”) as established by the Financial Accounting Standards Board (“FASB”). The FASB Accounting Standards Codification (“ASC”) is the definitive U.S. GAAP for non-governmental entities in the United States. Intercompany accounts and transactions between the consolidated companies have been eliminated in consolidation.
Investments in companies in which Unified has significant influence, or ownership between 20% and 50% of the investee, are accounted for using the equity method. Under the equity method, the investment is originally recorded at cost and adjusted to recognize the Company’s share of net earnings or losses of the investee. The adjustment is limited to the extent of the Company’s investment in and advances to the investee and financial guarantees made on behalf of the investee.
Fiscal Year End. The Company’s fiscal year ends on the Saturday nearest September 30. Fiscal 2012, 2011 and 2010 each comprised 52 weeks.
Quasi-reorganization. On September 25, 2002, the Company’s Board of Directors (the “Board”) approved a plan to affect a quasi-reorganization effective September 28, 2002. A quasi-reorganization is an accounting procedure that eliminates an accumulated deficit in retained earnings and permits a company to proceed on much the same basis as if it had been legally reorganized. A quasi-reorganization involves adjusting a company’s assets and liabilities to their fair values. Any remaining deficit in retained earnings is then eliminated by a transfer of amounts from paid-in capital and capital stock, if necessary, giving a company a “fresh start” and a zero balance in retained earnings. Accordingly, the Company eliminated its accumulated deficit of $26.9 million in retained earnings effective September 28, 2002 as a result of the quasi-reorganization.
Use of Estimates. The preparation of the financial statements in accordance with U.S. GAAP requires management to make estimates and assumptions that affect the amounts reported in the consolidated financial statements and accompanying notes. On an ongoing basis, management evaluates its estimates. These estimates are based on historical experience and on various other factors that management believes to be reasonable under the circumstances, the results of which form the basis for making judgments about the carrying value of assets and liabilities that are not readily apparent from other sources. Actual results could differ from those estimates. These estimates and assumptions include, but are not limited to, assessing the following: the recoverability of accounts receivable, investments, goodwill and other intangible assets, and deferred tax assets; the benefits related to uncertain tax positions; assumptions related to pension and other postretirement benefit expenses; and estimated losses related to insurance claims.
56
Cash Equivalents. The Company considers all highly liquid debt investments with maturities of three months or less when purchased to be cash equivalents.
The Company’s banking arrangements allow the Company to fund outstanding checks when presented for payment to the financial institutions utilized by the Company for disbursements. This cash management practice frequently results in total issued checks exceeding available cash balances at a single financial institution. The Company’s policy is to record its cash disbursement accounts with a cash book overdraft in accounts payable. At September 29, 2012 and October 1, 2011, the Company had book overdrafts of $69.4 million and $48.0 million, respectively, classified in accounts payable and included in cash provided by operating activities.
Inventories. Inventories are valued at the lower of cost or market. Cost is determined on the first-in, first-out method. Inventory is primarily comprised of products available for sale.
Depreciation. Depreciation is computed using the straight-line method over the estimated useful lives of the assets, which range from 2 to 40 years as follows: buildings (10 – 40 years), computer equipment and software (3 – 4 years), machinery and equipment (2 – 10 years) and furniture and fixtures (5 – 10 years). Leasehold improvements and equipment under capital leases are amortized on a straight-line basis over the shorter of the remaining lease term or their estimated useful lives. Expenditures for replacements or major improvements are capitalized; expenditures for normal maintenance and repairs are charged to operations as incurred. Upon the sale or retirement of properties, the cost and accumulated depreciation are removed from the accounts, and any gain or loss is included in the results of operations.
Investments. Investments in certain fixed-income securities are classified as held to maturity securities based on the Company’s positive intent and ability to hold those securities to maturity. Held to maturity securities are carried at cost, adjusted for amortization of premiums and accretion of discounts to maturity. Equity securities and other fixed maturity securities are classified as investments available for sale. Unrealized gains and losses, net of taxes, on available for sale investments are recorded as a separate component of accumulated other comprehensive earnings (loss) unless impairment is determined to be other-than-temporary.
Equity securities that do not have readily determinable fair values are accounted for using the cost or equity methods of accounting. The Company reviews the carrying value of its cost and equity method investments for impairment each reporting period unless (i) the investment’s fair value has not been estimated for any purpose, including estimates of fair value used to satisfy other financial reporting requirements, and (ii) there are no impairment indicators present for the investment during the period under review which would indicate there has been an event or change in circumstances that could have a negative effect on the investment’s fair value.
When an impairment test demonstrates that the fair value of an investment is less than its carrying value, the Company’s management will determine whether the impairment is either temporary or other-than-temporary. Examples of factors which may be indicative of an other-than-temporary impairment include (i) the length of time and extent to which market value has been less than cost, (ii) the financial condition and near-term prospects of the issuer, and (iii) the intent and ability of the Company to retain its investment in the issuer for a period of time sufficient to allow for any anticipated recovery in market value.
If the decline in fair value is determined by management to be other-than-temporary, the carrying value of the investment is written down to its estimated fair value as of the balance sheet date of the reporting period in which the assessment is made. This fair value becomes the investment’s new carrying value, which is not changed for subsequent recoveries in fair value. Any recorded impairment write-down will be included in earnings as a realized loss in the period such write-down occurs.
Fair Value Measurements. The Company evaluates the fair value of its assets and liabilities in accordance with ASC Topic 820, “Fair Value Measurements and Disclosures” (“ASC Topic 820”) and ASC Topic 825, “Financial Instruments” (“ASC Topic 825”).
ASC Topic 820 establishes a hierarchy for evaluating assets and liabilities valued at fair value as follows:
| | · | | Level 1—Quoted prices (unadjusted) in active markets for identical assets or liabilities. |
| | · | | Level 2—Inputs other than quoted prices included in Level 1 that are either directly or indirectly observable. These inputs include quoted prices for similar assets or liabilities other than quoted prices in |
57
| | Level 1, quoted prices in markets that are not active, or other inputs that are observable or can be derived principally from or corroborated by observable market data for substantially the full term of the assets or liabilities. |
| | · | | Level 3—Unobservable inputs in which little or no market activity exists, therefore requiring an entity to develop its own assumptions about the assumptions that market participants would use in pricing. |
The Company records marketable securities at fair value in accordance with ASC Topic 320, “Investments—Debt and Equity Securities.” These assets are held by the Company’s Insurance segment. The Company’s Wholesale Distribution segment holds insurance contracts and mutual funds valued at fair value in support of certain employee benefits.
See Note 16“Fair Value of Financial Instruments”for further information.
Goodwill and Intangible Assets. Goodwill, arising from business combinations, represents the excess of the purchase price over the estimated fair value of net assets acquired. In accordance with the provisions of ASC Topic 350-20 “Intangibles—Goodwill and other—Goodwill” (“ASC Topic 350-20”), goodwill and intangible assets deemed to have indefinite lives are not amortized but are subject to annual impairment tests. Other intangible assets are amortized over their estimated useful lives. ASC Topic 350-20 requires that goodwill and certain intangible assets be assessed for impairment on an annual basis and between annual tests, when circumstances or events have occurred that may indicate a potential impairment, using fair value measurement techniques. For purposes of financial reporting and impairment testing in accordance with ASC Topic 350-20, the Company operates in two principal reporting segments, Wholesale Distribution and Insurance.
For the annual impairment test, entities have the option of first performing a qualitative assessment to test goodwill for impairment on a reporting-unit-by reporting-unit basis. If after performing the qualitative assessment, an entity concludes that it is more likely than not that the fair value of a reporting unit is less than its carrying amount, the entity would perform the two-step goodwill impairment test described in ASC Topic 350. An entity that does not elect to use the qualitative analysis and proceeds directly to step one would not need to evaluate the qualitative factors as part of the annual impairment analysis.
The two-step impairment test process consists of the following: In the first step, the estimated fair value of each reporting unit is compared to the carrying value of the respective reporting unit. If the estimated fair value exceeds the carrying value, the goodwill is considered not to be impaired and no additional steps are necessary. If the carrying value exceeds the estimated fair value, the second step of the impairment test is performed to determine the amount of impairment loss. The second step involves comparing the carrying amount of the reporting unit’s goodwill with its implied fair value. If the carrying amount of goodwill exceeds the respective reporting unit’s implied fair value, an impairment loss would be recognized in an amount equal to the excess.
The Company evaluates goodwill (reported entirely within the Wholesale Distribution segment) for impairment at the end of the third quarter of each fiscal year. In addition to the annual impairment test required under ASC Topic 350-20, during fiscal 2012 and 2011, the Company assessed whether events or circumstances occurred that potentially indicate that the carrying amount of these assets may not be recoverable. The Company concluded that there were no such events or changes in circumstances during fiscal 2012 and 2011 and determined that the fair value of the Company’s reporting units was in excess of its carrying value as of September 29, 2012 and October 1, 2011. Consequently, no impairment charges were recorded in fiscal 2012 and 2011.
58
Intangible assets, excluding goodwill, are included in other assets in the consolidated balance sheets. Intangible assets, other than goodwill and trademarks, are recorded at cost, less accumulated amortization. Amortization of intangible assets with finite lives is provided over their estimated useful lives ranging from 3 to 180 months on a straight-line or accelerated basis. As of September 29, 2012 and October 1, 2011, balances of intangible assets with finite lives, net of accumulated amortization, goodwill and trademarks were as follows:
| | | | | | | | | | | | | | | | |
| (dollars in thousands) | | | | | | | | | | | | |
| September 29, 2012 | | Remaining
Amortization
Period | | | Historical
Cost | | | Accumulated
Amortization | | | Net | |
Intangible assets subject to amortization: | | | | | | | | | | | | | | | | |
Customer contracts | | | 3-36 months | | | $ | 6,885 | | | $ | 3,846 | | | $ | 3,039 | |
Customer relationships | | | 180 months | | | | 7,180 | | | | 3,086 | | | | 4,094 | |
Goodwill and Intangible assets not subject to amortization: | | | | | | | | | | | | | | | | |
Goodwill | | | | | | | | | | | | | | $ | 38,977 | |
Trademarks | | | | | | | | | | | | | | | 3,010 | |
| | | | | | | | | | | | | | | | |
| (dollars in thousands) | | | | | | | | | | | | |
| October 1, 2011 | | Remaining
Amortization
Period | | | Historical
Cost | | | Accumulated
Amortization | | | Net | |
Intangible assets subject to amortization: | | | | | | | | | | | | | | | | |
Customer contracts | | | 3-48 months | | | $ | 4,916 | | | $ | 1,697 | | | $ | 3,219 | |
Customer relationships | | | 192 months | | | | 7,180 | | | | 2,537 | | | | 4,643 | |
Goodwill and Intangible assets not subject to amortization: | | | | | | | | | | | | | | | | |
Goodwill | | | | | | | | | | | | | | $ | 38,977 | |
Trademarks | | | | | | | | | | | | | | | 3,010 | |
Amortization expense for other intangible assets was $4.7 million, $3.2 million and $3.0 million for the fiscal years ended September 29, 2012, October 1, 2011 and October 2, 2010, respectively. Amortization expense for other intangible assets is estimated to be $2.4 million in fiscal 2013, $1.4 million in fiscal 2014, $0.7 million in fiscal 2015, $0.4 million in fiscal 2016, $0.4 million in fiscal 2017 and $1.8 million thereafter.
Capitalized Software Costs. The Company capitalizes costs associated with the development of software for internal use pursuant to ASC Topic 350-40 “Intangibles—Goodwill and Other—Internal use software” and amortizes the costs over a 3 to 5-year period. These costs were $11.7 million and $9.6 million (net of accumulated amortization of $42.3 million and $39.8 million) at September 29, 2012 and October 1, 2011, respectively, and are included in other assets in the consolidated balance sheets. Costs incurred in planning, training and post-implementation activities are expensed as incurred.
Long-Lived Asset Groups. The Company reviews long-lived asset groups for impairment whenever events or changes in circumstances indicate that the carrying amount of an asset may not be recoverable. An asset group is the unit of accounting for a long-lived asset or assets to be held and used, which represents the lowest level for which identifiable cash flows are largely independent of the cash flows of other groups of assets and liabilities. Recoverability of asset groups to be held and used is measured by a comparison of the carrying amount of an asset group to expected future cash flows generated by the asset group. If the carrying amount of an asset group exceeds its estimated undiscounted future cash flows, the carrying amount is compared to fair value and an impairment charge is recognized to the extent of the difference. On a quarterly basis, the Company assesses whether events or changes in circumstances have occurred that potentially indicate the carrying amount of long-lived asset groups may not be recoverable. The Company concluded that there were no material events or significant changes in circumstances that led to impairment during fiscal 2012 and 2011.
Lease and Loan Guarantees. The Company evaluates lease and loan guarantees pursuant to ASC Topic 460 “Guarantees” (“ASC Topic 460”).Guarantees meeting the characteristics described in the interpretation are initially recorded at fair value. The Company is contingently liable for certain leases guaranteed for certain Members (See Notes 7 and 17).
59
Income Taxes. Unified operates primarily as a grocery wholesaler serving independent supermarket operators. In addition, the Company has several wholly-owned subsidiaries providing support services to its customers. These services are provided on a non-patronage basis and any earnings from these activities are taxable. In addition, the Company conducts wholesale business with Non-Member customers on a non-patronage basis and such earnings are retained by the Company and are taxable. The earnings of the Company’s subsidiaries and the business conducted with Non-Member customers are collectively referred to as “Non-Patronage Business.” Otherwise, the Company principally operates as a non-exempt cooperative owned by the Members for income tax purposes. Earnings from business (other than Non-Patronage Business) conducted with its Members are distributed to its Members in the form of patronage dividends. This allows the Company to deduct, for federal and certain state income tax purposes, the patronage dividends paid to Members made in the form of qualified written notices of allocation based on their proportionate share of business done with the cooperative.
Income taxes are accounted for under the asset and liability method. Deferred tax assets and liabilities are recognized for the future tax consequences attributable to differences between the financial statement carrying amounts of existing assets and liabilities and their respective tax bases and operating loss and tax credit carry-forwards. Deferred tax assets and liabilities are measured using enacted tax rates expected to apply to taxable income in the years in which those temporary differences are expected to be recovered or settled. The Company’s ability to realize the deferred tax asset is assessed throughout the year and a valuation allowance is established accordingly.
Revenue Recognition. The Company recognizes revenue in accordance with U.S. GAAP and with Securities and Exchange Commission (“SEC”) issued Staff Accounting Bulletin Topic 13,“Revenue Recognition,” which clarifies certain existing accounting principles for the timing of revenue recognition and classification of revenues in the financial statements. Revenue is recognized when persuasive evidence of an arrangement exists, delivery has occurred, the price is fixed or determinable, and collectibility is reasonably assured. Revenue generated from the Company’s Wholesale Distribution segment is not recognized until title and risk of loss is transferred to the customer, which occur upon delivery of the products. Provisions for discounts, rebates to customers, and returns are provided for at the time the related sales are recorded, and are reflected as a reduction of sales. Service revenues are recognized when such services have been rendered.
Vendor Funds. The Company receives funds from many of the vendors whose products the Company buys for resale to its Members. These vendor funds are provided to increase the sell-through of the related products. The Company receives funds for a variety of merchandising activities: placement of vendors’ products in the Members’ advertising; placement of vendors’ products in prominent locations in the Members’ stores; introduction of new products into the Company’s distribution system and Members’ stores; exclusivity rights in certain categories that have slower-turning products; and to compensate for temporary price reductions offered to customers on products held for sale at Members’ stores.
Consideration received from the Company’s vendors is reflected as a reduction of inventory costs or as an offset to service costs incurred on behalf of the vendor for which the Company is being reimbursed. Amounts recorded as a reduction of inventory costs at the time of purchase are recognized in cost of sales upon the sale of the product and amounts received as reimbursement of specific incremental costs to sell the vendor’s products by the Company on behalf of the vendor are recognized as a reduction in distribution, selling and administrative expenses. Amounts due from vendors upon achievement of certain milestones, such as minimum purchase volumes, are accrued prior to the achievement of the milestone if the Company believes it is probable the milestone will be achieved, and the amounts to be received are reasonably estimable.
As the Company provides sales incentives to its customers, the Company adheres to ASC Topic 605, “RevenueRecognition,” which requires vendors’ (and resellers’) sales incentives, paid in the form of cash consideration to customers, to be reflected as a reduction of revenue in the financial statements of a reseller.
Shipping and Handling Costs. Costs for shipping and handling are included as a component of distribution, selling and administrative expenses. Shipping and handling costs were $232.5 million, $235.7 million and $235.3 million for the fiscal years ended September 29, 2012, October 1, 2011 and October 2, 2010, respectively.
60
Environmental Costs. The Company expenses, on a current basis, certain recurring costs incurred in complying with environmental regulations and remediating environmental pollution. The Company also reserves for certain non-recurring future costs required to remediate environmental pollution for which the Company is liable whenever, by diligent legal and technical investigation, the scope or extent of pollution has been determined, the Company’s contribution to the pollution has been ascertained, remedial measures have been specifically identified as practical and viable, and the cost of remediation and the Company’s proportionate share can be reasonably estimated.
Comprehensive Earnings (Loss). Comprehensive earnings (loss) are net earnings, plus certain other items that are recorded by the Company directly to accumulated other comprehensive earnings (loss), bypassing net earnings. The balance and current period change for each component of comprehensive earnings (loss), net of taxes, are summarized as follows:
| | | | | | | | |
| (dollars in thousands) | | | | | | |
| | | Net Unrealized Gain (Loss)
on Appreciation
(Depreciation) of Investments | | | Defined Benefit
Pension Plans and
Other Postretirement
Benefit Plans:
Unrecognized Prior
Service Cost and (Loss)
Gain Arising During the
Period | |
Balance, October 3, 2009 | | $ | 2,470 | | | $ | (26,628 | ) |
Current period change | | | 713 | | | | (4,242 | ) |
| |
Balance, October 2, 2010 | | | 3,183 | | | | (30,870 | ) |
Current period change | | | (2,747 | ) | | | (5,906 | ) |
| |
Balance, October 1, 2011 | | | 436 | | | | (36,776 | ) |
Current period change | | | 1,220 | | | | (25,033 | ) |
| |
Balance, September 29, 2012 | | $ | 1,656 | | | $ | (61,809 | ) |
| |
The following table indicates the benefit plans that comprise the adjustment to accumulated other comprehensive earnings (loss) as of September 29, 2012 for the impact of ASC Topic 715-20 “Compensation—Retirement Benefits—Defined Benefits Plans—General” (“ASC Topic 715-20”):
| | | | | | | | | | | | |
| (dollars in thousands) | | | | | | | | | |
| Description of Benefit Plan | | Pre-tax Adjustment for Impact
of ASC Topic 715-20
(charge)/credit | | | Deferred Tax Benefit
(Liability) | | | Adjustment for Impact
of ASC Topic 715-20, Net of
Taxes (charge)/credit | |
Cash Balance Plan | | $ | (87,818 | ) | | $ | 31,110 | | | $ | (56,708 | ) |
ESPP | | | (11,160 | ) | | | 3,942 | | | | (7,218 | ) |
Postretirement benefit plans | | | 4,583 | | | | (2,787 | ) | | | 1,796 | |
Postemployment benefit plans | | | 496 | | | | (175 | ) | | | 321 | |
| |
Total, September 29, 2012 | | $ | (93,899 | ) | | $ | 32,090 | | | $ | (61,809 | ) |
| |
The following table indicates the benefit plans that comprise the adjustment to accumulated other comprehensive earnings (loss) as of October 1, 2011 for the impact of ASC Topic 715-20 “Compensation—Retirement Benefits—Defined Benefits Plans—General” (“ASC Topic 715-20”):
| | | | | | | | | | | | |
| (dollars in thousands) | | | | | | | | | |
| Description of Benefit Plan | | Pre-tax Adjustment for Impact
of ASC Topic 715-20
(charge)/credit | | | Deferred Tax Benefit
(Liability) | | | Adjustment for Impact
of ASC Topic 715-20, Net of
Taxes (charge)/credit | |
Cash Balance Plan | | $ | (64,802 | ) | | $ | 23,547 | | | $ | (41,255 | ) |
ESPP | | | (7,870 | ) | | | 2,871 | | | | (4,999 | ) |
Postretirement benefit plans | | | 15,098 | | | | (5,950 | ) | | | 9,148 | |
Postemployment benefit plans | | | 520 | | | | (190 | ) | | | 330 | |
| |
Total, October 1, 2011 | | $ | (57,054 | ) | | $ | 20,278 | | | $ | (36,776 | ) |
| |
61
The following table indicates the benefit plans that comprise the adjustment to accumulated other comprehensive earnings (loss) as of October 2, 2010 for the impact of ASC Topic 715-20:
| | | | | | | | | | | | |
| (dollars in thousands) | | | | | | | | | |
| Description of Benefit Plan | | Pre-tax Adjustment for Impact
of ASC Topic 715-20
(charge)/credit | | | Deferred Tax Benefit
(Liability) | | | Adjustment for Impact
of ASC Topic 715-20, Net of
Taxes (charge)/credit | |
Cash Balance Plan | | $ | (50,202 | ) | | $ | 18,220 | | | $ | (31,982 | ) |
ESPP | | | (8,211 | ) | | | 2,996 | | | | (5,215 | ) |
Postretirement benefit plans | | | 9,566 | | | | (3,490 | ) | | | 6,076 | |
Postemployment benefit plans | | | 396 | | | | (145 | ) | | | 251 | |
| |
Total, October 2, 2010 | | $ | (48,451 | ) | | $ | 17,581 | | | $ | (30,870 | ) |
| |
The components of the change in net unrealized gains (losses) on investments, net of taxes, are as follows:
| | | | | | | | | | | | |
| (dollars in thousands) | | | | | | | | | |
| | | September 29,
2012 | | | October 1,
2011 | | | October 2,
2010 | |
Unrealized holding losses arising during the period | | $ | (12 | ) | | $ | (3,540 | ) | | $ | (107 | ) |
Reclassification adjustment for gains included in net earnings | | | 1,232 | | | | 793 | | | | 820 | |
| |
Net unrealized holding gains (losses) | | $ | 1,220 | | | $ | (2,747 | ) | | $ | 713 | |
| |
Reclassifications—The Company has modified its cash flow presentation to disclose net borrowing activities under secured revolving credit agreements as a separate line item under financing activities. The Company has conformed its presentation for fiscal 2011 and 2010 to be consistent with the current year’s presentation.
Recently Adopted and Recently Issued Authoritative Accounting Guidance
In September 2011, the FASB issued Accounting Standards Update (“ASU”) No. 2011-09,“Compensation—Retirement Benefits—Multiemployer Plans (Subtopic 220): Disclosures about an Employer’s Participation in a Multiemployer Plan” (“ASU No. 2011-09”). ASU No. 2011-09 creates greater transparency in financial reporting by requiring additional disclosures about an employer’s participation in a multiemployer pension plan and multiemployer other postretirement benefit plans. The additional disclosures will increase awareness about the commitments that an employer has made to a multiemployer pension plan and multiemployer other postretirement benefit plans and the potential future cash flow implications of an employer’s participation in the plans. ASU No. 2011-09 is effective for annual periods for fiscal years ending after December 15, 2011; however, disclosure requirements should be applied retrospectively for all prior periods presented. Early adoption is permitted. Accordingly, the Company adopted ASU No. 2011-09 for fiscal year end 2012. Other than enhanced disclosure, the adoption of ASU No. 2011-09 did not have an impact on the Company’s consolidated financial statements.
In June 2011, the FASB and the International Accounting Standards Board (“IASB”) issued ASU No. 2011-05,“Comprehensive Income (Topic 220): Presentation of Comprehensive Income” (“ASU No. 2011-05”). ASU No. 2011-05 addresses concerns about how other comprehensive income is reported under U.S. GAAP and International Financial Reporting Standards (“IFRSs”) and increases the prominence of other comprehensive income in the financial statements. ASU No. 2011-05 allows for the option of presenting either one continuous statement of net income and other comprehensive income or two consecutive statements. Further, an entity will be required to present on the face of the financial statements reclassification adjustments for items that are reclassified from other comprehensive income to net income in the statement(s) where the components of net income and the components of other comprehensive income are presented for both interim and annual periods. The standard does not change the items which must be reported in other comprehensive income, how such items are measured or when they must be reclassified to net income. ASU No. 2011-05 is effective for fiscal years, and interim periods within those years, beginning after December 15, 2011. Early adoption is permitted. In December 2011, the FASB issued ASU No. 2011-12,“Deferral of the Effective Date for Amendments to the Presentation of Reclassifications Out of Accumulated Other Comprehensive Income in ASU No. 2011-05” (“ASU No. 2011-12”). ASU No. 2011-12 indefinitely defers only the specific provision requiring companies to present reclassification adjustments out of accumulated other comprehensive income by component in both the statement where net income is presented and the statement where other comprehensive income is presented.
62
The Company will formally adopt ASU No. 2011-05 commencing in the first quarter of fiscal 2013, except for the requirement to present reclassification adjustments out of accumulated other comprehensive income by component, which has been indefinitely deferred by ASU No. 2011-12. However, since the Company currently presents the consolidated statements of earnings and the consolidated statements of comprehensive earnings as two consecutive statements, the Company does not expect the adoption of this portion of ASU No. 2011-05 to have an impact on the consolidated financial statements.
In May 2011, the FASB and the IASB issued ASU No. 2011-04,“Fair Value Measurement (Topic 820): Amendments to Achieve Common Fair Value Measurement and Disclosure Requirements in U.S. GAAP and IFRSs” (“ASU No. 2011-04”). ASU No. 2011-04 does not extend the use of fair value accounting, but provides guidance on how it should be applied where its use is already required or permitted by other standards within U.S. GAAP or IFRSs. The amendments in ASU No. 2011-04 change the wording used to describe many of the requirements in U.S. GAAP for measuring fair value and for disclosing information about fair value measurements. Amendments in ASU No. 2011-04 include those that: (1) clarify the FASB’s intent about the application of existing fair value measurement and disclosure requirements; and (2) change a particular principle or requirement for measuring fair value or for disclosing information about fair value measurements. For many of the requirements, the FASB does not intend for the amendments in ASU No. 2011-04 to result in a change in the application of the requirements in Topic 820. ASU No. 2011-04 is effective during interim and annual periods beginning after December 15, 2011. Accordingly, the Company adopted ASU No. 2011-04 commencing in the second quarter of fiscal 2012. The adoption of ASU No. 2011-04 did not have an impact on the Company’s consolidated financial statements.
In October 2010, the FASB issued ASU No. 2010-26,“Financial Services—Insurance (Topic 944): Accounting for Costs Associated with Acquiring or Renewing Insurance Contracts (a consensus of the FASB Emerging Issues Task Force)” (“ASU No. 2010-26”). ASU No. 2010-26 addresses the diversity in practice regarding the interpretation of which costs relating to the acquisition of new or renewal insurance contracts qualify for deferral. ASU No. 2010-26 is effective for fiscal years, and interim periods within those fiscal years, beginning after December 15, 2011. The amendments in ASU No. 2010-26 are to be applied prospectively upon adoption. Retrospective application to all prior periods presented upon the date of adoption also is permitted, but not required. Accordingly, the Company will adopt ASU No. 2010-26 commencing in the first quarter of fiscal 2013. The adoption of ASU No. 2010-26 is expected to have an insignificant impact on the Company’s consolidated financial statements.
In January 2010, the FASB issued ASU No. 2010-06,“Improving Disclosures About Fair Value Measurements”(“ASU No. 2010-06”), an amendment to ASC Topic 820. ASU No. 2010-06 amends ASC Topic 820 to add new requirements for: (1) disclosures about transfers of assets and liabilities measured at fair value into and out of Levels 1 and 2 of the fair value measurement hierarchy; and (2) separate disclosures on a gross basis about purchases, sales, issuances and settlements relating to Level 3 measurements. It also clarifies existing fair value disclosures about the level of disaggregation and about inputs and valuation techniques used to measure fair value. ASU No. 2010-06 also amends guidance on employers’ disclosures about postretirement benefit plan assets under ASC Topic 715,“Compensation—Retirement Benefits—Defined Benefits Plans—General—Disclosure,”to require that disclosures be provided by classes of assets instead of by major categories of assets. The guidance in ASU No. 2010-06 is effective for the first reporting period (including interim periods) beginning after December 15, 2009, except for the requirement to provide the Level 3 activity of purchases, sales, issuances and settlements on a gross basis, which is effective for fiscal years beginning after December 15, 2010, and for interim periods within those fiscal years. In the period of initial adoption, entities will not be required to provide the amended disclosures for any previous periods presented for comparative purposes. However, those disclosures are required for periods ending after initial adoption.
The Company adopted ASU No. 2010-06 in its second quarter of fiscal year end 2010, except for the requirement to provide separate disclosures about purchases, sales, issuances and settlements relating to Level 3 measurements, which the Company adopted in its first quarter of fiscal year end 2012. Since the Company continues to have no transfers into and out of Levels 1 and 2, the requirements of ASU No. 2010-06 did not have an impact on the Company’s consolidated financial statements. Similarly, since the Company does not own any Level 3 financial instruments, the adoption of this portion of ASU No. 2010-06 did not have an impact on the Company’s consolidated financial statements.
63
2. Properties and Equipment
Properties and equipment, stated at cost, consisted of the following:
| | | | | | | | |
| (dollars in thousands) | | | | | | |
| | | September 29,
2012 | | | October 1,
2011 | |
Land | | $ | 61,182 | | | $ | 59,678 | |
Buildings and leasehold improvements | | | 142,646 | | | | 138,015 | |
Equipment | | | 116,370 | | | | 111,975 | |
Equipment under capital leases | | | 524 | | | | 1,560 | |
| |
| | | 320,722 | | | | 311,228 | |
Less accumulated depreciation and amortization | | | 144,384 | | | | 131,417 | |
| |
| | $ | 176,338 | | | $ | 179,811 | |
| |
Consolidated depreciation and amortization expense related to properties was $16.3 million, $15.9 million and $19.1 million for the years ended September 29, 2012, October 1, 2011 and October 2, 2010, respectively.
Included in accumulated amortization at September 29, 2012 and October 1, 2011 is $0.4 million and $1.4 million, respectively, related to capital leases. Amortization expense related to capital leases aggregated $0.1 million, $0.1 million and $0.4 million for the years ended September 29, 2012, October 1, 2011 and October 2, 2010, respectively.
3. Investments
The amortized cost and fair value of investments are as follows:
| | | | | | | | | | | | | | | | |
| (dollars in thousands) | | | | | | | | | | | | |
| September 29, 2012 | | Amortized
Cost | | | Gross
Unrealized
Gains | | | Gross
Unrealized
Losses | | | Fair Value | |
Available for sale securities: | | | | | | | | | | | | | | | | |
Fixed maturity securities: | | | | | | | | | | | | | | | | |
U.S. Treasury securities and obligations of U.S. government corporations and agencies | | $ | 39,014 | | | $ | 958 | | | $ | (8 | ) | | $ | 39,964 | |
Municipal securities | | | 245 | | | | 13 | | | | — | | | | 258 | |
Corporate securities | | | 25,617 | | | | 761 | | | | (7 | ) | | | 26,371 | |
| |
Total fixed maturity securities | | | 64,876 | | | | 1,732 | | | | (15 | ) | | | 66,593 | |
Equity securities | | | 9,251 | | | | 273 | | | | (376 | ) | | | 9,148 | |
| |
Total available for sale securities | | $ | 74,127 | | | $ | 2,005 | | | $ | (391 | ) | | | 75,741 | |
| | | | | |
Common stock, at cost | | | | | | | | | | | | | | | 13,250 | |
| |
Total investments | | | | | | | | | | | | | | $ | 88,991 | |
| |
64
| | | | | | | | | | | | | | | | |
| (dollars in thousands) | | | | | | | | | | | | |
| October 1, 2011 | | Amortized
Cost | | | Gross
Unrealized
Gains | | | Gross
Unrealized
Losses | | | Fair Value | |
Available for sale securities: | | | | | | | | | | | | | | | | |
Fixed maturity securities: | | | | | | | | | | | | | | | | |
U.S. Treasury securities and obligations of U.S. government corporations and agencies | | $ | 38,239 | | | $ | 1,883 | | | $ | (29 | ) | | $ | 40,093 | |
Municipal securities | | | 870 | | | | 37 | | | | — | | | | 907 | |
Corporate securities | | | 24,954 | | | | 652 | | | | (166 | ) | | | 25,440 | |
| |
Total fixed maturity securities | | | 64,063 | | | | 2,572 | | | | (195 | ) | | | 66,440 | |
Equity securities | | | 10,110 | | | | — | | | | (1,453 | ) | | | 8,657 | |
| |
Total available for sale securities | | $ | 74,173 | | | $ | 2,572 | | | $ | (1,648 | ) | | | 75,097 | |
| | | | | |
Common stock, at cost | | | | | | | | | | | | | | | 13,502 | |
| |
Total investments | | | | | | | | | | | | | | $ | 88,599 | |
| |
During the fiscal years ended September 29, 2012 and October 1, 2011, the Company did not hold any trading or held-to-maturity securities.
The Company’s insurance subsidiaries invest a significant portion of premiums received in fixed maturity securities and equity securities to fund loss reserves. As a result, the Company’s insurance subsidiaries are subject to both credit and interest rate risk. Management has established guidelines and practices to limit the amount of credit risk through limitation on investments in non-investment grade securities. The Company assesses whether unrealized losses are other-than-temporary. The discussion and table that follow describe the Company’s securities that have unrealized losses.
Unrealized losses on the Company’s investments in fixed maturity securities were caused by interest rate increases rather than credit quality. Unrealized losses on the Company’s investments in equity securities were caused by market conditions deemed temporary by the Company. Because the Company’s insurance subsidiaries do not intend to sell, nor do they have or anticipate having a regulatory requirement to sell, these investments until recovery of fair value, which may be upon maturity, the Company does not consider these investments to be other-than-temporarily impaired at September 29, 2012.
The table below illustrates the length of time available for sale fixed maturity securities and equity securities, not deemed to be other-than-temporarily impaired, have been in a continuous unrealized loss position at September 29, 2012:
| | | | | | | | | | | | | | | | | | | | | | | | |
| (dollars in thousands) | | | | | | | | | | | | | | | | | | |
| | | Less than 12 Months | | | 12 Months or Greater | | | Total | |
| Description of Securities | | Fair Value | | | Unrealized
Losses | | | Fair Value | | | Unrealized
Losses | | | Fair Value | | | Unrealized
Losses | |
U.S. Treasury securities and obligations of U.S. government corporations and agencies | | $ | 2,643 | | | $ | 8 | | | $ | — | | | $ | — | | | $ | 2,643 | | | $ | 8 | |
Corporate debt securities | | | 677 | | | | 7 | | | | — | | | | — | | | | 677 | | | | 7 | |
Equity securities | | | 3,164 | | | | 54 | | | | 1,607 | | | | 322 | | | | 4,771 | | | | 376 | |
| |
Total investments | | $ | 6,484 | | | $ | 69 | | | $ | 1,607 | | | $ | 322 | | | $ | 8,091 | | | $ | 391 | |
| |
65
The table below illustrates the length of time available for sale fixed maturity securities and equity securities, not deemed to be other-than-temporarily impaired, have been in a continuous unrealized loss position at October 1, 2011:
| | | | | | | | | | | | | | | | | | | | | | | | |
| (dollars in thousands) | | | | | | | | | | | | | | | |
| | | Less than 12 Months | | | 12 Months or Greater | | | Total | |
| Description of Securities | | Fair Value | | | Unrealized
Losses | | | Fair Value | | | Unrealized
Losses | | | Fair Value | | | Unrealized
Losses | |
U.S. Treasury securities and obligations of U.S. government corporations and agencies | | $ | 5,957 | | | $ | 29 | | | $ | — | | | $ | — | | | $ | 5,957 | | | $ | 29 | |
Corporate debt securities | | | 10,642 | | | | 166 | | | | — | | | | — | | | | 10,642 | | | | 166 | |
Equity securities | | | 8,657 | | | | 1,453 | | | | — | | | | — | | | | 8,657 | | | | 1,453 | |
| |
Total investments | | $ | 25,256 | | | $ | 1,648 | | | $ | — | | | $ | — | | | $ | 25,256 | | | $ | 1,648 | |
| |
Available for sale fixed maturity securities are due as follows:
| | | | | | | | |
| (dollars in thousands) | | | | | | |
| September 29, 2012 | | Amortized
Cost | | | Fair Value | |
Due in one year or less | | $ | 1,944 | | | $ | 1,964 | |
Due after one year through five years | | | 27,000 | | | | 27,694 | |
Due after five years through ten years | | | 15,893 | | | | 16,430 | |
Due after ten years | | | 20,039 | | | | 20,505 | |
| |
| | $ | 64,876 | | | $ | 66,593 | |
| |
Expected maturities will differ from contractual maturities because borrowers may have the right to call or prepay obligations with or without call or prepayment penalties. Corporate mortgage-backed securities are shown as being due at their average expected maturity dates.
Amounts reported as “due in one year or less” are included in long-term investments, as the Company’s insurance subsidiaries are required to maintain investments in support of regulatory deposit requirements. Hence, investments with maturities less than one year maintained in support of this long-term commitment are generally sold to repurchase investments with longer maturities. As these investments continue to support a long-term commitment obligation related to insurance reserves, the Company classifies such amounts as long-term. At September 29, 2012 and October 1, 2011, the long-term portion of the related insurance reserves of $36.1 million and $33.8 million, respectively, are included in long-term liabilities, other in the consolidated balance sheets.
Investments carried at fair values of $45.6 million and $42.4 million at September 29, 2012 and October 1, 2011 (which include $0.3 million and $0.5 million recorded in cash and cash equivalents), respectively, are maintained in support of regulatory deposit requirements ($40.9 million and $38.8 million in direct deposit of securities at September 29, 2012 and October 1, 2011, respectively) in compliance with statutory regulations. Investments with fair values of $7.3 million at both September 29, 2012 and October 1, 2011 (which include $0.1 million recorded in cash and cash equivalents) are on deposit with regulatory authorities in compliance with statutory regulations. Investments with fair values of $0.9 million at both September 29, 2012 and October 1, 2011 (which include zero recorded in cash and cash equivalents) are on deposit in compliance with collateral requirements on reinsurance arrangements.
66
Net investment income, which is included in net sales, is summarized as follows:
| | | | | | | | | | | | |
| (dollars in thousands) | |
| | | Fiscal Years Ended | |
| | | September 29,
2012 | | | October 1,
2011 | | | October 2,
2010 | |
Fixed maturity securities | | $ | 3,926 | | | $ | 4,515 | | | $ | 6,202 | |
Equity securities | | | 529 | | | | 1,562 | | | | 395 | |
Cash and cash equivalents | | | 2 | | | | 2 | | | | 1 | |
| |
| | | 4,457 | | | | 6,079 | | | | 6,598 | |
Less investment expenses | | | 294 | | | | 297 | | | | 287 | |
| |
| | $ | 4,163 | | | $ | 5,782 | | | $ | 6,311 | |
| |
Equity investments held by the Company that do not have readily determinable fair values are accounted for using the cost or equity methods of accounting. The Company evaluated its equity investments for impairment as of September 29, 2012 and October 1, 2011, and the Company did not consider any of these equity investments to be impaired.
The Company held investments in Western Family Holding Company (“Western Family”) common stock of $9.2 million and $9.4 million at September 29, 2012 and October 1, 2011, respectively. Western Family is a private cooperative located in Oregon from which the Company purchases food and general merchandise products. The investment represents approximately an 18% and a 20% ownership interest at September 29, 2012 and October 1, 2011, respectively. The Company’s ownership percentage in Western Family is based, in part, on the volume of purchases transacted with Western Family. During fiscal 2012, the Company received a return of invested capital in the amount of $0.2 million resulting from Western Family’s recalculation of its members’ ownership percentage in the cooperative based on purchase volume. The investment is accounted for using the equity method of accounting.
The Company’s wholly-owned finance subsidiary, Grocers Capital Company (“GCC”), has an investment in National Consumer Cooperative Bank (“NCB”), which operates as a cooperative and therefore its borrowers are required to own its Class B common stock. The investment in the Class B common stock of NCB, accounted for using the cost method of accounting, aggregated $4.1 million at both September 29, 2012 and October 1, 2011. The Company did not recognize dividend income from NCB in fiscal years 2012, 2011 or 2010.
4. Accrued Liabilities
Accrued liabilities are summarized as follows:
| | | | | | | | |
| (dollars in thousands) | | | | | | |
| | | September 29,
2012 | | | October 1,
2011 | |
Insurance loss reserves and other insurance liabilities | | $ | 23,626 | | | $ | 21,464 | |
Accrued wages, current portion of retirement benefits and related taxes | | | 23,810 | | | | 28,864 | |
Accrued income and other taxes payable | | | 5,402 | | | | 2,986 | |
Accrued promotional liabilities | | | 3,882 | | | | 2,977 | |
Other accrued liabilities | | | 7,565 | | | | 5,756 | |
| |
| | $ | 64,285 | | �� | $ | 62,047 | |
| |
67
5. Notes Payable
The Company’s notes payable and scheduled maturities are summarized as follows:
| | | | | | | | |
| (dollars in thousands) | | | | | | |
| | | September 29, 2012 | | | October 1, 2011 | |
Senior secured notes | | $ | 104,843 | | | $ | 108,450 | |
Secured revolving credit agreements | | | 95,500 | | | | 121,300 | |
Obligations under capital leases | | | 19 | | | | 160 | |
| |
Total notes payable | | | 200,362 | | | | 229,910 | |
Less portion due within one year | | | 3,878 | | | | 3,748 | |
| |
| | $ | 196,484 | | | $ | 226,162 | |
| |
Maturities of notes payable as of September 29, 2012 are:
| | | | |
| (dollars in thousands) | | | |
| Fiscal year | | | |
2013 | | $ | 3,878 | |
2014 | | | 4,127 | |
2015 | | | 4,416 | |
2016 | | | 162,941 | |
2017 | | | — | |
Thereafter | | | 25,000 | |
| |
| | $ | 200,362 | |
| |
Senior Secured Notes
The Company had a total of $104.8 million and $108.5 million outstanding at September 29, 2012 and October 1, 2011, respectively, in senior secured notes to certain insurance companies and pension funds (referred to collectively as “John Hancock Life Insurance Company” or “Hancock”) under a note purchase agreement dated September 29, 1999 (as amended, the “Senior Note Agreement”) as amended and restated effective January 6, 2006 and further amended on November 3, 2009.
On June 29, 2012, we entered into the fourth amendment (the “Fourth Amendment”) to the Senior Note Agreement. The Fourth Amendment (1) amends the covenant on Indebtedness to Consolidated EBITDAP ratio (as defined) to allow for a ratio of 4.0 to 1 for the fiscal quarters ended June 30 and September 29, 2012, after which it is reduced to 3.75 to 1 for the fiscal quarters ended December 29, 2012 and March 30, 2013, 3.5 to 1 for the fiscal quarter ended June 29, 2013 and 3.25 to 1 for all fiscal quarters thereafter, (2) sets forth the increase in the interest rates to be charged based on the Indebtedness to Consolidated EBITDAP ratio (0.5% if the ratio is greater than 3.5 to 1 but less than 3.75 to 1, and 1.5% if the ratio is equal to or greater than 3.75 to 1), (3) amends the debt-to-capital covenant to permit a ratio of Consolidated Adjusted Indebtedness to Consolidated Adjusted Indebtedness plus Consolidated Tangible Net Worth (as defined) of no higher than 65% from the beginning of the third fiscal quarter of the Company’s fiscal 2012 through the end of the first fiscal quarter of the Company’s fiscal 2014, after which the ratio returns to 60%, and (4) adds an additional covenant providing that the Company’s Consolidated Lease Expense (as defined) for the fiscal quarter ended September 29, 2012 and subsequent fiscal quarters may not exceed $7.5 million for the quarter.
The Senior Note Agreement is comprised of three tranches of $46.0 million, $40.0 million and $25.0 million with interest rates of 6.421%, 7.157% and 6.82%, respectively. The $46.0 million and $40.0 million tranches mature on January 1, 2016 and the $25.0 million tranche matures on November 1, 2019. The Senior Note Agreement calls for interest only payments for the first five years of the term, and then starting on the 61st payment, approximately $0.8 million principal plus interest on the $86.0 million of notes. At the January 1, 2016 maturity date, a balloon payment of $66.3 million is due. Additionally, at the November 1, 2019 maturity date, a balloon payment of $25.0 million is due. During fiscal 2011, principal payments of $2.5 million were made. During fiscal 2012, principal payments of $3.6 million were made.
68
The notes continue to be secured by certain of the Company’s personal and real property and contain customary covenants, default provisions (including acceleration of the debt in the event of an uncured default), and prepayment penalties similar to those included in the original note purchase agreement.
Secured Revolving Credit Agreement
The Company entered into a Credit Agreement (the “Agreement”) on October 8, 2010, among the Company, the lenders party thereto, and Wells Fargo Bank, National Association, as Administrative Agent. The Agreement replaced the Company’s previous revolving credit agreement, dated as of December 5, 2006, with substantially the same parties, terms and conditions.
The Agreement provides for a revolving credit facility with total commitments in the principal amount of $275 million. Borrowings under the Agreement may be made as revolving loans, swing line loans or letters of credit. The aggregate commitments under the Agreement may be increased from time to time, either through any of the existing lenders increasing its commitment or by means of the addition of new lenders, up to a maximum commitment of $400 million. While the consent of the lenders as a group is not required to any such increase, no individual lender is required to increase its own commitment to the Agreement. The Agreement expires on October 8, 2015, and refinances existing indebtedness and finances capital expenditures, working capital needs, certain acquisitions and general corporate purposes.
The Company’s obligations under the Agreement are guaranteed by certain of the Company’s subsidiaries, excluding its finance and insurance subsidiaries, and are secured by grants of security interests in the accounts receivable and inventory (subject to exceptions) of the Company and certain of its subsidiaries. The obligations are also senior to the rights of Members with respect to partially subordinated patrons’ deposit accounts.
The Agreement provides for loans which bear interest at either the Base Rate or the Eurodollar Rate, in each case plus a margin based upon the Consolidated Total Funded Debt (as defined in the Agreement) to earnings before interest, taxes, depreciation, amortization and patronage dividends (“EBITDAP”) ratio. Eurodollar Rate Loans will bear interest margins (and letters of credit issued under the Agreement will bear letter of credit fees) of between 1.00% per annum and 2.00% per annum, based upon the Consolidated Total Funded Debt to EBITDAP Ratio (“EBITDAP Ratio”) of the Company. Base Rate Loans will bear interest margins of between 0.00% per annum and 1.00% per annum, dependent upon the Company’s Consolidated Total Funded Debt to EBITDAP Ratio. Undrawn portions of the commitments under the Agreement bear commitment fees at rates of between 0.20% per annum and 0.30% per annum, also dependent upon the Company’s Consolidated Total Funded Debt to EBITDAP Ratio.
On June 19, 2012, we entered into the second amendment (the “Second Amendment”) of the Agreement. The Second Amendment raises the EBITDAP Ratio of the Company allowed by the financial covenants to be no higher than 4.0 to 1 for the fiscal quarters ended June 30 and September 29, 2012, after which it returns to 3.5 to 1, and sets forth a 0.5% increase in the interest rates to be charged if the ratio is greater than 3.5 to 1.
The Company had $90.0 million and $108.3 million (Eurodollar and Base Rate Loans at a blended average rate of 2.25% and 1.89% per annum) outstanding under the Agreement at September 29, 2012 and October 1, 2011, respectively.
The Agreement and the Senior Note Agreement each contain customary representations, warranties, financial covenants, default and pre-payment provisions for these types of financing. Obligations under these credit agreements are senior to the rights of Members with respect to Required Deposits and subordinated notes (see Notes 9 and 10). Both the Agreement and the Senior Note Agreement limit the incurrence of additional funded debt and the incurrence of liens except permitted liens. Examples of default conditions include the failure to pay an installment of principal or interest under the agreements, the making of false representations and warranties, and non-compliance with one or more financial covenants (minimum tangible net worth, fixed charge coverage ratio and funded debt to earnings before interest, income taxes, depreciation, amortization and patronage dividends, “EBITDAP”). The Agreement and the Senior Note Agreement both limit distributions to shareholders (including the repurchase of shares) to designated permitted redemptions, and prohibit all distributions and payments when an event of default has occurred and is continuing. In the event the Company is not in compliance with the financial covenants of the Agreement and the Senior Note Agreement, the continued availability of loan funds or the terms
69
upon which such loans would be available could be negatively impacted, and the impact to the Company could be material. As of September 29, 2012, the Company was in compliance with all applicable financial covenants of its Agreement and Senior Note Agreement.
Member Financing Arrangement
On September 24, 2010, the Company’s wholly-owned finance subsidiary, Grocers Capital Company (“GCC”), entered into a Loan and Security Agreement (the “GCC Loan Agreement”), by and among GCC, the lenders signatory thereto, and California Bank & Trust, as Arranger and Administrative Agent (the “Agent”). The GCC Loan Agreement provides for a revolving credit facility with total commitments in the principal amount of $15 million. Borrowings under the GCC Loan Agreement may not exceed 80% of GCC’s eligible notes receivable (certain notes receivable restricted to 50%), less any reserves as may be established by the Agent. The GCC Loan Agreement matures on September 24, 2013, and the proceeds therefrom will be used to fund loans to the Company’s customers and to be used for the general corporate purposes of GCC, including customary financing and operating activities. As of September 29, 2012, GCC was in compliance with all applicable financial covenants of the GCC Loan Agreement.
The GCC Loan Agreement provides for revolving loans and term loans. At the election of GCC, revolving loans shall bear interest at either the LIBOR Rate or the Base Rate, and term loans shall bear interest at either the LIBOR/Swap Rate or the Base Rate, in each case plus an interest rate margin. The interest rate margin for LIBOR Rate loans is 3.00% per annum. The interest rate margin for Base Rate loans is 0.75% per annum. The interest rate margin for LIBOR/Swap Rate loans is 3.25% per annum. Notwithstanding the foregoing, all loans will be subject to daily interest rate floors. For term loans that bear interest at a LIBOR/Swap Rate, the daily minimum rate is based on a 5.75% per annum rate. For all other loans, the daily minimum rate is based on a 4.00% per annum rate. Undrawn portions of the commitments under the GCC Loan Agreement bear commitment fees at the rate of 0.25% per annum. GCC had revolving loan borrowings of $5.5 million and $13.0 million bearing an interest rate of 4.00% (3.25% prime plus 0.75% interest rate margin), outstanding at September 29, 2012 and October 1, 2011, respectively. GCC’s revolving loan borrowings are included under the caption“Secured revolving credit agreements” in the foregoing notes payable table. There were no term loan borrowings outstanding at September 29, 2012 and October 1, 2011.
Standby Letters of Credit
The Company has $0.5 million and $1.5 million in standby letters of credit outstanding at September 29, 2012 and October 1, 2011, respectively, to secure various bank, insurance and vendor obligations.
6. Long-term Liabilities, Other
Long-term liabilities, other are summarized as follows:
| | | | | | | | |
| (dollars in thousands) | | | | | | |
| | | September 29,
2012 | | | October 1,
2011 | |
Pension and postretirement benefit liabilities | | $ | 205,821 | | | $ | 164,626 | |
Insurance loss reserves and other insurance liabilities | | | 36,124 | | | | 33,794 | |
Other long-term liabilities | | | 21,466 | | | | 23,353 | |
| |
| | $ | 263,411 | | | $ | 221,773 | |
| |
7. Leases
Capital and Operating Leases
The Company has entered into operating leases and non-cancelable capital leases for warehouse, transportation and data processing equipment.
70
The Company has also entered into operating leases for approximately twenty-four retail supermarkets. The majority of these locations are subleased to various Members of the Company. The operating leases and subleases are non-cancelable, renewable in certain instances, include purchase options that are not bargain purchase options, and require payment of real estate taxes, insurance and maintenance.
Rent expense for operating leases was $21.7 million, $22.7 million and $22.5 million for the fiscal years ended September 29, 2012, October 1, 2011 and October 2, 2010, respectively. Sublease rental income was $3.5 million, $3.8 million and $4.0 million for the fiscal years ended September 29, 2012, October 1, 2011 and October 2, 2010, respectively.
Minimum rentals on equipment under capital leases and properties leased by the Company, including properties subleased to third parties, as of September 29, 2012, are summarized as follows:
| | | | | | | | |
| (dollars in thousands) | | | | | | |
| Fiscal year | | Capital
Leases | | | Operating
Leases | |
2013 | | $ | 19 | | | $ | 21,475 | |
2014 | | | | | | | 18,554 | |
2015 | | | | | | | 16,316 | |
2016 | | | | | | | 11,718 | |
2017 | | | | | | | 6,045 | |
Thereafter | | | | | | | 16,117 | |
Total minimum lease payments | | | 19 | | | $ | 90,225 | |
Less: amount representing interest | | | — | | | | | |
Present value of net minimum lease payments | | | 19 | | | | | |
Less: current installments of obligations under capital leases | | | (19 | ) | | | | |
Obligations of capital leases excluding current installments | | $ | — | | | | | |
Future minimum sublease rental income on operating leases as of September 29, 2012 is summarized as follows:
| | | | |
| (dollars in thousands) | | | |
| Fiscal year | | Operating
Leases | |
2013 | | $ | 6,078 | |
2014 | | | 5,750 | |
2015 | | | 4,937 | |
2016 | | | 3,817 | |
2017 | | | 2,715 | |
Thereafter | | | 8,885 | |
| |
Total future minimum sublease income | | $ | 32,182 | |
| |
Lease Guarantees
At September 29, 2012, the Company was contingently liable with respect to three lease guarantees for certain Members with commitments expiring through 2017. The Company believes the locations underlying these leases are marketable and, accordingly, that it will be able to recover a substantial portion of the guaranteed amounts in the event the Company is required to satisfy its obligations under the guarantees.
71
The Company’s guarantees of these leases as of September 29, 2012 are summarized in the table below.
| | | | |
| (dollars in thousands) | | | |
| Remaining Lease Term | | Guaranteed
Leases | |
Less than 1 year | | $ | 1,929 | |
1-3 years | | | 1,696 | |
4-5 years | | | 844 | |
More than 5 years | | | — | |
| |
Total lease guarantees | | $ | 4,469 | |
| |
In consideration of lease guarantees and subleases, the Company typically receives a monthly fee equal to 5% of the monthly rent under the lease guarantees and subleases. Obligations of Members to the Company, including lease guarantees, are generally supported by the Company’s right of offset, upon default, against the Members’ cash deposits and shareholdings, as well as in certain instances, personal guarantees and reimbursement and indemnification agreements.
Total lease guarantees, as disclosed above, include one lease guarantee entered into during fiscal 2004 with a Member. The guarantee consists of a ten-year term and as of September 29, 2012, the maximum potential amount of future payments that the Company could be required to make as a result of the Member’s non-payment of rent is approximately $0.5 million. Pursuant to ASC Topic 460-10, Unified recorded a liability in connection with this guarantee arrangement. This liability, which no longer has a material impact on the financial statements at September 29, 2012 and October 1, 2011, represents the premiums receivable from the Member as consideration for the guarantee, and is deemed to be the fair value of the lease guarantee. The Company does not believe, based on historical experience and information currently available, that it is probable that any amounts will be required to be paid under the guarantee arrangement.
8. Income Taxes
The significant components of income tax (benefit) expense are summarized as follows:
| | | | | | | | | | | | |
| (dollars in thousands) | | Fiscal Years Ended | |
| | | September 29,
2012 | | | October 1,
2011 | | | October 2,
2010 | |
Federal: | | | | | | | | | | | | |
Current | | $ | 501 | | | $ | 4,875 | | | $ | 10,244 | |
Deferred | | | (170 | ) | | | 167 | | | | (4,095 | ) |
| |
Total federal | | | 331 | | | | 5,042 | | | | 6,149 | |
| |
State: | | | | | | | | | | | | |
Current | | | (22 | ) | | | 653 | | | | 574 | |
Deferred | | | (502 | ) | | | (422 | ) | | | (600 | ) |
| |
Total state | | | (524 | ) | | | 231 | | | | (26 | ) |
| |
Income taxes | | $ | (193 | ) | | $ | 5,273 | | | $ | 6,123 | |
| |
72
The effects of temporary differences and other items that give rise to deferred tax assets and liabilities are presented below:
| | | | | | | | |
| (dollars in thousands) | | | | | | |
| | | September 29,
2012 | | | October 1,
2011 | |
Deferred tax assets: | | | | | | | | |
Accounts receivable | | $ | 1,635 | | | $ | 1,250 | |
Accrued benefits | | | 80,376 | | | | 69,101 | |
Lease reserves | | | 3,442 | | | | 3,451 | |
Insurance reserves | | | 3,822 | | | | 3,459 | |
Net operating loss carry forwards | | | 490 | | | | 684 | |
Non-qualified written notice of allocation | | | 12,883 | | | | 13,187 | |
Inventory reserve | | | 862 | | | | 667 | |
Credits | | | 2,441 | | | | 2,217 | |
Interest capitalization | | | 387 | | | | 427 | |
Deferred revenue | | | 82 | | | | 225 | |
Other | | | 1,740 | | | | 243 | |
| |
Total gross deferred tax assets | | $ | 108,160 | | | $ | 94,911 | |
| |
Deferred tax liabilities: | | | | | | | | |
Depreciation of properties and equipment | | $ | 40,633 | | | $ | 41,058 | |
Market value adjustment | | | 2,667 | | | | 2,117 | |
Capitalized software | | | 4,668 | | | | 3,878 | |
Deferred state taxes | | | 1,860 | | | | 1,452 | |
Other | | | 478 | | | | 363 | |
| |
Total gross deferred tax liabilities | | $ | 50,306 | | | $ | 48,868 | |
| |
Net deferred tax assets | | $ | 57,854 | | | $ | 46,043 | |
| |
The Company had net deferred tax assets of $57.9 million and $46.0 million, of which $5.2 million and $8.4 million are classified as deferred income taxes in current assets and $52.7 million and $37.6 million are included in other assets in the consolidated balance sheets as of September 29, 2012 and October 1, 2011, respectively.
A valuation allowance is required to be provided to reduce the deferred tax assets to a level which, more likely than not, will be realized. The Company’s net deferred tax assets of approximately $57.9 million and $46.0 million were not reduced by tax valuation allowances at September 29, 2012 and October 1, 2011, respectively. Management evaluated the available positive and negative evidence in determining the realizability of the net deferred tax assets at September 29, 2012 and October 1, 2011 and concluded it is more likely than not that the Company should realize its net deferred tax assets through future operating results, the reversal of taxable temporary differences, and tax planning.
The Company had federal net operating loss carryforwards of approximately $1.4 million and $2.0 million and no state net operating loss carryforwards as of the fiscal years ended September 29, 2012 and October 1, 2011, respectively. A portion of the federal net operating loss has not been utilized in the current year and is being carried forward due to certain limitations under Internal Revenue Code Section 382. The net operating losses expire in 2018 for federal income taxes.
73
The (benefit) provision for income taxes at the Company’s effective tax rate differed from the provision for income taxes at the federal statutory rate (34% in 2012 and 35% in 2011 and 2010) as follows:
| | | | | | | | | | | | |
| (dollars in thousands) | | | | | | | | | |
| | | Fiscal Years Ended | |
| | | September 29, 2012 | | | October 1, 2011 | | | October 2,
2010 | |
Federal income tax expense at the statutory rate | | $ | 598 | | | $ | 4,431 | | | $ | 5,986 | |
State income taxes, net of federal income tax benefit | | | (346 | ) | | | 150 | | | | (17 | ) |
Life insurance | | | (1,308 | ) | | | 544 | | | | (538 | ) |
Adjustment to prior year tax liabilities | | | (39 | ) | | | 26 | | | | 413 | |
Meals and entertainment | | | 183 | | | | 227 | | | | 189 | |
Change in statutory tax rate from prior year | | | 529 | | | | — | | | | — | |
Other, net | | | 190 | | | | (105 | ) | | | 90 | |
| |
(Benefit) provision for income taxes | | $ | (193 | ) | | $ | 5,273 | | | $ | 6,123 | |
| |
At September 29, 2012, management is currently unaware of any issues under review that could result in significant payments, accruals or material deviations from its recognized tax positions. The Company continues to recognize interest and penalties accrued related to unrecognized tax benefits and penalties within its provision for income taxes. The Company had no material interest and penalties accrued at September 29, 2012.
As of September 29, 2012, the Company is subject to income tax examinations for its U.S. federal income taxes for fiscal years 2008 and thereafter and for state and local income taxes for fiscal years 2007 and thereafter. The Company is currently under audit with state taxing authorities for an amended return for fiscal year 2006.
9. Patronage Dividends
Unified distributes patronage dividends to its Members based upon its patronage earnings during a fiscal year. Non-Member customers are not entitled to receive patronage dividends. The Board approves the payment of patronage dividends and the form of such payment for the Company’s three patronage earnings divisions: the Southern California Dairy Division, the Pacific Northwest Dairy Division and the Cooperative Division.
| | · | | Southern California Dairy Division: Patronage earnings attributable to the Southern California Dairy Division are produced from sales of products primarily manufactured at a milk and fruit drink bottling plant located in Los Angeles, California. Patronage dividends for this division are paid solely to Members who purchase dairy and other related products from the Southern California Dairy Division. |
| | · | | Pacific Northwest Dairy Division: Patronage earnings attributable to the Pacific Northwest Dairy Division are produced from sales of dairy products manufactured by third party suppliers located in Oregon. Patronage dividends for this division are paid solely to Members who purchase dairy products from the Pacific Northwest Dairy Division. |
| | · | | Cooperative Division: Patronage earnings attributable to the Cooperative Division are produced from all patronage activities of Unified other than the Southern California and Pacific Northwest Dairy Divisions regardless of geographic location. Patronage dividends for this division are paid based on the qualified patronage purchases of the following types of products: dry grocery, deli, health and beauty care, tobacco, general merchandise, frozen food, ice cream, meat, produce and bakery. |
74
The following table summarizes the patronage dividend earnings of Unified during the past three fiscal years.
| | | | | | | | | | | | |
| (dollars in thousands) | | | | | | | | | |
| Division | | 2012 | | | 2011 | | | 2010 | |
Cooperative | | $ | — | | | $ | 301 | | | $ | 407 | |
Southern California Dairy | | | 9,676 | | | | 10,710 | | | | 11,974 | |
Pacific Northwest Dairy | | | 1,111 | | | | 1,420 | | | | 1,657 | |
| |
Total | | $ | 10,787 | | | $ | 12,431 | | | $ | 14,038 | |
| |
For fiscal 2012, there were no Cooperative Division patronage earnings available for distribution.
For fiscal 2011 and fiscal 2010, respectively, patronage dividends in the Cooperative Division were distributed to Members as follows:
| | · | | The total patronage dividend was qualified and distributed in cash. Typically, Members who do not hold Class B Shares with a combined issuance value equal to the Class B Share Requirement must purchase additional Class B Shares from their Required Deposit in an amount sufficient to achieve the requirement (see Note 10,“Capital Shares—Classes of Shares—Class B Shares”). For those Members who otherwise would be required to purchase additional Class B Shares from cash in their deposit fund, the Board waived such requirement for fiscal 2010 only. |
The financial statements reflect patronage dividends earned by Members as of the fiscal year ended September 29, 2012.
Patronage dividends produced by the dairy divisions are paid quarterly and have historically been paid in cash.
10. Capital Shares
Member Requirements
Members of Unified are both owners and customers of the Company. A Member must (1) own 350 Class A Shares and a number of Class B Shares based upon the amount of such Member’s average weekly purchases of product from the Company, or as otherwise specified by the Board; (2) be of approved financial standing; (3) be engaged in selling grocery and related products at retail or wholesale; (4) purchase products from the Company in amounts and in a manner that is established by the Board; (5) make application in such form as is prescribed by the Company; and (6) be accepted as a Member by Board action.
Members of Unified are typically required to satisfy a minimum purchase requirement of $1 million in annual purchases from the Company. This requirement may be modified from time to time by the Board, having been most recently changed in April 2008 at the time of the purchase of certain assets and assumption of certain liabilities of Associated Grocers, Incorporated (“AG”) and its subsidiaries, a retailer-owned grocery cooperative headquartered in Seattle, Washington (the “Acquisition”). Members at the time of this change, or who were shareholders or customers of AG who became Members in connection with the AG Acquisition, remain subject to the earlier requirement of $5,000 per week in purchases from the Company. Exceptions to the minimum purchase requirements may be granted by the Board.
A customer that does not meet the requirements to be a Member, or does not desire to become a Member, may conduct business with the Company as a Non-Member. However, any customer that purchases more than $3 million of product from the Company annually is typically required to be a Member.
Ownership and Exchange of Shares
The Class A and Class B Shares are issued by Unified to its Members, and repurchased by the Company from its Members, a process referred to as the exchange of shares, in accordance with the Company’s share purchase requirements and at a price (the “Exchange Value Per Share”) based on a formula approved by the Board. The Exchange Value Per Share, as currently calculated, is equal to Book Value (as defined below) divided by the number
75
of Class A and Class B Shares outstanding at the end of the fiscal year, excluding shares tendered for redemption. “Book Value” is computed based on (1) the fiscal year end balance of Class A and Class B Shares, excluding the redemption value of unredeemed shares tendered for redemption, plus (2) retained earnings, excluding non-allocated retained earnings. Prior to February 23, 2010, the Company computed the Exchange Value Per Share of the Class A and Class B Shares as Book Value divided by the number of Class A and Class B Shares outstanding at the end of the fiscal year. For purposes of such earlier calculation, “Book Value” was computed based on the sum of the fiscal year end balances of Class A and Class B Shares, plus retained earnings. At the Company’s annual meeting of shareholders held on February 23, 2010, the shareholders authorized the Board, in its sole discretion, to retain a portion of the Company’s annual earnings from its non-patronage business and not allocate those earnings to the Exchange Value Per Share. Additionally, the Company modified its Exchange Value Per Share computation, effective for fiscal year end 2010, to also exclude from Book Value non-allocated retained earnings (loss) and the redemption value of unredeemed shares tendered for redemption, and to exclude the number of shares tendered for redemption from the outstanding number of Class A and Class B Shares.
Exchange Value Per Share does not necessarily reflect the amount for which the net assets of the Company could be sold or the dollar amount that would be required to replace them. See Part II, Item 5. “MARKET FOR REGISTRANT’S COMMON EQUITY, RELATED STOCKHOLDER MATTERS AND ISSUER PURCHASES OF EQUITY SECURITIES” and Part II, Item 6.“SELECTED FINANCIAL DATA” for additional information on the calculation of the Exchange Value Per Share. See“OFFERING OF CLASS A, CLASS B AND CLASS E SHARES—Exchange Value Per Share” in the Company’s Amendment No. 2 to Registration Statement on Form S-1 filed on April 19, 2012 (unaudited), with respect to the Company’s offering of Class A, Class B and Class E Shares for further information.
The Non-Allocated Earnings Program authorizes the Board, in its sole discretion, to retain a portion of the Company’s future annual earnings from its non-patronage business and not allocate those earnings to the Exchange Value Per Share. The Company retained zero and $3.1 million, respectively, of fiscal 2012 and fiscal 2011 non-patronage earnings under the Non-Allocated Earnings Program. The amount retained is not included in computing the issuance and redemption prices of the Class A or Class B Shares. In addition, the Non-Allocated Earnings Program grants the Board the authority to reallocate the non-allocated earnings back to the Exchange Value Per Share. The Non-Allocated Earnings Program authorizes the Board to establish a category of non-allocated equity, but does not restrict the uses of that non-allocated equity. The Board intends to use the non-allocated equity authorized by the Non-Allocated Earnings Program for the same general purposes as the Board uses the Company’s retained earnings, including support of the growth of its business, other than the payment of the redemption price of Class A and Class B Shares.
The Class C and Class E Shares are exchanged with the Company’s directors and Members, respectively, at a fixed stated value.
Classes of Shares
Class A Shares
The Company’s Bylaws require that each Member own 350 Class A Shares, though in certain instances the Board may accept an affiliate of a Member without such affiliate holding any Class A Shares where the owners of such affiliate are the same, or sufficiently the same, as those of the Member, and the Member already holds the required number of Class A Shares. Holders of Class A Shares are entitled to one vote per share on all matters to be voted upon by the shareholders, and the holders of the Class A Shares are entitled to elect 80% of our authorized number of directors. If a person holding Class A Shares ceases to be a Member, the Class A Shares held by such outgoing Member are subject to redemption. See “—Redemption of Class A, Class B and Class E Shares.”
Such persons or entities who from time to time may be accepted as new Members of Unified will be required to purchase or subscribe for the purchase of the number of Class A Shares in the manner set forth in the preceding paragraph. The price for these shares is the Exchange Value Per Share of the Company’s outstanding shares at the close of the fiscal year end prior to purchase. At September 29, 2012 and October 1, 2011, the Exchange Value Per Share was $316.11 and $312.31, respectively. Any subscription will require a minimum cash down payment with terms to be determined by the Board.
76
Class B Shares
The Company’s Bylaws require that each Member own such amount of Class B Shares as may be established by the Board. The holders of Class B Shares have the right to elect 20% of the Company’s authorized number of directors. Except as provided above or by California law, the holders of Class B Shares do not have any other voting rights. Any Class B Shares held by an outgoing Member or which are held by a Member in an amount in excess of that required by the Board are subject to redemption. See “—Redemption of Class A, Class B and Class E Shares.”
The Company’s Board currently requires each Member to hold Class B Shares having an issuance value equal to approximately twice the Member’s average weekly purchases from the Cooperative Division, except that as to meat and produce purchases the requirement is approximately one times the Member’s average weekly purchases from the Cooperative Division (the “Class B Share Requirement”). If purchases are not made weekly, the average weekly purchases are based on the number of weeks in which purchases were actually made. For purposes of determining whether a Member holds Class B Shares having an issuance value satisfying the Class B Share Requirement, the issuance value of each Class B Share held by the Member is deemed to be the Exchange Value Per Share in effect at the close of the fiscal year end prior to the issuance of such Class B Share.
One of the ways in which Members may acquire Class B Shares is through the Company’s payment of Cooperative Division patronage dividends at the end of the Company’s fiscal year. If a Member, at the time a patronage dividend is declared, does not satisfy its Class B Share Requirement, the Company may issue Class B Shares to such Member as a portion of the Cooperative Division patronage dividends paid. As Class B Shares are issued as part of a Member’s patronage dividend distribution, the issuance value of such Class B Shares add to the amount of Class B Shares held by such Member for purposes of satisfying the Class B Share Requirement.
The Class B Share Requirement is determined twice a year, at the end of the Company’s second and fourth fiscal quarters, based on a Member’s purchases from the Cooperative Division during the preceding four quarters. If at the end of the Company’s second fiscal quarter, after giving effect to the value of Class B Shares estimated to be issued as part of the next Cooperative Division patronage dividend, a Member does not hold Class B Shares with a combined issuance value equal to the required amount of Class B Shares, the Company will typically require the Member to make a subordinated deposit (a “Required Deposit”) which may, at the Company’s option, be paid over a 26-week period. If at the end of the Company’s fourth fiscal quarter, after accounting for the issuance of Class B Shares as part of the Cooperative Division patronage dividend distribution declared for such fiscal year after the first year as a Member, a Member does not hold Class B Shares with a combined issuance value equal to the required amount of Class B Shares, then additional Class B Shares must be purchased by the Member in an amount sufficient to satisfy the requirement. The additional Class B Shares may be paid for by the Company charging the Member’s deposit fund in an amount equal to the issuance value of the additional Class B Shares or by direct purchase by the Member, which may be paid over a 26-week period. For those Members who otherwise would have been required to purchase additional Class B Shares from cash in their deposit fund at the end of fiscal 2010, the Board waived such requirement only as to fiscal 2010. The Board may increase or otherwise change the Class B Share Requirement at its discretion.
In September 1999, we completed a merger (the “Merger”) with United Grocers, Inc. (“United”), a grocery cooperative headquartered in Milwaukie, Oregon. In October 2007, we purchased certain assets and assumed certain liabilities of AG and its subsidiaries. Certain Members, including former shareholders of United and AG, also may elect to satisfy their Class B Share Requirement with respect to stores owned at the time of admission as a Member solely from their patronage dividend distributions by electing to receive Class B Shares in lieu of 80% of the Cooperative Division qualified cash patronage dividends the Member otherwise would receive in the future until the Class B Share Requirement is satisfied. In order to make the election to satisfy their Class B Share Requirement solely from patronage dividend distributions, former shareholders of AG were required to enter into supply agreements with us. During the build-up of its Class B Share Requirement, such a Member is not required to provide a Required Deposit with respect to stores owned at the time of admission as a Member. Satisfaction of the Class B Share Requirement of such Members relating to new stores or growth in the sales of existing stores may not be satisfied solely from their patronage dividend distributions, but is subject to the same payment requirements that apply to other Members.
New Members typically must satisfy their Class B Share Requirement in one of two ways: (1) the purchase of Class B Shares at the time of their admission as a Member such that the required amount is held at that time; or (2) the acquisition of Class B Shares over a five-year period commencing at the start of the Company’s first fiscal year
77
after the Member’s admission, at the rate of 20% of the required amount per fiscal year, such that by the start of the Company’s sixth full fiscal year after the Member’s admission, the required amount is held. If a new Member elects to satisfy the Class B Share Requirement through the acquisition of shares over a five-year period, it is typically required to make a Required Deposit with the Company for the full required amount during the five-year build-up of the Class B Share Requirement. The Required Deposit may generally be paid either in full upon acceptance as a Member or 75% upon acceptance and the balance paid over a 26-week period.
Required Deposits for new stores, replacement stores or growth in the sales of existing stores can be paid either in full or with a 50% down payment and the balance paid over a 26-week period.
The Company may make modifications to the requirements as to the timing of the purchase of Class B Shares and the timing and amount of the Required Deposit on a case-by-case basis, based on the particular circumstances of a Member.
A reduced investment option in lieu of the standard Class B Share Requirement (“SBI”) described above is available if certain qualifications are met. A Member may apply for a reduced Class B Share requirement (“RBI”), which requires the Member to pay for its purchases electronically on the statement due date and demonstrate credit worthiness. The purpose of the RBI is to encourage Member growth by offering a reduced requirement if the qualifications are met and to provide a cap on the investment requirement at certain volume levels. The RBI is based on a sliding scale such that additional purchase volume marginally reduces the requirement as a percentage of purchase volume. Members who do not apply for the RBI remain on the SBI. However, once a Member has elected the RBI option, it must notify the Company in writing if it wishes to change its election. Generally, changes can only be made at the time of the second quarter recalculation of the Class B Share Requirement in March.
Class C Shares
Certain of the Company’s directors hold Class C Shares. Each of such directors purchased one Class C Share for its stated value. Class C Shares are non-voting director qualifying shares, with no rights as to dividends or other distributions, and share in liquidation at their stated value of $10 per share. There are 24 authorized Class C Shares, of which 15 were outstanding as of September 29, 2012 and October 1, 2011.
Class E Shares
Class E Shares were issued as a portion of the Cooperative Division patronage dividends in fiscal years 2003 through 2009, and may be issued as a portion of the Cooperative Division patronage dividends in future periods, as determined annually at the discretion of the Board. The Class E Shares have a stated value of $100 per share and, unless required by law, are non-voting equity securities. Ordinary dividends on Class E Shares may be declared and may be payable in unique circumstances solely at the discretion of the Board. Class E Shares are transferable only with the consent of the Company, which will normally be withheld except in connection with the transfer of a Member’s business to an existing or new Member for continuation of such business. Class E Shares become eligible for redemption ten years after their date of issuance. Pursuant to the Company’s redemption policy, Class E Shares will not be repurchased for ten years from their date of issuance unless approved by the Board or upon sale or liquidation of the Company. Thereafter, shares may be repurchased by the Company subject to the limitations of California General Corporation Law, credit agreements, the Articles of Incorporation and Bylaws, redemption policy and approval by the Board.
Redemption of Class A, Class B and Class E Shares
Unified’s Articles of Incorporation and Bylaws provide that the Board has the absolute discretion to repurchase, or not repurchase, any Class A, Class B or Class E Shares of any outgoing Member regardless of when the membership terminated, and any Class B Shares in excess of the Class B Share Requirement (“Excess Class B Shares”) held by a current Member, whether or not the shares have been tendered for repurchase and regardless of when the shares were tendered. The Board considers the redemption of eligible Class A Shares at each board meeting. All other shares eligible for redemption are considered by the Board on an annual basis, usually in December. Class E Shares will only be redeemed upon approval of the Board or upon sale or liquidation of the Company. The Class E Shares, when redeemed, will be redeemed at stated value.
78
Excess Class B Shares may be redeemed at the sole discretion of the Board. If the Member tendering the shares for repurchase is current on all obligations owing to the Company, and no grounds exist for termination of membership, such redemption may be affected by paying cash to the Member or crediting the redemption price to the Member’s account. The redemption price for such shares shall be the same as provided on the termination of membership. If the Member tendering the shares for repurchase is not current on all obligations owing to the Company, and no grounds exist for termination of membership, the Company may redeem such Excess Class B Shares and apply the proceeds against all amounts owing to the Company.
The right to deduct any amounts owing to the Company against the total redemption price for shares is solely at the Company’s option. Shareholders may not offset or recoup any obligations to the Company or otherwise refuse to pay any amounts owed to the Company.
The Company’s redemption policy currently provides that the number of Class B Shares that Unified may redeem in any fiscal year is limited to no more than 5% of the sum of:
| | · | | The number of Class B Shares outstanding at the close of the preceding fiscal year end; and |
| | · | | The number of Class B Shares issuable as a part of the patronage dividend distribution for the preceding fiscal year. |
Unified’s Board has the absolute discretion to redeem Excess Class B Shares or to redeem Class A, Class B or Class E Shares of any outgoing Member regardless of when the membership terminated or the Class B Shares were tendered. The Board also has the right to elect to redeem Excess Class B or Class E Shares even though such redemption has not been requested and without regard to each year’s five percent limit or any other provision of the redemption policy.
Subject to the Board’s determination and approval to redeem shares, any repurchase of shares will be on the terms and, subject to the limitations and restrictions, if any, set forth in the California General Corporation Law, the Company’s Articles of Incorporation and Bylaws, credit agreements to which the Company is a party, and the Company’s redemption policy, which is subject to change at the sole discretion of the Board.
The following tables summarize the Class A and Class B Shares tendered for redemption, shares redeemed, and the remaining number of shares and their aggregated redemption value pending redemption at the fiscal year end of each of the following periods:
| | | | | | | | | | | | | | | | |
| (dollars in thousands) | | | | | | | | | | | | |
| Class A Shares | | Tendered | | | Redeemed | | | Remaining | | | Redemption
Value at Fiscal year end | |
Fiscal 2009 | | | | | | | | | | | 2,800 | | | $ | 767 | |
Fiscal 2010 | | | 10,500 | | | | 10,500 | | | | 2,800 | | | $ | 813 | |
Fiscal 2011 | | | 11,200 | | | | 11,200 | | | | 2,800 | | | $ | 853 | |
Fiscal 2012 | | | 10,150 | | | | 10,500 | | | | 2,450 | | | $ | 765 | |
| |
| | | | | | | | | | | | | | | | |
| (dollars in thousands) | | | | | | | | | | | | |
| Class B Shares | | Tendered | | | Redeemed | | | Remaining | | | Redemption
Value at Fiscal year end | |
Fiscal 2009 | | | | | | | | | | | 16,839 | | | $ | 4,245 | |
Fiscal 2010 | | | 54,360 | | | | 17,339 | | | | 53,860 | | | $ | 15,639 | |
Fiscal 2011 | | | 33,391 | | | | 22,305 | | | | 64,946 | | | $ | 19,463 | |
Fiscal 2012 | | | 24,921 | | | | 11,558 | | | | 78,309 | | | $ | 23,837 | |
| |
11. Benefit Plans
The Company sponsors a cash balance plan (“Unified Cash Balance Plan”). The Unified Cash Balance Plan is a noncontributory defined benefit pension plan covering substantially all employees of the Company who are not subject to a collective bargaining agreement. Under the Unified Cash Balance Plan, participants are credited with an
79
annual accrual based on years of service with the Company. The Unified Cash Balance Plan balance receives an annual interest credit, currently tied to the 30-year Treasury rate that is in effect the previous November, but in no event shall the rate be less than 5%. On retirement, participants will receive a lifetime annuity based on the total cash balance in their account. Benefits under the Unified Cash Balance Plan are provided through a trust.
The Company also sponsors an Executive Salary Protection Plan (“ESPP”) that provides supplemental post-termination retirement income based on each participant’s salary and years of service as an officer of the Company. Depending on when the officer became a participant in the ESPP, final salary is defined as the highest compensation of the last three years preceding employment separation or the average of the highest five years of compensation out of the last ten years preceding employment separation. Funds are held in a rabbi trust for the ESPP consisting primarily of life insurance policies reported at cash surrender value and mutual fund assets consisting of various publicly-traded mutual funds reported at estimated fair value based on quoted market prices. In accordance with ASC Topic 710,“Compensation—General”, the assets and liabilities of a rabbi trust must be accounted for as if they are assets and liabilities of the Company. The assets held in the rabbi trust are not available for general corporate purposes. In addition, all earnings and expenses of the rabbi trust are reported in the Company’s consolidated statement of earnings. The cash surrender value of such life insurance policies aggregated $16.8 million and $15.1 million at September 29, 2012 and October 1, 2011, respectively, and are included in other assets in the Company’s consolidated balance sheets. Mutual funds reported at their estimated fair value of $13.9 million and $10.7 million at September 29, 2012 and October 1, 2011, respectively, are included in other assets in the Company’s consolidated balance sheets. The related accrued benefit cost (representing the Company’s benefit obligation to participants) of $46.0 million and $38.5 million at September 29, 2012 and October 1, 2011, respectively, is recorded in long-term liabilities, other in the Company’s consolidated balance sheets. The rabbi trust is subject to creditor claims in the event of insolvency. The ESPP accrued benefit cost is included in the pension tables below. However, the trust assets are excluded from ESPP plan assets as they do not qualify as plan assets under ASC Topic 715, “Compensation—Retirement Benefits”.
Pension expense for the Unified Cash Balance Plan and ESPP totaled $13.0 million, $11.4 million and $11.6 million for the fiscal years ended September 29, 2012, October 1, 2011 and October 2, 2010, respectively.
The components of net periodic cost for the Unified Cash Balance Plan and ESPP consist of the following (measured at September 30, 2012, 2011 and 2010 for fiscal 2012, 2011 and 2010, respectively):
| | | | | | | | | | | | |
| (dollars in thousands) | | | |
| | | Fiscal Years Ended | |
| Unified Cash Balance Plan | | September 29,
2012 | | | October 1,
2011 | | | October 2,
2010 | |
Service cost | | $ | 5,527 | | | $ | 5,405 | | | $ | 4,543 | |
Interest cost | | | 10,927 | | | | 10,425 | | | | 10,293 | |
Expected return on plan assets | | | (12,671 | ) | | | (12,402 | ) | | | (10,989 | ) |
Amortization of prior service cost | | | 11 | | | | 11 | | | | 10 | |
Actuarial loss | | | 4,281 | | | | 2,913 | | | | 2,606 | |
| |
Net periodic cost | | $ | 8,075 | | | $ | 6,352 | | | $ | 6,463 | |
| |
| | | | | | | | | | | | |
| (dollars in thousands) | | | |
| | | Fiscal Years Ended | |
| ESPP | | September 29,
2012 | | | October 1,
2011 | | | October 2,
2010 | |
Service cost | | $ | 2,240 | | | $ | 2,295 | | | $ | 2,279 | |
Interest cost | | | 1,718 | | | | 1,464 | | | | 1,668 | |
Amortization of prior service cost | | | — | | | | 212 | | | | 241 | |
Recognized actuarial loss | | | 930 | | | | 1,069 | | | | 904 | |
| |
Net periodic cost | | $ | 4,888 | | | $ | 5,040 | | | $ | 5,092 | |
| |
80
The Company’s fiscal 2012 pension expense includes an approximate $5.2 million charge for the Unified Cash Balance Plan and ESPP plan combined as a result of amortizing prior service costs of $11 thousand and an actuarial loss of $5.2 million from accumulated other comprehensive income into pension expense over the 2012 fiscal year.
The Company’s projected fiscal 2013 pension expense includes an approximate $8.0 million charge for the Unified Cash Balance Plan and ESPP plan combined which are expected to be recognized as a result of amortizing projected prior service costs of $11 thousand and a projected actuarial loss of $8.0 million from accumulated other comprehensive income into pension expense over the 2013 fiscal year.
The combined accumulated plan benefit obligation for the Unified Cash Balance Plan and ESPP is $310.5 million and $251.1 million at the end of the year for fiscal 2012 and 2011, respectively.
The following table sets forth the change in benefit obligation for the Unified Cash Balance Plan and ESPP (measured at September 30, 2012 and 2011 for fiscal 2012 and 2011, respectively):
| | | | | | | | | | | | | | | | |
| (dollars in thousands) | | | | | | | | | | | | |
| | | Unified Cash Balance Plan | | | ESPP | |
| | | September 29,
2012 | | | October 1,
2011 | | | September 29,
2012 | | | October 1,
2011 | |
Benefit obligation at beginning of year | | $ | 212,576 | | | $ | 202,618 | | | $ | 38,530 | | | $ | 34,540 | |
Service cost | | | 5,527 | | | | 5,405 | | | | 2,240 | | | | 2,295 | |
Interest cost | | | 10,927 | | | | 10,425 | | | | 1,718 | | | | 1,464 | |
Actuarial loss(a) | | | 42,537 | | | | 939 | | | | 4,220 | | | | 940 | |
Benefits paid | | | (7,094 | ) | | | (6,811 | ) | | | (712 | ) | | | (709 | ) |
| |
Benefit obligation at end of year | | $ | 264,473 | | | $ | 212,576 | | | $ | 45,996 | | | $ | 38,530 | |
| |
| (a) | | The actuarial loss in fiscal 2012 for the Unified Cash Balance Plan includes approximately $40.4 million due to the change in the discount rate (from 5.25% to 4.00%). The actuarial loss in fiscal 2012 for the ESPP includes approximately $4.1 million due to the change in the discount rate (from 4.50% to 3.25%). |
The following table sets forth the change in plan assets for the Unified Cash Balance Plan and ESPP (measured at September 30, 2012 and 2011 for fiscal 2012 and 2011, respectively):
| | | | | | | | | | | | | | | | |
| (dollars in thousands) | | | | | | | | | | | | |
| | | Unified Cash Balance Plan | | | ESPP | |
| | | September 29,
2012 | | | October 1,
2011 | | | September 29,
2012 | | | October 1,
2011 | |
Fair value of plan assets at beginning of year | | $ | 147,168 | | | $ | 145,304 | | | $ | — | | | $ | — | |
Actual return on plan assets | | | 27,900 | | | | (4,183 | ) | | | — | | | | — | |
Employer contribution | | | 10,941 | | | | 12,858 | | | | 712 | | | | 709 | |
Benefits paid | | | (7,094 | ) | | | (6,811 | ) | | | (712 | ) | | | (709 | ) |
| |
Fair value of plan assets at end of year | | $ | 178,915 | | | $ | 147,168 | | | $ | — | | | $ | — | |
| |
The accrued pension and other benefit costs recognized for the Unified Cash Balance Plan and ESPP in the consolidated balance sheets are computed as follows:
| | | | | | | | | | | | | | | | |
| (dollars in thousands) | | | | | | | | | | | | |
| | | Unified Cash Balance Plan | | | ESPP | |
| | | September 29,
2012 | | | October 1,
2011 | | | September 29,
2012 | | | October 1,
2011 | |
Funded status at September 30, 2012 and 2011, respectively (under-funded) | | $ | (85,558 | ) | | $ | (65,408 | ) | | $ | (45,996 | ) | | $ | (38,530 | ) |
| |
Net amount recognized | | $ | (85,558 | ) | | $ | (65,408 | ) | | $ | (45,996 | ) | | $ | (38,530 | ) |
| |
81
The following table sets forth the amounts recognized in the consolidated balance sheets for the Unified Cash Balance Plan and ESPP (measured at September 30, 2012 and 2011 for fiscal 2012 and 2011, respectively):
| | | | | | | | | | | | | | | | |
| (dollars in thousands) | | | | | | | | | | | | |
| | | Unified Cash Balance Plan | | | ESPP | |
| | | September 29,
2012 | | | October 1,
2011 | | | September 29,
2012 | | | October 1,
2011 | |
Prepaid (accrued) benefit cost | | $ | 2,260 | | | $ | (606 | ) | | $ | (34,836 | ) | | $ | (30,660 | ) |
Accumulated other comprehensive loss | | | (87,818 | ) | | | (64,802 | ) | | | (11,160 | ) | | | (7,870 | ) |
| |
Net amount recognized | | $ | (85,558 | ) | | $ | (65,408 | ) | | $ | (45,996 | ) | | $ | (38,530 | ) |
| |
Total net accrued benefit costs of $131.6 million and $103.9 million at September 29, 2012 and October 1, 2011, respectively, are included in the consolidated balance sheets as follows: $130.9 million and $103.2 million are included in long-term liabilities, other and $0.7 million and $0.7 million are included in accrued liabilities at September 29, 2012 and October 1, 2011, respectively.
The following table reconciles the change in net periodic benefit cost, plan assets, benefit obligation and accumulated other comprehensive (income) loss (and components thereof) for the Unified Cash Balance Plan:
| | | | | | | | | | | | | | | | | | | | | | | | | | | | |
| (dollars in thousands) | | | | |
| Unified Cash Balance Plan | | | | | | | | | | | | | | | | | Accumulated Other
Comprehensive Income
Components | |
| September 29, 2012 | | Annual
Cost | | | Fiscal 2009
ASC 715-20
Measurement
Date
Adjustments
to Retained
Earnings | | | Plan
Assets | | | Benefit
Obligation | | | Accumulated
Other
Comprehensive
(Income)/Loss | | | Deferred Plan
Amendment
(Unrecognized
Prior Service
Cost) | | | Deferred
Actuarial
(Gains)/
Losses | |
Beginning balance | | | | | | $ | 673 | | | $ | 147,168 | | | $ | (212,576 | ) | | $ | 64,802 | | | $ | 65 | | | $ | 64,737 | |
Service cost | | $ | 5,527 | | | | — | | | | — | | | | (5,527 | ) | | | — | | | | — | | | | — | |
Interest cost | | | 10,927 | | | | — | | | | — | | | | (10,927 | ) | | | — | | | | — | | | | — | |
Actual return loss/(gain) | | | (27,900 | ) | | | — | | | | 27,900 | | | | — | | | | — | | | | — | | | | — | |
| | | | | | | | | | | | | | | | | | | | | | | | | | | | |
Basic annual cost | | | (11,446 | ) | | | — | | | | — | | | | — | | | | — | | | | — | | | | — | |
Contributions | | | — | | | | — | | | | 10,941 | | | | — | | | | — | | | | — | | | | — | |
Benefits paid | | | — | | | | — | | | | (7,094 | ) | | | 7,094 | | | | — | | | | — | | | | — | |
Deferrals | | | | | | | | | | | | | | | | | | | | | | | | | | | | |
Unexpected return adjustment | | | 15,229 | | | | — | | | | — | | | | — | | | | (15,229 | ) | | | — | | | | (15,229 | ) |
Unrecognized actuarial loss | | | — | | | | — | | | | — | | | | (42,537 | ) | | | 42,537 | | | | — | | | | 42,537 | |
Amortization | | | | | | | | | | | | | | | | | | | | | | | | | | | | |
Prior service cost | | | 11 | | | | — | | | | — | | | | — | | | | (11 | ) | | | (11 | ) | | | — | |
Unrecognized actuarial loss/(gain) | | | 4,281 | | | | — | | | | — | | | | — | | | | (4,281 | ) | | | — | | | | (4,281 | ) |
| | | | | |
Ending balance | | $ | 8,075 | | | $ | 673 | | | $ | 178,915 | | | $ | (264,473 | ) | | $ | 87,818 | | | $ | 54 | | | $ | 87,764 | |
| |
82
The following table reconciles the change in net periodic benefit cost, plan assets, benefit obligation and accumulated other comprehensive (income) loss (and components thereof) for the ESPP:
| | | | | | | | | | | | | | | | | | | | | | | | | | | | |
| (dollars in thousands) | | | | |
| ESPP Plan | | | | | | | | | | | | | | | | | Accumulated Other
Comprehensive Income
Components | |
| September 29, 2012 | | Annual
Cost | | | Fiscal 2009
ASC 715-20
Measurement
Date
Adjustments
to Retained
Earnings | | | Plan
Assets | | | Benefit
Obligation | | | Accumulated
Other
Comprehensive
(Income)/Loss | | | Deferred
Prior
Service
Cost | | | Deferred
Actuarial
(Gains)/
Losses | |
Beginning balance | | | | | | $ | 958 | | | $ | — | | | $ | (38,530 | ) | | $ | 7,870 | | | $ | — | | | $ | 7,870 | |
Service cost | | $ | 2,240 | | | | — | | | | — | | | | (2,240 | ) | | | — | | | | — | | | | — | |
Interest cost | | | 1,718 | | | | — | | | | — | | | | (1,718 | ) | | | — | | | | — | | | | — | |
| | | | | | | | | | | | | | | | | | | | | | | | | | | | |
Basic annual cost | | | 3,958 | | | | — | | | | — | | | | — | | | | — | | | | — | | | | — | |
Contributions | | | — | | | | — | | | | 712 | | | | — | | | | — | | | | — | | | | — | |
Benefits paid | | | — | | | | — | | | | (712 | ) | | | 712 | | | | — | | | | — | | | | — | |
Deferrals | | | | | | | | | | | | | | | | | | | | | | | | | | | | |
Unrecognized actuarial loss | | | — | | | | — | | | | — | | | | (4,220 | ) | | | 4,220 | | | | — | | | | 4,220 | �� |
Amortization | | | | | | | | | | | | | | | | | | | | | | | | | | | | |
Prior service cost | | | — | | | | — | | | | — | | | | — | | | | — | | | | — | | | | — | |
Unrecognized actuarial loss/(gain) | | | 930 | | | | — | | | | — | | | | — | | | | (930 | ) | | | — | | | | (930 | ) |
| | | | | |
Ending balance | | $ | 4,888 | | | $ | 958 | | | $ | — | | | $ | (45,996 | ) | | $ | 11,160 | | | $ | — | | | $ | 11,160 | |
| |
The weighted-average assumptions used in computing the preceding information for the Unified Cash Balance Plan and the ESPP as of September 30, 2012, 2011 and 2010 (the annual plan measurement dates) were as follows:
| | | | | | | | | | | | |
| Unified Cash Balance Plan | | 2012 | | | 2011 | | | 2010 | |
Benefit obligations: | | | | | | | | | | | | |
Discount rate for benefit obligation | | | 4.00 | % | | | 5.25 | % | | | 5.25 | % |
Rate of compensation increase | | | 3.00 | % | | | 3.00 | % | | | 3.00 | % |
Net periodic cost: | | | | | | | | | | | | |
Discount rate for net periodic benefit cost | | | 5.25 | % | | | 5.25 | % | | | 5.75 | % |
Expected long-term return on plan assets | | | 8.50 | % | | | 8.50 | % | | | 8.50 | % |
Rate of compensation increase | | | 3.00 | % | | | 3.00 | % | | | 3.50 | % |
| | | | | | | | | | | | |
| ESPP | | 2012 | | | 2011 | | | 2010 | |
Benefit obligations: | | | | | | | | | | | | |
Discount rate for benefit obligation | | | 3.25 | % | | | 4.50 | % | | | 4.25 | % |
Rate of compensation increase | | | 2.25 | % | | | 2.25 | % | | | 2.00 | % |
Net periodic cost: | | | | | | | | | | | | |
Discount rate for net periodic benefit cost | | | 4.50 | % | | | 4.25 | % | | | 5.75 | % |
Expected long-term return on plan assets | | | N/A | | | | N/A | | | | N/A | |
Rate of compensation increase | | | 2.25 | % | | | 2.00 | % | | | 3.50 | % |
The Company’s fiscal 2012 and fiscal 2011 pension expense was calculated based upon a number of actuarial assumptions, including an expected long-term rate of return on plan assets of 8.50%. In developing the long-term rate of return assumption, the Company evaluated historical asset class returns based on broad equity and bond indices. The expected long-term rate of return on plan assets assumes an asset allocation of approximately 60% equity, 25% fixed income financial instruments, 12.5% alternative investments, and 2.5% real asset investments (see description under“Plan Assets” below). The Company regularly reviews with its third party advisors the asset allocation and periodically rebalances the investment mix to achieve certain investment goals when considered appropriate (see further discussion and related table under“Plan Assets” below). Actuarial assumptions, including the expected rate of return, are reviewed at least annually, and are adjusted as necessary. Lowering the expected long-term rate of return on the Company’s plan assets (for the Unified Cash Balance Plan in fiscal 2012 and fiscal 2011) by 0.50% (from 8.50% to 8.00%) would have increased its pension expense for both fiscal 2012 and fiscal 2011 by approximately $0.7 million.
83
The discount rate that was utilized for determining the Company’s fiscal 2012 pension obligation and projected fiscal 2013 net periodic benefit cost for the Unified Cash Balance Plan and the ESPP was selected to reflect the rates of return currently available on high quality fixed income securities whose cash flows (via coupons and maturities) match the timing and amount of future benefit payments of the plan. Bond information was provided by a recognized rating agency for all high quality bonds receiving one of the two highest ratings. As a result of this modeling process, the discount rate was 4.00% and 5.25% for the Unified Cash Balance Plan and 3.25% and 4.50% for the ESPP at September 30, 2012 and September 30, 2011, respectively.
Plan Assets
The Company’s Unified Cash Balance Plan weighted-average asset allocation at September 29, 2012 and October 1, 2011, by asset category is as follows:
| | | | | | | | |
| (dollars in thousands) | | | | | | |
| | | September 29,
2012 | | | October 1,
2011 | |
Asset Category: | | | | | | | | |
Equity securities | | $ | 99,433 | | | $ | 84,963 | |
Debt securities (mutual funds comprised of investment grade bonds) | | | 43,521 | | | | 38,693 | |
Alternative investments | | | 33,771 | | | | 20,471 | |
Other | | | 2,190 | | | | 3,041 | |
| |
Total | | $ | 178,915 | | | $ | 147,168 | |
| |
The assets of the Unified Cash Balance Plan are invested to provide safety through diversification in a portfolio of common stocks, bonds, cash equivalents and other investments that may reflect varying rates of return. The overall return objective for the portfolio is a reasonable rate consistent with the risk levels established by the Company’s Benefits Committee. The investments are to be diversified within asset classes (e.g., equities should be diversified by economic sector, industry, quality and size).
The long-term target asset allocation for the investment portfolio is divided into five asset classes as follows:
| | | | | | | | | | | | |
| Asset Classes | | Maximum % | | | Minimum % | | | Target % | |
Equities | | | 80 | % | | | 40 | % | | | 60 | % |
Fixed Income | | | 40 | % | | | 20 | % | | | 25 | % |
Alternative Investments | | | 20 | % | | | 0 | % | | | 12.5 | % |
Real Assets | | | 10 | % | | | 0 | % | | | 2.5 | % |
Cash Equivalents | | | 30 | % | | | 0 | % | | | 0 | % |
The equity segment is further diversified by exposure to domestic and international, small and large capitalization, and growth and value stocks. The fixed income segment is subject to quality and duration targets, and is invested in core fixed income and high yield sectors. The purpose of using alternative investments is to reduce the volatility of the overall portfolio and to provide an alternative source of return from that of the domestic capital markets. Alternative investment strategies are defined as investment programs that offer the portfolios access to strategies that have low relative correlation to the domestic equity and fixed income markets. They may include alternative asset classes such as real estate, venture or private capital as well as a variety of investment strategies using marketable securities that seek to generate absolute positive returns regardless of the direction of the capital markets. The purpose of the real asset segment is to provide a level of protection against inflation as well as capitalize on rising commodity prices. Real assets represent investments in items that have intrinsic value because they are consumable or used in production, such as commodities, real estate, infrastructure, precious metals and global natural resources. The percentage of total assets allocated to cash equivalents should be sufficient to assure liquidity to meet disbursements and general operational expenses. Cash equivalents may also be used as an alternative to other investments when the investment manager believes that other asset classes carry higher than normal risk.
84
The credit and liquidity crisis in the United States and throughout the global financial system triggered substantial volatility in the world financial markets and banking system. As a result, the investment portfolios of the Unified Cash Balance Plan incurred a significant decline in fair value during fiscal 2008. While the values of the investment portfolios increased during fiscal 2009 and 2010, they declined in fair value during fiscal 2011 and reflected improvement in fiscal 2012, as the values of the plan’s individual investments have and will fluctuate in response to changing market conditions, and the amount of gains or losses that will be recognized in subsequent periods, if any, cannot be determined.
The value of each plan’s investments has a direct impact on its funded status. The actual impact, if any, and future required contributions cannot be determined at this time.
The Unified Cash Balance Plan’s investments are recorded at fair value in accordance with ASC Topic 820. See Note 1, “Basis of Presentation and Summary of Significant Accounting Policies” and Note 16, “Fair Value of Financial Instruments” for further discussion of ASC Topic 820.
The Company, as the Unified Cash Balance Plan sponsor, determines the classification of financial asset groups within the fair value hierarchy based on the lowest level of input that is significant into each group’s asset valuation.
Equities (comprised of common and preferred stocks and mutual funds) are valued at their fair value and are determined by the quoted market price on the last business day of the fiscal year.
Cash equivalents are valued at cost, which approximates fair value. Cash equivalents include cash in bank and short-term investment funds. Interest income on short-term investment funds is recorded on an accrual basis as earned.
The Unified Cash Balance Plan’s alternative investments, which include limited partnership funds and closely held investments,are valued at their estimated fair value. Estimated fair value is based on the Unified Cash Balance Plan’s pro-rata share of the investment’s net asset value as reported by the investee. The investee’s strategies include maximization of returns for investors through investment in public and non-public securities with a goal of identifying mis-priced and value-priced securities.
The Unified Cash Balance Plan currently holds five (5) limited partnership fund investments with funding commitments extending through 2016. One fund was started in 2008, and the remainder commenced in 2011. The Unified Cash Balance Plan’s remaining unfunded commitments to limited partnership fund investments as of September 29, 2012 was $7.1 million out of total original commitments of $10.5 million. While shares in the limited partnership fund investments are not redeemable, the Company expects to recover the Unified Cash Balance Plan’s investments in the limited partnership funds through investee distributions as the investee liquidates the underlying assets. The limited partnership fund investments have maturity dates through 2023.
The Unified Cash Balance Plan may redeem shares in its other closely held investments by submitting a request, generally 30 to 90 days prior to a period-end. There are no unfunded commitments for the other closely held investments.
85
The following table represents the Unified Cash Balance Plan’s financial instruments recorded at fair value and the hierarchy of those assets as of September 29, 2012:
| | | | | | | | | | | | | | | | |
| (dollars in thousands) | | | |
| | | Level 1 | | | Level 2 | | | Level 3 | | | Total | |
Equities (including mutual funds): | | | | | | | | | | | | | | | | |
Investment grade bonds | | $ | 43,521 | | | $ | — | | | $ | — | | | $ | 43,521 | |
Growth – foreign | | | 18,544 | | | | — | | | | — | | | | 18,544 | |
Growth – large cap | | | 10,993 | | | | — | | | | — | | | | 10,993 | |
Communication & technology | | | 14,725 | | | | — | | | | — | | | | 14,725 | |
Retail & industrial goods | | | 13,612 | | | | — | | | | — | | | | 13,612 | |
Financial & insurance | | | 9,905 | | | | — | | | | — | | | | 9,905 | |
Emerging markets | | | 9,151 | | | | — | | | | — | | | | 9,151 | |
Utilities, energy & extractive industries | | | 7,699 | | | | — | | | | — | | | | 7,699 | |
Medical & pharmaceutical | | | 8,810 | | | | — | | | | — | | | | 8,810 | |
Other | | | 5,994 | | | | — | | | | — | | | | 5,994 | |
| |
Total equities | | | 142,954 | | | | — | | | | — | | | | 142,954 | |
| |
Cash equivalents | | | 2,190 | | | | — | | | | — | | | | 2,190 | |
Alternative investments | | | — | | | | — | | | | 33,771 | | | | 33,771 | |
| |
Total | | $ | 145,144 | | | $ | — | | | $ | 33,771 | | | $ | 178,915 | |
| |
The table below sets forth a summary of changes in the fair value of the Unified Cash Balance Plan’s level 3 assets for the year ended September 29, 2012:
| | | | |
| (dollars in thousands) | | | |
| | | Total
Alternative
Investments | |
Estimated fair value, beginning of year | | $ | 20,471 | |
Purchases | | | 14,482 | |
Net investment gain | | | 745 | |
Distributions | | | (1,927 | ) |
| |
Estimated fair value, end of year | | $ | 33,771 | |
| |
In accordance with ASC Topic 820, the following table represents the Unified Cash Balance Plan’s financial instruments recorded at fair value and the hierarchy of those assets as of October 1, 2011:
| | | | | | | | | | | | | | | | |
| (dollars in thousands) | | | |
| | | Level 1 | | | Level 2 | | | Level 3 | | | Total | |
Equities (including mutual funds): | | | | | | | | | | | | | | | | |
Investment grade bonds | | $ | 38,693 | | | $ | — | | | $ | — | | | $ | 38,693 | |
Growth – foreign | | | 19,600 | | | | — | | | | — | | | | 19,600 | |
Growth – large cap | | | 10,020 | | | | — | | | | — | | | | 10,020 | |
Communication & technology | | | 11,413 | | | | — | | | | — | | | | 11,413 | |
Retail & industrial goods | | | 11,636 | | | | — | | | | — | | | | 11,636 | |
Financial & insurance | | | 7,304 | | | | — | | | | — | | | | 7,304 | |
Emerging markets | | | 7,197 | | | | — | | | | — | | | | 7,197 | |
Utilities, energy & extractive industries | | | 6,553 | | | | — | | | | — | | | | 6,553 | |
Medical & pharmaceutical | | | 7,069 | | | | — | | | | — | | | | 7,069 | |
Other | | | 4,171 | | | | — | | | | — | | | | 4,171 | |
| |
Total equities | | | 123,656 | | | | — | | | | — | | | | 123,656 | |
| |
Cash equivalents | | | 3,041 | | | | — | | | | — | | | | 3,041 | |
Alternative investments | | | — | | | | — | | | | 20,471 | | | | 20,471 | |
| |
Total | | $ | 126,697 | | | $ | — | | | $ | 20,471 | | | $ | 147,168 | |
| |
86
The table below sets forth a summary of changes in the fair value of the Unified Cash Balance Plan’s level 3 assets for the year ended October 1, 2011:
| | | | |
| (dollars in thousands) | | | |
| | | Total
Alternative
Investments | |
Estimated fair value, beginning of year | | $ | 13,596 | |
Purchases | | | 8,495 | |
Net investment loss | | | (121 | ) |
Distributions | | | (1,499 | ) |
| |
Estimated fair value, end of year | | $ | 20,471 | |
| |
Contributions
Unified Cash Balance Plan and ESPP
Contributions to the Unified Cash Balance Plan are made in amounts that are at least sufficient to meet the minimum funding requirements of applicable laws and regulations, but no more than amounts deductible for federal income tax purposes. During fiscal 2012, the Company made contributions to the Unified Cash Balance Plan totaling $10.9 million, comprised of $3.9 million and $7.0 million for the 2012 plan year and 2011 plan year, respectively. In addition, the Company also contributed $0.7 million in fiscal 2012 to the ESPP to fund benefit payments to participants. At this time, the Company expects to make estimated minimum contributions to the Unified Cash Balance Plan totaling $7.4 million in fiscal 2013, comprised of $3.6 million for the 2013 plan year and $3.8 million for the 2012 plan year. Additional contributions, if any, for the 2012 plan year will be due by September 15, 2013, while contributions for the 2013 plan year will be due by September 15, 2014. In addition, the Company expects to contribute $0.7 million to the ESPP to fund projected benefit payments to participants in fiscal 2013.
During July 2012, legislation to provide pension funding relief was enacted as part of the 2012 student loan and transportation legislation titled “Moving Ahead for Progress in the 21st Century” (“MAP-21”). Funding relief is to be achieved through changes in the methodology employed to determine interest rates used to calculate required funding contributions. The funding relief applies to Employee Retirement Income Security Act (“ERISA”) single-employer plans that base pension liability calculations on interest rates determined pursuant to the Pension Protection Act of 2006 and was predicted to reduce 2012 contribution requirements for typical plans. As a result of MAP-21, the Company was able to reduce its contribution to the Unified Cash Balance Plan for fiscal year 2012 by $2.0 million.
Multiemployer Pension Plans
The Company also contributes to a number of multiemployer defined benefit pension plans that provide defined benefit payments for retired employees under terms of the Company’s collective bargaining agreements (“Union Participants”). These multiemployer plans generally provide retirement benefits to Union Participants based on their service to contributing employers. The plans’ benefits are paid from assets held in trusts for this purpose and are administered by trustees that are appointed by participating employers and union parties.
The risks of participating in these multiemployer plans are different from the risks associated with single-employer plans in the following respects:
| | · | | Assets contributed to the multiemployer plan by one employer may be used to provide benefits to employees of other participating employers. |
| | · | | If a participating employer stops contributing to the plan, the unfunded obligations of the plan may be borne by the remaining participating companies. |
| | · | | If the Company stops participating in some or all of its multiemployer plans, and continues in business, the Company could be required to pay an amount, referred to as a withdrawal liability, based on the funded status of the plan. The Company has no intention of stopping its participation in any multiemployer plans. |
87
The Company made contributions of $13.8 million, $14.9 million and $15.0 million for the fiscal years ended September 29, 2012, October 1, 2011 and October 2, 2010, respectively, to its participating multiemployer plans. The following table provides information regarding the Company’s participation in these multiemployer plans. The table provides the following information:
| | · | | The EIN/Pension Plan Number column provides the Employee Identification Number (“EIN”) and the three-digit plan number, if applicable. |
| | · | | Unless otherwise noted, the most recent Pension Protection Act (“PPA”) zone status available in 2012 and 2011 relates to the plans’ two most recent fiscal year-ends. The zone status is based on information that the Company received from the plan and is certified by each plan’s actuary. Among other factors, red zone status plans are generally less than 65 percent funded and are considered in critical status, plans in yellow zone or orange zone status are less than 80 percent funded and are considered endangered or seriously endangered status, and green zone plans are at least 80 percent funded. |
| | · | | For plans that are in the red zone, we have indicated whether a Rehabilitation Plan (“RP”) is either pending or has been implemented by the trustees of each plan. Since none of the Company’s plans are considered to be in endangered (yellow zone) or seriously endangered (orange zone) status, disclosure of whether a Financial Improvement Plan (“FIP”) is either pending or has been implemented is not applicable and therefore is omitted from the table. |
| | · | | The table also includes the current expiration date(s) for the collective bargaining agreement(s) under which the plans are associated and our contributions to the plans for the last three years. |
| | | | | | | | | | | | | | | | | | | | | | | | | | |
| | | EIN | | Plan
Month/Day End Date | | | PPA Zone Status | | RP Status Pending/ Implemented | | Range of
Agreement
Expiration Dates | | Contributions (in ‘000’s) (4) | |
| Pension Fund | | | | 2012 | | 2011 | | | | 2012(5) | | | 2011 | | | 2010 | |
Western Conference of Teamsters Pension Trust | | 916145047
-001 | | | 11/30 | | | Green | | Green | | No | | 07/12/14 –
04/23/16(3) | | $ | 12,848 | | | $ | 13,908 | | | $ | 13,741 | |
Bakery & Confectionery Union and Industry International Pension Fund(2) | | 526118572
-001 | | | 7/31 | | | Red | | Red | | Implemented | | 7/6/13 | | | 629 | | | | 656 | | | | 832 | |
Washington Meat Industry Pension Trust(2) | | 916134141
-001 | | | 5/31 | | | Red | | Red | | Implemented | | 9/27/14 | | | 78 | | | | 78 | | | | 66 | |
Other Plans(1) | | | | | | | | | | | | | | | | | 249 | | | | 265 | | | | 274 | |
| |
Total | | | | | | | | | | | | | | | | $ | 13,804 | | | $ | 14,907 | | | $ | 14,913 | |
| |
| (1) | | Other plans consist of two plans (each with a PPA zone status of green) that have been aggregated in the foregoing table, as the contributions to each of these plans are not individually material. |
| (2) | | We are subject to critical status surcharge contributions that are imposed for plans that are in the red zone. |
| (3) | | The Company has 19 collective bargaining agreements participating in the Western Conference of Teamsters Pension Trust. Approximately 64% of the participants covered by this plan are subject to collective bargaining agreements that expire on September 19, 2015. |
| (4) | | None of the Company’s collective bargaining agreements require that a minimum contribution be made to these plans. None of the Company’s contributions exceed 5% of the total contributions to any of the plans. |
| (5) | | The decrease in contributions from fiscal 2011 to fiscal 2012 is due to reduction in headcount at various locations. |
Sheltered Savings Plan
The Company has a Sheltered Savings Plan (“SSP”), which is a defined contribution plan, adopted pursuant to Section 401(k) of the Internal Revenue Code for substantially all of its nonunion employees. The Company matches, after an employee’s one year of service, each dollar deferred up to 4% of compensation and, at its discretion, matches 40% of amounts deferred between 4% and 8%. At the end of each plan year, the Company may also contribute an amount equal to 2% of the compensation of those participants employed at that date. Participants are immediately 100% vested in the Company’s contribution.
88
The Company contributed approximately $5.3 million, $5.2 million and $5.3 million related to its SSP in the fiscal years ended September 29, 2012, October 1, 2011 and October 2, 2010, respectively.
Deferred Compensation Plan
The Company has a nonqualified Deferred Compensation Plan (“DCP”), which allows eligible employees to defer and contribute to an account a percentage of compensation on a pre-tax basis, as defined in the plan, in excess of amounts contributed to the SSP pursuant to IRS limitations, the value of which is measured by the fair value of the underlying investments. The Company informally funds its deferred compensation liability with assets held in a rabbi trust consisting primarily of life insurance policies reported at cash surrender value. The assets held in the rabbi trust are not available for general corporate purposes. Participants can direct the investment of their deferred compensation plan accounts in several investment funds as permitted by the DCP. Gains or losses on investments are fully allocable to the plan participants. The cash surrender value of life insurance policies is included in other assets in the Company’s consolidated balance sheets because they remain assets of the Company until paid out to the participants. The cash surrender value of the life insurance policies was $14.5 million and $12.2 million at September 29, 2012 and October 1, 2011, respectively. The liability to participants ($14.9 million and $12.4 million at September 29, 2012 and October 1, 2011, respectively) is included in long-term liabilities, other in the Company’s consolidated balance sheets. The rabbi trust is subject to creditor claims in the event of insolvency.
Employee Savings Plan
The Company has an Employee Savings Plan, which is a defined contribution plan, adopted pursuant to Section 401(k) of the Internal Revenue Code for substantially all of its union employees. The Company does not match any employee deferrals into the plan, and therefore, there is no related vesting schedule. No expense was incurred in the periods presented.
Estimated Future Benefit Payments
The following benefit payments, which reflect expected future service, as appropriate, are expected to be paid in fiscal years:
| | | | | | | | |
| (dollars in thousands) | | | | | | |
| | | Unified Cash
Balance Plan | | | ESPP | |
2013 | | $ | 9,571 | | | $ | 713 | |
2014 | | | 10,297 | | | | 2,139 | |
2015 | | | 11,018 | | | | 2,139 | |
2016 | | | 11,832 | | | | 4,305 | |
2017 | | | 12,686 | | | | 4,448 | |
2018 – 2022 | | | 74,456 | | | | 27,400 | |
| |
Total | | $ | 129,860 | | | $ | 41,144 | |
| |
12. Postretirement Benefit Plans Other Than Pensions
The Company sponsors postretirement benefit plans that provide certain medical coverage to retired non-union employees and provide unused sick leave benefits for certain eligible union and non-union employees. Retired non-union employees currently are eligible for a plan providing medical benefits, while officers who are at least 55 years of age and have seven years of service with the Company as an officer will be eligible to participate in the Officer Retirement Medical Plan, which includes the Company’s Executive Medical Reimbursement Plan, following termination of employment. A certain group of retired non-union employees currently participate in a plan providing life insurance benefits for which active non-union employees are no longer eligible. Additionally, certain eligible union and non-union employees have separate plans providing a lump-sum payout for unused days in the sick leave bank. The postretirement medical plan is contributory for non-union employees retiring after January 1, 1990, with the retiree contributions adjusted annually. The life insurance plan and the sick leave payout plans are noncontributory. A group of retired non-union employees in Oregon participate in a postretirement benefit plan
89
providing medical, dental, and vision care benefits. The Company also provides for the cost of life insurance on behalf of current and qualifying former officers of the Company through a split-dollar Executive Insurance Plan arrangement (see additional discussion herein). The plans are not funded.
The components of net periodic benefit cost consist of the following (for all postretirement benefit plans described above):
| | | | | | | | | | | | |
| (dollars in thousands) | | Fiscal Years Ended | |
| | | September 29,
2012 | | | October 1,
2011 | | | October 2,
2010 | |
Service cost | | $ | 1,522 | | | $ | 2,073 | | | $ | 1,732 | |
Interest cost | | | 2,520 | | | | 2,943 | | | | 2,636 | |
Recognized actuarial (gain) loss | | | (307 | ) | | | 141 | | | | (270 | ) |
Amortization of prior service cost | | | (986 | ) | | | (472 | ) | | | (472 | ) |
Benefit cost recognition in excess of APBO/AOCI previously recorded | | | — | | | | 4,553 | | | | — | |
| |
Net periodic benefit cost | | $ | 2,749 | | | $ | 9,238 | | | $ | 3,626 | |
| |
The change in the benefit obligations consists of the following:
| | | | | | | | |
| (dollars in thousands) | | | | | | |
| | | September 29,
2012 | | | October 1,
2011 | |
Benefit obligation at beginning of year | | $ | 51,914 | | | $ | 50,395 | |
Service cost | | | 1,522 | | | | 2,073 | |
Interest cost | | | 2,520 | | | | 2,943 | |
Plan amendments | | | — | | | | (1,749 | ) |
APBO recognition in excess of benefit obligation | | | — | | | | 6,472 | |
Actuarial loss (gain)(a) | | | 9,222 | | | | (6,033 | ) |
Benefits paid | | | (1,817 | ) | | | (2,187 | ) |
| |
Benefit obligation at end of year | | $ | 63,361 | | | $ | 51,914 | |
| |
| (a) | | The actuarial loss in fiscal 2012 for the postretirement benefit plans includes approximately $7.6 million due to the change in the discount rate (from 5.00% to 4.00% for the non-union retiree medical plan and split-dollar Executive Insurance Plan and from 5.25% to 4.00% for the Officer Retirement Medical Plan). |
The change in the plan assets during the year is:
| | | | | | | | |
| (dollars in thousands) | | | | | | |
| | | September 29,
2012 | | | October 1,
2011 | |
Fair value of plan assets at beginning of year | | $ | — | | | $ | — | |
Employer contribution | | | 1,817 | | | | 2,187 | |
Benefits paid | | | (1,817 | ) | | | (2,187 | ) |
| |
Fair value of plan assets at end of year | | $ | — | | | $ | — | |
| |
The funded status of the plans is:
| | | | | | | | |
| (dollars in thousands) | | | | | | |
| | | September 29,
2012 | | | October 1,
2011 | |
Funded status at September 30, 2012 and 2011 (under-funded) | | $ | (63,361 | ) | | $ | (51,914 | ) |
| |
Net amount recognized | | $ | (63,361 | ) | | $ | (51,914 | ) |
| |
90
Total accrued benefit costs of $63.4 million and $51.9 million at September 29, 2012 and October 1, 2011, respectively, are included in the consolidated balance sheets as follows: $59.4 million and $48.4 million are included in long-term liabilities, other and $4.0 million and $3.5 million are included in accrued liabilities at September 29, 2012 and October 1, 2011, respectively.
The following table reconciles the change in net periodic benefit cost, plan assets, benefit obligation and accumulated other comprehensive (income) loss (and components thereof) for the Company’s postretirement benefit plans:
| | | | | | | | | | | | | | | | | | | | | | | | | | | | | | |
| (dollars in thousands) | | | | | | | | | | | | | | | | | | | | | | | |
| Postretirement Benefit Plans | | | | | | | | | | | | | | | | | | | Accumulated Other
Comprehensive
Income
Components | |
| September 29, 2012 | | Annual
Cost | | | Retained
Earnings | | | Plan
Assets | | | Benefit
Obligation | | | Accumulated
Other
Comprehensive
(Income)/Loss | | | | | Deferred
Prior
Service
Cost | | | Deferred
Actuarial
(Gains)/
Losses | |
Beginning balance | | | — | | | $ | 3,260 | | | $ | — | | | $ | (51,914 | ) | | $ | (15,098 | ) | | | | $ | (5,166 | ) | | $ | (9,932 | ) |
Service cost | | $ | 1,522 | | | | — | | | | — | | | | (1,522 | ) | | | — | | | | | | — | | | | — | |
Interest cost | | | 2,520 | | | | — | | | | — | | | | (2,520 | ) | | | — | | | | | | — | | | | — | |
| | | | | | | | | | | | | | | | | | | | | | | | | | | | | | |
Basic annual cost | | | 4,042 | | | | | | | | — | | | | — | | | | — | | | | | | — | | | | — | |
Contributions | | | — | | | | — | | | | 1,817 | | | | — | | | | — | | | | | | — | | | | — | |
Benefits paid | | | — | | | | — | | | | (1,817 | ) | | | 1,817 | | | | — | | | | | | — | | | | — | |
Deferrals | | | | | | | | | | | | | | | | | | | | | | | | | | | | | | |
Plan amendments | | | — | | | | — | | | | — | | | | — | | | | — | | | | | | — | | | | — | |
Unrecognized actuarial (gain)/loss | | | — | | | | — | | | | — | | | | (9,222 | ) | | | 9,222 | | | | | | — | | | | 9,222 | |
Amortization | | | | | | | | | | | | | | | | | | | | | | | | | | | | | | |
Prior service cost | | | (986 | ) | | | — | | | | — | | | | — | | | | 986 | | | | | | 986 | | | | — | |
Recognized actuarial (gain)/loss | | | (307 | ) | | | — | | | | — | | | | — | | | | 307 | | | | | | — | | | | 307 | |
| | | | |
Ending balance | | $ | 2,749 | | | $ | 3,260 | | | $ | — | | | $ | (63,361 | ) | | $ | (4,583 | ) | | | | $ | (4,180 | ) | | $ | (403 | ) |
| | | | |
The Company’s fiscal 2012 postretirement expense includes an approximate $1.3 million credit for its postretirement benefit plans as a result of amortizing prior service cost credits of $1.0 million and actuarial gains of $0.3 million from accumulated other comprehensive income into postretirement expense over the 2012 fiscal year.
The Company’s projected fiscal 2013 postretirement expense includes an approximate $0.3 million charge for its postretirement benefit plans which is expected to be recognized as a result of amortizing projected prior service cost credits of $1.0 million and a projected actuarial loss of $1.3 million from accumulated other comprehensive income into postretirement expense over the 2013 fiscal year.
Benefit payments, including those amounts to be paid out of corporate assets and reflecting future expected service as appropriate, are expected to be paid in fiscal years:
| | | | |
| (dollars in thousands) | | | |
| | | Postretirement Benefit
Plans | |
2013 | | $ | 4,007 | |
2014 | | | 2,485 | |
2015 | | | 2,690 | |
2016 | | | 2,801 | |
2017 | | | 2,933 | |
2018 – 2022 | | | 14,831 | |
| |
Total | | $ | 29,747 | |
| |
91
The weighted-average assumptions as of September 30, 2012, 2011 and 2010 are as follows:
| | | | | | | | | | | | |
| | | Postretirement Benefit
Plans | |
| | | 2012 | | | 2011 | | | 2010 | |
Benefit obligations: | | | | | | | | | | | | |
Discount rate for benefit obligation(a) | | | 4.00 | % | | | 5.00 | % | | | 5.25 | % |
Rate of compensation increase(b) | | | 3.00 | % | | | 2.75 | % | | | 3.00 | % |
Net periodic benefit cost: | | | | | | | | | | | | |
Discount rate for net periodic benefit cost(c) | | | 5.00 | % | | | 5.25 | % | | | 5.75 | % |
Rate of compensation increase | | | 2.75 | % | | | 3.00 | % | | | 3.50 | % |
| (a) | | The discount rate for the Officer Retirement Medical Plan is 4.00%, 5.25% and 5.75% for fiscal 2012, 2011 and 2010, respectively. |
| (b) | | The rate of compensation increase for the fiscal 2012 split-dollar Executive Insurance Plan is 2.25%. |
| (c) | | The discount rate for the Officer Retirement Medical Plan is 5.25%, 5.50% and 5.50% for fiscal 2012, 2011 and 2010, respectively. |
For measurement purposes, the following table sets forth the assumed health care trend rates:
| | | | | | | | |
| | | September 29,
2012 | | | October 1,
2011 | |
Health care cost trend rate assumed for 2013 and 2012(a) | | | 7.50 | % | | | 8.00 | % |
Rate to which the cost trend rate is assumed to decline (the ultimate trend
rate)(b) | | | 5.00 | % | | | 5.00 | % |
Year that the rate reaches the ultimate trend rate | | | 2018 | | | | 2018 | |
| (a) | | The annual rate of increase in the per capita cost of covered health care benefits. |
| (b) | | For the years ended September 29, 2012 and October 1, 2011, the health care trend rate is assumed to remain at 8.00% for fiscal 2011 through fiscal 2012. The rate is assumed to decrease to 7.50% for fiscal 2013 and then decrease annually by 0.5% until reaching the ultimate trend rate of 5% in fiscal 2018. The year in which the health care trend rate is expected to reach the ultimate trend rate (fiscal 2018) and the rate at which the trend rate is assumed to decline (0.5% per year) reflect considerations of when health care costs are expected to stabilize and aligns the date of achieving the ultimate trend (fiscal 2018) with the implied cost containment time frame currently prevalent in Health Care Reform legislation. |
Assumed health care cost trend rates have a significant effect on the amounts reported for the health care plans. A one-percentage-point change in assumed health care cost trend rates would have the following effects as of September 29, 2012:
| | | | | | | | |
| (dollars in thousands) | | | | | | |
| | | 1-Percentage-Point Increase | | | 1-Percentage-Point Decrease | |
Effect on total of service and interest cost | | $ | 148 | | | $ | (113 | ) |
Effect on accumulated postretirement benefit obligation | | $ | 2,253 | | | $ | (1,821 | ) |
The Company’s union employees participate in a multi-employer plan that provides health care benefits for retired union employees. Amounts contributed to the multi-employer plan for these union employees totaled $5.3 million in fiscal 2012, $5.2 million in fiscal 2011 and $5.3 million in fiscal 2010. Information from the plans’ administrators is not available to permit the Company to determine its proportionate share of termination liability, if any.
ASC Topic 715-60“Compensation—Retirement Benefits—Defined Benefit Plans—Other Postretirement” (“ASC Topic 715-60”) requires deferred compensation or postretirement benefit aspects of an endorsement-type split-dollar life insurance arrangement to be recognized as a liability by the employer and states the obligation is not effectively settled by the purchase of a life insurance policy. The liability for future benefits should be recognized based on the substantive agreement with the employee, which may be either to provide a future death benefit or to pay for the future cost of life insurance. The Company recorded service and interest cost accretion to the liability for the future cost of life insurance of $0.2 million for fiscal 2012 and $0.4 million for fiscal 2011.
92
During fiscal year 2010, comprehensive health care reform legislation under thePatient Protection and Affordable Care Act (HR 3590) and theHealth Care Education and Affordability Reconciliation Act (HR 4872) (collectively, the “Acts”) was passed and signed into law. The Acts contain provisions that could impact the Company’s accounting for retiree medical benefits in future periods. However, the extent of that impact, if any, cannot be determined until regulations are promulgated under the Acts and additional interpretations of the Acts become available. Elements of the Acts, the impact of which are currently not determinable, include the elimination of lifetime limits on retiree medical coverage and reduction of the existing insurance coverage gap for prescription drug benefits that are actuarially equivalent to benefits available to retirees under theMedicare Prescription Drug Improvement and Modernization Act of 2003. On June 28, 2012, the U.S. Supreme Court generally upheld the constitutionality of the Acts; however, provisions in the Acts requiring each state to expand its Medicaid program or lose all federal Medicaid funds were struck down. The U.S. Supreme Court did not invalidate the Acts’ expansion of Medicaid for states that voluntarily participate; it only held that a state’s entire Medicaid funding cannot be withheld due to its failure to participate in the expansion. The Company will continue to assess the accounting implications of the Acts as related regulations and interpretations of the Acts become available. In addition, the Company may consider plan amendments in future periods that may have accounting implications.
13. Contingencies
The Company is party to various litigation, claims and disputes, some of which are for substantial amounts, arising in the ordinary course of business. While the ultimate effect of such actions cannot be predicted with certainty, the Company believes the outcome of these matters will not result in a material effect on its financial condition or results of operations.
14. Segment Reporting
Management identifies segments based on the information monitored by the Company’s chief operating decision makers to manage the business and, accordingly, has the following two reportable segments:
| | · | | The Wholesale Distribution segment includes the results of operations from the sale of groceries and general merchandise products to both Members and Non-Members, including a broad range of branded and corporate brand products in nearly all the categories found in a typical supermarket, including dry grocery, frozen food, deli, meat, dairy, eggs, produce, bakery, ethnic, gourmet, specialty foods, natural and organic, general merchandise and health and beauty care products. Support services (other than insurance and financing), including merchandising, retail pricing, advertising, promotional planning, retail technology, equipment purchasing and real estate services, are reported in our Wholesale Distribution segment. As of September 29, 2012, the Wholesale Distribution segment represents approximately 99% of the Company’s total net sales and 84% of total assets. |
Non-perishable products consist primarily of dry grocery, frozen food, deli, ethnic, gourmet, specialty foods, natural and organic, general merchandise and health and beauty care products. They also include (1) retail support services and (2) products and shipping services provided to Non-Member customers through Unified International, Inc. Perishable products consist primarily of service deli, service bakery, meat, eggs, produce, bakery, and dairy products. Net sales within the Wholesale Distribution segment include $2.6 billion, $2.7 billion and $2.8 billion, or 68%, 70% and 71% of total Wholesale Distribution segment net sales for fiscal years ended September 29, 2012, October 1, 2011 and October 2, 2010, respectively, attributable to sales of non-perishable products, and $1.2 billion, $1.1 billion and $1.1 billion, or 31%, 29% and 28% of total Wholesale Distribution segment net sales for the fiscal years ended September 29, 2012, October 1, 2011 and October 2, 2010, respectively, attributable to sales of perishable products. Wholesale Distribution segment net sales also include revenues attributable to the Company’s retail support services, which comprise less than 1% of total Wholesale Distribution segment net sales, for each of the foregoing respective periods.
| | · | | The Insurance segment includes the results of operations for the Company’s three insurance subsidiaries (Unified Grocers Insurance Services, Springfield Insurance Company and Springfield Insurance Company, Limited). These subsidiaries provide insurance and insurance-related products, including workers’ compensation and liability insurance policies, to both the Company and its customers. Unified Grocers Insurance Services is an insurance agency that places business with insurance carriers, both non-affiliated and Springfield Insurance Company. Springfield Insurance Company, Limited is a captive |
93
| | re-insurer for Springfield Insurance Company. Unified Grocers Insurance Services is a licensed insurance agency in Alaska, Arizona, California, Idaho, New Mexico, Nevada, Oregon, Texas, Washington and Utah. Springfield Insurance Company is a licensed insurance carrier in Arizona, California, Colorado, Idaho, Montana, New Mexico, Nevada, Oregon, Texas, Washington, Wyoming and Utah. Springfield Insurance Company, Limited is a licensed insurance carrier in the Commonwealth of Bermuda. As of September 29, 2012, the Company’s Insurance segment collectively accounts for approximately 1% of the Company’s total net sales and 13% of total assets. |
The All Other category includes the results of operations for the Company’s other support businesses, including its wholly-owned finance subsidiary, whose services are provided to a common customer base, none of which individually meets the quantitative thresholds of a reportable segment. As of September 29, 2012, the All Other category collectively accounts for less than 1% of the Company’s total net sales and 3% of total assets.
Information about the Company’s operating segments is as follows:
| | | | | | | | | | | | |
| (dollars in thousands) | | | | | | | | | |
| | | Fiscal Years Ended | |
| | | September 29,
2012 | | | October 1,
2011 | | | October 2,
2010 | |
Net sales | | | | | | | | | | | | |
Wholesale distribution | | $ | 3,776,173 | | | $ | 3,832,477 | | | $ | 3,904,102 | |
Insurance | | | 30,404 | | | | 27,280 | | | | 29,794 | |
All other | | | 1,280 | | | | 1,034 | | | | 974 | |
Intersegment elimination | | | (11,585 | ) | | | (13,016 | ) | | | (13,811 | ) |
| |
Total net sales | | $ | 3,796,272 | | | $ | 3,847,775 | | | $ | 3,921,059 | |
| |
Operating income (loss) | | | | | | | | | | | | |
Wholesale distribution | | $ | 21,318 | | | $ | 32,587 | | | $ | 38,122 | |
Insurance | | | 3,465 | | | | 4,791 | | | | 4,617 | |
All other | | | 336 | | | | 55 | | | | (89 | ) |
| |
Total operating income | | | 25,119 | | | | 37,433 | | | | 42,650 | |
| |
Interest expense | | | (12,572 | ) | | | (12,342 | ) | | | (11,511 | ) |
Patronage dividends | | | (10,787 | ) | | | (12,431 | ) | | | (14,038 | ) |
Income taxes | | | 193 | | | | (5,273 | ) | | | (6,123 | ) |
| |
Net earnings | | $ | 1,953 | | | $ | 7,387 | | | $ | 10,978 | |
| |
Depreciation and amortization | | | | | | | | | | | | |
Wholesale distribution | | $ | 25,648 | | | $ | 22,847 | | | $ | 25,271 | |
Insurance | | | 375 | | | | 332 | | | | 167 | |
All other | | | 56 | | | | 60 | | | | 6 | |
| |
Total depreciation and amortization | | $ | 26,079 | | | $ | 23,239 | | | $ | 25,444 | |
| |
Capital expenditures | | | | | | | | | | | | |
Wholesale distribution | | $ | 8,182 | | | $ | 8,865 | | | $ | 6,976 | |
Insurance | | | 4,617 | | | | 75 | | | | 797 | |
All other | | | — | | | | — | | | | — | |
| |
Total capital expenditures | | $ | 12,799 | | | $ | 8,940 | | | $ | 7,773 | |
| |
Identifiable assets at respective year end date | | | | | | | | | | | | |
Wholesale distribution | | $ | 780,446 | | | $ | 791,554 | | | $ | 796,738 | |
Insurance | | | 115,933 | | | | 106,272 | | | | 109,161 | |
All other | | | 24,596 | | | | 25,852 | | | | 21,789 | |
| |
Total identifiable assets at respective fiscal year end date | | $ | 920,975 | | | $ | 923,678 | | | $ | 927,688 | |
| |
94
15. Concentration of Credit Risk
Financial instruments which potentially expose the Company to concentrations of credit risk consist primarily of trade receivables, notes receivable, and lease guarantees for certain Members. These concentrations of credit risk may be affected by changes in economic or other conditions affecting the western United States, particularly Arizona, California, Nevada, Oregon and Washington. However, management believes that receivables are well diversified, and the allowances for doubtful accounts are sufficient to absorb estimated losses. Obligations of Members to the Company, including lease guarantees, are generally supported by the Company’s right of offset, upon default, against the Members’ cash deposits and shareholdings, as well as personal guarantees and reimbursement and indemnification agreements.
The Company’s largest customer, Smart & Final, Inc., accounted for 13%, 12% and 11% of total net sales for the fiscal years ended September 29, 2012, October 1, 2011 and October 2, 2010, respectively. The Company’s ten largest customers (including Smart & Final, Inc.) combined accounted for 46%, 45% and 44% of total net sales for the fiscal years ended September 29, 2012, October 1, 2011 and October 2, 2010, respectively.
The Company’s ten customers with the largest accounts receivable balances accounted for approximately 39%, 37% and 41% of total accounts receivable at September 29, 2012, October 1, 2011 and October 2, 2010, respectively.
16. Fair Value of Financial Instruments
The following methods and assumptions were used to estimate the fair value of each class of financial instruments for which it is practicable to estimate that value:
Cash and cash equivalents. The carrying amount approximates fair value due to the short maturity of these instruments.
Accounts receivable and current portion of notes receivable. The carrying amount of accounts receivable and the current portion of notes receivable approximates the fair value of net accounts and notes receivable due to their short-term maturity.
Investments. Generally, the fair values for investments are readily determinable based on actively traded securities in the marketplace. Investments that are not actively traded are valued based upon inputs including quoted prices for identical or similar assets. Equity securities that do not have readily determinable fair values are accounted for using the cost or equity methods of accounting. The Company regularly evaluates securities carried at cost to determine whether there has been any diminution in value that is deemed to be other than temporary and adjusts the value accordingly.
The following table represents the Company’s financial instruments recorded at fair value and the hierarchy of those assets as of September 29, 2012:
| | | | | | | | | | | | | | | | |
| (dollars in thousands) | | | | | | |
| | | Level 1 | | | Level 2 | | | Level 3 | | | Total | |
Money market funds | | $ | 2,162 | | | $ | — | | | $ | — | | | $ | 2,162 | |
Common equity securities | | | 9,148 | | | | — | | | | — | | | | 9,148 | |
Mutual funds | | | 13,908 | | | | — | | | | — | | | | 13,908 | |
Corporate securities | | | — | | | | 26,371 | | | | — | | | | 26,371 | |
Government securities | | | 9,617 | | | | 30,347 | | | | — | | | | 39,964 | |
Municipal securities | | | — | | | | 258 | | | | — | | | | 258 | |
| |
Total | | $ | 34,835 | | | $ | 56,976 | | | $ | — | | | $ | 91,811 | |
| |
95
The following table represents the Company’s financial instruments recorded at fair value and the hierarchy of those assets as of October 1, 2011:
| | | | | | | | | | | | | | | | |
| (dollars in thousands) | | | | | | |
| | | Level 1 | | | Level 2 | | | Level 3 | | | Total | |
Money market funds | | $ | 1,604 | | | $ | — | | | $ | — | | | $ | 1,604 | |
Common equity securities | | | 8,657 | | | | — | | | | — | | | | 8,657 | |
Mutual funds | | | 10,683 | | | | — | | | | — | | | | 10,683 | |
Corporate securities | | | — | | | | 25,440 | | | | — | | | | 25,440 | |
Government securities | | | 10,637 | | | | 29,456 | | | | — | | | | 40,093 | |
Municipal securities | | | — | | | | 907 | | | | — | | | | 907 | |
| |
Total | | $ | 31,581 | | | $ | 55,803 | | | $ | — | | | $ | 87,384 | |
| |
Money market funds are valued based on quoted prices in active markets (Level 1 inputs) and are included in cash and cash equivalents in the Company’s consolidated balance sheets. Common equity securities and mutual funds are valued based on information received from a third party. These assets are valued based on quoted prices in active markets (Level 1 inputs). At September 29, 2012, $9.1 million of common equity securities are included in investments and $13.9 million of mutual funds are included in other assets in the Company’s consolidated balance sheets. Corporate securities, consisting of high quality investment grade corporate bonds, and government and municipal securities, consisting of obligations of U.S. government corporations and agencies, U.S. government treasury securities and U.S. state and municipal bonds, are held by two of the Company’s insurance subsidiaries to fund loss reserves. These assets are valued by the Company based on information received from a third party pricing service. For assets traded in active markets, the assets are valued at quoted bond market prices (Level 1 inputs). For assets traded in inactive markets, the service’s pricing methodology uses observable inputs (such as bid/ask quotes) for identical or similar assets. Assets considered to be similar will have similar characteristics, such as: duration, volatility, prepayment speed, interest rates, yield curves, and/or risk profile and other market corroborated inputs (Level 2 inputs). The Company determines the classification of financial asset groups within the fair value hierarchy based on the lowest level of input into each group’s asset valuation. The financial instruments included in the preceding table, other than money market funds, common equity securities and mutual funds discussed above, are included in investments in the Company’s consolidated balance sheets at September 29, 2012.
The Company did not have any transfers into and out of Levels 1 and 2 during fiscal 2012 and 2011. Since the Company does not own any Level 3 financial instruments, the adoption of the requirement, pursuant to Accounting Standards Update No. 2010-06,“Improving Disclosures About Fair Value Measurements,” to separate disclosures on a gross basis about purchases, sales, issuances and settlements relating to Level 3 measurements did not have an impact on the Company’s consolidated financial statements.
Notes payable. The fair values of borrowings under the Company’s revolving credit facilities are estimated to approximate their carrying amounts due to the short maturities of those obligations. The fair values for other notes payable are based primarily on rates currently available to the Company for debt with similar terms and remaining maturities.
The fair value of notes payable, excluding capital leases, was $203.2 million and $237.2 million compared to their carrying value of $200.3 million and $229.7 million at September 29, 2012 and October 1, 2011, respectively.
The methods and assumptions used to estimate the fair values of the Company’s financial instruments at September 29, 2012 and October 1, 2011 were based on estimates of market conditions, estimates using present value and risks existing at that time (Level 3 inputs). These values represent an approximation of possible value and may never actually be realized.
17. Related Party Transactions
Members affiliated with directors of the Company make purchases of merchandise from the Company and also may receive benefits and services that are of the type generally offered by the Company to similarly situated eligible Members.
96
Since the programs listed below are only available to Members of the Company, it is not possible to assess whether transactions with Members of the Company, including entities affiliated with directors of the Company, are less favorable to the Company than similar transactions with unrelated third parties. However, management believes such transactions are on terms that are generally consistent with terms available to other Members similarly situated.
A brief description of related party transactions with Members affiliated with directors of the Company and transactions with executive officers follows.
Loans to Members
Unified provides loan financing to its Members. The Company had the following loans outstanding at September 29, 2012 to a Member affiliated with a director of the Company:
| | | | | | | | |
| (dollars in thousands) | | | | | | |
| Director | | Aggregate
Loan Balance at
September 29,
2012 | | | Maturity
Date | |
Michael A. Provenzano, Jr. | | $ | 5,822 | | | | 2013-2014 | |
The Company’s wholly-owned finance subsidiary, Grocers Capital Company (“GCC”) is a party to an Amended and Restated Credit Agreement (the “Loan Agreement”), dated July 1, 2011, with PRM Family Holding Company, LLC (“PRM”) and Bank of America, N.A., which is both the administrative agent and a lender under the Loan Agreement (“Bank of America”). Michael A. Provenzano, Jr., a director of the Company, is a shareholder, director and officer of PRM. Under the terms of the Loan Agreement, GCC loaned PRM $5 million in the form of a note receivable under which GCC is to receive monthly interest payments at 8% per annum on the outstanding principal balance and quarterly principal repayments of $225,000 commencing January 1, 2013 and continuing through July 1, 2014, with the note maturing and the balance of the note due to GCC on August 1, 2014. The loan by GCC is effectively subordinate to a $40 million line of credit by Bank of America also made under the Loan Agreement, which is scheduled for repayment on July 1, 2014.
On May 30, 2012, GCC, PRM and Bank of America entered into a first amendment to, and waiver of certain provisions of, the Loan Agreement (the “First Amendment and Waiver”). Under the First Amendment and Waiver, Bank of America and GCC agreed to waive the past non-compliance by PRM of certain covenants contained in the Loan Agreement. On August 13, 2012, GCC, PRM and Bank of America entered into a second amendment to, and waiver of certain provisions of, the Loan Agreement (the “Second Amendment and Waiver”). Under the Second Amendment and Waiver, the $40 million line of credit by Bank of America is reduced to $33.4 million effective September 30, 2012 and $30 million effective December 31, 2012, and Bank of America and GCC have agreed to waive the past non-compliance by PRM of certain covenants contained in the Loan Agreement. PRM has made all required interest payments to date, and the Company believes that it will be able to recover the full amount of the note receivable.
97
Lease Guarantees and Subleases
The Company provides lease guarantees and subleases to its Members. The Company has executed lease guarantees or subleases to Members affiliated with directors of the Company at September 29, 2012 as follows:
| | | | | | | | | | | | | | | | |
| (dollars in thousands) | | | | | | | | | | | | |
| Director | | No. of
Stores | | | Total
Current
Annual
Rent | | | Total
Guaranteed
Rent | | | Expiration
Date(s) | |
Michael A. Provenzano, Jr. | | | 2 | | | $ | 341 | | | $ | 5,758 | | | | 2027-2032 | |
John Berberian | | | 2 | | | | 310 | | | | 1,482 | | | | 2017-2018 | |
Mimi Song | | | 2 | | | | 670 | | | | 6,275 | | | | 2020-2023 | |
Supply Agreements
During the course of its business, the Company enters into individually negotiated supply agreements with its Members. These agreements require the Member to purchase certain agreed amounts of its merchandise requirements from the Company and obligate the Company to supply such merchandise under agreed terms and conditions relating to such matters as pricing and delivery. The Company has executed supply agreements with Members affiliated with directors of the Company at September 29, 2012 as follows:
| | | | |
| Director | | Expiration
Date | |
Oscar Gonzalez | | | 2015 | |
Jay T. McCormack | | | 2015 | |
Michael A. Provenzano, Jr. | | | *2015 | |
Mimi Song | | | 2016 | |
| * | | The supply agreement with Michael A. Provenzano, Jr. will expire in the later of the Company’s fiscal year 2015 or the year in which all obligations set forth in the Loan Agreement are paid in full. |
Loan to Executive Officer
In December 2000, to facilitate a senior executive’s relocation to Southern California, the Company loaned to this executive, pursuant to a note, $0.1 million with interest of 7.0% per annum payable quarterly and principal due at the option of the holder. During fiscal year 2011, the interest rate was modified prospectively to 3.0%.
18. Subsequent Events
On October 16, 2012, one of the Company’s directors, Michael A. Provenzano, Jr., resigned from the Company’s Board of Directors effective immediately.
On December 12, 2012, the Board authorized the repurchase on or before December 31, 2012 of 1,050 Class A Shares with an approximate redemption value of $0.3 million and 8,867 Class B Shares with an approximate redemption value of $2.7 million.
Subsequent events have been evaluated by the Company through the date financial statements were issued.
98
Item 9. CHANGES IN AND DISAGREEMENTS WITH ACCOUNTANTS ON ACCOUNTING AND FINANCIAL DISCLOSURE
None.
Item 9A. CONTROLS AND PROCEDURES
Disclosure controls and procedures. Disclosure controls are controls and procedures designed to reasonably assure that information required to be disclosed in our reports filed under the Securities Exchange Act of 1934, such as this Annual Report, is recorded, processed, summarized and reported within the time periods specified in the Securities and Exchange Commission’s rules and forms. Disclosure controls are also designed to reasonably assure that such information is accumulated and communicated to our management, including the Chief Executive Officer (“CEO”) and Chief Financial Officer (“CFO”), as appropriate, to allow timely decisions regarding required disclosure. Disclosure controls and procedures, no matter how well designed and implemented, can provide only reasonable assurance of achieving an entity’s disclosure objectives. The likelihood of achieving such objectives is affected by limitations inherent in disclosure controls and procedures. These include the fact that human judgment in decision-making can be faulty and that breakdowns in internal control can occur because of human failures such as simple errors, mistakes or intentional circumvention of the established processes.
At the end of the period covered by this report, our management, with the participation of our CEO and CFO, carried out an evaluation of the effectiveness of our disclosure controls and procedures (as defined in Rule 13a-15(e) and 15d-15(e) under the Securities Exchange Act of 1934). Our CEO and CFO concluded that these disclosure controls and procedures were effective at the reasonable assurance level described above as of the end of the period covered in this report.
Management’s annual report on internal control over financial reporting. Our management is responsible for establishing and maintaining adequate internal control over financial reporting (as defined in Rule 13a-15(f) under the Securities Exchange Act of 1934). Our internal control over financial reporting is a process designed by, or under the supervision of, our CEO and CFO and implemented by the Board, management and other personnel to provide reasonable assurance regarding the reliability of financial reporting and the preparation of financial statements for external purposes in accordance with generally accepted accounting principles in the United States of America.
Our internal control over financial reporting includes those policies and procedures that: (1) pertain to the maintenance of records that, in reasonable detail, accurately and fairly reflect the transactions and dispositions of our assets; (2) provide reasonable assurance that transactions are recorded as necessary to permit preparation of financial statements in accordance with generally accepted accounting principles in the United States of America, and that receipts and expenditures are being made only in accordance with authorizations of our management and the Board; and (3) provide reasonable assurance regarding prevention or timely detection of the unauthorized acquisition, use or disposition of our assets that could have a material effect on the financial statements.
Because of its inherent limitations, internal control over financial reporting may not prevent or detect misstatements. Also, projections of any evaluation of effectiveness to future periods are subject to the risk that controls may become inadequate because of changes in conditions, or that the degree of compliance with the policies or procedures may deteriorate.
Under the supervision and with the participation from management, including our CEO and CFO, we conducted an evaluation of the effectiveness of our internal control over financial reporting based on the framework and criteria established inInternal Control—Integrated Framework issued by the Committee of Sponsoring Organizations of the Treadway Commission (“COSO”). Based on this evaluation, our management concluded that our internal control over financial reporting was effective as of September 29, 2012 based on those criteria.
Changes in internal controls over financial reporting. Our management, with the participation of our CEO and CFO, has evaluated any changes in our internal control over financial reporting that occurred during the fourth quarter of our fiscal year ended September 29, 2012. Based on that evaluation, our management concluded that
99
no change in our internal control over financial reporting (as defined in Rule 13a—15(f) under the Securities Exchange Act of 1934) occurred during the fourth quarter of our fiscal year ended September 29, 2012 that has materially affected, or is reasonably likely to materially affect, our internal control over financial reporting.
Item 9B. OTHER INFORMATION
None.
100
Part III
Item 10. DIRECTORS, EXECUTIVE OFFICERS AND CORPORATE GOVERNANCE
Information regarding the directors of Unified is incorporated from the information under the captions “Election of Directors,” “Board Meetings and Committees,” “Section 16(a) Beneficial Ownership Reporting Compliance” and “Code of Financial Ethics” in the Company’s proxy statement for its 2013 annual meeting of shareholders to be filed within 120 days after the end of the most recent fiscal year.
We have adopted a code of ethics that applies to our principal executive officer, principal financial officer and principal accounting officer. The code of ethics has been posted to our Internet website at http://www.unifiedgrocers.com. We intend to satisfy disclosure requirements regarding the posting on our website of any amendments to, or waivers from, any provision of our code of ethics.
The following table sets forth certain information about our executive, senior and other officers that have direct financial reporting responsibilities. Information on all other officers will be provided in our Annual Report.
| | | | | | |
| Officer’s Name | | Age | | | Business Experience During Last Five Years |
Alfred A. Plamann | | | 70 | | | Chief Executive Officer since June 2011; President and Chief Executive Officer February 1994 to June 2011. |
| | |
Robert M. Ling, Jr. | | | 55 | | | President and General Counsel since September 2012; President, General Counsel and Secretary June 2011 to September 2012; Executive Vice President, General Counsel and Secretary November 1999 to June 2011. |
| | |
Richard J. Martin | | | 67 | | | Executive Vice President, Finance & Administration and Chief Financial Officer since November 1999. |
| | |
Philip S. Smith | | | 62 | | | Executive Vice President, Chief Marketing / Procurement Officer since October 2003. |
| | |
Joseph L. Falvey | | | 52 | | | President, Market Centre and Senior Vice President since May 2012; Senior Vice President, Sales August 2007 to May 2012. |
| | |
Daniel J. Murphy | | | 66 | | | Senior Vice President, Retail Support Services and Perishables, since July 2001. |
| | |
Christine Neal | | | 59 | | | Senior Vice President, Finance and Treasurer since January 2009; Vice President and Treasurer, March 2003 to January 2009. |
| | |
Rodney L. VanBebber | | | 57 | | | Senior Vice President, Distribution since January 2000. |
| | |
Joseph A. Ney | | | 64 | | | Vice President, Insurance since November 1998. |
| | |
Randall G. Scoville | | | 52 | | | Senior Vice President, Accounting and Chief Accounting Officer since January 2011; Vice President, Accounting and Chief Accounting Officer October 2005 to December 2010. |
Under the securities laws of the United States, our directors, executive officers and any persons holding more than 10 percent of our common stock are required to report their ownership of common stock and any changes in that ownership, to the SEC within two business days of a reportable event. Based on our review of such reports and written representations furnished to us, all such required reports were filed on a timely basis in 2012.
On October 16, 2012, Philip S. Smith, Executive Vice President, Chief Marketing / Procurement Officer, informed us of his intention to retire from the Company in January 2013.
Item 11. EXECUTIVE COMPENSATION
Incorporated by reference from the information under the captions “Compensation Discussion and Analysis,” “Compensation Committee Interlocks and Insider Participation,” “Report of Compensation Committee on Executive Compensation,” “Executive Officer Compensation” and “Director Compensation” in our proxy statement for the 2013 annual meeting of shareholders to be filed within 120 days after the end of the most recent fiscal year.
101
Item 12. SECURITY OWNERSHIP OF CERTAIN BENEFICIAL OWNERS AND MANAGEMENT AND RELATED STOCKHOLDER MATTERS
Incorporated by reference from the information under the caption “Security Ownership of Directors and Officers” in our proxy statement for the 2013 annual meeting of shareholders to be filed within 120 days after the end of the most recent fiscal year.
Item 13. CERTAIN RELATIONSHIPS AND RELATED TRANSACTIONS, AND DIRECTOR INDEPENDENCE
Entities with which our directors are affiliated, as Members of Unified, purchase groceries and related products and services from us in the ordinary course of business pursuant to published terms or according to the provisions of individually negotiated supply agreements. As Members, firms with which directors are affiliated may receive various benefits including patronage dividends, allowances and retail support services. We make a variety of benefits available to Members on a negotiated basis. We have provided to our Members loan financing in the form of direct loans and loan guarantees; provided lease guarantees and subleases; as well as invested directly in Members who are sometimes affiliated with our directors. In addition, we may also enter into other agreements with Members which are affiliated with our directors, as well as agreements with our executive officers. See Note 17 of Notes to Consolidated Financial Statements in Item 8,“Financial Statements and Supplementary Data,” which is incorporated herein by this reference, for a description of related party transactions. Additional information is incorporated by reference from the information under the captions“Compensation Committee Interlocks and Insider Participation,” “Transactions with Management and Other Persons,” “Audit Committee” and“Independence” in our proxy statement for the 2013 annual meeting of shareholders to be filed within 120 days after the end of the most recent fiscal year.
Item 14. PRINCIPAL ACCOUNTANT FEES AND SERVICES
Incorporated by reference from the information under the caption“Independent Registered Public Accounting Firm” in our proxy statement for the 2013 annual meeting of shareholders to be filed within 120 days after the end of the most recent fiscal year.
Part IV
Item 15. EXHIBITS AND FINANCIAL STATEMENT SCHEDULES
(a) (1) and (2) Financial Statements and Financial Statement Schedule
Our consolidated financial statements, the notes thereto, and the related report thereon of the independent registered public accounting firm are filed under Item 8 of this report. The financial statement schedule is filed herein and the related report thereon of the independent registered public accounting firm is filed under Item 8 of this report.
(a) (1) Consolidated Financial Statements:
| | · | | Report of Independent Registered Public Accounting Firm. |
| | · | | Consolidated Balance Sheets as of September 29, 2012 and October 1, 2011. |
| | · | | Consolidated Statements of Earnings for the fiscal years ended September 29, 2012, October 1, 2011 and October 2, 2010. |
| | · | | Consolidated Statements of Comprehensive (Loss) Earnings for the fiscal years ended September 29, 2012, October 1, 2011 and October 2, 2010. |
| | · | | Consolidated Statements of Shareholders’ Equity for the fiscal years ended September 29, 2012, October 1, 2011 and October 2, 2010. |
| | · | | Consolidated Statements of Cash Flows for the fiscal years ended September 29, 2012, October 1, 2011 and October 2, 2010. |
| | · | | Notes to Consolidated Financial Statements. |
102
(2) Financial Statement Schedule:
| | · | | Schedule II—Valuation and Qualifying Accounts for the fiscal years ended September 29, 2012, October 1, 2011 and October 2, 2010. |
All other financial statement schedules for which provision is made in the applicable accounting regulations of the SEC are not required under the instructions to Item 8 or are inapplicable and therefore have been omitted.
(3) Exhibits:
See Item 15 (b) below.
The following documents are filed as part of this Annual Report on Form 10-K:
| | |
Exhibit
No. | | Description |
| 3.1 | | Amended and Restated Articles of Incorporation of Unified Grocers, Inc., as amended (incorporated by reference to Exhibit 3.1 to the Company’s Quarterly Report on Form 10-Q for the fiscal quarter ended March 29, 2008, filed on May 13, 2008). |
| |
| 3.2 | | Bylaws of the Unified Grocers, Inc., as amended (incorporated by reference to Exhibit 3.2 to the Company’s Annual Report on Form 10-K for the fiscal year ended October 1, 2011, filed on December 9, 2011). |
| |
| 4.1 | | Retail Grocer Application and Agreement for Continuing Service Affiliation with Unified Grocers, Inc. and Pledge Agreement (incorporated by reference to Exhibit 4.7 to Amendment No. 2 to Form S-1 Registration Statement of the Company filed on December 31, 1981, File No. 2-70069). |
| |
| 4.2 | | Retail Grocer Application and Agreement for Service Affiliation with and the Purchase of Shares of Unified Grocers, Inc. and Pledge Agreement (incorporated by reference to Exhibit 4.2 to Post Effective Amendment No. 7 to Form S-2 Registration Statement of the Company filed on December 13, 1989, File No. 33-19284). |
| |
| 4.3 | | Copy of Application and Agreement for Service Affiliation as a Member-Patron/Affiliate with Unified Grocers, Inc. and Pledge and Security Agreement (incorporated by reference to Exhibit 4.1 to the Company’s Quarterly Report on Form 10-Q for the fiscal quarter ended April 1, 2000). |
| |
| 4.4 | | Subordination Agreement (Member-Patron-1988) (incorporated by reference to Exhibit 4.4 to Post-Effective Amendment No. 4 to Form S-2 Registration Statement of the Company filed on July 15, 1988, File No. 33-19284). |
| |
| 4.5 | | Subordination Agreement (New Member-Patron-1988) (incorporated by reference to Exhibit 4.6 to Post-Effective Amendment No. 4 to Form S-2 Registration Statement of the Company filed on
July 15, 1988, File No. 33-19284). |
| |
| 4.6 | | Copy of Member Patron/Affiliate Subordination Agreement (Subordination of Required Deposit) (incorporated by reference to Exhibit 4.10 to the Company’s Annual Report on Form 10-K for the fiscal year ended September 29, 2001 filed on December 27, 2001). |
| |
| 4.7 | | Form of Pledge and Security Agreement (effective July, 2008) (incorporated by reference to Exhibit 4.41.1 to the Company’s Quarterly Report on Form 10-Q for the fiscal quarter ended on June 28, 2008, filed on August 12, 2008). |
| |
| 4.8 | | Form of Member Subordination (effective July, 2008) (incorporated by reference to Exhibit 4.42.1 to the Company’s Quarterly Report on Form 10-Q for the fiscal quarter ended on June 28, 2008, filed on August 12, 2008). |
| |
| 4.9 | | Form of Continuing Guaranty (effective July, 2008) (incorporated by reference to Exhibit 4.43.1 to the Company’s Quarterly Report on Form 10-Q for the fiscal quarter ended on June 28, 2008, filed on August 12, 2008). |
| |
| 4.90 | | Form of Class A Share Certificate (incorporated by reference to Exhibit 4.12 to the Company’s Annual Report on Form 10-K for the fiscal year ended September 30, 2000, filed on
December 26, 2000). |
103
| | |
Exhibit
No. | | Description |
| |
| 4.91 | | Form of Class B Share Certificate (incorporated by reference to Exhibit 4.13 to the Company’s Annual Report on Form 10-K for the fiscal year ended September 30, 2000, filed on December 26, 2000). |
| |
| 4.92 | | Agreement respecting directors’ shares (incorporated by reference to Exhibit 4.9 to Amendment No. 2 to Form S-1 Registration Statement of the Company filed on December 31, 1981, File No. 2-70069). |
| |
| 4.93 | | Form of Class E Share Certificate (incorporated by reference to Exhibit 4.37 to the Company’s Registration Statement on Form S-1, filed on January 31, 2006, File No. 333-131414). |
| |
| 10.1** | | Form of Indemnification Agreement between Unified Grocers, Inc. and each Director and Officer (incorporated by reference to Exhibit 10.20.1 to the Company’s Quarterly Report on Form 10-Q for the fiscal quarter ended June 30, 2007 filed on August 14, 2007). |
| |
| 10.2** | | Form of Employment Agreement between Unified Grocers, Inc. and Alfred A. Plamann (incorporated by reference to Exhibit 10.19 to Form S-4 Registration Statement of the Company filed on August 26, 1999, File No. 333-85917). |
| |
| 10.2.1** | | Amendment to Employment Agreement dated as of August 1999, between Unified Grocers, Inc. and Alfred A. Plamann (incorporated by reference to Exhibit 10.27 to Form S-4 Registration Statement of the Company filed on August 26, 1999, File No. 333-85917). |
| |
| 10.2.2** | | Second Amendment to Employment Agreement dated as of April 2001, between Unified Grocers, Inc. and Alfred A. Plamann (incorporated by reference to Exhibit 10.51 to the Company’s Quarter Report on Form 10-Q for the fiscal quarter ended June 30, 2001, filed on August 14, 2001). |
| |
| 10.2.3** | | Third Amendment to Employment Agreement dated as of August 2003, between Unified Grocers, Inc. and Alfred A. Plamann (incorporated by reference to Exhibit 10.19.1 to the Company’s Annual Report on Form 10-K for the fiscal year ended September 27, 2003, filed on December 16, 2003). |
| |
| 10.2.4** | | Fourth Amendment to Employment Agreement dated as of December 30, 2010, between Unified Grocers, Inc. and Alfred A. Plamann (incorporated by reference to Exhibit 10.6 to Post-Effective Amendment No. 2 to Form S-1 Registration Statement of the Company filed on January 12, 2011, File No. 333-156519). |
| |
| 10.2.5** | | Fifth Amendment to Employment Agreement dated as of May 15, 2012, between Unified Grocers, Inc. and Alfred A. Plamann (incorporated by reference to Exhibit 10.6 to the Company’s Quarterly Report on Form 10-Q for the fiscal quarter ended March 31, 2012, filed on May 15, 2012). |
| |
| 10.3** | | Amended and Restated Severance Agreement for the Company President dated as of May 15, 2012, between Unified Grocers, Inc. and Robert M. Ling, Jr. (incorporated by reference to Exhibit 10.7 to the Company’s Quarterly Report on Form 10-Q for the fiscal quarter ended March 31, 2012, filed on May 15, 2012). |
| |
| 10.4** | | Form of Severance Agreement for Vice Presidents, Senior Vice Presidents and Executive Vice Presidents with Less Than Three Years in an Officer Position dated as of December 30, 2010, executed by John C. Bedrosian, Dirk T. Davis, Joseph L. Falvey, Gary C. Hammett, Gary S. Herman, Robert E. Lutz, Daniel J. Murphy, Christine Neal, Joseph A. Ney, Randall G. Scoville and Rodney L. Van Bebber (incorporated by reference to Exhibit 10.73 to Post-Effective Amendment No. 2 to Form S-1 Registration Statement of the Company filed on January 12, 2011, File No. 333-156519). |
| |
| 10.5** | | Form of Severance Agreement for Executive Vice Presidents with Three Years or More in an Officer Position dated as of December 30, 2010, executed by Richard J. Martin and Philip S. Smith (incorporated by reference to Exhibit 10.74 to Post-Effective Amendment No. 2 to Form S-1 Registration Statement of the Company filed on January 12, 2011, File No. 333-156519). |
| |
| 10.6** | | Amended and Restated Unified Grocers, Inc. Deferred Compensation Plan dated as of May 1, 1999 (incorporated by reference to Exhibit 10.2 to the Company’s Annual Report on Form 10-K for the fiscal year ended August 28, 1999 filed on November 14, 1999). |
104
| | |
Exhibit
No. | | Description |
| 10.6.1** | | Amendment No. 1 to the Amended and Restated Unified Grocers, Inc. Deferred Compensation Plan, amended as of October 19, 2007 (incorporated by reference to Exhibit 10.2.1 to the Company’s Annual Report on Form 10-K for the fiscal year ended September 29, 2007, filed on December 13, 2007). |
| 10.7** | | Unified Grocers, Inc. Deferred Compensation Plan II, Master Plan, dated as of September 26, 2008, effective January 1, 2005 (incorporated by reference to Exhibit 10.30 to the Company’s Annual Report on Form 10-K for the fiscal year ended September 27, 2008, filed on December 12, 2008). |
| 10.7.1** | | Amendment No. 1 to the Unified Grocers, Inc. Deferred Compensation Plan II, effective as of January 1, 2011, amended as of September 9, 2010 (incorporated by reference to Exhibit 10.30.1 to the Company’s Annual Report on Form 10-K for the fiscal year ended October 2, 2010, filed on December 10, 2010). |
| 10.8** | | Unified Grocers, Inc. Executive Salary Protection Plan III, Master Plan Document, dated as of September 26, 2008, effective January 1, 2005 (incorporated by reference to Exhibit 10.36 to the Company’s Annual Report on Form 10-K for the fiscal year ended September 27, 2008, filed on December 12, 2008). |
| 10.9** | | Comprehensive Amendment to Unified Grocers, Inc. Employees’ Excess Benefit Plan dated as of December 5, 1995 (incorporated by reference to Exhibit 10.7 to the Company’s Annual Report on Form 10-K for the fiscal year ended August 30, 1997 filed on November 28, 1997). |
| 10.10** | | Unified Grocers, Inc. Executive Insurance Plan Split dollar Agreement and Schedule of Executive Officers party thereto (incorporated by reference to Exhibit 10.6 to the Company’s Annual Report on Form 10-K for the fiscal year ended September 2, 1995 filed on December 1, 1995). |
| 10.11** | | Unified Grocers, Inc. Executive Medical Reimbursement Plan, dated as of January 1, 2011 (incorporated by reference to Exhibit 10.78 to the Company’s Annual Report on Form 10-K for the fiscal year ended October 1, 2011, filed on December 9, 2011). |
| 10.12** | | Unified Grocers, Inc. Officer Retiree Medical Plan Document and Summary Plan Description, effective October 1, 2011 (incorporated by reference to Exhibit 10.78 to the Company’s Annual Report on Form 10-K for the fiscal year ended October 1, 2011, filed on December 9, 2011). |
| 10.13** | | Union Bank of California Trust Agreement for Cash Balance Retirement Plan for Employees of Associated Grocers, Inc. (predecessor-in-interest to Unified Grocers, Inc.) as of September 13, 2004 (incorporated by reference to Exhibit 10.57 to the Company’s Quarterly Report on Form 10-Q for the fiscal quarter ended December 29, 2007, filed on February 12, 2008). |
| 10.14** | | Amended and Restated Unified Grocers, Inc. Cash Balance Plan, generally effective January 1, 2010, as amended (incorporated by reference to Exhibit 10.75 to the Company’s Quarterly Report on Form 10-Q for the fiscal quarter ended April 2, 2011, filed on May 17, 2011). |
| 10.14.1** | | Amendment No. 1 to the Unified Grocers, Inc. Cash Balance Plan, amended as of November 29, 2011 (incorporated by reference to Exhibit 10.75.1 to the Company’s Annual Report on Form 10-K for the fiscal year ended October 1, 2011 filed on December 9, 2011). |
| 10.15** | | Amended and Restated Unified Grocers, Inc. Employee Savings Plan, effective January 1, 2010, except as otherwise provided (incorporated by reference to Exhibit 10.76 to the Company’s Quarterly Report on Form 10-Q for the fiscal quarter ended April 2, 2011, filed on May 17, 2011). |
| 10.15.1** | | Amendment No. 1 to the Unified Grocers, Inc. Employees Savings Plan, amended as of March 17, 2011(incorporated by reference to Exhibit 10.76.1 to the Company’s Quarterly Report on Form 10-Q for the fiscal quarter ended April 2, 2011, filed on May 17, 2011). |
| 10.15.2** | | Amendment No. 2 to the Unified Grocers, Inc. Employees Savings Plan, amended as of May 7, 2011(incorporated by reference to Exhibit 10.3 to the Company’s Quarterly Report on Form 10-Q for the fiscal quarter ended June 30, 2012, filed on August 14, 2012). |
| 10.16** | | Amended and Restated Unified Grocers, Inc. Sheltered Savings Plan, effective January 1, 2010, except as otherwise provided (incorporated by reference to Exhibit 10.77 to the Company’s Quarterly Report on Form 10-Q for the fiscal quarter ended April 2, 2011, filed on May 17, 2011). |
105
| | |
Exhibit
No. | | Description |
| |
| 10.16.1** | | Amendment No. 1 to the Unified Grocers, Inc. Sheltered Savings Plan, amended as of March 17, 2011 (incorporated by reference to Exhibit 10.77.1 to the Company’s Quarterly Report on Form 10-Q for the fiscal quarter ended April 2, 2011, filed on May 17, 2011). |
| |
| 10.17 | | Promissory Note dated June 4, 1996, due on demand in favor of Grocers Capital Company by Robert M. Ling, Jr. (incorporated by reference to Exhibit 10.45 to the Company’s Annual Report on Form 10-K for the fiscal year ended September 27, 2003, filed on December 16, 2003). |
| |
| 10.18 | | Promissory Note dated December 6, 2000, due on demand in favor of Grocers Capital Company by Daniel J. Murphy and Debra A. Murphy (incorporated by reference to Exhibit 10.46 to the Company’s Annual Report on Form 10-K for the fiscal year ended September 27, 2003, filed on December 16, 2003). |
| |
| 10.19 | | Amended and Restated Note Purchase Agreement, effective January 6, 2006, by and among Unified Grocers, Inc. and the Noteholders listed on the signature pages thereto (incorporated by reference to Exhibit 4.1 to the Company’s Current Report on Form 8-K, filed on January 11, 2006). |
| |
| 10.19.1 | | Amendment to Note Purchase Agreement and Consent, dated as of December 19, 2006, by and among Unified Grocers, Inc., John Hancock Life Insurance Company as collateral agent for the Noteholders and the Noteholders under the Amended and Restated Note Purchase Agreement listed on the signature pages thereto (incorporated by reference to Exhibit 4.40 to the Company’s Quarterly Report on Form 10-Q for the fiscal quarter ended December 30, 2006 filed on February 13, 2007). |
| |
| 10.19.2 | | Second Amendment to Note Purchase Agreement dated as of November 7, 2008 by and among Unified Grocers, Inc. and the Noteholders listed on the signature page thereto (incorporated by reference to Exhibit 10.7.2 to the Company’s Annual Report on Form 10-K for the fiscal year ended September 27, 2008, filed on December 12, 2008). |
| |
| 10.19.3 | | Third Amendment to Note Purchase Agreement dated as of November 3, 2009 by and among Unified Grocers, Inc. and the Noteholders listed on the signature page thereto (incorporated by reference to Exhibit 10.1 to the Company’s Current Report on Form 8-K, filed on November 9, 2009). |
| |
| 10.19.4 | | Fourth Amendment to Note Purchase Agreement dated as of June 29, 2012 by and among Unified Grocers, Inc. and the Noteholders listed on the signature page thereto (incorporated by reference to Exhibit 10.2 to the Company’s Quarterly Report on Form 10-q for the fiscal quarter ended June 30, 2012, filed on August 14, 2012). |
| |
| 10.20 | | Credit Agreement, dated as of October 8, 2010, by and among Unified Grocers, Inc., the lenders party thereto, and Wells Fargo Bank, National Association, as Administrative Agent (incorporated by reference to Exhibit 99.1 to the Company’s Current Report on Form 8-K, filed on October 13, 2010). |
| |
| 10.20.1 | | First Amendment to Credit Agreement, dated as of November 12, 2010 (incorporated by reference to Exhibit 10.69.1 to the Company’s Annual Report on Form 10-K for the fiscal year ended October 2, 2010, filed on December 10, 2010). |
| |
| 10.20.2 | | Second Amendment to Credit Agreement, dated as of June 19, 2012 (incorporated by reference to Exhibit 10. 1 to the Company’s Quarterly Report on Form 10-Q for the fiscal quarter ended June 30, 2012, filed on August 14, 2012). |
| |
| 10.21 | | Security Agreement, dated as of October 8, 2010, by and among Unified Grocers, Inc., Crown Grocers, Inc., Market Centre, and Wells Fargo Bank, National Association, as Administrative Agent and Secured Party for the Beneficiaries (defined therein) (incorporated by reference to Exhibit 99.2 to the Company’s Current Report on Form 8-K, filed on October 13, 2010). |
| |
| 10.22 | | Subsidiary Guaranty, dated as of October 8, 2010, by and among Crown Grocers, Inc. and Market Centre, in favor of Wells Fargo Bank, National Association, as agent and representative of the Lenders and other Beneficiaries described therein (incorporated by reference to Exhibit 99.3 to the Company’s Current Report on Form 8-K, filed on October 13, 2010). |
106
| | |
Exhibit
No. | | Description |
| |
| 10.23 | | Loan and Security Agreement, dated as of September 24, 2010, by and among Grocers Capital Company, the lenders signatory thereto, and California Bank & Trust, as Arranger and Administrative Agent (incorporated by reference to Exhibit 99.4 to the Company’s Current Report on Form 8-K, filed on October 13, 2010). |
| |
| 10.24 | | Commercial Lease-Net dated December 6, 1994 between TriNet Essential Facilities XII and Unified Grocers, Inc. (incorporated by reference to Exhibit 10.17 to the Company’s Annual Report on Form 10-K for the fiscal year ended September 2, 1995 filed on December 1, 1995). |
| |
| 10.24.1 | | First Amendment to Lease, dated January 4, 2005, between iStart HQ, L.P. (successor-in-interest landlord) and Unified Grocers, Inc. (incorporated by reference to Exhibit 10.1 to the Company’s Quarterly report on Form 10-Q for the fiscal quarter ended March 31, 2012, filed on May 15, 2012). |
| |
| 10.25 | | First Amendment to Industrial Real Estate Lease Agreement by and between 3301 South Norfolk, LLC., as Landlord, and Unified Grocers, Inc., as assigned by Associated Grocers, Inc., as Tenant, under Industrial Real Estate Lease Agreement dated April 19, 2007 (incorporated by reference to Exhibit 10.68 to the Company’s Quarterly Report on Form 10-Q for the fiscal quarter ended April 3, 2010, filed on May 14, 2010). |
| |
| 10.25.1 | | Second Amendment to Industrial Real Estate Lease Agreement by and between 3301 South Norfolk, LLC., as Landlord, and Unified Grocers, Inc., formerly Unified Western Grocers, Inc., as assigned by Associated Grocers, Inc., as Tenant, under Industrial Real Estate Lease Agreement dated April 19, 2007 (incorporated by reference to Exhibit 10.68.1 to the Company’s Quarterly Report on Form 10-Q for the fiscal quarter ended January 1, 2011, filed on February 15, 2011). |
| |
| 10.25.2 | | Third Amendment to Industrial Real Estate Lease, dated September 14, 2011, between 3301 South Norfolk, LLC. and Unified Grocers, Inc. (incorporated by reference to Exhibit 10.2 to the Company’s Quarterly report on Form 10-Q for the fiscal quarter ended March 31, 2012, filed on May 15, 2012). |
| |
| 10.25.3 | | Fourth Amendment to Industrial Real Estate Lease, dated February 8, 2012, between 3301 South Norfolk, LLC. and Unified Grocers, Inc. (incorporated by reference to Exhibit 10.3 to the Company’s Quarterly report on Form 10-Q for the fiscal quarter ended March 31, 2012, filed on May 15, 2012). |
| |
| 10.26 | | Commercial Lease-Net, dated March 1, 2005, between Atlantic and Sheila, L.P. and Unified Grocers, Inc. (incorporated by reference to Exhibit 10.4 to the Company’s Quarterly report on Form 10-Q for the fiscal quarter ended March 31, 2012, filed on May 15, 2012). |
| |
| 10.26.1 | | Addendum to Commercial Lease-Net, dated March 1, 2005, between Atlantic and Sheila, L.P. and Unified Grocers, Inc. (incorporated by reference to Exhibit 10.4.1 to the Company’s Quarterly report on Form 10-Q for the fiscal quarter ended March 31, 2012, filed on May 15, 2012). |
| |
| 10.27 | | Standard Industrial Lease, dated May 23, 2002, among Dermody Properties, Dermody Family Limited Partnership II and Unified Grocers, Inc. (incorporated by reference to Exhibit 10.5 to the Company’s Quarterly report on Form 10-Q for the fiscal quarter ended March 31, 2012, filed on May 15, 2012). |
| |
| 10.27.1 | | Lease Amendment and Extension Agreement, dated September 20, 2011, between Endsley Fresno Properties, L.P., successor to Dermody Properties, and Unified Grocers, Inc. (incorporated by reference to Exhibit 10.5.1 to the Company’s Quarterly report on Form 10-Q for the fiscal quarter ended March 31, 2012, filed on May 15, 2012). |
| |
| 14 | | Code of Financial Ethics (incorporated by reference to Exhibit 14.1 to the Company’s Annual Report on Form 10-K for the fiscal year ended October 1, 2005, filed on December 21, 2005, File No. 000-10815). |
| |
| 21* | | Subsidiaries of the Company. |
| |
| 23.1* | | Consent of Independent Registered Public Accounting Firm. |
| |
| 31.1* | | Certification pursuant to Section 302 of the Sarbanes-Oxley Act of 2002. |
107
| | |
| Exhibit No. | | Description |
| |
| 31.2* | | Certification pursuant to Section 302 of the Sarbanes-Oxley Act of 2002. |
| |
| 32.1* | | Certification pursuant to Section 906 of the Sarbanes-Oxley Act of 2002. |
| |
| 32.2* | | Certification pursuant to Section 906 of the Sarbanes-Oxley Act of 2002. |
| |
| 101.INS*** | | XBRL Instance Document. |
| |
| 101.SCH*** | | XBRL Taxonomy Extension Schema Document. |
| |
| 101.CAL*** | | XBRL Taxonomy Extension Calculation Linkbase Document. |
| |
| 101.DEF*** | | XBRL Taxonomy Extension Definition Linkbase Document. |
| |
| 101.LAB*** | | XBRL Taxonomy Extension Label Linkbase Document. |
| |
| 101.PRE*** | | XBRL Taxonomy Extension Presentation Linkbase Document. |
| ** | | Management contract or compensatory plan or arrangement. |
| *** | | Pursuant to Rule 406T of Regulation S-T, the Interactive Data Files on Exhibit 101 hereto, formatted in XBRL (eXtensible Business Reporting Language), are deemed not filed or part of a registration statement or prospectus for purposes of Sections 11 or 12 of the Securities Act of 1933, as amended, are deemed not filed for purposes of Section 18 of the Securities Exchange Act of 1934, as amended, and otherwise are not subject to liability under those sections. |
(c) Financial Statement Schedule:
Schedule II—Valuation and Qualifying Accounts for the fiscal years ended September 29, 2012, October 1, 2011 and October 2, 2010.
108
SIGNATURES
Pursuant to the requirements of Section 13 or 15(d) of the Securities Exchange Act of 1934, the registrant has duly caused this report to be signed on its behalf by the undersigned, thereunto duly authorized.
UNIFIED GROCERS, INC.
| | |
| |
By | | /S/ RICHARD J. MARTIN |
| | Richard J. Martin |
| | Executive Vice President, Finance & Administration and Chief Financial Officer (Duly Authorized Officer and Principal Financial and Accounting Officer) |
Dated: December 14, 2012
POWER OF ATTORNEY
KNOW ALL PERSONS BY THESE PRESENTS, that each person whose signature appears below hereby constitutes and appoints Robert M. Ling, Jr., President and General Counsel, his or her true and lawful attorney-in-fact and agent, with full power of substitution, to sign and execute on behalf of the undersigned any and all amendments to this report, and to perform any acts necessary in order to file the same, with all exhibits thereto and other documents in connection therewith with the Securities and Exchange Commission, granting unto said attorney-in-fact and agent full power and authority to do and perform each and every act and thing requested and necessary to be done in connection therewith, as fully to all intents and purposes as he might or could do in person, hereby ratifying and confirming all that said attorney-in-fact and agent, or their or his or her substitutes, shall do or cause to be done by virtue hereof.
Pursuant to the requirements of the Securities Exchange Act of 1934, this report has been signed below by the following persons on behalf of the registrant and in the capacities and on the dates indicated.
| | | | |
| Signature | | Title | | Date |
| | |
/s/ ALFRED A. PLAMANN Alfred A. Plamann | | Chief Executive Officer (Principal Executive Officer) | | December 14, 2012 |
| | |
/s/ RICHARD J. MARTIN Richard J. Martin | | Executive Vice President, Finance & Administration and Chief Financial Officer (Principal Financial and Accounting Officer) | | December 14, 2012 |
| | |
/s/ RANDALL G. SCOVILLE Randall G. Scoville | | Senior Vice President, Accounting and Chief Accounting Officer | | December 14, 2012 |
| | |
/s/ LOUIS A. AMEN Louis A. Amen | | Director | | December 14, 2012 |
| | |
/s/ JOHN BERBERIAN John Berberian | | Director | | December 14, 2012 |
109
| | | | |
| Signature | | Title | | Date |
| | |
/s/ OSCAR GONZALEZ Oscar Gonzalez | | Director | | December 14, 2012 |
| | |
/s/ RICHARD E. GOODSPEED Richard E. Goodspeed | | Director | | December 14, 2012 |
| | |
/s/ TERRY R. HALVERSON Terry R. Halverson | | Director | | December 14, 2012 |
| | |
/s/ PAUL KAPIOSKI Paul Kapioski | | Director | | December 14, 2012 |
| | |
/s/ DARIOUSH KHALEDI Darioush Khaledi | | Director | | December 14, 2012 |
| | |
/s/ MARK KIDD Mark Kidd | | Director | | December 14, 2012 |
| | |
/s/ JOHN D. LANG John D. Lang | | Director | | December 14, 2012 |
| | |
/s/ JAY T. MCCORMACK Jay T. McCormack | | Director | | December 14, 2012 |
| | |
/s/ JOHN NAJJAR John Najjar | | Director | | December 14, 2012 |
| | |
/s/ THOMAS S. SAYLES Thomas S. Sayles | | Director | | December 14, 2012 |
| | |
/s/ MIMI R. SONG Mimi R. Song | | Director | | December 14, 2012 |
| | |
/s/ ROBERT E. STILES Robert E. Stiles | | Director | | December 14, 2012 |
| | |
/s/ MICHAEL S. TRASK Michael S. Trask | | Director | | December 14, 2012 |
| | |
/s/ KENNETH R. TUCKER Kenneth Ray Tucker | | Director | | December 14, 2012 |
| | |
/s/ RICHARD L. WRIGHT Richard L. Wright | | Director | | December 14, 2012 |
110
Schedule II
Valuation and Qualifying Accounts
For the Fiscal Years Ended September 29, 2012, October 1, 2011 and
October 2, 2010
| | | | | | | | | | | | | | | | |
| (dollars in thousands) | | | | | | | | | | | | |
| | | Balance at
Beginning
of Period | | | Additions (Reductions)
Charged
(Credited) to
Costs and
Expense | | | Write-Offs(a) | | | Balance
at end of Period | |
Year ended October 2, 2010: | | | | | | | | | | | | | | | | |
Reserves and allowances deducted from asset accounts: | | | | | | | | | | | | | | | | |
Allowance for uncollectible accounts and notes receivable | | $ | 3,459 | | | $ | 149 | | | $ | (386 | ) | | $ | 3,222 | |
| | | | |
Year ended October 1, 2011: | | | | | | | | | | | | | | | | |
Reserves and allowances deducted from asset accounts: | | | | | | | | | | | | | | | | |
Allowance for uncollectible accounts and notes receivable | | $ | 3,222 | | | $ | 389 | | | $ | (728 | ) | | $ | 2,883 | |
| | | | |
Year ended September 29, 2012: | | | | | | | | | | | | | | | | |
Reserves and allowances deducted from asset accounts: | | | | | | | | | | | | | | | | |
Allowance for uncollectible accounts and notes receivable | | $ | 2,883 | | | $ | 1,778 | | | $ | (854 | ) | | $ | 3,807 | |
| (a) | | Accounts written off, net of recoveries. |