UNITED STATES
SECURITIES AND EXCHANGE COMMISSION
Washington, D.C. 20549
FORM N-CSR
CERTIFIED SHAREHOLDER REPORT OF REGISTERED
MANAGEMENT INVESTMENT COMPANIES
Investment Company Act file number 811-00483
ELFUN TRUSTS
(Exact name of registrant as specified in charter)
3001 SUMMER STREET, STAMFORD, CONNECTICUT 06905
(Address of principal executive offices) (Zip code)
GE ASSET MANAGEMENT, INC.
3001 SUMMER STREET, STAMFORD, CONNECTICUT 06905
(Name and address of agent for service)
Registrant’s telephone number, including area code: 800-242-0134
Date of fiscal year end: 12/31
Date of reporting period: 12/31/10
| ITEM 1. | REPORTS TO STOCKHOLDERS. |
Elfun Funds
Annual Report
December 31, 2010


This report has been prepared for shareholders and may be distributed to others only if preceded or accompanied by a current prospectus.

Information on the following performance pages relates to the Elfun Funds.
Total returns take into account changes in share price and assume reinvestment of all dividends and capital gains distributions, if any.
The performance data quoted represent past performance; past performance does not guarantee future results. Investment return and principal value will fluctuate so your shares, when redeemed, may be worth more or less than their original cost. Current performance may be higher or lower than the performance data quoted. Periods less than one year are not annualized. Please call toll-free 800-242-0134 or visit the Funds’ website at http://www.geam.com for the most recent month-end performance data.
A portion of the Elfun Tax-Exempt Income Fund’s income may be subject to state, federal and/or alternative minimum tax. Capital gains, if any, are subject to capital gains tax.
An investment in a Fund is not a deposit of any bank and is not insured or guaranteed by the Federal Deposit Insurance Corporation (FDIC) or any other government agency. An investment in a Fund is subject to risk, including possible loss of principal invested.
The Standard & Poor’s (“S&P”) 500® Composite Price Index of stocks (S&P 500 Index), Morgan Stanley Capital International Europe, Australasia, Far East Index (MSCI EAFE® Index), Barclays Capital U.S. Aggregate Bond Index and the Barclays Capital U.S. Municipal Bond Index are unmanaged indices and do not reflect the actual cost of investing in the instruments that comprise each index.
S&P 500 Index is an unmanaged, market capitalization-weighted index of stocks of 500 large U.S. companies, which is widely used as a measure of large-cap stock market performance. MSCI EAFE® Index is a market capitalization-weighted index of equity securities of companies domiciled in various countries. The index is designed to represent the performance of developed stock markets outside the U.S. and Canada and excludes certain market segments unavailable to U.S. based investors. Barclays Capital U.S. Aggregate Bond Index is a market value-weighted index of taxable investment-grade debt issues, including government, corporate, asset-backed and mortgage-backed securities, with
maturities of one year or more. This index is designed to represent the performance of the U.S. investment-grade first-rate bond market. Barclays Capital U.S. Municipal Bond Index is an unmanaged index comprised of investment-grade, fixed rate securities with maturities of at least eight years and less than twelve years.
The 90 Day T-Bill is an unmanaged measure/index of the performance of U.S. Treasury bills currently available in the marketplace having a remaining maturity of 90 days.
The results shown for the foregoing indices assume the reinvestment of net dividends or interest. The above indices/measures do not reflect the actual costs of investing in the instruments that comprise each index.
The peer universe of underlying funds used in our peer ranking calculation is based on the blend of Morningstar peer categories, as shown. Morningstar is an independent mutual fund rating service. A Fund’s performance may be compared to or ranked within a universe of mutual funds with investment objectives and policies similar but not necessarily identical to the Fund.
©2010 Morningstar, Inc. All Rights Reserved. The Morningstar information contained herein: (1) is proprietary to Morningstar and/or its content providers; (2) may not be copied or distributed; and (3) is not warranted to be accurate, complete or timely. Neither Morningstar nor its content providers are responsible for any damage or losses relating from any use of this information. Past performance is no guarantee of future results.
The views, expressed in this document reflect our judgment as of the publication date and are subject to change at any time without notice.
GE Investment Distributors, Inc., member of FINRA, is the principal underwriter and distributor of the Elfun Funds and a wholly owned subsidiary of GE Asset Management Incorporated, the investment adviser of the Funds.
1
(Unaudited)


Ralph R. Layman
The Elfun International Equity Fund is managed by a team of portfolio managers that includes Brian Hopkinson, Ralph R. Layman (pictured to the left), Paul Nestro, Jonathan L. Passmore and Michael J. Solecki. As lead portfolio manager for the Fund, Mr. Layman oversees the entire team and assigns a portion of the Fund to each manager, including himself. Each portfolio manager is limited to the management of his or her portion of the Fund, the size of the portion which Mr. Layman determines on an annual basis. The portfolio managers do not operate independently of each other, rather, the team operates collaboratively, communicating purchases or sales of securities on behalf of the Fund. See portfolio managers’ biographical information beginning on page 116.
| Q. | How did the Elfun International Equity Fund perform compared to its benchmark for the twelve-month period ended December 31, 2010? |
| A. | The Elfun International Equity Fund rose 5.77% in the twelve months ending December 31, 2010. The MSCI EAFE Index, the Fund’s benchmark, returned 7.75% and the Fund’s Morningstar peer group of 851 Foreign Large Blend funds returned an average of 10.25% for the same period. |
| Q. | What market conditions impacted the Fund performance? |
| A. | Markets were volatile for much of the year as contradictory forces dampened performance early in the year but gave way to strong gains in the second half. The evolving sovereign debt crisis in Europe negatively affected markets concerned |
| | about a growing need for austerity but the persistence of low rates, anecdotal evidence of an improving global economy and strong earnings across the globe pushed stocks higher in all major markets. Similarly, doubts regarding much-needed regulatory reform in the financial sector cast a cloud over markets in the first half but increased clarity from bodies such as the Basel 3 Committee regarding bank capitalization, liquidity and leverage provided much-needed transparency to investors later in the year. |
| Q. | What were the primary drivers of Fund performance? |
| A. | Positive impact was seen from holdings in materials, energy stocks and telecom services. The steady rise of commodity prices throughout the year was highly beneficial to metals and mining stocks and fertilizer companies leveraged to rising crop prices. A somewhat different result was seen in energy where despite rising oil prices, a combination of the BP crisis and low natural gas prices saw that sector underperform. An underweight in the underperforming telecom sector was also beneficial for performance. The lion’s share of the negative performance in the portfolio came from holdings in the financial sector, mainly in European banks. Although underweight, the portfolio was hit by the assumption that all European banks would be dragged down by the sovereign debt crisis, although direct exposure to the troubled markets of Greece, Ireland and Portugal |
2
(Unaudited)

| | was insignificant. Japanese holdings, especially those in the export markets also suffered due to a strong Yen. |
| Q. | Were there any significant changes to the Fund during the period? |
| A. | Significant changes occurred during the year, most notably in the information technology and industrial sectors (additions) funded through sales in healthcare, financials, the consumer sectors and utilities. Generally, a growing conviction in a return to economic growth prompted purchases in the more cyclical sectors and disposals in the defensive segment of the portfolio. Stocks in the IT sector appealed for increasing evidence that corporate entities are beginning to spend and industrial companies in Europe gained material advantage from the weakness in the Euro caused by the sovereign debt crisis. While the outlook for the consumer is improving, especially in Emerging Asia, the outlook for consumer staples companies is less robust, as much for valuation reasons than lack of a catalyst. Financials have remained troubled all year with individual stocks in the commercial banking segment paying a steeper price than stocks in insurance for example and particular positions were reduced as a result. Healthcare companies, given the uncertainties surrounding the regulatory environment have offered little appeal and utilities have been challenged by anemic growth and a tough financing environment, despite low rates. The portfolio finished the year overweight IT, materials and industrials, and underweight consumer discretionary, utilities, healthcare, financials and telecom. |
3
(Unaudited)
Understanding Your Fund’s Expenses
As a shareholder of the Fund you incur transaction and ongoing expenses. Transaction expenses including sales charges on purchases payments, reinvested dividends (or other distributions), and redemption fees directly reduce the investment return of the Fund. Ongoing costs include portfolio management fees, distribution and services fees, professional fees, administrative fees and other Fund expenses. The following example is intended to help you understand your ongoing costs (in dollars) of investing in the Fund and to compare these costs with the ongoing costs of investing in other mutual funds.
To illustrate these ongoing costs, we have provided an example and calculated the expenses paid by investors in each share class of the Fund during the period. The information in the following table is based on an investment of $1,000, which is invested at the beginning of the period and held for the entire six-month period ended December 31, 2010.
Actual Expenses
The first section of the table provides information about actual account values and actual expenses.
You may use the information in this section, together with the amount you invested, to estimate the expenses that you paid over the period. To do so, simply divide your account value by $1,000 (for example, an $8,600 account value divided by $1,000 = 8.6), then multiply the result by the number given for your class under the heading “Expenses Paid During Period.”
Hypothetical Example for Comparison Purposes
The second section of the table provides information about hypothetical account values and hypothetical expenses based on the Fund’s actual expense ratio and an assumed rate of return of 5% per year before expenses, which is not the Fund’s actual return. You may use this information to compare the ongoing costs of investing in the Fund and other funds. To do so, compare this 5% hypothetical example with the 5% hypothetical examples that appear in the shareholders reports of other funds.
Please note that the expenses shown in the table for both “Actual” and “Hypothetical” do not reflect any transaction costs, such as sales charges or redemption fees.
July 1, 2010 – December 31, 2010
| | | | | | | | | | | | |
| | | Account value at
the beginning
of the period ($) | | | Account value
at the end of
the period ($) | | | Expenses
paid during
the period ($)* | |
| | | |
Actual Fund Return** | | | 1,000.00 | | | | 1,247.14 | | | | 1.81 | |
| | | |
Hypothetical 5% Return
(2.5% for the period) | | | 1,000.00 | | | | 1,023.32 | | | | 1.63 | |
| * | | Expenses are equal to the Fund’s annualized expense ratio of 0.32% (for the period July 1, 2010 - December 31, 2010), multiplied by the average account value over the period, multiplied by 184/365 (to reflect the one-half year period) |
| ** | | Actual Fund Return for the six-month period ended December 31, 2010 was: 24.71%. Past performance does not guarantee future results. |
4
(Unaudited)
Investment Profile
A mutual fund designed for investors who seek long-term growth of capital and future income by investing principally in foreign securities consistent with prudent investment management and the preservation of capital. The Fund invests at least 80% of its net assets under normal circumstances in equity securities, such as common stock and preferred stocks and invests primarily (meaning at least 65%) in companies in both developed and emerging market countries outside the United States.
Top Ten Largest Holdings
as of December 31, 2010 as a % of Fair Value(b)(c)
| | | | |
Nestle S.A. | | | 2.82% | |
Siemens AG | | | 2.53% | |
HSBC Holdings PLC | | | 2.30% | |
BHP Billiton PLC | | | 2.23% | |
Potash Corporation of Saskatchewan Inc. | | | 2.16% | |
Rio Tinto PLC | | | 2.09% | |
Linde AG | | | 1.88% | |
Suzuki Motor Corp. | | | 1.85% | |
BNP Paribas | | | 1.84% | |
Prudential PLC | | | 1.82% | |
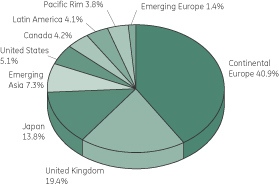
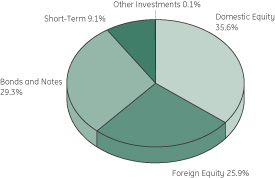
Sector Allocation
as a % of the Fair Value of $308,798 (in thousands) as of December 31, 2010.(b)(c)
Morningstar Performance Comparison
Based on average annual returns for periods ended 12/31/10
| | | | | | | | | | | | |
| | | One
Year | | | Five
Year | | | Ten
Year | |
Number of Funds in peer group | | | 851 | | | | 648 | | | | 502 | |
Peer group average annual total
return | | | 10.25 | % | | | 2.58 | % | | | 2.97 | % |
Morningstar category in peer group: Foreign Large Blend | |
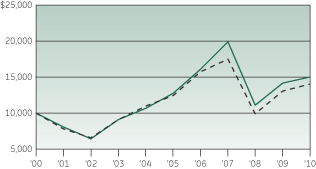
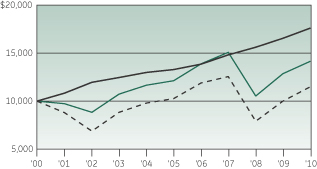
Change in Value of a $10,000 Investment(a)
Average Annual Total Return
for the periods ended December 31, 2010
| | | | | | | | | | | | | | | | |
| (Inception date: 01/01/88) | | | | | | | | | | |
| | | One
Year | | | Five
Year | | | Ten
Year | | | Ending value of a
$10,000
investment (a) | |
| | | | |
Elfun International Equity Fund | | | 5.77% | | | | 3.31% | | | | 4.16% | | | | 15,028 | |
| | | | |
MSCI EAFE Index | | | 7.75% | | | | 2.46% | | | | 3.48% | | | | 14,079 | |

| (a) | Ending value of a $10,000 investment for the ten-year period or since inception, whichever is less. |
| (b) | The securities information regarding holdings, allocations and other characteristics is presented to illustrate examples of securities that the Fund has bought and the diversity of areas in which the Fund may invest as of a particular date. It may not be representative of the Fund’s current or future investments and should not be construed as a recommendation to purchase or sell a particular security. |
| (c) | Fair value basis is inclusive of Short Term Investment in GE Money Market Fund. |
See Notes to Performance on page 1 for further information.
Past performance does not predict future performance. The performance shown on the graph and tables does not reflect the deduction of taxes that a shareholder would pay on Fund distributions or the redemption of Fund shares.
5
| | |
| Elfun International Equity Fund | | (in thousands) — December 31, 2010 |

| | | | | | | | | | |
| | | Number
of Shares | | | Fair
Value | | | |
| | | | | | | | | | |
Common Stock — 92.2%† | | | | | | | |
| |
| Australia — 2.2% | | | |
| | | |
Brambles Ltd. | | | 267,312 | | | $ | 1,951 | | | |
Lynas Corporation Ltd. | | | 1,023,773 | | | | 2,162 | | | (a) |
Paladin Energy Ltd. | | | 515,971 | | | | 2,607 | | | (a) |
| | | | | | | 6,720 | | | |
| |
| Brazil — 3.0% | | | |
| | | |
Banco Santander Brasil S.A. | | | 239,900 | | | | 3,259 | | | |
Petroleo Brasileiro S.A. ADR | | | 96,913 | | | | 3,312 | | | |
Vale S.A. ADR | | | 89,238 | | | | 2,697 | | | (a) |
| | | | | | | 9,268 | | | |
| |
| Canada — 4.2% | | | |
| | | |
Kinross Gold Corp. | | | 44,906 | | | | 855 | | | |
Potash Corporation of Saskatchewan Inc. | | | 42,936 | | | | 6,674 | | | |
Research In Motion Ltd. | | | 53,044 | | | | 3,100 | | | (a) |
Suncor Energy Inc. | | | 62,437 | | | | 2,405 | | | |
| | | | | | | 13,034 | | | |
| |
| Chile — 0.3% | | | |
| | | |
Sociedad Quimica y Minera de Chile S.A. ADR | | | 16,946 | | | | 990 | | | |
| |
| China — 1.8% | | | |
| | | |
Baidu Inc. ADR | | | 22,542 | | | | 2,176 | | | (a) |
Bank of China Ltd. | | | 2,708,976 | | | | 1,432 | | | |
CSR Corp Ltd. | | | 1,478,539 | | | | 1,944 | | | |
| | | | | | | 5,552 | | | |
| |
| Denmark — 0.6% | | | |
| | | |
AP Moller - Maersk A/S | | | 200 | | | | 1,819 | | | |
| |
| France — 10.9% | | | |
| | | |
AXA S.A. | | | 159,013 | | | | 2,656 | | | |
BNP Paribas | | | 88,790 | | | | 5,671 | | | |
Cap Gemini S.A. | | | 47,421 | | | | 2,222 | | | |
Cie Generale d’Optique Essilor International S.A. | | | 73,335 | | | | 4,740 | | | |
Credit Agricole S.A. | | | 91,683 | | | | 1,169 | | | |
European Aeronautic Defence and Space Company N.V. | | | 100,051 | | | | 2,341 | | | |
| | | | | | | | | | |
| | | Number
of Shares | | | Fair
Value | | | |
| | | | | | | | | | |
| | | |
Safran S.A. | | | 72,634 | | | $ | 2,582 | | | |
Schneider Electric S.A. | | | 33,411 | | | | 5,020 | | | |
Total S.A. | | | 59,580 | | | | 3,169 | | | |
Veolia Environnement S.A. | | | 73,434 | | | | 2,155 | | | |
Vinci S.A. | | | 37,313 | | | | 2,036 | | | |
| | | | | | | 33,761 | | | |
| |
| Germany — 11.2% | | | |
| | | |
Adidas AG | | | 33,524 | | | | 2,199 | | | |
Bayer AG | | | 34,808 | | | | 2,582 | | | |
Daimler AG | | | 52,972 | | | | 3,605 | | | |
Deutsche Boerse AG | | | 56,415 | | | | 3,920 | | | |
Linde AG | | | 38,182 | | | | 5,816 | | | |
Metro AG | | | 59,834 | | | | 4,325 | | | |
SAP AG | | | 42,202 | | | | 2,157 | | | |
Siemens AG | | | 62,780 | | | | 7,807 | | | |
ThyssenKrupp AG | | | 51,302 | | | | 2,132 | | | |
| | | | | | | 34,543 | | | |
| |
| Hong Kong — 1.6% | | | |
| | | |
AIA Group Ltd. | | | 457,927 | | | | 1,287 | | | (a) |
Esprit Holdings Ltd. | | | 226,067 | | | | 1,073 | | | |
Hutchison Whampoa Ltd. | | | 266,048 | | | | 2,745 | | | |
| | | | | | | 5,105 | | | |
| | | |
| India — 1.2% | | | | | | | | | | |
| | | |
Larsen & Toubro Ltd. | | | 62,728 | | | | 2,775 | | | |
Power Grid Corporation of India Ltd. | | | 404,897 | | | | 890 | | | |
| | | | | | | 3,665 | | | |
| |
| Ireland — 0.6% | | | |
| | | |
CRH PLC | | | 83,627 | | | | 1,756 | | | |
| | | |
| Italy — 1.3% | | | | | | | | | | |
| | | |
ENI S.p.A. | | | 51,043 | | | | 1,119 | | | |
UniCredit S.p.A. | | | 1,334,928 | | | | 2,772 | | | |
| | | | | | | 3,891 | | | |
| |
| Japan — 13.7% | | | |
| | | |
Daikin Industries Ltd. | | | 52,000 | | | | 1,845 | | | |
FANUC Corp. | | | 16,500 | | | | 2,537 | | | |
Mitsubishi Corp. | | | 95,000 | | | | 2,575 | | | |
Mitsubishi Estate Company Ltd. (REIT) | | | 89,946 | | | | 1,670 | | | |
See Notes to Schedules of Investments and Notes to Financial Statements.
6
| | |
| Elfun International Equity Fund | | (in thousands) — December 31, 2010 |
| | | | | | | | | | |
| | | Number
of Shares | | | Fair
Value | | | |
| | | | | | | | | | |
| | | |
Mitsubishi UFJ Financial Group Inc. | | | 570,269 | | | $ | 3,087 | | | |
Nomura Holdings Inc. | | | 646,413 | | | | 4,105 | | | |
SMC Corp. | | | 13,800 | | | | 2,367 | | | |
Sony Financial Holdings Inc. | | | 896 | | | | 3,629 | | | |
Sumitomo Metal Industries Ltd. | | | 1,410,923 | | | | 3,479 | | | |
Sumitomo Realty & Development Company Ltd. (REIT) | | | 59,000 | | | | 1,411 | | | |
Suzuki Motor Corp. | | | 232,031 | | | | 5,722 | | | |
Taiyo Nippon Sanso Corp. | | | 162,977 | | | | 1,441 | | | |
The Bank of Yokohama Ltd. | | | 420,007 | | | | 2,180 | | | |
Toyota Motor Corp. | | | 70,482 | | | | 2,798 | | | |
Unicharm Corp. | | | 92,700 | | | | 3,692 | | | |
| | | | | | | 42,538 | | | |
| |
| Mexico — 0.8% | | | |
| | | |
America Movil SAB de C.V. ADR | | | 41,120 | | | | 2,358 | | | |
| |
| Netherlands — 2.8% | | | |
| | | |
Koninklijke Ahold N.V. | | | 126,756 | | | | 1,679 | | | |
Koninklijke Philips Electronics N.V. | | | 159,899 | | | | 4,917 | | | |
Unilever N.V., CVA | | | 66,944 | | | | 2,093 | | | |
| | | | | | | 8,689 | | | |
| |
| Russian Federation — 0.5% | | | |
| | | |
Mobile Telesystems OJSC ADR | | | 74,460 | | | | 1,554 | | | |
| |
| South Africa — 0.9% | | | |
| | | |
MTN Group Ltd. | | | 133,297 | | | | 2,708 | | | |
| |
| South Korea — 1.5% | | | |
| | | |
Samsung Electronics Company Ltd. | | | 5,480 | | | | 4,582 | | | |
| |
| Spain — 2.4% | | | |
| | | |
Banco Santander S.A. | | | 443,639 | | | | 4,718 | | | (h) |
Telefonica S.A. | | | 125,616 | | | | 2,859 | | | |
| | | | | | | 7,577 | | | |
| |
| Sweden — 0.7% | | | |
| | | |
Telefonaktiebolaget LM Ericsson | | | 198,031 | | | | 2,302 | | | |
| | | | | | | | | | |
| | | Number
of Shares | | | Fair
Value | | | |
| | | | | | | | | | |
| |
| Switzerland — 7.9% | | | |
| | | |
Credit Suisse Group AG | | | 83,744 | | | $ | 3,384 | | | |
Nestle S.A. | | | 148,513 | | | | 8,723 | | | |
Novartis AG | | | 56,950 | | | | 3,357 | | | |
Roche Holding AG | | | 23,066 | | | | 3,390 | | | |
Syngenta AG | | | 13,470 | | | | 3,952 | | | |
Zurich Financial Services AG | | | 5,953 | | | | 1,547 | | | |
| | | | | | | 24,353 | | | |
| |
| Taiwan — 2.8% | | | |
| | | |
Delta Electronics Inc. | | | 571,000 | | | | 2,791 | | | |
Taiwan Semiconductor Manufacturing
Company Ltd. | | | 2,157,400 | | | | 5,254 | | | |
Taiwan Semiconductor Manufacturing
Company Ltd. ADR | | | 43,822 | | | | 550 | | | |
| | | | | | | 8,595 | | | |
| |
| United Kingdom — 19.3% | | | |
| | | |
Autonomy Corporation PLC | | | 75,375 | | | | 1,776 | | | (a) |
BG Group PLC | | | 194,844 | | | | 3,954 | | | |
BHP Billiton PLC | | | 172,260 | | | | 6,880 | | | (h) |
Diageo PLC | | | 68,417 | | | | 1,269 | | | |
G4S PLC | | | 512,431 | | | | 2,055 | | | |
HSBC Holdings PLC | | | 696,782 | | | | 7,103 | | | |
Lloyds Banking Group PLC | | | 3,467,287 | | | | 3,567 | | | (a) |
National Grid PLC | | | 418,884 | | | | 3,627 | | | |
Prudential PLC | | | 537,808 | | | | 5,625 | | | |
Reckitt Benckiser Group PLC | | | 72,678 | | | | 4,011 | | | |
Rio Tinto PLC | | | 91,993 | | | | 6,462 | | | |
Royal Dutch Shell PLC | | | 160,877 | | | | 5,386 | | | |
Tesco PLC | | | 575,271 | | | | 3,828 | | | |
The Capita Group PLC | | | 160,987 | | | | 1,756 | | | |
Vodafone Group PLC | | | 997,263 | | | | 2,589 | | | |
| | | | | | | 59,888 | | | |
| | | |
Total Common Stock
(Cost $249,250) | | | | | | | 285,248 | | | |
See Notes to Schedules of Investments and Notes to Financial Statements.
7
| | |
| Elfun International Equity Fund | | (in thousands) — December 31, 2010 |
| | | | | | | | | | |
| | | Number
of Shares | | | Fair
Value | | | |
| | | | | | | | | | |
Preferred Stock — 2.5% |
| | | |
Fresenius SE | | | 30,370 | | | $ | 2,610 | | | |
Volkswagen AG | | | 31,152 | | | | 5,074 | | | |
| | | |
Total Preferred Stock
(Cost $5,443) | | | | | | | 7,684 | | | |
Other Investments — 0.0%* | | | |
| | | |
GEI Investment Fund
(Cost $99) | | | | | | | 94 | | | (k) |
| | | |
Total Investments in Securities
(Cost $254,792) | | | | | | | 293,026 | | | |
Short-Term Investments — 5.1% | | | |
| | |
| Short-Term Investments — 4.5% | | | | | | | |
GE Money Market Fund Institutional Class | | | | | | | |
0.00% | | | | | | | 13,822 | | | (d,k) |
| | | | | | | | | | |
| | | | |
| | | | | Principal
Amount | | | | | |
|
| | | |
| Time Deposit — 0.6% | | | | | | | | |
| | |
State Street Corp. | | | | | |
| 0.01% | | 01/03/11 | | $ | 1,950 | | | 1,950 | | (e) |
Total Short-Term Investments
(Cost $15,772) | | | | | | 15,772 | | |
| | | |
Total Investments
(Cost $270,564) | | | | | | 308,798 | | |
| | | |
Other Assets and Liabilities
net — 0.2% | | | | | | 675 | | |
| | | | | | | | | | |
| | | |
NET ASSETS—100.0% | | | | | | $309,473 | | |
| | | | | | | | | | |
Other Information
The Fund had the following long futures contracts open at December 31, 2010:
| | | | | | | | | | | | | | |
| Description | | Expiration
date | | Number
of
Contracts | | | Current
Notional
Value | | | Unrealized
(Depreciation) | |
| | | | |
DJ Euro Stoxx 50 Index Futures | | March 2011 | | | 134 | | | $ | 5,023 | | | $ | (132) | |
| | | | |
FTSE 100 Index Futures | | March 2011 | | | 50 | | | | 4,613 | | | | (33) | |
| | | | |
Topix Index Futures | | March 2011 | | | 22 | | | | 2,430 | | | | (9) | |
| | | | | | | | | | | | | | |
| | | | | | | | | | | | $ | (174) | |
| | | | | | | | | | | | | | |
See Notes to Schedules of Investments and Notes to Financial Statements.
8
| | |
| Elfun International Equity Fund | | December 31, 2010 |
(Unaudited)
The Fund was invested in the following categories at December 31, 2010 as a % of Fair Value:
| | | | | | |
| Industry | | | |
Diversified Financial Services | | | 10.61% | |
Integrated Oil & Gas | | | 6.26% | |
Automobile Manufacturers | | | 5.57% | |
Diversified Metals & Mining | | | 5.02% | |
Industrial Conglomerates | | | 5.01% | |
Fertilizers & Agricultural Chemicals | | | 3.76% | |
Packaged Foods & Meats | | | 3.50% | |
Life & Health Insurance | | | 3.41% | |
Semiconductors | | | 3.36% | |
Pharmaceuticals | | | 3.02% | |
Wireless Telecommunication Services | | | 2.98% | |
Steel | | | 2.69% | |
Household Products | | | 2.49% | |
Industrial Gases | | | 2.35% | |
Multi-Utilities | | | 1.87% | |
Food Retail | | | 1.78% | |
Communications Equipment | | | 1.75% | |
Electrical Components & Equipment | | | 1.63% | |
Aerospace & Defense | | | 1.59% | |
Industrial Machinery | | | 1.59% | |
Construction & Engineering | | | 1.56% | |
Healthcare Supplies | | | 1.54% | |
Hypermarkets & Super Centers | | | 1.40% | |
Multi-Line Insurance | | | 1.36% | |
Investment Banking & Brokerage | | | 1.33% | |
Application Software | | | 1.27% | |
Specialized Finance | | | 1.27% | |
Diversified Capital Markets | | | 1.10% | |
Diversified Real Estate Activities | | | 1.00% | |
| | | | | | |
Integrated Telecommunication Services | | | 0.93% | |
Electronic Components | | | 0.90% | |
Healthcare Services | | | 0.85% | |
Coal & Consumable Fuels | | | 0.84% | |
Trading Companies & Distributors | | | 0.83% | |
IT Consulting & Other Services | | | 0.72% | |
Apparel, Accessories & Luxury Goods | | | 0.71% | |
Internet Software & Services | | | 0.71% | |
Regional Banks | | | 0.71% | |
Security & Alarm Services | | | 0.67% | |
Construction & Farm Machinery & Heavy Trucks | | | 0.63% | |
Diversified Support Services | | | 0.63% | |
Building Products | | | 0.60% | |
Marine | | | 0.59% | |
Construction Materials | | | 0.57% | |
Human Resource & Employment Services | | | 0.57% | |
Distillers & Vintners | | | 0.41% | |
Apparel Retail | | | 0.35% | |
Electric Utilities | | | 0.29% | |
Gold | | | 0.28% | |
| | | | | | |
| | | 94.86% | |
| | | | | | |
| | | | | | |
| Short-Term and Other Investments | | | |
Short-Term | | | 5.11% | |
Other Investments | | | 0.03% | |
| | | | |
| | | 5.14% | |
| | | | |
| | | 100.00% | |
| | | | |
See Notes to Schedules of Investments and Notes to Financial Statements.
9
(Unaudited)


David B. Carlson
The Elfun Trusts is managed by David B. Carlson. See portfolio managers’ biographical information beginning on page 116.
| Q. | How did the Elfun Trusts Fund perform compared to its benchmark and Morningstar peer group for the twelve-month period ended December 31, 2010? |
| A. | The Elfun Trusts had a return of 13.07% for the twelve-month period ended December 31, 2010. The S&P 500 Index returned 15.06%, while the Fund’s Morningstar peer group of 1,771 US Large-Cap Growth funds returned 15.40% over the same period. |
| Q. | What market conditions impacted the Fund performance? |
| A. | While the market posted a nice gain for the year, it was a roller-coaster ride as the year unfolded. The market rose in the first quarter, then plunged in the second as European sovereign debt fears flared. The market meandered in the third quarter and then finished strong in the fourth as economic indicators improved. Aggregate earnings rose at a double-digit pace for the year, in line with stock prices, leaving the price/earnings ratio (P/E) essentially unchanged for the year. Earnings estimates by Wall Street analysts were gradually revised higher throughout the year. |
The cyclical sectors were the strongest performers with consumer-cyclical, industrial, and materials sectors all up in excess of 20%. Technology was an exception, rising only 10% for the year.
Other sectors lagging the market included healthcare, up 3% and utilities, up 6%.
| Q. | What were the primary drivers of Fund performance? |
| A. | Technology is the largest sector overweight in Elfun Trusts comprising about 31% of the portfolio. Despite improving industry conditions, tech stocks lagged the market, especially the large cap tech bellwethers such as Cisco and Microsoft. Overall, Elfun Trusts’ tech holding rose 9% for the year, underperforming the market. We had a wide range of performance in our tech holdings with Baidu (+135%) and Intuit (+60%) the best performers and Visa (-19%) and Cisco (-16%) the worst performers. Most tech companies met or exceeded their earnings expectations, but negative sentiment around long term growth rates weighed on the valuations. |
The second largest weighting in the portfolio is the consumer-discretionary sector, comprising about 17% of the portfolio. Holdings in this sector rose 32%, positively contributing to overall results. Liberty Global was the best performer in this sector with a gain of 55%. The energy and materials sectors outperformed the market, but Elfun Trusts was underweighed in these sectors.
| Q. | Were there any significant changes to the Fund during the period? |
10
(Unaudited)
| A. | We ended the year with 51 stocks in the portfolio, coincidently the same as last year, but we added 8 new names and eliminated 8 over the course of the year. Portfolio turnover remains low, coming in at 13% for the year. New positions include Apple (better late than never), Praxair, Discovery Holdings, Sirius XM Radio, and Covidien. We eliminated Transocean after the rig explosion in the gulf in April. Other sales include Berkshire-Hathaway, Medtronic, and Corning. Overall, the portfolio still consists of high quality, above-average growers with strong financial characteristics. We continue to be overweighted in the tech sector due to its global reach, above-average growth, strong balance sheets, and attractive valuation. |
| Q. | What is your outlook for the Fund for this year? |
| A. | We have a constructive view of the market at the start of the year. Stimulus remains strong, both fiscal and monetary, and estimates of economic growth have been revised up in recent months. |
But the macro fears are still significant and will result in continued market volatility. Topping our list of worries are the sovereign debt woes of Europe, the massive fiscal deficit in the US, and the fragile US consumer. Corporate America is in good shape, with strong balance sheets and free cash flow, but global macro issues will likely flare up and negatively impact the US stock market. In a market that will be buffeted by macro concerns, we will continue to focus on high quality companies that can innovate and grow at above-average rates over the long term.
11
(Unaudited)

Understanding Your Fund’s Expenses
As a shareholder of the Fund you incur transaction and ongoing expenses. Transaction expenses including sales charges on purchases payments, reinvested dividends (or other distributions), and redemption fees directly reduce the investment return of the Fund. Ongoing costs include portfolio management fees, distribution and services fees, professional fees, administrative fees and other Fund expenses. The following example is intended to help you understand your ongoing costs (in dollars) of investing in the Fund and to compare these costs with the ongoing costs of investing in other mutual funds.
To illustrate these ongoing costs, we have provided an example and calculated the expenses paid by investors in each share class of the Fund during the period. The information in the following table is based on an investment of $1,000, which is invested at the beginning of the period and held for the entire six-month period ended December 31, 2010.
Actual Expenses
The first section of the table provides information about actual account values and actual expenses.
You may use the information in this section, together with the amount you invested, to estimate the expenses that you paid over the period. To do so, simply divide your account value by $1,000 (for example, an $8,600 account value divided by $1,000 = 8.6), then multiply the result by the number given for your class under the heading “Expenses Paid During Period.”
Hypothetical Example for Comparison Purposes
The second section of the table provides information about hypothetical account values and hypothetical expenses based on the Fund’s actual expense ratio and an assumed rate of return of 5% per year before expenses, which is not the Fund’s actual return. You may use this information to compare the ongoing costs of investing in the Fund and other funds. To do so, compare this 5% hypothetical example with the 5% hypothetical examples that appear in the shareholders reports of other funds.
Please note that the expenses shown in the table for both “Actual” and “Hypothetical” do not reflect any transaction costs, such as sales charges or redemption fees.
July 1, 2010 – December 31, 2010
| | | | | | | | | | | | |
| | | Account value at
the beginning of
the period ($) | | | Account value
at the end of
the period ($) | | | Expenses
paid during
the period ($)* | |
| | | |
Actual Fund Return** | | | 1,000.00 | | | | 1,231.75 | | | | 1.18 | |
| | | |
Hypothetical 5% Return
(2.5% for the period) | | | 1,000.00 | | | | 1,023.87 | | | | 1.07 | |
| * | | Expenses are equal to the Fund’s annualized expense ratio of 0.21% (for the period July 1, 2010 - December 31, 2010), multiplied by the average account value over the period, multiplied by 184/365 (to reflect the one-half year period) |
| ** | | Actual Fund Return for the six-month period ended December 31, 2010 was: 23.18%. Past performance does not guarantee future results. |
12
(Unaudited)
Investment Profile
A mutual fund designed for investors who seek long-term growth of capital and future income rather than current income by investing in equity securities of U.S. companies, such as common and preferred stocks.
Top Ten Largest Holdings
as of December 31, 2010 as a % of Fair Value(b)(c)
| | | | |
| Schlumberger Ltd. | | | 4.82% | |
| QUALCOMM Inc. | | | 4.43% | |
| The Western Union Co. | | | 4.04% | |
| PepsiCo Inc. | | | 3.96% | |
| Dover Corp. | | | 3.95% | |
| DIRECTV | | | 3.64% | |
| Bed Bath & Beyond Inc. | | | 3.58% | |
| CME Group Inc. | | | 3.53% | |
| Liberty Global Inc. | | | 3.39% | |
| Amgen Inc. | | | 3.33% | |
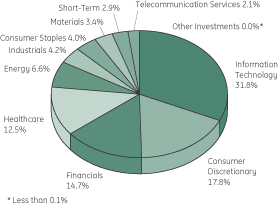
Sector Allocation
as a % of the Fair Value of $1,731,905 (in thousands) as of December 31, 2010.(b)(c)
Morningstar Performance Comparison
Based on average annual returns for periods ended 12/31/10
| | | | | | | | | | | | |
| | | One
Year | | | Five
Year | | | Ten
Year | |
Number of Funds in peer group | | | 1771 | | | | 1589 | | | | 1299 | |
Peer group average annual total return | | | 15.40 | % | | | 2.22 | % | | | -0.69 | % |
Morningstar category in peer group: Large Growth | |
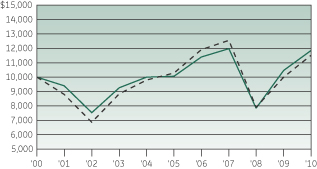
Change in Value of a $10,000 Investment(a)
Average Annual Total Return
for the periods ended December 31, 2010
| | | | | | | | | | | | | | | | |
| (Inception date: 05/27/35) | | | | | | | | | | |
| | | One
Year | | | Five
Year | | | Ten
Year | | | Ending value of a
$10,000
investment (a) | |
| | | | |
Elfun Trusts | | | 13.07% | | | | 3.28% | | | | 1.70% | | | | 11,837 | |
| | | | |
S&P 500 Index | | | 15.06% | | | | 2.29% | | | | 1.41% | | | | 11,508 | |

| (a) | Ending value of a $10,000 investment for the ten-year period or since inception, whichever is less. |
| (b) | The securities information regarding holdings, allocations and other characteristics is presented to illustrate examples of securities that the Fund has bought and the diversity of areas in which the Fund may invest as of a particular date. It may not be representative of the Fund’s current or future investments and should not be construed as a recommendation to purchase or sell a particular security. |
| (c) | Fair value basis is inclusive of Short Term Investment in GE Money Market Fund. |
See Notes to Performance on page 1 for further information.
Past performance does not predict future performance. The performance shown on the graph and tables does not reflect the deduction of taxes that a shareholder would pay on Fund distributions or the redemption of Fund shares.
13
| | |
| Elfun Trusts | | (in thousands) — December 31, 2010 |
| | | | | | | | | | | | |
| | | Number
of Shares | | | Fair
Value | | | | |
| | | | | | | | | | | | |
Common Stock — 97.1%† | | | | | |
| |
| Application Software — 1.4% | | | | | |
| | | |
Intuit Inc. | | | 510,000 | | | $ | 25,143 | | | | (a) | |
| |
| Asset Management & Custody Banks — 3.1% | | | | | |
| | | |
State Street Corp. | | | 1,170,000 | | | | 54,218 | | | | (e) | |
| |
| Biotechnology — 3.8% | | | | | |
| | | |
Amgen Inc. | | | 1,050,000 | | | | 57,645 | | | | (a) | |
Gilead Sciences Inc. | | | 220,000 | | | | 7,973 | | | | (a) | |
| | | | | | | 65,618 | | | | | |
| |
| Broadcasting — 0.3% | | | | | |
| | | |
Discovery Communications Inc. | | | 140,000 | | | | 5,137 | | | | (a) | |
| |
| Cable & Satellite — 9.5% | | | | | |
| | | |
Comcast Corp. | | | 1,850,000 | | | | 38,498 | | | | | |
DIRECTV | | | 1,580,000 | | | | 63,089 | | | | (a) | |
Liberty Global Inc. | | | 1,730,000 | | | | 58,630 | | | | (a) | |
Sirius XM Radio Inc. | | | 3,000,000 | | | | 4,920 | | | | (a) | |
| | | | | | | 165,137 | | | | | |
| |
| Communications Equipment — 7.7% | | | | | |
| | | |
Cisco Systems Inc. | | | 1,900,000 | | | | 38,437 | | | | (a) | |
QUALCOMM Inc. | | | 1,550,000 | | | | 76,709 | | | | | |
Research In Motion Ltd. | | | 300,000 | | | | 17,439 | | | | (a) | |
| | | | | | | 132,585 | | | | | |
| |
| Computer Hardware — 3.3% | | | | | |
| | | |
Apple Inc. | | | 175,000 | | | | 56,448 | | | | (a) | |
| |
| Data Processing & Outsourced Services — 9.7% | | | | | |
| | | |
Automatic Data Processing Inc. | | | 225,000 | | | | 10,413 | | | | | |
Paychex Inc. | | | 1,350,000 | | | | 41,729 | | | | | |
The Western Union Co. | | | 3,770,000 | | | | 70,009 | | | | | |
Visa Inc. | | | 650,000 | | | | 45,747 | | | | | |
| | | | | | | 167,898 | | | | | |
| |
| Diversified Financial Services — 1.0% | | | | | |
| | | |
JPMorgan Chase & Co. | | | 420,000 | | | | 17,816 | | | | | |
| | | | | | | | | | | | |
| | | Number
of Shares | | | Fair
Value | | | | |
| | | | | | | | | | | | |
| |
| Diversified Support Services — 1.2% | | | | | |
| | | |
Iron Mountain Inc. | | | 800,000 | | | $ | 20,008 | | | | | |
| |
| Electronic Manufacturing Services — 0.9% | | | | | |
| | | |
Molex Inc. | | | 870,000 | | | | 16,417 | | | | | |
| |
| Environmental & Facilities Services — 0.2% | | | | | |
| | | |
Stericycle Inc. | | | 45,000 | | | | 3,641 | | | | (a) | |
| |
| Fertilizers & Agricultural Chemicals — 2.6% | | | | | |
| | | |
Monsanto Co. | | | 650,000 | | | | 45,266 | | | | | |
| |
| Healthcare Equipment — 1.4% | | | | | |
| | | |
Becton Dickinson and Co. | | | 110,000 | | | | 9,297 | | | | | |
Covidien PLC | | | 340,000 | | | | 15,524 | | | | | |
| | | | | | | 24,821 | | | | | |
| |
| Healthcare Facilities — 0.6% | | | | | |
| | | |
VCA Antech Inc. | | | 430,000 | | | | 10,015 | | | | (a) | |
| |
| Healthcare Services — 4.1% | | | | | |
| | | |
Express Scripts Inc. | | | 800,000 | | | | 43,240 | | | | (a) | |
Lincare Holdings Inc. | | | 1,020,000 | | | | 27,367 | | | | | |
| | | | | | | 70,607 | | | | | |
| |
| Healthcare Supplies — 0.1% | | | | | |
| | | |
DENTSPLY International Inc. | | | 60,000 | | | | 2,050 | | | | | |
| |
| Home Improvement Retail — 2.3% | | | | | |
| | | |
Lowe’s Companies Inc. | | | 1,580,000 | | | | 39,626 | | | | | |
| |
| Homebuilding — 0.1% | | | | | |
| | | |
MDC Holdings Inc. | | | 60,000 | | | | 1,726 | | | | | |
| |
| Homefurnishing Retail — 3.6% | | | | | |
| | | |
Bed Bath & Beyond Inc. | | | 1,260,000 | | | | 61,929 | | | | (a) | |
| |
| Hotels, Resorts & Cruise Lines — 2.0% | | | | | |
| | | |
Carnival Corp. | | | 760,000 | | | | 35,044 | | | | | |
| |
| Industrial Gases — 0.4% | | | | | |
| | | |
Praxair Inc. | | | 70,000 | | | | 6,683 | | | | | |
See Notes to Schedules of Investments and Notes to Financial Statements.
14
| | |
| Elfun Trusts | | (in thousands) — December 31, 2010 |
| | | | | | | | | | | | |
| | | Number
of Shares | | | Fair
Value | | | | |
| | | | | | | | | | | | |
| |
| Industrial Machinery — 3.9% | | | | | |
| | | |
Dover Corp. | | | 1,170,000 | | | $ | 68,387 | | | | | |
| |
| Integrated Oil & Gas — 1.8% | | | | | |
| | | |
Exxon Mobil Corp. | | | 300,000 | | | | 21,936 | | | | | |
Suncor Energy Inc. | | | 220,000 | | | | 8,424 | | | | | |
| | | | | | | 30,360 | | | | | |
| |
| Internet Software & Services — 4.4% | | | | | |
| | | |
Baidu Inc. ADR | | | 400,000 | | | | 38,612 | | | | (a) | |
eBay Inc. | | | 1,350,000 | | | | 37,571 | | | | (a) | |
| | | | | | | 76,183 | | | | | |
| |
| Investment Banking & Brokerage — 2.8% | | | | | |
| | | |
The Goldman Sachs Group Inc. | | | 285,000 | | | | 47,926 | | | | | |
| |
| Life & Health Insurance — 1.5% | | | | | |
| | | |
Aflac Inc. | | | 450,000 | | | | 25,393 | | | | | |
| |
| Oil & Gas Equipment & Services — 4.8% | | | | | |
| | | |
Schlumberger Ltd. | | | 1,000,000 | | | | 83,500 | | | | | |
| |
| Pharmaceuticals — 2.6% | | | | | |
| | | |
Abbott Laboratories | | | 220,000 | | | | 10,540 | | | | | |
Hospira Inc. | | | 50,000 | | | | 2,784 | | | | (a) | |
Johnson & Johnson | | | 500,000 | | | | 30,925 | | | | | |
| | | | | | | 44,249 | | | | | |
| |
| Property & Casualty Insurance — 0.7% | | | | | |
| | | |
Alleghany Corp. | | | 38,000 | | | | 11,642 | | | | (a) | |
| |
| Real Estate Services — 2.1% | | | | | |
| | | |
CB Richard Ellis Group Inc. (REIT) | | | 1,800,000 | | | | 36,864 | | | | (a) | |
| |
| Soft Drinks — 4.0% | | | | | |
| | | |
PepsiCo Inc. | | | 1,050,000 | | | | 68,597 | | | | | |
| |
| Specialized Finance — 3.5% | | | | | |
| | | |
CME Group Inc. | | | 190,000 | | | | 61,132 | | | | | |
| | | | | | | | | | | | |
| | | Number
of Shares | | | Fair
Value | | | | |
| | | | | | | | | | | | |
| |
| Specialty Chemicals — 0.4% | | | | | |
| | | |
Ecolab Inc. | | | 150,000 | | | $ | 7,563 | | | | | |
| |
| Systems Software — 3.2% | | | | | |
| | | |
Microsoft Corp. | | | 2,000,000 | | | | 55,840 | | | | | |
| |
| Wireless Telecommunication Services — 2.1% | | | | | |
| | | |
American Tower Corp. | | | 700,000 | | | | 36,148 | | | | (a) | |
| | | |
Total Common Stock
(Cost $1,293,261) | | | | | | | 1,681,617 | | | | | |
Other Investments — 0.0%* | | | | | | | | | |
| | | |
GEI Investment Fund
(Cost $457) | | | | | | | 435 | | | | (k) | |
| | | |
Total Investments in Securities (Cost $1,293,718) | | | | | | | 1,682,052 | | | | | |
Short-Term Investments — 2.9% | | | | | | | | | |
GE Money Market Fund Institutional | | | | | | | | | |
Class 0.00% | | | | | | | 49,853 | | | | (d,k) | |
(Cost $49,853) | | | | | | | | | | | | |
| | | |
Total Investments
(Cost $1,343,571) | | | | | | | 1,731,905 | | | | | |
| | | |
Liabilities in Excess Of Other Assets, net — (0.0)%* | | | | | | | (189) | | | | | |
| | | | | | | | | | | | |
| | | |
NET ASSETS — 100.0% | | | | | | $ | 1,731,716 | | | | | |
| | | | | | | | | | | | |
See Notes to Schedules of Investments and Notes to Financial Statements.
15
(Unaudited)

| | |
| |

Paul M. Colonna | | 
Greg Hartch |
| |
Ralph R. Layman | | 
Thomas R. Lincoln |
| |

Diane M. Wehner | | 
David Wiederecht |
The Elfun Diversified Fund is managed by a team of portfolio managers that includes Paul M. Colonna, Greg Hartch, Ralph R. Layman, Thomas R. Lincoln, Diane M. Wehner and David Wiederecht. Mr. Hartch and Mr. David Wiederecht are each vested with oversight authority for determining asset allocations for the Fund, while each of the other portfolio managers is responsible for managing one of four sub-portfolios: U.S. equity, U.S. mid-cap equity, international equity and fixed income. A sub-portfolio refers to the portion of the Fund’s assets that are allocated to, and managed by, a particular portfolio manager on the Fund’s portfolio management team. Mr. Lincoln manages the U.S. equity portion, Ms. Wehner manages the U.S. mid-cap equity portion, Mr. Layman manages the international equity portion and Mr. Colonna manages the fixed income portion, each with a team of portfolio managers and analysts. The sub-portfolios underlying this Fund are managed independently of each other and the portfolio managers have full discretion over their particular sub-portfolio; however, the portfolio management team is collaborative to ensure strict adherence to the Fund’s objectives. See portfolio managers’ biographical information beginning on page 116.
| Q. | How did the Elfun Diversified Fund perform compared to its benchmark and Morningstar peer group for the twelve-month period ended December 31, 2010? |
| A. | For the twelve-month period ended December 31, 2010, the Elfun Diversified Fund returned 9.98%. The Fund’s broad based benchmarks, the S&P 500 Index and the Barclays Capital U.S. Aggregate Bond Index, returned 15.06% and 6.54%, respectively. The Fund’s Morningstar peer group of 1098 U.S. Moderate Allocation funds returned an average of 11.73% for the same period. |
16
(Unaudited)
| Q. | What market conditions impacted the performance of the Fund and what were the primary drivers of Fund performance? |
| A. | The absolute performance of the Fund for the twelve-month period ended December 31, 2010 was primarily driven by the Fund’s allocation to U.S. and international equity markets and fixed income markets. The Fund’s top performing asset classes were its exposure to mid cap and small cap U.S. equity markets which posted gains of 27.0% and 26.8% in 2010. All other asset classes provided positive returns, although International equities lagged U.S. large cap equities by several hundred basis points and cash produced only a nominal return. |
The Fund has traditionally had a higher allocation to international equities than its peer group. In 2010, the underperformance of international equities relative to U.S. equities was a key driver in the performance of the Fund relative to its peer group. Other factors that contributed to the relative performance were (i) positive contributions from allocations to mid cap and small cap U.S. equity markets; (ii) negative contributions from security selection within several of the Fund’s equity strategies which underperformed their benchmarks; and (iii) positive contributions from security selection within the Fund’s fixed income and U.S. mid cap strategies which outperformed their benchmarks.
As of December 31, 2010, the Fund’s four largest allocations by asset class were: (i) fixed income core plus (30.7% of the Fund; benchmark Barclays Capital U.S. Aggregate), (ii) U.S. large cap equities (27.1% of the Fund; benchmark S&P 500), (iii) international equities (22.4% of the Fund; benchmark MSCI EAFE), and (iv) U.S. mid cap equities (11.2% of the Fund; benchmark Russell Mid
Cap). A summary of these four markets and their contribution to performance are summarized below.
Fixed Income Markets and Performance
The fixed income market benefited from both declining interest rates and spread compression over the last fiscal period, producing positive price returns which added to income generated from coupon interest. U.S. 2-year and 10-year Treasury note yields ended the year at 0.59% and 3.29% respectively, down 54 basis points each. The U.S. 30-year bond finished the year yielding 4.33%, down 31 basis points. As the U.S. economy recovered in 2010 and growth expectations for 2011 picked up, non-treasury securities outperformed treasury securities during the period due to tightening spreads. The Barclays Capital U.S. Credit Index yield spread narrowed 11 basis points, which contributed to a total return of 8.47% last year, while the broader Barclays Capital U.S. Aggregate Index returned 6.54%. Commercial mortgage-backed securities experienced the largest spread compression and led all sectors with an annual return of 20.4%. Yield spreads on high yield and emerging market debt also narrowed contributing to double digit returns for both (BC High Yield Index returned 15.12% and JPM EMBI-GD Index returned 12.24%).
The Fund’s fixed income core plus strategy allocation returned 8.01%, outperforming its benchmark by 1.47%. The largest contributor to the fixed income allocation’s performance on an absolute basis and relative to its benchmark was the overweight positions in investment grade credit and commercial mortgage-backed securities plus non-index allocations to high yield and emerging market debt. Security selection within the agency
17
(Unaudited)
and commercial MBS sectors added value as did an overweight in financial versus non-corporate issuers in investment grade credit. Duration positioning had a negative effect on performance, primarily in April and May when the fund’s duration was shorter than that of the benchmark and U.S. interest rates fell significantly in a flight to quality away from risky assets brought on by the fiscal crises among the European peripheral countries, namely Greece, Ireland, Portugal and Spain.
U.S Large Cap Equity Markets and Performance
2010’s 15% advance did not feel like an easy climb for the S&P 500, amid ongoing debate around the durability of the economic expansion. Indeed, all U.S. equity indices were in negative territory at mid-year and over much of the summer, beset by concerns about the European debt crisis, persistently high unemployment levels and skyrocketing government debt. However, reassurances that the Fed would purchase additional treasury bonds in a $600B “quantitative easing-2” program ignited a mighty second-half rally. In this environment, cyclical sectors generally outperformed, while defensive sectors lagged. For the year, the S&P 500 consumer discretionary, industrials, materials and energy each advanced over 20%, while health care, utilities and IT lagged.
2010 was a challenging investment environment for large cap, high quality investors. Small and mid cap companies led—typical in the early innings of economic recovery. Smaller companies also benefitted from increased M&A activity as larger companies looked to spend excess balance sheet cash on strategic acquisitions. Low quality also outperformed high quality, with an approximately 22% increase in S&P 500 C-rated companies, while the high-quality A-rated companies rose only 15%.
Our large cap equity portfolio managers generally prefer to invest in high quality companies, and acknowledge that relative performance may be challenged in the early stages of an economic recovery, when higher-risk (i.e., lower quality) companies get re-rated. We continue to believe that higher quality companies make the best long-term investments, and a diversified portfolio of high quality large caps has the potential to outperform over a full market cycle.
Amid the year’s uncertainties, correlations of performance among S&P 500 stocks reached levels unseen since the Great Depression. It was difficult for the active manager to differentiate as top-down factors moved the markets, with fundamentals largely ignored. For example, Microsoft achieved and raised earnings estimates throughout the year, yet suffered severe multiple contraction. This seeming disconnect between fundamentals, valuations and performance created a source of frustration for many large-cap active managers.
In 2010, the Fund had significant allocations to two U.S. large cap equity strategies, large cap growth and U.S. core, both of which underperformed the S&P 500 Index. U.S. large cap growth returned 9.68%, underperforming by 5.38% while U.S. core returned 12.54%, underperforming by 2.52%.
International Equity Markets and Performance
Markets were volatile for much of the year as contradictory forces dampened performance early in the year but gave way to strong gains in the second half. The evolving sovereign debt crisis in Europe negatively affected markets concerned about a growing need for austerity but the persistence of low rates, anecdotal evidence of an improving global economy and strong earnings
18
(Unaudited)
across the globe pushed stocks higher in all major markets. Similarly, doubts regarding much-needed regulatory reform in the financial sector cast a cloud over markets in the first half but increased clarity from bodies such as the Basel 3 Committee regarding bank capitalization, liquidity and leverage provided much-needed transparency to investors later in the year.
The Fund’s allocation to international equity returned 6.15% while the MSCI EAFE benchmark returned 7.75%. Positive impact was seen from holdings in materials, energy stocks and telecom services. The steady rise of commodity prices throughout the year was highly beneficial to metals and mining stocks and fertilizer companies leveraged to rising crop prices. A somewhat different result was seen in energy where despite rising oil prices, a combination of the BP crisis and low natural gas prices saw that sector underperform. An underweight in the underperforming telecom sector was also beneficial for performance.
Most of the negative performance in the portfolio came from holdings in the financial sector, mainly in European banks. Although underweight, the portfolio was hit by the assumption that all European banks would be dragged down by the sovereign debt crisis, although direct exposure to the troubled markets of Greece, Ireland and Portugal was insignificant. Japanese holdings, especially those in the export markets also suffered due to a strong Yen.
U.S. Mid Cap Equity Markets and Performance
In general, correlations of performance among midcap stocks reached historically high levels in 2010. It was difficult for active managers to
differentiate as top-down factors moved the markets, with fundamentals largely ignored. An offset to this lack of differentiation has increased M&A activity as larger companies looked to spend excess balance sheet cash on strategic acquisitions. The Fund benefited from consolidation with several companies being acquired in the latter part of the year. Growth stocks outperformed Value by a small margin during the year which helped performance given our skew towards companies with growth-at-a-reasonable-price. From a sector perspective, information technology, though it underperformed the overall market was the most additive to performance due to good stock selection. Meanwhile, though new investments in the industrial and basic materials sectors participated in the year-end rally, performance was dominated by lower quality, higher beta, more cyclical companies. Finally, within the financial sector our underweight in regional banks/thrifts detracted from performance along with underperformance in individual stocks within the insurance and exchanges industries.
The Fund’s allocation to mid cap stocks returned 27.0%, outperforming the Russell Mid Cap Index which returned 25.5% during the twelve-month period, due to solid stock selection within the information technology, utilities, and consumer staples sectors. Within information technology, several software names meaningfully outperformed the overall market. Specifically, Rovi Corporation (+95%) benefited as investors continue to recognize its strong technology position and view the company as a play on the future of digital entertainment and connected devices. Citrix Systems (+65%) performed well as the company benefited from the trend towards desktop virtualization. Arcsight Inc. (+65%) a developer of security software was acquired by Hewlett
19
(Unaudited)
Packard. Also, within information technology, the Fund was positively impacted by Baidu (+135%), a Chinese internet search engine company which benefited from its dominant position within the fast-growing Chinese internet industry. The Fund’s underweight in the utility sector along with good stock selection added to Fund performance with investments such as Northeast Utilities (+28%). Consumer staple stocks were also strong contributors. For example, Mead Johnson Nutrition (+45%), a global leader in the pediatric-nutrition market, outperformed in part due to its large exposure to emerging markets and its attractiveness as a takeout candidate.
Detracting from performance were some of our more defensive investments within the industrial, materials, and financial sectors. Within the industrial sector, Alliant Techsystems (-16%) detracted from performance amid ongoing concerns about its NASA contract and its exposure to defense budgets. In the financial sector, diversified insurance company HCC (+6%) lagged, as overall pricing in the property and casualty industry remains under pressure. Among banks, People’s United Financial (-12%) is considered one of the highest quality thrifts in the industry having avoided the missteps of its competition in the residential real estate debacle. With an increased appetite for risk, investors favored lower quality regional banks with more leverage to an economic recovery. Meanwhile, basic materials company Monsanto (-13%) corrected as the company restructured its chemical business in response to overcapacity and competitive pricing resulting in a near-term hit to earnings.
As of December 31, 2010, the Fund also had smaller allocations to emerging market equities,
small cap U.S. equities, REITs, and cash. None of these allocations exceeded 5% of the Fund as of December 31, 2010.
| Q. | Were there any significant changes to the Fund during the period? |
| A. | During the past year, we did make certain tactical changes to the Fund. As the year progressed and we became more confident that the economy would avoid a double dip, we gradually reduced cash in the portfolio, increasing both equity and fixed income allocations. In September, we made a tactical decision to reduce our exposure slightly to emerging market equities in favor of U.S. large cap equities on the belief that a stronger U.S. recovery would result in U.S. equities outperforming in the 4th quarter of 2010. This change also added to performance as U.S. equities outperformed emerging market equities. In November, we added a 1% real estate exposure to the Fund in the form of a REIT ETF. The allocation to REITs returned 4.1% from funding to year end. Finally, in mid December, we added a third U.S. equity large cap strategy, equity yield at a 4% allocation, on the belief that companies with higher existing dividends or with dividends that are likely to grow will outperform in 2011. As of December 31, 2010, the Fund was overweight equities with 67.5% of the Fund invested in equity strategies. |
Finally, Judy Studer, GEAM’s Chief Marktet Strategist and portfolio manager responsible for asset allocation for the Fund, retired from GE Asset Management as of December 31, 2010. She is replaced by David Wiederecht, President and CIO of Investment Strategies for GEAM and Greg Hartch, Senior Vice President, Tactical Asset Allocation and Total Return Fund Portfolio Manager, starting January 1, 2011.
20
(Unaudited)
Understanding Your Fund’s Expenses
As a shareholder of the Fund you incur transaction and ongoing expenses. Transaction expenses including sales charges on purchases payments, reinvested dividends (or other distributions), and redemption fees directly reduce the investment return of the Fund. Ongoing costs include portfolio management fees, distribution and services fees, professional fees, administrative fees and other Fund expenses. The following example is intended to help you understand your ongoing costs (in dollars) of investing in the Fund and to compare these costs with the ongoing costs of investing in other mutual funds.
To illustrate these ongoing costs, we have provided an example and calculated the expenses paid by investors in each share class of the Fund during the period. The information in the following table is based on an investment of $1,000, which is invested at the beginning of the period and held for the entire six-month period ended December 31, 2010.
Actual Expenses
The first section of the table provides information about actual account values and actual expenses. You may use the information in this section,
together with the amount you invested, to estimate the expenses that you paid over the period. To do so, simply divide your account value by $1,000 (for example, an $8,600 account value divided by $1,000 = 8.6), then multiply the result by the number given for your class under the heading “Expenses Paid During Period.”
Hypothetical Example for Comparison Purposes
The second section of the table provides information about hypothetical account values and hypothetical expenses based on the Fund’s actual expense ratio and an assumed rate of return of 5% per year before expenses, which is not the Fund’s actual return. You may use this information to compare the ongoing costs of investing in the Fund and other funds. To do so, compare this 5% hypothetical example with the 5% hypothetical examples that appear in the shareholders reports of other funds.
Please note that the expenses shown in the table for both “Actual” and “ Hypothetical” do not reflect any transaction costs, such as sales charges or redemption fees.
July 1, 2010 – December 31, 2010
| | | | | | | | | | | | |
| | | Account value at
the beginning of
the period ($) | | | Account value
at the end of
the period ($) | | | Expenses
paid during
the period ($)* | |
| | | |
Actual Fund Return** | | | 1,000.00 | | | | 1,165.73 | | | | 2.62 | |
| | | |
Hypothetical 5% Return (2.5% for the period) | | | 1,000.00 | | | | 1,022.54 | | | | 2.45 | |
| * | | Expenses are equal to the Fund’s annualized expense ratio of 0.48% (for the period July 1, 2010 - December 31, 2010), multiplied by the average account value over the period, multiplied by 184/365 (to reflect the one-half year period) |
| ** | | Actual Fund Return for the six-month period ended December 31, 2010 was: 16.57%. Past performance does not guarantee future results. |
21
(Unaudited)
Investment Profile
A mutual fund designed for investors who seek the highest total return consistent with prudent investment management and the preservation of capital (total return includes both income and capital appreciation) by investing primarily in a combination of U.S. and foreign equity and debt securities and cash.
Top Ten Largest Holdings
as of December 31, 2010 as a % of Fair Value(b)(c)
| | | | |
U.S. Treasury Notes 3.00%, 08/15/20 | | | 2.77% | |
FNMA, 4.50%, TBA. | | | 1.91% | |
FNMA, 4.50%, 05/01/18 - 11/01/40 | | | 1.81% | |
U.S. Treasury Bonds 3.88%, 08/15/40 | | | 1.55% | |
FNMA, 5.00%, TBA. | | | 1.03% | |
Vanguard REIT ETF | | | 0.99% | |
Microsoft Corp. | | | 0.90% | |
FNMA 5.00%, 07/01/20 - 11/01/40 | | | 0.85% | |
FNMA 4.00%, 05/01/19 - 10/01/40 | | | 0.81% | |
FNMA 4.00%, 10/01/40 | | | 0.78% | |
Sector Allocation
as a % of the Fair Value of $235,991 (in thousands) as of December 31, 2010.(b)(c)
Morningstar Performance Comparison
Based on average annual returns for periods ended 12/31/10
| | | | | | | | | | | | |
| | | One
Year | | | Five
Year | | | Ten
Year | |
Number of Funds in peer group | | | 1098 | | | | 858 | | | | 645 | |
Peer group average annual total
return | | | 11.73 | % | | | 3.24 | % | | | 3.03 | % |
Morningstar category in peer group: Moderate Allocation | |
Change in Value of a $10,000 Investment(a)
Average Annual Total Return
for the periods ended December 31, 2010
| | | | | | | | | | | | | | | | |
| (Inception date: 01/01/88) | | | | | | | | | | |
| | | One
Year | | | Five
Year | | | Ten
Year | | | Ending value of a
$10,000
investment (a) | |
| | | | |
Elfun Diversified Fund | | | 9.98% | | | | 3.15% | | | | 3.53% | | | | 14,155 | |
| | | | |
S&P 500® Index | | | 15.06% | | | | 2.29% | | | | 1.41% | | | | 11,508 | |
| | | | |
Barclays Capital U.S. Aggregate Bond Index | | | 6.54% | | | | 5.80% | | | | 5.84% | | | | 17,633 | |

| (a) | Ending value of a $10,000 investment for the ten-year period or since inception, whichever is less. |
| (b) | The securities information regarding holdings, allocations and other characteristics is presented to illustrate examples of securities that the Fund has bought and the diversity of areas in which the Fund may invest as of a particular date. It may not be representative of the Fund’s current or future investments and should not be construed as a recommendation to purchase or sell a particular security. |
| (c) | Fair value basis is inclusive of Short Term Investment in GE Money Market Fund. |
See Notes to Performance on page 1 for further information.
Past performance does not predict future performance. The performance shown on the graph and tables do not reflect the deduction of taxes that a shareholder would pay on Fund distributions or the redemption of Fund shares.
22
| | |
| Elfun Diversified Fund | | (in thousands) — December 31, 2010 |
| | | | | | | | | | |
| | | Number
of Shares | | | Fair
Value | | | |
| | | | | | | | | | |
Domestic Equity — 35.1%† |
| |
| Advertising — 0.5% | | | |
| | | |
Omnicom Group Inc. | | | 24,136 | | | $ | 1,105 | | | |
| |
| Aerospace & Defense — 0.7% | | | |
| | | |
Alliant Techsystems Inc. | | | 4,311 | | | | 321 | | | (a) |
Hexcel Corp. | | | 23,026 | | | | 417 | | | (a) |
Honeywell International Inc. | | | 15,543 | | | | 826 | | | |
Rockwell Collins Inc. | | | 1,453 | | | | 85 | | | |
| | | | | | | 1,649 | | | |
| |
| Agricultural Products — 0.1% | | | |
| | | |
Archer-Daniels-Midland Co. | | | 6,680 | | | | 201 | | | |
| |
| Air Freight & Logistics — 0.1% | | | |
| | | |
FedEx Corp. | | | 1,789 | | | | 166 | | | |
UTi Worldwide Inc. | | | 5,987 | | | | 127 | | | |
| | | | | | | 293 | | | |
| |
| Apparel Retail — 0.1% | | | |
| | | |
Urban Outfitters Inc. | | | 7,393 | | | | 265 | | | (a) |
|
| Apparel, Accessories & Luxury Goods — 0.2% |
| | | |
Coach Inc. | | | 8,736 | | | | 483 | | | |
| |
| Application Software — 0.3% | | | |
| | | |
Blackboard Inc. | | | 5,402 | | | | 223 | | | (a) |
Citrix Systems Inc. | | | 6,201 | | | | 424 | | | (a) |
| | | | | | | 647 | | | |
|
| Asset Management & Custody Banks — 1.5% |
| | | |
Affiliated Managers Group Inc. | | | 5,020 | | | | 498 | | | (a) |
Ameriprise Financial Inc. | | | 8,337 | | | | 480 | | | |
Franklin Resources Inc. | | | 374 | | | | 42 | | | |
Invesco Ltd. | | | 37,085 | | | | 893 | | | |
State Street Corp. | | | 28,029 | | | | 1,299 | | | (e) |
The Bank of New York Mellon Corp. | | | 9,722 | | | | 294 | | | |
| | | | | | | 3,506 | | | |
| |
| Automobile Manufacturers — 0.2% | | | |
| | | |
O’Reilly Automotive Inc. | | | 6,529 | | | | 394 | | | |
| | | | | | | | | | |
| | | Number
of Shares | | | Fair
Value | | | |
| | | | | | | | | | |
| |
| Biotechnology — 1.4% | | | |
| | | |
Alexion Pharmaceuticals Inc. | | | 3,324 | | | $ | 268 | | | (a) |
Amgen Inc. | | | 21,639 | | | | 1,188 | | | (a) |
Gilead Sciences Inc. | | | 32,970 | | | | 1,195 | | | (a) |
Human Genome Sciences Inc. | | | 6,894 | | | | 165 | | | (a) |
Incyte Corp Ltd. | | | 9,571 | | | | 159 | | | (a) |
Vertex Pharmaceuticals Inc. | | | 6,702 | | | | 235 | | | (a) |
| | | | | | | 3,210 | | | |
| |
| Brewers — 0.0%* | | | |
| | | |
Molson Coors Brewing Co. | | | 1,403 | | | | 70 | | | |
| |
| Broadcasting — 0.1% | | | |
| | | |
Discovery Communications Inc. | | | 6,571 | | | | 254 | | | (a) |
| |
| Cable & Satellite — 0.5% | | | |
| | | |
DIRECTV | | | 17,133 | | | | 684 | | | (a) |
Liberty Global Inc. | | | 16,154 | | | | 548 | | | (a) |
| | | | | | | 1,232 | | | |
| |
| Casinos & Gaming — 0.1% | | | |
| | | |
Penn National Gaming Inc. | | | 9,650 | | | | 339 | | | (a) |
| |
| Coal & Consumable Fuels — 0.1% | | | |
| | | |
Peabody Energy Corp. | | | 4,830 | | | | 309 | | | |
| |
| Communications Equipment — 1.3% | | | |
| | | |
Cisco Systems Inc. | | | 48,864 | | | | 988 | | | (a) |
Juniper Networks Inc. | | | 11,683 | | | | 431 | | | (a) |
QUALCOMM Inc. | | | 33,561 | | | | 1,661 | | | |
| | | | | | | 3,080 | | | |
| |
| Computer Hardware — 0.6% | | | |
| | | |
Apple Inc. | | | 4,064 | | | | 1,311 | | | (a) |
Hewlett-Packard Co. | | | 4,051 | | | | 171 | | | |
| | | | | | | 1,482 | | | |
| |
| Computer Storage & Peripherals — 0.2% | | | |
| | | |
Synaptics Inc. | | | 12,612 | | | | 371 | | | (a) |
| |
| Construction & Engineering — 0.1% | | | |
| | | |
Quanta Services Inc. | | | 7,898 | | | | 157 | | | (a) |
See Notes to Schedules of Investments and Notes to Financial Statements.
23
| | |
| Elfun Diversified Fund | | (in thousands) — December 31, 2010 |
| | | | | | | | | | |
| | | Number
of Shares | | | Fair
Value | | | |
| | | | | | | | | | |
| |
| Construction & Farm Machinery & Heavy Trucks — 0.3% | | | |
| | | |
Cummins Inc. | | | 2,110 | | | $ | 232 | | | |
Deere & Co. | | | 4,543 | | | | 378 | | | |
| | | | | | | 610 | | | |
| |
| Consumer Finance — 0.1% | | | |
| | | |
American Express Co. | | | 4,749 | | | | 204 | | | |
| |
| Data Processing & Outsourced Services — 0.8% | | | |
| | | |
Automatic Data Processing Inc. | | | 1,403 | | | | 65 | | | |
The Western Union Co. | | | 47,545 | | | | 883 | | | |
Visa Inc. | | | 11,918 | | | | 839 | | | |
| | | | | | | 1,787 | | | |
| |
| Department Stores — 0.0%* | | | |
| | | |
Macy’s Inc. | | | 4,456 | | | | 113 | | | |
| |
| Distributors — 0.0%* | | | |
| | | |
Genuine Parts Co. | | | 1,518 | | | | 78 | | | |
| |
| Diversified Chemicals — 0.0%* | | | |
| | | |
EI du Pont de Nemours & Co. | | | 1,751 | | | | 87 | | | |
| |
| Diversified Financial Services — 0.9% | | | |
| | | |
Bank of America Corp. | | | 24,005 | | | | 320 | | | |
Citigroup Inc. | | | 36,684 | | | | 174 | | | (a) |
JPMorgan Chase & Co. | | | 23,334 | | | | 990 | | | |
US BanCorp | | | 5,249 | | | | 142 | | | |
Wells Fargo & Co. | | | 16,546 | | | | 513 | | | |
| | | | | | | 2,139 | | | |
| |
| Diversified Metals & Mining — 0.1% | | | |
| | | |
Freeport-McMoRan Copper & Gold Inc. | | | 1,841 | | | | 221 | | | |
| |
| Diversified Support Services — 0.1% | | | |
| | | |
Iron Mountain Inc. | | | 7,281 | | | | 182 | | | |
| |
| Drug Retail — 0.0%* | | | |
| | | |
CVS Caremark Corp. | | | 2,684 | | | | 93 | | | |
| |
| Electric Utilities — 0.7% | | | |
| | | |
Edison International | | | 3,830 | | | | 147 | | | |
| | | | | | | | | | |
| | | Number
of Shares | | | Fair
Value | | | |
| | | | | | | | | | |
| | | |
Entergy Corp. | | | 1,491 | | | $ | 106 | | | |
ITC Holdings Corp. | | | 10,769 | | | | 667 | | | |
NextEra Energy Inc. | | | 2,778 | | | | 144 | | | |
Northeast Utilities | | | 12,782 | | | | 407 | | | |
Southern Co. | | | 2,992 | | | | 114 | | | |
| | | | | | | 1,585 | | | |
|
| Electrical Components & Equipment — 0.3% |
| | | |
Cooper Industries PLC | | | 9,241 | | | | 539 | | | |
Emerson Electric Co. | | | 3,039 | | | | 174 | | | |
| | | | | | | 713 | | | |
| |
| Electronic Components — 0.1% | | | |
| | | |
Corning Inc. | | | 7,523 | | | | 145 | | | |
|
| Environmental & Facilities Services — 0.1% |
| | | |
Stericycle Inc. | | | 1,544 | | | | 125 | | | (a) |
|
| Fertilizers & Agricultural Chemicals — 0.5% |
| | | |
Intrepid Potash Inc. | | | 7,547 | | | | 281 | | | (a) |
Monsanto Co. | | | 12,977 | | | | 903 | | | |
| | | | | | | 1,184 | | | |
| |
| Food Distributors — 0.0%* | | | |
| | | |
Sysco Corp. | | | 2,572 | | | | 76 | | | |
| |
| General Merchandise Stores — 0.5% | | | |
| | | |
Dollar General Corp. | | | 6,970 | | | | 214 | | | (a) |
Target Corp. | | | 13,754 | | | | 827 | | | |
| | | | | | | 1,041 | | | |
| |
| Healthcare Distributors — 0.0%* | | | |
| | | |
Cardinal Health Inc. | | | 2,684 | | | | 103 | | | |
| |
| Healthcare Equipment — 1.0% | | | |
| | | |
Becton Dickinson and Co. | | | 775 | | | | 66 | | | |
Covidien PLC | | | 20,970 | | | | 958 | | | |
Gen-Probe Inc. | | | 4,148 | | | | 242 | | | (a) |
Masimo Corp. | | | 13,467 | | | | 391 | | | |
ResMed Inc. | | | 16,158 | | | | 560 | | | (a) |
| | | | | | | 2,217 | | | |
| |
| Healthcare Services — 0.8% | | | |
| | | |
Catalyst Health Solutions Inc. | | | 9,662 | | | | 449 | | | (a) |
See Notes to Schedules of Investments and Notes to Financial Statements.
24
| | |
| Elfun Diversified Fund | | (in thousands) — December 31, 2010 |
| | | | | | | | | | |
| | | Number
of Shares | | | Fair
Value | | | |
| | | | | | | | | | |
| | | |
Express Scripts Inc. | | | 20,943 | | | $ | 1,132 | | | (a) |
Medco Health Solutions Inc. | | | 1,372 | | | | 84 | | | (a) |
Omnicare Inc. | | | 7,812 | | | | 198 | | | |
| | | | | | | 1,863 | | | |
| |
| Healthcare Technology — 0.1% | | | |
| | | |
MedAssets Inc. | | | 13,594 | | | | 274 | | | (a) |
| |
| Home Entertainment Software — 0.2% | | | |
| | | |
Activision Blizzard Inc. | | | 32,295 | | | | 402 | | | |
| |
| Home Improvement Retail — 0.5% | | | |
| | | |
Home Depot Inc. | | | 3,273 | | | | 115 | | | |
Lowe’s companies Inc. | | | 45,358 | | | | 1,137 | | | |
| | | | | | | 1,252 | | | |
| |
| Homebuilding — 0.1% | | | |
| | | |
MDC Holdings Inc. | | | 4,734 | | | | 136 | | | |
| |
| Homefurnishing Retail — 0.2% | | | |
| | | |
Bed Bath & Beyond Inc. | | | 9,693 | | | | 476 | | | (a) |
| |
| Hotels, Resorts & Cruise Lines — 0.2% | | | |
| | | |
Carnival Corp. | | | 9,197 | | | | 424 | | | |
Marriott International Inc. | | | 2,392 | | | | 99 | | | |
| | | | | | | 523 | | | |
| |
| Household Products — 0.5% | | | |
| | | |
Clorox Co. | | | 5,581 | | | | 353 | | | |
Kimberly-Clark Corp. | | | 1,852 | | | | 117 | | | |
The Procter & Gamble Co. | | | 11,160 | | | | 718 | | | |
| | | | | | | 1,188 | | | |
| |
| Hypermarkets & Super Centers — 0.0%* | | | |
| | | |
Wal-Mart Stores Inc. | | | 1,904 | | | | 103 | | | |
| |
| Independent Power Producers & Energy Traders — 0.1% | | | |
| | | |
Calpine Corp. | | | 4,861 | | | | 65 | | | (a) |
The AES Corp. | | | 5,249 | | | | 64 | | | (a) |
| | | | | | | 129 | | | |
| |
| Industrial Conglomerates — 0.0%* | | | |
| | | |
3M Co. | | | 725 | | | | 63 | | | |
| | | | | | | | | | |
| | | Number
of Shares | | | Fair
Value | | | |
| | | | | | | | | | |
| |
| Industrial Gases — 0.5% | | | |
| | | |
Praxair Inc. | | | 12,177 | | | $ | 1,162 | | | |
| |
| Industrial Machinery — 0.3% | | | |
| | | |
Eaton Corp. | | | 1,808 | | | | 183 | | | |
Harsco Corp. | | | 18,003 | | | | 510 | | | |
| | | | | | | 693 | | | |
| |
| Integrated Oil & Gas — 1.0% | | | |
| | | |
Chevron Corp. | | | 10,090 | | | | 921 | | | |
ConocoPhillips | | | 3,694 | | | | 252 | | | |
Exxon Mobil Corp. | | | 10,155 | | | | 742 | | | (h) |
Marathon Oil Corp. | | | 5,016 | | | | 186 | | | |
Occidental Petroleum Corp. | | | 1,449 | | | | 142 | | | |
| | | | | | | 2,243 | | | |
|
| Integrated Telecommunication Services — 0.4% |
| | | |
AT&T Inc. | | | 17,777 | | | | 522 | | | |
Verizon Communications Inc. | | | 10,889 | | | | 389 | | | |
Windstream Corp. | | | 3,556 | | | | 50 | | | |
| | | | | | | 961 | | | |
| |
| Internet Software & Services — 0.7% | | | |
| | | |
Equinix Inc. | | | 7,059 | | | | 574 | | | (a) |
Google Inc. | | | 1,294 | | | | 769 | | | (a) |
MercadoLibre Inc. | | | 3,858 | | | | 257 | | | (a) |
| | | | | | | 1,600 | | | |
| |
| Investment Banking & Brokerage — 0.6% | | | |
| | | |
Morgan Stanley | | | 6,366 | | | | 173 | | | |
The Goldman Sachs Group Inc. | | | 7,482 | | | | 1,258 | | | |
| | | | | | | 1,431 | | | |
| |
| IT Consulting & Other Services — 0.4% | | | |
| | | |
International Business Machines Corp. | | | 6,344 | | | | 931 | | | (h) |
| |
| Life & Health Insurance — 0.6% | | | |
| | | |
Aflac Inc. | | | 7,376 | | | | 416 | | | |
MetLife Inc. | | | 7,219 | | | | 321 | | | |
Principal Financial Group Inc. | | | 6,944 | | | | 226 | | | |
Prudential Financial Inc. | | | 7,238 | | | | 425 | | | |
| | | | | | | 1,388 | | | |
See Notes to Schedules of Investments and Notes to Financial Statements.
25
| | |
| Elfun Diversified Fund | | (in thousands) — December 31, 2010 |
| | | | | | | | | | |
| | | Number
of Shares | | | Fair
Value | | | |
| | | | | | | | | | |
| |
| Life Sciences Tools & Services — 0.9% | | | |
| | | |
Covance Inc. | | | 6,172 | | | $ | 317 | | | (a) |
Illumina Inc. | | | 7,329 | | | | 464 | | | (a) |
Life Technologies Corp. | | | 4,864 | | | | 270 | | | (a) |
Mettler-Toledo International Inc. | | | 2,634 | | | | 398 | | | (a) |
Thermo Fisher Scientific Inc. | | | 11,266 | | | | 624 | | | (a) |
| | | | | | | 2,073 | | | |
| |
| Movies & Entertainment — 0.5% | | | |
| | | |
News Corp. | | | 17,824 | | | | 260 | | | |
Regal Entertainment Group | | | 11,132 | | | | 131 | | | |
The Walt Disney Co. | | | 6,655 | | | | 250 | | | |
Time Warner Inc. | | | 16,658 | | | | 536 | | | |
| | | | | | | 1,177 | | | |
| |
| Multi-Line Insurance — 0.3% | | | |
| | | |
HCC Insurance Holdings Inc. | | | 19,919 | | | | 576 | | | |
| |
| Multi-Utilities — 0.2% | | | |
| | | |
Dominion Resources Inc. | | | 9,664 | | | | 413 | | | |
Xcel Energy Inc. | | | 2,217 | | | | 52 | | | |
| | | | | | | 465 | | | |
| |
| Office REITs — 0.2% | | | |
| | | |
Douglas Emmett Inc. | | | 11,938 | | | | 198 | | | |
SL Green Realty Corp. | | | 2,493 | | | | 168 | | | |
| | | | | | | 366 | | | |
| |
| Oil & Gas Equipment & Services — 1.3% | | | |
| | | |
Dresser-Rand Group Inc. | | | 7,761 | | | | 331 | | | (a) |
Halliburton Co. | | | 1,736 | | | | 71 | | | |
McDermott International Inc. | | | 8,501 | | | | 176 | | | (a) |
National Oilwell Varco Inc. | | | 1,491 | | | | 100 | | | |
Schlumberger Ltd. | | | 21,955 | | | | 1,833 | | | |
Weatherford International Ltd. | | | 18,005 | | | | 411 | | | (a) |
| | | | | | | 2,922 | | | |
|
| Oil & Gas Exploration & Production — 0.9% |
| | | |
Apache Corp. | | | 6,146 | | | | 732 | | | |
Devon Energy Corp. | | | 1,620 | | | | 127 | | | |
EQT Corp. | | | 5,908 | | | | 265 | | | |
Petrohawk Energy Corp. | | | 15,544 | | | | 284 | | | (a) |
Pioneer Natural Resources Co. | | | 3,562 | | | | 309 | | | |
| | | | | | | | | | |
| | | Number
of Shares | | | Fair
Value | | | |
| | | | | | | | | | |
| | | |
Range Resources Corp. | | | 5,226 | | | $ | 235 | | | |
Southwestern Energy Co. | | | 3,129 | | | | 117 | | | (a) |
| | | | | | | 2,069 | | | |
|
| Oil & Gas Storage & Transportation — 0.2% |
| | | |
El Paso Corp. | | | 23,127 | | | | 318 | | | |
Spectra Energy Corp. | | | 7,034 | | | | 176 | | | |
| | | | | | | 494 | | | |
| |
| Packaged Foods & Meats — 0.5% | | | |
| | | |
Kellogg Co. | | | 1,777 | | | | 91 | | | |
Kraft Foods Inc. | | | 16,175 | | | | 510 | | | |
McCormick & Company Inc. | | | 6,678 | | | | 310 | | | |
Mead Johnson Nutrition Co. | | | 3,793 | | | | 236 | | | |
| | | | | | | 1,147 | | | |
| |
| Personal Products — 0.1% | | | |
| | | |
Avon Products Inc. | | | 4,155 | | | | 121 | | | |
| |
| Pharmaceuticals — 0.8% | | | |
| | | |
Abbott Laboratories | | | 1,636 | | | | 78 | | | |
Bristol-Myers Squibb Co. | | | 11,949 | | | | 316 | | | |
Hospira Inc. | | | 5,188 | | | | 289 | | | (a) |
Johnson & Johnson | | | 12,153 | | | | 751 | | | |
Merck & Company Inc. | | | 3,207 | | | | 116 | | | |
Pfizer Inc. | | | 22,958 | | | | 402 | | | |
| | | | | | | 1,952 | | | |
| |
| Property & Casualty Insurance — 0.3% | | | |
| | | |
ACE Ltd. | | | 9,028 | | | | 562 | | | |
The Travelers Companies Inc. | | | 1,683 | | | | 94 | | | |
| | | | | | | 656 | | | |
| |
| Railroads — 0.2% | | | |
| | | |
Union Pacific Corp. | | | 4,613 | | | | 428 | | | |
| |
| Real Estate Services — 0.4% | | | |
| | | |
CB Richard Ellis Group Inc. (REIT) | | | 40,113 | | | | 822 | | | (a,h) |
| |
| Regional Banks — 0.2% | | | |
| | | |
Regions Financial Corp. | | | 22,655 | | | | 159 | | | |
Zions Bancorp. | | | 8,358 | | | | 203 | | | |
| | | | | | | 362 | | | |
See Notes to Schedules of Investments and Notes to Financial Statements.
26
| | |
| Elfun Diversified Fund | | (in thousands) — December 31, 2010 |
| | | | | | | | | | |
| | | Number
of Shares | | | Fair
Value | | | |
| | | | | | | | | | |
| |
| Reinsurance — 0.1% | | | |
| | | |
PartnerRe Ltd. | | | 2,327 | | | $ | 187 | | | |
| |
| Research & Consulting Services — 0.2% | | | |
| | | |
IHS Inc. | | | 4,936 | | | | 397 | | | (a) |
| |
| Restaurants — 0.1% | | | |
| | | |
McDonald’s Corp. | | | 3,086 | | | | 237 | | | |
| |
| Security & Alarm Services — 0.4% | | | |
| | | |
Corrections Corporation of America | | | 31,703 | | | | 795 | | | (a) |
| |
| Semiconductor Equipment — 0.1% | | | |
| | | |
KLA-Tencor Corp. | | | 6,679 | | | | 258 | | | |
| |
| Semiconductors — 1.1% | | | |
| | | |
Cree Inc. | | | 2,315 | | | | 153 | | | (a) |
Hittite Microwave Corp. | | | 6,856 | | | | 418 | | | (a) |
Intel Corp. | | | 48,496 | | | | 1,019 | | | (h) |
Marvell Technology Group Ltd. | | | 21,193 | | | | 393 | | | (a) |
Microchip Technology Inc. | | | 5,469 | | | | 187 | | | |
Texas Instruments Inc. | | | 13,183 | | | | 428 | | | |
| | | | | | | 2,598 | | | |
| |
| Soft Drinks — 0.8% | | | |
| | | |
Coca-Cola Enterprises Inc. | | | 10,091 | | | | 253 | | | |
PepsiCo Inc. | | | 24,748 | | | | 1,617 | | | |
| | | | | | | 1,870 | | | |
| |
| Specialized Finance — 0.8% | | | |
| | | |
CBOE Holdings Inc. | | | 7,735 | | | | 177 | | | |
CME Group Inc. | | | 4,170 | | | | 1,342 | | | |
MSCI Inc. | | | 5,170 | | | | 201 | | | (a) |
| | | | | | | 1,720 | | | |
| |
| Specialized REITs — 0.1% | | | |
| | | |
Healthcare Inc. | | | 1,262 | | | | 60 | | | |
Public Storage | | | 701 | | | | 71 | | | |
Rayonier Inc. | | | 728 | | | | 38 | | | |
| | | | | | | 169 | | | |
| | | | | | | | | | |
| | | Number
of Shares | | | Fair
Value | | | |
| | | | | | | | | | |
| |
| Specialty Chemicals — 0.0%* | | | |
| | | |
Cytec Industries Inc. | | | 1,568 | | | $ | 83 | | | |
| |
| Steel — 0.7% | | | |
| | | |
Allegheny Technologies Inc. | | | 21,887 | | | | 1,207 | | | |
Steel Dynamics Inc. | | | 15,148 | | | | 277 | | | |
| | | | | | | 1,484 | | | |
| |
| Systems Software — 1.6% | | | |
| | | |
Microsoft Corp. | | | 75,767 | | | | 2,115 | | | |
Oracle Corp. | | | 20,213 | | | | 633 | | | |
Rovi Corp. | | | 15,587 | | | | 967 | | | (a) |
| | | | | | | 3,715 | | | |
| |
| Thrifts & Mortgage Finance — 0.2% | | | |
| | | |
People’s United Financial Inc. | | | 28,502 | | | | 399 | | | |
| |
| Tobacco — 0.1% | | | |
| | | |
Philip Morris International Inc. | | | 2,936 | | | | 172 | | | |
| |
| Trading Companies & Distributors — 0.1% | | | |
| | | |
MSC Industrial Direct Co. | | | 4,069 | | | | 263 | | | |
| |
| Water Utilities — 0.0%* | | | |
| | | |
American Water Works Company Inc. | | | 2,057 | | | | 52 | | | |
|
| Wireless Telecommunication Services — 0.9% |
| | | |
American Tower Corp. | | | 9,142 | | | | 472 | | | (a) |
NII Holdings Inc. | | | 34,232 | | | | 1,529 | | | (a) |
Syniverse Holdings Inc. | | | 1,598 | | | | 49 | | | (a) |
| | | | | | | 2,050 | | | |
| | | |
Total Domestic Equity
(Cost $68,682) | | | | | | | 80,647 | | | |
Foreign Equity — 25.8% | | | |
| |
| Aerospace & Defense — 0.6% | | | |
| | | |
CAE Inc. | | | 35,823 | | | | 415 | | | |
European Aeronautic Defence and Space Company N.V. | | | 17,149 | | | | 401 | | | |
See Notes to Schedules of Investments and Notes to Financial Statements.
27
| | |
| Elfun Diversified Fund | | (in thousands) — December 31, 2010 |
| | | | | | | | | | |
| | | Number
of Shares | | | Fair
Value | | | |
| | | | | | | | | | |
| | | |
Safran S.A. | | | 12,450 | | | $ | 443 | | | |
| | | | | | | 1,259 | | | |
| |
| Agricultural Products — 0.1% | | | |
| | | |
China Agri-Industries Holdings Ltd. | | | 37,652 | | | | 43 | | | |
Cosan SA Industria e Comercio | | | 5,699 | | | | 95 | | | |
Global Bio-Chem Technology Group Company Ltd. | | | 172,258 | | | | 26 | | | |
IOI Corporation Bhd | | | 18,622 | | | | 35 | | | |
| | | | | | | 199 | | | |
| |
| Apparel Retail — 0.1% | | | |
| | | |
Esprit Holdings Ltd. | | | 40,647 | | | | 193 | | | |
|
| Apparel, Accessories & Luxury Goods — 0.2% |
| | | |
Adidas AG | | | 5,746 | | | | 377 | | | |
China Dongxiang Group Company | | | 32,035 | | | | 14 | | | |
Ports Design Ltd. | | | 24,225 | | | | 67 | | | |
| | | | | | | 458 | | | |
| |
| Application Software — 0.4% | | | |
| | | |
Autonomy Corporation PLC | | | 12,918 | | | | 304 | | | (a) |
Longtop Financial Technologies Ltd. ADR | | | 4,293 | | | | 155 | | | (a) |
SAP AG | | | 7,233 | | | | 370 | | | |
| | | | | | | 829 | | | |
|
| Asset Management & Custody Banks — 0.0%* |
| | | |
Mirae Asset Securities Company Ltd. | | | 1,065 | | | | 56 | | | |
| |
| Automobile Manufacturers — 1.0% | | | |
| | | |
Daimler AG | | | 9,006 | | | | 613 | | | |
Hyundai Motor Company | | | 320 | | | | 49 | | | (a) |
Mahindra & Mahindra Ltd. | | | 2,025 | | | | 35 | | | |
Suzuki Motor Corp. | | | 40,466 | | | | 998 | | | |
Toyota Motor Corp. | | | 12,130 | | | | 482 | | | |
| | | | | | | 2,177 | | | |
| | | |
| Brewers — 0.0%* | | | | | | | | | | |
| | | |
Anadolu Efes Biracilik Ve Malt Sanayii AS | | | 3,459 | | | | 53 | | | |
| | | | | | | | | | |
| | | Number
of Shares | | | Fair
Value | | | |
| | | | | | | | | | |
| |
| Broadcasting — 0.1% | | | |
| | | |
Grupo Televisa S.A. ADR | | | 2,404 | | | $ | 62 | | | (a) |
Zee Entertainment Enterprises Ltd. | | | 14,678 | | | | 48 | | | |
Zee Learn Ltd. | | | 1,835 | | | | 1 | | | (a) |
| | | | | | | 111 | | | |
| | | |
| Building Products — 0.1% | | | | | | | | | | |
| | | |
Daikin Industries Ltd. | | | 8,000 | | | | 284 | | | |
| | | |
| Casinos & Gaming — 0.0%* | | | | | | | | | | |
| | | |
Genting Bhd | | | 9,900 | | | | 36 | | | |
|
| Coal & Consumable Fuels — 0.2% |
| | | |
Paladin Energy Ltd. | | | 88,426 | | | | 447 | | | (a) |
| |
| Communications Equipment — 0.6% | | | |
| | | |
HTC Corp. | | | 3,000 | | | | 93 | | | |
Research In Motion Ltd. | | | 13,402 | | | | 782 | | | (a) |
Telefonaktiebolaget LM Ericsson | | | 33,939 | | | | 395 | | | |
ZTE Corp. | | | 3,602 | | | | 14 | | | |
| | | | | | | 1,284 | | | |
| |
| Construction & Engineering — 0.4% | | | |
| | | |
China State Construction International Holdings Ltd. | | | 65,794 | | | | 62 | | | |
Doosan Heavy Industries and Construction Company Ltd. | | | 1,161 | | | | 88 | | | (a) |
Larsen & Toubro Ltd. | | | 11,948 | �� | | | 529 | | | |
Vinci S.A. | | | 6,395 | | | | 349 | | | |
| | | | | | | 1,028 | | | |
| |
| Construction & Farm Machinery & Heavy Trucks — 0.2% | | | |
| | | |
CSR Corp Ltd. | | | 276,906 | | | | 364 | | | |
First Tractor Company Ltd. | | | 21,643 | | | | 24 | | | |
Sany Heavy Equipment International Holdings Company Ltd. | | | 64,096 | | | | 95 | | | |
United Tractors Tbk PT | | | 19,499 | | | | 52 | | | |
| | | | | | | 535 | | | |
| | | |
| Construction Materials — 0.1% | | | | | | | | | | |
| | | |
CRH PLC | | | 14,333 | | | | 301 | | | |
See Notes to Schedules of Investments and Notes to Financial Statements.
28
| | |
| Elfun Diversified Fund | | (in thousands) — December 31, 2010 |
| | | | | | | | | | |
| | | Number
of Shares | | | Fair
Value | | | |
| | | | | | | | | | |
| | |
| Consumer Electronics — 0.0%* | | | | | | | |
| | | |
LG Electronics Inc. | | | 176 | | | $ | 18 | | | (a) |
| |
| Distillers & Vintners — 0.1% | | | |
| | | |
Diageo PLC | | | 11,723 | | | | 217 | | | |
Diageo PLC ADR | | | 957 | | | | 71 | | | |
| | | | | | | 288 | | | |
| |
| Diversified Capital Markets — 0.2% | | | |
| | | |
Credit Suisse Group AG | | | 14,353 | | | | 580 | | | |
| |
| Diversified Financial Services — 2.9% | | | |
| | | |
Axis Bank Ltd. | | | 2,796 | | | | 84 | | | |
Banco Santander Brasil S.A. | | | 51,500 | | | | 699 | | | |
Banco Santander S.A. | | | 76,032 | | | | 809 | | | |
Bank of China Ltd. | | | 800,996 | | | | 423 | | | |
Bank Rakyat Indonesia Persero Tbk PT | | | 68,500 | | | | 80 | | | |
BNP Paribas | | | 15,216 | | | | 972 | | | |
Credit Agricole S.A. | | | 15,714 | | | | 200 | | | |
Grupo Financiero Banorte SAB de C.V. | | | 8,527 | | | | 41 | | | |
Halyk Savings Bank of Kazakhstan JSC GDR | | | 3,370 | | | | 34 | | | (a) |
HSBC Holdings PLC | | | 119,416 | | | | 1,217 | | | |
ICICI Bank Ltd. | | | 1,807 | | | | 46 | | | |
Industrial & Commercial Bank of China | | | 70,222 | | | | 52 | | | |
Kasikornbank PCL | | | 22,910 | | | | 99 | | | |
KB Financial Group Inc. | | | 759 | | | | 40 | | | (a) |
Lloyds Banking Group PLC | | | 594,255 | | | | 611 | | | (a) |
Metropolitan Bank & Trust | | | 50,970 | | | | 84 | | | |
Mitsubishi UFJ Financial Group Inc. | | | 97,738 | | | | 529 | | | |
Standard Bank Group Ltd. | | | 4,073 | | | | 66 | | | |
UniCredit S.p.A. | | | 228,790 | | | | 475 | | | |
Yapi ve Kredi Bankasi AS | | | 29,918 | | | | 94 | | | (a) |
| | | | | | | 6,655 | | | |
| |
| Diversified Metals & Mining — 1.3% | | | |
| | | |
Anglo American PLC | | | 1,712 | | | | 89 | | | |
Antofagasta PLC | | | 5,176 | | | | 131 | | | |
BHP Billiton PLC | | | 29,523 | | | | 1,179 | | | |
China Molybdenum Company Ltd. | | | 37,914 | | | | 35 | | | |
| | | | | | | | | | |
| | | Number
of Shares | | | Fair
Value | | | |
| | | | | | | | | | |
| | | |
Eurasian Natural Resources Corporation PLC | | | 5,005 | | | $ | 82 | | | |
Lynas Corporation Ltd. | | | 175,410 | | | | 370 | | | (a) |
New World Resources N.V. | | | 5,471 | | | | 82 | | | |
Rio Tinto PLC | | | 15,766 | | | | 1,107 | | | |
| | | | | | | 3,075 | | | |
| |
| Diversified Real Estate Activities — 0.2% | | | |
| | | |
Mitsubishi Estate Company Ltd. (REIT) | | | 14,982 | | | | 278 | | | |
Sumitomo Realty & Development Company Ltd. (REIT) | | | 10,000 | | | | 239 | | | |
| | | | | | | 517 | | | |
| | |
| Diversified Support Services — 0.1% | | | | | | | |
| | | |
Brambles Ltd. | | | 45,815 | | | | 334 | | | |
| |
| Education Services — 0.0%* | | | |
| | | |
MegaStudy Company Ltd. | | | 276 | | | | 43 | | | (a) |
| |
| Electric Utilities — 0.1% | | | |
| | | |
Power Grid Corporation of India Ltd. | | | 69,343 | | | | 152 | | | |
| |
| Electrical Components & Equipment — 0.4% | | | |
| | | |
Schneider Electric S.A. | | | 5,726 | | | | 860 | | | |
Zhuzhou CSR Times Electric Company Ltd. | | | 19,606 | | | | 77 | | | |
| | | | | | | 937 | | | |
| |
| Electronic Components — 0.3% | | | |
| | | |
Delta Electronics Inc. | | | 135,296 | | | | 661 | | | |
Samsung SDI Company Ltd. | | | 410 | | | | 61 | | | (a) |
| | | | | | | 722 | | | |
| |
| Electronic Equipment & Instruments — 0.0%* | | | |
| | | |
China Security & Surveillance Technology Inc. | | | 6,359 | | | | 34 | | | (a) |
Wasion Group Holdings Ltd. | | | 45,228 | | | | 30 | | | |
| | | | | | | 64 | | | |
| |
| Electronic Manufacturing Services — 0.1% | | | |
| | | |
Hon Hai Precision Industry Company Ltd. | | | 31,296 | | | | 126 | | | |
See Notes to Schedules of Investments and Notes to Financial Statements.
29
| | |
| Elfun Diversified Fund | | (in thousands) — December 31, 2010 |
| | | | | | | | | | |
| | | Number
of Shares | | | Fair
Value | | | |
| | | | | | | | | | |
| |
| Fertilizers & Agricultural Chemicals — 1.0% | | | |
| | | |
Potash Corporation of Saskatchewan Inc. | | | 7,358 | | | $ | 1,144 | | | |
Potash Corporation of Saskatchewan Inc. | | | 1,100 | | | | 170 | | | |
Sinofert Holdings Ltd. | | | 40,616 | | | | 21 | | | |
Sociedad Quimica y Minera de Chile S.A. ADR | | | 4,411 | | | | 258 | | | |
Syngenta AG | | | 2,308 | | | | 677 | | | |
Taiwan Fertilizer Company Ltd. | | | 13,377 | | | | 50 | | | |
| | | | | | | 2,320 | | | |
| |
| Food Distributors — 0.0%* | | | |
| | | |
Alliance Global Group Inc. | | | 160,721 | | | | 46 | | | |
| |
| Food Retail — 0.5% | | | |
| | | |
Koninklijke Ahold N.V. | | | 21,724 | | | | 288 | | | |
Shoprite Holdings Ltd. | | | 4,664 | | | | 70 | | | |
Tesco PLC | | | 98,593 | | | | 656 | | | |
X5 Retail Group N.V. GDR | | | 1,182 | | | | 55 | | | (a) |
| | | | | | | 1,069 | | | |
| |
| Gold — 0.1% | | | |
| | | |
Barrick Gold Corp. | | | 3,388 | | | | 180 | | | |
Kinross Gold Corp. | | | 7,696 | | | | 146 | | | |
| | | | | | | 326 | | | |
| |
| Healthcare Distributors — 0.1% | | | |
| | | |
Sinopharm Group Co. | | | 6,000 | | | | 21 | | | |
| |
| Healthcare Services — 0.0%* | | | |
| | | |
Fleury S.A. | | | 5,077 | | | | 82 | | | |
| |
| Healthcare Supplies — 0.4% | | | |
| | | |
Cie Generale d’Optique Essilor International S.A. | | | 12,569 | | | | 812 | | | |
Shandong Weigao Group Medical Polymer Company Ltd. | | | 16,470 | | | | 47 | | | |
| | | | | | | 859 | | | |
| |
| Heavy Electrical Equipment — 0.0%* | | | |
| | | |
Xinjiang Goldwind Science & Technology Company Ltd. | | | 10,529 | | | | 22 | | | (a) |
| | | | | | | | | | |
| | | Number
of Shares | | | Fair
Value | | | |
| | | | | | | | | | |
| |
| Hotels, Resorts & Cruise Lines — 0.0%* | | | |
| | | |
Minor International PCL | | | 98,700 | | | $ | 39 | | | |
| |
| Household Appliances — 0.0%* | | | |
| | | |
Techtronic Industries Co. | | | 38,000 | | | | 50 | | | |
| |
| Household Products — 0.6% | | | |
| | | |
Reckitt Benckiser Group PLC | | | 12,458 | | | | 688 | | | |
Unicharm Corp. | | | 16,100 | | | | 641 | | | |
| | | | | | | 1,329 | | | |
| |
| Human Resource & Employment Services — 0.1% | | | |
| | | |
The Capita Group PLC | | | 27,593 | | | | 301 | | | |
| |
| Hypermarkets & Super Centers — 0.3% | | | |
| | | |
Metro AG | | | 10,255 | | | | 741 | | | |
| |
| Independent Power Producers & Energy Traders — 0.0%* | | | |
| | | |
China WindPower Group Ltd. | | | 158,153 | | | | 16 | | | (a) |
| |
| Industrial Conglomerates — 1.2% | | | |
| | | |
Chongqing Machinery & Electric Company Ltd. | | | 150,001 | | | | 56 | | | |
Hutchison Whampoa Ltd. | | | 45,584 | | | | 470 | | | |
Koninklijke Philips Electronics N.V. | | | 27,404 | | | | 843 | | | |
Siemens AG | | | 10,761 | | | | 1,338 | | | |
| | | | | | | 2,707 | | | |
| |
| Industrial Gases — 0.6% | | | |
| | | |
Linde AG | | | 6,544 | | | | 997 | | | |
OCI Materials Company Ltd. | | | 768 | | | | 69 | | | (a) |
Taiyo Nippon Sanso Corp. | | | 27,996 | | | | 247 | | | |
| | | | | | | 1,313 | | | |
| |
| Industrial Machinery — 0.4% | | | |
| | | |
FANUC Corp. | | | 2,800 | | | | 430 | | | |
Mitsubishi Heavy Industries Ltd. | | | 1,000 | | | | 4 | | | |
SMC Corp. | | | 2,400 | | | | 412 | | | |
| | | | | | | 846 | | | |
See Notes to Schedules of Investments and Notes to Financial Statements.
30
| | |
| Elfun Diversified Fund | | (in thousands) — December 31, 2010 |
| | | | | | | | | | |
| | | Number
of Shares | | | Fair
Value | | | |
| | | | | | | | | | |
| |
| Integrated Oil & Gas — 2.0% | | | |
| | | |
BG Group PLC | | | 33,393 | | | $ | 678 | | | |
ENI S.p.A. | | | 8,751 | | | | 192 | | | |
Gazprom OAO ADR | | | 3,848 | | | | 98 | | | |
Lukoil OAO ADR | | | 2,371 | | | | 136 | | | |
Petroleo Brasileiro S.A. ADR | | | 22,708 | | | | 776 | | | |
Royal Dutch Shell PLC | | | 27,569 | | | | 923 | | | |
Suncor Energy Inc. | | | 32,523 | | | | 1,248 | | | |
Total S.A. | | | 10,212 | | | | 543 | | | |
| | | | | | | 4,594 | | | |
| |
| Integrated Telecommunication Services — 0.3% | | | |
| | | |
China Unicom Hong Kong Ltd. | | | 47,121 | | | | 67 | | | |
Telefonica S.A. | | | 21,527 | | | | 490 | | | |
Telefonica S.A. ADR | | | 1,216 | | | | 83 | | | |
| | | | | | | 640 | | | |
| |
| Internet Retail — 0.0%* | | | |
| | | |
E-Commerce China Dangdang Inc. ADR | | | 507 | | | | 14 | | | (a) |
| |
| Internet Software & Services — 0.7% | | | |
| | | |
Baidu Inc. ADR | | | 17,201 | | | | 1,660 | | | (a) |
Tencent Holdings Ltd. | | | 600 | | | | 13 | | | |
| | | | | | | 1,673 | | | |
| |
| Investment Banking & Brokerage — 0.4% | | | |
| | | |
Egyptian Financial Group-Hermes Holding | | | 23,721 | | | | 137 | | | |
Nomura Holdings Inc. | | | 110,655 | | | | 703 | | | |
| | | | | | | 840 | | | |
| |
| IT Consulting & Other Services — 0.3% | | | |
| | | |
Cap Gemini S.A. | | | 8,128 | | | | 381 | | | |
HCL Technologies Ltd. | | | 6,354 | | | | 65 | | | |
Infosys Technologies Ltd. | | | 881 | | | | 68 | | | |
Telvent GIT S.A. | | | 5,095 | | | | 135 | | | |
| | | | | | | 649 | | | |
| |
| Life & Health Insurance — 0.8% | | | |
| | | |
AIA Group Ltd. | | | 96,716 | | | | 272 | | | (a) |
China Life Insurance Company Ltd. | | | 11,091 | | | | 45 | | | |
Prudential PLC | | | 91,790 | | | | 960 | | | |
| | | | | | | | | | |
| | | Number
of Shares | | | Fair
Value | | | |
| | | | | | | | | | |
| | | |
Sony Financial Holdings Inc. | | | 154 | | | $ | 624 | | | |
Tong Yang Life Insurance | | | 2,320 | | | | 24 | | | |
| | | | | | | 1,925 | | | |
| |
| Marine — 0.1% | | | |
| | | |
AP Moller—Maersk A/S | | | 34 | | | | 309 | | | |
| |
| Multi-Line Insurance — 0.3% | | | |
| | | |
AXA S.A. | | | 27,252 | | | | 455 | | | |
Zurich Financial Services AG | | | 1,021 | | | | 265 | | | |
| | | | | | | 720 | | | |
| |
| Multi-Utilities — 0.4% | | | |
| | | |
National Grid PLC | | | 71,795 | | | | 622 | | | |
Veolia Environnement S.A. | | | 12,584 | | | | 369 | | | |
| | | | | | | 991 | | | |
| |
| Oil & Gas Drilling — 0.1% | | | |
| | | |
Noble Corp. | | | 6,055 | | | | 217 | | | |
| |
| Oil & Gas Exploration & Production — 0.1% | | | |
| | | |
Afren PLC | | | 55,906 | | | | 129 | | | (a) |
CNOOC Ltd. | | | 34,000 | | | | 81 | | | |
| | | | | | | 210 | | | |
| |
| Oil & Gas Refining & Marketing — 0.1% | | | |
| | | |
Reliance Industries Ltd. | | | 1,185 | | | | 28 | | | |
Reliance Industries Ltd. GDR | | | 1,373 | | | | 65 | | | (b) |
| | | | | | | 93 | | | |
| |
| Packaged Foods & Meats — 0.8% | | | |
| | | |
Feihe International Inc. | | | 1,574 | | | | 17 | | | (a) |
Nestle S.A. | | | 25,453 | | | | 1,495 | | | |
Nestle S.A. ADR | | | 1,193 | | | | 70 | | | |
Unilever N.V., CVA | | | 11,470 | | | | 359 | | | |
| | | | | | | 1,941 | | | |
| |
| Personal Products — 0.0%* | | | |
| | | |
Natura Cosmeticos S.A. | | | 1,000 | | | | 29 | | | |
| |
| Pharmaceuticals — 0.8% | | | |
| | | |
Aspen Pharmacare Holdings Ltd. | | | 2,711 | | | | 38 | | | |
Bayer AG | | | 5,968 | | | | 443 | | | |
See Notes to Schedules of Investments and Notes to Financial Statements.
31
| | |
| Elfun Diversified Fund | | (in thousands) — December 31, 2010 |
| | | | | | | | | | |
| | | Number
of Shares | | | Fair
Value | | | |
| | | | | | | | | | |
| | | |
Lijun International Pharmaceutical Holding Ltd. | | | 68,311 | | | $ | 20 | | | |
Novartis AG | | | 9,712 | | | | 573 | | | |
Novartis AG ADR | | | 3,340 | | | | 197 | | | |
Roche Holding AG | | | 3,955 | | | | 581 | | | |
| | | | | | | 1,852 | | | |
| |
| Real Estate Development — 0.0%* | | | |
| | | |
Glorious Property Holdings Ltd. (REIT) | | | 83,329 | | | | 28 | | | |
Unitech Ltd. (REIT) | | | 31,912 | | | | 47 | | | |
| | | | | | | 75 | | | |
| |
| Real Estate Operating Companies — 0.0%* | | | |
| | | |
Iguatemi Empresa de Shopping Centers S.A. (REIT) | | | 1,406 | | | | 35 | | | |
| |
| Regional Banks — 0.2% | | | |
| | | |
The Bank of Yokohama Ltd. | | | 71,603 | | | | 372 | | | |
| |
| Security & Alarm Services — 0.2% | | | |
| | | |
G4S PLC | | | 87,828 | | | | 352 | | | |
| |
| Semiconductors — 1.0% | | | |
| | | |
Samsung Electronics Company Ltd. | | | 1,230 | | | | 1,028 | | | |
Taiwan Semiconductor Manufacturing Company Ltd. | | | 432,779 | | | | 1,054 | | | |
Taiwan Semiconductor Manufacturing Company Ltd. ADR | | | 7,644 | | | | 96 | | | |
| | | | | | | 2,178 | | | |
| |
| Specialized Finance — 0.3% | | | |
| | | |
Deutsche Boerse AG | | | 9,668 | | | | 672 | | | |
| |
| Steel — 0.7% | | | |
| | | |
Mechel ADR | | | 1,136 | | | | 11 | | | |
Mechel ADR | | | 3,495 | | | | 102 | | | |
POSCo. | | | 168 | | | | 72 | | | |
Sumitomo Metal Industries Ltd. | | | 241,957 | | | | 597 | | | |
Tata Steel Ltd. | | | 2,753 | | | | 42 | | | |
ThyssenKrupp AG | | | 8,792 | | | | 365 | | | |
Vale S.A. ADR | | | 15,247 | | | | 461 | | | (a) |
| | | | | | | 1,650 | | | |
| | | | | | | | | | |
| | | Number
of Shares | | | Fair
Value | | | |
| | | | | | | | | | |
| |
| Trading Companies & Distributors — 0.2% | | | |
| | | |
Mitsubishi Corp. | | | 16,000 | | | $ | 434 | | | |
| |
| Wireless Telecommunication Services — 0.9% | | | |
| | | |
America Movil SAB de C.V. ADR | | | 9,570 | | | | 549 | | | |
Mobile Telesystems OJSC ADR | | | 18,521 | | | | 387 | | | |
MTN Group Ltd. | | | 30,036 | | | | 610 | | | |
Vodafone Group PLC | | | 170,917 | | | | 444 | | | |
| | | | | | | 1,990 | | | |
| | | |
Total Foreign Equity (Common Stock)
(Cost $52,514) | | | | | | | 59,303 | | | |
Preferred Stock — 0.8% | | | |
| |
| Healthcare Services — 0.2% | | | |
| | | |
Fresenius SE | | | 5,203 | | | | 447 | | | |
| |
| Automobile Manufacturers — 0.4% | | | |
| | | |
Volkswagen AG | | | 5,340 | | | | 870 | | | |
| |
| Diversified Financial Services — 0.1% | | | |
| | | |
Itau Unibanco Holding S.A. | | | 6,292 | | | | 151 | | | |
| |
| Integrated Oil & Gas — 0.0%* | | | |
| | | |
Petroleo Brasileiro S.A. | | | 7,031 | | | | 116 | | | |
| |
| Steel — 0.1% | | | |
| | | |
Usinas Siderurgicas de Minas Gerais S.A. | | | 3,948 | | | | 46 | | | |
Vale S.A. | | | 7,987 | | | | 233 | | | |
| | | | | | | 279 | | | |
| |
| Wireless Telecommunication Services — 0.0%* | | | |
| | | |
Vivo Participacoes S.A. | | | 1,200 | | | | 39 | | | |
| | | |
Total Preferred Stock
(Cost $1,417) | | | | | | | 1,902 | | | |
See Notes to Schedules of Investments and Notes to Financial Statements.
32
| | |
| Elfun Diversified Fund | | (in thousands) — December 31, 2010 |
| | | | | | | | | | |
| | | Number
of Shares | | | Fair
Value | | | |
| | | | | | | | | | |
Rights — 0.0%* | | | | | | | | | | |
| | | |
Metropolitan Bank & Trust
(Cost $0) | | | 5,333 | | | $ | 3 | | | |
| | | |
Total Foreign Equity
(Cost $53,931) | | | | | | | 61,208 | | | |
| | | | | | | | | | | | |
| | | | |
| | | | | Principal
Amount | | | Value | | | |
| | | | | | | | | | | | |
Bonds and Notes — 30.1% |
| | |
| U.S. Treasuries - 4.9% | | | | | | | |
| | | |
U.S. Treasury Bonds | | | | | | | | | | |
| 3.88% | | 08/15/40 | | $ | 3,974 | | | | 3,661 | | | (h) |
U.S. Treasury Notes | | | | | | | | | | |
| 1.25% | | 09/30/15 | | | 499 | | | | 484 | | | (h) |
| 2.63% | | 08/15/20 | | | 6,883 | | | | 6,526 | | | (h) |
| 3.25% | | 07/31/16 | | | 506 | | | | 532 | | | (h) |
| | | | | | | | | 11,203 | | | |
| | |
| Agency Mortgage Backed — 9.3% | | | | | | | |
| | |
Federal Home Loan Mortgage Corp. | | | | | | | |
| 4.50% | | 06/01/33 - 02/01/35 | | | 21 | | | | 21 | | | (h) |
| 5.00% | | 07/01/35 - 08/01/40 | | | 1,159 | | | | 1,218 | | | (h) |
| 5.00% | | 07/01/35 | | | 8 | | | | 8 | | | (h,q) |
| 5.50% | | 05/01/20 - 04/01/39 | | | 123 | | | | 131 | | | (h,q) |
| 5.50% | | 01/01/38 | | | 174 | | | | 189 | | | |
| 6.00% | | 06/01/17 - 11/01/37 | | | 528 | | | | 582 | | | (h) |
| 6.00% | | 04/01/17 - 05/01/34 | | | 33 | | | | 37 | | | (h,q) |
| 6.50% | | 11/01/28 - 07/01/29 | | | 17 | | | | 19 | | | (h) |
| 7.00% | | 10/01/16 - 07/01/34 | | | 8 | | | | 9 | | | (h,q) |
| 7.00% | | 06/01/29 - 08/01/36 | | | 49 | | | | 55 | | | (h) |
| 7.50% | | 12/01/30 | | | 12 | | | | 13 | | | (h,q) |
| 7.50% | | 09/01/12 - 09/01/33 | | | 4 | | | | 4 | | | (h) |
| 8.00% | | 07/01/26 - 11/01/30 | | | 6 | | | | 7 | | | (h) |
| 8.50% | | 04/01/30 - 05/01/30 | | | 22 | | | | 26 | | | (h) |
Federal National Mortgage Assoc. | | | | | | | | | | |
| 4.00% | | 05/01/19 - 10/01/40 | | | 1,908 | | | | 1,901 | | | (h) |
| 4.50% | | 05/01/18 - 11/01/40 | | | 4,145 | | | | 4,269 | | | (h) |
| 5.00% | | 07/01/20 - 11/01/40 | | | 1,910 | | | | 2,011 | | | (h) |
| 5.32% | | 03/01/37 | | | 1 | | | | 1 | | | (i) |
| | | | | | | | | | | | |
| | | | | Principal
Amount | | | Fair
Value | | | |
| | | | | | | | | | | | |
| | | | |
| 5.50% | | 04/01/14 - 01/01/39 | | $ | 1,712 | | | $ | 1,845 | | | (h) |
| 5.53% | | 04/01/37 | | | 2 | | | | 2 | | | (i) |
| 6.00% | | 02/01/14 - 08/01/35 | | | 643 | | | | 711 | | | (h) |
| 6.50% | | 12/01/14 - 08/01/36 | | | 150 | | | | 167 | | | (h) |
| 7.00% | | 01/01/16 - 12/01/33 | | | 14 | | | | 15 | | | (h) |
| 7.50% | | 09/01/13 - 03/01/34 | | | 41 | | | | 47 | | | (h) |
| 8.00% | | 12/01/11 - 11/01/33 | | | 45 | | | | 52 | | | (h) |
| 8.50% | | 05/01/31 | | | 3 | | | | 3 | | | (h) |
| 9.00% | | 04/01/16 - 12/01/22 | | | 10 | | | | 11 | | | (h) |
| 4.50% | | TBA | | | 4,383 | | | | 4,500 | | | (c) |
| 5.00% | | TBA | | | 2,304 | | | | 2,430 | | | (c) |
| 6.50% | | TBA | | | 490 | | | | 545 | | | (c) |
Government National Mortgage Assoc. | | | | | | | | | | |
| 4.50% | | 08/15/33 - 09/15/34 | | | 84 | | | | 87 | | | (h) |
| 5.00% | | 08/15/33 | | | 34 | | | | 37 | | | (h) |
| 6.00% | | 04/15/30 - 09/15/36 | | | 38 | | | | 42 | | | (h) |
| 6.50% | | 06/15/24 - 07/15/36 | | | 73 | | | | 85 | | | (h) |
| 7.00% | | 03/15/12 - 10/15/36 | | | 50 | | | | 54 | | | (h) |
| 7.50% | | 07/15/23 - 04/15/28 | | | 29 | | | | 35 | | | (h) |
| 8.00% | | 05/15/30 | | | 1 | | | | 1 | | | (h) |
| 8.50% | | 10/15/17 | | | 20 | | | | 23 | | | (h) |
| 9.00% | | 11/15/16 - 12/15/21 | | | 22 | | | | 23 | | | (h) |
| 5.50% | | TBA | | | 50 | | | | 54 | | | (c) |
| | | | | | | | | 21,270 | | | |
| |
| Agency Collateralized Mortgage Obligations — 0.7% | | | |
| | | |
Collateralized Mortgage Obligation Trust (Class B) | | | | | | | | | | |
| 2.75% | | 11/01/18 | | | 1 | | | | 1 | | | (d,f,h,q) |
Fannie Mae Whole Loan | | | | | | | | | | |
| 0.97% | | 08/25/43 | | | 254 | | | | 8 | | | (g,h,r) |
Federal Home Loan Mortgage Corp. | | | | | | | | | | |
| 0.08% | | 09/25/43 | | | 350 | | | | 3 | | | (g,h,r) |
Federal Home Loan Mortgage Corp. REMIC | | | | | | | | | | |
| 5.00% | | 05/15/38 | | | 56 | | | | 58 | | | |
| 5.50% | | 04/15/17 | | | 21 | | | | 1 | | | (g,h,r) |
Federal Home Loan Mortgage Corp. REMIC (Series 1980)
(Class 1980) | | | | | | | | | | |
| 7.50% | | 07/15/27 | | | 23 | | | | 5 | | | (g,h,r) |
See Notes to Schedules of Investments and Notes to Financial Statements.
33
| | |
| Elfun Diversified Fund | | (in thousands) — December 31, 2010 |
| | | | | | | | | | | | |
| | | | | Principal
Amount | | | Fair
Value | | | |
| | | | | | | | | | | | |
| | | |
Federal Home Loan Mortgage Corp. REMIC (Series 2631) (Class DI) | | | | | | | | | | |
| 5.50% | | 06/15/33 | | $ | 54 | | | $ | 11 | | | (g,h,r) |
Federal Home Loan Mortgage Corp. REMIC (Series 2643) (Class IM) | | | | | | | | | | |
| 4.50% | | 03/15/18 | | | 48 | | | | 4 | | | (g,h,r) |
Federal Home Loan Mortgage Corp. REMIC (Series 2645) (Class BI) | | | | | | | | | | |
| 4.50% | | 02/15/18 | | | 23 | | | | 2 | | | (g,h,r) |
Federal Home Loan Mortgage Corp. REMIC (Series 2647) (Class DI)** | | | | | | | | | | |
| 4.50% | | 10/15/16 | | | 7 | | | | — | | | (g,h,r) |
Federal Home Loan Mortgage Corp. REMIC (Series 2656) (Class IU)** | | | | | | | | | | |
| 5.00% | | 04/15/28 | | | 3 | | | | — | | | (g,h,r) |
Federal Home Loan Mortgage Corp. REMIC (Series 2722) (Class PI)** | | | | | | | | | | |
| 5.00% | | 06/15/28 | | | 8 | | | | — | | | (g,h,r) |
Federal Home Loan Mortgage Corp. REMIC (Series 2763) (Class JI) | | | | | | | | | | |
| 5.00% | | 10/15/18 | | | 38 | | | | 3 | | | (g,h,r) |
Federal Home Loan Mortgage Corp. REMIC (Series 2781) (Class IC) | | | | | | | | | | |
| 5.00% | | 05/15/18 | | | 23 | | | | 1 | | | (g,h,r) |
Federal Home Loan Mortgage Corp. REMIC (Series 2852) (Class OJ) | | | | | | | | | | |
| 14.25% | | 09/15/34 | | | 15 | | | | 14 | | | (d,f) |
Federal Home Loan Mortgage Corp. REMIC (Series 2990)
(Class TS) | | | | | | | | | | |
| 6.49% | | 05/15/35 | | | 184 | | | | 18 | | | (g,r) |
Federal Home Loan Mortgage Corp. REMIC (Series 33)
(Class 33D) | | | | | | | | | | |
| 8.00% | | 04/15/20 | | | 1 | | | | 1 | | | (h) |
| | | | | | | | | | | | |
| | | | | Principal
Amount | | | Fair
Value | | | |
| | | | | | | | | | | | |
| | | |
Federal Home Loan Mortgage Corp. REMIC (Series 3311) (Class IA) | | | | | | | | | | |
| 6.15% | | 05/15/37 | | $ | 195 | | | $ | 30 | | | (g,r) |
Federal Home Loan Mortgage Corp. REMIC (Series 3311) (Class IB) | | | | | | | | | | |
| 6.15% | | 05/15/37 | | | 195 | | | | 30 | | | (g,r) |
Federal Home Loan Mortgage Corp. REMIC (Series 3311) (Class IC) | | | | | | | | | | |
| 6.15% | | 05/15/37 | | | 195 | | | | 30 | | | (g,r) |
Federal Home Loan Mortgage Corp. REMIC (Series 3311) (Class ID) | | | | | | | | | | |
| 6.15% | | 05/15/37 | | | 195 | | | | 30 | | | (g,r) |
Federal Home Loan Mortgage Corp. REMIC (Series 3311) (Class IE) | | | | | | | | | | |
| 6.15% | | 05/15/37 | | | 283 | | | | 44 | | | (g,r) |
Federal Home Loan Mortgage Corp. STRIPS** | | | | | | | | | | |
| 8.00% | | 02/01/23 - 07/01/24 | | | 4 | | | | — | | | (g,h,r) |
Federal Home Loan Mortgage Corp. STRIPS (Class IO) | | | | | | | | | | |
| 5.00% | | 12/01/34 | | | 163 | | | | 32 | | | (g,h,q,r) |
Federal Home Loan Mortgage STRIPS | | | | | | | | | | |
| 4.39% | | 08/01/27 | | | 1 | | | | 1 | | | (d,f,h) |
Federal National Mortgage Assoc. REMIC | | | | | | | | | | |
| 5.00% | | 08/25/38 | | | 56 | | | | 57 | | | |
| 5.24% | | 01/25/37 | | | 274 | | | | 33 | | | (g,r) |
| 5.74% | | 07/25/38 - 12/25/40 | | | 601 | | | | 84 | | | (g,r) |
| 5.79% | | 11/25/40 | | | 393 | | | | 65 | | | (g,r) |
| 6.07% | | 03/25/40 | | | 427 | | | | 62 | | | (g,r) |
| 6.14% | | 12/25/36 | | | 215 | | | | 26 | | | (g,r) |
Federal National Mortgage Assoc. REMIC (Class B) | | | | | | | | | | |
| 2.52% | | 12/25/22 | | | 2 | | | | 2 | | | (d,f,h) |
Federal National Mortgage Assoc. REMIC (Class CS)** | | | | | | | | | | |
| 7.44% | | 08/25/16 | | | 4 | | | | — | | | (g,h,r) |
See Notes to Schedules of Investments and Notes to Financial Statements.
34
| | |
| Elfun Diversified Fund | | (in thousands) — December 31, 2010 |
| | | | | | | | | | | | |
| | | | | Principal
Amount | | | Fair
Value | | | |
| | | | | | | | | | | | |
| | | |
Federal National Mortgage Assoc. REMIC (Class VZ) | | | | | | | | | | |
| 5.00% | | 10/25/35 | | $ | 53 | | | $ | 51 | | | |
Federal National Mortgage Assoc. REMIC (Series 2003) | | | | | | | | | | |
| 7.24% | | 05/25/18 | | | 378 | | | | 44 | | | (g,h,r) |
Federal National Mortgage Assoc. REMIC (Series 2003) (Class HI) | | | | | | | | | | |
| 5.00% | | 10/25/22 | | | 22 | | | | 2 | | | (g,h,r) |
Federal National Mortgage Assoc. REMIC (Series 2003) (Class IJ) | | | | | | | | | | |
| 5.00% | | 02/25/32 | | | 84 | | | | 10 | | | (g,r) |
Federal National Mortgage Assoc. REMIC (Series 2003) (Class IO) | | | | | | | | | | |
| 1.19% | | 12/25/42 | | | 88 | | | | 4 | | | (g,h,r) |
Federal National Mortgage Assoc. REMIC (Series 2003) (Class KI) | | | | | | | | | | |
| 4.50%** | | 05/25/18 | | | 6 | | | | — | | | (g,h,r) |
Federal National Mortgage Assoc. REMIC (Series 2003) (Class SL) | | | | | | | | | | |
| 16.04% | | 03/25/31 | | | 45 | | | | 52 | | | (h) |
Federal National Mortgage Assoc. REMIC (Series 2007) (Class IA) | | | | | | | | | | |
| 6.15% | | 06/25/37 | | | 146 | | | | 24 | | | (g,r) |
Federal National Mortgage Assoc. REMIC (Series 2007) (Class IB) | | | | | | | | | | |
| 6.15% | | 06/25/37 | | | 146 | | | | 24 | | | (g,r) |
Federal National Mortgage Assoc. REMIC (Series 2007) (Class IC) | | | | | | | | | | |
| 6.15% | | 06/25/37 | | | 146 | | | | 24 | | | (g,r) |
Federal National Mortgage Assoc. REMIC (Series 2007) (Class ID) | | | | | | | | | | |
| 6.15% | | 06/25/37 | | | 146 | | | | 24 | | | (g,r) |
| | | | | | | | | | | | |
| | | | | Principal
Amount | | | Fair
Value | | | |
| | | | | | | | | | | | |
| | | |
Federal National Mortgage Assoc. REMIC (Series 2007) (Class IE) | | | | | | | | | | |
| 6.15% | | 06/25/37 | | $ | 146 | | | $ | 24 | | | (g,r) |
Federal National Mortgage Assoc. REMIC (Series 2007) (Class IF) | | | | | | | | | | |
| 6.15% | | 06/25/37 | | | 224 | | | | 36 | | | (g,r) |
Federal National Mortgage Assoc. REMIC (Series 2008) (Class ZW) | | | | | | | | | | |
| 5.00% | | 07/25/38 | | | 45 | | | | 45 | | | |
Federal National Mortgage Assoc. STRIPS | | | | | | | | | | |
| 6.00% | | 01/01/35 | | | 48 | | | | 8 | | | (g,r) |
Federal National Mortgage Assoc. STRIPS (Class 2) | | | | | | | | | | |
| 4.50% | | 08/01/35 | | | 86 | | | | 16 | | | (g,r) |
| 5.00% | | 03/25/38 | | | 69 | | | | 11 | | | (g,r) |
| 5.50% | | 12/01/33 | | | 27 | | | | 6 | | | (g,r) |
| 7.50% | | 11/01/23 | | | 46 | | | | 8 | | | (g,h,r) |
| 8.00% | | 08/01/23 - 07/01/24 | | | 10 | | | | 2 | | | (g,h,r) |
| 8.50%** | | 04/01/17 | | | 3 | | | | — | | | (g,h,r) |
| 9.00%** | | 05/25/22 | | | 2 | | | | — | | | (g,h,r) |
Federal National Mortgage Assoc. STRIPS (Series 364) (Class 1) | | | | | | | | | | |
| 4.50% | | 09/01/35 | | | 141 | | | | 26 | | | (g,r) |
Federal National Mortgage Assoc. STRIPS (Series 378) (Class 1) | | | | | | | | | | |
| 4.50% | | 01/01/36 | | | 106 | | | | 19 | | | (g,r) |
Federal National Mortgage Assoc. STRIPS (Series 387) (Class 1) | | | | | | | | | | |
| 5.00% | | 05/25/38 | | | 68 | | | | 10 | | | (g,r) |
Government National Mortgage Assoc. | | | | | | | | | | |
| 4.50% | | 11/20/39 | | | 133 | | | | 129 | | | |
| 5.00% | | 10/20/37 - 09/20/38 | | | 334 | | | | 49 | | | (g,r) |
| 5.74% | | 11/20/39 | | | 835 | | | | 127 | | | (g,r) |
| 5.99% | | 10/16/39 | | | 296 | | | | 41 | | | (g,r) |
| 6.24% | | 01/16/39 | | | 504 | | | | 79 | | | (g,r) |
See Notes to Schedules of Investments and Notes to Financial Statements.
35
| | |
| Elfun Diversified Fund | | (in thousands) — December 31, 2010 |
| | | | | | | | | | | | |
| | | | | Principal
Amount | | | Fair
Value | | | |
| | | | | | | | | | | | |
| | | |
Government National Mortgage Assoc. (Class IC) | | | | | | | | | | |
| 5.99% | | 04/16/37 | | $ | 134 | | | $ | 23 | | | (g,r) |
Vendee Mortgage Trust | | | | | | | | | | |
| 0.38% | | 04/15/40 | | | 267 | | | | 6 | | | (g,h,r) |
Vendee Mortgage Trust
(Class 2003) | | | | | | | | | | |
| 0.86% | | 05/15/33 | | | 157 | | | | 6 | | | (g,r) |
| | | | | | | | | 1,586 | | | |
| |
| Asset Backed — 0.4% | | | |
| | | |
Bear Stearns Asset Backed Securities Trust (Series 2003) (Class A) | | | | | | | | | | |
| 4.40% | | 01/25/34 | | | 6 | | | | 5 | | | (d,h) |
Citicorp Residential Mortgage Securities Inc. (Series 2006) (Class A5) | | | | | | | | | | |
| 6.04% | | 09/25/36 | | | 50 | | | | 43 | | | (h) |
Countrywide Asset — Backed Certificates | | | | | | | | | | |
| 1.12% | | 05/25/33 | | | 3 | | | | 3 | | | (h) |
Countrywide Asset — Backed Certificates (Class A) | | | | | | | | | | |
| 21.59% | | 04/25/32 | | | 14 | | | | 9 | | | (d,h) |
Countrywide Asset — Backed Certificates (Class AF6) | | | | | | | | | | |
| 4.74% | | 10/25/35 | | | 44 | | | | 40 | | | |
Mid — State Trust (Class A3) | | | | | | | | | | |
| 7.54% | | 07/01/35 | | | 9 | | | | 9 | | | (h,q) |
Popular ABS Mortgage Pass — Through Trust (Class AF4) | | | | | | | | | | |
| 5.30% | | 11/25/35 | | | 50 | | | | 42 | | | |
Residential Asset Mortgage Products Inc. (Class A2) | | | | | | | | | | |
| 6.23% | | 06/25/32 | | | 13 | | | | 11 | | | (d,h) |
Residential Asset Securities Corp. (Series 2002) (Class AIIB) | | | | | | | | | | |
| 31.64% | | 07/25/32 | | | 5 | | | | 3 | | | (d,h) |
Saxon Asset Securities Trust | | | | | | | | | | |
| 5.23% | | 08/25/35 | | | 873 | | | | 837 | | | (h) |
| | | | | | | | | 1,002 | | | |
| | | | | | | | | | | | |
| | | | | Principal
Amount | | | Fair
Value | | | |
| | | | | | | | | | | | |
| |
| Corporate Notes — 10.6% | | | |
AES El Salvador Trust | | | | | | | | | | |
| 6.75% | | 02/01/16 | | $ | 100 | | | $ | 97 | | | (b) |
AES Panama S.A. | | | | | | | | | | |
| 6.35% | | 12/21/16 | | | 30 | | | | 32 | | | (b,h) |
Agilent Technologies Inc. | | | | | | | | | | |
| 5.00% | | 07/15/20 | | | 82 | | | | 83 | | | |
| 5.50% | | 09/14/15 | | | 40 | | | | 43 | | | (h) |
Alcoa Inc. | | | | | | | | | | |
| 6.15% | | 08/15/20 | | | 119 | | | | 122 | | | |
Allergan Inc. | | | | | | | | | | |
| 3.38% | | 09/15/20 | | | 163 | | | | 154 | | | |
Alliance One International Inc. | | | | | | | | | | |
| 10.00% | | 07/15/16 | | | 80 | | | | 82 | | | |
Ameren Illinois Co. | | | | | | | | | | |
| 9.75% | | 11/15/18 | | | 72 | | | | 92 | | | |
American International Group Inc. | | | | | | | | | | |
| 5.85% | | 01/16/18 | | | 41 | | | | 42 | | | |
American Tower Corp. | | | | | | | | | | |
| 4.50% | | 01/15/18 | | | 126 | | | | 125 | | | |
Amsted Industries Inc. | | | | | | | | | | |
| 8.13% | | 03/15/18 | | | 93 | | | | 99 | | | (b,h) |
Anadarko Petroleum Corp. | | | | | | | | | | |
| 6.20% | | 03/15/40 | | | 196 | | | | 191 | | | (h) |
| 6.38% | | 09/15/17 | | | 41 | | | | 45 | | | |
Anheuser-Busch InBev Worldwide Inc. | | | | | | | | | | |
| 3.63% | | 04/15/15 | | | 123 | | | | 127 | | | |
| 5.00% | | 04/15/20 | | | 202 | | | | 214 | | | |
| 5.38% | | 11/15/14 | | | 164 | | | | 181 | | | (b,h) |
ARAMARK Corp. | | | | | | | | | | |
| 8.50% | | 02/01/15 | | | 70 | | | | 73 | | | (h) |
Arizona Public Service Co. | | | | | | | | | | |
| 6.25% | | 08/01/16 | | | 80 | | | | 89 | | | (h) |
AT&T Inc. | | | | | | | | | | |
| 6.40% | | 05/15/38 | | | 213 | | | | 226 | | | (h) |
| 6.70% | | 11/15/13 | | | 84 | | | | 95 | | | (h) |
Avis Budget Car Rental LLC | | | | | | | | | | |
| 9.63% | | 03/15/18 | | | 44 | | | | 47 | | | |
Ball Corp. | | | | | | | | | | |
| 5.75% | | 05/15/21 | | | 63 | | | | 61 | | | |
See Notes to Schedules of Investments and Notes to Financial Statements.
36
| | |
| Elfun Diversified Fund | | (in thousands) — December 31, 2010 |
| | | | | | | | | | | | |
| | | | | Principal
Amount | | | Fair
Value | | | |
| | | | | | | | | | | | |
| | | |
Banco do Brasil Cayman | | | | | | | | | | |
| 8.50% | | 10/29/49 | | $ | 100 | | | $ | 115 | | | (b,h,i) |
Banco do Nordeste do Brasil S.A. | | | | | | | | | | |
| 3.63% | | 11/09/15 | | | 100 | | | | 98 | | | (b) |
Banco Mercantil del Norte S.A. (Series REGS) | | | | | | | | | | |
| 6.14% | | 10/13/16 | | | 12 | | | | 12 | | | (i) |
BanColombia S.A. | | | | | | | | | | |
| 6.13% | | 07/26/20 | | | 15 | | | | 15 | | | |
Bank of America Corp. | | | | | | | | | | |
| 4.50% | | 04/01/15 | | | 315 | | | | 320 | | | (h) |
| 5.63% | | 07/01/20 | | | 315 | | | | 321 | | | (h) |
| 5.75% | | 12/01/17 | | | 165 | | | | 172 | | | (h) |
| 6.50% | | 08/01/16 | | | 85 | | | | 92 | | | (h) |
BE Aerospace Inc. | | | | | | | | | | |
| 8.50% | | 07/01/18 | | | 56 | | | | 61 | | | |
Boise Paper Holdings LLC | | | | | | | | | | |
| 8.00% | | 04/01/20 | | | 119 | | | | 127 | | | |
Bombardier Inc. | | | | | | | | | | |
| 7.75% | | 03/15/20 | | | 849 | | | | 915 | | | (b,h) |
BP Capital Markets PLC | | | | | | | | | | |
| 3.13% | | 10/01/15 | | | 41 | | | | 41 | | | |
| 4.50% | | 10/01/20 | | | 41 | | | | 41 | | | |
Calpine Corp. | | | | | | | | | | |
| 7.25% | | 10/15/17 | | | 12 | | | | 12 | | | (b,h) |
Cantor Fitzgerald LP | | | | | | | | | | |
| 7.88% | | 10/15/19 | | | 31 | | | | 32 | | | (b,h) |
Cargill Inc. | | | | | | | | | | |
| 5.20% | | 01/22/13 | | | 215 | | | | 232 | | | (b,h) |
| 6.00% | | 11/27/17 | | | 1 | | | | 1 | | | (b,h) |
CBS Corp. | | | | | | | | | | |
| 5.75% | | 04/15/20 | | | 110 | | | | 117 | | | (h) |
| 5.90% | | 10/15/40 | | | 57 | | | | 55 | | | |
CCO Holdings LLC | | | | | | | | | | |
| 7.88% | | 04/30/18 | | | 188 | | | | 195 | | | |
| 8.13% | | 04/30/20 | | | 34 | | | | 36 | | | |
Central American Bank for Economic Integration | | | | | | | | | | |
| 5.38% | | 09/24/14 | | | 60 | | | | 64 | | | (b,h) |
Chesapeake Energy Corp. | | | | | | | | | | |
| 6.63% | | 08/15/20 | | | 87 | | | | 86 | | | |
| 7.25% | | 12/15/18 | | | 144 | | | | 149 | | | (h) |
| | | | | | | | | | | | |
| | | | | Principal
Amount | | | Fair
Value | | | |
| | | | | | | | | | | | |
| | | |
Cincinnati Bell Inc. | | | | | | | | | | |
| 8.25% | | 10/15/17 | | $ | 110 | | | $ | 109 | | | (h) |
| 8.75% | | 03/15/18 | | | 66 | | | | 62 | | | (h) |
Citigroup Inc. | | | | | | | | | | |
| 5.00% | | 09/15/14 | | | 189 | | | | 196 | | | (h) |
| 5.13% | | 05/05/14 | | | 326 | | | | 346 | | | (h) |
| 5.38% | | 08/09/20 | | | 171 | | | | 178 | | | |
| 6.13% | | 11/21/17 | | | 41 | | | | 45 | | | |
| 6.38% | | 08/12/14 | | | 150 | | | | 166 | | | (h) |
| 8.50% | | 05/22/19 | | | 73 | | | | 91 | | | |
Clarendon Alumina Production Ltd. | | | | | | | | | | |
| 8.50% | | 11/16/21 | | | 100 | | | | 100 | | | (b,h) |
Community Health Systems Inc. | | | | | | | | | | |
| 8.88% | | 07/15/15 | | | 210 | | | | 221 | | | (h) |
Consolidated Edison Company of New York Inc. | | | | | | | | | | |
| 6.65% | | 04/01/19 | | | 15 | | | | 18 | | | (h) |
Consolidated Edison Company of New York Inc. (Series 2008) | | | | | | | | | | |
| 5.85% | | 04/01/18 | | | 16 | | | | 18 | | | (h) |
Corp Nacional del Cobre de Chile | | | | | | | | | | |
| 3.75% | | 11/04/20 | | | 100 | | | | 95 | | | (b) |
| 5.63% | | 09/21/35 | | | 12 | | | | 12 | | | (b,h) |
Credit Suisse First Boston International for CJSC The EXIM of Ukraine | | | | | | | | | | |
| 7.65% | | 09/07/11 | | | 100 | | | | 101 | | | |
Crown Castle International Corp. | | | | | | | | | | |
| 7.13% | | 11/01/19 | | | 68 | | | | 72 | | | (h) |
Crown Castle Towers LLC | | | | | | | | | | |
| 4.88% | | 08/15/40 | | | 100 | | | | 96 | | | (b) |
| 6.11% | | 01/15/40 | | | 55 | | | | 57 | | | (b,h) |
CVS Caremark Corp. | | | | | | | | | | |
| 3.25% | | 05/18/15 | | | 60 | | | | 61 | | | (h) |
| 5.75% | | 06/01/17 | | | 46 | | | | 51 | | | (h) |
| 6.13% | | 09/15/39 | | | 259 | | | | 277 | | | (h) |
Denbury Resources Inc. | | | | | | | | | | |
| 8.25% | | 02/15/20 | | | 56 | | | | 61 | | | (h) |
DirecTV Holdings LLC | | | | | | | | | | |
| 4.75% | | 10/01/14 | | | 109 | | | | 116 | | | (h) |
| 5.88% | | 10/01/19 | | | 70 | | | | 76 | | | (h) |
See Notes to Schedules of Investments and Notes to Financial Statements.
37
| | |
| Elfun Diversified Fund | | (in thousands) — December 31, 2010 |
| | | | | | | | | | | | |
| | | | | Principal
Amount | | | Fair
Value | | | |
| | | | | | | | | | | | |
| | | |
Dolphin Energy Ltd. | | | | | | | | | | |
| 5.89% | | 06/15/19 | | $ | 92 | | | $ | 99 | | | (b) |
El Paso Corp. | | | | | | | | | | |
| 8.05% | | 10/15/30 | | | 56 | | | | 57 | | | (h) |
Empresa Nacional del Petroleo | | | | | | | | | | |
| 5.25% | | 08/10/20 | | | 100 | | | | 100 | | | (b) |
European Investment Bank | | | | | | | | | | |
| 4.88% | | 01/17/17 | | | 300 | | | | 334 | | | (h) |
Exelon Corp. | | | | | | | | | | |
| 4.90% | | 06/15/15 | | | 83 | | | | 89 | | | (h) |
Exelon Generation Company LLC | | | | | | | | | | |
| 6.25% | | 10/01/39 | | | 46 | | | | 46 | | | (h) |
Expedia Inc. | | | | | | | | | | |
| 5.95% | | 08/15/20 | | | 95 | | | | 95 | | | |
Fibria Overseas Finance Ltd. | | | | | | | | | | |
| 7.50% | | 05/04/20 | | | 119 | | | | 125 | | | (b,h) |
First Horizon National Corp. | | | | | | | | | | |
| 5.38% | | 12/15/15 | | | 80 | | | | 81 | | | |
Forest Oil Corp. | | | | | | | | | | |
| 7.25% | | 06/15/19 | | | 64 | | | | 65 | | | (h) |
FPL Group Capital Inc. | | | | | | | | | | |
| 2.60% | | 09/01/15 | | | 163 | | | | 160 | | | |
France Telecom S.A. | | | | | | | | | | |
| 2.13% | | 09/16/15 | | | 82 | | | | 80 | | | (h) |
Frontier Communications Corp. | | | | | | | | | | |
| 8.25% | | 04/15/17 | | | 78 | | | | 86 | | | (h) |
Gaz Capital SA for Gazprom | | | | | | | | | | |
| 9.25% | | 04/23/19 | | | 100 | | | | 123 | | | |
Georgia-Pacific LLC | | | | | | | | | | |
| 5.40% | | 11/01/20 | | | 190 | | | | 188 | | | (b,h) |
Globo Comunicacao e Participacoes S.A. | | | | | | | | | | |
| 7.25% | | 04/26/22 | | | 100 | | | | 108 | | | (b,h) |
Goldman Sachs Capital I | | | | | | | | | | |
| 6.35% | | 02/15/34 | | | 84 | | | | 80 | | | (h) |
Hanesbrands Inc. | | | | | | | | | | |
| 6.38% | | 12/15/20 | | | 130 | | | | 124 | | | (b,h) |
Hartford Financial Services Group Inc. | | | | | | | | | | |
| 5.50% | | 03/30/20 | | | 102 | | | | 103 | | | (h) |
HCA Inc. | | | | | | | | | | |
| 9.25% | | 11/15/16 | | | 127 | | | | 136 | | | (h) |
| | | | | | | | | | | | |
| | | | | Principal
Amount | | | Fair
Value | | | |
| | | | | | | | | | | | |
| | | |
Health Management Associates Inc. | | | | | | | | | | |
| 6.13% | | 04/15/16 | | $ | 83 | | | $ | 84 | | | (h) |
Hess Corp. | | | | | | | | | | |
| 5.60% | | 02/15/41 | | | 82 | | | | 81 | | | (h) |
Host Hotels & Resorts LP (REIT) | | | | | | | | | | |
| 9.00% | | 05/15/17 | | | 71 | | | | 79 | | | (h) |
HSBC Finance Corp. | | | | | | | | | | |
| 6.68% | | 01/15/21 | | | 318 | | | | 321 | | | (b) |
Huntington BancShares Inc. | | | | | | | | | | |
| 7.00% | | 12/15/20 | | | 56 | | | | 59 | | | |
IIRSA Norte Finance Ltd. | | | | | | | | | | |
| 8.75% | | 05/30/24 | | | 110 | | | | 123 | | | (b,h) |
Ingles Markets Inc. | | | | | | | | | | |
| 8.88% | | 05/15/17 | | | 130 | | | | 139 | | | (h) |
Intelsat Subsidiary Holding Company S.A. | | | | | | | | | �� | |
| 8.88% | | 01/15/15 | | | 59 | | | | 61 | | | (h) |
Intergen N.V. | | | | | | | | | | |
| 9.00% | | 06/30/17 | | | 449 | | | | 476 | | | (b,h) |
International Paper Co. | | | | | | | | | | |
| 7.50% | | 08/15/21 | | | 154 | | | | 182 | | | (h) |
Jarden Corp. | | | | | | | | | | |
| 6.13% | | 11/15/22 | | | 65 | | | | 62 | | | (h) |
JP Morgan Chase Capital XXV (Series Y) | | | | | | | | | | |
| 6.80% | | 10/01/37 | | | 75 | | | | 77 | | | (h) |
JPMorgan Chase & Co. | | | | | | | | | | |
| 5.13% | | 09/15/14 | | | 80 | | | | 85 | | | (h) |
JPMorgan Chase Bank NA | | | | | | | | | | |
| 5.88% | | 06/13/16 | | | 56 | | | | 61 | | | (h) |
Korea Development Bank | | | | | | | | | | |
| 3.25% | | 03/09/16 | | | 122 | | | | 119 | | | (h) |
Kraft Foods Inc. | | | | | | | | | | |
| 4.13% | | 02/09/16 | | | 84 | | | | 88 | | | (h) |
| 5.38% | | 02/10/20 | | | 266 | | | | 286 | | | (h) |
| 6.50% | | 02/09/40 | | | 82 | | | | 92 | | | (h) |
Kreditanstalt fuer Wiederaufbau | | | | | | | | | | |
| 3.50% | | 03/10/14 | | | 376 | | | | 400 | | | (h) |
| 4.13% | | 10/15/14 | | | 261 | | | | 284 | | | (h) |
| 4.50% | | 07/16/18 | | | 186 | | | | 202 | | | (h) |
Levi Strauss & Co. | | | | | | | | | | |
| 7.63% | | 05/15/20 | | | 211 | | | | 218 | | | (h) |
See Notes to Schedules of Investments and Notes to Financial Statements.
38
| | |
| Elfun Diversified Fund | | (in thousands) — December 31, 2010 |
| | | | | | | | | | | | |
| | | | | Principal
Amount | | | Fair
Value | | | |
| | | | | | | | | | | | |
| | | |
Lincoln National Corp. | | | | | | | | | | |
| 6.25% | | 02/15/20 | | $ | 87 | | | $ | 95 | | | (h) |
| 8.75% | | 07/01/19 | | | 109 | | | | 136 | | | (h) |
Lloyds TSB Bank PLC | | | | | | | | | | |
| 6.50% | | 09/14/20 | | | 100 | | | | 92 | | | (b,h) |
Majapahit Holding BV | | | | | | | | | | |
| 7.25% | | 10/17/11 | | | 100 | | | | 104 | | | (b,h) |
| 7.75% | | 10/17/16 - 02/20/20 | | | 200 | | | | 231 | | | (b,h) |
Merrill Lynch & Company Inc. | | | | | | | | | | |
| 6.05% | | 08/15/12 | | | 65 | | | | 69 | | | |
| 6.88% | | 04/25/18 | | | 108 | | | | 118 | | | |
MetroPCS Wireless Inc. | | | | | | | | | | |
| 6.63% | | 11/15/20 | | | 117 | | | | 111 | | | |
Midamerican Energy Holdings Co. | | | | | | | | | | |
| 6.13% | | 04/01/36 | | | 45 | | | | 49 | | | (h) |
Morgan Stanley | | | | | | | | | | |
| 5.50% | | 01/26/20 | | | 315 | | | | 318 | | | (h) |
| 5.63% | | 09/23/19 | | | 121 | | | | 123 | | | (h) |
Morgan Stanley (Series F) | | | | | | | | | | |
| 6.63% | | 04/01/18 | | | 133 | | | | 144 | | | (h) |
Mylan Inc. | | | | | | | | | | |
| 7.88% | | 07/15/20 | | | 78 | | | | 84 | | | (b) |
Nalco Company | | | | | | | | | | |
| 6.63% | | 01/15/19 | | | 36 | | | | 37 | | | (b) |
National Agricultural Cooperative Federation | | | | | | | | | | |
| 5.00% | | 09/30/14 | | | 56 | | | | 59 | | | (b) |
National Power Corp. | | | | | | | | | | |
| 4.53% | | 08/23/11 | | | 42 | | | | 43 | | | (i) |
NET Servicos de Comunicacao S.A. | | | | | | | | | | |
| 7.50% | | 01/27/20 | | | 100 | | | | 115 | | | |
News America Inc. | | | | | | | | | | |
| 6.65% | | 11/15/37 | | | 105 | | | | 116 | | | |
Nexen Inc. | | | | | | | | | | |
| 6.40% | | 05/15/37 | | | 201 | | | | 195 | | | (h) |
Nisource Finance Corp. | | | | | | | | | | |
| 6.13% | | 03/01/22 | | | 56 | | | | 60 | | | |
NRG Energy Inc. | | | | | | | | | | |
| 7.38% | | 02/01/16 | | | 100 | | | | 103 | | | |
Oglethorpe Power Corp. | | | | | | | | | | |
| 5.38% | | 11/01/40 | | | 84 | | | | 80 | | | |
| | | | | | | | | | | | |
| | | | | Principal
Amount | | | Fair
Value | | | |
| | | | | | | | | | | | |
| | | |
Pacific Gas & Electric Co. | | | | | | | | | | |
| 5.80% | | 03/01/37 | | $ | 120 | | | $ | 127 | | | |
| 6.05% | | 03/01/34 | | | 98 | | | | 107 | | | |
Pacific Rubiales Energy Corp. | | | | | | | | | | |
| 8.75% | | 11/10/16 | | | 100 | | | | 113 | | | (b) |
PacifiCorp | | | | | | | | | | |
| 6.25% | | 10/15/37 | | | 102 | | | | 116 | | | |
PAETEC Holding Corp. | | | | | | | | | | |
| 8.88% | | 06/30/17 | | | 20 | | | | 21 | | | |
Pemex Finance Ltd. | | | | | | | | | | |
| 9.03% | | 02/15/11 | | | 4 | | | | 4 | | | (h) |
Pemex Project Funding Master Trust | | | | | | | | | | |
| 6.63% | | 06/15/35 - 06/15/38 | | | 35 | | | | 35 | | | |
Petroleos Mexicanos | | | | | | | | | | |
| 4.88% | | 03/15/15 | | | 70 | | | | 74 | | | |
| 6.00% | | 03/05/20 | | | 20 | | | | 21 | | | |
| 8.00% | | 05/03/19 | | | 20 | | | | 24 | | | |
Petroleum Company of Trinidad & Tobago Ltd. | | | | | | | | | | |
| 6.00% | | 05/08/22 | | | 96 | | | | 96 | | | |
Petronas Capital Ltd. | | | | | | | | | | |
| 5.25% | | 08/12/19 | | | 100 | | | | 108 | | | (b) |
Pioneer Natural Resources Co. | | | | | | | | | | |
| 7.50% | | 01/15/20 | | | 117 | | | | 128 | | | |
Plains All American Pipeline LP Corp. | | | | | | | | | | |
| 3.95% | | 09/15/15 | | | 76 | | | | 79 | | | |
| 4.25% | | 09/01/12 | | | 31 | | | | 32 | | | |
Plains Exploration & Production Co. | | | | | | | | | | |
| 7.63% | | 06/01/18 | | | 16 | | | | 17 | | | |
Power Sector Assets & Liabilities Management Corp. | | | | | | | | | | |
| 7.25% | | 05/27/19 | | | 200 | | | | 232 | | | |
Prudential Financial Inc. | | | | | | | | | | |
| 3.63% | | 09/17/12 | | | 30 | | | | 31 | | | |
| 3.88% | | 01/14/15 | | | 262 | | | | 270 | | | |
| 6.20% | | 11/15/40 | | | 84 | | | | 89 | | | |
| 7.38% | | 06/15/19 | | | 62 | | | | 73 | | | |
PTTEP Australia International Finance Proprietary Ltd. | | | | | | | | | | |
| 4.15% | | 07/19/15 | | | 200 | | | | 199 | | | (b) |
See Notes to Schedules of Investments and Notes to Financial Statements.
39
| | |
| Elfun Diversified Fund | | (in thousands) — December 31, 2010 |
| | | | | | | | | | | | |
| | | | | Principal
Amount | | | Fair
Value | | | |
| | | | | | | | | | | | |
| | | |
Qatari Diar Finance QSC (REIT) | | | | | | | | | | |
| 3.50% | | 07/21/15 | | $ | 100 | | | $ | 100 | | | (b) |
| 5.00% | | 07/21/20 | | | 100 | | | | 100 | | | (b) |
QVC Inc. | | | | | | | | | | |
| 7.50% | | 10/01/19 | | | 51 | | | | 54 | | | (b) |
RailAmerica Inc. | | | | | | | | | | |
| 9.25% | | 07/01/17 | | | 72 | | | | 79 | | | |
Republic Services Inc. | | | | | | | | | | |
| 5.25% | | 11/15/21 | | | 55 | | | | 58 | | | |
| 5.50% | | 09/15/19 | | | 86 | | | | 94 | | | |
Reynolds Group Issuer Inc. | | | | | | | | | | |
| 7.75% | | 10/15/16 | | | 155 | | | | 164 | | | (b) |
Roche Holdings Inc. | | | | | | | | | | |
| 6.00% | | 03/01/19 | | | 101 | | | | 117 | | | (b) |
Rockies Express Pipeline LLC | | | | | | | | | | |
| 5.63% | | 04/15/20 | | | 137 | | | | 132 | | | (b,h) |
RR Donnelley & Sons Co. | | | | | | | | | | |
| 7.63% | | 06/15/20 | | | 98 | | | | 105 | | | (h) |
RSHB Capital SA for OJSC Russian Agricultural Bank | | | | | | | | | | |
| 6.30% | | 05/15/17 | | | 100 | | | | 101 | | | (b) |
Solutia Inc. | | | | | | | | | | |
| 7.88% | | 03/15/20 | | | 56 | | | | 60 | | | |
Southern Copper Corp. | | | | | | | | | | |
| 5.38% | | 04/16/20 | | | 109 | | | | 110 | | | |
| 6.75% | | 04/16/40 | | | 97 | | | | 100 | | | |
| 7.50% | | 07/27/35 | | | 100 | | | | 111 | | | |
Telecom Italia Capital S.A. | | | | | | | | | | |
| 6.00% | | 09/30/34 | | | 63 | | | | 52 | | | |
Telefonica Emisiones SAU | | | | | | | | | | |
| 3.73% | | 04/27/15 | | | 76 | | | | 75 | | | |
Teva Pharmaceutical Finance II BV | | | | | | | |
| 3.00% | | 06/15/15 | | | 164 | | | | 167 | | | |
Textron Inc. | | | | | | | | | | |
| 6.20% | | 03/15/15 | | | 156 | | | | 170 | | | |
The AES Corp. | | | | | | | | | | |
| 8.00% | | | | | 103 | | | | 109 | | | (h) |
The Goldman Sachs Group Inc. | | | | | | | | | | |
| 3.70% | | 08/01/15 | | | 272 | | | | 277 | | | (h) |
| 5.38% | | 03/15/20 | | | 241 | | | | 249 | | | (h) |
| 6.75% | | 10/01/37 | | | 41 | | | | 42 | | | (h) |
| | | | | | | | | | | | |
| | | | | Principal
Amount | | | Fair
Value | | | |
| | | | | | | | | | | | |
| | | |
The Potomac Edison Co. | | | | | | | | | | |
| 5.35% | | 11/15/14 | | $ | 40 | | | $ | 44 | | | (h) |
Time Warner Cable Inc. | | | | | | | | | | |
| 6.75% | | 07/01/18 | | | 48 | | | | 56 | | | |
| 7.50% | | 04/01/14 | | | 75 | | | | 86 | | | |
Time Warner Inc. | | | | | | | | | | |
| 3.15% | | 07/15/15 | | | 164 | | | | 167 | | | |
| 5.88% | | 11/15/16 | | | 166 | | | | 187 | | | |
| 6.20% | | 03/15/40 | | | 105 | | | | 112 | | | |
TNK-BP Finance S.A. | | | | | | | | | | |
| 6.13% | | 03/20/12 | | | 100 | | | | 104 | | | |
| 7.25% | | 02/02/20 | | | 10 | | | | 11 | | | (b) |
Transocean Inc. | | | | | | | | | | |
| 6.00% | | 03/15/18 | | | 25 | | | | 26 | | | |
| 6.80% | | 03/15/38 | | | 16 | | | | 16 | | | |
UnitedHealth Group Inc. | | | | | | | | | | |
| 5.80% | | 03/15/36 | | | 61 | | | | 62 | | | |
UPC Germany GmbH | | | | | | | | | | |
| 8.13% | | 12/01/17 | | | 100 | | | | 105 | | | (b) |
USB Capital XIII Trust | | | | | | | | | | |
| 6.63% | | 12/15/39 | | | 84 | | | | 86 | | | |
Valero Energy Corp. | | | | | | | | | | |
| 6.13% | | 02/01/20 | | | 234 | | | | 249 | | | (h) |
Verizon Communications Inc. | | | | | | | | | | |
| 6.35% | | 04/01/19 | | | 149 | | | | 172 | | | (h) |
| 6.40% | | 02/15/38 | | | 88 | | | | 97 | | | (h) |
| 6.90% | | 04/15/38 | | | 52 | | | | 61 | | | (h) |
Virgin Media Finance PLC | | | | | | | | | | |
| 8.38% | | 10/15/19 | | | 100 | | | | 109 | | | (h) |
WEA Finance LLC (REIT) | | | | | | | | | | |
| 6.75% | | 09/02/19 | | | 293 | | | | 326 | | | (b,h) |
| 7.50% | | 06/02/14 | | | 31 | | | | 35 | | | (b,h) |
Weatherford International Limited Bermuda | | | | | | | | | | |
| 6.75% | | 09/15/40 | | | 143 | | | | 150 | | | |
Williams Partners LP | | | | | | | | | | |
| 5.25% | | 03/15/20 | | | 130 | | | | 135 | | | |
| 6.30% | | 04/15/40 | | | 83 | | | | 86 | | | |
Windstream Corp. | | | | | | | | | | |
| 7.88% | | 11/01/17 | | | 22 | | | | 23 | | | |
Woodside Finance Ltd. | | | | | | | | | | |
| 4.50% | | 11/10/14 | | | 131 | | | | 138 | | | (b) |
See Notes to Schedules of Investments and Notes to Financial Statements.
40
| | |
| Elfun Diversified Fund | | (in thousands) — December 31, 2010 |
| | | | | | | | | | | | |
| | | | | Principal
Amount | | | Fair
Value | | | |
| | | | | | | | | | | | |
| | | |
Wyeth | | | | | | | | | | |
| 5.50% | | 03/15/13 | | $ | 120 | | | $ | 131 | | | |
Wynn Las Vegas LLC | | | | | | | | | | |
| 7.88% | | 05/01/20 | | | 204 | | | | 218 | | | |
Xstrata Finance Canada Ltd. | | | | | | | | | | |
| 5.80% | | 11/15/16 | | | 61 | | | | 66 | | | (b) |
| | | | | | | | | 24,274 | | | |
|
| Non-Agency Collateralized Mortgage Obligations — 3.3% |
| | | |
Banc of America Commercial Mortgage Inc. | | | | | | | | | | |
| 5.68% | | 07/10/46 | | | 80 | | | | 81 | | | |
| 5.74% | | 02/10/51 | | | 180 | | | | 192 | | | (h) |
Banc of America Commercial Mortgage Inc. (Class AJ) | | | | | | | | | | |
| 5.70% | | 07/10/46 | | | 40 | | | | 37 | | | (i) |
Banc of America Commercial Mortgage Inc. (Class C) | | | | | | | | | | |
| 5.70% | | 04/10/49 | | | 100 | | | | 18 | | | (h,q) |
Banc of America Funding Corp. (Class B1) | | | | | | | | | | |
| 5.44% | | 03/20/36 | | | 47 | | | | 1 | | | (h,q) |
Banc of America Mortgage Securities Inc. (Class B1) | | | | | | | | | | |
| 4.62% | | 01/25/36 | | | 24 | | | | 2 | | | (h,q) |
Banc of America Mortgage Securities Inc. (Class B2)** | | | | | | | | | | |
| 4.62% | | 01/25/36 | | | 24 | | | | — | | | (h,q) |
Bear Stearns Commercial Mortgage Securities | | | | | | | | | | |
| 5.58% | | 09/11/41 | | | 150 | | | | 152 | | | (i) |
| 5.76% | | 09/11/38 | | | 70 | | | | 73 | | | (i) |
Bear Stearns Commercial Mortgage Securities
(Class A M) | | | | | | | | | | |
| 5.51% | | 04/12/38 | | | 80 | | | | 85 | | | |
Bear Stearns Commercial Mortgage Securities (Class A2) | | | | | | | | | | |
| 5.41% | | 03/11/39 | | | 39 | | | | 39 | | | (h,i) |
| 5.51% | | 04/12/38 | | | 22 | | | | 22 | | | |
Bear Stearns Commercial Mortgage Securities (Class A4) | | | | | | | | | | |
| 5.47% | | 01/12/45 | | | 100 | | | | 107 | | | (h) |
| 5.69% | | 06/11/50 | | | 545 | | | | 578 | | | (h) |
| | | | | | | | | | | | |
| | | | | Principal
Amount | | | Fair
Value | | | |
| | | | | | | | | | | | |
| | | |
Bear Stearns Commercial Mortgage Securities (Class AJ) | | | | | | | | | | |
| 5.46% | | 03/11/39 | | $ | 50 | | | $ | 47 | | | (i) |
| 5.72% | | 06/11/40 | | | 60 | | | | 44 | | | (h) |
Bear Stearns Commercial Mortgage Securities (Class AM) | | | | | | | | | | |
| 5.24% | | 12/11/38 | | | 45 | | | | 45 | | | |
| 5.92% | | 06/11/50 | | | 110 | | | | 112 | | | (q) |
Bear Stearns Commercial Mortgage Securities (Series 2007) (Class D) | | | | | | | | | | |
| 5.99% | | 09/11/42 | | | 20 | | | | 9 | | | (h,q) |
Citigroup Commercial Mortgage Trust (Class AJ) | | | | | | | | | | |
| 5.73% | | 03/15/49 | | | 60 | | | | 57 | | | (h,i) |
Citigroup Commercial Mortgage Trust (Series 2006) (Class AJ) | | | | | | | | | | |
| 5.48% | | 10/15/49 | | | 50 | | | | 46 | | | (h) |
Commercial Mortgage Pass Through Certificates (Class AJ) | | | | | | | | | | |
| 5.79% | | 06/10/46 | | | 80 | | | | 77 | | | |
Commercial Mortgage Pass Through Certificates (Class AM) | | | | | | | | | | |
| 5.79% | | 06/10/46 | | | 220 | | | | 229 | | | |
Countrywide Commercial Mortgage Trust (Class AJ) | | | | | | | | | | |
| 5.91% | | 06/12/46 | | | 90 | | | | 85 | | | (h,i) |
Countrywide Commercial Mortgage Trust (Class AM) | | | | | | | | | | |
| 5.46% | | 07/12/46 | | | 25 | | | | 25 | | | (h,i) |
Credit Suisse First Boston Mortgage Securities Corp. (Class CB1) | | | | | | | | | | |
| 5.33% | | 10/25/35 | | | 43 | | | | 2 | | | (h,q) |
Credit Suisse Mortgage Capital Certificates (Class A3) | | | | | | | | | | |
| 5.47% | | 09/15/39 | | | 128 | | | | 134 | | | (h) |
Credit Suisse Mortgage Capital Certificates (Class C) | | | | | | | | | | |
| 5.54% | | 02/15/39 | | | 125 | | | | 91 | | | |
Credit Suisse Mortgage Capital Certificates (Class CB1) | | | | | | | | | | |
| 5.64% | | 02/25/36 | | | 24 | | | | 2 | | | (h,q) |
See Notes to Schedules of Investments and Notes to Financial Statements.
41
| | |
| Elfun Diversified Fund | | (in thousands) — December 31, 2010 |
| | | | | | | | | | | | |
| | | | | Principal
Amount | | | Fair
Value | | | |
| | | | | | | | | | | | |
| | | |
Extended Stay America Trust | | | | | | | | | | |
| 5.50% | | 11/05/27 | | $ | 170 | | | $ | 167 | | | (b) |
Greenwich Capital Commercial Funding Corp. | | | | | | | | | | |
| 5.88% | | 07/10/38 | | | 165 | | | | 180 | | | (h,i) |
Greenwich Capital Commercial Funding Corp. (Class A2) | | | | | | | | | | |
| 5.60% | | 12/10/49 | | | 130 | | | | 136 | | | (h) |
Greenwich Capital Commercial Funding Corp. (Class AM) | | | | | | | | | | |
| 5.88% | | 07/10/38 | | | 150 | | | | 155 | | | (i) |
Indymac INDA Mortgage Loan Trust (Class B1) | | | | | | | | | | |
| 4.50% | | 01/25/36 | | | 99 | | | | 2 | | | (h,q) |
Indymac INDA Mortgage Loan Trust (Class B2)** | | | | | | | | | | |
| 4.50% | | 01/25/36 | | | 15 | | | | — | | | (h,q) |
JP Morgan Chase Commercial Mortgage Securities Corp. | | | | | | | | | | |
| 4.07% | | 11/15/43 | | | 60 | | | | 57 | | | (b,h) |
| 5.87% | | 04/15/45 | | | 80 | | | | 83 | | | (h) |
JP Morgan Chase Commercial Mortgage Securities Corp. (Class A4) | | | | | | | | | | |
| 5.34% | | 08/12/37 | | | 230 | | | | 248 | | | (h) |
| 5.44% | | 06/12/47 | | | 140 | | | | 147 | | | (h) |
| 5.79% | | 02/12/51 | | | 390 | | | | 415 | | | (h) |
JP Morgan Chase Commercial Mortgage Securities Corp. (Class AM) | | | | | | | | | | |
| 5.44% | | 05/15/45 | | | 180 | | | | 182 | | | (h) |
| 5.90% | | 02/12/51 | | | 120 | | | | 121 | | | (h) |
JP Morgan Chase Commercial Mortgage Securities Corp. (Class B) | | | | | | | | | | |
| 5.52% | | 04/15/43 | | | 60 | | | | 51 | | | |
JP Morgan Chase Commercial Mortgage Securities Corp. (Class F) | | | | | | | | | | |
| 6.19% | | 02/12/51 | | | 30 | | | | 8 | | | (h,q) |
LB-UBS Commercial Mortgage Trust | | | | | | | | | | |
| 7.45% | | 01/15/36 | | | 451 | | | | 19 | | | (d,h,q) |
| | | | | | | | | | | | |
| | | | | Principal
Amount | | | Fair
Value | | | |
| | | | | | | | | | | | |
| | | |
LB-UBS Commercial Mortgage Trust ( Class A2) | | | | | | | | | | |
| 6.15% | | 04/15/41 | | $ | 210 | | | $ | 228 | | | (i) |
LB-UBS Commercial Mortgage Trust (Class A4) | | | | | | | | | | |
| 4.95% | | 09/15/30 | | | 50 | | | | 53 | | | |
| 5.16% | | 02/15/31 | | | 80 | | | | 85 | | | (h) |
| 5.66% | | 03/15/39 | | | 209 | | | | 225 | | | (h,i) |
LB-UBS Commercial Mortgage Trust (Class AJ) | | | | | | | | | | |
| 6.15% | | 04/15/41 | | | 20 | | | | 17 | | | (i) |
LB-UBS Commercial Mortgage Trust (Series 2001) (Class B) | | | | | | | | | | |
| 6.65% | | 07/14/16 | | | 26 | | | | 26 | | | (h,q) |
LB-UBS Commercial Mortgage Trust (Series 2004) (Class X) | | | | | | | | | | |
| 25.77% | | 12/15/39 | | | 791 | | | | 10 | | | (d,h,q) |
MASTR Alternative Loans Trust (Class 15 AX) | | | | | | | | | | |
| 5.00% | | 08/25/18 | | | 27 | | | | 3 | | | (g,h,q,r) |
Merrill Lynch Mortgage Trust (Class AJ) | | | | | | | | | | |
| 5.66% | | 05/12/39 | | | 50 | | | | 46 | | | (i) |
Merrill Lynch Mortgage Trust (Series 2006) (Class B) | | | | | | | | | | |
| 5.66% | | 05/12/39 | | | 54 | | | | 31 | | | |
Morgan Stanley Capital I | | | | | | | | | | |
| 5.16% | | 10/12/52 | | | 100 | | | | 107 | | | (h,i) |
| 5.19% | | 11/14/42 | | | 40 | | | | 43 | | | (h,i) |
| 5.73% | | 10/15/42 | | | 64 | | | | 50 | | | (h) |
Morgan Stanley Capital I
(Class A3) | | | | | | | | | | |
| 5.71% | | 07/12/44 | | | 100 | | | | 107 | | | (h) |
Morgan Stanley Capital I
(Class A31) | | | | | | | | | | |
| 5.44% | | 02/12/44 | | | 350 | | | | 362 | | | |
Morgan Stanley Capital I
(Class A4) | | | | | | | | | | |
| 5.33% | | 11/12/41 | | | 40 | | | | 42 | | | |
| 5.81% | | 08/12/41 | | | 30 | | | | 33 | | | (h,i) |
| 5.81% | | 12/12/49 | | | 611 | | | | 653 | | | (h) |
Morgan Stanley Capital I
(Class AJ) | | | | | | | | | | |
| 5.39% | | 11/12/41 | | | 162 | | | | 145 | | | (h,i) |
See Notes to Schedules of Investments and Notes to Financial Statements.
42
| | |
| Elfun Diversified Fund | | (in thousands) — December 31, 2010 |
| | | | | | | | | | | | |
| | | | | Principal
Amount | | | Fair
Value | | | |
| | | | | | | | | | | | |
| | | | |
| 5.57% | | 11/12/49 | | $ | 80 | | | $ | 75 | | | (i) |
| 5.73% | | 10/15/42 | | | 50 | | | | 48 | | | (h,i) |
Morgan Stanley Capital I
(Class AM) | | | | | | | | | | |
| 6.11% | | 12/12/49 | | | 70 | | | | 72 | | | (i) |
| 6.28% | | 01/11/43 | | | 80 | | | | 82 | | | |
Morgan Stanley Capital I (Class B) | | | | | | | | | | |
| 5.73% | | 10/15/42 | | | 40 | | | | 36 | | | (h) |
Morgan Stanley Capital I
(Series 2006) (Class AM) | | | | | | | | | | |
| 5.44% | | 03/12/44 | | | 125 | | | | 129 | | | (h,i) |
OBP Depositor LLC Trust | | | | | | | | | | |
| 4.65% | | 07/15/45 | | | 50 | | | | 51 | | | (b) |
Opteum Mortgage Acceptance Corp. (Class A1A) | | | | | | | | | | |
| 4.97% | | 02/25/35 | | | 87 | | | | 84 | | | (d,h) |
Structured Asset Securities Corp.(Series 1996) (Class X1)** | | | | | | | | | | |
| 3.00% | | 02/25/28 | | | 35 | | | | — | | | (d,q) |
Vornado DP LLC | | | | | | | | | | |
| 6.36% | | 09/13/28 | | | 30 | | | | 30 | | | (b) |
Wachovia Bank Commercial Mortgage Trust | | | | | | | | | | |
| 6.02% | | 06/15/45 | | | 50 | | | | 25 | | | (h) |
Wachovia Bank Commercial Mortgage Trust (Class A3) | | | | | | | | | | |
| 5.25% | | 12/15/43 | | | 80 | | | | 81 | | | (h) |
Wachovia Bank Commercial Mortgage Trust (Class AJ) | | | | | | | | | | |
| 5.74% | | 05/15/43 | | | 80 | | | | 76 | | | (i) |
Wachovia Bank Commercial Mortgage Trust (Class AM) | | | | | | | | | | |
| 5.47% | | 01/15/45 | | | 80 | | | | 82 | | | (h,i) |
Wachovia Bank Commercial Mortgage Trust (Series 2006) (Class AJ) | | | | | | | | | | |
| 5.99% | | 06/15/45 | | | 30 | | | | 26 | | | (h,i) |
WAMU Commercial Mortgage Securities Trust (Series 2005) (Class AJ) | | | | | | | | | | |
| 5.19% | | 05/25/36 | | | 80 | | | | 81 | | | (b,h) |
Wells Fargo Mortgage Backed Securities Trust (Class B1) | | | | | | | | | | |
| 5.50% | | 01/25/36 | | | 95 | | | | 1 | | | (h,q) |
| | | | | | | | | | | | |
| | | | | Principal
Amount | | | Fair
Value | | | |
| | | | | | | | | | | | |
| | | |
Wells Fargo Mortgage Backed Securities Trust (Class B2)** | | | | | | | | | | |
| 5.50% | | 03/25/36 | | $ | 94 | | | $ | — | | | (h,q) |
| | | | | | | | | 7,608 | | | |
| |
| Sovereign Bonds — 0.8% | | | |
Government of Argentina | | | | | | | | | | |
| 2.50% | | 12/31/38 | | | 18 | | | | 8 | | | (j) |
| 5.00% | | 08/03/12 | | | 69 | | | | 17 | | | (d,i) |
| 7.00% | | 10/03/15 | | | 26 | | | | 25 | | | |
| 8.28% | | 12/31/33 | | | 19 | | | | 17 | | | |
Government of Belize | | | | | | | | | | |
| 6.00% | | 02/20/29 | | | 34 | | | | 30 | | | (j) |
Government of Bermuda | | | | | | | | | | |
| 5.60% | | 07/20/20 | | | 100 | | | | 104 | | | (b,h) |
Government of Brazil | | | | | | | | | | |
| 6.00% | | 02/20/29 | | | 15 | | | | 13 | | | (b,j) |
| 8.00% | | 01/15/18 | | | 35 | | | | 41 | | | (h) |
| 8.25% | | 01/20/34 | | | 23 | | | | 31 | | | |
Government of Brazilian | | | | | | | | | | |
| 4.88% | | 01/22/21 | | | 100 | | | | 102 | | | |
Government of Colombia | | | | | | | | | | |
| 6.13% | | 01/18/41 | | | 100 | | | | 103 | | | |
| 7.38% | | 09/18/37 | | | 100 | | | | 119 | | | |
Government of Costa Rica | | | | | | | | | | |
| 10.00% | | 08/01/20 | | | 40 | | | | 55 | | | (b,h) |
Government of El Salvador | | | | | | | | | | |
| 7.65% | | 06/15/35 | | | 20 | | | | 21 | | | (b,h) |
Government of Grenada | | | | | | | | | | |
| 2.50% | | 09/15/25 | | | 22 | | | | 12 | | | (b,h,j) |
Government of Hungary | | | | | | | | | | |
| 4.75% | | 02/03/15 | | | 100 | | | | 98 | | | (h) |
Government of Lebanon | | | | | | | | | | |
| 6.38% | | 03/09/20 | | | 37 | | | | 39 | | | |
Government of Lithuania | | | | | | | | | | |
| 7.38% | | 02/11/20 | | | 100 | | | | 110 | | | (b,h) |
Government of Panama | | | | | | | | | | |
| 6.70% | | 01/26/36 | | | 29 | | | | 32 | | | |
Government of Peruvian | | | | | | | | | | |
| 6.55% | | 03/14/37 | | | 39 | | | | 43 | | | |
Government of Philippine | | | | | | | | | | |
| 6.38% | | 10/23/34 | | | 150 | | | | 159 | | | |
See Notes to Schedules of Investments and Notes to Financial Statements.
43
| | |
| Elfun Diversified Fund | | (in thousands) — December 31, 2010 |
| | | | | | | | | | | | |
| | | | | Principal
Amount | | | Fair
Value | | | |
| | | | | | | | | | | | |
| | | |
Government of Poland | | | | | | | | | | |
| 6.38% | | 07/15/19 | | $ | 7 | | | $ | 8 | | | |
Government of Turkey | | | | | | | | | | |
| 5.63% | | 03/30/21 | | | 100 | | | | 104 | | | |
| 6.75% | | 05/30/40 | | | 100 | | | | 109 | | | |
Government of Uruguay | | | | | | | | | | |
| 6.88% | | 09/28/25 | | | 20 | | | | 22 | | | |
Government of Venezuela | | | | | | | | | | |
| 1.29% | | 04/20/11 | | | 11 | | | | 11 | | | (i) |
| 10.75% | | 09/19/13 | | | 69 | | | | 66 | | | |
Government of Vietnam | | | | | | | | | | |
| 1.30% | | 03/12/16 | | | 7 | | | | 6 | | | (i) |
Korea National Oil Corp. | | | | | | | | | | |
| 2.88% | | 11/09/15 | | | 100 | | | | 96 | | | (b,h) |
Lebanese Republic | | | | | | | | | | |
| 5.15% | | 11/12/18 | | | 14 | | | | 14 | | | |
Province of Manitoba Canada | | | | | | | | | | |
| 4.90% | | 12/06/16 | | | 60 | | | | 66 | | | (h) |
Province of Quebec Canada | | | | | | | | | | |
| 7.50% | | 09/15/29 | | | 90 | | | | 124 | | | |
Republic of Dominican | | | | | | | | | | |
| 9.50% | | 09/27/11 | | | 22 | | | | 22 | | | |
Russian Foreign Bond — Eurobond | | | | | | | | | | |
| 7.50% | | 03/31/30 | | | 36 | | | | 41 | | | (j) |
United Mexican States | | | | | | | | | | |
| 5.13% | | 01/15/20 | | | 17 | | | | 18 | | | |
| | | | | | | | | 1,886 | | | |
| |
| Municipal Bonds and Notes — 0.1% | | | |
American Municipal Power-Ohio Inc. | | | | | | | | | | |
| 8.08% | | 02/15/50 | | | 55 | | | | 59 | | | |
Municipal Electric Authority of Georgia | | | | | | | | | | |
| 6.64% | | 04/01/57 | | | 158 | | | | 154 | | | |
New Jersey State Turnpike Authority | | | | | | | | | | |
| 7.10% | | 01/01/41 | | | 40 | | | | 43 | | | |
| 7.41% | | 01/01/40 | | | 20 | | | | 22 | | | |
New Jersey Transportation Trust Fund Authority | | | | | | | | | | |
| 6.88% | | 12/15/39 | | | 15 | | | | 15 | | | |
| | | | | | | | | | | | |
| | | | | Principal
Amount | | | Fair
Value | | | |
| | | | | | | | | | | | |
| | | |
South Carolina State Public Service Authority | | | | | | | | | | |
| 6.45% | | 01/01/50 | | $ | 40 | | | $ | 41 | | | |
| | | | | | | | | 334 | | | |
| | | |
Total Bonds and Notes
(Cost $68,487) | | | | | | | 69,163 | | | |
| | | | | | | | | | |
| | | |
| | | Number
of Shares | | | | | | |
| | | | | | | | | | |
| Exchange Traded Funds — 1.5% |
| | | |
Financial Select Sector
SPDR Fund | | | 12,500 | | | | 199 | | | (p) |
Industrial Select Sector
SPDR Fund | | | 23,236 | | | | 811 | | | (p) |
| | | |
iShares MSCI Emerging Markets Index Fund | | | 785 | | | | 37 | | | |
Vanguard REIT | | | 42,381 | | | | 2,347 | | | |
| | | |
Total Exchange Traded Funds
(Cost $3,360) | | | | | | | 3,394 | | | |
Other Investments — 0.1% | | | |
| | | |
GEI Investment Fund
(Cost $206) | | | | | | | 195 | | | (k) |
| | | |
Total Investments in Securities
(Cost $194,666) | | | | | | | 214,607 | | | |
Short-Term Investments — 9.3% | | | |
| |
GE Money Market Fund Institutional Class | | | |
0.00% | | | | | | | 21,384 | | | (d,k) |
(Cost $21,384) | | | | | | | | | | |
| | | |
Total Investments
(Cost $216,050) | | | | | | | 235,991 | | | |
| | | |
Liabilities in Excess of Other Assets, net — (2.7)% | | | | | | | (6,110) | | | |
| | | | | | | | | | |
| | | |
NET ASSETS — 100.0% | | | | | | $ | 229,881 | | | |
| | | | | | | | | | |
See Notes to Schedules of Investments and Notes to Financial Statements.
44
| | |
| Elfun Diversified Fund | | (in thousands) — December 31, 2010 |
Other Information
The Fund had the following long futures contracts open at December 31, 2010:
| | | | | | | | | | | | | | |
| Description | | Expiration
Date | | Number
of
Contracts | | | Current
Notional
Value | | | Unrealized
Appreciation/
(Depreciation) | |
| | | | |
DJ Euro Stoxx 50 Index Futures | | March 2011 | | | 3 | | | $ | 112 | | | $ | (2) | |
| | | | |
FTSE 100 Index Futures | | March 2011 | | | 1 | | | | 92 | | | | — | |
| | | | |
Russell 2000 Mini Index Futures | | March 2011 | | | 70 | | | | 5,476 | | | | 84 | |
| | | | |
S&P 500 Emini Index Futures | | March 2011 | | | 23 | | | | 1,441 | | | | 18 | |
| | | | |
S&P Midcap 400 Emini Index Futures | | March 2011 | | | 3 | | | | 272 | | | | 2 | |
| | | | |
2 Yr. U.S. Treasury Notes Futures | | March 2011 | | | 34 | | | | 7,443 | | | | (10) | |
| | | | |
5 Yr. U.S. Treasury Notes Futures | | March 2011 | | | 14 | | | | 1,648 | | | | (10) | |
The Fund had the following short futures contracts open at December 31, 2010:
| | | | | | | | | | | | | | |
| Description | | Expiration
date | | Number
of
Contracts | | | Current
Notional
Value | | | Unrealized
Appreciation/
(Depreciation) | |
| | | | |
Ultra Long U.S. Treasury Bond Futures | | March 2011 | | | 21 | | | $ | (2,669) | | | $ | (13) | |
| | | | |
10 Yr. U.S. Treasury Notes Futures | | March 2011 | | | 101 | | | | (12,164) | | | | 112 | |
| | | | | | | | | | | | | | |
| | | | |
| | | | | | | | | | | | $ | 181 | |
| | | | | | | | | | | | | | |
The Fund was invested in the following countries at December 31, 2010 as a % based on Fair Value:
| | | | | | |
| Country | | (Unaudited) | |
United States | | | 69.90% | |
United Kingdom | | | 4.68% | |
Germany | | | 3.49% | |
Japan | | | 3.08% | |
France | | | 2.49% | |
Canada | | | 2.31% | |
Switzerland | | | 1.97% | |
China | | | 1.54% | |
Brazil | | | 1.48% | |
Taiwan | | | 0.88% | |
Netherlands | | | 0.83% | |
South Korea | | | 0.77% | |
Australia | | | 0.70% | |
Spain | | | 0.62% | |
India | | | 0.51% | |
Russian Federation | | | 0.50% | |
Hong Kong | | | 0.42% | |
Mexico | | | 0.36% | |
South Africa | | | 0.33% | |
Italy | | | 0.31% | |
Philippines | | | 0.24% | |
Sweden | | | 0.22% | |
Peru | | | 0.21% | |
Chile | | | 0.20% | |
Indonesia | | | 0.20% | |
Supranationals | | | 0.17% | |
Colombia | | | 0.15% | |
Turkey | | | 0.15% | |
Thailand | | | 0.14% | |
Denmark | | | 0.13% | |
Ireland | | | 0.13% | |
Malaysia | | | 0.08% | |
Qatar | | | 0.09% | |
Bermuda | | | 0.07% | |
Israel | | | 0.07% | |
Egypt | | | 0.06% | |
El Salvador | | | 0.05% | |
Lithuania | | | 0.05% | |
Hungary | | | 0.04% | |
Jamaica | | | 0.04% | |
Trinidad And Tobago | | | 0.04% | |
See Notes to Schedules of Investments and Notes to Financial Statements.
45
| | |
| Elfun Diversified Fund | | December 31, 2010 |
(Unaudited)
| | | | | | |
Ukraine | | | 0.04% | |
United Arab Emirates | | | 0.04% | |
Argentina | | | 0.03% | |
Czech Republic | | | 0.03% | |
Panama | | | 0.03% | |
Venezuela, Bolivarian Republic Of | | | 0.03% | |
Belize | | | 0.02% | |
Costa Rica | | | 0.02% | |
Lebanon | | | 0.02% | |
Dominican Republic | | | 0.01% | |
Grenada | | | 0.01% | |
Kazakhstan | | | 0.01% | |
Uruguay | | | 0.01% | |
| | | | | | |
| | | 100.00% | |
| | | | | | |
The Fund’s % share of investment in the various categories, based on Fair Value, is as follows at December 31, 2010:
| | | | | | | | | | | | |
| Industry | | | Domestic | | | | Foreign | | | | Total | |
Diversified Financial Services | | | 0.91% | | | | 2.89% | | | | 3.80% | |
Integrated Oil & Gas | | | 0.95% | | | | 2.00% | | | | 2.95% | |
Semiconductors | | | 1.10% | | | | 0.92% | | | | 2.02% | |
Communications Equipment | | | 1.31% | | | | 0.54% | | | | 1.85% | |
Wireless Telecommunication Services | | | 0.87% | | | | 0.89% | | | | 1.76% | |
Pharmaceuticals | | | 0.83% | | | | 0.78% | | | | 1.61% | |
Systems Software | | | 1.57% | | | | 0.00% | | | | 1.57% | |
Asset Management & Custody Banks | | | 1.49% | | | | 0.02% | | | | 1.51% | |
Fertilizers & Agricultural Chemicals | | | 0.50% | | | | 0.98% | | | | 1.48% | |
Automobile Manufacturers | | | 0.17% | | | | 1.29% | | | | 1.46% | |
Steel | | | 0.63% | | | | 0.82% | | | | 1.45% | |
Exchange Traded Fund | | | 1.44% | | | | 0.00% | | | | 1.44% | |
Life & Health Insurance | | | 0.59% | | | | 0.82% | | | | 1.41% | |
Diversified Metals & Mining | | | 0.09% | | | | 1.30% | | | | 1.39% | |
Internet Software & Services | | | 0.68% | | | | 0.71% | | | | 1.39% | |
Biotechnology | | | 1.36% | | | | 0.00% | | | | 1.36% | |
Packaged Foods & Meats | | | 0.49% | | | | 0.82% | | | | 1.31% | |
Oil & Gas Equipment & Services | | | 1.24% | | | | 0.00% | | | | 1.24% | |
Aerospace & Defense | | | 0.70% | | | | 0.53% | | | | 1.23% | |
| | | | | | | | | | | | |
Industrial Conglomerates | | | 0.03% | | | | 1.15% | | | | 1.18% | |
Household Products | | | 0.50% | | | | 0.56% | | | | 1.06% | |
Industrial Gases | | | 0.49% | | | | 0.56% | | | | 1.05% | |
Healthcare Services | | | 0.79% | | | | 0.22% | | | | 1.01% | |
Specialized Finance | | | 0.73% | | | | 0.28% | | | | 1.01% | |
Investment Banking & Brokerage | | | 0.61% | | | | 0.36% | | | | 0.97% | |
Oil & Gas Exploration & Production | | | 0.88% | | | | 0.09% | | | | 0.97% | |
Healthcare Equipment | | | 0.94% | | | | 0.00% | | | | 0.94% | |
Life Sciences Tools & Services | | | 0.88% | | | | 0.00% | | | | 0.88% | |
Soft Drinks | | | 0.79% | | | | 0.00% | | | | 0.79% | |
Data Processing & Outsourced Services | | | 0.76% | | | | 0.00% | | | | 0.76% | |
Electric Utilities | | | 0.67% | | | | 0.06% | | | | 0.73% | |
Electrical Components & Equipment | | | 0.30% | | | | 0.40% | | | | 0.70% | |
IT Consulting & Other Services | | | 0.39% | | | | 0.27% | | | | 0.66% | |
Industrial Machinery | | | 0.29% | | | | 0.36% | | | | 0.65% | |
Integrated Telecommunication Services | | | 0.41% | | | | 0.24% | | | | 0.65% | |
Computer Hardware | | | 0.63% | | | | 0.00% | | | | 0.63% | |
Application Software | | | 0.27% | | | | 0.35% | | | | 0.62% | |
Multi-Utilities | | | 0.20% | | | | 0.42% | | | | 0.62% | |
Multi-Line Insurance | | | 0.24% | | | | 0.31% | | | | 0.55% | |
Home Improvement Retail | | | 0.53% | | | | 0.00% | | | | 0.53% | |
Cable & Satellite | | | 0.52% | | | | 0.00% | | | | 0.52% | |
Construction & Engineering | | | 0.07% | | | | 0.44% | | | | 0.51% | |
Movies & Entertainment | | | 0.50% | | | | 0.00% | | | | 0.50% | |
Construction & Farm Machinery & Heavy Trucks | | | 0.26% | | | | 0.23% | | | | 0.49% | |
Security & Alarm Services | | | 0.34% | | | | 0.15% | | | | 0.49% | |
Advertising | | | 0.47% | | | | 0.00% | | | | 0.47% | |
Food Retail | | | 0.00% | | | | 0.45% | | | | 0.45% | |
General Merchandise Stores | | | 0.44% | | | | 0.00% | | | | 0.44% | |
Apparel, Accessories & Luxury Goods | | | 0.20% | | | | 0.19% | | | | 0.39% | |
Electronic Components | | | 0.06% | | | | 0.31% | | | | 0.37% | |
Healthcare Supplies | | | 0.00% | | | | 0.36% | | | | 0.36% | |
Hypermarkets & Super Centers | | | 0.04% | | | | 0.31% | | | | 0.35% | |
Real Estate Services | | | 0.35% | | | | 0.00% | | | | 0.35% | |
Coal & Consumable Fuels | | | 0.13% | | | | 0.19% | | | | 0.32% | |
Regional Banks | | | 0.15% | | | | 0.16% | | | | 0.31% | |
Trading Companies & Distributors | | | 0.11% | | | | 0.18% | | | | 0.29% | |
Property & Casualty Insurance | | | 0.28% | | | | 0.00% | | | | 0.28% | |
Diversified Capital Markets | | | 0.00% | | | | 0.25% | | | | 0.25% | |
See Notes to Schedules of Investments and Notes to Financial Statements.
46
| | |
| Elfun Diversified Fund | | December 31, 2010 |
(Unaudited)
| | | | | | | | | | | | |
Hotels, Resorts & Cruise Lines | | | 0.22% | | | | 0.02% | | | | 0.24% | |
Diversified Real Estate Activities | | | 0.00% | | | | 0.22% | | | | 0.22% | |
Diversified Support Services | | | 0.08% | | | | 0.14% | | | | 0.22% | |
Oil & Gas Storage & Transportation | | | 0.21% | | | | 0.00% | | | | 0.21% | |
Homefurnishing Retail | | | 0.20% | | | | 0.00% | | | | 0.20% | |
Apparel Retail | | | 0.11% | | | | 0.08% | | | | 0.19% | |
Railroads | | | 0.18% | | | | 0.00% | | | | 0.18% | |
Home Entertainment Software | | | 0.17% | | | | 0.00% | | | | 0.17% | |
Research & Consulting Services | | | 0.17% | | | | 0.00% | | | | 0.17% | |
Thrifts & Mortgage Finance | | | 0.17% | | | | 0.00% | | | | 0.17% | |
Agricultural Products | | | 0.08% | | | | 0.08% | | | | 0.16% | |
Broadcasting | | | 0.11% | | | | 0.05% | | | | 0.16% | |
Casinos & Gaming | | | 0.14% | | | | 0.02% | | | | 0.16% | |
Computer Storage & Peripherals | | | 0.16% | | | | 0.00% | | | | 0.16% | |
Office REITs | | | 0.16% | | | | 0.00% | | | | 0.16% | |
Gold | | | 0.00% | | | | 0.14% | | | | 0.14% | |
Construction Materials | | | 0.00% | | | | 0.13% | | | | 0.13% | |
Human Resource & Employment Services | | | 0.00% | | | | 0.13% | | | | 0.13% | |
Marine | | | 0.00% | | | | 0.13% | | | | 0.13% | |
Air Freight & Logistics | | | 0.12% | | | | 0.00% | | | | 0.12% | |
Building Products | | | 0.00% | | | | 0.12% | | | | 0.12% | |
Healthcare Technology | | | 0.12% | | | | 0.00% | | | | 0.12% | |
Semiconductor Equipment | | | 0.11% | | | | 0.00% | | | | 0.11% | |
Restaurants | | | 0.10% | | | | 0.00% | | | | 0.10% | |
Consumer Finance | | | 0.09% | | | | 0.00% | | | | 0.09% | |
Distillers & Vintners | | | 0.00% | | | | 0.09% | | | | 0.09% | |
Oil & Gas Drilling | | | 0.00% | | | | 0.09% | | | | 0.09% | |
Reinsurance | | | 0.08% | | | | 0.00% | | | | 0.08% | |
Tobacco | | | 0.07% | | | | 0.00% | | | | 0.07% | |
Homebuilding | | | 0.06% | | | | 0.00% | | | | 0.06% | |
Independent Power Producers & Energy Traders | | | 0.05% | | | | 0.01% | | | | 0.06% | |
Personal Products | | | 0.05% | | | | 0.01% | | | | 0.06% | |
Specialized REITs | | | 0.06% | | | | 0.00% | | | | 0.06% | |
Brewers | | | 0.03% | | | | 0.02% | | | | 0.05% | |
Department Stores | | | 0.05% | | | | 0.00% | | | | 0.05% | |
Electronic Manufacturing Services | | | 0.00% | | | | 0.05% | | | | 0.05% | |
Environmental & Facilities Services | | | 0.05% | | | | 0.00% | | | | 0.05% | |
Food Distributors | | | 0.03% | | | | 0.02% | | | | 0.05% | |
Healthcare Distributors | | | 0.04% | | | | 0.01% | | | | 0.05% | |
Diversified Chemicals | | | 0.04% | | | | 0.00% | | | | 0.04% | |
Drug Retail | | | 0.04% | | | | 0.00% | | | | 0.04% | |
| | | | | | | | | | | | |
Oil & Gas Refining & Marketing | | | 0.00% | | | | 0.04% | | | | 0.04% | |
Specialty Chemicals | | | 0.04% | | | | 0.00% | | | | 0.04% | |
Beverages | | | 0.00% | | | | 0.03% | | | | 0.03% | |
Distributors | | | 0.03% | | | | 0.00% | | | | 0.03% | |
Electronic Equipment & Instruments | | | 0.00% | | | | 0.03% | | | | 0.03% | |
Real Estate Development | | | 0.00% | | | | 0.03% | | | | 0.03% | |
Education Services | | | 0.00% | | | | 0.02% | | | | 0.02% | |
Forest Products | | | 0.02% | | | | 0.00% | | | | 0.02% | |
Household Appliances | | | 0.00% | | | | 0.02% | | | | 0.02% | |
Utilities | | | 0.02% | | | | 0.00% | | | | 0.02% | |
Consumer Electronics | | | 0.00% | | | | 0.01% | | | | 0.01% | |
Heavy Electrical Equipment | | | 0.00% | | | | 0.01% | | | | 0.01% | |
Internet Retail | | | 0.00% | | | | 0.01% | | | | 0.01% | |
Real Estate Operating Companies | | | 0.00% | | | | 0.01% | | | | 0.01% | |
| | | | | | | | | | | | |
| | | | | | | | | | | 61.56% | |
| | | | | | | | | | | | |
| | | | | | |
| Sector | | % (based on Fair Value) | |
Corporate Notes | | | 10.29% | |
Agency Mortgage Backed | | | 9.01% | |
U.S. Treasuries | | | 4.75% | |
Non-Agency CMOs | | | 3.22% | |
Sovereign Bonds | | | 0.80% | |
Agency CMOs | | | 0.67% | |
Asset Backed | | | 0.42% | |
Municipal Bonds and Notes | | | 0.14% | |
| | | | | | |
| | | 29.30% | |
| | | | | | |
| | | | | | |
| Short Term and Other Investments | | | | |
Short-Term | | | 9.06% | |
Other Investments | | | 0.08% | |
| | | | | | |
| | | 9.14% | |
| | | | | | |
| | | 100.00% | |
| | | | | | |
See Notes to Schedules of Investments and Notes to Financial Statements.
47
(Unaudited)


Michael J.Caufield
The Elfun Tax-Exempt Income Fund is managed by Michael J. Caufield. See portfolio managers’ biographical information beginning on page 116.
| Q. | How did the Elfun Tax-Exempt Income perform compared to its benchmark for the twelve-months ending December 31, 2010? |
| A. | For the twelve-month period ended December 31 2010 the Elfun Tax-Exempt Income Fund returned, net of fees, 1.86%. The Barclay’s Capital Municipal Bond Index, returned 2.38%, while the Morningstar Long Tax-Exempt Fund group, consisting of 274 Long-term Municipal Bond funds had a median return of 1.65% for the same period. The Fund’s long term performance continues to distinguish it among its peers with returns placing it in the top 6%, for three and five years and top 3% for the 10 year period. |
| Q. | What were the primary drivers behind Fund performance? |
| A. | 2010 was clearly among the most challenging years in recent memory and portfolio returns encompassed a broad band throughout the year. In an effort to maintain a competitive portfolio dividend and faced with a historically steep yield curve as well as a decline in longer tax-exempt product, the portfolio extended its duration by .75 years, while maintaining a laddered approach to curve positioning during the first quarter of 2010. The portfolio performed well amid volatile markets through the first ten months of the |
| | year compared to the benchmark, but trailed the peer group given its more conservative positioning and the Fund’s continued emphasis on income. In the latter portion of 2010, however, thin tax-exempt supply attractive yields and high reinvestment capital were easily trumped by tax-exempt mutual fund outflows, volatile Treasury yields and significant negative headlines regarding the credit standing of municipal issuers. In the fourth quarter mutual fund flows driven by speculative headlines and perceived weakness of municipal credits combined with rising treasury yields and a surge in year-end new issue supply drove tax-exempt yields dramatically higher as long-term funds sought liquidity to satisfy unsettled individual investors. While the Fund was not immune from negative flows, the impact of peer group selling was far more damaging on municipal valuations and fund net asset value. |
| Q. | What happened in the U.S. economy during the twelve-month period ended December 31, 2010 and how was the portfolio positioned with respect to economic conditions? |
| A. | Over the last eighteen months recessionary pressures on municipal entities strained available resources necessary to provide basic services while state and local governments further struggled under increased unfunded federal mandates. The Federal government, in an effort to improve access to capital and relieve |
48
(Unaudited)
| | burdensome borrowing costs focused a significant part of its economic stimulus efforts on municipalities. The American Reinvestment and Recovery Act which passed in early 2009 created the Build America Bond (BAB) program providing federal subsidies to municipalities issuing bonds in the taxable market. This Act, due to expire on December 31 2010 allowed states and municipalities to issue federally taxable municipal bonds with 35% of the interest cost directly subsidized by a rebate from the federal government. This new source of financing for issuers translated into significant borrowing cost savings while introducing municipal debt to a new class of investor, both domestic and foreign. The diversion of new issue product away from traditional tax-exempt investors, when combined with the uncertainty regarding renewal of the Bush tax cuts as well as new taxes associated with the Health Care Reform Act of 2010, magnified the benefits of tax-exempt investing through the first ten months of the year . The resultant supply/demand imbalance was clearly a key determinant in the direction of rates for a large part of the year. The resultant shift in issuance pattern drove tax-exempt yields to all time low yields. |
Unfortunately such levels were not sustainable as external factors not directly connected to the economy began to take hold of the direction of rates in the fourth quarter.
The Great Recession of 2008-2010 was broader in depth and length than many expected and spared no municipal entity throughout the country. Faced with reduced revenue, lower pension returns and rising borrowing costs, the challenges faced by municipalities suddenly became front page news. Despite making great strides to make the difficult decisions and balance their respective budgets,
unfunded pension mandates took center stage. This has been a key initiative for many states over the last three years, challenging them to provide creative solutions in order to meet their future obligations. In 2009-2010 over 23 states legislatively addressed the problem, yet the scope of future mandates became a focal point and injected a significant degree of uncertainty into the market. Individual investors, who were the main proponent of rates in the first ten months of 2010, driving yields toward historic lows, became unsettled by increasing media attention to the challenges facing tax exempt issuers. While this information was well know to market professionals and entrenched in existing market prices, the unsubstantiated doomsday predictions of several “self anointed experts” led to panic redemptions by individuals, leading to a technical imbalance which overwhelmed available liquidity sources. At the same time uncertainty regarding the extension and eventual refusal of Congress to extend the BAB, which had a significant adverse impact to market technical factors, converged with a seasonal surge in new issue supply to create a “perfect storm”, derailing municipal values and ultimately undermined market stability in the fourth quarter.
While the Fund, with ample liquidity, a defensive cash position and less than 6% of its holdings longer than 30 years was not exempt from the volatility and asset value pressure experienced throughout the asset class, it did fare better than 75% of its peers over the last three hectic months of 2010.
49
(Unaudited)
Understanding Your Fund’s Expenses
As a shareholder of the Fund you incur transaction and ongoing expenses. Transaction expenses including sales charges on purchases payments, reinvested dividends (or other distributions), and redemption fees directly reduce the investment return of the Fund. Ongoing costs include portfolio management fees, distribution and services fees, professional fees, administrative fees and other Fund expenses. The following example is intended to help you understand your ongoing costs (in dollars) of investing in the Fund and to compare these costs with the ongoing costs of investing in other mutual funds.
To illustrate these ongoing costs, we have provided an example and calculated the expenses paid by investors in each share class of the Fund during the period. The information in the following table is based on an investment of $1,000, which is invested at the beginning of the period and held for the entire six-month period ended December 31, 2010.
Actual Expenses
The first section of the table provides information about actual account values and actual expenses. You may use the information in this section,
together with the amount you invested, to estimate the expenses that you paid over the period. To do so, simply divide your account value by $1,000 (for example, an $8,600 account value divided by $1,000 = 8.6), then multiply the result by the number given for your class under the heading “Expenses Paid During Period.”
Hypothetical Example for Comparison Purposes
The second section of the table provides information about hypothetical account values and hypothetical expenses based on the Fund’s actual expense ratio and an assumed rate of return of 5% per year before expenses, which is not the Fund’s actual return. You may use this information to compare the ongoing costs of investing in the Fund and other funds. To do so, compare this 5% hypothetical example with the 5% hypothetical examples that appear in the shareholders reports of other funds.
Please note that the expenses shown in the table for both “Actual” and “Hypothetical” do not reflect any transaction costs, such as sales charges or redemption fees.
July 1, 2010 – December 31, 2010
| | | | | | | | | | | | |
| | | Account value at
the beginning
of the period ($) | | | Account value
at the end of
the period ($) | | | Expenses
paid during
the period ($)* | |
| | | |
Actual Fund Return** | | | 1,000.00 | | | | 987.14 | | | | 0.95 | |
| | | |
Hypothetical 5% Return
(2.5% for the period) | | | 1,000.00 | | | | 1,023.97 | | | | 0.97 | |
| * | | Expenses are equal to the Fund’s annualized expense ratio of 0.19% (for the period July 1, 2010 - December 31, 2010), multiplied by the average account value over the period, multiplied by 184/365 (to reflect the one-half year period) |
| ** | | Actual Fund Return for the six-month period ended December 31, 2010 was: -1.29%. Past performance does not guarantee future results. |
50
(Unaudited)
Investment Profile
A mutual fund designed for investors who seek as high a level of current interest income exempt from federal income taxation as is available from concentration of investment in municipal bonds consistent with prudent investment management and the preservation of capital by investing primarily in investment-grade municipal securities.
Quality Ratings
as of December 31, 2010 as a % of Fair Value(b)
| | | | |
Moody’s / S&P / Fitch Rating* | |
| Percentage of
Fair Value |
|
| Aaa / AAA | | | 17.68% | |
| Aa / AA | | | 43.32% | |
| A / A | | | 30.38% | |
| Below A | | | 8.62% | |
| | | | 100.00% | |
| * | | Moody’s Investors Services Inc, Standard & Poor’s and Fitch are nationally recognized statistical rating organizations. |
Sector Allocation
as a % of the Fair Value of $1,646,223 (in thousands) as of December 31, 2010.(b)
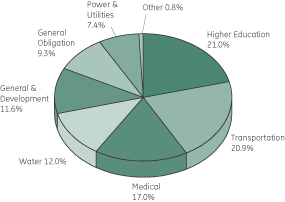
Morningstar Performance Comparison
Based on average annual returns for periods ended 12/31/10
| | | | | | | | | | | | |
| | | One
Year | | | Five
Year | | | Ten
Year | |
Number of Funds in peer group | | | 274 | | | | 267 | | | | 266 | |
Peer group average annual total return | | | 1.65 | % | | | 2.78 | % | | | 3.79 | % |
Morningstar category in peer group: Muni National Long | |
Change in Value of a $10,000 Investment(a)
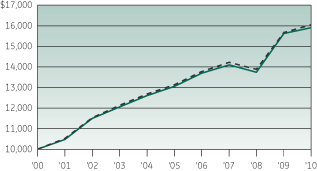
Average Annual Total Return
for the periods ended December 31, 2010
| | | | | | | | | | | | | | | | |
| (Inception date: 01/01/80) | | | | | | | | | | |
| | | One
Year | | | Five
Year | | | Ten
Year | | | Ending value of a
$10,000
investment (a) | |
| | | | |
Elfun Tax-Exempt Fund | | | 1.86% | | | | 4.02% | | | | 4.75% | | | | 15,901 | |
| | | | |
Barclays Capital U.S. Municipal Bond Index | | | 2.38% | | | | 4.09% | | | | 4.83% | | | | 16,034 | |

| (a) | Ending value of a $10,000 investment for the ten-year period or since inception, whichever is less. |
| (b) | The securities information regarding holdings, allocations and other characteristics is presented to illustrate examples of securities that the Fund has bought and the diversity of areas in which the Fund may invest as of a particular date. It may not be representative of the Fund’s current or future investments and should not be construed as a recommendation to purchase or sell a particular security. |
See Notes to Performance on page 1 for further information.
Past performance does not predict future performance. The performance shown on the graph and tables does not reflect the deduction of taxes that a shareholder would pay on Fund distributions or the redemption of Fund shares.
51
| | |
| Elfun Tax-Exempt Income Fund | | (in thousands) — December 31, 2010 |
| | | | | | | | | | | | |
| | | | | Principal
Amount | | | Fair
Value | | | |
| | | | | | | | | | | | |
Municipal Bonds and Notes — 98.0%† | | | |
| | |
| Alabama — 1.3% | | | | | | | |
| | | |
City of Birmingham AL | | | | | | | | | | |
| 0.53% | | 05/01/17 | | $ | 3,395 | | | $ | 3,565 | | | |
East Alabama Health Care Authority | | | | | | | | | | |
| 0.50% | | 09/01/33 | | | 5,500 | | | | 5,719 | | | |
Montgomery BMC Special Care Facilities Financing Authority (MBIA Insured) | | | | | | | | | | |
| 0.50% | | 11/15/20 | | | 8,375 | | | | 9,387 | | | (n) |
Montgomery Medical Clinic Board | | | | | | | | | | |
| 0.53% | | 03/01/31 - 03/01/36 | | | 3,000 | | | | 2,668 | | | |
| | | | | | | | | 21,339 | | | |
| | |
| Arizona — 4.1% | | | | | | | |
| | | |
Arizona State University
(FSA Insured) | | | | | | | | | | |
| 0.53% | | 07/01/15 | | | 5,000 | | | | 5,329 | | | (n) |
City of Phoenix AZ | | | | | | | | | | |
| 0.50% | | 07/01/19 | | | 5,000 | | | | 5,561 | | | |
Glendale Western Loop 101 Public Facilites Corp. | | | | | | | | | | |
| 0.63% | | 07/01/38 | | | 10,000 | | | | 10,296 | | | |
Maricopa County Industrial Development Authority | | | | | | | | | | |
| 0.55% | | 07/01/26 | | | 5,000 | | | | 5,041 | | | |
Maricopa County Stadium District (AMBAC Insured) | | | | | | | | | | |
| 0.54% | | 06/01/16 | | | 2,145 | | | | 2,217 | | | (n) |
Phoenix Civic Improvement Corp. | | | | | | | | | | |
| 0.50% | | 07/01/39 - 07/01/40 | | | 13,500 | | | | 13,147 | | | |
Phoenix Civic Improvement Corp. (FGIC Insured) | | | | | | | | | | |
| 0.55% | | 07/01/23 - 07/01/24 | | | 7,260 | | | | 8,213 | | | (n) |
Pima County Industrial Development Authority | | | | | | | | | | |
| 0.53% | | 10/01/40 | | | 2,000 | | | | 1,736 | | | |
| 0.58% | | 09/01/29 | | | 2,500 | | | | 2,517 | | | |
| | | | | | | | | | | | |
| | | | | Principal
Amount | | | Fair
Value | | | |
| | | | | | | | | | | | |
| | | |
Salt River Project Agricultural Improvement & Power District | | | | | | | | | | |
| 0.50% | | 12/01/21 | | $ | 10,000 | | | $ | 11,220 | | | |
Scottsdale Industrial Development Authority
(AGC Insured) | | | | | | | | | | |
| 0.50% | | 09/01/39 | | | 2,000 | | | | 1,823 | | | (n) |
University Medical Center Corp. | | | | | | | | | | |
| 0.65% | | 07/01/39 | | | 1,000 | | | | 1,048 | | | |
| | | | | | | | | 68,148 | | | |
| | |
| California — 6.6% | | | | | | | |
| | | |
Abag Finance Authority for Nonprofit Corps | | | | | | | | | | |
| 0.50% | | 12/01/37 | | | 2,940 | | | | 2,526 | | | |
Bay Area Toll Authority | | | | | | | | | | |
| 0.50% | | 04/01/31 - 04/01/34 | | | 15,000 | | | | 14,712 | | | (h) |
California Educational Facilities Authority | | | | | | | | | | |
| 0.50% | | 10/01/39 | | | 7,000 | | | | 6,957 | | | |
| 0.53% | | 10/01/39 - 04/01/40 | | | 16,000 | | | | 16,798 | | | |
California Health Facilities Financing Authority | | | | | | | | | | |
| 0.60% | | 07/01/39 | | | 5,000 | | | | 5,090 | | | |
| 0.65% | | 10/01/33 | | | 3,500 | | | | 3,793 | | | |
California State Public Works Board | | | | | | | | | | |
| 0.60% | | 04/01/26 | | | 8,475 | | | | 8,741 | | | |
Coast Community College District (FSA Insured) | | | | | | | | | | |
| 6.03% | | 08/01/33 | | | 8,750 | | | | 6,618 | | | (d,n) |
Foothill-De Anza Community College District
(AMBAC Insured) | | | | | | | | | | |
| 0.45% | | 08/01/31 | | | 4,600 | | | | 4,097 | | | (n) |
Los Angeles Department of Water & Power
(AMBAC Insured) | | | | | | | | | | |
| 0.50% | | 07/01/32 | | | 5,000 | | | | 4,890 | | | (n) |
Los Angeles Harbor Department | | | | | | | | | | |
| 0.50% | | 08/01/26 | | | 8,000 | | | | 8,128 | | | |
Metropolitan Water District of Southern California | | | | | | | | | | |
| 0.50% | | 07/01/35 | | | 5,000 | | | | 5,043 | | | |
See Notes to Schedules of Investments and Notes to Financial Statements.
52
| | |
| Elfun Tax-Exempt Income Fund | | (in thousands) — December 31, 2010 |
| | | | | | | | | | | | |
| | | | | Principal
Amount | | | Fair
Value | | | |
| | | | | | | | | | | | |
| | | |
San Diego Unified School District (FSA Insured) | | | | | | | | | | |
| 0.53% | | 07/01/17 - 07/01/19 | | $ | 8,795 | | | $ | 9,710 | | | (n) |
San Francisco Bay Area Rapid Transit District | | | | | | | | | | |
| 0.50% | | 08/01/27 | | | 5,000 | | | | 5,193 | | | |
San Francisco City & County Airports Commission | | | | | | | | | | |
| 0.53% | | 05/01/26 | | | 3,000 | | | | 3,051 | | | |
University of California
(AMBAC Insured) | | | | | | | | | | |
| 0.50% | | 05/15/34 - 05/15/34 | | | 6,000 | | | | 6,018 | | | (n) |
| | | | | | | | | 111,365 | | | |
| | |
| Colorado — 0.9% | | | | | | | |
| | | |
Colorado Water Resources & Power Development Authority | | | | | | | | | | |
| 0.53% | | 09/01/17 - 09/01/18 | | | 5,880 | | | | 6,185 | | | |
Regional Transportation District | | | | | | | | | | |
| 0.54% | | 06/01/31 | | | 2,500 | | | | 2,480 | | | |
University of Colorado Hospital Authority | | | | | | | | | | |
| 0.53% | | 11/15/39 | | | 7,000 | | | | 6,651 | | | |
| | | | | | | | | 15,316 | | | |
| | |
| Connecticut — 1.8% | | | | | | | |
| | | |
Connecticut State Health & Educational Facility Authority | | | | | | | | | | |
| 0.50% | | 07/01/40 - 07/01/42 | | | 10,500 | | | | 10,186 | | | |
Connecticut State Health & Educational Facility Authority (MBIA Insured) | | | | | | | | | | |
| 0.45% | | 07/01/37 | | | 8,055 | | | | 7,045 | | | (n) |
South Central Connecticut Regional Water Authority (MBIA Insured) | | | | | | | | | | |
| 0.50% | | 08/01/27 | | | 3,000 | | | | 3,068 | | | (n) |
State of Connecticut | | | | | | | | | | |
| 0.50% | | 11/01/26 | | | 10,000 | | | | 10,474 | | | |
| | | | | | | | | 30,773 | | | |
| | | | | | | | | | | | |
| | | | | Principal
Amount | | | Fair
Value | | | |
| | | | | | | | | | | | |
| | |
| Delaware — 1.1% | | | | | | | |
| | | |
County of New Castle DE | | | | | | | | | | |
| 0.50% | | 07/15/33 - 07/15/39 | | $ | 10,000 | | | $ | 10,182 | | | |
Delaware State Health Facilities Authority | | | | | | | | | | |
| 0.50% | | 10/01/40 | | | 8,300 | | | | 7,977 | | | |
| | | | | | | | | 18,159 | | | |
| | |
| District Of Columbia — 1.2% | | | | | | | |
| | | |
District of Columbia | | | | | | | | | | |
| 0.55% | | 04/01/36 | | | 15,000 | | | | 14,999 | | | |
District of Columbia Water & Sewer Authority | | | | | | | | | | |
| 0.53% | | 10/01/29 | | | 5,000 | | | | 5,199 | | | |
| | | | | | | | | 20,198 | | | |
| | |
| Florida — 2.0% | | | | | | | |
| | | |
Brevard County Health Facilities Authority | | | | | | | | | | |
| 0.70% | | 04/01/39 | | | 1,000 | | | | 1,072 | | | |
City of Tampa FL | | | | | | | | | | |
| 0.50% | | 10/01/26 | | | 5,000 | | | | 5,103 | | | |
Hillsborough County Industrial Development Authority | | | | | | | | | | |
| 0.50% | | 10/01/18 | | | 5,000 | | | | 5,072 | | | |
| 0.53% | | 10/01/15 - 10/01/24 | | | 10,630 | | | | 10,732 | | | |
Jacksonville Economic Development Commission | | | | | | | | | | |
| 0.55% | | 11/15/36 | | | 5,000 | | | | 5,022 | | | |
South Miami Health Facilities Authority | | | | | | | | | | |
| 0.53% | | 11/15/33 | | | 6,380 | | | | 6,944 | | | |
| | | | | | | | | 33,945 | | | |
| | |
| Georgia — 7.9% | | | | | | | |
| | | |
Athens-Clarke County Unified Government | | | | | | | | | | |
| 0.55% | | 01/01/38 | | | 7,000 | | | | 7,177 | | | |
Athens-Clarke County Unified Government Development Authority | | | | | | | | | | |
| 5.91% | | 06/15/31 | | | 6,050 | | | | 4,722 | | | (d) |
See Notes to Schedules of Investments and Notes to Financial Statements.
53
| | |
| Elfun Tax-Exempt Income Fund | | (in thousands) — December 31, 2010 |
| | | | | | | | | | | | |
| | | | | Principal
Amount | | | Fair
Value | | | |
| | | | | | | | | | | | |
| | | |
Augusta-Richmond County GA (FSA Insured) | | | | | | | | | | |
| 0.53% | | 10/01/34 | | $ | 8,500 | | | $ | 8,643 | | | (n) |
City of Atlanta GA | | | | | | | | | | |
| 0.50% | | 01/01/25 | | | 10,000 | | | | 9,960 | | | |
City of Atlanta GA (FSA Insured) | | | | | | | | | | |
| 0.53% | | 01/01/33 | | | 4,000 | | | | 3,928 | | | (n) |
| 0.58% | | 11/01/27 | | | 5,000 | | | | 5,381 | | | (n) |
County of DeKalb GA (FSA Insured) | | | | | | | | | | |
| 0.53% | | 10/01/32 | | | 15,000 | | | | 15,355 | | | (n) |
County of Fulton GA
(FGIC Insured) | | | | | | | | | | |
| 0.50% | | 01/01/30 | | | 5,000 | | | | 5,083 | | | (n) |
| 0.53% | | 01/01/35 | | | 5,500 | | | | 5,611 | | | (n) |
DeKalb Newton & Gwinnett Counties Joint Development Authority | | | | | | | | | | |
| 0.60% | | 07/01/34 | | | 8,500 | | | | 9,094 | | | |
Fayette County School District (FSA Insured) | | | | | | | | | | |
| 0.48% | | 03/01/22 | | | 2,520 | | | | 2,619 | | | (n) |
| 0.49% | | 03/01/23 | | | 2,290 | | | | 2,370 | | | (n) |
Gwinnett County School District | | | | | | | | | | |
| 0.50% | | 02/01/25 | | | 5,000 | | | | 5,545 | | | |
Henry County Hospital Authority (MBIA Insured) | | | | | | | | | | |
| 0.50% | | 07/01/24 | | | 1,865 | | | | 1,910 | | | (n) |
Metropolitan Atlanta Rapid Transit Authority | | | | | | | | | | |
| 0.50% | | 07/01/39 | | | 15,000 | | | | 14,710 | | | |
Municipal Electric Authority of Georgia | | | | | | | | | | |
| 0.53% | | 01/01/19 | | | 2,490 | | | | 2,739 | | | |
Private Colleges & Universities Authority | | | | | | | | | | |
| 0.53% | | 06/01/20 | | | 2,775 | | | | 2,825 | | | |
| 0.60% | | 06/01/21 | | | 2,410 | | | | 2,435 | | | |
Private Colleges & Universities Authority (MBIA Insured) | | | | | | | | | | |
| 0.65% | | 11/01/15 | | | 4,010 | | | | 4,641 | | | (n) |
| | | | | | | | | | | | |
| | | | | Principal
Amount | | | Fair
Value | | | |
| | | | | | | | | | | | |
| | | |
South Regional Joint Development Authority
(AGC Insured) | | | | | | | | | | |
| 0.45% | | 08/01/39 | | $ | 2,650 | | | $ | 2,268 | | | (n) |
State of Georgia | | | | | | | | | | |
| 0.45% | | 01/01/29 | | | 4,500 | | | | 4,548 | | | |
| 0.50% | | 08/01/22 | | | 4,460 | | | | 5,226 | | | (m) |
| 0.50% | | 08/01/22 - 01/01/26 | | | 4,790 | | | | 5,175 | | | |
| | | | | | | | | 131,965 | | | |
| | |
| Hawaii — 2.2% | | | | | | | |
| | | |
City & County of Honolulu HI | | | | | | | | | | |
| 0.50% | | 04/01/33 | | | 10,000 | | | | 10,161 | | | |
| 0.60% | | 01/01/12 - 01/01/12 | | | 2,000 | | | | 2,109 | | | |
State of Hawaii | | | | | | | | | | |
| 0.53% | | 07/01/24 | | | 16,000 | | | | 16,544 | | | |
State of Hawaii (FSA Insured) | | | | | | | | | | |
| 0.58% | | 02/01/14 | | | 6,500 | | | | 7,358 | | | (n) |
| | | | | | | | | 36,172 | | | |
| | |
| Idaho — 1.8% | | | | | | | |
| | | |
Idaho Health Facilities Authority | | | | | | | | | | |
| 0.68% | | 11/01/37 | | | 4,000 | | | | 4,244 | | | |
Idaho Housing & Finance Assoc. | | | | | | | | | | |
| 0.50% | | 07/15/17 | | | 6,025 | | | | 6,845 | | | |
Idaho Housing & Finance Assoc. (MBIA Insured) | | | | | | | | | | |
| 0.50% | | 07/15/22 - 07/15/24 | | | 17,900 | | | | 18,648 | | | (n) |
| | | | | | | | | 29,737 | | | |
| | |
| Illinois — 2.1% | | | | | | | |
| | | |
County of Cook IL
(AMBAC Insured) | | | | | | | | | | |
| 0.55% | | 11/15/26 | | | 10,000 | | | | 10,880 | | | (m,n) |
Illinois Finance Authority | | | | | | | | | | |
| 0.50% | | 12/01/38 | | | 4,960 | | | | 5,066 | | | |
| 0.55% | | 08/15/43 | | | 5,000 | | | | 5,710 | | | |
Metropolitan Pier & Exposition Authority (MBIA Insured) | | | | | | | | | | |
| 5.00% | | 06/15/19 | | | 4,000 | | | | 3,809 | | | (d,n) |
| 5.54% | | 06/15/22 | | | 4,505 | | | | 3,179 | | | (d,n) |
See Notes to Schedules of Investments and Notes to Financial Statements.
54
| | |
| Elfun Tax-Exempt Income Fund | | (in thousands) — December 31, 2010 |
| | | | | | | | | | | | |
| | | | | Principal
Amount | | | Fair
Value | | | |
| | | | | | | | | | | | |
| | | |
Southwestern Illinois Development Authority
(MBIA Insured) | | | | | | | | | | |
| 0.50% | | 10/01/21 | | $ | 4,000 | | | $ | 4,386 | | | (n) |
University of Illinois
(FGIC Insured) | | | | | | | | | | |
| 0.53% | | 04/01/32 | | | 2,540 | | | | 2,508 | | | (n) |
| | | | | | | | | 35,538 | | | |
| | |
| Indiana — 3.1% | | | | | | | |
| | | |
County of St. Joseph IN | | | | | | | | | | |
| 0.50% | | 03/01/36 | | | 10,000 | | | | 10,107 | | | |
Indiana Finance Authority | | | | | | | | | | |
| 0.50% | | 10/01/40 | | | 5,000 | | | | 4,668 | | | |
| 0.53% | | 02/15/40 | | | 10,000 | | | | 9,135 | | | |
Indiana Finance Authority (AMBAC Insured) | | | | | | | | | | |
| 0.54% | | 03/01/34 | | | 5,500 | | | | 5,244 | | | (n) |
Indiana Municipal Power Agency | | | | | | | | | | |
| 0.55% | | 01/01/27 | | | 2,500 | | | | 2,586 | | | |
| 0.58% | | 01/01/34 | | | 2,000 | | | | 2,050 | | | |
Indiana Municipal Power Agency (MBIA Insured) | | | | | | | | | | |
| 0.50% | | 01/01/42 | | | 6,150 | | | | 5,669 | | | (n) |
Indianapolis Local Public Improvement Bond Bank | | | | | | | | | | |
| 0.58% | | 01/01/38 | | | 7,000 | | | | 7,263 | | | |
Merrillville Multi School Building Corp. | | | | | | | | | | |
| 0.53% | | 07/15/28 | | | 5,000 | | | | 5,082 | | | |
| | | | | | | | | 51,804 | | | |
| | |
| Kansas — 0.3% | | | | | | | |
| | | |
University of Kansas Hospital Authority | | | | | | | | | | |
| 0.56% | | 09/01/32 | | | 4,150 | | | | 4,473 | | | |
| | |
| Kentucky — 2.7% | | | | | | | |
| | | |
Kentucky Economic Development Finance Authority | | | | | | | | | | |
| 0.60% | | 06/01/30 | | | 4,000 | | | | 3,932 | | | |
| 0.64% | | 06/01/40 | | | 7,900 | | | | 7,832 | | | |
| | | | | | | | | | | | |
| | | | | Principal
Amount | | | Fair
Value | | | |
| | | | | | | | | | | | |
| | | |
Kentucky State Property & Building Commission
(AGC Insured) | | | | | | | | | | |
| 0.53% | | 02/01/27 - 02/01/28 | | $ | 16,745 | | | $ | 17,214 | | | (n) |
Kentucky Turnpike Authority (AMBAC Insured) | | | | | | | | | | |
| 0.50% | | 07/01/26 | | | 5,000 | | | | 5,120 | | | (n) |
Louisville-Jefferson County Metropolitan Government | | | | | | | | | | |
| 0.53% | | 10/01/36 | | | 13,000 | | | | 11,525 | | | |
| | | | | | | | | 45,623 | | | |
| | |
| Louisiana — 1.2% | | | | | | | |
| | | |
Louisiana Public Facilities Authority (MBIA Insured) | | | | | | | | | | |
| 0.53% | | 07/01/33 | | | 10,925 | | | | 10,928 | | | (n) |
| 0.54% | | 05/15/16 | | | 7,870 | | | | 8,695 | | | (m,n) |
Regional Transit Authority (AGC Insured) | | | | | | | | | | |
| 0.50% | | 12/01/30 | | | 750 | | | | 738 | | | (n) |
| | | | | | | | | 20,361 | | | |
| | |
| Maine — 0.7% | | | | | | | |
| | | |
Maine Health & Higher Educational Facilities Authority | | | | | | | | | | |
| 0.51% | | 07/01/31 | | | 5,000 | | | | 5,117 | | | |
| 0.53% | | 07/01/21 | | | 1,790 | | | | 1,931 | | | |
Maine Municipal Bond Bank | | | | | | | | | | |
| 0.55% | | 11/01/21 | | | 3,325 | | | | 3,465 | | | (m) |
Maine Turnpike Authority | | | | | | | | | | |
| 0.60% | | 07/01/34 | | | 1,250 | | | | 1,336 | | | |
| | | | | | | | | 11,849 | | | |
| | |
| Maryland — 3.2% | | | | | | | |
| | | |
County of Frederick MD | | | | | | | | | | |
| 0.50% | | 07/01/40 | | | 5,130 | | | | 4,598 | | | |
County of Prince George’s MD | | | | | | | | | | |
| 0.50% | | 10/01/22 | | | 6,820 | | | | 7,575 | | | (m) |
Maryland Economic Development Corp. | | | | | | | | | | |
| 0.58% | | 06/01/35 | | | 3,000 | | | | 2,820 | | | |
See Notes to Schedules of Investments and Notes to Financial Statements.
55
| | |
| Elfun Tax-Exempt Income Fund | | (in thousands) — December 31, 2010 |
| | | | | | | | | | | | |
| | | | | Principal
Amount | | | Fair
Value | | | |
| | | | | | | | | | | | |
| | | |
Maryland Health & Higher Educational Facilities Authority | | | | | | | | | | |
| 0.50% | | 07/01/32 - 05/15/40 | | $ | 21,700 | | | $ | 21,367 | | | |
| 0.51% | | 11/15/34 | | | 7,200 | | | | 8,036 | | | (b) |
Washington Suburban Sanitation District | | | | | | | | | | |
| 0.45% | | 06/01/26 | | | 8,470 | | | | 8,755 | | | |
| | | | | | | | | 53,151 | | | |
| | |
| Massachusetts — 4.0% | | | | | | | |
| | | |
Massachusetts Development Finance Agency | | | | | | | | | | |
| 0.50% | | 01/01/40 | | | 10,000 | | | | 9,039 | | | |
Massachusetts Health & Educational Facilities Authority | | | | | | | | | | |
| 0.50% | | 07/01/34 - 07/15/35 | | | 20,000 | | | | 19,855 | | | |
| 0.55% | | 11/15/36 | | | 4,000 | | | | 4,251 | | | |
| 0.58% | | 07/01/39 | | | 8,000 | | | | 7,857 | | | |
Massachusetts State Department of Transportation | | | | | | | | | | |
| 0.50% | | 01/01/37 | | | 10,000 | | | | 9,552 | | | |
Massachusetts Water Resources Authority | | | | | | | | | | |
| 0.65% | | 07/15/19 | | | 14,125 | | | | 16,849 | | | |
| | | | | | | | | 67,403 | | | |
| | |
| Michigan — 1.9% | | | | | | | |
| | | |
City of Detroit MI (FSA Insured) | | | | | | | | | | |
| 0.53% | | 07/01/21 - 07/01/22 | | | 4,545 | | | | 4,668 | | | (n) |
City of Detroit MI (MBIA Insured) | | | | | | | | | | |
| 0.50% | | 07/01/27 | | | 7,145 | | | | 7,152 | | | (n) |
Michigan Municipal Bond Authority | | | | | | | | | | |
| 0.53% | | 10/01/17 | | | 6,465 | | | | 6,862 | | | |
Michigan State Hospital Finance Authority | | | | | | | | | | |
| 0.54% | | 12/01/30 | | | 2,000 | | | | 1,968 | | | |
State of Michigan | | | | | | | | | | |
| 0.55% | | 11/01/18 | | | 6,000 | | | | 6,868 | | | |
State of Michigan (FSA Insured) | | | | | | | | | | |
| 0.53% | | 09/15/27 | | | 5,000 | | | | 5,110 | | | (n) |
| | | | | | | | | 32,628 | | | |
| | | | | | | | | | | | |
| | | | | Principal
Amount | | | Fair
Value | | | |
| | | | | | | | | | | | |
| | |
| Minnesota — 0.3% | | | | | | | |
| | | |
City of Rochester MN | | | | | | | | | | |
| 0.50% | | 11/15/38 | | $ | 4,500 | | | $ | 4,460 | | | |
| | |
| Mississippi — 0.5% | | | | | | | |
| | | |
State of Mississippi | | | | | | | | | | |
| 0.55% | | 09/01/14 | | | 7,500 | | | | 8,549 | | | |
| | |
| Missouri — 0.7% | | | | | | | |
| | | |
Missouri Highway & Transportation Commission | | | | | | | | | | |
| 0.50% | | 05/01/21 | | | 1,500 | | | | 1,690 | | | |
Missouri Joint Municipal Electric Utility Commission | | | | | | | | | | |
| 0.58% | | 01/01/29 | | | 4,500 | | | | 4,663 | | | |
Missouri State Environmental Improvement & Energy Resources Authority | | | | | | | | | | |
| 0.50% | | 01/01/24 | | | 5,000 | | | | 5,254 | | | |
| | | | | | | | | 11,607 | | | |
| | |
| Nebraska — 0.3% | | | | | | | |
| | | |
City of Lincoln NE | | | | | | | | | | |
| 0.50% | | 09/01/32 | | | 4,000 | | | | 4,064 | | | |
| | |
| Nevada — 0.1% | | | | | | | |
| | | |
City of Las Vegas N.V. (AGC Insured) | | | | | | | | | | |
| 0.56% | | 06/01/16 | | | 1,670 | | | | 1,691 | | | (n) |
| | |
| New Jersey — 10.0% | | | | | | | |
| | | |
Cape May County Municipal Utilities Authority (FSA Insured) | | | | | | | | | | |
| 0.58% | | 01/01/15 - 01/01/16 | | | 8,500 | | | | 9,908 | | | (n) |
Essex County Improvement Authority (FSA Insured) | | | | | | | | | | |
| 0.53% | | 12/15/17 | | | 9,765 | | | | 10,511 | | | (n) |
| 0.53% | | 12/15/17 | | | 235 | | | | 264 | | | (m,n) |
New Jersey Economic Development Authority | | | | | | | | | | |
| 0.55% | | 12/15/29 | | | 5,000 | | | | 5,205 | | | |
See Notes to Schedules of Investments and Notes to Financial Statements.
56
| | |
| Elfun Tax-Exempt Income Fund | | (in thousands) — December 31, 2010 |
| | | | | | | | | | | | |
| | | | | Principal
Amount | | | Fair
Value | | | |
| | | | | | | | | | | | |
| | | |
New Jersey Educational Facilities Authority | | | | | | | | | | |
| 0.53% | | 07/01/32 | | $ | 2,625 | | | $ | 2,895 | | | |
| 0.60% | | 12/01/17 | | | 10,000 | | | | 11,234 | | | |
New Jersey Healthcare Facilities Financing Authority
(AGC Insured) | | | | | | | | | | |
| 0.50% | | 01/01/28 | | | 2,500 | | | | 2,350 | | | (n) |
New Jersey Higher Education Assistance Authority | | | | | | | | | | |
| 0.56% | | 06/01/30 | | | 7,500 | | | | 7,530 | | | |
New Jersey State Turnpike Authority | | | | | | | | | | |
| 0.53% | | 01/01/40 | | | 13,000 | | | | 13,067 | | | |
New Jersey State Turnpike Authority (AMBAC Insured) | | | | | | | | | | |
| 0.65% | | 01/01/16 - 01/01/16 | | | 49,960 | | | | 56,635 | | | (n) |
New Jersey Transportation Trust Fund Authority | | | | | | | | | | |
| 0.50% | | 12/15/24 | | | 7,000 | | | | 7,028 | | | |
| 0.55% | | 06/15/19 - 06/15/24 | | | 31,280 | | | | 34,751 | | | (m) |
New Jersey Transportation Trust Fund Authority
(FSA Insured) | | | | | | | | | | |
| 0.58% | | 12/15/14 | | | 1,390 | | | | 1,565 | | | (n) |
| 0.58% | | 12/15/14 | | | 4,610 | | | | 5,383 | | | (l,n) |
| | | | | | | | | 168,326 | | | |
| | |
| New Mexico — 2.0% | | | | | | | |
| | | |
City of Farmington NM | | | | | | | | | | |
| 0.47% | | 09/01/24 | | | 4,000 | | | | 3,746 | | | |
New Mexico Finance Authority | | | | | | | | | | |
| 0.50% | | 06/15/23 - 12/15/26 | | | 17,750 | | | | 18,730 | | | |
New Mexico Hospital Equipment Loan Council | | | | | | | | | | |
| 0.55% | | 08/01/25 - 08/01/30 | | | 10,750 | | | | 11,161 | | | |
| | | | | | | | | 33,637 | | | |
| | |
| New York — 5.8% | | | | | | | |
| | | |
Albany Industrial Development Agency | | | | | | | | | | |
| 0.53% | | 11/15/27 - 11/15/32 | | | 6,500 | | | | 6,058 | | | (h) |
| | | | | | | | | | | | |
| | | | | Principal
Amount | | | Fair
Value | | | |
| | | | | | | | | | | | |
| | | |
Brooklyn Arena Local Development Corp. | | | | | | | | | | |
| 0.60% | | 07/15/30 | | $ | 4,500 | | | $ | 4,518 | | | |
Long Island Power Authority | | | | | | | | | | |
| 0.60% | | 05/01/33 | | | 7,500 | | | | 8,010 | | | |
Metropolitan Transportation Authority | | | | | | | | | | |
| 0.53% | | 11/15/40 | | | 2,500 | | | | 2,437 | | | |
New York City Transitional Finance Authority | | | | | | | | | | |
| 0.55% | | 07/15/31 | | | 10,000 | | | | 10,541 | | | |
New York Liberty Development Corp. | | | | | | | | | | |
| 0.51% | | 01/15/44 | | | 10,000 | | | | 9,490 | | | |
New York State Dormitory Authority | | | | | | | | | | |
| 0.50% | | 03/15/25 - 07/01/39 | | | 15,260 | | | | 15,615 | | | |
| 0.53% | | 11/15/23 | | | 10,400 | | | | 10,909 | | | |
| 0.55% | | 05/01/37 | | | 2,500 | | | | 2,479 | | | |
| 0.65% | | 12/01/21 | | | 4,500 | | | | 4,715 | | | |
New York State Urban Development Corp. | | | | | | | | | | |
| 0.55% | | 07/01/16 - 01/01/19 | | | 9,000 | | | | 10,272 | | | |
Triborough Bridge & Tunnel Authority | | | | | | | | | | |
| 0.50% | | 11/15/26 | | | 10,000 | | | | 10,449 | | | |
Westchester County Healthcare Corp. | | | | | | | | | | |
| 0.61% | | 11/01/37 | | | 2,500 | | | | 2,453 | | | |
| | | | | | | | | 97,946 | | | |
| | |
| North Carolina — 2.3% | | | | | | | |
| | | |
Board of Governors of the University of North Carolina (MBIA Insured) | | | | | | | | | | |
| 0.50% | | 10/01/18 | | | 2,750 | | | | 2,989 | | | (n) |
City of Charlotte NC | | | | | | | | | | |
| 0.50% | | 06/01/23 - 07/01/38 | | | 10,780 | | | | 11,426 | | | |
North Carolina Capital Facilities Finance Agency | | | | | | | | | | |
| 0.46% | | 11/01/40 | | | 9,000 | | | | 8,045 | | | |
| 0.50% | | 01/01/38 | | | 1,000 | | | | 1,003 | | | |
See Notes to Schedules of Investments and Notes to Financial Statements.
57
| | |
| Elfun Tax-Exempt Income Fund | | (in thousands) — December 31, 2010 |
| | | | | | | | | | | | |
| | | | | Principal
Amount | | | Fair
Value | | | |
| | | | | | | | | | | | |
| | | |
North Carolina Eastern Municipal Power Agency | | | | | | | | | | |
| 0.50% | | 01/01/26 | | $ | 5,000 | | | $ | 4,938 | | | |
North Carolina Medical Care Commission | | | | | | | | | | |
| 0.48% | | 11/01/43 | | | 10,000 | | | | 8,560 | | | |
State of North Carolina | | | | | | | | | | |
| 0.46% | | 05/01/29 | | | 1,500 | | | | 1,454 | | | |
| | | | | | | | | 38,415 | | | |
| | |
| Ohio — 3.3% | | | | | | | |
| | | |
American Municipal Power-Ohio Inc. | | | | | | | | | | |
| 0.50% | | 02/15/38 | | | 5,000 | | | | 4,710 | | | |
City of Columbus OH | | | | | | | | | | |
| 0.45% | | 06/01/32 | | | 700 | | | | 647 | | | |
| 0.48% | | 06/01/31 | | | 5,000 | | | | 4,879 | | | |
County of Cuyahoga OH | | | | | | | | | | |
| 0.60% | | 01/01/32 | | | 10,000 | | | | 10,215 | | | |
County of Franklin OH | | | | | | | | | | |
| 0.45% | | 12/01/37 | | | 3,000 | | | | 2,560 | | | |
| 0.50% | | 05/15/21 | | | 2,685 | | | | 2,738 | | | |
| 0.53% | | 05/15/24 | | | 1,400 | | | | 1,422 | | | |
County of Hamilton OH
(AMBAC Insured) | | | | | | | | | | |
| 0.53% | | 12/01/32 | | | 1,520 | | | | 1,497 | | | (n) |
County of Hamilton OH
(MBIA Insured) | | | | | | | | | | |
| 0.50% | | 12/01/19 | | | 4,250 | | | | 4,730 | | | (m,n) |
Cuyahoga Community College District | | | | | | | | | | |
| 0.50% | | 08/01/26 - 08/01/27 | | | 3,000 | | | | 3,063 | | | |
Kent State University
(AGC Insured) | | | | | | | | | | |
| 0.50% | | 05/01/29 - 05/01/30 | | | 3,320 | | | | 3,337 | | | (n) |
Lorain County Port Authority | | | | | | | | | | |
| 0.68% | | 12/01/40 | | | 2,000 | | | | 1,980 | | | |
Ohio Higher Educational Facility Commission | | | | | | | | | | |
| 0.52% | | 11/01/26 | | | 3,700 | | | | 3,884 | | | |
| 0.63% | | 05/01/38 | | | 5,000 | | | | 5,261 | | | |
State of Ohio | | | | | | | | | | |
| 0.50% | | 11/01/32 | | | 1,100 | | | | 1,103 | | | |
| | | | | | | | | | | | |
| | | | | Principal
Amount | | | Fair
Value | | | |
| | | | | | | | | | | | |
| | | |
The Ohio State University | | | | | | | | | | |
| 0.53% | | 12/01/11 | | $ | 3,150 | | | $ | 3,284 | | | |
| | | | | | | | | 55,310 | | | |
| | |
| Oklahoma — 1.4% | | | | | | | |
| | | |
Claremore Public Works Authority (Class AFAC)
(FSA Insured) | | | | | | | | | | |
| 0.53% | | 06/01/34 | | | 6,315 | | | | 7,204 | | | (m,n) |
Oklahoma Municipal Power Authority (FGIC Insured) | | | | | | | | | | |
| 0.45% | | 01/01/47 | | | 9,000 | | | | 7,557 | | | (n) |
Oklahoma Turnpike Authority (AMBAC Insured) | | | | | | | | | | |
| 0.53% | | 01/01/15 | | | 8,005 | | | | 8,319 | | | (n) |
| | | | | | | | | 23,080 | | | |
| | |
| Oregon — 0.1% | | | | | | | |
| | | |
Ontario Hospital Facility Authority | | | | | | | | | | |
| 0.45% | | 12/01/37 | | | 2,500 | | | | 2,141 | | | |
| | |
| Pennsylvania — 3.4% | | | | | | | |
| | | |
Allegheny County Hospital Development Authority | | | | | | | | | | |
| 0.50% | | 11/15/28 | | | 8,000 | | | | 5,649 | | | |
Pennsylvania Higher Educational Facilities Authority | | | | | | | | | | |
| 0.55% | | 08/15/18 | | | 1,000 | | | | 1,131 | | | |
Pennsylvania Industrial Development Authority (AMBAC Insured) | | | | | | | | | | |
| 0.55% | | 07/01/17 | | | 3,100 | | | | 3,248 | | | (n) |
Pennsylvania Turnpike Commission | | | | | | | | | | |
| 0.53% | | 06/01/39 | | | 11,750 | | | | 11,362 | | | |
| 6.13% | | 12/01/34 | | | 12,000 | | | | 8,795 | | | (d) |
Pennsylvania Turnpike Commission (AMBAC Insured) | | | | | | | | | | |
| 0.53% | | 12/01/32 | | | 12,000 | | | | 12,147 | | | (n) |
Philadelphia Authority for Industrial Development | | | | | | | | | | |
| 0.53% | | 09/01/36 | | | 1,750 | | | | 1,396 | | | |
See Notes to Schedules of Investments and Notes to Financial Statements.
58
| | |
| Elfun Tax-Exempt Income Fund | | (in thousands) — December 31, 2010 |
| | | | | | | | | | | | |
| | | | | Principal
Amount | | | Fair
Value | | | |
| | | | | | | | | | | | |
| | | |
Southcentral General Authority | | | | | | | | | | |
| 0.54% | | 05/15/28 | | $ | 4,100 | | | $ | 4,214 | | | |
State Public School Building Authority (FSA Insured) | | | | | | | | | | |
| 0.53% | | 06/01/27 | | | 8,000 | | | | 8,816 | | | (m,n) |
| | | | | | | | | 56,758 | | | |
| | |
| Puerto Rico — 2.9% | | | | | | | |
| | | |
Commonwealth of Puerto Rico | | | | | | | | | | |
| 0.58% | | 07/01/38 | | | 7,000 | | | | 7,051 | | | |
| 0.60% | | 07/01/39 | | | 10,000 | | | | 10,173 | | | |
Puerto Rico Electric Power Authority | | | | | | | | | | |
| 0.53% | | 07/01/40 | | | 5,000 | | | | 4,654 | | | |
Puerto Rico Sales Tax Financing Corp. | | | | | | | | | | |
| 0.55% | | 08/01/42 | | | 15,000 | | | | 14,584 | | | |
| 5.70% | | 08/01/32 | | | 15,000 | | | | 11,835 | | | (d) |
| | | | | | | | | 48,297 | | | |
| | |
| Rhode Island — 0.1% | | | | | | | |
| | | |
Rhode Island Health & Educational Building Corp. | | | | | | | | | | |
| 0.63% | | 09/15/34 | | | 1,300 | | | | 1,349 | | | |
| 0.65% | | 09/15/28 | | | 1,000 | | | | 1,082 | | | |
| | | | | | | | | 2,431 | | | |
| | |
| South Carolina — 5.7% | | | | | | | |
| | | |
Berkeley County School District | | | | | | | | | | |
| 0.53% | | 12/01/24 | | | 15,000 | | | | 15,201 | | | (h) |
Charleston Educational Excellence Finance Corp. | | | | | | | | | | |
| 0.53% | | 12/01/27 - 12/01/30 | | | 21,850 | | | | 22,007 | | | |
City of Greenville SC | | | | | | | | | | |
| 0.51% | | 02/01/22 | | | 5,195 | | | | 5,455 | | | (m) |
County of Beaufort SC (MBIA Insured) | | | | | | | | | | |
| 0.55% | | 06/01/17 - 06/01/18 | | | 4,150 | | | | 4,347 | | | (n) |
Greenville County School District | | | | | | | | | | |
| 0.53% | | 12/01/21 | | | 2,000 | | | | 2,095 | | | |
| 0.55% | | 12/01/28 | | | 10,725 | | | | 11,799 | | | |
Lexington County Health Services District Inc. | | | | | | | | | | |
| 0.55% | | 11/01/13 | | | 4,050 | | | | 4,374 | | | |
| | | | | | | | | | | | |
| | | | | Principal
Amount | | | Fair
Value | | | |
| | | | | | | | | | | | |
| | | |
South Carolina Educational Facilities Authority | | | | | | | | | | |
| 0.50% | | 10/01/38 | | $ | 7,650 | | | $ | 7,243 | | | |
South Carolina State Public Service Authority | | | | | | | | | | |
| 0.55% | | 01/01/38 | | | 7,500 | | | | 7,870 | | | |
South Carolina State Public Service Authority
(FSA Insured) | | | | | | | | | | |
| 0.51% | | 01/01/32 | | | 10,000 | | | | 10,457 | | | (n) |
| 0.55% | | 01/01/36 | | | 5,000 | | | | 5,247 | | | (m,n) |
| | | | | | | | | 96,095 | | | |
| | |
| Tennessee — 0.6% | | | | | | | |
| | | |
Knox County Health Educational & Housing Facilities Board | | | | | | | | | | |
| 0.53% | | 04/01/36 | | | 10,000 | | | | 8,760 | | | |
State of Tennessee | | | | | | | | | | |
| 0.50% | | 05/01/19 | | | 1,000 | | | | 1,147 | | | |
| | | | | | | | | 9,907 | | | |
| | |
| Texas — 5.7% | | | | | | | |
| | | |
City of Austin TX
(AMBAC Insured) | | | | | | | | | | |
| 0.55% | | 11/15/16 | | | 5,450 | | | | 6,365 | | | (n) |
City of Dallas TX | | | | | | | | | | |
| 0.50% | | 10/01/39 | | | 10,000 | | | | 10,038 | | | |
City of Houston TX
(AMBAC Insured) | | | | | | | | | | |
| 0.58% | | 12/01/14 | | | 5,000 | | | | 5,470 | | | (m,n) |
City of Houston TX (FSA Insured) | | | | | | | | | | |
| 0.53% | | 05/15/22 | | | 10,000 | | | | 10,566 | | | (n) |
North Central Texas Health Facility Development Corp. | | | | | | | | | | |
| 0.51% | | 05/15/22 | | | 4,500 | | | | 4,514 | | | |
North Texas Tollway Authority | | | | | | | | | | |
| 0.53% | | 01/01/44 | | | 10,000 | | | | 8,786 | | | |
| 0.56% | | 01/01/33 | | | 1,500 | | | | 1,439 | | | |
| 0.58% | | 01/01/38 - 01/01/40 | | | 21,475 | | | | 20,334 | | | |
| 0.60% | | 01/01/38 | | | 5,000 | | | | 4,993 | | | |
San Antonio Independent School District | | | | | | | | | | |
| 0.54% | | 08/15/19 | | | 2,685 | | | | 2,768 | | | (m) |
See Notes to Schedules of Investments and Notes to Financial Statements.
59
| | |
| Elfun Tax-Exempt Income Fund | | (in thousands) — December 31, 2010 |
| | | | | | | | | | | | |
| | | | | Principal
Amount | | | Fair
Value | | | |
| | | | | | | | | | | | |
| | | |
State of Texas | | | | | | | | | | |
| 0.50% | | 04/01/33 | | $ | 5,000 | | | $ | 5,032 | | | |
Tarrant County Cultural Education Facilities Finance Corp. | | | | | | | | | | |
| 0.50% | | 11/15/40 | | | 5,000 | | | | 4,663 | | | |
University of Texas | | | | | | | | | | |
| 0.50% | | 08/15/24 | | | 10,000 | | | | 10,812 | | | |
| | | | | | | | | 95,780 | | | |
| | |
| Utah — 0.2% | | | | | | | |
| | | |
Utah State Board of Regents | | | | | | | | | | |
| 0.50% | | 11/01/30 | | | 4,000 | | | | 3,985 | | | |
| | |
| Vermont — 0.3% | | | | | | | |
| | | |
Vermont Educational & Health Buildings Financing Agency | | | | | | | | | | |
| 0.50% | | 10/31/46 | | | 5,700 | | | | 5,625 | | | |
| | |
| Virginia — 1.3% | | | | | | | |
| | | |
Chesterfield County Economic Development Authority (AGC Insured) | | | | | | | | | | |
| 0.50% | | 11/01/42 | | | 4,000 | | | | 3,735 | | | (n) |
City of Richmond VA | | | | | | | | | | |
| 0.50% | | 01/15/40 | | | 10,000 | | | | 10,000 | | | |
Roanoke Economic Development Authority | | | | | | | | | | |
| 0.50% | | 07/01/33 | | | 1,750 | | | | 1,639 | | | |
Virginia College Building Authority | | | | | | | | | | |
| 0.44% | | 02/01/28 | | | 845 | | | | 835 | | | |
Virginia Resources Authority | | | | | | | | | | |
| 0.53% | | 11/01/38 | | | 5,000 | | | | 5,125 | | | |
| | | | | | | | | 21,334 | | | |
| | |
| Washington — 0.7% | | | | | | | |
| | | |
County of King WA | | | | | | | | | | |
| 0.55% | | 12/01/13 - 12/01/13 | | | 5,120 | | | | 5,771 | | | (l) |
| 0.55% | | 12/01/13 | | | 4,880 | | | | 5,489 | | | |
| | | | | | | | | 11,260 | | | |
| | | | | | | | | | | | |
| | | | | Principal
Amount | | | Fair
Value | | | |
| | | | | | | | | | | | |
| | |
| Wisconsin — 0.2% | | | | | | | |
| | | |
State of Wisconsin
(AMBAC Insured) | | | | | | | | | | |
| 0.58% | | 07/01/14 | | $ | 2,990 | | | $ | 3,173 | | | (n) |
| | | |
Total Municipal Bonds
and Notes
(Cost $1,623,078) | | | | | | | 1,643,818 | | | |
Other Investments — 0.0%* | | | | | | | |
| | | |
GEI Investment Fund
(Cost $281) | | | | | | | 267 | | | (k) |
| | | |
Total Investment in Securities
(Cost $1,623,359) | | | | | | | 1,644,085 | | | |
Short-Term Investments — 0.1% | | | | | | | |
| | | |
| Time Deposit — 0.1% | | | | | | | | | | |
| | |
State Street Corp. | | | | | | | |
| 0.01% | | 01/03/11 | | | 2,138 | | | | 2,138 | | | (e) |
(Cost $2,138) | | | | | | | | | | |
| | | |
Total Investments
(Cost $1,625,497) | | | | | | | 1,646,223 | | | |
| | | |
Other Assets and Liabilities,
net — 1.9% | | | | | | | 31,702 | | | |
| | | | | | | | | | | | |
| | | |
NET ASSETS — 100.0% | | | | | | $ | 1,677,925 | | | |
| | | | | | | | | | | | |
See Notes to Schedules of Investments and Notes to Financial Statements.
60
(Unaudited)


Paul M. Colonna
The Elfun Income Fund is managed by a team of portfolio managers that includes Paul M. Colonna (pictured to the left), William M. Healey, Mark H. Johnson and Vita Marie Pike. The team is lead by Mr. Colonna who is vested with oversight authority. Each portfolio manager is assigned a class of assets, the size of which are determined by team consensus and adjusted on a monthly basis, if necessary. Although each portfolio manager manages his or her asset class independent of the other team members, the team is highly collaborative and communicative. See portfolio managers’ biographical information beginning on page 116.
| Q. | How did the Elfun Income Fund perform compared to its benchmark for the twelve-month period ended December 31, 2010? |
| A. | The Elfun Income Fund returned 8.31% (net of fees) for the twelve-month period ended December 31, 2010 versus a return of 6.54% for the Barclays Capital U.S. Aggregate Bond Index. The Morningstar peer group of 1,205 U.S. DE Intermediate-Term Funds had returned on average 7.71% over the same period. |
| Q. | Discuss the factors that materially affected the fund’s performance during the fiscal period. |
| A. | The fixed income market benefited from both declining interest rates and spread compression over the last fiscal period, producing positive price returns which added to income generated from coupon interest. U.S. 2-year and 10-year Treasury note yields ended the year at 0.59% and |
| | 3.29% respectively, down 54 basis points each. The U.S. 30-year bond finished the year yielding 4.33%, down 31 basis points. As the U.S. economy recovered in 2010 and growth expectations for 2011 picked up, non-treasury securities outperformed treasury securities during the period due to tightening spreads. The Barclays Capital U.S. Credit Index yield spread narrowed 11 basis points, which contributed to a total return of 8.47% last year. Commercial mortgage-backed securities experienced the largest spread compression and led all sectors with an annual return of 20.4%. Yield spreads on high yield and emerging market debt also narrowed contributing to double digit returns for both (BC High Yield Index returned 15.12% and JPM EMBI-GD Index returned 12.24%). The largest contributor to the Fund’s performance on an absolute basis and relative to its benchmark was the overweight positions in investment grade credit and commercial mortgage-backed securities plus non-index allocations to high yield and emerging market debt. Security selection within the agency and commercial MBS sectors added value as did an overweight in financial versus non-corporate issuers in investment grade credit. Duration positioning had a negative effect on performance, primarily in April and May when the Fund’s duration was shorter than that of the benchmark and U.S. interest rates fell significantly in a flight to quality away from risky assets brought on by the fiscal crises among the European peripheral |
61
(Unaudited)
| | countries, namely Greece, Ireland, Portugal and Spain. A small position in Greece bonds early in the year impacted performance negatively. |
| Q. | Were there any significant changes to the Fund during the period? |
| A. | Sector allocations did change throughout the year, primarily adding to non-treasury sectors vis-à-vis treasury securities. The underweight in agency MBS (approximately 10%) was brought back to a neutral weighting mid-year while the overweight in commercial MBS was increased during the first half of 2010 to roughly 7.5% and remained through yearend. Allocations to high yield and emerging market debt were increased to after the flight to quality in May and finished the year around 8% each in the fund. Duration relative to the benchmark remained short during most of the first half of 2010 but was brought back to neutral in the third quarter and tactically traded with a long bias towards the end of the year. |
62
(Unaudited)

Understanding Your Fund’s Expenses
As a shareholder of the Fund you incur transaction and ongoing expenses. Transaction expenses including sales charges on purchases payments, reinvested dividends (or other distributions), and redemption fees directly reduce the investment return of the Fund. Ongoing costs include portfolio management fees, distribution and services fees, professional fees, administrative fees and other Fund expenses. The following example is intended to help you understand your ongoing costs (in dollars) of investing in the Fund and to compare these costs with the ongoing costs of investing in other mutual funds.
To illustrate these ongoing costs, we have provided an example and calculated the expenses paid by investors in each share class of the Fund during the period. The information in the following table is based on an investment of $1,000, which is invested at the beginning of the period and held for the entire six-month period ended December 31, 2010.
Actual Expenses
The first section of the table provides information about actual account values and actual expenses. You may use the information in this section,
together with the amount you invested, to estimate the expenses that you paid over the period. To do so, simply divide your account value by $1,000 (for example, an $8,600 account value divided by $1,000 = 8.6), then multiply the result by the number given for your class under the heading “Expenses Paid During Period.”
Hypothetical Example for Comparison Purposes
The second section of the table provides information about hypothetical account values and hypothetical expenses based on the Fund’s actual expense ratio and an assumed rate of return of 5% per year before expenses, which is not the Fund’s actual return. You may use this information to compare the ongoing costs of investing in the Fund and other funds. To do so, compare this 5% hypothetical example with the 5% hypothetical examples that appear in the shareholders reports of other funds.
Please note that the expenses shown in the table for both “Actual” and “Hypothetical” do not reflect any transaction costs, such as sales charges or redemption fees.
July 1, 2010 – December 31, 2010
| | | | | | | | | | | | |
| | | Account value at
the beginning
of the period ($) | | | Account value
at the end of
the period ($) | | | Expenses
paid during
the period ($)* | |
| | | |
Actual Fund Return** | | | 1,000.00 | | | | 1,035.27 | | | | 1.18 | |
| | | |
Hypothetical 5% Return
(2.5% for the period) | | | 1,000.00 | | | | 1,023.77 | | | | 1.17 | |
| * | | Expenses are equal to the Fund’s annualized expense ratio of 0.23% (for the period July 1, 2010 - December 31, 2010), multiplied by the average account value over the period, multiplied by 184/365 (to reflect the one-half year period) |
| ** | | Actual Fund Return for the six-month period ended December 31, 2010 was: 3.53%. Past performance does not guarantee future results. |
63
(Unaudited)
Investment Profile
A mutual fund designed for investors who seek a high level of income consistent with prudent investment management and the preservation of capital by investing at least 80% of its net assets under normal circumstances in debt securities. The Fund invests primarily in a variety of investment-grade debt securities, such as mortgage-backed securities, corporate bonds, U.S. Government securities and money market instruments.
Quality Ratings
as of December 31, 2010 as a % of Fair Value(b)
| | | | |
Moody’s / S&P / Fitch Rating * | |
| Percentage of
Fair Value |
|
| Aaa / AAA | | | 62.02% | |
| Aa / AA | | | 1.90% | |
| A / A | | | 12.55% | |
| Baa / BBB | | | 13.57% | |
| Ba / BB and lower | | | 9.96% | |
| | | | 100.00% | |
| * | | Moody’s Investors Services Inc, Standard & Poor’s and Fitch are nationally recognized statistical rating organizations. |
Sector Allocation
as a % of the Fair Value of $375,733 (in thousands) as of December 31, 2010(b)(c)
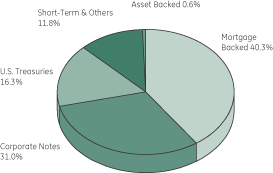
Morningstar Performance Comparison
Based on average annual returns for periods ended 12/31/10
| | | | | | | | | | | | |
| | | One
Year | | | Five
Year | | | Ten
Year | |
Number of Funds in peer group | | | 1205 | | | | 1074 | | | | 931 | |
Peer group average annual total return | | | 7.71 | % | | | 4.79 | % | | | 5.02 | % |
Morningstar category in peer group: Intermediate-Term Bond | |
Change in Value of a $10,000 Investment(a)
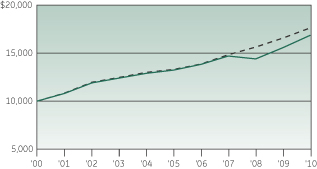
Average Annual Total Return
for the periods ended December 31, 2010
| | | | | | | | | | | | | | | | |
| (Inception date: 12/31/84) | | | | | | | | | | |
| | | One
Year | | | Five
Year | | | Ten
Year | | | Ending value of a
$10,000
investment (a) | |
| | | | |
Elfun Income Fund | | | 8.31% | | | | 4.97% | | | | 5.36% | | | | 16,849 | |
| | | | |
Barclays Capital U.S. Aggregate Bond Index | | | 6.54% | | | | 5.80% | | | | 5.84% | | | | 17,633 | |

| (a) | Ending value of a $10,000 investment for the ten-year period or since inception, whichever is less. |
| (b) | The securities information regarding holdings, allocations and other characteristics is presented to illustrate examples of securities that the Fund has bought and the diversity of areas in which the Fund may invest as of a particular date. It may not be representative of the Fund’s current or future investments and should not be construed as a recommendation to purchase or sell a particular security. |
| (c) | Fair value basis is inclusive of Short Term Investment in GE Money Market Fund. |
See Notes to Performance on page 1 for further information.
Past performance does not predict future performance. The performance shown on the graph and tables does not reflect the deduction of taxes that a shareholder would pay on Fund distributions or the redemption of Fund shares.
64
| | |
| Elfun Income Fund | | (in thousands) — December 31, 2010 |
[GRAPHIC]
| | | | | | | | | | | | |
| | | | | Principal
Amount | | | Fair
Value | | | |
| | | | | | | | | | | | |
| | | | | | | | | | | | |
Bonds and Notes — 98.3%† | | | | | | | |
| | |
| U.S. Treasuries — 17.5% | | | | | | | |
| | |
U.S. Treasury Bonds | | | | | | | |
| 3.88% | | 08/15/40 | | $ | 19,199 | | | $ | 17,684 | | | (h) |
U.S. Treasury Notes | | | | | | | |
| 0.39% | | 04/30/12 | | | 1,865 | | | | 1,880 | | | (d,h) |
| 1.25% | | 09/30/15 | | | 5,329 | | | | 5,171 | | | (h) |
| 2.63% | | 08/15/20 | | | 35,404 | | | | 33,565 | | | (h) |
| 3.13% | | 05/15/19 | | | 2 | | | | 2 | | | |
| 3.25% | | 07/31/16 | | | 2,929 | | | | 3,083 | | | (h) |
| | | | | | | | | 61,385 | | | |
| |
| Agency Mortgage Backed — 29.6% | | | |
| | | |
Federal Home Loan Mortgage Corp. | | | | | | | | | | |
| 4.50% | | 06/01/33 - 02/01/35 | | | 104 | | | | 106 | | | (h) |
| 5.00% | | 07/01/35 - 08/01/40 | | | 4,902 | | | | 5,151 | | | (h) |
| 5.00% | | 07/01/35 | | | 49 | | | | 52 | | | (h,q) |
| 5.50% | | 05/01/20 - 04/01/39 | | | 718 | | | | 768 | | | (h,q) |
| 5.50% | | 05/01/20 - 01/01/38 | | | 1,144 | | | | 1,240 | | | (h) |
| 6.00% | | 06/01/17 - 11/01/37 | | | 2,806 | | | | 3,091 | | | (h) |
| 6.00% | | 04/01/17 - 05/01/34 | | | 117 | | | | 130 | | | (h,q) |
| 6.50% | | 07/01/29 | | | 2 | | | | 3 | | | (h) |
| 7.00% | | 01/01/27 - 08/01/36 | | | 274 | | | | 310 | | | (h) |
| 7.00% | | 10/01/16 - 07/01/34 | | | 26 | | | | 29 | | | (h,q) |
| 7.50% | | 09/01/12 - 09/01/33 | | | 21 | | | | 24 | | | (h) |
| 7.50% | | 12/01/30 | | | 15 | | | | 17 | | | (h,q) |
| 8.00% | | 11/01/30 | | | 12 | | | | 14 | | | (h) |
| 5.50% | | TBA | | | 1,570 | | | | 1,673 | | | (c) |
Federal National Mortgage Assoc. | | | | | | | | | | |
| 4.00% | | 05/01/19 - 10/01/40 | | | 8,296 | | | | 8,280 | | | (h) |
| 4.50% | | 05/01/18 - 11/01/40 | | | 25,588 | | | | 26,326 | | | (h) |
| 5.00% | | 07/01/20 - 11/01/40 | | | 9,250 | | | | 9,748 | | | (h) |
| 5.32% | | 03/01/37 | | | 7 | | | | 8 | | | (i) |
| 5.50% | | 03/01/14 - 01/01/39 | | | 9,622 | | | | 10,355 | | | (h) |
| 5.53% | | 04/01/37 | | | 12 | | | | 12 | | | (i) |
| 6.00% | | 02/01/14 - 08/01/35 | | | 4,862 | | | | 5,364 | | | (h) |
| 6.50% | | 02/01/14 - 08/01/36 | | | 783 | | | | 872 | | | (h) |
| 7.00% | | 08/01/13 - 02/01/34 | | | 115 | | | | 128 | | | (h) |
| 7.50% | | 08/01/13 - 03/01/34 | | | 349 | | | | 397 | | | (h) |
| 8.00% | | 12/01/11 - 11/01/33 | | | 152 | | | | 174 | | | (h) |
| | | | | | | | | | | | |
| | | | | Principal
Amount | | | Fair
Value | | | |
| | | | | | | | | | | | |
| | | | |
| 8.50% | | 04/01/30 - 05/01/31 | | $ | 22 | | | $ | 26 | | | (h) |
| 9.00% | | 12/01/17 - 12/01/22 | | | 41 | | | | 45 | | | (h) |
| 4.50% | | TBA | | | 11,905 | | | | 12,219 | | | (c) |
| 5.00% | | TBA | | | 2,664 | | | | 2,826 | | | (c) |
| 5.50% | | TBA | | | 1,095 | | | | 1,177 | | | (c) |
| 6.00% | | TBA | | | 7,726 | | | | 8,394 | | | (c) |
| 6.50% | | TBA | | | 878 | | | | 976 | | | (c) |
Government National Mortgage Assoc. | | | | | | | | | | |
| 4.50% | | 08/15/33 - 09/15/34 | | | 608 | | | | 635 | | | (h) |
| 5.00% | | 08/15/33 | | | 214 | | | | 230 | | | (h) |
| 6.00% | | 04/15/27 - 09/15/36 | | | 846 | | | | 941 | | | (h) |
| 6.50% | | 04/15/19 - 09/15/36 | | | 625 | | | | 714 | | | (h) |
| 7.00% | | 03/15/12 - 10/15/36 | | | 301 | | | | 339 | | | (h) |
| 7.50% | | 03/15/23 - 10/15/33 | | | 92 | | | | 106 | | | (h) |
| 8.00% | | 09/15/27 | | | 39 | | | | 46 | | | (h) |
| 8.50% | | 10/15/17 | | | 41 | | | | 46 | | | (h) |
| 9.00% | | 11/15/16 - 12/15/21 | | | 88 | | | | 101 | | | (h) |
| 5.50% | | TBA | | | 435 | | | | 470 | | | (c) |
| | | | | | | | | 103,563 | | | |
| |
| Agency Collateralized Mortgage Obligations — 2.6% | | | |
| | | |
Collateralized Mortgage Obligation Trust (Class B) | | | | | | | | | | |
| 2.75% | | 11/01/18 | | | 12 | | | | 11 | | | (d,f,h,q) |
Fannie Mae Whole Loan | | | | | | | | | | |
| 0.97% | | 08/25/43 | | | 1,749 | | | | 54 | | | (g,r) |
Federal Home Loan Mortgage Corp. | | | | | | | | | | |
| 0.00% | | 09/25/43 | | | 2,389 | | | | 21 | | | (g,h,r) |
Federal Home Loan Mortgage Corp. REMIC | | | | | | | | | | |
| 5.00% | | 02/15/38 | | | 288 | | | | 28 | | | (g,r) |
| 5.00% | | 05/15/38 | | | 327 | | | | 335 | | | |
| 5.50% | | 04/15/17 | | | 62 | | | | 2 | | | (g,h,r) |
Federal Home Loan Mortgage Corp. REMIC (Class YQ) | | | | | | | | | | |
| 5.00% | | 05/15/17 | | | 38 | | | | 2 | | | (g,h,r) |
Federal Home Loan Mortgage Corp. REMIC (Series 2631)
(Class DI) | | | | | | | | | | |
| 5.50% | | 06/15/33 | | | 383 | | | | 78 | | | (g,h,r) |
Federal Home Loan Mortgage Corp. REMIC (Series 2643)
(Class IM) | | | | | | | | | | |
| 4.50% | | 03/15/18 | | | 303 | | | | 24 | | | (g,h,r) |
See Notes to Schedules of Investments and Notes to Financial Statements.
65
| | |
| Elfun Income Fund | | (in thousands) — December 31, 2010 |
| | | | | | | | | | | | |
| | | | | Principal
Amount | | | Fair
Value | | | |
| | | | | | | | | | | | |
| | | |
Federal Home Loan Mortgage Corp. REMIC (Series 2645) (Class BI) | | | | | | | | | | |
| 4.50% | | 02/15/18 | | $ | 68 | | | $ | 5 | | | (g,h,r) |
Federal Home Loan Mortgage Corp. REMIC (Series 2647) (Class DI) | | | | | | | | | | |
| 4.50% | | 10/15/16 | | | 33 | | | | 1 | | | (g,h,r) |
Federal Home Loan Mortgage Corp. REMIC (Series 2656) (Class IU) | | | | | | | | | | |
| 5.00%** | | 04/15/28 | | | 18 | | | | — | | | (g,h,r) |
Federal Home Loan Mortgage Corp. REMIC (Series 2722) (Class PI) | | | | | | | | | | |
| 5.00% | | 06/15/28 | | | 44 | | | | 1 | | | (g,h,r) |
Federal Home Loan Mortgage Corp. REMIC (Series 2763) (Class JI) | | | | | | | | | | |
| 5.00% | | 10/15/18 | | | 226 | | | | 20 | | | (g,h,r) |
Federal Home Loan Mortgage Corp. REMIC (Series 2781) (Class IC) | | | | | | | | | | |
| 5.00% | | 11/15/17 - 05/15/18 | | | 192 | | | | 10 | | | (g,h,r) |
Federal Home Loan Mortgage Corp. REMIC (Series 2795) (Class IC) | | | | | | | | | | |
| 5.00% | | 07/15/17 | | | 51 | | | | 2 | | | (g,h,r) |
Federal Home Loan Mortgage Corp. REMIC (Series 2852) (Class OJ) | | | | | | | | | | |
| 14.25% | | 09/15/34 | | | 85 | | | | 80 | | | (d,f) |
Federal Home Loan Mortgage Corp. REMIC (Series 2990) (Class TS) | | | | | | | | | | |
| 6.49% | | 05/15/35 | | | 911 | | | | 90 | | | (g,r) |
Federal Home Loan Mortgage Corp. REMIC (Series 33) (Class 33D) | | | | | | | | | | |
| 8.00% | | 04/15/20 | | | 8 | | | | 9 | | | (h) |
Federal Home Loan Mortgage Corp. REMIC (Series 3311) (Class IA) | | | | | | | | | | |
| 6.15% | | 05/15/37 | | | 941 | | | | 147 | | | (g,r) |
| | | | | | | | | | | | |
| | | | | Principal
Amount | | | Fair
Value | | | |
| | | | | | | | | | | | |
| | | |
Federal Home Loan Mortgage Corp. REMIC (Series 3311) (Class IB) | | | | | | | | | | |
| 6.15% | | 05/15/37 | | $ | 941 | | | $ | 147 | | | (g,r) |
Federal Home Loan Mortgage Corp. REMIC (Series 3311) (Class IC) | | | | | | | | | | |
| 6.15% | | 05/15/37 | | | 941 | | | | 147 | | | (g,r) |
Federal Home Loan Mortgage Corp. REMIC (Series 3311) (Class ID) | | | | | | | | | | |
| 6.15% | | 05/15/37 | | | 941 | | | | 147 | | | (g,r) |
Federal Home Loan Mortgage Corp. REMIC (Series 3311) (Class IE) | | | | | | | | | | |
| 6.15% | | 05/15/37 | | | 1,371 | | | | 214 | | | (g,r) |
Federal Home Loan Mortgage Corp. STRIPS | | | | | | | | | | |
| 8.00% | | 02/01/23 - 07/01/24 | | | 14 | | | | 3 | | | (g,h,r) |
Federal Home Loan Mortgage Corp. STRIPS (Class IO) | | | | | | | | | | |
| 5.00% | | 12/01/34 | | | 197 | | | | 38 | | | (g,h,q,r) |
Federal Home Loan Mortgage STRIPS | | | | | | | | | | |
| 4.39% | | 08/01/27 | | | 4 | | | | 3 | | | (d,f,h) |
Federal National Mortgage Assoc. REMIC | | | | | | | | | | |
| 5.00% | | 08/25/38 | | | 326 | | | | 331 | | | |
| 5.00% | | 02/25/40 | | | 361 | | | | 65 | | | (g,r) |
| 5.24% | | 01/25/37 | | | 1,396 | | | | 169 | | | (g,r) |
| 5.74% | | 07/25/38 - 12/25/40 | | | 2,866 | | | | 401 | | | (g,r) |
| 5.79% | | 11/25/40 | | | 1,964 | | | | 327 | | | (g,r) |
| 6.07% | | 03/25/40 | | | 2,047 | | | | 300 | | | (g,r) |
| 6.14% | | 12/25/36 | | | 1,064 | | | | 127 | | | (g,r) |
Federal National Mortgage Assoc. REMIC (Class B) | | | | | | | | | | |
| 2.52% | | 12/25/22 | | | 10 | | | | 9 | | | (d,f,h) |
Federal National Mortgage Assoc. REMIC (Class BZ) | | | | | | | | | | |
| 5.50% | | 01/25/33 | | | 427 | | | | 465 | | | |
Federal National Mortgage Assoc. REMIC (Class CS) | | | | | | | | | | |
| 7.44% | | 08/25/16 | | | 57 | | | | 1 | | | (g,h,r) |
See Notes to Schedules of Investments and Notes to Financial Statements.
66
| | |
| Elfun Income Fund | | (in thousands) — December 31, 2010 |
| | | | | | | | | | | | |
| | | | | Principal
Amount | | | Fair
Value | | | |
| | | | | | | | | | | | |
| | | |
Federal National Mortgage Assoc. REMIC (Class VZ) | | | | | | | | | | |
| 5.00% | | 10/25/35 | | $ | 297 | | | $ | 289 | | | |
Federal National Mortgage Assoc. REMIC (Series 1992) (Class K) | | | | | | | | | | |
| 8.00% | | 05/25/22 | | | — | | | | 1 | | | (g,h,r) |
Federal National Mortgage Assoc. REMIC (Series 2003) | | | | | | | | | | |
| 5.00% | | 08/25/17 | | | 90 | | | | 6 | | | (g,h,r) |
Federal National Mortgage Assoc. REMIC (Series 2003) (Class HI) | | | | | | | | | | |
| 5.00% | | 10/25/22 | | | 136 | | | | 11 | | | (g,h,r) |
Federal National Mortgage Assoc. REMIC (Series 2003) (Class IJ) | | | | | | | | | | |
| 5.00% | | 02/25/32 | | | 505 | | | | 58 | | | (g,h,r) |
Federal National Mortgage Assoc. REMIC (Series 2003) (Class IO) | | | | | | | | | | |
| 0.00% | | 12/25/42 | | | 618 | | | | 26 | | | (g,h,r) |
Federal National Mortgage Assoc. REMIC (Series 2003) (Class KI) | | | | | | | | | | |
| 4.50% | | 05/25/18 | | | 42 | | | | 1 | | | (g,h,r) |
Federal National Mortgage Assoc. REMIC (Series 2003) (Class SL) | | | | | | | | | | |
| 16.04% | | 03/25/31 | | | 344 | | | | 392 | | | (h) |
Federal National Mortgage Assoc. REMIC (Series 2007) (Class IA) | | | | | | | | | | |
| 6.15% | | 06/25/37 | | | 727 | | | | 118 | | | (g,r) |
Federal National Mortgage Assoc. REMIC (Series 2007) (Class IB) | | | | | | | | | | |
| 6.15% | | 06/25/37 | | | 727 | | | | 118 | | | (g,r) |
Federal National Mortgage Assoc. REMIC (Series 2007) (Class IC) | | | | | | | | | | |
| 6.15% | | 06/25/37 | | | 727 | | | | 118 | | | (g,r) |
Federal National Mortgage Assoc. REMIC (Series 2007) (Class ID) | | | | | | | | | | |
| 6.15% | | 06/25/37 | | | 727 | | | | 118 | | | (g,r) |
Federal National Mortgage Assoc. REMIC (Series 2007) (Class IE) | | | | | | | | | | |
| 6.15% | | 06/25/37 | | | 727 | | | | 118 | | | (g,r) |
Federal National Mortgage Assoc. REMIC (Series 2007) (Class IF) | | | | | | | | | | |
| 6.15% | | 06/25/37 | | | 1,108 | | | | 180 | | | (g,r) |
Federal National Mortgage Assoc. REMIC (Series 2008) (Class ZW) | | | | | | | | | | |
| | | | | | | | | | | | |
| | | | | Principal
Amount | | | Fair
Value | | | |
| | | | | | | | | | | | |
| | | | |
| 5.00% | | 07/25/38 | | $ | 261 | | | $ | 263 | | | |
Federal National Mortgage Assoc. STRIPS | | | | | | | | | | |
| 6.00% | | 01/01/35 - 01/01/35 | | | 323 | | | | 55 | | | (g,h,r) |
Federal National Mortgage Assoc. STRIPS (Class 2) | | | | | | | | | | |
| 4.50% | | 08/01/35 | | | 504 | | | | 91 | | | (g,h,r) |
| 5.00% | | 03/25/38 | | | 405 | | | | 67 | | | (g,r) |
| 5.50% | | 12/01/33 | | | 132 | | | | 27 | | | (g,r) |
| 7.50% | | 11/01/23 | | | 47 | | | | 8 | | | (g,h,r) |
| 8.00% | | 08/01/23 - 07/01/24 | | | 31 | | | | 7 | | | (g,h,r) |
| 8.50% | | 03/01/17 - 07/25/22 | | | 28 | | | | 5 | | | (g,h,r) |
| 9.00% | | 05/25/22 | | | 10 | | | | 2 | | | (g,h,r) |
Federal National Mortgage Assoc. STRIPS (Series 354) (Class 1) | | | | | | | | | | |
| 3.56% | | 11/01/34 | | | 471 | | | | 412 | | | (d,f,h) |
Federal National Mortgage Assoc. STRIPS (Series 364) (Class 1) | | | | | | | | | | |
| 4.50% | | 09/01/35 | | | 914 | | | | 166 | | | (g,h,r) |
Federal National Mortgage Assoc. STRIPS (Series 378) (Class 1) | | | | | | | | | | |
| 4.50% | | 01/01/36 | | | 683 | | | | 124 | | | (g,h,r) |
Federal National Mortgage Assoc. STRIPS (Series 387) (Class 1) | | | | | | | | | | |
| 5.00% | | 05/25/38 | | | 406 | | | | 62 | | | (g,r) |
Government National Mortgage Assoc. | | | | | | | | | | |
| 4.50% | | 05/20/38 | | | 441 | | | | 64 | | | (g,r) |
| 4.50% | | 11/20/39 | | | 642 | | | | 625 | | | |
| 5.00% | | 10/20/37 - 09/20/38 | | | 2,279 | | | | 336 | | | (g,r) |
| 5.74% | | 11/20/39 | | | 3,980 | | | | 604 | | | (g,r) |
| 5.99% | | 10/16/39 | | | 1,465 | | | | 201 | | | (g,r) |
| 6.24% | | 01/16/39 | | | 2,488 | | | | 391 | | | (g,r) |
Government National Mortgage Assoc. (Class IC) | | | | | | | | | | |
| 5.99% | | 04/16/37 | | | 924 | | | | 159 | | | (g,r) |
Vendee Mortgage Trust | | | | | | | | | | |
| 0.38% | | 04/15/40 | | | 1,843 | | | | 40 | | | (g,h,r) |
Vendee Mortgage Trust
(Class 2003) | | | | | | | | | | |
| 0.86% | | 05/15/33 | | | 1,079 | | | | 43 | | | (g,h,r) |
| | | | | | | | | 9,120 | | | |
See Notes to Schedules of Investments and Notes to Financial Statements.
67
| | |
| Elfun Income Fund | | (in thousands) — December 31, 2010 |
| | | | | | | | | | | | |
| | | | | Principal
Amount | | | Fair
Value | | | |
| | | | | | | | | | | | |
| |
| Asset Backed — 0.6% | | | |
Capital One Multi-Asset Execution Trust (Class B) | | | | | | | | | | |
| 1.48% | | 01/15/19 | | $ | 500 | | | $ | 476 | | | (d) |
Chase Funding Mortgage Loan Asset-Backed Certificates
(Class IB) | | | | | | | | | | |
| 5.75% | | 05/25/32 | | | 44 | | | | 25 | | | (h,q) |
Citicorp Residential Mortgage Securities Inc. (Series 2006) (Class A5) | | | | | | | | | | |
| 6.04% | | 09/25/36 | | | 360 | | | | 313 | | | |
Countrywide Asset-Backed Certificates | | | | | | | | | | |
| 1.12% | | 05/25/33 | | | 23 | | | | 19 | | | (h) |
Countrywide Asset-Backed Certificates (Class 2A1) | | | | | | | | | | |
| 2.22% | | 06/25/33 | | | 2 | | | | 2 | | | (d,h) |
Countrywide Asset-Backed Certificates (Class AF6) | | | | | | | | | | |
| 4.74% | | 10/25/35 | | | 305 | | | | 277 | | | |
Countrywide Asset-Backed Certificates (Series 2002) (Class A) | | | | | | | | | | |
| 17.63% | | 08/25/32 | | | 30 | | | | 19 | | | (d,h) |
GSAA Trust (Series 2004) (Class A1) | | | | | | | | | | |
| 10.03% | | 05/25/34 | | | 115 | | | | 88 | | | (d,h) |
Mid-State Trust (Class A3) | | | | | | | | | | |
| 7.54% | | 07/01/35 | | | 50 | | | | 51 | | | (h,q) |
Popular ABS Mortgage
Pass-Through Trust (Class AF4) | | | | | | | | | | |
| 5.30% | | 11/25/35 | | | 350 | | | | 292 | | | |
Residential Asset Securities Corp. (Class A2) | | | | | | | | | | |
| 48.54% | | 06/25/33 | | | 48 | | | | 24 | | | (d,h) |
Residential Asset Securities Corp. (Series 2002) (Class AIIB) | | | | | | | | | | |
| 31.64% | | 07/25/32 | | | 25 | | | | 14 | | | (d,h) |
Saxon Asset Securities Trust | | | | | | | | | | |
| 5.23% | | 08/25/35 | | | 288 | | | | 276 | | | |
Wachovia Asset Securitization Inc. (Series 2004) (Class A) | | | | | | | | | | |
| 13.05% | | 06/25/34 | | | 294 | | | | 253 | | | (d,h,i,q) |
| | | | | | | | | 2,129 | | | |
| | | | | | | | | | | | |
| | | | | Principal
Amount | | | Fair
Value | | | |
| | | | | | | | | | | | |
| |
| Corporate Notes — 33.2% | | | |
Abu Dhabi National Energy Co. | | | | | | | | | | |
| 4.75% | | 09/15/14 | | $ | 200 | | | $ | 207 | | | (b) |
| 6.25% | | 09/16/19 | | | 200 | | | | 207 | | | (b) |
AES El Salvador Trust | | | | | | | | | | |
| 6.75% | | 02/01/16 | | | 200 | | | | 193 | | | (b) |
AES Panama S.A. | | | | | | | | | | |
| 6.35% | | 12/21/16 | | | 219 | | | | 235 | | | (b) |
Agilent Technologies Inc. | | | | | | | | | | |
| 5.00% | | 07/15/20 | | | 401 | | | | 407 | | | |
| 5.50% | | 09/14/15 | | | 270 | | | | 293 | | | |
Air Jamaica Ltd. | | | | | | | | | | |
| 9.38% | | 07/08/15 | | | 7 | | | | 7 | | | |
Alcoa Inc. | | | | | | | | | | |
| 6.15% | | 08/15/20 | | | 453 | | | | 465 | | | |
Allergan Inc. | | | | | | | | | | |
| 3.38% | | 09/15/20 | | | 805 | | | | 759 | | | |
Alliance One International Inc. | | | | | | | | | | |
| 10.00% | | 07/15/16 | | | 533 | | | | 546 | | | |
ALROSA Finance S.A. | | | | | | | | | | |
| 7.75% | | 11/03/20 | | | 400 | | | | 420 | | | (b) |
| 8.88% | | 11/17/14 | | | 200 | | | | 224 | | | (b) |
Ameren Illinois Co. | | | | | | | | | | |
| 9.75% | | 11/15/18 | | | 522 | | | | 670 | | | |
American International Group Inc. | | | | | | | | | | |
| 5.85% | | 01/16/18 | | | 202 | | | | 208 | | | |
American Tower Corp. | | | | | | | | | | |
| 4.50% | | 01/15/18 | | | 600 | | | | 595 | | | |
Amsted Industries Inc. | | | | | | | | | | |
| 8.13% | | 03/15/18 | | | 637 | | | | 676 | | | (b) |
Anadarko Petroleum Corp. | | | | | | | | | | |
| 6.20% | | 03/15/40 | | | 1,180 | | | | 1,152 | | | (h) |
| 6.38% | | 09/15/17 | | | 202 | | | | 220 | | | |
Anheuser-Busch InBev Worldwide Inc. | | | | | | | | | | |
| 3.63% | | 04/15/15 | | | 606 | | | | 624 | | | |
| 5.00% | | 04/15/20 | | | 824 | | | | 871 | | | (h) |
| 5.38% | | 11/15/14 | | | 528 | | | | 582 | | | (b) |
ARAMARK Corp. | | | | | | | | | | |
| 8.50% | | 02/01/15 | | | 423 | | | | 442 | | | |
Arizona Public Service Co. | | | | | | | | | | |
| 6.25% | | 08/01/16 | | | 485 | | | | 542 | | | (h) |
See Notes to Schedules of Investments and Notes to Financial Statements.
68
| | |
| Elfun Income Fund | | (in thousands) — December 31, 2010 |
| | | | | | | | | | | | |
| | | | | Principal
Amount | | | Fair
Value | | | |
| | | | | | | | | | | | |
| | | |
AT&T Inc. | | | | | | | | | | |
| 6.40% | | 05/15/38 | | $ | 1,807 | | | $ | 1,921 | | | (h) |
| 6.70% | | 11/15/13 | | | 496 | | | | 564 | | | (h) |
Avis Budget Car Rental LLC | | | | | | | | | | |
| 9.63% | | 03/15/18 | | | 306 | | | | 330 | | | |
Ball Corp. | | | | | | | | | | |
| 5.75% | | 05/15/21 | | | 410 | | | | 397 | | | |
Banco do Brasil Cayman | | | | | | | | | | |
| 8.50% | | 10/29/49 | | | 350 | | | | 403 | | | (b,i) |
Banco Mercantil del Norte S.A. (Series REGS) | | | | | | | | | | |
| 6.14% | | 10/13/16 | | | 74 | | | | 76 | | | (i) |
BanColombia S.A. | | | | | | | | | | |
| 6.13% | | 07/26/20 | | | 70 | | | | 72 | | | |
Bank of America Corp. | | | | | | | | | | |
| 4.50% | | 04/01/15 | | | 610 | | | | 620 | | | |
| 5.63% | | 07/01/20 | | | 1,135 | | | | 1,157 | | | (h) |
| 5.75% | | 12/01/17 | | | 1,875 | | | | 1,951 | | | (h) |
| 6.50% | | 08/01/16 | | | 410 | | | | 445 | | | |
BE Aerospace Inc. | | | | | | | | | | |
| 8.50% | | 07/01/18 | | | 377 | | | | 413 | | | |
Boise Paper Holdings LLC | | | | | | | | | | |
| 8.00% | | 04/01/20 | | | 382 | | | | 409 | | | (h) |
Bombardier Inc. | | | | | | | | | | |
| 7.75% | | 03/15/20 | | | 716 | | | | 771 | | | (b) |
BP Capital Markets PLC | | | | | | | | | | |
| 3.13% | | 10/01/15 | | | 201 | | | | 201 | | | |
| 4.50% | | 10/01/20 | | | 201 | | | | 201 | | | |
Braskem Finance Ltd. | | | | | | | | | | |
| 7.00% | | 05/07/20 | | | 100 | | | | 103 | | | (b) |
Calpine Corp. | | | | | | | | | | |
| 7.25% | | 10/15/17 | | | 885 | | | | 885 | | | (b,h) |
Cantor Fitzgerald LP | | | | | | | | | | |
| 7.88% | | 10/15/19 | | | 179 | | | | 184 | | | (b) |
Cargill Inc. | | | | | | | | | | |
| 5.20% | | 01/22/13 | | | 131 | | | | 141 | | | (b,h) |
| 6.00% | | 11/27/17 | | | 247 | | | | 279 | | | (b,h) |
Case New Holland Inc. | | | | | | | | | | |
| 7.88% | | 12/01/17 | | | 462 | | | | 505 | | | (b) |
CBS Corp. | | | | | | | | | | |
| 5.75% | | 04/15/20 | | | 372 | | | | 395 | | | |
| 5.90% | | 10/15/40 | | | 284 | | | | 274 | | | |
| | | | | | | | | | | | |
| | | | | Principal
Amount | | | Fair
Value | | | |
| | | | | | | | | | | | |
| | | |
CCO Holdings LLC | | | | | | | | | | |
| 7.88% | | 04/30/18 | | $ | 192 | | | $ | 199 | | | |
| 8.13% | | 04/30/20 | | | 230 | | | | 242 | | | |
Centrais Eletricas Brasileiras S.A. | | | | | | | | | | |
| 6.88% | | 07/30/19 | | | 193 | | | | 218 | | | (b) |
Central American Bank for Economic Integration | | | | | | | | | | |
| 5.38% | | 09/24/14 | | | 380 | | | | 405 | | | (b) |
CFG Investment SAC | | | | | | | | | | |
| 9.25% | | 12/19/13 | | | 100 | | | | 105 | | | |
Chesapeake Energy Corp. | | | | | | | | | | |
| 6.63% | | 08/15/20 | | | 427 | | | | 421 | | | |
| 7.25% | | 12/15/18 | | | 856 | | | | 886 | | | |
Cincinnati Bell Inc. | | | | | | | | | | |
| 8.25% | | 10/15/17 | | | 676 | | | | 669 | | | |
| 8.75% | | 03/15/18 | | | 458 | | | | 429 | | | |
Citigroup Inc. | | | | | | | | | | |
| 5.00% | | 09/15/14 | | | 574 | | | | 594 | | | |
| 5.13% | | 05/05/14 | | | 674 | | | | 715 | | | |
| 5.38% | | 08/09/20 | | | 698 | | | | 725 | | | |
| 6.13% | | 11/21/17 | | | 202 | | | | 221 | | | |
| 6.38% | | 08/12/14 | | | 1,213 | | | | 1,341 | | | (h) |
| 8.50% | | 05/22/19 | | | 331 | | | | 411 | | | |
Clarendon Alumina Production Ltd. | | | | | | | | | | |
| 8.50% | | 11/16/21 | | | 135 | | | | 135 | | | (b,h) |
Community Health Systems Inc. | | | | | | | | | | |
| 8.88% | | 07/15/15 | | | 696 | | | | 731 | | | (h) |
Consolidated Edison Company of New York Inc. | | | | | | | | | | |
| 6.65% | | 04/01/19 | | | 308 | | | | 367 | | | |
Consolidated Edison Company of New York Inc. (Series 2008) | | | | | | | | | | |
| 5.85% | | 04/01/18 | | | 184 | | | | 211 | | | |
Corp Nacional del Cobre de Chile | | | | | | | | | | |
| 3.75% | | 11/04/20 | | | 497 | | | | 471 | | | (b) |
| 5.63% | | 09/21/35 | | | 76 | | | | 78 | | | (b) |
COX Communications Inc. | | | | | | | | | | |
| 6.25% | | 06/01/18 | | | 324 | | | | 362 | | | (b) |
Credit Suisse First Boston International for CJSC The EXIM of Ukraine | | | | | | | | | | |
| 7.65% | | 09/07/11 | | | 200 | | | | 203 | | | |
See Notes to Schedules of Investments and Notes to Financial Statements.
69
| | |
| Elfun Income Fund | | (in thousands) — December 31, 2010 |
| | | | | | | | | | | | |
| | | | | Principal
Amount | | | Fair
Value | | | |
| | | | | | | | | | | | |
| | | |
Crown Castle International Corp. | | | | | | | | | | |
| 7.13% | | 11/01/19 | | $ | 390 | | | $ | 412 | | | |
Crown Castle Towers LLC | | | | | | | | | | |
| 4.88% | | 08/15/40 | | | 379 | | | | 364 | | | (b) |
| 6.11% | | 01/15/40 | | | 378 | | | | 394 | | | (b) |
CSN Islands XII Corp. | | | | | | | | | | |
| 7.00% | | 09/29/49 | | | 100 | | | | 99 | | | (b) |
CVS Caremark Corp. | | | | | | | | | | |
| 3.25% | | 05/18/15 | | | 414 | | | | 421 | | | |
| 5.75% | | 06/01/17 | | | 154 | | | | 171 | | | |
| 6.13% | | 09/15/39 | | | 766 | | | | 818 | | | |
Denbury Resources Inc. | | | | | | | | | | |
| 8.25% | | 02/15/20 | | | 383 | | | | 416 | | | |
Development Bank of Kazakhstan JSC | | | | | | | | | | |
| 5.50% | | 12/20/15 | | | 200 | | | | 202 | | | (b) |
Digicel Ltd. | | | | | | | | | | |
| 8.25% | | 09/01/17 | | | 100 | | | | 103 | | | (b) |
DirecTV Holdings LLC | | | | | | | | | | |
| 4.75% | | 10/01/14 | | | 392 | | | | 418 | | | |
| 5.88% | | 10/01/19 | | | 420 | | | | 456 | | | |
Dolphin Energy Ltd. | | | | | | | | | | |
| 5.89% | | 06/15/19 | | | 369 | | | | 395 | | | (b) |
Drummond Company Inc. | | | | | | | | | | |
| 9.00% | | 10/15/14 | | | 370 | | | | 395 | | | (b) |
DTEK Finance BV | | | | | | | | | | |
| 9.50% | | 04/28/15 | | | 300 | | | | 311 | | | (b) |
Dubai Electricity & Water Authority | | | | | | | | | | |
| 6.38% | | 10/21/16 | | | 200 | | | | 193 | | | (b) |
| 7.38% | | 10/21/20 | | | 200 | | | | 187 | | | (b) |
El Paso Corp. | | | | | | | | | | |
| 8.05% | | 10/15/30 | | | 384 | | | | 390 | | | (h) |
Empresa Nacional del Petroleo | | | | | | | | | | |
| 5.25% | | 08/10/20 | | | 314 | | | | 314 | | | (b) |
| 6.25% | | 07/08/19 | | | 300 | | | | 324 | | | (b) |
European Investment Bank | | | | | | | | | | |
| 4.88% | | 01/17/17 | | | 1,050 | | | | 1,170 | | | (h) |
Exelon Corp. | | | | | | | | | | |
| 4.90% | | 06/15/15 | | | 567 | | | | 605 | | | |
Exelon Generation Company LLC | | | | | | | | | | |
| 6.25% | | 10/01/39 | | | 409 | | | | 412 | | | |
| | | | | | | | | | | | |
| | | | | Principal
Amount | | | Fair
Value | | | |
| | | | | | | | | | | | |
| | | |
Expedia Inc. | | | | | | | | | | |
| 5.95% | | 08/15/20 | | $ | 418 | | | $ | 420 | | | |
Export-Import Bank of Korea | | | | | | | | | | |
| 5.88% | | 01/14/15 | | | 58 | | | | 63 | | | |
Fibria Overseas Finance Ltd. | | | | | | | | | | |
| 7.50% | | 05/04/20 | | | 239 | | | | 251 | | | (b) |
First Horizon National Corp. | | | | | | | | | | |
| 5.38% | | 12/15/15 | | | 399 | | | | 403 | | | |
Forest Oil Corp. | | | | | | | | | | |
| 7.25% | | 06/15/19 | | | 382 | | | | 388 | | | |
FPL Group Capital Inc. | | | | | | | | | | |
| 2.60% | | 09/01/15 | | | 801 | | | | 784 | | | |
France Telecom S.A. | | | | | | | | | | |
| 2.13% | | 09/16/15 | | | 402 | | | | 391 | | | |
Frontier Communications Corp. | | | | | | | | | | |
| 8.25% | | 04/15/17 | | | 536 | | | | 588 | | | |
Gaz Capital SA for Gazprom | | | | | | | | | | |
| 8.13% | | 07/31/14 | | | 100 | | | | 113 | | | (b) |
| 9.25% | | 04/23/19 | | | 200 | | | | 246 | | | |
Gazprom Via Gaz Capital S.A. | | | | | | | | | | |
| 5.09% | | 11/29/15 | | | 200 | | | | 205 | | | (b) |
Georgia-Pacific LLC | | | | | | | | | | |
| 5.40% | | 11/01/20 | | | 306 | | | | 303 | | | (b) |
Globo Comunicacao e Participacoes S.A. | | | | | | | | | | |
| 6.25% | | 12/31/49 | | | 200 | | | | 210 | | | (b,j) |
| 7.25% | | 04/26/22 | | | 200 | | | | 215 | | | (b) |
Gold Fields Orogen Holding BVI Ltd. | | | | | | | | | | |
| 4.88% | | 10/07/20 | | | 400 | | | | 383 | | | (b) |
Goldman Sachs Capital I | | | | | | | | | | |
| 6.35% | | 02/15/34 | | | 401 | | | | 382 | | | |
Hartford Financial Services Group Inc. | | | | | | | | | | |
| 5.50% | | 03/30/20 | | | 710 | | | | 720 | | | (h) |
HCA Inc. | | | | | | | | | | |
| 9.25% | | 11/15/16 | | | 690 | | | | 736 | | | |
Health Management Associates Inc. | | | | | | | | | | |
| 6.13% | | 04/15/16 | | | 467 | | | | 472 | | | |
Hess Corp. | | | | | | | | | | |
| 5.60% | | 02/15/41 | | | 401 | | | | 398 | | | |
See Notes to Schedules of Investments and Notes to Financial Statements.
70
| | |
| Elfun Income Fund | | (in thousands) — December 31, 2010 |
| | | | | | | | | | | | |
| | | | | Principal
Amount | | | Fair
Value | | | |
| | | | | | | | | | | | |
| | | |
Hidili Industry International Development Ltd. | | | | | | | | | | |
| 8.63% | | 11/04/15 | | $ | 150 | | | $ | 149 | | | (b) |
Host Hotels & Resorts Inc. (REIT) | | | | | | | | | | |
| 6.00% | | 11/01/20 | | | 570 | | | | 561 | | | (b) |
Host Hotels & Resorts LP (REIT) | | | | | | | | | | |
| 9.00% | | 05/15/17 | | | 482 | | | | 535 | | | |
HSBC Finance Corp. | | | | | | | | | | |
| 6.68% | | 01/15/21 | | | 1,538 | | | | 1,554 | | | (b) |
Huntington BancShares Inc. | | | | | | | | | | |
| 7.00% | | 12/15/20 | | | 279 | | | | 294 | | | |
IIRSA Norte Finance Ltd. | | | | | | | | | | |
| 8.75% | | 05/30/24 | | | 457 | | | | 508 | | | (b,h) |
Indo Integrated Energy BV | | | | | | | | | | |
| 9.00% | | 06/01/12 | | | 100 | | | | 105 | | | (j) |
Ingles Markets Inc. | | | | | | | | | | |
| 8.88% | | 05/15/17 | | | 735 | | | | 786 | | | |
Intelsat Subsidiary Holding Company S.A. | | | | | | | | | | |
| 8.88% | | 01/15/15 | | | 380 | | | | 390 | | | |
Intergas Finance BV | | | | | | | | | | |
| 6.88% | | 11/04/11 | | | 100 | | | | 104 | | | |
Intergen N.V. | | | | | | | | | | |
| 9.00% | | 06/30/17 | | | 773 | | | | 819 | | | (b) |
International Paper Co. | | | | | | | | | | |
| 7.50% | | 08/15/21 | | | 520 | | | | 614 | | | |
IPIC GMTN Ltd. | | | | | | | | | | |
| 3.13% | | 11/15/15 | | | 348 | | | | 340 | | | (b) |
| 5.00% | | 11/15/20 | | | 348 | | | | 341 | | | (b) |
JP Morgan Chase Capital XXV (Series Y) | | | | | | | | | | |
| 6.80% | | 10/01/37 | | | 188 | | | | 194 | | | |
JPMorgan Chase & Co. | | | | | | | | | | |
| 5.13% | | 09/15/14 | | | 1,041 | | | | 1,108 | | | (h) |
JPMorgan Chase Bank NA | | | | | | | | | | |
| 5.88% | | 06/13/16 | | | 315 | | | | 345 | | | |
| 6.00% | | 10/01/17 | | | 750 | | | | 831 | | | |
Kazakhstan Temir Zholy Finance BV | | | | | | | | | | |
| 6.38% | | 10/06/20 | | | 200 | | | | 209 | | | (b) |
| 6.50% | | 05/11/11 | | | 200 | | | | 203 | | | |
KazMunaiGaz Finance Sub BV | | | | | | | | | | |
| 7.00% | | 05/05/20 | | | 100 | | | | 104 | | | (b,h) |
| | | | | | | | | | | | |
| | | | | Principal
Amount | | | Fair
Value | | | |
| | | | | | | | | | | | |
| | | | |
| 9.13% | | 07/02/18 | | $ | 100 | | | $ | 117 | | | (b) |
| 11.75% | | 01/23/15 | | | 100 | | | | 124 | | | (b,h) |
Korea Development Bank | | | | | | | | | | |
| 3.25% | | 03/09/16 | | | 600 | | | | 583 | | | |
Korea Hydro & Nuclear Power Company Ltd. | | | | | | | | | | |
| 6.25% | | 06/17/14 | | | 200 | | | | 219 | | | (b,h) |
Korea National Oil Corp. | | | | | | | | | | |
| 5.38% | | 07/30/14 | | | 200 | | | | 214 | | | (b,h) |
Kraft Foods Inc. | | | | | | | | | | |
| 4.13% | | 02/09/16 | | | 401 | | | | 421 | | | |
| 5.38% | | 02/10/20 | | | 1,408 | | | | 1,515 | | | (h) |
| 6.50% | | 02/09/40 | | | 401 | | | | 449 | | | |
Kreditanstalt fuer Wiederaufbau | | | | | | | | | | |
| 3.50% | | 03/10/14 | | | 1,936 | | | | 2,060 | | | (h) |
| 4.13% | | 10/15/14 | | | 958 | | | | 1,042 | | | (h) |
| 4.50% | | 07/16/18 | | | 811 | | | | 882 | | | (h) |
LBI Escrow Corp. | | | | | | | | | | |
| 8.00% | | 11/01/17 | | | 359 | | | | 397 | | | (b) |
Levi Strauss & Co. | | | | | | | | | | |
| 7.63% | | 05/15/20 | | | 100 | | | | 103 | | | |
Lincoln National Corp. | | | | | | | | | | |
| 6.25% | | 02/15/20 | | | 275 | | | | 300 | | | |
| 8.75% | | 07/01/19 | | | 435 | | | | 544 | | | |
Listrindo Capital BV | | | | | | | | | | |
| 9.25% | | 01/29/15 | | | 300 | | | | 338 | | | (b) |
Lloyds TSB Bank PLC | | | | | | | | | | |
| 6.50% | | 09/14/20 | | | 483 | | | | 444 | | | (b) |
Majapahit Holding BV | | | | | | | | | | |
| 7.25% | | 10/17/11 | | | 348 | | | | 360 | | | (b) |
| 7.75% | | 10/17/16 - 01/20/20 | | | 400 | | | | 462 | | | (b) |
MBPS Finance Co. | | | | | | | | | | |
| 11.25% | | 11/15/15 | | | 200 | | | | 197 | | | (b) |
MDC-GMTN B.V. | | | | | | | | | | |
| 7.63% | | 05/06/19 | | | 250 | | | | 294 | | | (b) |
Merrill Lynch & Company Inc. | | | | | | | | | | |
| 6.05% | | 08/15/12 | | | 304 | | | | 322 | | | |
| 6.88% | | 04/25/18 | | | 599 | | | | 656 | | | |
MetroPCS Wireless Inc. | | | | | | | | | | |
| 6.63% | | 11/15/20 | | | 557 | | | | 531 | | | |
Midamerican Energy Holdings Co. | | | | | | | | | | |
| 6.13% | | 04/01/36 | | | 330 | | | | 356 | | | (h) |
See Notes to Schedules of Investments and Notes to Financial Statements.
71
| | |
| Elfun Income Fund | | (in thousands) — December 31, 2010 |
| | | | | | | | | | | | |
| | | | | Principal
Amount | | | Fair
Value | | | |
| | | | | | | | | | | | |
| | | |
Morgan Stanley | | | | | | | | | | |
| 5.50% | | 01/26/20 | | $ | 798 | | | $ | 804 | | | |
| 5.63% | | 09/23/19 | | | 690 | | | | 704 | | | |
| 6.00% | | 04/28/15 | | | 333 | | | | 361 | | | |
Morgan Stanley (Series F) | | | | | | | | | | |
| 6.63% | | 04/01/18 | | | 627 | | | | 680 | | | |
Mylan Inc. | | | | | | | | | | |
| 7.88% | | 07/15/20 | | | 532 | | | | 573 | | | (b) |
NAK Naftogaz Ukraine | | | | | | | | | | |
| 9.50% | | 09/30/14 | | | 200 | | | | 218 | | | |
Nalco Company | | | | | | | | | | |
| 6.63% | | 01/15/19 | | | 174 | | | | 178 | | | (b) |
National Agricultural Cooperative Federation | | | | | | | | | | |
| 4.25% | | 01/28/16 | | | 231 | | | | 232 | | | (b) |
| 5.00% | | 09/30/14 | | | 201 | | | | 211 | | | (b) |
National Power Corp. | | | | | | | | | | |
| 4.53% | | 08/23/11 | | | 208 | | | | 212 | | | (i) |
NET Servicos de Comunicacao S.A. | | | | | | | | | | |
| 7.50% | | 01/27/20 | | | 200 | | | | 230 | | | |
News America Inc. | | | | | | | | | | |
| 6.65% | | 11/15/37 | | | 576 | | | | 638 | | | |
Nexen Inc. | | | | | | | | | | |
| 6.40% | | 05/15/37 | | | 972 | | | | 942 | | | |
Nisource Finance Corp. | | | | | | | | | | |
| 6.13% | | 03/01/22 | | | 346 | | | | 373 | | | |
NRG Energy Inc. | | | | | | | | | | |
| 7.38% | | 02/01/16 | | | 765 | | | | 784 | | | |
Odebrecht Drilling Norbe VIII/IX Ltd. | | | | | | | | | | |
| 6.35% | | 06/30/21 | | | 100 | | | | 104 | | | (b) |
Oglethorpe Power Corp. | | | | | | | | | | |
| 5.38% | | 11/01/40 | | | 400 | | | | 383 | | | |
Pacific Gas & Electric Co. | | | | | | | | | | |
| 5.80% | | 03/01/37 | | | 165 | | | | 175 | | | |
| 6.05% | | 03/01/34 | | | 883 | | | | 967 | | | |
Pacific Rubiales Energy Corp. | | | | | | | | | | |
| 8.75% | | 11/10/16 | | | 200 | | | | 225 | | | (b) |
PacifiCorp | | | | | | | | | | |
| 6.00% | | 01/15/39 | | | 500 | | | | 551 | | | |
| 6.25% | | 10/15/37 | | | 14 | | | | 16 | | | |
PAETEC Holding Corp. | | | | | | | | | | |
| 8.88% | | 06/30/17 | | | 1,069 | | | | 1,141 | | | (h) |
| | | | | | | | | | | | |
| | | | | Principal
Amount | | | Fair
Value | | | |
| | | | | | | | | | | | |
| | | |
Pemex Finance Ltd. | | | | | | | | | | |
| 9.03% | | 02/15/11 | | $ | 45 | | | $ | 46 | | | (h) |
Pemex Project Funding Master Trust | | | | | | | | | | |
| 6.63% | | 06/15/35 - 06/15/38 | | | 164 | | | | 167 | | | |
Petroleos Mexicanos | | | | | | | | | | |
| 4.88% | | 03/15/15 | | | 560 | | | | 589 | | | |
| 6.00% | | 03/05/20 | | | 150 | | | | 159 | | | |
| 8.00% | | 05/03/19 | | | 70 | | | | 84 | | | |
Petroleum Company of Trinidad & Tobago Ltd. | | | | | | | | | | |
| 6.00% | | 05/08/22 | | | 288 | | | | 288 | | | |
Petronas Capital Ltd. | | | | | | | | | | |
| 5.25% | | 08/12/19 | | | 287 | | | | 308 | | | (b) |
| 7.88% | | 05/22/22 | | | 100 | | | | 129 | | | (b) |
Petronas Global Sukuk Ltd. | | | | | | | | | | |
| 4.25% | | 08/12/14 | | | 200 | | | | 209 | | | (b) |
Pioneer Natural Resources Co. | | | | | | | | | | |
| 7.50% | | 01/15/20 | | | 656 | | | | 720 | | | |
Plains All American Pipeline LP Corp. | | | | | | | | | | |
| 3.95% | | 09/15/15 | | | 406 | | | | 420 | | | |
| 4.25% | | 09/01/12 | | | 174 | | | | 181 | | | |
Plains Exploration & Production Co. | | | | | | | | | | |
| 7.63% | | 06/01/18 | | | 572 | | | | 602 | | | |
Power Sector Assets & Liabilities Management Corp. | | | | | | | | | | |
| 7.39% | | 12/02/24 | | | 100 | | | | 119 | | | (b) |
Prudential Financial Inc. | | | | | | | | | | |
| 3.63% | | 09/17/12 | | | 173 | | | | 180 | | | |
| 3.88% | | 01/14/15 | | | 639 | | | | 659 | | | |
| 6.20% | | 11/15/40 | | | 400 | | | | 423 | | | |
| 7.38% | | 06/15/19 | | | 349 | | | | 411 | | | |
PTTEP Australia International Finance Proprietary Ltd. | | | | | | | | | | |
| 4.15% | | 07/19/15 | | | 100 | | | | 100 | | | (b) |
Qatari Diar Finance QSC (REIT) | | | | | | | | | | |
| 3.50% | | 07/21/15 | | | 100 | | | | 100 | | | (b) |
| 5.00% | | 07/21/20 | | | 100 | | | | 100 | | | (b) |
QVC Inc. | | | | | | | | | | |
| 7.50% | | 10/01/19 | | | 443 | | | | 466 | | | (b) |
See Notes to Schedules of Investments and Notes to Financial Statements.
72
| | |
| Elfun Income Fund | | (in thousands) — December 31, 2010 |
| | | | | | | | | | | | |
| | | | | Principal
Amount | | | Fair
Value | | | |
| | | | | | | | | | | | |
| | | |
RailAmerica Inc. | | | | | | | | | | |
| 9.25% | | 07/01/17 | | $ | 405 | | | $ | 445 | | | |
Republic Services Inc. | | | | | | | | | | |
| 5.25% | | 11/15/21 | | | 558 | | | | 588 | | | |
| 5.50% | | 09/15/19 | | | 243 | | | | 265 | | | |
Reynolds Group Issuer Inc. | | | | | | | | | | |
| 7.75% | | 10/15/16 | | | 872 | | | | 922 | | | (b) |
Roche Holdings Inc. | | | | | | | | | | |
| 6.00% | | 03/01/19 | | | 405 | | | | 471 | | | (b) |
Rockies Express Pipeline LLC | | | | | | | | | | |
| 5.63% | | 04/15/20 | | | 506 | | | | 489 | | | (b,h) |
RR Donnelley & Sons Co. | | | | | | | | | | |
| 7.63% | | 06/15/20 | | | 443 | | | | 474 | | | |
RSHB Capital SA for OJSC Russian Agricultural Bank | | | | | | | | | | |
| 6.30% | | 05/15/17 | | | 200 | | | | 201 | | | (b) |
| 6.97% | | 09/21/16 | | | 100 | | | | 100 | | | (i) |
Russian Railways | | | | | | | | | | |
| 5.74% | | 04/03/17 | | | 100 | | | | 104 | | | |
Solutia Inc. | | | | | | | | | | |
| 7.88% | | 03/15/20 | | | 383 | | | | 410 | | | |
Southern Copper Corp. | | | | | | | | | | |
| 5.38% | | 04/16/20 | | | 537 | | | | 543 | | | |
| 6.75% | | 04/16/40 | | | 477 | | | | 494 | | | |
| 7.50% | | 07/27/35 | | | 300 | | | | 333 | | | |
| Spirit Aerosystems Inc. | | | | | | | | | | |
| 7.50% | | 10/01/17 | | | 220 | | | | 229 | | | |
Suzano Trading Ltd. | | | | | | | | | | |
| 5.88% | | 01/23/21 | | | 100 | | | | 98 | | | (b) |
Talecris Biotherapeutics Holdings Corp. | | | | | | | | | | |
| 7.75% | | 11/15/16 | | | 50 | | | | 54 | | | |
Telecom Italia Capital S.A. | | | | | | | | | | |
| 6.00% | | 09/30/34 | | | 436 | | | | 362 | | | |
Telefonica Emisiones SAU | | | | | | | | | | |
| 3.73% | | 04/27/15 | | | 397 | | | | 394 | | | |
Teva Pharmaceutical Finance II BV | | | | | | | | | | |
| 3.00% | | 06/15/15 | | | 801 | | | | 815 | | | |
Textron Inc. | | | | | | | | | | |
| 6.20% | | 03/15/15 | | | 615 | | | | 671 | | | |
The AES Corp. | | | | | | | | | | |
| 8.00% | | 10/15/17 - 06/01/20 | | | 723 | | | | 765 | | | |
| | | | | | | | | | | | |
| | | | | Principal
Amount | | | Fair
Value | | | |
| | | | | | | | | | | | |
| | | |
The Goldman Sachs Group Inc. | | | | | | | | | | |
| 3.70% | | 08/01/15 | | $ | 686 | | | $ | 699 | | | |
| 5.38% | | 03/15/20 | | | 1,072 | | | | 1,108 | | | (h) |
| 6.75% | | 10/01/37 | | | 200 | | | | 204 | | | |
The Kroger Co. | | | | | | | | | | |
| 6.15% | | 01/15/20 | | | 612 | | | | 693 | | | (h) |
The Potomac Edison Co. | | | | | | | | | | |
| 5.35% | | 11/15/14 | | | 245 | | | | 267 | | | (h) |
Time Warner Cable Inc. | | | | | | | | | | |
| 6.75% | | 07/01/18 | | | 372 | | | | 434 | | | |
| 7.50% | | 04/01/14 | | | 480 | | | | 550 | | | |
Time Warner Inc. | | | | | | | | | | |
| 3.15% | | 07/15/15 | | | 792 | | | | 805 | | | |
| 5.88% | | 11/15/16 | | | 454 | | | | 512 | | | |
| 6.20% | | 03/15/40 | | | 443 | | | | 471 | | | |
TNK-BP Finance S.A. | | | | | | | | | | |
| 6.13% | | 03/20/12 | | | 200 | | | | 209 | | | |
| 7.25% | | 02/02/20 | | | 5 | | | | 5 | | | (b) |
Transocean Inc. | | | | | | | | | | |
| 6.00% | | 03/15/18 | | | 120 | | | | 126 | | | |
| 6.80% | | 03/15/38 | | | 81 | | | | 83 | | | |
Union Electric Co. | | | | | | | | | | |
| 6.70% | | 02/01/19 | | | 370 | | | | 431 | | | |
UnitedHealth Group Inc. | | | | | | | | | | |
| 5.80% | | 03/15/36 | | | 303 | | | | 307 | | | |
UPC Germany GmbH | | | | | | | | | | |
| 8.13% | | 12/01/17 | | | 400 | | | | 418 | | | (b) |
USB Capital XIII Trust | | | | | | | | | | |
| 6.63% | | 12/15/39 | | | 557 | | | | 569 | | | |
Valero Energy Corp. | | | | | | | | | | |
| 6.13% | | 02/01/20 | | | 810 | | | | 860 | | | |
Verizon Communications Inc. | | | | | | | | | | |
| 6.35% | | 04/01/19 | | | 279 | | | | 322 | | | |
| 6.40% | | 02/15/38 | | | 273 | | | | 302 | | | |
| 6.90% | | 04/15/38 | | | 302 | | | | 352 | | | |
VIP Finance Ireland Limited for OJSC Vimpel Communications (Class A) | | | | | | | | | | |
| 8.38% | | 04/30/13 | | | 100 | | | | 108 | | | (b) |
Virgin Media Finance PLC | | | | | | | | | | |
| 8.38% | | 10/15/19 | | | 400 | | | | 437 | | | |
Vnesheconombank Via VEB Finance Ltd. | | | | | | | | | | |
| 6.80% | | 11/22/25 | | | 100 | | | | 100 | | | (b) |
See Notes to Schedules of Investments and Notes to Financial Statements.
73
| | |
| Elfun Income Fund | | (in thousands) — December 31, 2010 |
| | | | | | | | | | | | |
| | | | | Principal
Amount | | | Fair
Value | | | |
| | | | | | | | | | | | |
| | | |
VTB Capital S.A. | | | | | | | | | | |
| 6.47% | | 03/04/15 | | $ | 200 | | | $ | 208 | | | (b) |
WEA Finance LLC (REIT) | | | | | | | | | | |
| 6.75% | | 09/02/19 | | | 814 | | | | 907 | | | (b) |
| 7.50% | | 06/02/14 | | | 175 | | | | 199 | | | (b) |
Weatherford International Limited Bermuda | | | | | | | | | | |
| 6.75% | | 09/15/40 | | | 703 | | | | 738 | | | |
Williams Partners LP | | | | | | | | | | |
| 5.25% | | 03/15/20 | | | 322 | | | | 334 | | | |
| 6.30% | | 04/15/40 | | | 569 | | | | 592 | | | (h) |
Windstream Corp. | | | | | | | | | | |
| 7.88% | | 11/01/17 | | | 882 | | | | 927 | | | |
Woodside Finance Ltd. | | | | | | | | | | |
| 4.50% | | 11/10/14 | | | 917 | | | | 964 | | | (b) |
Wyeth | | | | | | | | | | |
| 5.50% | | 03/15/13 | | | 660 | | | | 722 | | | |
Wynn Las Vegas LLC | | | | | | | | | | |
| 7.88% | | 05/01/20 | | | 534 | | | | 571 | | | |
Xstrata Finance Canada Ltd. | | | | | | | | | | |
| 5.80% | | 11/15/16 | | | 345 | | | | 379 | | | (b) |
| | | | | | | | | 116,348 | | | |
|
| Non-Agency Collateralized Mortgage Obligations — 11.1% |
| | | |
Banc of America Commercial Mortgage Inc. | | | | | | | | | | |
| 5.68% | | 07/10/46 | | | 400 | | | | 403 | | | |
| 5.74% | | 02/10/51 | | | 880 | | | | 937 | | | |
Banc of America Commercial Mortgage Inc. (Class A) | | | | | | | | | | |
| 5.49% | | 02/10/51 | | | 188 | | | | 196 | | | |
Banc of America Commercial Mortgage Inc. (Class A4) | | | | | | | | | | |
| 5.63% | | 07/10/46 | | | 587 | | | | 630 | | | |
Banc of America Commercial Mortgage Inc. (Class AJ) | | | | | | | | | | |
| 5.70% | | 07/10/46 | | | 200 | | | | 182 | | | (i) |
Banc of America Commercial Mortgage Inc. (Class C) | | | | | | | | | | |
| 5.70% | | 04/10/49 | | | 300 | | | | 53 | | | (h,q) |
Banc of America Commercial Mortgage Inc. (Series 2006) (Class A4) | | | | | | | | | | |
| 5.74% | | 05/10/45 | | | 1,000 | | | | 1,095 | | | (h) |
| | | | | | | | | | | | |
| | | | | Principal
Amount | | | Fair
Value | | | |
| | | | | | | | | | | | |
| | | |
Banc of America Funding Corp. (Class B1) | | | | | | | | | | |
| 5.44% | | 03/20/36 | | $ | 246 | | | $ | 5 | | | (h,q) |
Banc of America Mortgage Securities Inc. (Class B1) | | | | | | | | | | |
| 4.62% | | 01/25/36 | | | 210 | | | | 16 | | | (h,q) |
| 5.46% | | 02/25/36 | | | 206 | | | | 18 | | | (h,q) |
Banc of America Mortgage Securities Inc. (Class B2) | | | | | | | | | | |
| 4.62%** | | 01/25/36 | | | 59 | | | | — | | | (h,q) |
Bear Stearns Commercial Mortgage Securities | | | | | | | | | | |
| 5.58% | | 09/11/41 | | | 700 | | | | 708 | | | (i) |
| 5.76% | | 09/11/38 | | | 350 | | | | 364 | | | (i) |
Bear Stearns Commercial Mortgage Securities (Class A M) | | | | | | | | | | |
| 5.51% | | 04/12/38 | | | 370 | | | | 394 | | | |
Bear Stearns Commercial Mortgage Securities (Class A2) | | | | | | | | | | |
| 5.41% | | 03/11/39 | | | 222 | | | | 222 | | | (h,i) |
| 5.51% | | 04/12/38 | | | 211 | | | | 211 | | | |
Bear Stearns Commercial Mortgage Securities (Class A4) | | | | | | | | | | |
| 5.47% | | 01/12/45 | | | 625 | | | | 667 | | | |
| 5.69% | | 06/11/50 | | | 670 | | | | 710 | | | (h) |
Bear Stearns Commercial Mortgage Securities (Class AJ) | | | | | | | | | | |
| 5.46% | | 03/11/39 | | | 300 | | | | 283 | | | (i) |
| 5.72% | | 06/11/40 | | | 340 | | | | 249 | | | |
Bear Stearns Commercial Mortgage Securities (Class AM) | | | | | | | | | | |
| 5.24% | | 12/11/38 | | | 300 | | | | 303 | | | |
| 5.92% | | 06/11/50 | | | 510 | | | | 519 | | | (h,q) |
Bear Stearns Commercial Mortgage Securities (Series 2007) (Class D) | | | | | | | | | | |
| 5.99% | | 09/11/42 | | | 100 | | | | 44 | | | (h,q) |
Citigroup Commercial Mortgage Trust (Class AJ) | | | | | | | | | | |
| 5.73% | | 03/15/49 | | | 330 | | | | 311 | | | (i) |
Citigroup Commercial Mortgage Trust (Series 2006) (Class AJ) | | | | | | | | | | |
| 5.48% | | 10/15/49 | | | 360 | | | | 333 | | | |
See Notes to Schedules of Investments and Notes to Financial Statements.
74
| | |
| Elfun Income Fund | | (in thousands) — December 31, 2010 |
| | | | | | | | | | | | |
| | | | | Principal
Amount | | | Fair
Value | | | |
| | | | | | | | | | | | |
| | | |
Commercial Mortgage Pass Through Certificates (Class AJ) | | | | | | | | | | |
| 5.79% | | 06/10/46 | | $ | 410 | | | $ | 396 | | | |
Commercial Mortgage Pass Through Certificates (Class AM) | | | | | | | | | | |
| 5.79% | | 06/10/46 | | | 600 | | | | 625 | | | |
Countrywide Asset-Backed Certificates (Class A2) | | | | | | | | | | |
| 10.32% | | 11/25/35 | | | 118 | | | | 112 | | | (d,h) |
Countrywide Commercial Mortgage Trust (Class AJ) | | | | | | | | | | |
| 5.49% | | 07/12/46 | | | 500 | | | | 456 | | | (h,i) |
| 5.91% | | 06/12/46 | | | 450 | | | | 427 | | | (i) |
Countrywide Commercial Mortgage Trust (Class AM) | | | | | | | | | | |
| 5.46% | | 07/12/46 | | | 200 | | | | 202 | | | (i) |
Credit Suisse First Boston Mortgage Securities Corp. (Class CB1) | | | | | | | | | | |
| 5.33% | | 10/25/35 | | | 244 | | | | 12 | | | (h,q) |
Credit Suisse Mortgage Capital Certificates (Class A3) | | | | | | | | | | |
| 5.47% | | 09/15/39 | | | 689 | | | | 723 | | | (h) |
Credit Suisse Mortgage Capital Certificates (Class C) | | | | | | | | | | |
| 5.54% | | 02/15/39 | | | 750 | | | | 547 | | | |
Credit Suisse Mortgage Capital Certificates (Class CB1) | | | | | | | | | | |
| 5.64% | | 02/25/36 | | | 141 | | | | 11 | | | (h,q) |
Extended Stay America Trust | | | | | | | | | | |
| 5.50% | | 11/05/27 | | | 800 | | | | 788 | | | (b) |
Greenwich Capital Commercial Funding Corp. | | | | | | | | | | |
| 5.88% | | 07/10/38 | | | 1,446 | | | | 1,578 | | | (h,i) |
Greenwich Capital Commercial Funding Corp. (Class A2) | | | | | | | | | | |
| 5.60% | | 12/10/49 | | | 430 | | | | 450 | | | |
Greenwich Capital Commercial Funding Corp. (Class AM) | | | | | | | | | | |
| 5.88% | | 07/10/38 | | | 700 | | | | 721 | | | (i) |
Impac CMB Trust (Class 1A1) | | | | | | | | | | |
| 4.41% | | 10/25/34 | | | 348 | | | | 321 | | | (d,h) |
| 10.83% | | 04/25/35 | | | 436 | | | | 349 | | | (d,h) |
| | | | | | | | | | | | |
| | | | | Principal
Amount | | | Fair
Value | | | |
| | | | | | | | | | | | |
| | | |
Indymac INDA Mortgage Loan Trust (Class B1) | | | | | | | | | | |
| 4.50% | | 01/25/36 | | $ | 143 | | | $ | 3 | | | (h,q) |
Indymac INDA Mortgage Loan Trust (Class B2) | | | | | | | | | | |
| 4.50%** | | 01/25/36 | | | 15 | | | | — | | | (h,q) |
Interstar Millennium Trust (Series 2004) (Class A) | | | | | | | | | | |
| 0.60% | | 03/14/36 | | | 30 | | | | 29 | | | (d) |
JP Morgan Chase Commercial Mortgage Securities Corp. | | | | | | | | | | |
| 4.07% | | 11/15/43 | | | 280 | | | | 266 | | | (b) |
| 5.87% | | 04/15/45 | | | 410 | | | | 425 | | | |
JP Morgan Chase Commercial Mortgage Securities Corp. (Class A4) | | | | | | | | | | |
| 5.34% | | 08/12/37 | | | 1,380 | | | | 1,486 | | | (h) |
| 5.44% | | 06/12/47 | | | 950 | | | | 996 | | | (h) |
| 5.79% | | 02/12/51 | | | 1,120 | | | | 1,193 | | | (h) |
JP Morgan Chase Commercial Mortgage Securities Corp. (Class AM) | | | | | | | | | | |
| 5.44% | | 05/15/45 | | | 870 | | | | 882 | | | |
| 5.90% | | 02/12/51 | | | 660 | | | | 663 | | | (h) |
JP Morgan Chase Commercial Mortgage Securities Corp. (Class B) | | | | | | | | | | |
| 5.52% | | 04/15/43 | | | 280 | | | | 236 | | | |
JP Morgan Chase Commercial Mortgage Securities Corp. (Class F) | | | | | | | | | | |
| 6.19% | | 02/12/51 | | | 155 | | | | 39 | | | (q) |
LB-UBS Commercial Mortgage Trust | | | | | | | | | | |
| 7.45% | | 01/15/36 | | | 2,822 | | | | 119 | | | (d,h,q) |
LB-UBS Commercial Mortgage Trust ( Class A2) | | | | | | | | | | |
| 6.15% | | 04/15/41 | | | 1,000 | | | | 1,084 | | | (h,i) |
LB-UBS Commercial Mortgage Trust (Class A4) | | | | | | | | | | |
| 4.95% | | 09/15/30 | | | 310 | | | | 331 | | | |
| 5.16% | | 02/15/31 | | | 410 | | | | 438 | | | |
| 5.66% | | 03/15/39 | | | 1,464 | | | | 1,573 | | | (h,i) |
See Notes to Schedules of Investments and Notes to Financial Statements.
75
| | |
| Elfun Income Fund | | (in thousands) — December 31, 2010 |
| | | | | | | | | | | | |
| | | | | Principal
Amount | | | Fair
Value | | | |
| | | | | | | | | | | | |
| | | |
LB-UBS Commercial Mortgage Trust (Class AJ) | | | | | | | | | | |
| 6.15% | | 04/15/41 | | $ | 160 | | | $ | 132 | | | (i) |
LB-UBS Commercial Mortgage Trust (Series 2001) (Class B) | | | | | | | | | | |
| 6.65% | | 07/14/16 | | | 103 | | | | 103 | | | (h,q) |
LB-UBS Commercial Mortgage Trust (Series 2004) (Class X) | | | | | | | | | | |
| 25.77% | | 12/15/39 | | | 5,024 | | | | 63 | | | (d,h,q) |
MASTR Alternative Loans Trust (Class 15 AX) | | | | | | | | | | |
| 5.00% | | 08/25/18 | | | 183 | | | | 20 | | | (g,h,q,r) |
Merrill Lynch Mortgage Trust (Class AJ) | | | | | | | | | | |
| 5.66% | | 05/12/39 | | | 200 | | | | 183 | | | (i) |
Merrill Lynch Mortgage Trust (Series 2006) (Class B) | | | | | | | | | | |
| 5.66% | | 05/12/39 | | | 375 | | | | 213 | | | |
Morgan Stanley Capital I | | | | | | | | | | |
| 0.80% | | 01/15/21 | | | 485 | | | | 436 | | | (b,d,h) |
| 5.16% | | 10/12/52 | | | 450 | | | | 480 | | | (h,i) |
| 5.19% | | 11/14/42 | | | 200 | | | | 215 | | | (i) |
| 5.73% | | 10/15/42 | | | 449 | | | | 352 | | | |
Morgan Stanley Capital I (Class A3) | | | | | | | | | | |
| 5.71% | | 07/12/44 | | | 350 | | | | 373 | | | (h) |
Morgan Stanley Capital I (Class A4) | | | | | | | | | | |
| 5.33% | | 11/12/41 | | | 180 | | | | 191 | | | |
| 5.81% | | 08/12/41 | | | 160 | | | | 176 | | | (i) |
| 5.81% | | 12/12/49 | | | 1,570 | | | | 1,678 | | | (h) |
Morgan Stanley Capital I (Class AJ) | | | | | | | | | | |
| 5.39% | | 11/12/41 | | | 848 | | | | 761 | | | (h,i) |
| 5.57% | | 11/12/49 | | | 400 | | | | 375 | | | (i) |
| 5.73% | | 10/15/42 | | | 200 | | | | 191 | | | (i) |
Morgan Stanley Capital I (Class AM) | | | | | | | | | | |
| 6.11% | | 12/12/49 | | | 360 | | | | 370 | | | (i) |
| 6.28% | | 01/11/43 | | | 400 | | | | 411 | | | |
Morgan Stanley Capital I (Class B) | | | | | | | | | | |
| 5.73% | | 10/15/42 | | | 250 | | | | 225 | | | |
Morgan Stanley Capital I (Series 2006) (Class AM) | | | | | | | | | | |
| 5.44% | | 03/12/44 | | | 550 | | | | 569 | | | (i) |
| | | | | | | | | | | | |
| | | | | Principal
Amount | | | Fair
Value | | | |
| | | | | | | | | | | | |
| | | |
MortgageIT Trust (Class A1) | | | | | | | | | | |
| 10.63% | | 08/25/35 | | $ | 1,910 | | | $ | 1,461 | | | (d,h) |
National RMBS Trust (Series 2004) (Class A1) | | | | | | | | | | |
| 5.47% | | 03/20/34 | | | 58 | | | | 57 | | | (d) |
OBP Depositor LLC Trust | | | | | | | | | | |
| 4.65% | | 07/15/45 | | | 280 | | | | 286 | | | (b) |
Puma Finance Ltd. (Class A) | | | | | | | | | | |
| 5.28% | | 10/11/34 | | | 55 | | | | 54 | | | (d) |
Residential Funding Mortgage Securities I (Class M1) | | | | | | | | | | |
| 5.75%** | | 01/25/36 | | | 174 | | | | — | | | (h,q) |
Residential Funding Mortgage Securities I (Class M2) | | | | | | | | | | |
| 5.75%** | | 01/25/36 | | | 20 | | | | — | | | (h,q) |
Structured Asset Securities Corp.(Series 1996) (Class X1) | | | | | | | | | | |
| 3.00%** | | 02/25/28 | | | 243 | | | | — | | | (d,q) |
Vornado DP LLC | | | | | | | | | | |
| 6.36% | | 09/13/28 | | | 160 | | | | 159 | | | (b) |
Wachovia Bank Commercial Mortgage Trust | | | | | | | | | | |
| 6.02% | | 06/15/45 | | | 390 | | | | 191 | | | |
Wachovia Bank Commercial Mortgage Trust (Class A3) | | | | | | | | | | |
| 5.25% | | 12/15/43 | | | 670 | | | | 681 | | | (h) |
Wachovia Bank Commercial Mortgage Trust (Class AJ) | | | | | | | | | | |
| 5.52% | | 01/15/45 | | | 540 | | | | 531 | | | (h,i) |
| 5.74% | | 05/15/43 | | | 400 | | | | 381 | | | (i) |
Wachovia Bank Commercial Mortgage Trust (Class AM) | | | | | | | | | | |
| 5.47% | | 01/15/45 | | | 410 | | | | 419 | | | (i) |
Wachovia Bank Commercial Mortgage Trust (Series 2006) (Class AJ) | | | | | | | | | | |
| 5.99% | | 06/15/45 | | | 170 | | | | 150 | | | (i) |
WAMU Commercial Mortgage Securities Trust (Series 2005) (Class AJ) | | | | | | | | | | |
| 5.19% | | 05/25/36 | | | 410 | | | | 413 | | | (b) |
Wells Fargo Mortgage Backed Securities Trust (Class B1) | | | | | | | | | | |
| 5.50% | | 01/25/36 - 03/25/36 | | | 700 | | | | 87 | | | (h,q) |
| | | | | | | | | 38,721 | | | |
See Notes to Schedules of Investments and Notes to Financial Statements.
76
| | |
| Elfun Income Fund | | (in thousands) — December 31, 2010 |
| | | | | | | | | | | | |
| | | | | Principal
Amount | | | Fair
Value | | | |
| | | | | | | | | | | | |
| |
| Sovereign Bonds — 3.0% | | | |
Banco Nacional de Desenvolvimento Economico e Social | | | | | | | | | | |
| 5.50% | | 07/12/20 | | $ | 100 | | | $ | 103 | | | (b) |
| 6.50% | | 06/10/19 | | | 100 | | | | 110 | | | (b) |
Democratic Socialist Republic of Sri Lanka | | | | | | | | | | |
| 7.40% | | 01/22/15 | | | 100 | | | | 110 | | | (b) |
| 8.25% | | 10/24/12 | | | 100 | | | | 108 | | | |
Financing of Infrastrucural Projects State Enterprise | | | | | | | | | | |
| 8.38% | | 11/03/17 | | | 100 | | | | 105 | | | (b) |
Government of 1Malaysia Sukuk Global Berhad | | | | | | | | | | |
| 3.93% | | 06/04/15 | | | 125 | | | | 130 | | | (b) |
Government of Argentina | | | | | | | | | | |
| 2.50% | | 12/31/38 | | | 87 | | | | 39 | | | (j) |
| 5.00% | | 08/03/12 | | | 347 | | | | 83 | | | (d,i) |
| 7.00% | | 10/03/15 | | | 124 | | | | 120 | | | |
| 8.28% | | 12/31/33 | | | 89 | | | | 83 | | | |
Government of Belize | | | | | | | | | | |
| 6.00% | | 02/20/29 | | | 224 | | | | 197 | | | (j) |
Government of Brazil | | | | | | | | | | |
| 5.63% | | 01/07/41 | | | 100 | | | | 99 | | | |
| 6.00% | | 02/20/29 | | | 70 | | | | 61 | | | (b,j) |
| 8.00% | | 01/15/18 | | | 75 | | | | 88 | | | (h) |
| 8.25% | | 01/20/34 | | | 153 | | | | 204 | | | |
Government of Brazilian | | | | | | | | | | |
| 4.88% | | 01/22/21 | | | 633 | | | | 646 | | | |
Government of Colombia | | | | | | | | | | |
| 6.13% | | 01/18/41 | | | 200 | | | | 205 | | | |
| 7.38% | | 03/18/19 - 09/18/37 | | | 200 | | | | 239 | | | |
Government of Costa Rica | | | | | | | | | | |
| 10.00% | | 08/01/20 | | | 220 | | | | 301 | | | (b) |
Government of Egypt | | | | | | | | | | |
| 5.75% | | 04/29/20 | | | 200 | | | | 206 | | | (b) |
Government of El Salvador | | | | | | | | | | |
| 7.65% | | 06/15/35 | | | 160 | | | | 169 | | | (b) |
Government of Grenada | | | | | | | | | | |
| 2.50% | | 09/15/25 | | | 128 | | | | 69 | | | (b,j) |
Government of Indonesia | | | | | | | | | | |
| 10.38% | | 05/04/14 | | | 100 | | | | 124 | | | (b) |
| | | | | | | | | | | | |
| | | | | Principal
Amount | | | Fair
Value | | | |
| | | | | | | | | | | | |
| | | | |
| 11.63% | | 03/04/19 | | $ | 53 | | | $ | 79 | | | (b) |
Government of Lebanon | | | | | | | | | | |
| 6.38% | | 03/09/20 | | | 249 | | | | 260 | | | |
Government of Lithuania | | | | | | | | | | |
| 6.75% | | 01/15/15 | | | 100 | | | | 108 | | | (b) |
| 7.38% | | 02/11/20 | | | 200 | | | | 221 | | | (b) |
Government of Panama | | | | | | | | | | |
| 6.70% | | 01/26/36 | | | 155 | | | | 173 | | | |
Government of Peruvian | | | | | | | | | | |
| 6.55% | | 03/14/37 | | | 225 | | | | 246 | | | |
| 7.35% | | 07/21/25 | | | 100 | | | | 122 | | | |
Government of Philippine | | | | | | | | | | |
| 6.38% | | 10/23/34 | | | 100 | | | | 106 | | | |
| 6.50% | | 01/20/20 | | | 93 | | | | 107 | | | |
Government of Poland | | | | | | | | | | |
| 6.38% | | 07/15/19 | | | 37 | | | | 41 | | | |
Government of Qatar | | | | | | | | | | |
| 5.25% | | 01/20/20 | | | 300 | | | | 317 | | | (b) |
| 6.40% | | 01/20/40 | | | 100 | | | | 109 | | | (b) |
Government of South Africa | | | | | | | | | | |
| 5.50% | | 03/09/20 | | | 239 | | | | 254 | | | |
Government of Turkey | | | | | | | | | | |
| 5.63% | | 03/30/21 | | | 240 | | | | 250 | | | |
| 6.75% | | 05/30/40 | | | 400 | | | | 436 | | | |
Government of Ukraine | | | | | | | | | | |
| 6.88% | | 03/04/11 | | | 139 | | | | 140 | | | (b) |
Government of Uruguay | | | | | | | | | | |
| 6.88% | | 09/28/25 | | | 111 | | | | 127 | | | |
Government of Venezuela | | | | | | | | | | |
| 1.29% | | 04/20/11 | | | 77 | | | | 75 | | | (i) |
| 10.75% | | 09/19/13 | | | 359 | | | | 346 | | | |
Government of Vietnam | | | | | | | | | | |
| 1.30% | | 03/12/16 | | | 34 | | | | 30 | | | (i) |
Korea Expressway Corp. | | | | | | | | | | |
| 4.50% | | 03/23/15 | | | 200 | | | | 206 | | | (b,h) |
Korea National Oil Corp. | | | | | | | | | | |
| 2.88% | | 11/09/15 | | | 478 | | | | 459 | | | (b) |
Lebanese Republic | | | | | | | | | | |
| 5.15% | | 11/12/18 | | | 69 | | | | 68 | | | |
Province of Manitoba Canada | | | | | | | | | | |
| 4.90% | | 12/06/16 | | | 315 | | | | 351 | | | (h) |
Province of Quebec Canada | | | | | | | | | | |
| 7.50% | | 09/15/29 | | | 460 | | | | 632 | | | |
See Notes to Schedules of Investments and Notes to Financial Statements.
77
| | |
| Elfun Income Fund | | (in thousands) — December 31, 2010 |
| | | | | | | | | | | | |
| | | | | Principal
Amount | | | Fair
Value | | | |
| | | | | | | | | | | | |
| |
| Republic of Dominican | | | |
| 7.50% | | 05/06/21 | | $ | 300 | | | $ | 323 | | | (b) |
| 9.50% | | 09/27/11 | | | 124 | | | | 128 | | | |
Republic of Ghana | | | | | | | | | | |
| 8.50% | | 10/04/17 | | | 200 | | | | 225 | | | (b) |
Republic of Indonesia | | | | | | | | | | |
| 5.88% | | 03/13/20 | | | 100 | | | | 110 | | | (b) |
Russian Foreign Bond - Eurobond | | | | | | | | | | |
| 3.63% | | 04/29/15 | | | 100 | | | | 100 | | | (b) |
| 5.00% | | 04/29/20 | | | 200 | | | | 200 | | | (b) |
| 7.50% | | 03/31/30 | | | 240 | | | | 278 | | | (j) |
United Mexican States | | | | | | | | | | |
| 5.13% | | 01/15/20 | | | 116 | | | | 121 | | | |
| 6.05% | | 01/11/40 | | | 250 | | | | 256 | | | |
| | | | | | | | | 10,603 | | | |
| |
| Municipal Bonds and Notes — 0.7% | | | |
American Municipal Power-Ohio Inc. | | | | | | | | | | |
| 8.08% | | 02/15/50 | | | 280 | | | | 298 | | | |
Municipal Electric Authority of Georgia | | | | | | | | | | |
| 6.64% | | 04/01/57 | | | 949 | | | | 928 | | | |
New Jersey State Turnpike Authority | | | | | | | | | | |
| 7.10% | | 01/01/41 | | | 200 | | | | 217 | | | |
| 7.41% | | 01/01/40 | | | 560 | | | | 615 | | | |
New Jersey Transportation Trust Fund Authority | | | | | | | | | | |
| 6.88% | | 12/15/39 | | | 165 | | | | 160 | | | |
South Carolina State Public Service Authority | | | | | | | | | | |
| 6.45% | | 01/01/50 | | | 200 | | | | 205 | | | |
| | | | | | | | | 2,423 | | | |
| | | |
Total Bonds and Notes
(Cost $340,123) | | | | | | | 344,292 | | | |
Other Investments — 0.3% | | | | | | | |
| | | |
GEI Investment Fund
(Cost $1,040) | | | | | | | 988 | | | (k) |
| | | |
Total Investments in Securities
(Cost $341,163) | | | | | | | 345,280 | | | |
| | | | | | | | | | | | |
| | | | | | | | Fair
Value | | | |
| | | | | | | | | | | | |
Short-Term Investments — 8.7% | | | |
GE Money Market Fund Institutional Class | | | |
0.00% | | | | | | $ | 30,453 | | | (d,k) |
(Cost $30,453) | | | | | | | | | | |
| | | |
Total Investments
(Cost $371,616) | | | | | | | 375,733 | | | |
| | | |
Liabilities in Excess of Other Assets, net — (7.3)% | | | | | | | (25,408) | | | |
| | | | | | | | | | | | |
| | | |
NET ASSETS — 100.0% | | | | | | $ | 350,325 | | | |
| | | | | | | | | | | | |
Other Information
The Fund had the following long futures contracts open at December 31, 2010:
| | | | | | | | | | | | | | |
| Description | | Expiration
Date | | Number
of
Contracts | | | Current
Notional
Value | | | Unrealized
(Depreciation) | |
| | | | |
2 Yr. U.S. Treasury Notes Futures | | March 2011 | | | 188 | | | $ | 41,154 | | | $ | (46) | |
| | | | |
5 Yr. U.S. Treasury Notes Futures | | March 2011 | | | 63 | | | | 7,416 | | | | (72) | |
The Fund had the following short futures contracts open at December 31, 2010:
| | | | | | | | | | | | | | |
| Description | | Expiration
Date | | Number
of
Contracts | | | Current
Notional
Value | | | Unrealized
Appreciation/
(Depreciation) | |
| | | | |
Ultra Long U.S. Treasury Bond Futures | | March 2011 | | | 104 | | | $ | (13,218) | | | $ | (16) | |
| | | | |
10 Yr. U.S. Treasury Notes Futures | | March 2011 | | | 454 | | | | (54,679) | | | | 711 | |
| | | | | | | | | | | | | | |
| | | | | | | | | | | | $ | 577 | |
| | | | | | | | | | | | | | |
See Notes to Schedules of Investments and Notes to Financial Statements.
78
(Unaudited)


Michael E. Martini
The Elfun Money Market Fund is managed by a team of portfolio managers that includes James C. Gannon, Michael E. Martini (pictured to the left) and Adam Ackermann. The team is led by Mr. Martini, who is vested with oversight authority. See portfolio managers’ biographical information beginning on page 116.
| Q. | How did the Elfun Money Market Fund perform compared to its benchmark for the twelve-month period ended December 31, 2010? |
| A. | The Elfun Money Market Fund returned 0.24% (net of fees) for the twelve-month period ended December 31, 2010 versus a return of 0.14% for the U.S. 90-day Treasury bill. |
| Q. | Discuss the factors that materially affected the fund’s performance during the fiscal period. |
| A. | 2010 was a challenging year for money market funds to provide attractive yields/returns. The Federal Reserve kept its fed funds target at 0-0.25% throughout the entire year. The level and movement of LIBOR rates had a large affect on other short term investment yields (i.e., commercial paper, certificates of deposit and floating rate notes). 3-month LIBOR began to rise in the first quarter after the Treasury announced plans to restart the Supplementary Financing Program effectively removing $200 billion of excess reserves and money market funds lost $300 billion in assets. A confluence of factors pressured LIBOR rates higher in the second quarter including 1) Europe’s banking and sovereign debt crisis, 2) $170 billion decline |
| | in money market fund assets and 3) new SEC rules addressing very short-term liquidity requirements becoming effective. By the end of June, 3-month LIBOR had risen to 53 basis points from 25 bps at the beginning of the year and the 3-month LIBOR-OIS spread had widened from 12 to 33 basis points. |
LIBOR rates dropped and the LIBOR-OIS spread narrowed back to roughly end of March levels in the third quarter as the drain on money market fund assets subsided. The Fed announced a second round of quantitative easing (QE 2) in November that although directly impacted longer treasury yields, did have residual effects on money market rates, including repo. Although the European sovereign/banking crisis continued unresolved by yearend 2010, LIBOR rates remained unchanged in the fourth quarter. While improving U.S. economic fundamentals caused a repricing in the forward Fed Funds market, money market yields remained depressed at year end.
| Q. | Were there any significant changes to the Fund during the period? |
| A. | The most significant change to the Fund during 2010 resulted from the new SEC amendments to Rule 2a-7 governing money market mutual funds. Among the amendments were guidelines addressing liquidity, something not done before. These included minimum levels of securities/cash maturing in both 1-day and 7-days. Since the SEC deemed all US Treasury securities to be liquid and |
79
(Unaudited)
| | hence satisfy the 2 new liquidity requirements, about 10% of the Fund’s assets were allocated to US Treasuries. The US Government/Agency allocation remained at about 25%, so the Fund’s overall “Government” allocation grew to 35%. |
From the credit perspective, purchases of Irish banks (guaranteed by the Republic of Ireland) were curtailed. This was in response to the fallout of the European banking and sovereign debt crisis, and Ireland’s forced bailout.
80
(Unaudited)
Understanding Your Fund’s Expenses
As a shareholder of the Fund you incur transaction and ongoing expenses. Transaction expenses including sales charges on purchases payments, reinvested dividends (or other distributions), and redemption fees directly reduce the investment return of the Fund. Ongoing costs include portfolio management fees, distribution and services fees, professional fees, administrative fees and other Fund expenses. The following example is intended to help you understand your ongoing costs (in dollars) of investing in the Fund and to compare these costs with the ongoing costs of investing in other mutual funds.
To illustrate these ongoing costs, we have provided an example and calculated the expenses paid by investors in each share class of the Fund during the period. The information in the following table is based on an investment of $1,000, which is invested at the beginning of the period and held for the entire six-month period ended December 31, 2010.
Actual Expenses
The first section of the table provides information about actual account values and actual expenses. You may use the information in this section,
together with the amount you invested, to estimate the expenses that you paid over the period. To do so, simply divide your account value by $1,000 (for example, an $8,600 account value divided by $1,000 = 8.6), then multiply the result by the number given for your class under the heading “Expenses Paid During Period.”
Hypothetical Example for Comparison Purposes
The second section of the table provides information about hypothetical account values and hypothetical expenses based on the Fund’s actual expense ratio and an assumed rate of return of 5% per year before expenses, which is not the Fund’s actual return. You may use this information to compare the ongoing costs of investing in the Fund and other funds. To do so, compare this 5% hypothetical example with the 5% hypothetical examples that appear in the shareholders reports of other funds.
Please note that the expenses shown in the table for both “Actual” and “Hypothetical” do not reflect any transaction costs, such as sales charges or redemption fees.
July 1, 2010 – December 31, 2010
| | | | | | | | | | | | |
| | | Account value at
the beginning
of the period ($) | | | Account value
at the end of
the period ($) | | | Expenses
paid during
the period ($)* | |
| | | |
Actual Fund Return** | | | 1,000.00 | | | | 1,001.49 | | | | 1.31 | |
| | | |
Hypothetical 5% Return (2.5% for the period) | | | 1,000.00 | | | | 1,023.62 | | | | 1.33 | |
| * | | Expenses are equal to the Fund’s annualized expense ratio of 0.26% (for the period July 1, 2010 - December 31, 2010), multiplied by the average account value over the period, multiplied by 184/365 (to reflect the one-half year period) |
| ** | | Actual Fund Return for the six-month period ended December 31, 2010 was: 0.15%. Past performance does not guarantee future results. |
81
(Unaudited)
Investment Profile
A mutual fund designed for investors who seek a high level of current income consistent with prudent investment management and the preservation of capital by investing primarily in short-term, U.S. dollar denominated money market instruments.
Fund Yield At December 31, 2010
| | | | | | | | |
| | | Fund | | | Money Fund
Report* | |
| | |
7-day current† | | | 0.22% | | | | 0.07% | |
| | |
7-day effective | | | 0.22% | | | | 0.07% | |
Sector Allocation
as a % of the Fair Value of $207,024 (in thousands) as of December 31, 2010.(b)
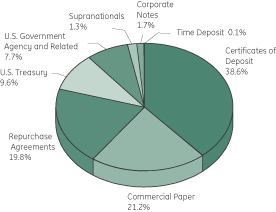
Morningstar Performance Comparison
US Money Market Taxable Peer Group
Based on average annual returns for periods ended 12/31/10
| | | | | | | | | | | | |
| | | One
Year | | | Five
Year | | | Ten
Year | |
Number of funds in peer group | | | 974 | | | | 813 | | | | 605 | |
Peer group average annual total return | | | 0.03 | % | | | 2.23 | % | | | 1.99 | % |
Morningstar Category in peer group: Money Market Taxable | |
Change in Value of a $10,000 Investment(a)
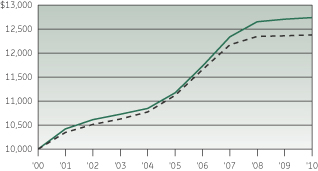
Average Annual Total Return
for the periods ended December 31, 2010
| | | | | | | | | | | | | | | | |
| (Inception date: 06/13/90) | | | | | | | | | | |
| | | One
Year | | | Five
Year | | | Ten
Year | | | Ending value of a
$10,000
investment (a) | |
| | | | |
Elfun Money Market Fund | | | 0.24% | | | | 2.66% | | | | 2.45% | | | | 12,739 | |
| | | | |
90 Day T-Bill | | | 0.14% | | | | 2.17% | | | | 2.16% | | | | 12,380 | |

| † | The seven day current yield, rather than the total return, more closely reflects the current earnings of the Money Market Fund at December 31, 2010. |
| * | IBC’s Money Fund report provides average yield for all major money market funds. |
| (a) | Ending value of a $10,000 investment for the ten-year period or since inception, whichever is less. |
| (b) | The securities information regarding holdings, allocations and other characteristics is presented to illustrate examples of securities that the Fund has bought and the diversity of areas in which the Fund may invest as of a particular date. It may not be representative of the Fund’s current or future investments and should not be construed as a recommendation to purchase or sell a particular security. |
See Notes to Performance on page 1 for further information, including an explanation of Morningstar peer categories.
Past performance does not predict future performance. The performance shown on the graph and tables does not reflect the deduction of taxes that a shareholder would pay on Fund distributions or the redemption of Fund shares.
An investment in the Elfun Money Market Fund is not insured or guaranteed by the Federal Deposit Insurance Corporation or by any other Government agency. Although the Fund seeks to preserve the value of your investment at $1.00 per unit, it is possible to lose money by investing in the Fund.
82
| | |
| Elfun Money Market Fund | | (in thousands) — December 31, 2010 |
| | | | | | | | | | | | |
| | | | | Principal
Amount | | | Amortized
Cost | | | |
| | | | | | | | | | | | |
Short-Term Investments — 100.0%† | | | |
| | |
| U.S. Treasury — 9.6% | | | | | | | |
| | | |
U.S. Treasury Bills | | | | | | | | | | |
| 0.13% | | 02/17/11 | | $ | 6,150 | | | $ | 6,150 | | | (d) |
| 0.19% | | 06/30/11 | | | 190 | | | | 190 | | | (d) |
U.S. Treasury Notes | | | | | | | | | | |
| 0.88% | | 02/28/11 - 4/30/11 | | | 9,400 | | | | 9,412 | | | |
| 1.00% | | 07/31/11 | | | 4,050 | | | | 4,067 | | | |
| | | | | | | | | 19,819 | | | |
| |
| U.S. Government Agency and Related — 7.7% | | | |
FHLB Disc Corp | | | | | | | | | | |
| 0.17% | | 02/02/11 - 02/16/11 | | | 9,850 | | | | 9,850 | | | (d) |
FNMA Discount Note | | | | | | | | | | |
| 0.27% | | 01/05/11 | | | 3,450 | | | | 3,450 | | | (d) |
Freddie Mac | | | | | | | | | | |
| 0.35% | | 04/01/11 | | | 2,700 | | | | 2,702 | | | (d,i) |
| | | | | | | | | 16,002 | | | |
| | |
| Commercial Paper — 21.2% | | | | | | | |
Banco Bilbao Viz London | | | | | | | | | | |
| 0.50% | | 02/25/11 | | | 2,950 | | | | 2,948 | | | (d) |
Caisse D’Amort Dette Soc | | | | | | | | | | |
| 0.26% | | 03/15/11 | | | 4,200 | | | | 4,198 | | | (b,d) |
Commonwealth Bank Australia | | | | | | | | | | |
| 0.27% | | 02/25/11 | | | 6,350 | | | | 6,347 | | | (d) |
Credit Suisse NY | | | | | | | | | | |
| 0.25% | | 01/19/11 | | | 3,900 | | | | 3,900 | | | (d) |
Eksportfinans Asa | | | | | | | | | | |
| 0.23% | | 01/21/11 | | | 5,500 | | | | 5,499 | | | (b,d) |
European Investment Bank | | | | | | | | | | |
| 0.26% | | 01/05/11 | | | 4,100 | | | | 4,100 | | | (d) |
Nordea North America Inc | | | | | | | | | | |
| 0.33% | | 01/06/11 | | | 5,000 | | | | 5,000 | | | (d) |
| Societe Generale N Amer | | | | | | | | | | |
| 0.33% | | 02/07/11 | | | 2,300 | | | | 2,299 | | | (d) |
| 0.50% | | 02/01/11 | | | 4,800 | | | | 4,798 | | | (d) |
UBS Finance Delaware LLC | | | | | | | | | | |
| 0.28% | | 02/14/11 | | | 2,100 | | | | 2,099 | | | (d) |
Westpac Banking Corp | | | | | | | | | | |
| 0.31% | | 04/08/11 | | | 2,750 | | | | 2,748 | | | (d) |
| | | | | | | | | 43,936 | | | |
| | | | | | | | | | | | |
| | | | | Principal
Amount | | | Amortized
Cost | | | |
| | | | | | | | | | | | |
| | |
| Repurchase Agreements — 19.8% | | | | | | | |
| | | |
Deutsche Bank Secuities, Inc. Gov Agcy Repo | | | | | | | | | | |
| 0.22% dated 12/31/10, to be repurchased at $4,500 on 01/01/11 collateralized by $4,590 U.S. Government Agency Bonds, 0.85% maturing 08/17/12 01/03/11 | | $ | 4,500 | | | $ | 4,500 | | | (d) |
Goldman Sachs & Co. Gov Agcy Repo | | | | | | | | | | |
| $14,200 on 01/01/11 collateralized by $14,485 U.S. Government Agency Bonds, 4.50% , 4.50%, 0.00% and 0.50% maturing on 09/16/13, 11/15/12, 10/02/12, and 10/30/12 respectively. 01/03/11 | | | 14,200 | | | | 14,200 | | | (d) |
HSBC Securities (USA) Inc. Gov Agcy Repo | | | | | | | | | | |
| 0.21% dated 12/31/10, to be repurchased at $11,800 on 01/01/11 collateralized by $11,980 U.S. Government Agency Bonds, 1.875% maturing 09/30/17 01/03/11 | | | 11,800 | | | | 11,800 | | | (d) |
J.P. Morgan Securities LLC Gov Agcy Repo | | | | | | | | | | |
| 0.18% dated 12/31/10, to be repurchased at $10,530 on 01/01/11 collateralized by $10,740 U.S. Government Agency Bonds, 0.00%, 0.00% maturing 05/04/11, 06/13/11 respectively. 01/03/11 | | | 10,530 | | | | 10,530 | | | (d) |
| | | | | | | | | 41,030 | | | |
| |
| Certificates of Deposit — 38.6% | | | |
| | | |
Abbey National Treasury Services | | | | | | | | | | |
| 0.34% | | 02/25/11 | | | 7,750 | | | | 7,750 | | | (d,i) |
Banco Bilbao Viz Arg NY | | | | | | | | | | |
| 0.56% | | 03/07/11 | | | 3,100 | | | | 3,100 | | | (d) |
Bank of Montreal Chicago | | | | | | | | | | |
| 0.24% | | 01/20/11 | | | 3,200 | | | | 3,200 | | | (d) |
See Notes to Schedules of Investments and Notes to Financial Statements.
83
| | |
| Elfun Money Market Fund | | (in thousands) — December 31, 2010 |
| | | | | | | | | | | | |
| | | | | Principal
Amount | | | Amortized
Cost | | | |
| | | | | | | | | | | | |
| | | |
Bank of Nova Scotia Houston | | | | | | | | | | |
| 0.30% | | 04/04/11 | | $ | 3,950 | | | $ | 3,950 | | | (d) |
Barclays Bank PLC NY | | | | | | | | | | |
| 0.36% | | 05/03/11 | | | 5,700 | | | | 5,700 | | | (d,i) |
| 0.41% | | 06/20/11 | | | 1,450 | | | | 1,450 | | | (d,i) |
BNP Paribas NY | | | | | | | | | | |
| 0.33% | | 02/18/11 | | | 4,150 | | | | 4,150 | | | (d) |
Credit Agricole CIB NY | | | | | | | | | | |
| 0.29% | | 02/03/11 | | | 6,050 | | | | 6,050 | | | (d) |
Deutsche Bank Ag NY | | | | | | | | | | |
| 0.47% | | 01/10/11 | | | 6,400 | | | | 6,400 | | | (d,i) |
National Australia BK NY | | | | | | | | | | |
| 0.32% | | 06/10/11 | | | 3,350 | | | | 3,350 | | | (d,i) |
Nordea Bank Fld PLC | | | | | | | | | | |
| 0.28% | | 03/17/11 | | | 1,600 | | | | 1,600 | | | (d) |
Rabobank Nederland NV NY | | | | | | | | | | |
| 0.29% | | 01/13/11 | | | 3,650 | | | | 3,650 | | | (d) |
| 0.55% | | 02/01/11 | | | 4,000 | | | | 4,000 | | | (d) |
Royal Bank of Canada NY | | | | | | | | | | |
| 0.26% | | 02/24/11 | | | 2,750 | | | | 2,750 | | | (d,i) |
| 0.28% | | 08/26/11 | | | 3,900 | | | | 3,900 | | | (d,i) |
Royal Bk of Scotland CT | | | | | | | | | | |
| 0.29% | | 01/20/11 | | | 5,050 | | | | 5,050 | | | (d) |
Svenska Handelsbanken NY | | | | | | | | | | |
| 0.27% | | 02/17/11 | | | 2,950 | | | | 2,950 | | | (d) |
| 0.30% | | 02/28/11 | | | 2,500 | | | | 2,500 | | | (d) |
Toronto-Dominion Bank NY | | | | | | | | | | |
| 0.25% | | 03/03/11 | | | 4,000 | | | | 4,000 | | | (d) |
Westpac Banking Corp NY | | | | | | | | | | |
| 0.29% | | 05/13/11 | | | 4,400 | | | | 4,400 | | | (d,i) |
| | | | | | | | | 79,900 | | | |
| |
| Corporate Notes — 1.7% | | | |
Australia & NZ Banking Group | | | | | | | | | | |
| 0.45% | | 04/26/11 | | | 2,050 | | | | 2,052 | | | (b,d,i) |
National Australia Bank | | | | | | | | | | |
| 0.37% | | 07/07/11 | | | 1,450 | | | | 1,451 | | | (b,d,i) |
| | | | | | | | | 3,503 | | | |
| |
| Supranationals — 1.3% | | | |
Intl Bk Recon & Develop | | | | | | | | | | |
| 0.31% | | 07/13/11 | | | 2,650 | | | | 2,650 | | | (d,i) |
| | | | | | | | | | | | |
| | | | | Principal
Amount | | | Amortized
Cost | | | |
| | | | | | | | | | | | |
| |
| Time Deposit — 0.1% | | | |
State Street Corp. | | | | | | | | | | |
| 0.01% | | 01/03/11 | | $ | 184 | | | $ | 184 | | | (e) |
| | | |
Total Short-Term Investments
(Cost $207,024) | | | | | | | 207,024 | | | |
| | | |
Other Assets and Liabilities
net — 0.0%* | | | | | | | 84 | | | |
| | | | | | | | | | | | |
| | | |
NET ASSETS — 100.0% | | | | | | $ | 207,108 | | | |
| | | | | | | | | | | | |
See Notes to Schedules of Investments and Notes to Financial Statements.
84

(In thousands) — December 31, 2010
The views expressed in this document reflect our judgment as of the publication date and are subject to change at any time without notice. The securities information regarding holdings, allocations and other characteristics are presented as of a particular date to illustrate examples of securities that the Funds have bought and the diversity of areas in which the funds may invest as of a particular date. It may not be representative of the Funds’ current or future investments and should not be construed as a recommendation to purchase or sell a particular security. See the prospectus for complete descriptions of investment objectives, policies, risks and permissible investments.
| (a) | Non-income producing security. |
| (b) | Pursuant to Rule 144A of the Securities Act of 1933, these securities may be resold in transactions exempt from registration, normally to qualified institutional buyers. At December 31, 2010, these securities amounted to $7,240; $8,036; $35,352 or 3.15%, 0.48%, 10.09% of the net assets of the Elfun Diversified Fund, Elfun Tax-Exempt Income Fund and Elfun Income Fund. These securities have been determined to be liquid using procedures established by the Board of Trustees. (Unaudited) |
| (c) | Settlement is on a delayed delivery or when-issued basis with final maturity to be announced (TBA) in the future. |
| (d) | Coupon amount represents effective yield. |
| (e) | State Street Corp. is the parent company of State Street Bank & Trust Co., the Fund’s custodian and accounting agent. |
| (f) | Principal only security. These type securities represent the right to receive the monthly principal payments on an underlying pool of mortgages. No payments of interest on the pool are passed through to the “principal only” holder. |
| (g) | Interest only security. These type of securities represent the right to receive the monthly interest |
| | payments on an underlying pool of mortgages. Payments of principal on the pool reduce the value of the “interest only” holding. |
| (h) | At December 31, 2010, all or a portion of this security was pledged to cover collateral requirements for futures, options, forward foreign currency contracts and/or TBA’s. |
| (i) | Variable or floating rate security. The stated rate represents the rate at December 31, 2010. |
| (j) | Step coupon bond. Security becomes interest bearing at a future date. |
| (k) | GE Asset Management Incorporated, the investment adviser of the Fund, also serves as investment adviser of the GEI Investment Fund and the GE Funds-GE Money Market Fund. |
| (l) | Escrowed to maturity bonds are collateralized by U.S. Treasury securities which are held in escrow by a trustee and used to pay principal and interest on such bonds. |
| (m) | Pre refunded bonds are collateralized by U.S. Treasury securities, which are held in escrow and are used to pay principal and interest on the tax-exempt issue and to retire the bonds at the earliest refunding date. |
| (n) | The security is insured by AMBAC, AGC, MBIA, FSA or FGIC. The Elfun Tax-Exempt Fund had insurance concentrations of 5% or greater as of December 31, 2010 (as a percentage of net assets) as follows: |
| | |
| FSA | | 8.76% |
| AMBAC | | 8.06% |
| MBIA | | 5.99% |
| (o) | Securities at default. |
| (p) | Sponsored by SSGA Funds Management, Inc., an affiliate of State Street Bank & Trust Co., the Fund’s custodian and accounting agent. |
85
(In thousands) — December 31, 2010
| (q) | Illiquid Securities. At December 31, 2010, these securities amounted to $2,486 and $455 or 0.71% and 0.20% of net assets for the Elfun Income and Elfun Diversified Fund respectively. These securities have been determined to be illiquid using procedures established by the Board of Directors (Unaudited). |
| (r) | Coupon amount represents the coupon of the underlying mortgage securities on which monthly interest payments are based. |
| † | Percentages are based on net assets as of December 31, 2010. |
| ** | Amount is less than $500. |
Abbreviations:
| | | | |
| | |
| ADR | | — | | American Depositary Receipt |
| AGC | | — | | Assured Guaranty Corporation |
| AMBAC | | — | | AMBAC Indemnity Corporation |
| FGIC | | — | | Financial Guaranty Insurance Corporation |
| FSA | | — | | Financial Security Assurance |
| GDR | | — | | Global Depositary Receipt |
| MBIA | | — | | Municipal Bond Investors Assurance Corporation |
| REIT | | — | | Real Estate Investment Trust |
| REMIC | | — | | Real Estate Mortgage Investment Conduit |
| SPDR | | — | | Standard & Poor’s Depository Receipts |
| STRIPS | | — | | Separate Trading of Registered Interest and Principal of Security |
| TBA | | — | | To be announced |
| FNMA | | — | | Federal National Mortgage Association |
| FHLB | | — | | Federal Home Loan Bank |
86

Selected data based on a unit outstanding during the fiscal years indicated
| | | | | | | | | | | | | | | | | | | | |
| Elfun International Equity Fund | | 2010 | | | 2009 | | | 2008 | | | 2007 | | | 2006 | |
Inception date | | | — | | | | — | | | | — | | | | — | | | | 1/1/88 | |
Net asset value, beginning of year | | | $18.24 | | | | $14.65 | | | | $28.32 | | | | $25.69 | | | | $21.82 | |
Income (loss) from investment operations: | | | | | | | | | | | | | | | | | | | | |
Net investment income | | | 0.36 | | | | 0.43 | | | | 0.77 | | | | 0.63 | | | | 0.51 | |
Net realized and unrealized
gains (losses) on investments | | | 0.69 | | | | 3.63 | | | | (13.26 | ) | | | 5.45 | | | | 5.16 | |
Total income (loss) from investment operations | | | 1.05 | | | | 4.06 | | | | (12.49 | ) | | | 6.08 | | | | 5.67 | |
Less distributions from: | | | | | | | | | | | | | | | | | | | | |
Net investment income | | | 0.37 | | | | 0.44 | | | | 0.74 | | | | 0.61 | | | | 0.52 | |
Net realized gains | | | — | | | | 0.03 | | | | 0.44 | | | | 2.84 | | | | 1.28 | |
Total distributions | | | 0.37 | | | | 0.47 | | | | 1.18 | | | | 3.45 | | | | 1.80 | |
Net asset value, end of year | | | $18.92 | | | | $18.24 | | | | $14.65 | | | | $28.32 | | | | $25.69 | |
TOTAL RETURN (a) | | | 5.77% | | | | 27.69 | % | | | (44.15) | % | | | 23.78 | % | | | 26.03 | % |
RATIOS/SUPPLEMENTAL DATA: | | | | | | | | | | | | | | | | | | | | |
Net assets, end of year (in thousands) | | | $309,473 | | | | $301,332 | | | | $248,781 | | | | $483,850 | | | | $385,518 | |
Ratios to average net assets: | | | | | | | | | | | | | | | | | | | | |
Net investment income | | | 2.05 | % | | | 2.66 | % | | | 3.10 | % | | | 2.23 | % | | | 2.11 | % |
Net expenses | | | 0.32 | % | | | 0.27 | %(c) | | | 0.44 | %(c) | | | 0.20 | % | | | 0.18 | % |
Gross expenses | | | 0.34 | % | | | 0.28 | % | | | 0.45 | % | | | 0.20 | % | | | 0.18 | % |
Portfolio turnover rate | | | 42 | % | | | 45 | % | | | 41 | % | | | 31 | % | | | 30 | % |
| | | | | | | | | | | | | | | | | | | | |
| Elfun Trusts | | 2010 | | | 2009 | | | 2008 | | | 2007 | | | 2006 | |
Inception date | | | — | | | | — | | | | — | | | | — | | | | 5/27/35 | |
Net asset value, beginning of year | | | $38.50 | | | | $30.23 | | | | $48.73 | | | | $51.58 | | | | $50.74 | |
Income (loss) from investment operations: | | | | | | | | | | | | | | | | | | | | |
Net investment income | | | 0.40 | | | | 0.35 | | | | 0.49 | | | | 0.61 | | | | 0.69 | |
Net realized and unrealized
gains (losses) on investments | | | 4.64 | | | | 9.83 | | | | (17.35 | ) | | | 2.01 | | | | 5.97 | |
Total income (loss) from investment operations | | | 5.04 | | | | 10.18 | | | | (16.86 | ) | | | 2.62 | | | | 6.66 | |
Less distributions from: | | | | | | | | | | | | | | | | | | | | |
Net investment income | | | 0.41 | | | | 0.37 | | | | 0.49 | | | | 0.61 | | | | 0.70 | |
Return of Capital | | | — | | | | 0.03 | | | | 0.02 | | | | — | | | | — | |
Net realized gains | | | 1.75 | | | | 1.51 | | | | 1.13 | | | | 4.86 | | | | 5.12 | |
Total distributions | | | 2.16 | | | | 1.91 | | | | 1.64 | | | | 5.47 | | | | 5.82 | |
Net asset value, end of year | | | $41.38 | | | | $38.50 | | | | $30.23 | | | | $48.73 | | | | $51.58 | |
TOTAL RETURN (a) | | | 13.07 | % | | | 33.62 | % | | | (34.53) | % | | | 5.05 | % | | | 13.10 | % |
RATIOS/SUPPLEMENTAL DATA: | | | | | | | | | | | | | | | | | | | | |
Net assets, end of year (in thousands) | | | $1,731,716 | | | | $1,639,896 | | | | $1,314,686 | | | | $2,199,017 | | | | $2,302,024 | |
Ratios to average net assets: | | | | | | | | | | | | | | | | | | | | |
Net investment income | | | 1.00 | % | | | 1.05 | % | | | 1.10 | % | | | 1.10 | % | | | 1.29 | % |
Net expenses | | | 0.21 | % | | | 0.23 | %(c) | | | 0.21 | %(c) | | | 0.12 | % | | | 0.13 | % |
Gross expenses | | | 0.22 | % | | | 0.24 | % | | | 0.22 | % | | | 0.12 | % | | | 0.13 | % |
Portfolio turnover rate | | | 14 | % | | | 8 | % | | | 20 | % | | | 12 | % | | | 14 | % |
The accompanying Notes are an integral part of these financial statements.
87
Selected data based on a unit outstanding during the fiscal years indicated
| | | | | | | | | | | | | | | | | | | | |
| Elfun Diversified Fund | | 2010 | | | 2009 | | | 2008 | | | 2007 | | | 2006 | |
Inception date | | | — | | | | — | | | | — | | | | — | | | | 1/1/88 | |
Net asset value, beginning of year | | | $16.08 | | | | $13.41 | | | | $19.80 | | | | $20.15 | | | | $18.74 | |
Income (loss) from investment operations: | | | | | | | | | | | | | | | | | | | | |
Net investment income | | | 0.28 | | | | 0.29 | | | | 0.42 | | | | 0.50 | | | | 0.50 | |
Net realized and unrealized
gains (losses) on investments | | | 1.32 | | | | 2.68 | | | | (6.41) | | | | 1.26 | | | | 2.24 | |
Total income (loss) from investment operations | | | 1.60 | | | | 2.97 | | | | (5.99) | | | | 1.76 | | | | 2.74 | |
Less distributions from: | | | | | | | | | | | | | | | | | | | | |
Net investment income | | | 0.27 | | | | 0.30 | | | | 0.40 | | | | 0.49 | | | | 0.50 | |
Net realized gains | | | — | | | | 0.00 | * | | | — | | | | 1.62 | | | | 0.83 | |
Total distributions | | | 0.27 | | | | 0.30 | | | | 0.40 | | | | 2.11 | | | | 1.33 | |
Net asset value, end of year | | | $17.41 | | | | $16.08 | | | | $13.41 | | | | $19.80 | | | | $20.15 | |
TOTAL RETURN (a) | | | 9.98 | % | | | 22.13 | % | | | (30.23) | % | | | 8.74 | %(b) | | | 14.60 | % |
RATIOS/SUPPLEMENTAL DATA: | | | | | | | | | | | | | | | | | | | | |
Net assets, end of year (in thousands) | | | $229,881 | | | | $220,654 | | | | $191,347 | | | | $292,224 | | | | $283,069 | |
Ratios to average net assets: | | | | | | | | | | | | | | | | | | | | |
Net investment income | | | 1.76 | % | | | 1.98 | % | | | 2.35 | % | | | 2.31 | % | | | 2.45 | % |
Net expenses | | | 0.48 | % | | | 0.43 | %(c) | | | 0.31 | %(c) | | | 0.20 | % | | | 0.20 | % |
Gross expenses | | | 0.75 | % | | | 0.47 | % | | | 0.33 | % | | | 0.20 | % | | | 0.20 | % |
Portfolio turnover rate | | | 148 | % | | | 142 | % | | | 180 | % | | | 171 | % | | | 119 | % |
| | | | | | | | | | | | | | | | | | | | |
| Elfun Tax-Exempt Income Fund | | 2010 | | | 2009 | | | 2008 | | | 2007 | | | 2006 | |
Inception date | | | — | | | | — | | | | — | | | | — | | | | 1/1/80 | |
Net asset value, beginning of year | | | $11.64 | | | | $10.73 | | | | $11.54 | | | | $11.74 | | | | $11.75 | |
Income (loss) from investment operations: | | | | | | | | | | | | | | | | | | | | |
Net investment income | | | 0.53 | | | | 0.53 | | | | 0.53 | | | | 0.54 | | | | 0.54 | |
Net realized and unrealized
gains (losses) on investments | | | (0.31) | | | | 0.91 | | | | (0.81) | | | | (0.20) | | | | 0.01 | |
Total income from investment operations | | | 0.22 | | | | 1.44 | | | | (0.28) | | | | 0.34 | | | | 0.55 | |
Less distributions from: | | | | | | | | | | | | | | | | | | | | |
Net investment income | | | 0.53 | | | | 0.53 | | | | 0.53 | | | | 0.54 | | | | 0.54 | |
Net realized gains | | | — | | | | — | | | | — | | | | 0.00 | * | | | 0.02 | |
Total distributions | | | 0.53 | | | | 0.53 | | | | 0.53 | | | | 0.54 | | | | 0.56 | |
Net asset value, end of year | | | 11.33 | | | | $11.64 | | | | $10.73 | | | | $11.54 | | | | $11.74 | |
TOTAL RETURN (a) | | | 1.86 | % | | | 13.64 | % | | | (2.51) | % | | | 2.96 | % | | | 4.83 | % |
RATIOS/SUPPLEMENTAL DATA: | | | | | | | | | | | | | | | | | | | | |
Net assets, end of year (in thousands) | | | $1,677,925 | | | | $1,776,803 | | | | $1,623,597 | | | | $1,757,490 | | | | $1,771,290 | |
Ratios to average net assets: | | | | | | | | | | | | | | | | | | | | |
Net investment income | | | 4.54 | % | | | 4.66 | % | | | 4.72 | % | | | 4.63 | % | | | 4.64 | % |
Net expenses | | | 0.19 | % | | | 0.18 | % | | | 0.12 | % | | | 0.12 | % | | | 0.12 | % |
Gross expenses | | | 0.19 | % | | | 0.18 | % | | | 0.12 | % | | | 0.12 | % | | | 0.12 | % |
Portfolio turnover rate | | | 26 | % | | | 33 | % | | | 37 | % | | | 39 | % | | | 36 | % |
The accompanying Notes are an integral part of these financial statements.
88
Selected data based on a unit outstanding during the fiscal years indicated
| | | | | | | | | | | | | | | | | | | | |
| Elfun Income Fund | | 2010 | | | 2009 | | | 2008 | | | 2007 | | | 2006 | |
Inception date | | | — | | | | — | | | | — | | | | — | | | | 12/31/84 | |
Net asset value, beginning of year | | | $10.73 | | | | $10.35 | | | | $11.09 | | | | $11.05 | | | | $11.14 | |
Income (loss) from investment operations: | | | | | | | | | | | | | | | | | | | | |
Net investment income | | | 0.36 | | | | 0.43 | | | | 0.52 | | | | 0.61 | | | | 0.59 | |
Net realized and unrealized
gains (losses) on investments | | | 0.52 | | | | 0.38 | | | | (0.74) | | | | 0.05 | | | | (0.09) | |
Total income from investment operations | | | 0.88 | | | | 0.80 | | | | (0.22) | | | | 0.66 | | | | 0.50 | |
Less distributions from: | | | | | | | | | | | | | | | | | | | | |
Net investment income | | | 0.43 | | | | 0.43 | | | | 0.52 | | | | 0.62 | | | | 0.59 | |
Net realized gains | | | — | | | | — | | | | — | | | | 0.00 | * | | | — | |
Total distributions | | | 0.43 | | | | 0.43 | | | | 0.52 | | | | 0.62 | | | | 0.59 | |
Net asset value, end of year | | | $11.18 | | | | $10.73 | | | | $10.35 | | | | $11.09 | | | | $11.05 | |
TOTAL RETURN (a) | | | 8.31 | % | | | 8.04 | % | | | (2.01) | % | | | 6.16 | % | | | 4.69 | % |
RATIOS/SUPPLEMENTAL DATA: | | | | | | | | | | | | | | | | | | | | |
Net assets, end of year (in thousands) | | | $350,325 | | | | $338,481 | | | | $328,913 | | | | $363,695 | | | | $363,142 | |
Ratios to average net assets: | | | | | | | | | | | | | | | | | | | | |
Net investment income | | | 3.34 | % | | | 4.15 | % | | | 4.88 | % | | | 5.58 | % | | | 5.41 | % |
Net expenses | | | 0.23 | % | | | 0.24 | %(c) | | | 0.16 | %(c) | | | 0.20 | % | | | 0.19 | % |
Gross expenses | | | 0.27 | % | | | 0.27 | % | | | 0.20 | % | | | 0.20 | % | | | 0.19 | % |
Portfolio turnover rate | | | 357 | % | | | 320 | % | | | 451 | % | | | 432 | % | | | 328 | % |
| | | | | | | | | | | | | | | | | | | | |
| Elfun Money Market Fund | | 2010 | | | 2009 | | | 2008 | | | 2007 | | | 2006 | |
Inception date | | | — | | | | — | | | | — | | | | — | | | | 6/13/90 | |
Net asset value, beginning of year | | | $1.00 | | | | $1.00 | | | | $1.00 | | | | $1.00 | | | | $1.00 | |
Income from investment operations: | | | | | | | | | | | | | | | | | | | | |
Net investment income | | | 0.00 | * | | | 0.00 | * | | | 0.03 | | | | 0.05 | | | | 0.05 | |
Total income from investment operations | | | 0.00 | * | | | 0.00 | * | | | 0.03 | | | | 0.05 | | | | 0.05 | |
Less distributions from: | | | | | | | | | | | | | | | | | | | | |
Net investment income | | | 0.00 | * | | | 0.00 | * | | | 0.03 | | | | 0.05 | | | | 0.05 | |
Total distributions | | | 0.00 | * | | | 0.00 | * | | | 0.03 | | | | 0.05 | | | | 0.05 | |
Net asset value, end of year | | | $1.00 | | | | $1.00 | | | | $1.00 | | | | $1.00 | | | | $1.00 | |
TOTAL RETURN (a) | | | 0.24 | % | | | 0.42 | % | | | 2.57 | % | | | 5.24 | % | | | 4.93 | % |
RATIOS/SUPPLEMENTAL DATA: | | | | | | | | | | | | | | | | | | | | |
Net assets, end of year (in thousands) | | | $207,108 | | | | $244,564 | | | | $285,389 | | | | $327,766 | | | | $306,582 | |
Ratios to average net assets: | | | | | | | | | | | | | | | | | | | | |
Net investment income | | | 0.06 | % | | | 0.43 | % | | | 2.57 | % | | | 5.12 | % | | | 4.87 | % |
Net expenses | | | 0.26 | % | | | 0.24 | % | | | 0.19 | % | | | 0.18 | % | | | 0.18 | % |
Gross expenses | | | 0.28 | % | | | 0.24 | % | | | 0.19 | % | | | 0.18 | % | | | 0.18 | % |
Notes to Financial Highlights
| (a) | Total returns are historical and assume changes in share price, reinvestment of dividends and capital gains distributions and assume no sales charge. Past performance does not guarantee future results. |
| (b) | The total return includes .03% related to the purchase and sales of initial public offerings. |
| (c) | Reflects GEAM’s waiver of a portion of the Fund’s management expenses in an amount equal to the management fee earned by GEAM with respect to the Fund’s investment in the GE Funds – GE Money Market Fund. |
| * | Less than 0.005 per share. |
The accompanying Notes are an integral part of these financial statements.
89
| | | | | | | | |
| | |
Statements of Assets
and Liabilities December 31, 2010
(Amounts in thousands) | | ELFUN
INTERNATIONAL
EQUITY FUND | | | ELFUN
TRUSTS | |
| | |
ASSETS | | | | | | | | |
Investments in securities, at fair value (cost $254,693; $1,293,261; $194,460; $1,623,078; $340,123 and $0 respectively) | | $ | 292,932 | | | $ | 1,681,617 | |
Investments in affiliated securities, at fair value (at cost $99; $457; $206; $281; $1,040 and $0 respectively) | | | 94 | | | | 435 | |
Short-term Investments (at amortized cost) | | | 1,950 | | | | — | |
Short-term affiliated investments (at amortized cost) | | | 13,822 | | | | 49,853 | |
Foreign currency (cost $81; $0; $14; $0; $0; and $0, respectively) | | | 82 | | | | — | |
Receivable for investments sold | | | — | | | | — | |
Income receivables | | | 589 | | | | 1,139 | |
Receivable for fund shares sold | | | 10 | | | | 170 | |
Other assets | | | 692 | | | | — | |
Total assets | | | 310,171 | | | | 1,733,214 | |
LIABILITIES | | | | | | | | |
Distribution payable to unit holders | | | — | | | | — | |
Payable for investments purchased | | | — | | | | — | |
Payable for fund units redeemed | | | 126 | | | | 709 | |
Payable to GEAM | | | 312 | | | | 595 | |
Accrued other expenses | | | 92 | | | | 194 | |
Variation margin payable | | | 168 | | | | — | |
Total liabilities | | | 698 | | | | 1,498 | |
NET ASSETS | | $ | 309,473 | | | $ | 1,731,716 | |
NET ASSETS CONSIST OF: | | | | | | | | |
Capital paid in | | | 324,900 | | | | 1,343,811 | |
Undistributed (distribution in excess of) net investment income | | | 11 | | | | (34 | ) |
Accumulated net realized gain (loss) | | | (53,531 | ) | | | (395 | ) |
Net unrealized appreciation/(depreciation) on: | | | | | | | | |
Investments | | | 38,234 | | | | 388,334 | |
Futures | | | (174 | ) | | | — | |
Foreign currency related transactions | | | 33 | | | | — | |
NET ASSETS | | $ | 309,473 | | | $ | 1,731,716 | |
Units outstanding (Par value $10; $10; $10; $10; $10; and $1, respectively; unlimited shares authorized) | | | 16,356 | | | | 41,849 | |
Net asset value, offering and redemption price per unit | | $ | 18.92 | | | $ | 41.38 | |
The accompanying Notes are an integral part of these financial statements.
90
| | | | | | | | | | | | |
| | | |
ELFUN
DIVERSIFIED
FUND | | ELFUN
TAX-EXEMPT
INCOME FUND | | | ELFUN
INCOME FUND | | | ELFUN
MONEY MARKET
FUND | |
| | | |
| | | | | | | | | | | | |
| | | |
| $214,412 | | $ | 1,643,818 | | | $ | 344,292 | | | $ | — | |
| | | |
| 195 | | | 267 | | | | 988 | | | | — | |
| — | | | 2,138 | | | | — | | | | 207,024 | |
| 21,384 | | | — | | | | 30,453 | | | | — | |
| 15 | | | — | | | | — | | | | — | |
| 820 | | | 8,915 | | | | — | | | | — | |
| 840 | | | 25,813 | | | | 3,325 | | | | 83 | |
| 98 | | | 92 | | | | 188 | | | | 517 | |
| 785 | | | — | | | | — | | | | — | |
| 238,549 | | | 1,681,043 | | | | 379,246 | | | | 207,624 | |
| | | | | | | | | | | | |
| — | | | 2,060 | | | | 329 | | | | — | |
| 8,332 | | | — | | | | 27,712 | | | | — | |
| 111 | | | 280 | | | | 268 | | | | 240 | |
| 34 | | | 651 | | | | 226 | | | | 214 | |
| 80 | | | 127 | | | | 68 | | | | 62 | |
| 111 | | | — | | | | 318 | | | | — | |
| 8,668 | | | 3,118 | | | | 28,921 | | | | 516 | |
| $229,881 | | $ | 1,677,925 | | | $ | 350,325 | | | $ | 207,108 | |
| | | |
| | | | | | | | | | | | |
| 228,738 | | | 1,661,538 | | | | 357,889 | | | | 207,184 | |
| 250 | | | — | | | | (89 | ) | | | 124 | |
| (19,235) | | | (4,339 | ) | | | (12,169 | ) | | | (200 | ) |
| | | | | | | | | | | | |
| 19,941 | | | 20,726 | | | | 4,117 | | | | — | |
| 181 | | | — | | | | 577 | | | | — | |
| 6 | | | — | | | | — | | | | — | |
| $229,881 | | $ | 1,677,925 | | | $ | 350,325 | | | $ | 207,108 | |
| | | |
| 13,201 | | | 148,084 | | | | 31,341 | | | | 207,315 | |
| $ 17.41 | | $ | 11.33 | | | $ | 11.18 | | | $ | 1.00 | |
91
| | | | | | | | |
| | |
Statements of Operations
For the year ended December 31, 2010
(Amounts in thousands) | | ELFUN
INTERNATIONAL
EQUITY FUND | | | ELFUN
TRUSTS | |
| | |
INVESTMENT INCOME | | | | | | | | |
Income: | | | | | | | | |
Dividends | | $ | 7,456 | | | $ | 18,705 | |
Interest | | | 12 | | | | 916 | |
Interest from affiliated investments | | | 1 | | | | 10 | |
Less: Foreign taxes withheld | | | (763 | ) | | | (4 | ) |
Total income | | | 6,706 | | | | 19,627 | |
Expenses: | | | | | | | | |
Administration expenses | | | 435 | | | | 2,552 | |
Transfer agent expenses | | | 170 | | | | 426 | |
Custody and accounting expenses | | | 182 | | | | 63 | |
Professional fees | | | 20 | | | | 36 | |
Registration, filing, printing and miscellaneous expenses | | | 150 | | | | 461 | |
Total expenses | | | 957 | | | | 3,538 | |
Less: Expenses Waived or borne by the adviser | | | (12 | ) | | | (112 | ) |
Less: Expenses recouped by the adviser | | | (38 | ) | | | — | |
Net expenses | | | 907 | | | | 3,426 | |
Net investment income | | | 5,799 | | | | 16,201 | |
NET REALIZED AND UNREALIZED GAIN (LOSS) ON INVESTMENTS | | | | | | | | |
| | |
Realized gain (loss) on: | | | | | | | | |
Investments | | | (10,563 | ) | | | 70,369 | |
Futures | | | 231 | | | | — | |
Foreign currency related transactions | | | (150 | ) | | | — | |
| | |
Increase (decrease) in unrealized appreciation/(depreciation) on: | | | | | | | | |
Investments | | | 20,329 | | | | 116,850 | |
Futures | | | (185 | ) | | | — | |
Foreign currency related transactions | | | 19 | | | | — | |
Net realized and unrealized gain (loss) on investments | | | 9,681 | | | | 187,219 | |
Net increase (decrease) in net assets resulting from operations | | $ | 15,480 | | | $ | 203,420 | |
The accompanying Notes are an integral part of these financial statements.
92
| | | | | | | | | | | | | | |
| | | |
ELFUN
DIVERSIFIED
FUND | | | ELFUN
TAX-EXEMPT
INCOME FUND | | | ELFUN
INCOME FUND | | | ELFUN
MONEY MARKET
FUND | |
| | | |
| | | | | | | | | | | | | | |
| | | | | | | | | | | | | | |
| $ | 2,560 | | | $ | — | | | $ | 12 | | | $ | — | |
| | 2,483 | | | | 85,071 | | | | 12,470 | | | | 684 | |
| | 6 | | | | — | | | | 11 | | | | — | |
| | (150 | ) | | | — | | | | — | | | | — | |
| | 4,899 | | | | 85,071 | | | | 12,493 | | | | 684 | |
| | | | | | | | | | | | | | |
| | 434 | | | | 2,936 | | | | 622 | | | | 368 | |
| | 241 | | | | 174 | | | | 133 | | | | 48 | |
| | 734 | | | | 87 | | | | 44 | | | | 49 | |
| | 29 | | | | 35 | | | | 19 | | | | 19 | |
| | 192 | | | | 261 | | | | 121 | | | | 122 | |
| | 1,630 | | | | 3,493 | | | | 939 | | | | 606 | |
| | (84 | ) | | | — | | | | (121 | ) | | | — | |
| | (494 | ) | | | — | | | | — | | | | (48 | ) |
| | 1,052 | | | | 3,493 | | | | 818 | | | | 558 | |
| | 3,847 | | | | 81,578 | | | | 11,675 | | | | 126 | |
| | | | | | | | | | | | | | |
| | | |
| | | | | | | | | | | | | | |
| | (695 | ) | | | 7,450 | | | | 10,257 | | | | 2 | |
| | 2,026 | | | | — | | | | (3,945 | ) | | | — | |
| | (14 | ) | | | — | | | | (17 | ) | | | — | |
| | | |
| | | | | | | | | | | | | | |
| | 16,047 | | | | (54,185 | ) | | | 9,363 | | | | — | |
| | (193 | ) | | | — | | | | 299 | | | | — | |
| | 5 | | | | — | | | | — | | | | — | |
| | 17,176 | | | | (46,735 | ) | | | 15,957 | | | | 2 | |
| $ | 21,023 | | | $ | 34,843 | | | $ | 27,632 | | | $ | 128 | |
93
| | | | | | | | | | | | | | | | |
| | |
Statements of Changes
in Net Assets For the year ended
December 31, 2010 and 2009 (Amounts in thousands) | | ELFUN
INTERNATIONAL
EQUITY FUND | | | ELFUN
TRUSTS
FUND | |
| | | | |
| | | 2010 | | | 2009 | | | 2010 | | | 2009 | |
INCREASE (DECREASE) IN NET ASSETS | | | | | | | | | | | | | | | | |
Operations: | | | | | | | | | | | | | | | | |
Net investment income | | $ | 5,799 | | | $ | 6,860 | | | $ | 16,201 | | | $ | 15,188 | |
Net realized gain (loss) on investments, futures, written options, foreign currency related transactions and swaps | | | (10,482 | ) | | | (38,433 | ) | | | 70,369 | | | | 62,060 | |
Net increase (decrease) in unrealized appreciation/(depreciation) on investments, futures and foreign currency related transactions | | | 20,163 | | | | 96,377 | | | | 116,850 | | | | 347,531 | |
Net increase (decrease) from operations | | | 15,480 | | | | 64,804 | | | | 203,420 | | | | 424,779 | |
Distributions to unit holders from: | | | | | | | | | | | | | | | | |
Net investment income | | | (5,980 | ) | | | (7,145 | ) | | | (16,402 | ) | | | (15,188 | ) |
Net realized gains | | | — | | | | (430 | ) | | | (70,387 | ) | | | (62,071 | ) |
Return of capital | | | — | | | | — | | | | — | | | | (1,246 | ) |
Total distributions | | | (5,980 | ) | | | (7,575 | ) | | | (86,789 | ) | | | (78,505 | ) |
Increase (decrease) in net assets from operations and distributions | | | 9,500 | | | | 57,229 | | | | 116,631 | | | | 346,274 | |
Unit transactions: | | | | | | | | | | | | | | | | |
Proceeds from sale of units | | | 23,108 | | | | 12,009 | | | | 41,106 | | | | 26,015 | |
Value of distributions reinvested | | | 5,263 | | | | 6,647 | | | | 66,789 | | | | 59,748 | |
Cost of units redeemed | | | (29,730 | ) | | | (23,333 | ) | | | (132,706 | ) | | | (106,827 | ) |
Net increase (decrease) from unit transactions | | | (1,359 | ) | | | (4,678 | ) | | | (24,811 | ) | | | (21,064 | ) |
Total increase (decrease) in net assets | | | 8,141 | | | | 52,551 | | | | 91,820 | | | | 325,210 | |
| | | | |
NET ASSETS | | | | | | | | | | | | | | | | |
Beginning of year | | | 301,332 | | | | 248,781 | | | | 1,639,896 | | | | 1,314,686 | |
End of year | | $ | 309,473 | | | $ | 301,332 | | | $ | 1,731,716 | | | $ | 1,639,896 | |
Undistributed (distribution in excess of)
net investment income, end of year | | $ | 11 | | | $ | 159 | | | $ | (34 | ) | | $ | — | |
| | | | | | | | | | | | | | | | |
| | | | |
| CHANGES IN FUND UNITS | | | | | | | | | | | | |
| | | | |
Units sold by subscription | | | 1,244 | | | | 755 | | | | 997 | | | | 775 | |
Issued for distribution reinvested | | | 279 | | | | 362 | | | | 1,609 | | | | 1,538 | |
| | | | |
| Units redeemed | | | (1,688 | ) | | | (1,582 | ) | | | (3,353 | ) | | | (3,200 | ) |
Net increase (decrease) in fund units | | | (165 | ) | | | (465 | ) | | | (747 | ) | | | (887 | ) |
The accompanying Notes are an integral part of these financial statements.
94
| | | | | | | | | | | | | | | | | | | | | | | | | | | | | | |
| | | |
ELFUN
DIVERSIFIED
FUND | | | ELFUN
TAX-EXEMPT
INCOME FUND | | | ELFUN
INCOME FUND | | | ELFUN
MONEY MARKET
FUND | |
| | | | | | | |
| 2010 | | | 2009 | | | 2010 | | | 2009 | | | 2010 | | | 2009 | | | 2010 | | | 2009 | |
| | | | | | | | | | | | | | | | | | | | | | | | | | | | | | |
| | | | | | | | | | | | | | | | | | | | | | | | | | | | | | |
| $ | 3,847 | | | $ | 3,968 | | | $ | 81,578 | | | $ | 80,344 | | | $ | 11,675 | | | $ | 13,529 | | | $ | 126 | | | $ | 1,161 | |
|
1,317 |
| | | (20,468 | ) | | | 7,450 | | | | (5,590 | ) | | | 6,295 | | | | (8,394 | ) | | | 2 | | | | 6 | |
|
15,859 |
| | | 57,044 | | | | (54,185 | ) | | | 143,175 | | | | 9,662 | | | | 20,348 | | | | — | | | | — | |
| | 21,023 | | | | 40,544 | | | | 34,843 | | | | 217,929 | | | | 27,632 | | | | 25,483 | | | | 128 | | | | 1,167 | |
| | | | | | | | | | | | | | | | | | | | | | | | | | | | | | |
| | (3,566 | ) | | | (4,031 | ) | | | (81,578 | ) | | | (80,344 | ) | | | (13,612 | ) | | | (13,587 | ) | | | (312 | ) | | | (1,161 | ) |
| | — | | | | (3 | ) | | | — | | | | — | | | | — | | | | — | | | | — | | | | — | |
| | — | | | | — | | | | — | | | | — | | | | — | | | | — | | | | — | | | | — | |
| | (3,566 | ) | | | (4,034 | ) | | | (81,578 | ) | | | (80,344 | ) | | | (13,612 | ) | | | (13,587 | ) | | | (312 | ) | | | (1,161 | ) |
|
17,457 |
| | | 36,510 | | | | (46,735 | ) | | | 137,585 | | | | 14,020 | | | | 11,896 | | | | (184 | ) | | | 6 | |
| | | | | | | | | | | | | | | | | | | | | | | | | | | | | | |
| | 9,623 | | | | 8,037 | | | | 60,865 | | | | 62,940 | | | | 23,355 | | | | 22,269 | | | | 83,709 | | | | 90,903 | |
| | 3,089 | | | | 3,480 | | | | 56,241 | | | | 55,172 | | | | 9,704 | | | | 9,605 | | | | 277 | | | | 1,019 | |
| | (20,942 | ) | | | (18,720 | ) | | | (169,249 | ) | | | (102,491 | ) | | | (35,235 | ) | | | (34,202 | ) | | | (121,258 | ) | | | (132,753 | ) |
| | (8,230 | ) | | | (7,203 | ) | | | (52,143 | ) | | | 15,621 | | | | (2,176 | ) | | | (2,328 | ) | | | (37,272 | ) | | | (40,831 | ) |
| | 9,227 | | | | 29,307 | | | | (98,878 | ) | | | 153,206 | | | | 11,844 | | | | 9,568 | | | | (37,456 | ) | | | (40,825 | ) |
| | | | | | | |
| | | | | | | | | | | | | | | | | | | | | | | | | | | | | | |
| | 220,654 | | | | 191,347 | | | | 1,776,803 | | | | 1,623,597 | | | | 338,481 | | | | 328,913 | | | | 244,564 | | | | 285,389 | |
| $ | 229,881 | | | $ | 220,654 | | | $ | 1,677,925 | | | $ | 1,776,803 | | | $ | 350,325 | | | $ | 338,481 | | | $ | 207,108 | | | $ | 244,564 | |
$ |
250 |
| | $ | 2 | | | $ | — | | | $ | — | | | $ | (89 | ) | | $ | 732 | | | $ | 124 | | | $ | 1 | |
| | | | | | | | | | | | | | | | | | | | | | | | | | | | | | |
| | | | | | | |
| | | | | | | | | | | | | | | | | | | | | | | |
| | | | | | | |
| | 570 | | | | 554 | | | | 5,181 | | | | 5,541 | | | | 2,114 | | | | 2,139 | | | | 83,519 | | | | 90,903 | |
| | 178 | | | | 215 | | | | 4,788 | | | | 4,841 | | | | 876 | | | | 920 | | | | 277 | | | | 1,019 | |
| | | | | | | |
| | (1,271 | ) | | | (1,316 | ) | | | (14,547 | ) | | | (9,028 | ) | | | (3,182 | ) | | | (3,298 | ) | | | (121,259 | ) | | | (132,753 | ) |
| | (523 | ) | | | (547 | ) | | | (4,578 | ) | | | 1,354 | | | | (192 | ) | | | (239 | ) | | | (37,463 | ) | | | (40,831 | ) |
95
December 31, 2010

| 1. | Organization of the Funds |
The Elfun Funds (each a “Fund” and collectively the “Funds”) are registered under the Investment Company Act of 1940, as amended (the “1940 Act”), as open-end management investment companies. The Funds operate as Employees’ Securities Companies (as defined in the 1940 Act) and as such are exempt from certain provisions of the 1940 Act.
GE Asset Management Incorporated (“GEAM”), the Funds’ investment adviser, is a wholly owned subsidiary of General Electric Company.
| 2. | Summary of Significant Accounting Policies |
The preparation of financial statements in conformity with U.S. generally accepted accounting principles (GAAP) requires management to make estimates and assumptions that affect the reported amounts of assets and liabilities and disclosure of contingent assets and liabilities at the date of the financial statements and the reported amounts of increases and decreases in net assets from operations during the reporting period. Actual results may differ from those estimates.
Subsequent events after the balance sheet date through the date the financial statements were issued, have been evaluated in the preparation of the financial statements.
There are no items to report.
The following summarizes the significant accounting policies of the Funds:
Securities Valuation and Transactions. All investments in securities are recorded at their estimated fair value, as described in Note 3.
Securities transactions are accounted for as of the trade date. Realized gains and losses on investments sold are recorded on the basis of identified cost for both financial statement and federal tax purposes.
Repurchase Agreements Some of the Funds engage in repurchase agreement transactions with respect to instruments that are consistent with the Fund’s invest-
ment objectives or policies. The Funds’ custodian takes possession of the collateral pledged for investments in repurchase agreements on behalf of the Funds. The Funds value the underlying collateral daily on a mark-to-market basis to determine that the value, including accrued interest, is at least equal to 102% for domestic securities and 105% international securities of the repurchase price. In the event the seller defaults and the value of the security declines, or if the seller enters an insolvency proceeding, realization of the collateral by the Funds may be delayed or limited.
Foreign Currency Accounting records of the Funds are maintained in U.S. dollars. Investment securities and other assets and liabilities denominated in a foreign currency are translated to U.S. dollars at the prevailing rates of exchange at period end. Purchases and sales of securities, income receipts and expense payments denominated in foreign currencies are translated into U.S. dollars at the prevailing exchange rate on the respective dates of such transactions.
All assets and liabilities of the Funds initially expressed in foreign currency values will be converted into U.S. dollars at the WM/Reuter exchange rate computed at 11:00 a.m., Eastern time.
The Funds do not isolate the portion of the results of operations resulting from changes in foreign exchange rates from the fluctuations arising from changes in the market prices of securities during the year. Such fluctuations are included in the net realized or unrealized gain or loss from investments. Net realized gains or losses on foreign currency transactions represent net gains or losses on sales and maturities of foreign currency contracts, disposition of foreign currencies, the difference between the amount of net investment income and withholding taxes accrued and the U.S. dollar amount actually received or paid, and gains or losses between the trade and settlement date on purchases and sales of foreign securities. Net unrealized foreign exchange gains and losses arising from changes in the value of other assets and liabilities (including foreign currencies and open foreign currency contracts) as a result of changes in foreign exchange rates are included as increases or decreases in unrealized appreciation/depreciation on foreign currency related transactions.
96
December 31, 2010
Derivatives The Funds are subject to equity price risk, interest rate risk, credit risk, and foreign currency exchange rate risk in the normal course of pursuing their investment objectives. The Funds entered into derivative transactions for the purpose of hedging, to gain market exposure for residual and accumulating cash positions, and for managing the duration of fixed-income investments.
Futures Contracts A futures contract represents a commitment for the future purchase or sale of an asset at a specified price on a specified date. Certain Funds invest in interest rate, financial and stock or bond index futures contracts subject to certain limitations. The Funds invest in futures contracts to manage their exposure to the stock and bond markets and fluctuations in currency values. Buying futures tends to increase a Fund’s exposure to the underlying instrument while selling futures tends to decrease a Fund’s exposure to the underlying instrument, or hedge other Fund investments. A Fund will not enter into a transaction involving futures for speculative purposes. With futures contracts, there is minimal counterparty credit risk to the Funds since futures contracts are exchange traded and the exchange’s clearinghouse, as counterparty to all traded futures, guarantees the futures against default. A Fund’s risks in using these contracts include changes in the value of the underlying instruments, non- performance of the counterparties under the contracts’ terms and changes in the liquidity of the secondary market for the contracts. Futures contracts are valued at the settlement price established each day by the board of trade or exchange on which they principally trade.
Upon entering into a financial futures contract, the Funds are required to pledge to the broker an amount of cash and/or other assets equal to a certain percentage of the contract amount, known as initial margin deposit. Subsequent payments, known as variation margin, are made or received by the Funds each day, depending on the daily fluctuation in the fair value of the underlying security. The Funds record an unrealized gain or loss equal to the daily variation margin. Should market conditions move unexpectedly, the Funds may not achieve the anticipated benefits of the futures contracts and may incur a loss. The Funds recognize a realized gain or loss on the expiration or closing of a futures contract.
Options Certain Funds purchase and write options, subject to certain limitations. The Funds invest in options contracts to manage their exposure to the stock and bond markets and fluctuations in foreign currency values. Writing puts and buying calls tend to increase a Fund’s exposure to the underlying instrument while buying puts and writing calls tend to decrease a Fund’s exposure to the underlying instrument, or economically hedge other Fund investments. A Fund will not enter into a transaction involving options for speculative purposes. A Fund’s risks in using these contracts include changes in the value of the underlying instruments, non-performance of the counterparties under the contracts’ terms and changes in the liquidity of the secondary market for the contracts. Options are valued at the last sale price, or if no sales occurred on that day, at the last quoted bid price. When a Fund writes an option, the amount of the premium received is recorded as a liability and is subsequently adjusted to the current fair value of the option written. Premiums received from writing options that expire unexercised are treated by the Funds on the expiration date as realized gains from investments. The difference between the premium and the amount paid on effecting a closing purchase transaction, including brokerage commissions, is also treated as a realized gain, or if the premium is less than the amount paid for the closing purchase, as a realized loss. When an option is exercised, the proceeds from the sale of the underlying security or the cost basis of the securities purchased is adjusted by the original premium received or paid.
When-Issued Securities and Forward Commitments Certain Funds purchase or sell securities on a when-issued or forward commitment basis. These transactions are arrangements in which the Funds purchase and sell securities with payment and delivery scheduled a month or more after entering into the transaction. The price of the underlying securities and the date when these securities will be delivered and paid for are fixed at the time the transaction is negotiated. Losses may arise due to changes in the market value of the underlying securities or if the counterparty does not perform under the commitments. In connection with such purchases, the Funds maintain cash or liquid assets in an amount equal to the purchase commitments for such underlying securities until settlement date and for sales commitments the
97
December 31, 2010
Funds maintain equivalent deliverable securities as “cover” for the transaction. Unsettled commitments are valued at the current market value of the underlying security. Daily fluctuations in the value of such commitments are recorded as unrealized gains or losses. The Funds will not enter into such commitments for the purpose of investment leverage.
Forward Foreign Currency Exchange Contracts Certain Funds enter into forward foreign currency exchange contracts to facilitate transactions in foreign denominated securities and to manage the Funds’ currency exposure. Forward foreign currency exchange contracts are valued at the mean between the bid and the offered forward rates as last quoted by a recognized dealer. The aggregate principal amounts of the contracts are not recorded in the Funds’ financial statements. Such amounts appear under the caption Forward Foreign Currency Contracts in the Schedule of Investments. Fluctuations in the value of the contracts are recorded in the Statement of Assets and Liabilities as an asset (or liability) and in the Statement of Operations as unrealized appreciation (depreciation) until the contracts are closed, when they are recorded as realized gains or losses on foreign currency related transactions. The Funds’ risks in using these contracts include changes in the value of foreign currency or the possibility that the counterparties do not perform under the contracts’ terms. When a Fund enters into a forward foreign currency exchange contract, it is required to segregate cash or liquid securities with its custodian in an amount equal to the value of the Fund’s total assets committed to the consummation of the forward contract. If the value of the segregated securities declines, additional cash or securities are segregated so that the value of the account will equal the amount of the Fund’s commitment with respect to the contract.
Investments in Foreign Markets Investments in foreign markets involve special risks and considerations not typically associated with investing in the United States. These risks include revaluation of currencies, high rates of inflation, restrictions on repatriation of income and capital, and adverse political and economic developments. Moreover, securities issued in these markets may be less liquid, subject to government ownership controls, tariffs and taxes, subject to delays in settlements, and their prices may be more volatile.
The Funds may be subject to capital gains and repatriation taxes imposed by certain countries in which they invest. Such taxes are generally based upon income and/or capital gains earned or repatriated. Taxes are accrued based on net investment income, net realized gains and net unrealized appreciation as income and/or capital gains are earned.
Investment Income Corporate actions (including cash dividends) are recorded on ex-dividend date, net of applicable withholding taxes, except for certain foreign corporate actions which are recorded as soon after ex-dividend date as such information becomes available. Interest income is recorded on the accrual basis.
Accretion of discounts and amortization premiums on taxable bonds are to the call or maturity date, whichever is shorter, using the effective yield method. Withholding taxes in foreign dividends have been provided for in accordance with the Funds’ understanding of the applicable country’s tax rules and rates.
Expenses Expenses of the Funds which are directly identifiable to a specific Fund are allocated to that Fund. Expenses which are not directly identifiable to a specific Fund are allocated in such a manner as deemed equitable, taking into consideration the nature and type of expense and the relative sizes of the Funds. All expenses of the Funds are paid by GEAM, and reimbursed by the Funds.
Federal Income Taxes The Funds intend to comply with all sections of the Internal Revenue Code applicable to regulated investment companies, including the distribution of substantially all of their taxable net investment income, tax-exempt income, and net realized capital gains to their shareholders. Therefore, no provision for federal income tax has been made. Each Fund is treated as a separate taxpayer for federal income tax purposes.
The Funds utilize various methods to measure the fair value of most of its investments on a recurring basis. GAAP establishes a framework for measuring fair value and providing related disclosures. Broadly, the framework requires fair value to be determined based on the exchange price that would be received for an asset or paid to transfer a liability (an exit price) in the principal or
98
December 31, 2010
most advantageous market for the asset or liability in an orderly transaction between market participants at the measurement date. In the absence of active markets for the identical assets or liabilities, such measurements involve developing assumptions based on market observable data and, in the absence of such data, internal information that is consistent with what market participants would use in a hypothetical transaction that occurs at the measurement date. It also establishes a three-level valuation hierarchy based upon observable and non-observable inputs.
Observable inputs reflect market data obtained from independent sources, while unobservable inputs reflect our market assumptions. Preference is given to observable inputs. These two types of inputs create the following fair value hierarchy:
Level 1—Quoted prices for identical investments in active markets.
Level 2—Quoted prices for similar investments in active markets; quoted prices for identical or similar investments in markets that are not active; and model-derived valuations whose inputs are observable or whose significant value drivers are observable.
Level 3—Significant inputs to the valuation model are unobservable.
Policies and procedures are maintained to value investments using the best and most relevant data available. In addition, pricing vendors are utilized to assist in valuing investments. GEAM performs periodic reviews of the methodologies used by independent pricing services including price validation of individual securities.
Fair Value Measurement The following section describes the valuation methodologies the Funds use to measure different financial investments at fair value.
A Fund’s portfolio securities are valued generally on the basis of market quotations. Equity securities generally are valued at the last reported sale price on the primary market in which they are traded. Portfolio securities listed on NASDAQ are valued using the NASDAQ Official Closing Price, Level 1 securities primarily include publicly-traded equity securities which may not necessarily represent the last sale price. If no sales occurred on the exchange or
NASDAQ that day, the portfolio security generally is valued using the last reported bid price. In those circumstances the Fund classifies the investment securities in Level 2.
Debt securities (other than short-term securities described below) generally are valued at an evaluated bid as reported by an independent pricing service. Municipal obligations are valued at the quoted bid prices, when available. The pricing vendor uses various pricing models for each asset class that are consistent with what other market participants would use. The inputs and assumptions to the model of the pricing vendor are derived from market observable sources including: benchmark yields, reported trades, broker/dealer quotes, issuer spreads, benchmark securities, bids, offers, and other market related data. Since many fixed income securities do not trade on a daily basis, the methodology of the pricing vendor uses available information as applicable such as benchmark curves, benchmarking of like securities, sector groupings, and matrix pricing. The pricing vendor considers all available market observable inputs in determining the evaluation for a security. Thus, certain securities may not be priced using quoted prices, but rather determined from market observable information. These investments are included in Level 2 and primarily comprise our portfolio of corporate fixed income, government, mortgage and asset-backed securities.
In the absence of a reliable price from such a pricing service, debt securities may be valued based on dealer supplied valuations or quotations. In these infrequent circumstances, pricing vendors may provide the Funds with valuations that are based on significant unobservable inputs, and in those circumstances we classify the investment securities in Level 3.
The Funds use non-binding broker quotes as the primary basis for valuation when there is limited, or no, relevant market activity for a specific investment or for other investments that share similar characteristics. The Funds have not adjusted the prices obtained. Investment securities priced using non-binding broker quotes are included in Level 3. As is the case with the primary pricing vendor, third-party brokers do not provide access to their proprietary valuation models, inputs and assumptions. Accordingly, GEAM conducts internal reviews of pricing for all such investment securities periodically to ensure
99
December 31, 2010
reasonableness of valuations used in the Funds‘ financial statements. These reviews are designed to identify prices that appear stale, those that have changed significantly from prior valuations, and other anomalies that may indicate that a price may not be accurate. Based on the information available, GEAM believes that the fair values provided by the brokers are representative of prices that would be received to sell the assets at the measurement date (exit prices).
All portfolio securities of the Elfun Money Market Fund and any short-term securities of sufficient credit quality held by any other fund with remaining maturities of sixty days or less at the time of purchase are valued on the basis of amortized cost which approximates market value and these are included in Level 2.
A Fund’s written or purchased options are valued at the last sale price, or if no sales occurred that day, at the last reported bid price and those are also included in Level 2.
If prices are not readily available for a portfolio security, or if it is believed that a price for a portfolio security does not represent its fair value, the security may be valued using procedures approved by the Funds’ Board of Trustees that are designed to establish its “fair” value. These securities would be classified in Level 3. Those procedures require that the fair value of a security be established by the valuation committee. The valuation committee follows different protocols for different types of investments and circumstances. The fair value procedures may be used to value any investment of any Fund in the appropriate circumstances.
Foreign securities may be valued with the assistance of an independent fair value pricing service in circumstances where it is believed that they have been or would be materially affected by events occurring after the close of the portfolio security’s primary market and before the close of regular trading on the NYSE. In these circumstances the Fund classifies the investment securities in Level 2. This independent fair value pricing service uses a model to identify affected securities and portfolios taking into consideration various factors and the fair value of such securities may be something other than the last available quotation or other market price.
Portfolio securities may be valued using techniques other than market quotations, under the circumstances described above. The value established for a portfolio security may be different than what would be produced through the use of another methodology or if it had been priced using market quotations. Portfolio securities that are valued using techniques other than market quotations, including “fair valued” securities, may be subject to greater fluctuation in their value from one day to the next than would be the case if market quotations were used. In addition, there is no assurance that the Funds could sell a portfolio security for the value established for it at any time and it is possible that the Funds would incur a loss because a portfolio security is sold at a discount to its established value.
Other financial investments are derivative instruments that are not reflected in total investments, such as futures, forwards, swaps, and written options contracts, which are valued based on fair value as discussed above.
The Funds use closing prices for derivatives included in Level 1, which are traded either on exchanges or liquid over-the counter markets. Derivative assets and liabilities included in Level 2 primarily represent interest rate swaps, cross-currency swaps and foreign currency and commodity forward and option contracts. Derivative assets and liabilities included in Level 3 primarily represent interest rate products that contain embedded optionality or prepayment features.
The inputs or methodology used for valuing securities are not an indication of the risk associated with investing in those securities. Fair value determinations are required for securities whose value is affected by a significant event that will materially affect the value of a domestic or foreign security and which occurs subsequent to the time of the close of the principal market on which such domestic or foreign security trades but prior to the calculation of the Fund’s NAV.
100
December 31, 2010
101
The following tables present the Funds’ investments measured at fair value on a recurring basis at December 31, 2010:
| | | | | | | | | | | | | | | | | | |
(In Thousands) | | | | | | | | | | | | | | |
Fund | | Investments | | | Level 1 | | | | Level 2 | | | | Level 3 | | | | Total | |
| | | | | |
Elfun International Equity Fund | | Investments in Securities | | | | | | | | | | | | | | | | |
| | Common Stock | | $ | 285,248 | | | $ | — | | | $ | — | | | $ | 285,248 | |
| | Preferred Stock | | | 7,684 | | | | — | | | | — | | | | 7,684 | |
| | Other Investments | | | — | | | | 94 | | | | — | | | | 94 | |
| | Short-Term Investments | | | 13,822 | | | | 1,950 | | | | — | | | | 15,772 | |
| | | | | |
| | | | | | | | | | | | | | | | | | | |
| | | Total Investments in Securities | | $ | 306,754 | | | $ | 2,044 | | | $ | — | | | $ | 308,798 | |
| | Other Financial Instruments | | | | | | | | | | | | | | | | |
| | Futures Contracts — Unrealized Depreciation | | $ | (174 | ) | | $ | — | | | $ | — | | | $ | (174 | ) |
| | | | | |
| | | | | | | | | | | | | | | | | | | |
| | | | | |
Elfun Trusts | | Investments in Securities | | | | | | | | | | | | | | | | |
| | Common Stock | | $ | 1,681,617 | | | $ | — | | | $ | — | | | $ | 1,681,617 | |
| | Other Investments | | | — | | | | 435 | | | | — | | | | 435 | |
| | Short-Term Investments | | | 49,853 | | | | — | | | | — | | | | 49,853 | |
| | | | | |
| | | | | | | | | | | | | | | | | | | |
| | | Total Investments in Securities | | $ | 1,731,470 | | | $ | 435 | | | $ | — | | | $ | 1,731,905 | |
| | | | | |
Elfun Diversified Fund | | Investments in Securities | | | | | | | | | | | | | | | | |
| | Domestic Equity | | $ | 80,647 | | | $ | — | | | $ | — | | | $ | 80,647 | |
| | Foreign Equity | | | 59,303 | | | | — | | | | — | | | | 59,303 | |
| | U.S. Treasuries | | | — | | | | 11,203 | | | | — | | | | 11,203 | |
| | Agency Mortgage Backed | | | — | | | | 21,270 | | | | — | | | | 21,270 | |
| | Agency CMOs | | | — | | | | 1,456 | | | | 130 | | | | 1,586 | |
| | Asset Backed | | | — | | | | 1,002 | | | | — | | | | 1,002 | |
| | Corporate Notes | | | — | | | | 24,274 | | | | — | | | | 24,274 | |
| | Non-Agency CMOs | | | — | | | | 7,607 | | | | 1 | | | | 7,608 | |
| | Sovereign Bonds | | | — | | | | 1,886 | | | | — | | | | 1,886 | |
| | Municipal Notes and Bonds | | | — | | | | 334 | | | | — | | | | 334 | |
| | Exchange Traded Funds | | | 3,394 | | | | — | | | | — | | | | 3,394 | |
| | Preferred Stock | | | 1,902 | | | | — | | | | — | | | | 1,902 | |
| | Rights | | | — | | | | 3 | | | | — | | | | 3 | |
| | Other Investments | | | — | | | | 195 | | | | — | | | | 195 | |
| | Short-Term Investments | | | 21,384 | | | | — | | | | — | | | | 21,384 | |
| | | | | |
| | | | | | | | | | | | | | | | | | | |
| | | Total Investments in Securities | | $ | 166,630 | | | $ | 69,230 | | | $ | 131 | | | $ | 235,991 | |
| | Other Financial Instruments | | | | | | | | | | | | | | | | |
| | Futures Contracts — Unrealized Appreciation | | $ | 216 | | | $ | — | | | $ | — | | | $ | 216 | |
| | Futures Contracts — Unrealized Depreciation | | | (35 | ) | | | — | | | | — | | | | (35 | ) |
| | | | | |
| | | | | | | | | | | | | | | | | | | |
| | | Total Other Financial Instruments | | $ | 181 | | | $ | — | | | $ | — | | | $ | 181 | |
December 31, 2010
| | | | | | | | | | | | | | | | | | |
| (In Thousands) | | | | | | | | | | | | | | |
| Fund | | Investments | | Level 1 | | | Level 2 | | | Level 3 | | | Total | |
Elfun Tax-Exempt Income Fund | | Investments in Securities | | | | | | | | | | | | | | | | |
| | Municipal Bonds and Notes | | $ | — | | | $ | 1,643,818 | | | $ | — | | | $ | 1,643,818 | |
| | Other Investments | | | — | | | | 267 | | | | — | | | | 267 | |
| | Short-Term Investments | | | — | | | | 2,138 | | | | — | | | | 2,138 | |
| | | | | |
| | | | | | | | | | | | | | | | | | | |
| | | Total Investments in Securities | | $ | — | | | $ | 1,646,223 | | | $ | — | | | $ | 1,646,223 | |
| | | | | |
Elfun Income Fund | | Investments in Securities | | | | | | | | | | | | | | | | |
| | U.S. Treasuries | | $ | — | | | $ | 61,385 | | | $ | — | | | $ | 61,385 | |
| | Agency Mortgage Backed | | | — | | | | 103,563 | | | | — | | | | 103,563 | |
| | Agency CMOs | | | — | | | | 8,605 | | | | 515 | | | | 9,120 | |
| | Asset Backed | | | — | | | | 2,104 | | | | 25 | | | | 2,129 | |
| | Corporate Notes | | | — | | | | 116,348 | | | | — | | | | 116,348 | |
| | Non-Agency CMOs | | | — | | | | 38,284 | | | | 437 | | | | 38,721 | |
| | Sovereign Bonds | | | — | | | | 10,603 | | | | — | | | | 10,603 | |
| | Municipal Notes and Bonds | | | — | | | | 2,423 | | | | — | | | | 2,423 | |
| | Other Investments | | | — | | | | 988 | | | | — | | | | 988 | |
| | Short-Term Investments | | | 30,453 | | | | — | | | | — | | | | 30,453 | |
| | | | | |
| | | | | | | | | | | | | | | | | | | |
| | | Total Investments in Securities | | $ | 30,453 | | | $ | 344,303 | | | $ | 977 | | | $ | 375,733 | |
| | Other Financial Instruments | | | | | | | | | | | | | | | | |
| | Futures Contracts — Unrealized Appreciation | | $ | 711 | | | $ | — | | | $ | — | | | $ | 711 | |
| | Futures Contracts — Unrealized Depreciation | | | (134 | ) | | | — | | | | — | | | | (134 | ) |
| | | | | |
| | | | | | | | | | | | | | | | | | | |
| | | Total Other Financial Instruments | | $ | 577 | | | $ | — | | | $ | — | | | $ | 577 | |
Elfun Money Market Fund | | Short-Term Investments | | | | | | | | | | | | | | | | |
| | U.S. Treasury | | $ | — | | | $ | 19,819 | | | $ | — | | | $ | 19,819 | |
| | U.S. Government Agency and Related | | | — | | | | 16,002 | | | | — | | | | 16,002 | |
| | Commercial Paper | | | — | | | | 43,936 | | | | — | | | | 43,936 | |
| | Repurchase Agreements | | | — | | | | 41,030 | | | | — | | | | 41,030 | |
| | Certificates of Deposit | | | — | | | | 79,900 | | | | — | | | | 79,900 | |
| | Corporate Notes | | | — | | | | 3,503 | | | | — | | | | 3,503 | |
| | Supranationals | | | — | | | | 2,650 | | | | — | | | | 2,650 | |
| | Time Deposit | | | — | | | | 184 | | | | — | | | | 184 | |
| | | | | |
| | | | | | | | | | | | | | | | | | | |
| | | Total Short-Term Investments | | $ | — | | | $ | 207,024 | | | $ | — | | | $ | 207,024 | |
The following table presents the changes in Level 3 investments measured on a recurring basis for the period ended December 31, 2010:
| | | | | | | | | | | | | | | | | | | | |
(In Thousands) | | | | | | | | | | | | | | | |
| Elfun Diversified Fund | | Agency
Mortgage
Backed | | | Agency CMOs | | | Corporate
Notes | | | Non-Agency
CMOs | | | Total | |
Balance at 12/31/09 | | $ | 1,581 | | | | 637 | | | $ | 111 | | | | 86 | | | $ | 2,415 | |
Accrued discounts/premiums | | | — | | | | (55 | ) | | | (1 | ) | | | — | | | | (56 | ) |
Realized gain (loss) | | | 7 | | | | 7 | | | | (11 | ) | | | (118 | ) | | | (115 | ) |
Change in unrealized gain (loss) | | | (5 | ) | | | (47 | ) | | | 51 | | | | 128 | | | | 127 | |
Net purchases (sales) | | | (1,490 | ) | | | (457 | ) | | | (88 | ) | | | (13 | ) | | | (2,048 | ) |
Net transfers in and out of Level 3 | | | (93 | ) | | | 45 | | | | (62 | ) | | | (82 | ) | | | (192 | ) |
Balance at 12/31/10 | | $ | — | | | $ | 130 | | | $ | — | | | $ | 1 | | | $ | 131 | |
Change in unrealized gain (loss) relating to
securities still held at 12/31/10 | | $ | — | | | $ | (16 | ) | | $ | — | | | $ | 80 | | | $ | 64 | |
102
December 31, 2010
The following table presents the changes in Level 3 investments measured on a recurring basis for the period ended December 31, 2010:
| | | | | | | | | | | | | | | | | | | | | | | | |
| (In Thousands) | | | | | | | | | | | | | | | | | | |
| Elfun Income Fund | | Agency
Mortgage
Backed | | | Agency CMOs | | | Asset Backed | | | Corporate Notes | | | Non-Agency
CMOs | | | Total | |
Balance at 12/31/09 | | $ | 9,071 | | | | 3,402 | | | $ | 25 | | | $ | 668 | | | | 404 | | | $ | 13,570 | |
Accrued discounts/premiums | | | — | | | | (480 | ) | | | — | | | | (4 | ) | | | — | | | | (484 | ) |
Realized gain (loss) | | | 41 | | | | (851 | ) | | | — | | | | (61 | ) | | | (688 | ) | | | (1,559 | ) |
Change in unrealized gain (loss) | | | (29 | ) | | | 1,130 | | | | 6 | | | | 277 | | | | 1,327 | | | | 2,711 | |
Net purchases (sales) | | | (8,640 | ) | | | (3,222 | ) | | | (6 | ) | | | (486 | ) | | | (405 | ) | | | (12,759 | ) |
Net transfers in and out of Level 3 | | | (443 | ) | | | 536 | | | | — | | | | (394 | ) | | | (201 | ) | | | (502 | ) |
Balance at 12/31/10 | | $ | — | | | $ | 515 | | | $ | 25 | | | $ | — | | | $ | 437 | | | $ | 977 | |
Change in unrealized gain (loss) relating to securities still held at 12/31/10 | | $ | — | | | $ | 625 | | | $ | 6 | | | $ | — | | | $ | 536 | | | $ | 1,167 | |
Transfers in and out of level 3 are considered to occur at the beginning of the period.
| 4. | Derivatives Transactions |
Shown below are the derivative contracts entered into by the Funds, summarized by primary risk exposure as they appear on the Statement of Assets and Liabilities, all of which are not accounted for as hedging instruments under FASB Accounting Standards Codification (“ASC”) No.815 Derivatives and Hedging.
| | | | | | | | | | | | |
| | | Asset Derivatives | | | Liability Derivatives | |
(In Thousands) | | Location | | Fair
Value | | | Location | | Fair
Value | |
Elfun International Equity Fund | | | | | | | | | | |
Equity Contracts | | | | | | | | Liabilities, Net Assets — Net unrealized Appreciation/ (Depreciation) on Futures | | | (174 | )* |
Elfun Diversified Fund | | | | | | | | | | |
Equity Contracts | | Assets, Net Assets — Net unrealized Appreciation/ (Depreciation) on Futures | | | 104 | * | | Liabilities, Net Assets — Net unrealized Appreciation/ (Depreciation) on Futures | | | (2 | )* |
Interest Rate Contracts | | Assets, Net Assets — Net unrealized Appreciation/ (Depreciation) on Futures | | | 112 | * | | Liabilities, Net Assets — Net unrealized Appreciation/ (Depreciation) on Futures | | | (33 | )* |
Elfun Income Fund | | | | | | | | | | |
Interest Rate Contracts | | Assets, Net Assets — Net unrealized Appreciation/ (Depreciation) on Futures | | | 711 | * | | Liabilities, Net Assets — Net unrealized Appreciation/ (Depreciation) on Futures | | | (134 | )* |
| * | Includes cumulative unrealized appreciation/depreciation of futures contracts as reported in the Schedule of Investments and Net Assets section of the Statement of Assets and Liabilities. Only the current day’s variation margin is reported within the Assets or Liabilities sections of the Statement of Assets and Liabilities. |
103
December 31, 2010
Shown below are the effects of derivative instruments on the Funds’ Statements of Operations, summarized by primary risk exposure all of which are not accounted for as hedging instruments under ASC 815.
| | | | | | | | | | | | | | |
(In Thousands) | | Location | | Notional
Amount
of Futures
Contracts
Purchased/(Sold) $ | | | Realized Gain
or (Loss) $ | | | Change in
Unrealized
Appreciation/
(Depreciation) $ | |
Elfun International Equity Fund | | | | | | | | | | | | |
Equity Contracts | | Net realized gain/(loss) on futures, Increase/(decrease) in unrealized appreciation/ (depreciation) on futures | | | 44,270/(33,420 | ) | | | 231 | | | | (185 | ) |
Elfun Diversified Fund | | | | | | | | | | | | |
Equity Contracts | | Net realized gain/(loss) on futures, Increase/(decrease) | | | 52,828/(67,741 | ) | | | 2,736 | | | | (197 | ) |
Interest Rate Contracts | | Net realized gain/(loss) on futures, Increase/(decrease) | | | 177,186/(178,466 | ) | | | (710 | ) | | | 4 | |
Elfun Income Fund | | | | | | | | | | | | |
Interest Rate Contracts | | Net realized gain/(loss) on futures, Increase/(decrease) | | | 876,244/(895,645) | | | | (3,946 | ) | | | 299 | |
The Funds share a revolving credit facility of up to $150 million with a number of its affiliates. The credit facility is with its custodian bank, State Street Bank and Trust Company (“State Street”). The revolving credit facility requires the payment of a commitment fee equal to 0.125% per annum on the daily unused portion of the credit facility, payable quarterly. The portion borne by the Funds generally is borne proportionally based upon net assets. In addition, the Funds have a $100 million uncommitted, unsecured line of credit with State Street. Generally, borrowings under the credit facilities would accrue interest at the Federal Funds Rate plus 50 basis points and would be borne by the borrowing Fund. The maximum amount allowed to be borrowed by any one Fund is the lesser of (i) its prospectus limitation or (ii) 20% of its net assets. The credit facilities were not utilized by the Funds during the period ended December 31, 2010.
During 2010, the Funds incurred expenses for the cost of services rendered by GEAM as investment adviser and for services GEAM rendered as unitholder servicing agent. These expenses are included as administration expenses and unitholder servicing agent expenses in the Statements of Operations. The Trustees received no compensation as Trustees for the Elfun Funds.
GEAM waives a portion of the Funds Management fees (except for the Elfun Tax-Exempt Income Fund) in the amount equal to the Management fee earned by GEAM with respect to the Funds investment in the GE Funds-GE Money Market Fund or the GE Institutional Money Market Fund.
104
December 31, 2010
| 7. | Investment Transactions |
Purchases and Sales of Securities
The cost of purchases and the proceeds from sales of investments, other than short-term securities and short-term options, for the year ended December 31, 2010, were as follows:
| | | | | | | | | | | | | | | | | | |
| | | U.S. Government
Securities | | | | | Other Securities | |
| (In Thousands) | | Purchases | | | Sales | | | | | Purchases | | | Sales | |
Elfun International Equity Fund | | $ | - | | | $ | - | | | | | $ | 114,064 | | | $ | 128,763 | |
Elfun Trusts Fund | | | - | | | | - | | | | | | 213,660 | | | | 334,341 | |
Elfun Diversified Fund | | | 171,577 | | | | 160,860 | | | | | | 123,130 | | | | 116,189 | |
Elfun Tax-Exempt Fund | | | - | | | | - | | | | | | 456,443 | | | | 530,331 | |
Elfun Income Fund | | | 852,849 | | | | 823,287 | | | | | | 325,652 | | | | 327,265 | |
The Funds are subject to ASC 740, Income Taxes. ASC 740 provides guidance for financial accounting and reporting for the effects of income taxes that result from an entity’s activities during the year. ASC 740 also provides guidance regarding how certain tax positions should be recognized, measured, presented and disclosed in the financial statements. ASC 740 requires evaluation of tax positions
taken or expected to be taken in the course of preparing the Funds’ tax returns to determine whether the tax positions are “more likely than not” of being sustained by the applicable tax authority. There are no adjustments to the Funds’ net assets required under ASC 740. The Funds’ 2007, 2008, 2009 and 2010 fiscal years tax returns are still open to examination by the Federal and applicable state tax authorities.
At December 31, 2010, information on the tax components of capital is as follows:
| | | | | | | | | | | | | | | | | | | | | | | | | | | | | | | | |
| (In Thousands) | |
| | | | | | | | | | | | Net Tax Appreciation/
(Depreciation) | | | | | | | | | | |
| | | Cost on
Tax Basis | | | Unrealized
Appreciation | | | Unrealized
Depreciation | | | Investments | | | Derivatives/
Currency | | | Undistributed
Income | | | Undistributed
(Accumulated
Capital Loss) | | | Post
October
Losses | |
Elfun International Equity Fund | | $ | 282,084 | | | $ | 47,548 | | | $ | (20,834 | ) | | $ | 26,714 | | | $ | (108 | ) | | $ | 19 | | | $ | (42,052 | ) | | $ | - | |
Elfun Trusts | | | 1,344,000 | | | | 434,866 | | | | (46,961 | ) | | | 387,905 | | | | - | | | | - | | | | - | | | | - | |
Elfun Diversified Fund | | | 217,376 | | | | 24,925 | | | | (6,310 | ) | | | 18,615 | | | | 6 | | | | 268 | | | | (17,744 | ) | | | - | |
Elfun Tax-Exempt Income Fund | | | 1,625,650 | | | | 54,830 | | | | (34,257 | ) | | | 20,573 | | | | - | | | | 21 | | | | (3,455 | ) | | | (753 | ) |
Elfun Income Fund | | | 372,534 | | | | 11,655 | | | | (8,456 | ) | | | 3,199 | | | | (2 | ) | | | - | | | | (10,763 | ) | | | - | |
Elfun Money Market Fund | | | 207,024 | | | | - | | | | - | | | | - | | | | - | | | | 124 | | | | (200 | ) | | | - | |
105
December 31, 2010
As of December 31, 2010, the following Funds have capital loss carryovers as indicated below. The capital loss carryover is available to offset future realized capital gains to the extent provided in the Internal Revenue Code and regulations thereunder. To the extent that these carryover losses are used to offset future capital gains, it is probable that the gains so offset will not be distributed to shareholders because they would be taxable as ordinary income.
| | | | | | | | |
| Fund (In Thousands) | | Amount | | | Expires | |
Elfun International Equity Fund | | $ | 33,349 | | | | 12/31/17 | |
| | | 8,703 | | | | 12/31/18 | |
Elfun Diversified Fund | | | 17,744 | | | | 12/31/17 | |
Elfun Tax-Exempt Income Fund | | | 3,455 | | | | 12/31/17 | |
Elfun Income Fund | | | 10,763 | | | | 12/31/17 | |
Elfun Money Market Fund | | | 200 | | | | 12/31/16 | |
These amounts will be available to offset future taxable capital gains. Under the recently enacted Regulated Investment Company Modernization Act of 2010, the Fund will be permitted to carry forward capital losses incurred in taxable years beginning after December 22, 2010 for an unlimited period. However, any losses incurred during those future years will be required to be utilized prior to the losses incurred in pre-enactment tax years. As a result of this ordering rule, pre-enactment capital loss carryforwards may be more likely to expire unused. Additionally, post-enactment capital losses that are carried forward will retain their character as either short-term or long-term capital losses rather than being considered all short-term as under previous law.
During the year ended December 31, 2010, the Funds utilized prior year capital loss carryovers as follows:
| | | | |
| Fund (In Thousands) | | Amount | |
Elfun Diversified Fund | | $ | 2,360 | |
Elfun Tax-Exempt Income Fund | | | 5,300 | |
Elfun Income Fund | | | 7,220 | |
Any net capital and currency losses incurred after October 31, within each Fund’s tax year, are deemed to arise on the first day of the Fund’s next tax year if the Fund so elects to defer such losses.
The Funds elected to defer losses incurred after October 31, 2010 as follows:
| | | | | | | | |
(In Thousands) | | Capital | | | Currency | |
Elfun Tax-Exempt Income Fund | | $ | 753 | | | $ | — | |
The tax composition of distributions paid during the years ended December 31, 2010, were as follows:
| | | | | | | | | | | | |
| (In Thousands) | | Exempt
Interest | | | Ordinary
Income | | | Long-Term
Capital Gains | |
Elfun International Equity Fund | | $ | — | | | $ | 5,979 | | | $ | — | |
Elfun Trusts | | | — | | | | 16,402 | | | | 70,387 | |
Elfun Diversified Fund | | | — | | | | 3,566 | | | | | |
Elfun Tax-Exempt Income Fund | | | 78,685 | | | | 2,893 | | | | | |
Elfun Income Fund | | | — | | | | 13,612 | | | | | |
Elfun Money Market Fund | | | — | | | | 312 | | | | | |
106
December 31, 2010
Distributions to Shareholders
Elfun Tax-Exempt Income Fund, Elfun Income Fund and Elfun Money Market Fund declare net investment income dividends daily and pay them monthly. All other Funds declare and pay dividends from net investment income annually. All Funds declare and pay net realized capital gains distributions annually. The character of income and gains to be distributed is determined in accordance with income tax regulations which may differ from generally accepted accounting principles. These differences include (but are not limited to) treatment of realized and unrealized
gains and losses on foreign currency contracts, futures, investments organized as partnerships for tax purposes, distributions from Real Estate Investment Trusts (REITs), losses deferred due to offsetting positions, and losses deferred due to wash sale transactions. Reclassifications are made to the Funds’ capital accounts to reflect income and gains available for distribution (or available capital loss carryovers) under income tax regulations. These reclassifications have no impact on net investment income, realized gains or losses, or net asset value of the Funds. The calculation of net investment income per share in the Financial Highlights table excludes these adjustments.
The reclassifications for the year ended December 31, 2010 were as follows:
| | | | | | | | | | | | |
| (In Thousands) | | | | | | | | | |
| | | Undistributed
Net Investment
Income | | | Accumulated
Net Realized Loss | | | Paid in
Capital | |
Elfun International Equity Fund | | $ | 33 | | | $ | (28 | ) | | $ | (5 | ) |
Elfun Trusts | | | 167 | | | | (83 | ) | | | (84 | ) |
Elfun Diversified Fund | | | (33 | ) | | | - | | | | 33 | |
Elfun Tax-Exempt Income Fund | | | - | | | | - | | | | - | |
Elfun Income Fund | | | 1,116 | | | | 198 | | | | (1,314 | ) |
Elfun Money Market Fund | | | 309 | | | | - | | | | (309 | ) |
107


The Unitholders and Board of Trustees
Elfun Funds
We have audited the accompanying statements of assets and liabilities, including the schedules of investments, of the Elfun International Equity Fund, Elfun Trusts, Elfun Diversified Fund, Elfun Tax-Exempt Income Fund, Elfun Income Fund and Elfun Money Market Fund, each a series of Elfun Funds (collectively, the “Funds”), as of December 31, 2010, and the related statements of operations for the year then ended, statements of changes in net assets for each of the years in the two-year period then ended, and the financial highlights for each of the years in the five-year period then ended. These financial statements and financial highlights are the responsibility of the Funds management. Our responsibility is to express an opinion on these financial statements and financial highlights based on our audits.
We conducted our audits in accordance with the standards of the Public Company Accounting Oversight Board (United States). Those standards require that we plan and perform the audit to obtain reasonable assurance about whether the financial statements and financial highlights are free of material misstatement. An audit includes examining, on a test basis, evidence supporting the amounts and disclosures in the financial statements. Our procedures included confirmation of securities owned as of December 31, 2010 by correspondence with the custodian and brokers, or by other appropriate auditing procedures where replies from brokers were not received. An audit also includes assessing the accounting principles used and significant estimates made by management, as well as evaluating the overall financial statement presentation. We believe that our audits provide a reasonable basis for our opinion.
In our opinion, the financial statements and financial highlights referred to above present fairly, in all material respects, the financial position of the Elfun International Equity Fund, Elfun Trusts, Elfun Diversified Fund, Elfun Tax-Exempt Income Fund, Elfun Income Fund and Elfun Money Market Fund as of December 31, 2010, the results of their operations, changes in their net assets and financial highlights for each of the years or periods described above, in conformity with U.S. generally accepted accounting principles.

Boston, Massachusetts
February 25, 2011
108

For the year ended December 31, 2010
The following funds intend to make an election under Internal Revenue Code Section 853. The election will allow shareholders to treat their attributable share of foreign taxes paid by the Funds to be paid by them directly. For the fiscal year ended December 31, 2010, the total amount of income received by the Funds from sources within foreign countries and possessions of the United States and the total amount of taxes paid by the Funds follows:
| | | | | | | | |
| | | Total Foreign
Source Income | | | Total Foreign
Taxes Paid | |
Elfun International Equity Fund | | $ | 7,455,714 | | | $ | 745,865 | |
Of the dividends paid from net investment income by the Elfun Tax Exempt Fund during the calendar year ended December 31, 2010, 96.46% represent exempt interest dividends for Federal income tax purposes.
For the year ended December 31, 2010, the Fund hereby designates as capital gain dividends the amounts set forth, or the amount ultimately treated as capital gain net income.
| | | | |
| Fund | | Gross Amount | |
Elfun Trusts | | $ | 70,386,813 | |
For the fiscal year ended December 31, 2010, certain dividends paid by the fund may be subject to a maximum income tax rate of 15% as provided for by the Jobs and Growth Tax Relief Reconciliation Act of 2003. The following represent the amounts that may be considered qualified dividend income:
| | | | |
| Fund | | Qualified Dividend Income | |
Elfun International Equity Fund | | $ | 5,978,388 | |
Elfun Trusts | | $ | 16,402,249 | |
Elfun Diversified Fund | | $ | 2,099,765 | |
For corporate shareholders the following represent the percentages of respective fund distributions that may be eligible for the dividends received deduction:
| | | | |
| Fund name | | Dividends Received Deduction | |
Elfun Trusts | | | 100.00 | % |
Elfun Diversified Fund | | | 24.32 | % |
The amounts presented herein may differ from amounts presented elsewhere in the financial statements due to differences between tax and financial accounting principles. Please consult a tax advisor if you have any questions about Federal or State income tax laws or on how to prepare your tax returns. If you have specific questions about your Fund account, please consult your investment representative or call 1-800-242-0134.
109

The Board of Trustees of the Elfun Funds The Elfun Funds include the Elfun Trusts, Elfun International Equity Fund, Elfun Diversified Fund, Elfun Tax-Exempt Income Fund, Elfun Income Fund, Elfun Money Market Fund (each, a “Fund” and collectively, the “Funds”). (the “Board”) considered and all those that were present unanimously approved the continuance of the investment advisory agreements with GE Asset Management Incorporated (“GEAM”) at a meeting held on December 13, 2010.
In considering whether to approve the Funds’ investment advisory agreements, the Board members considered and discussed a substantial amount of information and analysis provided by GEAM personnel. The Board members also considered detailed information regarding performance and expenses of other investment companies, including those with similar investment strategies and sizes, which was prepared by independent third party provider Morningstar, Inc. (“Morningstar”). The Board members reviewed the fees charged by GEAM for other mutual funds and investment products other than mutual funds that employ the same investment strategies as the Funds. The Board had the opportunity to ask questions and request additional information in connection with its considerations.
Before approving each Fund’s investment advisory agreement, the Board members received and considered memoranda prepared by GEAM personnel that set forth detailed information, including substantial exhibits and other materials related to GEAM’s business and the services it provides to each Fund. The Board members also reviewed materials discussing the legal standards for the consideration of the proposed continuances. The Board members reviewed and discussed the proposed continuance of the agreements with GEAM personnel, including representatives from the legal, compliance and finance departments and senior members of each relevant investment group (e.g., equity, fixed income). The Board members also heard presentations by these representatives, and posed questions and engaged in substantive discussions with them concerning the Funds’ operations and the investment process employed for each Fund.
The Board members took into account that many of them possess multi-year experience as Board members and that all of them possess a great deal of knowledge about GEAM and the Funds in their capacities as senior officers of GEAM. They also took into account their consideration of these types of agreements in recent years. The information was presented in a manner to facilitate comparison to prior periods and to reflect certain enhancements. To focus their review, the Board members asked GEAM personnel, in its oral presentations, to highlight material differences from the information presented in recent years.
In reaching their determinations relating to continuance of the Funds’ investment advisory agreements, the Board members considered all factors that they deemed relevant, including the factors discussed below. In their deliberations, the Board members did not identify any particular information that was all-important or controlling, and each Board member may have attributed different weights to the various factors. The Board members evaluated this information, and all other information available to them, for each Fund separately, and their determinations were made separately in respect of each Fund. In particular, the Board members focused on the following with respect to each Fund:
The Nature, Extent And Quality Of Services Provided
The Board members reviewed the services provided by GEAM and concurred that GEAM provides high quality advisory and administrative services to the Funds. In connection with their consideration of GEAM’s services, the Board members focused on the favorable attributes of GEAM, including (i) an investment philosophy oriented toward long-term performance; (ii) effective processes used for selecting investments and brokers; (iii) effective processes used for providing Fund administration, including controllership and compliance functions and oversight of the performance of other companies that provide services to the Funds; (iv) highly skilled professionals, including analysts, research professionals and portfolio managers with a depth of experience relevant to the Funds; (v) access to significant technological resources from which the Funds may benefit; and (vi) a favorable history and reputation. The Board members noted that each Fund represents only a small amount of the overall assets managed by GEAM, but benefits from a full array of services and resources provided by GEAM.
1 The Elfun Funds include the Elfun Trusts, Elfun International Equity Fund, Elfun Diversified Fund, Elfun Tax-Exempt Income Fund, Elfun Income Fund, Elfun Money Market Fund (each, a “Fund” and collectively, the “Funds”).
110
In particular, the Board members discussed that the Funds benefit from a large staff of research analysts employed by GEAM.
In light of the foregoing, the Board members concluded that the services provided by GEAM continue to be satisfactory.
Investment Performance Of The Funds
The Board members considered the investment performance of the Funds for various periods. The Board members reviewed detailed comparisons of the performance of the Funds with the relevant securities indices and peer groupings of mutual funds prepared by Morningstar with respect to various periods. The Board members also engaged in discussions with GEAM personnel regarding the investment process and performance results for each Fund. These discussions focused on each Fund’s investment objective, the number and experience of portfolio management and supporting research personnel, the investment style and approach employed, the likely market cycles for the investment style and, in some instances, relative underperformance in certain periods. The Board members discussed GEAM’s investment approach with respect to each of the Funds, and that the performance of the Funds is consistent with GEAM’s articulated long-term approach and overall investment philosophy.
The Board members concluded that the Funds’ performance was acceptable overall taking into consideration the factors discussed above.
Cost Of The Services Provided To The Funds
The Board members considered the cost of the services provided by GEAM, noting that, pursuant to each investment advisory agreement, GEAM is reimbursed for its reasonable costs incurred in providing the services contemplated by those agreements and is not paid a management fee. The Board also noted that GE Investment Distributors, Inc. (“GEID”), a subsidiary of GEAM, is reimbursed for its reasonable costs incurred in providing services specified in its agreement with the Funds as unitholder servicing agent and is not paid a unitholder servicing fee. The Board members considered that the charges resulting from this arrangement involve all of the expenses incurred by GEAM and GEID with respect to the management and unitholder operations of the Funds,
including, without limitation, indirect allocable overhead costs and the direct and indirect costs of GEAM and GEID personnel providing investment management and other services to the Funds. The Board members noted and discussed the additional services provided by GEAM to the Funds compared to other investment products managed by GEAM and the charges that result from those services and were provided a study conducted by the Investment Company Institute that discusses and compares advisory fees and services for mutual funds and institutional separate accounts. The Board members also noted that none of the charges resulting from the Funds’ arrangements with GEAM and GEID may include any element of profit.
The Board members reviewed the information they had requested from GEAM personnel concerning the underlying assumptions and methods of cost allocation used by GEAM in allocating its costs and those of the other Fund service providers, including GEID. The Board members also discussed with GEAM personnel the basis for their belief that the methods of allocation used were reasonable for each area of GEAM’s business.
Based on their review, the Board members concluded that they were satisfied that the assumptions and methods used in cost allocation and the level of expenses incurred by the Funds were not unreasonable or excessive.
The Extent to Which Economies of Scale Would be Realized for the Benefit of Fund Shareholders as the Funds Grow
The Board members considered the extent to which economies of scale would be realized for the benefit of Fund investors as the Funds grow. The Board noted that, although none of the Funds experienced significant growth in assets over the past year, the Funds continue to enjoy fee and expense levels within or below the group of lowest fee and expense funds in their respective peer group comparisons.
The Board members recognized the significant benefits to the Funds resulting from their arrangement with GEAM, which causes them to bear only the reasonable costs incurred by GEAM and GEID, without any element of profit, for the substantial services they provide to the Funds. The Board members also recognized the benefits to the
111
Funds of being able to leverage a favorable cost structure achieved with respect to the Funds’ other operating expenses as a result of GEAM’s large overall base of assets under management and its vendor management practices.
Comparison Of Services To Be Rendered And Costs To Be Incurred
The Board members discussed the services provided to the Funds by GEAM, and the costs incurred by the Funds for those services. The Board members reviewed information concerning the Funds’ expense ratios, and comparative information with respect to peer groupings of mutual funds prepared by Morningstar. They discussed that, in all cases, the Funds enjoy expense levels
within or below the group of lowest cost funds in each peer group comparison. In light of this information, the Board members determined that the level of expenses incurred was reasonable in relation to the services provided to the Funds.
Fall-Out Benefits
The Board members considered other actual and potential financial benefits that GEAM may derive from its relationship with the Funds, including, where applicable, soft dollar commission benefits generated through Fund portfolio transactions. The Board members noted, however, that the Funds benefit from the vast array of resources available through GEAM, and that each Fund represents only a small amount of the overall assets managed by GEAM.
Conclusion
No single factor was determinative to the Board’s decision. Based on their discussion and such other matters as were deemed relevant, the Board members concluded that the proposed level of cost reimbursement to GEAM and projected total expense ratios for the Funds are reasonable in relation to the services provided. In view of these facts, the Board members concluded that the renewal of each advisory agreement was in the best interests of the Funds and their shareholders.
112

Information about Trustees and Executive Officers:
The business and affairs of the Funds are managed under the direction of the Funds’ Board of Trustees. Information pertaining to the Trustees and officers of the Company is set forth below.
Interested Trustees and Executive Officers
James W. Ireland III
Address c/o GEAM, 3001 Summer St. Stamford, CT 06905
Age 55
Position Held with Fund Trustee
Term of Office and Length of Time Served Until successor is elected and qualified – Three years
Principal Occupation(s) During Past 5 Years President, Chief Executive Officer, and Director of GEAM since June 2007; President, NBC Universal Television Stations from December 1999 to July 2007.
Number of Portfolios in Fund Complex Overseen by Trustee 8
Other Directorships Held by Trustee Trustee of the Norman Rockwell Museum since September 1997 and Treasurer of the Norman Rockwell Museum Board of Trustees since September 1998; Member of the Board of Directors of the Damon Runyon Cancer Research Foundation since October 2008; Trustee and Vice Chair of the Campaign Steering Committee of St. Lawrence University since July 2001; Trustee of GE Savings & Security Funds and General Electric Pension Trust since July 2007.
Paul M. Colonna
Address c/o GEAM, 3001 Summer St. Stamford, CT 06905
Age 42
Position Held with Fund Trustee
Term of Office and Length of Time Served Until successor is elected and qualified – three years
Principal Occupation(s) During Past 5 Years President – Fixed Income at GEAM since March 2007; Executive Vice President of GEAM from February 2007 to March 2007; Senior Vice President-Total Return Management at GEAM from March 2005 to March 2007; Senior Vice President-Structured Products at GEAM from March 2002 to March 2005.
Number of Portfolios in Fund Complex Overseen by Trustee 8
Other Directorships Held by Trustee Trustee of GE Savings & Security Funds and General Electric Pension Trust since February 2007; Director of GE Asset Management Limited (GEAML) since December 2007.
Michael J. Cosgrove
Address c/o GEAM 3001 Summer St. Stamford, CT 06905
Age 61
Position(s) Held with Fund Trustee
Term of Office and Length of Time Served Until successor is elected and qualified – 23 years
Principal Occupation(s) During Past 5 years President and Chief Executive Officer – Mutual Funds and Intermediary Business of GEAM since March 2007; Executive Vice President of GEAM from February 2007 to March 2007; Vice President, GE Capital Corporation, an indirect wholly-owned subsidiary of GE, since December 1999; Executive Vice President – Mutual Funds of GEAM, a wholly-owned subsidiary of GE that is registered as an investment adviser under the Investment Advisers Act of 1940, as amended, since March 1993; Director of GEAM since 1988.
Number of Portfolios in Fund Complex Overseen by Trustee 51
Other Directorships Held by Trustee Chairman of the Board and President of GE Funds since 1993 and GE Institutional Funds, GE LifeStyle Funds and GE Investments Funds, Inc. since 1997; Trustee of GE Savings & Security Funds and General Electric Pension Trust since 1988; Trustee of Fordham University since 2003, Trustee of Elfun Foundation; Treasurer of GE Foundation; Director, GE Asset Management (Ireland) since February 1999; Director, GE Asset Management Funds Plc, GE Asset Management Canada Company, GE Asset Management Limited, and GE Volunteers.
Ralph R. Layman
Address c/o GEAM 3001 Summer St. Stamford, CT 06905
Age 55
Position(s) Held with Fund Trustee
Term of Office and Length of Time Served Until successor is elected and qualified – 19 years
Principal Occupation(s) During Past 5 years President – International Equity Investments of GEAM since March 2007; Executive Vice President of GEAM from 1993 to March 2007; Executive Vice President – International Equity Investments at
113
GEAM from 1993 to March 2007; Executive Vice President – International Equity Investments of GEIC from 1993-2000 (when GEIC was merged into GEAM); Senior Vice President – International Equity Investments of GEAM and GEIC from 1991 until 1993; Executive Vice President, Partner and Portfolio Manager of Northern Capital Management from 1989-1991; and prior thereto, Vice President and Portfolio Manager of Templeton Investment Counsel.
Number of Portfolios in Fund Complex Overseen by Trustee 8
Other Directorships Held by Trustee Trustee of GE Savings & Security Funds and General Electric Pension Trust since 1993; Director of GE Asset Management Limited (GEAML) since September 1995.
Matthew J. Simpson
Address c/o GEAM, 3001 Summer St. Stamford, CT 06905
Age 49
Position Held With Fund Trustee
Term of Office and Length of Time Served Three years
Principal Occupation(s) During Past 5 Years Executive Vice President, General Counsel and Secretary of GEAM since July 2007; Senior Vice President and General Counsel – Marketing and Client Services (formerly Asset Management Services) at GEAM and Senior Vice President and General Counsel of GEAMS from February 1997 to July 2007; from October 1992 to February 1997, Vice President and Associate General Counsel of GEAM; Secretary of GE Funds, GE Institutional Funds, GE LifeStyle Funds and GE Investments Funds, Inc. from 1997 to July 2007 and Vice President from September 2003 to July 2007; Assistant Secretary of Elfun Funds and GE Savings & Security Funds from 1998 to July 2007 and Vice President from October 2003 to July 2007.
Number of Portfolios in Fund Complex Overseen by Trustee 51
Other Directorships Held By Trustee Trustee of GE Funds and GE Institutional Funds since July 2007. Director of GE Investments Funds, Inc. since July 2007; Trustee of GE Savings & Security Funds and General Electric Pension Trust since July 2007.
Donald W. Torey
Address c/o GEAM 3001 Summer St. Stamford, CT 06905
Age 53
Position(s) Held with Fund Trustee
Term of Office and Length of Time Served Until successor is elected and qualified – 17 years
Principal Occupation(s) During Past 5 years President – Alternative Investments at GEAM since March 2007; Executive Vice President of GEAM from 1997 to March 2007; Executive Vice President – Alternative Investments from 1997 to March 2007; Director of GEIC from 1993-2000 (when GEIC was merged into GEAM); Executive Vice President – Alternative Investments of GEIC from 1997-2000; Executive Vice President – Finance and Administration of GEAM and GEIC from 1993 to 1997; Manager –Mergers and Acquisitions Finance for GE from 1989-1993; Vice President – Private Placements of GEIC from 1988-1989.
Number of Portfolios in Fund Complex Overseen by Trustee 8
Other Directorships Held by Trustee Trustee of GE Savings & Security Funds and General Electric Pension Trust since 1993.
John J. Walker
Address c/o GEAM 3001 Summer St. Stamford, CT 06905
Age 57
Position(s) Held with Fund Trustee
Term of Office and Length of Time Served Until successor is elected and qualified – 11 years
Principal Occupation(s) During Past 5 years Executive Vice President and Chief Operating Officer of Geam since January 2008; Chief Financial Officer of GEAM from 1999-2008; Chief Financial Officer of GEIC from 1999-2000 (when GEIC was merged into GEAM); Chief Financial Officer of GE Capital – Global Consumer Finance from 1996-1999; Chief Financial Officer of GE Capital – Commercial Finance from 1992 to 1996; Finance Director of GE Capital – TIFC from 1988-1992.
Number of Portfolios in Fund Complex Overseen by Trustee 8
Other Directorships Held by Trustee Trustee of GE Savings & Security Funds and General Electric Pension Trust since 1999; Director of GE Asset Management Limited (GEAML) since July 1995.
David Wiederecht
Address c/o GEAM, 3001 Summer St. Stamford, CT 06905
Age 54
Position Held with Fund Trustee
Term of Office and Length of Time Served Until successor is elected and qualified – two year
Principal Occupation(s) During Past 5 Years President – Investment Strategies since February 2008; Managing
114
Director – Alternative Investments from 2004 to 2008; Vice President – Alternative Investments/Private Equity/Hedge Fund from 1998 to 2004.
Number of Portfolios in Fund Complex Overseen by Trustee 8
Other Directorships Held by Trustee Trustee of Elfun Funds and General Electric Pension Trust since 2008; Director of Edmunds Holding Company since 1999; Director of The Ritten-house Hotel and Condominium since 1992; Director of Ross-Simons, Inc. since 2001.
Tracie Winbigler
Address c/o GEAM, 3001 Summer St. Stamford, CT 06905
Age 45
Position Held with Fund Trustee
Term of Office and Length of Time Served Until successor is elected and qualified – less than a year
Principal Occupation(s) During Past 5 Years GE’s HealthAhead Finance Leader, overseeing all financial aspects of GE’s company-wide initiative to drive employee engagement in a culture of health. Prior to this role, she was the Chief Financial Officer of GE Transportation in Erie, PA, which followed various positions at NBC Universal including Executive Vice President, Chief Financial Officer Integrated Media and Executive Vice President, Chief Financial Officer for TV Group (which includes NBCU’s owned & operated television stations, Sports, Olympics, and Telemundo) and NBCU Digital Media. In 2004, she joined NBCU as Executive Vice President, Chief Financial Officer of the Television Stations Division, which included 14 NBC stations and 15 Telemundo stations. From 2002 - 2004 Tracie was the Chief Financial Officer at GE Nuclear Energy in Wilmington, NC. Earlier in her career she was NBC’s Chief Financial Officer of Affiliate Relations & Broadcast and Network Operations (2000 - 2002), Quality for the GE Plastics Joint Venture in Tokyo. She was a member of GE’s Corporate Audit Staff for six years, after joining the company in its Financial Management Program. Tracie attended Ohio Wesleyan University and graduated with a B.A. degree in Economics with Management Concentration.
Number of Portfolios in Fund Complex Overseen by Trustee 8
Other Directorships Held by Trustee Member of the IESE Business School, Global Women’s Forum Advisory Board.
The Statement of Additional Information for the Funds includes additional information about the Trustees and Officers and is available, without charge, upon request by calling 1-800-242-0134.
115

Portfolio Manager Biographies
The following sets forth biographical information for those individuals who are primarily responsible for managing the specified Fund’s investments. The portfolio managers may change from time to time.
Adam W. Ackerman is an assistant portfolio manager at GE Asset Management. He has served on the portfolio management team for the Elfun Money Market Fund since June 2009. Since joining GE Asset Management in 2005, Mr. Ackerman served in various positions including manager of the global fixed income trading operations and became an assistant portfolio manager in June 2009.
David B. Carlson is the Chief Investment Officer – U.S. Equities at GE Asset Management. He manages the overall U.S. equity investments for GE Asset Management . Mr. Carlson is the portfolio manager for Elfun Trusts and has served in this capacity since 1988. Mr. Carlson joined GE Asset Management in 1982 as a securities analyst for investment operations. He became a Vice President for Mutual Fund Portfolios in 1987, a Senior Vice President in 1989 and an Executive Vice President in 2003.
Michael J. Caufield is a Senior Vice President of GE Asset Management. He is portfolio manager of the Elfun Tax-Exempt Income Fund and has served in that capacity since October 2000. Mr. Caufield joined GE Asset Management in 1987 as Vice President, manager of fixed income research & analysis and was promoted to Senior Vice President in 1994.
Paul M. Colonna is the President and Chief Investment Officer – Fixed Income and a Director at GE Asset Management. Since January 2005, he has led the team of portfolio managers for the Elfun Income Fund and has been responsible for the fixed income portion of the Elfun Diversified Fund. Mr. Colonna became President – Fixed Income in March 2007. Prior to joining GE Asset Management in February 2000, Mr. Colonna was a senior portfolio manager with the Federal Home Loan Mortgage Corporation, overseeing the Mortgage Investment Group.
James C. Gannon is an assistant portfolio manager of GE Asset Management. He has served on the portfolio
management team for the Elfun Money Market Fund since December 2000. Since joining GE Asset Management in 1995, Mr. Gannon served in various positions at GE Asset Management including Trade operations specialist in fixed income, and became an assistant portfolio manager in February 2003.
Greg Hartch is a Senior Vice President – Tactical Asset Allocation at GE Asset Management. He has served as a portfolio manager to the Elfun Diversified Fund since January 2011. Mr. Hartch joined GE Asset Management in 2002 and has held various positions at GE Asset Management including Senior Vice President – Alternative Assets from 2002-2004, Director of Fixed Income Research from 2004-2007 and Managing Director – International Real Estate from 2007 to 2010.
William M. Healey is a Senior Vice President of GE Asset Management. He has served on the portfolio management team for the Elfun Income Fund since joining GE Asset Management in 1996. Prior to joining GE Asset Management, Mr. Healey spent over 10 years in the fixed income group at MetLife.
Brian Hopkinson is a Senior Vice President of GE Asset Management. He has been a portfolio manager for the Elfun International Equity Fund since joining GE Asset Management in October 1996. Prior to joining GE Asset Management, Mr. Hopkinson worked for Fiduciary Trust International in both London and New York.
Mark H. Johnson is a Senior Vice President of GE Asset Management and senior portfolio manager of Structured Products. He has been a member of the portfolio management team for the Elfun Income Fund since September 2007. Mr. Johnson joined GE in 1998 in its Employers Reinsurance Corporation as a taxable income portfolio manager. Mr. Johnson joined GE Asset Management as a Vice President and portfolio manager in 2002 and became a Senior Vice President and senior portfolio manager of Structured Products in 2007.
Ralph R. Layman is the President and Chief Investment Officer – Public Equities and a Director at GE Asset Management. He manages the overall public equity investments for GE Asset Management. Mr. Layman has led the team of portfolio managers for the Elfun International Equity Fund since 1991 and has been
116
| Portfolio | Manager Biographies (continued) |
responsible for the international equity portion for the Elfun Diversified Fund since September 1997. Mr. Layman joined GE Asset Management in 1991 as Senior Vice President for International Investments and became and Executive Vice President in 1992 and President -International Equities in March 2007.
Thomas R. Lincoln is a Senior Vice President of GE Asset Management. He has served on the portfolio management team for the Elfun Diversified Fund since May 2007. Mr. Lincoln joined GE Asset Management in 1994 as a financial analyst in U.S. equities. Mr. Lincoln became part of the investment management team for U.S. equities at GE Asset Management in 1997 and a portfolio manager for U.S. equities in 2003.
Michael E. Martini is a portfolio manager at GE Asset Management. He has served on the portfolio management team for the Elfun Money Market Fund since joining GE Asset Management in March of 2008. Prior to joining GE Asset Management, Mr. Martini was a Vice President at Ceres Capital Partners LLC, where he worked at the firm’s treasury desk from March 2006 to January 2008, and a Senior Vice President at Pacific Investment Management Company (PIMCO) from 1996 to 2004, where he was a portfolio manager at the firm’s money market/short-term desk.
Paul Nestro is a Senior Vice President of GE Asset Management. He has been a member of the portfolio management team for the Elfun International Equity Fund since February 2007. Mr. Nestro joined GE Asset Management in 1993 as a performance and attribution analyst in domestic equities. He became a senior performance and attribution analyst in 1994 and since 1996 has been an analyst and portfolio manager in the international equities group.
Jonathan L. Passmore is a Senior Vice President of GE Asset Management. He has served as a portfolio manager of the Elfun International Equity Fund since January 2002. Prior to joining GE Asset Management in January 2001, he was with Merrill Lynch for six years, most recently as Director, international equity.
Vita Marie Pike is a Senior Vice President of GE Asset Management. She has served on the portfolio management team for the Elfun Income Fund since March 2005. Prior to joining GE Asset Management in January 2001, she was with Alliance Capital for over nine years serving in a number of different capacities including portfolio manager.
Michael J. Solecki is the Chief Investment Officer – International Equities at GE Asset Management. He has served as a portfolio manager of the Elfun International Equity Fund since August 1999. He joined GE Asset Management in 1990 as an international equity analyst. He became a Vice President for international equity portfolios in 1996 and Senior Vice President in 2000.
Diane M. Wehner is a Senior Vice President of GE Asset Management. Ms. Wehner has been responsible for the mid-cap equity portion of the Elfun Diversified Fund since May 2008. Before joining GE Asset Management, Ms. Wehner was a Vice President and Senior Portfolio Manager from January 1997 to June 2001, and associate portfolio manager from May 1995 to January 1997, with Benefit Capital Management Corporation. Ms. Wehner has served as an analyst/portfolio manager in the investment management industry since 1985.
David Wiederecht is the President and Chief Investment Officer – Investment Strategies and a Director at GE Asset Management. He has served as a portfolio manager to the Elfun Diversified Fund since January 2011. Mr. Wiederecht joined GE Asset Management in 1988 and has held various positions at GE Asset Management including Vice President – Alternative Investments/Private Equity/Hedge Fund from 1998 to 2004, Managing Director – Alternative Investments from 2004 to 2008, and President – Investment Strategies since 2008.
117
Portfolio Managers
Elfun International Equity Fund
Team led by Ralph R. Layman
Elfun Trusts
David B. Carlson
Elfun Diversified Fund
Thomas R. Lincoln
Ralph R. Layman
Paul M. Colonna
Diane M. Wehner
Elfun Tax-Exempt Income Fund
Michael Caufield
Elfun Income Fund
Team led by Paul M. Colonna
Elfun Money Market Fund
Team led by Michael E. Martini
Investment Adviser
GE Asset Management Incorporated
Independent Registered Public Accounting Firm
KPMG LLP
Custodian
State Street Bank & Trust Company
Unitholder Servicing Agent
Address all inquiries to:
GE Funds
c/o PNC Global Investment Servicing
P.O. Box 9838
Providence, RI 02940
Officers of the Investment Adviser
James W. Ireland III, Trustee, President and Chief Executive Officer, GE Asset Management Incorporated
Cheryl H. Beacock, Senior Vice President, Human Resources
Paul M. Colonna, Trustee, President and Chief Investment Officer – Fixed Income Investments
Michael J. Cosgrove, Trustee, President and Chief Executive Officer – Mutual Funds and Intermediary Business
Ralph R. Layman, Trustee, President and Chief Investment Officer – Public Equity Investments
Maureen B. Mitchell, President – Institutional Sales and Marketing (since July 2009)
Steve Rullo, Chief Information Officer (since February, 2011)
Matthew J. Simpson, Trustee, Executive Vice President, General Counsel and Secretary
Donald W. Torey, Trustee, President – Alternative Investments and Real Estate
John J. Walker, Trustee, Executive Vice President, Chief Operating Officer
David Wiederecht, Trustee, President and Chief Investment Officer – Investment Strategies
Tracie Winbigler, Executive Vice President, Chief Financial Officer*
| * | | Effective January, 2011. |
118

New Online Service
Your Elfun Mutual Fund accounts can now be accessed on the Internet at
www.elfun.org.
Here are some of the benefits of our online service:
| | |
•View account balance and transaction history | | •View and order tax forms |
•Make exchanges | | •View quarterly statements |
•Redeem shares | | •Change address |
•Purchase shares | | •Re-order money market checks |
Many more features will be added to the web site in the future for your convenience.
New Extended Telephone Service
Our Representatives at the Customer Service Center are available Monday to Friday from 8:30 AM to 8:00 PM Eastern Standard Time. Call toll-free, 1-800-242-0134, for assistance.
Automated Voice Response System
You can also access your account anytime during the day, 7 days a week by dialing 1-800-242-0134. Simply follow the menu to obtain information or make certain transactions.
Contact Us By Mail
If you’d like to write to us, address your inquiries regarding your account(s) to:
GE Funds
c/o PNC Global Investment Servicing
P.O. Box 9838
Providence, RI 02940
We are continuing to upgrade a variety of services in order to give you the tools you need to manage your financial objectives. In the meantime, we welcome all your comments and suggestions.
119
Elfun Funds
3001 Summer Street
Stamford, CT 06905
Distributor
GE Investment Distributors Inc.
Member FINRA and SIPC
3001 Summer Street
P.O. Box 7900
Stamford, CT 06904-7900
www.gefunds.com/elfun
|
|
The Funds file their complete schedules of portfolio holdings with the Securities and Exchange Commission for the first, second and third quarters of each fiscal year on Form N-Q. The Funds’ Forms N-Q, as well as a description of the policies and procedures that the Funds use to determine how to vote proxies (if any) relating to portfolio securities is available without charge (i) upon request, by calling 1-800-242-0134; (ii) on the Funds’ website at http://www.geam.com; and (iii) on the Commission’s website at http://www.sec.gov. The Funds’ Forms N-Q may be reviewed and copied at the Commission’s Public Reference Room in Washington, DC — information on the operation of the Public Reference Room may be obtained by calling 1-800-SEC-0330. Information (if any) regarding how the Funds voted proxies relating to portfolio securities during the most recently disclosed 12-months period ended June 30 is available without charge (i) through the Funds’ website at http://www.geam.com; and (ii) on the Commission’s website at http://www.sec.gov. |
| | |
 | | ELF 1 (2/11) |
PRSRT STD
U.S. POSTAGE
PAID
Permit No. 1793
Lancaster, PA
Please refer to the Code of Ethics included in the following link:
www.ge.com/files/usa/en/commitment/social/integrity/downloads/english.pdf
| ITEM 3. | AUDIT COMMITTEE FINANCIAL EXPERT. |
The Board of Trustees of the Registrant has determined that Donald W. Torey, Tracie Winbigler and John J. Walker are designated as audit committee financial experts for the Funds; and further that it is the finding of the Board of Trustees that Mr. Torey and Ms. Winbigler qualifies as an audit committee financial experts. Each audit committee member is deemed to be an “interested person” of the Funds as defined in Section 2(a)(19) of the Act (15 U.S.C. 80a-2(a)(19)).
| ITEM 4. | PRINCIPAL ACCOUNTANT FEES AND SERVICES. |
(a) AUDIT FEES. The aggregate fees billed for each of the last two fiscal years (the “Reporting Periods”) for professional services rendered by the Registrant’s principal accountant (the “Auditor”) for the audit of the Registrant’s annual financial statements, or services that are normally provide by the Auditor in connection with the statutory and regulatory filings or engagements for the Reporting Periods were $23,100 in 2009 and $23,350 in 2010.
(b) AUDIT RELATED FEES. There were no fees billed by the Auditor for assurance and related services that were related to the performance of the audit for the Registrant during the Reporting Periods.
(c) TAX FEES. There were no fees billed for professional services rendered by the Auditor for tax compliance, tax advice or tax planning for the Registrant during the Reporting Periods.
(d) ALL OTHER FEES. There were no fees billed for products and services provided by the Auditor, other than the services reported in paragraphs (a) through (c) of this Item for the Registrant during the Reporting Periods.
(e) (1) AUDIT COMMITTEE PRE-APPROVAL POLICIES AND PROCEDURES.
The Audit Committee of the Elfun Funds (the “Funds”) Board of Trustees is responsible, among other things, for the appointment, compensation and oversight of the work of the Fund’s independent accountants/auditors (the “Auditor”). As part of this responsibility and to ensure that the Auditor’s independence is not impaired, the Audit Committee (1) pre-approves the audit and non-audit services provided to the Funds by the Auditor, and (2) all non-audit services provided to the Funds’ investment adviser and covered affiliates (as defined in the Audit Committee Charter) that provide ongoing services to the Funds if the services directly impact the Funds’ operations or financial reporting, in accordance with the Audit Committee Charter. Following are excerpts from the Audit Committee Charter that sets forth the pre-approval policies and procedures:
1. Selection and Pre-Approval of Auditor and Approval of Fees.
(i) The Audit Committee shall pre-approve the selection of the Auditor and shall recommend for ratification the selection, retention or termination of the Auditor by the full Board, including the independent Trustees/Directors, and, in connection therewith, shall evaluate the independence of the Auditor, including: (i) an evaluation of whether the Auditor provides any consulting services to the Fund’s investment adviser and the extent to which the Auditor provides non-audit services to the Fund’s investment adviser and certain other affiliated service providers as defined in Section 2(f) below, which services are not subject to the pre-approval requirements set forth in Section 4 below; (ii) an evaluation of the extent to which the Auditor has any relationships with the Fund or its affiliated persons that are brought to the attention of the Audit Committee by the Auditor in accordance with applicable standards of the Independence Standards Board (“ISB”), because, in the Auditor’s professional judgment, such relationships may reasonably be thought to bear on the Auditor’s independence with respect to the Fund; and (iii) monitoring the Auditor’s compliance with respect to the rotation requirements for the lead and coordinating partners having primary responsibility for the Fund’s audits and any partner responsible for the reviewing the Fund’s audits. The Audit Committee shall review the Auditor’s specific representations as to its independence.
(b) The Audit Committee shall pre-approve and review the fees charged by the Auditor for audit and non-audit services to be provided to the Fund and certain affiliated service providers (as defined in Section 2(f) below) in accordance with the pre-approval requirements set forth in Section 4 below. The Fund shall provide for appropriate funding, as determined by the Audit Committee, to compensate the Auditor for any authorized service provided to the Fund.
2. Meetings with the Auditor. The Audit Committee shall meet with the Auditor, including private meetings, prior to the commencement of substantial work on the audit and following the conclusion of the audit, as well as such other times as the Audit Committee shall deem necessary or appropriate. The Auditor shall report directly to the Audit Committee. The Auditor shall report at least annually, concerning the following and other pertinent matters:
(a) to review the arrangements for and scope of the annual audit and any special audits;
(b) to provide the Auditor the opportunity to report to the Audit Committee, on a timely basis, all critical accounting policies and practices to be used;
(c) to discuss any matters of concern relating to the Fund’s financial statements, including: (i) any adjustments to such statements recommended by the Auditor, or other results of said audit(s), and (ii) any alternative treatments of financial information within GAAP that have been discussed with Fund management, the ramifications of the use of such alternative disclosures and treatments, and the treatment preferred by the Auditor;
(d) to provide the Auditor the opportunity to report to the Audit Committee, on a timely basis, any material written communication between the Auditor and Fund management, such as any management letter or schedule of unadjusted differences;
(e) to discuss the opinion the Auditor has rendered regarding the Fund’s financial statements;
(f) to report all non-audit services that do not require Audit Committee pre-approval and are provided to certain affiliated persons of the Fund, including: (1) the Fund’s investment adviser or sub-advisers (but excluding any investment sub-adviser whose role is primarily portfolio management and is overseen by the investment adviser), (2) the Fund’s principal underwriter, and (3) any entity controlling, controlled by, or under common control with the investment adviser or principal underwriter, that provides “ongoing” services to the Funds in accordance with the pre-approval requirements of paragraph (c)(7)(i) of Rule 2-01 of Regulation S-X (each, a “Covered Affiliate” and collectively, “Covered Affiliates”);
(g) to review, in accordance with current standards of ISB, all relationships between the Auditor and the Fund or its affiliated persons that, in the Auditor’s professional judgment, may reasonably be thought to bear on its independence, and to confirm, in light of such information, whether the Auditor believes, in its professional judgment, that it may properly serve as independent accountants/auditors with respect to the Fund;
(h) to consider the Auditor’s comments with respect to the Fund’s financial policies, procedures and internal accounting controls and responses thereto by the Fund’s officers and Fund management, as well as other personnel;
(i) to investigate any improprieties or suspected improprieties in the operations of the Fund to the extent necessary or appropriate in light of any internal investigations by the Fund’s officers and/or by officers or employees of the Fund management of such improprieties;
(j) to receive periodic reports concerning regulatory changes and new accounting pronouncements that significantly affect the value of the Fund’s assets and their financial reporting;
(k) to report on the Fund’s qualification under Subchapter M of the Internal Revenue Code, amounts distributed and reported to shareholders for Federal tax purposes and the Fund’s tax returns; and
(l) to provide the Auditor the opportunity to report on any other matter that the Auditor deems necessary or appropriate to discuss with the Audit Committee.
If the Auditor’s report on the above-listed (and other pertinent) matters is not made in person to the Audit Committee within 60 days following the end of the Fund’s fiscal year, the Auditor shall deliver a written report to the Audit Committee concerning these matters within such 60 day period.
3. Change in Accounting Principles. The Audit Committee shall consider the effect upon the Fund of any changes in accounting principles or practices proposed by the Auditor or the Fund’s officers.
4. Pre-Approval of Audit Related Services and Permissible Non-Audit Services. The Audit Committee shall pre-approve both audit (including audit, review, and attest) services and permissible non-audit services provided to the Fund and, if the nature of the engagement relates directly to the operations and financial reporting of the Fund, permissible non-audit services provided to any Covered Affiliate.
The Audit Committee may determine to delegate the authority to grant pre-approvals to one or more Audit Committee members, each acting on behalf of the Audit Committee. In this event, the member of the Audit Committee so delegated shall report each delegated pre-approval to the Audit Committee at its next regularly scheduled meeting. The Audit Committee may also adopt and follow, in lieu of explicit pre-approval described above, written policies and procedures detailed as to the particular service, designed to safeguard the continued independence of the Auditor, consistent with the requirements of the Act and SEC regulations thereunder.
Notwithstanding the foregoing, the pre-approval requirement concerning permissible non-audit services provided to the Fund or any Covered Affiliate is waived if: (1) the aggregate amount of all such non-audit services provided constitutes no more than five percent (5%) of the total amount of revenues paid to the Auditor by the Fund and the Covered Affiliates during the fiscal year in which the services are provided that would have to be pre-approved by the Audit Committee, (2) the non-audit services were not recognized as non-audit services at the time of the engagement, and (3) such non-audit services are promptly brought to the attention of the Audit Committee and approved by the Audit Committee or one or more designated members of the Audit Committee prior to the completion of the audit.
5. Prohibited Activities of the Auditor. The Audit Committee shall confirm with the Auditor that it is not performing contemporaneously (during the audit and professional engagement period) non-audit services for the Fund that the Audit Committee believes may taint the independence of the Auditor. The Auditor will be responsible for informing the Audit Committee of whether it believes that a particular non-audit service is permissible or prohibited pursuant to applicable regulations and standards.
(2) PERCENTAGE OF SERVICES IN PARAGRAPHS (b) THROUGH (d) APPROVED BY AUDIT COMMITTEE. No fees were charged during 2009 or 2010 for audit related, tax or other services as indicated in sections (b) through (d) of this Item.
(f) Not applicable.
(g) NON-AUDIT FEES. The aggregate non-audit fees billed by the Auditor for services rendered to the Registrant, and rendered to Service Affiliates, for the Reporting Periods were $0 in 2009 and $0 in 2010.
(h) AUDITOR INDEPENDENCE. There were no non-audit services rendered to Service Affiliates that were not pre-approved.
| ITEM 5. | Audit Committee of Listed Registrants |
The Registrant has a separately-designated standing audit committee established in accordance with Section 3(a)(58)(A) of the Exchange Act (15 U.S.C. 78c(a)(58)(A)). The Registrants audit committee members are: Donald W. Torey, Tracie Winbigler and John J. Walker.
| ITEM 6. | Schedule of Investments. |
Attached as part of ITEM 1.
| ITEM 7. | DISCLOSURE OF PROXY VOTING POLICIES AND PROCEDURES FOR CLOSED-END MANAGEMENT INVESTMENT COMPANIES. |
Applicable only to Closed-End Management Investment Companies.
| ITEM 8. | PORTFOLIO MANAGERS OF CLOSED-END MANAGEMENT INVESTMENT COMPANIES. |
Applicable only to Closed-End Management Investment Companies.
| ITEM 9. | Purchases of Equity Securities by Closed-End Management Investment Company and Affiliated Purchasers. |
Applicable only to Closed-End Management Investment Companies.
| ITEM 10. | Submission of Matters to a Vote of Security Holders. |
No material changes.
| ITEM 11. | CONTROLS AND PROCEDURES. |
The officers providing the certifications in this report in accordance with Rule 30a-3 under the Investment Company Act of 1940 have concluded, based on their evaluation of the registrant’s disclosure controls and procedures (as such term is defined in such rule), that such controls and procedures are adequate and reasonably designed to achieve the purpose described in paragraph (c) of such rule.
There were no significant changes in the registrant’s internal controls or in other factors that could significantly affect these controls subsequent to the date of their last evaluation, including any corrective actions with regard to significant deficiencies and material weaknesses.
(a) Not applicable.
(b) Attached hereto as Exhibit 1 and Exhibit 2 are the Certifications of James W. Ireland and Eunice Tsang as principal executive officer and principal financial officer, respectively of the Registrant as required by Rule 30a-2(a) under the Act (17 CFR 270.30a-2(a)).
SIGNATURES
Pursuant to the requirements of the Securities Exchange Act of 1934 and the Investment Company Act of 1940, the Registrant has duly caused this Report to be signed on its behalf by the undersigned, thereunto duly authorized.
Elfun Trusts
| | |
| By: | | /S/ JAMES W. IRELAND |
| | James W. Ireland |
| | Trustee, President and Chief Executive Officer GE Asset Management Incorporated |
| |
| Date: | | March 09, 2011 |
Pursuant to the requirements of the Securities Exchange Act of 1934 and the Investment Company Act of 1940, this Report has been signed below by the following persons on behalf of the Registrant and in the capacities and on the dates indicated.
| | |
| By: | | /S/ JAMES W. IRELAND |
| | James W. Ireland |
| | Trustee, President and Chief Executive Officer GE Asset Management Incorporated |
| |
| Date: | | March 09, 2011 |
| |
| By: | | /S/ EUNICE TSANG |
| | Eunice Tsang |
| | Treasurer, Elfun Funds |
| |
| Date: | | March 09, 2011 |
EXHIBIT INDEX
(b)(1) Certifications of principal executive officer and principal financial officer as required by Rule 30a-2 under the Investment Company Act of 1940.
(b)(2) Certification of principal executive officer and principal financial officer as required by Section 906 of the Sarbanes-Oxley Act of 2002.