Exhibit 99.1
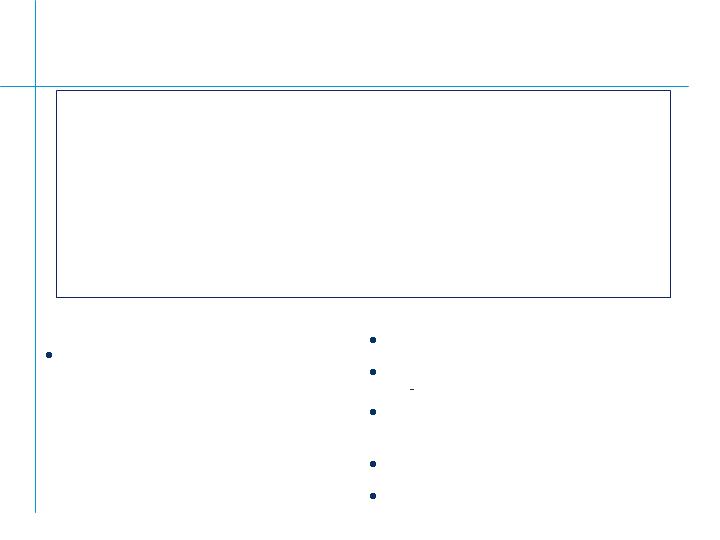
Fiscal Year 2009 Guidance: Very Uncertain and
Challenging Global Economics in 2009
Delta
2007-08 2008 2009 Forecast (11/4/08)
Sales +12% $24.8B $23.5 to $25.5B
Operating Margin* +70 basis 16.5% 16.0 – 16.6%
points
EPS (continuing operations) +17% $3.11 $2.80 to $3.20
Operating Cash Flow 9% $3.3B $3.3B to $3.5B
Capital Expenditures 5% $714M $680 - $725M
Assumed future and completed
acquisitions +4%
Restructuring: $125 to $150M
Pension Expense: approx. neutral;
cash funding up to $200M
Currency Unfavorable: ~$1.1B (-5%)
Euro to USD$ exchange rate: ~1.28
Underlying* sales growth: -4% to +4%
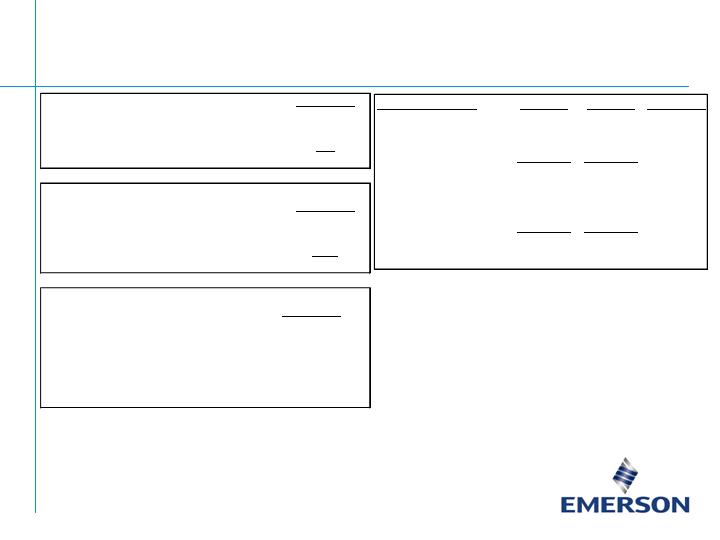
(3%) to (5%)
US: Non-residential
8% to 12%
India
10% to 12%
China
(15%) to (20%)
US: Residential
2008-2009
(1%) to 1%
Japan
(1%) to 2%
Europe
5% to 7%
Latin America
Gross Fixed Investment (GFI)
Assumptions:

Emerson delivered an outstanding fiscal year 2008, and our
businesses and financial position remain very strong as we finished
this record year
Emerson is well positioned as we move into an uncertain fiscal year
2009
Strong global footprint
International sales 54% of total business
Emerging markets 30% of total business
Good mix of businesses – we have continued to actively manage the
portfolio
Financial strength to invest internally and do acquisitions where
appropriate
Summary
The Global Management Team is Prepared for an
Uncertain and Declining Global Economy
Emerson Business Summary
Reconciliation of Non-GAAP Financial Measures
13.5%-14.2%
% Sales
~$3,165-$3,625
Pretax Earnings
~$ 600
Other Deductions, Net
Interest Expense and
16.0%-16.6%
% Sales*
~$3,765-$4,225
Operating Profit*
Fiscal 2009
Forecasted
(5) to 3%
Net Sales
4 pts
Assumed Future and Completed Acquisitions
(5) pts
Foreign Currency Translation
(4) to 4%
Underlying Sales *
Fiscal 2009
Forecasted
12%
Net Sales
1 pt
Acquisitions/Divestitures
4 pts
Foreign Currency Translation
7%
Underlying Sales *
Fiscal 2008
This information reconciles non-GAAP measures with the most directly comparable
GAAP measure ($M)
Operating Profit
FY 2007
FY 2008
% Change
Net Sales
22,131
$
24,807
$
12%
Cost of Sales
14,066
15,668
SG&A Expense
4,569
5,057
Operating Profit *
3,496
4,082
17%
O.P. % *
15.8%
16.5%
Other Deductions, Net
175
303
Interest Expense, Net
228
188
Pretax Earnings
3,093
$
3,591
$
16%
Earnings %
14.0%
14.5%