Use these links to rapidly review the document
TABLE OF CONTENTS
PART IV
UNITED STATES
SECURITIES AND EXCHANGE COMMISSION
WASHINGTON, D.C.20549
FORM 10-K
| | |
| (Mark One) | | |
ý |
|
Annual report pursuant to Section 13 or 15(d) of the Securities Exchange Act of 1934 |
For the fiscal year ended December 31, 2008 or |
o |
|
Transition report pursuant to Section 13 or 15(d) of the Securities Exchange Act of 1934 |
For the transition period from to .
|
Commission file number: 1-3368
THE EMPIRE DISTRICT ELECTRIC COMPANY
(Exact name of registrant as specified in its charter)
| | |
Kansas
(State of Incorporation) | | 44-0236370
(I.R.S. Employer Identification No.) |
602 S. Joplin Avenue, Joplin, Missouri
(Address of principal executive offices) |
|
64801
(zip code) |
Registrant's telephone number: (417) 625-5100 |
Securities registered pursuant to Section 12(b) of the Act:
| | |
| Title of each class | | Name of each exchange on which registered |
|---|
Common Stock ($1 par value)
Preference Stock Purchase Rights | | New York Stock Exchange
New York Stock Exchange |
Securities registered pursuant to Section 12(g) of the Act: None
Indicate by check mark if the registrant is a well-known seasoned issuer, as defined in Rule 405 of the Securities Act. Yes ý No o
Indicate by check mark if the registrant is not required to file reports pursuant to Section 13 or Section 15(d) of the Act. Yes o No ý
Indicate by check mark whether the registrant (1) has filed all reports required to be filed by Section 13 or 15(d) of the Securities Exchange Act of 1934 during the preceding 12 months (or for such shorter period that the registrant was required to file such reports), and (2) has been subject to such filing requirements for the past 90 days. Yes ý No o
Indicate by check mark if disclosure of delinquent filers pursuant to Item 405 of Regulation S-K is not contained herein, and will not be contained, to the best of registrant's knowledge, in definitive proxy or information statements incorporated by reference in Part III of this Form 10-K or any amendment to this Form 10-K. ý
Indicate by check mark whether the registrant is a large accelerated filer, an accelerated filer, a non-accelerated filer, or a smaller reporting company. See the definitions of "large accelerated filer," "accelerated filer" and "smaller reporting company" in Rule 12b-2 of the Exchange Act. (Check one):
| | | | | | |
| Large accelerated filer o | | Accelerated filer ý | | Non-accelerated filer o
(Do not check if a smaller reporting company) | | Smaller reporting company o |
Indicate by check mark whether the registrant is a shell company (as defined in Rule 12b-2 of the Exchange Act). Yes o No ý
The aggregate market value of the registrant's voting common stock held by nonaffiliates of the registrant, based on the closing price on the New York Stock Exchange on June 30, 2008, was approximately $627,768,368.
As of February 6 2009, 34,030,579 shares of common stock were outstanding.
The following documents have been incorporated by reference into the parts of the Form 10-K as indicated:
| | |
The Company's proxy statement, filed pursuant
to Regulation 14A under the Securities Exchange
Act of 1934, for its Annual Meeting of
Stockholders to be held on April 23, 2009 | | Part of Item 10 of Part III
All of Item 11 of Part III
Part of Item 12 of Part III
All of Item 13 of Part III
All of Item 14 of Part III |
Table of Contents
TABLE OF CONTENTS
| | | | | | | |
| |
| | Page | |
|---|
| | Forward Looking Statements | | | 3 | |
PART I | |
ITEM 1. | | BUSINESS | | | 4 | |
| | General | | | 4 | |
| | Electric Generating Facilities and Capacity | | | 5 | |
| | Gas Facilities. | | | 7 | |
| | Construction Program | | | 8 | |
| | Fuel and Natural Gas Supply | | | 9 | |
| | Employees | | | 11 | |
| | Electric Operating Statistics | | | 12 | |
| | Gas Operating Statistics | | | 13 | |
| | Executive Officers and other Officers of Empire | | | 14 | |
| | Regulation | | | 15 | |
| | Environmental Matters | | | 16 | |
| | Conditions Respecting Financing | | | 20 | |
| | Our Web Site | | | 21 | |
ITEM 1A. | | RISK FACTORS | | | 22 | |
ITEM 1B. | | UNRESOLVED STAFF COMMENTS | | | 25 | |
ITEM 2. | | PROPERTIES | | | 26 | |
| | | | Electric Segment Facilities | | | 26 | |
| | | | Gas Segment Facilities | | | 28 | |
| | | | Other Segment Businesses | | | 28 | |
ITEM 3. | | LEGAL PROCEEDINGS | | | 28 | |
ITEM 4. | | SUBMISSION OF MATTERS TO A VOTE OF SECURITY HOLDERS | | | 28 | |
PART II | |
ITEM 5. | | MARKET FOR REGISTRANT'S COMMON EQUITY, RELATED STOCKHOLDER MATTERS AND ISSUER PURCHASES OF EQUITY SECURITIES | | | 29 | |
ITEM 6. | | SELECTED FINANCIAL DATA | | | 31 | |
ITEM 7. | | MANAGEMENT'S DISCUSSION AND ANALYSIS OF FINANCIAL CONDITION AND RESULTS OF OPERATIONS | | | 32 | |
| | Executive Summary | | | 32 | |
| | Results of Operations | | | 37 | |
| | Rate Matters | | | 49 | |
| | Competition | | | 53 | |
| | Liquidity and Capital Resources | | | 54 | |
| | Contractual Obligations | | | 60 | |
| | Dividends | | | 61 | |
| | Off-Balance Sheet Arrangements | | | 62 | |
| | Critical Accounting Policies | | | 62 | |
| | Recently Issued Accounting Standards | | | 66 | |
ITEM 7A | | QUANTATATIVE AND QUALITATIVE DISCLOSURES ABOUT MARKET RISK | | | 67 | |
ITEM 8. | | FINANCIAL STATEMENTS AND SUPPLEMENTARY DATA | | | 69 | |
ITEM 9. | | CHANGES IN AND DISAGREEMENTS WITH ACCOUNTANTS ON ACCOUNTING AND FINANCIAL DISCLOSURE | | | 139 | |
ITEM 9A. | | CONTROLS AND PROCEDURES | | | 139 | |
ITEM 9B. | | OTHER INFORMATION | | | 139 | |
PART III | |
ITEM 10. | | DIRECTORS, EXECUTIVE OFFICERS AND CORPORATE GOVERNANCE | | | 140 | |
ITEM 11. | | EXECUTIVE COMPENSATION | | | 140 | |
ITEM 12. | | SECURITY OWNERSHIP OF CERTAIN BENEFICIAL OWNERS AND MANAGEMENT AND RELATED STOCKHOLDER MATTERS | | | 140 | |
ITEM 13. | | CERTAIN RELATIONSHIPS AND RELATED TRANSACTIONS, AND DIRECTOR INDEPENDENCE | | | 141 | |
ITEM 14. | | PRINCIPAL ACCOUNTANT FEES AND SERVICES | | | 141 | |
PART IV | |
ITEM 15. | | EXHIBITS AND FINANCIAL STATEMENT SCHEDULES | | | 142 | |
| | SIGNATURES | | | 147 | |
Table of Contents
FORWARD LOOKING STATEMENTS
Certain matters discussed in this annual report are "forward-looking statements" intended to qualify for the safe harbor from liability established by the Private Securities Litigation Reform Act of 1995. Such statements address or may address future plans, objectives, expectations and events or conditions concerning various matters such as capital expenditures, earnings, pension and other costs, competition, litigation, our construction program, our generation plans, our financing plans, potential acquisitions, rate and other regulatory matters, liquidity and capital resources and accounting matters. Forward-looking statements may contain words like "anticipate", "believe", "expect", "project", "objective" or similar expressions to identify them as forward-looking statements. Factors that could cause actual results to differ materially from those currently anticipated in such statements include:
- •
- the amount, terms and timing of rate relief we seek and related matters;
- •
- the cost and availability of purchased power and fuel, and the results of our activities (such as hedging) to reduce the volatility of such costs;
- •
- volatility in the credit, equity and other financial markets and the resulting impact on our short term debt costs and our ability to issue debt or equity securities, or otherwise secure funds to meet our capital expenditure, dividend and liquidity needs;
- •
- the results of prudency and similar reviews by regulators of costs we incur;
- •
- weather, business and economic conditions and other factors which may impact sales volumes and customer growth
- •
- operation of our electric generation facilities and electric and gas transmission and distribution systems, including the performance of our joint owners;
- •
- the costs and other impacts resulting from natural disasters, such as tornados and ice storms;
- •
- the periodic revision of our construction and capital expenditure plans and cost and timing estimates;
- •
- legislation;
- •
- regulation, including environmental regulation (such as NOx, SO2 and CO2 regulation);
- •
- competition, including the regional SPP energy imbalance market;
- •
- electric utility restructuring, including ongoing federal activities and potential state activities;
- •
- the impact of electric deregulation on off-system sales;
- •
- changes in accounting requirements;
- •
- other circumstances affecting anticipated rates, revenues and costs;
- •
- the timing of accretion estimates, and integration costs relating to completed and contemplated acquisitions and the performance of acquired businesses, which may lead to impairments of goodwill;
- •
- matters such as the effect of changes in credit ratings on the availability and our cost of funds;
- •
- the performance of our pension assets and the resulting impact on our pension funding commitments;
- •
- interruptions or changes in our coal delivery, gas transportation or storage agreements or arrangements;
- •
- the success of efforts to invest in and develop new opportunities;
- •
- costs and effects of legal and administrative proceedings, settlements, investigations and claims; and
- •
- our exposure to the credit risk of our hedging counterparties.
All such factors are difficult to predict, contain uncertainties that may materially affect actual results, and may be beyond our control. New factors emerge from time to time and it is not possible for management to predict all such factors or to assess the impact of each such factor on us. Any forward-looking statement speaks only as of the date on which such statement is made, and we do not undertake any obligation to update any forward-looking statement to reflect events or circumstances after the date on which such statement is made.
We caution you that any forward-looking statements are not guarantees of future performance and involve known and unknown risk, uncertainties and other factors which may cause our actual results, performance or achievements to differ materially from the facts, results, performance or achievements we have anticipated in such forward-looking statements.
3
Table of Contents
PART 1
ITEM 1. BUSINESS
General
We operate our businesses as three segments: electric, gas and other. The Empire District Electric Company (EDE), a Kansas corporation organized in 1909, is an operating public utility engaged in the generation, purchase, transmission, distribution and sale of electricity in parts of Missouri, Kansas, Oklahoma and Arkansas. As part of our electric segment, we also provide water service to three towns in Missouri. The Empire District Gas Company (EDG) is our wholly owned subsidiary formed to hold the Missouri Gas assets acquired from Aquila, Inc. on June 1, 2006. Our other segment consists primarily of our fiber optics business. In 2008, 86.5% of our gross operating revenues were provided from sales from our electric segment (including 0.3% from the sale of water), 12.6% from our gas segment, and 0.9% from our other segment.
The territory served by our electric operations embraces an area of about 10,000 square miles, located principally in southwestern Missouri, and also includes smaller areas in southeastern Kansas, northeastern Oklahoma and northwestern Arkansas. The principal economic activities of these areas include light industry, agriculture and tourism. Of our total 2008 retail electric revenues, approximately 88.7% came from Missouri customers, 5.4% from Kansas customers, 3.0% from Oklahoma customers and 2.9% from Arkansas customers.
We supply electric service at retail to 121 incorporated communities and to various unincorporated areas and at wholesale to four municipally owned distribution systems. The largest urban area we serve is the city of Joplin, Missouri, and its immediate vicinity, with a population of approximately 157,000. We operate under franchises having original terms of twenty years or longer in virtually all of the incorporated communities. Approximately 64% of our electric operating revenues in 2008 were derived from incorporated communities with franchises having at least ten years remaining and approximately 6% were derived from incorporated communities in which our franchises have remaining terms of ten years or less. Although our franchises contain no renewal provisions, in recent years we have obtained renewals of all of our expiring electric franchises prior to the expiration dates.
Our electric operating revenues in 2008 were derived as follows: residential 40.2%, commercial 29.8%, industrial 15.1%, wholesale on-system 4.3%, wholesale off-system 6.6%, miscellaneous sources, primarily public authorities, 2.5% and other electric revenues 1.5%. Our largest single on-system wholesale customer is the city of Monett, Missouri, which in 2008 accounted for approximately 3% of electric revenues. No single retail customer accounted for more than 1% of electric revenues in 2008.
Our gas operations serve customers in northwest, north central and west central Missouri. We provide natural gas distribution to 44 communities and 279 transportation customers as of December 31, 2008. Our gas operating revenues in 2008 were derived as follows: residential 60.6%, commercial 26.6%, industrial 7.7% and other 5.1%. No single retail customer accounted for more than 5% of gas revenues in 2008. The largest urban area we serve is the city of Sedalia with a population of over 20,000. We operate under franchises having original terms of twenty years in virtually all of the incorporated communities. Twenty-seven of the franchises have 10 years or more remaining on their term. Although our franchises contain no renewal provisions, since our acquisition, we have obtained renewals of all our expiring gas franchises prior to the expiration dates.
Our other segment consists primarily of a 100% interest in Empire District Industries, Inc., a non-regulated subsidiary for our fiber optics business. As of December 31, 2008, we have 84 fiber customers.
4
Table of Contents
Electric Generating Facilities and Capacity
At December 31, 2008, our generating plants consisted of:
| | | | | | |
Plant | | *Capacity
(megawatts) | | Primary Fuel |
|---|
Asbury | | | 210 | | Coal |
Riverton | | | 286 | | Coal and Natural Gas |
Iatan I (12% ownership) | | | 78 | ** | Coal |
State Line Combined Cycle (60% ownership) | | | 300 | ** | Natural Gas |
Empire Energy Center | | | 269 | | Natural Gas |
State Line Unit No. 1 | | | 96 | | Natural Gas |
Ozark Beach | | | 16 | | Hydro |
| | | | | |
| | Total | | | 1,255 | | |
| | | | | |
- *
- Based on summer rating conditions as utilized by Southwest Power Pool.
- **
- The 78 and 300 megawatts of Iatan and State Line Combined Cycle, respectively, reflect our allocated shares of the capacity of these plants.
See Item 2, "Properties — Electric Segment Facilities" for further information about these plants.
We, and most other electric utilities with interstate transmission facilities, have placed our facilities under the Federal Energy Regulatory Commission (FERC) regulated open access tariffs that provide all wholesale buyers and sellers of electricity the opportunity to procure transmission services (at the same rates) that the utilities provide themselves. We are a member of the Southwest Power Pool Regional Transmission Organization (SPP RTO). On February 1, 2007, the SPP RTO launched its energy imbalance services market (EIS). With the implementation of the SPP RTO EIS market and transmission expansion plans of the SPP RTO, we anticipate that our continued participation in the SPP will provide long-term benefits to our customers and other stakeholders. Our experience to date in the EIS market indicates that we have received benefits through our participation. In general, the SPP RTO EIS market is providing real time energy for most participating members within the SPP regional footprint. Imbalance energy prices are based on market bids and availability of dispatchable generation and transmission within the SPP market footprint. In addition to energy imbalance service, the SPP RTO performs a real time security-constrained economic dispatch of all generation voluntarily offered into the EIS market to the market participants to also serve the native load. See Item 7, "Management's Discussion and Analysis of Financial Condition and Results of Operations — Competition."
We currently supplement our on-system generating capacity with purchases of capacity and energy from other sources in order to meet the demands of our customers and the capacity margins applicable to us under current pooling agreements and National Electric Reliability Council rules. The SPP requires its members to maintain a minimum 12% capacity margin. We have contracted with Westar Energy for the purchase of 162 megawatts of capacity and energy through May 31, 2010 and have contracted to add 50 megawatts of purchased power beginning in 2010 from the Plum Point Energy Station discussed below. The amount of capacity purchased under such contracts supplements our on-system capacity and contributes to meeting our current expectations of future power needs.
Due to increased customer growth, we installed, at our Riverton facility, a Siemens V84.3A2 combustion turbine, Unit 12, with a summer rated capacity of 150 megawatts to allow us to meet the SPP's 12% minimum capacity margin requirement and increased our Riverton Plant's total generating capacity to 286 megawatts. The total expenditure for Unit 12, which began commercial operation as of April 10, 2007, was $39.5 million, excluding allowance for funds used during construction (AFUDC). In addition, in 2006, we entered into contracts to add 200 megawatts of power to our system. This energy is to
5
Table of Contents
come from two new plants that are scheduled to be operational in 2010, with 100 megawatts from the new Plum Point Energy Station and 100 megawatts from the new Iatan 2 generating facility, each of which is described below.
The Plum Point Energy Station is a new 665-megawatt, coal-fired generating facility which is being built near Osceola, Arkansas. Construction began in the spring of 2006 with completion scheduled for summer 2010. Initially we will own, through an undivided interest, 50 megawatts of the project's capacity for approximately $88.0 million in direct expenditures, excluding AFUDC. We spent $72.8 million through December 31, 2008 and anticipate spending an additional $9.4 million in 2009 and $5.8 million in 2010 for construction expenses related to our 50 megawatt ownership share of Plum Point Unit 1. All of our estimated construction expenditures exclude AFUDC. We also have a long-term (30 year) purchased power agreement for an additional 50 megawatts of capacity and have the option to purchase an undivided ownership interest in the 50 megawatts covered by the purchased power agreement in 2015.
We have also purchased an undivided ownership interest in the coal-fired Iatan 2 generating facility to be operated by Kansas City Power & Light Company (KCP&L) and located at the site of the existing Iatan Generating Station (Iatan 1) near Weston, Missouri. We will own 12%, or approximately 100 megawatts, of the 850-megawatt unit. Construction began in the spring of 2006 with completion scheduled for summer 2010. As a requirement for the air permit for Iatan 2, and to help meet requirements of the Clean Air Interstate Rule (CAIR), additional emission control equipment was required for Iatan 1. On May 7, 2008, KCP&L announced an update of their estimated construction figures for the construction of the Iatan 2 plant and for the environmental upgrades at the Iatan 1 plant. Our share of the Iatan 2 construction expenditures is expected to be in a range of approximately $218 million to $230 million. The updated estimate of our share of the expenditures for environmental upgrades at the Iatan 1 plant is a range of approximately $58 million to $60 million. The in-service date for the Iatan 1 project is expected to be late in the first quarter of 2009 to early in the second quarter of 2009.
Our current capital expenditures budget, discussed below, includes $69.9 million in 2009 and $32.4 million in 2010 for our share of Iatan 2 and $15.6 million in 2009 for Iatan 1 environmental upgrades. At December 31, 2008, we have recorded approximately $132.4 million in construction expenditures on the Iatan 2 project and approximately $43.4 million on the Iatan 1 environmental upgrades. As of January 15, 2009, KCP&L stated it had approximately 92% of the total budgeted direct construction expenditures of Iatan 2 under contract and the project was scheduled to be complete in the summer of 2010. The percentage of total budgeted direct construction expenditures is slightly lower than reported in January 2008 due to the May 2008 updated estimated construction figures for Iatan 2 discussed above.
The Missouri Public Service Commission (MPSC) issued an order on August 2, 2005 approving a Stipulation and Agreement (Agreement) with an effective date of August 12, 2005 regarding our Experimental Regulatory Plan (Plan). The Agreement contains conditions related to our infrastructure investments, including Iatan 2, environmental investments in Iatan 1, the 150 MW combustion turbine at our Riverton Plant and the installation of Selective Catalytic Reduction (SCR) equipment at the Asbury coal-fired plant. The other parties to the Agreement include the Missouri Department of Natural Resources, the MPSC Staff, two of our industrial customers and the Office of the Public Counsel. We had filed the original application on February 4, 2005 seeking approval of our Plan concerning our participation in a new 800–850 MW coal-fired unit (Iatan 2) or other baseload generation options. Our application also sought a certificate of convenience and necessity to participate in Iatan 2, if necessary, and in connection therewith, obtain approval that is intended to provide adequate assurance to potential investors to make financial options available to us concerning our potential investment in Iatan 2.
In June 2007, we entered into a purchased power agreement with Cloud County Windfarm, LLC, owned by Horizon Wind Energy, Houston, Texas. This agreement provides for a 20-year term commencing with the commercial operation date, which was December 15, 2008. Pursuant to the terms of the agreement, we will purchase all of the output from the approximately 105-megawatt Phase 1 Meridian
6
Table of Contents
Wind Farm located in Cloud County, Kansas. We also have a 20-year contract with Elk River Windfarm, LLC to purchase approximately 550,000 megawatt-hours of energy per year. The windfarm was declared commercial on December 15, 2005. We do not own any portion of either windfarm.
The following chart sets forth our purchase commitments and our anticipated owned capacity (in megawatts) during the indicated contract years (which run from June 1 to May 31 of the following year). The capacity ratings we use for our generating units are based on summer rating conditions under SPP guidelines. The portion of the purchased power that may be counted as capacity from the Elk River Windfarm, LLC and the Cloud County Windfarm, LLC, with which we have contracted to purchase approximately 900,000 megawatt-hours of energy per year, is included in this chart. Because the wind power is an intermittent, non-firm resource, SPP rating criteria does not allow us to count a substantial amount of the wind power as capacity. See Item 7, "Managements' Discussion and Analysis of Financial Condition and Results of Operations — Liquidity and Capital Resources."
| | | | | | | | | | |
Contract Year* | | Purchased
Power
Commitment*** | | Anticipated
Owned
Capacity | | Total
Megawatts | |
|---|
2008 | | | 169 | | | 1255 | | | 1424 | |
2009 | | | 174 | | | 1257 | | | 1431 | |
**2010 | | | 62 | | | 1407 | | | 1469 | |
**2011 | | | 62 | | | 1407 | | | 1469 | |
**2012 | | | 62 | | | 1407 | | | 1469 | |
- *
- Contract years begin June 1 and run through May 31 of the following year.
- **
- The contract years 2010, 2011 and 2012 assume 50 megawatts of purchased power capacity from Plum Point Unit 1, 50 megawatts of owned capacity from Plum Point Unit 1 and 100 megawatts of owned capacity from Iatan 2.
- ***
- Includes an estimated 7 megawatts for the Elk River Windfarm, LLC and 5 megawatts for the Cloud County Windfarm, LLC.
The charges for capacity purchases under the Westar contract referred to above during calendar year 2008 amounted to approximately $16.2 million. Minimum charges for capacity purchases under the Westar contract total approximately $32.4 million for the period June 1, 2008 through May 31, 2010.
The maximum hourly demand on our system reached a record high of 1,173 megawatts on August 15, 2007. Our previous record peak of 1,159 megawatts was established on July 19, 2006. A new maximum hourly winter demand of 1,100 megawatts was set on December 22, 2008. Our previous winter peak of 1,059 megawatts was established on February 16, 2007.
Gas Facilities
We acquired the Missouri natural gas distribution operations of Aquila, Inc. on June 1, 2006. At December 31, 2008, our principal gas utility properties consisted of approximately 87 miles of transmission mains and approximately 1,113 miles of distribution mains.
The following table sets forth the three pipelines that serve our gas customers:
| | |
Service Area | | Name of Pipeline |
|---|
| South | | Southern Star Central Gas Pipeline |
| North | | Panhandle Eastern Pipe Line Company |
| Northwest | | ANR Pipeline Company |
The maximum daily flow on our system for 2008 was a volume of 66,005 mcfs on December 21, 2008.
7
Table of Contents
Construction Program
Total property additions (including construction work in progress), excluding AFUDC, for the three years ended December 31, 2008, amounted to $501.3 million and retirements during the same period amounted to $27.9 million. Please refer to Item 7, "Management's Discussion and Analysis of Financial Condition and Results of Operations — Liquidity and Capital Resources" for more information.
Our total capital expenditures, excluding AFUDC and expenditures to retire assets, were $198.6 million in 2008 and for the next three years are estimated for planning purposes to be as follows:
| | | | | | | | | | | | | | |
| | Estimated Capital Expenditures (amounts in millions) | |
|---|
| | 2009 | | 2010 | | 2011 | | Total | |
|---|
New electric generating facilities: | | | | | | | | | | | | | |
| | Iatan 2 | | $ | 69.9 | | $ | 32.4 | | $ | — | | $ | 102.3 | |
| | Plum Point Energy Station | | | 9.4 | | | 5.8 | | | — | | | 15.2 | |
Additions to existing electric generating facilities: | | | | | | | | | | | | | |
| | Environmental upgrades — Iatan 1 | | | 15.6 | | | — | | | — | | | 15.6 | |
| | Other | | | 11.9 | | | 11.8 | | | 14.9 | | | 38.6 | |
Electric transmission facilities | | | 13.7 | | | 12.6 | | | 2.9 | | | 29.2 | |
Electric distribution system additions | | | 40.9 | | | 41.2 | | | 46.1 | | | 128.2 | |
Non-regulated additions | | | 1.5 | | | 3.0 | | | 1.5 | | | 6.0 | |
General and other additions | | | 3.8 | | | 6.9 | | | 9.7 | | | 20.4 | |
Gas system additions | | | 2.2 | | | 2.0 | | | 2.0 | | | 6.2 | |
| | | | | | | | | | |
| | Total | | $ | 168.9 | | $ | 115.7 | | $ | 77.1 | | $ | 361.7 | |
| | | | | | | | | | |
Construction expenditures for new generating facilities and additions to our transmission and distribution systems to meet projected increases in customer demand constitute the majority of the projected capital expenditures for the three-year period listed above.
Iatan 2 and Plum Point Unit 1 are important components of a long-term, least-cost resource plan to add approximately 200 megawatts of new coal-fired generation to our system by the summer of 2010. The plan is driven by the continued growth in our service area and the expiration of a major purchase power contract in 2010.
A new combustion turbine previously scheduled to be installed by the summer of 2011 is currently delayed until 2014 as our generation regulation needs for our purchased power agreements are being met through a combination of our existing units and the SPP energy imbalance market.
Estimated capital expenditures are reviewed and adjusted for, among other things, revised estimates of future capacity needs, the cost of funds necessary for construction and the availability and cost of alternative power. Actual capital expenditures may vary significantly from the estimates due to a number of factors including changes in equipment delivery schedules, changes in customer requirements, construction delays, ability to raise capital, environmental matters, the extent to which we receive timely and adequate rate increases, the extent of competition from independent power producers and cogenerators, other changes in business conditions and changes in legislation and regulation, including those relating to the energy industry. See " — Regulation" below and Item 7, "Management's Discussion and Analysis of Financial Condition and Results of Operations — Competition."
8
Table of Contents
Fuel and Natural Gas Supply
Electric Segment
In 2008, 60.0% of our total system input, based on kilowatt-hours generated, was supplied by our steam and combustion turbine generation units, 0.5% was supplied by our hydro generation, and we purchased the remaining 39.5%. Approximately 60.9% of the total fuel requirements for our generating units in 2008 (based on kilowatt-hours generated) were supplied by coal and approximately 38.9% supplied by natural gas with fuel oil and tire-derived fuel (TDF), which is produced from discarded passenger car tires, providing the remainder. The amount and percentage of electricity generated by coal increased in 2008 as compared to 2007 primarily as a result of an extended maintenance outage at the Asbury plant in the fourth quarter of 2007. The amount and percentage of electricity generated by natural gas decreased in 2008 as compared to 2007 while the energy we purchased on the spot market to supplement the purchased power from our long-term Westar contract and Elk River Windfarm, LLC contract increased. We have a 20-year contract with Elk River Windfarm, LLC to purchase approximately 550,000 megawatt-hours of energy per year. The windfarm was declared commercial on December 15, 2005. We have a 20-year purchased power agreement with Cloud County Windfarm, LLC, owned by Horizon Wind Energy, Houston, Texas to purchase the energy generated at the approximately 105-megawatt Phase 1 Meridian Way Wind Farm located in Cloud County, Kansas commencing with the commercial operation date, which was December 15, 2008. We offset the cost of these contracts by purchasing less higher-priced power from other suppliers or by displacing on-system generation.
Our Asbury Plant is fueled primarily by coal with oil being used as start-up fuel and TDF being used as a supplement fuel. In 2008, Asbury burned a coal blend consisting of approximately 89.1% Western coal (Powder River Basin) and 10.9% blend coal on a tonnage basis. Our average coal inventory target at Asbury is approximately 60 days. As of December 31, 2008, we had sufficient coal on hand to supply anticipated requirements at Asbury for 96–97 days, as compared to 104–115 days as of December 31, 2007, depending on the actual blend ratio within this range.
Our Riverton Plant fuel requirements are primarily met by coal with the remainder supplied by natural gas, petroleum coke and oil. We installed a Siemens V84.3A2 gas combustion turbine (Unit 12) at our Riverton plant in 2007. Riverton Unit 12 and three other smaller units are fueled by natural gas. During 2008, Riverton Units 7 and 8 burned an estimated blend of approximately 83.5% Western coal (Powder River Basin) and 16.5% petroleum coke on a tonnage basis. Our average coal inventory target at Riverton is approximately 60 days. As of December 31, 2008, we had approximately 42,526 tons of Western coal and approximately 14,663 tons of blend fuel (petroleum coke and local coal) at Riverton. Riverton Unit 7 requires a minimum amount of blend fuel to operate, while Riverton Unit 8 can burn 100% Western coal or a mix of Western and blend fuel. Based on these assumptions, we had sufficient coal as of December 31, 2008 to run 43 days on both units as compared to 37 days as of December 31, 2007. Riverton receives its Western inventory from coal transported by train to the Asbury Plant which is then transported by truck to Riverton.
We have secured 88% of our anticipated coal requirements for 2009, 75% for 2010 and 29% for 2011 through a combination of contracts and binding proposals with Peabody Coal Sales, Arch Coal Sales, Rio Tinto, Phoenix Coal Sales and Oxbow Carbon and Minerals (petroleum coke). We plan to fulfill our remaining 2009 coal requirements through spot purchases. All of the Western coal is shipped to the Asbury Plant by rail, a distance of approximately 800 miles, under a five-year contract with the Burlington Northern and Santa Fe Railway Company (BNSF) and the Kansas City Southern Railway Company which expires on June 29, 2010. The overall delivered price of coal is expected to be slightly higher in 2009 than in 2008 due to increased market costs.
We currently lease one aluminum unit train on a full time basis and a second set is leased on an interim basis. These trains deliver Western coal to the Asbury Plant.
9
Table of Contents
Unit 1 at the Iatan Plant is a coal-fired generating unit which is jointly-owned by KCP&L, a subsidiary of Great Plains Energy, Inc. and us, with our share or ownership being 12%. KCP&L is the operator of this plant and is responsible for arranging its fuel supply. KCP&L has secured contracts for low sulfur Western coal in quantities sufficient to meet substantially all of Iatan's requirements for 2009 and approximately 35% for 2010, 25% for 2011 and 15% for 2012 and 2013. The coal is transported by rail under a contract with BNSF Railway, which expires on December 31, 2010.
Our Energy Center and State Line combustion turbine facilities (not including the State Line Combined Cycle (SLCC) Unit, which is fueled 100% by natural gas) are fueled primarily by natural gas with oil also available for use as needed. During 2008, essentially all of the Energy Center generation came from natural gas. Based on kilowatt hours generated, State Line Unit 1 fuel consumption during 2008 was 90.4% natural gas with the remainder being oil. Our targeted oil inventory at the Energy Center facility permits eight days of full load operation on Units No. 1, 2, 3 and 4. As of December 31, 2008, oil inventories were sufficient for approximately 2 days of full load operation for these units at the Energy Center and 5 days of full load operation for State Line Unit No. 1.
We have firm transportation agreements with Southern Star Central Pipeline, Inc. with original expiration dates of July 31, 2016, for the transportation of natural gas to the SLCC. This date is adjusted for periods of contract suspension by us during outages of the SLCC. This transportation agreement can also supply natural gas to State Line Unit No.1, the Energy Center or the Riverton Plant, as elected by us on a secondary basis. In 2002, we signed a precedent agreement with Williams Natural Gas Company (now Southern Star Central), which provides additional transportation capability for 20 years. This contract provides firm transport to the sites listed above that previously were only served on a secondary basis. We expect that these transportation agreements will serve nearly all of our natural gas transportation needs for our generating plants over the next several years. Any remaining gas transportation requirements, although small, will be met by utilizing capacity release on other holder contracts, interruptible transport, or delivered to the plants by others. The majority of our physical natural gas supply requirements will be met by short-term forward contracts and spot market purchases. Forward natural gas commodity prices and volumes are hedged several years into the future in accordance with our Risk Management Policy in an attempt to lessen the volatility in our fuel expenditures and gain predictability.
The following table sets forth a comparison of the costs, including transportation and other miscellaneous costs, per million Btu of various types of fuels used in our electric facilities:
| | | | | | | | | | |
Fuel Type/Facility | | 2008 | | 2007 | | 2006 | |
|---|
Coal — Iatan | | $ | 1.070 | | $ | 0.978 | | $ | 0.793 | |
Coal — Asbury | | | 1.577 | | | 1.432 | | | 1.402 | |
Coal — Riverton | | | 1.724 | | | 1.548 | | | 1.458 | |
Natural Gas | | | 6.909 | | | 7.050 | | | 7.276 | |
Oil | | | 16.721 | | | 14.870 | | | 6.551 | |
Our weighted cost of fuel burned per kilowatt-hour generated was 3.1307 cents in 2008, 3.2197 cents in 2007 and 2.6502 cents in 2006.
Gas Segment
In June 2007, we acquired 10,000 MMBtus per day of firm transportation from Cheyenne Plains Pipeline Company to enhance our Rocky Mountain supply position so that up to 75% of our natural gas purchases going forward could come from the Rocky Mountain gas area. We were able to fill our storage with Rocky Mountain gas supplies that were significantly less expensive during the summer of 2008 than the gas supplies produced in the mid-continent region. Cheyenne Plains interconnects with all of the interstate pipelines listed below that feed our market area. Through this effort we were able to reduce costs for our gas customers.
10
Table of Contents
We have agreements with many of the major suppliers in both the Midcontinent and Rocky Mountain regions that provide us with both supply and price diversity. We have expanded our supplier base in 2008 and will continue to do so to enhance supply reliability as well as provide for increased price competition.
The following table sets forth the current costs, including storage, transportation and other miscellaneous costs, per mcf of gas used in our gas operations:
| | | | | | | | | | | | |
Service Area | | Name of Pipeline | | 2008 | | 2007 | | 2006 | |
|---|
| South | | Southern Star Central Gas Pipeline | | $ | 8.9898 | | $ | 8.2967 | | $ | 8.6513 | |
| North | | Panhandle Eastern Pipe Line Company | | | 8.3207 | | | 7.9568 | | | 8.9693 | |
| Northwest | | ANR Pipeline Company | | | 8.0716 | | | 7.0551 | | | 7.5771 | |
| | | Weighted average cost | | $ | 8.6964 | | $ | 8.0534 | | $ | 8.5857 | |
Employees
At December 31, 2008, we had 733 full-time employees, including 53 employees of EDG. 332 of the EDE employees are members of Local 1474 of The International Brotherhood of Electrical Workers (IBEW). On May 9, 2007, the Local 1474 IBEW voted to ratify a new five-year agreement effective retroactively to November 1, 2006, the expiration date of the last contract. At December 31, 2008, 26 of the EDG employees were members of Local 814 of the IBEW and 8 EDG employees were members of Local 695 of the IBEW. Local 814 of the IBEW and Local 695 of the IBEW both ratified a three-year contract with EDG which will expire on May 31, 2009. The contract requires at least 60 days notice to amend or cancel. At this time, no notice has been given to amend or cancel the contract by either Empire or Local 814 or Local 695. Effective January 1, 2009, both of these locals were merged into Local 1464 of the IBEW. The terms of the current contract remain the same.
11
Table of Contents
ELECTRIC OPERATING STATISTICS(1)
| | | | | | | | | | | | | | | | | | |
| | 2008 | | 2007 | | 2006 | | 2005 | | 2004 | |
|---|
Electric Operating Revenues (000's): | | | | | | | | | | | | | | | | |
| | Residential | | $ | 179,293 | | $ | 174,584 | | $ | 159,381 | | $ | 149,176 | | $ | 124,394 | |
| | Commercial | | | 132,888 | | | 129,035 | | | 115,059 | | | 106,093 | | | 92,407 | |
| | Industrial | | | 67,353 | | | 67,712 | | | 64,820 | | | 59,593 | | | 51,861 | |
| | Public authorities(2) | | | 10,876 | | | 9,933 | | | 8,892 | | | 8,464 | | | 7,441 | |
| | Wholesale on-system | | | 19,229 | | | 18,444 | | | 17,561 | | | 16,582 | | | 13,614 | |
| | Miscellaneous | | | 6,976 | | | 5,703 | | | 4,605 | | | 4,833 | | | 6,076 | |
| | Interdepartmental | | | 154 | | | 123 | | | 101 | | | 101 | | | 92 | |
| | | | | | | | | | | | |
| | | Total system | | | 416,769 | | | 405,534 | | | 370,419 | | | 344,842 | | | 295,885 | |
| | Wholesale off-system | | | 29,697 | | | 19,627 | | | 12,234 | | | 14,139 | | | 7,010 | |
| | | | | | | | | | | | |
| | | Total electric operating revenues(3) | | | 446,466 | | | 425,161 | | | 382,653 | | | 358,981 | | | 302,895 | |
| | | | | | | | | | | | |
Electricity generated and purchased (000's of kWh): | | | | | | | | | | | | | | | | |
| | Steam | | | 2,228,716 | | | 2,074,323 | | | 2,589,360 | | | 2,446,528 | | | 2,409,002 | |
| | Hydro | | | 32,601 | | | 71,360 | | | 22,673 | | | 62,325 | | | 63,036 | |
| | Combustion turbine | | | 1,480,729 | | | 1,427,298 | | | 955,856 | | | 1,453,297 | | | 1,009,259 | |
| | | | | | | | | | | | |
| | | Total generated | | | 3,742,046 | | | 3,572,981 | | | 3,567,889 | | | 3,962,150 | | | 3,481,297 | |
| | Purchased | | | 2,440,246 | | | 2,373,282 | | | 2,065,991 | | | 1,684,657 | | | 1,726,994 | |
| | | | | | | | | | | | |
| | | Total generated and purchased | | | 6,182,292 | | | 5,946,263 | | | 5,633,880 | | | 5,646,807 | | | 5,208,291 | |
Interchange (net) | | | (436 | ) | | (940 | ) | | (173 | ) | | (126 | ) | | 100 | |
| | | | | | | | | | | | |
| | | Total system input | | | 6,181,856 | | | 5,945,323 | | | 5,633,707 | | | 5,646,681 | | | 5,208,391 | |
| | | | | | | | | | | | |
Maximum hourly system demand (Kw) | | | 1,152,000 | | | 1,173,000 | | | 1,159,000 | | | 1,087,000 | | | 1,014,000 | |
Owned capacity (end of period) (Kw) | | | 1,255,000 | | | 1,255,000 | | | 1,102,000 | | | 1,102,000 | | | 1,102,000 | |
Annual load factor (%) | | | 54.29 | | | 53.39 | | | 52.50 | | | 55.59 | | | 55.98 | |
| | | | | | | | | | | | |
Electric sales (000's of kWh): | | | | | | | | | | | | | | | | |
| | Residential | | | 1,952,869 | | | 1,930,493 | | | 1,898,846 | | | 1,881,441 | | | 1,703,858 | |
| | Commercial | | | 1,622,048 | | | 1,610,814 | | | 1,547,077 | | | 1,485,034 | | | 1,417,307 | |
| | Industrial | | | 1,073,250 | | | 1,110,328 | | | 1,145,490 | | | 1,106,700 | | | 1,085,380 | |
| | Public authorities(2) | | | 122,375 | | | 115,109 | | | 111,204 | | | 111,245 | | | 106,416 | |
| | Wholesale on-system | | | 344,525 | | | 342,347 | | | 337,658 | | | 328,803 | | | 305,711 | |
| | | | | | | | | | | | |
| | | Total system | | | 5,115,067 | | | 5,109,091 | | | 5,040,275 | | | 4,913,223 | | | 4,618,672 | |
| | Wholesale off-system | | | 688,203 | | | 459,665 | | | 303,493 | | | 353,138 | | | 236,232 | |
| | | | | | | | | | | | |
| | | Total Electric Sales | | | 5,803,270 | | | 5,568,756 | | | 5,343,768 | | | 5,266,361 | | | 4,854,904 | |
| | | | | | | | | | | | |
Company use (000's of kWh)(4) | | | 9,209 | | | 9,369 | | | 9,324 | | | 10,263 | | | 10,087 | |
kWh losses (000's of kWh) | | | 369,377 | | | 367,198 | | | 280,615 | | | 370,157 | | | 343,400 | |
| | | | | | | | | | | | |
| | | Total System Input | | | 6,181,856 | | | 5,945,323 | | | 5,633,707 | | | 5,646,781 | | | 5,208,391 | |
| | | | | | | | | | | | |
Customers (average number): | | | | | | | | | | | | | | | | |
| | Residential | | | 140,791 | | | 139,840 | | | 137,689 | | | 134,724 | | | 132,172 | |
| | Commercial | | | 24,532 | | | 24,330 | | | 24,035 | | | 23,684 | | | 23,256 | |
| | Industrial | | | 361 | | | 362 | | | 370 | | | 365 | | | 357 | |
| | Public authorities(2) | | | 1,935 | | | 1,927 | | | 1,907 | | | 1,837 | | | 1,766 | |
| | Wholesale on-system | | | 4 | | | 4 | | | 4 | | | 4 | | | 4 | |
| | | | | | | | | | | | |
| | | Total System | | | 167,623 | | | 166,463 | | | 164,005 | | | 160,614 | | | 157,555 | |
| | Wholesale off-system | | | 22 | | | 20 | | | 20 | | | 17 | | | 16 | |
| | | | | | | | | | | | |
| | | Total | | | 167,645 | | | 166,483 | | | 164,025 | | | 160,631 | | | 157,571 | |
| | | | | | | | | | | | |
Average annual sales per residential customer (kWh) | | | 13,871 | | | 13,805 | | | 13,791 | | | 13,965 | | | 12,891 | |
Average annual revenue per residential customer | | $ | 1,273 | | $ | 1,248 | | $ | 1,158 | | $ | 1,107 | | $ | 941 | |
Average residential revenue per kWh | | | 9.18 | ¢ | | 9.04 | ¢ | | 8.39 | ¢ | | 7.93 | ¢ | | 7.30 | ¢ |
Average commercial revenue per kWh | | | 8.19 | ¢ | | 8.01 | ¢ | | 7.44 | ¢ | | 7.14 | ¢ | | 6.52 | ¢ |
Average industrial revenue per kWh | | | 6.28 | ¢ | | 6.10 | ¢ | | 5.66 | ¢ | | 5.38 | ¢ | | 4.78 | ¢ |
| | | | | | | | | | | | |
- (1)
- See Item 6, "Selected Financial Data" for additional financial information regarding Empire.
- (2)
- Includes Public Street & Highway Lighting and Public Authorities.
- (3)
- Before intercompany eliminations.
- (4)
- Includes kWh used by Company and Interdepartmental.
12
Table of Contents
GAS OPERATING STATISTICS(1)
| | | | | | | | | | | | |
| | 2008 | | 2007 | | 2006(2) | |
|---|
Gas Operating Revenues (000's): | | | | | | | | | | |
| | Residential | | $ | 39,639 | | $ | 39,205 | | $ | 15,957 | |
| | Commercial | | | 17,416 | | | 16,588 | | | 7,127 | |
| | Industrial | | | 5,069 | | | 752 | | | 356 | |
| | Public authorities | | | 416 | | | 373 | | | 161 | |
| | | | | | | | |
| | | Total retail sales revenues | | | 62,540 | | | 56,918 | | | 23,601 | |
| | Miscellaneous(3) | | | 231 | | | 206 | | | 93 | |
| | Transportation revenues | | | 2,667 | | | 2,753 | | | 1,451 | |
| | | | | | | | |
| | | Total Gas Operating Revenues | | | 65,438 | | | 59,877 | | | 25,145 | |
| | | | | | | | |
Maximum Daily Flow (mcf) | | | 66,005 | | | 68,379 | | | 60,890 | |
| | | | | | | | |
Gas delivered to customers (000's of mcf sales)(4) | | | | | | | | | | |
| | Residential | | | 2,949 | | | 2,835 | | | 1,101 | |
| | Commercial | | | 1,397 | | | 1,304 | | | 559 | |
| | Industrial | | | 553 | | | 76 | | | 32 | |
| | Public authorities | | | 35 | | | 30 | | | 12 | |
| | | | | | | | |
| | | Total retail sales | | | 4,934 | | | 4,245 | | | 1,704 | |
| | Transportation sales | | | 4,059 | | | 4,300 | | | 2,150 | |
| | | | | | | | |
| | | Total gas operating and transportation sales | | | 8,993 | | | 8,545 | | | 3,854 | |
| | | | | | | | |
| | Company use(3) | | | 4 | | | 2 | | | — | |
| | Transportation sales (cash outs) | | | — | | | 56 | | | 56 | |
| | Mcf losses | | | 140 | | | 8 | | | (70 | ) |
| | | | | | | | |
| | | Total system sales | | | 9,137 | | | 8,611 | | | 3,840 | |
| | | | | | | | |
Customers (average number): | | | | | | | | | | |
| | Residential | | | 39,159 | | | 40,315 | | | 40,673 | |
| | Commercial | | | 5,119 | | | 5,208 | | | 5,399 | |
| | Industrial | | | 26 | | | 24 | | | 26 | |
| | Public authorities | | | 127 | | | 124 | | | 128 | |
| | | | | | | | |
| | | Total retail customers | | | 44,431 | | | 45,671 | | | 46,226 | |
| | Transportation customers | | | 272 | | | 270 | | | 252 | |
| | | | | | | | |
| | | Total gas customers | | | 44,703 | | | 45,941 | | | 46,478 | |
| | | | | | | | |
- (1)
- See Item 6, "Selected Financial Data" for additional financial information regarding Empire.
- (2)
- 2006 revenues and mcf sales represent the months of June through December 2006.
- (3)
- Primarily includes miscellaneous service revenue and late fees.
- (4)
- Includes mcf used by Company and Interdepartmental mcf
13
Table of Contents
Executive Officers and Other Officers of Empire
The names of our officers, their ages and years of service with Empire as of December 31, 2008, positions held and effective date of such positions are presented below. All of our officers have been employed by Empire for at least the last five years.
| | | | | | | | | | | | |
| Name | | Age at
12/31/08 | | Positions With the Company | | With the Company Since | | Officer
Since | |
|---|
William L. Gipson | | | 51 | | President and Chief Executive Officer (2002), Executive Vice President and Chief Operating Officer (2001), Vice President — Commercial Operations (1997) | | | 1981 | | | 1997 | |
Bradley P. Beecher(1) | | | 43 | | Vice President and Chief Operating Officer — Electric (2006), Vice President — Energy Supply (2001), General Manager — Energy Supply (2001) | | | 2001 | | | 2001 | |
Harold Colgin | | | 59 | | Vice President — Energy Supply (2006), General Manager — Energy Supply (2006), Plant Manager, Asbury Plant (1995) | | | 1972 | | | 2006 | |
Ronald F. Gatz | | | 58 | | Vice President and Chief Operating Officer — Gas (2006), Vice President — Strategic Development (2002), Vice President — Nonregulated Services (2001), General Manager — Nonregulated Services (2001) | | | 2001 | | | 2001 | |
Gregory A. Knapp(2) | | | 57 | | Vice President — Finance and Chief Financial Officer (2002), General Manager — Finance (2002) | | | 2002 | | | 2002 | |
Michael E. Palmer | | | 52 | | Vice President — Commercial Operations (2001), General Manager — Commercial Operations (2001), Director of Commercial Operations (1997) | | | 1986 | | | 2001 | |
Kelly S. Walters(3) | | | 43 | | Vice President — Regulatory and General Services (2006), General Manager — Regulatory and General Services (2005), Director of Regulatory and Planning (2001) | | | 2001 | | | 2006 | |
Janet S. Watson | | | 56 | | Secretary — Treasurer (1995) | | | 1994 | | | 1995 | |
Laurie A. Delano(4) | | | 53 | | Controller, Assistant Secretary and Assistant Treasurer and Principal Accounting Officer (2005), Director of Financial Services (2002) | | | 2002 | | | 2005 | |
- (1)
- Bradley P. Beecher was previously with Empire from 1988 to 1999 and held the positions of Director of Production Planning and Administration (1993) and Director of Strategic Planning (1995). During the period from 1999 to 2001, Mr. Beecher served as the Associate Director of Marketing and Strategic Planning for the Energy Engineering and Construction Division of Black & Veatch.
14
Table of Contents
- (2)
- Gregory A. Knapp was previously with Empire from 1978 to 2000 and held the position of Controller and Assistant Treasurer (1983). During the period from 2000 to 2002, Mr. Knapp served as Controller for the Missouri Department of Transportation.
- (3)
- Kelly S. Walters was previously with Empire from 1988 to 1998 and held the position of Director of Internal Auditing (1997-1998). Prior to rejoining Empire, she was Director of Financial Services of Crowder College.
- (4)
- Laurie A. Delano was previously with Empire from 1979 to 1991 and held the position of Director of Internal Auditing (1983-1991). Immediately prior to rejoining Empire, she was with Lozier Corporation, a store fixture manufacturing company, from 1997 to 2002, where she served as Plant Controller.
Regulation
Electric Segment
General. As a public utility, our electric segment operations are subject to the jurisdiction of the MPSC, the State Corporation Commission of the State of Kansas (KCC), the Corporation Commission of Oklahoma (OCC) and the Arkansas Public Service Commission (APSC) with respect to services and facilities, rates and charges, accounting, valuation of property, depreciation and various other matters. Each such Commission has jurisdiction over the creation of liens on property located in its state to secure bonds or other securities. The KCC also has jurisdiction over the issuance of all securities because we are a regulated utility incorporated in Kansas. Our transmission and sale at wholesale of electric energy in interstate commerce and our facilities are also subject to the jurisdiction of the FERC, under the Federal Power Act. FERC jurisdiction extends to, among other things, rates and charges in connection with such transmission and sale; the sale, lease or other disposition of such facilities and accounting matters. See discussion in Item 7, "Management's Discussion and Analysis of Financial Condition and Results of Operations — Competition."
During 2008, approximately 87.5% of our electric operating revenues were received from retail customers. Approximately 88.7%, 5.4%, 3.0% and 2.9% of such retail revenues were derived from sales in Missouri, Kansas, Oklahoma and Arkansas, respectively. Sales subject to FERC jurisdiction represented approximately 11.5% of our electric operating revenues during 2008 with the remaining 1.0% being from miscellaneous sources.
Rates. See Item 7, "Management's Discussion and Analysis of Financial Condition and Results of Operations — Rate Matters" for information concerning recent electric rate proceedings.
Fuel Adjustment Clauses. Typical fuel adjustment clauses permit the distribution to customers of changes in fuel costs without the need for a general rate proceeding. Fuel adjustment clauses are presently applicable to our retail electric sales in Missouri (effective September 1, 2008), Oklahoma and Kansas (effective January 1, 2006) and system wholesale kilowatt-hour sales under FERC jurisdiction. We have an Energy Cost Recovery Rider in Arkansas that adjusts for changing fuel and purchased power costs on an annual basis.
Gas Segment
General. As a public utility, our gas segment operations are subject to the jurisdiction of the MPSC with respect to services and facilities, rates and charges, accounting, valuation of property, depreciation and various other matters. The MPSC also has jurisdiction over the creation of liens on property to secure bonds or other securities.
Purchased Gas Adjustment (PGA). The PGA clause allows EDG to recover from our customers, subject to routine regulatory review, the cost of purchased gas supplies, including costs associated with our
15
Table of Contents
use of natural gas financial instruments to hedge the purchase price of natural gas and related carrying costs. This PGA clause allows us to make rate changes periodically (up to four times) throughout the year in response to weather conditions and supply demands, rather than in one possibly extreme change per year.
Environmental Matters
We are subject to various federal, state, and local laws and regulations with respect to air and water quality and with respect to hazardous and toxic materials and wastes, including their identification, transportation, disposal, record-keeping and reporting, as well as other environmental matters. We believe that our operations are in compliance with present laws and regulations.
Electric Segment
Air. The 1990 Amendments to the Clean Air Act, referred to as the 1990 Amendments, affect the Asbury, Riverton, State Line and Iatan 1 Power Plants and Units 3 and 4 (the FT8 peaking units) at the Empire Energy Center. The 1990 Amendments require affected plants to meet certain emission standards, including maximum emission levels for sulfur dioxide (SO2) and nitrogen oxides (NOx).
SO2 Emissions. Under the 1990 Amendments, the amount of SO2 an affected unit can emit is regulated. Each existing affected unit has been allocated a specific number of emission allowances, each of which allows the holder to emit one ton of SO2. Utilities covered by the 1990 Amendments must have emission allowances equal to the number of tons of SO2 emitted during a given year by each of their affected units. The annual reconciliation of allowances, which occurs on a facility wide basis, is held each March 1 for the previous calendar year. Allowances may be traded between plants or utilities or "banked" for future use. A market for the trading of emission allowances exists on the Chicago Board of Trade. The Environmental Protection Agency (EPA) withholds annually a percentage of the emission allowances allocated to each affected unit and sells those emission allowances through a direct auction. We receive compensation from the EPA for the sale of these withheld allowances. During 2008, we received less than $0.1 million from the EPA auction.
Our Asbury, Riverton and Iatan coal plants collectively receive 11,723 allowances per year. They burn a blend of low sulfur Western coal (Powder River Basin) and higher sulfur blend coal and petroleum coke, or burn 100% low sulfur Western coal. In addition, tire-derived fuel (TDF) is used as a supplemental fuel at the Asbury Plant. The Riverton Plant can also burn natural gas as its primary fuel. The State Line Plant, the Energy Center Units 3 and 4 and Riverton Unit 12 are gas-fired facilities and are allocated zero SO2 allowances. In the near term, annual allowance requirements for the State Line Plant, the Energy Center Units 3 and 4 and Riverton Unit 12, which are not expected to exceed 20 allowances per year, will be transferred from our inventoried bank of allowances. In 2008, the combined actual SO2 allowance need for all affected plant facilities exceeded the number of allowances allocated to us by the EPA. The annual EPA reconciliation of SO2 allowances does not occur until March 1 of the year following the actual SO2 emissions. We project that after the EPA reconciliation of March 1, 2009, we will have approximately 17,600 banked SO2 allowances as compared to 23,800 at March 1, 2008. We project that our 2009 emissions will again exceed the number of allowances allocated by the EPA by an amount approximately equal to the difference during 2008.
When our SO2 allowance bank is exhausted, we will need to purchase additional SO2 allowances or build a Flue Gas Desulphurization (FGD) scrubber system at our Asbury Plant. Based on current and projected SO2 allowance prices and high-level estimated FGD scrubber construction costs ($81 million in 2010 dollars), we expect it will be more economical for us to purchase SO2 allowances than to build a scrubber at the Asbury Plant. We would expect the costs of SO2 allowances to be fully recoverable in our rates.
16
Table of Contents
Effective March 1, 2005, the MPSC approved a Stipulation and Agreement granting us authority to manage our SO2 allowance inventory in accordance with our SO2 Allowance Management Policy (SAMP). The SAMP allows us to exchange banked allowances for future vintage allowances and/or monetary value and, in extreme market conditions, to sell SO2 allowances outright for monetary value. We have not yet exchanged or sold any allowances under the SAMP.
SO2 emissions will be further regulated as described in the Clean Air Interstate Rule section below.
NOx Emissions. The Asbury, Iatan, State Line, Energy Center and Riverton Plants are each in compliance with the NOx limits applicable to them under the 1990 Amendments as currently operated.
The Asbury Plant received permission from the Missouri Department of Natural Resources (MDNR) to burn TDF at a maximum rate of 2% of total fuel input. During 2008, approximately 2,038 tons of TDF were burned. This is equivalent to 203,800 discarded passenger car tires.
Under the MDNR's Missouri NOx Rule, our Iatan, Asbury, State Line and Energy Center facilities, like other facilities in western Missouri, are generally subject to a maximum NOx emission rate of 0.35 lbs/MMBtu during the ozone season of May 1 through September 30. Facilities which burn at least 100,000 passenger tire equivalents of TDF per year, including our Asbury Plant, are subject to a higher NOx emission limit of 0.68 lbs/MMBtu. All of our plants currently meet the required emission limits.
In March 2008, the EPA lowered the National Ambient Air Quality Standard (NAAQS) for ozone from 84 ppb to 75 ppb. Ozone, also called ground level smog, is formed by the mixing of NOx and Volatile Organic Compounds (VOCs) in the presence of sunlight. It is possible that several counties in southwest Missouri will be classified as being in non-attainment of the ozone NAAQS standard by the EPA in 2010 or later. We anticipate that the EPA will classify the Kansas City area, where Iatan 1 is located, as being in non-attainment in 2010. At this time we do not foresee the need for additional pollution controls due to the reduction in the ozone standard. In addition, our units do not emit appreciable VOCs. We do not anticipate that southeast Kansas, where our Riverton Plant is located, will be classified as non-attainment under the new ozone NAAQS.
NOx emissions will be further regulated as described in the Clean Air Interstate Rule section below.
Clean Air Interstate Rule (CAIR)
The EPA issued its final CAIR on March 10, 2005. CAIR governed NOx and SO2 emissions from fossil fueled units greater than 25 megawatts in 28 states, including Missouri, where our Asbury, Energy Center, State Line and Iatan Units No. 1 and No. 2 are located and Arkansas where the Plum Point Energy Station is being constructed. Kansas was not included in CAIR and our Riverton Plant was not affected.
On July 11, 2008, the U.S. Court of Appeals for the District of Columbia Circuit vacated the CAIR Rule and remanded it back to the EPA. On September 24, 2008, the EPA filed a petition for rehearing with the United States Court of Appeals. The court vacated CAIR based on its interpretation that the Clean Air Act did not provide the EPA with the authority needed for CAIR implementation. However, the court stayed its vacatur on December 23, 2008. As a result, CAIR became effective for NOx on January 1, 2009 and will become effective for SO2 on January 1, 2010.
The CAIR is not directed to specific generation units, but instead, requires the states (including Missouri and Arkansas) to develop State Implementation Plans (SIPs) to comply with specific NOx and SO2 state-wide annual budgets. Missouri and Arkansas finalized their respective regulations and submitted their SIPs to the EPA, which were approved. We have received our full allotment of allowances as published in the Missouri CAIR Rule. Under the Arkansas CAIR rule, we will not receive allowances until approximately six years after Plum Point Unit 1 is operational. In the interim, we will transfer allowances from our Missouri units. Based on SIPs for Missouri and Arkansas, we believe we will have excess annual and ozone season NOx allowances. SO2 allowances must be utilized at a 2:1 ratio for our Missouri units as
17
Table of Contents
compared to our non-CAIR Kansas units beginning in 2010. As a result, based on current SO2 allowance usage projections, we expect to exhaust our banked allowances by the end of 2010 and will need to purchase additional SO2 allowances or build a scrubber at our Asbury Plant.
In order to meet CAIR requirements and to meet air permit requirements for Iatan 2, pollution control equipment is being installed on Iatan 1 with the in-service date expected to be late in the first quarter to early in the second quarter of 2009. This equipment includes a Selective Catalytic Reduction (SCR) system, an FGD scrubber and a baghouse, with our share of the capital cost estimated to be between $58 million and $60 million, excluding AFUDC. Of this amount, approximately $3.9 million was incurred in 2006, $12.1 million in 2007 and $27.3 million in 2008 with estimated expenditures of approximately $15.6 million in 2009. This project was also included as part of our Experimental Regulatory Plan approved by the MPSC.
Also to meet CAIR requirements, we constructed an SCR at Asbury that was completed in November 2007 and placed in service in February 2008 at a total cost of approximately $31.0 million (excluding AFUDC). This project was also included as part of our Experimental Regulatory Plan approved by the MPSC and its cost is now in base rates in Missouri.
Air Permits. Under Title V of the 1990 Amendments, we must obtain site operating permits for each of our plants from the authorities in the state in which the plant is located. These permits, which are valid for five years, regulate the plant site's total air emissions; including emissions from stacks, individual pieces of equipment, road dust, coal dust and other emissions. We have been issued permits for Asbury, Iatan, Riverton, State Line and the Energy Center Plants. We submitted the required renewal applications for the State Line and Energy Center Title V permits in 2003 and the Asbury Title V permit in 2004 and will operate under the existing permits until the Missouri Department of Natural Resources (MDNR) issues the renewed permits. A Compliance Assurance Monitoring (CAM) plan for particulate matter (PM) will be required by the renewed permit for Asbury. We estimate that the capital costs associated with the PM CAM plan will not exceed $2 million. We submitted the renewal application for the Riverton Title V permit in June 2008. A CAM plan for PM will also be required by the renewed permit for Riverton. No additional capital costs are anticipated. It is expected that the Kansas Department of Health and Environment (KDHE) will issue the renewal permit for Riverton in the first quarter of 2009.
A new air permit was issued for the Iatan Generating Station on January 31, 2006. The new permit covers the entire Iatan Generating Station and includes the existing Unit No. 1 and Iatan Unit No. 2 currently under construction. The new permit limits Unit No. 1 to a maximum of 6,600 MMBtu per hour of heat input. The 6,600 MMBtu per hour heat input limit is in effect until the new SCR, scrubber, and baghouse are in place and fully operational, currently estimated to be late in the first quarter of 2009 to early in the second quarter of 2009.
The Clean Air Act required companies to obtain permits and, if necessary, install control equipment to reduce emissions when making a major modification or a change in operation if either is expected to cause a significant net increase in regulated emissions. The Sierra Club and Concerned Citizens of Platte County have claimed that modifications were made to Iatan 1 prior to the Comprehensive Energy Plan project in violation of Clean Air Act regulations. We own 12% of Iatan 1. As operator, KCP&L entered into a Collaboration Agreement with those parties that provide, among other things, for the release of such claims. In May 2008, a grand jury subpoena requesting documents was received by KCP&L. KCP&L continues to produce documents in response to the subpoena. The outcome of these activities cannot presently be determined, nor can the costs and other liabilities that could potentially result from a negative outcome presently be reasonably estimated.
Clean Air Mercury Rule (CAMR)
On March 15, 2005, the EPA issued the CAMR regulations for mercury emissions by power plants under the requirements of the 1990 Amendments to the Clean Air Act. The new mercury emission limits
18
Table of Contents
of CAMR Phase 1 were to go into effect January 1, 2010. On February 8, 2008, the U.S. Court of Appeals for the District of Columbia vacated the EPA's CAMR regulations which was appealed to the U.S. Supreme Court on October 17, 2008.
The EPA has not yet issued guidance to the states regarding the vacated regulation nor recommended future actions. Based on CAMR, we installed a mercury analyzer at Asbury during late 2007 and installed two mercury analyzers at Riverton in 2008 in order to verify our mercury emissions and to meet the compliance date of January 1, 2009 for the Phase 1 mercury emission compliance date of January 1, 2010. We will operate the mercury analyzers at Riverton and Asbury in accordance with the appropriate state environmental regulator's guidance.
If the CAMR rulemaking is ultimately revoked by the EPA after final adjudication, Maximum Achievable Control Technology (MACT) will re-emerge under current law. No specific MACT rulemakings have yet been adopted in Missouri or Kansas.
CO2 Emissions
Our coal and gas plants emit carbon dioxide (CO2), a greenhouse gas. Although not currently regulated, increasing public concern and political pressure from local, regional, national and international bodies may result in the passage of new laws mandating limits on greenhouse gas emissions such as CO2. In April 2007, the U.S. Supreme Court issued a decision ruling the EPA improperly declined to address CO2 impacts in a rule-making related to new motor vehicle emissions. While this decision is not directly applicable to power plant emissions, the reasoning of the decision could affect other regulatory programs. The impact on us of any future greenhouse gas regulation will depend in large part on the details of the requirements and the timetable for mandatory compliance. We would expect the cost of complying with any such regulations to be fully recoverable in our rates.
Water. We operate under the Kansas and Missouri Water Pollution Plans that were implemented in response to the Federal Water Pollution Control Act Amendments of 1972. The Asbury, Iatan, Riverton, Energy Center and State Line plants are in compliance with applicable regulations and have received discharge permits and subsequent renewals as required.
The Riverton Plant is affected by final regulations for Cooling Water Intake Structures issued under the Clean Water Act (CWA) Section 316(b) Phase II. The regulations became final on February 16, 2004 and required the submission of a Sampling Report and Comprehensive Demonstration Study with the permit renewal in 2008. Sampling and summary reports, which were completed during the first quarter of 2008 and submitted to the KDHE, indicate that the effect of the cooling water intake structure on Empire Lake's aquatic life is insignificant. The need for a further Demonstration Study is not expected. On January 25, 2007, the United States Court of Appeals for the Second Circuit remanded key sections of these CWA regulations. On July 9, 2007, the EPA suspended the regulation and is expected to revise and re-propose the regulation in 2009. In addition, on April 14, 2008 certiorari was granted by the United States Supreme Court limited to the review as to whether Section 316(b) of the CWA authorized the EPA to compare costs with benefits in determining the best technology available for minimizing adverse environmental impacts at cooling water intake structures. The Supreme Court heard oral arguments on December 2, 2008 and will issue their ruling in the first half of 2009. The permit renewal application was prepared and submitted in June 2008 and the final permit was received on January 1, 2009. Under the initial regulations, we did not expect costs associated with compliance to be material. We will reassess costs after the Supreme Court issues its ruling and the revised rules are complete.
Ash Ponds. We own and maintain coal ash ponds located at our Riverton and Asbury Power Plants. Additionally, we own a 12 percent interest in a coal ash pond at the Iatan Generating Station. All of the ash ponds are compliant with state and federal regulations.
19
Table of Contents
Renewable Energy. On November 4, 2008, Missouri voters approved the Clean Energy Initiative. This initiative requires investor-owned utilities in Missouri (such as Empire) to generate or purchase electricity from renewable energy sources, such as solar, wind, biomass and hydro power, at the rate of at least 2% in retail sales by 2011, increasing to at least 15% by 2021. At least 25 other states have adopted renewable portfolio standard (RPS) programs that mandate some form of renewable generation. Some of these RPS programs incorporate a trading system in which utilities are allowed to buy and sell renewable energy certificates (RECs) in order to meet compliance. Additionally, RECs are utilized by many companies in "green" marketing efforts. REC prices are driven by various market forces. We have been selling RECs and plan to continue to sell all or a portion of the RECs associated with our contracts with Elk River Windfarm, LLC and Cloud County Windfarm, LLC. With respect to the energy underlying the RECs that we sell, we may not claim that we are purchasing renewable energy for any purpose, including for purposes of complying with the new Missouri requirements. Over time, we expect to retain some of the renewable attributes associated with these contracts in order to meet the new Missouri requirements. We realized revenues of $1.8 million from REC sales in 2008 and $0.9 million in 2007.
Gas Segment
The acquisition of Missouri Gas involved the property transfer of two former manufactured gas plant (MGP) sites previously owned by Aquila, Inc. and its predecessors. Site #1 in Chillicothe, Missouri is listed in the MDNR Registry of Confirmed Abandoned or Uncontrolled Hazardous Waste Disposal Sites in Missouri. Site #2 in Marshall, Missouri has received a letter of no further action from the MDNR. A Change of Use request and work plan was approved by the MDNR allowing us to expand our existing service center at Site #1 in Chillicothe, Missouri. This project, which was completed in October 2007, included the removal of all excavated soil and the addition of a new concrete surface replacing the existing gravel at a cost of approximately $0.1 million. We estimate further remediation costs at these two sites to be no more than approximately $0.2 million, based on our best estimate at this time. The remaining liability balance of $0.2 million is recorded under noncurrent liabilities and deferred credits. In our agreement with the MPSC approving the acquisition of Missouri Gas, it was agreed that we could reflect a liability and offsetting regulatory asset not to exceed $260,000 for the acquired sites. The MPSC agreed that up to $260,000 of costs related to the clean up of these MGP sites would be allowed for future rate recovery. Accordingly, we concluded that rate recovery was probable and at the acquisition date, a regulatory asset of $260,000 was recorded as part of the purchase price allocation based on our agreement with the MPSC, and in accordance with SFAS No. 71 — "Accounting for the Effects of Certain Types of Regulation" (FAS 71).
Conditions Respecting Financing
Our EDE Indenture of Mortgage and Deed of Trust, dated as of September 1, 1944, as amended and supplemented (the EDE Mortgage), and our Restated Articles of Incorporation (Restated Articles), specify earnings coverage and other conditions which must be complied with in connection with the issuance of additional first mortgage bonds or cumulative preferred stock, or the incurrence of unsecured indebtedness. The EDE Mortgage contains a requirement that for new first mortgage bonds to be issued, our net earnings (as defined in the EDE Mortgage) for any twelve consecutive months within the 15 months preceding issuance must be two times the annual interest requirements (as defined in the EDE Mortgage) on all first mortgage bonds then outstanding and on the prospective issue of new first mortgage bonds. Our earnings for the twelve months ended December 31, 2008, would permit us to issue approximately $253.5 million of new first mortgage bonds based on this test at an assumed interest rate of 7.0%. In addition to the interest coverage requirement, the EDE Mortgage provides that new bonds must be issued against, among other things, retired bonds or 60% of net property additions. At December 31, 2008, we had retired bonds and net property additions which would enable the issuance of at least $612.0 million principal amount of bonds if the annual interest requirements are met. As of December 31, 2008, we believe we are in compliance with all restrictive covenants of the EDE Mortgage.
20
Table of Contents
Under our Restated Articles, (a) cumulative preferred stock may be issued only if our net income available for interest and dividends (as defined in our Restated Articles) for a specified twelve-month period is at least 11/2 times the sum of the annual interest requirements on all indebtedness and the annual dividend requirements on all cumulative preferred stock to be outstanding immediately after the issuance of such additional shares of cumulative preferred stock, and (b) so long as any preferred stock is outstanding, the amount of unsecured indebtedness outstanding may not exceed 20% of the sum of the outstanding secured indebtedness plus our capital and surplus. We have no outstanding preferred stock. Accordingly, the restriction in our Restated Articles does not currently restrict the amount of unsecured indebtedness that we may have outstanding.
The EDG Indenture of Mortgage and Deed of Trust, dated as of June 1, 2006, as amended and supplemented (the EDG Mortgage) contains a requirement that for new first mortgage bonds to be issued, the amount of such new first mortgage bonds shall not exceed 75% of the cost of property additions acquired after the date of the Missouri Gas acquisition. The mortgage also contains a limitation on the issuance by EDG of debt (including first mortgage bonds, but excluding short-term debt incurred in the ordinary course under working capital facilities) unless, after giving effect to such issuance, EDG's ratio of EBITDA (defined as net income plus interest, taxes, depreciation, amortization and certain other non-cash charges) to interest charges for the most recent four fiscal quarters is at least 2.0 to 1. As of December 31, 2008, these tests would allow us to issue new first mortgage bonds of approximately $3.1 million based on $4.2 million of property additions.
See "Item 7. Management's Discussion and Analysis of Financial Condition and Results of Operations — Liquidity and Capital Resources."
Our Web Site
We maintain a web site at www.empiredistrict.com. Our annual report on Form 10-K, quarterly reports on Form 10-Q, current reports on form 8-K and related amendments are available free of charge through our web site as soon as reasonably practicable after such reports are filed with or furnished to the SEC electronically. Our Corporate Governance Guidelines, our Code of Business Conduct and Ethics, our Code of Ethics for the Chief Executive Officer and Senior Financial Officers, the charters for our Audit Committee, Compensation Committee and Nominating/Corporate Governance Committee, our Procedures for Reporting Complaints on Accounting, Internal Accounting Controls and Auditing Matters, our Procedures for Communicating with Non-Management Directors and our Policy and Procedures with Respect to Related Person Transactions can also be found on our web site. All of these documents are available in print to any interested party who requests them. Our web site and the information contained in it and connected to it shall not be deemed incorporated by reference into this Form 10-K.
21
Table of Contents
ITEM 1A. RISK FACTORS
Any reduction in our credit ratings could materially and adversely affect our business, financial condition and results of operations.
Currently, our corporate credit ratings and the ratings for our securities are as follows:
| | | | | | |
| | Fitch | | Moody's | | Standard & Poor's |
|---|
Corporate Credit Rating | | n/r* | | Baa2 | | BBB- |
EDE First Mortgage Bonds | | BBB+ | | Baa1 | | BBB+ |
EDE First Mortgage Bonds — Pollution Control Series | | AAA | | Aaa | | AAA |
Senior Notes | | BBB | | Baa2 | | BBB- |
Trust Preferred Securities | | BBB- | | Baa3 | | BB |
Commercial Paper | | F2 | | P-2 | | A-3 |
Outlook | | Negative | | Negative | | Stable |
- *
- Not rated.
The ratings indicate the agencies' assessment of our ability to pay interest, distributions and principal on these securities. A rating is not a recommendation to purchase, sell or hold securities and each rating should be evaluated independently of any other rating. The lower the rating, the higher the interest cost of the securities when they are sold. In addition, a downgrade in our senior unsecured long-term debt rating would result in an increase in our borrowing costs under our bank credit facility. If any of our ratings fall below investment grade (investment grade is defined as Baa3 or above for Moody's and BBB- or above for Standard & Poor's and Fitch), our ability to issue short-term debt, commercial paper or other securities or to market those securities would be impaired or made more difficult or expensive. Therefore, any such downgrades could have a material adverse effect on our business, financial condition and results of operations. In addition, any actual downgrade of our commercial paper rating from Moody's or Fitch, may make it difficult for us to issue commercial paper. To the extent we are unable to issue commercial paper, we will need to meet our short-term debt needs through borrowings under our revolving credit facility, which may result in higher costs.
We cannot assure that any of our current ratings will remain in effect for any given period of time or that a rating will not be lowered or withdrawn entirely by a rating agency if, in its judgment, circumstances in the future so warrant.
Financial market disruptions may increase financing costs, limit access to the credit markets or cause reductions in investment values in our pension plan assets.
The recent general market declines resulting in part from the sub-prime mortgage issues have generally reduced access to the capital markets and reduced market returns on investments. We estimate our capital expenditures to be $168.9 million in 2009. Although we believe it is unlikely we will have difficulty accessing the markets for the capital needed to complete these projects, our financing costs will likely be higher when compared to previous years. The market's effect on our pension plan assets resulted in a negative return of 25.1% in 2008. This decline will likely result in increased funding requirements under the Pension Protection Act of 2006.
We are exposed to factors that can increase our fuel and purchased power expenditures, including disruption in deliveries of coal or natural gas, decreased output from our power plants, failure of performance by purchased power counterparties and market lb in our fuel procurement strategy.
Fuel and purchased power costs are our largest expenditures. Increases in the price of coal, natural gas or the cost of purchased power will result in increased electric operating expenditures.
22
Table of Contents
We depend upon regular deliveries of coal as fuel for our Riverton, Asbury and Iatan plants, and as fuel for the facility which supplies us with purchased power under our contract with Westar Energy. Substantially all of this coal comes from mines in the Powder River Basin of Wyoming and is delivered to the plants by train. Production problems in these mines, railroad transportation or congestion problems, such as those that occurred in 2005 and 2006, or unavailability of trains could affect delivery cycle times required to maintain plant inventory levels, causing us to implement coal conservation and supply replacement measures to retain adequate reserve inventories at our facilities. These measures could include some or all of the following: reducing the output of our coal plants, increasing the utilization of our higher-cost gas-fired generation facilities, purchasing power from other suppliers, adding additional leased trains to our supply system and purchasing locally mined coal which can be delivered without using the railroads. Such measures could result in increased fuel and purchased power expenditures.
With the addition of the Missouri fuel adjustment mechanism effective September 1, 2008, we now have a fuel cost recovery mechanism in all of our jurisdictions, which significantly reduces our net income exposure to the impact of the lbs discussed above. However, cash flow could still be impacted by these increased expenditures. We are also subject to prudency reviews which could negatively impact our net income if a regulatory commission would conclude our costs were incurred imprudently.
We have also established a lb management practice of purchasing contracts for future fuel needs to meet underlying customer needs and manage cost and pricing uncertainty. Within this activity, we may incur losses from these contracts. By using physical and financial instruments, we are exposed to credit lb and market lb. Market lb is the exposure to a change in the value of commodities caused by fluctuations in market variables, such as price. The fair value of derivative financial instruments we hold is adjusted cumulatively on a monthly basis until prescribed determination periods. At the end of each determination period, which is the last day of each calendar month in the period, any realized gain or loss for that period related to the contract will be reclassified to fuel expense and recovered or refunded to the customer through our fuel adjustment mechanisms. Credit lb is the lb that the counterparty might fail to fulfill its obligations under contractual terms.
We are subject to regulation in the jurisdictions in which we operate.
We are subject to comprehensive regulation by federal and state utility regulatory agencies, which significantly influences our operating environment and our ability to recover our costs from utility customers. The utility commissions in the states where we operate regulate many aspects of our utility operations, including the rates that we can charge customers, siting and construction of facilities, pipeline safety and compliance, customer service and our ability to recover increases in our fuel and purchased power costs.
The FERC has jurisdiction over wholesale rates for electric transmission service and electric energy sold in interstate commerce. Federal, state and local agencies also have jurisdiction over many of our other activities.
Information concerning recent filings requesting increases in rates and related matters is set forth under Item 7, "Management's Discussion and Analysis of Financial Condition and Results of Operations — Rate Matters."
We are unable to predict the impact on our operating results from the regulatory activities of any of these agencies. Despite our requests, these regulatory commissions have sole discretion to leave rates unchanged, grant increases or order decreases in the base rates we charge our utility customers. They have similar authority with respect to our recovery of increases in our fuel and purchased power costs. If our costs increase and we are unable to recover increased costs through base rates or fuel adjustment clauses, our results of operations could be materially adversely affected. Changes in regulations or the imposition of additional regulations could also have a material adverse effect on our results of operations.
23
Table of Contents
Operations lbs may adversely affect our business and financial results.
The operation of our electric generation, and electric and gas transmission and distribution systems involves many lbs, including breakdown or failure of expensive and sophisticated equipment, processes and personnel performance; operating limitations that may be imposed by equipment conditions, environmental or other regulatory requirements; fuel supply or fuel transportation reductions or interruptions; transmission scheduling constraints; and catastrophic events such as fires, explosions, severe weather or other similar occurrences.
We have implemented training, preventive maintenance and other programs, but there is no assurance that these programs will prevent or minimize future breakdowns, outages or failures of our generation facilities. In those cases, we would need to either produce replacement power from our other facilities or purchase power from other suppliers at potentially volatile and higher cost in order to meet our sales obligations.
These and other operating events may reduce our revenues, increase costs, or both, and may materially affect our results of operations, financial position and cash flows.
We are exposed to increases in costs and reductions in revenue which we cannot control and which may adversely affect our business, financial condition and results of operations.
The primary drivers of our electric operating revenues in any period are: (1) rates we can charge our customers, (2) weather, (3) customer growth and (4) general economic conditions. Of the factors driving revenues, weather has the greatest short-term effect on the demand for electricity for our regulated business. Mild weather reduces demand and, as a result, our electric operating revenues. In addition, changes in customer demand due to downturns in the economy could reduce our revenues.
The primary drivers of our electric operating expenses in any period are: (1) fuel and purchased power expenses, (2) maintenance and repairs expense, including repairs following severe weather and plant outages, (3) taxes and (4) non-cash items such as depreciation and amortization expense. Although we generally recover maintenance and repairs expense and such costs through our rates, there can be no assurance that we will recover all, or any part of, such increased costs in future rate cases.
The primary drivers of our gas operating revenues in any period are: (1) rates we can charge our customers, (2) weather, (3) customer growth, (4) the cost of natural gas and interstate pipeline transportation charges and (5) general economic conditions. Because natural gas is heavily used for residential and commercial heating, the demand for this product depends heavily upon weather patterns throughout our natural gas service territory and a significant amount of our natural gas revenues are recognized in the first and fourth quarters related to the heating seasons. Accordingly, our natural gas operations have historically generated less revenues and income when weather conditions are warmer in the winter.
The primary driver of our gas operating expense in any period is the price of natural gas.
Significant increases in electric and gas operating expenses or reductions in electric and gas operating revenues may occur and result in a material adverse effect on our business, financial condition and results of operations.
We may be unable to recover increases in the cost of natural gas from our natural gas utility customers, or may lose customers as a result of any price increases.
In our natural gas utility business, we are permitted to recover the cost of gas directly from our customers through the use of a purchased gas adjustment provision. Our PGA provision is regularly reviewed by the MPSC. In addition to reviewing our adjustments to customer rates, the MPSC reviews our costs for prudency as well. To the extent the MPSC may determine certain costs were not incurred
24
Table of Contents
prudently, it could adversely affect our gas segment earnings and cash flows. In addition, increases in natural gas costs affect total prices to our customers and, therefore, the competitive position of gas relative to electricity and other forms of energy. Increases in natural gas costs may also result in lower usage by customers unable to switch to alternate fuels. Such disallowed costs or customer losses could have a material adverse effect on our business, financial condition and results of operations.
We are subject to environmental laws and the incurrence of environmental liabilities which may adversely affect our business, financial condition and results of operations.
We are subject to extensive federal, state and local regulation with regard to air and other environmental matters. Failure to comply with these laws and regulations could have a material adverse effect on our results of operations and financial position. In addition, new environmental laws and regulations, and new interpretations of existing environmental laws and regulations, have been adopted and may in the future be adopted which may substantially increase our future environmental expenditures for both new facilities and our existing facilities. Compliance with current and future air emission standards (such as those limiting emission levels of sulfur dioxide (SO2) and nitrogen oxide (NOx) and, potentially, carbon dioxide (CO2)) has required, and may in the future require, significant environmental expenditures. Although we generally recover such costs through our rates, there can be no assurance that we will recover all, or any part of, such increased costs in future rate cases. The incurrence of additional material environmental costs which are not recovered in our rates may result in a material adverse effect on our business, financial condition and results of operations.
The cost and schedule of construction projects may materially change.
We have entered into contracts to purchase an undivided interest in 50 megawatts of the Plum Point Energy Station's new 665-megawatt, coal-fired generating facility which is being built near Osceola, Arkansas. We have also entered into an agreement with KCP&L to purchase an undivided ownership interest in the coal-fired Iatan 2 generating facility. We will own 12%, or approximately 100 megawatts, of the 850-megawatt unit.
There are lbs that actual costs may exceed budget estimates, delays may occur in obtaining permits and materials, suppliers and contractors may not perform as required under their contracts, there may be inadequate availability or increased cost of qualified craft labor, the scope and timing of projects may change, and other events beyond our control may occur that may materially affect the schedule, budget and performance of these projects.
ITEM 1B. UNRESOLVED STAFF COMMENTS
None.
25
Table of Contents
ITEM 2. PROPERTIES
Electric Segment Facilities
At December 31, 2008, we owned generating facilities with an aggregate generating capacity of 1,255 megawatts.
Our principal electric baseload generating plant is the Asbury Plant with 210 megawatts of generating capacity. The plant, located near Asbury, Missouri, is a coal-fired generating station with two steam turbine generating units. The plant presently accounts for approximately 17% of our owned generating capacity and in 2008 accounted for approximately 35.0% of the energy generated by us. Routine plant maintenance, during which the entire plant is taken out of service, is scheduled once each year, normally for approximately four weeks in the spring. Approximately every fifth year, the maintenance outage is scheduled to be extended to a total of six weeks to permit inspection of the Unit No. 1 turbine. The last such outage took place in the fall of 2007. Our Asbury units went off-line September 21, 2007 and were expected to be back on-line during the last week of November, during which time we expected to tie in the SCR being constructed at Asbury. However, on December 7, 2007, during the reassembly of the generator, the unit failed inspection. On December 9, 2007, it was determined that corrective action would be necessary and that the additional work would require the unit to remain on outage an additional 60 days. Asbury went back online on February 10, 2008. The Unit No. 2 turbine is inspected approximately every 35,000 hours of operations and was last inspected in 2001. As of December 31, 2008, Unit No. 2 has operated approximately 2,745 hours since its last turbine inspection in 2001. When the Asbury Plant is out of service, we typically experience increased purchased power and fuel expenditures associated with replacement energy, which is now likely to be recovered through our fuel adjustment clauses.
Our generating plant located at Riverton, Kansas, has two steam-electric generating units with an aggregate generating capacity of 92 megawatts and four gas-fired combustion turbine units with an aggregate generating capacity of 194 megawatts. The steam-electric generating units burn coal as a primary fuel and have the capability of burning natural gas. Unit No. 8 was taken out of service on May 5, 2008 for a scheduled maintenance outage which was extended until July 1, 2008 in order to repair turbine blade damage discovered during the routine inspection. We installed a Siemens V84.3A2 combustion turbine (Unit 12) at our Riverton plant in 2007 with a summer rated capacity of 150 megawatts. It began commercial operation on April 10, 2007.
We own a 12% undivided interest in the coal-fired Unit No. 1 at the Iatan Generating Station located near Weston, Missouri, 35 miles northwest of Kansas City, Missouri, as well as a 3% interest in the site and a 12% interest in certain common facilities. A new air permit was issued for the Iatan Generating Station on January 31, 2006. The new permit covers the entire Iatan Generating Station and includes the existing Unit No. 1 and Unit No. 2, currently under construction. The new permit limits Unit No. 1 to a maximum of 6,600 MMBtu per hour of heat input. This heat input limit allows Unit No. 1 to produce a total of 652 net megawatts, and, as a result, our share decreased from 80 megawatts to 78 megawatts. The 6,600 MMBtu per hour heat input limit is in effect until the new SCR, scrubber, and baghouse are in place and fully operational. We are entitled to 12% of the unit's available capacity and are obligated to pay for that percentage of the operating costs of the unit. KCP&L operates the unit for the joint owners.
Iatan 1 began a planned major maintenance outage on October 18, 2008 which included activities ranging from a turbine upgrade and generator rewind to the tie-in of the new air quality control systems. The outage was scheduled to be complete on December 30, 2008; however, due to unforeseen circumstances related to the economizer upgrade that took place during the outage, the projected return to service date had to be extended to late January 2009. Once all the outage work was complete, start-up and commissioning activities began in late January. In early February vibration issues with the upgraded high pressure turbine were encountered requiring the turbine to be shipped off-site for repairs. Current estimates have the unit returning to service late in the first quarter to early in the second quarter of 2009.
26
Table of Contents
Our State Line Power Plant, which is located west of Joplin, Missouri, consists of Unit No. 1, a combustion turbine unit with generating capacity of 96 megawatts and a Combined Cycle Unit with generating capacity of 500 megawatts of which we are entitled to 60%, or 300 megawatts. The Combined Cycle Unit consists of the combination of two combustion turbines, two heat recovery steam generators, a steam turbine and auxiliary equipment. The Combined Cycle Unit is jointly owned with Westar Generating Inc., a subsidiary of Westar Energy, Inc., which owns the remaining 40% of the unit. Westar reimburses us for a percentage of the operating costs per our joint ownership agreement stipulations. We are the operator of the Combined Cycle Unit. All units at our State Line Power Plant burn natural gas as a primary fuel with Unit No. 1 having the additional capability of burning oil. Unit No. 1 had its first major inspection from September 7, 2006 until December 20, 2006.
We have four combustion turbine peaking units, including two FT8 peaking units installed in 2003, at the Empire Energy Center in Jasper County, Missouri, with an aggregate generating capacity of 269 megawatts. These peaking units operate on natural gas, as well as oil. On June 21, 2007, Unit No. 3 was taken out of service due to the failure of an engine bearing. It was returned to service on October 3, 2007.
Our hydroelectric generating plant (FERC Project No. 2221), located on the White River at Ozark Beach, Missouri, has a generating capacity of 16 megawatts. We have a long-term license from FERC to operate this plant which forms Lake Taneycomo in southwestern Missouri. As part of the Energy and Water Development Appropriations Act of 2006 (the Appropriations Act), a new minimum flow was established with the intent of increasing minimum flows on recreational streams in Arkansas. To accomplish this, the level of Bull Shoals Lake will be increased an average of 5 feet. The increase at Bull Shoals will decrease the head waters available for generation at Ozark Beach by 5 feet and, thus, reduce our electrical output. We estimate the lost production to be up to 16% of our average annual energy production for this unit. The Appropriations Act has a provision for the Army Corp of Engineers to provide a one time payment to us for lost energy production. The Appropriations Act requires the Southwest Power Administration (SWPA), in coordination with us and our relevant public service commissions, to determine our economic detriment. The SWPA published its Draft Determination in the Federal Register on March 6, 2008. Subsequently, on July 3, 2008, the SWPA published its Proposed Determination in the Federal Register. The SWPA published its Final Determination on January 23, 2009. SWPA's Final Determination Report documents the procedure to be used to calculate the present value of the future lifetime replacement cost of the electrical energy and capacity lost due to the White River Minimum Flows project at Ozark Beach. The actual hydropower compensation values are to be calculated using the method presented in the Final Determination and current values for the specified parameters based on the official implementation date. Assuming a January 1, 2011 date of implementation for the White River Minimum Flows project and November 2008 values for the specified parameters, the SWPA's determination results in a present value for the estimated future lifetime replacement costs of the electrical energy and capacity at Ozark Beach of $41,319,400. We expect that the Army Corp of Engineers will not implement the new minimum flow plan until at least 2010, but, at this time, we cannot be sure of the timetable as it is dependent on Congress providing funding for the economic detriment.
At December 31, 2008, our transmission system consisted of approximately 22 miles of 345 kV lines, 434 miles of 161 kV lines, 744 miles of 69 kV lines and 81 miles of 34.5 kV lines. Our distribution system consisted of approximately 6,857 miles of line.
Our electric generation stations are located on land owned in fee. We own a 3% undivided interest as tenant in common in the land for the Iatan Generating Station. We own a similar interest in 60% of the land used for the State Line Combined Cycle Unit. Substantially all of our electric transmission and distribution facilities are located either (1) on property leased or owned in fee; (2) over streets, alleys, highways and other public places, under franchises or other rights; or (3) over private property by virtue of easements obtained from the record holders of title. Substantially all of our electric segment property, plant and equipment are subject to the EDE Mortgage.
27
Table of Contents
We also own and operate water pumping facilities and distribution systems consisting of a total of approximately 87 miles of water mains in three communities in Missouri.
Gas Segment Facilities
At December 31, 2008, our principal gas utility properties consisted of approximately 87 miles of transmission mains and approximately 1,113 miles of distribution mains.
Substantially all of our gas transmission and distribution facilities are located either (1) on property leased or owned in fee; (2) under streets, alleys, highways and other public places, under franchises or other rights; or (3) under private property by virtue of easements obtained from the record holders of title. Substantially all of our gas segment property, plant and equipment are subject to the EDG Mortgage.
Other Segment Businesses
Our other segment consists of our non-regulated businesses, primarily a 100% interest in Empire District Industries, Inc., a subsidiary for our fiber optics business. We use the fiber optics cable and equipment in our own operations and also lease it to other entities. We sold our controlling 52% interest in MAPP on August 31, 2006, a company that specialized in close-tolerance custom manufacturing for the aerospace, electronics, telecommunications and machinery industries. In December 2006, we sold our 100% interest in Conversant, Inc., a software company that marketed Customer Watch, an Internet-based customer information system software. On September 28, 2007, we sold our 100% interest in Fast Freedom, Inc., an Internet service provider.
ITEM 3. LEGAL PROCEEDINGS
See description of legal matters set forth in Note 12 of "Notes to Consolidated Financial Statements" under Item 8, which description is incorporated herein by reference.
ITEM 4. SUBMISSION OF MATTERS TO A VOTE OF SECURITY HOLDERS
None.
28
Table of Contents
PART II
ITEM 5. MARKET FOR REGISTRANT'S COMMON EQUITY, RELATED STOCKHOLDER MATTERS AND ISSUER PURCHASES OF EQUITY SECURITIES.
Our common stock is listed on the New York Stock Exchange. On February 6, 2008, there were 5,142 record holders and 28,875 individual participants in security position listings. The high and low sale prices for our common stock as reported by the New York Stock Exchange for composite transactions, and the amount per share of quarterly dividends declared and paid on the common stock for each quarter of 2008 and 2007 were as follows:
| | | | | | | | | | | | | | | | | | | |
| | Price of Common Stock | |
| |
| |
|---|
| | Dividends Paid
Per Share | |
|---|
| | 2008 | | 2007 | |
|---|
| | High | | Low | | High | | Low | | 2008 | | 2007 | |
|---|
First Quarter | | $ | 23.29 | | $ | 19.33 | | $ | 26.11 | | $ | 23.07 | | $ | 0.32 | | $ | 0.32 | |
Second Quarter | | | 21.88 | | | 18.30 | | | 26.13 | | | 21.99 | | | 0.32 | | | 0.32 | |
Third Quarter | | | 23.48 | | | 18.37 | | | 24.29 | | | 21.09 | | | 0.32 | | | 0.32 | |
Fourth Quarter | | | 21.60 | | | 14.90 | | | 24.34 | | | 22.22 | | | 0.32 | | | 0.32 | |
Holders of our common stock are entitled to dividends, if, as, and when declared by the Board of Directors, out of funds legally available therefore subject to the prior rights of holders of any outstanding cumulative preferred stock and preference stock. Payment of dividends is determined by our Board of Directors after considering all relevant factors, including the amount of our retained earnings, which is essentially our accumulated net income less dividend payouts. As of December 31, 2008, our retained earnings balance was $13.6 million (compared to $17.2 million at December 31, 2007) after paying out $43.3 million in dividends during 2008. If we were to reduce our dividend per share, partially or in whole, it could have an adverse effect on our common stock price.
The EDE Mortgage and the Restated Articles contain certain dividend restrictions. The most restrictive of these is contained in the EDE Mortgage, which provides that we may not declare or pay any dividends (other than dividends payable in shares of our common stock) or make any other distribution on, or purchase (other than with the proceeds of additional common stock financing) any shares of, our common stock if the cumulative aggregate amount thereof after August 31, 1944 (exclusive of the first quarterly dividend of $98,000 paid after said date) would exceed the sum of $10.75 million and the earned surplus (as defined in the EDE Mortgage) accumulated subsequent to August 31, 1944, or the date of succession in the event that another corporation succeeds to our rights and liabilities by a merger or consolidation. On March 11, 2008, we amended the EDE Mortgage in order to provide us with more flexibility to pay dividends to our shareholders by increasing the basket available to pay dividends by $10.75 million, as described above. As of December 31, 2008, this restriction did not prevent us from issuing dividends.
In addition, under certain circumstances, our Junior Subordinated Debentures, 81/2% Series due 2031, reflected as a note payable to securitization trust on our balance sheet, held by Empire District Electric Trust I, an unconsolidated securitization trust subsidiary, may also restrict our ability to pay dividends on our common stock. These restrictions apply if: (1) we have knowledge that an event has occurred that would constitute an event of default under the indenture governing these junior subordinated debentures and we have not taken reasonable steps to cure the event, (2) we are in default with respect to payment of any obligations under our guarantee relating to the underlying preferred securities, or (3) we have deferred interest payments on the Junior Subordinated Debentures, 81/2% Series due 2031 or given notice of a deferral of interest payments. As of December 31, 2008, there were no such restrictions on our ability to pay dividends.
During 2008, no purchases of our common stock were made by or on behalf of us.
Participants in our Dividend Reinvestment and Stock Purchase Plan may acquire, at a 3% discount, newly issued common shares with reinvested dividends. Participants may also purchase, at an averaged
29
Table of Contents
market price, newly issued common shares with optional cash payments on a weekly basis, subject to certain restrictions. We also offer participants the option of safekeeping for their stock certificates.
Our shareholders rights plan provides each of the common stockholders one Preference Stock Purchase Right (Right) for each share of common stock owned. One Right enables the holder to acquire one one-hundredth of a share of Series A Participating Preference Stock (or, under certain circumstances, other securities) at a price of $75 per one-hundredth of a share, subject to adjustment. The rights (other than those held by an acquiring person or group (Acquiring Person)) will be exercisable only if an Acquiring Person acquires 10% or more of our common stock or if certain other events occur. See Note 6 of "Notes to Consolidated Financial Statements" under Item 8 for additional information. In addition, we have stock based compensation programs which are described in Note 5 of "Notes to Consolidated Financial Statements" under Item 8.
Our By-laws provide that K.S.A. Sections 17-1286 through 17-1298, the Kansas Control Share Acquisitions Act, will not apply to control share acquisitions of our capital stock.
See Note 5 of "Notes to Consolidated Financial Statements" under Item 8 for additional information regarding our common stock and equity compensation plans.
The following graph and table indicates the value at the end of the specified years of a $100 investment made on December 31, 2003, in our common stock and similar investments made in the securities of the companies in the Standard & Poor's 500 Composite Index (S&P 500 Index) and the Standard & Poor's Electric Utilities Index (S&P Electric Utility). The graph and table assume that dividends were reinvested when received.
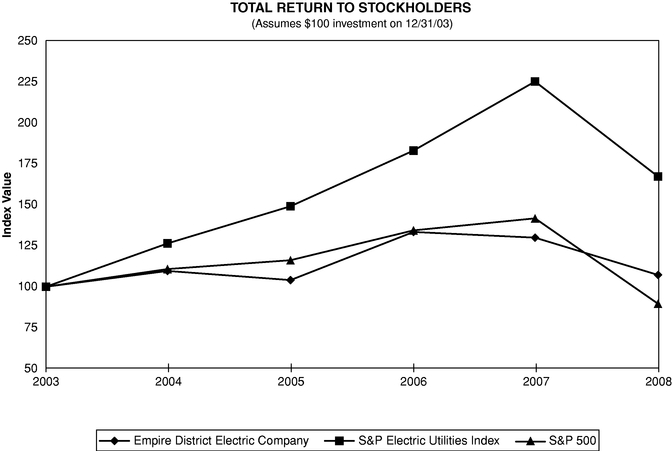
| | | | | | | | | | | | | | | | | | | |
Total Return Analysis | | 12/31/2003 | | 12/31/2004 | | 12/31/2005 | | 12/31/2006 | | 12/31/2007 | | 12/31/2008 | |
|---|
The Empire District Electric Company | | $ | 100.00 | | $ | 109.72 | | $ | 104.09 | | $ | 133.71 | | $ | 130.21 | | $ | 107.26 | |
S&P Electric Utilities Index | | $ | 100.00 | | $ | 126.67 | | $ | 149.53 | | $ | 183.81 | | $ | 226.31 | | $ | 167.84 | |
S&P 500 Index | | $ | 100.00 | | $ | 110.88 | | $ | 116.33 | | $ | 134.70 | | $ | 142.10 | | $ | 89.53 | |
30
Table of Contents
ITEM 6. SELECTED FINANCIAL DATA
(in thousands, except per share amounts)(1)
| | | | | | | | | | | | | | | | | |
| | 2008 | | 2007 | | 2006(2) | | 2005 | | 2004 | |
|---|
Operating revenues | | $ | 518,163 | | $ | 490,160 | | $ | 412,171 | | $ | 362,720 | | $ | 306,354 | |
Operating income | | $ | 71,012 | | $ | 65,566 | | $ | 69,821 | | $ | 53,920 | | $ | 53,212 | |
Total allowance for funds used during construction | | $ | 12,518 | | $ | 7,665 | | $ | 4,255 | | $ | 561 | | $ | 220 | |
Income from continuing operations | | $ | 39,722 | | $ | 33,181 | | $ | 40,029 | | $ | 24,944 | | $ | 23,542 | |
Income (loss) from discontinued operations, net of tax | | $ | — | | $ | 63 | | $ | (749 | ) | $ | (1,176 | ) | $ | (1,694 | ) |
Net income | | $ | 39,722 | | $ | 33,244 | | $ | 39,280 | | $ | 23,768 | | $ | 21,848 | |
Weighted average number of common shares outstanding — basic | | | 33,821 | | | 30,587 | | | 28,277 | | | 25,898 | | | 25,468 | |
Weighted average number of common shares outstanding — diluted | | | 33,860 | | | 30,610 | | | 28,296 | | | 25,941 | | | 25,521 | |
Earnings from continuing operations per weighted average share of common stock — basic and diluted | | $ | 1.17 | | $ | 1.09 | | $ | 1.42 | | $ | 0.96 | | $ | 0.93 | |
Loss from discontinued operations per weighted average share of common stock — basic and diluted | | $ | — | | $ | 0.00 | | $ | (0.03 | ) | $ | (0.04 | ) | $ | (0.07 | ) |
Total earnings per weighted average share of common stock — basic and diluted | | $ | 1.17 | | $ | 1.09 | | $ | 1.39 | | $ | 0.92 | | $ | 0.86 | |
Cash dividends per share | | $ | 1.28 | | $ | 1.28 | | $ | 1.28 | | $ | 1.28 | | $ | 1.28 | |
Common dividends paid as a percentage of net income | | | 109.0 | % | | 117.2 | % | | 91.8 | % | | 139.5 | % | | 149.3 | % |
Allowance for funds used during construction as a percentage of net income | | | 31.5 | % | | 23.1 | % | | 10.8 | % | | 2.4 | % | | 1.0 | % |
Book value per common share (actual) outstanding at end of year | | $ | 15.56 | | $ | 16.04 | | $ | 15.49 | | $ | 15.08 | | $ | 14.76 | |
Capitalization: | | | | | | | | | | | | | | | | |
| | Common equity | | $ | 528,872 | | $ | 539,176 | | $ | 468,609 | | $ | 393,411 | | $ | 379,180 | |
| | Long-term debt | | $ | 611,567 | | $ | 541,880 | | $ | 462,398 | | $ | 407,786 | | $ | 397,371 | |
Ratio of earnings to fixed charges | | | 2.19x | | | 2.08x | | | 2.60x | | | 2.21x | | | 2.12x | |
Total assets | | $ | 1,713,846 | | $ | 1,473,074 | | $ | 1,319,142 | | $ | 1,122,030 | | $ | 1,027,539 | |
Plant in service at original cost | | $ | 1,580,558 | | $ | 1,500,640 | | $ | 1,374,837 | | $ | 1,282,123 | | $ | 1,247,380 | |
Capital expenditures (including AFUDC)(3) | | $ | 206,405 | | $ | 195,568 | | $ | 120,171 | | $ | 73,232 | | $ | 41,045 | |
- (1)
- All years presented have been adjusted to show continuing operations, reflecting the sale of MAPP and Conversant in 2006 and Fast Freedom in 2007.
- (2)
- Includes EDG data for the months of June through December 2006.
- (3)
- 2006 capital expenditures do not include $103.2 million for the acquisition of the Missouri Gas operations.
31
Table of Contents
ITEM 7. MANAGEMENT'S DISCUSSION AND ANALYSIS OF FINANCIAL CONDITION AND RESULTS OF OPERATIONS
EXECUTIVE SUMMARY
We operate our businesses as three segments: electric, gas and other. The Empire District Electric Company (EDE) is an operating public utility engaged in the generation, purchase, transmission, distribution and sale of electricity in parts of Missouri, Kansas, Oklahoma and Arkansas. As part of our electric segment, we also provide water service to three towns in Missouri. The Empire District Gas Company (EDG) is our wholly owned subsidiary formed to hold the Missouri Gas assets acquired from Aquila, Inc. on June 1, 2006. It provides natural gas distribution to customers in 44 communities in northwest, north central and west central Missouri. Our other segment consists of our non-regulated businesses, primarily a 100% interest in Empire District Industries, Inc., a subsidiary for our fiber optics business. During the twelve months ended December 31, 2008, 86.5% of our gross operating revenues were provided from sales from our electric segment (including 0.3% from the sale of water), 12.6% from the sale of gas and 0.9% from our non-regulated businesses.
Electric Segment
The primary drivers of our electric operating revenues in any period are: (1) rates we can charge our customers, (2) weather, (3) customer growth and (4) general economic conditions. The utility commissions in the states in which we operate, as well as the Federal Energy Regulatory Commission (FERC), set the rates which we can charge our customers. In order to offset expenses, we depend on our ability to receive adequate and timely recovery of our costs (primarily fuel and purchased power) and/or rate relief. We assess the need for rate relief in all of the jurisdictions we serve and file for such relief when necessary. Weather affects the demand for electricity. Very hot summers and very cold winters increase electric demand, while mild weather reduces demand. Residential and commercial sales are impacted more by weather than industrial sales, which are mostly affected by business needs for electricity and by general economic conditions. Customer growth, which is the growth in the number of customers, contributes to the demand for electricity. We expect our annual electric customer growth to range from approximately 1.1% to 1.6% over the next several years. Our electric customer growth for the twelve months ended December 31, 2008 was 0.4%. We define electric sales growth to be growth in kWh sales period over period excluding the impact of weather. The primary drivers of electric sales growth are customer growth and general economic conditions.
The primary drivers of our electric operating expenses in any period are: (1) fuel and purchased power expense, (2) maintenance and repairs expense, including repairs following severe weather and plant outages, (3) taxes and (4) non-cash items such as depreciation and amortization expense. Historically, fuel and purchased power costs were the expense items that had the most significant impact on our net income. In our latest rate case, the Missouri Public Service Commission (MPSC) authorized a fuel adjustment clause for our Missouri customers effective September 1, 2008. The MPSC established a base rate for the recovery of fuel and purchased power expenses used to supply energy. The clause permits the distribution to customers of 95% of the changes in fuel and purchased power costs above or below the base. With the addition of the Missouri fuel adjustment mechanism, we now have a fuel cost recovery mechanism in all of our jurisdictions, which will significantly reduce the impact of fluctuating fuel costs on our net income.
Gas Segment
The primary drivers of our gas operating revenues in any period are: (1) rates we can charge our customers, (2) weather, (3) customer growth, (4) the cost of natural gas and interstate pipeline transportation charges and (5) general economic conditions. The MPSC sets the rates which we can charge our customers. In order to offset expenses, we depend on our ability to receive adequate and timely recovery of our costs (primarily commodity natural gas) and/or rate relief. We assess the need for rate
32
Table of Contents
relief and file for such relief when necessary. However, as part of the unanimous stipulation and agreement filed with the MPSC on March 1, 2006 and approved on April 18, 2006, we have agreed to not file a rate increase request for non-gas costs prior to June 1, 2009. A PGA clause is included in our gas rates, which allows us to recover our actual cost of natural gas from customers through rate changes, which are made periodically (up to four times) throughout the year in response to weather conditions, natural gas costs and supply demands. Weather affects the demand for natural gas. Very cold winters increase demand for gas, while mild weather reduces demand. Due to the seasonal nature of the gas business, revenues and earnings are typically concentrated in the November through March period, which generally corresponds with the heating season. Customer growth, which is the growth in the number of customers, contributes to the demand for gas. Our gas segment customer contraction for the twelve months ended December 31, 2008 was 1.5%, which we believe was due to higher gas prices and general economic conditions. The rate of gas customer contraction is expected to level out during the next two years and to remain relatively flat after 2010. We define gas sales growth to be growth in mcf sales excluding the impact of weather. The primary drivers of gas sales growth are customer growth and general economic conditions.
The primary driver of our gas operating expense in any period is the price of natural gas. However, because gas purchase costs for our gas utility operations are normally recovered from our customers, any change in gas prices does not have a corresponding impact on income unless such costs are deemed imprudent or cause customers to reduce usage.
Earnings
For the twelve months ended December 31, 2008, basic and diluted earnings per weighted average share of common stock were $1.17 compared to $1.09 for the twelve months ended December 31, 2007. As reflected in the table below, the primary positive drivers were increased electric and gas revenues while the primary negative drivers were increased fuel and purchased power costs.
The following reconciliation of basic earnings per share between 2007 and 2008 is a non-GAAP presentation. We believe this information is useful in understanding the fluctuation in earnings per share between the prior and current years. The reconciliation presents the after tax impact of significant items and components of the income statement on a per share basis before the impact of additional stock issuances which is presented separately. Earnings per share for the years ended December 31, 2007 and 2008 shown in the reconciliation are presented on a GAAP basis and are the same as the amounts included
33
Table of Contents
in the statements of operations. This reconciliation may not be comparable to other companies or more useful than the GAAP presentation included in the statements of operations.
| | | | | |
Earnings Per Share — 2007 | | $ | 1.09 | |
Revenues | | | | |
| | Electric on-system | | $ | 0.22 | |
| | Electric off-system and other | | | 0.26 | |
| | Gas | | | 0.12 | |
| | Water | | | — | |
| | Other | | | 0.03 | |
Expenses | | | | |
| | Electric fuel and purchased power | | | (0.29 | ) |
| | Cost of natural gas sold and transported | | | (0.11 | ) |
| | Regulated — electric segment | | | (0.02 | ) |
| | Regulated — gas segment | | | 0.01 | |
| | Other segment | | | (0.01 | ) |
| | Maintenance and repairs | | | 0.08 | |
| | Depreciation and amortization | | | (0.02 | ) |
| | Other taxes | | | (0.01 | ) |
| | Interest charges | | | (0.09 | ) |
| | AFUDC | | | 0.11 | |
| | Gain on sale of assets | | | (0.03 | ) |
| | Change in effective income tax rates | | | (0.04 | ) |
| | Other income and deductions | | | (0.02 | ) |
| | Dilutive effect of additional shares issued | | | (0.11 | ) |
| | | | |
Earnings Per Share — 2008 | | $ | 1.17 | |
| | | | |
Fourth Quarter Results
Earnings for the fourth quarter of 2008, were $7.7 million, or $0.23 per share, as compared to a net loss of $0.4 million, or ($0.01) per share, in the fourth quarter 2007. Total revenues increased approximately $16.5 million (14.4%) for the fourth quarter of 2008 as compared to the fourth quarter of 2007 primarily due to the Missouri rate increase. Total electric revenues were $11.5 million higher, primarily as a result of the rate increase, which had an estimated $5.3 million impact, weather, which had a positive impact of an estimated $2.3 million and an increase in off-system sales of $3.0 million. Increased revenues from our gas segment were $4.8 million. Electric fuel and purchased power costs were $2.8 million less this quarter versus last year, primarily due to lower natural gas prices and our regulatory adjustment of $1.7 million. Our fourth quarter electric fuel and purchased power expenditures were higher than the base cost in our Missouri rates. Therefore, $1.7 million was transferred from fuel costs to a regulatory asset. Costs of natural gas sold and transported for our gas segment increased $4.6 million. Other impacts to the quarter included increased income taxes (approximately $5.7 million) and maintenance and repairs expense (approximately $0.7 million).
2008 Activities
Recent Capital Market Events
We have monitored recent market events that could have potential business and accounting issues associated with our operations.
We evaluated our credit exposure with trading counterparties and we do not at this time believe that counterparty default is likely, although, according to published reports, certain of our counterparties
34
Table of Contents
continue to be adversely impacted by the current credit crisis. In the event that the counterparties to our hedging arrangements were no longer probable of performance, we would discontinue the use of cash flow hedge treatment for these contracts. However, the fuel adjustment clause authorized in the recent Missouri rate case allows us to record any gains or losses associated with our hedging arrangements as a regulatory asset or liability. Accordingly, we believe any counterparty defaults we may experience should not substantially impact our earnings.
Similar to many companies, we are exposed to the risk of credit rating downgrades from rating agencies; however, we have not received any downgrades of our securities.
The general market decline has negatively impacted the performance of our pension assets through December 31, 2008. Our net pension liability increased $53.2 million and our net liability for other postretirement benefits increased $15.5 million. These increases were recorded as increases in regulatory assets as we believe they are probable of recovery through customer rates based on rate orders received in our jurisdictions. We expect future pension funding commitments to increase. The expected minimum funding for 2009 is estimated to be between $0 million and $4 million. For 2010 it is estimated to be between $9 million and $15 million. The actual minimum funding requirements will be determined based on the results of the actuarial valuations, and, in the case of 2010, the performance of our pension assets during 2009.
Historically, we have met most of our short-term cash flow needs through the issuance of commercial paper. However, due to recent market events, we have generally been unable to issue commercial paper at rates below what we can borrow the funds at under our unsecured revolving credit facility. As a result, we have borrowed under this credit facility to meet short-term cash flow needs. See "Liquidity and Capital Resources" below for further discussion.
Financing
On May 16, 2008, we issued $90 million principal amount of first mortgage bonds. The net proceeds of approximately $89.4 million, less $0.4 million of legal and other financing fees, were added to our general funds and used primarily to pay down short-term indebtedness incurred, in part, as a result of our on-going construction program.
We have a $400 million shelf registration statement with the SEC, which became effective on August 15, 2008, covering our common stock, unsecured debt securities, preference stock, first mortgage bonds and trust preferred securities. We have received regulatory approval in all four of our state jurisdictions. Of the $400 million, $250 million is available for first mortgage bonds. We plan to use a portion of the proceeds from issuances under this shelf to fund a portion of the capital expenditures for our new generation projects.
Regulatory Matters
On October 1, 2007, we filed a request with the MPSC for an annual increase in base rates for our Missouri electric customers in the amount of $34.7 million, or 10.11%. The MPSC issued an order on July 30, 2008, granting an annual increase in revenues for our Missouri electric customers in the amount of $22.0 million, or 6.7%, based on a 10.8% return on equity. The new rates went into effect August 23, 2008.
The order contains two components. The first component provides an addition to base rates of approximately $27.7 million. This increase in base rates was partially offset by a $5.7 million reduction to regulatory amortization, which is the second component of the overall change in revenue authorized by the MPSC. Regulatory amortization provides us additional cash through rates to support certain credit metrics during the current construction cycle. This construction, which is part of our long-range plan to ensure reliability, includes the facilities at the Riverton Power Plant and Iatan 2 Power Plant, as well as
35
Table of Contents
environmental improvements at the Asbury Power Plant and at Iatan 1. The regulatory amortization is now approximately $4.5 million annually and is recorded as depreciation expense.
The MPSC also authorized a fuel adjustment clause for our Missouri customers effective September 1, 2008. The MPSC established a base cost for the recovery of fuel and purchased power expenses used to supply energy. The clause permits the distribution to customers of 95% of the changes in fuel and purchased power costs prudently incurred above or below the base cost. Off-system sales margins are also part of the recovery of fuel and purchased power costs. As a result, the off-system sales margin flows back to the customer. Rates related to the fuel adjustment clause will be modified twice a year subject to the review and approval by the MPSC. In accordance with FAS 71, 95% of the difference between the actual cost of fuel and purchased power and the base cost of fuel and purchased power recovered from our customers is recorded as an adjustment to fuel and purchased power expense with a corresponding regulatory asset or a regulatory liability. If the actual fuel and purchased power costs are higher or lower than the base fuel and purchased power costs billed to customers, 95% of these amounts will be recovered or refunded to our customers when the fuel adjustment clause is modified. At December 31, 2008, Missouri fuel and purchased power costs were over recovered $0.2 million, which is reflected as a regulatory liability.
The MPSC order approved a Stipulation and Agreement providing for the recovery of deferred expenses of approximately $14.2 million over a five year period for the 2007 ice storms. In addition, the MPSC order required the implementation of a two-way tracking mechanism for recovery of the costs relating to the new MPSC rules on infrastructure inspection and vegetation management. The mechanism authorized by the MPSC creates a regulatory liability in any year we spend less than the target amount, which has been set at $8.6 million for our Missouri jurisdiction, and a regulatory asset if we spend more than the target amount. Any regulatory asset and liability amounts created using the tracking mechanism will then be netted against each other and taken into account in our next rate case. The MPSC also approved Stipulations and Agreements providing for the continuation of the pension and other post-retirement employee benefits tracking mechanism established in our 2007 and 2008 Missouri rate orders. (When we refer to rate orders dates, we are referring to the date the order was effective). See Note 1 of "Notes to Consolidated Financial Statements" under Item 8 for discussion regarding the treatment of the pension and other post-retirement employee benefits tracked.
The MPSC issued its Report and Order on July 30, 2008, effective August 9, 2008. The OPC and intervenors Praxair, Inc. and Explorer Pipeline Company filed applications for rehearing with the MPSC regarding this order. On August 12, 2008, the MPSC issued its Order Granting Expedited Treatment and Approving Compliance Tariff Sheets, effective August 23, 2008, in which the MPSC approved our tariff sheets containing our base rates for service rendered on and after August 23, 2008, and approved our fuel adjustment clause tariff sheets effective September 1, 2008. On September 3, 2008, the MPSC denied all pending applications for rehearing.
On October 2, 2008, the OPC and intervenors Praxair, Inc. and Explorer Pipeline Company filed Petitions for Writ of Review with the Cole County Circuit Court. These actions were consolidated into one proceeding.
For additional information, see "Rate Matters" below.
Renewable Energy. On November 4, 2008, Missouri voters approved the Clean Energy Initiative. This initiative requires investor-owned utilities in Missouri (such as Empire) to generate or purchase electricity from renewable energy sources, such as solar, wind, biomass and hydro power, at the rate of at least 2% in retail sales by 2011, increasing to at least 15% by 2021. At least 25 other states have adopted renewable portfolio standard (RPS) programs that mandate some form of renewable generation. Some of these RPS programs incorporate a trading system in which utilities are allowed to buy and sell renewable energy certificates (RECs) in order to meet compliance. Additionally, RECs are utilized by many companies in "green" marketing efforts. REC prices are driven by various market forces. We have been selling RECs
36
Table of Contents
and plan to continue to sell all or a portion of the RECs associated with our contracts with Elk River Windfarm, LLC and Cloud County Windfarm, LLC. With respect to the energy underlying the RECs that we sell, we may not claim that we are purchasing renewable energy for any purpose, including for purposes of complying with the new Missouri requirements. Over time, we expect to retain some of the renewable attributes associated with these contracts in order to meet the new Missouri requirements. We realized revenues of $1.8 million from REC sales in 2008 and $0.9 million in 2007.
Amendment of EDE Mortgage
On March 11, 2008, we amended the Indenture of Mortgage and Deed of Trust of The Empire District Electric Company (EDE Mortgage) in order to provide us with additional flexibility to pay dividends to our shareholders by increasing the basket available to pay dividends by $10.75 million. The amendment followed the successful completion of a solicitation of consents from the holders of our First Mortgage Bonds outstanding under the EDE Mortgage. We received consents from holders of 94.46% in aggregate principal amount of the outstanding bonds and paid fees of approximately $1.6 million to the consenting bondholders. See " — Dividends" below.
Energy Supply
In June 2007, we entered into a purchased power agreement with Cloud County Windfarm, LLC, owned by Horizon Wind Energy, Houston, Texas. This agreement provides for a 20-year term commencing with the commercial operation date, which was December 15, 2008. Pursuant to the terms of the agreement, we will purchase all of the output from the approximately 105-megawatt Phase 1 Meridian Wind Farm located in Cloud County, Kansas. We do not own any portion of the windfarm.
Asbury SCR and Maintenance Outage
We constructed an SCR at Asbury that was completed in November 2007 and placed in service in February 2008. The total cost of the SCR project was approximately $31.0 million (excluding AFUDC), of which $28.1 million was expended through December 31, 2007 with the remainder expended in 2008. This project was also included as part of our Experimental Regulatory Plan approved by the MPSC and its cost is now in base rates in Missouri. We combined this project with our five year Asbury maintenance outage.
Our Asbury units went off-line September 21, 2007 and were expected to be back on-line during the last week of November, during which time we expected to tie in the SCR. However, on December 7, 2007, during the reassembly of the generator, the unit failed inspection. On December 9, 2007 it was determined that corrective action would be necessary and that additional work would require the unit to remain on outage an additional 60 days. The unit was returned to service on February 10, 2008. We replaced the energy that would have been generated by our coal-fired units at the Asbury plant with energy generated at our gas plants and with purchased power. After assessing the actual cost of the incremental purchased power and gas-fired generation, we estimate the original planned outage added incremental expenses of approximately $8.7 million for the fourth quarter of 2007. We estimate the extended outage increased expenses an additional $3.5 million in the fourth quarter of 2007 (December 8-December 31, 2007) and an additional $5.8 million in the first quarter of 2008 (January 1-February 10, 2008).
RESULTS OF OPERATIONS
The following discussion analyzes significant changes in the results of operations for the years 2008, 2007 and 2006.
37
Table of Contents
The following table represents our results of operations by operating segment for the applicable periods ended December 31:
| | | | | | | | | | | |
(in millions)
| | 2008 | | 2007 | | 2006 | |
|---|
Income from continuing operations: | | | | | | | | | | |
| | Electric | | $ | 37.4 | | $ | 31.8 | | $ | 40.9 | |
| | Gas | | | 1.7 | | | 1.0 | | | (1.0 | ) |
| | Other | | | 0.6 | | | 0.4 | | | 0.1 | |
| | | | | | | | |
Income from continuing operations | | $ | 39.7 | | $ | 33.2 | | $ | 40.0 | |
Income (loss) from discontinued operations | | | — | | | — | | | (0.7 | ) |
| | | | | | | | |
Net income | | $ | 39.7 | | $ | 33.2 | | $ | 39.3 | |
| | | | | | | | |
Differences could occur due to rounding.
Electric Segment
Overview
Our electric segment income from continuing operations for 2008 was $37.4 million as compared to $31.8 million for 2007.
Electric operating revenues comprised approximately 86.5% of our total operating revenues during 2008. Of these total electric operating revenues, approximately 40.2% were from residential customers, 29.8% from commercial customers, 15.1% from industrial customers 4.3% from wholesale on-system customers, 6.6% from wholesale off-system transactions, 2.5% from miscellaneous sources, primarily public authorities and 1.5% from other electric revenues. The percentage of revenues provided from our wholesale off-system transactions has increased during 2008 as compared to 2007 primarily due to sales facilitated by the EIS market that began on February 1, 2007.
The amounts and percentage changes from the prior periods in kilowatt-hour ("kWh") sales and electric segment operating revenues by major customer class for on-system and off-system sales were as follows:
| | | | | | | | | | | | | | | | | | | | |
| | kWh Sales
(in millions) | |
|---|
Customer Class | | 2008 | | 2007 | | % Change* | | 2007 | | 2006 | | % Change* | |
|---|
Residential | | | 1,952.9 | | | 1,930.5 | | | 1.2 | % | | 1,930.5 | | | 1,898.8 | | | 1.7 | % |
Commercial | | | 1,622.0 | | | 1,610.8 | | | 0.7 | | | 1,610.8 | | | 1,547.1 | | | 4.1 | |
Industrial | | | 1,073.3 | | | 1,110.3 | | | (3.3 | ) | | 1,110.3 | | | 1,145.5 | | | (3.1 | ) |
Wholesale on-system | | | 344.5 | | | 342.3 | | | 0.6 | | | 342.3 | | | 337.7 | | | 1.4 | |
Other** | | | 123.8 | | | 116.8 | | | 6.0 | | | 116.8 | | | 112.7 | | | 3.6 | |
| | | | | | | | | | | | | | | | |
| | Total on-system sales | | | 5,116.5 | | | 5,110.7 | | | 0.1 | | | 5,110.7 | | | 5,041.8 | | | 1.4 | |
Off-system | | | 688.2 | | | 459.7 | | | 49.7 | | | 459.7 | | | 303.5 | | | 51.5 | |
| | | | | | | | | | | | | | | | |
Total KWh Sales | | | 5,804.7 | | | 5,570.4 | | | 4.2 | | | 5,570.4 | | | 5,345.3 | | | 4.2 | |
- *
- Percentage changes are based on actual kWh sales and may not agree to the rounded amounts shown above.
- **
- Other kWh sales include street lighting, other public authorities and interdepartmental usage.
38
Table of Contents
| | | | | | | | | | | | | | | | | | | | |
| | Electric Segment Operating Revenues
(in millions) | |
|---|
Customer Class | | 2008 | | 2007 | | % Change* | | 2007 | | 2006 | | % Change* | |
|---|
Residential | | $ | 179.3 | | $ | 174.6 | | | 2.7 | % | $ | 174.6 | | $ | 159.4 | | | 9.5 | % |
Commercial | | | 132.9 | | | 129.0 | | | 3.0 | | | 129.0 | | | 115.0 | | | 12.1 | |
Industrial | | | 67.4 | | | 67.7 | | | (0.5 | ) | | 67.7 | | | 64.8 | | | 4.5 | |
Wholesale on-system | | | 19.2 | | | 18.4 | | | 4.3 | | | 18.4 | | | 17.6 | | | 5.0 | |
Other** | | | 11.0 | | | 10.1 | | | 9.7 | | | 10.1 | | | 9.0 | | | 11.8 | |
| | | | | | | | | | | | | | | | |
| | Total on-system revenues | | | 409.8 | | | 399.8 | | | 2.5 | | | 399.8 | | | 365.8 | | | 9.3 | |
Off-system | | | 29.7 | | | 19.6 | | | 51.3 | | | 19.6 | | | 12.2 | | | 60.4 | |
| | | | | | | | | | | | | | | | |
Total Revenues from KWh Sales | | | 439.5 | | | 419.4 | | | 4.8 | | | 419.4 | | | 378.0 | | | 11.0 | |
Miscellaneous Revenues*** | | | 7.0 | | | 5.7 | | | 22.3 | | | 5.7 | | | 4.6 | | | 23.8 | |
| | | | | | | | | | | | | | | | |
Total Operating Revenues | | $ | 446.5 | | $ | 425.1 | | | 5.0 | | $ | 425.1 | | $ | 382.6 | | | 11.1 | |
Water Revenues | | | 1.7 | | | 1.9 | | | (5.1 | ) | | 1.9 | | | 1.8 | | | 2.0 | |
| | | | | | | | | | | | | | | | |
Total Electric Segment Operating Revenues | | $ | 448.2 | | $ | 427.0 | | | 5.0 | | $ | 427.0 | | $ | 384.4 | | | 11.1 | |
- *
- Percentage changes are based on actual revenues and may not agree to the rounded amounts shown above.
- **
- Other operating revenues include street lighting, other public authorities and interdepartmental usage.
- ***
- Miscellaneous revenues include transmission service revenues, late payment fees, rent, etc.
2008 Compared to 2007
On-System Operating Revenues and Kilowatt-Hour Sales
KWh sales for our on-system customers increased approximately 0.1% during 2008 as compared to 2007 primarily due to continued sales growth. Revenues for our on-system customers increased approximately $10.0 million, or 2.5%. Rate changes, primarily the August 2008 Missouri rate increase (discussed below), contributed an estimated $8.9 million to revenues while continued sales growth contributed an estimated $3.9 million. Weather and other related factors decreased revenues an estimated $2.8 million. We expect our annual customer growth to range from approximately 1.1% to 1.6% over the next several years.
Residential and commercial kWh sales increased in 2008 primarily due to continued sales growth while the associated revenues also increased due to the August 2008 Missouri rate increase. Industrial kWh sales decreased 3.3% mainly due to a slowdown created by economic uncertainty while the associated revenues decreased 0.5%, reflecting the economic conditions, partially offset by the Missouri rate increase. On-system wholesale kWh sales increased reflecting the continued sales growth discussed above. Revenues associated with these FERC-regulated sales increased more than the kWh sales as a result of the fuel adjustment clause applicable to such sales. This clause permits the distribution to customers of changes in fuel and purchased power costs.
Off-System Electric Transactions
In addition to sales to our own customers, we also sell power to other utilities as available and provide transmission service through our system for transactions between other energy suppliers (including through the Southwest Power Pool (SPP) energy imbalance services (EIS) market). See "— Competition" below. The majority of our off-system sales margins are now included as a component of the fuel adjustment clause in our Missouri, Kansas and Oklahoma jurisdictions and generally get recorded as fuel
39
Table of Contents
and purchased power expense. The following table sets forth information regarding these sales and related expenses for the years ended December 31:
| | | | | | | | |
(in millions)
| | 2008 | | 2007 | |
|---|
EIS revenues | | $ | 13.1 | | $ | 8.8 | |
Other revenues | | | 16.6 | | | 10.8 | |
| | | | | | |
| | Subtotal off-system revenues | | | 29.7 | | | 19.6 | |
Transmission service revenues | | | 2.4 | | | 2.5 | |
| | | | | | |
| | Total off-system revenues | | | 32.1 | | | 22.1 | |
EIS expenses | | |
9.3 | | |
6.2 | |
Other expenses | | | 12.2 | | | 7.8 | |
| | | | | | |
| | Subtotal off-system expenses | | | 21.5 | | | 14.0 | |
Transmission service costs | | | 1.9 | | | 1.8 | |
| | | | | | |
| | Total off-system expenses | | | 23.4 | | | 15.8 | |
Net | |
$ |
8.7 | |
$ |
6.3 | |
Revenues increased during 2008 as compared to 2007 primarily due to sales facilitated by the EIS market that began on February 1, 2007. Total purchased power-related expenses are included in our discussion of purchased power costs below.
Operating Revenue Deductions
During 2008, total electric segment operating expenses increased approximately $17.0 million (4.6%) compared to 2007.
Total fuel and purchased power expense increased approximately $12.8 million (6.7%) during 2008 as compared to 2007. The table below is a reconciliation of our actual fuel and purchased power expenditures (netted with the regulatory adjustments) to the fuel and purchased power expense shown on our income statement for 2008. The regulatory adjustments shown below reduced fuel and purchased power expense by $0.3 million in 2008 and increased fuel and purchased power $0.2 million in 2007.
| | | | | | | | |
(in millions)
| | 2008 | | 2007 | |
|---|
Actual fuel and purchased power expenditures | | $ | 204.1 | | $ | 191.0 | |
Kansas regulatory adjustments* | | | (0.5 | ) | | 0.2 | |
Missouri regulatory adjustments* | | | 0.2 | | | — | |
Unrealized loss on derivatives | | | 0.3 | | | — | |
| | | | | | |
| | Total fuel and purchased power expense per income statement | | $ | 204.1 | | $ | 191.2 | |
- *
- A negative amount indicates costs have been under recovered from customers and a positive amount indicates costs have been over recovered from customers.
The overall fuel and purchased power increase included the effect of increased costs for off-system sales of $7.6 million and the effect of replacement power for the Asbury and Riverton 8 outages in both years. After assessing the actual cost of the incremental purchased power and gas-fired generation, we estimate the extended outage at Asbury increased our expenses by an additional $5.8 million in the first quarter of 2008 (January 1 – February 10, 2008). This compares to the impact of the 5-year planned maintenance outage in 2007 which we estimated added additional expenses of approximately $8.7 million and the extended outage (December 8 – December 31, 2007) which increased expenses an additional $3.5 million.
40
Table of Contents
Summarized in the table below are our estimated cost and volume changes in the components of fuel and purchased power costs when compared to 2007. This table incorporates all the changes mentioned above. As shown below, the largest impact on fuel and purchased power costs was increased costs for both purchased power and coal, offset by decreases in natural gas prices and the effect of the unwinding of future physical natural gas positions in February 2008.
| | | | | |
(in millions)
| | 2008 | |
|---|
Purchased power (cost per mWh) | | $ | 9.6 | |
Purchased power spot purchase volume | | | 0.4 | |
Coal (cost per mWh) | | | 4.0 | |
Coal generation volume | | | 2.5 | |
Natural gas (cost per mWh) | | | (1.3 | ) |
Natural gas generation volume | | | (0.2 | ) |
Natural gas — gain on unwind of positions | | | (2.1 | ) |
Other (including fuel adjustments) | | | (0.1 | ) |
| | | | |
| | TOTAL | | $ | 12.8 | |
Regulated operating expenses increased approximately $0.8 million (1.4%) during 2008 as compared to 2007 primarily due to increases of $1.4 million in transmission and distribution expense, $0.8 million in other steam power expense, $0.6 million in injuries and damages expense, $0.4 million in other power expense and $0.1 million in director and stockholder expense. These increases were partially offset by decreases of $0.9 million in uncollectible accounts expense, $0.7 million in employee pension expense, $0.7 million in employee health care expense and $0.2 million in professional services.
Maintenance and repairs expense decreased approximately $2.9 million (9.6%) during 2008 mainly due to decreases of approximately $4.2 million in distribution maintenance costs as compared to 2007. In 2007 we incurred $3.9 million of incremental costs (and $1.2 million non-incremental tree trimming and labor costs in the first quarter of 2007) related to the January 2007 ice storm and $1.5 million of incremental costs related to the December 2007 ice storm. In 2008 we began amortizing this cost and recognized $1.4 million in maintenance costs. Also contributing to the decrease during 2008 was a $0.5 million decrease in maintenance and repairs expense at the Asbury plant as compared to the same period in 2007 when there was an extended outage during the fourth quarter, and a $0.4 million decrease in maintenance expense at the Energy Center plant compared to 2007 when there was a bearing failure in Unit #3 in the second quarter of 2007. These decreases were partially offset by a $0.7 million increase in maintenance and repairs expense at the SLCC plant due to the extended spring maintenance outage in the second quarter of 2008, a $0.7 million increase in maintenance and repairs expense at the Riverton plant due to the extended outage on Unit 8 to repair damage to high pressure blades discovered during Riverton's scheduled maintenance outage in May 2008, a $0.5 million increase in transmission expense and a $0.1 million increase in maintenance costs for the Riverton gas-fired units.
We recognized a $1.2 million gain in the fourth quarter of 2007 from the sale of our steel unit train set. We recognized no corresponding gains in 2008.
Depreciation and amortization expense increased approximately $0.7 million (1.3%) mainly due to a $2.9 million increase in depreciation expense due to increased plant in service partially offset by a $2.3 million decrease in the amount of regulatory amortization related to the 2008 Missouri electric rate order that is recorded as depreciation expense. Other taxes increased approximately $0.4 million due to increased property taxes reflecting our additions to plant in service and increased municipal franchise taxes.
41
Table of Contents
2007 Compared to 2006
Operating Revenues and Kilowatt-Hour Sales
KWh sales for our on-system customers increased approximately 1.4% during 2007 as compared to 2006 primarily due to continued sales growth. Revenues for our on-system customers increased approximately $34.0 million, or 9.3%. The January 2007 Missouri rate increase (discussed below) contributed an estimated $38.3 million in revenues in 2007 while continued sales growth contributed an estimated $8.0 million. Weather and other factors contributed an estimated $2.2 million. These increases were partially offset by the $5.9 million revision to our estimate of unbilled revenues in the third quarter of 2006 and $8.6 million of interim energy charge (IEC) collected in 2006, neither of which reoccurred in 2007.
Residential and commercial kWh sales and associated revenues increased in 2007 primarily due to sales growth while the associated revenues also increased due to the January 2007 Missouri rate increase. Industrial kWh sales decreased 3.1% primarily due to a pipeline customer running at minimum output during the first quarter of 2007 as well as the revision to our estimate of unbilled revenues in the third quarter of 2006 while the associated revenues increased 4.5%, reflecting the aforementioned 2007 rate increase. On-system wholesale kWh sales increased reflecting the continued sales growth discussed above. Revenues associated with these FERC-regulated sales increased more than the kWh sales as a result of the fuel adjustment clause applicable to such sales.
Off-System Electric Transactions
In addition to sales to our own customers, we also sell power to other utilities as available and provide transmission service through our system for transactions between other energy suppliers (including through the SPP EIS market). See "— Competition" below. The following table sets forth information regarding these sales and related expenses for the years ended December 31:
| | | | | | | | |
(in millions)
| | 2007 | | 2006 | |
|---|
EIS revenues | | $ | 8.8 | | $ | — | |
Other revenues | | | 10.8 | | | 12.2 | |
| | | | | | |
| | Subtotal off-system revenues | | | 19.6 | | | 12.2 | |
Transmission service revenues | | | 2.5 | | | 2.2 | |
| | | | | | |
| | Total off-system revenues | | | 22.1 | | | 14.4 | |
EIS expenses | | |
6.2 | | |
— | |
Other expenses | | | 7.8 | | | 8.8 | |
| | | | | | |
| | Subtotal off-system expenses | | | 14.0 | | | 8.8 | |
Transmission service costs | | | 1.8 | | | 1.6 | |
| | | | | | |
| | Total off-system expenses | | | 15.8 | | | 10.4 | |
Net | |
$ |
6.3 | |
$ |
4.0 | |
Revenues less expenses increased during 2007 as compared to 2006 primarily due to sales facilitated by the EIS market that began on February 1, 2007. Total purchased power-related expenses are included in our discussion of purchased power costs below.
42
Table of Contents
Operating Revenue Deductions
During 2007, total electric segment operating expenses increased approximately $50.3 million (15.9%) compared to 2006.
Total fuel and purchased power expense increased approximately $30.9 million (19.3%) during 2007 as compared to 2006. This increase included the effect of increased costs for off-system sales of $5.4 million and the effect of replacement power for the Asbury and Riverton 8 outages in 2007. Our gas-fired generation increased primarily from the extended outage at the Asbury plant during the fourth quarter of 2007, the Iatan plant outage during the second quarter of 2007 and the fact that we increased on-system and off-system sales in 2007. The availability of Riverton 12 in the spring of 2007 added additional gas-fired capability that allowed us to sell power into the SPP energy imbalance services market. After assessing the actual cost of the incremental purchased power and gas-fired generation, we estimate the planned Asbury outage added incremental expenses for the fourth quarter in 2007 of approximately $8.7 million and the extended outage (December 8-December 31, 2007) increased expenses an additional $3.5 million.
Summarized in the table below are our estimated cost and volume changes in the components of fuel and purchased power costs when compared to 2006. This table incorporates all the changes mentioned above. As shown below, the largest impact on fuel and purchased power costs was increased volumes for both natural gas generation and purchased power offset by decreased coal generation volume mainly due to the Asbury outage.
| | | | | |
(in millions)
| | 2007 | |
|---|
Purchased power (cost per mWh) | | $ | 2.3 | |
Purchased power spot purchase volume | | | 8.2 | |
Coal (cost per mWh) | | | 1.6 | |
Coal generation volume | | | (7.3 | ) |
Natural gas (cost per mWh) | | | (3.6 | ) |
Natural gas generation volume | | | 28.7 | |
Other | | | 1.0 | |
| | | | |
| | TOTAL | | $ | 30.9 | |
Regulated operating expenses for our electric segment increased approximately $7.0 million (12.8%) during 2007 as compared to 2006 primarily due to increases of $2.1 million in employee pension expense, $1.3 million in uncollectible accounts, $1.1 million in transmission and distribution expense, $0.6 million in labor and other costs, $0.6 million in customer accounts expense, $0.4 million in regulatory commission expense, $0.4 million in other steam power expense, $0.4 million in injuries and damages and $0.2 million in other power supply expense, partially offset by a $0.2 million decrease in professional services. The increase in pension costs is primarily due to the effects of regulatory accounting. We defer or record pension and other postretirement benefit costs (other than EDG other postretirement benefit costs) if they are more or less, respectively, than those allowed in rates for the Missouri and Kansas portion of pension costs. See Note 4 of "Notes to Consolidated Financial Statements" under Item 8 for further discussion regarding the regulatory treatment of our pension and post-retirement benefit plans.
Maintenance and repairs expense increased approximately $8.5 million (38.7%) during 2007 as compared to 2006 primarily reflecting increases of approximately $7.7 million in distribution maintenance costs, including $3.9 million of incremental costs (and the $1.2 million non-incremental tree trimming and labor costs in the first quarter of 2007) related to the January 2007 ice storm and $1.5 million of incremental costs related to the December 2007 ice storm, $0.8 million in transmission distribution maintenance costs and $0.9 million in maintenance costs for our coal-fired units, partially offset by a decrease of approximately $0.8 million in maintenance costs for our gas-fired units. The $0.9 million
43
Table of Contents
increase in maintenance costs for our coal-fired units consisted mainly of a $0.5 million increase in maintenance costs at our Iatan Plant related to the 2007 first quarter inspection, a $0.2 million increase in maintenance costs at our Riverton Plant and a $0.1 million increase in maintenance costs at our Asbury Plant. The $0.8 million decrease in maintenance for our gas-fired units consisted mainly of a $0.8 million decrease in maintenance for our SLCC Plant as compared to 2006 expenses related to the spring 2006 SLCC maintenance outage and a $0.4 million decrease in maintenance at our State Line Unit 1 Plant, which had its first major inspection from September 7, 2006 until December 20, 2006, partially offset by a $0.4 million increase in maintenance during 2007 at the Empire Energy Center related to Unit #3 being repaired in the third quarter of 2007. Maintenance expense associated with our five year Asbury maintenance project is not expensed but is deferred as a regulatory asset and amortized over a five year period. A minor true up in December 2007 reclassified some of the January 2007 ice storm costs from maintenance expense to a regulatory asset. See Note 4 of "Notes to Consolidated Financial Statements" under Item 8 for further information regarding our regulatory assets and liabilities.
We recognized a $1.2 million gain in the fourth quarter of 2007 from the sale of our steel unit train set.
Depreciation and amortization expense increased approximately $13.2 million (36.2%) during 2007 primarily due to $10.4 million of regulatory amortization related to the 2007 Missouri rate order that has been recorded as depreciation expense as well as increased plant in service. Other taxes increased approximately $1.5 million due to increased property taxes reflecting our additions to plant in service and increased municipal franchise taxes.
Gas Segment
2008 Compared to 2007
Operating Revenues, Sales and Cost of Gas Sold
The following tables detail our natural gas sales and revenues for the periods ended December 31:
Total Gas Delivered to Customers
| | | | | | | | | | |
| | bcf sales
2008 | | bcf sales
2007 | | % Change | |
|---|
Residential | | | 2.95 | | | 2.83 | | | 4.0 | % |
Commercial | | | 1.40 | | | 1.30 | | | 7.2 | |
Industrial* | | | 0.55 | | | 0.08 | | | 628.3 | |
Other** | | | 0.03 | | | 0.03 | | | 20.5 | |
| | | | | | | | | |
Total retail sales | | | 4.93 | | | 4.24 | | | 16.3 | |
Transportation sales** | | | 4.06 | | | 4.30 | | | (5.6) | |
| | | | | | | | | |
Total gas operating sales | | | 8.99 | | | 8.54 | | | 5.3 | |
44
Table of Contents
Operating Revenues and Cost of Gas Sold
| | | | | | | | | | |
($ in millions)
| | 2008 | | 2007 | | % Change | |
|---|
Residential | | $ | 39.6 | | $ | 39.2 | | | 1.1 | % |
Commercial | | | 17.4 | | | 16.6 | | | 5.0 | |
Industrial* | | | 5.1 | | | 0.7 | | | 574.4 | |
Other** | | | 0.4 | | | 0.4 | | | 17.6 | |
| | | | | | | | | |
Total retail revenues | | $ | 62.5 | | $ | 56.9 | | | 9.9 | |
Other revenues | | | 0.2 | | | 0.2 | | | 0.5 | |
Transportation revenues* | | | 2.7 | | | 2.8 | | | (3.1) | |
| | | | | | | | | |
Total gas operating revenues | | $ | 65.4 | | $ | 59.9 | | | 9.3 | |
Cost of gas sold | | | 42.6 | | | 37.6 | | | 13.3 | |
| | | | | | | | | |
Gas operating revenues over cost of gas in rates | | $ | 22.8 | | $ | 22.3 | | | 2.5 | |
- *
- Percentage change reflects the transfer of a customer from transportation sales to industrial.
- **
- Other includes other public authorities and interdepartmental usage.
Gas retail sales increased 16.3%, primarily due to an increase in industrial sales as compared to 2007 and colder weather. The winter months are high sales months for the natural gas business, whose heating season runs from November to March of each year. Residential and commercial sales increased during 2008 as compared to 2007 primarily due to colder weather. Heating degree days were 13.5% higher than 2007. Industrial sales increased during 2008 due to the transfer of two large volume interruptible customers from transportation to sales service and the addition of a new large volume interruptible customer. These increases offset the effect of our gas segment customer contraction of 1.5% in 2008. We believe this contraction was due to higher gas prices and general economic conditions. The rate of gas customer contraction is expected to level out during the next two years and to remain relatively flat after 2010.
During 2008, gas segment revenues were approximately $65.4 million as compared to $59.9 million in 2007, an increase of 9.3%, reflecting the higher sales. During 2008, our PGA revenue (which represents the cost of gas recovered from our customers) was approximately $42.6 million as compared to $37.6 million in 2007, an increase of approximately $5.0 million. This increase was largely driven by the increase in the industrial sales and the effect of higher sales due to weather.
Our PGA clause allows us to recover from our customers, subject to routine regulatory review, the cost of purchased gas supplies, transportation and storage, including costs associated with the use of financial instruments to hedge the purchase price of natural gas. Pursuant to the provisions of the PGA clause, the difference between actual costs incurred and costs recovered through the application of the PGA are reflected as a regulatory asset or regulatory liability until the balance is recovered from or credited to customers. As of December 31, 2008, we had unrecovered purchased gas costs of $5.6 million recorded as a regulatory asset.
Operating Revenue Deductions
Total other operating expenses were $10.0 million during 2008 as compared to $10.2 million in 2007, a decrease of $0.2 million. This decrease was mainly due to a $0.8 million decrease in uncollectible accounts, and a $0.6 million decrease in administrative and general expenses, partially offset by a $0.9 million increase in customer accounts expense and a $0.2 million increase in distribution expense.
45
Table of Contents
2007 Compared to 2006
Operating Revenues, Sales and Cost of Gas Sold
During 2007, our total natural gas revenues were approximately $59.9 million. Our total natural gas revenues were approximately $25.1 million during 2006 (June 1, 2006 — December 31, 2006).
Total Gas Delivered to Customers
| | | | | | | |
| | bcf sales
2007 | | bcf sales
2006* | |
|---|
Residential | | | 2.83 | | | 1.10 | |
Commercial | | | 1.30 | | | 0.56 | |
Industrial | | | 0.08 | | | 0.03 | |
Other** | | | 0.03 | | | 0.01 | |
| | | | | | |
Total retail sales | | | 4.24 | | | 1.70 | |
Transportation sales | | | 4.30 | | | 2.23 | |
| | | | | | |
Total gas operating sales | | | 8.54 | | | 3.93 | |
Operating Revenues and Cost of Gas Sold
| | | | | | | |
($ in millions)
| | 2007 | | 2006* | |
|---|
Residential | | $ | 39.2 | | $ | 15.9 | |
Commercial | | | 16.6 | | | 7.1 | |
Industrial | | | 0.7 | | | 0.4 | |
Other** | | | 0.4 | | | 0.2 | |
| | | | | | |
Total retail revenues | | $ | 56.9 | | $ | 23.6 | |
Other revenues | | | 0.2 | | | 0.1 | |
Transportation revenues | | | 2.8 | | | 1.5 | |
| | | | | | |
Total gas operating revenues | | $ | 59.9 | | $ | 25.2 | |
Cost of gas sold | | | 37.6 | | | 15.3 | |
| | | | | | |
Gas operating revenues over cost of gas in rates | | $ | 22.3 | | $ | 9.9 | |
- *
- 2006 revenues and bcf sales represent the months of June through December 2006.
- **
- Other includes other public authorities and interdepartmental usage.
During 2007, EDG's cost of natural gas sold and transported was approximately $37.6 million. The cost of natural gas sold and transported during 2006 (June 1, 2006 — December 31, 2006) was approximately $15.3 million.
Operating Revenue Deductions
Total other operating expenses were approximately $10.2 million during 2007, primarily consisting of approximately $5.7 million of administrative and general expenses, approximately $2.5 million of customer accounts expense (including $1.7 million of uncollectible accounts) and approximately $1.7 million of distribution expense. Total other operating expenses were approximately $5.9 million during 2006 (June 1, 2006 — December 31, 2006) primarily consisting of approximately $4.0 million of administrative and general expenses, approximately $1.0 million of distribution expense and approximately $0.8 million of customer accounts expense (including $0.4 million of uncollectible accounts). EDG had net income of $1.0 million during 2007 and a net loss of $1.0 million during 2006. Approximately $1.2 million in transition costs were paid in 2006 for billing and other transition services. These services ended when they were transitioned to us by November 1, 2006.
46
Table of Contents
Other Segment
Our other segment consists of our non-regulated business, primarily the leasing of fiber optics cable and equipment (which we are also using in our own utility operations). See Note 13 of "Notes to Consolidated Financial Statements". The following table represents our results of continuing operations for our other segment for the applicable periods ended December 31:
| | | | | | | | | | |
(in millions)
| | 2008 | | 2007 | | 2006 | |
|---|
Revenues | | $ | 5.0 | | $ | 3.7 | | $ | 2.9 | |
Expenses | | | 4.4 | | | 3.3 | | | 2.8 | |
| | | | | | | | |
Net income from continuing operations | | $ | 0.6 | | $ | 0.4 | | $ | 0.1 | |
| | | | | | | | |
Consolidated Company
Income Taxes
Our consolidated provision for income taxes increased approximately $4.7 million during 2008 as compared to 2007. Our consolidated effective federal and state income tax rate for 2008 was 32.5% as compared to 30.3% for 2007. The rate in 2008 is higher primarily due to lower tax benefits received from cost of plant retirement expenditures. Our cost of retirement expenditures was unusually high in 2007 due to the ice storms we experienced. This reduced benefit in 2008 was partially offset by an increase in the tax effects of equity AFUDC compared to 2007.
Our consolidated provision for income taxes decreased approximately $7.5 million during 2007 as compared to 2006. Our consolidated effective federal and state income tax rate for 2007 was 30.3% as compared to 35.3% for 2006. The decrease in the effective tax rate for 2007 as compared to 2006 was mainly due to an increase in equity AFUDC, Medicare Part D tax benefits and increased tax benefits received from cost of plant retirement expenditures resulting from the January 2007 and December 2007 ice storms.
See Note 10 of "Notes to Consolidated Financial Statements" under Item 8 for additional information regarding income taxes.
Nonoperating Items
Total allowance for funds used during construction (AFUDC) increased $4.9 million in 2008 as compared to 2007. Total AFUDC increased $3.4 million in 2007 as compared to 2006. See Note 1 of "Notes to Consolidated Financial Statements" under Item 8.
Total interest charges on long-term debt increased $4.9 million (15.8%) in 2008 as compared to 2007 reflecting the interest on the $90 million principal amount of first mortgage bonds we issued on May 16, 2008. The increase also reflects a full year of interest on the $80 million principal amount of first mortgage bonds we issued on March 26, 2007. The proceeds of both bond issuances were added to our general funds and used to pay down short-term indebtedness incurred, in part, as a result of our on-going construction program.
Total interest charges on long-term debt increased $5.2 million (19.9%) in 2007 as compared to 2006 reflecting interest on the $80 million principal amount of first mortgage bonds issued March 26, 2007 by EDE. This increase also reflects interest on the first mortgage bonds issued June 1, 2006 by EDG to fund a portion of our acquisition of the Missouri natural gas distribution operations. See "— Liquidity and Capital Resources" for further information.
Short-term debt interest decreased $1.1 million during 2008 as compared to 2007, reflecting lower cost of borrowing in 2008. Short-term debt interest increased $0.7 million during 2007 as compared to 2006, reflecting increased usage of short-term debt in 2007.
47
Table of Contents
Gains or losses from discontinued operations were zero in 2008 compared to a slight gain from discontinued operations in 2007 of less than $0.1 million. Losses from discontinued operations were approximately $0.7 million in 2006. These transactions reflect the sales of Fast Freedom in 2007 and MAPP and Conversant in 2006.
Other Comprehensive Income
The change in the fair value of the effective portion of our open gas contracts designated as cashflow hedges entered into prior to September 1, 2008 for our electric business and our interest rate derivative contracts and the gains and losses on contracts settled during the periods being reported, including the tax effect of these items, are reflected in our Consolidated Statement of Comprehensive Income. The fair value of open electric segment derivative contracts decreased $17.4 million in 2008, reflecting falling natural gas prices. This net change is recorded as accumulated other comprehensive income in the capitalization section of our balance sheet and does not affect net income or earnings per share. All of these contracts have been designated as cash flow hedges. The unrealized gains and losses accumulated in other comprehensive income are reclassified to fuel and purchased power, or interest expense, in the periods in which the hedged transaction is actually realized or no longer qualifies for hedge accounting. Effective September 1, 2008, in conjunction with the implementation of the Missouri fuel adjustment clause in the 2008 MPSC rate order, the unrealized losses or gains from new cash flow hedges for our electric business, will be recorded in regulatory assets or liabilities. This is in accordance with FAS 71, given that those regulatory assets and liabilities are probable of recovery through our fuel adjustment mechanism. Unrealized gains and losses from cash flow hedges existing at September 1, 2008 will continue to be recorded through other comprehensive income. Once any contracts are settled, the realized gain or loss will be recorded as fuel expense and be subject to the fuel adjustment clause. No interest rate derivative contracts were open or settled during the periods shown below.
The following table sets forth the pre-tax gains/(losses) of our natural gas contracts for our electric segment that have settled and been reclassified, the pre-tax change in the fair market value (FMV) of our open contracts and the tax effect in Other Comprehensive Income for the presented periods ended December 31:
Change in Other Comprehensive Income
| | | | | | | | | | |
(in millions)
| | 2008 | | 2007 | | 2006 | |
|---|
Natural gas contracts settled(1) | | $ | (3.9 | ) | $ | (1.6 | ) | $ | (1.3 | ) |
Change in FMV of open contracts for natural gas | | $ | (17.4 | ) | $ | 5.2 | | $ | (13.6 | ) |
Taxes | | $ | 8.1 | | $ | (1.4 | ) | $ | 5.7 | |
| | | | | | | | |
Total change in OCI — net of tax | | $ | (13.2 | ) | $ | 2.2 | | $ | (9.2 | ) |
| | | | | | | | |
- (1)
- Reflected in fuel expense
Our average cost for our open financial natural gas hedges was $6.033/Dth at December 31, 2008, $5.460/Dth at December 31, 2007 and $4.805/Dth at December 31, 2006 for our electric segment.
As of June 30, 2007, we elected to change our valuation of natural gas derivatives (financial hedges) for financial reporting purposes to a new methodology which is more closely related to an independent market valuation. For accounting purposes, this change is considered a change in estimate. To reflect the change, an increase of approximately $6 million was recorded to the fair value of derivatives and $3.7 million, net of tax, was recorded to other comprehensive income at June 30, 2007. This change had no impact on the income statement.
48
Table of Contents
We had no interest rate derivative contracts in 2008, 2007 or 2006. On February 15, 2008, we unwound 992,000 Dths of physical gas contracts originally scheduled for delivery in July and August of 2010 and 2011. This transaction resulted in a non-recurring gain of approximately $1.3 million after taxes, which was recorded in the Statement of Income in the first quarter of 2008.
See Note 15 of "Notes to Consolidated Financial Statements" under Item 8 for additional discussion regarding our hedged commodity transactions.
RATE MATTERS
We continually assess the need for rate relief in all of the jurisdictions we serve and file for such relief when necessary.
Electric Segment
The following table sets forth information regarding electric and water rate increases since January 1, 2006:
| | | | | | | | | | | | | |
Jurisdiction
| | Date
Requested | | Annual
Increase
Granted | | Percent
Increase
Granted | | Date
Effective | |
|---|
Missouri — Electric | | | October 1, 2007 | | $ | 22,040,395 | | | 6.70 | % | | August 23, 2008 | |
Missouri — Electric | | | February 1, 2006 | | $ | 29,369,397 | | | 9.96 | % | | January 1, 2007 | |
Missouri — Water | | | June 24, 2005 | | $ | 469,000 | | | 35.90 | % | | February 4, 2006 | |
Kansas — Electric | | | April 29, 2005 | | $ | 2,150,000 | | | 12.67 | % | | January 4, 2006 | |
Missouri
2007 Rate Case
On October 1, 2007, we filed a request with the MPSC for an annual increase in base rates for our Missouri electric customers in the amount of $34.7 million, or 10.11%. We requested recovery of our investment in the new 150-megawatt combustion turbine, Unit 12, at our Riverton plant, capital expenditures associated with the construction of a selective catalytic reduction system at our Asbury Plant, capital expenditures and expenses related to the January and December 2007 ice storms and other changes in our underlying costs. We also requested implementation of a fuel adjustment clause in Missouri which would permit the distribution to Missouri customers of changes in fuel and purchased power costs.
The MPSC issued an order on July 30, 2008, granting an annual increase in revenues for our Missouri electric customers in the amount of $22.0 million, or 6.7%, based on a 10.8% return on equity. The new rates went into effect August 23, 2008.
The order contains two components. The first component provides an addition to base rates of approximately $27.7 million. This increase in base rates was partially offset by a $5.7 million reduction to regulatory amortization, which is the second component to support certain credit metrics of the overall change in revenue authorized by the MPSC. Regulatory amortization provides us additional cash through rates during the current construction cycle. This construction, which is part of our long-range plan to ensure reliability, includes the facilities at the Riverton Power Plant and Iatan 2 Power Plant, as well as environmental improvements at the Asbury Power Plant and at Iatan 1. The regulatory amortization is now approximately $4.5 million annually and is recorded as depreciation expense.
The MPSC also authorized a fuel adjustment clause for our Missouri customers effective September 1, 2008. The MPSC established a base cost for the recovery of fuel and purchased power expenses used to supply energy. The clause permits the distribution to customers of 95% of the changes in fuel and purchased power costs above or below the base cost. Off-system sales margins are also part of the
49
Table of Contents
recovery of fuel and purchased power costs. As a result, the off-system sales margin flows back to the customer. Rates related to the recovery of fuel and purchased power costs will be modified twice a year subject to the review and approval by the MPSC. In accordance with FAS 71, 95% of the difference between the actual cost of fuel and purchased power and the base cost of fuel and purchased power recovered from our customers is recorded as an adjustment to fuel and purchased power expense with a corresponding regulatory asset or a regulatory liability. If the actual fuel and purchased power costs are higher or lower than the base fuel and purchased power costs billed to customers, 95% of these amounts will be recovered or refunded to our customers when the fuel adjustment clause is modified. At December 31, 2008, Missouri fuel and purchased power costs were over-recovered $0.2 million, which is reflected as a regulatory liability.
The MPSC order approved a Stipulation and Agreement providing for the recovery of deferred expenses of approximately $14.2 million over a five year period for the 2007 ice storms. In addition, the MPSC order required the implementation of a two-way tracking mechanism for recovery of the costs relating to the new MPSC rules on infrastructure inspection and vegetation management. The mechanism authorized by the MPSC creates a regulatory liability in any year we spend less than the target amount, which has been set at $8.6 million for our Missouri jurisdiction, and a regulatory asset if we spend more than the target amount. Any regulatory asset and liability amounts created using the tracking mechanism will then be netted against each other and taken into account in our next rate case. The MPSC also approved Stipulations and Agreements providing for the continuation of the pension and other post-retirement employee benefits tracking mechanism established in our 2006 and 2007 Missouri rate orders.
The MPSC issued its Report and Order on July 30, 2008, effective August 9, 2008. The OPC and intervenors Praxair, Inc. and Explorer Pipeline Company filed applications for rehearing with the MPSC regarding this order. On August 12, 2008, the MPSC issued its Order Granting Expedited Treatment and Approving Compliance Tariff Sheets, effective August 23, 2008, in which the MPSC approved our tariff sheets containing our base rates for service rendered on and after August 23, 2008, and approved our fuel adjustment clause tariff sheets effective September 1, 2008. On September 3, 2008, the MPSC denied all pending applications for rehearing.
On October 2, 2008, the OPC and intervenors Praxair, Inc. and Explorer Pipeline Company filed Petitions for Writ of Review with the Cole County Circuit Court. These actions were consolidated into one proceeding, and briefs are currently being filed with the Cole County Circuit Court.
2006 Rate Case
On February 1, 2006, we filed a request with the MPSC for an annual increase in base rates for our Missouri electric customers in the amount of $29.5 million, or 9.63%. We also requested transition from the interim energy charge (IEC) from an earlier case to Missouri's new fuel adjustment mechanism. The MPSC issued an order May 2, 2006 ruling that while we may have the option of requesting that the IEC be terminated, we may not request the implementation of an energy cost recovery mechanism while the current IEC is effective. The MPSC issued an order on December 21, 2006 granting us an annual increase of $29.4 million, or 9.96%, with an effective date of January 1, 2007 and eliminating the IEC. Pursuant to this order, the collected IEC revenue was not refunded. The increase included an authorized return on equity of 10.9% and included our fuel and energy costs as a component of base electric rates. This order also allowed deferral of any other postretirement benefits that are different from those allowed recovery in this rate case. This treatment is similar to treatment afforded pension costs in our 2005 rate case. This order also approved regulatory treatment of additional liabilities arising from the adoption of FAS 158. We also agreed to write off $1 million of the construction cost associated with our Energy Center Units 3 and 4. The Missouri jurisdictional portion of this agreement resulted in a pre-tax write-off of $0.8 million in the fourth quarter of 2006.
50
Table of Contents
The $29.4 million authorized increase in annual revenues included $19 million in base rate revenue and $10.4 million in "regulatory amortization." The regulatory amortization, which is treated as additional book depreciation for rate-making purposes and is so reflected in the financial statements, was granted to provide additional cash flow to enhance the financial support for our current generation expansion plan. This regulatory amortization is related to our investment in Iatan 2 and also includes our Riverton V84-3A2 combustion turbine (Unit 12) and the environmental improvements and upgrades at Asbury and Iatan 1, all of which are part of the Experimental Regulatory Plan approved by the MPSC subject to a subsequent prudence review of actual expenditures. Amounts granted as regulatory amortization will reduce our rate base used in determining our base rates in subsequent rate cases.
On March 19, 2007, the OPC filed a Petition for Writ of Mandamus with the Missouri Supreme Court regarding the MPSC's order approving our tariffs issued on December 29, 2006. On October 30, 2007, the Missouri Supreme Court issued an opinion directing the MPSC to vacate its order approving tariffs and allow the OPC a reasonable amount of time to prepare and file an application for rehearing. The Court did not examine the lawfulness or reasonableness of the substance of the MPSC's order approving tariffs, and considered only the timing of the issuance of the order. The Court also did not consider the underlying tariff rates.
Acting upon the opinion of the Missouri Supreme Court, the MPSC issued an order on December 4, 2007, effective December 14, 2007, vacating the December 29, 2006 order and re-approving the tariffs and the same resulting increase in rates. The OPC and intervenors Praxair, Inc. and Explorer Pipeline Company, filed applications for rehearing with the MPSC regarding this order.
On March 26, 2008, the MPSC issued its Order Granting Reconsideration of Report and Order, effective April 5, 2008, and its Report and Order Upon Reconsideration, effective April 5, 2008, in which the MPSC made additional findings and reaffirmed the rate increase originally authorized in December of 2006. In this order, the MPSC made two adjustments, and an increase in the return on rate base was offset by a decrease in the regulatory amortization from $10.4 million to $10.2 million. The OPC and intervenors Praxair and Explorer Pipeline filed applications for rehearing regarding this Report and Order Upon Reconsideration, raising objections to many of the issues addressed in the order, including but not limited to issues relating to return on equity and fuel and purchased power expense.
On March 18, 2008, the OPC filed a second Petition for Writ of Mandamus with the Missouri Supreme Court regarding the MPSC's order approving our tariffs issued on December 29, 2006 and the MPSC's vacation order issued on December 4, 2007. On October 14, 2008, the Missouri Supreme Court issued a ruling directing the MPSC to comply with the Court's previous mandate and opinion. The Court took no position on the effect such action has on any tariffs the MPSC had approved. It is our position that the opinion and mandate do not impact the monies collected under the filed tariffs. On November 14, 2008, the MPSC issued an order in compliance with the Court's mandate.
All pending applications for rehearing in the 2006 rate case were denied by the MPSC on November 20, 2008. On December 15, 2008, the OPC filed a Petition for Writ of Review with the Cole County Circuit Court regarding the MPSC's decisions in our 2006 rate case. Praxair and Explorer Pipeline filed a Petition for Writ of Review on December 19, 2008. These actions were consolidated into one proceeding.
Kansas
On April 29, 2005, we filed a request with the Kansas Corporation Commission (KCC) for an increase in base rates for our Kansas electric customers in the amount of $4.2 million, or 24.64%. On October 4, 2005, we and the KCC Staff filed a Motion to Approve Joint Stipulated Settlement Agreement (Agreement) with the KCC. The Agreement called for an annual increase in base rates (which includes historical fuel costs) for our Kansas electric customers of approximately $2,150,000, or 12.67%, the implementation of an Energy Cost Adjustment Clause (ECA), a fuel rider that will collect or refund fuel
51
Table of Contents
costs in the future that are above or below the fuel costs included in the base rates and the adoption of the same depreciation rates approved by the MPSC in our 2005 Missouri rate case. In addition, we were allowed to change our recognition of pension costs, deferring the Kansas portion of any costs above or below the amount included in this rate case as a regulatory asset or liability. The KCC approved the Agreement on December 9, 2005 effective January 4, 2006. Pursuant to the Agreement, we sought KCC approval of an explicit natural gas hedging program in a separate docket by March 1, 2006. We requested and received an extension until April 1, 2006 and made this filing on March 30, 2006, which was denied in a February 4, 2008 order by the KCC. As a result, all gains or losses related to the financial instruments used to fix the future price of natural gas will be excluded from the Energy Cost Adjustment clause implemented in the last Kansas rate case and future base electric rates in Kansas.
Ice Storm Recovery
We filed applications for Accounting Authority Orders in Oklahoma and Kansas and filed a request for storm recovery in Arkansas respecting costs incurred due to two major ice storms in 2007. On May 23, 2008, the Arkansas Public Service Commission issued an Order allowing us to defer approximately $0.4 million of extraordinary incremental expenses incurred as a result of the 2007 ice storms as a regulatory asset and amortize such costs over a 5 year period beginning with the first full month following the storms. On June 24, 2008, the KCC issued an Order approving our application for an accounting order to accumulate and defer for recovery in future rate case proceedings, approximately $1.1 million of 2007 ice storm costs as a regulatory asset to be amortized over a 10 year period. On June 25, 2008, the Corporation Commission of Oklahoma issued a Final Order approving a Joint Stipulation and Settlement Agreement permitting deferral and recording of approximately $0.5 million of 2007 ice storm costs as a regulatory asset and authorizing recovery of the regulatory asset over a five year period, via a rider effective July 1, 2008. We were granted rate recovery of the Missouri ice storm costs as part of the order issued by the MPSC on July 30, 2008 as discussed above.
Gas Segment
On June 1, 2006, The Empire District Gas Company acquired the Missouri natural gas distribution operations of Aquila, Inc. (Missouri Gas). The Missouri Gas properties consist of 44 Missouri communities in northwest, north central and west central Missouri. The rates, excluding the cost of gas, are the same as had been in effect at Aquila, Inc. We agreed in the unanimous stipulation and agreement filed with the MPSC on March 1, 2006 and approved on April 18, 2006, to not file a rate increase request for non-gas costs for a period of 36 months following the closing date of the acquisition. We expect to file a gas rate case in 2009 as the 36 month limitation expires on June 1, 2009. We have also agreed to use Aquila Inc.'s current depreciation rates and were allowed to adopt the pension cost recovery methodology approved in our electric 2005 Missouri Rate Case.
A PGA clause is included in our gas rates which allows for the over recovery or under recovery of actual gas costs compared to the cost of gas in the PGA rate. This PGA clause allows us to make rate changes periodically (up to four times) throughout the year in response to weather conditions, natural gas prices and supply demands, rather than in one possibly extreme change per year. The Actual Cost Adjustment (ACA) is a scheduled yearly filing with the MPSC filed between October 15 and November 4 each year. This filing establishes the amount to be recovered from customers for the over/under recovered yearly amounts. A PGA is included in the ACA filing. An optional PGA filing without the ACA can be filed up to three times each year, provided a filing does not occur within 60 days of a previous filing. On October 28, 2008, we filed a new ACA and PGA with the MPSC that was effective November 12, 2008.
52
Table of Contents
COMPETITION
Electric Segment
SPP-RTO
On February 1, 2007, the Southwest Power Pool (SPP) regional transmission organization (RTO) launched its energy imbalance services market (EIS). With the implementation of the SPP RTO EIS market and transmission expansion plans of the SPP RTO, we anticipate that our continued participation in the SPP will provide long-term benefits to our customers and other stakeholders. Our experience to date in the EIS market indicates that we have received benefits through our participation.
In general, the SPP RTO EIS market is providing real time energy for most participating members within the SPP regional footprint. Imbalance energy prices are based on market bids and status/availability of dispatchable generation and transmission within the SPP market footprint. In addition to energy imbalance service, the SPP RTO performs a real time security-constrained economic dispatch of all generation voluntarily offered into the EIS market to the market participants to also serve the native load.
We will continue to actively engage with the SPP RTO, other members of the SPP and staffs of our state commissions to evaluate the impact and value of EIS market participation.
On August 15, 2008 the SPP filed with the FERC proposed revisions to its open access transmission pro forma tariff (OATT) to establish a process for including a "balanced portfolio" of economic transmission upgrades in the annual SPP Transmission Expansion Plan. The cost of such upgrades will be recovered through a regional rate allocated to SPP members based on their load ratio share within SPP's market area of the balanced portfolio's cost. On October 16, 2008, the FERC accepted the balanced portfolio approach, which sets forth the selection process of a group of projects and regional cost allocation rules based on projected benefits and allocated costs over a ten year period. The plan will be balanced if the portfolio is cost beneficial for each zone, including ours, within the SPP. A balanced portfolio could include projects below the 345 kv level (which is the bright line voltage level for projects to be included in the portfolio) to increase benefits to a particular zone to achieve balance of benefits and costs over the ten year study period. We continue our involvment in the discussions regarding the proposed projects, estimated benefits, and costs regarding SPP's first balanced portfolio. However, we are uncertain, at this time, what the benefits and costs of the first balanced portfolio will be for us. It is anticipated that the SPP Regional State Committee (composed of commissioners from the state commissions within the SPP footprint) will endorse, and the SPP Board of Directors will approve, the first SPP RTO balanced portfolio of economic transmission projects sometime in 2009.
FERC Market Power Order
On March 3, 2005, the FERC issued an order commencing an investigation to determine if we had market power within our control area based on our failure to meet one of the FERC's wholesale market share screens. We filed responses to that order in May and June 2005 and in early January 2006. On August 15, 2006, the FERC issued its order accepting Empire's proposed mitigation to become effective May 16, 2005, subject to a further compliance filing as directed in the order. Relying on a series of orders issued since March 17, 2006 in other proceedings, the FERC rejected our tariff language and directed us to file revisions to our market-based tariff to provide that service under the tariff applies only to sales outside our control area. The FERC directed us to make refunds, with interest, by September 15, 2006, which we initially estimated to be approximately $0.6 million (excluding interest) covering over 1,000 hourly energy sales since May 16, 2005 to numerous counterparties external to our system for wholesale sales made at market prices above the cost based prices permitted under the mitigation proposal accepted by the FERC. The refund obligation applied to certain wholesale power sales made "inside" our service area at market based rates, even though consumption of the energy occurred outside our service area. In response to the order, we filed a Motion For Extension of time and expedited treatment regarding the refund and
53
Table of Contents
requested that such refund be delayed until 15 days after the FERC's order on our rehearing request. On September 5, 2006, the FERC granted the Motion For Extension, as requested.
On September 14, 2006, we filed a Request For Rehearing of the FERC's August 15, 2006 order regarding the refund and market power mitigation we had proposed. We requested a rehearing and a waiver of the refund requirement in its entirety. On April 25, 2008, the FERC issued an Order that rejected our Request For Rehearing, required a Compliance Filing of our market based rate tariff and ordered refunds with interest. We made our Compliance Filing and issued refunds totaling $340,608, including interest, on May 27, 2008. We were also required to file an informational refund report with the FERC on June 26, 2008.
As a result of the FERC's requirement for us to issue the aforementioned refunds and our belief that the FERC erred in its orders, on June 30, 2008 we initiated a Petition For Review of the FERC's orders on our market based rate refunds in the United States Court of Appeals for the District of Columbia Circuit (DC Circuit). We requested and received approval for a consolidation of our Petition with a similar petition by Westar Energy. If a decision is reached in our favor, the DC Circuit will likely remand the FERC's orders back to the FERC for reconsideration. It is expected that the judicial review of the Petitions will take several months.
Other FERC Rulemaking
On June 21, 2007, the FERC issued an Advance Notice of Proposed Rulemaking (ANOPR) on potential reforms to improve operations in organized wholesale power markets, such as the SPP RTO in which we participate. On October 16, 2008, the FERC issued its Final Order on Wholesale Competition in Regions with Organized Electric Markets. The Final Order will affect us as it directly affects the SPP RTO. The Final Order addresses four key areas for amending its regulations in Wholesale Competition for RTOs and Independent System Operators (ISOs): (1) demand response and market pricing during periods of operating reserve shortage; (2) long-term power contracting; (3) market monitoring policies; and (4) the responsiveness of RTOs and ISOs to stakeholders and customers. We will be involved in the SPP RTOs discussions on compliance of these new rules.
On January 28, 2008, we filed with the FERC certain non-rate and ministerial revisions to our currently effective wholesale Open Access Transmission Tariff (OATT), which included the elimination of certain tariff sections that have become moot in light of our membership in the SPP, as well as correction of the formatting of our OATT for consistency with a previous FERC order, Order No. 614.
On April 2, 2008, the FERC accepted our revised OATT, as filed, with an effective date of January 29, 2008.
Gas Segment
Non-residential gas customers whose annual usage exceeds certain amounts may purchase natural gas from a source other than EDG. EDG does not have a non-regulated energy marketing service that sells natural gas in competition with outside sources. EDG continues to receive non-gas related revenues for distribution and other services if natural gas is purchased from another source by our eligible customers.
LIQUIDITY AND CAPITAL RESOURCES
We used approximately $211.3 million of cash for regulated capital expenditures during 2008. Our primary sources of cash flow for these expenditures during 2008 were $93.0 million in internally generated funds from continuing operations and $117.5 million in proceeds from financing activities.
54
Table of Contents
Our short-term debt at December 31, 2008 was $102.0 million, compared to $33.0 million at December 31, 2007. Our current short-term debt is at a high level on a historical basis, primarily as a result of funding our ongoing construction program. This high short-term debt balance is also the primary driver of our negative working capital. We intend to issue equity and long-term debt in the near future to repay all or a portion of our short-term debt and to provide liquidity to fund our ongoing construction program and operations. In addition, we expect to seek an increase in our unsecured revolving credit facility commitments (either within the same facility or through an additional facility) to help meet short-term liquidity needs. We believe it is unlikely we will have difficulty accessing the markets for needed capital. However, as a result of recent market conditions, we believe the costs of these financing activities will be significantly higher than our historical financing costs.
Summary of Cash Flows
| | | | | | | | | | | |
| | Fiscal Year | |
|---|
(in millions)
| | 2008 | | 2007 | | 2006 | |
|---|
Cash provided by (used in): | | | | | | | | | | |
| | Operating activities | | $ | 93.0 | | $ | 103.5 | | $ | 69.2 | |
| | Investing activities | | | (211.8 | ) | | (178.9 | ) | | (217.3 | ) |
| | Financing activities | | | 117.5 | | | 67.0 | | | 143.1 | |
| | | | | | | | |
Net change in cash and cash equivalents from continuing operations | | | (1.3 | ) | | (8.4 | ) | | (5.0 | ) |
Discontinued operations | | | — | | | 0.1 | | | 1.4 | |
| | | | | | | | |
Net change in cash and cash equivalents | | $ | (1.3 | ) | $ | (8.3 | ) | $ | (3.6 | ) |
Operating Activities
Our net cash flows provided by continuing operating activities were $93.0 million during 2008 as compared to $103.5 million during 2007. The $6.5 million increase in net income added to cash flows, but was offset by other activities. First, the effect of adjustments to net income to reconcile to cash flows had a $10.0 million negative impact when compared to last year, primarily due to changes in deferred taxes. In 2007, our tax payments decreased as a result of taking tax deductions associated with the 2007 ice storms. In 2008, an increase in deferred taxes also positively contributed to cash flows through the use of bonus depreciation, however, the effect was less when compared to 2007.
Changes in working capital and other balance sheet items also negatively impacted cash flows in 2008 compared to 2007. Expenditures for the December 2007 ice storm were primarily paid in January 2008. This use of cash in 2008 was offset by the effects of changes in our prepaid expenses and deferred charges. In 2007, $15.5 million in cash outlays from both the January and December ice storms are reflected in the increase in deferred charges. Cash also decreased in 2008 due to the change in deferred assets but the effect is much smaller than the effect from the ice storms in 2007.
Our net cash flows provided by continuing operating activities were $103.5 million during 2007 as compared to $69.2 during 2006. Net income decreased $6.0 million in 2007 but was offset by a $36.1 million positive impact from the effect of adjustments to net income to reconcile to cash flows. This resulted from the positive effects of increased depreciation and amortization, including $10.4 million in regulatory amortization and an increase in deferred taxes primarily resulting from tax deductions allowed as a result of the 2007 ice storms. In addition, cash flows were positively impacted in 2007 as compared to 2006 because of the increase in accounts payable in 2007 compared to the decrease in 2006. Payables associated with fuel costs increased $6.6 million in 2007 while fuel payables decreased by $11.6 million in 2006. Payables also increased due to the expenditures incurred for the December 2007 ice storm. The change in prepaid expense and deferred charges resulted in a $9.6 million decrease in cash this year versus 2006. The negative cash flow impact of $15.5 million in cash outlays as a result of the 2007 ice storms, included in deferred charges, that have been deferred as regulatory assets are offset by the net effect of decreases to
55
Table of Contents
our regulatory asset accounts. These decreases reflect the recovery of deferred gas costs during the year, as well as changes in our pension and OPEB liabilities. An increase in accounts receivable compared to 2006 had a negative impact on cash flow. This resulted from an increase in unbilled accounts receivable of $6.0 million for our electric segment at December 31, 2007 and an increase in various miscellaneous accounts receivable items.
Capital Requirements and Investing Activities
Our net cash flows used in investing activities increased $32.8 million during 2008 as compared to 2007, primarily reflecting our construction expenditures for Plum Point Unit 1 and Iatan 2.
Our net cash flows used in investing activities decreased $38.4 million during 2007 as compared to 2006, primarily reflecting our acquisition of Missouri Gas in 2006. Partially offsetting this decrease in 2007 were additions to our transmission and distribution systems, construction costs for Plum Point Unit 1 and Iatan 2, capital costs related to the January and December 2007 ice storms and capital costs related to the new SCR at the Asbury Plant. Proceeds from the sale of the unit train added $1.2 million.
Our capital costs incurred for continuing operations total approximately $206.4 million, $195.5 million, and $120.2 million in 2008, 2007 and 2006, respectively (excluding the acquisition of Missouri Gas in 2006). These capital costs include AFUDC, capital costs to retire assets and benefits from salvage.
A breakdown of these capital costs (including AFUDC) for 2008, 2007 and 2006 is as follows:
| | | | | | | | | | |
| | Capital Expenditures | |
|---|
(in millions)
| | 2008 | | 2007 | | 2006 | |
|---|
Distribution and transmission system additions | | $ | 46.8 | | $ | 43.5 | | $ | 44.1 | |
New generation — Riverton combustion turbine | | | — | | | 3.9 | | | 14.0 | |
New generation — Plum Point Energy Station | | | 30.9 | | | 29.8 | | | 19.6 | |
New generation — Iatan 2 | | | 82.6 | | | 44.0 | | | 12.4 | |
Storms(1) | | | 4.3 | | | 26.9 | | | 1.2 | |
Additions and replacements — Asbury | | | 6.0 | | | 21.7 | | | 14.6 | |
Additions and replacements — Iatan 1 | | | 32.3 | | | 14.2 | | | 5.1 | |
Additions and replacements — State Line Combined Cycle Unit,
Riverton, Energy Center, State Line Unit 1 and Ozark Beach | | | 1.9 | | | 2.1 | | | 2.0 | |
Gas segment additions and replacements | | | 1.9 | | | 1.8 | | | 0.9 | |
Transportation | | | 1.2 | | | 0.8 | | | 1.9 | |
Other (including retirements and salvage — net)(1)(2) | | | (3.6 | ) | | 1.8 | | | 1.8 | |
| | | | | | | | |
Subtotal | | $ | 204.3 | | $ | 190.5 | | $ | 117.6 | |
Non-regulated capital expenditures (primarily fiber optics) | | | 2.1 | | | 5.0 | | | 2.6 | |
| | | | | | | | |
Subtotal capital expenditures incurred(3) | | $ | 206.4 | | $ | 195.5 | | $ | 120.2 | |
| | | | | | | | |
Less capital expenditures payable(4) | | | (6.9 | ) | | 12.1 | | | 5.0 | |
| | | | | | | | |
Total cash outlay | | $ | 213.3 | | $ | 183.4 | | $ | 115.2 | |
| | | | | | | | |
- (1)
- For 2007, storm costs of $17.8 million and Other of $1.4 million, which relate to the cost of removal, are specifically related to capital expenditures associated with the January 2007 ice storm. $9.2 million of capitalized storm costs are related to the December 2007 ice storm.
- (2)
- Other includes equity AFUDC of $(5.9) million, $(2.9) million and $(1.4) million for 2008, 2007 and 2006, respectively. 2008 also includes proceeds from sale of property of $1.5 million.
56
Table of Contents
- (3)
- Expenditures incurred represent the total cost for work completed for the projects during the year. Discussion of capital expenditures throughout the 10-K is presented on this basis.
- (4)
- The amount of expenditures unpaid at the end of the year and not reflected in the Investing Activities section of the Statement of Cash Flows.
Approximately 23%, 36% and 30% of our cash requirements for capital expenditures for 2008, 2007 (excluding the acquisition of Missouri Gas) and 2006, respectively, were satisfied with internally generated funds (funds provided by operating activities less dividends paid). The remaining amounts of such requirements were satisfied from short-term borrowings and proceeds from our sales of common stock and debt securities discussed below.
In order to help meet anticipated CAIR requirements and the existing Missouri NOx Rule, we constructed an SCR at Asbury that was completed in November 2007 and placed in service in February 2008 at a total cost of approximately $31.0 million (excluding AFUDC), of which $28.1 million was expended through December 31, 2007 with the remainder expended in 2008. This project was included as part of our Experimental Regulatory Plan approved by the MPSC and its cost is now in base rates in Missouri. For additional information, see Item 1, "Business — Environmental Matters."
We estimate that our capital expenditures will total approximately $168.9 million in 2009, $115.7 million in 2010 and $77.1 million in 2011 (excluding AFUDC). See Item 1, "Business — Construction Program." Of these budgeted amounts, we anticipate that we will spend the following amounts over the next three years for the following projects:
| | | | | | | | | | | |
Project | | 2009 | | 2010 | | 2011 | |
|---|
Iatan 2 | | $ | 69.9 | | $ | 32.4 | | $ | — | |
Plum Point Energy Station | | | 9.4 | | | 5.8 | | | — | |
Electric distribution system additions | | | 40.9 | | | 41.2 | | | 46.1 | |
Electric transmission facilities additions | | | 13.7 | | | 12.6 | | | 2.9 | |
Environmental upgrades — Iatan 1 | | | 15.6 | | | — | | | — | |
Other | | | 19.4 | | | 23.7 | | | 28.1 | |
| | | | | | | | |
| | Total | | $ | 168.9 | | $ | 115.7 | | $ | 77.1 | |
Construction on the Plum Point Energy Station began in the spring of 2006 with completion scheduled for 2010. Initially we will own, through an undivided interest, 50 megawatts of the project's capacity. We also have a long term purchased power agreement (30 years) for an additional 50 megawatts of the project's capacity and have the option to purchase an undivided ownership interest in the 50 megawatts covered by the purchased power agreement in 2015. A new combustion turbine previously scheduled to be installed by the summer of 2011 will be delayed until 2014 as our generation regulation needs for our purchased power agreements are being met through a combination of our existing units and the SPP EIS market. See Note 12 of "Notes to Consolidated Financial Statements" under Item 8 for additional information regarding commitments.
We estimate that internally generated funds will provide approximately 40% of the funds required in 2009 for our budgeted capital expenditures. We intend to utilize a combination of short-term debt, the proceeds of sales of long-term debt and/or common stock (including common stock sold under our Employee Stock Purchase Plan, our Dividend Reinvestment and Stock Purchase Plan, and our 401(k) Plan and ESOP) to finance additional amounts needed beyond those provided by operating activities for such capital expenditures. We will continue to utilize short-term debt as needed to support normal operations or other temporary requirements. The estimates herein may be changed because of changes we make in our construction program, unforeseen construction costs, our ability to obtain financing, regulation and for other reasons. See further discussion under "Financing Activities" below.
57
Table of Contents
Financing Activities
Our net cash flows from continuing operations provided by financing activities increased $50.4 million to $117.5 million during 2008 as compared to $67.0 million in 2007, primarily due to the issuance of first mortgage bonds and increased usage of short-term borrowings in 2008.
Our net cash flows from continuing operations provided by financing activities decreased $76.1 million to $67.0 million during 2007 as compared to $143.1 million in 2006, primarily due to increased repayments of short-term borrowings in 2007.
On May 16, 2008, we issued $90 million principal amount of first mortgage bonds. The net proceeds of approximately $89.4 million, less $0.4 million of legal and other financing fees, were added to our general funds and used primarily to pay down short-term indebtedness incurred, in part, as a result of our on-going construction program.
On December 12, 2007, we sold 3,000,000 shares of our common stock in an underwritten public offering for $23.00 per share. The sale resulted in net proceeds of approximately $65.8 million ($69.0 million less issuance costs of $3.2 million). The proceeds were added to our general funds and used to pay down short-term indebtedness incurred, in part, as a result of our on-going construction program.
On March 26, 2007, we issued $80 million principal amount of first mortgage bonds. The net proceeds of approximately $79.1 million, less $0.4 million of legal and other financing fees, were added to our general funds and used to pay down short-term indebtedness incurred, in part, as a result of our on-going construction program.
On June 21, 2006, we sold 3,795,000 shares of our common stock, including an additional 495,000 shares to cover the underwriters' over-allotments, in an underwritten public offering for $20.25 per share. The sale resulted in net proceeds of approximately $73.3 million ($76.8 million less issuance costs of $3.5 million). The proceeds were used to pay down short-term debt, including short-term debt used to fund a portion of our acquisition of Missouri Gas.
On June 1, 2006, we used $55 million of privately placed 6.82% First Mortgage Bonds due 2036 issued by EDG to fund a portion of our acquisition of Missouri Gas. We used short-term debt to fund the remainder of the acquisition, which was replaced with common equity on June 21, 2006.
We have a $400 million shelf registration statement with the SEC, which became effective on August 15, 2008, covering our common stock, unsecured debt securities, preference stock, first mortgage bonds and trust preferred securities. We have received regulatory approval in all four of our state jurisdictions. Of the $400 million, $250 million is available for first mortgage bonds. We plan to use a portion of the proceeds from issuances under this shelf to fund a portion of the capital expenditures for our new generation projects.
On July 15, 2005, we entered into a $150 million unsecured revolving credit facility until July 15, 2010. Borrowings (other than through commercial paper) are at the bank's prime commercial rate or LIBOR plus 100 basis points based on our current credit ratings and the pricing schedule in the line of credit facility. On March 14, 2006, we entered into the First Amended and Restated Unsecured Credit Agreement which amends and restates the $150 million unsecured revolving credit facility. The principal amount of the credit facility was increased to $226 million, with the additional $76 million allocated to support a letter of credit issued in connection with our participation in the Plum Point Energy Station project. This extra $76 million of availability reduces over a four year period in line with the amount of construction expenditures we owe for Plum Point Unit 1 and was $19.5 million as of February 1, 2009. The unallocated credit facility is used for working capital, general corporate purposes and to back-up our use of commercial paper. This facility requires our total indebtedness (which does not include our note payable to the securitization trust) to be less than 62.5% of our total capitalization at the end of each fiscal quarter and our EBITDA (defined as net income plus interest, taxes, depreciation and amortization) to be at least
58
Table of Contents
two times our interest charges (which includes interest on the note payable to the securitization trust) for the trailing four fiscal quarters at the end of each fiscal quarter. Failure to maintain these ratios will result in an event of default under the credit facility and will prohibit us from borrowing funds thereunder. As of December 31, 2008, we are in compliance with these ratios. This credit facility is also subject to cross-default if we default on in excess of $10 million in the aggregate on our other indebtedness. This arrangement does not serve to legally restrict the use of our cash in the normal course of operations. There were $93.0 million of outstanding borrowings under this agreement at December 31, 2008. In addition, $9.0 million of the availability thereunder was used at such date to back up our outstanding commercial paper.
The principal amount of all series of first mortgage bonds outstanding at any one time under the EDE Mortgage is limited by terms of the mortgage to $1 billion. Substantially all of the property, plant and equipment of The Empire District Electric Company (but not its subsidiaries) is subject to the lien of the EDE Mortgage. Restrictions in the EDE mortgage bond indenture could affect our liquidity. The EDE Mortgage contains a requirement that for new first mortgage bonds to be issued, our net earnings (as defined in the EDE Mortgage) for any twelve consecutive months within the fifteen months preceding issuance must be two times the annual interest requirements (as defined in the EDE Mortgage) on all first mortgage bonds then outstanding and on the prospective issue of new first mortgage bonds. Our earnings for the twelve months ended December 31, 2008 would permit us to issue approximately $253.5 million of new first mortgage bonds based on this test with an assumed interest rate of 7.0%. In addition to the interest coverage requirement, the EDE Mortgage provides that new bonds must be issued against, among other things, retired bonds or 60% of net property additions. At December 31, 2008, we had retired bonds and net property additions which would enable the issuance of at least $612.0 million principal amount of bonds if the annual interest requirements are met. As of December 31, 2008, we are in compliance with all restrictive covenants of the EDE Mortgage.
The principal amount of all series of first mortgage bonds outstanding at any one time under the EDG Mortgage is limited by terms of the mortgage to $300 million. Substantially all of the property, plant and equipment of The Empire District Gas Company is subject to the lien of the EDG Mortgage. The EDG Mortgage contains a requirement that for new first mortgage bonds to be issued, the amount of such new first mortgage bonds shall not exceed 75% of the cost of property additions acquired after the date of the Missouri Gas acquisition. The mortgage also contains a limitation on the issuance by EDG of debt (including first mortgage bonds, but excluding short-term debt incurred in the ordinary course under working capital facilities) unless, after giving effect to such issuance, EDG's ratio of EBITDA (defined as net income plus interest, taxes, depreciation, amortization and certain other non-cash charges) to interest charges for the most recent four fiscal quarters is at least 2.0 to 1. As of December 31, 2008, these tests would allow us to issue new first mortgage bonds of approximately $3.1 million based on $4.2 million of property additions.
Currently, our corporate credit ratings and the ratings for our securities are as follows:
| | | | | | |
| | Fitch | | Moody's | | Standard & Poor's |
|---|
Corporate Credit Rating | | n/r* | | Baa2 | | BBB- |
First Mortgage Bonds | | BBB+ | | Baa1 | | BBB+ |
First Mortgage Bonds — Pollution Control Series | | AAA | | Aaa | | AAA |
Senior Notes | | BBB | | Baa2 | | BBB- |
Trust Preferred Securities | | BBB- | | Baa3 | | BB |
Commercial Paper | | F2 | | P-2 | | A-3 |
Outlook | | Negative | | Negative | | Stable |
- *
- Not rated
59
Table of Contents
On May 17, 2006, S&P lowered our long-term corporate credit rating to BBB- from BBB, senior secured debt to BBB+ from A-, senior unsecured debt rating to BB+ from BBB- and affirmed our short-term rating of A-3. S&P's downgrade reflected their view that our financial measures will be constrained over the next several years by fuel and power costs that continue to exceed the level recoverable in rates, and by our higher-than-historical level of capital spending, including the acquisition of Missouri Gas. S&P affirmed our ratings on June 8, 2007 and again on June 12, 2008 with a stable outlook. On November 5, 2008, Standard & Poor's raised our senior unsecured debt rating from BB+ (a non-investment grade rating) to BBB- as a result of a reevaluation of the application of their notching criteria for U. S. investment-grade investor-owned utility operating company unsecured debt to better reflect the relatively strong recovery prospects of creditors in this sector. As a result, the senior unsecured debt of most utilities will now be rated the same as the corporate credit rating almost uniformly, even when a considerable amount of secured debt is outstanding.
On January 24, 2007, Moody's affirmed our ratings but changed their rating outlook on us from stable to negative. The change to a negative rating outlook reflects Moody's view on the longer-term prospects for our ratings given the sizable capital spending program we have committed to through 2010 and the potential for further weakness in our credit metrics that could develop during this time. On February 14, 2008, Moody's placed all of our ratings on review for possible downgrade. Moody's announced that the review would consider the cumulative impact that certain negative events, including severe weather and operational disruptions in 2007 and 2008, have had on our cash flow and overall financial flexibility at the current rating level as well as consider the potential for elevated costs related to our capital spending plan in 2008. On May 12, 2008, Moody's affirmed our ratings with a negative outlook.
On December 19, 2005, Fitch Ratings initiated coverage and assigned ratings (see table above) with a stable rating outlook. Fitch announced that their ratings reflect our low business risk position as a regulated electric utility, a stable service territory and a seemingly improving regulatory environment in Missouri where we receive approximately 89% of our electric revenues. On January 25, 2008, Fitch affirmed our ratings but revised their rating outlook to negative. At the time of the change, the negative rating outlook reflected uncertainty surrounding the outcome of our Missouri rate filing and weakness in our projected financial measures relative to Fitch guidelines. Events leading to the revision were storm damage incurred in December 2007 and the extended Asbury coal plant outage we experienced last winter.
CONTRACTUAL OBLIGATIONS
Set forth below is information summarizing our contractual obligations as of December 31, 2008. Not included in these amounts are expected obligations associated with our share of the Iatan 2 construction and Iatan 1 environmental construction additions for which we have not yet been billed. Other postretirement benefit plans are funded on an ongoing basis to match their corresponding costs, per regulatory requirements and have been estimated for 2009-2013 as noted below. In light of the credit crisis and resulting market turmoil that occurred in the second half of the year, we expect future pension funding commitments to increase. The expected minimum funding for 2009 is estimated to be between $0 million and $4 million. For 2010 it is estimated to be between $9 million and $15 million. The actual minimum
60
Table of Contents
funding requirements will be determined based on the results of the actuarial valuations and, in the case of 2010, the performance of our pension assets during 2009.
| | | | | | | | | | | | | | | | |
| | Payments Due By Period
(in millions) | |
|---|
Contractual Obligations(1) | | Total | | Less Than
1 Year | | 1-3 Years | | 3-5 Years | | More Than
5 Years | |
|---|
Long-term debt (w/o discount) | | $ | 582.3 | | $ | 20.0 | | $ | 50.0 | | | 111.2 | | $ | 401.1 | |
Note payable to securitization trust | | | 50.0 | | | — | | | — | | | — | | | 50.0 | |
Interest on long-term debt | | | 581.7 | | | 34.0 | | | 59.5 | | | 56.6 | | | 431.6 | |
Short-term debt | | | 102.0 | | | 102.0 | | | — | | | — | | | — | |
Capital lease obligations | | | 0.5 | | | 0.3 | | | 0.2 | | | — | | | — | |
Operating lease obligations(2) | | | 3.1 | | | 1.1 | | | 1.0 | | | 0.5 | | | 0.5 | |
Electric purchase obligations(3) | | | 282.1 | | | 66.5 | | | 83.0 | | | 52.4 | | | 80.2 | |
Gas purchase obligations(4) | | | 64.6 | | | 9.2 | | | 14.3 | | | 14.8 | | | 26.3 | |
Open purchase orders | | | 51.5 | | | 24.1 | | | 27.4 | | | — | | | — | |
Plum Point | | | 14.6 | | | 9.3 | | | 5.3 | | | — | | | — | |
SPP transmission system upgrades | | | 4.6 | | | 4.6 | | | — | | | — | | | — | |
Postretirement benefit obligation funding | | | 15.8 | | | 3.0 | | | 6.3 | | | 6.5 | | | — | |
Other long-term liabilities(5) | | | 3.8 | | | 0.1 | | | 0.3 | | | 0.3 | | | 3.1 | |
| | | | | | | | | | | | |
TOTAL CONTRACTUAL OBLIGATIONS(6) | | $ | 1,756.6 | | $ | 274.2 | | $ | 247.3 | | $ | 242.3 | | $ | 992.8 | |
| | | | | | | | | | | | |
- (1)
- Some of our contractual obligations have price escalations based on economic indices, but we do not anticipate these escalations to be significant.
- (2)
- Excludes payments under our Elk River Wind Farm, LLC and Cloud County Wind Farm, LLC agreements, as payments are contingent upon output of the facilities. Payments under the Elk River Wind Farm, LLC agreement can run from zero up to a maximum of approximately $16.9 million per year based on a 20 year average cost and an annual output of 550,000 megawatt hours. Payments under the Meridian Way Wind Farm agreement can range from zero to a maximum of approximately $14.6 million per year based on a 20-year average cost.
- (3)
- Includes a water usage contract for our SLCC facility, fuel and purchased power contracts and associated transportation costs, as well as purchased power for 2010 through 2015 for Plum Point.
- (4)
- Represents fuel contracts and associated transportation costs of our gas segment.
- (5)
- Other long-term liabilities primarily represent electric facilities charges owed to City Utilities of Springfield, Missouri of $11,000 per month over 30 years.
- (6)
- Our estimate of uncertain tax liabilities as required by FIN 48 totaled $2.2 million at December 31, 2008. Due to the uncertainties surrounding this estimate, we cannot reasonably estimate the timing of potential payments, if any, and have not included any in the table above.
DIVIDENDS
Holders of our common stock are entitled to dividends if, as, and when declared by the Board of Directors, out of funds legally available therefore, subject to the prior rights of holders of any outstanding cumulative preferred stock and preference stock. Payment of dividends is determined by our Board of Directors after considering all relevant factors, including the amount of our retained earnings (which is essentially our accumulated net income less dividend payouts). As of December 31, 2008, our retained earnings balance was $13.6 million, compared to $17.2 million as of December 31, 2007, after paying out $43.3 million in dividends during 2008. A reduction of our dividend per share, partially or in whole, could have an adverse effect on our common stock price.
61
Table of Contents
Our diluted earnings per share were $1.17 for the year ended December 31, 2008 and were $1.09 and $1.39 for the years ended December 31, 2007 and 2006, respectively. Dividends paid per share were $1.28 for the year ended December 31, 2008 and for each of the years ended December 31, 2007 and 2006.
In addition, the EDE Mortgage and our Restated Articles contain certain dividend restrictions. The most restrictive of these is contained in the EDE Mortgage, which provides that we may not declare or pay any dividends (other than dividends payable in shares of our common stock) or make any other distribution on, or purchase (other than with the proceeds of additional common stock financing) any shares of, our common stock if the cumulative aggregate amount thereof after August 31, 1944 (exclusive of the first quarterly dividend of $98,000 paid after said date) would exceed the sum of $10.75 million and the earned surplus (as defined in the EDE Mortgage) accumulated subsequent to August 31, 1944, or the date of succession in the event that another corporation succeeds to our rights and liabilities by a merger or consolidation. On March 11, 2008, we amended the EDE Mortgage in order to provide us with more flexibility to pay dividends to our shareholders by increasing the basket available to pay dividends by $10.75 million, as described above. As of December 31, 2008, this restriction did not prevent us from issuing dividends.
In addition, under certain circumstances, our Junior Subordinated Debentures, 81/2% Series due 2031, reflected as a note payable to securitization trust on our balance sheet, held by Empire District Electric Trust I, an unconsolidated securitization trust subsidiary, may also restrict our ability to pay dividends on our common stock. These restrictions apply if: (1) we have knowledge that an event has occurred that would constitute an event of default under the indenture governing these junior subordinated debentures and we have not taken reasonable steps to cure the event, (2) we are in default with respect to payment of any obligations under our guarantee relating to the underlying preferred securities, or (3) we have deferred interest payments on the Junior Subordinated Debentures, 81/2% Series due 2031 or given notice of a deferral of interest payments. As of December 31, 2008, there were no such restrictions on our ability to pay dividends.
OFF-BALANCE SHEET ARRANGEMENTS
We have no off-balance sheet arrangements that have or are reasonably likely to have a current or future effect on our financial condition, changes in financial condition, revenues or expenses, results of operations, liquidity, capital expenditures or capital resources, other than operating leases entered into in the normal course of business.
CRITICAL ACCOUNTING POLICIES
Set forth below are certain accounting policies that are considered by management to be critical and that typically require difficult, subjective or complex judgments, often as a result of the need to make estimates about the effect of matters that are inherently uncertain (other accounting policies may also require assumptions that could cause actual results to be different than anticipated results). A change in assumptions or judgments applied in determining the following matters, among others, could have a material impact on future financial results.
Pensions and Other Postretirement Benefits (OPEB). We recognize expense related to pension and postretirement benefits as earned during the employee's period of service. Related assets and liabilities are established based upon the funded status of the plan compared to the accumulated benefit obligation. Our pension and OPEB expense or benefit includes amortization of previously unrecognized net gains or losses. Additional income or expense may be recognized when our unrecognized gains or losses as of the most recent measurement date exceed 10% of our postretirement benefit obligation or fair value of plan assets, whichever is greater. For pension benefits (effective January 1, 2005) and OPEB benefits (effective January 1, 2007) unrecognized net gains or losses as of the measurement date are amortized into actuarial expense over ten years.
62
Table of Contents
In our 2005 electric Missouri Rate Case the MPSC ruled that we would be allowed to recover pension costs consistent with our GAAP policy noted above. In accordance with the rate order, we prospectively calculated the value of plan assets using a market related value method (as allowed by Statement of Financial Accounting Standards No. 87 — "Employers' Accounting for Pensions" (FAS 87)).
The MPSC ruling also allowed us to record the Missouri portion of any costs above or below the amount included in rates as a regulatory asset or liability, respectively. Therefore, the deferral of these costs began in the second quarter of 2005. In our 2006 Kansas Rate Case, the KCC also ruled that we would be allowed to change our recognition of pension costs, deferring the Kansas portion of any costs above or below the amount included in our rate case as a regulatory asset or liability. In our agreement with the MPSC regarding the purchase of Missouri Gas by EDG, we were allowed to adopt this pension cost recovery methodology for EDG, as well. Also, it was agreed that the effects of purchase accounting entries related to pension and other post-retirement benefits would be recoverable in future rate proceedings. Thus the fair value adjustment acquisition entries have been recorded as regulatory assets, as we believe these amounts are probable of recovery in future rates. The regulatory asset will be reduced by an amount equal to the difference between the regulatory costs and the estimated FAS 87 costs. The difference between this total and the costs being recovered from customers will be deferred as a regulatory asset or liability in accordance with FAS 71, and recovered over a period of 5 years. We now expect future pension expense or benefits are probable of full recovery in rates charged to our Missouri and Kansas customers, thus lowering our sensitivity to accounting risks and uncertainties.
Our 2006 Missouri rate case order allows us to defer any OPEB cost that is different from those allowed recovery in this rate case. This treatment is similar to treatment afforded pension costs in our March 2005 rate case. This includes the use of a market-related value of assets, the amortization of unrecognized gains or losses into expense over ten years and the recognition of regulatory assets and liabilities as described in the immediately preceding paragraph.
On December 31, 2006, we adopted FASB No. 158, "Employers' Accounting for Defined Benefit Pension and Other Postretirement Plans an amendment of FASB Statements No. 87, 88, 106 and 132R" (FAS 158). FAS 158 requires an employer to recognize the overfunded or underfunded status of a defined benefit postretirement plan (other than a multiemployer plan) as an asset or liability in its statement of financial position and to recognize changes in that funded status in the year in which the changes occur through comprehensive income of a business entity. We adopted FAS 158 for the fiscal year ended December 31, 2006. Based on the regulatory treatment of pension and OPEB recovery afforded in our jurisdictions, we have concluded that the amount of unfunded defined benefit pension and postretirement plan obligations will be recorded as regulatory assets on our balance sheet rather than as reductions of equity through comprehensive income.
Our 2008 Missouri rate case order approved Stipulations providing for the continuation of the pension and other post-retirement employee benefits tracking mechanism established in our 2006 and 2007 Missouri rate cases. Due to the downturn of the financial markets in the second half of 2008, at December 31, 2008, our net liability for pension and OPEB increased $53.2 million and $15.5 million, respectively. These increases were recorded as increases to regulatory assets as we believe they are probable of recovery through customer rates based on rate orders received in our jurisdictions. (See Note 9 of "Notes to Consolidated Financial Statements" under Item 8).
Risks and uncertainties affecting the application of our pension accounting policy include: future rate of return on plan assets, interest rates used in valuing benefit obligations (i.e. discount rates), demographic assumptions (i.e. mortality and retirement rates) and employee compensation trend rates. Factors that could result in additional pension expense and/or funding include: a lower discount rate than estimated, higher compensation rate increases, lower return on plan assets, and longer retirement periods.
Risks and uncertainties affecting the application of our OPEB accounting policy and related funding include: future rate of return on plan assets, interest rates used in valuing benefit obligations (i.e. discount
63
Table of Contents
rates), healthcare cost trend rates, Medicare prescription drug costs and demographic assumptions (i.e. mortality and retirement rates). See Note 1 and Note 9 of "Notes to Consolidated Financial Statements" under Item 8 for further information.
Hedging Activities. We currently engage in hedging activities in an effort to minimize our risk from volatile natural gas prices. We enter into contracts with counterparties relating to our future natural gas requirements that lock in prices (with respect to a range of predetermined percentages of our expected future natural gas needs) in an attempt to lessen the volatility in our fuel expense and gain predictability. We recognize that if risk is not timely and adequately balanced or if counterparties fail to perform contractual obligations, actual results could differ materially from intended results. All derivative instruments are recognized at fair value on the balance sheet with gains and losses from effective instruments deferred in other comprehensive income (in stockholders' equity) or a regulatory asset or liability for instruments entered into after September 1, 2008, while gains and losses from ineffective (overhedged) instruments are recognized as the fair value of the derivative instrument changes. With the addition of the Missouri fuel adjustment mechanism effective September 1, 2008, we now have a fuel cost recovery mechanism in all of our jurisdictions, which significantly reduces the impact of fluctuating fuel costs on our net income.
Risks and uncertainties affecting the application of this accounting policy include: market conditions in the energy industry, especially the effects of price volatility, regulatory and global political environments and requirements, fair value estimations on longer term contracts, the effectiveness of the derivative instrument in hedging the change in fair value of the hedged item, estimating underlying fuel demand and counterparty ability to perform. If we estimate that we have overhedged forecasted demand, the gain or loss on the overhedged portion will be recognized immediately in our Consolidated Statement of Income. See Note 15 of "Notes to Consolidated Financial Statements" under Item 8 for detailed information regarding our hedging information.
As of February 6, 2009, approximately 78% of our anticipated volume of natural gas usage for our electric operations for the year 2009 is hedged, either through physical or financial contracts, at an average price of $6.274 per Dekatherm (Dth). In addition, the following volumes and percentages of our anticipated volume of natural gas usage for our electric operations for the next four years are hedged at the following average prices per Dth:
| | | | | | | | | | |
Year | | % Hedged | | Dth Hedged | | Average Price | |
|---|
2010 | | | 64 | % | | 5,715,000 | | $ | 6.538 | |
2011 | | | 37 | % | | 3,200,000 | | $ | 5.561 | |
2012 | | | 14 | % | | 1,200,000 | | $ | 7.295 | |
2013 | | | 12 | % | | 1,200,000 | | $ | 7.295 | |
We attempt to mitigate our natural gas price risk for our gas segment by a combination of (1) injecting natural gas into storage during the off-heating season months, (2) purchasing physical forward contracts and (3) purchasing financial derivative contracts. As of February 6, 2009, we have 100% of our expected remaining winter heating season usage (through March 2009) hedged with physical storage, physical forward contracts and financial derivative contracts. The average price of these hedges is $7.49 per Dth. We target to have 95% of our storage capacity full by November 1 for the upcoming winter heating season. As the winter progresses, gas is withdrawn from storage to serve our customers. As of February 6, 2009, we had 0.7 million Dths in storage on the three pipelines that serve our customers. This represents 36% of our storage capacity. Our long-term hedge strategy is to mitigate price volatility for our customers by hedging a minimum of 50% of current year, up to 50% of second year and up to 20% of third year expected gas usage by the beginning of the Actual Cost Adjustment (ACA) year at September 1. A PGA clause is included in our rates for our gas segment operations, therefore, we mark to market any unrealized gains or losses and
64
Table of Contents
any realized gains or losses relating to financial derivative contracts to a regulatory asset or regulatory liability account on our balance sheet.
Regulatory Assets and Liabilities. In accordance with SFAS No. 71, "Accounting for the Effects of Certain Types of Regulation" (FAS 71), our financial statements reflect ratemaking policies prescribed by the regulatory commissions having jurisdiction over us (FERC and Kansas, Arkansas, Missouri and Oklahoma).
In accordance with FAS 71, we record a regulatory asset for all or part of an incurred cost that would otherwise be charged to expense in accordance with FAS 71 paragraphs 9a and b which requires that an asset be recorded if it is probable that future revenue in an amount at least equal to the capitalized cost will be allowable for costs for rate making purposes and the current available evidence indicates that future revenue will be provided to permit recovery of the cost. Additionally, we follow FAS 71 paragraph 11 which says that a liability should be recorded when a regulator has provided current recovery for a cost that is expected to be incurred in the future. We follow this guidance for incurred costs or credits that are subject to future recovery from or refund to our customers in accordance with the orders of our regulators.
Historically, all costs of this nature, which are determined by our regulators to have been prudently incurred, have been recoverable through rates in the course of normal ratemaking procedures. Regulatory assets and liabilities are ratably eliminated through a charge or credit, respectively, to earnings while being recovered in revenues and fully recognized if and when it is no longer probable that such amounts will be recovered through future revenues. We continually assess the recoverability of our regulatory assets. Although we believe it unlikely, should retail electric competition legislation be passed in the states we serve, we may determine that we no longer meet the criteria set forth in FAS 71 with respect to continued recognition of some or all of the regulatory assets and liabilities. Any regulatory changes that would require us to discontinue application of FAS 71 based upon competitive or other events may also impact the valuation of certain utility plant investments. Impairment of regulatory assets or utility plant investments could have a material adverse effect on our financial condition and results of operations.
As of December 31, 2008, we have recorded $164.1 million in regulatory assets and $66.6 million as regulatory liabilities. See Note 4 of "Notes to Consolidated Financial Statements" under Item 8 for detailed information regarding our regulatory assets and liabilities.
Risks and uncertainties affecting the application of this accounting policy include: regulatory environment, external regulatory decisions and requirements, anticipated future regulatory decisions and their impact of deregulation and competition on ratemaking process, possible changes in accounting standards and the ability to recover costs.
Unbilled Revenue. At the end of each period we estimate, based on expected usage, the amount of revenue to record for energy and natural gas that has been provided to customers but not billed. Risks and uncertainties affecting the application of this accounting policy include: projecting customer energy usage, estimating the impact of weather and other factors that affect usage (such as line losses) for the unbilled period and estimating loss of energy during transmission and delivery.
Contingent Liabilities. We are a party to various claims and legal proceedings arising in the ordinary course of our business. We regularly assess our insurance deductibles, analyze litigation information with our attorneys and evaluate our loss experience. Based on our evaluation as of the end of 2008, we believe that we have accrued liabilities in accordance with the guidelines of Statement of Financial Accounting Standards SFAS 5, "Accounting for Contingencies" (FAS 5) sufficient to meet potential liabilities that could result from these claims. This liability at December 31, 2008 and 2007 was $3.5 million and $2.0 million, respectively.
Risks and uncertainties affecting these assumptions include: changes in estimates on potential outcomes of litigation and potential litigation yet unidentified in which we might be named as a defendant.
65
Table of Contents
Goodwill. We recorded goodwill of $39.5 million upon the completion of the 2006 Missouri Gas acquisition. Goodwill represents the excess of the cost of the acquisition over the fair value of the related net assets at the date of acquisition. In accordance with Statement of Financial Accounting Standards No. 142, "Goodwill and Other Intangible Assets," (FAS 142) goodwill is required to be tested for impairment on an annual basis or whenever events or circumstances indicate possible impairment. In performing impairment tests, we utilize valuation techniques which estimate the discounted future cash flows of operations. Our procedures include developing a baseline test and performing sensitivity analysis to calculate a reasonable valuation range. The sensitivities are derived from altering those assumptions which are subjective in nature and inherent to a discounted cash flows valuation technique. Other qualitative factors and comparisons to industry peers are also used to further support the assumptions and ultimately the overall evaluation. A significant qualitative factor considered in our evaluation is the impact of regulation, including rate regulation and cost recovery for our gas segment. Some of the more significant quantitative assumptions included in our tests involve: regulatory rate design and results; the discount rate; the growth rate; capital spending rates and terminal value calculations. Risks and uncertainties affecting these assumptions include: management's identification of impairment indicators, changes in business, industry, laws, technology or economic and market conditions. While management believes the assumptions utilized in our analysis were reasonable, significant adverse developments in the gas segment in future periods or changes in the assumptions could negatively impact goodwill impairment considerations, which could adversely impact earnings. We performed our annual goodwill impairment test as of November 30, 2008 and concluded our goodwill was not impaired.
Use of Management's Estimates. The preparation of our consolidated financial statements in conformity with generally accepted accounting principles (GAAP) requires management to make estimates and assumptions that affect the reported amounts of assets, liabilities, revenues and expenses, and related disclosure of contingent assets and liabilities at the date of the financial statements and the reported amounts of revenues and expenses during the reporting period. We evaluate our estimates on an on-going basis, including those related to unbilled utility revenues, collectibility of accounts receivable, depreciable lives, asset impairment and goodwill evaluations, employee benefit obligations, contingent liabilities, asset retirement obligations, the fair value of stock based compensation and tax provisions. Actual amounts could differ from those estimates.
RECENTLY ISSUED ACCOUNTING STANDARDS
See Recently Issued and Proposed Accounting Standards under Note 1 of "Notes to Consolidated Financial Statements" under Item 8.
66
Table of Contents
ITEM 7A. QUANTITATIVE AND QUALITATIVE DISCLOSURES ABOUT MARKET RISK
Market risk is the exposure to a change in the value of a physical asset or financial instrument, derivative or non-derivative, caused by fluctuations in market variables such as interest rates or commodity prices. We handle our commodity market risk in accordance with our established Energy Risk Management Policy, which typically includes entering into various derivative transactions. We utilize derivatives to manage our gas commodity market risk and to help manage our exposure resulting from purchasing most of our natural gas on the volatile spot market for the generation of power for our native-load customers. See Note 15 of "Notes to Consolidated Financial Statements" under Item 8 for further information.
Interest Rate Risk. We are exposed to changes in interest rates as a result of financing through our issuance of commercial paper and other short-term debt. We manage our interest rate exposure by limiting our variable-rate exposure (applicable to commercial paper and borrowings under our unsecured credit agreement) to a certain percentage of total capitalization, as set by policy, and by monitoring the effects of market changes in interest rates. See Notes 7 and 8 of "Notes to Consolidated Financial Statements" under Item 8 for further information.
If market interest rates average 1% more in 2009 than in 2008, our interest expense would increase, and income before taxes would decrease by less than $0.8 million. This amount has been determined by considering the impact of the hypothetical interest rates on our highest month-end commercial paper balance for 2008. These analyses do not consider the effects of the reduced level of overall economic activity that could exist in such an environment. In the event of a significant change in interest rates, management would likely take actions to further mitigate its exposure to the change. However, due to the uncertainty of the specific actions that would be taken and their possible effects, the sensitivity analysis assumes no changes in our financial structure.
Commodity Price Risk. We are exposed to the impact of market fluctuations in the price and transportation costs of coal, natural gas, and electricity and employ established policies and procedures to manage the risks associated with these market fluctuations, including utilizing derivatives.
We satisfied 60.9% of our 2008 generation fuel supply need through coal. Approximately 90% of our 2008 coal supply was Western coal. We have contracts and binding proposals to supply fuel for our coal plants through 2011. These contracts and binding proposals satisfy approximately 88% of our anticipated fuel requirements for 2009, 75% for 2010 and 29% for our 2011 requirements for our Asbury and Riverton coal plants. In order to manage our exposure to fuel prices, future coal supplies will be acquired using a combination of short-term and long-term contracts.
We are exposed to changes in market prices for natural gas we must purchase to run our combustion turbine generators. Our natural gas procurement program is designed to manage our costs to avoid volatile natural gas prices. We enter into physical forward and financial derivative contracts with counterparties relating to our future natural gas requirements that lock in prices (with respect to predetermined percentages of our expected future natural gas needs) in an attempt to lessen the volatility in our fuel expenditures and improve predictability. As of February 6, 2009, 78%, or 5.3 million Dths's, of our anticipated volume of natural gas usage for our electric operations for 2010 is hedged. See Note 15 of "Notes to Consolidated Financial Statements" under Item 8 for further information.
Based on our expected natural gas purchases for our electric operations for 2009, if average natural gas prices should increase 10% more in 2009 than the price at December 31, 2008, our natural gas expenditures would increase by approximately $2.4 million based on our December 31, 2008 total hedged positions for the next twelve months. However, this is probable of recovery through fuel adjustment mechanisms. With the addition of the Missouri fuel adjustment mechanism effective September 1, 2008, we now have a fuel cost recovery mechanism in all of our jurisdictions, which significantly reduces the impact of fluctuating fuel costs.
67
Table of Contents
We attempt to mitigate a portion of our natural gas price risk associated with our gas segment using physical forward purchase agreements, storage and derivative contracts. As of February 6, 2009, we have 100% of our expected remaining winter heating season usage (through March 2009) hedged with physical storage, physical forward contracts and financial derivative contracts. The average price of these hedges is $7.49 per Dth. We target to have 95% of our storage capacity full by November 1 for the upcoming winter heating season. As the winter progresses, gas is withdrawn from storage to serve our customers. As of February 6, 2009, we have 0.7 million Dths in storage on the three pipelines that serve our customers. This represents 36% of our storage capacity. Our long-term hedge strategy is to mitigate price volatility for our customers by hedging a minimum of 50% of the current year, up to 50% of the second year and up to 20% of third year expected gas usage by the beginning of the ACA year at September 1. However, due to purchased natural gas cost recovery mechanisms for our retail customers, fluctuations in the cost of natural gas have little effect on income.
Credit Risk. Credit risk is the risk of financial loss to the Company if counterparties fail to perform their contractual obligations. In order to minimize overall credit risk, we maintain credit policies, including the evaluation of counterparty financial condition and the use of standardized agreements that facilitate the netting of cash flows associated with a single counterparty. In addition, certain counterparties make available collateral in the form of cash held as margin deposits as a result of exceeding agreed-upon credit exposure thresholds or may be required to prepay the transaction. Conversely, we are required to post collateral with counterparties at certain thresholds, which is typically the result of changes in commodity prices. Amounts reported as margin deposit liabilities represent funds we hold that result from various trading counterparties exceeding agreed-upon credit exposure thresholds. Amounts reported as margin deposit assets represent funds held on deposit by various trading counterparties that resulted from us exceeding agreed-upon credit limits established by the counterparties. The following table depicts our margin deposit assets and margin deposit liabilities recorded on our balance sheet at December 31:
| | | | | | | |
(in millions)
| | 2008 | | 2007 | |
|---|
Margin deposit assets | | $ | 10.7 | | $ | 6.3 | |
Margin deposit liabilities | | $ | — | | $ | — | |
On September 30, 2008, we converted a $6.5 million letter of credit from a counterparty to cash. This amount has since been returned to the counterparty due to the decline in natural gas prices.
Our exposure to credit risk is concentrated primarily within our fuel procurement process, as we transact with a smaller, less diverse group of counterparties and transactions may involve large notional volumes and potentially volatile commodity prices. At February 6, 2009, net credit exposure related to these transactions totaled ($13.6) million reflecting that our counterparties are exposed to Empire for the net unrealized mark-to-market losses for physical forward and financial natural gas contracts carried at fair value. This ($13.6) million consists of ($7.2) million of net unrealized mark-to-market losses for physical forward natural gas contracts and ($6.4) million of net unrealized mark-to-market losses for financial natural gas contracts. Included in the ($6.4) million net unrealized mark-to-market losses for financial natural gas contracts, we have exposure with a single counterparty of $6.2 million of unrealized mark-to-market gains. We are holding no collateral from this counterparty since we are below the $10 million mark-to-market collateral threshold in our agreement with this counterparty. As noted above, we have $10.7 million on deposit covering NYMEX exposure to Empire.
We sell electricity and gas and provide distribution and transmission services to a diverse group of customers, including residential, commercial and industrial customers. Credit risk associated with trade accounts receivable from energy customers is limited due to the large number of customers. In addition, we enter into contracts with various companies in the energy industry for purchases of energy-related commodities, including natural gas in our fuel procurement process.
68
Table of Contents
ITEM 8. FINANCIAL STATEMENTS AND SUPPLEMENTARY DATA
REPORT OF INDEPENDENT REGISTERED PUBLIC ACCOUNTING FIRM
To the Board of Directors and Stockholders
of the Empire District Electric Company:
In our opinion, the consolidated financial statements listed in the index appearing under Item 15 present fairly, in all material respects, the financial position of The Empire District Electric Company and its subsidiaries at December 31, 2008 and 2007, and the results of their operations and their cash flows for each of the three years in the period ended December 31, 2008 in conformity with accounting principles generally accepted in the United States of America. In addition, in our opinion, the financial statement schedule listed in the index appearing under Item 15 presents fairly, in all material respects, the information set forth therein when read in conjunction with the related consolidated financial statements. Also in our opinion, the Company maintained, in all material respects, effective internal control over financial reporting as of December 31, 2008, based on criteria established inInternal Control — Integrated Framework issued by the Committee of Sponsoring Organizations of the Treadway Commission (COSO). The Company's management is responsible for these financial statements and financial statement schedule, for maintaining effective internal control over financial reporting and for its assessment of the effectiveness of internal control over financial reporting, included in the accompanying Management's Report on Internal Control Over Financial Reporting. Our responsibility is to express opinions on these financial statements, on the financial statement schedule, and on the Company's internal control over financial reporting based on our integrated audits (which were integrated audits in 2008 and 2007). We conducted our audits in accordance with the standards of the Public Company Accounting Oversight Board (United States). Those standards require that we plan and perform the audits to obtain reasonable assurance about whether the financial statements are free of material misstatement and whether effective internal control over financial reporting was maintained in all material respects. Our audits of the financial statements included examining, on a test basis, evidence supporting the amounts and disclosures in the financial statements, assessing the accounting principles used and significant estimates made by management, and evaluating the overall financial statement presentation. Our audit of internal control over financial reporting included obtaining an understanding of internal control over financial reporting, assessing the risk that a material weakness exists, and testing and evaluating the design and operating effectiveness of internal control based on the assessed risk. Our audits also included performing such other procedures as we considered necessary in the circumstances. We believe that our audits provide a reasonable basis for our opinions.
A company's internal control over financial reporting is a process designed to provide reasonable assurance regarding the reliability of financial reporting and the preparation of financial statements for external purposes in accordance with generally accepted accounting principles. A company's internal control over financial reporting includes those policies and procedures that (i) pertain to the maintenance of records that, in reasonable detail, accurately and fairly reflect the transactions and dispositions of the assets of the company; (ii) provide reasonable assurance that transactions are recorded as necessary to permit preparation of financial statements in accordance with generally accepted accounting principles, and that receipts and expenditures of the company are being made only in accordance with authorizations of management and directors of the company; and (iii) provide reasonable assurance regarding prevention or timely detection of unauthorized acquisition, use, or disposition of the company's assets that could have a material effect on the financial statements.
Because of its inherent limitations, internal control over financial reporting may not prevent or detect misstatements. Also, projections of any evaluation of effectiveness to future periods are subject to the risk that controls may become inadequate because of changes in conditions, or that the degree of compliance with the policies or procedures may deteriorate.
PricewaterhouseCoopers LLP
St. Louis, Missouri
February 20, 2009
69
Table of Contents
THE EMPIRE DISTRICT ELECTRIC COMPANY
CONSOLIDATED BALANCE SHEETS
| | | | | | | | |
| | December 31, | |
|---|
| | 2008 | | 2007 | |
|---|
| | ($-000's)
| |
|---|
Assets | | | | | | | |
Plant and property, at original cost: | | | | | | | |
| | Electric | | $ | 1,485,235 | | $ | 1,409,217 | |
| | Natural gas | | | 56,282 | | | 54,715 | |
| | Water | | | 10,560 | | | 10,353 | |
| | Non-regulated | | | 28,481 | | | 26,355 | |
| | Construction work in progress | | | 289,460 | | | 167,049 | |
| | | | | | |
| | | 1,870,018 | | | 1,667,689 | |
Accumulated depreciation and amortization | | | 527,245 | | | 488,816 | |
| | | | | | |
| | | 1,342,773 | | | 1,178,873 | |
| | | | | | |
Current assets: | | | | | | | |
| | Cash and cash equivalents | | | 2,754 | | | 4,043 | |
| | Accounts receivable — trade, net of allowance of $1,265 and $1,140 respectively | | | 39,487 | | | 38,011 | |
| | Accrued unbilled revenues | | | 25,170 | | | 20,886 | |
| | Accounts receivable — other | | | 19,353 | | | 15,465 | |
| | Fuel, material and supplies | | | 54,202 | | | 49,482 | |
| | Unrealized gain in fair value of derivative contracts | | | 2,395 | | | 2,499 | |
| | Prepaid expenses and other | | | 5,675 | | | 3,308 | |
| | Regulatory assets | | | 2,033 | | | — | |
| | | | | | |
| | | 151,069 | | | 133,694 | |
| | | | | | |
Noncurrent assets and deferred charges: | | | | | | | |
| | Regulatory assets | | | 162,026 | | | 92,785 | |
| | Goodwill | | | 39,492 | | | 39,492 | |
| | Unamortized debt issuance costs | | | 9,133 | | | 6,662 | |
| | Unrealized gain in fair value of derivative contracts | | | 6,434 | | | 17,520 | |
| | Other | | | 2,919 | | | 4,048 | |
| | | | | | |
| | | 220,004 | | | 160,507 | |
| | | | | | |
Total assets | | $ | 1,713,846 | | $ | 1,473,074 | |
| | | | | | |
(Continued)
The accompanying notes are an integral part of these consolidated financial statements.
70
Table of Contents
THE EMPIRE DISTRICT ELECTRIC COMPANY
CONSOLIDATED BALANCE SHEETS
| | | | | | | | | |
| | December 31, | |
|---|
| | 2008 | | 2007 | |
|---|
| | ($-000's)
| |
|---|
Capitalization and liabilities | | | | | | | |
Common stock, $1 par value, 100,000,000 shares authorized, 33,981,579 and 33,605,871 shares issued and outstanding, respectively | |
$ |
33,982 | |
$ |
33,606 | |
Capital in excess of par value | | | 483,443 | | | 477,385 | |
Retained earnings | | | 13,579 | | | 17,153 | |
Accumulated comprehensive income/(loss), net of income tax | | | (2,132 | ) | | 11,032 | |
| | | | | | |
| | | Total common stockholders' equity | | | 528,872 | | | 539,176 | |
Long-term debt (net of current portion) | | | | | | | |
| | Note payable to securitization trust | | | 50,000 | | | 50,000 | |
| | Obligations under capital lease | | | 174 | | | 349 | |
| | First mortgage bonds and secured debt | | | 312,953 | | | 242,959 | |
| | Unsecured debt | | | 248,440 | | | 248,572 | |
| | | | | | |
| | | Total long-term debt | | | 611,567 | | | 541,880 | |
| | | | | | |
| | | Total long-term debt and common stockholders' equity | | | 1,140,439 | | | 1,081,056 | |
| | | | | | |
Current liabilities: | | | | | | | |
| | Accounts payable and accrued liabilities | | | 69,502 | | | 79,282 | |
| | Current maturities of long-term debt | | | 20,160 | | | 150 | |
| | Short-term debt | | | 102,000 | | | 33,040 | |
| | Customer deposits | | | 9,577 | | | 8,414 | |
| | Interest accrued | | | 5,921 | | | 5,147 | |
| | Unrealized loss in fair value of derivative contracts | | | 12,276 | | | 1,611 | |
| | Taxes accrued | | | 3,174 | | | 2,931 | |
| | Other current liabilities | | | — | | | 328 | |
| | | | | | |
| | | 222,610 | | | 130,903 | |
| | | | | | |
Commitments and contingencies (Note 12) | | | | | | | |
Noncurrent liabilities and deferred credits: | | | | | | | |
| | Regulatory liabilities | | | 66,585 | | | 58,107 | |
| | Deferred income taxes | | | 173,511 | | | 165,989 | |
| | Unamortized investment tax credits | | | 2,917 | | | 3,441 | |
| | Pension and other postretirement benefit obligations | | | 83,151 | | | 14,115 | |
| | Unrealized loss in fair value of derivative contracts | | | 3,302 | | | 698 | |
| | Other | | | 21,331 | | | 18,765 | |
| | | | | | |
| | | 350,797 | | | 261,115 | |
| | | | | | |
| | | Total capitalization and liabilities | | $ | 1,713,846 | | $ | 1,473,074 | |
| | | | | | |
The accompanying notes are an integral part of these consolidated financial statements.
71
Table of Contents
THE EMPIRE DISTRICT ELECTRIC COMPANY
CONSOLIDATED STATEMENTS OF INCOME
| | | | | | | | | | | |
| | Year Ended December 31, | |
|---|
| | 2008 | | 2007 | | 2006 | |
|---|
| | ($-000's, except per share amounts)
| |
|---|
Operating revenues: | | | | | | | | | | |
| | Electric | | $ | 446,466 | | $ | 425,161 | | $ | 382,653 | |
| | Gas | | | 65,438 | | | 59,877 | | | 25,145 | |
| | Water | | | 1,782 | | | 1,879 | | | 1,843 | |
| | Other | | | 4,477 | | | 3,243 | | | 2,530 | |
| | | | | | | | |
| | | 518,163 | | | 490,160 | | | 412,171 | |
| | | | | | | | |
Operating revenue deductions: | | | | | | | | | | |
| | Fuel and purchased power | | | 204,058 | | | 191,230 | | | 160,294 | |
| | Cost of natural gas sold and transported | | | 42,630 | | | 37,626 | | | 15,285 | |
| | Regulated operating expenses | | | 71,918 | | | 71,367 | | | 60,092 | |
| | Other operating expenses | | | 1,889 | | | 1,611 | | | 1,335 | |
| | Maintenance and repairs | | | 28,549 | | | 32,059 | | | 23,150 | |
| | Loss on plant disallowance | | | — | | | — | | | 828 | |
| | Gain on sale of assets | | | — | | | (1,241 | ) | | — | |
| | Depreciation and amortization | | | 53,562 | | | 52,599 | | | 38,392 | |
| | Provision for income taxes | | | 19,128 | | | 14,416 | | | 21,947 | |
| | Other taxes | | | 25,417 | | | 24,927 | | | 21,027 | |
| | | | | | | | |
| | | 447,151 | | | 424,594 | | | 342,350 | |
| | | | | | | | |
Operating income | | | 71,012 | | | 65,566 | | | 69,821 | |
Other income and (deductions): | | | | | | | | | | |
| | Allowance for equity funds used during construction | | | 5,929 | | | 2,923 | | | 1,405 | |
| | Interest income | | | 1,057 | | | 326 | | | 389 | |
| | Benefit/(provision) for other income taxes | | | 2 | | | (28 | ) | | 16 | |
| | Other — non-operating expense, net | | | (1,569 | ) | | (969 | ) | | (962 | ) |
| | | | | | | | |
| | | 5,419 | | | 2,252 | | | 848 | |
| | | | | | | | |
Interest charges: | | | | | | | | | | |
| | Long-term debt | | | 36,041 | | | 31,120 | | | 25,947 | |
| | Note payable to securitization trust | | | 4,250 | | | 4,250 | | | 4,250 | |
| | Short-term debt | | | 1,854 | | | 2,940 | | | 2,276 | |
| | Allowance for borrowed funds used during construction | | | (6,589 | ) | | (4,742 | ) | | (2,850 | ) |
| | Other | | | 1,153 | | | 1,069 | | | 1,017 | |
| | | | | | | | |
| | | 36,709 | | | 34,637 | | | 30,640 | |
| | | | | | | | |
Income from continuing operations | | | 39,722 | | | 33,181 | | | 40,029 | |
| | Income (loss) from discontinued operations, net of tax | | | — | | | 63 | | | (749 | ) |
| | | | | | | | |
Net income | | $ | 39,722 | | $ | 33,244 | | $ | 39,280 | |
| | | | | | | | |
Weighted average number of common shares outstanding — basic | | | 33,821 | | | 30,587 | | | 28,277 | |
| | | | | | | | |
Weighted average number of common shares outstanding — diluted | | | 33,860 | | | 30,610 | | | 28,296 | |
| | | | | | | | |
Earnings from continuing operations per weighted average share of common stock — basic and diluted | | $ | 1.17 | | $ | 1.09 | | $ | 1.42 | |
| | | | | | | | |
Gain (loss) from discontinued operations per weighted average share of common stock — basic and diluted | | | — | | | 0.00 | | | (0.03 | ) |
| | | | | | | | |
Total earnings per weighted average share of common stock — basic and diluted | | $ | 1.17 | | $ | 1.09 | | $ | 1.39 | |
| | | | | | | | |
Dividends declared per share of common stock | | $ | 1.28 | | $ | 1.28 | | $ | 1.28 | |
| | | | | | | | |
The accompanying notes are an integral part of these consolidated financial statements.
72
Table of Contents
THE EMPIRE DISTRICT ELECTRIC COMPANY
CONSOLIDATED STATEMENTS OF COMPREHENSIVE INCOME
| | | | | | | | | | |
| | Year Ended December 31, | |
|---|
| | 2008 | | 2007 | | 2006 | |
|---|
| | ($-000's)
| |
|---|
Net income | | $ | 39,722 | | $ | 33,244 | | $ | 39,280 | |
| | | | | | | | |
Reclassification adjustments for gains included in net income or reclassified to regulatory asset or liability | | | (3,872 | ) | | (1,610 | ) | | (1,320 | ) |
Net change in fair market value of open derivative contracts for period | | | (17,394 | ) | | 5,229 | | | (13,604 | ) |
Income taxes | | | 8,102 | | | (1,379 | ) | | 5,686 | |
| | | | | | | | |
Comprehensive income | | $ | 26,558 | | $ | 35,484 | | $ | 30,042 | |
| | | | | | | | |
The accompanying notes are an integral part of these consolidated financial statements.
73
Table of Contents
THE EMPIRE DISTRICT ELECTRIC COMPANY
CONSOLIDATED STATEMENTS OF COMMON STOCKHOLDERS' EQUITY
| | | | | | | | | | | | | |
| | December 31, | |
|---|
| | 2008 | | 2007 | | 2006 | |
|---|
| | ($-000's)
| |
|---|
Common stock, $1 par value: | | | | | | | | | | |
| | Balance, beginning of year | | $ | 33,606 | | $ | 30,251 | | $ | 26,084 | |
| | Stock/stock units issued through: | | | | | | | | | | |
| | | Public offering | | | — | | | 3,000 | | | 3,795 | |
| | | Stock purchase and reinvestment plans | | | 376 | | | 355 | | | 372 | |
| | | | | | | | |
| | | | Balance, end of year | | $ | 33,982 | | $ | 33,606 | | $ | 30,251 | |
| | | | | | | | |
Capital in excess of par value: | | | | | | | | | | |
| | Balance, beginning of year | | $ | 477,385 | | $ | 406,650 | | $ | 329,605 | |
| | Excess of net proceeds over par value of stock issued: | | | | | | | | | | |
| | | Public offering | | | — | | | 62,779 | | | 69,519 | |
| | | Stock purchase and reinvestment plans | | | 6,058 | | | 7,956 | | | 7,526 | |
| | | | | | | | |
| | | | Balance, end of year | | $ | 483,443 | | $ | 477,385 | | $ | 406,650 | |
| | | | | | | | |
Retained earnings: | | | | | | | | | | |
| | Balance, beginning of year | | $ | 17,153 | | $ | 22,916 | | $ | 19,692 | |
| | Cumulative effect of adopting a change in accounting | | | — | | | (54 | ) | | — | |
| | Net income | | | 39,722 | | | 33,244 | | | 39,280 | |
| | | | | | | | |
| | | 56,875 | | | 56,106 | | | 58,972 | |
| | Less common stock dividends declared | | | 43,296 | | | 38,953 | | | 36,056 | |
| | | | | | | | |
| | | | Balance, end of year | | $ | 13,579 | | $ | 17,153 | | $ | 22,916 | |
| | | | | | | | |
Accumulated comprehensive income/(loss): | | | | | | | | | | |
| | Balance, beginning of year | | $ | 11,032 | | $ | 8,792 | | $ | 18,030 | |
| | Reclassification adjustment for gains included in net income | | | (3,872 | ) | | (1,610 | ) | | (1,320 | ) |
| | Change in fair value of open derivative contracts for period | | | (17,394 | ) | | 5,229 | | | (13,604 | ) |
| | Income taxes | | | 8,102 | | | (1,379 | ) | | 5,686 | |
| | | | | | | | |
| | | | Balance, end of year | | $ | (2,132 | ) | $ | 11,032 | | $ | 8,792 | |
| | | | | | | | |
Total Common Stockholders' Equity, end of year | | $ | 528,872 | | $ | 539,176 | | $ | 468,609 | |
| | | | | | | | |
The accompanying notes are an integral part of these consolidated financial statements.
74
Table of Contents
THE EMPIRE DISTRICT ELECTRIC COMPANY
CONSOLIDATED STATEMENTS OF CASH FLOWS
| | | | | | | | | | | |
| | Year Ended December 31, | |
|---|
| | 2008 | | 2007 | | 2006 | |
|---|
| | ($-000's)
| |
|---|
Operating activities: | | | | | | | | | | |
| | Net income | | $ | 39,722 | | $ | 33,244 | | $ | 39,280 | |
Adjustments to reconcile net income to cash flows: | | | | | | | | | | |
| | Depreciation and amortization | | | 59,066 | | | 57,317 | | | 42,969 | |
| | Pension and other postretirement benefit costs | | | 8,282 | | | 9,490 | | | 5,689 | |
| | Deferred income taxes and unamortized investment tax credit, net | | | 8,580 | | | 18,681 | | | 845 | |
| | Allowance for equity funds used during construction | | | (5,929 | ) | | (2,923 | ) | | (1,405 | ) |
| | Stock compensation expense | | | 2,169 | | | 2,394 | | | 1,887 | |
| | Loss on plant disallowance | | | — | | | — | | | 828 | |
| | Non cash gain on derivatives | | | (39 | ) | | (893 | ) | | (3,380 | ) |
| | Gain on the sale of assets | | | — | | | (1,241 | ) | | — | |
| | Gain on the sale of other segment businesses | | | — | | | (161 | ) | | (827 | ) |
| | Impairment of other non-operating investment | | | 556 | | | — | | | — | |
Cash flows impacted by changes in: | | | | | | | | | | |
| | Accounts receivable and accrued unbilled revenues | | | (10,938 | ) | | (10,216 | ) | | (1,648 | ) |
| | Fuel, materials and supplies | | | (4,720 | ) | | (2,869 | ) | | (5,378 | ) |
| | Prepaid expenses, other current assets and deferred charges | | | (2,683 | ) | | (13,057 | ) | | (3,506 | ) |
| | Accounts payable and accrued liabilities | | | (4,905 | ) | | 11,970 | | | (8,235 | ) |
| | Interest, taxes accrued and customer deposits | | | 2,234 | | | 2,532 | | | 1,314 | |
| | Other liabilities and other deferred credits | | | 1,597 | | | (811 | ) | | 742 | |
| | | | | | | | |
Net cash provided by operating activities of continuing operations | | | 92,992 | | | 103,457 | | | 69,175 | |
Net cash provided by operating activities of discontinued operations | | | — | | | 208 | | | 2,197 | |
| | | | | | | | |
Total net cash provided by operating activities | | | 92,992 | | | 103,665 | | | 71,372 | |
| | | | | | | | |
(Continued)
The accompanying notes are an integral part of these consolidated financial statements.
75
Table of Contents
THE EMPIRE DISTRICT ELECTRIC COMPANY
CONSOLIDATED STATEMENTS OF CASH FLOWS (Continued)
| | | | | | | | | | | |
| | Year Ended December 31, | |
|---|
| | 2008 | | 2007 | | 2006 | |
|---|
| | ($-000's)
| |
|---|
Investing activities: | | | | | | | | | | |
| | Capital expenditures — regulated | | | (211,311 | ) | $ | (178,469 | ) | $ | (112,577 | ) |
| | Acquisition of gas operations, net of cash acquired | | | — | | | — | | | (103,195 | ) |
| | Capital expenditures and other investments — non-regulated | | | (1,969 | ) | | (4,924 | ) | | (2,632 | ) |
| | Proceeds from the sale of property, plant and equipment | | | 1,538 | | | 1,250 | | | — | |
| | Proceeds from the sale of other segment businesses | | | — | | | 3,240 | | | 1,095 | |
| | | | | | | | |
Net cash used in investing activities of continuing operations | | | (211,742 | ) | | (178,903 | ) | | (217,309 | ) |
Net cash used in investing activities of discontinued operations | | | — | | | (12 | ) | | (366 | ) |
| | | | | | | | |
Total net cash used in investing activities | | | (211,742 | ) | | (178,915 | ) | | (217,675 | ) |
| | | | | | | | |
Financing activities: | | | | | | | | | | |
| | Proceeds from first mortgage bonds — electric | | | 89,950 | | | 79,831 | | | — | |
| | Proceeds from first mortgage bonds — gas | | | — | | | — | | | 55,000 | |
| | Proceeds from issuance of common stock, net of issuance costs | | | 5,385 | | | 71,721 | | | 79,326 | |
| | Long-term debt issuance costs | | | (3,168 | ) | | (1,078 | ) | | (751 | ) |
| | Net short-term borrowings (repayments) | | | 68,960 | | | (44,010 | ) | | 46,098 | |
| | Dividends | | | (43,296 | ) | | (38,953 | ) | | (36,056 | ) |
| | Other | | | (370 | ) | | (452 | ) | | (507 | ) |
| | | | | | | | |
Net cash provided by financing activities of continuing operations | | | 117,461 | | | 67,059 | | | 143,110 | |
Net cash used in financing activities of discontinued operations | | | — | | | (69 | ) | | (396 | ) |
| | | | | | | | |
Net cash provided by financing activities | | | 117,461 | | | 66,990 | | | 142,714 | |
| | | | | | | | |
Net decrease in cash and cash equivalents | | | (1,289 | ) | | (8,260 | ) | | (3,589 | ) |
Cash and cash equivalents, beginning of year | | | 4,043 | | | 12,303 | | | 15,892 | |
| | | | | | | | |
Cash and cash equivalents, end of year | | $ | 2,754 | | $ | 4,043 | | $ | 12,303 | |
| | | | | | | | |
|
|
2008 |
|
2007 |
|
2006 |
|
|---|
Supplemental cash flow information: | | | | | | | | | | |
| | Interest paid | | $ | 40,384 | | $ | 35,884 | | $ | 31,258 | |
| | Income taxes paid (received), net of refund | | | 8,706 | | | (1,211 | ) | | 15,107 | |
| | Capital lease obligations for purchase of new equipment | | | — | | | — | | | — | |
Supplementary non-cash investing activities: | | | | | | | | | | |
| | Change in accrued additions to property, plant and equipment not reported above | | $ | (6,895 | ) | $ | 12,175 | | $ | 4,963 | |
The accompanying notes are an integral part of these consolidated financial statements.
76
Table of Contents
THE EMPIRE DISTRICT ELECTRIC COMPANY
NOTES TO CONSOLIDATED FINANCIAL STATEMENTS
1. Summary of Significant Accounting Policies
General
We operate our businesses as three segments: electric, gas and other. The Empire District Electric Company (EDE), a Kansas corporation organized in 1909, is an operating public utility engaged in the generation, purchase, transmission, distribution and sale of electricity in parts of Missouri, Kansas, Oklahoma and Arkansas. As part of our electric segment, we also provide water service to three towns in Missouri. The Empire District Gas Company (EDG) is our wholly owned subsidiary formed to hold the Missouri Gas assets acquired from Aquila, Inc. on June 1, 2006. It provides natural gas distribution to communities in northwest, north central and west central Missouri. Our other segment primarily consists of a 100% interest in Empire District Industries Inc, a subsidiary of our wholly-owned subsidiary EDE Holdings, Inc. (EDE Holdings), for our fiber optics business. See Note 13. In 2008, 86.5% of our gross operating revenues were provided from sales from our electric segment (including 0.3% from the sale of water), 12.6% from sales from our gas segment and 0.9% from our other segment.
The utility portions of our business are subject to regulation by the Missouri Public Service Commission (MPSC), the State Corporation Commission of the State of Kansas (KCC), the Corporation Commission of Oklahoma (OCC), the Arkansas Public Service Commission (APSC) and the Federal Energy Regulatory Commission (FERC). Our accounting policies are in accordance with the ratemaking practices of the regulatory authorities and conform to generally accepted accounting principles as applied to regulated public utilities.
Our electric revenues in 2008 were derived as follows: residential 40.2%, commercial 29.8%, industrial 15.1%, wholesale on-system 4.3%, wholesale off-system 6.6%, miscellaneous sources, primarily public authorities, 2.5% and other electric revenues 1.5%. Our retail electric revenues for 2008 by jurisdiction were as follows: Missouri 88.7%, Kansas 5.4%, Arkansas 2.9%, and Oklahoma 3.0%.
Our gas operations serve approximately 45,000 customers and the 2008 gas operating revenues were derived as follows: residential 60.6%, commercial 26.6%, industrial 7.7%, and other 5.1%.
Following is a description of the Company's significant accounting policies:
Basis of Presentation
The consolidated financial statements include the accounts of EDE, EDG, and EDE Holdings and its subsidiaries. The consolidated entity is referred to throughout as "we" or the "Company". Significant intercompany balances and transactions have been eliminated in consolidation. See Note 13 for additional information regarding our three segments. Certain immaterial reclassifications have been made to prior year information to conform to the current year presentation.
Discontinued Operations
In August and December 2006, we sold two of our non-regulated businesses, our controlling 52% interest in Mid-America Precision Products (MAPP) and our 100% interest in Conversant, respectively. MAPP specialized in close-tolerance custom manufacturing for the aerospace, electronics, telecommunications and machinery industries, and was sold to other current owners. We owned 100% of Conversant, a software company that marketed Customer Watch, an internet-based customer information system software. In September 2007, we also sold our 100% interest in Fast Freedom, Inc., an Internet service provider. For financial reporting purposes, these businesses have been classified as discontinued operations and are not included in our segment information.
77
Table of Contents
THE EMPIRE DISTRICT ELECTRIC COMPANY
NOTES TO CONSOLIDATED FINANCIAL STATEMENTS (Continued)
Accounting for the Effects of Regulation
In accordance with Statement of Financial Accounting Standards (SFAS) No. 71, "Accounting for the Effects of Certain Types of Regulation" (FAS 71), our financial statements reflect ratemaking policies prescribed by the regulatory commissions having jurisdiction over our regulated generation and other utility operations (the MPSC, the KCC, the OCC, the APSC and the FERC).
We record a regulatory asset for all or part of an incurred cost that would otherwise be charged to expense in accordance with FAS 71 paragraphs 9a and b which say that an asset should be recorded if it is probable that future revenue in an amount at least equal to the capitalized cost will be allowable for costs for rate making purposes and the current available evidence indicates that future revenue will be provided to permit recovery of the cost. Additionally, we follow FAS 71 paragraph 11 which says that a liability should be recorded when a regulator has provided current recovery for a cost that is expected to be incurred in the future. We follow this guidance for incurred costs or credits that are subject to future recovery from or refund to our customers in accordance with the orders of our regulators.
Historically, all costs of this nature, which are determined by our regulators to have been prudently incurred, have been recoverable through rates in the course of normal ratemaking procedures. Regulatory assets and liabilities are ratably eliminated through a charge or credit, respectively, to earnings while being recovered in revenues and fully recognized if and when it is no longer probable that such amounts will be recovered through future revenues. We continually assess the recoverability of our regulatory assets. Although we believe it unlikely, should retail electric competition legislation be passed in the states we serve, we may determine that we no longer meet the criteria set forth in FAS 71 with respect to continued recognition of some or all of the regulatory assets and liabilities. Any regulatory changes that would require us to discontinue application of FAS 71 based upon competitive or other events may also impact the valuation of certain utility plant investments. Impairment of regulatory assets or utility plant investments could have a material adverse effect on our financial condition and results of operations. (See Note 4 for further discussion of regulatory assets and liabilities).
Use of Estimates
The preparation of financial statements in conformity with generally accepted accounting principles (GAAP) requires management to make estimates and assumptions that affect the reported amounts of assets and liabilities and disclosure of contingent assets and liabilities at the date of the financial statements. Estimates also affect the reported amounts of revenues and expenses during the period. Areas in the financial statements significantly affected by estimates and assumptions include unbilled utility revenues, collectibility of accounts receivable, depreciable lives, asset impairment and goodwill impairment evaluations, employee benefit obligations, contingent liabilities, asset retirement obligations, the fair value of stock based compensation, tax provisions and derivatives. Actual amounts could differ from those estimates.
Revenue Recognition
For our utility operations, we use cycle billing and accrue estimated, but unbilled, revenue for services provided between the last bill date and the period end date. Unbilled revenues represent the estimate of receivables for energy and natural gas services delivered, but not yet billed to customers. The unbilled estimates are determined based on various assumptions, such as current month load requirements, billing rates by customer classification and loss factors. Changes in those assumptions can significantly affect the estimates of unbilled revenues.
78
Table of Contents
THE EMPIRE DISTRICT ELECTRIC COMPANY
NOTES TO CONSOLIDATED FINANCIAL STATEMENTS (Continued)
Through December 31, 2006, we collected an Interim Energy Charge (IEC) of $0.002131 per kilowatt hour of customer usage authorized by the MPSC. The IEC was designed to recover variable fuel and purchased power costs we incurred subject to a ceiling and floor on the amount recoverable (including realized gains or losses associated with our natural gas hedging program) which are higher than such costs included in the base rates allowed in the 2005 Missouri rate case. This revenue was recorded when service was provided to the customer and subject to refund to the extent collected amounts exceeded variable fuel and purchased power costs. At each balance sheet date, we evaluated the probability that we would be required to refund either a portion or all of the amounts collected under the IEC to ratepayers. No provision for refund was recorded. Effective January 1, 2007 the IEC was terminated as a result of an order issued by the MPSC on December 22, 2006.
Property, Plant & Equipment
The costs of additions to utility property and replacements for retired property units are capitalized. Costs include labor, material and an allocation of general and administrative costs, plus an allowance for funds used during construction (AFUDC). The original cost of units retired or disposed of and the costs of removal are charged to accumulated depreciation, unless the removed property constitutes an operating unit or system. In this case a gain or loss is recognized upon the disposal of the asset. In 2007, we recognized a $1.2 million gain from the sale of our unit train. Maintenance expenditures and the removal of items not considered units of property are charged to income as incurred. A liability is created for any additions to electric or gas utility property that are paid for by advances from developers. For a period of five years the Company will refund, to the developer, a pro rata amount of the original cost of the extension for each new customer added to the extension. Nonrefundable payments at the end of the five year period are applied as a reduction to the cost of the plant in service. The liability as of December 31, 2008 and 2007 was $10.5 million and $10.2 million, respectively.
Until 2002, the depreciation/cost of service methodology utilized by our rate-regulated operations included an estimated cost of dismantling and removing plant from service upon retirement. From January 2002 through March 2005, we suspended accruing the cost of removing plant from service upon retirement through depreciation rates pursuant to the 2001 Missouri rate case. Pursuant to our 2005 Missouri rate order, we began accruing cost of removal in depreciation rates reclassified for mass property (including transmission, distribution and general plant assets) on April 1, 2005. We reclassified the accrued cost of dismantling and removing plant from service upon retirement, which is not considered an asset retirement obligation under SFAS 143, "Accounting for Obligations Associated with the Retirement of Long-Lived Assets" (FAS 143), from accumulated depreciation to a regulatory liability. At December 31, 2008 and 2007, the amount of accrued cost of removal was $40.1 million and $32.0 million, respectively, for our electric operating segment. We have a similar cost of removal regulatory liability for our gas operating segment. This amount at December 31, 2008 and 2007 was $3.6 million and $3.7 million, respectively. These amounts are net of our actual cost of removal expenditures.
Depreciation
Provisions for depreciation are computed at straight-line rates in accordance with GAAP consistent with rates approved by regulatory authorities. These rates are applied to the various classes of utility assets on a composite basis. Provisions for depreciation for our other businesses are computed at straight-line rates over the estimated useful life of the properties. (See Note 3 for additional details regarding depreciation rates).
In accordance with our 2006 and 2008 rate orders from the MPSC, we recorded approximately $8.2 million and $10.4 million of regulatory amortization during 2008 and 2007, respectively. This
79
Table of Contents
THE EMPIRE DISTRICT ELECTRIC COMPANY
NOTES TO CONSOLIDATED FINANCIAL STATEMENTS (Continued)
amortization included in our rates was granted in the Experimental Regulatory Plan approved by the MPSC on August 2, 2005. It provides additional cash flow to enhance the financial support for our current generation expansion plan. It is related to our investment in Iatan 2 and also includes our Riverton V84.3A2 combustion turbine (Riverton 12) and environmental improvement and upgrades at Asbury and Iatan 1. This amortization is included as depreciation and amortization expense and in accumulated depreciation and amortization on the consolidated balance sheet.
Allowance for Funds Used During Construction
As provided in the FERC regulatory Uniform System of Accounts, utility plant is recorded at original cost, including an allowance for funds used during construction (AFUDC) when first placed in service. The AFUDC is a utility industry accounting practice whereby the cost of borrowed funds and the cost of equity funds applicable to our construction program are capitalized as a cost of construction. This accounting practice offsets the effect on earnings of the cost of financing current construction, and treats such financing costs in the same manner as construction charges for labor and materials.
AFUDC does not represent current cash income. Recognition of this item as a cost of utility plant is in accordance with regulatory rate practice under which such plant costs are permitted as a component of rate base and the provision for depreciation.
In accordance with the methodology prescribed by the FERC, we utilized aggregate rates (on a before-tax basis) of 7.8% for 2008, 7.7% for 2007 and 7.2% for 2006, compounded semiannually, in determining AFUDC for all of our projects except Iatan 2. The specific Iatan 2 AFUDC rate is a result of our Experimental Regulatory Plan approved by the MPSC on August 2, 2005. In this agreement, we were allowed to receive the regulatory amortization discussed above, in rates prior to the completion of Iatan 2. As a result the equity portion of our AFUDC rate for the Iatan 2 project was reduced by 2.5 percentage points. (See Note 4 for additional discussion of our regulatory plan.)
Accounts Receivable
Accounts receivable are recorded at the tariffed rates for customer usage, including applicable taxes and fees and do not bear interest. We review the outstanding accounts receivable monthly, as well as the bad debt write-offs experienced in the past, and establish an allowance for doubtful accounts. Account balances are charged off against the allowance when management determines it is probable the receivable will not be recovered. The allowance for doubtful accounts at December 31, 2008 and 2007 was $1.3 million and $1.1 million, respectively.
Asset Impairments
We review long-lived assets for impairment whenever events or changes in circumstances indicate that the carrying amount of an asset may not be recoverable. To the extent that certain assets may be impaired, analysis is performed based on several criteria, including but not limited to revenue trends, undiscounted forecasted cash flows and other operating factors, to determine the impairment amount. None of our assets were impaired as of December 31, 2008. In December 2006, we reduced the capitalized value of our Energy Center Units 3 and 4 by recording a charge to expense for $0.8 million. In our Missouri rate case (ER-2006-0315) Stipulation and Agreement as to Certain Issues, approved December 21, 2006, we agreed to this disallowance for regulatory purposes and recorded the charge to expense, once it was determined it would not be afforded rate recovery in Missouri rates. Until this stipulation was finalized on December 21, 2006, we considered these capitalized costs to be probable of recovery in rates.
80
Table of Contents
THE EMPIRE DISTRICT ELECTRIC COMPANY
NOTES TO CONSOLIDATED FINANCIAL STATEMENTS (Continued)
Goodwill
We recorded goodwill of $39.5 million upon the completion of the 2006 Missouri Gas acquisition. Goodwill represents the excess of the cost of the acquisition over the fair value of the related net assets at the date of acquisition. In accordance with Statement of Financial Accounting Standards No. 142, "Goodwill and Other Intangible Assets," (FAS 142) goodwill is required to be tested for impairment on an annual basis or whenever events or circumstances indicate possible impairment. In performing impairment tests, we utilize valuation techniques which estimate the discounted future cash flows of operations. Our procedures include developing a baseline test and performing sensitivity analysis to calculate a reasonable valuation range. The sensitivities are derived from altering those assumptions which are subjective in nature and inherent to a discounted cash flows valuation technique. Other qualitative factors and comparisons to industry peers are also used to further support the assumptions and ultimately the overall evaluation. A significant qualitative factor considered in our evaluation is the impact of regulation, including rate regulation and cost recovery for our gas segment. Some of the more significant quantitative assumptions included in our tests involve: regulatory rate design and results; the discount rate; the growth rate; capital spending rates and, terminal value calculations. Risks and uncertainties affecting these assumptions include: management's identification of impairment indicators, changes in business, industry, laws, technology or economic and market conditions. While management believes the assumptions utilized in our analysis were reasonable, significant adverse developments in the gas segment in future periods or changes in the assumptions could negatively impact goodwill impairment considerations, which could adversely impact earnings. We performed our annual goodwill impairment test as of November 30, 2008 and concluded our goodwill was not impaired.
Fuel and Purchased Power
Electric Segment
Fuel and purchased power costs are recorded at the time the fuel is used, or the power purchased. This amount is adjusted to reflect regulatory treatment for our Missouri and Kansas fuel adjustment mechanisms discussed below.
The MPSC authorized a fuel adjustment clause (FAC) for our Missouri customers effective September 1, 2008. The MPSC established a base cost for the recovery of fuel and purchased power expenses used to supply energy. The FAC permits the distribution to customers of 95% of the changes in fuel and purchased power costs prudently incurred above or below the base cost. Off-system sales margins are also part of the recovery of fuel and purchased power costs. As a result, the off-system sales margin flows back to the customer. Rates related to the fuel adjustment clause will be modified twice a year subject to the review and approval by the MPSC. In accordance with FAS 71, 95% of the difference between the actual costs of fuel and purchased power and the base cost of fuel and purchased power recovered from our customers is recorded as an adjustment to fuel and purchased power expense with a corresponding regulatory asset or regulatory liability. If the actual fuel and purchased power costs are higher or lower than the base fuel and purchased power costs billed to customers, 95% of these amounts will be recovered or refunded to our customers when the fuel adjustment clause is modified. At December 31, 2008, Missouri fuel and purchased power costs were over-recovered $0.2 million, which is reflected as a regulatory liability.
In our Kansas jurisdiction, the costs of fuel are recovered from customers through a fuel adjustment clause, based upon estimated fuel costs and purchased power. The adjustments are subject to audit and final determination by regulators. The difference between the costs of fuel used and the cost of fuel recovered from our Kansas customers is recorded as a regulatory asset or a regulatory liability if the actual
81
Table of Contents
THE EMPIRE DISTRICT ELECTRIC COMPANY
NOTES TO CONSOLIDATED FINANCIAL STATEMENTS (Continued)
costs are higher or lower than the costs billed to customers, in accordance with FAS 71. Similar fuel recovery mechanisms are in place for our Oklahoma, Arkansas and the FERC jurisdictions.
We buy and sell power through the SPP RTO energy imbalance services market (EIS). We net settle these market transactions on an hourly basis.
Effective March 1, 2005, the MPSC approved a Stipulation and Agreement granting us authority to manage our SO2 allowance inventory in accordance with our SO2 Allowance Management Policy (SAMP). The SAMP allows us to exchange banked allowances for future vintage allowances and/or monetary value and, in extreme market conditions, to sell SO2 allowances outright for monetary value. We have not yet exchanged or sold any allowances. We classify our allowances as inventory and they are recorded at cost. The banked allowances are recorded at zero cost. The allowances are removed from inventory on a FIFO basis. We consider used allowances to be a part of fuel expense (See Note 12).
Gas Segment
Fuel expense for our gas segment is recognized when the natural gas is delivered to our customers, based on the current cost recovery allowed in rates. A Purchased Gas Adjustment (PGA) clause allows EDG to recover from our customers, subject to routine regulatory review, the cost of purchased gas supplies and related carrying costs associated with the Company's use of natural gas financial instruments to hedge the purchase price of natural gas. This PGA clause allows us to make rate changes periodically (up to four times) throughout the year in response to weather conditions and supply demands, rather than in one possibly extreme change per year.
We calculate the PGA factor based on our best estimate of our annual gas costs and volumes purchased for resale. The calculated factor is reviewed by the MPSC staff and approved by the MPSC. PGA factor elements considered include cost of gas supply, storage costs, hedging contracts, revenue and refunds, prior period adjustments and transportation costs.
Pursuant to the provisions of the PGA clause, the difference between actual costs incurred and costs recovered through the application of the PGA (including costs, cost reductions and carrying costs associated with the use of financial instruments), are reflected as a regulatory asset or liability. The balance is amortized as amounts are reflected in customer billings.
Derivatives
We utilize derivatives to help manage our natural gas commodity market risk resulting from purchasing natural gas, to be used as fuel in our electric business or sold in our natural gas business, on the volatile spot market and to manage certain interest rate exposure.
Electric Segment
Pursuant to SFAS 133, "Accounting for Derivative Instruments and Hedging Activities" (FAS 133), derivatives are required to be recognized on the balance sheet at their fair value. On the date a derivative contract is entered into, the derivative is designated as (1) a hedge of a forecasted transaction or of the variability of cash flows to be received or paid related to a recognized asset or liability ("cash-flow" hedge); or (2) an instrument that is held for non-hedging purposes (a "non-hedging" instrument). Changes in the fair value of a derivative that is highly effective and designated and qualifies as a cash-flow hedge are recorded in comprehensive income until earnings are affected by the variability of cash flows (e.g., when periodic settlements on a variable-rate asset or liability are recorded in earnings). Changes in the fair value of non-hedged derivative instruments and any ineffective portion of a qualified hedge are reported in
82
Table of Contents
THE EMPIRE DISTRICT ELECTRIC COMPANY
NOTES TO CONSOLIDATED FINANCIAL STATEMENTS (Continued)
current-period earnings in fuel expense. Effective September 1, 2008, in conjunction with the implementation of the Missouri fuel adjustment clause in the July 2008 MPSC rate order, the unrealized losses or gains from new cash flow hedges will be recorded in regulatory assets or liabilities. This is in accordance with FAS 71, given that those regulatory assets and liabilities are probable of recovery through our fuel adjustment mechanism. Unrealized gains and losses from cash flow hedges existing at September 1, 2008 will continue to be recorded through comprehensive income. Once settled, the realized gain or loss will be recorded as fuel expense and be subject to the fuel adjustment clause.
We discontinue hedge accounting prospectively when (1) it is determined that the derivative is no longer highly effective in offsetting changes in cash flows of a hedged item (including forecasted transactions); (2) the derivative expires or is sold, terminated, or exercised; (3) the derivative is no longer designated as a non-hedging instrument, because it is less than probable that a forecasted transaction will occur; or (4) management determines that designation of the derivative as a hedge instrument is no longer appropriate. (See Note 15).
We also enter into fixed-price forward physical contracts for the purchase of natural gas, coal and purchased power. These contracts, if they meet the definition of a derivative, are not subject to derivative accounting because they are considered to be normal purchase normal sales (NPNS) transactions. If these transactions don't qualify for NPNS treatment, they would be marked to market for each reporting period through income.
Gas Segment
Financial hedges for our natural gas business are recorded at fair value on our balance sheet. Because we have a commission approved natural gas cost recovery mechanism (PGA), we record the mark-to-market gain/loss on natural gas financial hedges each reporting period to a regulatory asset/liability account. The regulatory asset/liability account tracks the difference between revenues billed to customers for natural gas costs and actual natural gas expense which is trued up at the end of August each year and included in the Actual Cost Adjustment (ACA) factor to be billed to customers during the next year. This is consistent with FAS 71, in that we will be recovering our costs after the annual true up period (subject to a prudency review by the MPSC).
Cash flows from hedges for both electric and gas segments are classified within cash flows from operations.
Pension and Other Postretirement Benefits
We recognize expense related to pension and other postretirement benefits as earned during the employee's period of service. Related assets and liabilities are established based upon the funded status of the plan compared to the accumulated benefit obligation. Our pension and OPEB expense or benefit includes amortization of previously unrecognized net gains or losses. Additional income or expense may be recognized when our unrecognized gains or losses as of the most recent measurement date exceed 10% of our postretirement benefit obligation or fair value of plan assets, whichever is greater. For pension benefits (effective January 1, 2005) and OPEB benefits (effective January 1, 2007), unrecognized net gains or losses as of the measurement date are amortized into actuarial expense over ten years.
Pensions
In our 2005 electric Missouri rate order (effective March 27, 2005), the MPSC ruled the Company would be allowed to recover pension costs consistent with our GAAP policy noted above. In accordance with the rate order, we prospectively calculated the value of plan assets using a market-related value
83
Table of Contents
THE EMPIRE DISTRICT ELECTRIC COMPANY
NOTES TO CONSOLIDATED FINANCIAL STATEMENTS (Continued)
method (as allowed by FAS 87). As a result, we are allowed to record the Missouri portion of any costs above or below the amount included in rates as a regulatory asset or liability, respectively. Therefore, the deferral of these costs began in the second quarter of 2005. In our 2006 Kansas rate order, the KCC also ruled that the Company would be allowed to change the recognition of pension costs, deferring the Kansas portion of any costs above or below the amount included in the rate case as a regulatory asset or liability.
In the Company's agreement with the MPSC regarding the purchase of Missouri Gas by EDG, the Company was allowed to adopt this pension cost recovery methodology for EDG as well. Also, it was agreed that the effects of purchase accounting entries related to pension and other postretirement benefits would be recoverable in future rate proceedings. Thus the fair value adjustment acquisition entries have been recorded as regulatory assets, as these amounts are probable of recovery in future rates. The regulatory asset will be reduced by an amount equal to the difference between the regulatory costs and the estimated FAS 87 costs. The difference between this total and the costs being recovered from customers will be deferred as a regulatory asset or liability in accordance with FAS 71, and recovered over a period of five years.
Other Postretirement Benefits (OPEB)
In our 2006 Missouri rate case, the MPSC approved regulatory treatment for our OPEB costs similar to the treatment described above for pension costs. This includes the use of a market-related value of assets, the amortization of unrecognized gains or losses into actuarial expense over ten years and the recognition of regulatory assets and liabilities as described above.
In accordance with FASB staff position No. 106-2, "Accounting and Disclosure Requirements Related to the Medicare Prescription Drug, Improvement and Modernization Act of 2003", the accumulated postretirement benefit obligation (APBO) and net cost recognized for OPEB reflects the effects of the Medicare Prescription Drug, Improvement and Modernization Act of 2003 (the Act). The Act provides for a federal subsidy, beginning in 2006, of 28% of prescription drug costs between $250 and $5,000 for each Medicare-eligible retiree who does not join Medicare Part D, to companies whose plans provide prescription drug benefits to their retirees that are "actuarially equivalent" to the prescription drug benefits provided under Medicare. Equivalency must be certified annually by the Federal Government. Our plan provides prescription drug benefits that are "actuarially equivalent" to the prescription drug benefits provided under Medicare and have been certified as such.
SFAS No. 158, "Employers' Accounting for Defined Benefit Pension and Other Postretirement Plans an amendment of FASB Statements No. 87, 88, 106 and 132R" (FAS 158), requires an employer to recognize the overfunded or underfunded status of a defined benefit postretirement plan (other than a multiemployer plan) as an asset or liability in its statement of financial position and to recognize changes in that funded status in the year in which the changes occur through comprehensive income of a business entity. FAS 158 also requires an employer to measure the funded status of a plan as of the date of its year-end statement of financial position, with limited exceptions. During 2008, the MPSC approved Stipulations and Agreements providing for the continuation of the pension and other postretirement employee benefits tracking mechanism established in our 2006 and 2007 Missouri rate orders. This treatment will allow for future rate recovery of the obligations and as such, we record them as regulatory assets on the balance sheet rather than as reductions of equity through comprehensive income (See Note 4 and Note 9).
84
Table of Contents
THE EMPIRE DISTRICT ELECTRIC COMPANY
NOTES TO CONSOLIDATED FINANCIAL STATEMENTS (Continued)
Unamortized Debt Discount, Premium and Expense
Discount, premium and expense associated with long-term debt are amortized over the lives of the related issues. Costs, including gains and losses, related to refunded long-term debt are amortized over the lives of the related new debt issues, in accordance with regulatory rate practices.
Liability Insurance
We are primarily self-insured for workers' compensation claims, general liabilities, benefits paid under employee healthcare programs and long-term disability benefits. Accruals are primarily based on the estimated undiscounted cost of claims. We self-insure up to certain limits that vary by segment and type of risk. Periodically, we evaluate the level of insurance coverage and adjust insurance levels based on risk tolerance and premium expense. We carry excess liability insurance for workers' compensation and public liability claims for our electric segment. In order to provide for the cost of losses not covered by insurance, an allowance for injuries and damages is maintained based on our loss experience. Our gas segment is covered by excess liability insurance for public liability claims, and workers' compensation claims are covered by a guaranteed cost policy. (See Note 12).
Franchise Taxes
Franchise taxes are collected for and remitted to their respective entities and are included in operating revenues and other taxes in the Consolidated Statements of Income. Franchise taxes of $10.2 million, $10.0 million and $7.3 million were recorded for each of the years ended December 31, 2008, 2007 and 2006, respectively.
Cash & Cash Equivalents
Cash and cash equivalents include cash on hand and temporary investments purchased with an initial maturity of three months or less. It also includes checks and electronic funds transfers that have been issued but have not cleared the bank, which are also reflected in current accrued liabilities and were $16.1 million and $13.2 million at December 31, 2008 and 2007, respectively.
Fuel, Material and Supplies
Fuel, material and supplies consist primarily of coal, natural gas in storage and materials and supplies, which are reported at average cost. These balances are as follows (in thousands):
| | | | | | | |
| | 2008 | | 2007 | |
|---|
Electric fuel inventory | | $ | 16,430 | | $ | 16,643 | |
Natural gas inventory | | | 8,911 | | | 5,639 | |
Materials and supplies | | | 28,861 | | | 27,200 | |
| | | | | | |
Total | | $ | 54,202 | | $ | 49,482 | |
| | | | | | |
Income Taxes
Deferred tax assets and liabilities are recognized for the tax consequences of transactions that have been treated differently for financial reporting and tax return purposes, measured using statutory tax rates. (See Note 10.)
85
Table of Contents
THE EMPIRE DISTRICT ELECTRIC COMPANY
NOTES TO CONSOLIDATED FINANCIAL STATEMENTS (Continued)
Investment tax credits utilized in prior years were deferred and are being amortized over the useful lives of the properties to which they relate. Remaining unamortized investment tax credits are being amortized over remaining lives of approximately 22 years.
Accounting for Uncertainty in Income Taxes
On July 13, 2006, the FASB issued Interpretation No. 48 (FIN 48), which clarifies the accounting for uncertainty in income taxes recognized in an enterprise's financial statements in accordance with FASB Statement No. 109, "Accounting for Income Taxes." We file consolidated income tax returns in the U.S. federal and state jurisdictions. With few exceptions, we are no longer subject to U.S. federal, state and local, or non-U.S. income tax examinations by tax authorities for years before 2005. We adopted the provisions of FIN 48 on January 1, 2007. As a result of the implementation of FIN 48, we recognized approximately $54,000 of additional liability for unrecognized tax benefits, which was accounted for as a reduction to the January 1, 2007 balance of retained earnings. At December 31, 2008 and December 31, 2007, our balance sheet included approximately $2.2 million and $0.3 million, respectively, of unrecognized tax benefits which would affect our effective tax rate if recognized. We do not expect any material changes to unrecognized tax benefits within the next twelve months. We recognize interest accrued and penalties related to unrecognized tax benefits in other expenses.
Computations of Earnings Per Share
SFAS No. 128, "Earnings Per Share", requires dual presentation of basic and diluted earnings per share. Basic earnings per share does not include potentially dilutive securities and is computed by dividing net income by the weighted average number of common shares outstanding. Diluted earnings per share assumes the issuance of common shares pursuant to the Company's stock-based compensation plans at the beginning of each respective period, or at the date of grant or award if later. Shares attributable to stock options and time-vested restricted stock are excluded from the calculation of diluted earnings per share if the effect would be antidilutive.
| | | | | | | | | | |
| | 2008 | | 2007 | | 2006 | |
|---|
Weighted Average Number Of Shares | | | | | | | | | | |
Basic | | | 33,820,750 | | | 30,586,780 | | | 28,276,568 | |
Dilutive shares | | | 39,298 | | | 23,571 | | | 19,827 | |
| | | | | | | | |
Total Dilutive Shares | | | 33,860,048 | | | 30,610,351 | | | 28,296,395 | |
| | | | | | | | |
Antidilutive Shares | | | — | | | 48,903 | | | 48,903 | |
Potentially dilutive shares are not expected to have a material impact unless significant appreciation of the Company's stock price occurs.
Stock-Based Compensation
We have several stock-based compensation plans, which are described in more detail in Note 5. During 2002, we adopted SFAS No.��148, "Accounting for Stock-Based Compensation — Transition and Disclosure — an Amendment of SFAS 123" (FAS 148), and elected to adopt the accounting provision of FAS 123, "Accounting for Stock-Based Compensation" (FAS 123). Under FAS 123, we recognized compensation expense over the vesting period of all stock-based compensation awards issued subsequent to January 1, 2002 based upon the fair-value of the award as of the date of issuance. We adopted FAS 123(R) "Share Based Payment" on January 1, 2006 using the modified prospective approach. (See Note 5).
86
Table of Contents
THE EMPIRE DISTRICT ELECTRIC COMPANY
NOTES TO CONSOLIDATED FINANCIAL STATEMENTS (Continued)
Asset Retirement Obligation
We account and report for legal obligations associated with the retirement or anticipated retirement of tangible long-lived assets in accordance with SFAS No. 143 "Accounting for Obligations Associated with the Retirement of Long-Lived Assets" (FAS 143) and FASB Interpretation No. 47, "Accounting for Conditional Asset Retirement Obligations" (FIN 47). We record the estimated fair value of legal obligations associated with the retirement of tangible long-lived assets in the period in which the liabilities are incurred and capitalize a corresponding amount as part of the book value of the related long-lived asset. In subsequent periods, we are required to adjust asset retirement obligations based on changes in estimated fair value, and the corresponding increases in asset book values are depreciated over the useful life of the related asset. Uncertainties as to the probability, timing or cash flows associated with an asset retirement obligation affect our estimate of fair value.
We have identified future asset retirement obligations associated with the removal of certain river water intake structures and equipment at the Iatan Power Plant, in which we have a 12% ownership. We also have a liability for future containment of an ash landfill at the Riverton Power Plant along with a liability for future asset retirement obligations associated with the removal of asbestos located at the Riverton and Asbury Plants. In addition, we have a liability for the removal and disposal of Polychlorinated Biphenyls (PCB) contaminants associated with our transformers and substation equipment. These liabilities have been estimated based upon either third party costs or historical review of expenditures for the removal of similar past liabilities. The potential costs of these future liabilities are based on engineering estimates of third party costs to remove the assets in satisfaction of the associated obligations. This liability will be accreted over the period up to the estimated settlement date.
All of our recorded asset retirement obligations have been estimated as of the expected retirement date, or settlement date, and have been discounted using a credit adjusted risk-free rate ranging from 5.0% to 5.52% depending on the settlement date. Revisions to these liabilities could occur due to changes in the cost estimates, anticipated timing of settlement or federal or state regulatory requirements.
The balances at the end of 2007 and 2008 are shown below.
| | | | | | | | | | | | | | | | | | | |
(000's)
| | Liability
Balance
12/31/07 | | Liabilities
Recognized | | Liabilities
Settled | | Accretion | | Cash Flow
Revisions | | Liability
Balance at
12/31/08 | |
|---|
Asset Retirement Obligation | | $ | 3,333 | | $ | — | | $ | — | | $ | 135 | | $ | — | | $ | 3,468 | |
The balances at the end of 2006 and 2007 are shown below.
| | | | | | | | | | | | | | | | | | | |
(000's)
| | Liability
Balance
12/31/06 | | Liabilities
Recognized | | Liabilities
Settled | | Accretion | | Cash Flow
Revisions | | Liability
Balance at
12/31/07 | |
|---|
Asset Retirement Obligation | | $ | 3,448 | | $ | — | | $ | — | | $ | 104 | | $ | (219 | ) | $ | 3,333 | |
Upon adoption of these standards, we recorded a non-recurring discounted liability and a regulatory asset because we expect to recover these costs of removal in electric and gas rates either through depreciation accruals or direct expenses. We also defer the liability accretion and depreciation expense as a regulatory asset. At December 31, 2008 and 2007, our regulatory assets relating to asset retirement obligations totaled $3.1 million and $2.9 million, respectively.
Also as noted previously under property, plant and equipment, we reclassify the accrued cost of dismantling and removing plant from service upon retirement, which is not considered an asset retirement
87
Table of Contents
THE EMPIRE DISTRICT ELECTRIC COMPANY
NOTES TO CONSOLIDATED FINANCIAL STATEMENTS (Continued)
obligation under FAS 143, from accumulated depreciation to a regulatory liability. This balance sheet reclassification has no impact on results of operations.
Other Noncurrent Liabilities
Other noncurrent liabilities are comprised of accruals and other accounting estimates not sufficiently large enough to merit individual disclosure. At December 31, 2008, the balance of other noncurrent liabilities is primarily comprised of accruals for self insurance and customer advances for construction.
Recently Issued and Proposed Accounting Standards
On September 15, 2006, the FASB issued FASB No. 157, "Fair Value Measurements" (FAS 157). We adopted this statement on January 1, 2008. See Note 16 for the discussion of this adoption and the effect of FASB Staff Position (FSP) 157-2 which amended FAS 157 to delay the effective date for all non-financial assets and liabilities.
On February 15, 2007, the FASB issued FASB No. 159, "The Fair-Value Option for Financial Assets and Financial Liabilities — including an amendment of FAS 115" (FAS 159). Under FAS 159, a company may elect to measure eligible financial assets and financial liabilities at fair value. Unrealized gains and losses on items for which the fair value option has been elected are reported in earnings at each subsequent reporting date. FAS 159 is effective for financial statements issued for fiscal years beginning after November 15, 2007. FAS 159 had no effect on our financial statements.
On December 1, 2007, the FASB issued SFAS 141(R) "Business Combinations" (FAS 141(R)) and SFAS No. 160, "Noncontrolling Interests in Consolidated Financial Statements, an amendment of ARB No. 51" (FAS 160). FAS 141(R) and FAS 160 are effective for business combinations entered into in fiscal years beginning on or after December 15, 2008. FAS 141(R) changes the definitions of a business and a business combination, and will result in more transactions recorded as business combinations. Certain acquired contingencies will be recorded initially at fair value on the acquisition date, transactions and restructuring costs generally will be expensed as incurred and in partial acquisitions, companies generally will record 100 percent of the assets and liabilities at fair value, including goodwill. We do not expect these pronouncements to have an effect on our financial statements unless we enter into future business combinations.
In April 2008, the FASB issued SFAS 161 "Disclosure About Derivative Instruments and Hedging Activities, an Amendment of FASB Statement No. 133" (FAS 161). FAS 161 enhances the current disclosure framework in FAS 133, "Accounting for Derivative Instruments and Hedging Activities." FAS 161 is effective for periods beginning after November 15, 2008. We do not expect the adoption of FAS 161 to have a material effect on our financial statement disclosures.
2. Acquisition of Missouri Natural Gas Distribution Operations
On June 1, 2006, we acquired the Missouri natural gas distribution operations of Aquila, Inc. The total purchase price, including working capital and net plant adjustments but excluding acquisition costs, was $102.5 million. We recorded $39.5 million of goodwill as a result of the acquisition. All of this is expected to be tax deductible.
The components of the purchase price allocation for the Missouri Gas acquisition are shown below. (See Note 7, for the information on the purchase price financing). Assets and liabilities are valued at fair
88
Table of Contents
THE EMPIRE DISTRICT ELECTRIC COMPANY
NOTES TO CONSOLIDATED FINANCIAL STATEMENTS (Continued)
value. In the case of property, plant and equipment, fair value is calculated in a manner consistent with the amount recoverable for regulatory treatment.
| | | | | |
(in thousands)
| | Missouri Gas | |
|---|
Purchase Price: | | | | |
| | Cash paid | | $ | 102,502 | |
| | Acquisition costs | | | 2,447 | |
| | | | |
Total | | $ | 104,949 | |
| | | | |
Allocation: | | | | |
| | Property, plant and equipment | | $ | 52,226 | |
| | Current assets | | | 15,292 | |
| | Goodwill | | | 39,492 | |
| | Other assets | | | 11,082 | |
| | Other liabilities | | | (13,143 | ) |
| | | | |
Total | | $ | 104,949 | |
| | | | |
The 2007 changes to the goodwill reflect minor true-up items primarily relating to accounts receivable and pension adjustments in the first quarter.
The following presents certain consolidated pro forma financial information for the year ended December 31, 2006. These estimates are based on historical results of the Missouri Gas operations, provided to us by Aquila, Inc., and are unaudited. In addition, they do not include the effects of any financing costs (in thousands).
| | | | |
| | 2006 | |
|---|
Pro forma revenues | | $ | 441,815 | |
Pro forma net income from continuing operations | | $ | 41,586 | |
Pro forma earnings per share from continuing operations —
basic and diluted | | $ | 1.38 | |
89
Table of Contents
THE EMPIRE DISTRICT ELECTRIC COMPANY
NOTES TO CONSOLIDATED FINANCIAL STATEMENTS (Continued)
3. Property, Plant and Equipment
Our total property, plant and equipment are summarized below (in thousands).
| | | | | | | | |
| | December 31, | |
|---|
| | 2008 | | 2007 | |
|---|
Electric plant | | | | | | | |
| | Production | | $ | 589,117 | | $ | 550,339 | |
| | Transmission | | | 197,450 | | | 191,595 | |
| | Distribution | | | 625,919 | | | 596,245 | |
| | General(1) | | | 72,749 | | | 71,038 | |
| | | | | | |
| | Electric plant | | | 1,485,235 | | | 1,409,217 | |
Less accumulated depreciation and amortization | | | 511,750 | | | 476,657 | |
| | | | | | |
| | Electric plant net of depreciation and amortization | | | 973,485 | | | 932,560 | |
Construction work in progress | | | 289,108 | | | 166,685 | |
| | | | | | |
| | Net electric plant | | | 1,262,593 | | | 1,099,245 | |
| | | | | | |
Gas plant | | |
56,282 | | |
54,715 | |
Less accumulated depreciation and amortization | | | 4,599 | | | 2,936 | |
| | | | | | |
| | Gas plant net of accumulated depreciation | | | 51,683 | | | 51,779 | |
Construction work in progress | | | 291 | | | 220 | |
| | | | | | |
| | Net gas plant | | | 51,974 | | | 51,999 | |
| | | | | | |
Water plant | | |
10,560 | | |
10,353 | |
Less accumulated depreciation and amortization | | | 3,396 | | | 3,145 | |
| | | | | | |
| | Water plant net of depreciation and amortization | | | 7,164 | | | 7,208 | |
Construction work in progress | | | 56 | | | 60 | |
| | | | | | |
| | Net water plant | | | 7,220 | | | 7,268 | |
| | | | | | |
Other | | | | | | | |
| | Fiber | | | 28,478 | | | 26,310 | |
| | Other non-regulated property | | | 3 | | | 45 | |
Less accumulated depreciation and amortization | | | 7,500 | | | 6,078 | |
| | | | | | |
| | Non-regulated net of depreciation and amortization | | | 20,981 | | | 20,277 | |
Construction work in progress | | | 5 | | | 84 | |
| | | | | | |
| | Net non-regulated property | | | 20,986 | | | 20,361 | |
| | | | | | |
TOTAL NET PLANT AND PROPERTY | |
$ |
1,342,773 | |
$ |
1,178,873 | |
| | | | | | |
- (1)
- Includes intangible property of $11.9 and $11.6 million as of December 31, 2008 and 2007 respectively, primarily related to capitalized software. Accumulated amortization related to this property in 2008 and 2007 was $7.8 and $6.9 million respectively.
90
Table of Contents
THE EMPIRE DISTRICT ELECTRIC COMPANY
NOTES TO CONSOLIDATED FINANCIAL STATEMENTS (Continued)
The table below summarizes the total provision for depreciation and the depreciation rates for continuing operations, both capitalized and expensed, for the years ended December 31 (in thousands):
| | | | | | | | | | | |
| | 2008 | | 2007 | | 2006 | |
|---|
Provision for depreciation | | | | | | | | | | |
| | Regulated — Electric and Water | | $ | 42,389 | | $ | 39,577 | | $ | 37,174 | |
| | Regulated — Gas | | | 2,016 | | | 1,967 | | | 1,104 | |
| | Non-Regulated | | | 1,319 | | | 1,077 | | | 877 | |
| | | | | | | | |
TOTAL | | | 45,724 | | | 42,621 | | | 39,155 | |
| | Amortization(1) | | | 9,132 | | | 11,310 | | | 777 | |
| | | | | | | | |
TOTAL | | $ | 54,856 | | $ | 53,931 | | $ | 39,932 | |
| | | | | | | | |
- (1)
- Includes $8.2 million and $10.4 million of regulatory amortization for 2008 and 2007 respectively. This was granted by the MPSC effective January 1, 2007 and updated August 23, 2008.
| | | | | | | | | | | |
Annual depreciation rates | | | | | | | | | | |
| | Electric and water | | | 3.0 | % | | 3.0 | % | | 3.0 | % |
| | Gas | | | 3.7 | % | | 3.7 | % | | 2.1 | % |
| | Non-Regulated | | | 4.8 | % | | 4.5 | % | | 4.4 | % |
TOTAL COMPANY | | | 3.0 | % | | 3.0 | % | | 2.9 | % |
The table below sets forth the average depreciation rate for each class of assets for each period presented:
| | | | | | | | | | | |
| | 2008 | | 2007 | | 2006 | |
|---|
Annual Weighted Average Depreciation Rate | | | | | | | | | | |
Electric fixed assets: | | | | | | | | | | |
| | Production plant | | | 2.2 | % | | 2.2 | % | | 2.2 | % |
| | Transmission plant | | | 2.3 | % | | 2.3 | % | | 2.3 | % |
| | Distribution plant | | | 3.6 | % | | 3.6 | % | | 3.5 | % |
| | General plant | | | 6.2 | % | | 6.1 | % | | 6.1 | % |
Water | | | 2.8 | % | | 2.7 | % | | 2.8 | % |
Gas(1) | | | 3.7 | % | | 3.7 | % | | 2.1 | % |
Non-regulated | | | 4.8 | % | | 4.5 | % | | 4.4 | % |
- (1)
- 2006 reflects a 7 month rate. On an annualized basis, the rate is 3.7%.
91
Table of Contents
THE EMPIRE DISTRICT ELECTRIC COMPANY
NOTES TO CONSOLIDATED FINANCIAL STATEMENTS (Continued)
4. Regulatory Matters
Rate Matters
We continually assess the need for rate relief in all of the jurisdictions we serve and file for such relief when necessary.
Electric Segment
The following table sets forth information regarding electric and water rate increases since January 1, 2006:
| | | | | | | | | | |
Jurisdiction | | Date
Requested | | Annual
Increase
Granted | | Percent
Increase
Granted | | Date
Effective |
|---|
Missouri — Electric | | October 1, 2007 | | $ | 22,040,395 | | | 6.70 | % | August 23, 2008 |
Missouri — Electric | | February 1, 2006 | | $ | 29,369,397 | | | 9.96 | % | January 1, 2007 |
Missouri — Water | | June 24, 2005 | | $ | 469,000 | | | 35.90 | % | February 4, 2006 |
Kansas — Electric | | April 29, 2005 | | $ | 2,150,000 | | | 12.67 | % | January 4, 2006 |
Missouri
2007 Rate Case
On October 1, 2007, we filed a request with the MPSC for an annual increase in base rates for our Missouri electric customers in the amount of $34.7 million, or 10.11%. We requested recovery of our investment in the new 150-megawatt combustion turbine, Unit 12, at our Riverton plant, capital expenditures associated with the construction of a selective catalytic reduction system at our Asbury Plant, capital expenditures and expenses related to the January and December 2007 ice storms and other changes in our underlying costs. We also requested implementation of a fuel adjustment clause in Missouri which would permit the distribution to Missouri customers of changes in fuel and purchased power costs.
The MPSC issued an order on July 30, 2008, granting an annual increase in revenues for our Missouri electric customers in the amount of $22.0 million, or 6.7%, based on a 10.8% return on equity. The new rates went into effect August 23, 2008.
The order contains two components. The first component provides an addition to base rates of approximately $27.7 million. This increase in base rates was partially offset by a $5.7 million reduction to regulatory amortization, which is the second component to support certain credit metrics of the overall change in revenue authorized by the MPSC. Regulatory amortization provides us additional cash through rates during the current construction cycle. This construction, which is part of our long-range plan to ensure reliability, includes the facilities at the Riverton Power Plant and Iatan 2 Power Plant, as well as environmental improvements at the Asbury Power Plant and at Iatan 1. The regulatory amortization is now approximately $4.5 million annually and is recorded as depreciation expense.
The MPSC also authorized a fuel adjustment clause for our Missouri customers effective September 1, 2008. The MPSC established a base cost for the recovery of fuel and purchased power expenses used to supply energy. The clause permits the distribution to customers of 95% of the changes in fuel and purchased power costs above or below the base cost. Off-system sales margins are also part of the recovery of fuel and purchased power costs. As a result, the off-system sales margin flows back to the customer. Rates related to the recovery of fuel and purchased power costs will be modified twice a year subject to the review and approval by the MPSC. In accordance with FAS 71, 95% of the difference
92
Table of Contents
THE EMPIRE DISTRICT ELECTRIC COMPANY
NOTES TO CONSOLIDATED FINANCIAL STATEMENTS (Continued)
between the actual cost of fuel and purchased power and the base cost of fuel and purchased power recovered from our customers is recorded as an adjustment to fuel and purchased power expense with a corresponding regulatory asset or a regulatory liability. If the actual fuel and purchased power costs are higher or lower than the base fuel and purchased power costs billed to customers, 95% of these amounts will be recovered or refunded to our customers when the fuel adjustment clause is modified. At December 31, 2008, Missouri fuel and purchased power costs were over-recovered $0.2 million, which is reflected as a regulatory liability.
The MPSC order approved a Stipulation and Agreement providing for the recovery of deferred expenses of approximately $14.2 million over a five year period for the 2007 ice storms. In addition, the MPSC order required the implementation of a two-way tracking mechanism for recovery of the costs relating to the new MPSC rules on infrastructure inspection and vegetation management. The mechanism authorized by the MPSC creates a regulatory liability in any year we spend less than the target amount, which has been set at $8.6 million for our Missouri jurisdiction, and a regulatory asset if we spend more than the target amount. Any regulatory asset and liability amounts created using the tracking mechanism will then be netted against each other and taken into account in our next rate case. The MPSC also approved Stipulations and Agreements providing for the continuation of the pension and other post-retirement employee benefits tracking mechanism established in our 2006 and 2007 Missouri rate orders.
The MPSC issued its Report and Order on July 30, 2008, effective August 9, 2008. The OPC and intervenors Praxair, Inc. and Explorer Pipeline Company filed applications for rehearing with the MPSC regarding this order. On August 12, 2008, the MPSC issued its Order Granting Expedited Treatment and Approving Compliance Tariff Sheets, effective August 23, 2008, in which the MPSC approved our tariff sheets containing our base rates for service rendered on and after August 23, 2008, and approved our fuel adjustment clause tariff sheets effective September 1, 2008. On September 3, 2008, the MPSC denied all pending applications for rehearing.
On October 2, 2008, the OPC and intervenors Praxair, Inc. and Explorer Pipeline Company filed Petitions for Writ of Review with the Cole County Circuit Court. These actions were consolidated into one proceeding, and briefs are currently being filed with the Cole County Circuit Court.
2006 Rate Case
On February 1, 2006, we filed a request with the MPSC for an annual increase in base rates for our Missouri electric customers in the amount of $29.5 million, or 9.63%. We also requested transition from the interim energy charge (IEC) from an earlier case to Missouri's new fuel adjustment mechanism. The MPSC issued an order May 2, 2006 ruling that while we may have the option of requesting that the IEC be terminated, we may not request the implementation of an energy cost recovery mechanism while the current IEC is effective. The MPSC issued an order on December 21, 2006 granting us an annual increase of $29.4 million, or 9.96%, with an effective date of January 1, 2007 and eliminating the IEC. Pursuant to this order, the collected IEC revenue was not refunded. The increase included an authorized return on equity of 10.9% and included our fuel and energy costs as a component of base electric rates. This order also allowed deferral of any other postretirement benefits that are different from those allowed recovery in this rate case. This treatment is similar to treatment afforded pension costs in our 2005 rate case. This order also approved regulatory treatment of additional liabilities arising from the adoption of FAS 158. We also agreed to write off $1 million of the construction cost associated with our Energy Center Units 3 and 4. The Missouri jurisdictional portion of this agreement resulted in a pre-tax write-off of $0.8 million in the fourth quarter of 2006.
93
Table of Contents
THE EMPIRE DISTRICT ELECTRIC COMPANY
NOTES TO CONSOLIDATED FINANCIAL STATEMENTS (Continued)
The $29.4 million authorized increase in annual revenues included $19 million in base rate revenue and $10.4 million in "regulatory amortization." The regulatory amortization, which is treated as additional book depreciation for rate-making purposes and is so reflected in the financial statements, was granted to provide additional cash flow to enhance the financial support for our current generation expansion plan. This regulatory amortization is related to our investment in Iatan 2 and also includes our Riverton V84-3A2 combustion turbine (Unit 12) and the environmental improvements and upgrades at Asbury and Iatan 1, all of which are part of the Experimental Regulatory Plan approved by the MPSC subject to a subsequent prudence review of actual expenditures. Amounts granted as regulatory amortization will reduce our rate base used in determining our base rates in subsequent rate cases.
On March 19, 2007, the OPC filed a Petition for Writ of Mandamus with the Missouri Supreme Court regarding the MPSC's order approving our tariffs issued on December 29, 2006. On October 30, 2007, the Missouri Supreme Court issued an opinion directing the MPSC to vacate its order approving tariffs and allow the OPC a reasonable amount of time to prepare and file an application for rehearing. The Court did not examine the lawfulness or reasonableness of the substance of the MPSC's order approving tariffs, and considered only the timing of the issuance of the order. The Court also did not consider the underlying tariff rates.
Acting upon the opinion of the Missouri Supreme Court, the MPSC issued an order on December 4, 2007, effective December 14, 2007, vacating the December 29, 2006 order and re-approving the tariffs and the same resulting increase in rates. The OPC and intervenors Praxair, Inc. and Explorer Pipeline Company, filed applications for rehearing with the MPSC regarding this order.
On March 26, 2008, the MPSC issued its Order Granting Reconsideration of Report and Order, effective April 5, 2008, and its Report and Order Upon Reconsideration, effective April 5, 2008, in which the MPSC made additional findings and reaffirmed the rate increase originally authorized in December of 2006. In this order, the MPSC made two adjustments, and an increase in the return on rate base was offset by a decrease in the regulatory amortization from $10.4 million to $10.2 million. The OPC and intervenors Praxair and Explorer Pipeline filed applications for rehearing regarding this Report and Order Upon Reconsideration, raising objections to many of the issues addressed in the order, including but not limited to issues relating to return on equity and fuel and purchased power expense.
On March 18, 2008, the OPC filed a second Petition for Writ of Mandamus with the Missouri Supreme Court regarding the MPSC's order approving our tariffs issued on December 29, 2006 and the MPSC's vacation order issued on December 4, 2007. On October 14, 2008, the Missouri Supreme Court issued a ruling directing the MPSC to comply with the Court's previous mandate and opinion. The Court took no position on the effect such action has on any tariffs the MPSC had approved. It is our position that the opinion and mandate do not impact the monies collected under the filed tariffs. On November 14, 2008, the MPSC issued an order in compliance with the Court's mandate.
All pending applications for rehearing in the 2006 rate case were denied by the MPSC on November 20, 2008. On December 15, 2008, the OPC filed a Petition for Writ of Review with the Cole County Circuit Court regarding the MPSC's decisions in our 2006 rate case. Praxair and Explorer Pipeline filed a Petition for Writ of Review on December 19, 2008. These actions were consolidated into one proceeding.
Kansas
On April 29, 2005, we filed a request with the Kansas Corporation Commission (KCC) for an increase in base rates for our Kansas electric customers in the amount of $4.2 million, or 24.64%. On October 4, 2005, we and the KCC Staff filed a Motion to Approve Joint Stipulated Settlement Agreement
94
Table of Contents
THE EMPIRE DISTRICT ELECTRIC COMPANY
NOTES TO CONSOLIDATED FINANCIAL STATEMENTS (Continued)
(Agreement) with the KCC. The Agreement called for an annual increase in base rates (which includes historical fuel costs) for our Kansas electric customers of approximately $2,150,000, or 12.67%, the implementation of an Energy Cost Adjustment Clause (ECA), a fuel rider that will collect or refund fuel costs in the future that are above or below the fuel costs included in the base rates and the adoption of the same depreciation rates approved by the MPSC in our 2005 Missouri rate case. In addition, we were allowed to change our recognition of pension costs, deferring the Kansas portion of any costs above or below the amount included in this rate case as a regulatory asset or liability. The KCC approved the Agreement on December 9, 2005 effective January 4, 2006. Pursuant to the Agreement, we sought KCC approval of an explicit natural gas hedging program in a separate docket by March 1, 2006. We requested and received an extension until April 1, 2006 and made this filing on March 30, 2006, which was denied in a February 4, 2008 order by the KCC. As a result, all gains or losses related to the financial instruments used to fix the future price of natural gas will be excluded from the Energy Cost Adjustment clause implemented in the last Kansas rate case and future base electric rates in Kansas.
Ice Storm Recovery
We filed applications for Accounting Authority Orders in Oklahoma and Kansas and filed a request for storm recovery in Arkansas respecting costs incurred due to two major ice storms in 2007. On May 23, 2008, the Arkansas Public Service Commission issued an Order allowing us to defer approximately $0.4 million of extraordinary incremental expenses incurred as a result of the 2007 ice storms as a regulatory asset and amortize such costs over a 5 year period beginning with the first full month following the storms. On June 24, 2008, the KCC issued an Order approving our application for an accounting order to accumulate and defer for recovery in future rate case proceedings, approximately $1.1 million of 2007 ice storm costs as a regulatory asset to be amortized over a 10 year period. On June 25, 2008, the Corporation Commission of Oklahoma issued a Final Order approving a Joint Stipulation and Settlement Agreement permitting deferral and recording of approximately $0.5 million of 2007 ice storm costs as a regulatory asset and authorizing recovery of the regulatory asset over a five year period, via a rider effective July 1, 2008. We were granted rate recovery of the Missouri ice storm costs as part of the order issued by the MPSC on July 30, 2008 as discussed above.
Gas Segment
On June 1, 2006, The Empire District Gas Company acquired the Missouri natural gas distribution operations of Aquila, Inc. (Missouri Gas). The Missouri Gas properties consist of 44 Missouri communities in northwest, north central and west central Missouri. The rates, excluding the cost of gas, are the same as had been in effect at Aquila, Inc. We agreed in the unanimous stipulation and agreement filed with the MPSC on March 1, 2006 and approved on April 18, 2006, to not file a rate increase request for non-gas costs for a period of 36 months following the closing date of the acquisition. We expect to file a gas rate case in 2009 as the 36 month limitation expires on June 1, 2009. We have also agreed to use Aquila Inc.'s current depreciation rates and were allowed to adopt the pension cost recovery methodology approved in our electric 2005 Missouri Rate Case.
A PGA clause is included in our gas rates which allows for the over recovery or under recovery of actual gas costs compared to the cost of gas in the PGA rate. This PGA clause allows us to make rate changes periodically (up to four times) throughout the year in response to weather conditions, natural gas prices and supply demands, rather than in one possibly extreme change per year. The Actual Cost Adjustment (ACA) is a scheduled yearly filing with the MPSC filed between October 15 and November 4 each year. This filing establishes the amount to be recovered from customers for the over/under recovered yearly amounts. A PGA is included in the ACA filing. An optional PGA filing without the ACA can be
95
Table of Contents
THE EMPIRE DISTRICT ELECTRIC COMPANY
NOTES TO CONSOLIDATED FINANCIAL STATEMENTS (Continued)
filed up to three times each year, provided a filing does not occur within 60 days of a previous filing. On October 28, 2008, we filed a new ACA and PGA with the MPSC that was effective November 12, 2008.
Competition
Electric Segment
SPP-RTO
On February 1, 2007, the Southwest Power Pool (SPP) regional transmission organization (RTO) launched its energy imbalance services market (EIS). With the implementation of the SPP RTO EIS market and transmission expansion plans of the SPP RTO, we anticipate that our continued participation in the SPP will provide long-term benefits to our customers and other stakeholders. Our experience to date in the EIS market indicates that we have received benefits through our participation.
In general, the SPP RTO EIS market is providing real time energy for most participating members within the SPP regional footprint. Imbalance energy prices are based on market bids and status/availability of dispatchable generation and transmission within the SPP market footprint. In addition to energy imbalance service, the SPP RTO performs a real time security-constrained economic dispatch of all generation voluntarily offered into the EIS market to the market participants to also serve the native load.
We will continue to actively engage with the SPP RTO, other members of the SPP and staffs of our state commissions to evaluate the impact and value of EIS market participation.
On August 15, 2008 the SPP filed with the FERC proposed revisions to its open access transmission pro forma tariff (OATT) to establish a process for including a "balanced portfolio" of economic transmission upgrades in the annual SPP Transmission Expansion Plan. The cost of such upgrades will be recovered through a regional rate allocated to SPP members based on their load ratio share within SPP's market area of the balanced portfolio's cost. On October 16, 2008, the FERC accepted the balanced portfolio approach, which sets forth the selection process of a group of projects and regional cost allocation rules based on projected benefits and allocated costs over a ten year period. The plan will be balanced if the portfolio is cost beneficial for each zone, including ours, within the SPP. A balanced portfolio could include projects below the 345 kv level (which is the bright line voltage level for projects to be included in the portfolio) to increase benefits to a particular zone to achieve balance of benefits and costs over the ten year study period. We continue our involvement in the discussions regarding the proposed projects, estimated benefits, and costs regarding SPP's first balanced portfolio. However, we are uncertain, at this time, what the benefits and costs of the first balanced portfolio will be for us. It is anticipated that the SPP Regional State Committee (composed of commissioners from the state commissions within the SPP footprint) will endorse, and the SPP Board of Directors will approve, the first SPP RTO balanced portfolio of economic transmission projects sometime in 2009.
FERC Market Power Order
On March 3, 2005, the FERC issued an order commencing an investigation to determine if we had market power within our control area based on our failure to meet one of the FERC's wholesale market share screens. We filed responses to that order in May and June 2005 and in early January 2006. On August 15, 2006, the FERC issued its order accepting Empire's proposed mitigation to become effective May 16, 2005, subject to a further compliance filing as directed in the order. Relying on a series of orders issued since March 17, 2006 in other proceedings, the FERC rejected our tariff language and directed us to file revisions to our market-based tariff to provide that service under the tariff applies only to sales outside our control area. The FERC directed us to make refunds, with interest, by September 15, 2006, which we
96
Table of Contents
THE EMPIRE DISTRICT ELECTRIC COMPANY
NOTES TO CONSOLIDATED FINANCIAL STATEMENTS (Continued)
initially estimated to be approximately $0.6 million (excluding interest) covering over 1,000 hourly energy sales since May 16, 2005 to numerous counterparties external to our system for wholesale sales made at market prices above the cost based prices permitted under the mitigation proposal accepted by the FERC. The refund obligation applied to certain wholesale power sales made "inside" our service area at market based rates, even though consumption of the energy occurred outside our service area. In response to the order, we filed a Motion For Extension of time and expedited treatment regarding the refund and requested that such refund be delayed until 15 days after the FERC's order on our rehearing request. On September 5, 2006, the FERC granted the Motion For Extension, as requested.
On September 14, 2006, we filed a Request For Rehearing of the FERC's August 15, 2006 order regarding the refund and market power mitigation we had proposed. We requested a rehearing and a waiver of the refund requirement in its entirety. On April 25, 2008, the FERC issued an Order that rejected our Request For Rehearing, required a Compliance Filing of our market based rate tariff and ordered refunds with interest. We made our Compliance Filing and issued refunds totaling $340,608, including interest, on May 27, 2008. We were also required to file an informational refund report with the FERC on June 26, 2008.
As a result of the FERC's requirement for us to issue the aforementioned refunds and our belief that the FERC erred in its orders, on June 30, 2008 we initiated a Petition For Review of the FERC's orders on our market based rate refunds in the United States Court of Appeals for the District of Columbia Circuit (DC Circuit). We requested and received approval for a consolidation of our Petition with a similar petition by Westar Energy. If a decision is reached in our favor, the DC Circuit will likely remand the FERC's orders back to the FERC for reconsideration. It is expected that the judicial review of the Petitions will take several months.
Other FERC Rulemaking
On June 21, 2007, the FERC issued an Advance Notice of Proposed Rulemaking (ANOPR) on potential reforms to improve operations in organized wholesale power markets, such as the SPP RTO in which we participate. On October 16, 2008, the FERC issued its Final Order on Wholesale Competition in Regions with Organized Electric Markets. The Final Order will affect us as it directly affects the SPP RTO. The Final Order addresses four key areas for amending its regulations in Wholesale Competition for RTOs and Independent System Operators (ISOs): (1) demand response and market pricing during periods of operating reserve shortage; (2) long-term power contracting; (3) market monitoring policies; and (4) the responsiveness of RTOs and ISOs to stakeholders and customers. We will be involved in the SPP RTOs discussions on compliance of these new rules.
On January 28, 2008, we filed with the FERC certain non-rate and ministerial revisions to our currently effective wholesale Open Access Transmission Tariff (OATT), which included the elimination of certain tariff sections that have become moot in light of our membership in the SPP, as well as correction of the formatting of our OATT for consistency with a previous FERC order, Order No. 614.
On April 2, 2008, the FERC accepted our revised OATT, as filed, with an effective date of January 29, 2008.
Gas Segment
Non-residential gas customers whose annual usage exceeds certain amounts may purchase natural gas from a source other than EDG. EDG does not have a non-regulated energy marketing service that sells natural gas in competition with outside sources. EDG continues to receive non-gas related revenues for distribution and other services if natural gas is purchased from another source by our eligible customers.
97
Table of Contents
THE EMPIRE DISTRICT ELECTRIC COMPANY
NOTES TO CONSOLIDATED FINANCIAL STATEMENTS (Continued)
Other — Rate Matters
In accordance with FAS 71, we currently have deferred approximately $0.6 million of expense related to rate cases under other non-current assets and deferred charges of which $0.5 million is related to the 2007 Missouri rate case. This amount is being amortized over varying periods based upon the completion of the specific cases. Based on past history, we expect all these expenses to be recovered in rates.
Regulatory Assets and Liabilities and Other Deferred Credits
We have recorded the following regulatory assets and regulatory liabilities (in thousands).
| | | | | | | |
| | December 31, | |
|---|
| | 2008 | | 2007 | |
|---|
Regulatory Assets | | | | | | | |
Unrecovered purchase gas costs — current | | $ | 2,033 | | $ | — | |
Income taxes | | | 34,515 | | | 30,947 | |
Unamortized loss on reacquired debt | | | 13,490 | | | 14,813 | |
Unamortized loss on interest rate derivative | | | 2,405 | | | 2,719 | |
Asbury five-year maintenance | | | 1,855 | | | 2,054 | |
Pension and other postretirement benefits(1) | | | 84,926 | | | 22,760 | |
Ice storm costs | | | 14,704 | | | 15,518 | |
Asset retirement obligation | | | 3,118 | | | 2,971 | |
Unrecovered purchased gas costs — gas segment | | | 3,787 | | | — | |
Unsettled derivative losses — electric segment | | | 1,218 | | | — | |
Other | | | 2,008 | | | 1,003 | |
| | | | | | |
TOTAL REGULATORY ASSETS | | $ | 164,059 | | $ | 92,785 | |
| | | | | | |
Regulatory Liabilities | | | | | | | |
Income taxes | | $ | 11,126 | | $ | 11,214 | |
Unamortized gain on interest rate derivative | | | 4,221 | | | 4,391 | |
Costs of removal | | | 43,713 | | | 35,724 | |
Pension and other postretirement benefits(2) | | | 7,042 | | | 5,126 | |
Missouri over recovered fuel and purchased power costs | | | 228 | | | — | |
Other | | | 255 | | | 1,652 | |
| | | | | | |
TOTAL REGULATORY LIABILITIES | | $ | 66,585 | | $ | 58,107 | |
| | | | | | |
- (1)
- Primarily reflects regulatory assets resulting from the effects of FAS 158 and regulatory accounting for EDG acquisition costs. Approximately $0.6 million in pension and other postretirement benefit costs have been recognized since January 1, 2008 to reflect the amortization of the regulatory assets that were recorded at the time of the acquisition of the Aquila, Inc. gas properties.
- (2)
- Includes the effect of costs incurred that are more or less than those allowed in rates for the Missouri (EDE and EDG) and Kansas (EDE) portion of pension costs and the Missouri EDE portion of other postretirement benefit costs. Since January 1, 2008, approximately $1.9 million in additional regulatory liabilities and corresponding expense increases have been recognized as a result of this ratemaking treatment.
98
Table of Contents
THE EMPIRE DISTRICT ELECTRIC COMPANY
NOTES TO CONSOLIDATED FINANCIAL STATEMENTS (Continued)
Unamortized losses on debt and losses on interest rate derivatives are not included in rate base, but are included in our capital structure for rate base purposes. The remainder of our regulatory assets are not included in rate base, generally because they are not cash items or they are earning carrying costs. However, as of December 31, 2008, the costs of all of our regulatory assets are currently being recovered except for approximately $78.8 million of pension and other postretirement costs primarily related to the additional liabilities for future pension and OPEB costs recorded under FAS 158. The amount and timing of recovery of this item will be based on the changing funded status of the pension and OPEB plans in future periods.
The regulatory income tax assets and liabilities are generally amortized over the average depreciable life of the related assets. The loss on reacquired debt and the loss and gain on interest rate derivatives are amortized over the life of the related new debt issue, which currently ranges from 4 to 26 years. The unrecovered fuel costs are generally recovered within a year following their recognition. Ice storm costs and the Asbury five-year maintenance costs are recovered over five years. Pension and other postretirement benefit tracking mechanisms are recovered over a five year period.
5. Common Stock
Recent Issues
On December 12, 2007, we sold 3,000,000 shares of our common stock in an underwritten public offering for $23.00 per share. The sale resulted in net proceeds of approximately $65.8 million ($69.0 million less issuance costs of $3.2 million). The proceeds were used to pay down short-term debt incurred, in part, as a result of our ongoing construction program.
Stock Based Compensation
We have several stock-based awards and programs, which are described below. As of December 31, 2008, our performance based restricted stock awards, stock options and their related dividend equivalents have been revalued as liability awards, in accordance with fair value guidelines. We allow employees to elect to have taxes in excess of the minimum statutory requirements withheld from their awards and, therefore, the awards are classified as liability instruments under FAS 123(R) "Share Based Payment" (paragraph 35). Awards treated as liability instruments must be revalued each period until settled, and cost is accrued over the requisite service period and adjusted to fair value at each reporting period until settlement or expiration of the award.
We recognized the following amounts in compensation expense and tax benefits for all of our stock-based awards and programs for the applicable years ended December 31 (in thousands):
| | | | | | | | | | |
| | 2008 | | 2007 | | 2006 | |
|---|
Compensation expense | | $ | 1,841 | | $ | 2,122 | | $ | 1,670 | |
Tax benefit recognized | | | 659 | | | 772 | | | 599 | |
Stock Incentive Plans
Our 1996 Incentive Plan (the 1996 Stock Incentive Plan) provided for the grant of up to 650,000 shares of common stock through January 2006. The 1996 Stock Incentive Plan permitted grants of stock options and restricted stock to qualified employees and permitted Directors to receive common stock in lieu of cash compensation for service as a Director. Our 2006 Stock Incentive Plan (the 2006 Incentive Plan) was adopted by shareholders at the annual meeting on April 28, 2005 and provides for grants of up to
99
Table of Contents
THE EMPIRE DISTRICT ELECTRIC COMPANY
NOTES TO CONSOLIDATED FINANCIAL STATEMENTS (Continued)
650,000 shares of common stock through January 2016. The 2006 Stock Incentive Plan permits grants of stock options and restricted stock to qualified employees and permits Directors and, if approved by the Compensation Committee of the Board of Directors, qualified employees to receive common stock in lieu of cash. Executive officers and other senior managers applied to receive annual incentive awards related to 2008 performance in the form of Empire common stock rather than cash. These requests were granted by the Compensation Committee of the Board of Directors under the terms of our 2006 Stock Incentive Plan. The terms of the 2006 Incentive Plan are substantially the same as the 1996 Stock Incentive Plan. Awards made prior to 2006 were made under the 1996 Stock Incentive Plan. Awards made on or after January 1, 2006 are made under the 2006 Incentive Plan. The terms and conditions of any option or stock grant are determined by the Board of Directors Compensation Committee, within the provisions of these Stock Incentive Plans.
Performance-Based Restricted Stock Awards
Performance-based restricted stock awards are granted to qualified individuals consisting of the right to receive a number of shares of common stock at the end of the restricted period assuming performance criteria are met. The performance measure for the award is the total return to our shareholders over a three-year period compared with an investor-owned utility peer group. The threshold level of performance under the 2006, 2007 and 2008 grants was set at the 20th percentile level of the peer group, target at the 50th percentile level, and the maximum at the 80th percentile level. Shares would be earned at the end of the three-year performance period as follows: 100% of the target number of shares if the target level of performance is reached, 50% if the threshold is reached, and 200% if the percentile ranking is at or above the maximum, with the number of shares interpolated between these levels. However, no shares would be payable if the threshold level is not reached. As noted above, all performance-based restricted stock awards are classified as liability instruments, which must be revalued each period until settled. The fair value of the outstanding restricted stock awards was estimated as of December 31, 2008 using a Monte Carlo option valuation model. The 2008 valuation represents the estimated December 31, 2008 fair value for all awards granted in previous years, but not yet awarded. The 2007 grant value reflects the assumptions used for the fair value as of the grant date for awards outstanding. The assumptions used in the model for each grant year are noted in the following table:
| | | | |
| | Fair Value of Grants Outstanding at December 31, |
|---|
| | 2008 | | 2007 |
|---|
Risk-free interest rate | | 0.37% to 0.66% | | 4.5% to 5.09% |
Expected volatility of Empire stock | | 26.6% | | 15.2% to 16.6% |
Expected volatility of peer group stock | | 20.5% to 68.7% | | 18.9% to 19.8% |
Expected dividend yield on Empire stock | | 6.4% | | 5.6% to 5.8% |
Expected forfeiture rates | | 3% | | 3% |
Plan cycle | | 3 years | | 3 years |
Fair value percentage | | 99.0% to 124.0% | | 107.7% to 108.1% |
Weighted average fair value per share | | $19.23 | | $23.02 |
100
Table of Contents
THE EMPIRE DISTRICT ELECTRIC COMPANY
NOTES TO CONSOLIDATED FINANCIAL STATEMENTS (Continued)
Non-vested restricted stock awards (based on target number) as of December 31, 2008, 2007 and 2006 and changes during the year ended December 31, 2008, 2007 and 2006 were as follows:
| | | | | | | | | | | | | | | | | | | |
| | 2008 | | 2007 | | 2006 | |
|---|
| | Number of
Shares | | Weighted
Average
Grant Date
Fair Value | | Number of
Shares | | Weighted
Average
Grant Date
Fair Value | | Number of
Shares | | Weighted
Average
Grant Date
Fair Value | |
|---|
Nonvested at January 1, | | | 43,400 | | $ | 23.02 | | | 38,800 | | $ | 22.25 | | | 40,300 | | $ | 20.76 | |
Granted | | | 21,000 | | $ | 21.92 | | | 17,700 | | $ | 23.81 | | | 13,600 | | $ | 22.23 | |
Awarded | | | (6,486 | ) | $ | 22.77 | | | (7,598 | ) | $ | 21.79 | | | (7,954 | ) | $ | 18.25 | |
Not awarded | | | (5,614 | ) | $ | — | | | (5,502 | ) | $ | — | | | (7,146 | ) | $ | — | |
| | | | | | | | | | | | | | | | | |
Nonvested at December 31, | | | 52,300 | | $ | 22.64 | | | 43,400 | | $ | 23.02 | | | 38,800 | | $ | 22.25 | |
At December 31, 2008 and 2007, unrecognized compensation expense related to estimated outstanding awards was $0.4 million, respectively.
Stock Options
Stock options are issued with an exercise price equal to the fair market value of the shares on the date of grant, become exercisable after three years and expire ten years after the date granted. Participants' options that are not vested become forfeited when participants leave Empire except for terminations of employment under certain specified circumstances. Dividend equivalent awards are also issued to the recipients of the stock options under which dividend equivalents will be accumulated for the three-year period until the option becomes exercisable. Dividend equivalents cease to be accumulated on the date that a participant leaves Empire, and the accumulated dividend equivalents are forfeited when a participant leaves the Company, except for terminations of employment under certain specified circumstances. The fair value per dividend equivalent outstanding at December 31, 2008, 2007 and 2006 were $3.79, $3.82 and $3.84, respectively.
The dividend equivalents are accumulated for the three-year period and are converted to shares of common stock based on the fair market value of the shares on the date converted. To be in compliance with Section 409A of the Internal Revenue Code, added by the American Jobs Creation Act of 2004, the dividend equivalent awards were changed to vest and be payable in fully vested shares of our common stock on the third anniversary of the grant date (conversion date) or at a change in control and not dependent upon the exercise of the related option. This modification did not have a material impact on our financial statements.
As noted above, all outstanding stock option awards are now classified as liability instruments, which must be revalued each period until settled. Stock option grants vest upon satisfaction of service conditions. The cost of the awards is generally recognized over the requisite (explicit) service period. The fair value of
101
Table of Contents
THE EMPIRE DISTRICT ELECTRIC COMPANY
NOTES TO CONSOLIDATED FINANCIAL STATEMENTS (Continued)
the outstanding options was estimated as of December 31, 2008 and 2007, under a Black-Scholes methodology. The assumptions used in the valuations are shown below:
| | | | |
| | Fair Value of Grants Outstanding at December 31, |
|---|
| | 2008 | | 2007 |
|---|
Risk-free interest rate | | 0.85% to 1.70% | | 3.3% to 4.7% |
Dividend yield | | 6.4% | | 5.3% to 6.2% |
Expected volatility | | 24.0% | | 15.5% to 18.1% |
Expected life in months | | 78 | | 60 |
Market value | | $17.60 | | n/a |
Weighted average fair value per option | | $0.78 | | $2.71 |
A summary of option activity under the plan during the year ended December 31, 2008, 2007 and 2006 is presented below:
| | | | | | | | | | | | | | | | | | | |
| | 2008 | | 2007 | | 2006 | |
|---|
| | Options | | Weighted
Average
Exercise
Price | | Options | | Weighted
Average
Exercise
Price | | Options | | Weighted
Average
Exercise
Price | |
|---|
Outstanding at January 1, | | | 149,200 | | $ | 23.04 | | | 135,000 | | $ | 22.21 | | | 142,500 | | $ | 20.84 | |
Granted | | | 56,400 | | $ | 21.92 | | | 64,200 | | $ | 23.81 | | | 41,700 | | $ | 22.23 | |
Exercised | | | — | | $ | — | | | (50,000 | ) | $ | 21.79 | | | (49,200 | ) | $ | 18.25 | |
| | | | | | | | | | | | | | | | | |
Outstanding at December 31, | | | 205,600 | | $ | 22.73 | | | 149,200 | | $ | 23.04 | | | 135,000 | | $ | 22.21 | |
| | | | | | | | | | | | | | | | | |
Exercisable, end of year | | | 43,300 | | $ | 22.67 | | | 4,200 | | $ | 21.79 | | | — | | $ | — | |
| | | | | | | | | | | | | | | | | |
The aggregate intrinsic value at December 31, 2008, 2007 and 2006 was approximately $0.0 million, $0.0 million and $0.3 million, respectively. The intrinsic value of the unexercised options is the difference between the Company's closing stock price on the last day of the period and the exercise price multiplied by the number of in-the-money options, had all option holders exercised their options on the last day of the period.
The range of exercise prices for the options outstanding at December 31, 2008 was $21.79 to $23.81. The weighted-average remaining contractual life of outstanding options at December 31, 2008, 2007 and 2006 was 7.1, 7.6 and 8.1 years, respectively. As of December 31, 2008, this includes 43,300 shares at the weighted average price of $22.67, which are vested and exercisable. All others are non-vested. As of December 31, 2008 and 2007, there was $0.3 million, each year respectively, of unrecognized compensation expense.
Employee Stock Purchase Plan
Our Employee Stock Purchase Plan (ESPP) permits the grant to eligible employees of options to purchase common stock at 90% of the lower of market value at date of grant or at date of exercise. The lookback feature of this plan is valued at 90% of the Black-Scholes methodology plus 10% of the
102
Table of Contents
THE EMPIRE DISTRICT ELECTRIC COMPANY
NOTES TO CONSOLIDATED FINANCIAL STATEMENTS (Continued)
maximum subscription price. As of December 31, 2008, there were 442,009 shares available for issuance in this plan. The adoption of FAS 123(R) did not change the valuation of the options granted under this plan.
| | | | | | | | | | |
| | 2008 | | 2007 | | 2006 | |
|---|
Subscriptions outstanding at December 31, | | | 48,413 | | | 40,672 | | | 38,707 | |
Maximum subscription price | | $ | 18.57 | (1) | $ | 21.23 | | $ | 20.05 | |
Shares of stock issued | | | 38,803 | | | 37,686 | | | 39,322 | |
Stock issuance price | | $ | 18.61 | | $ | 20.05 | | $ | 19.62 | |
- (1)
- Stock will be issued on the closing date of the purchase period, which runs from June 1, 2008 to May 31, 2009.
Assumptions for valuation of these shares are shown in the table below.
| | | | | | | | | | |
| | 2008 | | 2007 | | 2006 | |
|---|
Weighted average fair value of grants | | $ | 3.46 | | $ | 3.40 | | $ | 3.19 | |
Risk-free interest rate | | | 2.17 | % | | 4.98 | % | | 5.02 | % |
Dividend yield | | | 6.20 | % | | 5.43 | % | | 5.75 | % |
Expected volatility(1) | | | 26.00 | % | | 18.01 | % | | 18.30 | % |
Expected life in months | | | 12 | | | 12 | | | 12 | |
Grant date | | | 6/2/08 | | | 6/1/07 | | | 6/1/06
| |
- (1)
- One-year historic volatility
Stock Unit Plan for Directors
Our Stock Unit Plan for directors (Stock Unit Plan) provides a stock-based compensation program for directors. This plan enhances our ability to attract and retain competent and experienced directors and allows the directors the opportunity to accumulate compensation in the form of common stock units. The Stock Unit Plan also provides directors the opportunity to convert previously earned cash retirement benefits to common stock units. All eligible directors who had benefits under the prior cash retirement plan converted their cash retirement benefits to common stock units.
A total of 400,000 shares are authorized under this plan. Each common stock unit earns dividends in the form of common stock units and can be redeemed for shares of common stock. The number of units granted annually is computed by dividing an annual credit (determined by the Compensation Committee) by the fair market value of our common stock on January 1 of the year the units are granted. Common stock unit dividends are computed based on the fair market value of our stock on the dividend's record date. We record the related compensation expense at the time we make the accrual for the directors' benefits as the directors provide services. At December 31, 2008 and 2007, there were 114,725 and 97,231 shares accrued to directors' accounts, respectively; and 352,722 and 356,206 shares available for issuance under this plan, respectively.
| | | | | | | | | | |
| | 2008 | | 2007 | | 2006 | |
|---|
Units accrued for service and dividends | | | 20,979 | | | 17,849 | | | 15,541 | |
Units redeemed for common stock | | | 3,484 | | | 3,299 | | | 3,119 | |
103
Table of Contents
THE EMPIRE DISTRICT ELECTRIC COMPANY
NOTES TO CONSOLIDATED FINANCIAL STATEMENTS (Continued)
401(k) Plan and ESOP
Our Employee 401(k) Plan and ESOP (the 401(k) Plan) allows participating employees to defer up to 25% of their annual compensation up to an Internal Revenue Service specified limit. We match 50% of each employee's deferrals by contributing shares of our common stock, with such matching contributions not to exceed 3% of the employee's eligible compensation. We record the compensation expense at the time the quarterly matching contributions are made to the plan. At December 31, 2008 and 2007, there were 242,839 and 52,092 shares available to be issued, respectively.
| | | | | | | | | | |
| | 2008 | | 2007 | | 2006 | |
|---|
Shares contributed | | | 59,253 | | | 47,563 | | | 46,123 | |
Dividends
Holders of our common stock are entitled to dividends, if, as and when declared by our Board of Directors out of funds legally available subject to the prior rights of holders of our outstanding cumulative preferred and preference stock. Payment of dividends is determined by our Board of Directors after considering all relevant factors, including the amount of our retained earnings (which is essentially our accumulated net income less dividend payouts). Also, the EDE Mortgage and our Restated Articles contain certain dividend restrictions. The most restrictive is contained in the EDE Mortgage, which provides that we may not declare or pay any dividends (other than dividends payable in shares of our common stock) or make any other distribution on, or purchase (other than with the proceeds of additional common stock financing) any shares of, our common stock if the cumulative aggregate amount thereof after August 31, 1944 (exclusive of the first quarterly dividend of $98,000 paid after said date) would exceed the sum of $10.75 million and earned surplus (as defined in the EDE Mortgage) accumulated subsequent to August 31, 1944, or the date of succession in the event that another corporation succeeds to our rights and liabilities by a merger or consolidation. As of December 31, 2008, our level of earned surplus did not prevent us from issuing dividends. On March 11, 2008, we amended the EDE Mortgage in order to provide us with more flexibility to pay dividends to our shareholders by increasing the basket available to pay dividends by $10.75 million, as described above. The amendment followed the successful completion of a solicitation of consents from the holders of our First Mortgage Bonds outstanding under the EDE Mortgage. We received consents from holders of 94.46% in aggregate principal amount of the outstanding bonds and paid fees of approximately $1.6 million to the consenting bondholders.
In addition, under certain circumstances, our Junior Subordinated Debentures, 81/2% Series due 2031, reflected as a note payable to securitization trust on our balance sheet, held by Empire District Electric Trust I, an unconsolidated securitization trust subsidiary, also restrict our ability to pay dividends on our common stock. These restrictions apply if: (1) we have knowledge that an event has occurred that would constitute an event of default under the indenture governing these junior subordinated debentures and we have not taken reasonable steps to cure the event, (2) we are in default with respect to payment of any obligations under our guarantee relating to the underlying preferred securities, or (3) we have deferred interest payments on the Junior Subordinated Debentures, 81/2% Series due 2031 or given notice of a deferral of interest payments. As of December 31, 2008, there were no such restrictions on our ability to pay dividends.
6. Preferred and Preference Stock
We have 2.5 million shares of preference stock authorized, including 0.5 million shares of Series A Participating Preference Stock, none of which have been issued. We have 5 million shares of $10.00 par value cumulative preferred stock authorized. There was no preferred stock issued and outstanding at December 31, 2008 or 2007.
104
Table of Contents
THE EMPIRE DISTRICT ELECTRIC COMPANY
NOTES TO CONSOLIDATED FINANCIAL STATEMENTS (Continued)
Preference Stock Purchase Rights
Our shareholder rights plan provides each of the common stockholders one Preference Stock Purchase Right (Right) for each share of common stock owned. Each Right enables the holder to acquire one one-hundredth of a share of Series A Participating Preference Stock (or, under certain circumstances, other securities) at a price of $75 per one one-hundredth share, subject to adjustment. The Rights (other than those held by an acquiring person or group (Acquiring Person)), which expire July 25, 2010, will be exercisable only if an Acquiring Person acquires 10% or more of our common stock or if certain other events occur. The Rights may be redeemed by us in whole, but not in part, for $0.01 per Right, prior to 10 days after the first public announcement of the acquisition of 10% or more of our common stock by an Acquiring Person. We had 33.9 million and 33.5 million Rights outstanding at December 31, 2008 and 2007, respectively.
In addition, upon the occurrence of a merger or other business combination, or an event of the type referred to in the preceding paragraph, holders of the Rights, other than an Acquiring Person, will be entitled, upon exercise of a Right, to receive either our common stock or common stock of the Acquiring Person having a value equal to two times the exercise price of the Right. Any time after an Acquiring Person acquires 10% or more (but less than 50%) of our outstanding common stock, our Board of Directors may, at their option, exchange part or all of the Rights (other than Rights held by the Acquiring Person) for our common stock on a one-for-one basis.
105
Table of Contents
THE EMPIRE DISTRICT ELECTRIC COMPANY
NOTES TO CONSOLIDATED FINANCIAL STATEMENTS (Continued)
7. Long-Term Debt
At December 31, 2008 and 2007, the balance of long-term debt outstanding was as follows (in thousands):
| | | | | | | | | |
| | 2008 | | 2007 | |
|---|
Note payable to securitization trust(1) | | $ | 50,000 | | $ | 50,000 | |
First mortgage bonds (EDE): | | | | | | | |
81/8% Series due 2009 | | | 20,000 | | | 20,000 | |
61/2% Series due 2010 | | | 50,000 | | | 50,000 | |
7.20% Series due 2016 | | | 25,000 | | | 25,000 | |
5.3% Pollution Control Series due 2013(2) | | | 8,000 | | | 8,000 | |
5.2% Pollution Control Series due 2013(2) | | | 5,200 | | | 5,200 | |
5.875% Series due 2037(3) | | | 80,000 | | | 80,000 | |
6.375% Series due 2018(3) | | | 90,000 | | | — | |
First mortgage bonds (EDG): | | | | | | | |
6.82% Series due 2036(3) | | | 55,000 | | | 55,000 | |
| | | | | | |
| | | 333,200 | | | 243,200 | |
Senior Notes, 7.05% Series due 2022(2) | | |
49,084 | | |
49,289 | |
Senior Notes, 41/2% Series due 2013(3) | | | 98,000 | | | 98,000 | |
Senior Notes, 6.70% Series due 2033(3) | | | 62,000 | | | 62,000 | |
Senior Notes, 5.80% Series due 2035(3) | | | 40,000 | | | 40,000 | |
Other | | | 334 | | | 499 | |
| | Less unamortized net discount | | | (891 | ) | | (958 | ) |
| | | | | | |
| | | 631,727 | | | 542,030 | |
| | Less current obligations of long-term debt | | |
(20,000 |
) | |
— | |
| | Less current obligations under capital lease | | | (160 | ) | | (150 | ) |
| | | | | | |
| | | Total long-term debt | | $ | 611,567 | | $ | 541,880 | |
| | | | | | |
- (1)
- Represented by our Junior Subordinated Debentures, 81/2% Series due 2031. We may redeem some or all of the debentures at any time at 100% of their principal amount plus accrued and unpaid interest to the redemption date.
- (2)
- We may redeem some or all of the notes at any time at 100% of their principal amount, plus accrued and unpaid interest to the redemption date.
- (3)
- We may redeem some or all of the notes at any time at 100% of their principal amount, plus a make-whole premium, plus accrued and unpaid interest to the redemption date.
Debt Financing Activities
On May 16, 2008, we issued $90 million principal amount of first mortgage bonds. The net proceeds of approximately $89.4 million, less $0.4 million of legal and other financing fees, were added to our general funds and used primarily to pay down short-term indebtedness incurred, in part, as a result of our on-going construction program.
106
Table of Contents
THE EMPIRE DISTRICT ELECTRIC COMPANY
NOTES TO CONSOLIDATED FINANCIAL STATEMENTS (Continued)
On March 26, 2007, we issued $80 million principal amount of first mortgage bonds. The net proceeds of approximately $79.1 million, less $0.4 million of legal and other financing fees, were added to our general funds and used to pay down short-term indebtedness incurred, in part, as a result of our on-going construction program.
On June 1, 2006, we used $55 million of privately placed 6.82% First Mortgage Bonds due 2036 issued by EDG to fund a portion of our acquisition of Missouri Gas. We used short-term debt to fund the remainder of the acquisition, which was replaced with common equity on June 21, 2006.
We have a $400 million shelf registration statement with the SEC, which became effective on August 15, 2008, covering our common stock, unsecured debt securities, preference stock, first mortgage bonds and trust preferred securities. We have received regulatory approval in all four of our state jurisdictions. Of the $400 million, $250 million is available for first mortgage bonds. We plan to use a portion of the proceeds from issuances under this shelf to fund a portion of the capital expenditures for our new generation projects.
The principal amount of all series of first mortgage bonds outstanding at any one time under the EDE Mortgage is limited by terms of the mortgage to $1 billion. Substantially all of the property, plant and equipment of The Empire District Electric Company (but not its subsidiaries) is subject to the lien of the EDE Mortgage. Restrictions in the EDE mortgage bond indenture could affect our liquidity. The EDE Mortgage contains a requirement that for new first mortgage bonds to be issued, our net earnings (as defined in the EDE Mortgage) for any twelve consecutive months within the fifteen months preceding issuance must be two times the annual interest requirements (as defined in the EDE Mortgage) on all first mortgage bonds then outstanding and on the prospective issue of new first mortgage bonds. Our earnings for the twelve months ended December 31, 2008 would permit us to issue approximately $253.5 million of new first mortgage bonds based on this test with an assumed interest rate of 7.0%. In addition to the interest coverage requirement, the EDE Mortgage provides that new bonds must be issued against, among other things, retired bonds or 60% of net property additions. At December 31, 2008, we had retired bonds and net property additions which would enable the issuance of at least $612.0 million principal amount of bonds if the annual interest requirements are met. As of December 31, 2008, we are in compliance with all restrictive covenants of the EDE Mortgage.
The principal amount of all series of first mortgage bonds outstanding at any one time under the EDG Mortgage is limited by terms of the mortgage to $300 million. Substantially all of the property, plant and equipment of The Empire District Gas Company is subject to the lien of the EDG Mortgage. The EDG Mortgage contains a requirement that for new first mortgage bonds to be issued, the amount of such new first mortgage bonds shall not exceed 75% of the cost of property additions acquired after the date of the Missouri Gas acquisition. The mortgage also contains a limitation on the issuance by EDG of debt (including first mortgage bonds, but excluding short-term debt incurred in the ordinary course under working capital facilities) unless, after giving effect to such issuance, EDG's ratio of EBITDA (defined as net income plus interest, taxes, depreciation, amortization and certain other non-cash charges) to interest charges for the most recent four fiscal quarters is at least 2.0 to 1. As of December 31, 2008, these tests would allow us to issue new first mortgage bonds of approximately $3.1 million based on $4.2 million of property additions.
The carrying amount of our total debt exclusive of capital leases at December 31, 2008 was $631.4 million compared to a fair market value of approximately $563.8 million. The carrying amount of our total debt exclusive of capital leases as of December 31, 2007 was $541.5 million, compared to a fair value of approximately $524 million. These estimates were based on the quoted market prices for the same or similar issues or on the current rates offered to us for debt of the same remaining maturities. The
107
Table of Contents
THE EMPIRE DISTRICT ELECTRIC COMPANY
NOTES TO CONSOLIDATED FINANCIAL STATEMENTS (Continued)
estimated fair market value may not represent the actual value that could have been realized as of year-end or that will be realizable in the future.
| | | | | | | | | | | | | | |
| | Payments Due By Period | |
|---|
Long-Term Debt Payout Schedule
(Excluding Unamortized Discount
(in thousands) | | Total | | Note
Payable to
Securitization
Trust | | Regulated
Entity
Debt
Obligations | | Capital
Lease
Obligations | |
|---|
2009 | | $ | 20,160 | | $ | — | | $ | 20,000 | | $ | 160 | |
2010 | | | 50,170 | | | — | | | 50,000 | | | 170 | |
2011 | | | 4 | | | — | | | — | | | 4 | |
2012 | | | — | | | — | | | — | | | — | |
2013 | | | 111,200 | | | — | | | 111,200 | | | — | |
Thereafter | | | 451,084 | | | 50,000 | | | 401,084 | | | — | |
| | | | | | | | | | |
| | Total long-term debt obligations | | $ | 632,618 | | $ | 50,000 | | $ | 582,284 | | $ | 334 | |
| | | | | | | | | | | |
Less current obligations and unamortized discount | | |
21,051 | | | | | | | | | | |
| | | | | | | | | | | | | |
| | Total long-term debt | | $ | 611,567 | | | | | | | | | | |
| | | | | | | | | | | | | |
8. Short-Term Borrowings
At December 31, 2008, total short-term borrowings consisted of $9.0 million in commercial paper and $93.0 million in borrowings from our line of credit. Short-term borrowings outstanding averaged $47.7 million and $51.0 million daily during 2008 and 2007, respectively, with the highest month-end balances being $102.0 million and $81.0 million, respectively. The weighted average interest rates during 2008 and 2007 were 3.89% and 5.76% in each period. The weighted average interest rate of borrowings outstanding at December 31, 2008 and 2007 was 2.96% and 5.76% respectively.
On July 15, 2005, we entered into a $150 million unsecured revolving credit facility until July 15, 2010. Borrowings (other than through commercial paper) are at the bank's prime commercial rate or LIBOR plus 100 basis points based on our current credit ratings and the pricing schedule in the line of credit facility. On March 14, 2006, we entered into the First Amended and Restated Unsecured Credit Agreement which amends and restates the $150 million unsecured revolving credit facility. The principal amount of the credit facility was increased to $226 million, with the additional $76 million allocated to support a letter of credit issued in connection with our participation in the Plum Point Energy Station project. This extra $76 million of availability reduces over a four year period in line with the amount of construction expenditures we owe for Plum Point Unit 1 and was $19.5 million as of February 1, 2009. The unallocated credit facility is used for working capital, general corporate purposes and to back-up our use of commercial paper. This facility requires our total indebtedness (which does not include our note payable to the securitization trust) to be less than 62.5% of our total capitalization at the end of each fiscal quarter and our EBITDA (defined as net income plus interest, taxes, depreciation and amortization) to be at least two times our interest charges (which includes interest on the note payable to the securitization trust) for the trailing four fiscal quarters at the end of each fiscal quarter. Failure to maintain these ratios will result in an event of default under the credit facility and will prohibit us from borrowing funds thereunder. As of December 31, 2008, we are in compliance with these ratios. This credit facility is also subject to cross-default if we default on in excess of $10 million in the aggregate on our other indebtedness. This arrangement does not serve to legally restrict the use of our cash in the normal course of operations. There were $93.0 million and $0.0 million of outstanding borrowings under this agreement at December 31, 2008
108
Table of Contents
THE EMPIRE DISTRICT ELECTRIC COMPANY
NOTES TO CONSOLIDATED FINANCIAL STATEMENTS (Continued)
and 2007 respectively. In addition, $9.0 million and $33.0 million of the availability thereunder was used to back up our outstanding commercial paper at December 31, 2008 and 2007, respectively.
9. Retirement Benefits
We record retirement benefits in accordance with FAS 158 and have recorded the appropriate liabilities to reflect the unfunded status of our benefit plans, with offsetting entries to a regulatory asset, because we believe it is probable that the unfunded amount of these plans will be afforded rate recovery. The tax effects of these entries, including the tax benefit of the Medicare Part D subsidy, are reflected as deferred tax assets and liabilities and regulatory liabilities. All of the benefit plans have been measured as of December 31, 2008, consistent with previous years. (See Note 1.)
Annually the Company evaluates the discount rate, retirement age, compensation rate increases, expected return on plan assets and healthcare cost trend rate assumptions related to its pension benefit and post-retirement medical plan. The Company utilizes an interest rate yield curve to determine an appropriate discount rate. The yield curve is constructed based on the yields on over 500 high-quality, non-callable corporate bonds with maturities between zero and thirty years. A theoretical spot rate curve constructed from this yield curve is then used to discount the annual benefit cash flows of the Empire pension plan and develop a single point discount rate matching the plan's payout structure. In evaluating these assumptions, many factors are considered, including, current market conditions, asset allocations, changes in demographics and the views of leading financial advisors and economists. In evaluating the expected retirement age assumption, the Company considers the retirement ages of past employees eligible for pension and medical benefits together with expectations of future retirement ages. It is reasonably possible that changes in these assumptions will occur in the near term and, due to the uncertainties inherent in setting assumptions, the effect of such changes could be material to the Company's consolidated financial statements. A roll forward technique is used to value the year ending pension obligations. The roll forward technique values the year-end obligation by rolling forward the beginning-of-year obligation using the demographic assumptions shown below. The economic assumptions are updated as of the end of the year.
Pensions
Our noncontributory defined benefit pension plan includes all employees meeting minimum age and service requirements. The benefits are based on years of service and the employee's average annual basic earnings. Annual contributions to the plan are at least equal to the minimum funding requirements of ERISA. We also have a supplemental retirement program ("SERP") for designated officers of the Company, which we fund from Company funds as the benefits are paid.
The general market decline has negatively impacted the performance of our pension assets through December 31, 2008. Our net pension liability increased $53.2 million. This increase was recorded as increase in regulatory assets as we believe it is probable of recovery through customer rates based on rate orders received in our jurisdictions. We expect future pension funding commitments to increase. The expected minimum funding for 2009 is estimated to be between $0.0 million and $4.0 million. For 2010, it is estimated to be between $9.0 million and $15.0 million. The actual minimum funding requirements will be determined based on the results of the actuarial valuations and, in the case of 2010, the performance of our pension assets during 2009.
109
Table of Contents
THE EMPIRE DISTRICT ELECTRIC COMPANY
NOTES TO CONSOLIDATED FINANCIAL STATEMENTS (Continued)
Expected benefit payments are as follows (in millions):
| | | | | | | |
Year | | Payments from Trust | | Payments from
Company Funds | |
|---|
2009 | | $ | 7.3 | | $ | 0.2 | |
2010 | | | 7.7 | | | 0.3 | |
2011 | | | 8.1 | | | 0.4 | |
2012 | | | 8.6 | | | 0.5 | |
2013 | | | 9.0 | | | 0.6 | |
2014 – 2018 | | $ | 50.6 | | $ | 4.6 | |
Other Postretirement Benefits (OPEB)
We provide certain healthcare and life insurance benefits to eligible retired employees, their dependents and survivors through trusts we have established. Participants generally become eligible for retiree healthcare benefits after reaching age 55 with 5 years of service.
The market decline that occurred in the second half of 2008 also had a negative impact on our OPEB asset performance. Our net liability increased $15.5 million. The increase was recorded as an increase in regulatory assets as we believe it is probable of recovery through customer rates based on rate orders received in our jurisdictions. Our funding policy is to contribute annually an amount at least equal to the actuarial cost of postretirement benefits. We expect to be required to fund approximately $2.9 million in 2009.
Estimated benefit payments are as follows (in millions):
| | | | | | | | | | |
Year | | Payments from Trust | | Expected
Federal Subsidy | | Payments from
Company Funds | |
|---|
2009 | | $ | 2.6 | | $ | 0.3 | | $ | 0.1 | |
2010 | | | 2.7 | | | 0.3 | | | 0.1 | |
2011 | | | 3.0 | | | 0.4 | | | 0.1 | |
2012 | | | 3.3 | | | 0.4 | | | 0.1 | |
2013 | | | 3.5 | | | 0.5 | | | 0.1 | |
2014 – 2018 | | $ | 20.4 | | $ | 2.8 | | $ | 0.8 | |
110
Table of Contents
THE EMPIRE DISTRICT ELECTRIC COMPANY
NOTES TO CONSOLIDATED FINANCIAL STATEMENTS (Continued)
The following tables set forth the Company's benefit plans' projected benefit obligation, the fair value of the plans' assets and the funded status (in thousands).
Reconciliation of Projected Benefit Obligations:
| | | | | | | | | | | | | | | | | | | |
| | Pension | | SERP | | OPEB | |
|---|
| | 2008 | | 2007 | | 2008 | | 2007 | | 2008 | | 2007 | |
|---|
Benefit obligation at beginning of year | | $ | 140,353 | | $ | 136,260 | | $ | 2,006 | | $ | 1,889 | | $ | 56,455 | | $ | 63,011 | |
Service cost | | | 3,568 | | | 3,492 | | | 57 | | | 50 | | | 1,651 | | | 1,705 | |
Interest cost | | | 9,048 | | | 8,238 | | | 137 | | | 117 | | | 3,617 | | | 3,416 | |
Amendments | | | — | | | 3,832 | | | — | | | (84 | ) | | — | | | (5,894 | ) |
Net actuarial (gain)/loss | | | 8,223 | | | (5,191 | ) | | 200 | | | 95 | | | 2,150 | | | (4,126 | ) |
Plan participant's contribution | | | — | | | — | | | — | | | — | | | 782 | | | 631 | |
Benefits and expenses paid | | | (6,815 | ) | | (6,278 | ) | | (63 | ) | | (61 | ) | | (2,980 | ) | | (2,545 | ) |
Federal subsidy | | | — | | | — | | | — | | | — | | | 275 | | | 257 | |
| | | | | | | | | | | | | | |
Benefit obligation at end of year | | $ | 154,377 | | $ | 140,353 | | $ | 2,337 | | $ | 2,006 | | $ | 61,950 | | $ | 56,455 | |
| | | | | | | | | | | | | | |
Reconciliation of Fair Value of Plan Assets:
| | | | | | | | | | | | | | | | | | | |
| | Pension | | SERP | | OPEB | |
|---|
| | 2008 | | 2007 | | 2008 | | 2007 | | 2008 | | 2007 | |
|---|
Fair value of plan assets at beginning of year | | $ | 131,939 | | $ | 126,812 | | $ | — | | $ | — | | $ | 52,480 | | $ | 47,727 | |
Actual return on plan assets — gain/(loss) | | | (32,394 | ) | | 11,405 | | | — | | | — | | | (9,240 | ) | | 3,323 | |
Employer contribution | | | — | | | — | | | — | | | — | | | 1,032 | | | 3,037 | |
Benefits paid | | | (6,815 | ) | | (6,278 | ) | | — | | | — | | | (2,858 | ) | | (2,462 | ) |
Plan participant's contribution | | | — | | | — | | | — | | | — | | | 753 | | | 608 | |
Federal subsidy | | | — | | | — | | | — | | | — | | | 316 | | | 247 | |
| | | | | | | | | | | | | | |
Fair value of plan assets at end of year | | $ | 92,730 | | $ | 131,939 | | $ | — | | $ | — | | $ | 42,483 | | $ | 52,480 | |
| | | | | | | | | | | | | | |
Reconciliation of Funded Status:
| | | | | | | | | | | | | | | | | | | |
| | Pension | | SERP | | OPEB | |
|---|
| | 2008 | | 2007 | | 2008 | | 2007 | | 2008 | | 2007 | |
|---|
Fair value of plan assets | | $ | 92,730 | | $ | 131,939 | | $ | — | | $ | — | | $ | 42,483 | | $ | 52,480 | |
Projected benefit obligations | | | (154,377 | ) | | (140,353 | ) | | (2,337 | ) | | (2,006 | ) | | (61,950 | ) | | (56,455 | ) |
| | | | | | | | | | | | | | |
Funded status | | $ | (61,647 | ) | $ | (8,414 | ) | $ | (2,337 | ) | $ | (2,006 | ) | $ | (19,467 | ) | $ | (3,975 | ) |
| | | | | | | | | | | | | | |
The employee pension plan accumulated benefit obligation at December 31, 2008 and 2007 is presented in the following table (in thousands):
| | | | | | | | | | | | | |
| | Pension Benefits | | SERP | |
|---|
| | 2008 | | 2007 | | 2008 | | 2007 | |
|---|
Accumulated benefit obligation | | $ | 135,296 | | $ | 123,310 | | $ | 1,570 | | $ | 1,304 | |
| | | | | | | | | | |
111
Table of Contents
THE EMPIRE DISTRICT ELECTRIC COMPANY
NOTES TO CONSOLIDATED FINANCIAL STATEMENTS (Continued)
Amounts recognized in the balance sheet consist of (in thousands):
| | | | | | | | | | | | | | | | | | | |
| | Pension | | SERP | | OPEB | |
|---|
| | 2008 | | 2007 | | 2008 | | 2007 | | 2008 | | 2007 | |
|---|
Other current liabilities | | $ | — | | $ | — | | $ | 165 | | $ | 164 | | $ | 135 | | $ | 116 | |
Pension and other postretirement benefit obligation | | $ | 61,647 | | $ | 8,414 | | $ | 2,172 | | $ | 1,842 | | $ | 19,332 | | $ | 3,859 | |
Net periodic benefit pension cost for 2008, 2007 and 2006, some of which is capitalized as a component of labor cost and some of which is deferred as a regulatory asset, is comprised of the following components (in thousands):
Net Periodic Pension Benefit Cost:
| | | | | | | | | | | | | | | | | | | | |
| | Pension | | OPEB | |
|---|
| | 2008 | | 2007 | | 2006 | | 2008 | | 2007 | | 2006 | |
|---|
Service cost | | $ | 3,568 | | $ | 3,492 | | $ | 3,355 | | $ | 1,651 | | $ | 1,705 | | $ | 1,866 | |
Interest cost | | | 9,048 | | | 8,238 | | | 7,368 | | | 3,617 | | | 3,416 | | | 3,425 | |
Expected return on plan assets | | | (10,729 | ) | | (10,300 | ) | | (9,512 | ) | | (3,750 | ) | | (3,398 | ) | | (2,781 | ) |
Amortization of: | | | | | | | | | | | | | | | | | | | |
| | Unrecognized transition obligation | | | — | | | — | | | — | | | — | | | — | | | — | |
| | Prior service cost | | | 744 | | | 588 | | | 447 | | | (1,011 | ) | | (1,011 | ) | | (461 | ) |
| | Actuarial loss | | | 1,693 | | | 2,601 | | | 3,174 | | | 511 | | | 1,152 | | | 2,398 | |
| | | | | | | | | | | | | | |
Net periodic benefit cost | | $ | 4,324 | | $ | 4,619 | | $ | 4,832 | | $ | 1,018 | | $ | 1,864 | | $ | 4,447 | |
| | | | | | | | | | | | | | |
Net Periodic Pension Benefit Cost:
| | | | | | | | | | | |
| | SERP | |
|---|
| | 2008 | | 2007 | | 2006 | |
|---|
Service cost | | $ | 57 | | $ | 50 | | $ | 48 | |
Interest cost | | | 137 | | | 117 | | | 105 | |
Expected return on plan assets | | | — | | | — | | | — | |
Amortization of: | | | | | | | | | | |
| | Unrecognized transition obligation | | | — | | | — | | | — | |
| | Prior service cost | | | (8 | ) | | (11 | ) | | — | |
| | Actuarial loss | | | 132 | | | 146 | | | 146 | |
| | | | | | | | |
Net periodic benefit cost | | $ | 318 | | $ | 302 | | $ | 299 | |
| | | | | | | | |
Our net periodic pension benefit cost, exclusive of capitalized and deferred amounts, net of tax, as a percentage of net income for 2008, 2007 and 2006 was 5.9%, 6.9% and 6.0%, respectively.
112
Table of Contents
THE EMPIRE DISTRICT ELECTRIC COMPANY
NOTES TO CONSOLIDATED FINANCIAL STATEMENTS (Continued)
The tables below present the activity in the regulatory asset accounts for the year (in thousands).
| | | | | | | | | | | | | | | | |
| |
| | Amount Recognized | |
| |
|---|
Regulatory Assets | | Beginning
Balance
12/31/07 | | Current Year
Actuarial
(Gain)/Loss | | Amortization
of Actuarial
Loss | | Amortization
of Prior
Service
(Cost)/Credit | | Ending
Balance
12/31/08 | |
|---|
Pension | | $ | 18,677 | | | 51,346 | | | (1,693 | ) | | (744 | ) | $ | 67,586 | |
SERP | | $ | 1,146 | | | 199 | | | (132 | ) | | 8 | | $ | 1,221 | |
OPEB | | $ | (5,663 | ) | | 15,141 | | | (511 | ) | | 1,011 | | $ | 9,978 | |
The following table presents the amount of net actuarial gains/losses, transition obligations/assets and prior period service costs in regulatory assets not yet recognized as a component of net periodic benefit cost. It also shows the amounts expected to be recognized in the subsequent year. The following table presents those items for the employee pension plan and other benefits plan at December 31, 2008, and the subsequent twelve-month period (in thousands):
| | | | | | | | | | | | | | | | | | | | |
| | Pension Benefits | | SERP | | OPEB | |
|---|
| | 2008 | | Subsequent
Period | | 2008 | | Subsequent
Period | | 2008 | | Subsequent
Period | |
|---|
Net actuarial loss | | $ | 63,407 | | $ | 3,017 | | $ | 1,285 | | $ | 129 | | $ | 18,626 | | $ | 580 | |
Transition obligation/(asset) | | | — | | | — | | | — | | | — | | | — | | | — | |
Prior service cost/(benefit) | | | 4,179 | | | 604 | | | (64 | ) | | (8 | ) | | (8,648 | ) | | (1,011 | ) |
| | | | | | | | | | | | | | |
| | Total | | $ | 67,586 | | $ | 3,621 | | $ | 1,221 | | $ | 121 | | $ | 9,978 | | $ | (431 | ) |
| | | | | | | | | | | | | | |
The measurement date used to determine the pension and other postretirement benefits is December 31. The assumptions used to determine the benefit obligation and the periodic costs are as follows:
Weighted-average assumptions used to determine the benefit obligation as of December 31:
| | | | | | | | | | | | | |
| | Pension Benefits | | OPEB | |
|---|
| | 2008 | | 2007 | | 2008 | | 2007 | |
|---|
Discount rate | | | 6.30 | % | | 6.40 | % | | 6.30 | % | | 6.40 | % |
Rate of compensation increase | | | 4.50 | % | | 4.50 | % | | 4.50 | % | | 4.50 | % |
Weighted-average assumptions used to determine the net benefit cost (income) as of January 1:
| | | | | | | | | | | | | | | | | | | |
| | Pension Benefits | | OPEB | |
|---|
| | 2008 | | 2007 | | 2006 | | 2008 | | 2007 | | 2006 | |
|---|
Discount rate | | | 6.40 | % | | 5.90 | % | | 5.65 | % | | 6.40 | % | | 5.90 | % | | 5.65 | % |
Expected return on plan assets | | | 8.50 | % | | 8.50 | % | | 8.50 | % | | 7.45 | % | | 7.45 | % | | 6.80 | % |
Rate of compensation increase | | | 4.50 | % | | 4.25 | % | | 4.00 | % | | 4.50 | % | | 4.25 | % | | 4.00 | % |
To determine the discount rate assumption used in our December 31, 2008 and 2007 plan obligation estimates, we used an interest rate yield curve that enables companies to make judgments pursuant to Emerging Issues Task Force EITF Topic No. D-36, "Selection of Discount Rates Used for Measuring Defined Benefit Pension Obligations and Obligations of Post Retirement Benefit Plans Other Than Pensions." The yield curve is constructed based on the yields on over 500 high-quality, non-callable corporate bonds with maturities between zero and thirty years. A theoretical spot rate curve constructed
113
Table of Contents
THE EMPIRE DISTRICT ELECTRIC COMPANY
NOTES TO CONSOLIDATED FINANCIAL STATEMENTS (Continued)
from this yield curve is then used to discount the annual benefit cash flows of our pension plan and develop a single-point discount rate matching the plan's payout structure.
The expected long-term rate of return assumption was based on historical return and adjusted to estimate the potential range of returns for the current asset allocation.
The assumed 2008 cost trend rate used to measure the expected cost of healthcare benefits and benefit obligation is 8.5%. Each trend rate decreases 0.50% through 2014 to an ultimate rate of 5.0% in 2014 and subsequent years.
The effect of a 1% increase in each future year's assumed healthcare cost trend rate on the current service and interest cost components of the net periodic benefit cost is $0.8 million, increasing the service and interest cost from $5.3 million to $6.1 million. The effect on the accumulated postretirement benefit obligation is $6.9 million, increasing the obligation from $61.9 million to $68.8 million. The effect of a 1% decrease in each future year's assumed healthcare cost trend rate for these components is $0.7 million which would decrease the current service and interest cost from $5.3 million to $4.6 million. The effect on the accumulated benefit obligation is $5.7 million, decreasing the obligation from $61.9 million to $56.2 million.
Allocation of Plan Assets
| | | | | | | | | | | |
| | % of Fair Value as of December 31, |
|---|
| | 2008 | | 2007 |
|---|
Pension | | Actual | | Target | | Actual | | Target |
|---|
Equity securities(1) | | | 62.4 | % | 60% – 80% | | | 71.8 | % | 60% – 80% |
Debt securities | | | 37.6 | % | 20% – 40% | | | 28.2 | % | 20% – 40% |
Other | | | 0 | % | 0% – 15% | | | 0 | % | 0% – 15% |
| | | | | | | | | |
| | Total | | | 100 | % | 100% | | | 100 | % | 100% |
- (1)
- Includes an investment in alternative investments.
We utilize fair value in determining the market-related values for the different classes of our pension plan assets. The market-related value is determined based on smoothing actual asset returns in excess of (or less than) expected return on assets over a 5-year period.
The Company's primary investment goals for pension fund assets are based around four basic elements:
- 1.
- Preserve capital,
- 2.
- Maintain a minimum level of return equal to the actuarial interest rate assumption,
- 3.
- Maintain a high degree of flexibility and a low degree of volatility, and
- 4.
- Maximize the rate of return while operating within the confines of prudence and safety.
The Company believes that it is appropriate for the pension fund to assume a moderate degree of investment risk with diversification of fund assets among different classes (or types) of investments, as appropriate, as a means of reducing risk. Although the pension fund can and will tolerate some variability in market value and rates of return in order to achieve a greater long-term rate of return, primary emphasis is placed on preserving the pension fund's principal. Full discretion is delegated to the investment managers to carry out investment policy within stated guidelines. The guidelines and performance of the managers are monitored by the Company's Investment Committee.
114
Table of Contents
THE EMPIRE DISTRICT ELECTRIC COMPANY
NOTES TO CONSOLIDATED FINANCIAL STATEMENTS (Continued)
Permissible Investments
Listed below are the investment vehicles specifically permitted:
Permissible Investments
| | | | | | |
Equity Oriented | | Fixed Income Oriented and Real Estate |
|---|
| • | | Common Stocks | | • | | Bonds |
| • | | Preferred Stocks | | • | | GICs, BICs |
| • | | Convertible Preferred Stocks | | • | | Corporate Bonds (minimum quality rating |
| • | | Convertible Bonds | | | | of Baa or BBB) |
| • | | Covered Options | | • | | Cash-Equivalent Securities (e.g., U.S. |
| • | | Hedged Equity Funds of Funds | | | | T-Bills, Commercial Paper, etc.) |
| | | | | • | | Certificates of Deposit in institutions with FDIC/FSLIC protection |
| | | | | • | | Money Market Funds / Bank STIF Funds |
| | | | | • | | Real Estate — Publicly Traded |
The above assets can be held in commingled (mutual) funds as well as privately managed separate accounts.
Those investments prohibited by the Investment Committee without prior approval are:
Prohibited Investments Requiring Pre-approval
| | | | | | |
| • | | Privately Placed Securities | | • | | Warrants |
| • | | Commodities Futures | | • | | Short Sales |
| • | | Securities of Empire District | | • | | Index Options |
| • | | Derivatives | | | | |
Allocation of Plan Assets
| | | | | | | | | | | |
| | % of Fair Value as of December 31, |
|---|
| | 2008 | | 2007 |
|---|
OPEB | | Actual | | Target | | Actual | | Target |
|---|
Cash equivalent | | | 2.3 | % | 0% – 10% | | | 3.2 | % | 0% – 10% |
Fixed income | | | 48.2 | % | 40% – 60% | | | 40.3 | % | 40% – 60% |
Equities | | | 49.5 | % | 40% – 60% | | | 56.5 | % | 40% – 60% |
| | | | | | | | | |
| | Total | | | 100 | % | 100% | | | 100 | % | 100% |
We utilize fair value in determining the market-related values for the different classes of our postretirement plan assets. The market-related value is determined based on smoothing actual asset returns in excess of (or less than) expected return on assets over a 5-year period.
The Company's primary investment goals for the component of the fund used to pay current benefits are liquidity and safety. The primary investment goals for the component of the fund used to accumulate funds to provide for payment of benefits after the retirement of plan participants are preservation of the fund with a reasonable rate of return.
The Company's guideline in the management of this fund is to endorse a long-term approach, but not expose the fund to levels of volatility that might adversely affect the value of the assets. Full discretion is
115
Table of Contents
THE EMPIRE DISTRICT ELECTRIC COMPANY
NOTES TO CONSOLIDATED FINANCIAL STATEMENTS (Continued)
delegated to the investment managers to carry out investment policy within stated guidelines. The guidelines and performance of the managers are monitored by the Company's Investment Committee.
Listed below are the investment vehicles specifically permitted:
Permissible Investments
| | | | | | |
Equity | | Fixed Income |
|---|
| • | | Common Stocks | | • | | Cash-Equivalent Securities with a maturity |
| • | | Preferred Stocks | | | | of one-year or less |
| | | | | • | | Bonds |
| | | | | • | | Money Market Funds / Bank STIF Funds |
| | | | | • | | Certificates of Deposit in institutions with FDIC protection |
| | | | | • | | Corporate Bonds (minimum quality rating of A) |
The above assets can be held in commingled (mutual) funds as well as privately managed separate accounts.
Listed below are those investments prohibited by the Investment Committee:
Prohibited Investments
| | | | | | |
| • | | Privately Placed Securities | | • | | Margin Transactions |
| • | | Commodities Futures | | • | | Short Sales |
| • | | Securities of Empire District | | • | | Index Options |
| • | | Derivatives | | • | | Real Estate and Real Property |
| • | | Instrumentalities in violation of the Prohibited Transactions Standards of ERISA | | • | | Restricted Stock |
10. Income Taxes
Income tax expense components for the years ended December 31 are as follows (in thousands):
| | | | | | | | | | | | |
| | 2008 | | 2007 | | 2006 | |
|---|
Current income taxes: | | | | | | | | | | |
| | Federal | | $ | 12,067 | | $ | (3,788 | ) | $ | 18,410 | |
| | State | | | 1,667 | | | (540 | ) | | 2,630 | |
| | | | | | | | |
| | | Total | | | 13,734 | | | (4,328 | ) | | 21,040 | |
Deferred income taxes: | | | | | | | | | | |
| | Federal | | | 5,179 | | | 16,895 | | | 1,091 | |
| | State | | | 738 | | | 2,407 | | | 330 | |
| | | | | | | | |
| | | Total | | | 5,917 | | | 19,302 | | | 1,421 | |
Investment tax credit amortization | | | (525 | ) | | (530 | ) | | (530 | ) |
| | | | | | | | |
Income tax from continuing operations | | | 19,126 | | | 14,444 | | | 21,931 | |
Income tax from discontinued operations | | | — | | | 39 | | | (461 | ) |
| | | | | | | | |
Total income tax expense | | $ | 19,126 | | $ | 14,483 | | $ | 21,470 | |
| | | | | | | | |
116
Table of Contents
THE EMPIRE DISTRICT ELECTRIC COMPANY
NOTES TO CONSOLIDATED FINANCIAL STATEMENTS (Continued)
Deferred Income Taxes
Deferred tax assets and liabilities are reflected on our consolidated balance sheet as follows (in thousands):
| | | | | | | |
| | December 31, | |
|---|
Deferred Income Taxes | | 2008 | | 2007 | |
|---|
Current deferred tax liability (included in other current liabilities) | | $ | — | | $ | 381 | |
Non-current deferred tax liabilities, net | | | 173,511 | | | 165,989 | |
| | | | | | |
Net deferred tax liabilities | | $ | 173,511 | | $ | 166,370 | |
| | | | | | |
Temporary differences related to deferred tax assets and deferred tax liabilities are summarized as follows (in thousands):
| | | | | | | | | |
| | December 31, | |
|---|
Temporary Differences | | 2008 | | 2007 | |
|---|
Deferred tax assets: | | | | | | | |
| | Disallowed plant costs | | $ | 1,127 | | $ | 1,218 | |
| | Gains on hedging transactions | | | 1,647 | | | 1,673 | |
| | Plant related basis differences | | | 14,617 | | | 11,881 | |
| | Regulated liabilities related to income taxes | | | 4,017 | | | 4,793 | |
| | Pensions and other post-retirement benefits | | | 15,027 | | | 11,988 | |
| | Other | | | 2,008 | | | 695 | |
| | | | | | |
| | | Total deferred tax assets | | $ | 38,443 | | $ | 32,248 | |
| | | | | | |
Deferred tax liabilities: | | | | | | | |
| | Depreciation, amortization and other plant related differences | | $ | 158,142 | | $ | 145,340 | |
| | Regulated assets related to income | | | 34,515 | | | 30,947 | |
| | Loss on reacquired debt | | | 5,000 | | | 5,504 | |
| | Accumulated comprehensive income | | | 1,114 | | | 6,790 | |
| | Losses on hedging transactions | | | 956 | | | 1,036 | |
| | Deferred ice storm expenses | | | 5,602 | | | 5,912 | |
| | Deferred fuel costs | | | 2,136 | | | — | |
| | Amortization of intangibles | | | 2,693 | | | 1,613 | |
| | Other | | | 1,796 | | | 1,476 | |
| | | | | | |
| | | Total deferred tax liabilities | | | 211,954 | | | 198,618 | |
| | | | | | |
Net deferred tax liabilities | | $ | 173,511 | | $ | 166,370 | |
| | | | | | |
117
Table of Contents
THE EMPIRE DISTRICT ELECTRIC COMPANY
NOTES TO CONSOLIDATED FINANCIAL STATEMENTS (Continued)
Effective Income Tax Rates
The difference between income taxes and amounts calculated by applying the federal legal rate to income tax expense for continuing operations were as follows:
| | | | | | | | | | | |
Effective Income Tax Rates | | 2008 | | 2007 | | 2006 | |
|---|
Federal statutory income tax rate | | | 35.0 | % | | 35.0 | % | | 35.0 | % |
Increase in income tax rate resulting from: | | | | | | | | | | |
| | State income tax (net of federal benefit) | | | 3.1 | | | 3.1 | | | 3.1 | |
| | Investment tax credit amortization | | | (0.9 | ) | | (1.1 | ) | | (0.9 | ) |
| | Effect of ratemaking on property related differences | | | (3.5 | ) | | (4.1 | ) | | (1.3 | ) |
| | Other | | | (1.2 | ) | | (2.6 | ) | | (0.6 | ) |
| | | | | | | | |
Effective income tax rate | | | 32.5 | % | | 30.3 | % | | 35.3 | % |
| | | | | | | | |
| | | | | | | |
Unrecognized Tax Benefits | | 2008 | | 2007 | |
|---|
Unrecognized tax benefits — January 1, | | $ | 328,000 | | $ | 219,000 | |
The gross amounts of increases in unrecognized tax benefits taken during prior periods | | | 1,957,000 | | | 109,000 | |
The gross amounts of decreases in unrecognized tax benefits taken during the period relating to positions accepted by taxing authorities | | | 109,000 | | | — | |
| | | | | | |
Unrecognized tax benefits — December 31, | | $ | 2,176,000 | | $ | 328,000 | |
| | | | | | |
If unrecognized tax benefits are recognized, the effective tax rate would change from 32.5% to 32.1% based on recognizing approximately $0.2 million of unrecognized benefits. The Company recognized interest or penalties of $0.2 million and $0.0 million during 2008 and 2007 respectively, related to unrecognized tax benefits in other expenses and on the balance sheet. The Company does not expect any significant changes to our unrecognized tax benefits over the next twelve months.
11. Commonly Owned Facilities
We own a 12% undivided interest in the coal-fired Unit No. 1 at the Iatan Generating Station located near Weston, Missouri, 35 miles northwest of Kansas City, Missouri, as well as a 3% interest in the site and a 12% interest in certain common facilities. At December 31, 2008 and 2007, our property, plant and equipment accounts included the amounts in the following chart (in millions):
| | | | | | | |
| | 2008 | | 2007 | |
|---|
Cost of ownership in plant | | $ | 50.1 | | $ | 49.4 | |
Accumulated Depreciation | | $ | 34.7 | | $ | 34.0 | |
Expenditures(1) | | $ | 9.2 | | $ | 8.4 | |
- (1)
- Excludes depreciation expense.
We are entitled to 12% of the unit's available capacity and are obligated to pay for that percentage of the operating costs of the unit. KCP&L and KCP&L Greater Missouri Operations Co. (formerly Aquila) own 70% and 18% respectively, of the Unit. KCP&L operates the unit for the joint owners. On June 13, 2006, we entered into an agreement with KCP&L to purchase a 12% undivided ownership interest in the new coal-fired Iatan 2.
118
Table of Contents
THE EMPIRE DISTRICT ELECTRIC COMPANY
NOTES TO CONSOLIDATED FINANCIAL STATEMENTS (Continued)
We and Westar Generating, Inc, ("WGI"), a subsidiary of Westar Energy, Inc., share joint ownership of a 500-megawatt combined cycle unit at the State Line Power Plant (the "State Line Combined Cycle Unit"). We are responsible for the operation and maintenance of the State Line Combined Cycle Unit, and are entitled to 60% of the available capacity and are responsible for approximately 60% of its costs. At December 31, 2008 and 2007, our property, plant and equipment accounts include the amounts in the following chart (in millions):
| | | | | | | |
| | 2008 | | 2007 | |
|---|
Cost of ownership in plant | | $ | 153.4 | | $ | 154.4 | |
Accumulated Depreciation | | $ | 35.7 | | $ | 31.5 | |
Expenditures(1) | | $ | 68.8 | | $ | 68.5 | |
- (1)
- Excludes depreciation expense.
All of the dollar amounts listed above represent our ownership share of costs. Each participant must provide their own financing.
12. Commitments and Contingencies
We are a party to various claims and legal proceedings arising out of the normal course of our business. Management regularly analyzes this information, and has provided accruals for any liabilities, in accordance with the guidelines of Statement of Financial Accounting Standards (SFAS 5), "Accounting for Contingencies" (FAS 5). In the opinion of management, it is not probable, given the company's defenses, that the ultimate outcome of these claims and lawsuits will have a material adverse effect upon our financial condition, or results of operations or cash flows.
Coal, Natural Gas and Transportation Contracts
We have entered into long and short-term agreements to purchase coal and natural gas for our energy supply and natural gas operations. Under these contracts, the natural gas supplies are divided into firm physical commitments and derivatives that are used to hedge future purchases. In the event that this gas cannot be used at our plants, the gas would be liquidated at market price. The firm physical gas and transportation commitments are as follows (in millions):
| | | | |
Firm physical gas and transportation contracts | |
| |
|---|
January 1, 2009 through December 31, 2009 | | $ | 29.3 | |
January 1, 2010 through December 31, 2011 | | | 50.1 | |
January 1, 2012 through December 31, 2013 | | | 44.2 | |
January 1, 2014 and beyond | | | 50.2 | |
We have coal supply agreements and transportation contracts in place to provide for the delivery of coal to the plants. These contracts are written with Force Majeure clauses that enable us to reduce tonnages or cease shipments under certain circumstances or events. These include mechanical or electrical maintenance items, acts of God, war or insurrection, strikes, weather and other disrupting events. This reduces the risk we have for not taking the minimum requirements of fuel under the contracts. Due to the extended Asbury maintenance outage from December 9, 2007 through February 10, 2008, we issued force majeure notices to our Western coal suppliers and to the railroads suspending Western coal shipments during the outage. This relieved us of our contractual obligations to receive shipments of coal to the extent caused by the Asbury outage. The minimum requirements for our coal and coal transportation contracts are $29.7 million for 2009 and $22.0 million for 2010.
119
Table of Contents
THE EMPIRE DISTRICT ELECTRIC COMPANY
NOTES TO CONSOLIDATED FINANCIAL STATEMENTS (Continued)
Purchased Power
We currently supplement our on-system generating capacity with purchases of capacity and energy from other utilities in order to meet the demands of our customers and the capacity margins applicable to us under current pooling agreements and National Electric Reliability Council (NERC) rules.
We have contracted with Westar Energy for the purchase of capacity and energy through May 31, 2010. Commitments under this contract total approximately $22.9 million through May 31, 2010.
We also have a long term (30 year) agreement for the purchase of capacity from the Plum Point Energy Station, a new 665-megawatt, coal-fired generating facility which is being built near Osceola, Arkansas. Construction began in the spring of 2006 with completion scheduled for the summer of 2010. We have the option to purchase an undivided ownership interest in the 50 megawatts covered by the purchased power agreement in 2015. Commitments under this contract total approximately $48.0 million through June 30, 2015.
We have a 20-year purchased power agreement with Cloud County Windfarm, LLC, owned by Horizon Wind Energy, Houston, Texas to purchase the energy generated at the approximately 105-megawatt Phase 1 Meridian Way Wind Farm located in Cloud County, Kansas commencing with the commercial operation date, which was December 15, 2008. We also have a 20-year contract with Elk River Windfarm, LLC to purchase the energy generated at the 150-megawatt Elk River Windfarm located in Butler County, Kansas. Although these agreements are considered operating leases under GAAP, payments for these agreements are recorded as purchased power expenses, and, because of the contingent nature of these payments, are not included in the operating lease obligations discussed below.
New Construction
On March 14, 2006, we entered into contracts to purchase an undivided interest in 50 megawatts of the Plum Point Energy Station's new 665-megawatt, coal-fired generating facility which is being built near Osceola, Arkansas. Construction began in the spring of 2006 with completion scheduled for the summer of 2010. Initially we will own, through an undivided interest, 50 megawatts of the project's capacity for approximately $88.0 million in direct costs, excluding allowance for funds used during construction (AFUDC). We spent $72.8 million through December 31, 2008 and anticipate spending an additional $9.4 million in 2009 and $5.8 million in 2010 for construction expenses related to our 50 megawatt ownership share of Plum Point Unit 1. All of our estimated construction expenditures exclude AFUDC. We also have a long-term (30 year) purchased power agreement for an additional 50 megawatts of capacity and have the option to purchase an undivided ownership interest in the 50 megawatts covered by the purchased power agreement in 2015.
On June 13, 2006, we entered into an agreement with Kansas City Power & Light Company (KCP&L) to purchase an undivided ownership interest in the coal-fired Iatan 2 generating facility. We will own 12%, or approximately 100 megawatts, of the 850-megawatt unit. Construction began in the spring of 2006 with completion scheduled for the summer of 2010. As a requirement for the air permit for Iatan 2, and to help meet requirements of the Clean Air Interstate Rule (CAIR), additional emission control equipment was required for Iatan 1. On May 7, 2008, KCP&L announced an update of their estimated construction figures for the construction of the Iatan 2 plant and for the environmental upgrades at the Iatan 1 plant. Our share of the Iatan 2 construction costs is expected to be in a range of approximately $218 million to $230 million. The updated estimate of our share of the cost for environmental upgrades at the Iatan 1 plant is a range of approximately $58 million to $60 million. The in-service date for the Iatan 1 project is expected to be late in the first quarter of 2009 to early in the second quarter of 2009.
120
Table of Contents
THE EMPIRE DISTRICT ELECTRIC COMPANY
NOTES TO CONSOLIDATED FINANCIAL STATEMENTS (Continued)
A new combustion turbine previously scheduled to be installed by the summer of 2011 will be delayed until 2014 as our generation regulation needs for our purchased power agreements are being met through a combination of our existing units and the SPP energy imbalance market.
Leases
As discussed above, on June 25, 2007, we entered into a 20-year purchased power agreement with Cloud County Windfarm, LLC, owned by Horizon Wind Energy, Houston, Texas. Pursuant to the terms of the agreement, we will purchase all of the output from the approximately 105-megawatt Phase 1 Meridian Way Wind Farm located in Cloud County, Kansas. We do not own any portion of the windfarm. Annual payments are contingent upon output of the facility and can range from zero to a maximum of approximately $14.6 million based on a 20-year average cost.
On December 10, 2004, we entered into a 20-year contract with Elk River Windfarm, LLC to purchase the energy generated at the 150-megawatt Elk River Windfarm located in Butler County, Kansas. We have contracted to purchase approximately 550,000 megawatt-hours of energy per year, or approximately 10% of our annual supply under the contract. We do not own any portion of the windfarm. Payments for wind energy from the Elk River Windfarm are contingent upon output of the facility. Annual payments can run from zero to a maximum of approximately $16.9 million based on a 20-year average cost.
Payments for these agreements are recorded as purchased power expenses, and, because of the contingent nature of these payments, are not included in the operating lease obligations shown below.
We also currently have short-term operating leases for two unit trains to meet coal delivery demands, for garage and office facilities for our electric segment and for six service center properties for our gas segment. In addition we have a five-year capital lease for telephone equipment.
The gross amount of assets recorded under capital leases total $1.3 million at December 31, 2008.
Our lease obligations over the next five years are as follows (in thousands):
| | | | |
| | Capital Leases | |
|---|
2009 | | $ | 288 | |
2010 | | | 241 | |
2011 | | | 3 | |
2012 | | | — | |
2013 | | | — | |
Thereafter | | | — | |
| | | | |
Total minimum payments | | $ | 532 | |
Less amount representing maintenance | | | 177 | |
| | | | |
Net minimum lease payments | | | 355 | |
Less amount representing interest | | | 21 | |
| | | | |
Present value of net minimum lease payments | | $ | 334 | |
| | | | |
121
Table of Contents
THE EMPIRE DISTRICT ELECTRIC COMPANY
NOTES TO CONSOLIDATED FINANCIAL STATEMENTS (Continued)
| | | | |
| | Operating Leases | |
|---|
2009 | | $ | 1,121 | |
2010 | | | 604 | |
2011 | | | 375 | |
2012 | | | 272 | |
2013 | | | 202 | |
Thereafter | | | 467 | |
| | | | |
Total minimum payments | | $ | 3,041 | |
| | | | |
Expenses incurred related to operating leases were $1.5 million, $1.4 million and $0.9 million for 2008, 2007, and 2006, respectively. The accumulated amount of amortization for our capital leases was $0.3 million and $0.2 million at December 31, 2008 and 2007, respectively.
Environmental Matters
We are subject to various federal, state, and local laws and regulations with respect to air and water quality and with respect to hazardous and toxic materials and wastes, including their identification, transportation, disposal, record-keeping and reporting, as well as other environmental matters. We believe that our operations are in compliance with present laws and regulations.
Electric Segment
Air. The 1990 Amendments to the Clean Air Act, referred to as the 1990 Amendments, affect the Asbury, Riverton, State Line and Iatan 1 Power Plants and Units 3 and 4 (the FT8 peaking units) at the Empire Energy Center. The 1990 Amendments require affected plants to meet certain emission standards, including maximum emission levels for sulfur dioxide (SO2) and nitrogen oxides (NOx).
SO2 Emissions. Under the 1990 Amendments, the amount of SO2 an affected unit can emit is regulated. Each existing affected unit has been allocated a specific number of emission allowances, each of which allows the holder to emit one ton of SO2. Utilities covered by the 1990 Amendments must have emission allowances equal to the number of tons of SO2 emitted during a given year by each of their affected units. The annual reconciliation of allowances, which occurs on a facility wide basis, is held each March 1 for the previous calendar year. Allowances may be traded between plants or utilities or "banked" for future use. A market for the trading of emission allowances exists on the Chicago Board of Trade. The Environmental Protection Agency (EPA) withholds annually a percentage of the emission allowances allocated to each affected unit and sells those emission allowances through a direct auction. We receive compensation from the EPA for the sale of these withheld allowances. During 2008, we received less than $0.1 million from the EPA auction.
Our Asbury, Riverton and Iatan coal plants collectively receive 11,723 allowances per year. They burn a blend of low sulfur Western coal (Powder River Basin) and higher sulfur blend coal and petroleum coke, or burn 100% low sulfur Western coal. In addition, tire-derived fuel (TDF) is used as a supplemental fuel at the Asbury Plant. The Riverton Plant can also burn natural gas as its primary fuel. The State Line Plant, the Energy Center Units 3 and 4 and Riverton Unit 12 are gas-fired facilities and are allocated zero SO2 allowances. In the near term, annual allowance requirements for the State Line Plant, the Energy Center Units 3 and 4 and Riverton Unit 12, which are not expected to exceed 20 allowances per year, will be transferred from our inventoried bank of allowances. In 2008, the combined actual SO2 allowance need for all affected plant facilities exceeded the number of allowances allocated to us by the EPA. The annual EPA
122
Table of Contents
THE EMPIRE DISTRICT ELECTRIC COMPANY
NOTES TO CONSOLIDATED FINANCIAL STATEMENTS (Continued)
reconciliation of SO2 allowances does not occur until March 1 of the year following the actual SO2 emissions. We project that after the EPA reconciliation of March 1, 2009, we will have approximately 17,600 banked SO2 allowances as compared to 23,800 at March 1, 2008. We project that our 2009 emissions will again exceed the number of allowances allocated by the EPA by an amount approximately equal to the difference during 2008.
When our SO2 allowance bank is exhausted, we will need to purchase additional SO2 allowances or build a Flue Gas Desulphurization (FGD) scrubber system at our Asbury Plant. Based on current and projected SO2 allowance prices and high-level estimated FGD scrubber construction costs ($81 million in 2010 dollars), we expect it will be more economical for us to purchase SO2 allowances than to build a scrubber at the Asbury Plant. We would expect the costs of SO2 allowances to be fully recoverable in our rates.
Effective March 1, 2005, the MPSC approved a Stipulation and Agreement granting us authority to manage our SO2 allowance inventory in accordance with our SO2 Allowance Management Policy (SAMP). The SAMP allows us to exchange banked allowances for future vintage allowances and/or monetary value and, in extreme market conditions, to sell SO2 allowances outright for monetary value. We have not yet exchanged or sold any allowances under the SAMP.
SO2 emissions will be further regulated as described in the Clean Air Interstate Rule section below.
NOx Emissions. The Asbury, Iatan, State Line, Energy Center and Riverton Plants are each in compliance with the NOx limits applicable to them under the 1990 Amendments as currently operated.
The Asbury Plant received permission from the Missouri Department of Natural Resources (MDNR) to burn TDF at a maximum rate of 2% of total fuel input. During 2008, approximately 2,038 tons of TDF were burned. This is equivalent to 203,800 discarded passenger car tires.
Under the MDNR's Missouri NOx Rule, our Iatan, Asbury, State Line and Energy Center facilities, like other facilities in western Missouri, are generally subject to a maximum NOx emission rate of 0.35 lbs/MMBtu during the ozone season of May 1 through September 30. Facilities which burn at least 100,000 passenger tire equivalents of TDF per year, including our Asbury Plant, are subject to a higher NOx emission limit of 0.68 lbs/MMBtu. All of our plants currently meet the required emission limits.
In March 2008, the EPA lowered the National Ambient Air Quality Standard (NAAQS) for ozone from 84 ppb to 75 ppb. Ozone, also called ground level smog, is formed by the mixing of NOx and Volatile Organic Compounds (VOCs) in the presence of sunlight. It is possible that several counties in southwest Missouri will be classified as being in non-attainment of the ozone NAAQS standard by the EPA in 2010 or later. We anticipate that the EPA will classify the Kansas City area, where Iatan 1 is located, as being in non-attainment in 2010. At this time we do not foresee the need for additional pollution controls due to the reduction in the ozone standard. In addition, our units do not emit appreciable VOCs. We do not anticipate that southeast Kansas, where our Riverton Plant is located, will be classified as non-attainment under the new ozone NAAQS.
NOx emissions will be further regulated as described in the Clean Air Interstate Rule section below.
Clean Air Interstate Rule (CAIR)
The EPA issued its final CAIR on March 10, 2005. CAIR governed NOx and SO2 emissions from fossil fueled units greater than 25 megawatts in 28 states, including Missouri, where our Asbury, Energy Center, State Line and Iatan Units No. 1 and No. 2 are located and Arkansas where the Plum Point Energy Station is being constructed. Kansas was not included in CAIR and our Riverton Plant was not affected.
123
Table of Contents
THE EMPIRE DISTRICT ELECTRIC COMPANY
NOTES TO CONSOLIDATED FINANCIAL STATEMENTS (Continued)
On July 11, 2008, the U.S. Court of Appeals for the District of Columbia Circuit vacated the CAIR Rule and remanded it back to the EPA. On September 24, 2008, the EPA filed a petition for rehearing with the United States Court of Appeals. The court vacated CAIR based on its interpretation that the Clean Air Act did not provide the EPA with the authority needed for CAIR implementation. However, the court stayed its vacatur on December 23, 2008. As a result, CAIR became effective for NOx on January 1, 2009 and will become effective for SO2 on January 1, 2010.
The CAIR is not directed to specific generation units, but instead, requires the states (including Missouri and Arkansas) to develop State Implementation Plans (SIPs) to comply with specific NOx and SO2 state-wide annual budgets. Missouri and Arkansas finalized their respective regulations and submitted their SIPs to the EPA, which were approved. We have received our full allotment of allowances as published in the Missouri CAIR Rule. Under the Arkansas CAIR rule, we will not receive allowances until approximately six years after Plum Point Unit 1 is operational. In the interim, we will transfer allowances from our Missouri units. Based on SIPs for Missouri and Arkansas, we believe we will have excess annual and ozone season NOx allowances. SO2 allowances must be utilized at a 2:1 ratio for our Missouri units as compared to our non-CAIR Kansas units beginning in 2010. As a result, based on current SO2 allowance usage projections, we expect to exhaust our banked allowances by the end of 2010 and will need to purchase additional SO2 allowances or build a scrubber at our Asbury Plant.
In order to meet CAIR requirements and to meet air permit requirements for Iatan 2, pollution control equipment is being installed on Iatan 1 with the in-service date expected to be late in the first quarter to early in the second quarter of 2009. This equipment includes a Selective Catalytic Reduction (SCR) system, an FGD scrubber and a baghouse, with our share of the capital cost estimated to be between $58 million and $60 million, excluding AFUDC. Of this amount, approximately $3.9 million was incurred in 2006, $12.1 million in 2007 and $27.3 million in 2008 with estimated expenditures of approximately $15.6 million in 2009. This project was also included as part of our Experimental Regulatory Plan approved by the MPSC.
Also to meet CAIR requirements, we constructed an SCR at Asbury that was completed in November 2007 and placed in service in February 2008 at a total cost of approximately $31.0 million (excluding AFUDC). This project was also included as part of our Experimental Regulatory Plan approved by the MPSC and its cost is now in base rates in Missouri.
Air Permits. Under Title V of the 1990 Amendments, we must obtain site operating permits for each of our plants from the authorities in the state in which the plant is located. These permits, which are valid for five years, regulate the plant site's total air emissions; including emissions from stacks, individual pieces of equipment, road dust, coal dust and other emissions. We have been issued permits for Asbury, Iatan, Riverton, State Line and the Energy Center Plants. We submitted the required renewal applications for the State Line and Energy Center Title V permits in 2003 and the Asbury Title V permit in 2004 and will operate under the existing permits until the Missouri Department of Natural Resources (MDNR) issues the renewed permits. A Compliance Assurance Monitoring (CAM) plan for particulate matter (PM) will be required by the renewed permit for Asbury. We estimate that the capital costs associated with the PM CAM plan will not exceed $2 million. We submitted the renewal application for the Riverton Title V permit in June 2008. A CAM plan for PM will also be required by the renewed permit for Riverton. No additional capital costs are anticipated. It is expected that the Kansas Department of Health and Environment (KDHE) will issue the renewal permit for Riverton in the first quarter of 2009.
A new air permit was issued for the Iatan Generating Station on January 31, 2006. The new permit covers the entire Iatan Generating Station and includes the existing Unit No. 1 and Iatan Unit No. 2 currently under construction. The new permit limits Unit No. 1 to a maximum of 6,600 MMBtu per hour of
124
Table of Contents
THE EMPIRE DISTRICT ELECTRIC COMPANY
NOTES TO CONSOLIDATED FINANCIAL STATEMENTS (Continued)
heat input. The 6,600 MMBtu per hour heat input limit is in effect until the new SCR, scrubber, and baghouse are in place and fully operational, currently estimated to be late in the first quarter of 2009 to early in the second quarter of 2009.
The Clean Air Act required companies to obtain permits and, if necessary, install control equipment to reduce emissions when making a major modification or a change in operation if either is expected to cause a significant net increase in regulated emissions. The Sierra Club and Concerned Citizens of Platte County have claimed that modifications were made to Iatan 1 prior to the Comprehensive Energy Plan project in violation of Clean Air Act regulations. We own 12% of Iatan 1. As operator, KCP&L entered into a Collaboration Agreement with those parties that provide, among other things, for the release of such claims. In May 2008, a grand jury subpoena requesting documents was received by KCP&L. KCP&L continues to produce documents in response to the subpoena. The outcome of these activities cannot presently be determined, nor can the costs and other liabilities that could potentially result from a negative outcome presently be reasonably estimated.
Clean Air Mercury Rule (CAMR)
On March 15, 2005, the EPA issued the CAMR regulations for mercury emissions by power plants under the requirements of the 1990 Amendments to the Clean Air Act. The new mercury emission limits of CAMR Phase 1 were to go into effect January 1, 2010. On February 8, 2008, the U.S. Court of Appeals for the District of Columbia vacated the EPA's CAMR regulations which was appealed to the U.S. Supreme Court on October 17, 2008.
The EPA has not yet issued guidance to the states regarding the vacated regulation nor recommended future actions. Based on CAMR, we installed a mercury analyzer at Asbury during late 2007 and installed two mercury analyzers at Riverton in 2008 in order to verify our mercury emissions and to meet the compliance date of January 1, 2009 for the Phase 1 mercury emission compliance date of January 1, 2010. We will operate the mercury analyzers at Riverton and Asbury in accordance with the appropriate state environmental regulator's guidance.
If the CAMR rulemaking is ultimately revoked by the EPA after final adjudication, Maximum Achievable Control Technology (MACT) will re-emerge under current law. No specific MACT rulemakings have yet been adopted in Missouri or Kansas.
CO2 Emissions
Our coal and gas plants emit carbon dioxide (CO2), a greenhouse gas. Although not currently regulated, increasing public concern and political pressure from local, regional, national and international bodies may result in the passage of new laws mandating limits on greenhouse gas emissions such as CO2. In April 2007, the U.S. Supreme Court issued a decision ruling the EPA improperly declined to address CO2 impacts in a rule-making related to new motor vehicle emissions. While this decision is not directly applicable to power plant emissions, the reasoning of the decision could affect other regulatory programs. The impact on us of any future greenhouse gas regulation will depend in large part on the details of the requirements and the timetable for mandatory compliance. We would expect the cost of complying with any such regulations to be fully recoverable in our rates.
Water. We operate under the Kansas and Missouri Water Pollution Plans that were implemented in response to the Federal Water Pollution Control Act Amendments of 1972. The Asbury, Iatan, Riverton, Energy Center and State Line plants are in compliance with applicable regulations and have received discharge permits and subsequent renewals as required.
125
Table of Contents
THE EMPIRE DISTRICT ELECTRIC COMPANY
NOTES TO CONSOLIDATED FINANCIAL STATEMENTS (Continued)
The Riverton Plant is affected by final regulations for Cooling Water Intake Structures issued under the Clean Water Act (CWA) Section 316(b) Phase II. The regulations became final on February 16, 2004 and required the submission of a Sampling Report and Comprehensive Demonstration Study with the permit renewal in 2008. Sampling and summary reports, which were completed during the first quarter of 2008 and submitted to the KDHE, indicate that the effect of the cooling water intake structure on Empire Lake's aquatic life is insignificant. The need for a further Demonstration Study is not expected. On January 25, 2007, the United States Court of Appeals for the Second Circuit remanded key sections of these CWA regulations. On July 9, 2007, the EPA suspended the regulation and is expected to revise and re-propose the regulation in 2009. In addition, on April 14, 2008 certiorari was granted by the United States Supreme Court limited to the review as to whether Section 316(b) of the CWA authorized the EPA to compare costs with benefits in determining the best technology available for minimizing adverse environmental impacts at cooling water intake structures. The Supreme Court heard oral arguments on December 2, 2008 and will issue their ruling in the first half of 2009. The permit renewal application was prepared and submitted in June 2008 and the final permit was received on January 1, 2009. Under the initial regulations, we did not expect costs associated with compliance to be material. We will reassess costs after the Supreme Court issues its ruling and the revised rules are complete.
Ash Ponds. We own and maintain coal ash ponds located at our Riverton and Asbury Power Plants. Additionally, we own a 12 percent interest in a coal ash pond at the Iatan Generating Station. All of the ash ponds are compliant with state and federal regulations.
Renewable Energy. On November 4, 2008, Missouri voters approved the Clean Energy Initiative. This initiative requires investor-owned utilities in Missouri (such as Empire) to generate or purchase electricity from renewable energy sources, such as solar, wind, biomass and hydro power, at the rate of at least 2% in retail sales by 2011, increasing to at least 15% by 2021. At least 25 other states have adopted renewable portfolio standard (RPS) programs that mandate some form of renewable generation. Some of these RPS programs incorporate a trading system in which utilities are allowed to buy and sell renewable energy certificates (RECs) in order to meet compliance. Additionally, RECs are utilized by many companies in "green" marketing efforts. REC prices are driven by various market forces. We have been selling RECs and plan to continue to sell all or a portion of the RECs associated with our contracts with Elk River Windfarm, LLC and Cloud County Windfarm, LLC. With respect to the energy underlying the RECs that we sell, we may not claim that we are purchasing renewable energy for any purpose, including for purposes of complying with the new Missouri requirements. Over time, we expect to retain some of the renewable attributes associated with these contracts in order to meet the new Missouri requirements. We realized revenues of $1.8 million from REC sales in 2008 and $0.9 million in 2007.
Gas Segment
The acquisition of Missouri Gas involved the property transfer of two former manufactured gas plant (MGP) sites previously owned by Aquila, Inc. and its predecessors. Site #1 in Chillicothe, Missouri is listed in the MDNR Registry of Confirmed Abandoned or Uncontrolled Hazardous Waste Disposal Sites in Missouri. Site #2 in Marshall, Missouri has received a letter of no further action from the MDNR. A Change of Use request and work plan was approved by the MDNR allowing us to expand our existing service center at Site #1 in Chillicothe, Missouri. This project, which was completed in October 2007, included the removal of all excavated soil and the addition of a new concrete surface replacing the existing gravel at a cost of approximately $0.1 million. We estimate further remediation costs at these two sites to be no more than approximately $0.2 million, based on our best estimate at this time. The remaining liability balance of $0.2 million is recorded under noncurrent liabilities and deferred credits. In our agreement with the MPSC approving the acquisition of Missouri Gas, it was agreed that we could reflect a liability and offsetting regulatory asset not to exceed $260,000 for the acquired sites. The MPSC agreed
126
Table of Contents
THE EMPIRE DISTRICT ELECTRIC COMPANY
NOTES TO CONSOLIDATED FINANCIAL STATEMENTS (Continued)
that up to $260,000 of costs related to the clean up of these MGP sites would be allowed for future rate recovery. Accordingly, we concluded that rate recovery was probable and at the acquisition date, a regulatory asset of $260,000 was recorded as part of the purchase price allocation based on our agreement with the MPSC, and in accordance with SFAS No. 71 — "Accounting for the Effects of Certain Types of Regulation" (FAS 71).
13. Segment Information
We operate our business as three segments: electric, gas and other. As part of our electric segment, we also provide water service to three towns in Missouri. The Empire District Gas Company is our wholly owned subsidiary formed to hold the Missouri Gas assets acquired from Aquila, Inc. on June 1, 2006. The other segment consists of our non-regulated businesses, primarily a subsidiary for our fiber optics business.
As discussed in "Note 19 — Discontinued Operations", we sold our controlling 52% interest in MAPP to other current owners on August 31, 2006. MAPP is a company that specialized in close-tolerance custom manufacturing for the aerospace, electronics, telecommunications and machinery industries. In December 2006, we sold our 100% interest in Conversant, Inc. a software company that marketed Customer Watch, an Internet-based customer information system software. On September 28, 2007, we sold our 100% interest in Fast Freedom, Inc., an Internet service provider. For financial reporting purposes, all of these businesses have been classified as a discontinued operation and are not included in our segment information as shown below (in thousands).
The tables below present statement of income information, balance sheet information and capital expenditures of our business segments.
| | | | | | | | | | | | | | | | |
| | For the year ended December 31 | |
|---|
| | 2008 | |
|---|
| | Electric | | Gas | | Other | | Eliminations | | Total | |
|---|
Statement of Income Information: | | | | | | | | | | | | | | | | |
Revenues | | $ | 448,248 | | $ | 65,438 | | $ | 5,005 | | $ | (528 | ) | $ | 518,163 | |
Depreciation and amortization | | | 50,305 | | | 1,940 | | | 1,317 | | | — | | | 53,562 | |
Federal and state income taxes | | | 17,764 | | | 987 | | | 375 | | | — | | | 19,126 | |
Operating income | | | 64,426 | | | 5,420 | | | 1,166 | | | — | | | 71,012 | |
Interest income | | | 1,162 | | | 390 | | | — | | | (495 | ) | | 1,057 | |
Interest expense | | | 39,627 | | | 3,962 | | | 204 | | | (495 | ) | | 43,298 | |
Income from AFUDC, (debt and equity) | | | 12,508 | | | 10 | | | — | | | — | | | 12,518 | |
Income from continuing operations | | $ | 37,436 | | $ | 1,677 | | $ | 609 | | $ | — | | $ | 39,722 | |
Capital Expenditures | |
$ |
202,295 | |
$ |
2,139 | |
$ |
1,952 | |
$ |
— | |
$ |
206,386 | |
127
Table of Contents
THE EMPIRE DISTRICT ELECTRIC COMPANY
NOTES TO CONSOLIDATED FINANCIAL STATEMENTS (Continued)
| | | | | | | | | | | | | | | | |
| | 2007 | |
|---|
| | Electric | | Gas | | Other | | Eliminations | | Total | |
|---|
Statement of Income Information: | | | | | | | | | | | | | | | | |
Revenues | | $ | 427,039 | | $ | 59,877 | | $ | 3,681 | | $ | (437 | ) | $ | 490,160 | |
Depreciation and amortization | | | 49,637 | | | 1,889 | | | 1,073 | | | — | | | 52,599 | |
Federal and state income taxes | | | 13,590 | | | 572 | | | 282 | | | — | | | 14,444 | |
Operating income | | | 60,222 | | | 4,688 | | | 656 | | | — | | | 65,566 | |
Interest income | | | 562 | | | 375 | | | — | | | (611 | ) | | 326 | |
Interest expense | | | 35,782 | | | 3,957 | | | 251 | | | (611 | ) | | 39,379 | |
Income from AFUDC, (debt and equity) | | | 7,648 | | | 17 | | | — | | | — | | | 7,665 | |
Income from continuing operations | | | 31,836 | | | 969 | | | 376 | | | — | | | 33,181 | |
Capital Expenditures | |
$ |
188,545 | |
$ |
2,024 | |
$ |
4,999 | |
$ |
— | |
$ |
195,568 | |
| | | | | | | | | | | | | | | | |
| | 2006 | |
|---|
| | Electric | | Gas(2) | | Other | | Eliminations | | Total | |
|---|
Statement of Income Information: | | | | | | | | | | | | | | | | |
Revenues | | $ | 384,496 | | $ | 25,145 | | $ | 2,920 | | $ | (390 | ) | $ | 412,171 | |
Depreciation and amortization | | | 36,453 | | | 1,065 | | | 874 | | | — | | | 38,392 | |
Federal and state income taxes | | | 22,485 | | | (619 | ) | | 65 | | | — | | | 21,931 | |
Operating income | | | 67,931 | | | 1,286 | | | 604 | | | — | | | 69,821 | |
Interest income | | | 984 | | | 40 | | | — | | | (635 | ) | | 389 | |
Interest expense | | | 31,227 | | | 2,350 | | | 548 | | | (635 | ) | | 33,490 | |
Income from AFUDC, (debt and equity) | | | 4,190 | | | 65 | | | — | | | — | | | 4,255 | |
Income from continuing operations | | | 40,931 | | | (959 | ) | | 57 | | | — | | | 40,029 | |
Capital Expenditures(1) | |
$ |
116,579 | |
$ |
996 | |
$ |
2,596 | |
$ |
— | |
$ |
120,171 | |
- (1)
- Does not include the acquisition of Missouri gas operation.
- (2)
- Represents the months of June through September 2006.
| | | | | | | | | | | | | | | | |
| | December 31, 2008 | |
|---|
| | Electric | | Gas(1) | | Other | | Eliminations | | Total | |
|---|
Balance Sheet Information: | | | | | | | | | | | | | | | | |
Total assets | | $ | 1,621,502 | | $ | 138,788 | | $ | 22,186 | | $ | (68,630 | ) | $ | 1,713,846 | |
| | | | | | | | | | | | | | | | |
| | December 31, 2007 | |
|---|
| | Electric | | Gas(1) | | Other | | Eliminations | | Total | |
|---|
Balance Sheet Information: | | | | | | | | | | | | | | | | |
Total assets | | $ | 1,395,289 | | $ | 121,918 | | $ | 22,101 | | $ | (66,234 | ) | $ | 1,473,074 | |
- (1)
- Includes goodwill of $39,492 at December 31, 2008 and 2007.
128
Table of Contents
THE EMPIRE DISTRICT ELECTRIC COMPANY
NOTES TO CONSOLIDATED FINANCIAL STATEMENTS (Continued)
14. Selected Quarterly Information (Unaudited)
The following is a summary of quarterly results for 2008 and 2007 (dollars in thousands except per share amounts):
| | | | | | | | | | | | | |
| | Quarters | |
|---|
Quarterly Results for 2008 | | First | | Second | | Third | | Fourth | |
|---|
Operating revenues | | $ | 136,946 | | $ | 111,280 | | $ | 138,685 | | $ | 131,252 | |
Operating income | | | 14,559 | | | 12,326 | | | 28,019 | | | 16,108 | |
Income from continuing operations | |
$ |
6,990 | |
$ |
4,817 | |
$ |
20,180 | |
$ |
7,735 | |
| | | | | | | | | | |
Net Income | | $ | 6,990 | | $ | 4,817 | | $ | 20,180 | | $ | 7,735 | |
Basic earnings per share — continuing operations | |
$ |
0.21 | |
$ |
0.14 | |
$ |
0.60 | |
$ |
0.23 | |
| | | | | | | | | | |
Basic Earning Per Share | | $ | 0.21 | | $ | 0.14 | | $ | 0.60 | | $ | 0.23 | |
Diluted earnings per share — continuing operations | |
$ |
0.21 | |
$ |
0.14 | |
$ |
0.59 | |
$ |
0.23 | |
| | | | | | | | | | |
Diluted Earnings Per Share | | $ | 0.21 | | $ | 0.14 | | $ | 0.59 | | $ | 0.23 | |
| | | | | | | | | | |
| | | | | | | | | | | | | |
| | Quarters | |
|---|
Quarterly Results for 2007 | | First | | Second | | Third | | Fourth | |
|---|
Operating revenues | | $ | 125,650 | | $ | 107,249 | | $ | 142,487 | | $ | 114,774 | |
Operating income | | | 11,913 | | | 14,123 | | | 31,670 | | | 7,860 | |
Income (loss) from continuing operations | |
$ |
4,531 | |
$ |
5,851 | |
$ |
23,200 | |
$ |
(401 |
) |
Income (loss) from discontinued operations | | | (31 | ) | | (17 | ) | | 111 | | | — | |
| | | | | | | | | | |
Net Income (loss) | | $ | 4,500 | | $ | 5,834 | | $ | 23,311 | | $ | (401 | ) |
Basic earnings (loss) per share — continuing operations | |
$ |
0.15 | |
$ |
0.19 | |
$ |
0.76 | |
$ |
(0.01 |
) |
Basic earnings (loss) per share — discontinued operations | | | — | | | — | | | — | | | — | |
| | | | | | | | | | |
Basic Earning (loss) Per Share | | $ | 0.15 | | $ | 0.19 | | $ | 0.76 | | $ | (0.01 | ) |
Diluted earnings (loss) per share — continuing operations | |
$ |
0.15 | |
$ |
0.19 | |
$ |
0.76 | |
$ |
(0.01 |
) |
Diluted earnings (loss) per share — discontinued operations | | | — | | | — | | | — | | | — | |
| | | | | | | | | | |
Diluted Earnings (loss) Per Share | | $ | 0.15 | | $ | 0.19 | | $ | 0.76 | | $ | (0.01 | ) |
| | | | | | | | | | |
The sum of the quarterly earnings per share of common stock may not equal the earnings per share of common stock as computed on an annual basis due to rounding.
Earnings for the fourth quarter of 2008, were $7.7 million, or $0.23 per share, as compared to a net loss of $0.4 million, or ($0.01) per share, in the fourth quarter 2007. Total revenues increased approximately $16.5 million (14.4%) for the fourth quarter of 2008 as compared to the fourth quarter of 2007 primarily due to the Missouri rate increase. Total electric revenues were $11.5 million higher, primarily as a result of the rate increase, which had an estimated $5.3 million impact, weather, which had a positive impact of an estimated $2.3 million and an increase in off-system sales of $3.0 million. Increased revenues from our gas segment were $4.8 million. Electric fuel and purchased power costs were $2.8 million less this quarter versus last year, primarily due to lower natural gas prices and our regulatory adjustment of $1.7 million. Our fourth quarter electric fuel and purchased power expenditures were higher than the base cost in our Missouri rates. Therefore, $1.7 million was transferred from fuel costs to a regulatory asset. Costs of natural gas sold and transported for our gas segment increased $4.6 million. Other impacts to the quarter included increased income taxes (approximately $5.7 million) and maintenance and repairs expense (approximately $0.7 million).
129
Table of Contents
THE EMPIRE DISTRICT ELECTRIC COMPANY
NOTES TO CONSOLIDATED FINANCIAL STATEMENTS (Continued)
15. RISK MANAGEMENT AND DERIVATIVE FINANCIAL INSTRUMENTS
As of December 31, 2008 and 2007, we have recorded the following assets and liabilities representing the fair value of derivative financial instruments held as of December 31, (in thousands):
ASSET DERIVATIVES
| | | | | | | | | | |
Derivatives designated as hedging instruments under FAS 133
| | 2008 | | 2007 | |
|---|
| | Balance Sheet Classification | | Fair
Value | | Fair
Value | |
|---|
Natural gas contracts, electric segment | | Current assets | | $ | 1,214 | | $ | 2,435 | |
| | Non-current assets and deferred charges | | | 6,208 | | | 17,520 | |
Derivatives not designated as hedging instruments under FAS 133
|
|
|
|
|
|
|---|
| |
| |
| |
| |
|---|
Natural gas contracts, gas segment | | Current assets | | | 1,177 | | | 64 | |
| | Non-current assets and deferred charges | | | 226 | | | — | |
Natural gas contracts, electric segment | | Current assets | | | 4 | | | — | |
| | Non-current assets and deferred charges | | | — | | | — | |
| | | | | | | | |
| | Total derivatives assets | | $ | 8,829 | | $ | 20,019 | |
| | | | | | | | |
LIABILITY DERIVATIVES
| | | | | | | | | | |
Derivatives designated as hedging instruments under FAS 133
| | 2008 | | 2007 | |
|---|
| | Balance Sheet Classification | | Fair
Value | | Fair
Value | |
|---|
Natural gas contracts, electric segment | | Current liabilities | | $ | 6,254 | | $ | 1,154 | |
| | Non-current liabilities and deferred charges | | | 3,282 | | | 698 | |
Derivatives not designated as hedging instruments under FAS 133
|
|
|
|
|
|
|---|
| |
| |
| |
| |
|---|
Natural gas contracts, gas segment | | Current liabilities | | | 4,474 | | | 457 | |
| | Non-current liabilities and deferred credits | | | 20 | | | — | |
Natural gas contracts, electric segment | | Current liabilities | | | 1,548 | | | — | |
| | Non-current liabilities and deferred charges | | | — | | | — | |
| | | | | | | | |
| | Total derivatives liabilities | | $ | 15,578 | | $ | 2,309 | |
| | | | | | | | |
Electric
A $(2.1) million net of tax, unrealized loss representing the fair market value of our electric segment derivative contracts treated as cash flow hedges is recognized as Accumulated Comprehensive Income in the capitalization section of the balance sheet as of December 31, 2008. The tax credit of $1.3 million on this loss is included in deferred taxes. These amounts will be adjusted cumulatively on a monthly basis
130
Table of Contents
THE EMPIRE DISTRICT ELECTRIC COMPANY
NOTES TO CONSOLIDATED FINANCIAL STATEMENTS (Continued)
during the determination periods, beginning January 1, 2009 and ending on September 30, 2011. At the end of each determination period, or if cash flow hedge treatment is discontinued, any gain or loss for that period related to the instrument will be reclassified to fuel expense. As of December 31, 2008, approximately $(6.4) million of unrealized losses are applicable to financial instruments which will settle within the next twelve months. Effective September 1, 2008, in conjunction with the implementation of the Missouri fuel adjustment clause in the July 2008 MPSC rate order, the unrealized losses or gains from new cash flow hedges are recorded in regulatory assets or liabilities. This is in accordance with FAS 71, given that those regulatory assets and liabilities are probable of recovery through our fuel adjustment mechanism. Unrealized gains and losses from cash flow hedges existing at September 1, 2008 will continue to be recorded through comprehensive income. Once settled, the realized gain or loss will be recorded as fuel expense and be subject to the fuel adjustment clause.
The following table sets forth the actual pre-tax gains/(losses) from the qualified portion of our hedging activities for settled contracts for the electric segment for each of the years ended December 31, (in thousands):
| | | | | | | | | | | | | | | | |
| |
| | Amount of
Gain/(Loss)
Reclassed from
OCI into Income
(Effective Portion) | | Amount of
Gain/(Loss)
Recognized in
OCI on Derivative
(Effective Portion) | |
|---|
Derivatives in FAS 133 Cash Flow Hedging Relationships
| |
| |
|---|
| | Income Statement Classification of Gain/(Loss) on Derivative | |
|---|
| | 2008 | | 2007 | | 2008 | | 2007 | |
|---|
Commodity contracts — electric segment | | Fuel and purchased power expense | | $ | 3,872 | | $ | 1,610 | | $ | (17,394 | ) | $ | 5,229 | |
| | | | | | | | | | | | |
| | Total Effective — Electric Segment | | $ | 3,872 | | $ | 1,610 | | $ | (17,394 | ) | $ | 5,229 | |
| | | | | | | | | | | | |
We record unrealized gains/(losses) on the ineffective portion of our gas hedging activities in "Fuel and purchased power" under the Operating Revenue Deductions section of our statement of operations since all of our gas hedging activities are related to stabilizing fuel costs as part of our fuel procurement program and are not speculative activities.
The following table sets forth "mark-to-market" pre-tax gains/(losses) from the ineffective portion of our hedging activities for the electric segment for each of the years ended December 31, (in thousands):
| | | | | | | | | | |
Derivatives in FAS 133 Cash Flow Hedging Relationships
| |
| | Amount of Gain/(Loss)
Recognized in
Income on Derivative
(Ineffective Portion) | |
|---|
| | Income Statement Classification of Gain/(Loss) on Derivative | | 2008 | | 2007 | |
|---|
Commodity contracts — electric segment | | Fuel and purchased power expense | | $ | 32 | | $ | — | |
| | | | | | | | |
| | Total Ineffective — Electric Segment | | $ | 32 | | $ | — | |
| | | | | | | | |
In accordance with the Missouri fuel adjustment clause discussed above, the recoverable portion of any gain or loss is recorded in a regulatory asset or liability account. The following tables sets forth
131
Table of Contents
THE EMPIRE DISTRICT ELECTRIC COMPANY
NOTES TO CONSOLIDATED FINANCIAL STATEMENTS (Continued)
"mark-to-market" pre-tax gains/ (losses) from derivatives not designated as hedging instruments under FAS 133 for the electric segment for each of the years ended December 31, (in thousands):
| | | | | | | | | | |
Derivatives Not Designated as Hedging Instruments Under FAS 133
| |
| | Amount of Gain/(Loss)
Recognized on
Balance Sheet | |
|---|
| | Balance Sheet Classification of Gain/(Loss) on Derivative | | 2008 | | 2007 | |
|---|
Commodity contracts — electric segment | | Regulatory assets | | $ | (1,218 | ) | $ | — | |
| | Regulatory liabilities | | | 3 | | | — | |
| | | | | | | | |
| | Total — Electric Segment | | $ | (1,215 | ) | $ | — | |
| | | | | | | | |
Derivatives Not Designated as Hedging Instruments Under FAS 133(1)
|
|
|
|
Amount of Gain/(Loss)
Recognized in
Income on Derivative |
|
|---|
| | Income Statement Classification of Gain/(Loss) on Derivative | | 2008 | | 2007 | |
|---|
Commodity contracts — electric segment | | Fuel and purchased power expense | | $ | (329 | ) | $ | 281 | |
| | | | | | | | |
| | Total — Electric Segment | | $ | (329 | ) | $ | 281 | |
| | | | | | | | |
- (1)
- All of our gas hedging activities are related to stabilizing fuel costs as part of our fuel procurement program and are not speculative activities. If conditions change, such as a planned unit outage, we may need to de-designate and/or unwind some of our previous derivatives designated under FAS 133. In this instance, these derivatives would be classified into the category above.
We also enter into fixed-price forward physical contracts for the purchase of natural gas, coal and purchased power. These contracts are not subject to the fair value accounting of FAS 133 because they are considered to be normal purchases. We have instituted a process to determine if any future executed contracts that otherwise qualify for the normal purchases exception contain a price adjustment feature and will account for these contracts accordingly.
As of February 6, 2009, 78% of our anticipated volume of natural gas usage for our electric operations for the year 2009 is hedged, either through physical or financial contracts, at an average price of $6.274 per Dekatherm (Dth). In addition, the following volumes and percentages of our anticipated volume of natural gas usage for our electric operations for the next six years are hedged at the following average prices per Dth:
| | | | | | | | | | |
Year | | % Hedged | | Dth Hedged | | Average Price | |
|---|
2010 | | | 64 | % | | 5,715,000 | | $ | 6.538 | |
2011 | | | 37 | % | | 3,200,000 | | $ | 5.561 | |
2012 | | | 14 | % | | 1,200,000 | | $ | 7.295 | |
2013 | | | 12 | % | | 1,200,000 | | $ | 7.295 | |
On February 15, 2008, the Company unwound 992,000 Dth of physical gas contracts originally scheduled for delivery in July and August of 2010 and 2011. This transaction resulted in a gain of approximately $1.3 million after tax which was recorded in the Statement of Income in the first quarter of 2008. We believe it is probable that we will take physical delivery under the remaining physical gas forward contracts.
132
Table of Contents
THE EMPIRE DISTRICT ELECTRIC COMPANY
NOTES TO CONSOLIDATED FINANCIAL STATEMENTS (Continued)
Gas
We attempt to mitigate our natural gas price risk for our gas segment by a combination of (1) injecting natural gas into storage during the off-heating season months, (2) purchasing physical forward contracts and (3) purchasing financial derivative contracts. As of February 6, 2009, we have 100% of our expected remaining winter heating season usage (through March 2009) hedged with physical storage, physical forward contracts and financial derivative contracts. The average price of these hedges is $7.49 per Dth. We target to have 95% of our storage capacity full by November 1 for the upcoming winter heating season. As the winter progresses, gas is withdrawn from storage to serve our customers. As of February 6, 2009, we had 0.7 million Dths in storage on the three pipelines that serve our customers. This represents 36% of our storage capacity. Our long-term hedge strategy is to mitigate price volatility for our customers by hedging a minimum of 50% of current year, up to 50% of second year and up to 20% of third year expected gas usage by the beginning of the Actual Cost Adjustment (ACA) year at September 1. A Purchased Gas Adjustment (PGA) clause is included in our rates for our gas segment operations, therefore, we mark to market any unrealized gains or losses and any realized gains or losses relating to financial derivative contracts to a regulatory asset or regulatory liability account on our balance sheet.
The following table sets forth "mark-to-market" pre-tax gains / (losses) from derivatives not designated as hedging instruments under FAS 133 for the gas segment for the years ended December 31, (in thousands):
| | | | | | | | | | |
Derivatives Not Designated as Hedging Instruments Under FAS 133
| |
| | Amount of Gain/(Loss)
Recognized on Balance Sheet | |
|---|
| | Balance Sheet Classification of Gain or (Loss) on Derivative | |
|---|
| | 2008 | | 2007 | |
|---|
Commodity contracts — gas segment | | Regulatory assets | | $ | (9,263 | ) | $ | (1,534 | ) |
| | | | | | | | |
| | Total — Gas Segment | | $ | (9,263 | ) | $ | (1,534 | ) |
| | | | | | | | |
133
Table of Contents
THE EMPIRE DISTRICT ELECTRIC COMPANY
NOTES TO CONSOLIDATED FINANCIAL STATEMENTS (Continued)
16. FAS 157 — Fair Value Measurements
In September 2006, FAS 157 was issued. This statement defines fair value, establishes a framework for measuring fair value in generally accepted accounting principles and expands disclosures about fair value measurements. This statement applies under other accounting pronouncements that require or permit fair value measurements. FASB Staff Position (FSP) 157-1, issued in February 2008, amended FAS 157 to exclude FASB Statement No. 13, "Accounting for Leases" (FAS 13) and other FAS 157 accounting pronouncements that address fair value measurements for purposes of lease classification or measurement under FAS 13. FASB Staff Position (FSP) 157-2 amended FAS 157 to delay the effective date of FAS 157 for all nonfinancial assets and nonfinancial liabilities to fiscal years beginning after November 15, 2008.
The adoption of FAS 157 for financial assets and financial liabilities, effective January 1, 2008 did not have a material impact on our consolidated financial position, results of operations and cash flows. We are evaluating the effect the adoption of FAS 157 for nonfinancial assets and nonfinancial liabilities will have on our consolidated financial position, results of operations and cash flows.
Level 1, 2 and 3 Valuation Techniques
FAS 157 establishes a three-tier fair value hierarchy, which prioritizes the inputs used in measuring fair value. These tiers include: (i) Level 1, defined as quoted prices in active markets for identical instruments; (ii) Level 2, defined as inputs other than quoted prices in active markets that are either directly or indirectly observable; and (iii) Level 3, defined as unobservable inputs in which little or no market data exists, therefore requiring an entity to develop its own assumptions. Our Level 2 fair value measurements consist of both quoted price inputs and inputs provided by a third party that are derived principally from or corroborated by observable market data by correlation. Our Level 3 fair value measurements consist of both quoted price inputs and unobservable quoted inputs provided by a third party.
Non Performance Assessment
We consider nonperformance risk in our evaluation of derivative instruments by analyzing our own credit standing and the credit standing of our counterparties and considering any counterparty credit enhancements (e.g. collateral). FAS 157 also requires that the fair value measurement assets and liabilities reflect the nonperformance risk of counterparties and the reporting entity, as applicable. Therefore, using credit default spreads, we factored the impact of our own credit standing and the credit standing of our counterparties, as well as any potential credit enhancements into the consideration of nonperformance risk for both derivative assets and liabilities. The results of this analysis were not material to the financial statements.
134
Table of Contents
THE EMPIRE DISTRICT ELECTRIC COMPANY
NOTES TO CONSOLIDATED FINANCIAL STATEMENTS (Continued)
The following fair value hierarchy table presents information about our assets measured at fair value using the market value approach on a recurring basis as of December 31, 2008:
Fair Value Measurements at Reporting Date Using
| | | | | | | | | | | | | |
($ in 000's)
Description | | As of
12/31/08 | | Quoted Prices in
Active Markets
for Identical
Assets
(Level 1) | | Significant Other
Observable
Inputs
(Level 2) | | Significant
Unobservable
Inputs
(Level 3) | |
|---|
Net derivative assets/(liabilities)* | | $ | (6,749 | ) | $ | (14,117 | ) | $ | 1,160 | | $ | 6,208 | |
- *
- The only recurring measurements are derivative related and assets and liabilities are netted together in the table above.
The following tables present the net fair value on a recurring basis using significant unobservable inputs (Level 3) during the twelve months ended December 31, 2008 (in thousands):
Fair Value Measurements Using Significant Unobservable Inputs (Level 3)
| | | | | | | | |
($ in 000's)
| | Net Derivatives(1) | | Total | |
|---|
Beginning Balance | | $ | 11,961 | | $ | 11,961 | |
Total gains or (losses) (realized/unrealized) | | | | | | | |
| | Included in earnings (or changes in net assets) | | | — | | | — | |
| | Included in comprehensive income | | | (5,753 | ) | | (5,753 | ) |
Purchases, issuances, and settlements | | | — | | | — | |
Transfers in and/or out of Level 3 | | | — | | | — | |
| | | | | | |
Ending Balance | | $ | 6,208 | | $ | 6,208 | |
| | | | | | |
Changes in unrealized Gains (Losses) relating to assets still held at reporting date | | $ | 5,753 | | $ | 5,753 | |
| | | | | | |
- (1)
- Net derivatives at December 31, 2008 included derivative assets of $6.2 million and no derivative liabilities.
135
Table of Contents
THE EMPIRE DISTRICT ELECTRIC COMPANY
NOTES TO CONSOLIDATED FINANCIAL STATEMENTS (Continued)
17. Accounts Receivable — Other
The following table sets forth the major components comprising "accounts receivable — other" on our consolidated balance sheet (in thousands):
| | | | | | | | |
| | December 31, | |
|---|
| | 2008 | | 2007 | |
|---|
Accounts receivable for meter loops, meter bases, line extensions, highway projects, etc. | | $ | 803 | | $ | 1,197 | |
Accounts receivable for gas segment | | | 76 | | | 31 | |
Accounts receivable for non-regulated subsidiary companies | | | 287 | | | 276 | |
Accounts receivable from Westar Generating, Inc., for commonly-owned facility | | | 1,673 | | | 932 | |
Taxes receivable — overpayment of estimated income taxes | | | 4,503 | | | 5,776 | |
Accounts receivable for energy trading margin deposit(1) | | | 10,768 | | | 6,267 | |
Accounts receivable for true-up on maintenance contracts(2) | | | 1,138 | | | 824 | |
Other | | | 105 | | | 162 | |
| | | | | | |
| | Total accounts receivable — other | | $ | 19,353 | | $ | 15,465 | |
| | | | | | |
- (1)
- The accounts receivable for energy trading margin deposit represents the balance in our brokerage account. NYMEX futures contracts are used in our hedging program of natural gas which require posting of margin.
- (2)
- Represents quarterly estimated credits due from Siemens Westinghouse related to our maintenance contract for State Line Combined Cycle Unit (SLCC). Forty percent of this credit belongs to Westar Generating, Inc., the owner of 40% of the SLCC, and has been recorded in accounts payable.
136
Table of Contents
THE EMPIRE DISTRICT ELECTRIC COMPANY
NOTES TO CONSOLIDATED FINANCIAL STATEMENTS (Continued)
18. Regulated Operating Expense
The following table sets forth the major components comprising "regulated operating expenses" under "Operating Revenue Deductions" on our consolidated statements of income for the years ended (in thousands):
| | | | | | | | | | | |
| | December 31, | |
|---|
| | 2008 | | 2007 | | 2006 | |
|---|
Electric transmission and distribution expense | | $ | 10,891 | | $ | 9,465 | | $ | 8,365 | |
Natural gas transmission and distribution expense | | | 1,995 | | | 1,755 | | | 1,043 | |
Power operation expense (other than fuel) | | | 11,671 | | | 10,417 | | | 9,600 | |
Customer accounts & assistance expense | | | 10,166 | | | 9,198 | | | 8,277 | |
Employee pension expense(1) | | | 5,892 | | | 6,553 | | | 4,066 | |
Employee healthcare plan(1) | | | 7,136 | | | 7,899 | | | 7,664 | |
General office supplies and expense | | | 9,330 | | | 10,294 | | | 7,954 | |
Administrative and general expense | | | 11,728 | | | 10,872 | | | 10,988 | |
Allowance for uncollectible accounts | | | 2,944 | | | 4,673 | | | 1,997 | |
Miscellaneous expense | | | 165 | | | 241 | | | 138 | |
| | | | | | | | |
| | Total | | $ | 71,918 | | $ | 71,367 | | $ | 60,092 | |
| | | | | | | | |
- (1)
- Does not include capitalized portion of costs, but reflects the GAAP expensed cost plus or minus costs deferred to a regulatory asset or recognized as a regulatory liability for Missouri and Kansas jurisdictions.
19. Discontinued Operations
In August 2006, we sold our controlling 52% interest in MAPP to other current owners. MAPP is a company that specialized in close-tolerance custom manufacturing for the aerospace, electronics, telecommunications and machinery industries. In December 2006, we sold our 100% interest in Conversant, Inc., a software company that marketed Customer Watch, an Internet-based customer information system software. On September 28, 2007, we sold our 100% interest in Fast Freedom, Inc., an Internet service provider. We have reported MAPP, Conversant and Fast Freedom's results as discontinued operations. A summary of the components of losses from discontinued operations for the years ended December 31, 2007 and 2006 follows (in thousands):
| | | | | | | | |
2007 | | Fast Freedom | | Total | |
|---|
Revenues | | $ | 905 | | $ | 905 | |
Expenses | | | 1,063 | | | 1,063 | |
| | | | | | |
Losses from discontinued operations before income taxes | | | (158 | ) | | (158 | ) |
Gain on disposal | | | 161 | | | 161 | |
Income tax | | | 60 | | | 60 | |
| | | | | | |
| | Gain from discontinued operations | | $ | 63 | | $ | 63 | |
| | | | | | |
137
Table of Contents
THE EMPIRE DISTRICT ELECTRIC COMPANY
NOTES TO CONSOLIDATED FINANCIAL STATEMENTS (Continued)
| | | | | | | | | | | | | | |
2006 | | MAPP | | Conversant | | Fast Freedom | | Total | |
|---|
Revenues | | $ | 8,927 | | $ | 1,822 | | $ | 1,363 | | $ | 12,112 | |
Expenses | | | 9,295 | | | 3,908 | | | 1,632 | | | 14,835 | |
| | | | | | | | | | |
Losses from discontinued operations before income taxes | | | (368 | ) | | (2,086 | ) | | (269 | ) | | (2,723 | ) |
Gain on disposal | | | 271 | | | 555 | | | — | | | 827 | |
Income tax | | | 140 | | | 795 | | | 102 | | | 1,037 | |
Minority interest | | | 177 | | | — | | | — | | | 177 | |
Income tax — minority interest | | | (67 | ) | | — | | | — | | | (67 | ) |
| | | | | | | | | | |
| | Gain (loss) from discontinued operations | | $ | 153 | | $ | (736 | ) | $ | (167 | ) | $ | (749 | ) |
| | | | | | | | | | |
138
Table of Contents
ITEM 9. CHANGES IN AND DISAGREEMENTS WITH ACCOUNTANTS ON ACCOUNTING AND FINANCIAL DISCLOSURE
None.
ITEM 9A. CONTROLS AND PROCEDURES
Evaluation of Disclosure Controls and Procedures
As of the end of the period covered by this report, an evaluation was carried out, under the supervision and with the participation of our management, including our Chief Executive Officer and Chief Financial Officer, of the effectiveness of the design and operation of our disclosure controls and procedures (as such term is defined in Rule 13a-15(e) of the Securities Exchange Act of 1934). Based upon that evaluation, the Chief Executive Officer and Chief Financial Officer concluded that our disclosure controls and procedures were effective as of December 31, 2008.
Management's Report on Internal Control Over Financial Reporting
Our management is responsible for establishing and maintaining adequate internal control over financial reporting, as such term is defined in Exchange Act Rule 13a-15(f). Under the supervision and with the participation of our management, including our Chief Executive Officer and Chief Financial Officer, we conducted an evaluation of the effectiveness of our internal control over financial reporting based on the framework in the Internal Control-Integrated Framework issued by the Committee of Sponsoring Organizations of the Treadway Commission. Based on this evaluation, our management concluded that our internal control over financial reporting was effective as of December 31, 2008.
Audit of Internal Control Over Financial Reporting
The effectiveness of our internal control over financial reporting as of December 31, 2008, has been audited by PricewaterhouseCoopers LLP, an independent registered public accounting firm, as stated in their report which appears herein.
Changes in Internal Control Over Financial Reporting
There have been no changes in our internal control over financial reporting that occurred during the fourth quarter of 2008 that have materially affected, or are reasonably likely to materially affect, our internal control over financial reporting.
ITEM 9B. OTHER INFORMATION
None.
139
Table of Contents
PART III
ITEM 10. DIRECTORS, EXECUTIVE OFFICERS AND CORPORATE GOVERNANCE
Except as set forth below, the information required by this Item may be found in our proxy statement for our Annual Meeting of Stockholders to be held April 23, 2009, which is incorporated herein by reference.
Pursuant to instruction 3 of paragraph (b) of Item 401 of Regulation S-K, the information required by this Item with respect to executive officers is set forth in Item 1 of Part I of this Form 10-K under "Executive Officers and Other Officers of Empire."
We have adopted a Code of Ethics for the Chief Executive Officer and Senior Financial Officers. A copy of the code is available on our website at www.empiredistrict.com. Any future amendments or waivers to the code will be posted on our website at www.empiredistrict.com.
Because our common stock is listed on the NYSE, our Chief Executive Officer is required to make a CEO's Annual Certification to the NYSE in accordance with Section 303A.12 of the NYSE Listed Company Manual stating that he is not aware of any violations by us of the NYSE corporate governance listing standards. Our Chief Executive Officer has provided, and intends to continue to timely provide, the NYSE with the CEO's Annual Certificate.
ITEM 11. EXECUTIVE COMPENSATION
Information required by this item may be found in our proxy statement for our Annual Meeting of Stockholders to be held April 23, 2009, which is incorporated herein by reference.
ITEM 12. SECURITY OWNERSHIP OF CERTAIN BENEFICIAL OWNERS AND MANAGEMENT AND RELATED STOCKHOLDER MATTERS
Except as set forth below, information required by this item may be found in our proxy statement for our Annual Meeting of Stockholders to be held April 23, 2009, which is incorporated herein by reference.
There are no arrangements the operation of which may at a subsequent date result in a change in control of Empire.
Securities Authorized For Issuance Under Equity Compensation Plans
We have four equity compensation plans, all of which have been approved by shareholders, the 1996 Stock Incentive Plan, the 2006 Stock Incentive Plan, the Employee Stock Purchase Plan (ESPP) and the Stock Unit Plan for Directors.
140
Table of Contents
The following table summarizes information about our equity compensation plans as of December 31, 2008:
| | | | | | | | | | | | |
Plan Category | | (a) Number of securities
to be issued upon exercise
of outstanding options,
warrants and rights. | | (b) Weighted-average
exercise price
of outstanding options,
warrants and rights(1) | | (c) Number of securities
remaining available
for future issuance
under equity compensation
plans (excluding securities
reflected in column (a)) | |
|---|
Equity compensation plans approved by securityholders | | | 473,338 | | $ | 21.94 | | | 1,509,855 | |
Equity compensation plans not approved by security holders | | | — | | | — | | | — | |
| | | | | | | | |
| | | TOTAL | | | 473,338 | | $ | 21.94 | | | 1,509,855 | |
| | | | | | | | |
- (1)
- The weighted average exercise price of $21.94 relates to 39,100 and 4,200 options granted to executive officers in 2005 and 2004, respectively, under the 1996 Stock Incentive Plan, 56,400, 64,200 and 41,700 options granted to executive officers in 2008, 2007 and 2006, respectively, under the 2006 Stock Incentive Plan and 48,413 subscriptions outstanding for our ESPP. The two stock incentive plans had a weighted average exercise price of $22.73 and the ESPP had an exercise price of $18.57. There is no exercise price for 104,600 performance-based stock awards awarded under the 2006 Stock Incentive Plans or for 114,725 units awarded under the Stock Unit Plan for Directors.
ITEM 13. CERTAIN RELATIONSHIPS AND RELATED TRANSACTIONS, AND DIRECTOR INDEPENDENCE
The information required by this Item may be found in our proxy statement for our Annual Meeting of Stockholders to be held April 23, 2009, which is incorporated herein by reference.
ITEM 14. PRINCIPAL ACCOUNTANT FEES AND SERVICES
The information required by this Item may be found in our proxy statement for our Annual Meeting of Stockholders to be held April 23, 2009, which is incorporated herein by reference.
141
Table of Contents
PART IV
ITEM 15. EXHIBITS AND FINANCIAL STATEMENT SCHEDULES
Index to Financial Statements and Financial Statement Schedule Covered by Report of
Independent Registered Public Accounting Firm
| | | | | |
Consolidated balance sheets at December 31, 2008 and 2007 | | | 71 | |
Consolidated statements of income for each of the three years in the period ended December 31, 2008 | | | 72 | |
Consolidated statements of comprehensive income for each of the three years in the period ended December 31, 2008 | | | 73 | |
Consolidated statements of common stockholders' equity for each of the three years in the period ended December 31, 2008 | | | 74 | |
Consolidated statements of cash flows for each of the three years in the period ended December 31, 2008 | | | 75 | |
Notes to consolidated financial statements | | | 77 | |
Schedule for the years ended December 31, 2008, 2007 and 2006: | | | | |
| | Schedule II — Valuation and qualifying accounts | | | 146 | |
All other schedules are omitted as the required information is either not present, is not present in sufficient amounts, or the information required therein is included in the financial statements or notes thereto.
List of Exhibits
| | |
| (3)(a) | | The Restated Articles of Incorporation of Empire (Incorporated by reference to Exhibit 4(a) to Registration Statement No. 33-54539 on Form S-3). |
(b) |
|
By-laws of Empire as amended October 31, 2002 (Incorporated by reference to Exhibit 4(b) to Annual Report on Form 10-K for year ended December 31, 2002, File No. 1-3368). |
(4)(a) |
|
Indenture of Mortgage and Deed of Trust dated as of September 1, 1944 and First Supplemental Indenture thereto among Empire, The Bank of New York Mellon Trust Company, N.A. and UMB Bank, N.A., (Incorporated by reference to Exhibits B(1) and B(2) to Form 10, File No. 1-3368). |
(b) |
|
Third Supplemental Indenture to Indenture of Mortgage and Deed of Trust (Incorporated by reference to Exhibit 2(c) to Form S-7, File No. 2-59924). |
(c) |
|
Sixth through Eighth Supplemental Indentures to Indenture of Mortgage and Deed of Trust (Incorporated by reference to Exhibit 2(c) to Form S-7, File No. 2-59924). |
(d) |
|
Fourteenth Supplemental Indenture to Indenture of Mortgage and Deed of Trust (Incorporated by reference to Exhibit 4(f) to Registration Statement No. 33-56635 on Form S-3). |
(e) |
|
Twenty-Second Supplemental Indenture dated as of November 1, 1993 to Indenture of Mortgage and Deed of Trust (Incorporated by reference to Exhibit 4(k) to Annual Report on Form 10-K for the year ended December 31, 1993, File No. 1-3368). |
(f) |
|
Twenty-Third Supplemental Indenture dated as of November 1, 1993 to Indenture of Mortgage and Deed of Trust (Incorporated by reference to Exhibit 4(l) to Annual Report on Form 10-K for the year ended December 31, 1993, File No. 1-3368). |
142
Table of Contents
| | |
| (g) | | Twenty-Fourth Supplemental Indenture dated as of March 1, 1994 to Indenture of Mortgage and Deed of Trust (Incorporated by reference to Exhibit 4(m) to Annual Report on Form 10-K for the year ended December 31, 1993, File No. 1-3368). |
(h) |
|
Twenty-Fifth Supplemental Indenture dated as of November 1, 1994 to Indenture of Mortgage and Deed of Trust (Incorporated by reference to Exhibit 4(p) to Registration Statement No. 33-56635 on Form S-3). |
(i) |
|
Twenty-Eighth Supplemental Indenture dated as of December 1, 1996 to Indenture of Mortgage and Deed of Trust (Incorporated by reference to Exhibit 4 to Annual Report on Form 10-K for the year ended December 31, 1996, File No. 1-3368). |
(j) |
|
Twenty-Ninth Supplemental Indenture dated as of April 1, 1998 to Indenture of Mortgage and Deed of Trust (Incorporated by reference to Exhibit 4 to Form 10-Q for quarter ended March 31, 1998, File No. 1-3368). |
(k) |
|
Thirty-First Supplemental Indenture dated as of March 26, 2007 to Indenture of Mortgage and Deed of Trust (Incorporated by reference to Exhibit 4.1 to Current Report on Form 8-K dated March 26, 2007 and filed March 28, 2007, File No. 1-3368). |
(l) |
|
Thirty-Second Supplemental Indenture dated as of March 11, 2008 to Indenture of Mortgage and Deed of Trust (Incorporated by reference to Exhibit 10.1 to Current Report on Form 8-K dated March 11, 2008 and filed March 12, 2008, File No. 1-3368). |
(m) |
|
Thirty-Third Supplemental Indenture dated as of May 16, 2008 to Indenture of Mortgage and Deed of Trust (Incorporated by reference to Exhibit 4.1 to Current Report on Form 8-K dated May 16, 2008 and filed May 16, 2008, File No. 1-3368). |
(n) |
|
Indenture for Unsecured Debt Securities, dated as of September 10, 1999 between Empire and Wells Fargo Bank, National Association (Incorporated by reference to Exhibit 4(v) to Registration Statement No. 333-87015 on Form S-3). |
(o) |
|
Securities Resolution No. 2, dated as of February 22, 2001, of Empire under the Indenture for Unsecured Debt Securities (Incorporated by reference to Exhibit 4(s) to Annual Report on Form 10-K for the year ended December 31, 2000, File No. 1-3368). |
(p) |
|
Securities Resolution No. 3, dated as of December 18, 2002, of Empire under the Indenture for Unsecured Debt Securities (Incorporated by reference to Exhibit 4(s) to Annual Report on Form 10-K for year ended December 31, 2002, File No. 1-3368). |
(q) |
|
Securities Resolution No. 4, dated as of June 10, 2003, of Empire under the Indenture for Unsecured Debt Securities (Incorporated by reference to Exhibit 4 to Current Report on Form 8-K dated June 10, 2003 and filed July 29, 2003, File No. 1-3368). |
(r) |
|
Securities Resolution No. 5, dated as of October 29, 2003, of Empire under the Indenture for Unsecured Debt Securities (Incorporated by reference to Exhibit 4 to Quarterly Report on Form 10-Q for quarter ended September 30, 2003), File No. 1-3368). |
(s) |
|
Securities Resolution No. 6, dated as of June 27, 2005, of Empire under the Indenture for Unsecured Debt Securities (Incorporated by reference to Exhibit 4.1 to Current Report on Form 8-K dated June 27, 2005 and filed June 28, 2005, File No. 1-3368). |
(t) |
|
Rights Agreement dated as of April 27, 2000 between Empire and Wells Fargo Bank, N.A. (as successor to Chase Mellon Shareholder Services LLC) (Incorporated by reference to Exhibit 4 to Quarterly Report on Form 10-Q for the quarter ended March 31, 2000, File No. 1-3368). |
143
Table of Contents
| | |
| (u) | | First Amended and Restated Unsecured Credit Agreement, dated as of March 14, 2006, among Empire, UMB Bank, N.A., as arranger and administrative agent, Bank of America, N.A., as syndication agent, and the lenders named therein (Incorporated by reference to Exhibit 4.1 to Current Report on Form 8-K dated March 14, 2006 and filed March 16, 2006, File No. 1-3368). |
(v) |
|
Bond Purchase Agreement dated June 1, 2006 among The Empire District Gas Company and the purchasers party thereto (Incorporated by reference to Exhibit 4.1 to Current Report on Form 8-K dated June 1, 2006 and filed June 6, 2006, File No. 1-3368). |
(w) |
|
Indenture of Mortgage and Deed of Trust dated as of June 1, 2006 by The Empire District Gas Company, as Grantor, to Spencer R. Thomson, Deed of Trust Trustee for the Benefit of The Bank of New York Trust Company, N.A., Bond Trustee, as Grantee (Incorporated by reference to Exhibit 4.2 to Current Report on Form 8-K dated June 1, 2006 and filed June 6, 2006, File No. 1-3368). |
(x) |
|
First Supplemental Indenture of Mortgage and Deed of Trust dated as of June 1, 2006 by The Empire District Gas Company, as Grantor, to Spencer R. Thomson, Deed of Trust Trustee for the Benefit of The Bank of New York Trust Company, N.A., Bond Trustee, as Grantee (Incorporated by reference to Exhibit 4.3 to Current Report on Form 8-K dated June 1, 2006 and filed June 6, 2006, File No. 1-3368). |
(10)(a) |
|
1996 Stock Incentive Plan (Incorporated by reference to Exhibit 4.1 to Form S-8, File No. 33-64639).† |
(b) |
|
First Amendment to 1996 Stock Incentive Plan. (Incorporated by reference to Exhibit 10(b) to Annual Report on Form 10-K for the year ended December 31, 2007, File No. 1-3368).† |
(c) |
|
2006 Stock Incentive Plan (Incorporated by reference to Exhibit 4(u) to Form S-8, File No. 333-130075).† |
(d) |
|
First Amendment to 2006 Stock Incentive Plan. (Incorporated by reference to Exhibit 10(d) to Annual Report on Form 10-K for the year ended December 31, 2007, File No. 1-3368).† |
(e) |
|
Second Amendment to 2006 Stock Incentive Plan. *† |
(f) |
|
Deferred Compensation Plan for Directors as amended and restated effective January 1, 2008. (Incorporated by reference to Exhibit 10(e) to Annual Report on Form 10-K for the year ended December 31, 2007). † |
(g) |
|
The Empire District Electric Company Change in Control Severance Pay Plan as amended and restated effective January 1, 2008. (Incorporated by reference to Exhibit 10(f) to Annual Report on Form 10-K for the year ended December 31, 2007, File No. 1-3368).† |
(h) |
|
Form of Severance Pay Agreement under The Empire District Electric Company Change in Control Severance Pay Plan. (Incorporated by reference to Exhibit 10(g) to Annual Report on Form 10-K for the year ended December 31, 2007, File No. 1-3368).† |
(i) |
|
The Empire District Electric Company Supplemental Executive Retirement Plan as amended and restated effective January 1, 2008. (Incorporated by reference to Exhibit 10(h) to Annual Report on Form 10-K for the year ended December 31, 2007, File No. 1-3368).† |
(j) |
|
Retirement Plan for Directors as amended August 1, 1998 (Incorporated by reference to Exhibit 10(a) to Form 10-Q for quarter ended September 30, 1998, File No. 1-3368).† |
(k) |
|
Stock Unit Plan for Directors of The Empire District Electric Company (Incorporated by reference to Exhibit 10(i) to Annual Report on Form 10-K for year ended December 31, 2005, File No. 1-3368).† |
144
Table of Contents
| | |
| (l) | | First Amendment to Stock Unit Plan for Directors. (Incorporated by reference to Exhibit 10(k) to Annual Report on Form 10-K for the year ended December 31, 2007).† |
(m) |
|
Summary of Annual Incentive Plan. (Incorporated by reference to Exhibit 10(l) to Annual Report on Form 10-K for year the ended December 31, 2007).† |
(n) |
|
Form of Notice of Award of Dividend Equivalents.*† |
(o) |
|
Form of Notice of Award of Non-Qualified Stock Options.*† |
(p) |
|
Form of Notice of Award of Performance-Based Restricted Stock.*† |
(q) |
|
Summary of Compensation of Non-Employee Directors.*† |
(r) |
|
Form of Indemnity Agreement (Incorporated by reference to Exhibit 10.1 to Current Report on Form 8-K dated February 5, 2009 and filed February 10, 2009, File No. 1-3368).† |
(12) |
|
Computation of Ratios of Earnings to Fixed Charges.* |
(21) |
|
Subsidiaries of Empire.* |
(23) |
|
Consent of PricewaterhouseCoopers LLP.* |
(24) |
|
Powers of Attorney.* |
(31)(a) |
|
Certification of Chief Executive Officer pursuant to Section 302 of the Sarbanes-Oxley Act of 2002.* |
(31)(b) |
|
Certification of Chief Financial Officer pursuant to Section 302 of the Sarbanes-Oxley Act of 2002.* |
(32)(a) |
|
Certification of Chief Executive Officer pursuant to 18 U.S.C. Section 1350, as adopted pursuant to Section 906 of the Sarbanes-Oxley Act of 2002.*~ |
(32)(b) |
|
Certification of Chief Financial Officer pursuant to 18 U.S.C. Section 1350, as adopted pursuant to Section 906 of the Sarbanes-Oxley Act of 2002.*~ |
- †
- This exhibit is a compensatory plan or arrangement as contemplated by Item 15(a)(3) of Form 10-K.
- *
- Filed herewith.
- ~
- This certification accompanies this Report pursuant to Section 906 of the Sarbanes-Oxley Act of 2002 and shall not be deemed filed by the Company for purposes of Section 18 or any other provision of the Securities Exchange Act of 1934, as amended.
145
Table of Contents
SCHEDULE II
Valuation and Qualifying Accounts
Years ended December 31, 2008, 2007 and 2006:
| | | | | | | | | | | | | | | | | | | | |
| |
| | Additions | | Deductions From Reserve | |
| |
|---|
| |
| |
| | Charged to Other Accounts | |
| |
| |
| |
|---|
| | Balance At
Beginning
Of Period | | Charged
To Income | | Description | | Amount | | Description | | Amount | | Balance At
Close of
Period | |
|---|
Year endedDecember 31, 2008: | | | | | | | | | | | | | | | | | | | | |
Reserve deducted from assets: accumulated provision for uncollectible accounts. | | $ | 1,140,955 | | $ | 2,903,922 | | Recovery of amounts previously written off | | $ | 1,877,576 | | Accounts written off | | $ | 4,657,032 | | $ | 1,265,421 | |
Year endedDecember 31, 2007: | | | | | | | | | | | | | | | | | | | | |
*Reserve deducted from assets: accumulated provision for uncollectible accounts. | |
$ |
1,180,577 | |
$ |
4,661,439 | | Recovery of amounts previously written off | |
$ |
1,203,544 | | Accounts written off | |
$ |
5,904,605 | |
$ |
1,140,955 | |
Year endedDecember 31, 2006: | | | | | | | | | | | | | | | | | | | | |
Electric reserve deducted from assets: accumulated provision for uncollectible accounts. | |
$ |
561,808 | |
$ |
1,624,200 | | Recovery of amounts previously written off | |
$ |
932,928 | | Accounts written off | |
$ |
2,653,083 | |
$ |
465,853 | |
EDG acquisition amount recorded to reserve — Balance as of June 1: | | $ | 506,505 | | $ | 351,530 | | | | $ | 140,700 | | | | $ | 284,011 | | $ | 714,724 | |
- *
- 2007 beginning balance combines the 2006 ending balance with the 2006 EDG acquisition amount recorded to reserve ending balance.
146
Table of Contents
SIGNATURES
Pursuant to the requirements of Section 13 or 15(d) of the Securities Exchange Act of 1934, the registrant has duly caused this report to be signed on its behalf by the undersigned, thereunto duly authorized.
| | | | |
| | | THE EMPIRE DISTRICT ELECTRIC COMPANY |
Date: February 20, 2009 |
|
By |
|
/s/ WILLIAM L. GIPSON
William L. Gipson, President and
Chief Executive Officer |
Pursuant to the requirements of the Securities Exchange Act of 1934, this report has been signed below by the following persons on behalf of the registrant and in the capacities and on the date indicated.
| | |
/s/ WILLIAM L. GIPSON
William L. Gipson, President,
Chief Executive Officer, Director
(Principal Executive Officer) | | Date: February 20, 2009 |
/s/ GREGORY A. KNAPP
Gregory A. Knapp, Vice President-Finance
(Principal Financial Officer) |
|
|
/s/ LAURIE A. DELANO
Laurie A. Delano, Controller, Assistant
Secretary and Assistant Treasurer
(Principal Accounting Officer) |
|
|
/s/ DR. JULIO S. LEON*
Dr. Julio S. Leon, Director |
|
|
/s/ KENNETH R. ALLEN*
Kenneth R. Allen, Director |
|
|
/s/ MYRON W. MCKINNEY*
Myron W. McKinney, Director |
|
|
/s/ ROSS C. HARTLEY*
Ross C. Hartley, Director |
|
|
/s/ D. RANDY LANEY*
D. Randy Laney, Director |
|
|
/s/ BILL D. HELTON*
Bill D. Helton, Director |
|
|
/s/ B. THOMAS MUELLER*
B. Thomas Mueller, Director |
|
|
/s/ ALLAN T. THOMS*
Allan T. Thoms, Director |
|
|
/s/ MARY MCCLEARY POSNER*
Mary McCleary Posner, Director |
|
|
/s/ GREGORY A. KNAPP
*By (Gregory A. Knapp, As attorney in fact for
each of the persons indicated) |
|
|
147