Table of Contents
| ECA Marcellus Trust I (Exact name of co-registrant as specified in its charter) | Energy Corporation of America (Exact name of co-registrant as specified in its charter) | |
| Delaware (State or other jurisdiction of incorporation or organization) | West Virginia (State or other jurisdiction of incorporation or organization) | |
| 1311 (Primary Standard Industrial Classification Code Number) | 1311 (Primary Standard Industrial Classification Code Number) | |
| 27-6522024 (I.R.S. Employer Identification No.) | 84-1235822 (I.R.S. Employer Identification No.) | |
| 1209 Orange Street Wilmington, Delaware 19801 (303) 694-2667 | 4643 South Ulster Street Suite 1100 Denver, Colorado 80237 (303) 694-2667 | |
| (Address, including zip code, and telephone number, including area code, of agent of service) | (Address, including zip code, and telephone number, including area code, of agent of service) | |
| Michael S. Fletcher 4643 South Ulster Street Suite 1100 Denver, Colorado 80237 (303) 694-2667 | Donald C. Supcoe 4643 South Ulster Street Suite 1100 Denver, Colorado 80237 (303) 694-2667 | |
| (Name, address, including zip code, and telephone number, including area code, of agent for service) | (Name, address, including zip code, and telephone number, including area code, of agent for service) |
| David P. Oelman Vinson & Elkins L.L.P. First City Tower 1001 Fannin Street, Suite 2500 Houston, Texas77002-6760 (713) 758-2222 | Thomas R. Goodwin Tammy J. Owen Goodwin & Goodwin, LLP 300 Summers Street Suite 1500 Charleston, West Virginia 25301 (304) 346-7000 | Joshua Davidson Baker Botts L.L.P. One Shell Plaza 910 Louisiana St. Houston, Texas 77002 (713) 229-1234 |
| Large accelerated filer o | Accelerated filer o | Non-accelerated filer o | Smaller reporting company o | |||
| (Do not check if a smaller reporting company) |
| Proposed Maximum | Amount of | |||||
| Title of Each Class of | Aggregate | Registration | ||||
| Securities to be Registered | Offering Price (1)(2) | Fee | ||||
| Units of Beneficial Interest in ECA Marcellus Trust I | $217,350,000 | $15,498 | ||||
| (1) | Includes common units issuable upon exercise of the underwriters’ over-allotment option. | |
| (2) | Estimated solely for the purpose of calculating the registration fee pursuant to Rule 457(o). |
Table of Contents
| The information in this preliminary prospectus is not complete and may be changed. These securities may not be sold until the registration statement filed with the Securities and Exchange Commission is effective. This preliminary prospectus is not an offer to sell these securities, and we are not soliciting an offer to buy these securities, in any jurisdiction where the offer or sale is not permitted. |
| Per Common Unit | Total | |||||||
| Price to the public | $ | $ | ||||||
| Underwriting discounts and commissions | $ | $ | ||||||
| Proceeds to the trust (before expenses) | $ | $ | ||||||
| RAYMOND JAMES | Citi |
Table of Contents
| 1 | ||||||||
| 16 | ||||||||
| 38 | ||||||||
| 39 | ||||||||
| 40 | ||||||||
| 43 | ||||||||
| 52 | ||||||||
| 55 | ||||||||
| 64 | ||||||||
| 76 | ||||||||
| 82 | ||||||||
| 88 | ||||||||
| 91 | ||||||||
| 93 | ||||||||
| 112 | ||||||||
| 113 | ||||||||
| 114 | ||||||||
| 115 | ||||||||
| 120 | ||||||||
| 123 | ||||||||
| 123 | ||||||||
| 123 | ||||||||
| 124 | ||||||||
| F-1 | ||||||||
| ECA-1 | ||||||||
| A-1 | ||||||||
| B-1 | ||||||||
| EX-3.1 | ||||||||
| EX-3.2 | ||||||||
| EX-3.3 | ||||||||
| EX-3.4 | ||||||||
| EX-3.5 | ||||||||
| EX-4.1 | ||||||||
| EX-10.1 | ||||||||
| EX-10.2 | ||||||||
| EX-21.1 | ||||||||
| EX-23.1 | ||||||||
| EX-23.4 | ||||||||
i
Table of Contents
1
Table of Contents
2
Table of Contents
3
Table of Contents
| Subordination | Target | Incentive | ||||||||||
| Period | Threshold | Distribution | Threshold | |||||||||
| (per unit) | ||||||||||||
2010: | ||||||||||||
| Second Quarter | $ | 0.217 | $ | 0.271 | $ | 0.326 | ||||||
| Third Quarter | 0.298 | 0.372 | 0.447 | |||||||||
| Fourth Quarter | 0.426 | 0.532 | 0.639 | |||||||||
2011: | ||||||||||||
| First Quarter | 0.413 | 0.516 | 0.619 | |||||||||
| Second Quarter | 0.418 | 0.523 | 0.627 | |||||||||
| Third Quarter | 0.520 | 0.650 | 0.780 | |||||||||
| Fourth Quarter | 0.544 | 0.680 | 0.815 | |||||||||
2012: | ||||||||||||
| First Quarter | 0.562 | 0.702 | 0.843 | |||||||||
| Second Quarter | 0.595 | 0.744 | 0.893 | |||||||||
| Third Quarter | 0.607 | 0.759 | 0.911 | |||||||||
| Fourth Quarter | 0.688 | 0.859 | 1.031 | |||||||||
2013: | ||||||||||||
| First Quarter | $ | 0.773 | $ | 0.967 | $ | 1.160 | ||||||
| Second Quarter | 0.771 | 0.964 | 1.157 | |||||||||
| Third Quarter | 0.717 | 0.896 | 1.075 | |||||||||
| Fourth Quarter | 0.674 | 0.842 | 1.010 | |||||||||
2014: | ||||||||||||
| First Quarter | 0.623 | 0.779 | 0.935 | |||||||||
| Second Quarter | 0.601 | 0.751 | 0.902 | |||||||||
| Third Quarter | 0.583 | 0.728 | 0.874 | |||||||||
| Fourth Quarter | 0.561 | 0.701 | 0.841 | |||||||||
2015: | ||||||||||||
| First Quarter | 0.530 | 0.663 | 0.795 | |||||||||
4
Table of Contents
| Quarters Ending | ||||||||||||||||||||
| June 30, | September 30, | December 31, | March 31, | June 30, | ||||||||||||||||
| 2010 | 2010 | 2010 | 2011 | 2011 | ||||||||||||||||
| (In thousands, except well number, volumetric and per unit data) | ||||||||||||||||||||
| Number of wells producing at quarter end | 8 | 17 | 22 | 25 | 31 | |||||||||||||||
Estimated Production from Trust Properties | ||||||||||||||||||||
| Natural Gas PDP Sales Volumes (MMcf) | 879 | 1,190 | 1,265 | 1,066 | 962 | |||||||||||||||
| Natural Gas PUD Sales Volumes (MMcf) | — | 81 | 514 | 553 | 769 | |||||||||||||||
| Total Sales Volumes (MMcf) | 879 | 1,271 | 1,779 | 1,619 | 1,731 | |||||||||||||||
| Daily Sales Volumes (Mcf/d) | 9,664 | 13,814 | 19,336 | 17,988 | 19,020 | |||||||||||||||
Commodity Prices and Hedging Positions (1) | ||||||||||||||||||||
| Assumed NYMEX Price ($/MMBtu) (2) | $ | 4.58 | $ | 4.75 | $ | 5.27 | $ | 5.81 | $ | 5.34 | ||||||||||
| Assumed Price ($/Mcf) (2) | 4.72 | 4.89 | 5.42 | 5.98 | 5.50 | |||||||||||||||
| Realized Unhedged Price after Basis Differential ($/Mcf) | 4.88 | 5.04 | 5.58 | 6.13 | 5.65 | |||||||||||||||
| Daily Hedged Volumes (MMcf/d) (3) | 7.3 | 7.3 | 9.7 | 9.0 | 9.5 | |||||||||||||||
| Percent of Total Volumes Swapped | 75 | % | 53 | % | 38 | % | 40 | % | 38 | % | ||||||||||
| Swap Price ($/MMBtu) | $ | 6.75 | $ | 6.75 | $ | 6.75 | $ | 6.75 | $ | 6.75 | ||||||||||
| Percent of Total Volumes Floored | — | — | 12 | % | 10 | % | 12 | % | ||||||||||||
5
Table of Contents
| Quarters Ending | ||||||||||||||||||||
| June 30, | September 30, | December 31, | March 31, | June 30, | ||||||||||||||||
| 2010 | 2010 | 2010 | 2011 | 2011 | ||||||||||||||||
| (In thousands, except well number, volumetric and per unit data) | ||||||||||||||||||||
| Floor Price ($/MMBtu) | $ | — | $ | — | $ | 5.00 | $ | 5.00 | $ | 5.00 | ||||||||||
| Realized Hedged Weighted Average Price ($/Mcf) (3) | $ | 6.55 | $ | 6.13 | $ | 6.15 | $ | 6.53 | $ | 6.21 | ||||||||||
Cash available for distribution | ||||||||||||||||||||
| Gas Sales Revenues | $ | 4,288 | $ | 6,408 | $ | 9,923 | $ | 9,932 | $ | 9,786 | ||||||||||
| Swap and Floor Hedge Revenues | 1,476 | 1,381 | 1,021 | 635 | 960 | |||||||||||||||
| Total Revenues | $ | 5,764 | $ | 7,788 | $ | 10,944 | $ | 10,566 | $ | 10,746 | ||||||||||
| Post-Production Services Fee (4) | $ | 471 | $ | 681 | $ | 953 | $ | 867 | $ | 927 | ||||||||||
| Trust Expenses | 200 | 200 | 200 | 200 | 201 | |||||||||||||||
| Franchise Taxes | 207 | 207 | 211 | 211 | 211 | |||||||||||||||
| Cash Available for Distribution | $ | 4,885 | $ | 6,701 | $ | 9,581 | $ | 9,288 | $ | 9,407 | ||||||||||
| Trust Units Outstanding | 18,000 | 18,000 | 18,000 | 18,000 | 18,000 | |||||||||||||||
| Target Distribution Per Trust Unit | $ | 0.271 | $ | 0.372 | $ | 0.532 | $ | 0.516 | $ | 0.523 | ||||||||||
| Subordination Threshold Per Trust Unit | $ | 0.217 | $ | 0.298 | $ | 0.426 | $ | 0.413 | $ | 0.418 | ||||||||||
| Incentive Threshold Per Trust Unit | $ | 0.326 | $ | 0.447 | $ | 0.639 | $ | 0.619 | $ | 0.627 | ||||||||||
| (1) | For a more detailed description of the natural gas hedging contracts established for the benefit of the trust, please see “Description of the Royalty Interests.” | |
| (2) | Based on NYMEX forward pricing as of March 11, 2010. Assumed price per Mcf calculated based on an assumed conversion rate of1.03 MMBtu per Mcf. | |
| (3) | Adjusted for an assumed basis differential of $0.15 per MMBtu. | |
| (4) | Consists of a fee of $0.52 per MMBtu. |
6
Table of Contents
| • | ECA will convey to a wholly owned subsidiary a term royalty interest entitling the holder of the interest to receive 45% of the proceeds from the sale of production of natural gas attributable to ECA’s interest in the Producing Wells (after deducting post-production costs and any applicable taxes) for a period of 20 years commencing on April 1, 2010 (the “Term PDP Royalty”) and a term royalty interest entitling such holder of the interest to receive 25% of the proceeds from the sale of the production of natural gas attributable to ECA’s interest in the PUD Wells (after deductingpost-production costs and any applicable taxes) for a period of 20 years commencing on April 1, 2010 (the “Term PUD Royalty”) in exchange for a demand note in the principal amount of $ million. The Term PDP Royalty and the Term PUD Royalty are collectively referred to as the “Term Royalties.” | |
| • | ECA and the Private Investors will convey to the trust perpetual royalty interests entitling the trust to receive, in the aggregate, 45% of the proceeds from the sale of production of natural gas attributable to the interests of ECA in the Producing Wells (after deducting post-production costs and any applicable taxes) (the “Perpetual PDP Royalty”) and ECA will convey to the trust a perpetual royalty interest entitling the trust to receive an additional 25% of the proceeds from the sale of production of natural gas attributable to ECA’s interest in the PUD Wells (after deductingpost-production costs and any applicable taxes) (the “Perpetual PUD Royalty”) in exchange for, in the case of ECA, 3,186,117 common units constituting 17.7% of the trust units outstanding and 4,500,000 subordinated units constituting 25% of the trust units outstanding and, in the case of the Private Investors, 1,313,883 common units constituting 7.3% of the trust units outstanding. The Perpetual PDP Royalty and the Perpetual PUD Royalty are collectively referred to as the “Perpetual Royalties.” | |
| • | The trust will sell the 9,000,000 common units offered hereby to the public, representing a 50% interest in the trust. | |
| • | ECA will convey to the trust the natural gas hedging contracts. | |
| • | ECA’s subsidiary will convey the Term Royalties to the trust in exchange for a distribution from the net proceeds of this offering and will use the net proceeds to repay the demand note to ECA. |
7
Table of Contents
| • | ECA will purchase 209,316 common units from the Private Investors at the initial offering price. | |
| • | ECA and the trust will enter into an Administrative and Drilling Services Agreement outlining the provision of administrative services to the trust and its compensation therefor and ECA’s drilling obligation to the trust with respect to the PUD Wells. Please see “The Trust — Administrative and Drilling Services Agreement.” | |
| • | ECA will grant to the trust the Drilling Support Lien which is nonrecourse to ECA. | |
| • | ECA will grant to the trust a lien, which is nonrecourse to ECA, on the PDP Royalty Interest and the PUD Royalty Interest (the “Royalty Interest Lien”) to provide protection to the trust, in the event of a bankruptcy of ECA, against the risk that the PDP Royalty Interest or PUD Royalty Interest were not considered a real property interest. |
| • | Royalty interests not burdened by operating or capital costs. The trust will not be responsible for any operating or capital costs associated with the Underlying Properties, including the costs to drill the PUD Wells. As a result, the trust’s burden to pay costs associated with any particular well will not arise until such well is producing natural gas attributable to the trust’s interest. The principal costs the trust will bear are the Post-Production Services Fee; property, ad valorem, production, severance, excise, |
8
Table of Contents
| franchise and similar taxes, if any; and trust administrative expenses including costs incurred as a result of being a publicly traded entity. In addition, the trust will be obligated to reimburse ECA for approximately $5 million incurred in establishing the hedging contracts to be transferred to the trust if and to the extent cash available for distribution by the trust exceeds certain levels. |
| • | Downside protection against natural gas price volatility through natural gas hedging contracts for 50% of estimated production through March 31, 2014. ECA will transfer to the trust hedging contracts covering approximately 50% of the expected production volumes attributable to the trust from April 1, 2010 through March 31, 2014. These hedging contracts will consist of swap contracts and floor price hedging contracts. The swap contracts will relate to approximately 7,500 MMBtu per day at an average price of $6.78 per MMBtu for the period from April 1, 2010 through June 2012. The floor price of any floor price hedging contract will be $5.00 per MMBtu. These hedging contracts should reduce commodity price risks inherent in holding interests in natural gas through the end of March 31, 2014. | |
| • | Alignment of interests between ECA and the trust unitholders. ECA is significantly incentivized to complete its drilling obligation, to increase production from the Underlying Properties and to obtain the best prices for the natural gas production from the Underlying Properties as a result of the following factors: |
| - | ECA will retain an approximate average of 66% total economic interest in the Underlying Properties through its retained interest in the Underlying Properties and its ownership of approximately 43% of the trust units. | |
| - | A portion of the trust units that ECA will own, constituting 25% of the outstanding trust units, will be subordinated units that will not be entitled to receive distributions unless there is sufficient cash to pay the subordination threshold to the common units. These subordinated units will only convert into common units upon completion of the subordination period. | |
| - | To the extent that the trust has cash available for distribution in excess of the incentive thresholds during the subordination period, ECA will be entitled to receive 50% of such cash as incentive distributions and 50% of such cash as recoupment of its costs for establishing the hedge contracts until it has recouped approximately $5 million. |
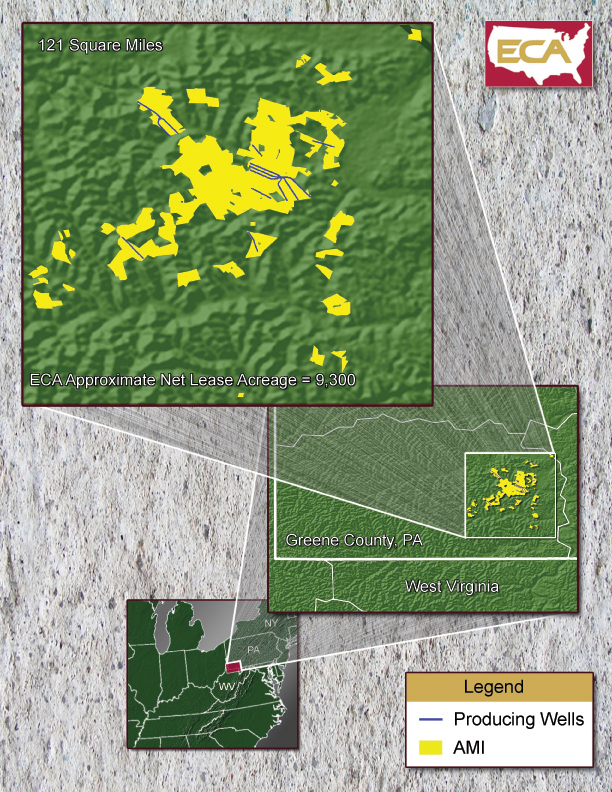
| - | ECA will not be permitted to drill and complete any development wells in the Marcellus Shale formation on the lease acreage within the AMI for its own account or sell the Underlying Properties until it has satisfied its drilling obligation. |
| • | Potential for initial depletion to be offset by results of development drilling. ECA is obligated to drill the PUD Wells by March 31, 2014. Furthermore, ECA is incentivized to increase production in the near term in order to receive incentive distributions. While production from the trust properties will decline in the long term, production from the PUD Wells will offset depletion of the Producing Wells in the near term. | |
| • | ECA’s experience and position as Marcellus Shale operator. Since January 1, 2006, ECA has drilled over 160 Marcellus Shale wells throughout the Appalachian Basin and operates Marcellus Shale wells in New York, Pennsylvania and West Virginia. ECA was one of the earliest operators in the Marcellus Shale region, having drilled test wells in this play in the late 1970s in partnership with the U.S. Department of Energy, and on April 18, 2008, it drilled and completed the Consol USX-13 well, which was one of the |
9
Table of Contents
| first horizontal Marcellus Shale wells in Greene County, Pennsylvania. ECA has drilled 141 gross vertical development wells and 21 gross horizontal wells in the Marcellus Shale formation, and it has successfully completed 100% of these wells. ECA is currently the operator of all of the Producing Wells and will agree to operate not less than 90% of the PUD Wells during the subordination period, allowing ECA to control the timing and amount of discretionary expenditures for operational and development activities with respect to substantially all of the PUD Wells. ECA’s senior managers possess an average of 27.5 years of industry experience with an extensive focus on operations in the Appalachian Basin and Marcellus Shale. |
| • | ECA’s prior experience sponsoring a royalty trust. In 1993, ECA sponsored the formation of the Eastern American Natural Gas Trust (NYSE: NGT), a publicly traded Delaware trust (“NGT”), to which it contributed term net profits interests in Appalachian Basin natural gas properties. In connection with the formation of this trust, ECA agreed to drill 65 development wells over five years from which NGT would be entitled to a specified percentage of the proceeds from the natural gas production. ECA completed its obligation within the stipulated period. The historical results of operations and performance of NGT should not be relied on as an indicator of how the trust will perform. |
| • | Experience of ECA marketing natural gas production. As the operator of all of the Producing Wells and substantially all the PUD Wells, ECA will have the responsibility to market or cause to be marketed the natural gas production related to the Underlying Properties. During the fiscal year ended June 30, 2009, ECA and its affiliates aggregated and sold domestically an average of 62 MMcf of gas per day, of which 57 MMcf per day represented sales of natural gas produced from wells operated by ECA. | |
| • | Proximity of the Appalachian Basin to major markets. The Appalachian Basin is located close to a substantial number of large commercial and industrial gas markets, including natural gas powered electricity plants, and major residential markets in the northeastern United States. This proximity, together with the stable nature of Appalachian Basin production and the availability of transportation facilities, has resulted in generally higher realized prices for Appalachian Basin natural gas (including Marcellus Shale formation natural gas) than realized prices available in other regions of the United States. |
| Average Greene County | Average NYMEX | |||||||
| Year | Gathering Price/MMBtu | Price/MMBtu | ||||||
| 2007 | $ | 7.17 | $ | 6.86 | ||||
| 2008 | 8.46 | 8.02 | ||||||
| 2009 | 6.85 | 6.39 | ||||||
10
Table of Contents
| Proved Gas | Discounted | |||||||||||
| Reserves | Estimated Future | Estimated Future | ||||||||||
| Proved Reserves | (Bcfe) | Net Revenues | Net Revenues (1) | |||||||||
| (Dollars in thousands) | ||||||||||||
| Underlying Properties | 193.8 | $ | 507,289 | $ | 168,687 | |||||||
| Royalty Interests: | ||||||||||||
| PDP Royalty Interest (90%) (2) | 32.2 | $ | 119,757 | $ | 67,161 | |||||||
| PUD Royalty Interest (50%) | 72.4 | $ | 269,175 | $ | 133,109 | |||||||
| Total | 104.6 | $ | 388,932 | $ | 200,270 | |||||||
| (1) | The present values of future net revenues for the Underlying Properties and the royalty interests were determined using a discount rate of 10% per annum. | |
| (2) | Includes reserves currently behind pipe in existing wells which are in the process of being completed. |
11
Table of Contents
12
Table of Contents
| Common units offered to public | 9,000,000 common units | |
| 10,350,000 common units, if the underwriters exercise their over-allotment option in full | ||
| Trust units owned by ECA after the offering | 3,395,433 common units and 4,500,000 subordinated units | |
| 2,045,433 common units and 4,500,000 subordinated units, if the underwriters exercise their over-allotment option in full | ||
| Common units owned by the Private Investors | 1,104,567 common units. For more information on the common units owned by the Private Investors, please read “Certain Transactions.” | |
| Total units outstanding after the offering | 13,500,000 common units and 4,500,000 subordinated units | |
| Use of proceeds | The trust is offering the common units to be sold in this offering. Assuming no exercise of the underwriters’ over-allotment option and an initial public offering price of $ per common unit, the estimated net proceeds of this offering will be approximately $ million, after deducting underwriting discounts and commissions and offering expenses. The trust will use the net proceeds to pay a wholly-owned subsidiary of ECA for the conveyance of the Term Royalties. In turn, such subsidiary will use such amount to repay a $ million demand note payable to ECA to be issued as consideration for the transfer of the Term Royalties thereto. | |
| The trust will use the net proceeds from any exercise of the underwriters’ over-allotment option to repurchase an equal number of common units from ECA at the initial public offering price, after deducting underwriting discounts and commissions. | ||
| ECA will use the proceeds received both from the repayment of the demand note by ECA’s subsidiary and from any exercise of the underwriters’ over-allotment option for general corporate purposes, including for the drilling of PUD Wells. | ||
| Proposed NYSE symbol | “ECT” | |
| Quarterly cash distributions | Actual cash distributions to the trust unitholders will fluctuate quarterly based on the quantity of natural gas produced from the Underlying Properties, the prices received for natural gas production and other factors. |
13
Table of Contents
| Because payments to the trust will be generated by depleting assets and the trust has a finite life with the production from the Underlying Properties initially increasing and subsequently diminishing over time, a portion of each distribution will represent a return of your original investment and the target distributions will decline over time. Production declines are expected to be offset in the near term by production realized from the drilling and successful completion of the PUD Wells. | ||
| It is expected that quarterly cash distributions during the term of the trust will be made by the trustee on or about the 60th day following the end of each calendar quarter to the trust unitholders of record on or about the 45th day following each calendar quarter. The first distribution from the trust to the trust unitholders will be made on or about August 31, 2010. The first distribution to the trust unitholders will be based upon amounts to be received from ECA for estimated production attributable to the royalty interests and proceeds attributable to the hedging contracts for the period commencing on April 1, 2010 and ending on June 30, 2010, regardless or whether such amounts have actually been received by ECA from the purchaser of the natural gas produced. | ||
| Termination of the trust | The trust will begin to liquidate on the Termination Date and will soon thereafter wind up its affairs and terminate. The Term Royalties will automatically revert to ECA at the Termination Date, while the Perpetual Royalties will be sold and the proceeds thereof will be distributed to the unitholders at the Termination Date or soon thereafter. ECA will have a first right of refusal to purchase the Perpetual Royalties at the Termination Date. | |
| Summary of income tax considerations | The trust will be treated as a partnership for federal income tax purposes. Consequently, the trust will not incur any federal income tax liability. Instead, trust unitholders will be allocated an amount of the trust’s income, gain, loss, or deductions corresponding to their interest in the trust, which amounts may differ in timing or amount from actual distributions. The Term PDP Royalty will and the Term PUD Royalty should be treated as debt instruments for federal income tax purposes, and the trust will be required to treat a portion of each payment it receives with respect to each such royalty interest as interest income in accordance with the “noncontingent bond method” under the original issue discount rules contained in the Internal Revenue Code of 1986, as amended, and the corresponding regulations. The Perpetual PDP Royalty will and the Perpetual PUD Royalty should be treated as mineral royalty interests for federal income tax purposes, which generates |
14
Table of Contents
| ordinary income subject to depletion. Please read “Federal income tax considerations.” | ||
| Estimated ratio of taxable income to distributions | The trust estimates that if you own the units you purchase in this offering through the record date for distributions for the period ending December 31, 2012, you will be allocated, on a cumulative basis, an amount of federal taxable income for that period that will be % or less of the cash distributed to you with respect to that period. For example, if you receive an annual distribution of $ per unit, the trust estimates that your average allocable federal taxable income per year will be no more than approximately $ per unit. Please read “Federal income tax considerations.” |
15
Table of Contents
| • | delays imposed by or resulting from compliance with regulatory requirements including permitting; | |
| • | unusual or unexpected geological formations; | |
| • | shortages of or delays in obtaining equipment and qualified personnel; | |
| • | equipment malfunctions, failures or accidents; | |
| • | lack of available gathering facilities or delays in construction of gathering facilities; | |
| • | lack of available capacity on interconnecting transmission pipelines; | |
| • | unexpected operational events and drilling conditions; | |
| • | pipe or cement failures; | |
| • | casing collapses; | |
| • | lost or damaged drilling and service tools; | |
| • | loss of drilling fluid circulation; | |
| • | uncontrollable flows of natural gas and fluids; | |
| • | fires and natural disasters; | |
| • | environmental hazards, such as natural gas leaks, pipeline ruptures and discharges of toxic gases; | |
| • | adverse weather conditions; |
16
Table of Contents
| • | reductions in natural gas prices; | |
| • | natural gas property title problems; and | |
| • | market limitations for natural gas. |
| • | weather conditions and seasonal trends; | |
| • | regional, domestic and foreign supply and perceptions of supply of natural gas; | |
| • | availability of imported liquefied natural gas, or LNG; | |
| • | the level of demand and perceptions of demand for natural gas; | |
| • | anticipated future prices of natural gas, LNG and other commodities; | |
| • | technological advances affecting energy consumption and energy supply; | |
| • | U.S. and worldwide political and economic conditions; | |
| • | the price and availability of alternative fuels; | |
| • | the proximity, capacity, cost and availability of gathering and transportation facilities; | |
| • | the volatility and uncertainty of regional pricing differentials; | |
| • | acts of force majeure; | |
| • | governmental regulations and taxation; and | |
| • | energy conservation and environmental measures. |
17
Table of Contents
| • | historical production from the area compared with production rates from other producing areas; | |
| • | natural gas prices, production levels, Btu content, production expenses, transportation costs, severance and excise taxes and capital expenditures; and | |
| • | the assumed effect of governmental regulation. |
18
Table of Contents
19
Table of Contents
20
Table of Contents
21
Table of Contents
22
Table of Contents
| • | Substantially all of the production from the Producing Wells and the PUD Wells will utilize ECA’s Greene Country Gathering System. The trust will pay the initial Post-Production Services Fee to ECA for use of such system, which includes ECA’s costs to gather, compress, transport, process, treat, dehydrate and market the gas. This fee is fixed until ECA’s obligation to drill the PUD Wells is satisfied; thereafter, ECA may increase this fee to the extent necessary to recover certain capital expenditures on the Greene County Gathering System, provided the resulting charge does not exceed the prevailing charges in the area for similar services. Additionally, the trust will be charged for the cost of fuel used in the compression process or equivalent electricity charges when electric compressors are used. | |
| • | There currently are no third party post-production costs; however, any third party post-production costs incurred in the future and associated with the trust’s interests will reduce cash received by or available for distribution, including any amounts paid by ECA for transportation on downstream interstate pipelines. | |
| • | Taxes allocated to or imposed on the trust will include Pennsylvania franchise tax and any applicable property, ad valorem, production, severance, excise and other similar taxes. Currently, there are no taxes in Pennsylvania related to the production or severance of oil and natural gas in Pennsylvania, but there are currently proposals pending in both the Pennsylvania Senate Finance and the House Energy and Environmental Resources Committees to enact a severance tax, and lawmakers may propose other taxes in the future. If adopted, such taxes would be a post-production cost that is borne by the trust. | |
| • | The trust will bear 100% of trust administrative expenses, including fees paid to the trustee and the Delaware trustee and an annual administrative services fee of $60,000 payable to ECA. | |
| • | The trust will also be responsible for paying other expenses incurred as a result of being a publicly traded entity, including costs associated with annual and quarterly reports to unitholders, tax return and Schedule K-1 preparation and distribution, independent auditor fees and registrar and transfer agent fees. | |
| • | ECA will be entitled, during the subordination period, to receive a quarterly incentive distribution from the trust in an amount equal to 50% of the amount by which distributions paid to all unitholders exceed the incentive thresholds described herein. A more detailed description of these distributions is set forth under the caption “Description of the Trust Agreement — Fees and Expenses — Fees to ECA.” | |
| • | ECA has incurred costs of approximately $5 million in securing the hedging contracts to be transferred to the trust. ECA will be entitled to reimbursement for these expenditures only if and to the extent distributions to trust unitholders would otherwise exceed the incentive threshold. This reimbursement will be deducted, over time, from the 50% of cash available for distribution in excess of the incentive thresholds otherwise payable to |
23
Table of Contents
| the common and subordinated unitholders. ECA’s reimbursement right will terminate at the end of the subordination period. |
24
Table of Contents
25
Table of Contents
26
Table of Contents
| • | Notwithstanding its drilling obligation to the trust, ECA’s interests may conflict with those of the trust and the trust unitholders in situations involving the development, maintenance, operation or abandonment of the Underlying Properties. Additionally, ECA may abandon a well which is uneconomic to it while such well is still generating revenue for the trust unitholders. Subsequent to fulfilling its drilling obligation, ECA may make decisions with respect to expenditures and decisions to allocate resources on projects in other areas that adversely affect the Underlying Properties, including reducing expenditures on these properties, which could cause gas production to decline at a faster rate and thereby result in lower cash distributions by the trust in the future. | |
| • | ECA may sell some or all of the Underlying Properties, subject to its obligation not to sell any of the underlying PUD properties prior to satisfying its obligation to drill the PUD Wells. Such sale may not be in the best interests of the trust unitholders. Any purchaser may lack ECA’s experience in the Marcellus Shale or its credit worthiness. | |
| • | ECA may, without the consent of the trust unitholders, require the trust to release royalty interests with an aggregate value to the trust of up to $5.0 million during any12-month period. These releases will be made only in connection with the sale by ECA of the Underlying Properties and are conditioned upon the trust receiving an amount equal to the fair value to the trust of such royalty interests. See “The Underlying Properties — Sale and abandonment of Underlying Properties.” | |
| • | After it has completed its drilling obligation, ECA may in its discretion increase its Post-Production Services Fee for post-production costs on its Greene County Gathering System to the extent necessary to recover certain capital expenditures on the Greene County Gathering System. | |
| • | ECA is permitted under the conveyance agreements creating the royalty interests to enter into new processing and transportation contracts without obtaining bids from or otherwise negotiating with any independent third parties, and ECA will deduct from the trust’s proceeds any charges under such contracts attributable to production from the trust properties. Provisions in the conveyance agreements, however, require that charges under future contracts with affiliates of ECA relating to processing or transportation of natural gas must be comparable to charges prevailing in the area for similar services. | |
| • | ECA has registration rights and can sell its units without considering the effects such sale may have on common unit prices or on the trust itself. Additionally, ECA can vote its trust units in its sole discretion. |
27
Table of Contents
28
Table of Contents
29
Table of Contents
30
Table of Contents
31
Table of Contents
32
Table of Contents
33
Table of Contents
34
Table of Contents
35
Table of Contents
36
Table of Contents
37
Table of Contents
| • | risks incident to the drilling and operation of natural gas wells; | |
| • | future production and development costs; | |
| • | the effect of existing and future laws and regulatory actions; | |
| • | the effect of changes in commodity prices, the ability of the trust’s hedge counterparties to meet their contractual obligations and conditions in the capital markets; | |
| • | competition from others in the energy industry; and | |
| • | uncertainty of estimates of natural gas reserves and production. |
38
Table of Contents
39
Table of Contents
| • | domestic economic and population growth; | |
| • | added capacity of natural gas-fired, as opposed to coal-fired, electricity generation; | |
| • | growth in the application of natural gas as a fuel source as a means of diversifying away from foreign oil, such as in natural gas vehicles; and | |
| • | indirectly through additions of electric vehicles. |
40
Table of Contents
41
Table of Contents
42
Table of Contents
43
Table of Contents
| Six Months Ended | ||||||||||||||||||||
| Year Ended June 30, | December 31, | |||||||||||||||||||
| Historical Results | 2007 | 2008 | 2009 | 2008 | 2009 | |||||||||||||||
| (Dollars in thousands, except per share and reserve data) | (Unaudited) | |||||||||||||||||||
| Operating revenue | $ | 211,954 | $ | 247,071 | $ | 216,220 | $ | 125,110 | $ | 85,040 | ||||||||||
| Income from operations | 40,658 | 51,912 | 30,350 | 15,478 | 11,989 | |||||||||||||||
| Earnings per common share basic and diluted | 33.66 | 19.93 | 36.98 | 25.39 | 2.85 | |||||||||||||||
| Dividends declared | 11.23 | 12.50 | 12.50 | 6.25 | 6.50 | |||||||||||||||
| Total assets | 413,321 | 557,980 | 543,719 | 538,501 | 534,025 | |||||||||||||||
| Total long-term debt | 135,166 | 197,125 | 218,134 | 213,490 | 237,779 | |||||||||||||||
| Production (MMcfe) — (unaudited) | 9,636 | 10,684 | 9,646 | 5,099 | 5,464 | |||||||||||||||
| Net proved developed reserves (MMcfe) — (unaudited) | 173,474 | 176,672 | 145,102 | — | — | |||||||||||||||
44
Table of Contents
| Name | Age | Position with ECA or its Subsidiaries | ||||
| John Mork | 62 | President and Chief Executive Officer | ||||
| Michael S. Fletcher | 60 | Chief Financial Officer | ||||
| Donald C. Supcoe | 53 | Senior Vice President, Secretary and General Counsel | ||||
| J. Michael Forbes | 49 | Vice President and Treasurer | ||||
| Kyle M. Mork | 30 | Vice President of Eastern Operations | ||||
| George V. O’Malley | 58 | Vice President Accounting | ||||
| W. Gaston Caperton, III | 70 | Director | ||||
| Peter H. Coors | 63 | Director | ||||
| L.B. Curtis | 85 | Director (Chairman Emeritus) | ||||
| John J. Dorgan | 86 | Director | ||||
| John S. Fischer | 59 | Director | ||||
| Thomas R. Goodwin | 66 | Director (Chairman) | ||||
| F.H. McCullough, III | 62 | Director | ||||
| Julie M. Mork | 59 | Director | ||||
| Jerry W. Neely | 73 | Director | ||||
| Arthur C. Nielsen, Jr. | 90 | Director | ||||
| Jay S. Pifer | 72 | Director | ||||
45
Table of Contents
46
Table of Contents
47
Table of Contents
48
Table of Contents
| Beneficial Ownership | ||||||||
| Common Stock | ||||||||
| Shares | Percent | |||||||
| W. Gaston Caperton, III | 11,680 | 2.24 | % | |||||
| Peter H. Coors | 8,196 | 1.57 | % | |||||
| L.B. Curtis | 10,750 | 2.06 | % | |||||
| John J. Dorgan | 4,130 | * | ||||||
| John S. Fischer | — | — | ||||||
| Michael S. Fletcher | 1,000 | * | ||||||
| J. Michael Forbes | 1,850 | * | ||||||
| Thomas R. Goodwin | — | — | ||||||
| F.H. McCullough, III (1) | 60,080 | 11.54 | % | |||||
| John Mork (2) | 365,443 | 70.18 | % | |||||
| Julie M. Mork (2) | 365,443 | 70.18 | % | |||||
| Kyle M. Mork (3) | 5,544 | 1.06 | % | |||||
| Arthur C. Nielsen, Jr. | 19,880 | 3.82 | % | |||||
| George O’Malley | — | — | ||||||
| Jerry W. Neely | — | — | ||||||
| Jay S. Pifer | — | — | ||||||
| Donald C. Supcoe | 4,583 | * | ||||||
| All officers and directors as a group (17 persons) | 493,136 | 94.70 | % | |||||
| * | Less than one percent | |
| (1) | Includes 58,000 shares held by F.H. McCullough, III and Kathy McCullough as joint tenants, 880 shares held by the Katherine F. McCullough Trust, and 400 shares held by each of the Lesley McCullough Trust, the Meredith McCullough Trust and the Kristin McCullough Trust. | |
| (2) | Includes 283,304 shares held by Shenandoah LLC, an entity wholly owned and controlled by a grantor trust created by John and Julie Mork, 74,032 shares held by John and Julie Mork as joint tenants, 2,563 shares held by Julie Mork individually, and 5,544 shares held by the Alison Mork Trust. | |
| (3) | Includes 5,544 shares held by the Kyle Mork Trust. |
49
Table of Contents
| Beneficial Ownership | ||||||||
| Class A Stock | ||||||||
| Shares | Percent | |||||||
| W. Gaston Caperton, III | 3,420 | 5.19 | % | |||||
| Peter H. Coors | 4,516 | 6.86 | % | |||||
| L.B. Curtis | 1,180 | 1.79 | % | |||||
| John J. Dorgan | 3,820 | 5.80 | % | |||||
| John S. Fischer | 480 | * | ||||||
| Michael S. Fletcher (2) | 2,270 | 3.45 | % | |||||
| J. Michael Forbes (2) | 1,550 | 2.35 | % | |||||
| Thomas R. Goodwin | 3,820 | 5.80 | % | |||||
| F.H. McCullough, III | 1,180 | 1.79 | % | |||||
| John Mork (1)(2) | 4,750 | 7.21 | % | |||||
| Julie M. Mork (1)(2) | 4,750 | 7.21 | % | |||||
| Kyle M. Mork (2)(3) | 1,969 | 2.98 | % | |||||
| Jerry W. Neely | — | — | ||||||
| Arthur C. Nielsen, Jr. | 1,180 | 1.79 | % | |||||
| George V. O’Malley (2) | 1,170 | 1.78 | % | |||||
| Jay S. Pifer | 1,340 | 2.03 | % | |||||
| Donald C. Supcoe (2) | 2,630 | 3.99 | % | |||||
| All officers and directors as a group (17 persons) | 35,275 | 53.55 | % | |||||
| * | Less than one percent | |
| (1) | Includes 1,730 shares held by John and Julie Mork as joint tenants, 1,800 shares held by Julie Mork individually and 1,220 shares held by the Alison Mork Trust. | |
| (2) | Includes shares included in ECA’s Incentive Stock Purchase Plan. | |
| (3) | Includes 1,219 shares held by the Kyle Mork Trust. |
50
Table of Contents
51
Table of Contents
52
Table of Contents
53
Table of Contents
54
Table of Contents
| • | the timing of initial production from the PUD Wells; | |
| • | natural gas prices received; | |
| • | the volume and Btu rating of natural gas produced and sold; | |
| • | post-production costs and any applicable taxes; | |
| • | the reimbursement by the trust, if any, of ECA’s costs associated with establishing hedging contracts for the benefit of the trust; and | |
| • | administrative expenses of the trust and expenses incurred as a result of being a publicly traded entity. |
55
Table of Contents
| Subordination | Target | Incentive | ||||||||||
| Period | Threshold | Distribution | Threshold | |||||||||
| (per unit) | ||||||||||||
2010: | ||||||||||||
| Second Quarter | $ | 0.217 | $ | 0.271 | $ | 0.326 | ||||||
| Third Quarter | 0.298 | 0.372 | 0.447 | |||||||||
| Fourth Quarter | 0.426 | 0.532 | 0.639 | |||||||||
2011: | ||||||||||||
| First Quarter | 0.413 | 0.516 | 0.619 | |||||||||
| Second Quarter | 0.418 | 0.523 | 0.627 | |||||||||
| Third Quarter | 0.520 | 0.650 | 0.780 | |||||||||
| Fourth Quarter | 0.544 | 0.680 | 0.815 | |||||||||
2012: | ||||||||||||
| First Quarter | 0.562 | 0.702 | 0.843 | |||||||||
| Second Quarter | 0.595 | 0.744 | 0.893 | |||||||||
| Third Quarter | 0.607 | 0.759 | 0.911 | |||||||||
| Fourth Quarter | 0.688 | 0.859 | 1.031 | |||||||||
2013: | ||||||||||||
| First Quarter | $ | 0.773 | $ | 0.967 | $ | 1.160 | ||||||
| Second Quarter | 0.771 | 0.964 | 1.157 | |||||||||
| Third Quarter | 0.717 | 0.896 | 1.075 | |||||||||
| Fourth Quarter | 0.674 | 0.842 | 1.010 | |||||||||
2014: | ||||||||||||
| First Quarter | 0.623 | 0.779 | 0.935 | |||||||||
| Second Quarter | 0.601 | 0.751 | 0.902 | |||||||||
| Third Quarter | 0.583 | 0.728 | 0.874 | |||||||||
| Fourth Quarter | 0.561 | 0.701 | 0.841 | |||||||||
2015: | ||||||||||||
| First Quarter | 0.530 | 0.663 | 0.795 | |||||||||
56
Table of Contents
57
Table of Contents
| Quarters Ending | ||||||||||||||||||||
| June 30, | September 30, | December 31, | March 31, | June 30, | ||||||||||||||||
| 2010 | 2010 | 2010 | 2011 | 2011 | ||||||||||||||||
| (In thousands, except well number, volumetric and per unit data) | ||||||||||||||||||||
| Number of wells producing at quarter end | 8 | 17 | 22 | 25 | 31 | |||||||||||||||
Estimated Production from Trust Properties | ||||||||||||||||||||
| Natural Gas PDP Sales Volumes (MMcf) | 879 | 1,190 | 1,265 | 1,066 | 962 | |||||||||||||||
| Natural Gas PUD Sales Volumes (MMcf) | — | 81 | 514 | 553 | 769 | |||||||||||||||
| Total Sales Volumes (MMcf) | 879 | 1,271 | 1,779 | 1,619 | 1,731 | |||||||||||||||
| Daily Sales Volumes (Mcf/d) | 9,664 | 13,814 | 19,336 | 17,988 | 19,020 | |||||||||||||||
Commodity Prices and Hedging Positions (1) | ||||||||||||||||||||
| Assumed NYMEX Price ($/MMBtu) (2) | $ | 4.58 | $ | 4.75 | $ | 5.27 | $ | 5.81 | $ | 5.34 | ||||||||||
| Assumed Price ($/Mcf) | 4.72 | 4.89 | 5.42 | 5.98 | 5.50 | |||||||||||||||
| Realized Unhedged Price after Basis Differential ($/Mcf) | 4.88 | 5.04 | 5.58 | 6.13 | 5.65 | |||||||||||||||
Daily Hedged Volumes(MMcf/d) (3) | 7.3 | 7.3 | 9.7 | 9.0 | 9.5 | |||||||||||||||
| Percent of Total Volumes Swapped | 75 | % | 53 | % | 38 | % | 40 | % | 38 | % | ||||||||||
| Swap Price ($/MMBtu) | $ | 6.75 | $ | 6.75 | $ | 6.75 | $ | 6.75 | $ | 6.75 | ||||||||||
| Percent of Total Volumes Floored | — | — | 12 | % | 10 | % | 12 | % | ||||||||||||
| Floor Price ($/MMBtu) | $ | — | $ | — | $ | 5.00 | $ | 5.00 | $ | 5.00 | ||||||||||
| Realized Hedged Weighted Average Price ($/Mcf) (3) | $ | 6.55 | $ | 6.13 | $ | 6.15 | $ | 6.53 | $ | 6.21 | ||||||||||
Cash available for distribution | ||||||||||||||||||||
| Gas Sales Revenues | $ | 4,288 | $ | 6,408 | $ | 9,923 | $ | 9,932 | $ | 9,786 | ||||||||||
| Swap and Floor Hedge Revenues | 1,476 | 1,381 | 1,021 | 635 | 960 | |||||||||||||||
| Total Revenues | $ | 5,764 | $ | 7,788 | $ | 10,944 | $ | 10,566 | $ | 10,746 | ||||||||||
| Post-Production Services Fee (4) | $ | 471 | $ | 681 | $ | 953 | $ | 867 | $ | 927 | ||||||||||
| Trust Expenses | 200 | 200 | 200 | 200 | 201 | |||||||||||||||
| Franchise Taxes | 207 | 207 | 211 | 211 | 211 | |||||||||||||||
| Cash Available for Distribution | $ | 4,885 | $ | 6,701 | $ | 9,581 | $ | 9,288 | $ | 9,407 | ||||||||||
| Trust Units Outstanding | 18,000 | 18,000 | 18,000 | 18,000 | 18,000 | |||||||||||||||
| Target Distribution Per Trust Unit | $ | 0.271 | $ | 0.372 | $ | 0.532 | $ | 0.516 | $ | 0.523 | ||||||||||
| Subordination Threshold Per Trust Unit | $ | 0.217 | $ | 0.298 | $ | 0.426 | $ | 0.413 | $ | 0.418 | ||||||||||
| Incentive Threshold Per Trust Unit | $ | 0.326 | $ | 0.447 | $ | 0.639 | $ | 0.619 | $ | 0.627 | ||||||||||
| (1) | For a more detailed description of the natural gas hedging contracts established for the benefit of the trust, please see “Description of the Royalty Interests.” | |
| (2) | Based on NYMEX forward pricing as of March 11, 2010. Assumed price per Mcf calculated based on an assumed conversion rate of 1.03 MMBtu per Mcf. |
58
Table of Contents
| (3) | Adjusted for an assumed basis differential of $0.15 per MMBtu. | |
| (4) | Consists of a fee of $0.52 per MMBtu. |
59
Table of Contents
60
Table of Contents
61
Table of Contents
62
Table of Contents
63
Table of Contents
| Six Months Ended | ||||
| Historical Results | December 31, 2009 | |||
| (Dollars in thousands, except volumetric data) | ||||
| Natural gas sales volumes (Mcf) (unaudited) | 841,261 | |||
| Gross sales price per Mcf (unaudited) | $ | 4.31 | ||
| Revenues from gas sales | $ | 3,623 | ||
| Direct operating expenses: | ||||
| Production and property taxes | — | |||
| Production expenses | 24 | |||
| Marketing fee (1) | 132 | |||
| Gathering and transportation charges | 458 | |||
| Total | 614 | |||
| Excess of revenues over direct operating expenses | $ | 3,009 | ||
| (1) | A wholly-owned subsidiary of ECA markets the production from the Underlying Properties. Historically, such subsidiary has charged a marketing fee for its services; however, the trust will not be charged a marketing fee by ECA for marketing production. |
64
Table of Contents
| Historical for | Pro forma for | |||||||
| Producing Wells | Royalty Interest (1) | |||||||
| Six Months Ended | Six Months Ended | |||||||
| December 31, | December 31, | |||||||
| 2009 | 2009 | |||||||
| Production (MMcf) | 841 | 757 | ||||||
| Average net sales price per Mcf: | ||||||||
| Average gross sales price per Mcf | $ | 4.31 | $ | 4.31 | ||||
| Gathering and transportation charges (Mcf) | 0.54 | 0.54 | ||||||
| Average sales price (2) | 3.60 | 3.76 | ||||||
| Average production cost per Mcf (3) | $ | 0.03 | — | |||||
| (1) | Pro forma figures are calculated as if the conveyances were in effect for the period indicated. | |
| (2) | Average sales price generally represents the realized price of gas which is net of post-production costs and applicable taxes, if any. | |
| (3) | Production costs include lease operating costs. |
65
Table of Contents
66
Table of Contents
| Proved Gas | Discounted | |||||||||||
| Reserves | Estimated Future | Estimated Future | ||||||||||
| Proved reserves | (Bcfe) | Net Revenues | Net Revenues (1) | |||||||||
| (Dollars in thousands) | ||||||||||||
| Underlying Properties | 193.8 | $ | 507,289 | $ | 168,687 | |||||||
| Royalty Interests: | ||||||||||||
| PDP Royalty Interest (90%) (2) | 32.2 | $ | 119,757 | $ | 67,161 | |||||||
| PUD Royalty Interest (50%) | 72.4 | $ | 269,175 | $ | 133,109 | |||||||
| Total | 104.6 | $ | 388,932 | $ | 200,270 | |||||||
| (1) | The present values of future net revenues for the Underlying Properties and the royalty interests were determined using a discount rate of 10% per annum. | |
| (2) | Includes reserves currently behind pipe in existing wells which are in the process of being completed. |
67
Table of Contents
68
Table of Contents
| • | royalties and other burdens, express and implied, under gas leases; | |
| • | production payments and similar interests and other burdens created by ECA or its predecessors in title; |
69
Table of Contents
| • | a variety of contractual obligations arising under operating agreements, farmout agreements, production sales contracts and other agreements that may affect the properties or their titles; | |
| • | liens that arise in the normal course of operations, such as those for unpaid taxes, statutory liens securing unpaid suppliers and contractors and contractual liens under operating agreements that are not yet delinquent or, if delinquent, are being contested in good faith by appropriate proceedings; | |
| • | pooling, unitization and communitization agreements, declarations and orders; | |
| • | easements, restrictions,rights-of-way and other matters that commonly affect property; | |
| • | conventional rights of reassignment that obligate ECA to reassign all or part of a property to a third party if ECA intends to release or abandon such property; and | |
| • | rights reserved to or vested in the appropriate governmental agency or authority to control or regulate the Underlying Properties and the royalty interests therein. |
70
Table of Contents
71
Table of Contents
72
Table of Contents
73
Table of Contents
74
Table of Contents
75
Table of Contents
| • | amount calculated based on estimated production volumes attributable to the Producing Wells; |
| • | any taxes levied on the severance or production of the natural gas produced from the Producing Wells and any property taxes attributable to the natural gas production attributable to the Producing Wells; and | |
| • | post-production costs, which will generally consist of costs incurred to gather, compress, transport, process, treat, dehydrate and market the natural gas produced. Any charge payable to ECA for such post-production costs on its Greene County Gathering System will be limited to $0.52 per MMBtu of gas gathered until ECA has fulfilled its drilling obligation. Thereafter, ECA may increase this Post-Production Service Fee to the extent it is necessary to recover certain capital expenditures in ECA’s Greene County Gathering System. Additionally, the trust will be charged for the cost of fuel used in the compression process, including equivalent electricity charges in instances when electric compressors are used. |
76
Table of Contents
| • | for any calendar quarter commencing on or after April 1, 2010, the amount calculated based on estimated production volumes attributable to the PUD Wells: |
| • | any taxes levied on the severance or production of the natural gas produced from the PUD Wells and any property taxes attributable to the gas produced from the PUD Wells; and | |
| • | post-production costs will generally consist of costs incurred to gather, compress, transport, process, treat, dehydrate and market the natural gas produced. Any charge payable to ECA for such post-production charges on its with ECA’s Greene County Gathering System will be limited to $0.52 per MMBtu of gas gathered until ECA has fulfilled its drilling obligation. Thereafter, ECA may increase this Post-Production Services Fee to the extent is necessary to recover certain capital expenditures in ECA’s Greene County Gathering System. Additionally, the trust will be charged for the cost of fuel used in the compression process, including equivalent electricity charges in instances when electric compressors are used. |
| • | will be determined on the basis that ECA’s working interest with respect to the PUD Wells is not subject to burdens (landowner’s royalties and other similar interests) in excess of 12.5% of the proceeds from gas production attributable to ECA’s interest; and | |
| • | will not be subject to any deductions for any expenses attributable to exploration, drilling, development, operating, maintenance or any other costs incident to the production of natural gas production attributable to the underlying PUD properties, including any costs to plug and abandon a well included in the underlying PUD properties. |
77
Table of Contents
78
Table of Contents
| Swap Volume | Swap Price | Floor Volume | Floor Price | |||||||||||||
| (MMBtu) | (MMBtu) | (MMBtu) | (MMBtu) | |||||||||||||
| Second Quarter 2010 | 682,500 | $ | 6.75 | — | — | |||||||||||
| Third Quarter 2010 | 690,000 | $ | 6.75 | — | — | |||||||||||
| Fourth Quarter 2010 | 690,000 | $ | 6.75 | 225,000 | $ | 5.00 | ||||||||||
| First Quarter 2011 | 675,000 | $ | 6.75 | 159,000 | $ | 5.00 | ||||||||||
| Second Quarter 2011 | 682,500 | $ | 6.75 | 210,000 | $ | 5.00 | ||||||||||
| Third Quarter 2011 | 690,000 | $ | 6.82 | 405,000 | $ | 5.00 | ||||||||||
| Fourth Quarter 2011 | 690,000 | $ | 6.82 | 384,000 | $ | 5.00 | ||||||||||
| First Quarter 2012 | 682,500 | $ | 6.82 | 369,000 | $ | 5.00 | ||||||||||
| Second Quarter 2012 | 682,500 | $ | 6.82 | 516,000 | $ | 5.00 | ||||||||||
| Third Quarter 2012 | 1,305,000 | $ | 5.00 | |||||||||||||
| Fourth Quarter 2012 | 1,362,000 | $ | 5.00 | |||||||||||||
| First Quarter 2013 | 1,395,000 | $ | 5.00 | |||||||||||||
| Second Quarter 2013 | 1,380,000 | $ | 5.00 | |||||||||||||
| Third Quarter 2013 | 1,278,000 | $ | 5.00 | |||||||||||||
| Fourth Quarter 2013 | 1,188,000 | $ | 5.00 | |||||||||||||
| First Quarter 2014 | 1,092,000 | $ | 5.00 | |||||||||||||
79
Table of Contents
| • | amounts withheld or placed in escrow by a purchaser are not considered to be received by the owner of the underlying property until actually collected; | |
| • | amounts received by the owner of the underlying property and promptly deposited with a nonaffiliated escrow agent will not be considered to have been received until disbursed to it by the escrow agent; and | |
| • | amounts received by the owner of the underlying property and not deposited with an escrow agent will be considered to have been received. |
80
Table of Contents
81
Table of Contents
82
Table of Contents
| • | increase the power of the trustee to engage in business or investment activities; | |
| • | alter the rights of the trust unitholders as among themselves; or | |
| • | permit the trustee to distribute the royalty interests in kind. |
| • | collecting cash attributable to the royalty interests; | |
| • | paying expenses, charges and obligations of the trust from the trust’s assets; | |
| • | determining whether cash distributions exceed subordination or incentive thresholds, and making such cash distributions to the common and subordinated unitholders accordingly; | |
| • | causing to be prepared and distributed aSchedule K-1 for each trust unitholder and to prepare and file tax returns on behalf of the trust; | |
| • | causing to be prepared and filed reports required to be filed under the Securities Exchange Act of 1934, as amended, and by the rules of any securities exchange or quotation system on which the trust units are listed or admitted to trading; and | |
| • | taking any action it deems necessary and advisable to best achieve the purposes of the trust. |
83
Table of Contents
| • | interest bearing obligations of the United States government; | |
| • | money market funds that invest only in United States government securities; | |
| • | repurchase agreements secured by interest-bearing obligations of the United States government; or | |
| • | bank certificates of deposit. |
| • | the sale does not involve a material part of the trust’s assets and is in the best interests of the trust unitholders; or | |
| • | the sale constitutes a material part of the trust’s assets and is in the best interests of the trust unitholders, subject to the holders representing a majority of the outstanding trust units approving the sale. |
84
Table of Contents
| • | charge for its services as trustee; | |
| • | retain funds to pay for future expenses and deposit them with one or more banks or financial institutions (which may include the trustee to the extent permitted by law); |
85
Table of Contents
| • | lend funds at commercial rates to the trust to pay the trust’s expenses; and | |
| • | seek reimbursement from the trust for itsout-of-pocket expenses. |
| • | the trust sells all of the royalty interests; | |
| • | gross proceeds attributable to the royalty interests are less than $1.5 million for any four consecutive quarters; | |
| • | the holders of a majority of the outstanding trust units vote in favor of dissolution; or | |
| • | judicial dissolution of the trust. |
86
Table of Contents
87
Table of Contents
88
Table of Contents
| • | dissolve the trust; | |
| • | remove the trustee or the Delaware trustee; | |
| • | amend the trust agreement (except with respect to certain matters that do not adversely affect the right of trust unitholders in any material respect); | |
| • | merge or consolidate the trust with or into another entity; or | |
| • | approve the sale of all or any material part of the assets of the trust. |
89
Table of Contents
| Trust units | Common stock | |||
Voting | Trust agreement provides voting rights to trust unitholders to remove and replace trustee (but not elect) and to approve or disapprove major trust transactions. | Corporate statutes provide voting rights to stockholders of the corporation to elect directors and to approve or disapprove major corporate transactions. | ||
Income Tax | The trust is not subject to federal income tax; trust unitholders are subject to income tax on their allocable share of trust income, gain, loss and deduction. | Corporations are taxed on their income, and their stockholders are taxed on dividends. | ||
Distributions | Substantially all trust revenue is distributed to trust unitholders. | Stockholders receive dividends at the discretion of the board of directors. | ||
Business and Assets | The business of the trust is limited to specific assets with a finite economic life. | A corporation conducts an active business for an unlimited term and can reinvest its earnings and raise additional capital to expand. | ||
Fiduciary Duties | To the extent provided in the trust agreement, the trustee has a fiduciary duty to the trust unitholders. | Officers and directors have a fiduciary duty of loyalty to stockholders and a duty to use due care in management and administration of a corporation. |
90
Table of Contents
| • | 1.0% of the total number of the securities outstanding, or | |
| • | the average weekly reported trading volume of the common units for the four calendar weeks prior to the sale. |
91
Table of Contents
| • | subject to the restrictions described above under“— Lock-up Agreements” and under “Underwriting —Lock-up Agreements,” to use its reasonable best efforts to file a registration statement, including, if so requested, a shelf registration statement, with the SEC as promptly as practicable following receipt of a notice requesting the filing of a registration statement from holders representing a majority of the then outstanding registrable trust units; | |
| • | to use its reasonable best efforts to cause the registration statement or shelf registration statement to be declared effective under the Securities Act as promptly as practicable after the filing thereof; and | |
| • | to continuously maintain the effectiveness of the registration statement under the Securities Act for 90 days (or for three years if a shelf registration statement is requested) after the effectiveness thereof or until the trust units covered by the registration statement have been sold pursuant to such registration statement or until all registrable trust units: |
| • | have been sold pursuant to Rule 144 under the Securities Act if the transferee thereof does not receive “restricted securities;” | |
| • | have been sold in a private transaction in which the transferor’s rights under the registration rights agreement are not assigned to the transferee of the trust units; or | |
| • | become eligible for resale pursuant to Rule 144 (or any similar rule then in effect under the Securities Act). |
92
Table of Contents
93
Table of Contents
| • | an individual who is a citizen of the United States or who is resident in the United States for U.S. federal income tax purposes, | |
| • | a corporation, or an entity treated as a corporation for U.S. federal income tax purposes, created or organized in or under the laws of the United States, a state thereof or the District of Columbia, | |
| • | an estate the income of which is subject to U.S. federal income taxation regardless of its source, or | |
| • | a trust if it is subject to the primary supervision of a U.S. court and the control of one or more United States persons (as defined for U.S. federal income tax purposes) or that has a valid election in effect under applicable U.S. Treasury regulations to be treated as a United States person. |
94
Table of Contents
95
Table of Contents
96
Table of Contents
97
Table of Contents
| • | his relative contributions to the trust; | |
| • | the interests of all the partners in profits and losses; | |
| • | the interest of all the partners in cash flow; and | |
| • | the rights of all the partners to distributions of capital upon liquidation. |
98
Table of Contents
| • | the product of (i) the adjusted issue price (as defined below) of the debt instrument as of the beginning of the accrual period; and (ii) the comparable yield to maturity (as defined below) of such debt instrument, adjusted for the length of the accrual period; | |
| • | divided by the number of days in the accrual period; and | |
| • | multiplied by the number of days during the accrual period that the trust held the debt instrument. |
99
Table of Contents
100
Table of Contents
101
Table of Contents
| • | interest on indebtedness properly allocable to property held for investment; |
102
Table of Contents
| • | the trust’s interest expense attributed to portfolio income; and | |
| • | the portion of interest expense incurred to purchase or carry an interest in a passive activity to the extent attributable to portfolio income. |
| • | any of the trust’s income, gain, loss, deduction or credit with respect to those trust units would not be reportable by the trust unitholder; | |
| • | any cash distributions received by the trust unitholder as to those trust units would be fully taxable; and | |
| • | all of these distributions would appear to be ordinary income. |
103
Table of Contents
104
Table of Contents
105
Table of Contents
| • | a short sale; | |
| • | an offsetting notional principal contract; or |
106
Table of Contents
| • | a futures or forward contract with respect to the partnership interest or substantially identical property. |
107
Table of Contents
108
Table of Contents
| • | the gain is, or is treated as, effectively connected with business conducted by thenon-U.S. trust unitholder in the United States, and in the case of an applicable tax treaty, is attributable to a U.S. permanent establishment maintained by thenon-U.S. trust unitholder; | |
| • | thenon-U.S. trust unitholder is an individual who is present in the United States for at least 183 days in the year of the sale and certain other conditions are met; or | |
| • | thenon-U.S. trust unitholder owns currently, or owned at certain earlier times, directly or by applying certain attribution rules, more than 5% of the trust units. |
109
Table of Contents
110
Table of Contents
| • | accuracy-related penalties with a broader scope, significantly narrower exceptions, and potentially greater amounts than described above at “— Accuracy-Related Penalties”; | |
| • | for those persons otherwise entitled to deduct interest on federal tax deficiencies, nondeductibility of interest on any resulting tax liability; and | |
| • | in the case of a listed transaction, an extended statute of limitations. |
111
Table of Contents
112
Table of Contents
| • | whether the investment satisfies the prudence requirements of Section 404(a)(1)(B) of ERISA; | |
| • | whether the investment satisfies the diversification requirements of Section 404(a)(1)(C) of ERISA; and | |
| • | whether the investment is in accordance with the documents and instruments governing the qualified plan as required by Section 404(a)(1)(D) of ERISA. |
113
Table of Contents
| Ownership of Trust Units | ||||||||||||||||||||
| Ownership of | After Offering (Assuming | |||||||||||||||||||
| Trust Units | Full Exercise | |||||||||||||||||||
| Before Exercise | Number of | of Underwriters’ | ||||||||||||||||||
| of Underwriters’ Over-Allotment Option | Common Units | Over-Allotment) | ||||||||||||||||||
| Selling Trust Unitholder | Number | Percentage | Being Offered | Number | Percentage | |||||||||||||||
| Energy Corporation of America | 7,895,433 | 43.9% | 1,350,000 | 6,545,433 | 36.4% | |||||||||||||||
114
Table of Contents
| Number of | ||||
| Name of Underwriter | Common Units | |||
| Raymond James & Associates, Inc. | ||||
| Citigroup Global Markets Inc. | ||||
| Total | 9,000,000 | |||
| • | the representations and warranties made by ECA to the underwriters are true; | |
| • | there is no material adverse change in the financial market; and | |
| • | ECA delivers customary closing documents and legal opinions to the underwriters. |
115
Table of Contents
| Total without | Total with | |||||||||||
| Over-Allotment | Over-Allotment | |||||||||||
| Per Unit | Exercise | Exercise | ||||||||||
| Price to the public | $ | |||||||||||
| Underwriting discount and commissions | $ | |||||||||||
| Proceeds, to the trust (before expenses) | $ | |||||||||||
| • | not to offer, sell, contract to sell, announce the intention to sell or pledge any of the trust units; | |
| • | not to grant or sell any option or contract to purchase any of the trust units; | |
| • | not to enter into any swap or other agreement that transfers any of the economic consequences of ownership of or otherwise transfer or dispose of, directly or indirectly, any of the trust units; and | |
| • | not to enter into any hedging, collar or other transaction or arrangement that is designed or reasonably expected to lead to or result in a transfer, in whole or in part, of any of the economic consequences of ownership of the trust units, whether or not such transfer would be for any consideration. |
116
Table of Contents
| • | during the last 17 days of the180-day period, the trust issues a release concerning distributable cash or announces material news or a material event relating to the trust occurs; or | |
| • | prior to the expiration of the180-day period, the trust announces that it will release distributable cash results during the16-day period beginning on the last day of the180-day period, in which case the restrictions described in the preceding paragraphs will continue to apply until the expiration of the18-day period beginning on the issuance of the earnings release, the announcement of the material news or the occurrence of the material event. |
| • | short sales, | |
| • | syndicate covering transactions, | |
| • | imposition of penalty bids, and | |
| • | purchases to cover positions created by short sales. |
117
Table of Contents
| • | estimates of distributions to trust unitholders, | |
| • | overall quality of the natural gas properties attributable to the Underlying Properties, | |
| • | industry and market conditions prevalent in the energy industry, | |
| • | the information set forth in this prospectus and otherwise available to the representatives, and | |
| • | the general conditions of the securities markets at the time of this offering. |
118
Table of Contents
119
Table of Contents
| Purchase Price for | Percentage | |||||||
| Participation | Interest in the | |||||||
| in Drilling | Drilling | |||||||
| Private Investors | Program | Program | ||||||
| W. Gaston Caperton, III | $ | 116,259 | 1.89% | |||||
| Peter H. Coors | 290,646 | 4.72% | ||||||
| L.B. Curtis | 67,430 | 1.10% | ||||||
| John J. Dorgan | 58,129 | 0.94% | ||||||
| John S. Fischer | 290,646 | 4.72% | ||||||
| Michael S. Fletcher | 29,065 | 0.47% | ||||||
| J. Michael Forbes | 40,458 | 0.66% | ||||||
| Thomas R. Goodwin | 174,388 | 2.83% | ||||||
| F.H. McCullough III (1) | 453,408 | 7.36% | ||||||
| John Mork (2) | 3,573,790 | 58.05% | ||||||
| Julie M. Mork (2) | 3,573,790 | 58.05% | ||||||
| Kyle M. Mork (3) | 337,150 | 5.48% | ||||||
| Arthur C. Nielsen, Jr. | 29,065 | 0.47% | ||||||
| George O’Malley | 29,669 | 0.48% | ||||||
| Jay S. Pifer | 29,065 | 0.47% | ||||||
| Donald C. Supcoe | 58,129 | 0.94% | ||||||
| $ | 5,577,297 | 90.59% | ||||||
| Other Private Investors | 549,043 | 8.92% | ||||||
| Private Investor Total | $ | 6,126,339 | 99.51% | |||||
| (1) | Includes investments by the Katherine F. McCullough Trust, the Lesley McCullough Trust and the Kristin McCullough Trust. | |
| (2) | Includes investments by John and Julie Mork as joint tenants, and investments by the Alison Mork Trust. | |
| (3) | Includes investments by the Kyle Mork Trust. |
120
Table of Contents
| Number of | Cash Proceeds | |||||||||||||||
| Value of | Percentage | Common Units | Upon Sale to | |||||||||||||
| Interest in the | Interest in the | After Purchase | ECA of | |||||||||||||
| Private Investors | Drilling Program | Drilling Program | by ECA | Common Units | ||||||||||||
| W. Gaston Caperton, III | $ | 496,209 | 1.89% | 24,933 | $ | |||||||||||
| Peter H. Coors | 1,240,522 | 4.72% | 62,333 | |||||||||||||
| L.B. Curtis | 287,801 | 1.10% | 13,000 | |||||||||||||
| John J. Dorgan | 248,104 | 0.94% | 12,467 | |||||||||||||
| John S. Fischer | 1,240,522 | 4.72% | 56,100 | |||||||||||||
| Michael S. Fletcher | 124,052 | 0.47% | 3,233 | |||||||||||||
| J. Michael Forbes | 172,681 | 0.66% | 8,677 | |||||||||||||
| Thomas R. Goodwin | 744,314 | 2.83% | 37,400 | |||||||||||||
| F.H. McCullough III (1) | 1,935,215 | 7.36% | 78,000 | |||||||||||||
| John Mork (2) | 15,253,477 | 58.05% | 616,451 | |||||||||||||
| Julie M. Mork (2) | 15,253,477 | 58.05% | 616,451 | |||||||||||||
| Kyle M. Mork (3) | 1,439,007 | 5.48% | 72,307 | |||||||||||||
| Arthur C. Nielsen, Jr. | 124,052 | 0.47% | 6,233 | |||||||||||||
| George O’Malley | 126,633 | 0.48% | 2,000 | |||||||||||||
| Jay S. Pifer | 124,052 | 0.47% | 6,233 | |||||||||||||
| Donald C. Supcoe | 248,104 | 0.94% | 6,234 | |||||||||||||
| $ | 23,804,748 | 90.59% | 1,005,601 | $ | ||||||||||||
| Other Private Investors | 2,343,397 | 8.92% | 98,966 | |||||||||||||
| Private Investor Total | $ | 26,148,144 | 99.51% | 1,104,567 | $ | |||||||||||
121
Table of Contents
| (1) | Includes investments by the Katherine F. McCullough Trust, the Lesley McCullough Trust and the Kristin McCullough Trust. | |
| (2) | Includes investments by John and Julie Mork as joint tenants, and investments by the Alison Mork Trust. | |
| (3) | Includes investments by the Kyle Mork Trust. |
122
Table of Contents
123
Table of Contents
TERMS RELATED TO THE TRUST
124
Table of Contents
125
Table of Contents
126
Table of Contents
| UNDERLYING PDP PROPERTIES | ||||
| F-2 | ||||
| F-3 | ||||
| F-4 | ||||
| F-8 | ||||
| F-8 | ||||
| F-9 | ||||
| F-10 |
F-1
Table of Contents
Energy Corporation of America:
F-2
Table of Contents
STATEMENT OF HISTORICAL REVENUES AND DIRECT OPERATING EXPENSES
For the Six Months Ended December 31, 2009
| (In thousands) | ||||
Revenues: | ||||
| Gas Sales | $ | 3,623 | ||
| Total Revenues | 3,623 | |||
Operating Expenses: | ||||
| Taxes on Production and Property | — | |||
| Lease Operation Expenses | 22 | |||
| Field Operation Expenses | 2 | |||
| Marketing Fee | 132 | |||
| Gathering and Transportation | 458 | |||
| Total Operating Expenses | 614 | |||
| Excess of revenues over operating expenses | $ | 3,009 | ||
F-3
Table of Contents
| 1. | PROPERTIES |
| 2. | BASIS OF PRESENTATION |
| 3. | SUPPLEMENTAL DISCLOSURES OF GAS PRODUCING ACTIVITIES (UNAUDITED) |
F-4
Table of Contents
Notes to the Statement of Historical Revenues and
Direct Operating Expenses — (Continued)
| Natural Gas | ||||
| (Mmcf) | ||||
| Proved reserves: | ||||
| June 30, 2009 | — | |||
| Revisions of previous estimates | — | |||
| Extensions and discoveries | 10,580 | |||
| Sales of reserves in place | — | |||
| Purchases of reserves in place | — | |||
| Production | (841 | ) | ||
| December 31, 2009 | 9,739 | |||
| Proved developed reserves: | ||||
| December 31, 2009 | 9,739 | |||
F-5
Table of Contents
Notes to the Statement of Historical Revenues and
Direct Operating Expenses — (Continued)
| 2009 | ||||
| Future cash in flows | $ | 38,821 | ||
| Future production and development costs | (6,305 | ) | ||
| Future income tax expense | — | |||
| Future net cash flows before discount | 32,516 | |||
| 10% discount to present value | (15,128 | ) | ||
| Standardized measure of discounted future net cash flows related to proved oil and gas reserves | $ | 17,388 | ||
F-6
Table of Contents
Notes to the Statement of Historical Revenues and
Direct Operating Expenses — (Continued)
| 2009 | ||||
| Standardized measure of discounted future net cash flow at beginning of period | $ | — | ||
| Sales of oil and gas produced, net of production costs | (3,009 | ) | ||
| Net changes in prices and production costs | 1,500 | |||
| Changes in production rates and other | — | |||
| Extensions, discoveries and other additions, net of future production and development costs | 18,897 | |||
| Changes in estimated future development costs | — | |||
| Development costs incurred | — | |||
| Revisions of previous quantity estimates | — | |||
| Purchase of reserves in place | — | |||
| Accretion of discount | — | |||
| Net change in income taxes | — | |||
| Standardized measure of discounted future net cash flows at end of period | $ | 17,388 | ||
F-7
Table of Contents
ECA Marcellus Trust I:
F-8
Table of Contents
| As of | ||||
| March 19, 2010 | ||||
Assets: | ||||
| Cash | $ | 10 | ||
Total | $ | 10 | ||
Trust Corpus: | ||||
| Trust corpus | $ | 10 | ||
Total | $ | 10 | ||
F-9
Table of Contents
| 1. | ORGANIZATION OF THE TRUST |
| 2. | SIGNIFICANT ACCOUNTING POLICIES |
| • | Royalty income recorded is the amount computed to be paid by ECA to the Trustee on behalf of the Trust for the corresponding quarter. | |
| • | Trust expenses are recorded when paid. | |
| • | Distributable income is reduced by cash reserves established for liabilities and contingencies. | |
| • | Distributions to unitholders are recorded in the quarter to which they apply. |
F-10
Table of Contents
| 3. | INCOME TAXES |
| 4. | DISTRIBUTIONS TO UNITHOLDERS |
F-11
Table of Contents
F-12
Table of Contents
| Historical | Adjustments | Pro Forma | ||||||||||
Assets: | ||||||||||||
| Cash | $ | 10 | $ | — | $ | 10 | ||||||
| Investment in Royalty Interest | — | 360,000,000 | (a) | 360,000,000 | ||||||||
| Floor price contracts | — | 4,957,920 | (a) | 4,957,920 | ||||||||
Total Assets | $ | 10 | $ | 364,957,920 | $ | 364,957,930 | ||||||
Liabilities: | ||||||||||||
| Floor premiums payable | $ | — | $ | 4,957,920 | (b) | $ | 4,957,920 | |||||
Total Liabilities | $ | — | $ | 4,957,920 | $ | 4,957,920 | ||||||
Trust Corpus: | ||||||||||||
| 18,000,000 Trust Units Issued and Outstanding at Formation | $ | 10 | $ | 360,000,000 | $ | 360,000,010 | ||||||
Total Liabilities and Trust Corpus | $ | 10 | $ | 364,957,920 | $ | 364,957,930 | ||||||
F-13
Table of Contents
| Six Months Ended | ||||
| December 31, | ||||
| 2009 | ||||
Historical results: | ||||
| Revenue from gas sales | $ | 3,623 | ||
| Direct operating expenses: | ||||
| Production and property taxes | — | |||
| Production expenses | 24 | |||
| Marketing fee | 132 | |||
| Gathering and transportation | 458 | |||
| Total | 614 | |||
| Excess of revenues over direct operating expenses before pro forma adjustments | $ | 3,009 | ||
Pro Forma adjustments: | ||||
| Historical production expenses | 24 | (c) | ||
| Marketing fee | 132 | (c) | ||
| Total pro forma adjustments | 156 | |||
| Pro forma gross net proceeds | $ | 3,165 | ||
| Overriding royalty interest percentage | 90 | % | ||
| Net proceeds to trust | $ | 2,849 | ||
| Less trust general and administrative expenses and state franchise taxes | 550 | (d) | ||
| Distributable income | $ | 2,299 | (e) | |
| Distributable income per unit | $ | 0.13 | ||
F-14
Table of Contents
| NOTE 1. | BASIS OF PRESENTATION |
F-15
Table of Contents
| NOTE 2. | TRUST ACCOUNTING POLICIES |
F-16
Table of Contents
| NOTE 3. | INCOME TAXES |
| NOTE 4. | PRO FORMA ADJUSTMENTS |
F-17
Table of Contents
ECA-1
Table of Contents
ECA-2
Table of Contents
ECA-3
Table of Contents
| 2007 | 2008 | 2009 | ||||||||||
Net proved developed: | ||||||||||||
| Gas (MMcf) | 170,625 | 174,396 | 143,167 | |||||||||
| Oil (MBbls) | 475 | 379 | 322 | |||||||||
| Total (MMcfe) | 173,474 | 176,672 | 145,099 | |||||||||
| Weighted Average Price ($/Mcf) | 7.43 | 14.41 | 3.88 | |||||||||
| Future net cash flows before discount (in thousands) | $ | 737,309 | $ | 1,362,849 | $ | 370,421 | ||||||
| Discounted future net cash flows related to proved developed oil and gas reserves (in thousands) (1) | $ | 261,229 | $ | 492,670 | $ | 153,646 | ||||||
| (1) | Discounted using an annual discount rate of 10%. |
ECA-4
Table of Contents
| Natural Gas | Oil | Natural Gas | Percent of Proved | Present Value | ||||||||||||||||
| Region | (MMcf) | (Mbbls) | Equivalent (MMcfe) | Developed Reserves | (Thousands) | |||||||||||||||
| Appalachian Basin | $ | 140,080 | 249 | 141,574 | 97.6 | % | $ | 147,129 | ||||||||||||
| Western | 3,087 | 73 | 3,525 | 2.4 | % | 6,517 | ||||||||||||||
| Total | $ | 143,167 | 322 | 145,099 | 100.0 | % | $ | 153,646 | (1) | |||||||||||
| (1) | Estimated future net revenue represents the estimated future gross revenue to be generated from the production of proved developed reserves, net of estimated production and future development costs, using prices and costs under existing economic conditions at June 30, 2009. Prices were determined by applying period-end prices of oil and natural gas relating to the Company in accordance with the SEC’s ruling in effect as of June 30, 2009, and do not give effect to any derivative transactions. This price should not be interpreted as a prediction of future prices, nor does it reflect the value of commodity hedges in place at June 30, 2009. The amounts shown do not give effect to non-property related expenses, such as corporate general and administrative expenses and debt service, or to depreciation, depletion and amortization. |
| Gross Wells | Net Wells | |||||||||||||||||||||||
| Region | Oil | Gas | Total | Oil | Gas | Total | ||||||||||||||||||
| Appalachian Basin | 50 | 5,094 | 5,144 | 35.4 | 3,527.9 | 3,563.3 | ||||||||||||||||||
| Western | — | 24 | 24 | 0 | 11.3 | 11.3 | ||||||||||||||||||
| Total | 50 | 5,118 | 5,168 | 35.4 | 3,539.2 | 3,574.6 | ||||||||||||||||||
| Developed Acreage | Undeveloped Acreage | |||||||||||||||
| Region | Gross | Net | Gross | Net | ||||||||||||
| Appalachian Basin | 836,277 | 766,676 | 189,405 | 163,993 | ||||||||||||
| Western | 21,709 | 9,356 | 22,892 | 15,248 | ||||||||||||
| New Zealand | — | — | 1,732,209 | 1,555,776 | ||||||||||||
| Total | 857,986 | 776,032 | 1,944,506 | 1,735,017 | ||||||||||||
ECA-5
Table of Contents
| 2007 | 2008 | 2009 | ||||||||||
Production data: | ||||||||||||
| Oil (MBbls) | 83 | 65 | 47 | |||||||||
| Natural gas (MMcf) | 9,138 | 10,294 | 9,364 | |||||||||
| Average sales price (before the effect of hedging): | ||||||||||||
| Oil per Bbl | $ | 60.10 | $ | 92.37 | $ | 64.98 | ||||||
| Natural gas per Mcf | $ | 7.01 | $ | 8.53 | $ | 6.76 | ||||||
| 2007 | 2008 | 2009 | ||||||||||||||||||||||
| Gross | Net | Gross | Net | Gross | Net | |||||||||||||||||||
Development | ||||||||||||||||||||||||
| Productive | ||||||||||||||||||||||||
| Appalachian | 93 | 80.3 | 93 | 82.1 | 24 | 19.5 | ||||||||||||||||||
| Western/New Zealand | 2 | 1.8 | 2 | 1.8 | — | — | ||||||||||||||||||
| Total | 95 | 82.1 | 95 | 83.9 | 24 | 19.5 | ||||||||||||||||||
| Nonproductive | ||||||||||||||||||||||||
| Appalachian | — | — | — | — | — | — | ||||||||||||||||||
| Western/New Zealand | — | — | — | — | — | — | ||||||||||||||||||
| Total | — | — | — | — | — | — | ||||||||||||||||||
Exploratory: | ||||||||||||||||||||||||
| Productive | ||||||||||||||||||||||||
| Appalachian | 5 | 4.5 | 2 | 1.8 | 2 | 1.4 | ||||||||||||||||||
| Western/New Zealand | — | — | — | — | — | — | ||||||||||||||||||
| Total | 5 | 4.5 | 2 | 1.8 | 2 | 1.4 | ||||||||||||||||||
| Nonproductive | ||||||||||||||||||||||||
| Appalachian | — | — | — | — | — | — | ||||||||||||||||||
| Western/New Zealand | 1 | 1 | 1 | 0.7 | — | — | ||||||||||||||||||
| Total | 101 | 87.6 | 98 | 86.4 | 26 | 20.9 | ||||||||||||||||||
ECA-6
Table of Contents
| Year Ended June 30, | Six Months Ended December 31, | |||||||||||||||||||
| 2007 | 2008 | 2009 | 2008 | 2009 | ||||||||||||||||
| (Unaudited) | ||||||||||||||||||||
| (In thousands, except per share data) | ||||||||||||||||||||
Revenues: | ||||||||||||||||||||
| Oil and gas sales | $ | 84,429 | $ | 96,514 | $ | 92,262 | $ | 45,703 | $ | 44,012 | ||||||||||
| Gas aggregation and pipeline sales | 120,549 | 142,825 | 116,730 | 75,655 | 37,240 | |||||||||||||||
| Well operations and service revenues | 6,976 | 7,732 | 7,228 | 3,752 | 3,788 | |||||||||||||||
| 211,954 | 247,071 | 216,220 | 125,110 | 85,040 | ||||||||||||||||
Costs and expenses: | ||||||||||||||||||||
| Field operating expenses | 17,700 | 18,234 | 18,772 | 9,754 | 9,085 | |||||||||||||||
| Gas aggregation and pipeline cost of sales | 110,226 | 131,051 | 104,685 | 68,678 | 31,867 | |||||||||||||||
| General and administrative | 17,742 | 17,933 | 18,858 | 9,417 | 8,678 | |||||||||||||||
| Taxes, other than income | 4,519 | 5,406 | 4,629 | 3,022 | 395 | |||||||||||||||
| Depletion and depreciation of oil and gas properties | 18,115 | 20,937 | 23,445 | 11,496 | 17,179 | |||||||||||||||
| Depreciation of pipelines, other property and equipment | 4,961 | 5,852 | 6,119 | 2,999 | 3,148 | |||||||||||||||
| Exploration and impairment | 8,487 | 3,033 | 18,476 | 9,878 | 10,460 | |||||||||||||||
| (Gain) on sale of assets | (10,454 | ) | (7,287 | ) | (9,114 | ) | (5,612 | ) | (7,761 | ) | ||||||||||
| 171,296 | 195,159 | 185,870 | 109,632 | 73,051 | ||||||||||||||||
| Income from operations | 40,658 | 51,912 | 30,350 | 15,478 | 11,989 | |||||||||||||||
ECA-7
Table of Contents
| Year Ended June 30, | Six Months Ended December 31, | |||||||||||||||||||
| 2007 | 2008 | 2009 | 2008 | 2009 | ||||||||||||||||
| (Unaudited) | ||||||||||||||||||||
| (In thousands, except per share data) | ||||||||||||||||||||
Other (income) and expense: | ||||||||||||||||||||
| Interest expense | 8,245 | 10,688 | 9,986 | 5,366 | 4,796 | |||||||||||||||
| Interest income (expense) and other | 8,547 | 21,884 | (18,722 | ) | (17,317 | ) | 3,656 | |||||||||||||
| 16,792 | 32,572 | (8,736 | ) | (11,951 | ) | 8,452 | ||||||||||||||
| Income from operations before income taxes | 23,866 | 19,340 | 39,086 | 27,429 | 3,537 | |||||||||||||||
| Income tax expense | 4,815 | 7,855 | 17,355 | 12,513 | 1,868 | |||||||||||||||
Net income | $ | 19,051 | $ | 11,485 | $ | 21,731 | $ | 14,916 | $ | 1,669 | ||||||||||
| Earnings per common share, basic and diluted: | $ | 33.66 | $ | 19.93 | $ | 36.98 | $ | 25.39 | $ | 2.85 | ||||||||||
| Balance sheet data (at end of period): | ||||||||||||||||||||
| Property, plant and equipment | $ | 347,617 | $ | 451,742 | $ | 479,722 | $ | 455,876 | $ | 478,768 | ||||||||||
| Total assets | 413,321 | 557,980 | 543,719 | 538,501 | 534,025 | |||||||||||||||
| Working capital deficiency | (41,155 | ) | (78,179 | ) | (23,997 | ) | (10,165 | ) | (17,515 | ) | ||||||||||
| Long term debt excluding current maturities | 135,166 | 197,125 | 218,134 | 213,490 | 237,779 | |||||||||||||||
| Stockholders’ equity | 69,891 | 24,666 | 100,935 | 99,645 | 89,859 | |||||||||||||||
ECA-8
Table of Contents
and Results of Operation of Energy Corporation of America
ECA-9
Table of Contents
ECA-10
Table of Contents
| Years Ended | ||||||||||||||||
| June 30, | Variance | |||||||||||||||
| 2008 | 2009 | Amount | Percent | |||||||||||||
| Natural gas | ||||||||||||||||
| Production (MMcf) | 10,294 | 9,364 | (930 | ) | (9.0 | )% | ||||||||||
| Average sales price received ($/Mcf) | $ | 8.53 | $ | 6.76 | $ | (1.77 | ) | (20.7 | )% | |||||||
| Sales (in thousands) | $ | 87,816 | $ | 63,339 | $ | (24,477 | ) | (27.9 | )% | |||||||
| Oil | ||||||||||||||||
| Production (MBbl) | 65 | 47 | (18 | ) | (27.7 | )% | ||||||||||
| Average sales price received ($/Bbl) | $ | 92.37 | $ | 64.98 | $ | (27.39 | ) | (29.7 | )% | |||||||
| Sales (in thousands) | $ | 6,004 | $ | 3,054 | $ | (2,950 | ) | (49.1 | )% | |||||||
| Hedging | 2,417 | 25,602 | 23,185 | 959.2 | % | |||||||||||
| Other | 277 | 267 | (10 | ) | (3.6 | )% | ||||||||||
| Total oil and gas sales (in thousands) | $ | 96,514 | $ | 92,262 | $ | (4,252 | ) | (4.4 | )% | |||||||
ECA-11
Table of Contents
| Years Ended | ||||||||||||||||
| June 30, | Variance | |||||||||||||||
| 2008 | 2009 | Amount | Percent | |||||||||||||
| Aggregation revenue | ||||||||||||||||
| Volume (Million MMBtu) | 12,607 | 13,165 | 558 | 4.4 | % | |||||||||||
| Average sales price received ($/MMBtu) | $ | 8.73 | $ | 6.99 | $ | (1.74 | ) | (19.9 | )% | |||||||
| Sales (in thousands) | $ | 110,029 | $ | 92,003 | $ | (18,026 | ) | (16.4 | )% | |||||||
| Pipeline revenue | ||||||||||||||||
| Volume (Million MMBtu) | 12,863 | 11,906 | (957 | ) | (7.4 | )% | ||||||||||
| Average sales price received ($/MMBtu) | $ | 2.55 | $ | 2.08 | $ | (0.47 | ) | (18.5 | )% | |||||||
| Sales (in thousands) | $ | 32,796 | $ | 24,727 | $ | (8,069 | ) | (24.6 | )% | |||||||
| Total aggregation and pipeline sales (in thousands) | $ | 142,825 | $ | 116,730 | $ | (26,095 | ) | (18.3 | )% | |||||||
| Aggregation gas cost | ||||||||||||||||
| Volume (Million MMBtu) | 12,607 | 13,165 | 558 | 4.4 | % | |||||||||||
| Average price paid ($/MMBtu) | $ | 8.49 | $ | 6.74 | $ | (1.75 | ) | (20.6 | )% | |||||||
| Cost (in thousands) | $ | 107,058 | $ | 88,767 | $ | (18,291 | ) | (17.1 | )% | |||||||
| Pipeline gas cost | ||||||||||||||||
| Volume (Million MMBtu) | 3,407 | 2,828 | (579 | ) | (17.0 | )% | ||||||||||
| Average price paid ($/MMBtu) | $ | 7.04 | $ | 5.63 | $ | (1.41 | ) | (20.0 | )% | |||||||
| Cost (in thousands) | $ | 23,993 | $ | 15,918 | $ | (8,075 | ) | (33.7 | )% | |||||||
| Total aggregation and pipeline sales (in thousands) | $ | 131,051 | $ | 104,685 | $ | (26,366 | ) | (20.1 | )% | |||||||
ECA-12
Table of Contents
ECA-13
Table of Contents
| Years Ended | ||||||||||||||||
| June 30, | Variance | |||||||||||||||
| 2007 | 2008 | Amount | Percent | |||||||||||||
| Natural gas | ||||||||||||||||
| Production (MMcf) | 9,138 | 10,294 | 1,156 | 12.7 | % | |||||||||||
| Average sales price received ($/Mcf) | $ | 7.01 | $ | 8.53 | $ | 1.52 | 21.7 | % | ||||||||
| Sales (in thousands) | $ | 64,024 | $ | 87,816 | $ | 23,792 | 37.2 | % | ||||||||
| Oil | ||||||||||||||||
| Production (MBbl) | 83 | 65 | (18 | ) | (21.7 | )% | ||||||||||
| Average sales price received ($/Bbl) | $ | 60.10 | $ | 92.37 | $ | 32.27 | 53.7 | % | ||||||||
| Sales (in thousands) | $ | 4,988 | $ | 6,004 | $ | 1,016 | 20.4 | % | ||||||||
| Hedging | 15,201 | 2,417 | (12,784 | ) | (84.1 | )% | ||||||||||
| Other | 216 | 277 | 61 | 28.2 | % | |||||||||||
| Total oil and gas sales (in thousands) | $ | 84,429 | $ | 96,514 | $ | 12,085 | 14.3 | % | ||||||||
| Aggregation revenue | ||||||||||||||||
| Volume (Million MMBtu) | 12,724 | 12,607 | (117 | ) | (0.9 | )% | ||||||||||
| Average sales price received ($/MMBtu) | $ | 7.27 | $ | 8.73 | $ | 1.46 | 20.1 | % | ||||||||
| Sales (in thousands) | $ | 92,500 | $ | 110,029 | $ | 17,529 | 19.0 | % | ||||||||
| Pipeline revenue | ||||||||||||||||
| Volume (Million MMBtu) | 11,800 | 12,863 | 1,063 | 9.0 | % | |||||||||||
| Average sales price received ($/MMBtu) | $ | 2.38 | $ | 2.55 | $ | 0.17 | 7.1 | % | ||||||||
| Sales (in thousands) | $ | 28,049 | $ | 32,796 | $ | 4,747 | 16.9 | % | ||||||||
| Total aggregation and pipeline sales (in thousands) | $ | 120,549 | $ | 142,825 | $ | 22,276 | 18.5 | % | ||||||||
| Aggregation gas cost | ||||||||||||||||
| Volume (Million MMBtu) | 12,724 | 12,607 | (117 | ) | (0.9 | )% | ||||||||||
| Average price paid ($/MMBtu) | $ | 7.20 | $ | 8.49 | $ | 1.29 | 17.9 | % | ||||||||
| Cost (in thousands) | $ | 91,669 | $ | 107,058 | $ | 15,389 | 16.8 | % | ||||||||
| Pipeline gas cost | ||||||||||||||||
| Volume (Million MMBtu) | 4,422 | 3,407 | (1,015 | ) | (23.0 | )% | ||||||||||
| Average price paid ($/MMBtu) | $ | 4.20 | $ | 7.04 | $ | 2.84 | 67.6 | % | ||||||||
| Cost (in thousands) | $ | 18,557 | $ | 23,993 | $ | 5,436 | 29.3 | % | ||||||||
| Total aggregation and pipeline sales (in thousands) | $ | 110,226 | $ | 131,051 | $ | 20,825 | 18.9 | % | ||||||||
ECA-14
Table of Contents
ECA-15
Table of Contents
| Six Months Ended | ||||||||||||||||
| December 31, | Variance | |||||||||||||||
| 2008 | 2009 | Amount | Percent | |||||||||||||
| Natural gas | ||||||||||||||||
| Production (MMcf) | 4,709 | 5,314 | 605 | 12.8 | % | |||||||||||
| Average sales price received ($/Mcf) | $ | 9.14 | $ | 3.78 | $ | (5.36 | ) | (58.6 | )% | |||||||
| Sales (in thousands) | $ | 43,047 | $ | 20,076 | $ | (22,971 | ) | (53.4 | )% | |||||||
| Oil | ||||||||||||||||
| Production (MBbl) | 23 | 25 | 2 | 8.7 | % | |||||||||||
| Average sales price received ($/Bbl) | $ | 85.43 | $ | 63.88 | $ | (21.55 | ) | (25.2 | )% | |||||||
| Sales (in thousands) | $ | 1,965 | $ | 1,572 | $ | (393 | ) | (20.0 | )% | |||||||
| Hedging | 558 | 22,249 | 21,691 | 3887.3 | % | |||||||||||
| Other | 133 | 115 | (18 | ) | (13.5 | )% | ||||||||||
| Total oil and gas sales ($ in thousands) | $ | 45,703 | $ | 44,012 | $ | (1,691 | ) | (3.7 | )% | |||||||
| Aggregation revenue | ||||||||||||||||
| Volume (Million MMBtu) | 6,481 | 6,924 | 443 | 6.8 | % | |||||||||||
| Average sales price received ($/MMBtu) | $ | 9.14 | $ | 4.30 | $ | (4.84 | ) | (53.0 | )% | |||||||
| Sales (in thousands) | $ | 59,245 | $ | 29,768 | $ | (29,477 | ) | (49.8 | )% | |||||||
| Pipeline revenue | ||||||||||||||||
| Volume (Million MMBtu) | 5,949 | 6,773 | 824 | 13.9 | % | |||||||||||
| Average sales price received ($/MMBtu) | $ | 2.76 | $ | 1.10 | $ | (1.66 | ) | (60.1 | )% | |||||||
| Sales (in thousands) | $ | 16,410 | $ | 7,472 | $ | (8,938 | ) | (54.5 | )% | |||||||
| Total aggregation and pipeline sales (in thousands) | $ | 75,655 | $ | 37,240 | $ | (38,415 | ) | (50.8 | )% | |||||||
ECA-16
Table of Contents
| Six Months Ended | ||||||||||||||||
| December 31, | Variance | |||||||||||||||
| 2008 | 2009 | Amount | Percent | |||||||||||||
| Aggregation gas cost | ||||||||||||||||
| Volume (Million MMBtu) | 6,481 | 6,924 | 443 | 6.8 | % | |||||||||||
| Average price paid ($/MMBtu) | $ | 8.87 | $ | 4.05 | $ | (4.82 | ) | (54.3 | )% | |||||||
| Cost (in thousands) | $ | 57,463 | $ | 28,034 | $ | (29,429 | ) | (51.2 | )% | |||||||
| Pipeline gas cost | ||||||||||||||||
| Volume (Million MMBtu) | 1,489 | 1,239 | (250 | ) | (16.8 | )% | ||||||||||
| Average price paid ($/MMBtu) | $ | 7.53 | $ | 3.09 | $ | (4.44 | ) | (59.0 | )% | |||||||
| Cost (in thousands) | $ | 11,215 | $ | 3,833 | $ | (7,382 | ) | (65.8 | )% | |||||||
| Total aggregation and pipeline sales (in thousands) | $ | 68,678 | $ | 31,867 | $ | (36,811 | ) | (53.6 | )% | |||||||
ECA-17
Table of Contents
ECA-18
Table of Contents
ECA-19
Table of Contents
| Year Ended June 30, | ||||||||||||
| 2007 | 2008 | 2009 | ||||||||||
| Net income | $ | 19,051 | $ | 11,485 | $ | 21,731 | ||||||
| Add: | ||||||||||||
| Interest expense | 8,245 | 10,688 | 9,986 | |||||||||
| Depletion and depreciation of oil and gas properties | 18,115 | 20,937 | 23,445 | |||||||||
| Depreciation of property, plant and equipment | 4,961 | 5,852 | 6,119 | |||||||||
| Exploration and impairment | 8,487 | 3,033 | 18,476 | |||||||||
| Income tax expense | 4,815 | 7,855 | 17,355 | |||||||||
| Unrealized (gain) loss on financial instruments | 923 | 16,887 | (18,166 | ) | ||||||||
| EBITDAX | $ | 64,597 | $ | 76,737 | $ | 78,946 | ||||||
ECA-20
Table of Contents
| Average | ||||||||||||||||
| Total Volumes | Contract/Strike | Unrealized | ||||||||||||||
| Market Index | (MMBtu) | Price | (Gain) | |||||||||||||
Time period | ||||||||||||||||
| Derivatives | ||||||||||||||||
| Natural Gas Swaps | ||||||||||||||||
| January 2010 — March 2010 | NYMEX | 540,000 | $ | 8.68 | $ | (1,627,977 | ) | |||||||||
| January 2010 — March 2010 | NYMEX | 360,000 | 9.03 | (1,210,363 | ) | |||||||||||
| January 2010 — March 2010 | NYMEX | 540,000 | 9.04 | (1,820,904 | ) | |||||||||||
| January 2010 — June 2010 | NYMEX | 1,357,500 | 8.83 | (4,311,174 | ) | |||||||||||
| April 2010 — June 2010 (1) | NYMEX | 728,000 | 9.20 | (2,582,934 | ) | |||||||||||
| April 2010 — June 2010 (1) | NYMEX | 227,500 | 10.00 | (984,306 | ) | |||||||||||
| July 2010 — June 2011 (2) | NYMEX | 547,500 | 6.59 | (220,075 | ) | |||||||||||
| July 2010 — June 2012 (2) | NYMEX | 2,193,000 | 6.54 | (485,848 | ) | |||||||||||
| July 2010 — June 2012 (2) | NYMEX | 2,193,000 | 7.03 | (1,449,050 | ) | |||||||||||
| July 2011 — June 2012 (2) | NYMEX | 549,000 | 6.94 | (238,058 | ) | |||||||||||
| Total Hedged Production | 9,235,500 | $ | (14,930,689 | ) | ||||||||||||
| (1) | Natural gas swaps attributable to approximately 682,500 MMBtu of gas will be conveyed to the trust at the closing of this offering at an average contract price of $6.75 per MMBtu. | |
| (2) | All such natural gas swaps will be conveyed to the trust at the closing of this offering. |
ECA-21
Table of Contents
ECA-22
Table of Contents
| Pages | ||||
| HISTORICAL CONSOLIDATED FINANCIAL STATEMENTS OF ENERGY CORPORATION OF AMERICA | ||||
| Report of Independent Registered Public Accounting Firm | ECA-24 | |||
| Consolidated Balance Sheets as of June 30, 2008 and 2009 | ECA-25 | |||
| Consolidated Statements of Operations for the Years Ended June 30, 2007, 2008 and 2009 | ECA-27 | |||
| Consolidated Statements of Stockholders’ Equity for the Years Ended June 30, 2007, 2008 and 2009 | ECA-28 | |||
| Consolidated Statements of Cash Flows for the Years Ended June 30, 2007, 2008 and 2009 | ECA-29 | |||
| Consolidated Statements of Comprehensive Income (Loss) for the Years Ended June 30, 2007, 2008 and 2009 | ECA-30 | |||
| Notes to Consolidated Financial Statements | ECA-31 | |||
| UNAUDITED INTERIM FINANCIAL STATEMENTS OF ENERGY CORPORATION OF AMERICA | ||||
| Consolidated Balance Sheets as of June 30, 2009 and December 31, 2009 (unaudited) | ECA-54 | |||
| Unaudited Consolidated Statements of Operations for the Six Months Ended December 31, 2008 and 2009 | ECA-56 | |||
| Unaudited Consolidated Statements of Cash Flows for the Six Months Ended December 31, 2008 and 2009 | ECA-57 | |||
| Unaudited Consolidated Statements of Comprehensive Income (Loss) for the Six Months Ended December 31, 2008 and 2009 | ECA-58 | |||
| Notes to Unaudited Consolidated Financial Statements for the Periods Ended December 31, 2008 and 2009 | ECA-59 | |||
ECA-23
Table of Contents
ECA-24
Table of Contents
AS OF JUNE 30
| 2008 | 2009 | |||||||
| (Amounts in thousands) | ||||||||
ASSETS | ||||||||
| CURRENT ASSETS: | ||||||||
| Cash and cash equivalents | $ | 6,988 | $ | 1,979 | ||||
| Accounts receivable: | ||||||||
| Oil and gas sales | 13,488 | 3,110 | ||||||
| Gas aggregation and pipeline | 27,054 | 8,040 | ||||||
| Other | 13,319 | 5,140 | ||||||
| Accounts receivable | 53,861 | 16,290 | ||||||
| Less allowances for doubtful accounts | (833 | ) | (737 | ) | ||||
| Accounts receivable, net of allowances | 53,028 | 15,553 | ||||||
| Inventory | 1,883 | 4,752 | ||||||
| Income taxes receivable | 1,973 | 1,884 | ||||||
| Deferred income tax asset | 2,440 | 1,359 | ||||||
| Deferred taxes — other comprehensive loss | 25,307 | — | ||||||
| Notes receivable, related party | 172 | 70 | ||||||
| Derivatives | 593 | 30,640 | ||||||
| Prepaid and other current assets | 1,041 | 574 | ||||||
| Total current assets | 93,425 | 56,811 | ||||||
| NET PROPERTY, PLANT AND EQUIPMENT (Note 2) | 451,742 | 479,722 | ||||||
| OTHER ASSETS: | ||||||||
| Deferred financing costs, less accumulated amortization of $2,111 and $2,583 | 1,033 | 1,057 | ||||||
| Deferred taxes — other comprehensive loss | 5,994 | 237 | ||||||
| Notes receivable, related party | 350 | 262 | ||||||
| Derivatives | 154 | 651 | ||||||
| Other | 5,282 | 4,979 | ||||||
| Total other assets | 12,813 | 7,186 | ||||||
| TOTAL | $ | 557,980 | $ | 543,719 | ||||
ECA-25
Table of Contents
| 2008 | 2009 | |||||||
| (Amounts in thousands, except share amounts) | ||||||||
LIABILITIES AND STOCKHOLDERS’ EQUITY | ||||||||
| CURRENT LIABILITIES: | ||||||||
| Accounts payable and accrued expenses | $ | 46,982 | $ | 32,417 | ||||
| Current portion of long-term debt | 198 | 212 | ||||||
| Current portion of non-recourse debt | 442 | 470 | ||||||
| Funds held for future distribution | 36,293 | 13,620 | ||||||
| Accrued taxes, other than income | 13,042 | 10,838 | ||||||
| Deferred taxes — other comprehensive income | — | 11,052 | ||||||
| Deferred revenue | 304 | 262 | ||||||
| Deferred gain | 7,483 | 6,992 | ||||||
| Derivatives | 66,037 | 3,331 | ||||||
| Other current liabilities | 823 | 1,614 | ||||||
| Total current liabilities | 171,604 | 80,808 | ||||||
| LONG-TERM OBLIGATIONS: | ||||||||
| Long-term debt | 180,347 | 201,826 | ||||||
| Non-recourse debt | 16,778 | 16,308 | ||||||
| Deferred revenue | 919 | 655 | ||||||
| Deferred gain | 75,122 | 68,277 | ||||||
| Deferred income tax liability | 37,210 | 53,609 | ||||||
| Derivatives | 30,145 | 1,237 | ||||||
| Other long-term obligations | 21,189 | 20,064 | ||||||
| Total liabilities | 533,314 | 442,784 | ||||||
| COMMITMENTS AND CONTINGENCIES (Note 11) | ||||||||
| STOCKHOLDERS’ EQUITY: | ||||||||
| Common stock, par value $1.00; 2,000 shares authorized; 730,039 shares issued and 520,712 outstanding | 730 | 730 | ||||||
| Class A non-voting common stock, no par value; 100,000 shares authorized; 91,982 and 91,224 shares issued and 64,276 and 65,895 shares outstanding | 9,452 | 9,787 | ||||||
| Additional paid-in capital | 5,503 | 5,503 | ||||||
| Retained earnings | 82,043 | 96,414 | ||||||
| Treasury stock | (26,140 | ) | (25,892 | ) | ||||
| Accumulated other comprehensive (loss) income | (46,030 | ) | 15,645 | |||||
| Notes receivable from the issuance of Class A stock | (892 | ) | (1,252 | ) | ||||
| Total stockholders’ equity | 24,666 | 100,935 | ||||||
| TOTAL | $ | 557,980 | $ | 543,719 | ||||
ECA-26
Table of Contents
| 2007 | 2008 | 2009 | ||||||||||
| (Amounts in thousands, | ||||||||||||
| except per share data) | ||||||||||||
| REVENUES: | ||||||||||||
| Oil and gas sales | $ | 84,429 | $ | 96,514 | $ | 92,262 | ||||||
| Gas aggregation and pipeline sales | 120,549 | 142,825 | 116,730 | |||||||||
| Well operation and service revenues | 6,976 | 7,732 | 7,228 | |||||||||
| 211,954 | 247,071 | 216,220 | ||||||||||
| COSTS AND EXPENSES: | ||||||||||||
| Field operating expenses | 17,700 | 18,234 | 18,772 | |||||||||
| Gas aggregation and pipeline cost of sales | 110,226 | 131,051 | 104,685 | |||||||||
| General and administrative | 17,742 | 17,933 | 18,858 | |||||||||
| Taxes, other than income | 4,519 | 5,406 | 4,629 | |||||||||
| Depletion and depreciation of oil and gas properties | 18,115 | 20,937 | 23,445 | |||||||||
| Depreciation of pipelines, other property and equipment | 4,961 | 5,852 | 6,119 | |||||||||
| Exploration and impairment | 8,487 | 3,033 | 18,476 | |||||||||
| Gain on sale of assets | (10,454 | ) | (7,287 | ) | (9,114 | ) | ||||||
| 171,296 | 195,159 | 185,870 | ||||||||||
| Income from operations | 40,658 | 51,912 | 30,350 | |||||||||
| OTHER (INCOME) AND EXPENSE: | ||||||||||||
| Interest expense | 8,245 | 10,688 | 9,986 | |||||||||
| Other | 8,547 | 21,884 | (18,722 | ) | ||||||||
| 16,792 | 32,572 | (8,736 | ) | |||||||||
| Income before income taxes | 23,866 | 19,340 | 39,086 | |||||||||
| Income tax expense | 4,815 | 7,855 | 17,355 | |||||||||
| NET INCOME | $ | 19,051 | $ | 11,485 | $ | 21,731 | ||||||
| Earnings per common share, basic and diluted | $ | 33.66 | $ | 19.93 | $ | 36.98 | ||||||
ECA-27
Table of Contents
| Notes | ||||||||||||||||||||||||||||||||
| Class A | Additional | Received / | Accum. Other | Total | ||||||||||||||||||||||||||||
| Common | Common | Paid-In | Retained | Treasury | Issuance of | Comprehensive | Stockholders’ | |||||||||||||||||||||||||
| Stock | Stock | Capital | Earnings | Stock | Stock | Income (Loss) | Equity | |||||||||||||||||||||||||
| (Amounts in thousands) | ||||||||||||||||||||||||||||||||
| Balance, June 30, 2006 | $ | 730 | $ | 8,081 | $ | 5,503 | $ | 65,105 | $ | (28,274 | ) | $ | — | $ | 1,339 | $ | 52,484 | |||||||||||||||
| Components of comprehensive income (loss): | ||||||||||||||||||||||||||||||||
| Net income | 19,051 | 19,051 | ||||||||||||||||||||||||||||||
| Foreign currency translation adjustment | (124 | ) | (124 | ) | ||||||||||||||||||||||||||||
| Unrealized gain on derivatives (net of tax): | ||||||||||||||||||||||||||||||||
| Unrealized gains arising during period | 12,256 | 12,256 | ||||||||||||||||||||||||||||||
| Reclassification adjustment for losses included in net income | (9,201 | ) | (9,201 | ) | ||||||||||||||||||||||||||||
| Total comprehensive income | 21,982 | |||||||||||||||||||||||||||||||
| Dividends | (6,347 | ) | (6,347 | ) | ||||||||||||||||||||||||||||
| Issuance of stock — Class A | 429 | 429 | ||||||||||||||||||||||||||||||
| Issuance of stock — Common | 980 | 980 | ||||||||||||||||||||||||||||||
| Restricted stock amortization | 463 | 463 | ||||||||||||||||||||||||||||||
| Purchase of stock — Class A | (52 | ) | (48 | ) | (100 | ) | ||||||||||||||||||||||||||
| Balance, June 30, 2007 | $ | 730 | $ | 8,921 | $ | 5,503 | $ | 77,809 | $ | (27,342 | ) | $ | — | $ | 4,270 | 69,891 | ||||||||||||||||
| Components of comprehensive income (loss): | ||||||||||||||||||||||||||||||||
| Net income | 11,485 | 11,485 | ||||||||||||||||||||||||||||||
| Foreign currency translation adjustment | (146 | ) | (146 | ) | ||||||||||||||||||||||||||||
| Unrealized loss on derivatives (net of tax): | ||||||||||||||||||||||||||||||||
| Unrealized losses arising during period | (48,906 | ) | (48,906 | ) | ||||||||||||||||||||||||||||
| Reclassification adjustment for losses included in net income | (1,248 | ) | (1,248 | ) | ||||||||||||||||||||||||||||
| Total comprehensive loss | (38,815 | ) | ||||||||||||||||||||||||||||||
| Dividends | (7,233 | ) | (7,233 | ) | ||||||||||||||||||||||||||||
| Issuance of stock — Class A | 89 | (19 | ) | 1,594 | 1,664 | |||||||||||||||||||||||||||
| Restricted stock amortization | 475 | 475 | ||||||||||||||||||||||||||||||
| Purchase of stock — Class A | (33 | ) | (392 | ) | (425 | ) | ||||||||||||||||||||||||||
| Issuance of notes receivable | (892 | ) | (892 | ) | ||||||||||||||||||||||||||||
| Balance, June 30, 2008 | $ | 730 | $ | 9,452 | $ | 5,503 | $ | 82,043 | $ | (26,140 | ) | $ | (892 | ) | $ | (46,030 | ) | $ | 24,666 | |||||||||||||
| Components of comprehensive income (loss): | ||||||||||||||||||||||||||||||||
| Net income | 21,731 | 21,731 | ||||||||||||||||||||||||||||||
| Foreign currency translation adjustment | (200 | ) | (200 | ) | ||||||||||||||||||||||||||||
| Unrealized gains on derivatives (net of tax): | ||||||||||||||||||||||||||||||||
| Unrealized gains arising during period | 75,510 | 75,510 | ||||||||||||||||||||||||||||||
| Reclassification adjustment for losses included in net income | (13,635 | ) | (13,635 | ) | ||||||||||||||||||||||||||||
| Total comprehensive income | 83,406 | |||||||||||||||||||||||||||||||
| Dividends | (7,360 | ) | (7,360 | ) | ||||||||||||||||||||||||||||
| Issuance of stock — Class A | 67 | 906 | 973 | |||||||||||||||||||||||||||||
| Restricted stock amortization | 301 | 301 | ||||||||||||||||||||||||||||||
| Purchase of stock — Class A | (33 | ) | (658 | ) | 59 | (632 | ) | |||||||||||||||||||||||||
| Issuance of notes receivable | (452 | ) | (452 | ) | ||||||||||||||||||||||||||||
| Notes receivable principal payments | 33 | 33 | ||||||||||||||||||||||||||||||
| Balance, June 30, 2009 | $ | 730 | $ | 9,787 | $ | 5,503 | $ | 96,414 | $ | (25,892 | ) | $ | (1,252 | ) | $ | 15,645 | $ | 100,935 | ||||||||||||||
ECA-28
Table of Contents
| 2007 | 2008 | 2009 | ||||||||||
| (Amounts in thousands) | ||||||||||||
| CASH FLOWS FROM OPERATING ACTIVITIES | ||||||||||||
| Net income | $ | 19,051 | $ | 11,485 | $ | 21,731 | ||||||
| Adjustments to reconcile net income to net cash provided by operating activities: | ||||||||||||
| Depletion, depreciation and amortization | 23,076 | 26,789 | 29,564 | |||||||||
| Gain on sale of assets | (10,454 | ) | (10,981 | ) | (9,114 | ) | ||||||
| Deferred income taxes | 4,638 | 7,844 | 17,480 | |||||||||
| Exploration and impairment | 8,047 | 2,896 | 17,863 | |||||||||
| Derivatives | 922 | 16,888 | (18,166 | ) | ||||||||
| Other, net | (722 | ) | 35 | (570 | ) | |||||||
| 44,558 | 54,956 | 58,788 | ||||||||||
| Changes in assets and liabilities: | ||||||||||||
| Accounts receivable | (4,145 | ) | (26,153 | ) | 37,477 | |||||||
| Inventory | (227 | ) | (332 | ) | (2,869 | ) | ||||||
| Income taxes receivable | 176 | 150 | 89 | |||||||||
| Income taxes payable | (100 | ) | — | — | ||||||||
| Prepaid and other assets | 101 | (521 | ) | 465 | ||||||||
| Accounts payable and accrued expenses | 10,613 | 10,390 | (14,571 | ) | ||||||||
| Funds held for future distributions | 3,082 | 10,983 | (22,673 | ) | ||||||||
| Other | 480 | 928 | (2,764 | ) | ||||||||
| Net cash provided by operating activities | 54,538 | 50,401 | 53,942 | |||||||||
| CASH FLOWS FROM INVESTING ACTIVITIES | ||||||||||||
| Expenditures for property, plant and equipment | (93,620 | ) | (100,810 | ) | (73,688 | ) | ||||||
| Proceeds from sale of assets, net of costs | 10,173 | 5,489 | 1,788 | |||||||||
| Notes receivable and other | (12,198 | ) | (8,305 | ) | 128 | |||||||
| Net cash used by investing activities from operations | (95,645 | ) | (103,626 | ) | (71,772 | ) | ||||||
| CASH FLOWS FROM FINANCING ACTIVITIES | ||||||||||||
| Proceeds from long-term debt | 113,490 | 160,396 | 99,201 | |||||||||
| Principal payment on long-term debt | (66,478 | ) | (97,919 | ) | (78,150 | ) | ||||||
| Purchase of treasury stock and other financing activities | 202 | (337 | ) | (876 | ) | |||||||
| Dividends paid | (5,917 | ) | (7,208 | ) | (7,354 | ) | ||||||
| Net cash provided by financing activities from operations | 41,297 | 54,932 | 12,821 | |||||||||
| Net increase (decrease) in cash and cash equivalents | 190 | 1,707 | (5,009 | ) | ||||||||
| Cash and cash equivalents, beginning of period | 5,091 | 5,281 | 6,988 | |||||||||
| Cash and cash equivalents, end of period | $ | 5,281 | $ | 6,988 | $ | 1,979 | ||||||
ECA-29
Table of Contents
| 2007 | 2008 | 2009 | ||||||||||
| (Amounts in thousands) | ||||||||||||
| Net income | $ | 19,051 | $ | 11,485 | $ | 21,731 | ||||||
| Other comprehensive income (loss), net of tax: | ||||||||||||
| Foreign currency translation adjustment: | ||||||||||||
| Current period change | (124 | ) | (146 | ) | (200 | ) | ||||||
| Oil and gas derivatives: | ||||||||||||
| Current period transactions | 12,127 | (48,242 | ) | 78,978 | ||||||||
| Reclassification to earnings | (8,960 | ) | (1,424 | ) | (15,034 | ) | ||||||
| Interest rate hedging: | ||||||||||||
| Current period transactions | 129 | (664 | ) | (3,468 | ) | |||||||
| Reclassification to earnings | (241 | ) | 176 | 1,399 | ||||||||
| Other comprehensive income (loss), net of tax | 2,931 | (50,300 | ) | 61,675 | ||||||||
| Comprehensive income (loss) | $ | 21,982 | $ | (38,815 | ) | $ | 83,406 | |||||
ECA-30
Table of Contents
| 1. | NATURE OF ORGANIZATION |
| 2. | SUMMARY OF SIGNIFICANT ACCOUNTING POLICIES |
ECA-31
Table of Contents
| 2008 | 2009 | |||||||
| Oil and gas properties | $ | 546,029 | $ | 585,376 | ||||
| Other property and equipment | 41,341 | 41,894 | ||||||
| Pipelines | 50,853 | 53,676 | ||||||
| 638,223 | 680,946 | |||||||
| Less accumulated depletion, depreciation and amortization | (186,481 | ) | (201,224 | ) | ||||
| Net property, plant and equipment | $ | 451,742 | $ | 479,722 | ||||
ECA-32
Table of Contents
ECA-33
Table of Contents
| 2008 | 2009 | |||||||
| Foreign currency translation | $ | (44 | ) | $ | (243 | ) | ||
| Oil and gas hedging | (45,504 | ) | 18,439 | |||||
| Interest rate hedging | (482 | ) | (2,551 | ) | ||||
| Accumulated other comprehensive (loss) income | $ | (46,030 | ) | $ | 15,645 | |||
ECA-34
Table of Contents
ECA-35
Table of Contents
| Asset retirement obligation as of the beginning of the year | $ | 15,100 | ||
| Accretion expense | 825 | |||
| Liabilities incurred | 117 | |||
| Liabilities settled | (65 | ) | ||
| Change in estimate | 75 | |||
| Asset retirement obligation as of the end of the year | $ | 16,052 | ||
| 2007 | 2008 | 2009 | ||||||||||
| Cash paid for: | ||||||||||||
| Interest | $ | 8,120 | $ | 10,646 | $ | 7,634 | ||||||
| Income taxes, net of amounts refunded | 100 | 54 | 4 | |||||||||
| Noncash investing and financing activities: | ||||||||||||
| Dividends declared and unpaid at year end | $ | 1,803 | $ | 1,828 | $ | 1,833 | ||||||
| Notes receivable from the issuance of Class A stock | — | 892 | 452 | |||||||||
| Liabilities settled through assignment | 980 | — | — | |||||||||
| 3. | RISK MANAGEMENT |
ECA-36
Table of Contents
| 2008 | 2009 | |||||||
| Asset | $ | 593 | $ | 31,291 | ||||
| Liability | (95,218 | ) | (282 | ) | ||||
| Net asset (liability) | $ | (94,625 | ) | $ | 31,009 | |||
ECA-37
Table of Contents
| 4. | DEBT |
| 2008 | 2009 | |||||||
| Term credit agreements, variable rates | $ | 100,000 | $ | 100,000 | ||||
| Revolving credit agreements, variable rates | 77,553 | 99,244 | ||||||
| Non-recourse debt | 17,220 | 16,778 | ||||||
| Installment notes payable, at imputed interest rates ranging from 6.0% to 8.0% | 2,992 | 2,794 | ||||||
| 197,765 | 218,816 | |||||||
| Less current portion | (640 | ) | (682 | ) | ||||
| $ | 197,125 | $ | 218,134 | |||||
| 2010 | $ | 1,883 | ||
| 2011 | 1,883 | |||
| 2012 | 201,126 | |||
| 2013 | 1,883 | |||
| 2014 | 1,866 | |||
| Thereafter | 18,770 | |||
| Total payments | 227,411 | |||
| Less: imputed interest | 8,595 | |||
| Present value of scheduled maturities | $ | 218,816 | ||
ECA-38
Table of Contents
ECA-39
Table of Contents
| 5. | INCOME TAXES |
| 2007 | 2008 | 2009 | ||||||||||
| Current: | ||||||||||||
| Federal | $ | (38 | ) | $ | 11 | $ | (125 | ) | ||||
| State | 215 | — | — | |||||||||
| Total current | 177 | 11 | (125 | ) | ||||||||
| Deferred: | ||||||||||||
| Federal | 3,207 | 6,643 | 13,627 | |||||||||
| State | 1,431 | 1,201 | 3,853 | |||||||||
| Total deferred | 4,638 | 7,844 | 17,480 | |||||||||
| Total provision for income taxes | $ | 4,815 | $ | 7,855 | $ | 17,355 | ||||||
| 2007 | 2008 | 2009 | ||||||||||
| Tax provision at the federal statutory rate | $ | 8,353 | $ | 6,769 | $ | 13,680 | ||||||
| State taxes, net of federal tax benefit | 1,476 | 806 | 2,376 | |||||||||
| State tax credits | 152 | — | — | |||||||||
| Excess statutory depletion | (168 | ) | (103 | ) | (59 | ) | ||||||
| Non-deductible entertainment | 53 | 224 | 134 | |||||||||
| Change in valuation allowance, net | — | — | 1,342 | |||||||||
| Change in tax contingency | (5,013 | ) | — | — | ||||||||
| Other, net | (38 | ) | 159 | (118 | ) | |||||||
| Total provision for income taxes | $ | 4,815 | $ | 7,855 | $ | 17,355 | ||||||
ECA-40
Table of Contents
| 2008 | 2009 | |||||||
| Deferred tax assets: | ||||||||
| Allowance for doubtful accounts | $ | 338 | $ | 181 | ||||
| Profit sharing plan liability | 2,008 | 2,007 | ||||||
| Royalty Trust agreements | 2,268 | 1,831 | ||||||
| Derivative instruments | 7,294 | — | ||||||
| Restricted stock compensation | 286 | 196 | ||||||
| Asset retirement obligation | 6,498 | 6,955 | ||||||
| Litigation settlement liability | — | 849 | ||||||
| State and federal income tax benefit | 2,048 | 3,327 | ||||||
| Tax credits and carryforwards | 15,934 | 22,432 | ||||||
| Other | 343 | 273 | ||||||
| Total deferred tax assets | 37,017 | 38,051 | ||||||
| Valuation allowance | — | (1,342 | ) | |||||
| Total deferred tax assets net of valuation allowance | 37,017 | 36,709 | ||||||
| Deferred tax liabilities | ||||||||
| Property, plant and equipment | (50,110 | ) | (66,265 | ) | ||||
| Black Stone Term Royalty Conveyance | (21,642 | ) | (21,342 | ) | ||||
| Derivative instruments | — | (1,313 | ) | |||||
| Other | (35 | ) | (39 | ) | ||||
| Total deferred tax liabilities | (71,787 | ) | (88,959 | ) | ||||
| Net deferred tax liability | $ | (34,770 | ) | $ | (52,250 | ) | ||
| Current deferred tax asset | $ | 2,440 | $ | 1,359 | ||||
| Long-term deferred tax liability | (37,210 | ) | (53,609 | ) | ||||
| Net deferred tax liability | $ | (34,770 | ) | $ | (52,250 | ) | ||
ECA-41
Table of Contents
| 2008 | 2009 | |||||||||||||||
| Year of | Year of | |||||||||||||||
| Amount | Expiration | Amount | Expiration | |||||||||||||
| AMT tax credits | $ | 2,082 | None | $ | 1,957 | None | ||||||||||
| Net operating loss carryforwards | 5,711 | 2025-2028 | 10,567 | 2025-2029 | ||||||||||||
| Charitable contribution carryforwards | 3,033 | 2009-2013 | 3,851 | 2009-2014 | ||||||||||||
| Percentage depletion carryforwards | 2,173 | None | 2,318 | None | ||||||||||||
| Total federal credits and carryforwards | $ | 12,999 | $ | 18,693 | ||||||||||||
| State net operating loss carryforwards | $ | 2,035 | 2009-2028 | $ | 2,701 | 2009-2029 | ||||||||||
| State charitable contribution carryforwards | 506 | 2009-2013 | 632 | 2009-2014 | ||||||||||||
| State percentage depletion carryforwards | 394 | None | 406 | None | ||||||||||||
| Total state carryforwards | $ | 2,935 | $ | 3,739 | ||||||||||||
| Total federal and state credits and carryforwards | $ | 15,934 | $ | 22,432 | ||||||||||||
ECA-42
Table of Contents
| 6. | EMPLOYEE BENEFIT PLANS |
| 7. | CAPITAL STOCK |
ECA-43
Table of Contents
| 8. | EARNINGS PER SHARE |
| 2007 | 2008 | 2009 | ||||||||||
| Net income | $ | 19,051 | $ | 11,485 | $ | 21,731 | ||||||
| Weighted average common shares, basic and diluted | 566,070 | 576,313 | 587,567 | |||||||||
| Basic and diluted net income per common share | $ | 33.66 | $ | 19.93 | $ | 36.98 | ||||||
| 9. | OPERATING LEASES |
ECA-44
Table of Contents
| 2010 | $ | 752 | ||
| 2011 | 459 | |||
| 2012 | 217 | |||
| 2013 | 175 | |||
| 2014 | 116 | |||
| Thereafter | 280 | |||
| $ | 1,999 | |||
| 10. | RELATED PARTY TRANSACTIONS |
| 11. | COMMITMENTS AND CONTINGENCIES |
ECA-45
Table of Contents
| 12. | FINANCIAL INSTRUMENTS |
ECA-46
Table of Contents
| 13. | INDUSTRY SEGMENTS |
| 2007 | 2008 | 2009 | ||||||||||
| Net income | $ | 19,051 | $ | 11,485 | $ | 21,731 | ||||||
| Add: | ||||||||||||
| Interest expense | 8,245 | 10,688 | 9,986 | |||||||||
| Depletion and depreciation of oil and gas properties | 18,115 | 20,937 | 23,445 | |||||||||
| Depreciation of property, plant and equipment | 4,961 | 5,852 | 6,119 | |||||||||
| Exploration and impairment | 8,487 | 3,033 | 18,476 | |||||||||
| Income tax expense | 4,815 | 7,855 | 17,355 | |||||||||
| Change in fair value — derivatives | 923 | 16,887 | (18,166 | ) | ||||||||
| EBITDAX | $ | 64,597 | $ | 76,737 | $ | 78,946 | ||||||
ECA-47
Table of Contents
| Exploration and | Aggregation and | |||||||||||||||
| Production | Pipeline | Other | Consolidated | |||||||||||||
Fiscal Year 2007 | ||||||||||||||||
| Sales to unaffiliated customers | $ | 91,405 | $ | 120,549 | $ | — | $ | 211,954 | ||||||||
| Depreciation, depletion, amortization | 19,560 | 2,405 | 1,111 | 23,076 | ||||||||||||
| Impairment and exploratory costs | 8,487 | — | — | 8,487 | ||||||||||||
| Operating profit (loss) | 27,194 | 5,418 | 8,046 | 40,658 | ||||||||||||
| Interest (net) | 15,195 | (6,613 | ) | (432 | ) | 8,150 | ||||||||||
| Other (income) & expense | 2,027 | — | 6,616 | 8,643 | ||||||||||||
| EBITDAX | 40,503 | 12,922 | 11,172 | 64,597 | ||||||||||||
| Total assets | 343,952 | 42,096 | 27,273 | 413,321 | ||||||||||||
| Capital expenditures | 87,557 | 5,349 | 714 | 93,620 | ||||||||||||
Fiscal Year 2008 | ||||||||||||||||
| Sales to unaffiliated customers | 104,247 | 142,825 | — | 247,072 | ||||||||||||
| Depreciation, depletion, amortization | 22,440 | 3,159 | 1,190 | 26,789 | ||||||||||||
| Impairment and exploratory costs | 3,033 | — | — | 3,033 | ||||||||||||
| Operating profit (loss) | 37,486 | 5,318 | 9,108 | 51,912 | ||||||||||||
| Interest (net) | 18,450 | (7,269 | ) | (575 | ) | 10,606 | ||||||||||
| Other (income) & expense | 18,924 | — | 3,042 | 21,966 | ||||||||||||
| EBITDAX | 44,133 | 14,128 | 18,476 | 76,737 | ||||||||||||
| Total assets | 468,189 | 55,327 | 34,464 | 557,980 | ||||||||||||
| Capital expenditures | 93,364 | 6,868 | 578 | 100,810 | ||||||||||||
Fiscal Year 2009 | ||||||||||||||||
| Sales to unaffiliated customers | 99,490 | 116,730 | — | 216,220 | ||||||||||||
| Depreciation, depletion, amortization | 25,012 | 3,239 | 1,313 | 29,564 | ||||||||||||
| Impairment and exploratory costs | 18,476 | — | — | 18,476 | ||||||||||||
| Operating profit (loss) | 14,940 | 5,502 | 9,908 | 30,350 | ||||||||||||
| Interest (net) | 16,035 | (7,965 | ) | 1,778 | 9,848 | |||||||||||
| Other (income) & expense | (25,733 | ) | 4 | 7,145 | (18,584 | ) | ||||||||||
| EBITDAX | 52,028 | 14,670 | 12,248 | 78,946 | ||||||||||||
| Total assets | 475,444 | 37,391 | 30,884 | 543,719 | ||||||||||||
| Capital expenditures | 70,153 | 2,824 | 711 | 73,688 | ||||||||||||
ECA-48
Table of Contents
| 2007 | 2008 | 2009 | ||||||||||
| Capitalized costs | ||||||||||||
| Proved properties | $ | 433,297 | $ | 536,122 | $ | 571,748 | ||||||
| Unproved properties | 12,302 | 9,908 | 13,629 | |||||||||
| Total | 445,599 | 546,030 | 585,377 | |||||||||
| Less accumulated depletion and depreciation | (136,658 | ) | (155,182 | ) | (165,146 | ) | ||||||
| Net capitalized costs | $ | 308,941 | $ | 390,848 | $ | 420,231 | ||||||
| Costs incurred: | ||||||||||||
| Acquisition of proved and unproved properties | $ | 320 | $ | 24 | $ | 19 | ||||||
| Development costs | 50,211 | 84,572 | 66,560 | |||||||||
| Exploration costs | 12,771 | 6,219 | 1,658 | |||||||||
| Total costs incurred | $ | 63,302 | $ | 90,815 | $ | 68,237 | ||||||
ECA-49
Table of Contents
| 2007 | 2008 | 2009 | ||||||||||
| Revenues from sale of oil and gas | $ | 84,429 | $ | 96,514 | $ | 92,262 | ||||||
| Less: | ||||||||||||
| Production costs | 10,872 | 10,738 | 10,486 | |||||||||
| Production taxes | 4,352 | 5,076 | 4,264 | |||||||||
| Exploration and impairment | 8,487 | 3,033 | 18,476 | |||||||||
| Depletion, depreciation and amortization | 18,115 | 20,937 | 23,445 | |||||||||
| Income tax expense | 16,935 | 22,976 | 14,414 | |||||||||
| Income from oil and gas operations | $ | 25,668 | $ | 33,754 | $ | 21,177 | ||||||
ECA-50
Table of Contents
| Natural Gas (Mmcf) | Crude Oil (Mbbls) | |||||||
| Proved reserves | ||||||||
| June 30, 2006 | 161,809 | 484 | ||||||
| Revisions of previous estimates | 1,033 | 80 | ||||||
| Extensions and discoveries | 17,532 | 65 | ||||||
| Sales of reserves in place | (611 | ) | (71 | ) | ||||
| Production | (9,138 | ) | (83 | ) | ||||
| June 30, 2007 | 170,625 | 475 | ||||||
| Revisions of previous estimates | (1,261 | ) | (42 | ) | ||||
| Extensions and discoveries | 15,326 | 11 | ||||||
| Sales of reserves in place | — | — | ||||||
| Production | (10,294 | ) | (65 | ) | ||||
| June 30, 2008 | 174,396 | 379 | ||||||
| Revisions of previous estimates | (29,065 | ) | (21 | ) | ||||
| Extensions and discoveries | 7,200 | 11 | ||||||
| Sales of reserves in place | — | — | ||||||
| Production | (9,364 | ) | (47 | ) | ||||
| June 30, 2009 | 143,167 | 322 | ||||||
| Proved developed reserves | ||||||||
| June 30, 2007 | 170,625 | 475 | ||||||
| June 30, 2008 | 174,396 | 379 | ||||||
| June 30, 2009 | 143,167 | 322 | ||||||
ECA-51
Table of Contents
| 2007 | 2008 | 2009 | ||||||||||
| Future cash in flows | $ | 1,317,154 | $ | 2,591,109 | $ | 581,996 | ||||||
| Future production and development costs | (283,845 | ) | (525,260 | ) | (211,575 | ) | ||||||
| Future income tax expense | (296,000 | ) | (703,000 | ) | (12,000 | ) | ||||||
| Future net cash flows before discount | 737,309 | 1,362,849 | 358,421 | |||||||||
| 10% discount to present value | (476,080 | ) | (870,179 | ) | (209,748 | ) | ||||||
| Standardized measure of discounted future net cash flows related to proved oil and gas reserves | $ | 261,229 | $ | 492,670 | $ | 148,673 | ||||||
ECA-52
Table of Contents
| 2007 | 2008 | 2009 | ||||||||||
| Standardized measure of discounted future net cash flows at beginning of period | $ | 200,238 | $ | 261,229 | $ | 492,670 | ||||||
| Sales of oil and gas produced, net of production costs | (62,378 | ) | (73,207 | ) | (69,225 | ) | ||||||
| Net changes in prices and production costs | 72,014 | 366,774 | (558,968 | ) | ||||||||
| Changes in production rates and other | 21,544 | 31 | (29,217 | ) | ||||||||
| Extensions, discoveries and other additions, net of future production and development costs | 37,843 | 65,065 | 7,716 | |||||||||
| Sale of reserves in place | (3,112 | ) | — | — | ||||||||
| Changes in estimated future development costs | (47,622 | ) | (84,572 | ) | (66,992 | ) | ||||||
| Development costs incurred | 50,211 | 84,572 | 66,560 | |||||||||
| Revisions of previous quantity estimates | 3,189 | (6,393 | ) | (30,996 | ) | |||||||
| Purchase of reserves in place | — | — | — | |||||||||
| Accretion of discount | 19,772 | 26,302 | 50,498 | |||||||||
| Net change in income taxes | (30,470 | ) | (147,131 | ) | 286,627 | |||||||
| Standardized measure of discount future net cash flows at end of period | $ | 261,229 | $ | 492,670 | $ | 148,673 | ||||||
ECA-53
Table of Contents
| June 30, | December 31, | |||||||
| 2009 | 2009 | |||||||
| (Unaudited) | ||||||||
| (Amounts in thousands) | ||||||||
| ASSETS | ||||||||
| CURRENT ASSETS | ||||||||
| Cash (overdraft) and cash equivalents | $ | 1,979 | $ | (94 | ) | |||
| Accounts receivable: | ||||||||
| Oil and gas sales | 3,110 | 5,347 | ||||||
| Gas aggregation and pipeline | 8,040 | 11,796 | ||||||
| Other | 5,140 | 8,068 | ||||||
| Accounts receivable | 16,290 | 25,211 | ||||||
| Less allowance for doubtful accounts | (737 | ) | (737 | ) | ||||
| Accounts receivable, net of allowance | 15,553 | 24,474 | ||||||
| Inventory | 4,752 | 5,440 | ||||||
| Income taxes receivable | 1,884 | 1,733 | ||||||
| Deferred income tax asset | 1,359 | 1,496 | ||||||
| Notes receivable, related party | 70 | 47 | ||||||
| Derivatives | 30,640 | 13,553 | ||||||
| Prepaid and other current assets | 574 | 1,100 | ||||||
| Total current assets | 56,811 | 47,749 | ||||||
| NET PROPERTY, PLANT AND EQUIPMENT (Note 2) | 479,722 | 478,768 | ||||||
| OTHER ASSETS | ||||||||
| Deferred financing costs, less accumulated amortization of $2,583 and $2,841 | 1,057 | 810 | ||||||
| Deferred taxes — other comprehensive loss | 237 | — | ||||||
| Notes receivable, related party | 262 | 277 | ||||||
| Derivatives | 651 | 1,398 | ||||||
| Other | 4,979 | 5,023 | ||||||
| Total other assets | 7,186 | 7,508 | ||||||
| TOTAL | $ | 543,719 | $ | 534,025 | ||||
ECA-54
Table of Contents
| June 30, | December 31, | |||||||
| 2009 | 2009 | |||||||
| (Unaudited) | ||||||||
| (Amounts in thousands) | ||||||||
| CURRENT LIABILITIES | ||||||||
| Accounts payable and accrued expenses | $ | 32,417 | $ | 22,611 | ||||
| Current portion of long-term debt | 212 | 219 | ||||||
| Current portion of non-recourse debt | 470 | 485 | ||||||
| Funds held for future distribution | 13,620 | 15,521 | ||||||
| Accrued taxes, other than income | 10,838 | 9,935 | ||||||
| Deferred income tax liability | — | 137 | ||||||
| Deferred taxes — other comprehensive income | 11,052 | 4,292 | ||||||
| Deferred revenue | 262 | 262 | ||||||
| Deferred gain | 6,992 | 6,757 | ||||||
| Derivatives | 3,331 | 3,163 | ||||||
| Other current liabilities | 1,614 | 1,882 | ||||||
| Total current liabilities | 80,808 | 65,264 | ||||||
| LONG-TERM OBLIGATIONS: | ||||||||
| Long-term debt | 201,826 | 221,717 | ||||||
| Non-recourse debt | 16,308 | 16,062 | ||||||
| Deferred revenue | 655 | 505 | ||||||
| Deferred gain | 68,277 | 64,879 | ||||||
| Deferred income tax liability | 53,609 | 55,477 | ||||||
| Deferred taxes — other comprehensive income | — | 537 | ||||||
| Derivatives | 1,237 | 104 | ||||||
| Other long-term obligations | 20,064 | 19,621 | ||||||
| Total liabilities | 442,784 | 444,166 | ||||||
| COMMITMENTS AND CONTINGENCIES | ||||||||
| STOCKHOLDERS’ EQUITY: | ||||||||
| Common stock, par value $1.00; 2,000 shares authorized; 730 shares issued and 571 outstanding | 730 | 730 | ||||||
| Class A non-voting common stock, no par value; 100 shares authorized; 91 shares issued and 66 shares outstanding | 9,787 | 9,847 | ||||||
| Additional paid-in capital | 5,503 | 5,503 | ||||||
| Retained earnings | 96,414 | 94,270 | ||||||
| Treasury stock | (25,892 | ) | (25,897 | ) | ||||
| Accumulated other comprehensive income | 15,645 | 6,628 | ||||||
| Notes receivable from the issuance of Class A stock | (1,252 | ) | (1,222 | ) | ||||
| Total stockholders’ equity | 100,935 | 89,859 | ||||||
| TOTAL | $ | 543,719 | $ | 534,025 | ||||
ECA-55
Table of Contents
| 2008 | 2009 | |||||||
| (Amounts in thousands, except per share data) | ||||||||
| REVENUES: | ||||||||
| Oil and gas sales | $ | 45,703 | $ | 44,012 | ||||
| Gas aggregation and pipeline sales | 75,655 | 37,240 | ||||||
| Well operations and service revenues | 3,752 | 3,788 | ||||||
| 125,110 | 85,040 | |||||||
| COSTS AND EXPENSES: | ||||||||
| Field operating expenses | 9,754 | 9,085 | ||||||
| Gas aggregation and pipeline cost of sales | 68,678 | 31,867 | ||||||
| General and administrative | 9,417 | 8,678 | ||||||
| Taxes, other than income | 3,022 | 395 | ||||||
| Depletion and depreciation of oil and gas properties | 11,496 | 17,179 | ||||||
| Depreciation of pipelines, other property and equipment | 2,999 | 3,148 | ||||||
| Exploration and impairment | 9,878 | 10,460 | ||||||
| Gain on sale of assets | (5,612 | ) | (7,761 | ) | ||||
| 109,632 | 73,051 | |||||||
| Income from operations | 15,478 | 11,989 | ||||||
| OTHER (INCOME) AND EXPENSE: | ||||||||
| Interest expense | 5,366 | 4,796 | ||||||
| Other | (17,317 | ) | 3,656 | |||||
| (11,951 | ) | 8,452 | ||||||
| Income before income taxes | 27,429 | 3,537 | ||||||
| Income tax expense | 12,513 | 1,868 | ||||||
| NET INCOME | $ | 14,916 | $ | 1,669 | ||||
| Earnings per common share, basic and diluted | $ | 25.39 | $ | 2.85 | ||||
ECA-56
Table of Contents
| 2008 | 2009 | |||||||
| (Amounts in thousands) | ||||||||
| CASH FLOWS FROM OPERATING ACTIVITIES | ||||||||
| Net income | $ | 14,916 | $ | 1,669 | ||||
| Adjustments to reconcile net income to net cash provided by operating activities: | ||||||||
| Depletion, depreciation and amortization | 14,495 | 20,327 | ||||||
| Gain on sale of assets | (5,612 | ) | (7,761 | ) | ||||
| Deferred income taxes | 12,513 | 1,868 | ||||||
| Exploration and impairment | 9,310 | 10,356 | ||||||
| Derivatives | (21,841 | ) | — | |||||
| Other, net | (425 | ) | (116 | ) | ||||
| 23,356 | 26,343 | |||||||
| Changes in assets and liabilities: | ||||||||
| Accounts receivable | 24,233 | (8,921 | ) | |||||
| Inventory | (542 | ) | (689 | ) | ||||
| Income taxes receivable | 117 | 151 | ||||||
| Prepaid and other assets | (2,200 | ) | (525 | ) | ||||
| Accounts payable and accrued expenses | (26,253 | ) | (9,880 | ) | ||||
| Funds held for future distributions | (13,212 | ) | 1,901 | |||||
| Other | (1,458 | ) | (1,681 | ) | ||||
| Net cash provided by operating activities | 4,041 | 6,699 | ||||||
| CASH FLOWS FROM INVESTING ACTIVITIES | ||||||||
| Expenditures for property, plant and equipment | (27,185 | ) | (29,576 | ) | ||||
| Proceeds from sale of assets, net of costs | 1,760 | 4,882 | ||||||
| Notes receivable and other | (40 | ) | (15 | ) | ||||
| Net cash used by investing activities from operations | (25,465 | ) | (24,709 | ) | ||||
| CASH FLOWS FROM FINANCING ACTIVITIES | ||||||||
| Proceeds from long-term debt | 54,374 | 59,404 | ||||||
| Principal payment on long-term debt | (37,989 | ) | (39,737 | ) | ||||
| Purchase of treasury stock and other financing activities | (280 | ) | 10 | |||||
| Dividends paid | (3,672 | ) | (3,740 | ) | ||||
| Net cash provided by financing activities from operations | 12,433 | 15,937 | ||||||
| Net decrease in cash and cash equivalents | (8,991 | ) | (2,073 | ) | ||||
| Cash and cash equivalents, beginning of period | 6,988 | 1,979 | ||||||
| Cash (overdraft) and cash equivalents, end of period | $ | (2,003 | ) | $ | (94 | ) | ||
ECA-57
Table of Contents
| 2008 | 2009 | |||||||
| (Amounts in thousands) | ||||||||
| Net income | $ | 14,916 | $ | 1,669 | ||||
| Other comprehensive income (loss), net of tax: | ||||||||
| Foreign currency translation adjustment | ||||||||
| Current period change | (246 | ) | 64 | |||||
| Oil and gas derivatives: | ||||||||
| Current period transactions | 66,562 | 3,099 | ||||||
| Reclassification to earnings | (371 | ) | (12,827 | ) | ||||
| Interest rate hedging: | ||||||||
| Current period transactions | (3,041 | ) | (441 | ) | ||||
| Reclassification to earnings | 377 | 1,088 | ||||||
| Other comprehensive income (loss), net of tax | 63,281 | (9,017 | ) | |||||
| Comprehensive income (loss) | $ | 78,197 | $ | (7,348 | ) | |||
ECA-58
Table of Contents
| 1. | NATURE OF ORGANIZATION |
| 2. | SUMMARY OF SIGNIFICANT ACCOUNTING POLICIES |
| 3. | INDUSTRY SEGMENTS |
ECA-59
Table of Contents
| Six Months Ended | ||||||||
| December 31, | December 31, | |||||||
| 2008 | 2009 | |||||||
| Net income | $ | 14,916 | $ | 1,669 | ||||
| Add: | ||||||||
| Interest expense | 5,366 | 4,796 | ||||||
| Depletion and depreciation of oil and gas properties | 11,496 | 17,179 | ||||||
| Depreciation of pipelines, other property and equipment | 2,999 | 3,148 | ||||||
| Exploration and impairment | 9,878 | 10,460 | ||||||
| Income tax expense | 12,513 | 1,868 | ||||||
| Change in fair value — derivatives | (21,842 | ) | (30 | ) | ||||
| EBITDAX | $ | 35,326 | $ | 39,090 | ||||
| Exploration and | Aggregation and | |||||||||||||||
| Production | Pipeline | Other | Consolidated | |||||||||||||
Six Months Ended December 31, 2008 | ||||||||||||||||
| Sales to unaffiliated customers | $ | 49,455 | $ | 75,655 | $ | — | $ | 125,110 | ||||||||
| Depreciation, depletion, amortization | 12,281 | 1,582 | 632 | 14,495 | ||||||||||||
| Exploratory costs | 9,878 | — | — | 9,878 | ||||||||||||
| Operating profit | 6,471 | 3,729 | 5,278 | 15,478 | ||||||||||||
| Interest (net) | 10,443 | (3,966 | ) | (1,199 | ) | 5,278 | ||||||||||
| Other (income) & expense | (21,084 | ) | (13 | ) | 3,869 | (17,228 | ) | |||||||||
| EBITDAX | 18,377 | 8,363 | 8,586 | 35,326 | ||||||||||||
| Total assets | 460,293 | 45,788 | 32,420 | 538,501 | ||||||||||||
| Capital expenditures | 25,505 | 1,680 | — | 27,185 | ||||||||||||
ECA-60
Table of Contents
| Exploration and | Aggregation and | |||||||||||||||
| Production | Pipeline | Other | Consolidated | |||||||||||||
Six Months Ended December 31, 2009 | ||||||||||||||||
| Sales to unaffiliated customers | $ | 47,800 | $ | 37,240 | $ | — | $ | 85,040 | ||||||||
| Depreciation, depletion, amortization | 17,973 | 1,697 | 657 | 20,327 | ||||||||||||
| Exploratory costs | 10,460 | — | — | 10,460 | ||||||||||||
| Operating profit | 5,343 | 1,676 | 4,970 | 11,989 | ||||||||||||
| Interest (net) | 5,815 | (3,922 | ) | 2,869 | 4,762 | |||||||||||
| Other (income) & expense | — | (3 | ) | 3,693 | 3,690 | |||||||||||
| EBITDAX | 29,016 | 6,229 | 3,845 | 39,090 | ||||||||||||
| Total assets | 458,357 | 41,635 | 34,033 | 534,025 | ||||||||||||
| Capital expenditures | 27,657 | 1,906 | 13 | 29,576 | ||||||||||||
| 4. | RISK MANAGEMENT |
ECA-61
Table of Contents
| Volumes | ||||||||
| Commodity | December 31, 2009 | June 30, 2009 | ||||||
| Natural gas | 9,236,500 MMBtu | 10,332,000 MMBtu | ||||||
| Oil | — Bbl | 18,000 Bbl | ||||||
ECA-62
Table of Contents
| Asset Derivatives | Liability Derivatives | |||||||||||||||
| Derivatives Designated as Hedging | 12/31/09 | 06/30/09 | 12/31/09 | 06/30/09 | ||||||||||||
| Instruments under ASC 815 | Fair Value | Fair Value | Fair Value | Fair Value | ||||||||||||
| Current: (1) | ||||||||||||||||
| Commodity contracts | $ | 13,553 | $ | 30,640 | $ | 12 | $ | 281 | ||||||||
| Interest rate contracts | — | — | 3,151 | 3,050 | ||||||||||||
| 13,553 | 30,640 | 3,163 | 3,331 | |||||||||||||
| Long-term: (2) | ||||||||||||||||
| Commodity contracts | 1,398 | 651 | — | — | ||||||||||||
| Interest rate contracts | — | — | 104 | 1,237 | ||||||||||||
| 1,398 | 651 | 104 | 1,237 | |||||||||||||
| Total Derivatives designated as hedging instruments under ASC 815 | $ | 14,951 | $ | 31,291 | $ | 3,267 | $ | 4,568 | ||||||||
| Total Derivatives not Designated | ||||||||||||||||
| as hedging instruments under ASC 815 | ||||||||||||||||
| Current: (1) | ||||||||||||||||
| Commodity contracts | $ | — | $ | — | $ | — | $ | — | ||||||||
| Long-term: (2) | ||||||||||||||||
| Commodity contracts | — | — | — | — | ||||||||||||
| Total Derivatives not designated as hedging instruments under ASC 815 | $ | — | $ | — | $ | — | $ | — | ||||||||
| Total derivatives | $ | 14,951 | $ | 31,291 | $ | 3,267 | $ | 4,568 | ||||||||
| (1) | Included in Derivatives under Current Assets and Current Liabilities. | |
| (2) | Included in Derivatives under Other Assets and Long-term Obligations. |
ECA-63
Table of Contents
for the Six Months Ended December 31, 2009 and December 31, 2008
| Amount of Gain | ||||||||||||||||
| or (Loss) Reclassified | ||||||||||||||||
| Amount of Gain or | from Accumulated | |||||||||||||||
| (Loss) Recognized in OCI on Derivative | OCI into Income | |||||||||||||||
| Derivatives in ASC 815 | (Effective Portion) | (Effective Portion) (1) | ||||||||||||||
| Cash Flow Hedging Relationships | 12/31/09 | 12/31/08 | 12/31/09 | 12/31/08 | ||||||||||||
| Commodity contracts | $ | 5,297 | $ | 111,869 | $ | 21,926 | (2) | $ | 624 | |||||||
| Interest rate contracts | (755 | ) | (5,111 | ) | (1,860 | ) (3) | (634 | ) | ||||||||
| Total | $ | 4,542 | $ | 106,758 | $ | 20,066 | $ | (10 | ) | |||||||
| Amount of Gain or | ||||||||
| (Loss) Recognized in | ||||||||
| Derivatives in ASC 815 | Income on Derivative (Ineffective Portion) | |||||||
| Cash Flow Hedging Relationships | 12/31/09 | 12/31/08 | ||||||
| Commodity contracts | $ | 30 | (4) | $ | 542 | |||
| Interest rate contracts | — | — | ||||||
| Total | $ | 30 | (4) | $ | 542 | |||
| Amount of Gain | ||||||||
| or (Loss) Recognized in Income | ||||||||
| Derivatives not Designated as | on Derivative | |||||||
| Hedging Instruments Under ASC 815 | 12/31/09 | 12/31/08 | ||||||
| Commodity contracts | $ | 27 | (4) | $ | 22,787 | |||
| (1) | If gains and losses associated with a type of contract (for example, commodity contracts) are displayed in multiple line items in the income statement, the entity is required to disclose the amount included in each line item. | |
| (2) | Included in Oil and gas sales. | |
| (3) | Included in Interest expense. | |
| (4) | Included in Other (income) expense. |
| 5. | COMMITMENTS AND CONTINGENCIES |
ECA-64
Table of Contents
| 6. | OTHER COMPREHENSIVE INCOME (LOSS) |
| June 30, | December 31, | |||||||
| 2009 | 2009 | |||||||
| Foreign currency translation | $ | (243 | ) | $ | (179 | ) | ||
| Oil and gas hedging | 18,439 | 8,711 | ||||||
| Interest rate hedging | (2,551 | ) | (1,904 | ) | ||||
| Accumulated other comprehensive income | $ | 15,645 | $ | 6,628 | ||||
| 7. | INCOME TAXES |
| 8. | FAIR VALUE MEASUREMENTS |
ECA-65
Table of Contents
Estimated Net Reserves and Income Data
Certain Leasehold and Royalty Interests of
ECA Marcellus Trust 1 — Underlying Properties
As of March 31, 2010
| Proved | ||||||||||||||||
| Developed | ||||||||||||||||
| Producing | Non-Producing | Undeveloped | Total Proved | |||||||||||||
Net Remaining Reserves | ||||||||||||||||
| Gas — MMCF | 21,703 | 16,459 | 155,610 | 193,771 | ||||||||||||
Income Data | ||||||||||||||||
| Future Gross Revenue | $ | 92,320,758 | $ | 70,013,877 | $ | 661,949,379 | $ | 824,284,013 | ||||||||
| Deductions | 13,850,580 | 23,566,501 | 279,577,616 | 316,994,698 | ||||||||||||
| Future Net Income (FNI) | $ | 78,470,177 | $ | 46,447,375 | $ | 382,371,763 | $ | 507,289,315 | ||||||||
| Discounted FNI @ 10% | $ | 42,050,024 | $ | 18,580,268 | $ | 108,057,099 | $ | 168,687,390 | ||||||||
A-1
Table of Contents
| Discounted Future Net Income | ||||
| As of March 31, 2010 | ||||
Discount Rate Percent | Total Proved | |||
| 5 | $ | 279,494,862 | ||
| 8 | $ | 204,849,089 | ||
| 12 | $ | 139,938,069 | ||
| 15 | $ | 106,703,864 | ||
A-2
Table of Contents
A-3
Table of Contents
A-4
Table of Contents
A-5
Table of Contents
| By: | /s/ Larry T. Nelms |
A-6
Table of Contents
Estimated Net Reserves and Income Data
Certain Royalty Interests of
ECA Marcellus Trust 1
As of March 31, 2010
| Proved | ||||||||||||||||
| Developed | ||||||||||||||||
| Producing | Non-Producing | Undeveloped | Total Proved | |||||||||||||
Net Remaining Reserves | ||||||||||||||||
| Gas — MMCF | 18,257 | 13,950 | 72,392 | 104,599 | ||||||||||||
Income Data | ||||||||||||||||
| Future Gross Revenue | $ | 77,662,894 | $ | 59,344,037 | $ | 307,947,958 | $ | 444,954,889 | ||||||||
| Deductions | 9,778,379 | 7,471,888 | 38,773,108 | 56,023,376 | ||||||||||||
| Future Net Income (FNI) | $ | 67,884,515 | $ | 51,872,149 | $ | 269,174,849 | $ | 388,931,513 | ||||||||
| Discounted FNI @ 10% | $ | 38,274,371 | $ | 28,887,300 | $ | 133,108,756 | $ | 200,270,426 | ||||||||
A-7
Table of Contents
| Discounted Future Net Income | ||||
| As of March 31, 2010 | ||||
Discount Rate Percent | Total Proved | |||
| 5 | $ | 266,589,604 | ||
| 8 | $ | 222,637,119 | ||
| 12 | $ | 181,841,206 | ||
| 15 | $ | 159,636,650 | ||
A-8
Table of Contents
A-9
Table of Contents
A-10
Table of Contents
A-11
Table of Contents
| By: | /s/ Larry T. Nelms |
A-12
Table of Contents
| Quarterly Target Distributions | ||||||||||||||||||
| Quarter | Subordination | Target | Incentive | Quarter | Target | |||||||||||||
| Ending | Threshold | Distribution | Threshold | Ending | Distribution | |||||||||||||
| June 30, 2010 | $ | 0.217 | $ | 0.271 | $ | 0.326 | June 30, 2020 | $ | 0.451 | |||||||||
| September 30, 2010 | 0.298 | 0.372 | 0.447 | September 30, 2020 | 0.449 | |||||||||||||
| December 31, 2010 | 0.426 | 0.532 | 0.639 | December 31, 2020 | 0.443 | |||||||||||||
| March 31, 2011 | 0.413 | 0.516 | 0.619 | March 31, 2021 | 0.426 | |||||||||||||
| June 30, 2011 | 0.418 | 0.523 | 0.627 | June 30, 2021 | 0.425 | |||||||||||||
| September 30, 2011 | 0.520 | 0.650 | 0.780 | September 30, 2021 | 0.423 | |||||||||||||
| December 31, 2011 | 0.544 | 0.680 | 0.815 | December 31, 2021 | 0.417 | |||||||||||||
| March 31, 2012 | 0.562 | 0.702 | 0.843 | March 31, 2022 | 0.402 | |||||||||||||
| June 30, 2012 | 0.595 | 0.744 | 0.893 | June 30, 2022 | 0.400 | |||||||||||||
| September 30, 2012 | 0.607 | 0.759 | 0.911 | September 30, 2022 | 0.399 | |||||||||||||
| December 31, 2012 | 0.688 | 0.859 | 1.031 | December 31, 2022 | 0.393 | |||||||||||||
| March 31, 2013 | 0.773 | 0.967 | 1.160 | March 31, 2023 | 0.378 | |||||||||||||
| June 30, 2013 | 0.771 | 0.964 | 1.157 | June 30, 2023 | 0.377 | |||||||||||||
| September 30, 2013 | 0.717 | 0.896 | 1.075 | September 30, 2023 | 0.375 | |||||||||||||
| December 31, 2013 | 0.674 | 0.842 | 1.010 | December 31, 2023 | 0.370 | |||||||||||||
| March 31, 2014 | 0.623 | 0.779 | 0.935 | March 31, 2024 | 0.360 | |||||||||||||
| June 30, 2014 | 0.601 | 0.751 | 0.902 | June 30, 2024 | 0.355 | |||||||||||||
| September 30, 2014 | 0.583 | 0.728 | 0.874 | September 30, 2024 | 0.353 | |||||||||||||
| December 31, 2014 | 0.561 | 0.701 | 0.841 | December 31, 2024 | 0.348 | |||||||||||||
| March 31, 2015 | 0.530 | 0.663 | 0.795 | March 31, 2025 | 0.334 | |||||||||||||
| June 30, 2015 | 0.650 | June 30, 2025 | 0.330 | |||||||||||||||
| September 30, 2015 | 0.639 | September 30, 2025 | 0.327 | |||||||||||||||
| December 31, 2015 | 0.622 | December 31, 2025 | 0.320 | |||||||||||||||
| March 31, 2016 | 0.600 | March 31, 2026 | 0.305 | |||||||||||||||
| June 30, 2016 | 0.587 | June 30, 2026 | 0.302 | |||||||||||||||
| September 30, 2016 | 0.581 | September 30, 2026 | 0.299 | |||||||||||||||
| December 31, 2016 | 0.569 | December 31, 2026 | 0.292 | |||||||||||||||
| March 31, 2017 | 0.546 | March 31, 2027 | 0.279 | |||||||||||||||
| June 30, 2017 | 0.543 | June 30, 2027 | 0.276 | |||||||||||||||
| September 30, 2017 | 0.540 | September 30, 2027 | 0.274 | |||||||||||||||
| December 31, 2017 | 0.531 | December 31, 2027 | 0.267 | |||||||||||||||
| March 31, 2018 | 0.510 | March 31, 2028 | 0.258 | |||||||||||||||
| June 30, 2018 | 0.508 | June 30, 2028 | 0.253 | |||||||||||||||
| September 30, 2018 | 0.506 | September 30, 2028 | 0.250 | |||||||||||||||
| December 31, 2018 | 0.499 | December 31, 2028 | 0.244 | |||||||||||||||
| March 31, 2019 | 0.480 | March 31, 2029 | 0.233 | |||||||||||||||
| June 30, 2019 | 0.479 | June 30, 2029 | 0.231 | |||||||||||||||
| September 30, 2019 | 0.477 | September 30, 2029 | 0.228 | |||||||||||||||
| December 31, 2019 | 0.470 | December 31, 2029 | 0.223 | |||||||||||||||
| March 31, 2020 | 0.458 | March 31, 2030 | 1.359 | |||||||||||||||
B-1
| 1 | ||||
| 16 | ||||
| 38 | ||||
| 39 | ||||
| 40 | ||||
| 43 | ||||
| 52 | ||||
| 55 | ||||
| 64 | ||||
| 76 | ||||
| 82 | ||||
| 88 | ||||
| 91 | ||||
| 93 | ||||
| 112 | ||||
| 113 | ||||
| 114 | ||||
| 115 | ||||
| 120 | ||||
| 123 | ||||
| 123 | ||||
| 123 | ||||
| 124 | ||||
| F-1 | ||||
| ECA-1 | ||||
| A-1 | ||||
| B-1 |
Trust I
Table of Contents
| Item 13. | Other Expenses Of Issuance And Distribution. |
| Registration fee | $ | 15,498 | ||
| FINRA filing fee | $ | 22,235 | ||
| NYSE listing fee | * | |||
| Printing and engraving expenses | * | |||
| Fees and expenses of legal counsel | * | |||
| Accounting fees and expenses | * | |||
| Transfer agent and registrar fees | * | |||
| Miscellaneous | * | |||
| Total | $ | * | ||
| * | To be provided by amendment |
| Item 14. | Indemnification Of Directors And Officers. |
II-1
Table of Contents
| Item 15. | Recent Sales Of Unregistered Securities. |
| Item 16. | Exhibits. |
| Exhibit | ||||||
| Number | Description | |||||
| 1 | .1** | — | Form of Underwriting Agreement | |||
| 3 | .1* | — | Certificate of Trust of ECA Marcellus Royalty Trust I | |||
| 3 | .2* | — | Articles of Incorporation of Energy Corporation of America. | |||
| 3 | .3* | — | Amended Articles of Incorporation of Energy Corporation of America dated July 31, 1998. | |||
| 3 | .4* | — | Amended Articles of Incorporation of Energy Corporation of America dated December 10, 1998. | |||
| 3 | .5* | — | Amended Bylaws of Energy Corporation of America. | |||
| 4 | .1* | — | Trust Agreement dated March 19, 2010 among Energy Corporation of America and Corporation Trust Company. | |||
| 4 | .2** | — | Form of Amended and Restated Trust Agreement among Energy Corporation of America and . | |||
| 4 | .2** | — | Form of Unit Certificate | |||
| 5 | .1** | — | Opinion of relating to the validity of the trust units | |||
| 8 | .1** | — | Opinion of Vinson & Elkins L.L.P. relating to tax matters | |||
| 10 | .1* | — | Second Amended and Restated Credit Agreement dated September 7, 2007 by and among Energy Corporation of America, the Lenders signatory thereto and Wells Fargo Foothill, Inc. (now Wells Fargo Capital Finance, Inc.), as the Arranger and Administrative Agent. | |||
| 10 | .2* | — | First Amendment to Second Amended and Restated Credit Agreement dated August 4, 2008, 2009 by and among Energy Corporation of America, the Lenders signatory thereto and Wells Fargo Foothill, Inc. (now Wells Fargo Capital Finance, Inc.), as the Arranger and Administrative Agent. | |||
| 10 | .4** | — | Form of Term Royalty Conveyance | |||
| 10 | .5** | — | Form of Perpetual Royalty Conveyance | |||
| 10 | .6** | — | Form of Administrative and Drilling Services Agreement | |||
| 21 | .1* | — | Subsidiaries of Energy Corporation of America | |||
| 23 | .1* | — | Consent of Ernst & Young LLP | |||
| 23 | .2** | — | Consent of (contained in Exhibit 5.1) | |||
| 23 | .3** | — | Consent of Vinson & Elkins, L.L.P. (contained in Exhibit 8.1) | |||
II-2
Table of Contents
| Exhibit | ||||||
| Number | Description | |||||
| 23 | .4* | — | Consent of Ryder Scott | |||
| 24 | .1* | — | Power of Attorney set forth on the signature page contained in Part II | |||
| * | Filed Herewith | |
| ** | To be filed by amendment |
| Item 17. | Undertakings. |
II-3
Table of Contents
| By: | Energy Corporation of America, |
| By: | /s/ Michael S. Fletcher |
| Title: Acting Trustee |
II-4
Table of Contents
| By: | /s/ John Mork |
| Title: | President and Chief Executive Officer |
| Signature | Title | |
/s/ John Mork John Mork | President and Chief Executive Officer (Principal executive officer) | |
/s/ Donald C. Supcoe Donald C. Supcoe | Senior Vice President; Secretary and General Counsel | |
/s/ Michael S. Fletcher Michael S. Fletcher | Chief Financial Officer (Principal accounting and financial officer) | |
/s/ W. Gaston Caperton, III W. Gaston Caperton, III | Director | |
/s/ Peter H. Coors Peter H. Coors | Director | |
/s/ L.B. Curtis L.B. Curtis | Director | |
/s/ John J. Dorgan John J. Dorgan | Director |
II-5
Table of Contents
| Signature | Title | |
/s/ John Fischer John Fischer | Director | |
/s/ Thomas R. Goodwin Thomas R. Goodwin | Director | |
/s/ F.H. McCullough, III F.H. McCullough, III | Director | |
/s/ Julie Mork Julie Mork | Director | |
/s/ Jerry Neely Jerry Neely | Director | |
/s/ Arthur C. Nielsen, Jr. Arthur C. Nielsen, Jr. | Director | |
/s/ Jay S. Pifer Jay S. Pifer | Director |
II-6