 September 3, 2015 Q3 2015 Supplemental Financial Information Exhibit 99.2 |
 1 This presentation may contain "forward-looking statements" within the meaning of the Private Securities Litigation Reform Act of 1995. These statements relate to future events or our future financial performance. In some cases, you can identify forward-looking statements by terminology such as “anticipate,” “believe,” “continue,” “could,” “estimate,” “expect,” “intend,” “may,” “might,” “plan,” “potential,” “predict,” “should” or “will,” or the negative of such terms, or other comparable terminology. These forward-looking statements are only predictions based on the current intent and expectations of the management of Esterline, are not guarantees of future performance or actions, and involve risks and uncertainties that are difficult to predict and may cause Esterline’s or its industry’s actual results, performance or achievements to be materially different from any future results, performance or achievements expressed or implied by the forward-looking statements. Esterline's actual results and the timing and outcome of events may differ materially from those expressed in or implied by the forward- looking statements due to risks detailed in Esterline's public filings with the Securities and Exchange Commission including its most recent Annual Report on Form 10-K. This presentation may also contain references to non-GAAP financial information subject to Regulation G. The reconciliations of each non-GAAP financial measure to its comparable GAAP measure as well as further information on management’s use of non-GAAP financial measures are included in Esterline’s press release dated September 3, 2015, included as Exhibit 99.1 to Form 8-K filed with the SEC on the same date, as well as in this presentation. Q3 2015 Supplemental Financial Information |
 Q3 2015 and Subsequent Highlights • Completed divestitures of Eclipse and PA&E • Announced new segment leadership structure • Redeemed $250 million, 7% Senior Notes – August 4, 2015 – Generates ~$7 million interest expense savings annually Q3 2015 Supplemental Financial Information 2 |
 Q3 2015 Financial Results • Sales of $496 million, down 2% – 2.8% organic sales decline – $32 million sales from DAT acquisition offset by $28 million FX impact • GAAP EPS of $0.97 – Adjusted EPS of $1.33* (excludes certain discrete items) • YTD free cash flow* conversion 116% of net earnings 3 *See Page 1 regarding non-GAAP financial measures Q3 2015 Supplemental Financial Information |
 Q3 2015 Year-over-Year (YOY) Summary 4 Dollars in millions, except EPS Q3 2015 Q3 2014 Change Sales $ 496 $ 506 $ (10) Gross Margin $ 170 $ 177 $ (7) - % of sales 34% 35% (1%) Net earnings from continuing operations $ 30 $ 40 $ (10) Net earnings per diluted share $0.97 $1.22 $(0.25) Q3 2015 Supplemental Financial Information |
 Q3 2015 Supplemental Financial Information Q3 2015 Earnings Adjustment 5 Dollars in millions, except EPS Earnings from Continuing Ops EPS GAAP $ 30 $ 0.97 • Accelerated integration 2 0.08 • Incremental compliance 6 0.18 • DAT net loss 3 0.10 Adjusted * $ 41 $ 1.33 *See Page 1 regarding non-GAAP financial measures |
 Q3 2015 Supplemental Financial Information Q3 2015 Sales Change (YOY) Items Sales Q3 2014 $ 506 • Foreign currency translation (23) • FX forward contract loss (5) • DAT acquisition 32 • Sales volume (2.8% organic decline) (14) Q3 2015 $ 496 Dollars in millions 6 |
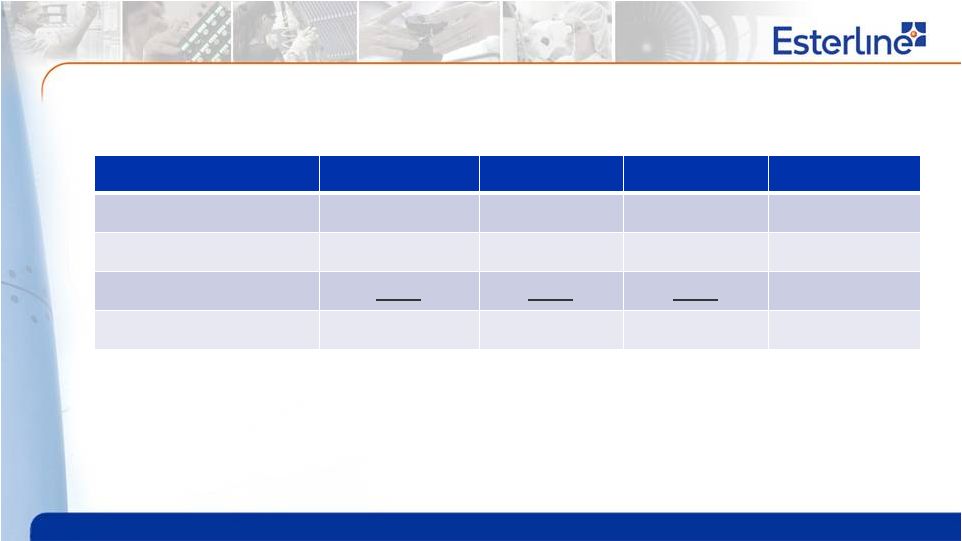 Q3 2015 Supplemental Financial Information Q3 2015 Segment Sales Change (YOY) Total Change Organic¹ FX Acquisition Avionics & Controls 8% (7%) (2%) 17% Sensors & Systems (9%) 2% (11%) - Advanced Materials (7%) (4%) (2%) - Total (2%) (3%) (6%) 6% ¹ Q3 2015 organic sales growth represents the total reported increase within the company’s continuing operations less the impact of all foreign currency translation and hedging activities and acquisitions. 7 |
 Q3 2015 Supplemental Financial Information Q3 2015 Gross Margin Change (YOY) Items Gross Margin Q3 2014 $ 177 • Foreign currency translation (1) • FX forward contract loss (5) • DAT acquisition ($16 million from operations less $3 million purchase accounting) 13 • Sales volume / mix (13) • Inventory reserves / EAC / Other adjustments (1) Q3 2015 $ 170 Dollars in millions 8 |
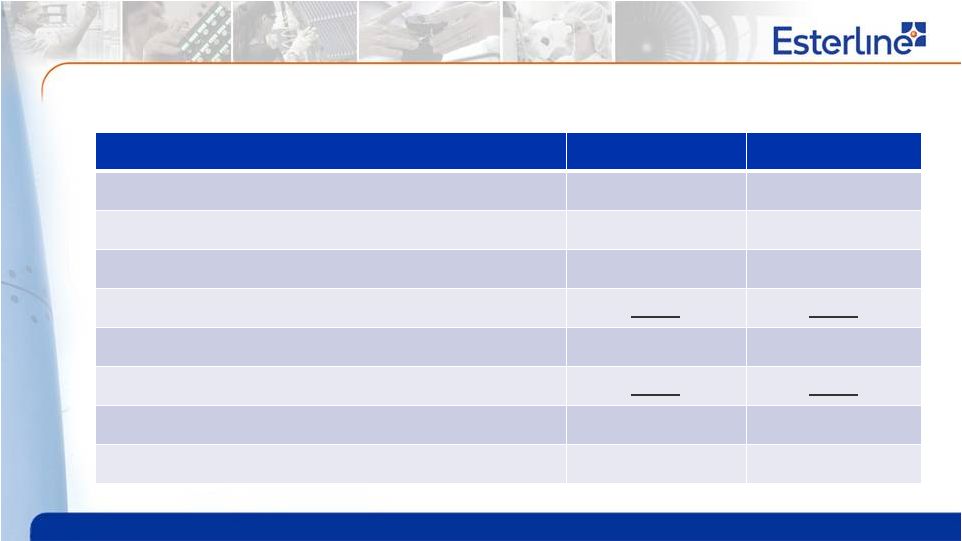
 Adjusted Gross Margin and EBIT See Appendix for supporting details Avionics & Controls Sensors & Systems Advanced Materials Total ESL Q3 2015 Gross Margin (Adjusted)* 32.9% 36.3% 32.4% 34.1% Q3 2014 Gross Margin (Adjusted)* 37.4% 33.8% 34.6% 35.4% YTD 2015 Gross Margin (Adjusted)* 33.8% 36.1% 32.1% 34.2% YTD 2014 Gross Margin (Adjusted)* 37.4% 34.0% 34.3% 35.4% Q3 2015 EBIT (Adjusted)* 15.6% 14.2% 22.2% 13.1% Q3 2014 EBIT (Adjusted)* 16.7% 11.6% 23.5% 13.5% YTD 2015 EBIT (Adjusted)* 14.9% 11.9% 20.6% 11.6% YTD 2014 EBIT (Adjusted)* 15.3% 12.1% 22.8% 12.8% *See Page 1 regarding non-GAAP financial measures 9 Q3 2015 Supplemental Financial Information |
 YTD Free Cash Flow Reconciliation YTD 2015 YTD 2014 Net earnings attributable to Esterline $ 57 $ 106 • Depreciation and amortization 77 87 • Change in working capital (A/R, Inventory, A/P) (17) (24) • Other (13) (34) Cash flow from operations $ 104 $ 135 • Capital expenditures (38) (35) Free cash flow* $ 66 $ 100 Cash conversion* 116% 94% Dollars in millions *See Page 1 regarding non-GAAP financial measures 10 Q3 2015 Supplemental Financial Information |
 Share Repurchase Update # Shares In thousands $ Value In millions • FY 2014 269 $ 30.3 • Q1 2015 850 92.6 • Q2 2015 312 34.7 • Q3 2015 1,400 132.2 Total spend since inception* 2,831 $ 289.8 * $400 million total authorization for share repurchase 11 Q3 2015 Supplemental Financial Information |
 Q3 2015 Supplemental Financial Information 2015 Updated Guidance 2015 Updated Guidance Comments Sales $1.775 - $1.800B • YTD Q3 Sales = $1.443B • Q4 Sales = $330 - $355M (2 months) • Above includes ~$100M from DAT Diluted EPS, reported $2.82 - $2.92 • Q1 = $0.78 • Q2 = $0.69 • Q3 = $0.97 • Q4 forecast = $0.38 - $0.48 (2 months) Diluted EPS, adjusted* $4.35 - $4.45 • Q1 = $0.85 • Q2 = $1.20 • Q3 = $1.33 • Q4 forecast = $0.97 - $1.07 (2 months) • Q4 adjustments (excluded from adjusted EPS) • Integration / Compliance = $0.16 • DAT net loss = $0.14 • 2020 Senior Notes call = $0.28 *See Page 1 regarding non-GAAP financial measures 12 |
 Company-Wide Efficiency Initiatives Update Ops Excellence Strategic Sourcing Global Footprint INITIATIVE GOALS Achieve significant savings in material and services Implement standards and tools for sustainability • Remaining restructuring projects will complete in 2016 • Acquisition integrating well • Increasing competitive global presence • Savings ahead of plan • Savings tracker in place and automated • All commodities progressing well, executing to plan • Further projects being scoped and opportunities identified • Lean transformation wave one sites launched in June • CI Academies in process – over 150 leaders trained • Material management activities started in May INITIATIVE GOALS Enterprise-wide Lean transformation New operating system deployed Leadership-driven, fully aligned operational improvements INITIATIVE GOALS Leverage global presence for growth Develop competitive cost structure Infrastructure supporting the Esterline Operating System 13 Q3 2015 Supplemental Financial Information |
 Appendix 14 Q3 2015 Supplemental Financial Information |
 Q3 2015 Adjusted Gross Margin and EBIT 15 Q3 2015 Supplemental Financial Information |
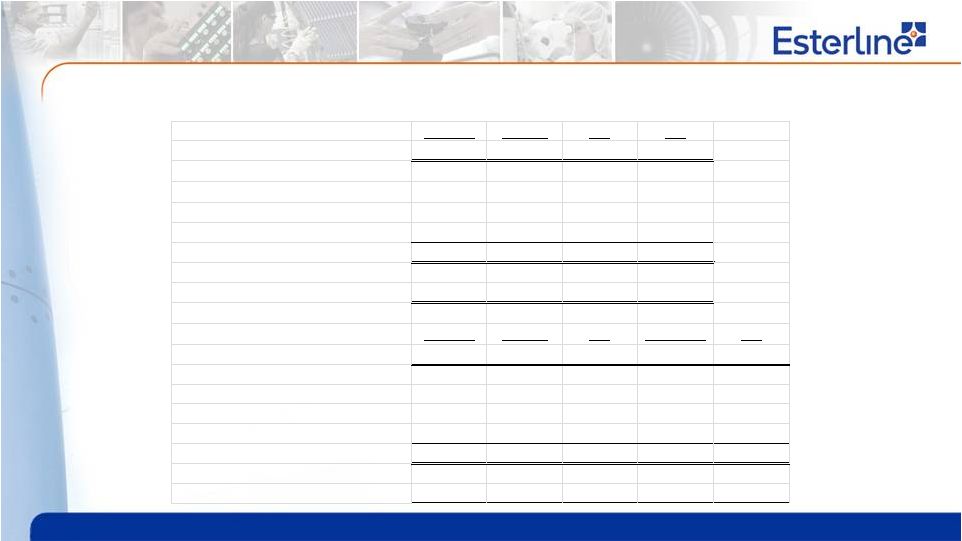 Q3 2014 Adjusted Gross Margin and EBIT 16 $ amounts in '000s Avionics Sensors AM ESL GAAP Sales 192,860 192,246 121,203 506,309 GAAP Gross Margin 71,566 63,620 41,901 177,087 Accelerated Integration Costs 515 1,335 137 1,987 Compliance Costs 24 78 (74) 28 Adjusted Gross Margin 72,105 65,033 41,964 179,102 Adjusted Gross Margin as a % of Sales 37.4% 33.8% 34.6% 35.4% $ amounts in '000s Avionics Sensors AM Corporate ESL GAAP Sales 192,860 192,246 121,203 - 506,309 GAAP EBIT 30,902 18,055 27,724 (16,142) 60,539 Accelerated Integration Costs 1,033 3,321 742 296 5,392 Compliance Costs 305 935 10 1,027 2,277 Adjusted EBIT 32,240 22,311 28,476 (14,819) 68,208 Adjusted EBIT as a % of Sales 16.7% 11.6% 23.5% - 13.5% Q3 2015 Supplemental Financial Information |
 Q3 2015 Supplemental Financial Information YTD Q3 2015 Adjusted Gross Margin and EBIT 17 $ amounts in '000s Avionics Sensors AM ESL GAAP Sales 594,534 515,611 332,496 1,442,641 DAT Sales (62,496) - - (62,496) Adjusted Sales 532,038 515,611 332,496 1,380,145 GAAP Gross Margin 190,771 181,841 106,185 478,797 Accelerated Integration Costs - 4,123 628 4,751 DAT Gross Margin (18,776) - - (18,776) Long-Term Contract Adjustment 7,814 - - 7,814 Adjusted Gross Margin 179,809 185,964 106,813 472,586 Adjusted Gross Margin as a % of Adjusted Sales 33.8% 36.1% 32.1% 34.2% $ amounts in '000s Avionics Sensors AM Corporate ESL GAAP Sales 594,534 515,611 332,496 - 1,442,641 DAT Sales (62,496) - - - (62,496) Sales excluding DAT 532,038 515,611 332,496 - 1,380,145 GAAP EBIT 52,024 55,491 65,908 (52,323) 121,100 Accelerated Integration Costs 640 6,111 2,531 844 10,126 Compliance Costs - - - 14,971 14,971 DAT Loss 10,439 - - - 10,439 DAT Closing Expenses 6,000 - - - 6,000 Long-Term Contract Adjustments 9,934 - - - 9,934 Pension - - - 3,000 3,000 Non-Income Tax Gain - - - (15,656) (15,656) Adjusted EBIT 79,037 61,602 68,439 (49,164) 159,914 Adjusted EBIT as a % of Adjusted Sales 14.9% 11.9% 20.6% - 11.6% |
 YTD Q3 2014 Adjusted Gross Margin and EBIT 18 Q3 2015 Supplemental Financial Information $ amounts in '000s Avionics Sensors AM ESL GAAP Sales 571,366 579,131 352,613 1,503,110 GAAP Gross Margin 211,936 194,567 120,544 527,047 Accelerated Integration Costs 1,617 2,129 292 4,038 Compliance Costs 307 296 91 694 Adjusted Gross Margin 213,860 196,992 120,927 531,779 Adjusted Gross Margin as a % of Sales 37.4% 34.0% 34.3% 35.4% $ amounts in '000s Avionics Sensors AM Corporate ESL GAAP Sales 571,366 579,131 352,613 - 1,503,110 GAAP EBIT 81,952 61,811 75,911 (48,398) 171,276 Accelerated Integration Costs 4,428 5,527 3,887 475 14,317 Compliance Costs 1,190 2,507 577 2,631 6,905 Adjusted EBIT 87,570 69,845 80,375 (45,292) 192,498 Adjusted EBIT as a % of Sales 15.3% 12.1% 22.8% - 12.8% |