Exhibit V
Unaudited Condensed Semi Annual Financial Statements as at June 30, 2011 - SEC Filing
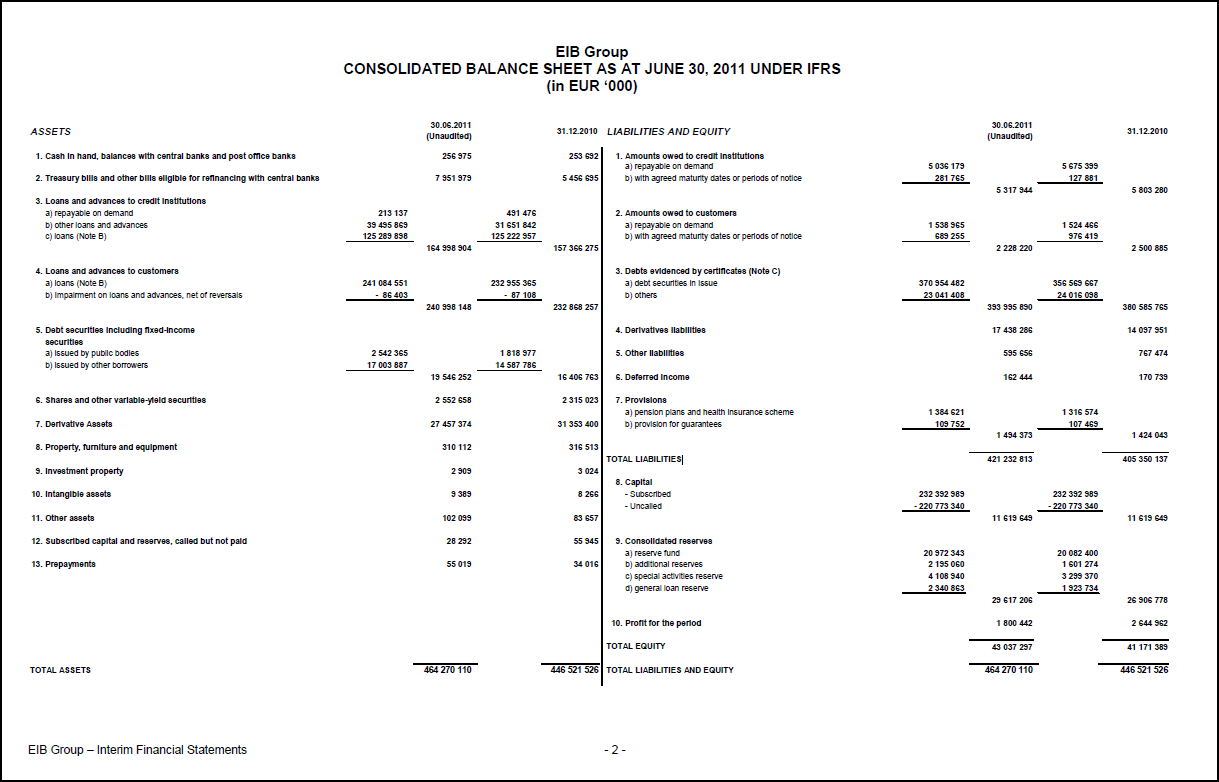
EIB Group CONSOLIDATED BALANCE SHEET AS AT JUNE 30, 2011 UNDER IFRS (in EUR ‘000) ASSETS 30.06.2011 (Unaudited) 31.12.2010 1. Cash in hand, balances with central banks and post office banks 256 975 253 692 2. Treasury bills and other bills eligible for refinancing with central banks 7 951 979 5 456 695 3. Loans and advances to credit institutions a) repayable on demand 213 137 491 476 b) other loans and advances 39 495 869 31 651 842 c) loans (Note B) 125 289 898 125 222 957 164 998 904 157 366 275 4. Loans and advances to customers a) loans (Note B) 241 084 551 232 955 365 b) Impairment on loans and advances, net of reversals - 86 403 - 87 108 240 998 148 232 868 257 5. Debt securities including fixed-income securities a) issued by public bodies 2 542 365 1 818 977 b) issued by other borrowers 17 003 887 14 587 786 19 546 252 16 406 763 6. Shares and other variable-yield securities 2 552 658 2 315 023 7. Derivative Assets 27 457 374 31 353 400 8. Property, furniture and equipment 310 112 316 513 9. Investment property 2 909 3 024 10. Intangible assets 9 389 8 266 11. Other assets 102 099 83 657 12. Subscribed capital and reserves, called but not paid 28 292 55 945 13. Prepayments 55 019 34 016 TOTAL ASSETS 464 270 110 446 521 526 LIABILITIES AND EQUITY 30.06.2011 (Unaudited) 31.12.2010 1. Amounts owed to credit institutions a) repayable on demand 5 036 179 5 675 399 b) with agreed maturity dates or periods of notice 281 765 127 881 5 317 944 5 803 280 2. Amounts owed to customers a) repayable on demand 1 538 965 1 524 466 b) with agreed maturity dates or periods of notice 689 255 976 419 2 228 220 2 500 885 3. Debts evidenced by certificates (Note C) a) debt securities in issue 370 954 482 356 569 667 b) others 23 041 408 24 016 098 393 995 890 380 585 765 4. Derivatives liabilities 17 438 286 14 097 951 5. Other liabilities 595 656 767 474 6. Deferred income 162 444 170 739 7. Provisions a) pension plans and health insurance scheme 1 384 621 1 316 574 b) provision for guarantees 109 752 107 469 1 494 373 1 424 043 TOTAL LIABILITIES 421 232 813 405 350 137 8. Capital - Subscribed 232 392 989 232 392 989 - Uncalled - 220 773 340 - 220 773 340 11 619 649 11 619 649 9. Consolidated reserves a) reserve fund 20 972 343 20 082 400 b) additional reserves 2 195 060 1 601 274 c) special activities reserve 4 108 940 3 299 370 d) general loan reserve 2 340 863 1 923 734 29 617 206 26 906 778 10. Profit for the period 1 800 442 2 644 962 TOTAL EQUITY 43 037 297 41 171 389 TOTAL LIABILITIES AND EQUITY 464 270 110 446 521 526
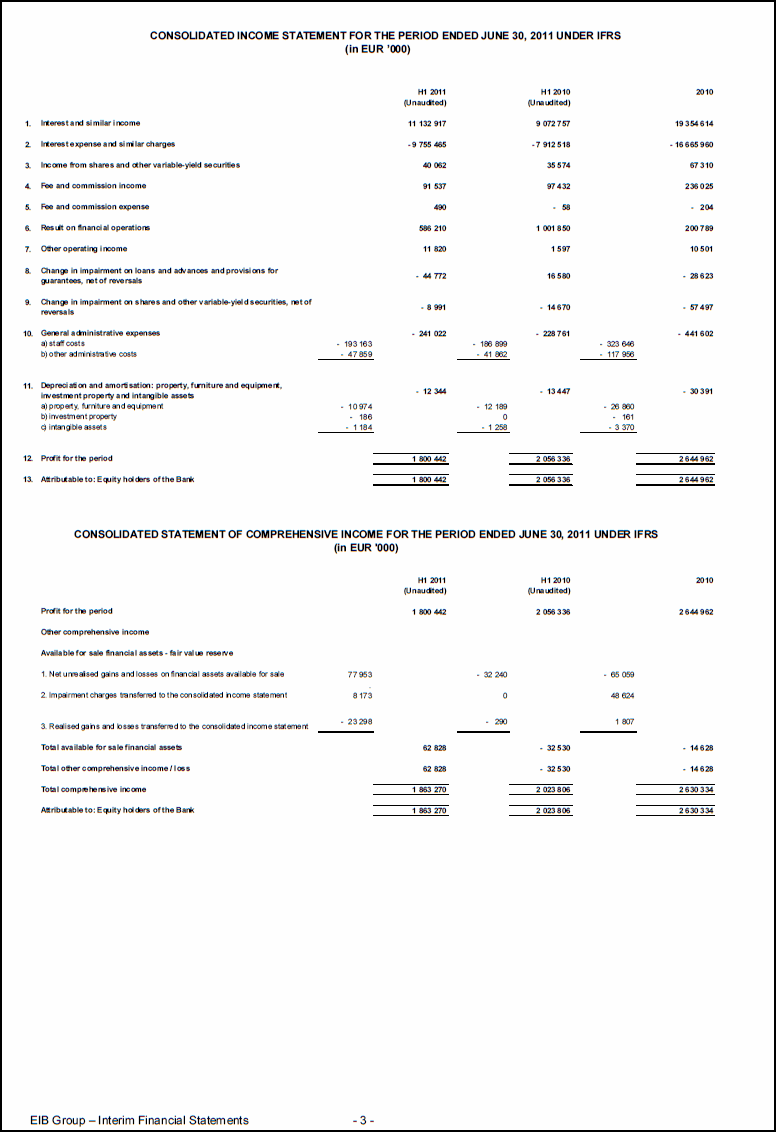
CONSOLIDATED INCOME STATEMENT FOR THE PERIOD ENDED JUNE 30, 2011 UNDER IFRS (in EUR ’000) H1 2011 H1 2010 2010 (Unaudited) (Unaudited) 1. Interest and similar income 11 132 917 9 072 757 19 354 614 2. Interest expense and similar charges - 9 755 465 - 7 912 518 - 16 665 960 3. Income from shares and other variable-yield securities 40 062 35 574 67 310 4. Fee and commission income 91 537 97 432 236 025 5. Fee and commission expense 490 - 58 - 204 6. Result on financial operations 586 210 1 001 850 200 789 7. Other operating income 11 820 1 597 10 501 8. Change in impairment on loans and advances and provisions for guarantees, net of reversals - 44 772 16 580 - 28 623 9. Change in impairment on shares and other variable-yield securities, net of reversals - 8 991 - 14 670 - 57 497 10. General administrative expenses - 241 022 - 228 761 - 441 602 a) staff costs - 193 163 - 186 899 - 323 646 b) other administrative costs - 47 859 - 41 862 - 117 956 11. Depreciation and amortisation: property, furniture and equipment, investment property and intangible assets - 12 344 - 13 447 - 30 391 a) property, furniture and equipment - 10 974 - 12 189 - 26 860 b) investment property - 186 0 - 161 c) intangible assets - 1 184 - 1 258 - 3 370 12. Profit for the period 1 800 442 2 056 336 2 644 962 13. Attributable to: Equity holders of the Bank 1 800 442 2 056 336 2 644 962 CONSOLIDATED STATEMENT OF COMPREHENSIVE INCOME FOR THE PERIOD ENDED JUNE 30, 2011 UNDER IFRS (in EUR '000) H1 2011 H1 2010 2010 (Unaudited) (Unaudited) Profit for the period 1 800 442 2 056 336 2 644 962 Other comprehensive income Available for sale financial assets - fair value reserve 1. Net unrealised gains and losses on financial assets available for sale 77 953 - 32 240 - 65 059 2. Impairment charges transferred to the consolidated income statement 8 173 0 48 624 3. Realised gains and losses transferred to the consolidated income statement - 23 298 - 290 1 807 Total available for sale financial assets 62 828 - 32 530 - 14 628 Total other comprehensive income / loss 62 828 - 32 530 - 14 628 Total comprehensive income 1 863 270 2 023 806 2 630 334 Attributable to: Equity holders of the Bank 1 863 270 2 023 806 2 630 334
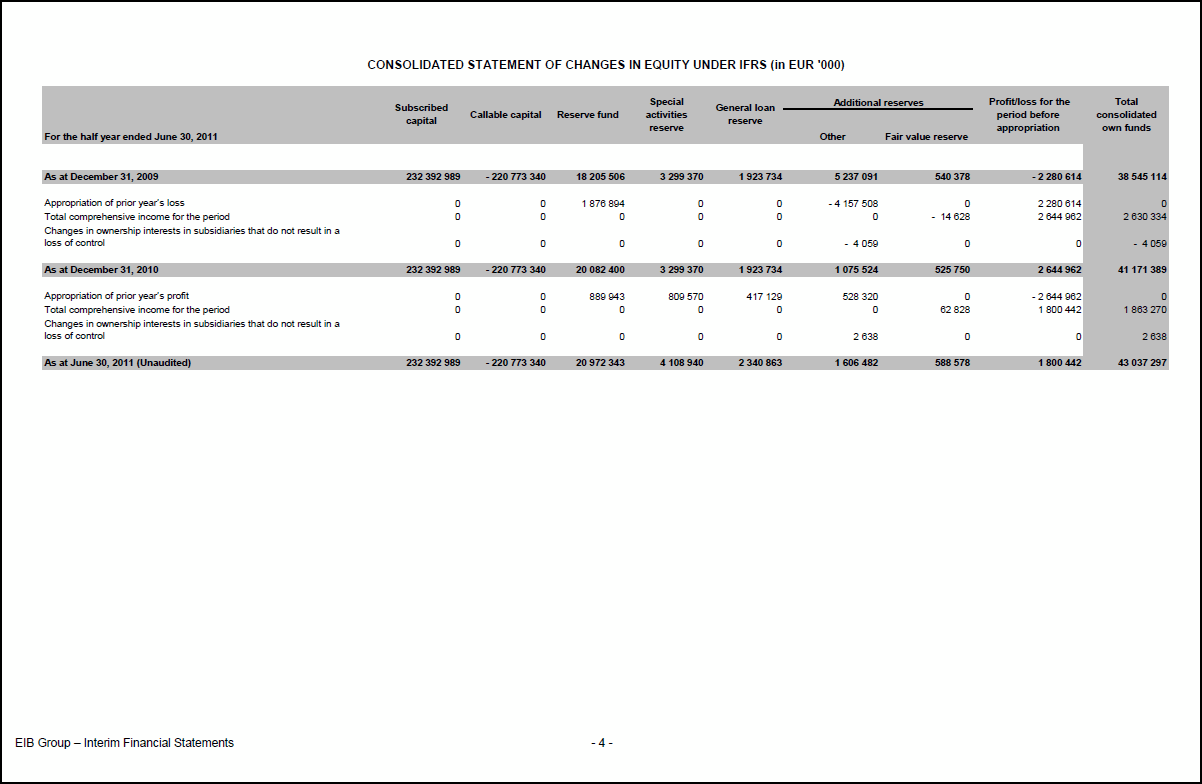
CONSOLIDATED STATEMENT OF CHANGES IN EQUITY UNDER IFRS (in EUR '000) For the half year ended June 30, 2011 Subscribed capital Callable capital Reserve fund Special activities reserve General loan reserve Additional reserves Other Fair value reserve Profit/loss for the period before appropriation Total consolidated own funds As at December 31, 2009 232 392 989 - 220 773 340 18 205 506 3 299 370 1 923 734 5 237 091 540 378 - 2 280 614 38 545 114 Appropriation of prior year’s loss 0 0 1 876 894 0 0 - 4 157 508 0 2 280 614 0 Total comprehensive income for the period 0 0 0 0 0 0 - 14 628 2 644 962 2 630 334 Changes in ownership interests in subsidiaries that do not result in a loss of control 0 0 0 0 0 - 4 059 0 0 - 4 059 As at December 31, 2010 232 392 989 - 220 773 340 20 082 400 3 299 370 1 923 734 1 075 524 525 750 2 644 962 41 171 389 Appropriation of prior year’s profit 0 0 889 943 809 570 417 129 528 320 0 - 2 644 962 0 Total comprehensive income for the period 0 0 0 0 0 0 62 828 1 800 442 1 863 270 Changes in ownership interests in subsidiaries that do not result in a loss of control 0 0 0 0 0 2 638 0 0 2 638 As at June 30, 2011 (Unaudited) 232 392 989 - 220 773 340 20 972 343 4 108 940 2 340 863 1 606 482 588 578 1 800 442 43 037 297
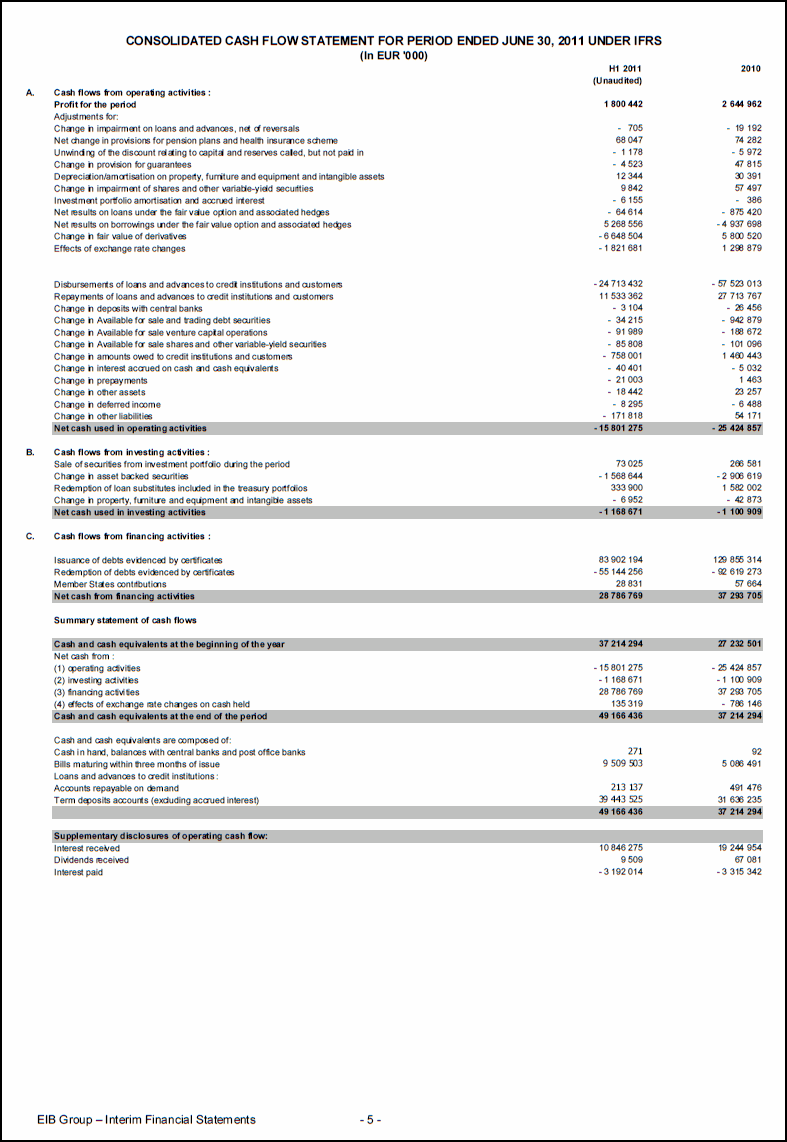
CONSOLIDATED CASH FLOW STATEMENT FOR PERIOD ENDED JUNE 30, 2011 UNDER IFRS (In EUR '000) H1 2011 2010 (Unaudited) A. Cash flows from operating activities : Profit for the period 1 800 442 2 644 962 Adjustments for: Change in impairment on loans and advances, net of reversals - 705 - 19 192 Net change in provisions for pension plans and health insurance scheme 68 047 74 282 Unwinding of the discount relating to capital and reserves called, but not paid in - 1 178 - 5 972 Change in provision for guarantees - 4 523 47 815 Depreciation/amortisation on property, furniture and equipment and intangible assets 12 344 30 391 Change in impairment of shares and other variable-yield securities 9 842 57 497 Investment portfolio amortisation and accrued interest - 6 155 - 386 Net results on loans under the fair value option and associated hedges - 64 614 - 875 420 Net results on borrowings under the fair value option and associated hedges 5 268 556 - 4 937 698 Change in fair value of derivatives - 6 648 504 5 800 520 Effects of exchange rate changes - 1 821 681 1 298 879 Disbursements of loans and advances to credit institutions and customers - 24 713 432 - 57 523 013 Repayments of loans and advances to credit institutions and customers 11 533 362 27 713 767 Change in deposits with central banks - 3 104 - 26 456 Change in Available for sale and trading debt securities - 34 215 - 942 879 Change in Available for sale venture capital operations - 91 989 - 188 672 Change in Available for sale shares and other variable-yield securities - 85 808 - 101 096 Change in amounts owed to credit institutions and customers - 758 001 1 460 443 Change in interest accrued on cash and cash equivalents - 40 401 - 5 032 Change in prepayments - 21 003 1 463 Change in other assets - 18 442 23 257 Change in deferred income - 8 295 - 6 488 Change in other liabilities - 171 818 54 171 Net cash used in operating activities - 15 801 275 - 25 424 857 B. Cash flows from investing activities : Sale of securities from investment portfolio during the period 73 025 266 581 Change in asset backed securities - 1 568 644 - 2 906 619 Redemption of loan substitutes included in the treasury portfolios 333 900 1 582 002 Change in property, furniture and equipment and intangible assets - 6 952 - 42 873 Net cash used in investing activities - 1 168 671 - 1 100 909 C. Cash flows from financing activities : Issuance of debts evidenced by certificates 83 902 194 129 855 314 Redemption of debts evidenced by certificates - 55 144 256 - 92 619 273 Member States contributions 28 831 57 664 Net cash from financing activities 28 786 769 37 293 705 Summary statement of cash flows Cash and cash equivalents at the beginning of the year 37 214 294 27 232 501 Net cash from : (1) operating activities - 15 801 275 - 25 424 857 (2) investing activities - 1 168 671 - 1 100 909 (3) financing activities 28 786 769 37 293 705 (4) effects of exchange rate changes on cash held 135 319 - 786 146 Cash and cash equivalents at the end of the period 49 166 436 37 214 294 Cash and cash equivalents are composed of: Cash in hand, balances with central banks and post office banks 271 92 Bills maturing within three months of issue 9 509 503 5 086 491 Loans and advances to credit institutions : Accounts repayable on demand 213 137 491 476 Term deposits accounts (excluding accrued interest) 39 443 525 31 636 235 49 166 436 37 214 294 Supplementary disclosures of operating cash flow: Interest received 10 846 275 19 244 954 Dividends received 9 509 67 081 Interest paid - 3 192 014 - 3 315 342
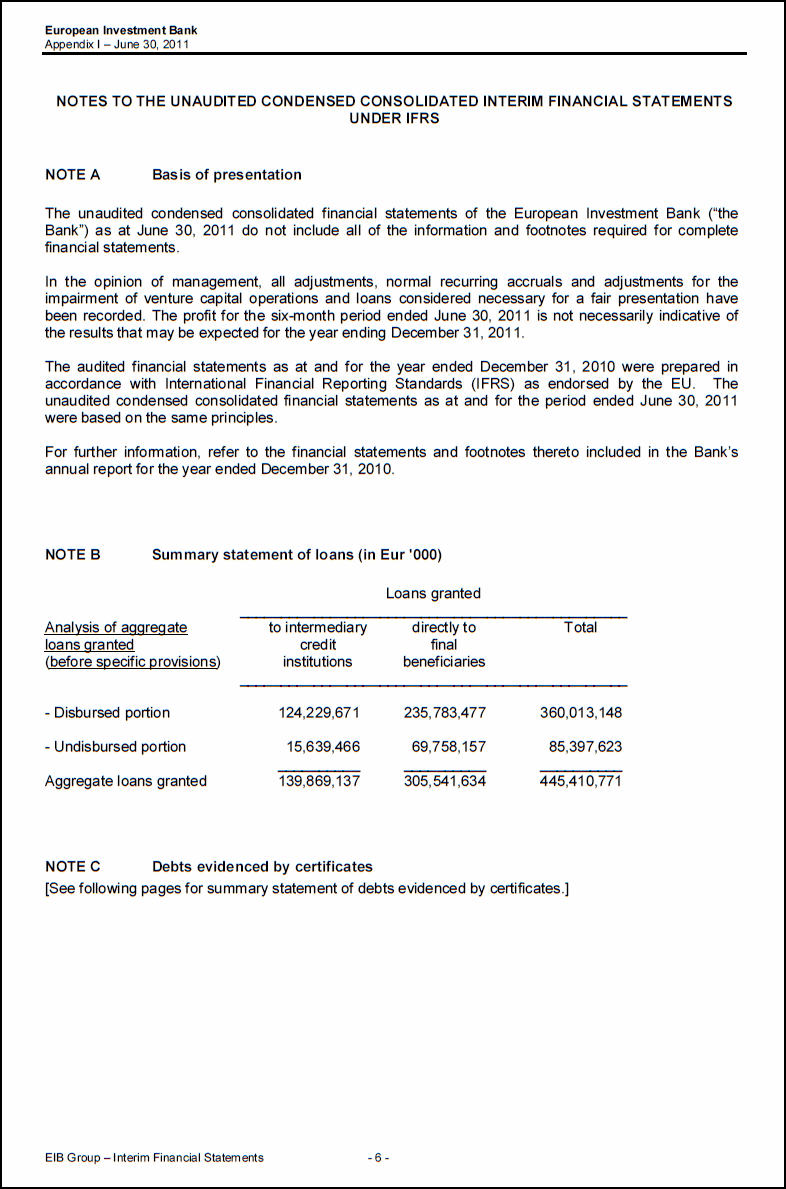
European Investment Bank Appendix I – June 30, 2011 NOTES TO THE UNAUDITED CONDENSED CONSOLIDATED INTERIM FINANCIAL STATEMENTS UNDER IFRS NOTE A Basis of presentation The unaudited condensed consolidated financial statements of the European Investment Bank (“the Bank”) as at June 30, 2011 do not include all of the information and footnotes required for complete financial statements. In the opinion of management, all adjustments, normal recurring accruals and adjustments for the impairment of venture capital operations and loans considered necessary for a fair presentation have been recorded. The profit for the six-month period ended June 30, 2011 is not necessarily indicative of the results that may be expected for the year ending December 31, 2011. The audited financial statements as at and for the year ended December 31, 2010 were prepared in accordance with International Financial Reporting Standards (IFRS) as endorsed by the EU. The unaudited condensed consolidated financial statements as at and for the period ended June 30, 2011 were based on the same principles. For further information, refer to the financial statements and footnotes thereto included in the Bank’s annual report for the year ended December 31, 2010. NOTE B Summary statement of loans (in Eur '000) Loans granted Analysis of aggregate to intermediary directly to Total loans granted credit final (before specific provisions) institutions beneficiaries - Disbursed portion 124,229,671 235,783,477 360,013,148 - Undisbursed portion 15,639,466 69,758,157 85,397,623 Aggregate loans granted 139,869,137 305,541,634 445,410,771 NOTE C Debts evidenced by certificates [See following pages for summary statement of debts evidenced by certificates.]
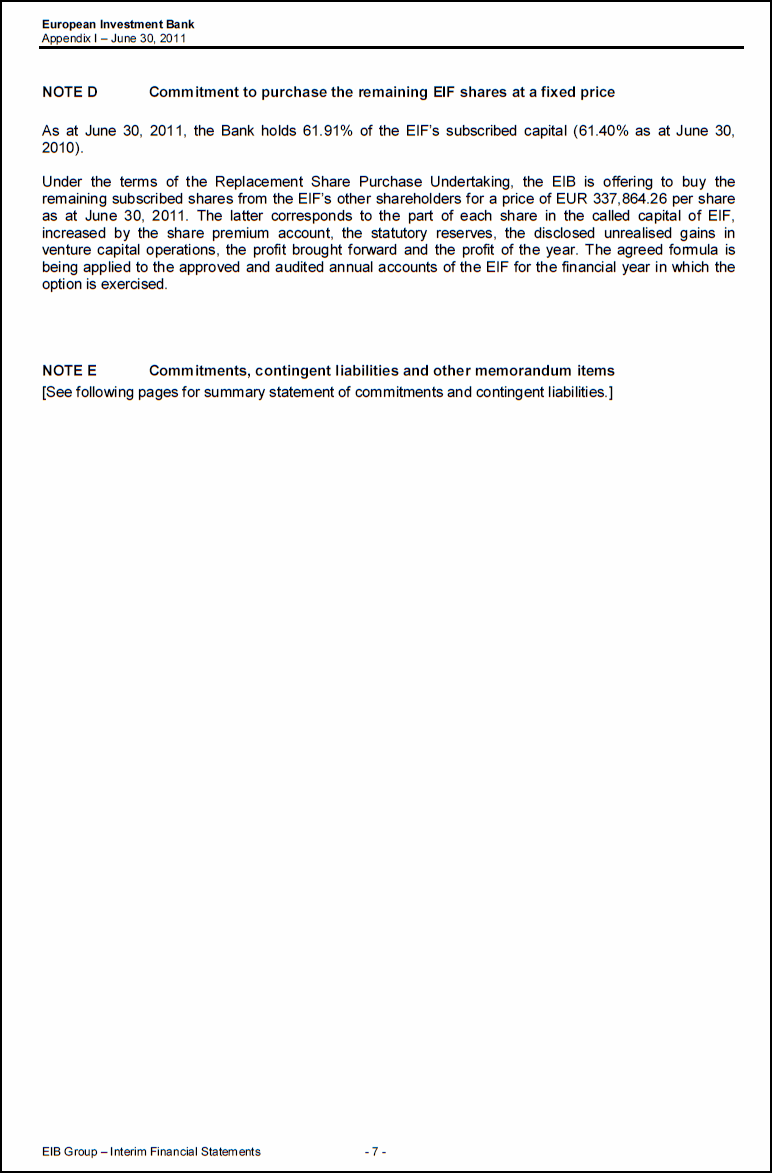
European Investment Bank Appendix I – June 30, 2011 NOTE D Commitment to purchase the remaining EIF shares at a fixed price As at June 30, 2011, the Bank holds 61.91% of the EIF’s subscribed capital (61.40% as at June 30, 2010). Under the terms of the Replacement Share Purchase Undertaking, the EIB is offering to buy the remaining subscribed shares from the EIF’s other shareholders for a price of EUR 337,864.26 per share as at June 30, 2011. The latter corresponds to the part of each share in the called capital of EIF, increased by the share premium account, the statutory reserves, the disclosed unrealised gains in venture capital operations, the profit brought forward and the profit of the year. The agreed formula is being applied to the approved and audited annual accounts of the EIF for the financial year in which the option is exercised. NOTE E Commitments, contingent liabilities and other memorandum items [See following pages for summary statement of commitments and contingent liabilities.]
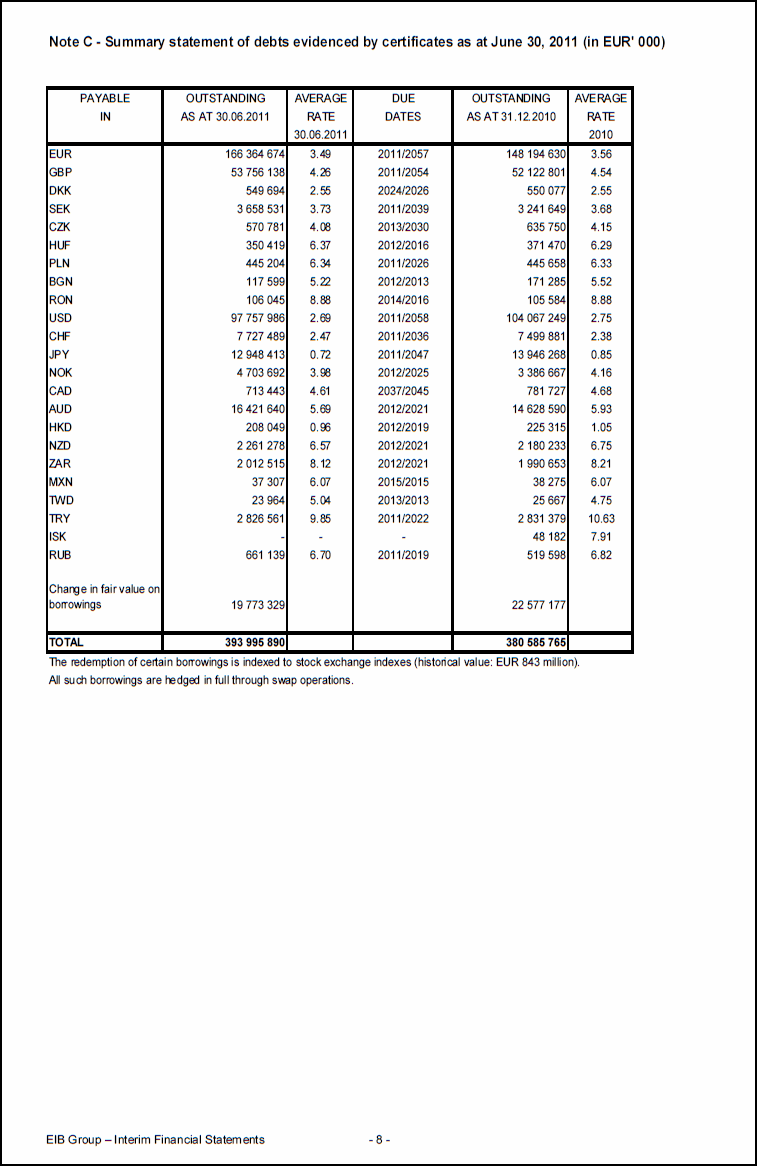
Note C - Summary statement of debts evidenced by certificates as at June 30, 2011 (in EUR' 000) PAYABLE OUTSTANDING AVERAGE DUE OUTSTANDING AVERAGE IN AS AT 30.06.2011 RATE DATES AS AT 31.12.2010 RATE 30.06.2011 2010 EUR 166 364 674 3.49 2011/2057 148 194 630 3.56 GBP 53 756 138 4.26 2011/2054 52 122 801 4.54 DKK 549 694 2.55 2024/2026 550 077 2.55 SEK 3 658 531 3.73 2011/2039 3 241 649 3.68 CZK 570 781 4.08 2013/2030 635 750 4.15 HUF 350 419 6.37 2012/2016 371 470 6.29 PLN 445 204 6.34 2011/2026 445 658 6.33 BGN 117 599 5.22 2012/2013 171 285 5.52 RON 106 045 8.88 2014/2016 105 584 8.88 USD 97 757 986 2.69 2011/2058 104 067 249 2.75 CHF 7 727 489 2.47 2011/2036 7 499 881 2.38 JPY 12 948 413 0.72 2011/2047 13 946 268 0.85 NOK 4 703 692 3.98 2012/2025 3 386 667 4.16 CAD 713 443 4.61 2037/2045 781 727 4.68 AUD 16 421 640 5.69 2012/2021 14 628 590 5.93 HKD 208 049 0.96 2012/2019 225 315 1.05 NZD 2 261 278 6.57 2012/2021 2 180 233 6.75 ZAR 2 012 515 8.12 2012/2021 1 990 653 8.21 MXN 37 307 6.07 2015/2015 38 275 6.07 TWD 23 964 5.04 2013/2013 25 667 4.75 TRY 2 826 561 9.85 2011/2022 2 831 379 10.63 ISK - - - 48 182 7.91 RUB 661 139 6.70 2011/2019 519 598 6.82 Change in fair value on borrowings 19 773 329 22 577 177 TOTAL 393 995 890 380 585 765 The redemption of certain borrowings is indexed to stock exchange indexes (historical value: EUR 843 million). All such borrowings are hedged in full through swap operations.
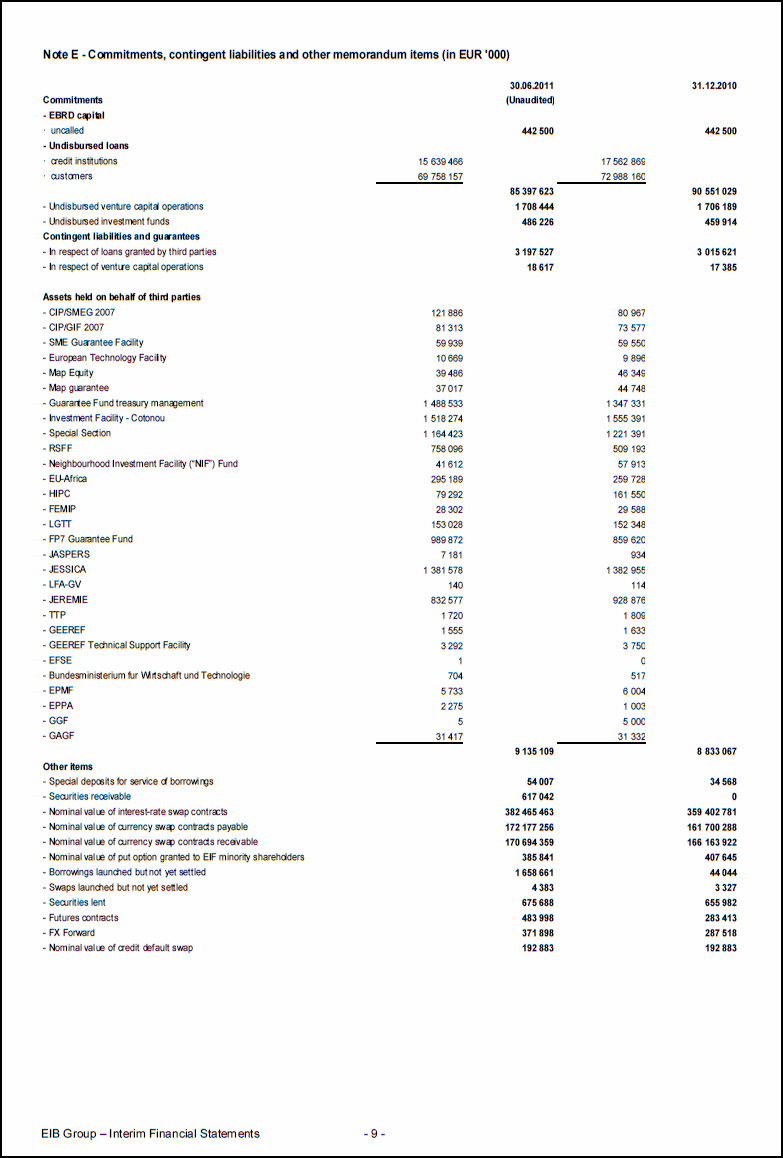
Note E - Commitments, contingent liabilities and other memorandum items (in EUR '000) 30.06.2011 31.12.2010 Commitments (Unaudited) - EBRD capital · uncalled 442 500 442 500 - Undisbursed loans · credit institutions 15 639 466 17 562 869 · customers 69 758 157 72 988 160 85 397 623 90 551 029 - Undisbursed venture capital operations 1 708 444 1 706 189 - Undisbursed investment funds 486 226 459 914 Contingent liabilities and guarantees - In respect of loans granted by third parties 3 197 527 3 015 621 - In respect of venture capital operations 18 617 17 385 Assets held on behalf of third parties - CIP/SMEG 2007 121 886 80 967 - CIP/GIF 2007 81 313 73 577 - SME Guarantee Facility 59 939 59 550 - European Technology Facility 10 669 9 896 - Map Equity 39 486 46 349 - Map guarantee 37 017 44 748 - Guarantee Fund treasury management 1 488 533 1 347 331 - Investment Facility - Cotonou 1 518 274 1 555 391 - Special Section 1 164 423 1 221 391 - RSFF 758 096 509 193 - Neighbourhood Investment Facility (“NIF”) Fund 41 612 57 913 - EU-Africa 295 189 259 728 - HIPC 79 292 161 550 - FEMIP 28 302 29 588 - LGTT 153 028 152 348 - FP7 Guarantee Fund 989 872 859 620 - JASPERS 7 181 934 - JESSICA 1 381 578 1 382 955 - LFA-GV 140 114 - JEREMIE 832 577 928 876 - TTP 1 720 1 809 - GEEREF 1 555 1 633 - GEEREF Technical Support Facility 3 292 3 750 - EFSE 1 0 - Bundesministerium fur Wirtschaft und Technologie 704 517 - EPMF 5 733 6 004 - EPPA 2 275 1 003 - GGF 5 5 000 - GAGF 31 417 31 332 9 135 109 8 833 067 Other items - Special deposits for service of borrowings 54 007 34 568 - Securities receivable 617 042 0 - Nominal value of interest-rate swap contracts 382 465 463 359 402 781 - Nominal value of currency swap contracts payable 172 177 256 161 700 288 - Nominal value of currency swap contracts receivable 170 694 359 166 163 922 - Nominal value of put option granted to EIF minority shareholders 385 841 407 645 - Borrowings launched but not yet settled 1 658 661 44 044 - Swaps launched but not yet settled 4 383 3 327 - Securities lent 675 688 655 982 - Futures contracts 483 998 283 413 - FX Forward 371 898 287 518 - Nominal value of credit default swap 192 883 192 883
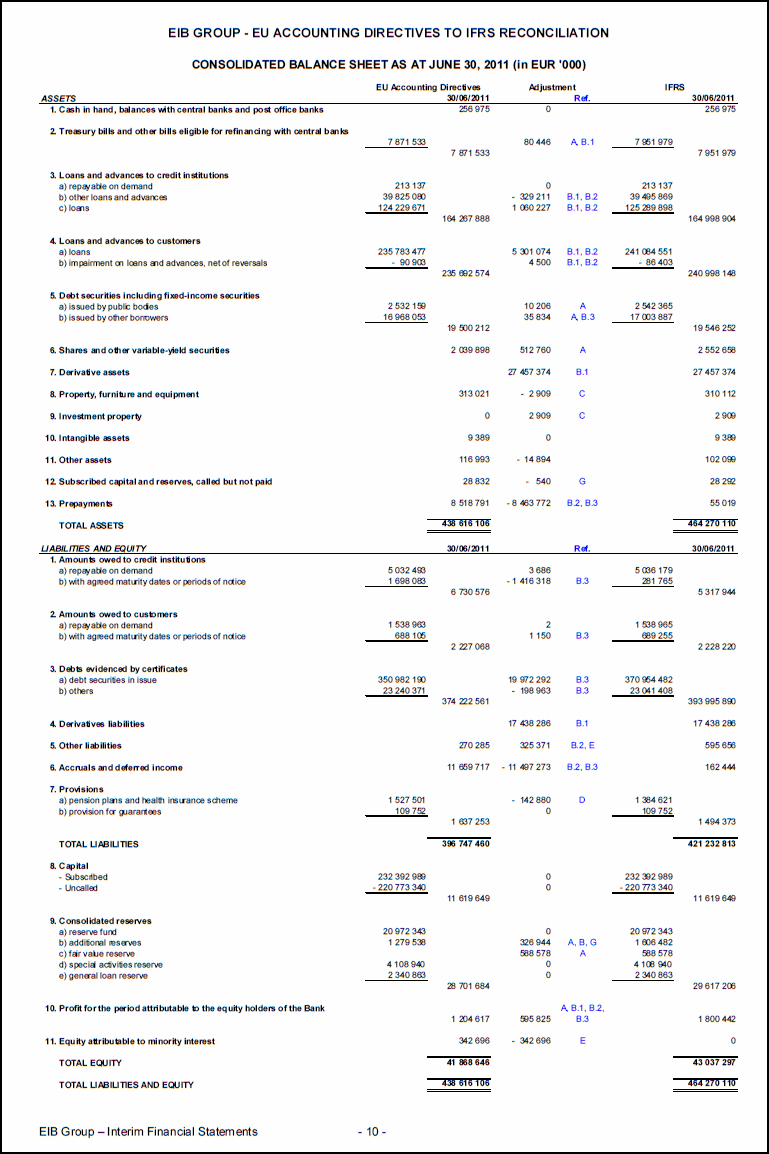
EIB GROUP - EU ACCOUNTING DIRECTIVES TO IFRS RECONCILIATION CONSOLIDATED BALANCE SHEET AS AT JUNE 30, 2011 (in EUR '000) EU Accounting Directives Adjustment IFRS ASSETS 30/06/2011 Ref. 30/06/2011 1. Cash in hand, balances with central banks and post office banks 256 975 0 256 975 2. Treasury bills and other bills eligible for refinancing with central banks 7 871 533 80 446 A, B.1 7 951 979 7 871 533 7 951 979 3. Loans and advances to credit institutions a) repayable on demand 213 137 0 213 137 b) other loans and advances 39 825 080 - 329 211 B.1, B.2 39 495 869 c) loans 124 229 671 1 060 227 B.1, B.2 125 289 898 164 267 888 164 998 904 4. Loans and advances to customers a) loans 235 783 477 5 301 074 B.1, B.2 241 084 551 b) impairment on loans and advances, net of reversals - 90 903 4 500 B.1, B.2 - 86 403 235 692 574 240 998 148 5. Debt securities including fixed-income securities a) issued by public bodies 2 532 159 10 206 A 2 542 365 b) issued by other borrowers 16 968 053 35 834 A, B.3 17 003 887 19 500 212 19 546 252 6. Shares and other variable-yield securities 2 039 898 512 760 A 2 552 658 7. Derivative assets 27 457 374 B.1 27 457 374 8. Property, furniture and equipment 313 021 - 2 909 C 310 112 9. Investment property 0 2 909 C 2 909 10. Intangible assets 9 389 0 9 389 11. Other assets 116 993 - 14 894 102 099 12. Subscribed capital and reserves, called but not paid 28 832 - 540 G 28 292 13. Prepayments 8 518 791 - 8 463 772 B.2, B.3 55 019 TOTAL ASSETS 438 616 106 464 270 110 LIABILITIES AND EQUITY 30/06/2011 Ref. 30/06/2011 1. Amounts owed to credit institutions a) repayable on demand 5 032 493 3 686 5 036 179 b) with agreed maturity dates or periods of notice 1 698 083 - 1 416 318 B.3 281 765 6 730 576 5 317 944 2. Amounts owed to customers a) repayable on demand 1 538 963 2 1 538 965 b) with agreed maturity dates or periods of notice 688 105 1 150 B.3 689 255 2 227 068 2 228 220 3. Debts evidenced by certificates a) debt securities in issue 350 982 190 19 972 292 B.3 370 954 482 b) others 23 240 371 - 198 963 B.3 23 041 408 374 222 561 393 995 890 4. Derivatives liabilities 17 438 286 B.1 17 438 286 5. Other liabilities 270 285 325 371 B.2, E 595 656 6. Accruals and deferred income 11 659 717 - 11 497 273 B.2, B.3 162 444 7. Provisions a) pension plans and health insurance scheme 1 527 501 - 142 880 D 1 384 621 b) provision for guarantees 109 752 0 109 752 1 637 253 1 494 373 TOTAL LIABILITIES 396 747 460 421 232 813 8. Capital - Subscribed 232 392 989 0 232 392 989 - Uncalled - 220 773 340 0 - 220 773 340 11 619 649 11 619 649 9. Consolidated reserves a) reserve fund 20 972 343 0 20 972 343 b) additional reserves 1 279 538 326 944 A, B, G 1 606 482 c) fair value reserve 588 578 A 588 578 d) special activities reserve 4 108 940 0 4 108 940 e) general loan reserve 2 340 863 0 2 340 863 28 701 684 29 617 206 10. Profit for the period attributable to the equity holders of the Bank 1 204 617 595 825 A, B.1, B.2, B.3 1 800 442 11. Equity attributable to minority interest 342 696 - 342 696 E 0 TOTAL EQUITY 41 868 646 43 037 297 TOTAL LIABILITIES AND EQUITY 438 616 106 464 270 110
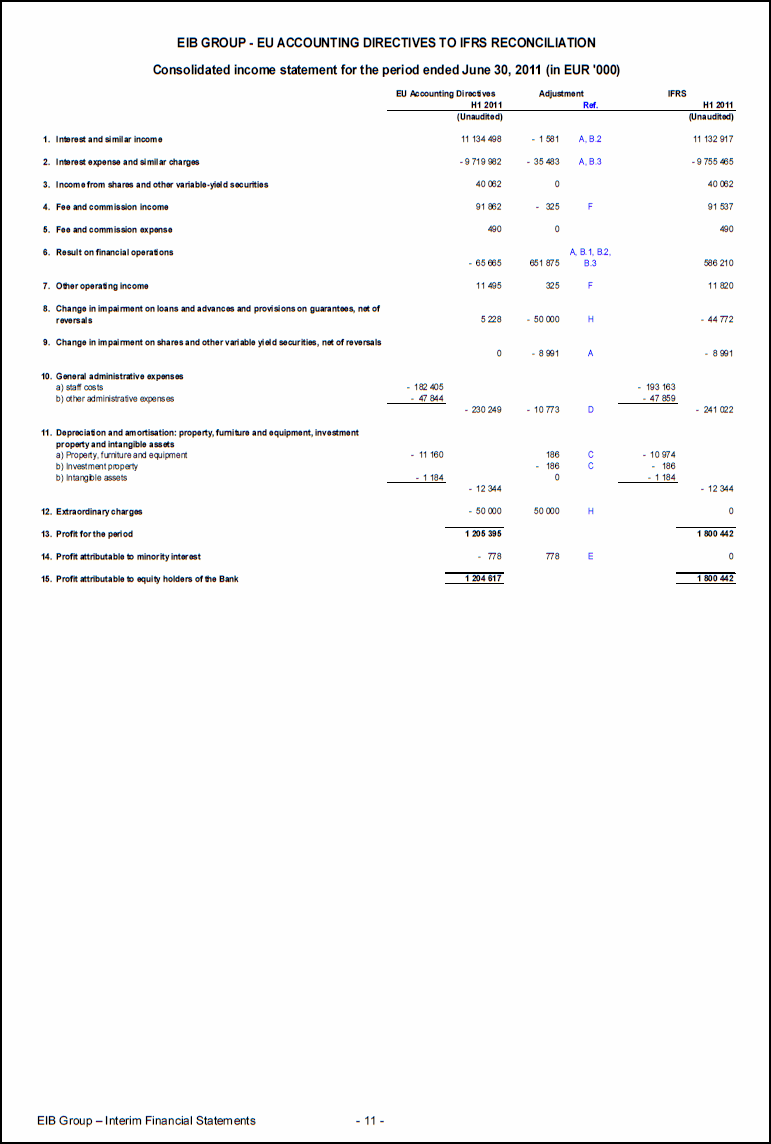
EIB GROUP - EU ACCOUNTING DIRECTIVES TO IFRS RECONCILIATION Consolidated income statement for the period ended June 30, 2011 (in EUR '000) EU Accounting Directives Adjustment IFRS H1 2011 Ref. H1 2011 (Unaudited) (Unaudited) 1. Interest and similar income 11 134 498 - 1 581 A, B.2 11 132 917 2. Interest expense and similar charges - 9 719 982 - 35 483 A, B.3 - 9 755 465 3. Income from shares and other variable-yield securities 40 062 0 40 062 4. Fee and commission income 91 862 - 325 F 91 537 5. Fee and commission expense 490 0 490 6. Result on financial operations - 65 665 651 875 A, B.1, B.2, B.3 586 210 7. Other operating income 11 495 325 F 11 820 8. Change in impairment on loans and advances and provisions on guarantees, net of reversals 5 228 - 50 000 H - 44 772 9. Change in impairment on shares and other variable yield securities, net of reversals 0 - 8 991 A - 8 991 10. General administrative expenses a) staff costs - 182 405 - 193 163 b) other administrative expenses - 47 844 - 47 859 - 230 249 - 10 773 D - 241 022 11. Depreciation and amortisation: property, furniture and equipment, investment property and intangible assets a) Property, furniture and equipment - 11 160 186 C - 10 974 b) Investment property - 186 C - 186 b) Intangible assets - 1 184 0 - 1 184 - 12 344 - 12 344 12. Extraordinary charges - 50 000 50 000 H 0 13. Profit for the period 1 205 395 1 800 442 14. Profit attributable to minority interest - 778 778 E 0 15. Profit attributable to equity holders of the Bank 1 204 617 1 800 442
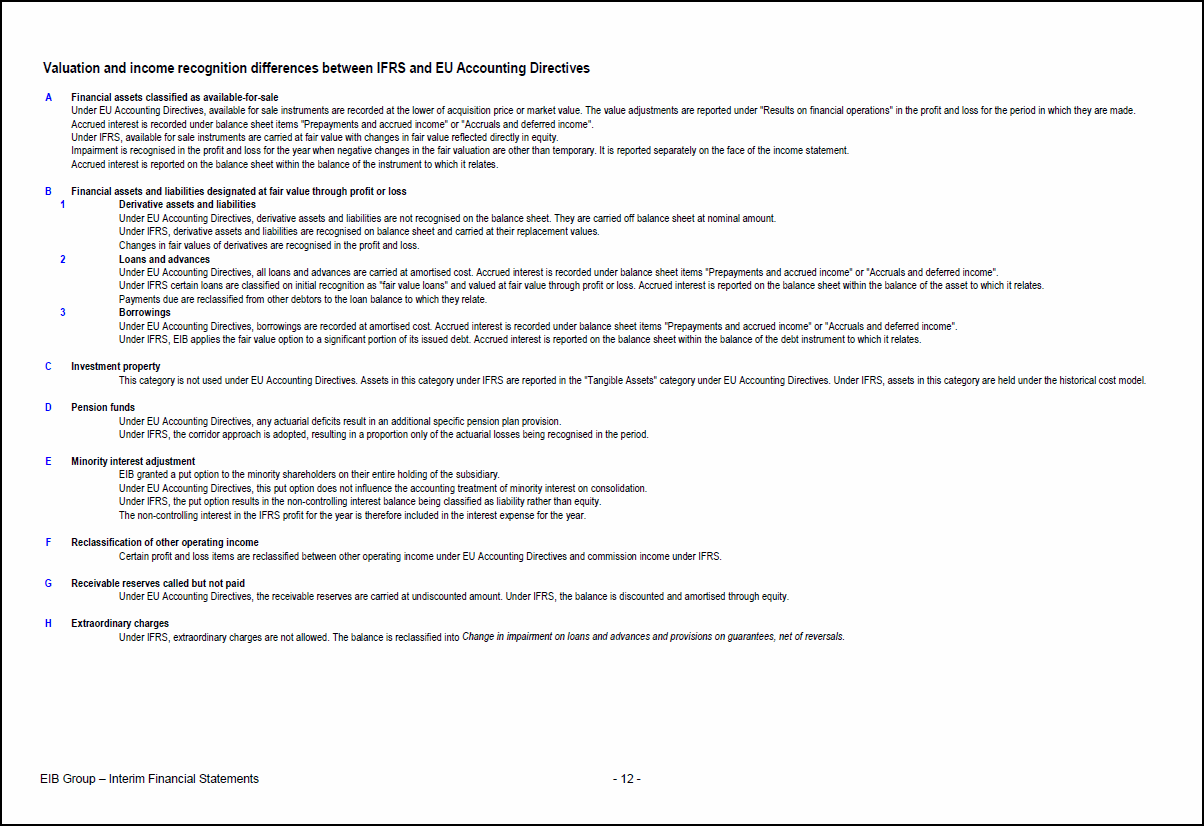
Valuation and income recognition differences between IFRS and EU Accounting Directives A Financial assets classified as available-for-sale Under EU Accounting Directives, available for sale instruments are recorded at the lower of acquisition price or market value. The value adjustments are reported under "Results on financial operations" in the profit and loss for the period in which they are made. Accrued interest is recorded under balance sheet items "Prepayments and accrued income" or "Accruals and deferred income". Under IFRS, available for sale instruments are carried at fair value with changes in fair value reflected directly in equity. Impairment is recognised in the profit and loss for the year when negative changes in the fair valuation are other than temporary. It is reported separately on the face of the income statement. Accrued interest is reported on the balance sheet within the balance of the instrument to which it relates. B Financial assets and liabilities designated at fair value through profit or loss 1 Derivative assets and liabilities Under EU Accounting Directives, derivative assets and liabilities are not recognised on the balance sheet. They are carried off balance sheet at nominal amount. Under IFRS, derivative assets and liabilities are recognised on balance sheet and carried at their replacement values. Changes in fair values of derivatives are recognised in the profit and loss. 2 Loans and advances Under EU Accounting Directives, all loans and advances are carried at amortised cost. Accrued interest is recorded under balance sheet items "Prepayments and accrued income" or "Accruals and deferred income". Under IFRS certain loans are classified on initial recognition as "fair value loans" and valued at fair value through profit or loss. Accrued interest is reported on the balance sheet within the balance of the asset to which it relates. Payments due are reclassified from other debtors to the loan balance to which they relate. 3 Borrowings Under EU Accounting Directives, borrowings are recorded at amortised cost. Accrued interest is recorded under balance sheet items "Prepayments and accrued income" or "Accruals and deferred income". Under IFRS, EIB applies the fair value option to a significant portion of its issued debt. Accrued interest is reported on the balance sheet within the balance of the debt instrument to which it relates. C Investment property This category is not used under EU Accounting Directives. Assets in this category under IFRS are reported in the "Tangible Assets" category under EU Accounting Directives. Under IFRS, assets in this category are held under the historical cost model. D Pension funds Under EU Accounting Directives, any actuarial deficits result in an additional specific pension plan provision. Under IFRS, the corridor approach is adopted, resulting in a proportion only of the actuarial losses being recognised in the period. E Minority interest adjustment EIB granted a put option to the minority shareholders on their entire holding of the subsidiary. Under EU Accounting Directives, this put option does not influence the accounting treatment of minority interest on consolidation. Under IFRS, the put option results in the non-controlling interest balance being classified as liability rather than equity. The non-controlling interest in the IFRS profit for the year is therefore included in the interest expense for the year. F Reclassification of other operating income Certain profit and loss items are reclassified between other operating income under EU Accounting Directives and commission income under IFRS. G Receivable reserves called but not paid Under EU Accounting Directives, the receivable reserves are carried at undiscounted amount. Under IFRS, the balance is discounted and amortised through equity. H Extraordinary charges Under IFRS, extraordinary charges are not allowed. The balance is reclassified into Change in impairment on loans and advances and provisions on guarantees, net of reversals.
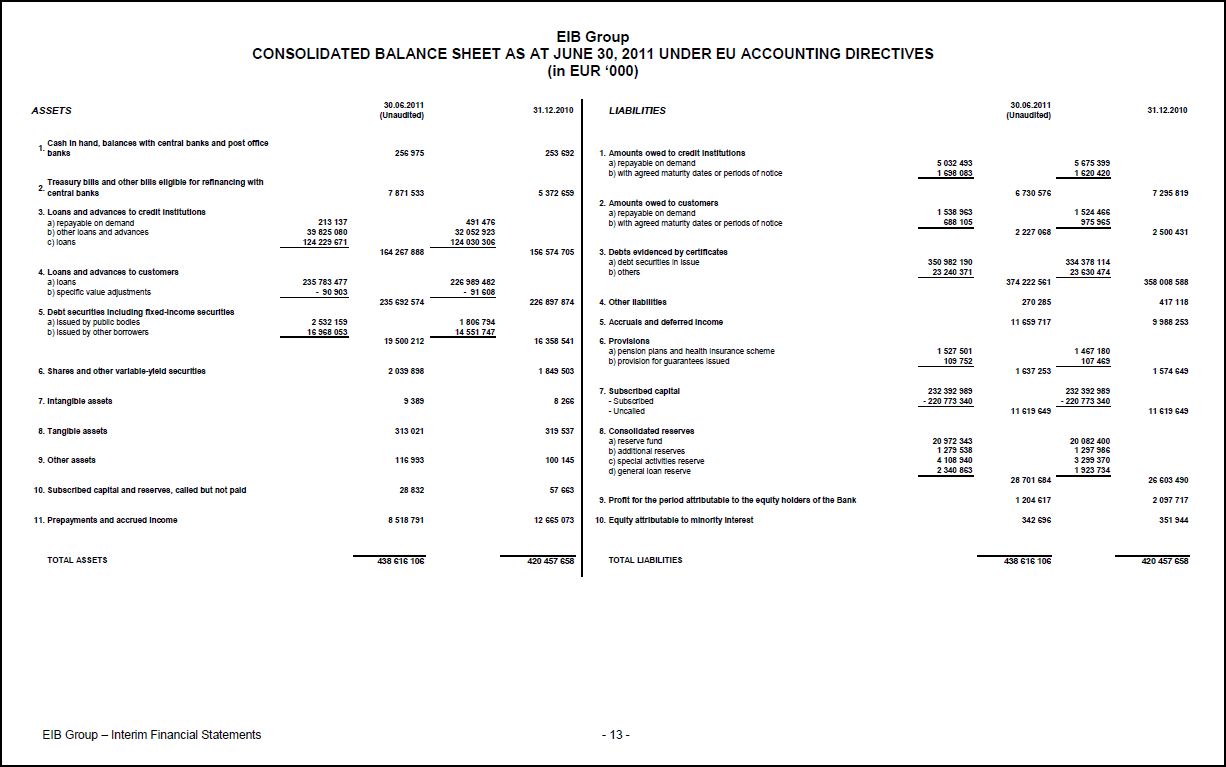
EIB Group CONSOLIDATED BALANCE SHEET AS AT JUNE 30, 2011 UNDER EU ACCOUNTING DIRECTIVES (in EUR ‘000) ASSETS 30.06.2011 (Unaudited) 31.12.2010 LIABILITIES 30.06.2011 (Unaudited) 31.12.2010 1. Cash in hand, balances with central banks and post office banks 256 975 253 692 1. Amounts owed to credit institutions a) repayable on demand 5 032 493 5 675 399 b) with agreed maturity dates or periods of notice 1 698 083 1 620 420 2. Treasury bills and other bills eligible for refinancing with central banks 7 871 533 5 372 659 6 730 576 7 295 819 2. Amounts owed to customers 3. Loans and advances to credit institutions a) repayable on demand 1 538 963 1 524 466 a) repayable on demand 213 137 491 476 b) with agreed maturity dates or periods of notice 688 105 975 965 b) other loans and advances 39 825 080 32 052 923 2 227 068 2 500 431 c) loans 124 229 671 124 030 306 164 267 888 156 574 705 3. Debts evidenced by certificates a) debt securities in issue 350 982 190 334 378 114 4. Loans and advances to customers b) others 23 240 371 23 630 474 a) loans 235 783 477 226 989 482 374 222 561 358 008 588 b) specific value adjustments - 90 903 - 91 608 235 692 574 226 897 874 4. Other liabilities 270 285 417 118 5. Debt securities including fixed-income securities a) issued by public bodies 2 532 159 1 806 794 5. Accruals and deferred income 11 659 717 9 988 253 b) issued by other borrowers 16 968 053 14 551 747 19 500 212 16 358 541 6. Provisions a) pension plans and health insurance scheme 1 527 501 1 467 180 b) provision for guarantees issued 109 752 107 469 6. Shares and other variable-yield securities 2 039 898 1 849 503 1 637 253 1 574 649 7. Subscribed capital 232 392 989 232 392 989 7. Intangible assets 9 389 8 266 - Subscribed - 220 773 340 - 220 773 340 - Uncalled 11 619 649 11 619 649 8. Tangible assets 313 021 319 537 8. Consolidated reserves a) reserve fund 20 972 343 20 082 400 b) additional reserves 1 279 538 1 297 986 9. Other assets 116 993 100 145 c) special activities reserve 4 108 940 3 299 370 d) general loan reserve 2 340 863 1 923 734 28 701 684 26 603 490 10. Subscribed capital and reserves, called but not paid 28 832 57 663 9. Profit for the period attributable to the equity holders of the Bank 1 204 617 2 097 717 11. Prepayments and accrued income 8 518 791 12 665 073 10. Equity attributable to minority interest 342 696 351 944 TOTAL ASSETS 438 616 106 420 457 658 TOTAL LIABILITIES 438 616 106 420 457 658
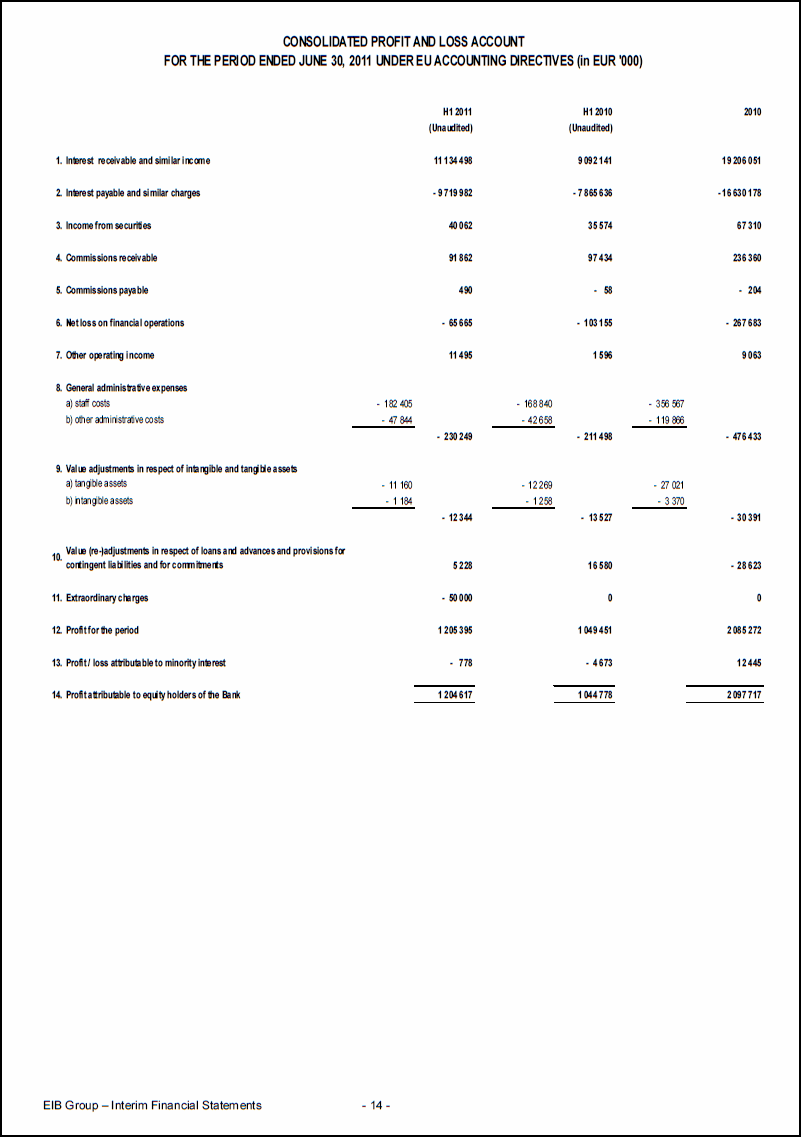
CONSOLIDATED PROFIT AND LOSS ACCOUNT FOR THE PERIOD ENDED JUNE 30, 2011 UNDER EU ACCOUNTING DIRECTIVES (in EUR '000) H1 2011 H1 2010 2010 (Unaudited) (Unaudited) 1. Interest receivable and similar income 11 134 498 9 092 141 19 206 051 2. Interest payable and similar charges - 9 719 982 - 7 865 636 - 16 630 178 3. Income from securities 40 062 35 574 67 310 4. Commissions receivable 91 862 97 434 236 360 5. Commissions payable 490 - 58 - 204 6. Net loss on financial operations - 65 665 - 103 155 - 267 683 7. Other operating income 11 495 1 596 9 063 8. General administrative expenses a) staff costs - 182 405 - 168 840 - 356 567 b) other administrative costs - 47 844 - 42 658 - 119 866 - 230 249 - 211 498 - 476 433 9. Value adjustments in respect of intangible and tangible assets a) tangible assets - 11 160 - 12 269 - 27 021 b) intangible assets - 1 184 - 1 258 - 3 370 - 12 344 - 13 527 - 30 391 10. Value (re-)adjustments in respect of loans and advances and provisions for contingent liabilities and for commitments 5 228 16 580 - 28 623 11. Extraordinary charges - 50 000 0 0 12. Profit for the period 1 205 395 1 049 451 2 085 272 13. Profit / loss attributable to minority interest - 778 - 4 673 12 445 14. Profit attributable to equity holders of the Bank 1 204 617 1 044 778 2 097 717
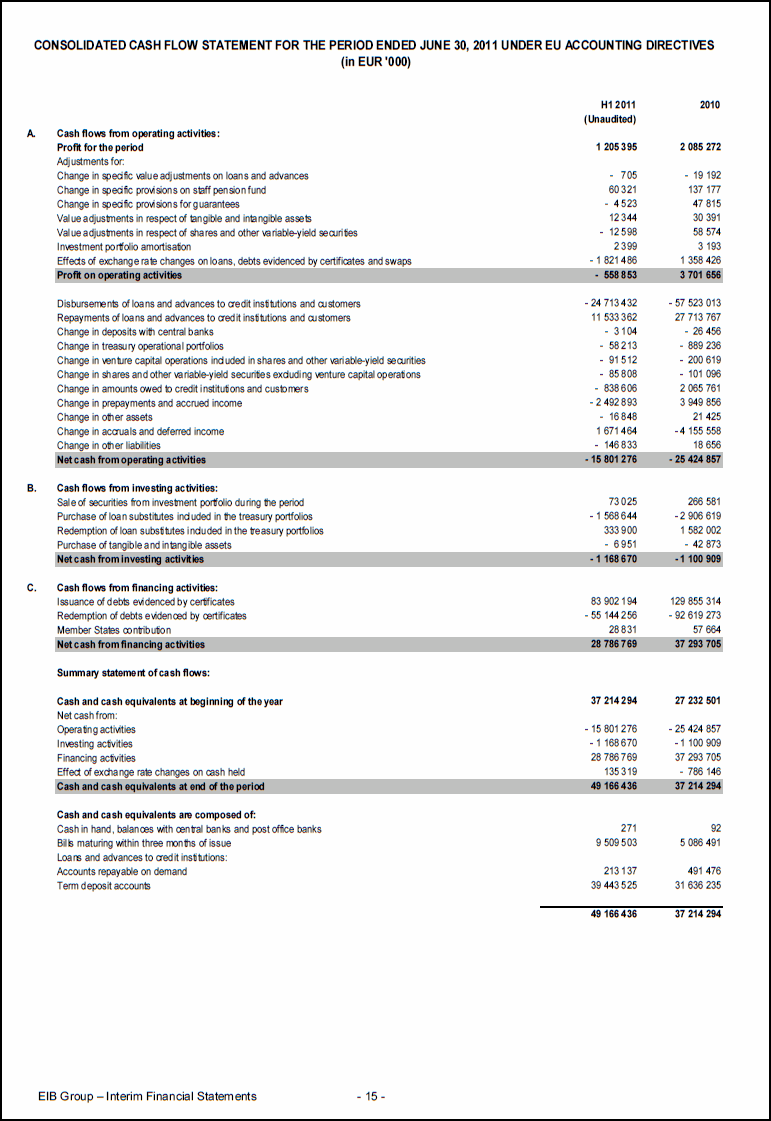
CONSOLIDATED CASH FLOW STATEMENT FOR THE PERIOD ENDED JUNE 30, 2011 UNDER EU ACCOUNTING DIRECTIVES (in EUR '000) H1 2011 2010 (Unaudited) A. Cash flows from operating activities: Profit for the period 1 205 395 2 085 272 Adjustments for: Change in specific value adjustments on loans and advances - 705 - 19 192 Change in specific provisions on staff pension fund 60 321 137 177 Change in specific provisions for guarantees - 4 523 47 815 Value adjustments in respect of tangible and intangible assets 12 344 30 391 Value adjustments in respect of shares and other variable-yield securities - 12 598 58 574 Investment portfolio amortisation 2 399 3 193 Effects of exchange rate changes on loans, debts evidenced by certificates and swaps - 1 821 486 1 358 426 Profit on operating activities - 558 853 3 701 656 Disbursements of loans and advances to credit institutions and customers - 24 713 432 - 57 523 013 Repayments of loans and advances to credit institutions and customers 11 533 362 27 713 767 Change in deposits with central banks - 3 104 - 26 456 Change in treasury operational portfolios - 58 213 - 889 236 Change in venture capital operations included in shares and other variable-yield securities - 91 512 - 200 619 Change in shares and other variable-yield securities excluding venture capital operations - 85 808 - 101 096 Change in amounts owed to credit institutions and customers - 838 606 2 065 761 Change in prepayments and accrued income - 2 492 893 3 949 856 Change in other assets - 16 848 21 425 Change in accruals and deferred income 1 671 464 - 4 155 558 Change in other liabilities - 146 833 18 656 Net cash from operating activities - 15 801 276 - 25 424 857 B. Cash flows from investing activities: Sale of securities from investment portfolio during the period 73 025 266 581 Purchase of loan substitutes included in the treasury portfolios - 1 568 644 - 2 906 619 Redemption of loan substitutes included in the treasury portfolios 333 900 1 582 002 Purchase of tangible and intangible assets - 6 951 - 42 873 Net cash from investing activities - 1 168 670 - 1 100 909 C. Cash flows from financing activities: Issuance of debts evidenced by certificates 83 902 194 129 855 314 Redemption of debts evidenced by certificates - 55 144 256 - 92 619 273 Member States contribution 28 831 57 664 Net cash from financing activities 28 786 769 37 293 705 Summary statement of cash flows: Cash and cash equivalents at beginning of the year 37 214 294 27 232 501 Net cash from: Operating activities - 15 801 276 - 25 424 857 Investing activities - 1 168 670 - 1 100 909 Financing activities 28 786 769 37 293 705 Effect of exchange rate changes on cash held 135 319 - 786 146 Cash and cash equivalents at end of the period 49 166 436 37 214 294 Cash and cash equivalents are composed of: Cash in hand, balances with central banks and post office banks 271 92 Bills maturing within three months of issue 9 509 503 5 086 491 Loans and advances to credit institutions: Accounts repayable on demand 213 137 491 476 Term deposit accounts 39 443 525 31 636 235 49 166 436 37 214 294
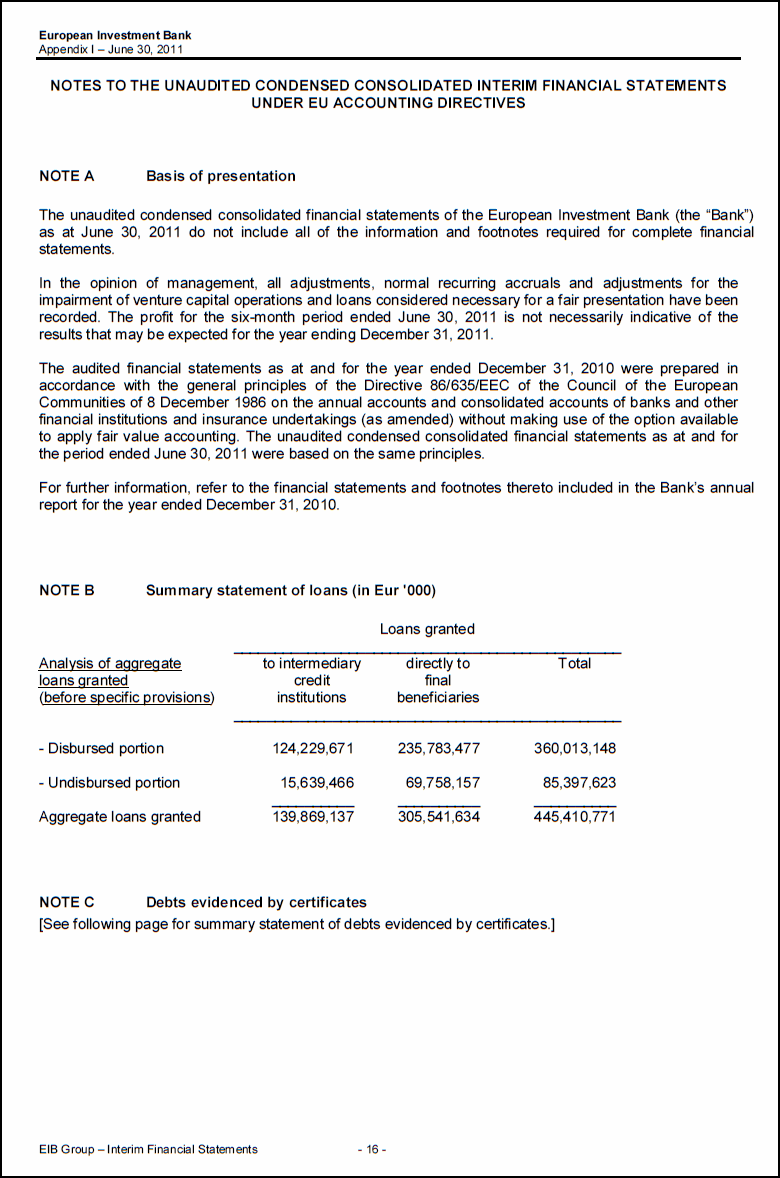
European Investment Bank Appendix I – June 30, 2011 NOTES TO THE UNAUDITED CONDENSED CONSOLIDATED INTERIM FINANCIAL STATEMENTS UNDER EU ACCOUNTING DIRECTIVES NOTE A Basis of presentation The unaudited condensed consolidated financial statements of the European Investment Bank (the “Bank”) as at June 30, 2011 do not include all of the information and footnotes required for complete financial statements. In the opinion of management, all adjustments, normal recurring accruals and adjustments for the impairment of venture capital operations and loans considered necessary for a fair presentation have been recorded. The profit for the six-month period ended June 30, 2011 is not necessarily indicative of the results that may be expected for the year ending December 31, 2011. The audited financial statements as at and for the year ended December 31, 2010 were prepared in accordance with the general principles of the Directive 86/635/EEC of the Council of the European Communities of 8 December 1986 on the annual accounts and consolidated accounts of banks and other financial institutions and insurance undertakings (as amended) without making use of the option available to apply fair value accounting. The unaudited condensed consolidated financial statements as at and for the period ended June 30, 2011 were based on the same principles. For further information, refer to the financial statements and footnotes thereto included in the Bank’s annual report for the year ended December 31, 2010. NOTE B Summary statement of loans (in Eur '000) Loans granted Analysis of aggregate to intermediary directly to Total loans granted credit final (before specific provisions) institutions beneficiaries - Disbursed portion 124,229,671 235,783,477 360,013,148 - Undisbursed portion 15,639,466 69,758,157 85,397,623 Aggregate loans granted 139,869,137 305,541,634 445,410,771 NOTE C Debts evidenced by certificates [See following page for summary statement of debts evidenced by certificates.]
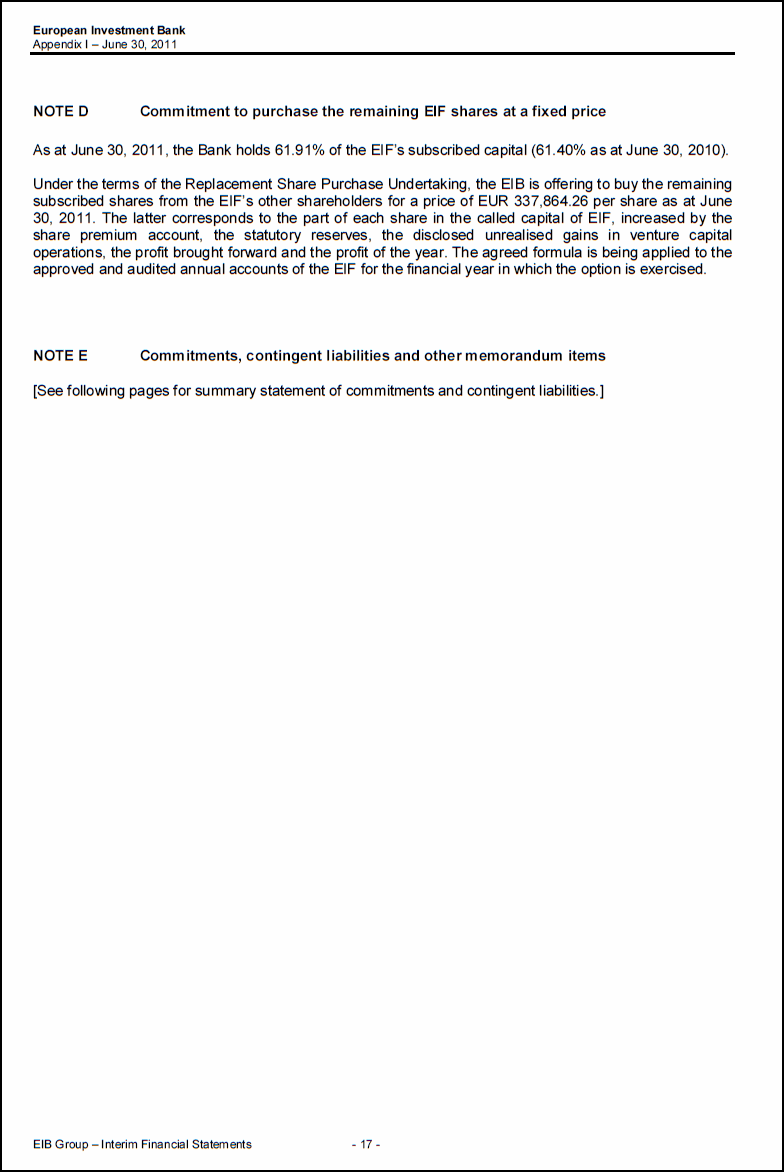
European Investment Bank Appendix I – June 30, 2011 NOTE D Commitment to purchase the remaining EIF shares at a fixed price As at June 30, 2011, the Bank holds 61.91% of the EIF’s subscribed capital (61.40% as at June 30, 2010). Under the terms of the Replacement Share Purchase Undertaking, the EIB is offering to buy the remaining subscribed shares from the EIF’s other shareholders for a price of EUR 337,864.26 per share as at June 30, 2011. The latter corresponds to the part of each share in the called capital of EIF, increased by the share premium account, the statutory reserves, the disclosed unrealised gains in venture capital operations, the profit brought forward and the profit of the year. The agreed formula is being applied to the approved and audited annual accounts of the EIF for the financial year in which the option is exercised. NOTE E Commitments, contingent liabilities and other memorandum items [See following pages for summary statement of commitments and contingent liabilities.]
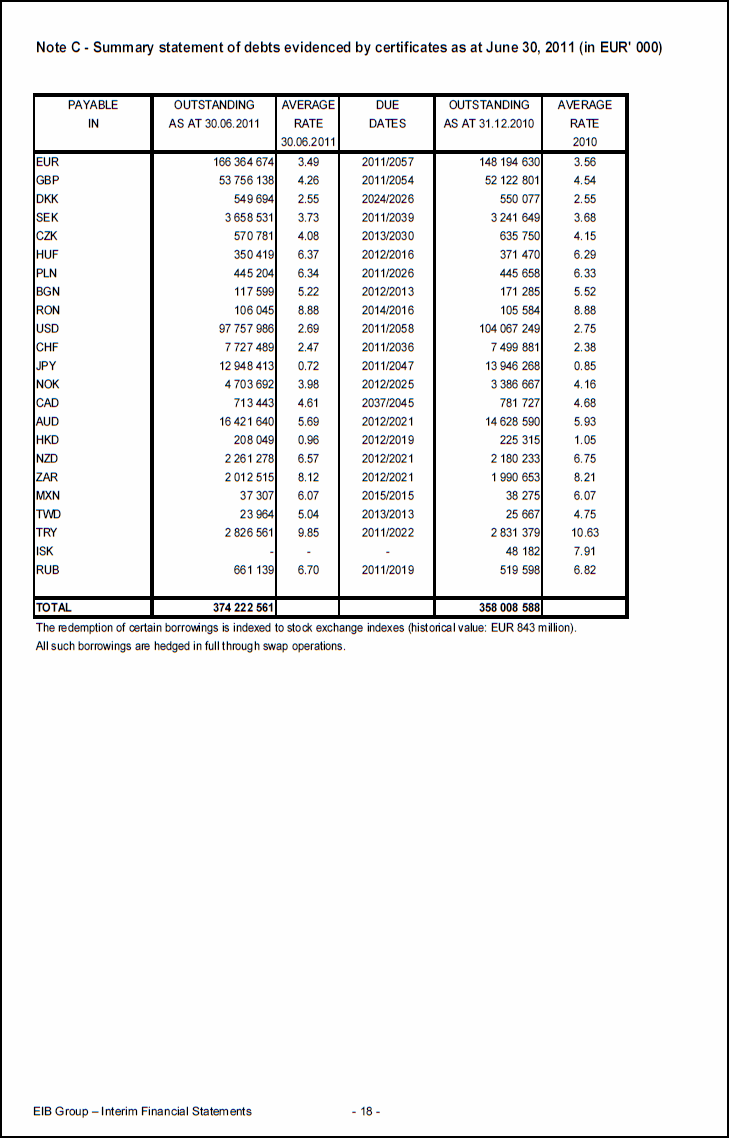
Note C - Summary statement of debts evidenced by certificates as at June 30, 2011 (in EUR' 000) PAYABLE OUTSTANDING AVERAGE DUE OUTSTANDING AVERAGE IN AS AT 30.06.2011 RATE DATES AS AT 31.12.2010 RATE 30.06.2011 2010 EUR 166 364 674 3.49 2011/2057 148 194 630 3.56 GBP 53 756 138 4.26 2011/2054 52 122 801 4.54 DKK 549 694 2.55 2024/2026 550 077 2.55 SEK 3 658 531 3.73 2011/2039 3 241 649 3.68 CZK 570 781 4.08 2013/2030 635 750 4.15 HUF 350 419 6.37 2012/2016 371 470 6.29 PLN 445 204 6.34 2011/2026 445 658 6.33 BGN 117 599 5.22 2012/2013 171 285 5.52 RON 106 045 8.88 2014/2016 105 584 8.88 USD 97 757 986 2.69 2011/2058 104 067 249 2.75 CHF 7 727 489 2.47 2011/2036 7 499 881 2.38 JPY 12 948 413 0.72 2011/2047 13 946 268 0.85 NOK 4 703 692 3.98 2012/2025 3 386 667 4.16 CAD 713 443 4.61 2037/2045 781 727 4.68 AUD 16 421 640 5.69 2012/2021 14 628 590 5.93 HKD 208 049 0.96 2012/2019 225 315 1.05 NZD 2 261 278 6.57 2012/2021 2 180 233 6.75 ZAR 2 012 515 8.12 2012/2021 1 990 653 8.21 MXN 37 307 6.07 2015/2015 38 275 6.07 TWD 23 964 5.04 2013/2013 25 667 4.75 TRY 2 826 561 9.85 2011/2022 2 831 379 10.63 ISK - - - 48 182 7.91 RUB 661 139 6.70 2011/2019 519 598 6.82 TOTAL 374 222 561 358 008 588 The redemption of certain borrowings is indexed to stock exchange indexes (historical value: EUR 843 million). All such borrowings are hedged in full through swap operations.
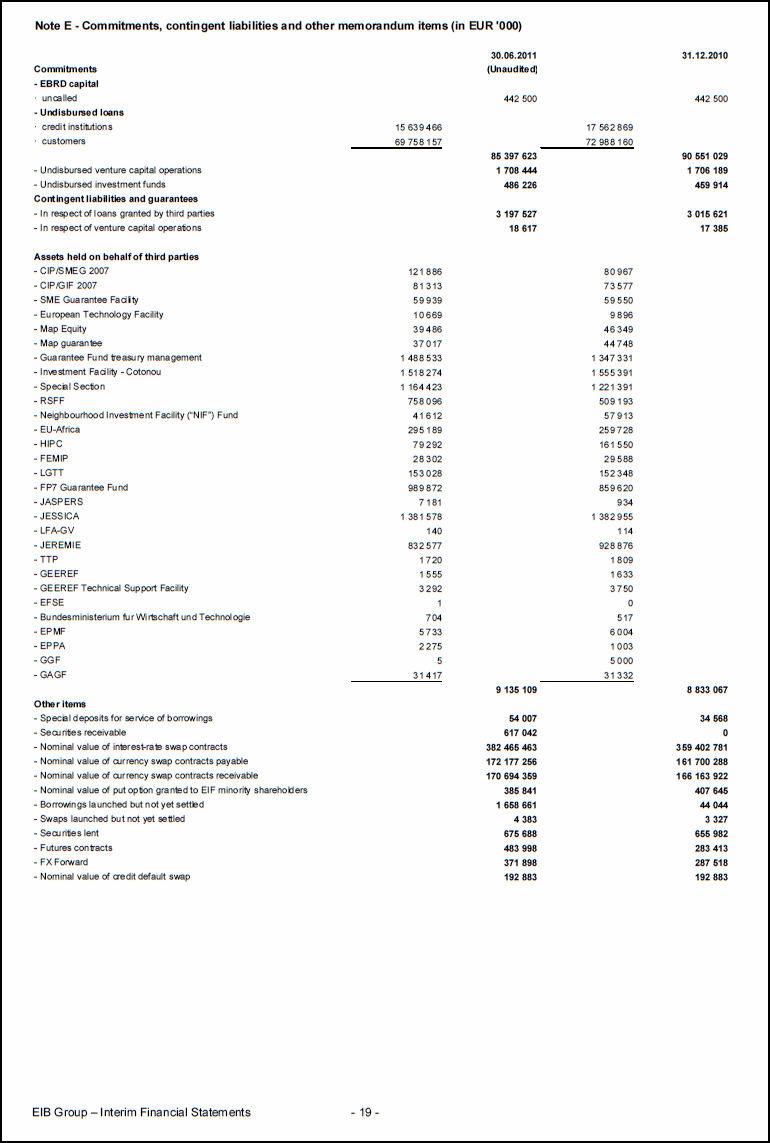
Note E - Commitments, contingent liabilities and other memorandum items (in EUR '000) 30.06.2011 31.12.2010 Commitments (Unaudited) - EBRD capital · uncalled 442 500 442 500 - Undisbursed loans · credit institutions 15 639 466 17 562 869 · customers 69 758 157 72 988 160 85 397 623 90 551 029 - Undisbursed venture capital operations 1 708 444 1 706 189 - Undisbursed investment funds 486 226 459 914 Contingent liabilities and guarantees - In respect of loans granted by third parties 3 197 527 3 015 621 - In respect of venture capital operations 18 617 17 385 Assets held on behalf of third parties - CIP/SMEG 2007 121 886 80 967 - CIP/GIF 2007 81 313 73 577 - SME Guarantee Facility 59 939 59 550 - European Technology Facility 10 669 9 896 - Map Equity 39 486 46 349 - Map guarantee 37 017 44 748 - Guarantee Fund treasury management 1 488 533 1 347 331 - Investment Facility - Cotonou 1 518 274 1 555 391 - Special Section 1 164 423 1 221 391 - RSFF 758 096 509 193 - Neighbourhood Investment Facility (“NIF”) Fund 41 612 57 913 - EU-Africa 295 189 259 728 - HIPC 79 292 161 550 - FEMIP 28 302 29 588 - LGTT 153 028 152 348 - FP7 Guarantee Fund 989 872 859 620 - JASPERS 7 181 934 - JESSICA 1 381 578 1 382 955 - LFA-GV 140 114 - JEREMIE 832 577 928 876 - TTP 1 720 1 809 - GEEREF 1 555 1 633 - GEEREF Technical Support Facility 3 292 3 750 - EFSE 1 0 - Bundesministerium fur Wirtschaft und Technologie 704 517 - EPMF 5 733 6 004 - EPPA 2 275 1 003 - GGF 5 5 000 - GAGF 31 417 31 332 9 135 109 8 833 067 Other items - Special deposits for service of borrowings 54 007 34 568 - Securities receivable 617 042 0 - Nominal value of interest-rate swap contracts 382 465 463 359 402 781 - Nominal value of currency swap contracts payable 172 177 256 161 700 288 - Nominal value of currency swap contracts receivable 170 694 359 166 163 922 - Nominal value of put option granted to EIF minority shareholders 385 841 407 645 - Borrowings launched but not yet settled 1 658 661 44 044 - Swaps launched but not yet settled 4 383 3 327 - Securities lent 675 688 655 982 - Futures contracts 483 998 283 413 - FX Forward 371 898 287 518 - Nominal value of credit default swap 192 883 192 883
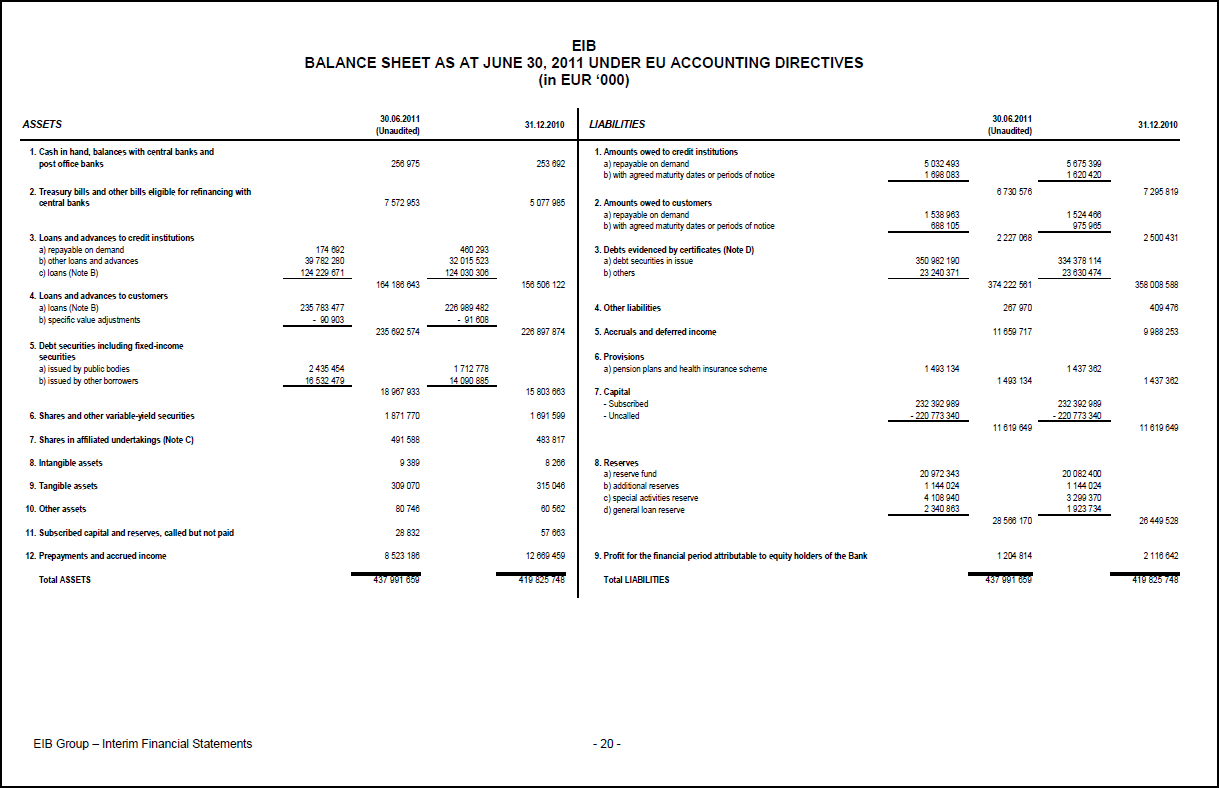
EIB BALANCE SHEET AS AT JUNE 30, 2011 UNDER EU ACCOUNTING DIRECTIVES (in EUR ‘000) ASSETS 30.06.2011 (Unaudited) 31.12.2010 LIABILITIES 30.06.2011 (Unaudited) 31.12.2010 1. Cash in hand, balances with central banks and 1. Amounts owed to credit institutions post office banks 256 975 253 692 a) repayable on demand 5 032 493 5 675 399 b) with agreed maturity dates or periods of notice 1 698 083 1 620 420 2. Treasury bills and other bills eligible for refinancing with 6 730 576 7 295 819 central banks 7 572 953 5 077 985 2. Amounts owed to customers a) repayable on demand 1 538 963 1 524 466 b) with agreed maturity dates or periods of notice 688 105 975 965 3. Loans and advances to credit institutions 2 227 068 2 500 431 a) repayable on demand 174 692 460 293 3. Debts evidenced by certificates (Note D) b) other loans and advances 39 782 280 32 015 523 a) debt securities in issue 350 982 190 334 378 114 c) loans (Note B) 124 229 671 124 030 306 b) others 23 240 371 23 630 474 164 186 643 156 506 122 374 222 561 358 008 588 4. Loans and advances to customers a) loans (Note B) 235 783 477 226 989 482 4. Other liabilities 267 970 409 476 b) specific value adjustments - 90 903 - 91 608 235 692 574 226 897 874 5. Accruals and deferred income 11 659 717 9 988 253 5. Debt securities including fixed-income securities 6. Provisions a) issued by public bodies 2 435 454 1 712 778 a) pension plans and health insurance scheme 1 493 134 1 437 362 b) issued by other borrowers 16 532 479 14 090 885 1 493 134 1 437 362 18 967 933 15 803 663 7. Capital - Subscribed 232 392 989 232 392 989 6. Shares and other variable-yield securities 1 871 770 1 691 599 - Uncalled - 220 773 340 - 220 773 340 11 619 649 11 619 649 7. Shares in affiliated undertakings (Note C) 491 588 483 817 8. Intangible assets 9 389 8 266 8. Reserves a) reserve fund 20 972 343 20 082 400 9. Tangible assets 309 070 315 046 b) additional reserves 1 144 024 1 144 024 c) special activities reserve 4 108 940 3 299 370 10. Other assets 80 746 60 562 d) general loan reserve 2 340 863 1 923 734 28 566 170 26 449 528 11. Subscribed capital and reserves, called but not paid 28 832 57 663 12. Prepayments and accrued income 8 523 186 12 669 459 9. Profit for the financial period attributable to equity holders of the Bank 1 204 814 2 116 642 Total ASSETS 437 991 659 419 825 748 Total LIABILITIES 437 991 659 419 825 748
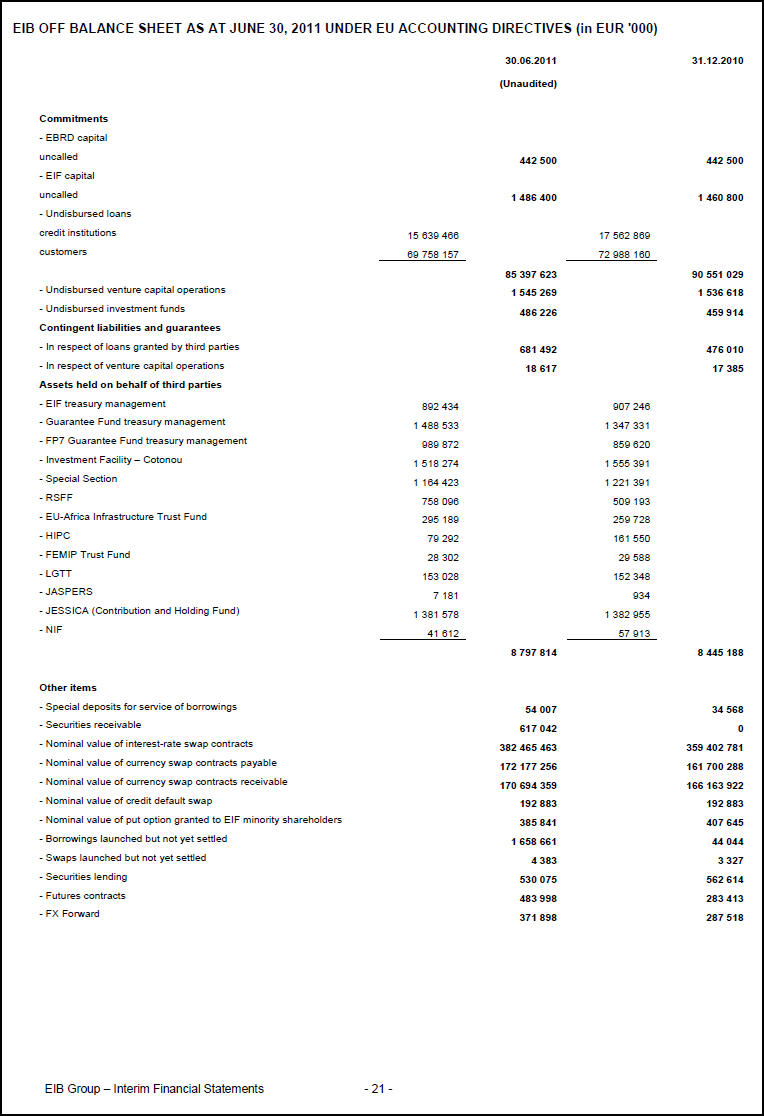
EIB OFF BALANCE SHEET AS AT JUNE 30, 2011 UNDER EU ACCOUNTING DIRECTIVES (in EUR '000) 30.06.2011 31.12.2010 (Unaudited) Commitments - EBRD capital uncalled 442 500 442 500 - EIF capital uncalled 1 486 400 1 460 800 - Undisbursed loans credit institutions 15 639 466 17 562 869 customers 69 758 157 72 988 160 85 397 623 90 551 029 - Undisbursed venture capital operations 1 545 269 1 536 618 - Undisbursed investment funds 486 226 459 914 Contingent liabilities and guarantees - In respect of loans granted by third parties 681 492 476 010 - In respect of venture capital operations 18 617 17 385 Assets held on behalf of third parties - EIF treasury management 892 434 907 246 - Guarantee Fund treasury management 1 488 533 1 347 331 - FP7 Guarantee Fund treasury management 989 872 859 620 - Investment Facility – Cotonou 1 518 274 1 555 391 - Special Section 1 164 423 1 221 391 - RSFF 758 096 509 193 - EU-Africa Infrastructure Trust Fund 295 189 259 728 - HIPC 79 292 161 550 - FEMIP Trust Fund 28 302 29 588 - LGTT 153 028 152 348 - JASPERS 7 181 934 - JESSICA (Contribution and Holding Fund) 1 381 578 1 382 955 - NIF 41 612 57 913 8 797 814 8 445 188 Other items - Special deposits for service of borrowings 54 007 34 568 - Securities receivable 617 042 0 - Nominal value of interest-rate swap contracts 382 465 463 359 402 781 - Nominal value of currency swap contracts payable 172 177 256 161 700 288 - Nominal value of currency swap contracts receivable 170 694 359 166 163 922 - Nominal value of credit default swap 192 883 192 883 - Nominal value of put option granted to EIF minority shareholders 385 841 407 645 - Borrowings launched but not yet settled 1 658 661 44 044 - Swaps launched but not yet settled 4 383 3 327 - Securities lending 530 075 562 614 - Futures contracts 483 998 283 413 - FX Forward 371 898 287 518
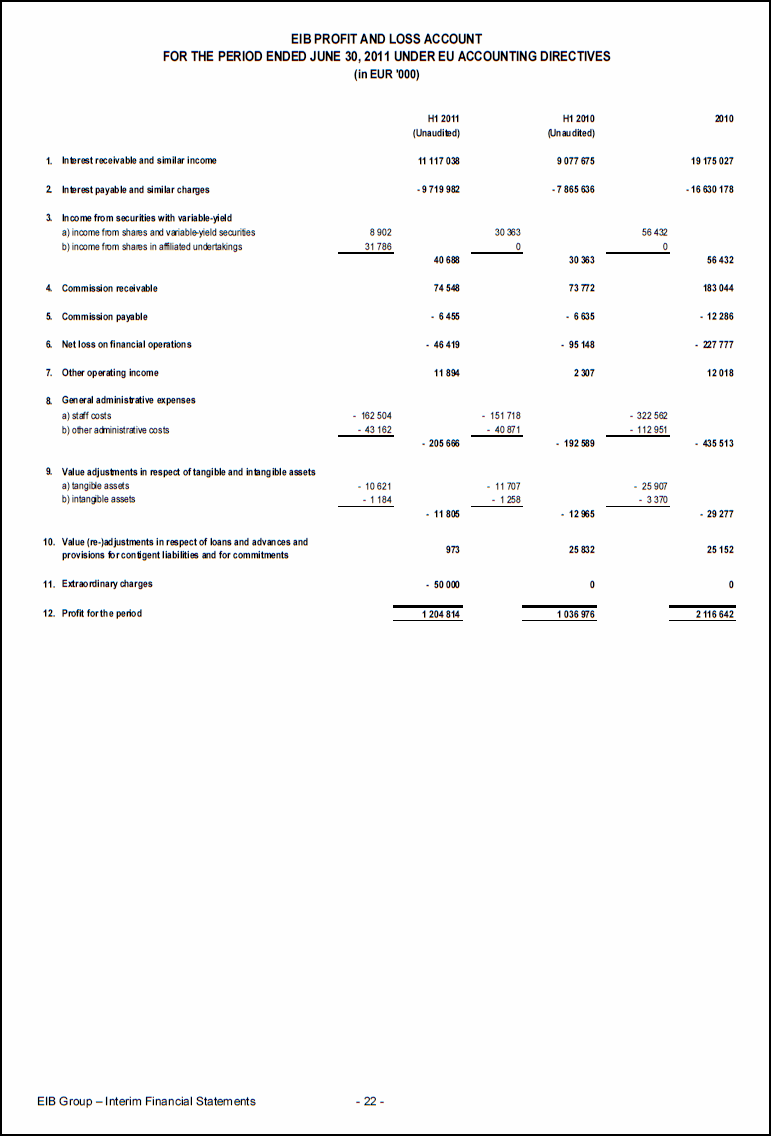
EIB PROFIT AND LOSS ACCOUNT FOR THE PERIOD ENDED JUNE 30, 2011 UNDER EU ACCOUNTING DIRECTIVES (in EUR '000) H1 2011 H1 2010 2010 (Unaudited) (Unaudited) 1. Interest receivable and similar income 11 117 038 9 077 675 19 175 027 2. Interest payable and similar charges - 9 719 982 - 7 865 636 - 16 630 178 3. Income from securities with variable-yield a) income from shares and variable-yield securities 8 902 30 363 56 432 b) income from shares in affiliated undertakings 31 786 0 0 40 688 30 363 56 432 4. Commission receivable 74 548 73 772 183 044 5. Commission payable - 6 455 - 6 635 - 12 286 6. Net loss on financial operations - 46 419 - 95 148 - 227 777 7. Other operating income 11 894 2 307 12 018 8. General administrative expenses a) staff costs - 162 504 - 151 718 - 322 562 b) other administrative costs - 43 162 - 40 871 - 112 951 - 205 666 - 192 589 - 435 513 9. Value adjustments in respect of tangible and intangible assets a) tangible assets - 10 621 - 11 707 - 25 907 b) intangible assets - 1 184 - 1 258 - 3 370 - 11 805 - 12 965 - 29 277 10. Value (re-)adjustments in respect of loans and advances and provisions for contigent liabilities and for commitments 973 25 832 25 152 11. Extraordinary charges - 50 000 0 0 12. Profit for the period 1 204 814 1 036 976 2 116 642
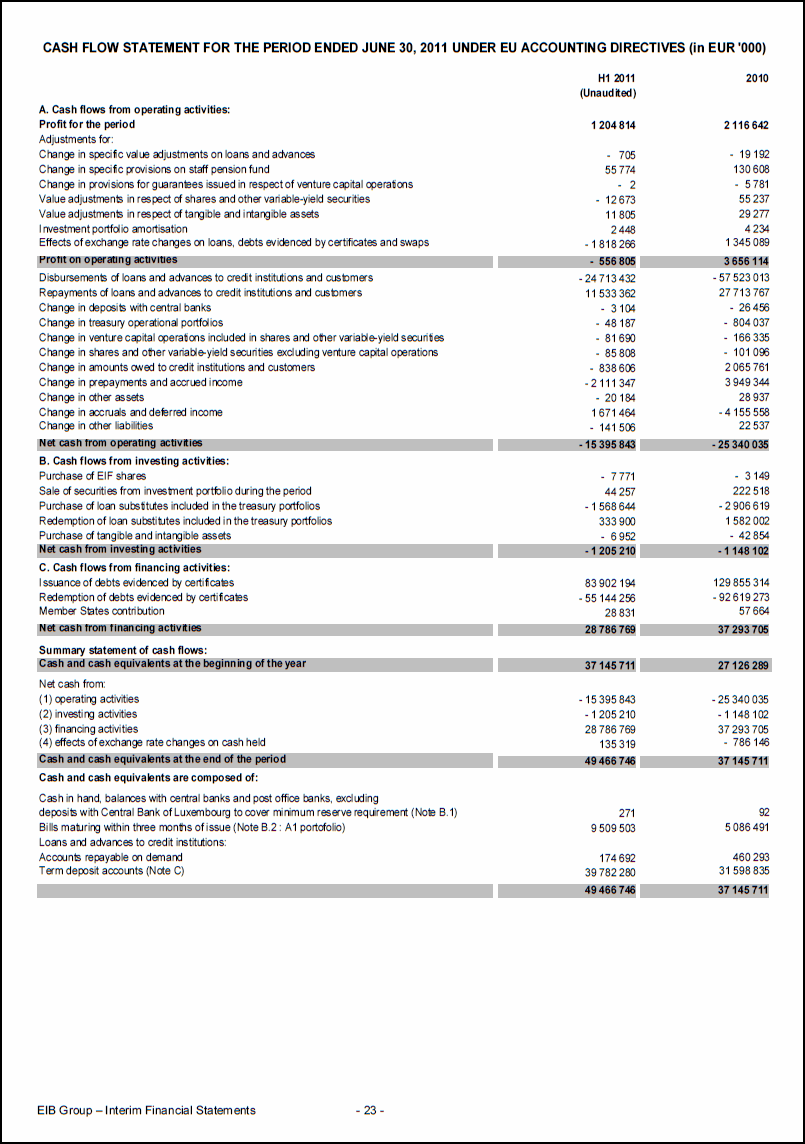
CASH FLOW STATEMENT FOR THE PERIOD ENDED JUNE 30, 2011 UNDER EU ACCOUNTING DIRECTIVES (in EUR '000) H1 2011 2010 (Unaudited) A. Cash flows from operating activities: Profit for the period 1 204 814 2 116 642 Adjustments for: Change in specific value adjustments on loans and advances - 705 - 19 192 Change in specific provisions on staff pension fund 55 774 130 608 Change in provisions for guarantees issued in respect of venture capital operations - 2 - 5 781 Value adjustments in respect of shares and other variable-yield securities - 12 673 55 237 Value adjustments in respect of tangible and intangible assets 11 805 29 277 Investment portfolio amortisation 2 448 4 234 Effects of exchange rate changes on loans, debts evidenced by certificates and swaps - 1 818 266 1 345 089 Profit on operating activities - 556 805 3 656 114 Disbursements of loans and advances to credit institutions and customers - 24 713 432 - 57 523 013 Repayments of loans and advances to credit institutions and customers 11 533 362 27 713 767 Change in deposits with central banks - 3 104 - 26 456 Change in treasury operational portfolios - 48 187 - 804 037 Change in venture capital operations included in shares and other variable-yield securities - 81 690 - 166 335 Change in shares and other variable-yield securities excluding venture capital operations - 85 808 - 101 096 Change in amounts owed to credit institutions and customers - 838 606 2 065 761 Change in prepayments and accrued income - 2 111 347 3 949 344 Change in other assets - 20 184 28 937 Change in accruals and deferred income 1 671 464 - 4 155 558 Change in other liabilities - 141 506 22 537 Net cash from operating activities - 15 395 843 - 25 340 035 B. Cash flows from investing activities: Purchase of EIF shares - 7 771 - 3 149 Sale of securities from investment portfolio during the period 44 257 222 518 Purchase of loan substitutes included in the treasury portfolios - 1 568 644 - 2 906 619 Redemption of loan substitutes included in the treasury portfolios 333 900 1 582 002 Purchase of tangible and intangible assets - 6 952 - 42 854 Net cash from investing activities - 1 205 210 - 1 148 102 C. Cash flows from financing activities: Issuance of debts evidenced by certificates 83 902 194 129 855 314 Redemption of debts evidenced by certificates - 55 144 256 - 92 619 273 Member States contribution 28 831 57 664 Net cash from financing activities 28 786 769 37 293 705 Summary statement of cash flows: Cash and cash equivalents at the beginning of the year 37 145 711 27 126 289 Net cash from: (1) operating activities - 15 395 843 - 25 340 035 (2) investing activities - 1 205 210 - 1 148 102 (3) financing activities 28 786 769 37 293 705 (4) effects of exchange rate changes on cash held 135 319 - 786 146 Cash and cash equivalents at the end of the period 49 466 746 37 145 711 Cash and cash equivalents are composed of: Cash in hand, balances with central banks and post office banks, excluding deposits with Central Bank of Luxembourg to cover minimum reserve requirement (Note B.1) 271 92 Bills maturing within three months of issue (Note B.2 : A1 portofolio) 9 509 503 5 086 491 Loans and advances to credit institutions: Accounts repayable on demand 174 692 460 293 Term deposit accounts (Note C) 39 782 280 31 598 835 49 466 746 37 145 711
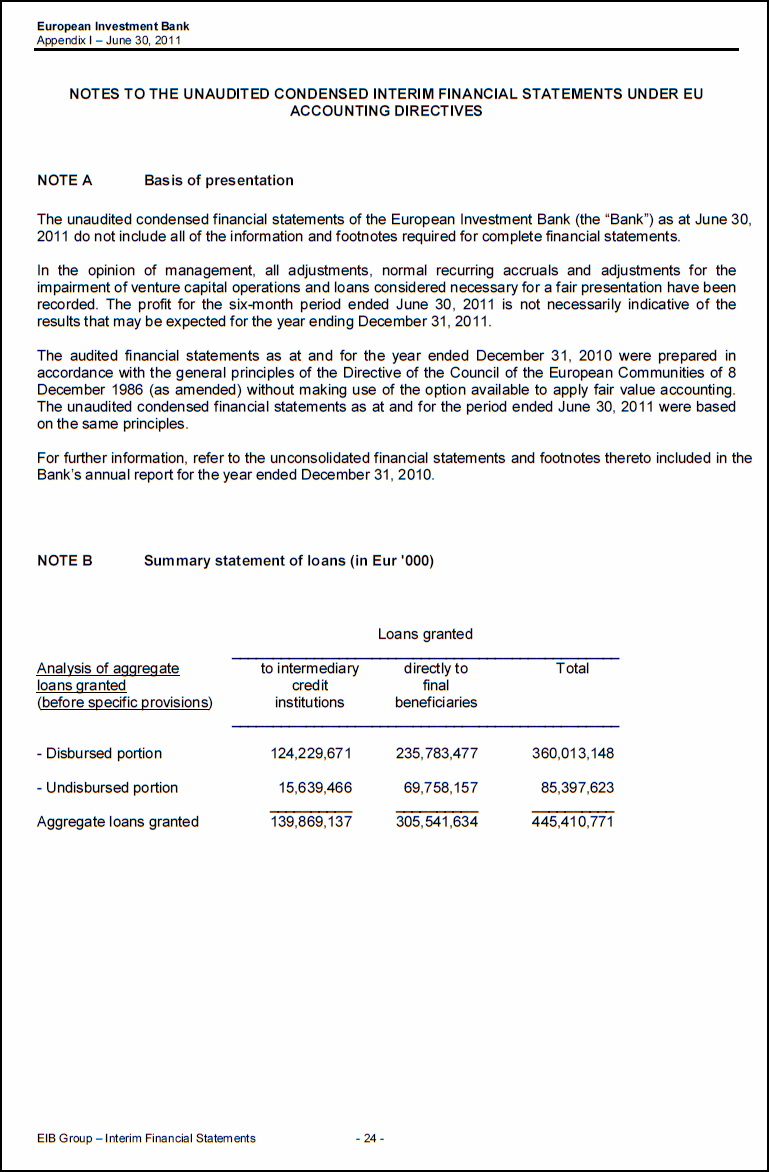
European Investment Bank Appendix I – June 30, 2011 NOTES TO THE UNAUDITED CONDENSED INTERIM FINANCIAL STATEMENTS UNDER EU ACCOUNTING DIRECTIVES NOTE A Basis of presentation The unaudited condensed financial statements of the European Investment Bank (the “Bank”) as at June 30, 2011 do not include all of the information and footnotes required for complete financial statements. In the opinion of management, all adjustments, normal recurring accruals and adjustments for the impairment of venture capital operations and loans considered necessary for a fair presentation have been recorded. The profit for the six-month period ended June 30, 2011 is not necessarily indicative of the results that may be expected for the year ending December 31, 2011. The audited financial statements as at and for the year ended December 31, 2010 were prepared in accordance with the general principles of the Directive of the Council of the European Communities of 8 December 1986 (as amended) without making use of the option available to apply fair value accounting. The unaudited condensed financial statements as at and for the period ended June 30, 2011 were based on the same principles. For further information, refer to the unconsolidated financial statements and footnotes thereto included in the Bank’s annual report for the year ended December 31, 2010. NOTE B Summary statement of loans (in Eur '000) Loans granted Analysis of aggregate to intermediary directly to Total loans granted credit final (before specific provisions) institutions beneficiaries - Disbursed portion 124,229,671 235,783,477 360,013,148 - Undisbursed portion 15,639,466 69,758,157 85,397,623 Aggregate loans granted 139,869,137 305,541,634 445,410,771
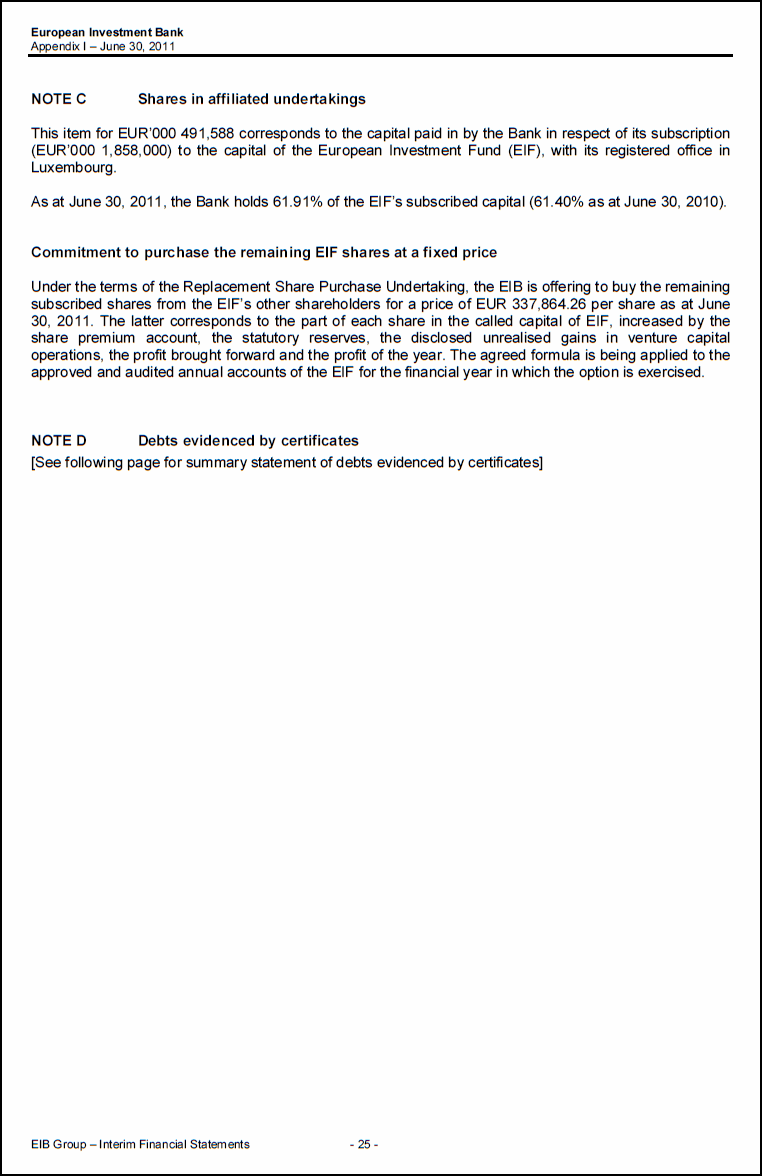
European Investment Bank Appendix I – June 30, 2011 NOTE C Shares in affiliated undertakings This item for EUR’000 491,588 corresponds to the capital paid in by the Bank in respect of its subscription (EUR’000 1,858,000) to the capital of the European Investment Fund (EIF), with its registered office in Luxembourg. As at June 30, 2011, the Bank holds 61.91% of the EIF’s subscribed capital (61.40% as at June 30, 2010). Commitment to purchase the remaining EIF shares at a fixed price Under the terms of the Replacement Share Purchase Undertaking, the EIB is offering to buy the remaining subscribed shares from the EIF’s other shareholders for a price of EUR 337,864.26 per share as at June 30, 2011. The latter corresponds to the part of each share in the called capital of EIF, increased by the share premium account, the statutory reserves, the disclosed unrealised gains in venture capital operations, the profit brought forward and the profit of the year. The agreed formula is being applied to the approved and audited annual accounts of the EIF for the financial year in which the option is exercised. NOTE D Debts evidenced by certificates [See following page for summary statement of debts evidenced by certificates]
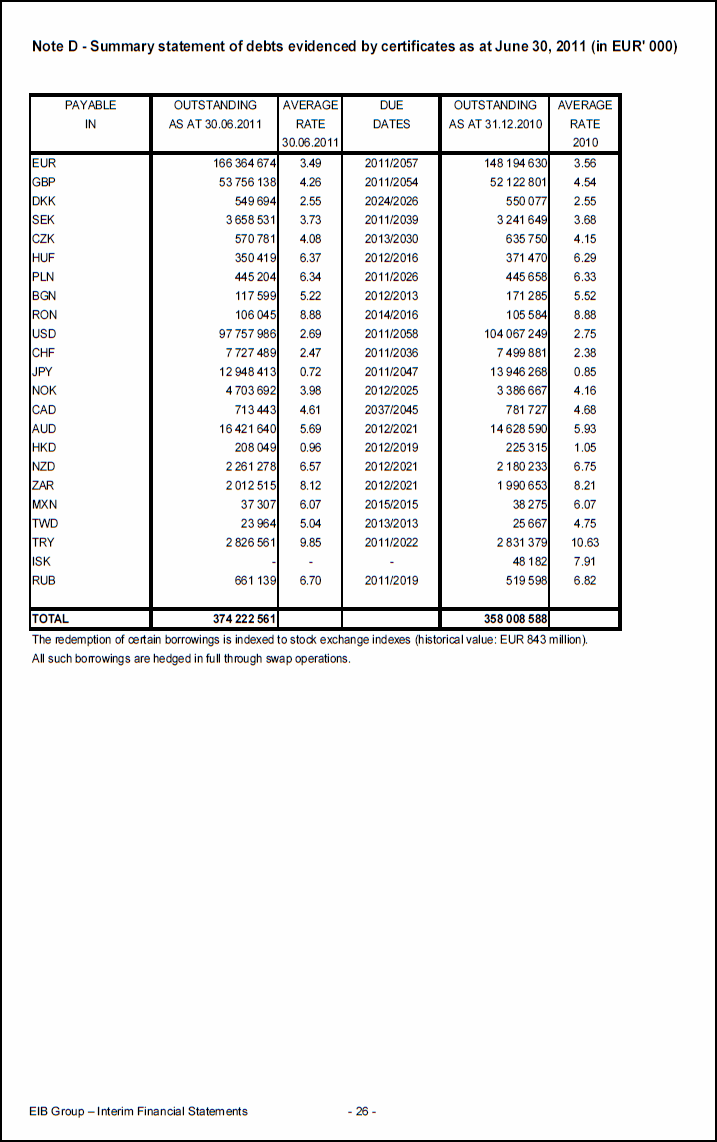
Note D - Summary statement of debts evidenced by certificates as at June 30, 2011 (in EUR' 000) PAYABLE OUTSTANDING AVERAGE DUE OUTSTANDING AVERAGE IN AS AT 30.06.2011 RATE DATES AS AT 31.12.2010 RATE 30.06.2011 2010 EUR 166 364 674 3.49 2011/2057 148 194 630 3.56 GBP 53 756 138 4.26 2011/2054 52 122 801 4.54 DKK 549 694 2.55 2024/2026 550 077 2.55 SEK 3 658 531 3.73 2011/2039 3 241 649 3.68 CZK 570 781 4.08 2013/2030 635 750 4.15 HUF 350 419 6.37 2012/2016 371 470 6.29 PLN 445 204 6.34 2011/2026 445 658 6.33 BGN 117 599 5.22 2012/2013 171 285 5.52 RON 106 045 8.88 2014/2016 105 584 8.88 USD 97 757 986 2.69 2011/2058 104 067 249 2.75 CHF 7 727 489 2.47 2011/2036 7 499 881 2.38 JPY 12 948 413 0.72 2011/2047 13 946 268 0.85 NOK 4 703 692 3.98 2012/2025 3 386 667 4.16 CAD 713 443 4.61 2037/2045 781 727 4.68 AUD 16 421 640 5.69 2012/2021 14 628 590 5.93 HKD 208 049 0.96 2012/2019 225 315 1.05 NZD 2 261 278 6.57 2012/2021 2 180 233 6.75 ZAR 2 012 515 8.12 2012/2021 1 990 653 8.21 MXN 37 307 6.07 2015/2015 38 275 6.07 TWD 23 964 5.04 2013/2013 25 667 4.75 TRY 2 826 561 9.85 2011/2022 2 831 379 10.63 ISK - - - 48 182 7.91 RUB 661 139 6.70 2011/2019 519 598 6.82 TOTAL 374 222 561 358 008 588 The redemption of certain borrowings is indexed to stock exchange indexes (historical value: EUR 843 million). All such borrowings are hedged in full through swap operations.
