EXHIBIT VII
European Investment Bank Group Unaudited Condensed Semi Annual Financial Statements as at June 30, 2012 - SEC Filing
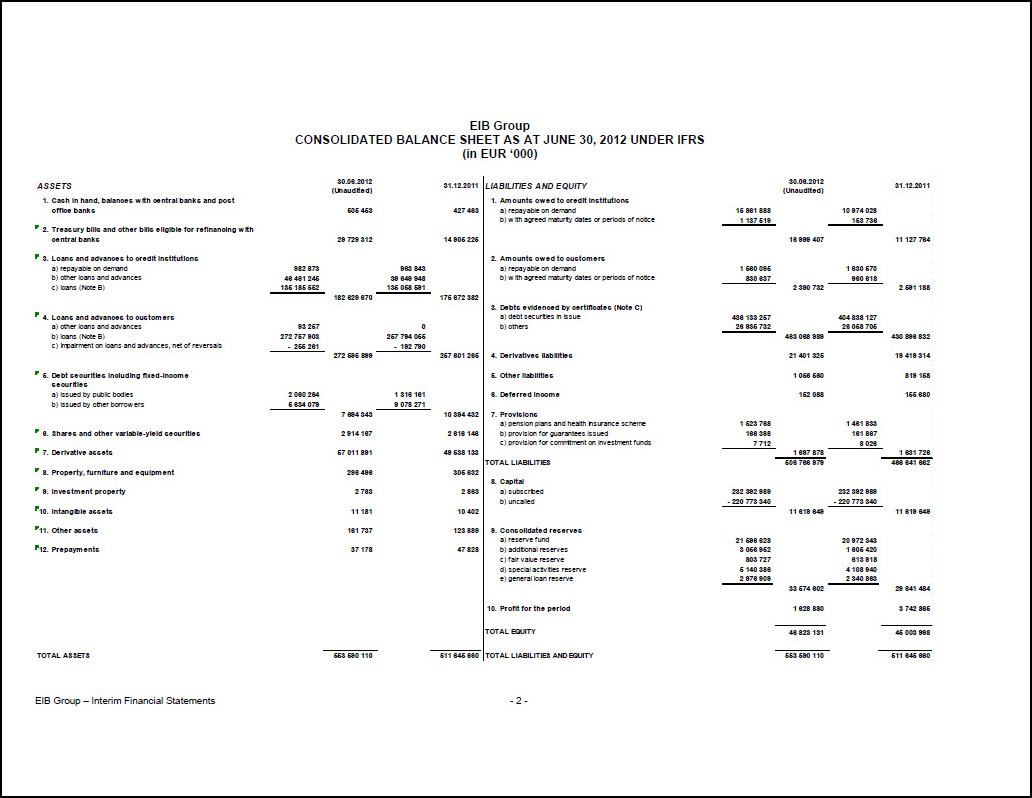
EIB Group CONSOLIDATED BALANCE SHEET AS AT JUNE 30, 2012 UNDER IFRS (in EUR ‘000) ASSETS 30.06.2012 (Unaudited) 31.12.2011 1. Cash in hand, balances with central banks and post office banks 505 453 427 463 2. Treasury bills and other bills eligible for refinancing with central banks 29 729 312
14 905 225 3. Loans and advances to credit institutions a) repayable on demand 982 873 963 843 b) other loans and advances 46 461 245 39 649 948 c) loans (Note B) 135 185 552 135 058 591 182 629 670 175 672 382 4. Loans and advances to customers a) other loans and advances 93 257 0 b) loans (Note B) 272 757 903 257 794 055 c) Impairment on loans and advances, net of reversals - 255 261 - 192 790 272 595 899 257 601 265 5. Debt securities including fixed-income securities a) issued by public bodies 2 060 264 1 316 161 b) issued by other borrowers 5 634 079 9 078 271 7 694 343 10 394 432 6. Shares and other variable-yield securities 2 914 167 2 616 146 7. Derivative assets 57 011 891 49 538 133 8. Property, furniture and equipment 296 496 305 632 9. Investment property 2 783 2 863 10. Intangible assets 11 181 10 402 11. Other assets 161 737 123 889 12. Prepayments 37 178 47 828 TOTAL ASSETS 553 590 110 511 645 660 LIABILITIES AND EQUITY 30.06.2012 (Unaudited) 31.12.2011 1. Amounts owed to credit institutions a) repayable on demand 15 861 888 10 974 028 b) with agreed maturity dates or periods of notice 1 137 519 153 736 16 999 407 11 127 764 2. Amounts owed to customers a) repayable on demand 1 560 095 1 630 570 b) with agreed maturity dates or periods of notice 830 637 960 618 2 390 732 2 591 188 3. Debts evidenced by certificates (Note C) a) debt securities in issue 436 133 257 404 838 127 b) others 26 935 732 26 058 705 463 068 989 430 896 832 4. Derivatives liabilities 21 401 325 19 419 314 5. Other liabilities 1 056 560 819 158 6. Deferred income 152 088 155 680 7. Provisions a) pension plans and health insurance scheme 1 523 768 1 461 833 b) provision for guarantees issued 166 398 161 867 c) provision for commitment on investment funds 7 712 8 026 1 697 878 1 631 726 TOTAL LIABILITIES 506 766 979 466 641 662 8. Capital a) subscribed 232 392 989 232 392 989 b) uncalled - 220 773 340 - 220 773 340 11 619 649 11 619 649 9. Consolidated reserves a) reserve fund 21 596 628 20 972 343 b) additional reserves 3 056 952 1 605 420 c) fair value reserve 803 727 613 918 d) special activities reserve 5 140 386 4 108 940 e) general loan reserve 2 976 909 2 340 863 33 574 602 29 641 484 10. Profit for the period 1 628 880 3 742 865 TOTAL EQUITY 46 823 131 45 003 998 TOTAL LIABILITIES AND EQUITY 553 590 110 511 645 660
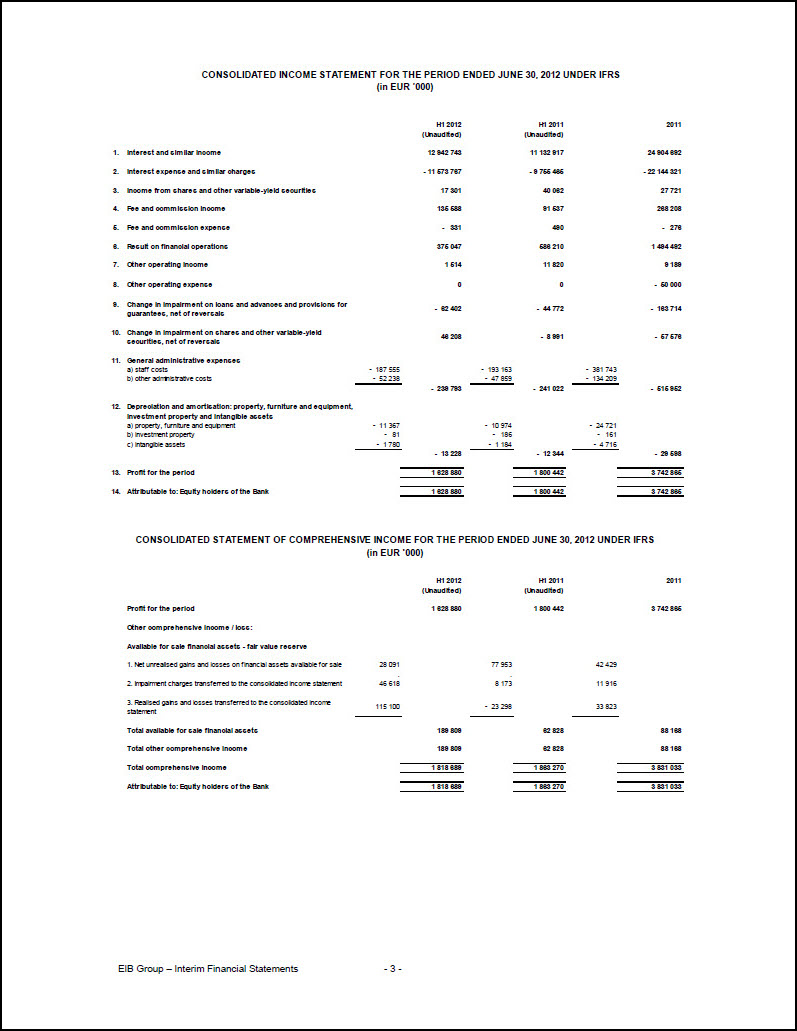
CONSOLIDATED INCOME STATEMENT FOR THE PERIOD ENDED JUNE 30, 2012 UNDER IFRS (in EUR ’000) H1 2012 (Unaudited) H1 2011 (Unaudited) 2011 1. Interest and similar income 12 942 743 11 132 917 24 904 692 2. Interest expense and similar charges - 11 573 767 - 9 755 465 - 22 144 321 3. Income from shares and other variable-yield securities 17 301 40 062 27 721 4. Fee and commission income 135 588 91 537 268 208 5. Fee and commission expense - 331 490 - 276 6. Result on financial operations 375 047 586 210 1 494 492 7. Other operating income 1 514 11 820 9 189 8. Other operating expense 0 0 - 50 000 9. Change in impairment on loans and advances and provisions for guarantees, net of reversals - 62 402 - 44 772 - 163 714 10. Change in impairment on shares and other variable-yield securities, net of reversals 46 208 - 8 991 - 57 576 11. General administrative expenses a) staff costs - 187 555 - 193 163 - 381 743 b) other administrative costs - 52 238 - 47 859 - 134 209 - 239 793 - 241 022 - 515 952 12. Depreciation and amortisation: property, furniture and equipment, investment property and intangible assets a) property, furniture and equipment - 11 367 - 10 974 - 24 721 b) investment property - 81 - 186 - 161 c) intangible assets - 1 780 - 1 184 - 4 716 - 13 228 - 12 344 - 29 598 13. Profit for the period 1 628 880 1 800 442 3 742 865 14. Attributable to: Equity holders of the Bank 1 628 880 1 800 442 3 742 865 CONSOLIDATED STATEMENT OF COMPREHENSIVE INCOME FOR THE PERIOD ENDED JUNE 30, 2012 UNDER IFRS (in EUR ’000) H1 2012 (Unaudited) H1 2011 (Unaudited) 2011 Profit for the period 1 628 880 1 800 442 3 742 865 Other comprehensive income/loss: Available for sale financial assets - fair value reserve 1. Net unrealised gains and losses on financial assets available for sale 28 091 77 953 42 429 2. Impairment charges transferred to the consolidated income statement 46 618 8 173 11 916 3. Realised gains and losses transferred to the consolidated income statement 115 100 - 23 298 33 823 Total available for sale financial assets 189 809 62 828 88 168 Total other comprehensive income 189 809 62 828 88 168 Total comprehensive income 1 818 689 1 863 270 3 831 033 Attributable to: Equity holders of the Bank 1 818 689 1 863 270 3 831 033

CONSOLIDATED STATEMENT OF CHANGES IN EQUITY UNDER IFRS (in EUR ‘000) For the half year ended June 30, 2012 Subscribed capital Callable capital Reserve fund Special activities reserve General loan reserve Additional reserves Other Fair value reserve Profit/loss for the period before appropriation Total consolidated equity As at December 31, 2010 232 392 989 - 220 773 340 20 082 400 3 299 370 1 923 734 1 075 524 525 750 2 644 962 41 171 389 Appropriation of prior year’s profit 0 0 889 943 809 570 417 129 528 320 0 - 2 644 962 0 Total comprehensive income for the period 0 0 0 0 0 0 88 168 3 742 865 3 831 033 Changes in ownership interests in subsidiaries that do not result in a loss of control 0 0 0 0 0 1 576 0 0 1 576 As at December 31, 2011 232 392 989 - 220 773 340 20 972 343 4 108 940 2 340 863 1 605 420 613 918 3 742 865 45 003 998 Appropriation of prior year’s profit 0 0 624 285 1 031 446 636 046 1 451 088 0 - 3 742 865 0 Total comprehensive income for the period 0 0 0 0 0 0 189 809 1 628 880 1 818 689 Changes in ownership interests in subsidiaries that do not result in a loss of control 0 0 0 0 0 444 0 0 444 As at June 30, 2012 (Unaudited) 232 392 989 - 220 773 340 21 596 628 5 140 386 2 976 909 3 056 952 803 727 1 628 880 46 823 131
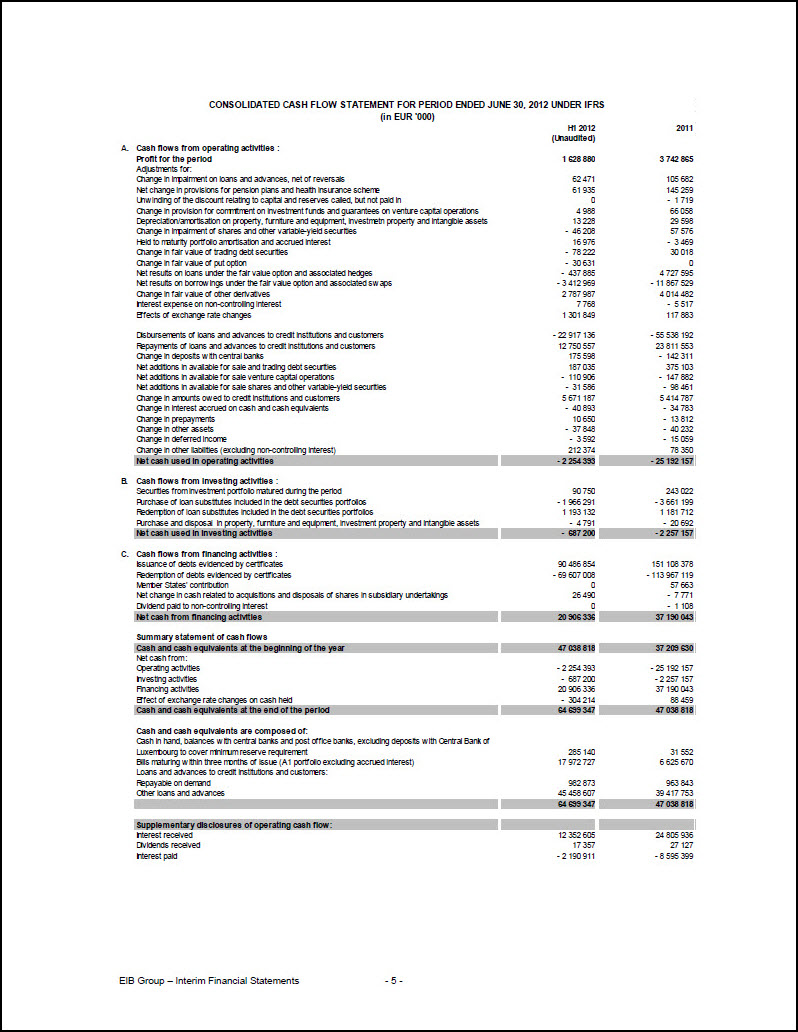
CONSOLIDATED CASH FLOW STATEMENT FOR PERIOD ENDED JUNE 30, 2012 UNDER IFRS (in EUR ‘000) H1 2012 (Unaudited) 2011 A. Cash flows from operating activities : Profit for the period 1 628 880 3 742 865 Adjustments for: Change in impairment on loans and advances, net of reversals 62 471 105 682 Net change in provisions for pension plans and health insurance scheme 61 935 145 259 Unwinding of the discount relating to capital and reserves called, but not paid in 0 - 1 719 Change in provision for commitment on investment funds and guarantees on venture capital operations 4 988 66 058 Depreciation/amortisation on property, furniture and equipment, investment property and intangible assets 13 228 29 598 Change in impairment of shares and other variable-yield securities - 46 208 57 576 Held to maturity portfolio amortisation and accrued interest 16 976 - 3 469 Change in fair value of trading debt securities - 78 222 30 018 Change in fair value of put option - 30 631 0 Net results on loans under the fair value option and associated hedges - 437 885 4 727 595 Net results on borrowings under the fair value option and associated swaps - 3 412 969 - 11 867 529 Change in fair value of other derivatives 2 787 987 4 014 482 Interest expense on non-controlling interest 7 768 - 5 517 Effects of exchange rate changes 1 301 849 117 883 Disbursements of loans and advances to credit institutions and customers - 22 917 136 - 55 538 192 Repayments of loans and advances to credit institutions and customers 12 750 557 23 811 553 Change in deposits with central banks 175 598 - 142 311 Net additions in available for sale and trading debt securities 187 035 375 103 Net additions in available for sale venture capital operations - 110 906 - 147 882 Net additions in available for sale shares and other variable-yield securities - 31 586 - 98 461 Change in amounts owed to credit institutions and customers 5 671 187 5 414 787 Change in interest accrued on cash and cash equivalents - 40 893 - 34 783 Change in prepayments 10 650 - 13 812 Change in other assets - 37 848 - 40 232 Change in deferred income - 3 592 - 15 059 Change in other liabilities (excluding non-controlling interest) 212 374 78 350 Net cash used in operating activities - 2 254 393 - 25 192 157 B. Cash flows from investing activities : Securities from investment portfolio matured during the period 90 750 243 022 Purchase of loan substitutes included in the debt securities portfolios - 1 966 291 - 3 661 199 Redemption of loan substitutes included in the debt securities portfolios 1 193 132 1 181 712 Purchase and disposal in property, furniture and equipment, investment property and intangible assets - 4 791 - 20 692 Net cash used in investing activities - 687 200 - 2 257 157 C. Cash flows from financing activities : Issuance of debts evidenced by certificates 90 486 854 151 108 378 Redemption of debts evidenced by certificates - 69 607 008 - 113 967 119 Member States’ contribution 0 57 663 Net change in cash related to acquisitions and disposals of shares in subsidiary undertakings 26 490 - 7 771 Dividend paid to non-controlling interest 0 - 1 108 Net cash from financing activities 20 906 336 37 190 043 Summary statement of cash flows Cash and cash equivalents at the beginning of the year 47 038 818 37 209 630 Net cash from : Operating activities - 2 254 393 - 25 192 157 Investing activities - 687 200 - 2 257 157 Financing activities 20 906 336 37 190 043 Effect of exchange rate changes on cash held - 304 214 88 459 Cash and cash equivalents at the end of the period 64 699 347 47 038 818 Cash and cash equivalents are composed of: Cash in hand, balances with central banks and post office banks, excluding deposits with Central Bank of Luxembourg to cover minimum reserve requirement 285 140 31 552 Bills maturing within three months of issue (A1 portfolio excluding accrued interest) 17 972 727 6 625 670 Loans and advances to credit institutions and customers: Repayable on demand 982 873 963 843 Other loans and advances 45 458 607 39 417 753 64 699 347 47 038 818 Supplementary disclosures of operating cash flow: Interest received 12 352 605 24 805 936 Dividends received 17 357 27 127 Interest paid - 2 190 911 - 8 595 399
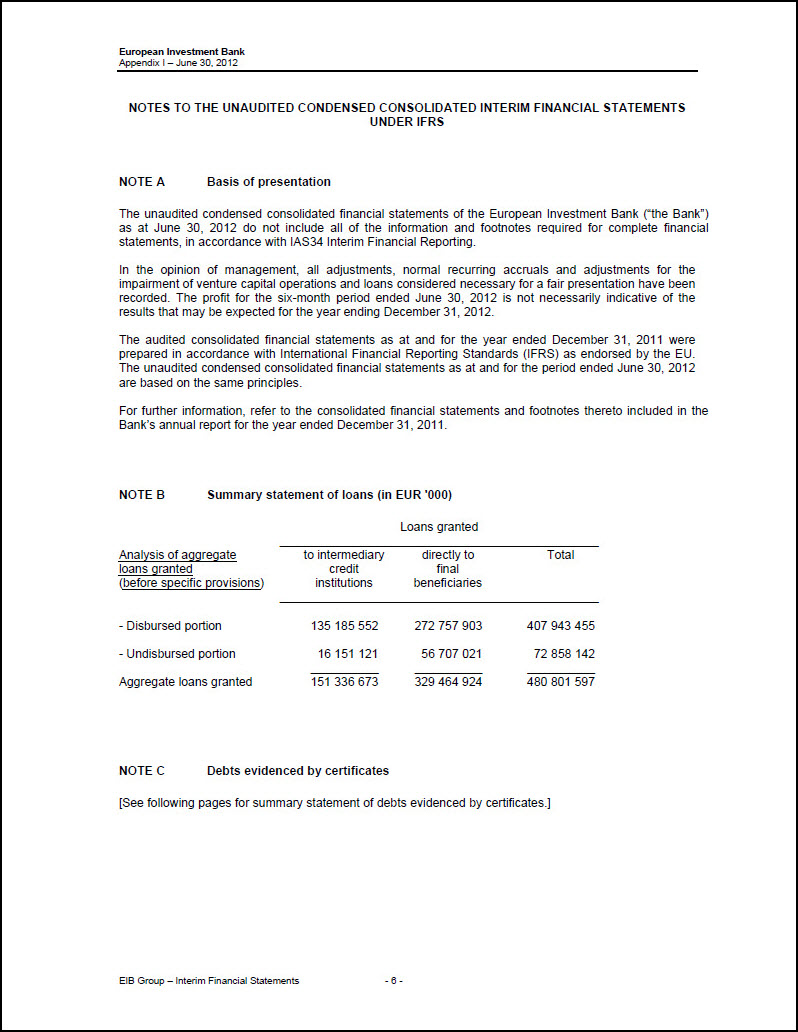
NOTES TO THE UNAUDITED CONDENSED CONSOLIDATED INTERIM FINANCIAL STATEMENTS UNDER IFRS NOTE A Basis of presentation The unaudited condensed consolidated financial statements of the European Investment Bank (“the Bank”) as at June 30, 2012 do not include all of the information and footnotes required for complete financial statements, in accordance with IAS34 Interim Financial Reporting. In the opinion of management, all adjustments, normal recurring accruals and adjustments for the impairment of venture capital operations and loans considered necessary for a fair presentation have been recorded. The profit for the six-month period ended June 30, 2012 is not necessarily indicative of the results that may be expected for the year ending December 31, 2012. The audited consolidated financial statements as at and for the year ended December 31, 2011 were prepared in accordance with International Financial Reporting Standards (IFRS) as endorsed by the EU. The unaudited condensed consolidated financial statements as at and for the period ended June 30, 2012 are based on the same principles. For further information, refer to the consolidated financial statements and footnotes thereto included in the Bank’s annual report for the year ended December 31, 2011. NOTE B Summary statement of loans (in EUR ‘000) Loans granted Analysis of aggregate loans granted (before specific provisions) to intermediary credit institutions directly to final beneficiaries Total - Disbursed portion 135 185 552 272 757 903 407 943 455 - Undisbursed portion 16 151 121 56 707 021 72 858 142 Aggregate loans granted 151 336 673 329 464 924 480 801 597 NOTE C Debts evidenced by certificates [See following pages for summary statement of debts evidenced by certificates.]
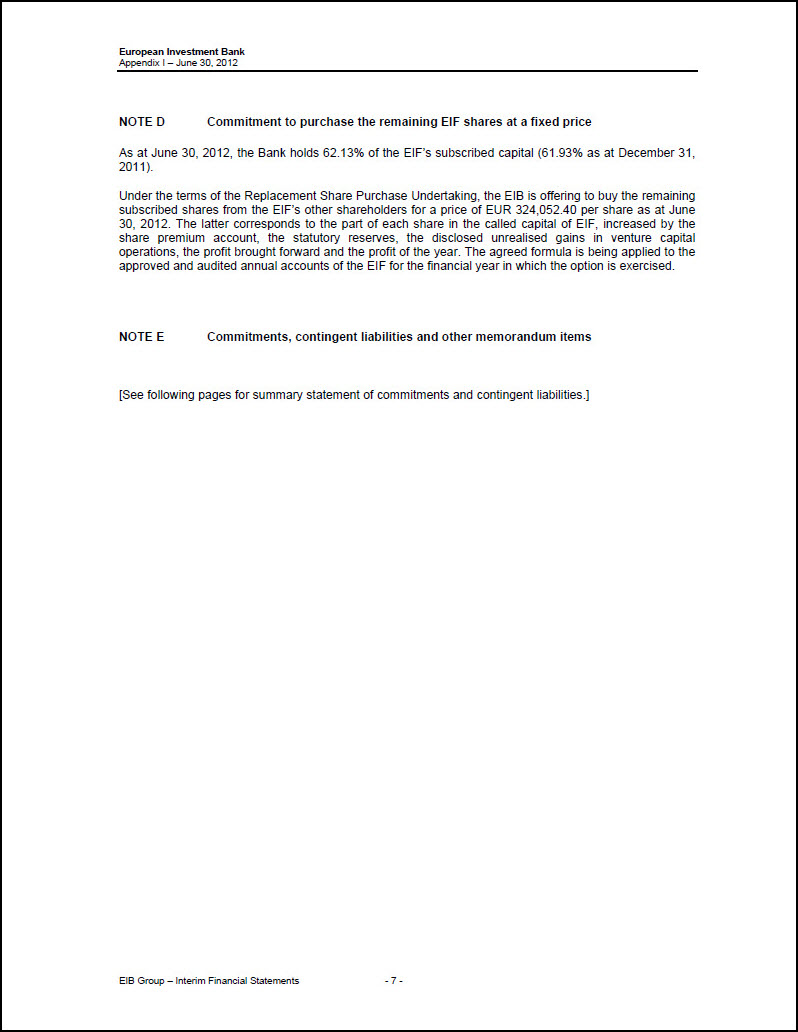
NOTE D Commitment to purchase the remaining EIF shares at a fixed price As at June 30, 2012, the Bank holds 62.13% of the EIF’s subscribed capital (61.93% as at December 31, 2011). Under the terms of the Replacement Share Purchase Undertaking, the EIB is offering to buy the remaining subscribed shares from the EIF’s other shareholders for a price of EUR 324,052.40 per share as at June 30, 2012. The latter corresponds to the part of each share in the called capital of EIF, increased by the share premium account, the statutory reserves, the disclosed unrealised gains in venture capital operations, the profit brought forward and the profit of the year. The agreed formula is being applied to the approved and audited annual accounts of the EIF for the financial year in which the option is exercised. NOTE E Commitments, contingent liabilities and other memorandum items [See following pages for summary statement of commitments and contingent liabilities.]
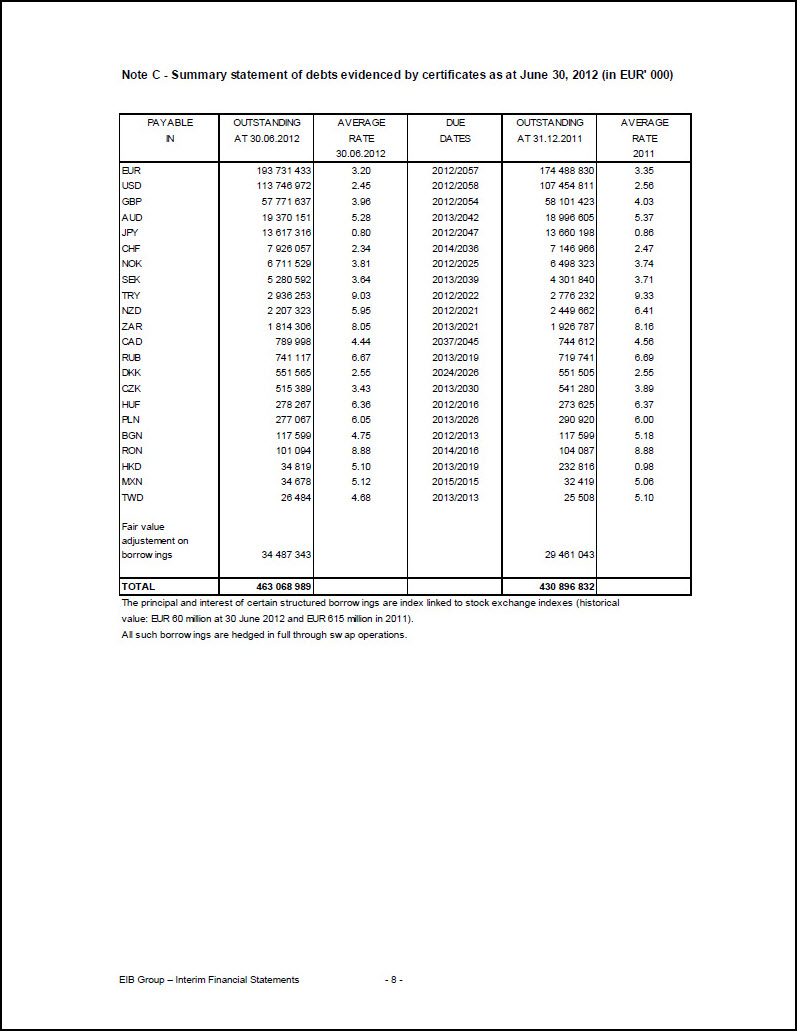
Note C - Summary statement of debts evidenced by certificates as at June 30, 2012 (in EUR’ 000) PAYABLE IN OUTSTANDING AT 30.06.2012 AVERAGE RATE 30.06.2012 DUE DATES OUTSTANDING AT 31.12.2011 AVERAGE RATE 2011 EUR 193 731 433 3.20 2012/2057 174 488 830 3.35 USD 113 746 972 2.45 2012/2058 107 454 811 2.56 GBP 57 771 637 3.96 2012/2054 58 101 423 4.03 AUD 19 370 151 5.28 2013/2042 18 996 605 5.37 JPY 13 617 316 0.80 2012/2047 13 660 198 0.86 CHF 7 926 057 2.34 2014/2036 7 146 966 2.47 NOK 6 711 529 3.81 2012/2025 6 498 323 3.74 SEK 5 280 592 3.64 2013/2039 4 301 840 3.71 TRY 2 936 253 9.03 2012/2022 2 776 232 9.33 NZD 2 207 323 5.95 2012/2021 2 449 662 6.41 ZAR 1 814 306 8.05 2013/2021 1 926 787 8.16 CAD 789 998 4.44 2037/2045 744 612 4.56 RUB 741 117 6.67 2013/2019 719 741 6.69 DKK 551 565 2.55 2024/2026 551 505 2.55 CZK 515 389 3.43 2013/2030 541 280 3.89 HUF 278 267 6.36 2012/2016 273 625 6.37 PLN 277 067 6.05 2013/2026 290 920 6.00 BGN 117 599 4.75 2012/2013 117 599 5.18 RON 101 094 8.88 2014/2016 104 087 8.88 HKD 34 819 5.10 2013/2019 232 816 0.98 MXN 34 678 5.12 2015/2015 32 419 5.06 TWD 26 484 4.68 2013/2013 25 508 5.10 Fair value adjustement on borrowings 34 487 343 29 461 043 TOTAL 463 068 989 430 896 832 The principal and interest of certain structured borrowings are index linked to stock exchange indexes (historical value: EUR 60 million at 30 June 2012 and EUR 615 million in 2011). All such borrowings are hedged in full through swap operations.
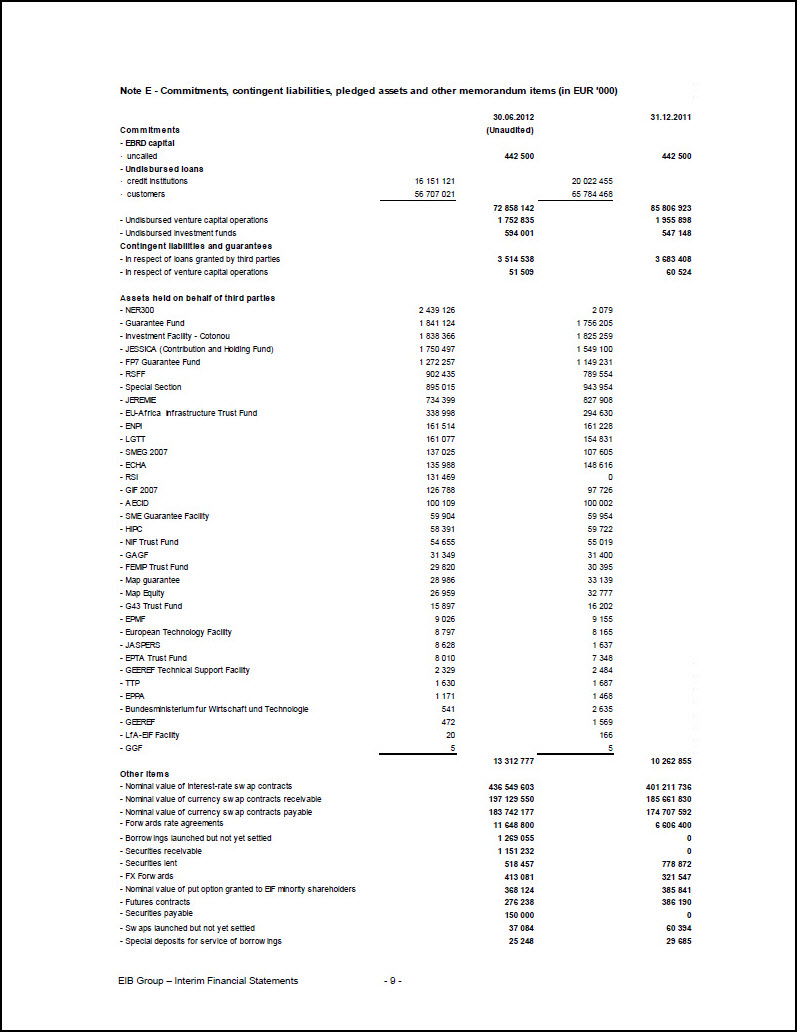
Note E - Commitments, contingent liabilities, pledged assets and other memorandum items (in EUR ‘000) 30.06.2012 31.12.2011 Commitments (Unaudited) - EBRD capital uncalled 442 500 442 500 - Undisbursed loans credit institutions 16 151 121 20 022 455 customers 56 707 021 65 784 468 72 858 142 85 806 923 - Undisbursed venture capital operations 1 752 835 1 955 898 - Undisbursed investment funds 594 001 547 148 Contingent liabilities and guarantees - In respect of loans granted by third parties
3 514 538 3 683 408 - In respect of venture capital operations 51 509 60 524 Assets held on behalf of third parties - NER300 2 439 126 2 079 - Guarantee Fund 1 841 124 1 756 205 - Investment Facility - Cotonou 1 838 366 1 825 259 - JESSICA (Contribution and Holding Fund) 1 750 497 1 549 100 - FP7 Guarantee Fund 1 272 257 1 149 231 - RSFF 902 435 789 554 - Special Section 895 015 943 954 - JEREMIE 734 399 827 908 - EU-Africa Infrastructure Trust Fund 338 998 294 630 - ENPI 161 514 161 228 - LGTT 161 077 154 831 - SMEG 2007 137 025 107 605 - ECHA 135 988 148 616 - RSI 131 469 0 - GIF 2007 126 788 97 726 - AECID 100 109 100 002 - SME Guarantee Facility 59 904 59 954 - HIPC 58 391 59 722 - NIF Trust Fund 54 655 55 019 - GAGF 31 349 31 400 - FEMIP Trust Fund 29 820 30 395 - Map guarantee 28 986 33 139 - Map Equity 26 959 32 777 - G43 Trust Fund 15 897 16 202 - EPMF 9 026 9 155 - European Technology Facility 8 797 8 165 - JASPERS 8 628 1 637 - EPTA Trust Fund 8 010 7 348 - GEEREF Technical Support Facility 2 329 2 484 - TTP 1 630 1 687 - EPPA 1 171 1 468 - Bundesministerium fur Wirtschaft und Technologie 541 2 635 - GEEREF 472 1 569 - LfA-EIF Facility 20 166 - GGF 5 5 13 312 777 10 262 855 Other items - Nominal value of interest-rate swap contracts 436 549 603 401 211 736 - Nominal value of currency swap contracts receivable 197 129 550 185 661 830 - Nominal value of currency swap contracts payable 183 742 177 174 707 592 - Forwards rate agreements 11 648 800 6 606 400 - Borrowings launched but not yet settled 1 269 055 0 - Securities receivable 1 151 232 0 - Securities lent 518 457 778 872 - FX Forwards 413 081 321 547 - Nominal value of put option granted to EIF minority shareholders 368 124 385 841 - Futures contracts 276 238 386 190 - Securities payable 150 000 0 - Swaps launched but not yet settled 37 084 60 394 - Special deposits for service of borrowings 25 248 29 685
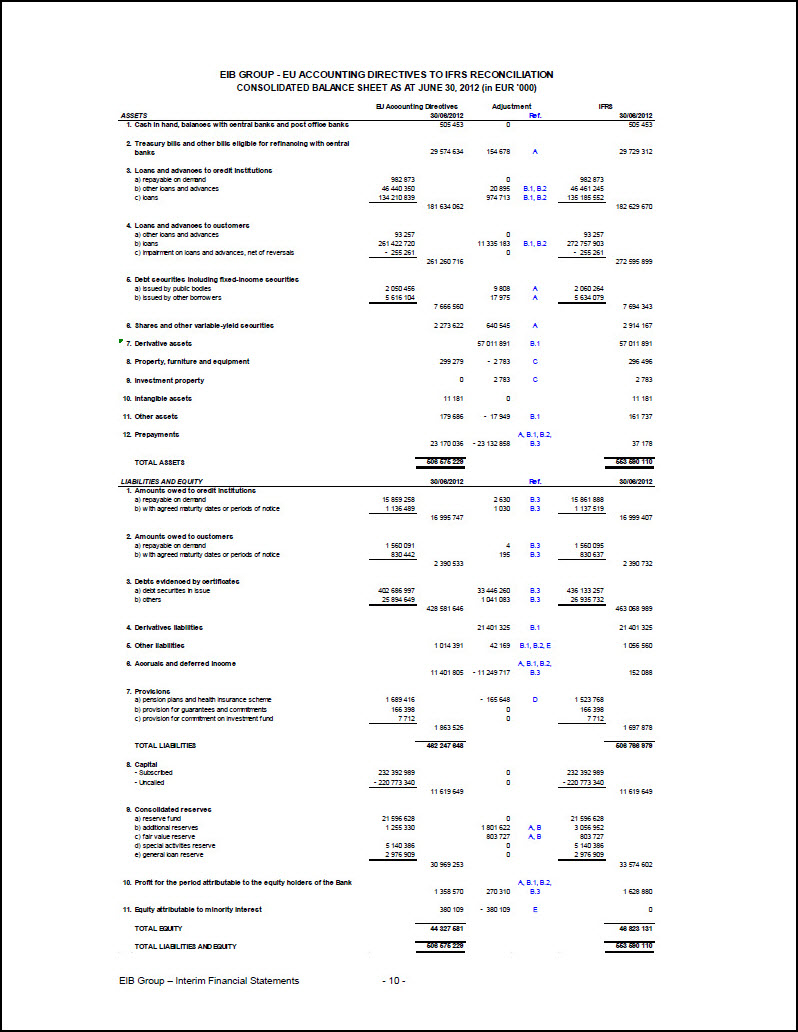
EIB GROUP - EU ACCOUNTING DIRECTIVES TO IFRS RECONCILIATION CONSOLIDATED BALANCE SHEET AS AT JUNE 30, 2012 (in EUR ‘000) Assets EU Accounting Directives 30/06/2012 Adjustment Ref. IFRS 30/06/2012 1. Cash in hand, balances with central banks and post office banks 505 453 0 505 453 2. Treasury bills and other bills eligible for refinancing with central banks 29 574 634 154 678 A 29 729 312 3. Loans and advances to credit institutions a) repayable on demand 982 873 0 982 873 b) other loans and advances 46 440 350 20 895 B.1, B.2 46 461 245 c) loans 134 210 839 974 713 B.1, B.2 135 185 552 181 634 062 182 629 670 4. Loans and advances to customers a) other loans and advances 93 257 0 93 257 b) loans 261 422 720 11 335 183 B.1, B.2 272 757 903 c) impairment on loans and advances, net of reversals - 255 261 0 - 255 261 261 260 716 272 595 899 5. Debt securities including fixed-income securities a) issued by public bodies 2 050 456 9 808 A 2 060 264 b) issued by other borrowers 5 616 104 17 975 A 5 634 079 7 666 560 7 694 343 6. Shares and other variable-yield securities 2 273 622 640 545 A 2 914 167 7. Derivative assets 57 011 891 B.1 57 011 891 8. Property, furniture and equipment 299 279 - 2 783 C 296 496 9. Investment property 0 2 783 C 2 783 10. Intangible assets 11 181 0 11 181 11. Other assets 179 686 - 17 949 B.1 161 737 12. Prepayments 23 170 036 - 23 132 858 A, B.1, B.2, B.3 37 178 TOTAL ASSETS 506 575 229 553 590 110 LIABILITIES AND EQUITY 30/06/2012 Ref. 30/06/2012 1. Amounts owed to credit institutions a) repayable on demand 15 859 258 2 630 B.3 15 861 888 b) with agreed maturity dates or periods of notice 1 136 489 1 030 B.3 1 137 519 16 995 747 16 999 407 2. Amounts owed to customers a) repayable on demand 1 560 091 4 B.3 1 560 095 b) with agreed maturity dates or periods of notice 830 442 195 B.3 830 637 2 390 533 2 390 732 3. Debts evidenced by certificates a) debt securities in issue 402 686 997 33 446 260 B.3 436 133 257 b) others 25 894 649 1 041 083 B.3 26 935 732 428 581 646 463 068 989 4. Derivatives liabilities 21 401 325 B.1 21 401 325 5. Other liabilities 1 014 391 42 169 B.1, B.2, E 1 056 560 6. Accruals and deferred income 11 401 805 - 11 249 717 A, B.1, B.2, B.3 152 088 7. Provisions a) pension plans and health insurance scheme 1 689 416 - 165 648 D 1 523 768 b) provision for guarantees and commitments 166 398 0 166 398 c) provision for commitment on investment fund 7 712 0 7 712 1 863 526 1 697 878 TOTAL LIABILITIES 462 247 648 506 766 979 8. Capital - Subscribed 232 392 989 0 232 392 989 - Uncalled - 220 773 340 0 - 220 773 340 11 619 649 11 619 649 9. Consolidated reserves a) reserve fund 21 596 628 0 21 596 628 b) additional reserves 1 255 330 1 801 622 A, B 3 056 952 c) fair value reserve 803 727 A, B 803 727 d) special activities reserve 5 140 386 0 5 140 386 e) general loan reserve 2 976 909 0 2 976 909 30 969 253 33 574 602 10. Profit for the period attributable to the equity holders of the Bank 1 358 570 270 310 A, B.1, B.2, B.3 1 628 880 11. Equity attributable to minority interest 380 109 - 380 109 E 0 TOTAL EQUITY 44 327 581 46 823 131 TOTAL LIABILITIES AND EQUITY 506 575 229 553 590 110
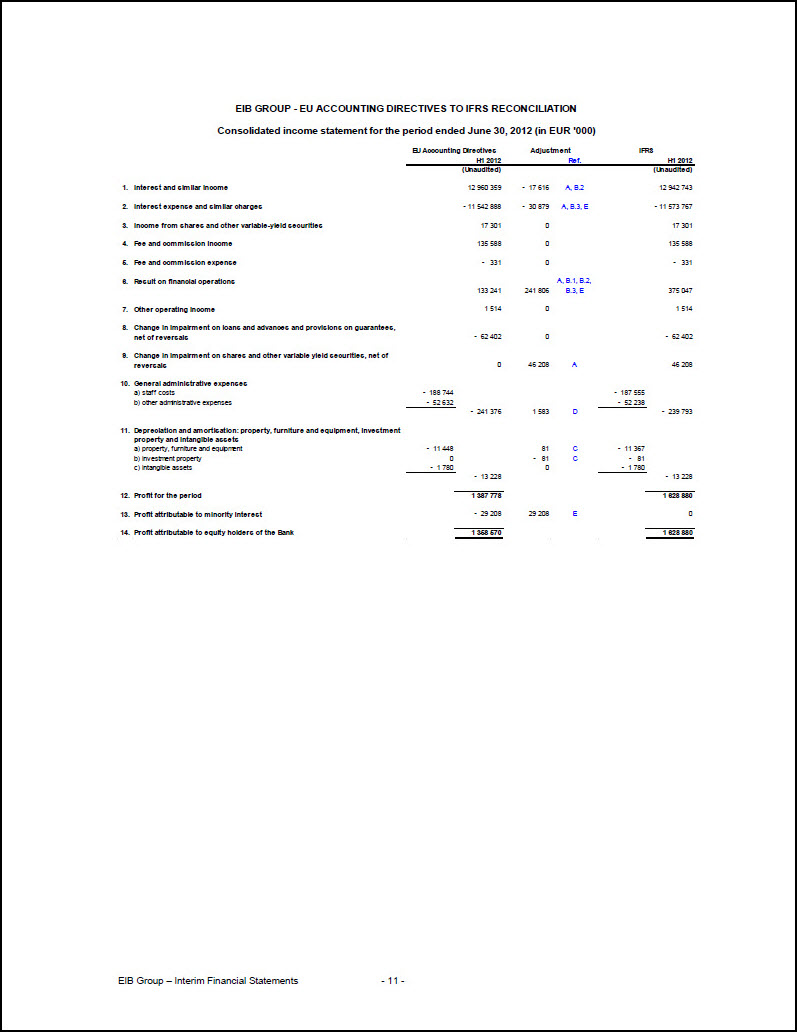
EIB GROUP - EU ACCOUNTING DIRECTIVES TO IFRS RECONCILIATION Consolidated income statement for the period ended June 30, 2012 (in EUR ’000) EU Accounting Directives H1 2012 (Unaudited) Adjustment Ref. IFRS H1 2012 (Unaudited) 1. Interest and similar income 12 960 359 - 17 616 A, B.2 12 942 743 2. Interest expense and similar charges - 11 542 888 - 30 879 A, B.3, E - 11 573 767 3. Income from shares and other variable-yield securities 17 301 0 17 301 4. Fee and commission income 135 588 0 135 588 5. Fee and commission expense - 331 0 - 331 6. Result on financial operations 133 241 241 806 A, B.1, B.2, B.3, E 375 047 7. Other operating income 1 514 0 1 514 8. Change in impairment on loans and advances and provisions on guarantees, net of reversals - 62 402 0 - 62 402 9. Change in impairment on shares and other variable yield securities, net of reversals 0 46 208 A 46 208 10. General administrative expenses a) staff costs - 188 744 - 187 555 b) other administrative expenses - 52 632 - 52 238 - 241 376 1 583 D - 239 793 11. Depreciation and amortisation: property, furniture and equipment, investment property and intangible assets a) property, furniture and equipment - 11 448 81 C - 11 367 b) investment property 0 - 81 C – 81 c) intangible assets - 1 780 0 - 1 780 - 13 228 - 13 228 12. Profit for the period 1 387 778 1 628 880 13. Profit attributable to minority interest - 29 208 29 208 E 0 14. Profit attributable to equity holders of the Bank 1 358 570 1 628 880

Valuation and income recognition differences between IFRS and EU Accounting Directives A Financial assets classified as available-for-sale Under EU Accounting Directives, available for sale instruments are recorded at market value. The value adjustments are reported under “Results on financial operations” in the profit and loss for the period in which they are made. Accrued interest is recorded under balance sheet items “Prepayments and accrued income” or “Accruals and deferred income”. Under IFRS, available for sale instruments are carried at fair value with changes in fair value reflected directly in equity. Impairment is recognised in the profit and loss for the year when negative changes in the fair valuation are other than temporary. It is reported separately on the face of the income statement. Accrued interest is reported on the balance sheet within the balance of the instrument to which it relates. B Financial assets and liabilities designated at fair value through profit or loss 1 Derivative assets and liabilities a Treasury derivatives Under EUGAAP, derivative instruments in the Bank’s available for sale and trading portfolios are marked to market and recorded under Other assets or Other liabilities. Interest accrued under derivative instruments is presented under Prepayments and accrued income and Accruals and deferred income. Under IFRS, all derivative assets and liabilities are recognised on balance sheet as such and carried at their replacement values. b Hedging derivatives Under EU Accounting Directives, hedging derivative instruments are not recognised on the balance sheet. They are carried off balance sheet at nominal amount. Under IFRS, all derivative assets and liabilities are recognised on balance sheet and carried at their replacement values. Changes in fair values of derivatives are recognised in the profit and loss. 2 Loans and advances Under EU Accounting Directives, all loans and advances are carried at amortised cost. Accrued interest is recorded under balance sheet items “Prepayments and accrued income” or “Accruals and deferred income”. Under IFRS certain loans are classified on initial recognition as “fair value loans” and valued at fair value through profit or loss. Accrued interest is reported on the balance sheet within the balance of the asset to which it relates. Payments due are reclassified from other debtors to the loan balance to which they relate. 3 Borrowings Under EU Accounting Directives, borrowings are recorded at amortised cost. Accrued interest is recorded under balance sheet items “Prepayments and accrued income” or “Accruals and deferred income”. Under IFRS, EIB applies the fair value option to a significant portion of its issued debt. Accrued interest is reported on the balance sheet within the balance of the debt instrument to which it relates. C Investment property This category is not used under EU Accounting Directives. Assets in this category under IFRS are reported in the “Tangible Assets” category under EU Accounting Directives. Under IFRS, assets in this category are held under the historical cost model. D Pension funds Under EU Accounting Directives, any actuarial deficits result in an additional specific pension plan provision. Under IFRS, the corridor approach is adopted, resulting in a proportion only of the actuarial losses being recognised in the period. E Minority interest adjustment EIB granted a put option to the minority shareholders on their entire holding of the subsidiary. Under EU Accounting Directives, this put option does not influence the accounting treatment of minority interest on consolidation. Under IFRS, the put option results in the non-controlling interest balance being classified as liability rather than equity and being carried at fair value through profit or loss. The non-controlling interest in the IFRS profit for the year is therefore included in the interest expense for the year. Fair value adjustment is reported under “Results on financial operations”.
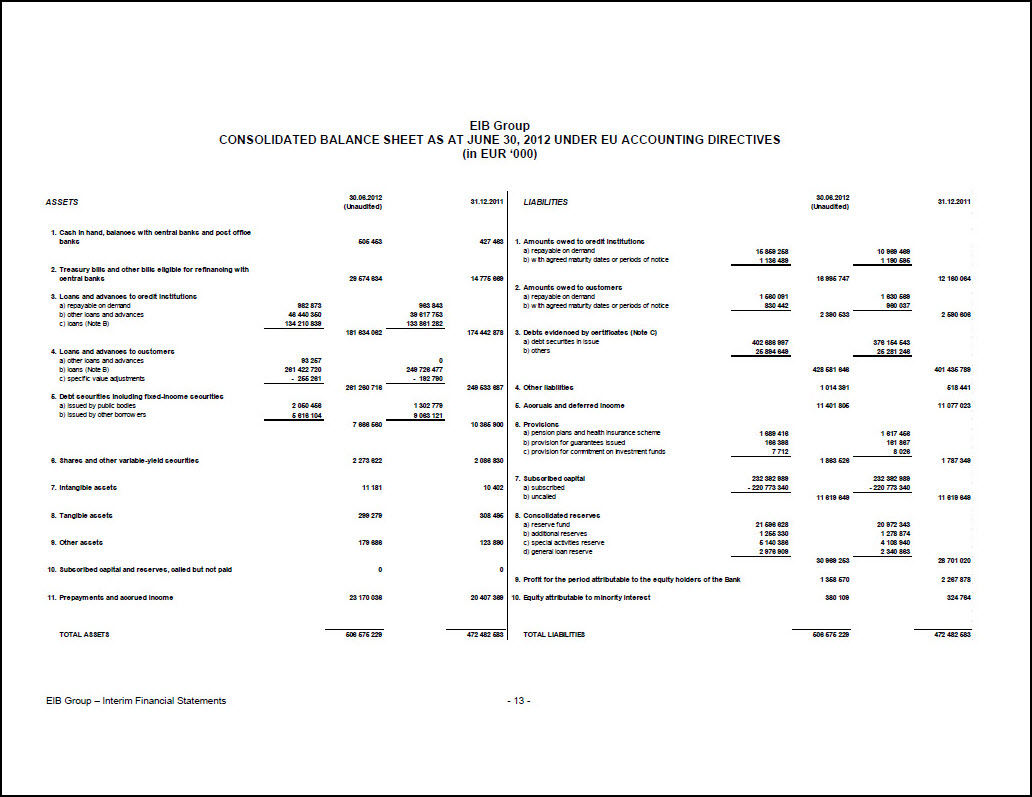
EIB Group CONSOLIDATED BALANCE SHEET AS AT JUNE 30, 2012 UNDER EU ACCOUNTING DIRECTIVES (in EUR ‘000) ASSETS 30.06.2012 (Unaudited) 31.12.2011 1. Cash in hand, balances with central banks and post office banks 505 453 427 463 2. Treasury bills and other bills eligible for refinancing with central banks 29 574 634 14 775 669 3. Loans and advances to credit institutions a) repayable on demand 982 873 963 843 b) other loans and advances 46 440 350 39 617 753 c) loans (Note B) 134 210 839 133 861 282 181 634 062 174 442 878 4. Loans and advances to customers a) other loans and advances 93 257 0 b) loans (Note B) 261 422 720 249 726 477 c) specific value adjustments - 255 261 - 192 790 261 260 716 249 533 687 5. Debt securities including fixed-income securities a) issued by public bodies 2 050 456 1 302 779 b) issued by other borrowers 5 616 104 9 063 121 7 666 560 10 365 900 6. Shares and other variable-yield securities 2 273 622 2 086 830 7. Intangible assets 11 181 10 402 8. Tangible assets 299 279 308 495 9. Other assets 179 686 123 890 10. Subscribed capital and reserves, called but not paid 0 0 11. Prepayments and accrued income 23 170 036 20 407 369 TOTAL ASSETS 506 575 229 472 482 583 LIABILITIES 30.06.2012 (Unaudited) 31.12.2011 1. Amounts owed to credit institutions a) repayable on demand 15 859 258 10 969 469 b) with agreed maturity dates or periods of notice 1 136 489 1 190 595 16 995 747 12 160 064 2. Amounts owed to customers a) repayable on demand 1 560 091 1 630 569 b) with agreed maturity dates or periods of notice 830 442 960 037 2 390 533 2 590 606 3. Debts evidenced by certificates (Note C) a) debt securities in issue 402 686 997 376 154 543 b) others 25 894 649 25 281 246 428 581 646 401 435 789 4. Other liabilities 1 014 391 518 441 5. Accruals and deferred income 11 401 805 11 077 023 6. Provisions a) pension plans and health insurance scheme 1 689 416 1 617 456 b) provision for guarantees issued 166 398 161 867 c) provision for commitment on investment funds 7 712 8 026 1 863 526 1 787 349 7. Subscribed capital 232 392 989 232 392 989 a) subscribed - 220 773 340 - 220 773 340 b) uncalled 11 619 649 11 619 649 8. Consolidated reserves a) reserve fund 21 596 628 20 972 343 b) additional reserves 1 255 330 1 278 874 c) special activities reserve 5 140 386 4 108 940 d) general loan reserve 2 976 909 2 340 863 30 969 253 28 701 020 9. Profit for the period attributable to the equity holders of the Bank 1 358 570 2 267 878 10. Equity attributable to minority interest 380 109 324 764 TOTAL LIABILITIES 506 575 229 472 482 583

CONSOLIDATED PROFIT AND LOSS ACCOUNT FOR THE PERIOD ENDED JUNE 30, 2012 UNDER EU ACCOUNTING DIRECTIVES (in EUR ’000) H1 2012 (Unaudited) H1 2011 (Unaudited) 2011 1. Interest receivable and similar income 12 960 359 11 134 498 24 946 788 2. Interest payable and similar charges - 11 542 888 - 9 719 982 - 22 038 846 3. Income from securities 17 301 40 062 27 721 4. Commissions receivable 135 588 91 862 268 208 5. Commissions payable - 331 490 - 276 6. Result on financial operations 133 241 - 65 665 - 181 149 7. Other operating income 1 514 11 495 9 189 8. General administrative expenses a) staff costs - 188 744 - 182 405 - 399 260 b) other administrative expenses - 52 632 - 47 844 - 134 392 - 241 376 - 230 249 - 533 652 9. Value adjustments in respect of intangible and tangible assets a) tangible assets - 11 448 - 11 160 - 24 882 b) intangible assets - 1 780 - 1 184 - 4 716 - 13 228 - 12 344 - 29 598 10. Value (re-)adjustments in respect of loans and advances and provisions for contingent liabilities - 62 402 5 228 - 167 240 11. Extraordinary charges 0 - 50 000 - 50 000 12. Profit for the period 1 387 778 1 205 395 2 251 145 13. Profit / loss attributable to minority interest - 29 208 - 778 16 733 14. Profit attributable to equity holders of the Bank 1 358 570 1 204 617 2 267 878
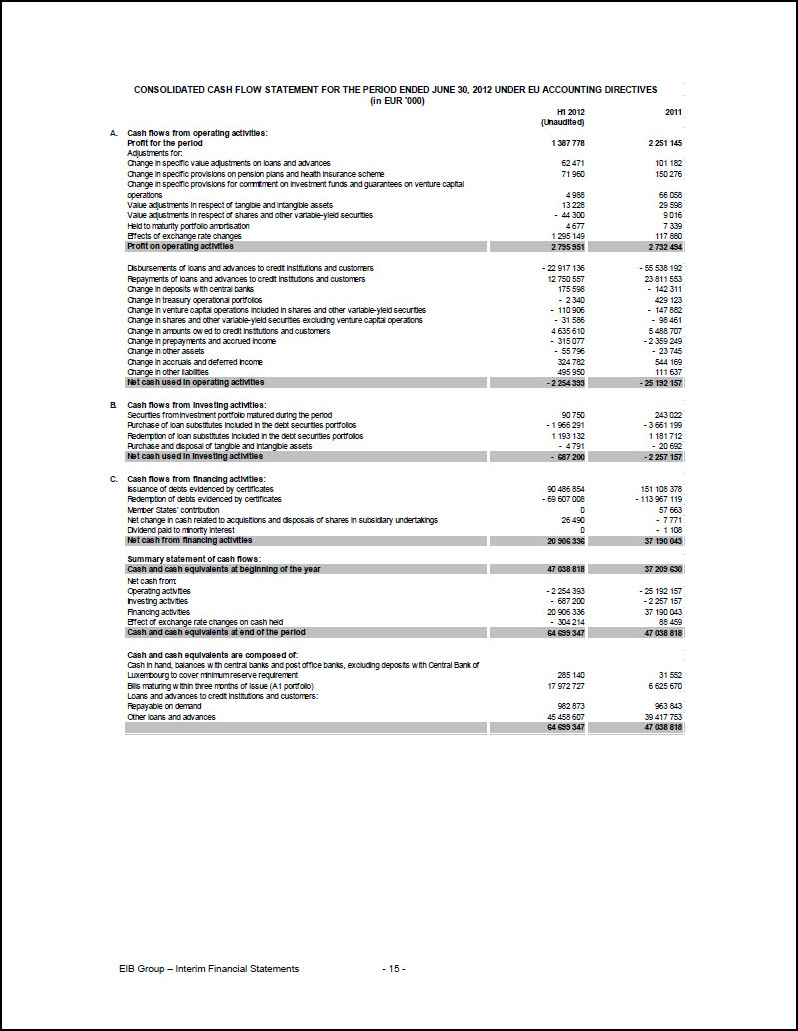
CONSOLIDATED CASH FLOW STATEMENT FOR THE PERIOD ENDED JUNE 30, 2012 UNDER EU ACCOUNTING DIRECTIVES (in EUR ‘000) H1 2012 (Unaudited) 2011 A. Cash flows from operating activities: Profit for the period 1 387 778 2 251 145 Adjustments for: Change in specific value adjustments on loans and advances 62 471 101 182 Change in specific provisions on pension plans and health insurance scheme 71 960 150 276 Change in specific provisions for commitment on investment funds and guarantees on venture capital operations 4 988 66 058 Value adjustments in respect of tangible and intangible assets 13 228 29 598 Value adjustments in respect of shares and other variable-yield securities - 44 300 9 016 Held to maturity portfolio amortisation 4 677 7 339 Effects of exchange rate changes 1 295 149 117 880 Profit on operating activities 2 795 951 2 732 494 Disbursements of loans and advances to credit institutions and customers - 22 917 136 - 55 538 192 Repayments of loans and advances to credit institutions and customers 12 750 557 23 811 553 Change in deposits with central banks 175 598 - 142 311 Change in treasury operational portfolios - 2 340 429 123 Change in venture capital operations included in shares and other variable-yield securities - 110 906 - 147 882 Change in shares and other variable-yield securities excluding venture capital operations - 31 586 - 98 461 Change in amounts owed to credit institutions and customers 4 635 610 5 488 707 Change in prepayments and accrued income - 315 077 - 2 359 249 Change in other assets - 55 796 - 23 745 Change in accruals and deferred income 324 782 544 169 Change in other liabilities 495 950 111 637 Net cash used in operating activities - 2 254 393 - 25 192 157 B. Cash flows from investing activities: Securities from investment portfolio matured during the period 90 750 243 022 Purchase of loan substitutes included in the debt securities portfolios - 1 966 291 - 3 661 199 Redemption of loan substitutes included in the debt securities portfolios 1 193 132 1 181 712 Purchase and disposal of tangible and intangible assets - 4 791 - 20 692 Net cash used in investing activities - 687 200 - 2 257 157 C. Cash flows from financing activities: Issuance of debts evidenced by certificates 90 486 854 151 108 378 Redemption of debts evidenced by certificates - 69 607 008 - 113 967 119 Member States’ contribution 0 57 663 Net change in cash related to acquisitions and disposals of shares in subsidiary undertakings 26 490 - 7 771 Dividend paid to minority interest 0 - 1 108 Net cash from financing activities 20 906 336 37 190 043 Summary statement of cash flows: Cash and cash equivalents at beginning of the year 47 038 818 37 209 630 Net cash from: Operating activities - 2 254 393 - 25 192 157 Investing activities - 687 200 - 2 257 157 Financing activities 20 906 336 37 190 043 Effect of exchange rate changes on cash held - 304 214 88 459 Cash and cash equivalents at end of the period 64 699 347 47 038 818 Cash and cash equivalents are composed of: Cash in hand, balances with central banks and post office banks, excluding deposits with Central Bank of Luxembourg to cover minimum reserve requirement 285 140 31 552 Bills maturing within three months of issue (A1 portfolio) 17 972 727 6 625 670 Loans and advances to credit institutions and customers: Repayable on demand 982 873 963 843 Other loans and advances 45 458 607 39 417 753 64 699 347 47 038 818
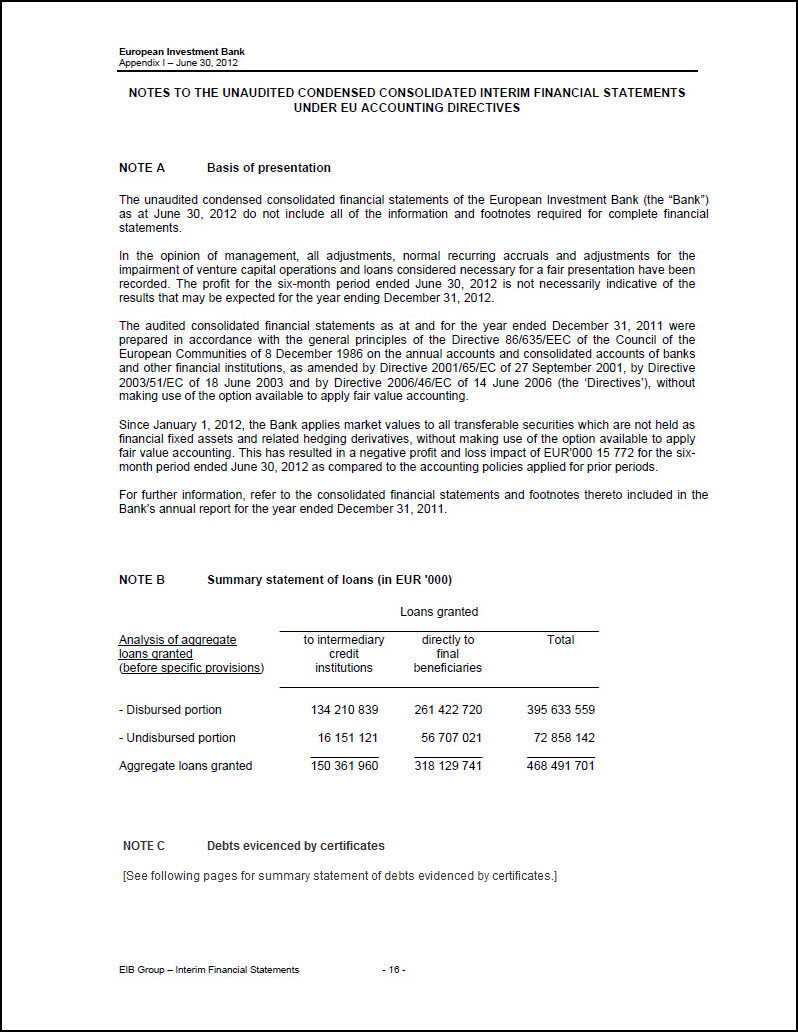
NOTES TO THE UNAUDITED CONDENSED CONSOLIDATED INTERIM FINANCIAL STATEMENTS UNDER EU ACCOUNTING DIRECTIVES NOTE A Basis of presentation The unaudited condensed consolidated financial statements of the European Investment Bank (the “Bank”) as at June 30, 2012 do not include all of the information and footnotes required for complete financial statements. In the opinion of management, all adjustments, normal recurring accruals and adjustments for the impairment of venture capital operations and loans considered necessary for a fair presentation have been recorded. The profit for the six-month period ended June 30, 2012 is not necessarily indicative of the results that may be expected for the year ending December 31, 2012. The audited consolidated financial statements as at and for the year ended December 31, 2011 were prepared in accordance with the general principles of the Directive 86/635/EEC of the Council of the European Communities of 8 December 1986 on the annual accounts and consolidated accounts of banks and other financial institutions, as amended by Directive 2001/65/EC of 27 September 2001, by Directive 2003/51/EC of 18 June 2003 and by Directive 2006/46/EC of 14 June 2006 (the ‘Directives’), without making use of the option available to apply fair value accounting. Since January 1, 2012, the Bank applies market values to all transferable securities which are not held as financial fixed assets and related hedging derivatives, without making use of the option available to apply fair value accounting. This has resulted in a negative profit and loss impact of EUR’000 15 772 for the six-month period ended June 30, 2012 as compared to the accounting policies applied for prior periods. For further information, refer to the consolidated financial statements and footnotes thereto included in the Bank’s annual report for the year ended December 31, 2011. NOTE B Summary statement of loans (in EUR ‘000) Loans granted Analysis of aggregate loans granted (before specific provisions) to intermediary credit institutions directly to final beneficiaries Total - Disbursed portion 134 210 839 261 422 720 395 633 559 - Undisbursed portion 16 151 121 56 707 021 72 858 142 Aggregate loans granted 150 361 960 318 129 741 468 491 701
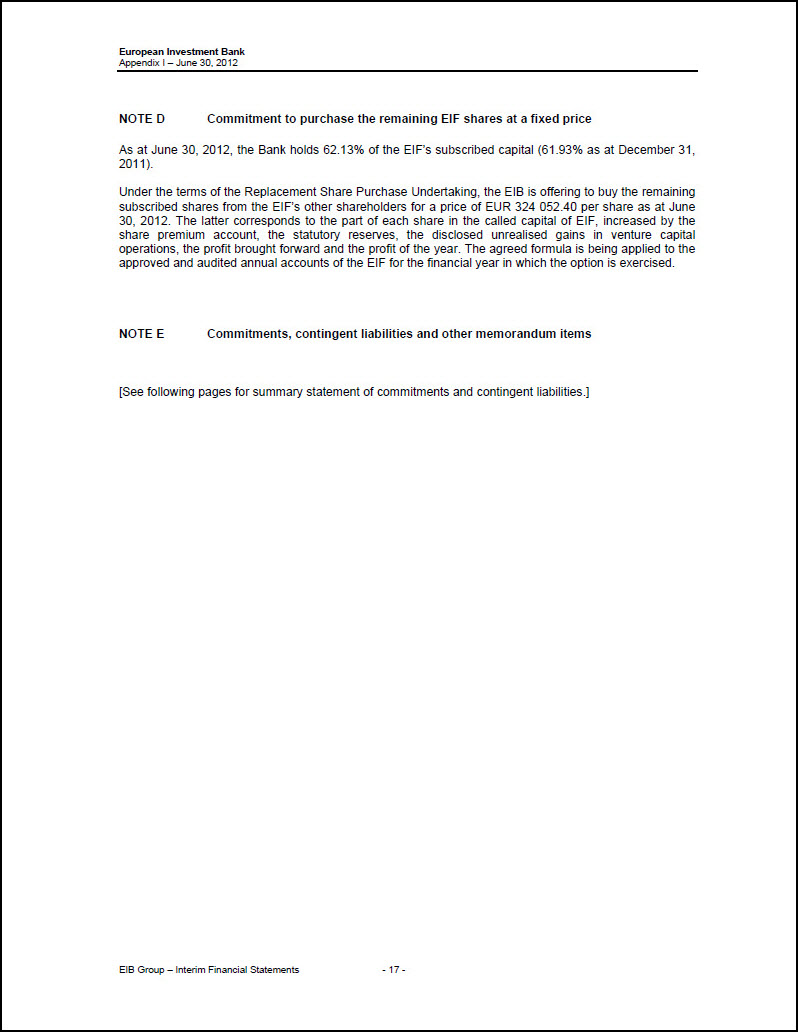
NOTE D Commitment to purchase the remaining EIF shares at a fixed price As at June 30, 2012, the Bank holds 62.13% of the EIF’s subscribed capital (61.93% as at December 31, 2011). Under the terms of the Replacement Share Purchase Undertaking, the EIB is offering to buy the remaining subscribed shares from the EIF’s other shareholders for a price of EUR 324 052.40 per share as at June 30, 2012. The latter corresponds to the part of each share in the called capital of EIF, increased by the share premium account, the statutory reserves, the disclosed unrealised gains in venture capital operations, the profit brought forward and the profit of the year. The agreed formula is being applied to the approved and audited annual accounts of the EIF for the financial year in which the option is exercised. NOTE E Commitments, contingent liabilities and other memorandum items [See following pages for summary statement of commitments and contingent liabilities.]
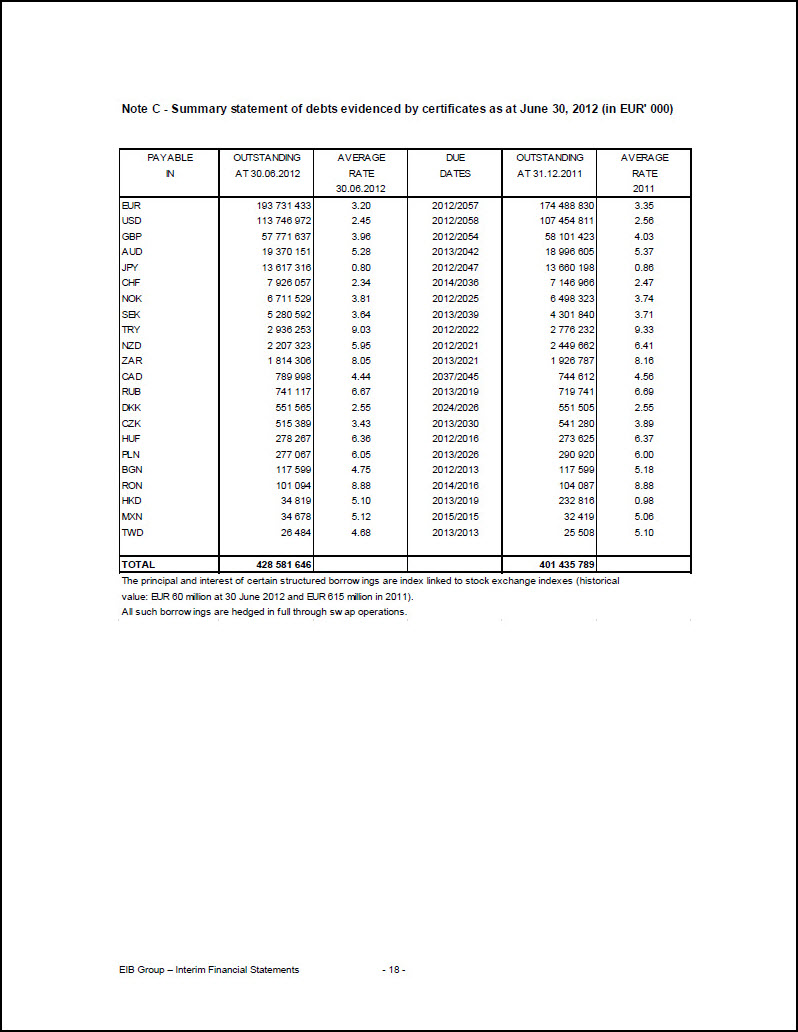
Note C - Summary statement of debts evidenced by certificates as at June 30, 2012 (in EUR’ 000) PAYABLE IN OUTSTANDING AT 30.06.2012 AVERAGE RATE 30.06.2012 DUE DATES OUTSTANDING AT 31.12.2011 AVERAGE RATE 2011 EUR 193 731 433 3.20 2012/2057 174 488 830 3.35 USD 113 746 972 2.45 2012/2058 107 454 811 2.56 GBP 57 771 637 3.96 2012/2054 58 101 423 4.03 AUD 19 370 151 5.28 2013/2042 18 996 605 5.37 JPY 13 617 316 0.80 2012/2047 13 660 198 0.86 CHF 7 926 057 2.34 2014/2036 7 146 966 2.47 NOK 6 711 529 3.81 2012/2025 6 498 323 3.74 SEK 5 280 592 3.64 2013/2039 4 301 840 3.71 TRY 2 936 253 9.03 2012/2022 2 776 232 9.33 NZD 2 207 323 5.95 2012/2021 2 449 662 6.41 ZAR 1 814 306 8.05 2013/2021 1 926 787 8.16 CAD 789 998 4.44 2037/2045 744 612 4.56 RUB 741 117 6.67 2013/2019 719 741 6.69 DKK 551 565 2.55 2024/2026 551 505 2.55 CZK 515 389 3.43 2013/2030 541 280 3.89 HUF 278 267 6.36 2012/2016 273 625 6.37 PLN 277 067 6.05 2013/2026 290 920 6.00 BGN 117 599 4.75 2012/2013 117 599 5.18 RON 101 094 8.88 2014/2016 104 087 8.88 HKD 34 819 5.10 2013/2019 232 816 0.98 MXN 34 678 5.12 2015/2015 32 419 5.06 TWD 26 484 4.68 2013/2013 25 508 5.10 TOTAL 428 581 646 401 435 789 The principal and interest of certain structured borrowings are index linked to stock exchange indexes (historical value: EUR 60 million at 30 June 2012 and EUR 615 million in 2011). All such borrowings are hedged in full through swap operations.
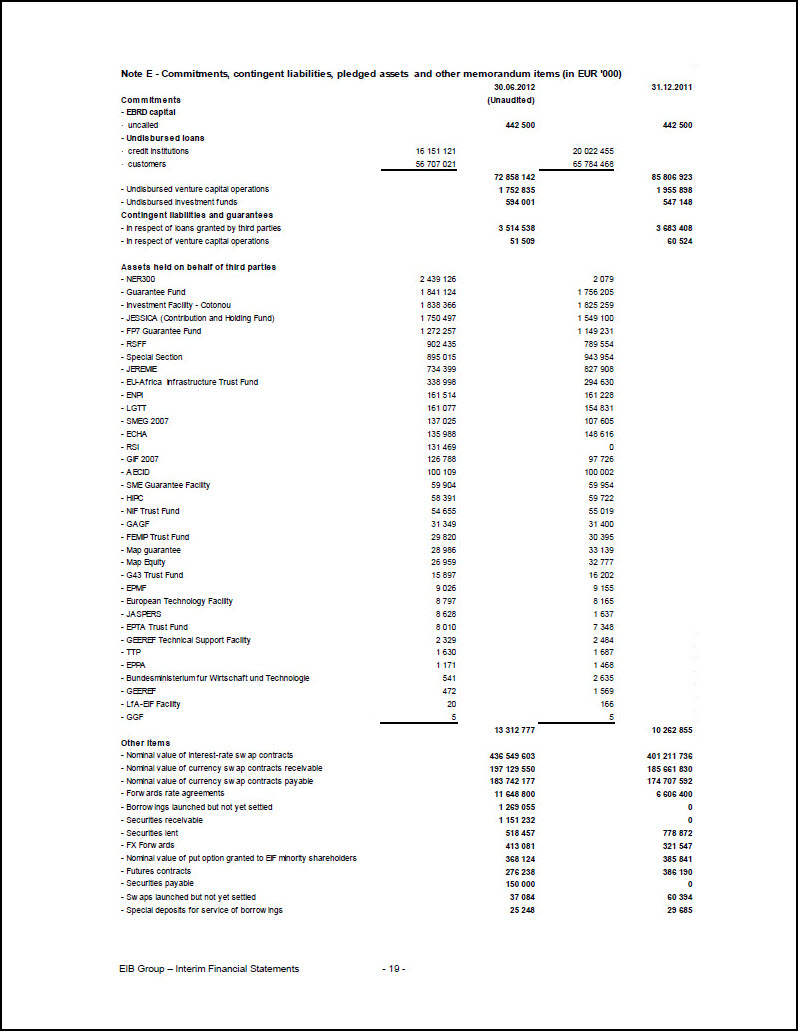
Note E - Commitments, contingent liabilities, pledged assets and other memorandum items (in EUR ’000) 30.06.2012 (Unaudited) 31.12.2011 Commitments - EBRD capital · uncalled 442 500 442 500 - Undisbursed loans · credit institutions 16 151 121 20 022 455 · customers 56 707 021 65 784 468 72 858 142 85 806 923 - Undisbursed venture capital operations 1 752 835 1 955 898 - Undisbursed investment funds 594 001 547 148 Contingent liabilities and guarantees - In respect of loans granted by third parties 3 514 538 3 683 408 - In respect of venture capital operations 51 509 60 524 Assets held on behalf of third parties - NER300 2 439 126 2 079 - Guarantee Fund 1 841 124 1 756 205 - Investment Facility - Cotonou 1 838 366 1 825 259 - JESSICA (Contribution and Holding Fund) 1 750 497 1 549 100 - FP7 Guarantee Fund 1 272 257 1 149 231 - RSFF 902 435 789 554 - Special Section 895 015 943 954 - JEREMIE 734 399 827 908 - EU-Africa Infrastructure Trust Fund 338 998 294 630 - ENPI 161 514 161 228 - LGTT 161 077 154 831 - SMEG 2007 137 025 107 605 - ECHA 135 988 148 616 - RSI 131 469 0 - GIF 2007 126 788 97 726 - AECID 100 109 100 002 - SME Guarantee Facility 59 904 59 954 - HIPC 58 391 59 722 - NIF Trust Fund 54 655 55 019 - GAGF 31 349 31 400 - FEMIP Trust Fund 29 820 30 395 - Map guarantee 28 986 33 139 - Map Equity 26 959 32 777 - G43 Trust Fund 15 897 16 202 - EPMF 9 026 9 155 - European Technology Facility 8 797 8 165 - JASPERS 8 628 1 637 - EPTA Trust Fund 8 010 7 348 - GEEREF Technical Support Facility 2 329 2 484 - TTP 1 630 1 687 - EPPA 1 171 1 468 - Bundesministerium fur Wirtschaft und Technologie 541 2 635 - GEEREF 472 1 569 - LfA-EIF Facility 20 166 - GGF 5 5 13 312 777 10 262 855 Other items - Nominal value of interest-rate swap contracts 436 549 603 401 211 736 - Nominal value of currency swap contracts receivable 197 129 550 185 661 830 - Nominal value of currency swap contracts payable 183 742 177 174 707 592 - Forwards rate agreements 11 648 800 6 606 400 - Borrowings launched but not yet settled 1 269 055 0 - Securities receivable 1 151 232 0 - Securities lent 518 457 778 872 - FX Forwards 413 081 321 547 - Nominal value of put option granted to EIF minority shareholders 368 124 385 841 - Futures contracts 276 238 386 190 - Securities payable 150 000 0 - Swaps launched but not yet settled 37 084 60 394 - Special deposits for service of borrowings 25 248 29 685
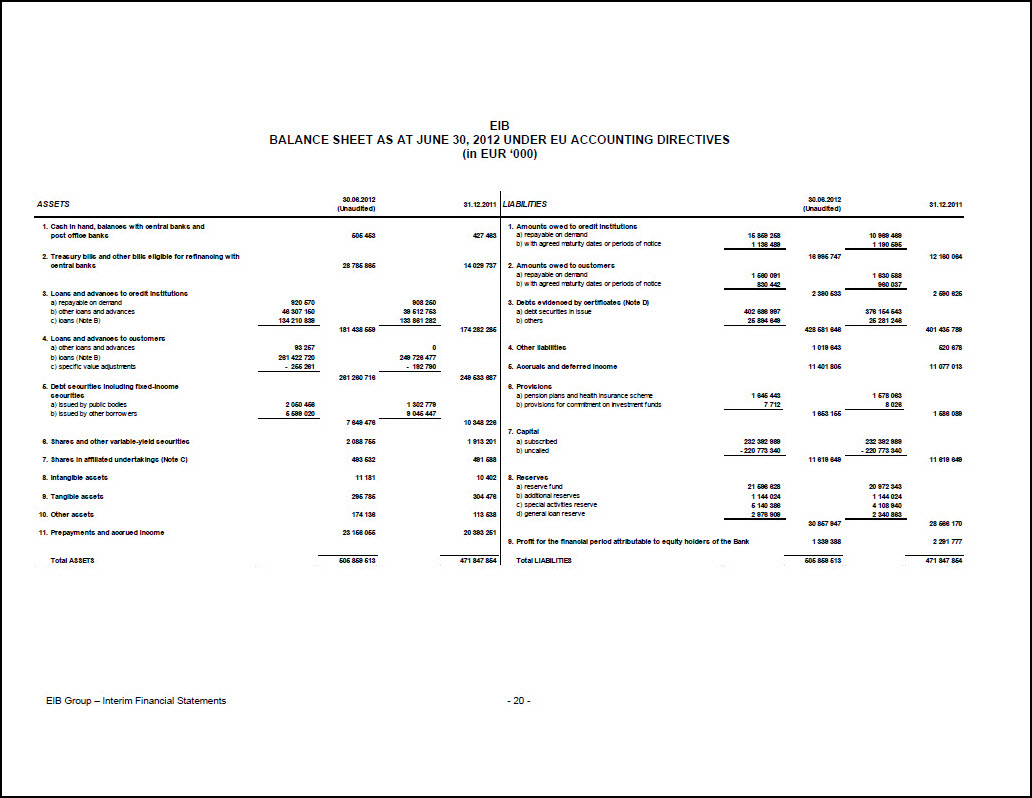
EIB BALANCE SHEET AS AT JUNE 30, 2012 UNDER EU ACCOUNTING DIRECTIVES (in EUR ‘000) ASSETS 30.06.2012 (Unaudited) 31.12.2011 LIABILITIES 30.06.2012 (Unaudited) 31.12.2011 1. Cash in hand, balances with central banks and post office banks 505 453 427 463 2. Treasury bills and other bills eligible for refinancing with central banks 28 785 865 14 029 737 3. Loans and advances to credit institutions a) repayable on demand 920 570 908 250 b) other loans and advances 46 307 150 39 512 753 c) loans (Note B) 134 210 839 133 861 282 181 438 559 174 282 285 4. Loans and advances to customers a) other loans and advances 93 257 0 b) loans (Note B) 261 422 720 249 726 477 c) specific value adjustments - 255 261 - 192 790 261 260 716 249 533 687 5. Debt securities including fixed-income securities a) issued by public bodies 2 050 456 1 302 779 b) issued by other borrowers 5 599 020 9 045 447 7 649 476 10 348 226 6. Shares and other variable-yield securities 2 088 755 1 913 201 7. Shares in affiliated undertakings (Note C) 493 532 491 588 8. Intangible assets 11 181 10 402 9. Tangible assets 295 785 304 476 10. Other assets 174 136 113 538 11. Prepayments and accrued income 23 156 055 20 393 251 Total ASSETS 505 859 513 471 847 854 LIABILITIES 30.06.2012 (Unaudited) 31.12.2011 1. Amounts owed to credit institutions a) repayable on demand 15 859 258 10 969 469 b) with agreed maturity dates or periods of notice 1 136 489 1 190 595 16 995 747 12 160 064 2. Amounts owed to customers a) repayable on demand 1 560 091 1 630 588 b) with agreed maturity dates or periods of notice 830 442 960 037 2 390 533 2 590 625 3. Debts evidenced by certificates (Note D) a) debt securities in issue 402 686 997 376 154 543 b) others 25 894 649 25 281 246 428 581 646 401 435 789 4. Other liabilities 1 019 643 520 678 5. Accruals and deferred income 11 401 805 11 077 013 6. Provisions a) pension plans and health insurance scheme 1 645 443 1 578 063 b) provisions for commitment on investment funds 7 712 8 026 1 653 155 1 586 089 7. Capital a) subscribed 232 392 989 232 392 989 b) uncalled - 220 773 340 - 220 773 340 11 619 649 11 619 649 8. Reserves a) reserve fund 21 596 628 20 972 343 b) additional reserves 1 144 024 1 144 024 c) special activities reserve 5 140 386 4 108 940 d) general loan reserve 2 976 909 2 340 863 30 857 947 28 566 170 9. Profit for the financial period attributable to equity holders of the Bank 1 339 388 2 291 777 Total LIABILITIES 505 859 513 471 847 854
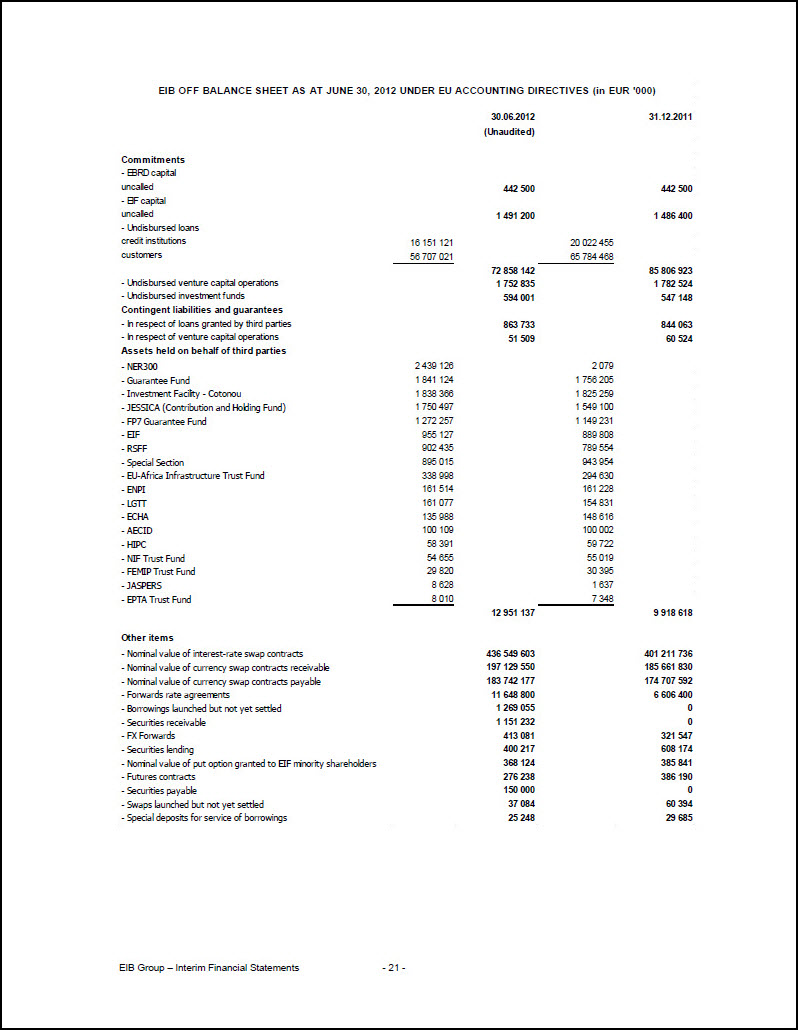
EIB OFF BALANCE SHEET AS AT JUNE 30, 2012 UNDER EU ACCOUNTING DIRECTIVES (in EUR ‘000) 30.06.2012 (Unaudited) 31.12.2011 Commitments - EBRD capital uncalled 442 500 442 500 - EIF capital uncalled 1 491 200 1 486 400 - Undisbursed loans credit institutions 16 151 121 20 022 455 customers 56 707 021 65 784 468 72 858 142 85 806 923 - Undisbursed venture capital operations 1 752 835 1 782 524 - Undisbursed investment funds 594 001 547 148 Contingent liabilities and guarantees - In respect of loans granted by third parties 863 733 844 063 - In respect of venture capital operations 51 509 60 524 Assets held on behalf of third parties - NER300 2 439 126 2 079 - Guarantee Fund 1 841 124 1 756 205 - Investment Facility - Cotonou 1 838 366 1 825 259 - JESSICA (Contribution and Holding Fund) 1 750 497 1 549 100 - FP7 Guarantee Fund 1 272 257 1 149 231 - EIF 955 127 889 808 - RSFF 902 435 789 554 - Special Section 895 015 943 954 - EU-Africa Infrastructure Trust Fund 338 998 294 630 - ENPI 161 514 161 228 - LGTT 161 077 154 831 - ECHA 135 988 148 616 - AECID 100 109 100 002 - HIPC 58 391 59 722 - NIF Trust Fund 54 655 55 019 - FEMIP Trust Fund 29 820 30 395 - JASPERS 8 628 1 637 - EPTA Trust Fund 8 010 7 348 12 951 137 9 918 618 Other items - Nominal value of interest-rate swap contracts 436 549 603 401 211 736 - Nominal value of currency swap contracts receivable 197 129 550 185 661 830 - Nominal value of currency swap contracts payable 183 742 177 174 707 592 - Forwards rate agreements 11 648 800 6 606 400 - Borrowings launched but not yet settled 1 269 055 0 - Securities receivable 1 151 232 0 - FX Forwards 413 081 321 547 - Securities lending 400 217 608 174 - Nominal value of put option granted to EIF minority shareholders 368 124 385 841 - Futures contracts 276 238 386 190 - Securities payable 150 000 0 - Swaps launched but not yet settled 37 084 60 394 - Special deposits for service of borrowings 25 248 29 685

EIB PROFIT AND LOSS ACCOUNT FOR THE PERIOD ENDED JUNE 30, 2012 UNDER EU ACCOUNTING DIRECTIVES (in EUR ’000) H1 2012 (Unaudited) H1 2011 (Unaudited) 2011 1. Interest receivable and similar income 12 943 159 11 117 038 24 911 031 2. Interest payable and similar charges - 11 542 792 - 9 719 982 - 22 038 661 3. Income from securities a) income from shares and other variable-yield securities 15 204 8 902 23 962 b) income from shares in affiliated undertakings 0 31 786 1 786 15 204 40 688 25 748 4. Commission receivable 107 708 74 548 217 392 5. Commission payable - 6 937 - 6 455 - 13 884 6. Net result on financial operations 108 184 - 46 419 - 146 442 7. Other operating income 2 720 11 894 11 734 8. General administrative expenses a) staff costs - 168 299 - 162 504 - 363 364 b) other administrative costs - 49 756 - 43 162 - 122 664 - 218 055 - 205 666 - 486 028 9. Value adjustments in respect of tangible and intangible assets a) tangible assets - 10 923 - 10 621 - 23 890 b) intangible assets - 1 780 - 1 184 - 4 716 - 12 703 - 11 805 - 28 606 10. Value (re-)adjustments in respect of loans and advances and provisions for contingent liabilities - 57 100 973 - 110 507 11. Extraordinary charges 0 - 50 000 - 50 000 12. Profit for the period 1 339 388 1 204 814 2 291 777
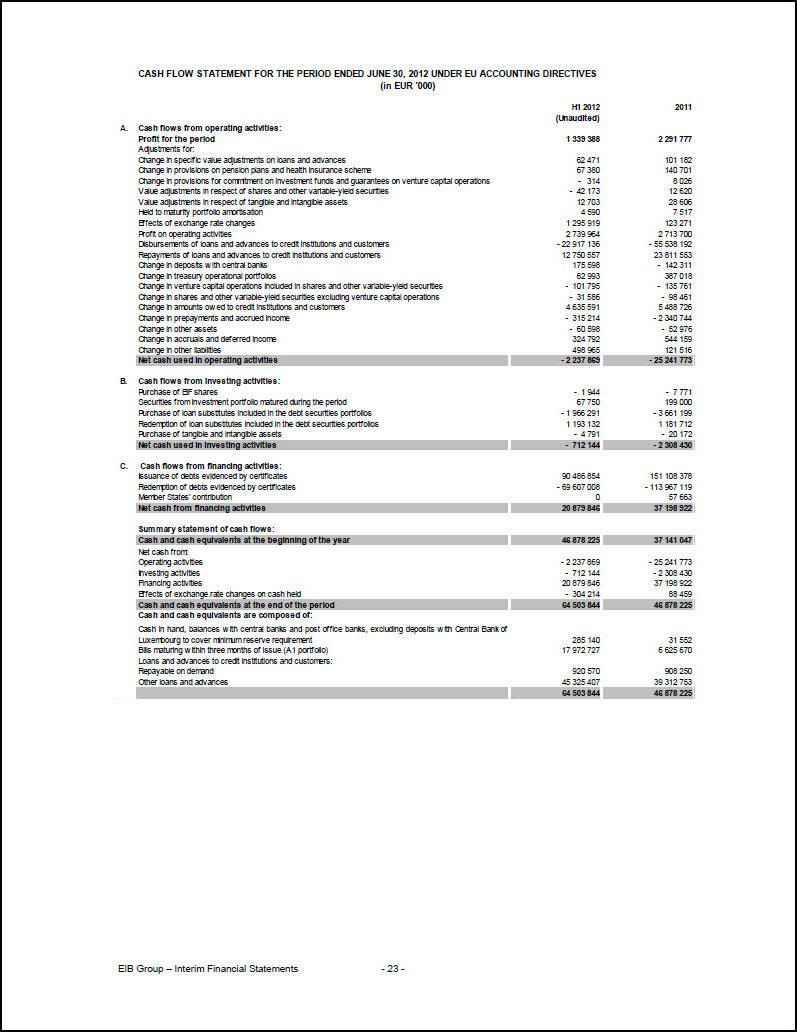
CASH FLOW STATEMENT FOR THE PERIOD ENDED JUNE 30, 2012 UNDER EU ACCOUNTING DIRECTIVES (in EUR ’000) H1 2012 (Unaudited) 2011 A. Cash flows from operating activities: Profit for the period 1 339 388 2 291 777 Adjustments for: Change in specific value adjustments on loans and advances 62 471 101 182 Change in provisions on pension plans and health insurance scheme 67 380 140 701 Change in provisions for commitment on investment funds and guarantees on venture capital operations - 314 8 026 Value adjustments in respect of shares and other variable-yield securities - 42 173 12 620 Value adjustments in respect of tangible and intangible assets 12 703 28 606 Held to maturity portfolio amortisation 4 590 7 517 Effects of exchange rate changes 1 295 919 123 271 Profit on operating activities 2 739 964 2 713 700 Disbursements of loans and advances to credit institutions and customers - 22 917 136 - 55 538 192 Repayments of loans and advances to credit institutions and customers 12 750 557 23 811 553 Change in deposits with central banks 175 598 - 142 311 Change in treasury operational portfolios 62 993 387 018 Change in venture capital operations included in shares and other variable-yield securities - 101 795 - 135 761 Change in shares and other variable-yield securities excluding venture capital operations - 31 586 - 98 461 Change in amounts owed to credit institutions and customers 4 635 591 5 488 726 Change in prepayments and accrued income - 315 214 - 2 340 744 Change in other assets - 60 598 - 52 976 Change in accruals and deferred income 324 792 544 159 Change in other liabilities 498 965 121 516 Net cash used in operating activities - 2 237 869 - 25 241 773 B. Cash flows from investing activities: Purchase of EIF shares - 1 944 - 7 771 Securities from investment portfolio matured during the period 67 750 199 000 Purchase of loan substitutes included in the debt securities portfolios - 1 966 291 - 3 661 199 Redemption of loan substitutes included in the debt securities portfolios 1 193 132 1 181 712 Purchase of tangible and intangible assets - 4 791 - 20 172 Net cash used in investing activities - 712 144 - 2 308 430 C. Cash flows from financing activities: Issuance of debts evidenced by certificates 90 486 854 151 108 378 Redemption of debts evidenced by certificates - 69 607 008 - 113 967 119 Member States’ contribution 0 57 663 Net cash from financing activities 20 879 846 37 198 922 Summary statement of cash flows: Cash and cash equivalents at the beginning of the year 46 878 225 37 141 047 Net cash from: Operating activities - 2 237 869 - 25 241 773 Investing activities - 712 144 - 2 308 430 Financing activities 20 879 846 37 198 922 Effects of exchange rate changes on cash held - 304 214 88 459 Cash and cash equivalents at the end of the period 64 503 844 46 878 225 Cash and cash equivalents are composed of: Cash in hand, balances with central banks and post office banks, excluding deposits with Central Bank of Luxembourg to cover minimum reserve requirement 285 140 31 552 Bills maturing within three months of issue (A1 portfolio) 17 972 727 6 625 670 Loans and advances to credit institutions and customers: Repayable on demand 920 570 908 250 Other loans and advances 45 325 407 39 312 753 64 503 844 46 878 225
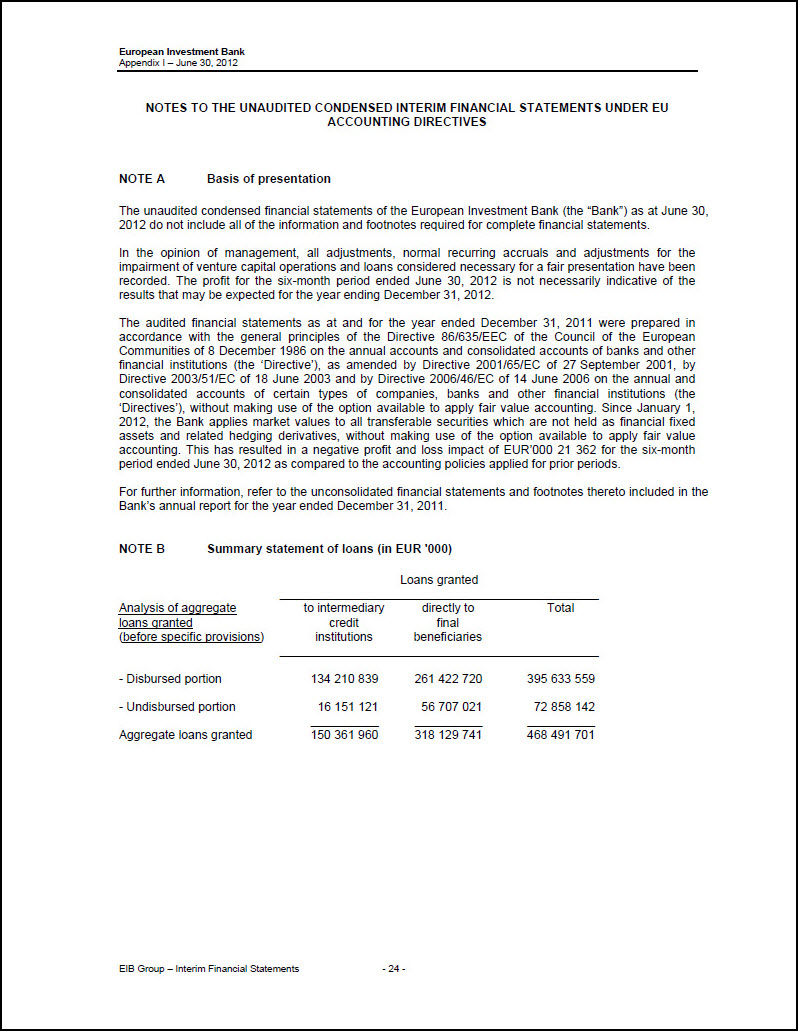
NOTES TO THE UNAUDITED CONDENSED INTERIM FINANCIAL STATEMENTS UNDER EU ACCOUNTING DIRECTIVES NOTE A Basis of presentation The unaudited condensed financial statements of the European Investment Bank (the “Bank”) as at June 30, 2012 do not include all of the information and footnotes required for complete financial statements. In the opinion of management, all adjustments, normal recurring accruals and adjustments for the impairment of venture capital operations and loans considered necessary for a fair presentation have been recorded. The profit for the six-month period ended June 30, 2012 is not necessarily indicative of the results that may be expected for the year ending December 31, 2012. The audited financial statements as at and for the year ended December 31, 2011 were prepared in accordance with the general principles of the Directive 86/635/EEC of the Council of the European Communities of 8 December 1986 on the annual accounts and consolidated accounts of banks and other financial institutions (the ‘Directive’), as amended by Directive 2001/65/EC of 27 September 2001, by Directive 2003/51/EC of 18 June 2003 and by Directive 2006/46/EC of 14 June 2006 on the annual and consolidated accounts of certain types of companies, banks and other financial institutions (the ‘Directives’), without making use of the option available to apply fair value accounting. Since January 1, 2012, the Bank applies market values to all transferable securities which are not held as financial fixed assets and related hedging derivatives, without making use of the option available to apply fair value accounting. This has resulted in a negative profit and loss impact of EUR’000 21 362 for the six-month period ended June 30, 2012 as compared to the accounting policies applied for prior periods. For further information, refer to the unconsolidated financial statements and footnotes thereto included in the Bank’s annual report for the year ended December 31, 2011. NOTE B Summary statement of loans (in EUR ‘000) Loans granted Analysis of aggregate loans granted (before specific provisions) to intermediary credit institutions directly to final beneficiaries Total - Disbursed portion 134 210 839 261 422 720 395 633 559 - Undisbursed portion 16 151 121 56 707 021 72 858 142 Aggregate loans granted 150 361 960 318 129 741 468 491 701
NOTE C Shares in affiliated undertakings This item for EUR’000 493 532 corresponds to the capital paid in by the Bank in respect of its subscription (EUR’000 1 864 000) to the capital of the European Investment Fund (EIF), with its registered office in Luxembourg. As at June 30, 2012, the Bank holds 62.13% of the EIF’s subscribed capital (61.93% as at December 31, 2011). Commitment to purchase the remaining EIF shares at a fixed price Under the terms of the Replacement Share Purchase Undertaking, the EIB is offering to buy the remaining subscribed shares from the EIF’s other shareholders for a price of EUR 324 052.40 per share as at June 30, 2012. The latter corresponds to the part of each share in the called capital of EIF, increased by the share premium account, the statutory reserves, the disclosed unrealised gains in venture capital operations, the profit brought forward and the profit of the year. The agreed formula is being applied to the approved and audited annual accounts of the EIF for the financial year in which the option is exercised. NOTE D Debts evidenced by certificates [See following page for summary statement of debts evidenced by certificates]
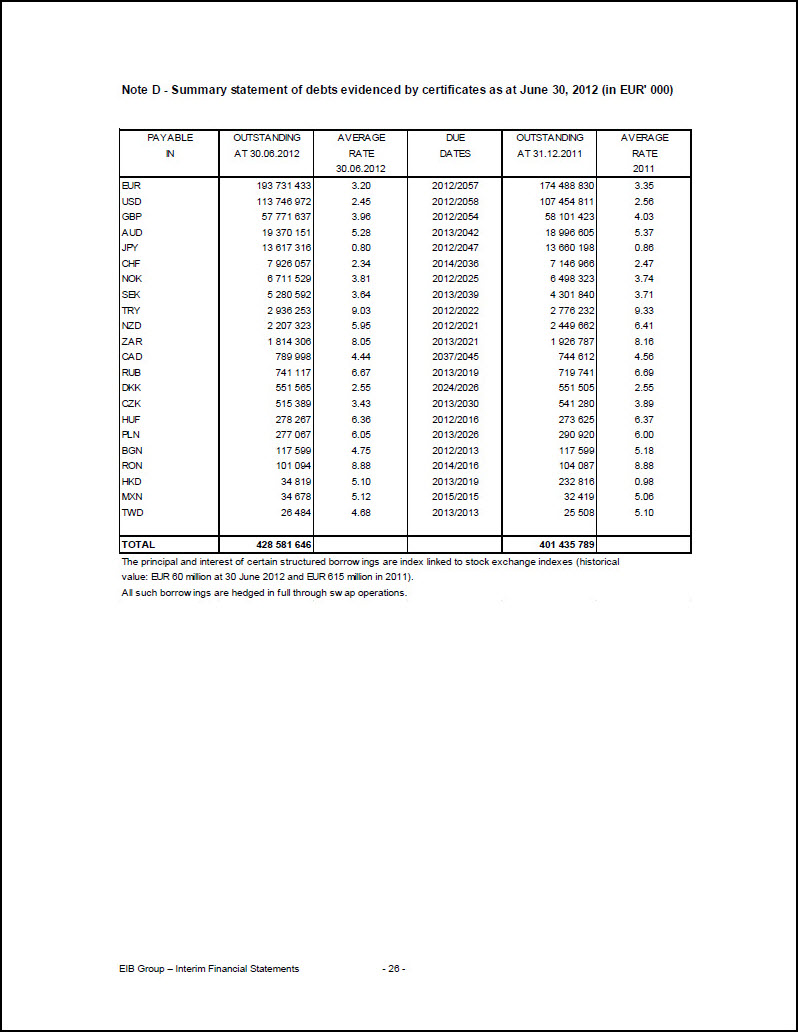
Note D - Summary statement of debts evidenced by certificates as at June 30, 2012 (in EUR’ 000) PAYABLE IN OUTSTANDING AT 30.06.2012 AVERAGE RATE 30.06.2012 DUE DATES OUTSTANDING AT 31.12.2011 AVERAGE RATE 2011 EUR 193 731 433 3.20 2012/2057 174 488 830 3.35 USD 113 746 972 2.45 2012/2058 107 454 811 2.56 GBP 57 771 637 3.96 2012/2054 58 101 423 4.03 AUD 19 370 151 5.28 2013/2042 18 996 605 5.37 JPY 13 617 316 0.80 2012/2047 13 660 198 0.86 CHF 7 926 057 2.34 2014/2036 7 146 966 2.47 NOK 6 711 529 3.81 2012/2025 6 498 323 3.74 SEK 5 280 592 3.64 2013/2039 4 301 840 3.71 TRY 2 936 253 9.03 2012/2022 2 776 232 9.33 NZD 2 207 323 5.95 2012/2021 2 449 662 6.41 ZAR 1 814 306 8.05 2013/2021 1 926 787 8.16 CAD 789 998 4.44 2037/2045 744 612 4.56 RUB 741 117 6.67 2013/2019 719 741 6.69 DKK 551 565 2.55 2024/2026 551 505 2.55 CZK 515 389 3.43 2013/2030 541 280 3.89 HUF 278 267 6.36 2012/2016 273 625 6.37 PLN 277 067 6.05 2013/2026 290 920 6.00 BGN 117 599 4.75 2012/2013 117 599 5.18 RON 101 094 8.88 2014/2016 104 087 8.88 HKD 34 819 5.10 2013/2019 232 816 0.98 MXN 34 678 5.12 2015/2015 32 419 5.06 TWD 26 484 4.68 2013/2013 25 508 5.10 TOTAL 428 581 646 401 435 789 The principal and interest of certain structured borrowings are index linked to stock exchange indexes (historical value: EUR 60 million at 30 June 2012 and EUR 615 million in 2011). All such borrowings are hedged in full through swap operations.