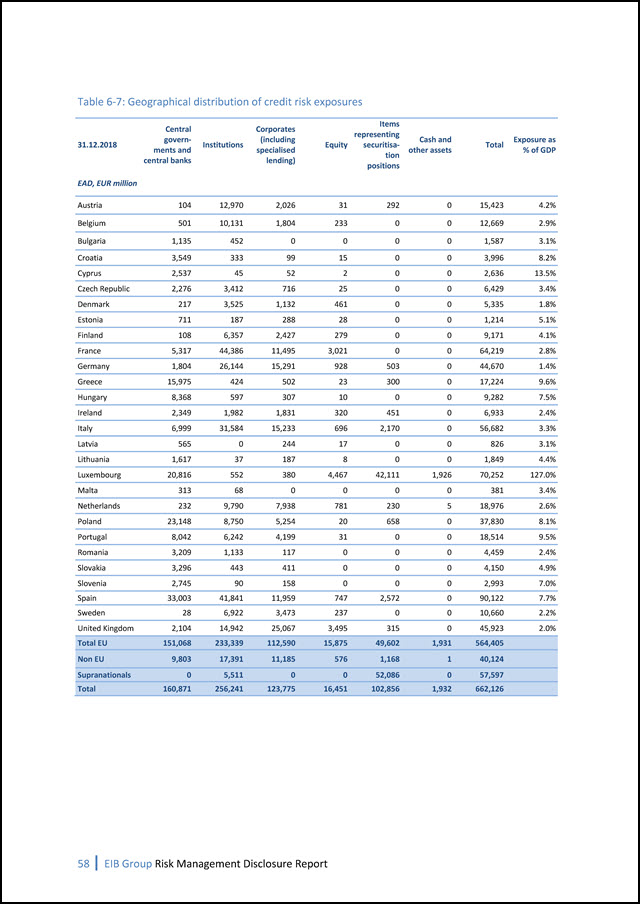
58 Table 6-7: Geographical distribution of credit risk exposures (including representing tion Cash and Exposure as Central govern- Corporates Items 31.12.2018 ments and Institutions specialised Equity securitisa- other assets Total % of GDP ce ntral banks lending) positions EAD, EUR million Austria 104 12,970 2,026 31 292 0 15,423 4.2% Belgium 501 10,131 1,804 233 0 0 12,669 2.9% Bulgaria 1,135 452 0 0 0 0 1,587 3.1% Croatia 3,549 333 99 15 0 0 3,996 8.2% Cyprus 2,537 45 52 2 0 0 2,636 13.5% Czech Republic 2,276 3,412 716 25 0 0 6,429 3.4% Denmark 217 3,525 1,132 461 0 0 5,335 1.8% Estonia 711 187 288 28 0 0 1,214 5.1% Finland 108 6,357 2,427 279 0 0 9,171 4.1% France 5,317 44,386 11,495 3,021 0 0 64,219 2.8% Germany 1,804 26,144 15,291 928 503 0 44,670 1.4% Greece 15,975 424 502 23 300 0 17,224 9.6% Hungary 8,368 597 307 10 0 0 9,282 7.5% Ireland 2,349 1,982 1,831 320 451 0 6,933 2.4% Italy 6,999 31,584 15,233 696 2,170 0 56,682 3.3% Latvia 565 0 244 17 0 0 826 3.1% Lithuania 1,617 37 187 8 0 0 1,849 4.4% Luxembourg 20,816 552 380 4,467 42,111 1,926 70,252 127.0% Malta 313 68 0 0 0 0 381 3.4% Netherlands 232 9,790 7,938 781 230 5 18,976 2.6% Poland 23,148 8,750 5,254 20 658 0 37,830 8.1% Portugal 8,042 6,242 4,199 31 0 0 18,514 9.5% Romania 3,209 1,133 117 0 0 0 4,459 2.4% Slovakia 3,296 443 411 0 0 0 4,150 4.9% Slovenia 2,745 90 158 0 0 0 2,993 7.0% Spain 33,003 41,841 11,959 747 2,572 0 90,122 7.7% Sweden 28 6,922 3,473 237 0 0 10,660 2.2% United Kingdom 2,104 14,942 25,067 3,495 315 0 45,923 2.0% Total EU 151,068 233,339 112,590 15,875 49,602 1,931 564,405 Non EU 9,803 17,391 11,185 576 1,168 1 40,124 Supranationals 0 5,511 0 0 52,086 0 57,597 Total 160,871 256,241 123,775 16,451 102,856 1,932 662,126