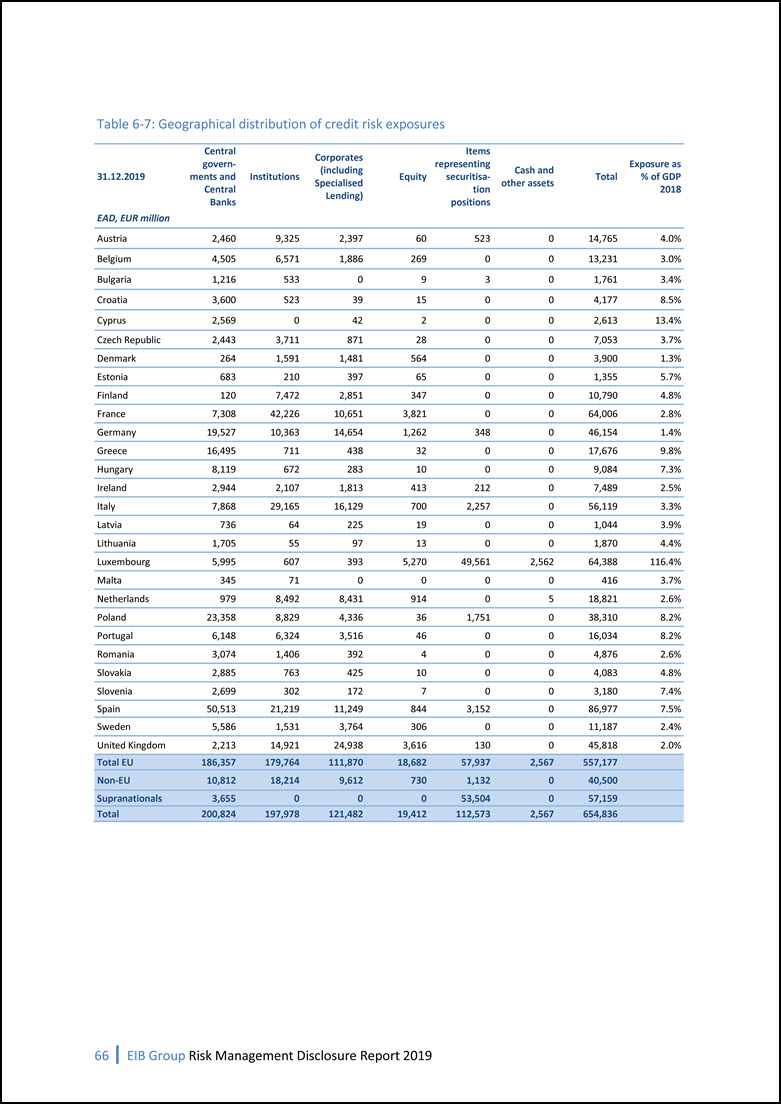
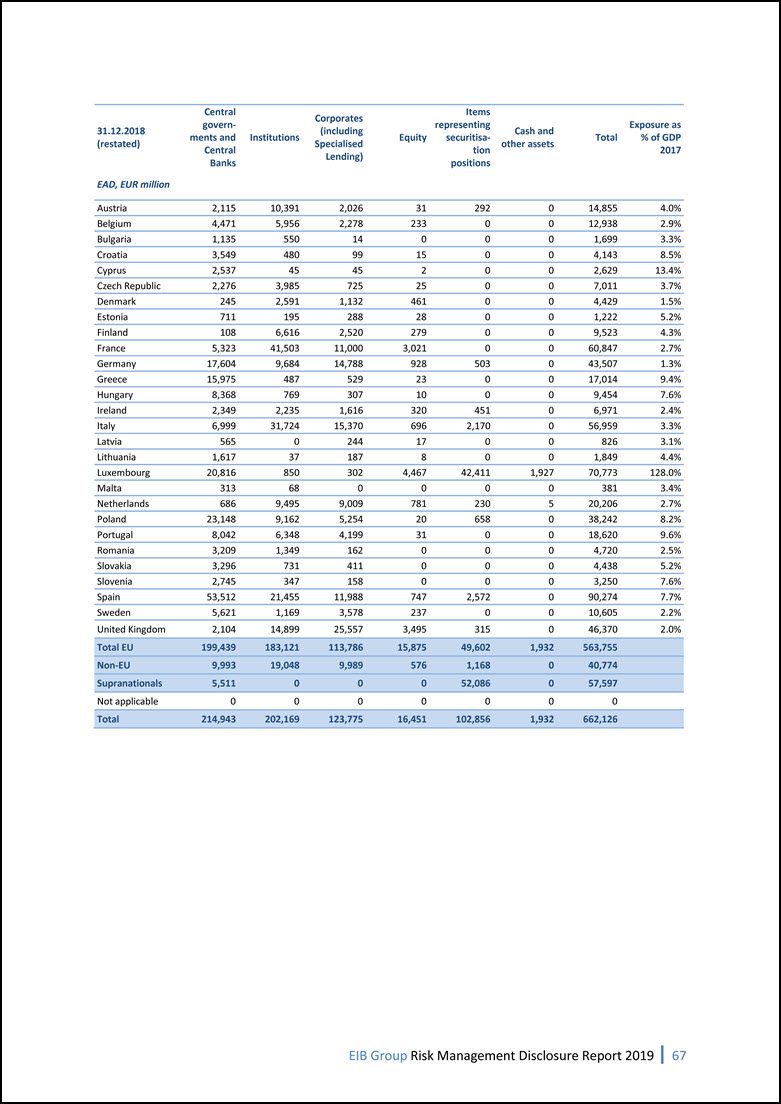
66 | EIB Group Risk Management Disclosure Report 2019 Table 6-7: Geographical distribution of credit risk exposures 31.12.2019 Centralgovern- ments andCentral Banks Institutions Corporates (including Specialised Lending) Equity Itemsrepresenting securitisa-tion positions Cash and other assets Total Exposure as% of GDP2018 EAD, EUR million Austria 2,460 9,325 2,397 60 523 0 14,765 4.0% Belgium 4,505 6,571 1,886 269 0 0 13,231 3.0% Bulgaria 1,216 533 0 9 3 0 1,761 3.4% Croatia 3,600 523 39 15 0 0 4,177 8.5% Cyprus 2,569 0 42 2 0 0 2,613 13.4% Czech Republic 2,443 3,711 871 28 0 0 7,053 3.7% Denmark 264 1,591 1,481 564 0 0 3,900 1.3% Estonia 683 210 397 65 0 0 1,355 5.7% Finland 120 7,472 2,851 347 0 0 10,790 4.8% France 7,308 42,226 10,651 3,821 0 0 64,006 2.8% Germany 19,527 10,363 14,654 1,262 348 0 46,154 1.4% Greece 16,495 711 438 32 0 0 17,676 9.8% Hungary 8,119 672 283 10 0 0 9,084 7.3% Ireland 2,944 2,107 1,813 413 212 0 7,489 2.5% Italy 7,868 29,165 16,129 700 2,257 0 56,119 3.3% Latvia 736 64 225 19 0 0 1,044 3.9% Lithuania 1,705 55 97 13 0 0 1,870 4.4% Luxembourg 5,995 607 393 5,270 49,561 2,562 64,388 116.4% Malta 345 71 0 0 0 0 416 3.7% Netherlands 979 8,492 8,431 914 0 5 18,821 2.6% Poland 23,358 8,829 4,336 36 1,751 0 38,310 8.2% Portugal 6,148 6,324 3,516 46 0 0 16,034 8.2% Romania 3,074 1,406 392 4 0 0 4,876 2.6% Slovakia 2,885 763 425 10 0 0 4,083 4.8% Slovenia 2,699 302 172 7 0 0 3,180 7.4% Spain 50,513 21,219 11,249 844 3,152 0 86,977 7.5% Sweden 5,586 1,531 3,764 306 0 0 11,187 2.4% United Kingdom 2,213 14,921 24,938 3,616 130 0 45,818 2.0% Total EU 186,357 179,764 111,870 18,682 57,937 2,567 557,177 Non-EU 10,812 18,214 9,612 730 1,132 0 40,500 Supranationals 3,655 0 0 0 53,504 0 57,159 Total 200,824 197,978 121,482 19,412 112,573 2,567 654,836