Under IFRS, some debt securities are not eligible for amortised cost and consequently must be carried at fair value with changes in fair value reflected directly in profit or loss. Changes in fair values of these debt securities are recognised in the income statement under "Result on financial operations". Accrued interest is reported on the consolidated balance sheet within the balance of the instrument to which they relate, while any related fees are recognised immediately under "Result on financial operations" in the consolidated income statement. 2 Shares and other variable-yield securities Under EU Accounting Directives, shares and other variable-yield securities are initially recorded at acquisition cost reduced by any reflow resulting from repayments. Their carrying value is subsequently adjusted to the lower of cost or market value at each balance sheet date. Respective value adjustments are recorded under "Result on financial operations". Under IFRS, shares and other variable-yield securities are carried at fair value with changes in fair value reflected directly in the consolidated income statement under "Result on financial operations", except of the investment in European Bank for Reconstruction and Development ("EBRD") whose fair value changes are reflected in OCI under "Fair value reserve". 3 Participating interests Under EU Accounting Directive, "Participating interests" are accounted for using the equity method as defined under EU-AD based on methods consistent with the Group’s accounting policies. Respective value adjustments are recorded under "Value (re-)adjustments in respect of transferable securities held as financial fixed assets and participating interests". Under IFRS, participating interests are included within "Shares and other variable-yield securities" and respective fair value adjustments are recorded in "Result on financial operations". 4 Loans and advances Under EU Accounting Directives, all loans and advances are carried at amortised cost. Accrued interest is recorded under consolidated balance sheet items "Prepayments and accrued income" or "Accruals and deferred income". The up-front fees on loans are amortised and recognised in the consolidated profit and loss account under "Interest receivable and similar income". Under IFRS, loans that are not eligible for amortised cost, are classified as measured at fair value through profit or loss. The up-front fees on these loans are recognised at inception under "Result on financial operations" in the consolidated income statement. Changes in fair values of loans are recognised in the consolidated income statement under "Result on financial operations". 5 Derivative assets and liabilities a Treasury derivatives Under EU Accounting Directives, derivative instruments in the Security liquidity portfolios are marked to market and recorded under "Other assets" or "Other liabilities". Interest accrued under derivative instruments is presented under "Prepayments and accrued income" or "Accruals and deferred income". Under IFRS, all derivative assets and derivative liabilities are recognised on the consolidated balance sheet and measured at fair value through profit or loss. Accrued interest is reported on the balance sheet within the balance of the instrument to which it relates. Credit valuation adjustment ("CVA"), Debit valuation adjustment ("DVA") and Collateral Value adjustment ("CollVA") are included in the fair valuation of derivatives. Changes in fair value of derivatives are recognised in the consolidated income statement under "Result on financial operations". 16 | SEC report as at June 30, 2021
b Derivatives and hedging activities Under EU Accounting Directives, hedging derivative instruments are not recognised on balance sheet. They are reported off balance sheet at nominal amount. Interest accrued under derivative instruments is presented under "Prepayments and accrued income" or "Accruals and deferred income". Up-front fees, redemption premiums or premiums/discounts are amortised over the period to maturity of the related derivatives under "Interest payable and similar charges". Under IFRS, all derivative assets and derivative liabilities are recognised on balance sheet and measured at fair value through profit or loss. Accrued interest is reported on the consolidated balance sheet within the balance of the instrument to which it relates. CVA, DVA and CollVA are included in the fair valuation of derivatives. Changes in fair value of derivatives are recognised in the consolidated income statement under "Result on financial operations". The amortisation of premiums and discounts of FX swaps and FX forwards are recorded under "Result on financial operations". For derivatives used in hedge accounting, the gain or loss of the designated part of the hedging instrument is recognised in consolidated the income statement. In addition, the Group separates the fair value of the foreign currency basis spread ("CBS") from the hedging instruments and applies a dedicated accounting treatment. The initial CBS amount, measured at the date of designation, is recorded under OCI and is amortised linearly over the residual lifetime of the hedge in the consolidated income statement. Subsequent changes in the fair value of the CBS are recognised directly in OCI. For derivatives used in hedge accounting, up-front fees or redemption premiums are amortised over the period to maturity of the related derivative using the effective interest method, unless these derivatives are not designated to hedge accounting, in which case they are recognised immediately under "Result on financial operations". Under IFRS, the Group has two transactions that meet the offsetting of financial assets and financial liabilities criteria. C Impairment of financial assets measured at amortised cost and loan commitments Under EU Accounting Directives, value adjustments on loans and advances are recorded where (i) there is a risk of non-recovery of all or part of their amounts, or (ii) to capture loans in the portfolio which are impaired but have not yet been identified as such or for losses which have been incurred but not yet reported. These value adjustments are accounted for in the consolidated profit and loss account as "Value (re-)adjustments in respect of loans and advances and provisions for contingent liabilities" and are deducted from the appropriate asset items on the consolidated balance sheet. Value adjustments for debt securities are recorded, if these are other than temporary, or to capture debt securities which are impaired but have not yet been identified as such or for losses which have been incurred but not yet reported. These value adjustments are accounted for in the consolidated profit and loss account under "Value (re-)adjustments in respect of transferable securities held as financial fixed assets and participating interests" and are deducted from the appropriate asset items on the consolidated balance sheet. Under IFRS, the Group is required to recognise a loss allowance for all loans and debt securities measured at amortised cost as well as for off-balance sheet loan commitments. This allowance is based on either lifetime Expected Credit Loss ("ECL"), if there has been a significant increase in credit risk since initial recognition or the instrument is considered as being credit-impaired or otherwise on 12-months ECL. Depending on the nature of the financial instrument, the ECL allowances are deducted from the appropriate asset items on the consolidated balance sheet. For off-balance sheet items, a provision for credit loss is reported under "Provisions b) provisions for guarantees issued and commitments". SEC report as at June 30, 2021 | 17

Changes in the ECL allowances are recorded in the consolidated income statement either under: • "Change in impairment on loans and advances and provisions for guarantees, net of reversals" for loans and loan commitments or; • "Change in impairment on transferable securities held as financial fixed assets, shares and other variable - yield securities, net of reversals" for debt securities. D Pension funds Under EU Accounting Directives, a 10% corridor approach is adopted, whereby prior year cumulative actuarial surpluses or deficits in excess of 10% of the commitments for retirement benefits are recognised over the expected average remaining service lives of the plan's participants on a straight-line basis in "General administrative expenses a) staff costs". Under IFRS, the Group applies IAS 19 revised for determining the income or expense related to its post-employment defined benefit plans. Cumulative actuarial surpluses and deficits are recognised in full in OCI under "Additional reserves". Adjustments to staff cost are recognised under "General administrative expenses a) staff costs" and adjustments to interest cost under "Interest expense and similar charges". E Non-controlling interest adjustment The Bank and the European Investment Fund (the "EIF") together are defined as the Group. The Bank granted a put option to the minority shareholders on their entire holding of its subsidiary, the EIF. Under EU Accounting Directives, the non-controlling interest is recorded separately in the consolidated balance sheet under "Equity attributable to minority interest" while the put option is recorded in the consolidated off-balance sheet of the Group. Under IFRS, the non-controlling interest is reclassified and a corresponding financial liability in the amount of the fair value of the option’s exercise price is recognised under "Other liabilities" and attributed to owners of the parent. Subsequently, this financial liability is measured in accordance with IFRS 9, i.e. any changes in the fair value of the financial liability subsequent to the acquisition date are recognised in the consolidated income statement under "Interest expense and similar charge". Any excess or deficit of non-controlling interest over the agreed price is reversed to "consolidated reserves". F Fee and commission income The Group recognises under EU Accounting Directives and IFRS fee and commission income from revenues that are satisfied over time on an accrual basis over the service period. Fee and commission income earned from providing or fulfilling point-in-time services (e.g. performance-linked) is recognised when the service has been completed. For certain mandates, the Group has established a deferred income policy in order to address the misalignment between the receipt of income and the services/cost incurred by the Group during the lifetime of the respective mandate. Corresponding adjustments are recorded in the consolidated balance sheet under "Deferred income" and released against "Fee and commission income". Under EU Accounting Directives, this deferral mechanism is only applied prospectively over time, i.e. recognising deferred revenue of the financial year, while under IFRS, the Group used the modified retrospective approach, i.e. recognising the cumulative impact at transition to IFRS 15 in equity. This resulted in a different stock of deferred income and corresponding amounts of revenue to be recorded over the individual years. 18 | SEC report as at June 30, 2021
G Leases Under EU Accounting Directives, the rental charges are recorded under "General administrative expenses b) other administrative expenses". In accordance with IFRS 16, the Group assesses whether a contract is a lease or not. In the case of lease, the Group recognises a right-of-use asset and a lease liability, except for those that are covered by the recognition exemptions (short-term leased assets and low value leased assets based on their original value, when new). The above-mentioned right-of-use assets are recognised under "Property, furniture and equipment" and corresponding lease liability is recognised under "Other liabilities". Subsequently, the Group carries the right-of-use asset applying a cost model, depreciating the right-of-use asset from the commencement date to the end of the lease agreements and assessing for any impairment, on an annual basis. The depreciation for the right-of-use assets is recorded under "Depreciation and amortisation: property, furniture and equipment and intangible assets a) property, furniture and equipment". The lease liability carrying amount is adjusted to reflect the lease payments made and interest from unwind of lease liability, with further re-measurements to reflect any reassessment or lease modifications. The interest from unwind of lease liability is recorded in the consolidated income statement under "Interest expense and similar charges". The revaluation result is recorded in the consolidated income statement under "Result on financial operations". H Financial Guarantee Contracts Under EU Accounting Directives, net liabilities from financial guarantees are presented in the consolidated balance sheet under "Provisions b) provision in respect of guarantee operations". Unrealised gains representing the excess of the net present value of expected future premium inflows over the amount of the excepted payment obligations remain unrecognised. Any increase or decrease in the net liability is recognised in the consolidated profit and loss account under "Value (re-)adjustments in respect of loans and advances and provisions for contingent liabilities". Under IFRS, net unrealised gains from financial guarantees are recorded in the consolidated balance sheet under "Other assets" in case the measurement of a financial guarantee contract results in a net asset position. In case the measurement of a financial guarantee contract results in a net liability position, contracts for which the amortised initial NPV is higher than the 12- months ECL or lifetime ECL, are presented under "Other liabilities". Guarantee contracts that are credit-impaired and for which a loss allowance based on lifetime ECL is recognised, are presented under "Provisions for guarantees issued and commitments". Any increase or decrease in the "Other assets" or "Other liabilities" relating to financial guarantees is recognised in the consolidated income statement under "Result on financial operations". Any increase or decrease in the "Provisions for guarantees issued and commitments" relating to financial guarantees other than the settlement of guarantee calls is recognised in the consolidated income statement under "Change in impairment on loans and advances and provisions for guarantees, net of reversals". I Subscribed capital and reserves, called but not paid Under EU Accounting Directives, the caption "Subscribed capital and reserves, called but not paid" contains the future payments from Poland and Romania following their capital increase at March 1, 2020. Under IFRS, these future payments are discounted using a discounted cash flow method. The discounting impact is reported under "Interest and similar income" and its amortisation is under "Interest expense and similar charges". SEC report as at June 30, 2021 | 19
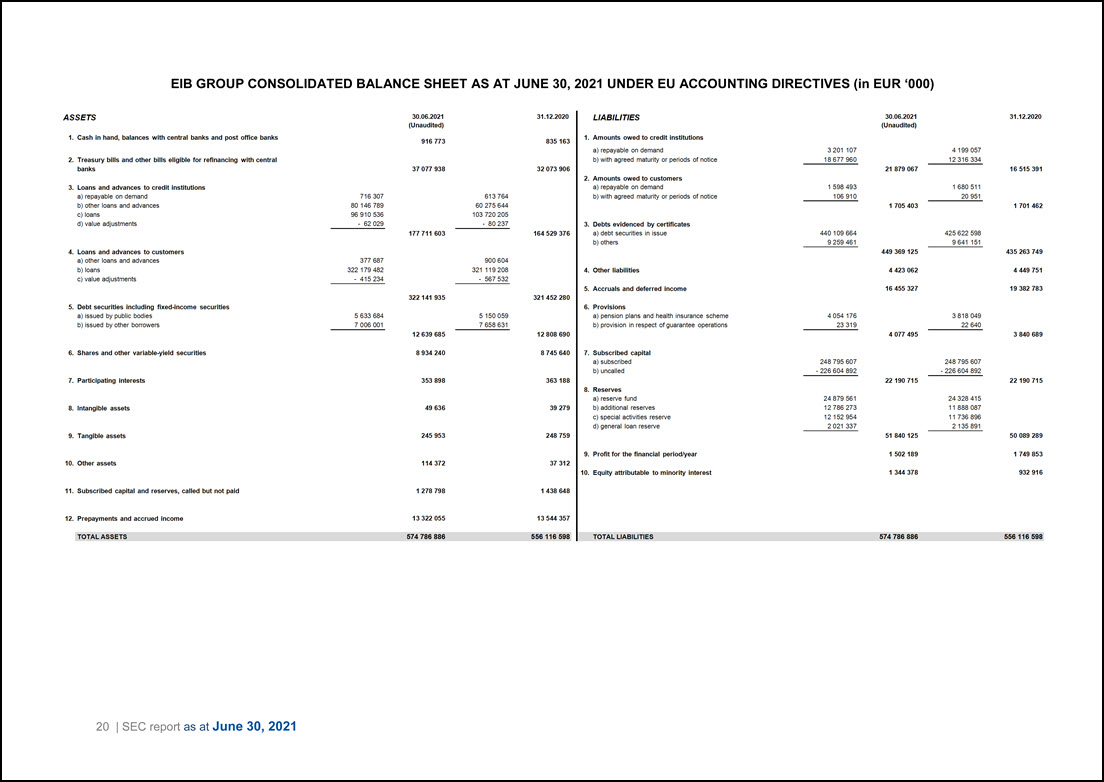
EIB GROUP CONSOLIDATED BALANCE SHEET AS AT JUNE 30, 2021 UNDER EU ACCOUNTING DIRECTIVES (in EUR ‘000) ASSETS 30.06.2021 31.12.2020 LIABILITIES 30.06.2021 31 .12.2020 (Unaudited) (Unaudited) 1. Cash in hand, balances with central banks and post office banks 916 773 835 163 1. Amounts owed to credit institutions a) repayable on demand 3 201 107 4199 057 2. Treasury bills and other bills eligible for refinancing with central b) with agreed maturity or periods of notice 18 677 960 12316334 banks 37 077 938 32 073 906 21 879 067 16 515 391 2. Amounts owed to customers 3. Loans and advances to credit institutions a) repayable on demand 1 598 493 1 680 511 a) repayable on demand 716 307 613 764 b) with agreed maturity or periods of notice 106 910 20 951 b) other loans and advances 80 146 789 60 275 644 1 705 403 1 701 462 c) loans 96 910 536 103 720 205 d) value adjustments - 62 029 - 80 237 3. Debts evidenced by certificates 177 711 603 164 529 376 a) debt securities in issue 440 109 664 425 622 598 b) others 9 259 461 9 641 151 4. Loans and advances to customers 449 369 125 435 263 749 a) other loans and advances 377 687 900 604 b) loans 322 179 482 321119 208 4. Other liabilities 4 423 062 4 449 751 c) value adjustments - 415 234 - 567 532 5. Accruals and deferred income 16 455 327 19 382 783 322141935 321 452 280 5. Debt securities including fixed-income securities 6. Provisions a) issued by public bodies 5 633 684 5 150 059 a) pension plans and health insurance scheme 4 054 176 3 818 049 b) issued by other borrowers 7 006 001 7 658 631 b) provision in respect of guarantee operations 23 319 22 640 12 639 685 12 808 690 4 077 495 3 840 689 6. Shares and other variable-yield securities 8 934 240 8 745 640 7. Subscribed capital a) subscribed 248 795 607 248 795 607 b) uncalled - 226 604 892 - 226 604 892 7. Participating interests 353 898 363 188 22 190 715 22 190 715 8. Reserves a) reserve fund 24 879 561 24 328 415 8. Intangible assets 49 636 39 279 b) additional reserves 12 786 273 11 888 087 c) special activities reserve 12 152 954 11 736 896 d) general loan reserve 2 021 337 2 135 891 9. Tangible assets 245 953 248 759 51 840 125 50 089 289 9. Profit for the financial period year 1 502 189 1 749 853 10. Other assets 114 372 37 312 10. Equity attributable to minority interest 1 344 378 932 916 11. Subscribed capital and reserves, called but not paid 1 278 798 1 438 648 12. Prepayments and accrued income 13 322 055 13 544 357 TOTAL ASSETS 574 786 886 556116 598 TOTAL LIABILITIES 574 786 886 556116 598 20 | SEC report as at June 30, 2021
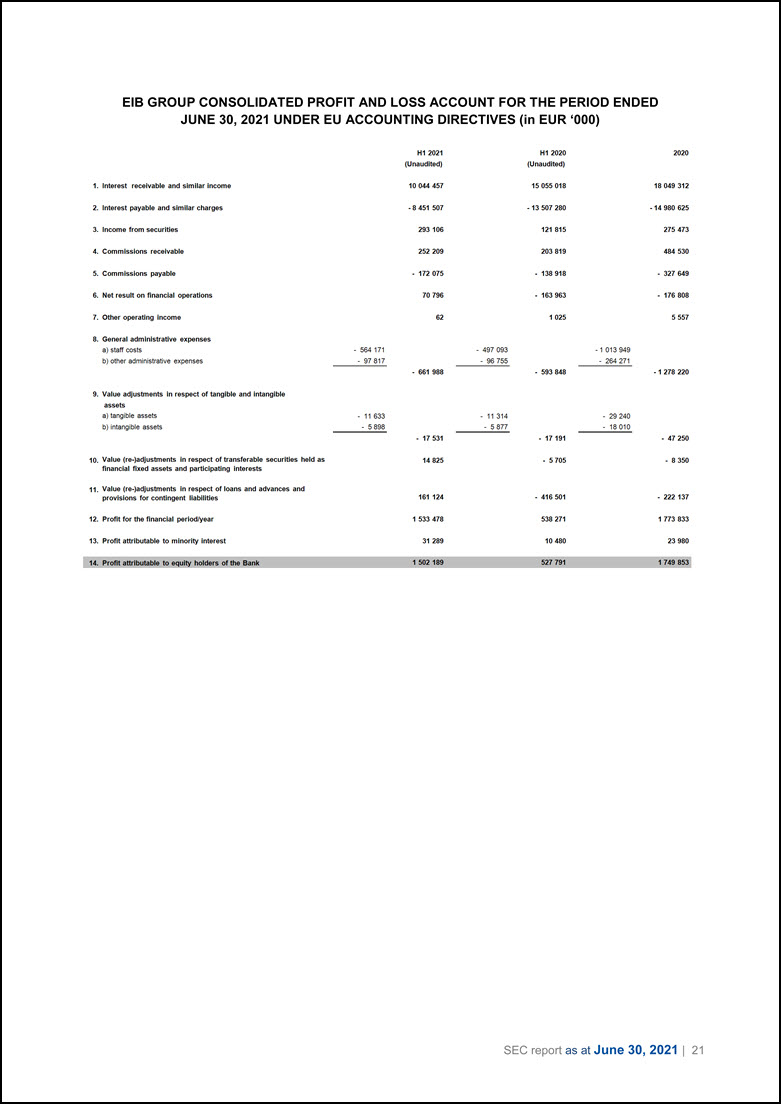
EIB GROUP CONSOLIDATED PROFIT AND LOSS ACCOUNT FOR THE PERIOD ENDED JUNE 30, 2021 UNDER EU ACCOUNTING DIRECTIVES (in EUR ‘000) 1. Interest receivable and similar income 2. Interest payable and similar charges 3. Income from securities 4. Commissions receivable 5. Commissions payable 6. Net result on financial operations 7. Other operating income 8. General administrative expenses a) staff costs b) other administrative expenses 9. Value adjustments in respect of tangible and intangible assets a) tangible assets b) intangible assets 10. Value (re-)adjustments in respect of transferable securities held as financial fixed assets and participating interests 11. Value (re-)adjustments in respect of loans and advances and provisions for contingent liabilities 12. Profit for the financial period year 13. Profit attributable to minority interest 14. Profit attributable to equity holders of the Bank H1 2021 (Unaudited) 10 044 457 - 8 451 507 293 106 252 209 - 172 075 70 796 62 - 564 171 - 97 817 - 661 988 - 11 633 - 5 898 - 17 531 14 825 161 124 1 533 478 31 289 1 502 189 H1 2020 2020 (Unaudited) 15 055 018 18 049 312 - 13 507 280 -14 980 625 121 815 275 473 203 819 484 530 - 138 918 - 327 649 - 163 963 - 176 808 1 025 5 557 - 497 093 - 1 013 949 - 96 755 - 264 271 - 593 848 - 1 278 220 - 11 314 - 29 240 - 5 877 - 18 010 - 17 191 - 47 250 - 5 705 - 8 350 - 416 501 - 222 137 538 271 1 773 833 10 480 23 980 527 791 1 749 853 SEC report as at June 30, 2021 | 21
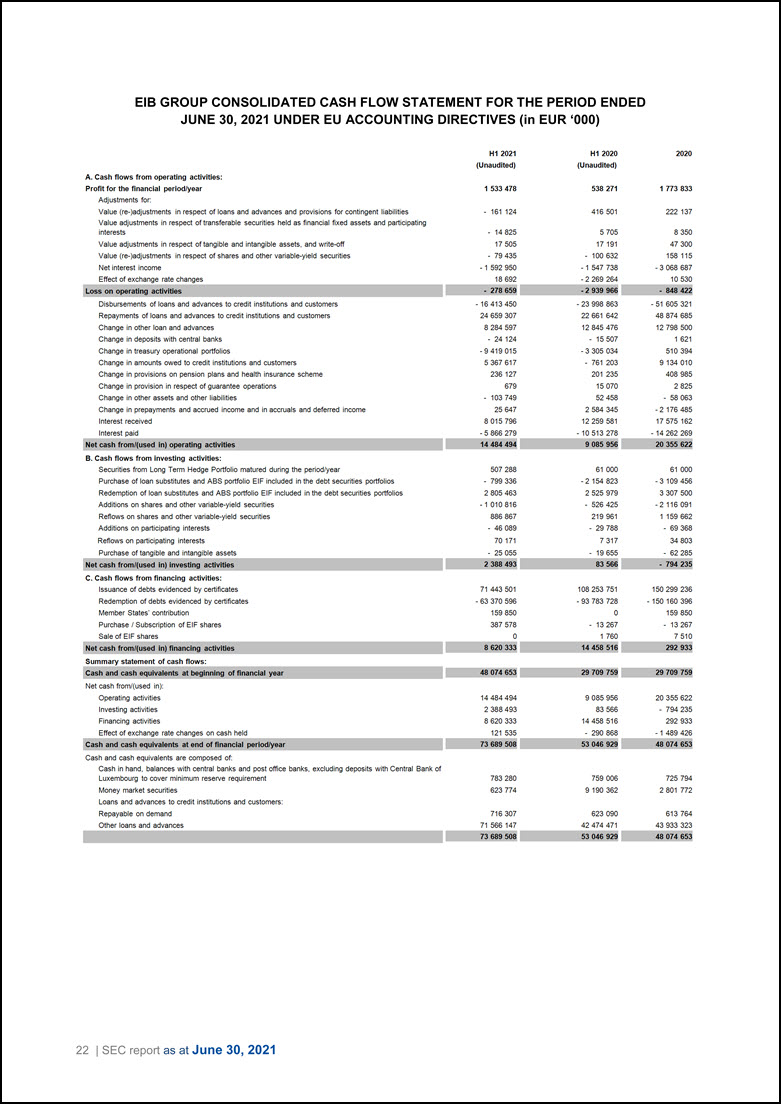
EIB GROUP CONSOLIDATED CASH FLOW STATEMENT FOR THE PERIOD ENDED JUNE 30, 2021 UNDER EU ACCOUNTING DIRECTIVES (in EUR ‘000) . Cash flows from operating activities : Profit for the financial period/year Adjustments for: Value (re-)adjustments in respect of loans and advances and provisions for contingent liabilities Value adjustments in respect of transferable securities held as financial fixed assets and participating H1 2021 (Unaudited) 1 533 478 - 161 124 interests - 14 825 Value adjustments in respect of tangible and intangible assets, and write-off 17 505 Value (re-)adjustments in respect of shares and other variable-yield securities - 79 435 Net interest income - 1 592 950 H1 2020 (Unaudited) 538 271 416 501 5 705 17 191 - 100 632 -1 547 738 Effect of exchange rate changes 18 692 Loss on operating activites 278 659 -2 269 264 -2 939 966 Disbursements of loans and advances to credit institutions and customers - 16 413 450 • 23 998 863 Repayments of loans and advances to credit institutions and customers 24 659 307 22 661 642 Change in other loan and advances 8 284 597 12 845 476 Change in deposits with central banks - 24 124 • 15 507 Change in treasury operational portfolios - 9 419 015 - 3 305 034 Change in amounts owed to credit institutions and customers 5 367 617 • 761 203 Change in provisions on pension plans and health insurance scheme 236 127 201 235 Change in provision in respect of guarantee operations 679 15 070 Change in other assets and other liabilities - 103 749 52 458 Change in prepayments and accrued income and in accruals and deferred income 25 647 2 584 345 Interest received 8 015 796 12 259 581 Interest paid -5 866 279 - 10 513 278 Net cash from ( used In) operating activities 14 484 494 9 085 956 20 355 622 B. Cash flows from investing activities: Securities from Long Term Hedge Portfolio matured during the period/year 507 288 61 000 Purchase of loan substitutes and ABS portfolio EIF included in the debt securities portfolios - 799 336 - 2 154 823 Redemption of loan substitutes and ABS portfolio EIF included in the debt securities portfolios 2 805 463 2 525 979 Additions on shares and other variable-yield securities - 1 010 816 • 526 425 Reflows on shares and other variable-yield securities 886 867 219 961 Additions on participating interests - 46 089 - 29 788 Reflows on participating interests 70 171 7 317 Purchase of tangible and intangible assets - 25 055 • 19 655 Not cash from (used in) Investing activities, 2 388 493 83 566 -794 235 C. Cash flows from financing activities: Issuance of debts evidenced by certificates 71 443 501 108 253 751 Redemption of debts evidenced by certificates - 63 370 596 - 93 783 728 Member States' contribution 159 850 0 Purchase I Subscription of EIF shares 387 578 • 13 267 Sale of EIF s ha res 0 1 760 Not cash from (used in) financing activities 8 620 333 14 458 516 292 933 Summary statement of cash flows: Cash and cash equivalents at beginning of financial year Net cash from/(used in): Operating activities Investing activities Financing activities Effect of exchange rate changes on cash held Cash and cash equivalents at end of financial period/year Cash and cash equivalents are composed of: Cash in hand, balances with central banks and post office banks, excluding deposits with Central Bank of Luxembourg to cover minimum reserve requirement Money market securities Loans and advances to credit institutions and customers: Repayable on demand Other loans and advances 14 484 494 2 388 493 8 620 333 121 535 9 085 956 83 566 14 458 516 -290 868 73 689 508 53 0 46 929 783 280 623 774 716 307 71 566 147 759 006 9 190 362 623 090 42 474 471 2020 1 773 833 222 137 8 350 47 300 158 115 - 3 068 687 10 530 - 848 422 - 51 605 321 48 874 685 12 798 500 1 621 5 10 394 9 134 010 408 985 2 825 - 58 063 - 2 176 485 17 575 162 - 14 262 269 20 355 622 61 000 - 3 109456 3 307 500 - 2 116 091 1 159 662 - 69 368 34 803 - 62 285 - 794 235 150 299 236 - 150 160 396 159 850 - 13 267 7 510 292 933 29]09J5~ 20 355 622 - 794 235 292 933 - 1 489 426 48 074 653 725 794 2 801 772 613 764 43 933 323 53 046 929 48 074 653 73 689 508 22 | SEC report as at June 30, 2021
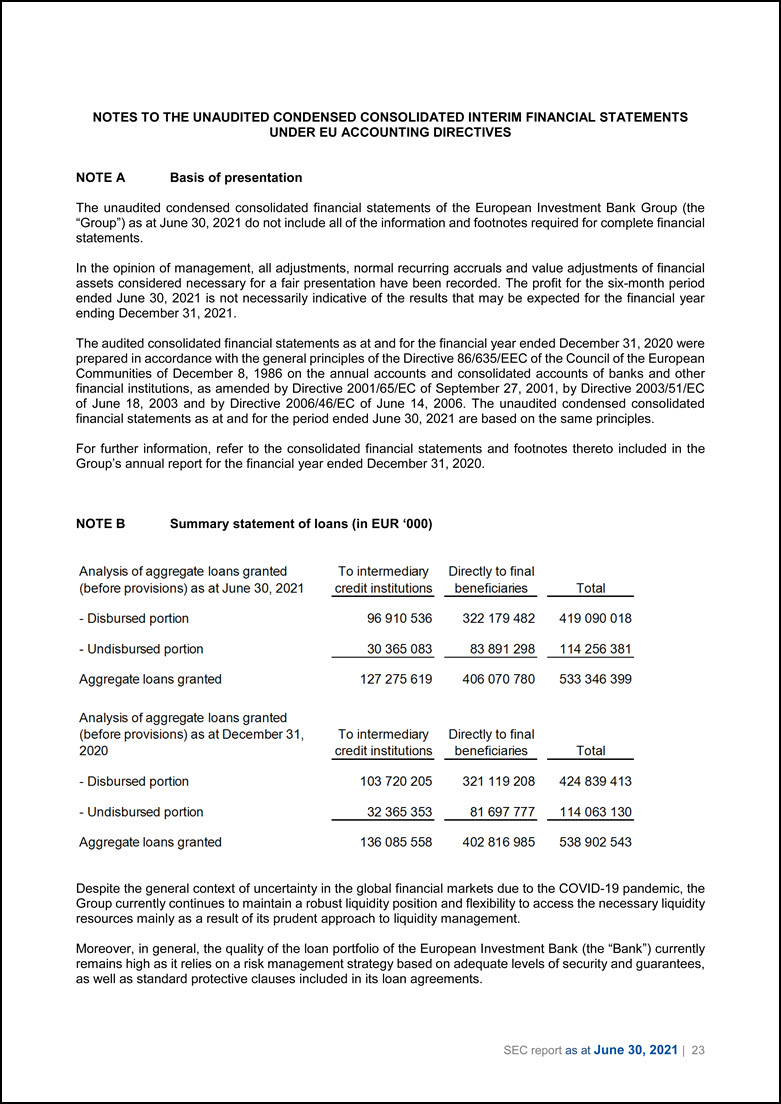
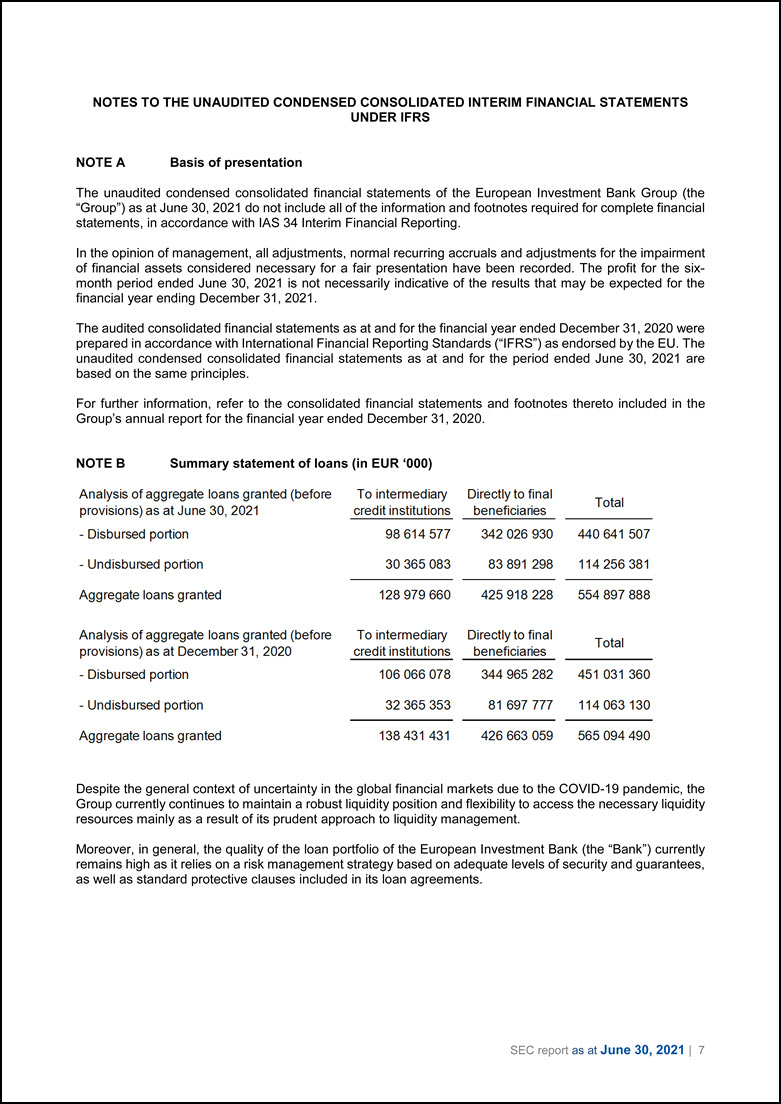
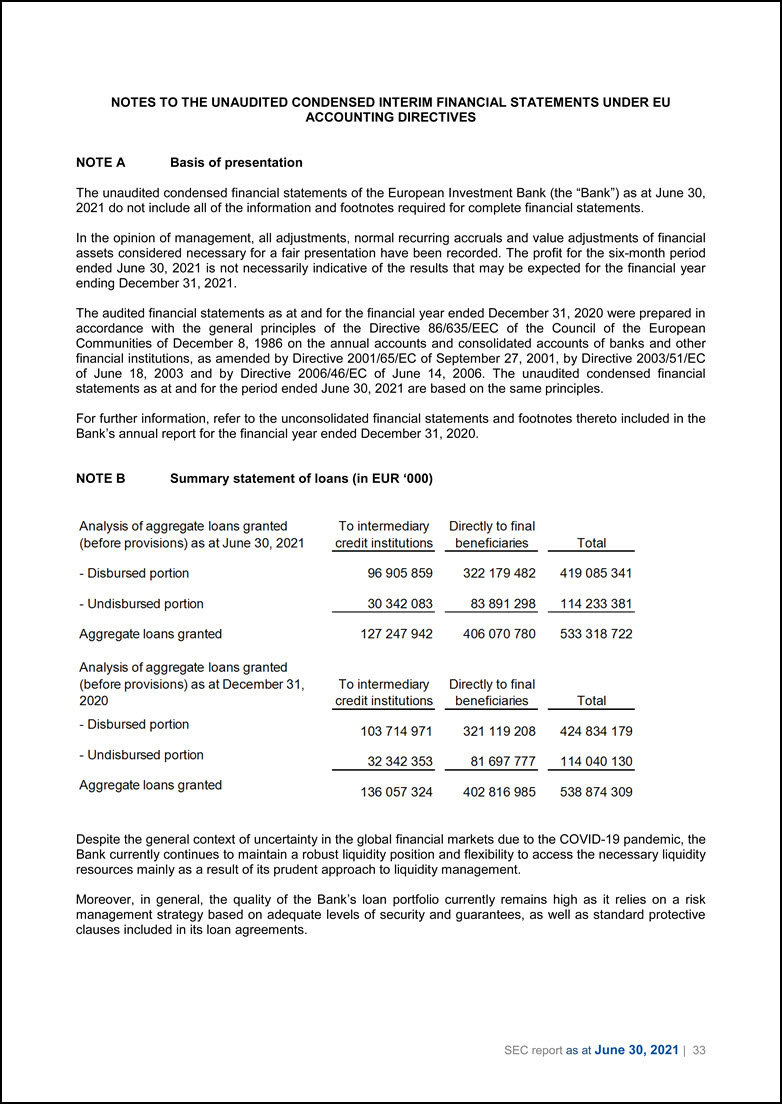
NOTES TO THE UNAUDITED CONDENSED CONSOLIDATED INTERIM FINANCIAL STATEMENTS UNDER EU ACCOUNTING DIRECTIVES NOTE A Basis of presentation The unaudited condensed consolidated financial statements of the European Investment Bank Group (the “Group”) as at June 30, 2021 do not include all of the information and footnotes required for complete financial statements. In the opinion of management, all adjustments, normal recurring accruals and value adjustments of financial assets considered necessary for a fair presentation have been recorded. The profit for the six-month period ended June 30, 2021 is not necessarily indicative of the results that may be expected for the financial year ending December 31, 2021. The audited consolidated financial statements as at and for the financial year ended December 31, 2020 were prepared in accordance with the general principles of the Directive 86/635/EEC of the Council of the European Communities of December 8, 1986 on the annual accounts and consolidated accounts of banks and other financial institutions, as amended by Directive 2001/65/EC of September 27, 2001, by Directive 2003/51/EC of June 18, 2003 and by Directive 2006/46/EC of June 14, 2006. The unaudited condensed consolidated financial statements as at and for the period ended June 30, 2021 are based on the same principles. For further information, refer to the consolidated financial statements and footnotes thereto included in the Group’s annual report for the financial year ended December 31, 2020. NOTE B Summary statement of loans (in EUR ‘000) Analysis of aggregate loans granted To intermediary Directly to final (before provisions) as at June 30, 2021 credit institutions beneficiaries Total - Disbursed portion 96 910 536 322 179 482 419 090 018 - Undisbursed portion 30 365 083 83 891 298 114 256 381 Aggregate loans granted 127275619 406 070 780 533 346 399 Analysis of aggregate loans granted (before provisions) as at December 31 , To intermediary Directly to final 2020 credit institutions beneficiaries Total - Disbursed portion 103 720 205 321 119 208 424 839 413 - Undisbursed portion 32 365 353 81697777 114 063 130 Aggregate loans granted 136 085 558 402 816 985 538 902 543 Despite the general context of uncertainty in the global financial markets due to the COVID-19 pandemic, the Group currently continues to maintain a robust liquidity position and flexibility to access the necessary liquidity resources mainly as a result of its prudent approach to liquidity management. Moreover, in general, the quality of the loan portfolio of the European Investment Bank (the “Bank”) currently remains high as it relies on a risk management strategy based on adequate levels of security and guarantees, as well as standard protective clauses included in its loan agreements. SEC report as at June 30, 2021 | 23

Value adjustments for potential losses in respect of the Bank’s loan portfolio have been accounted for as at June 30, 2021 and as at December 31, 2020 as follows: Value adjustments on loans and advances (in EUR million) Balance sheet caption Type of value adjustment 30.06.2021 31.12.2020 Loans and advances to credit institutions d) value adjustments Collective 0 14 Specific 62 66 Loans and advances to customers c) value adjustments Collective 0 61 Specific 415 507 Total value adjustments 477 648 24 | SEC report as at June 30, 2021
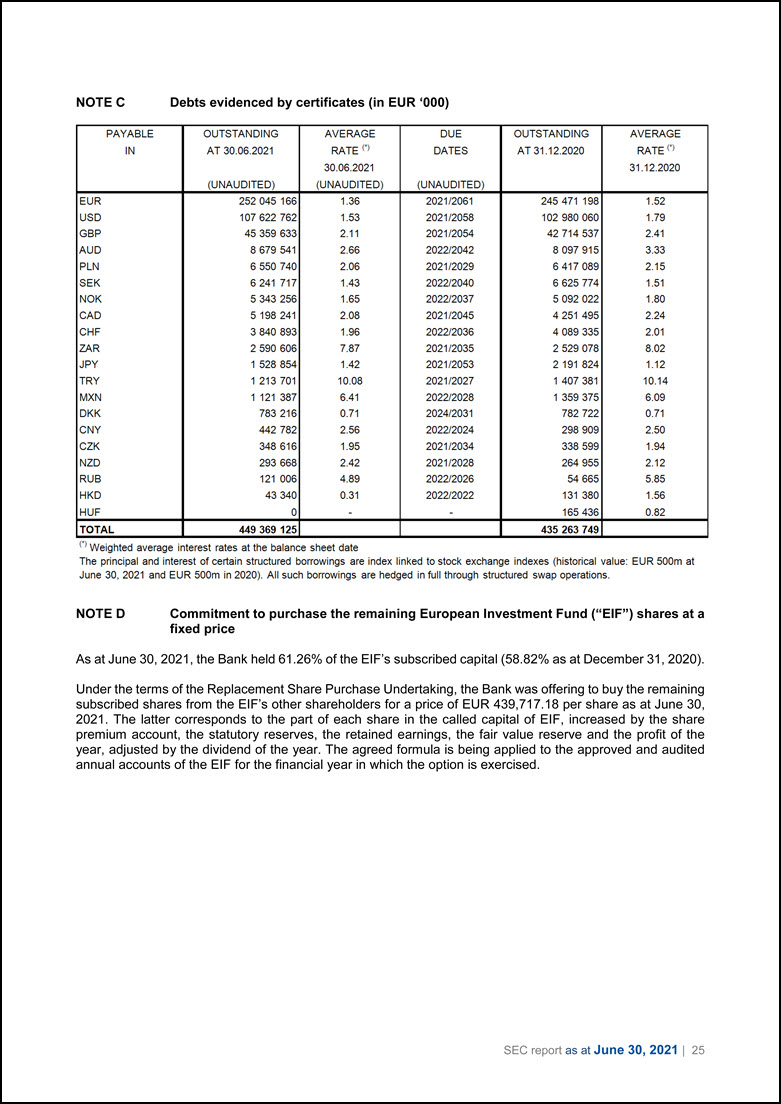
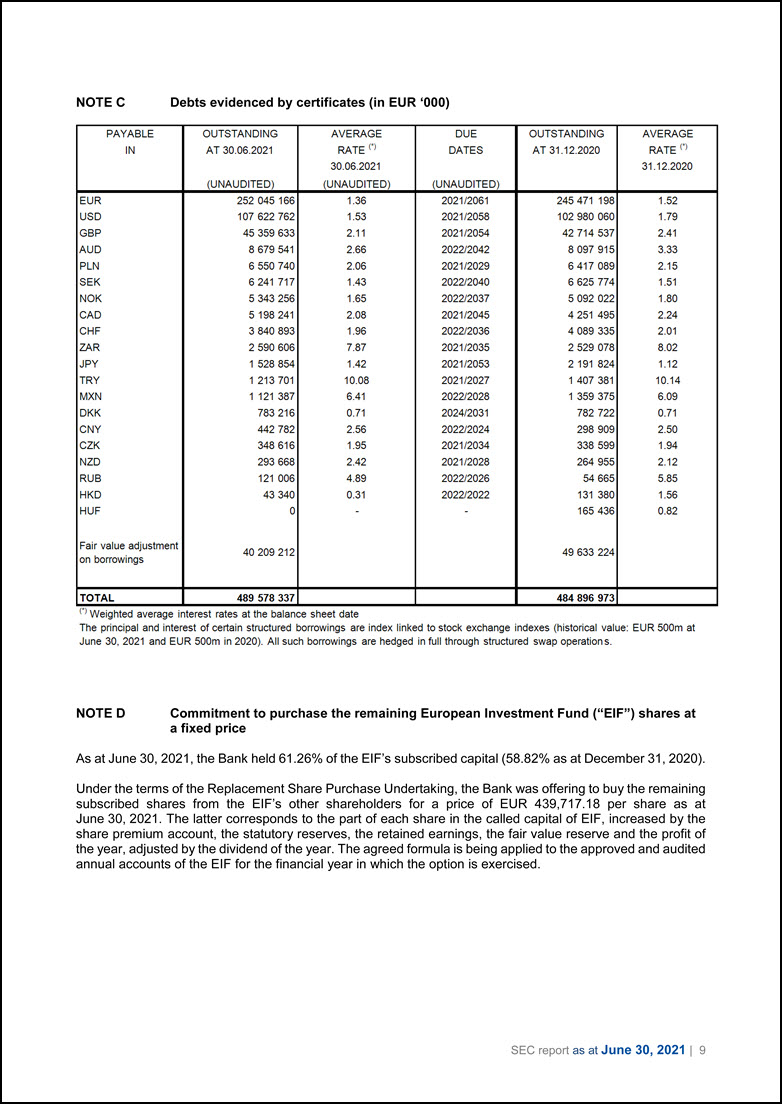
NOTE C Debts evidenced by certificates (in EUR ‘000) PAYABLE OUTSTANDING AVERAGE DUE OUTSTANDING AVERAGE IN AT 30.06.2021 RATE (1) DATES AT 31.12.2020 RATE (1) 30.06.2021 31.12.2020 (UNAUDITED) (UNAUDITED) (UNAUDITED) EUR 252 045 166 1.36 2021/2061 245 471 198 1.52 USO 107 622 762 1.53 2021/2058 102 980 060 1.79 GBP 45 359 633 2.11 2021/2054 42 714 537 2.41 AUD 8 679 541 2.66 2022/2042 8 097 915 3.33 PLN 6 550 740 2.06 2021/2029 6 417 089 2.15 SEK 6 241 717 1.43 2022/2040 6 625 774 1.51 NOK 5 343 256 1.65 2022/2037 5 092 022 1.80 CAD 5 198 241 2.08 2021/2045 4 251 495 2.24 CHF 3 840 893 1.96 2022/2036 4 089 335 2.01 ZAR 2 590 606 7.87 2021/2035 2 529 078 8.02 JPY 1 528 854 1.42 2021/2053 2 191 824 1.12 TRY 1 213 701 10.08 2021/2027 1 407 381 10.14 MXN 1 121 387 6.41 2022/2028 1 359 375 6.09 DKK 783 216 0.71 2024/2031 782 722 0.71 CNY 442 782 2.56 2022/2024 298 909 2.50 CZK 348 616 1.95 2021/2034 338 599 1.94 NZD 293 668 2.42 2021/2028 264 955 2.12 RUB 121 006 4.89 2022/2026 54 665 5.85 HKD 43 340 0.31 2022/2022 131 380 1.56 HUF 0 - - 165 436 0.82 TOTAL 449 369 125 435 263 749 (1) Weighted average interest rates at the balance sheet date The principal and interest of certain structured borrowings are index linked to stock exchange indexes (historical value: EUR 500m at June 30, 2021 and EUR 500m in 2020). All such borrowings are hedged in full through structured swap operations. NOTE D Commitment to purchase the remaining European Investment Fund (“EIF”) shares at a fixed price As at June 30, 2021, the Bank held 61.26% of the EIF’s subscribed capital (58.82% as at December 31, 2020). Under the terms of the Replacement Share Purchase Undertaking, the Bank was offering to buy the remaining subscribed shares from the EIF’s other shareholders for a price of EUR 439,717.18 per share as at June 30, 2021. The latter corresponds to the part of each share in the called capital of EIF, increased by the share premium account, the statutory reserves, the retained earnings, the fair value reserve and the profit of the year, adjusted by the dividend of the year. The agreed formula is being applied to the approved and audited annual accounts of the EIF for the financial year in which the option is exercised. SEC report as at June 30, 2021 | 25
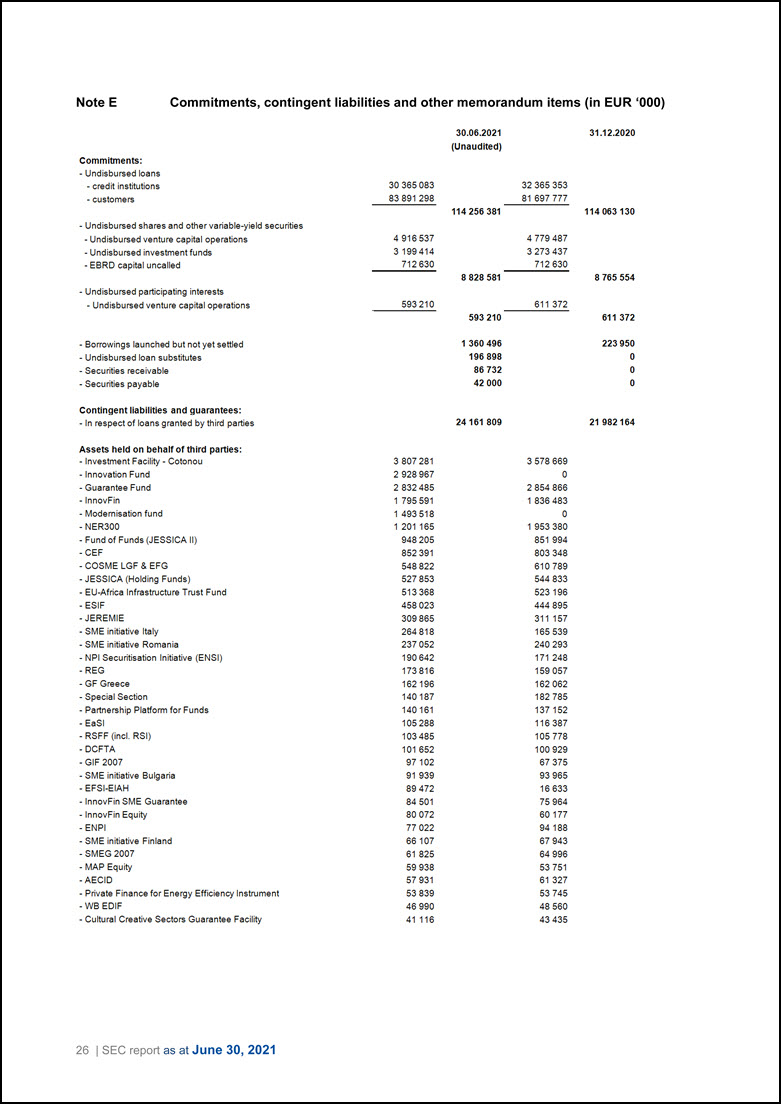
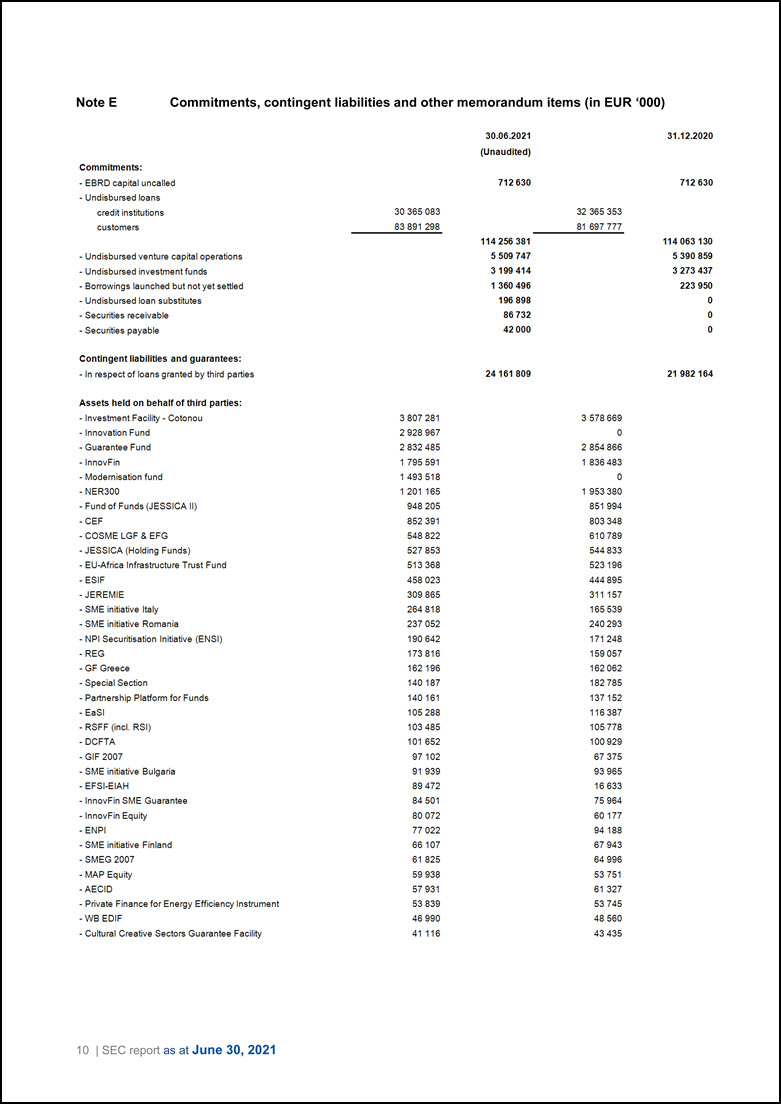
Note E Commitments, contingent liabilities and other memorandum items (in EUR ‘000) 30.06.2021 31.12.2020 (Unaudited) Commitments: - Undisbursed loans - credit institutions 30 365 083 32 365 353 - customers 83 891 298 81 697 777 114256381 114 063 130 - Un disbursed shares and other variable-yield securities - Undisbursed venture capital operations 4 916 537 4 779 487 - Undisbursed investment funds 3 199414 3 273 437 - EBRO capital uncalled 712 630 712 630 8 828 581 8 765 554 - Undisbursed participating interests - Undisbursed venture capital operations 593 210 611 372 593 210 611 372 - Borrowings launched but not yet settled 1360496 223 950 - Undisbursed loan substitutes 196 898 0 - Securities receivable 86 732 0 - Securities payable 42 000 0 Contingent liabilities and guarantees: - In respect of loans granted by third parties 24 161 809 21 982 164 Assets held on behalf of third parties: - Investment Facility - Cotonou 3 807 281 3 578 669 - Innovation Fund 2 928 967 0 - Guarantee Fund 2 832 485 2 854 866 - lnnovFin 1 795 591 1 836 483 - Modernisation fund 1 493 518 0 - NER300 1 201 165 1 953 380 - Fund of Funds (JESSICA II) 948 205 851 994 - CEF 852 391 803 348 - COSME LGF & EFG 548 822 610 789 - JESSICA (Holding Funds) 527 853 544 833 - EU-Africa Infrastructure Trust Fund 513 368 523 196 - ESIF 458 023 444 895 - JEREMIE 309 865 311 157 - SME initiative Italy 264 818 165 539 - SME initiative Romania 237 052 240 293 - NPI Securitisation Initiative (ENS!) 190 642 171 248 - REG 173 816 159 057 - GF Greece 162 196 162 062 - Special Section 140 187 182 785 - Partnership Platform for Funds 140 161 137 152 - EaSI 105 288 116 387 - RSFF (incl. RSI) 103 485 105 778 - DCFTA 101 652 100 929 - GIF 2007 97 102 67 375 - SME initiative Bulgaria 91 939 93 965 - EFSI-EIAH 89 472 16 633 - lnnovFin SME Guarantee 84 501 75 964 - lnnovFin Equity 80 072 60 177 - ENPI 77 022 94 188 - SME initiative Finland 66 107 67 943 - SMEG 2007 61 825 64 996 - MAP Equity 59 938 53 751 - AECID 57 931 61 327 - Private Finance for Energy Efficiency Instrument 53 839 53 745 - WB EDIF 46 990 48 560 - Cultural Creative Sectors Guarantee Facility 41 116 43 435 26 | SEC report as at June 30, 2021
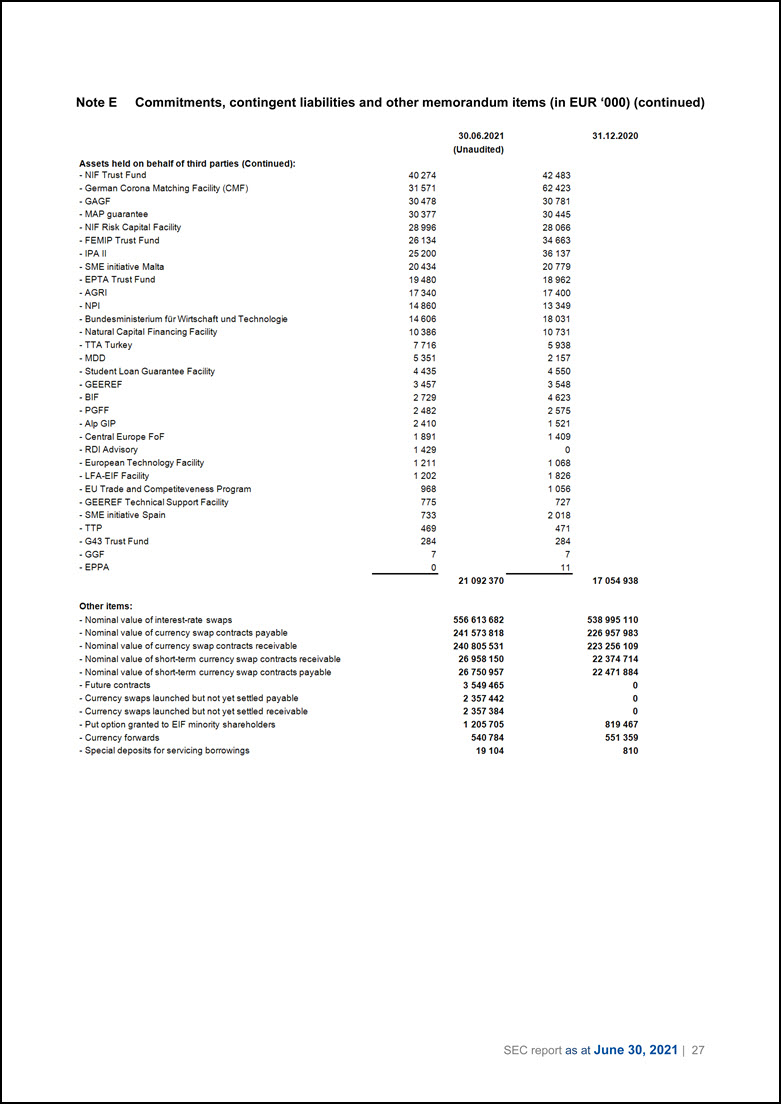
Note E Commitments, contingent liabilities and other memorandum items (in EUR ‘000) (continued) 30.06.2021 31 .12.2020 (Unaudited) Assets held on behalf of third parties (Continued): - NIF Trust Fund 40 274 42 483 - German Corona Matching Facility (CMF) 31 571 62 423 - GAGF 30478 30 781 - MAP guarantee 30377 30 445 - NIF Risk Capital Facility 28996 28 066 - FEMIP Trust Fund 26 134 34 663 - IPA II 25200 36 137 - SME initiative Malta 20434 20 779 - EPTA Trust Fund 19480 18 962 - AGRI 17340 17 400 - NPI 14 860 13 349 - Bundesministerium fOrWirtschaft und Technologie 14 606 18 031 - Natural Capital Financing Facility 10 386 10 731 - TTA Turkey 7 716 5 938 - MDD 5 351 2 157 - Student Loan Guarantee Facility 4 435 4 550 - GEEREF 3 457 3 548 - BIF 2 729 4 623 - PGFF 2 482 2 575 - Alp GIP 2 410 1 521 - Central Europe FoF 1 891 1 409 - RDI Advisory 1 429 0 - European Technology Facility 1 211 1 068 - LFA-EIF Facility 1 202 1 826 - EU Trade and Competiteveness Program 968 1 056 - GEEREF Technical Support Facility 775 727 - SME initiative Spain 733 2 018 - TTP 469 471 - G43 Trust Fund 284 284 - GGF 7 7 - EPPA 0 11 21092 370 17 054 938 Other items: - Nominal value of interest-rate swaps 556 613 682 538 995 110 - Nominal value of currency swap contracts payable 241 573 818 226 957 983 - Nominal value of currency swap contracts receivable 240 805 531 223 256 109 - Nominal value of short-term currency swap contracts receivable 26 958150 22 374 714 - Nominal value of short-term currency swap contracts payable 26 750 957 22 471 884 - Future contracts 3 549 465 0 - Currency swaps launched but not yet settled payable 2 357 442 0 - Currency swaps launched but not yet settled receivable 2 357 384 0 - Put option granted to EIF minority shareholders 1 205 705 819 467 - Currency forwards 540 784 551 359 - Special deposits for servicing borrowings 19 104 810 SEC report as at June 30, 2021 | 27
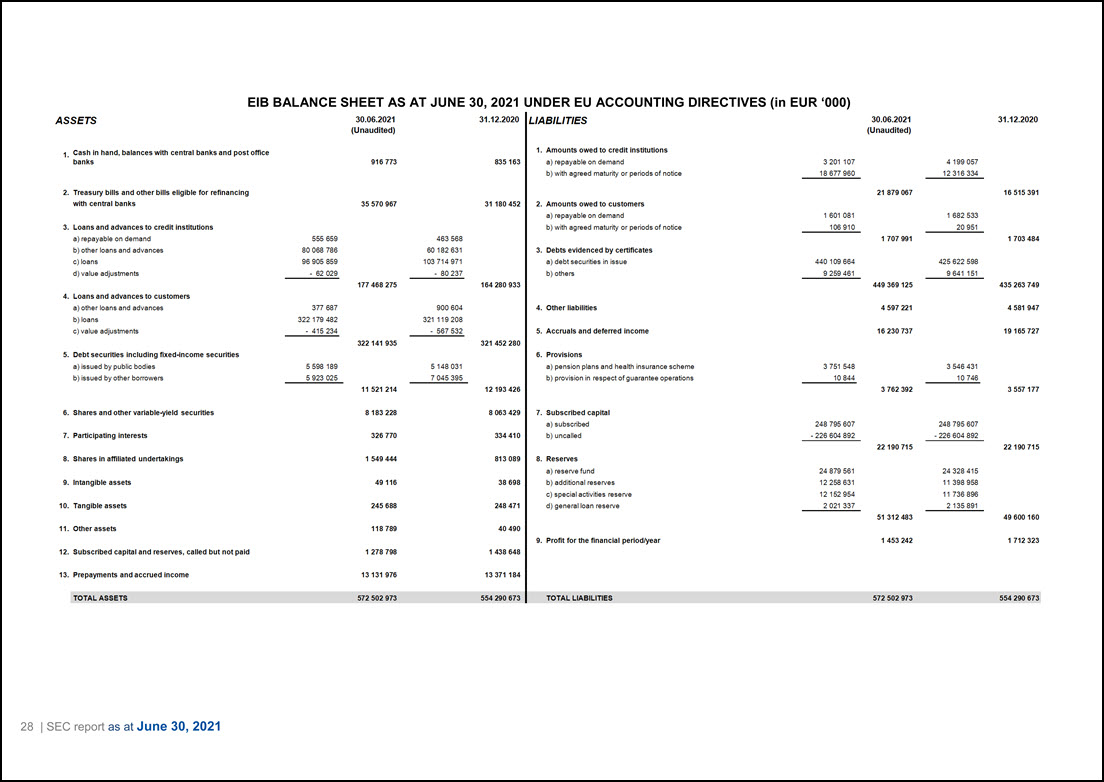
EIB BALANCE SHEET AS AT JUNE 30, 2021 UNDER EU ACCOUNTING DIRECTIVES (in EUR ‘000) ASSETS 30.06.2021 31.12.2020 LIABILITIES 30.06.2021 31.12.2020 (Unaudited) (Unaudited) 1. Cash in hand, balances with central banks and post office 1. Amounts owed to credit institutions banks 916 773 835 163 a ) re payable on demand 3 201 107 4 199 057 b) with ag reed maturity or periods of notice 18 677 960 12 3 16334 2. Treasury bills and other bills eligible for refinancing 21 879 067 16 515 391 with central banks 35 570 967 31 180 452 2. Amounts owed to customers a ) repayable on demand 1 601 081 1 682 533 3. Loans and advances to credit institutions b) with ag reed maturity or periods of notice 106 910 20 951 a) repayable on demand 555 659 463 568 1 707 991 1 703 484 b) other loans and advances 80 0 68 786 60 182 631 3. Debts evidenced by certificates c) loans 96 905 859 103 714 971 a) debt securities in issue 440 109 664 425 622 598 d) value adjustments - 62 029 - 80 237 b) others 9 259 461 9 641 151 177 468 275 164 280 933 449 369 125 435 263 749 4. Loans and advances to customers a) other loans and advances 3 77 687 900 604 4. Other liabilities 4 597 221 4 581 947 b) loans 322 179 482 321 119 208 c) value adjustments - 415 234 - 567 532 5. Accruals and deferred income 16 230 737 19 165 727 322 141 935 321 452 280 5. Debt securities including fixed-income securities 6. Provisions a) issued by public bodies 5 598 189 5 148 031 a) pension plans and health insurance scheme 3 751 548 3 546 431 b) issued by other borrowers 5 923 025 7 045 395 b) provision in respect of guarantee operations 10 844 10 746 11 521 214 12 193 426 3 762 392 3 557 177 6. Shares and other variable-yield securities 8 183 228 8 063 429 7. Subscribed capital a) subscribed 248 795 607 248 795 607 7. Participating interests 326770 334 410 b) uncalled - 226 604 892 - 226 604 892 22 190715 22 190 715 8. Shares in affiliated undertakings 1 549 444 81 3 089 8. Reserves a) reserve fund 24 879 561 24328415 9. Intangible assets 49 116 38 698 b) additional reserves 12 258 631 11 398 958 c) special activities reserve 121 52 954 11 736 896 1 o. Tangible assets 245 688 248 471 d) general loan reserve 2 021 337 2 135 891 51 312483 49 600 160 11. Other assets 118 789 40 490 9. Profit for the financial period/year 1 453 242 1 712 323 12. Subscribed capital and reserves, called but not paid 1 278 798 1 438 648 13. Prepayments and accrued income 13 131 976 13 371 184 TOTAL ASSETS 572 502 973 554 290 673 TOTAL LIABILITIES 572 502 973 554 290 673 EIB BALANCE SHEET AS AT JUNE 30, 2021 UNDER EU ACCOUNTING DIRECTIVES (in EUR ‘000) 28 | SEC report as at June 30, 2021
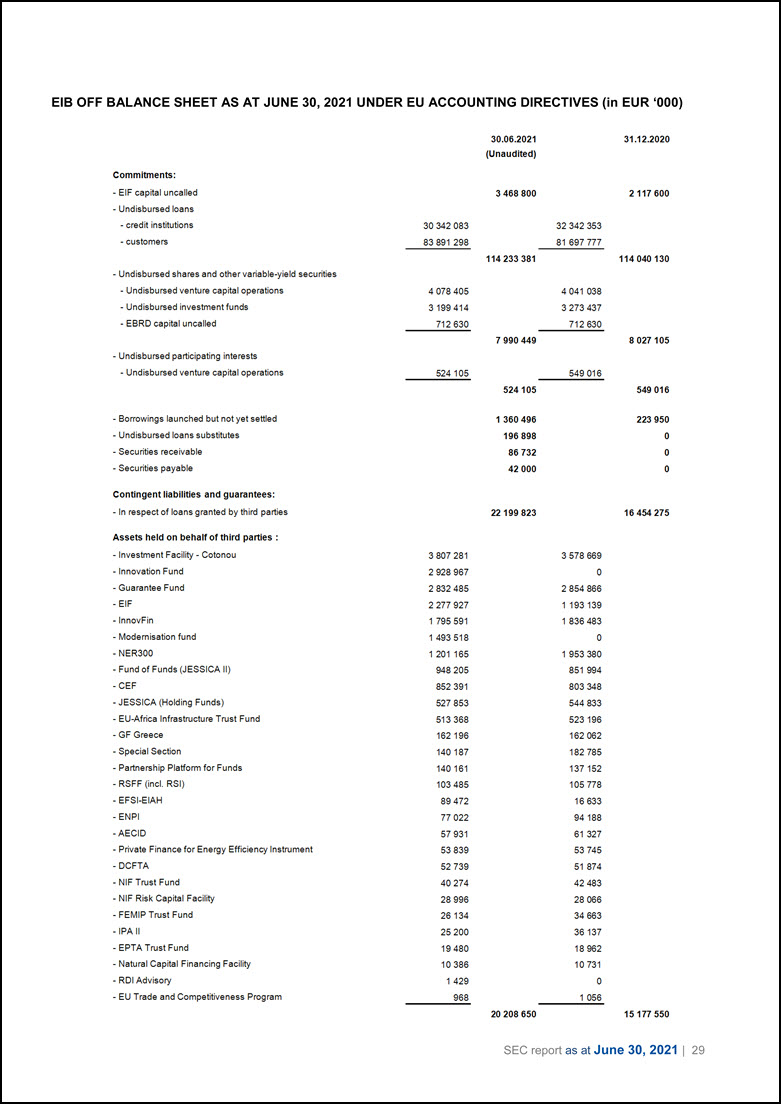
EIB OFF BALANCE SHEET AS AT JUNE 30, 2021 UNDER EU ACCOUNTING DIRECTIVES (in EUR ‘000) 30.06.2021 31.12.2020 (Unaudited) Commitments: - EIF capital uncalled 3 468 800 2 117 600 - Undisbursed loans - credit institutions 30 342 083 32 342 353 - customers 83 891 298 81 697 777 114 233 381 114 040130 - Un disbursed shares and other variable-yield securities - Undisbursed venture capital operations 4 078 405 4 041 038 - Undisbursed investment funds 3 199414 3 273 437 - EBRO capital uncalled 712 630 712 630 7 990 449 8 027 105 - Undisbursed participating interests - Undisbursed venture capital operations 524 105 549 016 524 105 549 016 - Borrowings launched but not yet settled 1 360 496 223 950 - Undisbursed loans substitutes 196 898 0 - Securities receivable 86 732 0 - Securities payable 42 000 0 Contingent liabilities and guarantees: - In respect of loans granted by third parties 22 199 823 16 454 275 Assets held on behalf of third parties : - Investment Facility - Cotonou 3807281 3 578 669 - Innovation Fund 2 928 967 0 - Guarantee Fund 2 832 485 2 854 866 - EIF 2 277 927 1 193 139 - lnnovFin 1 795 591 1 836 483 - Modernisation fund 1 493518 0 - NER300 1 201 165 1 953 380 - Fund of Funds (JESSICA II) 948 205 851 994 - CEF 852 391 803 348 - JESSICA (Holding Funds) 527 853 544 833 - EU-Africa Infrastructure Trust Fund 513 368 523 196 - GF Greece 162 196 162 062 - Special Section 140 187 182 785 - Partnership Platform for Funds 140 161 137 152 - RSFF (incl. RSI) 103 485 105 778 - EFSI-EIAH 89 472 16 633 - ENPI 77 022 94 188 -AECIO 57 931 61 327 - Private Finance for Energy Efficiency Instrument 53 839 53 745 - OCFTA 52 739 51 874 - NIF Trust Fund 40 274 42 483 - NIF Risk Capital Facility 28 996 28 066 - FEMIP Trust Fund 26 134 34 663 - IPA II 25 200 36 137 - EPTA Trust Fund 19 480 18 962 - Natural Capital Financing Facility 10 386 10 731 - ROI Advisory 1 429 0 - EU Trade and Competitiveness Program 968 1 056 20 208 650 15 177 550 EIB OFF BALANCE SHEET AS AT JUNE 30, 2021 UNDER EU ACCOUNTING DIRECTIVES (in EUR ‘000) SEC report as at June 30, 2021 | 29
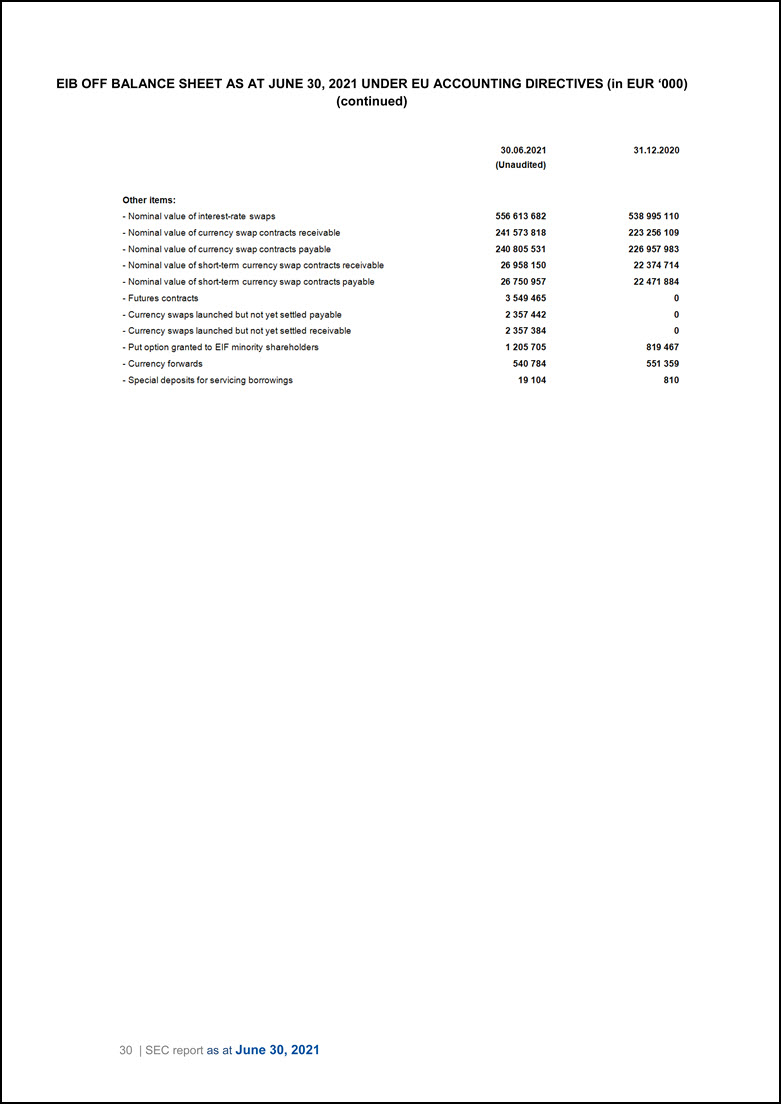
EIB OFF BALANCE SHEET AS AT JUNE 30, 2021 UNDER EU ACCOUNTING DIRECTIVES (in EUR ‘000) (continued) Other items: - Nominal value of interest-rate swaps - Nominal value of currency swap contracts receivable - Nominal value of currency swap contracts payable - Nominal value of short-term currency swap contracts receivable - Nominal value of short-term currency swap contracts payable - Futures contracts - Currency swaps launched but not yet settled payable - Currency swaps launched but not yet settled receivable - Put option granted to EIF minority shareholders - Currency forwards - Special deposits for servicing borrowings 30.06.2021 (Unaudited) 556 613 682 241 573 818 240 805 531 26 958 150 26 750 957 3 549 465 2 357 442 2 357 384 1 205 705 540 784 19 104 31.12.2020 538 995 110 223 256 109 226 957 983 22 374 714 22 471 884 0 0 0 819 467 551 359 810 30 | SEC report as at June 30, 2021
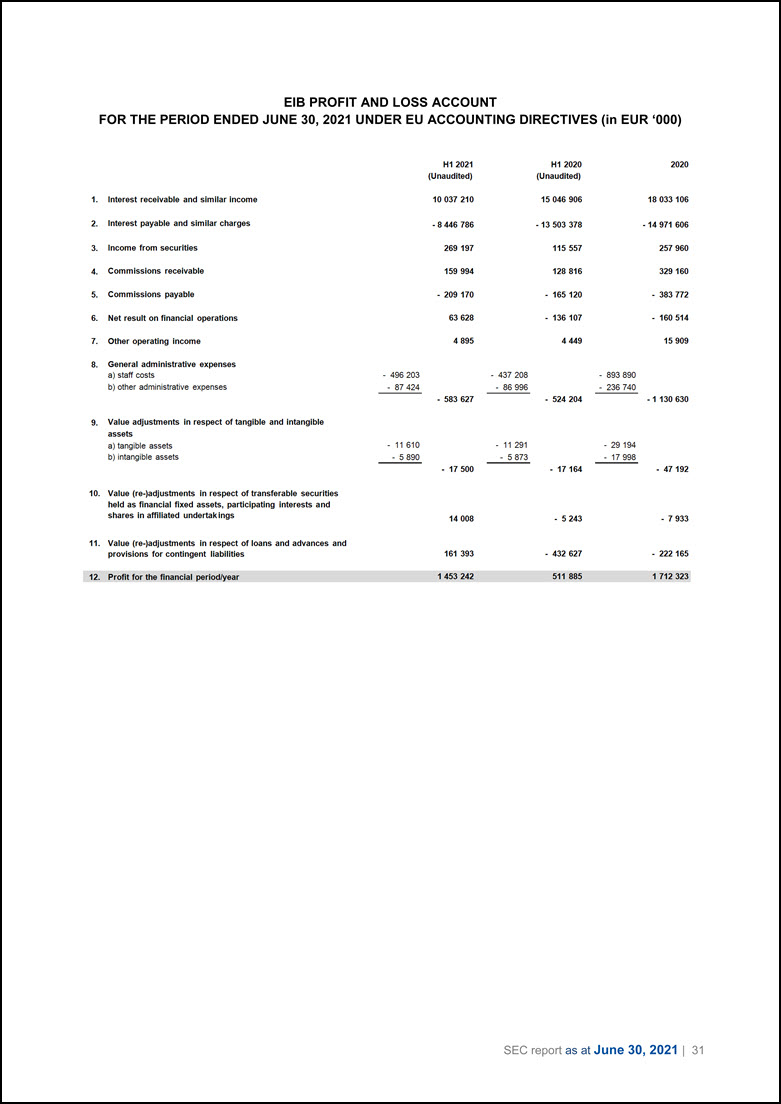
EIB PROFIT AND LOSS ACCOUNT FOR THE PERIOD ENDED JUNE 30, 2021 UNDER EU ACCOUNTING DIRECTIVES (in EUR ‘000) H1 2021 H1 2020 2020 (Unaudited) (Unaudited) 1. Interest receivable and similar income 10 037 210 15 046 906 18 033 106 2. Interest payable and similar charges • 8 446 786 • 13 503 378 -14 971 606 3. Income from securities 269 197 115 557 257 960 4. Commissions receivable 159 994 128 816 329 160 5. Commissions payable - 209 170 165 120 383 772 6. Net result on financial operations 63 628 136 107 160 514 7. Other operating income 4 895 4 449 15 909 8. General administrative expenses a) staff costs - 496 203 - 437 208 893 890 b) other administrative expenses - 87 424 - 86 996 236 740 - 583 627 - 524 204 - 1 130 630 9. Value adjustments in respect of tangible and intangible assets a) tangible assets - 11 610 - 11 291 - 29 194 b) intangible assets - 5 890 - 5 873 • 17 998 - 17 500 - 17 164 - 47 192 10. Value (re-)adjustments in respect of transferable securities held as financial fixed assets, participating interests and shares in affiliated undertakings 14 008 - 5 243 - 7 933 11. Value (re-)adjustments In respect of loans and advances and provisions for contingent liabilities 161 393 432 627 • 222 165 12. Profit for the financial period/year 1 453 242 511 885 1 712 323 SEC report as at June 30, 2021 | 31
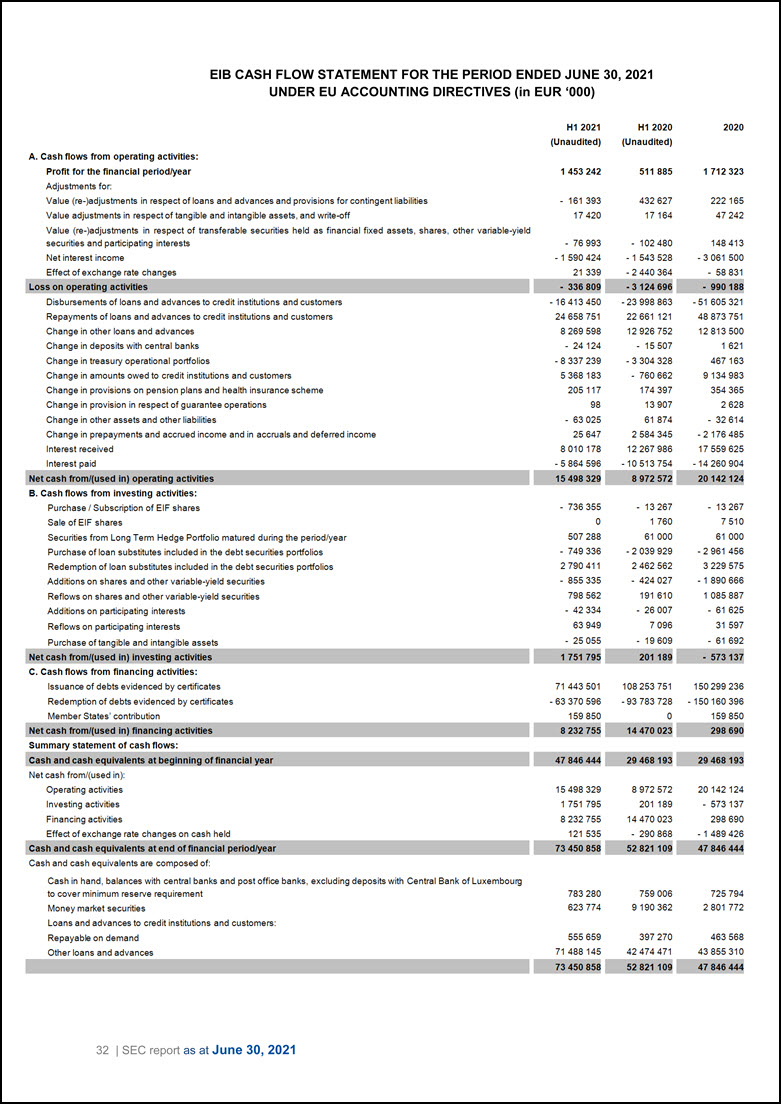
EIB CASH FLOW STATEMENT FOR THE PERIOD ENDED JUNE 30, 2021 UNDER EU ACCOUNTING DIRECTIVES (in EUR ‘000) A. Cash flows from operating activities: Profit for the financial period/year Adjustments for: Value (re-)adjustments in respect of loans and advances and provisions for contingent liabilities Value adjustments in respect of tangible and intangible assets, and write-off Value (re-)adjustments in respect of transferable securities held as financial fixed assets, shares, other variable-yield securities and participating interests Net interest income Effect of exchange rate changes Loss on operating activities Disbursements of loans and advances to credit institutions and customers Repayments of loans and advances to credit institutions and customers Change in other loans and advances Change in deposits with central banks Change in treasury operational portfolios Change in amounts owed to credit institutions and customers Change in provisions on pension plans and health insurance scheme Change in provision in respect of guarantee operations Change in other assets and other liabilities Change in prepayments and accrued income and in accruals and deferred income Interest received Interest paid Net cash from/(used in) operating activities B. Cash flows from investing activities: Purchase / Subscription of EIF shares Sale of EIF shares Securities from Long Term Hedge Portfolio matured during the period/year Purchase of loan substitutes included in the debt securities portfolios Redemption of loan substitutes included in the debt securities portfolios Additions on shares and other variable-yield securities Reflows on shares and other variable-yield securities Additions on participating interests Reflows on participating interests Purchase of tangible and intangible assets Net cash from/(used In) Investing activities C. Cash flows from financing activities: Issuance of debts evidenced by certificates Redemption of debts evidenced by certificates Member States' contribution Net cash from/(used In) financing activities Summary statement of cash flows: Cash and cash equivalents at beginning of financial year Net cash from/(used in): Operating activities Investing activities Financing activities Effect of exchange rate changes on cash held Cash and cash equivalents at end of financial J>period/year Cash and cash equivalents are composed of: Cash in hand, balances with central banks and post office banks, excluding deposits with Central Bank of Luxembourg to cover minimum reserve requirement Money market securities Loans and advances to credit institutions and customers: Repayable on demand Other loans and advances H1 2021 (Unaudited) 1 453 242 161 393 17 420 76 993 - 1 590 424 21 339 336 809 - 16 413 450 24 658 751 8 269 598 - 24 124 - 8 337 239 5 368 183 205 117 98 63 025 25 647 8010 178 - 5 864 596 H1 2020 (Unaudited) 511 885 432 627 17 164 102 480 - 1 543 528 - 2 440 364 -3 124 696 - 23 998 863 22 661 121 12 926 752 - 15 507 - 3 304 328 760 662 174 397 13 907 61 874 2 584 345 12 267 986 - 10513754 15498 329 8 972 572 736 355 0 507 288 749 336 2 790 411 855 335 798 562 42 334 63 949 25 055 1 751 795 71 443 501 - 63 370 596 159 850 8 232 755 47 846 444 15 498 329 1 751 795 8 232 755 121 535 73 450 858 783 280 623 774 555 659 71 488 145 73 450 858 13 267 1 760 61 000 - 2 039 929 2 462 562 424 027 191 610 26 007 7 096 19 609 201 189 108 253 751 - 93 783 728 0 14 470 023 29 468 193 8 972 572 201 189 14 470 023 - 290 868 52 821 109 759 006 9 190 362 397 270 42 474 471 52 821 109 2020 1 712323 222 165 47 242 148 413 - 3 061 500 - 58 831 - 990 188 - 51 605 321 48 873 751 12 813 500 1 621 467 163 9 134 983 354 365 2 628 32 614 - 2 176 485 17 559 625 - 14 260 904 20 142 124 13 267 7 510 61 000 - 2 961 456 3 229 575 - 1 890 666 1 085 887 61 625 31 597 61 692 - 573 137 150 299 236 - 150 160 396 159 850 298 690 29 46819 - 20 142 124 573 137 298 690 - 1 489 426 47 846 444 725 794 2 801 772 463 568 43 855 310 47 846 444 32 | SEC report as at June 30, 2021
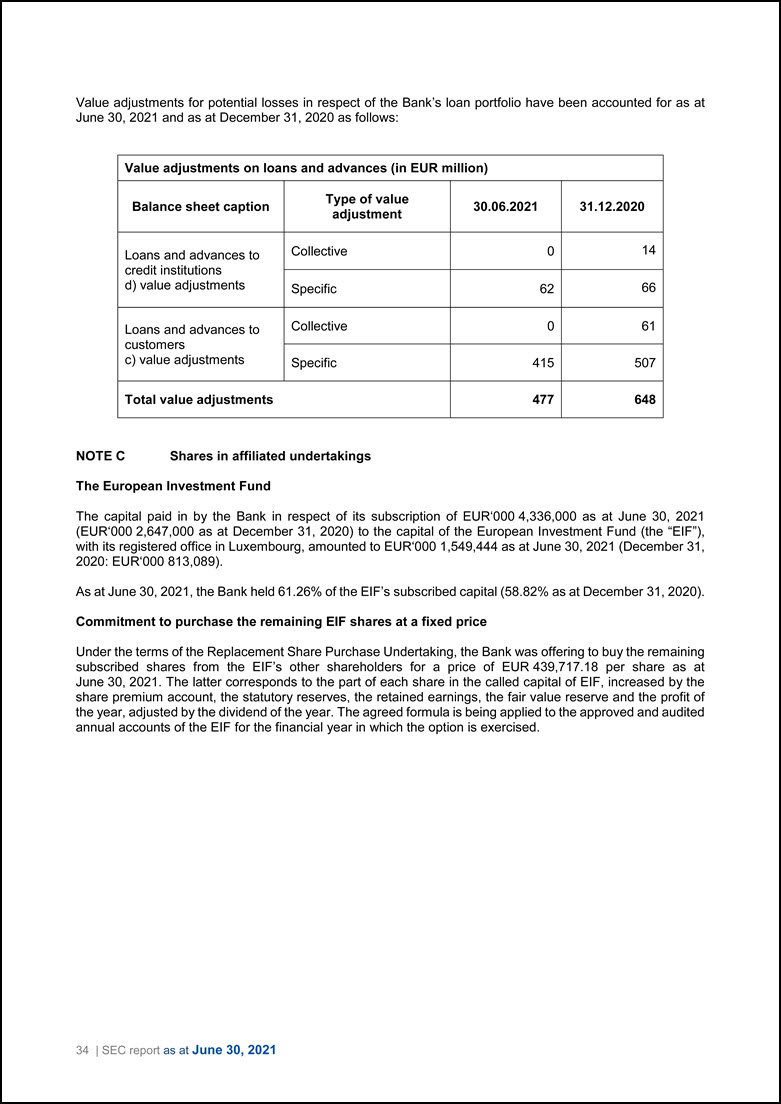
Value adjustments for potential losses in respect of the Bank’s loan portfolio have been accounted for as at June 30, 2021 and as at December 31, 2020 as follows: Value adjustments on loans and advances (in EUR million) Balance sheet caption Type of value adjustment 30.06.2021 31.12.2020 Loans and advances to credit institutions d) value adjustments Collective 0 14 Specific 62 66 Loans and advances to customers c) value adjustments Collective 0 61 Specific 415 507 Total value adjustments 477 648 NOTE C Shares in affiliated undertakings The European Investment Fund The capital paid in by the Bank in respect of its subscription of EUR‘000 4,336,000 as at June 30, 2021 (EUR‘000 2,647,000 as at December 31, 2020) to the capital of the European Investment Fund (the “EIF”), with its registered office in Luxembourg, amounted to EUR‘000 1,549,444 as at June 30, 2021 (December 31, 2020: EUR‘000 813,089). As at June 30, 2021, the Bank held 61.26% of the EIF’s subscribed capital (58.82% as at December 31, 2020). Commitment to purchase the remaining EIF shares at a fixed price Under the terms of the Replacement Share Purchase Undertaking, the Bank was offering to buy the remaining subscribed shares from the EIF’s other shareholders for a price of EUR 439,717.18 per share as at June 30, 2021. The latter corresponds to the part of each share in the called capital of EIF, increased by the share premium account, the statutory reserves, the retained earnings, the fair value reserve and the profit of the year, adjusted by the dividend of the year. The agreed formula is being applied to the approved and audited annual accounts of the EIF for the financial year in which the option is exercised. 34 | SEC report as at June 30, 2021
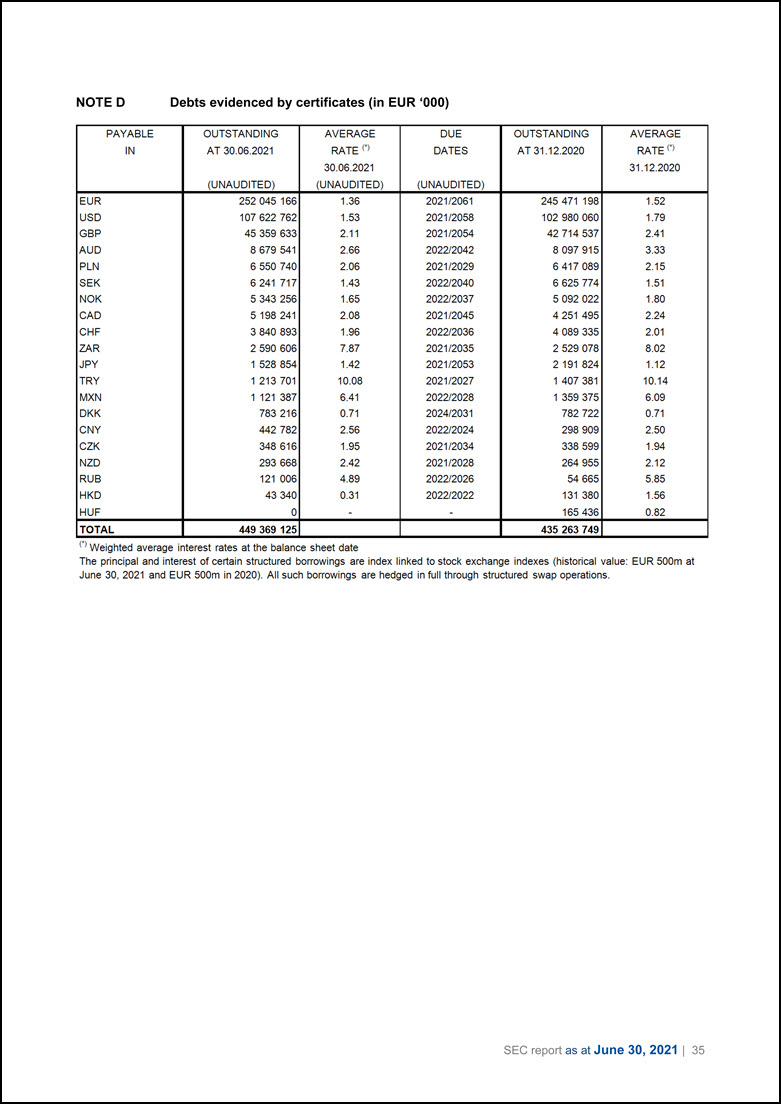
NOTE D Debts evidenced by certificates (in EUR ‘000) PAYABLE OUTSTANDING AVERAGE DUE OUTSTANDING AVERAGE IN AT 30.06.2021 RATE (1) DATES AT 31.12.2020 RATE (1) 30.06.2021 31.12.2020 (UNAUDITED) (UNAUDITED) (UNAUDITED) EUR 252 045 166 1.36 2021/2061 245 471 198 1.52 USO 107 622 762 1.53 2021/2058 102 980 060 1.79 GBP 45 359 633 2.11 2021/2054 42 714 537 2.41 AUD 8 679 541 2.66 2022/2042 8 097 915 3.33 PLN 6 550 740 2.06 2021/2029 6 417 089 2.15 SEK 6 241 717 1.43 2022/2040 6 625 774 1.51 NOK 5 343 256 1.65 2022/2037 5 092 022 1.80 CAD 5 198 241 2.08 2021/2045 4 251 495 2.24 CHF 3 840 893 1.96 2022/2036 4 089 335 2.01 ZAR 2 590 606 7.87 2021/2035 2 529 078 8.02 JPY 1 528 854 1.42 2021/2053 2 191 824 1.12 TRY 1 213 701 1008 2021/2027 1 407 381 10.14 MXN 1 121 387 6.41 2022/2028 1 359 375 6.09 DKK 783 216 0.71 2024/2031 782 722 0.71 CNY 442 782 2.56 2022/2024 298 909 2.50 CZK 348 616 1.95 2021/2034 338 599 1.94 NZD 293 668 2.42 2021/2028 264 955 2.12 RUB 121 006 4.89 2022/2026 54 665 5.85 HKD 43 340 0.31 2022/2022 131 380 1.56 HUF - - - 165 436 0.82 TOTAL 449 369 125 435 263 749 (1) Weighted average interest rates at the balance sheet date The principal and interest of certain structured borrowings are index linked to stock exchange indexes (historical value: EUR 500m at June 30, 2021 and EUR 500m in 2020). All such borrowings are hedged in full through structured swap operations. SEC report as at June 30, 2021 | 35
NOTE D Debts evidenced by certificates (in EUR ‘000) PAYABLE OUTSTANDING AVERAGE DUE OUTSTANDING AVERAGE IN AT 30.06.2021 RATE (•> DATES AT 31.12.2020 RATE (•> 30.06.2021 31.12.2020 (UNAUDITED) (UNAUDITED) (UNAUDITED) EUR 252 045 166 1.36 2021/2061 245 471 198 1.52 USO 107 622 762 1.53 2021/2058 102 980 060 1.79 GBP 45 359 633 2.11 2021/2054 42 714 537 2.41 AUD 8 679 541 2.66 2022/2042 8 097 915 3.33 PLN 6 550 740 2.06 2021/2029 6 417 089 2.15 SEK 6 241 717 1.43 2022/2040 6 625 774 1.51 NOK 5 343 256 1.65 2022/2037 5 092 022 1.80 CAD 5 198 241 2.08 2021/2045 4 251 495 2.24 CHF 3 840 893 1.96 2022/2036 4 089 335 2.01 ZAR 2 590 606 7.87 2021/2035 2 529 078 8.02 JPY 1 528 854 1.42 2021/2053 2 191 824 1.12 TRY 1 213 701 10.08 2021/2027 1 407 381 10.14 MXN 1 121 387 6.41 2022/2028 1 359 375 6.09 DKK 783 216 0.71 2024/2031 782 722 0.71 CNY 442 782 2.56 2022/2024 298 909 2.50 CZK 348 616 1.95 2021/2034 338 599 1.94 NZD 293 668 2.42 2021/2028 264 955 2.12 RUB 121 006 4.89 2022/2026 54 665 5.85 HKD 43 340 0.31 2022/2022 131 380 1.56 HUF 0 - - 165 436 0.82 TOTAL 449 369 125 435 263 749 (1) Weighted average interest rates at the balance sheet date The principal and interest of certain structured borrowings are index linked to stock exchange indexes (historical value: EUR 500m at June 30, 2021 and EUR 500m in 2020). All such borrowings are hedged in full through structured swap operations.