Exhibit VI
SEC report as at June 30, 2022 | 1 SEC report as at June 30, 2022 Financial Statements filed with the U.S. Securities and Exchange Commission
2 | SEC report as at June 30, 2022 Unaudited Condensed Semi-Annual Financial Statements as at June 30, 2022 SEC Filing
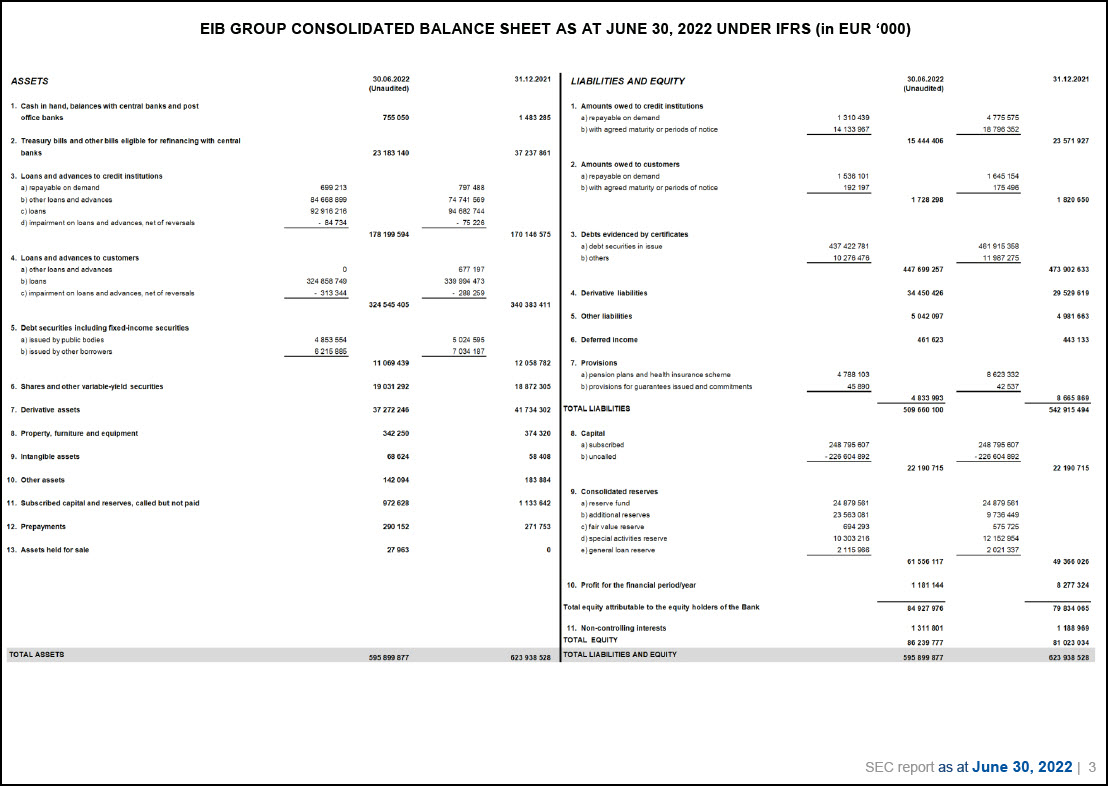
EIB GROUP CONSOLIDATED BALANCE SHEET AS AT JUNE 30, 2022 UNDER IFRS (in EUR ‘000) ASSETS 30.06.2022 (Unaudited) 31.12.2021 1. Cash in hand, balances with central banks and post office banks 755 050 1 483 285 2. Treasury bills and other bills eligible for refinancing with central banks 23 183 140 37 237 861 3. Loans and advances to credit institutions a) repayable on demand 699 213 797 488 b) other loans and advances 84 668 899 74 741 569 c) loans 92 916 216 94 682 744 d) impairment on loans and advances. net of reversals - 84 734 - 75 226 178 199 594 170 146 575 4. Loans and advances to customers a) other loans and advances 0 677 197 b) loans 324 858 749 339 994 473 c) impairment on loans and advances. net of reversals - 313 344 - 288 259 324 545 405 340 383 411 5. Debt securities including fixed-income securities a) issued by public bodies 4 853 554 5 024 595 b) issued by other borrowers 6 215 885 7 034 187 11 069 439 12 058 782 6. Shares and other variable-yield securities 19 031 292 18 872 305 7. Derivative assets 37 272 246 41 734 302 8. Property, furniture and equipment 342 250 374 320 9. Intangible assets 68 624 58 408 10. Other assets 142 094 183 884 11. Subscribed capital and reserves, called but not paid 972 628 1 133 642 12. Prepayments 290 152 271 753 13. Assets held for sale 27 963 0 TOTAL ASSETS 595 899 877 623 938 528 LIABILITIES AND EQUITY 1. Amounts owed to credit institutions 30.06.2022 (Unaudited) 31.12.2021 a) repayable on demand 1 310 439 4 775 575 b) with agreed maturity or periods of notice 14 133 967 18 796 352 15 444 406 23 571 927 2. Amounts owed to customers a) repayable on demand 1 536 101 1 645 154 b) with agreed maturity or periods of notice 192 197 175 496 1 728 298 1 820 650 3. Debts evidenced by certificates a) debt securities in issue 437 422 781 461 915 358 b) others 10 276 476 11 987 275 447 699 257 473 902 633 4. Derivative liabilities 34 450 426 29 529 619 5. Other liabilities 5 042 097 4 981 663 6. Deferred income 461 623 443 133 7. Provisions a) pension plans and health insurance scheme 4 788 103 8 623 332 b) provisions for guarantees issued and commitments 45 890 42 537 4 833 993 8 665 869 TOTAL LIABILITIES 509 660 100 542 915 494 8. Capital a) subscribed 248 795 607 248 795 607 b) uncalled - 226 604 892 - 226 604 892 22 190 715 22 190 715 9. Consolidated reserves a) reserve fund 24 879 561 24 879 561 b) additional reserves 23 563 081 9 736 449 c) fair value reserve 694 293 575 725 d) special activities reserve 10 303 216 12 152 954 e) general loan reserve 2 115 %6 2 021 337 61 556 117 49 366 026 10. Profit for the financial period/year 1 181 144 8 277 324 Total equity attributable to the equity holders of the Bank 84 927 976 79 834 065 11. Non-controlling interests 1 311 801 1 188 969 TOTAL EQUITY 86 239 777 81 023 034 'TOTAL LIABILITIES AND EQUITY 595 899 877 623 938 528 SEC report as at June 30, 2022 | 3
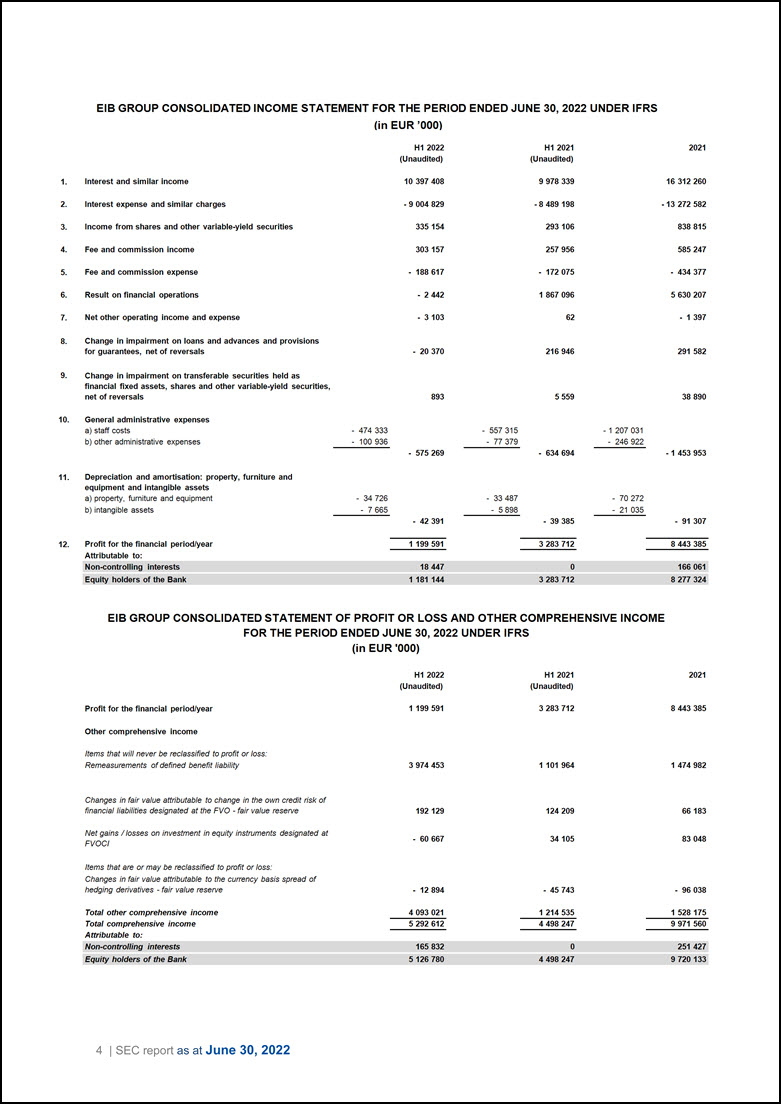
SEC report as at June 30, 2022 | 3 EIB GROUP CONSOLIDATED BALANCE SHEET AS AT JUNE 30, 2022 UNDER IFRS (in EUR ‘000) EIB GROUP CONSOLIDATED INCOME STATEMENT FOR THE PERIOD ENDED JUNE 30, 2022 UNDER IFRS (in EUR '000) H1 2022 H1 2021 2021 (Unaudited) (Unaudited) 1. Interest and similar income 10 397 408 9 978 339 16 312 260 2. Interest expense and similar charges - 9 004 829 - 8 489 198 - 13 272 582 3. Income from shares and other variable-yield securities 335 154 293 106 838 815 4. Fee and commission income 303 157 257 956 585 247 5. Fee and commission expense - 188 617 - 172 075 - 434 377 6. Result on financial operations - 2 442 1 867 096 5 630 207 7. Net other operating income and expense - 3 103 62 - 1 397 8. Change in impairment on loans and advances and provisions for guarantees, net of reversals - 20 370 216 946 291 582 9. Change in impairment on transferable securities held as financial fixed assets, shares and other variable-yield securities, net of reversals 893 5 559 38 890 10. General administrative expenses a) staff costs b) other administrative expenses - 474 333 - 100 936 - 557 315 - 1 207 031 - 77 379 - 246 922 - 575 269 - 634 694 - 1 453 953 11. Depreciation and amortisation: property, furniture and equipment and intangible assets a) property, furniture and equipment b) intangible assets 12. Profit for the financial period/year Attributable to: Non-controlling interests Equity holders of the Bank - 34 726 - 33 487 - 70 272 - 7 665 - 5 898 - 21 035 - 42 391 - 39 385 - 91 307 3 283 712 8 443 385 18 447 0 166 061 1 181 144 3 283 712 8 277 324 1 199 591 EIB GROUP CONSOLIDATED STATEMENT OF PROFIT OR LOSS AND OTHER COMPREHENSIVE INCOME FOR THE PERIOD ENDED JUNE 30, 2022 UNDER IFRS (in EUR '000) H1 2022 H1 2021 2021 (Unaudited) (Unaudited) Profit for the financial period/yearOther comprehensive income 1 199 591 3 283 712 8 443 385 Items that will never be reclassified to profit or loss: Remeasurements of defined benefit liability 3 974 453 1 101 964 1 474 982 Changes in fair value attributable to change in the own credit risk of financial liabilities designated at the FVO - fair value reserve Net gains /losses on investment in equity instruments designated at FVOCI 192 129 124 209 66 183 - 60 667 34 105 83 048 Items that are or may be reclassified to profit or loss: Changes in fair value attributable to the currency basis spread of hedging derivatives - fair value reserve - 12 894 - 45 743 - 96 038 Total other comprehensive income 4 093 021 1 214 535 1 528 175 Total comprehensive income 5 292 612 4 498 247 9 971 560 Attributable to: Non-controlling interests 165 832 0 251 427 Equity holders of the Bank 5 126 780 4 498 247 9 720 133 4 | SEC report as at June 30, 2022
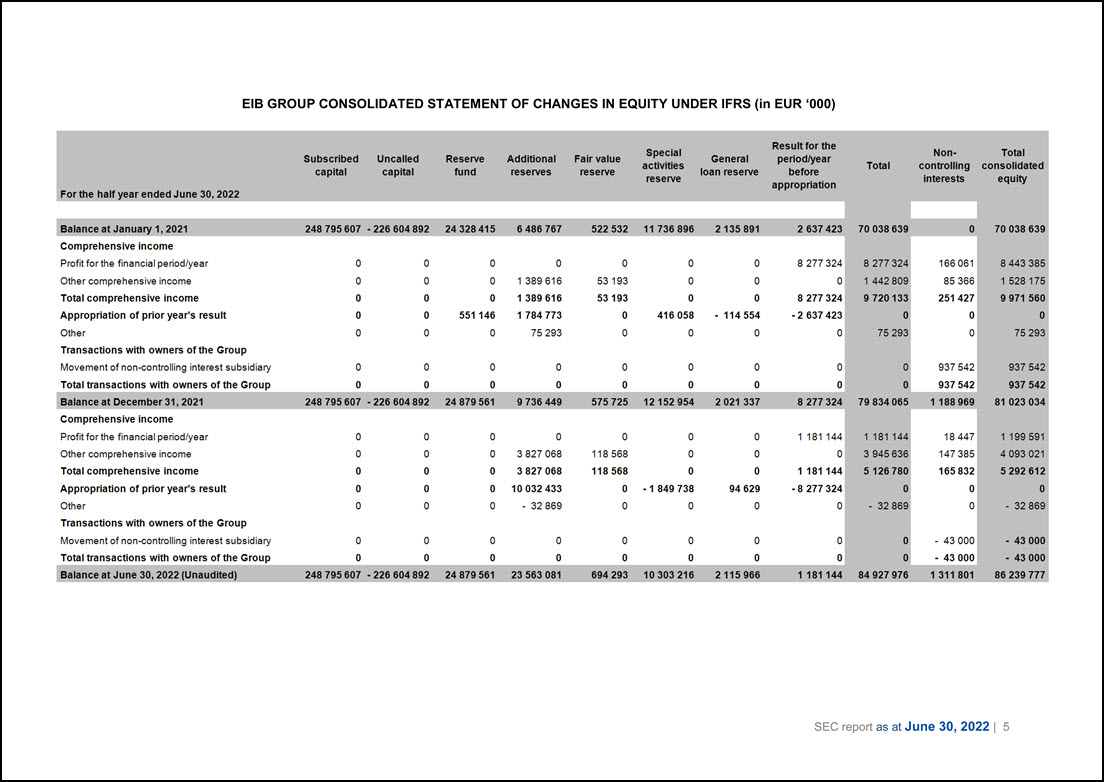
SEC report as at June 30, 2022 | 5 EIB GROUP CONSOLIDATED STATEMENT OF CHANGES IN EQUITY UNDER IFRS (in EUR ‘000) For the half year ended June 30, 2022 Subscribed capital Uncalled capital Reserve fund Additional reserves Fair value reserve Special activities reserve General loan reserve Result for the period/year before appropriation Total Non-controlling interests Total consolidated equity Balance at January 1, 2021 248 795 607 - 226 604 892 24 328 415 6 486 767 522 532 11 736 896 2 135 891 2 637 423 70 038 639 0 70 038 639 Comprehensive income Profit for the financial period/year 0 0 0 0 0 0 0 8 277 324 8 277 324 166 061 8 443 385 Other comprehensive income 0 0 0 1 389 616 53 193 0 0 0 1 442 809 85 366 1 528 175 Total comprehensive income 0 0 0 1 389 616 53 193 0 0 8 277 324 9 720 133 251 427 9 971 560 Appropriation of prior year's result 0 0 551 146 1 784 773 0 416 058 - 114 554 - 2 637 423 0 0 0 Other 0 0 0 75 293 0 0 0 0 75 293 0 75 293 Transactions with owners of the Group Movement of non-controlling interest subsidiary 0 0 0 0 0 0 0 0 0 937 542 937 542 Total transactions with owners of the Group 0 0 0 0 0 0 0 0 0 937 542 937 542 Balance at December 31, 2021 248 795 607 - 226 604 892 24 879 561 9 736 449 575 725 12 152 954 2 021 337 8 277 324 79 834 065 1 188 969 81 023 034 Comprehensive income Profit for the financial period/year 0 0 0 0 0 0 0 1 181 144 1 181 144 18 447 1 199 591 Other comprehensive income 0 0 0 3 827 068 118 568 0 0 0 3 945 636 147 385 4 093 021 Total comprehensive income 0 0 0 3 827 068 118 568 0 0 1 181 144 5 126 780 165 832 5 292 612 Appropriation of prior year's result 0 0 0 10 032 433 0 1 849 738 94 629 - 8 277 324 0 0 0 Other 0 0 0 - 32 869 0 0 0 0 - 32 869 0 - 32 869 Transactions with owners of the Group Movement of non-controlling interest subsidiary 0 0 0 0 0 0 0 0 0 - 43 000 - 43 000 Total transactions with owners of the Group 0 0 0 0 0 0 0 0 0 - 43 000 - 43 000 Balance at June 30, 2022 (Unaudited) 248 795 607 - 226 604 892 24 879 561 23 563 081 694 293 10 303 216 2 115 966 1 181 144 84 927 976 1 311 801 86 239 777
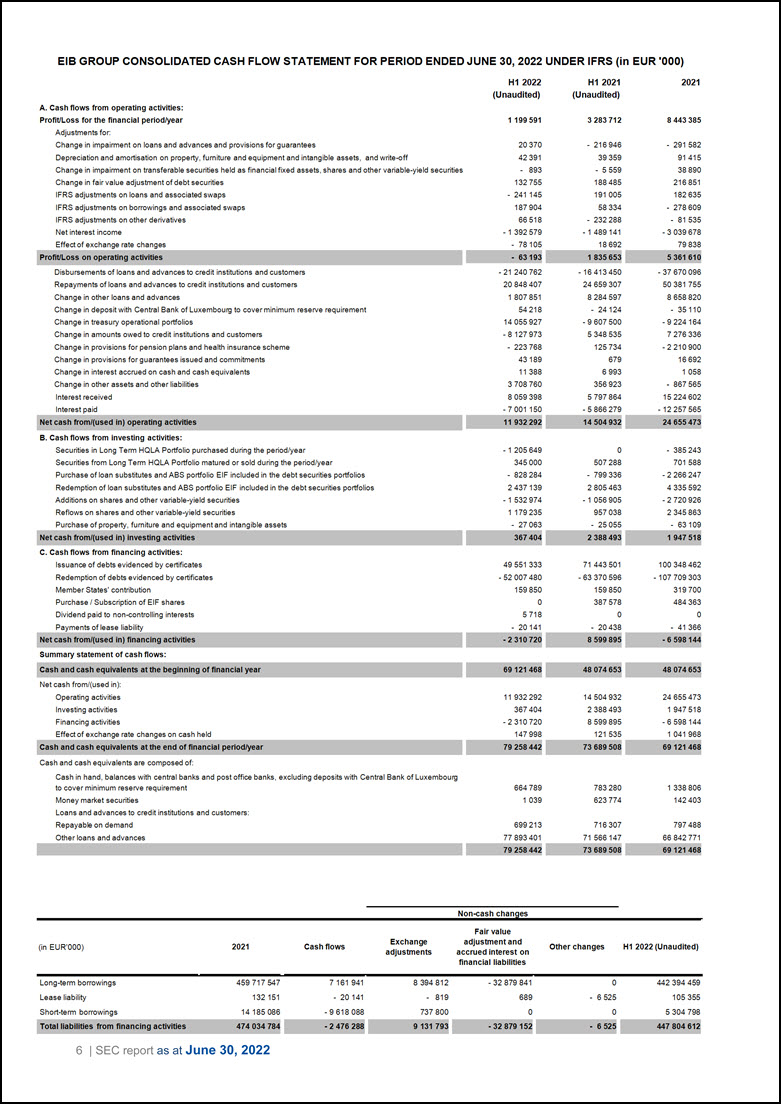
6 | SEC report as at June 30, 2022 EIB GROUP CONSOLIDATED CASH FLOW STATEMENT FOR PERIOD ENDED JUNE 30, 2022 UNDER IFRS (in EUR '000) A. Cash flows from operating activities: H12022 (Unaudited) H12021 (Unaudited) 2021 Profit/Loss for the financial period/year 1 199 591 3 283 712 8 443 385 Adjustments for: Change in impairment on loans and advances and provisions for guarantees 20 370 - 216 946 - 291 582 Depreciation and amortisation on property, furniture and equipment and intangible assets, and write-off 42 391 39 359 91 415 Change in impairment on transferable securities held as financial fixed assets, shares and other variable-yield securities - 893 - 5 559 38 890 Change in fair value adjustment of debt securities 132 755 188 485 216 851 IFRS adjustments on loans and associated swaps - 241 145 191 005 182 635 IFRS adjustments on borrowings and associated swaps 187 904 58 334 - 278 609 IFRS adjustments on other derivatives 66 518 - 232 288 - 81 535 Net interest income - 1 392 579 - 1 489 141 - 3 039 678 Effect of exchange rate changes - 78 105 18 692 79 838 Profit/Loss on operating activities - 63 193 1 835 653 5 361 610 Disbursements of loans and advances to credit institutions and customers - 21 240 762 - 16 413 450 - 37 670 096 Repayments of loans and advances to credit institutions and customers 20 848 407 24 659 307 50 381 755 Change in other loans and advances 1 807 851 8 284 597 8 658 820 Change in deposit with Central Bank of Luxembourg to cover minimum reserve requirement 54 218 - 24 124 - 35 110 Change in treasury operational portfolios 14 055 927 - 9 607 500 - 9 224 164 Change in amounts owed to credit institutions and customers - 8 127 973 5 348 535 7 276 336 Change in provisions for pension plans and health insurance scheme - 223 768 125 734 -2210900 Change in provisions for guarantees issued and commitments 43 189 679 16 692 Change in interest accrued on cash and cash equivalents 11 388 6 993 1 058 Change in other assets and other liabilities 3 708 760 356 923 - 867 565 Interest received 8 059 398 5 797 864 15 224 602 Interest paid -7001150 -5866279 -12257565 Net cash from/(used in) operating activities B. Cash flows from investing activities: Securities in Long Term HQLA Portfolio purchased during the period/year - 1 205 649 0 - 385 243 Securities from Long Term HQLA Portfolio matured or sold during the period/year 345 000 507 288 701 588 Purchase of loan substitutes and ABS portfolio EIF included in the debt securities portfolios - 828 284 - 799 336 - 2 266 247 Redemption of loan substitutes and ABS portfolio EIF included in the debt securities portfolios 2 437 139 2 805 463 4 335 592 Additions on shares and other variable-yield securities - 1 532 974 - 1 056 905 - 2 720 926 Reflows on shares and other variable-yield securities 1 179 235 957 038 2 345 863 Purchase of property, furniture and equipment and intangible assets - 27 063 - 25 055 - 63 109 Net cash from/(used in) investing activities C. Cash flows from financing activities: Issuance of debts evidenced by certificates 49 551 333 71 443 501 100 348 462 Redemption of debts evidenced by certificates - 52 007 480 - 63 370 596 - 107 709 303 Member States' contribution 159 850 159 850 319 700 Purchase / Subscription of EIF shares 0 387 578 484 363 Dividend paid to non-controlling interests 5 718 0 0 Payments of lease liability - 20 141 - 20 438 - 41 366 Net cash from/(used in) financing activities Summary statement of cash flows: Cash and cash equivalents at the beginning of financial year Net cash from/(used in) Operating activities 11 932 292 14 504 932 24 655 473 Investing activities 367 404 2 388 493 1 947 518 Financing activities -2310720 8 599 895 -6598144 Effect of exchange rate changes on cash held 147 998 121 535 1 041 968 Cash and cash equivalents at the end of financial period/year Cash and cash equivalents are composed of Cash in hand, balances with central banks and post office banks, excluding deposits with Central Bank of Luxembourg to cover minimum reserve requirement 664 789 783 280 1 338 806 Money market securities 1 039 623 774 142 403 Loans and advances to credit institutions and customers: Repayable on demand 699 213 716 307 797 488 Other loans and advances 77 893 401 71 566 147 66 842 771 Non-cash changes Exchange Fair value adjustment and (in EUR'000) 2021 Cash flows adjustments accrued interest on financial liabilities Other changes HI 2022 (Unaudited) Long-term borrowings 459 717 547 7 161 941 8 394 812 - 32 879 841 0 442 394 459 Lease liability 132 151 - 20 141 - 819 6B9 - 6 525 105 355 Short-tens borrowings 14 185 086 - 9 618 088 737 800 0 0 5 304 798 iallnlitiesmnancing activities 474 034 784 6 | SEC report as at June 30, 2022
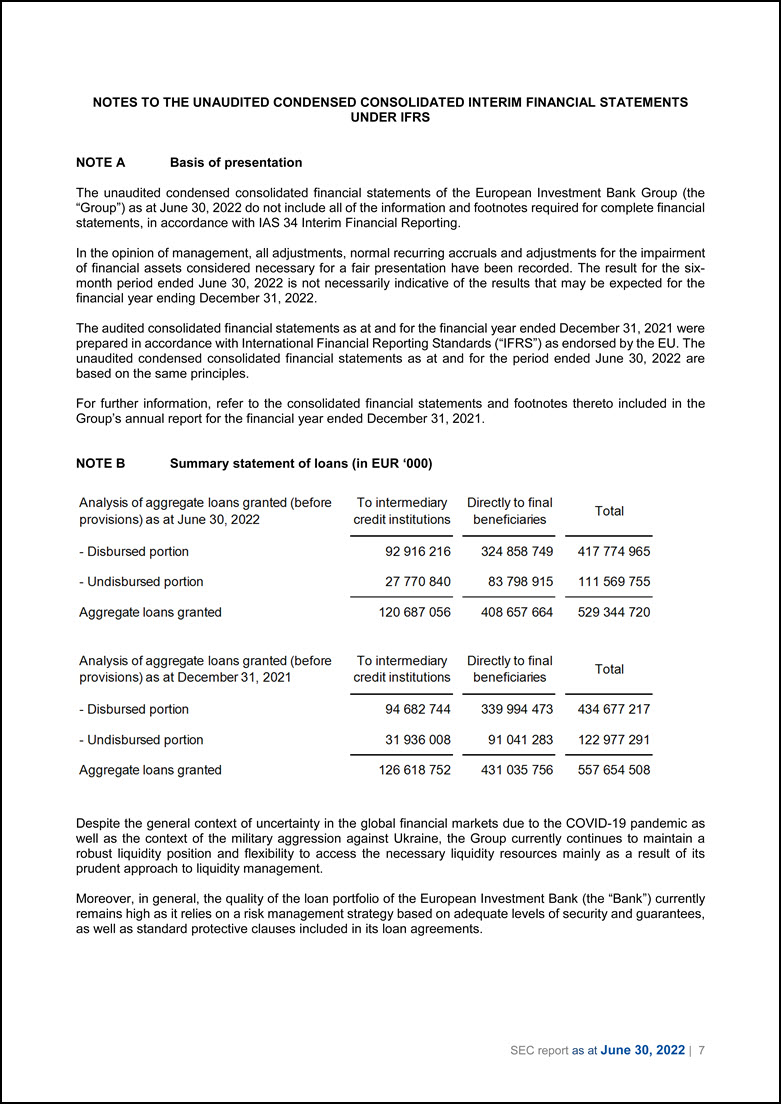
SEC report as at June 30, 2022 | 7 NOTES TO THE UNAUDITED CONDENSED CONSOLIDATED INTERIM FINANCIAL STATEMENTS UNDER IFRS NOTE A Basis of presentation The unaudited condensed consolidated financial statements of the European Investment Bank Group (the “Group”) as at June 30, 2022 do not include all of the information and footnotes required for complete financial statements, in accordance with IAS 34 Interim Financial Reporting. In the opinion of management, all adjustments, normal recurring accruals and adjustments for the impairment of financial assets considered necessary for a fair presentation have been recorded. The result for the six- month period ended June 30, 2022 is not necessarily indicative of the results that may be expected for the financial year ending December 31, 2022. The audited consolidated financial statements as at and for the financial year ended December 31, 2021 were prepared in accordance with International Financial Reporting Standards (“IFRS”) as endorsed by the EU. The unaudited condensed consolidated financial statements as at and for the period ended June 30, 2022 are based on the same principles. For further information, refer to the consolidated financial statements and footnotes thereto included in the Group’s annual report for the financial year ended December 31, 2021. NOTE B Summary statement of loans (in EUR ‘000) Despite the general context of uncertainty in the global financial markets due to the COVID-19 pandemic as well as the context of the military aggression against Ukraine, the Group currently continues to maintain a robust liquidity position and flexibility to access the necessary liquidity resources mainly as a result of its prudent approach to liquidity management. Moreover, in general, the quality of the loan portfolio of the European Investment Bank (the “Bank”) currently remains high as it relies on a risk management strategy based on adequate levels of security and guarantees, as well as standard protective clauses included in its loan agreements.
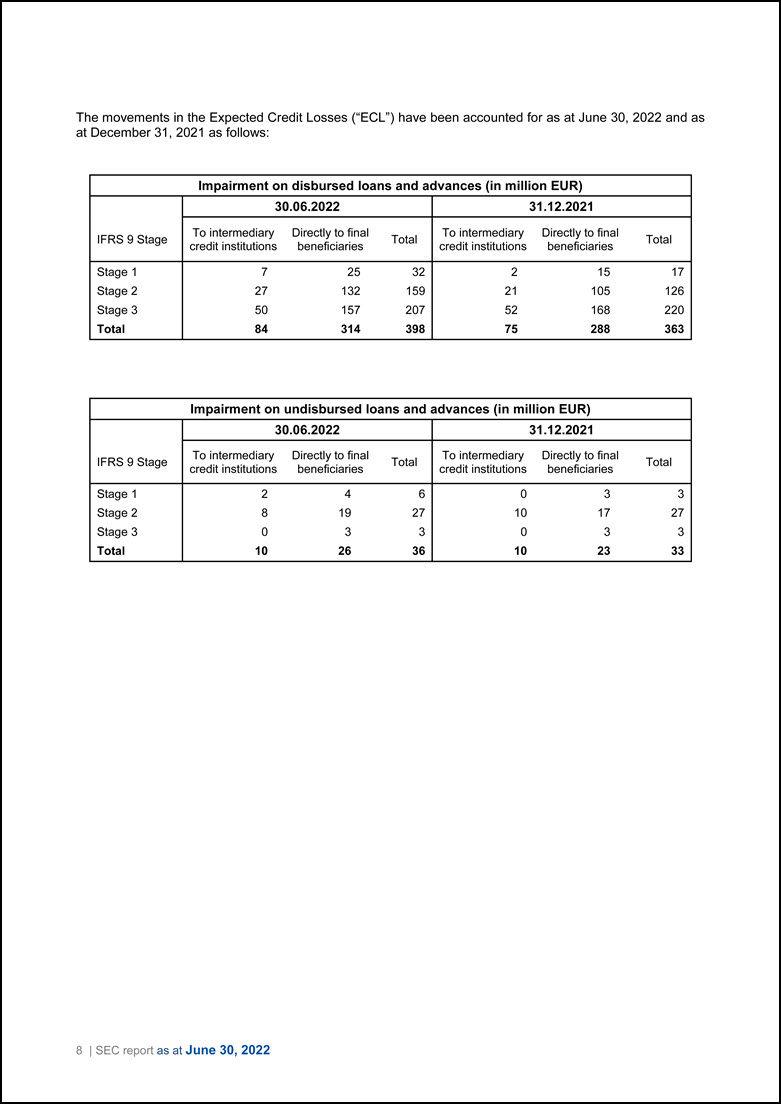
8 | SEC report as at June 30, 2022 The movements in the Expected Credit Losses (“ECL”) have been accounted for as at June 30, 2022 and as at December 31, 2021 as follows: Impairment on disbursed loans and advances (in million EUR) IFRS 9 Stage 30.06.2022 31.12.2021 To intermediary credit institutions Directly to final beneficiaries Total To intermediary credit institutions Directly to final beneficiaries Total Stage 1 7 25 32 2 15 17 Stage 2 27 132 159 21 105 126 Stage 3 50 157 207 52 168 220 Total 84 314 398 75 288 363 Impairment on undisbursed loans and advances (in million EUR) IFRS 9 Stage 30.06.2022 31.12.2021 To intermediary credit institutions Directly to final beneficiaries Total To intermediary credit institutions Directly to final beneficiaries Total Stage 1 2 4 6 0 3 3 Stage 2 8 19 27 10 17 27 Stage 3 0 3 3 0 3 3 Total 10 26 36 10 23 33
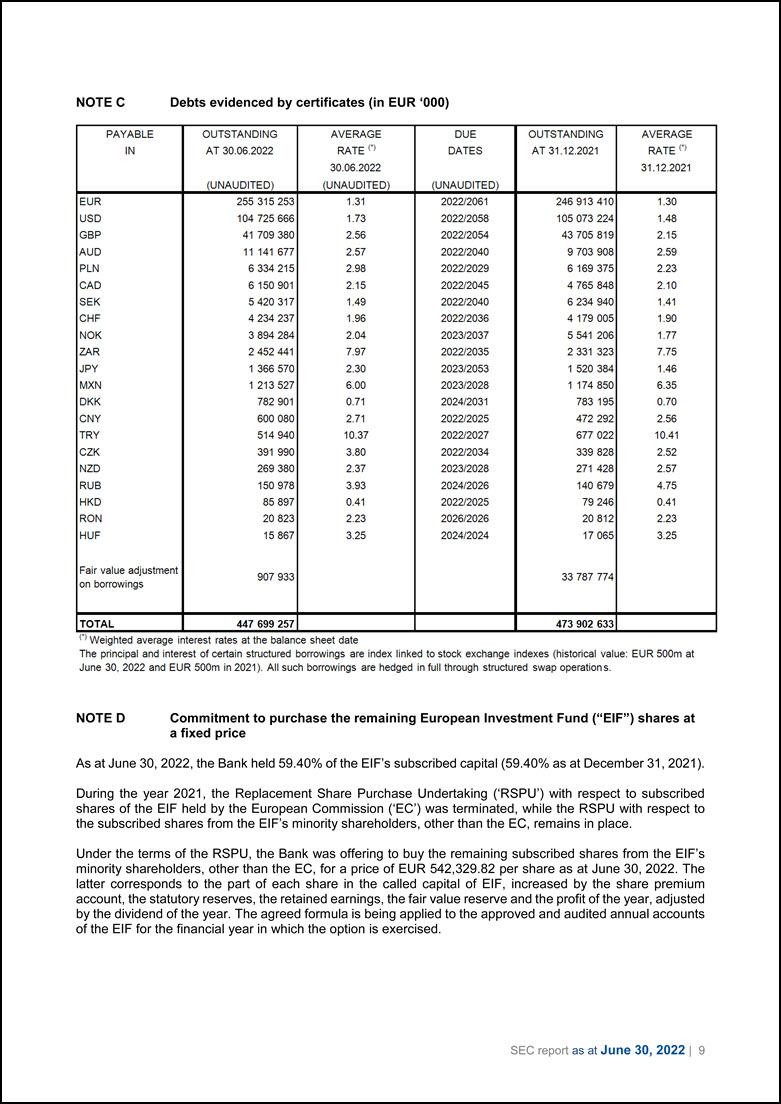
SEC report as at June 30, 2022 | 9 NOTE C Debts evidenced by certificates (in EUR ‘000) PAYABLE IN OUTSTANDING AT 30.06.2022 (UNAUDITED) AVERAGE RATE Ixf 30.06.2022 (UNAUDITED) DUE DATES (UNAUDITED) OUTSTANDING AT 31.12.2021 AVERAGE RATE (`31.12.2021 EUR 255 315 253 1.31 2022/2061 246 913 410 1.30 USD 104 725 666 1.73 2022/2058 105 073 224 1.48 GBP 41 709 380 2.56 2022/2054 43 705 819 2.15 AUD 11 141 677 2.57 2022/2040 9 703 908 2.59 PLN 6 334 215 2.98 2022/2029 6 169 375 2.23 CAD 6 150 901 2.15 2022/2045 4 765 848 2.10 SEK 5 420 317 1.49 2022/2040 6 234 940 1.41 CHF 4 234 237 1.96 2022/2036 4 179 005 1.90 NOK 3 894 284 2.04 2023/2037 5 541 206 1.77 ZAR 2 452 441 7.97 2022/2035 2 331 323 7.75 JPY 1 366 570 2.30 2023/2053 1 520 384 1.46 MXN 1 213 527 6.00 2023/2028 1 174 850 6.35 DKK 782 901 0.71 2024/2031 783 195 0.70 CNY 600 080 2.71 2022/2025 472 292 2.56 TRY 514 940 10.37 2022/2027 677 022 10.41 CZK 391 990 3.80 2022/2034 339 828 2.52 NZD 269 380 2.37 2023/2028 271 428 2.57 RUB 150 978 3.93 2024/2026 140 679 4.75 HKD 85 897 0.41 2022/2025 79 246 0.41 RON 20 823 2.23 2026/2026 20 812 2.23 HUF 15 867 3.25 2024/2024 17 065 3.25 Fair value adjustment on borrowings 907 933 33 787 774 TOTAL 447 699 257 473 902 633 Weighted average interest rates at the balance sheet date The principal and interest of certain structured borrowings are index linked to stock exchange indexes (historical value: EUR 500m at June 30, 2022 and EUR 500m in 2021). All such borrowings are hedged in full through structured swap operations. NOTE D Commitment to purchase the remaining European Investment Fund (“EIF”) shares at a fixed price As at June 30, 2022, the Bank held 59.40% of the EIF’s subscribed capital (59.40% as at December 31, 2021). During the year 2021, the Replacement Share Purchase Undertaking (‘RSPU’) with respect to subscribed shares of the EIF held by the European Commission (‘EC’) was terminated, while the RSPU with respect to the subscribed shares from the EIF’s minority shareholders, other than the EC, remains in place. Under the terms of the RSPU, the Bank was offering to buy the remaining subscribed shares from the EIF’s minority shareholders, other than the EC, for a price of EUR 542,329.82 per share as at June 30, 2022. The latter corresponds to the part of each share in the called capital of EIF, increased by the share premium account, the statutory reserves, the retained earnings, the fair value reserve and the profit of the year, adjusted by the dividend of the year. The agreed formula is being applied to the approved and audited annual accounts of the EIF for the financial year in which the option is exercised.
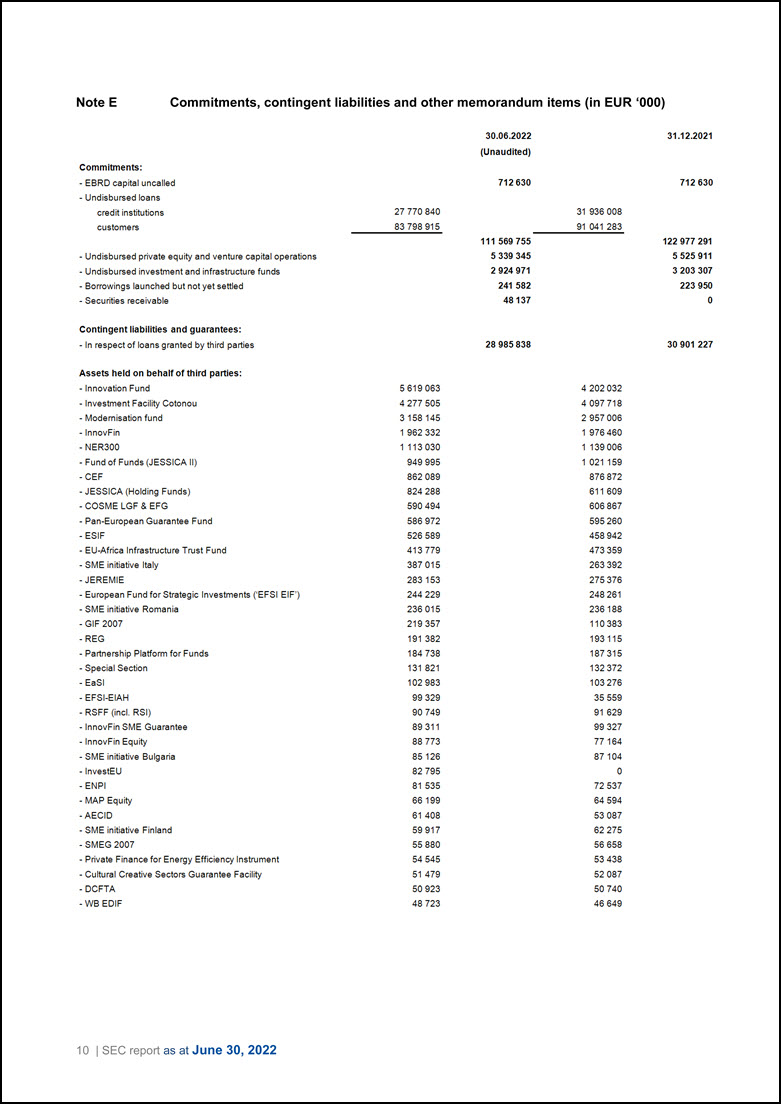
10 | SEC report as at June 30, 2022 Note E Commitments, contingent liabilities and other memorandum items (in EUR ‘000) Commitments: 30.06.2022 (Unaudited) 31.12.2021 - EBRD capital uncalled 712 630 712 630 - Undisbursed loans credit institutions 27 770 840 31 936 008 customers 83 798 915 91 041 283 111 569 755 122 977 291 - Undisbursed private equity and venture capital operations 5 339 345 5 525 911 - Undisbursed investment and infrastructure funds 2 924 971 3 203 307 - Borrowings launched but not yet settled 241 582 223 950 - Securities receivable 48 137 0 Contingent liabilities and guarantees: - In respect of loans granted by third parties 28 985 838 30 901 227 Assets held on behalf of third parties: - Innovation Fund 5 619 063 4 202 032 - Investment Facility Cotonou 4 277 505 4 097 718 - Modernisation fund 3 158 145 2 957 006 - InnovFin 1 962 332 1 976 460 - NER300 1 113 030 1 139 006 - Fund of Funds (JESSICA II) 949 995 1 021 159 - CEF 862 089 876 872 - JESSICA (Holding Funds) 824 288 611 609 - COSME LGF & EFG 590 494 606 867 - Pan-European Guarantee Fund 586 972 595 260 - ESIF 526 589 458 942 - EU-Africa Infrastructure Trust Fund 413 779 473 359 - SME initiative Italy 387 015 263 392 - JEREMIE 283 153 275 376 - European Fund for Strategic Investments (`EFSI EIF') 244 229 248 261 - SME initiative Romania 236 015 236 188 - GIF 2007 219 357 110 383 - REG 191 382 193 115 - Partnership Platform for Funds 184 738 187 315 - Special Section 131 821 132 372 - EaSI 102 983 103 276 - EFSI-EIAH 99 329 35 559 - RSFF (incl. RSI) 90 749 91 629 - InnovFin SME Guarantee 89 311 99 327 - InnovFin Equity 88 773 77 164 - SME initiative Bulgaria 85 126 87 104 - InvestEU 82 795 0 - ENPI 81 535 72 537 - MAP Equity 66 199 64 594 -AECID 61 408 53 087 - SME initiative Finland 59 917 62 275 - SMEG 2007 55 880 56 658 - Private Finance for Energy Efficiency Instrument 54 545 53 438 - Cultural Creative Sectors Guarantee Facility 51 479 52 087 - DCFTA 50 923 50 740 - WB EDIF 48 723 46 649
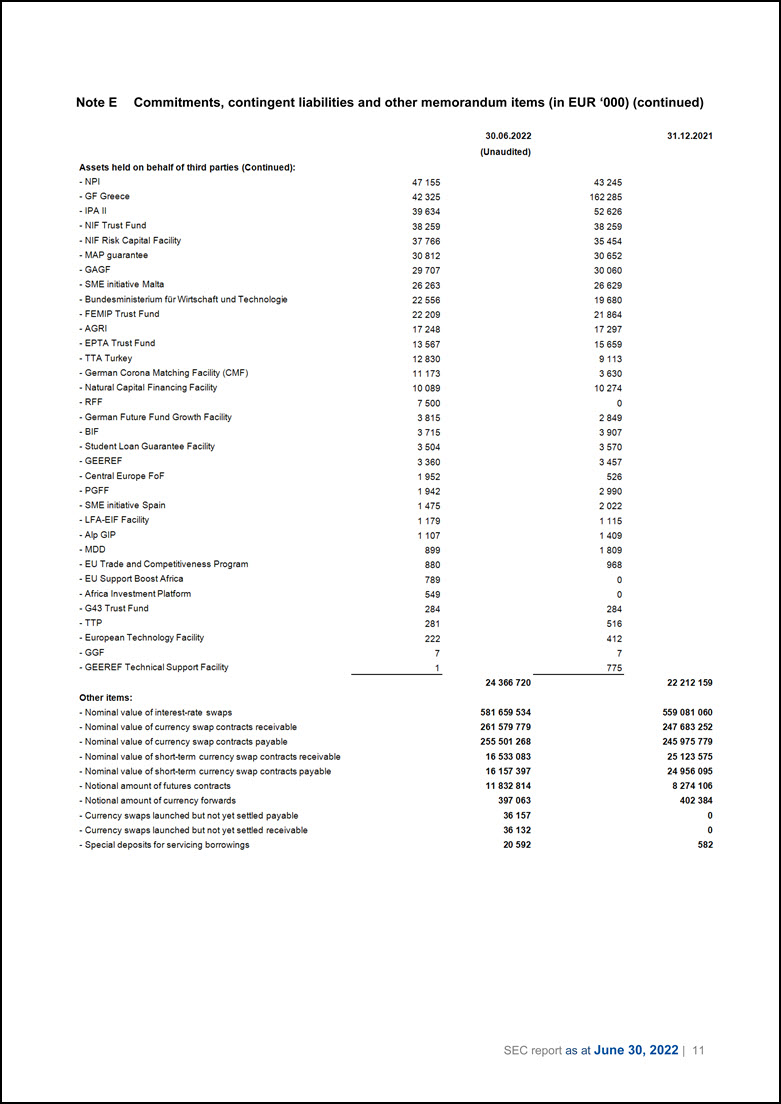
SEC report as at June 30, 2022 | 11 Note E Commitments, contingent liabilities and other memorandum items (in EUR ‘000) (continued) Assets held on behalf of third parties (Continued): 30.06.2022 (Unaudited) 31.12.2021 NPI 47 155 43 245 - GF Greece 42 325 162 285 - IPA II 39 634 52 626 -NIF Trust Fund 38 259 38 259 - NIF Risk Capital Facility 37 766 35 454 - MAP guarantee 30 812 30 652 - GAGF 29 707 30 060 - SME initiative Malta 26 263 26 629 - Bundesministerium fur Wirtschaft and Technologie 22 556 19 680 - FEMIP Trust Fund 22 209 21 864 - AGRI 17 248 17 297 - EPTA Trust Fund 13 567 15 659 - TTA Turkey 12 830 9 113 - German Corona Matching Facility (CMF) 11 173 3 630 - Natural Capital Financing Facility 10 089 10 274 RFF 7 500 0 - German Future Fund Growth Facility 3 815 2 849 BIF 3 715 3 907 - Student Loan Guarantee Facility 3 504 3 570 - GEEREF 3 360 3 457 - Central Europe FoF 1 952 526 - PGFF 1 942 2 990 - SME initiative Spain 1 475 2 022 - LFA-EIF Facility 1 179 1 115 -Alp GIP 1 107 1 409 - MDD 899 1 809 - EU Trade and Competitiveness Program 880 968 - EU Support Boost Africa 789 0 - Africa Investment Platform 549 0 - G43 Trust Fund 284 284 - TTP 281 516 - European Technology Facility 222 412 - GGF 7 7 - GEEREF Technical Support Facility 1 775 24 366 720 22 212 159 Other items: - Nominal value of interest-rate swaps 581 659 534 559 081 060 - Nominal value of currency swap contracts receivable 261 579 779 247 683 252 - Nominal value of currency swap contracts payable 255 501 268 245 975 779 - Nominal value of short-term currency swap contracts receivable 16 533 083 25 123 575 - Nominal value of short-term currency swap contracts payable 16 157 397 24 956 095 - Notional amount of futures contracts 11 832 814 8 274 106 - Notional amount of currency forwards 397 063 402 384 - Currency swaps launched but not yet settled payable 36 157 0 - Currency swaps launched but not yet settled receivable 36 132 0 - Special deposits for servicing borrowings 20 592 582
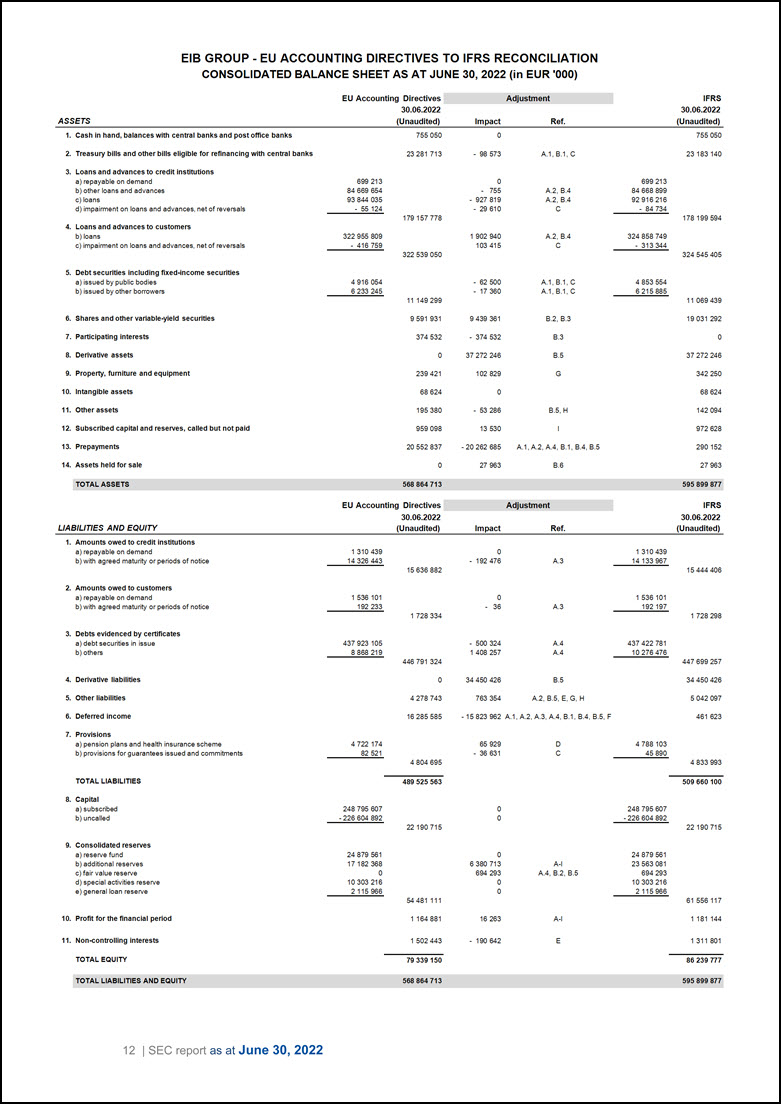
ASSETS EU Accounting Directives 30.06.2022 (Unaudited) Impact Adjustment Ref. IFRS 30.06.2022 (Unaudited) 1. Cash in hand, balances with central banks and post office banks 755 050 755 050 2. Treasury bills and other bills eligible for refinancing with central banks 23 281 713 - 98 573 A.1, B.1, C 23 183 140 3. Loans and advances to credit institutions 699 213 699 213 a) repayable on demand 84 669 654 - 755 A.2, B.4 84 668 899 b) other loans and advances 931344 035 - 927 819 A.2, B.4 92 916 216 c) loans - 55 124 - 29 610 C - 84 734 d) impairment on loans and advances, net of reversals 179 157 778 178 199 594 4. Loans and advances to customers 322 955 809 1 902 940 A.2, B.4 324 858 749 b) loans - 416 759 103 415 - 313 344 c) impairment on loans and advances, net of reversals 322 539 050 324 545 405 5. Debt securities including fixed-income securities 4 916 054 - 62 500 Al, B.1, C 4 853 554 a) issued by public bodies 6 233 245 - 17 360 Al, B.1, C 6 215 885 b) issued by other borrowers 11 149 299 11 069 439 6. Shares and other variable-yield securities 9 591 931 9 439 361 B.2, B.3 19 031 292 7. Participating interests 374 532 - 374 532 B.3 0 8. Derivative assets 0 37 272 246 B.5 37 272 246 9. Property, furniture and equipment 239 421 102 829 G 342 250 10. Intangible assets 68 624 68 624 11. Other assets 195 380 - 53 286 B.5, H 142 094 12. Subscribed capital and reserves, called but not paid 959 098 13 530 972 628 13. Prepayments 20 552 837 - 20 262 685 Al, A.2, A.4, B.1, B.4, B.5 290 152 14. Assets held for sale 0 27 963 B.6 27 963 TOTAL ASSETS 568 864 713 • 595 899 877 12 | SEC report as at June 30, 2022 LIABILITIES AND EQUITY 30.06.2022 (Unaudited) Impact Ref. 30.06.2022 (Unaudited) 1. Amounts owed to credit institutions 1 310 439 0 1 310 439 a) repayable on demand 14 326 443 - 192 476 A.3 14 133 967 b) with agreed maturity or periods of notice 15 636 882 15 444 406 2. Amounts owed to customers 1 536 101 0 1 536 101 a) repayable on demand 192 233 - 36 A.3 192 197 b) with agreed maturity or periods of notice 1 728 334 1 728 298 3. Debts evidenced by certificates 437 923 105 - 500 324 A.4 437 422 781 a) debt securities in issue 8 868 219 1 408 257 A.4 10 276 476 b) others 446 791 324 447 699 257 4. Derivative liabilities 0 34 450 426 B.5 34 450 426 5. Other liabilities 4 278 743 763 354 A.2, B.5, E, G, H 5 042 097 6. Deferred income 16 285 585 - 15 823 962 Al, A.2, A.3, A.4, B.1, B.4, B.5, F 461 623 7. Provisions 4 722 174 65 929 D 4 788 103 a) pension plans and health insurance scheme 82 521 - 36 631 45 890 b) provisions for guarantees issued and commitments 4 804 695 4 833 993 TOTAL LIABILITIES 489 525 563 509 660 100 8. Capital 248 795 607 248 795 607 a) subscribed - 226 604 892 - 226 604 892 b) uncalled 22 190 715 22 190 715 9. Consolidated reserves 24 879 561 0 24 879 561 a) reserve fund 17 182 368 6 380 713 A-I 23 563 081 b) additional reserves 0 694 293 A.4, B.2, B.5 694 293 c) fair value reserve 10 303 216 0 10 303 216 d) special activities reserve 2 115 966 0 2 115 966 e) general loan reserve 54 481 111 61 556 117 10. Profit for the financial period 1 164 881 16 263 A-I 1 181 144 11. Non-controlling interests 1 502 443 - 190 642 E 1 311 801 TOTAL EQUITY 79 339 150 86 239 777 TOTAL LIABILITIES AND EQUITY 568 864 713 595 899 877
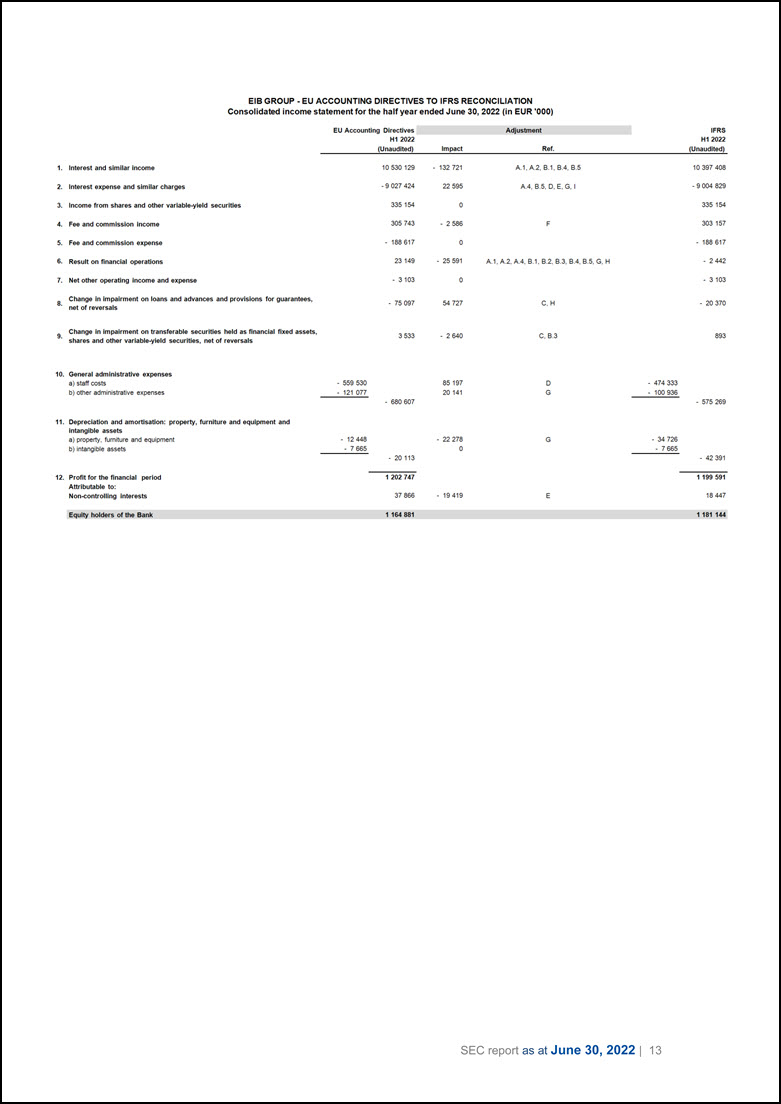
EU Accounting Directives H1 2022 (Unaudited) Adjustment IFRS H1 2022 (Unaudited) Impact Ref. 1. Interest and similar income 2. Interest expense and similar charges 3. Income from shares and other variable-yield securities 4. Fee and commission Income 5. Fee and commission expense 6. Result on financial operations 7. Net other operating income and expense Change in impairment on loans and advances and provisions for guarantees, 8. net of reversals 9. Change in impairment on transferable securities held as financial fixed assets, shares and other variable-yield securities, net of reversals 10. General administrative expenses a) staff costs b) other administrative expenses - 559 530 - 121 077 10 530129 - 9 027 424 335 154 305 743 - 188 617 23 149 - 3 103 - 75 097 3 533 - 680 607 - 20 113 - 132 721 22 595 0 - 2 586 0 - 25 591 0 54 727 - 2 640 85 197 20 141 - 22 278 - 19 419 0 A.1. A.1, A.2, B.1, B.4, B.5 A.4. B.S. D. E. G. I F A.2. A.4, B.1. 8.2.13.3.13.4,13.5. G. H C, H C, B.3 D G G E - 474 333 - 100 936 10 397 408 - 9 004 829 335 154 303 157 - 188 617 - 2 442 - 3 103 - 20 370 893 - 575 269 - 42 391 11. Depreciation and amortisation: property, furniture and equipment and intangible assets a) property, fumiture and equipment b) intangible assets - 12 448 - 7 665 - 34 726 - 7 665 12. Profit for the financial period Attributable to: Non-controlling Interests 1 202 747 37 866 1 199 591 18 447 Equity holders of the Bank 1 164 881 1 181 144 SEC report as at June 30, 2022 | 13
14 | SEC report as at June 30, 2022 Valuation and income recognition differences between IFRS and EU Accounting Directives A Financial assets and liabilities designated at fair value through profit or loss or carried at amortised cost (including hedge accounting) 1 Debt securities portfolio Under EU Accounting Directives, debt securities portfolios are recorded at purchase price and measured at amortised cost (with the exception of the Securities Liquidity Portfolio). Accrued interest is recorded under consolidated balance sheet item "Prepayments and accrued income". Accrued retrocessions and up-front fees are recorded under consolidated balance sheet item "Accruals and deferred income". Under IFRS, the Group applies hedge accounting for eligible hedged debt securities. The carrying amount of these securities is adjusted for the fair value attributable to the risk being hedged. Economically hedged debt securities that cannot be included in hedge accounting are designated irrevocably on initial recognition to the fair value option and are measured at fair value through profit or loss. Accrued interest less accrued retrocessions and unamortized up-front fees are reported on the consolidated balance sheet within the balance of the instrument to which it relates. Changes in fair values and hedge fair values of hedged debt securities are recognised in the consolidated income statement under "Result on financial operations". 2 Loans and advances Under EU Accounting Directives, all loans and advances are carried at amortised cost. Accrued interest is recorded under consolidated balance sheet items "Prepayments and accrued income" or "Accruals and deferred income". The up-front fees on loans are amortised and recognised in the consolidated profit and loss account under "Interest receivable and similar income". Under IFRS, the Group applies hedge accounting to eligible hedged loans. The carrying amount of these loans is adjusted for the fair value attributable to the risk being hedged. Economically hedged loans that cannot be included in hedge accounting are designated irrevocably on initial recognition to the fair value option and are measured at fair value through profit or loss. Changes in fair values and hedge fair values of loans are recognised in the consolidated income statement under "Result on financial operations". Accrued interest is reported on the consolidated balance sheet within the balance of the asset to which it relates. Accrued interest on loans and advances, which are credit impaired, are reversed under "Interest receivable and similar income". Under IFRS the up-front fees on loans: are recognised immediately under "Result on financial operations" in the consolidated income statement for the loans that are designated to the fair value option; are amortised over the maturity of the loan and recognised in consolidated balance sheet under "Loans and advances to credit institutions and customers" for the loans that are designated to hedge accounting and/or amortised cost. Under IFRS, a substantial contractual modification on the cash flows of a financial asset measured at amortised cost leads to the recording of the new financial asset at its fair value, and the recording of the net modification gain or loss impact in the consolidated income statement under "Result on financial operations". Transitory accounts on loans are reclassified from "Other liabilities" to the loan balance to which they relate.
SEC report as at June 30, 2022 | 15 3 Amounts owed to credit institutions and customers Under EU Accounting Directives, "Amounts owed to credit institutions" and "Amounts owed to customers" are presented in the consolidated balance sheet at their redemption amounts. Interest on amounts owed to credit institutions and customers is recorded in the consolidated profit and loss account on an accrual basis as "Interest payable and similar charges" or "Interest receivable and similar income" if interest is negative. Accrued interest is included in "Accruals and deferred income". Under IFRS, "Amounts owed to credit institutions" and "Amounts owed to customers" are initially recorded at cost and are presented in the consolidated balance sheet at amortised cost. Interest on amounts owed to credit institutions and customers is recorded in the consolidated income statement as "Interest expense and similar charges" or "Interest and similar income" using the effective interest method. Accrued interest is reported on the consolidated balance sheet within the balance of the instrument to which it relates. 4 Debts evidenced by certificates Under EU Accounting Directives, debts evidenced by certificates are recorded at amortised cost. Accrued interest is recorded under consolidated balance sheet item "Accruals and deferred income". Issuance fees and redemption premiums or discounts, which are recorded under "Prepayments and accrued income" or "Accruals and deferred income", are amortised on a straight- line basis and subsequently recognised in the consolidated profit and loss account under "Interest payable and similar charges". Under IFRS, the Group applies hedge accounting to a significant portion of its hedged issued debt whenever these are eligible. The carrying amount of these debts evidenced by certificates is adjusted for the fair value attributable to the risk being hedged. Economically hedged debts evidenced by certificates that cannot be included in hedge accounting are designated irrevocably on initial recognition to the fair value option and measured at fair value through profit or loss. Changes in fair values and hedge fair values of debts evidenced by certificates are recognised in the consolidated income statement under "Result on financial operations". Accrued interest is reported on the consolidated balance sheet within the balance of the debt instrument to which it relates. Issuance fees and redemption premiums or discounts are reported on the consolidated balance sheet within the caption of the instrument to which they relate and are amortised over the period to maturity of the related debts evidenced by certificates using the effective interest method, unless those debts evidenced by certificates are measured at fair value through profit or loss, in which case the issuance fees, premiums/discounts and redemption premiums are recognised immediately in the consolidated income statement under "Result on financial operations". For debts evidenced by certificates designated to the fair value option, own credit adjustment ("OCA"), reflecting own credit risk as per IFRS 13, is calculated and the respective changes are recorded in "Other comprehensive income" ("OCI") in the "Fair value reserve". Under IFRS, the Group has one transaction that meets the offsetting of financial assets and financial liabilities criteria. B Financial assets and liabilities classified mandatorily at fair value through profit or loss or designated at fair value through other comprehensive income 1 Debt securities portfolio Under EU Accounting Directives, debt securities portfolios, with the exception of the Securities Liquidity Portfolio, are recorded at purchase price and measured at amortised cost. Securities Liquidity Portfolio debt securities are carried at fair value. Changes in fair value are reflected directly in consolidated income statement under "Result on financial operations". Accrued interest is recorded under consolidated balance sheet items "Prepayments and accrued income" and "Accruals and deferred income".
16 | SEC report as at June 30, 2022 Under IFRS, some debt securities are not eligible for amortised cost and consequently must be carried at fair value with changes in fair value reflected directly in profit or loss. Changes in fair values of these debt securities are recognised in the consolidated income statement under "Result on financial operations". Accrued interest is reported on the consolidated balance sheet within the balance of the instrument to which they relate, while any related fees are recognised immediately under "Result on financial operations" in the consolidated income statement. 2 Shares and other variable-yield securities Under EU Accounting Directives, shares and other variable-yield securities are initially recorded at acquisition cost reduced by any reflow resulting from repayments. Their carrying value is subsequently adjusted to the lower of cost or market value at each balance sheet date. Respective value adjustments are recorded under "Result on financial operations". Under IFRS, shares and other variable-yield securities are carried at fair value with changes in fair value reflected directly in the consolidated income statement under "Result on financial operations", except of the investment in European Bank for Reconstruction and Development ("EBRD") whose fair value changes are reflected in OCI under "Fair value reserve". 3 Participating interests Under EU Accounting Directive, "Participating interests" are accounted for using the equity method as defined under EU-AD based on methods consistent with the Group’s accounting policies. Respective value adjustments are recorded under "Value (re-)adjustments in respect of transferable securities held as financial fixed assets and participating interests". Under IFRS, participating interests are included within "Shares and other variable-yield securities" and respective fair value adjustments are recorded in "Result on financial operations". 4 Loans and advances Under EU Accounting Directives, all loans and advances are carried at amortised cost. Accrued interest is recorded under consolidated balance sheet items "Prepayments and accrued income" or "Accruals and deferred income". The up-front fees on loans are amortised and recognised in the consolidated profit and loss account under "Interest receivable and similar income". Under IFRS, loans that are not eligible for amortised cost are classified as measured at fair value through profit or loss. The up-front fees on these loans are recognised at inception under "Result on financial operations" in the consolidated income statement. Changes in fair values of loans are recognised in the consolidated income statement under "Result on financial operations". 5 Derivative assets and liabilities a Treasury derivatives Under EU Accounting Directives, derivative instruments in the Security liquidity portfolios are marked to market and recorded under "Other assets" or "Other liabilities". Interest accrued under derivative instruments is presented under "Prepayments and accrued income" or "Accruals and deferred income". Under IFRS, all derivative assets and derivative liabilities are recognised on the consolidated balance sheet and measured at fair value through profit or loss. Accrued interest is reported on the consolidated balance sheet within the balance of the instrument to which it relates. Credit valuation adjustment ("CVA"), Debit valuation adjustment ("DVA") and Collateral Value adjustment ("CollVA") are included in the fair valuation of derivatives. Changes in fair value of derivatives are recognised in the consolidated income statement under "Result on financial operations".
SEC report as at June 30, 2022 | 17 b Derivatives and hedging activities Under EU Accounting Directives, hedging derivative instruments are not recognised on balance sheet. They are reported off balance sheet at nominal amount. Interest accrued under derivative instruments is presented under "Prepayments and accrued income" or "Accruals and deferred income". Up-front fees, redemption premiums or premiums/discounts are amortised over the period to maturity of the related derivatives under "Interest payable and similar charges". Under IFRS, all derivative assets and derivative liabilities are recognised on balance sheet and measured at fair value through profit or loss. Accrued interest is reported on the consolidated balance sheet within the balance of the instrument to which it relates. CVA, DVA and CollVA are included in the fair valuation of derivatives. Changes in fair value of derivatives are recognised in the consolidated income statement under "Result on financial operations". The amortisation of premiums and discounts of FX swaps and FX forwards are recorded under "Result on financial operations". For derivatives used in hedge accounting, the gain or loss of the designated part of the hedging instrument is recognised in the consolidated income statement. In addition, the Group separates the fair value of the foreign currency basis spread ("CBS") from the hedging instruments and applies a dedicated accounting treatment. The initial CBS amount, measured at the date of designation, is recorded under OCI and is amortised linearly over the residual lifetime of the hedge in the consolidated income statement. Subsequent changes in the fair value of the CBS are recognised directly in OCI. For derivatives used in hedge accounting, up-front fees or redemption premiums are amortised over the period to maturity of the related derivative using the effective interest method, unless these derivatives are not designated to hedge accounting, in which case they are recognised immediately under "Result on financial operations". Under IFRS, the Group has two transactions that meet the offsetting of financial assets and financial liabilities criteria. 6 Assets held for sale Under EU Accounting Directives, assets held for sale are presented and measured in line with the nature of the underlying asset. Under IFRS, the Group presented as assets held for sale those financial assets, which are subject to secondary sales. These financial assets continue to be measured in accordance with IFRS 9 and the Group’s accounting policies. They are classified as held for sale if their carrying amount will be recovered principally through a sale transaction rather than through continuing use. C Impairment of financial assets measured at amortised cost and loan commitments Under EU Accounting Directives, value adjustments on loans and advances are recorded where: (i) there is a risk of non-recovery of all or part of their amounts, or (ii) to capture loans in the portfolio which are impaired but have not yet been identified as such or for losses which have been incurred but not yet reported. These value adjustments are accounted for in the consolidated profit and loss account as "Value (re-)adjustments in respect of loans and advances and provisions for contingent liabilities" and are deducted from the appropriate asset items on the consolidated balance sheet. Value adjustments for debt securities are recorded, if these are other than temporary, or to capture debt securities which are impaired but have not yet been identified as such or for losses which have been incurred but not yet reported. These value adjustments are accounted for in the consolidated profit and loss account under "Value (re-)adjustments in respect of transferable securities held as financial fixed assets and participating interests" and are deducted from the appropriate asset items on the consolidated balance sheet.
18 | SEC report as at June 30, 2022 Under IFRS, the Group is required to recognise a loss allowance for all loans and debt securities measured at amortised cost as well as for off-balance sheet loan commitments. This allowance is based on either lifetime Expected Credit Loss ("ECL"), if there has been a significant increase in credit risk since initial recognition or the instrument is considered as being credit-impaired, or otherwise on 12-months ECL. Depending on the nature of the financial instrument, the ECL allowances are deducted from the appropriate asset items on the consolidated balance sheet. For off-balance sheet items, a provision for credit loss is reported under "Provisions b) provisions for guarantees issued and commitments". Changes in the ECL allowances are recorded in the consolidated income statement either under: "Change in impairment on loans and advances and provisions for guarantees, net of reversals" for loans and loan commitments or; "Change in impairment on transferable securities held as financial fixed assets, shares and other variable - yield securities, net of reversals" for debt securities. D Pension funds Under EU Accounting Directives, the 10% corridor approach is adopted, whereby cumulative current year actuarial gains or losses in excess of 10% of the commitments for retirement benefits are recognised over a period of 7 years on a straight-line basis in "General administrative expenses a) staff costs". Under IFRS, the Group applies IAS 19 revised for determining the income or expense related to its post-employment defined benefit plans. Cumulative actuarial surpluses and deficits are recognised in full in OCI under "Additional reserves". Adjustments to staff costs are recognised under "General administrative expenses a) staff costs" and adjustments to interest cost under "Interest expense and similar charges". E Non-controlling interests adjustment The Bank and the European Investment Fund (the "EIF") together are defined as the Group. The Bank granted a put option to the minority shareholders, other than EC, on their entire holding of its subsidiary, the EIF. Under EU Accounting Directives, the non-controlling interests are recorded separately in the consolidated balance sheet under "Equity attributable to minority interest" while the put option is recorded in the consolidated off-balance sheet of the Group. Under IFRS, the non-controlling interests are reclassified and a corresponding financial liability in the amount of the fair value of the option’s exercise price is recognised under "Other liabilities" and attributed to owners of the parent. Subsequently, this financial liability is measured in accordance with IFRS 9, i.e. any changes in the fair value of the financial liability subsequent to the acquisition date are recognised in the consolidated income statement under "Interest expense and similar charge". Any excess or deficit of non-controlling interests over the agreed price is reversed to "consolidated reserves". F Fee and commission income The Group recognises under EU Accounting Directives and IFRS fee and commission income from revenues that are satisfied over time on an accrual basis over the service period. Fee and commission income earned from providing or fulfilling point-in-time services (e.g. performance-linked) is recognised when the service has been completed. For certain mandates, the Group has established a deferred income policy in order to address the misalignment between the receipt of income and the services/cost incurred by the Group during the lifetime of the respective mandate. Corresponding adjustments are recorded in the consolidated balance sheet under "Deferred income" and released against "Fee and commission income".
SEC report as at June 30, 2022 | 19 Under EU Accounting Directives, this deferral mechanism is only applied prospectively over time, i.e. recognising deferred revenue of the financial year, while under IFRS, the Group used the modified retrospective approach, i.e. recognising the cumulative impact at transition to IFRS 15 in equity. This resulted in a different stock of deferred income and corresponding amounts of revenue to be recorded over the individual years. G Leases Under EU Accounting Directives, the rental charges are recorded under "General administrative expenses b) other administrative expenses". In accordance with IFRS 16, the Group assesses whether a contract is a lease or not. In the case of lease, the Group recognises a right-of-use asset and a lease liability, except for those that are covered by the recognition exemptions (short-term leased assets and low value leased assets based on their original value, when new). The above-mentioned right-of-use assets are recognised under "Property, furniture and equipment" and corresponding lease liability is recognised under "Other liabilities". Subsequently, the Group carries the right-of-use asset applying a cost model, depreciating the right-of-use asset from the commencement date to the end of the lease agreements and assessing for any impairment, on an annual basis. The depreciation for the right-of-use assets is recorded under "Depreciation and amortisation: property, furniture and equipment and intangible assets a) property, furniture and equipment". The lease liability carrying amount is adjusted to reflect the lease payments made and interest from unwind of lease liability, with further re-measurements to reflect any reassessment or lease modifications. The interest from unwind of lease liability is recorded in the consolidated income statement under "Interest expense and similar charges". The revaluation result is recorded in the consolidated income statement under "Result on financial operations". H Financial Guarantee Contracts Under EU Accounting Directives, net liabilities from financial guarantees are presented in the consolidated balance sheet under "Provisions b) provision in respect of guarantee operations". Unrealised gains representing the excess of the net present value of expected future premium inflows over the amount of the excepted payment obligations remain unrecognised. Any increase or decrease in the net liability is recognised in the consolidated profit and loss account under "Value (re-)adjustments in respect of loans and advances and provisions for contingent liabilities". Under IFRS, net unrealised gains from financial guarantees are recorded in the consolidated balance sheet under "Other assets" in case the measurement of a financial guarantee contract results in a net asset position. In case the measurement of a financial guarantee contract results in a net liability position, contracts for which the amortised initial NPV is higher than the 12- months ECL or lifetime ECL are presented under "Other liabilities". Guarantee contracts that are credit-impaired and for which a loss allowance based on lifetime ECL is recognised, are presented under "Provisions for guarantees issued and commitments". Any increase or decrease in the "Other assets" or "Other liabilities" relating to financial guarantees is recognised in the consolidated income statement under "Result on financial operations". Any increase or decrease in the "Provisions for guarantees issued and commitments" relating to financial guarantees other than the settlement of guarantee calls is recognised in the consolidated income statement under "Change in impairment on loans and advances and provisions for guarantees, net of reversals". I Subscribed capital and reserves, called but not paid Under EU Accounting Directives, the caption "Subscribed capital and reserves, called but not paid" contains the future payments from Poland and Romania following their capital increase on March 1, 2020. Under IFRS, these future payments are discounted using a discounted cash flow method. The discounting impact was initially reported under "Interest and similar income" and its amortisation is under "Interest expense and similar charges".
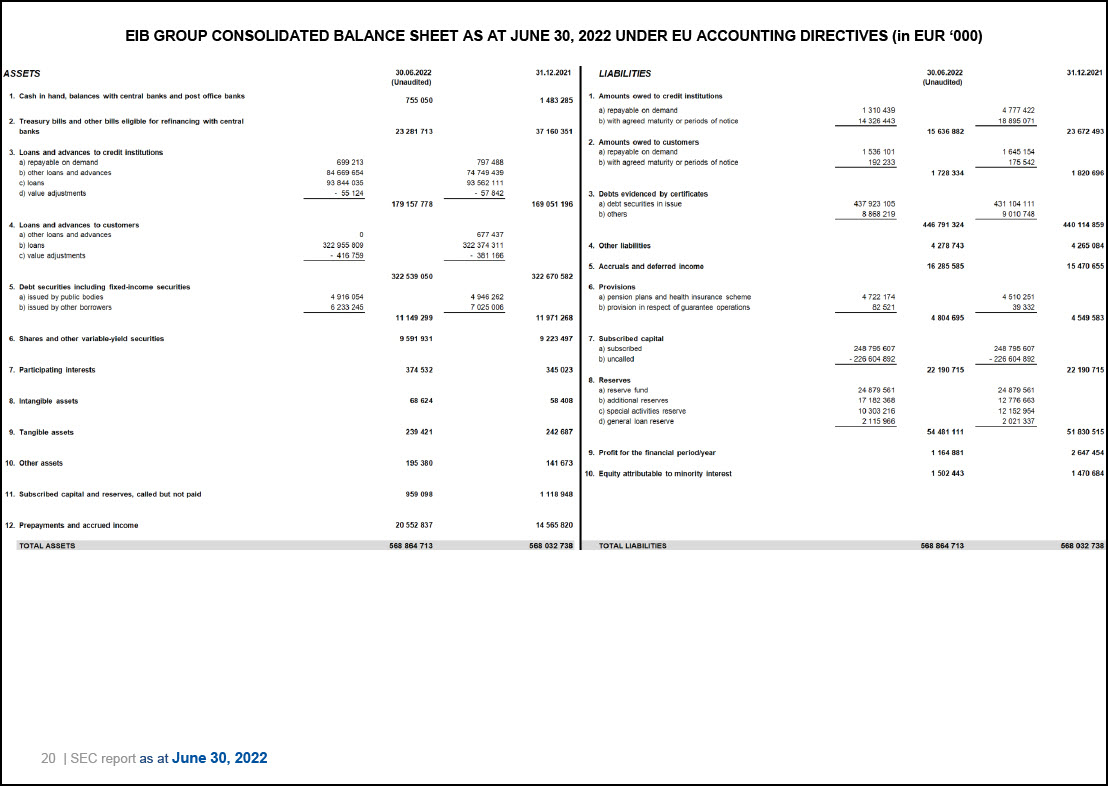
20 | SEC report as at June 30, 2022 EIB GROUP CONSOLIDATED BALANCE SHEET AS AT JUNE 30, 2022 UNDER EU ACCOUNTING DIRECTIVES (in EUR ‘000) ASSETS 1. Cash in hand, balances with central banks and post office banks 30.06.2022 (Unaudited) 755 050 31.12.2021 1 483 285 LIABILITIES 1. Amounts owed to credit institutions 30.06.2022 (Unaudited) 31.12.2021 a) repayable on demand 1 310 439 4 777 422 2. Treasury bills and other bills eligible for refinancing with central b) with agreed maturity or periods of notice 14 326 443 18 895 071 banks 23 281 713 37 160 351 15 636 882 23 672 493 2. Amounts owed to customers 3. Loans and advances to credit institutions a) repayable on demand 1 536 101 1 645 154 a) repayable on demand 699 213 797 488 b) with agreed maturity or periods of notice i 92 233 175 542 b) other loans and advances 84 669 654 74 749 439 1 728 334 1 820 696 c) loans 93 844 035 93 562 111 d) value adjustments - 55 124 - 57 842 3. Debts evidenced by certificates 179 157 778 169 051 196 a) debt securities in issue 437 923 105 431 104 111 b) others 8 868 219 9 010 748 4. Loans and advances to customers 446 791 324 440 114 859 a) other loans and advances 0 677 437 b) loans 322 955 809 322 374 311 4. Other liabilities 4 278 743 4 265 084 c) value adjustments - 416 759 - 381 166 5. Accruals and deferred income 16 285 585 15 470 655 322 539 050 322 670 582 5. Debt securities including fixed-Income securities 6. Provisions a) issued by public bodies 4 916 054 4 946 262 a) pension plans and health insurance scheme 4 722 174 4 510 251 b) issued by other borrowers 6 233 245 7 025 006 b) provision in respect of guarantee operations 82 521 39 332 11 149 299 11 971 268 4 804 695 4 549 583 6. Shares and other variable-yield securities 9 591 931 9 223 497 7. Subscribed capital a) subscribed 248 795 607 248 795 607 b) uncalled - 226 604 892 - 226 604 892 7. Participating interests 374 532 345 023 22 190 715 22 190 715 8. Reserves a) reserve fund 24 879 561 24 879 561 8. Intangible assets 68 624 58 408 b) additional reserves 17 182 368 12 776 663 c) special activities reserve 10 303 216 12 152 954 d) general loan reserve 2 115 966 2 021 337 9. Tangible assets 239 421 242 687 54 481 111 51 830 515 9. Profit for the financial period/year 1 164 881 2 647 454 10. Other assets 195 380 141 673 10. Equity attributable to minority interest 1 502 443 1 470 684 11. Subscribed capital and reserves, called but not paid 959 098 1 118 948 12. Prepayments and accrued Income 20 552 837 14 565 820 TOTAL ASSETS 568 864 713 568 032 738 TOTAL LIABILITIES 568 864 713 568 032 738
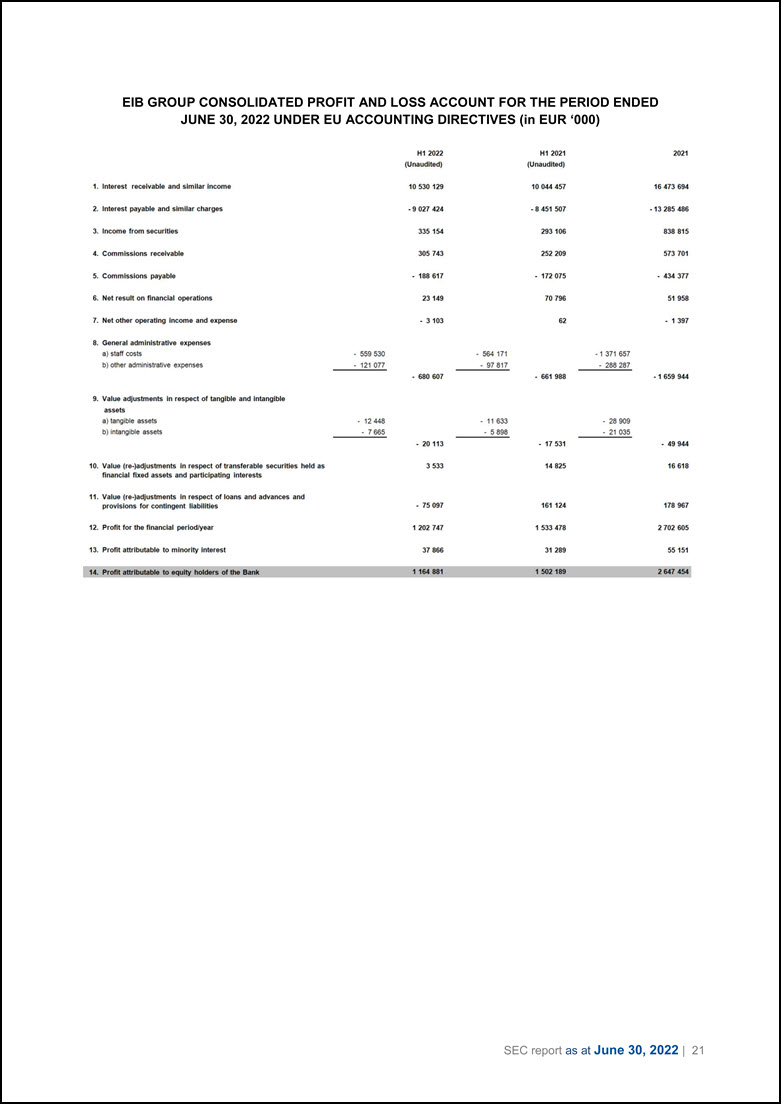
SEC report as at June 30, 2022 | 21 EIB GROUP CONSOLIDATED PROFIT AND LOSS ACCOUNT FOR THE PERIOD ENDED JUNE 30, 2022 UNDER EU ACCOUNTING DIRECTIVES (in EUR ‘000) H1 2022 (Unaudited) H1 2021 (Unaudited) 2021 1. Interest receivable and similar income 10 530 129 10 044 457 16 473 694 2. Interest payable and similar charges - 9 027 424 - 8 451 507 -13 285 486 3. Income from securities 335 154 293 106 838 815 4. Commissions receivable 305 743 252 209 573 701 5. Commissions payable - 188 617 - 172 075 - 434 377 6. Net result on financial operations 23 149 70 796 51 958 7. Net other operating income and expense - 3 103 62 - 1 397 8. General administrative expenses a) staff costs - 559 530 - 564 171 -1 371 657 b) other administrative expenses - 121 077 - 97 817 - 288 287 - 680 607 - 661 988 - 1 659 944 9. Value adjustments in respect of tangible and intangible assets a) tangible assets - 12 448 - 11 633 - 28 909 b) intangible assets - 7 665 - 5 898 - 21 035 - 20 113 - 17 531 - 49 944 10. Value (re-)adjustments in respect of transferable securities held as 3 533 14 825 16 618 financial fixed assets and participating interests 11. Value (re-)adjustments in respect of loans and advances and provisions for contingent liabilities - 75 097 161 124 178 967 12. Profit for the financial period/year 1 202 747 1 533 478 2 702 605 13. Profit attributable to minority interest 37 866 31 289 55 151 14. Profit attributable to equity holders of the Bank 1 164 881 1 502 189 2 647 454
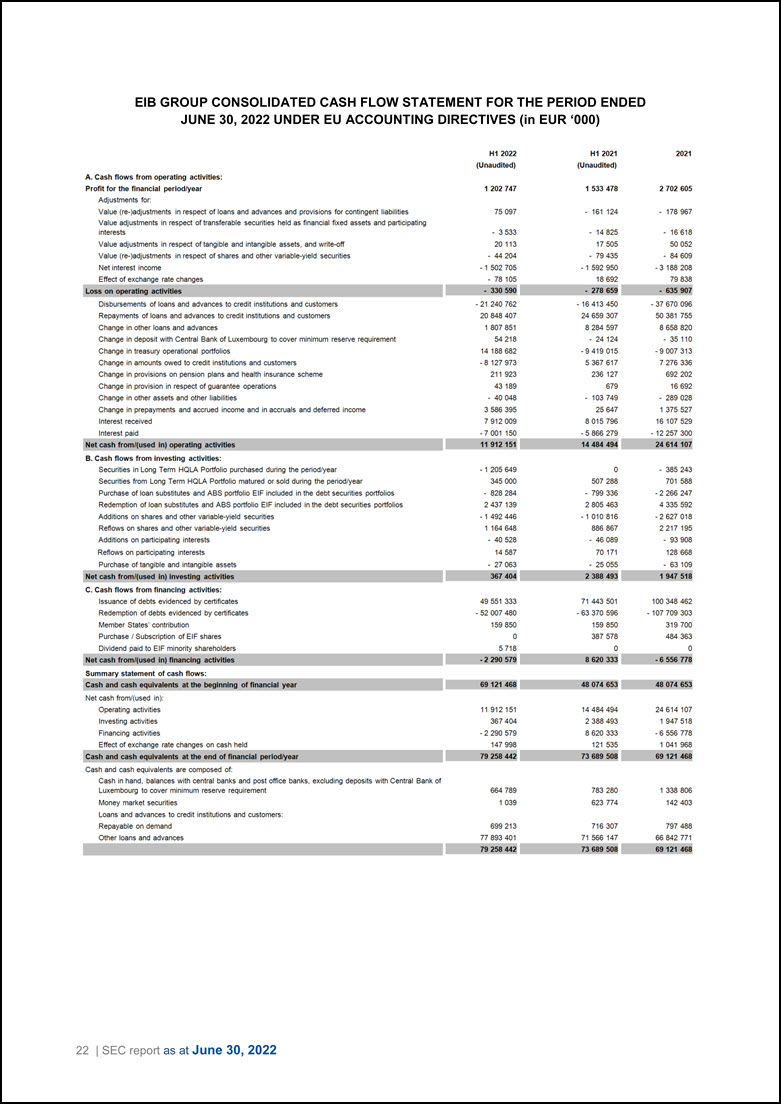
22 | SEC report as at June 30, 2022 EIB GROUP CONSOLIDATED CASH FLOW STATEMENT FOR THE PERIOD ENDED JUNE 30, 2022 UNDER EU ACCOUNTING DIRECTIVES (in EUR ‘000) A. Cash flows from operating activities: H1 2022 (Unaudited) H1 2021 (Unaudited) 2021 Profit for the financial period/year 1 202 747 1 533 478 2 702 605 Adjustments for: Value (re-)adjustments in respect of loans and advances and provisions for contingent liabilities 75 097 - 161 124 - 178 967 Value adjustments in respect of transferable securities held as financial fixed assets and participating interests - 3 533 - 14 825 - 16 618 Value adjustments in respect of tangible and intangible assets, and write-off 20 113 17 505 50 052 Value (re-)adjustments in respect of shares and other variable-yield securities - 44 204 - 79 435 - 84 609 Net interest income - 1 502 705 - 1 592 950 - 3 188 208 Effect of exchange rate changes - 78 105 18 692 79 838 Loss on operating activities - 330 590 - 278 659 - 635 907 Disbursements of loans and advances to credit institutions and customers - 21 240 762 - 16 413 450 - 37 670 096 Repayments of loans and advances to credit institutions and customers 20 848 407 24 659 307 50 381 755 Change in other loans and advances 1 807 851 8 284 597 8 658 820 Change in deposit with Central Bank of Luxembourg to cover minimum reserve requirement 54 218 - 24 124 - 35 110 Change in treasury operational portfolios 14 188 682 - 9 419 015 - 9 007 313 Change in amounts owed to credit institutions and customers - 8 127 973 5 367 617 7 276 336 Change in provisions on pension plans and health insurance scheme 211 923 236 127 692 202 Change in provision in respect of guarantee operations 43 189 679 16 692 Change in other assets and other liabilities - 40 048 - 103 749 - 289 028 Change in prepayments and accrued income and in accruals and deferred income 3 586 395 25 647 1 375 527 Interest received 7 912 009 8 015 796 16 107 529 Interest paid - 7 001 150 - 5 866 279 - 12 257 300 Net cash froml(used in) operating activities 11 912 151 14 484 494 24 614 107 B. Cash flows from investing activities: Securities in Long Term HQLA Portfolio purchased during the period/year - 1 205 649 0 - 385 243 Securities from Long Term HQLA Portfolio matured or sold during the period/year 345 000 507 288 701 588 Purchase of loan substitutes and ABS portfolio EIF included in the debt securities portfolios - 828 284 - 799 336 - 2 266 247 Redemption of loan substitutes and ABS portfolio EIF included in the debt securities portfolios 2 437 139 2 805 463 4 335 592 Additions on shares and other variable-yield securities - 1 492 446 - 1 010 816 - 2 627 018 Reflows on shares and other variable-yield securities 1 164 648 886 867 2 217 195 Additions on participating interests - 40 528 - 46 089 - 93 908 Reflows on participating interests 14 587 70 171 128 668 Purchase of tangible and intangible assets - 27 063 - 25 055 - 63 109 Net cash froml(used in) investing activities WIC 367 404 2 388 493 1 947 518 C. Cash flows from financing activities: Issuance of debts evidenced by certificates 49 551 333 71 443 501 100 348 462 Redemption of debts evidenced by certificates 52 007 480 - 63 370 596 - 107 709 303 Member States' contribution 159 850 159 850 319 700 Purchase / Subscription of EIF shares 0 387 578 484 363 Dividend paid to EIF minority shareholders 5 718 0 0 Net cash from/(used in) financing activities il Pr -2 290 579 8 620 333 6 556 778 Summary statement of cash flows: Cash and cash equivalents at the beginning of financial year 69 121 468 48 074 653 48 074 653 Net cash from/(used in): Operating activities 11 912 151 14 484 494 24 614 107 Investing activities 367 404 2 388 493 1 947 518 Financing activities - 2 290 579 8 620 333 - 6 556 778 Effect of exchange rate changes on cash held 147 998 121 535 1 041 968 Cash and cash equivalents at the end of financial period/year NM 79 258 442 73 689 508 69 121 468 Cash and cash equivalents are composed of: Cash in hand, balances with central banks and post office banks, excluding deposits with Central Bank of Luxembourg to cover minimum reserve requirement 664 789 783 280 1 338 806 Money market securities 1 039 623 774 142 403 Loans and advances to credit institutions and customers: Repayable on demand 699 213 716 307 797 488 Other loans and advances 77 893 401 71 566 147 66 842 771 79 258 442 73 689 508 69 121 468
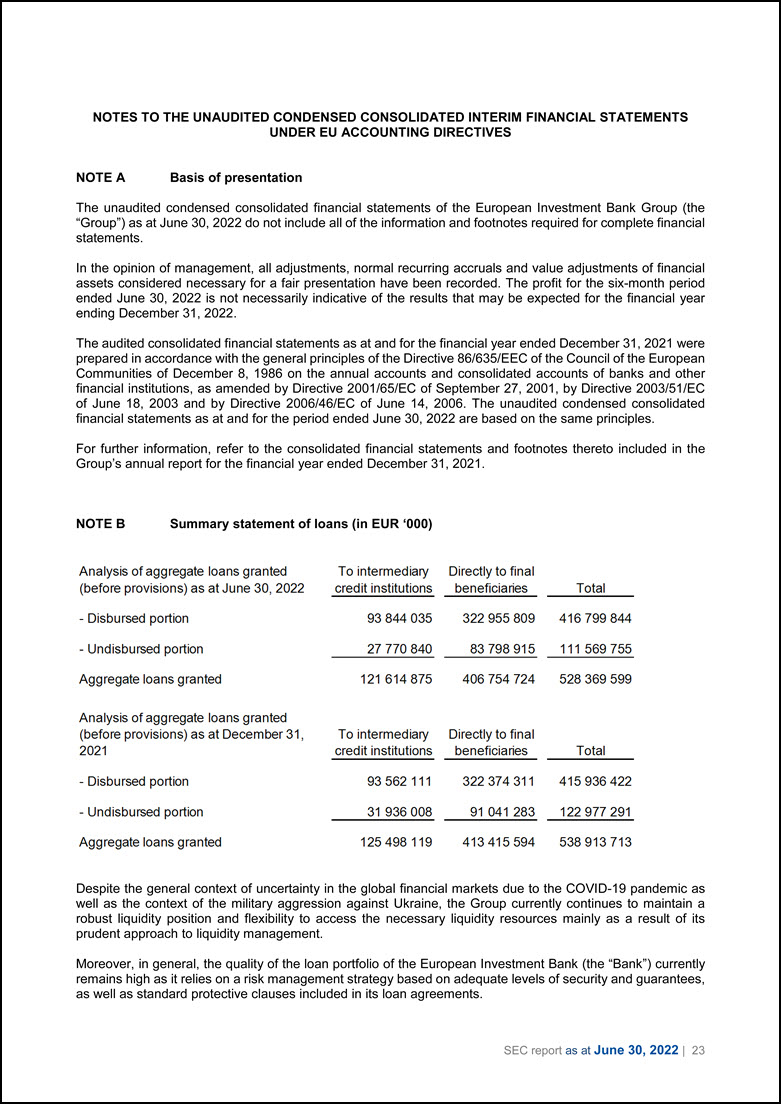
SEC report as at June 30, 2022 | 23 NOTES TO THE UNAUDITED CONDENSED CONSOLIDATED INTERIM FINANCIAL STATEMENTS UNDER EU ACCOUNTING DIRECTIVES NOTE A Basis of presentation The unaudited condensed consolidated financial statements of the European Investment Bank Group (the “Group”) as at June 30, 2022 do not include all of the information and footnotes required for complete financial statements. In the opinion of management, all adjustments, normal recurring accruals and value adjustments of financial assets considered necessary for a fair presentation have been recorded. The profit for the six-month period ended June 30, 2022 is not necessarily indicative of the results that may be expected for the financial year ending December 31, 2022. The audited consolidated financial statements as at and for the financial year ended December 31, 2021 were prepared in accordance with the general principles of the Directive 86/635/EEC of the Council of the European Communities of December 8, 1986 on the annual accounts and consolidated accounts of banks and other financial institutions, as amended by Directive 2001/65/EC of September 27, 2001, by Directive 2003/51/EC of June 18, 2003 and by Directive 2006/46/EC of June 14, 2006. The unaudited condensed consolidated financial statements as at and for the period ended June 30, 2022 are based on the same principles. For further information, refer to the consolidated financial statements and footnotes thereto included in the Group’s annual report for the financial year ended December 31, 2021. Analysis of aggregate loans granted (before provisions) as at June 30, 2022 To intermediary credit institutions Directly to final beneficiaries Total - Disbursed portion 93 844 035 322 955 809 416 799 844 - Undisbursed portion 27 770 840 83 798 915 111 569 755 Aggregate loans granted 121 614 875 406 754 724 528 369 599 Analysis of aggregate loans granted (before provisions) as at December 31 , To intermediary Directly to final 2021 cred it institutions beneficiaries Total - Disbursed portion 93 562 111 322 374 311 415 936 422 - Undisbursed portion 31 936 008 91 041 283 122 977 291 Aggregate loans granted 125 498 119 413 415 594 538 913 713 NOTE B Summary statement of loans (in EUR ‘000) Despite the general context of uncertainty in the global financial markets due to the COVID-19 pandemic as well as the context of the military aggression against Ukraine, the Group currently continues to maintain a robust liquidity position and flexibility to access the necessary liquidity resources mainly as a result of its prudent approach to liquidity management. Moreover, in general, the quality of the loan portfolio of the European Investment Bank (the “Bank”) currently remains high as it relies on a risk management strategy based on adequate levels of security and guarantees, as well as standard protective clauses included in its loan agreements.
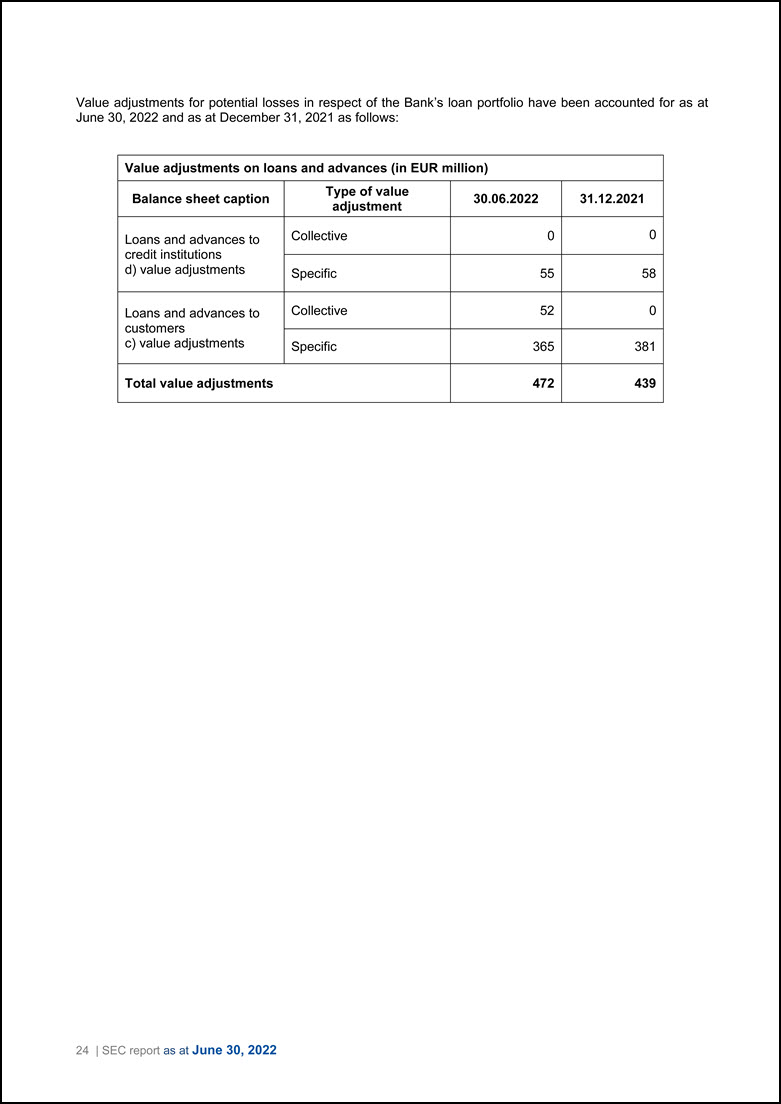
24 | SEC report as at June 30, 2022 Value adjustments for potential losses in respect of the Bank’s loan portfolio have been accounted for as at June 30, 2022 and as at December 31, 2021 as follows: Value adjustments on loans and advances (in EUR million) Balance sheet caption Type of value adjustment 30.06.2022 31.12.2021 Loans and advances to credit institutions d) value adjustments Collective 0 0 Specific 55 58 Loans and advances to customers c) value adjustments Collective 52 0 Specific 365 381 Total value adjustments 472 439
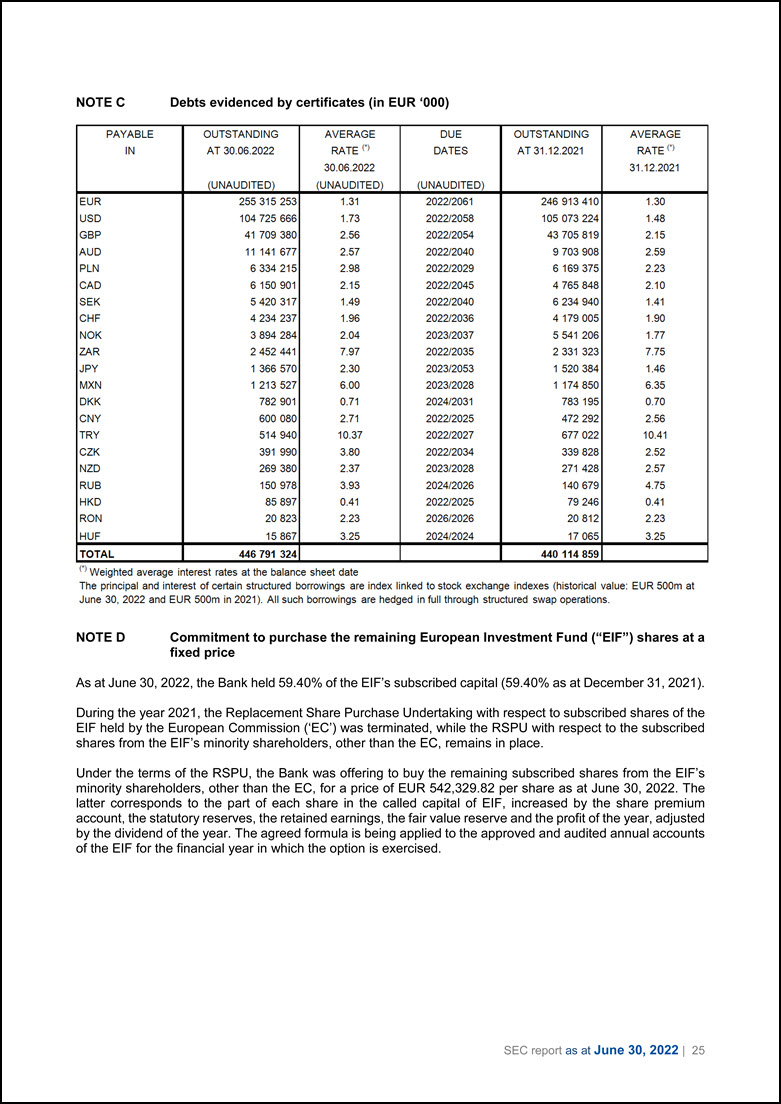
SEC report as at June 30, 2022 | 25 NOTE C Debts evidenced by certificates (in EUR ‘000) PAYABLE OUTSTANDING AVERAGE DUE OUTSTANDING AVERAGE IN AT 30.06.2022 RATE (•> DATES AT 31 .12.2021 RATE (•>30.06.2022 31 .12.2021 (UNAUDITED) (UNAUDITED) (UNAUDITED) EUR 255 315 253 1.31 2022/2061 246 913 410 1.30 USO 104 725 666 1.73 2022/2058 105 073 224 1.48 GBP 41 709 380 2.56 2022/2054 43 705 819 2.15 AUD 11 141 677 2.57 2022/2040 9 703 908 2.59 PLN 6 334 215 2.98 2022/2029 6 169 375 2.23 CAD 6 150 901 2.15 2022/2045 4 765 848 2.10 SEK 5 420 317 1.49 2022/2040 6 234 940 1.41 CHF 4 234 237 1.96 2022/2036 4 179 005 1.90 NOK 3 894 284 2.04 2023/2037 5 541 206 1.77 ZAR 2 452 441 7.97 2022/2035 2 331 323 7.75 JPY 1 366 570 2.30 2023/2053 1 520 384 1.46 MXN 1 213 527 6.00 2023/2028 1 174 850 6.35 DKK 782 901 0.71 2024/2031 783 195 0.70 CNY 600 080 2.71 2022/2025 472 292 2.56 TRY 514 940 10.37 2022/2027 677 022 10.41 CZK 391 990 3.80 2022/2034 339 828 2.52 NZD 269 380 2.37 2023/2028 271 428 2.57 RUB 150 978 3.93 2024/2026 140 679 4.75 HKD 85 897 0.41 2022/2025 79 246 0.41 RON 20 823 2.23 2026/2026 20 812 2.23 HUF 15 867 3.25 2024/2024 17 065 3.25 TOTAL 446 791 324 440 114 859 (•> Weighted average interest rates at the balance sheet date The principal and interest of certain structured borrowings are index linked to stock exchange indexes (historical value: EUR 500m at June 30, 2022 and EUR 500m in 2021 ). All such borrowings are hedged in full through structured swap operations. NOTE D Commitment to purchase the remaining European Investment Fund (“EIF”) shares at a fixed price As at June 30, 2022, the Bank held 59.40% of the EIF’s subscribed capital (59.40% as at December 31, 2021). During the year 2021, the Replacement Share Purchase Undertaking with respect to subscribed shares of the EIF held by the European Commission (‘EC’) was terminated, while the RSPU with respect to the subscribed shares from the EIF’s minority shareholders, other than the EC, remains in place. Under the terms of the RSPU, the Bank was offering to buy the remaining subscribed shares from the EIF’s minority shareholders, other than the EC, for a price of EUR 542,329.82 per share as at June 30, 2022. The latter corresponds to the part of each share in the called capital of EIF, increased by the share premium account, the statutory reserves, the retained earnings, the fair value reserve and the profit of the year, adjusted by the dividend of the year. The agreed formula is being applied to the approved and audited annual accounts of the EIF for the financial year in which the option is exercised.
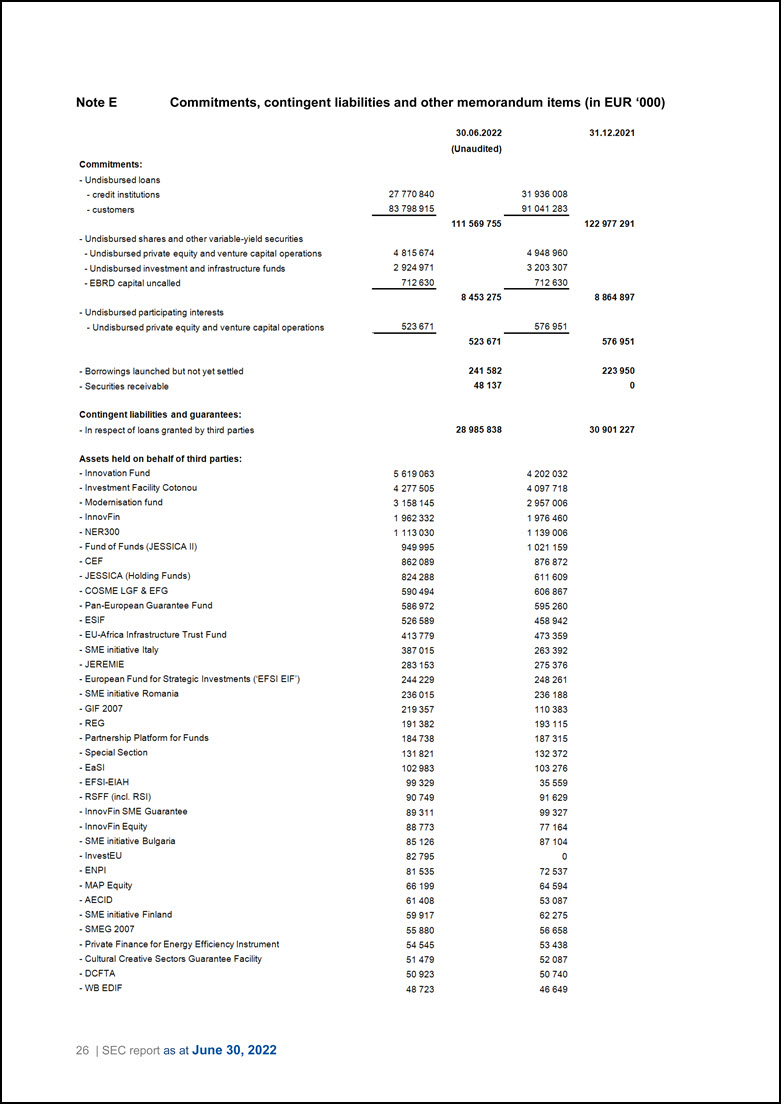
26 | SEC report as at June 30, 2022 Note E Commitments, contingent liabilities and other memorandum items (in EUR ‘000) Commitments: - Undisbursed loans 30.06.2022 (Unaudited) 31.12.2021 - credit institutions 27 770 840 31 936 008 - customers 83 798 915 91 041 283 111 569 755 122 977 291 - Undisbursed shares and other variable-yield securities - Undisbursed private equity and venture capital operations 4 815 674 4 948 960 - Undisbursed investment and infrastructure funds 2 924 971 3 203 307 - EBRD capital uncalled 712 630 712 630 8 453 275 8 864 897 - Undisbursed participating interests - Undisbursed private equity and venture capital operations 523 671 576 951 523 671 576 951 - Borrowings launched but not yet settled 241 582 223 950 - Securities receivable 48 137 0 Contingent liabilities and guarantees: - In respect of loans granted by third parties 28 985 838 30 901 227 Assets held on behalf of third parties: - Innovation Fund 5 619 063 4 202 032 - Investment Facility Cotonou 4 277 505 4 097 718 - Modernisation fund 3 158 145 2 957 006 - InnovFin 1 962 332 1 976 460 - NER300 1 113 030 1 139 006 - Fund of Funds (JESSICA II) 949 995 1 021 159 - CEF 862 089 876 872 - JESSICA (Holding Funds) 824 288 611 609 - COSME LGF & EFG 590 494 606 867 - Pan-European Guarantee Fund 586 972 595 260 - ESIF 526 589 458 942 - EU-Africa Infrastructure Trust Fund 413 779 473 359 - SME initiative Italy 387 015 263 392 - JEREMIE 283 153 275 376 - European Fund for Strategic Investments (`EFSI EIF') 244 229 248 261 - SME initiative Romania 236 015 236 188 - GIF 2007 219 357 110 383 - REG 191 382 193 115 - Partnership Platform for Funds 184 738 187 315 - Special Section 131 821 132 372 - EaSI 102 983 103 276 - EFSI-EIAH 99 329 35 559 - RSFF (incl. RSI) 90 749 91 629 - InnovFin SME Guarantee 89 311 99 327 - InnovFin Equity 88 773 77 164 - SME initiative Bulgaria 85 126 87 104 - InvestEU 82 795 0 - ENPI 81 535 72 537 - MAP Equity 66 199 64 594 -AECID 61 408 53 087 - SME initiative Finland 59 917 62 275 - SMEG 2007 55 880 56 658 - Private Finance for Energy Efficiency Instrument 54 545 53 438 - Cultural Creative Sectors Guarantee Facility 51 479 52 087 - DCFTA 50 923 50 740 -WB EDIF 48 723 46 649
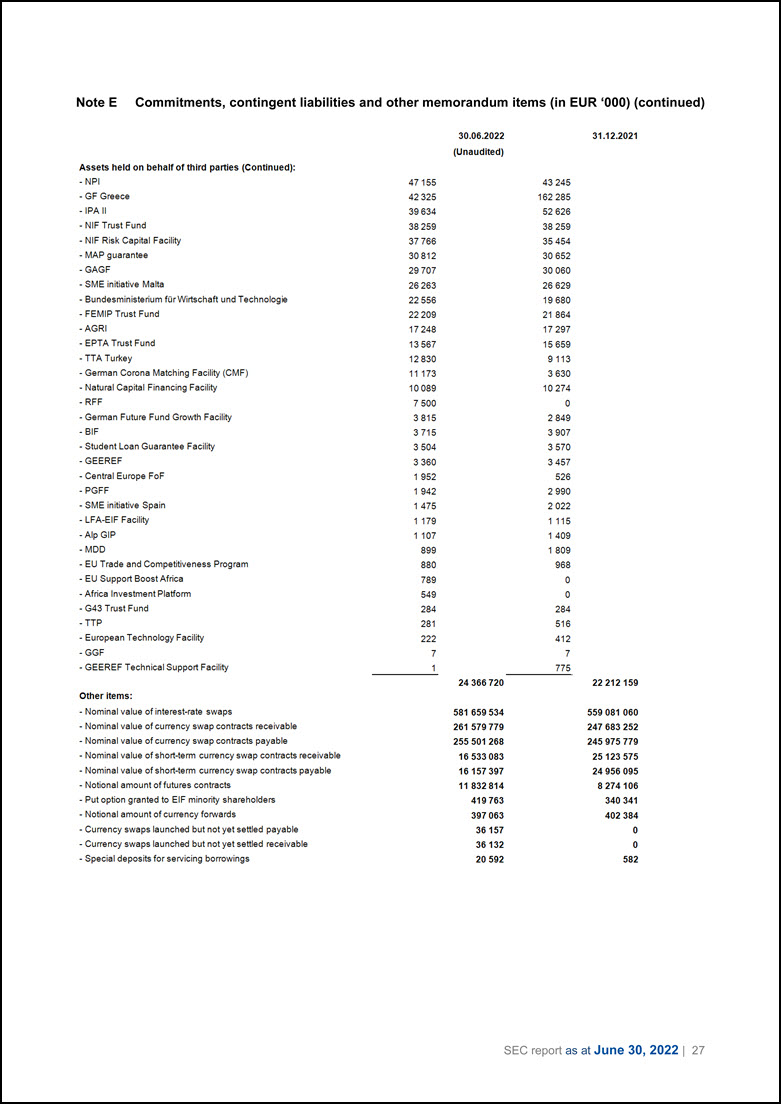
SEC report as at June 30, 2022 | 27 Note E Commitments, contingent liabilities and other memorandum items (in EUR ‘000) (continued) Assets held on behalf of third parties (Continued): 30.06.2022 (Unaudited) 31.12.2021 - NPI 47 155 43 245 - GF Greece 42 325 162 285 -IPA II 39 634 52 626 -NIF Trust Fund 38 259 38 259 - NIF Risk Capital Facility 37 766 35 454 - MAP guarantee 30 812 30 652 - GAGF 29 707 30 060 - SME initiative Malta 26 263 26 629 - Bundesministerium fur Wirtschaft and Technologie 22 556 19 680 - FEMIP Trust Fund 22 209 21 864 - AGRI 17 248 17 297 - EPTA Trust Fund 13 567 15 659 - TTA Turkey 12 830 9 113 - German Corona Matching Facility (CMF) 11 173 3 630 - Natural Capital Financing Facility 10 089 10 274 RFF 7 500 0 - German Future Fund Growth Facility 3 815 2 849 BIF 3 715 3 907 - Student Loan Guarantee Facility 3 504 3 570 - GEEREF 3 360 3 457 - Central Europe FoF 1 952 526 - PGFF 1 942 2 990 - SME initiative Spain 1 475 2 022 - LFA-EIF Facility 1 179 1 115 -Alp GIP 1 107 1 409 - MDD 899 1 809 - EU Trade and Competitiveness Program 880 968 - EU Support Boost Africa 789 0 - Africa Investment Platform 549 0 - G43 Trust Fund 284 284 - TTP 281 516 - European Technology Facility 222 412 - GGF 7 7 - GEEREF Technical Support Facility 1 775 24 366 720 22 212 159 Other items: - Nominal value of interest-rate swaps 581 659 534 559 081 060 - Nominal value of currency swap contracts receivable 261 579 779 247 683 252 - Nominal value of currency swap contracts payable 255 501 268 245 975 779 - Nominal value of short-term currency swap contracts receivable 16 533 083 25 123 575 - Nominal value of short-term currency swap contracts payable 16 157 397 24 956 095 - Notional amount of futures contracts 11 832 814 8 274 106 - Put option granted to EIF minority shareholders 419 763 340 341 - Notional amount of currency forwards 397 063 402 384 - Currency swaps launched but not yet settled payable 36 157 0 - Currency swaps launched but not yet settled receivable 36 132 0 - Special deposits for servicing borrowings 20 592 582
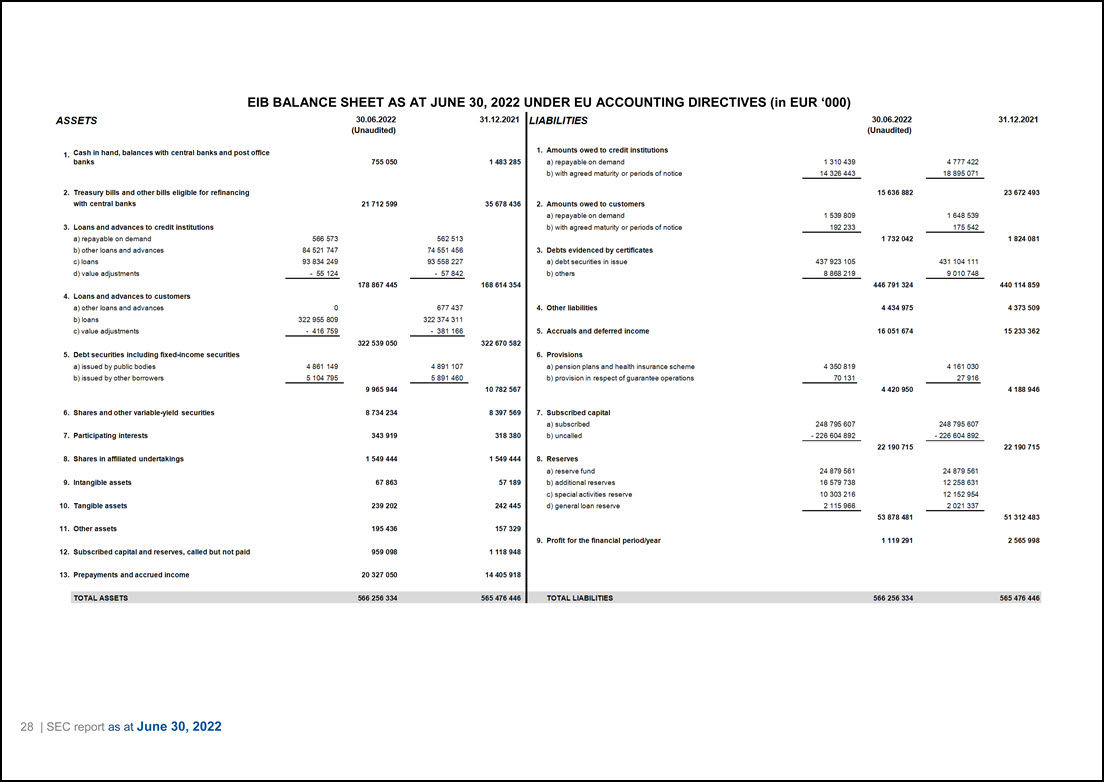
28 | SEC report as at June 30, 2022 EIB BALANCE SHEET AS AT JUNE 30, 2022 UNDER EU ACCOUNTING DIRECTIVES (in EUR ‘000) ASSETS 1. Cash in hand, balances with central banks and post office 30.06.2022 (Unaudited) 31.12.2021 banks 755 050 1 483 285 2. Treasury bills and other bills eligible for refinancing with central banks 21 712 599 35 678 436 3. Loans and advances to credit institutions a) repayable on demand 566 573 562 513 b) other loans and advances 84 521 747 74 551 456 c) loans 93 834 249 93 558 227 d) value adjustments - 55 124 - 57 842 178 867 445 168 614 354 4. Loans and advances to customers a) other loans and advances 0 677 437 b) loans 322 955 809 322 374 311 c) value adjustments - 416 759 - 381 166 322 539 050 322 670 582 5. Debt securities including fixed-income securities a) issued by public bodies 4 861 149 4 891 107 b) issued by other borrowers 5 104 795 5 891 460 9 965 944 10 782 567 6. Shares and other variable-yield securities 8 734 234 8 397 569 7. Participating interests 343 919 318 380 8. Shares in affiliated undertakings 1 549 444 1 549 444 9. Intangible assets 67 863 57 189 10. Tangible assets 239 202 242 445 11. Other assets 195 436 157 329 12. Subscribed capital and reserves, called but not paid 959 098 1 118 948 13. Prepayments and accrued income 20 327 050 14 405 918 TOTAL ASSETS 566 256 334 565 476 446 LIABILITIES 30.06.2022 (Unaudited) 31.12.2021 1. Amounts owed to credit institutions a) repayable on demand 1 310 439 4 777 422 b) with agreed maturity or periods of notice 14 326 443 18 895 071 15 636 882 23 672 493 2. Amounts owed to customers a) repayable on demand 1 539 809 1 648 539 b) with agreed maturity or periods of notice 192 233 175 542 1 732 042 1 824 081 3. Debts evidenced by certificates a) debt securities in issue 437 923 105 431 104 111 b) others 8 868 219 9 010 748 446 791 324 440 114 859 4. Other liabilities 4 434 975 4 373 509 5. Accruals and deferred income 16 051 674 15 233 362 6. Provisions a) pension plans and health insurance scheme 4 350 819 4 161 030 b) provision in respect of guarantee operations 70 131 27 916 4 420 950 4 188 946 7. Subscribed capital a) subscribed 248 795 607 248 795 607 b) uncalled - 226 604 892 - 226 604 892 22 190 715 22 190 715 8. Reserves a) reserve fund 24 879 561 24 879 561 b) additional reserves 16 579 738 12 258 631 c) special activities reserve 10 303 216 12 152 954 d) general loan reserve 2 115 966 2 021 337 53 878 481 51 312 483 9. Profit for the financial period/year 1 119 291 2 565 998 TOTAL LIABILITIES 566 256 334 565 476 446
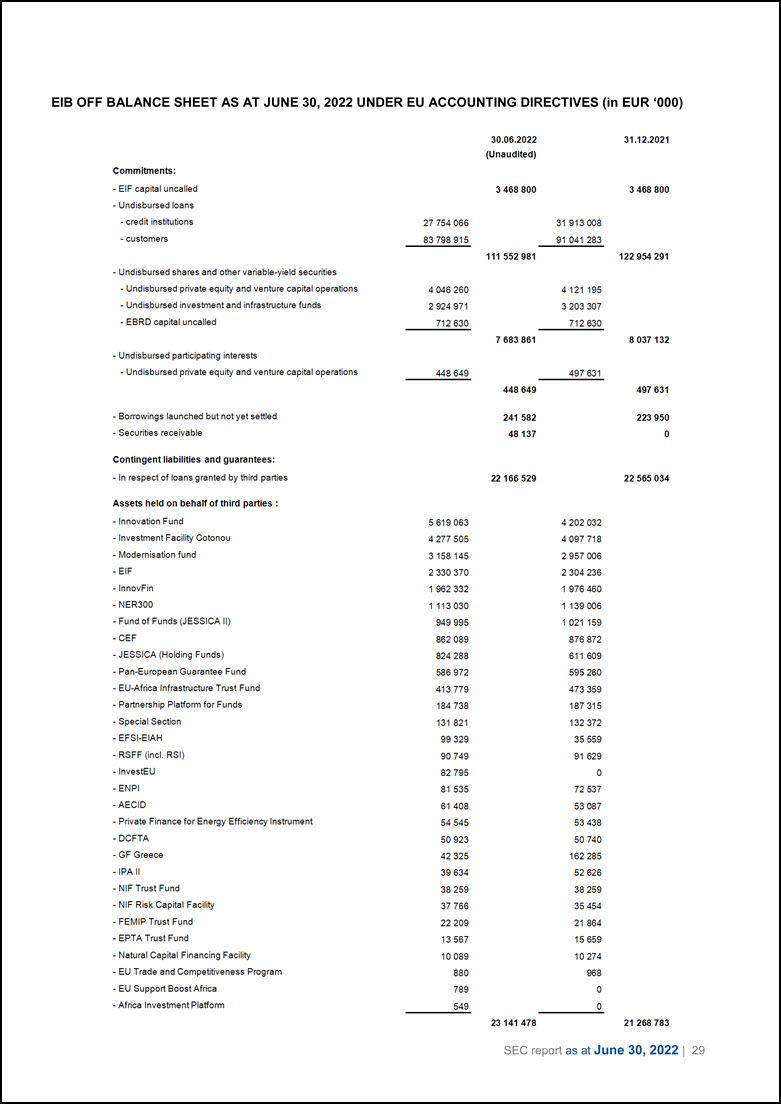
SEC report as at June 30, 2022 | 29 EIB OFF BALANCE SHEET AS AT JUNE 30, 2022 UNDER EU ACCOUNTING DIRECTIVES (in EUR ‘000) Commitments: 30.06.2022 (Unaudited) 31.12.2021 - EIF capital uncalled 3 468 800 3 468 800 - Undisbursed loans - credit institutions 27 754 066 31 913 008 - customers 83 798 915 91 041 283 111 552 981 122 954 291 - Undisbursed shares and other variable-yield securities - Undisbursed private equity and venture capital operations 4 046 260 4 121 195 - Undisbursed investment and infrastructure funds 2 924 971 3 203 307 - EBRD capital uncalled 712 630 712 630 7 683 861 8 037 132 - Undisbursed participating interests - Undisbursed private equity and venture capital operations 448 649 497 631 448 649 497 631 - Borrowings launched but not yet settled 241 582 223 950 - Securities receivable 48 137 0 Contingent liabilities and guarantees: - In respect of loans granted by third parties 22 166 529 22 565 034 Assets held on behalf of third parties : - Innovation Fund 5 619 063 4 202 032 - Investment Facility Cotonou 4 277 505 4 097 718 - Modernisation fund 3 158 145 2 957 006 - EIF 2 330 370 2 304 236 - InnovFin 1 962 332 1 976 460 - NER300 1 113 030 1 139 006 - Fund of Funds (JESSICA II) 949 995 1 021 159 - CEF 862 089 876 872 - JESSICA (Holding Funds) 824 288 611 609 - Pan-European Guarantee Fund 586 972 595 260 - EU-Africa Infrastructure Trust Fund 413 779 473 359 - Partnership Platform for Funds 184 738 187 315 - Special Section 131 821 132 372 - EFSI-EIAH 99 329 35 559 - RSFF (incl. RSI) 90 749 91 629 - InvestEU 82 795 0 - ENPI 81 535 72 537 - AECID 61 408 53 087 - Private Finance for Energy Efficiency Instrument 54 545 53 438 - DCFTA 50 923 50 740 - GF Greece 42 325 162 285 - IPA II 39 634 52 626 - NIF Trust Fund 38 259 38 259 - NIF Risk Capital Facility 37 766 35 454 - FEMIP Trust Fund 22 209 21 864 - EPTA Trust Fund 13 567 15 659 - Natural Capital Financing Facility 10 089 10 274 - EU Trade and Competitiveness Program 880 968 - EU Support Boost Africa 789 0 - Africa Investment Platform 549 0 23 141 478 21 268 783
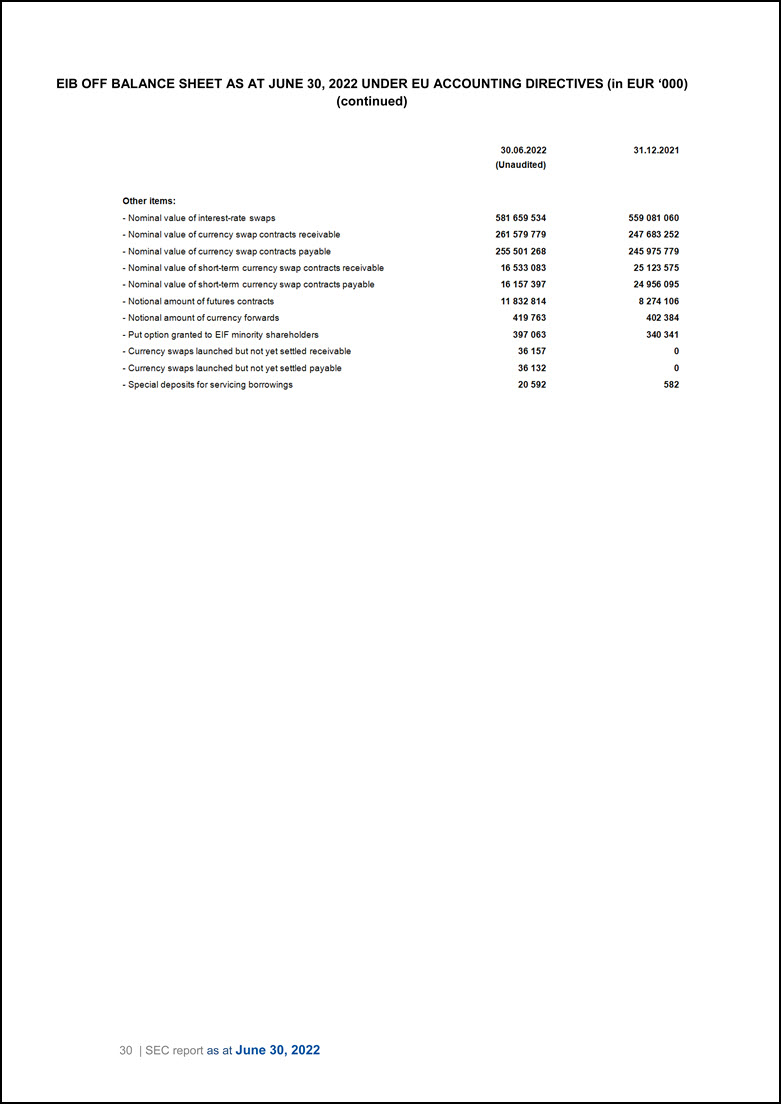
30 | SEC report as at June 30, 2022 EIB OFF BALANCE SHEET AS AT JUNE 30, 2022 UNDER EU ACCOUNTING DIRECTIVES (in EUR ‘000) (continued) Other items: - Nominal value of interest-rate swaps - Nominal value of cu rrency swap contracts receivable - Nominal value of cu rrency swap contracts payable - Nominal value of short-term currency swap contracts receivable - Nominal value of short-term currency swap contracts payable - Notional amount of futures contracts - Notional amount of currency forwards - Put option granted to EIF minority shareholders - Currency swaps launched but not yet settled receivable - Currency swaps launched but not yet settled payable - Special deposits for serv icing borrowings 30.06.2022 (Unaudited) 581 659 534 261 579 779 255 501 268 16 533 083 16 157 397 11 832 814 419 763 397 063 36157 36132 20 592 31 .12.2021 559 081 060 247 683 252 245 975 779 25 123 575 24 956 095 8274 106 402 384 340 341 0 0 582
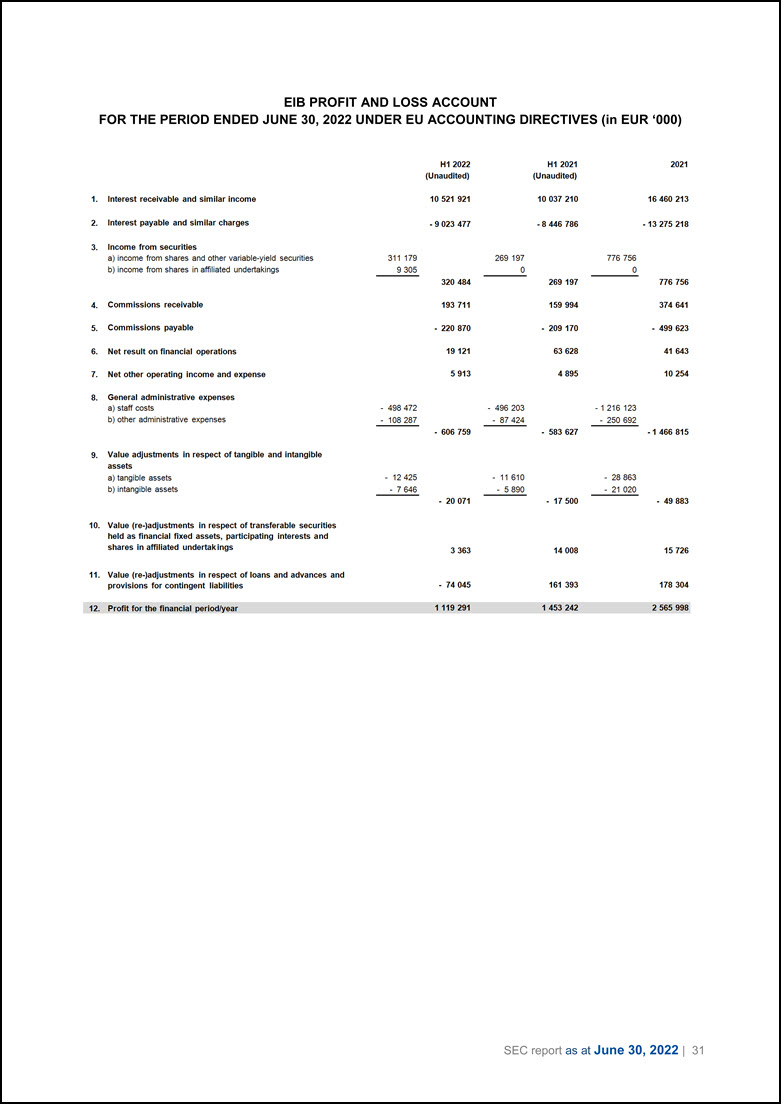
SEC report as at June 30, 2022 | 31 EIB PROFIT AND LOSS ACCOUNT FOR THE PERIOD ENDED JUNE 30, 2022 UNDER EU ACCOUNTING DIRECTIVES (in EUR ‘000) H12022 H12021 2021 (Unaudited) (Unaudited) 1. Interest receivable and similar income 10 521 921 10 037 210 16 460 213 2. Interest payable and similar charges - 9 023 477 - 8 446 786 - 13 275 218 3. Income from securities a) income from shares and other variable-yield securities b) income from shares in affiliated undertakings 311 179 269 197 776 756 9 305 0 0 320 484 269 197 776 756 4. Commissions receivable 193 711 159 994 374 641 5. Commissions payable - 220 870 - 209 170 - 499 623 6. Net result on financial operations 19 121 63 628 41 643 7. Net other operating income and expense 5 913 4 895 10 254 8. General administrative expenses a) staff costs - 498 472 - 496 203 - 1 216 123 b) other administrative expenses - 108 287 - 87 424 - 250 692 - 606 759 - 583 627 - 1 466 815 9. Value adjustments in respect of tangible and intangible assets a) tangible assets b) intangible assets - 12 425 - 11 610 - 28 863 - 7 646 - 5 890 - 21 020 - 20 071 - 17 500 - 49 883 10. Value (re-)adjustments in respect of transferable securities held as financial fixed assets, participating interests and shares in affiliated undertakings 11. Value (re-)adjustments in respect of loans and advances and provisions for contingent liabilities 12. Profit for the financial period/year 3 363 14 008 15 726 - 74 045 161 393 178 304 1 119 291 1 453 242 2 565 998
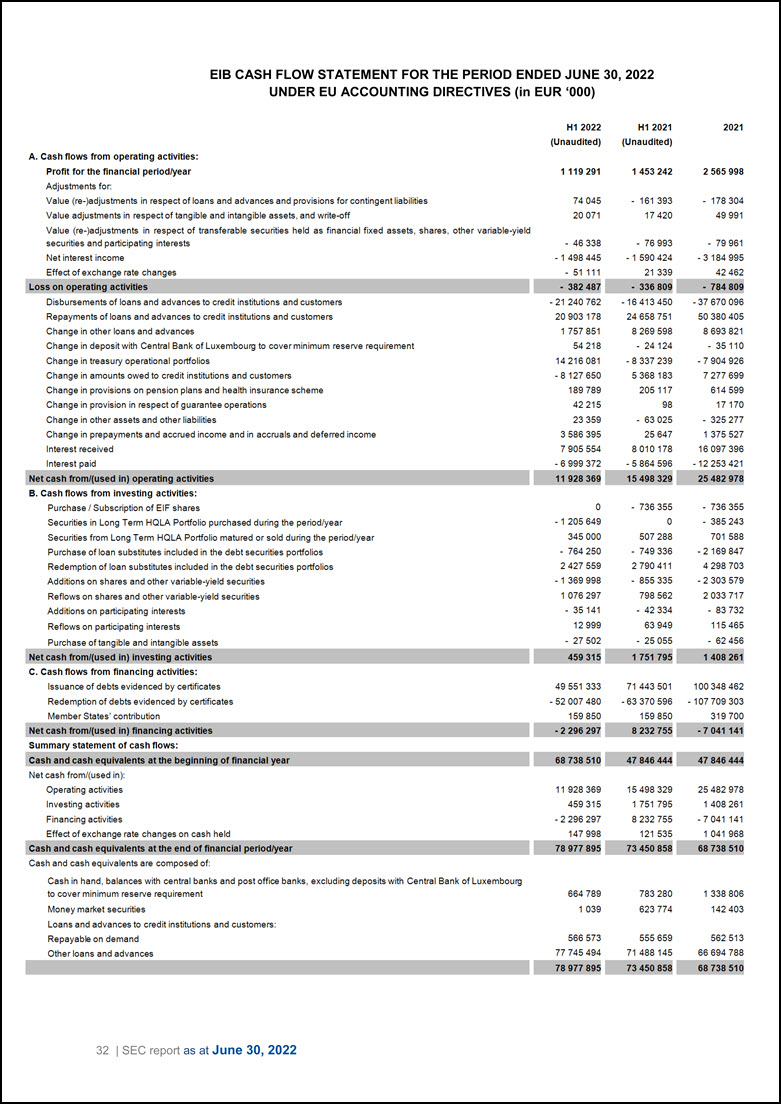
32 | SEC report as at June 30, 2022 EIB CASH FLOW STATEMENT FOR THE PERIOD ENDED JUNE 30, 2022 UNDER EU ACCOUNTING DIRECTIVES (in EUR ‘000) H12022 (Unaudited) H12021 (Unaudited) 2021 A. Cash flows from operating activities: Profit for the financial period/year 1 119 291 1 453 242 2 565 998 Adjustments for: Value (re-)adjustments in respect of loans and advances and provisions for contingent liabilities 74 045 - 161 393 - 178 304 Value adjustments in respect of tangible and intangible assets. and write-off 20 071 17 420 49 991 Value (re-)adjustments in respect of transferable securities held as financial fixed assets. shares. other variable-yield - 76 993 - 79 961 securities and participating interests - 46 338 - 1 590 424 - 3 184 995 Net interest income - 1 498 445 21 339 42 462 Effect of exchange rate changes - 51 111 - 336 809 - 784 809 Loss on operating activities - 382 487 - 16 413 450 - 37 670 096 Disbursements of loans and advances to credit institutions and customers - 21 240 762 24 658 751 50 380 405 Repayments of loans and advances to credit institutions and customers 20 903 178 8 269 598 8 693 821 Change in other loans and advances 1 757 851 - 24 124 - 35 110 Change in deposit with Central Bank of Luxembourg to cover minimum reserve requirement 54 218 - 8 337 239 - 7 904 926 Change in treasury operational portfolios 14 216 081 5 368 183 7 277 699 Change in amounts owed to credit institutions and customers - 8 127 650 205 117 614 599 Change in provisions on pension plans and health insurance scheme 189 789 98 17 170 Change in provision in respect of guarantee operations 42 215 - 63 025 - 325 277 Change in other assets and other liabilities 23 359 25 647 1 375 527 Change in prepayments and accrued income and in accruals and deferred income 3 586 395 8 010 178 16 097 396 Interest received 7 905 554 - 5 864 596 - 12 253 421 Interest paid - 6 999 372 15 498 329 25 482 978 Net cash from/(used in) operating activities 11 928 369 B. Cash flows from investing activities: - 736 355 - 736 355 Purchase / Subscription of EIF shares 0 0 - 385 243 Securities in Long Term HQLA Portfolio purchased during the period/year - 1 205 649 507 288 701 588 Securities from Long Term HQLA Portfolio matured or sold during the period/year 345 000 - 749 336 - 2 169 847 Purchase of loan substitutes included in the debt securities portfolios - 764 250 2 790 411 4 298 703 Redemption of loan substitutes included in the debt securities portfolios 2 427 559 - 855 335 - 2 303 579 Additions on shares and other variable-yield securities - 1 369 998 798 562 2 033 717 Reflows on shares and other variable-yield securities 1 076 297 - 42 334 - 83 732 Additions on participating interests - 35 141 63 949 115 465 Reflows on participating interests 12 999 - 25 055 - 62 456 Purchase of tangible and intangible assets - 27 502 1 751 795 1 408 261 Net cash from/(used in) investing activities 459 315 C. Cash flows from financing activities: 71 443 501 100 348 462 Issuance of debts evidenced by certificates 49 551 333 - 63 370 596 - 107 709 303 Redemption of debts evidenced by certificates - 52 007 480 159 850 319 700 Member States' contribution 159 850 8 232 755 - 7 041 141 Net cash from/(used in) financing activities - 2 296 297 Summary statement of cash flows: 47 846 444 47 846 444 Cash and cash equivalents at the beginning of financial year r- 68 738 510 Net cash from/(used in): Operating activities 11 928 369 15 498 329 25 482 978 Investing activities 459 315 1 751 795 1 408 261 Financing activities - 2 296 297 8 232 755 - 7 041 141 Effect of exchange rate changes on cash held 147 998 121 535 1 041 968 Cash and cash equivalents at the end of financial period/year 78 977 895 73 450 858 68 738 510 Cash and cash equivalents are composed of: Cash in hand. balances with central banks and post office banks. excluding deposits with Central Bank of Luxembourg to cover minimum reserve requirement 664 789 783 280 1 338 806 Money market securities 1 039 623 774 142 403 Loans and advances to credit institutions and customers: Repayable on demand 566 573 555 659 562 513 Other loans and advances 77 745 494 71 488 145 66 694 788 78 977 895 73 450 858 68 738 510
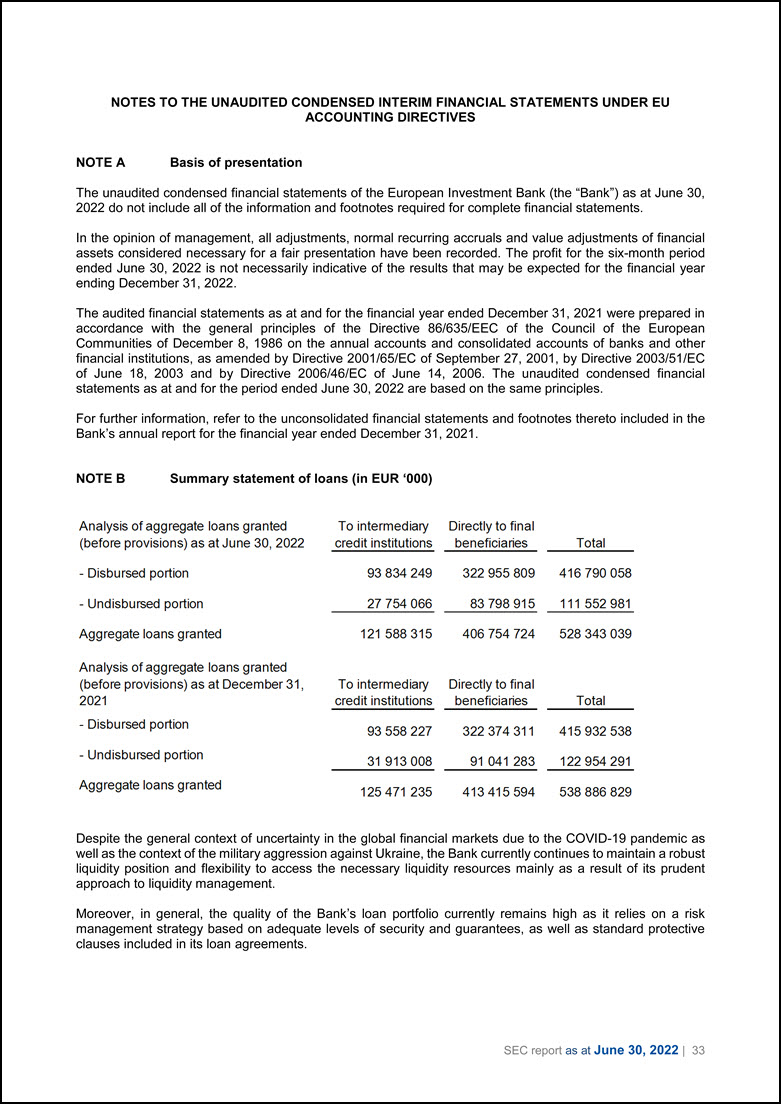
SEC report as at June 30, 2022 | 33 NOTES TO THE UNAUDITED CONDENSED INTERIM FINANCIAL STATEMENTS UNDER EU ACCOUNTING DIRECTIVES NOTE A Basis of presentation The unaudited condensed financial statements of the European Investment Bank (the “Bank”) as at June 30, 2022 do not include all of the information and footnotes required for complete financial statements. In the opinion of management, all adjustments, normal recurring accruals and value adjustments of financial assets considered necessary for a fair presentation have been recorded. The profit for the six-month period ended June 30, 2022 is not necessarily indicative of the results that may be expected for the financial year ending December 31, 2022. The audited financial statements as at and for the financial year ended December 31, 2021 were prepared in accordance with the general principles of the Directive 86/635/EEC of the Council of the European Communities of December 8, 1986 on the annual accounts and consolidated accounts of banks and other financial institutions, as amended by Directive 2001/65/EC of September 27, 2001, by Directive 2003/51/EC of June 18, 2003 and by Directive 2006/46/EC of June 14, 2006. The unaudited condensed financial statements as at and for the period ended June 30, 2022 are based on the same principles. For further information, refer to the unconsolidated financial statements and footnotes thereto included in the Bank’s annual report for the financial year ended December 31, 2021. NOTE B Summary statement of loans (in EUR ‘000) Analysis of aggregate loans granted To intermediary credit institutions Directly to final beneficiaries (before provisions) as at June 30, 2022 Total - Disbursed portion 93 834 249 322 955 809 416 790 058 - Undisbursed portion 27 754 066 83 798 915 11 1 552981 Aggregate loans granted 121 588 315 406 754 724 528 343 039 Analysis of aggregate loans granted (before provisions) as at December 31, To intermediary Directly to final 2021 cred it institutions beneficiaries Total - Disbursed portion 93 558 227 322 374 311 415 932 538 - Undisbursed portion 31 913 008 91 041 283 122 954 291 Aggregate loans granted 125471235 413 415 594 538 886 829 Despite the general context of uncertainty in the global financial markets due to the COVID-19 pandemic as well as the context of the military aggression against Ukraine, the Bank currently continues to maintain a robust liquidity position and flexibility to access the necessary liquidity resources mainly as a result of its prudent approach to liquidity management. Moreover, in general, the quality of the Bank’s loan portfolio currently remains high as it relies on a risk management strategy based on adequate levels of security and guarantees, as well as standard protective clauses included in its loan agreements.
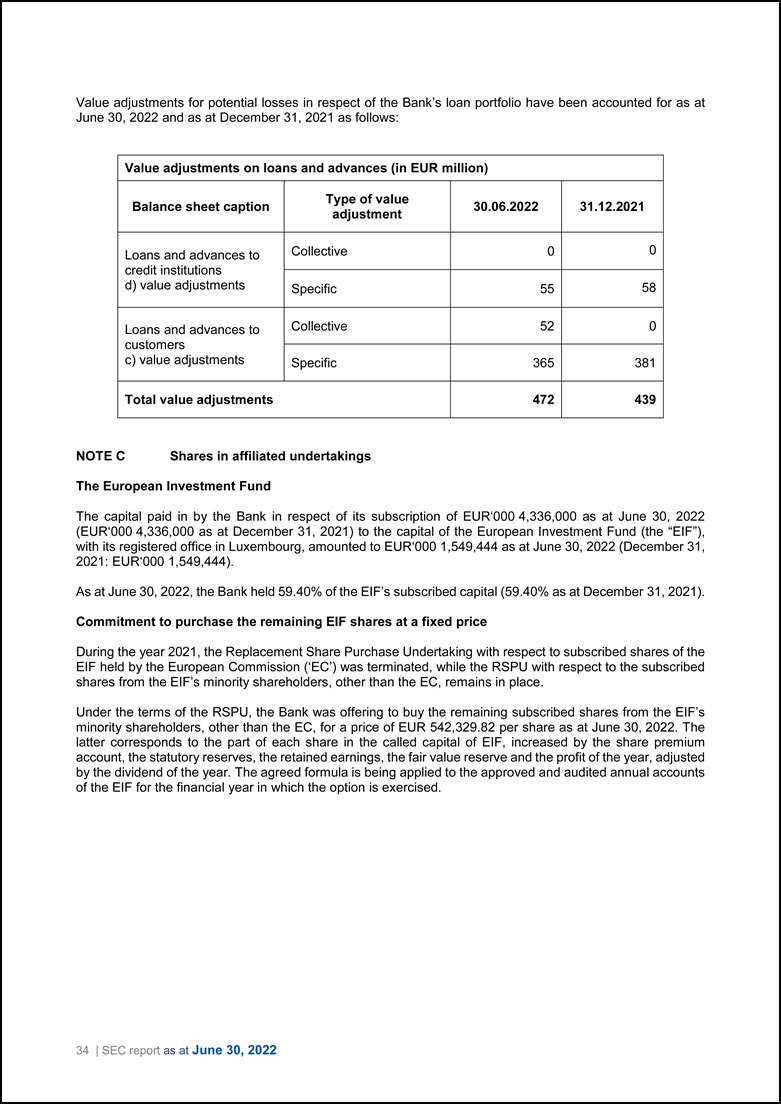
34 | SEC report as at June 30, 2022 Value adjustments for potential losses in respect of the Bank’s loan portfolio have been accounted for as at June 30, 2022 and as at December 31, 2021 as follows: Value adjustments on loans and advances (in EUR million) Balance sheet caption Type of value adjustment 30.06.2022 31.12.2021 Loans and advances to credit institutions d) value adjustments Collective 0 0 Specific 55 58 Loans and advances to customers c) value adjustments Collective 52 0 Specific 365 381 Total value adjustments 472 439 NOTE C Shares in affiliated undertakings The European Investment Fund The capital paid in by the Bank in respect of its subscription of EUR‘000 4,336,000 as at June 30, 2022 (EUR‘000 4,336,000 as at December 31, 2021) to the capital of the European Investment Fund (the “EIF”), with its registered office in Luxembourg, amounted to EUR‘000 1,549,444 as at June 30, 2022 (December 31, 2021: EUR‘000 1,549,444). As at June 30, 2022, the Bank held 59.40% of the EIF’s subscribed capital (59.40% as at December 31, 2021). Commitment to purchase the remaining EIF shares at a fixed price During the year 2021, the Replacement Share Purchase Undertaking with respect to subscribed shares of the EIF held by the European Commission (‘EC’) was terminated, while the RSPU with respect to the subscribed shares from the EIF’s minority shareholders, other than the EC, remains in place. Under the terms of the RSPU, the Bank was offering to buy the remaining subscribed shares from the EIF’s minority shareholders, other than the EC, for a price of EUR 542,329.82 per share as at June 30, 2022. The latter corresponds to the part of each share in the called capital of EIF, increased by the share premium account, the statutory reserves, the retained earnings, the fair value reserve and the profit of the year, adjusted by the dividend of the year. The agreed formula is being applied to the approved and audited annual accounts of the EIF for the financial year in which the option is exercised.
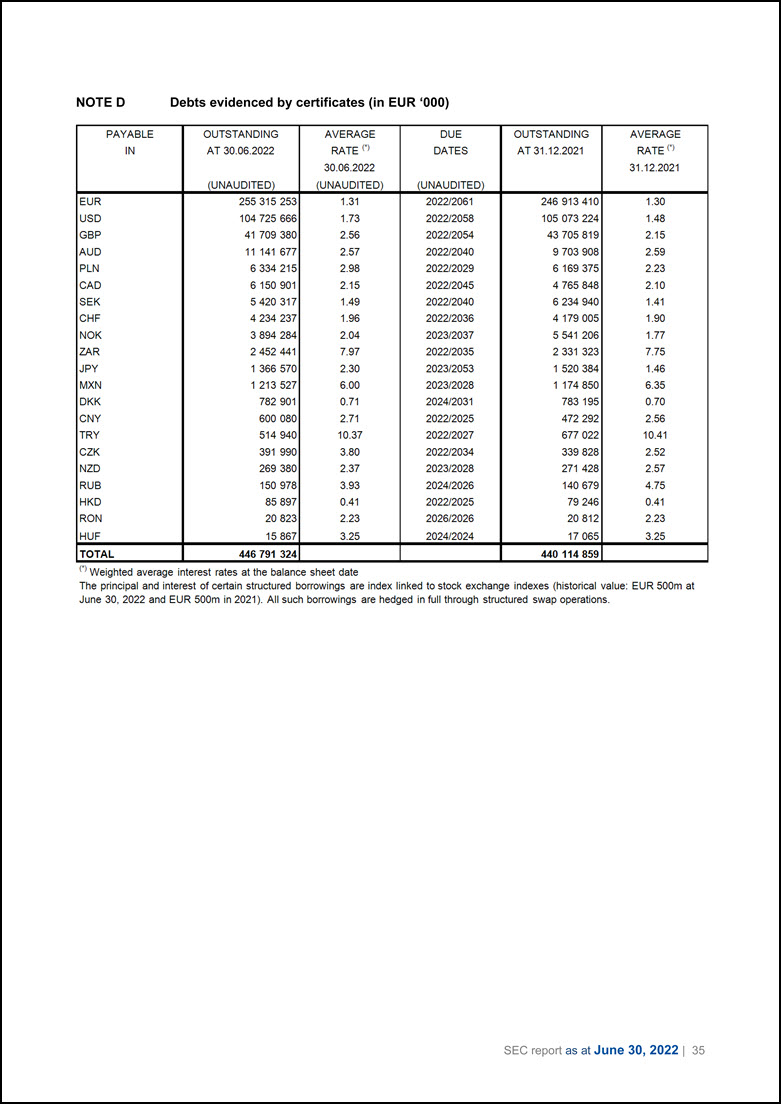
SEC report as at June 30, 2022 | 35 NOTE D Debts evidenced by certificates (in EUR ‘000) PAYABLE IN OUTSTANDING AT 30.06.2022 (UNAUDITED) AVERAGE RATE (*) 30.06.2022 (UNAUDITED) DUE DATES (UNAUDITED) OUTSTANDING AT 31.12.2021 AVERAGE RATE (*) 31.12.2021 EUR 255 315 253 1.31 2022/2061 246 913 410 1.30 USD 104 725 666 1.73 2022/2058 105 073 224 1.48 GBP 41 709 380 2.56 2022/2054 43 705 819 2.15 AUD 11 141 677 2.57 2022/2040 9 703 908 2.59 PLN 6 334 215 2.98 2022/2029 6 169 375 2.23 CAD 6 150 901 2.15 2022/2045 4 765 848 2.10 SEK 5 420 317 1.49 2022/2040 6 234 940 1.41 CHF 4 234 237 1.96 2022/2036 4 179 005 1.90 NOK 3 894 284 2.04 2023/2037 5 541 206 1.77 ZAR 2 452 441 7.97 2022/2035 2 331 323 7.75 JPY 1 366 570 2.30 2023/2053 1 520 384 1.46 MXN 1 213 527 6.00 2023/2028 1 174 850 6.35 DKK 782 901 0.71 2024/2031 783 195 0.70 CNY 600 080 2.71 2022/2025 472 292 2.56 TRY 514 940 10.37 2022/2027 677 022 10.41 CZK 391 990 3.80 2022/2034 339 828 2.52 NZD 269 380 2.37 2023/2028 271 428 2.57 RUB 150 978 3.93 2024/2026 140 679 4.75 HKD 85 897 0.41 2022/2025 79 246 0.41 RON 20 823 2.23 2026/2026 20 812 2.23 HUF 15 867 3.25 2024/2024 17 065 3.25 TOTAL 446 791 324 440 114 859