Exhibit VI
European Investment Bank Group Risk Management Disclosure Report 2022
European Investment Bank Group Risk Management Disclosure Report 2022
European Investment Bank Group – Risk Management Disclosure Report 2022 © European Investment Bank, 2023. All rights reserved. All questions on rights and licensing should be addressed to publications@eib.org For further information on the EIB’s activities, please consult our website, www.eib.org. You can also contact info@eib.org. For further information on the EIF’s activities, please consult our website, www.eif.org, where you can also contact our Info Desk. Published by the European Investment Bank. European Investment Bank 98 -100, boulevard Konrad Adenauer L-2950 Luxembourg +352 4379-1 info@eib.org www.eib.org twitter.com/eib facebook.com/europeaninvestmentbank youtube.com/eibtheeubank Disclaimer The information presented in this report has not been subject to external audit. Printed on FSC® Paper.
Table of contents 1 Introduction ............................................................................................................ 1 1.1 Executive Summary .................................................................................................................. 1 1.2 Key risk metrics ........................................................................................................................ 5 2 Basis of preparation................................................................................................. 9 2.1 Scope of consolidation.............................................................................................................. 9 2.2 Reconciliation with financial statements ................................................................................... 9 2.3 Disclosure criteria................................................................................................................... 10 2.4 Frequency, extent and means of disclosures ............................................................................ 12 2.5 EIB Group Risk Management Disclosure Policy......................................................................... 12 2.6 Approval process .................................................................................................................... 12 3 Governance and risk management ..........................................................................14 3.1 Risk management structure and organisation .......................................................................... 14 3.2 Risk management framework ................................................................................................. 16 3.3 Corporate governance ............................................................................................................ 20 4 Capital adequacy and risk-weighted exposure amounts ..........................................23 4.1 Capital requirements .............................................................................................................. 23 4.2 Own funds.............................................................................................................................. 28 5 Credit risk ...............................................................................................................36 5.1 Introduction ........................................................................................................................... 36 5.2 Credit risk quality ................................................................................................................... 39 5.3 Credit risk mitigation .............................................................................................................. 48 5.4 Use of the standardised approach ........................................................................................... 49 5.5 Use of the Internal Rating Based Approach .............................................................................. 51 5.6 Equity risk .............................................................................................................................. 71 6 Counterparty credit risk ..........................................................................................73 7 Securitisation .........................................................................................................80 8 Leverage ratio ........................................................................................................88 9 Liquidity risk ...........................................................................................................93 9.1 Internal framework for liquidity risk management ................................................................... 93 9.2 Internal Liquidity Adequacy Assessment Process (ILAAP) ......................................................... 95 9.3 Liquidity coverage ratio (LCR).................................................................................................. 95 9.4 Net stable funding ratio (NSFR) ............................................................................................... 99 9.5 Asset encumbrance .............................................................................................................. 100
10 Market risk...........................................................................................................103 11 Interest rate risk in the banking book....................................................................105 11.1 Gap risk................................................................................................................................ 106 11.2 Basis risk .............................................................................................................................. 107 11.3 Option risk ........................................................................................................................... 109 12 Operational risk....................................................................................................110 13 Other risks............................................................................................................119 13.1 Pension and health insurance risks........................................................................................ 119 13.2 Reputational and strategic risks ............................................................................................ 119 13.3 Climate, environmental and social risk .................................................................................. 120 14 Remuneration ......................................................................................................124 14.1 Introduction ......................................................................................................................... 124 14.2 EIB Group annual self-assessment ......................................................................................... 124 14.3 2022 EIB Group remuneration data ....................................................................................... 127 15 Appendix..............................................................................................................131 15.1 Appendix I - Overview of the EIB Group................................................................................. 131 15.2 Appendix II - Abbreviations................................................................................................... 134 15.3 Appendix III - CRR 2 Disclosure compliance reference............................................................. 140
Introduction | 1 1 Introduction The EIB Group does not fall within the scope of application of the European Union’s (EU) legislation applicable to credit institutions, in particular the Capital Requirements Directive and Regulation (Directive 2013/36/EU or ‘CRD V’, Regulation 575/2013 or “CRR II”, commonly referred to as ‘CRD/CRR package’), being the EU legal framework binding on institutions, financial holding companies and mixed financial holding companies. The EIB, therefore, is not legally obliged to meet the requirements of the above mentioned Directives and Regulations. However, reflecting its statutory duty to conform with best banking practice (BBP), the EIB aims to comply both at individual and consolidated level with relevant EU banking legislative acts and guidelines, to the extent determined by the competent governing bodies and in line with the BBP Guiding Principles approved, as further described in Section 2.3 below. Following on from the above, the EIB’s Group Risk Management Disclosure Report (‘GRMDR’) has been prepared in line with the prudential disclosure requirements as set out in Articles 431 to 455 of Part Eight of CRR II1, which became applicable in June 2021, and the related technical standards, guidelines and opinions of the European Banking Authority (‘EBA’), as applicable to the EIB and which are relevant and compatible with the EIB's statutory framework and business model. These disclosure requirements and the corresponding European Commission Implementing Regulation2 constitute a fundamental review of regulators’ strategy on banks’ Pillar III disclosures3. Also in this report edition, disclosures are compatible with the EIB’s specificities, thus reflecting the non- applicability or non-availability of certain templates, as described in Section 2.3 below. Accordingly, the EIB’s disclosures are not fully comparable with those published mandatorily by institutions, financial holding companies and mixed financial holding companies, owing that to the EIB’s status as an EU body pursuant to the Treaty on the Functioning of the European Union. The EIB Group (also ‘the Group’) consists of the European Investment Bank (‘EIB’ or ‘the Bank’) and the European Investment Fund (‘EIF’ or ‘the Fund’). For a more detailed overview of the Group entities please refer to Appendix 15.1. The information provided in this report is unaudited. Due to rounding, numbers presented throughout this document may not add up precisely to the totals provided and percentages may not precisely reflect the absolute figures. For the purpose of the certifications foreseen in Articles 435(1)(e) and 431(3) of the CRR, applicable to the EIB on an individual and consolidated basis as best banking practice, the EIB President confirms that the EIB’s risk management systems are adequate with regard to the institution's profile and strategy and that the disclosures in this report have been prepared in accordance with the EIB’s policies, internal processes, systems and controls. 1.1 Executive Summary Business strategy and overall risk profile In performing its activities, the EIB Group follows a conservative risk management framework. The Group regularly adapts its risk management policies and practices to market conditions and best banking industry’s practice. 1 2 3 Part Eight (Articles 431 to 455) of Regulation (EU) No 575/2013 of the European Parliament and of the Council, of 26 June 2013 (CRR), as amended by Regulation (EU) 2019/876 of the European Parliament and of the Council, of 20 May 2019 (CRR II). Commission Implementing Regulation 2021/637 of 15 March 2021 laying down implementing technical standards with regard to public disclosures by institutions of the information referred to in Titles II and III of Part Eight of Regulation (EU) No 575/2013 of the European Parliament and of the Council and repealing Commission Implementing Regulation (EU) No 1423/2013, Commission Delegated Regulation (EU) 2015/1555, Commission Implementing Regulation (EU) 2016/200 and Commission Delegated Regulation (EU) 2017/2295. The Commission Implementing Regulation is based on the EBA’s final draft Implementing Technical Standards (ITS) on public disclosures by institutions of the information referred to in Titles II and III of Part Eight of Regulation (EU) No 575/2013, EBA/ITS/2020/04, EBA/ITS/2021/07 and EBA/ITS/2022/01. The disclosure report in the context of the Basel Framework is also referred to as “Pillar III”, representing the third Basel pillar for market discipline.
2 | EIB Group Risk Management Disclosure Report 2022 In pursuit of its business strategy, the Group accepts to take financial and non-financial risk up to the level where it remains aligned with its risk appetite and public mission. The risk appetite is the level of risk that the Group is willing and able to incur in pursuing its activities in the context of its public mission and objectives. Key to this is the Group’s capacity to provide attractive long-term financing to serve EU objectives across all EU Member States (and beyond in Partner Countries). A primary pillar of the Group’s business model is to retain the long-term AAA issuer rating from the major credit rating agencies. The processes and activities performed by the Group to manage its risk appetite are formalised in the Group Risk Appetite Framework (‘RAF’) Policy approved by the Board of Directors (BoD). The Group RAF Policy covers the major financial risks and non-financial risks categories. It helps to embed a healthy organisational risk culture within the Group through the implementation and monitoring of measurable risk appetite metrics, which are subject to risk limits and (where applicable) cascaded further down within the Group entities. The EIB Group Risk Appetite Statement 2022 as included in Section 3.2. together with the Group RAF Policy 2022 were approved by the EIB Board of Directors on 15 June 2022. The approach to determining annual operational targets and orientations takes into account the Group’s objective of maintaining a robust credit standing, the long-term nature of its lending business and the granularity of its portfolio. The EIB’s financial strength, reflected by its high credit rating assessments, is key to the Bank’s business model as it enables favourable access to capital markets and low funding costs. Solid key risk measures are essential to sustain the financial strength of the Bank. The EIB Group remains watchful to ensure that activities are financially sustainable and aligned with the Group’s business model, relying on its credit standing, including the EIB’s AAA ratings and its status as prime issuer on the capital markets. The evolution of the short- and longer-term capital needs of the Group are being closely monitored. The Group Operational Plan (‘OP’) is deemed financially sustainable over the long-term. Key risk ratios are projected to remain within their respective Risk Appetite Limits over the longer-term horizon under 2022 business assumptions as well as under an adverse stress scenario. For a full overview of the key business developments of the Bank’s and the Fund’s activities over the last financial year please refer to, respectively, the Overview of the EIB Financial Report and the EIF’s Annual Report. Operations outside the European Union The EIB has decades of experience as a leading multilateral development bank, actively contributing to the European Union’s external policy objectives for nearly 60 years. Since the start of 2022, the EIB’s development finance role has moved forward and intensified through the establishment of EIB Global, the Bank’s development organisational unit focused on activities outside the European Union. EIB Global brings the resources of the EIB to bear on operations outside the European Union through integrated and impact-driven product offering while reinforcing and deepening upstream policy dialogue and cooperation with partner countries, clients, EU Member States, development finance institutions, UN agencies, civil society and other partners. EIB Global is an internal organisational unit within the EIB, operating under the Bank’s legal framework. It brings together EIB development staff under a dedicated management team. EIB Global has a dedicated capital allocation provided annually by the EIB Board of Directors under the Group Operational Plan, and benefits from a dedicated Board Advisory Group involving European development stakeholders. It has flexibility to establish its own policies and strategies and develop its own products. EIB Global nonetheless operates fully within EIB Group- wide financial policies on areas such as risk management, as determined by the EIB Board of Directors. As part of its operating model, EIB Global maintains a strong local presence on the ground through a network of 30 external representations located in partner countries, with further openings and more staff being planned where needs are the greatest and where local presence will have the greatest impact by bringing the Bank closer to its clients. Most of EIB Global’s outstanding portfolio is covered by guarantees from the European Union in the form of either comprehensive guarantees or political risk guarantees or by guarantees from the Member States within the Cotonou Agreement framework. Under the current EU long-term budget (Multiannual Financial Framework),
Introduction | 3 EIB Global’s business implementation relies on the new generation of EU mandates within the Neighbourhood, Development and International Cooperation Instrument (NDICI) – Global Europe framework to deliver on key priorities as the EU bank. Russian invasion of Ukraine and EIB support for Ukraine and countries affected by war The Bank has stopped its lending activities in the Russian Federation since 2014 to stay consistent with the overall objectives of EU common foreign and security policy, including applicable sanctions. The EIB started operations in Ukraine in 2005 with the signing of a framework agreement, and the first operations were signed in 2007. The Bank’s financing in the country has been focused on social and economic infrastructure, development of the private sector and climate action. As detailed in the Overview of the EIB Financial Report, the EIB’s disbursed exposure in Ukraine is predominantly covered by the EU Comprehensive Guarantee and the EU Political Risk Guarantees under the EU External Lending Mandate. In response to Russia’s invasion of Ukraine, the EIB disbursed the first EUR 0.7 billion of its ‘Ukraine Solidarity Urgent Response’ in March 2022 to help the Ukrainian authorities meet their most urgent financial needs. In April 2022, the Bank launched a EUR 4.0 billion programme to support EU cities and regions affected by the conflict, during 2022-2023 with the integration of refugees from Ukraine. It aims to provide financing for key infrastructure and services for refugees and host communities, such as housing, schools, hospitals and access to jobs. Half of this programme was allocated to Poland, where more than one million Ukrainian refugees have fled, as a specific support to the country’s national Aid Fund, established to address the humanitarian crisis caused by Russia´s invasion of Ukraine. Another EUR 1.6 billion of support to Ukraine was approved in July 2022, with around EUR 1 billion dedicated to providing immediate financial assistance, supporting strategic state-owned companies, making urgent repairs to damaged infrastructure, resuming the provision of disrupted municipal services, and supporting urgent energy and energy efficiency measures4. To reflect potential impacts of the war in Ukraine, additional provisions have been recorded in the Statutory Financial Statements since June 2022 in the form of collective provisions. The evolution of the war continues to be closely monitored for impacts on the EIB’s portfolio. A robust compliance control, including a dedicated Sanctions Compliance Programme, is in place ensuring that EIB Group activities that, even indirectly, relate to the Russian Federation, have complied with all applicable sanctions, and will ensure compliance with any new ones, including sectoral sanctions affecting the Russian Federation. A summary of the EIB’s exposure in Russia, Ukraine, Belarus, Türkiye, Lebanon and Tunisia is provided in the Overview of the EIB Financial Report. Asset quality A significant portion of the Bank’s loan portfolio benefits from credit enhancements or recourse to EU or EU Member State guarantees. Credit enhancements are largely in the form of portfolio guarantees from EU sovereigns, the EU budget, investment-grade banks and corporates and high-quality financial collateral and assignments of rights or pledges at transaction level. The asset quality of the EIB’s risk portfolio is high. The share of best of borrower or guarantor internal ratings at investment grade level5 stood at 84.0% of the Bank’s risk portfolio as at end-2022 (end-2021: 83.5%). Despite the general context of uncertainty and various risks resulting from the Russian invasion of Ukraine, the credit quality of the loan portfolio is deemed stable at present. Corporate responsibility and sustainability The remit of the EIB is to foster balanced and steady development within the European Union and beyond. Sustainability is at the heart of what the Bank does and it is integrated in lending, borrowing and advisory activities. 4 5 The remaining funds are reserved for resuming EIB-financed projects in Ukraine, covering energy, energy efficiency, roads, transport, education and infrastructure, as well as reconstruction and recovery programmes. Above Baa3 Moody’s equivalent rating.
4 | EIB Group Risk Management Disclosure Report 2022 As the EU climate bank, the EIB is committed to: (i) align all new operations with the principles and goals of the Paris Agreement for addressing climate change, (ii) gradually increase EIB annual financing dedicated to climate action and environmental sustainability to exceed 50% of total financing by 2025 and beyond, and (iii) support EUR 1 trillion of investment in climate action and environmental sustainability in the decade from 2021-2030. In parallel, the EIB strives to be exemplary in terms of transparency and accountability. The Bank proactively publishes information about its projects and activities and engages regularly with a broad spectrum of stakeholders. The EIB has established procedures and screening tools to assess, manage and monitor climate change-related physical and transition risks at the level of its portfolio, counterparties and individual projects financed. Climate action and environmental sustainability aspects are also taken into consideration throughout the assessment and monitoring of all projects. The Bank calculates and reports the carbon footprint, in absolute and relative terms, for all directly financed projects that have emissions above a defined threshold. In addition, an economic cost of carbon is incorporated into the accounting of environmental externalities. Furthermore, since January 2022, the EIB has applied its Paris Alignment of counterparties – or PATH framework to corporates, financial intermediaries and those highly exposed to physical climate risk. The PATH framework requires direct lending counterparties, which are in scope and screened in, to develop and publicly disclose their plans to mitigate their decarbonisation and/or resilience plans, in case not already done. In addition, they are required, save for some limited exceptions, to undertake not to engage in certain activities which are incompatible with the goals of the Paris Agreement. Financial intermediaries that are in scope and screened in are required to make public disclosures in line with the recommendations of the Task Force on Climate-related Financial Disclosures (TCFD). The Bank can provide technical assistance to counterparties with developing their decarbonisation or resilience plans and with TCFD disclosures. Applying the PATH framework therefore contributes to mitigating the climate-related risks of the EIB’s loan portfolio. In February 2022, the EIB published its updated Environmental and Social Standards, promoting an integrated approach to impact assessment and risk management by ensuring that environmental, climate, social and human rights considerations are addressed and taken into account in the decision-making processes. These Standards outline promoters’ responsibilities for assessing and managing environmental, climate and social impacts and risks in EIB-financed projects. As part of the update, the ten earlier environmental and social standards were revised and a new standard on intermediated finance was added. In terms of reporting, every year the Bank issues a Sustainability Report, including the carbon footprint of its financed projects, a carbon footprint report for its own emissions, a report in line with the recommendations of the TCFD, as well as Global Reporting Initiative (GRI) disclosures and Sustainability Accounting Standards Board (SASB) disclosures. All reports are available on a dedicated page on the Bank’s website. Group Operational Plan and higher-risk/mandate activities The 2023-2025 Group Operational Plan was approved by the EIB’s BoD in December 2022. Business delivery is adapting to the changing market needs with a renewed focus on proven and scalable EIB financial instruments and a targeted delivery of higher volumes. With the end of COVID-restrictions and the return of business travel, the Bank is seeing a revival of business origination. While there remains a high level of uncertainty in the operating environment, with implications for the demand for higher-risk products, an increase of EIB higher-risk activities and mandates is expected in 2023, with further increases in 2024 and 2025. Higher-risk products remain unique instruments that enable the Bank to achieve greater impact and additionality and meet specific needs. The planned increase of own higher-risk activities will also be supported by the development of new own risk products, for which there appears to be a strong market demand. Following the expiry of the European Fund for Strategic Investments (‘EFSI’) and the Pan-European Guarantee Fund (‘EGF‘) mandates, origination efforts have begun for the linked risk-sharing and ABS mezzanine own risk products. Further details on the 2023-2025 Group Operational Plan approved are available on the EIB website. EIB’s and EIF’s credit ratings The Bank’s high credit rating is a core feature of our business model and facilitates broad and deep investor support, even in times of turbulence. The EIB retains a ‘AAA’ rating with a ‘stable’ outlook from the three major
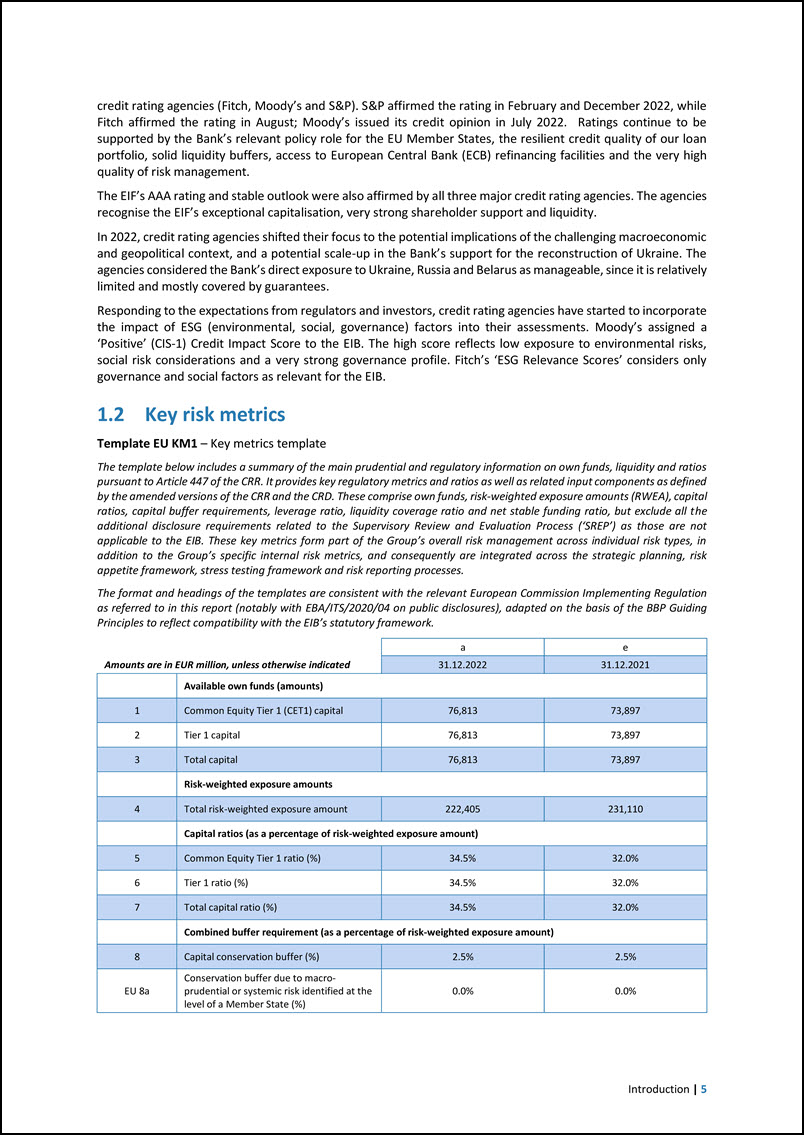
Introduction | 5 credit rating agencies (Fitch, Moody’s and S&P). S&P affirmed the rating in February and December 2022, while Fitch affirmed the rating in August; Moody’s issued its credit opinion in July 2022. Ratings continue to be supported by the Bank’s relevant policy role for the EU Member States, the resilient credit quality of our loan portfolio, solid liquidity buffers, access to European Central Bank (ECB) refinancing facilities and the very high quality of risk management. The EIF’s AAA rating and stable outlook were also affirmed by all three major credit rating agencies. The agencies recognise the EIF’s exceptional capitalisation, very strong shareholder support and liquidity. In 2022, credit rating agencies shifted their focus to the potential implications of the challenging macroeconomic and geopolitical context, and a potential scale-up in the Bank’s support for the reconstruction of Ukraine. The agencies considered the Bank’s direct exposure to Ukraine, Russia and Belarus as manageable, since it is relatively limited and mostly covered by guarantees. Responding to the expectations from regulators and investors, credit rating agencies have started to incorporate the impact of ESG (environmental, social, governance) factors into their assessments. Moody’s assigned a ‘Positive’ (CIS-1) Credit Impact Score to the EIB. The high score reflects low exposure to environmental risks, social risk considerations and a very strong governance profile. Fitch’s ‘ESG Relevance Scores’ considers only governance and social factors as relevant for the EIB. 1.2 Key risk metrics Template EU KM1 – Key metrics template The template below includes a summary of the main prudential and regulatory information on own funds, liquidity and ratios pursuant to Article 447 of the CRR. It provides key regulatory metrics and ratios as well as related input components as defined by the amended versions of the CRR and the CRD. These comprise own funds, risk-weighted exposure amounts (RWEA), capital ratios, capital buffer requirements, leverage ratio, liquidity coverage ratio and net stable funding ratio, but exclude all the additional disclosure requirements related to the Supervisory Review and Evaluation Process (‘SREP’) as those are not applicable to the EIB. These key metrics form part of the Group’s overall risk management across individual risk types, in addition to the Group’s specific internal risk metrics, and consequently are integrated across the strategic planning, risk appetite framework, stress testing framework and risk reporting processes. The format and headings of the templates are consistent with the relevant European Commission Implementing Regulation as referred to in this report (notably with EBA/ITS/2020/04 on public disclosures), adapted on the basis of the BBP Guiding Principles to reflect compatibility with the EIB’s statutory framework. Amounts are in EUR million, unless otherwise indicated a e 31.12.2022 31.12.2021 Available own funds (amounts) 1 Common Equity Tier 1 (CET1) capital 76,813 73,897 2 Tier 1 capital 76,813 73,897 3 Total capital 76,813 73,897 Risk-weighted exposure amounts 4 Total risk-weighted exposure amount 222,405 231,110 Capital ratios (as a percentage of risk-weighted exposure amount) 5 Common Equity Tier 1 ratio (%) 34.5% 32.0% 6 Tier 1 ratio (%) 34.5% 32.0% 7 Total capital ratio (%) 34.5% 32.0% Combined buffer requirement (as a percentage of risk-weighted exposure amount) 8 Capital conservation buffer (%) 2.5% 2.5% EU 8a Conservation buffer due to macro- prudential or systemic risk identified at the level of a Member State (%) 0.0% 0.0%
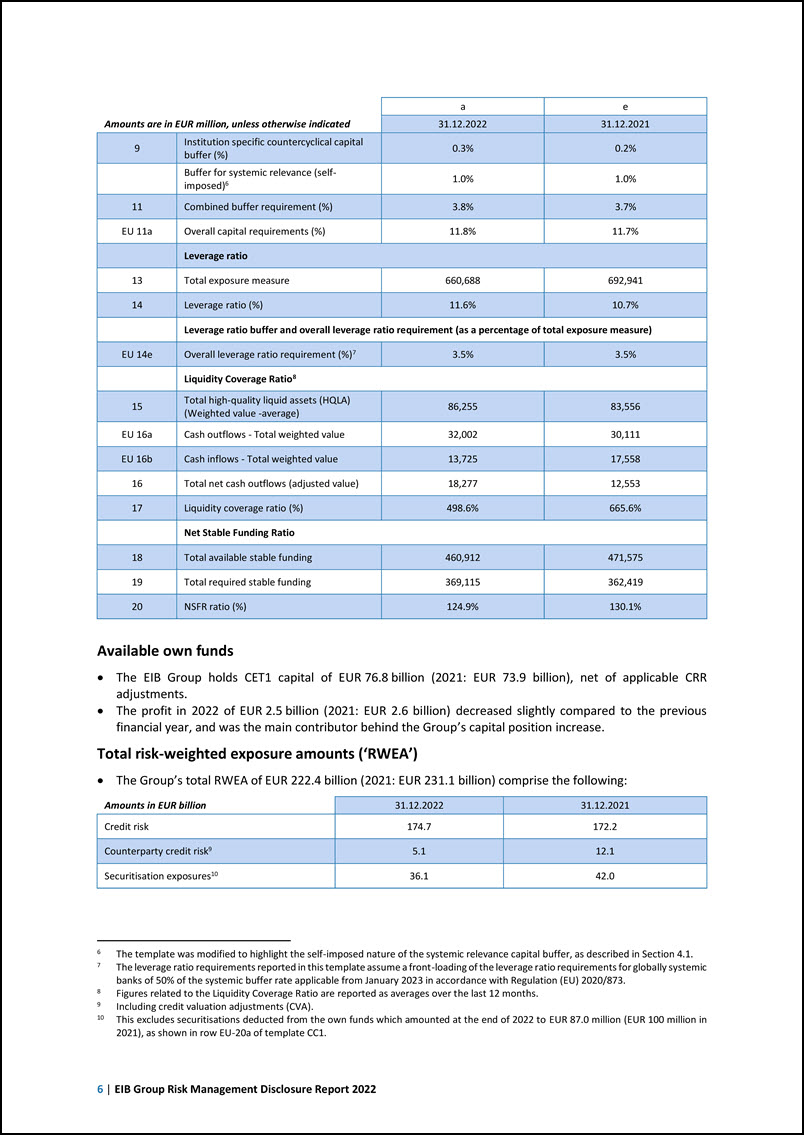
6 | EIB Group Risk Management Disclosure Report 2022 Amounts are in EUR million, unless otherwise indicated a e 31.12.2022 31.12.2021 9 Institution specific countercyclical capital buffer (%) 0.3% 0.2% Buffer for systemic relevance (self- imposed)6 1.0% 1.0% 11 Combined buffer requirement (%) 3.8% 3.7% EU 11a Overall capital requirements (%) 11.8% 11.7% Leverage ratio 13 Total exposure measure 660,688 692,941 14 Leverage ratio (%) 11.6% 10.7% Leverage ratio buffer and overall leverage ratio requirement (as a percentage of total exposure measure) EU 14e Overall leverage ratio requirement (%)7 3.5% 3.5% Liquidity Coverage Ratio8 15 Total high-quality liquid assets (HQLA) (Weighted value -average) 86,255 83,556 EU 16a Cash outflows - Total weighted value 32,002 30,111 EU 16b Cash inflows - Total weighted value 13,725 17,558 16 Total net cash outflows (adjusted value) 18,277 12,553 17 Liquidity coverage ratio (%) 498.6% 665.6% Net Stable Funding Ratio 18 Total available stable funding 460,912 471,575 19 Total required stable funding 369,115 362,419 20 NSFR ratio (%) 124.9% 130.1% Available own funds The EIB Group holds CET1 capital of EUR 76.8 billion (2021: EUR 73.9 billion), net of applicable CRR adjustments. The profit in 2022 of EUR 2.5 billion (2021: EUR 2.6 billion) decreased slightly compared to the previous financial year, and was the main contributor behind the Group’s capital position increase. Total risk-weighted exposure amounts (‘RWEA’) The Group’s total RWEA of EUR 222.4 billion (2021: EUR 231.1 billion) comprise the following: Amounts in EUR billion 31.12.2022 31.12.2021 Credit risk 174.7 172.2 Counterparty credit risk9 5.1 12.1 Securitisation exposures10 36.1 42.0 6 7 8 9 10 The template was modified to highlight the self-imposed nature of the systemic relevance capital buffer, as described in Section 4.1. The leverage ratio requirements reported in this template assume a front-loading of the leverage ratio requirements for globally systemic banks of 50% of the systemic buffer rate applicable from January 2023 in accordance with Regulation (EU) 2020/873. Figures related to the Liquidity Coverage Ratio are reported as averages over the last 12 months. Including credit valuation adjustments (CVA). This excludes securitisations deducted from the own funds which amounted at the end of 2022 to EUR 87.0 million (EUR 100 million in 2021), as shown in row EU-20a of template CC1.
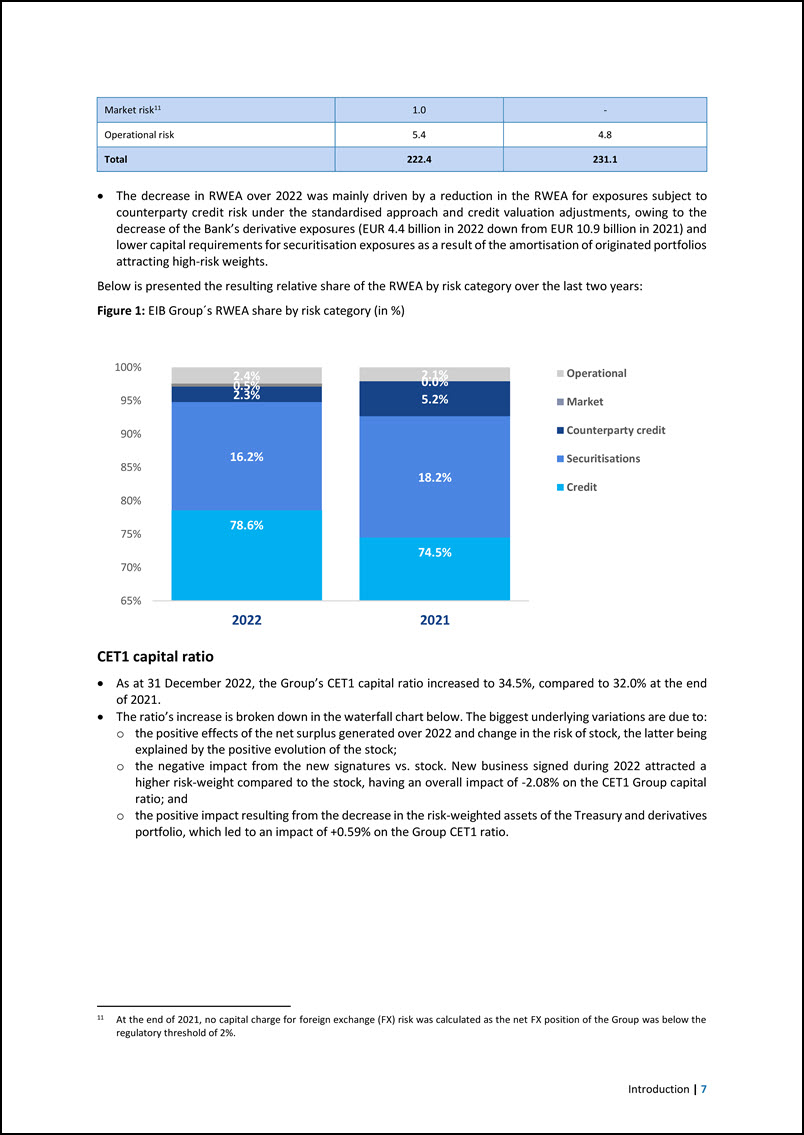
Introduction | 7 Market risk11 1.0 - Operational risk 5.4 4.8 Total 222.4 231.1 The decrease in RWEA over 2022 was mainly driven by a reduction in the RWEA for exposures subject to counterparty credit risk under the standardised approach and credit valuation adjustments, owing to the decrease of the Bank’s derivative exposures (EUR 4.4 billion in 2022 down from EUR 10.9 billion in 2021) and lower capital requirements for securitisation exposures as a result of the amortisation of originated portfolios attracting high-risk weights. Below is presented the resulting relative share of the RWEA by risk category over the last two years: Figure 1: EIB Group´s RWEA share by risk category (in %) CET1 capital ratio As at 31 December 2022, the Group’s CET1 capital ratio increased to 34.5%, compared to 32.0% at the end of 2021. The ratio’s increase is broken down in the waterfall chart below. The biggest underlying variations are due to: the positive effects of the net surplus generated over 2022 and change in the risk of stock, the latter being explained by the positive evolution of the stock; the negative impact from the new signatures vs. stock. New business signed during 2022 attracted a higher risk-weight compared to the stock, having an overall impact of -2.08% on the CET1 Group capital ratio; and the positive impact resulting from the decrease in the risk-weighted assets of the Treasury and derivatives portfolio, which led to an impact of +0.59% on the Group CET1 ratio. 11 At the end of 2021, no capital charge for foreign exchange (FX) risk was calculated as the net FX position of the Group was below the regulatory threshold of 2%. 78.6% 74.5% 16.2% 18.2% 2.3% 5.2% 0.5% 0.0% 2.4% 2.1% 70% 65% 75% 80% 85% 90% 95% 100% 2022 2021 Operational Market Counterparty credit Securitisations Credit
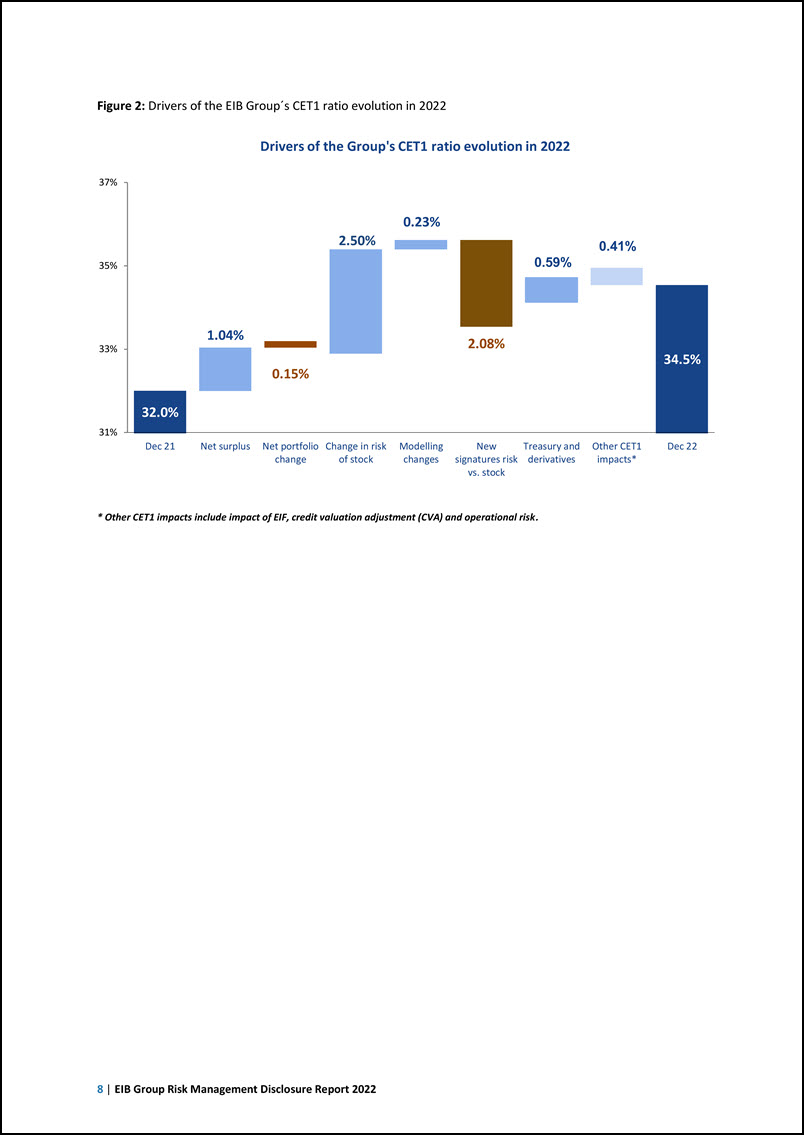
8 | EIB Group Risk Management Disclosure Report 2022 * Other CET1 impacts include impact of EIF, credit valuation adjustment (CVA) and operational risk. 32.0% 1.04% 0.15% 2.50% 2.08% 0.59% 0.41% 34.5% 31% 33% 35% Dec 21 Net surplus Net portfolio Change in risk change of stock Modelling changes New Treasury and signatures risk derivatives vs. stock Other CET1 impacts* Dec 22 Figure 2: Drivers of the EIB Group´s CET1 ratio evolution in 2022 Drivers of the Group's CET1 ratio evolution in 2022 37% 0.23%
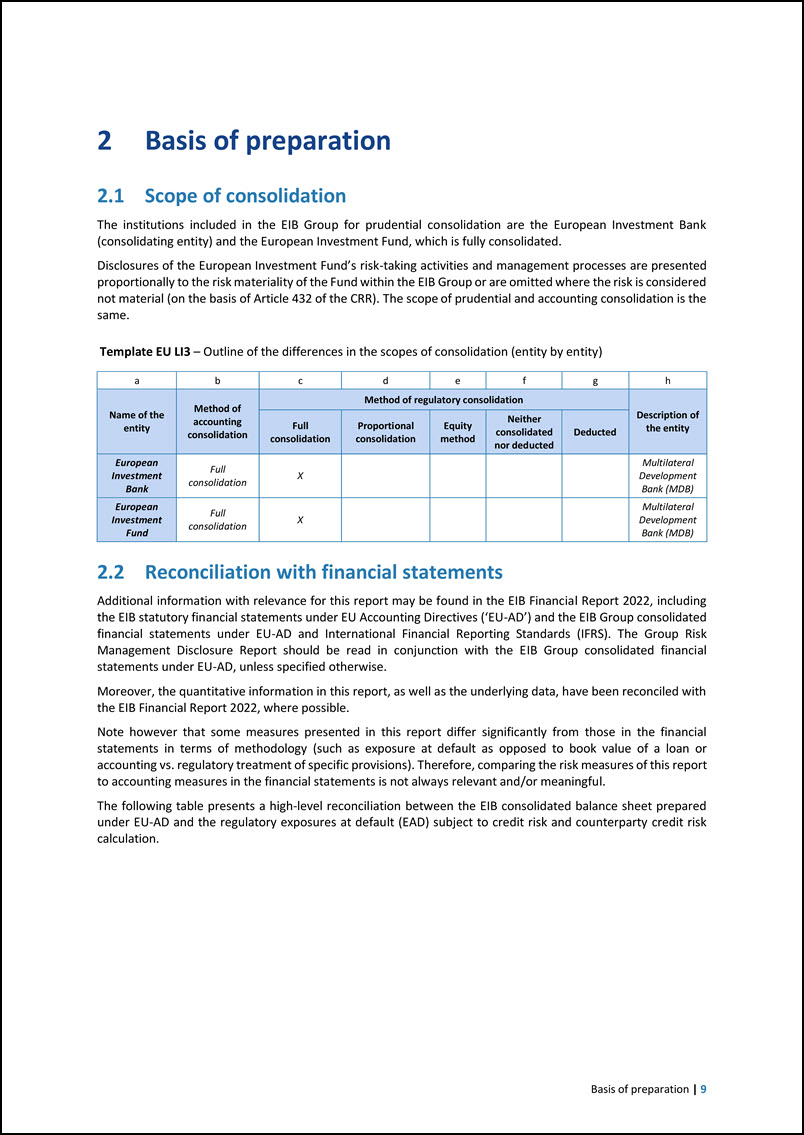
Basis of preparation | 9 Basis of preparation Scope of consolidation The institutions included in the EIB Group for prudential consolidation are the European Investment Bank (consolidating entity) and the European Investment Fund, which is fully consolidated. Disclosures of the European Investment Fund’s risk-taking activities and management processes are presented proportionally to the risk materiality of the Fund within the EIB Group or are omitted where the risk is considered not material (on the basis of Article 432 of the CRR). The scope of prudential and accounting consolidation is the same. Template EU LI3 – Outline of the differences in the scopes of consolidation (entity by entity) a b c d e f g h Name of the entity Method of accounting consolidation Method of regulatory consolidation Description of the entity Full consolidation Proportional consolidation Equity method Neither consolidated nor deducted Deducted European Investment Bank Full consolidation X Multilateral Development Bank (MDB) European Investment Fund Full consolidation X Multilateral Development Bank (MDB) 2.2 Reconciliation with financial statements Additional information with relevance for this report may be found in the EIB Financial Report 2022, including the EIB statutory financial statements under EU Accounting Directives (‘EU-AD’) and the EIB Group consolidated financial statements under EU-AD and International Financial Reporting Standards (IFRS). The Group Risk Management Disclosure Report should be read in conjunction with the EIB Group consolidated financial statements under EU-AD, unless specified otherwise. Moreover, the quantitative information in this report, as well as the underlying data, have been reconciled with the EIB Financial Report 2022, where possible. Note however that some measures presented in this report differ significantly from those in the financial statements in terms of methodology (such as exposure at default as opposed to book value of a loan or accounting vs. regulatory treatment of specific provisions). Therefore, comparing the risk measures of this report to accounting measures in the financial statements is not always relevant and/or meaningful. The following table presents a high-level reconciliation between the EIB consolidated balance sheet prepared under EU-AD and the regulatory exposures at default (EAD) subject to credit risk and counterparty credit risk calculation.
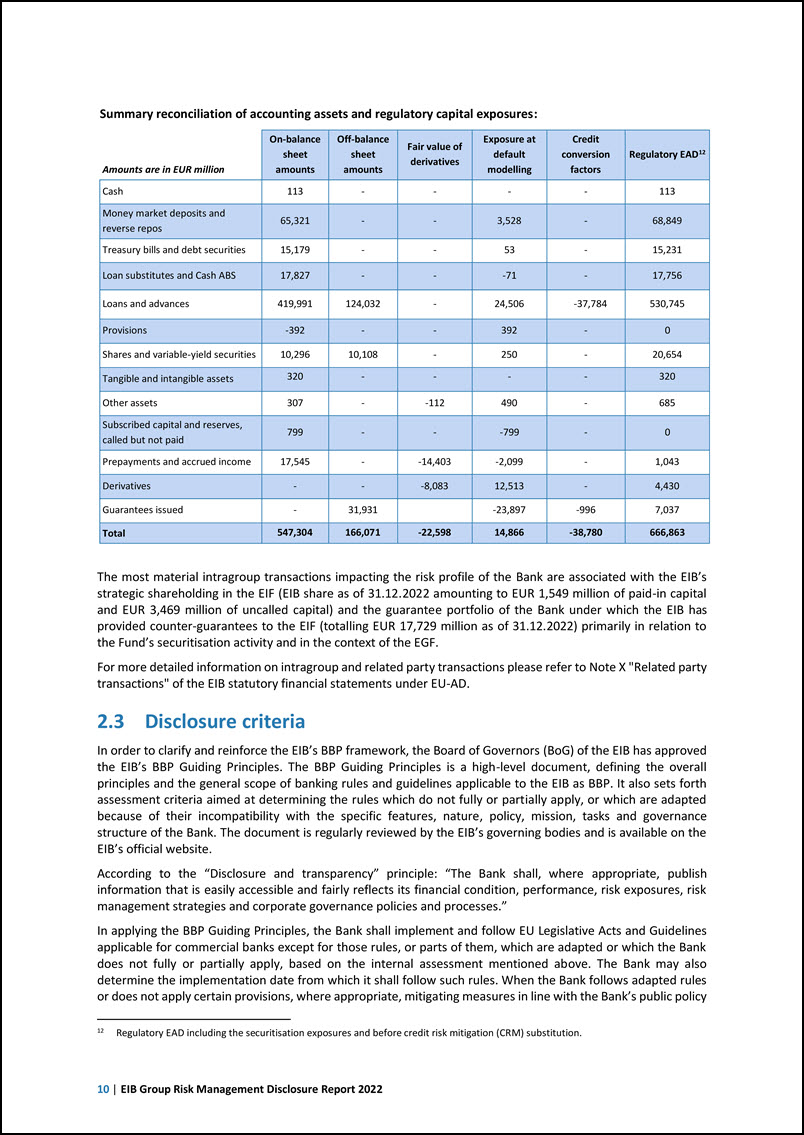
10 | EIB Group Risk Management Disclosure Report 2022 Summary reconciliation of accounting assets and regulatory capital exposures: Amounts are in EUR million On-balance sheet amounts Off-balance sheet amounts Fair value of derivatives Exposure at default modelling Credit conversion factors Regulatory EAD12 Cash 113 - - - - 113 Money market deposits and reverse repos 65,321 - - 3,528 - 68,849 Treasury bills and debt securities 15,179 - - 53 - 15,231 Loan substitutes and Cash ABS 17,827 - - -71 - 17,756 Loans and advances 419,991 124,032 - 24,506 -37,784 530,745 Provisions -392 - - 392 - 0 Shares and variable-yield securities 10,296 10,108 - 250 - 20,654 Tangible and intangible assets 320 - - - - 320 Other assets 307 - -112 490 - 685 Subscribed capital and reserves, called but not paid 799 - - -799 - 0 Prepayments and accrued income 17,545 - -14,403 -2,099 - 1,043 Derivatives - - -8,083 12,513 - 4,430 Guarantees issued - 31,931 -23,897 -996 7,037 Total 547,304 166,071 -22,598 14,866 -38,780 666,863 The most material intragroup transactions impacting the risk profile of the Bank are associated with the EIB’s strategic shareholding in the EIF (EIB share as of 31.12.2022 amounting to EUR 1,549 million of paid-in capital and EUR 3,469 million of uncalled capital) and the guarantee portfolio of the Bank under which the EIB has provided counter-guarantees to the EIF (totalling EUR 17,729 million as of 31.12.2022) primarily in relation to the Fund’s securitisation activity and in the context of the EGF. For more detailed information on intragroup and related party transactions please refer to Note X "Related party transactions" of the EIB statutory financial statements under EU-AD. 2.3 Disclosure criteria In order to clarify and reinforce the EIB’s BBP framework, the Board of Governors (BoG) of the EIB has approved the EIB’s BBP Guiding Principles. The BBP Guiding Principles is a high-level document, defining the overall principles and the general scope of banking rules and guidelines applicable to the EIB as BBP. It also sets forth assessment criteria aimed at determining the rules which do not fully or partially apply, or which are adapted because of their incompatibility with the specific features, nature, policy, mission, tasks and governance structure of the Bank. The document is regularly reviewed by the EIB’s governing bodies and is available on the EIB’s official website. According to the “Disclosure and transparency” principle: “The Bank shall, where appropriate, publish information that is easily accessible and fairly reflects its financial condition, performance, risk exposures, risk management strategies and corporate governance policies and processes.” In applying the BBP Guiding Principles, the Bank shall implement and follow EU Legislative Acts and Guidelines applicable for commercial banks except for those rules, or parts of them, which are adapted or which the Bank does not fully or partially apply, based on the internal assessment mentioned above. The Bank may also determine the implementation date from which it shall follow such rules. When the Bank follows adapted rules or does not apply certain provisions, where appropriate, mitigating measures in line with the Bank’s public policy 12 Regulatory EAD including the securitisation exposures and before credit risk mitigation (CRM) substitution.
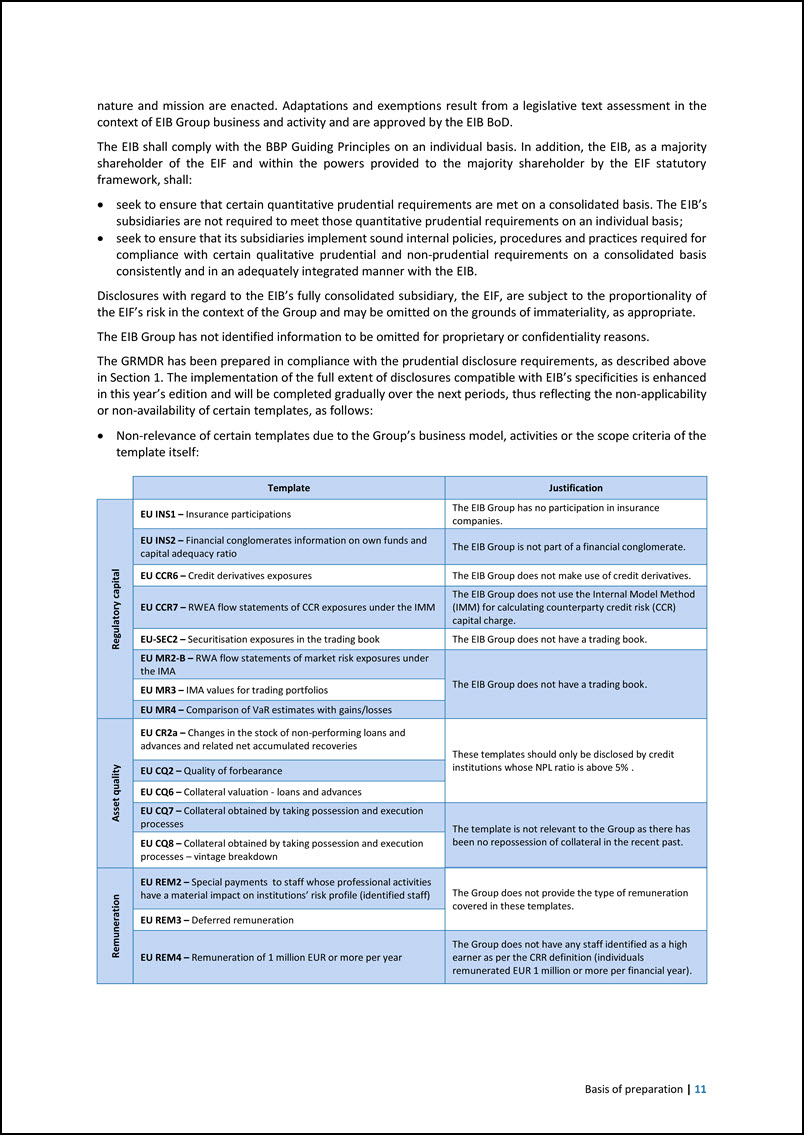
Basis of preparation | 11 nature and mission are enacted. Adaptations and exemptions result from a legislative text assessment in the context of EIB Group business and activity and are approved by the EIB BoD. The EIB shall comply with the BBP Guiding Principles on an individual basis. In addition, the EIB, as a majority shareholder of the EIF and within the powers provided to the majority shareholder by the EIF statutory framework, shall: seek to ensure that certain quantitative prudential requirements are met on a consolidated basis. The EIB’s subsidiaries are not required to meet those quantitative prudential requirements on an individual basis; seek to ensure that its subsidiaries implement sound internal policies, procedures and practices required for compliance with certain qualitative prudential and non-prudential requirements on a consolidated basis consistently and in an adequately integrated manner with the EIB. Disclosures with regard to the EIB’s fully consolidated subsidiary, the EIF, are subject to the proportionality of the EIF’s risk in the context of the Group and may be omitted on the grounds of immateriality, as appropriate. The EIB Group has not identified information to be omitted for proprietary or confidentiality reasons. The GRMDR has been prepared in compliance with the prudential disclosure requirements, as described above in Section 1. The implementation of the full extent of disclosures compatible with EIB’s specificities is enhanced in this year’s edition and will be completed gradually over the next periods, thus reflecting the non-applicability or non-availability of certain templates, as follows: Non-relevance of certain templates due to the Group’s business model, activities or the scope criteria of the template itself: Template Justification Regulatory capital EU INS1 – Insurance participations The EIB Group has no participation in insurance companies. EU INS2 – Financial conglomerates information on own funds and capital adequacy ratio The EIB Group is not part of a financial conglomerate. EU CCR6 – Credit derivatives exposures The EIB Group does not make use of credit derivatives. EU CCR7 – RWEA flow statements of CCR exposures under the IMM The EIB Group does not use the Internal Model Method (IMM) for calculating counterparty credit risk (CCR) capital charge. EU-SEC2 – Securitisation exposures in the trading book The EIB Group does not have a trading book. EU MR2-B – RWA flow statements of market risk exposures under the IMA The EIB Group does not have a trading book. EU MR3 – IMA values for trading portfolios EU MR4 – Comparison of VaR estimates with gains/losses Asset quality EU CR2a – Changes in the stock of non-performing loans and advances and related net accumulated recoveries These templates should only be disclosed by credit institutions whose NPL ratio is above 5% . EU CQ2 – Quality of forbearance EU CQ6 – Collateral valuation - loans and advances EU CQ7 – Collateral obtained by taking possession and execution processes The template is not relevant to the Group as there has been no repossession of collateral in the recent past. EU CQ8 – Collateral obtained by taking possession and execution processes – vintage breakdown Remuneration EU REM2 – Special payments to staff whose professional activities have a material impact on institutions’ risk profile (identified staff) The Group does not provide the type of remuneration covered in these templates. EU REM3 – Deferred remuneration EU REM4 – Remuneration of 1 million EUR or more per year The Group does not have any staff identified as a high earner as per the CRR definition (individuals remunerated EUR 1 million or more per financial year).
12 | EIB Group Risk Management Disclosure Report 2022 Partial non-applicability of templates due to the BBP Guiding Principles - certain templates were adapted by omitting/changing certain lines/columns in order to reflect their incompatibility with the EIB's statutory framework and business model13. Details on the various adaptations are provided in footnotes below the respective templates. Non-availability of templates due to ongoing data implementations/ongoing assessment of compliance with BBP Guiding Principles: EU LI1 – Differences between accounting and regulatory scopes of consolidation and mapping of financial statement categories with regulatory risk categories EU LI2 – Main sources of differences between regulatory exposure amounts and carrying values in financial statements EU LR1 – LRSum: Summary reconciliation of accounting assets and leverage ratio exposures EU CCR5 – Composition of collateral for CCR exposures EU CR3 – CRM techniques overview: Disclosure of the use of credit risk mitigation techniques EU CR8 – RWEA flow statements of credit risk exposures under the IRB approach EU IRRBB1 – Interest rate risk of non-trading book activities EU ESG 1 – Banking book- Climate Change transition risk: Credit quality of exposures by sector, emissions and residual maturity EU ESG 2 – Banking book - Climate change transition risk: Loans collateralised by immovable property - Energy efficiency of the collateral EU ESG 4 – Climate change transition risk: Exposures to top 20 carbon-intensive firms EU ESG 5 – Climate change physical risk: Exposures subject to physical risk EU ESG 10 – Other climate change mitigating actions that are not covered in the EU Taxonomy Frequency, extent and means of disclosures The content of the disclosures in this report follows the one specified in Article 433a of the CRR. As an adaptation following its BBP Guiding Principles available on the EIB’s official website, the EIB Group will disclose information on a semi-annual basis compared to the quarterly frequency provided for by CRR, as amended, with the first semi-annual disclosure report to be issued for the June 2023 reference date. The disclosures are published as soon as practically possible after the publication of the respective consolidated financial statements under EU-AD. The current and all previous GRMDRs are available on the EIB’s official website. EIB Group Risk Management Disclosure Policy The GRMD Report is prepared in accordance with the EIB Group Risk Management Disclosure Policy (“the Policy”) disciplining the EIB Group’s approach for complying with the risk management best practice public disclosure requirements, as applicable to the EIB Group, the approval process and governance of preparation of disclosure. Approval process This report and its external publication have been approved by the EIB BoD on the basis of a proposal by the EIB’s Management Committee (‘MC’) and upon recommendation of the EIB Board Committee on Risk Policy (hereinafter ‘RPC’ or ‘Risk Policy Committee’). In parallel to the EIB BoD, the report is also distributed for information and discussion to the EIB’s Audit Committee (‘AC’). Any AC recommendations thereon are taken into account for the next reporting iteration. 13 For instance, the data used to populate the disclosure templates are based on the statutory or consolidated accounts which are produced under EU-AD accounting standards. Consequently, certain parts of the templates designed to capture IFRS specific accounting elements/concepts are not applicable.

Basis of preparation | 13 The general approval process of this report entails thorough consultation with the EIF and the participation of its representatives in the main steps of the process, notably in the discussions and approvals at the level of the EIB’s governing bodies.
14 | EIB Group Risk Management Disclosure Report 2022 Governance and risk management This chapter provides an overview of the EIB Group’s risk governance structure, outlining the key roles and responsibilities regarding risk-taking and oversight in the Group, as well as its key governance arrangements. Risk management structure and organisation Both the EIB and the EIF have established their risk management functions responsible for risk management on an institutional level and in respect of financial and non-financial risks. Each EIB Group entity has defined specific risk management policies, procedures and controls in line with the Group Risk Management Charter (‘GRMC’) and any applicable Group risk management policies, described below. Group Risk Management Charter and Framework The GRMC codifies the sound principles-based approach to risk management to ensure that Group Risks are managed in an effective and consistent manner and defines the Group Risk Management Framework (‘GRMF’). The GRMF, extending across all relevant business lines of the EIB Group, aims to fully recognise the economic substance of all EIB Group risk exposures and to enable the Group to make fully informed decisions on risk-taking. The GRMC sets out key principles of the GRMF aimed at ensuring that all Group Risks are overseen and managed in an effective and consistent manner. The GRMC applies on an individual basis and on a consolidated basis, which means the situation as if the EIB formed together with its subsidiaries (entities controlled by the EIB) a single entity (“on a consolidated basis”). The procedural and organisational aspects are implemented by GRMC implementing provisions, approved by the EIB and the EIF. The following principles, as defined by the GRMC, are the fundamentals of the Group Risk Management Framework and shall be adhered to at all times: Risk culture: The Group promotes a sound risk culture in the performance of its activities. Best banking practice: The Group operates in adherence to best banking practice applicable to it. Risk appetite framework: Risk awareness and sustainability of the business model of the Group are supported by the application of the Group Risk Appetite Framework (Group RAF). Risk management policies, procedures, risk limits and controls: The EIB as the parent entity sets and oversees risk management policies, procedures, risk limits and controls related to Group Risks and commensurate with entities’ respective statutes and activities, in compliance with the principles of the Charter. Proactive, adaptive and ongoing risk management: Each institution continuously identifies, assesses, measures, monitors, mitigates and reports risks inherent to its activities. Capital and liquidity adequacy: Strategic decision-making shall be supported by a comprehensive and forward-looking view of the Group’s capital and liquidity resources in relation to its risk profile and operating environment. Information exchange, risk reporting and data aggregation: Appropriate arrangements shall be in place to enable the exchange and aggregation of information and data across the Group for the purposes of sound and effective risk management. Organisational structure functions The EIB Group Risk and Compliance Directorate (‘GR&C’), created during 2021 by reorganising the risk and compliance functions, is responsible for both financial risks and non-financial risks relating to the EIB Group’s business. The Directorate independently identifies, assesses, monitors and reports on the risks to which the Group is exposed in its capacity as an independent second line of defence with direct access to the Bank’s governing bodies.
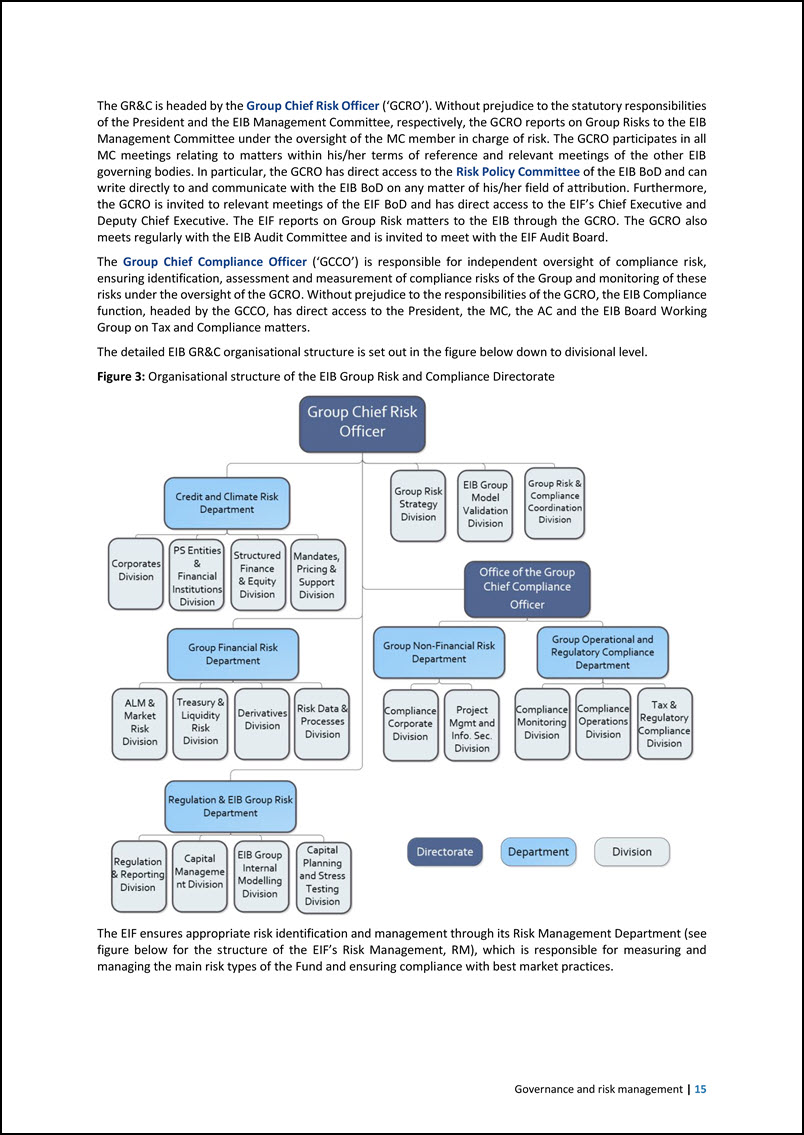
Governance and risk management | 15 The GR&C is headed by the Group Chief Risk Officer (‘GCRO’). Without prejudice to the statutory responsibilities of the President and the EIB Management Committee, respectively, the GCRO reports on Group Risks to the EIB Management Committee under the oversight of the MC member in charge of risk. The GCRO participates in all MC meetings relating to matters within his/her terms of reference and relevant meetings of the other EIB governing bodies. In particular, the GCRO has direct access to the Risk Policy Committee of the EIB BoD and can write directly to and communicate with the EIB BoD on any matter of his/her field of attribution. Furthermore, the GCRO is invited to relevant meetings of the EIF BoD and has direct access to the EIF’s Chief Executive and Deputy Chief Executive. The EIF reports on Group Risk matters to the EIB through the GCRO. The GCRO also meets regularly with the EIB Audit Committee and is invited to meet with the EIF Audit Board. The Group Chief Compliance Officer (‘GCCO’) is responsible for independent oversight of compliance risk, ensuring identification, assessment and measurement of compliance risks of the Group and monitoring of these risks under the oversight of the GCRO. Without prejudice to the responsibilities of the GCRO, the EIB Compliance function, headed by the GCCO, has direct access to the President, the MC, the AC and the EIB Board Working Group on Tax and Compliance matters. The detailed EIB GR&C organisational structure is set out in the figure below down to divisional level. Figure 3: Organisational structure of the EIB Group Risk and Compliance Directorate The EIF ensures appropriate risk identification and management through its Risk Management Department (see figure below for the structure of the EIF’s Risk Management, RM), which is responsible for measuring and managing the main risk types of the Fund and ensuring compliance with best market practices.
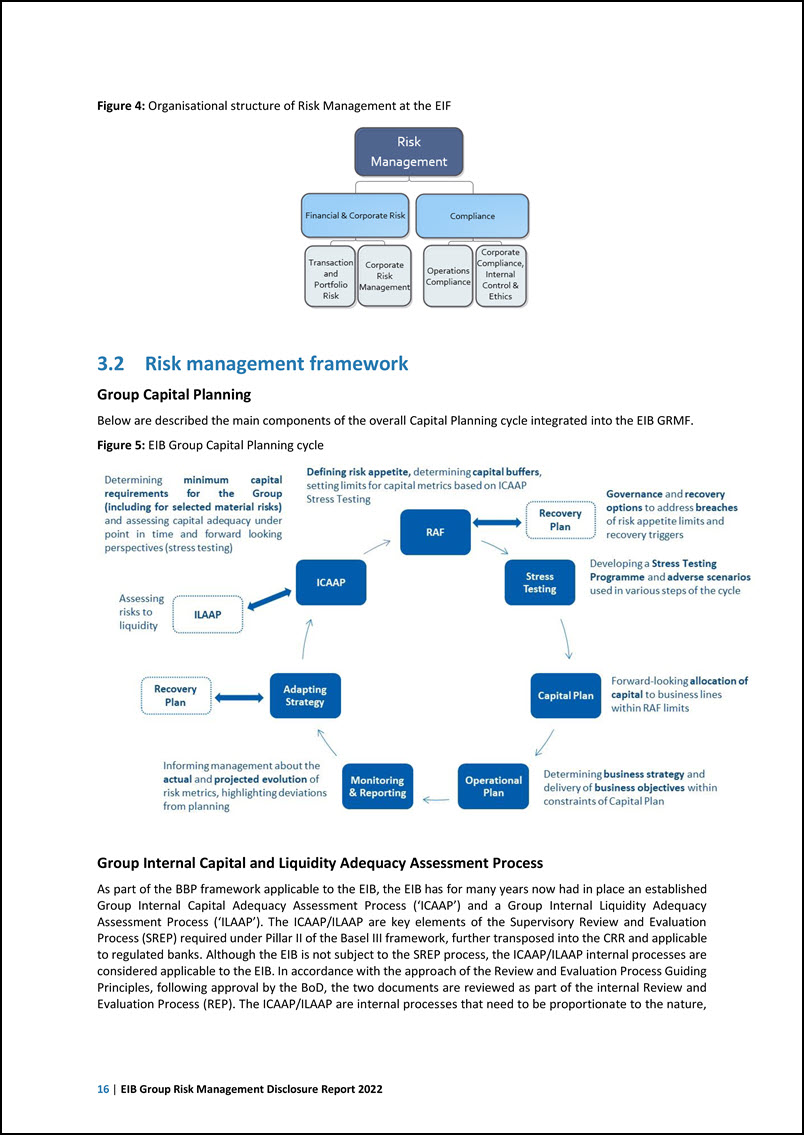
16 | EIB Group Risk Management Disclosure Report 2022 Figure 4: Organisational structure of Risk Management at the EIF 3.2 Risk management framework Group Capital Planning Below are described the main components of the overall Capital Planning cycle integrated into the EIB GRMF. Figure 5: EIB Group Capital Planning cycle Group Internal Capital and Liquidity Adequacy Assessment Process As part of the BBP framework applicable to the EIB, the EIB has for many years now had in place an established Group Internal Capital Adequacy Assessment Process (‘ICAAP’) and a Group Internal Liquidity Adequacy Assessment Process (‘ILAAP’). The ICAAP/ILAAP are key elements of the Supervisory Review and Evaluation Process (SREP) required under Pillar II of the Basel III framework, further transposed into the CRR and applicable to regulated banks. Although the EIB is not subject to the SREP process, the ICAAP/ILAAP internal processes are considered applicable to the EIB. In accordance with the approach of the Review and Evaluation Process Guiding Principles, following approval by the BoD, the two documents are reviewed as part of the internal Review and Evaluation Process (REP). The ICAAP/ILAAP are internal processes that need to be proportionate to the nature,
Governance and risk management | 17 scale and complexity of the activities of a financial institution for respectively assessing solvency and liquidity adequacy of an institution. In alignment with BBP, the EIB Group has put in place effective and comprehensive strategies and processes to assess and maintain adequate capital levels to cover the nature and level of the risks to which it is exposed. The ICAAP is an integral part of the overall risk management framework of the EIB Group, supports EIB Group’s strategic decision-making and ensures that the institution - in line with its risk appetite - maintains adequate capitalisation on an ongoing basis. A regular risk identification and assessment process is in place, aimed at ensuring that the Group identifies all of the risks to which it is exposed in the pursuit of its business. The Group assesses these identified risks in terms of materiality and incorporates these, as opportune, into stress testing, capitalisation and liquidity buffering as needed, hence feeding the ILAAP and ICAAP processes. The EIBG’s ICAAP – having in scope the Group and its constituent entities – provides an overview of the capital adequacy assessment from point-in-time and forward-looking perspectives (five-year horizon) under both baseline and adverse scenarios. It includes the monitoring of relevant metrics to identify and assess potential vulnerabilities for capitalisation in a timely fashion, drawing practical conclusions and measures to ensure that the EIB Group’s own funds remain adequate in relation to the risks to which the EIB Group is exposed. The EIB Group ICAAP provides insight and facilitates the Group´s strategic decision-making through the Group Operational Plan (Group OP) process and within the GRMF. The Group ILAAP process is described in greater detail under Section 9.2. The governance process regarding the approval of the Group ICAAP is similar to that of the disclosure report described in Section 2.6 and in compliance with the Group Risk approval process. Upon the recommendation of the RPC, the BoD ultimately approves the Group ICAAP/ILAAP documents at least annually. The Group ICAAP/ILAAP documents are also distributed for information and discussion to the EIB’s AC and additionally, the Group ILAAP to the Central Bank of Luxembourg (‘BCL’). Any AC or BCL recommendations thereon are taken into account for the next reporting iteration. In line with the applicable regulations and the three lines of defence model applied by the EIB Group, the Group ICAAP/ILAAP processes are subject to an annual review by Internal Audit and the internal models which are part of their production undergo a regular model validation process in line with the EIB Group´s corresponding policy. Risk Appetite Framework The EIB Group’s risk appetite is articulated in the Group Risk Appetite Statement (‘Group RAS’) document, which communicates to management and governing bodies of all Group entities, employees and other key stakeholders, the risk profile the EIB Group is willing to assume in the pursuit of its strategy. The main building blocks through which the Group RAS is derived and embedded are listed below: Stakeholders’ expectations and public mission; Strategy and business models of the Group entities; Risk Identification process; Risk Appetite Statement; The Group’s risk appetite setting process starts with the identification of its main stakeholders and their respective expectations. Subsequently, the process entails the assessment of the Group entities’ long-term policy objectives and business models in conjunction with the identification and assessment of the main risk categories to which the Group is exposed, which is then articulated into the Group RAS and the related risk metrics. The core of the Group’s business model is to provide financing on attractive terms to promote the attainment of the European Commission’s policy objectives in which the Group entities play an integral and essential role. The EIB mainly funds itself through the capital markets on relatively attractive terms and it (partly) passes on its attractive funding cost to clients by offering debt and equity-type financing either directly or via intermediated channels.
18 | EIB Group Risk Management Disclosure Report 2022 The EIF finances its activities out of its capital base and through third-party mandates and cooperation schemes with public and private counterparts, including the EIB and the European Union, represented by the European Commission. In addition, the EIF strives at contributing to: the development and stabilisation of the targeted financial markets; and the emergence of standards and/or practices which enhance the competitiveness, transparency and credibility of the targeted markets. The Group originates business either (a) at its own risk; (b) through a risk-sharing mechanism by which a third party (for example the European Commission, Member States) provides credit enhancement to the Bank and/or to the EIF; or (c) on behalf of third parties at their own risk. A large part of the Bank’s loan portfolio is secured through credit guarantees and collateral or recourse to EU Member States. Exposures to the latter benefit from the EIB’s Preferred Creditor Status (‘PCS’) based on international law practice and the EIB’s statutory framework14. Furthermore the EIB Group mobilises additional funds from other parties (private investors, European Commission, Member States) to maximise the financing impact within the scope of the EU policy goals. In this catalysing role, the Group thereby creates a multiplier effect. In order to provide financing on attractive terms, the Group needs to maintain broad access to attractive funding from the capital markets by preserving the EIB AAA rating15, which is mainly a function of its capital resources16, asset quality and performance, available liquidity and shareholder’s support. Consequently, for risk appetite purposes, the Group shall operate in such a way as to retain its AAA rating. The Group RAS integrates all the elements described above by stating the level of appetite for the Group by each risk category and by translating these statements into risk metrics and related limits that constitute the Group RAF. For financial risks, quantitative limits are set. For non-financial risks, mainly qualitative limits are set which will evolve to more quantitative limits in the future. Group Risk Appetite Statement17 The EIB Group is committed to retaining its long-term AAA rating, which is a primary pillar of its business model. To this end, the EIB Group has implemented a strong risk management framework supported by a multitude of statutory, regulatory and internally developed risk appetite metrics. As a public financial institution, the Group does not focus on making profits from speculative exposures to risks. As a consequence, the Group does not consider its treasury or funding activities as profit-maximising centres and does not engage in speculative operations. The EIB Group is focused on the stability of earnings and preservation of the economic value of own funds in order to ensure sustainability and self-financing of its growth in the long term. The EIB Group monitors and manages its ability to fulfil this dual objective through related risk appetite metrics. The EIB Group is committed to maintaining its business model and strategy whilst ensuring a robust operating environment with regard to operational, strategic, climate and reputational risks through a strong internal control framework supported by risk appetite metrics capturing a broad range of risks. The EIB Group is committed to doing business in an ethical and fair way with zero tolerance for fraud, money laundering and financing of terrorism and from being used, intentionally or unintentionally, for criminal activities. The EIB Group aligns with best practice anti-money laundering and combating the financing of terrorism standards, promoting high ethical and professional behaviour in the financial sector. For this purpose, the Group promotes a strong compliance and risk culture and manages conduct and compliance risks through an appropriate internal control framework and specific risk appetite metrics. The EIB Group takes concrete actions to counter the rapid growth in ICT (Information and Communications Technology), Information Security and Cyber risks and the increasing severity and impacts that these risks pose to the Group’s business operation and to its reputation towards stakeholders, clients and employees. 14 15 16 17 Except for exposures in the form of debt instruments with collective action clauses. To some extent the preservation of the AAA rating is subject to external parties’ (credit rating agencies’) judgment, hence not entirely under the Group’s control. Commonly measured by credit rating agencies with respect to the consolidated risk position. EIB Group RAS 2022 and Group RAF Policy 2022 were approved by the BoD on 15 June 2022.
Governance and risk management | 19 The EIB Group is committed to preserving the reputation of the Group amongst its stakeholders in line with the highest standards and is monitoring risk appetite metrics related both to external and internal developments, such as media coverage and staff engagement and well-being. The EIB Group is committed to supporting the Paris Agreement in order to limit the impact of climate change and related environmental, economic and social systemic risks. As the climate bank and a leader in climate- related financing, the EIB Group aims to adapt its processes and risk management framework to address the financial and non-financial risks induced by climate change and incorporate climate and environmental risk related considerations into the ongoing management of operations and business priorities. Group Stress Testing Framework As part of the Group Stress Testing Framework, the EIB Group develops a Stress Testing Programme on an annual basis, which identifies the list of stress and sensitivity tests to be performed over a year, by the Group or by each Group entity, and which is approved by the MC and the Chief Executive of the EIF for its relevant parts. Group Recovery Planning The Group Recovery Plan (‘Group RP’) describes how the EIB Group would identify and manage actual and potential crises threatening the Group’s capital adequacy and/or liquidity position. The Group RP covers the recovery stage for both capital adequacy and liquidity indicators (for the latter, reference is made to the Group Contingency Funding Plan (‘Group CFP‘)). It also covers the contingency stage for capital adequacy indicators. The contingency stage for liquidity indicators remains in the scope of the Group CFP. The Group RP complements the Group RAF as it elaborates on a range of contingency and recovery options and actions in response to breaches of risk appetite limits/recovery triggers, in order to avoid exceeding the Group’s risk capacity. Group Capital Sustainability Policy The Group Capital Sustainability Policy (‘GCSP’) aims to ensure that the Group’s business strategy remains sustainable from a capital perspective. Under normal (non-stress) conditions, capital adequacy is aligned to capital sustainability as defined in the GCSP. Under stressed conditions, however, capital adequacy may still be ensured (breaching risk appetite, but complying with risk capacity limits) while capital sustainability could be breached. In such case, the EIB Group will take the requisite management actions to bring the Group’s risk profile back within risk appetite and restore sustainability from a GCSP perspective (for example, by operationalising the measures provided for in the Group RP). Group Risk Reporting The GCRO is responsible for overseeing internal risk reporting to the MC, the BoD, the RPC and the AC. Several risk reporting processes are in place within the EIB Group to support managerial decisions with a focus on the various risks and limit monitoring. Based on the function, risk monitored, audience and purpose, different reports have a customised level of detail and are produced with frequencies ranging from daily to quarterly as needed. An overarching Group Risk Report provides to senior management the overview over the Group‘s financial and non-financial risks, including monthly monitoring of Group and entity-level RAF metrics. Quarterly and monthly versions of this report provide different levels of detail to management and support managerial decision-making for the governing bodies of the EIB (MC and BoD). The report is also provided to and discussed at the RPC and AC on a regular basis. The EIB Group aims at complying with BCBS (Basel Committee on Banking Supervision) 239 principles in its risk reporting activity.
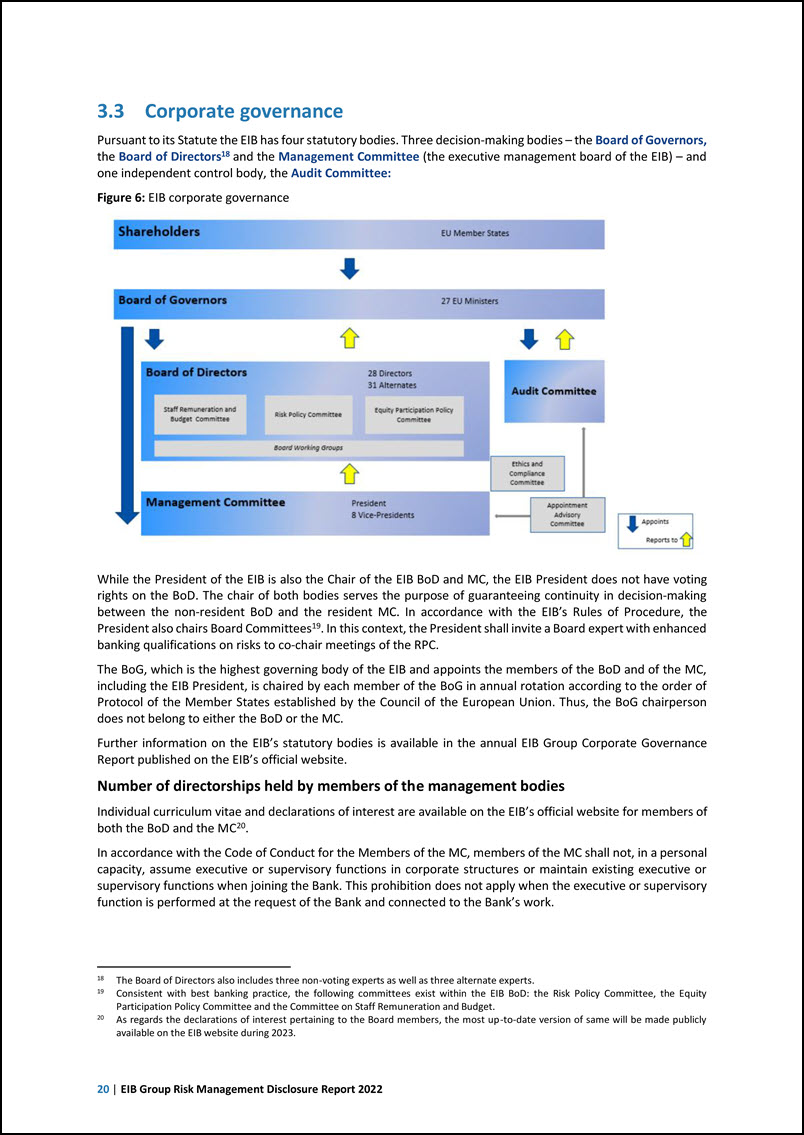
20 | EIB Group Risk Management Disclosure Report 2022 3.3 Corporate governance Pursuant to its Statute the EIB has four statutory bodies. Three decision-making bodies – the Board of Governors, the Board of Directors18 and the Management Committee (the executive management board of the EIB) – and one independent control body, the Audit Committee: Figure 6: EIB corporate governance While the President of the EIB is also the Chair of the EIB BoD and MC, the EIB President does not have voting rights on the BoD. The chair of both bodies serves the purpose of guaranteeing continuity in decision-making between the non-resident BoD and the resident MC. In accordance with the EIB’s Rules of Procedure, the President also chairs Board Committees19. In this context, the President shall invite a Board expert with enhanced banking qualifications on risks to co-chair meetings of the RPC. The BoG, which is the highest governing body of the EIB and appoints the members of the BoD and of the MC, including the EIB President, is chaired by each member of the BoG in annual rotation according to the order of Protocol of the Member States established by the Council of the European Union. Thus, the BoG chairperson does not belong to either the BoD or the MC. Further information on the EIB’s statutory bodies is available in the annual EIB Group Corporate Governance Report published on the EIB’s official website. Number of directorships held by members of the management bodies Individual curriculum vitae and declarations of interest are available on the EIB’s official website for members of both the BoD and the MC20. In accordance with the Code of Conduct for the Members of the MC, members of the MC shall not, in a personal capacity, assume executive or supervisory functions in corporate structures or maintain existing executive or supervisory functions when joining the Bank. This prohibition does not apply when the executive or supervisory function is performed at the request of the Bank and connected to the Bank’s work. 18 19 20 The Board of Directors also includes three non-voting experts as well as three alternate experts. Consistent with best banking practice, the following committees exist within the EIB BoD: the Risk Policy Committee, the Equity Participation Policy Committee and the Committee on Staff Remuneration and Budget. As regards the declarations of interest pertaining to the Board members, the most up-to-date version of same will be made publicly available on the EIB website during 2023.

Governance and risk management | 21 In accordance with their respective Codes of Conduct, members of both the MC and of the BoD shall disclose to the Ethics and Compliance Committee (ECC) any official or professional position they hold at the time of their appointment, as well as any subsequent changes thereto. Information regarding the recruitment policy for the selection of members of the management bodies and their actual knowledge, skills and expertise The Appointment Advisory Committee, pursuant to Articles 23.a.2 and 27.8 of the Rules of Procedure of the EIB, shall give an opinion on candidates' suitability to perform the duties of a member of the EIB MC (or those of a full member or observer of the EIB AC) before the Board of Governors makes the statutory appointment. In the context of the assessment of the collective knowledge and expertise of the MC pursuant to the Operating Rules of the Appointment Advisory Committee, the Committee shall consult the President of the Bank for nominations to the MC on any potential specific need within the MC, at the time of appointment. The Secretary General shall inform the nominating Member State of any such specific need within the MC, at the time of a vacancy. In accordance with the Statute of the Bank, the EIB’s Board of Directors consists of 28 directors and 31 alternate directors who shall be chosen from persons whose independence and competence are beyond doubt and appointed by the BoG for a collective five-year mandate that is renewable. To broaden its professional expertise, the BoD has made use of the possibility of co-opting non-voting experts (three non-voting experts as well as three alternate experts). The end of their mandate coincides with that of the entire BoD. In accordance with Article 23.a, first paragraph, of the Rules of Procedure of the Bank, the members of the MC shall be persons of independence and competence and have experience in financial, banking and/or EU matters. They shall at all times be of sound integrity and enjoy high reputation, and possess sufficient knowledge, skills and expertise to perform their duties. Information on the knowledge, skills and expertise of members of the EIB management bodies is available in their individual curriculum vitae on the EIB’s website. Information on the diversity21 policies with regard to the members of the management bodies In accordance with the Rules of Procedure of the Bank, the overall composition of the BoD and of the MC shall aim to reflect an adequately broad range of expertise as well as gender diversity. Gender diversity in the BoD is reported in Annex 2 to the annual EIB Group Corporate Governance Report available on the EIB’s website. Risk Policy Committee Within the BoD, the Risk Policy Committee (RPC) is the EIB’s risk committee, composed of nine members of the BoD, appointed by the BoD on a proposal by the Chairman of the BoD. Its role is to discuss and advise the BoD on the Bank’s risk policies, including those policies relevant for aspects of the EIB Group regarding risk appetite, tolerance and strategy. The RPC provides non-binding opinions and/or recommendations to the BoD so as to facilitate the decision-making process of the BoD. More specifically, the Committee advises the BoD on the EIB’s policies regarding overall risk appetite, tolerance and strategy by reviewing the EIB Group Risk Management Framework with respect to credit, market and liquidity risks. It provides opinions and recommendations to the BoD as to whether the policies related to identification, assessment and management of risks are appropriate to the Bank's risk profile. Furthermore, it discusses policies associated with all risks relevant to the EIB Group. The Committee advises the BoD on risk policies by reviewing and providing opinions and/or recommendations to the BoD on the following high-level risk policy documents upon proposal from the Bank: 21 Reflecting the EIB statutory framework, the process and rules relating to the nomination and appointment of the members of the EIB governance bodies are all not based on the same suitability requirements applicable to commercial banks, in this case the requirements of diversity in the CRD and in the joint European Securities and Markets Authority (ESMA) and European Banking Authority (EBA) Guidelines on the assessment of the suitability of members of the management body and key function holders; hence, no diversity policy as such is in place in that regard.
22 | EIB Group Risk Management Disclosure Report 2022 Group Risk Management Charter; Group Capital Sustainability Policy; Group Risk Appetite Framework; Group Internal Capital Adequacy Assessment Process (‘ICAAP’); Group Internal Liquidity Adequacy Assessment Process (‘ILAAP’); Group Contingency Funding Plan; Group Recovery Plan; Group Stress Testing Framework. The Committee also reviews and discusses: The Group Capital Plan, and recommends the capital allocation part of the Operational Plan; The EIB Group Risk Report on a quarterly basis; The annual report prepared by the Bank on the implemented restructurings of existing operations; The main changes to the Credit Risk Guidelines (CRGs) and Financial Risk Guidelines (FRGs) as approved from time to time by the MC of the Bank; Any written contributions submitted to it by the GCRO, in accordance with Article 11.3 of the Rules of Procedure. Further details on the RPC Terms of Reference are available on the EIB’s website. In the course of 2022, the RPC met eight times. Three lines of defence The EIB Group’s internal control functions and risk management systems are consistent with the three lines of defence model. As a first line of defence, the front units are responsible, within their respective areas, for managing risks within the established set of limits and boundaries. Amongst other functions, the second line of defence includes the respective Risk Management and Compliance functions as well as IT resources. Financial Control as a second line of defence function is responsible for the maintenance, development and oversight of the internal control framework. The second line of defence also includes functions in the EIB's Projects Directorate and the Legal Directorate. The third line of defence is ensured by the Internal Audit function which provides an independent review of the risk management practices and internal control framework and reports to the AC or to the EIF's Audit Board, as relevant. At both the EIB and the EIF, the segregation of duties is supported by the fact that internal control functions are separate functions, each having direct access to the relevant executive body (President/MC for the EIB, Chief Executive for the EIF) and to the BoD. Furthermore, the Audit Committee finalised during the year the implementation of an internal and specific review and evaluation process (the “EIB REP”). Since March 2021, this process has been framed by the EIB’s Review and Evaluation Guiding Principles, which were complemented by implementing rules and a methodology specific to the EIB Group. Globally, this framework is based on the European Banking Authority’s Guidelines on the Supervisory Review and Evaluation Process, while considering the EIB’s specific nature, policy mission, tasks and governance structure. The EIB REP supports the AC in its role to ensure that the Bank complies with applicable BBP.
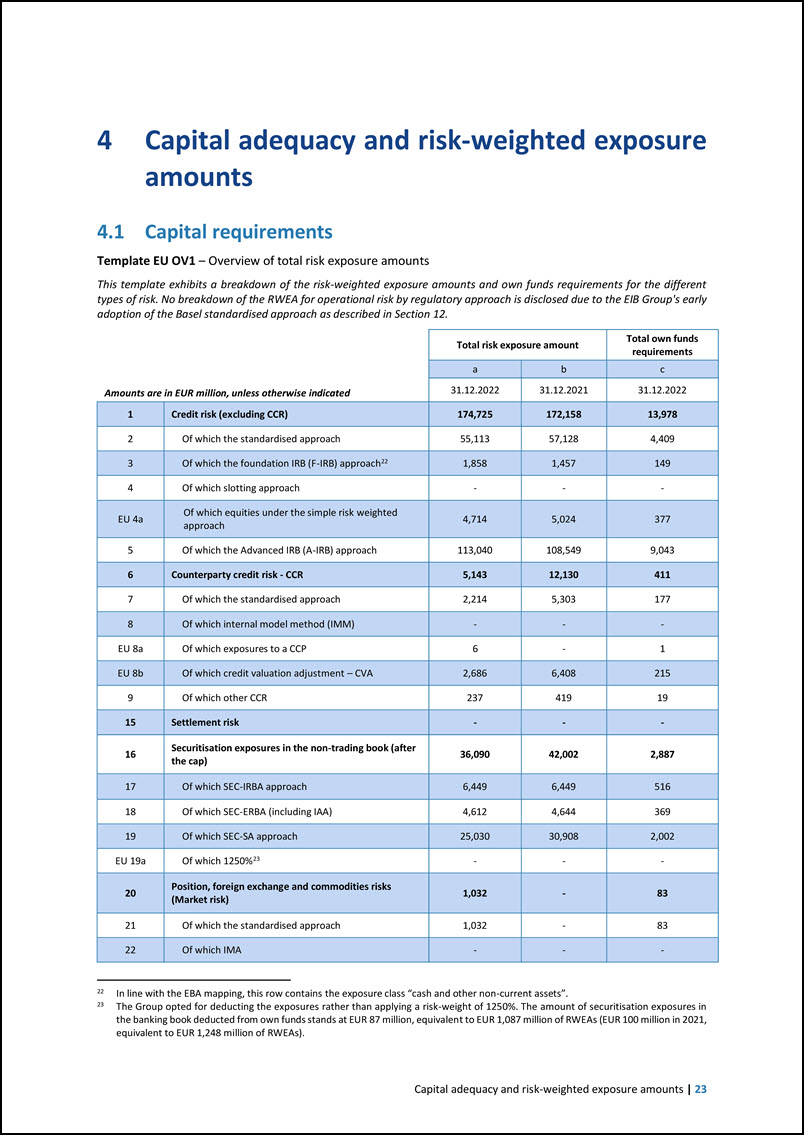
Capital adequacy and risk-weighted exposure amounts | 23 Capital adequacy and risk-weighted exposure amounts Capital requirements Template EU OV1 – Overview of total risk exposure amounts This template exhibits a breakdown of the risk-weighted exposure amounts and own funds requirements for the different types of risk. No breakdown of the RWEA for operational risk by regulatory approach is disclosed due to the EIB Group's early adoption of the Basel standardised approach as described in Section 12. Amounts are in EUR million, unless otherwise indicated Total risk exposure amount Total own funds requirements a b c 31.12.2022 31.12.2021 31.12.2022 1 Credit risk (excluding CCR) 174,725 172,158 13,978 2 Of which the standardised approach 55,113 57,128 4,409 3 Of which the foundation IRB (F-IRB) approach22 1,858 1,457 149 4 Of which slotting approach - - - EU 4a Of which equities under the simple risk weighted approach 4,714 5,024 377 5 Of which the Advanced IRB (A-IRB) approach 113,040 108,549 9,043 6 Counterparty credit risk - CCR 5,143 12,130 411 7 Of which the standardised approach 2,214 5,303 177 8 Of which internal model method (IMM) - - - EU 8a Of which exposures to a CCP 6 - 1 EU 8b Of which credit valuation adjustment – CVA 2,686 6,408 215 9 Of which other CCR 237 419 19 15 Settlement risk - - - 16 Securitisation exposures in the non-trading book (after the cap) 36,090 42,002 2,887 17 Of which SEC-IRBA approach 6,449 6,449 516 18 Of which SEC-ERBA (including IAA) 4,612 4,644 369 19 Of which SEC-SA approach 25,030 30,908 2,002 EU 19a Of which 1250%23 - - - 20 Position, foreign exchange and commodities risks (Market risk) 1,032 - 83 21 Of which the standardised approach 1,032 - 83 22 Of which IMA - - - 22 23 In line with the EBA mapping, this row contains the exposure class “cash and other non-current assets”. The Group opted for deducting the exposures rather than applying a risk-weight of 1250%. The amount of securitisation exposures in the banking book deducted from own funds stands at EUR 87 million, equivalent to EUR 1,087 million of RWEAs (EUR 100 million in 2021, equivalent to EUR 1,248 million of RWEAs).
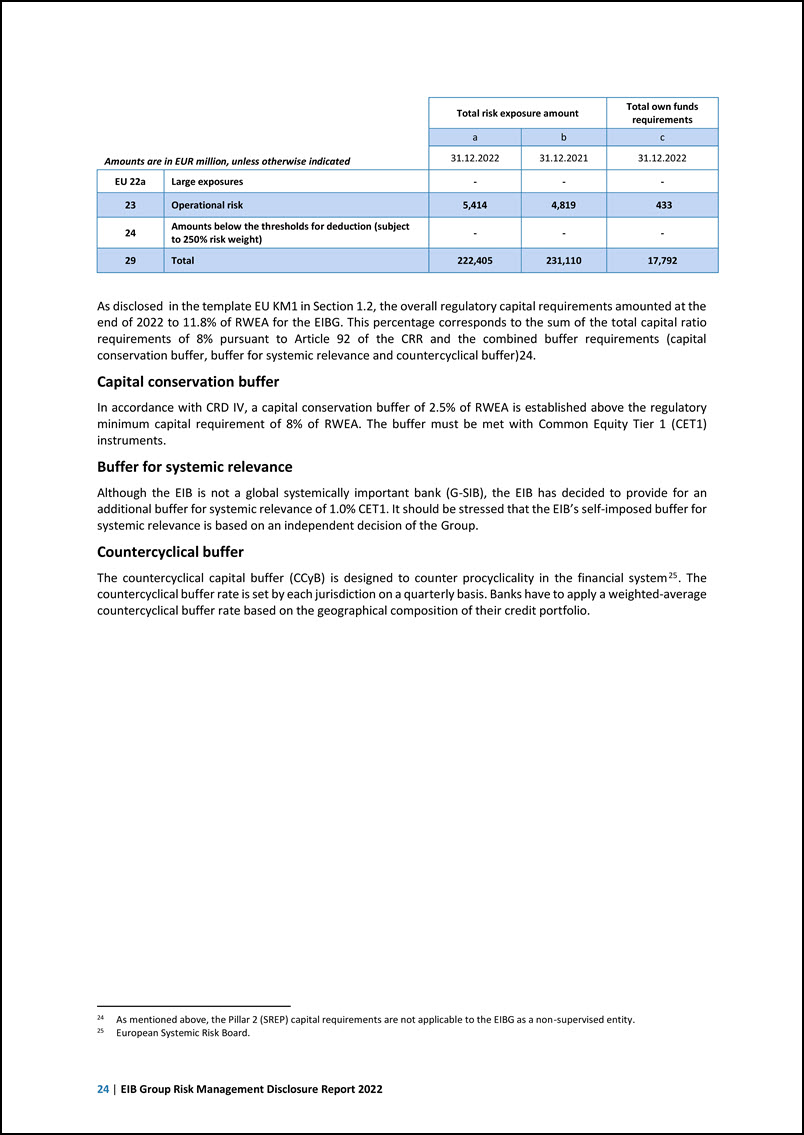
24 | EIB Group Risk Management Disclosure Report 2022 Amounts are in EUR million, unless otherwise indicated Total risk exposure amount Total own funds requirements a b c 31.12.2022 31.12.2021 31.12.2022 EU 22a Large exposures - - - 23 Operational risk 5,414 4,819 433 24 Amounts below the thresholds for deduction (subject to 250% risk weight) - - - 29 Total 222,405 231,110 17,792 As disclosed in the template EU KM1 in Section 1.2, the overall regulatory capital requirements amounted at the end of 2022 to 11.8% of RWEA for the EIBG. This percentage corresponds to the sum of the total capital ratio requirements of 8% pursuant to Article 92 of the CRR and the combined buffer requirements (capital conservation buffer, buffer for systemic relevance and countercyclical buffer)24. Capital conservation buffer In accordance with CRD IV, a capital conservation buffer of 2.5% of RWEA is established above the regulatory minimum capital requirement of 8% of RWEA. The buffer must be met with Common Equity Tier 1 (CET1) instruments. Buffer for systemic relevance Although the EIB is not a global systemically important bank (G-SIB), the EIB has decided to provide for an additional buffer for systemic relevance of 1.0% CET1. It should be stressed that the EIB’s self-imposed buffer for systemic relevance is based on an independent decision of the Group. Countercyclical buffer The countercyclical capital buffer (CCyB) is designed to counter procyclicality in the financial system 25. The countercyclical buffer rate is set by each jurisdiction on a quarterly basis. Banks have to apply a weighted-average countercyclical buffer rate based on the geographical composition of their credit portfolio. 24 25 As mentioned above, the Pillar 2 (SREP) capital requirements are not applicable to the EIBG as a non-supervised entity. European Systemic Risk Board.
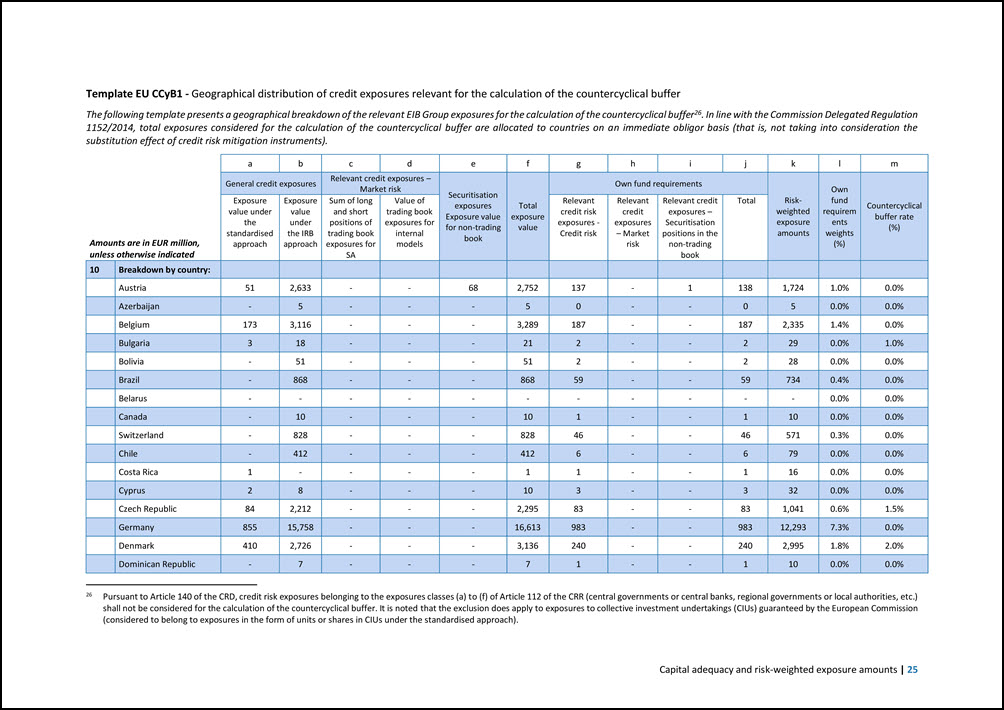
Capital adequacy and risk-weighted exposure amounts | 25 Template EU CCyB1 - Geographical distribution of credit exposures relevant for the calculation of the countercyclical buffer The following template presents a geographical breakdown of the relevant EIB Group exposures for the calculation of the countercyclical buffer26. In line with the Commission Delegated Regulation 1152/2014, total exposures considered for the calculation of the countercyclical buffer are allocated to countries on an immediate obligor basis (that is, not taking into consideration the substitution effect of credit risk mitigation instruments). Amounts are in EUR million, unless otherwise indicated a b c d e f g h i j k l m General credit exposures Relevant credit exposures – Market risk Securitisation exposures Exposure value for non-trading book Total exposure value Own fund requirements Risk- weighted exposure amounts Own fund requirem ents weights (%) Countercyclical buffer rate (%) Exposure value under the standardised approach Exposure value under the IRB approach Sum of long and short positions of trading book exposures for SA Value of trading book exposures for internal models Relevant credit risk exposures - Credit risk Relevant credit exposures – Market risk Relevant credit exposures – Securitisation positions in the non-trading book Total 10 Breakdown by country: Austria 51 2,633 - - 68 2,752 137 - 1 138 1,724 1.0% 0.0% Azerbaijan - 5 - - - 5 0 - - 0 5 0.0% 0.0% Belgium 173 3,116 - - - 3,289 187 - - 187 2,335 1.4% 0.0% Bulgaria 3 18 - - - 21 2 - - 2 29 0.0% 1.0% Bolivia - 51 - - - 51 2 - - 2 28 0.0% 0.0% Brazil - 868 - - - 868 59 - - 59 734 0.4% 0.0% Belarus - - - - - - - - - - - 0.0% 0.0% Canada - 10 - - - 10 1 - - 1 10 0.0% 0.0% Switzerland - 828 - - - 828 46 - - 46 571 0.3% 0.0% Chile - 412 - - - 412 6 - - 6 79 0.0% 0.0% Costa Rica 1 - - - - 1 1 - - 1 16 0.0% 0.0% Cyprus 2 8 - - - 10 3 - - 3 32 0.0% 0.0% Czech Republic 84 2,212 - - - 2,295 83 - - 83 1,041 0.6% 1.5% Germany 855 15,758 - - - 16,613 983 - - 983 12,293 7.3% 0.0% Denmark 410 2,726 - - - 3,136 240 - - 240 2,995 1.8% 2.0% Dominican Republic - 7 - - - 7 1 - - 1 10 0.0% 0.0% 26 Pursuant to Article 140 of the CRD, credit risk exposures belonging to the exposures classes (a) to (f) of Article 112 of the CRR (central governments or central banks, regional governments or local authorities, etc.) shall not be considered for the calculation of the countercyclical buffer. It is noted that the exclusion does apply to exposures to collective investment undertakings (CIUs) guaranteed by the European Commission (considered to belong to exposures in the form of units or shares in CIUs under the standardised approach).
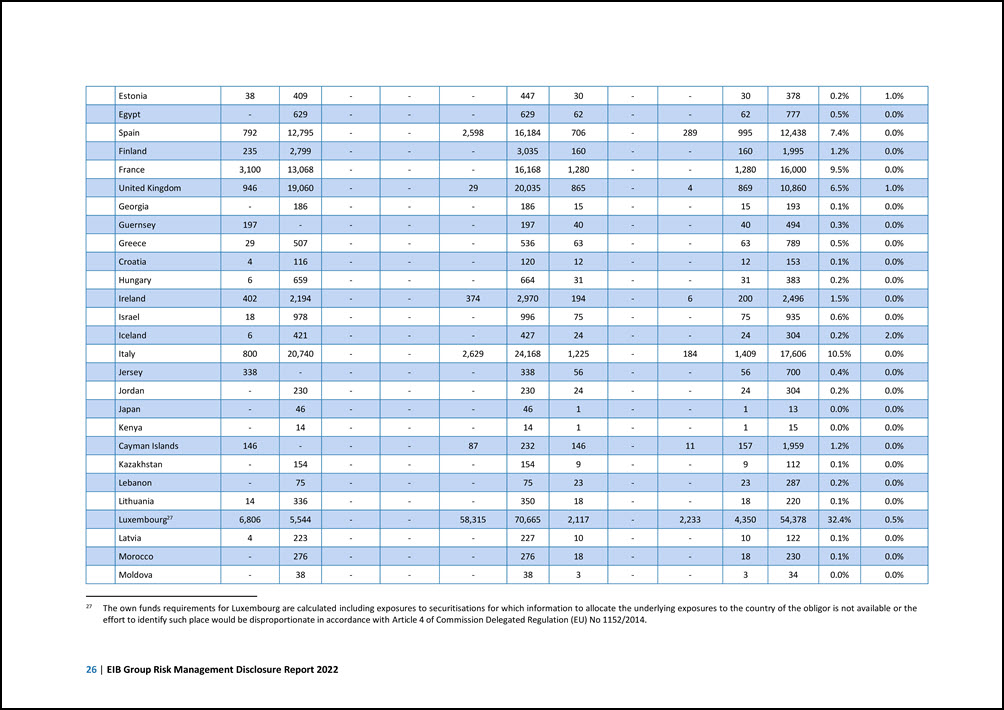
26 | EIB Group Risk Management Disclosure Report 2022 Estonia 38 409 - - - 447 30 - - 30 378 0.2% 1.0% Egypt - 629 - - - 629 62 - - 62 777 0.5% 0.0% Spain 792 12,795 - - 2,598 16,184 706 - 289 995 12,438 7.4% 0.0% Finland 235 2,799 - - - 3,035 160 - - 160 1,995 1.2% 0.0% France 3,100 13,068 - - - 16,168 1,280 - - 1,280 16,000 9.5% 0.0% United Kingdom 946 19,060 - - 29 20,035 865 - 4 869 10,860 6.5% 1.0% Georgia - 186 - - - 186 15 - - 15 193 0.1% 0.0% Guernsey 197 - - - - 197 40 - - 40 494 0.3% 0.0% Greece 29 507 - - - 536 63 - - 63 789 0.5% 0.0% Croatia 4 116 - - - 120 12 - - 12 153 0.1% 0.0% Hungary 6 659 - - - 664 31 - - 31 383 0.2% 0.0% Ireland 402 2,194 - - 374 2,970 194 - 6 200 2,496 1.5% 0.0% Israel 18 978 - - - 996 75 - - 75 935 0.6% 0.0% Iceland 6 421 - - - 427 24 - - 24 304 0.2% 2.0% Italy 800 20,740 - - 2,629 24,168 1,225 - 184 1,409 17,606 10.5% 0.0% Jersey 338 - - - - 338 56 - - 56 700 0.4% 0.0% Jordan - 230 - - - 230 24 - - 24 304 0.2% 0.0% Japan - 46 - - - 46 1 - - 1 13 0.0% 0.0% Kenya - 14 - - - 14 1 - - 1 15 0.0% 0.0% Cayman Islands 146 - - - 87 232 146 - 11 157 1,959 1.2% 0.0% Kazakhstan - 154 - - - 154 9 - - 9 112 0.1% 0.0% Lebanon - 75 - - - 75 23 - - 23 287 0.2% 0.0% Lithuania 14 336 - - - 350 18 - - 18 220 0.1% 0.0% Luxembourg27 6,806 5,544 - - 58,315 70,665 2,117 - 2,233 4,350 54,378 32.4% 0.5% Latvia 4 223 - - - 227 10 - - 10 122 0.1% 0.0% Morocco - 276 - - - 276 18 - - 18 230 0.1% 0.0% Moldova - 38 - - - 38 3 - - 3 34 0.0% 0.0% 27 The own funds requirements for Luxembourg are calculated including exposures to securitisations for which information to allocate the underlying exposures to the country of the obligor is not available or the effort to identify such place would be disproportionate in accordance with Article 4 of Commission Delegated Regulation (EU) No 1152/2014.
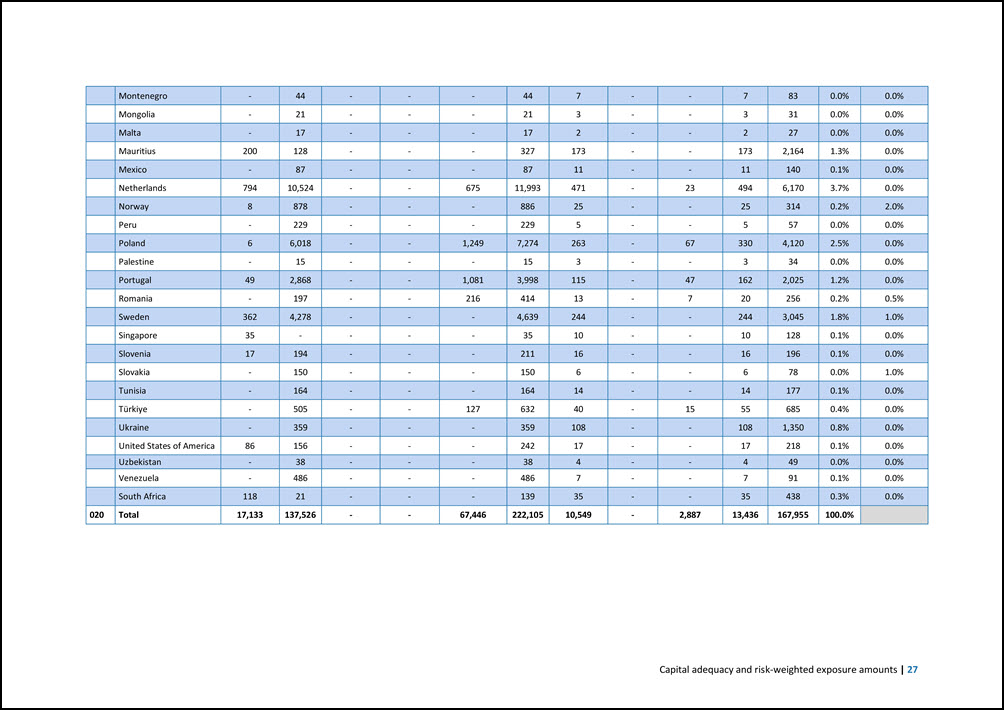
Capital adequacy and risk-weighted exposure amounts | 27 Montenegro - 44 - - - 44 7 - - 7 83 0.0% 0.0% Mongolia - 21 - - - 21 3 - - 3 31 0.0% 0.0% Malta - 17 - - - 17 2 - - 2 27 0.0% 0.0% Mauritius 200 128 - - - 327 173 - - 173 2,164 1.3% 0.0% Mexico - 87 - - - 87 11 - - 11 140 0.1% 0.0% Netherlands 794 10,524 - - 675 11,993 471 - 23 494 6,170 3.7% 0.0% Norway 8 878 - - - 886 25 - - 25 314 0.2% 2.0% Peru - 229 - - - 229 5 - - 5 57 0.0% 0.0% Poland 6 6,018 - - 1,249 7,274 263 - 67 330 4,120 2.5% 0.0% Palestine - 15 - - - 15 3 - - 3 34 0.0% 0.0% Portugal 49 2,868 - - 1,081 3,998 115 - 47 162 2,025 1.2% 0.0% Romania - 197 - - 216 414 13 - 7 20 256 0.2% 0.5% Sweden 362 4,278 - - - 4,639 244 - - 244 3,045 1.8% 1.0% Singapore 35 - - - - 35 10 - - 10 128 0.1% 0.0% Slovenia 17 194 - - - 211 16 - - 16 196 0.1% 0.0% Slovakia - 150 - - - 150 6 - - 6 78 0.0% 1.0% Tunisia - 164 - - - 164 14 - - 14 177 0.1% 0.0% Türkiye - 505 - - 127 632 40 - 15 55 685 0.4% 0.0% Ukraine - 359 - - - 359 108 - - 108 1,350 0.8% 0.0% United States of America 86 156 - - - 242 17 - - 17 218 0.1% 0.0% Uzbekistan - 38 - - - 38 4 - - 4 49 0.0% 0.0% Venezuela - 486 - - - 486 7 - - 7 91 0.1% 0.0% South Africa 118 21 - - - 139 35 - - 35 438 0.3% 0.0% 020 Total 17,133 137,526 - - 67,446 222,105 10,549 - 2,887 13,436 167,955 100.0%
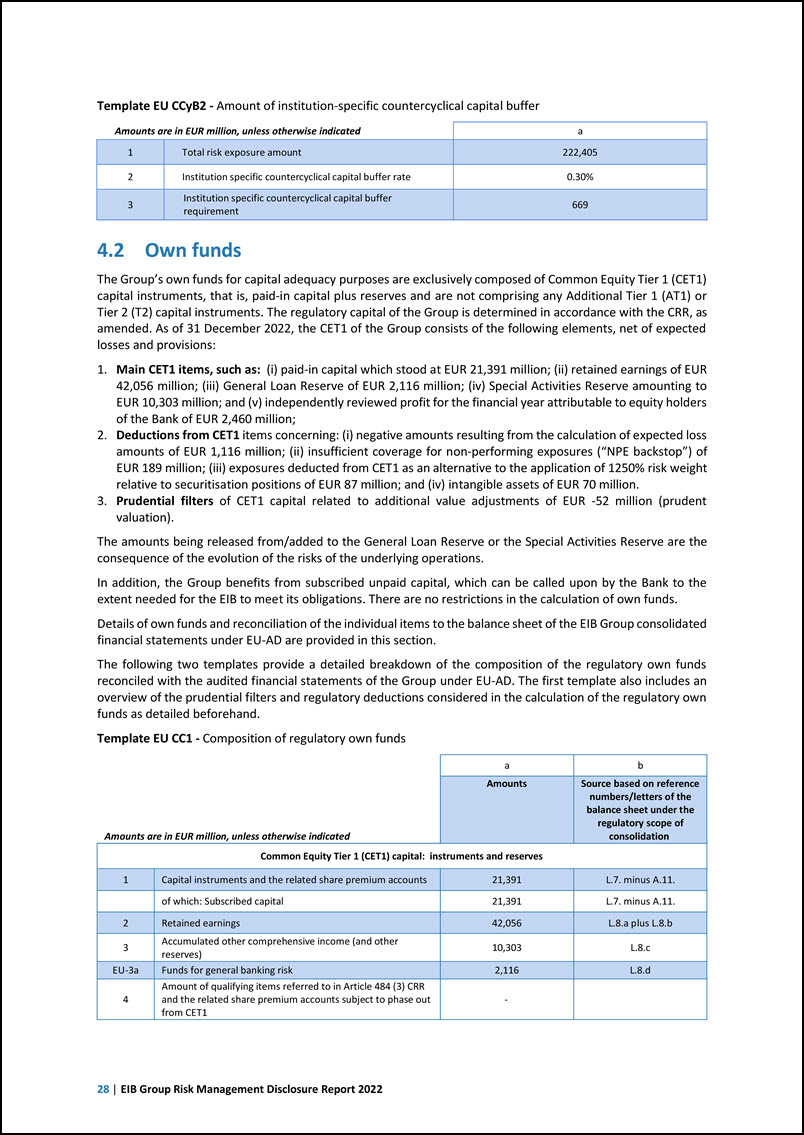
28 | EIB Group Risk Management Disclosure Report 2022 Template EU CCyB2 - Amount of institution-specific countercyclical capital buffer Amounts are in EUR million, unless otherwise indicated a 1 Total risk exposure amount 222,405 2 Institution specific countercyclical capital buffer rate 0.30% 3 Institution specific countercyclical capital buffer requirement 669 4.2 Own funds The Group’s own funds for capital adequacy purposes are exclusively composed of Common Equity Tier 1 (CET1) capital instruments, that is, paid-in capital plus reserves and are not comprising any Additional Tier 1 (AT1) or Tier 2 (T2) capital instruments. The regulatory capital of the Group is determined in accordance with the CRR, as amended. As of 31 December 2022, the CET1 of the Group consists of the following elements, net of expected losses and provisions: Main CET1 items, such as: (i) paid-in capital which stood at EUR 21,391 million; (ii) retained earnings of EUR 42,056 million; (iii) General Loan Reserve of EUR 2,116 million; (iv) Special Activities Reserve amounting to EUR 10,303 million; and (v) independently reviewed profit for the financial year attributable to equity holders of the Bank of EUR 2,460 million; Deductions from CET1 items concerning: (i) negative amounts resulting from the calculation of expected loss amounts of EUR 1,116 million; (ii) insufficient coverage for non-performing exposures (“NPE backstop”) of EUR 189 million; (iii) exposures deducted from CET1 as an alternative to the application of 1250% risk weight relative to securitisation positions of EUR 87 million; and (iv) intangible assets of EUR 70 million. Prudential filters of CET1 capital related to additional value adjustments of EUR -52 million (prudent valuation). The amounts being released from/added to the General Loan Reserve or the Special Activities Reserve are the consequence of the evolution of the risks of the underlying operations. In addition, the Group benefits from subscribed unpaid capital, which can be called upon by the Bank to the extent needed for the EIB to meet its obligations. There are no restrictions in the calculation of own funds. Details of own funds and reconciliation of the individual items to the balance sheet of the EIB Group consolidated financial statements under EU-AD are provided in this section. The following two templates provide a detailed breakdown of the composition of the regulatory own funds reconciled with the audited financial statements of the Group under EU-AD. The first template also includes an overview of the prudential filters and regulatory deductions considered in the calculation of the regulatory own funds as detailed beforehand. Template EU CC1 - Composition of regulatory own funds Amounts are in EUR million, unless otherwise indicated a b Amounts Source based on reference numbers/letters of the balance sheet under the regulatory scope of consolidation Common Equity Tier 1 (CET1) capital: instruments and reserves 1 Capital instruments and the related share premium accounts 21,391 L.7. minus A.11. of which: Subscribed capital 21,391 L.7. minus A.11. 2 Retained earnings 42,056 L.8.a plus L.8.b 3 Accumulated other comprehensive income (and other reserves) 10,303 L.8.c EU-3a Funds for general banking risk 2,116 L.8.d 4 Amount of qualifying items referred to in Article 484 (3) CRR and the related share premium accounts subject to phase out from CET1 -
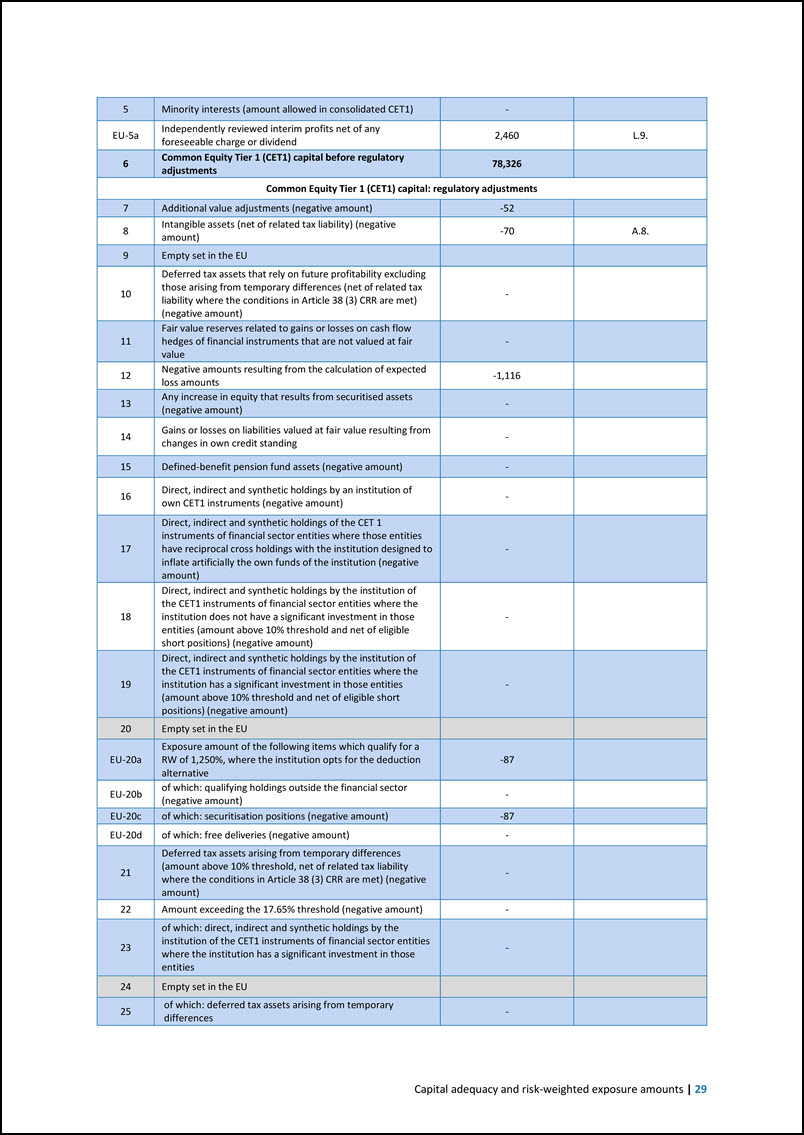
Capital adequacy and risk-weighted exposure amounts | 29 5 Minority interests (amount allowed in consolidated CET1) - EU-5a Independently reviewed interim profits net of any foreseeable charge or dividend 2,460 L.9. 6 Common Equity Tier 1 (CET1) capital before regulatory adjustments 78,326 Common Equity Tier 1 (CET1) capital: regulatory adjustments 7 Additional value adjustments (negative amount) -52 8 Intangible assets (net of related tax liability) (negative amount) -70 A.8. 9 Empty set in the EU 10 Deferred tax assets that rely on future profitability excluding those arising from temporary differences (net of related tax liability where the conditions in Article 38 (3) CRR are met) (negative amount) - 11 Fair value reserves related to gains or losses on cash flow hedges of financial instruments that are not valued at fair value - 12 Negative amounts resulting from the calculation of expected loss amounts -1,116 13 Any increase in equity that results from securitised assets (negative amount) - 14 Gains or losses on liabilities valued at fair value resulting from changes in own credit standing - 15 Defined-benefit pension fund assets (negative amount) - 16 Direct, indirect and synthetic holdings by an institution of own CET1 instruments (negative amount) - 17 Direct, indirect and synthetic holdings of the CET 1 instruments of financial sector entities where those entities have reciprocal cross holdings with the institution designed to inflate artificially the own funds of the institution (negative amount) - 18 Direct, indirect and synthetic holdings by the institution of the CET1 instruments of financial sector entities where the institution does not have a significant investment in those entities (amount above 10% threshold and net of eligible short positions) (negative amount) - 19 Direct, indirect and synthetic holdings by the institution of the CET1 instruments of financial sector entities where the institution has a significant investment in those entities (amount above 10% threshold and net of eligible short positions) (negative amount) - 20 Empty set in the EU EU-20a Exposure amount of the following items which qualify for a RW of 1,250%, where the institution opts for the deduction alternative -87 EU-20b of which: qualifying holdings outside the financial sector (negative amount) - EU-20c of which: securitisation positions (negative amount) -87 EU-20d of which: free deliveries (negative amount) - 21 Deferred tax assets arising from temporary differences (amount above 10% threshold, net of related tax liability where the conditions in Article 38 (3) CRR are met) (negative amount) - 22 Amount exceeding the 17.65% threshold (negative amount) - 23 of which: direct, indirect and synthetic holdings by the institution of the CET1 instruments of financial sector entities where the institution has a significant investment in those entities - 24 Empty set in the EU 25 of which: deferred tax assets arising from temporary differences -

30 | EIB Group Risk Management Disclosure Report 2022 EU-25a Losses for the current financial year (negative amount) - EU-25b Foreseeable tax charges relating to CET1 items except where the institution suitably adjusts the amount of CET1 items insofar as such tax charges reduce the amount up to which those items may be used to cover risks or losses (negative amount) - 26 Empty set in the EU 27 Qualifying AT1 deductions that exceed the AT1 items of the institution (negative amount) - 27a Other regulatory adjustments to CET1 capital (including IFRS 9 transitional adjustments when relevant) -189 28 Total regulatory adjustments to Common Equity Tier 1 (CET1) -1,514 29 Common Equity Tier 1 (CET1) capital 76,813 Additional Tier 1 (AT1) capital: instruments 30 Capital instruments and the related share premium accounts - 31 of which: classified as equity under applicable accounting standards - 32 of which: classified as liabilities under applicable accounting standards - 33 Amount of qualifying items referred to in Article 484 (4) CRR and the related share premium accounts subject to phase out from AT1 as described in Article 486(3) CRR - EU-33a Amount of qualifying items referred to in Article 494a(1) CRR subject to phase out from AT1 - EU-33b Amount of qualifying items referred to in Article 494b(1) CRR subject to phase out from AT1 - 34 Qualifying Tier 1 capital included in consolidated AT1 capital (including minority interests not included in row 5) issued by subsidiaries and held by third parties - 35 of which: instruments issued by subsidiaries subject to phase out - 36 Additional Tier 1 (AT1) capital before regulatory adjustments - Additional Tier 1 (AT1) capital: regulatory adjustments 37 Direct, indirect and synthetic holdings by an institution of own AT1 instruments (negative amount) - 38 Direct, indirect and synthetic holdings of the AT1 instruments of financial sector entities where those entities have reciprocal cross holdings with the institution designed to inflate artificially the own funds of the institution (negative amount) - 39 Direct, indirect and synthetic holdings of the AT1 instruments of financial sector entities where the institution does not have a significant investment in those entities (amount above 10% threshold and net of eligible short positions) (negative amount) - 40 Direct, indirect and synthetic holdings by the institution of the AT1 instruments of financial sector entities where the institution has a significant investment in those entities (net of eligible short positions) (negative amount) - 41 Empty set in the EU 42 Qualifying T2 deductions that exceed the T2 items of the institution (negative amount) - 42a Other regulatory adjustments to AT1 capital - 43 Total regulatory adjustments to Additional Tier 1 (AT1) capital - 44 Additional Tier 1 (AT1) capital - 45 Tier 1 capital (T1 = CET1 + AT1) 76,813
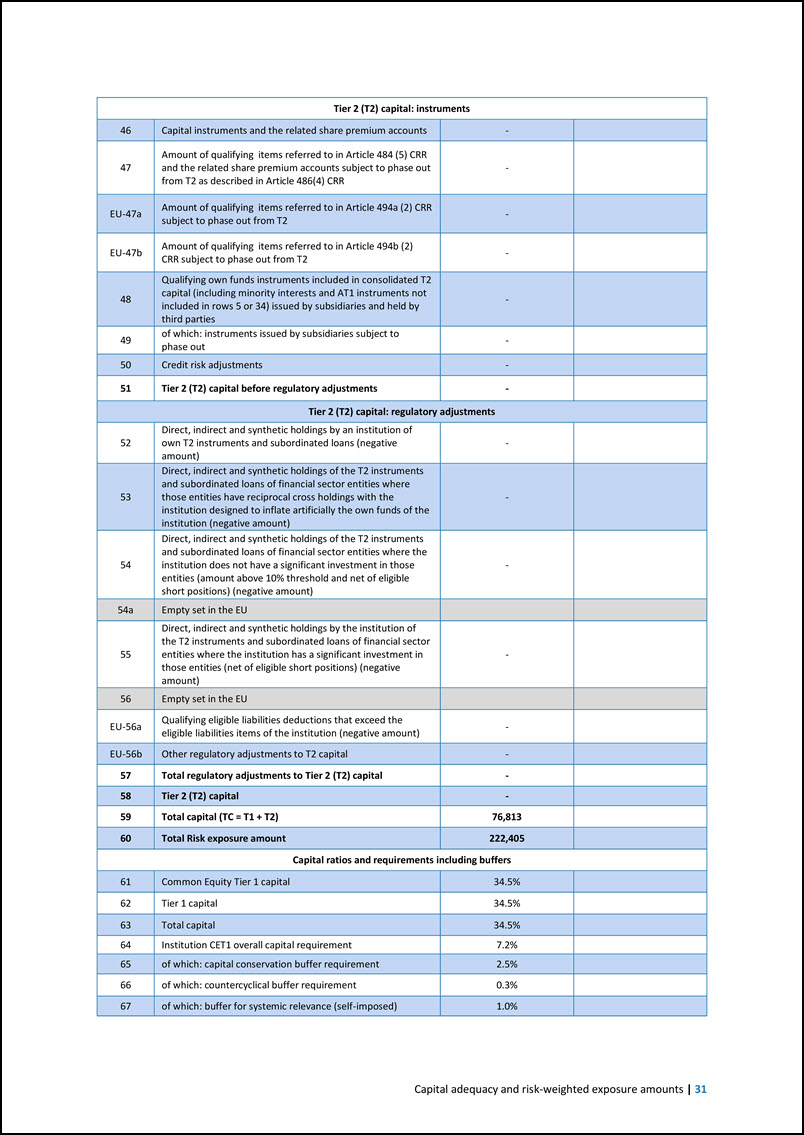
Capital adequacy and risk-weighted exposure amounts | 31 Tier 2 (T2) capital: instruments 46 Capital instruments and the related share premium accounts - 47 Amount of qualifying items referred to in Article 484 (5) CRR and the related share premium accounts subject to phase out from T2 as described in Article 486(4) CRR - EU-47a Amount of qualifying items referred to in Article 494a (2) CRR subject to phase out from T2 - EU-47b Amount of qualifying items referred to in Article 494b (2) CRR subject to phase out from T2 - 48 Qualifying own funds instruments included in consolidated T2 capital (including minority interests and AT1 instruments not included in rows 5 or 34) issued by subsidiaries and held by third parties - 49 of which: instruments issued by subsidiaries subject to phase out - 50 Credit risk adjustments - 51 Tier 2 (T2) capital before regulatory adjustments - Tier 2 (T2) capital: regulatory adjustments 52 Direct, indirect and synthetic holdings by an institution of own T2 instruments and subordinated loans (negative amount) - 53 Direct, indirect and synthetic holdings of the T2 instruments and subordinated loans of financial sector entities where those entities have reciprocal cross holdings with the institution designed to inflate artificially the own funds of the institution (negative amount) - 54 Direct, indirect and synthetic holdings of the T2 instruments and subordinated loans of financial sector entities where the institution does not have a significant investment in those entities (amount above 10% threshold and net of eligible short positions) (negative amount) - 54a Empty set in the EU 55 Direct, indirect and synthetic holdings by the institution of the T2 instruments and subordinated loans of financial sector entities where the institution has a significant investment in those entities (net of eligible short positions) (negative amount) - 56 Empty set in the EU EU-56a Qualifying eligible liabilities deductions that exceed the eligible liabilities items of the institution (negative amount) - EU-56b Other regulatory adjustments to T2 capital - 57 Total regulatory adjustments to Tier 2 (T2) capital - 58 Tier 2 (T2) capital - 59 Total capital (TC = T1 + T2) 76,813 60 Total Risk exposure amount 222,405 Capital ratios and requirements including buffers 61 Common Equity Tier 1 capital 34.5% 62 Tier 1 capital 34.5% 63 Total capital 34.5% 64 Institution CET1 overall capital requirement 7.2% 65 of which: capital conservation buffer requirement 2.5% 66 of which: countercyclical buffer requirement 0.3% 67 of which: buffer for systemic relevance (self-imposed) 1.0%
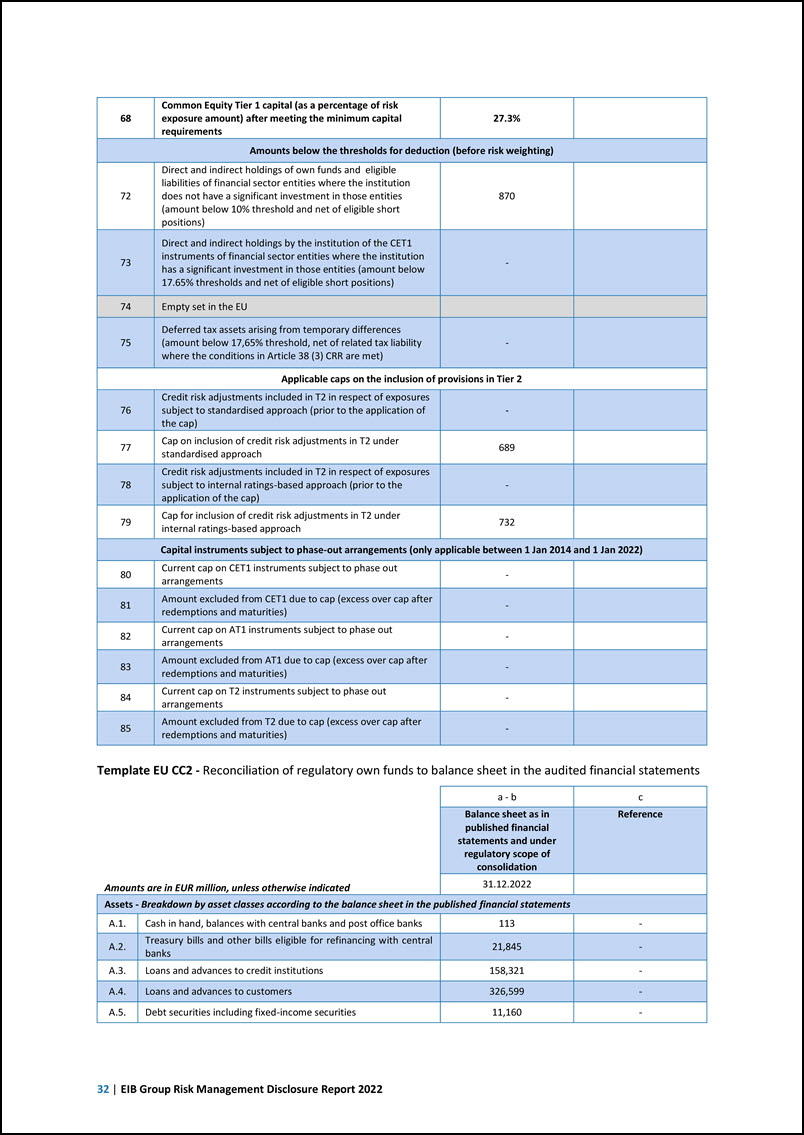
32 | EIB Group Risk Management Disclosure Report 2022 68 Common Equity Tier 1 capital (as a percentage of risk exposure amount) after meeting the minimum capital requirements 27.3% Amounts below the thresholds for deduction (before risk weighting) 72 Direct and indirect holdings of own funds and eligible liabilities of financial sector entities where the institution does not have a significant investment in those entities (amount below 10% threshold and net of eligible short positions) 870 73 Direct and indirect holdings by the institution of the CET1 instruments of financial sector entities where the institution has a significant investment in those entities (amount below 17.65% thresholds and net of eligible short positions) - 74 Empty set in the EU 75 Deferred tax assets arising from temporary differences (amount below 17,65% threshold, net of related tax liability where the conditions in Article 38 (3) CRR are met) - Applicable caps on the inclusion of provisions in Tier 2 76 Credit risk adjustments included in T2 in respect of exposures subject to standardised approach (prior to the application of the cap) - 77 Cap on inclusion of credit risk adjustments in T2 under standardised approach 689 78 Credit risk adjustments included in T2 in respect of exposures subject to internal ratings-based approach (prior to the application of the cap) - 79 Cap for inclusion of credit risk adjustments in T2 under internal ratings-based approach 732 Capital instruments subject to phase-out arrangements (only applicable between 1 Jan 2014 and 1 Jan 2022) 80 Current cap on CET1 instruments subject to phase out arrangements - 81 Amount excluded from CET1 due to cap (excess over cap after redemptions and maturities) - 82 Current cap on AT1 instruments subject to phase out arrangements - 83 Amount excluded from AT1 due to cap (excess over cap after redemptions and maturities) - 84 Current cap on T2 instruments subject to phase out arrangements - 85 Amount excluded from T2 due to cap (excess over cap after redemptions and maturities) - Template EU CC2 - Reconciliation of regulatory own funds to balance sheet in the audited financial statements Amounts are in EUR million, unless otherwise indicated a - b c Balance sheet as in published financial statements and under regulatory scope of consolidation Reference 31.12.2022 Assets - Breakdown by asset classes according to the balance sheet in the published financial statements A.1. Cash in hand, balances with central banks and post office banks 113 - A.2. Treasury bills and other bills eligible for refinancing with central banks 21,845 - A.3. Loans and advances to credit institutions 158,321 - A.4. Loans and advances to customers 326,599 - A.5. Debt securities including fixed-income securities 11,160 -
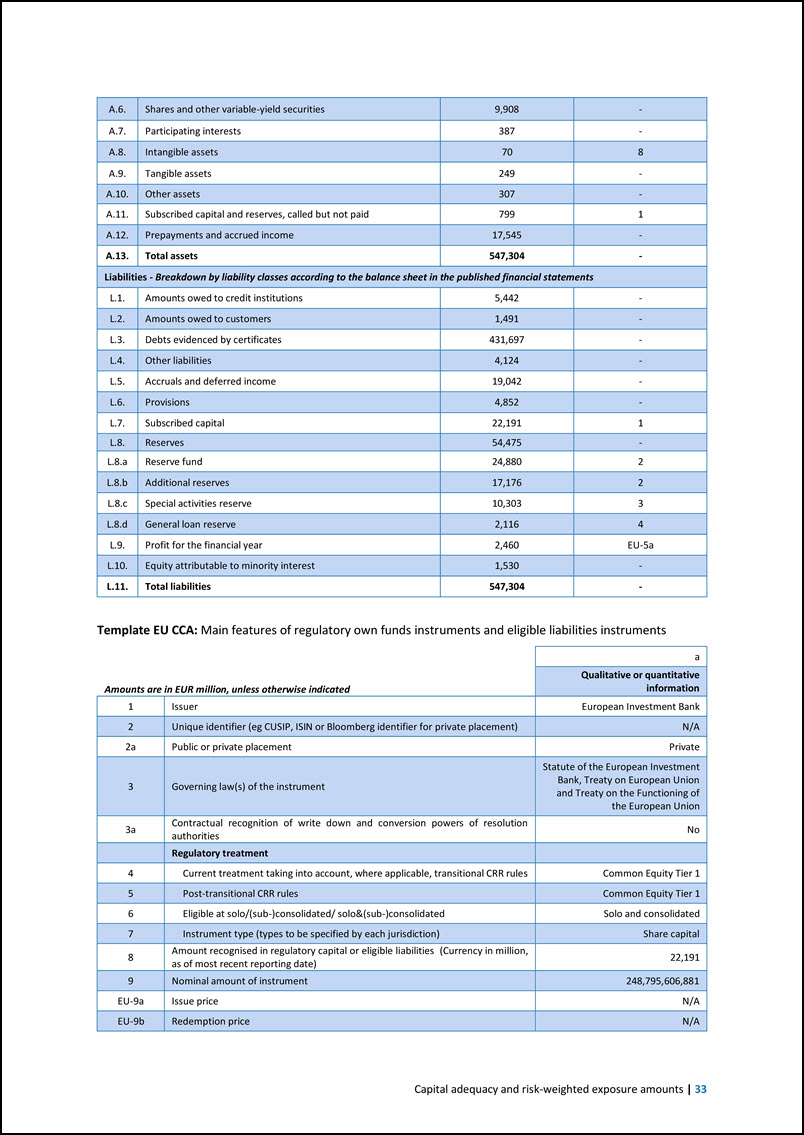
Capital adequacy and risk-weighted exposure amounts | 33 A.6. Shares and other variable-yield securities 9,908 - A.7. Participating interests 387 - A.8. Intangible assets 70 8 A.9. Tangible assets 249 - A.10. Other assets 307 - A.11. Subscribed capital and reserves, called but not paid 799 1 A.12. Prepayments and accrued income 17,545 - A.13. Total assets 547,304 - Liabilities - Breakdown by liability classes according to the balance sheet in the published financial statements L.1. Amounts owed to credit institutions 5,442 - L.2. Amounts owed to customers 1,491 - L.3. Debts evidenced by certificates 431,697 - L.4. Other liabilities 4,124 - L.5. Accruals and deferred income 19,042 - L.6. Provisions 4,852 - L.7. Subscribed capital 22,191 1 L.8. Reserves 54,475 - L.8.a Reserve fund 24,880 2 L.8.b Additional reserves 17,176 2 L.8.c Special activities reserve 10,303 3 L.8.d General loan reserve 2,116 4 L.9. Profit for the financial year 2,460 EU-5a L.10. Equity attributable to minority interest 1,530 - L.11. Total liabilities 547,304 - Template EU CCA: Main features of regulatory own funds instruments and eligible liabilities instruments Amounts are in EUR million, unless otherwise indicated a Qualitative or quantitative information 1 Issuer European Investment Bank 2 Unique identifier (eg CUSIP, ISIN or Bloomberg identifier for private placement) N/A 2a Public or private placement Private 3 Governing law(s) of the instrument Statute of the European Investment Bank, Treaty on European Union and Treaty on the Functioning of the European Union 3a Contractual recognition of write down and conversion powers of resolution authorities No Regulatory treatment 4 Current treatment taking into account, where applicable, transitional CRR rules Common Equity Tier 1 5 Post-transitional CRR rules Common Equity Tier 1 6 Eligible at solo/(sub-)consolidated/ solo&(sub-)consolidated Solo and consolidated 7 Instrument type (types to be specified by each jurisdiction) Share capital 8 Amount recognised in regulatory capital or eligible liabilities (Currency in million, as of most recent reporting date) 22,191 9 Nominal amount of instrument 248,795,606,881 EU-9a Issue price N/A EU-9b Redemption price N/A
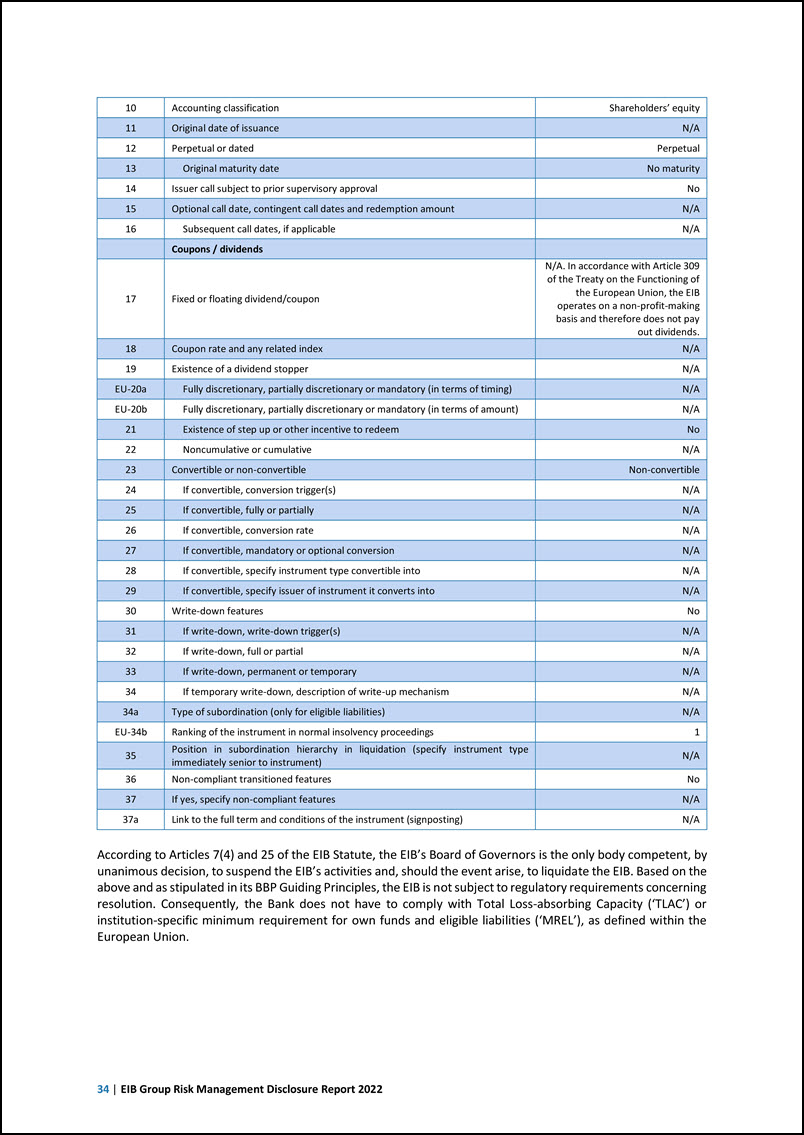
34 | EIB Group Risk Management Disclosure Report 2022 10 Accounting classification Shareholders’ equity 11 Original date of issuance N/A 12 Perpetual or dated Perpetual 13 Original maturity date No maturity 14 Issuer call subject to prior supervisory approval No 15 Optional call date, contingent call dates and redemption amount N/A 16 Subsequent call dates, if applicable N/A Coupons / dividends 17 Fixed or floating dividend/coupon N/A. In accordance with Article 309 of the Treaty on the Functioning of the European Union, the EIB operates on a non-profit-making basis and therefore does not pay out dividends. 18 Coupon rate and any related index N/A 19 Existence of a dividend stopper N/A EU-20a Fully discretionary, partially discretionary or mandatory (in terms of timing) N/A EU-20b Fully discretionary, partially discretionary or mandatory (in terms of amount) N/A 21 Existence of step up or other incentive to redeem No 22 Noncumulative or cumulative N/A 23 Convertible or non-convertible Non-convertible 24 If convertible, conversion trigger(s) N/A 25 If convertible, fully or partially N/A 26 If convertible, conversion rate N/A 27 If convertible, mandatory or optional conversion N/A 28 If convertible, specify instrument type convertible into N/A 29 If convertible, specify issuer of instrument it converts into N/A 30 Write-down features No 31 If write-down, write-down trigger(s) N/A 32 If write-down, full or partial N/A 33 If write-down, permanent or temporary N/A 34 If temporary write-down, description of write-up mechanism N/A 34a Type of subordination (only for eligible liabilities) N/A EU-34b Ranking of the instrument in normal insolvency proceedings 1 35 Position in subordination hierarchy in liquidation (specify instrument type immediately senior to instrument) N/A 36 Non-compliant transitioned features No 37 If yes, specify non-compliant features N/A 37a Link to the full term and conditions of the instrument (signposting) N/A According to Articles 7(4) and 25 of the EIB Statute, the EIB’s Board of Governors is the only body competent, by unanimous decision, to suspend the EIB’s activities and, should the event arise, to liquidate the EIB. Based on the above and as stipulated in its BBP Guiding Principles, the EIB is not subject to regulatory requirements concerning resolution. Consequently, the Bank does not have to comply with Total Loss-absorbing Capacity (‘TLAC’) or institution-specific minimum requirement for own funds and eligible liabilities (‘MREL’), as defined within the European Union.
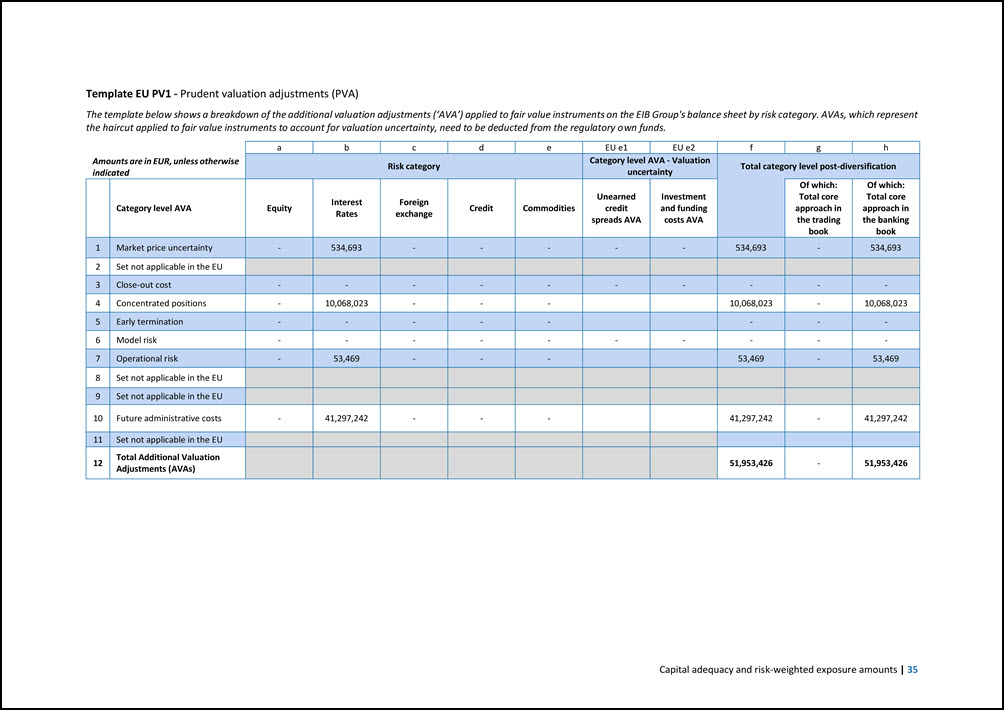
Capital adequacy and risk-weighted exposure amounts | 35 Template EU PV1 - Prudent valuation adjustments (PVA) The template below shows a breakdown of the additional valuation adjustments (‘AVA’) applied to fair value instruments on the EIB Group's balance sheet by risk category. AVAs, which represent the haircut applied to fair value instruments to account for valuation uncertainty, need to be deducted from the regulatory own funds. Amounts are in EUR, unless otherwise indicated a b c d e EU e1 EU e2 f g h Risk category Category level AVA - Valuation uncertainty Total category level post-diversification Category level AVA Equity Interest Rates Foreign exchange Credit Commodities Unearned credit spreads AVA Investment and funding costs AVA Of which: Total core approach in the trading book Of which: Total core approach in the banking book 1 Market price uncertainty - 534,693 - - - - - 534,693 - 534,693 2 Set not applicable in the EU 3 Close-out cost - - - - - - - - - - 4 Concentrated positions - 10,068,023 - - - 10,068,023 - 10,068,023 5 Early termination - - - - - - - - 6 Model risk - - - - - - - - - - 7 Operational risk - 53,469 - - - 53,469 - 53,469 8 Set not applicable in the EU 9 Set not applicable in the EU 10 Future administrative costs - 41,297,242 - - - 41,297,242 - 41,297,242 11 Set not applicable in the EU 12 Total Additional Valuation Adjustments (AVAs) 51,953,426 - 51,953,426
36 | EIB Group Risk Management Disclosure Report 2022 Credit risk Introduction This section does not cover credit risk arising from over-the-counter (OTC) derivatives transactions and securities- financing transactions, which is defined as counterparty credit risk in this report and is covered in Chapter 6. Credit exposures on securitisation positions are included in this chapter only when indicated, but are covered in more detail in Chapter 7. The credit risk management process consists of identifying, analysing, measuring and reporting the risks incurred by the Group in its operations and making decisions to effectively manage these risks. The following sections describe in turn the credit risk assessment processes of the EIB and of the EIF. EIB’s credit risk responsibilities and processes The main credit risk responsibilities are divided between GR&C, the Operations Directorate (‘OPS’), the EIB Global Directorate (‘GLO‘) and the Portfolio Management and Monitoring Directorate (‘PMM’). As a second line of defence, GR&C is responsible for setting the credit risk management framework for the origination and monitoring of lending exposures. In addition, GR&C provides an independent second line of defence opinion in relation to credit risk decision making within the entire credit cycle, including loan proposal, credit risk related contractual amendments, restructuring, validation of specific provisions, Early Warning Signals/Non Performing Exposures (EWS/NPE) and forbearance status, counterpart internal rating based on established framework, LGD (Loss Given Default) and counterparty climate risk assessment. OPS/GLO is responsible for the origination of new loans, due diligence and the evaluation of the structure of the operations using quantitative and qualitative metrics with input from the Projects Directorate (‘PJ‘) and the Legal Directorate (‘JU‘) for specific aspects. PMM monitors the credit quality of lending operations, in particular the borrowers’ and guarantors' creditworthiness, the value of securities and collateral received, management of event resolutions etc. together with assessment and negotiation of restructuring operations within a dedicated restructuring team. Credit risk guidelines GR&C, in consultation with other services within the Bank, is responsible for the credit risk guidelines setting the key principles for origination of new lending exposures including, amongst others, minimum qualifying criteria for borrowers and guarantors in lending operations, acceptable structure of the operations, acceptable securities, risk pricing, etc. The Bank’s MC approves changes to the credit risk guidelines. The BoD is informed annually about changes to the guidelines. Any derogation from the guidelines must be specifically approved by the Bank’s MC on the basis of a duly justified request from OPS/GLO or PMM (as relevant), which will be accompanied by an opinion from GR&C. Product-specific guidelines for complex/higher-risk products In order to ensure that the additional risk involved in complex or structured lending transactions is adequately analysed, quantified and mitigated, specific detailed guidelines have been developed in respect of certain types of operations complementing the general credit risk guidelines, presented above. The following types of operations are covered by specific sections of the guidelines: Subordinated corporate lending and corporate hybrids. Project finance transactions. Loan substitutes, in particular Covered Bonds and Asset Backed Securities. Risk-sharing products. Operations involving risk tranching. Trade Finance.

Credit risk | 37 Lending outside the EU As lending outside the European Union often implies a higher risk profile than lending operations within the Union, the Bank established dedicated credit risk guidelines for such transactions to ensure that they are in line with the Bank’s risk appetite. Moreover, on certain operations outside the Union originated under dedicated mandates, the EIB benefits from a comprehensive guarantee from the European Union. Similarly to all other transactions, the EIB estimates expected losses taking into account a counterpart’s internal rating and a transaction’s contractual features and assigns a loan grading to non-EU lending transactions. The EIB also takes into account the comprehensive credit support provided by the European Union or Member States as applicable. Beyond capturing the credit strength of a potential counterpart, EIB risk assessment also considers local and country jurisdiction and currency circumstances, which affect particular market environments, such as for emerging market investments. General Mandate Risk Principles for Impact Finance Mandates Impact Finance Mandates are mandates with virtually full risk coverage for the Bank and whereby implementation and the risk spectrum are beyond the Bank’s rules, policies and procedures applied to operations it carries out at its own risk. As a consequence, the standard credit risk guidelines do not apply and the Bank has codified general mandate credit risk principles and follows specific qualitative credit risk assessment procedures agreed between the Bank and the mandators. Exposures under Impact Finance Mandates are carved out from the application of the NPE regulations and are consequently excluded from the templates on credit risk quality. GR&C has also established specific guidelines for the management and monitoring of existing credit exposures. The lending process: contractual guidelines A legal analysis is performed to determine whether a counterpart can comply with the contractual standards. Legal framework Guidelines set out orientation points for the legal framework under which the Bank may lend and, in particular, aspects like the governing laws and jurisdictions for the settlement of disputes which the Bank deems acceptable in view of its specific status as a multilateral financial institution owned by the Member States of the European Union. Risk mitigation techniques In its credit risk guidelines, the Bank details its approach to credit risk mitigation, which is based on a robust due diligence process, adequate levels of security and guarantees as well as standard protective clauses included in its loan agreements. Risk mitigation clauses are the contractual clauses included in the lending documents signed by the Bank and its counterparts. These documents are, principally, the loan agreement and any guarantee, security or collateral agreement. Risk mitigating clauses may include, amongst others, specific clauses making the disbursement of the loan conditional on certain requirements being satisfied, undertakings (covenants) given by the counterpart to the Bank (such as financial covenants or Loss of Rating clauses vis-à-vis the borrower or guarantor) and events of default enabling the Bank to take certain steps on the occurrence of a credit event post-signature. These clauses are designed to protect the Bank against the deterioration of an operation’s credit risk and to enable it to take action to preserve its position upon the occurrence of any such event and reflect the nature of the counterpart and other factors affecting the credit risk profile of the relevant operation. Acceptable counterparts Whether or not a given entity is acceptable to the Bank as a counterpart in a lending operation is determined on the basis of a careful analysis and evaluation of the entity using, amongst others, quantitative metrics but also relying on experience and expert judgment. The following key elements are taken into account: Satisfaction of a Minimum Internal Rating (‘MIR’) requirement set on the basis of the Bank’s Internal Rating Methodology;
38 | EIB Group Risk Management Disclosure Report 2022 Minimum Qualifying Status (‘MQS’) in case of the existence of a rating from a recognised credit rating agency; Concentration limits/thresholds for the entity; Any independent collateral, securities or guarantees available. The lending process: counterpart exposure limits Counterpart and sector limits The EIB Group monitors and manages single name concentration risk28 from a regulatory, internal and credit rating agencies’ point of view. From an internal point of view, in order to ensure adequate diversification of credit exposures, the Bank places counterpart-based threshold/limits on its maximum exposure 29 to financial institutions, corporates, sub- sovereign public authorities and public sector entities (as borrowers and/or guarantors). Counterpart thresholds/limits, set upon consideration of new approvals, are designed to keep lending exposures within a pre-defined proportion of the Bank’s own funds or the counterparts’ own funds/operating revenue. Thresholds/limits can be set on a nominal or risk-weighted basis, the latter based on 0% to 100% risk-weights depending on the nature of the counterpart and the existence of external guarantees or collateral provided as security for the relevant exposure. The Bank also has exposure limits for certain sectors of economic activity. Regulatory limits In addition to the Bank’s own limits referred to above, and in compliance with best banking practice applicable to the EIB, the Group applies the regulatory large exposure limits on the maximum exposure to a single client or a group of connected clients. EIB’s loan grading system The loan grading system is used for internal credit risk assessment of the EIB’s lending operations and is an important part of the loan appraisal and monitoring process. A loan grading reflects the present value of the estimated level of the lifetime expected loss for that loan, this being the Net Present Value of the product of the probability of default, the loan exposure at risk and the loss given default. The loan grading system is used for the following purposes: aid to a finer and more quantitative assessment of lending risks; indicator of credit risk variations for the purposes of prioritising monitoring efforts; description of the Bank’s loan portfolio quality at a given date; benchmark for calculating the annual additions to the General Loan Reserve and Special Activities Reserve; input in risk-pricing decisions. The following factors are used to determine a loan grading: The borrower’s creditworthiness: GR&C independently reviews borrowers and assesses their creditworthiness based on internal methodologies. In line with the Basel III Internal Ratings Based approach adopted, the Bank has developed an internal rating methodology (‘IRM’) to determine the internal ratings of borrowers and guarantors. This is based on a set of scoring sheets specific to defined counterparty types. The default correlation: it quantifies the chances of simultaneous financial difficulties arising for both the borrower and the guarantor. The higher the correlation between the borrower and the guarantor’s default, the lower the value of the guarantee and therefore the lower (worse) the loan grading. The value of guarantee instruments and of securities: this value is assessed on the basis of a combination of the issuer’s creditworthiness and the type of instrument used. The applicable recovery rate: the amount assumed to be recovered following a default by the relevant counterpart expressed as a percentage of the relevant loan exposure. The contractual framework: a sound contractual framework will add to the loan’s quality and enhance its loan grading. 28 29 Including concentration risk arising from credit mitigation activities. The Bank’s consolidated exposure to the same counterparty, including lending, treasury and derivative exposures.
Credit risk | 39 The duration of the loan or, more generally, the cash-flows of the loan: all else being equal, the longer the loan, the higher the risk of incurring difficulties in the servicing of the loan. Risk pricing methodology The Bank has a risk pricing methodology, which ensures that the risk attached to any given operation is adequately remunerated. The level of risk pricing is based on a number of factors including the loan grading assigned to the relevant lending operation. EIF’s credit risk and related management The EIF’s credit risk arises mainly through its activity linked to debt products, which encompasses guarantees and securitisations. Credit risk management is based on a three lines of defence model which permeates all areas of the EIF’s business functions and processes: (i) front office, (ii) risk management and compliance functions and (iii) internal audit. The EIF has developed a sound risk management framework for its Guarantee and Securitisation (G&S) business in order to analyse and monitor portfolio guarantees and structured finance transactions in line with common market practices. In the context of the independent opinion process relating to its guarantees and securitisations, the Transaction and Portfolio Risk (“TPR”) division reviews each transaction proposal provided by the Equity Investments and Guarantees (“EIG”) department in accordance with the EIF’s internal rules and procedures. To limit the concentration risk in the portfolio, the EIF has internal limits based on maximum exposure both at individual transaction and originator level. Transaction limits define maximum possible exposure dependent on underlying rating and weighted average life. Originator limits are applied to the respective originator’s position per country and exposure rating. 5.2 Credit risk quality Early Warning Signals (‘EWS’) and Non Performing Exposures (‘NPE’) During 2022, for its lending operations, the Bank continued the implementation of the EWS and NPE processes following the adoption of relevant NPE requirements as best banking practice applicable to the EIB and defined in the internal EWS/NPE and Forbearance Guidelines. The EWS concept is intended to allow for early detection and prevention of deteriorating credit quality counterparties/transactions or counterparties/transactions presenting higher risk characteristics at the time of origination requiring more enhanced monitoring. NPEs, which are also relevant for accounting purposes, include loans, debt securities and off-balance-sheet exposures that satisfy either one or both of the criteria from Article 178 of the CRR. Non-performing exposures include30 defaulted and impaired exposures. Total NPEs are the sum of non-performing loans (‘NPL’), non-performing debt securities and non-performing off-balance-sheet items. Through the loan lifecycle, the responsible service carries out screening controls based on a dedicated EWS/NPE framework. The EWS and NPE process is typically targeted at assessing and recording financial issues at the level of a counterparty; that is, it does not take into consideration any specificity of the EIB loan, security / collateral arrangements and portfolio guarantees. The EWS/NPE portfolios are updated on a continuing basis throughout the year and reported to the management. The EIF has implemented the EWS and NPE concept applying specific triggers to its guarantee and securitisation business. 30 The EIB Group is adhering to the NPE/NPL regulatory requirements subject to adaptations to be approved in line with its BBP Guiding Principles. At the end of 2022, the only approved adaptation reflected relates to the Impact Finance Mandates as described in Section 5.1.
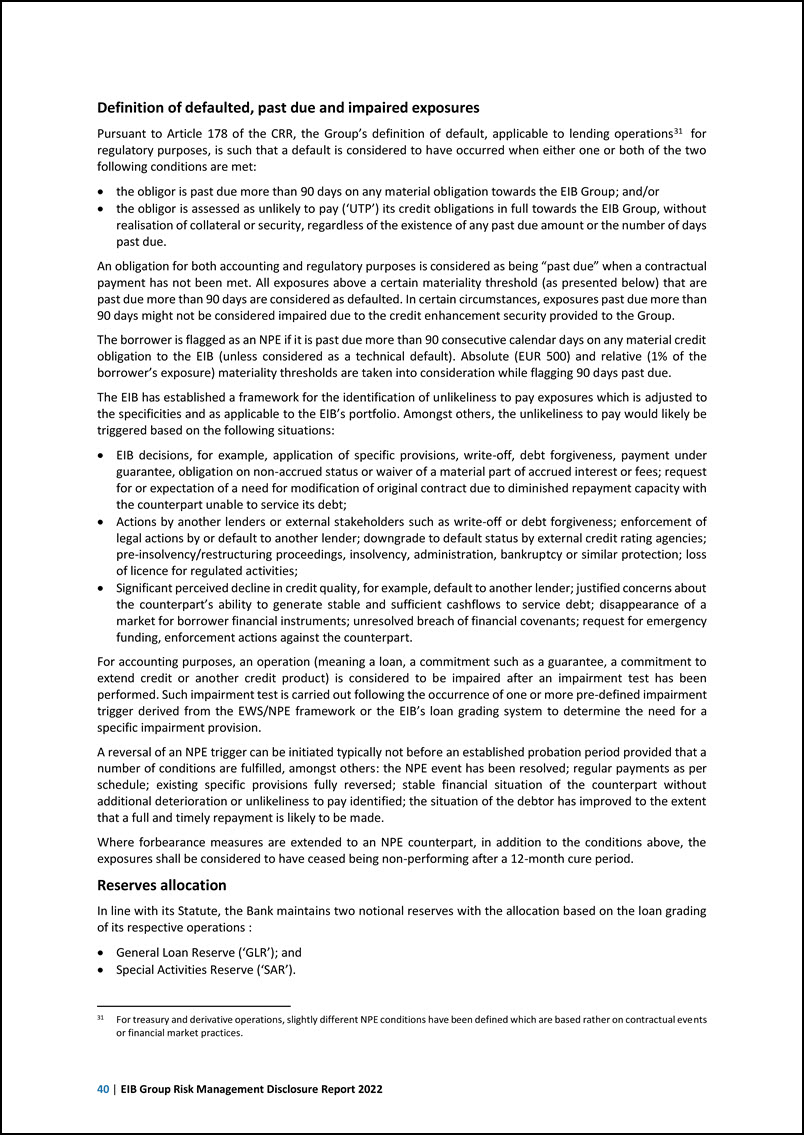
40 | EIB Group Risk Management Disclosure Report 2022 Definition of defaulted, past due and impaired exposures Pursuant to Article 178 of the CRR, the Group’s definition of default, applicable to lending operations31 for regulatory purposes, is such that a default is considered to have occurred when either one or both of the two following conditions are met: the obligor is past due more than 90 days on any material obligation towards the EIB Group; and/or the obligor is assessed as unlikely to pay (‘UTP’) its credit obligations in full towards the EIB Group, without realisation of collateral or security, regardless of the existence of any past due amount or the number of days past due. An obligation for both accounting and regulatory purposes is considered as being “past due” when a contractual payment has not been met. All exposures above a certain materiality threshold (as presented below) that are past due more than 90 days are considered as defaulted. In certain circumstances, exposures past due more than 90 days might not be considered impaired due to the credit enhancement security provided to the Group. The borrower is flagged as an NPE if it is past due more than 90 consecutive calendar days on any material credit obligation to the EIB (unless considered as a technical default). Absolute (EUR 500) and relative (1% of the borrower’s exposure) materiality thresholds are taken into consideration while flagging 90 days past due. The EIB has established a framework for the identification of unlikeliness to pay exposures which is adjusted to the specificities and as applicable to the EIB’s portfolio. Amongst others, the unlikeliness to pay would likely be triggered based on the following situations: EIB decisions, for example, application of specific provisions, write-off, debt forgiveness, payment under guarantee, obligation on non-accrued status or waiver of a material part of accrued interest or fees; request for or expectation of a need for modification of original contract due to diminished repayment capacity with the counterpart unable to service its debt; Actions by another lenders or external stakeholders such as write-off or debt forgiveness; enforcement of legal actions by or default to another lender; downgrade to default status by external credit rating agencies; pre-insolvency/restructuring proceedings, insolvency, administration, bankruptcy or similar protection; loss of licence for regulated activities; Significant perceived decline in credit quality, for example, default to another lender; justified concerns about the counterpart’s ability to generate stable and sufficient cashflows to service debt; disappearance of a market for borrower financial instruments; unresolved breach of financial covenants; request for emergency funding, enforcement actions against the counterpart. For accounting purposes, an operation (meaning a loan, a commitment such as a guarantee, a commitment to extend credit or another credit product) is considered to be impaired after an impairment test has been performed. Such impairment test is carried out following the occurrence of one or more pre-defined impairment trigger derived from the EWS/NPE framework or the EIB’s loan grading system to determine the need for a specific impairment provision. A reversal of an NPE trigger can be initiated typically not before an established probation period provided that a number of conditions are fulfilled, amongst others: the NPE event has been resolved; regular payments as per schedule; existing specific provisions fully reversed; stable financial situation of the counterpart without additional deterioration or unlikeliness to pay identified; the situation of the debtor has improved to the extent that a full and timely repayment is likely to be made. Where forbearance measures are extended to an NPE counterpart, in addition to the conditions above, the exposures shall be considered to have ceased being non-performing after a 12-month cure period. Reserves allocation In line with its Statute, the Bank maintains two notional reserves with the allocation based on the loan grading of its respective operations : General Loan Reserve (‘GLR’); and Special Activities Reserve (‘SAR’). 31 For treasury and derivative operations, slightly different NPE conditions have been defined which are based rather on contractual events or financial market practices.
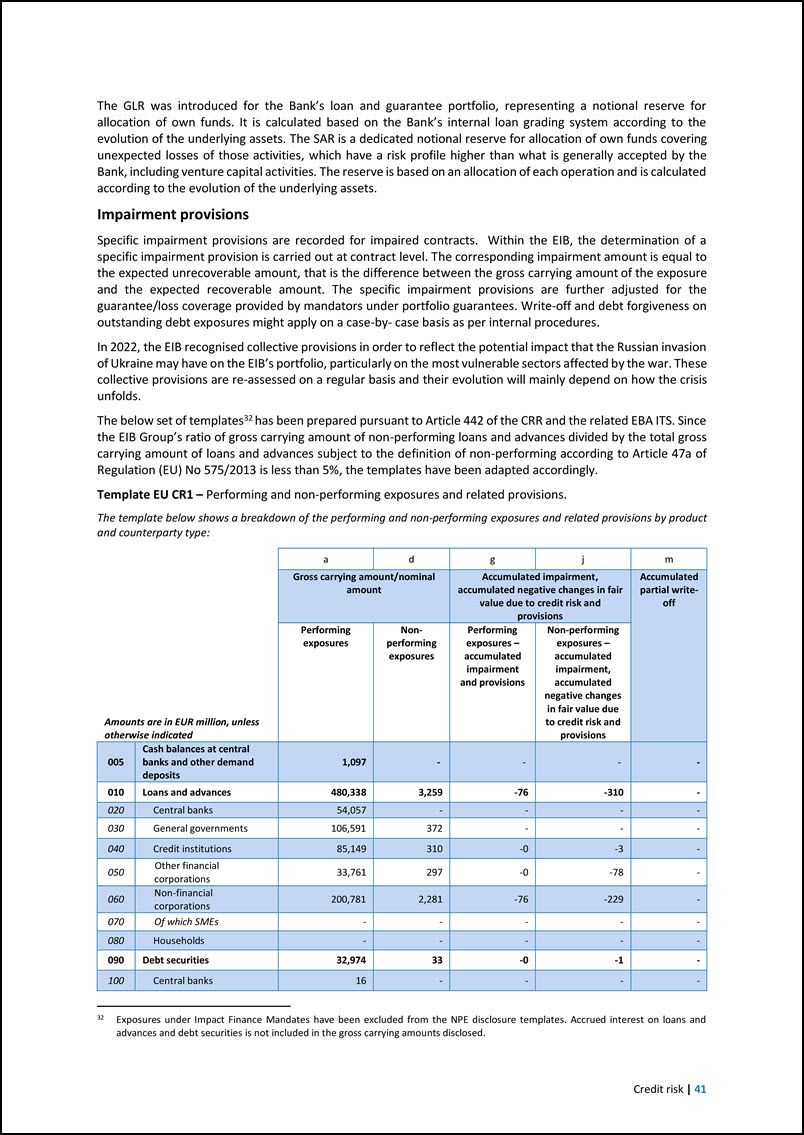
Credit risk | 41 The GLR was introduced for the Bank’s loan and guarantee portfolio, representing a notional reserve for allocation of own funds. It is calculated based on the Bank’s internal loan grading system according to the evolution of the underlying assets. The SAR is a dedicated notional reserve for allocation of own funds covering unexpected losses of those activities, which have a risk profile higher than what is generally accepted by the Bank, including venture capital activities. The reserve is based on an allocation of each operation and is calculated according to the evolution of the underlying assets. Impairment provisions Specific impairment provisions are recorded for impaired contracts. Within the EIB, the determination of a specific impairment provision is carried out at contract level. The corresponding impairment amount is equal to the expected unrecoverable amount, that is the difference between the gross carrying amount of the exposure and the expected recoverable amount. The specific impairment provisions are further adjusted for the guarantee/loss coverage provided by mandators under portfolio guarantees. Write-off and debt forgiveness on outstanding debt exposures might apply on a case-by- case basis as per internal procedures. In 2022, the EIB recognised collective provisions in order to reflect the potential impact that the Russian invasion of Ukraine may have on the EIB’s portfolio, particularly on the most vulnerable sectors affected by the war. These collective provisions are re-assessed on a regular basis and their evolution will mainly depend on how the crisis unfolds. The below set of templates32 has been prepared pursuant to Article 442 of the CRR and the related EBA ITS. Since the EIB Group’s ratio of gross carrying amount of non-performing loans and advances divided by the total gross carrying amount of loans and advances subject to the definition of non-performing according to Article 47a of Regulation (EU) No 575/2013 is less than 5%, the templates have been adapted accordingly. Template EU CR1 – Performing and non-performing exposures and related provisions. The template below shows a breakdown of the performing and non-performing exposures and related provisions by product and counterparty type: Amounts are in EUR million, unless otherwise indicated a d g j m Gross carrying amount/nominal amount Accumulated impairment, accumulated negative changes in fair value due to credit risk and provisions Accumulated partial write- off Performing exposures Non- performing exposures Performing exposures – accumulated impairment and provisions Non-performing exposures – accumulated impairment, accumulated negative changes in fair value due to credit risk and provisions 005 Cash balances at central banks and other demand deposits 1,097 - - - - 010 Loans and advances 480,338 3,259 -76 -310 - 020 Central banks 54,057 - - - - 030 General governments 106,591 372 - - - 040 Credit institutions 85,149 310 -0 -3 - 050 Other financial corporations 33,761 297 -0 -78 - 060 Non-financial corporations 200,781 2,281 -76 -229 - 070 Of which SMEs - - - - - 080 Households - - - - - 090 Debt securities 32,974 33 -0 -1 - 100 Central banks 16 - - - - 32 Exposures under Impact Finance Mandates have been excluded from the NPE disclosure templates. Accrued interest on loans and advances and debt securities is not included in the gross carrying amounts disclosed.
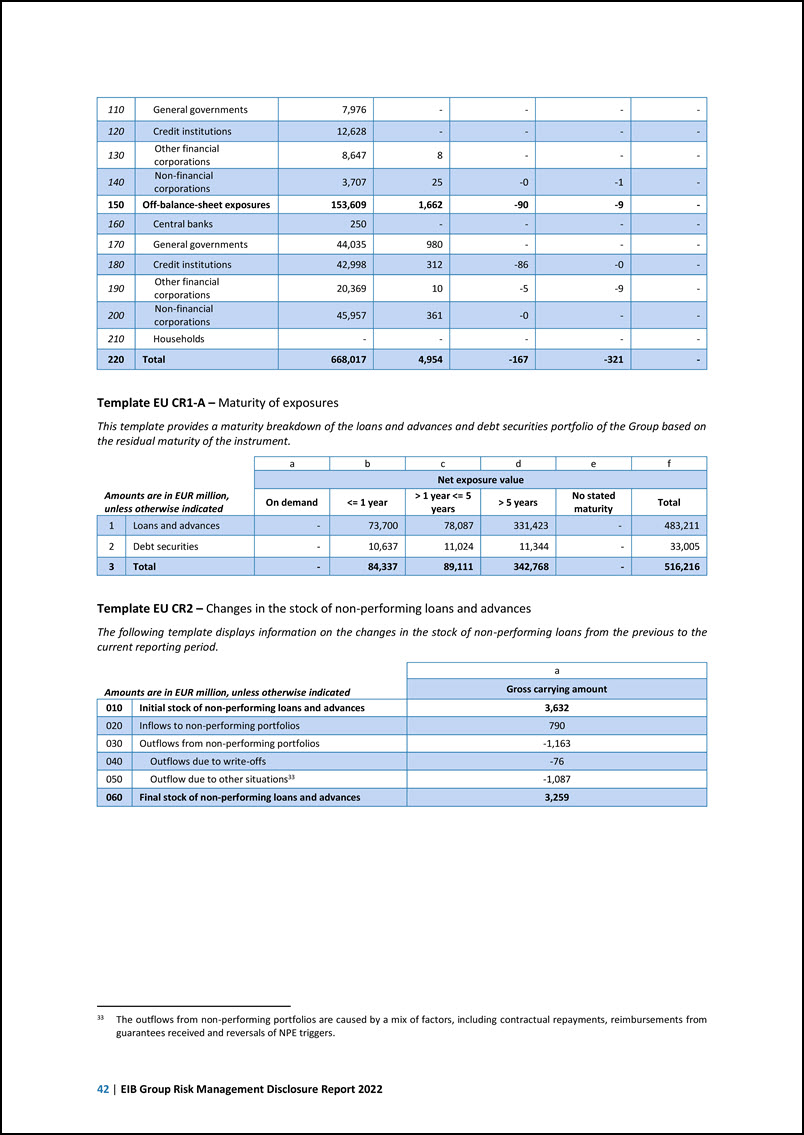
42 | EIB Group Risk Management Disclosure Report 2022 110 General governments 7,976 - - - - 120 Credit institutions 12,628 - - - - 130 Other financial corporations 8,647 8 - - - 140 Non-financial corporations 3,707 25 -0 -1 - 150 Off-balance-sheet exposures 153,609 1,662 -90 -9 - 160 Central banks 250 - - - - 170 General governments 44,035 980 - - - 180 Credit institutions 42,998 312 -86 -0 - 190 Other financial corporations 20,369 10 -5 -9 - 200 Non-financial corporations 45,957 361 -0 - - 210 Households - - - - - 220 Total 668,017 4,954 -167 -321 - Template EU CR1-A – Maturity of exposures This template provides a maturity breakdown of the loans and advances and debt securities portfolio of the Group based on the residual maturity of the instrument. Amounts are in EUR million, unless otherwise indicated a b c d e f Net exposure value On demand <= 1 year > 1 year <= 5 years > 5 years No stated maturity Total 1 Loans and advances - 73,700 78,087 331,423 - 483,211 2 Debt securities - 10,637 11,024 11,344 - 33,005 3 Total - 84,337 89,111 342,768 - 516,216 Template EU CR2 – Changes in the stock of non-performing loans and advances The following template displays information on the changes in the stock of non-performing loans from the previous to the current reporting period. Amounts are in EUR million, unless otherwise indicated a Gross carrying amount 010 Initial stock of non-performing loans and advances 3,632 020 Inflows to non-performing portfolios 790 030 Outflows from non-performing portfolios -1,163 040 Outflows due to write-offs -76 050 Outflow due to other situations33 -1,087 060 Final stock of non-performing loans and advances 3,259 33 The outflows from non-performing portfolios are caused by a mix of factors, including contractual repayments, reimbursements from guarantees received and reversals of NPE triggers.
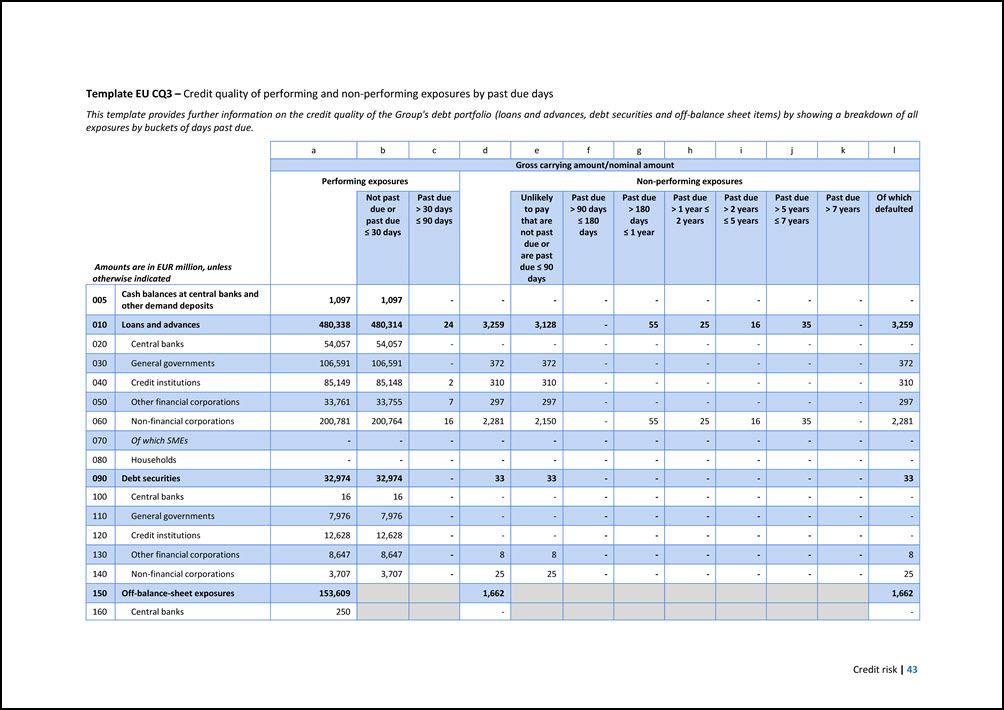
Credit risk | 43 Template EU CQ3 – Credit quality of performing and non-performing exposures by past due days This template provides further information on the credit quality of the Group's debt portfolio (loans and advances, debt securities and off-balance sheet items) by showing a breakdown of all exposures by buckets of days past due. Amounts are in EUR million, unless otherwise indicated a b c d e f g h i j k l Gross carrying amount/nominal amount Performing exposures Non-performing exposures Not past due or past due ≤ 30 days Past due > 30 days ≤ 90 days Unlikely to pay that are not past due or are past due ≤ 90 days Past due > 90 days ≤ 180 days Past due > 180 days ≤ 1 year Past due > 1 year ≤ 2 years Past due > 2 years ≤ 5 years Past due > 5 years ≤ 7 years Past due > 7 years Of which defaulted 005 Cash balances at central banks and other demand deposits 1,097 1,097 - - - - - - - - - - 010 Loans and advances 480,338 480,314 24 3,259 3,128 - 55 25 16 35 - 3,259 020 Central banks 54,057 54,057 - - - - - - - - - - 030 General governments 106,591 106,591 - 372 372 - - - - - - 372 040 Credit institutions 85,149 85,148 2 310 310 - - - - - - 310 050 Other financial corporations 33,761 33,755 7 297 297 - - - - - - 297 060 Non-financial corporations 200,781 200,764 16 2,281 2,150 - 55 25 16 35 - 2,281 070 Of which SMEs - - - - - - - - - - - - 080 Households - - - - - - - - - - - - 090 Debt securities 32,974 32,974 - 33 33 - - - - - - 33 100 Central banks 16 16 - - - - - - - - - - 110 General governments 7,976 7,976 - - - - - - - - - - 120 Credit institutions 12,628 12,628 - - - - - - - - - - 130 Other financial corporations 8,647 8,647 - 8 8 - - - - - - 8 140 Non-financial corporations 3,707 3,707 - 25 25 - - - - - - 25 150 Off-balance-sheet exposures 153,609 1,662 1,662 160 Central banks 250 - -

44 | EIB Group Risk Management Disclosure Report 2022 170 General governments 44,035 980 980 180 Credit institutions 42,998 312 312 190 Other financial corporations 20,369 10 10 200 Non-financial corporations 45,957 361 361 210 Households - - - 220 Total 668,017 514,385 24 4,954 3,161 - 55 25 16 35 - 4,954
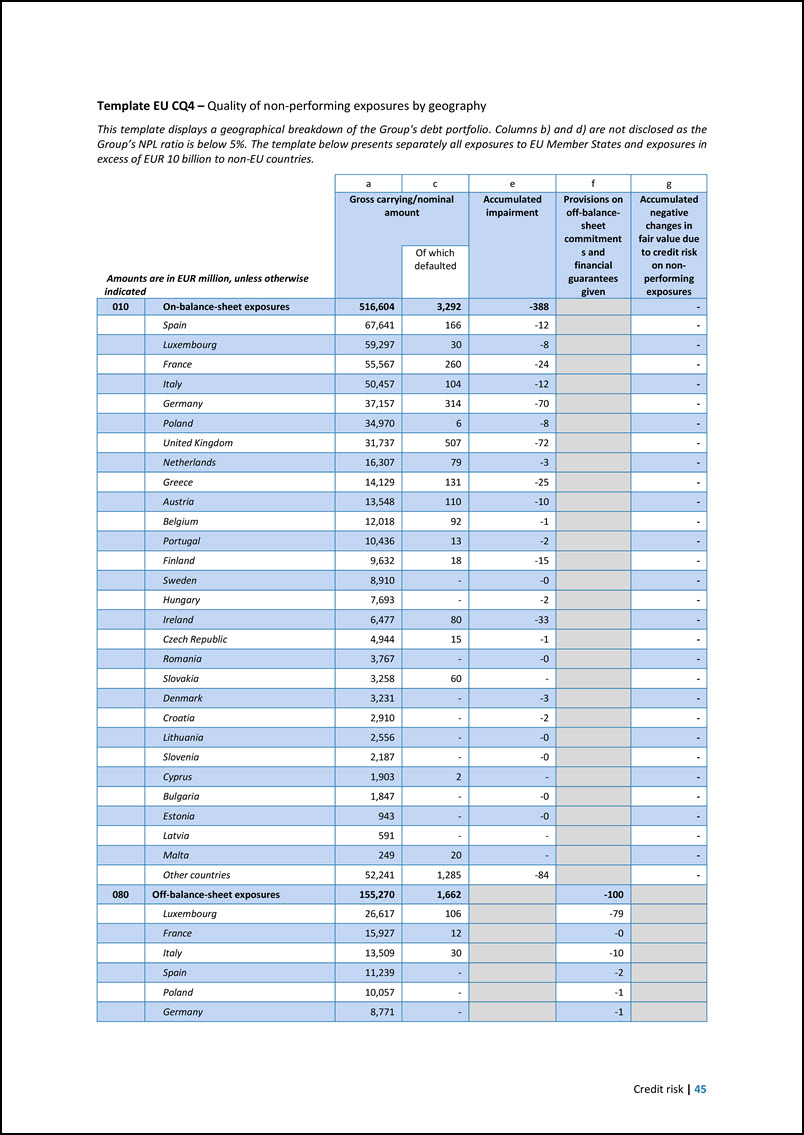
Credit risk | 45 Template EU CQ4 – Quality of non-performing exposures by geography This template displays a geographical breakdown of the Group's debt portfolio. Columns b) and d) are not disclosed as the Group’s NPL ratio is below 5%. The template below presents separately all exposures to EU Member States and exposures in excess of EUR 10 billion to non-EU countries. Amounts are in EUR million, unless otherwise indicated a c e f g Gross carrying/nominal amount Accumulated impairment Provisions on off-balance- sheet commitment s and financial guarantees given Accumulated negative changes in fair value due to credit risk on non- performing exposures Of which defaulted 010 On-balance-sheet exposures 516,604 3,292 -388 - Spain 67,641 166 -12 - Luxembourg 59,297 30 -8 - France 55,567 260 -24 - Italy 50,457 104 -12 - Germany 37,157 314 -70 - Poland 34,970 6 -8 - United Kingdom 31,737 507 -72 - Netherlands 16,307 79 -3 - Greece 14,129 131 -25 - Austria 13,548 110 -10 - Belgium 12,018 92 -1 - Portugal 10,436 13 -2 - Finland 9,632 18 -15 - Sweden 8,910 - -0 - Hungary 7,693 - -2 - Ireland 6,477 80 -33 - Czech Republic 4,944 15 -1 - Romania 3,767 - -0 - Slovakia 3,258 60 - - Denmark 3,231 - -3 - Croatia 2,910 - -2 - Lithuania 2,556 - -0 - Slovenia 2,187 - -0 - Cyprus 1,903 2 - - Bulgaria 1,847 - -0 - Estonia 943 - -0 - Latvia 591 - - - Malta 249 20 - - Other countries 52,241 1,285 -84 - 080 Off-balance-sheet exposures 155,270 1,662 -100 Luxembourg 26,617 106 -79 France 15,927 12 -0 Italy 13,509 30 -10 Spain 11,239 - -2 Poland 10,057 - -1 Germany 8,771 - -1
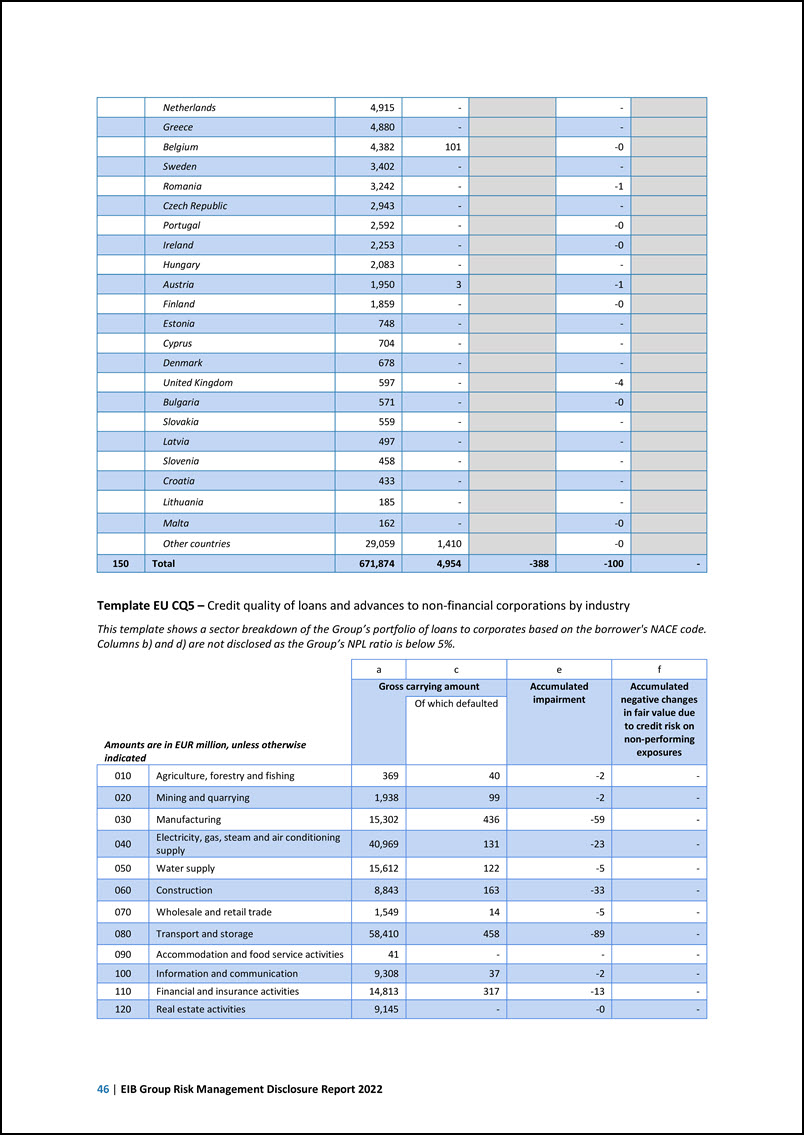
46 | EIB Group Risk Management Disclosure Report 2022 Netherlands 4,915 - - Greece 4,880 - - Belgium 4,382 101 -0 Sweden 3,402 - - Romania 3,242 - -1 Czech Republic 2,943 - - Portugal 2,592 - -0 Ireland 2,253 - -0 Hungary 2,083 - - Austria 1,950 3 -1 Finland 1,859 - -0 Estonia 748 - - Cyprus 704 - - Denmark 678 - - United Kingdom 597 - -4 Bulgaria 571 - -0 Slovakia 559 - - Latvia 497 - - Slovenia 458 - - Croatia 433 - - Lithuania 185 - - Malta 162 - -0 Other countries 29,059 1,410 -0 150 Total 671,874 4,954 -388 -100 - Template EU CQ5 – Credit quality of loans and advances to non-financial corporations by industry This template shows a sector breakdown of the Group’s portfolio of loans to corporates based on the borrower's NACE code. Columns b) and d) are not disclosed as the Group’s NPL ratio is below 5%. Amounts are in EUR million, unless otherwise indicated a c e f Gross carrying amount Accumulated impairment Accumulated negative changes in fair value due to credit risk on non-performing exposures Of which defaulted 010 Agriculture, forestry and fishing 369 40 -2 - 020 Mining and quarrying 1,938 99 -2 - 030 Manufacturing 15,302 436 -59 - 040 Electricity, gas, steam and air conditioning supply 40,969 131 -23 - 050 Water supply 15,612 122 -5 - 060 Construction 8,843 163 -33 - 070 Wholesale and retail trade 1,549 14 -5 - 080 Transport and storage 58,410 458 -89 - 090 Accommodation and food service activities 41 - - - 100 Information and communication 9,308 37 -2 - 110 Financial and insurance activities 14,813 317 -13 - 120 Real estate activities 9,145 - -0 -
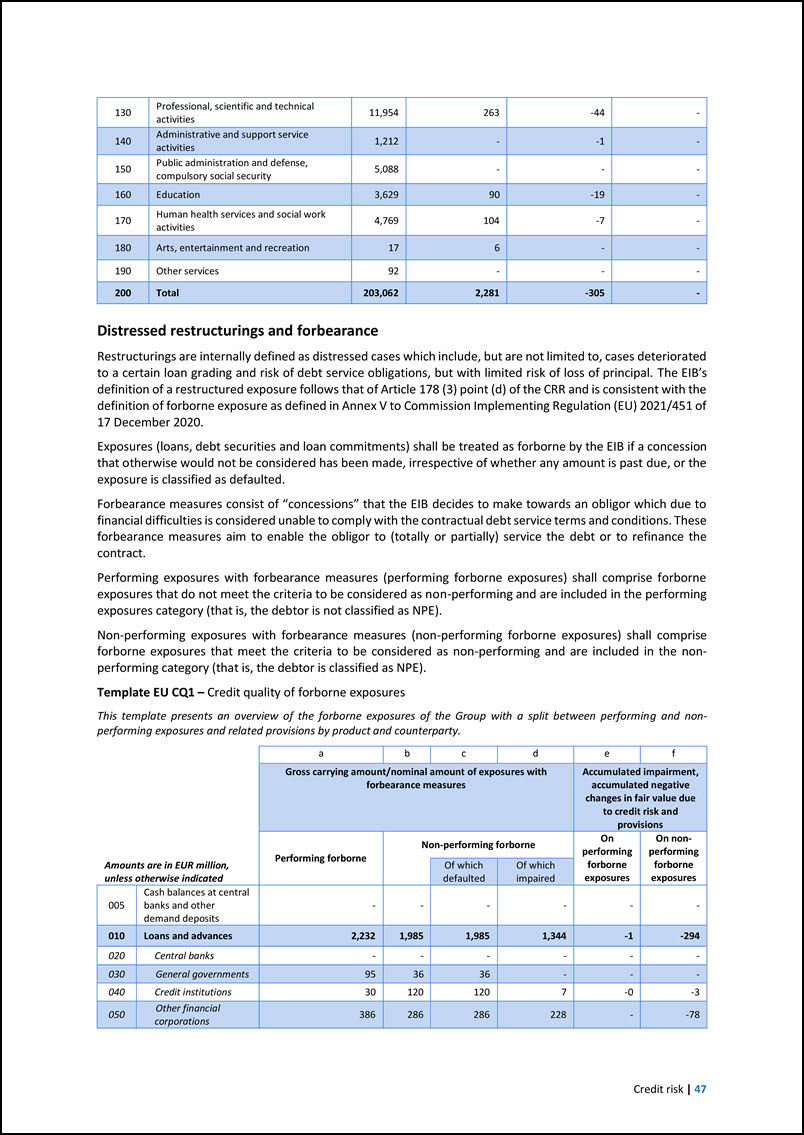
Credit risk | 47 130 Professional, scientific and technical activities 11,954 263 -44 - 140 Administrative and support service activities 1,212 - -1 - 150 Public administration and defense, compulsory social security 5,088 - - - 160 Education 3,629 90 -19 - 170 Human health services and social work activities 4,769 104 -7 - 180 Arts, entertainment and recreation 17 6 - - 190 Other services 92 - - - 200 Total 203,062 2,281 -305 - Distressed restructurings and forbearance Restructurings are internally defined as distressed cases which include, but are not limited to, cases deteriorated to a certain loan grading and risk of debt service obligations, but with limited risk of loss of principal. The EIB’s definition of a restructured exposure follows that of Article 178 (3) point (d) of the CRR and is consistent with the definition of forborne exposure as defined in Annex V to Commission Implementing Regulation (EU) 2021/451 of 17 December 2020. Exposures (loans, debt securities and loan commitments) shall be treated as forborne by the EIB if a concession that otherwise would not be considered has been made, irrespective of whether any amount is past due, or the exposure is classified as defaulted. Forbearance measures consist of “concessions” that the EIB decides to make towards an obligor which due to financial difficulties is considered unable to comply with the contractual debt service terms and conditions. These forbearance measures aim to enable the obligor to (totally or partially) service the debt or to refinance the contract. Performing exposures with forbearance measures (performing forborne exposures) shall comprise forborne exposures that do not meet the criteria to be considered as non-performing and are included in the performing exposures category (that is, the debtor is not classified as NPE). Non-performing exposures with forbearance measures (non-performing forborne exposures) shall comprise forborne exposures that meet the criteria to be considered as non-performing and are included in the non- performing category (that is, the debtor is classified as NPE). Template EU CQ1 – Credit quality of forborne exposures This template presents an overview of the forborne exposures of the Group with a split between performing and non- performing exposures and related provisions by product and counterparty. Amounts are in EUR million, unless otherwise indicated a b c d e f Gross carrying amount/nominal amount of exposures with forbearance measures Accumulated impairment, accumulated negative changes in fair value due to credit risk and provisions Performing forborne Non-performing forborne On performing forborne exposures On non- performing forborne exposures Of which defaulted Of which impaired 005 Cash balances at central banks and other demand deposits - - - - - - 010 Loans and advances 2,232 1,985 1,985 1,344 -1 -294 020 Central banks - - - - - - 030 General governments 95 36 36 - - - 040 Credit institutions 30 120 120 7 -0 -3 050 Other financial corporations 386 286 286 228 - -78

48 | EIB Group Risk Management Disclosure Report 2022 060 Non-financial corporations 1,721 1,543 1,543 1,109 -1 -213 070 Households - - - - - - 080 Debt securities 5 33 33 25 - -1 090 Loan commitments given 280 35 35 - - -0 100 Total 2,517 2,053 2,053 1,369 -1 -295 5.3 Credit risk mitigation The Bank details its approach to credit risk mitigation in its credit risk guidelines and capital requirements procedures, which include the type of collateral and guarantees the Bank accepts. Credit risk mitigation used to limit the exposure of derivatives and securities financing transactions is presented in Chapter 6. The Bank follows a detailed security classification to differentiate the quality of the security provided by a guarantor or collateral provider. The Bank accepts various types of credit enhancements and has defined requirements on the security’s quality. The eligible credit enhancements include guarantees, assignment of financial rights (for example, claim on underlying loan exposures or revenues), pledge of assets like government securities and financial collateral such as cash, bonds and, on an exceptional basis, shares. The Bank does not use credit derivatives as a means of mitigating credit risk. The effect of credit risk mitigation is calculated using the Financial Collateral Comprehensive Method pursuant to Article 228 of the CRR34. Netting is solely applied for OTC derivatives as described in Chapter 6. For further information on collateral received, refer to Note S.2.5.1 (financial collateral for derivatives), Note S.2.3.4 (collateral on loans) and Note S.2.3.3 (guarantees received by the Group) of the EIB Group consolidated financial statements under IFRS. Collateral and guarantee management The credit risk attached to a particular borrower may be enhanced by the provision of third party guarantees and/or collateral. In order to distinguish between the quality of such credit enhancements, the Bank has a granular classification system defining the essential characteristics of the different types of credit enhancement that may be offered as security. This distinction is based not only on the credit standing of the issuer of the relevant instrument but also on the instruments’ legal enforceability and liquidity. Guarantees Guarantees represent one type of credit enhancement. Detailed rules are set out in the credit risk guidelines in relation to, among others: minimum rating requirements for guarantors and the Bank’s rights if the guarantor loses such rating; monitoring of guarantors; acceptable caps on guarantees. Pledge of assets and/or financial collateral Alternatively, a credit enhancement can be made by a pledge on assets: pledge of financial collateral (government and corporate bonds, cash and, on an exceptional basis, shares); assignment of financial rights (for example claim on underlying loan exposures or revenues); and cash on bank accounts (no pledge agreement) held with an independent bank. Security eligibility and collateral management Detailed rules are set out in the credit risk guidelines in relation to, among others: asset eligibility; haircuts based on security type, rating, maturity, liquidity, currency; frequency of monitoring of collateral, exposures and coverage ratios (daily); and 34 Under the Financial Comprehensive Method, the effects of credit risk mitigation are reflected when using the IRB approach by adjusting the loss given default parameter in the calculation of the risk-weighted exposure.
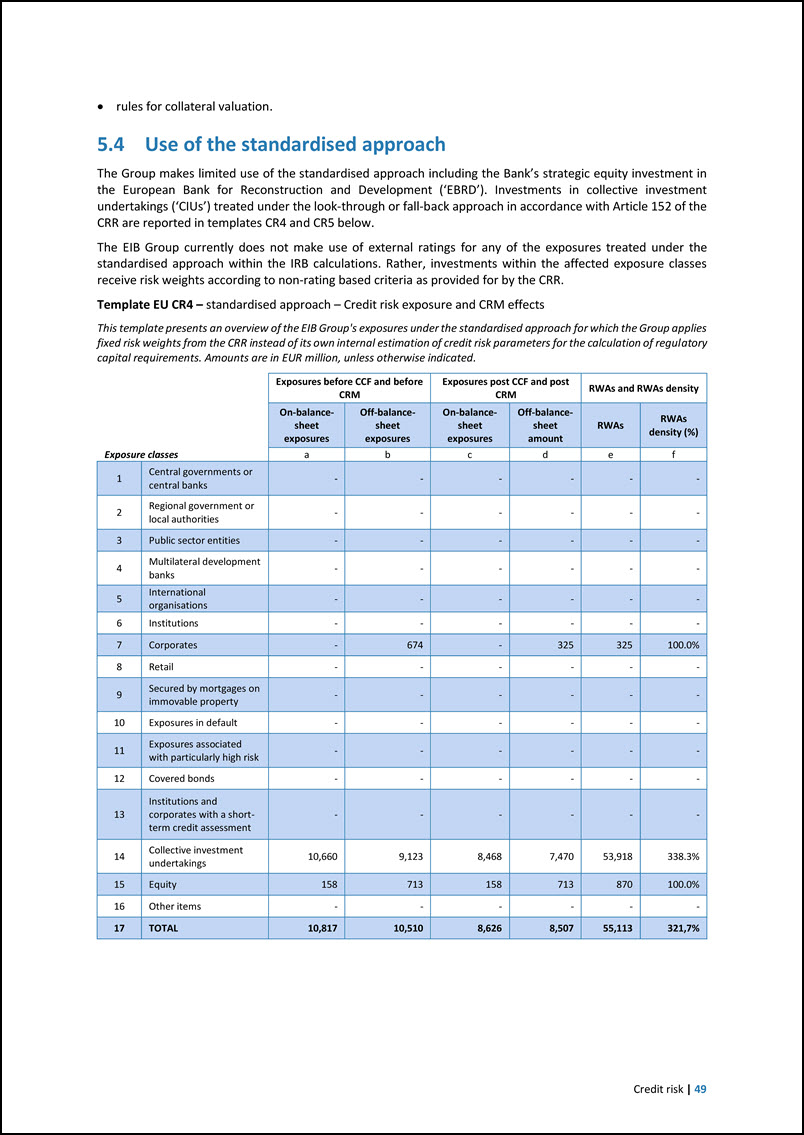
Credit risk | 49 rules for collateral valuation. 5.4 Use of the standardised approach The Group makes limited use of the standardised approach including the Bank’s strategic equity investment in the European Bank for Reconstruction and Development (‘EBRD’). Investments in collective investment undertakings (‘CIUs’) treated under the look-through or fall-back approach in accordance with Article 152 of the CRR are reported in templates CR4 and CR5 below. The EIB Group currently does not make use of external ratings for any of the exposures treated under the standardised approach within the IRB calculations. Rather, investments within the affected exposure classes receive risk weights according to non-rating based criteria as provided for by the CRR. Template EU CR4 – standardised approach – Credit risk exposure and CRM effects This template presents an overview of the EIB Group's exposures under the standardised approach for which the Group applies fixed risk weights from the CRR instead of its own internal estimation of credit risk parameters for the calculation of regulatory capital requirements. Amounts are in EUR million, unless otherwise indicated. Exposure classes Exposures before CCF and before CRM Exposures post CCF and post CRM RWAs and RWAs density On-balance- sheet exposures Off-balance- sheet exposures On-balance- sheet exposures Off-balance- sheet amount RWAs RWAs density (%) a b c d e f 1 Central governments or central banks - - - - - - 2 Regional government or local authorities - - - - - - 3 Public sector entities - - - - - - 4 Multilateral development banks - - - - - - 5 International organisations - - - - - - 6 Institutions - - - - - - 7 Corporates - 674 - 325 325 100.0% 8 Retail - - - - - - 9 Secured by mortgages on immovable property - - - - - - 10 Exposures in default - - - - - - 11 Exposures associated with particularly high risk - - - - - - 12 Covered bonds - - - - - - 13 Institutions and corporates with a short- term credit assessment - - - - - - 14 Collective investment undertakings 10,660 9,123 8,468 7,470 53,918 338.3% 15 Equity 158 713 158 713 870 100.0% 16 Other items - - - - - - 17 TOTAL 10,817 10,510 8,626 8,507 55,113 321,7%
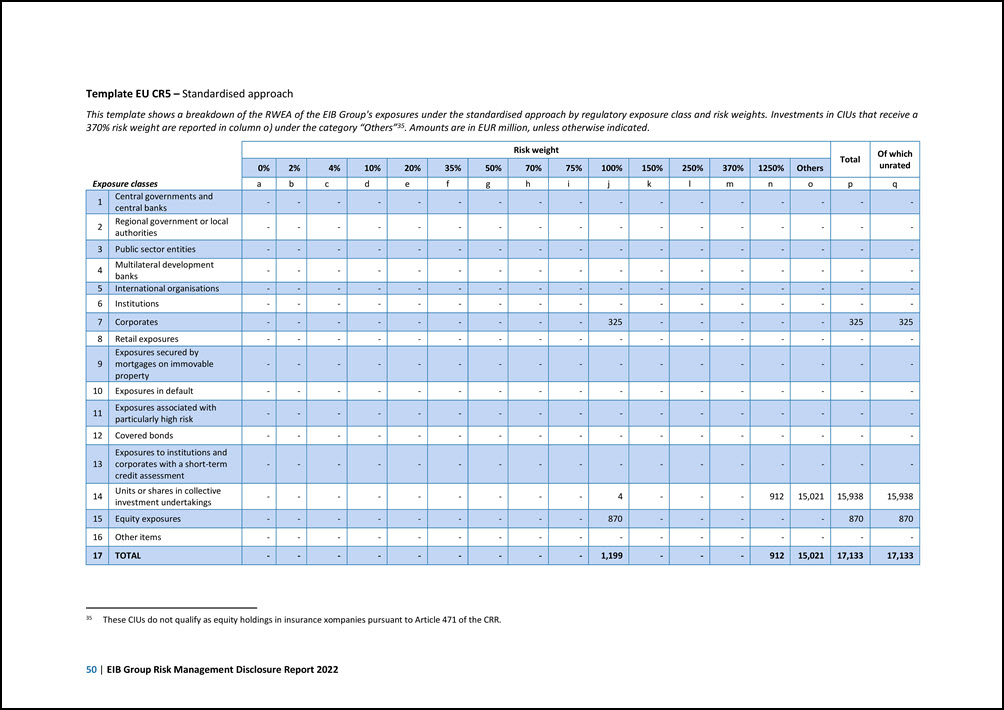
50 | EIB Group Risk Management Disclosure Report 2022 Template EU CR5 – Standardised approach This template shows a breakdown of the RWEA of the EIB Group's exposures under the standardised approach by regulatory exposure class and risk weights. Investments in CIUs that receive a 370% risk weight are reported in column o) under the category “Others”35. Amounts are in EUR million, unless otherwise indicated. Exposure classes Risk weight Total Of which unrated 0% 2% 4% 10% 20% 35% 50% 70% 75% 100% 150% 250% 370% 1250% Others a b c d e f g h i j k l m n o p q 1 Central governments and central banks - - - - - - - - - - - - - - - - - 2 Regional government or local authorities - - - - - - - - - - - - - - - - - 3 Public sector entities - - - - - - - - - - - - - - - - - 4 Multilateral development banks - - - - - - - - - - - - - - - - - 5 International organisations - - - - - - - - - - - - - - - - - 6 Institutions - - - - - - - - - - - - - - - - - 7 Corporates - - - - - - - - - 325 - - - - - 325 325 8 Retail exposures - - - - - - - - - - - - - - - - - 9 Exposures secured by mortgages on immovable property - - - - - - - - - - - - - - - - - 10 Exposures in default - - - - - - - - - - - - - - - - - 11 Exposures associated with particularly high risk - - - - - - - - - - - - - - - - - 12 Covered bonds - - - - - - - - - - - - - - - - - 13 Exposures to institutions and corporates with a short-term credit assessment - - - - - - - - - - - - - - - - - 14 Units or shares in collective investment undertakings - - - - - - - - - 4 - - - 912 15,021 15,938 15,938 15 Equity exposures - - - - - - - - - 870 - - - - - 870 870 16 Other items - - - - - - - - - - - - - - - - - 17 TOTAL - - - - - - - - - 1,199 - - - 912 15,021 17,133 17,133 35 These CIUs do not qualify as equity holdings in insurance xompanies pursuant to Article 471 of the CRR.
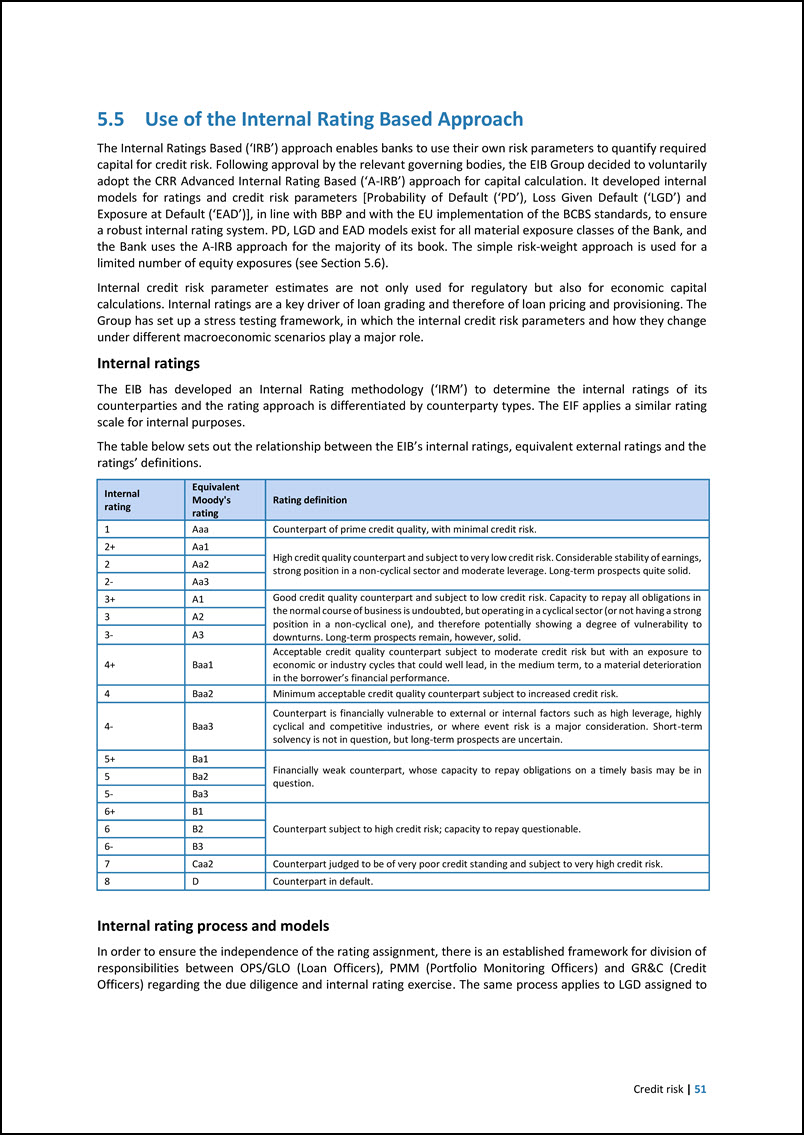
Credit risk | 51 5.5 Use of the Internal Rating Based Approach The Internal Ratings Based (‘IRB’) approach enables banks to use their own risk parameters to quantify required capital for credit risk. Following approval by the relevant governing bodies, the EIB Group decided to voluntarily adopt the CRR Advanced Internal Rating Based (‘A-IRB’) approach for capital calculation. It developed internal models for ratings and credit risk parameters [Probability of Default (‘PD’), Loss Given Default (‘LGD’) and Exposure at Default (‘EAD’)], in line with BBP and with the EU implementation of the BCBS standards, to ensure a robust internal rating system. PD, LGD and EAD models exist for all material exposure classes of the Bank, and the Bank uses the A-IRB approach for the majority of its book. The simple risk-weight approach is used for a limited number of equity exposures (see Section 5.6). Internal credit risk parameter estimates are not only used for regulatory but also for economic capital calculations. Internal ratings are a key driver of loan grading and therefore of loan pricing and provisioning. The Group has set up a stress testing framework, in which the internal credit risk parameters and how they change under different macroeconomic scenarios play a major role. Internal ratings The EIB has developed an Internal Rating methodology (‘IRM’) to determine the internal ratings of its counterparties and the rating approach is differentiated by counterparty types. The EIF applies a similar rating scale for internal purposes. The table below sets out the relationship between the EIB’s internal ratings, equivalent external ratings and the ratings’ definitions. Internal rating Equivalent Moody's rating Rating definition 1 Aaa Counterpart of prime credit quality, with minimal credit risk. 2+ Aa1 High credit quality counterpart and subject to very low credit risk. Considerable stability of earnings, strong position in a non-cyclical sector and moderate leverage. Long-term prospects quite solid. 2 Aa2 2- Aa3 3+ A1 Good credit quality counterpart and subject to low credit risk. Capacity to repay all obligations in the normal course of business is undoubted, but operating in a cyclical sector (or not having a strong position in a non-cyclical one), and therefore potentially showing a degree of vulnerability to downturns. Long-term prospects remain, however, solid. 3 A2 3- A3 4+ Baa1 Acceptable credit quality counterpart subject to moderate credit risk but with an exposure to economic or industry cycles that could well lead, in the medium term, to a material deterioration in the borrower’s financial performance. 4 Baa2 Minimum acceptable credit quality counterpart subject to increased credit risk. 4- Baa3 Counterpart is financially vulnerable to external or internal factors such as high leverage, highly cyclical and competitive industries, or where event risk is a major consideration. Short-term solvency is not in question, but long-term prospects are uncertain. 5+ Ba1 Financially weak counterpart, whose capacity to repay obligations on a timely basis may be in question. 5 Ba2 5- Ba3 6+ B1 Counterpart subject to high credit risk; capacity to repay questionable. 6 B2 6- B3 7 Caa2 Counterpart judged to be of very poor credit standing and subject to very high credit risk. 8 D Counterpart in default. Internal rating process and models In order to ensure the independence of the rating assignment, there is an established framework for division of responsibilities between OPS/GLO (Loan Officers), PMM (Portfolio Monitoring Officers) and GR&C (Credit Officers) regarding the due diligence and internal rating exercise. The same process applies to LGD assigned to
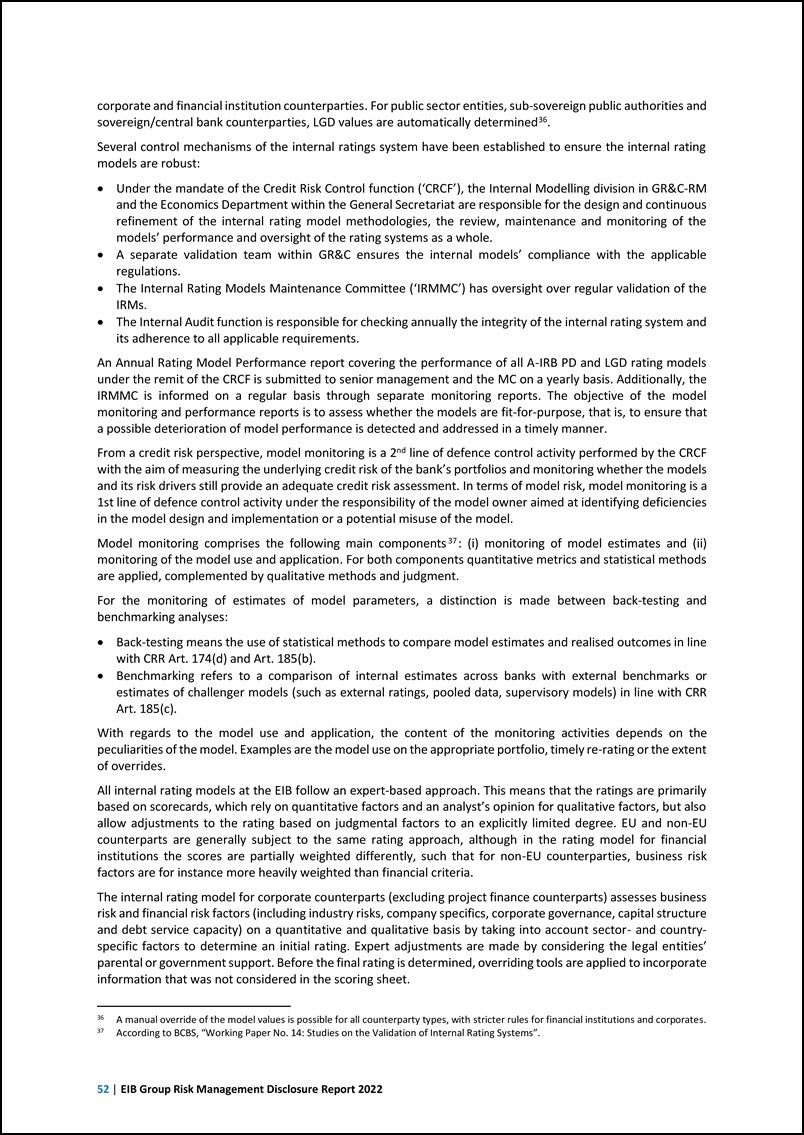
52 | EIB Group Risk Management Disclosure Report 2022 corporate and financial institution counterparties. For public sector entities, sub-sovereign public authorities and sovereign/central bank counterparties, LGD values are automatically determined36. Several control mechanisms of the internal ratings system have been established to ensure the internal rating models are robust: Under the mandate of the Credit Risk Control function (‘CRCF’), the Internal Modelling division in GR&C-RM and the Economics Department within the General Secretariat are responsible for the design and continuous refinement of the internal rating model methodologies, the review, maintenance and monitoring of the models’ performance and oversight of the rating systems as a whole. A separate validation team within GR&C ensures the internal models’ compliance with the applicable regulations. The Internal Rating Models Maintenance Committee (‘IRMMC’) has oversight over regular validation of the IRMs. The Internal Audit function is responsible for checking annually the integrity of the internal rating system and its adherence to all applicable requirements. An Annual Rating Model Performance report covering the performance of all A-IRB PD and LGD rating models under the remit of the CRCF is submitted to senior management and the MC on a yearly basis. Additionally, the IRMMC is informed on a regular basis through separate monitoring reports. The objective of the model monitoring and performance reports is to assess whether the models are fit-for-purpose, that is, to ensure that a possible deterioration of model performance is detected and addressed in a timely manner. From a credit risk perspective, model monitoring is a 2nd line of defence control activity performed by the CRCF with the aim of measuring the underlying credit risk of the bank’s portfolios and monitoring whether the models and its risk drivers still provide an adequate credit risk assessment. In terms of model risk, model monitoring is a 1st line of defence control activity under the responsibility of the model owner aimed at identifying deficiencies in the model design and implementation or a potential misuse of the model. Model monitoring comprises the following main components 37 : (i) monitoring of model estimates and (ii) monitoring of the model use and application. For both components quantitative metrics and statistical methods are applied, complemented by qualitative methods and judgment. For the monitoring of estimates of model parameters, a distinction is made between back-testing and benchmarking analyses: Back-testing means the use of statistical methods to compare model estimates and realised outcomes in line with CRR Art. 174(d) and Art. 185(b). Benchmarking refers to a comparison of internal estimates across banks with external benchmarks or estimates of challenger models (such as external ratings, pooled data, supervisory models) in line with CRR Art. 185(c). With regards to the model use and application, the content of the monitoring activities depends on the peculiarities of the model. Examples are the model use on the appropriate portfolio, timely re-rating or the extent of overrides. All internal rating models at the EIB follow an expert-based approach. This means that the ratings are primarily based on scorecards, which rely on quantitative factors and an analyst’s opinion for qualitative factors, but also allow adjustments to the rating based on judgmental factors to an explicitly limited degree. EU and non-EU counterparts are generally subject to the same rating approach, although in the rating model for financial institutions the scores are partially weighted differently, such that for non-EU counterparties, business risk factors are for instance more heavily weighted than financial criteria. The internal rating model for corporate counterparts (excluding project finance counterparts) assesses business risk and financial risk factors (including industry risks, company specifics, corporate governance, capital structure and debt service capacity) on a quantitative and qualitative basis by taking into account sector- and country- specific factors to determine an initial rating. Expert adjustments are made by considering the legal entities’ parental or government support. Before the final rating is determined, overriding tools are applied to incorporate information that was not considered in the scoring sheet. 36 37 A manual override of the model values is possible for all counterparty types, with stricter rules for financial institutions and corporates. According to BCBS, “Working Paper No. 14: Studies on the Validation of Internal Rating Systems”.

Credit risk | 53 An internal rating model was developed for financial institutions even though most of these counterparts are rated by external credit rating agencies. The internal ratings process is very similar to that of corporates despite differences in the rating criteria, and measures, on the one hand, qualitative criteria such as economic environment, regulatory and legal framework or competitive position and, on the other hand, financial criteria assessing the institution’s financial soundness. The final rating allows for judgmental overrides as seen above. Non-EU sovereigns (incl. central banks) are rated by the Economics Department. The internal rating model for sub-sovereign public authority (‘SSPA’) counterparties assesses the two main areas, operating environment and financial position/risk, to derive an initial rating from the scorecard. Subsequently, model-driven adjustments including a country test (to ensure the rating is in line with the rating of the sovereign) and overriding adjustments (expert-based) and market information are made. A specific internal rating model exists for public sector entities (‘PSE’) that are neither sovereign, sub-sovereign public authorities, nor corporates and are considered within the institutions’ IRB exposure class for capital calculation purposes. The initial scorecard rating of these entities assesses the business and financial risk of the counterparty. Potential adjustments are allowed by assessing specific criteria to reflect the degree and likelihood of extraordinary support from the sponsoring sovereign or sub-sovereign. Requests for information addressed to the EIB Group including those related to the decisions made on internal ratings assigned to applicants for loans are handled by the InfoDesk in line with the Group’s Transparency Policy. As the Group does not directly lend to SMEs, these will usually be informed that loan decisions and conditions of financing fall within the remit of the financial intermediaries and that the Group is not involved in the rating decision-making process. Credit risk parameters The following table provides an overview of the internal models per exposure class including the models and methodologies applied to estimate the internal credit risk parameters. Component Portfolio Main models Description of model and methodology CRR category No. Description PD Corporates 2 PD Corporates Scoring sheet Exposures to Corporates PD Project Finance Scoring sheet Exposures to Corporates - specialised lending Financial Institutions 1 PD Financial Institutions Scoring sheet Exposures to Institutions Sovereign/Public Sector 4 PD Sub-Sovereign Public Authorities Scoring sheet Exposures to Central governments and central banks PD Public Sector Entities Scoring sheet PD Central governments and their central banks (non EU) Statistical based model with expert judgement PD Central governments and their central banks (EU) and supranational organisations Simplified approach LGD Corporates 2 LGD Corporates inside Europe Model based on sector and legislation Exposures to Corporates LGD Corporates outside Europe Benchmark model Financial Institutions 2 LGD Financial Institutions inside Europe Model based on financials and legislation Exposures to Institutions LGD Financial Institutions outside Europe Benchmark model Sovereign/Public Sector 4 LGD Public Institutions (SSPAs and PSEs) inside Europe Benchmark model Exposures to Central governments and central banks LGD Public Institutions (SSPAs and PSEs) outside Europe Benchmark model LGD Central governments and their central banks inside Europe but non EU member states Benchmark model with literature
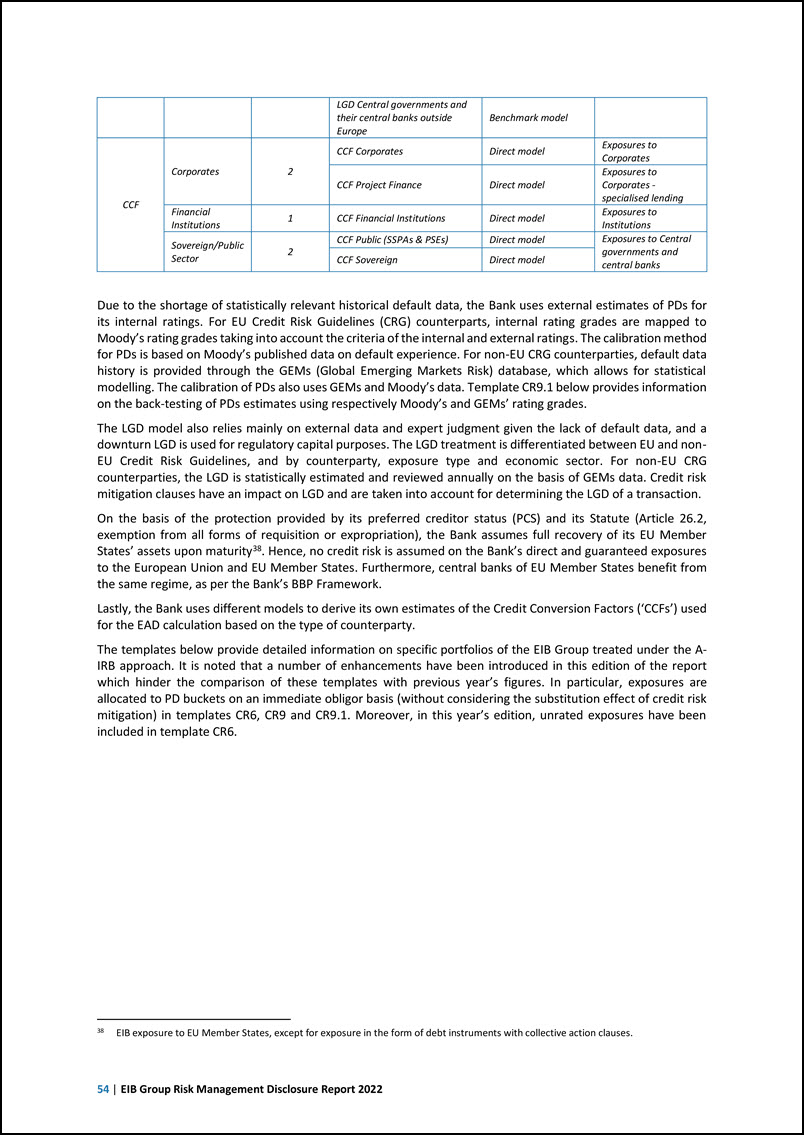
54 | EIB Group Risk Management Disclosure Report 2022 LGD Central governments and their central banks outside Europe Benchmark model CCF Corporates 2 CCF Corporates Direct model Exposures to Corporates CCF Project Finance Direct model Exposures to Corporates - specialised lending Financial Institutions 1 CCF Financial Institutions Direct model Exposures to Institutions Sovereign/Public Sector 2 CCF Public (SSPAs & PSEs) Direct model Exposures to Central governments and central banks CCF Sovereign Direct model Due to the shortage of statistically relevant historical default data, the Bank uses external estimates of PDs for its internal ratings. For EU Credit Risk Guidelines (CRG) counterparts, internal rating grades are mapped to Moody’s rating grades taking into account the criteria of the internal and external ratings. The calibration method for PDs is based on Moody’s published data on default experience. For non-EU CRG counterparties, default data history is provided through the GEMs (Global Emerging Markets Risk) database, which allows for statistical modelling. The calibration of PDs also uses GEMs and Moody’s data. Template CR9.1 below provides information on the back-testing of PDs estimates using respectively Moody’s and GEMs’ rating grades. The LGD model also relies mainly on external data and expert judgment given the lack of default data, and a downturn LGD is used for regulatory capital purposes. The LGD treatment is differentiated between EU and non- EU Credit Risk Guidelines, and by counterparty, exposure type and economic sector. For non-EU CRG counterparties, the LGD is statistically estimated and reviewed annually on the basis of GEMs data. Credit risk mitigation clauses have an impact on LGD and are taken into account for determining the LGD of a transaction. On the basis of the protection provided by its preferred creditor status (PCS) and its Statute (Article 26.2, exemption from all forms of requisition or expropriation), the Bank assumes full recovery of its EU Member States’ assets upon maturity38. Hence, no credit risk is assumed on the Bank’s direct and guaranteed exposures to the European Union and EU Member States. Furthermore, central banks of EU Member States benefit from the same regime, as per the Bank’s BBP Framework. Lastly, the Bank uses different models to derive its own estimates of the Credit Conversion Factors (‘CCFs’) used for the EAD calculation based on the type of counterparty. The templates below provide detailed information on specific portfolios of the EIB Group treated under the A- IRB approach. It is noted that a number of enhancements have been introduced in this edition of the report which hinder the comparison of these templates with previous year’s figures. In particular, exposures are allocated to PD buckets on an immediate obligor basis (without considering the substitution effect of credit risk mitigation) in templates CR6, CR9 and CR9.1. Moreover, in this year’s edition, unrated exposures have been included in template CR6. 38 EIB exposure to EU Member States, except for exposure in the form of debt instruments with collective action clauses.
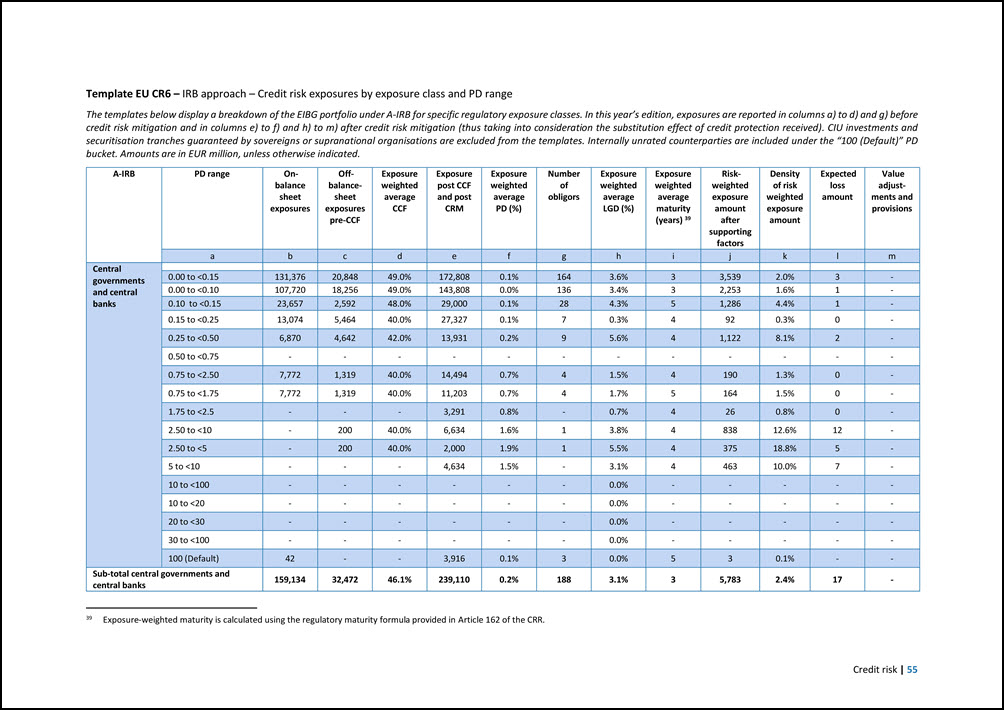
Credit risk | 55 Template EU CR6 – IRB approach – Credit risk exposures by exposure class and PD range The templates below display a breakdown of the EIBG portfolio under A-IRB for specific regulatory exposure classes. In this year’s edition, exposures are reported in columns a) to d) and g) before credit risk mitigation and in columns e) to f) and h) to m) after credit risk mitigation (thus taking into consideration the substitution effect of credit protection received). CIU investments and securitisation tranches guaranteed by sovereigns or supranational organisations are excluded from the templates. Internally unrated counterparties are included under the “100 (Default)” PD bucket. Amounts are in EUR million, unless otherwise indicated. A-IRB PD range On- balance sheet exposures Off- balance- sheet exposures pre-CCF Exposure weighted average CCF Exposure post CCF and post CRM Exposure weighted average PD (%) Number of obligors Exposure weighted average LGD (%) Exposure weighted average maturity (years) 39 Risk- weighted exposure amount after supporting factors Density of risk weighted exposure amount Expected loss amount Value adjust- ments and provisions a b c d e f g h i j k l m Central governments and central banks 0.00 to <0.15 131,376 20,848 49.0% 172,808 0.1% 164 3.6% 3 3,539 2.0% 3 - 0.00 to <0.10 107,720 18,256 49.0% 143,808 0.0% 136 3.4% 3 2,253 1.6% 1 - 0.10 to <0.15 23,657 2,592 48.0% 29,000 0.1% 28 4.3% 5 1,286 4.4% 1 - 0.15 to <0.25 13,074 5,464 40.0% 27,327 0.1% 7 0.3% 4 92 0.3% 0 - 0.25 to <0.50 6,870 4,642 42.0% 13,931 0.2% 9 5.6% 4 1,122 8.1% 2 - 0.50 to <0.75 - - - - - - - - - - - - 0.75 to <2.50 7,772 1,319 40.0% 14,494 0.7% 4 1.5% 4 190 1.3% 0 - 0.75 to <1.75 7,772 1,319 40.0% 11,203 0.7% 4 1.7% 5 164 1.5% 0 - 1.75 to <2.5 - - - 3,291 0.8% - 0.7% 4 26 0.8% 0 - 2.50 to <10 - 200 40.0% 6,634 1.6% 1 3.8% 4 838 12.6% 12 - 2.50 to <5 - 200 40.0% 2,000 1.9% 1 5.5% 4 375 18.8% 5 - 5 to <10 - - - 4,634 1.5% - 3.1% 4 463 10.0% 7 - 10 to <100 - - - - - - 0.0% - - - - - 10 to <20 - - - - - - 0.0% - - - - - 20 to <30 - - - - - - 0.0% - - - - - 30 to <100 - - - - - - 0.0% - - - - - 100 (Default) 42 - - 3,916 0.1% 3 0.0% 5 3 0.1% - - Sub-total central governments and central banks 159,134 32,472 46.1% 239,110 0.2% 188 3.1% 3 5,783 2.4% 17 - 39 Exposure-weighted maturity is calculated using the regulatory maturity formula provided in Article 162 of the CRR.
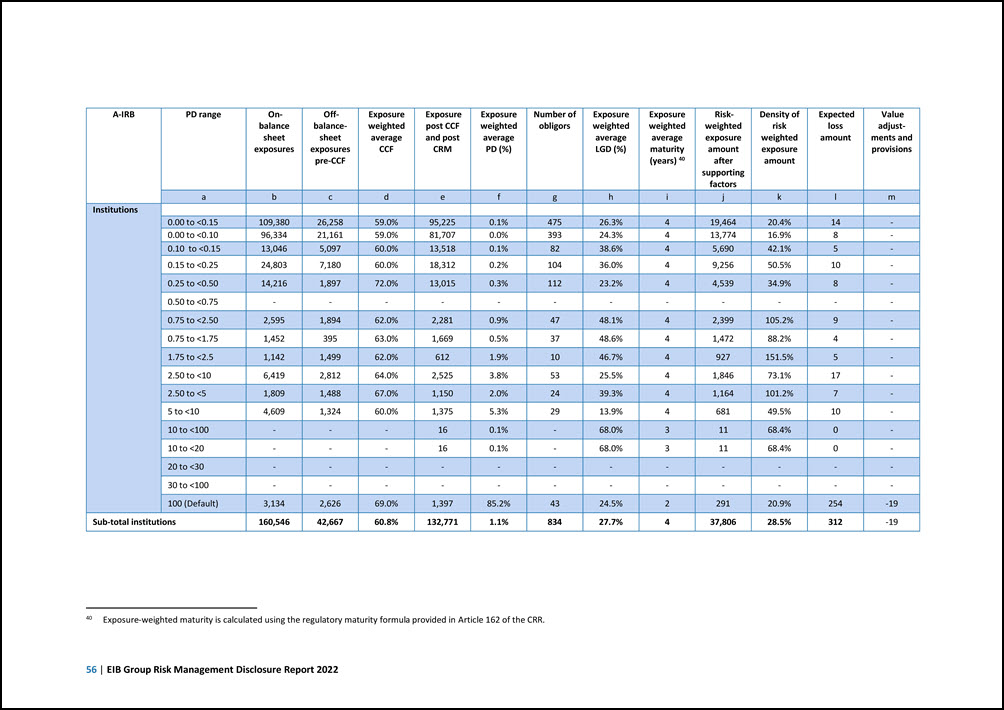
56 | EIB Group Risk Management Disclosure Report 2022 A-IRB PD range On- balance sheet exposures Off- balance- sheet exposures pre-CCF Exposure weighted average CCF Exposure post CCF and post CRM Exposure weighted average PD (%) Number of obligors Exposure weighted average LGD (%) Exposure weighted average maturity (years) 40 Risk- weighted exposure amount after supporting factors Density of risk weighted exposure amount Expected loss amount Value adjust- ments and provisions a b c d e f g h i j k l m Institutions 0.00 to <0.15 109,380 26,258 59.0% 95,225 0.1% 475 26.3% 4 19,464 20.4% 14 - 0.00 to <0.10 96,334 21,161 59.0% 81,707 0.0% 393 24.3% 4 13,774 16.9% 8 - 0.10 to <0.15 13,046 5,097 60.0% 13,518 0.1% 82 38.6% 4 5,690 42.1% 5 - 0.15 to <0.25 24,803 7,180 60.0% 18,312 0.2% 104 36.0% 4 9,256 50.5% 10 - 0.25 to <0.50 14,216 1,897 72.0% 13,015 0.3% 112 23.2% 4 4,539 34.9% 8 - 0.50 to <0.75 - - - - - - - - - - - - 0.75 to <2.50 2,595 1,894 62.0% 2,281 0.9% 47 48.1% 4 2,399 105.2% 9 - 0.75 to <1.75 1,452 395 63.0% 1,669 0.5% 37 48.6% 4 1,472 88.2% 4 - 1.75 to <2.5 1,142 1,499 62.0% 612 1.9% 10 46.7% 4 927 151.5% 5 - 2.50 to <10 6,419 2,812 64.0% 2,525 3.8% 53 25.5% 4 1,846 73.1% 17 - 2.50 to <5 1,809 1,488 67.0% 1,150 2.0% 24 39.3% 4 1,164 101.2% 7 - 5 to <10 4,609 1,324 60.0% 1,375 5.3% 29 13.9% 4 681 49.5% 10 - 10 to <100 - - - 16 0.1% - 68.0% 3 11 68.4% 0 - 10 to <20 - - - 16 0.1% - 68.0% 3 11 68.4% 0 - 20 to <30 - - - - - - - - - - - - 30 to <100 - - - - - - - - - - - - 100 (Default) 3,134 2,626 69.0% 1,397 85.2% 43 24.5% 2 291 20.9% 254 -19 Sub-total institutions 160,546 42,667 60.8% 132,771 1.1% 834 27.7% 4 37,806 28.5% 312 -19 40 Exposure-weighted maturity is calculated using the regulatory maturity formula provided in Article 162 of the CRR.
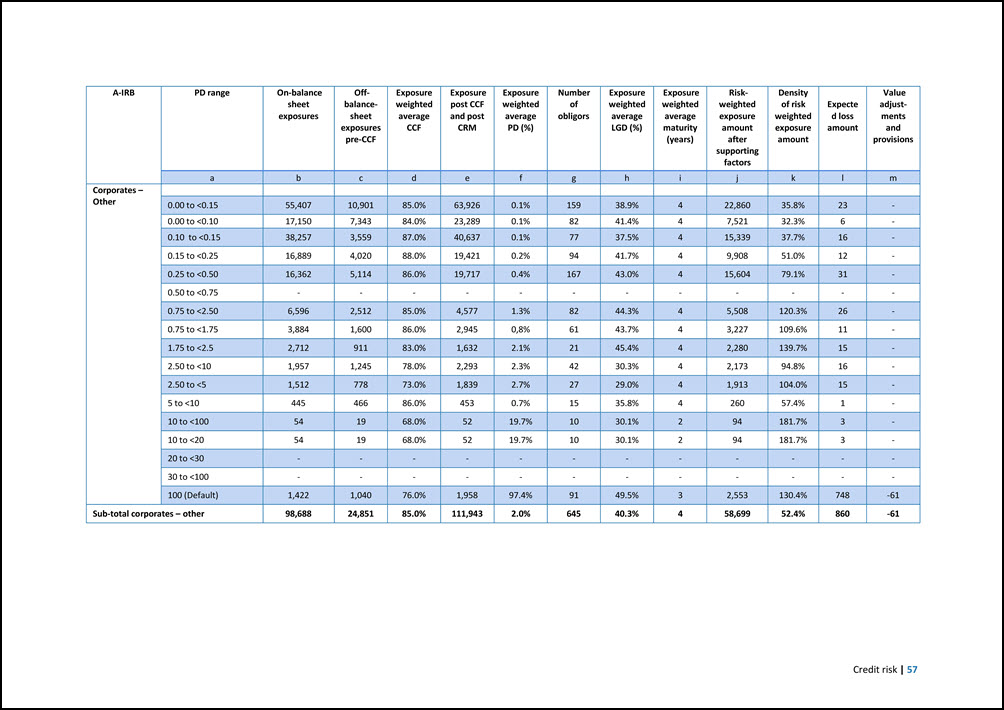
Credit risk | 57 A-IRB PD range On-balance sheet exposures Off- balance- sheet exposures pre-CCF Exposure weighted average CCF Exposure post CCF and post CRM Exposure weighted average PD (%) Number of obligors Exposure weighted average LGD (%) Exposure weighted average maturity (years) Risk- weighted exposure amount after supporting factors Density of risk weighted exposure amount Expecte d loss amount Value adjust- ments and provisions a b c d e f g h i j k l m Corporates – Other 0.00 to <0.15 55,407 10,901 85.0% 63,926 0.1% 159 38.9% 4 22,860 35.8% 23 - 0.00 to <0.10 17,150 7,343 84.0% 23,289 0.1% 82 41.4% 4 7,521 32.3% 6 - 0.10 to <0.15 38,257 3,559 87.0% 40,637 0.1% 77 37.5% 4 15,339 37.7% 16 - 0.15 to <0.25 16,889 4,020 88.0% 19,421 0.2% 94 41.7% 4 9,908 51.0% 12 - 0.25 to <0.50 16,362 5,114 86.0% 19,717 0.4% 167 43.0% 4 15,604 79.1% 31 - 0.50 to <0.75 - - - - - - - - - - - - 0.75 to <2.50 6,596 2,512 85.0% 4,577 1.3% 82 44.3% 4 5,508 120.3% 26 - 0.75 to <1.75 3,884 1,600 86.0% 2,945 0,8% 61 43.7% 4 3,227 109.6% 11 - 1.75 to <2.5 2,712 911 83.0% 1,632 2.1% 21 45.4% 4 2,280 139.7% 15 - 2.50 to <10 1,957 1,245 78.0% 2,293 2.3% 42 30.3% 4 2,173 94.8% 16 - 2.50 to <5 1,512 778 73.0% 1,839 2.7% 27 29.0% 4 1,913 104.0% 15 - 5 to <10 445 466 86.0% 453 0.7% 15 35.8% 4 260 57.4% 1 - 10 to <100 54 19 68.0% 52 19.7% 10 30.1% 2 94 181.7% 3 - 10 to <20 54 19 68.0% 52 19.7% 10 30.1% 2 94 181.7% 3 - 20 to <30 - - - - - - - - - - - - 30 to <100 - - - - - - - - - - - - 100 (Default) 1,422 1,040 76.0% 1,958 97.4% 91 49.5% 3 2,553 130.4% 748 -61 Sub-total corporates – other 98,688 24,851 85.0% 111,943 2.0% 645 40.3% 4 58,699 52.4% 860 -61
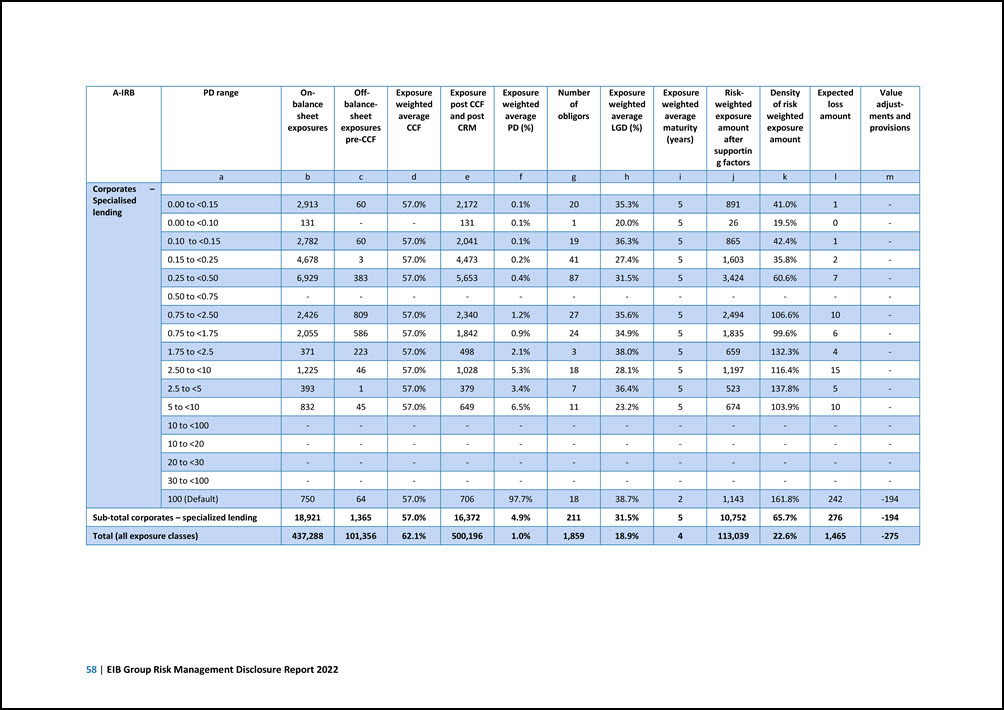
58 | EIB Group Risk Management Disclosure Report 2022 A-IRB PD range On- balance sheet exposures Off- balance- sheet exposures pre-CCF Exposure weighted average CCF Exposure post CCF and post CRM Exposure weighted average PD (%) Number of obligors Exposure weighted average LGD (%) Exposure weighted average maturity (years) Risk- weighted exposure amount after supportin g factors Density of risk weighted exposure amount Expected loss amount Value adjust- ments and provisions a b c d e f g h i j k l m Corporates – Specialised lending 0.00 to <0.15 2,913 60 57.0% 2,172 0.1% 20 35.3% 5 891 41.0% 1 - 0.00 to <0.10 131 - - 131 0.1% 1 20.0% 5 26 19.5% 0 - 0.10 to <0.15 2,782 60 57.0% 2,041 0.1% 19 36.3% 5 865 42.4% 1 - 0.15 to <0.25 4,678 3 57.0% 4,473 0.2% 41 27.4% 5 1,603 35.8% 2 - 0.25 to <0.50 6,929 383 57.0% 5,653 0.4% 87 31.5% 5 3,424 60.6% 7 - 0.50 to <0.75 - - - - - - - - - - - - 0.75 to <2.50 2,426 809 57.0% 2,340 1.2% 27 35.6% 5 2,494 106.6% 10 - 0.75 to <1.75 2,055 586 57.0% 1,842 0.9% 24 34.9% 5 1,835 99.6% 6 - 1.75 to <2.5 371 223 57.0% 498 2.1% 3 38.0% 5 659 132.3% 4 - 2.50 to <10 1,225 46 57.0% 1,028 5.3% 18 28.1% 5 1,197 116.4% 15 - 2.5 to <5 393 1 57.0% 379 3.4% 7 36.4% 5 523 137.8% 5 - 5 to <10 832 45 57.0% 649 6.5% 11 23.2% 5 674 103.9% 10 - 10 to <100 - - - - - - - - - - - - 10 to <20 - - - - - - - - - - - - 20 to <30 - - - - - - - - - - - - 30 to <100 - - - - - - - - - - - - 100 (Default) 750 64 57.0% 706 97.7% 18 38.7% 2 1,143 161.8% 242 -194 Sub-total corporates – specialized lending 18,921 1,365 57.0% 16,372 4.9% 211 31.5% 5 10,752 65.7% 276 -194 Total (all exposure classes) 437,288 101,356 62.1% 500,196 1.0% 1,859 18.9% 4 113,039 22.6% 1,465 -275

Credit risk | 59 Template EU CR6-A – Scope of the use of IRB and SA approaches The below template exhibits the total amount of exposures treated under the IRB approach before credit risk mitigation (column a) compared to the exposure calculated in the context of the leverage ratio (column b). It shows that exposure values under IRB tend to be higher than those considered for the calculation of the leverage ratio, and this, regardless of the difference in scope, is due to the application of a different credit conversion factor. Furthermore, as explained above, the EIBG treats most of its exposures under the A-IRB approach and makes limited use of the standardised approach. Amounts are in EUR million, unless otherwise indicated Exposure value as defined in Article 166 CRR for exposures subject to IRB approach Total exposure value for exposures subject to the Standardised approach and to the IRB approach Percentage of total exposure value subject to the permanent partial use of the SA (%) Percentag e of total exposure value subject to a roll-out plan (%) Percentage of total exposure value subject to IRB Approach (%)41 a b c d e 1 Central governments and central banks 174,090 175,370 - - 100.0% 1.1 Of which Regional governments or local authorities 22,998 - - 100.0% 1.2 Of which Public sector entities 37,217 - - 100.0% 2 Institutions 191,753 187,324 - - 100.0% 3 Corporates 154,135 146,233 0.2% - 99.8% 3.1 Of which Corporates – Specialised lending, excluding slotting approach 19,603 - - 100.0% 3.2 Of which Corporates – Specialised lending under slotting approach - - - - 4 Retail - - - - - 4.1 of which Retail – Secured by real estate SMEs - - - - 4.2 of which Retail – Secured by real estate non- SMEs - - - - 4.3 of which Retail – Qualifying revolving - - - - 4.4 of which Retail – Other SMEs - - - - 4.5 of which Retail – Other non-SMEs - - - - 5 Equity 3,528 4,398 19.8% - 80.2% 6 Other non-credit obligation assets 2,693 2,693 - - 100.0% 7 Total 526,200 516,019 0.2% 0.0% 99.8% 41 For the purpose of this template, CIUs treated in accordance with Article 152 of the CRR are considered in the scope of IRB exposures (and allocated for the most part to the corporate exposure class).
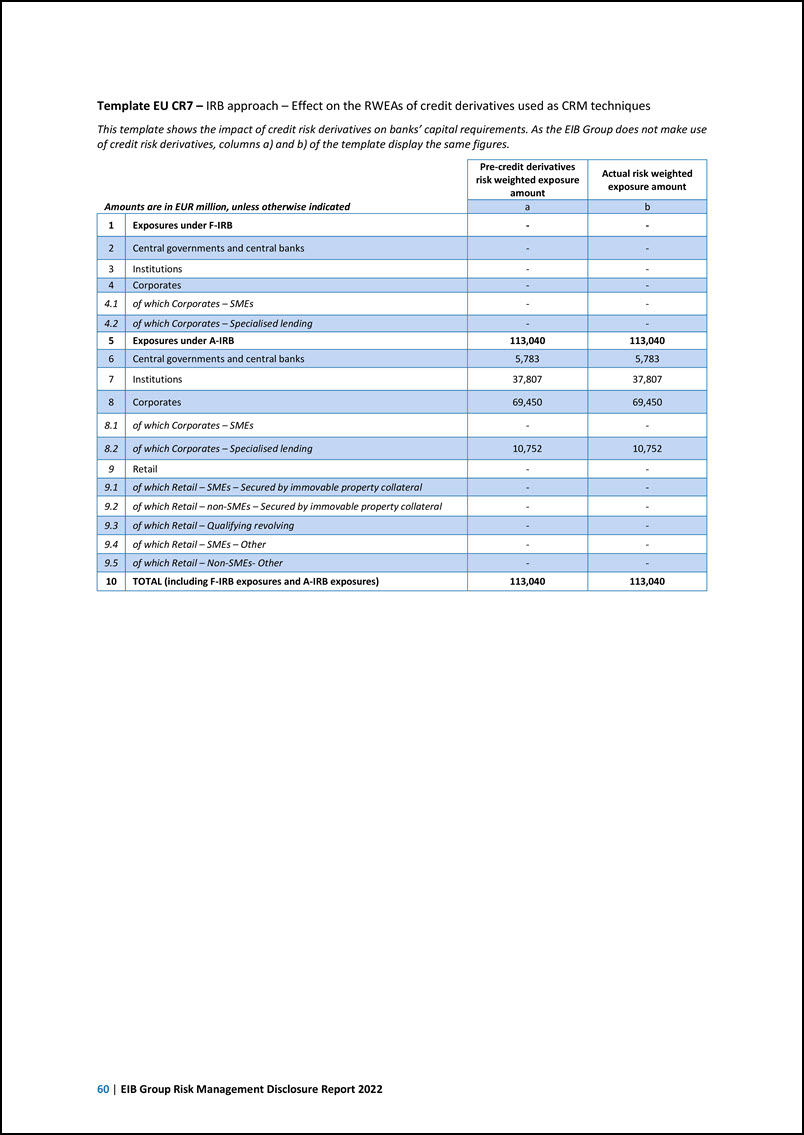
60 | EIB Group Risk Management Disclosure Report 2022 Template EU CR7 – IRB approach – Effect on the RWEAs of credit derivatives used as CRM techniques This template shows the impact of credit risk derivatives on banks’ capital requirements. As the EIB Group does not make use of credit risk derivatives, columns a) and b) of the template display the same figures. Amounts are in EUR million, unless otherwise indicated Pre-credit derivatives risk weighted exposure amount Actual risk weighted exposure amount a b 1 Exposures under F-IRB - - 2 Central governments and central banks - - 3 Institutions - - 4 Corporates - - 4.1 of which Corporates – SMEs - - 4.2 of which Corporates – Specialised lending - - 5 Exposures under A-IRB 113,040 113,040 6 Central governments and central banks 5,783 5,783 7 Institutions 37,807 37,807 8 Corporates 69,450 69,450 8.1 of which Corporates – SMEs - - 8.2 of which Corporates – Specialised lending 10,752 10,752 9 Retail - - 9.1 of which Retail – SMEs – Secured by immovable property collateral - - 9.2 of which Retail – non-SMEs – Secured by immovable property collateral - - 9.3 of which Retail – Qualifying revolving - - 9.4 of which Retail – SMEs – Other - - 9.5 of which Retail – Non-SMEs- Other - - 10 TOTAL (including F-IRB exposures and A-IRB exposures) 113,040 113,040
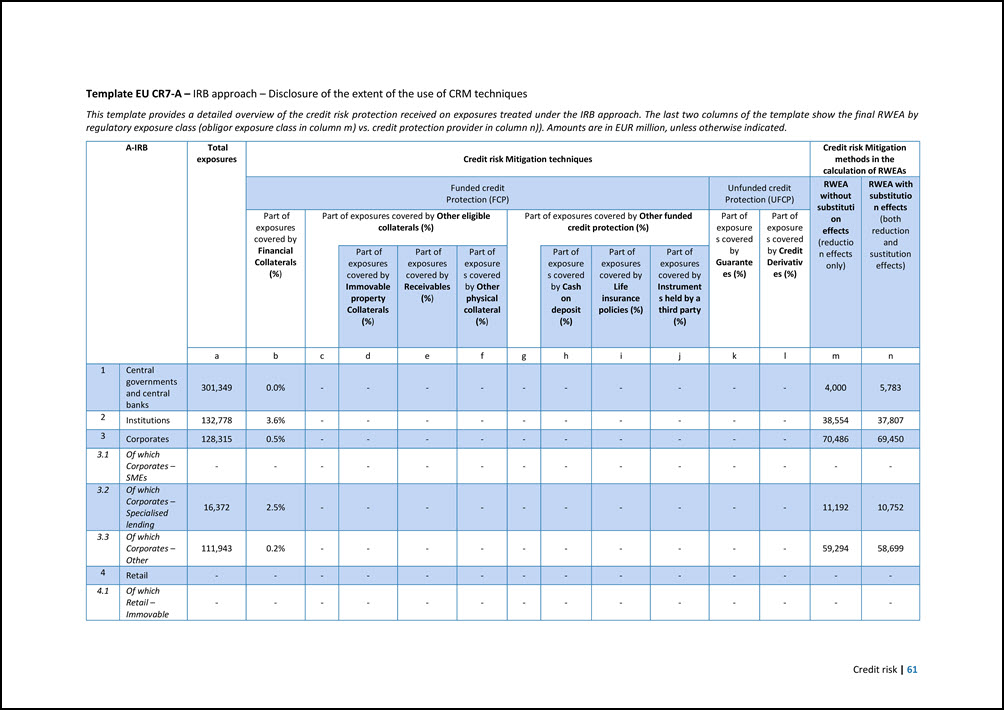
Credit risk | 61 Template EU CR7-A – IRB approach – Disclosure of the extent of the use of CRM techniques This template provides a detailed overview of the credit risk protection received on exposures treated under the IRB approach. The last two columns of the template show the final RWEA by regulatory exposure class (obligor exposure class in column m) vs. credit protection provider in column n)). Amounts are in EUR million, unless otherwise indicated. A-IRB Total exposures Credit risk Mitigation techniques Credit risk Mitigation methods in the calculation of RWEAs Funded credit Protection (FCP) Unfunded credit Protection (UFCP) RWEA without substituti on effects (reductio n effects only) RWEA with substitutio n effects (both reduction and sustitution effects) Part of exposures covered by Financial Collaterals (%) Part of exposures covered by Other eligible collaterals (%) Part of exposures covered by Other funded credit protection (%) Part of exposure s covered by Guarante es (%) Part of exposure s covered by Credit Derivativ es (%) Part of exposures covered by Immovable property Collaterals (%) Part of exposures covered by Receivables (%) Part of exposure s covered by Other physical collateral (%) Part of exposure s covered by Cash on deposit (%) Part of exposures covered by Life insurance policies (%) Part of exposures covered by Instrument s held by a third party (%) a b c d e f g h i j k l m n 1 Central governments and central banks 301,349 0.0% - - - - - - - - - - 4,000 5,783 2 Institutions 132,778 3.6% - - - - - - - - - - 38,554 37,807 3 Corporates 128,315 0.5% - - - - - - - - - - 70,486 69,450 3.1 Of which Corporates – SMEs - - - - - - - - - - - - - - 3.2 Of which Corporates – Specialised lending 16,372 2.5% - - - - - - - - - - 11,192 10,752 3.3 Of which Corporates – Other 111,943 0.2% - - - - - - - - - - 59,294 58,699 4 Retail - - - - - - - - - - - - - - 4.1 Of which Retail – Immovable - - - - - - - - - - - - - -
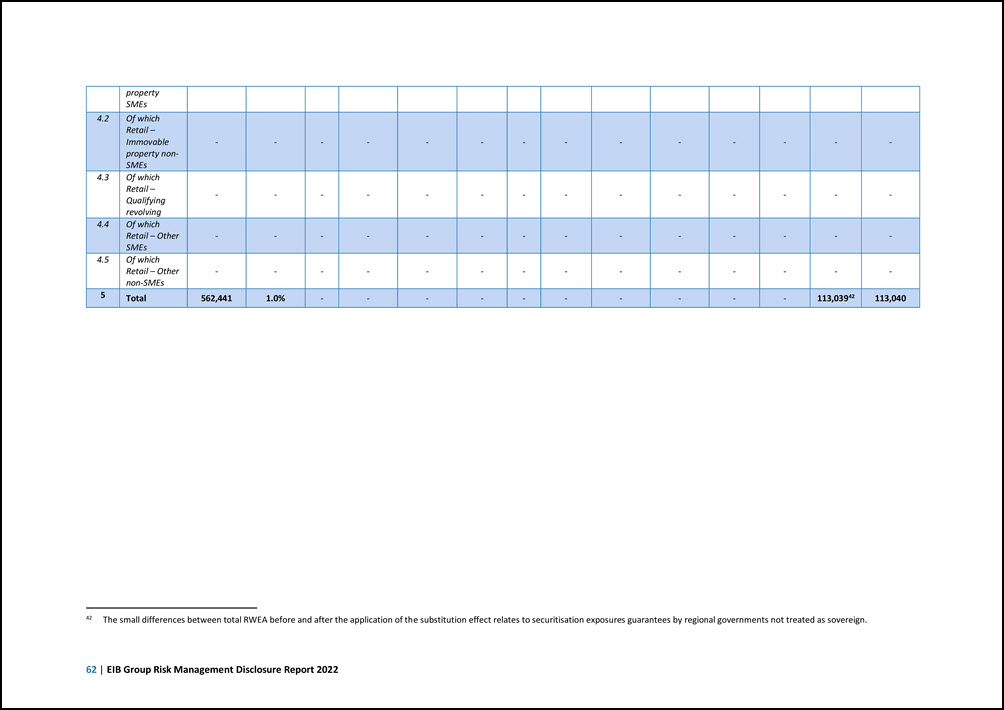
62 | EIB Group Risk Management Disclosure Report 2022 property SMEs 4.2 Of which Retail – Immovable property non- SMEs - - - - - - - - - - - - - - 4.3 Of which Retail – Qualifying revolving - - - - - - - - - - - - - - 4.4 Of which Retail – Other SMEs - - - - - - - - - - - - - - 4.5 Of which Retail – Other non-SMEs - - - - - - - - - - - - - - 5 Total 562,441 1.0% - - - - - - - - - - 113,03942 113,040 42 The small differences between total RWEA before and after the application of the substitution effect relates to securitisation exposures guarantees by regional governments not treated as sovereign.
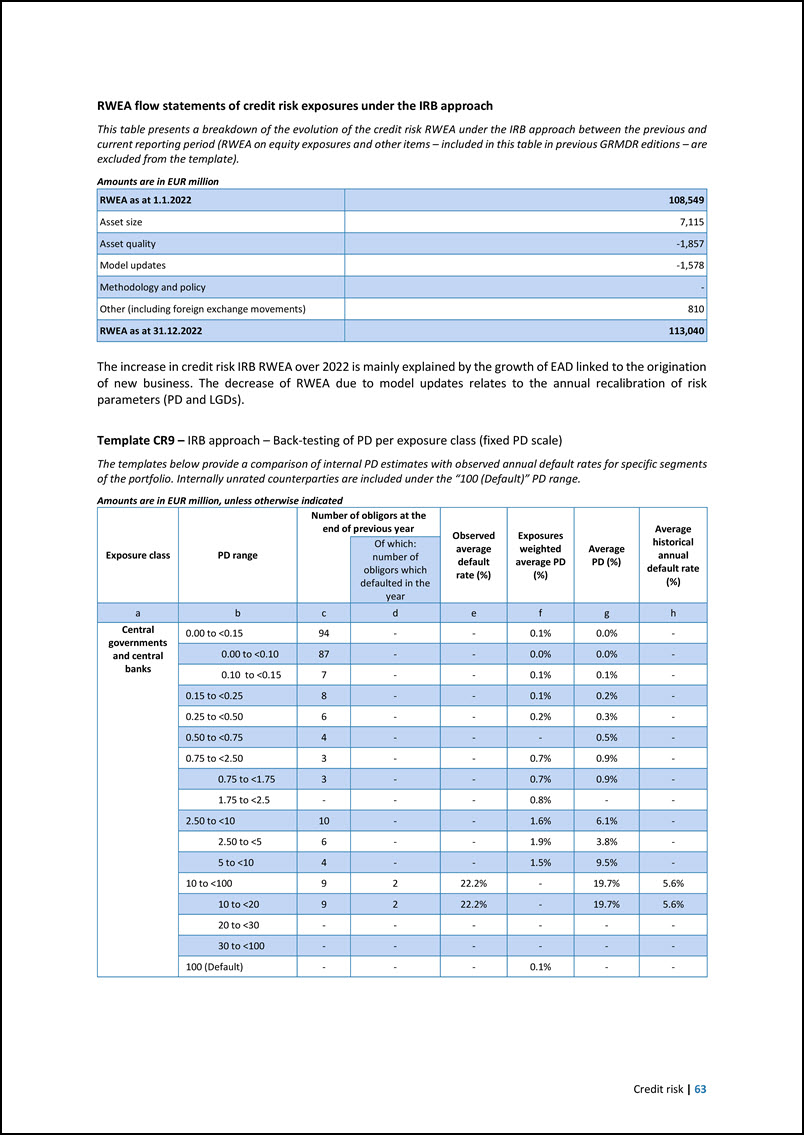
Credit risk | 63 RWEA flow statements of credit risk exposures under the IRB approach This table presents a breakdown of the evolution of the credit risk RWEA under the IRB approach between the previous and current reporting period (RWEA on equity exposures and other items – included in this table in previous GRMDR editions – are excluded from the template). Amounts are in EUR million RWEA as at 1.1.2022 108,549 Asset size 7,115 Asset quality -1,857 Model updates -1,578 Methodology and policy - Other (including foreign exchange movements) 810 RWEA as at 31.12.2022 113,040 The increase in credit risk IRB RWEA over 2022 is mainly explained by the growth of EAD linked to the origination of new business. The decrease of RWEA due to model updates relates to the annual recalibration of risk parameters (PD and LGDs). Template CR9 – IRB approach – Back-testing of PD per exposure class (fixed PD scale) The templates below provide a comparison of internal PD estimates with observed annual default rates for specific segments of the portfolio. Internally unrated counterparties are included under the “100 (Default)” PD range. Amounts are in EUR million, unless otherwise indicated Exposure class PD range Number of obligors at the end of previous year Observed average default rate (%) Exposures weighted average PD (%) Average PD (%) Average historical annual default rate (%) Of which: number of obligors which defaulted in the year a b c d e f g h Central 0.00 to <0.15 94 - - 0.1% 0.0% - governments 0.00 to <0.10 87 - - 0.0% 0.0% - and central banks 0.10 to <0.15 7 - - 0.1% 0.1% - 0.15 to <0.25 8 - - 0.1% 0.2% - 0.25 to <0.50 6 - - 0.2% 0.3% - 0.50 to <0.75 4 - - - 0.5% - 0.75 to <2.50 3 - - 0.7% 0.9% - 0.75 to <1.75 3 - - 0.7% 0.9% - 1.75 to <2.5 - - - 0.8% - - 2.50 to <10 10 - - 1.6% 6.1% - 2.50 to <5 6 - - 1.9% 3.8% - 5 to <10 4 - - 1.5% 9.5% - 10 to <100 9 2 22.2% - 19.7% 5.6% 10 to <20 9 2 22.2% - 19.7% 5.6% 20 to <30 - - - - - - 30 to <100 - - - - - - 100 (Default) - - - 0.1% - -
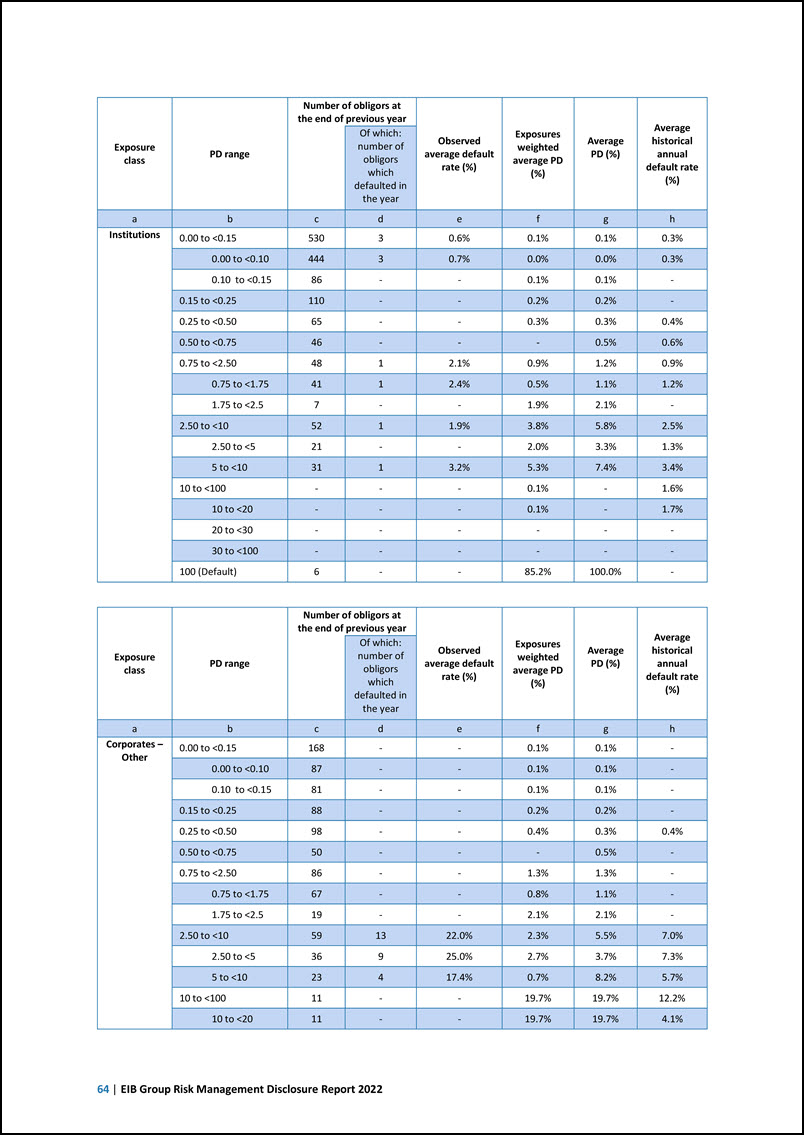
64 | EIB Group Risk Management Disclosure Report 2022 Exposure class PD range Number of obligors at the end of previous year Observed average default rate (%) Exposures weighted average PD (%) Average PD (%) Average historical annual default rate (%) Of which: number of obligors which defaulted in the year a b c d e f g h Institutions 0.00 to <0.15 530 3 0.6% 0.1% 0.1% 0.3% 0.00 to <0.10 444 3 0.7% 0.0% 0.0% 0.3% 0.10 to <0.15 86 - - 0.1% 0.1% - 0.15 to <0.25 110 - - 0.2% 0.2% - 0.25 to <0.50 65 - - 0.3% 0.3% 0.4% 0.50 to <0.75 46 - - - 0.5% 0.6% 0.75 to <2.50 48 1 2.1% 0.9% 1.2% 0.9% 0.75 to <1.75 41 1 2.4% 0.5% 1.1% 1.2% 1.75 to <2.5 7 - - 1.9% 2.1% - 2.50 to <10 52 1 1.9% 3.8% 5.8% 2.5% 2.50 to <5 21 - - 2.0% 3.3% 1.3% 5 to <10 31 1 3.2% 5.3% 7.4% 3.4% 10 to <100 - - - 0.1% - 1.6% 10 to <20 - - - 0.1% - 1.7% 20 to <30 - - - - - - 30 to <100 - - - - - - 100 (Default) 6 - - 85.2% 100.0% - Exposure class PD range Number of obligors at the end of previous year Observed average default rate (%) Exposures weighted average PD (%) Average PD (%) Average historical annual default rate (%) Of which: number of obligors which defaulted in the year a b c d e f g h Corporates – Other 0.00 to <0.15 168 - - 0.1% 0.1% - 0.00 to <0.10 87 - - 0.1% 0.1% - 0.10 to <0.15 81 - - 0.1% 0.1% - 0.15 to <0.25 88 - - 0.2% 0.2% - 0.25 to <0.50 98 - - 0.4% 0.3% 0.4% 0.50 to <0.75 50 - - - 0.5% - 0.75 to <2.50 86 - - 1.3% 1.3% - 0.75 to <1.75 67 - - 0.8% 1.1% - 1.75 to <2.5 19 - - 2.1% 2.1% - 2.50 to <10 59 13 22.0% 2.3% 5.5% 7.0% 2.50 to <5 36 9 25.0% 2.7% 3.7% 7.3% 5 to <10 23 4 17.4% 0.7% 8.2% 5.7% 10 to <100 11 - - 19.7% 19.7% 12.2% 10 to <20 11 - - 19.7% 19.7% 4.1%
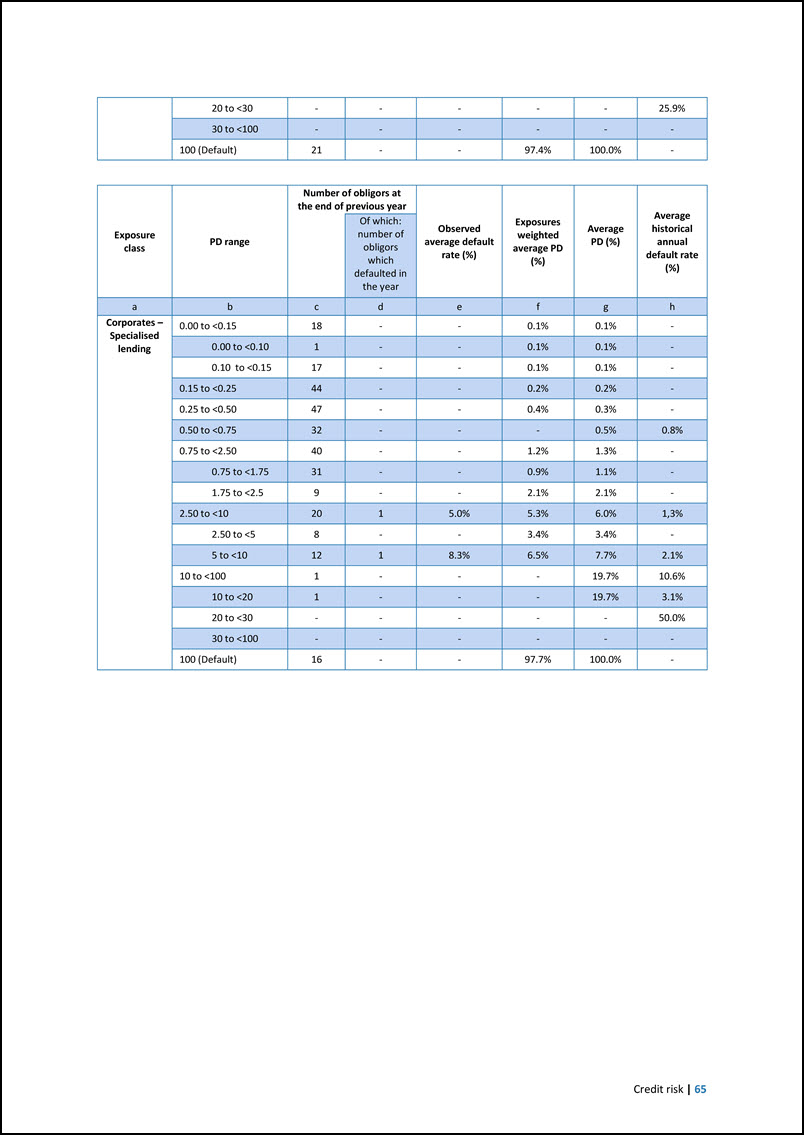
Credit risk | 65 20 to <30 - - - - - 25.9% 30 to <100 - - - - - - 100 (Default) 21 - - 97.4% 100.0% - Exposure class PD range Number of obligors at the end of previous year Observed average default rate (%) Exposures weighted average PD (%) Average PD (%) Average historical annual default rate (%) Of which: number of obligors which defaulted in the year a b c d e f g h Corporates – Specialised lending 0.00 to <0.15 18 - - 0.1% 0.1% - 0.00 to <0.10 1 - - 0.1% 0.1% - 0.10 to <0.15 17 - - 0.1% 0.1% - 0.15 to <0.25 44 - - 0.2% 0.2% - 0.25 to <0.50 47 - - 0.4% 0.3% - 0.50 to <0.75 32 - - - 0.5% 0.8% 0.75 to <2.50 40 - - 1.2% 1.3% - 0.75 to <1.75 31 - - 0.9% 1.1% - 1.75 to <2.5 9 - - 2.1% 2.1% - 2.50 to <10 20 1 5.0% 5.3% 6.0% 1,3% 2.50 to <5 8 - - 3.4% 3.4% - 5 to <10 12 1 8.3% 6.5% 7.7% 2.1% 10 to <100 1 - - - 19.7% 10.6% 10 to <20 1 - - - 19.7% 3.1% 20 to <30 - - - - - 50.0% 30 to <100 - - - - - - 100 (Default) 16 - - 97.7% 100.0% -
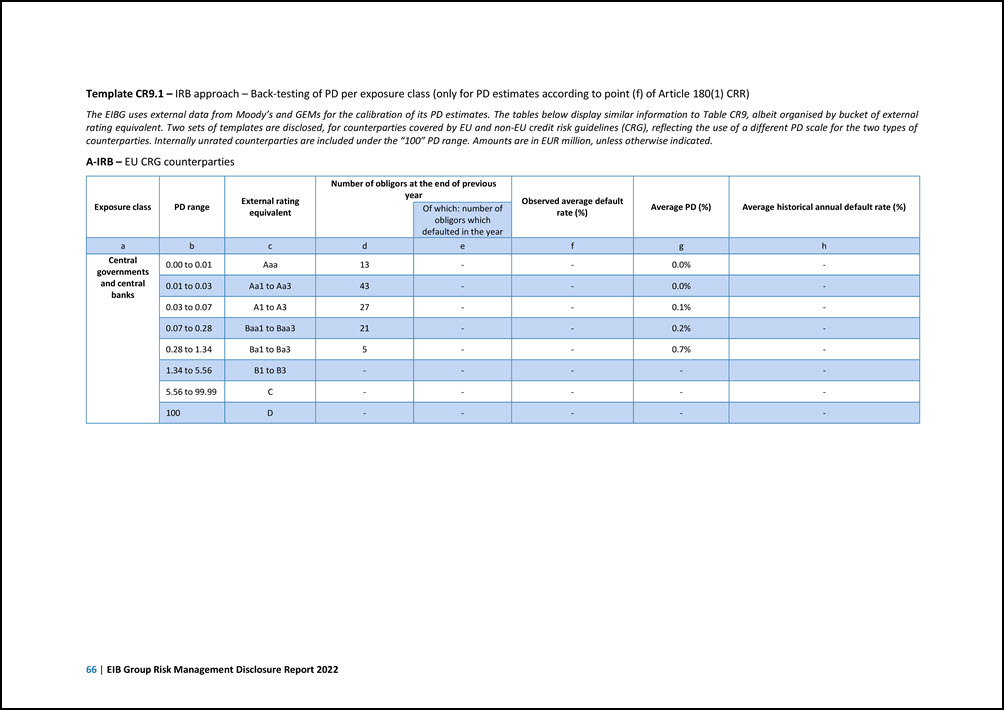
66 | EIB Group Risk Management Disclosure Report 2022 Template CR9.1 – IRB approach – Back-testing of PD per exposure class (only for PD estimates according to point (f) of Article 180(1) CRR) The EIBG uses external data from Moody’s and GEMs for the calibration of its PD estimates. The tables below display similar information to Table CR9, albeit organised by bucket of external rating equivalent. Two sets of templates are disclosed, for counterparties covered by EU and non-EU credit risk guidelines (CRG), reflecting the use of a different PD scale for the two types of counterparties. Internally unrated counterparties are included under the “100” PD range. Amounts are in EUR million, unless otherwise indicated. A-IRB – EU CRG counterparties Exposure class PD range External rating equivalent Number of obligors at the end of previous year Observed average default rate (%) Average PD (%) Average historical annual default rate (%) Of which: number of obligors which defaulted in the year a b c d e f g h Central governments and central banks 0.00 to 0.01 Aaa 13 - - 0.0% - 0.01 to 0.03 Aa1 to Aa3 43 - - 0.0% - 0.03 to 0.07 A1 to A3 27 - - 0.1% - 0.07 to 0.28 Baa1 to Baa3 21 - - 0.2% - 0.28 to 1.34 Ba1 to Ba3 5 - - 0.7% - 1.34 to 5.56 B1 to B3 - - - - - 5.56 to 99.99 C - - - - - 100 D - - - - -

Credit risk | 67 Exposure class PD range External rating equivalent Number of obligors at the end of previous year Observed average default rate (%) Average PD (%) Average historical annual default rate (%) Of which: number of obligors which defaulted in the year a b c d e f g h Institutions 0.00 to 0.01 Aaa 12 - - 0.0% - 0.01 to 0.03 Aa1 to Aa3 138 - - 0.0% - 0.03 to 0.07 A1 to A3 292 3 1.0% 0.1% 0.5% 0.07 to 0.28 Baa1 to Baa3 260 - - 0.2% 0.1% 0.28 to 1.34 Ba1 to Ba3 85 1 1.2% 0.9% 1.1% 1.34 to 5.56 B1 to B3 41 - - 3.7% 1.4% 5.56 to 99.99 C 13 1 7.7% 9.8% 3.2% 100 D 6 - - 100.0% - Exposure class PD range External rating equivalent Number of obligors at the end of previous year Observed average default rate (%) Average PD (%) Average historical annual default rate (%) Of which: number of obligors which defaulted in the year a b c d e f g h Corporates – Other 0.00 to 0.01 Aaa - - - - - 0.01 to 0.03 Aa1 to Aa3 12 - - 0.0% - 0.03 to 0.07 A1 to A3 74 - - 0.1% - 0.07 to 0.28 Baa1 to Baa3 264 - - 0.2% 0.1% 0.28 to 1.34 Ba1 to Ba3 109 - - 0.9% - 1.34 to 5.56 B1 to B3 40 - - 3.7% 1.0% 5.56 to 99.99 C 4 1 25.0% 9.8% 14.6% 100 D 11 - - 100.0% -
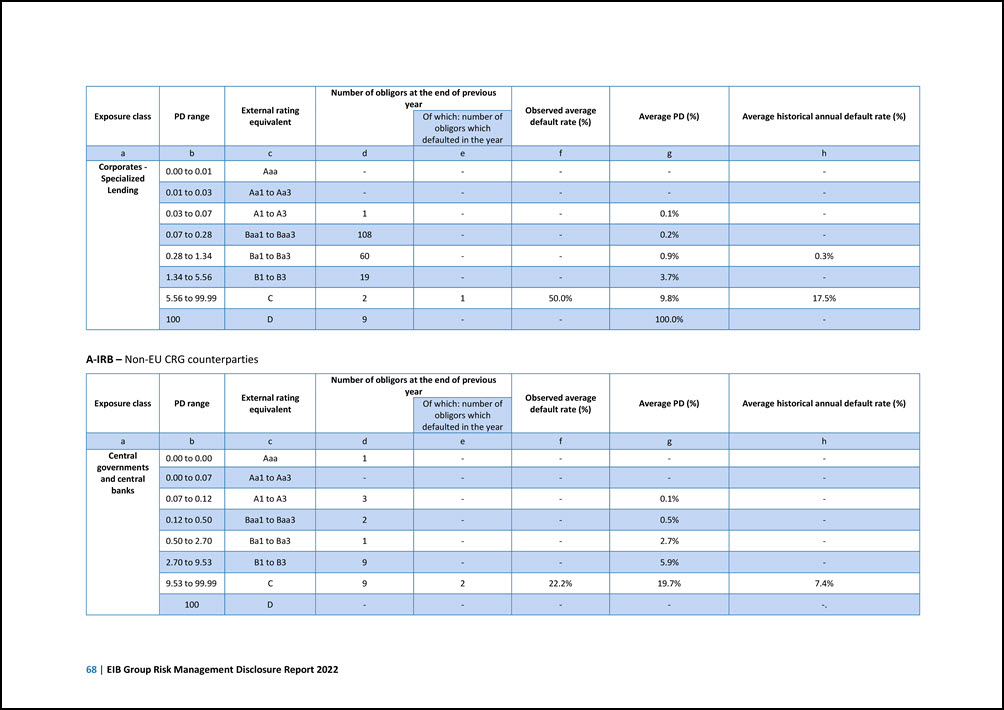
68 | EIB Group Risk Management Disclosure Report 2022 Exposure class PD range External rating equivalent Number of obligors at the end of previous year Observed average default rate (%) Average PD (%) Average historical annual default rate (%) Of which: number of obligors which defaulted in the year a b c d e f g h Corporates - Specialized Lending 0.00 to 0.01 Aaa - - - - - 0.01 to 0.03 Aa1 to Aa3 - - - - - 0.03 to 0.07 A1 to A3 1 - - 0.1% - 0.07 to 0.28 Baa1 to Baa3 108 - - 0.2% - 0.28 to 1.34 Ba1 to Ba3 60 - - 0.9% 0.3% 1.34 to 5.56 B1 to B3 19 - - 3.7% - 5.56 to 99.99 C 2 1 50.0% 9.8% 17.5% 100 D 9 - - 100.0% - A-IRB – Non-EU CRG counterparties Exposure class PD range External rating equivalent Number of obligors at the end of previous year Observed average default rate (%) Average PD (%) Average historical annual default rate (%) Of which: number of obligors which defaulted in the year a b c d e f g h Central governments and central banks 0.00 to 0.00 Aaa 1 - - - - 0.00 to 0.07 Aa1 to Aa3 - - - - - 0.07 to 0.12 A1 to A3 3 - - 0.1% - 0.12 to 0.50 Baa1 to Baa3 2 - - 0.5% - 0.50 to 2.70 Ba1 to Ba3 1 - - 2.7% - 2.70 to 9.53 B1 to B3 9 - - 5.9% - 9.53 to 99.99 C 9 2 22.2% 19.7% 7.4% 100 D - - - - -.
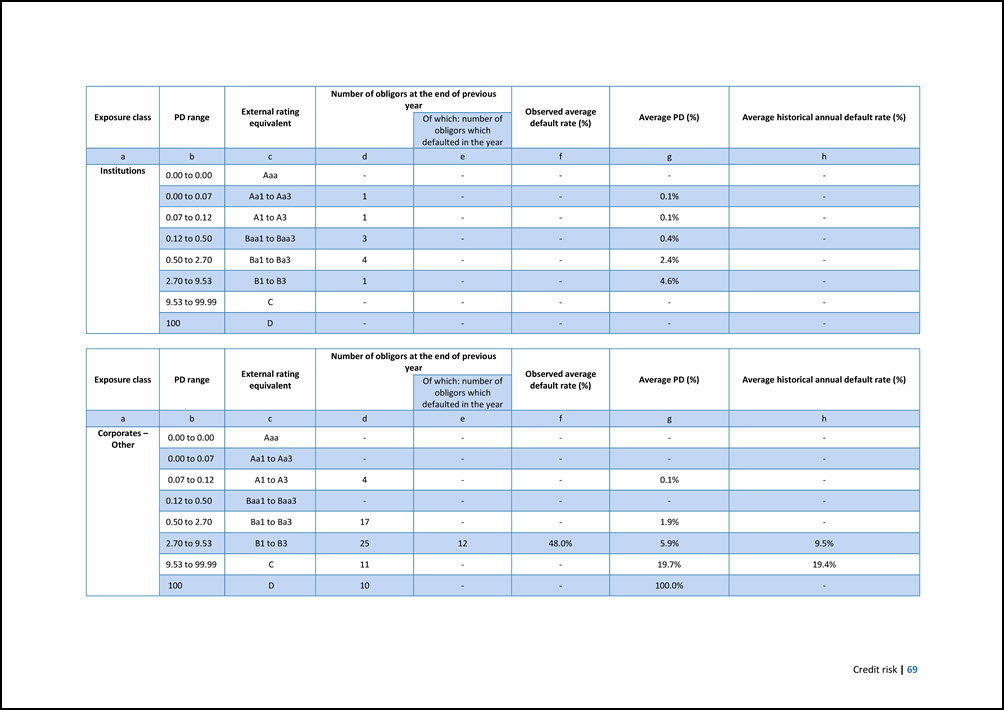
Credit risk | 69 Exposure class PD range External rating equivalent Number of obligors at the end of previous year Observed average default rate (%) Average PD (%) Average historical annual default rate (%) Of which: number of obligors which defaulted in the year a b c d e f g h Institutions 0.00 to 0.00 Aaa - - - - - 0.00 to 0.07 Aa1 to Aa3 1 - - 0.1% - 0.07 to 0.12 A1 to A3 1 - - 0.1% - 0.12 to 0.50 Baa1 to Baa3 3 - - 0.4% - 0.50 to 2.70 Ba1 to Ba3 4 - - 2.4% - 2.70 to 9.53 B1 to B3 1 - - 4.6% - 9.53 to 99.99 C - - - - - 100 D - - - - - Exposure class PD range External rating equivalent Number of obligors at the end of previous year Observed average default rate (%) Average PD (%) Average historical annual default rate (%) Of which: number of obligors which defaulted in the year a b c d e f g h Corporates – Other 0.00 to 0.00 Aaa - - - - - 0.00 to 0.07 Aa1 to Aa3 - - - - - 0.07 to 0.12 A1 to A3 4 - - 0.1% - 0.12 to 0.50 Baa1 to Baa3 - - - - - 0.50 to 2.70 Ba1 to Ba3 17 - - 1.9% - 2.70 to 9.53 B1 to B3 25 12 48.0% 5.9% 9.5% 9.53 to 99.99 C 11 - - 19.7% 19.4% 100 D 10 - - 100.0% -
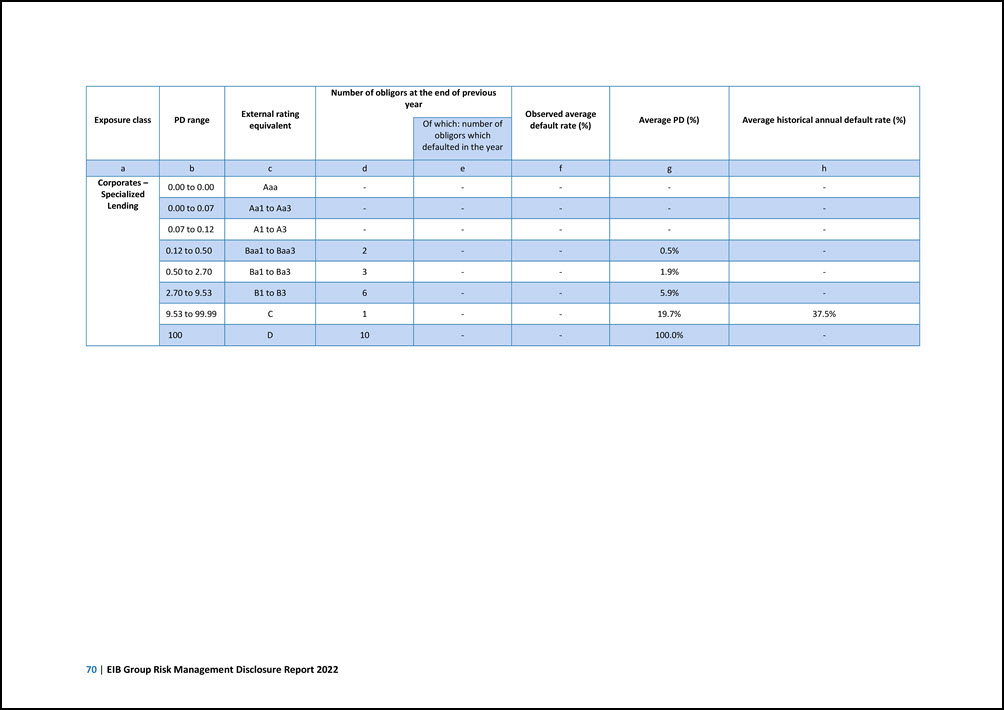
70 | EIB Group Risk Management Disclosure Report 2022 Exposure class PD range External rating equivalent Number of obligors at the end of previous year Observed average default rate (%) Average PD (%) Average historical annual default rate (%) Of which: number of obligors which defaulted in the year a b c d e f g h Corporates – Specialized Lending 0.00 to 0.00 Aaa - - - - - 0.00 to 0.07 Aa1 to Aa3 - - - - - 0.07 to 0.12 A1 to A3 - - - - - 0.12 to 0.50 Baa1 to Baa3 2 - - 0.5% - 0.50 to 2.70 Ba1 to Ba3 3 - - 1.9% - 2.70 to 9.53 B1 to B3 6 - - 5.9% - 9.53 to 99.99 C 1 - - 19.7% 37.5% 100 D 10 - - 100.0% -
Credit risk | 71 5.6 Equity risk Equity-type risks result from the Group’s investments that in effect expose the Group to the risk of the performance of the investee’s business. The Group is exposed to equity risk from the following sources: Strategic investments: EIB’s strategic participation in the European Bank for Reconstruction and Development (‘EBRD’); Equity investments: Equity-type investments including investments in infrastructure and climate funds as well as private equity funds, predominantly focusing on geographies outside the European Union. Equity-type investments originated by the EIF on behalf of the EIB in the form of investments in infrastructure and climate funds, venture capital/private equity funds, private debt funds and related structures (for example, co-investment vehicles) and similar structures under ad-hoc facilities mainly under the following mandates: Risk Capital Resources (‘RCR’); Infrastructure and Climate Fund Facility (‘INCF’); Senior Private Credit (‘SPC’) under the EGF; EIB Group Risk Enhancement Mandate (‘EREM’). Quasi-equity operations which are financing legally structured as loans but usually remunerated with an equity kicker 43 and are considered as equity-type operations from a risk perspective. They are typically originated under risk-sharing mandates44 such as InnovFin/EFSI/InvestEU. Shares that have been obtained in the context of financial restructuring of a publicly quoted or privately held company to which the EIB has lent (“accidental equity”). EIF own resources indirect equity investments Indirect equity exposures via Private Equity, Venture Capital and Private Debt funds; Indirect equity exposures via Funds of Funds; Secondary indirect equity investments through the purchase of a secondary stake in a fund (for the EIF Equity Discretionary portfolio only); Direct equity exposures via co-investments (in companies or portfolio companies) to a limited extent. Management, monitoring and reporting The EIB’s Equity Risk Guidelines (“ERG”) address risk issues and related risk-mitigating measures associated with indirect equity originated by the EIB and quasi-equity investments irrespective of their geographical focus and origin of funds. Together with the Equity Monitoring Procedures (“EMP”), they set out the monitoring procedures, including the periodic scoring of equity-type investments prepared by PMM and reviewed by GR&C. The equity-type investments are fair valued periodically and set against their carrying value to calculate performance. The EIF’s Equity Risk Policy Guidelines (“ERPG”) cover the equity risk investment and monitoring process under EIF own resources and under mandate. The core of the EIF’s equity specific risk management practices consists of a structured and regular fund manager review process, in which the financial performance of each fund manager and fund in the portfolio is assessed, operational issues at the level of fund managers are identified, and remedy actions are agreed. This process is run by both the first and second lines of defence. More specifically, the Fund has developed a toolset to design, manage and monitor portfolios of private equity (‘PE’) funds tailored to the dynamics of this market place. This toolset is based on an internal model, which enables the Fund to better assess and verify each fund’s but also each portfolio of funds’ valuations, risks and expected future cash flows and performances. Before committing to a PE fund, the EIF assigns an equity score 43 44 From an accounting point of view, quasi-equity loans are considered as debt and consequently reported in the EBA templates under “Loans and advances” as applicable. Arrangements whereby the Bank shares the risk on underlying credit risk exposures with the mandator.
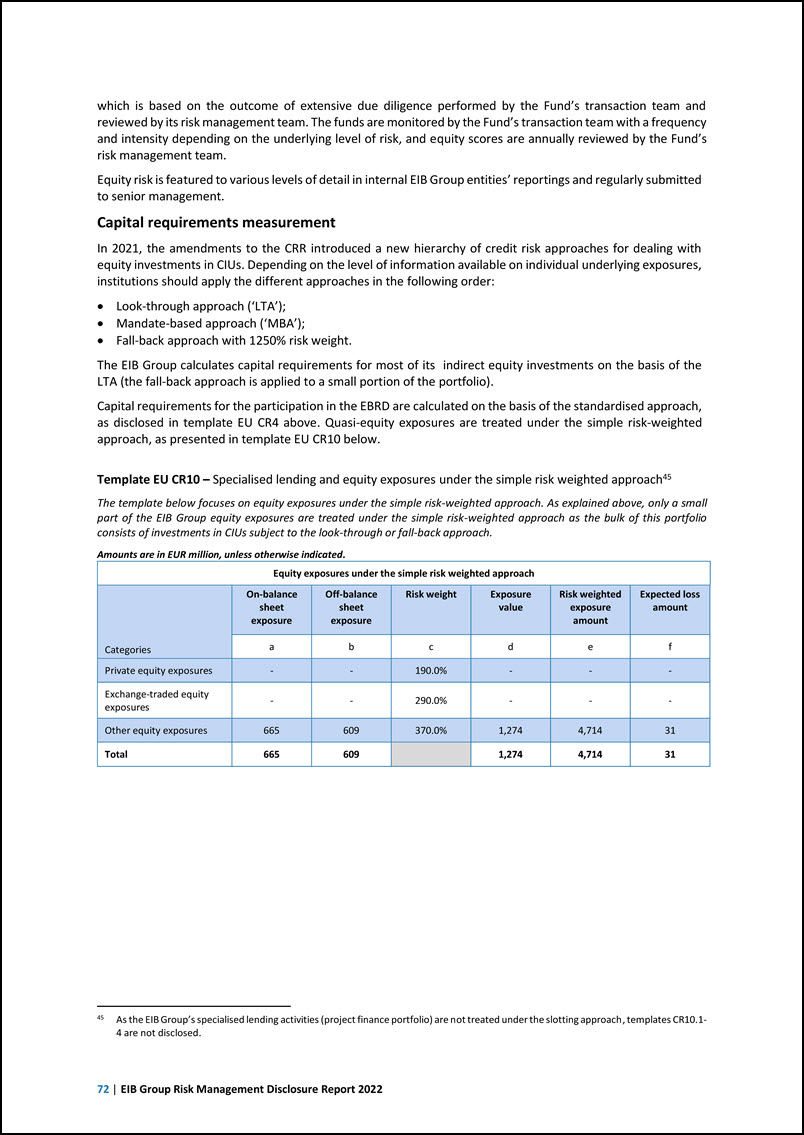
72 | EIB Group Risk Management Disclosure Report 2022 which is based on the outcome of extensive due diligence performed by the Fund’s transaction team and reviewed by its risk management team. The funds are monitored by the Fund’s transaction team with a frequency and intensity depending on the underlying level of risk, and equity scores are annually reviewed by the Fund’s risk management team. Equity risk is featured to various levels of detail in internal EIB Group entities’ reportings and regularly submitted to senior management. Capital requirements measurement In 2021, the amendments to the CRR introduced a new hierarchy of credit risk approaches for dealing with equity investments in CIUs. Depending on the level of information available on individual underlying exposures, institutions should apply the different approaches in the following order: Look-through approach (‘LTA’); Mandate-based approach (‘MBA’); Fall-back approach with 1250% risk weight. The EIB Group calculates capital requirements for most of its indirect equity investments on the basis of the LTA (the fall-back approach is applied to a small portion of the portfolio). Capital requirements for the participation in the EBRD are calculated on the basis of the standardised approach, as disclosed in template EU CR4 above. Quasi-equity exposures are treated under the simple risk-weighted approach, as presented in template EU CR10 below. Template EU CR10 – Specialised lending and equity exposures under the simple risk weighted approach45 The template below focuses on equity exposures under the simple risk-weighted approach. As explained above, only a small part of the EIB Group equity exposures are treated under the simple risk-weighted approach as the bulk of this portfolio consists of investments in CIUs subject to the look-through or fall-back approach. Amounts are in EUR million, unless otherwise indicated. Equity exposures under the simple risk weighted approach Categories On-balance sheet exposure Off-balance sheet exposure Risk weight Exposure value Risk weighted exposure amount Expected loss amount a b c d e f Private equity exposures - - 190.0% - - - Exchange-traded equity exposures - - 290.0% - - - Other equity exposures 665 609 370.0% 1,274 4,714 31 Total 665 609 1,274 4,714 31 45 As the EIB Group’s specialised lending activities (project finance portfolio) are not treated under the slotting approach, templates CR10.1- 4 are not disclosed.
Counterparty credit risk | 73 6 Counterparty credit risk Introduction Counterparty credit risk is defined as the risk that the counterparty of an OTC derivatives transaction or securities-financing transaction (‘SFT’) defaults before the final settlement of the transaction’s cash flows meaning that the counterparty will not be able to fulfil present and future payment obligations. The exposure at risk changes over time as market parameters change and it is of a bilateral nature. The EIB uses derivatives, mainly cross currency swaps (‘CCS’) and interest rate swaps (‘IRS’), but also structured swaps, futures, forward rate agreements and currency forwards, as part of its Asset and Liability Management (‘ALM’) activities to manage exposures to interest rate and foreign currency risk and as part of its treasury operations. The EIF does not hold derivatives. The EIB enters into SFTs, mostly in the form of reverse repos with banking counterparties. Such transactions are used as part of its treasury management activities to place liquidity not immediately needed for disbursement of loans. The EIF does not engage in SFTs. Mitigation, monitoring and reporting The EIB’s counterparty credit risk is governed by its FRGs. The Derivatives division within GR&C is responsible for monitoring and measuring counterparty credit risk on derivatives and the Treasury & Liquidity division for monitoring and measuring counterparty credit risk on SFTs. Changes to models and methodology in relation to counterparty credit risk for derivatives are discussed by the Derivatives Strategy and Models Committee (DSMC), which meets quarterly and has the mission to analyse and discuss possible improvements in policies, procedures, models, methods and tools that constitute the operational framework for derivatives transactions at the EIB. Methodology used to assign internal capital and credit limits for counterparty credit exposures, including the methods to assign those limits to exposures to central counterparties The EIB uses internal credit limits for derivatives and SFTs, which are approved by the MC, and monitored on a daily basis. Corrective actions are taken in the event of limit breaches and dedicated daily reporting about limit usage is in place. For internal purposes, the Group measures the credit risk exposure related to derivative transactions using the Current Unsecured Exposure46 and the Potential Future Exposure for reporting and limit monitoring. The Potential Future Exposure is computed in a simulation engine on multiple time points and under various rating scenarios47. With regard to SFTs, the Group follows a similar approach for calculating the exposure, that is, the total exposure with each counterparty is the sum of the Current Exposure (“CE”) and the Potential Future Exposure (“PFE”) of the net position of bilateral repo and reverse repo transactions outstanding with such counterparty at master netting agreement level. Exposures related to multiple GMRAs with one counterparty are summed up to obtain the exposure for this counterparty. To compute the credit limit usage of SFTs, exposures are risk-weighted by percentage factors depending on the SFT type. Exposures and limits for derivatives and SFTs are consolidated with general credit risk exposures in the global limit system to manage these within the overall credit processes. As regards the methodologies used to assign economic capital for counterparty credit risk exposures, the Group uses its aforementioned internal PFE model. For information on the methodology applied to SFTs, see details under “Capital requirements measurement” below. 46 47 The Current Unsecured Exposure is the larger of zero and the market value of the portfolio of transactions within the netting set with a counterparty less the value of collateral received. It is the amount that would be lost upon the default of the counterparty, using the received collateral and assuming no recovery on the value of those transactions as well as immediate replacement of the swap counterparty for all the transactions. Potential Future Exposure is computed taking into account the possible increase in the netting set’s exposure over the margin period of risk of 20 business days. The EIB computes the Potential Future Exposure at 90% confidence level using stressed market parameters to arrive at conservative estimates. This is in line with the recommendations issued by regulators in order to take into consideration the conditions that will prevail in the event of default of an important market participant.
74 | EIB Group Risk Management Disclosure Report 2022 Policies related to guarantees and other credit risk mitigants, such as netting and the policies for securing collateral and establishing credit reserves As referred to under Section 5.3, a number of credit risk mitigants are used to limit the EIB’s counterparty credit risk. To be able to trade OTC derivatives with the EIB, the internal guidelines require commercial banks to enter into an ISDA Master Agreement and an ISDA Credit Support Annex (‘CSA’), as applicable, that has independent amounts linked to the counterparty rating, and the counterparty also needs to satisfy a minimum rating requirement. Institutions such as multilateral development banks and central banks are not required to enter into CSAs. In order to trade repos and reverse repos with the EIB, commercial banks need to enter into a Global Master Repurchase Agreement (GMRA) which contains the close-out netting provisions. The GMRAs currently in place do not have rating-dependent parameters. Such legally enforceable master netting arrangements are generally accepted and practised contract types and create a right of set-off of recognised amounts that is enforceable only after termination of outstanding transactions following an event of default, including insolvency or bankruptcy, of either party. More specifically, under such bilateral netting agreements, the amounts payable by each party on any day in respect of the same transaction and in the same currency may be aggregated into a single net amount being payable by one party to the other. In certain circumstances, for example when an event of default occurs, all outstanding transactions under the agreement are terminated, the termination value is assessed and only a single net amount is payable in settlement of all transactions. Minimum conditions for new agreements are specified in the internal EIB risk guidelines. Eligibility criteria for derivatives and repo counterparties as well as risk limits are approved by the MC. All derivative exposures are priced on a daily basis and, if applicable, collateralised by cash or bonds under a CSA which allows for daily margin calls in nearly all cases. The EIB does not post collateral under any CSA. Collateral received is monitored and valued regularly and an internal haircut that is at least as conservative as the regulatory haircut is applied for internal and external exposure measurement purposes. Margining for SFTs such as tri-party repos is outsourced to tri-party agents that calculate exposure and administer margin calls on an intra-day basis. Margining for SFTs such as bilateral repos is performed by the EIB on a daily basis. The exposure is fully collateralised at transaction level, with a subsequent call in accordance with the underlying agreement. Under the terms of a CSA, securities received as collateral can be re-used. The terms of an ISDA Master Agreement also give the Group the right to terminate the related transactions upon the counterparty’s failure to post collateral after an applicable grace period following notice. The Group receives a material amount of collateral for derivatives covered by a CSA and for reverse repurchase transactions covered by a GMRA. A comprehensive overview of the composition of collateral received for derivatives under an ISDA Master Agreement can be found in Note S.2.5.1, while a summary of collateral received in SFTs is given in Note S.2.4.2 of the EIB Group consolidated financial statements under IFRS. As of 31.12.2022, the collaterals received for derivatives are mainly concentrated in EUR and to a lesser extent in USD while collaterals received under SFTs are mainly denominated in CHF, USD and DKK. Under its contractual arrangements, the EIB Group is not required to post collateral in the event of a downgrade in its credit rating. A reserve for derivatives counterparty credit risk is established. It is computed as a function of expected positive exposures and of internally estimated PDs and LGDs. Policies with respect to Wrong-Way Risk as defined in Article 291 of the CRR Wrong-way risk arises when there is significant increasing exposure to a counterparty combined with a simultaneous increase in the probability of the counterparty’s default. Wrong-way risk is commonly categorised into two types: Specific Wrong-Way Risk (SWWR) and General Wrong-Way Risk (GWWR). SWWR occurs when future exposure to a specific counterparty is highly (positively) correlated with the counterparty’s credit quality due to the nature of the transactions with that counterparty. It also arises when the counterparty’s credit quality is highly (positively) correlated with the collateral credit quality.
Counterparty credit risk | 75 GWWR occurs when there is high (positive) correlation between the probability of default of a counterparty and general market risk factors affecting the exposure to that counterparty. The EIB has procedures in place to actively identify, monitor and control SWWR at trade inception and continuing throughout its term48. Furthermore, identified SWWR in derivatives is considered through additional stress applied to exposures. Additionally, for derivative transactions, the EIB manages GWWR within the derivatives limit framework by applying conservative assumptions on market-risk factor volatilities producing a strong positive correlation between the counterparty default and the Bank’s potential future exposure to that counterparty. Capital requirements measurement SFTs’ regulatory capital requirements are calculated under the Financial Collateral Comprehensive Method, as per Articles 223 and 285 of the CRR. Since the transition to CRR II at end-2021, the Group is treating its derivative exposures using the Standardised approach for Counterparty Credit Risk (‘SA-CCR’). The regulatory capital requirements for credit valuation adjustment (‘CVA’) risk are calculated in accordance with the standardised method and include both OTC derivatives and SFTs. The disclosure templates below provide an overview of the exposures, RWEA and capital requirements the Group assumes with regard to counterparty credit risk. The Group has neither exposure on derivatives to a central counterparty clearing house (CCP), nor does it have any credit derivatives transactions. In terms of SFTs, it transacts cleared reverse repos and repos with two qualifying CCPs, the rest being dealt with with banking counterparties. 48 Since 1 January 2023, the SWWR component is taken into account in credit limit usage computation for treasury transactions, and mitigation measures are applied as per internal policies against counterparties exhibiting materially high SWWR levels.
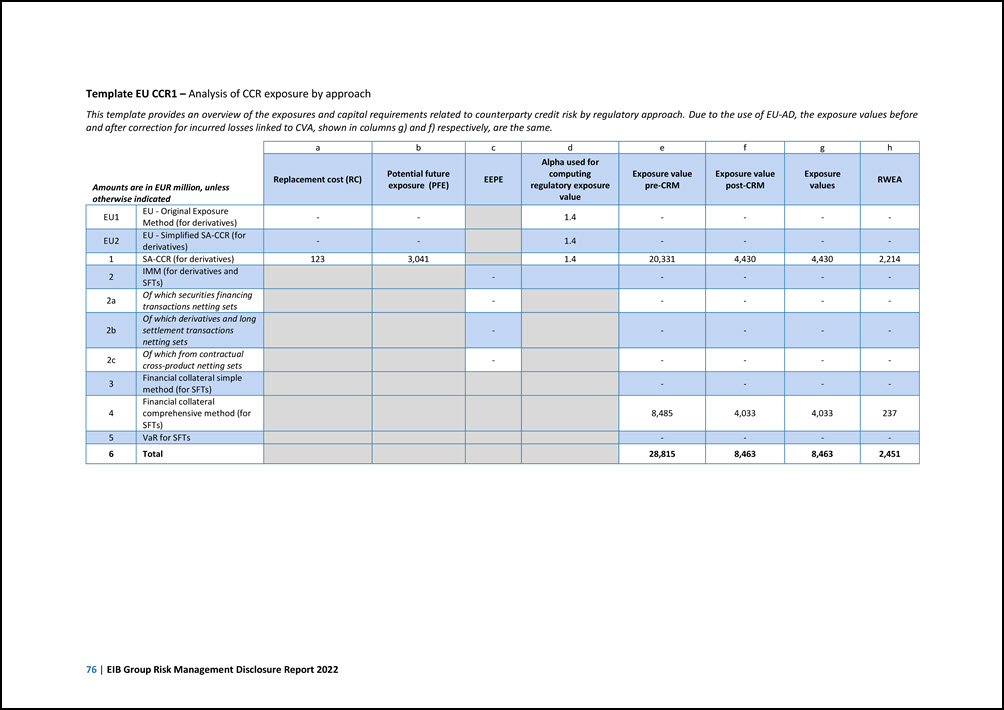
76 | EIB Group Risk Management Disclosure Report 2022 Template EU CCR1 – Analysis of CCR exposure by approach This template provides an overview of the exposures and capital requirements related to counterparty credit risk by regulatory approach. Due to the use of EU-AD, the exposure values before and after correction for incurred losses linked to CVA, shown in columns g) and f) respectively, are the same. Amounts are in EUR million, unless otherwise indicated a b c d e f g h Replacement cost (RC) Potential future exposure (PFE) EEPE Alpha used for computing regulatory exposure value Exposure value pre-CRM Exposure value post-CRM Exposure values RWEA EU1 EU - Original Exposure Method (for derivatives) - - 1.4 - - - - EU2 EU - Simplified SA-CCR (for derivatives) - - 1.4 - - - - 1 SA-CCR (for derivatives) 123 3,041 1.4 20,331 4,430 4,430 2,214 2 IMM (for derivatives and SFTs) - - - - - 2a Of which securities financing transactions netting sets - - - - - 2b Of which derivatives and long settlement transactions netting sets - - - - - 2c Of which from contractual cross-product netting sets - - - - - 3 Financial collateral simple method (for SFTs) - - - - 4 Financial collateral comprehensive method (for SFTs) 8,485 4,033 4,033 237 5 VaR for SFTs - - - - 6 Total 28,815 8,463 8,463 2,451
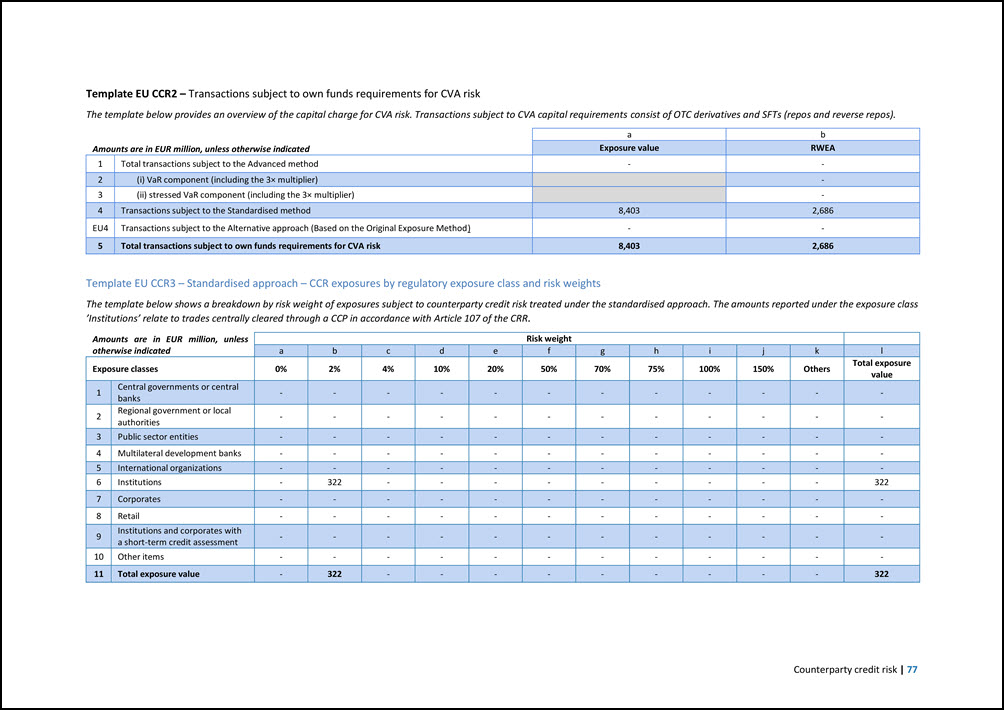
Counterparty credit risk | 77 Template EU CCR2 – Transactions subject to own funds requirements for CVA risk The template below provides an overview of the capital charge for CVA risk. Transactions subject to CVA capital requirements consist of OTC derivatives and SFTs (repos and reverse repos). Amounts are in EUR million, unless otherwise indicated a b Exposure value RWEA 1 Total transactions subject to the Advanced method - - 2 (i) VaR component (including the 3× multiplier) - 3 (ii) stressed VaR component (including the 3× multiplier) - 4 Transactions subject to the Standardised method 8,403 2,686 EU4 Transactions subject to the Alternative approach (Based on the Original Exposure Method) - - 5 Total transactions subject to own funds requirements for CVA risk 8,403 2,686 Template EU CCR3 – Standardised approach – CCR exposures by regulatory exposure class and risk weights The template below shows a breakdown by risk weight of exposures subject to counterparty credit risk treated under the standardised approach. The amounts reported under the exposure class ’Institutions’ relate to trades centrally cleared through a CCP in accordance with Article 107 of the CRR. Amounts are in EUR million, unless otherwise indicated Risk weight a b c d e f g h i j k l Exposure classes 0% 2% 4% 10% 20% 50% 70% 75% 100% 150% Others Total exposure value 1 Central governments or central banks - - - - - - - - - - - - 2 Regional government or local authorities - - - - - - - - - - - - 3 Public sector entities - - - - - - - - - - - - 4 Multilateral development banks - - - - - - - - - - - - 5 International organizations - - - - - - - - - - - - 6 Institutions - 322 - - - - - - - - - 322 7 Corporates - - - - - - - - - - - - 8 Retail - - - - - - - - - - - - 9 Institutions and corporates with a short-term credit assessment - - - - - - - - - - - - 10 Other items - - - - - - - - - - - - 11 Total exposure value - 322 - - - - - - - - - 322
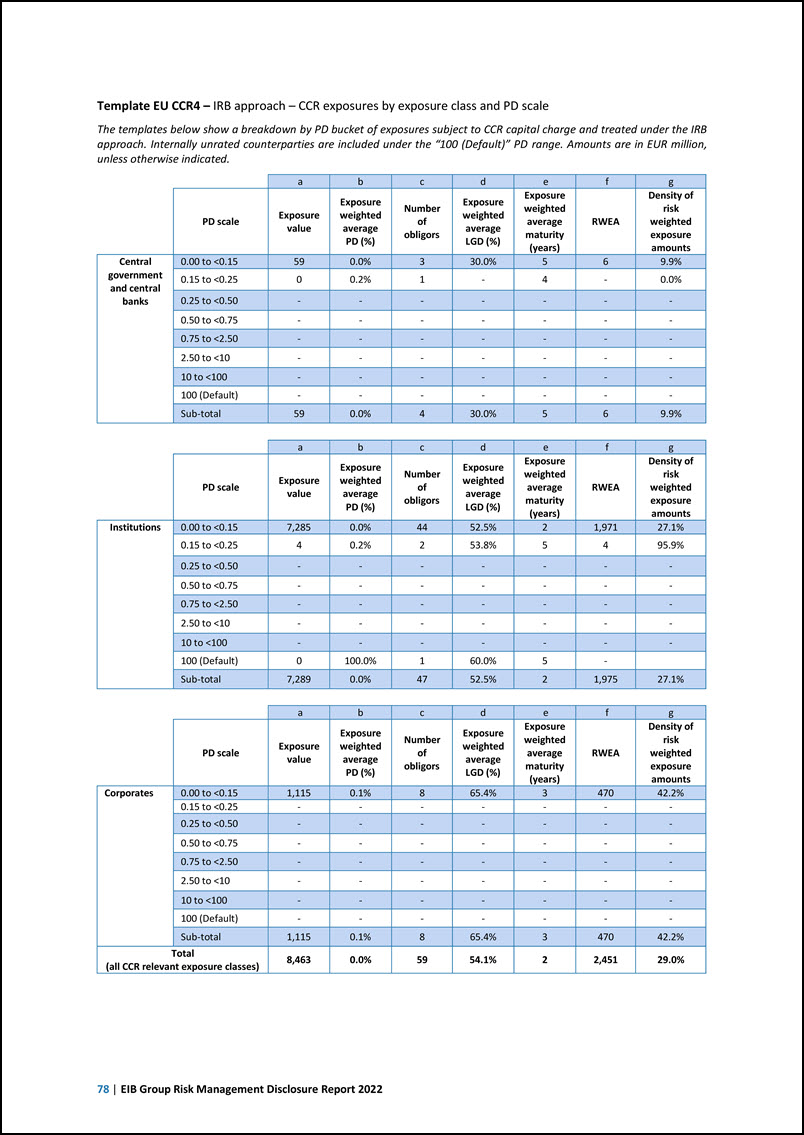
78 | EIB Group Risk Management Disclosure Report 2022 Template EU CCR4 – IRB approach – CCR exposures by exposure class and PD scale The templates below show a breakdown by PD bucket of exposures subject to CCR capital charge and treated under the IRB approach. Internally unrated counterparties are included under the “100 (Default)” PD range. Amounts are in EUR million, unless otherwise indicated. a b c d e f g PD scale Exposure value Exposure weighted average PD (%) Number of obligors Exposure weighted average LGD (%) Exposure weighted average maturity (years) RWEA Density of risk weighted exposure amounts Central 0.00 to <0.15 59 0.0% 3 30.0% 5 6 9.9% government 0.15 to <0.25 0 0.2% 1 - 4 - 0.0% and central 0.25 to <0.50 - - - - - - - banks 0.50 to <0.75 - - - - - - - 0.75 to <2.50 - - - - - - - 2.50 to <10 - - - - - - - 10 to <100 - - - - - - - 100 (Default) - - - - - - - Sub-total 59 0.0% 4 30.0% 5 6 9.9% a b c d e f g PD scale Exposure value Exposure weighted average PD (%) Number of obligors Exposure weighted average LGD (%) Exposure weighted average maturity (years) RWEA Density of risk weighted exposure amounts Institutions 0.00 to <0.15 7,285 0.0% 44 52.5% 2 1,971 27.1% 0.15 to <0.25 4 0.2% 2 53.8% 5 4 95.9% 0.25 to <0.50 - - - - - - - 0.50 to <0.75 - - - - - - - 0.75 to <2.50 - - - - - - - 2.50 to <10 - - - - - - - 10 to <100 - - - - - - - 100 (Default) 0 100.0% 1 60.0% 5 - Sub-total 7,289 0.0% 47 52.5% 2 1,975 27.1% a b c d e f g PD scale Exposure value Exposure weighted average PD (%) Number of obligors Exposure weighted average LGD (%) Exposure weighted average maturity (years) RWEA Density of risk weighted exposure amounts Corporates 0.00 to <0.15 1,115 0.1% 8 65.4% 3 470 42.2% 0.15 to <0.25 - - - - - - - 0.25 to <0.50 - - - - - - - 0.50 to <0.75 - - - - - - - 0.75 to <2.50 - - - - - - - 2.50 to <10 - - - - - - - 10 to <100 - - - - - - - 100 (Default) - - - - - - - Sub-total 1,115 0.1% 8 65.4% 3 470 42.2% Total (all CCR relevant exposure classes) 8,463 0.0% 59 54.1% 2 2,451 29.0%
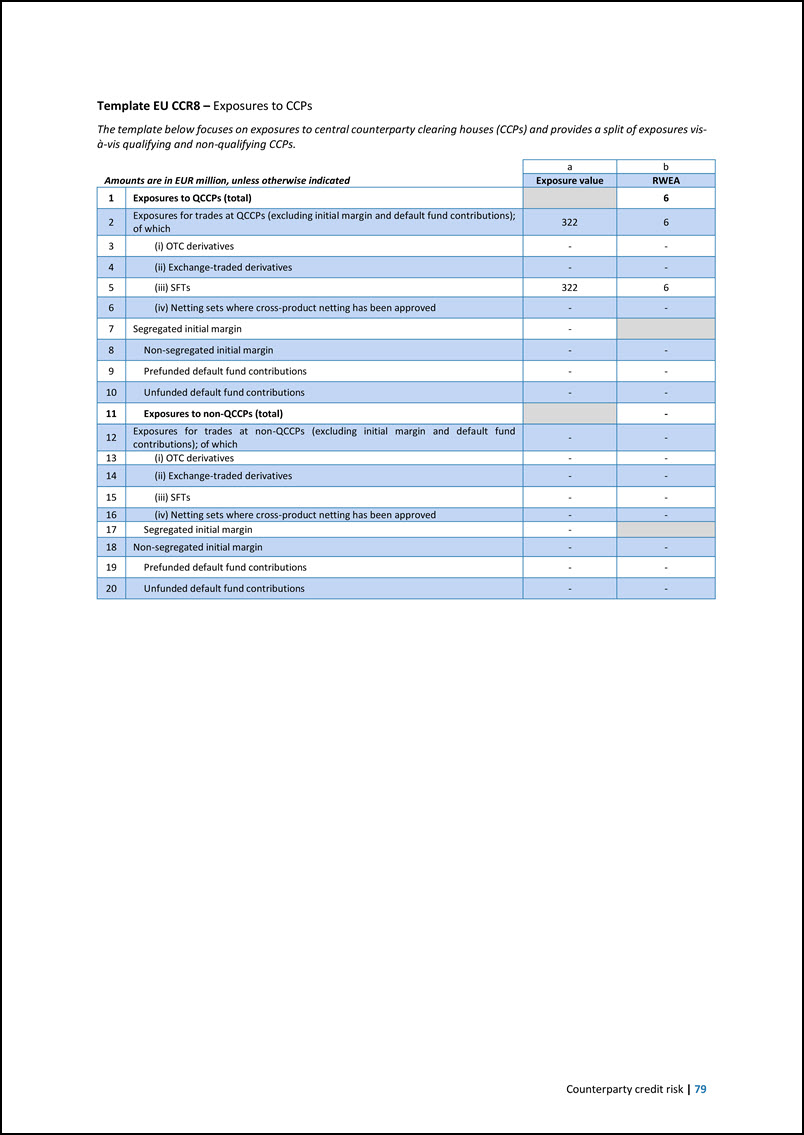
Counterparty credit risk | 79 Template EU CCR8 – Exposures to CCPs The template below focuses on exposures to central counterparty clearing houses (CCPs) and provides a split of exposures vis- à-vis qualifying and non-qualifying CCPs. Amounts are in EUR million, unless otherwise indicated a b Exposure value RWEA 1 Exposures to QCCPs (total) 6 2 Exposures for trades at QCCPs (excluding initial margin and default fund contributions); of which 322 6 3 (i) OTC derivatives - - 4 (ii) Exchange-traded derivatives - - 5 (iii) SFTs 322 6 6 (iv) Netting sets where cross-product netting has been approved - - 7 Segregated initial margin - 8 Non-segregated initial margin - - 9 Prefunded default fund contributions - - 10 Unfunded default fund contributions - - 11 Exposures to non-QCCPs (total) - 12 Exposures for trades at non-QCCPs (excluding initial margin and default fund contributions); of which - - 13 (i) OTC derivatives - - 14 (ii) Exchange-traded derivatives - - 15 (iii) SFTs - - 16 (iv) Netting sets where cross-product netting has been approved - - 17 Segregated initial margin - 18 Non-segregated initial margin - - 19 Prefunded default fund contributions - - 20 Unfunded default fund contributions - -
80 | EIB Group Risk Management Disclosure Report 2022 7 Securitisation The Group applies the EU securitisation framework, with adaptations as applicable to the EIB, which comprises: Regulation (EU) 2017/2402 (the ‘Securitisation Regulation’) laying down a general framework for securitisation and establishing a set of criteria for identifying simple, transparent and standardised (‘STS’) securitisation; and Regulation (EU) 2017/2401 (the ‘CRR amending Regulation’) containing targeted amendments to the CRR with regard to capital treatment of securitisations held by credit institutions, amongst other provisions (for example, significant risk transfer). As per the Securitisation Regulation’s definitions, securitisation refers to a transaction or scheme where the credit risk associated with an exposure or pool of exposures is tranched and has the following characteristics: payments in the transaction or scheme are dependent upon the performance of the exposure or pool of exposures; the subordination of tranches determines the distribution of losses during the ongoing life of the transaction or scheme; and the transaction or scheme does not create exposures which possess all of the characteristics listed in CRR Article 147(8). A “traditional securitisation” is one where there is an economic transfer of ownership of the exposures being securitised from the originator institution to a securitisation special purpose entity (‘SSPE’), while in a “synthetic securitisation” the transfer of risk is achieved by the use of credit derivatives or guarantees, and the exposures being securitised remain exposures of the originator. A “re-securitisation” means securitisation where at least one of the underlying exposures is a securitisation position. It should be noted that the Group has not yet implemented the STS (simple, transparent and standardised) criteria for regulatory capital purposes and all securitisations are currently treated as non-STS. The Group has exposure to both synthetic and traditional securitisations as investor and is the originator of synthetic securitisation and one re-securitisation structure. The re-securitisation structure’s treatment has been retained based on Article 8(1) of the Securitisation Regulation. In a nutshell, the Group is involved in the following transactions (see next section for further details): The EIB invests in loan substitutes, which are typically ABS; The EIB has exposure to several facilities that focus on debt-based financing via loans and guarantees, where a part of the first loss is taken by a third party and the EIB is the originator of these synthetic securitisations; Under its Guarantee and Securitisation (‘G&S‘) business, the EIF provides guarantees to financial intermediaries, credit enhancement to SME securitisation transactions and can purchase tranches of SME securitisation transactions. Securitisation activities, related risks and the Group’s objectives From an originator perspective, the EIB Group has exposure to several synthetic securitisation programmes in which the risk transfer is done through guarantees (for example, InvestEU; its predecessor, EFSI; the Neighbourhood, Development and International Cooperation Instrument (NDICI)/European Fund for Sustainable Development Plus (EFSD+); its predecessor, the External Lending Mandate (‘ELM’); the Connecting Europe Facility (‘CEF’); InnovFin). Details on the exact objectives of these programmes can be found in Note Z of the EIB Group consolidated financial statements under EU-AD. The EIB Group has an exposure to re-securitisations through the InvestEU D2 portfolio 49 where it acts as originator in the context of mandates. 49 The former EFSI Hybrid debt portfolio was migrated during the year into the InvestEU D2 debt portfolio.
Securitisation | 81 When acting as investor, the EIBG uses so-called loan substitutes as alternative financing structures to reach new clients, enhance value added and improve the Group’s risk profile. By utilising capital market instruments, such as ABS as a substitute for loans, the Group significantly increases its ability to diversify the nature of its lending activity. In the field of SME securitisations, the EIB and the EIF cooperate closely to ensure a consistent risk-assessment approach within the Group. Through its Guarantee and Securitisation (‘G&S’) business, the EIF is a major provider of guarantees on SME financing and its aim is to catalyse bank lending to support SMEs and small mid-caps. The EIF cooperates with financial intermediaries to provide guarantees on, or on a more limited basis, invest in, specific tranches of securitisation of SME loan/lease portfolios. These activities are split into own and mandate activities: The EIF uses its own capital to credit-enhance tranches of securitisations, which transfer risk from the financial institution providing the loan or lease and enables funding; and The EIF manages resources mainly on behalf of the European Commission or Member States and regional authorities in mandate activities that facilitate the granting of loans and leases to SMEs, where the EIF acts as guarantor or counter guarantor. One such mandate from the European Commission is the Risk-Sharing Instrument (‘RSI/InnovFin’), which targets SMEs and mid-caps in research, development and innovation and is managed by the EIF. RSI/InnovFin involves guarantee facilities, in which the European Union takes the first- loss tranche (and in the case of InnovFin/EFSI/InvestEU takes the second-loss tranche) and EIB/EIF the senior tranche. The different programmes are described further in the annual report of the EIF. By providing guarantees (for example, synthetic risk transfer), the EIF can be seen as the investor in a synthetic securitisation. The nature of its activities as originator of synthetic securitisations exposes the Group not only to credit risk, but also to concentration risk, liquidity risk arising from the needs to cover potential guarantee calls, foreign exchange risk if guarantees are not in EUR, and potentially prepayment risk. In its role as investor in traditional securitisations, the Group assumes in addition to credit risk various risks generally inherent in bonds – mainly prepayment risk, liquidity risk and foreign exchange risk. Management, monitoring and reporting Securitised loans under the InvestEU D1 and D2 debt portfolios including former EFSI IIW (Infrastructure and Innovation Window) operations or similar structures are subject to the same approval, management, monitoring and reporting procedures as conventional lending transactions: namely, the information provided in Chapter 5 applies. The residual risk of these loans is significantly reduced by the EU guarantee. In addition, for operations under InvestEU, projects are submitted to the InvestEU Investment Committee for inclusion in the corresponding InvestEU debt portfolio partially guaranteed by the EU budget50. In relation to loan substitute transactions, the EIB Group attempts to minimise financial losses. This requires: an appropriate financial structure, allocation and mitigation of risks, including an appropriate limit system also addressing EIB Group exposures; the application of the four-eyes principle; appropriate and enforceable documentation; monitoring of the transaction after purchase; timely and active management of transactions in distress. Credit risk of loan substitutes is managed through an individual analysis of all inherent risks of a transaction, detailed analysis of new transactions and monitoring of the loan substitute portfolio, mainly relying on external ratings. Due to its importance, there is no cap on the overall volume of loan substitutes, unless they do not fulfil minimum acceptable criteria. EIB Group services monitor loan substitutes on a continuous basis and actions are taken with respect to any deterioration of credit quality. Due to the complex structure of securitisations, the credit performance during times of stress can only be approximated. Therefore, the EIB’s credit review is prompted to identify the ability of the originator to cover 50 Similarly, projects under the former EFSI IIW were submitted to the EFSI Investment Committee.
82 | EIB Group Risk Management Disclosure Report 2022 high-quality assets in order to understand the nature and potential of the risks that arise in respect of the underlying asset pool. The Group manages the credit risk arising from guarantee and securitisation transactions of the EIF that are financed by own resources under risk management policies (covered by the Statutes) and the EIF’s internal risk operational guidelines. Each new transaction is reviewed in detail to analyse the risks, the methodologies that should be applied, and an internal rating assessment is performed. The performance of each transaction is reviewed regularly, at least on a quarterly basis but more frequently for transactions not performing in line with the EIF’s expectations, and discussed at regular Portfolio IRC (Investment Risk Committee) meetings. Semi-annual risk reports are also submitted to the EIF Board of Directors and quarterly surveillance reports are submitted to the IRC. Further information with respect to the EIF’s guarantee activities and its management, monitoring and reporting can be found in both the Group consolidated financial statements and the EIF’s Annual Report. Measurement Following the EU securitisation framework, the Group applies the following hierarchy of approaches: For securitisation activities in which the EIB is the originator, such as the InvestEU D1 portfolio (including operations under the former EFSI Standard debt portfolio) and other mentioned facilities, and which are internally rated, the SEC-IRBA is used to calculate capital requirements. The SEC-SA is mandatorily used for re-securitisations (InvestEU D2 portfolio, including operations under the former EFSI Hybrid debt portfolio), as well as positions for which the SEC-IRBA approach could not be applied (for example, structures originated by the EIF as the SME initiative mandates). The SEC-SA relies on a formula using as an input the underlying portfolio delinquency rates and respective asset classes. When the first two approaches above cannot be followed, the Group applies the SEC-ERBA, in the event that an external rating is available for the tranche. The EIB Group applies the aforementioned hierarchy of approaches in line with the securitisation framework which entered into force on 1 January 2019 (Regulation EU 2017/2401). External ratings from the major credit rating agencies (Moody’s, S&P and Fitch) are taken into consideration when applying SEC-ERBA to determine the RWEA of securitisation exposures. Securitisations positions that attract a 1250% risk weighting are deducted from Common Equity Tier 1 capital in accordance with point (k) of Article 36 of the CRR. Summary of EIB Group accounting policies for the securitisation activity All securitised exposures composed of loans and guarantees are retained on the balance sheet. A summary of the applicable Group accounting policies under EU-AD is presented hereafter. The detailed accounting policies thereon are available in Notes A.2.7. “Loans and advances to credit institutions and customers” and A.2.14. “Financial guarantees” of the EIB Group consolidated financial statements under EU-AD. Loans and advances are included in the assets of the Group at their net disbursed amounts. Individual value adjustments have been recorded for loans outstanding at the end of the period and presenting risks of non- recovery of all or part of their amounts. Collective value adjustments have been recorded to capture loans in the portfolio which are impaired but have not yet been identified as such or for losses which have been incurred but not yet reported. Such value adjustments are held in the same currency as the assets to which they relate. Value adjustments are accounted for in the profit and loss account and are deducted from the appropriate asset items on the balance sheet. Undisbursed parts of loans and advances are recorded off-balance sheet at their nominal value. Financial guarantee contracts require the issuer to make specified payments to reimburse the holder for a loss it incurs, if a particular debtor fails to make payment when due under the original or modified terms of a debt instrument.
Securitisation | 83 Net liabilities from financial guarantees are presented on the balance sheet as a provision intended to cover risks inherent in the Group’s activity of issuing guarantees in favour of financial intermediaries or issued in respect of loans granted by third parties. Financial guarantees are initially recognised at fair value corresponding to the net present value (‘NPV’) of expected premium inflows or the initial expected loss. Subsequent to initial recognition, financial guarantees are measured as the deficit of the net present value of expected future premium inflows over the higher of: the amount of the expected credit loss; and the fair value initially recognised less any cumulative amount of income/amortisation recognised. Unrealised gains representing the excess of the net present value of expected future premium inflows over the amount of the expected payment obligations remain unrecognised. Any increase or decrease in the net liability relating to financial guarantees is recognised in the profit and loss account. Signed financial guarantees are generally accounted for and disclosed as off-balance sheet items.
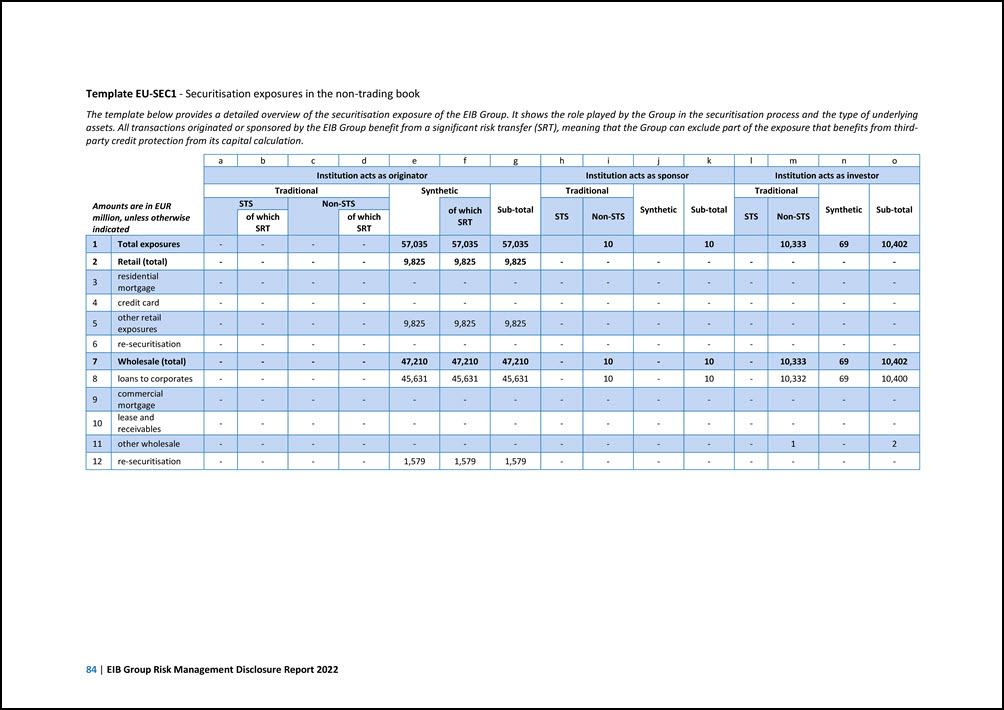
84 | EIB Group Risk Management Disclosure Report 2022 Template EU-SEC1 - Securitisation exposures in the non-trading book The template below provides a detailed overview of the securitisation exposure of the EIB Group. It shows the role played by the Group in the securitisation process and the type of underlying assets. All transactions originated or sponsored by the EIB Group benefit from a significant risk transfer (SRT), meaning that the Group can exclude part of the exposure that benefits from third- party credit protection from its capital calculation. Amounts are in EUR million, unless otherwise indicated a b c d e f g h i j k l m n o Institution acts as originator Institution acts as sponsor Institution acts as investor Traditional Synthetic Sub-total Traditional Synthetic Sub-total Traditional Synthetic Sub-total STS Non-STS of which SRT STS Non-STS STS Non-STS of which SRT of which SRT 1 Total exposures - - - - 57,035 57,035 57,035 10 10 10,333 69 10,402 2 Retail (total) - - - - 9,825 9,825 9,825 - - - - - - - - 3 residential mortgage - - - - - - - - - - - - - - - 4 credit card - - - - - - - - - - - - - - - 5 other retail exposures - - - - 9,825 9,825 9,825 - - - - - - - - 6 re-securitisation - - - - - - - - - - - - - - - 7 Wholesale (total) - - - - 47,210 47,210 47,210 - 10 - 10 - 10,333 69 10,402 8 loans to corporates - - - - 45,631 45,631 45,631 - 10 - 10 - 10,332 69 10,400 9 commercial mortgage - - - - - - - - - - - - - - - 10 lease and receivables - - - - - - - - - - - - - - - 11 other wholesale - - - - - - - - - - - - 1 - 2 12 re-securitisation - - - - 1,579 1,579 1,579 - - - - - - - -
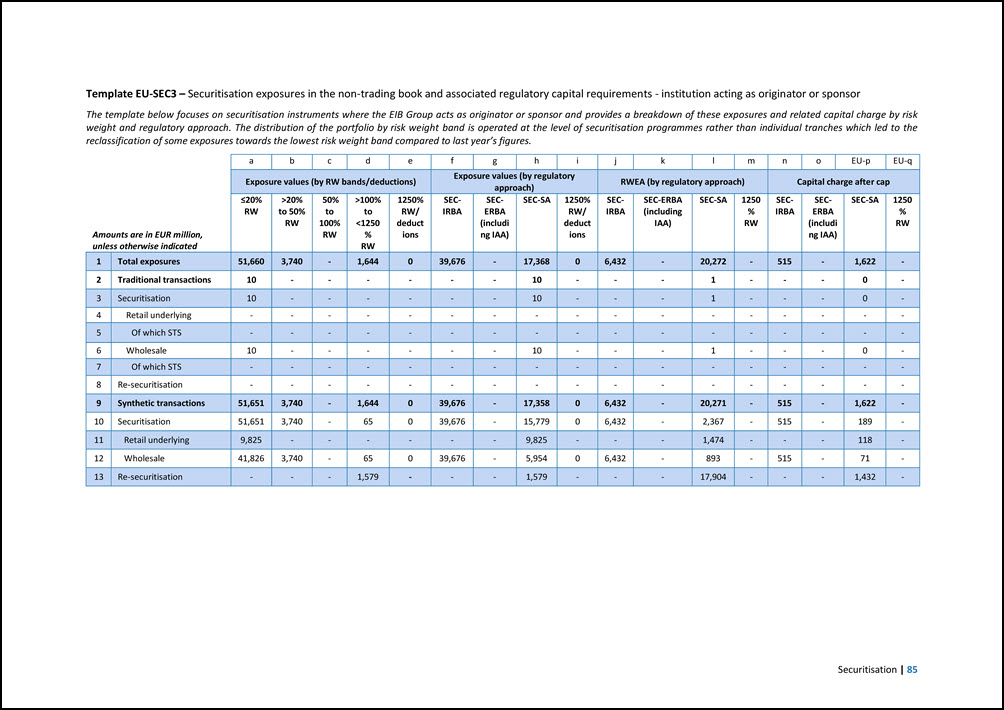
Securitisation | 85 Template EU-SEC3 – Securitisation exposures in the non-trading book and associated regulatory capital requirements - institution acting as originator or sponsor The template below focuses on securitisation instruments where the EIB Group acts as originator or sponsor and provides a breakdown of these exposures and related capital charge by risk weight and regulatory approach. The distribution of the portfolio by risk weight band is operated at the level of securitisation programmes rather than individual tranches which led to the reclassification of some exposures towards the lowest risk weight band compared to last year’s figures. Amounts are in EUR million, unless otherwise indicated a b c d e f g h i j k l m n o EU-p EU-q Exposure values (by RW bands/deductions) Exposure values (by regulatory approach) RWEA (by regulatory approach) Capital charge after cap ≤20% RW >20% to 50% RW 50% to 100% RW >100% to <1250 % RW 1250% RW/ deduct ions SEC- IRBA SEC- ERBA (includi ng IAA) SEC-SA 1250% RW/ deduct ions SEC- IRBA SEC-ERBA (including IAA) SEC-SA 1250 % RW SEC- IRBA SEC- ERBA (includi ng IAA) SEC-SA 1250 % RW 1 Total exposures 51,660 3,740 - 1,644 0 39,676 - 17,368 0 6,432 - 20,272 - 515 - 1,622 - 2 Traditional transactions 10 - - - - - - 10 - - - 1 - - - 0 - 3 Securitisation 10 - - - - - - 10 - - - 1 - - - 0 - 4 Retail underlying - - - - - - - - - - - - - - - - - 5 Of which STS - - -�� - - - - - - - - - - - - - - 6 Wholesale 10 - - - - - - 10 - - - 1 - - - 0 - 7 Of which STS - - - - - - - - - - - - - - - - - 8 Re-securitisation - - - - - - - - - - - - - - - - - 9 Synthetic transactions 51,651 3,740 - 1,644 0 39,676 - 17,358 0 6,432 - 20,271 - 515 - 1,622 - 10 Securitisation 51,651 3,740 - 65 0 39,676 - 15,779 0 6,432 - 2,367 - 515 - 189 - 11 Retail underlying 9,825 - - - - - - 9,825 - - - 1,474 - - - 118 - 12 Wholesale 41,826 3,740 - 65 0 39,676 - 5,954 0 6,432 - 893 - 515 - 71 - 13 Re-securitisation - - - 1,579 - - - 1,579 - - - 17,904 - - - 1,432 -
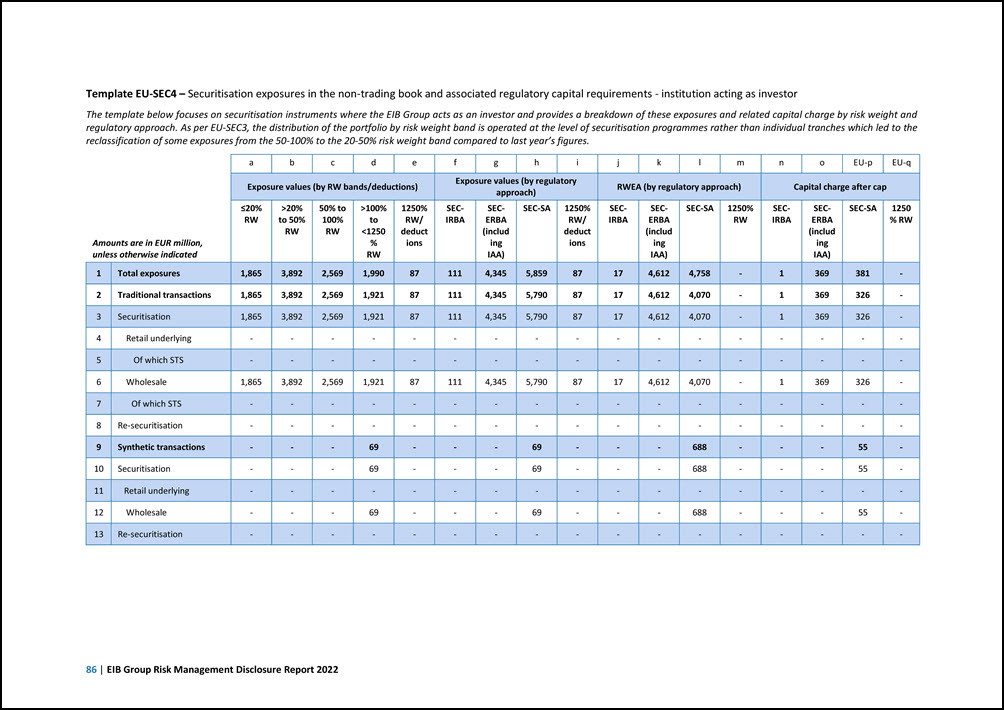
86 | EIB Group Risk Management Disclosure Report 2022 Template EU-SEC4 – Securitisation exposures in the non-trading book and associated regulatory capital requirements - institution acting as investor The template below focuses on securitisation instruments where the EIB Group acts as an investor and provides a breakdown of these exposures and related capital charge by risk weight and regulatory approach. As per EU-SEC3, the distribution of the portfolio by risk weight band is operated at the level of securitisation programmes rather than individual tranches which led to the reclassification of some exposures from the 50-100% to the 20-50% risk weight band compared to last year’s figures. Amounts are in EUR million, unless otherwise indicated a b c d e f g h i j k l m n o EU-p EU-q Exposure values (by RW bands/deductions) Exposure values (by regulatory approach) RWEA (by regulatory approach) Capital charge after cap ≤20% RW >20% to 50% RW 50% to 100% RW >100% to <1250 % RW 1250% RW/ deduct ions SEC- IRBA SEC- ERBA (includ ing IAA) SEC-SA 1250% RW/ deduct ions SEC- IRBA SEC- ERBA (includ ing IAA) SEC-SA 1250% RW SEC- IRBA SEC- ERBA (includ ing IAA) SEC-SA 1250 % RW 1 Total exposures 1,865 3,892 2,569 1,990 87 111 4,345 5,859 87 17 4,612 4,758 - 1 369 381 - 2 Traditional transactions 1,865 3,892 2,569 1,921 87 111 4,345 5,790 87 17 4,612 4,070 - 1 369 326 - 3 Securitisation 1,865 3,892 2,569 1,921 87 111 4,345 5,790 87 17 4,612 4,070 - 1 369 326 - 4 Retail underlying - - - - - - - - - - - - - - - - - 5 Of which STS - - - - - - - - - - - - - - - - - 6 Wholesale 1,865 3,892 2,569 1,921 87 111 4,345 5,790 87 17 4,612 4,070 - 1 369 326 - 7 Of which STS - - - - - - - - - - - - - - - - - 8 Re-securitisation - - - - - - - - - - - - - - - - - 9 Synthetic transactions - - - 69 - - - 69 - - - 688 - - - 55 - 10 Securitisation - - - 69 - - - 69 - - - 688 - - - 55 - 11 Retail underlying - - - - - - - - - - - - - - - - - 12 Wholesale - - - 69 - - - 69 - - - 688 - - - 55 - 13 Re-securitisation - - - - - - - - - - - - - - - - -
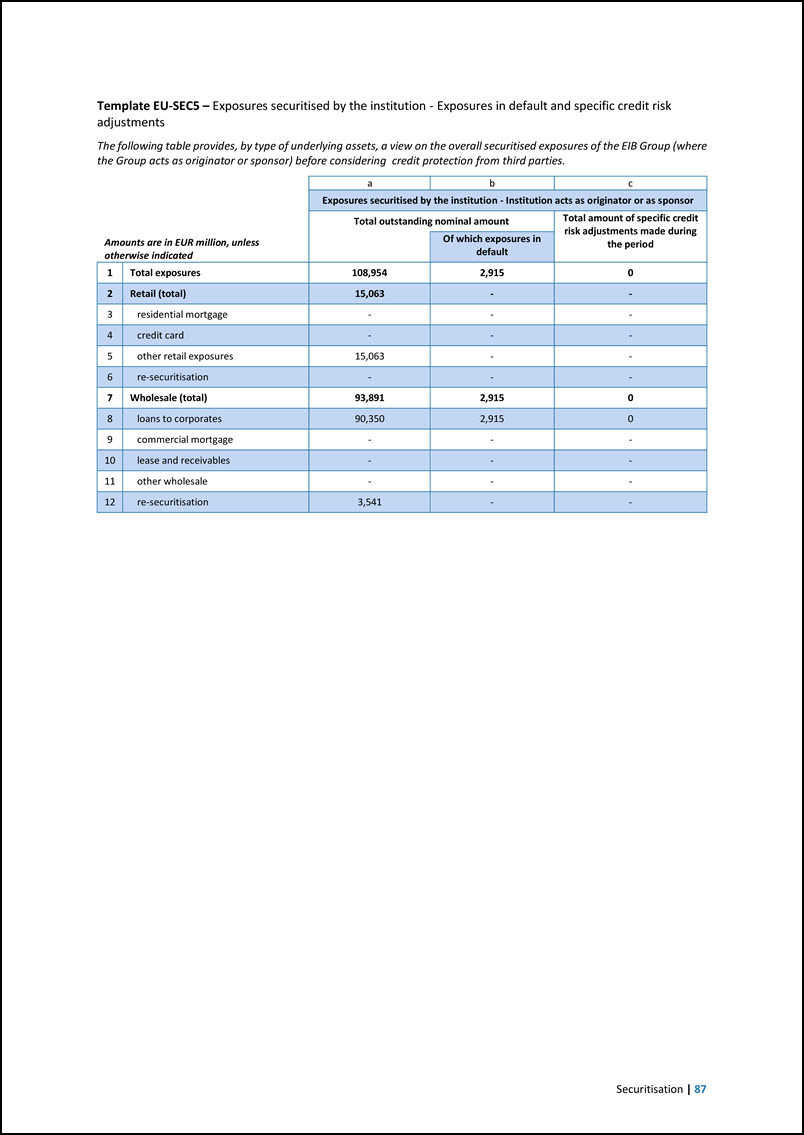
Securitisation | 87 Template EU-SEC5 – Exposures securitised by the institution - Exposures in default and specific credit risk adjustments The following table provides, by type of underlying assets, a view on the overall securitised exposures of the EIB Group (where the Group acts as originator or sponsor) before considering credit protection from third parties. Amounts are in EUR million, unless otherwise indicated a b c Exposures securitised by the institution - Institution acts as originator or as sponsor Total outstanding nominal amount Total amount of specific credit risk adjustments made during the period Of which exposures in default 1 Total exposures 108,954 2,915 0 2 Retail (total) 15,063 - - 3 residential mortgage - - - 4 credit card - - - 5 other retail exposures 15,063 - - 6 re-securitisation - - - 7 Wholesale (total) 93,891 2,915 0 8 loans to corporates 90,350 2,915 0 9 commercial mortgage - - - 10 lease and receivables - - - 11 other wholesale - - - 12 re-securitisation 3,541 - -
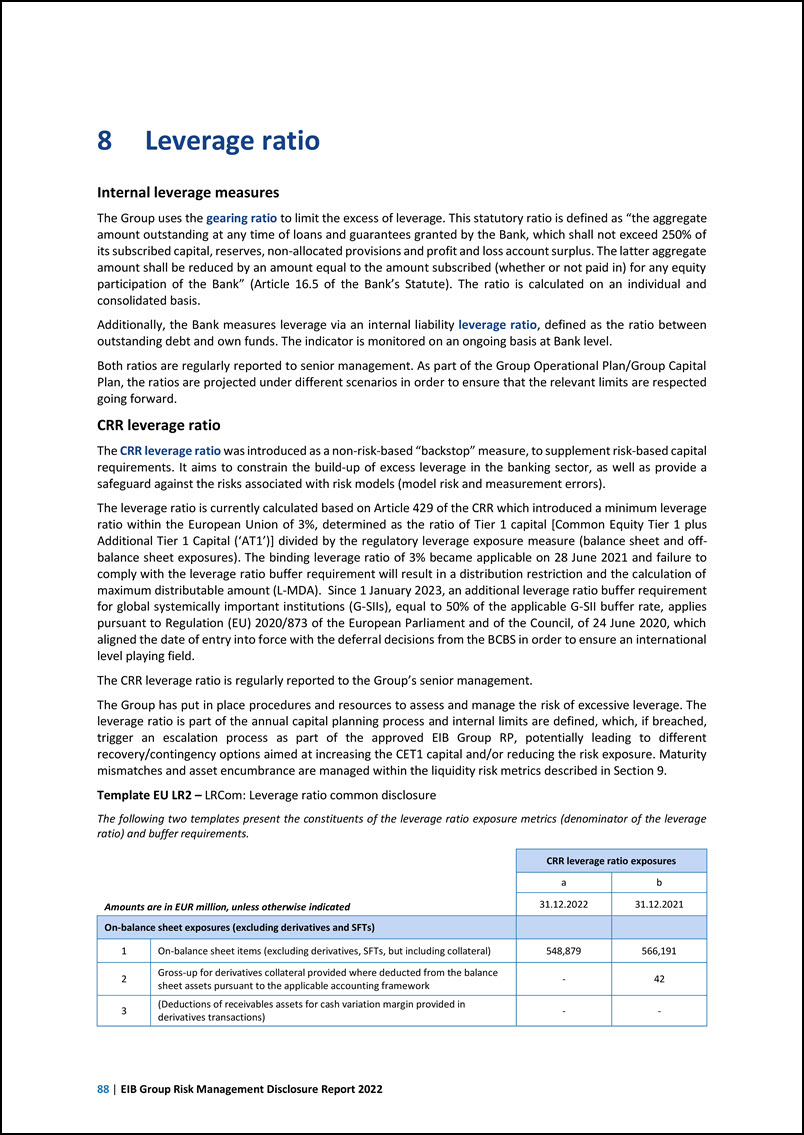
88 | EIB Group Risk Management Disclosure Report 2022 8 Leverage ratio Internal leverage measures The Group uses the gearing ratio to limit the excess of leverage. This statutory ratio is defined as “the aggregate amount outstanding at any time of loans and guarantees granted by the Bank, which shall not exceed 250% of its subscribed capital, reserves, non-allocated provisions and profit and loss account surplus. The latter aggregate amount shall be reduced by an amount equal to the amount subscribed (whether or not paid in) for any equity participation of the Bank” (Article 16.5 of the Bank’s Statute). The ratio is calculated on an individual and consolidated basis. Additionally, the Bank measures leverage via an internal liability leverage ratio, defined as the ratio between outstanding debt and own funds. The indicator is monitored on an ongoing basis at Bank level. Both ratios are regularly reported to senior management. As part of the Group Operational Plan/Group Capital Plan, the ratios are projected under different scenarios in order to ensure that the relevant limits are respected going forward. CRR leverage ratio The CRR leverage ratio was introduced as a non-risk-based “backstop” measure, to supplement risk-based capital requirements. It aims to constrain the build-up of excess leverage in the banking sector, as well as provide a safeguard against the risks associated with risk models (model risk and measurement errors). The leverage ratio is currently calculated based on Article 429 of the CRR which introduced a minimum leverage ratio within the European Union of 3%, determined as the ratio of Tier 1 capital [Common Equity Tier 1 plus Additional Tier 1 Capital (‘AT1’)] divided by the regulatory leverage exposure measure (balance sheet and off- balance sheet exposures). The binding leverage ratio of 3% became applicable on 28 June 2021 and failure to comply with the leverage ratio buffer requirement will result in a distribution restriction and the calculation of maximum distributable amount (L-MDA). Since 1 January 2023, an additional leverage ratio buffer requirement for global systemically important institutions (G-SIIs), equal to 50% of the applicable G-SII buffer rate, applies pursuant to Regulation (EU) 2020/873 of the European Parliament and of the Council, of 24 June 2020, which aligned the date of entry into force with the deferral decisions from the BCBS in order to ensure an international level playing field. The CRR leverage ratio is regularly reported to the Group’s senior management. The Group has put in place procedures and resources to assess and manage the risk of excessive leverage. The leverage ratio is part of the annual capital planning process and internal limits are defined, which, if breached, trigger an escalation process as part of the approved EIB Group RP, potentially leading to different recovery/contingency options aimed at increasing the CET1 capital and/or reducing the risk exposure. Maturity mismatches and asset encumbrance are managed within the liquidity risk metrics described in Section 9. Template EU LR2 – LRCom: Leverage ratio common disclosure The following two templates present the constituents of the leverage ratio exposure metrics (denominator of the leverage ratio) and buffer requirements. Amounts are in EUR million, unless otherwise indicated CRR leverage ratio exposures a b 31.12.2022 31.12.2021 On-balance sheet exposures (excluding derivatives and SFTs) 1 On-balance sheet items (excluding derivatives, SFTs, but including collateral) 548,879 566,191 2 Gross-up for derivatives collateral provided where deducted from the balance sheet assets pursuant to the applicable accounting framework - 42 3 (Deductions of receivables assets for cash variation margin provided in derivatives transactions) - -
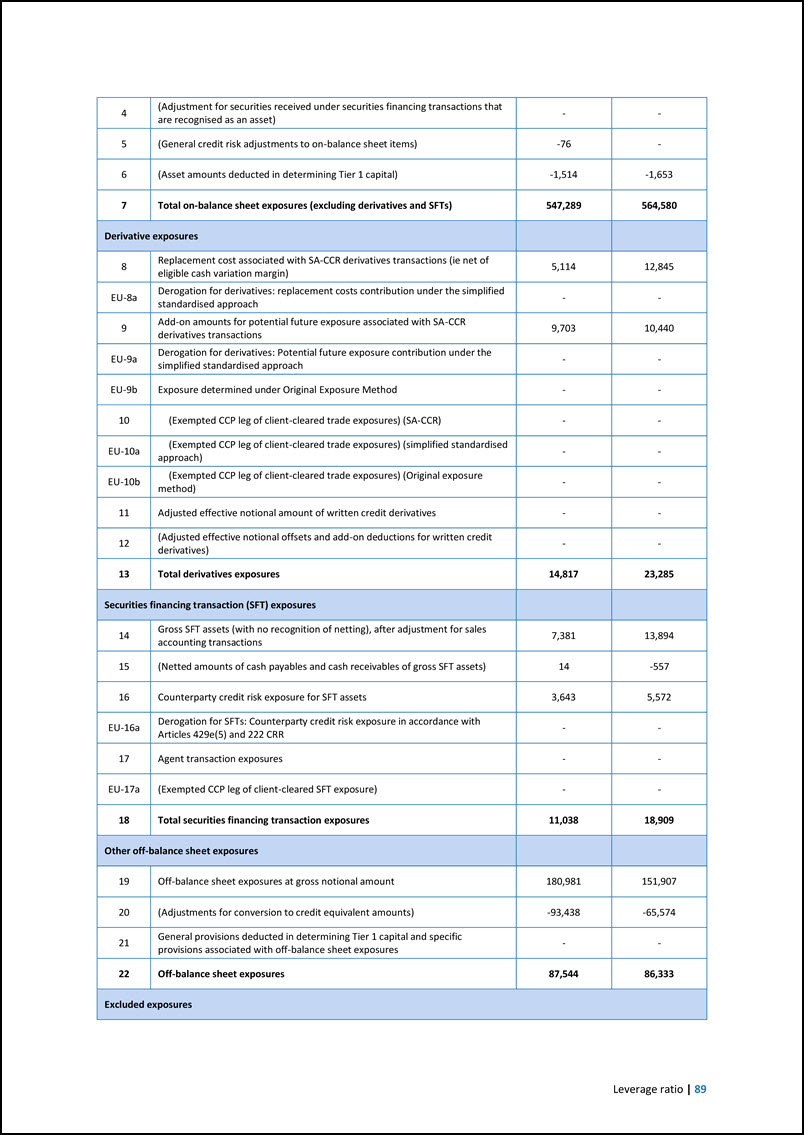
Leverage ratio | 89 4 (Adjustment for securities received under securities financing transactions that are recognised as an asset) - - 5 (General credit risk adjustments to on-balance sheet items) -76 - 6 (Asset amounts deducted in determining Tier 1 capital) -1,514 -1,653 7 Total on-balance sheet exposures (excluding derivatives and SFTs) 547,289 564,580 Derivative exposures 8 Replacement cost associated with SA-CCR derivatives transactions (ie net of eligible cash variation margin) 5,114 12,845 EU-8a Derogation for derivatives: replacement costs contribution under the simplified standardised approach - - 9 Add-on amounts for potential future exposure associated with SA-CCR derivatives transactions 9,703 10,440 EU-9a Derogation for derivatives: Potential future exposure contribution under the simplified standardised approach - - EU-9b Exposure determined under Original Exposure Method - - 10 (Exempted CCP leg of client-cleared trade exposures) (SA-CCR) - - EU-10a (Exempted CCP leg of client-cleared trade exposures) (simplified standardised approach) - - EU-10b (Exempted CCP leg of client-cleared trade exposures) (Original exposure method) - - 11 Adjusted effective notional amount of written credit derivatives - - 12 (Adjusted effective notional offsets and add-on deductions for written credit derivatives) - - 13 Total derivatives exposures 14,817 23,285 Securities financing transaction (SFT) exposures 14 Gross SFT assets (with no recognition of netting), after adjustment for sales accounting transactions 7,381 13,894 15 (Netted amounts of cash payables and cash receivables of gross SFT assets) 14 -557 16 Counterparty credit risk exposure for SFT assets 3,643 5,572 EU-16a Derogation for SFTs: Counterparty credit risk exposure in accordance with Articles 429e(5) and 222 CRR - - 17 Agent transaction exposures - - EU-17a (Exempted CCP leg of client-cleared SFT exposure) - - 18 Total securities financing transaction exposures 11,038 18,909 Other off-balance sheet exposures 19 Off-balance sheet exposures at gross notional amount 180,981 151,907 20 (Adjustments for conversion to credit equivalent amounts) -93,438 -65,574 21 General provisions deducted in determining Tier 1 capital and specific provisions associated with off-balance sheet exposures - - 22 Off-balance sheet exposures 87,544 86,333 Excluded exposures
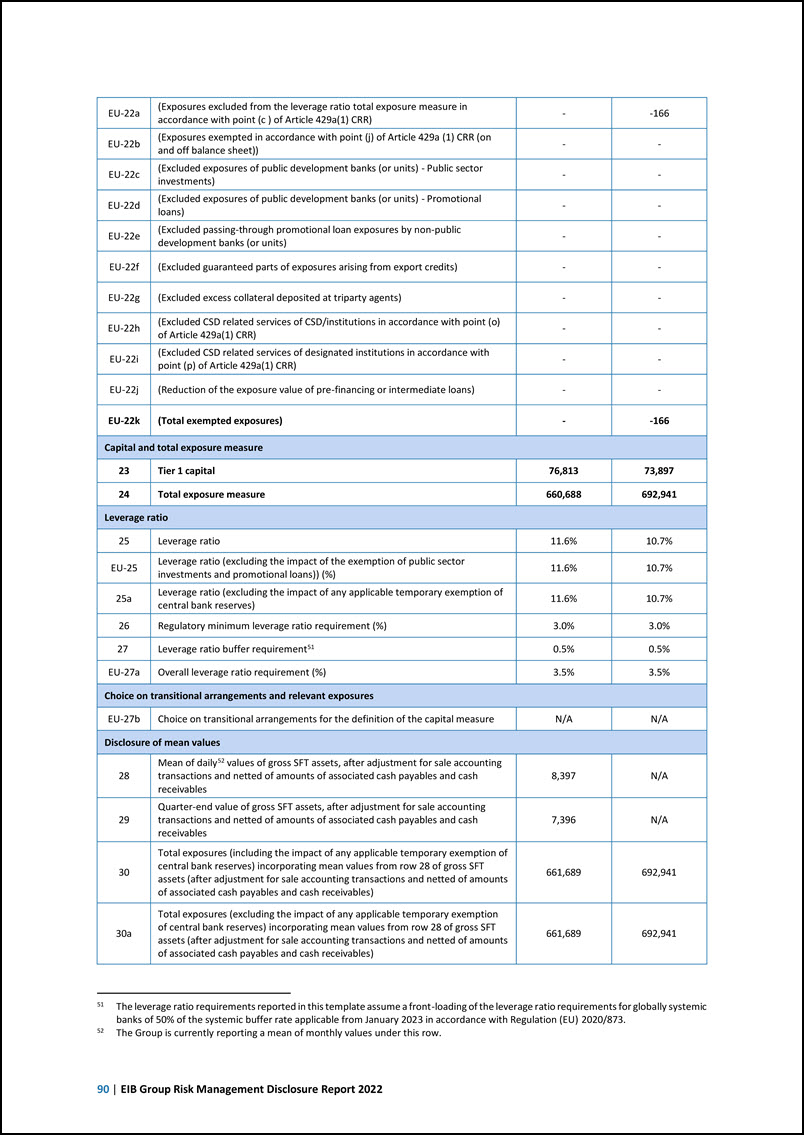
90 | EIB Group Risk Management Disclosure Report 2022 EU-22a (Exposures excluded from the leverage ratio total exposure measure in accordance with point (c ) of Article 429a(1) CRR) - -166 EU-22b (Exposures exempted in accordance with point (j) of Article 429a (1) CRR (on and off balance sheet)) - - EU-22c (Excluded exposures of public development banks (or units) - Public sector investments) - - EU-22d (Excluded exposures of public development banks (or units) - Promotional loans) - - EU-22e (Excluded passing-through promotional loan exposures by non-public development banks (or units) - - EU-22f (Excluded guaranteed parts of exposures arising from export credits) - - EU-22g (Excluded excess collateral deposited at triparty agents) - - EU-22h (Excluded CSD related services of CSD/institutions in accordance with point (o) of Article 429a(1) CRR) - - EU-22i (Excluded CSD related services of designated institutions in accordance with point (p) of Article 429a(1) CRR) - - EU-22j (Reduction of the exposure value of pre-financing or intermediate loans) - - EU-22k (Total exempted exposures) - -166 Capital and total exposure measure 23 Tier 1 capital 76,813 73,897 24 Total exposure measure 660,688 692,941 Leverage ratio 25 Leverage ratio 11.6% 10.7% EU-25 Leverage ratio (excluding the impact of the exemption of public sector investments and promotional loans)) (%) 11.6% 10.7% 25a Leverage ratio (excluding the impact of any applicable temporary exemption of central bank reserves) 11.6% 10.7% 26 Regulatory minimum leverage ratio requirement (%) 3.0% 3.0% 27 Leverage ratio buffer requirement51 0.5% 0.5% EU-27a Overall leverage ratio requirement (%) 3.5% 3.5% Choice on transitional arrangements and relevant exposures EU-27b Choice on transitional arrangements for the definition of the capital measure N/A N/A Disclosure of mean values 28 Mean of daily52 values of gross SFT assets, after adjustment for sale accounting transactions and netted of amounts of associated cash payables and cash receivables 8,397 N/A 29 Quarter-end value of gross SFT assets, after adjustment for sale accounting transactions and netted of amounts of associated cash payables and cash receivables 7,396 N/A 30 Total exposures (including the impact of any applicable temporary exemption of central bank reserves) incorporating mean values from row 28 of gross SFT assets (after adjustment for sale accounting transactions and netted of amounts of associated cash payables and cash receivables) 661,689 692,941 30a Total exposures (excluding the impact of any applicable temporary exemption of central bank reserves) incorporating mean values from row 28 of gross SFT assets (after adjustment for sale accounting transactions and netted of amounts of associated cash payables and cash receivables) 661,689 692,941 51 52 The leverage ratio requirements reported in this template assume a front-loading of the leverage ratio requirements for globally systemic banks of 50% of the systemic buffer rate applicable from January 2023 in accordance with Regulation (EU) 2020/873. The Group is currently reporting a mean of monthly values under this row.
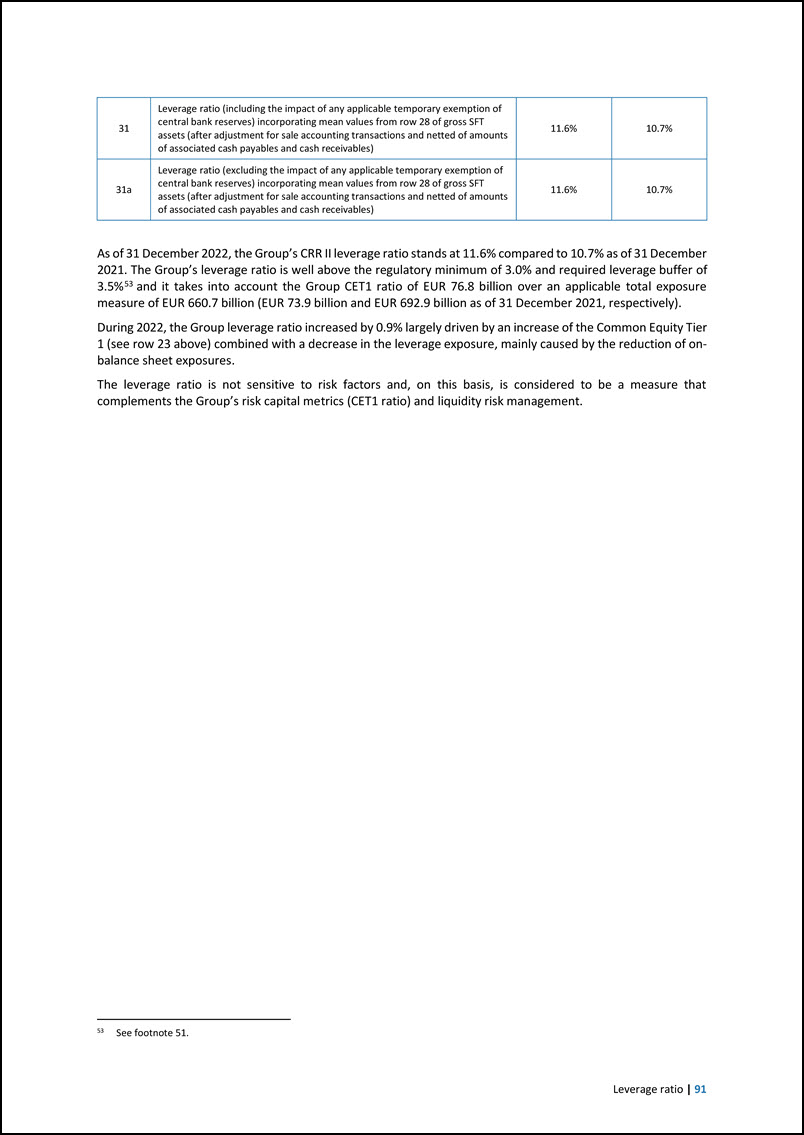
Leverage ratio | 91 31 Leverage ratio (including the impact of any applicable temporary exemption of central bank reserves) incorporating mean values from row 28 of gross SFT assets (after adjustment for sale accounting transactions and netted of amounts of associated cash payables and cash receivables) 11.6% 10.7% 31a Leverage ratio (excluding the impact of any applicable temporary exemption of central bank reserves) incorporating mean values from row 28 of gross SFT assets (after adjustment for sale accounting transactions and netted of amounts of associated cash payables and cash receivables) 11.6% 10.7% As of 31 December 2022, the Group’s CRR II leverage ratio stands at 11.6% compared to 10.7% as of 31 December 2021. The Group’s leverage ratio is well above the regulatory minimum of 3.0% and required leverage buffer of 3.5%53 and it takes into account the Group CET1 ratio of EUR 76.8 billion over an applicable total exposure measure of EUR 660.7 billion (EUR 73.9 billion and EUR 692.9 billion as of 31 December 2021, respectively). During 2022, the Group leverage ratio increased by 0.9% largely driven by an increase of the Common Equity Tier 1 (see row 23 above) combined with a decrease in the leverage exposure, mainly caused by the reduction of on- balance sheet exposures. The leverage ratio is not sensitive to risk factors and, on this basis, is considered to be a measure that complements the Group’s risk capital metrics (CET1 ratio) and liquidity risk management. 53 See footnote 51.
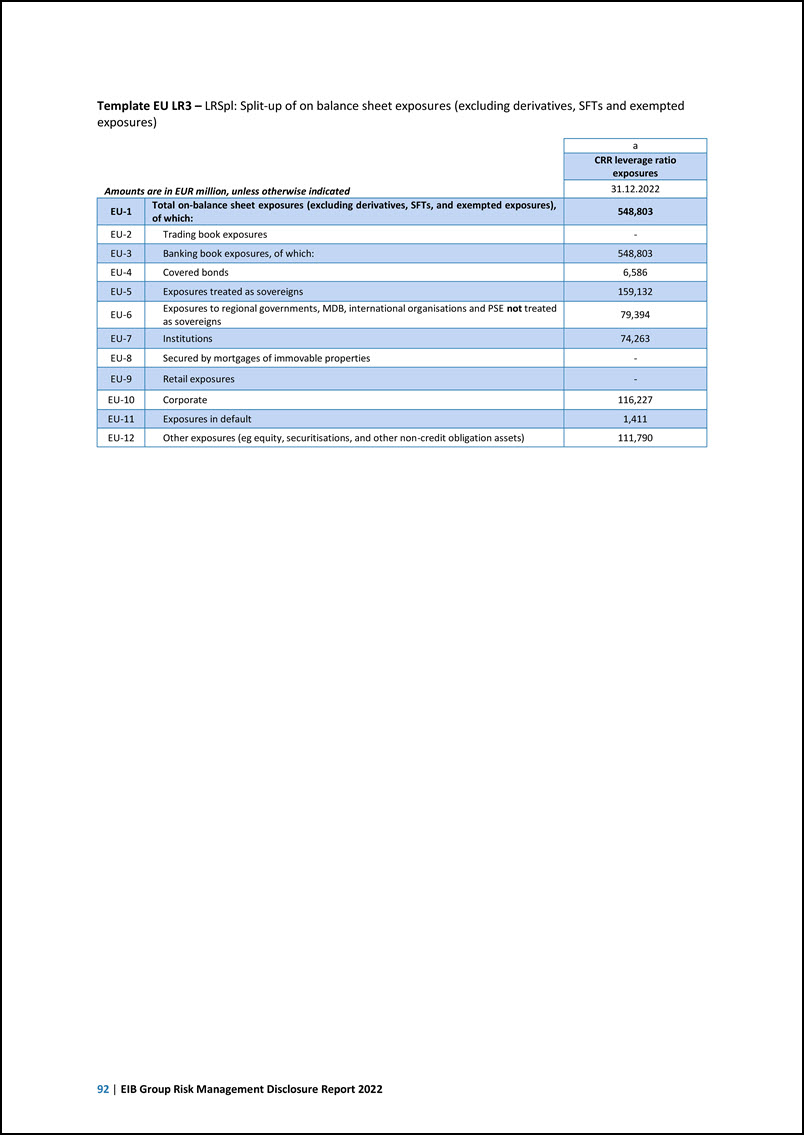
92 | EIB Group Risk Management Disclosure Report 2022 Template EU LR3 – LRSpl: Split-up of on balance sheet exposures (excluding derivatives, SFTs and exempted exposures) Amounts are in EUR million, unless otherwise indicated a CRR leverage ratio exposures 31.12.2022 EU-1 Total on-balance sheet exposures (excluding derivatives, SFTs, and exempted exposures), of which: 548,803 EU-2 Trading book exposures - EU-3 Banking book exposures, of which: 548,803 EU-4 Covered bonds 6,586 EU-5 Exposures treated as sovereigns 159,132 EU-6 Exposures to regional governments, MDB, international organisations and PSE not treated as sovereigns 79,394 EU-7 Institutions 74,263 EU-8 Secured by mortgages of immovable properties - EU-9 Retail exposures - EU-10 Corporate 116,227 EU-11 Exposures in default 1,411 EU-12 Other exposures (eg equity, securitisations, and other non-credit obligation assets) 111,790
Liquidity risk | 93 Liquidity risk Internal framework for liquidity risk management Introduction Liquidity risk is defined as the risk of the Group’s ability to fund increases in assets and meet obligations as they come due, without incurring unacceptable losses. It can be further split into funding liquidity risk and market liquidity risk. Funding liquidity risk is the risk of being unable to refinance the asset side of its balance sheet and to meet payment obligations punctually and in full out of readily available liquid resources. Market liquidity risk is the volatility in the economic value of the assets or in the income due to the potential inability to execute a transaction to offset, eliminate or reduce outstanding positions at reasonable market prices. The EIB is an eligible counterparty in Eurosystem monetary policy operations. As such, the EIB has access to the ECB’s refinancing operations. Within the context of the EIB’s access to the ECB’s liquidity facilities, the BCL, on behalf of the ECB, performs liquidity assessments on the EIB periodically, aimed at monitoring its liquidity position and liquidity risk management activities. For liquidity management and liquidity risk management, the Group follows a decentralised model where both the EIB and the EIF have a separate liquidity framework in place tailored to the entity business model with the objective of ensuring that each entity can always meet its payment obligations punctually and in full. Both entities, the EIB and the EIF, have in place an independent Risk Management function monitoring and controlling the liquidity risk of each respective entity. For the EIB, the liquidity risk management framework follows the same organisational structure as described in Section 3.3 of the GRMDR. More specifically, there are different specialised EIB commitees involved in liquidity risk related matters such as the RPC at Board level or, for example, the Asset/Liability Committee (ALCO) at Service level. The EIF Asset and Liquidity Committee (ALC) is involved in oversight and management of EIF liquidity risks. Given the Bank’s business model, wholesale long-term funding primarily through bond issuance is the prevailing source of resources for its lending activities. The funding strategy of the EIB relies on the issuance of large and liquid benchmark transactions in the main currencies (EUR and USD). These benchmark transactions are complemented by targeted issuance offerings, prudent diversification of investors, currencies and markets. A growing issuance share comes in the form of Climate- and Sustainability Awareness Bonds, whose proceeds are allocated to disbursements of projects contributing substantially to sustainability objectives, in line with evolving EU legislation on sustainable finance. A breakdown of debt securities issued by the EIB is provided in Note K of the EIB statutory financial statements and EIB Group consolidated financial statements under EU-AD54. In defining its funding programme, the Bank considers all relevant future cash flows in a prudent manner and pays due regard to the control of the structural maturity mismatch between its lending and borrowing activities. The Bank has a specific policy in place on the transfer of costs to the client. In order to manage its liquid assets, the Bank holds a liquidity buffer composed of several treasury portfolios with short, medium and long-term investment horizons, each of them managed according to risk guidelines approved by the MC. In addition, the liquidity buffer is also composed of unencumbered and re-usable collateral received. Further to this, the Bank can participate in the monetary refinancing operations of the Eurosystem, through its access to the BCL55. By contrast, the EIF does not fund itself on the capital markets. Liquid assets are managed by the EIF in such a way as to ensure that guarantee calls, private equity drawdowns and administrative expenditures can be regularly met, while earning a reasonable return on the assets invested, compatible with the protection of the value of the paid-in capital. The liquidity is managed so as to meet the Fund’s liquidity needs, while the Fund also keeps a sizeable portion of its portfolio in liquid assets as a reserve. 54 55 Further information on the funding strategy of the Bank can be found in Section 3 of the Overview of the EIB Group Financial Report and in the Investor Relations tab of the EIB website. Further information on the treasury portfolios of the EIBG can be found in Notes A 2.6 and B.2 of the EIB Group Financial Statements under EU-AD.
94 | EIB Group Risk Management Disclosure Report 2022 The Bank uses derivative instruments as part of its asset and liability management activities, to manage interest rate, maturity mismatch, cross-currency basis and foreign currency risks and reduce the exposures to such risks56. The Bank’s exposure to derivative counterparts is mitigated through CSAs to the ISDA Master Agreements, which provide for daily collateralisation of exposures as explained in Chapter 6. The CSAs signed by the Bank are unilateral (or one-way), meaning that the EIB is not obliged to post collateral – neither in the form of cash, nor securities – as it would be under an ordinary CSA. Within the unilateral CSA framework, the Bank is also executing cross currency swaps with quarterly resets of their nominal to match the changes in the relevant FX rate over the period. These resets are settled in cash on a quarterly basis. The Bank’s internal policies related to liquidity risk identification, measurement, monitoring, including limit setting, compliance and reporting, as well as the broad organisational framework to implement such rules are documented in the FRG. For the EIF, the liquidity risk principles are documented in the EIF’s Financial Risk Policy Guidelines, and further defined in additional procedures. Management, monitoring and reporting The Group has in place sound internal processes for identifying, measuring, monitoring and controlling liquidity risk. The management, monitoring and reporting are implemented within the Group taking into consideration proportionality and the business model specificities of each entity. On a daily basis, information about EIB daily cash flows in all the operating currencies is available for the purposes of short-term liquidity planning and investment. On a weekly and end-of-month basis, all cash flows arising from assets, liabilities and off-balance sheet items are simulated over several time horizons, under both “base-case” and internally determined “stressed” conditions. For the EIF, short-term liquidity planning is done on a weekly basis, and asset, liability and off- balance sheet cash flow simulations are performed on a monthly basis, under both “base-case” and internally determined “stressed” conditions, reflecting the EIF’s business model. The EIB Group performs liquidity stress tests, at Group level and at Group entity level, as necessary. Stress tests are designed by taking into consideration the EIBG business activities, the funding sources and its financial products. The cash flow projections contribute to determining the appropriate size of the Bank’s liquidity buffer, by ensuring that it is sufficient to cover the Bank’s future net cash outflows under all conditions, “base-case” and “stressed” alike. The results of the stress tests are regularly reported to the ALCO, while EIF stress tests are reported to the EIF’s internal liquidity committee (ALC) on a quarterly basis. With regard to long-term liquidity risk, specific stress tests are executed on a monthly and annual basis as part of monitoring activities linked to the funding programme. Tolerance levels and limits for the internal liquidity risk indicators are specified in the Group RAF with the aim of ensuring that the Bank and the Fund hold an adequate liquidity buffer to cover their future net cash outflows. Such indicators are calculated by the EIB on a daily, weekly and monthly basis, and by the EIF on a monthly and semi-annual basis. The Group RAF indicators are approved by the BoD through the respective RAFs and are subject to regular updates to ensure their ongoing adherence to the business model of the two entities. The Risk Management functions of both the EIB and the EIF report the level of the liquidity risk indicators to senior management on a monthly basis. During 2022, all liquidity risk indicators were well in line with the approved risk tolerance. In line with the BBP, both the EIB and the EIF have in place standalone contingency funding plans that define the escalation procedures and course of actions in the event of a liquidity crisis. The contingency plans may be activated as a result of extraordinary market conditions and/or as a result of the internal liquidity indicators reaching pre-defined crisis levels. The EIB Group also has available a Group Contingency Funding Plan (‘GCFP‘), which is updated and tested on an annual basis. Further information on the Group’s liquidity risk management is provided in the EIB Group consolidated financial statements under IFRS, Note S.3. These also provide the maturity profile for derivative and non-derivative financial liabilities. 56 Further information on the use of derivatives can be found in Note V and section A.2.3 of the EIB Group Financial Statements under EU- AD.
Liquidity risk | 95 Internal Liquidity Adequacy Assessment Process (ILAAP) As an integral part of its risk management framework, the EIB Group has in place an Internal Liquidity Adequacy Assessment Process. In addition to this, a standalone ILAAP is prepared by the Fund, which is tailored to its public function and to its specific business model. Both entities in the Group have established robust liquidity risk management frameworks and liquidity risk is managed prudently in order to ensure the regular functioning of the core activities under both normal and stressed conditions. Relevant policies and practices are in place and in line with the identified liquidity risk tolerance levels and are communicated to senior management through internal reporting tools, in order to facilitate the robust measurement, monitoring and control of liquidity risk. Stress tests aiming to test the Group’s overall capacity to withstand hypothetical adverse liquidity conditions are performed in the context of the ILAAP. Such scenarios are performed coherently across the Group and consist of: (i) an idiosyncratic scenario; (ii) a market-wide scenario; (iii) a scenario combining market and idiosyncratic elements; and (iv) a scenario related to operational risk. On top of the above mentioned scenarios performed at consolidated level, an additional stress test is dedicated to address the potential intra-group consequences of severe liquidity outflows at the EIF. Lastly, in order to complement the aforementioned “traditional” stress tests, a reverse stress test is performed by both entities of the Group, with the objective of assessing a hypothetical extreme scenario that would lead to a pre-defined severe impact in the liquidity risk indicators. Within the annual approval of the EIB Group ILAAP, the Board of Directors of the EIB, as Board of the Group parent company, approved the Liquidity Adequacy Statement (“LAS”) for the EIB Group, having acknowledged all assumptions, arguments and facts, underlying the conclusions of the EIB Group ILAAP. The BoD took note that liquidity RAF metrics defined on an EIB consolidated and standalone basis, as well as on an EIF standalone basis, were within their respective limits and withstood the liquidity stress tests considered for the Group ILAAP. The BoD concluded that the liquidity assessment framework of the EIB Group is adequate and proportionate to its business model, both from a point in time as well as from a forward-looking perspective. Liquidity coverage ratio (LCR) The EIB Group implemented the LCR in line with Regulation (EU) No 2015/61 of 10 October 2014 and Regulation (EU) No 2018/1620 of 13 July 2018. The LCR is calculated and monitored on an EIB standalone, as well as on an EIB Group consolidated basis, in its reporting currency (EUR) as defined in Article 3 of Commission Delegated Regulation (EU) 2015/61. The EIB standalone LCR is calculated daily and the EIB Group LCR is calculated monthly. Furthermore, the LCR is monitored for significant57 currencies (EUR, GBP and USD as at 31.12.2022). Consistency of the currency denomination of its liquid assets with its net liquidity outflows is ensured by the EIB Group on an ongoing basis, in order to prevent an excessive currency mismatch. The EIB Group LCR as at 31.12.2022 stood at 352% (31.12.2021: 586%). The decrease year-on-year is driven by both a decrease in HQLA and an increase in net cash outflows. In particular, the HQLA decreased by EUR 15 billion, over the course of last year, attributed to the decrease in Level 1 assets. The net cash outflows increased by EUR 6 billion, as a result of a decrease in inflows from secured financing transactions. Composition of HQLA and net cash outflows The HQLA (regulatory liquidity buffer) as at 31 December 2022 of EUR 72 billion is primarily driven by the Level 1 cash and reserves at the Central Bank (75%) and Level 1 securities (21%). The Level 2a and level 2b securities stood at EUR 2.7 billion and EUR 0.2 billion, respectively. The average total HQLA held throughout 2022 amounted to EUR 86 billion. The net cash outflows as at 31 December 2022 of EUR 20 billion are the result of EUR 12 billion of inflows and EUR 32 billion of outflows. The main elements of the LCR denominator are loan cash flows (both inflows and outflows) and wholesale funding due redemptions. A significant part of the outflows is related to derivatives transactions and to additional collateral outflows that would result from the impact of an adverse market 57 A currency is deemed “significant” according to the CRR definition if “the aggregate liabilities denominated in a given currency amount to 5% or more of the bank's total liabilities excluding capital and off-balance sheet items”.
96 | EIB Group Risk Management Disclosure Report 2022 scenario on the Bank’s derivatives transactions 58 , which is calculated based on the regulatory 24 months historical look-back approach. Other items relevant for the Group’s liquidity profile The Bank operates in a multicurrency environment and uses different settlement platforms and correspondent banks that impose time constraints within the day to perform the settlement of payments. As a result the Bank is exposed to intra-day liquidity risk. The Bank actively manages its intraday liquidity positions and risks to ensure that all payments and settlement obligations are met in a timely manner, under both normal and stressed conditions. In addition, several proactive and reactive mitigation actions have been implemented to manage this risk. The intraday liquidity risk is monitored by the 1st and 2nd lines of defence on a daily and monthly basis, under both normal and stressed scenarios. 58 Further information on the collateral received on derivative transactions can be found in sections S.2.4.2 and S.2.5.1 of the EIB Group consolidated financial statements under IFRS.
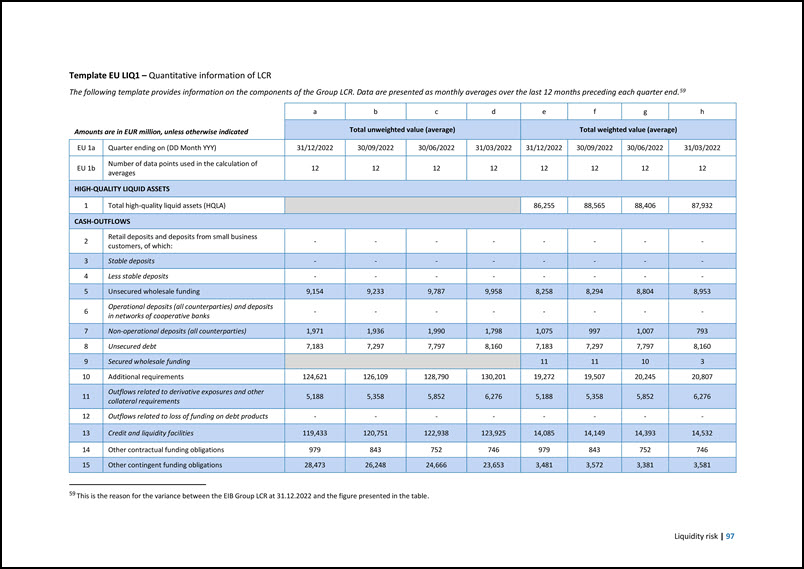
Liquidity risk | 97 Template EU LIQ1 – Quantitative information of LCR The following template provides information on the components of the Group LCR. Data are presented as monthly averages over the last 12 months preceding each quarter end.59 Amounts are in EUR million, unless otherwise indicated a b c d e f g h Total unweighted value (average) Total weighted value (average) EU 1a Quarter ending on (DD Month YYY) 31/12/2022 30/09/2022 30/06/2022 31/03/2022 31/12/2022 30/09/2022 30/06/2022 31/03/2022 EU 1b Number of data points used in the calculation of averages 12 12 12 12 12 12 12 12 HIGH-QUALITY LIQUID ASSETS 1 Total high-quality liquid assets (HQLA) 86,255 88,565 88,406 87,932 CASH-OUTFLOWS 2 Retail deposits and deposits from small business customers, of which: - - - - - - - - 3 Stable deposits - - - - - - - - 4 Less stable deposits - - - - - - - - 5 Unsecured wholesale funding 9,154 9,233 9,787 9,958 8,258 8,294 8,804 8,953 6 Operational deposits (all counterparties) and deposits in networks of cooperative banks - - - - - - - - 7 Non-operational deposits (all counterparties) 1,971 1,936 1,990 1,798 1,075 997 1,007 793 8 Unsecured debt 7,183 7,297 7,797 8,160 7,183 7,297 7,797 8,160 9 Secured wholesale funding 11 11 10 3 10 Additional requirements 124,621 126,109 128,790 130,201 19,272 19,507 20,245 20,807 11 Outflows related to derivative exposures and other collateral requirements 5,188 5,358 5,852 6,276 5,188 5,358 5,852 6,276 12 Outflows related to loss of funding on debt products - - - - - - - - 13 Credit and liquidity facilities 119,433 120,751 122,938 123,925 14,085 14,149 14,393 14,532 14 Other contractual funding obligations 979 843 752 746 979 843 752 746 15 Other contingent funding obligations 28,473 26,248 24,666 23,653 3,481 3,572 3,381 3,581 59 This is the reason for the variance between the EIB Group LCR at 31.12.2022 and the figure presented in the table.
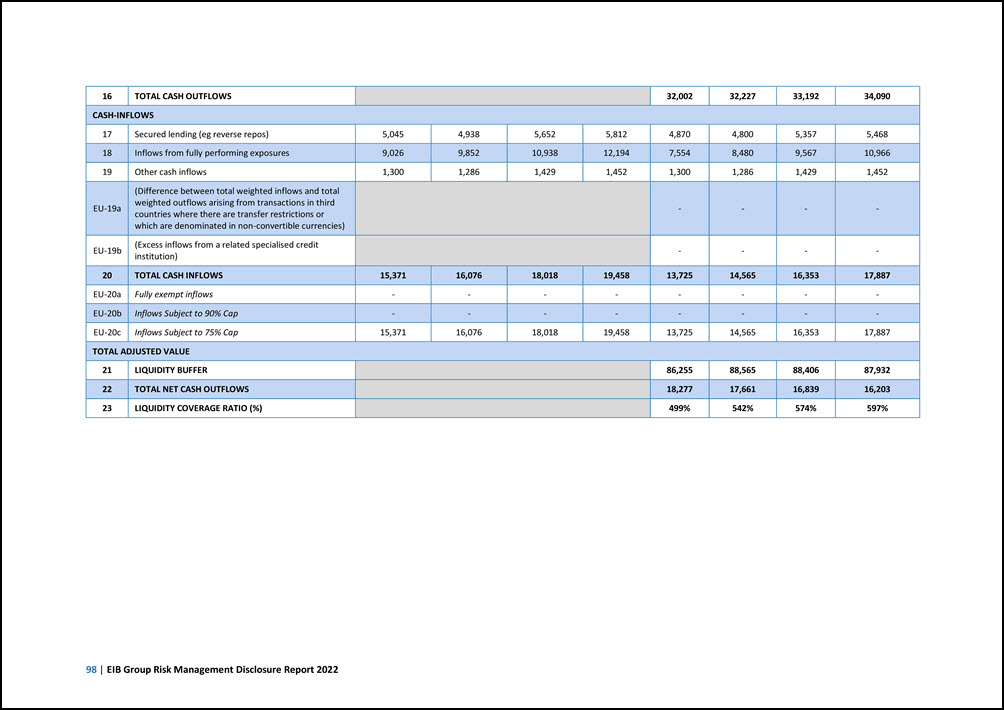
98 | EIB Group Risk Management Disclosure Report 2022 16 TOTAL CASH OUTFLOWS 32,002 32,227 33,192 34,090 CASH-INFLOWS 17 Secured lending (eg reverse repos) 5,045 4,938 5,652 5,812 4,870 4,800 5,357 5,468 18 Inflows from fully performing exposures 9,026 9,852 10,938 12,194 7,554 8,480 9,567 10,966 19 Other cash inflows 1,300 1,286 1,429 1,452 1,300 1,286 1,429 1,452 EU-19a (Difference between total weighted inflows and total weighted outflows arising from transactions in third countries where there are transfer restrictions or which are denominated in non-convertible currencies) - - - - EU-19b (Excess inflows from a related specialised credit institution) - - - - 20 TOTAL CASH INFLOWS 15,371 16,076 18,018 19,458 13,725 14,565 16,353 17,887 EU-20a Fully exempt inflows - - - - - - - - EU-20b Inflows Subject to 90% Cap - - - - - - - - EU-20c Inflows Subject to 75% Cap 15,371 16,076 18,018 19,458 13,725 14,565 16,353 17,887 TOTAL ADJUSTED VALUE 21 LIQUIDITY BUFFER 86,255 88,565 88,406 87,932 22 TOTAL NET CASH OUTFLOWS 18,277 17,661 16,839 16,203 23 LIQUIDITY COVERAGE RATIO (%) 499% 542% 574% 597%
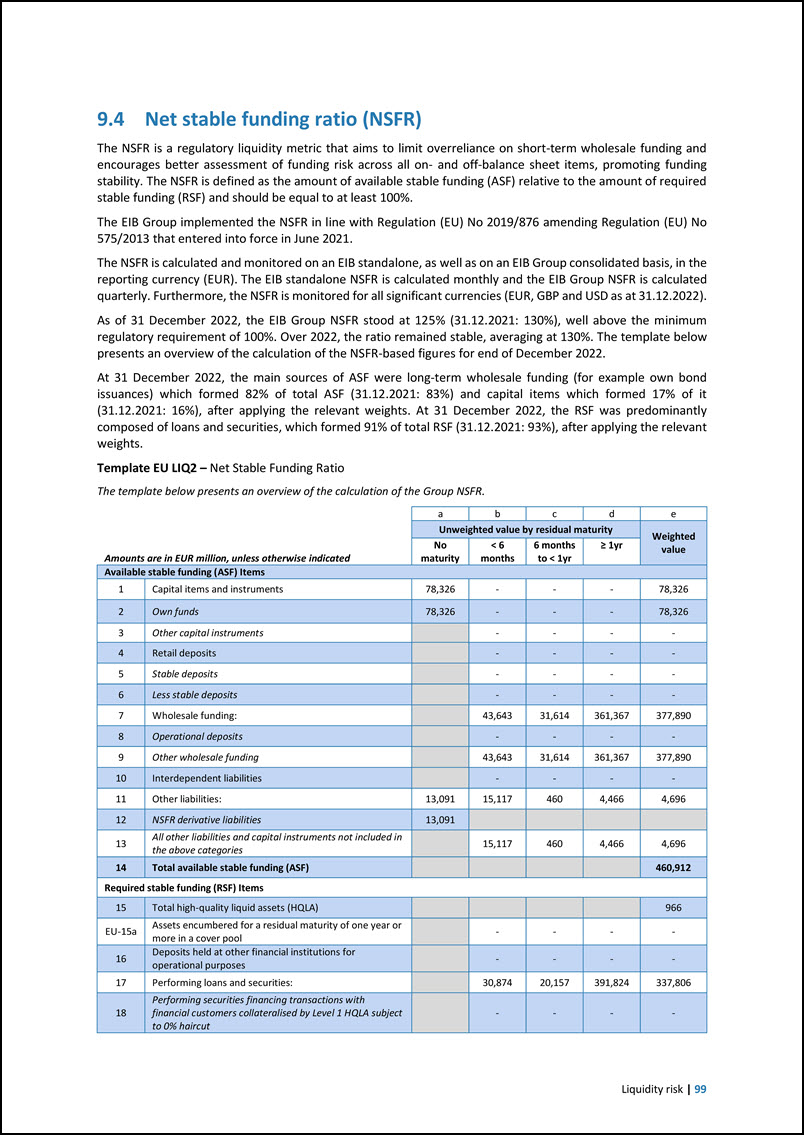
Liquidity risk | 99 9.4 Net stable funding ratio (NSFR) The NSFR is a regulatory liquidity metric that aims to limit overreliance on short-term wholesale funding and encourages better assessment of funding risk across all on- and off-balance sheet items, promoting funding stability. The NSFR is defined as the amount of available stable funding (ASF) relative to the amount of required stable funding (RSF) and should be equal to at least 100%. The EIB Group implemented the NSFR in line with Regulation (EU) No 2019/876 amending Regulation (EU) No 575/2013 that entered into force in June 2021. The NSFR is calculated and monitored on an EIB standalone, as well as on an EIB Group consolidated basis, in the reporting currency (EUR). The EIB standalone NSFR is calculated monthly and the EIB Group NSFR is calculated quarterly. Furthermore, the NSFR is monitored for all significant currencies (EUR, GBP and USD as at 31.12.2022). As of 31 December 2022, the EIB Group NSFR stood at 125% (31.12.2021: 130%), well above the minimum regulatory requirement of 100%. Over 2022, the ratio remained stable, averaging at 130%. The template below presents an overview of the calculation of the NSFR-based figures for end of December 2022. At 31 December 2022, the main sources of ASF were long-term wholesale funding (for example own bond issuances) which formed 82% of total ASF (31.12.2021: 83%) and capital items which formed 17% of it (31.12.2021: 16%), after applying the relevant weights. At 31 December 2022, the RSF was predominantly composed of loans and securities, which formed 91% of total RSF (31.12.2021: 93%), after applying the relevant weights. Template EU LIQ2 – Net Stable Funding Ratio The template below presents an overview of the calculation of the Group NSFR. Amounts are in EUR million, unless otherwise indicated a b c d e Unweighted value by residual maturity Weighted value No maturity < 6 months 6 months to < 1yr ≥ 1yr Available stable funding (ASF) Items 1 Capital items and instruments 78,326 - - - 78,326 2 Own funds 78,326 - - - 78,326 3 Other capital instruments - - - - 4 Retail deposits - - - - 5 Stable deposits - - - - 6 Less stable deposits - - - - 7 Wholesale funding: 43,643 31,614 361,367 377,890 8 Operational deposits - - - - 9 Other wholesale funding 43,643 31,614 361,367 377,890 10 Interdependent liabilities - - - - 11 Other liabilities: 13,091 15,117 460 4,466 4,696 12 NSFR derivative liabilities 13,091 13 All other liabilities and capital instruments not included in the above categories 15,117 460 4,466 4,696 14 Total available stable funding (ASF) 460,912 Required stable funding (RSF) Items 15 Total high-quality liquid assets (HQLA) 966 EU-15a Assets encumbered for a residual maturity of one year or more in a cover pool - - - - 16 Deposits held at other financial institutions for operational purposes - - - - 17 Performing loans and securities: 30,874 20,157 391,824 337,806 18 Performing securities financing transactions with financial customers collateralised by Level 1 HQLA subject to 0% haircut - - - -
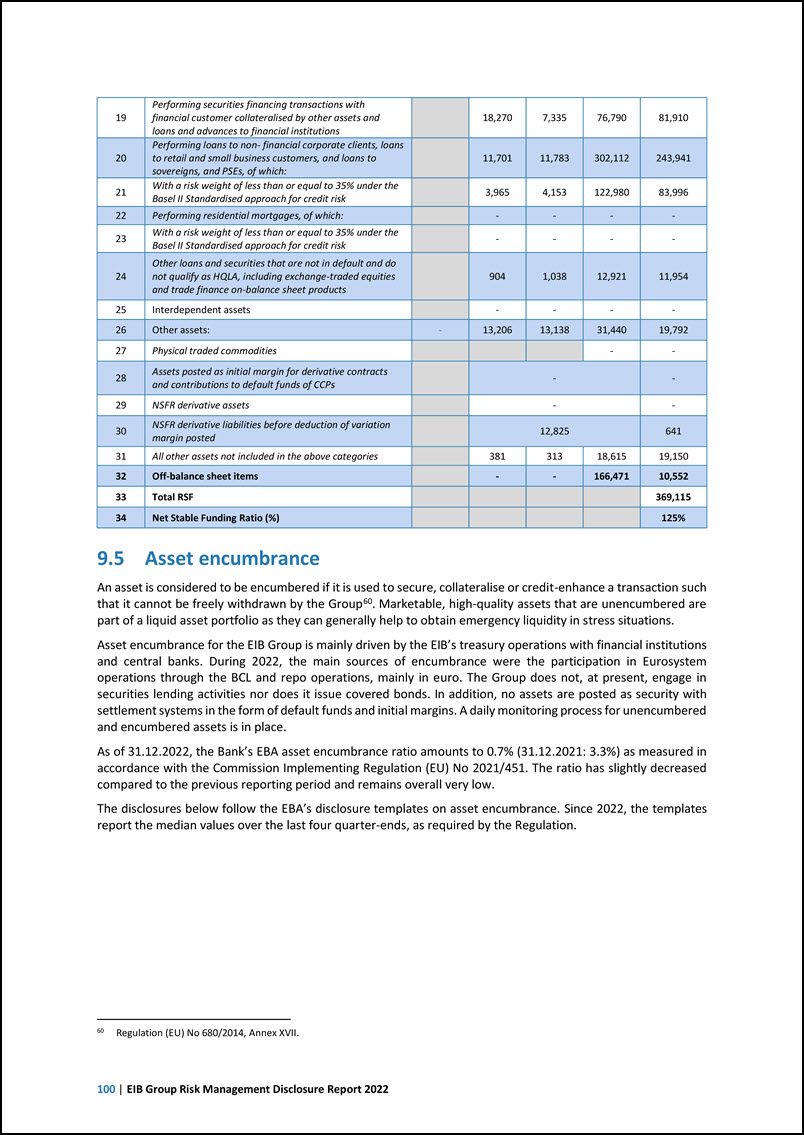
100 | EIB Group Risk Management Disclosure Report 2022 19 Performing securities financing transactions with financial customer collateralised by other assets and loans and advances to financial institutions 18,270 7,335 76,790 81,910 20 Performing loans to non- financial corporate clients, loans to retail and small business customers, and loans to sovereigns, and PSEs, of which: 11,701 11,783 302,112 243,941 21 With a risk weight of less than or equal to 35% under the Basel II Standardised approach for credit risk 3,965 4,153 122,980 83,996 22 Performing residential mortgages, of which: - - - - 23 With a risk weight of less than or equal to 35% under the Basel II Standardised approach for credit risk - - - - 24 Other loans and securities that are not in default and do not qualify as HQLA, including exchange-traded equities and trade finance on-balance sheet products 904 1,038 12,921 11,954 25 Interdependent assets - - - - 26 Other assets: - 13,206 13,138 31,440 19,792 27 Physical traded commodities - - 28 Assets posted as initial margin for derivative contracts and contributions to default funds of CCPs - - 29 NSFR derivative assets - - 30 NSFR derivative liabilities before deduction of variation margin posted 12,825 641 31 All other assets not included in the above categories 381 313 18,615 19,150 32 Off-balance sheet items - - 166,471 10,552 33 Total RSF 369,115 34 Net Stable Funding Ratio (%) 125% 9.5 Asset encumbrance An asset is considered to be encumbered if it is used to secure, collateralise or credit-enhance a transaction such that it cannot be freely withdrawn by the Group60. Marketable, high-quality assets that are unencumbered are part of a liquid asset portfolio as they can generally help to obtain emergency liquidity in stress situations. Asset encumbrance for the EIB Group is mainly driven by the EIB’s treasury operations with financial institutions and central banks. During 2022, the main sources of encumbrance were the participation in Eurosystem operations through the BCL and repo operations, mainly in euro. The Group does not, at present, engage in securities lending activities nor does it issue covered bonds. In addition, no assets are posted as security with settlement systems in the form of default funds and initial margins. A daily monitoring process for unencumbered and encumbered assets is in place. As of 31.12.2022, the Bank’s EBA asset encumbrance ratio amounts to 0.7% (31.12.2021: 3.3%) as measured in accordance with the Commission Implementing Regulation (EU) No 2021/451. The ratio has slightly decreased compared to the previous reporting period and remains overall very low. The disclosures below follow the EBA’s disclosure templates on asset encumbrance. Since 2022, the templates report the median values over the last four quarter-ends, as required by the Regulation. 60 Regulation (EU) No 680/2014, Annex XVII.

Liquidity risk | 101 Template EU AE1 – Encumbered and unencumbered assets The template below exhibits the total assets of the EIB Group separating encumbered from unencumbered assets. Additional information is provided for the Group’s portfolio of debt securities, which are more likely to be encumbered as part of treasury or hedging transactions. At the end of December 2022, the encumbered assets of the Group were denominated almost entirely in EUR61. The unencumbered “other assets” include mainly loans and advances and derivatives not available for encumbrance. Amounts are in EUR million, unless otherwise indicated Carrying amount of encumbered assets Fair value of encumbered assets Carrying amount of unencumbered assets Fair value of unencumbered assets of which notionally eligible EHQLA and HQLA of which notionally eligible EHQLA and HQLA of which EHQLA and HQLA of which EHQLA and HQLA 010 030 040 050 060 080 090 100 010 Assets of the disclosing institution 11,090 8,591 558,454 82,015 030 Equity instruments - - - - 10,003 - 18,985 - 040 Debt securities 10,817 8,591 10,687 8,483 27,064 13,373 26,156 12,974 050 of which: covered bonds 4,527 3,851 4,504 3,833 3,084 1,455 3,060 1,445 060 of which: securitisations 201 - 202 - 7,027 250 6,835 247 070 of which: issued by general governments 3,209 3,203 3,115 3,109 7,723 7,023 7,478 6,783 080 of which: issued by financial corporations 2,134 1,270 2,126 1,266 3,894 2,193 3,842 2,153 090 of which: issued by non-financial corporations 103 103 103 103 2,672 619 2,474 602 120 Other assets 294 - 519,479 67,178 61 The Group has only a very limited proportion of encumbered assets denominated in other currencies (USD).
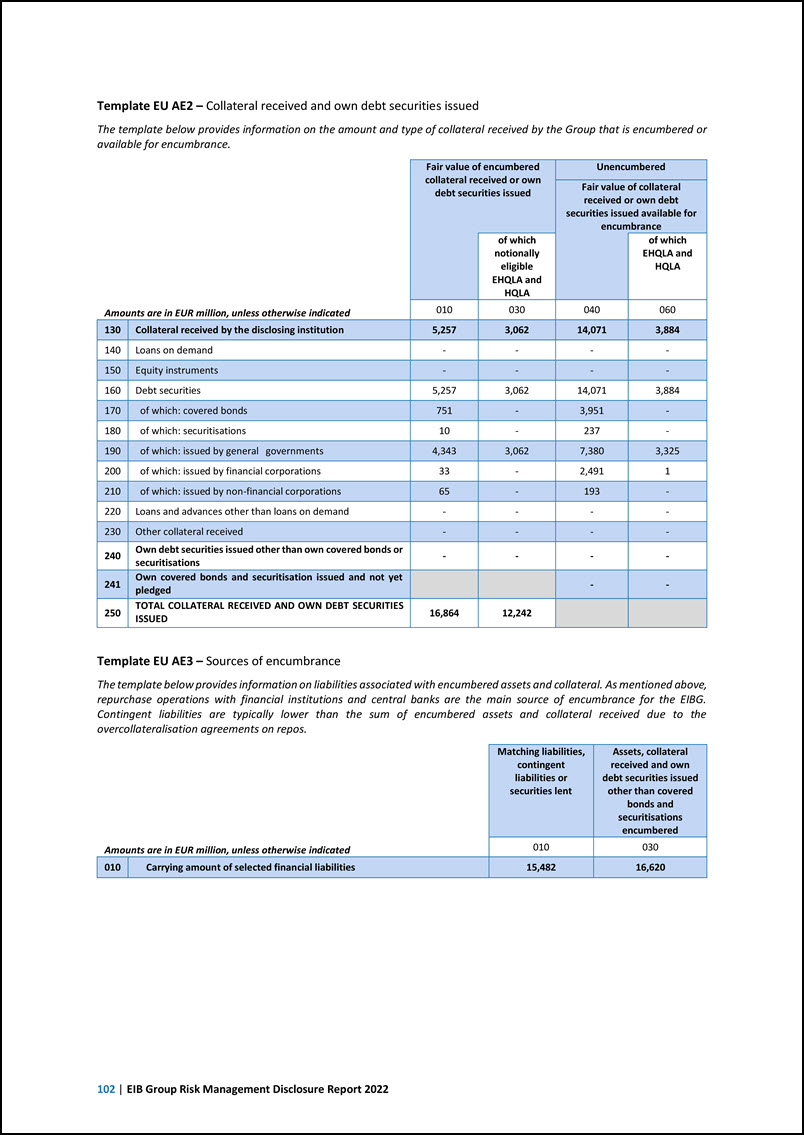
102 | EIB Group Risk Management Disclosure Report 2022 Template EU AE2 – Collateral received and own debt securities issued The template below provides information on the amount and type of collateral received by the Group that is encumbered or available for encumbrance. Amounts are in EUR million, unless otherwise indicated Fair value of encumbered collateral received or own debt securities issued Unencumbered Fair value of collateral received or own debt securities issued available for encumbrance of which notionally eligible EHQLA and HQLA of which EHQLA and HQLA 010 030 040 060 130 Collateral received by the disclosing institution 5,257 3,062 14,071 3,884 140 Loans on demand - - - - 150 Equity instruments - - - - 160 Debt securities 5,257 3,062 14,071 3,884 170 of which: covered bonds 751 - 3,951 - 180 of which: securitisations 10 - 237 - 190 of which: issued by general governments 4,343 3,062 7,380 3,325 200 of which: issued by financial corporations 33 - 2,491 1 210 of which: issued by non-financial corporations 65 - 193 - 220 Loans and advances other than loans on demand - - - - 230 Other collateral received - - - - 240 Own debt securities issued other than own covered bonds or securitisations - - - - 241 Own covered bonds and securitisation issued and not yet pledged - - 250 TOTAL COLLATERAL RECEIVED AND OWN DEBT SECURITIES ISSUED 16,864 12,242 Template EU AE3 – Sources of encumbrance The template below provides information on liabilities associated with encumbered assets and collateral. As mentioned above, repurchase operations with financial institutions and central banks are the main source of encumbrance for the EIBG. Contingent liabilities are typically lower than the sum of encumbered assets and collateral received due to the overcollateralisation agreements on repos. Amounts are in EUR million, unless otherwise indicated Matching liabilities, contingent liabilities or securities lent Assets, collateral received and own debt securities issued other than covered bonds and securitisations encumbered 010 030 010 Carrying amount of selected financial liabilities 15,482 16,620
Market risk | 103 10 Market risk Introduction Following the reclassification of the Securities Liquidity Portfolio (SLP) as banking book in 2020, the Group does not have regulatory own funds requirements for market risk in the trading book. Non-trading book positions are however subject to foreign exchange risk. According to Article 351 of the CRR, should the net foreign-exchange position exceed 2% of the Group’s total own funds, the Group shall calculate an own funds requirement for foreign exchange risk. The management of foreign exchange risk at the Group is described in the following section. Foreign exchange risk Foreign exchange (FX) risk is the risk to the economic value or to the income derived from the Group’s positions due to adverse movements of foreign exchange rates. The entities of the Group have different business models and separate governing frameworks (the principles of which are laid down in their respective Statutes and Rules and Procedures) and thus follow different day-to-day management approaches with respect to FX risk. The Group is exposed to FX risk whenever there is a currency mismatch between its assets, liabilities and hedge instruments. FX risk also comprises the effect of unfavourable changes in the value of the Group’s future P&L caused by currency movements. More specifically, at the EIB, FX risk can stem from the variety of currencies employed in its lending, funding, treasury activities and equity investments. At the EIF, FX risk stems primarily from guarantees and equity operations. More details on the management of FX risk at the EIB and the EIF are presented hereafter. Management of FX risk at the EIB The main objective of the EIB’s FX risk management is to minimise to the extent possible the effect of variation of FX rates on earnings in non-reporting currencies (that is, non-EUR currencies). The key bodies involved in the management of FX risk in the Bank are the MC and the ALCO. The EIB’s FX position for risk management is defined, for each non-reporting currency, as the balance between the accounting value of assets and liabilities under EU-AD and measured in EUR equivalent. It is in line with the net FX position defined in the CRR and used for regulatory capital calculation purposes, except for the CIUs, which are considered at the respective fund’s currency (that is, the LTA is not applied). The FX position for each non- reporting currency is monitored daily. On a daily basis, the Bank’s FX position is impacted by transactions that create a mismatch between assets and liabilities. On a monthly basis, the P&L impact is taken into account and hedged. The Bank hedges its FX risk by keeping the FX position for each non-reporting currency within pre- approved limits. In the event of a limit breach, the position is reduced by FX spot deals within the same day. Risk Management, as a second line of defence, is in charge of independently monitoring the daily FX position. Finance Directorate - Operational Support and Monitoring division, as a first line of defence, is in charge of calculating and reporting on a daily basis the FX position to the Finance Directorate - Treasury department that manages the position. Management of the FX risk at the EIF At the EIF, FX risk is monitored and managed at business line and product level via value at risk models: RM/TPR monitors securitisation guarantees on a continuous basis. Following a deviation from the expected performance or an ad-hoc event, surveillance triggers might be breached. In such cases, a model rerun may be required leading to an update of internal ratings and risk parameters. When downgrades imply reclassification to Stage 362, RM/TPR analyses whether hedging a certain part of the exposure would be recommended based on potential cash outflows. Non-EUR transactions under portfolio guarantees (risk-sharing mandates, RSM) are initially hedged by purchasing 50% of the expected loss (EL). The hedged amount is reassessed by RM/TPR on a yearly basis for each transaction according to the Exposure at Risk (EaR) and the cumulative EL of both drawn and undrawn 62 that is, credit-impaired in accordance with the staging concept of IFRS 9.
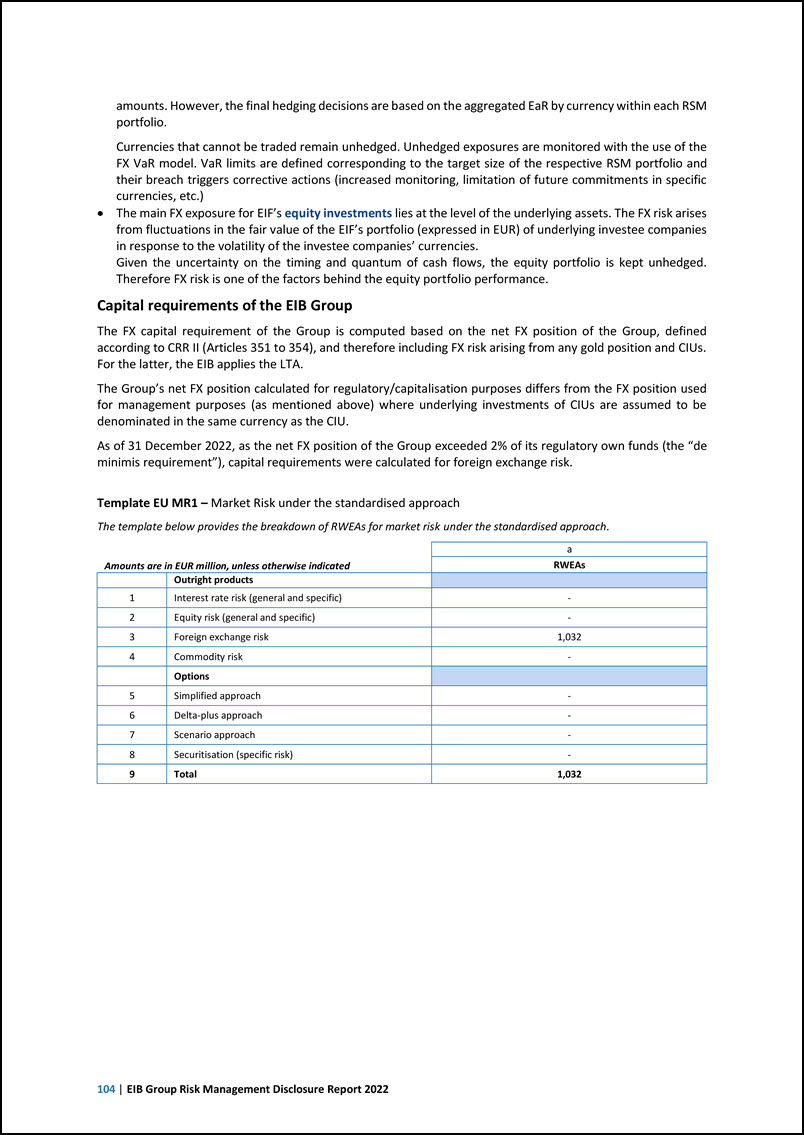
104 | EIB Group Risk Management Disclosure Report 2022 amounts. However, the final hedging decisions are based on the aggregated EaR by currency within each RSM portfolio. Currencies that cannot be traded remain unhedged. Unhedged exposures are monitored with the use of the FX VaR model. VaR limits are defined corresponding to the target size of the respective RSM portfolio and their breach triggers corrective actions (increased monitoring, limitation of future commitments in specific currencies, etc.) The main FX exposure for EIF’s equity investments lies at the level of the underlying assets. The FX risk arises from fluctuations in the fair value of the EIF’s portfolio (expressed in EUR) of underlying investee companies in response to the volatility of the investee companies’ currencies. Given the uncertainty on the timing and quantum of cash flows, the equity portfolio is kept unhedged. Therefore FX risk is one of the factors behind the equity portfolio performance. Capital requirements of the EIB Group The FX capital requirement of the Group is computed based on the net FX position of the Group, defined according to CRR II (Articles 351 to 354), and therefore including FX risk arising from any gold position and CIUs. For the latter, the EIB applies the LTA. The Group’s net FX position calculated for regulatory/capitalisation purposes differs from the FX position used for management purposes (as mentioned above) where underlying investments of CIUs are assumed to be denominated in the same currency as the CIU. As of 31 December 2022, as the net FX position of the Group exceeded 2% of its regulatory own funds (the “de minimis requirement”), capital requirements were calculated for foreign exchange risk. Template EU MR1 – Market Risk under the standardised approach The template below provides the breakdown of RWEAs for market risk under the standardised approach. Amounts are in EUR million, unless otherwise indicated a RWEAs Outright products 1 Interest rate risk (general and specific) - 2 Equity risk (general and specific) - 3 Foreign exchange risk 1,032 4 Commodity risk - Options 5 Simplified approach - 6 Delta-plus approach - 7 Scenario approach - 8 Securitisation (specific risk) - 9 Total 1,032
Interest rate risk in the banking book | 105 11 Interest rate risk in the banking book From a Group perspective, interest rate risk is defined as the risk to the Economic Value of Equity/Own Funds (EVE) or to the Net Interest Income (NII) arising from adverse movements in interest rates that affect interest rate-sensitive instruments, including gap risk, basis risk and option risk. Scope The scope of interest rate sensitive instruments are all assets, liabilities and off-balance sheet items in the non- trading book, excluding assets deducted from CET1 capital. Exposure to interest rate risk occurs when there are differences in repricing and maturity characteristics of the different asset, liability and hedge instruments. Governance The BoD sets the Bank’s risk appetite for interest rate risk in the banking book from both an earnings and economic value perspective. The EIF’s risk appetite does not currently include specific limits for IRRBB, but the EIF instead allocates economic capital to cover its interest rate risk exposures. It is the responsibility of the MC to approve the interest rate strategy of the EIB, while ensuring that it remains within the risk appetite limits. The MC is also assisted by the ALCO in the monitoring and management of IRRBB. The ALCO itself is supported by a permanent working group on interest rate risk monitoring. Reporting directly to the ALCO, this working group reviews and analyses the interest rate risk exposures, discusses possible hedging actions, based on recommendations from the Treasury (1st line of defence (LoD)) and reports to the ALCO on the operational actions taken by the 1st LoD. The decision on, and execution of, hedging actions remains under the responsibility of the 1st LoD. Key IRRBB risk metrics and their evolution are reported at least quarterly to the governing bodies. Risk management and mitigation The EIB follows relevant key principles of the BCBS63 and the EBA64 in its management and monitoring of interest rate risk. As prescribed by those principles the EIB manages the IRRBB from both NII and EVE perspectives, seeking to maintain a balanced and sustainable revenue profile as well as limiting the volatility of its economic value. For managing and mitigating interest rate exposures, a preference is given to natural hedges. Natural hedges occur in the course of normal business activity when assets (loans) and liabilities (borrowings) cancel out their interest rate exposures. When natural hedges are not sufficient for managing the interest rate exposures, the Bank makes use of derivative instruments. The most common types of derivatives used by the Bank are interest rate swaps (IRS) and cross currency swaps65. The Bank uses both micro and macro hedging approaches. A hedge is defined as micro when it matches back-to- back the interest rate structure of a specific loan or borrowing. A macro-hedge rather serves the purpose of rebalancing the interest rate exposure at portfolio level. To reduce the volatility of IFRS accounting P&L, the Bank applies, when possible, both fair value and cash flow hedge accounting methods: Fair value hedges recognise the derivative’s hedging of changes in the fair value of a recognised fixed-rate loan or bond. Cash flow hedges recognise the derivative’s hedging of changes in the future cash flows of floating-rate instruments. 63 64 65 BCBS 368: Standards for Interest Rate Risk in the Banking Book (IRRBB) (April 2016). EBA Guidelines on the management of interest rate risk arising from non-trading book activities - EBA/GL/2018/02 will be replaced by the Guidelines on the management of interest rate risk and credit spread risk arising from non-trading book activities – EBA/GL/2022/14, which will apply from 30 June 2023, except for the part on credit spread risk from the banking book (CSRBB), which will apply from 31 December 2023. Contracts that involve the exchange of notional in two different currencies at the beginning and at the end of the swap, and the exchange of floating rates during the contract term.
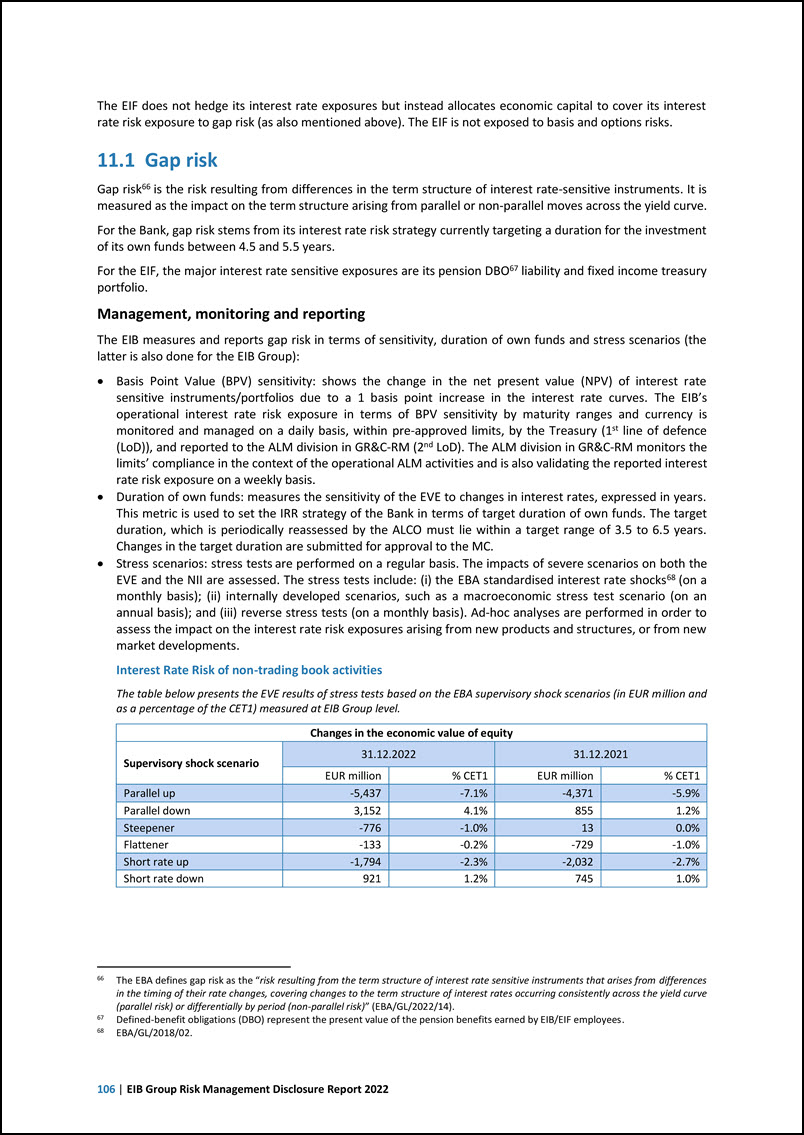
106 | EIB Group Risk Management Disclosure Report 2022 The EIF does not hedge its interest rate exposures but instead allocates economic capital to cover its interest rate risk exposure to gap risk (as also mentioned above). The EIF is not exposed to basis and options risks. 11.1 Gap risk Gap risk66 is the risk resulting from differences in the term structure of interest rate-sensitive instruments. It is measured as the impact on the term structure arising from parallel or non-parallel moves across the yield curve. For the Bank, gap risk stems from its interest rate risk strategy currently targeting a duration for the investment of its own funds between 4.5 and 5.5 years. For the EIF, the major interest rate sensitive exposures are its pension DBO67 liability and fixed income treasury portfolio. Management, monitoring and reporting The EIB measures and reports gap risk in terms of sensitivity, duration of own funds and stress scenarios (the latter is also done for the EIB Group): Basis Point Value (BPV) sensitivity: shows the change in the net present value (NPV) of interest rate sensitive instruments/portfolios due to a 1 basis point increase in the interest rate curves. The EIB’s operational interest rate risk exposure in terms of BPV sensitivity by maturity ranges and currency is monitored and managed on a daily basis, within pre-approved limits, by the Treasury (1st line of defence (LoD)), and reported to the ALM division in GR&C-RM (2nd LoD). The ALM division in GR&C-RM monitors the limits’ compliance in the context of the operational ALM activities and is also validating the reported interest rate risk exposure on a weekly basis. Duration of own funds: measures the sensitivity of the EVE to changes in interest rates, expressed in years. This metric is used to set the IRR strategy of the Bank in terms of target duration of own funds. The target duration, which is periodically reassessed by the ALCO must lie within a target range of 3.5 to 6.5 years. Changes in the target duration are submitted for approval to the MC. Stress scenarios: stress tests are performed on a regular basis. The impacts of severe scenarios on both the EVE and the NII are assessed. The stress tests include: (i) the EBA standardised interest rate shocks68 (on a monthly basis); (ii) internally developed scenarios, such as a macroeconomic stress test scenario (on an annual basis); and (iii) reverse stress tests (on a monthly basis). Ad-hoc analyses are performed in order to assess the impact on the interest rate risk exposures arising from new products and structures, or from new market developments. Interest Rate Risk of non-trading book activities The table below presents the EVE results of stress tests based on the EBA supervisory shock scenarios (in EUR million and as a percentage of the CET1) measured at EIB Group level. Changes in the economic value of equity Supervisory shock scenario 31.12.2022 31.12.2021 EUR million % CET1 EUR million % CET1 Parallel up -5,437 -7.1% -4,371 -5.9% Parallel down 3,152 4.1% 855 1.2% Steepener -776 -1.0% 13 0.0% Flattener -133 -0.2% -729 -1.0% Short rate up -1,794 -2.3% -2,032 -2.7% Short rate down 921 1.2% 745 1.0% 66 67 68 The EBA defines gap risk as the “risk resulting from the term structure of interest rate sensitive instruments that arises from differences in the timing of their rate changes, covering changes to the term structure of interest rates occurring consistently across the yield curve (parallel risk) or differentially by period (non-parallel risk)” (EBA/GL/2022/14). Defined-benefit obligations (DBO) represent the present value of the pension benefits earned by EIB/EIF employees. EBA/GL/2018/02.
Interest rate risk in the banking book | 107 The scenario that would produce the largest EVE decrease is the parallel up, causing a decrease equivalent to 7.1% of CET1. The year-on-year increase is driven by the improved economic modelling applied to the pension liability. Key modelling and parametric assumptions The models and key assumptions used to produce the table above are the same as those used in the operational measurement of the interest rate risk exposures: Risk-free yield curves: the projection of forward rates and the computation of discount factors are performed using risk-free yield curves that do not include any commercial, credit or liquidity spreads. Behavioural models: the Bank does not have behavioural models, given the specific nature of its business activities: Unlike many commercial institutions, the Bank does not have exposure to non-maturing deposits. In the event of a voluntary prepayment of fixed rate loans, the borrowers shall pay an indemnity to cover for potential financial losses that might arise when redeploying the prepaid amounts at lower rates. Prepayments on floating rate loans are not charged with a prepayment indemnity. However, the loan pricing framework of the Bank aims at recovering the net prepayment cost that may arise when redeploying prepaid amounts at lower spreads. Non-performing exposures: even though the non-performing exposures ratio is below the regulatory 2%, the Bank still conservatively includes them in the interest rate risk exposure. Run-off balance sheet: existing positions that mature are not replaced with new business in the EVE stress tests. Margin-free cash flows: commercial margins are not included in the projection of interest payments for the EVE-related metrics and stress tests. Pension obligations are included in the interest rate risk exposure: the sensitivity of these liabilities considers the impact of inflation, more specifically the correlation (co-movement) between the changes in inflation and interest rates. 11.2 Basis risk Basis risk is the risk arising from the impact of relative changes in interest rates on interest rate-sensitive instruments that have similar tenors but are priced using different interest rate indices. Basis risk arises from the imperfect correlation in the adjustment of the rates earned and paid on different interest rate-sensitive instruments with otherwise similar rate change characteristics. The Bank has identified three main types of basis risks to which it is exposed: 1) Cross currency basis risk (CCBR); 2) Tenor basis risk (TBR) and 3) Funding spread risk (FSR). Cross Currency Basis Risk Cross currency basis risk is the risk due to currency mismatches (in terms of volume and/or maturity) between the Bank’s funding and lending activities. The cross-currency basis indicates the amount by which the interest paid to borrow one currency by swapping it against another differs from the cost of directly borrowing this currency in the cash market. Management, monitoring and reporting of CCBR The Bank measures, manages and reports CCBR for its major currencies69 in terms of BPV sensitivity and stress scenarios: CCBR BPV sensitivity: measures the change in the NPV of interest rate sensitive instruments/portfolios due to a 1 basis point increase in the CCY/EUR basis spread. The EIB’s operational CCBR exposure by maturity ranges and currency is monitored and managed on a daily basis, within pre-approved limits, by the Treasury (1st LoD) and reported to the ALM division in GR&C-RM (2nd LoD). The ALM division in GR&C-RM is monitoring that the 69 The residual exposure from minor currencies is currently not material and thus outside the scope of the CCBR. Moreover, those lending operations are normally in a “synthetic format”, that is, denominated in local currency, but settled in hard currency (usually EUR or USD). However, and outside the CCBR framework, that exposure is monitored regularly to ensure it remains immaterial from an IRRBB perspective.
108 | EIB Group Risk Management Disclosure Report 2022 exposure stays within the pre-approved limits in the context of the operational ALM activities and validating the CCBR exposure on a weekly basis. The Bank applies a portfolio-based management approach for CCBR. Hedging of the CCBR is usually done by means of entering into cross currency swaps, which are financial products that swap principal and interest payments in two different currencies, allowing for the transformation of the exposure on one currency into the swapped one. Stress scenarios: the Bank performs CCBR stress tests on a monthly basis to understand their impact on the EVE. It considers the following internally developed stress scenarios for each CCY in scope: parallel monthly and annual shifts; monthly and annual per tenor shifts; historical extremes with shocks being determined dynamically at tenor level. Ad-hoc analyses are performed in order to assess the impact on the CCBR exposures arising from new products and structures, or from new market developments. Tenor Basis Risk The Bank’s exposure to TBR arises from floating rate instruments priced with different interest rate indices. This exposure is originated from all main asset and liability classes present in the Bank’s balance sheet: lending (assets), funding (liabilities), hedging (derivatives) and treasury (securities). The activity on both sides of the balance sheet might be asymmetrical in terms of underlying interest rate indices, leading to mismatches and therefore exposing the Bank to the volatility of the spread between different indices. Management, monitoring and reporting of TBR The EIB measures, manages and reports TBR in terms of BPV sensitivity and stress scenarios: TBR BPV sensitivity: the change in the NPV of interest rate-sensitive instruments/portfolios due to a 1 basis point increase in the tenor basis spread, measured as the spread between the different local indices swap curves (for example, Euribor 3-month swap curve vs. Euribor 6-month swap curve). The EIB’s operational TBR exposure by maturity ranges and currency is monitored and managed on a daily basis, within pre-approved limits, by the Treasury (1st LoD) and reported to the ALM division in GR&C-RM (2nd LoD). The ALM division in GR&C-RM is monitoring that the exposure stays within the pre-approved limits in the context of the operational ALM activities and validates the TBR exposure on a weekly basis. The EIB applies a portfolio-based management approach for TBR. Hedging of TBR is usually done by means of entering into tenor basis swaps, which are financial products that exchange one floating index for another. Stress scenarios: the Bank performs TBR stress tests on a monthly basis to assess the impact on its EVE. It considers the following internally developed stress scenarios: parallel monthly and annual shifts monthly and annual per tenor shifts historical extremes with shocks being determined dynamically at tenor level. Ad-hoc analyses are performed in order to assess the impact on the interest rate risk exposures arising from new products and structures, or from new market developments. Funding Spread Risk Funding spread risk refers to the risk to the economic value or to the net interest income arising from movements in the funding spread of the Bank. Funding spread risk may arise due to the divergence between the funding rate of the EIB (the market reference rate plus the funding margin/spread) and the market reference rate itself70. This relationship may not be stable over time, that is, the funding margin might increase or decrease. The EIB’s exposure to funding spread risk originates from its core activities (lending and funding) and primarily stems from financing maturity mismatches between its assets and liabilities. 70 See BCBS 368.
Interest rate risk in the banking book | 109 Management, monitoring and reporting of FSR The Bank’s current interest rate risk and funding strategies do not incorporate any formal requirement or limit with regard to the management of the funding spread risk. Being derived from the evolution of the Bank’s own credit quality, the risk cannot be directly hedged with third parties. The funding spread risk is mitigated by setting on a semi-annual basis a target funding maturity profile that keeps the maturity transformation between new lending and funding the future refinancing risk) under control. Another mitigant comes from the loan rate setting policy which ensures the transfer of the Bank’s funding spreads to its borrowers. The Bank performs Funding Spread Risk stress tests to assess the impact on the EVE (monthly) and on the NII (yearly). It also simulates an adverse scenario of an increasing Bank’s funding spread, due to a rating downgrade of 3 notches. 11.3 Option risk Option risk is defined as the risk arising from options (embedded and explicit), where the institution or its customer can alter the level and timing of their cash flows, namely the risk arising from interest rate sensitive instruments where the holders will almost certainly exercise the option if it is in their financial interest to do so (embedded or explicit automatic options) and the risk arising from flexibility embedded implicitly or within the terms of interest rate sensitive instruments, such that changes in interest rates may affect a change in the behaviour of the client (embedded behavioural option risk). Option risk can be broken down into two distinct sub-types: Automatic option risk: it arises from standalone instruments, such as option contracts (caps, floors, etc.), or is explicitly embedded within the contractual terms of a financial instrument (i.e. a capped or floored rate loan). Behavioural option risk: it arises from the flexibility embedded implicitly or within the terms of financial contracts. For instance, changes in interest rates may affect a change in the behaviour of the client (e.g. right to prepay a loan or to withdraw a deposit). As for the Bank’s exposure to option risk, contractual options are hedged back-to-back, apart from embedded zero floors on floating rate loans which can only generate a positive contribution to the Bank’s P&L (namely when rates are negative). Finally, risk arising from the prepayment options on loans is mitigated via individual (for fixed rate loans) or portfolio-based (for floating rate loans) recovery mechanisms.
110 | EIB Group Risk Management Disclosure Report 2022 12 Operational risk Introduction Operational risk means the risk of loss resulting from inadequate or failed internal processes, people and systems or from external events71. In line with regulatory guidance 72 and the EIB Group’s internal non-financial risk classification, operational risk covers the following risk categories: Operational Risk Types Level I People Technology Third Party Fraud Conduct Information Security (including Cyber) Physical Security and Safety Legal Statutory Reporting and Tax Business Continuity Financial Crime Data Management Transaction Processing and Execution Regulatory Compliance Model Together with climate and environmental, reputational and strategic risks, operational risk is one of the main constituents of non-financial risk. All EIB Group activities may be affected by operational risk and therefore the Group aims to systematically identify, assess, monitor and report operational risks on a regular basis, and ensure that sufficient controls and risk mitigants are in place to limit the exposure to the risk. While the management of day-to-day operational risk exposure is, as a matter of principle, the responsibility of everyone in all Group entities, the definition of general standards and the implementation of an integrated Operational Risk Management Framework shall be coordinated by dedicated and independent73 Operational Risk Management function(s) within the EIB and the EIF: At the EIB, the Operational Risk mandate and its implementation is under the responsibility of the Operational Risk function, within the Non-Financial Risk Department of GR&C-OCCO. At the EIF, the Operational Risk mandate and its implementation is fulfilled by the Operational Risk Management function, within the Corporate Risk Division. The EIB Group Operational Risk Policy is a key component of the Operational Risk Management Framework. The purpose of the policy is to define the objectives, general principles and framework components to be applied in the Operational Risk Management functions in the EIB Group. The high- level EIB Group document is further complemented by the EIB Group Event Reporting Procedure and other more granular process guidelines and procedures developed separately for the EIB and the EIF. EIB Group’s Operational Risk Management Framework The EIB Group Operational Risk Management Framework (ORMF), described in the EIB Group Operational Risk Policy, covers four main components: Governance, Risk Appetite, Risk Management Process and Capital Management. Governance In line with BBP Guiding Principles, the management of operational risks operates within the three lines of defence model. The business lines as the first LoD take risks and are responsible for the day-to-day management of such risks directly and on a permanent basis. The Operational Risk function (within the GR&C-OCCO Directorate) as the second LoD is responsible for the implementation of the sound ORMF. The independent Internal Audit as the third LoD provides assurance to the relevant governing bodies of the appropriateness and 71 72 73 The definition of external events excludes cases of client bankruptcy or unfavourable market movements or similar events, which represent triggers for credit and market risk, respectively. In line with Basel III’s definition of Operational Risk as detailed in “Revisions to the Principles for the Sound Management of Operational Risk” of March 2021 and the EBA’s definition of Operational Risk published on the EBA website. In line with EBA’s Guidelines on Internal Governance and BCBS’s Principles for Sound Operational Risk Management, independence refers to the Operational Risk function having a reporting structure independent of the risk generating business lines and being responsible for the design, maintenance and ongoing development of the operational risk framework.
Operational risk | 111 efficient implementation of the ORMF. Its responsibilities include independently verifying that the ORMF has been adequately designed and implemented by both the first and second lines of defence. Operational risk appetite The EIB Group strives to minimise the risk of losses related to operational failure through the establishment and development of a strong ORMF to provide a systematic and integrated approach to the management of operational risk. However, recognising that expected and unexpected losses can occur, the Group defines a certain level of risk appetite and a set of monitoring tools and processes, which together define the Risk Appetite Framework for operational risk. In addition, both the EIB and the EIF put policies, procedures and systems in place in order to minimise operational risk losses and remain within the Operational Risk Appetite levels. The EIB Group’s risk appetite for operational risk is articulated in the Group Risk Appetite Statement document, which communicates to management, the governing bodies of all Group entities, employees and other key stakeholders the risk profile the Group is willing to assume in the pursuit of its activities. Risk management process The ORMF and its implementation are supported by a set of processes and tools, namely: Risk identification Risk identification is the process whereby operational risks are recognised and classified in line with the EIB Group’s risk inventory for operational risk and where the risk sources in all business activities and risk drivers (employees, process failure, external, systems) are linked to Operational Risk Events and to their consequences. All identified risks have an agreed risk owner at the business level who is responsible for assessing, monitoring and managing the risk. All identified risks are categorised in line with the Group’s risk classification and documented accordingly. The risk identification process within the EIB Group is backed by a set of activities, among which the most prominent being: Risk and control identification and assessment, as part of the Internal Control Framework74; Group Compliance risk assessment75; Root cause analysis and backtesting of Operational Risk Events; Analysis of new products carried out by the New Product Committee (“NPC”) (for the EIB) and the Product and Mandate Committee (“PMC”) (for the EIF); Annual risk identification process, across all risk types. Risk assessment Risk assessment is used to assess and quantify the EIB Group’s operational risks and to ensure that the appropriate means and resources can be identified and allocated to the management of these risks. Risk assessment also serves to determine the appropriate capital requirements for operational risk. The objectives of the risk assessment process in the EIB Group can be summarised as follows: To provide detailed and updated information on operational risk in relation to the key business processes of the Group; To provide senior management with an overall picture of the Group's operational risk exposure and risk/control framework; To align the Group’s operational risk profile to its operational Risk Appetite; To align the Group’s operational risk management to BBP and best market practices. The main component of the Operational Risk assessment within the Group is the risk and control assessment, the process managed by the Internal Control Assertions division within the Financial Control Directorate together with other relevant second lines within the EIB and the Internal Control function at the EIF and governed by the EIB’s Internal Control Framework Policy and the EIF’s Internal Control Framework Policy, respectively. 74 75 Process owned and managed by the Internal Control Assertions division within the Financial Control Directorate in the EIB, and the Compliance function within the EIF’s Risk Management Department. Process owned and managed by GR&C-OCCO.
112 | EIB Group Risk Management Disclosure Report 2022 The EIB Internal Control Framework (‘ICF’) materialises the regular actions implemented by the Bank’s management to (i) identify risks generated by activities under their responsibility (inherent and residual risks), (ii) design adequate controls to cover these, and (iii) be in a position to report thereon. The ICF covers all processes implemented in the Bank. On that basis, the Bank’s senior management issues yearly internal control assurance declarations to the EIB President and the AC. The ICF’s definition, review and maintenance are administered in line with the EIB ICF Policy approved by the Board of Directors. ICF policy oversight actions are implemented by the ICF Control function (‘ICFC’), which is the second line of defence function. Similarly to the EIB, the EIF has implemented several processes to manage and monitor operational risks, including the EIF Risk and Control Matrix. The Risk Control Matrix identifies the main risks for the EIF inherent to each process or activity, including: a rating of the inherent risk (gross risk), the existing key controls mitigating that risk, and a rating of the residual risk (net risk). For each identified risk, the rating of the inherent risk is based on: its potential financial and reputational impact; and its estimated likelihood, based on the frequency of the underlying process and the intrinsic complexity/instability of the assessed process. Another important component of the risk assessment process is the qualitative and quantitative assessment of forward-looking operational risk scenarios. Risk mitigation Risk mitigation activities are designed and implemented in the EIB Group to address and control risks. Risks that cannot be controlled adequately by the Group are addressed to senior management/governing bodies in order to establish whether to accept or to withdraw from the activities generating these risks. Risk mitigation activities are an integral part of the regular activities of the Group and involve all organisational and hierarchical levels in order to be effective. Effective mitigation includes processes on the basis of the following process frameworks: The EIB Group rules, codes and policies as listed under the sub-section “Regulatory compliance, financial crime and conduct risks”; Segregation of duties between the three lines of defence; New product approval process; Sound Internal Control Framework; Independent risk management and compliance; Accounting, record-keeping, valuation, safeguarding and information systems controls; Independent internal and external audit functions; Insurance policies. The Group has policies, guidelines and procedures to control and mitigate operational risk. The Group assesses the costs and benefits of alternative risk limitation and control strategies and adjusts its operational risk exposure accordingly and in line with its Risk Appetite. As part of the risk mitigation process, the Operational Risk Management function ensures the close monitoring of mitigation actions stemming from Operational Risk Events. Risk monitoring and reporting Operational risk monitoring involves all Services of the EIB Group: Services undertake a regular review of their risk profile in line with a defined level of risk and a related risk review schedule. Key Risk Indicators, as defined by Services in collaboration with the Operational Risk Management function, are used to monitor on a regular basis the operational risk exposures with respect to their related risk appetite, with appropriate actions taken when risk levels are breached. Operational Risk Events are reported by the Services and collected, reviewed and analysed on a regular basis by the Operational Risk Management function in order to identify the actual exposure to operational risk. This should ensure that root causes are understood, and that any lessons learned from Operational Risk Events are used to improve the controls. All issues and actions relating to Operational Risk Events and out- of-appetite operational risks are tracked and monitored by the Operational Risk Management function on a regular basis to ensure timely remediation.
Operational risk | 113 The EIB’s Operational Risk function has established a comprehensive Group operational risk reporting framework.Critical operational risk events, key risk indicators, and operational risk capital are reported in the EIB Group Risk Report. The EIB Group also produces a quarterly Operational Risk Report, which includes statistics on operational risk events, root causes trends, mitigating actions and End User Computing tools compliance. The EIB’s risk-control self-assessment and control testing results are reported to the senior management and the AC by the ICF Control function. The EIF's Compliance function produces the ICF report and coordinates the ISAE-3402 report (assessment of key controls-related mandate activities), as well as specific contributions to broader reports as relevant. The following sections provide further details on some categories of operational risk at the EIBG. Information security (including cyber) ICT risk is defined as the risk of loss due to the inappropriateness or unavailability of systems and data or the inability to change information technology (IT) within a reasonable time and at reasonable cost when the environment or business requirements change (agility). This includes risks resulting from inadequate or failed internal systems. Security risk is the risk of incurring losses due to a breach of confidentiality, loss of integrity or unavailability of systems and data due to information security incidents. This includes risks resulting from external events including cyber-attacks or inadequate physical security. ICT risk and data security are considered to be among the top operational risks in the industry. In response to the increasing complexity and intensity of external threats, and in view of the reliance of the Group’s operations on information technology, the Group is constantly reinforcing both its technical defences (IT Security) and procedural and people capabilities (Information Security), and will continue to do so in line with best banking practice. On the Information Security side, the Group is focused on increasing user awareness of ICT threats and is addressing this need through various events, communication campaigns, risk assessments and training programmes. The EIB’s IT Security function as a first line of defence is responsible for deploying technical and operating measures to protect the security of computer systems, networks and other technology assets hosted on the EIB Group premises. Information Security acts as a second line of defence and provides oversight of activities performed by the first line of defence, cyber-security awareness training and various critical compliance tasks (SWIFT Customer Security Programme and TARGET2). To protect information consistently, an information classification scheme is in place, and users are informed of associated best practices with regard to data leakage, prevention of malware and general sound information management. This scheme enables the Group to embed good information handling/processing processes in all that it does so that it is clear to everyone with access to know how best to protect it from unauthorised disclosure, alteration or destruction, dissemination or loss. These security efforts are intended to protect against attacks by unauthorised parties to obtain access to confidential information, destroy data, disrupt service, sabotage systems or cause other damage. The Group continues to enhance its cyberdefence capabilities and strengthen its partnerships with the appropriate agencies, such as CERT-EU, in order to address the full spectrum of ICT security risks in its operating environment, enhance defences and improve resiliency against these threats. Third parties with which the Group does business or that facilitate the Group’s business activities could also be sources of ICT risk to the Group. Third-party ICT risk incidents such as system breakdowns or failures, misconduct by the employees of such parties, or attacks could affect their ability to deliver a product or service to the Bank or result in lost or compromised information. To protect the confidentiality, integrity and availability of the Group’s infrastructure, resources and information, the Group ensures that risks are identified and managed. Regulation EU 2018/1725 (repealing Regulation (EC) No 45/2001 and Decision No 1247/2002/EC) of the European Parliament and of the Council of 23 October 2018 on the protection of natural persons with regard to the processing of personal data by the European Union’s institutions, bodies, offices and agencies, and on the free movement of such data, has now been in force since autumn 2018. The designated Data Protection Officers (‘DPO’) at both the EIB and the EIF ensure that the responsible controllers and processors of personal data are informed about their responsibilities and duties, and provide advice to the organisation and to staff members on all matters related to the implementation of the Regulation. The DPOs also act as the contact point of the EIB and the EIF with the European Data Protection Supervisor (‘EDPS’).
114 | EIB Group Risk Management Disclosure Report 2022 Model risk Model risk refers to the potential loss an institution may incur as a consequence of decisions that could be principally based on the output of internal models, due to errors in the development, implementation or use of such models. Model risk can stem from all models used in the EIB Group. The relevant responsibilities, the process and the guiding principles to be followed as well as the documentation to be produced in order to minimise the model risk are currently governed by the EIB Group Model Risk Management Policy, the EIB’s model validation policy and the EIF’s Model Management Governance Framework, respectively. The Group Model Risk Management Policy delegates oversight on model risk management across the EIB Group to a Model Risk Committee (MRC), chaired by the GCRO. The policy establishes a Model Risk Management function (MRM function), responsible for the roll-out, maintenance and ongoing day-to-day activities of the model risk management framework. Models are part of an Inventory of Models, maintained by the Model Validation function exercised by the EIB Group Model Validation division within GR&C. Model validation refers to the set of processes and activities intended to minimise model risk by verifying that the models are performing as expected, in line with their objectives and business uses. As in other areas of risk, the Group follows the three lines of defence approach in model risk management. Accordingly, the first line of defence responsibility is assigned to the model owner. The model owner is defined as the unit(s) responsible for development, operation and maintenance of the model/estimate under consideration. The owner(s) of each model is/(are) identified in the Inventory of Models. The second line of defence role is fulfilled by the GR&C Model Validation function, which acts as a control and advisory function via independent assessment of the models, estimates and related processes developed by other units within the EIB Group. To achieve its goals, GR&C Model Validation follows the appropriate validation methodologies and the validation process. It is also responsible for producing detailed methodological guidelines for the validation of individual models. Lastly, Internal Audit intervenes as the third line of defence in model risk management and bears the responsibility for assessing whether the first and second lines of defence can fulfil their roles adequately. Credit risk models, encompassing Basel II/III Pillar 1, Pillar 2 models and other models in the area of liquidity, interest rate risk, ALM and derivatives together with their processes, data and IT implementation, are subject to regular validation in line with the model validation policy. Validation activities of models are overseen by specific committees (IRMMC, ALCO and DSMC respectively) or the MRC. The Bank has implemented a tiering methodology for the allocation of models to different tiers based on their use and materiality. While the Tier 1 models (and model changes) are approved by a corresponding committee, the other models (Tier 2 and Tier 3) need to be approved by the Director(s) of the directorates that were identified as model stakeholders. Regulatory compliance, financial crime and conduct risks Compliance is ensured by independent functions under the responsibility of the EIB and the EIF Heads of Compliance. While the GCRO oversees compliance at the EIB Group level, both functions have direct access to their respective relevant governing bodies. The Group Chief Compliance Officer (GCCO, heading EIB Compliance) has responsibility for all non-financial risks within the remit of the GCRO, thus it oversees non-financial risks at Group level, in consultation with the EIF and under the oversight of the GCRO.
Operational risk | 115 The independent Compliance functions are responsible for the ongoing monitoring and oversight of: Regulatory compliance risk: the risk of legal or regulatory sanctions, financial loss, or loss to reputation a member of the EIB Group may suffer as a result of his/her failure to comply with all applicable laws, regulations, staff codes of conduct and standards of good practice76; Conduct risk: the current or prospective risk of financial loss, or loss to reputation to the EIB Group arising from cases of misconduct or inadequate rules on ethics and integrity other than prohibited conduct of a member of the EIBG; Financial crime risk: Risk arising from money laundering and terrorism financing, sanctions violation, breach of NCJ policy. In order to identify, assess, monitor, control, mitigate and report these non-financial risks, a number of policies, procedures and/or initiatives are in place at Group level, including: Group Compliance Risk Assessment (annual exercise) and for the EIB the Compliance Monitoring Programme (CMP) with an annual CMP review plan; Integrity Policy and Compliance Charter; EIB Group Staff Code of Conduct; EIB Group Whistleblowing Policy; EIB Group Data Protection Policy; EIB Group Anti-Fraud Policy; EIB Group Dignity at Work Policy; EIB Group Staff Conflicts of Interest Policy; EIB Management Committee and EIF CE/DCE Code of Conduct; Code of Conduct for the members of the Board of Directors of the EIB/EIF; Code of Conduct for the members of the Audit Committee of the EIB/Audit Board of the EIF; Staff Regulations; Staff Rules; EIB Group AML-CFT Policy; EIB Group policy towards weakly regulated, non-transparent and non-cooperative jurisdictions and tax good governance; EIB Group Market Abuse Policy; EIB Group Sanctions Compliance Policy; Internal procedures of the Compliance function that are leverage ratio-related. Anti-money laundering and combating the financing of terrorism risks are reported on a regular basis to the MC, the AC and the EIB Board Working Group on tax and compliance. Cases of suspected money laundering and financing of terrorism are reported by each of the EIB and the EIF to the Luxembourg financial intelligence unit. The EIB Group Compliance Activity Report provides further details on the topics above and is available on the Bank’s website. Fraud risk Fraud risk is the current or prospective risk of losses to the EIBG arising from cases of fraud or other prohibited conduct. The EIB Group Anti-Fraud Policy (AFP) sets forth the policy in preventing and deterring fraud and other prohibited conduct in the Group’s activities and applies to all members of governing bodies and staff. The AFP assigns a key role in addressing fraud and other forms of prohibited conduct to the Inspectorate General, Fraud Investigations division (IG/IN), which not only has the sole mandate to investigate, but also a significant role in prevention and detection of fraud, including the assessment of fraud risk and its deterrence. All Group staff have the duty to report any suspicion of fraud promptly to IG/IN for assessment. Allegations concerning money laundering and financing of terrorism are investigated by IG/IN in close cooperation with EIB OCCO/EIF Compliance. 76 The EIB Compliance function (GR&C-OCCO) oversees, among others, the EIB’s compliance with various regulations which apply to the financial sector in general and which constitute BBP in GR&C-OCCO’s remit.
116 | EIB Group Risk Management Disclosure Report 2022 Fraud investigations conducted by IG/IN are reported on a quarterly basis to the MC, the EIF Chief Executive, the AC and the Audit Board of, respectively, the EIB and the EIF, the European Public Prosecutor’s Office (EPPO) and the European Anti-Fraud Office (OLAF). The Group issues an annual report on its anti-fraud activities, which is available on its website. Operational risk capital requirements measurement Since 2019, the EIB Group has decided to adopt early the standardised approach (‘SA’) as determined by Basel III standards to replace the Advanced Measurement Approach (AMA)77. Operational risk RWEA are calculated annually, as per market practice, based on the EIBG’s audited consolidated financial statements. The SA includes three main components further detailed in the templates OR1 to OR3 below: the Business Indicator (BI) which is a financial statements based proxy for operational risk and comprises three components: the interest, leases and dividend component (ILDC); the services component (SC), and the financial component (FC); the Business Indicator Component (BIC), which is calculated by multiplying the BI by a set of regulatory determined marginal coefficients; and the Internal Loss Multiplier (ILM), which is a scaling factor that is based on a bank’s average historical losses and the BIC. 77 Following the publication of the “Basel III: Finalising post crisis reforms” in December 2017, the standardised approach replaced all approaches used to calculate operational risk RWEA existing in the Basel II framework from January 2023. The standardised approach to Operational Risk is intended to be implemented in the European Union from January 2025 with the entry into force of new amendments to the CRR.

Operational risk | 117 The below templates have been prepared in line with the future disclosure requirements as set out in the version effective as at 1 January 2023 of the BCBS DIS60 document. Template OR1: Historical losses The template displays aggregate operational losses incurred over the past seven years used in the calculation of operational risk capital charge according to different thresholds. Amounts are in EUR, unless otherwise indicated a b c d e f g h 2022 2021 2020 2019 2018 2017 2016 7-year average Using €20,000 threshold 1 Total amount of operational losses net of recoveries (no exclusions) 822,033 37,704,203 737,218 601,575 3,849,893 1,557,356 1,713,522 6,712,257 2 Total number of operational risk losses 1 8 5 6 8 5 8 6 3 Total amount of excluded operational risk losses - - - - - - - - 4 Total number of exclusions - - - - - - - - 5 Total amount of operational losses net of recoveries and net of excluded losses 822,033 37,704,203 737,218 601,575 3,849,893 1,557,356 1,713,522 6,712,257 Using €100,000 threshold 6 Total amount of operational losses net of recoveries (no exclusions) 822,033 37,530,496 721,259 466,469 3,683,682 1,545,355 1,560,222 6,618,503 7 Total number of operational risk losses 1 4 2 2 5 3 5 3 8 Total amount of excluded operational risk losses - - - - - - - - 9 Total number of exclusions - - - - - - - - 10 Total amount of operational losses net of recoveries and net of excluded losses 822,033 37,530,496 721,259 466,469 3,683,682 1,545,355 1,560,222 6,618,503 Details of operational risk capital calculation 11 Are losses used to calculate the ILM (yes/no)? Yes 12 If “no” in row 11, is the exclusion of internal loss data due to non-compliance with the minimum loss data standards (yes/no)? n/a 13 Loss event threshold: €20,000 or €100,000 for the operational risk capital calculation if applicable 20,000

118 | EIB Group Risk Management Disclosure Report 2022 Template OR2: Business Indicator and subcomponents This template displays the Business Indicator and its subcomponents. The Business Indicator is a proxy of operational risk based on the consolidated P&L of the institution, which is incorporated in the calculation of operational risk capital charge. Amounts are in EUR million, unless otherwise indicated 2022 2021 2020 a b c BI and its subcomponents T T-1 T-2 1 Interest, lease and dividend component 3,677 - - 1a Interest and lease income 18,684 16,474 18,049 1b Interest and lease expense 15,697 13,285 14,981 1c Interest earning assets 527,590 549,642 537,640 1d Dividend income 672 839 275 2 Service component 779 - - 2a Fee and commission income 670 574 485 2b Fee and commission expense 383 434 328 2c Other operating income 10 -1 5 2d Other operating expense 241 191 178 3 Financial component 92 - - 3a Net P&L on the trading book - - - 3b Net P&L on the banking book -47 52 -177 4 BI 4,548 - - 5 Business indicator component (BIC) 652 - - 6a BI gross of excluded divested activities - 6b Reduction in BI due to excluded divested activities 4,548 Template OR3: Minimum required operational risk capital This template provides details on the calculation of the capital charge for operational risk. One can see from the template below that the Internal Loss Multiplier of the EIBG is below 1 because historical losses are low compared to the Business Indicator Component, resulting into a lower capital charge for operational risk for the EIBG. Amounts are in EUR million, unless otherwise indicated a 31.12.2022 31.12.2021 1 Business indicator component (BIC) 652 624 2 Internal loss multiplier (ILM) 66% 62% 3 Minimum required operational risk capital (ORC) 433 386 4 Operational risk RWEA 5,414 4,819
Other risks | 119 Other risks Pension and health insurance risks Introduction Pension and health insurance risks are defined as the risks of losses due to the volatility of the Group’s pension and health insurance Defined Benefits Obligations (DBO). The EIB and EIF pension schemes are defined-benefit schemes financed by contributions from staff and the EIB/EIF. Their characteristics are presented in Notes A 2.11 and L of the EIB Group consolidated financial statements under EU-AD. The Group does not have segregated pension assets, it is therefore not exposed to pension fund related investment risk and does not have to deduct any (net) pension assets from its own funds as provided for by Article 41 of the CRR. Pension and health insurance risks stem primarily from a potential increase of the Group’s DBO under adverse conditions. Management, monitoring and reporting At the EIB’s level, the pensions are managed by the EIB’s Pension Scheme Regulations while the Health Insurance Scheme is managed by the EIB’s Staff Rules. Corresponding procedures exist as well at EIF level. Both the EIB and the EIF have Pension Boards, which provide oversight of the pension schemes and are responsible for implementing the provisions governing the schemes. The Pension Boards also ensure consistent and systematic adherence to actuarial principles. The Pension Boards also issue an annual report setting out the main developments in the EIB’s and the EIF’s pension schemes, along with a summary of the work carried out by the Boards and an update of key financial and actuarial data. The EIB and EIF Pensions Boards receive an annual report from the external actuary on the status of the pension scheme which includes a sensitivity analysis of the main factors impacting pensions, namely discount rate changes, increases in salary, inflation, life expectancy and healthcare costs. The results of the risk sensitivity analysis performed by the external actuary are provided in Note L of the consolidated financial statements under EU-AD. The EIB’s and the EIF’s Health Insurance Schemes are administered with a view to balancing benefits and contributions. The Health Insurance Scheme Committee examines the financial situation of the Health Insurance Scheme each year and draws up a report that is submitted to the MC. An actuarial valuation of the Health Insurance Scheme obligations is performed once a year. The EIB’s and the EIF’s exposure to actuarial risks is appraised in line with the respective accounting standards, which value the accrued benefits, by reference to their projected amount at the date of payment. Contribution levels are reviewed periodically to reflect the evolution of actuarial parameters (interest rate, inflation, longevity, salary increase, healthcare cost, etc.) and minimise the risk of future deficits. The interest rate risk arising from the EIB’s pension and health insurance obligations is managed within the EIB’s overall interest rate exposure as those long-term obligations form an integral part of the liabilities of the EIB’s balance sheet. The EIB capitalises for the interest rate risk related to pension liabilities under Pillar 2. The EIF does not actively manage the interest rate exposure arising from its pension and health insurance obligations. However the EIF’s DBO exposure to interest rate risk is capitalised under Pillar 2. Although salary increase, inflation, longevity and healthcare cost risks are not hedged for both the EIB and the EIF, those risks are also capitalised under Pillar 2 by both the EIB and the EIF. Reputational and strategic risks Reputational risk is the risk that arises from negative perception on the part of customers, counterparties, shareholders, investors, debt-holders, market analysts, other relevant parties or regulators that can adversely affect an institution’s ability to maintain existing or establish new business relationships and continued access to sources of funding.

120 | EIB Group Risk Management Disclosure Report 2022 Reputational risk assessment is an inherent part of the operational risk assessment and monitoring as outlined in Section 12 above with the Group policies and procedures mentioned in the operational risk section contributing to its effective management. Strategic risk is the risk that a sub-optimal contribution to achieve the EIB Group’s policy mission supporting EU policy objectives could indirectly through decreasing shareholder or stakeholder support affect the long -term financial sustainability of the EIB or the EIF. Strategic risk could be affected by inadequate strategic decisions, a failure to execute strategy or a lack of effective response to changes in the economic, political and business environment. Despite being policy-driven institutions (EU policy and policy goals), both the EIB and the EIF are exposed to strategic risk. The EIB’s strategy implementation is manifested through its EIB Group Operational Plan (OP), whose elaboration process is based on close interaction between the Group Strategy Department and all relevant services. Additionally, the Group OP is updated annually and reviewed semi-annually by the Board of Directors. 13.3 Climate, environmental and social risk The EIBG has made sustainability, in its climate, environmental and social dimensions, one of its key goals and priorities. On the climate side, the Climate Strategy guides the EIB’s medium to long-term actions within and outside the European Union to support the objectives of the EU in the fight against climate change and define where the Bank shall focus its actions. In supporting the transition to a low carbon, climate resilient and sustainable economy, the Group wants moreover to ensure that no people or places are left behind. The EIBG Environmental and Social Sustainability Framework, comprises the EIBG Environmental and Social Policy, the EIB Environmental and Social Standards and the EIF’s ESG Principles. The Policy lays out the Group’s vision up to 2030 towards achieving sustainable development, inclusive growth and the respect of human rights. A number of concrete steps and commitments have already been taken by the EIBG towards the achievement of its sustainability goals, notably: Since 2021, the EIBG has aligned all its new operations with the principles and goals of the Paris Agreement; The EIBG will support EUR 1 trillion of investment in climate action and environmental sustainability between 2021 and 2030; The EIB will gradually raise the share of its annual climate action and environmental sustainability financing to at least 50% by 2025 and beyond; The EIB will increase its support to climate adaptation to reach 15% of the Bank’s climate action financing by 2025; The Group is also committed to reducing its internal carbon footprint (scope 1, scope 2 and scope 3 absolute emissions) by approximately 12% by 2025 relative to 2018. The Climate Bank Roadmap outlines in further detail how the Group plans to deliver these ambitions, and continue to play a leading role in the fight against climate change while ensuring a just transition for all78. The recently approved EIB Environment Framework builds on the Climate Bank Roadmap with a focus on the environmental sustainability dimensions. The document, also available on the EIB website, consolidates the EIB’s efforts and activities in the area of environmental sustainability. Governance In line with the objectives put forward by the EIB Climate Strategy and EIBG Climate Bank Roadmap, climate action and environmental sustainability are increasingly integrated throughout the Group’s governance framework. The implementation of the Climate Bank Roadmap is overseen by the Climate and Environmental Steering Committee (C&E Steering Committee). The Committee, which meets every quarter, is composed of the Bank’s Directors General and the EIF’s Chief Executive and Deputy Chief Executive and chaired by a member of the MC. The Climate and Environment Advisory Council complements the C&E Steering Committee in providing 78 Progress of the EIBG in delivering the commitments made under the Climate Bank Roadmap is reported in annual EIBG Climate Bank Roadmap Progress Reports.
Other risks | 121 independent advice and expertise on the activities that the EIBG is carrying out to reach its climate action and environmental sustainability ambitions. In addition, a Climate and Environment Coordination Committee brings together all relevant departments across the Group to ensure the coordination of various climate and environment-related work streams and to promote knowledge sharing. The committee meets regularly to discuss key topics. Further details on the climate and environmental governance framework are available in the “Governance” Section of the TCFD report. EIBG targets for 2023 The Management Committee and EIB Board of Directors are in charge of setting the short- to medium-term targets related to climate action and environmental sustainability for the Group. In the Operational Plan approved by the BoD on 14 December 2022, the Group aims that new operations contributing to Climate Action and Environmental Sustainability (CA&ES) and Economic and Social Cohesion and Convergence would reach respectively around 39% and 42% of 2023 new signature volumes. More information on how the EIBG defines and monitors its short-term operational objectives can be found in the EIBG Operational Plan79. The short-term targets of the Group are integrated into the remuneration framework of the EIB and the EIF. The two institutions’ performance in terms of new signatures contributing to the CA&ES and Economic and Social Cohesion and Convergence policy goals are linked to the variable component of the EIBG’s staff remuneration. Policies The EIBG has several policies and procedures in place to support its sustainability objectives and mitigate associated risks. The Environmental and Social Sustainability Framework, recently updated following a public consultation in 2021, governs the assessment and management of climate, environmental and social impacts and risks throughout financed operations. The Environmental and Social Policy is guided by the general principles of EU environmental law enshrined in the EU Treaties, by the Charter of Fundamental Rights of the European Union and by the fundamental rights and freedoms recognised by the European Convention on Human Rights, as well as the principles of the Universal Declaration of Human Rights and the EU Global Human Rights Sanctions Regime. In line with its Environmental and Social Policy, the Group only supports operations that respect human rights and do not significantly harm the environment nor impinge on the sustainable use of natural and living resources80. The EIB’s Environmental and Social Standards further outline the responsibilities of counterparties with regard to the process of assessing the potential environmental, climate and social risks of their activities. The Standards are organised around a set of 11 key areas further articulated in other thematic documents of the Bank 81 . The EIF applies specific policies and procedures, as summarised in the Environmental, Social and Governance (ESG) Principles published on the EIF’s website. At the level of operations, the EIB has an Eligibility, Excluded Activities and Excluded sectors list in place to ensure that projects unacceptable in climate and environment terms, or which result in limiting people’s individual rights and freedom or violating human rights cannot benefit from EIB financing. Annex 2 to the Climate Bank Roadmap further provides a framework for alignment of projects with the low carbon goals of the Paris Agreement, presenting activities that are supported or not supported by the EIB Group. Risk management framework As the EU Climate Bank, the EIBG is fully committed to establishing a comprehensive climate risk management framework for climate, environmental and social risks in line with the relevant regulatory requirements and statutes of the two entities of the Group. In terms of risk governance framework, the EIBG applies the three lines of defence system to the management of climate risk, similarly to other types of risk. 79 80 81 The EIF sets separate targets for itself which are reflected in the Group’s objectives. Further details can be found in the EIF Operational Plan. In line with paragraph 3.2(iii) of the Environmental and Social Policy. for example, the EIBG Strategy on Gender Equality and Women’s Economic Empowerment, and the EIB Strategic Approach to Fragility and Conflict.
122 | EIB Group Risk Management Disclosure Report 2022 From a prudential perspective, the Group considers that climate change and environmental risks may stem from both the negative financial impact of climate change on the Group and the impact of the Group on climate change in accordance with the classification provided by the European Commission in the Non-Financial Reporting Directive. As part of the negative impact of climate change on the Group, a distinction is made between transition and physical risks. Transition risks are the risks arising from the transition to a low-carbon, climate-resilient and more environmentally sustainable economy while physical risks are the risks linked to the physical effects of climate change, including more frequent extreme weather events and gradual changes in the climate. On the other hand, activities the Group finances may also have a negative impact on climate change through greenhouse gas emissions or contribute to the climate vulnerability of others. Detailed information on how the EIBG mitigates these two types of risk is provided in the “Risk identification and assessment” section below. Transmission channels Climate change may further affect the Group and its activities through different transmission channels and time horizons. Credit risk is expected to be one of the risk categories most affected by climate change while the impact of climate change on the Group’s market and liquidity risk is deemed relatively low in view of the policies put in place by the Group to mitigate this risk (PATH framework, Financial Risk Guidelines). From a non-financial risk perspective, the impact of climate change on the operational risk of the Bank is also deemed relatively low due to the limited exposure of the Group’s day-to-day operations to physical climate risk and the active monitoring of the related disruption risk. In addition, risks related to climate change can also materialise through reputational and strategic risks but these are also assessed and mitigated by the control processes, monitoring tools and other measures put in place by the Group. More details on the impact of climate change on the activities of the Group are provided in Section 2.3 of the TCFD report. Risk identification and assessment The EIBG has implemented several tools and processes to identify and monitor risks from climate change, environmental and social factors. At the level of projects, the EIB has established a strong sustainability due diligence process to ensure that all activities financed by the EIB are compliant with the relevant policies and overarching objectives of the Bank as well as in line with its risk appetite82. As part of this process, the Bank conducts an economic appraisal of all new projects to measure the costs and benefits to broader society generated by the project, taking into account the various resources used (human, technological or natural). The economic appraisal takes into account a number of environmental externalities such as net greenhouse gas emissions changes of the projects and local air pollutants. Moreover, the EIB introduced in 2019 the Climate Risk Assessment (CRA) system with the objective to identify and assess the physical climate risk of new projects. This system ensures the resilience of EIB operations to climate hazard and helps the EIB and its clients understand how climate change may affect their projects. It contributes to identifying adaptation measures necessary to secure a good performance by the project and protect investments from the threats brought about by climate change. Projects are also screened during the appraisal process for environmental and social risks using different risk assessment tools and methodologies. In the near term, the current systems will become part of an integrated climate, environment and social risk assessment system. At the EIF, the ESG due diligence is essentially conducted through a dedicated questionnaire and an adverse media screening of counterparties to identify companies potentially associated with an ESG incident. The ESG assessment includes the evaluation of the financial intermediaries’ policies, processes and systems to ensure that they adequately factor in sustainability impacts and risks in their investment decisions. The aim is to evaluate the ESG risk profile of the financial intermediaries, including their reputational risk exposure to ESG issues, at the time of the commitments and during the lifetime of the investments. Other elements of the EIF policy framework also indirectly contribute to identification, assessment and, where required, mitigation of ESG-related risks. 82 In 2022, the EIBG enhanced its RAF by expanding the definition of Climate and Environmental Risk as a transversal category with both financial and non-financial impacts.
Other risks | 123 At the level of the counterparty, the EIBG has put in place a Paris Alignment for counterparties framework (PATH). For direct financing, the framework focuses on counterparties active in carbon intensive sectors as well as those exposed to a high degree of physical risk to climate change with the aim to facilitate the transition towards a low-carbon and build a climate-resilient future83. It ensures that these counterparties are taking steps towards decarbonising their business activities in line with the objectives of Paris-Agreement or developing, where appropriate, strategies to mitigate the impact of climate risk in view of the specific nature of their business model84. The EIB will offer technical support to corporate borrowers and financial intermediaries that do not yet have these plans in place to help them meet the goals of the Paris Agreement and contribute to a more sustainable future. Another set of important tools used by the EIB and the EIF to monitor climate-risk at counterparty level is the Climate Risk Screening Tool (CRST). The CRST was developed to assess consistently the exposure of the EIBG’s counterparties (for all credit segments of the Group including the EIF’s intermediated equity and guarantee portfolios) to both physical and transition climate risk over the medium to longer term (5-10 years) as well as their mitigation/adaptation capacity. Starting from 2021, all counterparties are scored using the screening tools at the appraisal stage. The scores generated by the CRST are reviewed for our counterparties on a yearly basis. The output of the screening tools enables the EIBG to map (by sector, geography, rating and economic sector) and benchmark all its counterparties according to their climate risk exposure. The tool is used furthermore as a basis for climate risk reporting and sensitivity analyses (see Sections 2.3 and 3.2 of the TCFD report for further details). In 2022, the EIB replicated internally the ECB climate risk stress test, albeit with some adaptations reflecting the specific nature of the institution. The replication of this exercise enabled the EIB to test its capability and capacity to perform supervisory climate stress tests and showed that the Bank’s climate risk framework development is broadly in line with commercial banks. Both sensitivity analyses and the replication stress test indicated that the EIB Group balance sheet is resilient even to severe climate risk scenarios, with an impact on the Group risk metrics that appears to be moderate overall. However, the EIB will continue to closely and pro-actively manage climate-related risks in its portfolio as these risks may become material in the longer-term if corporations fail to accomplish their climate transition. 83 84 The PATH framework also requires its large and significant financial intermediaries counterparties to disclose information in line with the TCFD recommendations. A temporary exception to the PATH framework was introduced in October 2022 in the context of the EIB support of REPowerEU, whereby the existing exemption under the PATH framework for demonstration projects and early commercial deployment of low-carbon technologies with excellent innovation content is extended to include all renewable energy projects and electric-vehicle charging infrastructure inside the EU until the end of 2027, subject to a Climate Bank Roadmap review foreseen in 2025. More information can be found on the EIB website.
124 | EIB Group Risk Management Disclosure Report 2022 Remuneration Introduction The Group applies the EU legislation on remuneration policies85 in the financial sector with adaptations to reflect the limits set in its Statutes and in line with the non-profit nature and internal governance mechanism of the EIB. The present chapter provides detailed qualitative and quantitative information on the EIB Group’s remuneration policies and practices, as required under Article 450 of CRR II. EIB Group annual self-assessment Remuneration policy In the context of complying with the BBP framework, the EIB has developed internally the “EIB Remuneration Framework”, a policy document that describes and summarises the key principles for consistent and coherent design, implementation and monitoring of remuneration practices across the organisation as required under the CRD. This document was approved by the EIB governing bodies and was published on the EIB’s website in December 2021. The “EIB Remuneration Framework” consolidates and summarises the existing key elements of the EIB’s policies and practices on remuneration. It sets the framework for defining and implementing compensation practices consistently across the EIB. The “EIB Remuneration Framework” and related polices are amended as the need arises following a review and recommendation from the Remuneration Committee. The EIB Remuneration Framework supports the mission and needs of the organisation and its staff members. It reflects the long-term interests of its shareholders and is aligned with the organisation’s best banking practice. The key principles of this framework are applied to the entire Bank and reflected in the remuneration practices for employees in all areas of the Bank’s activity. These key principles are: Compliance with relevant regulatory requirements as best banking practice; Clear governance on remuneration; Remuneration based on sustainable performance; Attraction, motivation and retention of talented staff. The EIF Board of Directors committed to fully align with the EIB Remuneration Framework and therefore the relevant policies and procedures are aligned across both institutions. The “EIF Remuneration Framework”86 was designed following the approach set out in the EIB’s Remuneration Framework, taking into account the specific nature of the EIF, for instance its business activities, governance and organisational structure. The EIB’s and EIF’s remuneration frameworks are consistent with and promote sound and effective risk management, and do not encourage risk-taking that exceeds the level of tolerated risk at Group level. They are in line with the business strategy, objectives, values and long-term interests of the Group and incorporate measures to avoid conflicts of interest. Governance on remuneration As per the regulatory requirements, all significant institutions must establish risk, nomination and remuneration committees to advise the management body in its supervisory function and to prepare the decisions to be taken by this body. Delegating to committees does not in any way release the management body in its supervisory function from collectively fulfilling its duties and responsibilities. In line with the BBP framework applicable to the EIB, a Committee on Staff Remuneration and Budget has been established within the Board of Directors. The Committee on Staff Remuneration and Budget discusses proposals and makes recommendations concerning budget and staff remuneration matters in preparation for the 85 86 CRR, CRD, the EBA Guidelines on sound remuneration policies (EBA/GL/2021/04) and the Commission Delegated Regulation (EU) 2021/923 of 25 March 2021 supplementing Directive 2013/36/EU with regard to regulatory technical standards setting out the criteria to define managerial responsibility, control functions, material business units and a significant impact on a material business The “EIF Remuneration Framework” was approved in April 2022 and published on the EIF website shortly after that.
Remuneration | 125 subsequent debates and decisions in the full Board session. The Terms of Reference87 on the Board Committee on Staff Remuneration and Budget are available on the EIB website. The Committee met seven times in 2022. In line with the EIF Board of Directors’ decision to commit to full intra-Group alignment on employment status, an EIF Committee on Staff Remuneration has not been established. Consequently, the EIF Chief Executive retains the responsibility for proposals to the EIF Board of Directors made based on corresponding decisions taken by the EIB Board of Directors. Identified Staff The CRD requires institutions to determine their Identified Staff following a specific annual process, on the basis of the quantitative and qualitative criteria defined by the European Banking Authority (“EBA”). At the EIB Group, the self-assessment for defining the Identified Staff is based on the EBA criteria, also taking into consideration the following elements: The proportionality principle provided by allowing exemptions from the application of some of the remuneration principles; The application of waivers permitted by the relevant authorities of the Member States at the level of institution and/or at the level of Identified Staff; Practices existing across the private financial institutions showing the application of exemptions based on remuneration thresholds; Factors related to the internal organisation, nature, scope and complexity of the EIB’s activities. Therefore, as endorsed by the EIB governing bodies, the EIB defined its Identified Staff as the members of the MC, the Directors General88 and Directors89, considering that they have been entrusted with high responsibility for the institution, its strategy and activities and therefore have a material impact on the institution’s risk profile. Likewise, the EIF definition of Identified Staff includes the Chief Executive, the Deputy Chief Executive and the Senior Management Cadre90. Whilst the Chief Executive and the Deputy Chief Executive are not staff members, for the purpose of the EIF Remuneration Framework, they are included in the Identified Staff population. Remuneration structure The EIB’s remuneration structure recognises the EIB’s dual role as a bank and as a European public policy-driven institution by providing a total remuneration package that is aligned to private and public financial market practices. The remuneration structure makes a clear distinction between fixed and variable remuneration and provides for a cap of variable vs. fixed remuneration in line with the CRD: The fixed remuneration constitutes the predominant component of total remuneration; The variable remuneration is the secondary component of total remuneration and does not contribute to excessive risk taking as its collective part is rather substantial and the levels of variable reward are moderate in comparison to regulatory thresholds and the private sector. Since 2010, at Group level, individual variable rewards have been limited to a maximum of 35% of an employee’s annual salary (for the net performance award over the gross annual base salary, or the equivalent of about 60% if calculated as the gross performance award over the gross annual base salary). The variable remuneration budget is approved by the Board of Directors on an annual basis. It amounts to a limited proportion of the overall staff budget available for the respective calendar year, and thus does not limit the Bank’s ability to maintain a sound capital base. The size of the variable remuneration is directly linked to the Bank’s overall performance, as measured against the organisation’s Key Performance Indicators91 (KPIs), which are also linked to the Bank’s Risk Appetite Framework (RAF). In case the Bank’s KPIs remain below a set target, variable pay could be either reduced or fully suspended for the respective performance year. 87 88 89 90 91 They include detailed information on the Committee’s mandate, duties, composition and meetings. The “Director General” title is internally associated with function SC/9. The “Director” title is internally associated with function SC/8. The “Senior Management Cadre“ at the EIF is internally associated with function SC/8. The full set of the Bank’s KPIs is provided in the EIB Group Operational Plan available on the EIB website.
126 | EIB Group Risk Management Disclosure Report 2022 Furthermore, the variable remuneration is consistent with the performance levels assessment at year-end at individual level and can be withheld in case of low performance. Low performance is defined as failing to meet the required expectations related to one or more objectives and/or competencies. Moreover, the restrictions on the payment of variable remuneration in the context of capital conservation measures are applicable to the EIB under the BBP framework: “MDA” and “L-MDA” related regulatory requirements apply to the EIB in respect of the payment of variable remuneration. It should be noted that current Group RAF triggers are above the MDA and L-MDA thresholds, hence management actions and/or recovery options are considered even before any relevant breach. The EIB Group promotes equal treatment of staff members through the maintenance of a single salary spine for all employees and the consistent application of rules and procedures for all remuneration elements. The objectives of managers in control functions92, are predominantly control objectives and independent from the results of the business area they control, while the remuneration structure for all staff also applies to staff in control functions. The EIB Group remuneration policies and structure are compliant with the principle of equal pay for female and male employees for equal work or work of equal value as both institutions have had in place, for many years, mechanisms to ensure that staff decisions, including rewards, are gender neutral. Furthermore, in 2022, the EIB’s progress in the area of gender equality has earned the second level of the EDGE (Economic Dividends for Gender Equality) certification – EDGE Move. The EIB achieved this recognition only two years after obtaining the first EDGE certification level. The EIF’s progress in terms of gender equality was recognised in 2022 when the EIF was awarded the EDGE Assess Certification. Due to different timelines, the EIF will commence its second EDGE assessment in 2023. The outcome of the assessments carried out on both the EIB and EIF sides showed that the pay gap is statistically insignificant, according to the EDGE standards. Performance related awards are provided to eligible staff members in the form of one-off annual cash payments. They consist of two components: the Bank Award, rewarding collective performance; and the Individual Performance Award, rewarding individual performance. Similarly, the EIF remuneration structure makes a clear distinction between fixed and variable remuneration and provides a cap for variable vs. fixed remuneration, in line with regulatory requirements. Variable remuneration at the EIF includes payments depending on performance. The overall variable remuneration pool is dependent on the EIF’s overall performance in terms of its policy objectives and the generation of an appropriate return on its resources. 100% of both policy and financial objectives will deliver the full award pool budgeted in the EIF Corporate Operational Plan (COP)93. In line with the EIB approach, performance-related rewards at the EIF consist of a Fund Award and an Individual Award. In line with the relevant regulations, particular attention is paid to avoid incentive elements in variable compensation that may induce behaviours not aligned with the EIF risk appetite. The EIF Remuneration Framework is risk-aligned and consistent with the maintenance of a sound capital base. Neither the EIB nor the EIF grant other types of variable remuneration, such as long-term incentive plans, guaranteed variable remuneration or retention bonuses. In addition, due to the EIB’s nature, strategy and business model, a number of regulatory requirements (such as pay-out in instruments and shareholding requirements) cannot be applied at the Bank. Similarly, and due to the annual bonus structure, regulatory requirements such as malus, clawback and deferrals are not applicable at the EIB Group. Further, the EIB has no commitment to provide any type of severance payment to its Identified Staff as defined by the relevant regulations. 92 93 The control functions at the EIB are defined in the “Remuneration Framework” as the Group Risk and Compliance Directorate, and the Internal Audit Department. At the EIF, the control functions comprise the Risk Management Department, including Compliance, and the EIB Internal Audit, acting under a service level agreement and pursuant to the EIBG Internal Audit Charter. The EIF Corporate Operational Plan is available on the EIF website.

Remuneration | 127 14.3 2022 EIB Group remuneration data The content of this section is based on the qualitative and quantitative remuneration disclosure requirements outlined in Article 450 of the amended CRR. Remuneration of Identified Group Staff Following the self-assessment process, the EIB Group identified 11 members of the Management function (9 MC members at the EIB and the Chief Executive and Deputy Chief Executive at the EIF) and 92 Directors General, Directors and Senior Management Cadre as Identified Staff for the financial year 2022. The remuneration of the MC members is set by the Board of Governors and does not include any variable component. The emoluments of the members of the MC (President and Vice-Presidents of the EIB) are aligned with those of the President and Vice-Presidents of the European Commission respectively. As such, any decisions taken in regard to the establishment of the remuneration principles has no impact on their remuneration. The remuneration structure of the EIB Directors General and Directors, who are members of the senior management of the Bank, follows the remuneration structure applicable to all staff (fixed remuneration, allowances, benefits and variable remuneration). The fixed and variable remuneration of the EIF Chief Executive and the Deputy Chief Executive are set by the EIF Board of Directors. The remuneration of the EIF Senior Management Cadre follows the remuneration structure applicable to all staff, following the Group approach. The remuneration of the Identified Staff is detailed in the tables below.
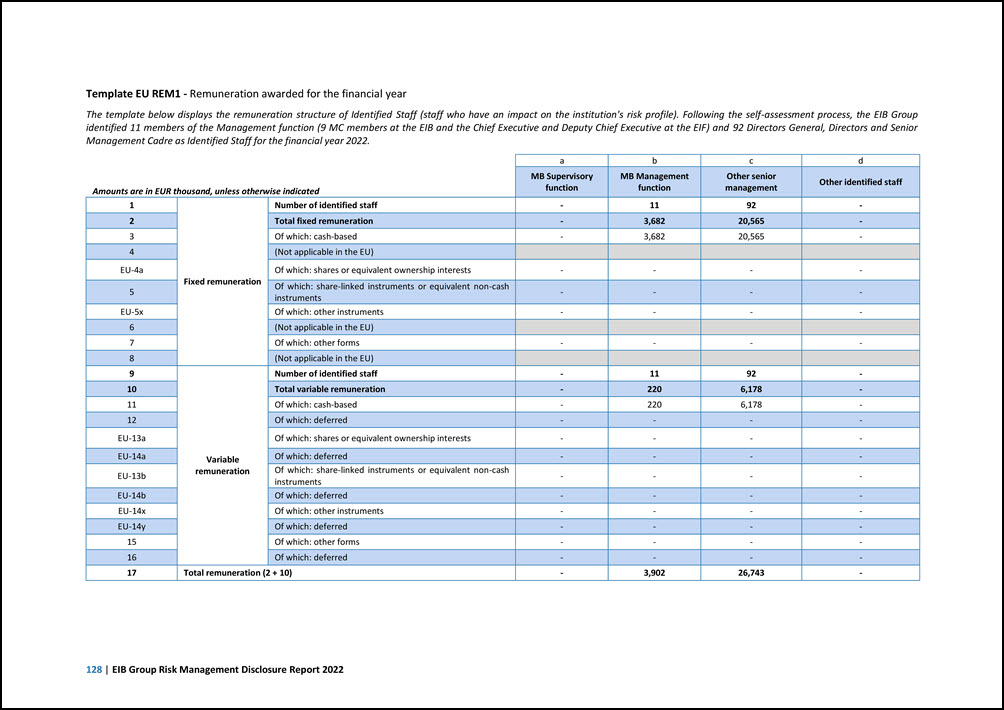
128 | EIB Group Risk Management Disclosure Report 2022 Template EU REM1 - Remuneration awarded for the financial year The template below displays the remuneration structure of Identified Staff (staff who have an impact on the institution's risk profile). Following the self-assessment process, the EIB Group identified 11 members of the Management function (9 MC members at the EIB and the Chief Executive and Deputy Chief Executive at the EIF) and 92 Directors General, Directors and Senior Management Cadre as Identified Staff for the financial year 2022. Amounts are in EUR thousand, unless otherwise indicated a b c d MB Supervisory function MB Management function Other senior management Other identified staff 1 Fixed remuneration Number of identified staff - 11 92 - 2 Total fixed remuneration - 3,682 20,565 - 3 Of which: cash-based - 3,682 20,565 - 4 (Not applicable in the EU) EU-4a Of which: shares or equivalent ownership interests - - - - 5 Of which: share-linked instruments or equivalent non-cash instruments - - - - EU-5x Of which: other instruments - - - - 6 (Not applicable in the EU) 7 Of which: other forms - - - - 8 (Not applicable in the EU) 9 Variable remuneration Number of identified staff - 11 92 - 10 Total variable remuneration - 220 6,178 - 11 Of which: cash-based - 220 6,178 - 12 Of which: deferred - - - - EU-13a Of which: shares or equivalent ownership interests - - - - EU-14a Of which: deferred - - - - EU-13b Of which: share-linked instruments or equivalent non-cash instruments - - - - EU-14b Of which: deferred - - - - EU-14x Of which: other instruments - - - - EU-14y Of which: deferred - - - - 15 Of which: other forms - - - - 16 Of which: deferred - - - - 17 Total remuneration (2 + 10) - 3,902 26,743 -
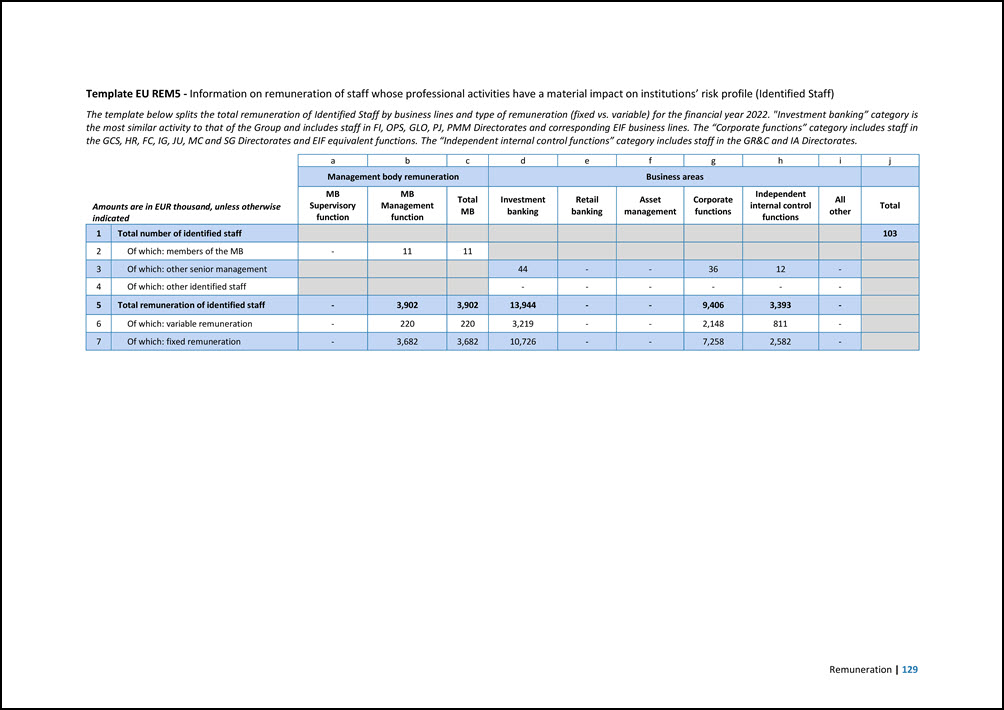
Remuneration | 129 Template EU REM5 - Information on remuneration of staff whose professional activities have a material impact on institutions’ risk profile (Identified Staff) The template below splits the total remuneration of Identified Staff by business lines and type of remuneration (fixed vs. variable) for the financial year 2022. "Investment banking” category is the most similar activity to that of the Group and includes staff in FI, OPS, GLO, PJ, PMM Directorates and corresponding EIF business lines. The “Corporate functions” category includes staff in the GCS, HR, FC, IG, JU, MC and SG Directorates and EIF equivalent functions. The “Independent internal control functions” category includes staff in the GR&C and IA Directorates. Amounts are in EUR thousand, unless otherwise indicated a b c d e f g h i j Management body remuneration Business areas MB Supervisory function MB Management function Total MB Investment banking Retail banking Asset management Corporate functions Independent internal control functions All other Total 1 Total number of identified staff 103 2 Of which: members of the MB - 11 11 3 Of which: other senior management 44 - - 36 12 - 4 Of which: other identified staff - - - - - - 5 Total remuneration of identified staff - 3,902 3,902 13,944 - - 9,406 3,393 - 6 Of which: variable remuneration - 220 220 3,219 - - 2,148 811 - 7 Of which: fixed remuneration - 3,682 3,682 10,726 - - 7,258 2,582 -
130 | EIB Group Risk Management Disclosure Report 2022 Remuneration of members of the management and supervisory function for 2022 The compensation of the EIB’s and the EIF’s governing bodies is defined by their respective governance framework. Compensation of members of the governing bodies is composed of fixed allowances, fees or indemnities payable for the attendance at meetings and aiming to cover expenses related to such. The members of the Board of Governors receive no remuneration from the Bank. Likewise, the EIF General Meeting is a non-remunerated governing body. The remuneration of the members of the EIB Board of Directors is composed of a fixed attendance allowance, for each meeting day in which they participate, and a flat-rate subsistence allowance, to cover expenses if they have to stay overnight at the place of the meeting. The attendance allowance corresponds to EUR 600. The flat- rate subsistence allowance corresponds to EUR 250 for each hotel night. The Bank also reimburses their travel expenses in respect of their attendance at meetings. The attendance allowance amount has been kept constant in nominal terms (no increase for inflation) since 2002. The remuneration of the members of the EIF Board of Directors consists of an attendance fee of EUR 300 per meeting, a flat-rate daily allowance of EUR 220 to cover expenses, and the reimbursement of travel expenses. The EIB Audit Committee (“AC”) members do not receive remuneration from the Bank. For each meeting of the AC that they attend, members and observers of the AC receive a daily attendance emolument of EUR 1,500 a day. The Bank pays a flat-rate subsistence allowance of EUR 250 in addition to the reimbursement of travel expenses incurred by individual AC members. The members of the AC do not receive a bonus and are not paid for preparation times between the meetings. The remuneration of the members of the EIF Audit Board consists of an attendance fee of EUR 1,500 per meeting, a flat-rate daily allowance of EUR 220 to cover expenses, and the reimbursement of travel expenses. The remuneration of the EIB MC members is disclosed under the “Identified Staff” sub-section.
Appendix | 131 Appendix Appendix I - Overview of the EIB Group EIB The European Investment Bank was created by the Treaty of Rome in 1958 as the long-term lending institution of the European Union (‘EU’). The EIB enjoys legal personality and financial autonomy and is endowed with its own decision-making bodies. The EIB’s Statute is drawn up as a Protocol (No 5) annexed to the Treaty on European Union (‘TEU’) and the Treaty on the Functioning of the European Union (‘TFEU’). In accordance with Article 51 TEU, it forms an integral part of both Treaties. In accordance with its statutory framework, the mission of the Bank is to contribute towards the integration, balanced development and economic and social cohesion of the EU Member States. To achieve this, the EIB raises substantial volumes of funds on the capital markets and lends these funds on favourable terms to projects furthering EU policy objectives. Due to the particular nature of the EIB, its mission and its shareholder structure, there are a number of key aspects that differentiate the EIB from commercial banks: Governance Under its Statute the EIB is governed by a three-layer structure: the BoG, the BoD and the MC. Supervision The EIB is neither subject to requirements for an authorisation nor supervised by an external supervisory banking authority, and consequently is not subject to an SREP. Notwithstanding, the Bank is committed through its Statute to conform to BBP applicable to it, which includes adherence to relevant EU banking legislation and guidelines, assessed pursuant to the criteria set out in the BBP Guiding Principles. Fully respecting its statutory framework and duly considering its mission and mandate, the EIB determines which and how the BBP requirements apply to it, on an individual as well as on a consolidated basis. The AC, as part of its statutory duties, is required to verify, and report to the Board of Governors that the activities of the Bank conform to best banking practice applicable to it. The EIB has adopted a framework for implementing an internal and specific review and evaluation process (the “EIB REP”) for which the Audit Committee is responsible. Since March 2021, this process has been framed by the EIB’s Review and Evaluation Guiding Principles, complemented by implementing rules and a methodology specific to the EIB Group. Globally, this framework is based on the EBA’s Guidelines on the Supervisory Review and Evaluation Process, while considering the EIB’s specific nature, policy mission, specific tasks and governance structure. The EIB REP supports the Audit Committee in its role to verify that the EIB complies with applicable BBP. Public policy-driven, operating on a non-profit-making basis The EIB differs considerably from commercial banks in that its activity is driven by public policy objectives and it operates on a non-profit-making basis, as specified in Article 309 TFEU. As such, the Bank does not have a specific statutory target for return on equity, but rather aims at generating an income that shall enable it to meet its obligations, cover its expenses and risks and build up a reserve fund. Taxation The EIB is not subject to national taxation and benefits from the provisions of the Protocol on Privileges and Immunities annexed to the EU Treaties (Protocol No 7). Financial protection and preferred creditor status The principle of supremacy of EU primary law and the principle that the property of the EIB shall be exempt from all forms of requisition and expropriation, as enshrined in the EIB Statute, are deemed to guarantee a full recovery of the EU sovereign exposures on maturity. The EIB’s exposures to the EU Member States benefit from the EIB’s preferred creditor status. Such exposures are treated as posing no risk of loss to the EIB and are therefore not taken into account for the purposes of determining the EIB’s capital requirements. However, similarly to other creditors, the EIB is bound by the majority decision based on collective action clauses included
132 | EIB Group Risk Management Disclosure Report 2022 in debt instruments issued by EU sovereigns. When operating outside the European Union, the EIB is deemed to enjoy treatment comparable to that of other international financial institutions. Mandate business The EIB originates business on its own risk, and to a lesser extent, through a risk-sharing mechanism by which a third party – the mandator – provides credit enhancement to the EIB or on behalf of third parties at their own risk. Shareholder structure The EIB’s shareholders comprise all EU Member States, which in addition to paid-in capital also commit to providing additional capital to such extent as may be required for the Bank to meet its obligations, upon the request of the EIB (callable capital). Accounting standards The EIB uses the EU Accounting Directives for its stand-alone statutory and consolidated financial statements. Consolidated financial statements are also prepared in accordance with the International Financial Reporting Standards as adopted by the European Union. EIF The EIF was established in 1994 by decision of the Board of Governors of the EIB, with legal personality and financial autonomy. The EIF is a specialist provider of risk finance to small and medium-sized enterprises (‘SMEs’). It develops and implements equity and debt financial instruments which respond to the current financing needs of European businesses. Similarly to the EIB, there are a number of important aspects that differentiate the EIF from commercial players. The following elements apply to the EIF: Governance Under its Statutes the EIF is also governed by a three-layer structure: the General Meeting, the Board of Directors and the Chief Executive. Supervision The EIF is not subject to prudential supervision but is committed through its Statutes to base its activities on sound banking principles or other sound commercial principles, as applicable. The EIF Audit Board is responsible for the annual audit of the EIF and it shall confirm that EIF operations have been carried out in compliance with its Statutes and Rules of Procedure94. Public policy-driven organisation The EIF differs from commercial players in that its task is to contribute to the objectives of the European Union. The level of remuneration or other income sought by the EIF shall be determined in such a way as to reflect risks incurred, cover operating expenses, establish necessary reserves and generate an appropriate return on its resources. Taxation The EIF is not subject to national taxation and benefits from the Protocol on Privileges and Immunities of the European Union annexed to the TFEU (Protocol No 7). Financial protection and preferred creditor status In line with the EIB, the EIF’s specific status under EU law is deemed to guarantee a full recovery of the EU sovereign exposures on maturity. The EIF’s exposures to the EU Member States are deemed to benefit from the EIF’s preferred creditor status and are therefore treated as posing no risk of loss to the EIF. However, similarly to other creditors, the EIF is bound by the majority decision based on collective action clauses included in debt instruments issued by EU sovereigns. 94 With effect as of 1 January 2023, the remit of the Audit Board covers additionally the application of sound banking principles or other sound commercial principles and practices as applicable to the EIF.
Appendix | 133 Mandate business The EIF finances part of its operations out of its own resources. In addition, the EIF may accept the task of administering resources entrusted to it by third parties (mandates). The majority of the EIF’s operations are currently funded under mandates governed by specific mandate agreements. Under such mandates, the EIF deploys financial instruments in the form of cash investments, guarantees or other forms of credit enhancement. Shareholder structure The EIF’s shareholders comprise the EIB (59.4%), the European Union (30.0%), and financial institutions (10.6%). The EIF’s shareholders have committed to provide additional capital (up to 80% of the par value of each share - callable capital) in addition to paid-in capital upon request by the EIF General Meeting and to the extent required for the EIF to meet its liabilities towards its creditors. Accounting standards The EIF statutory financial statements are prepared in accordance with IFRS as adopted by the European Union.
134 | EIB Group Risk Management Disclosure Report 2022 15.2 Appendix II - Abbreviations ABS Asset Backed Securities AC Audit Committee ALCO Assets & Liabilities Committee ALM Asset and Liability Management AMA Advanced Measurement Approach (for operational risk): one of the regulatory approaches available to banks to quantify required capital for operational risk. The AMA is expected to be replaced by the standardised approach for operational risk, which is expected to enter into force from January 2025 as part of CRR III. ASF Available Stable Funding (ASF): amount of liabilities and own funds expected to be stable over a one-year time horizon, calculated by multiplying the accounting value of various categories or types of liabilities and own funds by the available stable funding factors determined based on the instruments' characteristics and residual maturity provided by Articles 428k to 428o of the Capital Requirements Regulation. AT1 Additional Tier 1 (Capital): One of the three elements composing regulatory own funds (together with the CET1 and T2). AT1 is composed of capital instruments providing loss absorption on a going-concern basis, that do not meet the criteria for CET1. AT1 includes for example perpetual contingent convertible capital instrument95. AVA Additional value adjustments (AVA) are regulatory deductions to a bank's regulatory own funds due to its assets measured at fair value. BBP Best Banking Practice BPV Basis Point Value BPV sensitivity BPV sensitivity shows the change in the net present value (NPV) of interest rate sensitive instruments/portfolios due to a 1 basis point increase in the interest rate curves (shifting both pricing and discounting curves) BCBS Basel Committee on Banking Supervision BCL Banque Centrale du Luxembourg BIC The Business Indicator Component (BIC) is a parameter used as part of the standardised approach for operational risk. This parameter is calculated by multiplying the business indicator (financial statement-based proxy for operational risk) by a set of regulatory determined marginal coefficients. BoD Board of Directors BoG Board of Governors CBR Climate Bank Roadmap CCBR Cross Currency Basis Risk CCF Credit conversion factor: ratio of the currently undrawn amount of a commitment that could be drawn in a given period. This ratio is used to convert part of the unused part of credit facilities and other off-balance sheet items into exposure at default amount96. CCP Central Counterparty Clearing (CCP) houses are financial institutions that facilitate trading of derivatives and equity products between counterparties, by becoming the buyer to every seller and the seller to every buyer, in order to reduce the risk in the contracts traded97. CCR Counterparty Credit Risk (CCR) is the risk that the counterparty (of usually an over-the-counter derivatives transaction or securities-financing transaction) defaults before the final settlement of the transaction’s cash flows, creating an economic loss for the institution. CCS Cross Currency Swaps are contracts that involve the exchange of notional in two different currencies at the beginning and at the end of the swap, and the exchange of floating rates during the contract term CEF The Connecting Europe Facility (CEF) is an EU programme to support the development of high performing, sustainable and efficiently interconnected trans-European networks in the fields of transport, energy and digital services. CET1 Common Equity Tier 1 (CET1) capital is one of the three elements composing regulatory own funds (together with the AT1 and T2). CET1 is composed of the highest quality of regulatory capital, absorbing losses immediately when they occur. CET1 includes, for example, common shares or retained earnings98. CIUs Collective Investment Undertakings CRCF Credit Risk Control function CRD Capital Requirements Directive CRR Capital Requirements Regulation CRGs Credit Risk Guidelines CRM Credit Risk Mitigation (CRM) are techniques used by banks to mitigate credit risk, thereby reducing the capital requirement of their exposures99. CSA Credit Support Annex (CSA) is a legal document annexed on a voluntary basis to an ISDA Master Agreement which defines the terms and conditions under which collateral is posted to mitigate counterparty credit risk. 95 96 97 98 99 Bank for International Settlement (https://www.bis.org/fsi/fsisummaries/defcap_b3.pdf). Article 4(1)(56) of the Capital Requirements Directive. European Securities and Markets Authority (https://www.esma.europa.eu/policy-rules/post-trading/central-counterparties). Bank for International Settlements (https://www.bis.org/fsi/fsisummaries/defcap_b3.pdf). Article 4(1)(57) of the Capital Requirements Directive.
Appendix | 135 CVA Credit Value Adjustment (CVA) is the expected loss caused by changes in the credit spread of a counterparty on derivatives transactions due to changes in its credit quality100. DBO Defined benefit obligations (DBO) represent the present value of the pension benefits earned by EIB/EIF’s employees DPD Days past due (DPD) is the number of days where any amount has not been paid since the date it was due101. DPO Data Protection Officer EAD Exposure at default (EAD) is the estimated amount owed by an obligor borrower at the time of default. EBA European Banking Authority EBRD European Bank for Reconstruction and Development EC European Commission ECB European Central Bank EFSI The European Fund for Strategic Investments (EFSI) is the core of the Investment Plan for Europe, aimed at boosting long- term economic growth and competitiveness in the European Union102. EGF The Pan-European Guarantee Fund, set up the by EIB Group and backed by 22 Member States, is designed to help businesses weather the economic impact of COVID-19 and support innovation and transformation. The EGF is part of the EUR 540 billion EU recovery package agreed in 2020 by EU leaders. It is the largest crisis mechanism that the EIB Group has put on the market, enabling immediate impact. EIB European Investment Bank EIF European Investment Fund EIG Equity Investments and Guarantees Department EL Expected Loss (EL) is the ratio of the amount expected to be lost on an exposure from a potential default of a counterparty or dilution over a one-year period over the amount outstanding at default103. ELM External Lending Mandate: strategic instrument, based on a guarantee from EU budget resources, through which the European Union supports investments in partner countries104. EREM EIB Group Risk Enhancement Mandate (EREM) is a mandate conceived in response to the conclusions of the June 2013 Council calling for urgent mobilisation of EU resources to support SMEs and boost financing of the economy. ESG Environmental, Social, Governance ESMA European Securities and Markets Authority EU European Union EU-AD EU Accounting Directives: Directive 2013/34/EU of the European Parliament and of the Council of 26 June 2013 on the annual financial statements, consolidated financial statements and related reports of certain types of undertakings, amending Directive 2006/43/EC of the European Parliament and of the Council and repealing Council Directives 78/660/EEC and 83/349/EEC Text with EEA relevance. EWS Early Warning Signals (EWS) are internal indicators intended to allow for the early detection and prevention of deteriorating credit quality of counterparties or counterparties presenting higher risk characteristics requiring more enhanced monitoring. FRGs Financial Risk Guidelines FX Foreign Exchange GCCO Group Chief Compliance Officer GEMs Global Emerging Markets GLO EIB Global GLR The General Loan Reserve (GLR) is one of the Bank's two notional reserves (together with the Special Activities Reserve, or SAR), which covers expected losses resulting from the EIBG’s loan and guarantee portfolio. GMRA Global Master Repurchase Agreement (GMRA) is a model legal agreement designed for parties transacting repos and is published by the International Capital Market Association (ICMA). This agreement allows for netting of amounts due under transactions governed by different agreements, often including one or more GMRAs105. GCFP The Group Contingency Funding Plan (GCFP) defines the escalation procedures and course of actions in the event of a liquidity crisis within the EIB Group. GCRO Group Chief Risk Officer GCSP Group Capital Sustainability Policy GRMC Group Risk Management Charter GRMF Group Risk Management Framework GR&C Group Risk and Compliance Directorate Group RP Group Recovery Plan 100 European Banking Authority. 101 European Banking Authority (EBA/GL/2016/07). 102 European Council – Council of the European Union. (https://www.consilium.europa.eu/en/policies/investment-plan/strategic- investments-fund/). 103 Article 5 (3) of the Capital Requirements Regulation. 104 European Commission (https://eur-lex.europa.eu/legal-content/EN/TXT/HTML/?uri=CELEX:52020DC0097&rid=7). 105 International Capital Market Association and Bank for International Settlements (https://www.bis.org/statistics/glossary.htm?&selection=214&scope=Statistics&c=a&base=term).
136 | EIB Group Risk Management Disclosure Report 2022 G-SIB Global Systemically Important Bank (G-SIB) are financial institutions that can cause a significant disruption to the financial or economic system in case of default due to their size, complexity and inter-dependence with other institutions106. GWWR General Wrong-Way Risk (GWWR) is the risk that arises from a situation in which there is a high (positive) correlation between the probability of default of a counterparty and general market risk factors affecting the exposure to that counterparty. This includes for example fluctuations in interest rates which, in the context of derivative transactions ( such as interest rate swaps), would lead to an increase in the value of the derivatives but also to a decrease of the counterparty's credit worthiness (due to the increased liability). HQLA High Quality Liquid Assets (HQLA) are assets of high liquidity and credit quality that can be easily and immediately converted into cash without significant loss of value107. IA Internal Audit ICAAP Internal Capital Adequacy Assessment Process: core internal risk management processes for institutions to assess and maintain on an ongoing basis the amounts, types and distribution of internal capital that they consider adequate to cover the nature and level of the risks to which they are or might be exposed108. ICF Internal control framework IFRS International Financial Reporting Standards IIW The Infrastructure and Innovation Window (IIW) is one of the two components (together with the SME Window) of the European Fund for Strategic Investments (EFSI). ILAAP Internal Liquidity Adequacy Assessment Process: core internal risk management processes and systems for the identification, measurement, management and monitoring of liquidity risk over an appropriate set of time horizons and management and monitoring of funding positions, so as to ensure that institutions maintain adequate levels of liquidity buffers and adequate funding109. ILM The Internal Loss Multiplier Regulatory (ILM) is a regulatory scaling factor used as part of the standardised approach for operational risk. This factor is based on a bank’s average historical losses and the business indicator component ('BIC'). IMA The Internal Model Approach (IMA) is one of the regulatory approaches available to banks to quantify the required capital for market risk. This approach enables banks to use their own risk parameters to calculate a value at risk (VaR). IMM The Internal Model Method (IMM) is one of the regulatory approaches available to banks to quantify required capital for counterparty credit risk. This approach enables banks to use their own risk parameters to quantify the required amount of capital for counterparty credit risk, subject to the explicit approval of their respective supervisors. INCF Infrastructure and Climate Fund Facility: equity-type investment originated by the EIF on behalf of the EIB, with a primary focus on climate action and environmental sustainability. IRB The Internal Ratings Based (IRB) approach is one of the regulatory approaches available to banks to quantify the required capital for credit risk. This approach enables banks to use their own risk parameters to quantify the required amount of capital for credit risk, subject to the explicit approval of their respective supervisors. IRC Investment & Risk Committee IRM Internal Rating Methodology IRMMC Internal Rating Models Maintenance Committee IRRBB Interest Rate Risk in the Banking Book: the current or prospective risk to a bank's capital and earnings arising from adverse movements in interest rates that affect the bank's banking book positions110. IRS Interest Rate Swaps are interest rate derivatives where a counterparty exchanges interests at a predetermined fixed rate against interest at a floating rate on a pre-determined notional. The floating rate is tied to an interest rate market index in the leg currency and corresponding to the payment frequency (for example, 3 months Euribor), and resets at the beginning of the calculation period. The swap has two legs: one fixed leg and one floating leg. When both legs are floating, it is referred to as a basis swap. ISDA International Swaps and Derivatives Association IG Inspectorate General Directorate ITS Implementing Technical Standards KPI Key Performance Indicator LCR The Liquidity Coverage Ratio (LCR) is a regulatory liquidity metric that aims to ensure that institutions maintain levels of liquidity buffers which are adequate to face any possible imbalance between liquidity inflows and outflows under severely stressed conditions over a period of 30 days111. LEF Large Exposure Framework (LEF) is a regulatory framework aiming to act as a backstop to prevent an institution from incurring disproportionately high losses due to the default of a large individual client or group of connected clients (large exposures)112. 106 Bank for International Settlements (https://www.bis.org/bcbs/gsib/). 107 Bank for International Settlements (https://www.bis.org/basel_framework/chapter/LCR/30.htm?tldate=20191231&inforce=20191215#:~:text=Assets%20are%20consider ed%20to%20be,or%20no%20loss%20of%20value). 108 European Banking Authority (EBA/GL/2016/10). 109 European Banking Authority (EBA/GL/2016/10). 110 Bank for International Settlements. 111 Article 412(1) of the Capital Requirements Regulation. 112 European Banking Authority (https://www.eba.europa.eu/regulation-and-policy/large-exposures).
Appendix | 137 LGD Loss Given Default (LGD) is the ratio of the loss on an exposure due to the default of a counterparty in respect of the amount outstanding at default113. LoD Line of defence LTA The Look-Through approach (LTA) is one of the regulatory approaches available to banks to calculate risk-weighted exposure amounts of CIUs. This approach enables banks, under certain conditions, to look through to the individual underlying exposures of a CIU to calculate the risk-weighted exposure amount of the CIU, risk weighting all underlying exposures of the CIU as if they were directly held by those banks114. MBA The Mandate-Based approach (MBA) is one of the regulatory approaches available to banks to calculate risk-weighted exposure amounts of CIUs. This approach enables banks, if they do not have sufficient information about the individual underlying exposures of a CIU, to calculate the risk weighted exposure amount of those exposures in accordance with the limits set in the CIU's mandate and relevant law115. MC Management Committee MDA Maximum Distributable Amount (MDA) is the maximum amount that can be distributed by a bank as variable payment (e.g. such as to shareholders, holders of AT1 instruments or staff) to avoid depletion of Common Equity Tier 1 capital below the level of the combined buffer requirements116. MIR Minimum internal rating MRC Model Risk Committee MREL The minimum requirement for own funds and eligible liabilities (MREL) is set by resolution authorities to ensure that banks maintain at all times sufficient eligible instruments to facilitate the implementation of the preferred resolution strategy, aimed at preventing a bank’s resolution from depending on the provision of public financial support, and thereby ensuring that shareholders and creditors contribute to loss absorption and recapitalisation117. NDICI Neighbourhood, Development and International Cooperation Instrument: new instrument merging several former EU external financing instruments and aiming to support countries most in need to overcome long-term developmental challenges118. NPE Non-performing Exposures (NPE) are loans, debt securities and off-balance sheet exposures that satisfy either or both of the following criteria: 1) material exposures which are more than 90 days past due (‘DPD’); 2) the debtor is assessed as unlikely to pay (‘UTP’) its credit obligations in full without realisation of collateral, regardless of the existence of any past- due amount or the number of days past due119. NPL Non-performing loans are loans that qualify as non-performing exposures ('NPE'). NSFR The Net Stable Funding Ratio (NSFR) is a regulatory liquidity metric that aims to limit overreliance on short-term wholesale funding and encourages better assessment of funding risk across all on- and off-balance sheet items, promoting funding stability. The NSFR is defined as the amount of available stable funding ('ASF') relative to the amount of required stable funding ('RSF') and should be equal to at least 100%120. OCCO Office of the Chief Compliance Officer OP Operational Plan OPS Operations Directorates ORM Operational Risk Management ORMF Operational Risk Management Framework OTC Over-the-counter (OTC) contracts are derivatives contracts traded and negotiated directly between two parties (without going through an exchange). OTC derivatives also include transactions with central counterparties where contracts are based on novation121. PATH Paris Alignment for Counterparties PCS Preferred creditor status: for a sovereign debtor, status which creditors (clubs) grant to international financial organisations, by which they may enjoy a more favourable treatment than bilateral official creditors or commercial creditors in the course of the rescheduling of the sovereign debt (political right). PD Probability of default (PD) of a counterparty over a one-year period122. PJ Projects Directorate PMM Portfolio Management and Monitoring PSE Public Sector Entity RAF The Risk Appetite Framework (RAF) is the overall framework (including policies, processes, limits, control and systems) implemented by banks when establishing their risk appetite, including banks' policies, processes, limits, controls and systems put in place to define, communicate and monitor how much risk they are willing to take on123. 113 Article 4(1)(55) of the Capital Requirements Regulation. 114 Article 132a(1) of the Capital Requirements Regulation. 115 Article 132a(2) of the Capital Requirements Regulation. 116 Article 141 of the Capital Requirements Directive. 117 Single Resolution Board (https://www.srb.europa.eu/en/content/mrel). 118 European Commission (https://neighbourhood-enlargement.ec.europa.eu/funding-and-technical-assistance/neighbourhood- development-and-international-cooperation-instrument-global-europe-ndici-global-europe_en). 119 Annex V of the Commission Implementing Regulation (EU) No 680/2014. 120 Article 428b of Capital Requirements Regulation. 121 European Central Bank (https://www.bankingsupervision.europa.eu/legalframework/publiccons/html/egam_202002_FAQ.en.html). 122 Articles 4(1)(54) and 178(1) of the Capital Requirements Regulation. 123 European Central Bank (https://www.bankingsupervision.europa.eu/press/speeches/date/2018/html/ssm.sp180410.en.html).
138 | EIB Group Risk Management Disclosure Report 2022 RAS The Risk Appetite Statement (RAF) is the articulation in written form of the aggregate level and types of risk that a financial institution is willing to accept, or to avoid, in order to achieve its business objectives124. RCR Risk Capital Resources: equity-type investment originated by the EIF on behalf of the EIB. The Risk Capital Resources mandate is one of the core pillars of the EIF’s equity activity. (S)REP The Bank is not subject to the Supervisory Review and Evaluation Process (SREP) but has put in place a similar internal process, the Review and Evaluation Process (REP) to support the Audit Committee to verify EIB’s adherence with applicable Best Banking Practices. RM Risk management RPC Board Committee on Risk Policy RSF The required amount of stable funding (RSF) is calculated by multiplying the accounting value of various categories or types of assets and off-balance-sheet items by the required stable funding factors determined based on the instruments' characteristics and residual maturity provided by Articles 428r to 428ah of the CRR. RSI The Risk Sharing Instrument (RSI) was a guarantee scheme managed by the EIF in the 2007-2013 programming period launched in cooperation with the European Investment Bank and the European Commission under the 7th EU Framework Programme for Research and Technological Development. RWEA Risk-weighted exposure amounts (RWEA) represent a measure of the risks that a bank is exposed to through its assets and off-balance sheet items125. SA The new standardised approach (SA) proposed by the BCBS and intended to replace the approaches currently available to banks under the CRR (expected to enter into force from January 2025 as part of CRR III), to quantify required capital for operational risk126. SAR The Special Activities Reserve (SAR) is one of the Bank's two notional reserves (together with the General Loan Reserve, or 'GLR'), which covers unexpected losses of operations which are classified as Special Activities. SEC-ERBA The Securitisation External Ratings Based Approach (SEC-ERBA) is one of the regulatory approaches available to banks to quantify required capital for securitisation exposures. This approach relies on a formula using as an input the exposure's external credit rating. SEC-IAA The Securitisation Internal Assessment Approach (SEC-IAA) is a regulatory approach available to banks to quantify required capital for certain Asset Backed Commercial Paper transactions. This approach relies on the institutions' internal assessments of the credit quality of the transaction. SEC-IRBA The Securitisation IRB Approach (SEC-IRBA) is one of the regulatory approaches available to banks to quantify required capital for securitisation exposures. This approach relies on a formula using as an input the Bank's own risk parameters calculated at the level of the underlying portfolio. SEC-SA The Securitisation Standardised Approach (SEC-SA) is one of the regulatory approaches available to banks to quantify required capital for securitisation exposures. This approach relies on a formula using as an input the exposure's underlying portfolio delinquency rates and respective asset classes. SFT Securities Financing Transactions (SFTs) are financial operations enabling investors and institutions to use assets, such as the securities they own, to secure funding for their activities. Examples of SFTs include the repurchase transaction (repo), buy-sell back / sell-buy back transaction or margin lending127. SG Secretariat General SLP Securities Liquidity Portfolio SMEs Small and medium-sized enterprises SPC Senior Private Credit: equity-type investment originated by the EIF on behalf of the EIB, whose objective is to contribute to the availability of alternative debt financing to the target final recipient, in response to the crisis following the COVID-19 pandemic. SRT Securitisation transactions are considered as meeting the significant risk transfer (SRT) criteria if they fulfill the regulatory requirements outlined in Article 243 and 244 of the CRR and EBA Guidelines on significant risk transfer for securitisations, allowing their originator to exclude the underlying exposures from their risk-weighted exposure amount calculations. SSPE Securitisation special purpose entities (SSPEs) are corporation trusts or entities, other than a credit institution or an investment firm, organised for carrying out securitisations. The activities of these entities, which are structured to isolate the obligations of the originator institution, are limited to those appropriate to accomplish the objective of the securitisation issuance128. STS Simple, transparent and standardised: technical characteristics applicable to securitization instruments used to differentiate those products from complex, opaque and risky instruments and to apply a more risk-sensitive prudential framework129. SWWR Specific Wrong Way Risk (SWWR) is a risk arising from a situation in which future exposure to a specific counterparty is highly (positively) correlated with the counterparty’s credit quality due to the nature of the transactions with that counterparty. This includes for example, accepting securities issued by a given counterparty (or closely related entity) as collateral to secure a transaction with that same counterparty. This includes for example accepting securities issued by a given counterparty (or closely related entity) as collateral to secure a transaction with that same counterparty. 124 Financial Stability Board (https://www.fsb.org/wp-content/uploads/r_131118.pdf). 125 European Central Bank (https://www.bankingsupervision.europa.eu/about/ssmexplained/html/internal_models.en.html). 126 Bank of International Settlements (https://www.bis.org/fsi/fsisummaries/oprisk_sa.pdf). 127 European Commission (https://finance.ec.europa.eu/capital-markets-union-and-financial-markets/financial-markets/post-trade- services/securities-financing-transactions-sfts_en). 128 Article 4(1)(66) of the Capital Requirements Regulation. 129 Regulation (EU) 2017/2402.
Appendix | 139 S&P Standard & Poor’s T2 Tier 2 (T2) capital is one of the three elements composing regulatory own funds (together with the CET1 and AT1). T2 is made of instruments that must be subordinated to repayment if the institution becomes insolvent. As opposed to AT1, instruments with a maturity date can be eligible for Tier 2130. TBR Tenor Basis Risk TLAC Total loss-absorbing capacity: regulatory requirement for G-SIBs to hold a sufficient amount of own funds and highly loss absorbing (bail-enable) liabilities to ensure smooth and fast absorption of losses and recapitalisation in the event of a resolution. UTP Unlikely To Pay (UTP) is one of the two criteria considered to determine the default of a particular obligor 131. VaR Value at Risk (VaR) is a probabilistic method used to measure the potential loss in value of an asset over a given time period for a given distribution of historical returns and at a given confidence interval. 130 Bank for International Settlements (https://www.bis.org/fsi/fsisummaries/defcap_b3.pdf). 131 Article 178(1) and (3) of the Capital Requirements Regulation.
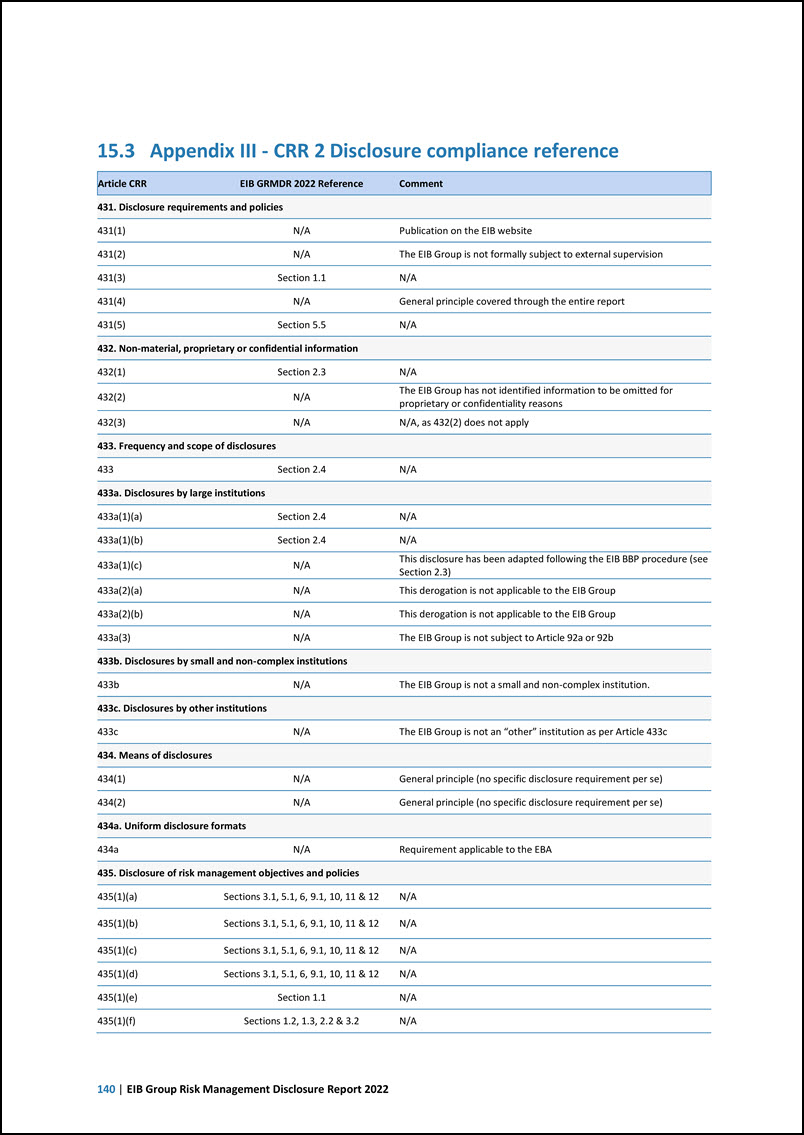
140 | EIB Group Risk Management Disclosure Report 2022 15.3 Appendix III - CRR 2 Disclosure compliance reference Article CRR EIB GRMDR 2022 Reference Comment 431. Disclosure requirements and policies 431(1) N/A Publication on the EIB website 431(2) N/A The EIB Group is not formally subject to external supervision 431(3) Section 1.1 N/A 431(4) N/A General principle covered through the entire report 431(5) Section 5.5 N/A 432. Non-material, proprietary or confidential information 432(1) Section 2.3 N/A 432(2) N/A The EIB Group has not identified information to be omitted for proprietary or confidentiality reasons 432(3) N/A N/A, as 432(2) does not apply 433. Frequency and scope of disclosures 433 Section 2.4 N/A 433a. Disclosures by large institutions 433a(1)(a) Section 2.4 N/A 433a(1)(b) Section 2.4 N/A 433a(1)(c) N/A This disclosure has been adapted following the EIB BBP procedure (see Section 2.3) 433a(2)(a) N/A This derogation is not applicable to the EIB Group 433a(2)(b) N/A This derogation is not applicable to the EIB Group 433a(3) N/A The EIB Group is not subject to Article 92a or 92b 433b. Disclosures by small and non-complex institutions 433b N/A The EIB Group is not a small and non-complex institution. 433c. Disclosures by other institutions 433c N/A The EIB Group is not an “other” institution as per Article 433c 434. Means of disclosures 434(1) N/A General principle (no specific disclosure requirement per se) 434(2) N/A General principle (no specific disclosure requirement per se) 434a. Uniform disclosure formats 434a N/A Requirement applicable to the EBA 435. Disclosure of risk management objectives and policies 435(1)(a) Sections 3.1, 5.1, 6, 9.1, 10, 11 & 12 N/A 435(1)(b) Sections 3.1, 5.1, 6, 9.1, 10, 11 & 12 N/A 435(1)(c) Sections 3.1, 5.1, 6, 9.1, 10, 11 & 12 N/A 435(1)(d) Sections 3.1, 5.1, 6, 9.1, 10, 11 & 12 N/A 435(1)(e) Section 1.1 N/A 435(1)(f) Sections 1.2, 1.3, 2.2 & 3.2 N/A
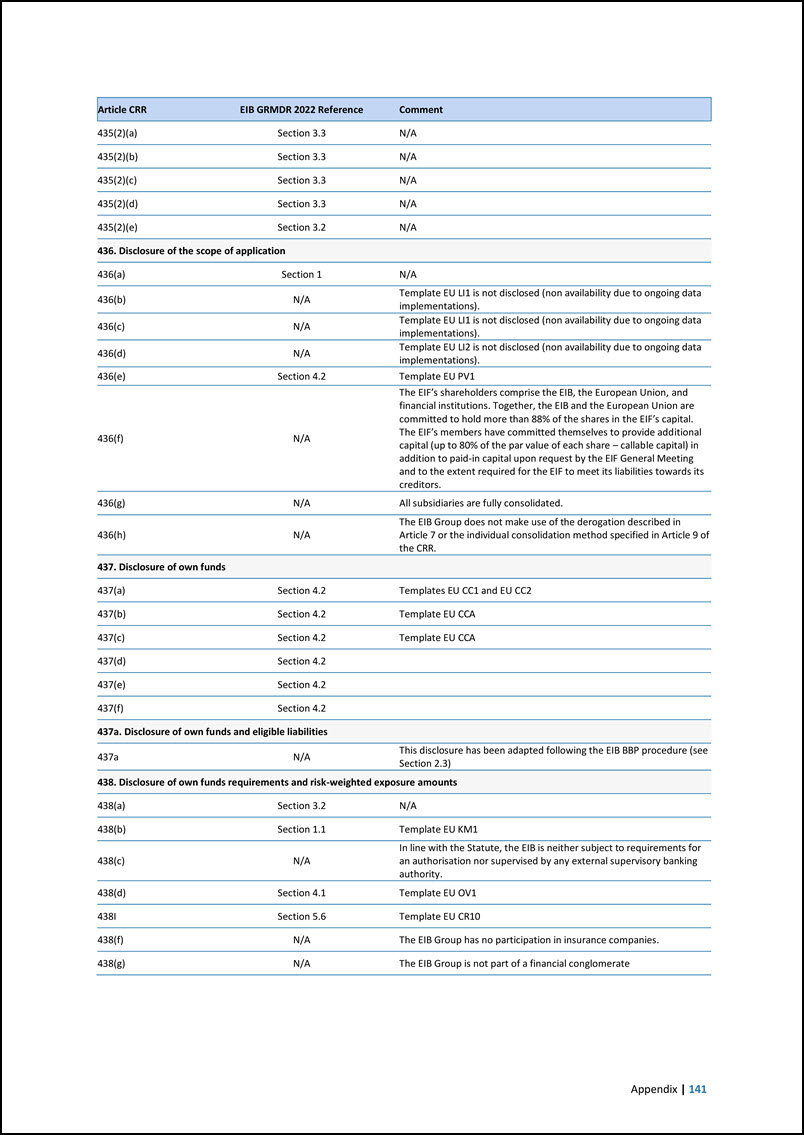
Appendix | 141 Article CRR EIB GRMDR 2022 Reference Comment 435(2)(a) Section 3.3 N/A 435(2)(b) Section 3.3 N/A 435(2)(c) Section 3.3 N/A 435(2)(d) Section 3.3 N/A 435(2)(e) Section 3.2 N/A 436. Disclosure of the scope of application 436(a) Section 1 N/A Template EU LI1 is not disclosed (non availability due to ongoing data implementations). Template EU LI1 is not disclosed (non availability due to ongoing data implementations). Template EU LI2 is not disclosed (non availability due to ongoing data implementations). 436(b) N/A 436(c) N/A 436(d) N/A 436(e) Section 4.2 Template EU PV1 436(f) N/A The EIF’s shareholders comprise the EIB, the European Union, and financial institutions. Together, the EIB and the European Union are committed to hold more than 88% of the shares in the EIF’s capital. The EIF’s members have committed themselves to provide additional capital (up to 80% of the par value of each share – callable capital) in addition to paid-in capital upon request by the EIF General Meeting and to the extent required for the EIF to meet its liabilities towards its creditors. 436(g) N/A All subsidiaries are fully consolidated. 436(h) N/A The EIB Group does not make use of the derogation described in Article 7 or the individual consolidation method specified in Article 9 of the CRR. 437. Disclosure of own funds 437(a) Section 4.2 Templates EU CC1 and EU CC2 437(b) Section 4.2 Template EU CCA 437(c) Section 4.2 Template EU CCA 437(d) Section 4.2 437(e) Section 4.2 437(f) Section 4.2 437a. Disclosure of own funds and eligible liabilities 437a N/A This disclosure has been adapted following the EIB BBP procedure (see Section 2.3) 438. Disclosure of own funds requirements and risk-weighted exposure amounts 438(a) Section 3.2 N/A 438(b) Section 1.1 Template EU KM1 438(c) N/A In line with the Statute, the EIB is neither subject to requirements for an authorisation nor supervised by any external supervisory banking authority. 438(d) Section 4.1 Template EU OV1 438I Section 5.6 Template EU CR10 438(f) N/A The EIB Group has no participation in insurance companies. 438(g) N/A The EIB Group is not part of a financial conglomerate
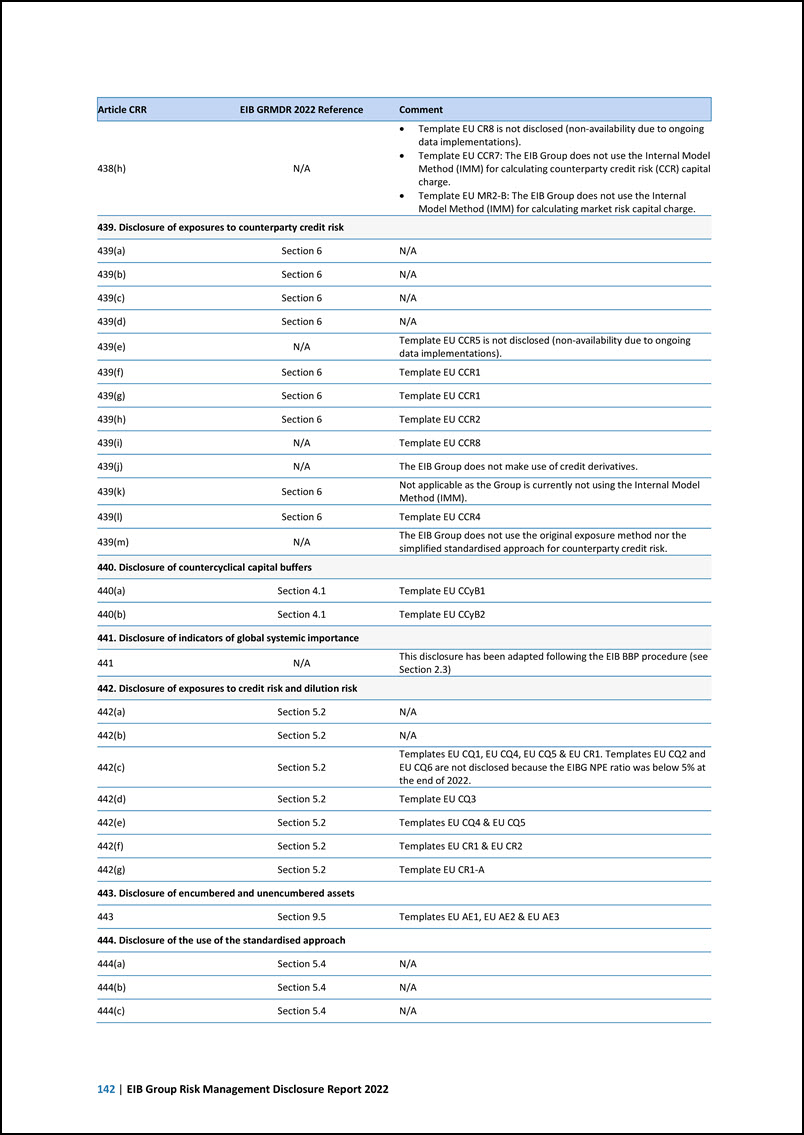
142 | EIB Group Risk Management Disclosure Report 2022 Article CRR EIB GRMDR 2022 Reference Comment Template EU CR8 is not disclosed (non-availability due to ongoing data implementations). Template EU CCR7: The EIB Group does not use the Internal Model 438(h) N/A Method (IMM) for calculating counterparty credit risk (CCR) capital charge. Template EU MR2-B: The EIB Group does not use the Internal Model Method (IMM) for calculating market risk capital charge. 439. Disclosure of exposures to counterparty credit risk 439(a) Section 6 N/A 439(b) Section 6 N/A 439(c) Section 6 N/A 439(d) Section 6 N/A 439(e) N/A Template EU CCR5 is not disclosed (non-availability due to ongoing data implementations). 439(f) Section 6 Template EU CCR1 439(g) Section 6 Template EU CCR1 439(h) Section 6 Template EU CCR2 439(i) N/A Template EU CCR8 439(j) N/A The EIB Group does not make use of credit derivatives. 439(k) Section 6 Not applicable as the Group is currently not using the Internal Model Method (IMM). 439(l) Section 6 Template EU CCR4 439(m) N/A The EIB Group does not use the original exposure method nor the simplified standardised approach for counterparty credit risk. 440. Disclosure of countercyclical capital buffers 440(a) Section 4.1 Template EU CCyB1 440(b) Section 4.1 Template EU CCyB2 441. Disclosure of indicators of global systemic importance 441 N/A This disclosure has been adapted following the EIB BBP procedure (see Section 2.3) 442. Disclosure of exposures to credit risk and dilution risk 442(a) Section 5.2 N/A 442(b) Section 5.2 N/A 442(c) Section 5.2 Templates EU CQ1, EU CQ4, EU CQ5 & EU CR1. Templates EU CQ2 and EU CQ6 are not disclosed because the EIBG NPE ratio was below 5% at the end of 2022. 442(d) Section 5.2 Template EU CQ3 442(e) Section 5.2 Templates EU CQ4 & EU CQ5 442(f) Section 5.2 Templates EU CR1 & EU CR2 442(g) Section 5.2 Template EU CR1-A Templates EU AE1, EU AE2 & EU AE3 443. Disclosure of encumbered and unencumbered assets 443 Section 9.5 444. Disclosure of the use of the standardised approach 444(a) Section 5.4 N/A 444(b) Section 5.4 N/A 444(c) Section 5.4 N/A
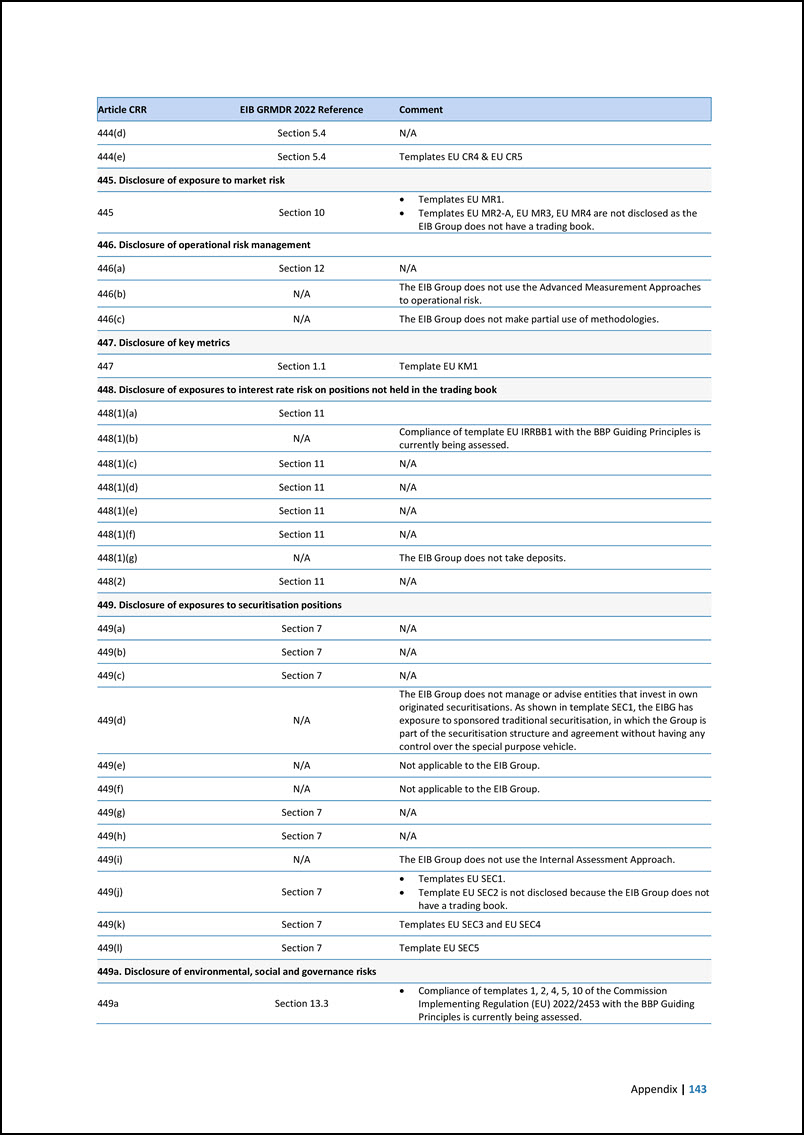
Appendix | 143 Article CRR EIB GRMDR 2022 Reference Comment 444(d) Section 5.4 N/A 444(e) Section 5.4 Templates EU CR4 & EU CR5 445. Disclosure of exposure to market risk Templates EU MR1. Templates EU MR2-A, EU MR3, EU MR4 are not disclosed as the EIB Group does not have a trading book. 445 Section 10 446. Disclosure of operational risk management 446(a) Section 12 N/A 446(b) N/A The EIB Group does not use the Advanced Measurement Approaches to operational risk. 446(c) N/A The EIB Group does not make partial use of methodologies. 447. Disclosure of key metrics 447 Section 1.1 Template EU KM1 448. Disclosure of exposures to interest rate risk on positions not held in the trading book 448(1)(a) Section 11 448(1)(b) N/A Compliance of template EU IRRBB1 with the BBP Guiding Principles is currently being assessed. 448(1)(c) Section 11 N/A 448(1)(d) Section 11 N/A 448(1)(e) Section 11 N/A 448(1)(f) Section 11 N/A 448(1)(g) N/A The EIB Group does not take deposits. 448(2) Section 11 N/A 449. Disclosure of exposures to securitisation positions 449(a) Section 7 N/A 449(b) Section 7 N/A 449(c) Section 7 N/A The EIB Group does not manage or advise entities that invest in own originated securitisations. As shown in template SEC1, the EIBG has 449(d) N/A exposure to sponsored traditional securitisation, in which the Group is part of the securitisation structure and agreement without having any control over the special purpose vehicle. 449(e) N/A Not applicable to the EIB Group. 449(f) N/A Not applicable to the EIB Group. 449(g) Section 7 N/A 449(h) Section 7 N/A 449(i) N/A The EIB Group does not use the Internal Assessment Approach. 449(j) Section 7 Templates EU SEC1. Template EU SEC2 is not disclosed because the EIB Group does not have a trading book. 449(k) Section 7 Templates EU SEC3 and EU SEC4 449(l) Section 7 Template EU SEC5 449a. Disclosure of environmental, social and governance risks 449a Section 13.3 Compliance of templates 1, 2, 4, 5, 10 of the Commission Implementing Regulation (EU) 2022/2453 with the BBP Guiding Principles is currently being assessed.
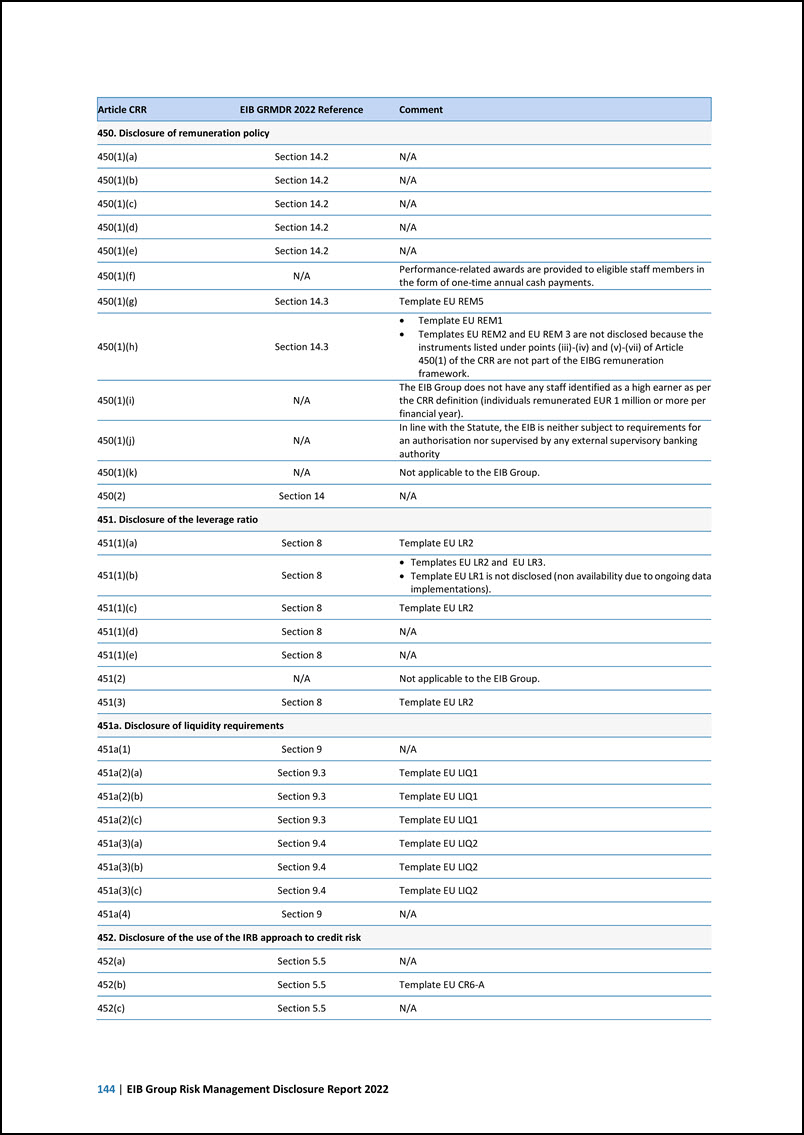
144 | EIB Group Risk Management Disclosure Report 2022 Article CRR EIB GRMDR 2022 Reference Comment 450. Disclosure of remuneration policy 450(1)(a) Section 14.2 N/A 450(1)(b) Section 14.2 N/A 450(1)(c) Section 14.2 N/A 450(1)(d) Section 14.2 N/A 450(1)(e) Section 14.2 N/A 450(1)(f) N/A Performance-related awards are provided to eligible staff members in the form of one-time annual cash payments. 450(1)(g) Section 14.3 Template EU REM5 Template EU REM1 Templates EU REM2 and EU REM 3 are not disclosed because the 450(1)(h) Section 14.3 instruments listed under points (iii)-(iv) and (v)-(vii) of Article 450(1) of the CRR are not part of the EIBG remuneration framework. The EIB Group does not have any staff identified as a high earner as per 450(1)(i) N/A the CRR definition (individuals remunerated EUR 1 million or more per financial year). In line with the Statute, the EIB is neither subject to requirements for 450(1)(j) N/A an authorisation nor supervised by any external supervisory banking authority 450(1)(k) N/A Not applicable to the EIB Group. 450(2) Section 14 N/A 451. Disclosure of the leverage ratio 451(1)(a) Section 8 Template EU LR2 451(1)(b) Section 8 Templates EU LR2 and EU LR3. Template EU LR1 is not disclosed (non availability due to ongoing data implementations). 451(1)(c) Section 8 Template EU LR2 451(1)(d) Section 8 N/A 451(1)(e) Section 8 N/A 451(2) N/A Not applicable to the EIB Group. 451(3) Section 8 Template EU LR2 451a. Disclosure of liquidity requirements 451a(1) Section 9 N/A 451a(2)(a) Section 9.3 Template EU LIQ1 451a(2)(b) Section 9.3 Template EU LIQ1 451a(2)(c) Section 9.3 Template EU LIQ1 451a(3)(a) Section 9.4 Template EU LIQ2 451a(3)(b) Section 9.4 Template EU LIQ2 451a(3)(c) Section 9.4 Template EU LIQ2 451a(4) Section 9 N/A 452. Disclosure of the use of the IRB approach to credit risk 452(a) Section 5.5 N/A 452(b) Section 5.5 Template EU CR6-A 452(c) Section 5.5 N/A

Appendix | 145 Article CRR EIB GRMDR 2022 Reference Comment 452(d) Section 5.5 N/A 452(e) Section 5.5 N/A 452(f) Section 5.5 N/A 452(g) Section 5.5 Template EU CR6 452(h) Section 5.5 Template EU CR9 453. Disclosure of the use of credit risk mitigation techniques 453(a) Section 5.3 N/A 453(b) Section 5.3 N/A 453(c) Section 5.3 N/A 453(d) Section 5.3 N/A 453(e) Section 5.3 N/A 453(f) N/A Template EU CR3 is not disclosed (non-availability due to ongoing data implementations). 453(g) Sections 5.4 & 5.5 Templates EU CR4 and EU CR7-A 453(h) Section 5.4 Template EU CR4 453(i) Section 5.4 Template EU CR4 453(j) Section 5.5 Template EU CR7 454. Disclosure of the use of the Advanced Measurement Approaches to operational risk 454 N/A The EIB Group does not use the Advanced Measurement Approaches to operational risk. 455. Use of internal market risk models 455 N/A The EIB Group does not have a trading book.
European Investment Bank Group Risk Management Disclosure Report 2022 European Investment Bank 98 -100, boulevard Konrad Adenauer L-2950 Luxembourg +352 4379-22000 www.eib.org – info@eib.org © European Investment Bank, 07/2023 EN 2023-0068