Exhibit XXV
June 2024 European Investment Bank Group Risk Management Disclosure Report European Investment Bank Group
June 2024 European Investment Bank Group Risk Management Disclosure Report European Investment Bank | Group

June 2024 European Investment Bank Group – Risk Management Disclosure Report © European Investment Bank, 2024. All rights reserved. All questions on rights and licensing should be addressed to publications@eib.org. European Investment Bank 98 -100, boulevard Konrad Adenauer L-2950 Luxembourg For further information on the EIB’s activities, please consult our website, www.eib.org. For further information on the EIF’s activities, please consult our website, www.eif.org You can also contact our Info Desk, info@eib.org. Get our e-newsletter at www.eib.org/sign-up. Published by the European Investment Bank. Disclaimer The information presented in this report has not been subject to external audit. Printed on FSC® Paper.
Table of contents 1 Introduction 1 1.1 Regulatory framework and basis of preparation 1 1.2 Key risk metrics 2 2 Capital adequacy and risk-weighted exposure amounts 4 2.1 Capital requirements 4 2.2 Own funds 8 3 Credit risk 14 3.1 Credit risk quality 14 3.2 Use of the standardised approach 20 3.3 Use of the Internal Ratings Based Approach 22 3.4 Equity risk 32 4 Counterparty credit risk 33 5 Securitisation 38 6 Leverage ratio 42 7 Liquidity risk 45 7.1 Liquidity coverage ratio (LCR) 45 7.2 Net stable funding ratio (NSFR 48 8 Market risk 50 9 Interest rate risk in the banking book 51 10 Climate risk 52 11 Appendix 57 11.1 Appendix I — Extent and frequency of disclosures 57 11.2 Appendix II — Abbreviations 59
1 Introduction 1.1 Regulatory framework and basis of preparation The EIB Group (the ‘EIBG’ or the ‘Group’) does not fall within the scope of application of the European Union (EU)’s legislation applicable to credit institutions, in particular the Capital Requirements Directive and Regulation (Directive 2013/36/EU or ‘CRD’, Regulation 575/2013 or ‘CRR’, as amended from time to time, commonly referred to as the ‘CRD/CRR package’), being the EU legal framework binding on credit institutions, financial holding companies and mixed financial holding companies. The EIB, therefore, is not legally obliged to meet the requirements of the above-mentioned Directive and Regulation. However, reflecting its statutory duty to conform with best banking practice (BBP), the EIB aims to comply both at individual and consolidated level with relevant EU banking legislative acts and guidelines, to the extent determined by its competent governing bodies and in line with the BBP Guiding Principles approved. Following on from the above, the June 2024 EIB Group Risk Management Disclosure Report (the ‘GRMDR’ or the ‘Report’) has been prepared in line with the prudential disclosure requirements as set out in Articles 431 to 455 of Part Eight of CRR1 and the related technical standards, guidelines and opinions of the European Banking Authority (‘EBA’) deemed applicable to the EIB as BBP. These disclosure requirements and the corresponding European Commission Implementing Regulation2 constitute a fundamental review of regulators’ strategy on banks’ Pillar III disclosures3. 1 Part Eight (Articles 431 to 455) of Regulation (EU) No 575/2013 of the European Parliament and of the Council, of 26 June 2013 (CRR), as subsequently amended, notably by Regulation (EU) 2019/876 of the European Parliament and of the Council, of 20 May 2019. 2 (i) Commission Implementing Regulation 2021/637 of 15 March 2021 laying down implementing technical standards with regard to public disclosures by institutions of the information referred to in Titles II and III of Part Eight of Regulation (EU) No 575/2013 of the European Parliament and of the Council and repealing Commission Implementing Regulation (EU) No 1423/2013, Commission Delegated Regulation (EU) 2015/1555, Commission Implementing Regulation (EU) 2016/200 and Commission Delegated Regulation (EU) 2017/2295 (based on EBA/ITS/2020/04), as amended by Commission Implementing Regulations (EU) 2021/1018 of 22 June 2021, (EU) 2022/631 of 13 April 2022, and (EU) 2022/2453 of 30 November 2022. . (ii) Commission Implementing Regulation (EU) 2022/631 of 13 April 2022 amending the implementing technical standards laid down in the Implementing Regulation (EU) 2021/637 as regards the disclosure of exposures to interest rate risk on positions not held in the trading book (based on EBA/ITS/2021/07); and (iii) Commission Implementing Regulation (EU) 2022/2453 of 30 November 2022 amending the implementing technical standards laid down in Implementing Regulation (EU) 2021/637 as regards the disclosure of environmental, social and governance risks (based on EBA/ITS/2022/01), jointly also referred to in the current report as “EBA ITS”. 3 The disclosure report in the context of the Basel Framework is also referred to as “Pillar III”, representing the third Basel pillar based on market discipline. Further, in this edition of the report, disclosures reflect the non-applicability of certain templates, as described in Appendix 11.1, in line with the EIB’s specificities as an EU body and supranational institution pursuant to the Treaty on the Functioning of the European Union. Accordingly, the EIB Group’s disclosures are not fully comparable to those published by EU credit institutions, financial holding companies and mixed financial holding companies, directly within the subjective scope of the CRD/CRR banking package. The EIBG consists of the European Investment Bank (the ‘EIB’ or the ‘Bank’) and the European Investment Fund (the ‘EIF’ or the ‘Fund’). For a more detailed overview of the Group entities, scope of consolidation, criteria, means and policies underlying the disclosures please refer to the December 2023 GRMDR available on the EIB website. The information provided in this report is unaudited. Due to rounding, numbers presented throughout this document may not add up precisely to the totals provided and percentages may not precisely reflect the absolute figures. Introduction | 1
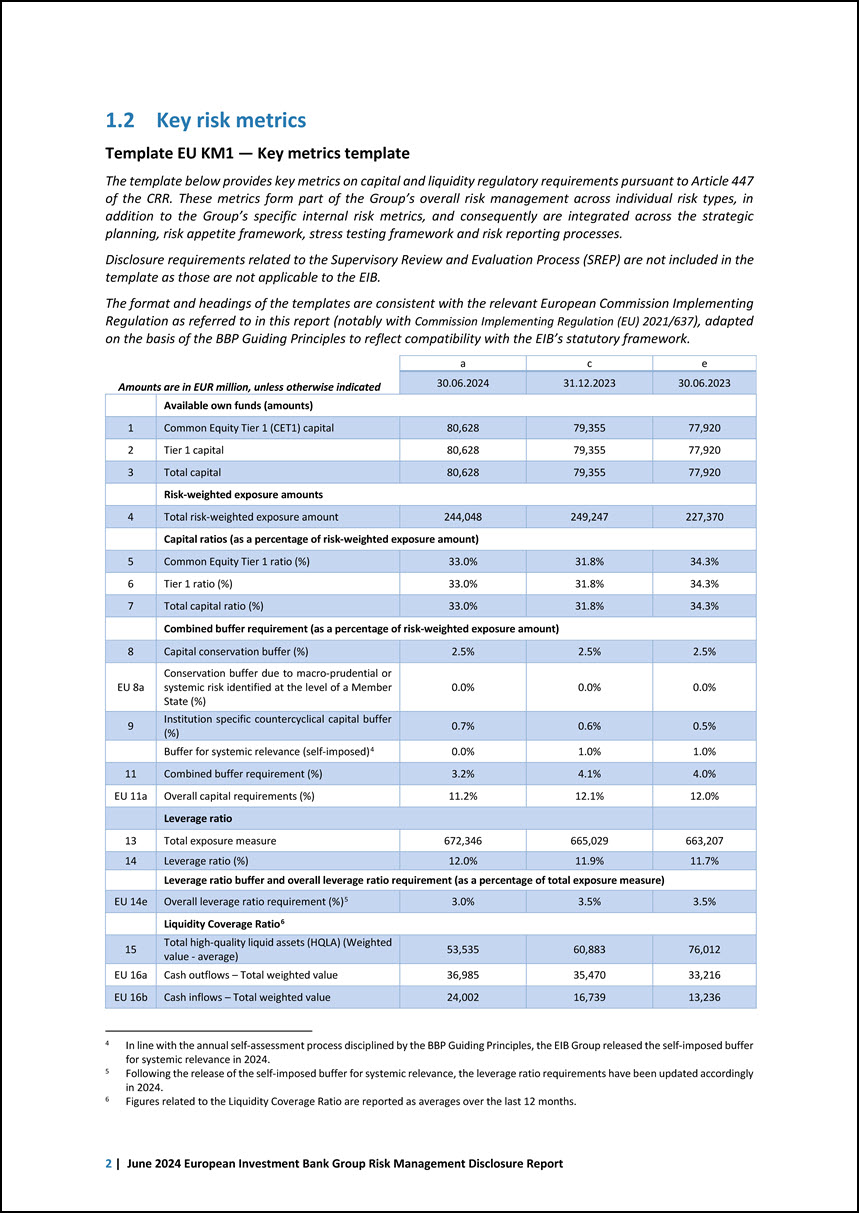
1.2 Key risk metrics Template EU KM1 — Key metrics template The template below provides key metrics on capital and liquidity regulatory requirements pursuant to Article 447 of the CRR. These metrics form part of the Group’s overall risk management across individual risk types, in addition to the Group’s specific internal risk metrics, and consequently are integrated across the strategic planning, risk appetite framework, stress testing framework and risk reporting processes. Disclosure requirements related to the Supervisory Review and Evaluation Process (SREP) are not included in the template as those are not applicable to the EIB. The format and headings of the templates are consistent with the relevant European Commission Implementing Regulation as referred to in this report (notably with Commission Implementing Regulation (EU) 2021/637), adapted on the basis of the BBP Guiding Principles to reflect compatibility with the EIB’s statutory framework. 4 Amounts are in EUR million, unless otherwise indicated a c e 30.06.2024 31.12.2023 30.06.2023 Available own funds (amounts) 1 Common Equity Tier 1 (CET1) capital 80,628 79,355 77,920 2 Tier 1 capital 80,628 79,355 77,920 3 Total capital 80,628 79,355 77,920 Risk-weighted exposure amounts 4 Total risk-weighted exposure amount 244,048 249,247 227,370 Capital ratios (as a percentage of risk-weighted exposure amount) 5 Common Equity Tier 1 ratio (%) 33.0% 31.8% 34.3% 6 Tier 1 ratio (%) 33.0% 31.8% 34.3% 7 Total capital ratio (%) 33.0% 31.8% 34.3% Combined buffer requirement (as a percentage of risk-weighted exposure amount) 8 Capital conservation buffer (%) 2.5% 2.5% 2.5% EU 8a Conservation buffer due to macro-prudential or systemic risk identified at the level of a Member State (%) 0.0% 0.0% 0.0% 9 Institution specific countercyclical capital buffer (%) 0.7% 0.6% 0.5% Buffer for systemic relevance (self-imposed)4 0.0% 1.0% 1.0% 11 Combined buffer requirement (%) 3.2% 4.1% 4.0% EU 11a Overall capital requirements (%) 11.2% 12.1% 12.0% Leverage ratio 13 Total exposure measure 672,346 665,029 663,207 14 Leverage ratio (%) 12.0% 11.9% 11.7% Leverage ratio buffer and overall leverage ratio requirement (as a percentage of total exposure measure) EU 14e Overall leverage ratio requirement (%)5 3.0% 3.5% 3.5% Liquidity Coverage Ratio6 15 Total high-quality liquid assets (HQLA) (Weighted value - average) 53,535 60,883 76,012 EU 16a Cash outflows – Total weighted value 36,985 35,470 33,216 EU 16b Cash inflows – Total weighted value 24,002 16,739 13,236 In line with the annual self-assessment process disciplined by the BBP Guiding Principles, the EIB Group released the self-imposed buffer for systemic relevance in 2024. Following the release of the self-imposed buffer for systemic relevance, the leverage ratio requirements have been updated accordingly in 2024. Figures related to the Liquidity Coverage Ratio are reported as averages over the last 12 months. 5 6 2 | June 2024 European Investment Bank Group Risk Management Disclosure Report
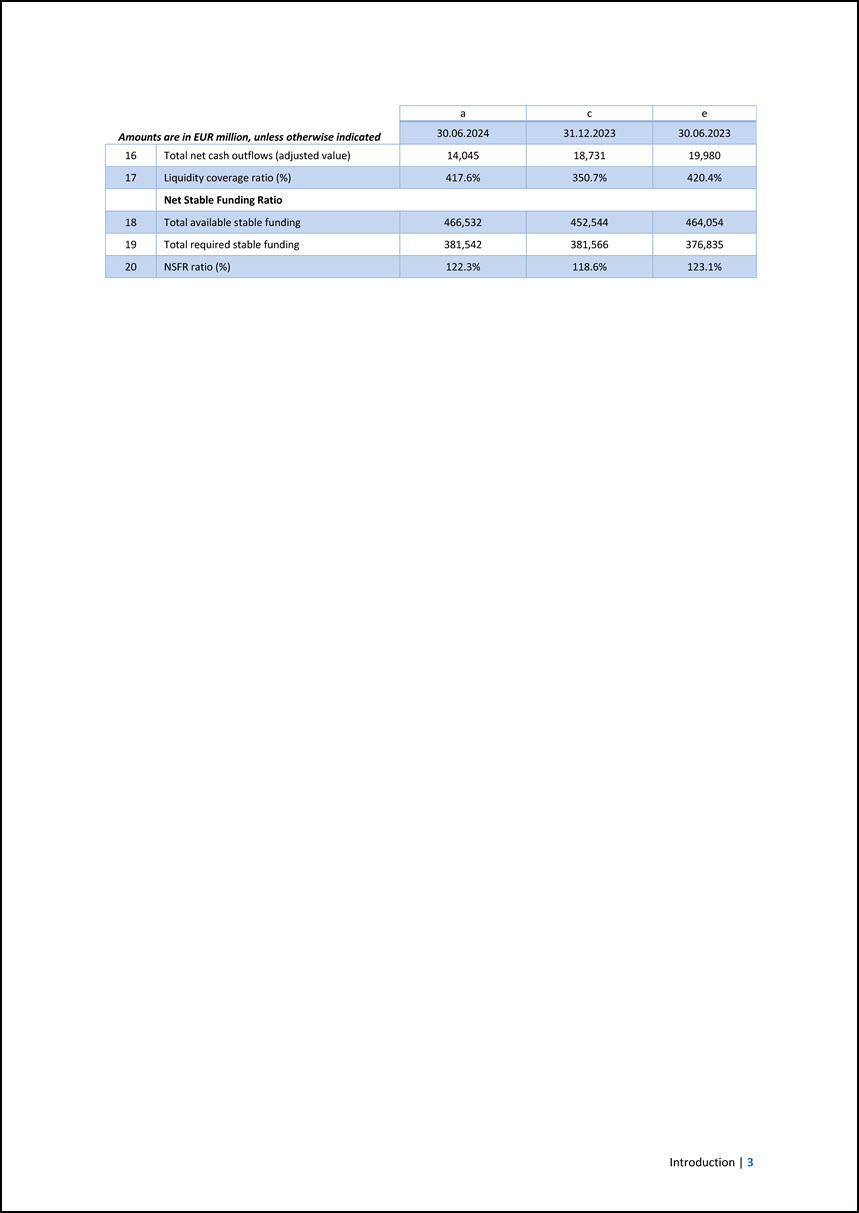
a c e Amounts are in EUR million, unless otherwise indicated 30.06.2024 31.12.2023 30.06.2023 16 Total net cash outflows (adjusted value) 14,045 18,731 19,980 17 Liquidity coverage ratio (%) 417.6% 350.7% 420.4% Net Stable Funding Ratio 18 Total available stable funding 466,532 452,544 464,054 19 Total required stable funding 381,542 381,566 376,835 20 NSFR ratio (%) 122.3% 118.6% 123.1% Introduction | 3
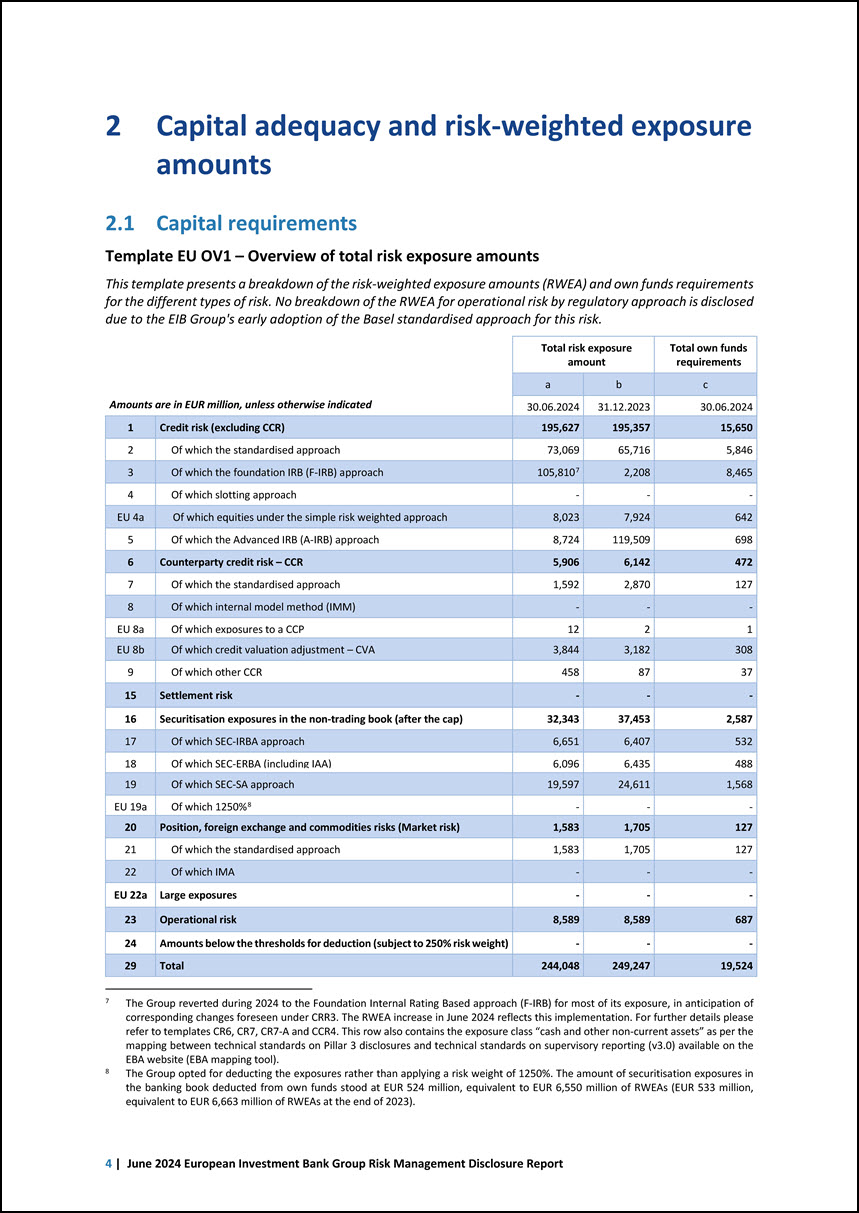
2 Capital adequacy and risk-weighted exposure amounts 2.1 Capital requirements Template EU OV1 – Overview of total risk exposure amounts This template presents a breakdown of the risk-weighted exposure amounts (RWEA) and own funds requirements for the different types of risk. No breakdown of the RWEA for operational risk by regulatory approach is disclosed due to the EIB Group’s early adoption of the Basel standardised approach for this risk. Amounts are in EUR million, unless otherwise indicated Total risk exposure amount Total own funds requirements a b c 30.06.2024 31.12.2023 30.06.2024 1 Credit risk (excluding CCR) 195,627 195,357 15,650 2 Of which the standardised approach 73,069 65,716 5,846 3 Of which the foundation IRB (F-IRB) approach 105,8107 2,208 8,465 4 Of which slotting approach - - - EU 4a Of which equities under the simple risk weighted approach 8,023 7,924 642 5 Of which the Advanced IRB (A-IRB) approach 8,724 119,509 698 6 Counterparty credit risk – CCR 5,906 6,142 472 7 Of which the standardised approach 1,592 2,870 127 8 Of which internal model method (IMM) - - - EU 8a Of which exposures to a CCP 12 2 1 EU 8b Of which credit valuation adjustment – CVA 3,844 3,182 308 9 Of which other CCR 458 87 37 15 Settlement risk - - - 16 Securitisation exposures in the non-trading book (after the cap) 32,343 37,453 2,587 17 Of which SEC-IRBA approach 6,651 6,407 532 18 Of which SEC-ERBA (including IAA) 6,096 6,435 488 19 Of which SEC-SA approach 19,597 24,611 1,568 EU 19a Of which 1250%8 - - - 20 Position, foreign exchange and commodities risks (Market risk) 1,583 1,705 127 21 Of which the standardised approach 1,583 1,705 127 22 Of which IMA - - - EU 22a Large exposures - - - 23 Operational risk 8,589 8,589 687 24 Amounts below the thresholds for deduction (subject to 250% risk weight) - - - 29 Total 244,048 249,247 19,524 7 The Group reverted during 2024 to the Foundation Internal Rating Based approach (F-IRB) for most of its exposure, in anticipation of corresponding changes foreseen under CRR3. The RWEA increase in June 2024 reflects this implementation. For further details please refer to templates CR6, CR7, CR7-A and CCR4. This row also contains the exposure class “cash and other non-current assets” as per the mapping between technical standards on Pillar 3 disclosures and technical standards on supervisory reporting (v3.0) available on the EBA website (EBA mapping tool). 8 The Group opted for deducting the exposures rather than applying a risk weight of 1250%. The amount of securitisation exposures in the banking book deducted from own funds stood at EUR 524 million, equivalent to EUR 6,550 million of RWEAs (EUR 533 million, equivalent to EUR 6,663 million of RWEAs at the end of 2023). 4 | June 2024 European Investment Bank Group Risk Management Disclosure Report
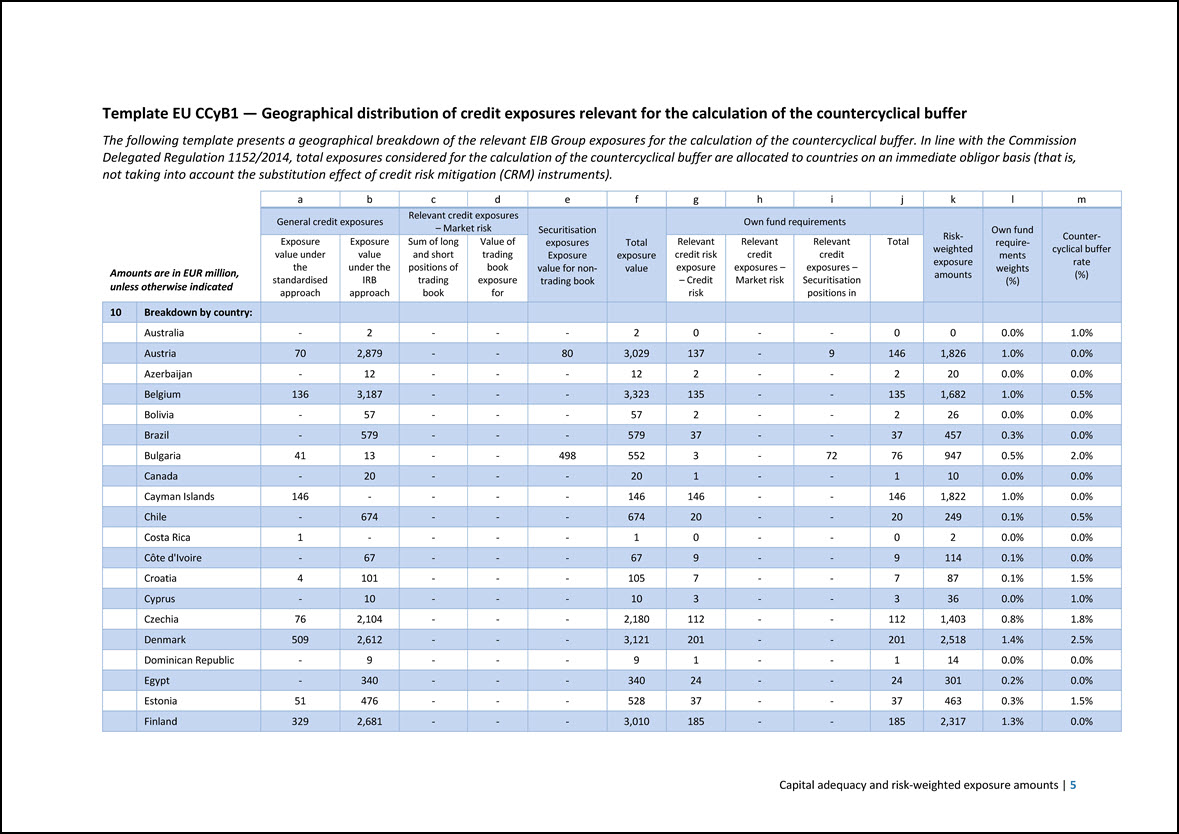
Template EU CCyB1 — Geographical distribution of credit exposures relevant for the calculation of the countercyclical buffer The following template presents a geographical breakdown of the relevant EIB Group exposures for the calculation of the countercyclical buffer. In line with the Commission Delegated Regulation 1152/2014, total exposures considered for the calculation of the countercyclical buffer are allocated to countries on an immediate obligor basis (that is, not taking into account the substitution effect of credit risk mitigation (CRM) instruments). Amounts are in EUR million, unless otherwise indicated a b c d e f g h i j k l m General credit exposures Relevant credit exposures – Market risk Securitisation exposures Exposure value for nontrading book Total exposure value Own fund requirements Risk- weighted exposure amounts Own fund requirements weights (%) Countercyclical buffer rate (%) Exposure value under the standardised approach Exposure value under the IRB approach Sum of long and short positions of trading book Value of trading book exposure for Relevant credit risk exposure – Credit risk Relevant credit exposures – Market risk Relevant credit exposures – Securitisation positions in Total 10 Breakdown by country: Australia - 2 - - - 2 0 - - 0 0 0.0% 1.0% Austria 70 2,879 - - 80 3,029 137 - 9 146 1,826 1.0% 0.0% Azerbaijan - 12 - - - 12 2 - - 2 20 0.0% 0.0% Belgium 136 3,187 - - - 3,323 135 - - 135 1,682 1.0% 0.5% Bolivia - 57 - - - 57 2 - - 2 26 0.0% 0.0% Brazil - 579 - - - 579 37 - - 37 457 0.3% 0.0% Bulgaria 41 13 - - 498 552 3 - 72 76 947 0.5% 2.0% Canada - 20 - - - 20 1 - - 1 10 0.0% 0.0% Cayman Islands 146 - - - - 146 146 - - 146 1,822 1.0% 0.0% Chile - 674 - - - 674 20 - - 20 249 0.1% 0.5% Costa Rica 1 - - - - 1 0 - - 0 2 0.0% 0.0% Côte d’Ivoire - 67 - - - 67 9 - - 9 114 0.1% 0.0% Croatia 4 101 - - - 105 7 - - 7 87 0.1% 1.5% Cyprus - 10 - - - 10 3 - - 3 36 0.0% 1.0% Czechia 76 2,104 - - - 2,180 112 - - 112 1,403 0.8% 1.8% Denmark 509 2,612 - - - 3,121 201 - - 201 2,518 1.4% 2.5% Dominican Republic - 9 - - - 9 1 - - 1 14 0.0% 0.0% Egypt - 340 - - - 340 24 - - 24 301 0.2% 0.0% Estonia 51 476 - - - 528 37 - - 37 463 0.3% 1.5% Finland 329 2,681 - - - 3,010 185 - - 185 2,317 1.3% 0.0% Capital adequacy and risk-weighted exposure amounts | 5
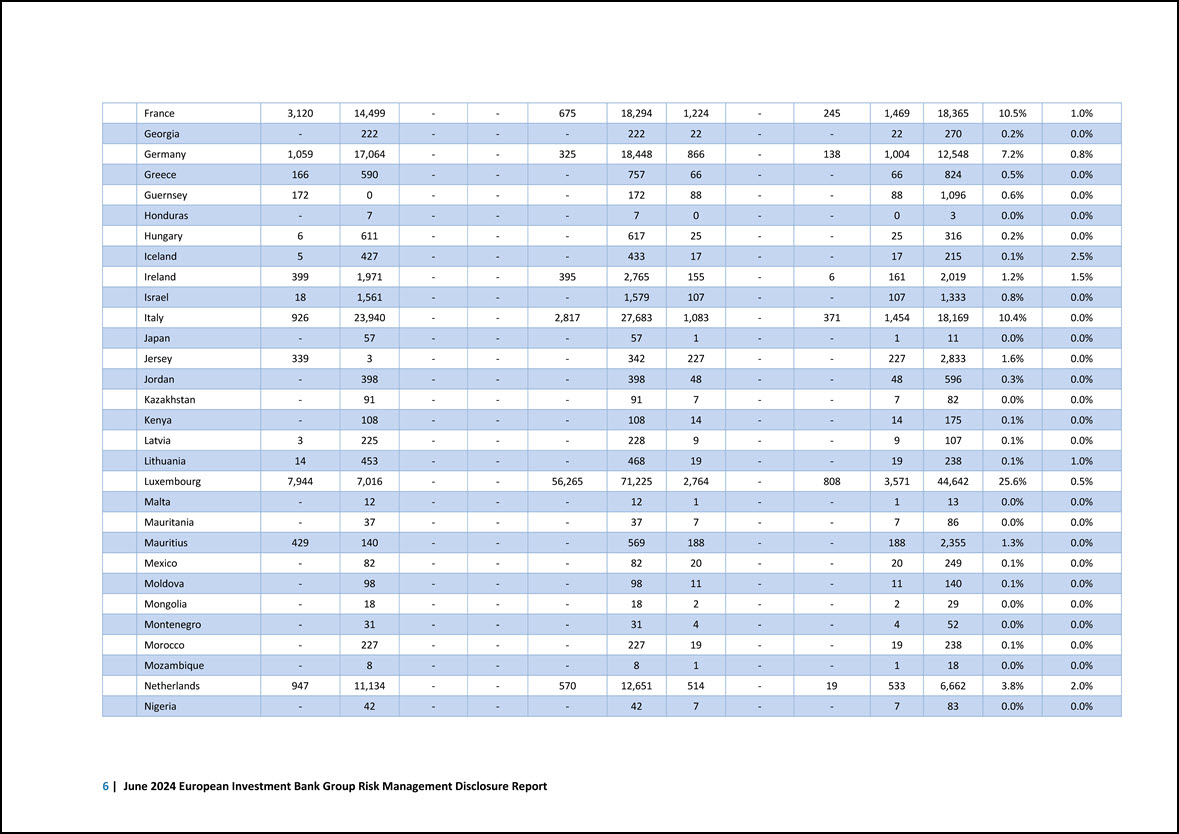
France 3,120 14,499 - - 675 18,294 1,224 - 245 1,469 18,365 10.5% 1.0% Georgia - 222 - - - 222 22 - - 22 270 0.2% 0.0% Germany 1,059 17,064 - - 325 18,448 866 - 138 1,004 12,548 7.2% 0.8% Greece 166 590 - - - 757 66 - - 66 824 0.5% 0.0% Guernsey 172 0 - - - 172 88 - - 88 1,096 0.6% 0.0% Honduras - 7 - - - 7 0 - - 0 3 0.0% 0.0% Hungary 6 611 - - - 617 25 - - 25 316 0.2% 0.0% Iceland 5 427 - - - 433 17 - - 17 215 0.1% 2.5% Ireland 399 1,971 - - 395 2,765 155 - 6 161 2,019 1.2% 1.5% Israel 18 1,561 - - - 1,579 107 - - 107 1,333 0.8% 0.0% Italy 926 23,940 - - 2,817 27,683 1,083 - 371 1,454 18,169 10.4% 0.0% Japan - 57 - - - 57 1 - - 1 11 0.0% 0.0% Jersey 339 3 - - - 342 227 - - 227 2,833 1.6% 0.0% Jordan - 398 - - - 398 48 - - 48 596 0.3% 0.0% Kazakhstan - 91 - - - 91 7 - - 7 82 0.0% 0.0% Kenya - 108 - - - 108 14 - - 14 175 0.1% 0.0% Latvia 3 225 - - - 228 9 - - 9 107 0.1% 0.0% Lithuania 14 453 - - - 468 19 - - 19 238 0.1% 1.0% Luxembourg 7,944 7,016 - - 56,265 71,225 2,764 - 808 3,571 44,642 25.6% 0.5% Malta - 12 - - - 12 1 - - 1 13 0.0% 0.0% Mauritania - 37 - - - 37 7 - - 7 86 0.0% 0.0% Mauritius 429 140 - - - 569 188 - - 188 2,355 1.3% 0.0% Mexico - 82 - - - 82 20 - - 20 249 0.1% 0.0% Moldova - 98 - - - 98 11 - - 11 140 0.1% 0.0% Mongolia - 18 - - - 18 2 - - 2 29 0.0% 0.0% Montenegro - 31 - - - 31 4 - - 4 52 0.0% 0.0% Morocco - 227 - - - 227 19 - - 19 238 0.1% 0.0% Mozambique - 8 - - - 8 1 - - 1 18 0.0% 0.0% Netherlands 947 11,134 - - 570 12,651 514 - 19 533 6,662 3.8% 2.0% Nigeria - 42 - - - 42 7 - - 7 83 0.0% 0.0% 6 | June 2024 European Investment Bank Group Risk Management Disclosure Report
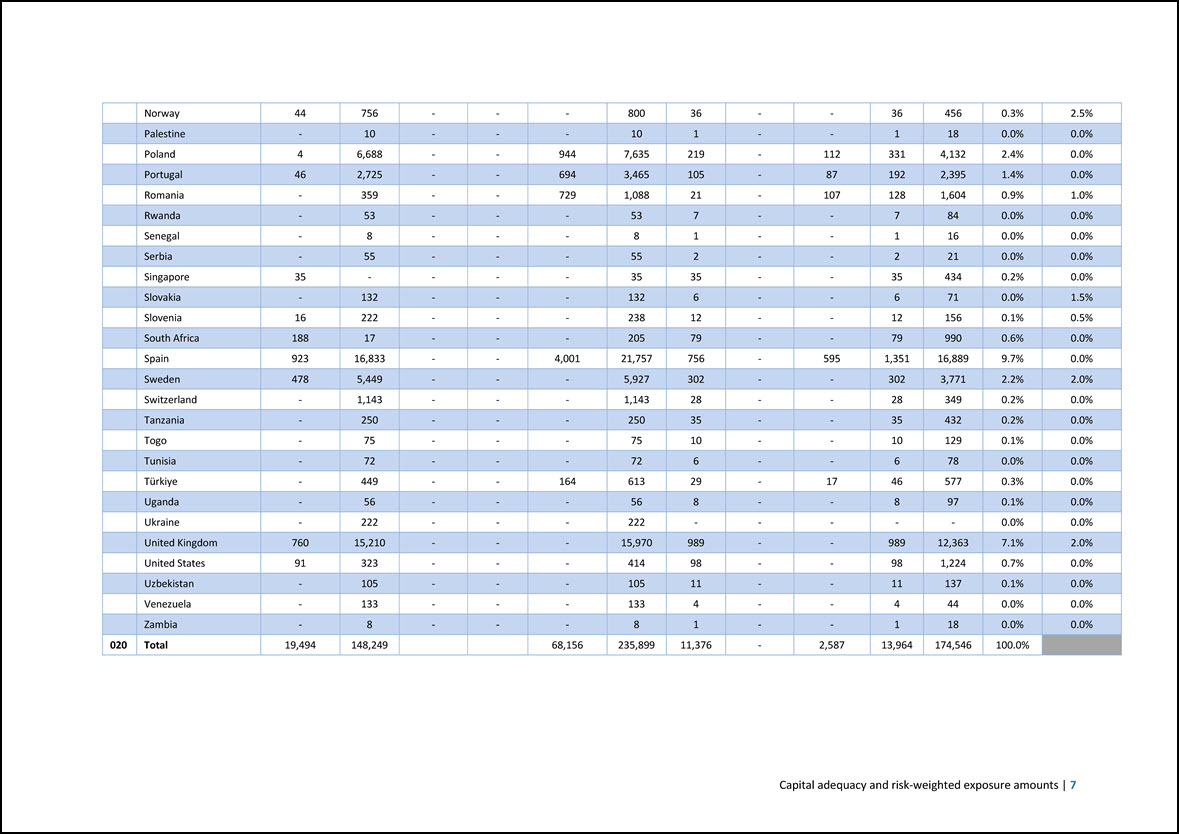
Norway 44 756 - - - 800 36 - - 36 456 0.3% 2.5% Palestine - 10 - - - 10 1 - - 1 18 0.0% 0.0% Poland 4 6,688 - - 944 7,635 219 - 112 331 4,132 2.4% 0.0% Portugal 46 2,725 - - 694 3,465 105 - 87 192 2,395 1.4% 0.0% Romania - 359 - - 729 1,088 21 - 107 128 1,604 0.9% 1.0% Rwanda - 53 - - - 53 7 - - 7 84 0.0% 0.0% Senegal - 8 - - - 8 1 - - 1 16 0.0% 0.0% Serbia - 55 - - - 55 2 - - 2 21 0.0% 0.0% Singapore 35 - - - - 35 35 - - 35 434 0.2% 0.0% Slovakia - 132 - - - 132 6 - - 6 71 0.0% 1.5% Slovenia 16 222 - - - 238 12 - - 12 156 0.1% 0.5% South Africa 188 17 - - - 205 79 - - 79 990 0.6% 0.0% Spain 923 16,833 - - 4,001 21,757 756 - 595 1,351 16,889 9.7% 0.0% Sweden 478 5,449 - - - 5,927 302 - - 302 3,771 2.2% 2.0% Switzerland - 1,143 - - - 1,143 28 - - 28 349 0.2% 0.0% Tanzania - 250 - - - 250 35 - - 35 432 0.2% 0.0% Togo - 75 - - - 75 10 - - 10 129 0.1% 0.0% Tunisia - 72 - - - 72 6 - - 6 78 0.0% 0.0% Türkiye - 449 - - 164 613 29 - 17 46 577 0.3% 0.0% Uganda - 56 - - - 56 8 - - 8 97 0.1% 0.0% Ukraine - 222 - - - 222 - - - - - 0.0% 0.0% United Kingdom 760 15,210 - - - 15,970 989 - - 989 12,363 7.1% 2.0% United States 91 323 - - - 414 98 - - 98 1,224 0.7% 0.0% Uzbekistan - 105 - - - 105 11 - - 11 137 0.1% 0.0% Venezuela - 133 - - - 133 4 - - 4 44 0.0% 0.0% Zambia - 8 - - - 8 1 - - 1 18 0.0% 0.0% 020 Total 19,494 148,249 68,156 235,899 11,376 - 2,587 13,964 174,546 100.0% Capital adequacy and risk-weighted exposure amounts | 7

Template EU CCyB2 — Amount of institution-specific countercyclical capital buffer Amounts are in EUR million, unless otherwise indicated a 1 Total risk exposure amount 244,048 2 Institution specific countercyclical capital buffer rate 0.66% 3 Institution specific countercyclical capital buffer requirement 1,606 2.2 Own funds Template EU CC1 — Composition of regulatory own funds The template provides a detailed breakdown of the composition of the regulatory own funds reconciled with the unaudited financial statements of the Group under EU-AD. The template also includes an overview of the prudential filters and regulatory deductions considered in the calculation of the regulatory own funds as detailed beforehand. Amounts are in EUR million, unless otherwise indicated a b Amounts Source based on reference numbers/letters of the balance sheet under the regulatory scope of consolidation Common Equity Tier 1 (CET1) capital: instruments and reserves 1 Capital instruments and the related share premium accounts 21,871 L.7. minus A.11. of which: Subscribed capital 21,871 L.7. minus A.11. 2 Retained earnings 44,384 L.8.a plus L.8.b 3 Accumulated other comprehensive income (and other reserves) 12,666 L.8.c EU-3a Funds for general banking risk 2,281 L.8.d 4 Amount of qualifying items referred to in Article 484 (3) CRR and the related share premium accounts subject to phase out from CET1 - 5 Minority interests (amount allowed in consolidated CET1) - EU-5a Independently reviewed interim profits net of any foreseeable charge or dividend9 1,564 L.9. 6 Common Equity Tier 1 (CET1) capital before regulatory adjustments 82,766 Common Equity Tier 1 (CET1) capital: regulatory adjustments 7 Additional value adjustments (negative amount) -94 8 Intangible assets (net of related tax liability) (negative amount) -119 A.8. 10 Deferred tax assets that rely on future profitability excluding those arising from temporary differences (net of related tax liability where the conditions in Article 38 (3) CRR are met) (negative amount) - 11 Fair value reserves related to gains or losses on cash flow hedges of financial instruments that are not valued at fair value - 12 Negative amounts resulting from the calculation of expected loss amounts -1,140 13 Any increase in equity that results from securitised assets (negative amount) - 14 Gains or losses on liabilities valued at fair value resulting from changes in own credit standing - 15 Defined-benefit pension fund assets (negative amount) - Financial data used in the production of this quantitative template are based on the unaudited semi-annual financial statements of the Group under EU-AD as of 30.06.2024. 8 | June 2024 European Investment Bank Group Risk Management Disclosure Report
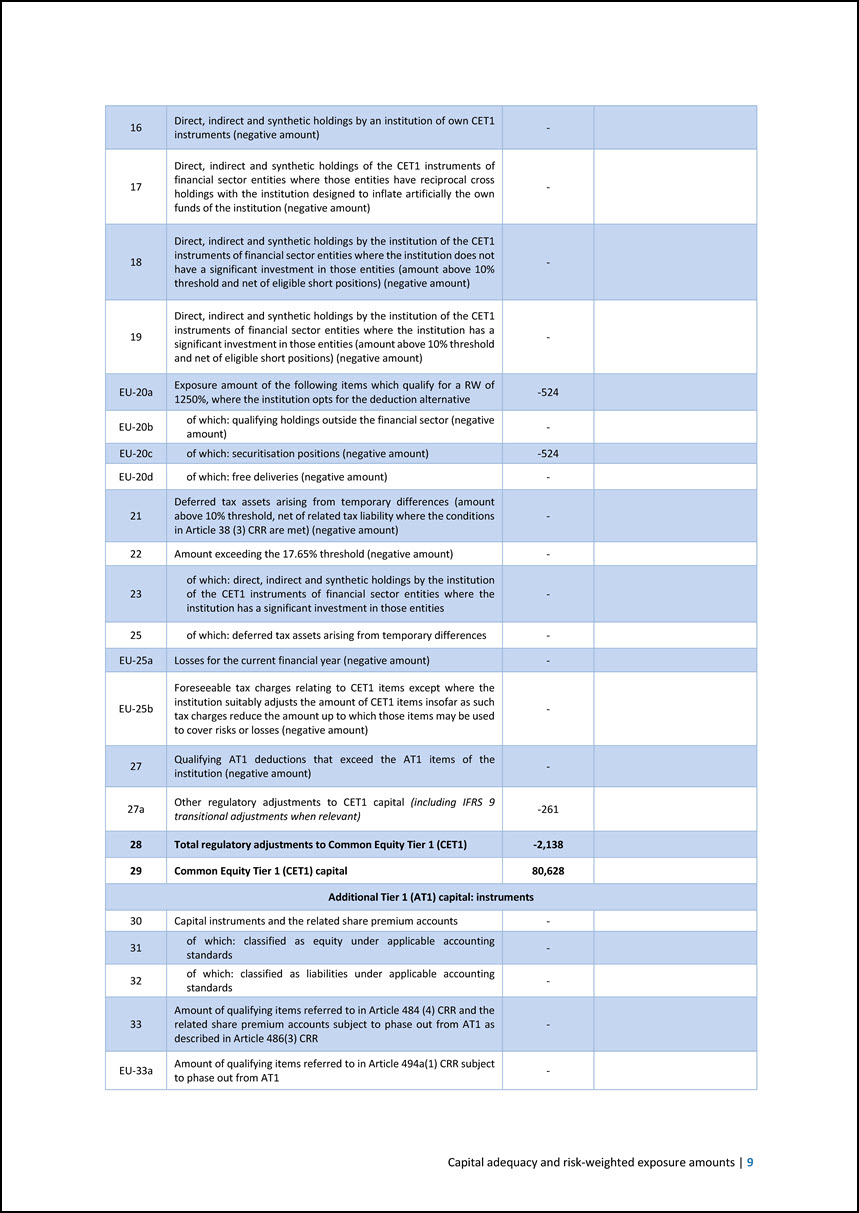
16 Direct, indirect and synthetic holdings by an institution of own CET1 instruments (negative amount) - 17 Direct, indirect and synthetic holdings of the CET1 instruments of financial sector entities where those entities have reciprocal cross holdings with the institution designed to inflate artificially the own funds of the institution (negative amount) - 18 Direct, indirect and synthetic holdings by the institution of the CET1 instruments of financial sector entities where the institution does not have a significant investment in those entities (amount above 10% threshold and net of eligible short positions) (negative amount) - 19 Direct, indirect and synthetic holdings by the institution of the CET1 instruments of financial sector entities where the institution has a significant investment in those entities (amount above 10% threshold and net of eligible short positions) (negative amount) - EU-20a Exposure amount of the following items which qualify for a RW of 1250%, where the institution opts for the deduction alternative -524 EU-20b of which: qualifying holdings outside the financial sector (negative amount) - EU-20c of which: securitisation positions (negative amount) -524 EU-20d of which: free deliveries (negative amount) - 21 Deferred tax assets arising from temporary differences (amount above 10% threshold, net of related tax liability where the conditions in Article 38 (3) CRR are met) (negative amount) - 22 Amount exceeding the 17.65% threshold (negative amount) - 23 of which: direct, indirect and synthetic holdings by the institution of the CET1 instruments of financial sector entities where the institution has a significant investment in those entities - 25 of which: deferred tax assets arising from temporary differences - EU-25a Losses for the current financial year (negative amount) - EU-25b Foreseeable tax charges relating to CET1 items except where the institution suitably adjusts the amount of CET1 items insofar as such tax charges reduce the amount up to which those items may be used to cover risks or losses (negative amount) - 27 Qualifying AT1 deductions that exceed the AT1 items of the institution (negative amount) - 27a Other regulatory adjustments to CET1 capital (including IFRS 9 transitional adjustments when relevant) -261 28 Total regulatory adjustments to Common Equity Tier 1 (CET1) -2,138 29 Common Equity Tier 1 (CET1) capital 80,628 Additional Tier 1 (AT1) capital: instruments 30 Capital instruments and the related share premium accounts - 31 of which: classified as equity under applicable accounting standards - 32 of which: classified as liabilities under applicable accounting standards - 33 Amount of qualifying items referred to in Article 484 (4) CRR and the related share premium accounts subject to phase out from AT1 as described in Article 486(3) CRR - EU-33a Amount of qualifying items referred to in Article 494a(1) CRR subject to phase out from AT1 - Capital adequacy and risk-weighted exposure amounts | 9
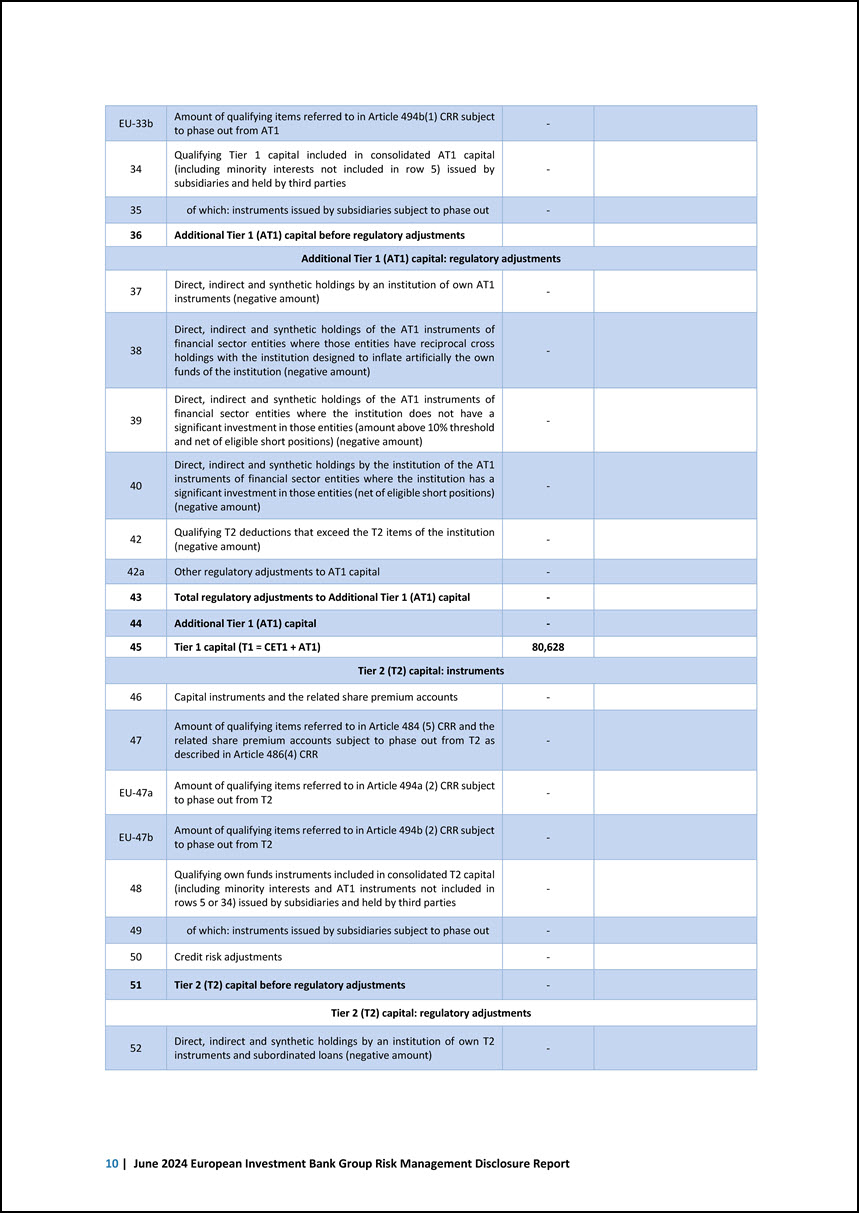
EU-33b Amount of qualifying items referred to in Article 494b(1) CRR subject to phase out from AT1 - 34 Qualifying Tier 1 capital included in consolidated AT1 capital (including minority interests not included in row 5) issued by subsidiaries and held by third parties - 35 of which: instruments issued by subsidiaries subject to phase out - 36 Additional Tier 1 (AT1) capital before regulatory adjustments Additional Tier 1 (AT1) capital: regulatory adjustments 37 Direct, indirect and synthetic holdings by an institution of own AT1 instruments (negative amount) - 38 Direct, indirect and synthetic holdings of the AT1 instruments of financial sector entities where those entities have reciprocal cross holdings with the institution designed to inflate artificially the own funds of the institution (negative amount) - 39 Direct, indirect and synthetic holdings of the AT1 instruments of financial sector entities where the institution does not have a significant investment in those entities (amount above 10% threshold and net of eligible short positions) (negative amount) - 40 Direct, indirect and synthetic holdings by the institution of the AT1 instruments of financial sector entities where the institution has a significant investment in those entities (net of eligible short positions) (negative amount) - 42 Qualifying T2 deductions that exceed the T2 items of the institution (negative amount) - 42a Other regulatory adjustments to AT1 capital - 43 Total regulatory adjustments to Additional Tier 1 (AT1) capital - 44 Additional Tier 1 (AT1) capital - 45 Tier 1 capital (T1 = CET1 + AT1) 80,628 Tier 2 (T2) capital: instruments 46 Capital instruments and the related share premium accounts - 47 Amount of qualifying items referred to in Article 484 (5) CRR and the related share premium accounts subject to phase out from T2 as described in Article 486(4) CRR - EU-47a Amount of qualifying items referred to in Article 494a (2) CRR subject to phase out from T2 - EU-47b Amount of qualifying items referred to in Article 494b (2) CRR subject to phase out from T2 - 48 Qualifying own funds instruments included in consolidated T2 capital (including minority interests and AT1 instruments not included in rows 5 or 34) issued by subsidiaries and held by third parties - 49 of which: instruments issued by subsidiaries subject to phase out - 50 Credit risk adjustments - 51 Tier 2 (T2) capital before regulatory adjustments - Tier 2 (T2) capital: regulatory adjustments 52 Direct, indirect and synthetic holdings by an institution of own T2 instruments and subordinated loans (negative amount) - 10 | June 2024 European Investment Bank Group Risk Management Disclosure Report
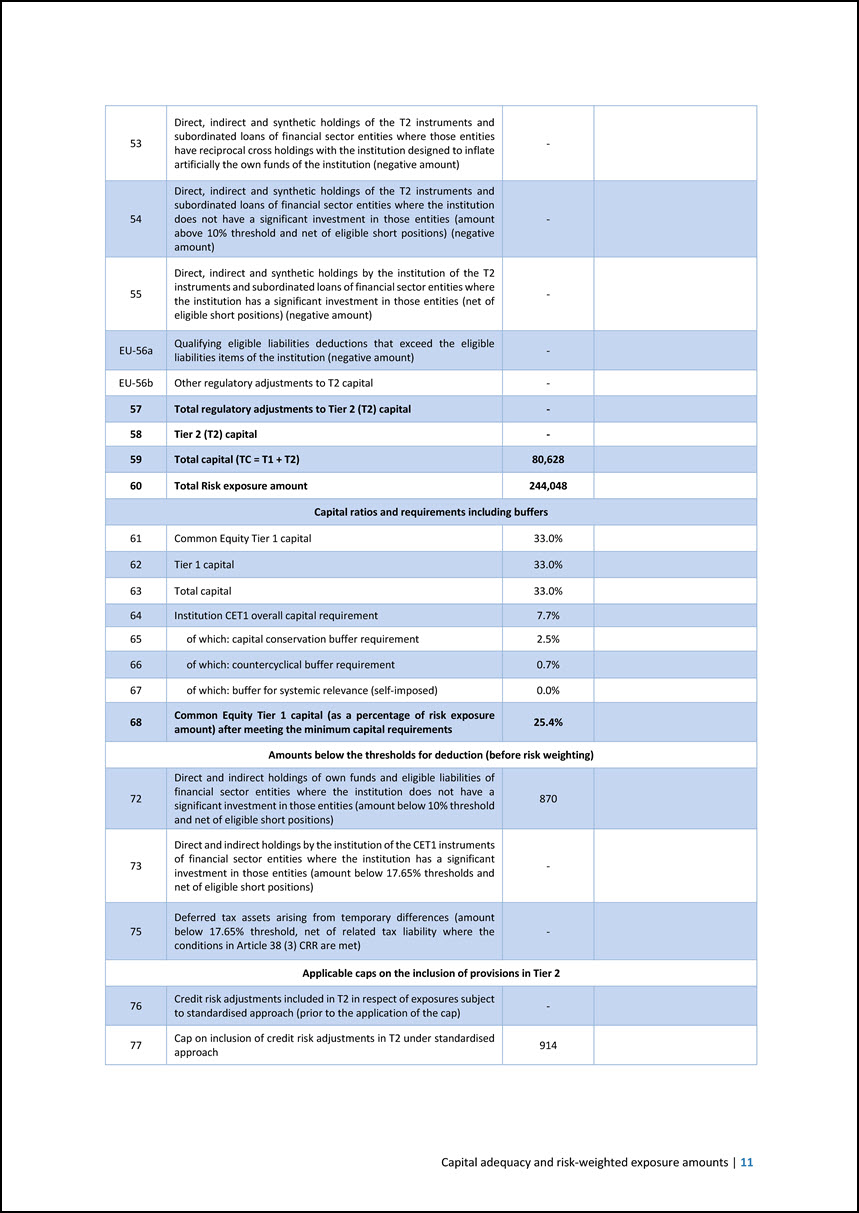
53 Direct, indirect and synthetic holdings of the T2 instruments and subordinated loans of financial sector entities where those entities have reciprocal cross holdings with the institution designed to inflate artificially the own funds of the institution (negative amount) - 54 Direct, indirect and synthetic holdings of the T2 instruments and subordinated loans of financial sector entities where the institution does not have a significant investment in those entities (amount above 10% threshold and net of eligible short positions) (negative amount) - 55 Direct, indirect and synthetic holdings by the institution of the T2 instruments and subordinated loans of financial sector entities where the institution has a significant investment in those entities (net of eligible short positions) (negative amount) - EU-56a Qualifying eligible liabilities deductions that exceed the eligible liabilities items of the institution (negative amount) - EU-56b Other regulatory adjustments to T2 capital - 57 Total regulatory adjustments to Tier 2 (T2) capital - 58 Tier 2 (T2) capital - 59 Total capital (TC = T1 + T2) 80,628 60 Total Risk exposure amount 244,048 Capital ratios and requirements including buffers 61 Common Equity Tier 1 capital 33.0% 62 Tier 1 capital 33.0% 63 Total capital 33.0% 64 Institution CET1 overall capital requirement 7.7% 65 of which: capital conservation buffer requirement 2.5% 66 of which: countercyclical buffer requirement 0.7% 67 of which: buffer for systemic relevance (self-imposed) 0.0% 68 Common Equity Tier 1 capital (as a percentage of risk exposure amount) after meeting the minimum capital requirements 25.4% Amounts below the thresholds for deduction (before risk weighting) 72 Direct and indirect holdings of own funds and eligible liabilities of financial sector entities where the institution does not have a significant investment in those entities (amount below 10% threshold and net of eligible short positions) 870 73 Direct and indirect holdings by the institution of the CET1 instruments of financial sector entities where the institution has a significant investment in those entities (amount below 17.65% thresholds and net of eligible short positions) - 75 Deferred tax assets arising from temporary differences (amount below 17.65% threshold, net of related tax liability where the conditions in Article 38 (3) CRR are met) - Applicable caps on the inclusion of provisions in Tier 2 76 Credit risk adjustments included in T2 in respect of exposures subject to standardised approach (prior to the application of the cap) - 77 Cap on inclusion of credit risk adjustments in T2 under standardised approach 914 Capital adequacy and risk-weighted exposure amounts | 11
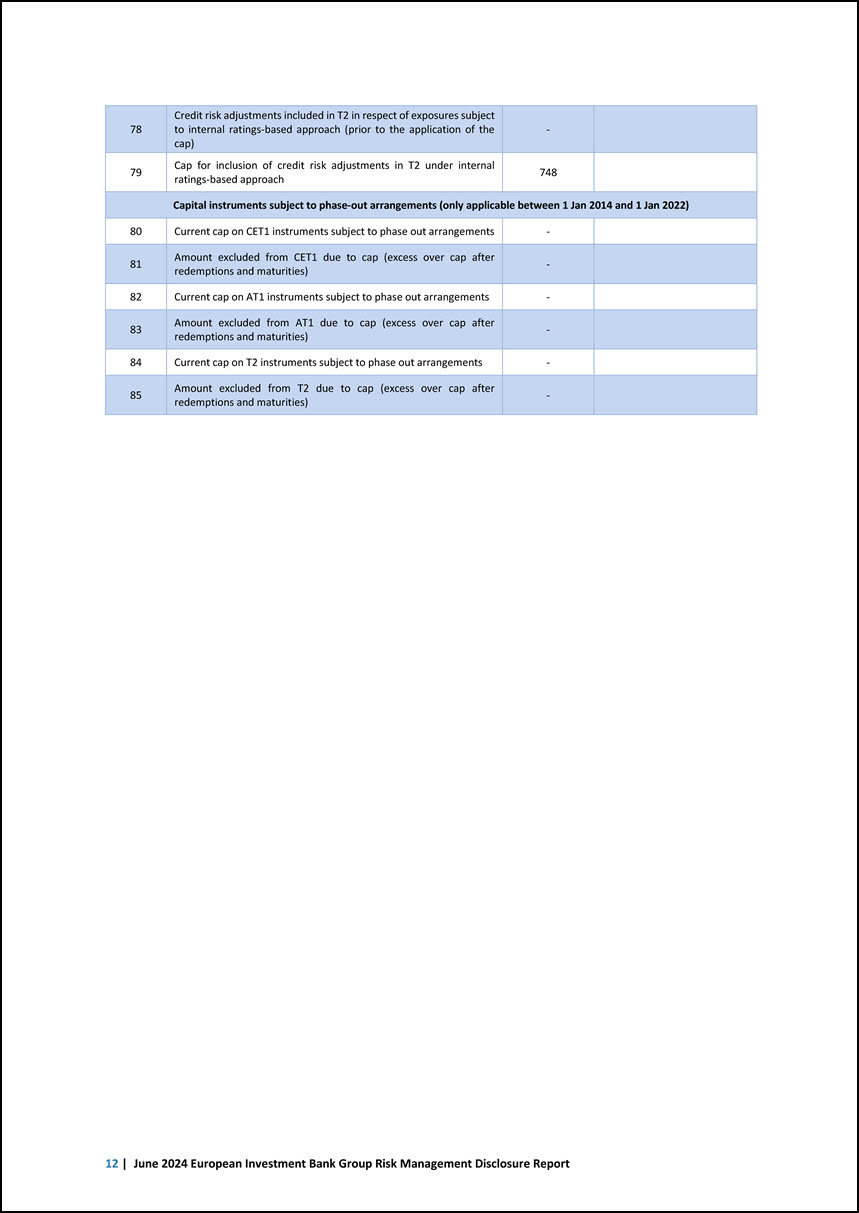
78 Credit risk adjustments included in T2 in respect of exposures subject to internal ratings-based approach (prior to the application of the cap) - 79 Cap for inclusion of credit risk adjustments in T2 under internal ratings-based approach 748 Capital instruments subject to phase-out arrangements (only applicable between 1 Jan 2014 and 1 Jan 2022) 80 Current cap on CET1 instruments subject to phase out arrangements - 81 Amount excluded from CET1 due to cap (excess over cap after redemptions and maturities) - 82 Current cap on AT1 instruments subject to phase out arrangements - 83 Amount excluded from AT1 due to cap (excess over cap after redemptions and maturities) - 84 Current cap on T2 instruments subject to phase out arrangements - 85 Amount excluded from T2 due to cap (excess over cap after redemptions and maturities) - 12 | June 2024 European Investment Bank Group Risk Management Disclosure Report
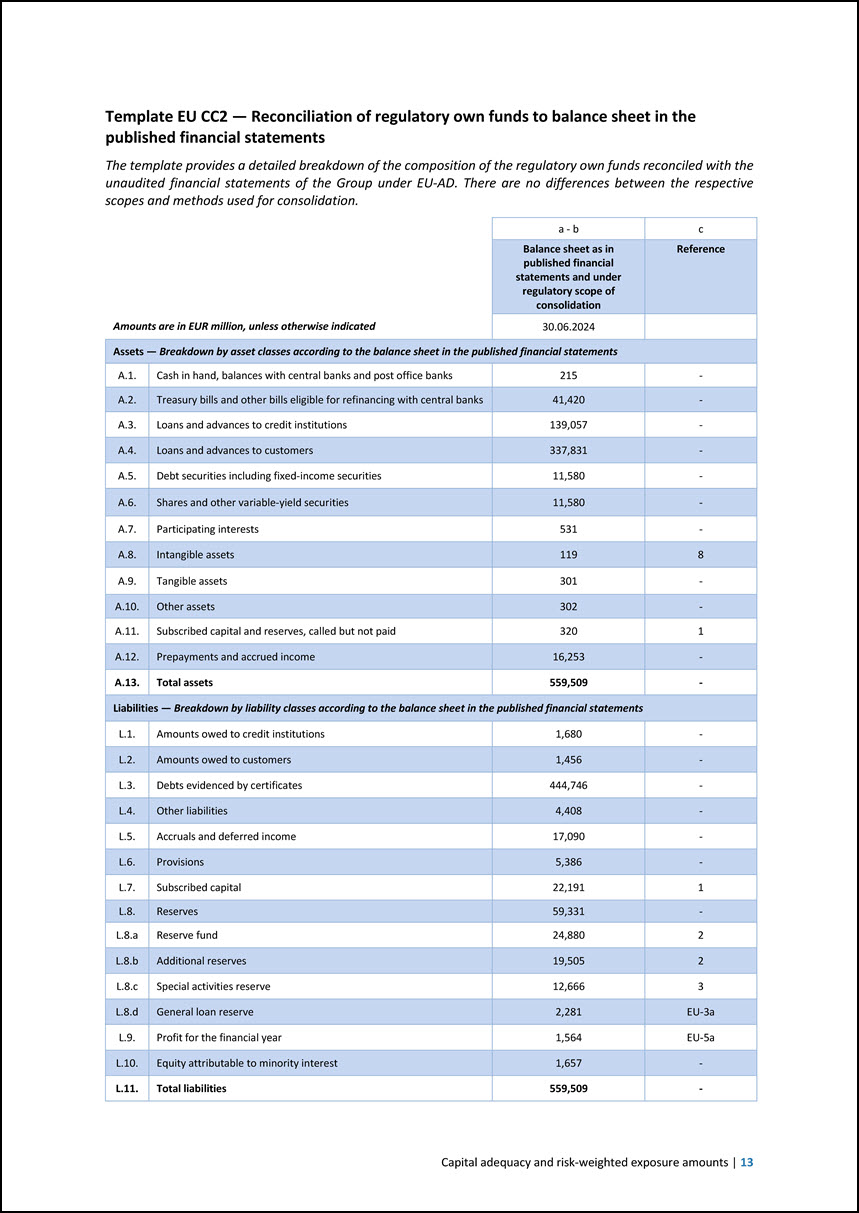
Template EU CC2 — Reconciliation of regulatory own funds to balance sheet in the published financial statements The template provides a detailed breakdown of the composition of the regulatory own funds reconciled with the unaudited financial statements of the Group under EU-AD. There are no differences between the respective scopes and methods used for consolidation. Amounts are in EUR million, unless otherwise indicated a - b c Balance sheet as in published financial statements and under regulatory scope of consolidation Reference 30.06.2024 Assets — Breakdown by asset classes according to the balance sheet in the published financial statements A.1. Cash in hand, balances with central banks and post office banks 215 - A.2. Treasury bills and other bills eligible for refinancing with central banks 41,420 - A.3. Loans and advances to credit institutions 139,057 - A.4. Loans and advances to customers 337,831 - A.5. Debt securities including fixed-income securities 11,580 - A.6. Shares and other variable-yield securities 11,580 - A.7. Participating interests 531 - A.8. Intangible assets 119 8 A.9. Tangible assets 301 - A.10. Other assets 302 - A.11. Subscribed capital and reserves, called but not paid 320 1 A.12. Prepayments and accrued income 16,253 - A.13. Total assets 559,509 - Liabilities — Breakdown by liability classes according to the balance sheet in the published financial statements L.1. Amounts owed to credit institutions 1,680 - L.2. Amounts owed to customers 1,456 - L.3. Debts evidenced by certificates 444,746 - L.4. Other liabilities 4,408 - L.5. Accruals and deferred income 17,090 - L.6. Provisions 5,386 - L.7. Subscribed capital 22,191 1 L.8. Reserves 59,331 - L.8.a Reserve fund 24,880 2 L.8.b Additional reserves 19,505 2 L.8.c Special activities reserve 12,666 3 L.8.d General loan reserve 2,281 EU-3a L.9. Profit for the financial year 1,564 EU-5a L.10. Equity attributable to minority interest 1,657 - L.11. Total liabilities 559,509 - Capital adequacy and risk-weighted exposure amounts | 13
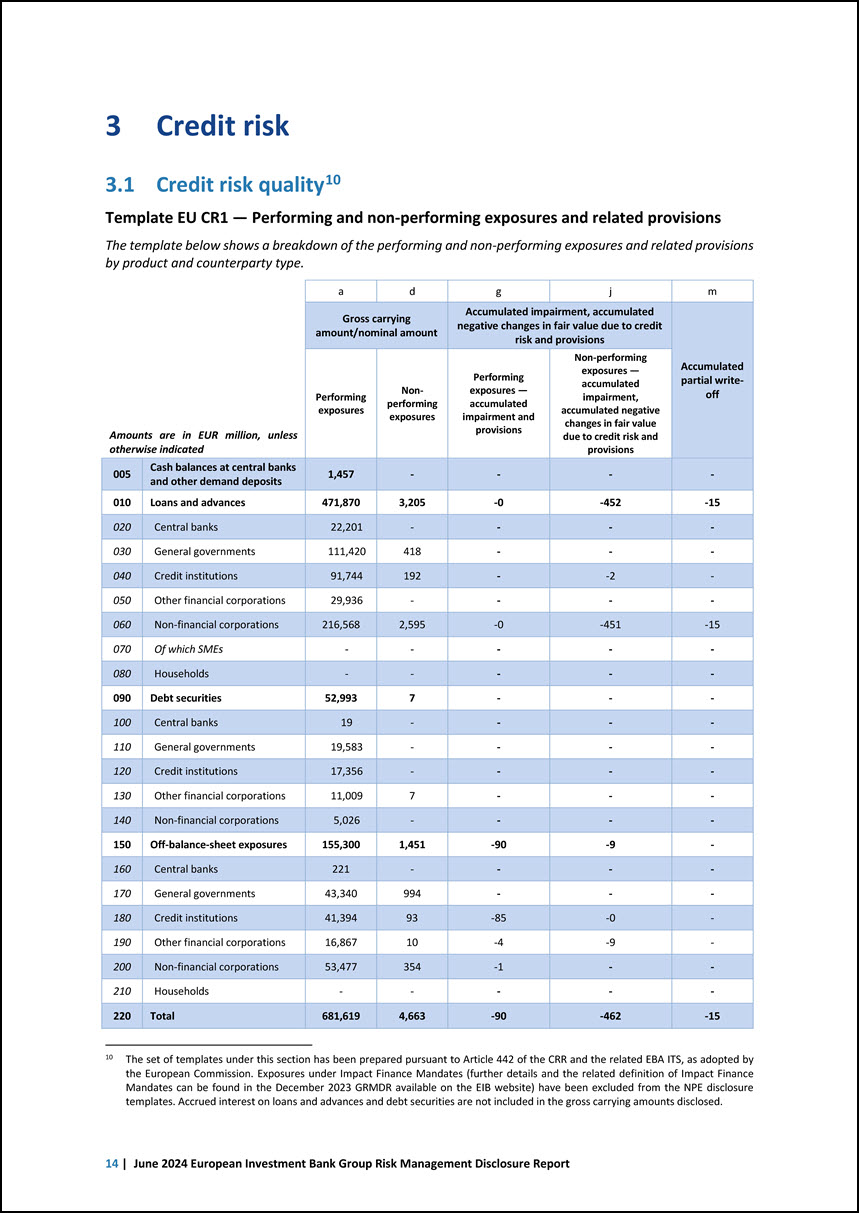
3 Credit risk 3.1 Credit risk quality10 10 The set of templates under this section has been prepared pursuant to Article 442 of the CRR and the related EBA ITS, as adopted by the European Commission. Exposures under Impact Finance Mandates (further details and the related definition of Impact Finance Mandates can be found in the December 2023 GRMDR available on the EIB website) have been excluded from the NPE disclosure templates. Accrued interest on loans and advances and debt securities are not included in the gross carrying amounts disclosed. Template EU CR1 — Performing and non-performing exposures and related provisions The template below shows a breakdown of the performing and non-performing exposures and related provisions by product and counterparty type. Amounts are in EUR million, unless otherwise indicated a d g j m Gross carrying amount/nominal amount Accumulated impairment, accumulated negative changes in fair value due to credit risk and provisions Accumulated partial writeoff Performing exposures Nonperforming exposures Performing exposures — accumulated impairment and provisions Non-performing exposures — accumulated impairment, accumulated negative changes in fair value due to credit risk and provisions 005 Cash balances at central banks and other demand deposits 1,457 - - - - 010 Loans and advances 471,870 3,205 -0 -452 -15 020 Central banks 22,201 - - - - 030 General governments 111,420 418 - - - 040 Credit institutions 91,744 192 - -2 - 050 Other financial corporations 29,936 - - - - 060 Non-financial corporations 216,568 2,595 -0 -451 -15 070 Of which SMEs - - - - - 080 Households - - - - - 090 Debt securities 52,993 7 - - - 100 Central banks 19 - - - - 110 General governments 19,583 - - - - 120 Credit institutions 17,356 - - - - 130 Other financial corporations 11,009 7 - - - 140 Non-financial corporations 5,026 - - - - 150 Off-balance-sheet exposures 155,300 1,451 -90 -9 - 160 Central banks 221 - - - - 170 General governments 43,340 994 - - - 180 Credit institutions 41,394 93 -85 -0 - 190 Other financial corporations 16,867 10 -4 -9 - 200 Non-financial corporations 53,477 354 -1 - - 210 Households - - - - - 220 Total 681,619 4,663 -90 -462 -15 14 | June 2024 European Investment Bank Group Risk Management Disclosure Report
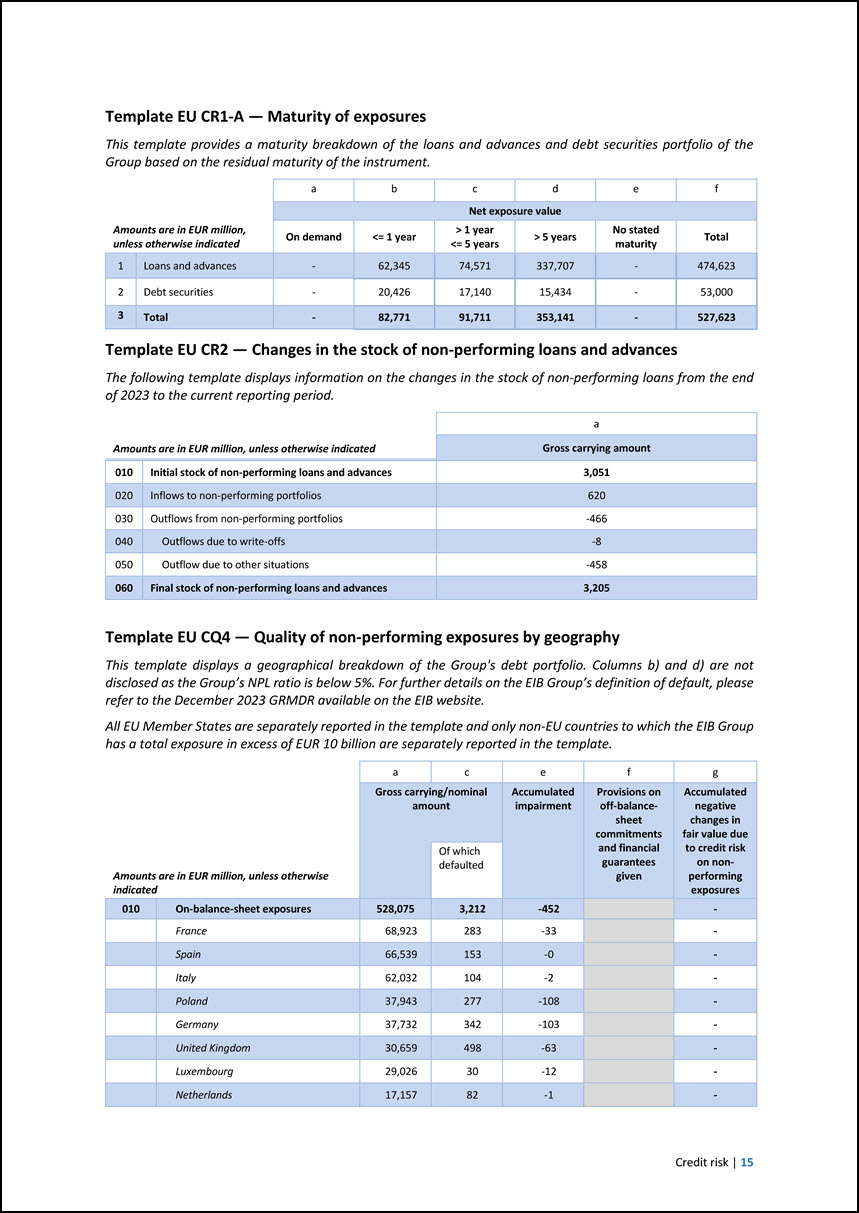
Template EU CR1-A — Maturity of exposures This template provides a maturity breakdown of the loans and advances and debt securities portfolio of the Group based on the residual maturity of the instrument. Amounts are in EUR million, unless otherwise indicated a b c d e f Net exposure value On demand <= 1 year > 1 year <= 5 years > 5 years No stated maturity Total 1 Loans and advances - 62,345 74,571 337,707 - 474,623 2 Debt securities - 20,426 17,140 15,434 - 53,000 3 Total - 82,771 91,711 353,141 - 527,623 Template EU CR2 — Changes in the stock of non-performing loans and advances The following template displays information on the changes in the stock of non-performing loans from the end of 2023 to the current reporting period. Amounts are in EUR million, unless otherwise indicated a Gross carrying amount 010 Initial stock of non-performing loans and advances 3,051 020 Inflows to non-performing portfolios 620 030 Outflows from non-performing portfolios -466 040 Outflows due to write-offs -8 050 Outflow due to other situations -458 060 Final stock of non-performing loans and advances 3,205 Template EU CQ4 — Quality of non-performing exposures by geography This template displays a geographical breakdown of the Group’s debt portfolio. Columns b) and d) are not disclosed as the Group’s NPL ratio is below 5%. For further details on the EIB Group’s definition of default, please refer to the December 2023 GRMDR available on the EIB website. All EU Member States are separately reported in the template and only non-EU countries to which the EIB Group has a total exposure in excess of EUR 10 billion are separately reported in the template. Amounts are in EUR million, unless otherwise indicated a c e f g Gross carrying/nominal amount Accumulated impairment Provisions on off-balancesheet commitments and financial guarantees given Accumulated negative changes in fair value due to credit risk on nonperforming exposures Of which defaulted 010 On-balance-sheet exposures 528,075 3,212 -452 - France 68,923 283 -33 - Spain 66,539 153 -0 - Italy 62,032 104 -2 - Poland 37,943 277 -108 - Germany 37,732 342 -103 - United Kingdom 30,659 498 -63 - Luxembourg 29,026 30 -12 - Netherlands 17,157 82 -1 - Credit risk | 15

Finland 16,397 18 -14 - Belgium 14,010 - - - Austria 13,934 37 -8 - Greece 13,767 107 -15 - Sweden 10,628 188 -4 - Portugal 10,272 12 -1 - Hungary 7,721 - - - Ireland 6,362 80 -38 - Czechia 5,416 - - - Romania 4,638 - - - Denmark 3,864 - - - Slovakia 3,315 - - - Lithuania 2,738 - - - Croatia 2,633 - - - Slovenia 1,938 - - - Cyprus 1,881 1 - - Bulgaria 1,805 15 -3 - Estonia 1,435 29 -0 - Latvia 792 - - - Malta 298 - - - Other countries 54,220 955 -47 - 080 Off-balance-sheet exposures 156,751 1,451 -99 Luxembourg 23,271 76 -74 France 17,683 36 -0 Spain 14,389 5 -1 Germany 12,263 8 -1 Italy 11,424 10 -11 Poland 9,291 40 -0 Greece 5,545 - -1 Netherlands 4,537 70 - Romania 4,225 - -1 Belgium 4,093 - - Czechia 3,453 - - Sweden 2,631 - - Portugal 2,234 - -2 Ireland 1,930 - -0 Austria 1,757 - -0 Finland 1,395 - -2 Denmark 1,171 - - Bulgaria 1,023 - -1 Estonia 1,017 - - Croatia 795 - -1 16 | June 2024 European Investment Bank Group Risk Management Disclosure Report
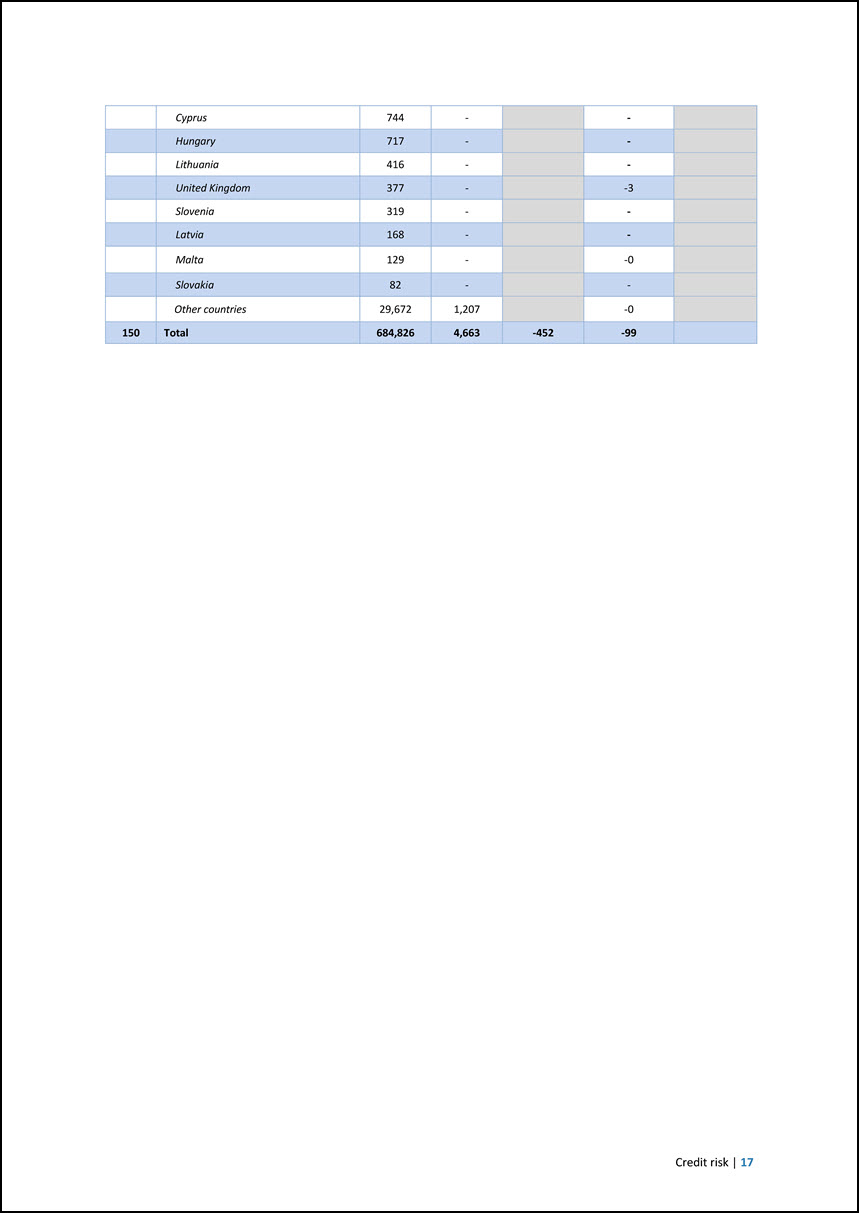
Cyprus 744 - - Hungary 717 - - Lithuania 416 - - United Kingdom 377 - -3 Slovenia 319 - - Latvia 168 - - Malta 129 - -0 Slovakia 82 - - Other countries 29,672 1,207 -0 150 Total 684,826 4,663 -452 -99 Credit risk | 17
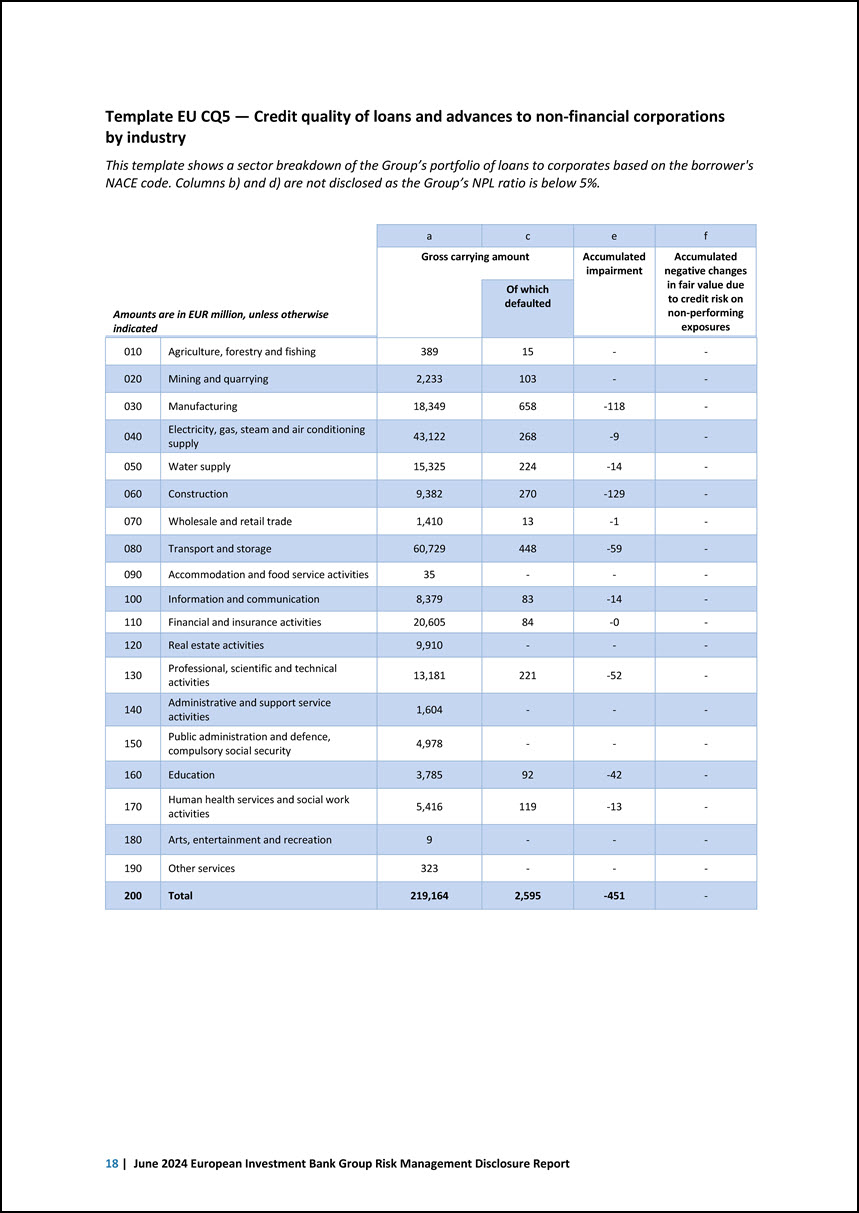
Template EU CQ5 — Credit quality of loans and advances to non-financial corporations by industry This template shows a sector breakdown of the Group’s portfolio of loans to corporates based on the borrower’s NACE code. Columns b) and d) are not disclosed as the Group’s NPL ratio is below 5%. Amounts are in EUR million, unless otherwise indicated a c e f Gross carrying amount Accumulated impairment Accumulated negative changes in fair value due to credit risk on non-performing exposures Of which defaulted 010 Agriculture, forestry and fishing 389 15 - - 020 Mining and quarrying 2,233 103 - - 030 Manufacturing 18,349 658 -118 - 040 Electricity, gas, steam and air conditioning supply 43,122 268 -9 - 050 Water supply 15,325 224 -14 - 060 Construction 9,382 270 -129 - 070 Wholesale and retail trade 1,410 13 -1 - 080 Transport and storage 60,729 448 -59 - 090 Accommodation and food service activities 35 - - - 100 Information and communication 8,379 83 -14 - 110 Financial and insurance activities 20,605 84 -0 - 120 Real estate activities 9,910 - - - 130 Professional, scientific and technical activities 13,181 221 -52 - 140 Administrative and support service activities 1,604 - - - 150 Public administration and defence, compulsory social security 4,978 - - - 160 Education 3,785 92 -42 - 170 Human health services and social work activities 5,416 119 -13 - 180 Arts, entertainment and recreation 9 - - - 190 Other services 323 - - - 200 Total 219,164 2,595 -451 - 18 | June 2024 European Investment Bank Group Risk Management Disclosure Report
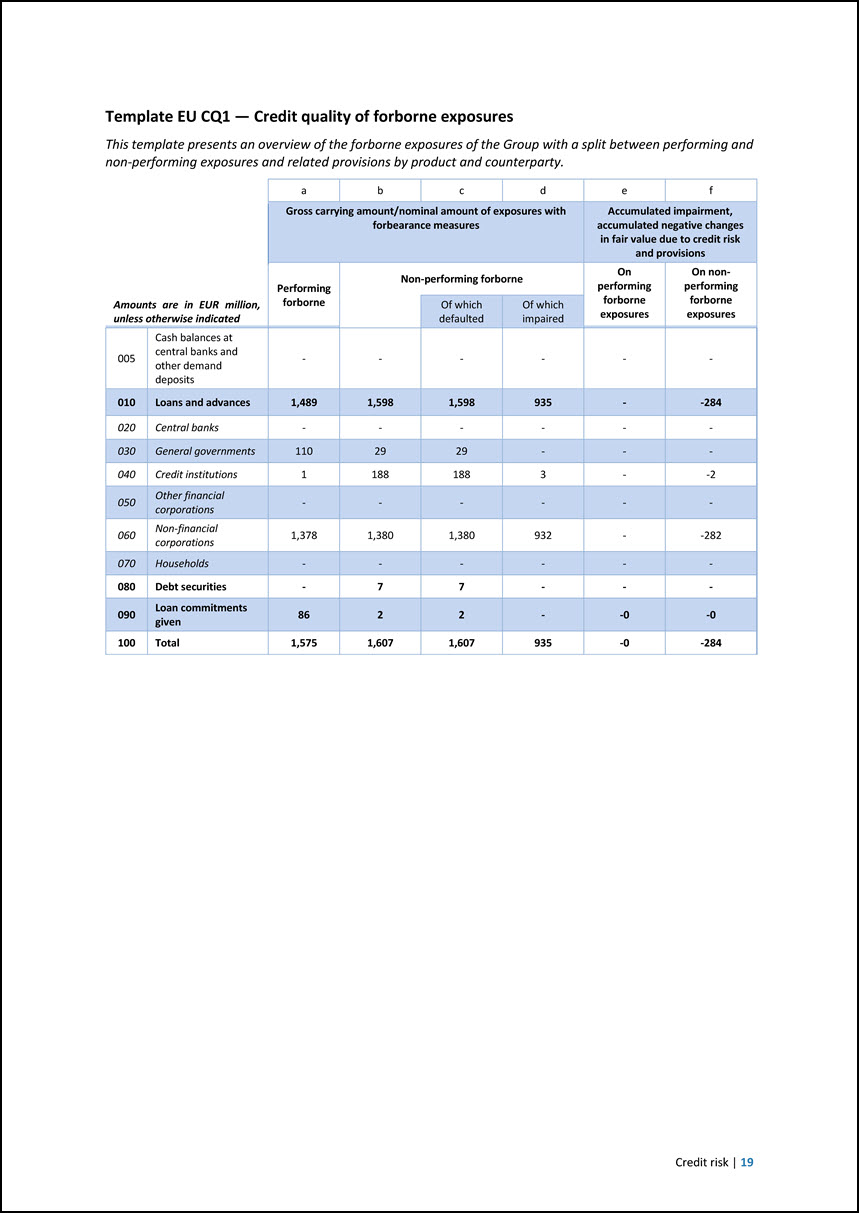
Template EU CQ1 — Credit quality of forborne exposures This template presents an overview of the forborne exposures of the Group with a split between performing and non-performing exposures and related provisions by product and counterparty. Amounts are in EUR million, unless otherwise indicated a b c d e f Gross carrying amount/nominal amount of exposures with forbearance measures Accumulated impairment, accumulated negative changes in fair value due to credit risk and provisions Performing forborne Non-performing forborne On performing forborne exposures On nonperforming forborne exposures Of which defaulted Of which impaired 005 Cash balances at central banks and other demand deposits - - - - - - 010 Loans and advances 1,489 1,598 1,598 935 - -284 020 Central banks - - - - - - 030 General governments 110 29 29 - - - 040 Credit institutions 1 188 188 3 - -2 050 Other financial corporations - - - - - - 060 Non-financial corporations 1,378 1,380 1,380 932 - -282 070 Households - - - - - - 080 Debt securities - 7 7 - - - 090 Loan commitments given 86 2 2 - -0 -0 100 Total 1,575 1,607 1,607 935 -0 -284 Credit risk | 19
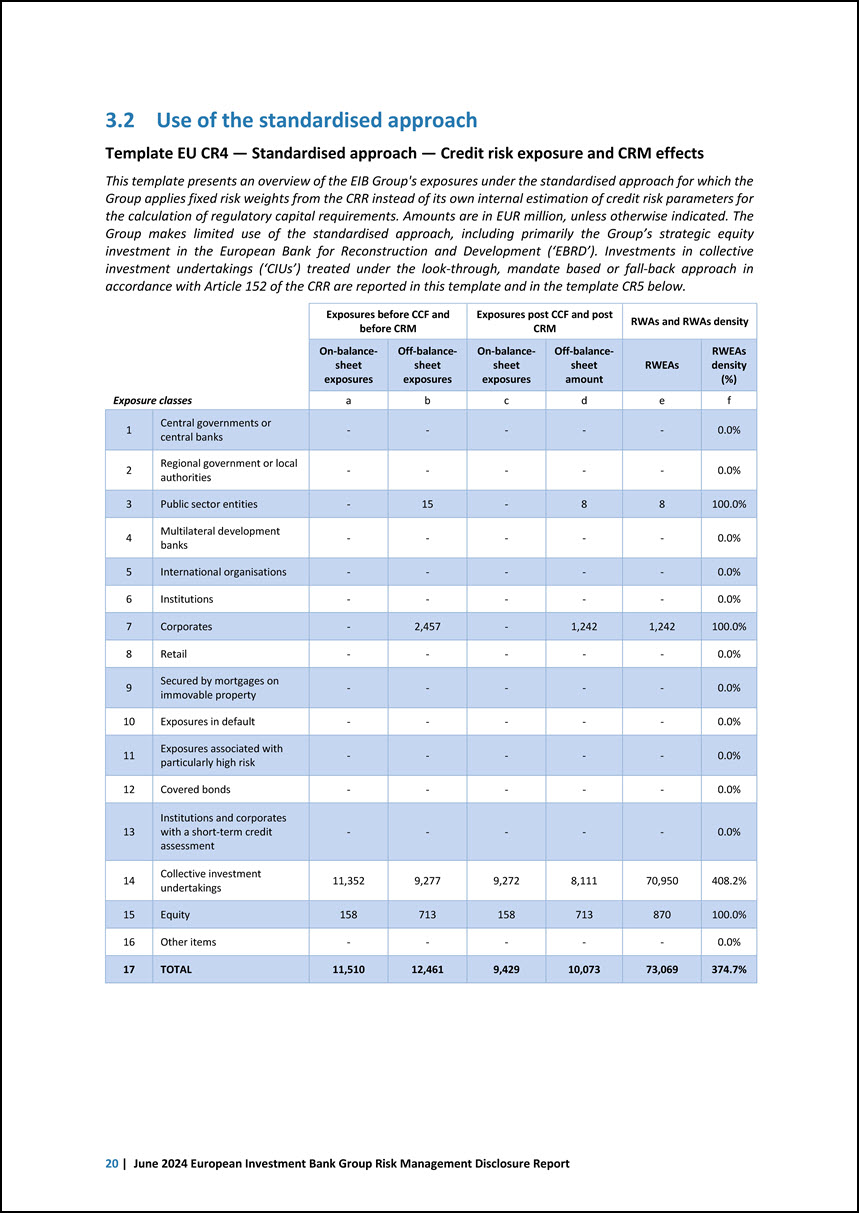
3.2 Use of the standardised approach Template EU CR4 — Standardised approach — Credit risk exposure and CRM effects This template presents an overview of the EIB Group’s exposures under the standardised approach for which the Group applies fixed risk weights from the CRR instead of its own internal estimation of credit risk parameters for the calculation of regulatory capital requirements. Amounts are in EUR million, unless otherwise indicated. The Group makes limited use of the standardised approach, including primarily the Group’s strategic equity investment in the European Bank for Reconstruction and Development (‘EBRD’). Investments in collective investment undertakings (‘CIUs’) treated under the look-through, mandate based or fall-back approach in accordance with Article 152 of the CRR are reported in this template and in the template CR5 below. Exposure classes Exposures before CCF and before CRM Exposures post CCF and post CRM RWAs and RWAs density On-balancesheet exposures Off-balancesheet exposures On-balancesheet exposures Off-balancesheet amount RWEAs RWEAs density (%) a b c d e f 1 Central governments or central banks - - - - - 0.0% 2 Regional government or local authorities - - - - - 0.0% 3 Public sector entities - 15 - 8 8 100.0% 4 Multilateral development banks - - - - - 0.0% 5 International organisations - - - - - 0.0% 6 Institutions - - - - - 0.0% 7 Corporates - 2,457 - 1,242 1,242 100.0% 8 Retail - - - - - 0.0% 9 Secured by mortgages on immovable property - - - - - 0.0% 10 Exposures in default - - - - - 0.0% 11 Exposures associated with particularly high risk - - - - - 0.0% 12 Covered bonds - - - - - 0.0% 13 Institutions and corporates with a short-term credit assessment - - - - - 0.0% 14 Collective investment undertakings 11,352 9,277 9,272 8,111 70,950 408.2% 15 Equity 158 713 158 713 870 100.0% 16 Other items - - - - - 0.0% 17 TOTAL 11,510 12,461 9,429 10,073 73,069 374.7% 20 | June 2024 European Investment Bank Group Risk Management Disclosure Report
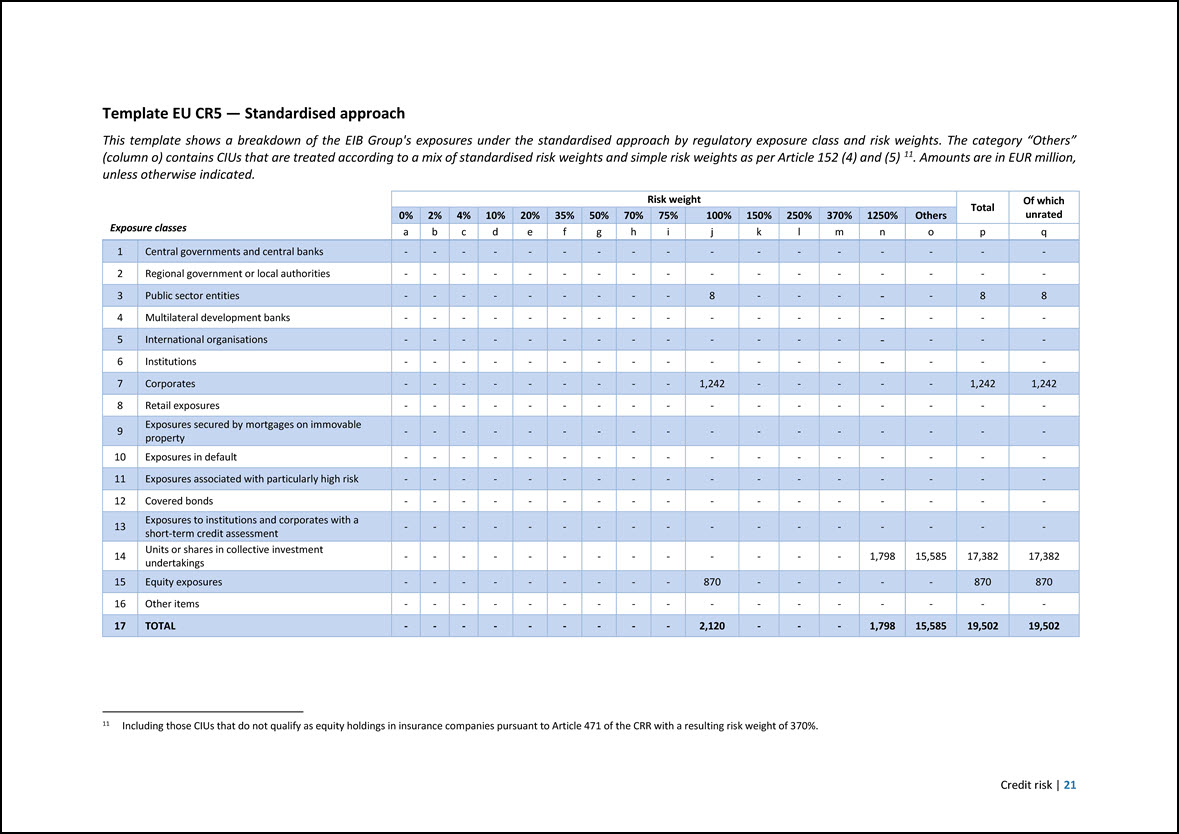
Template EU CR5 — Standardised approach This template shows a breakdown of the EIB Group’s exposures under the standardised approach by regulatory exposure class and risk weights. The category “Others” (column o) contains CIUs that are treated according to a mix of standardised risk weights and simple risk weights as per Article 152 (4) and (5) 11. Amounts are in EUR million, unless otherwise indicated. 11 Including those CIUs that do not qualify as equity holdings in insurance companies pursuant to Article 471 of the CRR with a resulting risk weight of 370%. Exposure classes Risk weight Total Of which unrated 0% 2% 4% 10% 20% 35% 50% 70% 75% 100% 150% 250% 370% 1250% Others a b c d e f g h i j k l m n o p q 1 Central governments and central banks - - - - - - - - - - - - - - - - - 2 Regional government or local authorities - - - - - - - - - - - - - - - - - 3 Public sector entities - - - - - - - - - 8 - - - - - 8 8 4 Multilateral development banks - - - - - - - - - - - - - - - - - 5 International organisations - - - - - - - - - - - - - - - - - 6 Institutions - - - - - - - - - - - - - - - - - 7 Corporates - - - - - - - - - 1,242 - - - - - 1,242 1,242 8 Retail exposures - - - - - - - - - - - - - - - - - 9 Exposures secured by mortgages on immovable property - - - - - - - - - - - - - - - - - 10 Exposures in default - - - - - - - - - - - - - - - - - 11 Exposures associated with particularly high risk - - - - - - - - - - - - - - - - - 12 Covered bonds - - - - - - - - - - - - - - - - - 13 Exposures to institutions and corporates with a short-term credit assessment - - - - - - - - - - - - - - - - - 14 Units or shares in collective investment undertakings - - - - - - - - - - - - - 1,798 15,585 17,382 17,382 15 Equity exposures - - - - - - - - - 870 - - - - - 870 870 16 Other items - - - - - - - - - - - - - - - - - 17 TOTAL - - - - - - - - - 2,120 - - - 1,798 15,585 19,502 19,502 Credit risk | 21
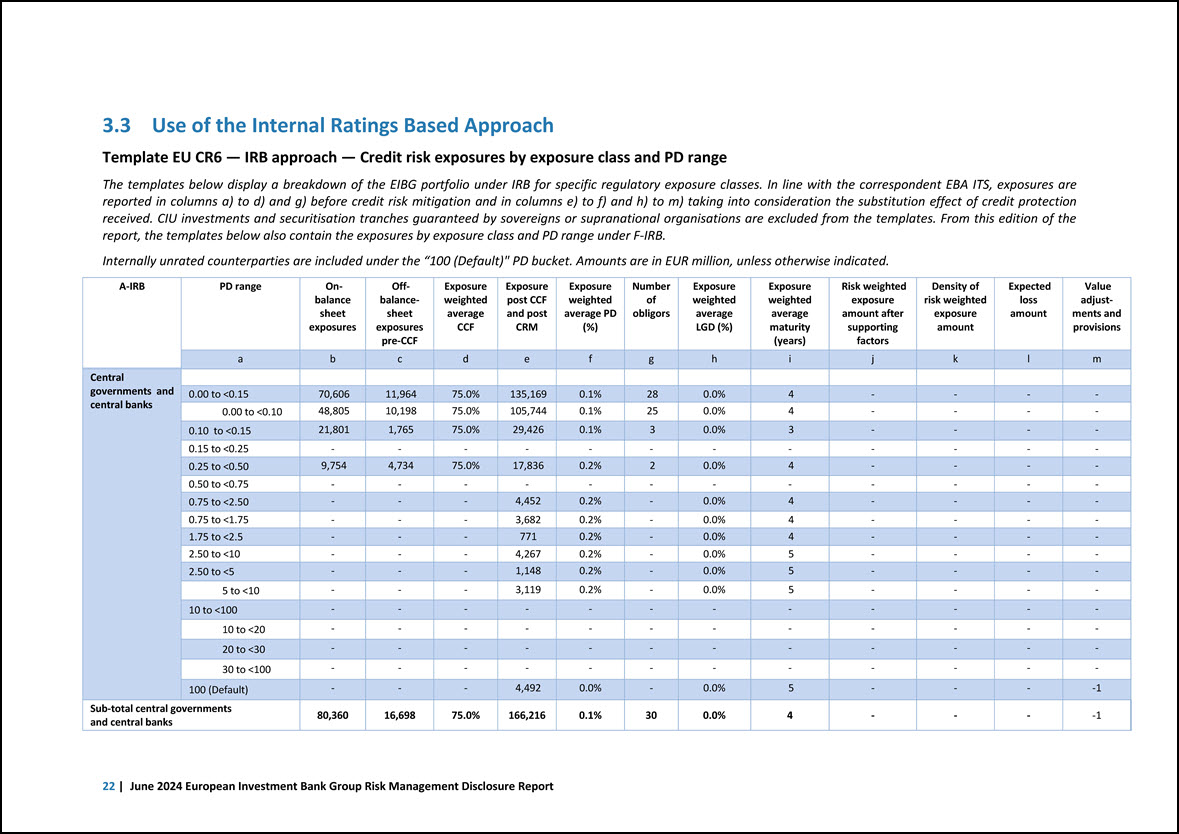
3.3 Use of the Internal Ratings Based Approach Template EU CR6 — IRB approach — Credit risk exposures by exposure class and PD range The templates below display a breakdown of the EIBG portfolio under IRB for specific regulatory exposure classes. In line with the correspondent EBA ITS, exposures are reported in columns a) to d) and g) before credit risk mitigation and in columns e) to f) and h) to m) taking into consideration the substitution effect of credit protection received. CIU investments and securitisation tranches guaranteed by sovereigns or supranational organisations are excluded from the templates. From this edition of the report, the templates below also contain the exposures by exposure class and PD range under F-IRB. Internally unrated counterparties are included under the “100 (Default)” PD bucket. Amounts are in EUR million, unless otherwise indicated. A-IRB PD range On- balance sheet exposures Off- balancesheet exposures pre-CCF Exposure weighted average CCF Exposure post CCF and post CRM Exposure weighted average PD (%) Number of obligors Exposure weighted average LGD (%) Exposure weighted average maturity (years) Risk weighted exposure amount after supporting factors Density of risk weighted exposure amount Expected loss amount Value adjustments and provisions a b c d e f g h i j k l m Central governments and central banks 0.00 to <0.15 70,606 11,964 75.0% 135,169 0.1% 28 0.0% 4 - - - - 0.00 to <0.10 48,805 10,198 75.0% 105,744 0.1% 25 0.0% 4 - - - - 0.10 to <0.15 21,801 1,765 75.0% 29,426 0.1% 3 0.0% 3 - - - - 0.15 to <0.25 - - - - - - - - - - - - 0.25 to <0.50 9,754 4,734 75.0% 17,836 0.2% 2 0.0% 4 - - - - 0.50 to <0.75 - - - - - - - - - - - - 0.75 to <2.50 - - - 4,452 0.2% - 0.0% 4 - - - - 0.75 to <1.75 - - - 3,682 0.2% - 0.0% 4 - - - - 1.75 to <2.5 - - - 771 0.2% - 0.0% 4 - - - - 2.50 to <10 - - - 4,267 0.2% - 0.0% 5 - - - - 2.50 to <5 - - - 1,148 0.2% - 0.0% 5 - - - - 5 to <10 - - - 3,119 0.2% - 0.0% 5 - - - - 10 to <100 - - - - - - - - - - - - 10 to <20 - - - - - - - - - - - - 20 to <30 - - - - - - - - - - - - 30 to <100 - - - - - - - - - - - - 100 (Default) - - - 4,492 0.0% - 0.0% 5 - - - -1 Sub-total central governments and central banks 80,360 16,698 75.0% 166,216 0.1% 30 0.0% 4 - - - -1 22 | June 2024 European Investment Bank Group Risk Management Disclosure Report
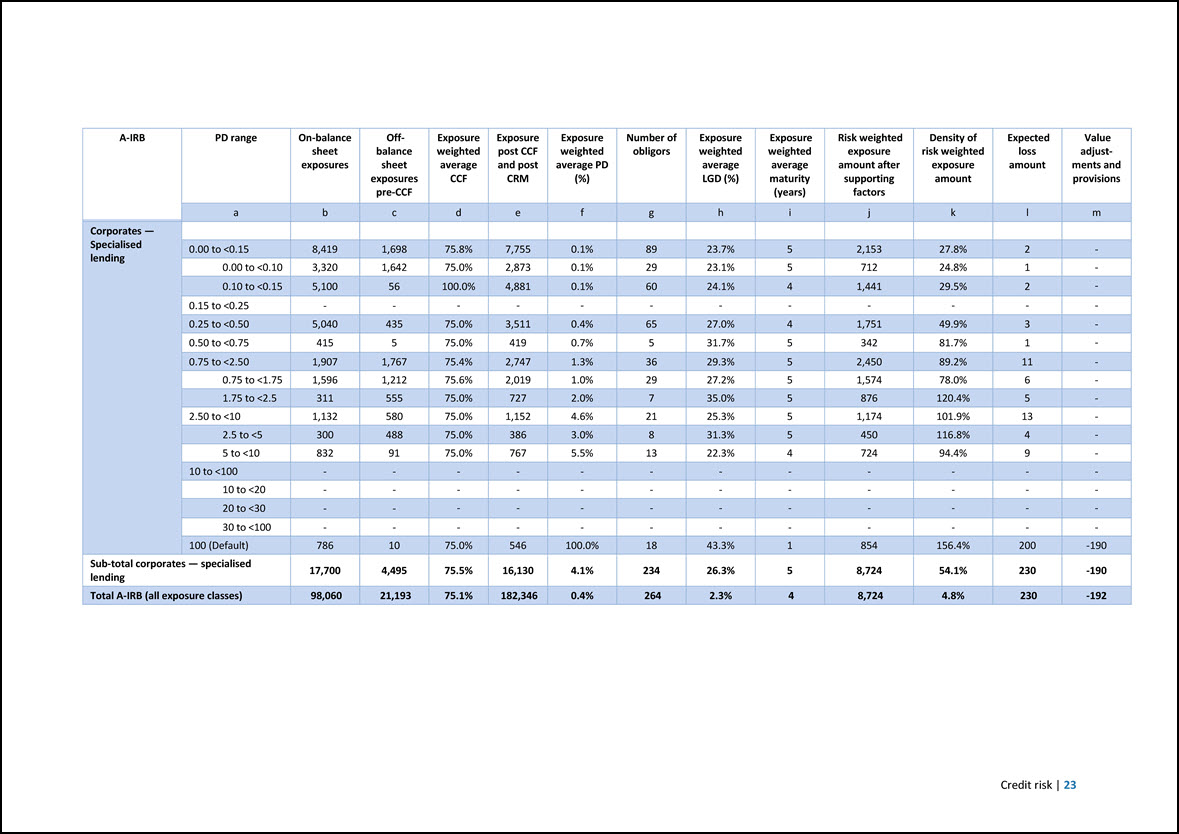
A-IRB PD range On-balance sheet exposures Off- balance sheet exposures pre-CCF Exposure weighted average CCF Exposure post CCF and post CRM Exposure weighted average PD (%) Number of obligors Exposure weighted average LGD (%) Exposure weighted average maturity (years) Risk weighted exposure amount after supporting factors Density of risk weighted exposure amount Expected loss amount Value adjustments and provisions a b c d e f g h i j k l m Corporates — Specialised lending 0.00 to <0.15 8,419 1,698 75.8% 7,755 0.1% 89 23.7% 5 2,153 27.8% 2 - 0.00 to <0.10 3,320 1,642 75.0% 2,873 0.1% 29 23.1% 5 712 24.8% 1 - 0.10 to <0.15 5,100 56 100.0% 4,881 0.1% 60 24.1% 4 1,441 29.5% 2 - 0.15 to <0.25 - - - - - - - - - - - - 0.25 to <0.50 5,040 435 75.0% 3,511 0.4% 65 27.0% 4 1,751 49.9% 3 - 0.50 to <0.75 415 5 75.0% 419 0.7% 5 31.7% 5 342 81.7% 1 - 0.75 to <2.50 1,907 1,767 75.4% 2,747 1.3% 36 29.3% 5 2,450 89.2% 11 - 0.75 to <1.75 1,596 1,212 75.6% 2,019 1.0% 29 27.2% 5 1,574 78.0% 6 - 1.75 to <2.5 311 555 75.0% 727 2.0% 7 35.0% 5 876 120.4% 5 - 2.50 to <10 1,132 580 75.0% 1,152 4.6% 21 25.3% 5 1,174 101.9% 13 - 2.5 to <5 300 488 75.0% 386 3.0% 8 31.3% 5 450 116.8% 4 - 5 to <10 832 91 75.0% 767 5.5% 13 22.3% 4 724 94.4% 9 - 10 to <100 - - - - - - - - - - - - 10 to <20 - - - - - - - - - - - - 20 to <30 - - - - - - - - - - - - 30 to <100 - - - - - - - - - - - - 100 (Default) 786 10 75.0% 546 100.0% 18 43.3% 1 854 156.4% 200 -190 Sub-total corporates — specialised lending 17,700 4,495 75.5% 16,130 4.1% 234 26.3% 5 8,724 54.1% 230 -190 Total A-IRB (all exposure classes) 98,060 21,193 75.1% 182,346 0.4% 264 2.3% 4 8,724 4.8% 230 -192 Credit risk | 23
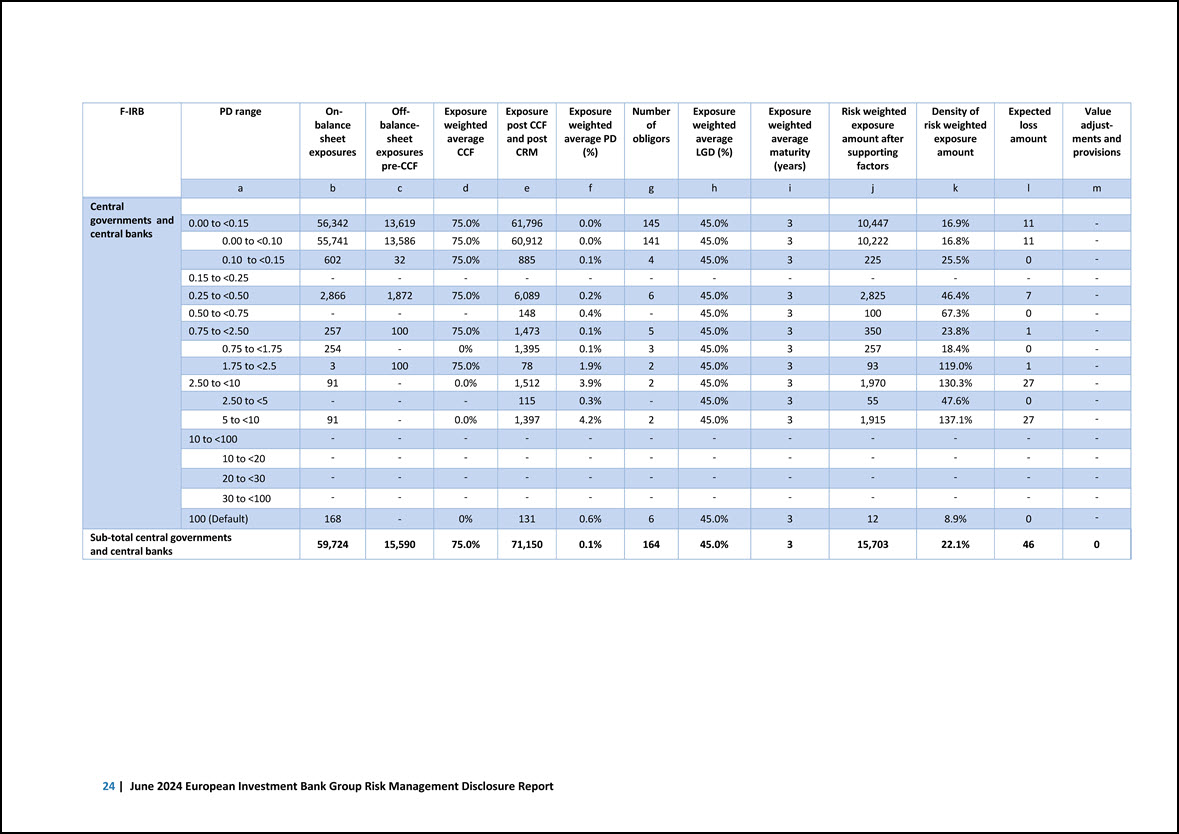
F-IRB PD range On- balance sheet exposures Off- balancesheet exposures pre-CCF Exposure weighted average CCF Exposure post CCF and post CRM Exposure weighted average PD (%) Number of obligors Exposure weighted average LGD (%) Exposure weighted average maturity (years) Risk weighted exposure amount after supporting factors Density of risk weighted exposure amount Expected loss amount Value adjustments and provisions a b c d e f g h i j k l m Central governments and central banks 0.00 to <0.15 56,342 13,619 75.0% 61,796 0.0% 145 45.0% 3 10,447 16.9% 11 - 0.00 to <0.10 55,741 13,586 75.0% 60,912 0.0% 141 45.0% 3 10,222 16.8% 11 - 0.10 to <0.15 602 32 75.0% 885 0.1% 4 45.0% 3 225 25.5% 0 - 0.15 to <0.25 - - - - - - - - - - - - 0.25 to <0.50 2,866 1,872 75.0% 6,089 0.2% 6 45.0% 3 2,825 46.4% 7 - 0.50 to <0.75 - - - 148 0.4% - 45.0% 3 100 67.3% 0 - 0.75 to <2.50 257 100 75.0% 1,473 0.1% 5 45.0% 3 350 23.8% 1 - 0.75 to <1.75 254 - 0% 1,395 0.1% 3 45.0% 3 257 18.4% 0 - 1.75 to <2.5 3 100 75.0% 78 1.9% 2 45.0% 3 93 119.0% 1 - 2.50 to <10 91 - 0.0% 1,512 3.9% 2 45.0% 3 1,970 130.3% 27 - 2.50 to <5 - - - 115 0.3% - 45.0% 3 55 47.6% 0 - 5 to <10 91 - 0.0% 1,397 4.2% 2 45.0% 3 1,915 137.1% 27 - 10 to <100 - - - - - - - - - - - - 10 to <20 - - - - - - - - - - - - 20 to <30 - - - - - - - - - - - - 30 to <100 - - - - - - - - - - - - 100 (Default) 168 - 0% 131 0.6% 6 45.0% 3 12 8.9% 0 - Sub-total central governments and central banks 59,724 15,590 75.0% 71,150 0.1% 164 45.0% 3 15,703 22.1% 46 0 24 | June 2024 European Investment Bank Group Risk Management Disclosure Report
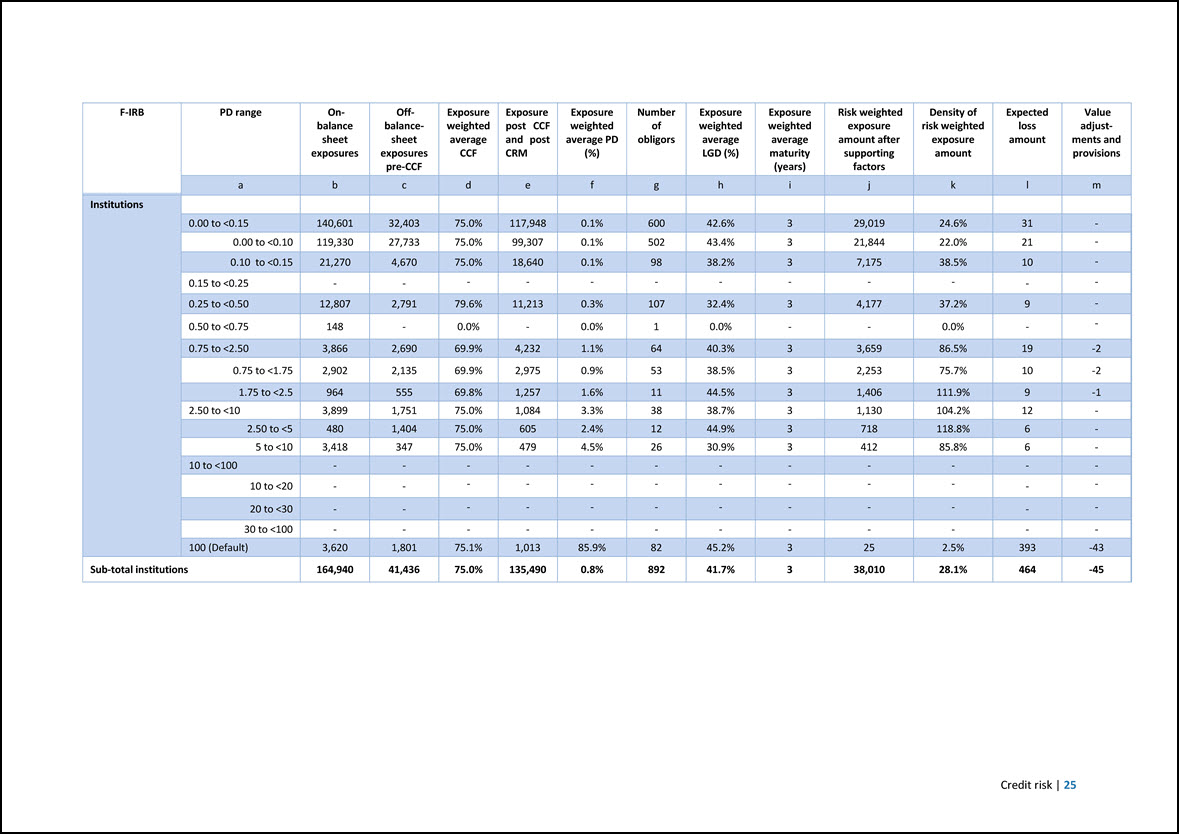
F-IRB PD range On- balance sheet exposures Off- balancesheet exposures pre-CCF Exposure weighted average CCF Exposure post CCF and post CRM Exposure weighted average PD (%) Number of obligors Exposure weighted average LGD (%) Exposure weighted average maturity (years) Risk weighted exposure amount after supporting factors Density of risk weighted exposure amount Expected loss amount Value adjustments and provisions a b c d e f g h i j k l m Institutions 0.00 to <0.15 140,601 32,403 75.0% 117,948 0.1% 600 42.6% 3 29,019 24.6% 31 - 0.00 to <0.10 119,330 27,733 75.0% 99,307 0.1% 502 43.4% 3 21,844 22.0% 21 - 0.10 to <0.15 21,270 4,670 75.0% 18,640 0.1% 98 38.2% 3 7,175 38.5% 10 - 0.15 to <0.25 - - - - - - - - - - - - 0.25 to <0.50 12,807 2,791 79.6% 11,213 0.3% 107 32.4% 3 4,177 37.2% 9 - 0.50 to <0.75 148 - 0.0% - 0.0% 1 0.0% - - 0.0% - - 0.75 to <2.50 3,866 2,690 69.9% 4,232 1.1% 64 40.3% 3 3,659 86.5% 19 -2 0.75 to <1.75 2,902 2,135 69.9% 2,975 0.9% 53 38.5% 3 2,253 75.7% 10 -2 1.75 to <2.5 964 555 69.8% 1,257 1.6% 11 44.5% 3 1,406 111.9% 9 -1 2.50 to <10 3,899 1,751 75.0% 1,084 3.3% 38 38.7% 3 1,130 104.2% 12 - 2.50 to <5 480 1,404 75.0% 605 2.4% 12 44.9% 3 718 118.8% 6 - 5 to <10 3,418 347 75.0% 479 4.5% 26 30.9% 3 412 85.8% 6 - 10 to <100 - - - - - - - - - - - - 10 to <20 - - - - - - - - - - - - 20 to <30 - - - - - - - - - - - - 30 to <100 - - - - - - - - - - - - 100 (Default) 3,620 1,801 75.1% 1,013 85.9% 82 45.2% 3 25 2.5% 393 -43 Sub-total institutions 164,940 41,436 75.0% 135,490 0.8% 892 41.7% 3 38,010 28.1% 464 -45 Credit risk | 25
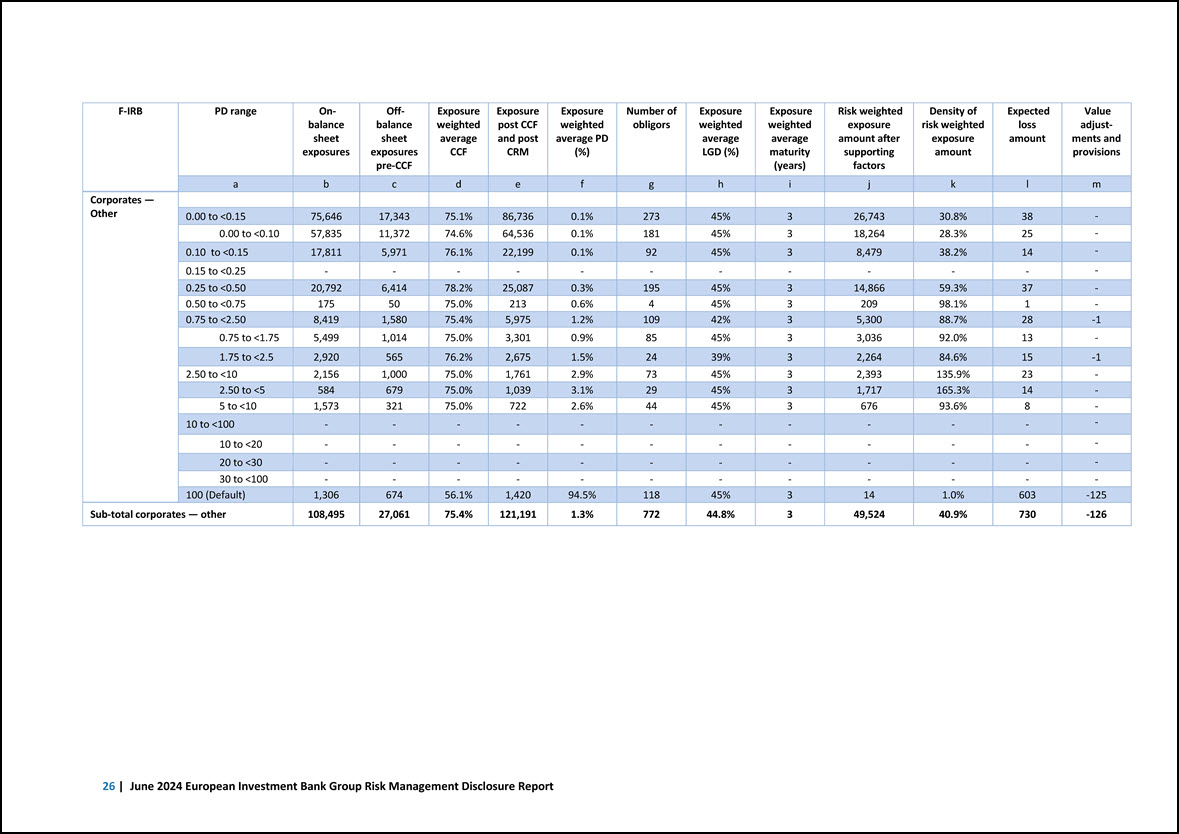
F-IRB PD range On- balance sheet exposures Off- balance sheet exposures pre-CCF Exposure weighted average CCF Exposure post CCF and post CRM Exposure weighted average PD (%) Number of obligors Exposure weighted average LGD (%) Exposure weighted average maturity (years) Risk weighted exposure amount after supporting factors Density of risk weighted exposure amount Expected loss amount Value adjustments and provisions a b c d e f g h i j k l m Corporates — Other 0.00 to <0.15 75,646 17,343 75.1% 86,736 0.1% 273 45% 3 26,743 30.8% 38 - 0.00 to <0.10 57,835 11,372 74.6% 64,536 0.1% 181 45% 3 18,264 28.3% 25 - 0.10 to <0.15 17,811 5,971 76.1% 22,199 0.1% 92 45% 3 8,479 38.2% 14 - 0.15 to <0.25 - - - - - - - - - - - - 0.25 to <0.50 20,792 6,414 78.2% 25,087 0.3% 195 45% 3 14,866 59.3% 37 - 0.50 to <0.75 175 ,50 75.0% 213 0.6% 4 45% 3 209 98.1% 1 - 0.75 to <2.50 8,419 1,580 75.4% 5,975 1.2% 109 42% 3 5,300 88.7% 28 -1 0.75 to <1.75 5,499 1,014 75.0% 3,301 0.9% 85 45% 3 3,036 92.0% 13 - 1.75 to <2.5 2,920 565 76.2% 2,675 1.5% 24 39% 3 2,264 84.6% 15 -1 2.50 to <10 2,156 1,000 75.0% 1,761 2.9% 73 45% 3 2,393 135.9% 23 - 2.50 to <5 584 679 75.0% 1,039 3.1% 29 45% 3 1,717 165.3% 14 - 5 to <10 1,573 321 75.0% 722 2.6% 44 45% 3 676 93.6% 8 - 10 to <100 - - - - - - - - - - - - 10 to <20 - - - - - - - - - - - - 20 to <30 - - - - - - - - - - - - 30 to <100 - - - - - - - - - - - - 100 (Default) 1,306 674 56.1% 1,420 94.5% 118 45% 3 14 1.0% 603 -125 Sub-total corporates — other 108,495 27,061 75.4% 121,191 1.3% 772 44.8% 3 49,524 40.9% 730 -126 26 | June 2024 European Investment Bank Group Risk Management Disclosure Report
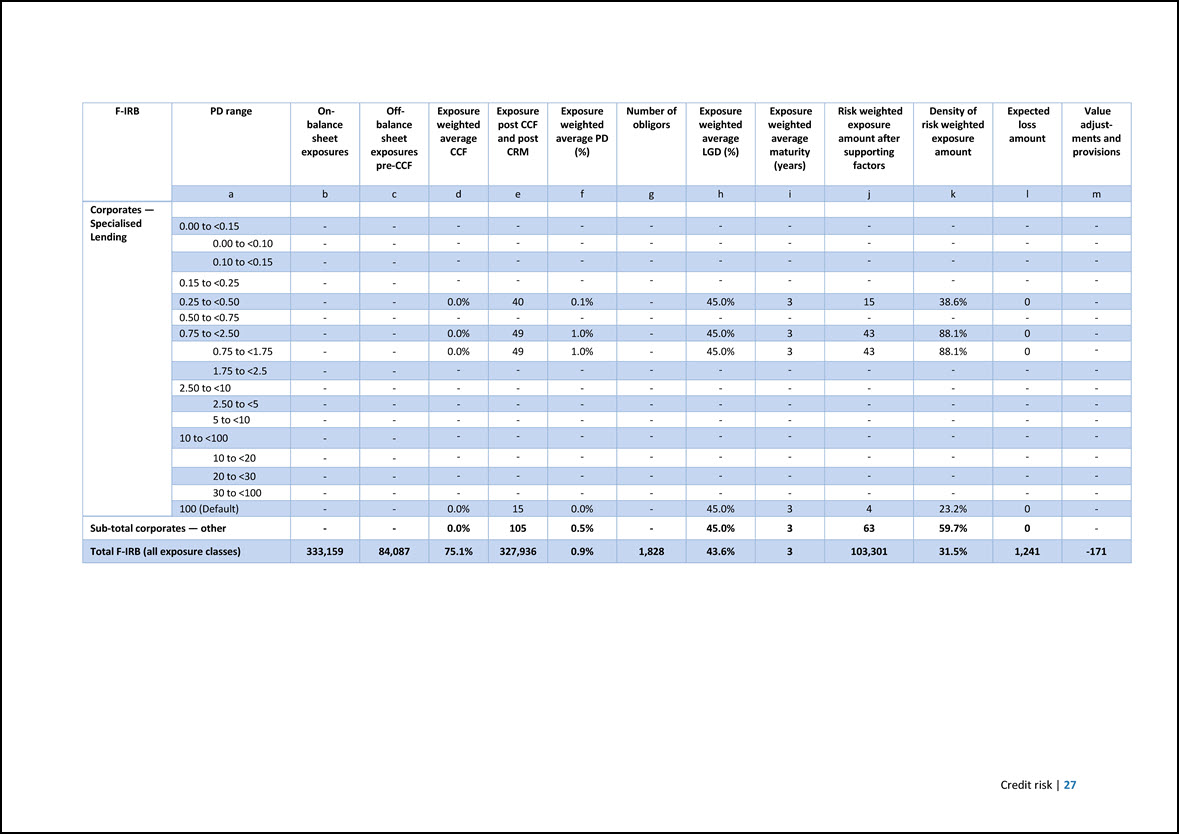
F-IRB PD range On- balance sheet exposures Off- balance sheet exposures pre-CCF Exposure weighted average CCF Exposure post CCF and post CRM Exposure weighted average PD (%) Number of obligors Exposure weighted average LGD (%) Exposure weighted average maturity (years) Risk weighted exposure amount after supporting factors Density of risk weighted exposure amount Expected loss amount Value adjustments and provisions a b c d e f g h i j k l m Corporates — Specialised Lending 0.00 to <0.15 - - - - - - - - - - - - 0.00 to <0.10 - - - - - - - - - - - - 0.10 to <0.15 - - - - - - - - - - - - 0.15 to <0.25 - - - - - - - - - - - - 0.25 to <0.50 - - 0.0% 40 0.1% - 45.0% 3 15 38.6% 0 - 0.50 to <0.75 - - - - - - - - - - - - 0.75 to <2.50 - - 0.0% 49 1.0% - 45.0% 3 43 88.1% 0 - 0.75 to <1.75 - - 0.0% 49 1.0% - 45.0% 3 43 88.1% 0 - 1.75 to <2.5 - - - - - - - - - - - - 2.50 to <10 - - - - - - - - - - - - 2.50 to <5 - - - - - - - - - - - - 5 to <10 - - - - - - - - - - - - 10 to <100 - - - - - - - - - - - - 10 to <20 - - - - - - - - - - - - 20 to <30 - - - - - - - - - - - - 30 to <100 - - - - - - - - - - - - 100 (Default) - - 0.0% 15 0.0% - 45.0% 3 4 23.2% 0 - Sub-total corporates — other - - 0.0% 105 0.5% - 45.0% 3 63 59.7% 0 - Total F-IRB (all exposure classes) 333,159 84,087 75.1% 327,936 0.9% 1,828 43.6% 3 103,301 31.5% 1,241 -171 Credit risk | 27
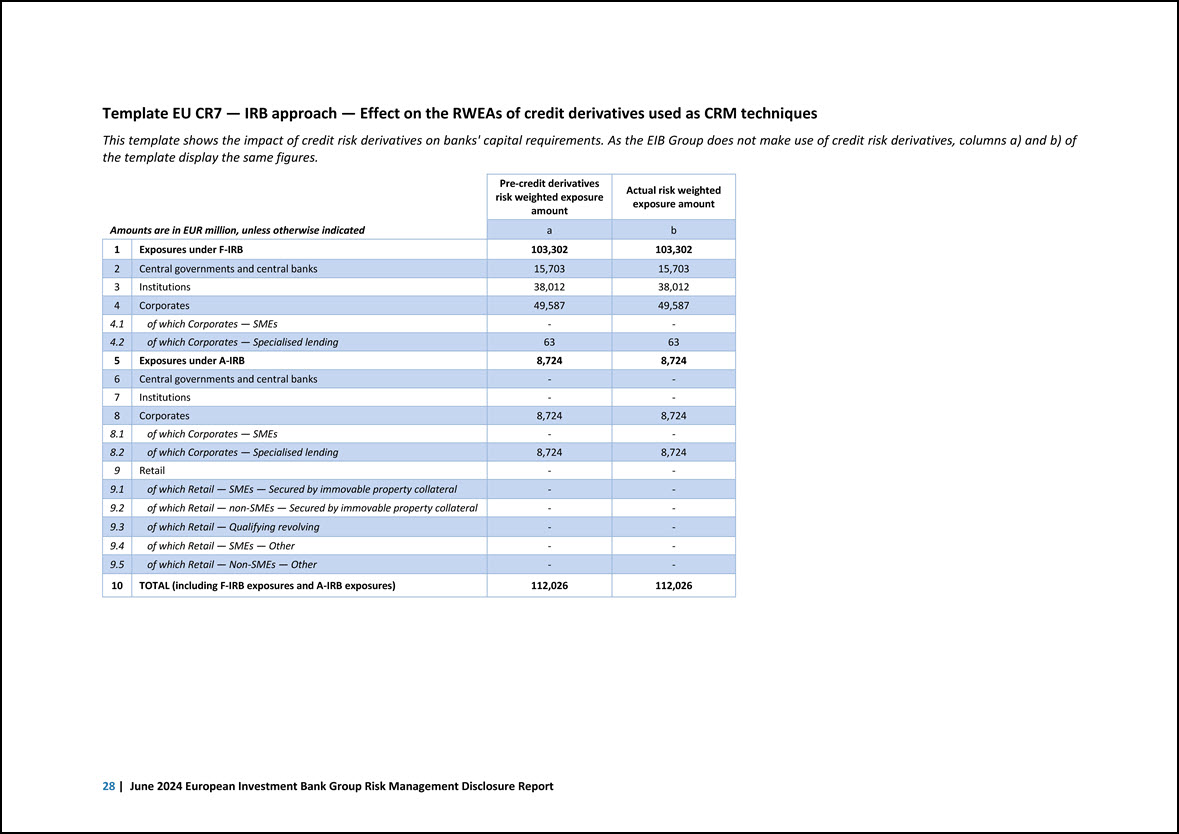
Template EU CR7 — IRB approach — Effect on the RWEAs of credit derivatives used as CRM techniques This template shows the impact of credit risk derivatives on banks’ capital requirements. As the EIB Group does not make use of credit risk derivatives, columns a) and b) of the template display the same figures. Amounts are in EUR million, unless otherwise indicated Pre-credit derivatives risk weighted exposure amount Actual risk weighted exposure amount a b 1 Exposures under F-IRB 103,302 103,302 2 Central governments and central banks 15,703 15,703 3 Institutions 38,012 38,012 4 Corporates 49,587 49,587 4.1 of which Corporates — SMEs - - 4.2 of which Corporates — Specialised lending 63 63 5 Exposures under A-IRB 8,724 8,724 6 Central governments and central banks - - 7 Institutions - - 8 Corporates 8,724 8,724 8.1 of which Corporates — SMEs - - 8.2 of which Corporates — Specialised lending 8,724 8,724 9 Retail - - 9.1 of which Retail — SMEs — Secured by immovable property collateral - - 9.2 of which Retail — non-SMEs — Secured by immovable property collateral - - 9.3 of which Retail — Qualifying revolving - - 9.4 of which Retail — SMEs — Other - - 9.5 of which Retail — Non-SMEs — Other - - 10 TOTAL (including F-IRB exposures and A-IRB exposures) 112,026 112,026 28 | June 2024 European Investment Bank Group Risk Management Disclosure Report
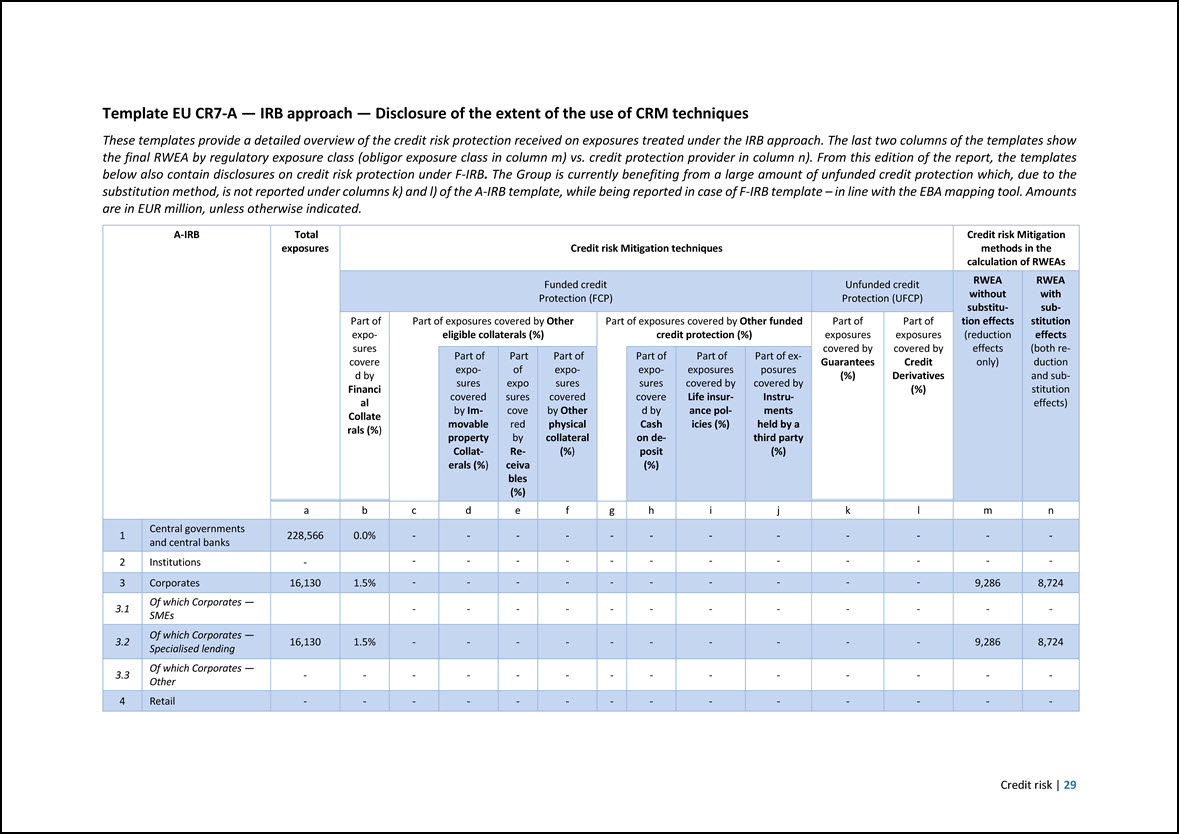
Template EU CR7-A — IRB approach — Disclosure of the extent of the use of CRM techniques These templates provide a detailed overview of the credit risk protection received on exposures treated under the IRB approach. The last two columns of the templates show the final RWEA by regulatory exposure class (obligor exposure class in column m) vs. credit protection provider in column n). From this edition of the report, the templates below also contain disclosures on credit risk protection under F-IRB. The Group is currently benefiting from a large amount of unfunded credit protection which, due to the substitution method, is not reported under columns k) and l) of the A-IRB template, while being reported in case of F-IRB template – in line with the EBA mapping tool. Amounts are in EUR million, unless otherwise indicated. A-IRB Total exposures Credit risk Mitigation techniques Credit risk Mitigation methods in the calculation of RWEAs Funded credit Protection (FCP) Unfunded credit Protection (UFCP) RWEA without substitution effects (reduction effects only) RWEA with substitution effects (both reduction and substitution effects) Part of exposures covere d by Financi al Collate rals (%) Part of exposures covered by Other eligible collaterals (%) Part of exposures covered by Other funded credit protection (%) Part of exposures covered by Guarantees (%) Part of exposures covered by Credit Derivatives (%) Part of exposures covered by Immovable property Collaterals (%) Part of expo sures cove red by Re- ceiva bles (%) Part of exposures covered by Other physical collateral (%) Part of exposures covere d by Cash on deposit (%) Part of exposures covered by Life insurance policies (%) Part of exposures covered by Instruments held by a third party (%) a b c d e f g h i j k l m n 1 Central governments and central banks 228,566 0.0% - - - - - - - - - - - - 2 Institutions - - - - - - - - - - - - - 3 Corporates 16,130 1.5% - - - - - - - - - - 9,286 8,724 3.1 Of which Corporates — SMEs - - - - - - - - - - - - 3.2 Of which Corporates — Specialised lending 16,130 1.5% - - - - - - - - - - 9,286 8,724 3.3 Of which Corporates — Other - - - - - - - - - - - - - - 4 Retail - - - - - - - - - - - - - - Credit risk | 29
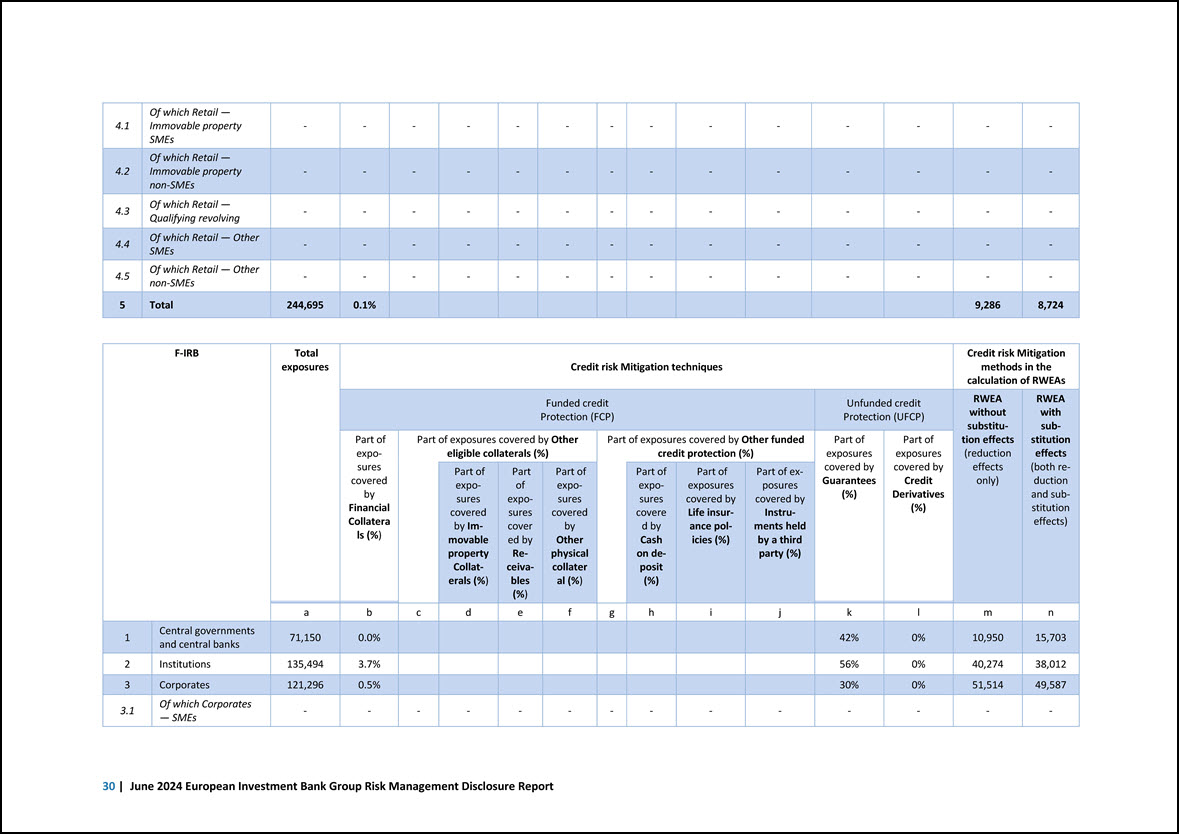
4.1 Of which Retail — Immovable property SMEs - - - - - - - - - - - - - - 4.2 Of which Retail — Immovable property non-SMEs - - - - - - - - - - - - - - 4.3 Of which Retail — Qualifying revolving - - - - - - - - - - - - - - 4.4 Of which Retail — Other SMEs - - - - - - - - - - - - - - 4.5 Of which Retail — Other non-SMEs - - - - - - - - - - - - - - 5 Total 244,695 0.1% 9,286 8,724 F-IRB Total exposures Credit risk Mitigation techniques Credit risk Mitigation methods in the calculation of RWEAs Funded credit Protection (FCP) Unfunded credit Protection (UFCP) RWEA without substitution effects (reduction effects only) RWEA with substitution effects (both reduction and substitution effects) Part of exposures covered by Financial Collatera ls (%) Part of exposures covered by Other eligible collaterals (%) Part of exposures covered by Other funded credit protection (%) Part of exposures covered by Guarantees (%) Part of exposures covered by Credit Derivatives (%) Part of exposures covered by Immovable property Collaterals (%) Part of exposures cover ed by Re- ceiva- bles (%) Part of exposures covered by Other physical collater al (%) Part of exposures covere d by Cash on deposit (%) Part of exposures covered by Life insurance policies (%) Part of exposures covered by Instruments held by a third party (%) a b c d e f g h i j k l m n 1 Central governments and central banks 71,150 0.0% 42% 0% 10,950 15,703 2 Institutions 135,494 3.7% 56% 0% 40,274 38,012 3 Corporates 121,296 0.5% 30% 0% 51,514 49,587 3.1 Of which Corporates — SMEs - - - - - - - - - - - - - - 30 | June 2024 European Investment Bank Group Risk Management Disclosure Report
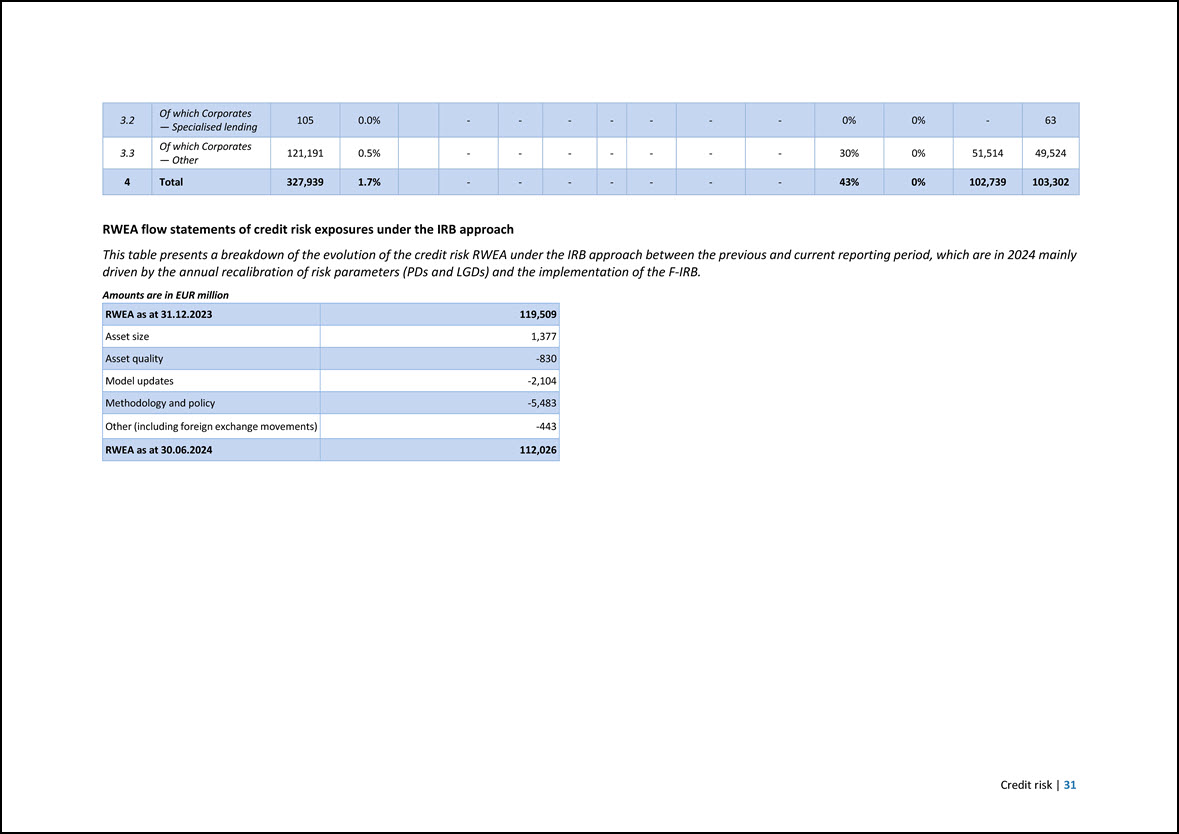
3.2 Of which Corporates — Specialised lending 105 0.0% - - - - - - - 0% 0% - 63 3.3 Of which Corporates — Other 121,191 0.5% - - - - - - - 30% 0% 51,514 49,524 4 Total 327,939 1.7% - - - - - - - 43% 0% 102,739 103,302 RWEA flow statements of credit risk exposures under the IRB approach This table presents a breakdown of the evolution of the credit risk RWEA under the IRB approach between the previous and current reporting period, which are in 2024 mainly driven by the annual recalibration of risk parameters (PDs and LGDs) and the implementation of the F-IRB. Amounts are in EUR million RWEA as at 31.12.2023 119,509 Asset size 1,377 Asset quality -830 Model updates -2,104 Methodology and policy -5,483 Other (including foreign exchange movements) -443 RWEA as at 30.06.2024 112,026 Credit risk | 31
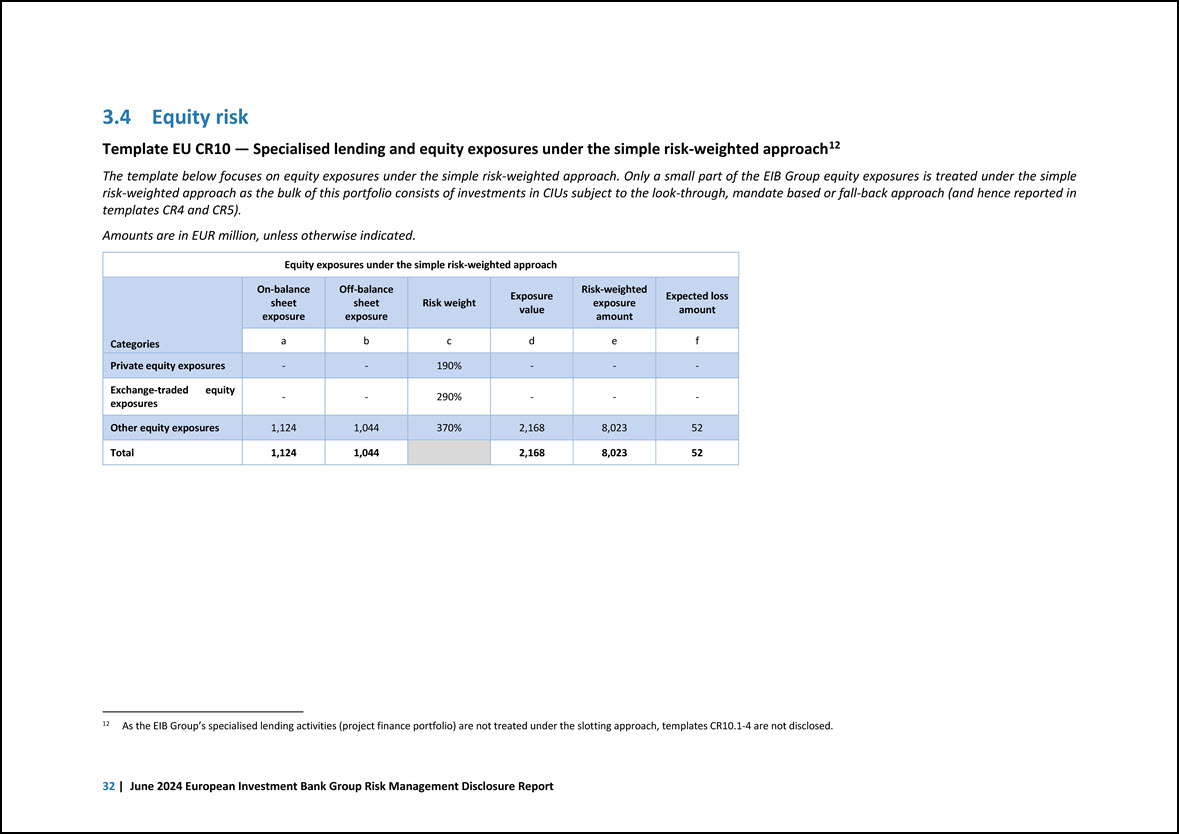
3.4 Equity risk Template EU CR10 — Specialised lending and equity exposures under the simple risk-weighted approach12 12 As the EIB Group’s specialised lending activities (project finance portfolio) are not treated under the slotting approach, templates CR10.1-4 are not disclosed. The template below focuses on equity exposures under the simple risk-weighted approach. Only a small part of the EIB Group equity exposures is treated under the simple risk-weighted approach as the bulk of this portfolio consists of investments in CIUs subject to the look-through, mandate based or fall-back approach (and hence reported in templates CR4 and CR5). Amounts are in EUR million, unless otherwise indicated. Equity exposures under the simple risk-weighted approach Categories On-balance sheet exposure Off-balance sheet exposure Risk weight Exposure value Risk-weighted exposure amount Expected loss amount a b c d e f Private equity exposures - - 190% - - - Exchange-traded equity exposures - - 290% - - - Other equity exposures 1,124 1,044 370% 2,168 8,023 52 Total 1,124 1,044 2,168 8,023 52 32 | June 2024 European Investment Bank Group Risk Management Disclosure Report
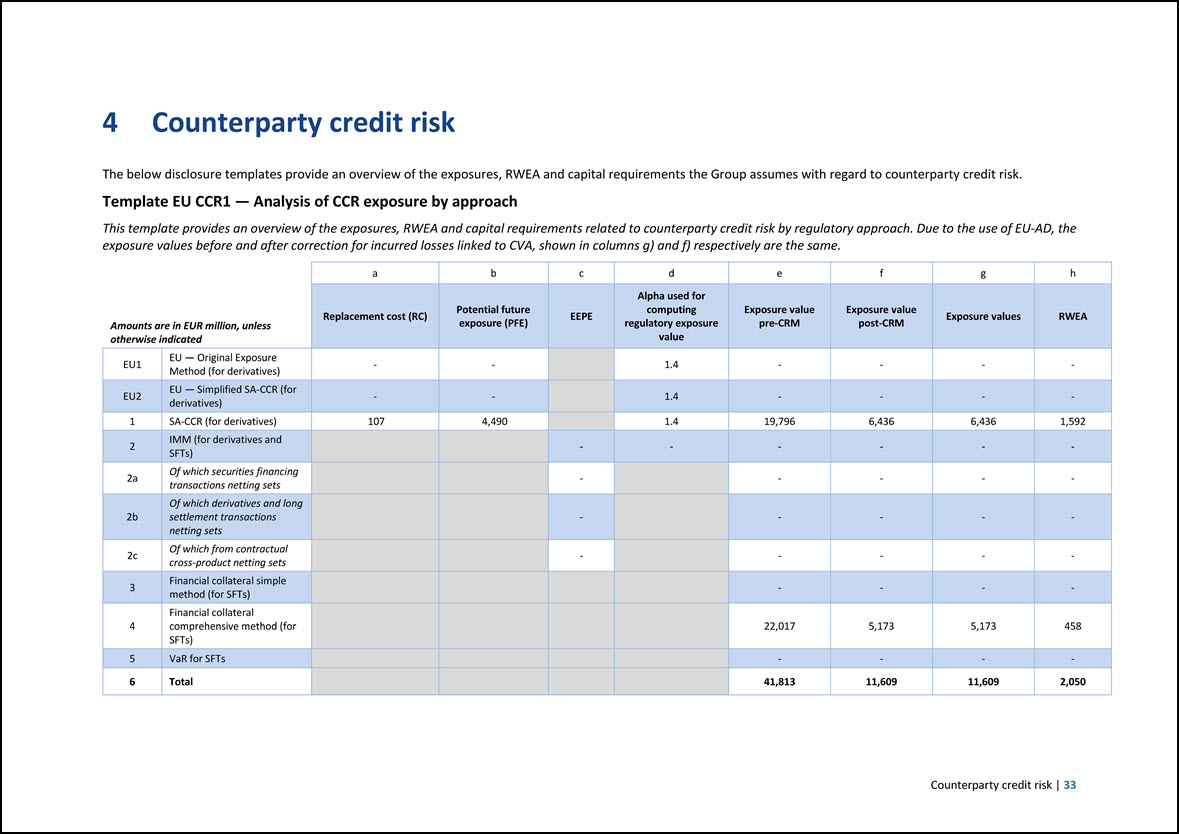
4 Counterparty credit risk The below disclosure templates provide an overview of the exposures, RWEA and capital requirements the Group assumes with regard to counterparty credit risk. Template EU CCR1 — Analysis of CCR exposure by approach This template provides an overview of the exposures, RWEA and capital requirements related to counterparty credit risk by regulatory approach. Due to the use of EU-AD, the exposure values before and after correction for incurred losses linked to CVA, shown in columns g) and f) respectively are the same. Amounts are in EUR million, unless otherwise indicated a b c d e f g h Replacement cost (RC) Potential future exposure (PFE) EEPE Alpha used for computing regulatory exposure value Exposure value pre-CRM Exposure value post-CRM Exposure values RWEA EU1 EU — Original Exposure Method (for derivatives) - - 1.4 - - - - EU2 EU — Simplified SA-CCR (for derivatives) - - 1.4 - - - - 1 SA-CCR (for derivatives) 107 4,490 1.4 19,796 6,436 6,436 1,592 2 IMM (for derivatives and SFTs) - - - - - - 2a Of which securities financing transactions netting sets - - - - - 2b Of which derivatives and long settlement transactions netting sets - - - - - 2c Of which from contractual cross-product netting sets - - - - - 3 Financial collateral simple method (for SFTs) - - - - 4 Financial collateral comprehensive method (for SFTs) 22,017 5,173 5,173 458 5 VaR for SFTs - - - - 6 Total 41,813 11,609 11,609 2,050 Counterparty credit risk | 33
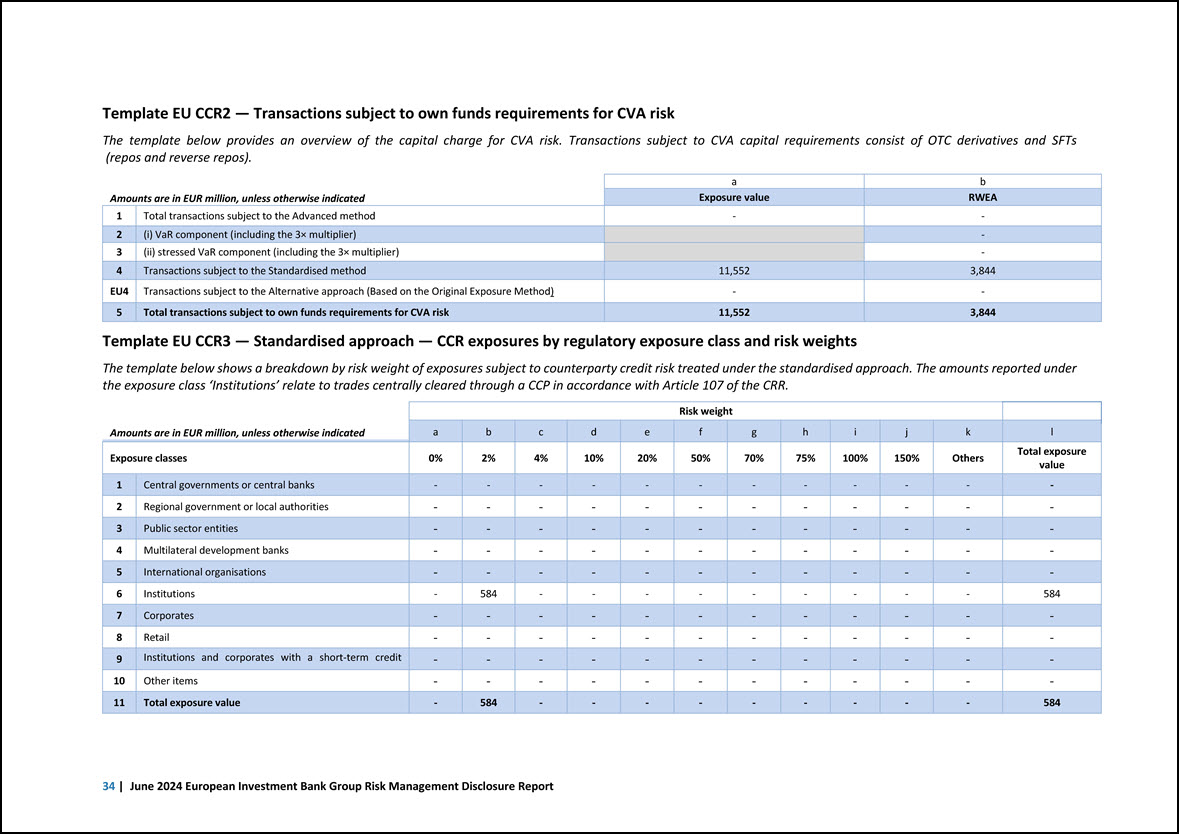
Template EU CCR2 — Transactions subject to own funds requirements for CVA risk The template below provides an overview of the capital charge for CVA risk. Transactions subject to CVA capital requirements consist of OTC derivatives and SFTs (repos and reverse repos). Amounts are in EUR million, unless otherwise indicated a b Exposure value RWEA 1 Total transactions subject to the Advanced method - - 2 (i) VaR component (including the 3× multiplier) 11,552 - 3 (ii) stressed VaR component (including the 3× multiplier) - 4 Transactions subject to the Standardised method 3,844 EU4 Transactions subject to the Alternative approach (Based on the Original Exposure Method) - - 5 Total transactions subject to own funds requirements for CVA risk 11,552 3,844 Template EU CCR3 — Standardised approach — CCR exposures by regulatory exposure class and risk weights The template below shows a breakdown by risk weight of exposures subject to counterparty credit risk treated under the standardised approach. The amounts reported under the exposure class ‘Institutions’ relate to trades centrally cleared through a CCP in accordance with Article 107 of the CRR. Amounts are in EUR million, unless otherwise indicated Risk weight a b c d e f g h i j k l Exposure classes 0% 2% 4% 10% 20% 50% 70% 75% 100% 150% Others Total exposure value 1 Central governments or central banks - - - - - - - - - - - - 2 Regional government or local authorities - - - - - - - - - - - - 3 Public sector entities - - - - - - - - - - - - 4 Multilateral development banks - - - - - - - - - - - - 5 International organisations - - - - - - - - - - - - 6 Institutions - 584 - - - - - - - - - 584 7 Corporates - - - - - - - - - - - - 8 Retail - - - - - - - - - - - - 9 Institutions and corporates with a short-term credit - - - - - - - - - - - - 10 Other items - - - - - - - - - - - - 11 Total exposure value - 584 - - - - - - - - - 584 34 | June 2024 European Investment Bank Group Risk Management Disclosure Report
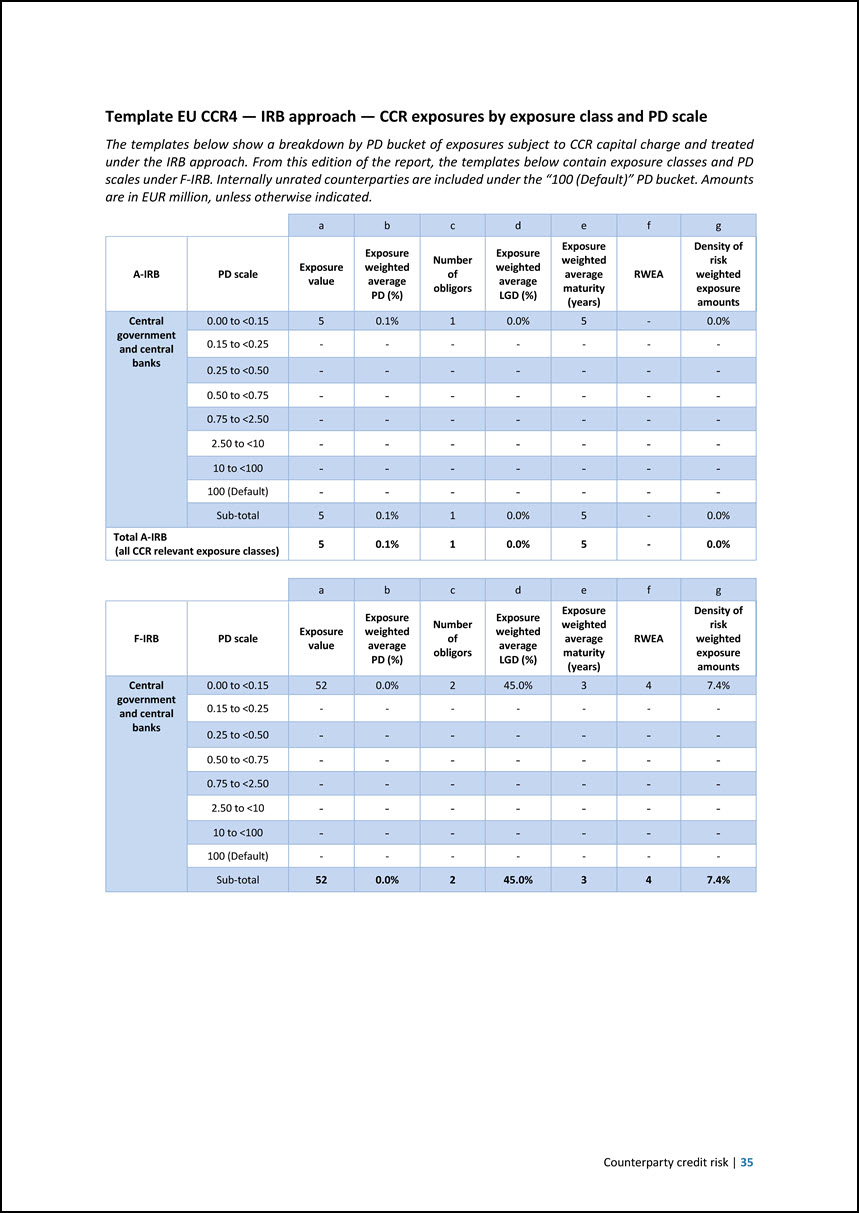
Template EU CCR4 — IRB approach — CCR exposures by exposure class and PD scale The templates below show a breakdown by PD bucket of exposures subject to CCR capital charge and treated under the IRB approach. From this edition of the report, the templates below contain exposure classes and PD scales under F-IRB. Internally unrated counterparties are included under the “100 (Default)” PD bucket. Amounts are in EUR million, unless otherwise indicated. a b c d e f g A-IRB PD scale Exposure value Exposure weighted average PD (%) Number of obligors Exposure weighted average LGD (%) Exposure weighted average maturity (years) RWEA Density of risk weighted exposure amounts Central government and central banks 0.00 to <0.15 5 0.1% 1 0.0% 5 - 0.0% 0.15 to <0.25 - - - - - - - 0.25 to <0.50 - - - - - - - 0.50 to <0.75 - - - - - - - 0.75 to <2.50 - - - - - - - 2.50 to <10 - - - - - - - 10 to <100 - - - - - - - 100 (Default) - - - - - - - Sub-total 5 0.1% 1 0.0% 5 - 0.0% Total A-IRB (all CCR relevant exposure classes) 5 0.1% 1 0.0% 5 - 0.0% a b c d e f g F-IRB PD scale Exposure value Exposure weighted average PD (%) Number of obligors Exposure weighted average LGD (%) Exposure weighted average maturity (years) RWEA Density of risk weighted exposure amounts Central government and central banks 0.00 to <0.15 52 0.0% 2 45.0% 3 4 7.4% 0.15 to <0.25 - - - - - - - 0.25 to <0.50 - - - - - - - 0.50 to <0.75 - - - - - - - 0.75 to <2.50 - - - - - - - 2.50 to <10 - - - - - - - 10 to <100 - - - - - - - 100 (Default) - - - - - - - Sub-total 52 0.0% 2 45.0% 3 4 7.4% Counterparty credit risk | 35
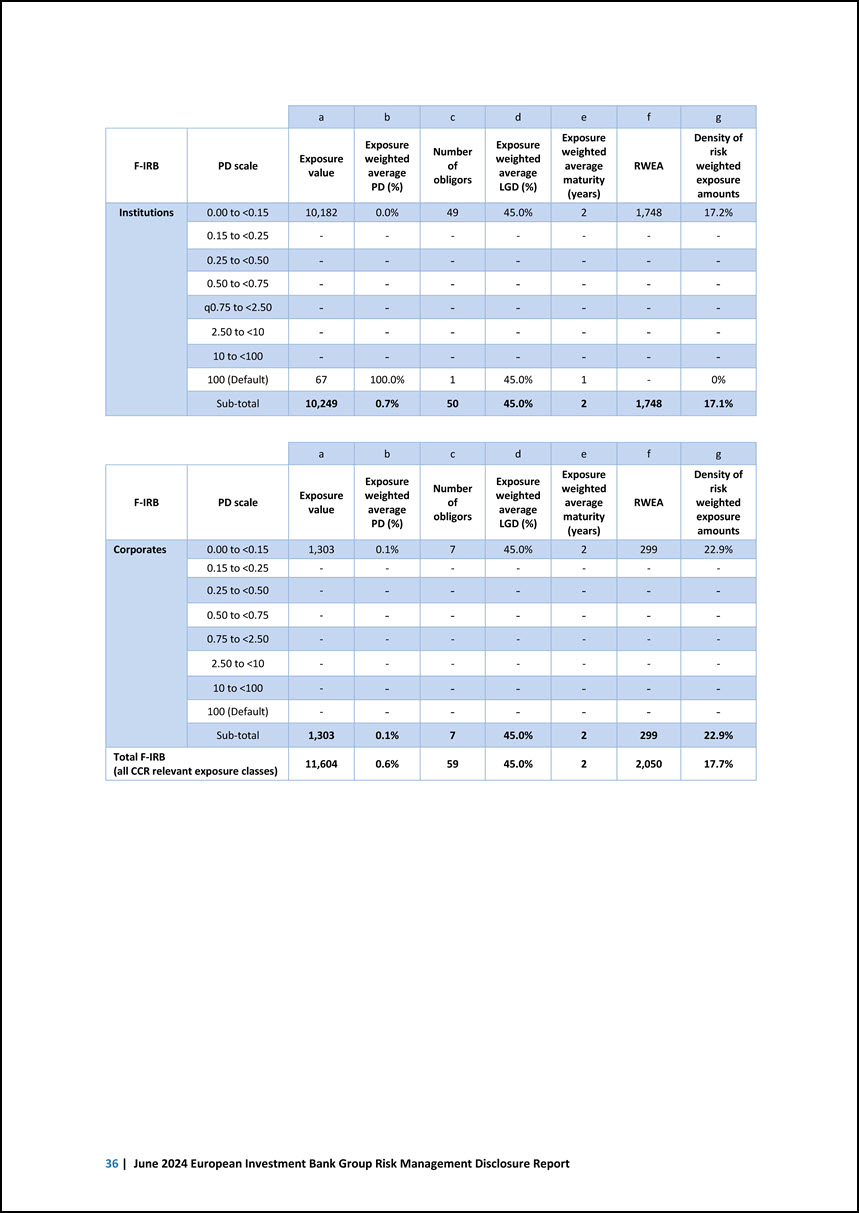
a b c d e f g F-IRB PD scale Exposure value Exposure weighted average PD (%) Number of obligors Exposure weighted average LGD (%) Exposure weighted average maturity (years) RWEA Density of risk weighted exposure amounts Institutions 0.00 to <0.15 10,182 0.0% 49 45.0% 2 1,748 17.2% 0.15 to <0.25 - - - - - - - 0.25 to <0.50 - - - - - - - 0.50 to <0.75 - - - - - - - q0.75 to <2.50 - - - - - - - 2.50 to <10 - - - - - - - 10 to <100 - - - - - - - 100 (Default) 67 100.0% 1 45.0% 1 - 0% Sub-total 10,249 0.7% 50 45.0% 2 1,748 17.1% a b c d e f g F-IRB PD scale Exposure value Exposure weighted average PD (%) Number of obligors Exposure weighted average LGD (%) Exposure weighted average maturity (years) RWEA Density of risk weighted exposure amounts Corporates 0.00 to <0.15 1,303 0.1% 7 45.0% 2 299 22.9% 0.15 to <0.25 - - - - - - - 0.25 to <0.50 - - - - - - - 0.50 to <0.75 - - - - - - - 0.75 to <2.50 - - - - - - - 2.50 to <10 - - - - - - - 10 to <100 - - - - - - - 100 (Default) - - - - - - - Sub-total 1,303 0.1% 7 45.0% 2 299 22.9% Total F-IRB (all CCR relevant exposure classes) 11,604 0.6% 59 45.0% 2 2,050 17.7% 36 | June 2024 European Investment Bank Group Risk Management Disclosure Report
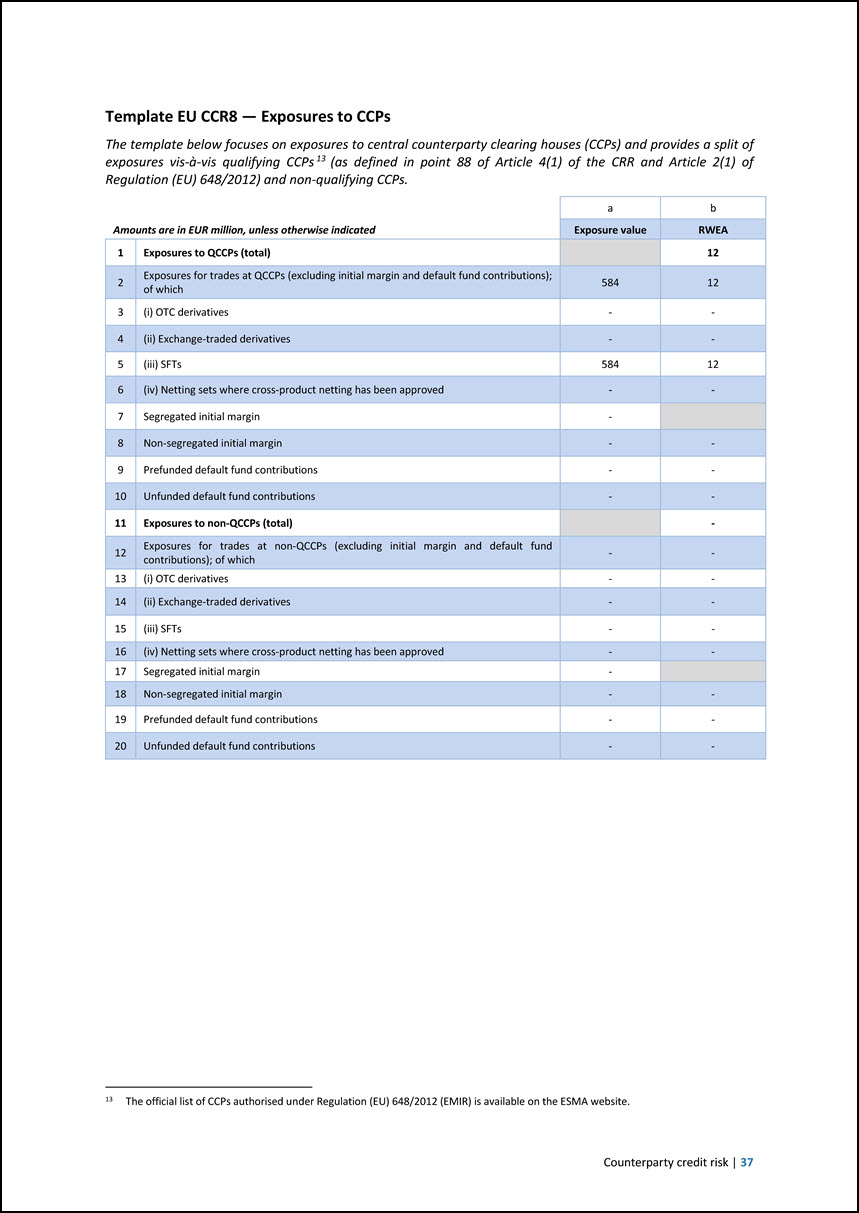
Template EU CCR8 — Exposures to CCPs The template below focuses on exposures to central counterparty clearing houses (CCPs) and provides a split of exposures vis-à-vis qualifying CCPs 13 (as defined in point 88 of Article 4(1) of the CRR and Article 2(1) of Regulation (EU) 648/2012) and non-qualifying CCPs. 13 The official list of CCPs authorised under Regulation (EU) 648/2012 (EMIR) is available on the ESMA website. Amounts are in EUR million, unless otherwise indicated a b Exposure value RWEA 1 Exposures to QCCPs (total) 12 2 Exposures for trades at QCCPs (excluding initial margin and default fund contributions); of which 584 12 3 (i) OTC derivatives - - 4 (ii) Exchange-traded derivatives - - 5 (iii) SFTs 584 12 6 (iv) Netting sets where cross-product netting has been approved - - 7 Segregated initial margin - 8 Non-segregated initial margin - - 9 Prefunded default fund contributions - - 10 Unfunded default fund contributions - - 11 Exposures to non-QCCPs (total) - 12 Exposures for trades at non-QCCPs (excluding initial margin and default fund contributions); of which - - 13 (i) OTC derivatives - - 14 (ii) Exchange-traded derivatives - - 15 (iii) SFTs - - 16 (iv) Netting sets where cross-product netting has been approved - - 17 Segregated initial margin - 18 Non-segregated initial margin - - 19 Prefunded default fund contributions - - 20 Unfunded default fund contributions - - Counterparty credit risk | 37
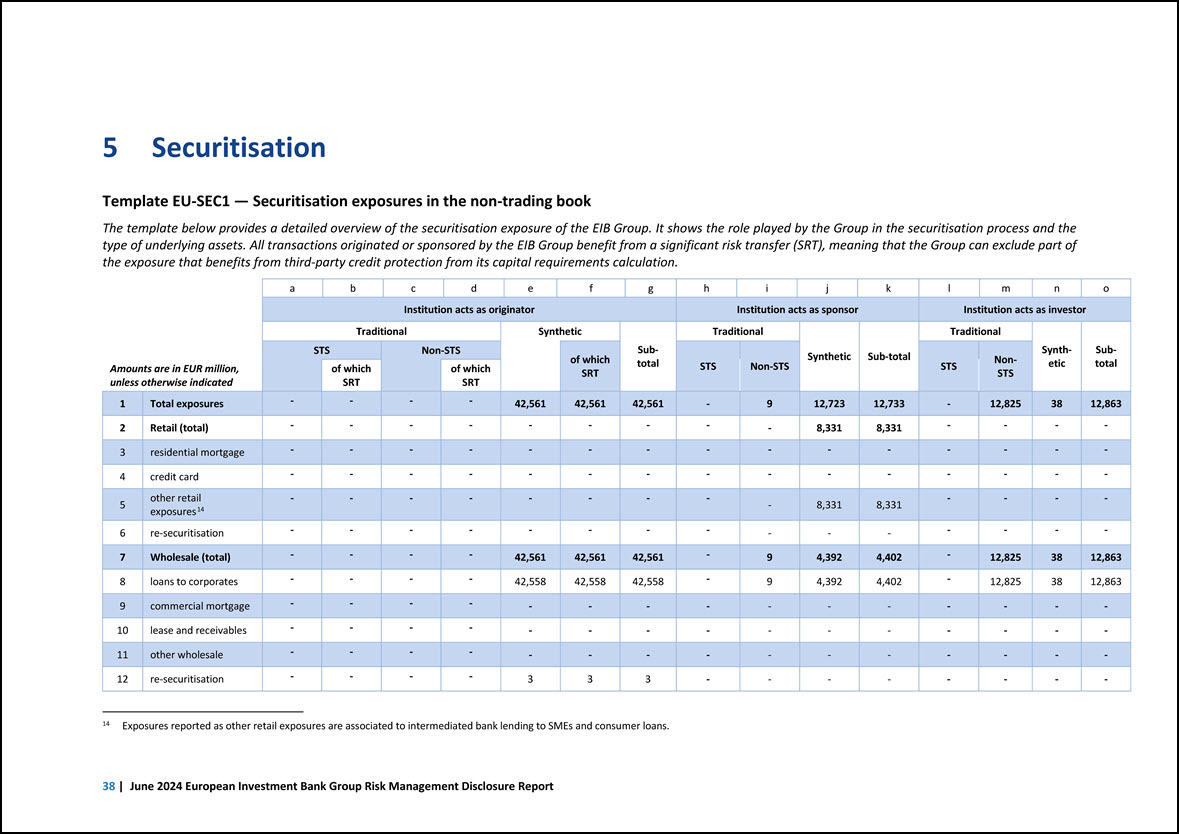
5 Securitisation Template EU-SEC1 — Securitisation exposures in the non-trading book The template below provides a detailed overview of the securitisation exposure of the EIB Group. It shows the role played by the Group in the securitisation process and the type of underlying assets. All transactions originated or sponsored by the EIB Group benefit from a significant risk transfer (SRT), meaning that the Group can exclude part of the exposure that benefits from third-party credit protection from its capital requirements calculation. Amounts are in EUR million, unless otherwise indicated a b c ] d ] e 1 f ] g 1 h 1 i j k 1 l m 1 n 1 o Institution acts as originator Institution acts as sponsor Institution acts as investor Traditional Synthetic Subtotal Traditional Synthetic Sub-total Traditional Synthetic Subtotal STS Non-STS of which SRT STS Non-STS STS NonSTS of which SRT of which SRT 1 Total exposures - - - - 42,561 42,561 42,561 - 9 12,723 12,733 - 12,825 38 12,863 - 2 Retail (total) - - - - - - - - - 8,331 8,331 - - - 3 residential mortgage - - - - - - - - - - - - - - - - 4 credit card - - - - - - - - - - - - - - 5 other retail exposures14 - - - - - - - - - 8,331 8,331 - - - - 6 re-securitisation - - - - - - - - - - - - - - - 7 Wholesale (total) - - - - 42,561 42,561 42,561 - 9 4,392 4,402 - 12,825 38 12,863 8 loans to corporates - - - - 42,558 42,558 42,558 - 9 4,392 4,402 - 12,825 38 12,863 9 commercial mortgage - - - - - - - - - - - - - - - - 10 lease and receivables - - - - - - - - - - - - - - 11 other wholesale - - - - - - - - - - - - - - - - 12 re-securitisation - - - - 3 3 3 - - - - - - - 14 Exposures reported as other retail exposures are associated to intermediated bank lending to SMEs and consumer loans. 38 | June 2024 European Investment Bank Group Risk Management Disclosure Report
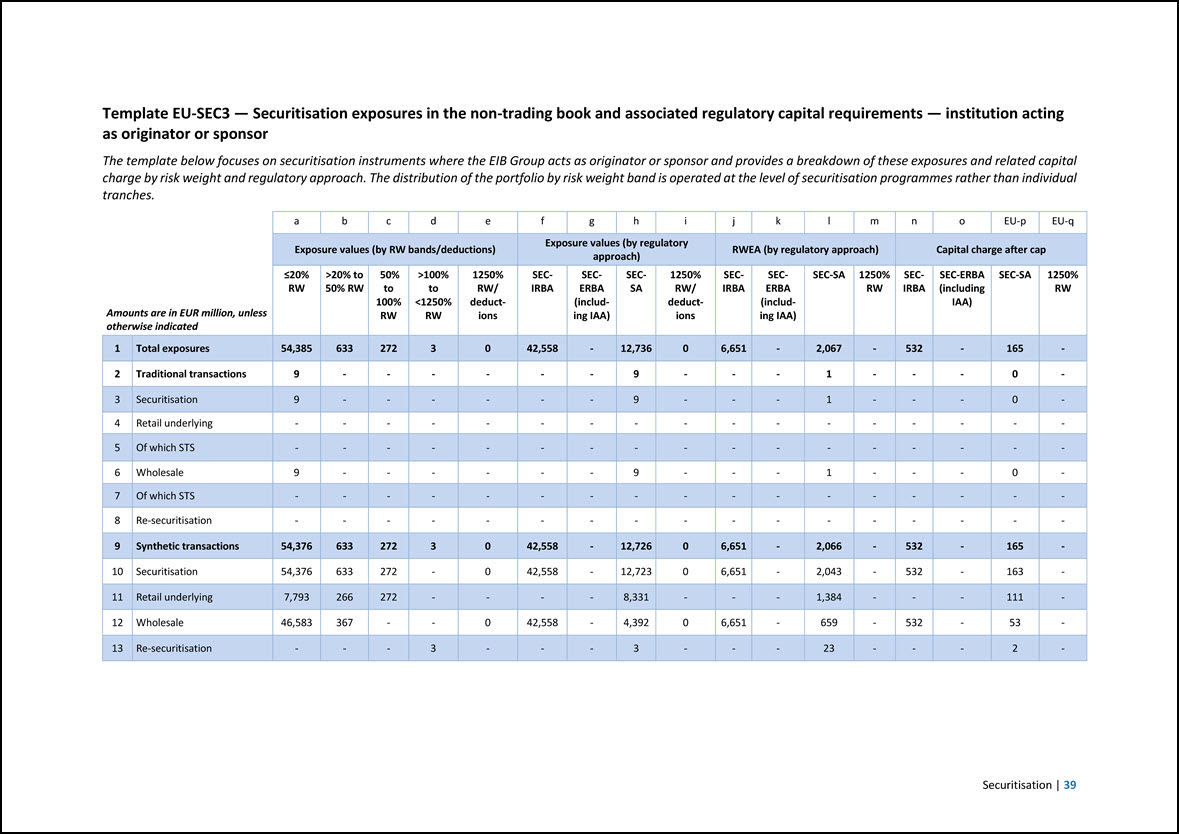
Template EU-SEC3 — Securitisation exposures in the non-trading book and associated regulatory capital requirements — institution acting as originator or sponsor The template below focuses on securitisation instruments where the EIB Group acts as originator or sponsor and provides a breakdown of these exposures and related capital charge by risk weight and regulatory approach. The distribution of the portfolio by risk weight band is operated at the level of securitisation programmes rather than individual tranches. Amounts are in EUR million, unless otherwise indicated a b c d e f g h i j k l m n o EU-p EU-q Exposure values (by RW bands/deductions) Exposure values (by regulatory approach) RWEA (by regulatory approach) Capital charge after cap =20% RW >20% to 50% RW 50% to 100% RW >100% to <1250% RW 1250% RW/ deductions SEC- IRBA SEC ERBA (including IAA) SECSA 1250% RW/ deductions SEC- IRBA SECERBA (including IAA) SEC-SA 1250% RW SEC- IRBA SEC-ERBA (including IAA) SEC-SA 1250% RW 1 Total exposures 54,385 633 272 3 0 42,558 - 12,736 0 6,651 - 2,067 - 532 - 165 - 2 Traditional transactions 9 - - - - - - 9 - - - 1 - - - 0 - 3 Securitisation 9 - - - - - - 9 - - - 1 - - - 0 - 4 Retail underlying - - - - - - - - - - - - - - - - - 5 Of which STS - - - - - - - - - - - - - - - - - 6 Wholesale 9 - - - - - - 9 - - - 1 - - - 0 - 7 Of which STS - - - - - - - - - - - - - - - - - 8 Re-securitisation - - - - - - - - - - - - - - - - - 9 Synthetic transactions 54,376 633 272 3 0 42,558 - 12,726 0 6,651 - 2,066 - 532 - 165 - 10 Securitisation 54,376 633 272 - 0 42,558 - 12,723 0 6,651 - 2,043 - 532 - 163 - 11 Retail underlying 7,793 266 272 - - - - 8,331 - - - 1,384 - - - 111 - 12 Wholesale 46,583 367 - - 0 42,558 - 4,392 0 6,651 - 659 - 532 - 53 - 13 Re-securitisation - - - 3 - - - 3 - - - 23 - - - 2 - Securitisation | 39
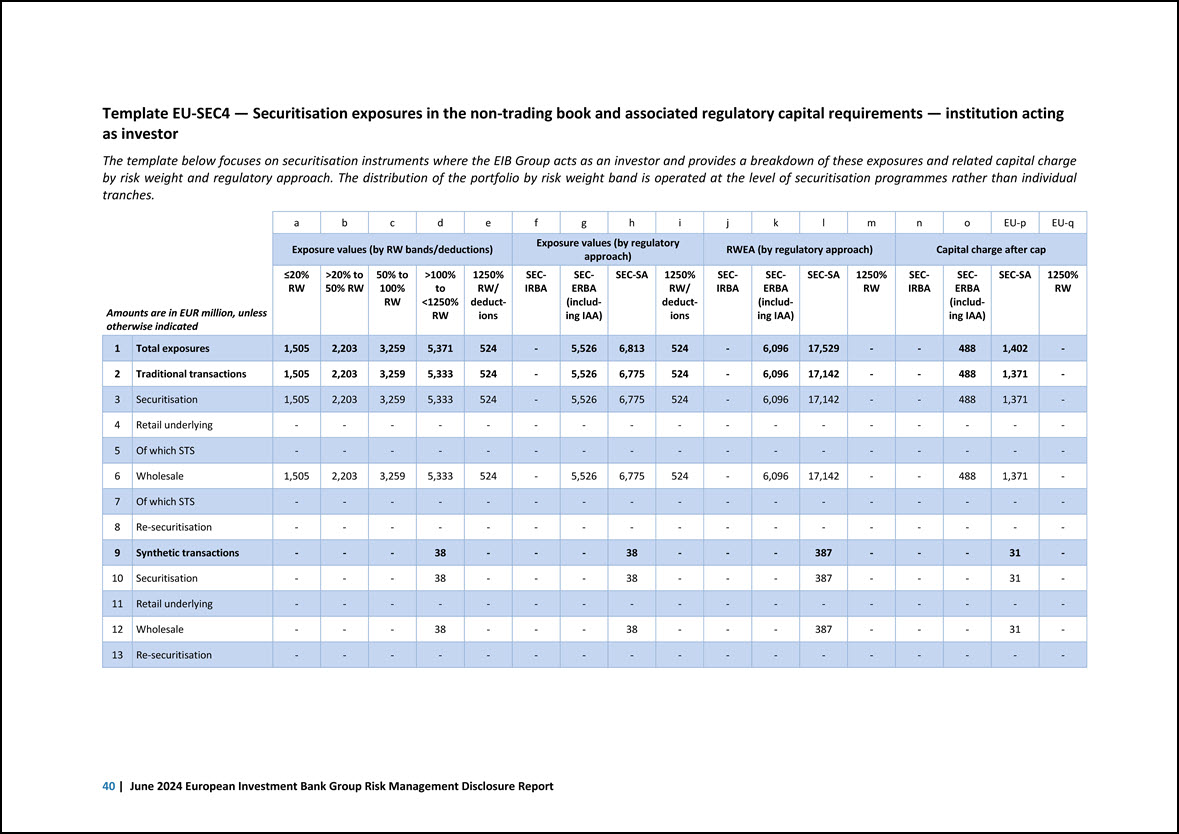
Template EU-SEC4 — Securitisation exposures in the non-trading book and associated regulatory capital requirements — institution acting as investor The template below focuses on securitisation instruments where the EIB Group acts as an investor and provides a breakdown of these exposures and related capital charge by risk weight and regulatory approach. The distribution of the portfolio by risk weight band is operated at the level of securitisation programmes rather than individual tranches. Amounts are in EUR million, unless otherwise indicated a b c d e f g h i j k l m n o EU-p EU-q Exposure values (by RW bands/deductions) Exposure values (by regulatory approach) RWEA (by regulatory approach) Capital charge after cap =20% RW >20% to 50% RW 50% to 100% RW >100% to <1250% RW 1250% RW/ deductions SEC- IRBA SEC ERBA (including IAA) SEC-SA 1250% RW/ deductions SEC- IRBA SECERBA (including IAA) SEC-SA 1250% RW SEC- IRBA SECERBA (including IAA) SEC-SA 1250% RW 1 Total exposures 1,505 2,203 3,259 5,371 524 - 5,526 6,813 524 - 6,096 17,529 - - 488 1,402 - 2 Traditional transactions 1,505 2,203 3,259 5,333 524 - 5,526 6,775 524 - 6,096 17,142 - - 488 1,371 - 3 Securitisation 1,505 2,203 3,259 5,333 524 - 5,526 6,775 524 - 6,096 17,142 - - 488 1,371 - 4 Retail underlying - - - - - - - - - - - - - - - - - 5 Of which STS - - - - - - - - - - - - - - - - - 6 Wholesale 1,505 2,203 3,259 5,333 524 - 5,526 6,775 524 - 6,096 17,142 - - 488 1,371 - 7 Of which STS - - - - - - - - - - - - - - - - - 8 Re-securitisation - - - - - - - - - - - - - - - - - 9 Synthetic transactions - - - 38 - - - 38 - - - 387 - - - 31 - 10 Securitisation - - - 38 - - - 38 - - - 387 - - - 31 - 11 Retail underlying - - - - - - - - - - - - - - - - - 12 Wholesale - - - 38 - - - 38 - - - 387 - - - 31 - 13 Re-securitisation - - - - - - - - - - - - - - - - - 40 | June 2024 European Investment Bank Group Risk Management Disclosure Report

Template EU-SEC5 — Exposures securitised by the institution — Exposures in default and specific credit risk adjustments The following table provides, by asset type, a view on the overall securitised (on- and off-balance) exposures of the EIB Group where the Group acts as originator or sponsor before considering credit protection from third parties. Amounts are in EUR million, unless otherwise indicated a b c Exposures securitised by the institution — Institution acts as originator or as sponsor Total outstanding nominal amount Total amount of specific credit risk adjustments made during the period Of which exposures in default 1 Total exposures 109,57615 2,669 -16 2 Retail (total) 8,262 241 - 3 residential mortgage - - - 4 credit card - - - 5 other retail exposures 8,262 241 - 6 re-securitisation - - - 7 Wholesale (total) 101,314 2,428 -16 8 loans to corporates 99,063 2,428 - 9 commercial mortgage - - - 10 lease and receivables - - - 11 other wholesale - - - 12 re-securitisation 2,251 - -16 15 These are outstanding securitised exposures for which the Group has acted as originator under either synthetic securitisation programmes or re-securitisations and relate to financial guarantees or off-and on-balance sheet exposures securitised in the context of mandate activities. Securitisation | 41
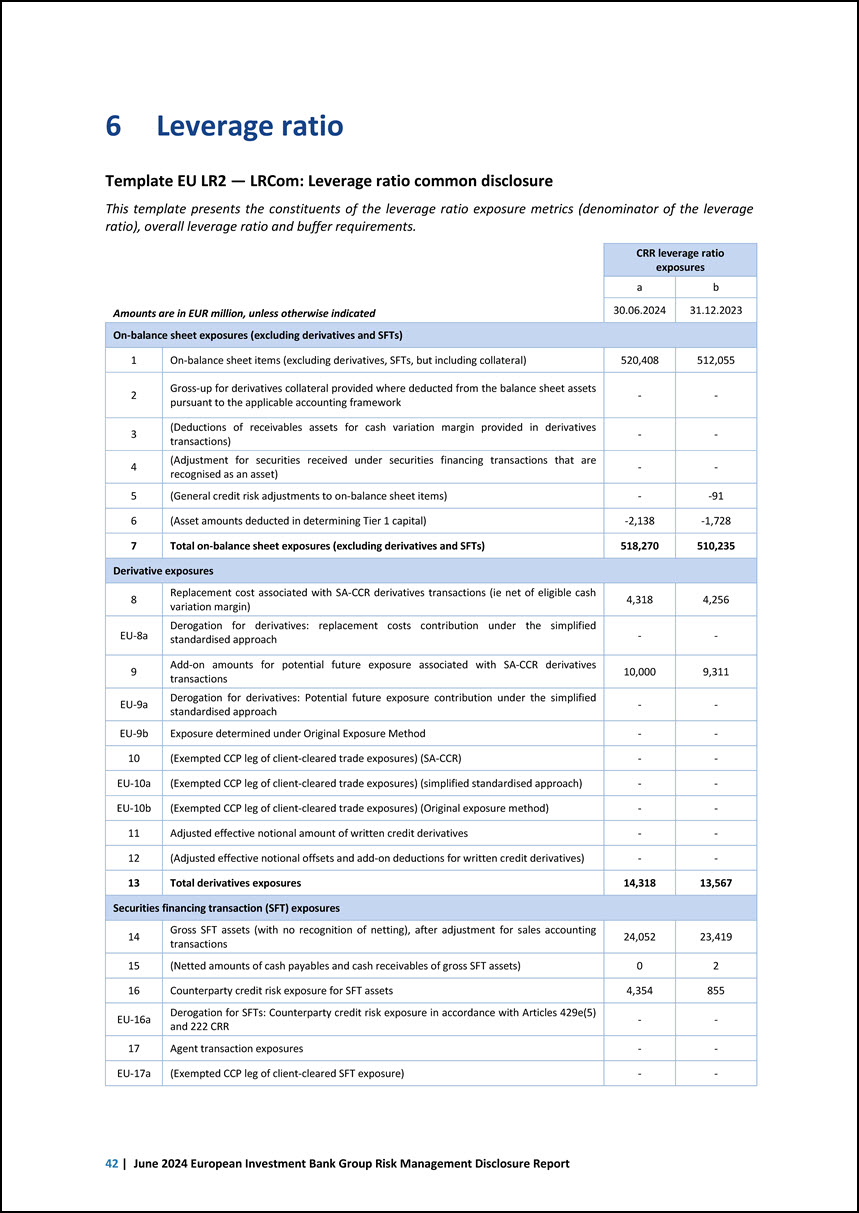
6 Leverage ratio Template EU LR2 — LRCom: Leverage ratio common disclosure This template presents the constituents of the leverage ratio exposure metrics (denominator of the leverage ratio), overall leverage ratio and buffer requirements. Amounts are in EUR million, unless otherwise indicated CRR leverage ratio exposures a b 30.06.2024 31.12.2023 On-balance sheet exposures (excluding derivatives and SFTs) 1 On-balance sheet items (excluding derivatives, SFTs, but including collateral) 520,408 512,055 2 Gross-up for derivatives collateral provided where deducted from the balance sheet assets pursuant to the applicable accounting framework - - 3 (Deductions of receivables assets for cash variation margin provided in derivatives transactions) - - 4 (Adjustment for securities received under securities financing transactions that are recognised as an asset) - - 5 (General credit risk adjustments to on-balance sheet items) - -91 6 (Asset amounts deducted in determining Tier 1 capital) -2,138 -1,728 7 Total on-balance sheet exposures (excluding derivatives and SFTs) 518,270 510,235 Derivative exposures 8 Replacement cost associated with SA-CCR derivatives transactions (ie net of eligible cash variation margin) 4,318 4,256 EU-8a Derogation for derivatives: replacement costs contribution under the simplified standardised approach - - 9 Add-on amounts for potential future exposure associated with SA-CCR derivatives transactions 10,000 9,311 EU-9a Derogation for derivatives: Potential future exposure contribution under the simplified standardised approach - - EU-9b Exposure determined under Original Exposure Method - - 10 (Exempted CCP leg of client-cleared trade exposures) (SA-CCR) - - EU-10a (Exempted CCP leg of client-cleared trade exposures) (simplified standardised approach) - - EU-10b (Exempted CCP leg of client-cleared trade exposures) (Original exposure method) - - 11 Adjusted effective notional amount of written credit derivatives - - 12 (Adjusted effective notional offsets and add-on deductions for written credit derivatives) - - 13 Total derivatives exposures 14,318 13,567 Securities financing transaction (SFT) exposures 14 Gross SFT assets (with no recognition of netting), after adjustment for sales accounting transactions 24,052 23,419 15 (Netted amounts of cash payables and cash receivables of gross SFT assets) 0 2 16 Counterparty credit risk exposure for SFT assets 4,354 855 EU-16a Derogation for SFTs: Counterparty credit risk exposure in accordance with Articles 429e(5) and 222 CRR - - 17 Agent transaction exposures - - EU-17a (Exempted CCP leg of client-cleared SFT exposure) - - 42 | June 2024 European Investment Bank Group Risk Management Disclosure Report
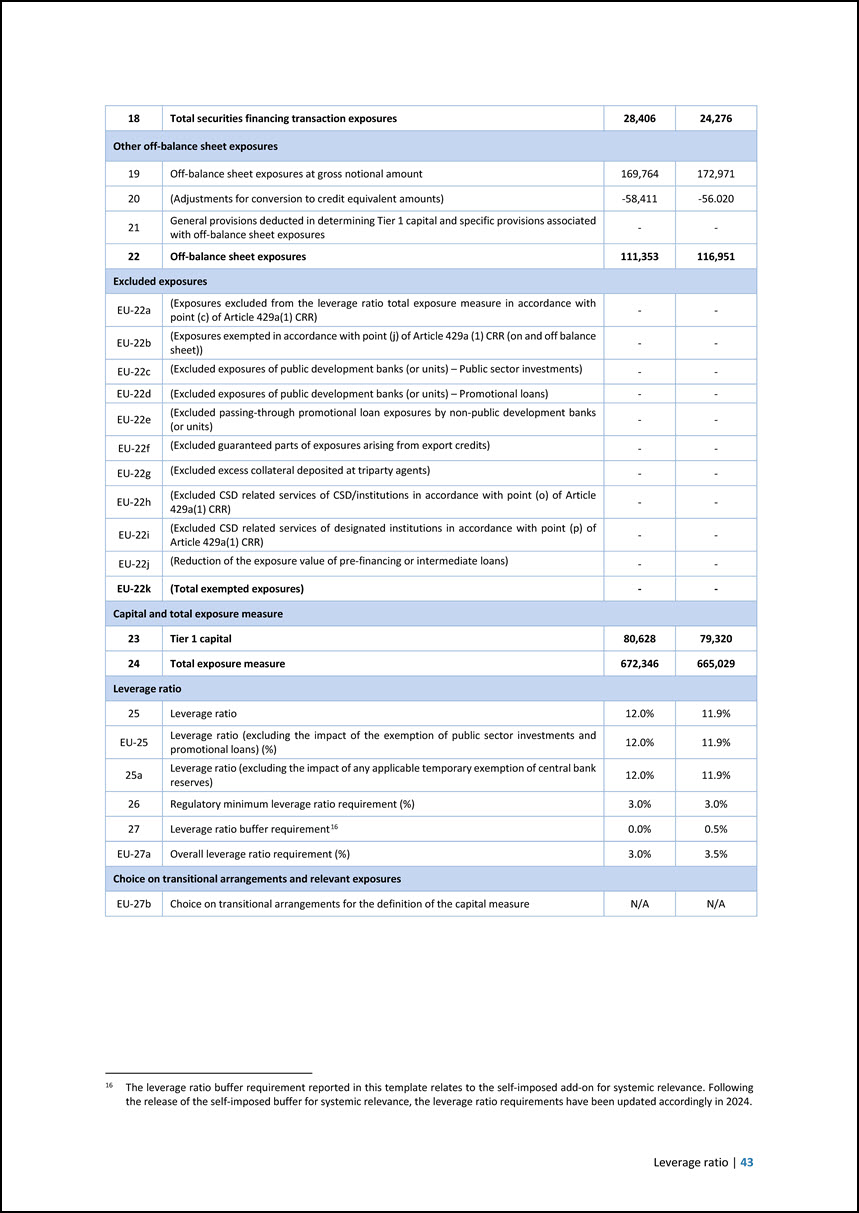
18 Total securities financing transaction exposures 28,406 24,276 Other off-balance sheet exposures 19 Off-balance sheet exposures at gross notional amount 169,764 172,971 20 (Adjustments for conversion to credit equivalent amounts) -58,411 -56.020 21 General provisions deducted in determining Tier 1 capital and specific provisions associated with off-balance sheet exposures - - 22 Off-balance sheet exposures 111,353 116,951 Excluded exposures EU-22a (Exposures excluded from the leverage ratio total exposure measure in accordance with point (c) of Article 429a(1) CRR) - - EU-22b (Exposures exempted in accordance with point (j) of Article 429a (1) CRR (on and off balance sheet)) - - EU-22c (Excluded exposures of public development banks (or units) – Public sector investments) - - EU-22d (Excluded exposures of public development banks (or units) – Promotional loans) - - EU-22e (Excluded passing-through promotional loan exposures by non-public development banks (or units) - - EU-22f (Excluded guaranteed parts of exposures arising from export credits) - - EU-22g (Excluded excess collateral deposited at triparty agents) - - EU-22h (Excluded CSD related services of CSD/institutions in accordance with point (o) of Article 429a(1) CRR) - - EU-22i (Excluded CSD related services of designated institutions in accordance with point (p) of Article 429a(1) CRR) - - EU-22j (Reduction of the exposure value of pre-financing or intermediate loans) - - EU-22k (Total exempted exposures) - - Capital and total exposure measure 23 Tier 1 capital 80,628 79,320 24 Total exposure measure 672,346 665,029 Leverage ratio 25 Leverage ratio 12.0% 11.9% EU-25 Leverage ratio (excluding the impact of the exemption of public sector investments and promotional loans) (%) 12.0% 11.9% 25a Leverage ratio (excluding the impact of any applicable temporary exemption of central bank reserves) 12.0% 11.9% 26 Regulatory minimum leverage ratio requirement (%) 3.0% 3.0% 27 Leverage ratio buffer requirement16 0.0% 0.5% EU-27a Overall leverage ratio requirement (%) 3.0% 3.5% Choice on transitional arrangements and relevant exposures EU-27b Choice on transitional arrangements for the definition of the capital measure N/A N/A 16 The leverage ratio buffer requirement reported in this template relates to the self-imposed add-on for systemic relevance. Following the release of the self-imposed buffer for systemic relevance, the leverage ratio requirements have been updated accordingly in 2024. Leverage ratio | 43
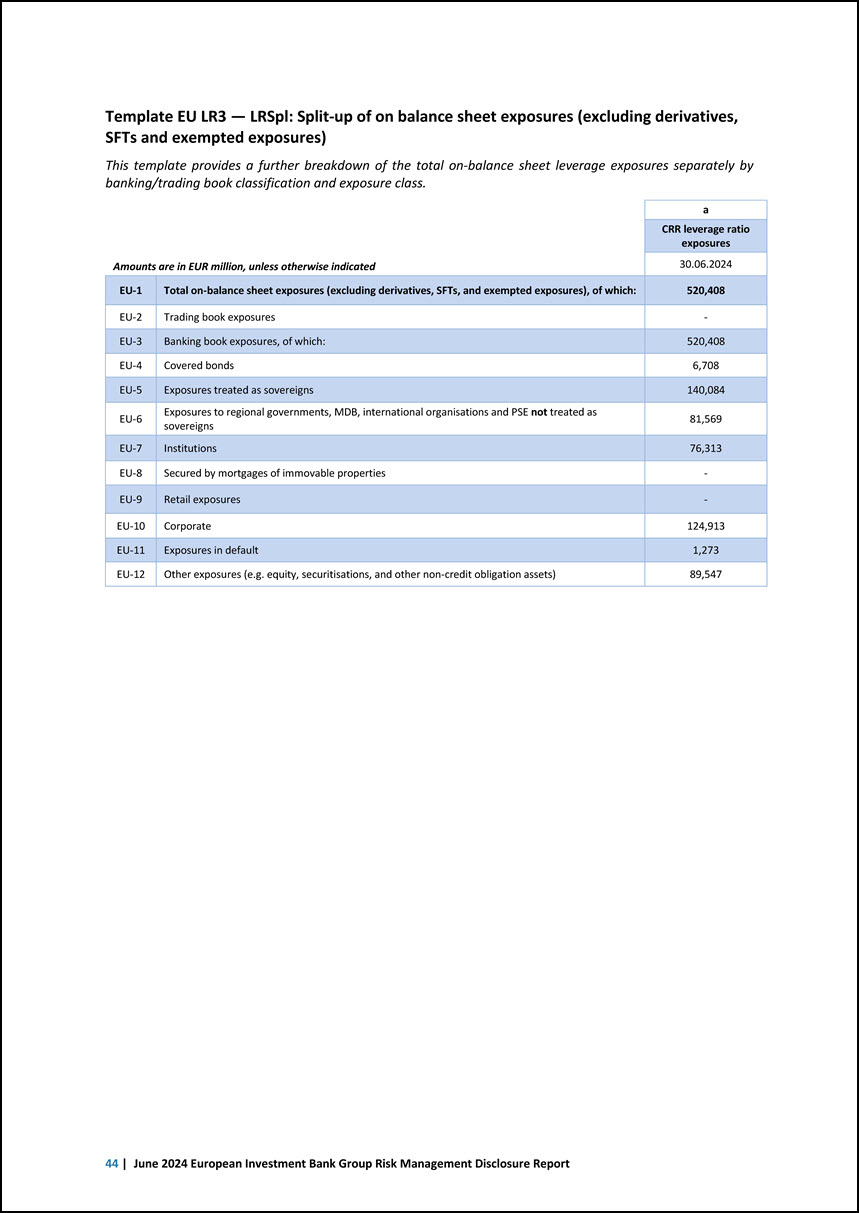
Template EU LR3 — LRSpl: Split-up of on balance sheet exposures (excluding derivatives, SFTs and exempted exposures) This template provides a further breakdown of the total on-balance sheet leverage exposures separately by banking/trading book classification and exposure class. Amounts are in EUR million, unless otherwise indicated a CRR leverage ratio exposures 30.06.2024 EU-1 Total on-balance sheet exposures (excluding derivatives, SFTs, and exempted exposures), of which: 520,408 EU-2 Trading book exposures - EU-3 Banking book exposures, of which: 520,408 EU-4 Covered bonds 6,708 EU-5 Exposures treated as sovereigns 140,084 EU-6 Exposures to regional governments, MDB, international organisations and PSE not treated as sovereigns 81,569 EU-7 Institutions 76,313 EU-8 Secured by mortgages of immovable properties - EU-9 Retail exposures - EU-10 Corporate 124,913 EU-11 Exposures in default 1,273 EU-12 Other exposures (e.g. equity, securitisations, and other non-credit obligation assets) 89,547 44 | June 2024 European Investment Bank Group Risk Management Disclosure Report
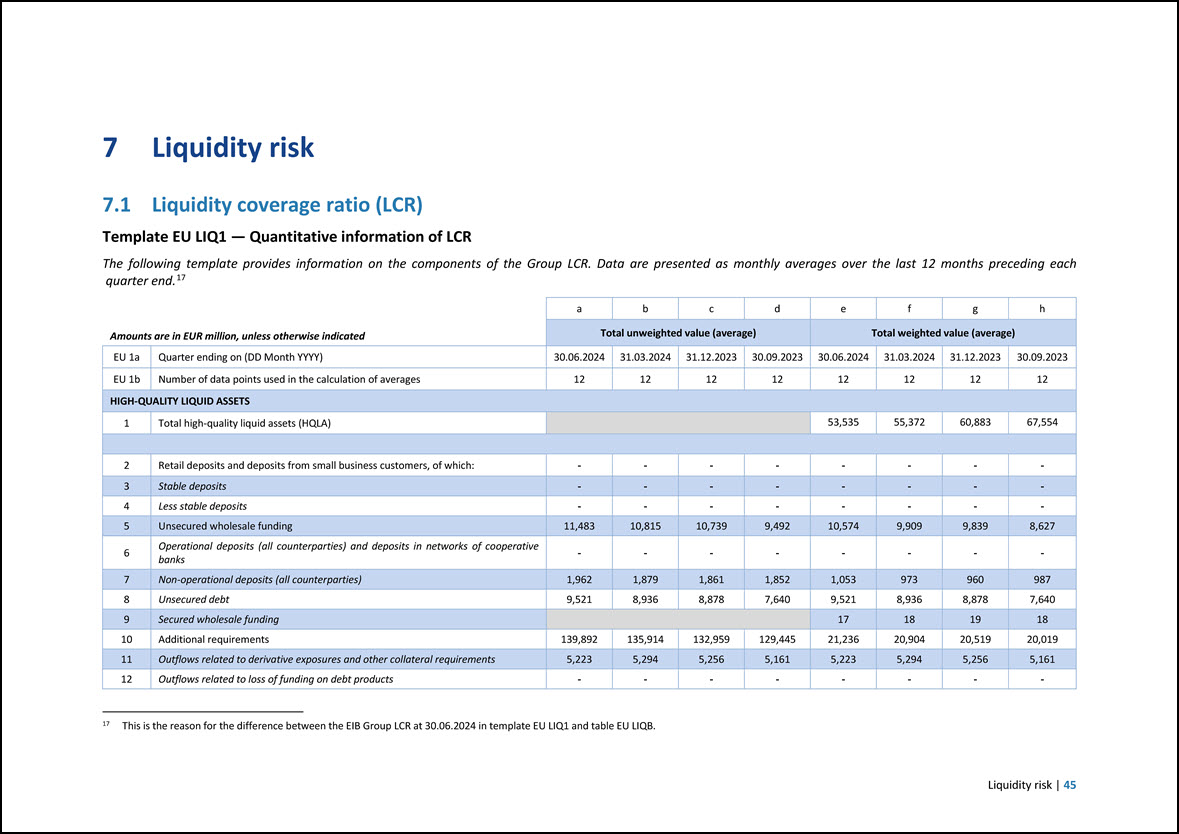
7 Liquidity risk 7.1 Liquidity coverage ratio (LCR) Template EU LIQ1 — Quantitative information of LCR The following template provides information on the components of the Group LCR. Data are presented as monthly averages over the last 12 months preceding each quarter end.17 17 This is the reason for the difference between the EIB Group LCR at 30.06.2024 in template EU LIQ1 and table EU LIQB. Amounts are in EUR million, unless otherwise indicated a b c d e f g h Total unweighted value (average) Total weighted value (average) EU 1a Quarter ending on (DD Month YYYY) 30.06.2024 31.03.2024 31.12.2023 30.09.2023 30.06.2024 31.03.2024 31.12.2023 30.09.2023 EU 1b Number of data points used in the calculation of averages 12 12 12 12 12 12 12 12 HIGH-QUALITY LIQUID ASSETS 1 Total high-quality liquid assets (HQLA) 53,535 55,372 60,883 67,554 2 Retail deposits and deposits from small business customers, of which: - - - - - - - - 3 Stable deposits - - - - - - - - 4 Less stable deposits - - - - - - - - 5 Unsecured wholesale funding 11,483 10,815 10,739 9,492 10,574 9,909 9,839 8,627 6 Operational deposits (all counterparties) and deposits in networks of cooperative banks - - - - - - - - 7 Non-operational deposits (all counterparties) 1,962 1,879 1,861 1,852 1,053 973 960 987 8 Unsecured debt 9,521 8,936 8,878 7,640 9,521 8,936 8,878 7,640 9 Secured wholesale funding 17 18 19 18 10 Additional requirements 139,892 135,914 132,959 129,445 21,236 20,904 20,519 20,019 11 Outflows related to derivative exposures and other collateral requirements 5,223 5,294 5,256 5,161 5,223 5,294 5,256 5,161 12 Outflows related to loss of funding on debt products - - - - - - - - Liquidity risk | 45
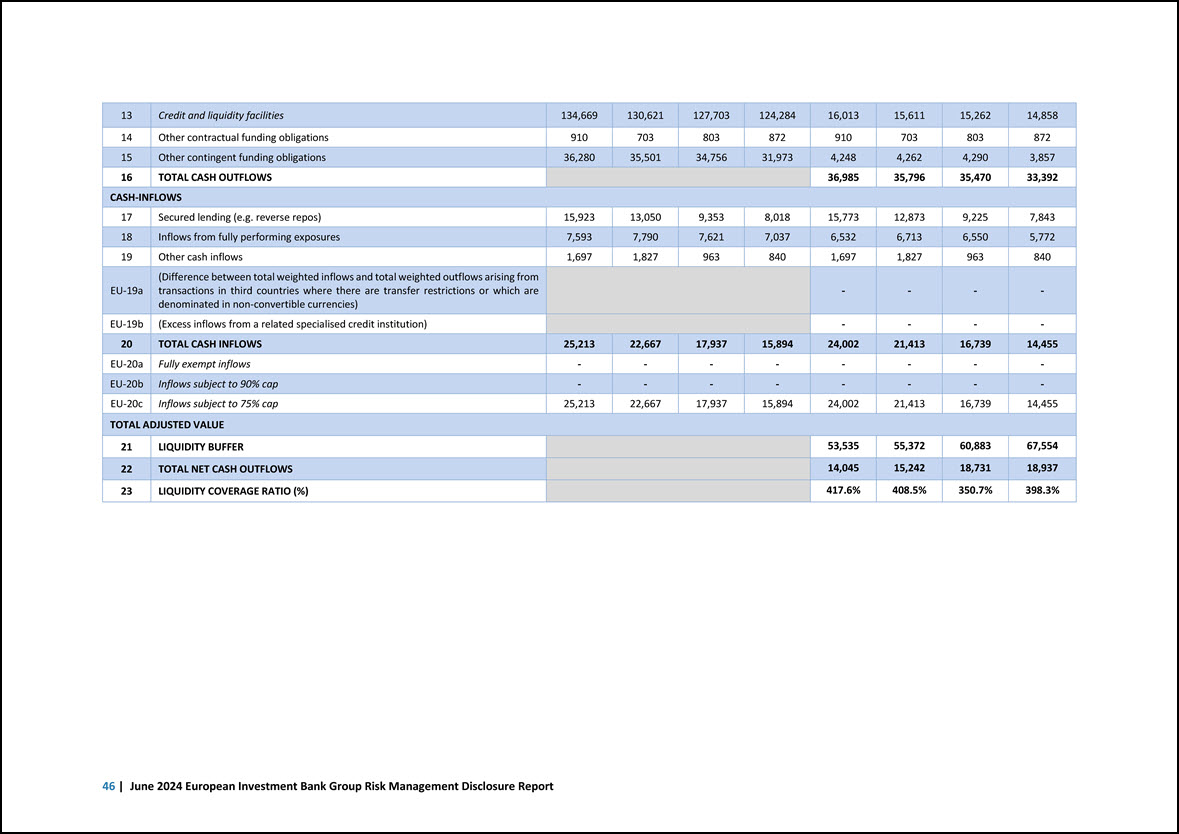
13 Credit and liquidity facilities 134,669 130,621 127,703 124,284 16,013 15,611 15,262 14,858 14 Other contractual funding obligations 910 703 803 872 910 703 803 872 15 Other contingent funding obligations 36,280 35,501 34,756 31,973 4,248 4,262 4,290 3,857 16 TOTAL CASH OUTFLOWS 36,985 35,796 35,470 33,392 CASH-INFLOWS 17 Secured lending (e.g. reverse repos) 15,923 13,050 9,353 8,018 15,773 12,873 9,225 7,843 18 Inflows from fully performing exposures 7,593 7,790 7,621 7,037 6,532 6,713 6,550 5,772 19 Other cash inflows 1,697 1,827 963 840 1,697 1,827 963 840 EU-19a (Difference between total weighted inflows and total weighted outflows arising from transactions in third countries where there are transfer restrictions or which are denominated in non-convertible currencies) - - - - EU-19b (Excess inflows from a related specialised credit institution) - - - - 20 TOTAL CASH INFLOWS 25,213 22,667 17,937 15,894 24,002 21,413 16,739 14,455 EU-20a Fully exempt inflows - - - - - - - - EU-20b Inflows subject to 90% cap - - - - - - - - EU-20c Inflows subject to 75% cap 25,213 22,667 17,937 15,894 24,002 21,413 16,739 14,455 TOTAL ADJUSTED VALUE 21 LIQUIDITY BUFFER 53,535 55,372 60,883 67,554 22 TOTAL NET CASH OUTFLOWS 14,045 15,242 18,731 18,937 23 LIQUIDITY COVERAGE RATIO (%) 417.6% 408.5% 350.7% 398.3% 46 | June 2024 European Investment Bank Group Risk Management Disclosure Report
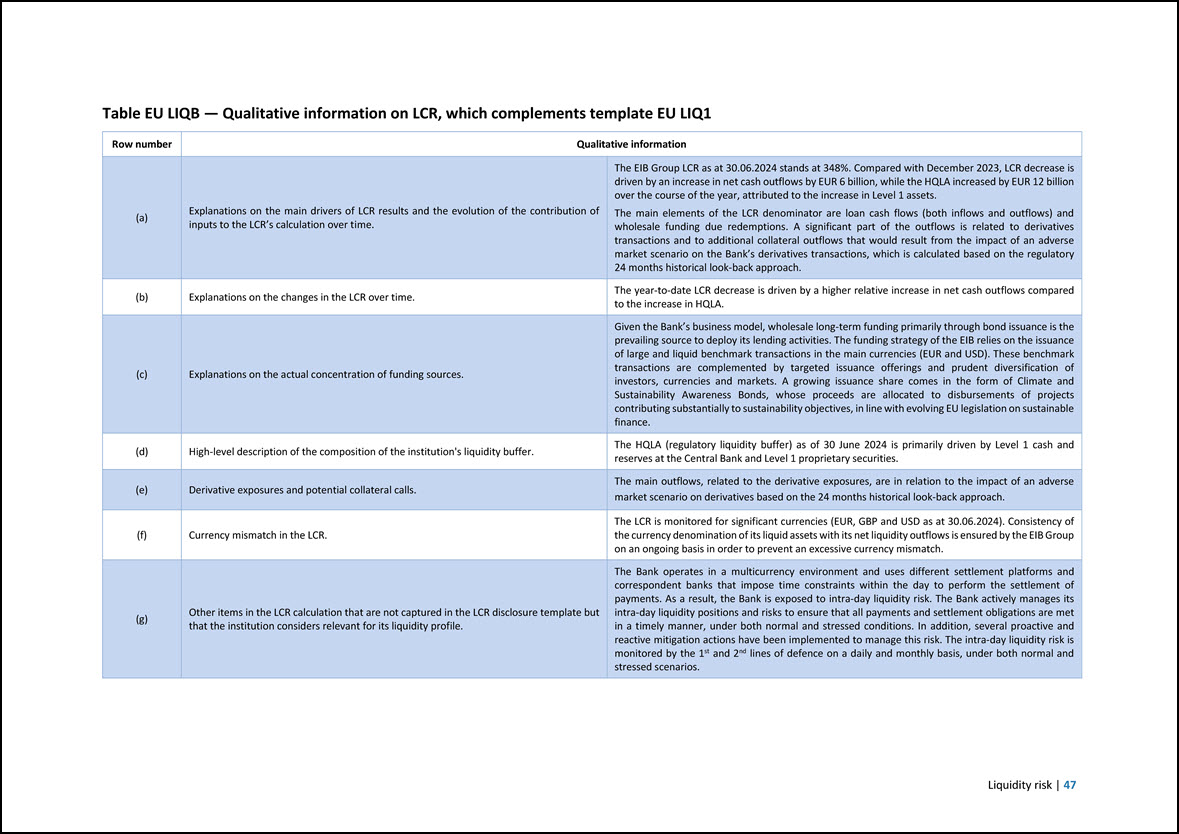
Table EU LIQB — Qualitative information on LCR, which complements template EU LIQ1 Row number Qualitative information (a) Explanations on the main drivers of LCR results and the evolution of the contribution of inputs to the LCR’s calculation over time. The EIB Group LCR as at 30.06.2024 stands at 348%. Compared with December 2023, LCR decrease is driven by an increase in net cash outflows by EUR 6 billion, while the HQLA increased by EUR 12 billion over the course of the year, attributed to the increase in Level 1 assets. The main elements of the LCR denominator are loan cash flows (both inflows and outflows) and wholesale funding due redemptions. A significant part of the outflows is related to derivatives transactions and to additional collateral outflows that would result from the impact of an adverse market scenario on the Bank’s derivatives transactions, which is calculated based on the regulatory 24 months historical look-back approach. (b) Explanations on the changes in the LCR over time. The year-to-date LCR decrease is driven by a higher relative increase in net cash outflows compared to the increase in HQLA. (c) Explanations on the actual concentration of funding sources. Given the Bank’s business model, wholesale long-term funding primarily through bond issuance is the prevailing source to deploy its lending activities. The funding strategy of the EIB relies on the issuance of large and liquid benchmark transactions in the main currencies (EUR and USD). These benchmark transactions are complemented by targeted issuance offerings and prudent diversification of investors, currencies and markets. A growing issuance share comes in the form of Climate and Sustainability Awareness Bonds, whose proceeds are allocated to disbursements of projects contributing substantially to sustainability objectives, in line with evolving EU legislation on sustainable finance. (d) High-level description of the composition of the institution’s liquidity buffer. The HQLA (regulatory liquidity buffer) as of 30 June 2024 is primarily driven by Level 1 cash and reserves at the Central Bank and Level 1 proprietary securities. (e) Derivative exposures and potential collateral calls. The main outflows, related to the derivative exposures, are in relation to the impact of an adverse market scenario on derivatives based on the 24 months historical look-back approach. (f) Currency mismatch in the LCR. The LCR is monitored for significant currencies (EUR, GBP and USD as at 30.06.2024). Consistency of the currency denomination of its liquid assets with its net liquidity outflows is ensured by the EIB Group on an ongoing basis in order to prevent an excessive currency mismatch. (g) Other items in the LCR calculation that are not captured in the LCR disclosure template but that the institution considers relevant for its liquidity profile. The Bank operates in a multicurrency environment and uses different settlement platforms and correspondent banks that impose time constraints within the day to perform the settlement of payments. As a result, the Bank is exposed to intra-day liquidity risk. The Bank actively manages its intra-day liquidity positions and risks to ensure that all payments and settlement obligations are met in a timely manner, under both normal and stressed conditions. In addition, several proactive and reactive mitigation actions have been implemented to manage this risk. The intra-day liquidity risk is monitored by the 1st and 2nd lines of defence on a daily and monthly basis, under both normal and stressed scenarios. Liquidity risk | 47
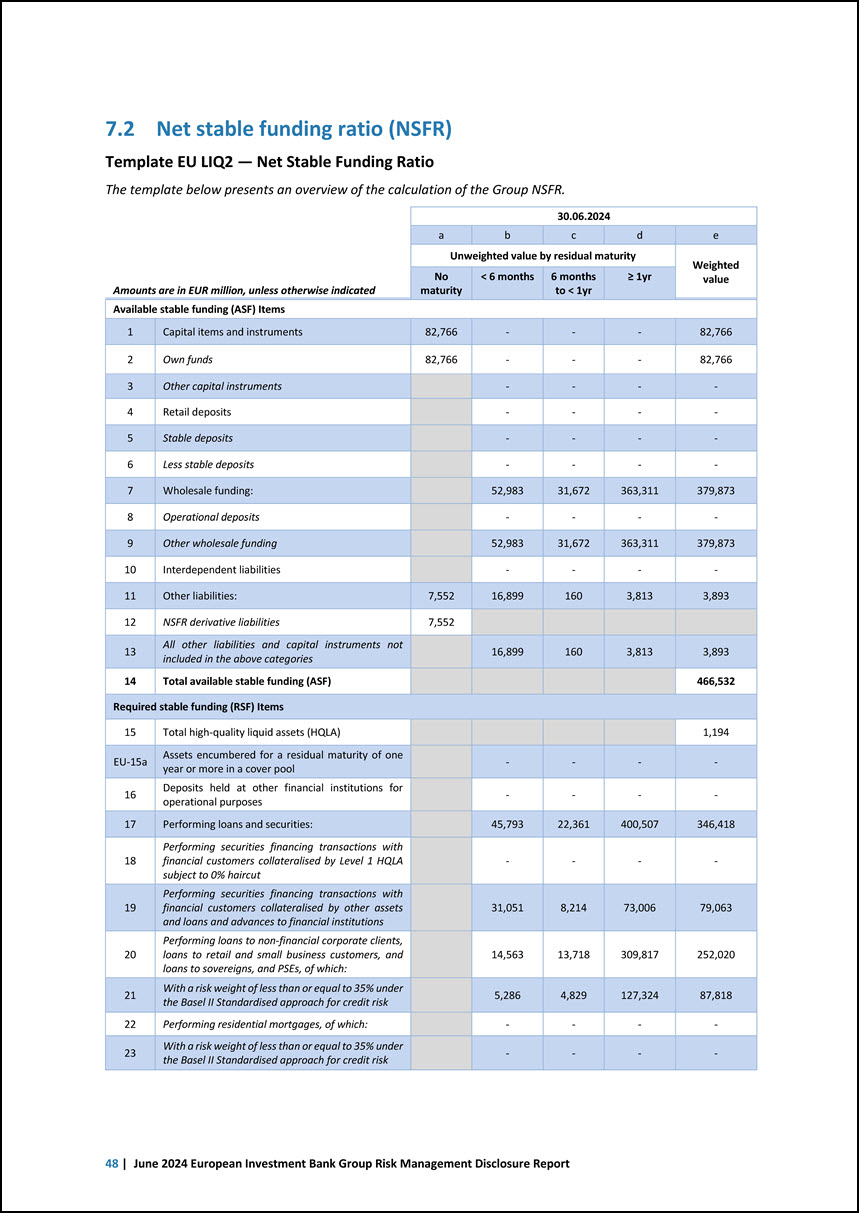
7.2 Net stable funding ratio (NSFR) Template EU LIQ2 — Net Stable Funding Ratio The template below presents an overview of the calculation of the Group NSFR. Amounts are in EUR million, unless otherwise indicated 30.06.2024 a b c d e Unweighted value by residual maturity Weighted value No maturity < 6 months 6 months to < 1yr = 1yr Available stable funding (ASF) Items 1 Capital items and instruments 82,766 - - - 82,766 2 Own funds 82,766 - - - 82,766 3 Other capital instruments - - - - 4 Retail deposits - - - - 5 Stable deposits - - - - 6 Less stable deposits - - - - 7 Wholesale funding: 52,983 31,672 363,311 379,873 8 Operational deposits - - - - 9 Other wholesale funding 52,983 31,672 363,311 379,873 10 Interdependent liabilities - - - - 11 Other liabilities: 7,552 16,899 160 3,813 3,893 12 NSFR derivative liabilities 7,552 13 All other liabilities and capital instruments not included in the above categories 16,899 160 3,813 3,893 14 Total available stable funding (ASF) 466,532 Required stable funding (RSF) Items 15 Total high-quality liquid assets (HQLA) 1,194 EU-15a Assets encumbered for a residual maturity of one year or more in a cover pool - - - - 16 Deposits held at other financial institutions for operational purposes - - - - 17 Performing loans and securities: 45,793 22,361 400,507 346,418 18 Performing securities financing transactions with financial customers collateralised by Level 1 HQLA subject to 0% haircut - - - - 19 Performing securities financing transactions with financial customers collateralised by other assets and loans and advances to financial institutions 31,051 8,214 73,006 79,063 20 Performing loans to non-financial corporate clients, loans to retail and small business customers, and loans to sovereigns, and PSEs, of which: 14,563 13,718 309,817 252,020 21 With a risk weight of less than or equal to 35% under the Basel II Standardised approach for credit risk 5,286 4,829 127,324 87,818 22 Performing residential mortgages, of which: - - - - 23 With a risk weight of less than or equal to 35% under the Basel II Standardised approach for credit risk - - - - 48 | June 2024 European Investment Bank Group Risk Management Disclosure Report
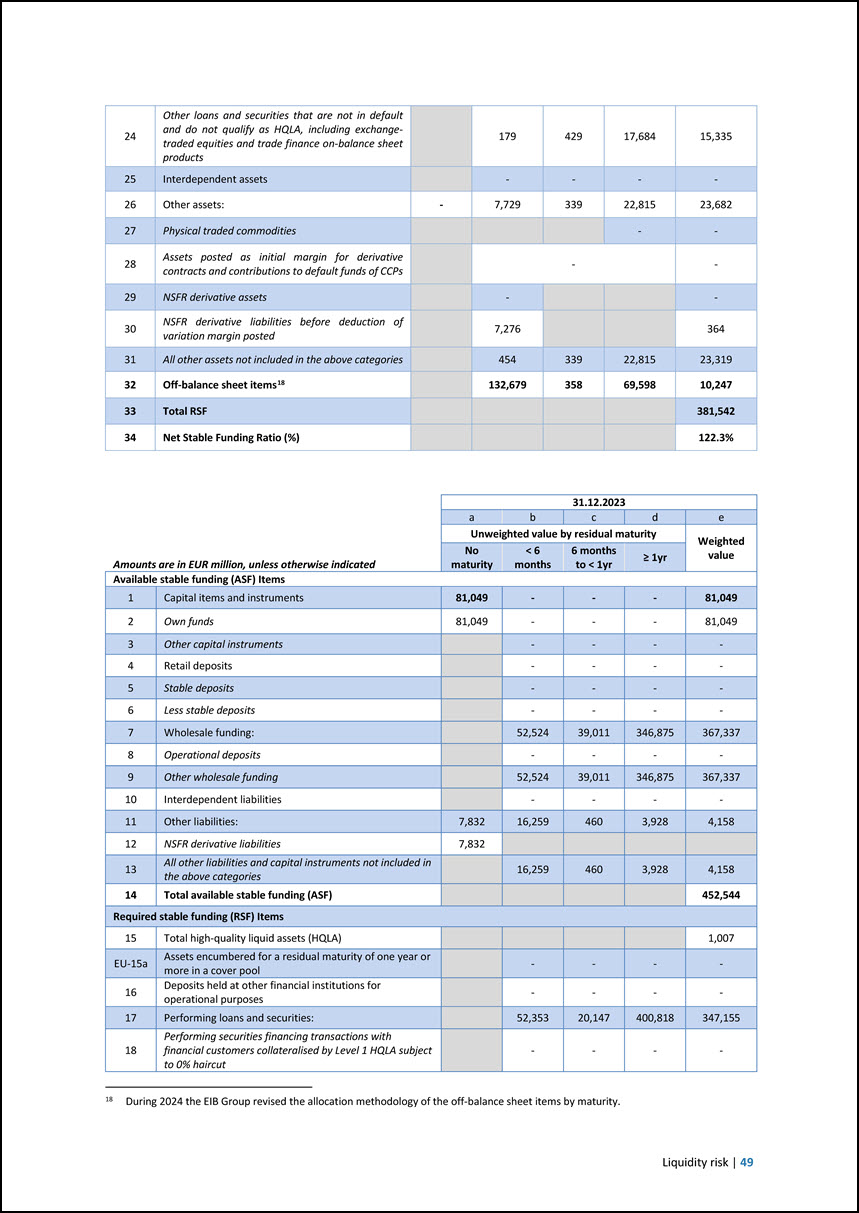
24 Other loans and securities that are not in default and do not qualify as HQLA, including exchange- traded equities and trade finance on-balance sheet products 179 429 17,684 15,335 25 Interdependent assets - - - - 26 Other assets: - 7,729 339 22,815 23,682 27 Physical traded commodities - - 28 Assets posted as initial margin for derivative contracts and contributions to default funds of CCPs - - 29 NSFR derivative assets - - 30 NSFR derivative liabilities before deduction of variation margin posted 7,276 364 31 All other assets not included in the above categories 454 339 22,815 23,319 32 Off-balance sheet items18 132,679 358 69,598 10,247 33 Total RSF 381,542 34 Net Stable Funding Ratio (%) 122.3% 18 During 2024 the EIB Group revised the allocation methodology of the off-balance sheet items by maturity. Amounts are in EUR million, unless otherwise indicated 31.12.2023 a b c 1 d e Unweighted value by residual maturity Weighted value No maturity < 6 months 6 months to < 1yr = 1yr Available stable funding (ASF) Items 1 Capital items and instruments 81,049 - - - 81,049 2 Own funds 81,049 - - - 81,049 3 Other capital instruments - - - - 4 Retail deposits - - - - 5 Stable deposits - - - - 6 Less stable deposits - - - - 7 Wholesale funding: 52,524 39,011 346,875 367,337 8 Operational deposits - - - - 9 Other wholesale funding 52,524 39,011 346,875 367,337 10 Interdependent liabilities - - - - 11 Other liabilities: 7,832 16,259 460 3,928 4,158 12 NSFR derivative liabilities 7,832 13 All other liabilities and capital instruments not included in the above categories 16,259 460 3,928 4,158 14 Total available stable funding (ASF) 452,544 Required stable funding (RSF) Items 15 Total high-quality liquid assets (HQLA) 1,007 EU-15a Assets encumbered for a residual maturity of one year or more in a cover pool - - - - 16 Deposits held at other financial institutions for operational purposes - - - - 17 Performing loans and securities: 52,353 20,147 400,818 347,155 18 Performing securities financing transactions with financial customers collateralised by Level 1 HQLA subject to 0% haircut - - - - Liquidity risk | 49

19 Performing securities financing transactions with financial customers collateralised by other assets and loans and advances to financial institutions 37,175 6,158 75,532 81,171 20 Performing loans to non-financial corporate clients, loans to retail and small business customers, and loans to sovereigns, and PSEs, of which: 12,699 13,785 308,620 250,477 21 With a risk weight of less than or equal to 35% under the Basel II Standardised approach for credit risk 3,817 4,908 125,459 85,911 22 Performing residential mortgages, of which: - - - - 23 With a risk weight of less than or equal to 35% under the Basel II Standardised approach for credit risk - - - - 24 Other loans and securities that are not in default and do not qualify as HQLA, including exchange-traded equities and trade finance on-balance sheet products 2,479 204 16,666 15,508 25 Interdependent assets - - - - 26 Other assets: - 8,416 438 21,432 22,440 27 Physical traded commodities - - 28 Assets posted as initial margin for derivative contracts and contributions to default funds of CCPs - - 29 NSFR derivative assets - - 30 NSFR derivative liabilities before deduction of variation margin posted 7,991 400 31 All other assets not included in the above categories 425 438 21,432 22,041 32 Off-balance sheet items - - 204,452 10,963 33 Total RSF 381,566 34 Net Stable Funding Ratio (%) 118.6% 8 Market risk Template EU MR1 — Market risk under the standardised approach The template below provides the breakdown of RWEAs for market risk under the standardised approach. Amounts are in EUR million, unless otherwise indicated a RWEAs Outright products 1 Interest rate risk (general and specific) - 2 Equity risk (general and specific) - 3 Foreign exchange risk 1,583 4 Commodity risk - Options 5 Simplified approach - 6 Delta-plus approach - 7 Scenario approach - 8 Securitisation (specific risk) - 9 Total 1,583 50 | June 2024 European Investment Bank Group Risk Management Disclosure Report
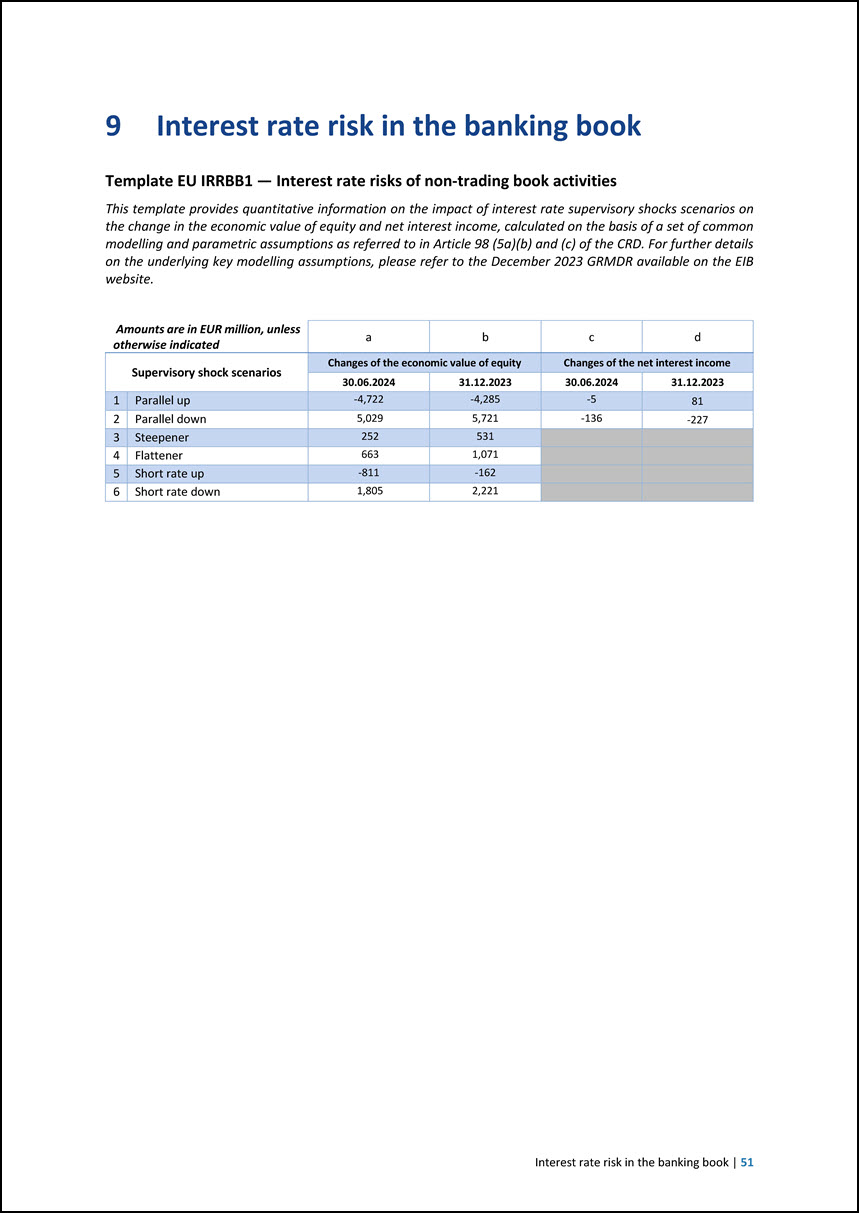
9 Interest rate risk in the banking book Template EU IRRBB1 — Interest rate risks of non-trading book activities This template provides quantitative information on the impact of interest rate supervisory shocks scenarios on the change in the economic value of equity and net interest income, calculated on the basis of a set of common modelling and parametric assumptions as referred to in Article 98 (5a)(b) and (c) of the CRD. For further details on the underlying key modelling assumptions, please refer to the December 2023 GRMDR available on the EIB website. Amounts are in EUR million, unless otherwise indicated a b c d Supervisory shock scenarios Changes of the economic value of equity Changes of the net interest income 30.06.2024 31.12.2023 30.06.2024 31.12.2023 1 Parallel up -4,722 -4,285 -5 81 2 Parallel down 5,029 5,721 -136 -227 3 Steepener 252 531 4 Flattener 663 1,071 5 Short rate up -811 -162 6 Short rate down 1,805 2,221 Interest rate risk in the banking book | 51

10 Climate risk19 19 The below set of templates has been prepared pursuant to Article 449a of the CRR and the related EBA ITS. 20 In accordance with the Commission Delegated Regulation (EU) 2020/1818 supplementing Regulation (EU) 2016/1011 as regards minimum standards for EU Climate Transition Benchmarks and EU Paris-aligned Benchmarks – Climate Benchmark Standards Regulation – Recital 6: Sectors listed in Sections A to H and Section L of Annex I to Regulation (EC) No 1893/2006. Template EU ESG1— Banking book — Climate change transition risk: Credit quality of exposures by sector, emissions and residual maturity This template presents a breakdown of the EIB Group’s non-financial corporation portfolio outstanding at end of June 2024 presenting details for sectors that highly contribute to climate change by counterparty NACE sector. Amounts are in EUR million unless otherwise indicated. The EIBG’s largest exposure to high emitting sectors is towards the transport and energy sectors which have traditionally been major recipients of EIBG support. a e f h l m n o p Gross carrying amount Accumulated impairment, accumulated negative changes in fair value due to credit risk Average and provisions <= 5 years > 5 years to <= 10 > 10 years <= 20 > 20 years weighted Sector/subsector Of which nonperforming exposures Of which nonperforming exposures years years maturity (years) Exposures towards sectors that highly contribute to climate change20 163,798 1,997 -330 -330 29,215 44,634 59,388 30,561 13 A - Agriculture, forestry and fishing 389 15 - - 10 297 81 - 8 B - Mining and quarrying 2,233 103 - - 532 865 836 - 8 B.05 - Mining of coal and lignite - - - - - - - - - B.06 - Extraction of crude petroleum and natural gas 1,426 - - - 204 520 702 - 9 B.07 - Mining of metal ores 659 103 - - 221 345 92 - 7 B.08 - Other mining and quarrying 101 - - - 101 - - - 2 B.09 - Mining support service activities 47 - - - 6 - 41 - 9 C – Manufacturing 18,690 658 -118 -118 9,024 8,216 1,430 19 5 C.10 - Manufacture of food products 734 134 -0 -0 332 402 - - 5 C.11 - Manufacture of beverages 56 - - - 42 14 - - 5 52 | June 2024 European Investment Bank Group Risk Management Disclosure Report
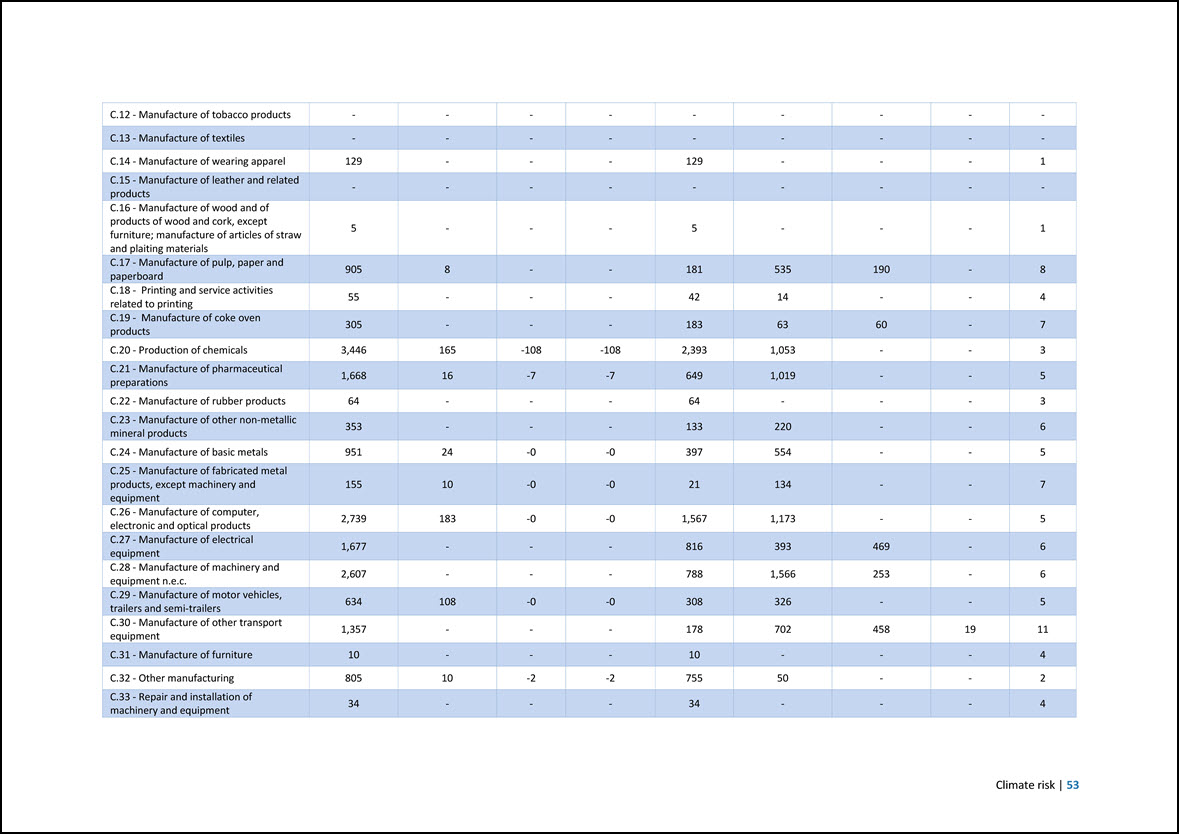
C.12 - Manufacture of tobacco products - - - - - - - - - C.13 - Manufacture of textiles - - - - - - - - - C.14 - Manufacture of wearing apparel 129 - - - 129 - - - 1 C.15 - Manufacture of leather and related products - - - - - - - - - C.16 - Manufacture of wood and of products of wood and cork, except furniture; manufacture of articles of straw and plaiting materials 5 - - - 5 - - - 1 C.17 - Manufacture of pulp, paper and paperboard 905 8 - - 181 535 190 - 8 C.18 - Printing and service activities related to printing 55 - - - 42 14 - - 4 C.19 - Manufacture of coke oven products 305 - - - 183 63 60 - 7 C.20 - Production of chemicals 3,446 165 -108 -108 2,393 1,053 - - 3 C.21 - Manufacture of pharmaceutical preparations 1,668 16 -7 -7 649 1,019 - - 5 C.22 - Manufacture of rubber products 64 - - - 64 - - - 3 C.23 - Manufacture of other non-metallic mineral products 353 - - - 133 220 - - 6 C.24 - Manufacture of basic metals 951 24 -0 -0 397 554 - - 5 C.25 - Manufacture of fabricated metal products, except machinery and equipment 155 10 -0 -0 21 134 - - 7 C.26 - Manufacture of computer, electronic and optical products 2,739 183 -0 -0 1,567 1,173 - - 5 C.27 - Manufacture of electrical equipment 1,677 - - - 816 393 469 - 6 C.28 - Manufacture of machinery and equipment n.e.c. 2,607 - - - 788 1,566 253 - 6 C.29 - Manufacture of motor vehicles, trailers and semi-trailers 634 108 -0 -0 308 326 - - 5 C.30 - Manufacture of other transport equipment 1,357 - - - 178 702 458 19 11 C.31 - Manufacture of furniture 10 - - - 10 - - - 4 C.32 - Other manufacturing 805 10 -2 -2 755 50 - - 2 C.33 - Repair and installation of machinery and equipment 34 - - - 34 - - - 4 Climate risk | 53
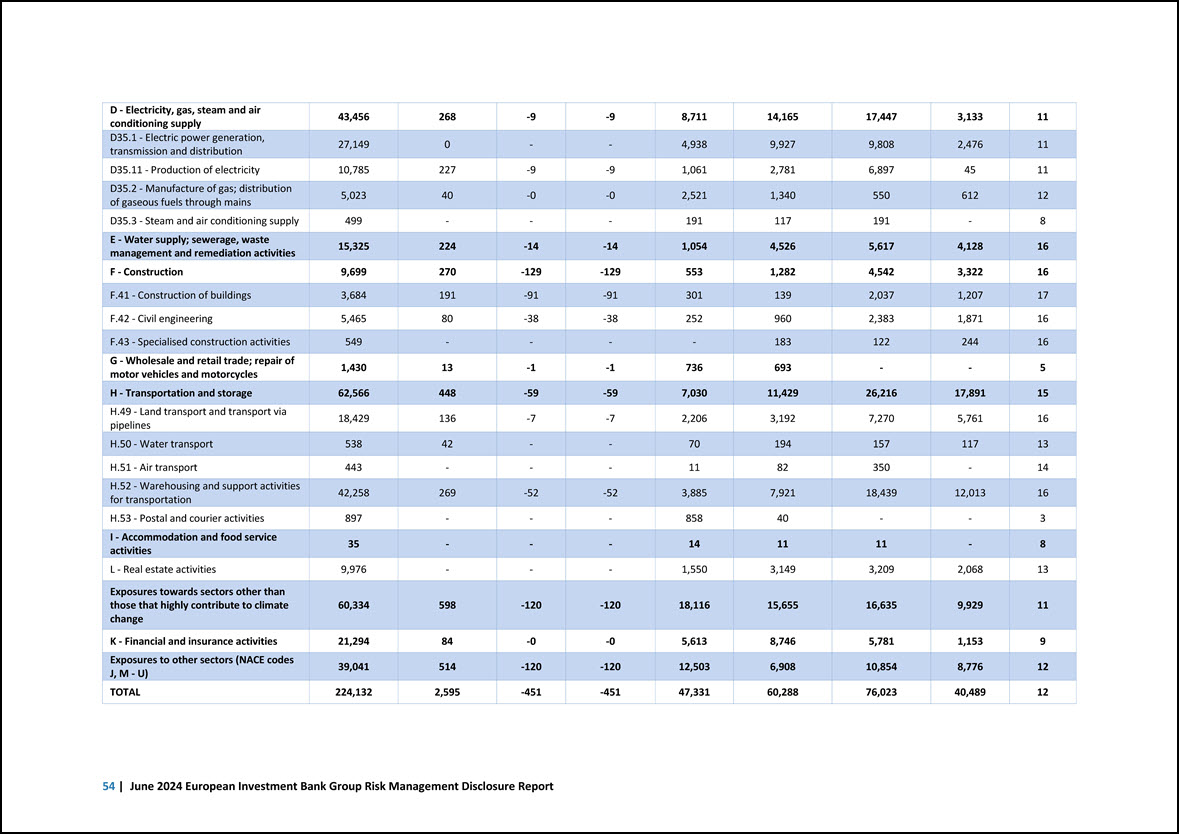
D - Electricity, gas, steam and air conditioning supply 43,456 268 -9 -9 8,711 14,165 17,447 3,133 11 D35.1 - Electric power generation, transmission and distribution 27,149 0 - - 4,938 9,927 9,808 2,476 11 D35.11 - Production of electricity 10,785 227 -9 -9 1,061 2,781 6,897 45 11 D35.2 - Manufacture of gas; distribution of gaseous fuels through mains 5,023 40 -0 -0 2,521 1,340 550 612 12 D35.3 - Steam and air conditioning supply 499 - - - 191 117 191 - 8 E - Water supply; sewerage, waste management and remediation activities 15,325 224 -14 -14 1,054 4,526 5,617 4,128 16 F - Construction 9,699 270 -129 -129 553 1,282 4,542 3,322 16 F.41 - Construction of buildings 3,684 191 -91 -91 301 139 2,037 1,207 17 F.42 - Civil engineering 5,465 80 -38 -38 252 960 2,383 1,871 16 F.43 - Specialised construction activities 549 - - - - 183 122 244 16 G - Wholesale and retail trade; repair of motor vehicles and motorcycles 1,430 13 -1 -1 736 693 - - 5 H - Transportation and storage 62,566 448 -59 -59 7,030 11,429 26,216 17,891 15 H.49 - Land transport and transport via pipelines 18,429 136 -7 -7 2,206 3,192 7,270 5,761 16 H.50 - Water transport 538 42 - - 70 194 157 117 13 H.51 - Air transport 443 - - - 11 82 350 - 14 H.52 - Warehousing and support activities for transportation 42,258 269 -52 -52 3,885 7,921 18,439 12,013 16 H.53 - Postal and courier activities 897 - - - 858 40 - - 3 I - Accommodation and food service activities 35 - - - 14 11 11 - 8 L - Real estate activities 9,976 - - - 1,550 3,149 3,209 2,068 13 Exposures towards sectors other than those that highly contribute to climate change 60,334 598 -120 -120 18,116 15,655 16,635 9,929 11 K - Financial and insurance activities 21,294 84 -0 -0 5,613 8,746 5,781 1,153 9 Exposures to other sectors (NACE codes J, M - U) 39,041 514 -120 -120 12,503 6,908 10,854 8,776 12 TOTAL 224,132 2,595 -451 -451 47,331 60,288 76,023 40,489 12 54 | June 2024 European Investment Bank Group Risk Management Disclosure Report
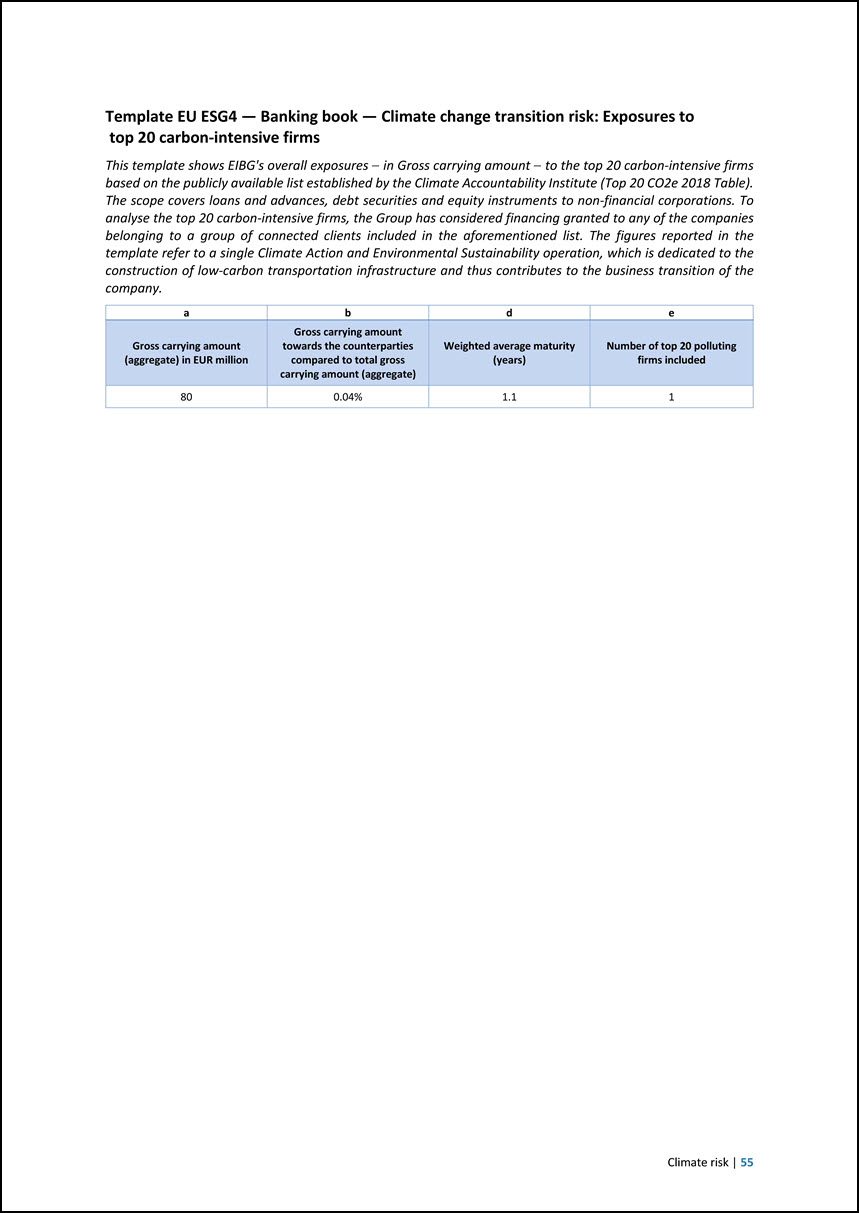
Template EU ESG4 — Banking book — Climate change transition risk: Exposures to top 20 carbon-intensive firms This template shows EIBG’s overall exposures – in Gross carrying amount – to the top 20 carbon-intensive firms based on the publicly available list established by the Climate Accountability Institute (Top 20 CO2e 2018 Table). The scope covers loans and advances, debt securities and equity instruments to non-financial corporations. To analyse the top 20 carbon-intensive firms, the Group has considered financing granted to any of the companies belonging to a group of connected clients included in the aforementioned list. The figures reported in the template refer to a single Climate Action and Environmental Sustainability operation, which is dedicated to the construction of low-carbon transportation infrastructure and thus contributes to the business transition of the company. a b d e Gross carrying amount (aggregate) in EUR million Gross carrying amount towards the counterparties compared to total gross carrying amount (aggregate) Weighted average maturity (years) Number of top 20 polluting firms included 80 0.04% 1.1 1 Climate risk | 55
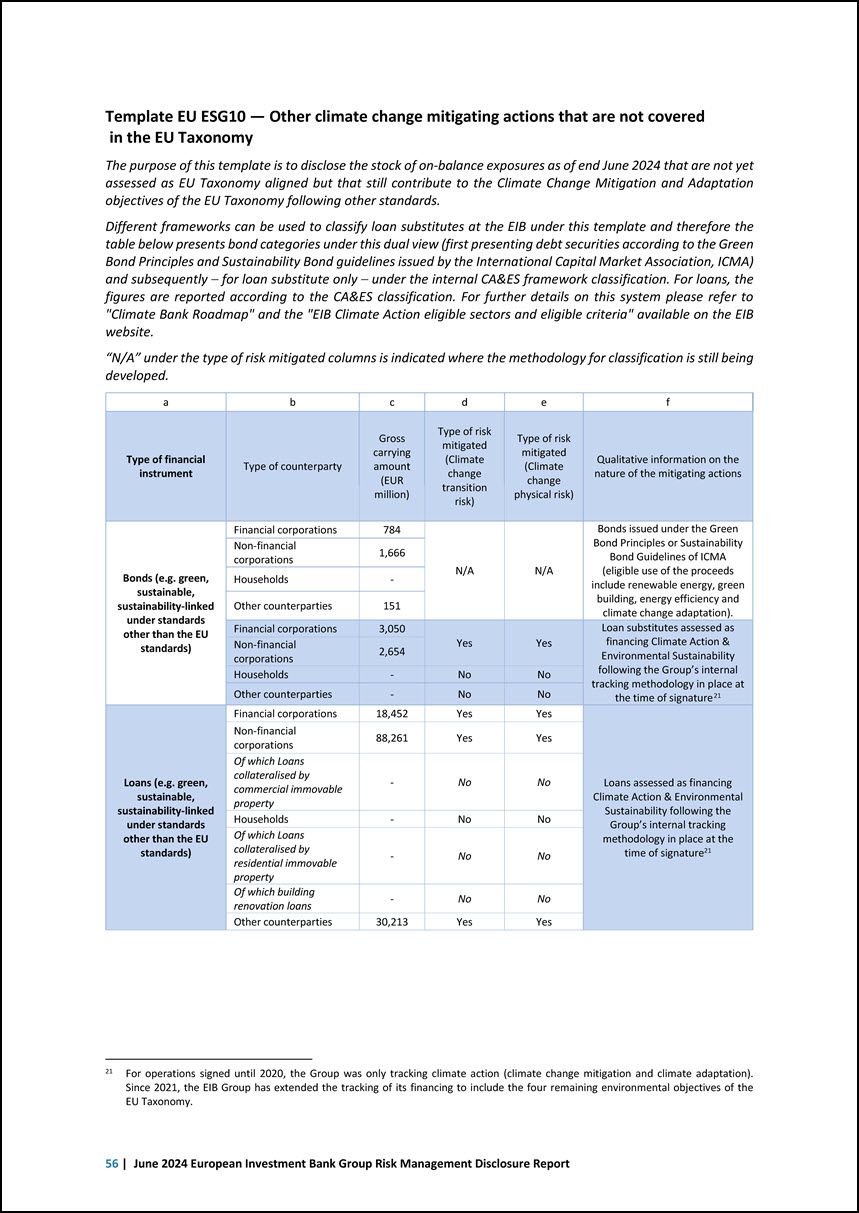
Template EU ESG10 — Other climate change mitigating actions that are not covered in the EU Taxonomy The purpose of this template is to disclose the stock of on-balance exposures as of end June 2024 that are not yet assessed as EU Taxonomy aligned but that still contribute to the Climate Change Mitigation and Adaptation objectives of the EU Taxonomy following other standards. Different frameworks can be used to classify loan substitutes at the EIB under this template and therefore the table below presents bond categories under this dual view (first presenting debt securities according to the Green Bond Principles and Sustainability Bond guidelines issued by the International Capital Market Association, ICMA) and subsequently – for loan substitute only – under the internal CA&ES framework classification. For loans, the figures are reported according to the CA&ES classification. For further details on this system please refer to “Climate Bank Roadmap” and the “EIB Climate Action eligible sectors and eligible criteria” available on the EIB website. “N/A” under the type of risk mitigated columns is indicated where the methodology for classification is still being developed. a b c d e f Type of financial instrument Type of counterparty Gross carrying amount (EUR million) Type of risk mitigated (Climate change transition risk) Type of risk mitigated (Climate change physical risk) Qualitative information on the nature of the mitigating actions Bonds (e.g. green, sustainable, sustainability-linked under standards other than the EU standards) Financial corporations 784 N/A N/A Bonds issued under the Green Bond Principles or Sustainability Bond Guidelines of ICMA (eligible use of the proceeds include renewable energy, green building, energy efficiency and climate change adaptation). Non-financial corporations 1,666 Households - Other counterparties 151 Financial corporations Non-financial corporations 3,050 2,654 Yes Yes Loan substitutes assessed as financing Climate Action & Environmental Sustainability Households - No No following the Group’s internal tracking methodology in place at the time of signature21 Other counterparties - No No Loans (e.g. green, sustainable, sustainability-linked under standards other than the EU standards) Financial corporations 18,452 Yes Yes Loans assessed as financing Climate Action & Environmental Sustainability following the Group’s internal tracking methodology in place at the time of signature21 Non-financial corporations Of which Loans collateralised by commercial immovable property 88,261 - Yes No Yes No Households - No No Of which Loans collateralised by residential immovable property - No No Of which building renovation loans - No No Other counterparties 30,213 Yes Yes 21 For operations signed until 2020, the Group was only tracking climate action (climate change mitigation and climate adaptation). Since 2021, the EIB Group has extended the tracking of its financing to include the four remaining environmental objectives of the EU Taxonomy. 56 | June 2024 European Investment Bank Group Risk Management Disclosure Report
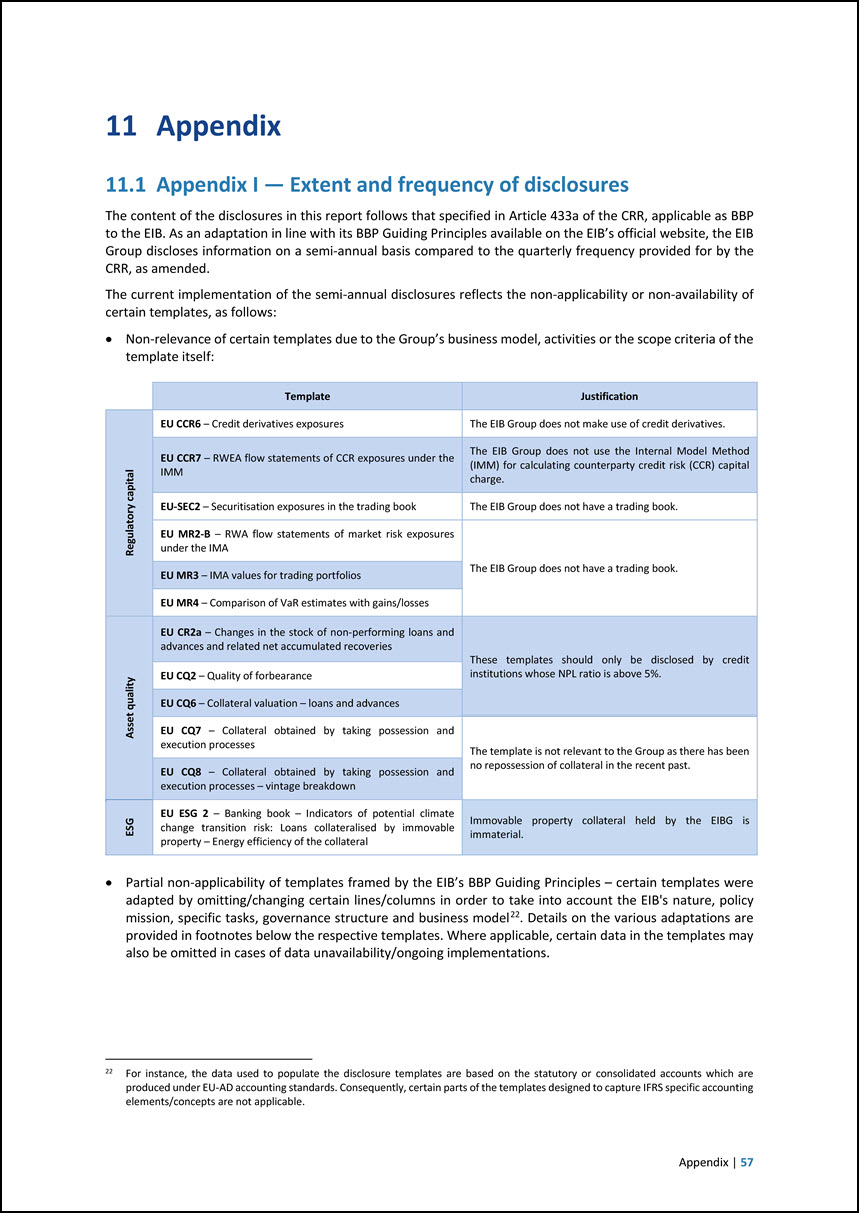
11 Appendix 11.1 Appendix I — Extent and frequency of disclosures The content of the disclosures in this report follows that specified in Article 433a of the CRR, applicable as BBP to the EIB. As an adaptation in line with its BBP Guiding Principles available on the EIB’s official website, the EIB Group discloses information on a semi-annual basis compared to the quarterly frequency provided for by the CRR, as amended. The current implementation of the semi-annual disclosures reflects the non-applicability or non-availability of certain templates, as follows: • Non-relevance of certain templates due to the Group’s business model, activities or the scope criteria of the template itself: Template Justification re s > O eg Qi EU CCR6 – Credit derivatives exposures The EIB Group does not make use of credit derivatives. EU CCR7 – RWEA flow statements of CCR exposures under the IMM The EIB Group does not use the Internal Model Method (IMM) for calculating counterparty credit risk (CCR) capital charge. EU-SEC2 – Securitisation exposures in the trading book The EIB Group does not have a trading book. EU MR2-B – RWA flow statements of market risk exposures under the IMA The EIB Group does not have a trading book. EU MR3 – IMA values for trading portfolios EU MR4 – Comparison of VaR estimates with gains/losses > CT Q w w < EU CR2a – Changes in the stock of non-performing loans and advances and related net accumulated recoveries These templates should only be disclosed by credit institutions whose NPL ratio is above 5%. EU CQ2 – Quality of forbearance EU CQ6 – Collateral valuation – loans and advances EU CQ7 – Collateral obtained by taking possession and execution processes The template is not relevant to the Group as there has been no repossession of collateral in the recent past. EU CQ8 – Collateral obtained by taking possession and execution processes – vintage breakdown EU ESG 2 – Banking book – Indicators of potential climate change transition risk: Loans collateralised by immovable property – Energy efficiency of the collateral Immovable property collateral held by the EIBG is immaterial. • Partial non-applicability of templates framed by the EIB’s BBP Guiding Principles – certain templates were adapted by omitting/changing certain lines/columns in order to take into account the EIB’s nature, policy mission, specific tasks, governance structure and business model. Details on the various adaptations are provided in footnotes below the respective templates. Where applicable, certain data in the templates may also be omitted in cases of data unavailability/ongoing implementations. 22 22 For instance, the data used to populate the disclosure templates are based on the statutory or consolidated accounts which are produced under EU-AD accounting standards. Consequently, certain parts of the templates designed to capture IFRS specific accounting elements/concepts are not applicable. Appendix | 57
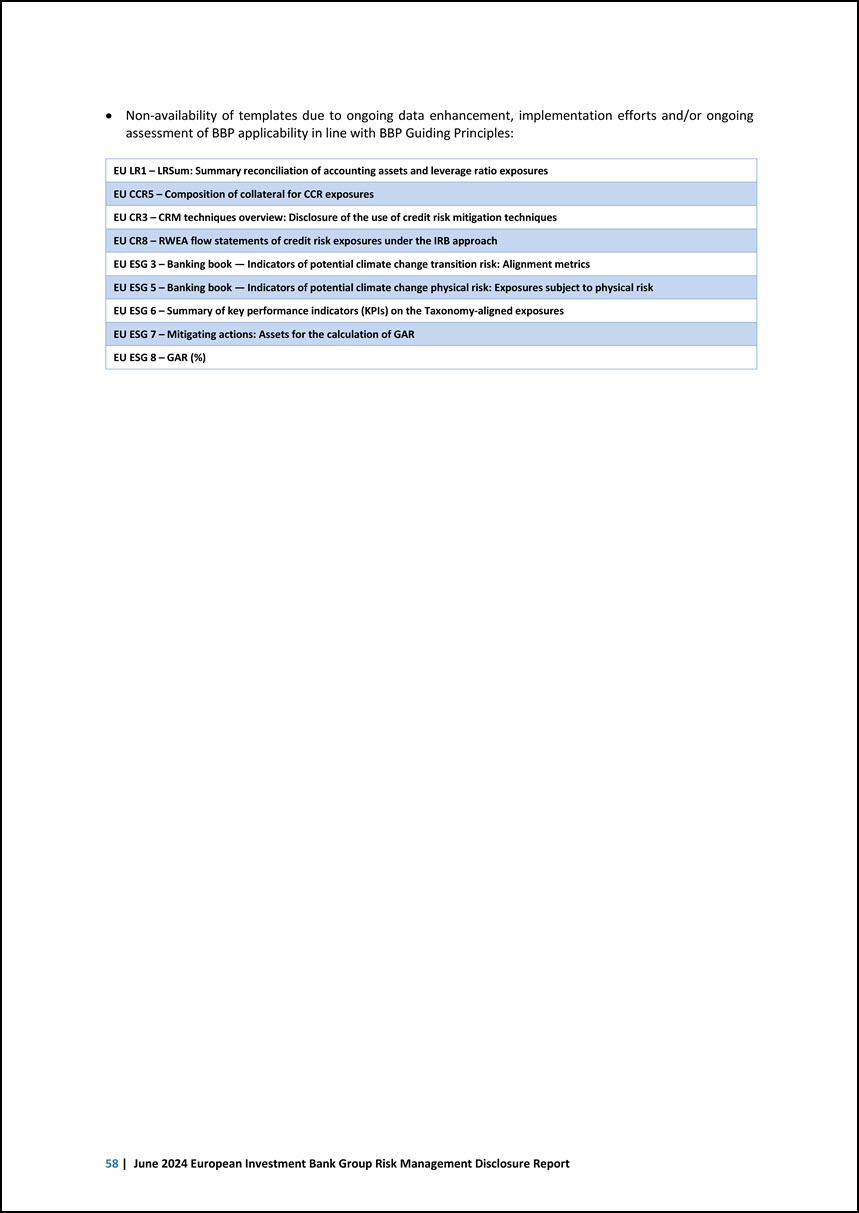
• Non-availability of templates due to ongoing data enhancement, implementation efforts and/or ongoing assessment of BBP applicability in line with BBP Guiding Principles: EU LR1 – LRSum: Summary reconciliation of accounting assets and leverage ratio exposures EU CCR5 – Composition of collateral for CCR exposures EU CR3 – CRM techniques overview: Disclosure of the use of credit risk mitigation techniques EU CR8 – RWEA flow statements of credit risk exposures under the IRB approach EU ESG 3 – Banking book — Indicators of potential climate change transition risk: Alignment metrics EU ESG 5 – Banking book — Indicators of potential climate change physical risk: Exposures subject to physical risk EU ESG 6 – Summary of key performance indicators (KPIs) on the Taxonomy-aligned exposures EU ESG 7 – Mitigating actions: Assets for the calculation of GAR EU ESG 8 – GAR (%) 58 | June 2024 European Investment Bank Group Risk Management Disclosure Report
11.2 Appendix II — Abbreviations ASF Available Stable Funding (ASF): amount of liabilities and own funds calculated as per Article 428i et seq. of the Capital Requirements Regulation. AT1 Additional Tier 1 (Capital): one of the three elements composing regulatory own funds (together with the CET1 and T2). AT1 is composed of Additional Tier 1 items calculated as per Article 61 of the Capital Requirements Regulation. BBP Best Banking Practice CA&ES Climate Action & Environmental Sustainability, as per the EIBG’s internal terminology CCF Credit conversion factor: ratio of the currently undrawn amount of a commitment that could be drawn as per Article 4(1)(56) of the CRR, and which is used to convert part of the unused part of credit facilities and other off-balance sheet items into exposure at default amount. (Q)CCP (Qualifying) Central Counterparties (CCP) are financial institutions that facilitate trading of derivatives and equity products between counterparties, by becoming the buyer to every seller and the seller to every buyer, in order to reduce the risk in the contracts traded. A qualifying CCP is a CCP as defined by Article 4(1)(88) of the CRR and by Article 2(1) of Regulation (EU) 648/2012. CCR Counterparty Credit Risk (CCR) is the risk that the counterparty (usually of an over-the-counter derivatives transaction or securities financing transaction) defaults before the final settlement of the transaction’s cash flows, creating an economic loss for the institution. CET1 Common Equity Tier 1 (CET1) capital is one of the three elements composing regulatory own funds (together with AT1 and T2). CET1 is composed of the CET1 items representing the highest quality of regulatory capital, absorbing losses immediately when they occur and calculated as per Article 50 of the Capital Requirements Regulation. CIUs Collective Investment Undertakings, as defined in Article 4(1)(7) of the Capital Requirements Regulation. CRD Capital Requirements Directive or Directive 2013/36/EU of the European Parliament and of the Council, as amended from time to time. CRM Credit Risk Mitigation (CRM) means a technique used by banks to mitigate credit risk, as defined in Article 4(1)(57) of the CRR. CRR Capital Requirements Regulation or Regulation (EU) No 575/2013 of the European Parliament and of the Council, as amended from time to time. CSD Central Securities Depositories (CSD) are entities operating a securities settlement system and are responsible for the registration and safekeeping of securities as defined in Article 2(1)(1) of Regulation (EU) No 909/2014 of the European Parliament and of the Council of 23 July 2014, as amended from time to time. CVA Credit Value Adjustment (CVA) reflects the current market value of the credit risk of the counterparty to the institution as provided for under Article 381 of the CRR. EBA European Banking Authority EBRD European Bank for Reconstruction and Development EEPE Under the Internal Model Method, institutions shall calculate their exposure value to counterparty credit risk taking into consideration their Effective Expected Positive Exposure (EEPE) — a measure of the expected increase in the exposure value of the contract over a horizon of maximum one year. EIB European Investment Bank EIBG European Investment Bank Group EIF European Investment Fund ESG Environmental, Social, Governance EU European Union EU-AD EU Accounting Directives: Directive 2013/34/EU of the European Parliament and of the Council of 26 June 2013 on the annual financial statements, consolidated financial statements and related reports of certain types of undertakings, amending Directive 2006/43/EC of the European Parliament and of the Council and repealing Council Directives 78/660/EEC and 83/349/EEC Text with European Economic Area (EEA) relevance, as amended from time to time. GAR Green Asset Ratio GRMDR Group Risk Management Disclosure Report HQLA High-Quality Liquid Assets (HQLA) are assets of high liquidity and credit quality that can be easily and immediately converted into cash without significant loss of value, and which are part of the liquidity buffer as per Article 6 of Regulation (EU) No 2015/61 of 10 October 2014, as amended from time to time. ICMA International Capital Market Association IFRS International Financial Reporting Standards IMA The Internal Model Approach (IMA) is one of the regulatory approaches available to banks to quantify the required capital for market risk. This approach enables banks to use their own risk parameters to calculate a value at risk (VaR). Appendix | 59
IMM The Internal Model Method (IMM) is one of the regulatory approaches available to banks to quantify required capital for counterparty credit risk. This approach enables banks to use their own risk parameters to quantify the required amount of capital for counterparty credit risk, subject to the explicit approval of their respective supervisors. IRB (A-IRB and F-IRB) The Internal Ratings Based (IRB) approach is one of the regulatory approaches available to banks to quantify the required capital for credit risk. This approach enables banks to use their own risk parameters to quantify the required amount of capital for credit risk, subject to the explicit approval of their respective supervisors. The difference between the Advanced and Foundation IRB (A-IRB and F-IRB) lies in the type of parameters modelled by banks; notably under the F-IRB, LGDs are not modelled. IRRBB Interest Rate Risk in the Banking Book: the current and prospective risk of a negative impact on the institution’s economic value of equity or net interest income, taking market value changes into account as appropriate, which arise from adverse movements in interest rates affecting interest rate-sensitive instruments, including gap risk, basis risk and option risk 23. ITS Implementing Technical Standards LCR The Liquidity Coverage Ratio (LCR) is a regulatory liquidity metric that aims to ensure that institutions maintain levels of liquidity buffers which are adequate to face any possible imbalance between liquidity inflows and outflows under severely stressed conditions over a period of 30 days, as provided for under Article 412(1) of the CRR. LGD Loss Given Default (LGD) is the ratio of the loss on an exposure due to the default of a counterparty as defined in Article 4(1)(55) of the CRR. MDB Multilateral Development Bank NPE Non-performing Exposures (NPE) are exposures considered to be non-performing as per Article 47a of the CRR. NPL Non-performing Loans are loans that qualify as non-performing exposures (‘NPE’). NSFR The Net Stable Funding Ratio (NSFR) is a regulatory liquidity metric that aims to limit overreliance on short-term wholesale funding and encourages better assessment of funding risk across all on- and off-balance sheet items, promoting funding stability. The NSFR is calculated as per Article 428b of the CRR. OTC Over-the-counter (OTC) contracts are derivatives contracts traded and negotiated directly between two parties (without going through an exchange). OTC derivatives also include transactions with central counterparties where contracts are based on novation. PD Probability of default (PD) of a counterparty over a one-year period, as defined in Article 4(1)(54) of the CRR. RSF The required amount of stable funding (RSF) is calculated in accordance with Articles 428p et seq. of the CRR. RWEA or RWA Risk-weighted exposure amounts (RWEA) or Risk-weighted amounts (RWA) represent a measure of the risks that a bank is exposed to through its assets and off-balance sheet items. SA-CCR The Standardised Approach for Counterparty Credit Risk (SA-CCR) is one of the regulatory approaches available to banks to calculate their Exposure at Default (EAD) of derivatives and long-settlement transaction exposure to counterparty credit risk based on the replacement cost and potential future exposure of the transactions. SEC-ERBA The Securitisation External Ratings Based Approach (SEC-ERBA) is one of the regulatory approaches available to banks to quantify required capital for securitisation exposures. This approach relies on a formula using as an input the exposure’s external credit rating. SEC-IAA The Securitisation Internal Assessment Approach (SEC-IAA) is a regulatory approach available to banks to quantify required capital for certain asset-backed commercial paper transactions. This approach relies on the institutions’ internal assessments of the credit quality of the transaction. SEC-IRBA The Securitisation IRB Approach (SEC-IRBA) is one of the regulatory approaches available to banks to quantify required capital for securitisation exposures. This approach relies on a formula using as an input the Bank’s own risk parameters calculated at the level of the underlying portfolio. SEC-SA The Securitisation Standardised Approach (SEC-SA) is one of the regulatory approaches available to banks to quantify required capital for securitisation exposures. This approach relies on a formula using as an input the exposure’s underlying portfolio delinquency rates and respective asset classes. SFTs Securities Financing Transactions (SFTs) are the financial operations listed in Article 4(1)(139) of the CRR, such as repurchase transaction (repo), buy-sell back/sell-buy back transaction or margin lending. SMEs Small and medium-sized enterprises, as defined by Commission Recommendation 2003/361. SRT Securitisations that meet the conditions for Significant Risk Transfer (SRT) as per Title 2, Chapter 5, Section 2 of the CRR. STS Simple, transparent and standardised: technical characteristics applicable to securitisation instruments, which are allowed to use that designation as per Article 18 of Regulation (EU) 2017/2402 of the European Parliament and of the Council of 12 December 2017, as amended from time to time. VaR Value at Risk (VaR) is a probabilistic method used to measure the potential loss in value of an asset over a given time period for a given distribution of historical returns and at a given confidence interval. 23 EBA GL/2022/14. 60 | June 2024 European Investment Bank Group Risk Management Disclosure Report

June 2024 European Investment Bank Group Risk Management Disclosure Report European Investment Bank Group © European Investment Bank, 10/2024 EN