Exhibit I
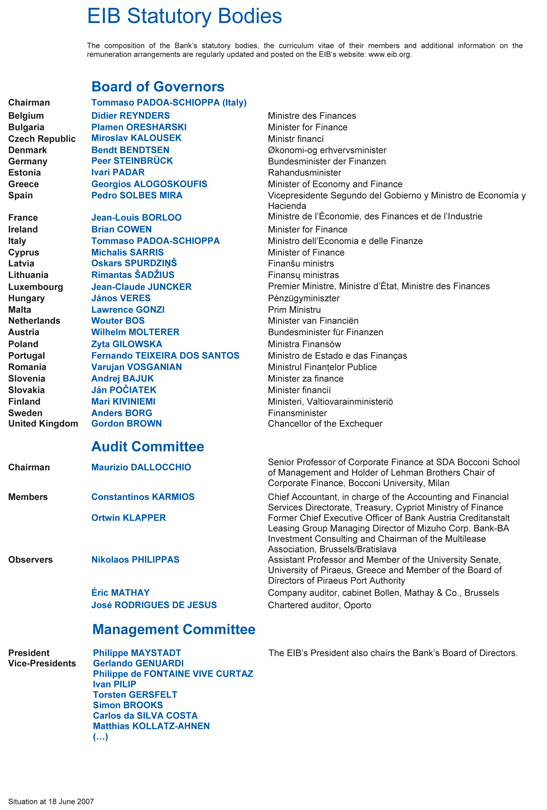
EIB Statutory Bodies
The composition of the Bank’s statutory bodies, the curriculum vitae of their members and additional information on the remuneration arrangements are regularly updated and posted on the EIB’s website: www.eib.org.
Board of Governors
Chairman Tommaso PADOA-SCHIOPPA (Italy)
Belgium Didier REYNDERS Ministre des Finances
Bulgaria Plamen ORESHARSKI Minister for Finance
Czech Republic Miroslav KALOUSEK Ministr financí
Denmark Bendt BENDTSEN Økonomi-og erhvervsminister
Germany Peer STEINBRÜCK Bundesminister der Finanzen
Estonia Ivari PADAR Rahandusminister
Greece Georgios ALOGOSKOUFIS Minister of Economy and Finance
Spain Pedro SOLBES MIRA Vicepresidente Segundo del Gobierno y Ministro de Economía y
Hacienda
France Jean-Louis BORLOO Ministre de l’Économie, des Finances et de l’Industrie
Ireland Brian COWEN Minister for Finance
Italy Tommaso PADOA-SCHIOPPA Ministro dell’Economia e delle Finanze
Cyprus Michalis SARRIS Minister of Finance
Latvia Oskars SPURDZINŠ Finanšu ministrs
Lithuania Rimantas ŠADZIUS Finansu ministras
Luxembourg Jean-Claude JUNCKER Premier Ministre, Ministre d’État, Ministre des Finances
Hungary János VERES Pénzügyminiszter
Malta Lawrence GONZI Prim Ministru
Netherlands Wouter BOS Minister van Financiën
Austria Wilhelm MOLTERER Bundesminister für Finanzen
Poland Zyta GILOWSKA Ministra Finansów
Portugal Fernando TEIXEIRA DOS SANTOS Ministro de Estado e das Finanças
Romania Varujan VOSGANIAN Ministrul Finantelor Publice
Slovenia Andrej BAJUK Minister za finance
Slovakia Ján POCIATEK Minister financií
Finland Mari KIVINIEMI Ministeri, Valtiovarainministeriö
Sweden Anders BORG Finansminister
United Kingdom Gordon BROWN Chancellor of the Exchequer
Audit Committee
Chairman Maurizio DALLOCCHIO Senior Professor of Corporate Finance at SDA Bocconi School of Management and Holder of Lehman Brothers Chair of Corporate Finance, Bocconi University, Milan
Members Constantinos KARMIOS Chief Accountant, in charge of the Accounting and Financial Services Directorate, Treasury, Cypriot Ministry of Finance
Ortwin KLAPPER Former Chief Executive Officer of Bank Austria Creditanstalt Leasing Group Managing Director of Mizuho Corp. Bank-BA Investment Consulting and Chairman of the Multilease Association, Brussels/Bratislava
Observers Nikolaos PHILIPPAS Assistant Professor and Member of the University Senate, University of Piraeus, Greece and Member of the Board of Directors of Piraeus Port Authority
Éric MATHAY Company auditor, cabinet Bollen, Mathay & Co., Brussels
José RODRIGUES DE JESUS Chartered auditor, Oporto
Management Committee
President Vice-Presidents Philippe MAYSTADT Gerlando GENUARDI Philippe de FONTAINE VIVE CURTAZ Ivan PILIP Torsten GERSFELT Simon BROOKS Carlos da SILVA COSTA Matthias KOLLATZ-AHNEN (…) The EIB’s President also chairs the Bank’s Board of Directors.
Situation at 18 June 2007
1
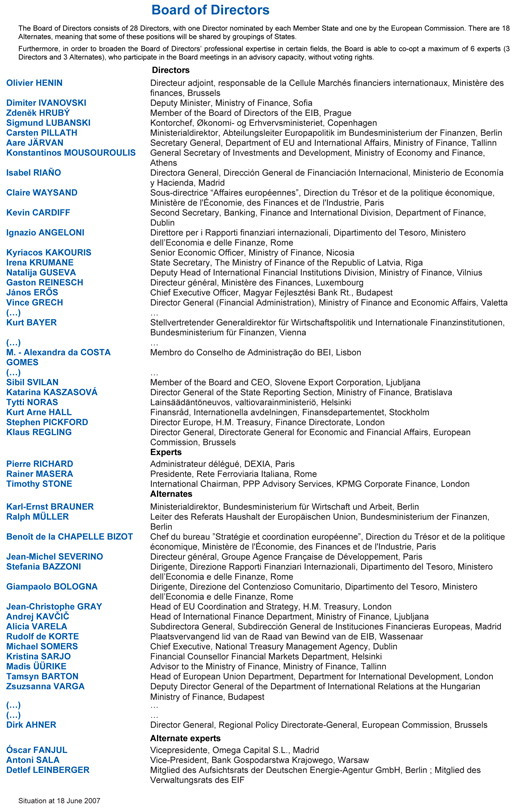
Board of Directors
The Board of Directors consists of 28 Directors, with one Director nominated by each Member State and one by the European Commission. There are 18 Alternates, meaning that some of these positions will be shared by groupings of States.
Furthermore, in order to broaden the Board of Directors’ professional expertise in certain fields, the Board is able to co-opt a maximum of 6 experts (3 Directors and 3 Alternates), who participate in the Board meetings in an advisory capacity, without voting rights.
Directors
Olivier HENIN Directeur adjoint, responsable de la Cellule Marchés financiers internationaux, Ministère des finances, Brussels
Dimiter IVANOVSKI Deputy Minister, Ministry of Finance, Sofia
Zdenek HRUBÝ Member of the Board of Directors of the EIB, Prague
Sigmund LUBANSKI Kontorchef, Økonomi- og Erhvervsministeriet, Copenhagen
Carsten PILLATH Ministerialdirektor, Abteilungsleiter Europapolitik im Bundesministerium der Finanzen, Berlin
Aare JÄRVAN Secretary General, Department of EU and International Affairs, Ministry of Finance, Tallinn
Konstantinos MOUSOUROULIS General Secretary of Investments and Development, Ministry of Economy and Finance, Athens
Isabel RIAÑO Directora General, Dirección General de Financiación Internacional, Ministerio de Economía y Hacienda, Madrid
Claire WAYSAND Sous-directrice “Affaires européennes”, Direction du Trésor et de la politique économique, Ministère de l’Économie, des Finances et de l’Industrie, Paris
Kevin CARDIFF Second Secretary, Banking, Finance and International Division, Department of Finance, Dublin
Ignazio ANGELONI Direttore per i Rapporti finanziari internazionali, Dipartimento del Tesoro, Ministero dell’Economia e delle Finanze, Rome
Kyriacos KAKOURIS Senior Economic Officer, Ministry of Finance, Nicosia
Irena KRUMANE State Secretary, The Ministry of Finance of the Republic of Latvia, Riga
Natalija GUSEVA Deputy Head of International Financial Institutions Division, Ministry of Finance, Vilnius
Gaston REINESCH Directeur général, Ministère des Finances, Luxembourg
János ERÖS Chief Executive Officer, Magyar Fejlesztési Bank Rt., Budapest
Vince GRECH Director General (Financial Administration), Ministry of Finance and Economic Affairs, Valetta
(…) …
Kurt BAYER Stellvertretender Generaldirektor für Wirtschaftspolitik und Internationale Finanzinstitutionen, Bundesministerium für Finanzen, Vienna
(…) …
M. - Alexandra da COSTA GOMES Membro do Conselho de Administração do BEI, Lisbon
(…) …
Sibil SVILAN Member of the Board and CEO, Slovene Export Corporation, Ljubljana
Katarina KASZASOVÁ Director General of the State Reporting Section, Ministry of Finance, Bratislava
Tytti NORAS Lainsäädäntöneuvos, valtiovarainministeriö, Helsinki
Kurt Arne HALL Finansråd, Internationella avdelningen, Finansdepartementet, Stockholm
Stephen PICKFORD Director Europe, H.M. Treasury, Finance Directorate, London
Klaus REGLING Director General, Directorate General for Economic and Financial Affairs, European Commission, Brussels
Experts
Pierre RICHARD Administrateur délégué, DEXIA, Paris
Rainer MASERA Presidente, Rete Ferroviaria Italiana, Rome
Timothy STONE International Chairman, PPP Advisory Services, KPMG Corporate Finance, London
Alternates
Karl-Ernst BRAUNER Ministerialdirektor, Bundesministerium für Wirtschaft und Arbeit, Berlin
Ralph MÜLLER Leiter des Referats Haushalt der Europäischen Union, Bundesministerium der Finanzen, Berlin
Benoît de la CHAPELLE BIZOT Chef du bureau ”Stratégie et coordination européenne”, Direction du Trésor et de la politique économique, Ministère de l’Économie, des Finances et de l’Industrie, Paris
Jean-Michel SEVERINO Directeur général, Groupe Agence Française de Développement, Paris
Stefania BAZZONI Dirigente, Direzione Rapporti Finanziari Internazionali, Dipartimento del Tesoro, Ministero dell’Economia e delle Finanze, Rome
Giampaolo BOLOGNA Dirigente, Direzione del Contenzioso Comunitario, Dipartimento del Tesoro, Ministero dell’Economia e delle Finanze, Rome
Jean-Christophe GRAY Head of EU Coordination and Strategy, H.M. Treasury, London
Andrej KAVČIČ Head of International Finance Department, Ministry of Finance, Ljubljana
Alicia VARELA Subdirectora General, Subdirección General de Instituciones Financieras Europeas, Madrid
Rudolf de KORTE Plaatsvervangend lid van de Raad van Bewind van de EIB, Wassenaar
Michael SOMERS Chief Executive, National Treasury Management Agency, Dublin
Kristina SARJO Financial Counsellor Financial Markets Department, Helsinki
Madis ÜÜRIKE Advisor to the Ministry of Finance, Ministry of Finance, Tallinn
Tamsyn BARTON Head of European Union Department, Department for International Development, London
Zsuzsanna VARGA Deputy Director General of the Department of International Relations at the Hungarian
Ministry of Finance, Budapest
(…) …
(…) …
Dirk AHNER Director General, Regional Policy Directorate-General, European Commission, Brussels
Alternate experts
Óscar FANJUL Vicepresidente, Omega Capital S.L., Madrid
Antoni SALA Vice-President, Bank Gospodarstwa Krajowego, Warsaw
Detlef LEINBERGER Mitglied des Aufsichtsrats der Deutschen Energie-Agentur GmbH, Berlin ; Mitglied des Verwaltungsrats des EIF
Situation at 18 June 2007
2
EIB financing in 2006
In 2006, the European Investment Bank (EIB) lent a total of 45.7 billion euros1 in support of the objectives of the Euro-pean Union: 39.8 billion in the Member States of the Union and 5.9 billion in the partner countries.
Under its new strategy, the Bank pursues five operational priorities in Europe: economic and social cohesion in the enlarged European Union; fostering innovation; developing trans-European networks and their access routes; protecting and improving the environment; and supporting small and medium-sized enterprises (SMEs).
Economic and social cohesion in the enlarged European Union therefore remains the Bank’s prime operational priority. In 2006, financing operations aimed at reducing economic disparities between the regions accounted for almost two thirds of loans granted in the European Union. Individual loans totalled 20.2 billion, including 11.5 billion targeting the poorest regions under Objective 1. More than half of the projects were carried out in the transport and energy sectors. Credit lines in these regions amounted to an estimated 6.5 billion.
By fostering innovation, the Bank assists the development of a knowledge-based economy. Since May 2000, when the Innovation 2010 Initiative (i2i) was launched, loans worth 45.7 billion have already been signed, while the objective is to reach 50 billion by the end of the decade. In 2006, the Bank advanced 10.9 billion in three areas: research, development and innovation (6.7 billion); education and training (2.1 billion); and the creation and dissemination of information and communications technologies (1.7 billion). The European Investment Fund also supports i2i by taking stakes in venture capital funds2.
Efficient communications and energy transfer networks are a key factor in economic integration. The Bank provided 7.3 billion for trans-European transport networks (TENs) within the European Union, 37% of which for priority projects, and 740 million for major transport arteries in the neighbouring countries. At the same time, it pumped 321 million into trans-European energy networks.
In 2006, individual loans for capital projects relating to the environment ran to 10.9 billion, accounting for 24% of total lending. The bulk of loans went to projects in the European Union (9.6 billion). Financing centred on the urban environment (4.6 billion), water treatment and pollution reduction (2.8 billion), combating climate change (2.3 billion) and a range of projects involving nature conservation, environmental efficiency and waste management (1.1 billion).
Investment by small and medium-sized enterprises is supported through credit lines extended to financial intermediaries. In 2006, these amounted to 11.3 billion in the European Union, of which an estimated 5.8 billion served to assist SMEs.
The EIF also furthers this objective by investing in venture capital funds that take stakes in fledgling SMEs and by providing guarantees for SME portfolios2.
1 Unless otherwise indicated, all amounts are expressed in EUR.
2 See section on EIF activity.
8 EIB Group
3
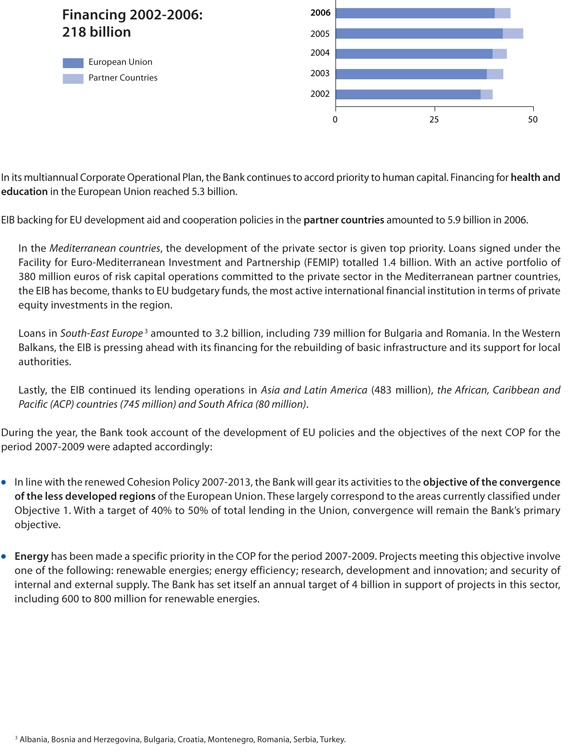
Financing 2002-2006: 218 billion
European Union Partner Countries
2006
2005
2004
2003
2002
0 25 50
In its multiannual Corporate Operational Plan, the Bank continues to accord priority to human capital. Financing for health and education in the European Union reached 5.3 billion.
EIB backing for EU development aid and cooperation policies in the partner countries amounted to 5.9 billion in 2006.
In the Mediterranean countries, the development of the private sector is given top priority. Loans signed under the Facility for Euro-Mediterranean Investment and Partnership (FEMIP) totalled 1.4 billion. With an active portfolio of 380 million euros of risk capital operations committed to the private sector in the Mediterranean partner countries, the EIB has become, thanks to EU budgetary funds, the most active international financial institution in terms of private equity investments in the region.
Loans in South-East Europe 3 amounted to 3.2 billion, including 739 million for Bulgaria and Romania. In the Western Balkans, the EIB is pressing ahead with its financing for the rebuilding of basic infrastructure and its support for local authorities.
Lastly, the EIB continued its lending operations in Asia and Latin America (483 million), the African, Caribbean and
Pacific (ACP) countries (745 million) and South Africa (80 million).
During the year, the Bank took account of the development of EU policies and the objectives of the next COP for the period 2007-2009 were adapted accordingly:
In line with the renewed Cohesion Policy 2007-2013, the Bank will gear its activities to the objective of the convergence of the less developed regions of the European Union. These largely correspond to the areas currently classified under Objective 1. With a target of 40% to 50% of total lending in the Union, convergence will remain the Bank’s primary objective.
Energy has been made a specific priority in the COP for the period 2007-2009. Projects meeting this objective involve one of the following: renewable energies; energy efficiency; research, development and innovation; and security of internal and external supply. The Bank has set itself an annual target of 4 billion in support of projects in this sector, including 600 to 800 million for renewable energies.
3 Albania, Bosnia and Herzegovina, Bulgaria, Croatia, Montenegro, Romania, Serbia, Turkey.
Financial report 2006 9
4
EIB Borrowing Activity
A leading international debt issuer
Borrowing: strategy adds value for customers
The Bank remained committed to making best use of its financial strength, founded notably on support from shareholders – the EU Member States – to secure funding at optimal cost and thus to add value for customers. In the pursuit of these objectives, the Bank maintained a consistent funding strategy, entailing both continuity and innovation in its benchmark programmes and tailor-made issuance. The resulting achievements benefited loan customers, both in the EU and local developing markets targeted by the Bank.
The funding volume of EUR 48bn was similar to last year. Funds were raised via 303 transactions (before swaps) in a record 24 currencies, including six currencies in synthetic format. There was increased demand in non-core currencies (notably Australian dollars), which generated funding for EUR 8bn, compared with EUR 6bn in 2005. However, core currencies (euro, sterling and US dollars) remained the main source of funding, accounting for EUR 40bn of funding (EUR 44bn in 2005).
The market’s favourable reception for the EIB’s funding activities was reflected in the EuroWeek poll, where market participants voted the Bank ‘Most Impressive Borrower’, ‘Most Innovative Borrower’ and ‘Best Supranational or Agency Borrower’ for the third consecutive year. The Bank was also voted ‘Most Exciting and Challenging Borrower for the year ahead’.
Core currencies – sovereign class and innovation
Benchmark programmes strengthened the unique positioning as a multi-currency sovereign-class benchmark issuer. The EIB is exceptional in offering highly comprehensive yield curves across EUR, GBP and USD. Benchmark issues in the Bank’s three core currencies remained a cornerstone of cost-effective funding, and raised EUR 28bn equivalent (59% of total funding). Of this, the largest amount was raised in
euro (EUR 10.6bn), followed by USD (EUR 9.7bn equivalent) and GBP (EUR 8.0bn equivalent).
In its benchmark programmes, the Bank remained responsive to investor requirements. It therefore continued to pay particular attention to market-sensitive execution, for example in terms of timing, sizing, maturity selection and fairness of pricing. Such attention to quality of execution, coupled with the Bank’s attention to the secondary market in its benchmark bonds, has supported strong aftermarket performance. Investor demand for benchmark issues in the three core currencies remained well diversified, with Europe, Asia and the US providing the largest volumes of demand.
A number of innovations and distinctive features differentiated 2006 activities in core currencies. In EUR, where the Bank raised EUR 17.4bn, there was continued proactive alignment with sovereign issuance features, including an issue size of EUR 5bn for benchmark ‘EARN’ issues – with two new EUR 5bn transactions in the 5-year and 10-year sectors. This helped deliver the funding advantage associated with the strong performance of European sovereign-class bonds in 2006. Further attention to sovereign class liquidity was visible in the EUR 580m increase of the 2008 EARN, via an auction-based liquidity allocation procedure. The Bank remains the only borrower to complement sovereigns with benchmark issues in Global format of EUR 5bn size with outstanding maturities from 3 years to 30 years. EUR benchmark outstandings reached EUR 68bn as of end-2006.
An important highlight in EUR targeted and structured issuance (raising EUR 6.9bn in total) was the first issue to be launched via a Public Offering in all 12 countries of the euro area (termed European Public Offering of Securities or ‘EPOS’). The issue was a EUR 1bn structured bond linked to eurozone inflation. It was a practical proposition thanks to the ‘passporting mechanism’ foreseen in the EU Prospectus Directive4. This was the first time that the passporting mechanism was used on this scale in the bond market. The
4 This Directive sets out an efficient mechanism for the ‘passporting’ of prospectuses in the Member States of the European Union: a prospectus approved by the competent authority in one Member State (‘home country regulator’) can be used as a valid prospectus in any other Member State (‘host Member State’) without the need for any further prospectus approval (‘mutual recognition’).
10 EIB Group
5
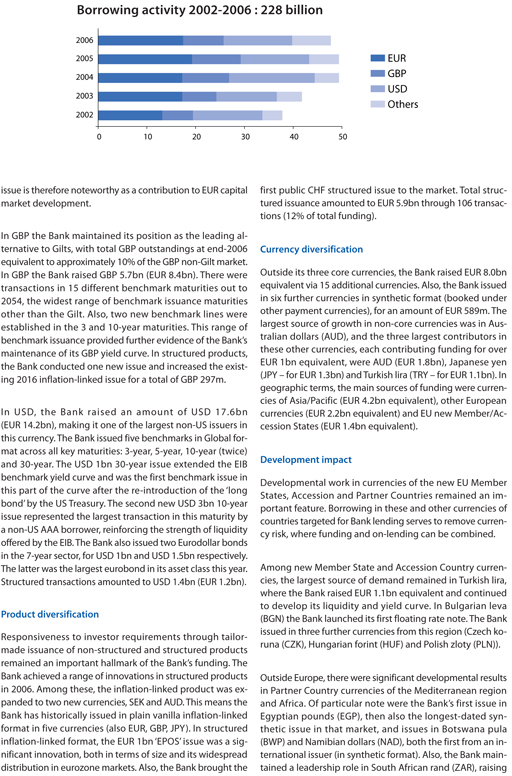
Borrowing activity 2002-2006 : 228 billion
2006
2005
2004
2003
2002
0 10 20 30 40 50
EUR GBP USD Others
issue is therefore noteworthy as a contribution to EUR capital market development.
In GBP the Bank maintained its position as the leading alternative to Gilts, with total GBP outstandings at end-2006 equivalent to approximately 10% of the GBP non-Gilt market. In GBP the Bank raised GBP 5.7bn (EUR 8.4bn). There were transactions in 15 different benchmark maturities out to 2054, the widest range of benchmark issuance maturities other than the Gilt. Also, two new benchmark lines were established in the 3 and 10-year maturities. This range of benchmark issuance provided further evidence of the Bank’s maintenance of its GBP yield curve. In structured products, the Bank conducted one new issue and increased the existing 2016 inflation-linked issue for a total of GBP 297m.
In USD, the Bank raised an amount of USD 17.6bn (EUR 14.2bn), making it one of the largest non-US issuers in this currency. The Bank issued five benchmarks in Global format across all key maturities: 3-year, 5-year, 10-year (twice) and 30-year. The USD 1bn 30-year issue extended the EIB benchmark yield curve and was the first benchmark issue in this part of the curve after the re-introduction of the ‘long bond’ by the US Treasury. The second new USD 3bn 10-year issue represented the largest transaction in this maturity by a non-US AAA borrower, reinforcing the strength of liquidity offered by the EIB. The Bank also issued two Eurodollar bonds in the 7-year sector, for USD 1bn and USD 1.5bn respectively. The latter was the largest eurobond in its asset class this year. Structured transactions amounted to USD 1.4bn (EUR 1.2bn).
Product diversification
Responsiveness to investor requirements through tailor-made issuance of non-structured and structured products remained an important hallmark of the Bank’s funding. The Bank achieved a range of innovations in structured products in 2006. Among these, the inflation-linked product was expanded to two new currencies, SEK and AUD. This means the Bank has historically issued in plain vanilla inflation-linked format in five
currencies (also EUR, GBP, JPY). In structured inflation-linked format, the EUR 1bn ‘EPOS’ issue was a significant innovation, both in terms of size and its widespread distribution in eurozone markets. Also, the Bank brought the
first public CHF structured issue to the market. Total structured issuance amounted to EUR 5.9bn through 106 transactions (12% of total funding).
Currency diversification
Outside its three core currencies, the Bank raised EUR 8.0bn equivalent via 15 additional currencies. Also, the Bank issued in six further currencies in synthetic format (booked under other payment currencies), for an amount of EUR 589m. The largest source of growth in non-core currencies was in Aus-tralian dollars (AUD), and the three largest contributors in these other currencies, each contributing funding for over EUR 1bn equivalent, were AUD (EUR 1.8bn), Japanese yen (JPY – for EUR 1.3bn) and Turkish lira (TRY – for EUR 1.1bn). In geographic terms, the main sources of funding were currencies of Asia/Pacific (EUR 4.2bn equivalent), other European currencies (EUR 2.2bn equivalent) and EU new Member/Accession States (EUR 1.4bn equivalent).
Development impact
Developmental work in currencies of the new EU Member States, Accession and Partner Countries remained an important feature. Borrowing in these and other currencies of countries targeted for Bank lending serves to remove currency risk, where funding and on-lending can be combined.
Among new Member State and Accession Country currencies, the largest source of demand remained in Turkish lira, where the Bank raised EUR 1.1bn equivalent and continued to develop its liquidity and yield curve. In Bulgarian leva (BGN) the Bank launched its first floating rate note. The Bank issued in three further currencies from this region (Czech koruna (CZK), Hungarian forint (HUF) and Polish zloty (PLN)).
Outside Europe, there were significant developmental results in Partner Country currencies of the Mediterranean region and Africa. Of particular note were the Bank’s first issue in Egyptian pounds (EGP), then also the longest-dated synthetic issue in that market, and issues in Botswana pula (BWP) and Namibian dollars (NAD), both the first from an international issuer (in synthetic format). Also, the Bank maintained a leadership role in South African rand (ZAR), raising
Financial report 2006 11
6
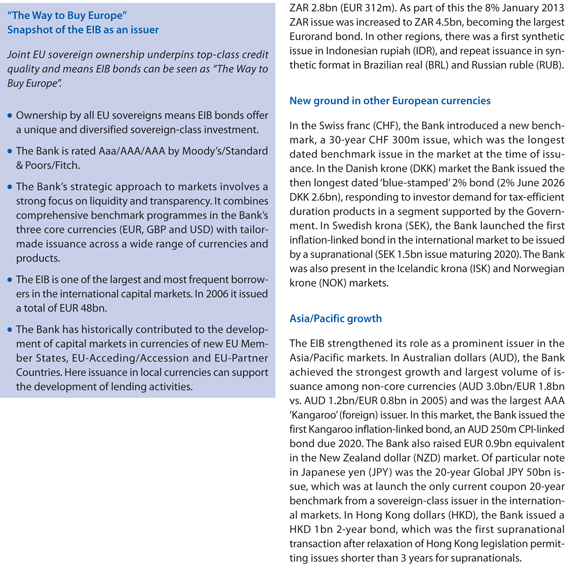
“The Way to Buy Europe” Snapshot of the EIB as an issuer
Joint EU sovereign ownership underpins top-class credit quality and means EIB bonds can be seen as “The Way to Buy Europe”.
Ownership by all EU sovereigns means EIB bonds offer a unique and diversified sovereign-class investment.? The Bank is rated Aaa/AAA/AAA by Moody’s/Standard & Poors/Fitch.
The Bank’s strategic approach to markets involves a strong focus on liquidity and transparency. It combines comprehensive benchmark programmes in the Bank’s three core currencies (EUR, GBP and USD) with tailor-made issuance across a wide range of currencies and products.
The EIB is one of the largest and most frequent borrowers in the international capital markets. In 2006 it issued a total of EUR 48bn.
The Bank has historically contributed to the development of capital markets in currencies of new EU Member States, EU-Acceding/Accession and EU-Partner Countries. Here issuance in local currencies can support the development of lending activities.
ZAR 2.8bn (EUR 312m). As part of this the 8% January 2013 ZAR issue was increased to ZAR 4.5bn, becoming the largest Eurorand bond. In other regions, there was a first synthetic issue in Indonesian rupiah (IDR), and repeat issuance in synthetic format in Brazilian real (BRL) and Russian ruble (RUB).
New ground in other European currencies
In the Swiss franc (CHF), the Bank introduced a new benchmark, a 30-year CHF 300m issue, which was the longest dated benchmark issue in the market at the time of issuance. In the Danish krone (DKK) market the Bank issued the then longest dated ‘blue-stamped’ 2% bond (2% June 2026 DKK 2.6bn), responding to investor demand for tax-efficient duration products in a segment supported by the Government. In Swedish krona (SEK), the Bank launched the first inflation-linked bond in the international market to be issued by a supranational (SEK 1.5bn issue maturing 2020). The Bank was also present in the Icelandic krona (ISK) and Norwegian krone (NOK) markets.
Asia/Pacific growth
The EIB strengthened its role as a prominent issuer in the Asia/Pacific markets. In Australian dollars (AUD), the Bank achieved the strongest growth and largest volume of issuance among non-core currencies (AUD 3.0bn/EUR 1.8bn vs. AUD 1.2bn/EUR 0.8bn in 2005) and was the largest AAA ‘Kangaroo’ (foreign) issuer. In this market, the Bank issued the first Kangaroo inflation-linked bond, an AUD 250m CPI-linked bond due 2020. The Bank also raised EUR 0.9bn equivalent in the New
Zealand dollar (NZD) market. Of particular note in Japanese yen (JPY) was the 20-year Global JPY 50bn issue, which was at launch the only current coupon 20-year benchmark from a sovereign-class issuer in the international markets. In Hong Kong dollars (HKD), the Bank issued a HKD 1bn 2-year bond, which was the first supranational transaction after relaxation of Hong Kong legislation permitting issues shorter than 3 years for supranationals.
12 EIB Group
7
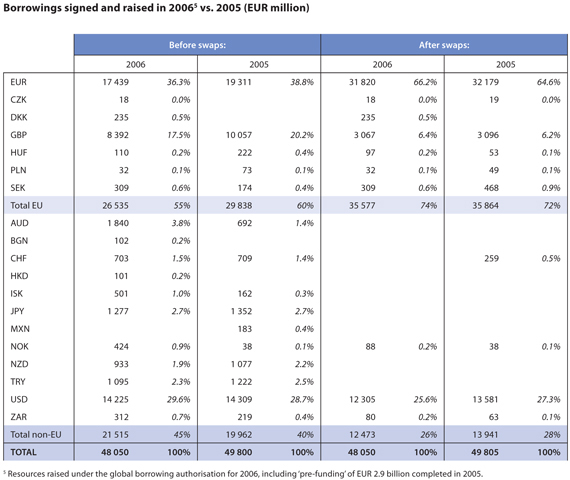
Borrowings signed and raised in 20065 vs. 2005 (EUR million)
Before swaps:
After swaps:
2006
2005
2006
2005
EUR
17 439
36.3%
19 311
38.8%
31 820
66.2%
32 179
64.6%
CZK
18
0.0%
18
0.0%
19
0.0%
DKK
235
0.5%
235
0.5%
GBP
8 392
17.5%
10 057
20.2%
3 067
6.4%
3 096
6.2%
HUF
110
0.2%
222
0.4%
97
0.2%
53
0.1%
PLN
32
0.1%
73
0.1%
32
0.1%
49
0.1%
SEK
309
0.6%
174
0.4%
309
0.6%
468
0.9%
Total EU
26 535
55%
29 838
60%
35 577
74%
35 864
72%
AUD
1 840
3.8%
692
1.4%
BGN
102
0.2%
CHF
703
1.5%
709
1.4%
259
0.5%
HKD
101
0.2%
ISK
501
1.0%
162
0.3%
JPY
1 277
2.7%
1 352
2.7%
MXN
183
0.4%
NOK
424
0.9%
38
0.1%
88
0.2%
38
0.1%
NZD
933
1.9%
1 077
2.2%
TRY
1 095
2.3%
1 222
2.5%
USD
14 225
29.6%
14 309
28.7%
12 305
25.6%
13 581
27.3%
ZAR
312
0.7%
219
0.4%
80
0.2%
63
0.1%
Total non-EU
21 515
45%
19 962
40%
12 473
26%
13 941
28%
TOTAL
48 050
100%
49 800
100%
48 050
100%
49 805
100%
5 Resources raised under the global borrowing authorisation for 2006, including ‘pre-funding’ of EUR 2.9 billion completed in 2005.
Financial report 2006 13
8

EIB Group
Financial Statements
EIB Group - Financial Statements 2006 19
9

RESULTS FOR THE YEAR
For the EIB Group, the year 2006 was marked by an increase in the profit to be appropriated and a slight decrease in the balance sheet total (-2%). The profit to be appropriated for the reporting year stands at EUR 3 235 million, an increase of EUR 2 048 million (+173%). It includes, however, an exceptional item of EUR 975 million due to the reversal of the Fund for general banking risks and its proposed appropriation to the Additional Reserves by the Board of Governors (see note L).
Barring this special item, the profit before movements to/from the Fund for general banking risks for 2006 amounts to EUR 2 260 million, an increase of EUR 1 013 million or 81%. (In 2005 an amount of EUR 60 million was added to the Fund for general banking risks.)
The main contributing factors to the increase in profit are:
– The result on financial operations, which mainly comprises the net results on derivatives, loans and borrowings, with application of the fair value option under IAS 39, increased by EUR 881 million (see Note N).
– The credit loss expense, together with the movements in the specific provision for credit risk, resulted in a profit of EUR 102 million, compared with a loss of EUR 38 million in 2005, a positive impact of EUR 140 million.
– The lower impairment on venture capital operations (Note E) gave a positive impact on the result of EUR 19 million.
– General administrative expenses (Note P) increased, giving a negative impact on the result of EUR 82 million. This was mainly due to an increase in expenses relating to the Group’s defined benefit post-employment schemes (Note K) under IAS19, as compared with 2005.
– The net result of interest and similar income and charges stands at EUR 1 690 million in 2006, i.e. a positive impact on the result of EUR 15 million (items 1 and 2 of the Income Statement).
EIB Group – Financial Statements 2006 21
10
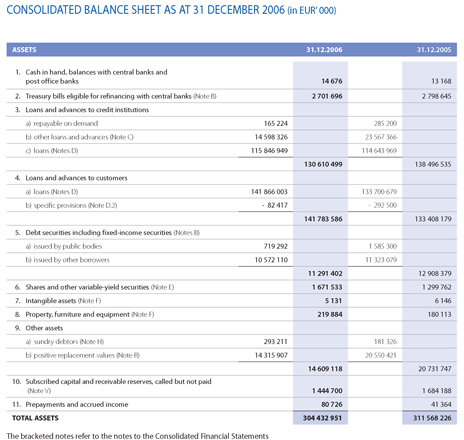
CONSOLIDATED BALANCE SHEET AS AT 31 DECEMBER 2006 (in EUR’ 000)
ASSETS 31.12.2006
31.12.2005
1.
Cash in hand, balances with central banks and
post office banks
14 676
13 168
2.
Treasury bills eligible for refinancing with central banks (Note B)
2 701 696
2 798 645
3.
Loans and advances to credit institutions
a) repayable on demand
165224
285 200
b) other loans and advances (Note C)
14598326
23 567 366
c) loans (Notes D)
115846949
114 643 969
130 610 499
138 496 535
4.
Loans and advances to customers
a) loans (Notes D)
141866003
133700679
b) specific provisions (Note D.2)
- 82 417
- 292 500
141 783 586
133 408 179
5.
Debt securities including fixed-income securities (Notes B)
a) issued by public bodies
719 292
1 585 300
b) issued by other borrowers
10 572 110
11 323 079
11 291 402
12 908 379
6.
Shares and other variable-yield securities (Note E)
1 671 533
1 299 762
7.
Intangible assets (Note F)
5 131
6 146
8.
Property, furniture and equipment (Note F)
219 884
180 113
9.
Other assets
a) sundry debtors (Note H)
293 211
181 326
b) positive replacement values (Note R)
14 315 907
20 550 421
14 609 118
20 731 747
10.
Subscribed capital and receivable reserves, called but not paid
(Note V)
1 444 700
1 684 188
11.
Prepayments and accrued income
80 726
41 364
TOTAL ASSETS
304 432 951
311 568 226
The bracketed notes refer to the notes to the Consolidated Financial Statements
22 EIB Group
11
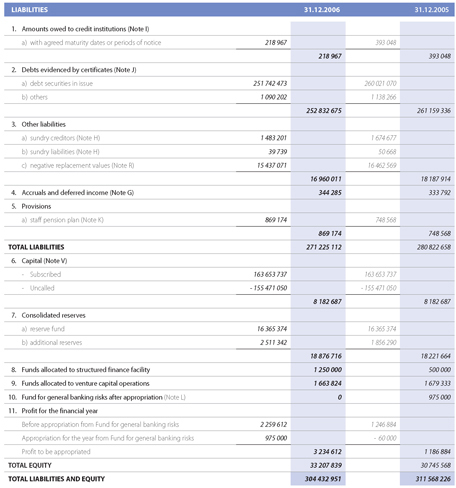
LIABILITIES
31.12.2006
31.12.2005
1.
Amounts owed to credit institutions (Note I)
a) with agreed maturity dates or periods of notice
218 967
393 048
218 967
393 048
2.
Debts evidenced by certificates (Note J)
a) debt securities in issue
251 742 473
260 021 070
b) others
1 090 202
1 138 266
252 832 675
261 159 336
3.
Other liabilities
a) sundry creditors (Note H)
1483201
1 674 677
b) sundry liabilities (Note H)
39 739
50 668
c) negative replacement values (Note R)
15437071
16462569
16 960 011
18 187 914
4.
Accruals and deferred income (Note G)
344 285
333 792
5.
Provisions
a) staff pension plan (Note K)
869 174
748 568
869 174
748 568
TOTAL LIABILITIES
271 225 112
280 822 658
6.
Capital (Note V)
- Subscribed
163 653 737
163 653 737
- Uncalled
-155471050
- 155 471 050
8 182 687
8 182 687
7.
Consolidated reserves
a) reserve fund
16 365 374
16 365 374
b) additional reserves
2 511 342
1 856 290
18 876 716
18 221 664
8.
Funds allocated to structured finance facility
1 250 000
500 000
9.
Funds allocated to venture capital operations
1 663 824
1 679 333
10.
Fund for general banking risks after appropriation (Note L)
0
975 000
11.
Profit for the financial year
Before appropriation from Fund for general banking risks
2 259 612
1 246 884
Appropriation for the year from Fund for general banking risks
975 000
- 60 000
Profit to be appropriated
3 234 612
1 186 884
TOTAL EQUITY
33 207 839
30 745 568
TOTAL LIABILITIES AND EQUITY
304 432 951
311 568 226
EIB Group – Financial Statements 2006 23
12
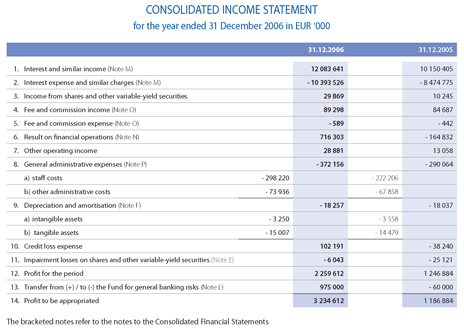
CONSOLIDATED INCOME STATEMENT
for the year ended 31 December 2006 in EUR ‘000
31.12.2006
31.12.2005
1.
Interest and similar income (Note M)
12 083 641
10 150 405
2.
Interest expense and similar charges (Note M)
- 10 393 526
- 8 474 775
3.
Income from shares and other variable-yield securities
29 869
10 245
4.
Fee and commission income (Note O)
89 298
84 687
5.
Fee and commission expense (Note O)
- 589
- 442
6.
Result on financial operations (Note N)
716 303
- 164 832
7.
Other operating income
28 881
13 058
8.
General administrative expenses (Note P)
- 372 156
- 290 064
a) staff costs
-298220
-222206
b) other administrative costs
- 73 936
- 67 858
9.
Depreciation and amortisation (Note F)
- 18 257
- 18 037
a) intangible assets
- 3 250
- 3 558
b) tangible assets
- 15 007
- 14 479
10.
Credit loss expense
102 191
- 38 240
11.
Impairment losses on shares and other variable-yield securities (Note E)
- 6 043
- 25 121
12.
Profit for the period
2 259 612
1 246 884
13.
Transfer from (+) / to (-) the Fund for general banking risks (Note L)
975 000
- 60 000
14.
Profit to be appropriated
3 234 612
1 186 884
The bracketed notes refer to the notes to the Consolidated Financial Statements
EIB Group 24
13
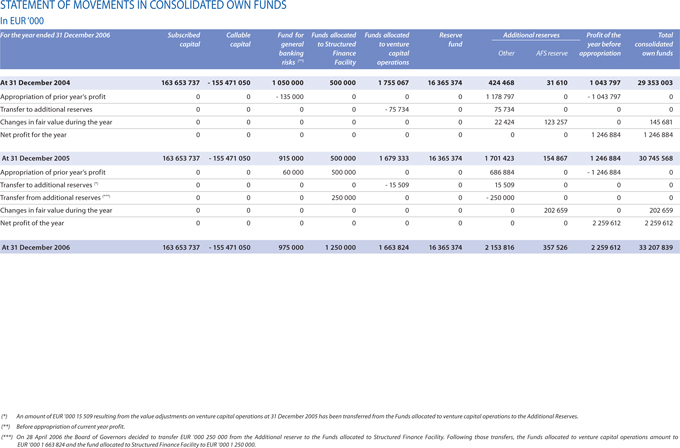
STATEMENT OF MOVEMENTS IN CONSOLIDATED OWN FUNDS
In EUR ‘000
For the year ended 31 December 2006
Subscribed
capital
Callable
capital
Fund for
general banking risks (**)
Funds allocated
to Structured Finance Facility
Funds allocated
to venture capital operations
Reserve
fund
Additional reserves
Profit of the
year before appropriation
Total
consolidated own funds
Other
AFS reserve
At 31 December 2004
163653737
-155471050
1050000
500000
1755067
16365374
424468
31610
1043797
29353003
Appropriation of prior year’s profit
0
0
-135000
0
0
0
1178797
0
-1043797
0
Transfer to additional reserves
0
0
0
0
- 75 734
0
75 734
0
0
0
Changes in fair value during the year
0
0
0
0
0
0
22 424
123 257
0
145 681
Net profit for the year
0
0
0
0
0
0
0
0
1 246884
1 246 884
At 31 December 2005
163653737
-155471050
915 000
500000
1 679333
16365374
1701423
154867
1 246884
30745568
Appropriation of prior year’s profit
0
0
60 000
500 000
0
0
686 884
0
-1246884
0
Transfer to additional reserves (*)
0
0
0
0
- 15 509
0
15 509
0
0
0
Transfer from additional reserves (***)
0
0
0
250 000
0
0
-250000
0
0
0
Changes in fair value during the year
0
0
0
0
0
0
0
202659
0
202 659
Net profit of the year
0
0
0
0
0
0
0
0
2 259612
2 259 612
At 31 December 2006
163 653 737
- 155 471 050
975 000
1 250 000
1 663 824
16 365 374
2 153 816
357 526
2 259 612
33 207 839
(*) An amount of EUR ‘000 15 509 resulting from the value adjustments on venture capital operations at 31 December 2005 has been transferred from the Funds allocated to venture capital operations to the Additional Reserves. (**) Before appropriation of current year profit.
(***) On 28 April 2006 the Board of Governors decided to transfer EUR ‘000 250 000 from the Additional reserve to the Funds allocated to Structured Finance Facility. Following those transfers, the Funds allocated to venture capital operations amount to EUR ‘000 1 663 824 and the fund allocated to Structured Finance Facility to EUR ‘000 1 250 000.
EIB Group – Financial Statements 2006 25
14
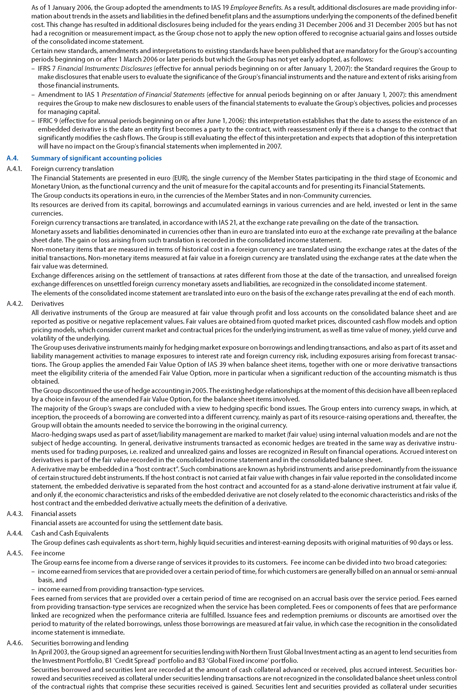
CONSOLIDATED CASH FLOW STATEMENT AS AT 31 DECEMBER 2006
In EUR ‘000
31.12.2006
31.12.2005
A. Cash flows from operating activities :
Profit for the financial year
2259612
1246884
Adjustments:
Unwinding of the discount relating to capital and reserve called, but not paid in
- 61 508
- 63 956
Allowance to provision for guarantees issued
- 30 969
- 36 499
Depreciation and amortisation on tangible and intangible assets
18 257
18 037
Impairment losses on venture capital operations
12 190
25 121
Increase/Decrease in accruals and deferred income
10 493
- 13 313
Increase in prepayments and accrued income
- 34 009
- 34 131
Investment portfolio amortisation
- 18 180
22 104
Changes in replacement values on derivatives others than those associated with borrowing and loan
- 272 582
- 1 257 452
Profit on operating activities
1883304
- 93 205
Net loans disbursements
-35391121
-38532747
Repayments
21 143605
22 997158
Effects of exchange rate changes on loans
3 778 695
- 6 636861
Increase in prepayments and accrued income on loans
- 72 258
- 97 206
Adjustment of loans (fair value option)
1 172 776
- 607 984
Changes in replacement values on derivatives associated with loan
- 1 323349
448 839
Increase in operational portfolio
- 7 200
- 1 664 599
Increase in venture capital operations
- 160 886
- 151 562
Specific provisions on loans and advances
- 210 083
53 500
Increase in shares and other variable-yield securities
- 29 913
- 1 270
Increase in other assets
- 111 887
- 12 814
Decrease/Increase in other liabilities
- 44 540
343 775
Net cash from operating activities
- 9 372857
-23954976
B. Cash flows from investing activities:
Sales of securities
444 272
340 259
Purchases of securities
- 323 639
- 408 704
Increase in asset backed securities
- 943 224
- 868 434
Purchase of property, furniture and equipment
- 54 778
- 55 801
Purchase of intangible fixed assets
- 2 235
- 3 135
Net cash from investing activities
- 879 604
- 995 815
C. Cash flows from financing activities:
Issue of borrowings
45 549825
52 627352
Redemption of borrowings
-39904317
-32061496
Effects of exchange rate changes on borrowings and swaps
- 4 709148
7 796 711
Adjustments of borrowings (fair value option)
- 6 299275
1 267 904
Changes in replacement values on derivatives associated with borrowing
4 302 267
- 1 463966
Decrease/Increase in accrual and deferred income on borrowings and swaps
- 253 792
357 637
Paid in by Member States
300 996
297 637
Decrease/Increase in commercial paper
- 207 278
2 734 713
Decrease in amounts owed to credit institutions
- 174 081
- 2 995
Net cash from financing activities
- 1 394803
31 553497
Summary statement of cash flows:
Cash and cash equivalents at beginning of financial year
29 899127
23 296421
Net cash from:
(1) operating activities
- 9 372857
-23954976
(2) investing activities
- 879 604
- 995 815
(3) financing activities
- 1 394803
31 553497
Cash and cash equivalents at end of financial year
18 251 863
29 899 127
Cash analysis:
Cash in hand, balances with central banks and post office banks
14 676
13 168
Bills maturing within three months of issue
3 473 637
6 033 393
Loans and advances to credit institutions:
Accounts repayable on demand
165 224
285 200
Term deposit accounts
14 598326
23 567366
18 251863
29 899127
26 EIB Group
15
EUROPEAN INVESTMENT BANK GROUP
NOTES TO THE CONSOLIDATED FINANCIAL STATEMENTS AS AT 31 DECEMBER 2006
Note A – Significant accounting policies
A.1. Basis of preparation
Statement of compliance
The Group’s consolidated financial statements (the “Financial Statements”) have been prepared in accordance with international financial reporting standards (IFRS), as endorsed by the European Union.
The accounting policies applied are in conformity, in all material respects, with the general principles of the Directive 86/635/EEC of the Council of the European Communities of 8 December 1986 on the annual accounts and consolidated accounts of banks and other financial institutions, as amended by Directive 2001/65/EC of 27 September 2001 and by Directive 2003/51/EC of 18 June 2003 on the annual and consolidated accounts of certain types of companies, banks and other financial institutions and insurance undertakings (the “Directives”). However, the Financial Statements do not include any management report. The Group prepares an Activity Report which is presented separately from the Financial Statements and its consistency with the Financial Statements is not audited.
Basis of consolidation
The Financial Statements comprise those of the European Investment Bank (the “Bank” or the “EIB”) having its registered office at 100, boulevard Konrad Adenauer and those of its subsidiary, the European Investment Fund (the “Fund” or the “EIF”), having its registered office at 43, avenue J.F. Kennedy, Luxembourg. The financial statements of the Fund are prepared for the same reporting year as the Bank, using consistent accounting policies.
After aggregation of the balance sheets and income statements, all intra-group balances, transactions, income and expenses resulting from intragroup transactions are eliminated.
The Bank holds 61.20% (2005: 61.90%) of the subscribed capital of the EIF.
Minority interests represent the portion of profit or loss and net assets not owned, directly or indirectly, by the Bank and are presented under item
6. Result on financial operations in the consolidated income statement and under item 3. Other liabilities—b) sundry creditors (Note A.4.21) in the consolidated balance sheet.
Assets held in an agency or fiduciary capacity are not assets of the Group and are reported in Note U.
A.2. Significant accounting judgements and estimates
In preparing the Financial Statements, the Management Committee is required to make estimates and assumptions that affect reported income, expenses, assets, liabilities and disclosure of contingent assets and liabilities. Use of available information and application of judgement are inherent in the formation of estimates. Actual results in the future could differ from such estimates and the differences may be material to the Financial Statements.
The most significant use of judgements and estimates are as follows:
Fair value of financial instruments
Where the fair values of financial assets and financial liabilities recorded on the balance sheet cannot be derived from active markets, they are determined using a variety of valuation techniques that include the use of mathematical models. The input to these models is taken from observable markets where possible, but where this is not feasible, a degree of judgement is required in establishing fair values. The judgements include considerations of liquidity and model inputs such as correlation and volatility for longer dated derivatives.
Impairment losses on loans and advances
The Group reviews its problem loans and advances at each reporting date to assess whether an allowance for impairment should be recorded in the consolidated income statement. In particular, judgement by management is required in the estimation of the amount and timing of future cash flows when determining the level of allowance required. Such estimates are based on assumptions about a number of factors and actual results may differ, resulting in future changes to the allowance. In addition to specific allowance against individually significant loans and advances, the Bank also makes a collective impairment allowance against exposures which, although not specifically identified as requiring a specific allowance, have a greater risk of default than when originally granted. This collective allowance is based on any deterioration in the internal rating of the loan or investment since it was granted or acquired. These internal ratings take into consideration factors such as any deterioration in country risk, industry, and technological obsolescence, as well as identified structural weaknesses or deterioration in cash flows.
Valuation of unquoted equity investments
Valuation of unquoted equity investments is normally based on one of the following: – recent arms length market transactions; – current fair value of another instrument that is substantially the same;
– the expected cash flows discounted at current rates applicable for items with similar terms and risk characteristics; or – other valuation models.
The determination of the cash flows and discount factors for unquoted equity investments requires significant estimation. The Group calibrates the valuation techniques periodically and tests them for validity using either prices from observable current market transactions in the same instrument or from other available observable market data.
Impairment of equity investments
The Group treats available-for-sale equity investments as impaired when there has been a significant or prolonged decline in the fair value below its cost or where other objective evidence of impairment exists. The determination of what is “significant “ or “prolonged “ requires judgement. The Group treats “significant “ generally as 20% or more and “prolonged “ greater than 6 months. In addition, the Group evaluates other factors, including normal volatility in share price for quoted equities and the future cash flows and the discount factors for unquoted equities.
Pension and other post employment benefits
The cost of defined benefit pension plans and other post employment medical benefits is determined using actuarial valuations. The actuarial valuation involves making assumptions about discount rates, expected rates of return on assets,
future salary increases, mortality rates and future pension increases. Due to the long term nature of these plans, such estimates are subject to significant uncertainty.
A.3. Changes in accounting policies
The accounting policies adopted are consistent with those used in the previous financial year except as follows:
The Group adopted the amendment to IAS 39 Financial Instruments: Recognition and Measurement for financial guarantee contracts (issued in August 2005), which requires for financial guarantee contracts that are not considered to be insurance contracts to be recognised initially at fair value and to be remeasured at the higher of the amount determined in accordance with IAS 37 Provision, Contingent Liabilities and Contingent Assets and the amount initially recognised less, when appropriate, cumulative amortisation recognised in accordance with IAS 18 Revenue.
EIB Group – Financial Statements 2006 27
16
As of 1 January 2006, the Group adopted the amendments to IAS 19 Employee Benefits. As a result, additional disclosures are made providing information about trends in the assets and liabilities in the defined benefit plans and the assumptions underlying the components of the defined benefit cost. This change has resulted in additional disclosures being included for the years ending 31 December 2006 and 31 December 2005 but has not had a recognition or measurement impact, as the Group chose not to apply the new option offered to recognise actuarial gains and losses outside of the consolidated income statement.
Certain new standards, amendments and interpretations to existing standards have been published that are mandatory for the Group’s accounting periods beginning on or after 1 March 2006 or later periods but which the Group has not yet early adopted, as follows:
– IFRS 7 Financial Instruments: Disclosures (effective for annual periods beginning on or after January 1, 2007): the Standard requires the Group to make disclosures that enable users to evaluate the significance of the Group’s financial instruments and the nature and extent of risks arising from those financial instruments.
– Amendment to IAS 1 Presentation of Financial Statements (effective for annual periods beginning on or after January 1, 2007): this amendment requires the Group to make new disclosures to enable users of the financial statements to evaluate the Group’s objectives, policies and processes for managing capital.
– IFRIC 9 (effective for annual periods beginning on or after June 1, 2006): this interpretation establishes that the date to assess the existence of an embedded derivative is the date an entity first becomes a party to the contract, with reassessment only if there is a change to the contract that significantly modifies the cash flows. The Group is still evaluating the effect of this interpretation and expects that adoption of this interpretation will have no impact on the Group’s financial statements when implemented in 2007.
A.4. Summary of significant accounting policies
A.4.1. Foreign currency translation
The Financial Statements are presented in euro (EUR), the single currency of the Member States participating in the third stage of Economic and Monetary Union, as the functional currency and the unit of measure for the capital accounts and for presenting its Financial Statements.
The Group conducts its operations in euro, in the currencies of the Member States and in non-Community currencies.
Its resources are derived from its capital, borrowings and accumulated earnings in various currencies and are held, invested or lent in the same currencies.
Foreign currency transactions are translated, in accordance with IAS 21, at the exchange rate prevailing on the date of the transaction.
Monetary assets and liabilities denominated in currencies other than in euro are translated into euro at the exchange rate prevailing at the balance sheet date. The gain or loss arising from such translation is recorded in the consolidated income statement.
Non-monetary items that are measured in terms of historical cost in a foreign currency are translated using the exchange rates at the dates of the initial transactions. Non-monetary items measured at fair value in a foreign currency are translated using the exchange rates at the date when the fair value was determined.
Exchange differences arising on the settlement of transactions at rates different from those at the date of the transaction, and unrealised foreign exchange differences on unsettled foreign currency monetary assets and liabilities, are recognized in the consolidated income statement.
The elements of the consolidated income statement are translated into euro on the basis of the exchange rates prevailing at the end of each month. A.4.2. Derivatives All derivative instruments of the Group are measured at fair value through profit and loss accounts on the consolidated balance sheet and are reported as positive or negative replacement values. Fair values are obtained from quoted market prices, discounted cash flow models and option pricing models, which consider current market and contractual prices for the underlying instrument, as well as time value of money, yield curve and volatility of the underlying.
The Group uses derivative instruments mainly for hedging market exposure on borrowings and lending transactions, and also as part of its asset and liability management activities to manage exposures to interest rate and foreign currency risk, including exposures arising from forecast transactions. The Group applies the amended Fair Value Option of IAS 39 when balance sheet items, together with one or more derivative transactions meet the eligibility criteria of the amended Fair Value Option, more in particular when a significant reduction of the accounting mismatch is thus obtained.
The Group discontinued the use of hedge accounting in 2005. The existing hedge relationships at the moment of this decision have all been replaced by a choice in favour of the amended Fair Value Option, for the balance sheet items involved.
The majority of the Group’s swaps are concluded with a view to hedging specific bond issues. The Group enters into currency swaps, in which, at inception, the proceeds of a borrowing are converted into a different currency, mainly as part of its resource-raising operations and, thereafter, the Group will obtain the amounts needed to service the borrowing in the original currency.
Macro-hedging swaps used as part of asset/liability management are marked to market (fair value) using internal valuation models and are not the subject of hedge accounting. In general, derivative instruments transacted as economic hedges are treated in the same way as derivative instruments used for trading purposes, i.e. realized and unrealized gains and losses are recognized in Result on financial operations. Accrued interest on derivatives is part of the fair value recorded in the consolidated income statement and in the consolidated balance sheet.
A derivative may be embedded in a “host contract”. Such combinations are known as hybrid instruments and arise predominantly from the issuance of certain structured debt instruments. If the host contract is not carried at fair value with changes in fair value reported in the consolidated income statement, the embedded derivative is separated from the host contract and accounted for as a stand-alone derivative instrument at fair value if, and only if, the economic characteristics and risks of the embedded derivative are not closely related to the economic characteristics and risks of the host contract and the embedded derivative actually meets the definition of a derivative.
A.4.3. Financial assets
Financial assets are accounted for using the settlement date basis. A.4.4. Cash and Cash Equivalents
The Group defines cash equivalents as short-term, highly liquid securities and interest-earning deposits with original maturities of 90 days or less. A.4.5. Fee income The Group earns fee income from a diverse range of services it provides to its customers. Fee income can be divided into two broad categories: – income earned from services that are provided over a certain period of time, for which customers are generally billed on an annual or semi-annual basis, and – income earned from providing transaction-type services.
Fees earned from services that are provided over a certain period of time are recognised on an accrual basis over the service period. Fees earned from providing transaction-type services are recognized when the service has been completed. Fees or components of fees that are performance linked are recognized when the performance criteria are fulfilled. Issuance fees and redemption premiums or discounts are amortised over the period to maturity of the related borrowings, unless those borrowings are measured at fair value, in which case the recognition in the consolidated income statement is immediate.
A.4.6. Securities borrowing and lending
In April 2003, the Group signed an agreement for securities lending with Northern Trust Global Investment acting as an agent to lend securities from the Investment Portfolio, B1 ‘Credit Spread’ portfolio and B3 ‘Global Fixed income’ portfolio.
Securities borrowed and securities lent are recorded at the amount of cash collateral advanced or received, plus accrued interest. Securities borrowed and securities received as collateral under securities lending transactions are not recognized in the consolidated balance sheet unless control of the contractual rights that comprise these securities received is gained. Securities lent and securities provided as collateral under securities
28 EIB Group
17
borrowing transactions are not derecognised from the consolidated balance sheet unless control of the contractual rights that comprise these securities transferred is relinquished. The Group monitors the market value of the securities borrowed and lent on a daily basis and provides or requests additional collateral in accordance with the underlying agreements.
Fees and interest received or paid are recorded as interest income or interest expense, on an accrual basis.
A.4.7. Treasury bills and other bills eligible for refinancing with central banks and debt securities including fixed-income securities and other variable-yield securities With a view to clarifying management of its liquid assets and consolidating its solvency, the Group has established the following portfolio categories:
A.4.7.1. Held for trading portfolio
The held for trading portfolio (see Operational portfolio B3 in Note B) comprises listed debt securities issued and guaranteed by financial establishments, which are owned by the Group (“long” positions). Securities held in this portfolio are marked to market in the consolidated balance sheet, any gain or loss arising from a change in fair value being included in the consolidated income statement in the period in which it arises.
Gains and losses realized on disposal or redemption and unrealized gains and losses from changes in the fair value of trading portfolio assets are reported as Net trading income in the account “Result on financial operations”. Interest income on trading portfolio assets is included in interest income. The determination of fair values of trading portfolio assets is based on quoted market prices in active markets or dealer price quotations, pricing models (using assumptions based on market and economic conditions), or management’s estimates, as applicable.
A.4.7.2. Held-to-maturity portfolio
The held-to-maturity portfolio comprises the Group’s Investment portfolio and the operational portfolio A1 of EIB (see Note B).
The Investment portfolio consists of securities purchased with the intention of holding them to maturity. These securities are issued or guaranteed by:
– Governments of the European Union, G10 countries and their agencies;
– Supranational public institutions, including multinational development banks.
These securities are initially recorded at the purchase price, or more exceptionally the transfer price. The difference between entry price and redemption value is amortised prorata temporis over the remaining life of the securities.
The Group has decided to phase out the investment portfolio of the Bank, by ceasing to invest the redemption proceeds of matured securities in the portfolio.
The Operational portfolios A1 of the Group are held for the purpose of maintaining an adequate level of liquidity in the Group and comprise money market products with a maximum maturity of twelve months, in particular Treasury bills and negotiable debt securities issued by credit institutions. The securities are held until their final maturity and presented in the Financial Statements at their amortized cost.
A.4.7.3. Available for sale portfolio
The available for sale portfolio comprises the securities of the operational money market portfolio A2 and of the operational bond portfolios B1 and B2 (see Note B), the operational portfolio of the Fund, shares, other variable-yield securities and participating interests (see Note B). Securities are classified as available for sale where they do not appropriately belong to one of the other categories of financial instruments recognised under IAS 39, i.e. “held for trading” or “held-to-maturity”. The Management Committee determines the appropriate classification of its investments at the time of the constitution of a portfolio, financial instruments within one portfolio have always the same classification. Available-for-sale financial investments may be sold in response to or in anticipation of needs for liquidity or changes in interest rates, foreign exchange rates or equity prices. Available for sale financial investments are carried at fair value. Unrealised gains or losses are reported in consolidated reserves until such investment is sold, collected or otherwise disposed of, or until such investment is determined to be impaired. If an available for sale investment is determined to be impaired, the cumulative unrealised gain or loss previously recognised in own funds is included in consolidated income statement for the period. A financial investment is considered impaired if its carrying value exceeds the recoverable amount. Quoted financial investments are considered impaired if the decline in market price below cost is of such a magnitude that recovery of the cost value cannot be reasonably expected within the foreseeable future. For non-quoted equity investments, the recoverable amount is determined by applying recognized valuation techniques. On disposal of an available for sale investment, the accumulated unrealised gain or loss included in own funds is transferred to consolidated income statement for the period. Gains and losses on disposal are determined using the average cost method. Interest and dividend income on available-for-sale financial investments are included in “interest and similar income” and “income from securities with variable yield”.
The determination of fair values of available for sale financial investments is generally based on quoted market rates in active markets, dealer price quotations, discounted expected cash flows using market rates commensurate with the credit quality and maturity of the investment or based upon review of the investee’s financial results, condition and prospects including comparisons to similar companies for which quoted market prices are available. Venture capital operations and participating interests held represent medium and long-term investments and are measured at fair value, by using fair value measurement techniques including entity inputs, in absence of liquid market prices, commonly used by market participants. However, some are accounted for at cost when the fair value cannot be reliably measured. The nature of those investments is such that an accurate fair value can be determined only upon realization of those investments. The estimation by the Group of a fair value for venture capital investments for which the method and timing of realization have not yet been determined is therefore considered to be inappropriate in those instances. All venture capital operations are subject to review for impairment.
The Group assesses at each balance sheet date whether there is any objective evidence that a financial asset or a group of financial assets is impaired. A financial asset or a group of financial assets is deemed to be impaired if, and only if, there is objective evidence of impairment as a result of one or more events that has occurred after the initial recognition of the asset (an incurred “loss event”) and that loss event (or events) has an impact on the estimated future cash flows of the financial asset or the group of financial assets that can be reliably estimated.
In the case of equity investments classified as available-for-sale, this would include a significant or prolonged decline in the fair value of the investments below its cost. Where there is evidence of impairment, the cumulative loss measured as the difference between the acquisition cost and the current fair value, less any impairment loss on that financial asset previously recognised in the consolidated income statement is removed from equity and recognised in the income statement. Impairment losses on equity investments are not reversed through the consolidated income statement; increases in their fair value after impairment are recognised directly in equity.
A.4.8. Loans and advances to credit institutions and customers
Loans and receivable include loans where money is provided directly to the borrower. A participation in a loan from another lender is considered to be originated by the Group, provided it is funded on the date the loan is originated by the lender.
Loans and receivable are recognized in the assets of the Group when cash is advanced to borrowers. They are initially recorded at cost (their net disbursed amounts), which is the fair value of the cash given to originate the loan, including any transaction costs, and are subsequently measured at amortized cost using the effective interest rate method.
Where loans meet the eligibility criteria of the amended Fair Value Option and have been designated as at Fair Value through Profit and Loss, they are measured at their fair value. The fair value measurement technique used is a discounted cash flow technique, using current yield curves and a spread which is equal to the spread at inception of the instrument, unless credit quality of the instrument varied.
A.4.8.1. Interest on loans
Interest on loans originated by the Group is recorded in the consolidated income statement (interest and similar income) and on the consolidated balance sheet (loans and advances) on an accruals basis.
A.4.8.2. Reverse repurchase and repurchase operations (reverse repos and repos)
A reverse repurchase (repurchase) operation is one under which the Group lends (borrows) liquid funds to (from) a credit institution which provides (receives) collateral in the form of securities. The two parties enter into an irrevocable commitment to complete the operation on a date and at a price fixed at the outset.
EIB Group – Financial Statements 2006 29
18
The operation is based on the principle of delivery against payment: the borrower (lender) of the liquid funds transfers the securities to the Group’s (counterparty’s) custodian in exchange for settlement at the agreed price, which generates a return (cost) for the Group linked to the money market. This type of operation is considered for the purposes of the Group to be a loan (borrowing) at a guaranteed rate of interest. Generally treated as collateralized financing transactions, they are carried at the amounts of cash advanced or received, plus accrued interest and are entered on the assets side of the consolidated balance sheet under item 3. Loans and advances to credit institutions—b) other loans and advances (on the liabilities side of the consolidated balance sheet under item 1. Amounts owed to credit institutions—a) with agreed maturity dates or periods of notice). The securities provided as collateral are maintained in the consolidated balance sheet accounts.
Securities received under reverse repurchase agreements and securities delivered under repurchase agreements are not recognized in the consolidated balance sheet or derecognized from the consolidated balance sheet, unless control of the contractual rights that comprise these securities is relinquished. The Group monitors the market value of the securities received or delivered on a daily basis, and provides or requests additional collateral in accordance with the underlying agreements.
Interest earned on reverse repurchase agreements and interest incurred on repurchase agreements is recognized as interest income or interest expense, over the life of each agreement.
A.4.8.3. Fees on loans
Front-end fees and commitment fees are deferred in accordance with IAS 18, together with the related direct costs of originating and maintaining the commitment, and are recognised as an adjustment to the effective yield, being recorded in the consolidated income statement over the period from disbursement to repayment of the related loan. If the commitment expires without the loan being drawn down, the fee is recognised as income on expiry.
A.4.8.4. Interest subsidies
Interest subsidies received in advance (see Note G) are deferred in accordance with IAS 18, and are recognised as an adjustment to the effective yield, being recorded in the consolidated income statement over the period from disbursement to repayment of the subsidized loan.
A.4.9. Credit loss expense
An allowance for credit losses is established if there is objective evidence that the Group will be unable to collect all amounts due on a claim according to the original contractual terms or the equivalent value. A “claim” means a loan, a commitment such as a letter of credit, a guarantee, a commitment to extend credit, or other credit product.
An allowance for credit losses is reported as a reduction of the carrying value of a claim on the consolidated balance sheet, whereas for an off-balance sheet item such as a commitment a provision for credit loss is reported in Other liabilities. Additions to the allowances and provisions for credit losses are made through credit loss expense.
A.4.9.1. Credit losses related to individual loans and advances
Specific provisions have been made for individual loans and advances outstanding at the end of the financial year and presenting objective evidence of risks of non-recovery of all or part of their amounts according to the original contractual terms or the equivalent value. Changes to these provisions are entered on the consolidated income statement as “Credit loss expense”. Allowances and provisions for credit losses are evaluated on the following counterparty specific based principle.
A claim is considered impaired when the Management Committee determines that it is probable that the Group will not be able to collect all amounts due according to the original contractual terms or the equivalent value. Individual credit exposures are evaluated based upon the borrower’s character, overall financial condition, resources and payment record, the prospects for support from any financially responsible guarantors and, where applicable, the realizable value of any collateral. The estimated recoverable amount is the present value of expected future cash flows, which may result from restructuring or liquidation. Impairment is measured and allowances for credit losses are established for the difference between the carrying amount and its estimated recoverable amount of any claim considered as impaired. The amount of the loss is the difference between the asset’s carrying amount and the present value of expected future cash flows discounted at the financial instrument’s original effective interest rate.
All impaired claims are reviewed and analysed at least semi-annually. Any subsequent changes to the amounts and timing of the expected future cash flows compared to the prior estimates will result in a change in the provision for credit losses and be charged or credited to credit loss expense. An allowance for impairment is reversed only when the credit quality has improved such that there is reasonable assurance of timely collection of principal and interest in accordance with the original contractual terms of the claim agreement. A write-off is made when all or part of a claim is deemed uncollectible or forgiven. Write-offs are charged against previously established provisions for credit losses or directly to credit loss expense and reduce the principal amount of a claim. Recoveries in part or in full of amounts previously written off are credited to credit loss expense.
Upon impairment the accrual of interest income based on the original terms of the claim is discontinued, and is replaced by an accrual based upon the impaired value; in addition, the increase of the present value of impaired claims due to the passage of time is reported as interest income.
A.4.9.2. Collective impairment
In addition to specific allowances against individually significant loans and advances, the Group also makes a collective impairment allowance against exposures which, although not specifically identified as requiring a specific allowance, have a greater risk of default than when originally granted. This collective allowance is based on any deterioration in the internal rating of the loan or investment since it was granted or acquired. These internal ratings take into consideration factors such as any deterioration in counterparty risk, value of collateral or security received, and sectorial outlook, as well as identified structural weaknesses or deterioration in cash flows. As at 31 December 2006, there was no need for collective impairment provisions, following this process.
A.4.9.3. Guarantees
In the normal course of business, the Group issues various forms of guarantees to support some institutions.
Under the existing rules, these guarantees don’t meet the definition of an insurance contract (IFRS 4 Insurance Contracts) and are accounted for under IAS 39 Financial Instruments: Recognition and Measurement, either as “Derivatives” or “Financial Guarantees”, depending on their features and characteristics as defined by IAS 39.
The accounting policy for Derivatives is disclosed under Note A.4.2.
Financial Guarantees are initially recognised at fair value in the consolidated balance sheet under item 3c. Other liabilities – sundry liabilities, being the premium received.
Subsequent to initial recognition, the Group’s liabilities under each financial guarantee are measured at the higher of 1) the amount initially recognized less, when appropriate, cumulative amortization recognized in accordance with IAS 18 and 2) the best estimate of expenditure required to settle any present financial obligation arising as a result of the guarantee in accordance with IAS 37.
Any increase in the liability relating to financial guarantee is taken to the consolidated income statement in “Credit loss expense”. The premium received is recognised in the consolidated income statement in “Fee and commission income” on the basis of an amortization schedule in accordance with IAS 18 over the life of the financial guarantee.
A.4.10. Property, furniture and equipment
Property, furniture and equipment include land, Group-occupied properties and other machines and equipment. Property, furniture and equipment are carried at cost less accumulated depreciation and accumulated impairment losses. Property, furniture and equipment are reviewed periodically for impairment.
Land and buildings are stated at acquisition cost less accumulated depreciation. The value of the Group’s headquarters building in Luxembourg-Kirchberg and its buildings in Luxembourg-Hamm, Luxembourg-Weimershof and Lisbon is depreciated on the straight-line basis as set out below. Office furniture and equipment were, until end-1997, depreciated in full in the year of acquisition. With effect from 1998, permanent equipment,
30 EIB Group
19
fixtures and fittings, furniture, office equipment and vehicles have been recorded in the consolidated balance sheet at their acquisition cost, less accumulated depreciation.
Depreciation is calculated on the straight-line basis over the estimated life of each item purchased, as set out below:
– Buildings in Kirchberg, Hamm and Weimershof
30years
– Building in Lisbon
25years
– Permanent equipment, fixtures and fittings .
10years
– Furniture
5years
– Office equipment and vehicles
3years
A.4.11. Intangible assets
Intangible assets comprise computer software. Software development costs are capitalized if they meet certain criteria relating to identifiability, to the probability that future economic benefits will flow to the enterprise, and to the reliability of cost measurement.
Intangible assets are recognized as assets and are amortized using the straight-line basis over their estimated useful economic life. At each consolidated balance sheet date, intangible assets are reviewed for indications of impairment or changes in estimated future benefits. If such indications exist, an analysis is performed to assess whether the carrying amount is fully recoverable. A write-down is made if the carrying amount exceeds the recoverable amount.
Internally developed software meeting these criteria is carried at cost less accumulated depreciation calculated on the straight-line basis over three years from completion.
Software purchased is depreciated on the straight-line basis over its estimated life (2 to 5 years).
A.4.12. Staff pension plan and health insurance scheme
The Group operates defined benefit pension plans to provide retirement benefits to substantially all of its staff. The Group also provides certain additional post-employment healthcare benefits to former employees in EIB. These benefits are unfunded, as defined by IAS 19. The cost of providing benefits under the plans is determined separately for each plan using the projected unit credit actuarial valuation method. Actuarial gains and losses are recognised as income or expense over the expected average remaining working lives of the employees participating in the plans. The charge to the consolidated income statement in respect of the defined benefit pension plan is based on the current service cost and other actuarial adjustments as determined by qualified external actuaries.
A.4.12.1. Pension plan
The Bank’s main pension plan is a defined benefit pension plan funded by contributions from staff and from the Bank which covers all employees. Commitments for retirements benefits are valued at least every year using the projected unit credit method, in order to ensure that the liability entered in the accounts is adequate. The results of the latest valuation are as at 30 September 2006, with an extrapolation to 31 December 2006. The main actuarial assumptions used by the actuary are set out in Note K. Actuarial surpluses and deficits are spread forward over the average expected remaining service lives of the plan participants.
The main pension scheme of the EIF is a defined benefit scheme funded by contributions from staff and from the EIF which covers all employees. The scheme entered into force in March 2003, replacing the previous defined contribution scheme. All contributions of the EIF and its members of staff are transferred to the EIB for management. The transferred funds allocated to the pension scheme are invested for by the Group, following the rules and principles applied by EIB for its own staff pension plan.
A.4.12.2. Health insurance plan
The Bank has set up its own health insurance scheme for the benefit of staff and Management Committee, financed by contributions from the Bank and the its employees. The health insurance scheme is subject to actuarial calculations as per the same dates as the pension plan. A specific provision is set aside on the liabilities side of the consolidated balance sheet. The EIF has set up its own health care coverage by subscribing to an external insurance plan provided by an insurance company.
A.4.12.3. Pension plan for members of the Management Committee
The related provision shown on the liability side of the Group’s balance sheet is determined, as for all schemes, in conformity with IAS 19. Benefits are based on years of service and a percentage of final gross base salary as defined in the scheme.
A.4.13. Debts evidenced by certificates
Debts evidenced by certificates initially are measured at cost, which is the fair value of the consideration received. Transaction costs and net premiums (discounts) are included in the initial measurement. Subsequent measurement is at amortised cost, and any difference between net proceeds and the redemption value is recognised in the consolidated income statement over the period of the borrowings using the effective yield method. Where borrowings meet the eligibility criteria of the amended Fair Value Option and have been designated as at Fair Value through Profit and Loss, they are measured at their fair value. The fair value measurement technique used, in the case of absence of liquid market prices, is a discounted cash flow technique, using current yield curves.
Combined debt instruments that are related to non-EIB equity instruments, foreign exchange or indices are considered structured instruments. For all the debt instruments including embedded derivatives, the Group has concluded a reversed swap agreement to fully hedge the exposure. It is the Group policy to hedge the fixed interest rate risk on debt issues and to apply the amended Fair Value Option when this results in a significant reduction of an accounting mismatch. The effect is such that the carrying value of the thus elected debt instruments is adjusted for changes in fair value rather than carried and accrued at cost (see Note R – Derivatives for further discussion).
Interest expense on debt instruments is included in the account “interest expense and similar charges” in the consolidated income statement and in the liabilities caption including the underlying debt instruments in the consolidated balance sheet.
A.4.14. Fund for general banking risks
Until 31 December 2005 the Group identified, as a separate balance sheet item, the amounts it decided to put aside to cover risks associated with loans and other financial operations, having regard to the particular risks attached to such operations.
Starting from 2006, the Group no longer identifies such separate balance sheet item. The decision to release it completely does not affect the ability of the Group to cover its risks. The Group will continue to compute the amount corresponding to the general banking risks, for internal and disclosure purposes (see Note L), according to the existing methodology (see Note Q and R).
The amount corresponding to the general banking risks with respect to operations of the Structured Finance Facility is disclosed in “Fund allocated to Structured Finance Facility” on the consolidated balance sheet.
A.4.15. Funds allocated to venture capital operations and to the Structured Finance Facility
A.4.15.1. Funds allocated to venture capital operations
This item comprises the amount of appropriations from the annual result of the Group, determined each year by the Board of Governors to facilitate instruments providing venture capital in the context of implementing the European Council Resolution on Growth and Employment.
A.4.15.2. Funds allocated to the Structured Finance Facility
This item comprises the amount of appropriations from the annual result of the Group, determined each year by the Board of Governors to facilitate implementation of operations with a greater degree of risk for this new type of instrument. Value adjustments on venture capital and structured finance operations are accounted for in the profit and loss accounts. Upon appropriation of the Group’s result, such value adjustments are taken into consideration for determining the amounts to be recorded in the “Funds allocated to venture capital operations” and “Funds allocated to the Structured Finance Facility’s accounts”.
EIB Group – Financial Statements 2006 31
20
A.4.16. Taxation
The Protocol on the Privileges and Immunities of the European Communities, appended to the Treaty of 8 April 1965 establishing a Single Council and a Single Commission of the European Communities, stipules that the assets, revenues and other property of the Group are exempt from all direct taxes.
A.4.17. Prepayments and accrued income – Accruals and deferred income These accounts comprise:
Prepayments and accrued income: expenditure incurred during the financial year but relating to a subsequent financial year, together with any income not disclosed in the reporting value of the underlying financial instrument which, though relating to the financial year in question, is not due until after its expiry.
Accruals and deferred income: income received before the balance sheet date but relating to a subsequent financial year, together with any charges not disclosed in the reporting value of the underlying financial instrument which, though relating to the financial year in question, will be paid only in the course of a subsequent financial year (principally interest on borrowings).
A.4.18. Interest and similar income
Interest is recorded on an accruals basis using the effective yield method. Interest is recognised on impaired loans through unwinding the discount used in the present value calculations applied to expected future cash flows.
In addition to interest and commission on loans, deposits and other revenue from the securities portfolio, this heading includes the indemnities received by the Group in respect of early loan reimbursements prepayments made by its borrowers.
In accordance with the provisions of the International Accounting Standard IAS 39 – Financial Instruments: Recognition and Measurement—the Group takes immediately into the consolidated income statement the indemnities received for early reimbursement of loans at the time of derecog-nition of those related loans instead of depreciating the indemnities over the remaining life of loans.
A.4.19. Fiduciary operations
Pursuant to Article 28 of its Statutes, the EIF acquires, manages and disposes of investments in venture capital enterprises, in its own name but on behalf and at the risk of the European Community, according to Fiduciary and Management Agreements concluded with the European Community (“ETF Start-up Facility”).
The EIF is also empowered to issue guarantees in its own name but on behalf and at the risk of the European Community according to the Fiduciary and Management Agreement concluded with the European Community (“SME Guarantee Facility”).
A.4.20. Assets held for third parties
Assets held for third parties, as set out below, represent trust accounts opened and maintained in the name of the Group entities but for the benefit of the Commission. Sums held in these accounts remain the property of the Commission so long as they are not disbursed for the purposes set out in relation to each project.
– Under the Growth and Environment Pilot Project, the EIF provides a free guarantee to the financial intermediaries for loans extended to SME’s with the purpose of financing environmentally friendly investments. The ultimate risk from the guarantee rests with the EIF and the guarantee fee is paid out of European Union budget funds.
– Under the SME Guarantee Facility and the MAP Guarantee programme, the EIF is empowered to issue guarantees in its own name but on behalf of and at the risk of the Commission.
– Under the ETF Start-Up Facility and the MAP Equity programme, the EIF is empowered to acquire, manage and dispose of ETF start-up investments, in its own name but on behalf of and at the risk of the Commission.
The support provided by the Seed Capital Action is aimed at the long-term recruitment of additional investment managers by the venture capital funds to increase the number of qualified personnel and to reinforce the capacity of the venture capital and incubator industries to cater for investments in seed capital.
The Investment Facility, which is managed by the EIB, has been established within the framework of the Cotonou Agreement on cooperation and development of the African, Caribbean and Pacific Group of States and the European Union and its Member States on 23 June 2000. The EIB prepares separate financial statements for the Investment Facility.
The Commission entrusted financial management of the Guarantee Fund to the EIB under an agreement signed between the two parties in November 1994.
The Femip Trust Fund, which is also managed by the EIB, was set up to enhance the existing activities of the EIB in the Mediterranean Partner Countries, with the support of a number of donor countries and with a view to directing resources to operations in certain priority sectors through the provision of technical assistance and risk capital. The EIB prepares separate financial statements for the Femip Trust Fund.
A.4.21. Commitment to purchase EIF shares
Under the terms of a replacement share purchase undertaking in respect of the remaining 776 shares (2005: 762 shares), the EIB is offering to buy these shares from EIF’s other shareholders at a price per share, which will correspond to the part of each share in the called capital of EIF, increased by the share premium account, the statutory reserves, the disclosed unrealised gains in venture capital operations, the profit bought forward and profit of the year. The commitment to purchase is shown in the consolidated balance sheet as a debt item under sundry creditors (see also Note H).
A.4.22. Reclassification of prior year figures
Where necessary, certain prior-year figures have been reclassified to conform with changes to the current year’s presentation for comparative purpose. Main reclassifications comprise: – the profit of the year of minority interests amounting to EUR ‘000 16 330 as at 31 December 2005 are presented under item 6. Result on financial operations in the consolidated income statement; – the sundry debtors related to derivative amounting to EUR ‘000 325 051 as at 31 December 2005 are reclassified under positive replacement values on derivatives; – the interest subsidies received in advances amounting to EUR ‘000 237 765 as at 31 December 2005 are reclassified under the item 4. Accruals and deferred income in the consolidated balance sheet; – the income and expenses related to premium/discount on foreign exchange transaction for a net amount of EUR ‘000 132 111 as at 31 December 2005 are reclassified under item 6. Result on financial operations in the consolidated income statement; – the provision for guarantees issued in respect of venture capital operations amounting to EUR ‘000 36 750 as at 31 December 2005 are reclassified under item 3.b) Other liabilities – Sundry liabilities.
A.4.23. Accounting for operating leases
Leases of assets under which all the risks and benefits of ownership are effectively retained by the lessor are classified as operating leases. Payments made under operating leases are charged to the consolidated income statement on a straight-line basis over the period of the lease. When an operating lease is terminated before the lease period has expired, any payment required to be made to the lessor by way of penalty is recognised as an expense in the period in which the termination takes place.
21
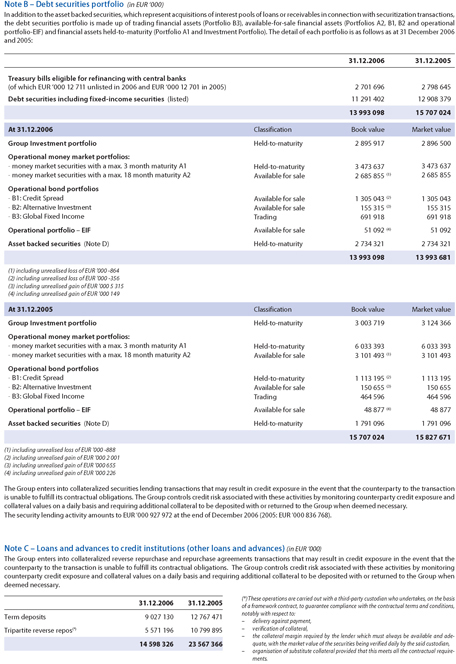
Note B – Debt securities portfolio (in EUR ‘000)
In addition to the asset backed securities, which represent acquisitions of interest pools of loans or receivables in connection with securitization transactions, the debt securities portfolio is made up of trading financial assets (Portfolio B3), available-for-sale financial assets (Portfolios A2, B1, B2 and operational portfolio-EIF) and financial assets held-to-maturity (Portfolio A1 and Investment Portfolio). The detail of each portfolio is as follows as at 31 December 2006 and 2005:
31.12.2006
31.12.2005
Treasury bills eligible for refinancing with central banks
(of which EUR ‘000 12 711 unlisted in 2006 and EUR ‘000 12 701 in 2005)
2 701 696
2 798 645
Debt securities including fixed-income securities (listed)
11 291 402
12 908 379
13 993 098
15 707 024
At 31.12.2006
Classification
Book value
Market value
Group Investment portfolio
Held-to-maturity
2 895 917
2 896 500
Operational money market portfolios:
- money market securities with a max. 3 month maturity A1
Held-to-maturity
3 473 637
3 473 637
- money market securities with a max. 18 month maturity A2
Available for sale
2 685 855 (1)
2 685 855
Operational bond portfolios
- B1: Credit Spread
Available for sale
1 305 043(2)
1 305 043
- B2: Alternative Investment
Available for sale
155 315(3)
155 315
- B3: Global Fixed Income
Trading
691 918
691 918
Operational portfolio – EIF
Available for sale
51 092 (4)
51 092
Asset backed securities (Note D)
Held-to-maturity
2 734 321
2 734 321
13 993 098
13 993 681
(1) including unrealised loss of EUR ‘000 -864
(2) including unrealised loss of EUR ‘000 -356
(3) including unrealised gain of EUR ‘000 5 315
(4) including unrealised gain of EUR ‘000 149
At 31.12.2005
Classification
Book value
Market value
Group Investment portfolio
Held-to-maturity
3 003 719
3 124 366
Operational money market portfolios:
- money market securities with a max. 3 month maturity A1
Held-to-maturity
6 033 393
6 033 393
- money market securities with a max. 18 month maturity A2
Available for sale
3 101 493 (1)
3 101 493
Operational bond portfolios
- B1: Credit Spread
Held-to-maturity
1 113 195(2)
1 113 195
- B2: Alternative Investment
Available for sale
150 655(3)
150 655
- B3: Global Fixed Income
Trading
464 596
464 596
Operational portfolio – EIF
Available for sale
48 877 (4)
48 877
Asset backed securities (Note D)
Held-to-maturity
1 791 096
1 791 096
15 707 024
15 827 671
(1) including unrealised loss of EUR ‘000 -888 (2) including unrealised gain of EUR ‘000 2 001 (3) including unrealised gain of EUR ‘000 655 (4) including unrealised gain of EUR ‘000 226
The Group enters into collateralized securities lending transactions that may result in credit exposure in the event that the counterparty to the transaction is unable to fulfill its contractual obligations. The Group controls credit risk associated with these activities by monitoring counterparty credit exposure and collateral values on a daily basis and requiring additional collateral to be deposited with or returned to the Group when deemed necessary.
The security lending activity amounts to EUR ‘000 927 972 at the end of December 2006 (2005: EUR ‘000 836 768).
Note C – Loans and advances to credit institutions (other loans and advances) (in EUR ‘000)
The Group enters into collateralized reverse repurchase and repurchase agreements transactions that may result in credit exposure in the event that the counterparty to the transaction is unable to fulfill its contractual obligations. The Group controls credit risk associated with these activities by monitoring counterparty credit exposure and collateral values on a daily basis and requiring additional collateral to be deposited with or returned to the Group when deemed necessary.
31.12.2006
31.12.2005
Term deposits
9 027 130
12 767 471
Tripartite reverse repos(*)
5 571 196
10 799 895
14 598 326
23 567 366
(*) These operations are carried out with a third-party custodian who undertakes, on the basis of a framework contract, to guarantee compliance with the contractual terms and conditions, notably with respect to: – delivery against payment, – verification of collateral, – the collateral margin required by
the lender which must always be available and adequate, with the market value of the securities being verified daily by the said custodian, – organisation of substitute collateral provided that this meets all the contractual requirements.
EIB Group – Financial Statements 2006 33
22
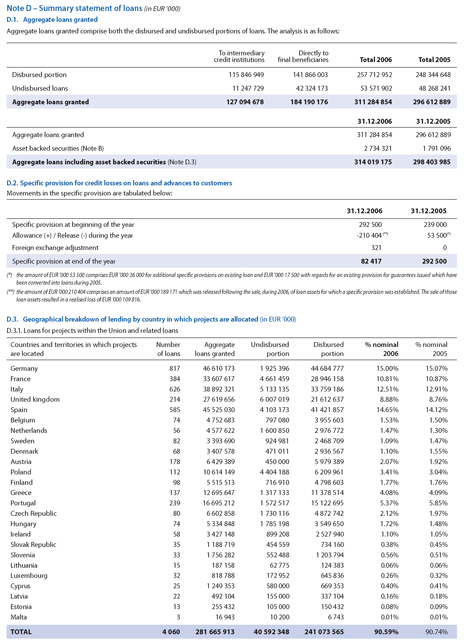
Note D – Summary statement of loans (in EUR ‘000)
D.1. Aggregate loans granted
Aggregate loans granted comprise both the disbursed and undisbursed portions of loans. The analysis is as follows:
To intermediary credit institutions
Directly to final beneficiaries
Total 2006
Total 2005
Disbursed portion
115846949
141866003
257712952
248344648
Undisbursed loans
11 247 729
42 324 173
53 571 902
48 268 241
Aggregate loans granted
127094678
184190176
311284854
296612889
31.12.2006
31.12.2005
Aggregate loans granted
311284854
296612889
Asset backed securities (Note B)
2 734 321
1 791 096
Aggregate loans including asset backed securities (Note D.3)
314019175
298403985
D.2. Specific provision for credit losses on loans and advances to customers
Movements in the specific provision are tabulated below:
31.12.2006
31.12.2005
Specific provision at beginning of the year
292 500
239 000
Allowance (+) / Release (-) during the year
-210404(**)
53 500(*)
Foreign exchange adjustment
321
0
Specific provision at end of the year
82 417
292 500
(*) the amount of EUR ‘000 53 500 comprises EUR ‘000 36 000 for additional specific provisions on existing loan and EUR ‘000 17 500 with regards for an existing provision for guarantees issued which have been converted into loans during 2005.
(**) the amount of EUR ‘000 210 404 comprises an amount of EUR ‘000 189 171 which was released following the sale, during 2006, of loan assets for which a specific provision was established. The sale of those loan assets resulted in a realised loss of EUR ‘000 109 816.
D.3. Geographical breakdown of lending by country in which projects are allocated (in EUR ‘000) D.3.1. Loans for projects within the Union and related loans
Countries and territories in which projects are located
Number of loans
Aggregate loans granted
Undisbursed portion
Disbursed portion
% nominal 2006
% nominal 2005
Germany
817
46610173
1925396
44684777
15.00%
15.07%
France
384
33607617
4661459
28946158
10.81%
10.87%
Italy
626
38892321
5133135
33759186
12.51%
12.91%
United kingdom
214
27619656
6007019
21612637
8.88%
8.76%
Spain
585
45525030
4103173
41421857
14.65%
14.12%
Belgium
74
4 752 683
797 080
3 955 603
1.53%
1.50%
Netherlands
56
4 577 622
1600850
2 976 772
1.47%
1.30%
Sweden
82
3 393 690
924 981
2 468 709
1.09%
1.47%
Denmark
68
3 407 578
471 011
2 936 567
1.10%
1.55%
Austria
178
6 429 389
450 000
5 979 389
2.07%
1.92%
Poland
112
10614149
4404188
6 209 961
3.41%
3.04%
Finland
98
5 515 513
716 910
4 798 603
1.77%
1.76%
Greece
137
12695647
1317133
11378514
4.08%
4.09%
Portugal
239
16695212
1572517
15122695
5.37%
5.85%
Czech Republic
80
6 602 858
1730116
4 872 742
2.12%
1.97%
Hungary
74
5 334 848
1785198
3 549 650
1.72%
1.48%
Ireland
58
3 427 148
899 208
2 527 940
1.10%
1.05%
Slovak Republic
35
1 188 719
454 559
734 160
0.38%
0.45%
Slovenia
33
1 756 282
552 488
1 203 794
0.56%
0.51%
Lithuania
15
187 158
62 775
124 383
0.06%
0.06%
Luxembourg
32
818 788
172 952
645 836
0.26%
0.32%
Cyprus
25
1 249 353
580 000
669 353
0.40%
0.41%
Latvia
22
492 104
155 000
337 104
0.16%
0.18%
Estonia
13
255 432
105 000
150 432
0.08%
0.09%
Malta
3
16 943
10 200
6 743
0.01%
0.01%
TOTAL
4 060
281 665 913
40 592 348
241 073 565
90.59%
90.74%
34 EIB Group
23
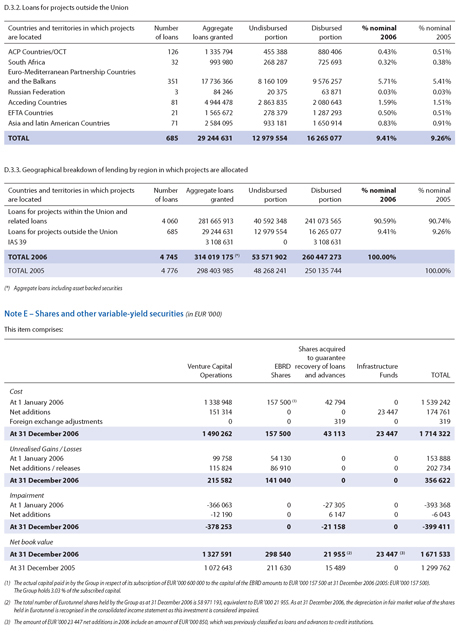
D.3.2. Loans for projects outside the Union
Countries and territories in which projects are located
Number of loans
Aggregate loans granted
Undisbursed portion
Disbursed portion
% nominal 2006
% nominal 2005
ACP Countries/OCT
126
1 335 794
455 388
880 406
0.43%
0.51%
South Africa
32
993 980
268 287
725 693
0.32%
0.38%
Euro-Mediterranean Partnership Countriesand the Balkans
351
17736366
8 160 109
9 576 257
5.71%
5.41%
Russian Federation
3
84 246
20 375
63 871
0.03%
0.03%
Acceding Countries
81
4 944 478
2 863 835
2 080 643
1.59%
1.51%
EFTA Countries
21
1 565 672
278 379
1 287 293
0.50%
0.51%
Asia and latin American Countries
71
2 584 095
933 181
1 650 914
0.83%
0.91%
TOTAL
685
29244631
12 979 554
16265077
9.41%
9.26%
D.3.3. Geographical breakdown of lending by region in which projects are allocated
Countries and territories in which projects are located
Number of loans
Aggregate loans granted
Undisbursed portion
Disbursed portion
% nominal 2006
% nominal 2005
Loans for projects within the Union andrelated loans
4 060
281665913
40 592 348
241073565
90.59%
90.74%
Loans for projects outside the Union
685
29 244 631
12 979 554
16 265 077
9.41%
9.26%
IAS 39
3 108 631
0
3 108 631
TOTAL 2006
4 745
314019175(*)
53 571 902
260447273
100.00%
TOTAL 2005
4 776
298403985
48 268 241
250135744
100.00%
(*) Aggregate loans including asset backed securities
Note E – Shares and other variable-yield securities (in EUR ‘000)
This item comprises:
Venture Capital Operations
EBRD Shares
Shares acquired to guarantee recovery of loans and advances
Infrastructure Funds
TOTAL
Cost
At 1 January 2006
1338948
157500
(1)42794
0
1539242
Net additions
151 314
0
0
23 447
174 761
Foreign exchange adjustments
0
0
319
0
319
At 31 December 2006
1490262
157500
43113
23447
1714322
Unrealised Gains / Losses
At 1 January 2006
99 758
54 130
0
0
153 888
Net additions / releases
115 824
86 910
0
0
202 734
At 31 December 2006
215 582
141040
0
0
356 622
Impairment
At 1 January 2006
-366063
0
-27305
0
-393368
Net additions
-12 190
0
6 147
0
-6 043
At 31 December 2006
-378253
0
-21158
0
-399411
Net book value
At 31 December 2006
1327591
298540
21955(2)
23447(3)
1671533
At 31 December 2005
1072643
211630
15 489
0
1299762
(1) The actual capital paid in by the Group in respect of its subscription of EUR ‘000 600 000 to the capital of the EBRD amounts to EUR ‘000 157 500 at 31 December 2006 (2005: EUR ‘000 157 500).
The Group holds 3.03 % of the subscribed capital.
(2) The total number of Eurotunnel shares held by the Group as at 31 December 2006 is 58 971 193, equivalent to EUR ‘000 21 955. As at 31 December 2006, the depreciation in fair market value of the shares
held in Eurotunnel is recognised in the consolidated income statement as this investment is considered impaired.
(3) The amount of EUR ‘000 23 447 net additions in 2006 include an amount of EUR ‘000 850, which was previously classified as loans and advances to credit institutions.
EIB Group – Financial Statements 2006 35
24
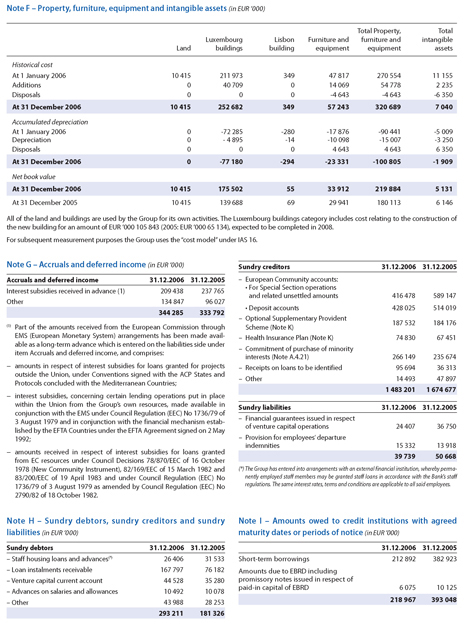
Note F – Property, furniture, equipment and intangible assets (in EUR ‘000)
Total Property,
Total
Luxembourg
Lisbon
Furniture and
furniture and
intangible
Land
buildings
building
equipment
equipment
assets
Historical cost
At 1 January 2006
10 415
211 973
349
47 817
270 554
11 155
Additions
0
40 709
0
14 069
54 778
2 235
Disposals
0
0
0
-4 643
-4 643
-6 350
At 31 December 2006
10 415
252 682
349
57 243
320 689
7 040
Accumulated depreciation
At 1 January 2006
0
-72 285
-280
-17 876
-90 441
-5 009
Depreciation
0
- 4 895
-14
-10 098
-15 007
-3 250
Disposals
0
0
0
4 643
4 643
6 350
At 31 December 2006
0
-77 180
-294
-23 331
-100 805
-1 909
Net book value
At 31 December 2006
10 415
175 502
55
33 912
219 884
5 131
At 31 December 2005
10 415
139 688
69
29 941
180 113
6 146
All of the land and buildings are used by the Group for its own activities. The Luxembourg buildings category includes cost relating to the construction of the new building for an amount of EUR ‘000 105 843 (2005: EUR ‘000 65 134), expected to be completed in 2008.
For subsequent measurement purposes the Group uses the “cost model” under IAS 16.
Note G – Accruals and deferred income (in EUR ‘000)
Accruals and deferred income
31.12.2006
31.12.2005
Interest subsidies received in advance (1)
209 438
237 765
Other
134 847
96 027
344 285
333 792
(1) Part of the amounts received from the European Commission through EMS (European Monetary System) arrangements has been made available as a long-term advance which is entered on the liabilities side under item Accruals and deferred income, and comprises:—amounts in respect of interest subsidies for loans granted for projects outside the Union, under Conventions signed with the ACP States and Protocols concluded with the Mediterranean Countries;—interest subsidies, concerning certain lending operations put in place within the Union from the Group’s own resources, made available in conjunction with the EMS under Council Regulation (EEC) No 1736/79 of 3 August 1979 and in conjunction with the financial mechanism established by the EFTA Countries under the EFTA Agreement signed on 2 May 1992;—amounts received in respect of interest subsidies for loans granted from EC resources under Council Decisions 78/870/EEC of 16 October 1978 (New Community Instrument), 82/169/EEC of 15 March 1982 and 83/200/EEC of 19 April 1983 and under Council Regulation (EEC) No
1736/79 of 3 August 1979 as amended by Council Regulation (EEC) No 2790/82 of 18 October 1982.
Note H – Sundry debtors, sundry creditors and sundry liabilities (in EUR ‘000)
Sundry debtors
31.12.2006
31.12.2005
– Staff housing loans and advances(*)
26 406
31 533
– Loan instalments receivable
167 797
76 182
– Venture capital current account
44 528
35 280
– Advances on salaries and allowances
10 492
10 078
– Other
43 988
28 253
293 211
181 326
Sundry creditors
31.12.2006
31.12.2005
– European Community accounts:
• For Special Section operationsand related unsettled amounts
416 478
589 147
• Deposit accounts
428 025
514 019
– Optional Supplementary Provident
187 532
184 176
Scheme (Note K)
– Health Insurance Plan (Note K)
74 830
67 451
– Commitment of purchase of minorityinterests (Note A.4.21)
266 149
235 674
– Receipts on loans to be identified
95 694
36 313
– O ther
14 493
47 897
1 483 201
1 674 677
Sundry liabilities
31.12.2006
31.12.2005
– Financial guarantees issued in respectof venture capital operations
24 407
36 750
– Provision for employees’ departureindemnities
15 332
13 918
39 739
50 668
(*) The Group has entered into arrangements with an external financial institution, whereby perma-
nently employed staff members may be granted staff loans in accordance with the Bank’s staff
regulations. The same interest rates, terms and conditions are applicable to all said employees.
Note I – Amounts owed to credit
institutions
with agreed
maturity dates or periods of notice
(in EUR ‘000)
31.12.2006
31.12.2005
Short-term borrowings
212 892
382 923
Amounts due to EBRD includingpromissory notes issued in respect ofpaid-in capital of EBRD
6 075
10 125
218 967
393 048
36 EIB Group
25
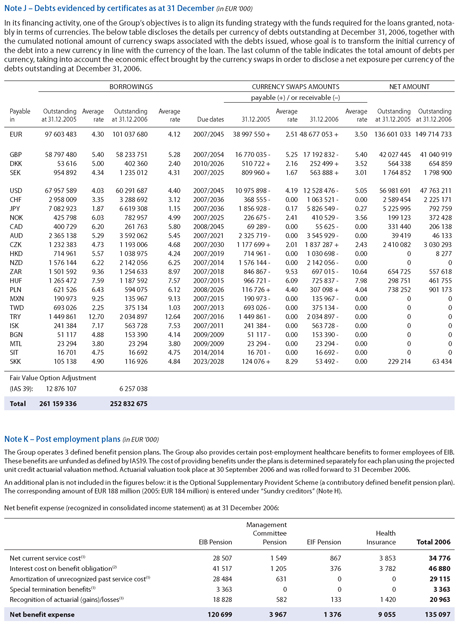
Note J – Debts evidenced by certificates as at 31 December (in EUR ‘000)
In its financing activity, one of the Group’s objectives is to align its funding strategy with the funds required for the loans granted, notably in terms of currencies. The below table discloses the details per currency of debts outstanding at December 31, 2006, together with the cumulated notional amount of currency swaps associated with the debts issued, whose goal is to transform the initial currency of the debt into a new currency in line with the currency of the loan. The last column of the table indicates the total amount of debts per currency, taking into account the economic effect brought by the currency swaps in order to disclose a net exposure per currency of the debts outstanding at December 31, 2006.
BORROWINGS
CURRENCY SWAPS AMOUNTS
NET AMOUNT
payable (+) / or receivable (–)
Payable
Outstanding
Average
Outstanding
Average
Average
Average
Outstanding
Outstanding
in
at 31.12.2005
rate
at 31.12.2006
rate
Due dates
31.12.2005
rate
31.12.2006
rate
at 31.12.2005
at 31.12.2006
EUR
97 603 483
4.30
101 037 680
4.12
2007/2045
38 997 550 +
2.51
48 677 053 +
3.50
136 601 033
149 714 733
GBP
58 797 480
5.40
58 233 751
5.28
2007/2054
16 770 035 -
5.25
17 192 832 -
5.40
42 027 445
41 040 919
DKK
53 616
5.00
402 360
2.40
2010/2026
510 722 +
2.16
252 499 +
3.52
564 338
654 859
SEK
954 892
4.34
1 235 012
4.31
2007/2025
809 960 +
1.67
563 888 +
3.01
1 764 852
1 798 900
USD
67 957 589
4.03
60 291 687
4.40
2007/2045
10 975 898 -
4.19
12 528 476 -
5.05
56 981 691
47 763 211
CHF
2 958 009
3.35
3 288 692
3.12
2007/2036
368 555 -
0.00
1 063 521 -
0.00
2 589 454
2 225 171
JPY
7 082 923
1.87
6 619 308
1.15
2007/2036
1 856 928 -
0.17
5 826 549 -
0.27
5 225 995
792 759
NOK
425 798
6.03
782 957
4.99
2007/2025
226 675 -
2.41
410 529 -
3.56
199 123
372 428
CAD
400 729
6.20
261 763
5.80
2008/2045
69 289 -
0.00
55 625 -
0.00
331 440
206 138
AUD
2 365 138
5.29
3 592 062
5.45
2007/2021
2 325 719 -
0.00
3 545 929 -
0.00
39 419
46 133
CZK
1 232 383
4.73
1 193 006
4.68
2007/2030
1 177 699 +
2.01
1 837 287 +
2.43
2 410 082
3 030 293
HKD
714 961
5.57
1 038 975
4.24
2007/2019
714 961 -
0.00
1 030 698 -
0.00
0
8 277
NZD
1 576 144
6.22
2 142 056
6.25
2007/2014
1 576 144 -
0.00
2 142 056 -
0.00
0
0
ZAR
1 501 592
9.36
1 254 633
8.97
2007/2018
846 867 -
9.53
697 015 -
10.64
654 725
557 618
HUF
1 265 472
7.59
1 187 592
7.57
2007/2015
966 721 -
6.09
725 837 -
7.98
298 751
461 755
PLN
621 526
6.43
594 075
6.12
2008/2026
116 726 +
4.40
307 098 +
4.04
738 252
901 173
MXN
190 973
9.25
135 967
9.13
2007/2015
190 973 -
0.00
135 967 -
0.00
0
0
TWD
693 026
2.25
375 134
1.03
2007/2013
693 026 -
0.00
375 134 -
0.00
0
0
TRY
1 449 861
12.70
2 034 897
12.64
2007/2016
1 449 861 -
0.00
2 034 897 -
0.00
0
0
ISK
241 384
7.17
563 728
7.53
2007/2011
241 384 -
0.00
563 728 -
0.00
0
0
BGN
51 117
4.88
153 390
4.14
2009/2009
51 117 -
0.00
153 390 -
0.00
0
0
MTL
23 294
3.80
23 294
3.80
2009/2009
23 294 -
0.00
23 294 -
0.00
0
0
SIT
16 701
4.75
16 692
4.75
2014/2014
16 701 -
0.00
16 692 -
0.00
0
0
SKK
105 138
4.90
116 926
4.84
2023/2028
124 076 +
8.29
53 492 -
0.00
229 214
63 434
Fair Value Option Adjustment
(IAS 39):
12 876 107
6 257 038
Total
261 159 336
252 832 675
Note K – Post employment plans (in EUR ‘000)
The Group operates 3 defined benefit pension plans. The Group also provides certain post-employment healthcare benefits to former employees of EIB. These benefits are unfunded as defined by IAS19. The cost of providing benefits under the plans is determined separately for each plan using the projected unit credit actuarial valuation method. Actuarial valuation took place at 30 September 2006 and was rolled forward to 31 December 2006.
An additional plan is not included in the figures below: it is the Optional Supplementary Provident Scheme (a contributory defined benefit pension plan). The corresponding amount of EUR 188 million (2005: EUR 184 million) is entered under “Sundry creditors” (Note H).
Net benefit expense (recognized in consolidated income statement) as at 31 December 2006:
Management
Committee
Health
EIB Pension
Pension
EIF Pension
Insurance
Total 2006
Net current service cost(1)
28 507
1 549
867
3 853
34 776
Interest cost on benefit obligation(2)
41 517
1 205
376
3 782
46 880
Amortization of unrecognized past service cost(1)
28 484
631
0
0
29 115
Special termination benefits(1)
3 363
0
0
0
3 363
Recognition of actuarial (gains)/losses(1)
18 828
582
1 420
20 963
Net benefit expense
120 699
3 967
1 376
9 055
135 097
EIB Group – Financial Statements 2006 37
26
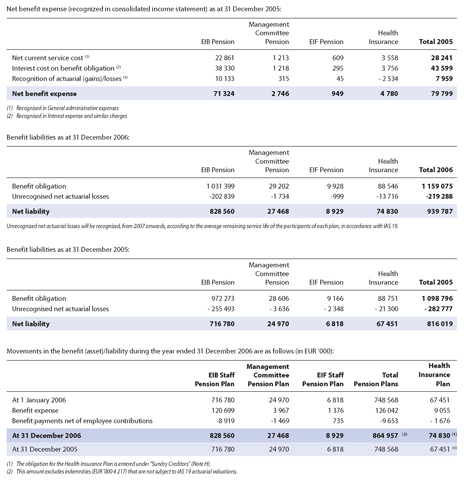
Net benefit expense (recognized in consolidated income statement) as at 31 December 2005:
Management
Committee
Health
EIB Pension
Pension
EIF Pension
Insurance
Total 2005
Net current service cost (1)
22 861
1 213
609
3 558
28 241
Interest cost on benefit obligation (2)
38 330
1 218
295
3 756
43 599
Recognition of actuarial (gains)/losses (1)
10 133
315
45
- 2 534
7 959
Net benefit expense
71 324
2 746
949
4 780
79 799
(1) Recognised in General administrative expenses
(2) Recognised in Interest expense and similar charges
Benefit liabilities as at 31 December 2006:
Management
Committee
Health
EIB Pension
Pension
EIF Pension
Insurance
Total 2006
Benefit obligation
1 031 399
29 202
9 928
88 546
1 159 075
Unrecognised net actuarial losses
-202 839
-1 734
-999
-13 716
-219 288
Net liability
828 560
27 468
8 929
74 830
939 787
Unrecognised net actuarial losses will be recognised, from 2007 onwards, according to the average remaining service life of the participants of each plan, in accordance with IAS 19.
Benefit liabilities as at 31 December 2005:
Management
Committee
Health
EIB Pension
Pension
EIF Pension
Insurance
Total 2005
Benefit obligation
972 273
28 606
9 166
88 751
1 098 796
Unrecognised net actuarial losses
- 255 493
- 3 636
- 2 348
- 21 300
- 282 777
Net liability
716 780
24 970
6 818
67 451
816 019
Movements in the benefit (asset)/liability during the year ended 31 December 2006 are as follows (in EUR ‘000):
Management
Health
EIB Staff
Committee
EIF Staff
Total
Insurance
Pension Plan
Pension Plan
Pension Plan
Pension Plans
Plan
At 1 January 2006
716 780
24 970
6 818
748 568
67 451
Benefit expense
120 699
3 967
1 376
126 042
9 055
Benefit payments net of employee contributions
-8 919
-1 469
735
-9 653
- 1 676
At 31 December 2006
828 560
27 468
8 929
864 957 (2)
74 830 (1)
At 31 December 2005
716 780
24 970
6 818
748 568
67 451 (1)
(1) | | The obligation for the Health Insurance Plan is entered under “Sundry Creditors” (Note H). |
(2) | | This amount excludes indemnities (EUR ‘000 4 217) that are not subject to IAS 19 actuarial valuations. |
(1) | | The obligation for the Health Insurance Plan is entered under “Sundry Creditors” (Note H). |
(2) | | This amount excludes indemnities (EUR ‘000 4 217) that are not subject to IAS 19 actuarial valuations. |
27
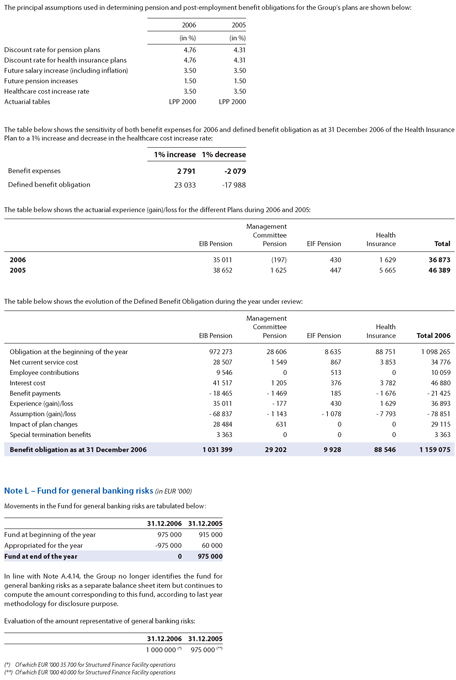
The principal assumptions used in determining pension and post-employment benefit obligations for the Group’s plans are shown below:
2006
2005
(in %)
(in %)
Discount rate for pension plans
4.76
4.31
Discount rate for health insurance plans
4.76
4.31
Future salary increase (including inflation)
3.50
3.50
Future pension increases
1.50
1.50
Healthcare cost increase rate
3.50
3.50
Actuarial tables
LPP 2000
LPP 2000
The table below shows the sensitivity of both benefit expenses for 2006 and defined benefit obligation as at 31 December 2006 of the Health Insurance Plan to a 1% increase and decrease in the healthcare cost increase rate:
1% increase
1% decrease
Benefit expenses
2 791
-2 079
Defined benefit obligation
23 033
-17 988
The table below shows the actuarial experience (gain)/loss for the different Plans during 2006 and 2005:
Management
Committee
Health
EIB Pension
Pension
EIF Pension
Insurance
Total
2006
35 011
(197)
430
1 629
36 873
2005
38 652
1 625
447
5 665
46 389
The table below shows the evolution of the Defined Benefit Obligation during the year under review:
Management
Committee
Health
EIB Pension
Pension
EIF Pension
Insurance
Total 2006
Obligation at the beginning of the year
972 273
28 606
8 635
88 751
1 098 265
Net current service cost
28 507
1 549
867
3 853
34 776
Employee contributions
9 546
0
513
0
10 059
Interest cost
41 517
1 205
376
3 782
46 880
Benefit payments
- 18 465
- 1 469
185
- 1 676
- 21 425
Experience (gain)/loss
35 011
- 177
430
1 629
36 893
Assumption (gain)/loss
- 68 837
- 1 143
- 1 078
- 7 793
- 78 851
Impact of plan changes
28 484
631
0
0
29 115
Special termination benefits
3 363
0
0
0
3 363
Benefit obligation as at 31 December 2006
1 031 399
29 202
9 928
88 546
1 159 075
Note L – Fund for general banking risks (in EUR ‘000)
Movements in the Fund for general banking risks are tabulated below :
31.12.2006
31.12.2005
Fund at beginning of the year
975 000
915 000
Appropriated for the year
-975 000
60 000
Fund at end of the year
0
975 000
In line with Note A.4.14, the Group no
longer identifies
the fund for
general banking risks as a separate balance sheet item but continues tocompute the amount corresponding to this fund, according to last yearmethodology for disclosure purpose.
Evaluation of the amount representative of general banking risks:
31.12.2006
31.12.2005
1 000 000 (*)
975 000 (**)
(*) Of which EUR ‘000 35 700 for Structured Finance Facility operations (**) Of which EUR ‘000 40 000 for Structured Finance Facility operations
EIB Group – Financial Statements 2006 39
28
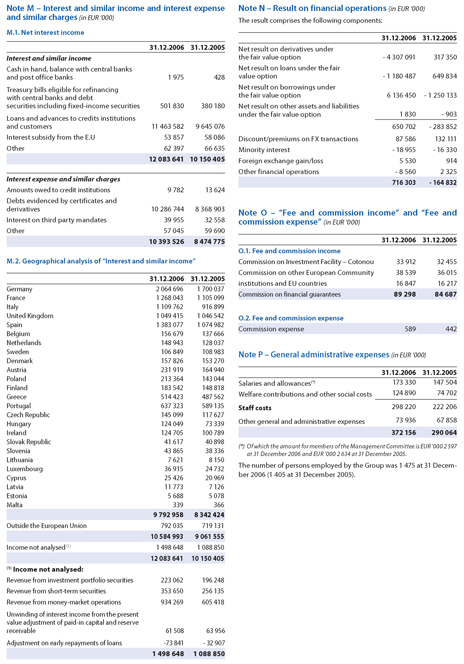
Note M – Interest and similar income and interest expense and similar charges (in EUR ‘000)
M.1. Net interest income
31.12.2006
31.12.2005
Interest and similar income
Cash in hand, balance with central bank sand post office banks
1 975
428
Treasury bills eligible for refinancing with central banks and debt securities including fixed-income securities
501 830
380 180
Loans and advances to credits institution sand customers
11 463 582
9 645 076
Interest subsidy from the E.U
53 857
58 086
Other
62 397
66 635
12 083 641
10 150 405
Interest expense and similar charges
Amounts owed to credit institutions
9 782
13 624
Debts evidenced by certificates and derivatives
10 286 744
8 368 903
Interest on third party mandates
39 955
32 558
Other
57 045
59 690
10 393 526
8 474 775
Note N – Result on financial operations (in EUR ‘000)
The result comprises the following components:
M.2.
Geographical analysis of “Interest and similar income”
31.12.2006
31.12.2005
Germany
2 064 696
1 700 037
France
1 268 043
1 105 099
Italy
1 109 762
916 899
United Kingdom
1 049 415
1 046 542
Spain
1 383 077
1 074 982
Belgium
156 679
137 666
Netherlands
148 943
128 037
Sweden
106 849
108 983
Denmark
157 826
153 270
Austria
231 919
164 940
Poland
213 364
143 044
Finland
183 542
148 818
Greece
514 423
487 562
Portugal
637 323
589 135
Czech Republic
145 099
117 627
Hungary
124 049
73 339
Ireland
124 705
100 789
Slovak Republic
41 617
40 898
Slovenia
43 865
38 336
Lithuania
7 621
8 150
Luxembourg
36 915
24 732
Cyprus
25 426
20 969
Latvia
11 773
7 126
Estonia
5 688
5 078
Malta
339
366
9 792 958
8 342 424
Outside the European Union
792 035
719 131
10 584 993
9 061 555
Income not analysed (1)
1 498 648
1 088 850
12 083 641
10 150 405
(1) Income not analysed:
Revenue from investment portfolio securities
223 062
196 248
Revenue from short-term securities
353 650
256 135
Revenue from money-market operations
934 269
605 418
Unwinding of interest income from the present value adjustment of paid-in capital and reserve receivable
61 508
63 956
Adjustment on early repayments of loans
-73 841
- 32 907
1 498 648
1 088 850
31.12.2006
31.12.2005
Net result on derivatives under the fair value option
- 4 307 091
317 350
Net result on loans under the fair value option
- 1 180 487
649 834
Net result on borrowings under the fair value option
6 136 450
- 1 250 133
Net result on other assets and liabilities under the fair value option
1 830
- 903
650 702
- 283 852
Discount
/premiums on FX transactions
87 586
132 111
Minority interest
- 18 955
- 16 330
Foreign exchange gain/loss
5 530
914
Other financial operations
- 8 560
2 325
716 303
- 164 832
Note O – “Fee and commission income” and “Fee and commission expense” (in EUR ‘000)
31.12.2006
31.12.2005
O.1. Fee and commission income
Commission on Investment Facility – Cotonou
33 912
32 455
Commission on other European Community
38 539
36 015
institutions and EU countries
16 847
16 217
Commission on financial guarantees
89 298
84 687
O.2. Fee and commission expense
Commission expense
589
442
Note P – General administrative expenses
(in EUR ‘000)
31.12.2006
31.12.2005
Salaries and allowances(*)
173 330
147 504
Welfare contributions and other social costs
124 890
74 702
Staff costs
298 220
222 206
Other general and administrative expenses
73 936
67 858
372 156
290 064
(*) Of which the amount for members of the Management Committee is EUR ‘000 2 597 at 31 December 2006 and EUR ‘000 2 634 at 31 December 2005.
The number of persons employed by the Group was 1 475 at 31 Decem-ber 2006 (1 405 at 31 December 2005).
29
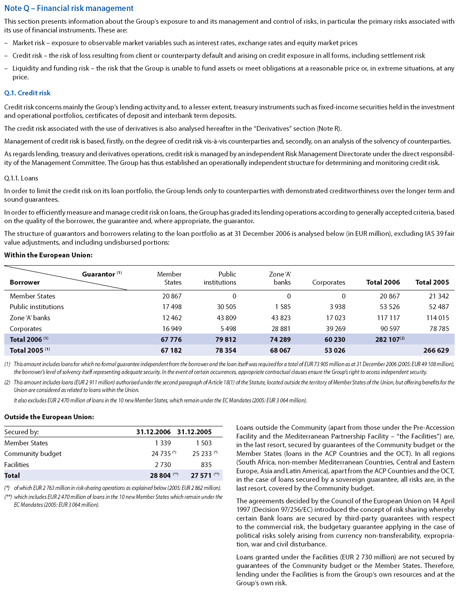
Note Q – Financial risk management
This section presents information about the Group’s exposure to and its management and control of risks, in particular the primary risks associated with its use of financial instruments. These are:
– Market risk – exposure to observable market variables such as interest rates, exchange rates and equity market prices
– Credit risk – the risk of loss resulting from client or counterparty default and arising on credit exposure in all forms, including settlement risk
– Liquidity and funding risk – the risk that the Group is unable to fund assets or meet obligations at a reasonable price or, in extreme situations, at any price.
Q.1. Credit risk
Credit risk concerns mainly the Group’s lending activity and, to a lesser extent, treasury instruments such as fixed-income securities held in the investment and operational portfolios, certificates of deposit and interbank term deposits.
The credit risk associated with the use of derivatives is also analysed hereafter in the “Derivatives” section (Note R).
Management of credit risk is based, firstly, on the degree of credit risk vis-à-vis counterparties and, secondly, on an analysis of the solvency of counterparties. As regards lending, treasury and derivatives operations, credit risk is managed by an independent Risk Management Directorate under the direct responsibility of the Management Committee. The Group has thus established an operationally independent structure for determining and monitoring credit risk.
Q.1.1. Loans
In order to limit the credit risk on its loan portfolio, the Group lends only to counterparties with demonstrated creditworthiness over the longer term and sound guarantees.
In order to efficiently measure and manage credit risk on loans, the Group has graded its lending operations according to generally accepted criteria, based on the quality of the borrower, the guarantee and, where appropriate, the guarantor.
The structure of guarantors and borrowers relating to the loan portfolio as at 31 December 2006 is analysed below (in EUR million), excluding IAS 39 fair value adjustments, and including undisbursed portions:
Within the European Union:
Guarantor (1)
Member
Public
Zone ‘A’
Borrower
States
institutions
banks
Corporates
Total 2006
Total 2005
Member States
20 867
0
0
0
20 867
21 342
Public institutions
17 498
30 505
1 585
3 938
53 526
52 487
Zone ‘A’ banks
12 462
43 809
43 823
17 023
117 117
114 015
Corporates
16 949
5 498
28 881
39 269
90 597
78 785
Total 2006 (1)
67 776
79 812
74 289
60 230
282 107(2)
Total 2005 (1)
67 182
78 354
68 067
53 026
266 629
(1) This amount includes loans for which no formal guarantee independent from the borrower and the loan itself was required for a total of EUR 73 905 million as at 31 December 2006 (2005: EUR 49 108 million), the borrower’s level of solvency itself representing adequate security. In the event of certain occurrences, appropriate contractual clauses ensure the Group’s right to access independent security.
(2) This amount includes loans (EUR 2 911 million) authorised under the second paragraph of Article 18(1) of the Statute, located outside the territory of Member States of the Union, but offering benefits for the Union are considered as related to loans within the Union.
It also excludes EUR 2 470 million of loans in the 10 new Member States, which remain under the EC Mandates (2005: EUR 3 064 million).
Outside the European Union:
Secured by:
31.12.2006
31.12.2005
Member States
1 339
1 503
Community budget
24 735 (*)
25 233 (*)
Facilities
2 730
835
Total
28 804 (**)
27 571 (**)
(*) of which EUR 2 763 million in risk-sharing operations as explained below (2005: EUR 2 862 million).
(**) which includes EUR 2 470 million of loans in the 10 new Member States which remain under the
EC Mandates (2005: EUR 3 064 million).
Loans outside the Community (apart from those under the Pre-Accession Facility and the Mediterranean Partnership Facility – “the Facilities”) are, in the last resort, secured by guarantees of the Community budget or the Member States (loans in the ACP Countries and the OCT). In all regions (South Africa, non-member
Mediterranean Countries, Central and Eastern Europe, Asia and Latin America), apart from the ACP Countries and the OCT, in the case of loans secured by a sovereign guarantee, all risks are, in the last resort, covered by the Community budget.
The agreements decided by the Council of the European Union on 14 April 1997 (Decision 97/256/EC) introduced the concept of risk sharing whereby certain Bank loans are secured by third-party guarantees with respect to the commercial risk, the budgetary guarantee applying in the case of political risks solely arising from currency non-transferability, expropriation, war and civil disturbance.
Loans granted under the Facilities (EUR 2 730 million) are not secured by guarantees of the Community budget or the Member States. Therefore, lending under the Facilities is from the Group��s own resources and at the Group’s own risk.
EIB Group – Financial Statements 2006 41
30
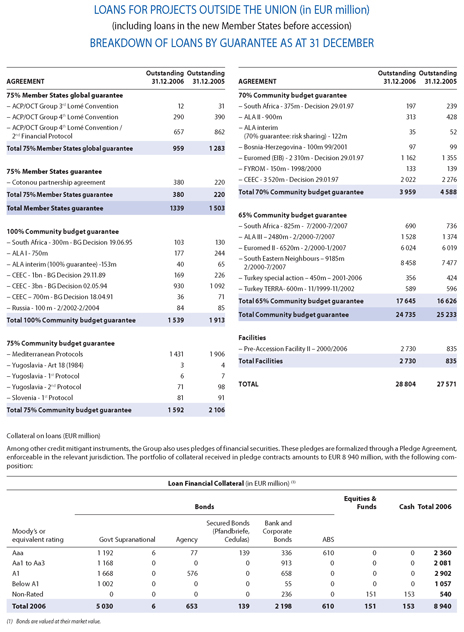
LOANS FOR PROJECTS OUTSIDE THE UNION (in EUR million)
(including loans in the new Member States before accession)
BREAKDOWN OF LOANS BY GUARANTEE AS AT 31 DECEMBER
Outstanding
Outstanding
AGREEMENT
31.12.2006
31.12.2005
75% Member States global guarantee
- ACP/OCT Group 3rd Lomé Convention
12
31
- ACP/OCT Group 4th Lomé Convention
290
390
- ACP/OCT Group 4th Lomé Convention /
657
862
2nd Financial Protocol
Total 75% Member States global guarantee
959
1 283
75% Member States guarantee
- Cotonou partnership agreement
380
220
Total 75% Member States guarantee
380
220
Total Member States guarantee
1339
1 503
100% Community budget guarantee
- South Africa—300m—BG Decision 19.06.95
103
130
- ALA I—750m
177
244
- ALA interim (100% guarantee) -153m
40
65
- CEEC—1bn—BG Decision 29.11.89
169
226
- CEEC—3bn—BG Decision 02.05.94
930
1 092
- CEEC – 700m—BG Decision 18.04.91
36
71
- Russia—100 m—2/2002-2/2004
84
85
Total 100% Community budget guarantee
1 539
1 913
75% Community budget guarantee
- Mediterranean Protocols
1 431
1 906
- Yugoslavia—Art 18 (1984)
3
4
- Yugoslavia—1st Protocol
6
7
- Yugoslavia—2nd Protocol
71
98
- Slovenia—1st Protocol
81
91
Total 75% Community budget guarantee
1 592
2 106
Outstanding
Outstanding
AGREEMENT
31.12.2006
31.12.2005
70% Community budget guarantee
- South Africa—375m—Decision 29.01.97
197
239
- ALA II—900m
313
428
- ALA interim
35
52
(70% guarantee: risk sharing)—122m
- Bosnia-Herzegovina—100m 99/2001
97
99
- Euromed (EIB)—2 310m—Decision 29.01.97
1 162
1 355
- FYROM—150m—1998/2000
133
139
- CEEC—3 520m—Decision 29.01.97
2 022
2 276
Total 70% Community budget guarantee
3 959
4 588
65% Community budget guarantee
- South Africa—825m—7/2000-7/2007
690
736
- ALA III – 2480m—2/2000-7/2007
1 528
1 374
- Euromed II—6520m—2/2000-1/2007
6 024
6 019
- South Eastern Neighbours – 9185m
8 458
7 477
2/2000-7/2007
- Turkey special action – 450m – 2001-2006
356
424
- Turkey TERRA- 600m—11/1999-11/2002
589
596
Total 65% Community budget guarantee
17 645
16 626
Total Community budget guarantee
24 735
25 233
Facilities
- Pre-Accession Facility II – 2000/2006
2 730
835
Total Facilities
2 730
835
TOTAL
28 804
27 571
Collateral on loans (EUR million)
Among other credit mitigant instruments, the Group also uses pledges of financial securities. These pledges are formalized through a Pledge Agreement, enforceable in the relevant jurisdiction. The portfolio of collateral received in pledge contracts amounts to EUR 8 940 million, with the following composition:
Loan Financial Collateral (in EUR million) (1)
Equities &
Bonds
Funds
Cash
Total 2006
Secured Bonds
Bank and
Moody’s or
(Pfandbriefe,
Corporate
equivalent rating
Govt
Supranational
Agency
Cedulas)
Bonds
ABS
Aaa
1 192
6
77
139
336
610
0
0
2 360
Aa1 to Aa3
1 168
0
0
0
913
0
0
0
2 081
A1
1 668
0
576
0
658
0
0
0
2 902
Below A1
1 002
0
0
0
55
0
0
0
1 057
Non-Rated
0
0
0
0
236
0
151
153
540
Total 2006
5 030
6
653
139
2 198
610
151
153
8 940
(1) Bonds are valued at their market value.
42 EIB Group
31
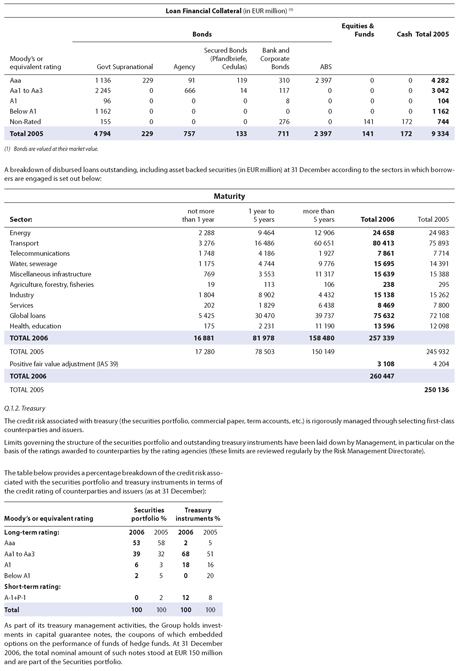
Loan Financial Collateral (in EUR million) (1)
Equities &
Bonds
Funds
Cash
Total 2005
Secured Bonds
Bank and
Moody’s or
(Pfandbriefe,
Corporate
equivalent rating
Govt
Supranational
Agency
Cedulas)
Bonds
ABS
Aaa
1 136
229
91
119
310
2 397
0
0
4 282
Aa1 to Aa3
2 245
0
666
14
117
0
0
0
3 042
A1
96
0
0
0
8
0
0
0
104
Below A1
1 162
0
0
0
0
0
0
0
1 162
Non-Rated
155
0
0
0
276
0
141
172
744
Total 2005
4 794
229
757
133
711
2 397
141
172
9 334
(1) Bonds are valued at their market value.
A breakdown of disbursed loans outstanding, including asset backed securities (in EUR million) at 31 December according to the sectors in which borrowers are engaged is set out below:
Maturity
not more
1 year to
more than
Sector:
than 1 year
5 years
5 years
Total 2006
Total 2005
Energy
2 288
9 464
12 906
24 658
24 983
Transport
3 276
16 486
60 651
80 413
75 893
Telecommunications
1 748
4 186
1 927
7 861
7 714
Water, sewerage
1 175
4 744
9 776
15 695
14 391
Miscellaneous infrastructure
769
3 553
11 317
15 639
15 388
Agriculture, forestry, fisheries
19
113
106
238
295
Industry
1 804
8 902
4 432
15 138
15 262
Services
202
1 829
6 438
8 469
7 800
Global loans
5 425
30 470
39 737
75 632
72 108
Health, education
175
2 231
11 190
13 596
12 098
TOTAL 2006
16 881
81 978
158 480
257 339
TOTAL 2005
17 280
78 503
150 149
245 932
Positive fair value adjustment (IAS 39)
3 108
4 204
TOTAL 2006
260 447
TOTAL 2005
250 136
Securities
Treasury
Moody’s or equivalent rating
portfolio %
instruments %
Long-term rating:
2006
2005
2006
2005
Aaa
53
58
2
5
Aa1 to Aa3
39
32
68
51
A1
6
3
18
16
Below A1
2
5
0
20
Short-term rating:
A-1+P-1
0
2
12
8
Total
100
100
100
100
Q.1.2. Treasury
The credit risk associated with treasury (the securities portfolio, commercial paper, term accounts, etc.) is rigorously managed through selecting first-class counterparties and issuers.
Limits governing the structure of the securities portfolio and outstanding treasury instruments have been laid down by Management, in particular on the basis of the ratings awarded to counterparties by the rating agencies (these limits are reviewed regularly by the Risk Management Directorate).
The table below provides a percentage breakdown of the credit risk associated with the securities portfolio and treasury instruments in terms of the credit rating of counterparties and issuers (as at 31 December):
As part of its treasury management activities, the Group holds investments in capital guarantee notes, the coupons of which embedded options on the performance of funds of hedge funds. At 31 December 2006, the total nominal amount of such notes stood at EUR 150 million and are part of the Securities portfolio.
EIB Group – Financial Statements 2006 43
32
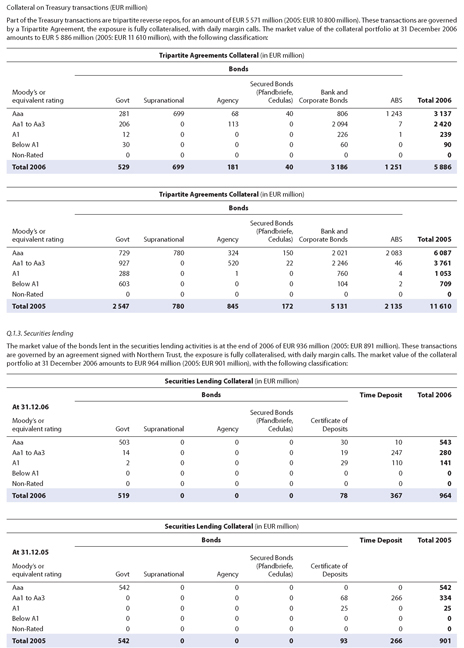
Collateral on Treasury transactions (EUR million)
Part of the Treasury transactions are tripartite reverse repos, for an amount of EUR 5 571 million (2005: EUR 10 800 million). These transactions are governed by a Tripartite Agreement, the exposure is fully collateralised, with daily margin calls. The market value of the collateral portfolio at 31 December 2006 amounts to EUR 5 886 million (2005: EUR 11 610 million), with the following classification:
Tripartite Agreements Collateral (in EUR million)
Bonds
Secured Bonds
Moody’s or
(Pfandbriefe,
Bank and
equivalent rating
Govt
Supranational
Agency
Cedulas)
Corporate Bonds
ABS
Total 2006
Aaa
281
699
68
40
806
1 243
3 137
Aa1 to Aa3
206
0
113
0
2 094
7
2 420
A1
12
0
0
0
226
1
239
Below A1
30
0
0
0
60
0
90
Non-Rated
0
0
0
0
0
0
0
Total 2006
529
699
181
40
3 186
1 251
5 886
Tripartite Agreements Collateral (in EUR million)
Bonds
Secured Bonds
Moody’s or
(Pfandbriefe,
Bank and
equivalent rating
Govt
Supranational
Agency
Cedulas)
Corporate Bonds
ABS
Total 2005
Aaa
729
780
324
150
2 021
2 083
6 087
Aa1 to Aa3
927
0
520
22
2 246
46
3 761
A1
288
0
1
0
760
4
1 053
Below A1
603
0
0
0
104
2
709
Non-Rated
0
0
0
0
0
0
0
Total 2005
2 547
780
845
172
5 131
2 135
11 610
Q.1.3. Securities lending
The market value of the bonds lent in the securities lending activities is at the end of 2006 of EUR 936 million (2005: EUR 891 million). These transactions are governed by an agreement signed with Northern Trust, the exposure is fully collateralised, with daily margin calls. The market value of the collateral portfolio at 31 December 2006 amounts to EUR 964 million (2005: EUR 901 million), with the following classification:
Securities Lending Collateral (in EUR million)
Bonds
Time Deposit
Total 2006
At 31.12.06
Secured Bonds
Moody’s or
(Pfandbriefe,
Certificate of
equivalent rating
Govt
Supranational
Agency
Cedulas)
Deposits
Aaa
503
0
0
0
30
10
543
Aa1 to Aa3
14
0
0
0
19
247
280
A1
2
0
0
0
29
110
141
Below A1
0
0
0
0
0
0
0
Non-Rated
0
0
0
0
0
0
0
Total 2006
519
0
0
0
78
367
964
Securities Lending Collateral (in EUR million)
Bonds
Time Deposit
Total 2005
At 31.12.05
Secured Bonds
Moody’s or
(Pfandbriefe,
Certificate of
equivalent rating
Govt
Supranational
Agency
Cedulas)
Deposits
Aaa
542
0
0
0
0
0
542
Aa1 to Aa3
0
0
0
0
68
266
334
A1
0
0
0
0
25
0
25
Below A1
0
0
0
0
0
0
0
Non-Rated
0
0
0
0
0
0
0
Total 2005
542
0
0
0
93
266
901
44 EIB Group
33
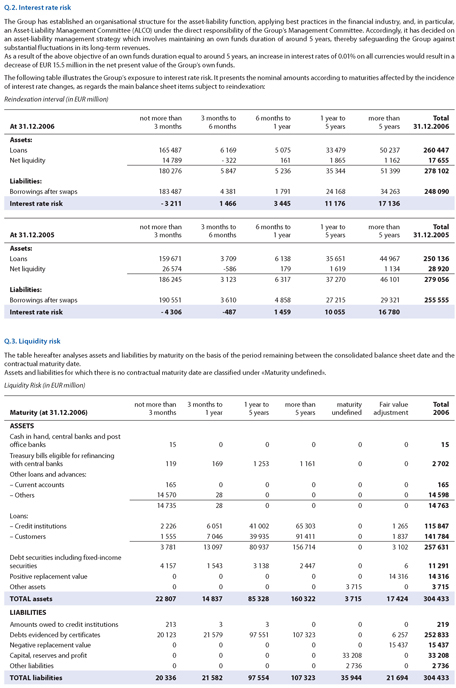
Q.2. Interest rate risk
The Group has established an organisational structure for the asset-liability function, applying best practices in the financial industry, and, in particular, an Asset-Liability Management Committee (ALCO) under the direct responsibility of the Group’s Management Committee. Accordingly, it has decided on an asset-liability management strategy which involves maintaining an own funds duration of around 5 years, thereby safeguarding the Group against substantial fluctuations in its long-term revenues.
As a result of the above objective of an own funds duration equal to around 5 years, an increase in interest rates of 0.01% on all currencies would result in a decrease of EUR 15.5 million in the net present value of the Group’s own funds.
The following table illustrates the Group’s exposure to interest rate risk. It presents the nominal amounts according to maturities affected by the incidence of interest rate changes, as regards the main balance sheet items subject to reindexation:
Reindexation interval (in EUR million)
not more than
3 months to
6 months to
1 year to
more than
Total
At 31.12.2006
3 months
6 months
1 year
5 years
5 years
31.12.2006
Assets:
Loans
165 487
6 169
5 075
33 479
50 237
260 447
Net liquidity
14 789
- 322
161
1 865
1 162
17 655
180 276
5 847
5 236
35 344
51 399
278 102
Liabilities:
Borrowings after swaps
183 487
4 381
1 791
24 168
34 263
248 090
Interest rate risk
- 3 211
1 466
3 445
11 176
17 136
not more than
3 months to
6 months to
1 year to
more than
Total
At 31.12.2005
3 months
6 months
1 year
5 years
5 years
31.12.2005
Assets:
Loans
159 671
3 709
6 138
35 651
44 967
250 136
Net liquidity
26 574
-586
179
1 619
1 134
28 920
186 245
3 123
6 317
37 270
46 101
279 056
Liabilities:
Borrowings after swaps
190 551
3 610
4 858
27 215
29 321
255 555
Interest rate risk
- 4 306
-487
1 459
10 055
16 780
Q.3. Liquidity risk
The table hereafter analyses assets and liabilities by maturity on the basis of the period remaining between the consolidated balance sheet date and the contractual maturity date.
Assets and liabilities for which there is no contractual maturity date are classified under «Maturity undefined».
Liquidity Risk (in EUR million)
not more than
3 months to
1 year to
more than
maturity
Fair value
Total
Maturity (at 31.12.2006)
3 months
1 year
5 years
5 years
undefined
adjustment
2006
ASSETS
Cash in hand, central banks and postoffice banks
15
0
0
0
0
0
15
Treasury bills eligible for refinancingwith central banks
119
169
1 253
1 161
0
0
2 702
Other loans and advances:
– Current accounts
165
0
0
0
0
0
165
– Others
14 570
28
0
0
0
0
14 598
14 735
28
0
0
0
0
14 763
Loans:
– Credit institutions
2 226
6 051
41 002
65 303
0
1 265
115 847
– Customers
1 555
7 046
39 935
91 411
0
1 837
141 784
3 781
13 097
80 937
156 714
0
3 102
257 631
Debt securities including fixed-incomesecurities
4 157
1 543
3 138
2 447
0
6
11 291
Positive replacement value
0
0
0
0
0
14 316
14 316
Other assets
0
0
0
0
3 715
0
3 715
TOTAL assets
22 807
14 837
85 328
160 322
3 715
17 424
304 433
LIABILITIES
Amounts owed to credit institutions
213
3
3
0
0
0
219
Debts evidenced by certificates
20 123
21 579
97 551
107 323
0
6 257
252 833
Negative replacement value
0
0
0
0
0
15 437
15 437
Capital, reserves and profit
0
0
0
0
33 208
0
33 208
Other liabilities
0
0
0
0
2 736
0
2 736
TOTAL liabilities
20 336
21 582
97 554
107 323
35 944
21 694
304 433
EIB Group – Financial Statements 2006 45
34
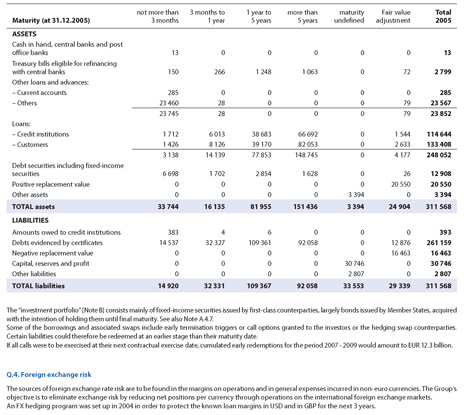
not more than
3 months to
1 year to
more than
maturity
Fair value
Total
Maturity (at 31.12.2005)
3 months
1 year
5 years
5 years
undefined
adjustment
2005
ASSETS
Cash in hand, central banks and postoffice banks
13
0
0
0
0
0
13
Treasury bills eligible for refinancingwith central banks
150
266
1 248
1 063
0
72
2 799
Other loans and advances:
– Current accounts
285
0
0
0
0
0
285
– Others
23 460
28
0
0
0
79
23 567
23 745
28
0
0
0
79
23 852
Loans:
– Credit institutions
1 712
6 013
38 683
66 692
0
1 544
114 644
– Customers
1 426
8 126
39 170
82 053
0
2 633
133 408
3 138
14 139
77 853
148 745
0
4 177
248 052
Debt securities including fixed-incomesecurities
6 698
1 702
2 854
1 628
0
26
12 908
Positive replacement value
0
0
0
0
0
20 550
20 550
Other assets
0
0
0
0
3 394
0
3 394
TOTAL assets
33 744
16 135
81 955
151 436
3 394
24 904
311 568
LIABILITIES
Amounts owed to credit institutions
383
4
6
0
0
0
393
Debts evidenced by certificates
14 537
32 327
109 361
92 058
0
12 876
261 159
Negative replacement value
0
0
0
0
0
16 463
16 463
Capital, reserves and profit
0
0
0
0
30 746
0
30 746
Other liabilities
0
0
0
0
2 807
0
2 807
TOTAL liabilities
14 920
32 331
109 367
92 058
33 553
29 339
311 568
The “investment portfolio” [Note B] consists mainly of fixed-income securities issued by first-class counterparties, largely bonds issued by Member States, acquired with the intention of holding them until final maturity. See also Note A.4.7.
Some of the borrowings and associated swaps include early termination triggers or call options granted to the investors or the hedging swap counterparties. Certain liabilities could therefore be redeemed at an earlier stage than their maturity date.
If all calls were to be exercised at their next contractual exercise date, cumulated early redemptions for the period 2007—2009 would amount to EUR 12.3 billion.
Q.4. Foreign exchange risk
The sources of foreign exchange rate risk are to be found in the margins on operations and in general expenses incurred in non-euro currencies. The Group’s objective is to eliminate exchange risk by reducing net positions per currency through operations on the international foreign exchange markets.
An FX hedging program was set up in 2004 in order to protect the known loan margins in USD and in GBP for the next 3 years.
46 EIB Group
35
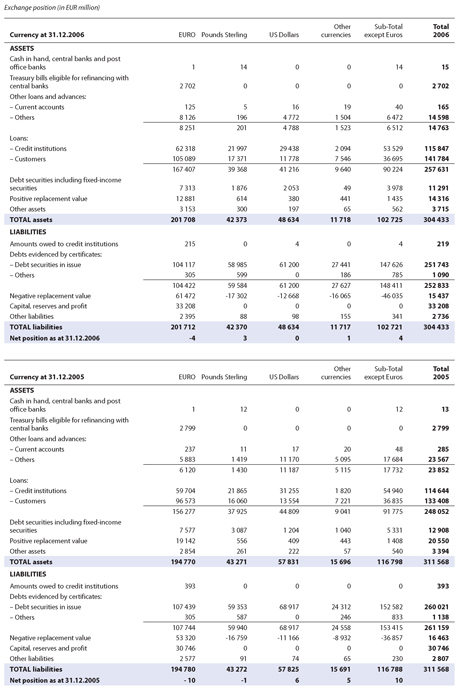
Exchange position (in EUR million)
Other
Sub-Total
Total
Currency at 31.12.2006
EURO
Pounds Sterling
US Dollars
currencies
except Euros
2006
ASSETS
Cash in hand, central banks and postoffice banks
1
14
0
0
14
15
Treasury bills eligible for refinancing withcentral banks
2 702
0
0
0
0
2 702
Other loans and advances:
– Current accounts
125
5
16
19
40
165
– Others
8 126
196
4 772
1 504
6 472
14 598
8 251
201
4 788
1 523
6 512
14 763
Loans:
– Credit institutions
62 318
21 997
29 438
2 094
53 529
115 847
– Customers
105 089
17 371
11 778
7 546
36 695
141 784
167 407
39 368
41 216
9 640
90 224
257 631
Debt securities including fixed-incomesecurities
7 313
1 876
2 053
49
3 978
11 291
Positive replacement value
12 881
614
380
441
1 435
14 316
Other assets
3 153
300
197
65
562
3 715
TOTAL assets
201 708
42 373
48 634
11 718
102 725
304 433
LIABILITIES
Amounts owed to credit institutions
215
0
4
0
4
219
Debts evidenced by certificates:
– Debt securities in issue
104 117
58 985
61 200
27 441
147 626
251 743
– Others
305
599
0
186
785
1 090
104 422
59 584
61 200
27 627
148 411
252 833
Negative replacement value
61 472
-17 302
-12 668
-16 065
-46 035
15 437
Capital, reserves and profit
33 208
0
0
0
0
33 208
Other liabilities
2 395
88
98
155
341
2 736
TOTAL liabilities
201 712
42 370
48 634
11 717
102 721
304 433
Net position as at 31.12.2006
-4
3
0
1
4
Other
Sub-Total
Total
Currency at 31.12.2005
EURO
Pounds Sterling
US Dollars
currencies
except Euros
2005
ASSETS
Cash in hand, central banks and postoffice banks
1
12
0
0
12
13
Treasury bills eligible for refinancing withcentral banks
2 799
0
0
0
0
2 799
Other loans and advances:
– Current accounts
237
11
17
20
48
285
– Others
5 883
1 419
11 170
5 095
17 684
23 567
6 120
1 430
11 187
5 115
17 732
23 852
Loans:
– Credit institutions
59 704
21 865
31 255
1 820
54 940
114 644
– Customers
96 573
16 060
13 554
7 221
36 835
133 408
156 277
37 925
44 809
9 041
91 775
248 052
Debt securities including fixed-incomesecurities
7 577
3 087
1 204
1 040
5 331
12 908
Positive replacement value
19 142
556
409
443
1 408
20 550
Other assets
2 854
261
222
57
540
3 394
TOTAL assets
194 770
43 271
57 831
15 696
116 798
311 568
LIABILITIES
Amounts owed to credit institutions
393
0
0
0
0
393
Debts evidenced by certificates:
– Debt securities in issue
107 439
59 353
68 917
24 312
152 582
260 021
– Others
305
587
0
246
833
1 138
107 744
59 940
68 917
24 558
153 415
261 159
Negative replacement value
53 320
-16 759
-11 166
-8 932
-36 857
16 463
Capital, reserves and profit
30 746
0
0
0
0
30 746
Other liabilities
2 577
91
74
65
230
2 807
TOTAL liabilities
194 780
43 272
57 825
15 691
116 788
311 568
Net position as at 31.12.2005
- 10
-1
6
5
10
EIB Group – Financial Statements 2006 47
36
Note R – Derivatives
Derivatives are contractual financial instruments, the value of which fluctuates according to trends in the underlying assets, interest rates, exchange rates or indices.
R.1. As part of funding activity
The Group uses derivatives mainly as part of its funding strategy in order to bring the characteristics, in terms of currencies and interest rates, of the funds raised into line with those of loans granted and also to reduce funding costs.
Long-term derivatives transactions are not used for trading, but only in connexion with fund-raising and for the reduction of market risk exposure. All interest rate and currency swaps linked to the borrowing portfolio have maturities matching the corresponding borrowings and are therefore of a long-term nature.
The derivatives most commonly used are:—Currency swaps;—Interest rate swaps;—Asset swaps.
R.1.1. Currency swaps
Currency swaps are contracts under which it is agreed to convert funds raised through borrowings into another currency and, simultaneously, a forward exchange contract is concluded to re-exchange the two currencies in the future in order to be able to repay the funds raised on the due dates.
R.1.2. Interest rate swaps
Interest rate swaps are contracts under which, generally, it is agreed to exchange floating-rate interest for fixed-rate interest or vice versa.
R.1.3. Asset swaps
Asset swaps are arranged for investments in bonds that do not have the desired cash-flow features. Specifically, swaps are used to convert investments into floating-rate instruments with 3-month coupon payment and reset frequency. Thus, the Group eliminates interest-rate and/or exchange risk, while retaining, as intended, the credit risk.
Interest rate or currency swaps allow the Group to modify the interest rates and currencies of its borrowing portfolio in order to accommodate requests from its clients and also to reduce funding costs by exchanging its advantageous access conditions to certain capital markets with its counterparties. – Derivatives credit risk mitigation policy: The credit risk with respect to derivatives lies in the loss which the Group would incur were a counterparty unable to honour its contractual obligations. In view of the special nature and complexity of the derivatives transactions, a series of procedures has been put in place to safeguard the Group against losses arising out of the use of such instruments.
– Contractual framework:
All Group long-term derivatives transactions are concluded in the contractual framework of Master Swap Agreements and, where non-standard structures are covered, of Credit Support Annexes, which specify the conditions of exposure collateralisation. These are generally accepted and practised contract types.
– Counterparty selection:
The minimum rating at the outset is set at A1, the Group having the right of early termination if the rating drops below a certain level. – Limits have been set in terms of: • Total net present value of derivatives exposure with a counterparty; • Unsecured exposure to a counterparty; • Specific concentration limits expressed as nominal amount.
All limits are dynamically adapted to the credit quality of the counterparty. – Monitoring: The derivatives portfolio is regularly valued and compared against limits. – Collateralisation:
• Derivatives exposure exceeding the limit for unsecured exposure is collateralised by cash and first-class bonds. • Very complex and illiquid transactions require collateralisation over and above the current market value.
• Both the derivatives portfolio with individual counterparties and the collateral received are regularly valued, with a subsequent call for additional collateral or release.
The credit risk associated with derivatives varies according to a number of factors (such as interest and exchange rates) and generally corresponds to only a small portion of their notional amount.
The notional amount is a derivative’s underlying contract amount and is the basis upon which changes in the value of derivatives are measured. It provides an indication of the underlying volume of business transacted by the Group but does not provide any measure of risk. The majority of derivatives are negotiated as to amount, tenor and price, between the Group and its counterparties, whether other professionals or customers (OTC).
In the Group’s case, where only mutually agreed derivatives are negotiated, the credit risk is evaluated on the basis of the «current exposure» method recommended by the Bank for International Settlements (BIS). Hence, the credit risk is expressed in terms of the positive “fair value” or replacement value of the contracts, increased by the potential risks (add-on), contingent on the duration and type of transaction, weighted by a coefficient linked to the category of counterparty (BIS I weighted risk).
Positive replacement value represents the cost to the Group of replacing all transactions with a fair value in the Group’s favour if all the relevant coun-terparties of the Group were to default at the same time, and transactions could be replaced instantaneously. Negative replacement value is the cost to the Group’s counterparties of replacing all their transactions with the Group where the fair value is in their favour if the Group were to default. The total positive and negative replacement values are included in the consolidated balance sheet separately.
The following tables show the maturities of currency swaps (excluding short-term currency swaps – see S.2 below) and interest rate swaps plus DRS combined, sub-divided according to their notional amount and the associated credit risk:
48 EIB Group
37
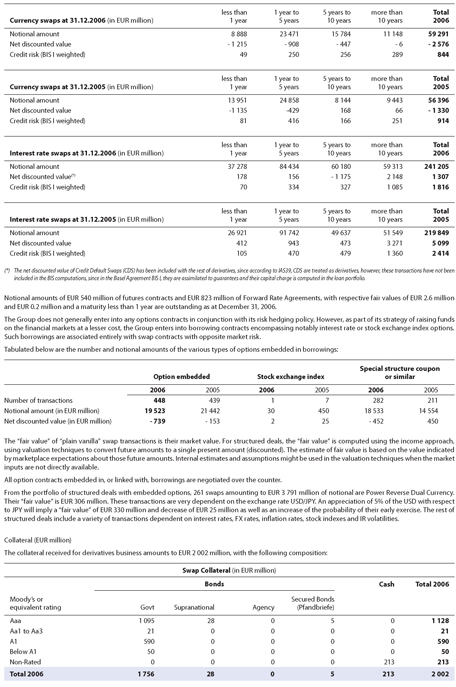
less than
1 year to
5 years to
more than
Total
Currency swaps at 31.12.2006 (in EUR million)
1 year
5 years
10 years
10 years
2006
Notional amount
8 888
23 471
15 784
11 148
59 291
Net discounted value
- 1 215
- 908
- 447
- 6
- 2 576
Credit risk (BIS I weighted)
49
250
256
289
844
less than
1 year to
5 years to
more than
Total
Currency swaps at 31.12.2005 (in EUR million)
1 year
5 years
10 years
10 years
2005
Notional amount
13 951
24 858
8 144
9 443
56 396
Net discounted value
-1 135
-429
168
66
- 1 330
Credit risk (BIS I weighted)
81
416
166
251
914
less than
1 year to
5 years to
more than
Total
Interest rate swaps at 31.12.2006 (in EUR million)
1 year
5 years
10 years
10 years
2006
Notional amount
37 278
84 434
60 180
59 313
241 205
Net discounted value(*)
178
156
- 1 175
2 148
1 307
Credit risk (BIS I weighted)
70
334
327
1 085
1 816
less than
1 year to
5 years to
more than
Total
Interest rate swaps at 31.12.2005 (in EUR million)
1 year
5 years
10 years
10 years
2005
Notional amount
26 921
91 742
49 637
51 549
219 849
Net discounted value
412
943
473
3 271
5 099
Credit risk (BIS I weighted)
105
470
479
1 360
2 414
(*) The net discounted value of Credit Default Swaps (CDS) has been included with the rest of derivatives, since according to IAS39, CDS are treated as derivatives, however, these transactions have not been included in the BIS computations, since in the Basel Agreement BIS I, they are assimilated to guarantees and their capital charge is computed in the loan portfolio.
Notional amounts of EUR 540 million of futures contracts and EUR 823 million of Forward Rate Agreements, with respective fair values of EUR 2.6 million and EUR 0.2 million and a maturity less than 1 year are outstanding as at December 31, 2006.
The Group does not generally enter into any options contracts in conjunction with its risk hedging policy. However, as part of its strategy of raising funds on the financial markets at a lesser cost, the Group enters into borrowing contracts encompassing notably interest rate or stock exchange index options. Such borrowings are associated entirely with swap contracts with opposite market risk.
Tabulated below are the number and notional amounts of the various types of options embedded in borrowings:
Special structure coupon
Option embedded
Stock exchange index
or similar
2006
2005
2006
2005
2006
2005
Number of transactions
448
439
1
7
282
211
Notional amount (in EUR million)
19 523
21 442
30
450
18 533
14 554
Net discounted value (in EUR million)
- 739
- 153
2
25
- 452
450
The “fair value” of “plain vanilla” swap transactions is their market value. For structured deals, the “fair value” is computed using the income approach, using valuation techniques to convert future amounts to a single present amount (discounted). The estimate of fair value is based on the value indicated by marketplace expectations about those future amounts. Internal estimates and assumptions might be used in the valuation techniques when the market inputs are not directly available.
Swap Collateral (in EUR million)
Bonds
Cash
Total 2006
Moody’s or
Secured Bonds
equivalent rating
Govt
Supranational
Agency
(Pfandbriefe)
Aaa
1 095
28
0
5
0
1 128
Aa1 to Aa3
21
0
0
0
0
21
A1
590
0
0
0
0
590
Below A1
50
0
0
0
0
50
Non-Rated
0
0
0
0
213
213
Total 2006
1 756
28
0
5
213
2 002
All option contracts embedded in, or linked with, borrowings are negotiated over the counter.
From the portfolio of structured deals with embedded options, 261 swaps amounting to EUR 3 791 million of notional are Power Reverse Dual Currency. Their “fair value” is EUR 306 million. These transactions are very dependent on the exchange rate USD/JPY. An appreciation of 5% of the USD with respect to JPY will imply a “fair value” of EUR 330 million and decrease of EUR 25 million as well as an increase of the probability of their early exercise. The rest of structured deals include a variety of transactions dependent on interest rates, FX rates, inflation rates, stock indexes and IR volatilities.
Collateral (EUR million)
The collateral received for derivatives business amounts to EUR 2 002 million, with the following composition:
EIB Group – Financial Statements 2006 49
38
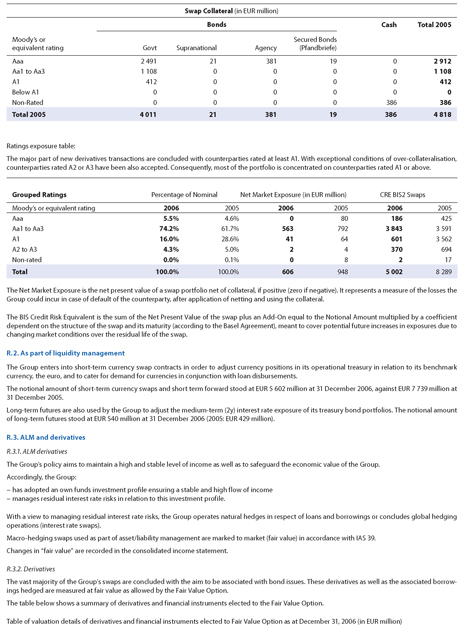
Swap Collateral (in EUR million)
Bonds
Cash
Total 2005
Moody’s or
Secured Bonds
equivalent rating
Govt
Supranational
Agency
(Pfandbriefe)
Aaa
2 491
21
381
19
0
2 912
Aa1 to Aa3
1 108
0
0
0
0
1 108
A1
412
0
0
0
0
412
Below A1
0
0
0
0
0
0
Non-Rated
0
0
0
0
386
386
Total 2005
4 011
21
381
19
386
4 818
Ratings exposure table:
The major part of new derivatives transactions are concluded with counterparties rated at least A1. With exceptional conditions of over-collateralisation,counterparties rated A2 or A3 have been also accepted. Consequently, most of the portfolio is concentrated on counterparties rated A1 or above.
Grouped Ratings
Percentage of Nominal
Net Market Exposure (in EUR million)
CRE BIS2 Swaps
Moody’s or equivalent rating
2006
2005
2006
2005
2006
2005
Aaa
5.5%
4.6%
0
80
186
425
Aa1 to Aa3
74.2%
61.7%
563
792
3 843
3 591
A1
16.0%
28.6%
41
64
601
3 562
A2 to A3
4.3%
5.0%
2
4
370
694
Non-rated
0.0%
0.1%
0
8
2
17
Total
100.0%
100.0%
606
948
5 002
8 289
The Net Market Exposure is the net present value of a swap portfolio net of collateral, if positive (zero if negative). It represents a measure of the losses the Group could incur in case of default of the counterparty, after application of netting and using the collateral.
The BIS Credit Risk Equivalent is the sum of the Net Present Value of the swap plus an Add-On equal to the Notional Amount multiplied by a coefficient dependent on the structure of the swap and its maturity (according to the Basel Agreement), meant to cover potential future increases in exposures due to changing market conditions over the residual life of the swap.
R.2. As part of liquidity management
The Group enters into short-term currency swap contracts in order to adjust currency positions in its operational treasury in relation to its benchmark currency, the euro, and to cater for demand for currencies in conjunction with loan disbursements.
The notional amount of short-term currency swaps and short term forward stood at EUR 5 602 million at 31 December 2006, against EUR 7 739 million at 31 December 2005.
Long-term futures are also used by the Group to adjust the medium-term (2y) interest rate exposure of its treasury bond portfolios. The notional amount of long-term futures stood at EUR 540 million at 31 December 2006 (2005: EUR 429 million).
R.3. ALM and derivatives
R.3.1. ALM derivatives
The Group’s policy aims to maintain a high and stable level of income as well as to safeguard the economic value of the Group. Accordingly, the Group:—has adopted an own funds investment profile ensuring a stable and high flow of income—manages residual interest rate risks in relation to this investment profile.
With a view to managing residual interest rate risks, the Group operates natural hedges in respect of loans and borrowings or concludes global hedging operations (interest rate swaps).
Macro-hedging swaps used as part of asset/liability management are marked to market (fair value) in accordance with IAS 39. Changes in “fair value” are recorded in the consolidated income statement.
R.3.2. Derivatives
The table below shows a summary of derivatives and financial instruments elected to the Fair Value Option.
Table of valuation details of derivatives and financial instruments elected to Fair Value Option as at December 31, 2006 (in EUR million)
50 EIB Group
39
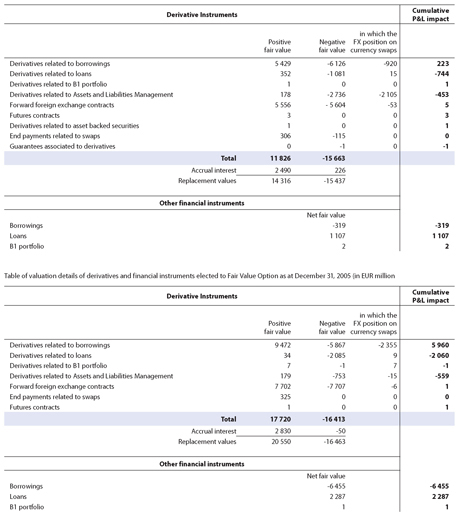
Cumulative
Derivative Instruments
P&L impact
in which the
Positive
Negative
FX position on
fair value
fair value
currency swaps
Derivatives related to borrowings
5 429
-6 126
-920
223
Derivatives related to loans
352
-1 081
15
-744
Derivatives related to B1 portfolio
1
0
0
1
Derivatives related to Assets and Liabilities Management
178
-2 736
-2 105
-453
Forward foreign exchange contracts
5 556
- 5 604
-53
5
Futures contracts
3
0
0
3
Derivatives related to asset backed securities
1
0
0
1
End payments related to swaps
306
-115
0
0
Guarantees associated to derivatives
0
-1
0
-1
Total
11 826
-15 663
Accrual interest
2 490
226
Replacement values
14 316
-15 437
Cumulative
Derivative Instruments
P&L impact
in which the
Positive
Negative
FX position on
fair value
fair value
currency swaps
Derivatives related to borrowings
9 472
-5 867
-2 355
5 960
Derivatives related to loans
34
-2 085
9
-2 060
Derivatives related to B1 portfolio
7
-1
7
-1
Derivatives related to Assets and Liabilities Management
179
-753
-15
-559
Forward foreign exchange contracts
7 702
-7 707
-6
1
End payments related to swaps
325
0
0
0
Futures contracts
1
0
0
1
Total
17 720
-16 413
Accrual interest
2 830
-50
Replacement values
20 550
-16 463
Other financial instruments
Net fair value
Borrowings
-6 455
-6 455
Loans
2 287
2 287
B1 portfolio
1
1
Other financial instruments
Net fair value
Borrowings
-319
-319
Loans
1 107
1 107
B1 portfolio
2
2
Table of valuation details of derivatives and financial instruments elected to Fair Value Option as at December 31, 2005 (in EUR million
EIB Group – Financial Statements 2006 51
40
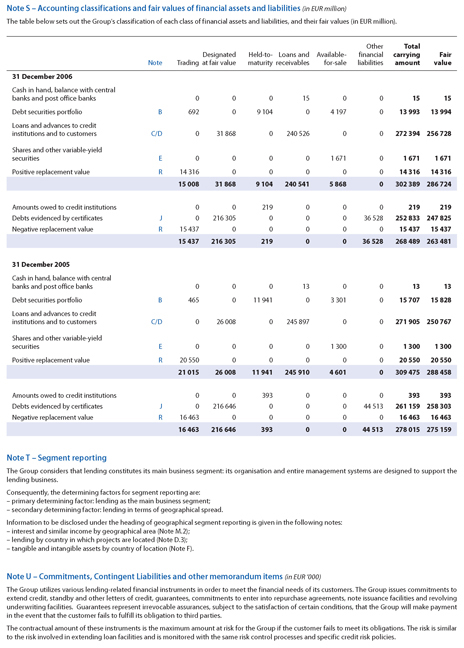
Note S – Accounting classifications and fair values of financial assets and liabilities (in EUR million)
The table below sets out the Group’s classification of each class of financial assets and liabilities, and their fair values (in EUR million).
Note
Trading
Designated at fair value
Held-to- Maturity
Loans and Receivables
Available- for-sale
Other financial Amount
Total carrying liabilities
Fair value
31 December 2006
Cash in hand, balance with central banks and post office banks
0
0
0
15
0
0
15
15
Debt securities portfolio
B
692
0
9 104
0
4 197
0
13 993
13 994
Loans and advances to credit institutions and to customers
C/D
0
31 868
0
240 526
0
0
272 394
256 728
Shares and other variable-yield securities
E
0
0
0
0
1 671
0
1 671
1 671
Positive replacement value
R
14 316
0
0
0
0
0
14 316
14 316
15 008
31 868
9 104
240 541
5 868
0
302 389
286 724
Amounts owed to credit institutions
0
0
219
0
0
0
219
219
Debts evidenced by certificates
J
0
216 305
0
0
0
36 528
252 833
247 825
Negative replacement value
R
15 437
0
0
0
0
0
15 437
15 437
15 437
216 305
219
0
0
36 528
268 489
263 481
31 December 2005
Cash in hand, balance with central banks and post office banks
0
0
0
13
0
0
13
13
Debt securities portfolio
B
465
0
11 941
0
3 301
0
15 707
15 828
Loans and advances to credit institutions and to customers
C/D
0
26 008
0
245 897
0
0
271 905
250 767
Shares and other variable-yieldsecurities
E
0
0
0
0
1 300
0
1 300
1 300
Positive replacement value
R
20 550
0
0
0
0
0
20 550
20 550
21 015
26 008
11 941
245 910
4 601
0
309 475
288 458
Amounts owed to credit institutions
0
0
393
0
0
0
393
393
Debts evidenced by certificates
J
0
216 646
0
0
0
44 513
261 159
258 303
Negative replacement value
R
16 463
0
0
0
0
0
16 463
16 463
16 463
216 646
393
0
0
44 513
278 015
275 159
Note T – Segment reporting
The Group considers that lending constitutes its main business segment: its organisation and entire management systems are designed to support the lending business.
Consequently, the determining factors for segment reporting are: – primary determining factor: lending as the main business segment; – secondary determining factor: lending in terms of geographical spread.
Information to be disclosed under the heading of geographical segment reporting is given in the following notes: – interest and similar income by geographical area (Note M.2); – lending by country in which projects are located (Note D.3); – tangible and intangible assets by country of location (Note F).
Note U – Commitments, Contingent Liabilities and other memorandum items (in EUR ‘000)
The Group utilizes various lending-related financial instruments in order to meet the financial needs of its customers. The Group issues commitments to extend credit, standby and other letters of credit, guarantees, commitments to enter into repurchase agreements, note issuance facilities and revolving underwriting facilities. Guarantees represent irrevocable assurances, subject to the satisfaction of certain conditions, that the Group will make payment in the event that the customer fails to fulfill its obligation to third parties.
The contractual amount of these instruments is the maximum amount at risk for the Group if the customer fails to meet its obligations. The risk is similar to the risk involved in extending loan facilities and is monitored with the same risk control processes and specific credit risk policies.
52 EIB Group
41
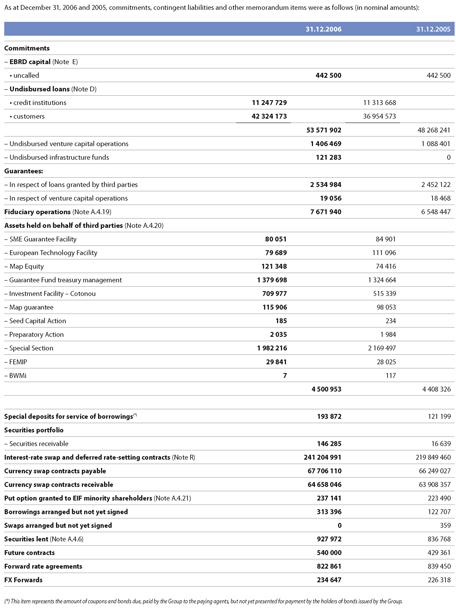
As at December 31, 2006 and 2005, commitments, contingent liabilities and other memorandum items were as follows (in nominal amounts):
31.12.2006
31.12.2005
Commitments
– EBRD capital (Note E)• uncalled
442 500
442 500
– Undisbursed loans (Note D)• credit institutions
11 247 729
11 313 668
• customers
42 324 173
36 954 573
53 571 902
48 268 241
– Undisbursed venture capital operations
1 406 469
1 088 401
– Undisbursed infrastructure funds
121 283
0
Guarantees:
– In respect of loans granted by third parties
2 534 984
2 452 122
– In respect of venture capital operations
19 056
18 468
Fiduciary operations (Note A.4.19)
7 671 940
6 548 447
Assets held on behalf of third parties (Note A.4.20)
– SME Guarantee Facility
80 051
84 901
– European Technology Facility
79 689
111 096
– Map Equity
121 348
74 416
– Guarantee Fund treasury management
1 379 698
1 324 664
– Investment Facility – Cotonou
709 977
515 339
– Map guarantee
115 906
98 053
– Seed Capital Action
185
234
– Preparatory Action
2 035
1 984
– Special Section
1 982 216
2 169 497
– FEMIP
29 841
28 025
– BWMi
7
117
4 500 953
4 408 326
Special deposits for service of borrowings(*)
193 872
121 199
Securities portfolio
– Securities receivable
146 285
16 639
Interest-rate swap and deferred rate-setting contracts (Note R)
241 204 991
219 849 460
Currency swap contracts payable
67 706 110
66 249 027
Currency swap contracts receivable
64 658 046
63 908 357
Put option granted to EIF minority shareholders (Note A.4.21)
237 141
223 490
Borrowings arranged but not yet signed
313 396
122 707
Swaps arranged but not yet signed
0
359
Securities lent (Note A.4.6)
927 972
836 768
Future contracts
540 000
429 361
Forward rate agreements
822 861
839 450
FX Forwards
234 647
226 318
(*) This item represents the amount of coupons and bonds due, paid by the Group to the paying agents, but not yet presented for payment by the holders of bonds issued by the Group.
EIB Group – Financial Statements 2006 53
42
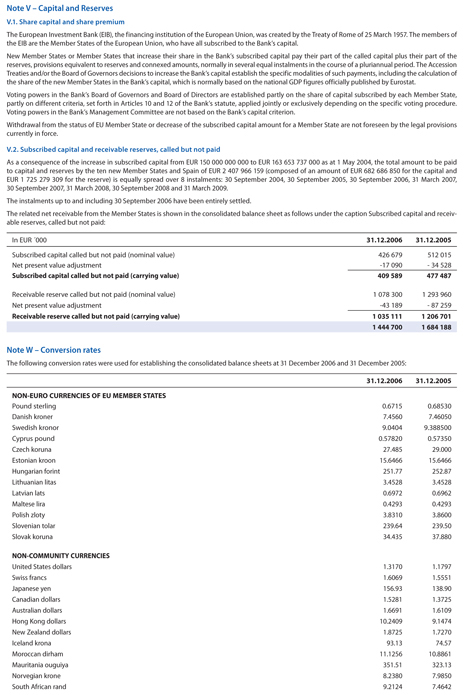
Note V – Capital and Reserves
V.1. Share capital and share premium
The European Investment Bank (EIB), the financing institution of the European Union, was created by the Treaty of Rome of 25 March 1957. The members of the EIB are the Member States of the European Union, who have all subscribed to the Bank’s capital.
New Member States or Member States that increase their share in the Bank’s subscribed capital pay their part of the called capital plus their part of the reserves, provisions equivalent to reserves and connexed amounts, normally in several equal instalments in the course of a pluriannual period. The Accession Treaties and/or the Board of Governors decisions to increase the Bank’s capital establish the specific modalities of such payments, including the calculation of the share of the new Member States in the Bank’s capital, which is normally based on the national GDP figures officially published by Eurostat.
Voting powers in the Bank’s Board of Governors and Board of Directors are established partly on the share of capital subscribed by each Member State, partly on different criteria, set forth in Articles 10 and 12 of the Bank’s statute, applied jointly or exclusively depending on the specific voting procedure. Voting powers in the Bank’s Management Committee are not based on the Bank’s capital criterion.
Withdrawal from the status of EU Member State or decrease of the subscribed capital amount for a Member State are not foreseen by the legal provisions currently in force.
V.2. Subscribed capital and receivable reserves, called but not paid
As a consequence of the increase in subscribed capital from EUR 150 000 000 000 to EUR 163 653 737 000 as at 1 May 2004, the total amount to be paid to capital and reserves by the ten new Member States and Spain of EUR 2 407 966 159 (composed of an amount of EUR 682 686 850 for the capital and EUR 1 725 279 309 for the reserve) is equally spread over 8 instalments: 30 September 2004, 30 September 2005, 30 September 2006, 31 March 2007, 30 September 2007, 31 March 2008, 30 September 2008 and 31 March 2009.
The instalments up to and including 30 September 2006 have been entirely settled.
The related net receivable from the Member States is shown in the consolidated balance sheet as follows under the caption Subscribed capital and receivable reserves, called but not paid:
In EUR ´000
31.12.2006
31.12.2005
Subscribed capital called but not paid (nominal value)
426 679
512 015
Net present value adjustment
-17 090
- 34 528
Subscribed capital called but not paid (carrying value)
409 589
477 487
Receivable reserve called but not paid (nominal value)
1 078 300
1 293 960
Net present value adjustment
-43 189
- 87 259
Receivable reserve called but not paid (carrying value)
1 035 111
1 206 701
1 444 700
1 684 188
Note W – Conversion rates
The following conversion rates were used for establishing the consolidated balance sheets at 31 December 2006 and 31 December 2005:
31.12.2006
31.12.2005
NON-EURO CURRENCIES OF EU MEMBER STATES
Pound sterling
0.6715
0.68530
Danish kroner
7.4560
7.46050
Swedish kronor
9.0404
9.388500
Cyprus pound
0.57820
0.57350
Czech koruna
27.485
29.000
Estonian kroon
15.6466
15.6466
Hungarian forint
251.77
252.87
Lithuanian litas
3.4528
3.4528
Latvian lats
0.6972
0.6962
Maltese lira
0.4293
0.4293
Polish zloty
3.8310
3.8600
Slovenian tolar
239.64
239.50
Slovak koruna
34.435
37.880
NON-COMMUNITY CURRENCIES
United States dollars
1.3170
1.1797
Swiss francs
1.6069
1.5551
Japanese yen
156.93
138.90
Canadian dollars
1.5281
1.3725
Australian dollars
1.6691
1.6109
Hong Kong dollars
10.2409
9.1474
New Zealand dollars
1.8725
1.7270
Iceland krona
93.13
74.57
Moroccan dirham
11.1256
10.8861
Mauritania ouguiya
351.51
323.13
Norvegian krone
8.2380
7.9850
South African rand
9.2124
7.4642
54 EIB Group
43
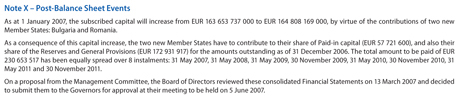
Note X – Post-Balance Sheet Events
As at 1 January 2007, the subscribed capital will increase from EUR 163 653 737 000 to EUR 164 808 169 000, by virtue of the contributions of two new Member States: Bulgaria and Romania.
As a consequence of this capital increase, the two new Member States have to contribute to their share of Paid-in capital (EUR 57 721 600), and also their share of the Reserves and General Provisions (EUR 172 931 917) for the amounts outstanding as of 31 December 2006. The total amount to be paid of EUR 230 653 517 has been equally spread over 8 instalments: 31 May 2007, 31 May 2008, 31 May 2009, 30 November 2009, 31 May 2010, 30 November 2010, 31 May 2011 and 30 November 2011.
On a proposal from the Management Committee, the Board of Directors reviewed these consolidated Financial Statements on 13 March 2007 and decided to submit them to the Governors for approval at their meeting to be held on 5 June 2007.
EIB Group – Financial Statements 2006 55
44
ADDITIONAL INFORMATION
STATEMENT OF SPECIAL SECTION (1) AS AT 31 DECEMBER 2006
In EUR ‘000
ASSETS
31.12.2006
31.12.2005
Turkey
From resources of Member States
Disbursed loans outstanding (2)
17 657
19 653
Mediterranean Countries
From resources of the European Community
Disbursed loans outstanding
161 441
171 803
Risk capital operations
– amounts to be disbursed
151 609
120 128
– amounts disbursed
210 891
223 893
362 500
344 021
Total (3)
523 941
515 824
African, Caribbean and Pacific State and Overseas Countries and Territories
From resources of the European Community
• Yaoundé Conventions
Loans disbursed
18 700
23 860
Contributions to the formation of risk capital
– amounts disbursed
419
611
Total (4)
19 119
24 471
• Lomé Conventions
Operations from risk capital resources:
– amounts to be disbursed
260 064
338 831
– amounts disbursed
1 147 689
1 263 070
1 407 753
1 601 901
Operations from other resources
– amounts to be disbursed
9 838
4 707
– amounts disbursed
3 908
2 941
13 746
7 648
Total (5)
1 421 499
1 609 549
TOTAL
1 982 216
2 169 497
56 EIB Group
45
LIABILITIES
31.12.2006
31.12.2005
Funds under trust management
Under mandate from the European Communities
– Financial Protocols with the Mediterranean Countries
372 332
395 696
– Yaoundé Conventions
19 119
24 471
– Lomé Conventions
1 147 689
1 263 070
– Other resources under the Lomé Conventions
3 908
2 941
1 543 048
1 686 178
Under mandate from Member States
17 657
19 653
Total
1 560 705
1 705 831
Funds to be disbursed
On loans and risk capital operations in the Mediterranean countries
151 609
120 128
On operations from risk capital resources under the Lomé Conventions
260 064
338 831
On operations from other resources under the Lomé Conventions
9 838
4 707
Total
421 511
463 666
TOTAL
1 982 216
2 169 497
For information:
Total amounts disbursed and not yet repaid on loans on special conditions made available by the Commission in respect of which the Bank has accepted an EC mandate for recovering principal and interest: a) Under the First, Second and Third Lomé Conventions: at 31.12.2006 = 835 003 (at 31.12.2005: 986 536) b) Under Financial Protocols signed with the Mediterranean Countries: at 31.12.2006 = 122 412 (at 31.12.2005: 137 706)
Note (1): The Special Section was set up by the Board of Governors on
27 May 1963: under a Decision taken on 4 August 1977 its purpose was redefined as being that of recording financing operations carried out by the European Investment Bank for the account of and under mandate from third parties. However, for the Investment Facility under the Cotonou Agreement separate Financial Statements are presented. In addition, since 2005, the EIB also prepares financial statements of different types for other mandates.
The Statement of Special Section reflects amounts disbursed or to be disbursed, less cancellations and repayments, under mandate from the European Communities and the Member States. No account is taken in the Statement of Special Section of provisions or value adjustments, which may be required to cover risks associated with such operations. Amounts in foreign currency are translated at exchange rates prevailing on 31 December.
Note (2): Initial amount of contracts signed for financing projects in Turkey under mandate, for the account and at the risk of Member States.
Initial amount:
405 899
add:
exchange adjustments
22 867
less:
cancellations
215
repayments
410 894
- 411 109
17 657
Note (3): Initial amount of contracts signed for financing projects in the Maghreb and Mashreq countries, Malta, Cyprus, Turkey and Greece (EUR 10 million lent prior to accession to the EC on 1 January 1981) under mandate, for the account and at the risk of the European Community.
Initial amount:
794 557
less:
exchange adjustments
11 166
cancellations
59 255
repayments
200 195
- 270 616
523 941
Note (4): Initial amount of contracts signed for financing projects in the Associated African States, Madagascar and Mauritius and the Overseas Countries, Territories and Departments (AASMM-OCTD) under mandate, for the account and at the risk of the European Community:
– loans on special conditions
139 483
– contributions to the formation of risk capital
2 503
Initial amount:
141 986
add:
capitalised interest
1 178
exchange adjustments
9 838
11 016
less:
cancellations
1 758
repayments
132 125
- 133 883
19 119
Note (5): Initial amount of contracts signed for financing projects in the African, Caribbean and Pacific States and the Overseas Countries and Territories (ACP-OCT) under mandate, for the account and at the risk of the European Community:
Loans from risk capital resources:
– conditional and subordinated loans
3 121 877
– equity participations
120 984
Initial amount:
3 242 861
add:
capitalised interest
7 088
less:
cancellations
515 601
repayments
1 274 131
exchange adjustments
52 464
- 1 842 196
1 407 753
Loans from other resources:
Initial amount:
16 500
less:
cancellations
1 436
repayments
1 318
- 2 754
13 746
1 421 499
EIB Group – Financial Statements 2006 57
46
INDEPENDENT AUDITOR’S REPORT
To the chairman of the Audit Committee of EUROPEAN INVESTMENT BANK
Luxembourg
We have audited the accompanying consolidated financial statements of the European Investment Bank, which show a profit to be appropriated of EUR 3,234.612 million and a total balance sheet of EUR 304,432.951 million and which comprise the consolidated balance sheet as at December 31, 2006, the consolidated income statement, the statement of movements in consolidated own funds, the consolidated cash flow statement for the year then ended, and a summary of significant accounting policies and other explanatory notes to the consolidated financial statements.
Management Committee’s responsibility for the consolidated financial statements
The Management Committee is responsible for the preparation and fair presentation of these consolidated financial statements in accordance with International Financial Reporting Standards and with the general principles of the Directives of the European Union on the annual accounts and consolidated accounts of certain type of companies, banks and other financial institutions and insurance undertakings. This responsibility includes: designing, implementing and maintaining internal control relevant to the preparation and fair presentation of consolidated financial statements that are free from material misstatement, whether due to fraud or error, selecting and applying appropriate accounting policies, and making accounting estimates that are reasonable in the circumstances.
Responsibility of the “Réviseur d’Entreprises”
Our responsibility is to express an opinion on these consolidated financial statements based on our audit. We conducted our audit in accordance with International Standards on Auditing as adopted by the Luxembourg “Institut des Réviseurs d’Entreprises”. Those standards require that we comply with ethical requirements and plan and perform the audit to obtain reasonable assurance whether the consolidated financial statements are free from material misstatement.
An audit involves performing procedures to obtain audit evidence about the amounts and disclosures in the consolidated financial statements. The procedures selected depend on the judgement of the “Réviseur d’Entreprises”, including the assessment of the risks of material misstatement of the consolidated financial statements, whether due to fraud or error. In making those risk assessments, the “Réviseur d’Entreprises” considers internal control relevant to the entity’s preparation and fair presentation of the consolidated financial statements in order to design audit procedures that are appropriate in the circumstances, but not for the purpose of expressing an opinion on the effectiveness of the entity’s internal control.
An audit also includes evaluating the appropriateness of accounting policies used and the reasonableness of accounting estimates made by the Management Committee, as well as evaluating the overall presentation of the consolidated financial statements. We believe that the audit evidence we have obtained is sufficient and appropriate to provide a basis for our audit opinion.
Opinion
In our opinion, the consolidated financial statements give a true and fair view of the consolidated financial position of the European Investment Bank as of December 31, 2006, of its consolidated financial performance, of its movements in consolidated own funds and of its consolidated cash flows for the year then ended in accordance with International Financial Reporting Standards and with the general principles of the Directives of the European Union on the annual accounts and consolidated accounts of certain types of companies, banks and other financial institutions and insurance undertakings.
ERNST & YOUNG Société Anonyme Réviseur d’Entreprises
March 13, 2007 Bernard LHOEST Alain KINSCH
58 EIB Group
47
THE AUDIT COMMITTEE
The Audit Committee reports to the Board of Governors, the following statement being communicated to the Governors prior to their approval of the Annual Report and the financial statements for the past financial year.
Statement by the Audit Committee on the EIB consolidated financial statements
The Committee, instituted in pursuance of Article 14 of the Statute and Article 25 of the Rules of Procedure of the European Investment Bank for the purpose of verifying that the operations of the Bank are conducted and its books kept in a proper manner, having
– designated Ernst & Young as external auditors, reviewed their audit planning process, examined and discussed their reports,
– noted that the opinion of Ernst & Young on the consolidated financial statements of the European Investment Bank for the financial period ending on 31 December 2006 is unqualified,
– convened on a regular basis with the Heads of Directorates and relevant services, met regularly the Head of Internal Audit and discussed the relevant internal audit reports, and studied the documents which it deemed necessary to examine in the discharge of its duties,
– received assurance from the Management Committee concerning the effectiveness of the internal control structure and internal administration,
and considering
– the consolidated financial statements for the financial year ending on 31 December 2006 as drawn up by the Board of Directors at its meeting on 13 March 2007,
– that the foregoing provides a reasonable basis for its statement and,
– Articles 22, 23 & 24 of the Rules of Procedure, to the best of its knowledge and judgement:
confirms that the consolidated financial statements, comprising the consolidated balance sheet, the consolidated income statement, the statement of movements in consolidated own funds, the consolidated cash flow statement and the notes to the consolidated financial statements give a true and fair view of the financial position of the Bank as at 31 December 2006 in respect of its assets and liabilities, and of the results of its operations and cash flows for the year then ended.
Luxembourg, 13 March 2007
The Audit Committee
R. POVEDA ANADÓN
EIB Group – Financial Statements 2006 59
48
EIB
Financial Statements
EIB – Financial Statements 2006 61
49
RESULTS FOR THE YEAR
2006 was marked by an increase in the profit for the financial year and stability in the balance sheet total. The profit for the financial year 2006 stands at EUR 2 566 million, an increase of EUR 1 177million (+85%). It includes, however, an exceptional item of EUR 975 million, due to the reversal of the Fund for general banking risks, which is proposed for appropriation to the Additional Reserves by the Board of Governors (see ‘appropriation’ below and note M).
Barring this special item, the profit before reversal of the Fund for general banking risks for 2006 amounts to EUR 1 591 million, an increase of EUR 202 million or 15%, as compared with the profit for the financial year 2005.
Several factors influenced the results either positively or negatively, the main ones being the following:
– The average interest rate on outstanding loans increased by 0.40% to 4.28%, whereas the average interest rate on outstanding debt increased by 0.53% to 4.03%.
– The average interest rate on outstanding treasury assets increased by 0.81% to 3.90%.
– Value adjustment on loans of EUR 3.8 million, down from EUR 37 million in 2005 (Note D.3.).
– An amount of EUR 189.2 million was released following the sale, during 2006, of loan assets for which a specific provision was established. This amount compares favourably with the credit loss expense of EUR 110 million resulting from the sale.
– The value adjustment on venture capital operations provided a profit of EUR 2.2 million, against a loss of EUR 23 million in 2005 (Note E).
– The cost of general administrative expenses, depreciations, amortisations and extraordinary charges increased by 6% to EUR 356 million (Notes F and P).
Other salient facts:
– The volume of loan signatures decreased by 3% to EUR 45.8 billion.
– The volume of borrowings before swaps signed in 2006 decreased by 14% versus 2005 to EUR 45.2 billion.
– The operating income increased by EUR 30.4 million to EUR 1 566 million.
Appropriation of the result for the year 2006 in 2007:
On the basis of the EIB statutory accounts and acting on a proposal from the Management Committee, the Board of Directors is recommending that the Board of Governors appropriate the balance of the profit and loss account for the year ended 31 December 2006, which amounts to EUR 2 565 910 664 after a release of EUR 975 000 000 from the Fund for general banking risks, as well as the contribution of Bulgaria and Romania to the balance of the profit to be appropriated, which amounts to EUR 18 115 329, to the Additional Reserves. This decision brings the balance of the Additional Reserves to EUR 5 272 897 061.
Furthermore, an amount of EUR 27 116 291 will be transferred from the Additional Reserves to the Funds allocated to venture capital operations, in view of the increase of the carrying amount of the venture capital operations. Following this transfer, the balance of the Funds allocated to venture capital operations stands at EUR 1 690 940 071 and the Additional Reserves at EUR 5 245 780 770.
EIB – Financial Statements 2006 63
50
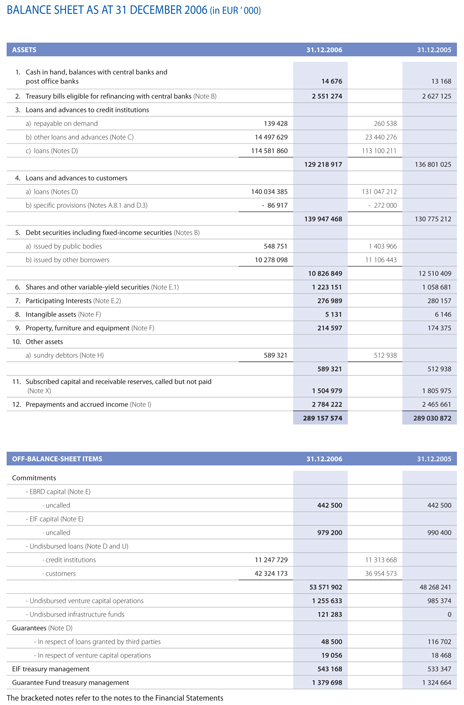
BALANCE SHEET AS AT 31 DECEMBER 2006 (in EUR ‘ 000)
ASSETS
31.12.2006
31.12.2005
1.
Cash in hand, balances with central banks and
post office banks
14 676
13 168
2.
Treasury bills eligible for refinancing with central banks (Note B)
2 551 274
2 627 125
3.
Loans and advances to credit institutions
a) repayable on demand
139 428
260 538
b) other loans and advances (Note C)
14 497 629
23 440 276
c) loans (Notes D)
114 581 860
113 100 211
129 218 917
136 801 025
4.
Loans and advances to customers
a) loans (Notes D)
140 034 385
131 047 212
b) specific provisions (Notes A.8.1 and D.3)
- 86 917
- 272 000
139 947 468
130 775 212
5.
Debt securities including fixed-income securities (Notes B)
a) issued by public bodies
548 751
1 403 966
b) issued by other borrowers
10 278 098
11 106 443
10 826 849
12 510 409
6.
Shares and other variable-yield securities (Note E.1)
1 223 151
1 058 681
7.
Participating Interests (Note E.2)
276 989
280 157
8.
Intangible assets (Note F)
5 131
6 146
9.
Property, furniture and equipment (Note F)
214 597
174 375
10.
Other assets
a) sundry debtors (Note H)
589 321
512 938
589 321
512 938
11.
Subscribed capital and receivable reserves, called but not paid
(Note X)
1 504 979
1 805 975
12.
Prepayments and accrued income (Note I)
2 784 222
2 465 661
289 157 574
289 030 872
OFF-BALANCE-SHEET ITEMS
31.12.2006
31.12.2005
Commitments
- EBRD capital (Note E)
· uncalled
442 500
442 500
- EIF capital (Note E)
· uncalled
979 200
990 400
- Undisbursed loans (Note D and U)
· credit institutions
11 247 729
11 313 668
· customers
42 324 173
36 954 573
53 571 902
48 268 241
- Undisbursed venture capital operations
1 255 633
985 374
- Undisbursed infrastructure funds
121 283
0
Guarantees (Note D)
- In respect of loans granted by third parties
48 500
116 702
- In respect of venture capital operations
19 056
18 468
EIF treasury management
543 168
533 347
Guarantee Fund treasury management
1 379 698
1 324 664
The bracketed notes refer to the notes to the Financial Statements
51
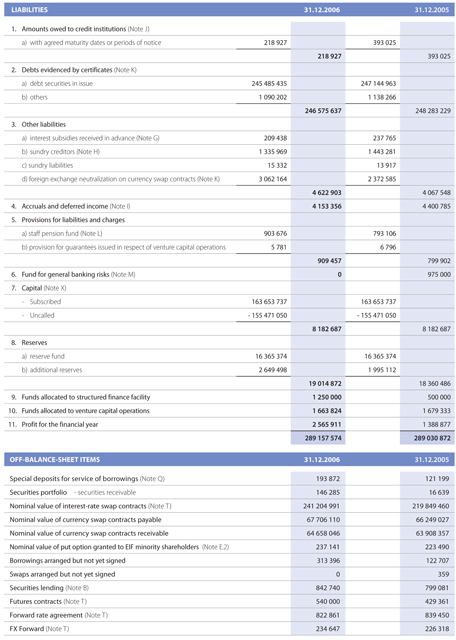
LIABILITIES
31.12.2006
31.12.2005
1.
Amounts owed to credit institutions (Note J)
a) with agreed maturity dates or periods of notice
218 927
393 025
218 927
393 025
2.
Debts evidenced by certificates (Note K)
a) debt securities in issue
245 485 435
247 144 963
b) others
1 090 202
1 138 266
246 575 637
248 283 229
3.
Other liabilities
a) interest subsidies received in advance (Note G)
209 438
237 765
b) sundry creditors (Note H)
1 335 969
1 443 281
c) sundry liabilities
15 332
13 917
d) foreign exchange neutralization on currency swap contracts (Note K)
3 062 164
2 372 585
4 622 903
4 067 548
4.
Accruals and deferred income (Note I)
4 153 356
4 400 785
5.
Provisions for liabilities and charges
a) staff pension fund (Note L)
903 676
793 106
b) provision for guarantees issued in respect of venture capital operations
5 781
6 796
909 457
799 902
6.
Fund for general banking risks (Note M)
0
975 000
7.
Capital (Note X)
- Subscribed
163 653 737
163 653 737
- Uncalled
- 155 471 050
- 155 471 050
8 182 687
8 182 687
8.
Reserves
a) reserve fund
16 365 374
16 365 374
b) additional reserves
2 649 498
1 995 112
19 014 872
18 360 486
9.
Funds allocated to structured finance facility
1 250 000
500 000
10.
Funds allocated to venture capital operations
1 663 824
1 679 333
11.
Profit for the financial year
2 565 911
1 388 877
289 157 574
289 030 872
OFF-BALANCE-SHEET ITEMS
31.12.2006
31.12.2005
Special deposits for service of borrowings (Note Q)
193 872
121 199
Securities portfolio - securities receivable
146 285
16 639
Nominal value of interest-rate swap contracts (Note T)
241 204 991
219 849 460
Nominal value of currency swap contracts payable
67 706 110
66 249 027
Nominal value of currency swap contracts receivable
64 658 046
63 908 357
Nominal value of put option granted to EIF minority shareholders (Note E.2)
237 141
223 490
Borrowings arranged but not yet signed
313 396
122 707
Swaps arranged but not yet signed
0
359
Securities lending (Note B)
842 740
799 081
Futures contracts (Note T)
540 000
429 361
Forward rate agreement (Note T)
822 861
839 450
FX Forward (Note T)
234 647
226 318
EIB – Financial Statements 2006 65
52
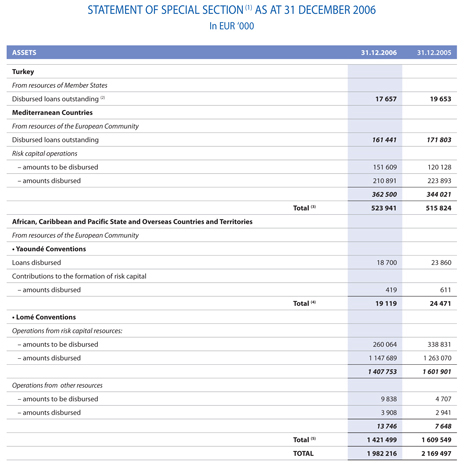
STATEMENT OF SPECIAL SECTION (1) AS AT 31 DECEMBER 2006
In EUR ‘000
ASSETS
31.12.2006
31.12.2005
Turkey
From resources of Member States
Disbursed loans outstanding (2)
17 657
19 653
Mediterranean Countries
From resources of the European Community
Disbursed loans outstanding
161 441
171 803
Risk capital operations
– amounts to be disbursed
151 609
120 128
– amounts disbursed
210 891
223 893
362 500
344 021
Total (3)
523 941
515 824
African, Caribbean and Pacific State and Overseas Countries and Territories
From resources of the European Community
• Yaoundé Conventions
Loans disbursed
18 700
23 860
Contributions to the formation of risk capital
– amounts disbursed
419
611
Total (4)
19 119
24 471
• Lomé Conventions
Operations from risk capital resources:
– amounts to be disbursed
260 064
338 831
– amounts disbursed
1 147 689
1 263 070
1 407 753
1 601 901
Operations from other resources
– amounts to be disbursed
9 838
4 707
– amounts disbursed
3 908
2 941
13 746
7 648
Total (5)
1 421 499
1 609 549
TOTAL
1 982 216
2 169 497
66 EIB Group
53
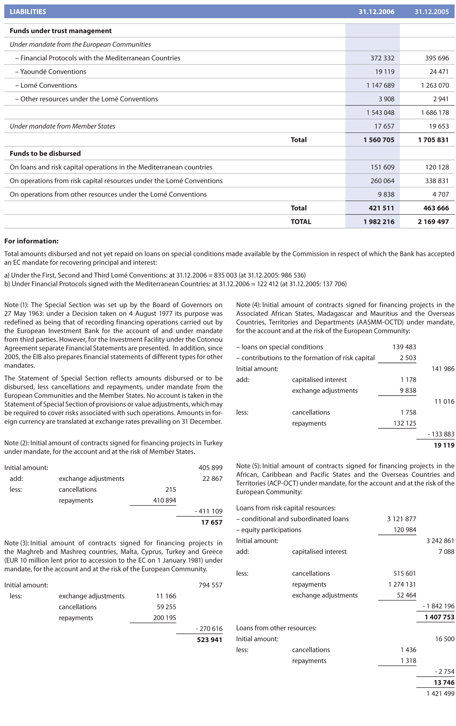
LIABILITIES
31.12.2006
31.12.2005
Funds under trust management
Under mandate from the European Communities
– Financial Protocols with the Mediterranean Countries
372 332
395 696
– Yaoundé Conventions
19 119
24 471
– Lomé Conventions
1 147 689
1 263 070
– Other resources under the Lomé Conventions
3 908
2 941
1 543 048
1 686 178
Under mandate from Member States
17 657
19 653
Total
1 560 705
1 705 831
Funds to be disbursed
On loans and risk capital operations in the Mediterranean countries
151 609
120 128
On operations from risk capital resources under the Lomé Conventions
260 064
338 831
On operations from other resources under the Lomé Conventions
9 838
4 707
Total
421 511
463 666
TOTAL
1 982 216
2 169 497
For information:
Total amounts disbursed and not yet repaid on loans on special conditions made available by the Commission in respect of which the Bank has accepted an EC mandate for recovering principal and interest: a) Under the First, Second and Third Lomé Conventions: at 31.12.2006 = 835 003 (at 31.12.2005: 986 536) b) Under Financial Protocols signed with the Mediterranean Countries: at 31.12.2006 = 122 412 (at 31.12.2005: 137 706)
Note (1): The Special Section was set up by the Board of Governors on
27 May 1963: under a Decision taken on 4 August 1977 its purpose was redefined as being that of recording financing operations carried out by the European Investment Bank for the account of and under mandate from third parties. However, for the Investment Facility under the Cotonou Agreement separate Financial Statements are presented. In addition, since 2005, the EIB also prepares financial statements of different types for other mandates.
The Statement of Special Section reflects amounts disbursed or to be disbursed, less cancellations and repayments, under mandate from the European Communities and the Member States. No account is taken in the Statement of Special Section of provisions or value adjustments, which may be required to cover risks associated with such operations. Amounts in foreign currency are translated at exchange rates prevailing on 31 December.
Note (2): Initial amount of contracts signed for financing projects in Turkey under mandate, for the account and at the risk of Member States.
Initial amount:
405 899
add:
exchange adjustments
22 867
less:
cancellations
215
repayments
410 894
- 411 109
17 657
Note (3): Initial amount of contracts signed for financing projects in the Maghreb and Mashreq countries, Malta, Cyprus, Turkey and Greece (EUR 10 million lent prior to accession to the EC on 1 January 1981) under mandate, for the account and at the risk of the European Community.
Initial amount:
794 557
less:
exchange adjustments
11 166
cancellations
59 255
repayments
200 195
- 270 616
523 941
Note (4): Initial amount of contracts signed for financing projects in the Associated African States, Madagascar and Mauritius and the Overseas Countries, Territories and Departments (AASMM-OCTD) under mandate, for the account and at the risk of the European Community:
– loans on special conditions
139 483
– contributions to the formation of risk capital
2 503
Initial amount:
141 986
add:
capitalised interest
1 178
exchange adjustments
9 838
11 016
less:
cancellations
1 758
repayments
132 125
- 133 883
19 119
Note (5): Initial amount of contracts signed for financing projects in the African, Caribbean and Pacific States and the Overseas Countries and Territories (ACP-OCT) under mandate, for the account and at the risk of the European Community:
Loans from risk capital resources:
– conditional and subordinated loans
3 121 877
– equity participations
120 984
Initial amount:
3 242 861
add:
capitalised interest
7 088
less:
cancellations
515 601
repayments
1 274 131
exchange adjustments
52 464
- 1 842 196
1 407 753
Loans from other resources:
Initial amount:
16 500
less:
cancellations
1 436
repayments
1 318
- 2 754
13 746
1 421 499
EIB – Financial Statements 2006 67
54
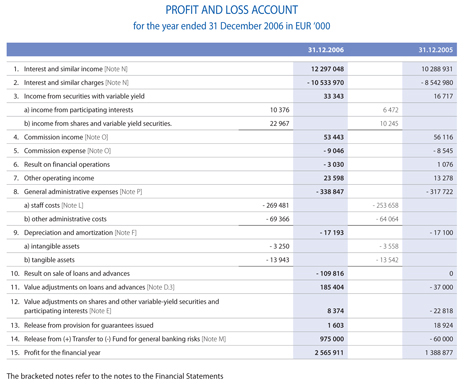
PROFIT AND LOSS ACCOUNT
for the year ended 31 December 2006 in EUR ‘000
31.12.2006
31.12.2005
1.
Interest and similar income [Note N]
12 297 048
10 288 931
2.
Interest and similar charges [Note N]
- 10 533 970
- 8 542 980
3.
Income from securities with variable yield
33 343
16 717
a) income from participating interests
10 376
6 472
b) income from shares and variable yield securities.
22 967
10 245
4.
Commission income [Note O]
53 443
56 116
5.
Commission expense [Note O]
- 9 046
- 8 545
6.
Result on financial operations
- 3 030
1 076
7.
Other operating income
23 598
13 278
8.
General administrative expenses [Note P]
- 338 847
- 317 722
a) staff costs [Note L]
- 269 481
- 253 658
b) other administrative costs
- 69 366
- 64 064
9.
Depreciation and amortization [Note F]
- 17 193
- 17 100
a) intangible assets
- 3 250
- 3 558
b) tangible assets
- 13 943
- 13 542
10.
Result on sale of loans and advances
- 109 816
0
11.
Value adjustments on loans and advances [Note D.3]
185 404
- 37 000
12.
Value adjustments on shares and other variable-yield securities and
participating interests [Note E]
8 374
- 22 818
13.
Release from provision for guarantees issued
1 603
18 924
14.
Release from (+) Transfer to (-) Fund for general banking risks [Note M]
975 000
- 60 000
15.
Profit for the financial year
2 565 911
1 388 877
The bracketed notes refer to the notes to the Financial Statements
68 EIB Group
55
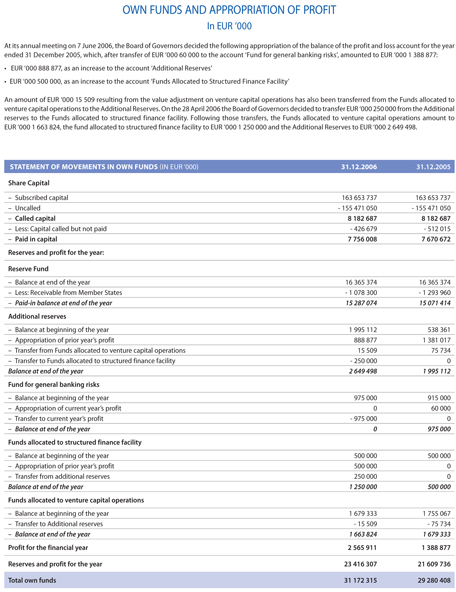
OWN FUNDS AND APPROPRIATION OF PROFIT
In EUR ‘000
At its annual meeting on 7 June 2006, the Board of Governors decided the following appropriation of the balance of the profit and loss account for the year ended 31 December 2005, which, after transfer of EUR ‘000 60 000 to the account ‘Fund for general banking risks’, amounted to EUR ‘000 1 388 877:
• EUR ‘000 888 877, as an increase to the account ‘Additional Reserves’
• EUR ‘000 500 000, as an increase to the account ‘Funds Allocated to Structured Finance Facility’
An amount of EUR ‘000 15 509 resulting from the value adjustment on venture capital operations has also been transferred from the Funds allocated to venture capital operations to the Additional Reserves. On the 28 April 2006 the Board of Governors decided to transfer EUR ‘000 250 000 from the Additional reserves to the Funds allocated to structured finance facility. Following those transfers, the Funds allocated to venture capital operations amount to EUR ‘000 1 663 824, the fund allocated to structured finance facility to EUR ‘000 1 250 000 and the Additional Reserves to EUR ‘000 2 649 498.
STATEMENT OF MOVEMENTS IN OWN FUNDS _IN EUR ‘000_
31.12.2006
31.12.2005
Share Capital
– Subscribed capital
163 653 737
163 653 737
– Uncalled
- 155 471 050
- 155 471 050
– Called capital
8 182 687
8 182 687
– Less: Capital called but not paid
- 426 679
- 512 015
– Paid in capital
7 756 008
7 670 672
Reserves and profit for the year:
Reserve Fund
– Balance at end of the year
16 365 374
16 365 374
– Less: Receivable from Member States
- 1 078 300
- 1 293 960
– Paid-in balance at end of the year
15 287 074
15 071 414
Additional reserves
– Balance at beginning of the year
1 995 112
538 361
– Appropriation of prior year’s profit
888 877
1 381 017
– Transfer from Funds allocated to venture capital operations
15 509
75 734
– Transfer to Funds allocated to structured finance facility
- 250 000
0
Balance at end of the year
2 649 498
1 995 112
Fund for general banking risks
– Balance at beginning of the year
975 000
915 000
– Appropriation of current year’s profit
0
60 000
– Transfer to current year’s profit
- 975 000
0
– Balance at end of the year
0
975 000
Funds allocated to structured finance facility
– Balance at beginning of the year
500 000
500 000
– Appropriation of prior year’s profit
500 000
0
– Transfer from additional reserves
250 000
0
Balance at end of the year
1 250 000
500 000
Funds allocated to venture capital operations
– Balance at beginning of the year
1 679 333
1 755 067
– Transfer to Additional reserves
- 15 509
- 75 734
– Balance at end of the year
1 663 824
1 679 333
Profit for the financial year
2 565 911
1 388 877
Reserves and profit for the year
23 416 307
21 609 736
Total own funds
31 172 315
29 280 408
EIB – Financial Statements 2006 69
56
STATEMENT OF SUBSCRIPTIONS TO THE CAPITAL OF THE BANK
AS AT 31 DECEMBER 2006 (in EUR)
Paid-in and to be
paid-in capital at
MEMBER STATES
Subscribed capital
Uncalled capital (*)
31.12.2006(**)
GERMANY
26 649 532 500
25 316 065 017
1 333 467 483
FRANCE
26 649 532 500
25 316 065 017
1 333 467 483
ITALY
26 649 532 500
25 316 065 017
1 333 467 483
UNITED KINGDOM
26 649 532 500
25 316 065 017
1 333 467 483
SPAIN
15 989 719 500
15 191 419 977
798 299 523
NETHERLANDS
7 387 065 000
7 018 606 548
368 458 452
BELGIUM
7 387 065 000
7 018 606 548
368 458 452
SWEDEN
4 900 585 500
4 655 556 231
245 029 269
DENMARK
3 740 283 000
3 553 721 865
186 561 135
AUSTRIA
3 666 973 500
3 483 624 843
183 348 657
POLAND
3 411 263 500
3 240 700 325
170 563 175
FINLAND
2 106 816 000
2 001 475 188
105 340 812
GREECE
2 003 725 500
1 903 781 233
99 944 267
PORTUGAL
1 291 287 000
1 226 879 033
64 407 967
CZECH REPUBLIC
1 258 785 500
1 195 846 225
62 939 275
HUNGARY
1 190 868 500
1 131 325 075
59 543 425
IRELAND
935 070 000
888 429 814
46 640 186
SLOVAK REPUBLIC
428 490 500
407 065 975
21 424 525
SLOVENIA
397 815 000
377 924 250
19 890 750
LITHUANIA
249 617 500
237 136 625
12 480 875
LUXEMBOURG
187 015 500
177 687 377
9 328 123
CYPRUS
183 382 000
174 212 900
9 169 100
LATVIA
152 335 000
144 718 250
7 616 750
ESTONIA
117 640 000
111 758 000
5 882 000
MALTA
69 804 000
66 313 800
3 490 200
TOTAL
163 653 737 000
155 471 050 150
8 182 686 850
(*) Could be called by decision of the Board of Directors to such extent as may be required for the Bank to meet its obligations towards those who have made loans to it. (**) Refer to Note X for details on the payment schedule on capital to be paid-in.
70 EIB Group
57
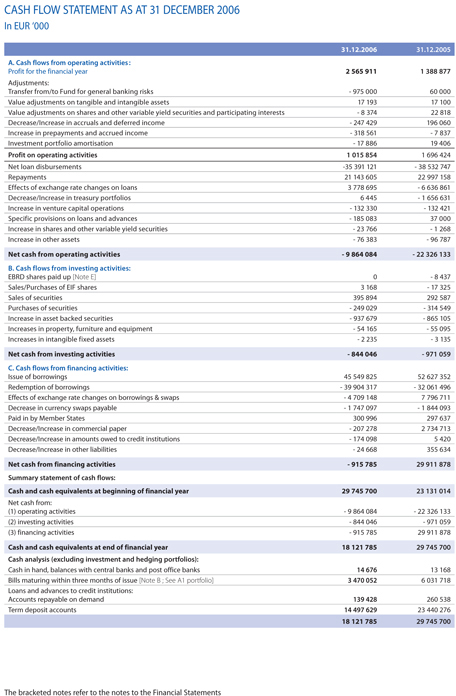
CASH FLOW STATEMENT AS AT 31 DECEMBER 2006
In EUR ‘000
31.12.2006
31.12.2005
A. Cash flows from operating activities :
Profit for the financial year
2 565 911
1 388 877
Adjustments:
Transfer from/to Fund for general banking risks
- 975 000
60 000
Value adjustments on tangible and intangible assets
17 193
17 100
Value adjustments on shares and other variable yield securities and participating interests
- 8 374
22 818
Decrease/Increase in accruals and deferred income
- 247 429
196 060
Increase in prepayments and accrued income
- 318 561
- 7 837
Investment portfolio amortisation
- 17 886
19 406
Profit on operating activities
1 015 854
1 696 424
Net loan disbursements
-35 391 121
- 38 532 747
Repayments
21 143 605
22 997 158
Effects of exchange rate changes on loans
3 778 695
- 6 636 861
Decrease/Increase in treasury portfolios
6 445
- 1 656 631
Increase in venture capital operations
- 132 330
- 132 421
Specific provisions on loans and advances
- 185 083
37 000
Increase in shares and other variable yield securities
- 23 766
- 1 268
Increase in other assets
- 76 383
- 96 787
Net cash from operating activities
- 9 864 084
- 22 326 133
B. Cash flows from investing activities:
EBRD shares paid up [Note E]
0
- 8 437
Sales/Purchases of EIF shares
3 168
- 17 325
Sales of securities
395 894
292 587
Purchases of securities
- 249 029
- 314 549
Increase in asset backed securities
- 937 679
- 865 105
Increases in property, furniture and equipment
- 54 165
- 55 095
Increases in intangible fixed assets
- 2 235
- 3 135
Net cash from investing activities
- 844 046
- 971 059
C. Cash flows from financing activities:
Issue of borrowings
45 549 825
52 627 352
Redemption of borrowings
- 39 904 317
- 32 061 496
Effects of exchange rate changes on borrowings & swaps
- 4 709 148
7 796 711
Decrease in currency swaps payable
- 1 747 097
- 1 844 093
Paid in by Member States
300 996
297 637
Decrease/Increase in commercial paper
- 207 278
2 734 713
Decrease/Increase in amounts owed to credit institutions
- 174 098
5 420
Decrease/Increase in other liabilities
- 24 668
355 634
Net cash from financing activities
- 915 785
29 911 878
Summary statement of cash flows:
Cash and cash equivalents at beginning of financial year
29 745 700
23 131 014
Net cash from:
(1) operating activities
- 9 864 084
- 22 326 133
(2) investing activities
- 844 046
- 971 059
(3) financing activities
- 915 785
29 911 878
Cash and cash equivalents at end of financial year
18 121 785
29 745 700
Cash analysis (excluding investment and hedging portfolios):
Cash in hand, balances with central banks and post office banks
14 676
13 168
Bills maturing within three months of issue [Note B ; See A1 portfolio]
3 470 052
6 031 718
Loans and advances to credit institutions:
Accounts repayable on demand
139 428
260 538
Term deposit accounts
14 497 629
23 440 276
18 121 785
29 745 700
The bracketed notes refer to the notes to the Financial Statements
EIB – Financial Statements 2006 71
58
EUROPEAN INVESTMENT BANK
NOTES TO THE FINANCIAL STATEMENTS AS AT 31 DECEMBER 2006
Note A – Significant accounting policies
A.1. Accounting standards
The unconsolidated financial statements (the ‘Financial Statements’) of the European Investment Bank (the ‘Bank’ or ‘EIB’) have been prepared in accordance with the general principles of the Directive 86/635/EEC of the Council of the European Communities of 8 December 1986 on the annual accounts and consolidated accounts of banks and other financial institutions (the ‘Directive’), as amended by Directive 2001/65/EC of 27 September 2001 and by Directive 2003/51/EC of 18 June 2003 on the annual and consolidated accounts of certain types of companies, banks and other financial institutions and insurance undertakings (the ‘Directives’). However, the Financial Statements do not include any management report. The Bank prepares an Activity Report which is presented separately from the Financial Statements and its consistency with the Financial Statements is not audited.
On a proposal from the Management Committee, the Board of Directors decided on 13 March 2007 to submit the Financial Statements to the Governors for approval at their meeting on 5 June 2007.
In preparing the Financial Statements, the Management Committee is required to make estimates and assumptions that affect reported income, expenses, assets, liabilities and disclosure of contingent assets and liabilities. Use of available information and application of judgement are inherent in the formation of estimates. Actual results in the future could differ from such estimates and the resulting differences may be material to the Financial Statements.
The Bank also publishes consolidated Financial Statements.
A.2. Foreign currency translation
In accordance with Article 4(1) of its Statute, the EIB uses the euro, the single currency of the Member States participating in the third stage of Economic and Monetary Union, as the unit of measure for the capital accounts of Member S tates and for presenting its Financial Statements. The Bank conducts its operations in the currencies of its Member States, in euro and in non-Community currencies.
Its resources are derived from its capital, borrowings and accumulated earnings in various currencies and are held, invested or lent in the same currencies.
Foreign currency transactions are translated at the exchange rate prevailing on the date of the transaction.
The Bank’s assets and liabilities denominated in currencies other than in euro are translated at closing exchange rates prevailing at the balance sheet date. The gain or loss arising from such translation is recorded in the profit and loss account.
The elements of the profit and loss accounts are translated into euro monthly on the basis of the exchange rates prevailing at the end of each month.
A.3. Derivatives
The Bank uses derivative instruments, i.e. mainly currency and interest rate swaps, as part of its asset and liability management activities to manage exposures to interest rate and foreign currency risks, including exposures arising from forecast transactions.
The majority of the Bank’s swaps are concluded with a view to hedging specific bond issues. The Bank enters into currency swaps, in which, at inception the proceeds of a borrowing are converted into a different currency, mainly as part of its resource-raising operations, and, thereafter, the Bank will obtain the amounts needed to service the borrowing in the original currency. The amounts corresponding to these operations are booked as off-balance sheet items at the date of the transaction.
The Bank also enters into currency and interest rate swaps as part of its hedging operations on loans or for the global ALM position. The corresponding interest is accounted for on a prorata temporis basis. The nominal amounts of these swaps are booked as off-balance sheet items at the date of the transaction.
The bank also enters into short-term currency swap contracts in order to adjust currency positions in its operational treasury in relation to its benchmark currency, the euro, and to cater for demand for currencies in conjunction with loan disbursements.
The Bank also enters into credit default swaps as part of its credit risk mitigation. The corresponding amounts are booked as off-balance sheet items at the date of the transaction.
A.4. Financial assets
Financial assets are accounted for using the settlement date basis.
A.5. Cash and Cash Equivalents
The Bank defines cash equivalents as short-term, highly liquid securities and interest-earning deposits with original maturities of 90 days or less.
A.6. Treasury bills and other bills eligible for refinancing with central banks and debt securities including fixed-income securities
With a view to clarifying management of its liquid assets and consolidating its solvency, the Bank has established the following portfolio categories: A.6.1. Investment portfolio The investment portfolio consists of securities purchased with the intention of holding them to maturity. These securities are issued or guaranteed by:
– Governments of the European Union, G10 countries and their agencies;
– Supranational public institutions, including multinational development banks.
These securities are initially recorded at purchase price or more exceptionally at transfer price. The difference between entry price and redemption value is accounted for prorata temporis over the remaining life of the securities.
During 2006, the Bank has decided to phase out the investment portfolio. The bank will not make any new addition to the investment portfolio and will keep the existing portfolio lines until final maturity upon which the redemption proceeds of such matured securities will be invested in the operational portfolios described in paragraph A.6.2.
A.6.2. Operational portfolios
– Operational money market portfolios A1 and A2
In order to maintain an adequate level of liquidity, the Bank purchases money market products with a maximum maturity of twelve months, in particular Treasury bills and negotiable debt securities issued by credit institutions. The securities in the A1 portfolio are held until their final maturity and presented in the financial statements at their nominal value. The securities in the A2 portfolio are available for sale and presented in the accounts at the lower of cost or market value. Value adjustments are recorded under item 6. Result on financial operations in the profit and loss account. During 2005, the securities in the previous A2 portfolio matured and were reinvested in the A2 AFS portfolio, which was renamed A2 as at December 31, 2005 (see note B).
Treasury bills appear on the assets side of the balance sheet under item 2. Treasury bills eligible for refinancing with central banks.
Negotiable debt securities issued by credit institutions appear on the assets side of the balance sheet under item 5. Debt securities including fixed-income securities—b) issued by other borrowers.
72 EIB Group
59
– Operational bond portfolios B1, B2 and B3
The B1 ‘Credit Spread’ portfolio comprises floating-rate and fixed-rate bonds issued or guaranteed by national governments, supranational institutions, financial institutions and corporations with a maximum residual maturity of 5 years. As at 31 December 2005, the securities in the portfolio were presented in the financial statements at their amortised cost and were held until their final maturity. As from 1 July 2006, the securities were converted into available for sale securities, and the related realised result from the conversion has been recognized in the profit and loss account under item 6. Result on financial operations. The securities are presented in the financial statements at the lower of cost or market value. Value adjustments are recorded under item 6. Result on financial operations in the profit and loss account.
The B2 ‘Alternative investment’ portfolio comprises capital guaranteed notes, by issuers which meet the Bank’s Treasury investment criteria and with coupons linked to the performance of underlying Funds of Hedge Funds with initial maturities of approximately five years. The securities are available for sale and presented in the accounts at the lower of cost or market value. Value adjustments are recorded under item 6. Result on financial operations in the profit and loss account.
The B3 ‘Global Fixed income’ portfolio comprises listed securities with a maximum residual maturity of 10 years, issued and guaranteed by financial institutions. Securities held in this portfolio are marked to market value in the balance sheet; the corresponding value adjustment is recorded under item 6. Result on financial operations in the profit and loss account.
A.7. Securities borrowing and lending
In April 2003, the Bank signed an agreement for securities lending with Northern Trust Global Investment acting as an agent to lend securities from the Investment Portfolio, the B1 ‘Credit Spread’ portfolio and the B3 ‘Global Fixed income’ portfolio.
Securities borrowed and securities lent are recorded at the amount of cash collateral advanced or received, plus accrued interest. Securities borrowed and securities received as collateral under securities lending transactions are not recognized in the balance sheet unless control of the contractual rights that comprise these securities received is gained. Securities lent and securities provided as collateral under securities borrowing transactions are not derecognised from the balance sheet unless control of the contractual rights that comprise these securities transferred is relinquished. The Bank monitors the market value of the securities borrowed and lent on a daily basis and provides or requests additional collateral in accordance with the underlying agreements.
Fees and interest received or paid are recorded as interest income or interest expense, on an accrual basis.
A.8. Loans and advances to credit institutions and customers
A.8.1. Loans and advances
Loans and advances are included in the assets of the Bank at their net disbursed amounts. Specific value adjustments have been made for loans and advances outstanding at the end of the financial year and presenting risks of non-recovery of all or part of their amounts. Such value adjustments are held in the same currency as the asset to which they relate. Value adjustments are accounted for in the profit and loss account as ‘Value adjustments on loans and advances’ and are deducted from the appropriate asset items on the balance sheet.
A.8.2. Interest on loans
Interest on loans is recorded in the profit and loss account on an accruals basis, i.e. over the life of the loans. On the balance sheet, accrued interest is included in ‘Prepayments and accrued income’ under assets. Value adjustments to interest amounts on these loans are determined on a case-by-case basis by the Bank’s Management and recorded under ‘Specific provisions’ under assets together with the relevant line item under assets.
A.8.3. Reverse repurchase and repurchase operations (reverse repos and repos)
The Bank enters into tripartite reverse repos for the purpose of optimising credit risk usage involved an assets held in operational portfolios. Under a Tripartite repo a custodian/clearing agency arranges for custody, clearing and settlement of repos transactions between the Bank and a third party. They operate under a standard global master purchase agreement and provides for delivery against payment system, substitution of securities, automatic marking to market, reporting and daily administration by single agency which takes care of the risk on itself and automatic rollovers while does not insist on disclosing the identities by counterparties.
This type of operation is considered for the purposes of the Bank to be a loan (borrowing) at a guaranteed rate of interest. They are carried at the amounts of cash advanced or received, plus accrued interest and are entered on the assets side of the balance sheet under asset item 3. Loans and advances to credit institutions – b) other loans and advances or liability item 1. Amounts owed to credit institutions – with agreed maturity dates or periods of notice.
Interest earned on reverse repurchase agreements and interest incurred on repurchase agreements is recognised as interest income or interest expense, over the life of each agreement.
A.8.4. Interest subsidies
Interest subsidies received in advance (see Note G) are deferred and recognised in the profit and loss account over the period from disbursement to repayment of the subsidised loan.
A.9. Shares, other variable-yield securities and participating interests
A.9.1. Shares and other variable-yield securities
Shares and other variable-yield securities are recorded at acquisition cost. At the balance sheet date, their carrying value is adjusted to the lower of cost or market value. The Bank acquires shares and other variable-yield securities when it enters into venture capital operations or infrastructure funds under the S tructured Finance Facility (see Note A.15).
Investments in venture capital enterprises and infrastructure funds represent shares and other variable-yield securities acquired for the longer term in the normal course of the Bank’s activities and are initially shown in the balance sheet at their original purchase cost. Based on the reports received from fund managers up to the balance sheet date, the portfolios of investments are valued on a line-by-line basis at the lower of cost or attributable net asset value (‘NAV’), thus excluding any attributable unrealised gain that may be prevailing in the portfolio. The attributable NAV is determined through applying either the Bank’s percentage ownership in the underlying vehicle to the NAV reflected in the most recent report or, to the extent available, the value per share at the same date, submitted by the respective Fund Manager. The attributable NAV is adjusted for events having occurred between the date of the latest available NAV and the balance sheet date to the extent that such adjustment is considered to be material. Unrealised losses due solely to administrative expenses and management fees of venture capital or infrastructure funds in existence for less than two years at the balance sheet date are not taken into consideration in determining the attributable NAV.
A.9.2. Participating interests
Participating interests held represent medium and long-term investments and are accounted for at cost. Value impairments are accounted for, if these are other than temporary.
A.10. Property, furniture and equipment
Property, furniture and equipment include land, Bank-occupied properties, other machines and equipment.
Land and buildings are stated at acquisition cost less accumulated depreciation. The value of the Bank’s headquarters building in Luxembourg-Kirchberg and its buildings in Luxembourg-Hamm, Luxembourg-Weimershof and Lisbon is depreciated on the straight-line basis as set out below. Office furniture and equipment were, until end-1997, depreciated in full in the year of acquisition. With effect from 1998, permanent equipment, fixtures and fittings, furniture, office equipment and vehicles have been recorded in the balance sheet at their acquisition cost, less accumulated depreciation.
EIB – Financial Statements 2006 73
60
Depreciation is calculated on the straight-line basis over the estimated life of each item purchased, as set out below:
– Buildings in Kirchberg, Hamm and Weimershof
30 years
– Building in Lisbon
25 years
– Permanent equipment, fixtures and fittings
10 years
– Furniture
5 years
– Office equipment and vehicles
3 years
Works of art are depreciated in full in the year of acquisition.
A.11. Intangible assets
Intangible assets comprise computer software. Software development costs are capitalized if they meet certain criteria relating to identifiability, to the probability that future economic benefits will flow to the enterprise and to the reliability of cost measurement.
Internally developed software meeting these criteria is carried at cost less accumulated depreciation calculated on the straight-line basis over three years from completion.
Software purchased is depreciated on the straight-line basis over its estimated life (2 to 5 years).
A.12. Staff pension fund and health insurance scheme
A.12.1. Pension fund
The Bank’s main pension scheme is a defined benefit pension scheme funded by contributions from staff and from the Bank which covers all employees. All contributions of the Bank and its staff are invested in the assets of the Bank. These annual contributions are set aside and accumulated as a specific provision on the liabilities side of the Bank’s balance sheet, together with annual interest.
Commitments for retirement benefits are valued at least every year using the projected unit credit method, in order to ensure that the provision entered in the accounts is adequate. The latest valuation was carried out as at 30 September 2006. The main actuarial assumptions used by the actuary are set out in Note L. Actuarial surpluses do not influence provisioning and deficits result in an additional specific provision.
The main pension scheme of the European Investment Fund (‘EIF’) is a defined benefit scheme funded by contributions from staff and from the EIF which covers all employees. The scheme entered into force in March 2003, replacing the previous defined contribution scheme. The funds allocated to the pension scheme are in the custody of and invested by the EIB, following the rules and principles applied by EIB for its own pension scheme.
A.12.2. Health insurance scheme
The Bank has set up its own health insurance scheme for the benefit of staff, financed by contributions from the Bank and its employees. The health insurance scheme is managed under the same principles as the pension scheme. The latest valuation was carried out as at 30 S eptember 2006.
A.13. Debts evidenced by certificates
Debts evidenced by certificates are presented in this account at their redemption amounts. Transaction costs and premiums/ discounts are amortized in the profit and loss account on a straight line basis over the life of the debt through ‘accruals and deferred income’ or ‘prepayments and accrued income’.
Interest expense on debt instruments is included in ‘Interest and similar charges’ in the profit and loss account.
A.14. Fund for general banking risks and provision for guarantees issued
A.14.1. Fund for general banking risks
Until 31 December 2005, the Bank identified, as a separate balance sheet item, the amounts it decided to put aside to cover risks associated with loans and other financial operations, having regard to the particular risks attached to such operations.
Starting from 2006, the Bank no longer identifies such separate balance sheet item. The decision to release it completely does not affect the ability of the Bank to cover its risks. The Bank will continue to compute the amount corresponding to the general banking risks for internal and disclosure purposes (see Note M), according to the existing methodology (see Notes S and T).
The amount corresponding to the general banking risks with respect to operations of the Structured Finance Facility is disclosed in ‘Funds allocated to Structured Finance Facility’ on the balance sheet.
A.14.2. Provision for guarantees issued
This provision is intended to cover risks inherent in the Bank’s activity of issuing guarantees in favour of financial intermediaries or issued in respect of loans granted by third parties. A provision for credit losses is established if there is objective evidence that the Bank will have to incur a credit loss in respect of a given guarantee granted.
A.15. Funds allocated to structured finance facility and to venture capital operations
A.15.1. Funds allocated to structured finance facility
This item comprises the cumulative amount of appropriations from the annual result of the Bank, determined each year by the Board of Governors to facilitate the implementation of operations with a greater degree of risk for this new type of instrument.
A.15.2. Funds allocated to venture capital operations
This item comprises the cumulative amount of appropriations from the annual result of the Bank, determined each year by the Board of Governors to facilitate instruments providing venture capital in the context of implementing the European Council Resolution on Growth and Employment. Value adjustments on venture capital and structured finance operations are accounted for in the profit and loss account. Upon appropriation of the Bank’s result, such value adjustments are taken into consideration for determining the amounts to be recorded in ‘Funds allocated to structured finance facility’ and ‘Funds allocated to venture capital operations’.
A.16. Taxation
The Protocol on the Privileges and Immunities of the European Communities, appended to the Treaty of 8 April 1965 establishing a Single Council and a Single Commission of the European Communities, stipules that the assets, revenues and other property of the Bank are exempt from all direct taxes.
A.17. Prepayments and accrued income—Accruals and deferred income
These accounts comprise:
Prepayments and accrued income: Expenditure incurred during the financial year but relating to a subsequent financial year, together with any income which, though relating to the financial year in question, is not due until after its expiry (principally interest on loans).
Accruals and deferred income: Income received before the balance sheet date but relating to a subsequent financial year, together with any charges which, though relating to the financial year in question, will be paid only in the course of a subsequent financial year (principally interest on borrowings).
A.18. Interest and similar income
In addition to interest and commission income on loans and deposits and other revenue from the securities portfolio, the ‘Interest and similar income’ includes the indemnities received by the Bank for prepayments made by its borrowers. In order to maintain equivalent accounting treatment between income on loans and the cost of borrowings, the Bank amortises prepayment indemnities received over the remaining life of the loans concerned.
74 EIB Group
61
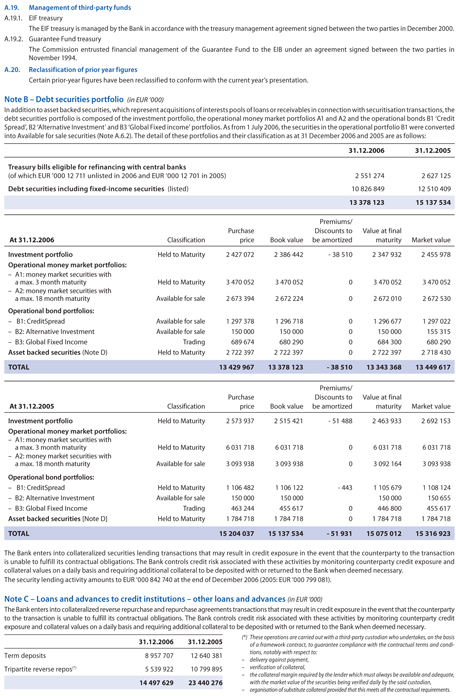
A.19. Management of third-party funds
A.19.1. EIF treasury
The EIF treasury is managed by the Bank in accordance with the treasury management agreement signed between the two parties in December 2000. A.19.2. Guarantee Fund treasury The Commission entrusted financial management of the Guarantee Fund to the EIB under an agreement signed between the two parties in November 1994.
A.20. Reclassification of prior year figures
Certain prior-year figures have been reclassified to conform with the current year’s presentation.
31.12.2006
31.12.2005
Treasury bills eligible for refinancing with central banks
(of which EUR ‘000 12 711 unlisted in 2006 and EUR ‘000 12 701 in 2005)
2 551 274
2 627 125
Debt securities including fixed-income securities (listed)
10 826 849
12 510 409
13 378 123
15 137 534
At 31.12.2006
Classification
Purchase price
Book value
Premiums/ Discounts to be amortized
Value at final maturity
Market value
Investment portfolio
Held to Maturity
2 427 072
2 386 442
- 38 510
2 347 932
2 455 978
Operational money market portfolios:
– A1: money market securities with a max. 3 month maturity
Held to Maturity
3 470 052
3 470 052
0
3 470 052
3 470 052
– A2: money market securities with a max. 18 month maturity
Available for sale
2 673 394
2 672 224
0
2 672 010
2 672 530
Operational bond portfolios:
– B1: CreditSpread
Available for sale
1 297 378
1 296 718
0
1 296 677
1 297 022
– B2: Alternative Investment
Available for sale
150 000
150 000
0
150 000
155 315
– B3: Global Fixed Income
Trading
689 674
680 290
0
684 300
680 290
Asset backed securities (Note D)
Held to Maturity
2 722 397
2 722 397
0
2 722 397
2 718 430
TOTAL
13 429 967
13 378 123
- 38 510
13 343 368
13 449 617
At 31.12.2005
Classification
Purchase price
Book value
Premiums/ Discounts to be amortized
Value at final maturity
Market value
Investment portfolio
Held to Maturity
2 573 937
2 515 421
- 51 488
2 463 933
2 692 153
Operational money market portfolios:
– A1: money market securities with a max. 3 month maturity
Held to Maturity
6 031 718
6 031 718
0
6 031 718
6 031 718
– A2: money market securities with a max. 18 month maturity
Available for sale
3 093 938
3 093 938
0
3 092 164
3 093 938
Operational bond portfolios:
– B1: CreditSpread
Held to Maturity
1 106 482
1 106 122
- 443
1 105 679
1 108 124
– B2: Alternative Investment
Available for sale
150 000
150 000
150 000
150 655
– B3: Global Fixed Income
Trading
463 244
455 617
0
446 800
455 617
Asset backed securities [Note D]
Held to Maturity
1 784 718
1 784 718
0
1 784 718
1 784 718
TOTAL
15 204 037
15 137 534
- 51 931
15 075 012
15 316 923
The Bank enters into collateralized securities lending transactions that may result in credit exposure in the event that the counterparty to the transaction is unable to fulfill its contractual obligations. The Bank controls credit risk associated with these activities by monitoring counterparty credit exposure and collateral values on a daily basis and requiring additional collateral to be deposited with or returned to the Bank when deemed necessary.
The security lending activity amounts to EUR ‘000 842 740 at the end of December 2006 (2005: EUR ‘000 799 081).
Note C – Loans and advances to credit institutions – other loans and advances (in EUR ‘000)
The Bank enters into collateralized reverse repurchase and repurchase agreements transactions that may result in credit exposure in the event that the counterparty to the transaction is unable to fulfill its contractual obligations. The Bank controls credit risk associated with these activities by monitoring counterparty credit exposure and collateral values on a daily basis and requiring additional collateral to be deposited with or returned to the Bank when deemed necessary.
31.12.2006
31.12.2005
Term deposits
8 957 707
12 640 381
Tripartite reverse repos(*)
5 539 922
10 799 895
14 497 629
23 440 276
(*) These operations are carried out with a third-party custodian who undertakes, on the basis of a framework contract, to guarantee compliance with the contractual terms and conditions, notably with respect to: – delivery against payment, – verification of collateral, – the collateral margin required by the lender which must always be available and adequate, with the market value of the securities being verified daily by the said custodian, – organisation of substitute collateral provided that this meets all the contractual requirements.
EIB – Financial Statements 2006 75
62
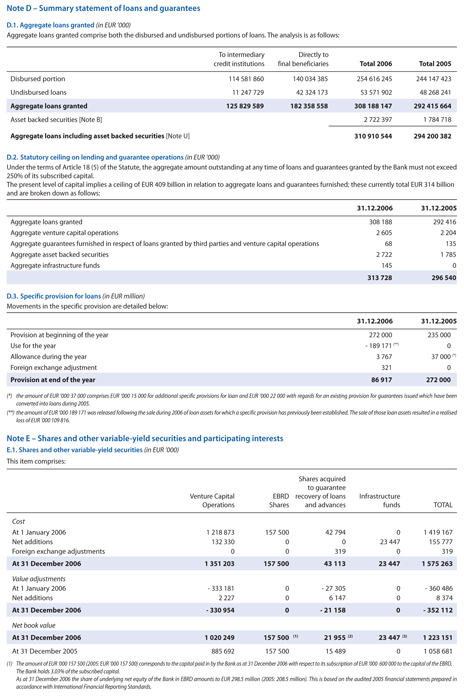
Note D – Summary statement of loans and guarantees
D.1. Aggregate loans granted (in EUR ‘000)
Aggregate loans granted comprise both the disbursed and undisbursed portions of loans. The analysis is as follows:
To intermediary credit institutions
Directly to final beneficiaries
Total 2006
Total 2005
Disbursed portion
114 581 860
140 034 385
254 616 245
244 147 423
Undisbursed loans
11 247 729
42 324 173
53 571 902
48 268 241
Aggregate loans granted
125 829 589
182 358 558
308 188 147
292 415 664
Asset backed securities [Note B]
2 722 397
1 784 718
Aggregate loans including asset backed securities [Note U]
310 910 544
294 200 382
D.2. Statutory ceiling on lending and guarantee operations (in EUR ‘000)
Under the terms of Article 18 (5) of the Statute, the aggregate amount outstanding at any time of loans and guarantees granted by the Bank must not exceed 250% of its subscribed capital.
The present level of capital implies a ceiling of EUR 409 billion in relation to aggregate loans and guarantees furnished; these currently total EUR 314 billion and are broken down as follows:
31.12.2006
31.12.2005
Aggregate loans granted
308 188
292 416
Aggregate venture capital operations
2 605
2 204
Aggregate guarantees furnished in respect of loans granted by third parties and venture capital operations
68
135
Aggregate asset backed securities
2 722
1 785
Aggregate infrastructure funds
145
0
313 728
296 540
D.3. Specific provision for loans (in EUR million)
Movements in the specific provision are detailed below:
31.12.2006
31.12.2005
Provision at beginning of the year
272 000
235 000
Use for the year
- 189 171 (**)
0
Allowance during the year
3 767
37 000(*)
Foreign exchange adjustment
321
0
Provision at end of the year
86 917
272 000
(*) the amount of EUR ‘000 37 000 comprises EUR ‘000 15 000 for additional specific provisions for loan and EUR ‘000 22 000 with regards for an existing provision for guarantees issued which have been converted into loans during 2005.
(**) the amount of EUR ‘000 189 171 was released following the sale during 2006 of loan assets for which a specific provision has previously been established. The sale of those loan assets resulted in a realised loss of EUR ‘000 109 816.
Note E – Shares and other variable-yield securities and participating interests
E.1. Shares and other variable-yield securities (in EUR ‘000)
This item comprises:
Venture Capital Operations
EBRD Shares
Shares acquired to guarantee recovery of loans and advances
Infrastructure funds
TOTAL
Cost
At 1 January 2006
1 218 873
157 500
42 794
0
1 419 167
Net additions
132 330
0
0
23 447
155 777
Foreign exchange adjustments
0
0
319
0
319
At 31 December 2006
1 351 203
157 500
43 113
23 447
1 575 263
Value adjustments
At 1 January 2006
- 333 181
0
- 27 305
0
- 360 486
Net additions
2 227
0
6 147
0
8 374
At 31 December 2006
- 330 954
0
- 21 158
0
- 352 112
Net book value
At 31 December 2006
1 020 249
157 500
(1) 21 955 (2)
23 447 (3)
1 223 151
At 31 December 2005
885 692
157 500
15 489
0
1 058 681
(1) The amount of EUR ‘000 157 500 (2005: EUR ‘000 157 500) corresponds to the capital paid in by the Bank as at 31 December 2006 with respect to its subscription of EUR ‘000 600 000 to the capital of the EBRD. The Bank holds 3.03% of the subscribed capital.
As at 31 December 2006 the share of underlying net equity of the Bank in EBRD amounts to EUR 298.5 million (2005: 208.5 million). This is based on the audited 2005 financial statements prepared in accordance with International Financial Reporting Standards.
63
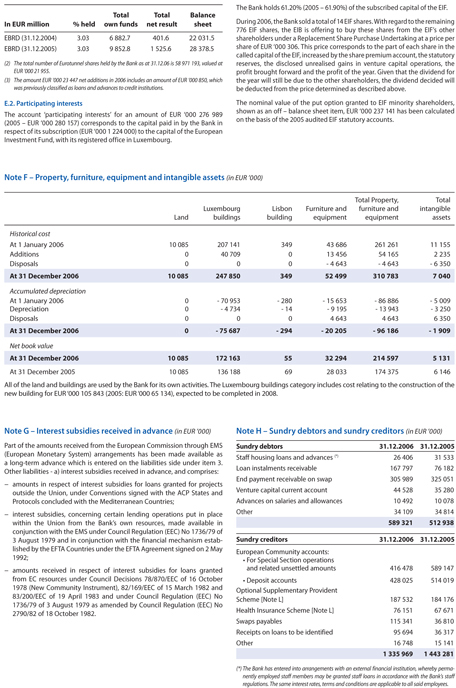
Total
Total
Balance
In EUR million
% held
own funds
net result
sheet
EBRD (31.12.2004)
3.03
6 882.7
401.6
22 031.5
EBRD (31.12.2005)
3.03
9 852.8
1 525.6
28 378.5
(2) The total number of Eurotunnel shares held by the Bank as at 31.12.06 is 58 971 193, valued at EUR ‘000 21 955.
(3) The amount EUR ‘000 23 447 net additions in 2006 includes an amount of EUR ‘000 850, which was previously classified as loans and advances to credit institutions.
E.2. Participating interests
The account ‘participating interests’ for an amount of EUR ‘000 276 989 (2005 – EUR ‘000 280 157) corresponds to the capital paid in by the Bank in respect of its subscription (EUR ‘000 1 224 000) to the capital of the European Investment Fund, with its registered office in Luxembourg.
The Bank holds 61.20% (2005 – 61.90%) of the subscribed capital of the EIF. During 2006, the Bank sold a total of 14 EIF shares. With regard to the remaining 776 EIF shares, the EIB is offering to buy these shares from the EIF’s other shareholders under a Replacement Share Purchase Undertaking at a price per share of EUR ‘000 306. This price corresponds to the part of each share in the called capital of the EIF, increased by the share premium account, the statutory reserves, the disclosed unrealised gains in venture capital operations, the profit brought forward and the profit of the year. Given that the dividend for the year will still be due to the other shareholders, the dividend decided will be deducted from the price determined as described above.
The nominal value of the put option granted to EIF minority shareholders, shown as an off – balance sheet item, EUR ‘000 237 141 has been calculated on the basis of the 2005 audited EIF statutory accounts.
Note F – Property, furniture, equipment and intangible assets (in EUR ‘000)
Land
Luxembourg buildings
Lisbon building
Furniture and equipment
Total Property, furniture and equipment
Total intangible assets
Historical cost
At 1 January 2006
10 085
207 141
349
43 686
261 261
11 155
Additions
0
40 709
0
13 456
54 165
2 235
Disposals
0
0
0
- 4 643
- 4 643
- 6 350
At 31 December 2006
10 085
247 850
349
52 499
310 783
7 040
Accumulated depreciation
At 1 January 2006
0
- 70 953
- 280
- 15 653
- 86 886
- 5 009
Depreciation
0
- 4 734
- 14
- 9 195
- 13 943
- 3 250
Disposals
0
0
0
4 643
4 643
6 350
At 31 December 2006
0
- 75 687
- 294
- 20 205
- 96 186
- 1 909
Net book value
At 31 December 2006
10 085
172 163
55
32 294
214 597
5 131
At 31 December 2005
10 085
136 188
69
28 033
174 375
6 146
All of the land and buildings are used by the Bank for its own activities. The Luxembourg buildings category includes cost relating to the construction of the new building for EUR ‘000 105 843 (2005: EUR ‘000 65 134), expected to be completed in 2008.
Note G – Interest subsidies received in advance (in EUR ‘000)
Part of the amounts received from the European Commission through EMS (European Monetary System) arrangements has been made available as a long-term advance which is entered on the liabilities side under item 3. Other liabilities—a) interest subsidies received in advance, and comprises:—amounts in respect of interest subsidies for loans granted for projects outside the Union, under Conventions signed with the ACP States and Protocols concluded with the Mediterranean Countries;—interest subsidies, concerning certain lending operations put in place within the Union from the Bank’s own resources, made available in conjunction with the EMS under Council Regulation (EEC) No 1736/79 of 3 August 1979 and in conjunction with the financial mechanism established by the EFTA Countries under the EFTA Agreement signed on 2 May 1992;—amounts received in respect of interest subsidies for loans granted from EC resources under Council Decisions 78/870/EEC of 16 October 1978 (New Community Instrument), 82/169/EEC of 15 March 1982 and 83/200/EEC of 19 April 1983 and under Council Regulation (EEC) No 1736/79 of 3 August 1979 as amended by Council Regulation (EEC) No 2790/82 of 18 October 1982.
Note H – Sundry debtors and sundry creditors (in EUR ‘000)
Sundry debtors
31.12.2006
31.12.2005
Staff housing loans and advances (*)
26 406
31 533
Loan instalments receivable
167 797
76 182
End payment receivable on swap
305 989
325 051
Venture capital current account
44 528
35 280
Advances on salaries and allowances
10 492
10 078
Other
34 109
34 814
589 321
512 938
Sundry creditors
31.12.2006
31.12.2005
European Community accounts:
• For Special Section operations and related unsettled amounts
416 478
589 147
• Deposit accounts
428 025
514 019
Optional Supplementary Provident
Scheme [Note L]
187 532
184 176
Health Insurance Scheme [Note L]
76 151
67 671
Swaps payables
115 341
36 810
Receipts on loans to be identified
95 694
36 317
Other
16 748
15 141
1 335 969
1 443 281
(*) The Bank has entered into arrangements with an external financial institution, whereby permanently employed staff members may be granted staff loans in accordance with the Bank’s staff regulations. The same interest rates, terms and conditions are applicable to all said employees.
EIB – Financial Statements 2006 77
64
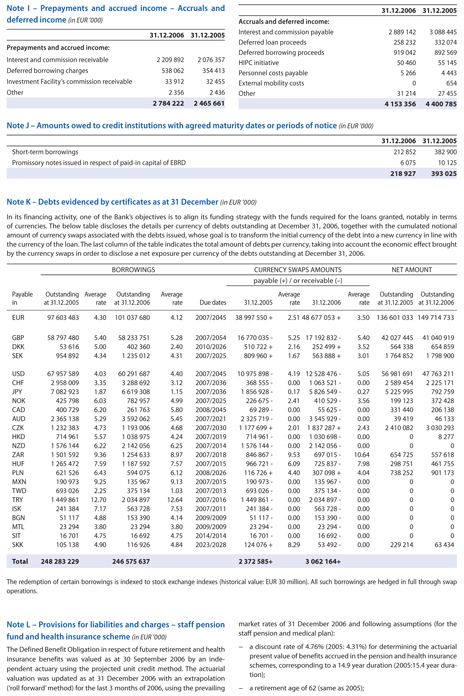
Note I – Prepayments and accrued income – Accruals and deferred income (in EUR ‘000)
31.12.2006
31.12.2005
Prepayments and accrued income:
Interest and commission receivable
2 209 892
2 076 357
Deferred borrowing charges
538 062
354 413
Investment Facility’s commission receivable
33 912
32 455
Other
2 356
2 436
2 784 222
2 465 661
Note J – Amounts owed to credit institutions with agreed maturity dates or periods of notice (in EUR ‘000)
31.12.2006
31.12.2005
Short-term borrowings
212 852
382 900
Promissory notes issued in respect of paid-in capital of EBRD
6 075
10 125
218 927
393 025
31.12.2006
31.12.2005
Accruals and deferred income:
Interest and commission payable
2 889 142
3 088 445
Deferred loan proceeds
258 232
332 074
Deferred borrowing proceeds
919 042
892 569
HIPC initiative
50 460
55 145
Personnel costs payable
5 266
4 443
External mobility costs
0
654
Other
31 214
27 455
4 153 356
4 400 785
Note K – Debts evidenced by certificates as at 31 December (in EUR ‘000)
In its financing activity, one of the Bank’s objectives is to align its funding strategy with the funds required for the loans granted, notably in terms of currencies. The below table discloses the details per currency of debts outstanding at December 31, 2006, together with the cumulated notional amount of currency swaps associated with the debts issued, whose goal is to transform the initial currency of the debt into a new currency in line with the currency of the loan. The last column of the table indicates the total amount of debts per currency, taking into account the economic effect brought by the currency swaps in order to disclose a net exposure per currency of the debts outstanding at December 31, 2006.
BORROWINGS
CURRENCY SWAPS AMOUNTS
NET AMOUNT
payable (+) / or receivable (–)
Payable
Outstanding
Average
Outstanding
Average
Average
Average
Outstanding
Outstanding
in
at 31.12.2005
rate
at 31.12.2006
rate
Due dates
31.12.2005
rate
31.12.2006
rate
at 31.12.2005
at 31.12.2006
EUR
97 603 483
4.30
101 037 680
4.12
2007/2045
38 997 550 +
2.51
48 677 053 +
3.50
136 601 033
149 714 733
GBP
58 797 480
5.40
58 233 751
5.28
2007/2054
16 770 035 -
5.25
17 192 832 -
5.40
42 027 445
41 040 919
DKK
53 616
5.00
402 360
2.40
2010/2026
510 722 +
2.16
252 499 +
3.52
564 338
654 859
SEK
954 892
4.34
1 235 012
4.31
2007/2025
809 960 +
1.67
563 888 +
3.01
1 764 852
1 798 900
USD
67 957 589
4.03
60 291 687
4.40
2007/2045
10 975 898 -
4.19
12 528 476 -
5.05
56 981 691
47 763 211
CHF
2 958 009
3.35
3 288 692
3.12
2007/2036
368 555 -
0.00
1 063 521 -
0.00
2 589 454
2 225 171
JPY
7 082 923
1.87
6 619 308
1.15
2007/2036
1 856 928 -
0.17
5 826 549 -
0.27
5 225 995
792 759
NOK
425 798
6.03
782 957
4.99
2007/2025
226 675 -
2.41
410 529 -
3.56
199 123
372 428
CAD
400 729
6.20
261 763
5.80
2008/2045
69 289 -
0.00
55 625 -
0.00
331 440
206 138
AUD
2 365 138
5.29
3 592 062
5.45
2007/2021
2 325 719 -
0.00
3 545 929 -
0.00
39 419
46 133
CZK
1 232 383
4.73
1 193 006
4.68
2007/2030
1 177 699 +
2.01
1 837 287 +
2.43
2 410 082
3 030 293
HKD
714 961
5.57
1 038 975
4.24
2007/2019
714 961 -
0.00
1 030 698 -
0.00
0
8 277
NZD
1 576 144
6.22
2 142 056
6.25
2007/2014
1 576 144 -
0.00
2 142 056 -
0.00
0
0
ZAR
1 501 592
9.36
1 254 633
8.97
2007/2018
846 867 -
9.53
697 015 -
10.64
654 725
557 618
HUF
1 265 472
7.59
1 187 592
7.57
2007/2015
966 721 -
6.09
725 837 -
7.98
298 751
461 755
PLN
621 526
6.43
594 075
6.12
2008/2026
116 726 +
4.40
307 098 +
4.04
738 252
901 173
MXN
190 973
9.25
135 967
9.13
2007/2015
190 973 -
0.00
135 967 -
0.00
0
0
TWD
693 026
2.25
375 134
1.03
2007/2013
693 026 -
0.00
375 134 -
0.00
0
0
TRY
1 449 861
12.70
2 034 897
12.64
2007/2016
1 449 861 -
0.00
2 034 897 -
0.00
0
0
I S K
241 384
7.17
563 728
7.53
2007/2011
241 384 -
0.00
563 728 -
0.00
0
0
BGN
51 117
4.88
153 390
4.14
2009/2009
51 117 -
0.00
153 390 -
0.00
0
0
MTL
23 294
3.80
23 294
3.80
2009/2009
23 294 -
0.00
23 294 -
0.00
0
0
SIT
16 701
4.75
16 692
4.75
2014/2014
16 701 -
0.00
16 692 -
0.00
0
0
SKK
105 138
4.90
116 926
4.84
2023/2028
124 076 +
8.29
53 492 -
0.00
229 214
63 434
Total
248 283 229
246 575 637
2 372 585+
3 062 164+
The redemption of certain borrowings is indexed to stock exchange indexes (historical value: EUR 30 million). All such borrowings are hedged in full through swap operations.
Note L – Provisions for liabilities and charges – staff pension fund and health insurance scheme (in EUR ‘000)
The Defined Benefit Obligation in respect of future retirement and health insurance benefits was valued as at 30 September 2006 by an independent actuary using the projected unit credit method. The actuarial valuation was updated as at 31 December 2006 with an extrapolation (‘roll forward’ method) for the last 3 months of 2006, using the prevailing market rates of 31 December 2006 and following assumptions (for the staff pension and medical plan):— a discount rate of 4.76% (2005: 4.31%) for determining the actuarial present value of benefits accrued in the pension and health insurance schemes, corresponding to a 14.9 year duration (2005:15.4 year duration);—a retirement age of 62 (same as 2005);
78 EIB Group
65
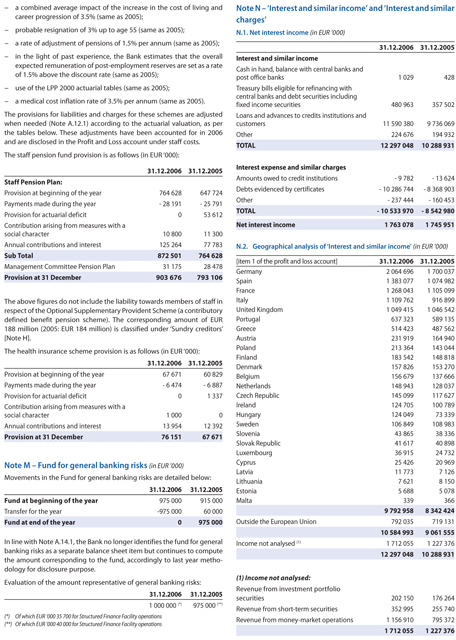
- a combined average impact of the increase in the cost of living and career progression of 3.5% (same as 2005);—probable resignation of 3% up to age 55 (same as 2005);—a rate of adjustment of pensions of 1.5% per annum (same as 2005);—in the light of past experience, the Bank estimates that the overall expected remuneration of post-employment reserves are set as a rate of 1.5% above the discount rate (same as 2005);—use of the LPP 2000 actuarial tables (same as 2005);—a medical cost inflation rate of 3.5% per annum (same as 2005). The provisions for liabilities and charges for these schemes are adjusted when needed (Note A.12.1) according to the actuarial valuation, as per the tables below. These adjustments have been accounted for in 2006 and are disclosed in the Profit and Loss account under staff costs. The staff pension fund provision is as follows (in EUR ‘000):
31.12.2006
31.12.2005
Staff Pension Plan:
Provision at beginning of the year
764 628
647 724
Payments made during the year
- 28 191
- 25 791
Provision for actuarial deficit
0
53 612
Contribution arising from measures with asocial character
10 800
11 300
Annual contributions and interest
125 264
77 783
Sub Total
872 501
764 628
Management Committee Pension Plan
31 175
28 478
Provision at 31 December
903 676
793 106
The above figures do not include the liability towards members of staff in respect of the Optional Supplementary Provident Scheme (a contributory defined benefit pension scheme). The corresponding amount of EUR 188 million (2005: EUR 184 million) is classified under ‘Sundry creditors’ [Note H].
The health insurance scheme provision is as follows (in EUR ‘000):
31.12.2006
31.12.2005
Provision at beginning of the year
67 671
60 829
Payments made during the year
- 6 474
- 6 887
Provision for actuarial deficit
0
1 337
Contribution arising from measures with asocial character
1 000
0
Annual contributions and interest
13 954
12 392
Provision at 31 December
76 151
67 671
Note M – Fund for general banking risks (in EUR ‘000)
Movements in the Fund for general banking risks are detailed below:
31.12.2006
31.12.2005
Fund at beginning of the year
975 000
915 000
Transfer for the year
-975 000
60 000
Fund at end of the year
0
975 000
In line with Note A.14.1, the Bank no longer identifies the fund for general banking risks as a separate balance sheet item but continues to compute the amount corresponding to the fund, accordingly to last year methodology for disclosure purpose.
Evaluation of the amount representative of general banking risks:
31.12.2006
31.12.2005
1 000 000 (*)
975 000 (**)
(*) Of which EUR ‘000 35 700 for Structured Finance Facility operations (**) Of which EUR ‘000 40 000 for Structured Finance Facility operations
Note N – ‘Interest and similar income’ and ‘Interest and similar charges’
N.1. Net interest income (in EUR ‘000)
31.12.2006
31.12.2005
Interest and similar income
Cash in hand, balance with central banks and post office banks
1 029
428
Treasury bills eligible for refinancing with central banks and debt securities including fixed income securities
480 963
357 502
Loans and advances to credits institutions and customers
11 590 380
9 736 069
Other
224 676
194 932
TOTAL
12 297 048
10 288 931
Interest expense and similar charges
Amounts owed to credit institutions
- 9 782
- 13 624
Debts evidenced by certificates
- 10 286 744
- 8 368 903
Other
- 237 444
- 160 453
TOTAL
- 10 533 970
- 8 542 980
Net interest income
1 763 078
1 745 951
N.2. Geographical analysis of ‘Interest and similar income’ (in EUR ‘000)
[item 1 of the profit and loss account]
31.12.2006
31.12.2005
Germany
2 064 696
1 700 037
Spain
1 383 077
1 074 982
France
1 268 043
1 105 099
Italy
1 109 762
916 899
United Kingdom
1 049 415
1 046 542
Portugal
637 323
589 135
Greece
514 423
487 562
Austria
231 919
164 940
Poland
213 364
143 044
Finland
183 542
148 818
Denmark
157 826
153 270
Belgium
156 679
137 666
Netherlands
148 943
128 037
Czech Republic
145 099
117 627
Ireland
124 705
100 789
Hungary
124 049
73 339
Sweden
106 849
108 983
Slovenia
43 865
38 336
Slovak Republic
41 617
40 898
Luxembourg
36 915
24 732
Cyprus
25 426
20 969
Latvia
11 773
7 126
Lithuania
7 621
8 150
Estonia
5 688
5 078
Malta
339
366
9 792 958
8 342 424
Outside the European Union
792 035
719 131
10 584 993
9 061 555
Income not analysed (1)
1 712 055
1 227 376
12 297 048
10 288 931
(1) Income not analysed:
Revenue from investment portfolio securities
202 150
176 264
Revenue from short-term securities
352 995
255 740
Revenue from money-market operations
1 156 910
795 372
1 712 055
1 227 376
EIB – Financial Statements 2006 79
66
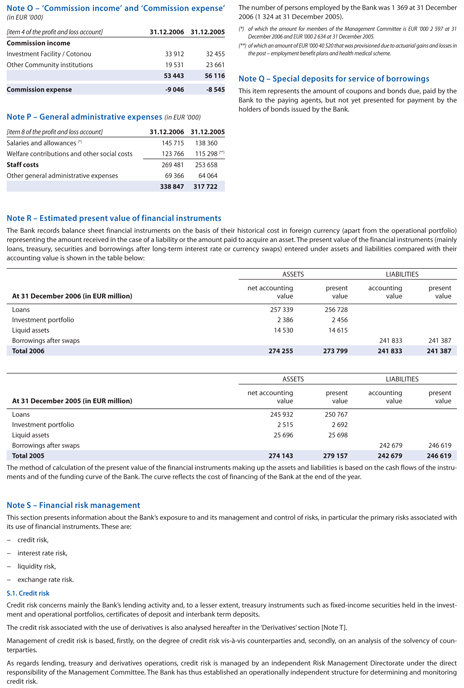
Note O – ‘Commission income’ and ‘Commission expense’
(in EUR ‘000)
[item 4 of the profit and loss account]
31.12.2006
31.12.2005
Commission income
Investment Facility / Cotonou
33 912
32 455
Other Community institutions
19 531
23 661
53 443
56 116
Commission expense
-9 046
-8 545
Note P – General administrative expenses (in EUR ‘000)
[item 8 of the profit and loss account]
31.12.2006
31.12.2005
Salaries and allowances (*)
145 715
138 360
Welfare contributions and other social costs
123 766
115 298 (**)
Staff costs
269 481
253 658
Other general administrative expenses
69 366
64 064
338 847
317 722
The number of persons employed by the Bank was 1 369 at 31 December 2006 (1 324 at 31 December 2005).
(*) of which the amount for members of the Management Committee is EUR ‘000 2 597 at 31 December 2006 and EUR ‘000 2 634 at 31 December 2005.
(**) of which an amount of EUR ‘000 40 520 that was provisioned due to actuarial gains and losses in the post – employment benefit plans and health medical scheme.
Note Q – Special deposits for service of borrowings
This item represents the amount of coupons and bonds due, paid by the Bank to the paying agents, but not yet presented for payment by the holders of bonds issued by the Bank.
Note R – Estimated present value of financial instruments
The Bank records balance sheet financial instruments on the basis of their historical cost in foreign currency (apart from the operational portfolio) representing the amount received in the case of a liability or the amount paid to acquire an asset. The present value of the financial instruments (mainly loans, treasury, securities and borrowings after long-term interest rate or currency swaps) entered under assets and liabilities compared with their accounting value is shown in the table below:
ASSETS
LIABILITIES
net accounting
present
accounting
present
At 31 December 2006 (in EUR million)
value
value
value
value
Loans
257 339
256 728
Investment portfolio
2 386
2 456
Liquid assets
14 530
14 615
Borrowings after swaps
241 833
241 387
Total 2006
274 255
273 799
241 833
241 387
ASSETS
LIABILITIES
net accounting
present
accounting
present
At 31 December 2005 (in EUR million)
value
value
value
value
Loans
245 932
250 767
Investment portfolio
2 515
2 692
Liquid assets
25 696
25 698
Borrowings after swaps
242 679
246 619
Total 2005
274 143
279 157
242 679
246 619
The method of calculation of the present value of the financial instruments making up the assets and liabilities is based on the cash flows of the instruments and of the funding curve of the Bank. The curve reflects the cost of financing of the Bank at the end of the year.
Note S – Financial risk management
This section presents information about the Bank’s exposure to and its management and control of risks, in particular the primary risks associated with its use of financial instruments. These are:—credit risk,—interest rate risk,—liquidity risk,—exchange rate risk.
S.1. Credit risk
Credit risk concerns mainly the Bank’s lending activity and, to a lesser extent, treasury instruments such as fixed-income securities held in the investment and operational portfolios, certificates of deposit and interbank term deposits.
The credit risk associated with the use of derivatives is also analysed hereafter in the ‘Derivatives’ section [Note T].
Management of credit risk is based, firstly, on the degree of credit risk vis-à-vis counterparties and, secondly, on an analysis of the solvency of coun-terparties.
As regards lending, treasury and derivatives operations, credit risk is managed by an independent Risk Management Directorate under the direct responsibility of the Management Committee. The Bank has thus established an operationally independent structure for determining and monitoring credit risk.
80 EIB Group
67
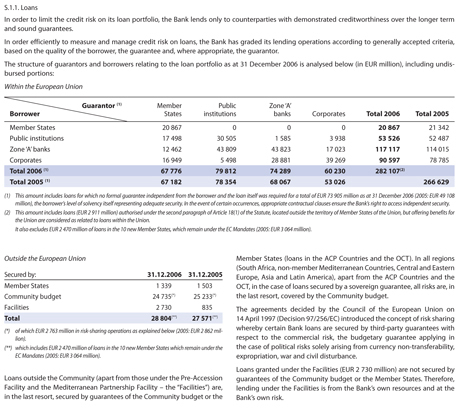
S.1.1. Loans
In order to limit the credit risk on its loan portfolio, the Bank lends only to counterparties with demonstrated creditworthiness over the longer term and sound guarantees.
In order efficiently to measure and manage credit risk on loans, the Bank has graded its lending operations according to generally accepted criteria, based on the quality of the borrower, the guarantee and, where appropriate, the guarantor.
The structure of guarantors and borrowers relating to the loan portfolio as at 31 December 2006 is analysed below (in EUR million), including undis-bursed portions:
Within the European Union
Borrower
Guarantor (1)
Member States
Public institutions
Zone ‘A’ banks
Corporates
Total 2006
Total 2005
Member States
20 867
0
0
0
20 867
21 342
Public institutions
17 498
30 505
1 585
3 938
53 526
52 487
Zone ‘A’ banks
12 462
43 809
43 823
17 023
117 117
114 015
Corporates
16 949
5 498
28 881
39 269
90 597
78 785
Total 2006 (1)
67 776
79 812
74 289
60 230
282 107(2)
Total 2005 (1)
67 182
78 354
68 067
53 026
266 629
(1) This amount includes loans for which no formal guarantee independent from the borrower and the loan itself was required for a total of EUR 73 905 million as at 31 December 2006 (2005: EUR 49 108 million), the borrower’s level of solvency itself representing adequate security. In the event of certain occurrences, appropriate contractual clauses ensure the Bank’s right to access independent security. (2) This amount includes loans (EUR 2 911 million) authorised under the second paragraph of Article 18(1) of the Statute, located outside the territory of Member States of the Union, but offering benefits for the Union are considered as related to loans within the Union.
It also excludes EUR 2 470 million of loans in the 10 new Member States, which remain under the EC Mandates (2005: EUR 3 064 million).
Outside the European Union
Secured by:
31.12.2006
31.12.2005
Member States
1 339
1 503
Community budget
24 735(*)
25 233(*)
Facilities
2 730
835
Total
28 804(**)
27 571 (**)
(*) of which EUR 2 763 million in risk-sharing operations as explained below (2005: EUR 2 862 million).
(**) which includes EUR 2 470 million of loans in the 10 new Member States which remain under the EC Mandates (2005: EUR 3 064 million).
Loans outside the Community (apart from those under the Pre-Accession Facility and the Mediterranean Partnership Facility – the “Facilities”) are, in the last resort, secured by guarantees of the Community budget or the
Member States (loans in the ACP Countries and the OCT). In all regions ( South Africa, non-member Mediterranean Countries, Central and Eastern Europe, Asia and Latin America), apart from the ACP Countries and the OCT, in the case of loans secured by a sovereign guarantee, all risks are, in the last resort, covered by the Community budget.
The agreements decided by the Council of the European Union on 14 April 1997 (Decision 97/256/EC) introduced the concept of risk sharing whereby certain Bank loans are secured by third-party guarantees with respect to the commercial risk, the budgetary guarantee applying in the case of political risks solely arising from currency non-transferability, expropriation, war and civil disturbance.
Loans granted under the Facilities (EUR 2 730 million) are not secured by guarantees of the Community budget or the Member States. Therefore, lending under the Facilities is from the Bank’s own resources and at the Bank’s own risk.
EIB – Financial Statements 2006 81
68

LOANS FOR PROJECTS OUTSIDE THE UNION (in EUR million)
(including loans in the new Member States before accession)
BREAKDOWN OF LOANS BY GUARANTEE AS AT 31 DECEMBER
Outstanding
Outstanding
AGREEMENT
31.12.2006
31.12.2005
75% Member States global guarantee
- ACP/OCT Group 3rd Lomé Convention
12
31
- ACP/OCT Group 4th Lomé Convention
290
390
- ACP/OCT Group 4th Lomé Convention /
2nd Financial Protocol
657
862
Total 75% Member States global guarantee
959
1 283
75% Member States guarantee
- Cotonou partnership agreement
380
220
Total 75% Member States guarantee
380
220
Total Member States guarantee
1 339
1 503
100% Community budget guarantee
- South Africa—300m—BG Decision 19.06.95
103
130
- ALA I—750m
177
244
- ALA interim (100% guarantee)—153m
40
65
- CEEC—1bn—BG Decision 29.11.89
169
226
- CEEC—3bn—BG Decision 02.05.94
930
1 092
- CEEC—700m—BG Decision 18.04.91
36
71
- Russia—100 m—2/2002-2/2004
84
85
Total 100% Community budget guarantee
1 539
1 913
75% Community budget guarantee
- Mediterranean Protocols
1 431
1 906
- Yugoslavia—Art 18 (1984)
3
4
- Yugoslavia—1st Protocol
6
7
- Yugoslavia—2nd Protocol
71
98
- Slovenia—1st Protocol
81
91
Total 75% Community budget guarantee
1 592
2 106
Outstanding
Outstanding
AGREEMENT
31.12.2006
31.12.2005
70% Community budget guarantee
- South Africa—375m—Decision 29.01.97
197
239
- ALA II—900m
313
428
- ALA interim
(70% guarantee: risk sharing)—122m
35
52
- Bosnia-Herzegovina—100m 99/2001
97
99
- Euromed (EIB)—2 310m—Decision 29.01.97
1 162
1 355
- FYROM—150m—1998/2000
133
139
- CEEC—3 520m—Decision 29.01.97
2 022
2 276
Total 70% Community budget guarantee
3 959
4 588
65% Community budget guarantee
- South Africa—825m—7/2000-7/2007
690
736
- ALA III – 2 480m—2/2000-7/2007
1 528
1 374
- Euromed II—6 520m—2/2000-1/2007
6 024
6 019
- South Eastern Neighbours – 9 185m
2/2000-7/2007
8 458
7 477
- Turkey special action – 450m – 2001-2006
356
424
- Turkey TERRA- 600m—11/1999-11/2002
589
Loan Financial Collateral (in EUR million) (1)
Bonds
Funds
Equities & Cash
Total 2006
Secured Bonds
Bank and
Moody’s or
(Pfandbriefe,
Corporate
equivalent rating
Govt
Supranational
Agency
Cedulas)
Bonds
ABS
Aaa
1 192
6
77
139
336
610
0
0
2 360
Aa1 to Aa3
1 168
0
0
0
913
0
0
0
2 081
A1
1 668
0
576
0
658
0
0
0
2 902
Below A1
1 002
0
0
0
55
0
0
0
1 057
Non-Rated
0
0
0
0
236
0
151
153
540
Total 2006
5 030
6
653
139
2 198
610
151
153
8 940
596
Total 65% Community budget guarantee
17 645
16 626
Total Community budget guarantee
24 735
25 233
Facilities
- Pre-Accession Facility II – 2000/2006
2 730
835
Total Facilities
2 730
835
TOTAL
28 804
27 571
Collateral on loans (EUR million)
Among other credit mitigant instruments, the Bank also uses pledges of financial securities. These pledges are formalized through a Pledge Agreement, enforceable in the relevant jurisdiction. The portfolio of collateral received in pledge contracts amounts to EUR 8 940 million, with the following composition:
(1) | | Bonds are valued at their market value. |
69
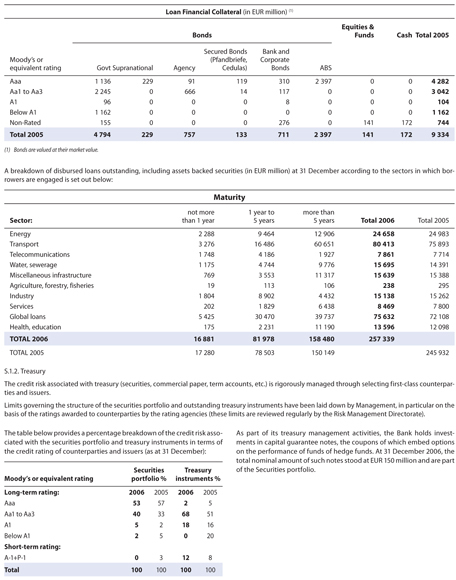
Loan Financial Collateral (in EUR million) (1)
Equities &
Bonds
Funds
Cash
Total 2005
Secured Bonds
Bank and
Moody’s or
(Pfandbriefe,
Corporate
equivalent rating
Govt
Supranational
Agency
Cedulas)
Bonds
ABS
Aaa
1 136
229
91
119
310
2 397
0
0
4 282
Aa1 to Aa3
2 245
0
666
14
117
0
0
0
3 042
A1
96
0
0
0
8
0
0
0
104
Below A1
1 162
0
0
0
0
0
0
0
1 162
Non-Rated
155
0
0
0
276
0
141
172
744
Total 2005
4 794
229
757
133
711
2 397
141
172
9 334
(1) | | Bonds are valued at their market value. |
A breakdown of disbursed loans outstanding, including assets backed securities (in EUR million) at 31 December according to the sectors in which bor- rowers are engaged is set out below:
Maturity
Sector:
not more than 1 year
1 year to 5 years
more than 5 years
Total 2006
Total 2005
Energy
2 288
9 464
12 906
24 658
24 983
Transport
3 276
16 486
60 651
80 413
75 893
Telecommunications
1 748
4 186
1 927
7 861
7 714
Water, sewerage
1 175
4 744
9 776
15 695
14 391
Miscellaneous infrastructure
769
3 553
11 317
15 639
15 388
Agriculture, forestry, fisheries
19
113
106
238
295
Industry
1 804
8 902
4 432
15 138
15 262
Services
202
1 829
6 438
8 469
7 800
Global loans
5 425
30 470
39 737
75 632
72 108
Health, education
175
2 231
11 190
13 596
12 098
TOTAL 2006
16 881
81 978
158 480
Securities
Treasury
Moody’s or equivalent rating
portfolio
%
Instruments
%
Long-term rating:
2006
2005
2006
2005
Aaa
53
57
2
5
Aa1 to Aa3
40
33
68
51
A1
5
2
18
16
Below A1
2
5
0
20
Short-term rating:
A-1+P-1
0
3
12
8
Total
100
100
100
100
257 339
TOTAL 2005
17 280
78 503
150 149
245 932
S.1.2. Treasury
The credit risk associated with treasury (securities, commercial paper, term accounts, etc.) is rigorously managed through selecting first-class counterpar-ties and issuers.
Limits governing the structure of the securities portfolio and outstanding treasury instruments have been laid down by Management, in particular on the basis of the ratings awarded to counterparties by the rating agencies (these limits are reviewed regularly by the Risk Management Directorate).
As part of its treasury management activities, the Bank holds investments in capital guarantee notes, the coupons of which embed options on the performance of funds of hedge funds. At 31 December 2006, the total nominal amount of such notes stood at EUR 150 million and are part of the Securities portfolio.
EIB – Financial Statements 2006 83
70
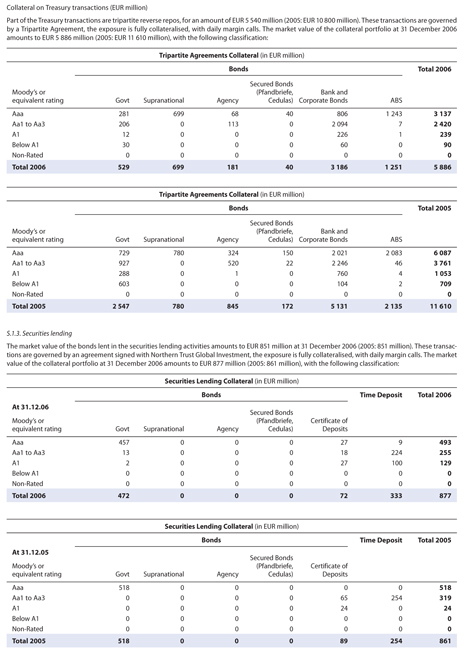
Collateral on Treasury transactions (EUR million)
Part of the Treasury transactions are tripartite reverse repos, for an amount of EUR 5 540 million (2005: EUR 10 800 million). These transactions are governed by a Tripartite Agreement, the exposure is fully collateralised, with daily margin calls. The market value of the collateral portfolio at 31 December 2006 amounts to EUR 5 886 million (2005: EUR 11 610 million), with the following classification:
Tripartite Agreements Collateral (in EUR million)
Bonds
Total 2006
Moody’s or equivalent rating
Govt
Supranational
Agency
Secured Bonds (Pfandbriefe, Cedulas)
Bank and Corporate Bonds
ABS
Aaa
281
699
68
40
806
1 243
3 137
Aa1 to Aa3
206
0
113
0
2 094
7
2 420
A1
12
0
0
0
226
1
239
Below A1
30
0
0
0
60
0
90
Non-Rated
0
0
0
0
0
0
0
Total 2006
529
699
181
40
3 186
1 251
5 886
Tripartite Agreements Collateral (in EUR million)
Bonds
Total 2005
Moody’s or equivalent rating
Govt
Supranational
Agency
Secured Bonds (Pfandbriefe, Cedulas)
Bank and Corporate Bonds
ABS
Aaa
729
780
324
150
2 021
2 083
6 087
Aa1 to Aa3
927
0
520
22
2 246
46
3 761
A1
288
0
1
0
760
4
1 053
Below A1
603
0
0
0
104
2
709
Non-Rated
0
0
0
0
0
0
0
Total 2005
2 547
780
845
172
5 131
2 135
11 610
S.1.3. Securities lending
The market value of the bonds lent in the securities lending activities amounts to EUR 851 million at 31 December 2006 (2005: 851 million). These transactions are governed by an agreement signed with Northern Trust Global Investment, the exposure is fully collateralised, with daily margin calls. The market value of the collateral portfolio at 31 December 2006 amounts to EUR 877 million (2005: 861 million), with the following classification:
Securities Lending Collateral (in EUR million)
Bonds
Time Deposit
Total 2006
At 31.12.06 Moody’s or equivalent rating
Govt
Supranational
Agency
Secured Bonds (Pfandbriefe, Cedulas)
Certificate of Deposits
Aaa
457
0
0
0
27
9
493
Aa1 to Aa3
13
0
0
0
18
224
255
A1
2
0
0
0
27
100
129
Below A1
0
0
0
0
0
0
0
Non-Rated
0
0
0
0
0
0
0
Total 2006
472
Securities Lending Collateral (in EUR million)
Bonds
Time Deposit
Total 2005
At 31.12.05
Moody’s or equivalent rating
Govt
Supranational
Agency
Secured Bonds (Pfandbriefe, Cedulas)
Certificate of Deposits
Aaa
518
0
0
0
0
0
518
Aa1 to Aa3
0
0
0
0
65
254
319
A1
0
0
0
0
24
0
24
Below A1
0
0
0
0
0
0
0
Non-Rated
0
0
0
0
0
0
0
Total 2005
518
0
0
0
89
254
861
0
0
0
72
333
877
84 EIB Group
71
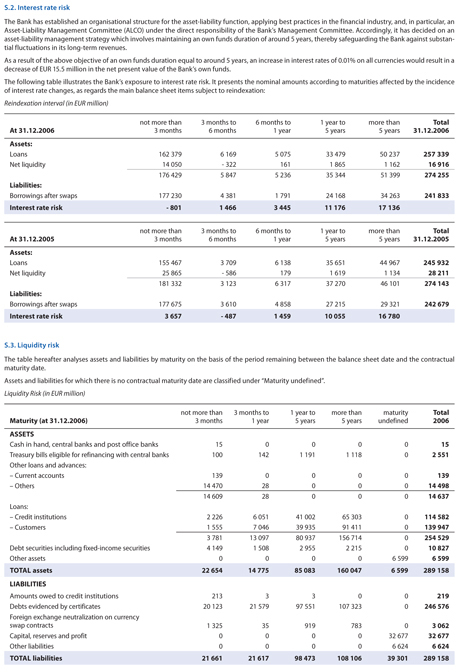
S.2. Interest rate risk
The Bank has established an organisational structure for the asset-liability function, applying best practices in the financial industry, and, in particular, an Asset-Liability Management Committee (ALCO) under the direct responsibility of the Bank’s Management Committee. Accordingly, it has decided on an asset-liability management strategy which involves maintaining an own funds duration of around 5 years, thereby safeguarding the Bank against substantial fluctuations in its long-term revenues.
As a result of the above objective of an own funds duration equal to around 5 years, an increase in interest rates of 0.01% on all currencies would result in a decrease of EUR 15.5 million in the net present value of the Bank’s own funds.
The following table illustrates the Bank’s exposure to interest rate risk. It presents the nominal amounts according to maturities affected by the incidence of interest rate changes, as regards the main balance sheet items subject to reindexation:
Reindexation interval (in EUR million)
At 31.12.2006
not more than 3 months
3 months to 6 months
6 months to 1 year
1 year to 5 years
more than 5 years
Total 31.12.2006
Assets:
Loans
162 379
6 169
5 075
33 479
50 237
257 339
Net liquidity
14 050
- 322
161
1 865
1 162
16 916
176 429
5 847
5 236
35 344
51 399
274 255
Liabilities:
Borrowings after swaps
177 230
4 381
1 791
24 168
34 263
241 833
Interest rate risk
- 801
1 466
3 445
11 176
17 136
At 31.12.2005
not more than 3 months
3 months to 6 months
6 months to 1 year
1 year to 5 years
more than 5 years
Total 31.12.2005
Assets:
Loans
155 467
3 709
6 138
35 651
44 967
245 932
Net liquidity
25 865
- 586
179
1 619
1 134
28 211
181 332
3 123
6 317
37 270
46 101
274 143
Liabilities:
Borrowings after swaps
177 675
3 610
4 858
27 215
29 321
242 679
Interest rate risk
3 657
- 487
1 459
10 055
16 780
S.3. Liquidity risk
The table hereafter analyses assets and liabilities by maturity on the basis of the period remaining between the balance sheet date and the contractual maturity date.
Assets and liabilities for which there is no contractual maturity date are classified under “Maturity undefined”.
Liquidity Risk (in EUR million)
Maturity (at 31.12.2006)
not more than 3 months
3 months to 1 year
1 year to 5 years
more than 5 years
maturity undefined
Total 2006
ASSETS
Cash in hand, central banks and post office banks
15
0
0
0
0
15
Treasury bills eligible for refinancing with central banks
100
142
1 191
1 118
0
2 551
Other loans and advances:
– Current accounts
139
0
0
0
0
139
– Others
14 470
28
0
0
0
14 498
14 609
28
0
0
0
14 637
Loans:
– Credit institutions
2 226
6 051
41 002
65 303
0
114 582
– Customers
1 555
7 046
39 935
91 411
0
139 947
3 781
13 097
80 937
156 714
0
254 529
Debt securities including fixed-income securities
4 149
1 508
2 955
2 215
0
10 827
Other assets
0
0
0
0
6 599
6 599
TOTAL assets
22 654
14 775
85 083
160 047
6 599
289 158
LIABILITIES
Amounts owed to credit institutions
213
3
3
0
0
219
Debts evidenced by certificates
20 123
21 579
97 551
107 323
0
246 576
Foreign exchange neutralization on currencyswap contracts
1 325
35
919
783
0
3 062
Capital, reserves and profit
0
0
0
0
32 677
32 677
Other liabilities
0
0
0
0
6 624
6 624
TOTAL liabilities
21 661
21 617
98 473
108 106
39 301
289 158
EIB – Financial Statements 2006 85
72
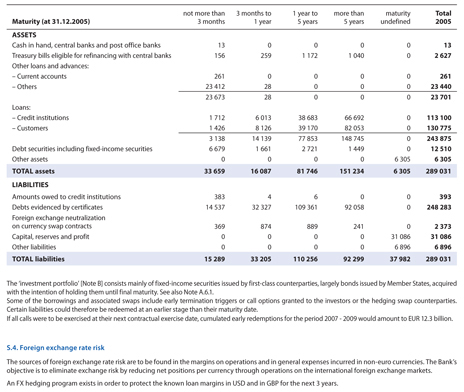
Maturity (at 31.12.2005)
not more than 3 months
3 months to 1 year
1 year to 5 years
more than 5 years
maturity undefined
Total 2005
ASSETS
Cash in hand, central banks and post office banks
13
0
0
0
0
13
Treasury bills eligible for refinancing with central banks
156
259
1 172
1 040
0
2 627
Other loans and advances:
– Current accounts
261
0
0
0
0
261
– Others
23 412
28
0
0
0
23 440
23 673
28
0
0
0
23 701
Loans:
– Credit institutions
1 712
6 013
38 683
66 692
0
113 100
– Customers
1 426
8 126
39 170
82 053
0
130 775
3 138
14 139
77 853
148 745
0
243 875
Debt securities including fixed-income securities
6 679
1 661
2 721
1 449
0
12 510
Other assets
0
0
0
0
6 305
6 305
TOTAL assets
33 659
16 087
81 746
151 234
6 305
289 031
LIABILITIES
Amounts owed to credit institutions
383
4
6
0
0
393
Debts evidenced by certificates
14 537
32 327
109 361
92 058
0
248 283
Foreign exchange neutralizationon currency swap contracts
369
874
889
241
0
2 373
Capital, reserves and profit
0
0
0
0
31 086
31 086
Other liabilities
0
0
0
0
6 896
6 896
TOTAL liabilities
15 289
33 205
110 256
92 299
37 982
289 031
The ‘investment portfolio’ [Note B] consists mainly of fixed-income securities issued by first-class counterparties, largely bonds issued by Member States, acquired with the intention of holding them until final maturity. See also Note A.6.1.
Some of the borrowings and associated swaps include early termination triggers or call options granted to the investors or the hedging swap counterparties. Certain liabilities could therefore be redeemed at an earlier stage than their maturity date.
If all calls were to be exercised at their next contractual exercise date, cumulated early redemptions for the period 2007—2009 would amount to EUR 12.3 billion.
S.4. Foreign exchange rate risk
The sources of foreign exchange rate risk are to be found in the margins on operations and in general expenses incurred in non-euro currencies. The Bank’s objective is to eliminate exchange risk by reducing net positions per currency through operations on the international foreign exchange markets.
An FX hedging program exists in order to protect the known loan margins in USD and in GBP for the next 3 years.
86 EIB Group
73
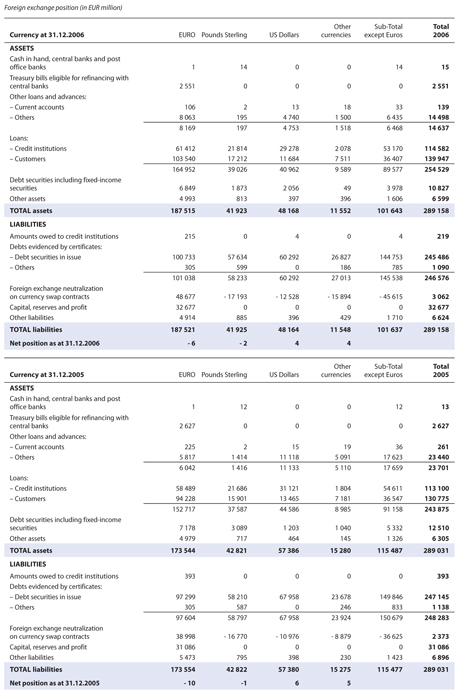
Foreign exchange position (in EUR million)
Currency at 31.12.2006
EURO
Pounds Sterling
US Dollars
Other currencies
Sub-Total except Euros
Total 2006
ASSETS
Cash in hand, central banks and postoffice banks
1
14
0
0
14
15
Treasury bills eligible for refinancing withcentral banks
2 551
0
0
0
0
2 551
Other loans and advances:
– Current accounts
106
2
13
18
33
139
– Others
8 063
195
4 740
1 500
6 435
14 498
8 169
197
4 753
1 518
6 468
14 637
Loans:
– Credit institutions
61 412
21 814
29 278
2 078
53 170
114 582
– Customers
103 540
17 212
11 684
7 511
36 407
139 947
164 952
39 026
40 962
9 589
89 577
254 529
Debt securities including fixed-incomesecurities
6 849
1 873
2 056
49
3 978
10 827
Other assets
4 993
813
397
396
1 606
6 599
TOTAL assets
187 515
41 923
48 168
11 552
101 643
289 158
LIABILITIES
Amounts owed to credit institutions
215
0
4
0
4
219
Debts evidenced by certificates:
– Debt securities in issue
100 733
57 634
60 292
26 827
144 753
245 486
– Others
305
599
0
186
785
1 090
101 038
58 233
60 292
27 013
145 538
246 576
Foreign exchange neutralizationon currency swap contracts
48 677
- 17 193
- 12 528
- 15 894
- 45 615
3 062
Capital, reserves and profit
32 677
0
0
0
0
32 677
Other liabilities
4 914
885
396
429
1 710
6 624
TOTAL liabilities
187 521
41 925
48 164
11 548
101 637
289 158
Net position as at 31.12.2006
- 6
- 2
4
4
Currency at 31.12.2005
EURO
Pounds Sterling
US Dollars
Other currencies
Sub-Total except Euros
Total 2005
ASSETS
Cash in hand, central banks and postoffice banks
1
12
0
0
12
13
Treasury bills eligible for refinancing withcentral banks
2 627
0
0
0
0
2 627
Other loans and advances:
– Current accounts
225
2
15
19
36
261
– Others
5 817
1 414
11 118
5 091
17 623
23 440
6 042
1 416
11 133
5 110
17 659
23 701
Loans:
– Credit institutions
58 489
21 686
31 121
1 804
54 611
113 100
– Customers
94 228
15 901
13 465
7 181
36 547
130 775
152 717
37 587
44 586
8 985
91 158
243 875
Debt securities including fixed-incomesecurities
7 178
3 089
1 203
1 040
5 332
12 510
Other assets
4 979
717
464
145
1 326
6 305
TOTAL assets
173 544
42 821
57 386
15 280
115 487
289 031
LIABILITIES
Amounts owed to credit institutions
393
0
0
0
0
393
Debts evidenced by certificates:
– Debt securities in issue
97 299
58 210
67 958
23 678
149 846
247 145
– Others
305
587
0
246
833
1 138
97 604
58 797
67 958
23 924
150 679
248 283
Foreign exchange neutralizationon currency swap contracts
38 998
- 16 770
- 10 976
- 8 879
- 36 625
2 373
Capital, reserves and profit
31 086
0
0
0
0
31 086
Other liabilities
5 473
795
398
230
1 423
6 896
TOTAL liabilities
173 554
42 822
57 380
15 275
115 477
289 031
Net position as at 31.12.2005
- 10
-1
6
5
EIB – Financial Statements 2006 87
74
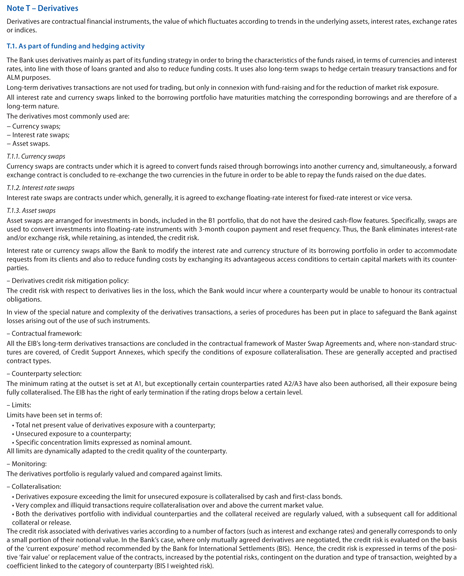
Note T – Derivatives
Derivatives are contractual financial instruments, the value of which fluctuates according to trends in the underlying assets, interest rates, exchange rates or indices.
T.1. As part of funding and hedging activity
The Bank uses derivatives mainly as part of its funding strategy in order to bring the characteristics of the funds raised, in terms of currencies and interest rates, into line with those of loans granted and also to reduce funding costs. It uses also long-term swaps to hedge certain treasury transactions and for ALM purposes.
Long-term derivatives transactions are not used for trading, but only in connexion with fund-raising and for the reduction of market risk exposure. All interest rate and currency swaps linked to the borrowing portfolio have maturities matching the corresponding borrowings and are therefore of a long-term nature.
The derivatives most commonly used are:—Currency swaps;—Interest rate swaps;—Asset swaps.
T.1.1. Currency swaps
Currency swaps are contracts under which it is agreed to convert funds raised through borrowings into another currency and, simultaneously, a forward exchange contract is concluded to re-exchange the two currencies in the future in order to be able to repay the funds raised on the due dates.
T.1.2. Interest rate swaps
Interest rate swaps are contracts under which, generally, it is agreed to exchange floating-rate interest for fixed-rate interest or vice versa.
T.1.3. Asset swaps
Asset swaps are arranged for investments in bonds, included in the B1 portfolio, that do not have the desired cash-flow features. Specifically, swaps are used to convert investments into floating-rate instruments with 3-month coupon payment and reset frequency. Thus, the Bank eliminates interest-rate and/or exchange risk, while retaining, as intended, the credit risk.
Interest rate or currency swaps allow the Bank to modify the interest rate and currency structure of its borrowing portfolio in order to accommodate requests from its clients and also to reduce funding costs by exchanging its advantageous access conditions to certain capital markets with its counter-parties.
– Derivatives credit risk mitigation policy:
The credit risk with respect to derivatives lies in the loss, which the Bank would incur where a counterparty would be unable to honour its contractual obligations.
In view of the special nature and complexity of the derivatives transactions, a series of procedures has been put in place to safeguard the Bank against losses arising out of the use of such instruments.
– Contractual framework:
All the EIB’s long-term derivatives transactions are concluded in the contractual framework of Master Swap Agreements and, where non-standard structures are covered, of Credit Support Annexes, which specify the conditions of exposure collateralisation. These are generally accepted and practised contract types.
– Counterparty selection:
The minimum rating at the outset is set at A1, but exceptionally certain counterparties rated A2/A3 have also been authorised, all their exposure being fully collateralised. The EIB has the right of early termination if the rating drops below a certain level.
– Limits:
Limits have been set in terms of:
• Total net present value of derivatives exposure with a counterparty; • Unsecured exposure to a counterparty; • Specific concentration limits expressed as nominal amount.
All limits are dynamically adapted to the credit quality of the counterparty. – Monitoring: The derivatives portfolio is regularly valued and compared against limits. – Collateralisation:
• Derivatives exposure exceeding the limit for unsecured exposure is collateralised by cash and first-class bonds. • Very complex and illiquid transactions require collateralisation over and above the current market value.
• Both the derivatives portfolio with individual counterparties and the collateral received are regularly valued, with a subsequent call for additional collateral or release.
The credit risk associated with derivatives varies according to a number of factors (such as interest and exchange rates) and generally corresponds to only a small portion of their notional value. In the Bank’s case, where only mutually agreed derivatives are negotiated, the credit risk is evaluated on the basis of the ‘current exposure’ method recommended by the Bank for International Settlements (BIS). Hence, the credit risk is expressed in terms of the positive ‘fair value’ or replacement value of the contracts, increased by the potential risks, contingent on the duration and type of transaction, weighted by a coefficient linked to the category of counterparty (BIS I weighted risk).
88 EIB Group
75
The following tables show the maturities of currency swaps (excluding short-term currency swaps – see T.2 below) and interest rate swaps, sub-divided according to their notional amount and the associated credit risk. The notional amounts are disclosed off balance sheet.
Currency swaps at 31.12.2006 (in EUR million)
less than 1 year
1 year to 5 years
5 years to 10 years
more than 10 years
Total 2006
Notional amount
8 888
23 471
15 784
11 148
59 291
Net discounted value
- 1 215
- 908
- 447
- 6
- 2 576
Credit risk (BIS I weighted)
49
250
256
289
844
Currency swaps at 31.12.2005 (in EUR million)
less than 1 year
1 year to 5 years
5 years to 10 years
more than 10 years
Total 2005
Notional amount
13 951
24 858
8 144
9 443
56 396
Net discounted value
-1 135
-429
168
66
- 1 330
Credit risk (BIS I weighted)
81
416
166
251
914
Interest rate swaps at 31.12.2006 (in EUR million)
less than 1 year
1 year to 5 years
5 years to 10 years
more than 10 years
Total 2006
Notional amount
37 278
84 434
60 180
59 313
241 205
Net discounted value (*)
178
156
- 1 175
2 148
1 307
Credit risk (BIS I weighted)
70
334
327
1 085
1 816
Interest rate swaps at 31.12.2005 (in EUR million)
less than 1 year
1 year to 5 years
5 years to 10 years
more than 10 years
Total 2005
Notional amount
26 921
91 742
49 637
51 549
219 849
Net discounted value
412
943
473
3 271
5 099
Credit risk (BIS I weighted)
105
470
479
1 360
2 414
(*) The net discounted value of Credit Default Swaps (CDS) has been included with the rest of derivatives, since according to IAS39, CDS are treated as derivatives, however, these transactions have not been included in the BIS computations, since in the Basel Agreement BIS I, they are assimilated to guarantees and their capital charge is computed in the loan portfolio.
Notional amounts of EUR 540 million of futures contracts and EUR 823 million of Forward Rate Agreements, with respective fair values of EUR 2.6 million and EUR 0.2 million and a maturity less than 1 year are outstanding as at December 31, 2006.
The Bank does not generally enter into any options contracts in conjunction with its risk hedging policy. However, as part of its strategy of raising funds on the financial markets at a lesser cost, the Bank enters into borrowing contracts encompassing notably interest rate or stock exchange index options. Such borrowings are entirely covered by swap contracts to hedge the corresponding market risk.
Tabulated below are the number and notional amounts of the various types of options embedded in borrowings:
Option embedded
Stock exchange index
Special structure coupon or similar
2006
2005
2006
2005
2006
2005
Number of transactions
448
439
1
7
282
211
Notional amount (in EUR million)
19 523
21 442
30
450
18 533
14 554
Net discounted value (in EUR million)
- 739
- 153
2
25
- 452
450
The ‘fair value’ of ‘plain vanilla’ swap transactions is their market value. For structured deals, the ‘fair value’ is computed using the income approach, using valuation techniques to convert future amounts to a single present amount (discounted). The estimate of fair value is based on the value indicated by marketplace expectations about those future amounts. Internal estimates and assumptions might be used in the valuation techniques when the market inputs are not directly available.
All option contracts embedded in, or linked with, borrowings are negotiated over the counter. From the portfolio of structured deals with embedded options, 261 swaps amounting to EUR 3 791 million of notional are Power Reverse Dual Currency. Their ‘fair value’ is EUR 306 million. These transactions are very dependent on the exchange rate USD/JPY. An appreciation of 5% of the USD with respect to JPY will imply a ‘fair value’ of EUR 330 million and decrease of EUR 25 million as well as an increase of the probability of their early exercise. The rest of structured deals include a variety of transactions dependent on interest rates, FX rates, inflation rates, stock indexes and IR volatilities.
Generally, there is a reduced credit risk on these swaps, because security exists in the form of regularly monitored collateral.
EIB – Financial Statements 2006 89
76
Collateral (EUR million)
The collateral received for derivatives business amounts to EUR 2 002 million, with the following composition:
Swap Collateral (in EUR million)
Bonds
Cash
Total 2006
Moody’s or equivalent rating
Govt
Supranational
Agency
Secured Bonds (Pfandbriefe)
Aaa
1 095
28
0
5
0
1 128
Aa1 to Aa3
21
0
0
0
0
21
A1
590
0
0
0
0
590
Below A1
50
0
0
0
0
50
Non-Rated
0
0
0
0
213
213
Total 2006
1 756
28
0
5
213
2 002
Swap Collateral (in EUR million)
Bonds
Cash
Total 2005
Moody’s or equivalent rating
Govt
Supranational
Agency
Secured Bonds (Pfandbriefe)
Aaa
2 491
21
381
19
0
2 912
Aa1 to Aa3
1 108
0
0
0
0
1 108
A1
412
0
0
0
0
412
Below A1
0
0
0
0
0
0
Non-Rated
0
0
0
0
386
386
Total 2005
4 011
21
381
19
386
4 818
Ratings exposure table: The major part of new derivatives transactions are concluded with counterparties rated at least A1. With exceptional conditions of over-collateralisation, counterparties rated A2 or A3 have been also accepted. Consequently, most of the portfolio is concentrated on counterparties rated A1 or above.
Grouped Ratings
Percentage of Nominal
Net Market Exposure (in EUR million)
CRE BIS2 Swaps
Moody’s or equivalent rating
2006
2005
2006
2005
2006
2005
Aaa
5.5%
4.6%
0
80
186
425
Aa1 to Aa3
74.2%
61.7%
563
792
3 843
3 591
A1
16.0%
28.6%
41
64
601
3 562
A2 to A3
4.3%
5.0%
2
4
370
694
Non-rated
0.0%
0.1%
0
8
2
17
Total
100.0%
100.0%
606
948
5 002
8 289
The Net Market Exposure is the net present value of a swap portfolio net of collateral, if positive (zero if negative). It represents a measure of the losses the Bank could incur in case of default of the counterparty, after application of netting and using the collateral.
The BIS Credit Risk Equivalent is the sum of the Net Present Value of the swap plus an Add-On equal to the Notional Amount multiplied by a coefficient dependent on the structure of the swap and its maturity (according to the Basel Agreement), meant to cover potential future increases in exposures due to changing market conditions over the residual life of the swap.
T.2. As part of liquidity management
The Bank also enters into short-term currency swap contracts in order to adjust currency positions in its operational treasury in relation to its benchmark currency, the euro, and to cater for demand for currencies in conjunction with loan disbursements.
The notional amount of short-term currency swaps and short term forwards stood at EUR 5 602 million at 31 December 2006, against EUR 7 739 million at 31 December 2005.
Long-term futures are also used by the Bank to adjust the medium-term (2y) interest rate exposure of its treasury bond portfolios. The notional amount of long-term futures stood at EUR 540 million at 31 December 2006 (2005: EUR 429 million).
90 EIB Group
77
Note U – Geographical breakdown of lending by country in which projects are allocated (in EUR ‘000)
U.1. Loans for projects within the Union and related loans
Countries and territories in which projects
Number
Aggregate
Undisbursed
Disbursed
% of total
% fin year
are located
of loans
loans granted
portion
portion
2006
2005
Germany
817
46 610 173
1 925 396
44 684 777
15.00%
15.07%
France
384
33 607 617
4 661 459
28 946 158
10.81%
10.87%
Italy
626
38 892 321
5 133 135
33 759 186
12.51%
12.91%
United Kingdom
214
27 619 656
6 007 019
21 612 637
8.88%
8.76%
Spain
585
45 525 030
4 103 173
41 421 857
14.65%
14.12%
Belgium
74
4 752 683
797 080
3 955 603
1.53%
1.50%
Netherlands
56
4 577 622
1 600 850
2 976 772
1.47%
1.30%
Sweden
82
3 393 690
924 981
2 468 709
1.09%
1.47%
Denmark
68
3 407 578
471 011
2 936 567
1.10%
1.55%
Austria
178
6 429 389
450 000
5 979 389
2.07%
1.92%
Poland
112
10 614 149
4 404 188
6 209 961
3.41%
3.04%
Finland
98
5 515 513
716 910
4 798 603
1.77%
1.76%
Greece
137
12 695 647
1 317 133
11 378 514
4.08%
4.09%
Portugal
239
16 695 212
1 572 517
15 122 695
5.37%
5.85%
Czech Republic
80
6 602 858
1 730 116
4 872 742
2.12%
1.97%
Hungary
74
5 334 848
1 785 198
3 549 650
1.72%
1.48%
Ireland
58
3 427 148
899 208
2 527 940
1.10%
1.05%
Slovak Republic
35
1 188 719
454 559
734 160
0.38%
0.45%
Slovenia
33
1 756 282
552 488
1 203 794
0.56%
0.51%
Lithuania
15
187 158
62 775
124 383
0.06%
0.06%
Luxembourg
32
818 788
172 952
645 836
0.26%
0.32%
Cyprus
25
1 249 353
580 000
669 353
0.40%
0.41%
Latvia
22
492 104
155 000
337 104
0.16%
0.18%
Estonia
13
255 432
105 000
150 432
0.08%
0.09%
Malta
3
16 943
10 200
6 743
0.01%
0.01%
TOTAL
4 060
281 665 913
40 592 348
241 073 565
90.59%
90.74%
EIB – Financial Statements 2006 91
78
U.2. Loans for projects outside the Union
U.2.1. ACP Countries/OCT
Countries and territories in which projects are located
Number of loans
Aggregate loans granted
Undisbursed portion
Disbursed portion
% of total 2006
% fin year 2005
Ghana
6
147 176
115 000
32 176
Mauritius
13
129 735
83 448
46 287
Namibia
10
104 660
—
104 660
Nigeria
3
87 903
30 972
56 931
Mozambique
6
87 826
—
87 826
Dominican Republic
4
83 256
80 000
3 256
Kenya
6
63 813
—
63 813
Barbados
5
53 476
11 250
42 226
Regional – Africa
3
48 924
—
48 924
Swaziland
3
48 150
30 944
17 206
Jamaica
6
46 686
—
46 686
Regional – Caribbean
2
45 821
40 000
5 821
Botswana
5
43 649
4 621
39 028
Lesotho
3
39 744
—
39 744
ACP Group
3
37 830
—
37 830
Regional – West Africa
2
37 289
3 000
34 289
Senegal
1
32 891
—
32 891
Fiji Islands
2
30 500
30 500
—
Mauritania
2
27 537
—
27 537
Zimbabwe
7
21 332
—
21 332
Cape Verde
1
20 000
—
20 000
Zambie
1
18 000
18 000
—
Bahamas
2
14 429
—
14 429
Trinidad and Tobago
3
14 389
—
14 389
Saint Vincent and The Grenadines
2
9 514
2 653
6 861
Saint Lucia
3
8 583
5 000
3 583
Gabon
1
6 071
—
6 071
Côte-d’Ivoire
3
4 552
—
4 552
Papua New Guinea
2
4 348
—
4 348
French Polynesia
2
3 748
—
3 748
Malawi
1
3 339
—
3 339
British Virgin Islands
3
2 788
—
2 788
New Caledonia and Dependencies
2
1 749
—
1 749
Regional PTOM
1
1 546
—
1 546
Grenada
1
1 435
—
1 435
Cayman Islands
1
980
—
980
Falkland Islands
2
808
—
808
Belize
1
762
—
762
Tonga
1
466
—
466
Netherlands Antilles
1
89
—
89
SUB_TOTAL
126
1 335 794
455 388
880 406
0.43%
0.51%
U.2.2. South Africa
Countries and territories in which projects are located
Number of loans
Aggregate loans granted
Undisbursed portion
Disbursed portion
% of total 2006
% fin year 2005
South Africa
32
993 980
268 287
725 693
SUB_TOTAL
32
993 980
268 287
725 693
0.32%
0.38%
92 EIB Group
79
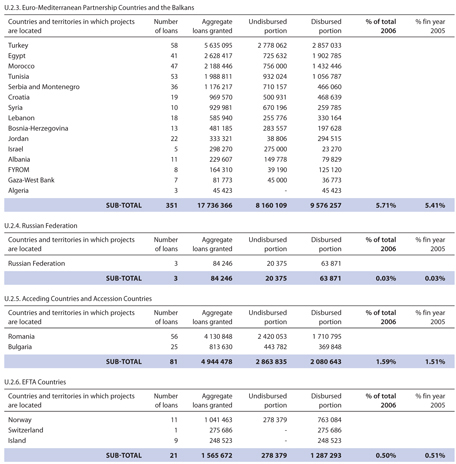
U.2.3. Euro-Mediterranean Partnership Countries and the Balkans
Countries and territories in which projects are located
Number of loans
Aggregate loans granted
Undisbursed portion
Disbursed portion
% of total 2006
% fin year 2005
Turkey
58
5 635 095
2 778 062
2 857 033
Egypt
41
2 628 417
725 632
1 902 785
Morocco
47
2 188 446
756 000
1 432 446
Tunisia
53
1 988 811
932 024
1 056 787
Serbia and Montenegro
36
1 176 217
710 157
466 060
Croatia
19
969 570
500 931
468 639
Syria
10
929 981
670 196
259 785
Lebanon
18
585 940
255 776
330 164
Bosnia-Herzegovina
13
481 185
283 557
197 628
Jordan
22
333 321
38 806
294 515
Israel
5
298 270
275 000
23 270
Albania
11
229 607
149 778
79 829
FYROM
8
164 310
39 190
125 120
Gaza-West Bank
7
81 773
45 000
36 773
Algeria
3
45 423
—
45 423
SUB_TOTAL
351
17 736 366
8 160 109
9 576 257
5.71%
5.41%
U.2.4. Russian Federation
Countries and territories in which projects are located
Number of loans
Aggregate loans granted
Undisbursed portion
Disbursed portion
% of total 2006
% fin year 2005
Russian Federation
3
84 246
20 375
63 871
SUB_TOTAL
3
84 246
20 375
63 871
0.03%
0.03%
U.2.5. Acceding Countries and Accession Countries
Countries and territories in which projects are located
Number of loans
Aggregate loans granted
Undisbursed portion
Disbursed portion
% of total 2006
% fin year 2005
Romania
56
4 130 848
2 420 053
1 710 795
Bulgaria
25
813 630
443 782
369 848
SUB_TOTAL
81
4 944 478
2 863 835
2 080 643
1.59%
1.51%
U.2.6. EFTA Countries
Countries and territories in which projects are located
Number of loans
Aggregate loans granted
Undisbursed portion
Disbursed portion
% of total 2006
% fin year 2005
Norway
11
1 041 463
278 379
763 084
Switzerland
1
275 686
—
275 686
Island
9
248 523
—
248 523
SUB_TOTAL
21
1 565 672
278 379
1 287 293
0.50%
0.51%
EIB – Financial Statements 2006 93
80
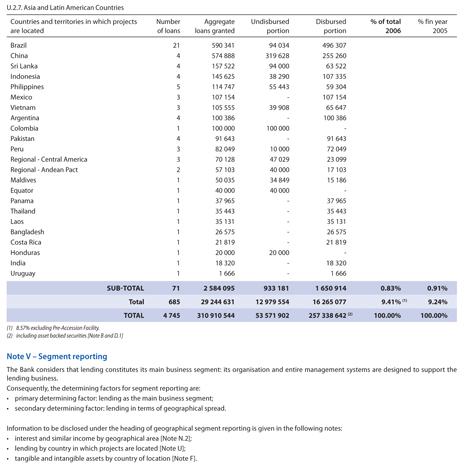
U.2.7. Asia and Latin American Countries
Countries and territories in which projects are located
Number of loans
Aggregate loans granted
Undisbursed portion
Disbursed portion
% of total 2006
% fin year 2005
Brazil
21
590 341
94 034
496 307
China
4
574 888
319 628
255 260
Sri Lanka
4
157 522
94 000
63 522
Indonesia
4
145 625
38 290
107 335
Philippines
5
114 747
55 443
59 304
Mexico
3
107 154
—
107 154
Vietnam
3
105 555
39 908
65 647
Argentina
4
100 386
—
100 386
Colombia
1
100 000
100 000
—
Pakistan
4
91 643
—
91 643
Peru
3
82 049
10 000
72 049
Regional - Central America
3
70 128
47 029
23 099
Regional - Andean Pact
2
57 103
40 000
17 103
Maldives
1
50 035
34 849
15 186
Equator
1
40 000
40 000
—
Panama
1
37 965
—
37 965
Thailand
1
35 443
—
35 443
Laos
1
35 131
—
35 131
Bangladesh
1
26 575
—
26 575
Costa Rica
1
21 819
—
21 819
Honduras
1
20 000
20 000
—
India
1
18 320
—
18 320
Uruguay
1
1 666
—
1 666
SUB_TOTAL
71
2 584 095
933 181
1 650 914
0.83%
0.91%
Total
685
29 244 631
12 979 554
16 265 077
9.41% (1)
9.24%
TOTAL
4 745
310 910 544
53 571 902
257 338 642 (2)
100.00%
100.00%
(1) 8.57% excluding Pre-Accession Facility.
(2) including asset backed securities [Note B and D.1]
Note V – Segment reporting
The Bank considers that lending constitutes its main business segment: its organisation and entire management systems are designed to support the lending business.
Consequently, the determining factors for segment reporting are: • primary determining factor: lending as the main business segment; • secondary determining factor: lending in terms of geographical spread.
Information to be disclosed under the heading of geographical segment reporting is given in the following notes: • interest and similar income by geographical area [Note N.2]; • lending by country in which projects are located [Note U]; • tangible and intangible assets by country of location [Note F].
94 EIB Group
81
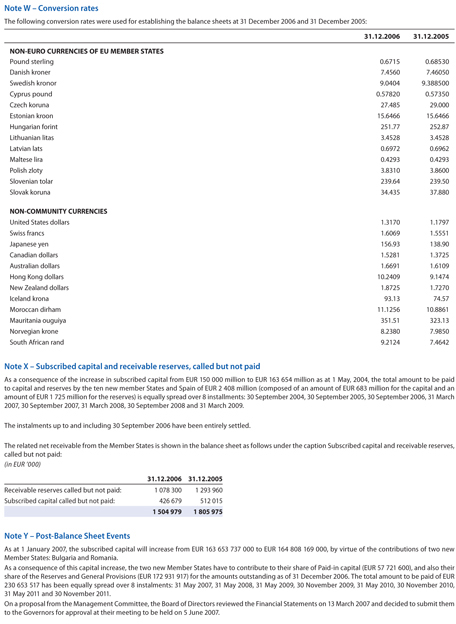
Note W – Conversion rates
The following conversion rates were used for establishing the balance sheets at 31 December 2006 and 31 December 2005:
31.12.2006
31.12.2005
NON-EURO CURRENCIES OF EU MEMBER STATES
Pound sterling
0.6715
0.68530
Danish kroner
7.4560
7.46050
Swedish kronor
9.0404
9.388500
Cyprus pound
0.57820
0.57350
Czech koruna
27.485
29.000
Estonian kroon
15.6466
15.6466
Hungarian forint
251.77
252.87
Lithuanian litas
3.4528
3.4528
Latvian lats
0.6972
0.6962
Maltese lira
0.4293
0.4293
Polish zloty
3.8310
3.8600
Slovenian tolar
239.64
239.50
Slovak koruna
34.435
37.880
NON-COMMUNITY CURRENCIES
United States dollars
1.3170
1.1797
Swiss francs
1.6069
1.5551
Japanese yen
156.93
138.90
Canadian dollars
1.5281
1.3725
Australian dollars
1.6691
1.6109
Hong Kong dollars
10.2409
9.1474
New Zealand dollars
1.8725
1.7270
Iceland krona
93.13
74.57
Moroccan dirham
11.1256
10.8861
Mauritania ouguiya
351.51
323.13
Norvegian krone
8.2380
7.9850
South African r and
9.2124
7.4642
Note X – Subscribed capital and receivable reserves, called but not paid
As a consequence of the increase in subscribed capital from EUR 150 000 million to EUR 163 654 million as at 1 May, 2004, the total amount to be paid to capital and reserves by the ten new member States and Spain of EUR 2 408 million (composed of an amount of EUR 683 million for the capital and an amount of EUR 1 725 million for the reserves) is equally spread over 8 installments: 30 September 2004, 30 September 2005, 30 September 2006, 31 March 2007, 30 September 2007, 31 March 2008, 30 September 2008 and 31 March 2009.
The instalments up to and including 30 September 2006 have been entirely settled.
The related net receivable from the Member States is shown in the balance sheet as follows under the caption Subscribed capital and receivable reserves, called but not paid:
(in EUR ‘000)
31.12.2006
31.12.2005
Receivable reserves called but not paid:
1 078 300
1 293 960
Subscribed capital called but not paid:
426 679
512 015
1 504 979
1 805 975
Note Y – Post-Balance Sheet Events
As at 1 January 2007, the subscribed capital will increase from EUR 163 653 737 000 to EUR 164 808 169 000, by virtue of the contributions of two new Member States: Bulgaria and Romania.
As a consequence of this capital increase, the two new Member States have to contribute to their share of Paid-in capital (EUR 57 721 600), and also their share of the Reserves and General Provisions (EUR 172 931 917) for the amounts outstanding as of 31 December 2006. The total amount to be paid of EUR 230 653 517 has been equally spread over 8 instalments: 31 May 2007, 31 May 2008, 31 May 2009, 30 November 2009, 31 May 2010, 30 November 2010, 31 May 2011 and 30 November 2011.
On a proposal from the Management Committee, the Board of Directors reviewed the Financial Statements on 13 March 2007 and decided to submit them to the Governors for approval at their meeting to be held on 5 June 2007.
EIB – Financial Statements 2006 95
82
INDEPENDENT AUDITOR’S REPORT
To the chairman of the Audit Committee of EUROPEAN INVESTMENT BANK
Luxembourg
We have audited the accompanying financial statements of the European Investment Bank, which show a profit of EUR 2,565.911 million and a total balance sheet of EUR 289,157.574 million and which comprise the balance sheet as at December 31, 2006, the profit and loss account, the statement of Special Section, the own funds and appropriation profit, the statement of subscriptions to the capital of the Bank, the cash flow statement for the year then ended, and a summary of significant accounting policies and other explanatory notes to the financial statements.
Management Committee’s responsibility for the financial statements
The Management Committee is responsible for the preparation and fair presentation of these financial statements in accordance with the general principles of the Directives of the European Union on the annual accounts and consolidated accounts of certain type of companies, banks and other financial institutions and insurance undertakings. This responsibility includes: designing, implementing and maintaining internal control relevant to the preparation and fair presentation of financial statements that are free from material misstatement, whether due to fraud or error, selecting and applying appropriate accounting policies, and making accounting estimates that are reasonable in the circumstances.
Responsibility of the “Réviseur d’Entreprises”
Our responsibility is to express an opinion on these financial statements based on our audit. We conducted our audit in accordance with International Standards on Auditing as adopted by the Luxembourg “Institut des Réviseurs d’Entreprises”. Those standards require that we comply with ethical requirements and plan and perform the audit to obtain reasonable assurance whether the financial statements are free from material misstatement.
An audit involves performing procedures to obtain audit evidence about the amounts and disclosures in the financial statements. The procedures selected depend on the judgement of the “Réviseur d’Entreprises”, including the assessment of the risks of material misstatement of the financial statements, whether due to fraud or error. In making those risk assessments, the “Réviseur d’Entreprises” considers internal control relevant to the entity’s preparation and fair presentation of the financial statements in order to design audit procedures that are appropriate in the circumstances, but not for the purpose of expressing an opinion on the effectiveness of the entity’s internal control.
An audit also includes evaluating the appropriateness of accounting policies used and the reasonableness of accounting estimates made by the Management Committee, as well as evaluating the overall presentation of the financial statements. We believe that the audit evidence we have obtained is sufficient and appropriate to provide a basis for our audit opinion.
Opinion
In our opinion, the financial statements give a true and fair view of the financial position of the European Investment Bank as of December 31, 2006, of its financial performance, of its own funds and appropriation profit, of its statement of Special Section, of its subscriptions to the capital of the Bank and of its cash flows for the year then ended in accordance with the general principles of the Directives of the European Union on the annual accounts and consolidated accounts of certain types of companies, banks and other financial institutions and insurance undertakings.
ERNST & YOUNG Société Anonyme Réviseur d’Entreprises
March 13, 2007 Bernard LHOEST Alain KINSCH
83
THE AUDIT COMMITTEE
The Audit Committee reports to the Board of Governors, the following statement being communicated to the Governors prior to their approval of the Annual Report and the financial statements for the past financial year.
Statement by the Audit Committee on the Bank unconsolidated financial statements
The Committee, instituted in pursuance of Article 14 of the Statute and Article 25 of the Rules of Procedure of the European Investment Bank for the purpose of verifying that the operations of the Bank are conducted and its books kept in a proper manner, having
– designated Ernst & Young as external auditors, reviewed their audit planning process, examined and discussed their reports,
– noted that the opinion of Ernst & Young on the financial statements of the European Investment Bank for the financial period ending on 31 December 2006 is unqualified,
– convened on a regular basis with the Heads of Directorates and relevant services, met regularly the Head of Internal Audit and discussed the relevant internal audit reports, and studied the documents which it deemed necessary to examine in the discharge of its duties,
– received assurance from the Management Committee concerning the effectiveness of the internal control structure and internal administration,
and considering
– the financial statements for the financial year ending on 31 December 2006 as drawn up by the Board of Directors at its meeting on 13 March 2007,
– that the foregoing provides a reasonable basis for its statement and,
– Articles 22, 23 & 24 of the Rules of Procedure, to the best of its knowledge and judgement:
confirms that the activities of the Bank are conducted in a proper manner, in particular with regard to risk management and monitoring;
has verified that the operations of the Bank have been conducted and its books kept in a proper manner and that to this end, it has verified that the Bank’s operations have been carried out in compliance with the formalities and procedures laid down by the Statute and Rules of Procedure;
confirms that the financial statements, comprising the balance sheet, the statement of special section, the profit and loss account, the statement of own funds and appropriation of profit, the statement of subscriptions to the capital of the Bank, the cash flow statement and the notes to the financial statements give a true and fair view of the financial position of the Bank as at 31 December 2006 in respect of its assets and liabilities, and of the results of its operations and cash flows for the year then ended.
Luxembourg, 13 March 2007
The Audit Committee
R. POVEDA ANADÓN M. DAllOCChIO
EIB – Financial Statements 2006 97
84
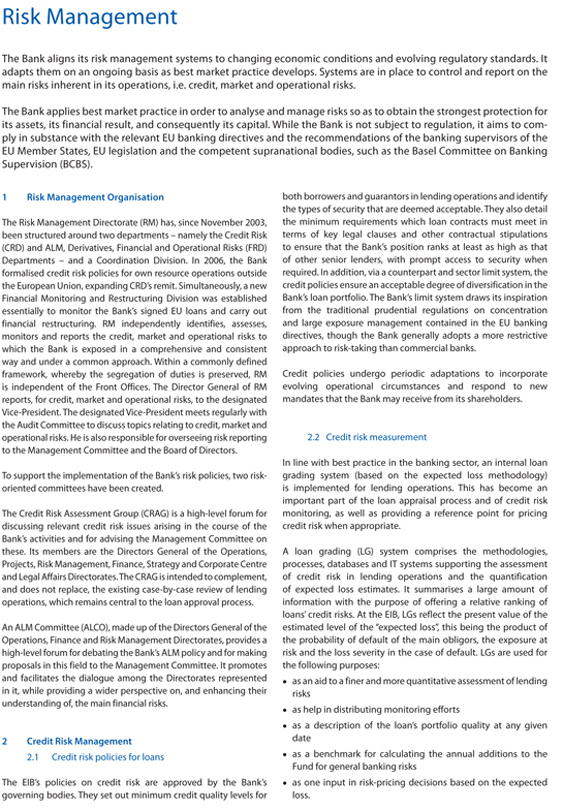
Risk Management
The Bank aligns its risk management systems to changing economic conditions and evolving regulatory standards. It adapts them on an ongoing basis as best market practice develops. Systems are in place to control and report on the main risks inherent in its operations, i.e. credit, market and operational risks.
The Bank applies best market practice in order to analyse and manage risks so as to obtain the strongest protection for its assets, its financial result, and consequently its capital. While the Bank is not subject to regulation, it aims to comply in substance with the relevant EU banking directives and the recommendations of the banking supervisors of the EU Member States, EU legislation and the competent supranational bodies, such as the Basel Committee on Banking Supervision (BCBS).
1 Risk Management Organisation
The Risk Management Directorate (RM) has, since November 2003, been structured around two departments – namely the Credit Risk (CRD) and ALM, Derivatives, Financial and Operational Risks (FRD) Departments – and a Coordination Division. In 2006, the Bank formalised credit risk policies for own resource operations outside the European Union, expanding CRD’s remit. Simultaneously, a new Financial Monitoring and Restructuring Division was established essentially to monitor the Bank’s signed EU loans and carry out financial restructuring. RM independently identifies, assesses, monitors and reports the credit, market and operational risks to which the Bank is exposed in a comprehensive and consistent way and under a common approach. Within a commonly defined framework, whereby the segregation of duties is preserved, RM is independent of the Front Offices. The Director General of RM reports, for credit, market and operational risks, to the designated Vice-President. The designated Vice-President meets regularly with the Audit Committee to discuss topics relating to credit, market and operational risks. He is also responsible for overseeing risk reporting to the Management Committee and the Board of Directors.
To support the implementation of the Bank’s risk policies, two risk-oriented committees have been created.
The Credit Risk Assessment Group (CRAG) is a high-level forum for discussing relevant credit risk issues arising in the course of the Bank’s activities and for advising the Management Committee on these. Its members are the Directors General of the Operations, Projects, Risk Management, Finance, Strategy and Corporate Centre and Legal Affairs Directorates. The CRAG is intended to complement, and does not replace, the existing case-by-case review of lending operations, which remains central to the loan approval process.
An ALM Committee (ALCO), made up of the Directors General of the Operations, Finance and Risk Management Directorates, provides a high-level forum for debating the Bank’s ALM policy and for making proposals in this field to the Management Committee. It promotes and facilitates the dialogue among the Directorates represented in it, while providing a wider perspective on, and enhancing their understanding of, the main financial risks.
2 Credit Risk Management
2.1 Credit risk policies for loans
The EIB’s policies on credit risk are approved by the Bank’s governing bodies. They set out minimum credit quality levels for both borrowers and guarantors in lending operations and identify the types of security that are deemed acceptable. They also detail the minimum requirements which loan contracts must meet in terms of key legal clauses and other contractual stipulations to ensure that the Bank’s position ranks at least as high as that of other senior lenders, with prompt access to security when required. In addition, via a counterpart and sector limit system, the credit policies ensure an acceptable degree of diversification in the Bank’s loan portfolio. The Bank’s limit system draws its inspiration from the traditional prudential regulations on concentration and large exposure management contained in the EU banking directives, though the Bank generally adopts a more restrictive approach to risk-taking than commercial banks.
Credit policies undergo periodic adaptations to incorporate evolving operational circumstances and respond to new mandates that the Bank may receive from its shareholders.
2.2 | | Credit risk measurement |
In line with best practice in the banking sector, an internal loan grading system (based on the expected loss methodology) is implemented for lending operations. This has become an important part of the loan appraisal process and of credit risk monitoring, as well as providing a reference point for pricing credit risk when appropriate.
A loan grading (LG) system comprises the methodologies, processes, databases and IT systems supporting the assessment of credit risk in lending operations and the quantification of expected loss estimates. It summarises a large amount of information with the purpose of offering a relative ranking of loans’ credit risks. At the EIB, LGs reflect the present value of the estimated level of the “expected loss”, this being the product of the probability of default of the main obligors, the exposure at risk and the loss severity in the case of default. LGs are used for the following purposes: • as an aid to a finer and more quantitative assessment of lending risks • as help in distributing monitoring efforts • as a description of the loan’s portfolio quality at any given date • as a benchmark for calculating the annual additions to the Fund for general banking risks • as one input in risk-pricing decisions based on the expected loss.
Financial report 2006 149
85
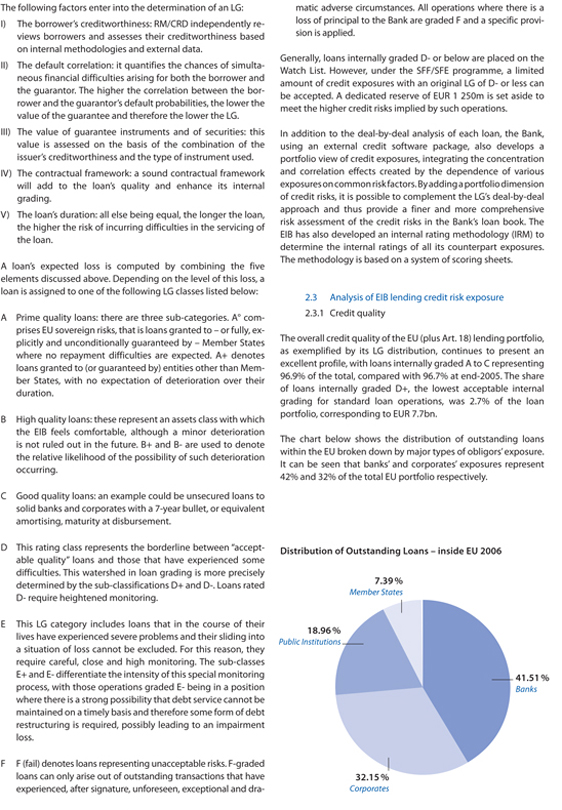
The following factors enter into the determination of an LG: I) The borrower’s creditworthiness: RM/CRD independently reviews borrowers and assesses their creditworthiness based on internal methodologies and external data.
II) The default correlation: it quantifies the chances of simultaneous financial difficulties arising for both the borrower and the guarantor. The higher the correlation between the borrower and the guarantor’s default probabilities, the lower the value of the guarantee and therefore the lower the LG. III) The value of guarantee instruments and of securities: this value is assessed on the basis of the combination of the issuer’s creditworthiness and the type of instrument used. IV) The contractual framework: a sound contractual framework will add to the loan’s quality and enhance its internal grading.
V) The loan’s duration: all else being equal, the longer the loan, the higher the risk of incurring difficulties in the servicing of the loan.
A loan’s expected loss is computed by combining the five elements discussed above. Depending on the level of this loss, a loan is assigned to one of the following LG classes listed below:
A Prime quality loans: there are three sub-categories. A° comprises EU sovereign risks, that is loans granted to – or fully, explicitly and unconditionally guaranteed by – Member States where no repayment difficulties are expected. A+ denotes loans granted to (or guaranteed by) entities other than Member States, with no expectation of deterioration over their duration.
B High quality loans: these represent an assets class with which the EIB feels comfortable, although a minor deterioration is not ruled out in the future. B+ and B- are used to denote the relative likelihood of the possibility of such deterioration occurring.
C Good quality loans: an example could be unsecured loans to solid banks and corporates with a 7-year bullet, or equivalent amortising, maturity at disbursement.
D This rating class represents the borderline between “acceptable quality” loans and those that have experienced some difficulties. This watershed in loan grading is more precisely determined by the sub-classifications D+ and D-. Loans rated D- require heightened monitoring.
E This LG category includes loans that in the course of their lives have experienced severe problems and their sliding into a situation of loss cannot be excluded. For this reason, they require careful, close and high monitoring. The sub-classes E+ and E- differentiate the intensity of this special monitoring process, with those operations graded E- being in a position where there is a strong possibility that debt service cannot be maintained on a timely basis and therefore some form of debt restructuring is required, possibly leading to an impairment loss.
F F (fail) denotes loans representing unacceptable risks. F-graded loans can only arise out of outstanding transactions that have experienced, after signature, unforeseen, exceptional and dramatic adverse circumstances. All operations where there is a loss of principal to the Bank are graded F and a specific provision is applied.
Generally, loans internally graded D- or below are placed on the Watch List. However, under the SFF/SFE programme, a limited amount of credit exposures with an original LG of D- or less can be accepted. A dedicated reserve of EUR 1 250m is set aside to meet the higher credit risks implied by such operations.
In addition to the deal-by-deal analysis of each loan, the Bank, using an external credit software package, also develops a portfolio view of credit exposures, integrating the concentration and correlation effects created by the dependence of various exposures on common risk factors. By adding a portfolio dimension of credit risks, it is possible to complement the LG’s deal-by-deal approach and thus provide a finer and more comprehensive risk assessment of the credit risks in the Bank’s loan book. The EIB has also developed an internal rating methodology (IRM) to determine the internal ratings of all its counterpart exposures. The methodology is based on a system of scoring sheets.
2.3 Analysis of EIB lending credit risk exposure 2.3.1 Credit quality
The overall credit quality of the EU (plus Art. 18) lending portfolio, as exemplified by its LG distribution, continues to present an excellent profile, with loans internally graded A to C representing 96.9% of the total, compared with 96.7% at end-2005. The share of loans internally graded D+, the lowest acceptable internal grading for standard loan operations, was 2.7% of the loan portfolio, corresponding to EUR 7.7bn.
The chart below shows the distribution of outstanding loans within the EU broken down by major types of obligors’ exposure. It can be seen that banks’ and corporates’ exposures represent 42% and 32% of the total EU portfolio respectively.
Distribution of Outstanding Loans – inside EU 2006
7.39%
Member States
18.96%
Public Institutions
41.51%
Banks
32.15%
Corporates
150 EIB Group
5.69%
86
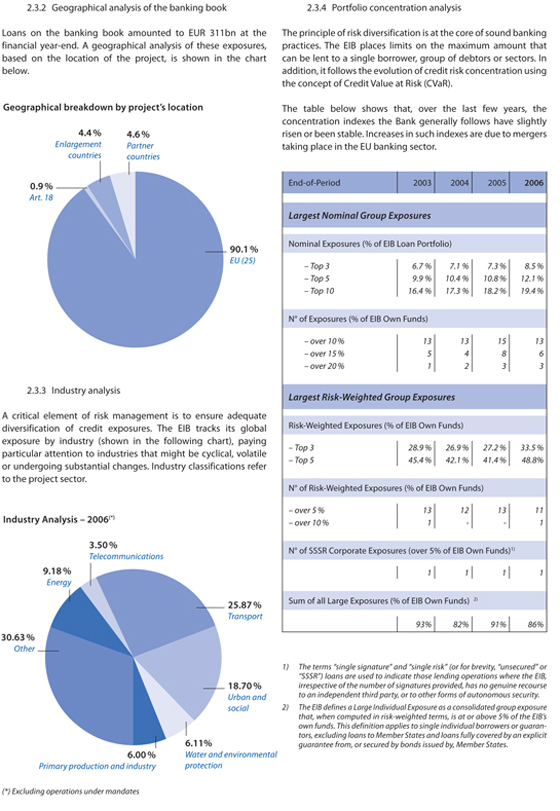
2.3.2 Geographical analysis of the banking book
.00%
84.20%
Loans on the banking book amounted to EUR 311bn at the financial year-end. A geographical analysis of these exposures, based on the location of the project, is shown in the chart
AC CE S S ION CANDIDATE E U Old Members (15)
Member States below.
EU New Members (10) P AR TNE R S
Geographical breakdown by project’s location
43.00%
4.4%
Enlargement countries
4.6%
Partner countries
0.9%
Art. 18
90.1%
EU (25)
A critical element of risk management is to ensure adequate diversification of credit exposures. The EIB tracks its global exposure by industry (shown in the following chart), paying particular attention to industries that might be cyclical, volatile or undergoing substantial changes. Industry classifications refer to the project sector.
Industry Analysis – 2006(*)
3.50%
Telecommunications
9.18%
Energy
30.63%
Other
25.87%
Transport
18.70%
Urban and social
6.11%
Water and environmental protection
6.00%
Primary production and industry
(*) Excluding operations under mandates
10.02%
30.32% 4.06%
Transport
2.3.4 Portfolio concentration analysis
Urban and social
The principle of risk diversification is at the core of sound banking Water and environmental
protection practices. The EIB places limits on the maximum amount that
Primary production can be lent to a single borrower, group of debtors or sectors. In and industry
5.99% | | addition, it follows the evolution of credit risk concentration using Other |
the concept of Credit Value at Risk (CVaR).
The table below shows that, over the last few years, the concentration indexes the Bank generally follows have slightly risen or been stable. Increases in such indexes are due to mergers taking place in the EU banking sector.
End-of-Period
2003
2004
2005
2006
Largest Nominal Group Exposures
Nominal Exposures (% of EIB Loan Portfolio)
– Top 3
6.7%
7.1%
7.3%
8.5%
– Top 5
9.9%
10.4%
10.8%
12.1%
– Top 10
16.4%
17.3%
18.2%
19.4%
N° of Exposures (% of EIB Own Funds)
– over 10 %
13
13
15
13
– over 15 %
5
4
8
6
– over 20 %
1
2
3
3
Largest Risk-Weighted Group Exposures
Risk-Weighted Exposures (% of EIB Own Funds)
– Top 3
28.9%
26.9%
27.2%
33.5%
– Top 5
45.4%
42.1%
41.4%
48.8%
N° of Risk-Weighted Exposures (% of EIB Own Funds)
– over 5 %
13
12
13
11
– over 10 %
1
—
—
1
N° of SSSR Corporate Exposures (over 5% of EIB Own Funds)1)
1
1
1
1
Sum of all Large Exposures (% of EIB Own Funds) 2)
93%
82%
91%
86%
1) The terms “single signature” and “single risk” (or for brevity, “unsecured” or “SSSR”) loans are used to indicate those lending operations where the EIB, irrespective of the number of signatures provided, has no genuine recourse to an independent third party, or to other forms of autonomous security.
2) The EIB defines a Large Individual Exposure as a consolidated group exposure that, when computed in risk-weighted terms, is at or above 5% of the EIB’s own funds. This definition applies to single individual borrowers or guarantors, excluding loans to Member States and loans fully covered by an explicit guarantee from, or secured by bonds issued by, Member States.
Financial report 2006 151
87
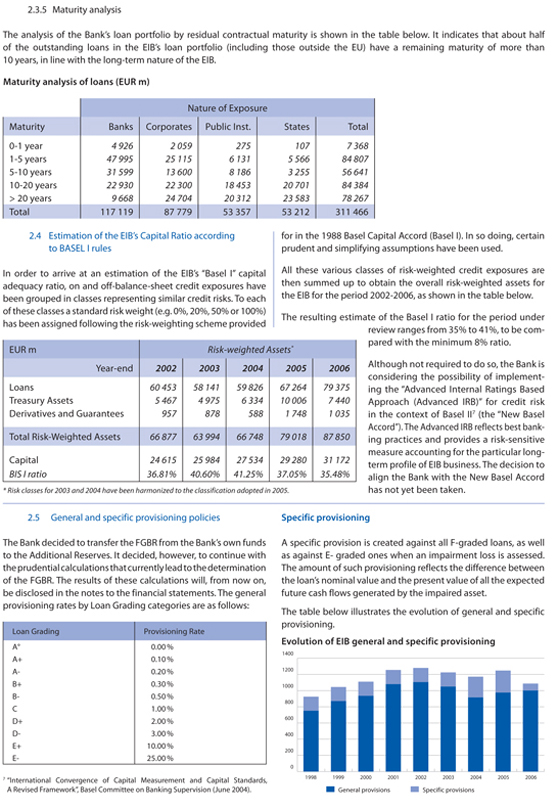
2.3.5 Maturity analysis
The analysis of the Bank’s loan portfolio by residual contractual maturity is shown in the table below. It indicates that about half of the outstanding loans in the EIB’s loan portfolio (including those outside the EU) have a remaining maturity of more than 10 years, in line with the long-term nature of the EIB.
Maturity analysis of loans(EUR m)
Maturity
Banks
Nature of Exposure Corporates
Public Inst.
States
Total
0-1 year
4 926
2 059
275
107
7 368
1-5 years
47 995
25 115
6 131
5 566
84 807
5-10 years
31 599
13 600
8 186
3 255
56 641
10-20 years
22 930
22 300
18 453
20 701
84 384
> 20 years
9 668
24 704
20 312
23 583
78 267
Total
117 119
87 779
53 357
53 212
311 466
2.4 Estimation of the EIB’s Capital Ratio according to BASEL I rules
In order to arrive at an estimation of the EIB’s “Basel I” capital adequacy ratio, on and off-balance-sheet credit exposures have been grouped in classes representing similar credit risks. To each of these classes a standard risk weight (e.g. 0%, 20%, 50% or 100%) has been assigned following the risk-weighting scheme provided for in the 1988 Basel Capital Accord (Basel I). In so doing, certain prudent and simplifying assumptions have been used.
All these various classes of risk-weighted credit exposures are then summed up to obtain the overall risk-weighted assets for the EIB for the period 2002-2006, as shown in the table below.
The resulting estimate of the Basel I ratio for the period under review ranges from 35% to 41%, to be compared with the minimum 8% ratio.
Although not required to do so, the Bank is considering the possibility of implementing the “Advanced Internal Ratings Based Approach (Advanced IRB)” for credit risk in the context of Basel II7 (the “New Basel Accord”). The Advanced IRB reflects best banking practices and provides a risk-sensitive measure accounting for the particular long-term profile of EIB business. The decision to align the Bank with the New Basel Accord has not yet been taken.
EUR m
Risk-weighted Assets*
Year-end
2002
2003
2004
2005
2006
Loans
60 453
58 141
59 826
67 264
79 375
Treasury Assets
5 467
4 975
6 334
10 006
7 440
Derivatives and Guarantees
957
878
588
1 748
1 035
Total Risk-Weighted Assets
66 877
63 994
66 748
79 018
87 850
Capital
24 615
25 984
27 534
29 280
31 172
BIS I ratio
36.81%
40.60%
41.25%
37.05%
35.48%
* Risk classes for 2003 and 2004 have been harmonized to the classification adopted in 2005.
2.5 General and specific provisioning policies
The Bank decided to transfer the FGBR from the Bank’s own funds to the Additional Reserves. It decided, however, to continue with the prudential calculations that currently lead to the determination of the FGBR. The results of these calculations will, from now on, be disclosed in the notes to the financial statements. The general provisioning rates by Loan Grading categories are as follows:
Loan Grading
Provisioning Rate
A°
0.00%
A+
0.10%
A—
0.20%
B+
0.30%
B—
0.50%
C
1.00%
D+
2.00%
D—
3.00%
E+
10.00%
E—
25.00%
7 “International Convergence of Capital Measurement and Capital Standards, A Revised Framework”, Basel Committee on Banking Supervision (June 2004).
Specific provisioning
A specific provision is created against all F-graded loans, as well as against E- graded ones when an impairment loss is assessed. The amount of such provisioning reflects the difference between the loan’s nominal value and the present value of all the expected future cash flows generated by the impaired asset.
The table below illustrates the evolution of general and specific provisioning.
Evolution of EIB general and specific provisioning
1400 1200 1000 800
600 400 200 0
1998 1999 2000 2001 2002 2003 2004 2005 2006
General provisions
Specific provisions
152 EIB Group
88
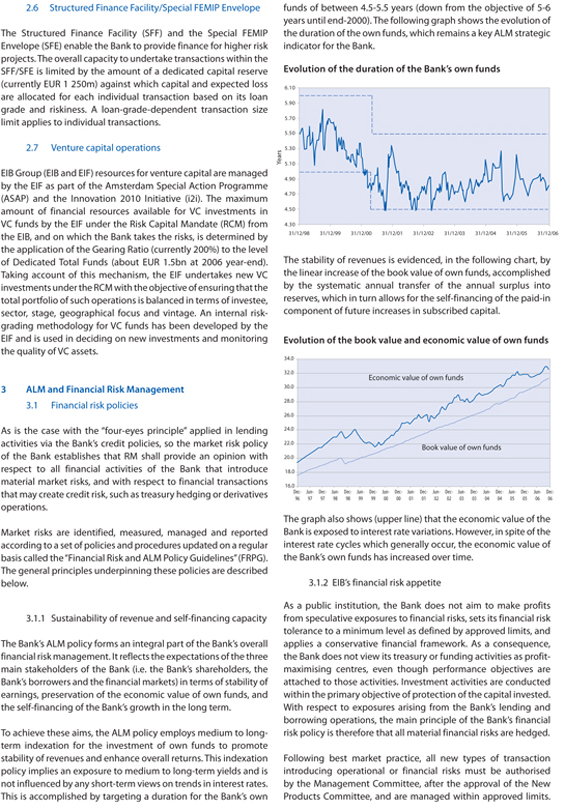
2.6 | | Structured Finance Facility/Special FEMIP Envelope |
The Structured Finance Facility (SFF) and the Special FEMIP Envelope (SFE) enable the Bank to provide finance for higher risk projects. The overall capacity to undertake transactions within the SFF/SFE is limited by the amount of a dedicated capital reserve (currently EUR 1 250m) against which capital and expected loss are allocated for each individual transaction based on its loan grade and riskiness. A loan-grade-dependent transaction size limit applies to individual transactions.
2.7 | | Venture capital operations |
EIB Group (EIB and EIF) resources for venture capital are managed by the EIF as part of the Amsterdam Special Action Programme (ASAP) and the Innovation 2010 Initiative (i2i). The maximum amount of financial resources available for VC investments in VC funds by the EIF under the Risk Capital Mandate (RCM) from the EIB, and on which the Bank takes the risks, is determined by the application of the Gearing Ratio (currently 200%) to the level of Dedicated Total Funds (about EUR 1.5bn at 2006 year-end). Taking account of this mechanism, the EIF undertakes new VC investments under the RCM with the objective of ensuring that the total portfolio of such operations is balanced in terms of investee, sector, stage, geographical focus and vintage. An internal risk-grading methodology for VC funds has been developed by the EIF and is used in deciding on new investments and monitoring the quality of VC assets.
3 | | ALM and Financial Risk Management |
3.1 | | Financial risk policies |
As is the case with the “four-eyes principle” applied in lending activities via the Bank’s credit policies, so the market risk policy of the Bank establishes that RM shall provide an opinion with respect to all financial activities of the Bank that introduce material market risks, and with respect to financial transactions that may create credit risk, such as treasury hedging or derivatives operations.
Market risks are identified, measured, managed and reported according to a set of policies and procedures updated on a regular basis called the “Financial Risk and ALM Policy Guidelines” (FRPG). The general principles underpinning these policies are described below.
3.1.1 | | Sustainability of revenue and self-financing capacity |
The Bank’s ALM policy forms an integral part of the Bank’s overall financial risk management. It reflects the expectations of the three main stakeholders of the Bank (i.e. the Bank’s shareholders, the Bank’s borrowers and the financial markets) in terms of stability of earnings, preservation of the economic value of own funds, and the self-financing of the Bank’s growth in the long term.
To achieve these aims, the ALM policy employs medium to long-term indexation for the investment of own funds to promote stability of revenues and enhance overall returns.
This indexation policy implies an exposure to medium to long-term yields and is not influenced by any short-term views on trends in interest rates. This is accomplished by targeting a duration for the Bank’s own funds of between 4.5-5.5 years (down from the objective of 5-6 years until end-2000). The following graph shows the evolution of the duration of the own funds, which remains a key ALM strategic indicator for the Bank.
Evolution of the duration of the Bank’s own funds
6.10 5.90 5.70 5.50 5.30 5.10 4.90 4.70 4.50 4.30
31/12/98 31/12/99 31/12/00 31/12/01 31/12/02 31/12/03 31/12/04 31/12/05 31/12/06
The stability of revenues is evidenced, in the following chart, by the linear increase of the book value of own funds, accomplished by the systematic annual transfer of the annual surplus into reserves, which in turn allows for the self-financing of the paid-in component of future increases in subscribed capital.
Evolution of the book value and economic value of own funds
34.0 32.0 30.0 28.0 26.0 24.0 22.0 20.0 18.0 16.0
Dec- 96 Jun- 97 Dec- 97 Jun- 98 Dec- 98 Jun- 99 Dec- 99 Jun- 00 Dec- 00 Jun- 01 Dec- 01 Jun- 02 Dec- 02 Jun- 03 Dec- 03 Jun- 04 Dec- 04 Jun- 05 Dec- 05 Jun- 06 Dec- 06
The graph also shows (upper line) that the economic value of the Bank is exposed to interest rate variations. However, in spite of the interest rate cycles which generally occur, the economic value of the Bank’s own funds has increased over time.
3.1.2 | | EIB’s financial risk appetite |
As a public institution, the Bank does not aim to make profits from speculative exposures to financial risks, sets its financial risk tolerance to a minimum level as defined by approved limits, and applies a conservative financial framework. As a consequence, the Bank does not view its treasury or funding activities as profit- maximising centres, even though performance objectives are attached to those activities. Investment activities are conducted within the primary objective of protection of the capital invested. With respect to exposures arising from the Bank’s lending and borrowing operations, the main principle of the Bank’s financial risk policy is therefore that all material financial risks are hedged.
Following best market practice, all new types of transaction introducing operational or financial risks must be authorised by the Management Committee, after the approval of the New Products Committee, and are managed within approved limits.
Financial report 2006 153
89
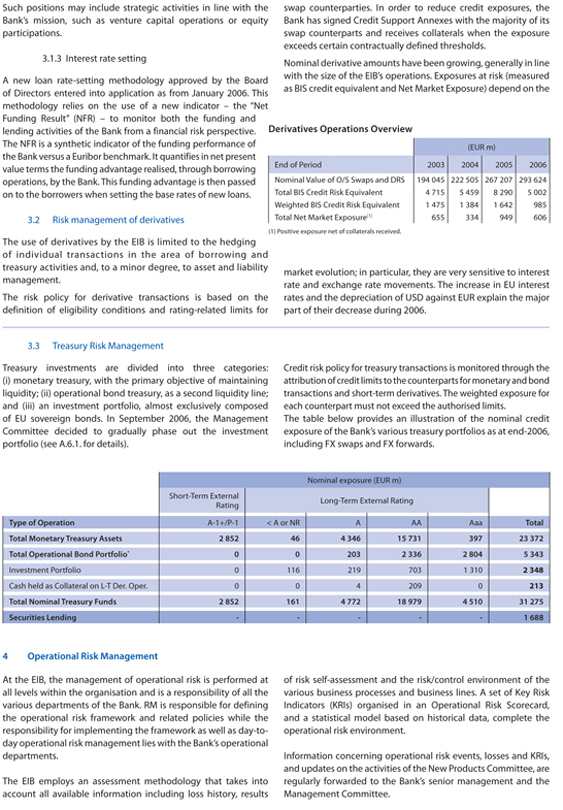
Such positions may include strategic activities in line with the Bank’s mission, such as venture capital operations or equity participations.
3.1.3 Interest rate setting
A new loan rate-setting methodology approved by the Board of Directors entered into application as from January 2006. This methodology relies on the use of a new indicator – the “Net Funding Result” (NFR) – to monitor both the funding and lending activities of the Bank from a financial risk perspective. The NFR is a synthetic indicator of the funding performance of the Bank versus a Euribor benchmark. It quantifies in net present value terms the funding advantage realised, through borrowing operations, by the Bank. This funding advantage is then passed on to the borrowers when setting the base rates of new loans.
3.2 Risk management of derivatives
The use of derivatives by the EIB is limited to the hedging of individual transactions in the area of borrowing and treasury activities and, to a minor degree, to asset and liability management.
The risk policy for derivative transactions is based on the definition of eligibility conditions and rating-related limits for swap counterparties. In order to reduce credit exposures, the Bank has signed Credit Support Annexes with the majority of its swap counterparts and receives collaterals when the exposure exceeds certain contractually defined thresholds.
Nominal derivative amounts have been growing, generally in line with the size of the EIB’s operations. Exposures at risk (measured as BIS credit equivalent and Net Market Exposure) depend on the
Derivatives Operations Overview
(EUR m)
End of Period
2003
2004
2005
2006
Nominal Value of O/S Swaps and DRS
194 045
222 505
267 207
293 624
Total BIS Credit Risk Equivalent
4 715
5 459
8 290
5 002
Weighted BIS Credit Risk Equivalent
1 475
1 384
1 642
985
Total Net Market Exposure(1)
655
334
949
606
(1) Positive exposure net of collaterals received.
market evolution; in particular, they are very sensitive to interest rate and exchange rate movements. The increase in EU interest rates and the depreciation of USD against EUR explain the major part of their decrease during 2006.
3.3 Treasury Risk Management
Treasury investments are divided into three categories: (i) monetary treasury, with the primary objective of maintaining liquidity; (ii) operational bond treasury, as a second liquidity line; and (iii) an investment portfolio, almost exclusively composed of EU sovereign bonds. In September 2006, the Management Committee decided to gradually phase out the investment portfolio (see A.6.1. for details).
Nominal exposure (EUR m)
Short-Term External
Long-Term External Rating
Rating
Type of Operation
A-1+/P-1
< A or NR
A
AA
Aaa
Total
Total Monetary Treasury Assets
2 852
46
4 346
15 731
397
23 372
Total Operational Bond Portfolio*
0
0
203
2 336
2 804
5 343
Investment Portfolio
0
116
219
703
1 310
2 348
Cash held as Collateral on L-T Der. Oper.
0
0
4
209
0
213
Total Nominal Treasury Funds
2 852
161
4 772
18 979
4 510
31 275
Securities Lending
—
—
—
—
—
1 688
4 Operational Risk Management
At the EIB, the management of operational risk is performed at all levels within the organisation and is a responsibility of all the various departments of the Bank. RM is responsible for defining the operational risk framework and related policies while the responsibility for implementing the framework as well as day-today operational risk management lies with the Bank’s operational departments.
The EIB employs an assessment methodology that takes into account all available information including loss history, results Credit risk policy for treasury transactions is monitored through the attribution of credit limits to the counterparts for monetary and bond transactions and short-term derivatives. The weighted exposure for each counterpart must not exceed the authorised limits.
The table below provides an illustration of the nominal credit exposure of the Bank’s various treasury portfolios as at end-2006, including FX swaps and FX forwards.
of risk self-assessment and the risk/control environment of the various business processes and business lines. A set of Key Risk Indicators (KRIs) organised in an Operational Risk Scorecard, and a statistical model based on historical data, complete the operational risk environment.
Information concerning operational risk events, losses and KRIs, and updates on the activities of the New Products Committee, are regularly forwarded to the Bank’s senior management and the Management Committee.
154 EIB Group
90
Audit and Control
Audit Committee – The Audit Committee is an independent statutory body, appointed by, and answerable directly to, the Board of Governors. In compliance with formalities and procedures defined in the Statute and Rules of Procedure, the Audit Committee’s role is to verify that the Bank’s operations have been conducted and its books kept in a proper manner and to obtain assurance on the effectiveness of the internal control systems, risk management and internal administration. The Audit Committee has overall responsibility for the auditing of the Bank’s accounts. The Committee provides statements each year on whether the financial statements, as well as any other financial information contained in the annual accounts drawn up by the Board of Directors give a true and fair view of the financial position of the Bank, the EIB Group, the Investment Facility and the FEMIP Trust Fund. The Governors take note of the statements by the Committee and of the conclusions in the annual reports of the Audit Committee when reviewing the Annual Report of the Board of Directors.
In fulfilling its role, the Committee meets with representatives of the other statutory bodies and with key staff members, reviews the financial statements and accounting policies, takes note of the work performed by the internal auditors, oversees and supervises the external auditors, safeguards the independence and integrity of the audit function, and coordinates audit work in general and understands and monitors how Management is providing for adequate and effective internal control systems, risk management and internal administration.
External Auditors – The external auditors report directly to the Audit Committee, which is empowered to delegate the day-to-day work concerning the audit of the financial statements to the external auditors. The Audit Committee designated the firm Ernst & Young in 2004, after consultation with the Management Committee. The contract will expire on the date on which the Board of Governors approves the 2008 financial statements. The external auditors are not allowed to carry out any work of an advisory nature or act in any other capacity that could compromise their independence when performing their audit tasks.
Inspectorate General – In 2005 the Inspectorate General for the EIB Group was created as an autonomous department. This underlined the importance that the Bank attaches to the main internal, ex post functions.
Internal audit. Catering for audit needs at all levels of management of the EIB Group and acting with the guarantees of independence and of professional standards conferred upon it by its Charter revised in 2001, Internal Audit examines and evaluates the relevance and effectiveness of the internal control systems and the procedures involved. It is also introducing an internal control framework based on BIS guidelines. Action Plans agreed with the Bank’s departments are a catalyst for improving procedures and strengthening controls. Hence, Internal Audit reviews and tests controls in critical banking, information technology and administrative areas on a rotational basis using a risk-based approach.
Ex post evaluation. Ex post evaluations cover the EIB’s activities and have been extended to the Group through the evaluation of the venture capital activities of the EIF and an interim evaluation of the FEMIP Trust Fund. The evaluation studies and reports enable the EIB Group to learn from past experience. Ex post evaluations are published on the website of the Bank (or EIF), thereby contributing to the transparency and accountability of the EIB Group.
Investigation. Under internal procedures to combat fraud, the Inspector General has authority to conduct inquiries. The Bank may also call upon external assistance or experts in accordance with the requirements of the inquiry, and works closely with the services of the European Anti-Fraud Office (OLAF). In addition, the Inspector General provides, when required, an independent recourse mechanism for investigating complaints that the European Ombudsman considers to be outside his remit.
Management Control – Within the new Strategy and Corporate Centre Directorate (created on 1 January 2007), the Strategy, Management Control and Financial Control Department brings together the functions responsible for Management Control
(Financial Control and Accounting; Planning, Budget and Control and units responsible for relations with the EIF and the European Court of Auditors and for Bank-wide organisational aspects) and integrates them with teams responsible for macro-economic research and corporate responsibility policies and corporate governance issues. This structure covers the entire process of defining the Bank’s strategy, co-ordinating its implementation and ultimately monitoring the results achieved. Key tools include the Corporate Operational Plan, financial control and accounting, and the budget and associated control systems. A suite of integrated reports facilitates evaluation of both the financial position and cash flows in relation to strategy, institutional and operational objectives and business plans. Management Control provides an opinion on any proposal to the Management Committee that may have a financial, accounting, budgetary or organisational impact.
Financial report 2006 155
91