Exhibit I
Preface
Highlights of financial developments at the EIB in 2014
Overview
In 2014, the EIB was in the second year of implementation of incremental lending associated with the EUR 10bn capital increase, which was approved unanimously by the shareholders at the end of 2012 and enabled the Bank to conduct more business over 2013–2015, while at the same time reinforcing its financial strength. The size, cash nature and rapid implementation of the capital increase were also a clear demonstration of the importance attached to the Bank by the EIB’s shareholders.
The Bank continued to achieve the additional lending volumes targeted and signed (from all resources) a total of EUR 77.0bn of new loans in 2014 (2013: EUR 71.7bn). The Basel III capital adequacy ratio decreased slightly from 26.1% to 26.0% as the new capital was partially consumed.
The incremental lending facilitated by the capital increase was delivered subject to reduced leverage, as planned. Overall, the Bank’s leverage1 remained substantially lower than the levels attained immediately prior to the capital increase, although it increased marginally on the previous year to 779% (end-2013: 764%).
The quality of the loan portfolio remained high, with impaired loans representing only 0.2% of the total loan portfolio, the same as at the end of 2013. Similarly, overdue payments (> 90 days) amounted to just EUR 87m. The specific provisions on loans recorded at year-end were EUR 483m (end-2013: EUR 361m).
The Bank’s financial performance maintained a steady progression in 2014. The annual net surplus was EUR 2.63bn – slightly higher than the EUR 2.51bn surplus recorded in 2013. The annual surplus is entirely retained, thus contributing to the growth of the EIB’s own funds and the Bank’s financing capacity.
To finance its lending activities, the EIB raised EUR 61.6bn in the capital markets. This was achieved with the targeted maturity profile (average of 7.2 years). The funding cost improved slightly compared to the prior year, benefiting from a tightening of spreads, which was more concentrated in the second half of the year, after the bulk of funding had been completed. Liquidity management remained prudent, with total treasury assets of EUR 65.6bn (end-2013: EUR 66bn), ensuring coverage of 69% of 2015 total projected net cash outflows (compared with 70% at year-end-2013).
1 Leverage is computed as gross debt (long and short-term) divided by adjusted shareholders’ equity (own funds less the EIB’s participation in the EIF’s capital).
1
Preface
1. The EIB’s importance to the EU reinforced by the Investment Plan for Europe
The EIB remained committed to its traditional role of financing viable projects that promote the attainment of the EU’s policy objectives within all EU Member States. During the challenges of 2008-2011, the EIB provided exceptional support to the European economy to help soften the impact of the crisis. The Bank is again on course to do so with additional lending volumes for the period 2013-2015, facilitated by the EUR 10bn capital increase. Over 2015-2018, the EIB is once more expected to shoulder additional responsibilities to support sustainable long-term growth and employment in Europe, bolstered by EU guarantees.
In 2014 the European Commission unveiled an Investment Plan for Europe, intending to counter the low investment levels that have hampered the EU’s recovery in the wake of the global economic and financial crisis. The Investment Plan, which was endorsed by the European Council on 18 December 2014, aims to mobilise EUR 315bn of new investments through the European Fund for Strategic Investments (EFSI). The structure is designed to underpin the Bank’s capital adequacy, thanks to credit enhancements in the form of guarantees provided to the EIB Group from the EU budget.
EFSI’s initial size was set at EUR 21bn, comprising EUR 16bn of EU guarantees and a EUR 5bn contribution from the EIB. Through EFSI, the EIB Group (including the EIF) is expected to deliver around EUR 60bn of new investments over roughly three to four years, starting in 2015. This will be in addition to average EIB baseline business volumes of around EUR 50bn per year from 2016, similar to pre-crisis volumes.
2. EIB financial results – continuous capital generation
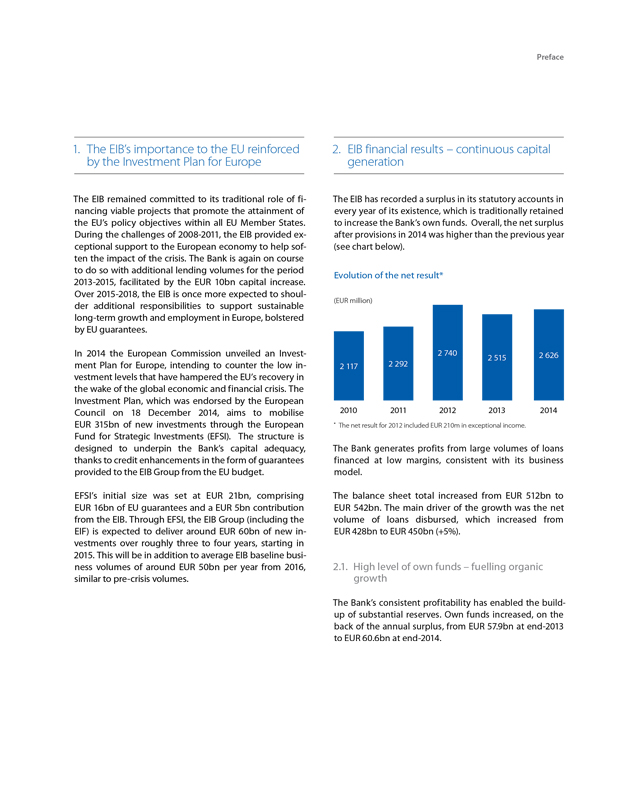
The EIB has recorded a surplus in its statutory accounts in every year of its existence, which is traditionally retained to increase the Bank’s own funds. Overall, the net surplus after provisions in 2014 was higher than the previous year (see chart below).
Evolution of the net result*
(EUR million)
2 740 2 515 2 626
2 117 2 292
2010 2011 2012 2013 2014
* The net result for 2012 included EUR 210m in exceptional income.
The Bank generates profits from large volumes of loans financed at low margins, consistent with its business model.
The balance sheet total increased from EUR 512bn to EUR 542bn. The main driver of the growth was the net volume of loans disbursed, which increased from EUR 428bn to EUR 450bn (+5%).
2.1. High level of own funds – fuelling organic growth
The Bank’s consistent profitability has enabled the buildup of substantial reserves. Own funds increased, on the back of the annual surplus, from EUR 57.9bn at end-2013 to EUR 60.6bn at end-2014.
2
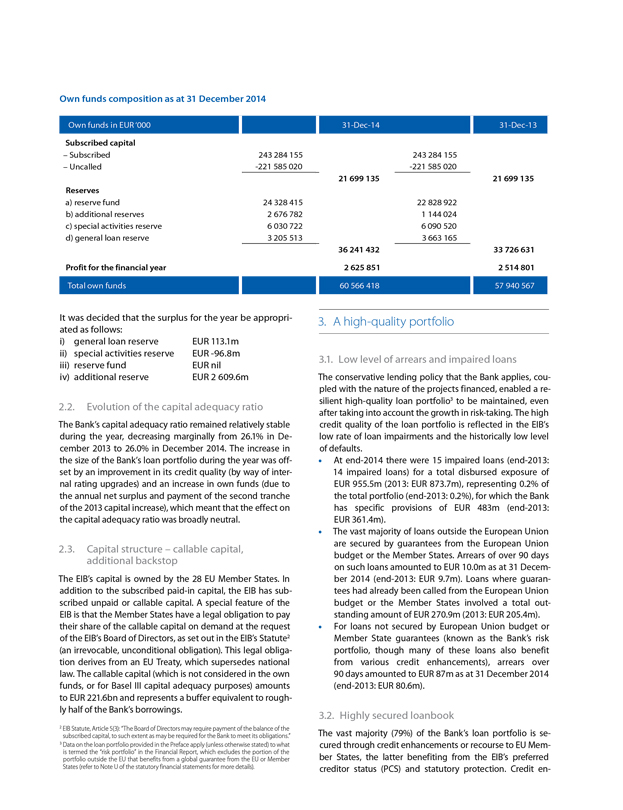
Own funds composition as at 31 December 2014
Own funds in EUR ‘000 31-Dec-14 31-Dec-13
Subscribed capital
– Subscribed 243 284 155 243 284 155
– Uncalled -221 585 020 -221 585 020
21 699 135 21 699 135
Reserves
a) reserve fund 24 328 415 22 828 922
b) additional reserves 2 676 782 1 144 024
c) special activities reserve 6 030 722 6 090 520
d) general loan reserve 3 205 513 3 663 165
36 241 432 33 726 631
Profit for the financial year 2 625 851 2 514 801
Total own funds 60 566 418 57 940 567
It was decided that the surplus for the year be appropriated as follows:
i) general loan reserve EUR 113.1m
ii) special activities reserve EUR -96.8m
iii) reserve fund EUR nil
iv) additional reserve EUR 2 609.6m
2.2. Evolution of the capital adequacy ratio
The Bank’s capital adequacy ratio remained relatively stable during the year, decreasing marginally from 26.1% in December 2013 to 26.0% in December 2014. The increase in the size of the Bank’s loan portfolio during the year was offset by an improvement in its credit quality (by way of internal rating upgrades) and an increase in own funds (due to the annual net surplus and payment of the second tranche of the 2013 capital increase), which meant that the effect on the capital adequacy ratio was broadly neutral.
2.3. Capital structure – callable capital, additional backstop
The EIB’s capital is owned by the 28 EU Member States. In addition to the subscribed paid-in capital, the EIB has subscribed unpaid or callable capital. A special feature of the EIB is that the Member States have a legal obligation to pay their share of the callable capital on demand at the request of the EIB’s Board of Directors, as set out in the EIB’s Statute2 (an irrevocable, unconditional obligation). This legal obligation derives from an EU Treaty, which supersedes national law. The callable capital (which is not considered in the own funds, or for Basel III capital adequacy purposes) amounts to EUR 221.6bn and represents a buffer equivalent to roughly half of the Bank’s borrowings.
2 EIB Statute, Article 5(3): “The Board of Directors may require payment of the balance of the subscribed capital, to such extent as may be required for the Bank to meet its obligations.”
3 Data on the loan portfolio provided in the Preface apply (unless otherwise stated) to what is termed the “risk portfolio” in the Financial Report, which excludes the portion of the portfolio outside the EU that benefits from a global guarantee from the EU or Member States (refer to Note U of the statutory financial statements for more details).
3. A high-quality portfolio
3.1. Low level of arrears and impaired loans
The conservative lending policy that the Bank applies, coupled with the nature of the projects financed, enabled a resilient high-quality loan portfolio3 to be maintained, even after taking into account the growth in risk-taking. The high credit quality of the loan portfolio is reflected in the EIB’s low rate of loan impairments and the historically low level of defaults.
• At end-2014 there were 15 impaired loans (end-2013: 14 impaired loans) for a total disbursed exposure of EUR 955.5m (2013: EUR 873.7m), representing 0.2% of the total portfolio (end-2013: 0.2%), for which the Bank has specific provisions of EUR 483m (end-2013: EUR 361.4m).
• The vast majority of loans outside the European Union are secured by guarantees from the European Union budget or the Member States. Arrears of over 90 days on such loans amounted to EUR 10.0m as at 31 December 2014 (end-2013: EUR 9.7m). Loans where guarantees had already been called from the European Union budget or the Member States involved a total outstanding amount of EUR 270.9m (2013: EUR 205.4m).
• For loans not secured by European Union budget or Member State guarantees (known as the Bank’s risk portfolio, though many of these loans also benefit from various credit enhancements), arrears over 90 days amounted to EUR 87m as at 31 December 2014 (end-2013: EUR 80.6m).
3.2. Highly secured loanbook
The vast majority (79%) of the Bank’s loan portfolio is secured through credit enhancements or recourse to EU Member States, the latter benefiting from the EIB’s preferred creditor status (PCS) and statutory protection. Credit en-
3
Preface
hancements are largely in the form of guarantees from EU sovereigns, the European Community budget, investment-grade banks and corporates, as well as financial collateral and assignments of rights or pledges. Unsecured loans to banks and corporates had a combined value of EUR 102.5bn, representing 21% of the overall loan portfolio at 31 December 2014 (end-2013: 19%); the remainder of the portfolio benefits from security or has recourse to Member States.
The share of the risk portfolio with a borrower or guarantor with an investment grade-equivalent internal rating was
79.4% as at end-2014 (end-2013: 79.3%).
The disbursed sovereign exposures of the Bank through its lending activities amounted to EUR 38bn (end-2013: EUR 35bn), and the sovereign-guaranteed exposure was EUR 82bn (end-2013: EUR 73bn) – see also Note U of the statutory financial statements. In 2014 and 2013, the Bank did not record any impairment in respect of its holding of EU sovereign and sovereign-guaranteed exposures. For the Bank’s financing activities, which mainly entail lending, the Bank’s preferred creditor status and the protection afforded by the Bank’s Statute are deemed to guarantee full recovery of the Bank’s sovereign assets on maturity.
3.3. Watchlist stabilised
The amount of operations on the watchlist remained on a downward trend in 2014, ending the year at EUR 9.0bn (2013: EUR 10.2bn; 2012: EUR 12.4bn). Watchlist operations now represent 1.7% of the risk portfolio (2013: 2.1%). Loans are placed on the internal watchlist for heightened monitoring in the event of counterparty downgrades or other adverse events, though they generally continue to perform.
3.4. Operations outside the EU
By offering finance outside the EU, the Bank actively promotes the EU’s external policy objectives. The majority of its non-EU activities are covered by the guarantee of the EU (External Lending Mandate) or Member States (Cotonou Agreement), in the form of either a comprehensive or political risk guarantee.
In its activities in Russia and with Russian entities, the Bank applies the sanctions adopted by the European Council. The Bank’s total disbursed exposure to borrowers in the Russian Federation was limited to EUR 335m at 31 December 2014, of which EUR 255m is at the EIB’s own risk. The remaining EUR 80m relates to operations under the EC comprehensive guarantee. In addition, the EIB has exposure to foreign subsidiaries of Russian groups outside the Russian Federation amounting to EUR 928m; EUR 314m of this exposure is secured by pledge of bonds or financial collateral.
As far as operations in Ukraine are concerned, total disbursed exposure amounted to EUR 749m as at 31 December 2014. Of this amount, EUR 717m is covered by the EU External Lending Mandate guarantee and the residual EUR 32m in the EIB’s risk portfolio is secured by financial collateral. A further EUR 2.3bn is committed to Ukraine in signed operations not yet disbursed, of which approximately EUR 0.5bn is expected to be at the EIB’s risk.
3.5. Solid due diligence and stable selection criteria
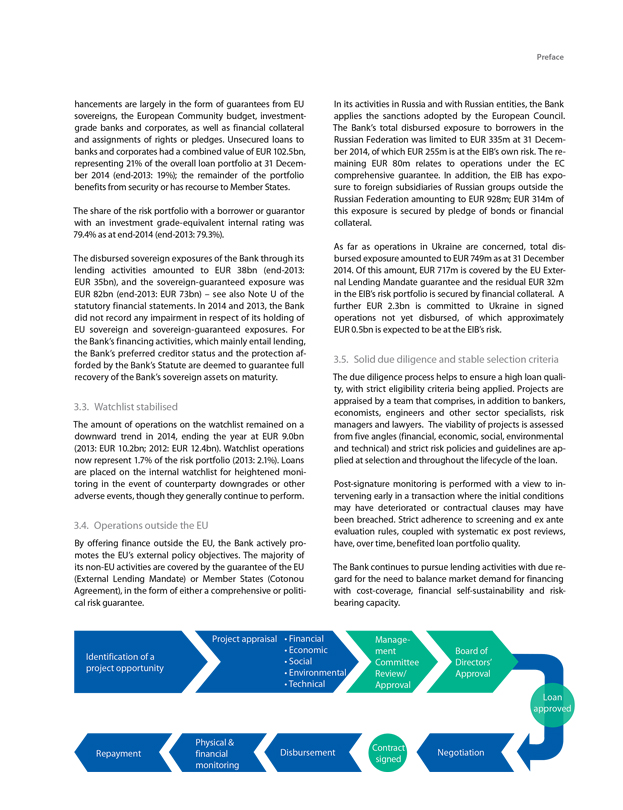
The due diligence process helps to ensure a high loan quality, with strict eligibility criteria being applied. Projects are appraised by a team that comprises, in addition to bankers, economists, engineers and other sector specialists, risk managers and lawyers. The viability of projects is assessed from five angles (financial, economic, social, environmental and technical) and strict risk policies and guidelines are applied at selection and throughout the lifecycle of the loan.
Post-signature monitoring is performed with a view to intervening early in a transaction where the initial conditions may have deteriorated or contractual clauses may have been breached. Strict adherence to screening and ex ante evaluation rules, coupled with systematic ex post reviews, have, over time, benefited loan portfolio quality.
The Bank continues to pursue lending activities with due regard for the need to balance market demand for financing with cost-coverage, financial self-sustainability and risk-bearing capacity.
Project appraisal
Financial Economic
Management
Board of
Identification of a project opportunity
Social Environmental Technical
Committee Review/ Approval
Directors’ Approval
Loan approved
Repayment
Physical & financial monitoring
Disbursement
Contract signed
Negotiation
4
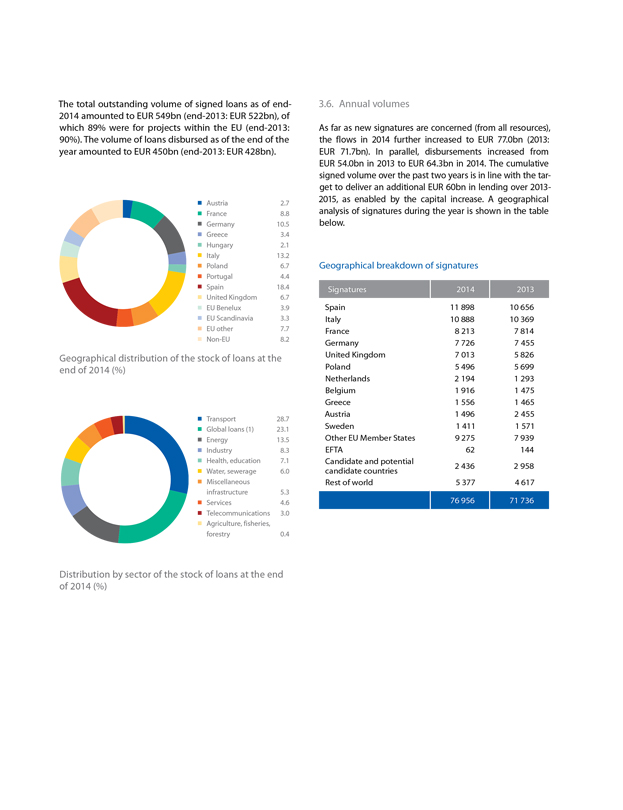
The total outstanding volume of signed loans as of end-2014 amounted to EUR 549bn (end-2013: EUR 522bn), of which 89% were for projects within the EU (end-2013: 90%). The volume of loans disbursed as of the end of the year amounted to EUR 450bn (end-2013: EUR 428bn).
Austria 2.7
France 8.8
Germany 10.5
Greece 3.4
Hungary 2.1
Italy 13.2
Poland 6.7
Portugal 4.4
Spain 18.4
United Kingdom 6.7
EU Benelux 3.9
EU Scandinavia 3.3
EU other 7.7
Non-EU 8.2
Geographical distribution of the stock of loans at the end of 2014 (%)
Transport 28.7
Global loans (1) 23.1
Energy 13.5
Industry 8.3
Health, education 7.1
Water, sewerage 6.0
Miscellaneous infrastructure 5.3
Services 4.6
Telecommunications 3.0
Agriculture, fisheries, forestry 0.4
Distribution by sector of the stock of loans at the end of 2014 (%)
3.6. Annual volumes
As far as new signatures are concerned (from all resources), the flows in 2014 further increased to EUR 77.0bn (2013: EUR 71.7bn). In parallel, disbursements increased from EUR 54.0bn in 2013 to EUR 64.3bn in 2014. The cumulative signed volume over the past two years is in line with the target to deliver an additional EUR 60bn in lending over 2013-2015, as enabled by the capital increase. A geographical analysis of signatures during the year is shown in the table below.
Geographical breakdown of signatures
Signatures 2014 2013
Spain 11 898 10 656
Italy 10 888 10 369
France 8 213 7 814
Germany 7 726 7 455
United Kingdom 7 013 5 826
Poland 5 496 5 699
Netherlands 2 194 1 293
Belgium 1 916 1 475
Greece 1 556 1 465
Austria 1 496 2 455
Sweden 1 411 1 571
Other EU Member States 9 275 7 939
EFTA 62 144
Candidate and potential candidate countries 2 436 2 958
Rest of world 5 377 4 617
76 956 71 736
5
Preface
4. Risk management activities – following best banking practice
The Bank aligns its risk management systems with best market practices, and adherence to those practices is monitored by the independent Audit Committee. The methodology used to determine operational targets and orientations takes into account the Bank’s objective of maintaining a robust credit standing, the long-term nature of its lending business and the granularity of its portfolio. The Bank has defined a set of indicators to monitor the credit, liquidity, market and operational risks inherent in its operations. These indicators include minimum capital requirements, credit quality distribution of the Bank’s portfolio, risk concentration measures and liquidity measures.
The EIB’s lending policies establish minimum credit quality levels for both borrowers and guarantors in lending operations and identify the types of security that are deemed acceptable. In analysing risks, the Bank applies an internal loan grading system and assigns internal ratings to counterparties. In addition, via a counterparty and sector limit system, the credit policies ensure an acceptable degree of diversification in the loan portfolio. The established sector limits for the Bank’s ten largest industries effectively cap the aggregated exposure to each industry in the case of a downturn, whilst the Bank also monitors the aggregate exposure to 12 additional industries.
With respect to market risk arising from the Bank’s lending and borrowing operations, the main principle of the Bank’s financial risk policy is that all material financial risks are hedged. For more details on financial risk management, refer to Note U of the statutory financial statements.
5. Prudent liquidity management
Treasury activities are conducted with the primary objective of protecting the capital invested and to ensure that the Bank can meet its payment obligations on time and in full. Liquidity is consistently maintained at appropriate levels to cater for the operating environment. Total treasury assets amounted to EUR 65.6bn (end-2013: EUR 66bn), ensuring coverage of 69% of 2015 total projected net cash outflows (end-2013: 70%).
The EIB is an eligible counterparty in the Eurosystem’s monetary policy operations and therefore has access to the monetary policy operations of the European Central Bank. This access has been activated, albeit at low levels, in a continuous manner to ensure its permanent operational maintenance. The Bank conducts the operations via the Central Bank of Luxembourg, where it maintains a deposit to cover the minimum reserve requirements. The ability to repo ECB-eligible collateral adds substantially to the EIB’s liquidity buffer.
The treasury assets include several portfolios with different investments, benchmarks and maturities. The bulk of these assets (87% at end-2014) were held in an operational portfolio invested in short-term instruments with a maturity of up to three months. Secured transactions
(e.g. repo instruments) accounted for 39% of treasury investments (end-2013: 53%), thus further enhancing portfolio quality.
The other portfolios form a buffer to be used in exceptional circumstances, and are invested in a diversified range of liquid securities. They include some medium-term debt issued by private and public sector entities with good credit standards (for a breakdown of the credit exposure on various treasury portfolios, please see Note S in the Consolidated Financial Statements under IFRS).
The total EU sovereign treasury exposure, excluding loan substitutes, as of 31 December 2014 was EUR 13.0bn, or 20% of total treasury assets (end-2013: EUR 14.7bn and 22% respectively). In terms of maturity, the bulk of these exposures (83% at end-2014) were held in short-term instruments of less than three months (end-2013: 84%).
6
Borrowing Activities in 2014
Resilient funding strategy
The EIB raises long-term funds via bond issuance in international capital markets to support its lending operations. With the objectives of attaining adequate volume and maturity, as well as optimising the funding cost on a sustainable basis, the EIB’s funding strategy combines the issuance of large and liquid bonds (“benchmarks”) in core currencies – EUR, USD and GBP – with targeted and tailor-made issuance across currencies. Guided by this approach, the EIB raised EUR 61.6bn in 2014.
Market conditions
In 2014, the funding environment was generally positive. The low level of interest rates supported a compression and convergence of spreads in the sovereign, supranational and agency (SSA) sector. Generally this had a favourable impact on bond performance and funding cost.
The Bank’s funding benefited from the reinforcement of the EIB’s high credit standing, supported by the EUR 10bn capital increase of 2013, stabilisation of the Bank’s asset quality and diminishing risks emanating from the euro area debt crisis.
Highlights of funding in the EIB’s core currencies
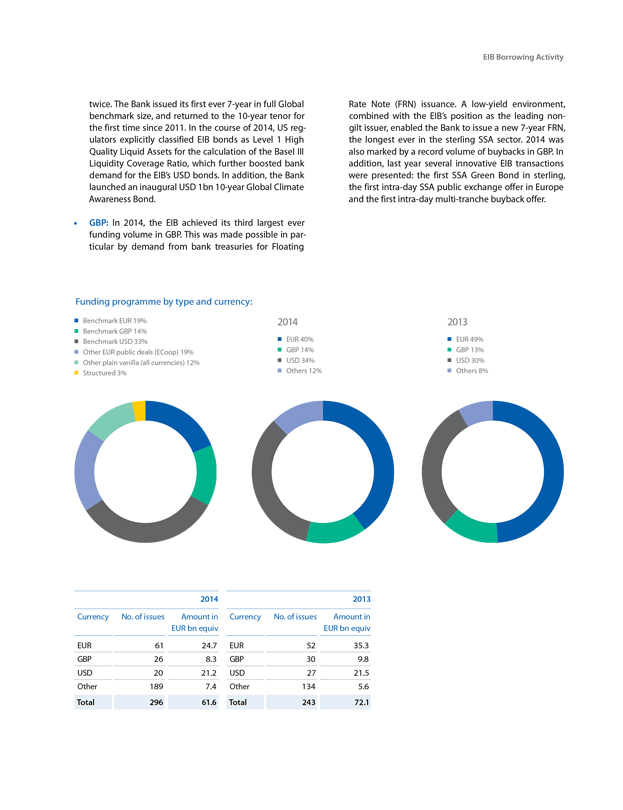
The pillar of the EIB’s funding continued to be issuance in the Bank’s core currencies EUR, USD and GBP, which together accounted for 88% of the total volumes raised, 76% of which in benchmark format.
EUR: EUR remained the largest source of funding (representing EUR 24.7bn, or 40% of total issuance) and contributed the longest average maturity among the EIB’s core currencies (9.3 years). The all-time low and decreasing level of interest rates encouraged investors to pursue yields in the 6 to 10-year maturity bracket, but tended to curtail interest beyond 10 years. The EIB thus concentrated issuance on the intermediate part of the curve.
Mini-benchmarks (“ECoops”) raised EUR 11.9bn in total, proving again to be a valuable tool in addressing specific pockets of demand, for example in maturities beyond 10 years. ECoop is also the chosen format for the EIB’s EUR-denominated Green Bonds. In 2014, EUR 2.2bn of ECoops were issued in Climate Awareness Bond (CAB) format, in 5- and 12-year maturities, creating the largest and longest benchmarks in this market.
USD: With almost USD 28.8bn issued, 2014 was one of the strongest years to date for the EIB in this funding currency, and the Bank was the only SSA issuer to refresh its full USD benchmark curve (3, 5, 7 and 10-year)
7
EIB Borrowing Activity
twice. The Bank issued its first ever 7-year in full Global benchmark size, and returned to the 10-year tenor for the first time since 2011. In the course of 2014, US regulators explicitly classified EIB bonds as Level 1 High Quality Liquid Assets for the calculation of the Basel III Liquidity Coverage Ratio, which further boosted bank demand for the EIB’s USD bonds. In addition, the Bank launched an inaugural USD 1bn 10-year Global Climate Awareness Bond.
GBP: In 2014, the EIB achieved its third largest ever funding volume in GBP. This was made possible in particular by demand from bank treasuries for Floating
Rate Note (FRN) issuance. A low-yield environment, combined with the EIB’s position as the leading non-gilt issuer, enabled the Bank to issue a new 7-year FRN, the longest ever in the sterling SSA sector. 2014 was also marked by a record volume of buybacks in GBP. In addition, last year several innovative EIB transactions were presented: the first SSA Green Bond in sterling, the first intra-day SSA public exchange offer in Europe and the first intra-day multi-tranche buyback offer.
Funding programme by type and currency:
Benchmark EUR 19% 2014 2013
Benchmark GBP 14%
Benchmark USD 33% EUR 40% EUR 49%
Other EUR public deals (ECoop) 19% GBP 14% GBP 13%
Other plain vanilla (all currencies) 12% USD 34% USD 30%
Structured 3% Others 12% Others 8%
2014 2013
Currency No. of issues Amount in EUR bn equiv. Currency No. of issues Amount in EUR bn equiv.
EUR 61 24.7 EUR 52 35.3
GBP 26 8.3 GBP 30 9.8
USD 20 21.2 USD 27 21.5
Other 189 7.4 Other 134 5.6
Total 296 61.6 Total 243 72.1
8
Diversification of EIB funding
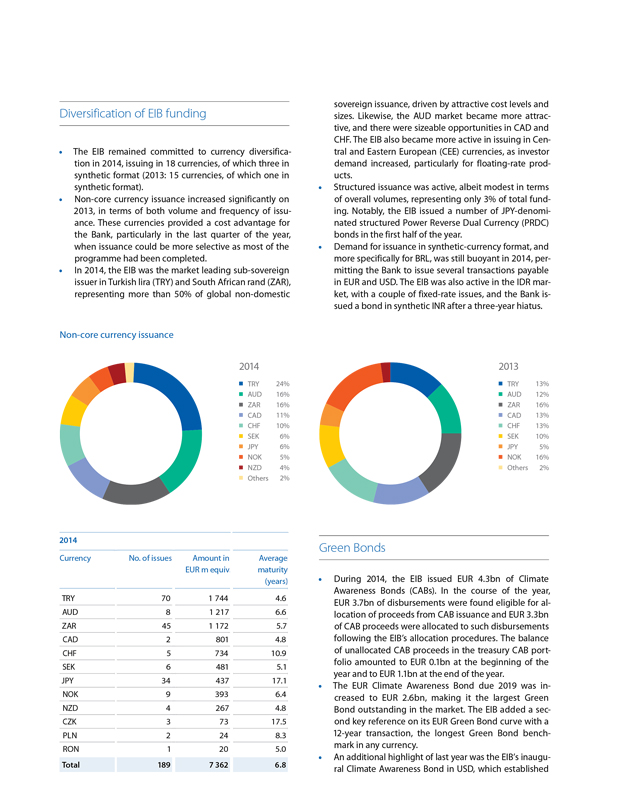
The EIB remained committed to currency diversification in 2014, issuing in 18 currencies, of which three in synthetic format (2013: 15 currencies, of which one in synthetic format).
Non-core currency issuance increased significantly on 2013, in terms of both volume and frequency of issuance. These currencies provided a cost advantage for the Bank, particularly in the last quarter of the year, when issuance could be more selective as most of the programme had been completed.
In 2014, the EIB was the market leading sub-sovereign issuer in Turkish lira (TRY) and South African rand (ZAR), representing more than 50% of global non-domestic
sovereign issuance, driven by attractive cost levels and sizes. Likewise, the AUD market became more attractive, and there were sizeable opportunities in CAD and CHF. The EIB also became more active in issuing in Central and Eastern European (CEE) currencies, as investor demand increased, particularly for floating-rate products.
Structured issuance was active, albeit modest in terms of overall volumes, representing only 3% of total funding. Notably, the EIB issued a number of JPY-denominated structured Power Reverse Dual Currency (PRDC) bonds in the first half of the year.
Demand for issuance in synthetic-currency format, and more specifically for BRL, was still buoyant in 2014, permitting the Bank to issue several transactions payable in EUR and USD. The EIB was also active in the IDR market, with a couple of fixed-rate issues, and the Bank issued a bond in synthetic INR after a three-year hiatus.
Non-core currency issuance
2014
TRY 24%
AUD 16%
ZAR 16%
CAD 11%
CHF 10%
SEK 6%
JPY 6%
NOK 5%
NZD 4%
Others 2%
2014
Currency No. of issues Amount in EUR m equiv. Average maturity (years)
TRY 70 1 744 4.6
AUD 8 1 217 6.6
ZAR 45 1 172 5.7
CAD 2 801 4.8
CHF 5 734 10.9
SEK 6 481 5.1
JPY 34 437 17.1
NOK 9 393 6.4
NZD 4 267 4.8
CZK 3 73 17.5
PLN 2 24 8.3
RON 1 20 5.0
Total 189 7 362 6.8
2013
TRY 13%
AUD 12%
ZAR 16%
CAD 13%
CHF 13%
SEK 10%
JPY 5%
NOK 16%
Others 2%
Green Bonds
During 2014, the EIB issued EUR 4.3bn of Climate Awareness Bonds (CABs). In the course of the year, EUR 3.7bn of disbursements were found eligible for allocation of proceeds from CAB issuance and EUR 3.3bn of CAB proceeds were allocated to such disbursements following the EIB’s allocation procedures. The balance of unallocated CAB proceeds in the treasury CAB portfolio amounted to EUR 0.1bn at the beginning of the year and to EUR 1.1bn at the end of the year.
The EUR Climate Awareness Bond due 2019 was increased to EUR 2.6bn, making it the largest Green Bond outstanding in the market. The EIB added a second key reference on its EUR Green Bond curve with a 12-year transaction, the longest Green Bond benchmark in any currency.
An additional highlight of last year was the EIB’s inaugural Climate Awareness Bond in USD, which established
9
EIB Borrowing Activity
the longest (10-year) USD Green Bond benchmark in the market. The Bank also launched its first GBP-denominated CAB, the first Green Bond in this currency from an SSA issuer.
Maturity mix of EIB funding
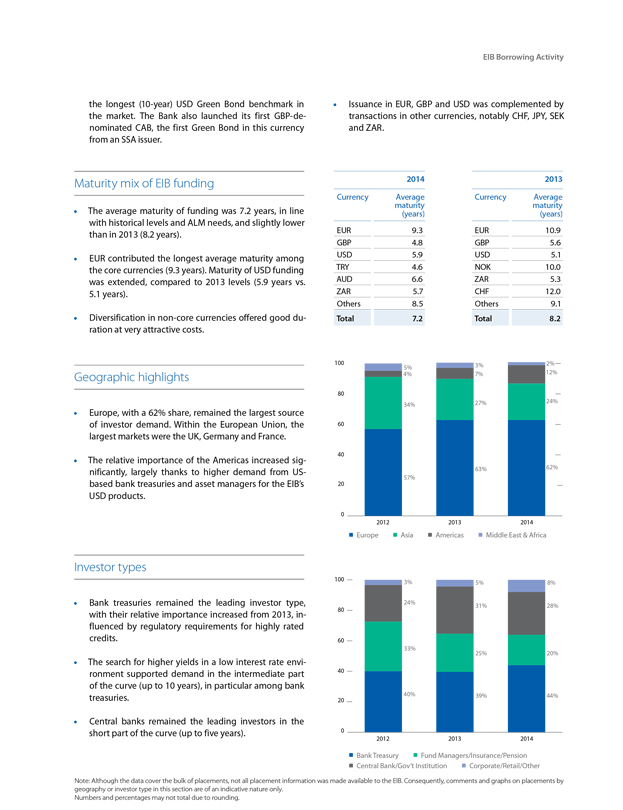
The average maturity of funding was 7.2 years, in line with historical levels and ALM needs, and slightly lower than in 2013 (8.2 years).
EUR contributed the longest average maturity among the core currencies (9.3 years). Maturity of USD funding was extended, compared to 2013 levels (5.9 years vs. 5.1 years).
Diversification in non-core currencies offered good duration at very attractive costs.
Geographic highlights
Europe, with a 62% share, remained the largest source of investor demand. Within the European Union, the largest markets were the UK, Germany and France.
The relative importance of the Americas increased significantly, largely thanks to higher demand from US-based bank treasuries and asset managers for the EIB’s USD products.
Investor types
Bank treasuries remained the leading investor type, with their relative importance increased from 2013, influenced by regulatory requirements for highly rated credits.
The search for higher yields in a low interest rate environment supported demand in the intermediate part of the curve (up to 10 years), in particular among bank treasuries.
Central banks remained the leading investors in the short part of the curve (up to five years).
Issuance in EUR, GBP and USD was complemented by transactions in other currencies, notably CHF, JPY, SEK and ZAR.
2014 2013
Currency
Average maturity (years) Currency Average maturity (years)
EUR 9.3 EUR 10.9
GBP 4.8 GBP 5.6
USD 5.9 USD 5.1
TRY 4.6 NOK 10.0
AUD 6.6 ZAR 5.3
ZAR 5.7 CHF 12.0
Others 8.5 Others 9.1
Total 7.2 Total 8.2
100 5% 3% 2%
4% 7% 12%
80
34% 27% 24%
60
40
57% 63% 62%
20
0 2012 2013 2014
Europe Asia Americas Middle East & Africa
100 3% 5% 8%
24% 31% 28%
80
60 33% 25% 20%
40
40% 39% 44%
20
0 2012 2013 2014
Bank Treasury Fund Managers/Insurance/Pension Central Bank/Gov’t Institution Corporate/Retail/Other
Note: Although the data cover the bulk of placements, not all placement information was made available to the EIB. Consequently, comments and graphs on placements by geography or investor type in this section are of an indicative nature only.
Numbers and percentages may not total due to rounding.
10
EIB Statutory Bodies
Situation at 20 April 2015
The composition of the Bank’s statutory bodies, the curricula vitae of their members and additional information on the remuneration arrangements are regularly updated and posted on the EIB’s website: www.eib.org.
Board of Governors
Chairman Jeroen DIJSSELBLOEM (Netherlands)
Belgium Johan Van OVERTVELDT Minister for Finance
Bulgaria Vladislav GORANOV Minister for Finance
Czech Republic Andrej BABIŠ Deputy Prime Minister, Minister of Finance
Denmark Henrik Sass LARSEN Minister for Business and Growth
Germany Wolfgang SCHÄUBLE Federal Minister for Finance
Estonia Maris LAURI Minister for Finance
Ireland Michael NOONAN Minister for Finance
Greece Yanis VAROUFAKIS Minister for Finance
Spain Luis de GUINDOS Minister for Economic Affairs and Competitiveness
France Michel SAPIN Minister for Finance and Public Accounts
Croatia Boris LALOVAC Minister of Finance
Italy Pier Carlo PADOAN Minister of Economy and Finance
Cyprus Harris GEORGIADES Minister for Finance
Latvia Jānis REIRS Minister for Finance
Lithuania Rimantas ŠADŽIUS Minister for Finance
Luxembourg Pierre GRAMEGNA Minister for Finance
Hungary Mihály VARGA Minister for National Economy
Malta Edward SCICLUNA Minister for Finance
Netherlands Jeroen DIJSSELBLOEM Minister for Finance
Austria Hans Jörg SCHELLING Federal Minister for Finance
Poland Mateusz SZCZUREK Minister for Finance
Portugal Maria Luís ALBUQUERQUE Minister of State and Minister of Finance
Romania Eugen Orlando TEODOROVICI Minister of Public Finance
Slovenia Dušan MRAMOR Minister for Finance
Slovakia Peter KAŽIMÍR Deputy Prime Minister and Minister of Finance
Finland Antti RINNE Minister of Finance
Sweden Magdalena ANDERSSON Minister for Finance
United Kingdom George OSBORNE Chancellor of the Exchequer
Audit Committee
Members Miroslav MATEJ Director of Regional Budgets Financing Department, Ministry of Finance, Czech Republic
Madis ÜÜRIKE Advisor, Ministry of Finance, Tallinn
Bettina JAKOBSEN Assistant Auditor General in the National Audit Office of Denmark, Copenhagen
Jean-Nicolas SCHAUS Former Director General, Luxembourg Banking Supervisory Authority (CSSF), Luxembourg
Duarte PITTA FERRAZ Professor, Nova School of Business and Economics, Lisbon
John SUTHERLAND Senior Adviser, Prudential Regulation Authority, Bank of England, London
Observer Uldis CERPS Executive Director for Banking Supervision, Swedish Financial Supervisory Authority, Stockholm
Management Committee
President Werner HOYER
Vice-Presidents Dario SCANNAPIECO
Wilhelm MOLTERER
Pim van BALLEKOM
Mihai TÃNÃSESCU
Jonathan TAYLOR
László BARANYAY
Román ESCOLANO
Ambroise FAYOLLE
11

Board of Directors
The Board of Directors consists of 29 Directors, with one Director nominated by each Member State and one by the European Commission. There are 19 Alternates, meaning that some of these positions will be shared by groupings of states.
Furthermore, in order to broaden the Board of Directors’ professional expertise in certain fields, the Board is able to co-opt a maximum of six experts (three Directors and three Alternates), who participate in the Board meetings in an advisory capacity, without voting rights.
Directors
Marc DESCHEEMAECKER Chairman of the Board, De Lijn, Mechelen
Karina KARAIVANOVA Deputy Minister of Finance, Ministry of Finance, Sofia
Jan GREGOR Deputy Minister of Finance, Ministry of Finance, Prague
Hans HØJ Head of Division, Financial Affairs, Ministry for Business and Growth, Copenhagen
Thomas WESTPHAL Director General – European Policy, Federal Ministry of Finance, Berlin
Martin PÕDER Head of the Finance Section, Estonia’s Permanent Representation to the EU, Brussels
John A. MORAN Member of the Board of Directors of the EIB, Dublin
Konstantin J. ANDREOPOULOS Member of the Board of Directors of the EIB, Athens
José María FERNÁNDEZ RODRÍGUEZ Director General, Treasury, Ministry for Economic Affairs and Competitiveness, Madrid
Muriel LACOUE-LABARTHE Deputy Director for European Affairs, Treasury Directorate General, Ministry for Economic Affairs and Finance, Paris
Vladimira IVANDIĆ Head of Sector for European Union Relations, Ministry of Finance, Zagreb
Carlo MONTICELLI Director General, International Financial Relations, Treasury Department, Ministry of Economic Affairs and Finance, Rome
Kyriacos KAKOURIS Senior Economic Officer, Ministry of Finance, Nicosia
Armands EBERHARDS Deputy State Secretary, Ministry of Finance, Riga
Miglė TUSKIENĖ Financial counsellor, Permanent Representation of Lithuania to the EU, Brussels
Arsène JACOBY Head of International Financial Institutions Department, Ministry of Finance, Luxembourg
Zoltán URBÁN CEO, Hungarian Export-Import Bank Plc., Hungarian Export Credit Insurance Plc., Budapest
Noel CAMILLERI Director General, Treasury, Ministry for Finance, Valletta
Irene JANSEN Head of the International Economics and Financial Institutions Division, Foreign Financial Relations Directorate, Ministry of Finance, The Hague
Wolfgang NITSCHE Deputy Head of the Division for Coordination of European Integration Matters and Trade Policy, Federal Ministry of Finance, Vienna
Artur RADZIWIŁŁ Undersecretary of State, Ministry of Finance, Warsaw
Elsa RONCON SANTOS Director General for Treasury and Finance, Ministry of Finance, Lisbon
Enache JIRU Secretary of State, Ministry of Public Finance, Bucharest
Anton ROP Honorary Vice-President of the European Investment Bank, Vodice
Katarina KASZASOVÁ Director General of the State Reporting Section, Ministry of Finance, Bratislava
Kristina SARJO Financial Counsellor, Director of Unit for International Affairs, Financial Markets Department, Ministry of Finance, Helsinki
Mattias HECTOR Senior advisor, Swedish Central Bank, Stockholm
Jonathan BLACK Director Europe, HM Treasury, London
Maarten VERWEY Deputy Director General, Directorate-General for Economic and Financial Affairs, European Commission, Brussels
Experts
Dr Timothy STONE Independent non-executive director, former Senior Advisor to the Secretary of State for Energy and Climate Change, former Chairman of KPMG, Global Infrastructure & Projects, Essex
Dr Ingrid HENGSTER Member of the Executive Board, KfW Bankengruppe, Frankfurt
Hugues MINGARELLI Managing Director for North Africa, Middle East, Arabian Peninsula, Iran and Iraq, European External Action Service, Brussels
12
Alternates
Gauthier BOURLARD Inspector, Coordinator within the Multilateral Institutions Unit, International and European Financial Affairs (IEFA), Treasury, Ministry of Finance, Brussels
(…) …
Martin HEIPERTZ Head of Division “European Policy”, Federal Ministry of Finance, Berlin
Rudolf LEPERS Head of Division, Federal Ministry of Economic Affairs and Technology, Berlin
Nico PETRIS Treasury Specialist, National Treasury Management Agency, Department of Finance, Dublin
Achilleas TZIMAS Economist – Financial Expert, Direcorate General for Economic Policy, Ministry of Finance, Athens
Ignacio VICENTE GONZÁLEZ Chief of Staff of the General Secretary of Treasury and Financial Policy, Ministry for Economic Affairs and Competitiveness, Madrid
Alice TERRACOL Head of Bilateral Affairs and European Financial Instruments Office, Europe Department, Treasury Directorate General, Ministry for Economic Affairs and Finance, Paris
Anne PAUGAM Chief Executive Officer of Agence Française de Développement, Paris
Riina LAIGO Adviser in the European Union and International Affairs Department, Ministry of Finance, Tallinn
Adolfo DI CARLUCCIO Division Chief, Directorate for International Financial Relations, Department of the Treasury, Ministry of Economic Affairs and Finance, Rome
(…) …
Claude CUSCHIERI Director General, Strategy and Operations Support, Ministry for Finance, Valletta
Karin RYSAVY Economic and Financial Counsellor, Permanent Mission of Austria to the OECD, Paris
Tomasz SKURZEWSKI Director, International Department, Ministry of Finance, Warsaw
Martina KOBILICOVÁ Director General for International Relations, Ministry of Finance, Bratislava
Vanessa MACDOUGALL Head of EU Financing, H.M. Treasury, London
Anna WECHSBERG Head of Europe Department, Department for International Development, London
Walter DEFFAA Director-General, Directorate-General for Regional Policy, European Commission, Brussels
Alternate experts
Philippe MILLS Chief Executive Officer, Société de Financement Local, Paris
Franco PASSACANTANDO Member of the Board of Directors of the EIB, Rome
José María MÉNDEZ ÁLVAREZ-CEDRÓN General Manager, Confederación Española de Cajas de Ahorros (CECA) & Cecabank S.A., Madrid
13

Audit and Control
Audit Committee – The Audit Committee is an independent statutory body, appointed by and reporting directly to the Board of Governors, in compliance with the formalities and procedures defined in the Bank’s Statute and Rules of Procedure. The role of the Audit Committee is to verify that the Bank’s operations have been conducted and its books kept in a proper manner and that the activities of the Bank conform to best banking practice. The Audit Committee has overall responsibility for the auditing of the Bank’s accounts.
The Audit Committee is composed of six members, who are appointed by the Board of Governors for a non-renewable term of six years. Members are chosen from among persons having independence, competence and integrity and who possess financial, auditing or banking supervisory expertise in the private or public sector. In addition, a maximum of three observers may be appointed to the Audit Committee on the basis of their particular qualifications, especially with regard to banking supervision.
The Audit Committee provides Statements each year on whether the financial statements, as well as any other financial information contained in the financial report drawn up by the Board of Directors, give a true and fair view of the financial position of the Bank, the EIB Group, and certain Trust Funds administered by the Bank. The Audit Committee reports on the EIB’s compliance with best banking practice through its Annual Report to the Board of Governors.
14
Audit and Control
In fulfilling its role, the Audit Committee meets with representatives of the other statutory bodies, reviews the financial statements, oversees the verification procedures and practical modalities for implementing and maintaining the framework of best banking practices applicable to the Bank’s services, takes note of the work performed by the internal auditors, monitors the work of the external auditors, safeguards the independence of the external audit function and coordinates audit work in general. Regular meetings with Bank staff and reviews of internal and external reports enable the Audit Committee to understand and monitor how Management is providing for adequate and effective internal control systems, risk management and internal administration. The Inspector General, the Chief Compliance Officer and the Financial Controller have direct access to the Audit Committee and may request private meetings if necessary.
External Auditors – The EIB’s external auditors, KPMG, report directly to the Audit Committee, which is empowered to delegate the day-to-day work of auditing the financial statements to them. The external auditors are not allowed to carry out any work of an advisory nature or act in any other capacity that might compromise their independence when performing their audit tasks. A summary of services provided by the external auditors and the associated fees is published each year by the Bank on its website.
Financial Control – Financial Control (FC) is an independent Directorate and reports directly to the Bank’s Management Committee. FC’s main responsibilities relate to the Bank’s books and records and its various financial statements. Together with the Secretary General, the Financial Controller manages the relationship with the external auditors, the Audit Committee and the European Court of Auditors.
Inspectorate General – The Inspectorate General (IG) for the EIB Group comprises four independent control functions.
Internal Audit. Catering for audit needs at all levels of management of the EIB Group and acting with the guarantees of independence and of professional standards conferred upon it by its Charter, Internal Audit examines and evaluates the relevance and effectiveness of the internal control systems and the procedures involved in managing risk within the Group. An internal control framework covering all key operational activities of the Group and any newly identified processes continues to be maintained. Action Plans agreed with the Bank’s departments are a catalyst for improving procedures and strengthening controls. In support of the Audit Committee’s mandate on best banking practice, Internal Audit includes such assessments in all elements of its work. Internal Audit therefore reviews and tests controls in critical banking, information technology and administrative areas on a rotational basis using a risk-based approach.
Operations Evaluation. Operations Evaluation (EV) independently carries out evaluations (mainly ex post) of the EIB Group’s operations. The objective is to assess EIB activities with a view to identifying aspects that could improve operational performance, accountability and transparency. EV focuses on how the institution (EIB/EIF) conducts its operations within the framework of relevant EU policies and the decisions of the EIB’s Governors. EV’s work also includes analysis of the related policies and strategies to identify those aspects that may need to be reviewed by the appropriate bodies. Evaluation reports are published in a dedicated section of the EIB’s website (www.eib.org/ evaluation).
Fraud Investigation. Under the anti-fraud policy approved by the Board, the Inspector General, through the Fraud Investigation Division (IG/IN), has the authority to conduct independent inquiries into allegations of possible fraud, corruption, collusion, coercion or obstruction involving EIB operations or activities. The Bank may also call upon external assistance or experts in accordance with the requirements of the inquiry, and works closely with the services of the European Anti-Fraud Office (OLAF). The scope of activities also encompasses a proactive anti-fraud approach – the Proactive Integrity Reviews (PIRs). Through PIRs the Inspectorate General supports the Bank’s efforts to monitor projects, identify red flags and search for possible indicators of fraud and/or corruption. Projects are selected for PIRs independently by IG on the basis of an extensive risk assessment process. Moreover, IG/IN is working to implement Exclusion Procedures, which will permit the Management Committee, following an adversary procedure resulting in a recommendation from an Exclusion Committee, to exclude from future operations and activities for a certain length of time entities found to have engaged in fraud or corruption.
Complaints Mechanism. The EIB Complaints Mechanism, as defined by its published Principles, Terms of Reference and Rules of Procedure, is a tool of horizontal accountability of the EIB Group vis-à-vis its stakeholders as regards the handling of complaints concerning its activities. It ensures that stakeholders have appropriate means available to voice their concerns and aims to provide the public with procedures to enable the pre-emptive settlement of disputes between the public and the EIB Group. Any member of the public has access to a two-tier sequential mechanism: an internal part – under the responsibility of the Complaints Mechanism Division (EIB-CM) – and, if a complainant is not satisfied with the outcome of the internal mechanism, an external one – the European Ombudsman. To that end, the EIB and the European Ombudsman have signed a Memorandum of Understanding.
15
Office of the Group Chief Compliance Officer (OCCO) –
In accordance with the principles set out by the Basel Committee, OCCO’s remit is: “to identify, assess, advise on, monitor and report on the compliance risk of the EIB Group, that is, the risk of legal or regulatory sanctions, financial loss, or loss to reputation a member of the EIB Group may suffer as a result of its failure to comply with all applicable laws, regulations, staff codes of conduct and standards of good practice.” In particular, OCCO “acts as a first line detector of potential incidents of non-observance or breaches by the staff of the rules on ethics and integrity, monitors compliance therewith by the staff of the EIB Group and recommends the adoption of such protective or redressing measures as are appropriate.”
OCCO is a group function headed by the Group Chief Compliance Officer (GCCO), supported by a dedicated compliance unit at the EIF. As set out in the EIB Integrity Policy and Compliance Charter, in line with best banking practices and the Basel Committee, OCCO is an independent function “reporting directly to the President of the EIB under the functional authority of a Vice-President”. In October 2012, OCCO was transformed into a Directorate.
OCCO is entrusted with a control mission and acts in close cooperation with EIB operational services, the Legal Directorate and other control services such as IG/Investigations.
Regular contacts are held by GCCO with peer international financial institutions (such as the World Bank, the EBRD and the IFC), EU bodies, standard-setting international organisations (e.g. FATF) and local authorities (e.g. FIU Luxembourg) in order to enable ongoing alignment of OCCO activities with relevant international standards and best banking practice.
OCCO activities are currently focused on the following main areas:
1. the assessment of integrity, money laundering and financing of terrorism risks in EIB operations for EIB lending, borrowing and treasury activities;
2. the establishment and updating of policies and guidelines, with particular reference to (i) money laundering/financing of terrorism (AML-CFT); (ii) specific transparency/integrity risks (e.g. for operations linked to non-compliant jurisdictions); and (iii) primary ethics and regulatory issues (e.g. insider dealing, conflicts of interest, etc.);
3. administration of (i) the Staff Code of Conduct and (ii) the Management Committee Code of Conduct, except for matters within the remit of the Ethics and Compliance Committee (where the GCCO delivers opinions and participates without voting rights); and
4. controls on procedures related to procurement for the Bank’s own account.
The above activities are complemented by regular training and awareness-building initiatives (AML-CFT training; presentations of OCCO activities to newcomers and members of EIB governing bodies; presentations and workshops on main OCCO policies and general compliance issues), in order to ensure staff awareness and, whenever possible, involvement in OCCO control activities for the timely detection and management of compliance risks within the EIB Group.
Management Control – Within the Secretariat General, the Planning, Budget and Analytics Division brings together the functions responsible for management control – namely operational planning, budget/cost accounting and associated analyses. This structure ensures that the overall planning and management reporting processes are coordinated and support the achievement of the Bank-wide objectives and ultimately that the results achieved are monitored. Key tools include the Corporate Operational Plan, the budget and independent opinions and analysis on proposals affecting them, plus the associated management accounting and control systems. A suite of integrated reports facilitates ongoing evaluation of the situation in relation to strategy, institutional and operational (including financial) objectives and business plans.
16
EIB
Statutory Financial Statements
EIB
Statutory Financial Statements
as at 31 December 2014
17
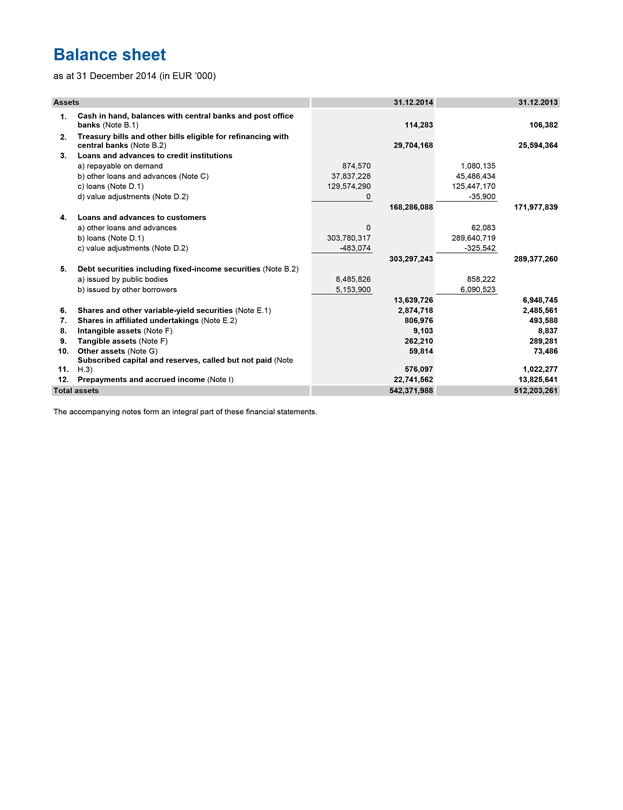
Balance sheet
as at 31 December 2014 (in EUR ’000)
Assets 31.12.2014 31.12.2013
1. Cash in hand, balances with central banks and post office banks (Note B.1) 114,283 106,382
2. Treasury bills and other bills eligible for refinancing with central banks (Note B.2) 29,704,168 25,594,364
3. Loans and advances to credit institutions
a) repayable on demand 874,570 1,080,135
b) other loans and advances (Note C) 37,837,228 45,486,434
c) loans (Note D.1) 129,574,290 125,447,170
d) value adjustments (Note D.2) 0 -35,900
168,286,088 171,977,839
4. Loans and advances to customers
a) other loans and advances 0 62,083
b) loans (Note D.1) 303,780,317 289,640,719
c) value adjustments (Note D.2) -483,074 -325,542
303,297,243 289,377,260
5. Debt securities including fixed-income securities (Note B.2)
a) issued by public bodies 8,485,826 858,222
b) issued by other borrowers 5,153,900 6,090,523
13,639,726 6,948,745
6. Shares and other variable-yield securities (Note E.1) 2,874,718 2,485,561
7. Shares in affiliated undertakings (Note E.2) 806,976 493,588
8. Intangible assets (Note F) 9,103 8,837
9. Tangible assets (Note F) 262,210 289,281
10. Other assets (Note G) 59,814 73,486
Subscribed capital and reserves, called but not paid (Note
11. H.3) 576,097 1,022,277
12. Prepayments and accrued income (Note I) 22,741,562 13,825,641
Total assets 542,371,988 512,203,261
The accompanying notes form an integral part of these financial statements.
18
EIB Statutory Financial Statements
Balance sheet (continued)
as at 31 December 2014 (in EUR ’000)
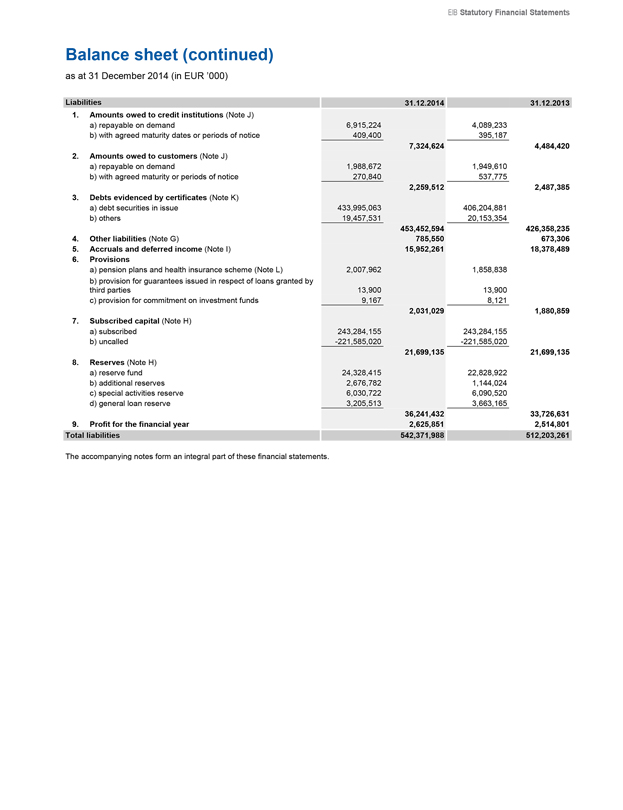
Liabilities 31.12.2014 31.12.2013
1. Amounts owed to credit institutions (Note J)
a) repayable on demand 6,915,224 4,089,233
b) with agreed maturity dates or periods of notice 409,400 395,187
7,324,624 4,484,420
2. Amounts owed to customers (Note J)
a) repayable on demand 1,988,672 1,949,610
b) with agreed maturity or periods of notice 270,840 537,775
2,259,512 2,487,385
3. Debts evidenced by certificates (Note K)
a) debt securities in issue 433,995,063 406,204,881
b) others 19,457,531 20,153,354
453,452,594 426,358,235
4. Other liabilities (Note G) 785,550 673,306
5. Accruals and deferred income (Note I) 15,952,261 18,378,489
6. Provisions
a) pension plans and health insurance scheme (Note L) 2,007,962 1,858,838
b) provision for guarantees issued in respect of loans granted by
third parties 13,900 13,900
c) provision for commitment on investment funds 9,167 8,121
2,031,029 1,880,859
7. Subscribed capital (Note H)
a) subscribed 243,284,155 243,284,155
b) uncalled -221,585,020 -221,585,020
21,699,135 21,699,135
8. Reserves (Note H)
a) reserve fund 24,328,415 22,828,922
b) additional reserves 2,676,782 1,144,024
c) special activities reserve 6,030,722 6,090,520
d) general loan reserve 3,205,513 3,663,165
36,241,432 33,726,631
9. Profit for the financial year 2,625,851 2,514,801
Total liabilities 542,371,988 512,203,261
The accompanying notes form an integral part of these financial statements.
19
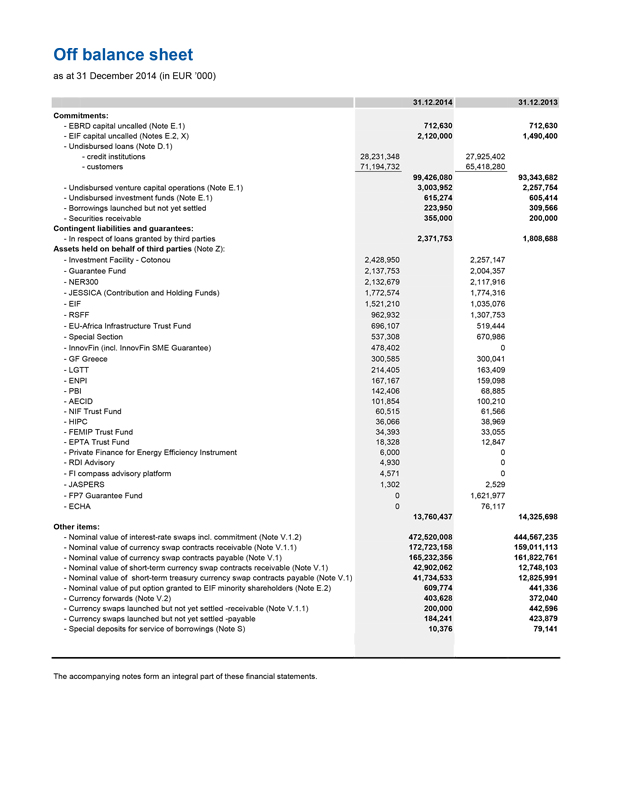
Off balance sheet
as at 31 December 2014 (in EUR ’000)
31.12.2014 31.12.2013
Commitments:
- EBRD capital uncalled (Note E.1) 712,630 712,630
- EIF capital uncalled (Notes E.2, X) 2,120,000 1,490,400
- Undisbursed loans (Note D.1)
- credit institutions 28,231,348 27,925,402
- customers 71,194,732 65,418,280
99,426,080 93,343,682
- Undisbursed venture capital operations (Note E.1) 3,003,952 2,257,754
- Undisbursed investment funds (Note E.1) 615,274 605,414
- Borrowings launched but not yet settled 223,950 309,566
- Securities receivable 355,000 200,000
Contingent liabilities and guarantees:
- In respect of loans granted by third parties 2,371,753 1,808,688
Assets held on behalf of third parties (Note Z):
- Investment Facility - Cotonou 2,428,950 2,257,147
- Guarantee Fund 2,137,753 2,004,357
- NER300 2,132,679 2,117,916
- JESSICA (Contribution and Holding Funds) 1,772,574 1,774,316
- EIF 1,521,210 1,035,076
- RSFF 962,932 1,307,753
- EU-Africa Infrastructure Trust Fund 696,107 519,444
- Special Section 537,308 670,986
- InnovFin (incl. InnovFin SME Guarantee) 478,402 0
- GF Greece 300,585 300,041
- LGTT 214,405 163,409
- ENPI 167,167 159,098
- PBI 142,406 68,885
- AECID 101,854 100,210
- NIF Trust Fund 60,515 61,566
- HIPC 36,066 38,969
- FEMIP Trust Fund 34,393 33,055
- EPTA Trust Fund 18,328 12,847
- Private Finance for Energy Efficiency Instrument 6,000 0
- RDI Advisory 4,930 0
- FI compass advisory platform 4,571 0
- JASPERS 1,302 2,529
- FP7 Guarantee Fund 0 1,621,977
- ECHA 0 76,117
13,760,437 14,325,698
Other items:
- Nominal value of interest-rate swaps incl. commitment (Note V.1.2) 472,520,008 444,567,235
- Nominal value of currency swap contracts receivable (Note V.1.1) 172,723,158 159,011,113
- Nominal value of currency swap contracts payable (Note V.1) 165,232,356 161,822,761
- Nominal value of short-term currency swap contracts receivable (Note V.1) 42,902,062 12,748,103
- Nominal value of short-term treasury currency swap contracts payable (Note V.1) 41,734,533 12,825,991
- Nominal value of put option granted to EIF minority shareholders (Note E.2) 609,774 441,336
- Currency forwards (Note V.2) 403,628 372,040
- Currency swaps launched but not yet settled -receivable (Note V.1.1) 200,000 442,596
- Currency swaps launched but not yet settled -payable 184,241 423,879
- Special deposits for service of borrowings (Note S) 10,376 79,141
The accompanying notes form an integral part of these financial statements.
20
EIB Statutory Financial Statements
Profit and loss account
for the year ended 31 December 2014 (in EUR ‘000)
2014 2013
1. Interest receivable and similar income (Note N) 22,662,887 23,124,679
2. Interest payable and similar charges (Note N) -19,476,277 -19,998,604
3. Income from securities
a) income from shares and other variable-yield securities 101,350 48,410
b) income from shares in affiliated undertakings 9,737 3,810
111,087 52,220
4. Commissions receivable (Note O) 136,379 173,188
5. Commissions payable (Note O) -25,553 -16,081
6. Net result on financial operations (Note P) -67,762 -148,729
7. Other operating income (Note Q) 23,068 6,510
8. General administrative expenses (Note R)
a) staff costs (Note L) -427,124 -415,948
b) other administrative expenses -161,684 -127,845
-588,808 -543,793
9. Value adjustments in respect of tangible and intangible
assets (Note F)
a) tangible assets -23,428 -23,988
b) intangible assets -6,672 -6,499
-30,100 -30,487
10. Value adjustments in respect of loans and advances
(Note D.2) and provisions for contingent liabilities -119,070 -104,102
11. Profit for the financial year 2,625,851 2,514,801
The accompanying notes form an integral part of these financial statements.
21
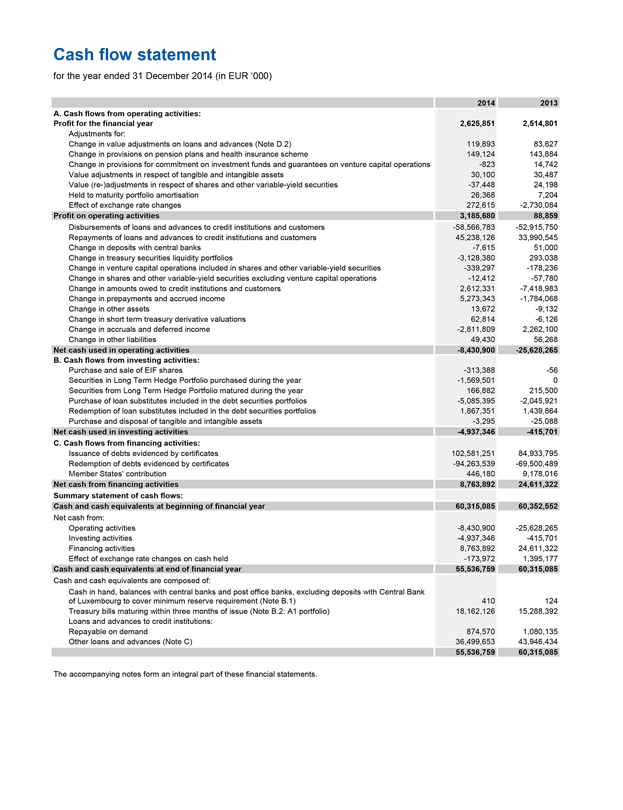
Cash flow statement
for the year ended 31 December 2014 (in EUR ‘000)
2014 2013
A. Cash flows from operating activities:
Profit for the financial year 2,625,851 2,514,801
Adjustments for:
Change in value adjustments on loans and advances (Note D.2) 119,893 83,627
Change in provisions on pension plans and health insurance scheme 149,124 143,884
Change in provisions for commitment on investment funds and guarantees on venture capital operations -823 14,742
Value adjustments in respect of tangible and intangible assets 30,100 30,487
Value (re-)adjustments in respect of shares and other variable-yield securities -37,448 24,198
Held to maturity portfolio amortisation 26,368 7,204
Effect of exchange rate changes 272,615 -2,730,084
Profit on operating activities 3,185,680 88,859
Disbursements of loans and advances to credit institutions and customers -58,566,783 -52,915,750
Repayments of loans and advances to credit institutions and customers 45,238,126 33,990,545
Change in deposits with central banks -7,615 51,000
Change in treasury securities liquidity portfolios -3,128,380 293,038
Change in venture capital operations included in shares and other variable-yield securities -339,297 -178,236
Change in shares and other variable-yield securities excluding venture capital operations -12,412 -57,780
Change in amounts owed to credit institutions and customers 2,612,331 -7,418,983
Change in prepayments and accrued income 5,273,343 -1,784,068
Change in other assets 13,672 -9,132
Change in short term treasury derivative valuations 62,814 -6,126
Change in accruals and deferred income -2,811,809 2,262,100
Change in other liabilities 49,430 56,268
Net cash used in operating activities -8,430,900 -25,628,265
B. Cash flows from investing activities:
Purchase and sale of EIF shares -313,388 -56
Securities in Long Term Hedge Portfolio purchased during the year -1,569,501 0
Securities from Long Term Hedge Portfolio matured during the year 166,882 215,500
Purchase of loan substitutes included in the debt securities portfolios -5,085,395 -2,045,921
Redemption of loan substitutes included in the debt securities portfolios 1,867,351 1,439,864
Purchase and disposal of tangible and intangible assets -3,295 -25,088
Net cash used in investing activities -4,937,346 -415,701
C. Cash flows from financing activities:
Issuance of debts evidenced by certificates 102,581,251 84,933,795
Redemption of debts evidenced by certificates -94,263,539 -69,500,489
Member States’ contribution 446,180 9,178,016
Net cash from financing activities 8,763,892 24,611,322
Summary statement of cash flows:
Cash and cash equivalents at beginning of financial year 60,315,085 60,352,552
Net cash from:
Operating activities -8,430,900 -25,628,265
Investing activities -4,937,346 -415,701
Financing activities 8,763,892 24,611,322
Effect of exchange rate changes on cash held -173,972 1,395,177
Cash and cash equivalents at end of financial year 55,536,759 60,315,085
Cash and cash equivalents are composed of:
Cash in hand, balances with central banks and post office banks, excluding deposits with Central Bank of Luxembourg to cover minimum reserve requirement (Note B.1) 410 124
Treasury bills maturing within three months of issue (Note B.2: A1 portfolio) 18,162,126 15,288,392
Loans and advances to credit institutions:
Repayable on demand 874,570 1,080,135
Other loans and advances (Note C) 36,499,653 43,946,434
55,536,759 60,315,085
The accompanying notes form an integral part of these financial statements.
22
EIB Statutory Financial Statements
European Investment Bank
Notes to the financial statements
as at 31 December 2014
The European Investment Bank (the ‘Bank’ or ‘EIB’) was created by the Treaty of Rome in 1958 as the long-term lending bank of the European Union (‘EU’). The task of the Bank is to contribute towards the integration, balanced development and economic and social cohesion of the EU Member States. The EIB raises substantial volumes of funds on the capital markets and lends these funds on favourable terms to projects furthering EU policy objectives. The EIB continuously adapts its activities to developments in EU policies.
The Bank has its registered office at 98-100, boulevard Konrad Adenauer, Luxembourg.
Note A – Significant accounting policies
A.1. Accounting standards
The unconsolidated financial statements (the ‘Financial Statements’) of the European Investment Bank have been prepared in accordance with the general principles of the Directive 86/635/EEC of the Council of the European Communities of 8 December 1986 on the annual accounts and consolidated accounts of banks and other financial institutions, as amended by Directive 2001/65/EC of 27 September 2001, by Directive 2003/51/EC of 18 June 2003 and by Directive 2006/46/EC of 14 June 2006 on the annual and consolidated accounts of certain types of companies, banks and other financial institutions (the ‘Directives’). However, the Financial Statements do not include any management report. The Bank prepares an Activity Report which is presented separately from the Financial Statements and its consistency with the Financial Statements is not audited.
On a proposal from the Management Committee, the Board of Directors adopted the Financial Statements on 12 March 2015 and authorised their submission to the Board of Governors for approval by 28 April 2015.
In preparing the Financial Statements, the Management Committee is required to make estimates and assumptions that affect reported income, expenses, assets, liabilities and disclosure of contingent assets and liabilities. Use of available information and application of judgement are inherent in the formation of estimates. Actual results in the future could differ from such estimates and the resulting differences may be material to the Financial Statements.
The Bank also publishes consolidated financial statements as at the same date as the annual Financial Statements.
A.2. Foreign currency translation
The EIB uses the euro (EUR) as the unit of measure for the capital accounts of Member States and for presenting its Financial Statements.
The Bank conducts its operations in the currencies of its Member States, in euro and in non-EU currencies.
Its resources are derived from its capital, borrowings and accumulated earnings in various currencies.
Foreign currency transactions are translated at the exchange rate prevailing on the date of the transaction. The Bank’s monetary assets and liabilities denominated in currencies other than euro are translated into euro at closing exchange rates prevailing at the balance sheet date. The gain or loss arising from such translation is recorded in the profit and loss account.
A.3. Derivatives
The Bank uses derivative instruments, mainly currency and interest rate swaps, as part of its asset and liability management (“ALM”) activities to manage exposures to interest rate and foreign currency risks, including exposures arising from forecast transactions. All derivatives transactions are booked at nominal as off-balance sheet items at the date of the transaction.
The majority of the Bank’s swaps are concluded with a view to hedging specific bond issues. The Bank enters into currency swaps, whereby the proceeds of a borrowing are initially converted into a different currency and on maturity the Bank will obtain the amounts needed to service the borrowing in the original currency.
The Bank also enters into currency, interest rate and overnight index swaps as part of its hedging operations on loans or for the global ALM position. The corresponding interest is accounted for on a pro rata temporis basis.
The Bank also uses derivative instruments as part of its treasury operations.
A.3.1. Trading portfolio derivatives
Trading portfolio derivatives are recorded at market value in the balance sheet as Other assets when their market value is positive or Other liabilities when their market value is negative. Changes in the market value are included in Net result on financial operations. Market values are
23
obtained from quoted market prices, discounted cash flow models and option pricing models, which consider current market and contractual prices for the underlying instrument, as well as time value of money, yield curve and volatility of the underlying.
Interest on derivative instruments is accrued pro rata temporis under Prepayments and accrued income or Accruals and deferred income.
Currency swaps
Currency swap contracts are entered into in order to adjust currency positions. The revaluation of the spot leg of a currency swap is neutralised in Accruals and deferred income or Prepayments and accrued income. The premium/discount between the spot and forward settlement amounts is amortised pro rata temporis through the profit and loss account in Interest receivable and similar income or Interest payable and similar charges. The market value is recorded under Other assets when their market value is positive or Other liabilities when their market value is negative. Changes in the market value are included in Net result on financial operations.
Interest rate swaps
The interest received and paid under interest rate swaps is accrued pro rata temporis and reported in the profit and loss account under Interest receivable and similar income or Interest payable and similar charges. The market value is recorded under Other assets when their market value is positive or Other liabilities when their market value is negative. Changes in the market value are included in Net result on financial operations.
A.3.2 All other derivatives
Currency swaps
Currency swap contracts are entered into in order to adjust currency positions. The revaluation of the spot leg of a currency swap is neutralised in Accruals and deferred income or Prepayments and accrued income. The forward leg of the currency swap is recorded off-balance sheet at settlement amount and is not revalued. The premium/discount between the spot and forward settlement amounts is amortised pro rata temporis through the profit and loss account in Interest receivable and similar income or Interest payable and similar charges.
Interest rate swaps
The hedging interest rate swaps are not revalued. The interest received and paid under interest rate swaps is accrued pro rata temporis and reported in the profit and loss account under Interest receivable and similar income or Interest payable and similar charges.
Currency forwards
Currency forwards are entered into in order to adjust future currency positions. The forward leg is recorded off-balance sheet at settlement amount and is not revalued. The difference between the spot amounts and the forward settlement amounts is amortised pro rata temporis through the profit and loss account in Interest receivable and similar income or Interest payable and similar charges.
Interest on derivative instruments is accrued pro rata temporis under Prepayments and accrued income or Accruals and deferred income.
A.4. Financial assets
Financial assets are accounted for using the settlement date basis.
A.5. Cash and cash equivalents
The Bank defines cash and cash equivalents as short term, highly liquid securities and interest-earning deposits with maturities of 90 days or less.
A.6. Treasury bills and other bills eligible for refinancing with central banks and debt securities including fixed-income securities
The Bank changed its debt securities portfolio structure during 2014, in order to reduce the portfolio complexity and optimise allocation of liquid assets. As a result, three new portfolios were created (Securities liquidity portfolios P1 and P2, classified as held for trading, and long term hedge portfolio, classified as held to maturity) and five former portfolios are phased out (Operational bond portfolio A2, B1, B3 and B4 and the investment portfolio).
A.6.1. Long term hedge portfolio (formerly the Investment portfolio)
The long term hedge portfolio consists of securities purchased with the intention of holding them to maturity. These securities are issued or guaranteed by:
Governments of the European Union Member States, G10 countries and their agencies;
Supranational public institutions, including multinational development banks.
These securities are initially recorded at purchase price or more exceptionally at transfer price. Value adjustments are accounted for, if these are other than temporary. The difference between entry price and redemption value is accounted for pro rata temporis over the life of the securities.
All the securities remaining in the former Investment portfolio were transferred into the newly created Long term hedge portfolio, where they will continue to be held until final maturity.
24
EIB Statutory Financial Statements
A.6.2. Operational portfolios
A.6.2.1 Current operational portfolio structure
Operational money market portfolio A1 and Unitary Fund (UF)
In order to maintain an adequate level of liquidity, the Bank purchases money market products with a maximum maturity of 3 months, in particular Treasury bills and negotiable debt securities issued by public bodies and credit institutions. The securities in the A1 portfolio are held until their final maturity and presented in the Financial Statements at amortised cost. Value adjustments are accounted for, if these are other than temporary.
The UF portfolio includes securities with maturities of up to 12 months which are available for sale.
Bonds are initially recorded at acquisition cost and presented in the Financial Statements at market value. Changes in market value are recorded under Net result on financial operations in the profit and loss account.
Securities liquidity portfolios P1 and P2
The P1 ‘fixed rate’ and P2 ‘floating rate’ portfolios comprise bonds issued or guaranteed by national governments, supranational institutions, financial institutions and corporations. Securities in these portfolios are initially recorded at acquisition cost and presented in the Financial Statements at market value. Changes in market value are recorded under Net result on financial operations in the profit and loss account.
The market value of treasury portfolios is based on published price quotations in an active market as the first source. For instruments without available published price quotations, the market values are determined by obtaining quotes from market participants and/or by using valuation techniques or models, based whenever possible on observable market data prevailing at the balance sheet date.
A.6.2.2 Former operational portfolio structure
Operational bond portfolios A2, B1, B3 and B4
The A2 portfolio included securities with maturities of up to 18 months which were available for sale. Bonds were initially recorded at acquisition cost and presented in the Financial Statements at market value. Changes in market value were recorded under Net result on financial operations in the profit and loss account. The difference between the acquisition cost and redemption amount was amortised pro rata temporis as Interest receivable and similar income.
The B1 ‘Credit Spread’ portfolio comprised floating-rate and fixed-rate bonds issued or guaranteed by national governments, supranational institutions, financial institutions and corporations. These securities were available for sale.
Bonds were initially recorded at acquisition cost and presented in the Financial Statements at market value. Changes in market value were recorded under Net result on financial operations in the profit and loss account. The difference between the acquisition cost and redemption amount was amortised pro rata temporis as Interest receivable and similar income.
The B3 ‘Global Fixed Income’ portfolio comprised listed securities with a maximum residual maturity of 10 years, issued and/or guaranteed by sovereigns, their agencies or by financial institutions. Securities held in this portfolio were marked to market value in the balance sheet; the corresponding changes in market value were recorded under Net result on financial operations in the profit and loss account.
The B4 ‘Inflation Linked Investment’ portfolio comprised listed securities with a maximum residual maturity of 30 years, issued by EU Governments. Securities held in this portfolio were marked to market value in the balance sheet; the corresponding changes in market value were recorded under Net result on financial operations in the profit and loss account.
No change has occurred in the treatment of A1 portfolio.
A.6.3. Loan substitutes
This portfolio mainly consists of obligations in the form of bonds, notes or certificates issued by Special Purpose Vehicles (SPV), trust vehicles or financial institutions. These securities are classified as held to maturity and initially recorded at purchase price and valued at amortised cost. The difference between purchase price and redemption value is accounted for pro rata temporis over the life of the securities. Value adjustments are accounted for, if these are other than temporary.
A.7. Loans and advances to credit institutions and customers
A.7.1. Loans and advances
Loans and advances are included in the assets of the Bank at their net disbursed amounts. Value adjustments have been made for loans and advances outstanding at the end of the financial year and presenting risks of non-recovery of all or part of their amounts. Such value adjustments are held in the same currency as the assets to which they relate. Value adjustments are accounted for in the profit and loss account as ‘Value adjustments in respect of loans and advances’ and are deducted from the appropriate asset items on the balance sheet.
25
A.7.2. Interest on loans
Interest on loans are recorded in the profit and loss account on an accruals basis, i.e. over the life of the loans. On the balance sheet, accrued interest is included in ‘Prepayments and accrued income’ under assets. Value adjustments to interest amounts on these loans are determined on a case-by-case basis by the Bank’s Management and deducted from the appropriate asset item on the balance sheet.
A.7.3. Reverse repurchase operations (reverse repos)
Under a tripartite reverse repo, a custodian/clearing agency arranges for custody, clearing and settlement of the transactions between the Bank and a third party. The custodians/clearing agencies operate under standardised global master purchase agreements and provide for delivery against payment systems, substitution of securities, automatic marking to market, reporting and daily transaction administration.
Reverse repos are carried at the amounts of cash advanced and are entered on the balance sheet under Loans and advances to credit institutions – b) other loans and advances. Interest on reverse repos is accrued pro rata temporis.
A.7.4. Interest subsidies
Interest subsidies received in advance (see Note I) are deferred and recognised in the profit and loss account over the period from disbursement to repayment of the subsidised loan.
A.8. Shares, other variable-yield securities and shares in affiliated undertakings
A.8.1. Shares and other variable-yield securities
The Bank acquires shares and other variable-yield securities when it enters into venture capital operations, infrastructure funds or investment funds. Shares and other variable-yield securities are initially recorded at acquisition cost. Their carrying value is adjusted to the lower of cost or market value at subsequent measurement at the balance sheet date.
Investments in venture capital enterprises, infrastructure funds and investment funds represent shares and other variable-yield securities acquired for the longer term in the normal course of the Bank’s activities. They are initially recorded at their original purchase cost. Based on the reports received from fund managers, the portfolios of investments are valued on a line-by-line basis at the lower of cost or attributable net asset value (‘NAV’), thus excluding any attributable unrealised gain that may be prevailing in the portfolio. The attributable NAV is determined through applying either the Bank’s percentage ownership in the underlying vehicle to the NAV reflected in the most recent report or, to the extent available, the value per share at the same date, submitted by the respective Fund Manager. The attributable NAV is adjusted for events having occurred between the date of the latest available NAV and the balance sheet date to the extent that such adjustment is considered to be material. Unrealised losses due solely to administrative expenses and management fees of venture capital, infrastructure funds and investment funds in existence for less than two years at the balance sheet date are not taken into consideration in determining the attributable NAV.
A.8.2. Shares in affiliated undertakings
Shares in affiliated undertakings represent medium and long-term investments and are accounted for at cost. Value adjustments are accounted for, if these are other than temporary.
A.9. Tangible assets
Tangible assets include land, Bank-occupied properties, other machines and equipment.
Land is stated at acquisition cost and buildings are stated at acquisition cost less accumulated depreciation. The value of the Bank’s headquarter buildings in Luxembourg-Kirchberg and its building in Luxembourg-Weimershof are depreciated on a straight-line basis as set out below.
Permanent equipment, fixtures and fittings, furniture, office equipment and vehicles have been recorded in the balance sheet at their acquisition cost, less accumulated depreciation.
Depreciation is calculated on a straight-line basis over the estimated life of each item purchased, as set out below:
Buildings in Kirchberg and Weimershof: 30 years
Permanent equipment, fixtures and fittings: 10 years
Furniture: 5 years
Office equipment and vehicles: 3 years
A.10. Intangible assets
Intangible assets comprise developed computer software. Software development costs are capitalised if they meet certain criteria relating to identifiability, to the probability that future economic benefits will flow to the enterprise and to the reliability of cost measurement.
26

EIB Statutory Financial Statements
Internally developed software meeting these criteria is carried at cost less accumulated amortisation calculated on a straight-line basis over three years from completion.
A.11. Pension plans and health insurance scheme
A.11.1. Pension plan for staff
The Bank operates defined benefit pension plans to provide retirement benefits to substantially its entire staff.
The Bank’s main pension scheme is a defined benefit pension scheme funded by contributions from staff and from the Bank which covers all employees. All contributions of the Bank and its staff are invested in the assets of the Bank.
Commitments for retirement benefits are valued at least every year using the projected unit credit method, in order to ensure that the provision entered in the accounts is adequate. The latest valuation was carried out as at 30 September 2014 and was updated as at 31 December 2014 with an extrapolation (roll forward method) for the last three months of 2014. The main assumptions used by the actuary are set out in Note L.
Cumulative prior year actuarial deficits and surpluses in excess of 10% of the commitments for retirement benefits are recognised over the expected average remaining service lives of the plan’s participants on a straight line basis.
A.11.2. Health insurance scheme
The Bank has set up its own health insurance scheme for the benefit of staff, financed by contributions from the Bank and its employees. The health insurance scheme is managed and accounted for under the same principles as the pension plan for staff described in Note A.11.1. The latest valuation was carried out as at 30 September 2014 and was updated as at 31 December 2014 with an extrapolation (roll forward method) for the last three months of 2014.
A.11.3. The Management Committee pension plan
The Management Committee pension plan is a defined benefit pension scheme funded by contributions from the Bank only which covers all Management Committee members. All contributions of the Bank are invested in the assets of the Bank. The Management Committee pension plan is managed and accounted for under the same principles as the pension plan for staff described in Note A.11.1.
A.11.4. Optional Supplementary provident scheme
The optional supplementary provident scheme is a defined contribution pension scheme, funded by voluntary staff’s contributions and employer’s contributions. The corresponding liability is recorded in Other liabilities.
A.12. Amounts owed to credit institutions and customers
Amounts owed to credit institutions and customers are presented in the financial statements at their redemption amounts. Interest on amounts owed to credit institutions and customers is recorded in the profit and loss account on an accruals basis as Interest payable and similar charges. Accrued interest is included in Accruals and deferred income under liabilities.
A.13. Debts evidenced by certificates
Debts evidenced by certificates are presented at their redemption amounts, except for zero coupon bonds which are presented at their amortised cost. Transaction costs and premiums/ discounts are amortised in the profit and loss account on a straight line basis over the life of the debt through Accruals and deferred income or Prepayments and accrued income. Interest expense on debt instruments is included in Interest payable and similar charges in the profit and loss account.
A.14. Provision for guarantees issued and for commitment on investment funds
A.14.1 Provision for guarantees issued
This provision is intended to cover risks inherent in the Bank’s activity of issuing guarantees in favour of financial intermediaries or issued in respect of loans granted by third parties. A provision for guarantees issued is established if there is objective evidence that the Bank will have to incur a loss in respect of a given guarantee granted.
A.14.2 Provision for commitment on investment funds
This provision is intended to cover risks inherent in the Bank’s commitment on investment funds signed but not yet disbursed.
27

A.15. Reserves
A.15.1. Reserve fund
As foreseen by Article 22.1 of the Statute, “a reserve fund of up to 10% of the subscribed capital shall be built up progressively” from the retained profit of the Bank.
A.15.2. Additional reserves
Additional reserves contain the remaining retained earnings of the Bank.
A.15.3. Special activities reserve
As foreseen by Article 16.5 of the Statute, “the special activities of the Bank […] will have a specific allocation of reserve”. The reserve is based on the capital allocation of each operation.
A.15.4. General loan reserve
In 2009 a “general loan reserve” was introduced for the expected loss of the Bank’s loan and guarantee portfolio, modelled upon the Bank’s policy guidelines.
A.16. Prepayments and accrued income
Expenditure incurred during the financial year but relating to a subsequent financial year, together with any income for which payment is not due until the expiry of the underlying instrument.
A.17. Accruals and deferred income
Income received before the balance sheet date but relating to a subsequent financial year, together with any charges which, though relating to the financial year in question, will be paid only in the course of a subsequent financial year.
A.18. Interest receivable and similar income
Revenues on loans are mainly composed of interest revenue, commitment fees, front-end fees and prepayment indemnities.
Prepayment indemnities are recognised in the profit and loss when received, as the revenue is earned.
From 1 January 2014, commitment fees are classified under “Interest receivable and similar income” while those fees were previously classified under “Commission receivable”. See note A.20.
The Bank changed the accounting policy applied on front-end fees from 1 January 2014. Those front-end fees are now deferred and recognised under “Interest receivable and similar income” in the profit and loss account over the life of the underlying loan. Front-end fees were previously recognised in the P&L under “Commission receivable” when received. See note A.20.
In addition to revenue on loans, the ‘Interest receivable and similar income’ includes also interest revenue from the securities portfolio and derivatives.
A.19. Dividend income
Dividends are recognised in the profit and loss account when the entity’s right to receive payment is established.
A.20. Reclassification of prior year figures
Certain prior year figures have been reclassified to conform with the current year’s presentation. The reclassifications principally relate to:
Commitment fees and Front-end fees on loans:
From: Commissions receivable EUR‘000 119,634
To: Interest receivable and similar income EUR‘000 119,634
Loan instalments receivable:
From: Other assets EUR‘000 129,713
To: Loans and advances to credit institutions c) loans EUR’000 2,691 / Loans and advances to customers b) loans EUR‘000 127,022
28
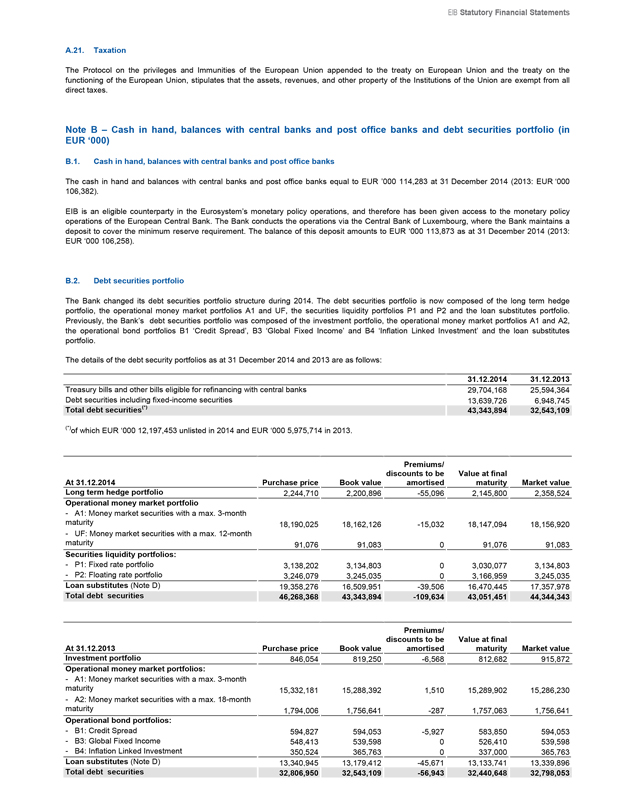
EIB Statutory Financial Statements
A.21. Taxation
The Protocol on the privileges and Immunities of the European Union appended to the treaty on European Union and the treaty on the functioning of the European Union, stipulates that the assets, revenues, and other property of the Institutions of the Union are exempt from all direct taxes.
Note B - Cash in hand, balances with central banks and post office banks and debt securities portfolio (in EUR ‘000)
B.1. Cash in hand, balances with central banks and post office banks
The cash in hand and balances with central banks and post office banks equal to EUR ’000 114,283 at 31 December 2014 (2013: EUR ‘000 106,382).
EIB is an eligible counterparty in the Eurosystem’s monetary policy operations, and therefore has been given access to the monetary policy operations of the European Central Bank. The Bank conducts the operations via the Central Bank of Luxembourg, where the Bank maintains a deposit to cover the minimum reserve requirement. The balance of this deposit amounts to EUR ‘000 113,873 as at 31 December 2014 (2013: EUR ‘000 106,258).
B.2. Debt securities portfolio
The Bank changed its debt securities portfolio structure during 2014. The debt securities portfolio is now composed of the long term hedge portfolio, the operational money market portfolios A1 and UF, the securities liquidity portfolios P1 and P2 and the loan substitutes portfolio. Previously, the Bank’s debt securities portfolio was composed of the investment portfolio, the operational money market portfolios A1 and A2, the operational bond portfolios B1 ‘Credit Spread’, B3 ‘Global Fixed Income’ and B4 ‘Inflation Linked Investment’ and the loan substitutes portfolio.
The details of the debt security portfolios as at 31 December 2014 and 2013 are as follows:
31.12.2014 31.12.2013
Treasury bills and other bills eligible for refinancing with central banks 29,704,168 25,594,364
Debt securities including fixed-income securities 13,639,726 6,948,745
Total debt securities(*) 43,343,894 32,543,109
(*)of which EUR ‘000 12,197,453 unlisted in 2014 and EUR ‘000 5,975,714 in 2013.
At 31.12.2014
Purchase price
Book value
Premiums/ discounts to be amortised
Value at final maturity
Market value
Long term hedge portfolio 2,244,710 2,200,896 -55,096 2,145,800 2,358,524
Operational money market portfolio
- A1: Money market securities with a max. 3-month maturity 18,190,025 18,162,126 -15,032 18,147,094 18,156,920
- UF: Money market securities with a max. 12-month maturity 91,076 91,083 0 91,076 91,083
Securities liquidity portfolios:
- P1: Fixed rate portfolio 3,138,202 3,134,803 0 3,030,077 3,134,803
- P2: Floating rate portfolio 3,246,079 3,245,035 0 3,166,959 3,245,035
Loan substitutes (Note D) 19,358,276 16,509,951 -39,506 16,470,445 17,357,978
Total debt securities 46,268,368 43,343,894 -109,634 43,051,451 44,344,343
At 31.12.2013
Purchase price
Book value
Premiums/ discounts to be amortised
Value at final maturity
Market value
Investment portfolio 846,054 819,250 -6,568 812,682 915,872
Operational money market portfolios:
- A1: Money market securities with a max. 3-month maturity 15,332,181 15,288,392 1,510 15,289,902 15,286,230
- A2: Money market securities with a max. 18-month maturity 1,794,006 1,756,641 -287 1,757,063 1,756,641
Operational bond portfolios:
- B1: Credit Spread 594,827 594,053 -5,927 583,850 594,053
- B3: Global Fixed Income 548,413 539,598 0 526,410 539,598
- B4: Inflation Linked Investment 350,524 365,763 0 337,000 365,763
Loan substitutes (Note D) 13,340,945 13,179,412 -45,671 13,133,741 13,339,896
Total debt securities 32,806,950 32,543,109 -56,943 32,440,648 32,798,053
29
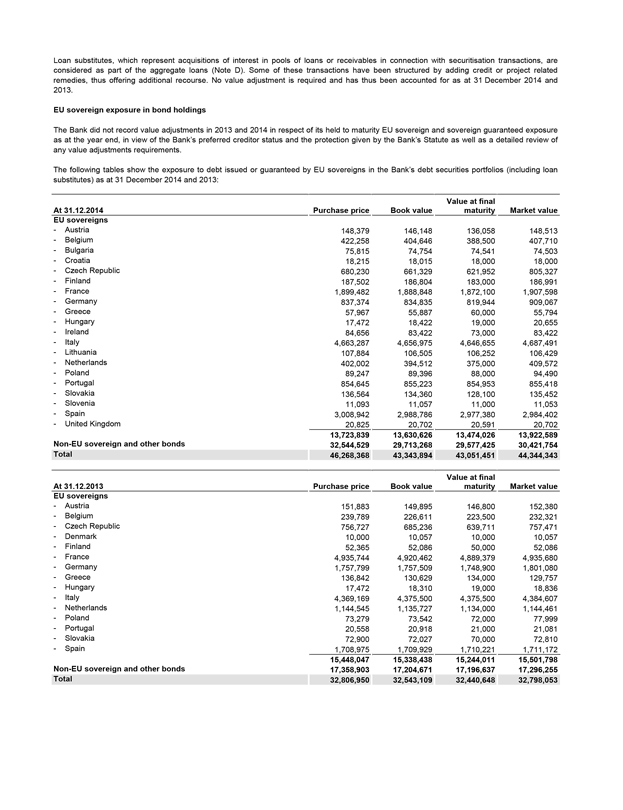
Loan substitutes, which represent acquisitions of interest in pools of loans or receivables in connection with securitisation transactions, are considered as part of the aggregate loans (Note D). Some of these transactions have been structured by adding credit or project related remedies, thus offering additional recourse. No value adjustment is required and has thus been accounted for as at 31 December 2014 and 2013.
EU sovereign exposure in bond holdings
The Bank did not record value adjustments in 2013 and 2014 in respect of its held to maturity EU sovereign and sovereign guaranteed exposure as at the year end, in view of the Bank’s preferred creditor status and the protection given by the Bank’s Statute as well as a detailed review of any value adjustments requirements.
The following tables show the exposure to debt issued or guaranteed by EU sovereigns in the Bank’s debt securities portfolios (including loan substitutes) as at 31 December 2014 and 2013:
At 31.12.2014 Purchase price Book value Value at final maturity Market value
EU sovereigns
- Austria 148,379 146,148 136,058 148,513
- Belgium 422,258 404,646 388,500 407,710
- Bulgaria 75,815 74,754 74,541 74,503
- Croatia 18,215 18,015 18,000 18,000
- Czech Republic 680,230 661,329 621,952 805,327
- Finland 187,502 186,804 183,000 186,991
- France 1,899,482 1,888,848 1,872,100 1,907,598
- Germany 837,374 834,835 819,944 909,067
- Greece 57,967 55,887 60,000 55,794
- Hungary 17,472 18,422 19,000 20,655
- Ireland 84,656 83,422 73,000 83,422
- Italy 4,663,287 4,656,975 4,646,655 4,687,491
- Lithuania 107,884 106,505 106,252 106,429
- Netherlands 402,002 394,512 375,000 409,572
- Poland 89,247 89,396 88,000 94,490
- Portugal 854,645 855,223 854,953 855,418
- Slovakia 136,564 134,360 128,100 135,452
- Slovenia 11,093 11,057 11,000 11,053
- Spain 3,008,942 2,988,786 2,977,380 2,984,402
- United Kingdom 20,825 20,702 20,591 20,702
13,723,839 13,630,626 13,474,026 13,922,589
Non-EU sovereign and other bonds 32,544,529 29,713,268 29,577,425 30,421,754
Total 46,268,368 43,343,894 43,051,451 44,344,343
At 31.12.2013 Purchase price Book value Value at final maturity Market value
EU sovereigns
- Austria 151,883 149,895 146,800 152,380
- Belgium 239,789 226,611 223,500 232,321
- Czech Republic 756,727 685,236 639,711 757,471
- Denmark 10,000 10,057 10,000 10,057
- Finland 52,365 52,086 50,000 52,086
- France 4,935,744 4,920,462 4,889,379 4,935,680
- Germany 1,757,799 1,757,509 1,748,900 1,801,080
- Greece 136,842 130,629 134,000 129,757
- Hungary 17,472 18,310 19,000 18,836
- Italy 4,369,169 4,375,500 4,375,500 4,384,607
- Netherlands 1,144,545 1,135,727 1,134,000 1,144,461
- Poland 73,279 73,542 72,000 77,999
- Portugal 20,558 20,918 21,000 21,081
- Slovakia 72,900 72,027 70,000 72,810
- Spain 1,708,975 1,709,929 1,710,221 1,711,172
15,448,047 15,338,438 15,244,011 15,501,798
Non-EU sovereign and other bonds 17,358,903 17,204,671 17,196,637 17,296,255
Total 32,806,950 32,543,109 32,440,648 32,798,053
30
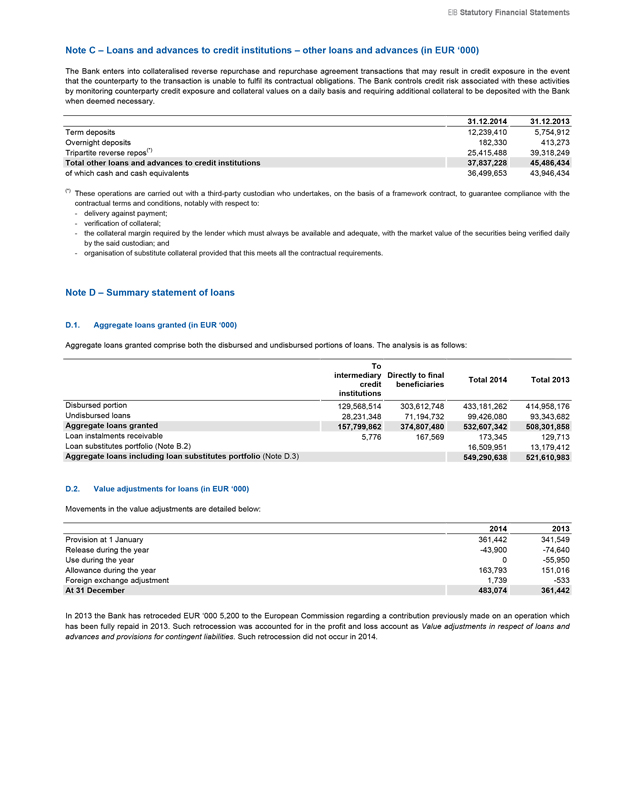
EIB Statutory Financial Statements
Note C - Loans and advances to credit institutions - other loans and advances (in EUR ‘000)
The Bank enters into collateralised reverse repurchase and repurchase agreement transactions that may result in credit exposure in the event that the counterparty to the transaction is unable to fulfil its contractual obligations. The Bank controls credit risk associated with these activities by monitoring counterparty credit exposure and collateral values on a daily basis and requiring additional collateral to be deposited with the Bank when deemed necessary.
31.12.2014 31.12.2013
Term deposits 12,239,410 5,754,912
Overnight deposits 182,330 413,273
Tripartite reverse repos(*) 25,415,488 39,318,249
Total other loans and advances to credit institutions 37,837,228 45,486,434
of which cash and cash equivalents 36,499,653 43,946,434
(*) These operations are carried out with a third-party custodian who undertakes, on the basis of a framework contract, to guarantee compliance with the contractual terms and conditions, notably with respect to:
delivery against payment;
verification of collateral;
the collateral margin required by the lender which must always be available and adequate, with the market value of the securities being verified daily by the said custodian; and
organisation of substitute collateral provided that this meets all the contractual requirements.
Note D - Summary statement of loans
D.1. Aggregate loans granted (in EUR ‘000)
Aggregate loans granted comprise both the disbursed and undisbursed portions of loans. The analysis is as follows:
To intermediary credit institutions
Directly to final beneficiaries
Total 2014
Total 2013
Disbursed portion 129,568,514 303,612,748 433,181,262 414,958,176
Undisbursed loans 28,231,348 71,194,732 99,426,080 93,343,682
Aggregate loans granted 157,799,862 374,807,480 532,607,342 508,301,858
Loan instalments receivable 5,776 167,569 173,345 129,713
Loan substitutes portfolio (Note B.2) 16,509,951 13,179,412
Aggregate loans including loan substitutes portfolio (Note D.3) 549,290,638 521,610,983
D.2. Value adjustments for loans (in EUR ‘000)
Movements in the value adjustments are detailed below:
2014 2013
Provision at 1 January 361,442 341,549
Release during the year -43,900 -74,640
Use during the year 0 -55,950
Allowance during the year 163,793 151,016
Foreign exchange adjustment 1,739 -533
At 31 December 483,074 361,442
In 2013 the Bank has retroceded EUR ‘000 5,200 to the European Commission regarding a contribution previously made on an operation which has been fully repaid in 2013. Such retrocession was accounted for in the profit and loss account as Value adjustments in respect of loans and advances and provisions for contingent liabilities. Such retrocession did not occur in 2014.
31
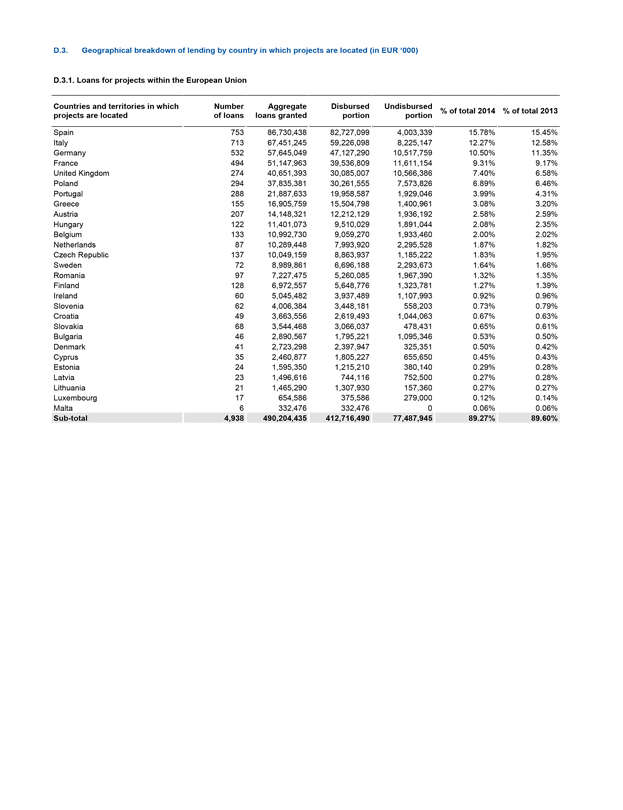
D.3. Geographical breakdown of lending by country in which projects are located (in EUR ‘000)
D.3.1. Loans for projects within the European Union
Countries and territories in which projects are located
Number of loans
Aggregate loans granted
Disbursed portion
Undisbursed portion
% of total 2014
% of total 2013
Spain 753 86,730,438 82,727,099 4,003,339 15.78% 15.45%
Italy 713 67,451,245 59,226,098 8,225,147 12.27% 12.58%
Germany 532 57,645,049 47,127,290 10,517,759 10.50% 11.35%
France 494 51,147,963 39,536,809 11,611,154 9.31% 9.17%
United Kingdom 274 40,651,393 30,085,007 10,566,386 7.40% 6.58%
Poland 294 37,835,381 30,261,555 7,573,826 6.89% 6.46%
Portugal 288 21,887,633 19,958,587 1,929,046 3.99% 4.31%
Greece 155 16,905,759 15,504,798 1,400,961 3.08% 3.20%
Austria 207 14,148,321 12,212,129 1,936,192 2.58% 2.59%
Hungary 122 11,401,073 9,510,029 1,891,044 2.08% 2.35%
Belgium 133 10,992,730 9,059,270 1,933,460 2.00% 2.02%
Netherlands 87 10,289,448 7,993,920 2,295,528 1.87% 1.82%
Czech Republic 137 10,049,159 8,863,937 1,185,222 1.83% 1.95%
Sweden 72 8,989,861 6,696,188 2,293,673 1.64% 1.66%
Romania 97 7,227,475 5,260,085 1,967,390 1.32% 1.35%
Finland 128 6,972,557 5,648,776 1,323,781 1.27% 1.39%
Ireland 60 5,045,482 3,937,489 1,107,993 0.92% 0.96%
Slovenia 62 4,006,384 3,448,181 558,203 0.73% 0.79%
Croatia 49 3,663,556 2,619,493 1,044,063 0.67% 0.63%
Slovakia 68 3,544,468 3,066,037 478,431 0.65% 0.61%
Bulgaria 46 2,890,567 1,795,221 1,095,346 0.53% 0.50%
Denmark 41 2,723,298 2,397,947 325,351 0.50% 0.42%
Cyprus 35 2,460,877 1,805,227 655,650 0.45% 0.43%
Estonia 24 1,595,350 1,215,210 380,140 0.29% 0.28%
Latvia 23 1,496,616 744,116 752,500 0.27% 0.28%
Lithuania 21 1,465,290 1,307,930 157,360 0.27% 0.27%
Luxembourg 17 654,586 375,586 279,000 0.12% 0.14%
Malta 6 332,476 332,476 0 0.06% 0.06%
Sub-total 4,938 490,204,435 412,716,490 77,487,945 89.27% 89.60%
32
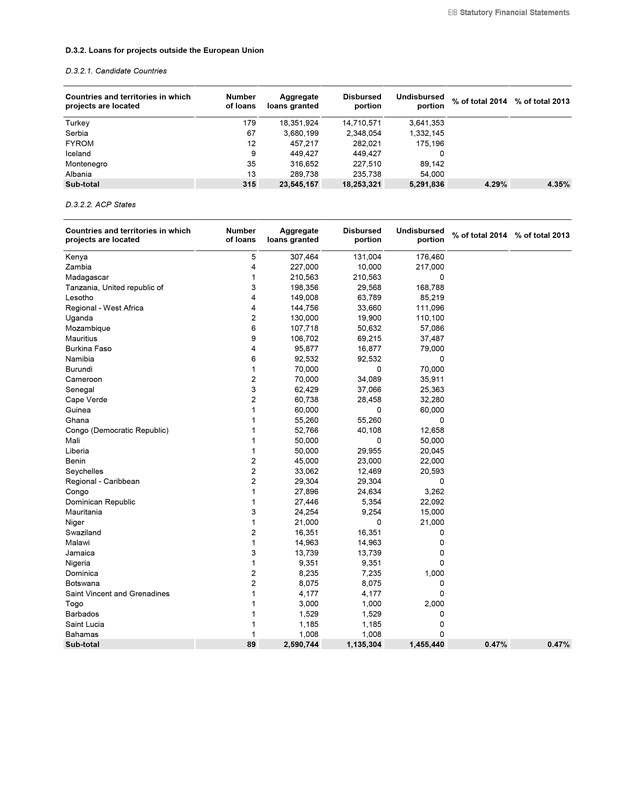
EIB Statutory Financial Statements
D.3.2. Loans for projects outside the European Union
D.3.2.1. Candidate Countries
Countries and territories in which projects are located
Number of loans Aggregate loans granted Disbursed portion Undisbursed portion % of total 2014 % of total 2013
Turkey 179 18,351,924 14,710,571 3,641,353
Serbia 67 3,680,199 2,348,054 1,332,145
FYROM 12 457,217 282,021 175,196
Iceland 9 449,427 449,427 0
Montenegro 35 316,652 227,510 89,142
Albania 13 289,738 235,738 54,000
Sub-total 315 23,545,157 18,253,321 5,291,836 4.29% 4.35%
D.3.2.2. ACP States
Countries and territories in which projects are located
Number of loans Aggregate loans granted Disbursed portion Undisbursed portion % of total 2014 % of total 2013
Kenya 5 307,464 131,004 176,460
Zambia 4 227,000 10,000 217,000
Madagascar 1 210,563 210,563 0
Tanzania, United republic of 3 198,356 29,568 168,788
Lesotho 4 149,008 63,789 85,219
Regional - West Africa 4 144,756 33,660 111,096
Uganda 2 130,000 19,900 110,100
Mozambique 6 107,718 50,632 57,086
Mauritius 9 106,702 69,215 37,487
Burkina Faso 4 95,877 16,877 79,000
Namibia 6 92,532 92,532 0
Burundi 1 70,000 0 70,000
Cameroon 2 70,000 34,089 35,911
Senegal 3 62,429 37,066 25,363
Cape Verde 2 60,738 28,458 32,280
Guinea 1 60,000 0 60,000
Ghana 1 55,260 55,260 0
Congo (Democratic Republic) 1 52,766 40,108 12,658
Mali 1 50,000 0 50,000
Liberia 1 50,000 29,955 20,045
Benin 2 45,000 23,000 22,000
Seychelles 2 33,062 12,469 20,593
Regional - Caribbean 2 29,304 29,304 0
Congo 1 27,896 24,634 3,262
Dominican Republic 1 27,446 5,354 22,092
Mauritania 3 24,254 9,254 15,000
Niger 1 21,000 0 21,000
Swaziland 2 16,351 16,351 0
Malawi 1 14,963 14,963 0
Jamaica 3 13,739 13,739 0
Nigeria 1 9,351 9,351 0
Dominica 2 8,235 7,235 1,000
Botswana 2 8,075 8,075 0
Saint Vincent and Grenadines 1 4,177 4,177 0
Togo 1 3,000 1,000 2,000 Barbados 1 1,529 1,529 0
Saint Lucia 1 1,185 1,185 0
Bahamas 1 1,008 1,008 0 Sub-total 89 2,590,744 1,135,304 1,455,440 0.47% 0.47%
33
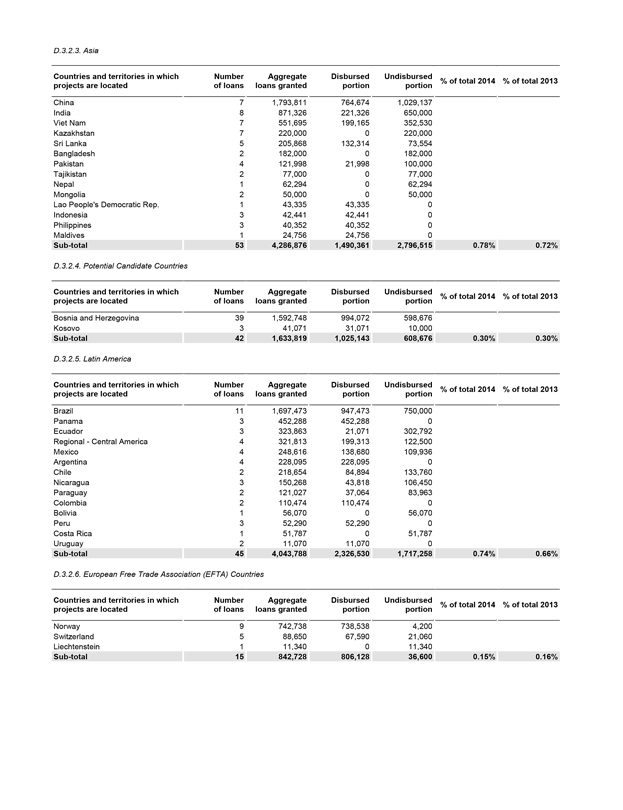
D.3.2.3. Asia
Countries and territories in which projects are located Number of loans Aggregate loans granted Disbursed portion Undisbursed portion % of total 2014 % of total 2013
China 7 1,793,811 764,674 1,029,137
India 8 871,326 221,326 650,000
Viet Nam 7 551,695 199,165 352,530
Kazakhstan 7 220,000 0 220,000
Sri Lanka 5 205,868 132,314 73,554
Bangladesh 2 182,000 0 182,000
Pakistan 4 121,998 21,998 100,000
Tajikistan 2 77,000 0 77,000
Nepal 1 62,294 0 62,294
Mongolia 2 50,000 0 50,000
Lao People’s Democratic Rep. 1 43,335 43,335 0
Indonesia 3 42,441 42,441 0
Philippines 3 40,352 40,352 0
Maldives 1 24,756 24,756 0
Sub-total 53 4,286,876 1,490,361 2,796,515 0.78% 0.72%
D.3.2.4. Potential Candidate Countries
Countries and territories in which projects are located Number of loans Aggregate loans granted Disbursed portion Undisbursed portion % of total 2014 % of total 2013
Bosnia and Herzegovina 39 1,592,748 994,072 598,676
Kosovo 3 41,071 31,071 10,000
Sub-total 42 1,633,819 1,025,143 608,676 0.30% 0.30%
D.3.2.5. Latin America
Countries and territories in which projects are located Number of loans Aggregate loans granted Disbursed portion Undisbursed portion % of total 2014 % of total 2013
Brazil 11 1,697,473 947,473 750,000
Panama 3 452,288 452,288 0
Ecuador 3 323,863 21,071 302,792
Regional - Central America 4 321,813 199,313 122,500
Mexico 4 248,616 138,680 109,936
Argentina 4 228,095 228,095 0
Chile 2 218,654 84,894 133,760
Nicaragua 3 150,268 43,818 106,450
Paraguay 2 121,027 37,064 83,963
Colombia 2 110,474 110,474 0
Bolivia 1 56,070 0 56,070
Peru 3 52,290 52,290 0
Costa Rica 1 51,787 0 51,787
Uruguay 2 11,070 11,070 0
Sub-total 45 4,043,788 2,326,530 1,717,258 0.74% 0.66%
D.3.2.6. European Free Trade Association (EFTA) Countries
Countries and territories in which projects are located Number of loans Aggregate loans granted Disbursed portion Undisbursed portion % of total 2014 % of total 2013
Norway 9 742,738 738,538 4,200
Switzerland 5 88,650 67,590 21,060
Liechtenstein 1 11,340 0 11,340
Sub-total 15 842,728 806,128 36,600 0.15% 0.16%
34
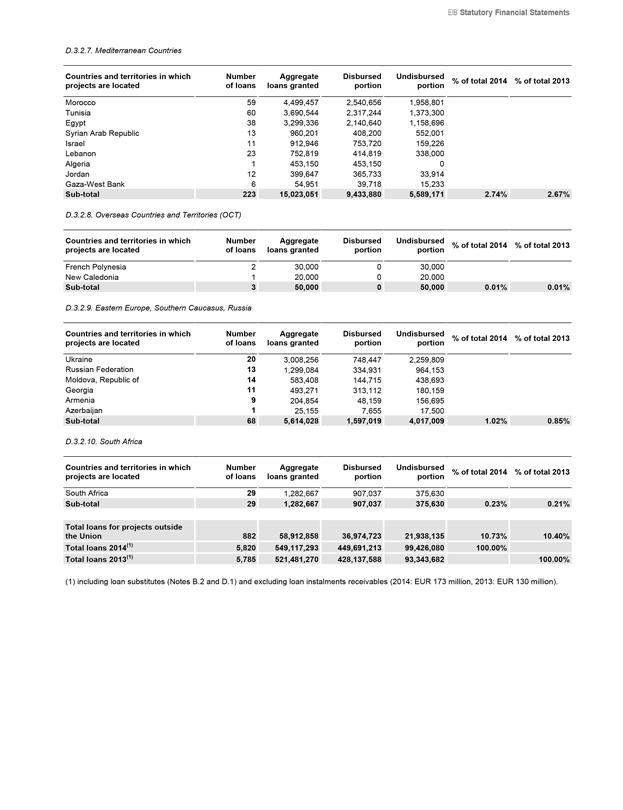
EIB Statutory Financial Statements
D.3.2.7. Mediterranean Countries
Countries and territories in which projects are located Number of loans Aggregate loans granted Disbursed portion Undisbursed portion % of total 2014 % of total 2013
Morocco 59 4,499,457 2,540,656 1,958,801
Tunisia 60 3,690,544 2,317,244 1,373,300
Egypt 38 3,299,336 2,140,640 1,158,696
Syrian Arab Republic 13 960,201 408,200 552,001
Israel 11 912,946 753,720 159,226
Lebanon 23 752,819 414,819 338,000
Algeria 1 453,150 453,150 0
Jordan 12 399,647 365,733 33,914
Gaza-West Bank 6 54,951 39,718 15,233
Sub-total 223 15,023,051 9,433,880 5,589,171 2.74% 2.67%
D.3.2.8. Overseas Countries and Territories (OCT)
Countries and territories in which projects are located Number of loans Aggregate loans granted Disbursed portion Undisbursed portion % of total 2014 % of total 2013
French Polynesia 2 30,000 0 30,000
New Caledonia 1 20,000 0 20,000
Sub-total 3 50,000 0 50,000 0.01% 0.01%
D.3.2.9. Eastern Europe, Southern Caucasus, Russia
Countries and territories in which projects are located Number of loans Aggregate loans granted Disbursed portion Undisbursed portion % of total 2014 % of total 2013
Ukraine 20 3,008,256 748,447 2,259,809
Russian Federation 13 1,299,084 334,931 964,153
Moldova, Republic of 14 583,408 144,715 438,693
Georgia 11 493,271 313,112 180,159
Armenia 9 204,854 48,159 156,695
Azerbaijan 1 25,155 7,655 17,500
Sub-total 68 5,614,028 1,597,019 4,017,009 1.02% 0.85%
D.3.2.10. South Africa
Countries and territories in which projects are located Number of loans Aggregate loans granted Disbursed portion Undisbursed portion % of total 2014 % of total 2013
South Africa 29 1,282,667 907,037 375,630
Sub-total 29 1,282,667 907,037 375,630 0.23% 0.21%
Total loans for projects outside the Union 882 58,912,858 36,974,723 21,938,135 10.73% 10.40%
Total loans 2014(1) 5,820 549,117,293 449,691,213 99,426,080 100.00%
Total loans 2013(1) 5,785 521,481,270 428,137,588 93,343,682 100.00%
(1) including loan substitutes (Notes B.2 and D.1) and excluding loan instalments receivables (2014: EUR 173 million, 2013: EUR 130 million).
35
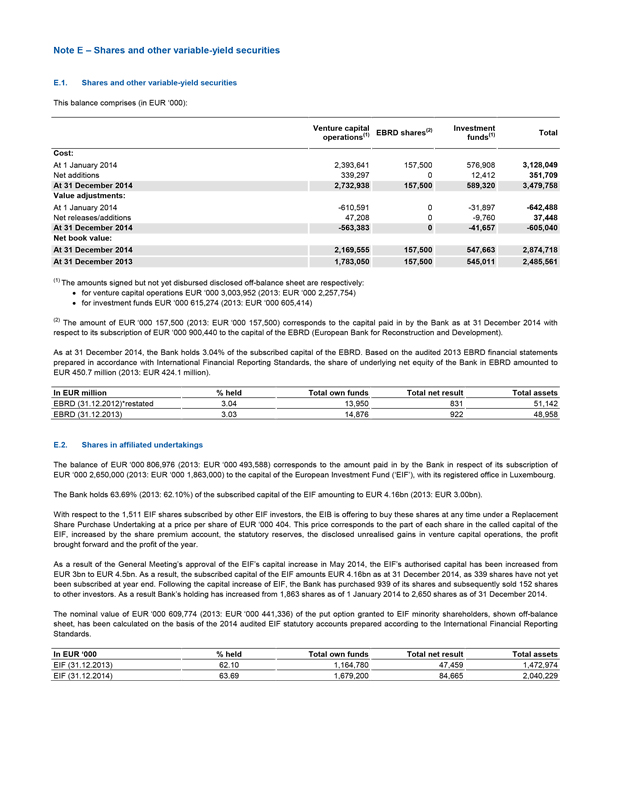
Note E – Shares and other variable-yield securities
E.1. Shares and other variable-yield securities
This balance comprises (in EUR ‘000):
Venture capital operations(1) EBRD shares(2) Investment funds(1) Total
Cost:
At 1 January 2014 2,393,641 157,500 576,908 3,128,049
Net additions 339,297 0 12,412 351,709
At 31 December 2014 2,732,938 157,500 589,320 3,479,758
Value adjustments:
At 1 January 2014 -610,591 0 -31,897 -642,488
Net releases/additions 47,208 0 -9,760 37,448
At 31 December 2014 -563,383 0 -41,657 -605,040
Net book value:
At 31 December 2014 2,169,555 157,500 547,663 2,874,718
At 31 December 2013 1,783,050 157,500 545,011 2,485,561
(1) The amounts signed but not yet disbursed disclosed off-balance sheet are respectively:
• for venture capital operations EUR ‘000 3,003,952 (2013: EUR ‘000 2,257,754)
• for investment funds EUR ‘000 615,274 (2013: EUR ‘000 605,414)
(2) The amount of EUR ‘000 157,500 (2013: EUR ‘000 157,500) corresponds to the capital paid in by the Bank as at 31 December 2014 with respect to its subscription of EUR ‘000 900,440 to the capital of the EBRD (European Bank for Reconstruction and Development).
As at 31 December 2014, the Bank holds 3.04% of the subscribed capital of the EBRD. Based on the audited 2013 EBRD financial statements prepared in accordance with International Financial Reporting Standards, the share of underlying net equity of the Bank in EBRD amounted to EUR 450.7 million (2013: EUR 424.1 million).
In EUR million % held Total own funds Total net result Total assets
EBRD (31.12.2012)*restated 3.04 13,950 831 51,142
EBRD (31.12.2013) 3.03 14,876 922 48,958
E.2. Shares in affiliated undertakings
The balance of EUR ‘000 806,976 (2013: EUR ‘000 493,588) corresponds to the amount paid in by the Bank in respect of its subscription of EUR ‘000 2,650,000 (2013: EUR ‘000 1,863,000) to the capital of the European Investment Fund (‘EIF’), with its registered office in Luxembourg.
The Bank holds 63.69% (2013: 62.10%) of the subscribed capital of the EIF amounting to EUR 4.16bn (2013: EUR 3.00bn).
With respect to the 1,511 EIF shares subscribed by other EIF investors, the EIB is offering to buy these shares at any time under a Replacement Share Purchase Undertaking at a price per share of EUR ‘000 404. This price corresponds to the part of each share in the called capital of the EIF, increased by the share premium account, the statutory reserves, the disclosed unrealised gains in venture capital operations, the profit brought forward and the profit of the year.
As a result of the General Meeting’s approval of the EIF’s capital increase in May 2014, the EIF’s authorised capital has been increased from EUR 3bn to EUR 4.5bn. As a result, the subscribed capital of the EIF amounts EUR 4.16bn as at 31 December 2014, as 339 shares have not yet been subscribed at year end. Following the capital increase of EIF, the Bank has purchased 939 of its shares and subsequently sold 152 shares to other investors. As a result Bank’s holding has increased from 1,863 shares as of 1 January 2014 to 2,650 shares as of 31 December 2014.
The nominal value of EUR ‘000 609,774 (2013: EUR ‘000 441,336) of the put option granted to EIF minority shareholders, shown off-balance sheet, has been calculated on the basis of the 2014 audited EIF statutory accounts prepared according to the International Financial Reporting Standards.
In EUR ‘000 % held Total own funds Total net result Total assets
EIF (31.12.2013) 62.10 1,164,780 47,459 1,472,974
EIF (31.12.2014) 63.69 1,679,200 84,665 2,040,229
36
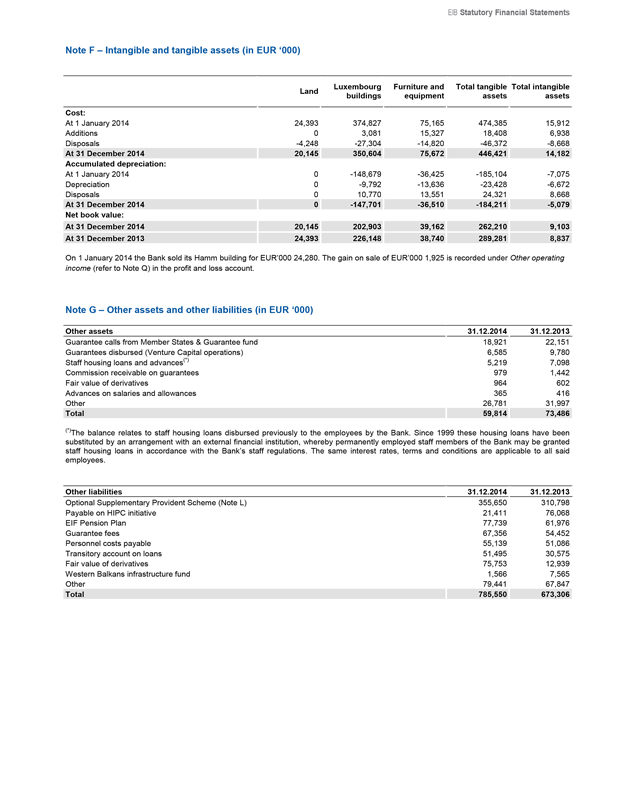
EIB Statutory Financial Statements
Note F – Intangible and tangible assets (in EUR ‘000)
Luxembourg Furniture and Total tangible Total intangible
Land buildings equipment assets assets
Cost:
At 1 January 2014 24,393 374,827 75,165 474,385 15,912
Additions 0 3,081 15,327 18,408 6,938
Disposals -4,248 -27,304 -14,820 -46,372 -8,668
At 31 December 2014 20,145 350,604 75,672 446,421 14,182
Accumulated depreciation:
At 1 January 2014 0 -148,679 -36,425 -185,104 -7,075
Depreciation 0 -9,792 -13,636 -23,428 -6,672
Disposals 0 10,770 13,551 24,321 8,668
At 31 December 2014 0 -147,701 -36,510 -184,211 -5,079
Net book value:
At 31 December 2014 20,145 202,903 39,162 262,210 9,103
At 31 December 2013 24,393 226,148 38,740 289,281 8,837
On 1 January 2014 the Bank sold its Hamm building for EUR’000 24,280. The gain on sale of EUR’000 1,925 is recorded under Other operating income (refer to Note Q) in the profit and loss account.
Note G – Other assets and other liabilities (in EUR ‘000)
Other assets 31.12.2014 31.12.2013
Guarantee calls from Member States & Guarantee fund 18,921 22,151
Guarantees disbursed (Venture Capital operations) 6,585 9,780
Staff housing loans and advances(*) 5,219 7,098
Commission receivable on guarantees 979 1,442
Fair value of derivatives 964 602
Advances on salaries and allowances 365 416
Other 26,781 31,997
Total 59,814 73,486
(*)The balance relates to staff housing loans disbursed previously to the employees by the Bank. Since 1999 these housing loans have been substituted by an arrangement with an external financial institution, whereby permanently employed staff members of the Bank may be granted staff housing loans in accordance with the Bank’s staff regulations. The same interest rates, terms and conditions are applicable to all said employees.
Other liabilities 31.12.2014 31.12.2013
Optional Supplementary Provident Scheme (Note L) 355,650 310,798
Payable on HIPC initiative 21,411 76,068
EIF Pension Plan 77,739 61,976
Guarantee fees 67,356 54,452
Personnel costs payable 55,139 51,086
Transitory account on loans 51,495 30,575
Fair value of derivatives 75,753 12,939
Western Balkans infrastructure fund 1,566 7,565
Other 79,441 67,847
Total 785,550 673,306
37
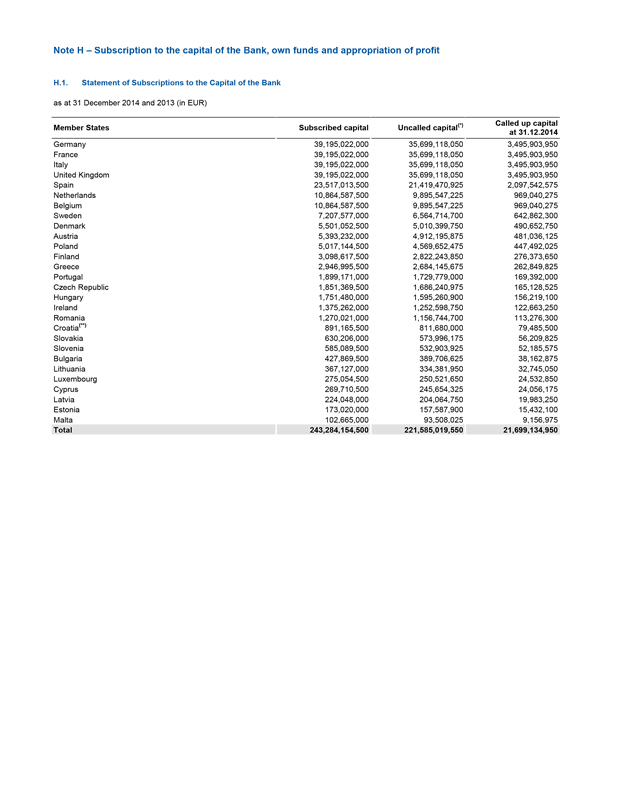
Note H – Subscription to the capital of the Bank, own funds and appropriation of profit
H.1. Statement of Subscriptions to the Capital of the Bank
as at 31 December 2014 and 2013 (in EUR)
Member States Subscribed capital Uncalled capital(*) Called up capital
at 31.12.2014
Germany 39,195,022,000 35,699,118,050 3,495,903,950
France 39,195,022,000 35,699,118,050 3,495,903,950
Italy 39,195,022,000 35,699,118,050 3,495,903,950
United Kingdom 39,195,022,000 35,699,118,050 3,495,903,950
Spain 23,517,013,500 21,419,470,925 2,097,542,575
Netherlands 10,864,587,500 9,895,547,225 969,040,275
Belgium 10,864,587,500 9,895,547,225 969,040,275
Sweden 7,207,577,000 6,564,714,700 642,862,300
Denmark 5,501,052,500 5,010,399,750 490,652,750
Austria 5,393,232,000 4,912,195,875 481,036,125
Poland 5,017,144,500 4,569,652,475 447,492,025
Finland 3,098,617,500 2,822,243,850 276,373,650
Greece 2,946,995,500 2,684,145,675 262,849,825
Portugal 1,899,171,000 1,729,779,000 169,392,000
Czech Republic 1,851,369,500 1,686,240,975 165,128,525
Hungary 1,751,480,000 1,595,260,900 156,219,100
Ireland 1,375,262,000 1,252,598,750 122,663,250
Romania 1,270,021,000 1,156,744,700 113,276,300
Croatia(**) 891,165,500 811,680,000 79,485,500
Slovakia 630,206,000 573,996,175 56,209,825
Slovenia 585,089,500 532,903,925 52,185,575
Bulgaria 427,869,500 389,706,625 38,162,875
Lithuania 367,127,000 334,381,950 32,745,050
Luxembourg 275,054,500 250,521,650 24,532,850
Cyprus 269,710,500 245,654,325 24,056,175
Latvia 224,048,000 204,064,750 19,983,250
Estonia 173,020,000 157,587,900 15,432,100
Malta 102,665,000 93,508,025 9,156,975
Total 243,284,154,500 221,585,019,550 21,699,134,950
38
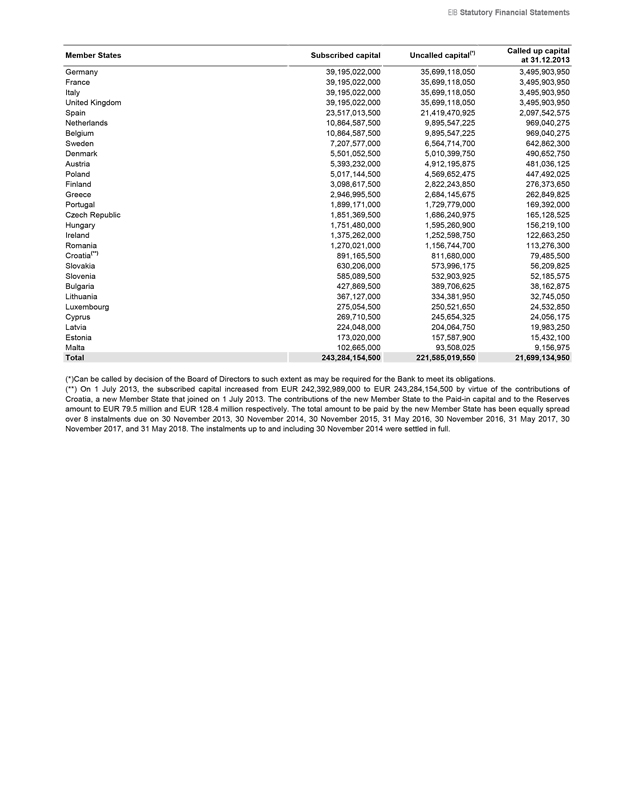
EIB Statutory Financial Statements
Member States Subscribed capital Uncalled capital(*) Called up capital
at 31.12.2013
Germany 39,195,022,000 35,699,118,050 3,495,903,950
France 39,195,022,000 35,699,118,050 3,495,903,950
Italy 39,195,022,000 35,699,118,050 3,495,903,950
United Kingdom 39,195,022,000 35,699,118,050 3,495,903,950
Spain 23,517,013,500 21,419,470,925 2,097,542,575
Netherlands 10,864,587,500 9,895,547,225 969,040,275
Belgium 10,864,587,500 9,895,547,225 969,040,275
Sweden 7,207,577,000 6,564,714,700 642,862,300
Denmark 5,501,052,500 5,010,399,750 490,652,750
Austria 5,393,232,000 4,912,195,875 481,036,125
Poland 5,017,144,500 4,569,652,475 447,492,025
Finland 3,098,617,500 2,822,243,850 276,373,650
Greece 2,946,995,500 2,684,145,675 262,849,825
Portugal 1,899,171,000 1,729,779,000 169,392,000
Czech Republic 1,851,369,500 1,686,240,975 165,128,525
Hungary 1,751,480,000 1,595,260,900 156,219,100
Ireland 1,375,262,000 1,252,598,750 122,663,250
Romania 1,270,021,000 1,156,744,700 113,276,300
Croatia(**) 891,165,500 811,680,000 79,485,500
Slovakia 630,206,000 573,996,175 56,209,825
Slovenia 585,089,500 532,903,925 52,185,575
Bulgaria 427,869,500 389,706,625 38,162,875
Lithuania 367,127,000 334,381,950 32,745,050
Luxembourg 275,054,500 250,521,650 24,532,850
Cyprus 269,710,500 245,654,325 24,056,175
Latvia 224,048,000 204,064,750 19,983,250
Estonia 173,020,000 157,587,900 15,432,100
Malta 102,665,000 93,508,025 9,156,975
Total 243,284,154,500 221,585,019,550 21,699,134,950
(*)Can be called by decision of the Board of Directors to such extent as may be required for the Bank to meet its obligations.
(**) On 1 July 2013, the subscribed capital increased from EUR 242,392,989,000 to EUR 243,284,154,500 by virtue of the contributions of Croatia, a new Member State that joined on 1 July 2013. The contributions of the new Member State to the Paid-in capital and to the Reserves amount to EUR 79.5 million and EUR 128.4 million respectively. The total amount to be paid by the new Member State has been equally spread over 8 instalments due on 30 November 2013, 30 November 2014, 30 November 2015, 31 May 2016, 30 November 2016, 31 May 2017, 30 November 2017, and 31 May 2018. The instalments up to and including 30 November 2014 were settled in full.
39
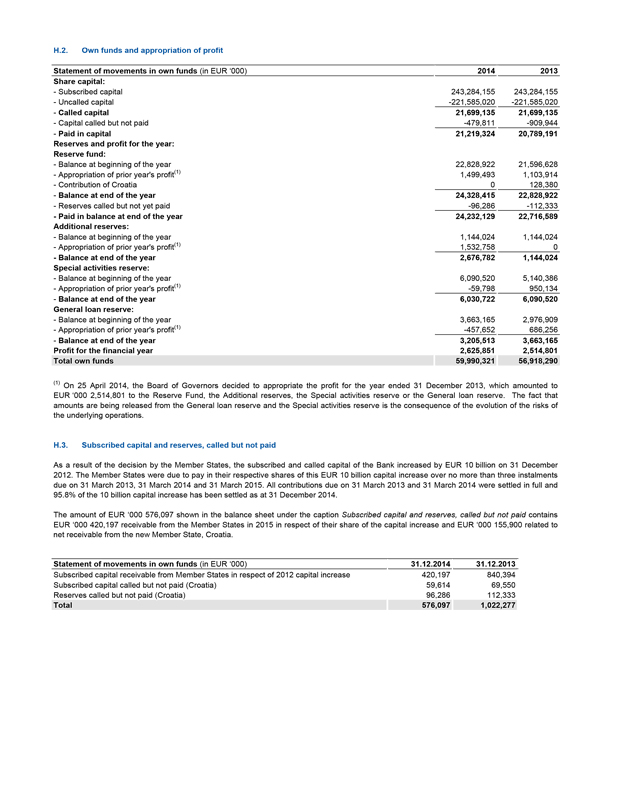
H.2. Own funds and appropriation of profit
Statement of movements in own funds (in EUR ‘000) 2014 2013
Share capital:
- Subscribed capital 243,284,155 243,284,155
- Uncalled capital -221,585,020 -221,585,020
- Called capital 21,699,135 21,699,135
- Capital called but not paid -479,811 -909,944
- Paid in capital 21,219,324 20,789,191
Reserves and profit for the year:
Reserve fund:
- Balance at beginning of the year 22,828,922 21,596,628
- Appropriation of prior year’s profit(1) 1,499,493 1,103,914
- Contribution of Croatia 0 128,380
- Balance at end of the year 24,328,415 22,828,922
- Reserves called but not yet paid -96,286 -112,333
- Paid in balance at end of the year 24,232,129 22,716,589
Additional reserves:
- Balance at beginning of the year 1,144,024 1,144,024
- Appropriation of prior year’s profit(1) 1,532,758 0
- Balance at end of the year 2,676,782 1,144,024
Special activities reserve:
- Balance at beginning of the year 6,090,520 5,140,386
- Appropriation of prior year’s profit(1) -59,798 950,134
- Balance at end of the year 6,030,722 6,090,520
General loan reserve:
- Balance at beginning of the year 3,663,165 2,976,909
- Appropriation of prior year’s profit(1) -457,652 686,256
- Balance at end of the year 3,205,513 3,663,165
Profit for the financial year 2,625,851 2,514,801
Total own funds 59,990,321 56,918,290
(1) On 25 April 2014, the Board of Governors decided to appropriate the profit for the year ended 31 December 2013, which amounted to EUR ‘000 2,514,801 to the Reserve Fund, the Additional reserves, the Special activities reserve or the General loan reserve. The fact that amounts are being released from the General loan reserve and the Special activities reserve is the consequence of the evolution of the risks of the underlying operations.
H.3. Subscribed capital and reserves, called but not paid
As a result of the decision by the Member States, the subscribed and called capital of the Bank increased by EUR 10 billion on 31 December 2012. The Member States were due to pay in their respective shares of this EUR 10 billion capital increase over no more than three instalments due on 31 March 2013, 31 March 2014 and 31 March 2015. All contributions due on 31 March 2013 and 31 March 2014 were settled in full and 95.8% of the 10 billion capital increase has been settled as at 31 December 2014.
The amount of EUR ‘000 576,097 shown in the balance sheet under the caption Subscribed capital and reserves, called but not paid contains EUR ‘000 420,197 receivable from the Member States in 2015 in respect of their share of the capital increase and EUR ‘000 155,900 related to net receivable from the new Member State, Croatia.
Statement of movements in own funds (in EUR ‘000) 31.12.2014 31.12.2013
Subscribed capital receivable from Member States in respect of 2012 capital increase 420,197 840,394
Subscribed capital called but not paid (Croatia) 59,614 69,550
Reserves called but not paid (Croatia) 96,286 112,333
Total 576,097 1,022,277
40
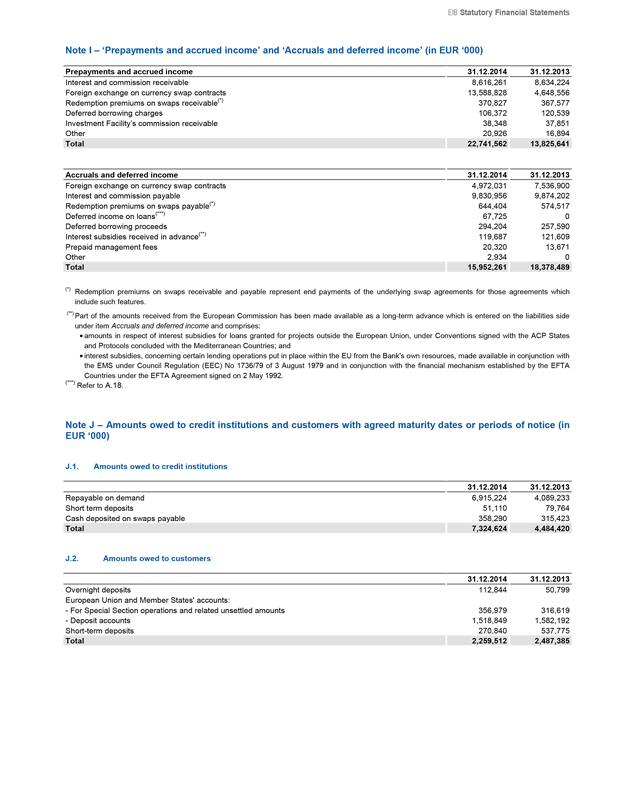
EIB Statutory Financial Statements
Note I – ‘Prepayments and accrued income’ and ‘Accruals and deferred income’ (in EUR ‘000)
Prepayments and accrued income 31.12.2014 31.12.2013
Interest and commission receivable 8,616,261 8,634,224
Foreign exchange on currency swap contracts 13,588,828 4,648,556
Redemption premiums on swaps receivable(*) 370,827 367,577
Deferred borrowing charges 106,372 120,539
Investment Facility’s commission receivable 38,348 37,851
Other 20,926 16,894
Total 22,741,562 13,825,641
Accruals and deferred income 31.12.2014 31.12.2013
Foreign exchange on currency swap contracts 4,972,031 7,536,900
Interest and commission payable 9,830,956 9,874,202
Redemption premiums on swaps payable(*) 644,404 574,517
Deferred income on loans(***) 67,725 0
Deferred borrowing proceeds 294,204 257,590
Interest subsidies received in advance(**) 119,687 121,609
Prepaid management fees 20,320 13,671
Other 2,934 0
Total 15,952,261 18,378,489
(*) Redemption premiums on swaps receivable and payable represent end payments of the underlying swap agreements for those agreements which include such features.
(**) Part of the amounts received from the European Commission has been made available as a long-term advance which is entered on the liabilities side under item Accruals and deferred income and comprises:
amounts in respect of interest subsidies for loans granted for projects outside the European Union, under Conventions signed with the ACP States and Protocols concluded with the Mediterranean Countries; and
interest subsidies, concerning certain lending operations put in place within the EU from the Bank’s own resources, made available in conjunction with the EMS under Council Regulation (EEC) No 1736/79 of 3 August 1979 and in conjunction with the financial mechanism established by the EFTA
Countries under the EFTA Agreement signed on 2 May 1992.
(***) Refer to A.18.
Note J – Amounts owed to credit institutions and customers with agreed maturity dates or periods of notice (in EUR ‘000)
J.1. Amounts owed to credit institutions
31.12.2014 31.12.2013
Repayable on demand 6,915,224 4,089,233
Short term deposits 51,110 79,764
Cash deposited on swaps payable 358,290 315,423
Total 7,324,624 4,484,420
J.2. Amounts owed to customers
31.12.2014 31.12.2013
Overnight deposits 112,844 50,799
European Union and Member States’ accounts:
- For Special Section operations and related unsettled amounts 356,979 316,619
- Deposit accounts 1,518,849 1,582,192
Short-term deposits 270,840 537,775
Total 2,259,512 2,487,385
41
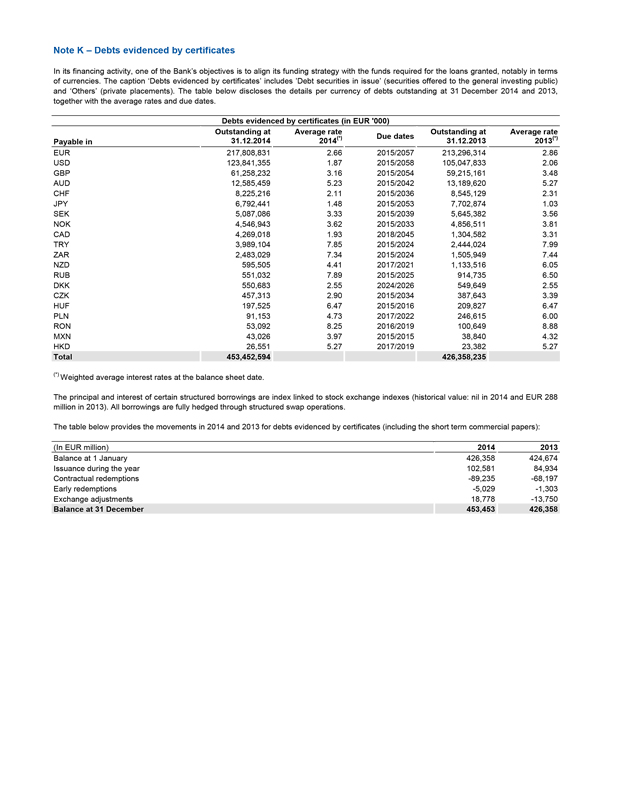
Note K – Debts evidenced by certificates
In its financing activity, one of the Bank’s objectives is to align its funding strategy with the funds required for the loans granted, notably in terms of currencies. The caption ‘Debts evidenced by certificates’ includes ‘Debt securities in issue’ (securities offered to the general investing public) and ‘Others’ (private placements). The table below discloses the details per currency of debts outstanding at 31 December 2014 and 2013, together with the average rates and due dates.
Debts evidenced by certificates (in EUR ‘000)
Payable in Outstanding at 31.12.2014 Average rate 2014(*) Due dates Outstanding at 31.12.2013 Average rate 2013(*)
EUR 217,808,831 2.66 2015/2057 213,296,314 2.86
USD 123,841,355 1.87 2015/2058 105,047,833 2.06
GBP 61,258,232 3.16 2015/2054 59,215,161 3.48
AUD 12,585,459 5.23 2015/2042 13,189,620 5.27
CHF 8,225,216 2.11 2015/2036 8,545,129 2.31
JPY 6,792,441 1.48 2015/2053 7,702,874 1.03
SEK 5,087,086 3.33 2015/2039 5,645,382 3.56
NOK 4,546,943 3.62 2015/2033 4,856,511 3.81
CAD 4,269,018 1.93 2018/2045 1,304,582 3.31
TRY 3,989,104 7.85 2015/2024 2,444,024 7.99
ZAR 2,483,029 7.34 2015/2024 1,505,949 7.44
NZD 595,505 4.41 2017/2021 1,133,516 6.05
RUB 551,032 7.89 2015/2025 914,735 6.50
DKK 550,683 2.55 2024/2026 549,649 2.55
CZK 457,313 2.90 2015/2034 387,643 3.39
HUF 197,525 6.47 2015/2016 209,827 6.47
PLN 91,153 4.73 2017/2022 246,615 6.00
RON 53,092 8.25 2016/2019 100,649 8.88
MXN 43,026 3.97 2015/2015 38,840 4.32
HKD 26,551 5.27 2017/2019 23,382 5.27
Total 453,452,594 426,358,235
(*) Weighted average interest rates at the balance sheet date.
The principal and interest of certain structured borrowings are index linked to stock exchange indexes (historical value: nil in 2014 and EUR 288 million in 2013). All borrowings are fully hedged through structured swap operations.
The table below provides the movements in 2014 and 2013 for debts evidenced by certificates (including the short term commercial papers):
(In EUR million) 2014 2013
Balance at 1 January 426,358 424,674
Issuance during the year 102,581 84,934
Contractual redemptions -89,235 -68,197
Early redemptions -5,029 -1,303
Exchange adjustments 18,778 -13,750
Balance at 31 December 453,453 426,358
42
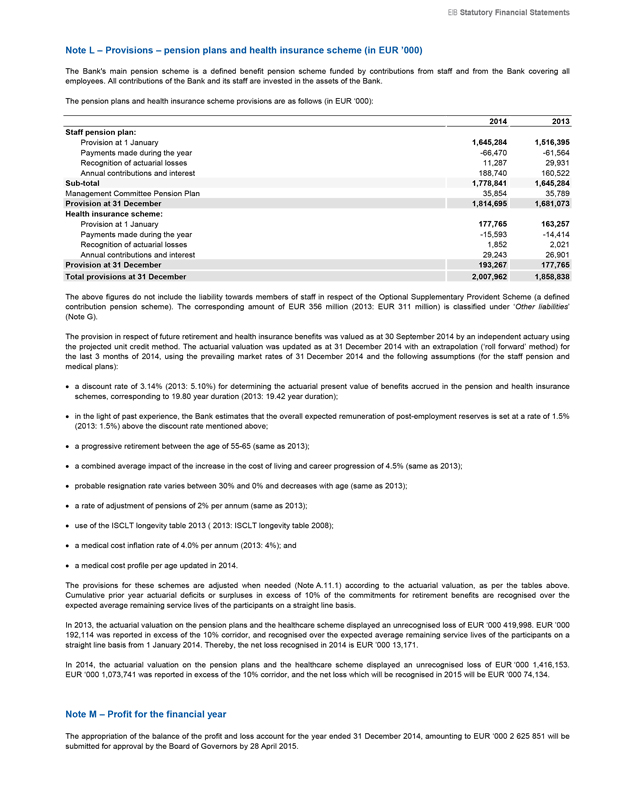
EIB Statutory Financial Statements
Note L – Provisions – pension plans and health insurance scheme (in EUR ’000)
The Bank’s main pension scheme is a defined benefit pension scheme funded by contributions from staff and from the Bank covering all employees. All contributions of the Bank and its staff are invested in the assets of the Bank.
The pension plans and health insurance scheme provisions are as follows (in EUR ‘000):
2014 2013
Staff pension plan:
Provision at 1 January 1,645,284 1,516,395
Payments made during the year -66,470 -61,564
Recognition of actuarial losses 11,287 29,931
Annual contributions and interest 188,740 160,522
Sub-total 1,778,841 1,645,284
Management Committee Pension Plan 35,854 35,789
Provision at 31 December 1,814,695 1,681,073
Health insurance scheme:
Provision at 1 January 177,765 163,257
Payments made during the year -15,593 -14,414
Recognition of actuarial losses 1,852 2,021
Annual contributions and interest 29,243 26,901
Provision at 31 December 193,267 177,765
Total provisions at 31 December 2,007,962 1,858,838
The above figures do not include the liability towards members of staff in respect of the Optional Supplementary Provident Scheme (a defined contribution pension scheme). The corresponding amount of EUR 356 million (2013: EUR 311 million) is classified under ‘Other liabilities’ (Note G).
The provision in respect of future retirement and health insurance benefits was valued as at 30 September 2014 by an independent actuary using the projected unit credit method. The actuarial valuation was updated as at 31 December 2014 with an extrapolation (‘roll forward’ method) for the last 3 months of 2014, using the prevailing market rates of 31 December 2014 and the following assumptions (for the staff pension and medical plans):
a discount rate of 3.14% (2013: 5.10%) for determining the actuarial present value of benefits accrued in the pension and health insurance schemes, corresponding to 19.80 year duration (2013: 19.42 year duration);
in the light of past experience, the Bank estimates that the overall expected remuneration of post-employment reserves is set at a rate of 1.5% (2013: 1.5%) above the discount rate mentioned above;
a progressive retirement between the age of 55-65 (same as 2013);
a combined average impact of the increase in the cost of living and career progression of 4.5% (same as 2013);
probable resignation rate varies between 30% and 0% and decreases with age (same as 2013);
a rate of adjustment of pensions of 2% per annum (same as 2013);
use of the ISCLT longevity table 2013 ( 2013: ISCLT longevity table 2008);
a medical cost inflation rate of 4.0% per annum (2013: 4%); and
a medical cost profile per age updated in 2014.
The provisions for these schemes are adjusted when needed (Note A.11.1) according to the actuarial valuation, as per the tables above. Cumulative prior year actuarial deficits or surpluses in excess of 10% of the commitments for retirement benefits are recognised over the expected average remaining service lives of the participants on a straight line basis.
In 2013, the actuarial valuation on the pension plans and the healthcare scheme displayed an unrecognised loss of EUR ‘000 419,998. EUR ’000 192,114 was reported in excess of the 10% corridor, and recognised over the expected average remaining service lives of the participants on a straight line basis from 1 January 2014. Thereby, the net loss recognised in 2014 is EUR ’000 13,171.
In 2014, the actuarial valuation on the pension plans and the healthcare scheme displayed an unrecognised loss of EUR ‘000 1,416,153. EUR ‘000 1,073,741 was reported in excess of the 10% corridor, and the net loss which will be recognised in 2015 will be EUR ‘000 74,134.
Note M – Profit for the financial year
The appropriation of the balance of the profit and loss account for the year ended 31 December 2014, amounting to EUR ‘000 2 625 851 will be submitted for approval by the Board of Governors by 28 April 2015.
43
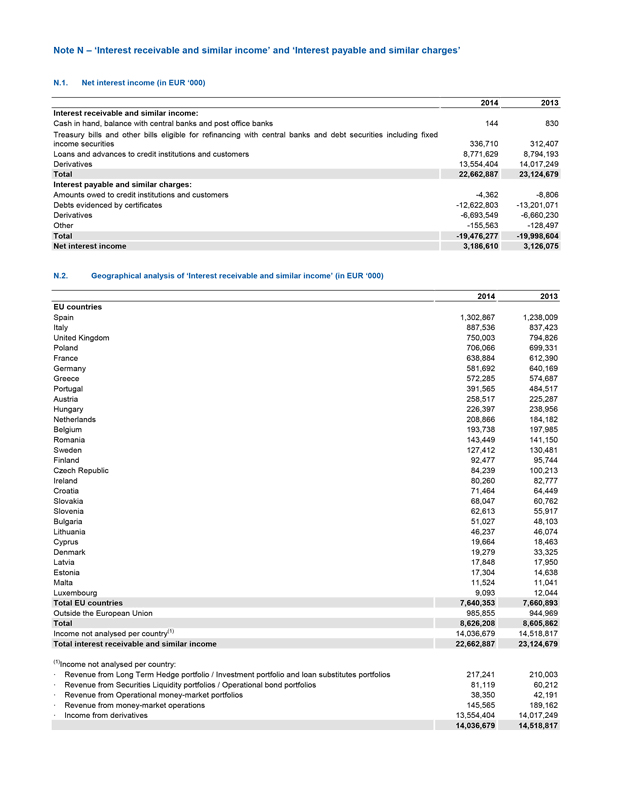
Note N – ‘Interest receivable and similar income’ and ‘Interest payable and similar charges’
N.1. Net interest income (in EUR ‘000)
2014 2013
Interest receivable and similar income:
Cash in hand, balance with central banks and post office banks 144 830
Treasury bills and other bills eligible for refinancing with central banks and debt securities including fixed income securities 336,710 312,407
Loans and advances to credit institutions and customers 8,771,629 8,794,193
Derivatives 13,554,404 14,017,249
Total 22,662,887 23,124,679
Interest payable and similar charges:
Amounts owed to credit institutions and customers -4,362 -8,806
Debts evidenced by certificates -12,622,803 -13,201,071
Derivatives -6,693,549 -6,660,230
Other -155,563 -128,497
Total -19,476,277 -19,998,604
Net interest income 3,186,610 3,126,075
N.2. Geographical analysis of ‘Interest receivable and similar income’ (in EUR ‘000)
2014 2013
EU countries
Spain 1,302,867 1,238,009
Italy 887,536 837,423
United Kingdom 750,003 794,826
Poland 706,066 699,331
France 638,884 612,390
Germany 581,692 640,169
Greece 572,285 574,687
Portugal 391,565 484,517
Austria 258,517 225,287
Hungary 226,397 238,956
Netherlands 208,866 184,182
Belgium 193,738 197,985
Romania 143,449 141,150
Sweden 127,412 130,481
Finland 92,477 95,744
Czech Republic 84,239 100,213
Ireland 80,260 82,777
Croatia 71,464 64,449
Slovakia 68,047 60,762
Slovenia 62,613 55,917
Bulgaria 51,027 48,103
Lithuania 46,237 46,074
Cyprus 19,664 18,463
Denmark 19,279 33,325
Latvia 17,848 17,950
Estonia 17,304 14,638
Malta 11,524 11,041
Luxembourg 9,093 12,044
Total EU countries 7,640,353 7,660,893
Outside the European Union 985,855 944,969
Total 8,626,208 8,605,862
Income not analysed per country(1) 14,036,679 14,518,817
Total interest receivable and similar income 22,662,887 23,124,679
(1)Income not analysed per country:
Revenue from Long Term Hedge portfolio / Investment portfolio and loan substitutes portfolios 217,241 210,003
· Revenue from Securities Liquidity portfolios / Operational bond portfolios 81,119 60,212
· Revenue from Operational money-market portfolios 38,350 42,191
· Revenue from money-market operations 145,565 189,162
· Income from derivatives 13,554,404 14,017,249
14,036,679 14,518,817
44
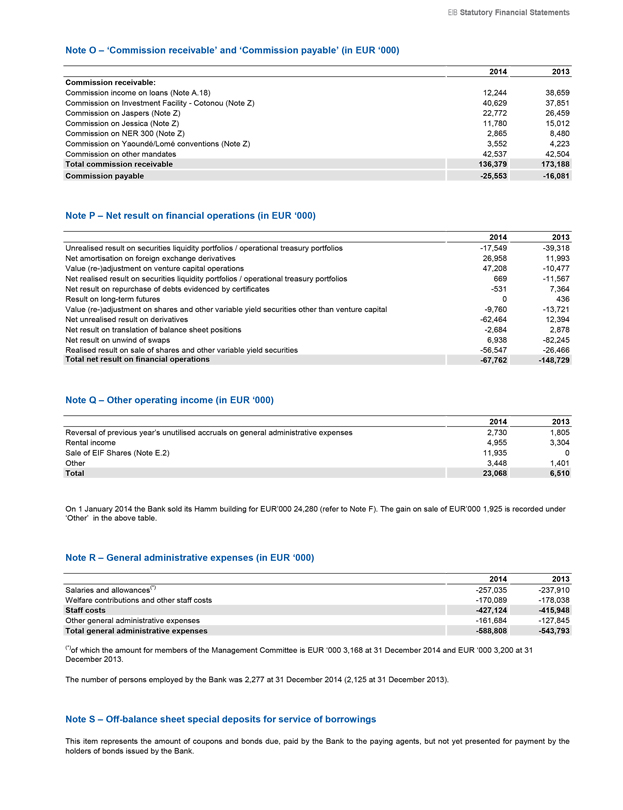
EIB Statutory Financial Statements
Note O – ‘Commission receivable’ and ‘Commission payable’ (in EUR ‘000)
2014 2013
Commission receivable:
Commission income on loans (Note A.18) 12,244 38,659
Commission on Investment Facility - Cotonou (Note Z) 40,629 37,851
Commission on Jaspers (Note Z) 22,772 26,459
Commission on Jessica (Note Z) 11,780 15,012
Commission on NER 300 (Note Z) 2,865 8,480
Commission on Yaoundé/Lomé conventions (Note Z) 3,552 4,223
Commission on other mandates 42,537 42,504
Total commission receivable 136,379 173,188
Commission payable -25,553 -16,081
Note P – Net result on financial operations (in EUR ‘000)
2014 2013
Unrealised result on securities liquidity portfolios / operational treasury portfolios -17,549 -39,318
Net amortisation on foreign exchange derivatives 26,958 11,993
Value (re-)adjustment on venture capital operations 47,208 -10,477
Net realised result on securities liquidity portfolios / operational treasury portfolios 669 -11,567
Net result on repurchase of debts evidenced by certificates -531 7,364
Result on long-term futures 0 436
Value (re-)adjustment on shares and other variable yield securities other than venture capital -9,760 -13,721
Net unrealised result on derivatives -62,464 12,394
Net result on translation of balance sheet positions -2,684 2,878
Net result on unwind of swaps 6,938 -82,245
Realised result on sale of shares and other variable yield securities -56,547 -26,466
Total net result on financial operations -67,762 -148,729
Note Q – Other operating income (in EUR ‘000)
2014 2013
Reversal of previous year’s unutilised accruals on general administrative expenses 2,730 1,805
Rental income 4,955 3,304
Sale of EIF Shares (Note E.2) 11,935 0
Other 3,448 1,401
Total 23,068 6,510
On 1 January 2014 the Bank sold its Hamm building for EUR’000 24,280 (refer to Note F). The gain on sale of EUR’000 1,925 is recorded under ‘Other’ in the above table.
Note R – General administrative expenses (in EUR ‘000)
2014 2013
Salaries and allowances(*) -257,035 -237,910
Welfare contributions and other staff costs -170,089 -178,038
Staff costs -427,124 -415,948
Other general administrative expenses -161,684 -127,845
Total general administrative expenses -588,808 -543,793
(*)of which the amount for members of the Management Committee is EUR ‘000 3,168 at 31 December 2014 and EUR ‘000 3,200 at 31 December 2013.
The number of persons employed by the Bank was 2,277 at 31 December 2014 (2,125 at 31 December 2013).
Note S – Off-balance sheet special deposits for service of borrowings
This item represents the amount of coupons and bonds due, paid by the Bank to the paying agents, but not yet presented for payment by the holders of bonds issued by the Bank.
45
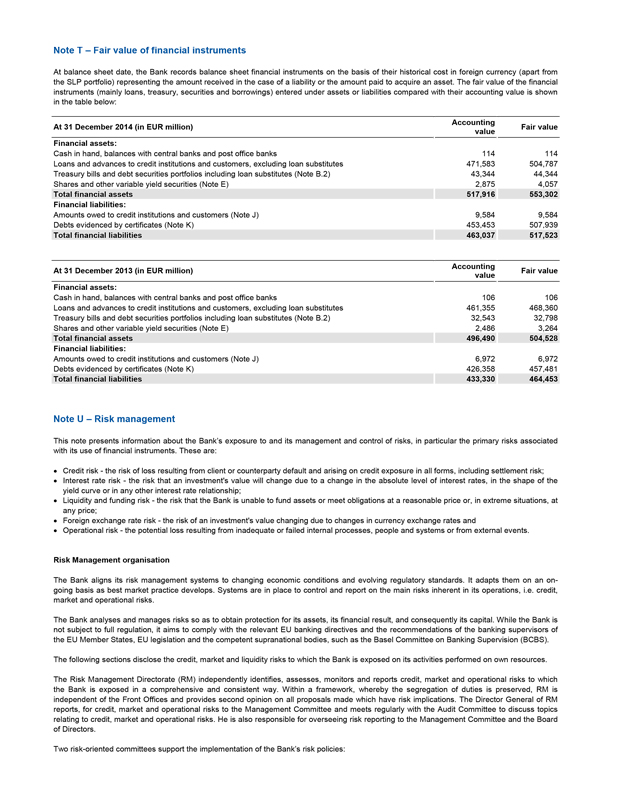
Note T - Fair value of financial instruments
At balance sheet date, the Bank records balance sheet financial instruments on the basis of their historical cost in foreign currency (apart from the SLP portfolio) representing the amount received in the case of a liability or the amount paid to acquire an asset. The fair value of the financial instruments (mainly loans, treasury, securities and borrowings) entered under assets or liabilities compared with their accounting value is shown in the table below:
At 31 December 2014 (in EUR million) Accounting value Fair value
Financial assets:
Cash in hand, balances with central banks and post office banks 114 114
Loans and advances to credit institutions and customers, excluding loan substitutes 471,583 504,787
Treasury bills and debt securities portfolios including loan substitutes (Note B.2) 43,344 44,344
Shares and other variable yield securities (Note E) 2,875 4,057
Total financial assets 517,916 553,302
Financial liabilities:
Amounts owed to credit institutions and customers (Note J) 9,584 9,584
Debts evidenced by certificates (Note K) 453,453 507,939
Total financial liabilities 463,037 517,523
At 31 December 2013 (in EUR million) Accounting value Fair value
Financial assets:
Cash in hand, balances with central banks and post office banks 106 106
Loans and advances to credit institutions and customers, excluding loan substitutes 461,355 468,360
Treasury bills and debt securities portfolios including loan substitutes (Note B.2) 32,543 32,798
Shares and other variable yield securities (Note E) 2,486 3,264
Total financial assets 496,490 504,528
Financial liabilities:
Amounts owed to credit institutions and customers (Note J) 6,972 6,972
Debts evidenced by certificates (Note K) 426,358 457,481
Total financial liabilities 433,330 464,453
Note U - Risk management
This note presents information about the Bank’s exposure to and its management and control of risks, in particular the primary risks associated with its use of financial instruments. These are:
Credit risk - the risk of loss resulting from client or counterparty default and arising on credit exposure in all forms, including settlement risk;
Interest rate risk - the risk that an investment’s value will change due to a change in the absolute level of interest rates, in the shape of the yield curve or in any other interest rate relationship;
Liquidity and funding risk - the risk that the Bank is unable to fund assets or meet obligations at a reasonable price or, in extreme situations, at any price;
Foreign exchange rate risk - the risk of an investment’s value changing due to changes in currency exchange rates and
Operational risk - the potential loss resulting from inadequate or failed internal processes, people and systems or from external events.
Risk Management organisation
The Bank aligns its risk management systems to changing economic conditions and evolving regulatory standards. It adapts them on an ongoing basis as best market practice develops. Systems are in place to control and report on the main risks inherent in its operations, i.e. credit, market and operational risks.
The Bank analyses and manages risks so as to obtain protection for its assets, its financial result, and consequently its capital. While the Bank is not subject to full regulation, it aims to comply with the relevant EU banking directives and the recommendations of the banking supervisors of the EU Member States, EU legislation and the competent supranational bodies, such as the Basel Committee on Banking Supervision (BCBS).
The following sections disclose the credit, market and liquidity risks to which the Bank is exposed on its activities performed on own resources.
The Risk Management Directorate (RM) independently identifies, assesses, monitors and reports credit, market and operational risks to which the Bank is exposed in a comprehensive and consistent way. Within a framework, whereby the segregation of duties is preserved, RM is independent of the Front Offices and provides second opinion on all proposals made which have risk implications. The Director General of RM reports, for credit, market and operational risks to the Management Committee and meets regularly with the Audit Committee to discuss topics relating to credit, market and operational risks. He is also responsible for overseeing risk reporting to the Management Committee and the Board of Directors.
Two risk-oriented committees support the implementation of the Bank’s risk policies:
46
EIB Statutory Financial Statements
The Credit Risk Assessment Group (CRAG) is a high-level forum for discussing relevant credit risk issues arising in the course of the Bank’s activities and for advising the Management Committee on these. Its members are the Directors General of the Operations, Projects, RM, Transaction Monitoring & Restructuring (TMR), Finance and Legal Affairs Directorates. The CRAG is intended to complement, and does not replace, the existing case-by-case review of lending operations, which remains central to the loan approval process.
An Asset/Liability Committee (ALCO), made up of the Directors General of the Operations, Finance, Financial Control and RM Directorates and the Chief Economist, provides a high-level forum for debating the Bank’s Asset/Liability Management (ALM) matters and for making proposals in this field to the Management Committee. It promotes and facilitates the dialogue among the Directorates represented in it, while providing a wider perspective on, and enhancing their understanding of, the main financial risks.
The Bank continued to develop its capacity to manage loans post signature in line with the Bank’s overall higher lending volume and the economic environment. For significant parts of the portfolio this is the responsibility of TMR, a Directorate independent from RM. TMR is focusing on monitoring higher risk counterparts and certain forms of security and it also manages transactions requiring particular attention. All of its proposals which have credit risk implications are subject to an independent second opinion by RM.
Risk measurement and reporting system
Risks are assessed both under normal circumstances and possible stressed conditions, with the purpose to quantify their impact on the Bank’s solvency, liquidity and operations. Risk measurements combine metrics such as expected and unexpected loss estimations based on historical default probabilities together with scenario-based and sensitivity analyses. Worst case scenarios aim at capturing extreme, low probability events which could impact the Bank.
Information on the risk measures described above are presented and explained to the Management Committee and to the Board of Directors on a monthly basis. The reports include aggregate credit exposures, credit concentration analyses and other key portfolio risk indicators, as well as Value at Risk (VaR), sensitivity analysis, liquidity indicators and cumulative funding gaps.
The Bank maintains two reserves within its own funds for the expected and unexpected losses - the General Loan Reserve (GLR) and the Special Activities Reserve (SAR), respectively. The General Loan Reserve is a dedicated reserve for the expected loss of the Bank’s loan portfolio. It is calculated monthly according to the evolution of the underlying assets and reported to the Bank’s senior management. The Special Activities Reserve is a dedicated reserve for the capital allocation covering the unexpected loss of those activities which have a risk profile higher than what is generally accepted by the Bank, including venture capital activities undertaken by the EIF on the Bank’s behalf. It is calculated monthly according to the evolution of the underlying assets.
The Bank’s financial risk tolerance
As a public institution, the Bank does not aim to make profits from speculative exposures to financial risks, setting its financial risk tolerance to a minimum level as defined by approved limits, and applying a conservative financial framework.
As a consequence, the Bank does not consider its treasury or funding activities as profit-maximising centres, even though performance objectives are attached to these activities. Investment activities are conducted within the primary objective of protection of the capital invested. With respect to exposures arising from the Bank’s lending and borrowing operations, the main principle of the Bank’s financial risk policy is therefore to ensure that all material financial risks are hedged.
All new types of transactions introducing operational or financial risks must be authorised by the Management Committee, after the approval of the New Products Committee, and are managed within approved limits.
Sustainability of revenue and self-financing capacity
The Bank’s ALM policy forms an integral part of the Bank’s overall financial risk management. It reflects the expectations of the main stakeholders of the Bank in terms of stability of earnings, preservation of the economic value of own funds, and the self-financing of the Bank’s growth in the long term.
To achieve these aims, the ALM policy employs medium to long term indexation for the investment of own funds to promote stability of revenues and enhance overall returns. This indexation policy implies an exposure to medium to long term yields and is not influenced by any short term views on trends in interest rates.
This is accomplished by targeting a duration for the Bank’s own funds of between 4.5 and 5.5 years.
U.1. Credit risk
Credit risk concerns mainly the Bank’s lending activities and, to a lesser extent, its derivative transactions and treasury instruments, such as debt securities, certificates of deposit and interbank term deposits. No credit risk is attached to the Bank’s venture capital operations, which are performed entirely through equity participations and are therefore only exposed to market risk. As regards lending, treasury and derivatives operations, credit risk is managed by an independent Risk Management Directorate under the direct responsibility of the Management Committee of the Bank. The Bank has thus established an operationally independent structure for determining and monitoring credit risk.
The credit risk associated with the use of derivatives is analysed in Note V.
The Bank’s policies on credit risk are approved by the governing bodies. They set out minimum credit quality levels for both borrowers and guarantors in lending operations and identify the types of security that are deemed acceptable. They also detail the minimum requirements which loan contracts must meet in terms of key legal clauses and other contractual stipulations to ensure that the Bank’s position ranks at least equal to that of other senior lenders, with prompt access to security when required. In addition, via a counterparty and sector limit system, the credit
47
policies ensure an acceptable degree of diversification in the Bank’s loan portfolio. The Bank’s limit system draws its inspiration from the traditional prudential regulations on concentration and large exposure management contained in the EU banking directives, though the Bank generally adopts a more restrictive approach to risk-taking than commercial banks. The policies also set out the minimum credit quality of counterparties of derivatives and treasury transactions as well as the contractual framework for each type of transaction.
Following the capital increase in 2012, the Bank expanded its Credit Risk Policy Guidelines by a dedicated chapter on the remedy of non-compliance events with bank intermediaries, and a dedicated chapter for incremental new lending in connection with the additional capital.
Credit policies undergo periodic adaptations to incorporate evolving operational circumstances and respond to new mandates that the Bank may receive.
Management of credit risk is based, firstly, on the level of credit risk vis-à-vis counterparties and, secondly, on an analysis of the solvency of counterparties.
U.1.1. Loans
In order to limit the credit risk on its loan portfolio, the Bank lends only to counterparties with demonstrated long term creditworthiness and with sound guarantees.
In order to measure and manage credit risk on loans, the Bank has graded its lending operations according to generally accepted criteria, based on the quality of the borrower, the available security and, where appropriate, the guarantor.
The structure of borrowers and guarantors relating to the loan portfolio as at 31 December 2014 is analysed below, including undisbursed portions.
Loans outside the European Union (apart from those under the Facilities(*)) are, in the last resort, secured by guarantees of the European Union budget or the Member States (loans in the ACP Countries and the OCT). The agreements decided by the Council of the European Union on
14 April 1997 (Decision 97/256/EC) introduced the concept of risk sharing whereby certain Bank loans are secured by third-party guarantees with respect to the commercial risk, the budgetary guarantee applying in the case of political risks solely arising from currency non-transferability, expropriation, war and civil disturbance.
(*) Loans granted under Article 16 (previously Article 18) of the Bank’s Statute and loans granted under the Pre Accession Facility, the Mediterranean Partnership Facility, the Energy Sustainability Facility and the EFTA Facility. These loans, granted under the Facilities, are not secured by guarantees of the European Union budget or the Member States. Therefore, lending under the Facilities is from the Bank’s own resources and at the Bank’s own risk.
The table below shows (in EUR million) the loans for projects inside and outside the European Union granted under the Facilities and under the risk-sharing operations:
Guarantor Borrower States Public institutions Banks Corporates Not (1) guaranteed Total 2014 Total 2013
States 0 0 0 0 46,299 46,299 43,971
Public institutions 26,565 16,186 617 2,655 68,497 114,520 106,188
Banks 33,529 33,115 35,330 28,088 23,326 153,388 149,445
Corporates 21,961 9,503 26,838 42,740 79,212 180,254 173,229
Total 2014(1)(2)(3)(4)(5) 82,055 58,804 62,785 73,483 217,334 494,461
Total 2013(1)(2)(3)(4)(5) 73,023 61,457 64,883 76,600 196,870 472,833
(1) These amounts include loans for which no formal guarantee independent from the borrower and the loan itself was required, the borrower’s level of solvency itself representing adequate security. In the event of certain occurrences, appropriate contractual clauses ensure the Bank’s right to access independent security.
(2) The loans in risk-sharing operations amount to EUR 7,209 million as of 31 December 2014 (2013: EUR 6,817 million).
(3) This amount includes loans granted under Facilities.
(4) This amount does not include loan substitutes (2014: EUR 16,510 million; 2013: EUR 13,179 million).
(5) These amounts exclude loans to current European Union Member States but granted before their accession to the European Union and guaranteed by the European Union budget or the Member States.
The Bank did not record value adjustments in 2013 and 2014 in respect of its EU sovereign and sovereign guaranteed exposure as at the year end as the Bank’s preferred creditor status and the protection given by the Bank’s Statute are deemed to guarantee a full recovery of the Bank’s assets on maturity.
The table below discloses information regarding the sovereign credit risk on loans granted inside and outside the European Union granted under the Facilities and under the risk-sharing operations:
48
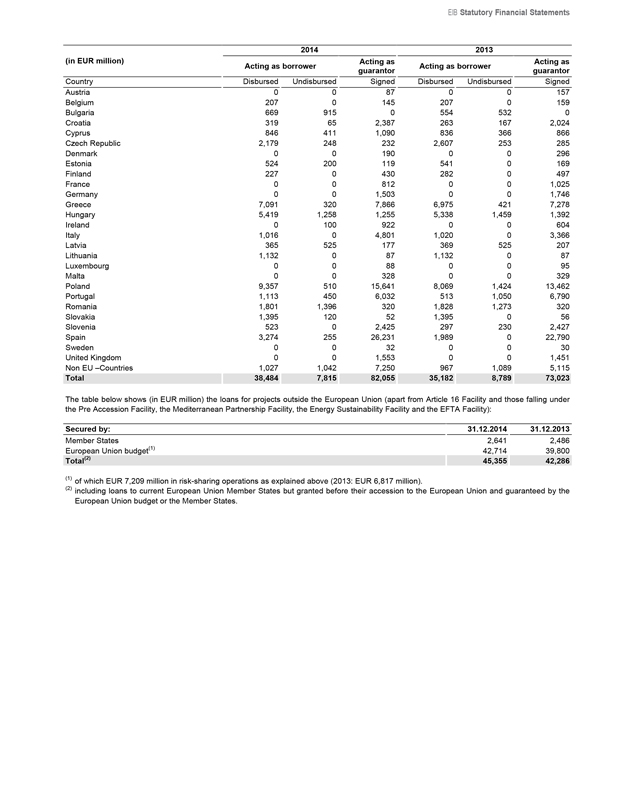
EIB Statutory Financial Statements
2014 2013
(in EUR million) Acting as borrower Acting as guarantor Acting as borrower Acting as guarantor
Country Disbursed Undisbursed Signed Disbursed Undisbursed Signed
Austria 0 0 87 0 0 157
Belgium 207 0 145 207 0 159
Bulgaria 669 915 0 554 532 0
Croatia 319 65 2,387 263 167 2,024
Cyprus 846 411 1,090 836 366 866
Czech Republic 2,179 248 232 2,607 253 285
Denmark 0 0 190 0 0 296
Estonia 524 200 119 541 0 169
Finland 227 0 430 282 0 497
France 0 0 812 0 0 1,025
Germany 0 0 1,503 0 0 1,746
Greece 7,091 320 7,866 6,975 421 7,278
Hungary 5,419 1,258 1,255 5,338 1,459 1,392
Ireland 0 100 922 0 0 604
Italy 1,016 0 4,801 1,020 0 3,366
Latvia 365 525 177 369 525 207
Lithuania 1,132 0 87 1,132 0 87
Luxembourg 0 0 88 0 0 95
Malta 0 0 328 0 0 329
Poland 9,357 510 15,641 8,069 1,424 13,462
Portugal 1,113 450 6,032 513 1,050 6,790
Romania 1,801 1,396 320 1,828 1,273 320
Slovakia 1,395 120 52 1,395 0 56
Slovenia 523 0 2,425 297 230 2,427
Spain 3,274 255 26,231 1,989 0 22,790
Sweden 0 0 32 0 0 30
United Kingdom 0 0 1,553 0 0 1,451
Non EU -Countries 1,027 1,042 7,250 967 1,089 5,115
Total 38,484 7,815 82,055 35,182 8,789 73,023
The table below shows (in EUR million) the loans for projects outside the European Union (apart from Article 16 Facility and those falling under the Pre Accession Facility, the Mediterranean Partnership Facility, the Energy Sustainability Facility and the EFTA Facility):
Secured by: 31.12.2014 31.12.2013
Member States 2,641 2,486
European Union budget(1) 42,714 39,800
Total(2) 45,355 42,286
(1) of which EUR 7,209 million in risk-sharing operations as explained above (2013: EUR 6,817 million).
(2) including loans to current European Union Member States but granted before their accession to the European Union and guaranteed by the European Union budget or the Member States.
49
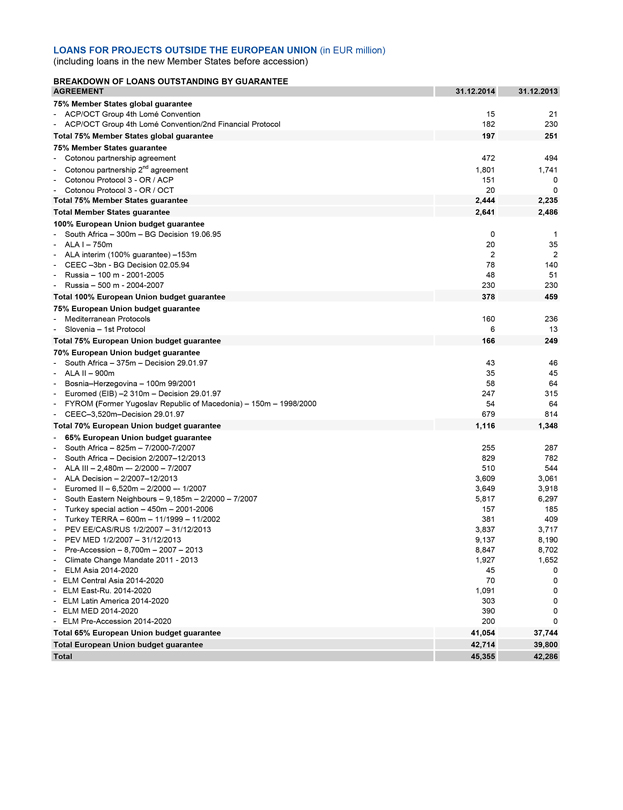
LOANS FOR PROJECTS OUTSIDE THE EUROPEAN UNION (in EUR million)
(including loans in the new Member States before accession)
BREAKDOWN OF LOANS OUTSTANDING BY GUARANTEE
AGREEMENT 31.12.2014 31.12.2013
75% Member States global guarantee
- ACP/OCT Group 4th Lomé Convention 15 21
- ACP/OCT Group 4th Lomé Convention/2nd Financial Protocol 182 230
Total 75% Member States global guarantee 197 251
75% Member States guarantee
- Cotonou partnership agreement 472 494
- Cotonou partnership 2nd agreement 1,801 1,741
- Cotonou Protocol 3 - OR / ACP 151 0
- Cotonou Protocol 3 - OR / OCT 20 0
Total 75% Member States guarantee 2,444 2,235
Total Member States guarantee 2,641 2,486
100% European Union budget guarantee
- South Africa - 300m - BG Decision 19.06.95 0 1
- ALA I - 750m 20 35
- ALA interim (100% guarantee) -153m 2 2
- CEEC -3bn - BG Decision 02.05.94 78 140
- Russia - 100 m - 2001-2005 48 51
- Russia - 500 m - 2004-2007 230 230
Total 100% European Union budget guarantee 378 459
75% European Union budget guarantee
- Mediterranean Protocols 160 236
- Slovenia - 1st Protocol 6 13
Total 75% European Union budget guarantee 166 249
70% European Union budget guarantee
- South Africa - 375m - Decision 29.01.97 43 46
- ALA II - 900m 35 45
- Bosnia-Herzegovina - 100m 99/2001 58 64
- Euromed (EIB) -2 310m - Decision 29.01.97 247 315
- FYROM (Former Yugoslav Republic of Macedonia) - 150m - 1998/2000 54 64
- CEEC-3,520m-Decision 29.01.97 679 814
Total 70% European Union budget guarantee 1,116 1,348
- 65% European Union budget guarantee
- South Africa - 825m - 7/2000-7/2007 255 287
- South Africa - Decision 2/2007-12/2013 829 782
- ALA III - 2,480m - 2/2000 - 7/2007 510 544
- ALA Decision - 2/2007-12/2013 3,609 3,061
- Euromed II - 6,520m - 2/2000 - 1/2007 3,649 3,918
- South Eastern Neighbours - 9,185m - 2/2000 - 7/2007 5,817 6,297
- Turkey special action - 450m - 2001-2006 157 185
- Turkey TERRA - 600m - 11/1999 - 11/2002 381 409
- PEV EE/CAS/RUS 1/2/2007 - 31/12/2013 3,837 3,717
- PEV MED 1/2/2007 - 31/12/2013 9,137 8,190
- Pre-Accession - 8,700m - 2007 - 2013 8,847 8,702
- Climate Change Mandate 2011 - 2013 1,927 1,652
- ELM Asia 2014-2020 45 0
- ELM Central Asia 2014-2020 70 0
- ELM East-Ru. 2014-2020 1,091 0
- ELM Latin America 2014-2020 303 0
- ELM MED 2014-2020 390 0
- ELM Pre-Accession 2014-2020 200 0
Total 65% European Union budget guarantee 41,054 37,744
Total European Union budget guarantee 42,714 39,800
Total 45,355 42,286
50
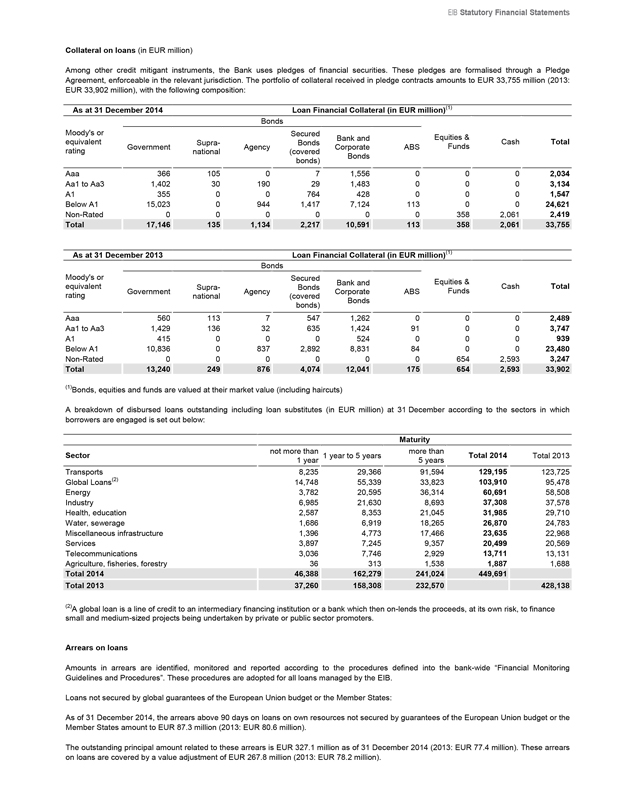
EIB Statutory Financial Statements
Collateral on loans (in EUR million)
Among other credit mitigant instruments, the Bank uses pledges of financial securities. These pledges are formalised through a Pledge Agreement, enforceable in the relevant jurisdiction. The portfolio of collateral received in pledge contracts amounts to EUR 33,755 million (2013: EUR 33,902 million), with the following composition:
As at 31 December 2014 Loan Financial Collateral (in EUR million)(1)
Bonds
Moody’s or equivalent rating Government Supranational Agency Secured Bonds (covered bonds) Bank and Corporate Bonds ABS Equities & Funds Cash Total
Aaa 366 105 0 7 1,556 0 0 0 2,034
Aa1 to Aa3 1,402 30 190 29 1,483 0 0 0 3,134
A1 355 0 0 764 428 0 0 0 1,547
Below A1 15,023 0 944 1,417 7,124 113 0 0 24,621
Non-Rated 0 0 0 0 0 0 358 2,061 2,419
Total 17,146 135 1,134 2,217 10,591 113 358 2,061 33,755
As at 31 December 2013 Loan Financial Collateral (in EUR million)(1)
Bonds
Moody’s or equivalent rating Government Supranational Agency Secured Bonds (covered bonds) Bank and Corporate Bonds ABS Equities & Funds Cash Total
Aaa 560 113 7 547 1,262 0 0 0 2,489
Aa1 to Aa3 1,429 136 32 635 1,424 91 0 0 3,747
A1 415 0 0 0 524 0 0 0 939
Below A1 10,836 0 837 2,892 8,831 84 0 0 23,480
Non-Rated 0 0 0 0 0 0 654 2,593 3,247
Total 13,240 249 876 4,074 12,041 175 654 2,593 33,902
(1)Bonds, equities and funds are valued at their market value (including haircuts)
A breakdown of disbursed loans outstanding including loan substitutes (in EUR million) at 31 December according to the sectors in which borrowers are engaged is set out below:
Maturity
Sector not more than 1 year to 5 years more than Total 2014 Total 2013
1 year 5 years
Transports 8,235 29,366 91,594 129,195 123,725
Global Loans(2) 14,748 55,339 33,823 103,910 95,478
Energy 3,782 20,595 36,314 60,691 58,508
Industry 6,985 21,630 8,693 37,308 37,578
Health, education 2,587 8,353 21,045 31,985 29,710
Water, sewerage 1,686 6,919 18,265 26,870 24,783
Miscellaneous infrastructure 1,396 4,773 17,466 23,635 22,968
Services 3,897 7,245 9,357 20,499 20,569
Telecommunications 3,036 7,746 2,929 13,711 13,131
Agriculture, fisheries, forestry 36 313 1,538 1,887 1,688
Total 2014 46,388 162,279 241,024 449,691
Total 2013 37,260 158,308 232,570 428,138
(2)A global loan is a line of credit to an intermediary financing institution or a bank which then on-lends the proceeds, at its own risk, to finance small and medium-sized projects being undertaken by private or public sector promoters.
Arrears on loans
Amounts in arrears are identified, monitored and reported according to the procedures defined into the bank-wide “Financial Monitoring Guidelines and Procedures”. These procedures are adopted for all loans managed by the EIB.
Loans not secured by global guarantees of the European Union budget or the Member States:
As of 31 December 2014, the arrears above 90 days on loans on own resources not secured by guarantees of the European Union budget or the Member States amount to EUR 87.3 million (2013: EUR 80.6 million).
The outstanding principal amount related to these arrears is EUR 327.1 million as of 31 December 2014 (2013: EUR 77.4 million). These arrears on loans are covered by a value adjustment of EUR 267.8 million (2013: EUR 78.2 million).
51
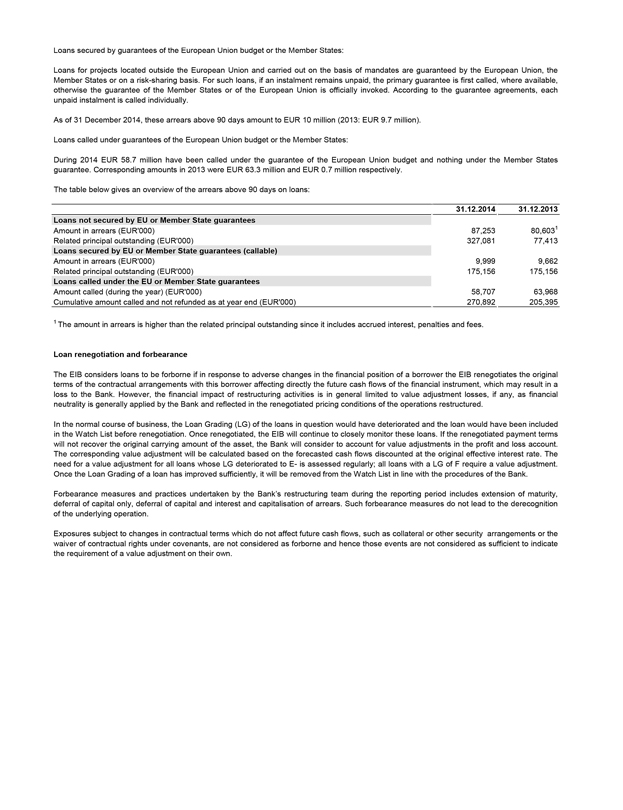
Loans secured by guarantees of the European Union budget or the Member States:
Loans for projects located outside the European Union and carried out on the basis of mandates are guaranteed by the European Union, the Member States or on a risk-sharing basis. For such loans, if an instalment remains unpaid, the primary guarantee is first called, where available, otherwise the guarantee of the Member States or of the European Union is officially invoked. According to the guarantee agreements, each unpaid instalment is called individually.
As of 31 December 2014, these arrears above 90 days amount to EUR 10 million (2013: EUR 9.7 million).
Loans called under guarantees of the European Union budget or the Member States:
During 2014 EUR 58.7 million have been called under the guarantee of the European Union budget and nothing under the Member States guarantee. Corresponding amounts in 2013 were EUR 63.3 million and EUR 0.7 million respectively.
The table below gives an overview of the arrears above 90 days on loans:
31.12.2014 31.12.2013
Loans not secured by EU or Member State guarantees
Amount in arrears (EUR’000) 87,253 80,6031
Related principal outstanding (EUR’000) 327,081 77,413
Loans secured by EU or Member State guarantees (callable)
Amount in arrears (EUR’000) 9,999 9,662
Related principal outstanding (EUR’000) 175,156 175,156
Loans called under the EU or Member State guarantees
Amount called (during the year) (EUR’000) 58,707 63,968
Cumulative amount called and not refunded as at year end (EUR’000) 270,892 205,395
1 The amount in arrears is higher than the related principal outstanding since it includes accrued interest, penalties and fees.
Loan renegotiation and forbearance
The EIB considers loans to be forborne if in response to adverse changes in the financial position of a borrower the EIB renegotiates the original terms of the contractual arrangements with this borrower affecting directly the future cash flows of the financial instrument, which may result in a loss to the Bank. However, the financial impact of restructuring activities is in general limited to value adjustment losses, if any, as financial neutrality is generally applied by the Bank and reflected in the renegotiated pricing conditions of the operations restructured.
In the normal course of business, the Loan Grading (LG) of the loans in question would have deteriorated and the loan would have been included in the Watch List before renegotiation. Once renegotiated, the EIB will continue to closely monitor these loans. If the renegotiated payment terms will not recover the original carrying amount of the asset, the Bank will consider to account for value adjustments in the profit and loss account. The corresponding value adjustment will be calculated based on the forecasted cash flows discounted at the original effective interest rate. The need for a value adjustment for all loans whose LG deteriorated to E- is assessed regularly; all loans with a LG of F require a value adjustment. Once the Loan Grading of a loan has improved sufficiently, it will be removed from the Watch List in line with the procedures of the Bank.
Forbearance measures and practices undertaken by the Bank’s restructuring team during the reporting period includes extension of maturity, deferral of capital only, deferral of capital and interest and capitalisation of arrears. Such forbearance measures do not lead to the derecognition of the underlying operation.
Exposures subject to changes in contractual terms which do not affect future cash flows, such as collateral or other security arrangements or the waiver of contractual rights under covenants, are not considered as forborne and hence those events are not considered as sufficient to indicate the requirement of a value adjustment on their own.
52
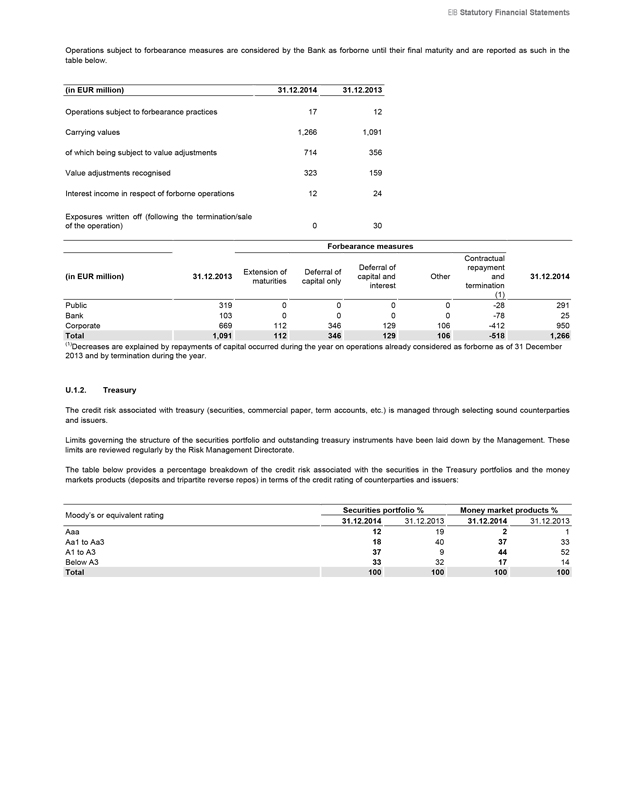
EIB Statutory Financial Statements
Operations subject to forbearance measures are considered by the Bank as forborne until their final maturity and are reported as such in the table below.
(in EUR million) 31.12.2014 31.12.2013
Operations subject to forbearance practices 17 12
Carrying values 1,266 1,091
of which being subject to value adjustments 714 356
Value adjustments recognised 323 159
Interest income in respect of forborne operations 12 24
Exposures written off (following the termination/sale of the operation) 0 30
Forbearance measures
(in EUR million)
31.12.2013
Extension of maturities
Deferral of capital only
Deferral of capital and interest
Other
Contractual repayment and termination (1)
31.12.2014
Public 319 0 0 0 0 -28 291
Bank 103 0 0 0 0 -78 25
Corporate 669 112 346 129 106 -412 950
Total 1,091 112 346 129 106 -518 1,266
(1)Decreases are explained by repayments of capital occurred during the year on operations already considered as forborne as of 31 December 2013 and by termination during the year.
U.1.2. Treasury
The credit risk associated with treasury (securities, commercial paper, term accounts, etc.) is managed through selecting sound counterparties and issuers.
Limits governing the structure of the securities portfolio and outstanding treasury instruments have been laid down by the Management. These limits are reviewed regularly by the Risk Management Directorate.
The table below provides a percentage breakdown of the credit risk associated with the securities in the Treasury portfolios and the money markets products (deposits and tripartite reverse repos) in terms of the credit rating of counterparties and issuers:
Moody’s or equivalent rating
Securities portfolio %
Money market products %
31.12.2014
31.12.2013
31.12.2014
31.12.2013
Aaa 12 19 2 1
Aa1 to Aa3 18 40 37 33
A1 to A3 37 9 44 52
Below A3 33 32 17 14
Total 100 100 100 100
53
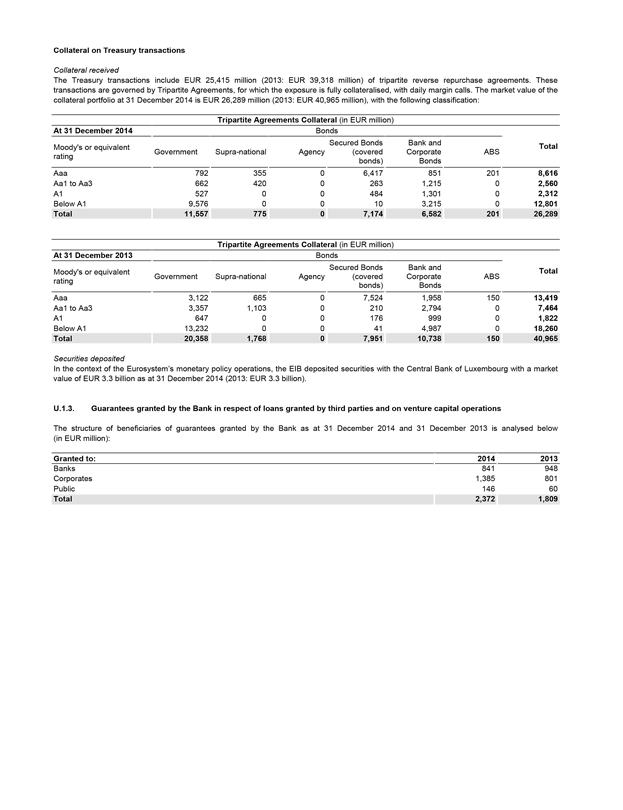
Collateral on Treasury transactions
Collateral received
The Treasury transactions include EUR 25,415 million (2013: EUR 39,318 million) of tripartite reverse repurchase agreements. These transactions are governed by Tripartite Agreements, for which the exposure is fully collateralised, with daily margin calls. The market value of the collateral portfolio at 31 December 2014 is EUR 26,289 million (2013: EUR 40,965 million), with the following classification:
Tripartite Agreements Collateral (in EUR million)
At 31 December 2014
Bonds
Moody’s or equivalent rating
Government
Supra-national
Agency
Secured Bonds (covered bonds)
Bank and Corporate Bonds
ABS
Total
Aaa 792 355 0 6,417 851 201 8,616
Aa1 to Aa3 662 420 0 263 1,215 0 2,560
A1 527 0 0 484 1,301 0 2,312
Below A1 9,576 0 0 10 3,215 0 12,801
Total 11,557 775 0 7,174 6,582 201 26,289
Tripartite Agreements Collateral (in EUR million)
At 31 December 2013
Bonds
Moody’s or equivalent rating
Government
Supra-national
Agency
Secured Bonds (covered bonds)
Bank and Corporate Bonds
ABS
Total
Aaa 3,122 665 0 7,524 1,958 150 13,419
Aa1 to Aa3 3,357 1,103 0 210 2,794 0 7,464
A1 647 0 0 176 999 0 1,822
Below A1 13,232 0 0 41 4,987 0 18,260
Total 20,358 1,768 0 7,951 10,738 150 40,965
Securities deposited
In the context of the Eurosystem’s monetary policy operations, the EIB deposited securities with the Central Bank of Luxembourg with a market value of EUR 3.3 billion as at 31 December 2014 (2013: EUR 3.3 billion).
U.1.3. Guarantees granted by the Bank in respect of loans granted by third parties and on venture capital operations
The structure of beneficiaries of guarantees granted by the Bank as at 31 December 2014 and 31 December 2013 is analysed below (in EUR million):
Granted to: 2014 2013
Banks 841 948
Corporates 1,385 801
Public 146 60
Total 2,372 1,809
54
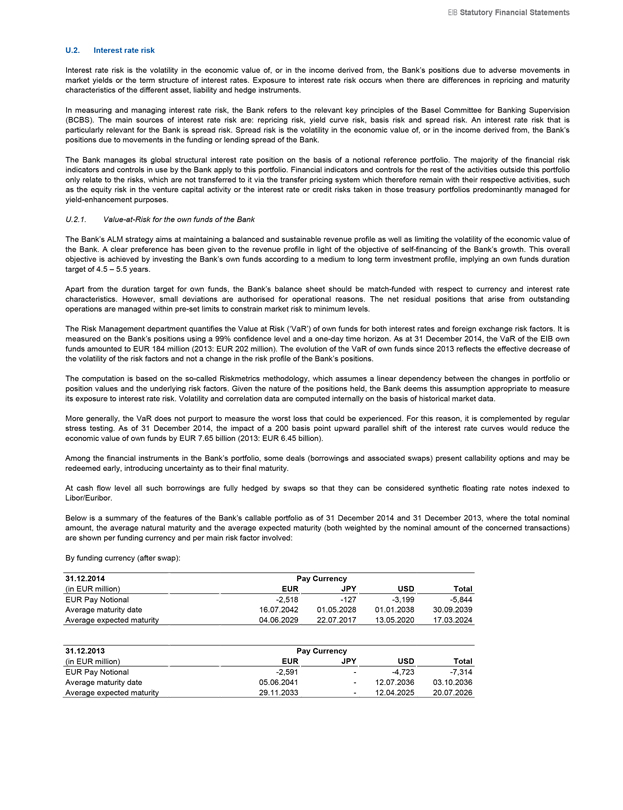
EIB Statutory Financial Statements
U.2. Interest rate risk
Interest rate risk is the volatility in the economic value of, or in the income derived from, the Bank’s positions due to adverse movements in market yields or the term structure of interest rates. Exposure to interest rate risk occurs when there are differences in repricing and maturity characteristics of the different asset, liability and hedge instruments.
In measuring and managing interest rate risk, the Bank refers to the relevant key principles of the Basel Committee for Banking Supervision (BCBS). The main sources of interest rate risk are: repricing risk, yield curve risk, basis risk and spread risk. An interest rate risk that is particularly relevant for the Bank is spread risk. Spread risk is the volatility in the economic value of, or in the income derived from, the Bank’s positions due to movements in the funding or lending spread of the Bank.
The Bank manages its global structural interest rate position on the basis of a notional reference portfolio. The majority of the financial risk indicators and controls in use by the Bank apply to this portfolio. Financial indicators and controls for the rest of the activities outside this portfolio only relate to the risks, which are not transferred to it via the transfer pricing system which therefore remain with their respective activities, such as the equity risk in the venture capital activity or the interest rate or credit risks taken in those treasury portfolios predominantly managed for yield-enhancement purposes.
U.2.1. Value-at-Risk for the own funds of the Bank
The Bank’s ALM strategy aims at maintaining a balanced and sustainable revenue profile as well as limiting the volatility of the economic value of the Bank. A clear preference has been given to the revenue profile in light of the objective of self-financing of the Bank’s growth. This overall objective is achieved by investing the Bank’s own funds according to a medium to long term investment profile, implying an own funds duration target of 4.5 - 5.5 years.
Apart from the duration target for own funds, the Bank’s balance sheet should be match-funded with respect to currency and interest rate characteristics. However, small deviations are authorised for operational reasons. The net residual positions that arise from outstanding operations are managed within pre-set limits to constrain market risk to minimum levels.
The Risk Management department quantifies the Value at Risk (‘VaR’) of own funds for both interest rates and foreign exchange risk factors. It is measured on the Bank’s positions using a 99% confidence level and a one-day time horizon. As at 31 December 2014, the VaR of the EIB own funds amounted to EUR 184 million (2013: EUR 202 million). The evolution of the VaR of own funds since 2013 reflects the effective decrease of the volatility of the risk factors and not a change in the risk profile of the Bank’s positions.
The computation is based on the so-called Riskmetrics methodology, which assumes a linear dependency between the changes in portfolio or position values and the underlying risk factors. Given the nature of the positions held, the Bank deems this assumption appropriate to measure its exposure to interest rate risk. Volatility and correlation data are computed internally on the basis of historical market data.
More generally, the VaR does not purport to measure the worst loss that could be experienced. For this reason, it is complemented by regular stress testing. As of 31 December 2014, the impact of a 200 basis point upward parallel shift of the interest rate curves would reduce the economic value of own funds by EUR 7.65 billion (2013: EUR 6.45 billion).
Among the financial instruments in the Bank’s portfolio, some deals (borrowings and associated swaps) present callability options and may be redeemed early, introducing uncertainty as to their final maturity.
At cash flow level all such borrowings are fully hedged by swaps so that they can be considered synthetic floating rate notes indexed to Libor/Euribor.
Below is a summary of the features of the Bank’s callable portfolio as of 31 December 2014 and 31 December 2013, where the total nominal amount, the average natural maturity and the average expected maturity (both weighted by the nominal amount of the concerned transactions) are shown per funding currency and per main risk factor involved:
By funding currency (after swap):
31.12.2014
Pay Currency
(in EUR million)
EUR
JPY
USD
Total
EUR Pay Notional -2,518 -127 -3,199 -5,844
Average maturity date 16.07.2042 01.05.2028 01.01.2038 30.09.2039
Average expected maturity 04.06.2029 22.07.2017 13.05.2020 17.03.2024
31.12.2013
Pay Currency
(in EUR million)
EUR
JPY
USD
Total
EUR Pay Notional -2,591 - -4,723 -7,314
Average maturity date 05.06.2041 - 12.07.2036 03.10.2036
Average expected maturity 29.11.2033 - 12.04.2025 20.07.2026
55
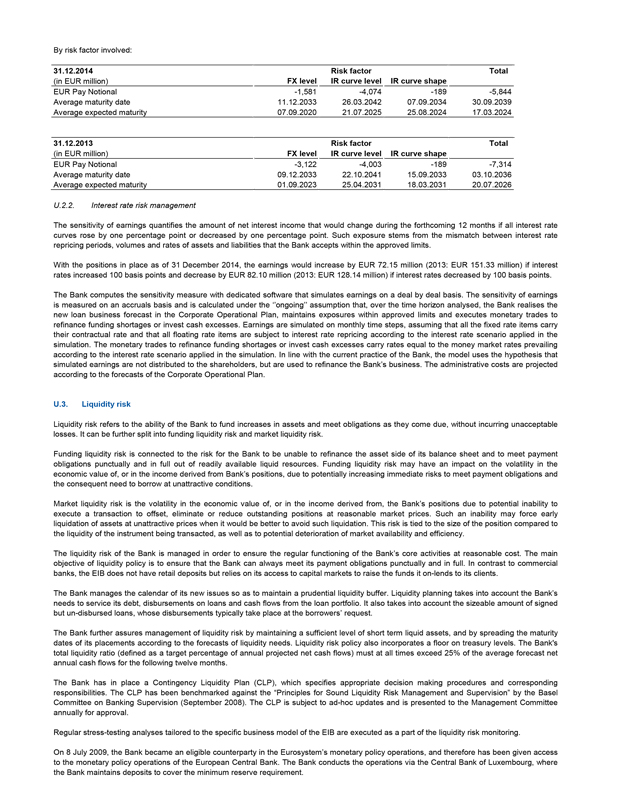
By risk factor involved:
31.12.2014
Risk factor
Total
(in EUR million)
FX level
IR curve level
IR curve shape
EUR Pay Notional -1,581 -4,074 -189 -5,844
Average maturity date 11.12.2033 26.03.2042 07.09.2034 30.09.2039
Average expected maturity 07.09.2020 21.07.2025 25.08.2024 17.03.2024
31.12.2013
Risk factor
Total
(in EUR million)
FX level
IR curve level
IR curve shape
EUR Pay Notional -3,122 -4,003 -189 -7,314
Average maturity date 09.12.2033 22.10.2041 15.09.2033 03.10.2036
Average expected maturity 01.09.2023 25.04.2031 18.03.2031 20.07.2026
U.2.2. Interest rate risk management
The sensitivity of earnings quantifies the amount of net interest income that would change during the forthcoming 12 months if all interest rate curves rose by one percentage point or decreased by one percentage point. Such exposure stems from the mismatch between interest rate repricing periods, volumes and rates of assets and liabilities that the Bank accepts within the approved limits.
With the positions in place as of 31 December 2014, the earnings would increase by EUR 72.15 million (2013: EUR 151.33 million) if interest rates increased 100 basis points and decrease by EUR 82.10 million (2013: EUR 128.14 million) if interest rates decreased by 100 basis points.
The Bank computes the sensitivity measure with dedicated software that simulates earnings on a deal by deal basis. The sensitivity of earnings is measured on an accruals basis and is calculated under the ‘’ongoing’’ assumption that, over the time horizon analysed, the Bank realises the new loan business forecast in the Corporate Operational Plan, maintains exposures within approved limits and executes monetary trades to refinance funding shortages or invest cash excesses. Earnings are simulated on monthly time steps, assuming that all the fixed rate items carry their contractual rate and that all floating rate items are subject to interest rate repricing according to the interest rate scenario applied in the simulation. The monetary trades to refinance funding shortages or invest cash excesses carry rates equal to the money market rates prevailing according to the interest rate scenario applied in the simulation. In line with the current practice of the Bank, the model uses the hypothesis that simulated earnings are not distributed to the shareholders, but are used to refinance the Bank’s business. The administrative costs are projected according to the forecasts of the Corporate Operational Plan.
U.3. Liquidity risk
Liquidity risk refers to the ability of the Bank to fund increases in assets and meet obligations as they come due, without incurring unacceptable losses. It can be further split into funding liquidity risk and market liquidity risk.
Funding liquidity risk is connected to the risk for the Bank to be unable to refinance the asset side of its balance sheet and to meet payment obligations punctually and in full out of readily available liquid resources. Funding liquidity risk may have an impact on the volatility in the economic value of, or in the income derived from Bank’s positions, due to potentially increasing immediate risks to meet payment obligations and the consequent need to borrow at unattractive conditions.
Market liquidity risk is the volatility in the economic value of, or in the income derived from, the Bank’s positions due to potential inability to execute a transaction to offset, eliminate or reduce outstanding positions at reasonable market prices. Such an inability may force early liquidation of assets at unattractive prices when it would be better to avoid such liquidation. This risk is tied to the size of the position compared to the liquidity of the instrument being transacted, as well as to potential deterioration of market availability and efficiency.
The liquidity risk of the Bank is managed in order to ensure the regular functioning of the Bank’s core activities at reasonable cost. The main objective of liquidity policy is to ensure that the Bank can always meet its payment obligations punctually and in full. In contrast to commercial banks, the EIB does not have retail deposits but relies on its access to capital markets to raise the funds it on-lends to its clients.
The Bank manages the calendar of its new issues so as to maintain a prudential liquidity buffer. Liquidity planning takes into account the Bank’s needs to service its debt, disbursements on loans and cash flows from the loan portfolio. It also takes into account the sizeable amount of signed but un-disbursed loans, whose disbursements typically take place at the borrowers’ request.
The Bank further assures management of liquidity risk by maintaining a sufficient level of short term liquid assets, and by spreading the maturity dates of its placements according to the forecasts of liquidity needs. Liquidity risk policy also incorporates a floor on treasury levels. The Bank’s total liquidity ratio (defined as a target percentage of annual projected net cash flows) must at all times exceed 25% of the average forecast net annual cash flows for the following twelve months.
The Bank has in place a Contingency Liquidity Plan (CLP), which specifies appropriate decision making procedures and corresponding responsibilities. The CLP has been benchmarked against the “Principles for Sound Liquidity Risk Management and Supervision” by the Basel Committee on Banking Supervision (September 2008). The CLP is subject to ad-hoc updates and is presented to the Management Committee annually for approval.
Regular stress-testing analyses tailored to the specific business model of the EIB are executed as a part of the liquidity risk monitoring.
On 8 July 2009, the Bank became an eligible counterparty in the Eurosystem’s monetary policy operations, and therefore has been given access to the monetary policy operations of the European Central Bank. The Bank conducts the operations via the Central Bank of Luxembourg, where the Bank maintains deposits to cover the minimum reserve requirement.
56
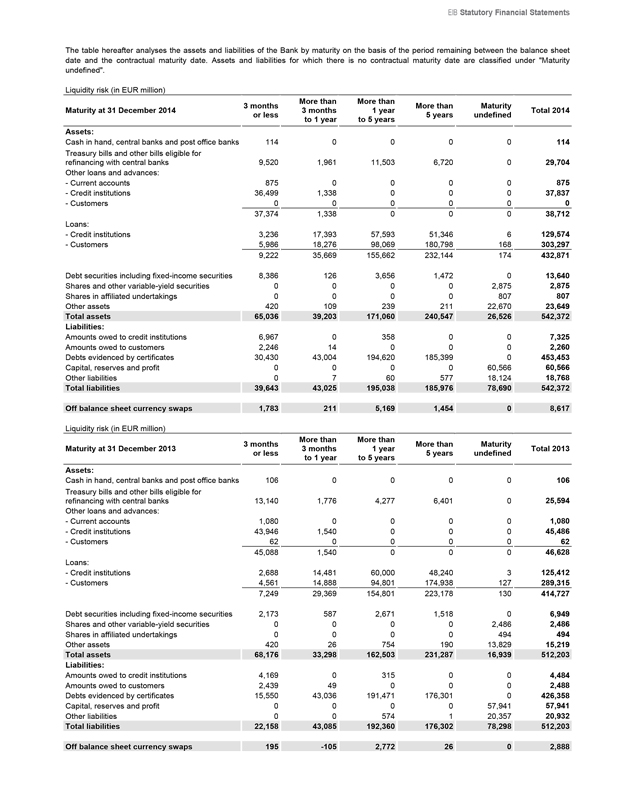
EIB Statutory Financial Statements
The table hereafter analyses the assets and liabilities of the Bank by maturity on the basis of the period remaining between the balance sheet date and the contractual maturity date. Assets and liabilities for which there is no contractual maturity date are classified under “Maturity undefined”.
Liquidity risk (in EUR million)
Maturity at 31 December 2014
3 months or less
More than 3 months to 1 year
More than 1 year to 5 years
More than 5 years
Maturity undefined
Total 2014
Assets:
Cash in hand, central banks and post office banks 114 0 0 0 0 114
Treasury bills and other bills eligible for refinancing with central banks 9,520 1,961 11,503 6,720 0 29,704
Other loans and advances:
- Current accounts 875 0 0 0 0 875
- Credit institutions 36,499 1,338 0 0 0 37,837
- Customers 0 0 0 0 0 0
37,374 1,338 0 0 0 38,712
Loans:
- Credit institutions 3,236 17,393 57,593 51,346 6 129,574
- Customers 5,986 18,276 98,069 180,798 168 303,297
9,222 35,669 155,662 232,144 174 432,871
Debt securities including fixed-income securities 8,386 126 3,656 1,472 0 13,640
Shares and other variable-yield securities 0 0 0 0 2,875 2,875
Shares in affiliated undertakings 0 0 0 0 807 807
Other assets 420 109 239 211 22,670 23,649
Total assets 65,036 39,203 171,060 240,547 26,526 542,372
Liabilities:
Amounts owed to credit institutions 6,967 0 358 0 0 7,325
Amounts owed to customers 2,246 14 0 0 0 2,260
Debts evidenced by certificates 30,430 43,004 194,620 185,399 0 453,453
Capital, reserves and profit 0 0 0 0 60,566 60,566
Other liabilities 0 7 60 577 18,124 18,768
Total liabilities 39,643 43,025 195,038 185,976 78,690 542,372
Off balance sheet currency swaps 1,783 211 5,169 1,454 0 8,617
Liquidity risk (in EUR million)
Maturity at 31 December 2013
3 months or less
More than 3 months to 1 year
More than 1 year to 5 years
More than 5 years
Maturity undefined
Total 2013
Assets:
Cash in hand, central banks and post office banks 106 0 0 0 0 106
Treasury bills and other bills eligible for refinancing with central banks 13,140 1,776 4,277 6,401 0 25,594
Other loans and advances:
- Current accounts 1,080 0 0 0 0 1,080
- Credit institutions 43,946 1,540 0 0 0 45,486
- Customers 62 0 0 0 0 62
45,088 1,540 0 0 0 46,628
Loans:
- Credit institutions 2,688 14,481 60,000 48,240 3 125,412
- Customers 4,561 14,888 94,801 174,938 127 289,315
7,249 29,369 154,801 223,178 130 414,727
Debt securities including fixed-income securities 2,173 587 2,671 1,518 0 6,949
Shares and other variable-yield securities 0 0 0 0 2,486 2,486
Shares in affiliated undertakings 0 0 0 0 494 494
Other assets 420 26 754 190 13,829 15,219
Total assets 68,176 33,298 162,503 231,287 16,939 512,203
Liabilities:
Amounts owed to credit institutions 4,169 0 315 0 0 4,484
Amounts owed to customers 2,439 49 0 0 0 2,488
Debts evidenced by certificates 15,550 43,036 191,471 176,301 0 426,358
Capital, reserves and profit 0 0 0 0 57,941 57,941
Other liabilities 0 0 574 1 20,357 20,932
Total liabilities 22,158 43,085 192,360 176,302 78,298 512,203
Off balance sheet currency swaps 195 -105 2,772 26 0 2,888
57
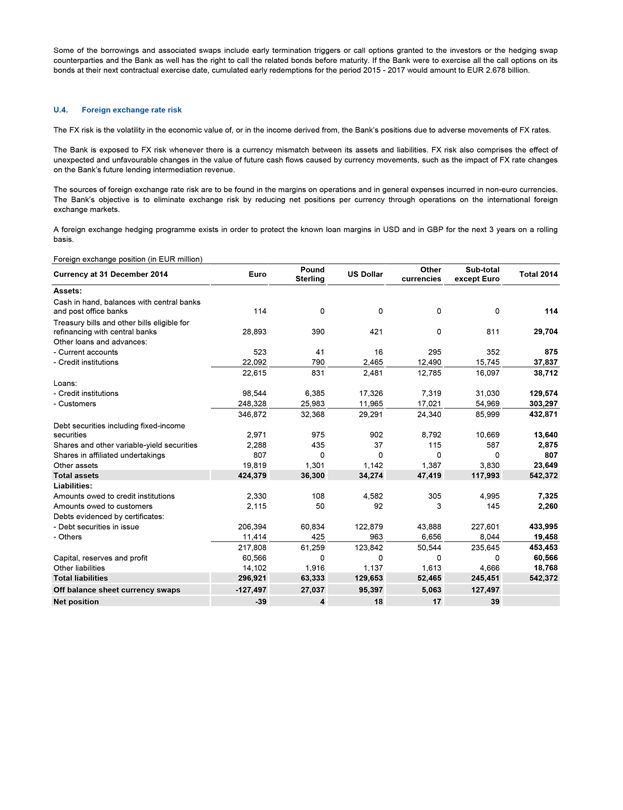
Some of the borrowings and associated swaps include early termination triggers or call options granted to the investors or the hedging swap counterparties and the Bank as well has the right to call the related bonds before maturity. If the Bank were to exercise all the call options on its bonds at their next contractual exercise date, cumulated early redemptions for the period 2015 - 2017 would amount to EUR 2.678 billion.
U.4. Foreign exchange rate risk
The FX risk is the volatility in the economic value of, or in the income derived from, the Bank’s positions due to adverse movements of FX rates.
The Bank is exposed to FX risk whenever there is a currency mismatch between its assets and liabilities. FX risk also comprises the effect of unexpected and unfavourable changes in the value of future cash flows caused by currency movements, such as the impact of FX rate changes on the Bank’s future lending intermediation revenue.
The sources of foreign exchange rate risk are to be found in the margins on operations and in general expenses incurred in non-euro currencies. The Bank’s objective is to eliminate exchange risk by reducing net positions per currency through operations on the international foreign exchange markets.
A foreign exchange hedging programme exists in order to protect the known loan margins in USD and in GBP for the next 3 years on a rolling basis.
Foreign exchange position (in EUR million)
Currency at 31 December 2014 Euro Pound Sterling US Dollar Other currencies Sub-total except Euro Total 2014
Assets:
Cash in hand, balances with central banks and post office banks 114 0 0 0 0 114
Treasury bills and other bills eligible for refinancing with central banks 28,893 390 421 0 811 29,704
Other loans and advances:
- Current accounts 523 41 16 295 352 875
- Credit institutions 22,092 790 2,465 12,490 15,745 37,837
22,615 831 2,481 12,785 16,097 38,712
Loans:
- Credit institutions 98,544 6,385 17,326 7,319 31,030 129,574
- Customers 248,328 25,983 11,965 17,021 54,969 303,297
346,872 32,368 29,291 24,340 85,999 432,871
Debt securities including fixed-income securities 2,971 975 902 8,792 10,669 13,640
Shares and other variable-yield securities 2,288 435 37 115 587 2,875
Shares in affiliated undertakings 807 0 0 0 0 807
Other assets 19,819 1,301 1,142 1,387 3,830 23,649
Total assets 424,379 36,300 34,274 47,419 117,993 542,372
Liabilities:
Amounts owed to credit institutions 2,330 108 4,582 305 4,995 7,325
Amounts owed to customers 2,115 50 92 3 145 2,260
Debts evidenced by certificates:
- Debt securities in issue 206,394 60,834 122,879 43,888 227,601 433,995
- Others 11,414 425 963 6,656 8,044 19,458
217,808 61,259 123,842 50,544 235,645 453,453
Capital, reserves and profit 60,566 0 0 0 0 60,566
Other liabilities 14,102 1,916 1,137 1,613 4,666 18,768
Total liabilities 296,921 63,333 129,653 52,465 245,451 542,372
Off balance sheet currency swaps -127,497 27,037 95,397 5,063 127,497
Net position -39 4 18 17 39
58
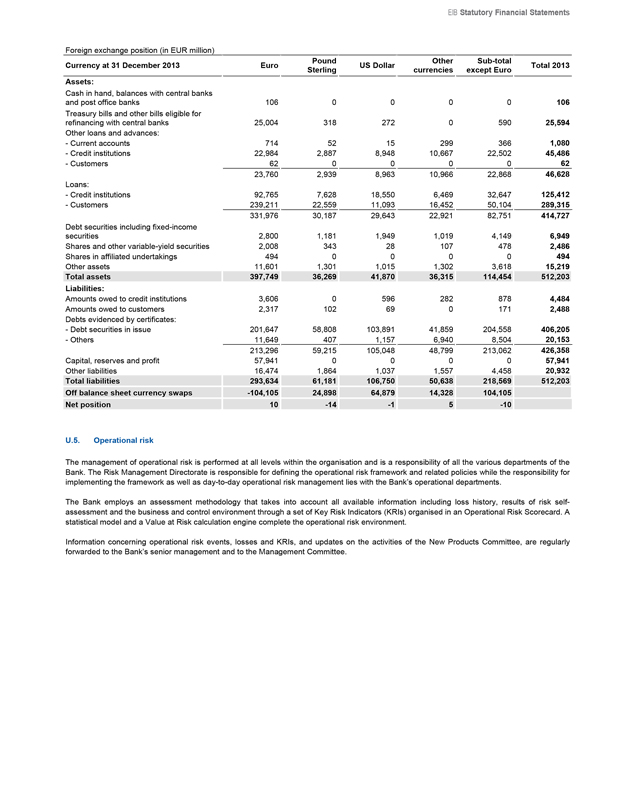
EIB Statutory Financial Statements
Foreign exchange position (in EUR million)
Currency at 31 December 2013 Euro Pound Sterling US Dollar Other currencies Sub-total except Euro Total 2013
Assets:
Cash in hand, balances with central banks and post office banks 106 0 0 0 0 106
Treasury bills and other bills eligible for refinancing with central banks 25,004 318 272 0 590 25,594
Other loans and advances:
- Current accounts 714 52 15 299 366 1,080
- Credit institutions 22,984 2,887 8,948 10,667 22,502 45,486
- Customers 62 0 0 0 0 62
23,760 2,939 8,963 10,966 22,868 46,628
Loans:
- Credit institutions 92,765 7,628 18,550 6,469 32,647 125,412
- Customers 239,211 22,559 11,093 16,452 50,104 289,315
331,976 30,187 29,643 22,921 82,751 414,727
Debt securities including fixed-income securities 2,800 1,181 1,949 1,019 4,149 6,949
Shares and other variable-yield securities 2,008 343 28 107 478 2,486
Shares in affiliated undertakings 494 0 0 0 0 494
Other assets 11,601 1,301 1,015 1,302 3,618 15,219
Total assets 397,749 36,269 41,870 36,315 114,454 512,203
Liabilities:
Amounts owed to credit institutions 3,606 0 596 282 878 4,484
Amounts owed to customers 2,317 102 69 0 171 2,488
Debts evidenced by certificates:
- Debt securities in issue 201,647 58,808 103,891 41,859 204,558 406,205
- Others 11,649 407 1,157 6,940 8,504 20,153
213,296 59,215 105,048 48,799 213,062 426,358
Capital, reserves and profit 57,941 0 0 0 0 57,941
Other liabilities 16,474 1,864 1,037 1,557 4,458 20,932
Total liabilities 293,634 61,181 106,750 50,638 218,569 512,203
Off balance sheet currency swaps -104,105 24,898 64,879 14,328 104,105
Net position 10 -14 -1 5 -10
U.5. Operational risk
The management of operational risk is performed at all levels within the organisation and is a responsibility of all the various departments of the Bank. The Risk Management Directorate is responsible for defining the operational risk framework and related policies while the responsibility for implementing the framework as well as day-to-day operational risk management lies with the Bank’s operational departments.
The Bank employs an assessment methodology that takes into account all available information including loss history, results of risk self-assessment and the business and control environment through a set of Key Risk Indicators (KRIs) organised in an Operational Risk Scorecard. A statistical model and a Value at Risk calculation engine complete the operational risk environment.
Information concerning operational risk events, losses and KRIs, and updates on the activities of the New Products Committee, are regularly forwarded to the Bank’s senior management and to the Management Committee.
59
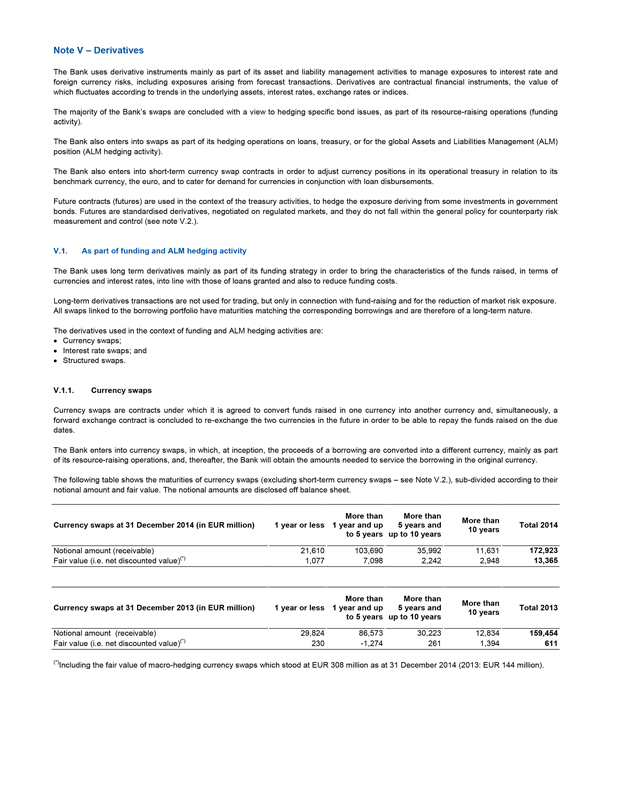
Note V – Derivatives
The Bank uses derivative instruments mainly as part of its asset and liability management activities to manage exposures to interest rate and foreign currency risks, including exposures arising from forecast transactions. Derivatives are contractual financial instruments, the value of which fluctuates according to trends in the underlying assets, interest rates, exchange rates or indices.
The majority of the Bank’s swaps are concluded with a view to hedging specific bond issues, as part of its resource-raising operations (funding activity).
The Bank also enters into swaps as part of its hedging operations on loans, treasury, or for the global Assets and Liabilities Management (ALM) position (ALM hedging activity).
The Bank also enters into short-term currency swap contracts in order to adjust currency positions in its operational treasury in relation to its benchmark currency, the euro, and to cater for demand for currencies in conjunction with loan disbursements.
Future contracts (futures) are used in the context of the treasury activities, to hedge the exposure deriving from some investments in government bonds. Futures are standardised derivatives, negotiated on regulated markets, and they do not fall within the general policy for counterparty risk measurement and control (see note V.2.).
V.1. As part of funding and ALM hedging activity
The Bank uses long term derivatives mainly as part of its funding strategy in order to bring the characteristics of the funds raised, in terms of currencies and interest rates, into line with those of loans granted and also to reduce funding costs.
Long-term derivatives transactions are not used for trading, but only in connection with fund-raising and for the reduction of market risk exposure.
All swaps linked to the borrowing portfolio have maturities matching the corresponding borrowings and are therefore of a long-term nature.
The derivatives used in the context of funding and ALM hedging activities are:
Currency swaps;
Interest rate swaps; and
Structured swaps.
V.1.1. Currency swaps
Currency swaps are contracts under which it is agreed to convert funds raised in one currency into another currency and, simultaneously, a forward exchange contract is concluded to re-exchange the two currencies in the future in order to be able to repay the funds raised on the due dates.
The Bank enters into currency swaps, in which, at inception, the proceeds of a borrowing are converted into a different currency, mainly as part of its resource-raising operations, and, thereafter, the Bank will obtain the amounts needed to service the borrowing in the original currency.
The following table shows the maturities of currency swaps (excluding short-term currency swaps – see Note V.2.), sub-divided according to their notional amount and fair value. The notional amounts are disclosed off balance sheet.
Currency swaps at 31 December 2014 (in EUR million) 1 year or less More than 1 year and up to 5 years More than 5 years and up to 10 years More than 10 years Total 2014
Notional amount (receivable) 21,610 103,690 35,992 11,631 172,923
Fair value (i.e. net discounted value)(*) 1,077 7,098 2,242 2,948 13,365
Currency swaps at 31 December 2013 (in EUR million) 1 year or less More than 1 year and up to 5 years More than 5 years and up to 10 years More than 10 years Total 2013
Notional amount (receivable) 29,824 86,573 30,223 12,834 159,454 Fair value (i.e. net discounted value)(*) 230 -1,274 261 1,394 611
(*)Including the fair value of macro-hedging currency swaps which stood at EUR 308 million as at 31 December 2014 (2013: EUR 144 million).
60
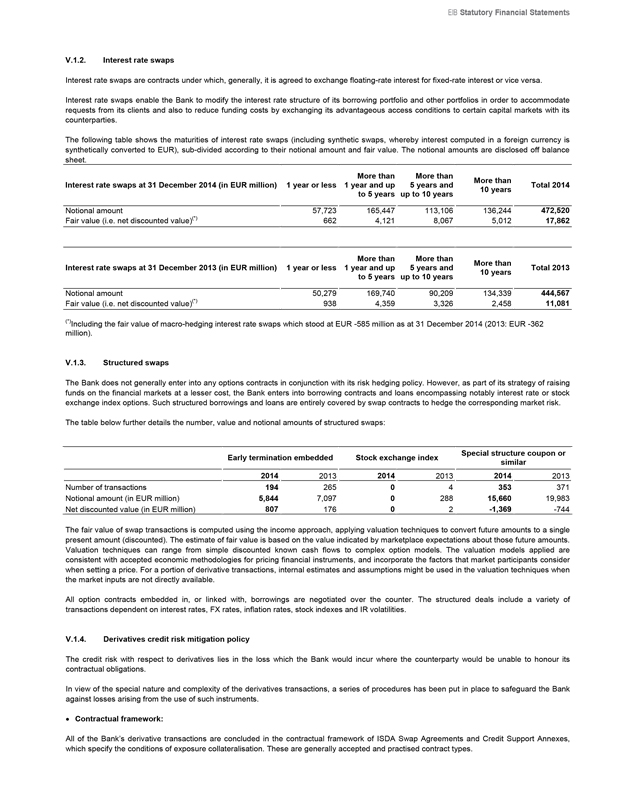
EIB Statutory Financial Statements
V.1.2. Interest rate swaps
Interest rate swaps are contracts under which, generally, it is agreed to exchange floating-rate interest for fixed-rate interest or vice versa.
Interest rate swaps enable the Bank to modify the interest rate structure of its borrowing portfolio and other portfolios in order to accommodate requests from its clients and also to reduce funding costs by exchanging its advantageous access conditions to certain capital markets with its counterparties.
The following table shows the maturities of interest rate swaps (including synthetic swaps, whereby interest computed in a foreign currency is synthetically converted to EUR), sub-divided according to their notional amount and fair value. The notional amounts are disclosed off balance sheet.
Interest rate swaps at 31 December 2014 (in EUR million) 1 year or less More than 1 year and up to 5 years More than 5 years and up to 10 years More than 10 years Total 2014
Notional amount 57,723 165,447 113,106 136,244 472,520
Fair value (i.e. net discounted value)(*) 662 4,121 8,067 5,012 17,862
Interest rate swaps at 31 December 2013 (in EUR million) 1 year or less More than 1 year and up to 5 years More than 5 years and up to 10 years More than 10 years Total 2013
Notional amount 50,279 169,740 90,209 134,339 444,567
Fair value (i.e. net discounted value)(*) 938 4,359 3,326 2,458 11,081
(*)Including the fair value of macro-hedging interest rate swaps which stood at EUR -585 million as at 31 December 2014 (2013: EUR -362 million).
V.1.3. Structured swaps
The Bank does not generally enter into any options contracts in conjunction with its risk hedging policy. However, as part of its strategy of raising funds on the financial markets at a lesser cost, the Bank enters into borrowing contracts and loans encompassing notably interest rate or stock exchange index options. Such structured borrowings and loans are entirely covered by swap contracts to hedge the corresponding market risk.
The table below further details the number, value and notional amounts of structured swaps:
Early termination embedded Stock exchange index Special structure coupon or similar
2014 2013 2014 2013 2014 2013
Number of transactions 194 265 0 4 353 371
Notional amount (in EUR million) 5,844 7,097 0 288 15,660 19,983
Net discounted value (in EUR million) 807 176 0 2 -1,369 -744
The fair value of swap transactions is computed using the income approach, applying valuation techniques to convert future amounts to a single present amount (discounted). The estimate of fair value is based on the value indicated by marketplace expectations about those future amounts. Valuation techniques can range from simple discounted known cash flows to complex option models. The valuation models applied are consistent with accepted economic methodologies for pricing financial instruments, and incorporate the factors that market participants consider when setting a price. For a portion of derivative transactions, internal estimates and assumptions might be used in the valuation techniques when the market inputs are not directly available.
All option contracts embedded in, or linked with, borrowings are negotiated over the counter. The structured deals include a variety of transactions dependent on interest rates, FX rates, inflation rates, stock indexes and IR volatilities.
V.1.4. Derivatives credit risk mitigation policy
The credit risk with respect to derivatives lies in the loss which the Bank would incur where the counterparty would be unable to honour its contractual obligations.
In view of the special nature and complexity of the derivatives transactions, a series of procedures has been put in place to safeguard the Bank against losses arising from the use of such instruments.
Contractual framework:
All of the Bank’s derivative transactions are concluded in the contractual framework of ISDA Swap Agreements and Credit Support Annexes, which specify the conditions of exposure collateralisation. These are generally accepted and practised contract types.
61
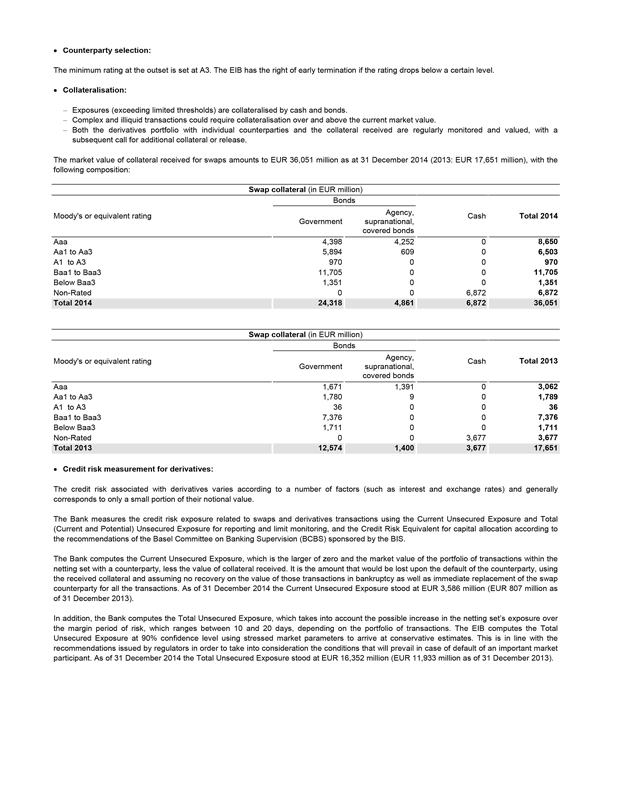
Counterparty selection:
The minimum rating at the outset is set at A3. The EIB has the right of early termination if the rating drops below a certain level.
Collateralisation:
Exposures (exceeding limited thresholds) are collateralised by cash and bonds.
Complex and illiquid transactions could require collateralisation over and above the current market value.
- Both the derivatives portfolio with individual counterparties and the collateral received are regularly monitored and valued, with a subsequent call for additional collateral or release.
The market value of collateral received for swaps amounts to EUR 36,051 million as at 31 December 2014 (2013: EUR 17,651 million), with the following composition:
Swap collateral (in EUR million)
Bonds
Moody’s or equivalent rating Government Agency, supranational, covered bonds Cash Total 2014
Aaa 4,398 4,252 0 8,650
Aa1 to Aa3 5,894 609 0 6,503
A1 to A3 970 0 0 970
Baa1 to Baa3 11,705 0 0 11,705
Below Baa3 1,351 0 0 1,351
Non-Rated 0 0 6,872 6,872
Total 2014 24,318 4,861 6,872 36,051
Swap collateral (in EUR million)
Bonds
Moody’s or equivalent rating Government Agency, supranational, covered bonds Cash Total 2013
Aaa 1,671 1,391 0 3,062
Aa1 to Aa3 1,780 9 0 1,789
A1 to A3 36 0 0 36
Baa1 to Baa3 7,376 0 0 7,376
Below Baa3 1,711 0 0 1,711
Non-Rated 0 0 3,677 3,677
Total 2013 12,574 1,400 3,677 17,651
Credit risk measurement for derivatives:
The credit risk associated with derivatives varies according to a number of factors (such as interest and exchange rates) and generally corresponds to only a small portion of their notional value.
The Bank measures the credit risk exposure related to swaps and derivatives transactions using the Current Unsecured Exposure and Total (Current and Potential) Unsecured Exposure for reporting and limit monitoring, and the Credit Risk Equivalent for capital allocation according to the recommendations of the Basel Committee on Banking Supervision (BCBS) sponsored by the BIS.
The Bank computes the Current Unsecured Exposure, which is the larger of zero and the market value of the portfolio of transactions within the netting set with a counterparty, less the value of collateral received. It is the amount that would be lost upon the default of the counterparty, using the received collateral and assuming no recovery on the value of those transactions in bankruptcy as well as immediate replacement of the swap counterparty for all the transactions. As of 31 December 2014 the Current Unsecured Exposure stood at EUR 3,586 million (EUR 807 million as of 31 December 2013).
In addition, the Bank computes the Total Unsecured Exposure, which takes into account the possible increase in the netting set’s exposure over the margin period of risk, which ranges between 10 and 20 days, depending on the portfolio of transactions. The EIB computes the Total Unsecured Exposure at 90% confidence level using stressed market parameters to arrive at conservative estimates. This is in line with the recommendations issued by regulators in order to take into consideration the conditions that will prevail in case of default of an important market participant. As of 31 December 2014 the Total Unsecured Exposure stood at EUR 16,352 million (EUR 11,933 million as of 31 December 2013).
62
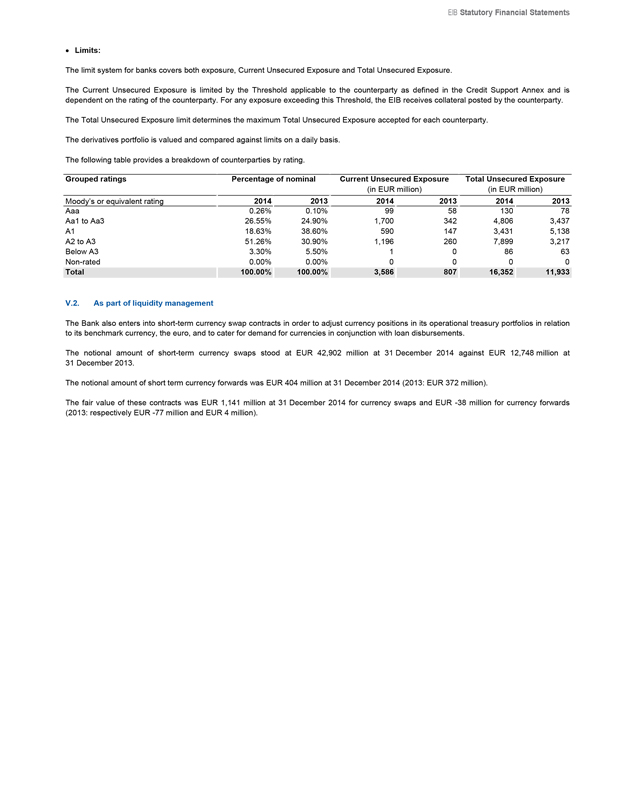
EIB Statutory Financial Statements
Limits:
The limit system for banks covers both exposure, Current Unsecured Exposure and Total Unsecured Exposure.
The Current Unsecured Exposure is limited by the Threshold applicable to the counterparty as defined in the Credit Support Annex and is dependent on the rating of the counterparty. For any exposure exceeding this Threshold, the EIB receives collateral posted by the counterparty.
The Total Unsecured Exposure limit determines the maximum Total Unsecured Exposure accepted for each counterparty.
The derivatives portfolio is valued and compared against limits on a daily basis.
The following table provides a breakdown of counterparties by rating.
Grouped ratings Percentage of nominal Current Unsecured Exposure Total Unsecured Exposure
(in EUR million) (in EUR million)
Moody’s or equivalent rating 2014 2013 2014 2013 2014 2013
Aaa 0.26% 0.10% 99 58 130 78
Aa1 to Aa3 26.55% 24.90% 1,700 342 4,806 3,437
A1 18.63% 38.60% 590 147 3,431 5,138
A2 to A3 51.26% 30.90% 1,196 260 7,899 3,217
Below A3 3.30% 5.50% 1 0 86 63
Non-rated 0.00% 0.00% 0 0 0 0
Total 100.00% 100.00% 3,586 807 16,352 11,933
V.2. As part of liquidity management
The Bank also enters into short-term currency swap contracts in order to adjust currency positions in its operational treasury portfolios in relation to its benchmark currency, the euro, and to cater for demand for currencies in conjunction with loan disbursements.
The notional amount of short-term currency swaps stood at EUR 42,902 million at 31 December 2014 against EUR 12,748 million at 31 December 2013.
The notional amount of short term currency forwards was EUR 404 million at 31 December 2014 (2013: EUR 372 million).
The fair value of these contracts was EUR 1,141 million at 31 December 2014 for currency swaps and EUR -38 million for currency forwards (2013: respectively EUR -77 million and EUR 4 million).
63
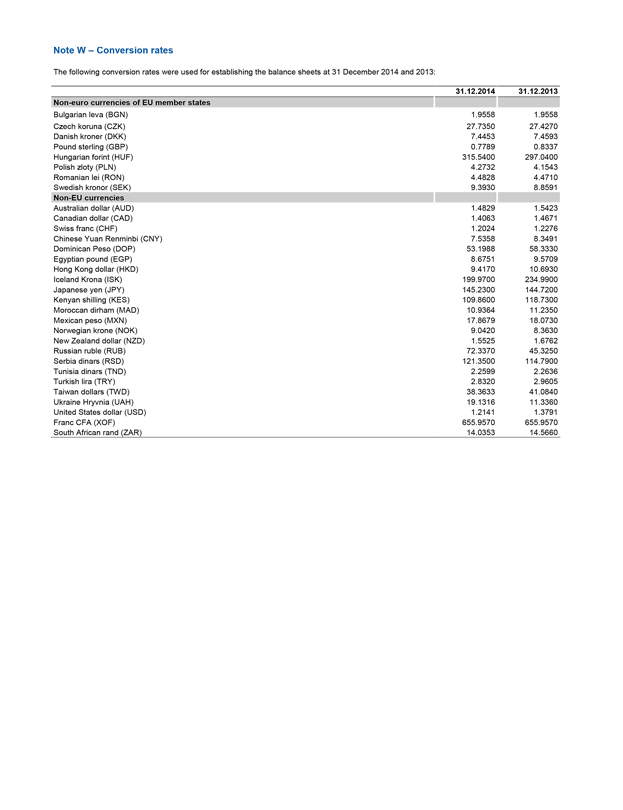
Note W – Conversion rates
The following conversion rates were used for establishing the balance sheets at 31 December 2014 and 2013:
31.12.2014
31.12.2013
Non-euro currencies of EU member states
Bulgarian leva (BGN) 1.9558 1.9558
Czech koruna (CZK) 27.7350 27.4270
Danish kroner (DKK) 7.4453 7.4593
Pound sterling (GBP) 0.7789 0.8337
Hungarian forint (HUF) 315.5400 297.0400
Polish zloty (PLN) 4.2732 4.1543
Romanian lei (RON) 4.4828 4.4710
Swedish kronor (SEK) 9.3930 8.8591
Non-EU currencies
Australian dollar (AUD) 1.4829 1.5423
Canadian dollar (CAD) 1.4063 1.4671
Swiss franc (CHF) 1.2024 1.2276
Chinese Yuan Renminbi (CNY) 7.5358 8.3491
Dominican Peso (DOP) 53.1988 58.3330
Egyptian pound (EGP) 8.6751 9.5709
Hong Kong dollar (HKD) 9.4170 10.6930
Iceland Krona (ISK) 199.9700 234.9900
Japanese yen (JPY) 145.2300 144.7200
Kenyan shilling (KES) 109.8600 118.7300
Moroccan dirham (MAD) 10.9364 11.2350
Mexican peso (MXN) 17.8679 18.0730
Norwegian krone (NOK) 9.0420 8.3630
New Zealand dollar (NZD) 1.5525 1.6762
Russian ruble (RUB) 72.3370 45.3250
Serbia dinars (RSD) 121.3500 114.7900
Tunisia dinars (TND) 2.2599 2.2636
Turkish lira (TRY) 2.8320 2.9605
Taiwan dollars (TWD) 38.3633 41.0840
Ukraine Hryvnia (UAH) 19.1316 11.3360
United States dollar (USD) 1.2141 1.3791
Franc CFA (XOF) 655.9570 655.9570
South African rand (ZAR) 14.0353 14.5660
64
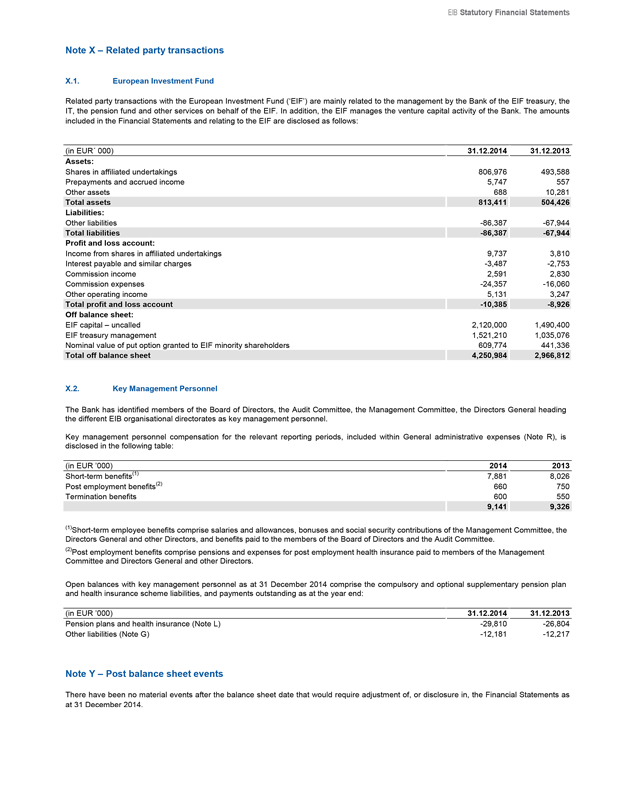
EIB Statutory Financial Statements
Note X – Related party transactions
X.1. European Investment Fund
Related party transactions with the European Investment Fund (‘EIF’) are mainly related to the management by the Bank of the EIF treasury, the IT, the pension fund and other services on behalf of the EIF. In addition, the EIF manages the venture capital activity of the Bank. The amounts included in the Financial Statements and relating to the EIF are disclosed as follows:
(in EUR´ 000) 31.12.2014 31.12.2013
Assets:
Shares in affiliated undertakings 806,976 493,588
Prepayments and accrued income 5,747 557
Other assets 688 10,281
Total assets 813,411 504,426
Liabilities:
Other liabilities -86,387 -67,944
Total liabilities -86,387 -67,944
Profit and loss account:
Income from shares in affiliated undertakings 9,737 3,810
Interest payable and similar charges -3,487 -2,753
Commission income 2,591 2,830
Commission expenses -24,357 -16,060
Other operating income 5,131 3,247
Total profit and loss account -10,385 -8,926
Off balance sheet:
EIF capital – uncalled 2,120,000 1,490,400
EIF treasury management 1,521,210 1,035,076
Nominal value of put option granted to EIF minority shareholders 609,774 441,336
Total off balance sheet 4,250,984 2,966,812
X.2. Key Management Personnel
The Bank has identified members of the Board of Directors, the Audit Committee, the Management Committee, the Directors General heading the different EIB organisational directorates as key management personnel.
Key management personnel compensation for the relevant reporting periods, included within General administrative expenses (Note R), is disclosed in the following table:
(in EUR ’000) 2014 2013
Short-term benefits(1) 7,881 8,026
Post employment benefits(2) 660 750
Termination benefits 600 550
9,141 9,326
(1)Short-term employee benefits comprise salaries and allowances, bonuses and social security contributions of the Management Committee, the Directors General and other Directors, and benefits paid to the members of the Board of Directors and the Audit Committee.
(2)Post employment benefits comprise pensions and expenses for post employment health insurance paid to members of the Management Committee and Directors General and other Directors.
Open balances with key management personnel as at 31 December 2014 comprise the compulsory and optional supplementary pension plan and health insurance scheme liabilities, and payments outstanding as at the year end:
(in EUR ’000) 31.12.2014 31.12.2013
Pension plans and health insurance (Note L) -29,810 -26,804
Other liabilities (Note G) -12,181 -12,217
Note Y – Post balance sheet events
There have been no material events after the balance sheet date that would require adjustment of, or disclosure in, the Financial Statements as at 31 December 2014.
65
Note Z – Management of third party funds
Z.1. Investment Facility – Cotonou
The Investment Facility, which is managed by the EIB, has been established within the framework of the Cotonou Agreement on cooperation and development of the African, Caribbean and Pacific Group of States and the European Union and its Member States on 23 June 2000 and subsequently revised. The EIB prepares separate financial statements for the Investment Facility.
Z.2. Guarantee Fund
The Guarantee Fund for External Actions was set up in 1994 to cover defaults on loans and loan guarantees granted to non-Member States or for projects in non-Member States. The European Commission (‘EC’) entrusted financial management of the Guarantee Fund to the EIB under an agreement signed between the two parties in November 1994. The EIB prepares separate financial statements for the Guarantee Fund.
Z.3. NER300
The EIB supports the EC as an agent in the implementation of the NER 300 initiative - a funding programme for carbon capture and storage demonstration projects and innovative renewable energy technologies. The EIB prepares separate financial statements for NER300.
Z.4. JESSICA (Contribution and Holding Funds)
JESSICA (The Joint European Support for Sustainable Investment in City Area) is an initiative developed by the EC and the EIB, in collaboration with the Council of Europe Development Bank.
Under new procedures, Managing Authorities are being given the option of using some of their EU grant funding to make repayable investments in projects forming part of an integrated plan for sustainable urban development. These investments are delivered to projects via Urban Development Funds or if required Holding Funds (JESSICA Holding Funds).
JESSICA Holding Funds are used in the context of the JESSICA initiative. As manager, EIB gathers the funding received from the Managing Authorities and invests it in Urban Development Funds, according to investment guidelines agreed with the donors. The EIB prepares separate financial statements for JESSICA.
Z.5. EIF treasury
The EIF treasury is managed by the Bank in accordance with the treasury management agreement signed between the two parties in December 2000.
Z.6. Risk-Sharing Finance Facility (‘RSFF’)
The RSFF has been established within the framework of the Co-operation Agreement, entered into force on 5 June 2007 between the EC on behalf of the European Union and the EIB. The RSFF aims at fostering investment in research, technological development and demonstration, and innovation. As part of the RSFF, the EIF set up the Risk Sharing Instrument for Innovative and Research oriented SMEs and small Mid-Caps (‘RSI’). The RSI provides guarantees to banks and leasing companies for loans and financial leases to research-based small and medium-sized enterprises (SMEs) and small Mid-Caps. The EIB prepares separate financial statements for the RSFF.
Z.7. EU-Africa Infrastructure Trust Fund (the ‘Trust Fund’)
The Trust Fund has been created within the framework of the Trust Fund Agreement between the EC on behalf of the European Union as the Founding Donor and the EIB as Manager, also open to Member States of the European Union which subsequently accede to this agreement as Donors. On 9 February 2006, the EC and the EIB signed a Memorandum of Understanding to promote jointly the EU-Africa Infrastructure Partnership and, in particular, to establish a supporting EU-Africa Infrastructure Trust Fund. The EIB prepares separate financial statements for the Trust Fund.
Z.8. Special Section
The Special Section was set up by the Board of Governors on 27 May 1963. Under a decision taken on 4 August 1977, its purpose was redefined as being that of recording financing operations carried out by the EIB for the account of and under mandate from third parties. It includes the FED, MED/FEMIP, IPA (Instrument for Pre-Accession), Turkey mandates and the guarantee component of the European Development Finance Institutions Private Sector Development Facility.
Z.9. InnovFin
The InnovFin or “InnovFin-EU Finance for Innovators” is a joint initiative between the EIB, the EIF and the European Commission under the new EU research programme for 2014-2020 “Horizon 2020”. On 11 December 2013, Regulation (EU) N 1291/2013 of the European Parliament and
66
EIB Statutory Financial Statements
the Council establishing Horizon 2020 – the Framework Programme for Research and Innovation (2014-2020) and repealing Decision N 1982/2006/EC (“Horizon 2020 Regulation”) was adopted. On 12 June 2014 the European Commission, the EIB and the EIF signed a Delegation Agreement establishing the financial instrument InnovFin. InnovFin consists of a series of integrated and complementary financing tools and advisory services offered by the EIB Group, covering the entire value chain of research and innovation (R&I) in order to support investments from the smallest to the largest enterprise. The EIB prepares separate financial statements for the InnovFin.
Z.10. GF Greece
The Fund is a joint initiative between the Hellenic Republic, the EC and the EIB and was set up to support the lending to SMEs in Greece. Established by using unabsorbed Structural Funds for Greece, the Fund will guarantee EIB loans to SMEs via partner banks in Greece. The EIB prepares separate financial statements for the GF Greece.
Z.11. Loan Guarantee Instrument for Ten-T Projects (’LGTT’)
The LGTT has been established within the framework of the Co-operation Agreement, entered into force on 11 January 2008 between the EC on behalf of the European Union and the EIB. The LGTT aims at facilitating a greater private sector involvement in the financing of Trans-European transport networks infrastructure. The EIB prepares separate financial statements for the LGTT.
Z.12. European Neighbourhood and Partnership Instrument (‘ENPI’)
The Framework Agreement between the European Union and the EIB on the implementation of operations financed from the general budget of the European Union in the countries covered by the European Neighbourhood Policy is channelled through the ENPI. The EIB prepares separate financial statements for ENPI.
Z.13. Project Bond Initiative (‘PBI’)
A Cooperation Agreement between the EC and the EIB in respect of the Project Bond Instrument: Pilot Phase was signed in November 2012. The PBI is designed to stimulate capital market financing for infrastructure delivered under ‘project finance’ structures, including Public Private Partnerships (PPPs). The initiative will seek to enhance the credit rating of bonds issued by project companies to a rating level that is attractive for investors and to lower the project’s overall financing costs. The EIB prepares separate financial statements for the PBI.
Z.14. AECID
This partnership agreement signed between the Kingdom of Spain (the Spanish Agency for International Development Cooperation (AECID)) and the EIB was set up to invest in operations in the countries covered by the FEMIP together with Mauritania (the “Southern Mediterranean region”), targeting mainly risk capital activities for micro and small/medium enterprises as well as engaging in the wider development of the private sector in the region.
Z.15. Neighbourhood Investment Facility (‘NIF’) Trust Fund
The NIF Trust Fund managed by the EIB was set up to achieve the strategic objective of the European Neighbourhood Partnership Instrument through targeted funding aimed at strengthening infrastructure interconnection between the EU and its neighbours in the areas of Transport and Energy, at addressing common environmental concerns and at supporting other relevant activities. The EIB prepares separate financial statements for the NIF Trust Fund.
Z.16. Heavily Indebted Poor Countries (‘HIPC’) Initiative
The HIPC Initiative (the ‘Initiative’) is an international debt relief mechanism that provides special assistance to the world’s poorest countries. It was launched in 1996 following a proposal from the World Bank and the International Monetary Fund. The principal objective of the Initiative is to reduce the debt burden of poor countries to sustainable levels. The EIB prepares separate financial statements for the Initiative.
Z.17. FEMIP Trust Fund
The FEMIP (Facility for Euro-Mediterranean Investment and Partnership)Trust Fund, which is also managed by the EIB, was set up to enhance the existing activities of the EIB in the Mediterranean Partner Countries, with the support of a number of donor countries and with a view of directing resources to operations in certain priority sectors through the provision of technical assistance and risk capital. The EIB prepares separate financial statements for the FEMIP Trust Fund.
Z.18. EPTA Trust Fund
EPTA (The Eastern Partnership Technical Assistance) Trust Fund is focused on increasing the quality and development impact of EIB Eastern Partnership operations by offering a multi-purpose, multi-sector funding facility for technical assistance. It will be complementary to the Neighbourhood Investment Facility. The EIB prepares separate financial statements for EPTA Trust Fund.
67

Z.19. Private Finance for Energy Efficiency (‘PF4EE’) Instrument
The Private Finance for Energy Efficiency (PF4EE) instrument is a joint agreement between the EIB and the European Commission with aims to address the limited access to adequate and affordable commercial financing for energy efficiency investments. The instrument targets projects which support the implementation of National Energy Efficiency Action Plans or other energy efficiency programmes of EU Member States. In December 2014 the European Commission and the EIB signed a Delegation Agreement establishing the financial Instrument PF4EE.
Z.20. Research and Innovation Advisory (‘RDI Advisory’)
RDI Advisory was set up in partnership with the European Commission under a 7 year framework agreement signed in June 2014, as part of the InnovFin programme under Horizon 2020. It has two main lines of activity: (i) upstream project related advisory and (ii) horizontal activities destined to improve the overall framework conditions for RDI investments as well as the financing tools under Horizon 2020.
Z.21. Financial Instrument (‘fi’) compass advisory platform
The fi-compass advisory platform provides EU Member States and their managing authorities as well as microcredit providers with advisory support and learning opportunities for developing financial instruments, within the scope of European Structural Investment Funds (ESIF) and the Programme for Employment and Social Innovation (EaSI). It is implemented by the EIB and funded by the EC under a Framework Contract for the period 2014-2020.
Z.22. JASPERS
JASPERS (Joint Assistance to Support Projects in European Regions) provides advice to the 13 countries that joined the European Union in 2004, 2007 and 2013 (Bulgaria, Croatia, Cyprus, Czech Republic, Estonia, Hungary, Latvia, Lithuania, Malta, Poland, Romania, Slovak and Slovenia) as well as to Greece, the former Yugoslav Republic of Macedonia, Montenegro and Serbia during project preparation, to help improve the quality of the major projects to be submitted for grant financing under the Structural and Cohesion Funds.
Z.23. FP7 Guarantee Fund
The 7th Framework Programme (‘FP7’) is designed to support research, technological development and demonstration projects all over Europe. The rules and principles for the management of the FP7 are laid out in the Agreement between the EC on behalf of the European Atomic Energy Community and the EIB. The EC entrusted financial management of the FP7 Guarantee Fund to the EIB under an agreement signed between the two parties in December 2007. The EIB prepared separate financial statements for FP7 Guarantee Fund until 2013 and the FP7 Guarantee Fund was transferred back to the European Commission in 2014.
Z.24. ECHA
On 1 April 2011 the EIB entered into an asset management agreement with the European Chemicals Agency (ECHA). Under this agreement the EIB manages the investment portfolio of ECHA in accordance with the pre-agreed Asset Management Guidelines. The EIB prepares separate financial statements for ECHA.
68
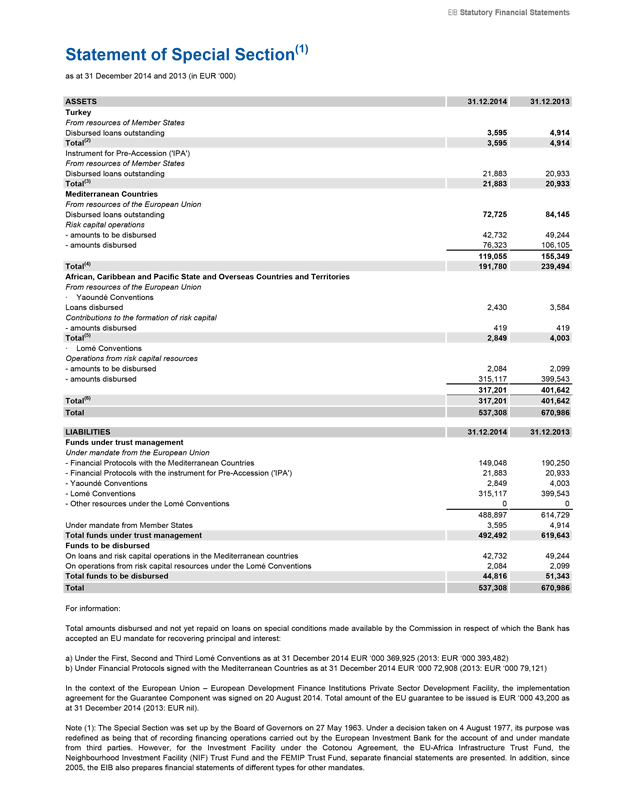
EIB Statutory Financial Statements
Statement of Special Section(1)
as at 31 December 2014 and 2013 (in EUR ‘000)
ASSETS 31.12.2014 31.12.2013
Turkey
From resources of Member States
Disbursed loans outstanding 3,595 4,914
Total(2) 3,595 4,914
Instrument for Pre-Accession (‘IPA’)
From resources of Member States
Disbursed loans outstanding 21,883 20,933
Total(3) 21,883 20,933
Mediterranean Countries
From resources of the European Union
Disbursed loans outstanding 72,725 84,145
Risk capital operations
- amounts to be disbursed 42,732 49,244
- amounts disbursed 76,323 106,105
119,055 155,349
Total(4) 191,780 239,494
African, Caribbean and Pacific State and Overseas Countries and Territories
From resources of the European Union
· Yaoundé Conventions
Loans disbursed 2,430 3,584
Contributions to the formation of risk capital
- amounts disbursed 419 419
Total(5) 2,849 4,003
· Lomé Conventions
Operations from risk capital resources
- amounts to be disbursed 2,084 2,099
- amounts disbursed 315,117 399,543
317,201 401,642
Total(6) 317,201 401,642
Total 537,308 670,986
LIABILITIES
31.12.2014 31.12.2013
Funds under trust management
Under mandate from the European Union
- Financial Protocols with the Mediterranean Countries 149,048 190,250
- Financial Protocols with the instrument for Pre-Accession (‘IPA’) 21,883 20,933
- Yaoundé Conventions 2,849 4,003
- Lomé Conventions 315,117 399,543
- Other resources under the Lomé Conventions 0 0
488,897 614,729
Under mandate from Member States 3,595 4,914
Total funds under trust management 492,492 619,643
Funds to be disbursed
On loans and risk capital operations in the Mediterranean countries 42,732 49,244
On operations from risk capital resources under the Lomé Conventions 2,084 2,099
Total funds to be disbursed 44,816 51,343
Total 537,308 670,986
For information:
Total amounts disbursed and not yet repaid on loans on special conditions made available by the Commission in respect of which the Bank has accepted an EU mandate for recovering principal and interest:
a) Under the First, Second and Third Lomé Conventions as at 31 December 2014 EUR ‘000 369,925 (2013: EUR ‘000 393,482) b) Under Financial Protocols signed with the Mediterranean Countries as at 31 December 2014 EUR ‘000 72,908 (2013: EUR ‘000 79,121)
In the context of the European Union – European Development Finance Institutions Private Sector Development Facility, the implementation agreement for the Guarantee Component was signed on 20 August 2014. Total amount of the EU guarantee to be issued is EUR ‘000 43,200 as at 31 December 2014 (2013: EUR nil).
Note (1): The Special Section was set up by the Board of Governors on 27 May 1963. Under a decision taken on 4 August 1977, its purpose was redefined as being that of recording financing operations carried out by the European Investment Bank for the account of and under mandate from third parties. However, for the Investment Facility under the Cotonou Agreement, the EU-Africa Infrastructure Trust Fund, the Neighbourhood Investment Facility (NIF) Trust Fund and the FEMIP Trust Fund, separate financial statements are presented. In addition, since 2005, the EIB also prepares financial statements of different types for other mandates.
69
The Statement of Special Section reflects amounts disbursed or to be disbursed, less cancellations and repayments, under mandate from the European Union and the Member States. Amounts disbursed and to be disbursed and funds received and to be received are carried at nominal value. No account is taken in the Statement of Special Section of provisions or value adjustments, which may be required to cover risks associated with such operations except for definite write-offs. Amounts in foreign currency are translated at exchange rates prevailing on 31 December.
Note (2): Initial amount of contracts signed for financing projects in Turkey under mandate, for the account and at the risk of Member States.
Initial amount: 405,899 add: exchange adjustments 20,514 less: cancellations repayments 215 422,603 -422,818 3,595
Note (3): Initial amount of contracts signed for financing projects under the Instrument for Pre-Accession, for the account and at the risk of the European Union.
Initial amount: 29,640 less: exchange adjustments 7,757 cancellations repayments 0 0 -7,757 21,883
Note (4): Initial amount of contracts signed for financing projects in the Maghreb and Mashreq countries, Malta, Cyprus, Turkey and Greece (EUR 10 million lent prior to accession to the EC on 1 January 1981) under mandate, for the account and at the risk of the European Union.
Initial amount: 840,457 less: exchange adjustments 51,048 cancellations repayments 130,445 467,184 -648,677 191,780
Note (5): Initial amount of contracts signed for financing projects in the Associated African States, Madagascar and Mauritius and the Overseas Countries, Territories and Departments (AASMM-OCTD) under mandate, for the account and at the risk of the European Union.
Loans on special conditions 139,483 Contributions to the formation of risk capital 2,503 Initial amount: 141,986 add: capitalised interest 1,178 exchange adjustments 9,823 11,001 less: cancellations repayments 3,310 146,828 -150,138 2,849
Note (6): Initial amount of contracts signed for financing projects in the African, Caribbean and Pacific States and the Overseas Countries and Territories (ACP-OCT) under mandate, for the account and at the risk of the European Union:
Loans from risk capital resources: Conditional and subordinated loans 3,116,097 Equity participations 121,002 Initial amount: 3,237,099 add: capitalised interest 9,548 less: cancellations repayments 714,753 2,158,410 exchange adjustments 56,283 -2,929,446 317,201 Loans from other resources: Initial amount: 16,500 add: exchange adjustments 58 less: cancellations repayments 8,414 8,144 -16,558 0 317,201
70
EIB
Statutory Financial Statements
Independent Auditor’s Report
To the Chairman of the Audit Committee of EUROPEAN INVESTMENT BANK
98-100, Boulevard Konrad Adenauer
L-2950 LUXEMBOURG
REPORT OF THE REVISEUR D’ENTREPRISES AGREE
We have audited the accompanying financial statements of EUROPEAN INVESTMENT BANK, which comprise the balance sheet as at 31 December 2014, the profit and loss account and the cash flow statement for the year then ended, and a summary of significant accounting policies and other explanatory information.
Management’s responsibility for the financial statements
The Management is responsible for the preparation and fair presentation of these financial statements in accordance with the general principles of the Directive 86/635/EEC of the Council of the European Communities of 8 December 1986 on the annual accounts and consolidated accounts of banks and other financial institutions, as amended by Directive 2001/65/EC of 27 September 2001, by Directive 2003/51/EC of 18 June 2003 and by Directive 2006/46/EC of 14 June 2006 (the ‘Directives’), and for such internal control as the Management determines is necessary to enable the preparation of financial statements that are free from material misstatement, whether due to fraud or error.
Responsibility of the Réviseur d’Entreprises agréé
Our responsibility is to express an opinion on these financial statements based on our audit. We conducted our audit in accordance with International Standards on Auditing as adopted for Luxembourg by the Commission de Surveillance du Secteur Financier. Those standards require that we comply with ethical requirements and plan and perform the audit to obtain reasonable assurance
about whether the financial statements are free from material misstatement.
An audit involves performing procedures to obtain audit evidence about the amounts and disclosures in the financial statements. The procedures selected depend on the judgement of the Réviseur d’Entreprises agréé, including the assessment of the risks of material misstatement of the financial statements, whether due to fraud or error. In making those risk assessments, the Réviseur d’Entreprises agréé considers internal control relevant to the entity’s preparation and fair presentation of the financial statements in order to design audit procedures that are appropriate in the circumstances, but not for the purpose of expressing an opinion on the effectiveness of the entity’s internal control. An audit also includes evaluating the appropriateness of accounting policies used and the reasonableness of accounting estimates made by the Management, as well as evaluating the overall presentation of the financial statements.
We believe that the audit evidence we have obtained is sufficient and appropriate to provide a basis for our audit opinion.
Opinion
In our opinion, the financial statements give a true and fair view of the financial position of EUROPEAN INVESTMENT BANK as of 31 December 2014, and of the results of its operations and its cash flows for the year then ended in accordance with the general principles of the Directives.
Luxembourg, 12 March 2015
KPMG Luxembourg, Société coopérative
39, Avenue John F. Kennedy
L-1855 Luxembourg
Société coopérative de droit luxembourgeois
R.C.S. Luxembourg B 149133
Capital EUR 12 503
KPMG Luxembourg, Société coopérative
Cabinet de révision agréé
E. DOLLÉ
71
Statement by The Audit Committee
The Audit Committee reports to the Board of Governors, the following statement being communicated to the Governors prior to their approval of the Annual Report and the financial statements for the past financial year.
Statement by the Audit Committee on the Bank’s un-consolidated financial statements prepared in accordance with the general principles of the EU Directives
The Committee, instituted in pursuance of Article 12 of the Statute and Chapter V of the Rules of Procedure of the European Investment Bank for the purpose of verifying that the operations of the Bank are conducted and its books kept in a proper manner, having
designated KPMG as external auditors, reviewed their audit planning process, examined and discussed their reports,
noted that the opinion of KPMG on the unconsolidated financial statements of the European Investment Bank for the year ended 31 December 2014 prepared in accordance with the general principles of the EU
Directives is unqualified,
convened on a regular basis with the Heads of Directorates and relevant services including,
the Financial Controller,
the Directors General of Risk Management and Transaction Monitoring and Restructuring,
met regularly the Head of Internal Audit and discussed the relevant internal audit reports, and studied the documents which it deemed necessary to examine in the discharge of its duties,
received assurance from the Management Committee concerning the effectiveness of the internal control structure and internal administration,
and considering
the financial statements for the financial year ended 31 December 2014 as drawn up by the Board of Directors at its meeting on 12 March 2015,
that the foregoing provides a reasonable basis for its statement and,
Articles 24, 25 & 26 of the Rules of Procedure,
to the best of its knowledge and judgement:
confirms that the activities of the Bank are conducted in a proper manner, in particular with regard to risk management and monitoring;
has verified that the operations of the Bank have been conducted and its books kept in a proper manner and that, to this end, it has verified that the Bank’s operations have been carried out in compliance with the formalities and procedures laid down by the Statute and Rules of Procedure;
confirms that the financial statements, comprising the balance sheet, the profit and loss account and the cash flow statement and a summary of significant accounting policies and other explanatory information give a true and fair view of the financial position of the Bank as at 31 December 2014 in respect of its assets and liabilities, and of the results of its operations and cash flows for the year then ended, in accordance with the general principles of EU Directives.
Luxembourg, 12 March 2015
The Audit Committee
M. MATEJ
J.N. SCHAUS
M. ÜÜRIKE
D. PITTA FERRAZ
B. JAKOBSEN
J. SUTHERLAND
72
EIB Group
Consolidated Financial Statements under EU Directives
EIB Group
Consolidated Financial
Statements under
EU Directives
as at 31 December 2014
73
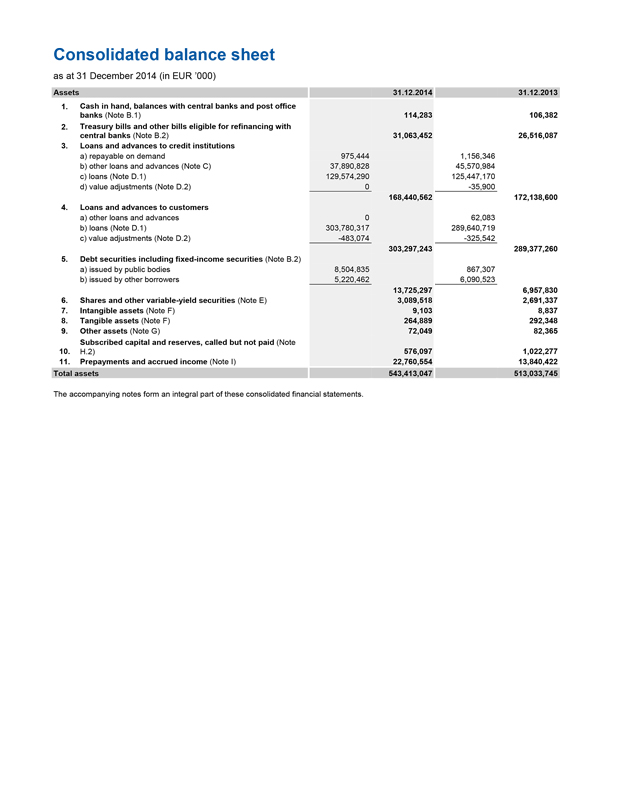
Consolidated balance sheet
as at 31 December 2014 (in EUR ’000)
Assets 31.12.2014 31.12.2013
1. Cash in hand, balances with central banks and post office banks (Note B.1) 114,283 106,382
2. Treasury bills and other bills eligible for refinancing with central banks (Note B.2) 31,063,452 26,516,087
3. Loans and advances to credit institutions a) repayable on demand 975,444 1,156,346 b) other loans and advances (Note C) 37,890,828 45,570,984 c) loans (Note D.1) 129,574,290 125,447,170 d) value adjustments (Note D.2)
0 -35,900 168,440,562 172,138,600
4. Loans and advances to customers a) other loans and advances 0 62,083
b) loans (Note D.1) 303,780,317 289,640,719 c) value adjustments (Note D.2) -483,074 -325,542 303,297,243 289,377,260
5. Debt securities including fixed-income securities (Note B.2) a) issued by public bodies 8,504,835 867,307
b) issued by other borrowers 5,220,462 6,090,523 13,725,297 6,957,830
6. Shares and other variable-yield securities (Note E) 3,089,518 2,691,337
7. Intangible assets (Note F) 9,103 8,837
8. Tangible assets (Note F) 264,889 292,348
9. Other assets (Note G) 72,049 82,365
Subscribed capital and reserves, called but not paid (Note
10. H.2) 576,097 1,022,277
11. Prepayments and accrued income (Note I) 22,760,554 13,840,422 Total assets 543,413,047 513,033,745
The accompanying notes form an integral part of these consolidated financial statements.
74
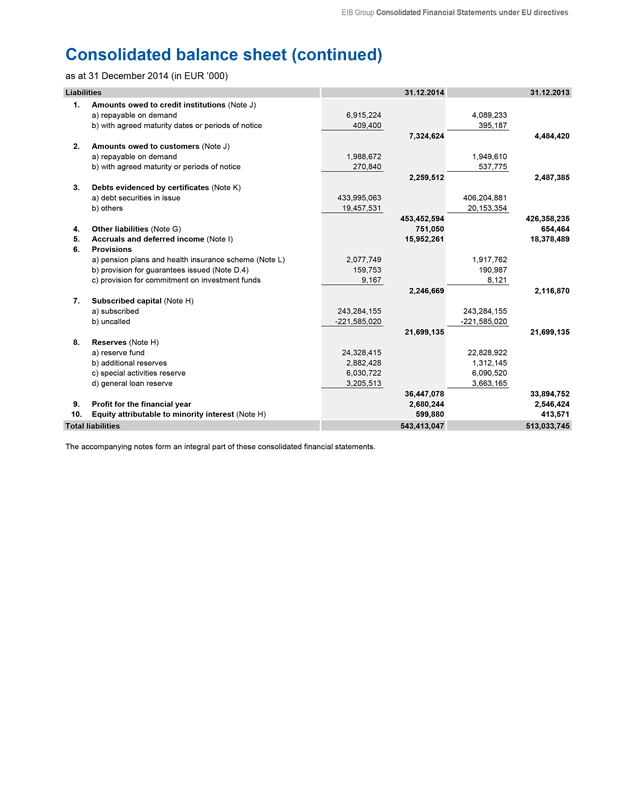
EIB Group Consolidated Financial Statements under EU directives
Consolidated balance sheet (continued)
as at 31 December 2014 (in EUR ’000)
Liabilities 31.12.2014 31.12.2013
1. Amounts owed to credit institutions (Note J) a) repayable on demand 6,915,224 4,089,233
b) with agreed maturity dates or periods of notice 409,400 395,187 7,324,624 4,484,420
2. Amounts owed to customers (Note J) a) repayable on demand 1,988,672 1,949,610
b) with agreed maturity or periods of notice 270,840 537,775 2,259,512 2,487,385
3. Debts evidenced by certificates (Note K) a) debt securities in issue 433,995,063 406,204,881
b) others 19,457,531 20,153,354 453,452,594 426,358,235
4. Other liabilities (Note G) 751,050 654,464
5. Accruals and deferred income (Note I) 15,952,261 18,378,489
6. Provisions a) pension plans and health insurance scheme (Note L) 2,077,749 1,917,762
b) provision for guarantees issued (Note D.4) 159,753 190,987
c) provision for commitment on investment funds 9,167 8,121 2,246,669 2,116,870
7. Subscribed capital (Note H) a) subscribed 243,284,155 243,284,155
b) uncalled -221,585,020 -221,585,020 21,699,135 21,699,135
8. Reserves (Note H) a) reserve fund 24,328,415 22,828,922
b) additional reserves 2,882,428 1,312,145
c) special activities reserve 6,030,722 6,090,520
d) general loan reserve 3,205,513 3,663,165 36,447,078 33,894,752
9. Profit for the financial year 2,680,244 2,546,424
10. Equity attributable to minority interest (Note H) 599,880 413,571
Total liabilities 543,413,047 513,033,745
The accompanying notes form an integral part of these consolidated financial statements.
75
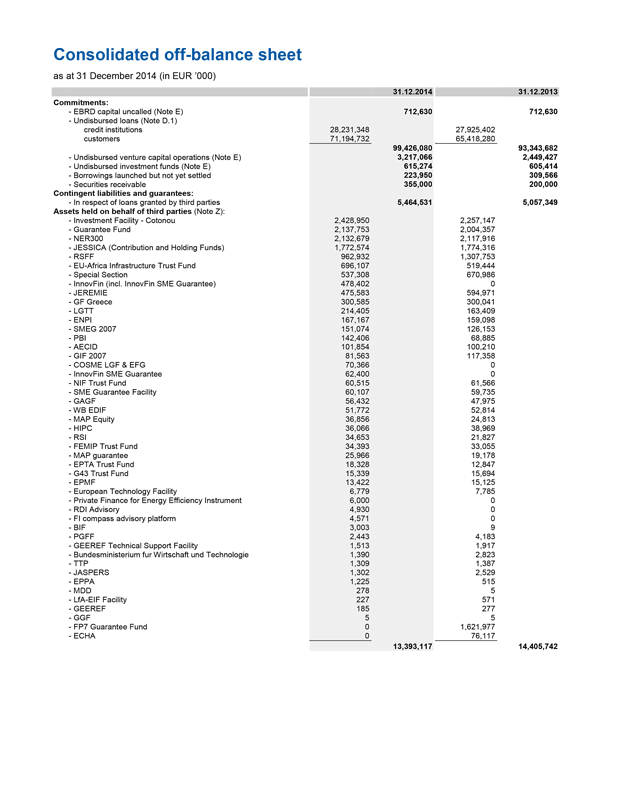
Consolidated off-balance sheet
as at 31 December 2014 (in EUR ’000)
31.12.2014 31.12.2013
Commitments:
- EBRD capital uncalled (Note E) 712,630 712,630
- Undisbursed loans (Note D.1) credit institutions customers 28,231,348 27,925,402
71,194,732 65,418,280
99,426,080 93,343,682
- Undisbursed venture capital operations (Note E) 3,217,066 2,449,427
- Undisbursed investment funds (Note E) 615,274 605,414
- Borrowings launched but not yet settled 223,950 309,566
- Securities receivable 355,000 200,000
Contingent liabilities and guarantees:
- In respect of loans granted by third parties 5,464,531 5,057,349
Assets held on behalf of third parties (Note Z):
- Investment Facility - Cotonou 2,428,950 2,257,147
- Guarantee Fund 2,137,753 2,004,357
- NER300 2,132,679 2,117,916
- JESSICA (Contribution and Holding Funds) 1,772,574 1,774,316
- RSFF 962,932 1,307,753
- EU-Africa Infrastructure Trust Fund 696,107 519,444
- Special Section 537,308 670,986
- InnovFin (incl. InnovFin SME Guarantee) 478,402 0
- JEREMIE 475,583 594,971
- GF Greece 300,585 300,041
- LGTT 214,405 163,409
- ENPI 167,167 159,098
- SMEG 2007 151,074 126,153
- PBI 142,406 68,885
- AECID 101,854 100,210
- GIF 2007 81,563 117,358
- COSME LGF & EFG 70,366 0
- InnovFin SME Guarantee 62,400 0
- NIF Trust Fund 60,515 61,566
- SME Guarantee Facility 60,107 59,735
- GAGF 56,432 47,975
- WB EDIF 51,772 52,814
- MAP Equity 36,856 24,813
- HIPC 36,066 38,969
- RSI 34,653 21,827
- FEMIP Trust Fund 34,393 33,055
- MAP guarantee 25,966 19,178
- EPTA Trust Fund 18,328 12,847
- G43 Trust Fund 15,339 15,694
- EPMF 13,422 15,125
- European Technology Facility 6,779 7,785
- Private Finance for Energy Efficiency Instrument 6,000 0
- RDI Advisory 4,930 0
- FI compass advisory platform 4,571 0
- BIF 3,003 9
- PGFF 2,443 4,183
- GEEREF Technical Support Facility 1,513 1,917
- Bundesministerium fur Wirtschaft und Technologie 1,390 2,823
- TTP 1,309 1,387
- JASPERS 1,302 2,529
- EPPA 1,225 515
- MDD 278 5
- LfA-EIF Facility 227 571
- GEEREF 185 277
- GGF 5 5
- FP7 Guarantee Fund 0 1,621,977
- ECHA 0 76,117
13,393,117 14,405,742
76
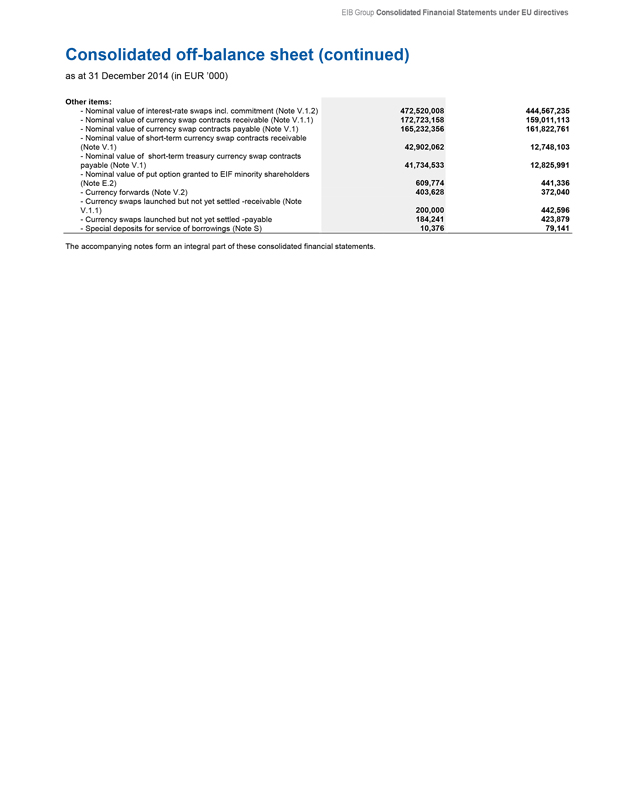
EIB Group Consolidated Financial Statements under EU directives
Consolidated off-balance sheet (continued)
as at 31 December 2014 (in EUR ’000)
Other items:
- Nominal value of interest-rate swaps incl. commitment (Note V.1.2) 472,520,008 444,567,235
- Nominal value of currency swap contracts receivable (Note V.1.1) 172,723,158 159,011,113
- Nominal value of currency swap contracts payable (Note V.1) 165,232,356 161,822,761
- Nominal value of short-term currency swap contracts receivable (Note V.1) 42,902,062 12,748,103
- Nominal value of short-term treasury currency swap contracts payable (Note V.1) 41,734,533 12,825,991
- Nominal value of put option granted to EIF minority shareholders (Note E.2) 609,774 441,336
- Currency forwards (Note V.2) 403,628 372,040
- Currency swaps launched but not yet settled -receivable (Note V.1.1) 200,000 442,596
- Currency swaps launched but not yet settled -payable 184,241 423,879
- Special deposits for service of borrowings (Note S) 10,376 79,141
The accompanying notes form an integral part of these consolidated financial statements.
77
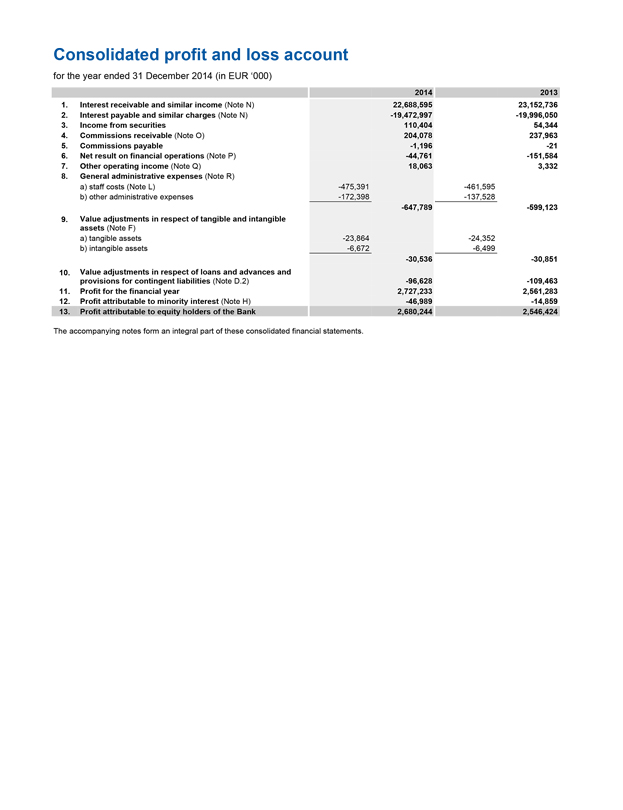
Consolidated profit and loss account
for the year ended 31 December 2014 (in EUR ‘000)
2014 2013
1. Interest receivable and similar income (Note N) 22,688,595 23,152,736
2. Interest payable and similar charges (Note N) -19,472,997 -19,996,050
3. Income from securities 110,404 54,344
4. Commissions receivable (Note O) 204,078 237,963
5. Commissions payable -1,196 -21
6. Net result on financial operations (Note P) -44,761 -151,584
7. Other operating income (Note Q) 18,063 3,332
8. General administrative expenses (Note R)
a) staff costs (Note L) -475,391 -461,595
b) other administrative expenses -172,398 -137,528
-647,789 -599,123
9. Value adjustments in respect of tangible and intangible assets (Note F)
a) tangible assets -23,864 -24,352
b) intangible assets -6,672 -6,499
-30,536 -30,851
10. Value adjustments in respect of loans and advances and provisions for contingent liabilities (Note D.2) -96,628 -109,463
11. Profit for the financial year 2,727,233 2,561,283
12. Profit attributable to minority interest (Note H) -46,989 -14,859
13. Profit attributable to equity holders of the Bank 2,680,244 2,546,424
The accompanying notes form an integral part of these consolidated financial statements.
78

EIB Group Consolidated Financial Statements under EU directives
Consolidated cash flow statement
for the year ended 31 December 2014 (in EUR ‘000)
2014 2013
A. Cash flows from operating activities:
Profit for the financial year 2,727,233 2,561,283
Adjustments for:
Change in value adjustments on loans and advances (Note D.2) 119,893 83,627
Change in provisions on pension plans and health insurance scheme 159,987 154,769
Change in provisions for commitment on investment funds and guarantees on venture capital operations -25,134 20,103
Value adjustments in respect of tangible and intangible assets 30,536 30,851
Value (re-)adjustments in respect of shares and other variable-yield securities -40,596 24,435
Held to maturity portfolio amortisation 26,379 12,290
Effect of exchange rate changes 273,580 -2,732,733
Profit on operating activities 3,271,878 154,625
Disbursements of loans and advances to credit institutions and customers -58,566,783 -52,915,750
Repayments of loans and advances to credit institutions and customers 45,238,126 33,990,545
Change in deposits with central banks -7,615 51,000
Change in treasury securities liquidity portfolios -3,682,638 198,571
Change in venture capital operations included in shares and other variable-yield securities -345,173 -187,308
Change in shares and other variable-yield securities excluding venture capital operations -12,412 -57,780
Change in amounts owed to credit institutions and customers 2,612,331 -7,419,070
Change in prepayments and accrued income 5,269,132 -1,783,382
Change in other assets 10,316 -9,260
Change in short term treasury derivative valuations 62,814 -6,126
Change in accruals and deferred income -2,811,809 2,262,100
Change in other liabilities 33,772 45,902
Net cash used in operating activities -8,928,061 -25,675,933
B. Cash flows from investing activities:
Securities in Long Term Hedge Portfolio purchased during the year -1,569,501 0
Securities from Long Term Hedge Portfolio matured during the year 207,082 261,000
Purchase of loan substitutes included in the debt securities portfolios -5,085,395 -2,045,921
Redemption of loan substitutes included in the debt securities portfolios 1,867,351 1,439,864
Purchase and disposal of tangible and intangible assets -3,343 -25,426
Net cash used in investing activities -4,583,806 -370,483
C. Cash flows from financing activities:
Issuance of debts evidenced by certificates 102,581,251 84,933,795
Redemption of debts evidenced by certificates -94,263,539 -69,500,489
Member States’ contribution 446,180 9,178,016
Net change in cash related to acquisitions and disposals of share in subsidiary undertakings 143,257 -56
Dividend paid to minority interest -5,923 -2,322
Net cash from financing activities 8,901,226 24,608,944
Summary statement of cash flows:
Cash and cash equivalents at beginning of financial year 60,475,846 60,518,141
Net cash from:
Operating activities -8,928,061 -25,675,933
Investing activities -4,583,806 -370,483
Financing activities 8,901,226 24,608,944
Effect of exchange rate changes on cash held -173,972 1,395,177
Cash and cash equivalents at end of financial year 55,691,233 60,475,846
Cash and cash equivalents are composed of:
Cash in hand, balances with central banks and post office banks, excluding deposits with Central Bank of Luxembourg to cover minimum reserve requirement (Note B.1) 410 124
Bills maturing within three months of issue (Note B.2: A1 portfolio) 18,162,126 15,288,392
Loans and advances to credit institutions:
Repayable on demand 975,444 1,156,346
Other loans and advances (Note C) 36,553,253 44,030,984
55,691,233 60,475,846
The accompanying notes form an integral part of these consolidated financial statements.
79
European Investment Bank Group
Notes to the consolidated financial statements
as at 31 December 2014
The European Investment Bank (the ‘Bank’ or ‘EIB’) was created by the Treaty of Rome in 1958 as the long term lending bank of the European Union (‘EU’). The task of the Bank is to contribute towards the integration, balanced development and economic and social cohesion of the EU Member States. The EIB raises substantial volumes of funds on the capital markets and lends these funds on favourable terms to projects furthering EU policy objectives. The EIB continuously adapts its activities to developments in EU policies.
The Bank has its registered office at 98-100, boulevard Konrad Adenauer, Luxembourg.
The European Investment Fund (the ‘Fund’ or ‘EIF’) was incorporated on 14 June 1994, in Luxembourg, as an international financial institution. The address of its registered office is 37 B, avenue J.F. Kennedy, L-2968 Luxembourg.
The primary task of the Fund, while providing adequate return on equity, is to contribute to the pursuit of European Union objectives through:
the provision of guarantees to financial institutions that cover credits to small and medium sized entities (‘SME’);
the acquisition, holding, managing and disposal of equity participations;
the administration of special resources entrusted by third parties; and
related activities.
The Bank holds 63.69% (2013: 62.10%) of the subscribed capital of the EIF. The Bank and the Fund together are defined as the ‘Group’.
Note A – Significant accounting policies
A.1. Accounting standards
The consolidated financial statements (the ‘Financial Statements’) of the European Investment Bank have been prepared in accordance with the general principles of the Directive 86/635/EEC of the Council of the European Communities of 8 December 1986 on the annual accounts and consolidated accounts of banks and other financial institutions, as amended by Directive 2001/65/EC of 27 September 2001, by Directive 2003/51/EC of 18 June 2003 and by Directive 2006/46/EC of 14 June 2006 on the annual and consolidated accounts of certain types of companies, banks and other financial institutions (the ‘Directives’). However, the Financial Statements do not include any management report. The Group prepares an Activity Report which is presented separately from the Financial Statements and its consistency with the Financial Statements is not audited.
On a proposal from the Management Committee, the Board of Directors adopted the Financial Statements on 12 March 2015 and authorised their submission to the Board of Governors for approval by 28 April 2015.
In preparing the Financial Statements, the Management Committee is required to make estimates and assumptions that affect reported income, expenses, assets, liabilities and disclosure of contingent assets and liabilities. Use of available information and application of judgement are inherent in the formation of estimates. Actual results in the future could differ from such estimates and the resulting differences may be material to the Financial Statements.
The Group also publishes consolidated financial statements, which have been prepared in accordance with International Financial Reporting Standards (IFRS), as endorsed by the European Union.
A.2. Foreign currency translation
The Group uses the euro (EUR) as the unit of measure for the capital accounts of Member States and for presenting its Financial Statements.
The Group conducts its operations in the currencies of its Member States, in euro and in non-EU currencies. Its resources are derived from its capital, borrowings and accumulated earnings in various currencies.
Foreign currency transactions are translated at the exchange rate prevailing on the date of the transaction. The Group’s monetary assets and liabilities denominated in currencies other than euro are translated into euro at closing exchange rates prevailing at the balance sheet date. The gain or loss arising from such translation is recorded in the profit and loss account.
A.3. Basis of consolidation
The Financial Statements comprise those of the European Investment Bank (the “Bank” or the “EIB”) and those of its subsidiary, the European Investment Fund (the “Fund” or the “EIF”). The financial statements of the Fund are prepared for the same reporting year as the Bank, using consistent accounting policies.
The Bank consolidates the financial statements of the EIF.
80

EIB Group Consolidated Financial Statements under EU directives
After aggregation of the balance sheets and the profit and loss accounts, all intra-group balances, transactions, income and expenses resulting from intra-group transactions are eliminated.
Minority interest represents the portion of profit or loss and net assets not owned, directly or indirectly, by the Bank. Assets held in an agency or fiduciary capacity are not assets of the Group and are reported in Note Z.
A.4. Derivatives
The Group uses derivative instruments, mainly currency and interest rate swaps, as part of its asset and liability management (‘ALM’) activities to manage exposures to interest rate and foreign currency risks, including exposures arising from forecast transactions. All derivatives transactions are booked at nominal as off-balance sheet items at the date of the transaction.
The majority of the Group’s swaps are concluded with a view to hedging specific bond issues. The Group enters into currency swaps, whereby the proceeds of a borrowing are initially converted into a different currency and on maturity the Group will obtain the amounts needed to service the borrowing in the original currency.
The Group also enters into currency, interest rate and overnight index swaps as part of its hedging operations on loans or for the global ALM position. The corresponding interest is accounted for on a pro rata temporis basis.
The Group also uses derivative instruments as part of its treasury operations.
A.4.1. Trading portfolio derivatives
Trading portfolio derivatives are recorded at market value in the balance sheet as Other assets when their market value is positive or Other liabilities when their market value is negative. Changes in the market value are included in Net result on financial operations. Market values are obtained from quoted market prices, discounted cash flow models and option pricing models, which consider current market and contractual prices for the underlying instrument, as well as time value of money, yield curve and volatility of the underlying.
Interest on derivative instruments is accrued pro rata temporis under Prepayments and accrued income or Accruals and deferred income.
Currency swaps
Currency swap contracts are entered into in order to adjust currency positions. The revaluation of the spot leg of a currency swap is neutralised in Accruals and deferred income or Prepayments and accrued income. The premium/discount between the spot and forward settlement amounts is amortised pro rata temporis through the profit and loss account in Interest receivable and similar income or Interest payable and similar charges. The market value is recorded under Other assets when their market value is positive or Other liabilities when their market value is negative. Changes in the market value are included in Net result on financial operations.
Interest rate swaps
The interest received and paid under interest rate swaps is accrued pro rata temporis and reported in the profit and loss account under Interest receivable and similar income or Interest payable and similar charges. The market value is recorded under Other assets when their market value is positive or Other liabilities when their market value is negative. Changes in the market value are included in Net result on financial operations.
A.4.2 All other derivatives
Currency swaps
Currency swap contracts are entered into in order to adjust currency positions. The revaluation of the spot leg of a currency swap is neutralised in Accruals and deferred income or Prepayments and accrued income. The forward leg of the currency swap is recorded off-balance sheet at settlement amount and is not revalued. The premium/discount between the spot and forward settlement amounts is amortised pro rata temporis through the profit and loss account in Interest receivable and similar income or Interest payable and similar charges.
Interest rate swaps
The hedging interest rate swaps are not revalued. The interest received and paid under interest rate swaps is accrued pro rata temporis and reported in the profit and loss account under Interest receivable and similar income or Interest payable and similar charges.
Currency forwards
Currency forwards are entered into in order to adjust future currency positions. The forward leg is recorded off-balance sheet at settlement amount and is not revalued. The difference between the spot amounts and the forward settlement amounts is amortised pro rata temporis through the profit and loss account in Interest receivable and similar income or Interest payable and similar charges.
Interest on derivative instruments is accrued pro rata temporis under Prepayments and accrued income or Accruals and deferred income.
A.5. Financial assets
Financial assets are accounted for using the settlement date basis.
81
A.6. Cash and cash equivalents
The Group defines cash and cash equivalents as short term, highly liquid securities and interest-earning deposits with maturities of 90 days or less.
A.7. Treasury bills and other bills eligible for refinancing with central banks and debt securities including fixed-income securities
The Bank changed its debt securities portfolio structure during 2014, in order to reduce the portfolio complexity and optimise allocation of liquid assets. As a result, three new portfolios were created (Securities liquidity portfolios P1 and P2, classified as held for trading, and long term hedge portfolio, classified as held to maturity) and five former portfolios are phased out (Operational bond portfolio A2, B1, B3 and B4 and the investment portfolio).
A.7.1. Group long term hedge portfolio (formerly Group investment portfolio)
The Group long term hedge portfolio contains securities of the Bank’s long term hedge portfolio and the EIF investment portfolio, and consists of securities purchased with the intention of holding them to maturity. These securities are issued or guaranteed by:
Governments of the European Union Member States, G10 countries and their agencies;
Supranational public institutions, including multinational development banks.
These securities are initially recorded at purchase price or more exceptionally at transfer price. Value adjustments are accounted for, if these are other than temporary. The difference between entry price and redemption value is accounted for pro rata temporis over the life of the securities.
All the securities remaining in the former Investment portfolio were transferred into the newly created Long term hedge portfolio, where they will continue to be held until final maturity.
A.7.2. Operational portfolios
A.7.2.1 Current operational portfolio structure
Operational money market portfolio A1 and Unitary Fund (UF)
In order to maintain an adequate level of liquidity, the Bank purchases money market products with a maximum maturity of 3 months, in particular Treasury bills and negotiable debt securities issued by public bodies and credit institutions. The securities in the A1 portfolio are held until their final maturity and presented in the Financial Statements at amortised cost. Value adjustments are accounted for, if these are other than temporary.
The UF portfolio includes securities with maturities of up to 12 months which are available for sale.
Bonds are initially recorded at acquisition cost and presented in the Financial Statements at market value. Changes in market value are recorded under Net result on financial operations in the profit and loss account.
Securities liquidity portfolios P1 and P2 and Operational portfolio EIF
The P1 ‘fixed rate’ and P2 ‘floating rate’ portfolios comprise bonds issued or guaranteed by national governments, supranational institutions, financial institutions and corporations. Securities in these portfolios are initially recorded at acquisition cost and presented in the Financial Statements at market value. Changes in market value are recorded under Net result on financial operations in the profit and loss account.
The Operational portfolio EIF comprises listed securities with a maximum residual maturity of 10 years.
These securities are classified in the available for sale category and are presented in the Financial Statements at market value. Changes in market value are recorded under Net result on financial operations in the profit and loss account.
The market value of treasury portfolios is based on published price quotations in an active market as the first source. For instruments without available published price quotations, the market values are determined by obtaining quotes from market participants and/or by using valuation techniques or models, based whenever possible on observable market data prevailing at the balance sheet date.
A.7.2.2 Former operational portfolio structure
Operational bond portfolios A2, B1, B3 and B4
The A2 portfolio included securities with maturities of up to 18 months which were available for sale. Bonds were initially recorded at acquisition cost and presented in the Financial Statements at market value. Changes in market value were recorded under Net result on financial operations in the profit and loss account. The difference between the acquisition cost and redemption amount was amortised pro rata temporis as Interest receivable and similar income.
The B1 ‘Credit Spread’ portfolio comprised floating-rate and fixed-rate bonds issued or guaranteed by national governments, supranational institutions, financial institutions and corporations. These securities were available for sale.
Bonds were initially recorded at acquisition cost and presented in the Financial Statements at market value. Changes in market value were recorded under Net result on financial operations in the profit and loss account. The difference between the acquisition cost and redemption amount was amortised pro rata temporis as Interest receivable and similar income.
82
EIB Group Consolidated Financial Statements under EU directives
The B3 ‘Global Fixed Income’ portfolio comprised listed securities with a maximum residual maturity of 10 years, issued and/or guaranteed by sovereigns, their agencies or by financial institutions. Securities held in this portfolio were marked to market value in the balance sheet; the corresponding changes in market value were recorded under Net result on financial operations in the profit and loss account.
The B4 ‘Inflation Linked Investment’ portfolio comprised listed securities with a maximum residual maturity of 30 years, issued by EU Governments. Securities held in this portfolio were marked to market value in the balance sheet; the corresponding changes in market value were recorded under Net result on financial operations in the profit and loss account.
No change has occurred in the treatment of A1 portfolio and Operational portfolio EIF.
A.7.3. Loan substitutes
This portfolio mainly consists of obligations in the form of bonds, notes or certificates issued by Special Purpose Vehicles (SPV), trust vehicles or financial institutions. These securities are classified as held to maturity and initially recorded at purchase price and valued at amortised cost. The difference between purchase price and redemption value is accounted for pro rata temporis over the life of the securities. Value adjustments are accounted for, if these are other than temporary.
A.8. Loans and advances to credit institutions and customers
A.8.1. Loans and advances
Loans and advances are included in the assets of the Group at their net disbursed amounts. Value adjustments have been made for loans and advances outstanding at the end of the financial year and presenting risks of non-recovery of all or part of their amounts. Such value adjustments are held in the same currency as the assets to which they relate. Value adjustments are accounted for in the profit and loss account as ‘Value adjustments in respect of loans and advances’ and are deducted from the appropriate asset items on the balance sheet.
A.8.2. Interest on loans
Interest on loans are recorded in the profit and loss account on an accruals basis, i.e. over the life of the loans. On the balance sheet, accrued interest is included in ‘Prepayments and accrued income’ under assets. Value adjustments to interest amounts on these loans are determined on a case-by-case basis by the Group’s Management and deducted from the appropriate asset item on the balance sheet.
A.8.3. Reverse repurchase operations (reverse repos)
Under a tripartite reverse repo, a custodian/clearing agency arranges for custody, clearing and settlement of the transactions between the Bank and a third party. The custodians/clearing agencies operate under standardised global master purchase agreements and provide for delivery against payment systems, substitution of securities, automatic marking to market, reporting and daily transaction administration.
Reverse repos are carried at the amounts of cash advanced and are entered on the balance sheet under Loans and advances to credit institutions - b) other loans and advances. Interest on reverse repos is accrued pro rata temporis.
A.8.4. Interest subsidies
Interest subsidies received in advance (see Note I) are deferred and recognised in the profit and loss account over the period from disbursement to repayment of the subsidised loan.
A.9. Shares and other variable-yield securities
The Group acquires shares and other variable-yield securities when it enters into venture capital operations, infrastructure funds or investment funds. Shares and other variable-yield securities are initially recorded at acquisition cost. Their carrying value is adjusted to the lower of cost or market value at subsequent measurement at the balance sheet date.
Investments in venture capital enterprises, infrastructure funds and investment funds represent shares and other variable-yield securities acquired for the longer term in the normal course of the Group’s activities. They are initially recorded at their original purchase cost. Based on the reports received from fund managers, the portfolios of investments are valued on a line-by-line basis at the lower of cost or attributable net asset value (‘NAV’), thus excluding any attributable unrealised gain that may be prevailing in the portfolio. The attributable NAV is determined through applying either the Group’s percentage ownership in the underlying vehicle to the NAV reflected in the most recent report or, to the extent available, the value per share at the same date, submitted by the respective Fund Manager. The attributable NAV is adjusted for events having occurred between the date of the latest available NAV and the balance sheet date to the extent that such adjustment is considered to be material. Unrealised losses due solely to administrative expenses and management fees of venture capital, infrastructure funds and investment funds in existence for less than two years at the balance sheet date are not taken into consideration in determining the attributable NAV.
A.10. Tangible assets
Tangible assets include land, Group-occupied properties, other machines and equipment.
83
Land is stated at acquisition cost and buildings are stated at acquisition cost less accumulated depreciation. The value of the Group’s headquarters building in Luxembourg-Kirchberg and its building in Luxembourg-Weimershof are depreciated on a straight-line basis as set out below.
Permanent equipment, fixtures and fittings, furniture, office equipment and vehicles have been recorded in the balance sheet at their acquisition cost, less accumulated depreciation.
Depreciation is calculated on a straight-line basis over the estimated life of each item purchased, as set out below:
Buildings in Kirchberg and Weimershof: 30 years
Permanent equipment, fixtures and fittings: 10 years
Furniture: 5 years
Office equipment and vehicles: 3 years
A.11. Intangible assets
Intangible assets comprise internally developed computer software. Software development costs are capitalised if they meet certain criteria relating to identifiability, to the probability that future economic benefits will flow to the enterprise and to the reliability of cost measurement.
Internally developed software meeting these criteria is carried at cost less accumulated amortisation calculated on a straight-line basis over three years from completion.
A.12. Pension plans and health insurance scheme
A.12.1. Pension plans for staff
The Group operates defined benefit pension plans to provide retirement benefits to substantially its entire staff.
The Bank’s main pension scheme is a defined benefit pension scheme funded by contributions from staff and from the Bank which covers all employees. All contributions of the Bank and its staff are invested in the assets of the Bank.
Commitments for retirement benefits are valued at least every year using the projected unit credit method, in order to ensure that the provision entered in the accounts is adequate. The latest valuation was carried out as at 30 September 2014 and was updated as at 31 December 2014 with an extrapolation (roll forward method) for the last three months of 2014. The main assumptions used by the actuary are set out in Note L.
The main pension scheme of the EIF is a defined benefit scheme funded by contributions from staff and from the EIF which covers all employees. The scheme entered into force in March 2003, replacing the previous defined contribution scheme.
Cumulative prior year actuarial deficits and surpluses in excess of 10% of the commitments for retirement benefits are recognised over the expected average remaining service lives of the plan’s participants on a straight line basis.
A.12.2. Health insurance scheme
The Group has set up its own health insurance scheme for the benefit of staff, financed by contributions from the Group and its employees. The health insurance scheme is managed and accounted for under the same principles as the pension plan for staff described in Note A.12.1. The latest valuation was carried out as at 30 September 2014 and was updated as at 31 December 2014 with an extrapolation (roll forward method) for the last three months of 2014.
A.12.3. The Management Committee pension plan
The Management Committee pension plan is a defined benefit pension scheme funded by contributions from the Group only which covers all Management Committee members. All contributions of the Group are invested in the assets of the Group. The Management Committee pension plan is managed and accounted for under the same principles as the pension plan for staff described in Note A.12.1.
A.12.4. Optional Supplementary provident scheme
The optional supplementary provident scheme is a defined contribution pension scheme, funded by voluntary staff’s contributions and employer’s contributions. The corresponding liability is recorded in Other liabilities.
A.13. Amounts owed to credit institutions and customers
Amounts owed to credit institutions and customers are presented in the financial statements at their redemption amounts. Interest on amounts owed to credit institutions and customers is recorded in the profit and loss account on an accruals basis as Interest payable and similar charges. Accrued interest is included in Accruals and deferred income under liabilities.
84

EIB Group Consolidated Financial Statements under EU directives
A.14. Debts evidenced by certificates
Debts evidenced by certificates are presented at their redemption amounts, except for zero coupon bonds which are presented at their amortised cost. Transaction costs and premiums/ discounts are amortised in the profit and loss account on a straight line basis over the life of the debt through Accruals and deferred income or Prepayments and accrued income. Interest expense on debt instruments is included in Interest payable and similar charges in the consolidated profit and loss account.
A.15. Provision for guarantees issued and for commitment on investment funds
A.15.1. Provision for guarantees issued
This provision is intended to cover risks inherent in the Group’s activity of issuing guarantees in favour of financial intermediaries or issued in respect of loans granted by third parties. A provision for guarantees issued is established if there is objective evidence that the Group will have to incur a loss in respect of a given guarantee granted.
A.15.2. Provision for commitment on investment funds
This provision is intended to cover risks inherent in the Group’s commitment on investment funds signed but not yet disbursed.
A.16. Reserves
A.16.1. Reserve fund
As foreseen by Article 22.1 of the Statute, “a reserve fund of up to 10% of the subscribed capital shall be built up progressively” from the retained profit of the Bank.
A.16.2. Additional reserves
Additional reserves contain the remaining retained earnings of the Group.
A.16.3. Special activities reserve
As foreseen by Article 16.5 of the Statute, “the special activities of the Bank […] will have a specific allocation of reserve”. The reserve is based on the capital allocation of each operation.
A.16.4. General loan reserve
In 2009 a “general loan reserve” was introduced for the expected loss of the Bank’s loan and guarantee portfolio, modelled upon the Group’s policy guidelines.
A.17. Prepayments and accrued income
Expenditure incurred during the financial year but relating to a subsequent financial year, together with any income for which payment is not due until the expiry of the underlying instrument.
A.18. Accruals and deferred income
Income received before the balance sheet date but relating to a subsequent financial year, together with any charges which, though relating to the financial year in question, will be paid only in the course of a subsequent financial year.
A.19. Interest receivable and similar income
Revenues on loans are mainly composed of interest revenue, commitment fees, front-end fees and prepayment indemnities.
Prepayment indemnities are recognised in the profit and loss when received, as the revenue is earned.
From 1 January 2014, commitment fees are classified under “Interest receivable and similar income” while those fees were previously classified under “Commission receivable”. See note A.21.
The Group changed the accounting policy applied on front-end fees from 1 January 2014. Those front-end fees are now deferred and recognised under “Interest receivable and similar income” in the profit and loss account over the life of the underlying loan. Front-end fees were previously recognised in the P&L under “Commission receivable” when received. See note A.21.
85
In addition to revenue on loans, the ‘Interest receivable and similar income’ includes also interest revenue from the securities portfolio and derivatives.
A.20. Dividend income
Dividends are recognised in the profit and loss account when the entity’s right to receive payment is established.
A.21. Reclassification of prior year figures
Certain prior year figures have been reclassified to conform with the current year’s presentation. The reclassifications principally relate to:
Commitment fees and Front-end fees on loans:
- From: Commissions receivable EUR‘000 119,634
- To: Interest receivable and similar income EUR‘000 119,634
Loan instalments receivable:
- From: Other assets EUR‘000 129,713
- To: Loans and advances to credit institutions c) loans EUR’000 2,691 / Loans and advances to customers b) loans EUR‘000 127,022
A.22. Taxation
The Protocol on the privileges and Immunities of the European Union appended to the treaty on European Union and the treaty on the functioning of the European Union, stipulates that the assets, revenues, and other property of the Institutions of the Union are exempt from all direct taxes.
Note B - Cash in hand, balances with central banks and post office banks and debt securities portfolio (in EUR ‘000)
B.1. Cash in hand, balances with central banks and post office banks
The cash in hand and balances with central banks and post office banks equal to EUR ’000 114,283 at 31 December 2014 (2013: EUR ‘000 106,382).
EIB is an eligible counterparty in the Eurosystem’s monetary policy operations, and therefore has been given access to the monetary policy operations of the European Central Bank. The Bank conducts the operations via the Central Bank of Luxembourg, where the Bank maintains a deposit to cover the minimum reserve requirement. The balance of this deposit amounts to EUR ‘000 113,873 as at 31 December 2014 (2013: EUR ‘000 106,258).
B.2. Debt securities portfolio
The Group changed its debt securities portfolio structure during 2014. The debt securities portfolio is now composed of the Group long term hedge portfolio, the operational money market portfolios A1 and UF, the securities liquidity portfolios P1 and P2, the operational EIF portfolio and the loan substitutes portfolio. Previously, the Group’s debt securities portfolio was composed of the Group investment portfolio, the operational money market portfolios A1 and A2, the operational bond portfolios B1 ‘Credit Spread’, B3 ‘Global Fixed Income’, B4 ‘Inflation Linked Investment’, the Operational EIF portfolio and the loan substitutes portfolio.
The details of these portfolios and their classification as at 31 December 2014 and 2013 are as follows:
31.12.2014 31.12.2013
Treasury bills and other bills eligible for refinancing with central banks
31,063,452 26,516,087
Debt securities including fixed-income securities
13,725,297 6,957,830
Total debt securities(*) 44,788,749 33,473,917
(*)of which EUR ‘000 12,217,269 unlisted in 2014 and EUR ‘000 6,005,052 in 2013.
86
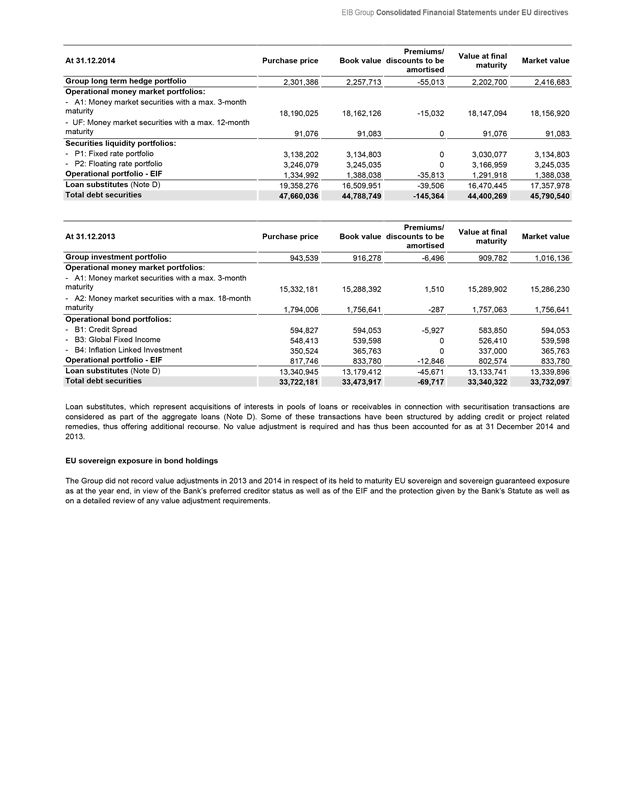
EIB Group Consolidated Financial Statements under EU directives
At 31.12.2014 Purchase price Book value Premiums/discounts to be amortised Value at final maturity Market value
Group long term hedge portfolio 2,301,386 2,257,713 -55,013 2,202,700 2,416,683
Operational money market portfolios:
- A1: Money market securities with a max. 3-month maturity 18,190,025 18,162,126 -15,032 18,147,094 18,156,920
- UF: Money market securities with a max. 12-month maturity 91,076 91,083 0 91,076 91,083
Securities liquidity portfolios:
- P1: Fixed rate portfolio 3,138,202 3,134,803 0 3,030,077 3,134,803
- P2: Floating rate portfolio 3,246,079 3,245,035 0 3,166,959 3,245,035
Operational portfolio - EIF 1,334,992 1,388,038 -35,813 1,291,918 1,388,038
Loan substitutes (Note D) 19,358,276 16,509,951 -39,506 16,470,445 17,357,978
Total debt securities 47,660,036 44,788,749 -145,364 44,400,269 45,790,540
At 31.12.2013 Purchase price Book value Premiums/ discounts to be amortised Value at final maturity Market value
Group investment portfolio 943,539 916,278 -6,496 909,782 1,016,136
Operational money market portfolios:
- A1: Money market securities with a max. 3-month maturity 15,332,181 15,288,392 1,510 15,289,902 15,286,230
- A2: Money market securities with a max. 18-month maturity 1,794,006 1,756,641 -287 1,757,063 1,756,641
Operational bond portfolios:
- B1: Credit Spread 594,827 594,053 -5,927 583,850 594,053
- B3: Global Fixed Income 548,413 539,598 0 526,410 539,598
- B4: Inflation Linked Investment 350,524 365,763 0 337,000 365,763
Operational portfolio - EIF 817,746 833,780 -12,846 802,574 833,780
Loan substitutes (Note D) 13,340,945 13,179,412 -45,671 13,133,741 13,339,896
Total debt securities 33,722,181 33,473,917 -69,717 33,340,322 33,732,097
Loan substitutes, which represent acquisitions of interests in pools of loans or receivables in connection with securitisation transactions are considered as part of the aggregate loans (Note D). Some of these transactions have been structured by adding credit or project related remedies, thus offering additional recourse. No value adjustment is required and has thus been accounted for as at 31 December 2014 and 2013.
EU sovereign exposure in bond holdings
The Group did not record value adjustments in 2013 and 2014 in respect of its held to maturity EU sovereign and sovereign guaranteed exposure as at the year end, in view of the Bank’s preferred creditor status as well as of the EIF and the protection given by the Bank’s Statute as well as on a detailed review of any value adjustment requirements.
87
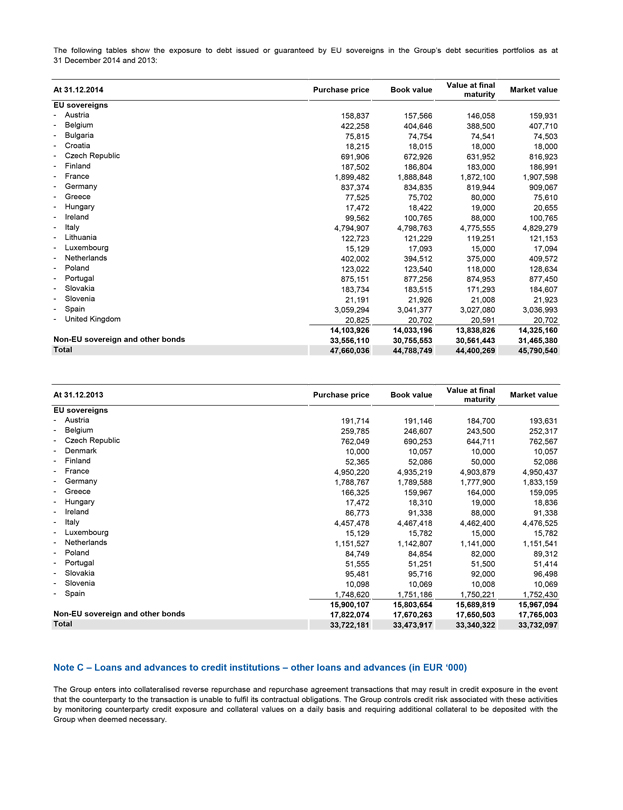
The following tables show the exposure to debt issued or guaranteed by EU sovereigns in the Group’s debt securities portfolios as at 31 December 2014 and 2013:
At 31.12.2014 Purchase price Book value Value at final maturity Market value
EU sovereigns
- Austria 158,837 157,566 146,058 159,931
- Belgium 422,258 404,646 388,500 407,710
- Bulgaria 75,815 74,754 74,541 74,503
- Croatia 18,215 18,015 18,000 18,000
- Czech Republic 691,906 672,926 631,952 816,923
- Finland 187,502 186,804 183,000 186,991
- France 1,899,482 1,888,848 1,872,100 1,907,598
- Germany 837,374 834,835 819,944 909,067
- Greece 77,525 75,702 80,000 75,610
- Hungary 17,472 18,422 19,000 20,655
- Ireland 99,562 100,765 88,000 100,765
- Italy 4,794,907 4,798,763 4,775,555 4,829,279
- Lithuania 122,723 121,229 119,251 121,153
- Luxembourg 15,129 17,093 15,000 17,094
- Netherlands 402,002 394,512 375,000 409,572
- Poland 123,022 123,540 118,000 128,634
- Portugal 875,151 877,256 874,953 877,450
- Slovakia 183,734 183,515 171,293 184,607
- Slovenia 21,191 21,926 21,008 21,923
- Spain 3,059,294 3,041,377 3,027,080 3,036,993
- United Kingdom 20,825 20,702 20,591 20,702
14,103,926 14,033,196 13,838,826 14,325,160
Non-EU sovereign and other bonds 33,556,110 30,755,553 30,561,443 31,465,380
Total 47,660,036 44,788,749 44,400,269 45,790,540
At 31.12.2013 Purchase price Book value Value at final maturity Market value
EU sovereigns
- Austria 191,714 191,146 184,700 193,631
- Belgium 259,785 246,607 243,500 252,317
- Czech Republic 762,049 690,253 644,711 762,567
- Denmark 10,000 10,057 10,000 10,057
- Finland 52,365 52,086 50,000 52,086
- France 4,950,220 4,935,219 4,903,879 4,950,437
- Germany 1,788,767 1,789,588 1,777,900 1,833,159
- Greece 166,325 159,967 164,000 159,095
- Hungary 17,472 18,310 19,000 18,836
- Ireland 86,773 91,338 88,000 91,338
- Italy 4,457,478 4,467,418 4,462,400 4,476,525
- Luxembourg 15,129 15,782 15,000 15,782
- Netherlands 1,151,527 1,142,807 1,141,000 1,151,541
- Poland 84,749 84,854 82,000 89,312
- Portugal 51,555 51,251 51,500 51,414
- Slovakia 95,481 95,716 92,000 96,498
- Slovenia 10,098 10,069 10,008 10,069
- Spain 1,748,620 1,751,186 1,750,221 1,752,430
15,900,107 15,803,654 15,689,819 15,967,094
Non-EU sovereign and other bonds 17,822,074 17,670,263 17,650,503 17,765,003
Total 33,722,181 33,473,917 33,340,322 33,732,097
Note C – Loans and advances to credit institutions – other loans and advances (in EUR ‘000)
The Group enters into collateralised reverse repurchase and repurchase agreement transactions that may result in credit exposure in the event that the counterparty to the transaction is unable to fulfil its contractual obligations. The Group controls credit risk associated with these activities by monitoring counterparty credit exposure and collateral values on a daily basis and requiring additional collateral to be deposited with the Group when deemed necessary.
88
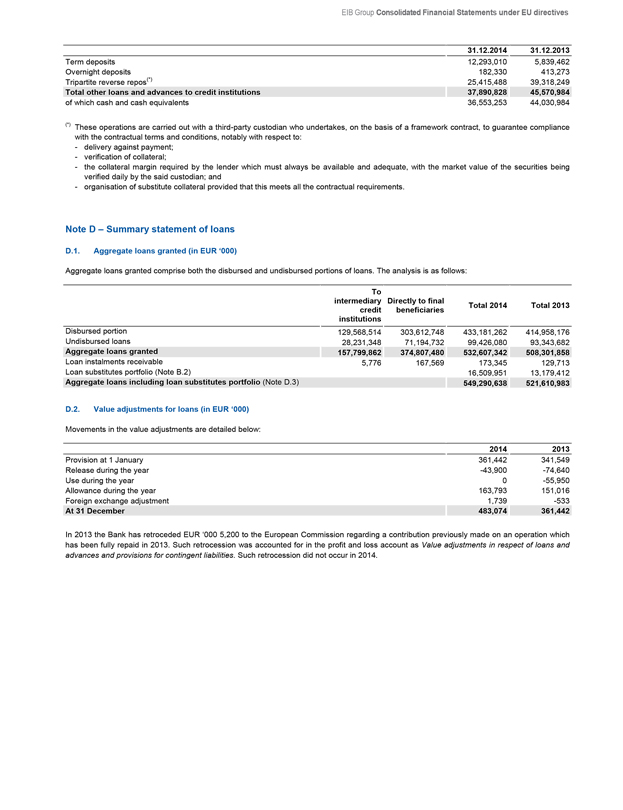
EIB Group Consolidated Financial Statements under EU directives
31.12.2014 31.12.2013
Term deposits 12,293,010 5,839,462
Overnight deposits 182,330 413,273
Tripartite reverse repos(*) 25,415,488 39,318,249
Total other loans and advances to credit institutions 37,890,828 45,570,984
of which cash and cash equivalents 36,553,253 44,030,984
(*) These operations are carried out with a third-party custodian who undertakes, on the basis of a framework contract, to guarantee compliance with the contractual terms and conditions, notably with respect to:
delivery against payment;
verification of collateral;
the collateral margin required by the lender which must always be available and adequate, with the market value of the securities being verified daily by the said custodian; and
organisation of substitute collateral provided that this meets all the contractual requirements.
Note D – Summary statement of loans
D.1. Aggregate loans granted (in EUR ‘000)
Aggregate loans granted comprise both the disbursed and undisbursed portions of loans. The analysis is as follows:
To intermediary credit institutions Directly to final beneficiaries Total 2014 Total 2013
Disbursed portion 129,568,514 303,612,748 433,181,262 414,958,176
Undisbursed loans 28,231,348 71,194,732 99,426,080 93,343,682
Aggregate loans granted 157,799,862 374,807,480 532,607,342 508,301,858
Loan instalments receivable 5,776 167,569 173,345 129,713
Loan substitutes portfolio (Note B.2) 16,509,951 13,179,412
Aggregate loans including loan substitutes portfolio (Note D.3) 549,290,638 521,610,983
D.2. Value adjustments for loans (in EUR ‘000)
Movements in the value adjustments are detailed below:
2014 2013
Provision at 1 January 361,442 341,549
Release during the year -43,900 -74,640
Use during the year 0 -55,950
Allowance during the year 163,793 151,016
Foreign exchange adjustment 1,739 -533
At 31 December 483,074 361,442
In 2013 the Bank has retroceded EUR ‘000 5,200 to the European Commission regarding a contribution previously made on an operation which has been fully repaid in 2013. Such retrocession was accounted for in the profit and loss account as Value adjustments in respect of loans and advances and provisions for contingent liabilities. Such retrocession did not occur in 2014.
89
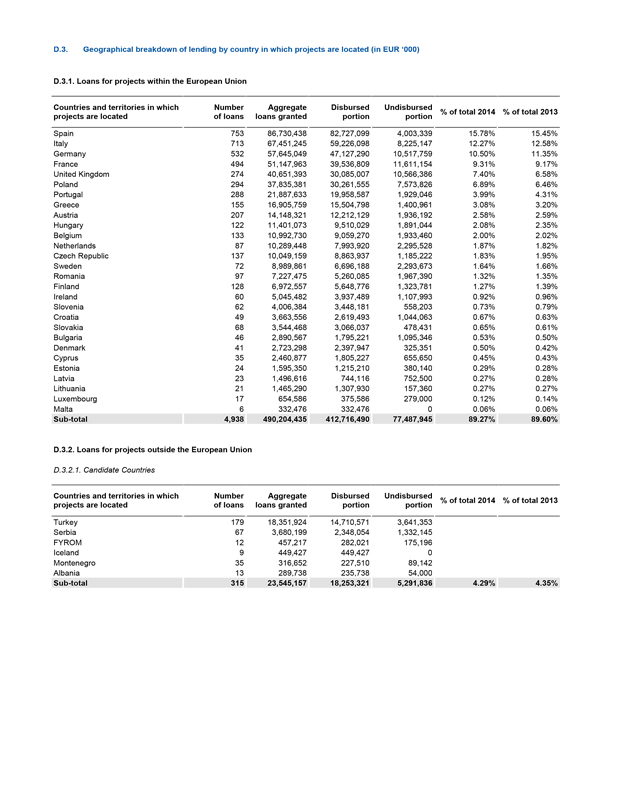
D.3. Geographical breakdown of lending by country in which projects are located (in EUR ‘000)
D.3.1. Loans for projects within the European Union
Countries and territories in which projects are located Number of loans Aggregate loans granted Disbursed portion Undisbursed portion % of total 2014 % of total 2013
Spain 753 86,730,438 82,727,099 4,003,339 15.78% 15.45%
Italy 713 67,451,245 59,226,098 8,225,147 12.27% 12.58%
Germany 532 57,645,049 47,127,290 10,517,759 10.50% 11.35%
France 494 51,147,963 39,536,809 11,611,154 9.31% 9.17%
United Kingdom 274 40,651,393 30,085,007 10,566,386 7.40% 6.58%
Poland 294 37,835,381 30,261,555 7,573,826 6.89% 6.46%
Portugal 288 21,887,633 19,958,587 1,929,046 3.99% 4.31%
Greece 155 16,905,759 15,504,798 1,400,961 3.08% 3.20%
Austria 207 14,148,321 12,212,129 1,936,192 2.58% 2.59%
Hungary 122 11,401,073 9,510,029 1,891,044 2.08% 2.35%
Belgium 133 10,992,730 9,059,270 1,933,460 2.00% 2.02%
Netherlands 87 10,289,448 7,993,920 2,295,528 1.87% 1.82%
Czech Republic 137 10,049,159 8,863,937 1,185,222 1.83% 1.95%
Sweden 72 8,989,861 6,696,188 2,293,673 1.64% 1.66%
Romania 97 7,227,475 5,260,085 1,967,390 1.32% 1.35%
Finland 128 6,972,557 5,648,776 1,323,781 1.27% 1.39%
Ireland 60 5,045,482 3,937,489 1,107,993 0.92% 0.96%
Slovenia 62 4,006,384 3,448,181 558,203 0.73% 0.79%
Croatia 49 3,663,556 2,619,493 1,044,063 0.67% 0.63%
Slovakia 68 3,544,468 3,066,037 478,431 0.65% 0.61%
Bulgaria 46 2,890,567 1,795,221 1,095,346 0.53% 0.50%
Denmark 41 2,723,298 2,397,947 325,351 0.50% 0.42%
Cyprus 35 2,460,877 1,805,227 655,650 0.45% 0.43%
Estonia 24 1,595,350 1,215,210 380,140 0.29% 0.28%
Latvia 23 1,496,616 744,116 752,500 0.27% 0.28%
Lithuania 21 1,465,290 1,307,930 157,360 0.27% 0.27%
Luxembourg 17 654,586 375,586 279,000 0.12% 0.14%
Malta 6 332,476 332,476 0 0.06% 0.06%
Sub-total 4,938 490,204,435 412,716,490 77,487,945 89.27% 89.60%
D.3.2. Loans for projects outside the European Union
D.3.2.1. Candidate Countries
Countries and territories in which projects are located Number of loans Aggregate loans granted Disbursed portion Undisbursed portion % of total 2014 % of total 2013
Turkey 179 18,351,924 14,710,571 3,641,353
Serbia 67 3,680,199 2,348,054 1,332,145
FYROM 12 457,217 282,021 175,196
Iceland 9 449,427 449,427 0
Montenegro 35 316,652 227,510 89,142
Albania 13 289,738 235,738 54,000
Sub-total 315 23,545,157 18,253,321 5,291,836 4.29% 4.35%
90
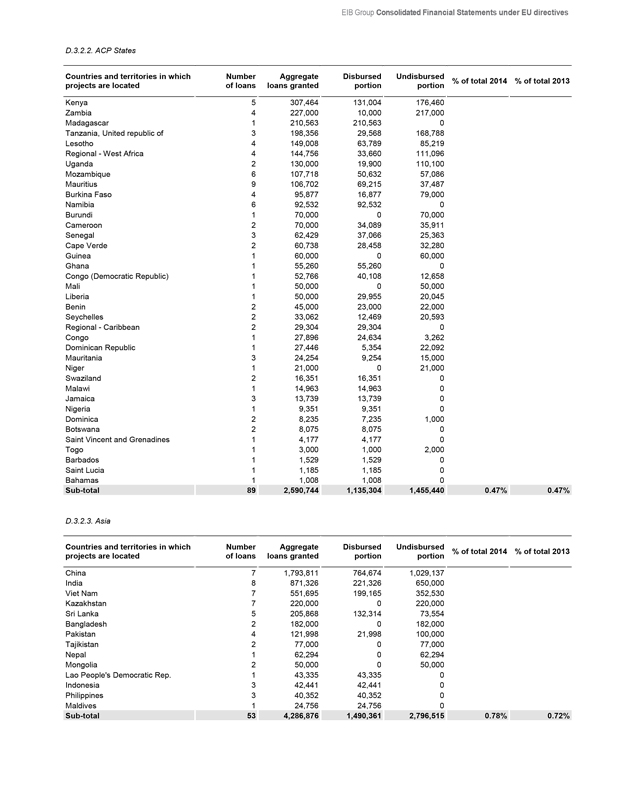
EIB Group Consolidated Financial Statements under EU directives
D.3.2.2. ACP States
Countries and territories in which projects are located Number of loans Aggregate loans granted Disbursed portion Undisbursed portion % of total 2014 % of total 2013
Kenya 5 307,464 131,004 176,460
Zambia 4 227,000 10,000 217,000
Madagascar 1 210,563 210,563 0
Tanzania, United republic of 3 198,356 29,568 168,788
Lesotho 4 149,008 63,789 85,219
Regional - West Africa 4 144,756 33,660 111,096
Uganda 2 130,000 19,900 110,100
Mozambique 6 107,718 50,632 57,086
Mauritius 9 106,702 69,215 37,487
Burkina Faso 4 95,877 16,877 79,000
Namibia 6 92,532 92,532 0
Burundi 1 70,000 0 70,000
Cameroon 2 70,000 34,089 35,911
Senegal 3 62,429 37,066 25,363
Cape Verde 2 60,738 28,458 32,280
Guinea 1 60,000 0 60,000
Ghana 1 55,260 55,260 0
Congo (Democratic Republic) 1 52,766 40,108 12,658
Mali 1 50,000 0 50,000
Liberia 1 50,000 29,955 20,045
Benin 2 45,000 23,000 22,000
Seychelles 2 33,062 12,469 20,593
Regional - Caribbean 2 29,304 29,304 0
Congo 1 27,896 24,634 3,262
Dominican Republic 1 27,446 5,354 22,092
Mauritania 3 24,254 9,254 15,000
Niger 1 21,000 0 21,000
Swaziland 2 16,351 16,351 0
Malawi 1 14,963 14,963 0
Jamaica 3 13,739 13,739 0
Nigeria 1 9,351 9,351 0
Dominica 2 8,235 7,235 1,000
Botswana 2 8,075 8,075 0
Saint Vincent and Grenadines 1 4,177 4,177 0
Togo 1 3,000 1,000 2,000
Barbados 1 1,529 1,529 0
Saint Lucia 1 1,185 1,185 0
Bahamas 1 1,008 1,008 0
Sub-total 89 2,590,744 1,135,304 1,455,440 0.47% 0.47%
D.3.2.3. Asia
Countries and territories in which projects are located Number of loans Aggregate loans granted Disbursed portion Undisbursed portion % of total 2014 % of total 2013
China 7 1,793,811 764,674 1,029,137
India 8 871,326 221,326 650,000
Viet Nam 7 551,695 199,165 352,530
Kazakhstan 7 220,000 0 220,000
Sri Lanka 5 205,868 132,314 73,554
Bangladesh 2 182,000 0 182,000
Pakistan 4 121,998 21,998 100,000
Tajikistan 2 77,000 0 77,000
Nepal 1 62,294 0 62,294
Mongolia 2 50,000 0 50,000
Lao People’s Democratic Rep. 1 43,335 43,335 0
Indonesia 3 42,441 42,441 0
Philippines 3 40,352 40,352 0
Maldives 1 24,756 24,756 0
Sub-total 53 4,286,876 1,490,361 2,796,515 0.78% 0.72%
91
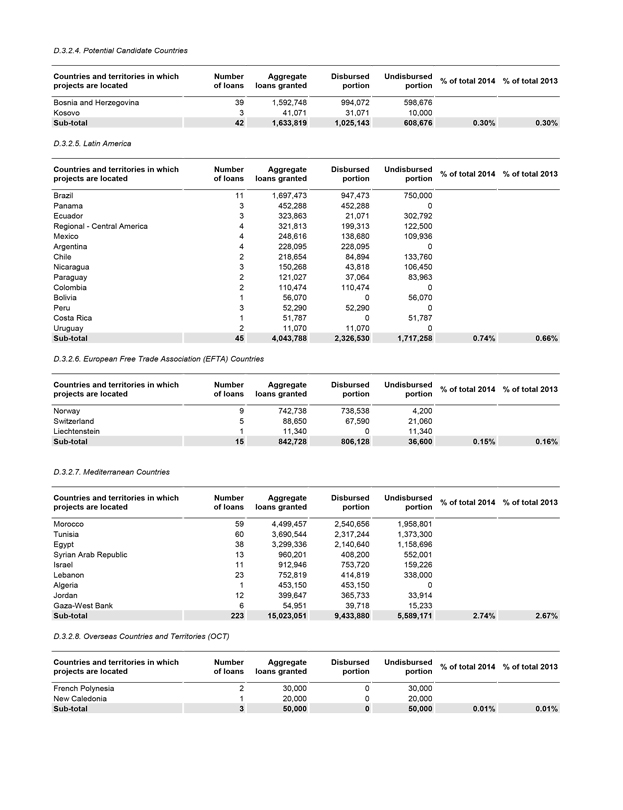
D.3.2.4. Potential Candidate Countries
Countries and territories in which projects are located Number of loans Aggregate loans granted Disbursed portion Undisbursed portion % of total 2014 % of total 2013
Bosnia and Herzegovina 39 1,592,748 994,072 598,676
Kosovo 3 41,071 31,071 10,000
Sub-total 42 1,633,819 1,025,143 608,676 0.30% 0.30%
D.3.2.5. Latin America
Countries and territories in which projects are located Number of loans Aggregate loans granted Disbursed portion Undisbursed portion % of total 2014 % of total 2013
Brazil 11 1,697,473 947,473 750,000
Panama 3 452,288 452,288 0
Ecuador 3 323,863 21,071 302,792
Regional - Central America 4 321,813 199,313 122,500
Mexico 4 248,616 138,680 109,936
Argentina 4 228,095 228,095 0
Chile 2 218,654 84,894 133,760
Nicaragua 3 150,268 43,818 106,450
Paraguay 2 121,027 37,064 83,963
Colombia 2 110,474 110,474 0
Bolivia 1 56,070 0 56,070
Peru 3 52,290 52,290 0
Costa Rica 1 51,787 0 51,787
Uruguay 2 11,070 11,070 0
Sub-total 45 4,043,788 2,326,530 1,717,258 0.74% 0.66%
D.3.2.6. European Free Trade Association (EFTA) Countries
Countries and territories in which projects are located Number of loans Aggregate loans granted Disbursed portion Undisbursed portion % of total 2014 % of total 2013
Norway 9 742,738 738,538 4,200
Switzerland 5 88,650 67,590 21,060
Liechtenstein 1 11,340 0 11,340
Sub-total 15 842,728 806,128 36,600 0.15% 0.16%
D.3.2.7. Mediterranean Countries
Countries and territories in which projects are located Number of loans Aggregate loans granted Disbursed portion Undisbursed portion % of total 2014 % of total 2013
Morocco 59 4,499,457 2,540,656 1,958,801
Tunisia 60 3,690,544 2,317,244 1,373,300
Egypt 38 3,299,336 2,140,640 1,158,696
Syrian Arab Republic 13 960,201 408,200 552,001
Israel 11 912,946 753,720 159,226
Lebanon 23 752,819 414,819 338,000
Algeria 1 453,150 453,150 0
Jordan 12 399,647 365,733 33,914
Gaza-West Bank 6 54,951 39,718 15,233
Sub-total 223 15,023,051 9,433,880 5,589,171 2.74% 2.67%
D.3.2.8. Overseas Countries and Territories (OCT)
Countries and territories in which projects are located Number of loans Aggregate loans granted Disbursed portion Undisbursed portion % of total 2014 % of total 2013
French Polynesia 2 30,000 0 30,000
New Caledonia 1 20,000 0 20,000
Sub-total 3 50,000 0 50,000 0.01% 0.01%
92
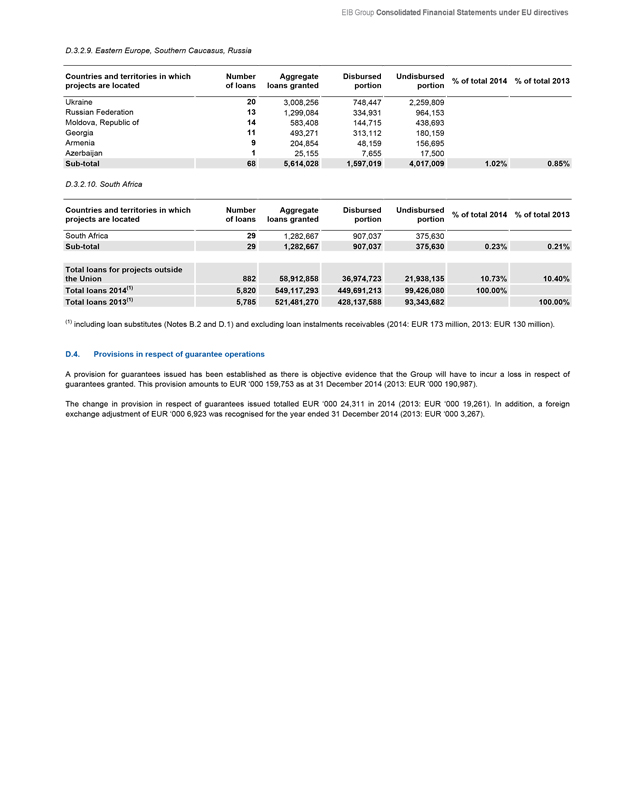
EIB Group Consolidated Financial Statements under EU directives
D.3.2.9. Eastern Europe, Southern Caucasus, Russia
Countries and territories in which projects are located
Number of loans
Aggregate loans granted
Disbursed portion
Undisbursed portion
% of total 2014
% of total 2013
Ukraine 20 3,008,256 748,447 2,259,809
Russian Federation 13 1,299,084 334,931 964,153
Moldova, Republic of 14 583,408 144,715 438,693
Georgia 11 493,271 313,112 180,159
Armenia 9 204,854 48,159 156,695
Azerbaijan 1 25,155 7,655 17,500
Sub-total 68 5,614,028 1,597,019 4,017,009 1.02% 0.85%
D.3.2.10. South Africa
Countries and territories in which projects are located Number of loans Aggregate loans granted Disbursed portion Undisbursed portion % of total 2014 % of total 2013
South Africa 29 1,282,667 907,037 375,630
Sub-total 29 1,282,667 907,037 375,630 0.23% 0.21%
Total loans for projects outside the Union 882 58,912,858 36,974,723 21,938,135 10.73% 10.40%
Total loans 2014(1) 5,820 549,117,293 449,691,213 99,426,080 100.00%
Total loans 2013(1) 5,785 521,481,270 428,137,588 93,343,682 100.00%
(1) including loan substitutes (Notes B.2 and D.1) and excluding loan instalments receivables (2014: EUR 173 million, 2013: EUR 130 million).
D.4. Provisions in respect of guarantee operations
A provision for guarantees issued has been established as there is objective evidence that the Group will have to incur a loss in respect of guarantees granted. This provision amounts to EUR ‘000 159,753 as at 31 December 2014 (2013: EUR ‘000 190,987).
The change in provision in respect of guarantees issued totalled EUR ‘000 24,311 in 2014 (2013: EUR ‘000 19,261). In addition, a foreign exchange adjustment of EUR ‘000 6,923 was recognised for the year ended 31 December 2014 (2013: EUR ‘000 3,267).
93
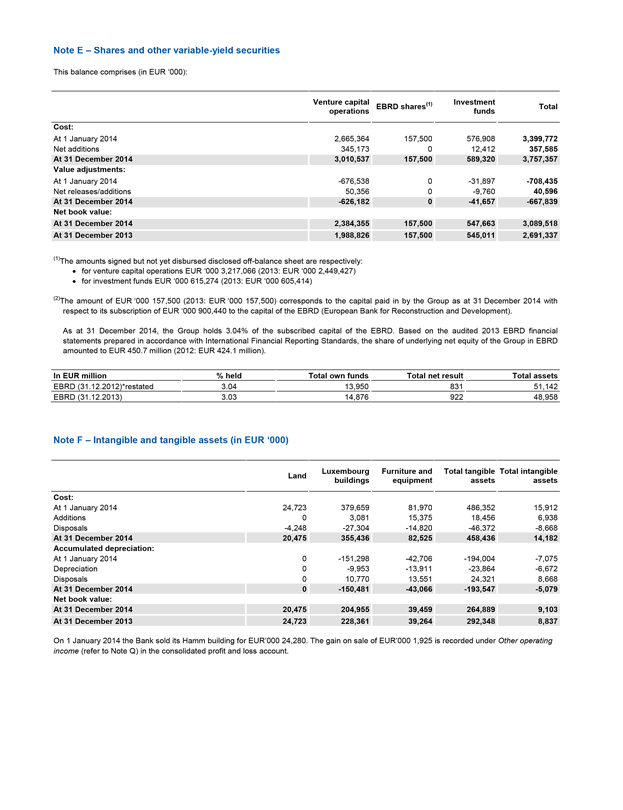
Note E – Shares and other variable-yield securities
This balance comprises (in EUR ‘000):
Venture capital operations EBRD shares(1) Investment funds Total
Cost:
At 1 January 2014 2,665,364 157,500 576,908 3,399,772
Net additions 345,173 0 12,412 357,585
At 31 December 2014 3,010,537 157,500 589,320 3,757,357
Value adjustments:
At 1 January 2014 -676,538 0 -31,897 -708,435
Net releases/additions 50,356 0 -9,760 40,596
At 31 December 2014 -626,182 0 -41,657 -667,839
Net book value:
At 31 December 2014 2,384,355 157,500 547,663 3,089,518
At 31 December 2013 1,988,826 157,500 545,011 2,691,337
(1) The amounts signed but not yet disbursed disclosed off-balance sheet are respectively:
for venture capital operations EUR ‘000 3,217,066 (2013: EUR ‘000 2,449,427)
for investment funds EUR ‘000 615,274 (2013: EUR ‘000 605,414)
(2) The amount of EUR ‘000 157,500 (2013: EUR ‘000 157,500) corresponds to the capital paid in by the Group as at 31 December 2014 with respect to its subscription of EUR ‘000 900,440 to the capital of the EBRD (European Bank for Reconstruction and Development).
As at 31 December 2014, the Group holds 3.04% of the subscribed capital of the EBRD. Based on the audited 2013 EBRD financial statements prepared in accordance with International Financial Reporting Standards, the share of underlying net equity of the Group in EBRD amounted to EUR 450.7 million (2012: EUR 424.1 million).
In EUR million % held Total own funds Total net result Total assets
EBRD (31.12.2012)*restated 3.04 13,950 831 51,142
EBRD (31.12.2013) 3.03 14,876 922 48,958
Note F – Intangible and tangible assets (in EUR ‘000)
Land Luxembourg buildings Furniture and equipment Total tangible assets Total intangible assets
Cost:
At 1 January 2014 24,723 379,659 81,970 486,352 15,912
Additions 0 3,081 15,375 18,456 6,938
Disposals -4,248 -27,304 -14,820 -46,372 -8,668
At 31 December 2014 20,475 355,436 82,525 458,436 14,182
Accumulated depreciation:
At 1 January 2014 0 -151,298 -42,706 -194,004 -7,075
Depreciation 0 -9,953 -13,911 -23,864 -6,672
Disposals 0 10,770 13,551 24,321 8,668
At 31 December 2014 0 -150,481 -43,066 -193,547 -5,079
Net book value:
At 31 December 2014 20,475 204,955 39,459 264,889 9,103
At 31 December 2013 24,723 228,361 39,264 292,348 8,837
On 1 January 2014 the Bank sold its Hamm building for EUR’000 24,280. The gain on sale of EUR’000 1,925 is recorded under Other operating income (refer to Note Q) in the consolidated profit and loss account.
94
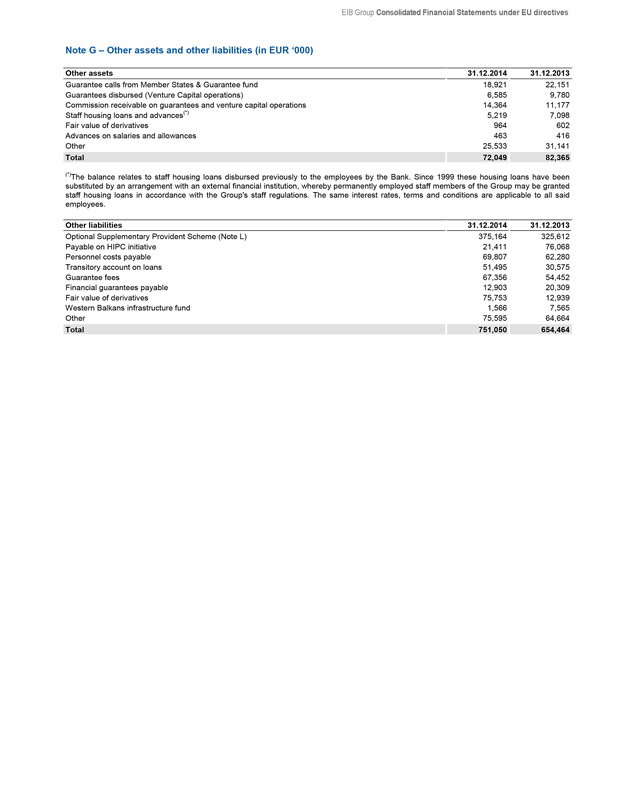
EIB Group Consolidated Financial Statements under EU directives
Note G – Other assets and other liabilities (in EUR ‘000)
Other assets 31.12.2014 31.12.2013
Guarantee calls from Member States & Guarantee fund 18,921 22,151
Guarantees disbursed (Venture Capital operations) 6,585 9,780
Commission receivable on guarantees and venture capital operations 14,364 11,177
Staff housing loans and advances(*) 5,219 7,098
Fair value of derivatives 964 602
Advances on salaries and allowances 463 416
Other 25,533 31,141
Total 72,049 82,365
(*)The balance relates to staff housing loans disbursed previously to the employees by the Bank. Since 1999 these housing loans have been substituted by an arrangement with an external financial institution, whereby permanently employed staff members of the Group may be granted staff housing loans in accordance with the Group’s staff regulations. The same interest rates, terms and conditions are applicable to all said employees.
Other liabilities 31.12.2014 31.12.2013
Optional Supplementary Provident Scheme (Note L) 375,164 325,612
Payable on HIPC initiative 21,411 76,068
Personnel costs payable 69,807 62,280
Transitory account on loans 51,495 30,575
Guarantee fees 67,356 54,452
Financial guarantees payable 12,903 20,309
Fair value of derivatives 75,753 12,939
Western Balkans infrastructure fund 1,566 7,565
Other 75,595 64,664
Total 751,050 654,464
95
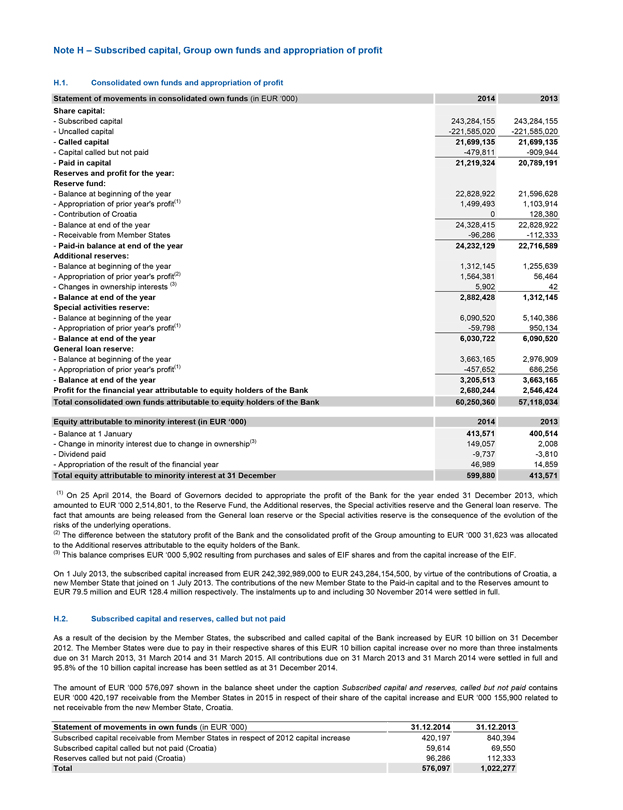
Note H – Subscribed capital, Group own funds and appropriation of profit
H.1. Consolidated own funds and appropriation of profit
Statement of movements in consolidated own funds (in EUR ‘000) 2014 2013
Share capital:
- Subscribed capital 243,284,155 243,284,155
- Uncalled capital -221,585,020 -221,585,020
- Called capital 21,699,135 21,699,135
- Capital called but not paid -479,811 -909,944
- Paid in capital 21,219,324 20,789,191
Reserves and profit for the year:
Reserve fund:
- Balance at beginning of the year 22,828,922 21,596,628
- Appropriation of prior year’s profit(1) 1,499,493 1,103,914
- Contribution of Croatia 0 128,380
- Balance at end of the year 24,328,415 22,828,922
- Receivable from Member States -96,286 -112,333
- Paid-in balance at end of the year 24,232,129 22,716,589
Additional reserves:
- Balance at beginning of the year 1,312,145 1,255,639
- Appropriation of prior year’s profit(2) 1,564,381 56,464
- Changes in ownership interests (3) 5,902 42
- Balance at end of the year 2,882,428 1,312,145
Special activities reserve:
- Balance at beginning of the year 6,090,520 5,140,386
- Appropriation of prior year’s profit(1) -59,798 950,134
- Balance at end of the year 6,030,722 6,090,520
General loan reserve:
- Balance at beginning of the year 3,663,165 2,976,909
- Appropriation of prior year’s profit(1) -457,652 686,256
- Balance at end of the year 3,205,513 3,663,165
Profit for the financial year attributable to equity holders of the Bank 2,680,244 2,546,424
Total consolidated own funds attributable to equity holders of the Bank 60,250,360 57,118,034
Equity attributable to minority interest (in EUR ‘000) 2014 2013
- Balance at 1 January 413,571 400,514
- Change in minority interest due to change in ownership(3) 149,057 2,008
- Dividend paid -9,737 -3,810
- Appropriation of the result of the financial year 46,989 14,859
Total equity attributable to minority interest at 31 December 599,880 413,571
(1) On 25 April 2014, the Board of Governors decided to appropriate the profit of the Bank for the year ended 31 December 2013, which amounted to EUR ‘000 2,514,801, to the Reserve Fund, the Additional reserves, the Special activities reserve and the General loan reserve. The fact that amounts are being released from the General loan reserve or the Special activities reserve is the consequence of the evolution of the risks of the underlying operations.
(2) The difference between the statutory profit of the Bank and the consolidated profit of the Group amounting to EUR ‘000 31,623 was allocated to the Additional reserves attributable to the equity holders of the Bank.
(3) This balance comprises EUR ‘000 5,902 resulting from purchases and sales of EIF shares and from the capital increase of the EIF.
On 1 July 2013, the subscribed capital increased from EUR 242,392,989,000 to EUR 243,284,154,500, by virtue of the contributions of Croatia, a new Member State that joined on 1 July 2013. The contributions of the new Member State to the Paid-in capital and to the Reserves amount to EUR 79.5 million and EUR 128.4 million respectively. The instalments up to and including 30 November 2014 were settled in full.
H.2. Subscribed capital and reserves, called but not paid
As a result of the decision by the Member States, the subscribed and called capital of the Bank increased by EUR 10 billion on 31 December 2012. The Member States were due to pay in their respective shares of this EUR 10 billion capital increase over no more than three instalments due on 31 March 2013, 31 March 2014 and 31 March 2015. All contributions due on 31 March 2013 and 31 March 2014 were settled in full and 95.8% of the 10 billion capital increase has been settled as at 31 December 2014.
The amount of EUR ‘000 576,097 shown in the balance sheet under the caption Subscribed capital and reserves, called but not paid contains EUR ‘000 420,197 receivable from the Member States in 2015 in respect of their share of the capital increase and EUR ‘000 155,900 related to net receivable from the new Member State, Croatia.
Statement of movements in own funds (in EUR ‘000) 31.12.2014 31.12.2013
Subscribed capital receivable from Member States in respect of 2012 capital increase 420,197 840,394
Subscribed capital called but not paid (Croatia) 59,614 69,550
Reserves called but not paid (Croatia) 96,286 112,333
Total 576,097 1,022,277
96
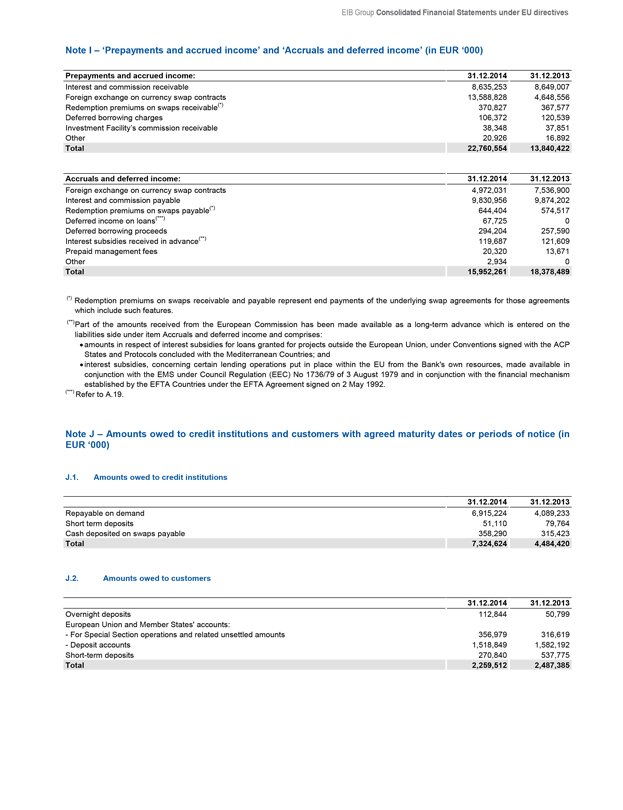
EIB Group Consolidated Financial Statements under EU directives
Note I – ‘Prepayments and accrued income’ and ‘Accruals and deferred income’ (in EUR ‘000)
Prepayments and accrued income: 31.12.2014 31.12.2013
Interest and commission receivable 8,635,253 8,649,007
Foreign exchange on currency swap contracts 13,588,828 4,648,556
Redemption premiums on swaps receivable(*) 370,827 367,577
Deferred borrowing charges 106,372 120,539
Investment Facility’s commission receivable 38,348 37,851
Other 20,926 16,892
Total 22,760,554 13,840,422
Accruals and deferred income: 31.12.2014 31.12.2013
Foreign exchange on currency swap contracts 4,972,031 7,536,900
Interest and commission payable 9,830,956 9,874,202
Redemption premiums on swaps payable(*) 644,404 574,517
Deferred income on loans(***) 67,725 0
Deferred borrowing proceeds 294,204 257,590
Interest subsidies received in advance(**) 119,687 121,609
Prepaid management fees 20,320 13,671
Other 2,934 0
Total 15,952,261 18,378,489
(*) Redemption premiums on swaps receivable and payable represent end payments of the underlying swap agreements for those agreements which include such features.
(**) Part of the amounts received from the European Commission has been made available as a long-term advance which is entered on the liabilities side under item Accruals and deferred income and comprises:
amounts in respect of interest subsidies for loans granted for projects outside the European Union, under Conventions signed with the ACP States and Protocols concluded with the Mediterranean Countries; and
interest subsidies, concerning certain lending operations put in place within the EU from the Bank’s own resources, made available in conjunction with the EMS under Council Regulation (EEC) No 1736/79 of 3 August 1979 and in conjunction with the financial mechanism established by the EFTA Countries under the EFTA Agreement signed on 2 May 1992.
(***) Refer to A.19.
Note J – Amounts owed to credit institutions and customers with agreed maturity dates or periods of notice (in EUR ‘000)
J.1. Amounts owed to credit institutions
31.12.2014 31.12.2013
Repayable on demand 6,915,224 4,089,233
Short term deposits 51,110 79,764
Cash deposited on swaps payable 358,290 315,423
Total 7,324,624 4,484,420
J.2. Amounts owed to customers
31.12.2014 31.12.2013
Overnight deposits 112,844 50,799
European Union and Member States’ accounts:
- For Special Section operations and related unsettled amounts 356,979 316,619
- Deposit accounts 1,518,849 1,582,192
Short-term deposits 270,840 537,775
Total 2,259,512 2,487,385
97
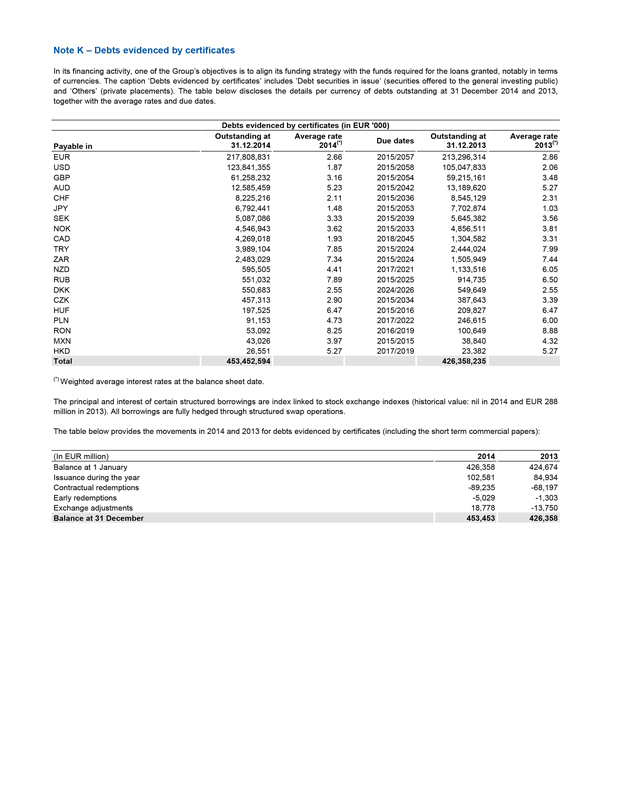
Note K – Debts evidenced by certificates
In its financing activity, one of the Group’s objectives is to align its funding strategy with the funds required for the loans granted, notably in terms of currencies. The caption ‘Debts evidenced by certificates’ includes ’Debt securities in issue’ (securities offered to the general investing public) and ‘Others’ (private placements). The table below discloses the details per currency of debts outstanding at 31 December 2014 and 2013, together with the average rates and due dates.
Debts evidenced by certificates (in EUR ‘000)
Outstanding at Average rate Outstanding at Average rate
Payable in 31.12.2014 2014(*) Due dates 31.12.2013 2013(*)
EUR 217,808,831 2.66 2015/2057 213,296,314 2.86
USD 123,841,355 1.87 2015/2058 105,047,833 2.06
GBP 61,258,232 3.16 2015/2054 59,215,161 3.48
AUD 12,585,459 5.23 2015/2042 13,189,620 5.27
CHF 8,225,216 2.11 2015/2036 8,545,129 2.31
JPY 6,792,441 1.48 2015/2053 7,702,874 1.03
SEK 5,087,086 3.33 2015/2039 5,645,382 3.56
NOK 4,546,943 3.62 2015/2033 4,856,511 3.81
CAD 4,269,018 1.93 2018/2045 1,304,582 3.31
TRY 3,989,104 7.85 2015/2024 2,444,024 7.99
ZAR 2,483,029 7.34 2015/2024 1,505,949 7.44
NZD 595,505 4.41 2017/2021 1,133,516 6.05
RUB 551,032 7.89 2015/2025 914,735 6.50
DKK 550,683 2.55 2024/2026 549,649 2.55
CZK 457,313 2.90 2015/2034 387,643 3.39
HUF 197,525 6.47 2015/2016 209,827 6.47
PLN 91,153 4.73 2017/2022 246,615 6.00
RON 53,092 8.25 2016/2019 100,649 8.88
MXN 43,026 3.97 2015/2015 38,840 4.32
HKD 26,551 5.27 2017/2019 23,382 5.27
Total 453,452,594 426,358,235
(*) Weighted average interest rates at the balance sheet date.
The principal and interest of certain structured borrowings are index linked to stock exchange indexes (historical value: nil in 2014 and EUR 288 million in 2013). All borrowings are fully hedged through structured swap operations.
The table below provides the movements in 2014 and 2013 for debts evidenced by certificates (including the short term commercial papers):
(In EUR million) 2014 2013
Balance at 1 January 426,358 424,674
Issuance during the year 102,581 84,934
Contractual redemptions -89,235 -68,197
Early redemptions -5,029 -1,303
Exchange adjustments 18,778 -13,750
Balance at 31 December 453,453 426,358
98
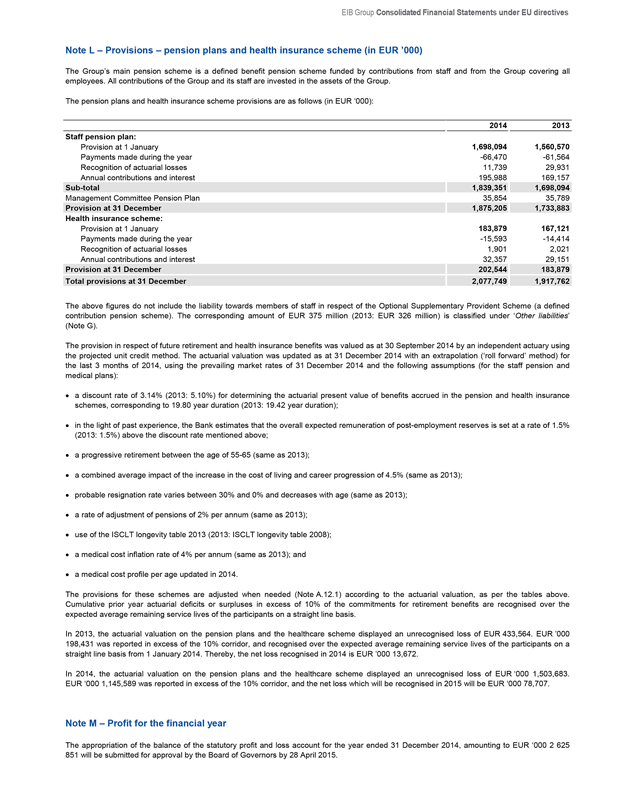
EIB Group Consolidated Financial Statements under EU directives Note L – Provisions – pension plans and health insurance scheme (in EUR ’000) The Group’s main pension scheme is a defined benefit pension scheme funded by contributions from staff and from the Group covering all employees. All contributions of the Group and its staff are invested in the assets of the Group. The pension plans and health insurance scheme provisions are as follows (in EUR ‘000): 2014 2013 Staff pension plan: Provision at 1 January 1,698,094 1,560,570 Payments made during the year -66,470 -61,564 Recognition of actuarial losses 11,739 29,931 Annual contributions and interest 195,988 169,157 Sub-total 1,839,351 1,698,094 Management Committee Pension Plan 35,854 35,789 Provision at 31 December 1,875,205 1,733,883 Health insurance scheme: Provision at 1 January 183,879 167,121 Payments made during the year -15,593 -14,414 Recognition of actuarial losses 1,901 2,021 Annual contributions and interest 32,357 29,151 Provision at 31 December 202,544 183,879 Total provisions at 31 December 2,077,749 1,917,762 The above figures do not include the liability towards members of staff in respect of the Optional Supplementary Provident Scheme (a defined contribution pension scheme). The corresponding amount of EUR 375 million (2013: EUR 326 million) is classified under ‘Other liabilities’ (Note G). The provision in respect of future retirement and health insurance benefits was valued as at 30 September 2014 by an independent actuary using the projected unit credit method. The actuarial valuation was updated as at 31 December 2014 with an extrapolation (‘roll forward’ method) for the last 3 months of 2014, using the prevailing market rates of 31 December 2014 and the following assumptions (for the staff pension and medical plans): a discount rate of 3.14% (2013: 5.10%) for determining the actuarial present value of benefits accrued in the pension and health insurance schemes, corresponding to 19.80 year duration (2013: 19.42 year duration); in the light of past experience, the Bank estimates that the overall expected remuneration of post-employment reserves is set at a rate of 1.5% (2013: 1.5%) above the discount rate mentioned above; a progressive retirement between the age of 55-65 (same as 2013); a combined average impact of the increase in the cost of living and career progression of 4.5% (same as 2013); probable resignation rate varies between 30% and 0% and decreases with age (same as 2013); a rate of adjustment of pensions of 2% per annum (same as 2013); use of the ISCLT longevity table 2013 (2013: ISCLT longevity table 2008); a medical cost inflation rate of 4% per annum (same as 2013); and a medical cost profile per age updated in 2014. The provisions for these schemes are adjusted when needed (Note A.12.1) according to the actuarial valuation, as per the tables above. Cumulative prior year actuarial deficits or surpluses in excess of 10% of the commitments for retirement benefits are recognised over the expected average remaining service lives of the participants on a straight line basis. In 2013, the actuarial valuation on the pension plans and the healthcare scheme displayed an unrecognised loss of EUR 433,564. EUR ’000 198,431 was reported in excess of the 10% corridor, and recognised over the expected average remaining service lives of the participants on a straight line basis from 1 January 2014. Thereby, the net loss recognised in 2014 is EUR ’000 13,672. In 2014, the actuarial valuation on the pension plans and the healthcare scheme displayed an unrecognised loss of EUR ‘000 1,503,683. EUR ‘000 1,145,589 was reported in excess of the 10% corridor, and the net loss which will be recognised in 2015 will be EUR ‘000 78,707. Note M – Profit for the financial year The appropriation of the balance of the statutory profit and loss account for the year ended 31 December 2014, amounting to EUR ‘000 2 625 851 will be submitted for approval by the Board of Governors by 28 April 2015.
99
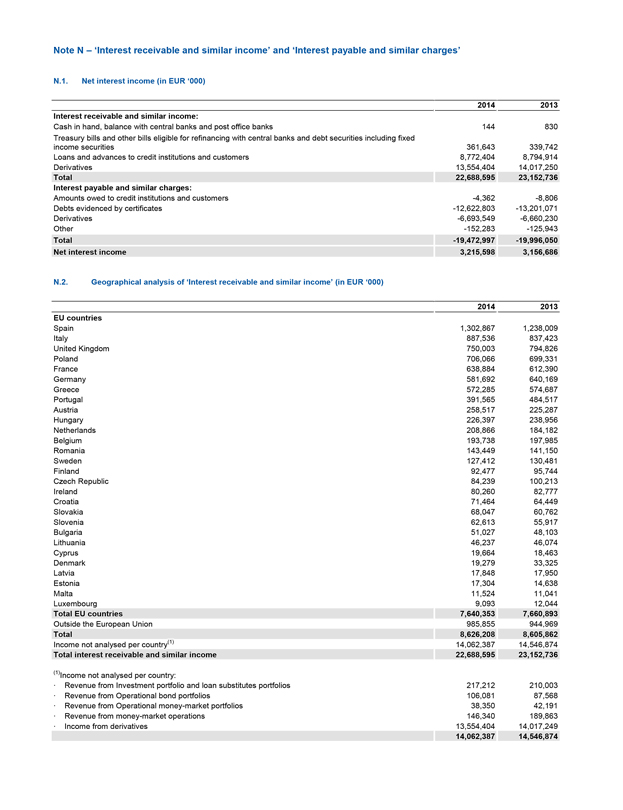
Note N – ‘Interest receivable and similar income’ and ‘Interest payable and similar charges’ N.1. Net interest income (in EUR ‘000) 2014 2013 Interest receivable and similar income: Cash in hand, balance with central banks and post office banks 144 830 Treasury bills and other bills eligible for refinancing with central banks and debt securities including fixed income securities 361,643 339,742 Loans and advances to credit institutions and customers 8,772,404 8,794,914 Derivatives 13,554,404 14,017,250 Total 22,688,595 23,152,736 Interest payable and similar charges: Amounts owed to credit institutions and customers -4,362 -8,806 Debts evidenced by certificates -12,622,803 -13,201,071 Derivatives -6,693,549 -6,660,230 Other -152,283 -125,943 Total -19,472,997 -19,996,050 Net interest income 3,215,598 3,156,686 N.2. Geographical analysis of ‘Interest receivable and similar income’ (in EUR ‘000) 2014 2013 EU countries Spain 1,302,867 1,238,009 Italy 887,536 837,423 United Kingdom 750,003 794,826 Poland 706,066 699,331 France 638,884 612,390 Germany 581,692 640,169 Greece 572,285 574,687 Portugal 391,565 484,517 Austria 258,517 225,287 Hungary 226,397 238,956 Netherlands 208,866 184,182 Belgium 193,738 197,985 Romania 143,449 141,150 Sweden 127,412 130,481 Finland 92,477 95,744 Czech Republic 84,239 100,213 Ireland 80,260 82,777 Croatia 71,464 64,449 Slovakia 68,047 60,762 Slovenia 62,613 55,917 Bulgaria 51,027 48,103 Lithuania 46,237 46,074 Cyprus 19,664 18,463 Denmark 19,279 33,325 Latvia 17,848 17,950 Estonia 17,304 14,638 Malta 11,524 11,041 Luxembourg 9,093 12,044 Total EU countries 7,640,353 7,660,893 Outside the European Union 985,855 944,969 Total 8,626,208 8,605,862 Income not analysed per country(1) 14,062,387 14,546,874 Total interest receivable and similar income 22,688,595 23,152,736 (1) Income not analysed per country: . Revenue from Investment portfolio and loan substitutes portfolios 217,212 210,003 . Revenue from Operational bond portfolios 106,081 87,568 . Revenue from Operational money-market portfolios 38,350 42,191 . Revenue from money-market operations 146,340 189,863 . Income from derivatives 13,554,404 14,017,249 14,062,387 14,546,874
100
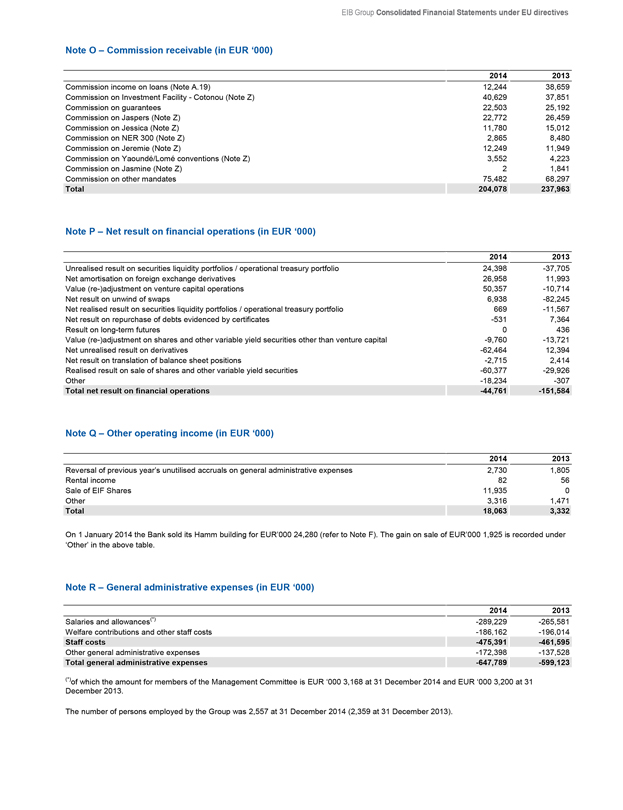
EIB Group Consolidated Financial Statements under EU directives Note O – Commission receivable (in EUR ‘000) 2014 2013 Commission income on loans (Note A.19) 12,244 38,659 Commission on Investment Facility - Cotonou (Note Z) 40,629 37,851 Commission on guarantees 22,503 25,192 Commission on Jaspers (Note Z) 22,772 26,459 Commission on Jessica (Note Z) 11,780 15,012 Commission on NER 300 (Note Z) 2,865 8,480 Commission on Jeremie (Note Z) 12,249 11,949 Commission on Yaoundé/Lomé conventions (Note Z) 3,552 4,223 Commission on Jasmine (Note Z) 2 1,841 Commission on other mandates 75,482 68,297 Total 204,078 237,963 Note P – Net result on financial operations (in EUR ‘000) 2014 2013 Unrealised result on securities liquidity portfolios / operational treasury portfolio 24,398 -37,705 Net amortisation on foreign exchange derivatives 26,958 11,993 Value (re-)adjustment on venture capital operations 50,357 -10,714 Net result on unwind of swaps 6,938 -82,245 Net realised result on securities liquidity portfolios / operational treasury portfolio 669 -11,567 Net result on repurchase of debts evidenced by certificates -531 7,364 Result on long-term futures 0 436 Value (re-)adjustment on shares and other variable yield securities other than venture capital -9,760 -13,721 Net unrealised result on derivatives -62,464 12,394 Net result on translation of balance sheet positions -2,715 2,414 Realised result on sale of shares and other variable yield securities -60,377 -29,926 Other -18,234 -307 Total net result on financial operations -44,761 -151,584 Note Q – Other operating income (in EUR ‘000) 2014 2013 Reversal of previous year’s unutilised accruals on general administrative expenses 2,730 1,805 Rental income 82 56 Sale of EIF Shares 11,935 0 Other 3,316 1,471 Total 18,063 3,332 On 1 January 2014 the Bank sold its Hamm building for EUR’000 24,280 (refer to Note F). The gain on sale of EUR’000 1,925 is recorded under ‘Other’ in the above table. Note R – General administrative expenses (in EUR ‘000) 2014 2013 Salaries and allowances(*) -289,229 -265,581 Welfare contributions and other staff costs -186,162 -196,014 Staff costs -475,391 -461,595 Other general administrative expenses -172,398 -137,528 Total general administrative expenses -647,789 -599,123 (*) of which the amount for members of the Management Committee is EUR ‘000 3,168 at 31 December 2014 and EUR ‘000 3,200 at 31 December 2013. The number of persons employed by the Group was 2,557 at 31 December 2014 (2,359 at 31 December 2013).
101
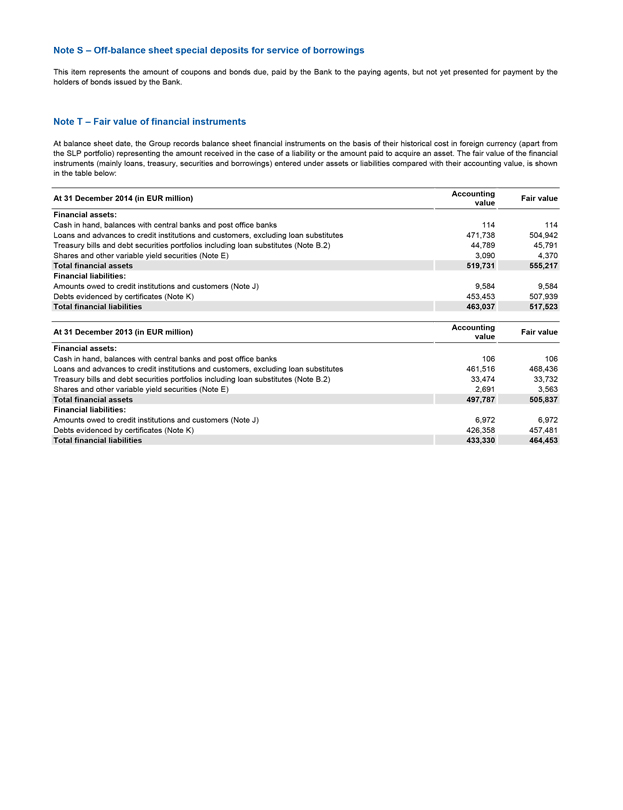
Note S – Off-balance sheet special deposits for service of borrowings This item represents the amount of coupons and bonds due, paid by the Bank to the paying agents, but not yet presented for payment by the holders of bonds issued by the Bank. Note T – Fair value of financial instruments At balance sheet date, the Group records balance sheet financial instruments on the basis of their historical cost in foreign currency (apart from the SLP portfolio) representing the amount received in the case of a liability or the amount paid to acquire an asset. The fair value of the financial instruments (mainly loans, treasury, securities and borrowings) entered under assets or liabilities compared with their accounting value, is shown in the table below: At 31 December 2014 (in EUR million) Accounting value Fair value Financial assets: Cash in hand, balances with central banks and post office banks 114 114 Loans and advances to credit institutions and customers, excluding loan substitutes 471,738 504,942 Treasury bills and debt securities portfolios including loan substitutes (Note B.2) 44,789 45,791 Shares and other variable yield securities (Note E) 3,090 4,370 Total financial assets 519,731 555,217 Financial liabilities: Amounts owed to credit institutions and customers (Note J) 9,584 9,584 Debts evidenced by certificates (Note K) 453,453 507,939 Total financial liabilities 463,037 517,523 At 31 December 2013 (in EUR million) Accounting value Fair value Financial assets: Cash in hand, balances with central banks and post office banks 106 106 Loans and advances to credit institutions and customers, excluding loan substitutes 461,516 468,436 Treasury bills and debt securities portfolios including loan substitutes (Note B.2) 33,474 33,732 Shares and other variable yield securities (Note E) 2,691 3,563 Total financial assets 497,787 505,837 Financial liabilities: Amounts owed to credit institutions and customers (Note J) 6,972 6,972 Debts evidenced by certificates (Note K) 426,358 457,481 Total financial liabilities 433,330 464,453
102
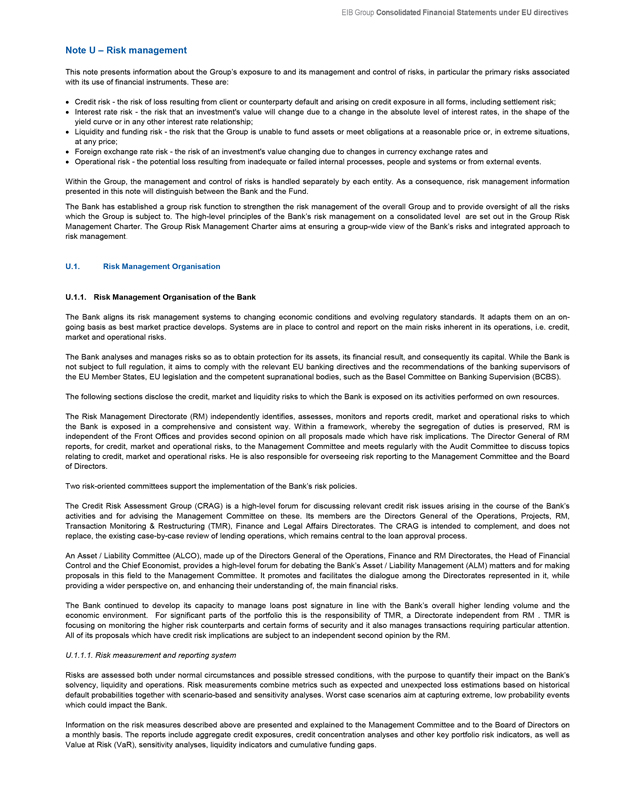
EIB Group Consolidated Financial Statements under EU directives Note U – Risk management This note presents information about the Group’s exposure to and its management and control of risks, in particular the primary risks associated with its use of financial instruments. These are: Credit risk - the risk of loss resulting from client or counterparty default and arising on credit exposure in all forms, including settlement risk; Interest rate risk - the risk that an investment’s value will change due to a change in the absolute level of interest rates, in the shape of the yield curve or in any other interest rate relationship; Liquidity and funding risk - the risk that the Group is unable to fund assets or meet obligations at a reasonable price or, in extreme situations, at any price; Foreign exchange rate risk - the risk of an investment’s value changing due to changes in currency exchange rates and Operational risk - the potential loss resulting from inadequate or failed internal processes, people and systems or from external events. Within the Group, the management and control of risks is handled separately by each entity. As a consequence, risk management information presented in this note will distinguish between the Bank and the Fund. The Bank has established a group risk function to strengthen the risk management of the overall Group and to provide oversight of all the risks which the Group is subject to. The high-level principles of the Bank’s risk management on a consolidated level are set out in the Group Risk Management Charter. The Group Risk Management Charter aims at ensuring a group-wide view of the Bank’s risks and integrated approach to risk management. U.1. Risk Management Organisation U.1.1. Risk Management Organisation of the Bank The Bank aligns its risk management systems to changing economic conditions and evolving regulatory standards. It adapts them on an ongoing basis as best market practice develops. Systems are in place to control and report on the main risks inherent in its operations, i.e. credit, market and operational risks. The Bank analyses and manages risks so as to obtain protection for its assets, its financial result, and consequently its capital. While the Bank is not subject to full regulation, it aims to comply with the relevant EU banking directives and the recommendations of the banking supervisors of the EU Member States, EU legislation and the competent supranational bodies, such as the Basel Committee on Banking Supervision (BCBS). The following sections disclose the credit, market and liquidity risks to which the Bank is exposed on its activities performed on own resources. The Risk Management Directorate (RM) independently identifies, assesses, monitors and reports credit, market and operational risks to which the Bank is exposed in a comprehensive and consistent way. Within a framework, whereby the segregation of duties is preserved, RM is independent of the Front Offices and provides second opinion on all proposals made which have risk implications. The Director General of RM reports, for credit, market and operational risks, to the Management Committee and meets regularly with the Audit Committee to discuss topics relating to credit, market and operational risks. He is also responsible for overseeing risk reporting to the Management Committee and the Board of Directors. Two risk-oriented committees support the implementation of the Bank’s risk policies. The Credit Risk Assessment Group (CRAG) is a high-level forum for discussing relevant credit risk issues arising in the course of the Bank’s activities and for advising the Management Committee on these. Its members are the Directors General of the Operations, Projects, RM, Transaction Monitoring & Restructuring (TMR), Finance and Legal Affairs Directorates. The CRAG is intended to complement, and does not replace, the existing case-by-case review of lending operations, which remains central to the loan approval process. An Asset / Liability Committee (ALCO), made up of the Directors General of the Operations, Finance and RM Directorates, the Head of Financial Control and the Chief Economist, provides a high-level forum for debating the Bank’s Asset / Liability Management (ALM) matters and for making proposals in this field to the Management Committee. It promotes and facilitates the dialogue among the Directorates represented in it, while providing a wider perspective on, and enhancing their understanding of, the main financial risks. The Bank continued to develop its capacity to manage loans post signature in line with the Bank’s overall higher lending volume and the economic environment. For significant parts of the portfolio this is the responsibility of TMR, a Directorate independent from RM . TMR is focusing on monitoring the higher risk counterparts and certain forms of security and it also manages transactions requiring particular attention. All of its proposals which have credit risk implications are subject to an independent second opinion by the RM. U.1.1.1. Risk measurement and reporting system Risks are assessed both under normal circumstances and possible stressed conditions, with the purpose to quantify their impact on the Bank’s solvency, liquidity and operations. Risk measurements combine metrics such as expected and unexpected loss estimations based on historical default probabilities together with scenario-based and sensitivity analyses. Worst case scenarios aim at capturing extreme, low probability events which could impact the Bank. Information on the risk measures described above are presented and explained to the Management Committee and to the Board of Directors on a monthly basis. The reports include aggregate credit exposures, credit concentration analyses and other key portfolio risk indicators, as well as Value at Risk (VaR), sensitivity analyses, liquidity indicators and cumulative funding gaps.
103
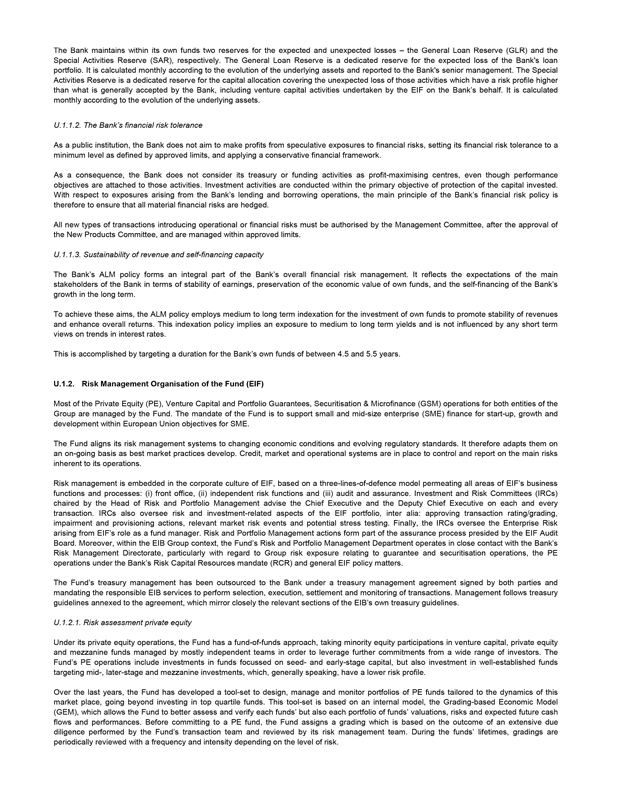
The Bank maintains within its own funds two reserves for the expected and unexpected losses – the General Loan Reserve (GLR) and the Special Activities Reserve (SAR), respectively. The General Loan Reserve is a dedicated reserve for the expected loss of the Bank’s loan portfolio. It is calculated monthly according to the evolution of the underlying assets and reported to the Bank’s senior management. The Special Activities Reserve is a dedicated reserve for the capital allocation covering the unexpected loss of those activities which have a risk profile higher than what is generally accepted by the Bank, including venture capital activities undertaken by the EIF on the Bank’s behalf. It is calculated monthly according to the evolution of the underlying assets. U.1.1.2. The Bank’s financial risk tolerance As a public institution, the Bank does not aim to make profits from speculative exposures to financial risks, setting its financial risk tolerance to a minimum level as defined by approved limits, and applying a conservative financial framework. As a consequence, the Bank does not consider its treasury or funding activities as profit-maximising centres, even though performance objectives are attached to those activities. Investment activities are conducted within the primary objective of protection of the capital invested. With respect to exposures arising from the Bank’s lending and borrowing operations, the main principle of the Bank’s financial risk policy is therefore to ensure that all material financial risks are hedged. All new types of transactions introducing operational or financial risks must be authorised by the Management Committee, after the approval of the New Products Committee, and are managed within approved limits. U.1.1.3. Sustainability of revenue and self-financing capacity The Bank’s ALM policy forms an integral part of the Bank’s overall financial risk management. It reflects the expectations of the main stakeholders of the Bank in terms of stability of earnings, preservation of the economic value of own funds, and the self-financing of the Bank’s growth in the long term. To achieve these aims, the ALM policy employs medium to long term indexation for the investment of own funds to promote stability of revenues and enhance overall returns. This indexation policy implies an exposure to medium to long term yields and is not influenced by any short term views on trends in interest rates. This is accomplished by targeting a duration for the Bank’s own funds of between 4.5 and 5.5 years. U.1.2. Risk Management Organisation of the Fund (EIF) Most of the Private Equity (PE), Venture Capital and Portfolio Guarantees, Securitisation & Microfinance (GSM) operations for both entities of the Group are managed by the Fund. The mandate of the Fund is to support small and mid-size enterprise (SME) finance for start-up, growth and development within European Union objectives for SME. The Fund aligns its risk management systems to changing economic conditions and evolving regulatory standards. It therefore adapts them on an on-going basis as best market practices develop. Credit, market and operational systems are in place to control and report on the main risks inherent to its operations. Risk management is embedded in the corporate culture of EIF, based on a three-lines-of-defence model permeating all areas of EIF’s business functions and processes: (i) front office, (ii) independent risk functions and (iii) audit and assurance. Investment and Risk Committees (IRCs) chaired by the Head of Risk and Portfolio Management advise the Chief Executive and the Deputy Chief Executive on each and every transaction. IRCs also oversee risk and investment-related aspects of the EIF portfolio, inter alia: approving transaction rating/grading, impairment and provisioning actions, relevant market risk events and potential stress testing. Finally, the IRCs oversee the Enterprise Risk arising from EIF’s role as a fund manager. Risk and Portfolio Management actions form part of the assurance process presided by the EIF Audit Board. Moreover, within the EIB Group context, the Fund’s Risk and Portfolio Management Department operates in close contact with the Bank’s Risk Management Directorate, particularly with regard to Group risk exposure relating to guarantee and securitisation operations, the PE operations under the Bank’s Risk Capital Resources mandate (RCR) and general EIF policy matters. The Fund’s treasury management has been outsourced to the Bank under a treasury management agreement signed by both parties and mandating the responsible EIB services to perform selection, execution, settlement and monitoring of transactions. Management follows treasury guidelines annexed to the agreement, which mirror closely the relevant sections of the EIB’s own treasury guidelines. U.1.2.1. Risk assessment private equity Under its private equity operations, the Fund has a fund-of-funds approach, taking minority equity participations in venture capital, private equity and mezzanine funds managed by mostly independent teams in order to leverage further commitments from a wide range of investors. The Fund’s PE operations include investments in funds focussed on seed- and early-stage capital, but also investment in well-established funds targeting mid-, later-stage and mezzanine investments, which, generally speaking, have a lower risk profile. Over the last years, the Fund has developed a tool-set to design, manage and monitor portfolios of PE funds tailored to the dynamics of this market place, going beyond investing in top quartile funds. This tool-set is based on an internal model, the Grading-based Economic Model (GEM), which allows the Fund to better assess and verify each funds’ but also each portfolio of funds’ valuations, risks and expected future cash flows and performances. Before committing to a PE fund, the Fund assigns a grading which is based on the outcome of an extensive due diligence performed by the Fund’s transaction team and reviewed by its risk management team. During the funds’ lifetimes, gradings are periodically reviewed with a frequency and intensity depending on the level of risk.
104
EIB Group Consolidated Financial Statements under EU directives
These efforts, supported by the development of a proprietary IT system and an integrated software (front to back), improve the investment decision-making process and the management of the portfolio’s financial risks and of liquidity, in particular enabling forward-looking and stress-test based decision making.
U.1.2.2. Risk assessment guarantees
The Fund extends portfolio guarantees to financial intermediaries involved in SME financing and provides credit enhancement to SME securitisation transactions. By taking on these risks, it facilitates access to funding, and, in turn, it helps to finance SMEs.
For its guarantee & securitisation business, over the last years, the Fund has developed a tool-set to analyse portfolio guarantees and structured finance transactions in line with best market practices. Before the Fund enters legally into a guarantee transaction, an internal rating is assigned to each new own risk guarantee transaction in accordance with the Fund’s Credit Risk Policy and Model Review Guidelines. The rating is based on internal models, which analyse and summarise the transaction’s credit quality (expected loss concept), considering not only quantitative parameters but also qualitative aspects. Guarantee transactions are monitored regularly, at least quarterly; their statuses are regularly reviewed by EIF IRCs which, depending on their performances, may review their internal ratings. A four-eye principle applies throughout the process, with actions initiated by the front office and reviewed by Risk Management.
The guarantees portfolio is valued according to a mark-to-model approach. The main impact on the valuation of the transactions in the portfolio stems from the assigned rating and the possible subsequent rating changes.
The EIF’s monitoring follows potential negative rating migration and provides the basis for appropriate management of transactions. The Fund’s stress testing methodology is applied at the outset of a transaction and throughout the life of the portfolio, i.e. its scenario analysis with regard to portfolio downgrades and defaults in the portfolio and related impacts on capital allocation and expected losses, as well as on the profit and loss. As is the case for PE, stress tests on the guarantee portfolio are presented regularly to the EIF Board of Directors.
Moreover, within the EIB Group context, the Fund’s Risk and Portfolio Management Department operates in close contact with the European Investment Bank’s Risk Management Directorate, particularly with regard to Group risk exposure relating to guarantee and securitisation operations, the PE operations under the Bank’s Risk Capital Resources mandate (RCR), the different windows under the Bank’s EIB Group Risk Enhancement Mandate (EREM) and general EIF policy matters.
U.2. Credit risk
Credit risk concerns mainly the Group’s lending activities and, to a lesser extent, treasury instruments such as fixed-income securities held in the investment and operational portfolios, certificates of deposit and interbank term deposits as well as the derivative transactions of the Group and the Fund’s guarantee transactions funded by own resources. No credit risk is attached to the Group’s venture capital operations, which are performed entirely through equity participations and are, hence, only exposed to market risk. As regards lending, treasury and derivatives operations, credit risk is managed by an independent Risk Management Directorate under the direct responsibility of the Management Committee of the Bank. The Group has thus established an operationally independent structure for determining and monitoring credit risk.
The credit risk associated with the use of derivatives is analysed in the ‘Derivatives’ section (Note V).
The Group’s policies on credit risk are approved by the respective governing bodies. They set out minimum credit quality levels for both borrowers and guarantors in lending operations and identify the types of security that are deemed acceptable. They also detail the minimum requirements which loan contracts must meet in terms of key legal clauses and other contractual stipulations to ensure that the Bank’s position ranks at least equal to that of other senior lenders, with prompt access to security when required. In addition, via a counterparty and sector limit system, the credit policies ensure an acceptable degree of diversification in the Group’s loan portfolio. The Group’s limit system draws its inspiration from the traditional prudential regulations on concentration and large exposure management contained in the EU banking directives, though the Group generally adopts a more restrictive approach to risk-taking than commercial banks. They Group’s policies on credit risk also set out the minimum credit quality of counterparties of derivatives and treasury transactions as well as the contractual framework for each type of transaction.
Following the capital increase in 2012, the Bank expanded its Credit Risk Policy Guidelines by a dedicated chapter on the remedy of non-compliance events with bank intermediaries, and a dedicated chapter for incremental new lending in connection with the additional capital.
The Fund manages exposures and risks in the frame of conservative policies deriving from statutory provisions and Credit Risk Policy Guidelines approved by the Fund’s Board of Directors or guidelines as set out under mandates.
Credit policies undergo periodic adaptations to incorporate evolving operational circumstances and respond to new mandates that the Group may receive from its shareholders.
Management of credit risk is based, firstly, on the level of credit risk vis-à-vis counterparties and, secondly, on an analysis of the solvency of counterparties.
U.2.1. Loans
In order to limit the credit risk on its loan portfolio, the Group lends only to counterparties with demonstrated long term creditworthiness and with sound guarantees.
In order to measure and manage credit risk on loans, the Group has graded its lending operations according to generally accepted criteria, based on the quality of the borrower, the guarantee and, where appropriate, the guarantor.
105
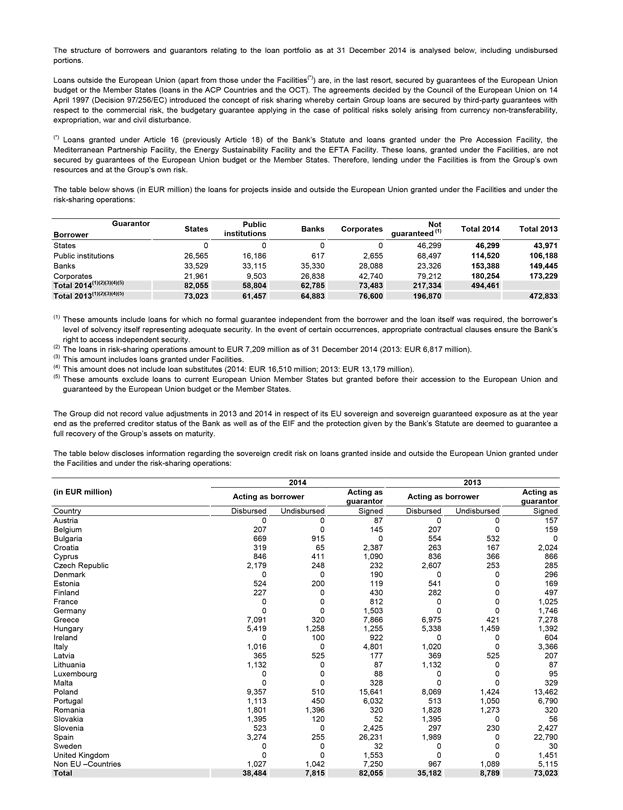
The structure of borrowers and guarantors relating to the loan portfolio as at 31 December 2014 is analysed below, including undisbursed portions.
Loans outside the European Union (apart from those under the Facilities(*)) are, in the last resort, secured by guarantees of the European Union budget or the Member States (loans in the ACP Countries and the OCT). The agreements decided by the Council of the European Union on 14 April 1997 (Decision 97/256/EC) introduced the concept of risk sharing whereby certain Group loans are secured by third-party guarantees with respect to the commercial risk, the budgetary guarantee applying in the case of political risks solely arising from currency non-transferability, expropriation, war and civil disturbance.
(*) Loans granted under Article 16 (previously Article 18) of the Bank’s Statute and loans granted under the Pre Accession Facility, the Mediterranean Partnership Facility, the Energy Sustainability Facility and the EFTA Facility. These loans, granted under the Facilities, are not secured by guarantees of the European Union budget or the Member States. Therefore, lending under the Facilities is from the Group’s own resources and at the Group’s own risk.
The table below shows (in EUR million) the loans for projects inside and outside the European Union granted under the Facilities and under the risk-sharing operations:
Guarantor Borrower States Public institutions Banks Corporates Not guaranteed (1) Total 2014 Total 2013
States 0 0 0 0 46,299 46,299 43,971
Public institutions 26,565 16,186 617 2,655 68,497 114,520 106,188
Banks 33,529 33,115 35,330 28,088 23,326 153,388 149,445
Corporates 21,961 9,503 26,838 42,740 79,212 180,254 173,229
Total 2014(1)(2)(3)(4)(5) 82,055 58,804 62,785 73,483 217,334 494,461
Total 2013(1)(2)(3)(4)(5) 73,023 61,457 64,883 76,600 196,870 472,833
(1) These amounts include loans for which no formal guarantee independent from the borrower and the loan itself was required, the borrower’s level of solvency itself representing adequate security. In the event of certain occurrences, appropriate contractual clauses ensure the Bank’s right to access independent security.
(2) The loans in risk-sharing operations amount to EUR 7,209 million as of 31 December 2014 (2013: EUR 6,817 million).
(3) This amount includes loans granted under Facilities.
(4) This amount does not include loan substitutes (2014: EUR 16,510 million; 2013: EUR 13,179 million).
(5) These amounts exclude loans to current European Union Member States but granted before their accession to the European Union and guaranteed by the European Union budget or the Member States.
The Group did not record value adjustments in 2013 and 2014 in respect of its EU sovereign and sovereign guaranteed exposure as at the year end as the preferred creditor status of the Bank as well as of the EIF and the protection given by the Bank’s Statute are deemed to guarantee a full recovery of the Group’s assets on maturity.
The table below discloses information regarding the sovereign credit risk on loans granted inside and outside the European Union granted under the Facilities and under the risk-sharing operations:
(in EUR million) 2014 2013
Acting as borrower Acting as guarantor Acting as borrower Acting as guarantor
Country Disbursed Undisbursed Signed Disbursed Undisbursed Signed
Austria 0 0 87 0 0 157
Belgium 207 0 145 207 0 159
Bulgaria 669 915 0 554 532 0
Croatia 319 65 2,387 263 167 2,024
Cyprus 846 411 1,090 836 366 866
Czech Republic 2,179 248 232 2,607 253 285
Denmark 0 0 190 0 0 296
Estonia 524 200 119 541 0 169
Finland 227 0 430 282 0 497
France 0 0 812 0 0 1,025
Germany 0 0 1,503 0 0 1,746
Greece 7,091 320 7,866 6,975 421 7,278
Hungary 5,419 1,258 1,255 5,338 1,459 1,392
Ireland 0 100 922 0 0 604
Italy 1,016 0 4,801 1,020 0 3,366
Latvia 365 525 177 369 525 207
Lithuania 1,132 0 87 1,132 0 87
Luxembourg 0 0 88 0 0 95
Malta 0 0 328 0 0 329
Poland 9,357 510 15,641 8,069 1,424 13,462
Portugal 1,113 450 6,032 513 1,050 6,790
Romania 1,801 1,396 320 1,828 1,273 320
Slovakia 1,395 120 52 1,395 0 56
Slovenia 523 0 2,425 297 230 2,427
Spain 3,274 255 26,231 1,989 0 22,790
Sweden 0 0 32 0 0 30
United Kingdom 0 0 1,553 0 0 1,451
Non EU -Countries 1,027 1,042 7,250 967 1,089 5,115
Total 38,484 7,815 82,055 35,182 8,789 73,023
106

EIB Group Consolidated Financial Statements under EU directives
The table below shows (in EUR million) the loans for projects outside the European Union (apart from Article 16 Facility and those falling under the Pre Accession Facility, the Mediterranean Partnership Facility, the Energy Sustainability Facility and the EFTA Facility):
Secured by: 31.12.2014 31.12.2013
Member States 2,641 2,486
European Union budget(1)
42,714 39,800
Total(2) 45,355 42,286
(1) of which EUR 7,209 million in risk-sharing operations as explained above (2013: EUR 6,817 million).
(2) including loans to current European Union Member States but granted before their accession to the European Union and guaranteed by the European Union budget or the Member States.
107
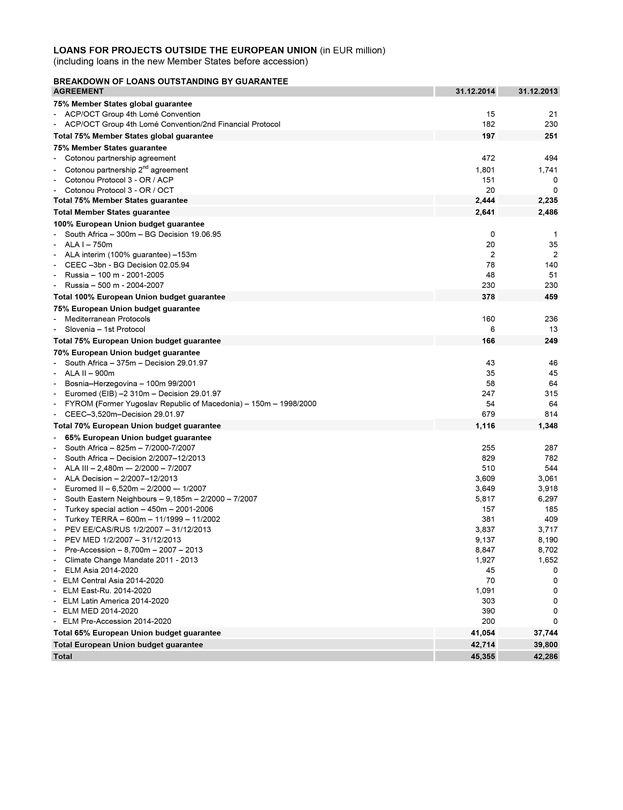
LOANS FOR PROJECTS OUTSIDE THE EUROPEAN UNION (in EUR million)
(including loans in the new Member States before accession)
BREAKDOWN OF LOANS OUTSTANDING BY GUARANTEE
AGREEMENT 31.12.2014 31.12.2013
75% Member States global guarantee
- ACP/OCT Group 4th Lomé Convention 15 21
- ACP/OCT Group 4th Lomé Convention/2nd Financial Protocol 182 230
Total 75% Member States global guarantee 197 251
75% Member States guarantee
- Cotonou partnership agreement 472 494
- Cotonou partnership 2nd agreement 1,801 1,741
- Cotonou Protocol 3 - OR / ACP 151 0
- Cotonou Protocol 3 - OR / OCT 20 0
Total 75% Member States guarantee 2,444 2,235
Total Member States guarantee 2,641 2,486
100% European Union budget guarantee
- South Africa - 300m - BG Decision 19.06.95 0 1
- ALA I - 750m 20 35
- ALA interim (100% guarantee) –153m 2 2
- CEEC –3bn - BG Decision 02.05.94 78 140
- Russia - 100 m - 2001-2005 48 51
- Russia - 500 m - 2004-2007 230 230
Total 100% European Union budget guarantee 378 459
75% European Union budget guarantee
- Mediterranean Protocols 160 236
- Slovenia - 1st Protocol 6 13
Total 75% European Union budget guarantee 166 249
70% European Union budget guarantee
- South Africa - 375m - Decision 29.01.97 43 46
- ALA II - 900m 35 45
- Bosnia–Herzegovina - 100m 99/2001 58 64
- Euromed (EIB) –2 310m - Decision 29.01.97 247 315
- FYROM (Former Yugoslav Republic of Macedonia) - 150m - 1998/2000 54 64
- CEEC–3,520m–Decision 29.01.97 679 814
Total 70% European Union budget guarantee 1,116 1,348
- 65% European Union budget guarantee
- South Africa - 825m - 7/2000-7/2007 255 287
- South Africa - Decision 2/2007–12/2013 829 782
- ALA III - 2,480m –- 2/2000 - 7/2007 510 544
- ALA Decision - 2/2007–12/2013 3,609 3,061
- Euromed II - 6,520m - 2/2000 –- 1/2007 3,649 3,918
- South Eastern Neighbours - 9,185m - 2/2000 - 7/2007 5,817 6,297
- Turkey special action - 450m - 2001-2006 157 185
- Turkey TERRA - 600m - 11/1999 - 11/2002 381 409
- PEV EE/CAS/RUS 1/2/2007 - 31/12/2013 3,837 3,717
- PEV MED 1/2/2007 - 31/12/2013 9,137 8,190
- Pre-Accession - 8,700m - 2007 - 2013 8,847 8,702
- Climate Change Mandate 2011 - 2013 1,927 1,652
- ELM Asia 2014-2020 45 0
- ELM Central Asia 2014-2020 70 0
- ELM East-Ru. 2014-2020 1,091 0
- ELM Latin America 2014-2020 303 0
- ELM MED 2014-2020 390 0
- ELM Pre-Accession 2014-2020 200 0
Total 65% European Union budget guarantee 41,054 37,744
Total European Union budget guarantee 42,714 39,800
Total 45,355 42,286
108
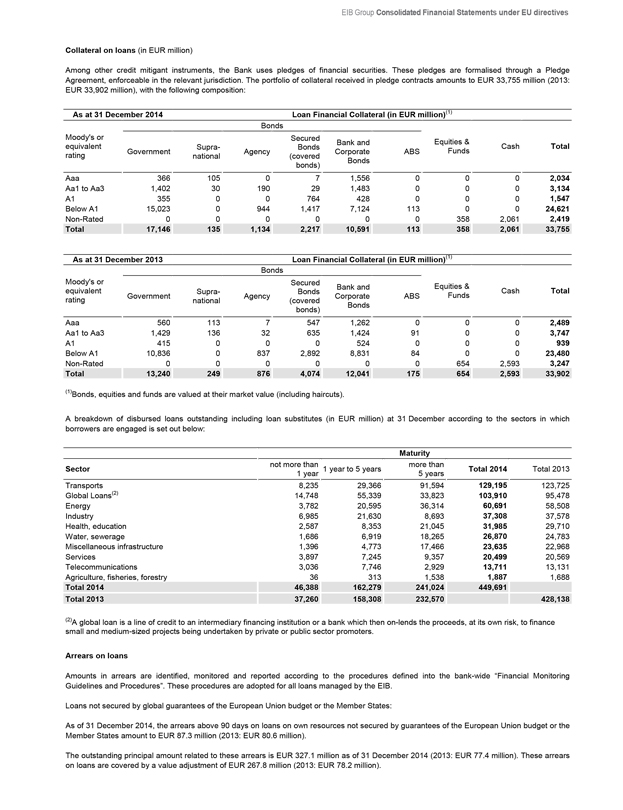
EIB Group Consolidated Financial Statements under EU directives
Collateral on loans (in EUR million)
Among other credit mitigant instruments, the Bank uses pledges of financial securities. These pledges are formalised through a Pledge Agreement, enforceable in the relevant jurisdiction. The portfolio of collateral received in pledge contracts amounts to EUR 33,755 million (2013: EUR 33,902 million), with the following composition:
As at 31 December 2014 Loan Financial Collateral (in EUR million)(1)
Bonds
Moody’s or equivalent rating Government Supra-national Agency Secured Bonds (covered bonds) Bank and Corporate Bonds ABS Equities & Funds Cash Total
Aaa 366 105 0 7 1,556 0 0 0 2,034
Aa1 to Aa3 1,402 30 190 29 1,483 0 0 0 3,134
A1 355 0 0 764 428 0 0 0 1,547
Below A1 15,023 0 944 1,417 7,124 113 0 0 24,621
Non-Rated 0 0 0 0 0 0 358 2,061 2,419
Total 17,146 135 1,134 2,217 10,591 113 358 2,061 33,755
As at 31 December 2013 Loan Financial Collateral (in EUR million)(1)
Bonds
Moody’s or equivalent rating Government Supra-national Agency Secured Bonds (covered bonds) Bank and Corporate Bonds ABS Equities & Funds Cash Total
Aaa 560 113 7 547 1,262 0 0 0 2,489
Aa1 to Aa3 1,429 136 32 635 1,424 91 0 0 3,747
A1 415 0 0 0 524 0 0 0 939
Below A1 10,836 0 837 2,892 8,831 84 0 0 23,480
Non-Rated 0 0 0 0 0 0 654 2,593 3,247
Total 13,240 249 876 4,074 12,041 175 654 2,593 33,902
(1)Bonds, equities and funds are valued at their market value (including haircuts).
A breakdown of disbursed loans outstanding including loan substitutes (in EUR million) at 31 December according to the sectors in which borrowers are engaged is set out below:
Maturity
Sector not more than 1 year 1 year to 5 years more than 5 years Total 2014 Total 2013
Transports 8,235 29,366 91,594 129,195 123,725
Global Loans(2) 14,748 55,339 33,823 103,910 95,478
Energy 3,782 20,595 36,314 60,691 58,508
Industry 6,985 21,630 8,693 37,308 37,578
Health, education 2,587 8,353 21,045 31,985 29,710
Water, sewerage 1,686 6,919 18,265 26,870 24,783
Miscellaneous infrastructure 1,396 4,773 17,466 23,635 22,968
Services 3,897 7,245 9,357 20,499 20,569
Telecommunications 3,036 7,746 2,929 13,711 13,131
Agriculture, fisheries, forestry 36 313 1,538 1,887 1,688
Total 2014 46,388 162,279 241,024 449,691
Total 2013 37,260 158,308 232,570 428,138
(2)A global loan is a line of credit to an intermediary financing institution or a bank which then on-lends the proceeds, at its own risk, to finance small and medium-sized projects being undertaken by private or public sector promoters.
Arrears on loans
Amounts in arrears are identified, monitored and reported according to the procedures defined into the bank-wide “Financial Monitoring Guidelines and Procedures”. These procedures are adopted for all loans managed by the EIB.
Loans not secured by global guarantees of the European Union budget or the Member States:
As of 31 December 2014, the arrears above 90 days on loans on own resources not secured by guarantees of the European Union budget or the Member States amount to EUR 87.3 million (2013: EUR 80.6 million).
The outstanding principal amount related to these arrears is EUR 327.1 million as of 31 December 2014 (2013: EUR 77.4 million). These arrears on loans are covered by a value adjustment of EUR 267.8 million (2013: EUR 78.2 million).
109
Loans secured by guarantees of the European Union budget or the Member States:
Loans for projects located outside the European Union and carried out on the basis of mandates are guaranteed by the European Union, the Member States or on a risk-sharing basis. For such loans, if an instalment remains unpaid, the primary guarantee is first called, where available, otherwise the guarantee of the Member States or of the European Union is officially invoked. According to the guarantee agreements, each unpaid instalment is called individually.
As of 31 December 2014, these arrears above 90 days amount to EUR 10 million (2013: EUR 9.7 million).
Loans called under guarantees of the European Union budget or the Member States:
During 2014 EUR 58.7 million have been called under the guarantee of the European Union budget and nothing under the Member States guarantee. Corresponding amounts in 2013 were EUR 63.3 million and EUR 0.7 million respectively.
The table below gives an overview of the arrears above 90 days on loans:
31.12.2014 31.12.2013
Loans not secured by EU or Member State guarantees
Amount in arrears (EUR’000) 87,253 80,6031
Related principal outstanding (EUR’000) 327,081 77,413
Loans secured by EU or Member State guarantees (callable)
Amount in arrears (EUR’000) 9,999 9,662
Related principal outstanding (EUR’000) 175,156 175,156
Loans called under the EU or Member State guarantees
Amount called (during the year) (EUR’000) 58,707 63,968
Cumulative amount called and not refunded as at year end (EUR’000) 270,892 205,395
1 The amount in arrears is higher than the related principal outstanding since it includes accrued interest, penalties and fees.
Loan renegotiation and forbearance
The Group considers loans to be forborne if in response to adverse changes in the financial position of a borrower the Group renegotiates the original terms of the contractual arrangements with this borrower affecting directly the future cash flows of the financial instrument, which may result in a loss to the Group. However, the financial impact of restructuring activities is in general limited to value adjustment losses, if any, as financial neutrality is generally applied by the Group and reflected in the renegotiated pricing conditions of the operations restructured.
In the normal course of business, the Loan Grading (LG) of the loans in question would have deteriorated and the loan would have been included in the Watch List before renegotiation. Once renegotiated, the Group will continue to closely monitor these loans. If the renegotiated payment terms will not recover the original carrying amount of the asset, the Group will consider to account for value adjustments in the profit and loss account. The corresponding value adjustment will be calculated based on the forecasted cash flows discounted at the original effective interest rate. The need for a value adjustment for all loans whose LG deteriorated to E- is assessed regularly; all loans with a LG of F require a value adjustment. Once the Loan Grading of a loan has improved sufficiently, it will be removed from the Watch List in line with the procedures of the Group.
Forbearance measures and practices undertaken by the Group’s restructuring team during the reporting period includes extension of maturity, deferral of capital only, deferral of capital and interest and capitalisation of arrears. Such forbearance measures do not lead to the derecognition of the underlying operation.
Exposures subject to changes in contractual terms which do not affect future cash flows, such as collateral or other security arrangements or the waiver of contractual rights under covenants, are not considered as forborne and hence those events are not considered as sufficient to indicate the requirement of a value adjustment on their own.
Operations subject to forbearance measures are considered by the Group as forborne until their final maturity and are reported as such in the table below.
(in EUR million) 31.12.2014 31.12.2013
Operations subject to forbearance practices 17 12
Carrying values 1,266 1,091
of which being subject to value adjustments 714 356
Value adjustments recognised 323 159
Interest income in respect of forborne operations 12 24
Exposures written off (following the termination/sale of the operation) 0 30
110
EIB Group Consolidated Financial Statements under EU directives
Forbearance measures
(in EUR million) 31.12.2013 Extension of maturities Deferral of capital only Deferral of capital and interest Other Contractual repayment and termination (1) 31.12.2014
Public 319 0 0 0 0 -28 291
Bank 103 0 0 0 0 -78 25
Corporate 669 112 346 129 106 -412 950
Total 1,091 112 346 129 106 -518 1,266
(1) Decreases are explained by repayments of capital occured during the year on operations already considered as forborne as of 31 December 2013 and by termination during the year.
U.2.2. Treasury
The credit risk associated with treasury (securities, commercial paper, term accounts, etc.) is managed through selecting sound counterparties and issuers.
Limits governing the structure of the securities portfolio and outstanding treasury instruments have been laid down by the Management. These limits are reviewed regularly by the Risk Management Directorate.
The table below provides a percentage breakdown of the credit risk associated with the securities in the Treasury portfolios and the money markets products (deposits and repos) in terms of the credit rating of counterparties and issuers:
Moody’s or equivalent rating Securities portfolio % Treasury instruments %
31.12.2014 31.12.2013 31.12.2014 31.12.2013
Aaa 13 19 2 1
Aa1 to Aa3 18 40 37 33
A1 to A3 37 9 44 52
Below A3 32 32 17 14
Total 100 100 100 100
Collateral on Treasury transactions
Collateral received
The Treasury transactions include EUR 25,415 million (2013: EUR 39,318 million) of tripartite reverse repurchase agreements. These transactions are governed by Tripartite Agreements, for which the exposure is fully collateralised, with daily margin calls. The market value of the collateral portfolio at 31 December 2014 is EUR 26,289 million (2013: EUR 40,965 million), with the following classification:
Tripartite Agreements Collateral (in EUR million)
At 31 December 2014 Bonds
Moody’s or equivalent rating Government Supra-national Agency Secured Bonds (covered bonds) Bank and Corporate Bonds ABS Total
Aaa 792 355 0 6,417 851 201 8,616
Aa1 to Aa3 662 420 0 263 1,215 0 2,560
A1 527 0 0 484 1,301 0 2,312
Below A1 9,576 0 0 10 3,215 0 12,801
Total 11,557 775 0 7,174 6,582 201 26,289
Tripartite Agreements Collateral (in EUR million)
At 31 December 2013 Bonds
Moody’s or equivalent rating Government Supra-national Agency Secured Bonds (covered bonds) Bank and Corporate Bonds ABS Total
Aaa 3,122 665 0 7,524 1,958 150 13,419
Aa1 to Aa3 3,357 1,103 0 210 2,794 0 7,464
A1 647 0 0 176 999 0 1,822
Below A1 13,232 0 0 41 4,987 0 18,260
Total 20,358 1,768 0 7,951 10,738 150 40,965
Securities deposited
In the context of the Eurosystem’s monetary policy operations, the EIB deposited securities with the Central Bank of Luxembourg with a market value of EUR 3.3 billion as at 31 December 2014 (2013: EUR 3.3 billion).
U.2.3. Guarantees granted by the Group in respect of loans granted by third parties
Credit risk arising from the Group’s guarantees and securitisations transactions funded by own resources is managed by risk management policies covered by the Statute and the Credit Risk Policy Guidelines. The Statute limits own-risk guarantees to approximately EUR 9.0 billion. The EUR 5.5 billion exposure at risk at the end of 2014 (2013: EUR 5.1 billion) was well below the statutory limit of EUR 9.0 billion.
111
The Credit Risk Policy Guidelines ensure that the Group continues to develop a diversified guarantee portfolio in terms of product range, geographic coverage, counterparty exposure, obligor exposure, industry concentration and also set out the capital allocation rules based on the ratings of the exposures.
Concentration risk is limited because of the granular nature of the Group’s transactions; typically the underlying portfolios are highly diversified in terms of single obligor concentration, sectors, and also with regard to regional diversification. To cover concentration risk, the Group has strict limits (based on capital allocation) for individual transactions and on originator level (maximum aggregate exposures for originators and originator groups).
In the context of the Group’s own risk guarantee operations, the credit risk is tracked from the very beginning on a deal-by-deal basis whilst adopting a different model analysis approach depending on the granularity and homogeneity of the underlying portfolios. The industry sector exposures are analysed on a deal-by-deal basis through their impact on the ratings assigned by the Group to each transaction or tranche. For instance, dependent on the financial model to analyse the transaction, industry exposures can be reflected in implicit correlation or can be indirectly captured through the assumption on default rate volatility, as a key model input variable.
Furthermore, concentration exposures are analysed in the context of each deal using qualitative measures such as current status and forecast for sectors with high concentrations in the portfolio. Exceptionally, some deals have a concentrated exposure in the same (broad) sector. This is typically captured through increased credit enhancement (e.g. subordination) to the benefit of the Group. Typically, deals with replenishing features have portfolio criteria, such as maximum single obligor, maximum top five obligors, and maximum industry concentration levels. Furthermore, the consideration of sector exposures is part of the Group’s overall portfolio analysis.
Counterparty risk is mitigated by the quality of the Group’s counterparties which are usually major market players. The Group performs additional on-site monitoring visits to ensure compliance with procedures and processes during the transaction life. Stress-test scenarios for the portfolio of guarantees, including extreme case assumptions, are regularly carried out to determine the ability of the capital base to sustain adverse shocks.
U.3. Interest rate risk
Interest rate risk is the volatility in the economic value of, or in the income derived from, the Group’s positions due to adverse movements in market yields or the term structure of interest rates. Exposure to interest rate risk occurs when there are differences in repricing and maturity characteristics of the different asset, liability and hedge instruments.
In measuring and managing interest rate risk, the Group refers to the relevant key principles of the Basel Committee for Banking Supervision (BCBS). The main sources of interest rate risk are: repricing risk, yield curve risk, basis risk and spread risk. An interest rate risk that is particularly relevant for the Group is spread risk. Spread risk is the volatility in the economic value of, or in the income derived from, the Group’s positions due to movements in the funding or lending spread of the Group.
The Group manages its global structural interest rate position on the basis of a notional reference portfolio. The majority of the financial risk indicators and controls in use by the Group apply to this portfolio. Financial indicators and controls for the rest of the activities outside this portfolio only relate to the risks, which are not transferred to it via the transfer pricing system, and which therefore remain with their respective activities, such as the equity risk in the venture capital activity or the interest rate or credit risks taken in those treasury portfolios predominantly managed for yield-enhancement purposes.
U.3.1. Value-at-Risk for the own funds of the Group
The Group’s ALM strategy aims at maintaining a balanced and sustainable revenue profile as well as limiting the volatility of the economic value of the Group. A clear preference has been given to the revenue profile in light of the objective of self-financing of the Group’s growth. This overall objective is achieved by investing the Group’s own funds according to a medium to long term investment profile, implying an own funds duration target of 4.5 – 5.5 years.
Apart from the duration target for own funds, the Group’s balance sheet should be match-funded with respect to currency and interest rate characteristics. However, small deviations are authorised for operational reasons. The net residual positions that arise from outstanding operations are managed within pre-set limits to constrain market risk to minimum levels.
The Risk Management department quantifies the Value at Risk (‘VaR’) of own funds for both interest rates and foreign exchange risk factors. It is measured on the Group’s positions using a 99% confidence level and a one-day time horizon. As at 31 December 2014, the VaR of the Group amounted to EUR 185 million (2013: EUR 204 million). The evolution of the VaR of own funds since 2013 reflects the effective decrease of the volatility of the risk factors and not a change in the risk profile of the Group’s positions.
The computation is based on the so-called Riskmetrics methodology, which assumes a linear dependency between the changes in portfolio or position values and the underlying risk factors. Given the nature of the positions held, the Group deems this assumption appropriate to measure its exposure to interest rate risk. Volatility and correlation data are computed internally on the basis of historical market data.
More generally, the VaR does not purport to measure the worst loss that could be experienced. For this reason, it is complemented by regular stress testing. As of 31 December 2014, the impact of a 200 basis point upward parallel shift of the interest rate curves would reduce the economic value of own funds by EUR 7.76 billion (2013: EUR 6.52 billion).
Among the financial instruments in the Group’s portfolio, some deals (borrowings and associated swaps) present callability options and may be redeemed early, introducing uncertainty as to their final maturity.
112
EIB Group Consolidated Financial Statements under EU directives
At cash flows level all such borrowings are fully hedged by swaps so that they can be considered synthetic floating rate notes indexed to Euribor/Libor.
Below is a summary of the features of the Group’s callable portfolio as of 31 December 2014 and 31 December 2013, where the total nominal amount, the average natural maturity and the average expected maturity (both weighted by the nominal amount of the concerned transactions) are shown per funding currency and per main risk factor involved:
By funding currency (after swap):
31.12.2014 Pay Currency
(in EUR million) EUR JPY USD Total
EUR Pay Notional -2,518 -127 -3,199 -5,844
Average maturity date 16.07.2042 01.05.2028 01.01.2038 30.09.2039
Average expected maturity 04.06.2029 22.07.2017 13.05.2020 17.03.2024
31.12.2013 Pay Currency
(in EUR million) EUR JPY USD Total
EUR Pay Notional -2,591 — -4,723 -7,314
Average maturity date 05.06.2041 — 12.07.2036 03.10.2036
Average expected maturity 29.11.2033 — 12.04.2025 20.07.2026
By risk factor involved:
31.12.2014 Risk factor
(in EUR million) FX level IR curve level IR curve shape Total
EUR Pay Notional -1,581 -4,074 -189 -5,844
Average maturity date 11.12.2033 26.03.2042 07.09.2034 30.09.2039
Average expected maturity 07.09.2020 21.07.2025 25.08.2024 17.03.2024
31.12.2013 Risk factor
(in EUR million) FX level IR curve level IR curve shape Total
EUR Pay Notional -3,122 -4,003 -189 -7,314
Average maturity date 09.12.2033 22.10.2041 15.09.2033 03.10.2036
Average expected maturity 01.09.2023 25.04.2031 18.03.2031 20.07.2026
U.3.2. Interest rate risk management for the Group
The sensitivity of the earnings quantifies the amount of net interest income that would change during the forthcoming 12 months if all interest rate curves rose by one percentage point or decreased by one percentage point. Such exposure stems from the mismatch between interest rate repricing periods, volumes and rates of assets and liabilities that the Group accepts within the approved limits.
With the positions in place as of 31 December 2014, the earnings would increase by EUR 73.2 million (2013: EUR 152.5 million) if interest rates increased by 100 basis points and decrease by EUR 83.1 million (2013: EUR 129.3 million) if interest rates decreased by 100 basis points.
The Group computes the sensitivity measure with dedicated software that simulates earnings on a deal by deal basis. The sensitivity of the earnings is measured on an accruals basis and is calculated under the ‘’ongoing’’ assumption that, over the time horizon analysed, the Group realises the new loan business forecast in the Corporate Operational Plan, maintains exposures within approved limits and executes monetary trades to refinance funding shortages or invest cash excesses. Earnings are simulated on monthly time steps, assuming that all the fixed rate items carry their contractual rate and that all floating rate items are subject to interest rate repricing according to the interest rate scenario applied in the simulation. The monetary trades to refinance funding shortages or invest cash excesses carry rates equal to the money market rates prevailing according to the interest rate scenario applied in the simulation. In line with the current practice of the Group, the model uses the hypothesis that simulated earnings are not distributed to the shareholders, but are used to refinance the Group’s business. The administrative costs are projected according to the forecasts of the Corporate Operational Plan.
The sensitivity of the EIF is computed by taking into consideration the coupon repricing of all the positions present in the EIF treasury portfolio managed by the Group on a deal by deal basis. Each fixed rate asset is assumed to be reinvested at maturity in a new asset with the same residual life of the previous one as of end of year’s date. Positions in floating rate assets are assumed to have quarterly repricing.
U.4. Liquidity risk
Liquidity risk refers to the ability of the Group to fund increases in assets and meet obligations as they come due, without incurring unacceptable losses. It can be further split into funding liquidity risk and market liquidity risk.
Funding liquidity risk is connected to the risk for the Group to be unable to refinance the asset side of its balance sheet and to meet payment obligations punctually and in full out of readily available liquid resources. Funding liquidity risk may have an impact on the volatility in the economic value of, or in the income derived from Group’s positions, due to potentially increasing immediate risks to meet payment obligations and the consequent need to borrow at unattractive conditions.
113

Market liquidity risk is the volatility in the economic value of, or in the income derived from, the Group’s positions due to potential inability to execute a transaction to offset, eliminate or reduce outstanding positions at reasonable market prices. Such an inability may force early liquidation of assets at unattractive prices when it would be better to avoid such liquidation. This risk is tied to the size of the position compared to the liquidity of the instrument being transacted, as well as to potential deterioration of market availability and efficiency.
Liquidity risk management of the Bank
Liquidity risk is managed in order to ensure the regular functioning of the Bank’s core activities at reasonable cost. The main objective of liquidity policy is to ensure that the Bank can always meet its payment obligations punctually and in full. In contrast to commercial banks, the EIB does not have retail deposits but relies on its access to capital markets to raise the funds it on-lends to its clients.
The Bank manages the calendar of its new issues so as to maintain a prudential liquidity buffer. Liquidity planning takes into account the Bank’s needs to service its debt, disbursements on loans and cash flows from the loan portfolio. It also takes into account the sizeable amount of signed but un-disbursed loans, whose disbursements typically take place at the borrowers’ request.
The Bank further assures management of liquidity risk by maintaining a sufficient level of short term liquid assets, and by spreading the maturity dates of its placements according to the forecasts of liquidity needs. Liquidity risk policy also incorporates a floor on treasury levels. The Bank’s total liquidity ratio (defined as a target percentage of annual projected net cash flows) must at all times exceed 25% of the average forecast net annual cash flows for the following year.
The Bank has in place a Contingency Liquidity Plan (CLP), which specifies appropriate decision making procedures and corresponding responsibilities. The CLP has been benchmarked against the “Principles for Sound Liquidity Risk Management and Supervision” by the Basel Committee on Banking Supervision (September 2008). The CLP is subject to ad-hoc updates and is presented to the Management Committee annually for approval.
Regular stress-testing analyses tailored to the specific business model of the EIB are executed as a part of the liquidity risk monitoring and drive the size of the Bank’s liquidity buffer.
On 8 July 2009, the Bank became an eligible counterparty in the Eurosystem’s monetary policy operations, and therefore has been given access to the monetary policy operations of the European Central Bank. The Bank conducts the operations via the Central Bank of Luxembourg, where the Bank maintains deposits to cover the minimum reserve requirement.
Liquidity risk management of the Fund
Liquidity risk is managed in such a way as to protect the value of the paid–in capital, ensure an adequate level of liquidity to meet possible guarantee calls, private equity commitments and administrative expenditure and earn a reasonable return on assets invested with due regard to minimisation of risk.
Liquidity risk measurement
The table hereafter analyses the assets and liabilities of the Group by maturity on the basis of the period remaining between the balance sheet date and the contractual maturity date. Assets and liabilities for which there is no contractual maturity date are classified under “Maturity undefined”.
114
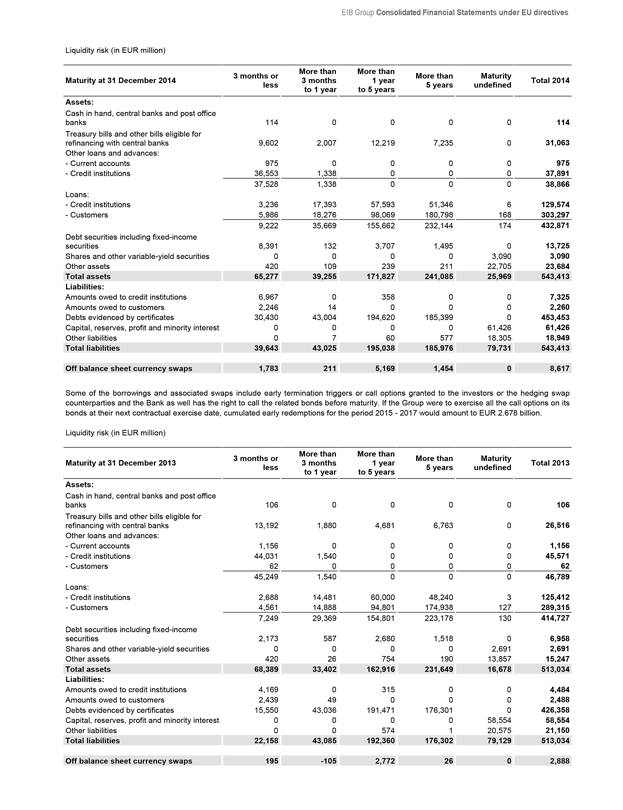
EIB Group Consolidated Financial Statements under EU directives
Liquidity risk (in EUR million)
Maturity at 31 December 2014 3 months or less More than 3 months to 1 year More than 1 year to 5 years More than 5 years Maturity undefined Total 2014
Assets:
Cash in hand, central banks and post office banks 114 0 0 0 0 114
Treasury bills and other bills eligible for refinancing with central banks 9,602 2,007 12,219 7,235 0 31,063
Other loans and advances:
- Current accounts 975 0 0 0 0 975
- Credit institutions 36,553 1,338 0 0 0 37,891
37,528 1,338 0 0 0 38,866
Loans:
- Credit institutions 3,236 17,393 57,593 51,346 6 129,574
- Customers 5,986 18,276 98,069 180,798 168 303,297
9,222 35,669 155,662 232,144 174 432,871
Debt securities including fixed-income securities 8,391 132 3,707 1,495 0 13,725
Shares and other variable-yield securities 0 0 0 0 3,090 3,090
Other assets 420 109 239 211 22,705 23,684
Total assets 65,277 39,255 171,827 241,085 25,969 543,413
Liabilities:
Amounts owed to credit institutions 6,967 0 358 0 0 7,325
Amounts owed to customers 2,246 14 0 0 0 2,260
Debts evidenced by certificates 30,430 43,004 194,620 185,399 0 453,453
Capital, reserves, profit and minority interest 0 0 0 0 61,426 61,426
Other liabilities 0 7 60 577 18,305 18,949
Total liabilities 39,643 43,025 195,038 185,976 79,731 543,413
Off balance sheet currency swaps 1,783 211 5,169 1,454 0 8,617
Some of the borrowings and associated swaps include early termination triggers or call options granted to the investors or the hedging swap counterparties and the Bank as well has the right to call the related bonds before maturity. If the Group were to exercise all the call options on its bonds at their next contractual exercise date, cumulated early redemptions for the period 2015—2017 would amount to EUR 2.678 billion.
Liquidity risk (in EUR million)
Maturity at 31 December 2013 3 months or less More than 3 months to 1 year More than 1 year to 5 years More than 5 years Maturity undefined Total 2013
Assets:
Cash in hand, central banks and post office banks 106 0 0 0 0 106
Treasury bills and other bills eligible for refinancing with central banks 13,192 1,880 4,681 6,763 0 26,516
Other loans and advances:
- Current accounts 1,156 0 0 0 0 1,156
- Credit institutions 44,031 1,540 0 0 0 45,571
- Customers 62 0 0 0 0 62
45,249 1,540 0 0 0 46,789
Loans:
- Credit institutions 2,688 14,481 60,000 48,240 3 125,412
- Customers 4,561 14,888 94,801 174,938 127 289,315
7,249 29,369 154,801 223,178 130 414,727
Debt securities including fixed-income securities 2,173 587 2,680 1,518 0 6,958
Shares and other variable-yield securities 0 0 0 0 2,691 2,691
Other assets 420 26 754 190 13,857 15,247
Total assets 68,389 33,402 162,916 231,649 16,678 513,034
Liabilities:
Amounts owed to credit institutions 4,169 0 315 0 0 4,484
Amounts owed to customers 2,439 49 0 0 0 2,488
Debts evidenced by certificates 15,550 43,036 191,471 176,301 0 426,358
Capital, reserves, profit and minority interest 0 0 0 0 58,554 58,554
Other liabilities 0 0 574 1 20,575 21,150
Total liabilities 22,158 43,085 192,360 176,302 79,129 513,034
Off balance sheet currency swaps 195 -105 2,772 26 0 2,888
115
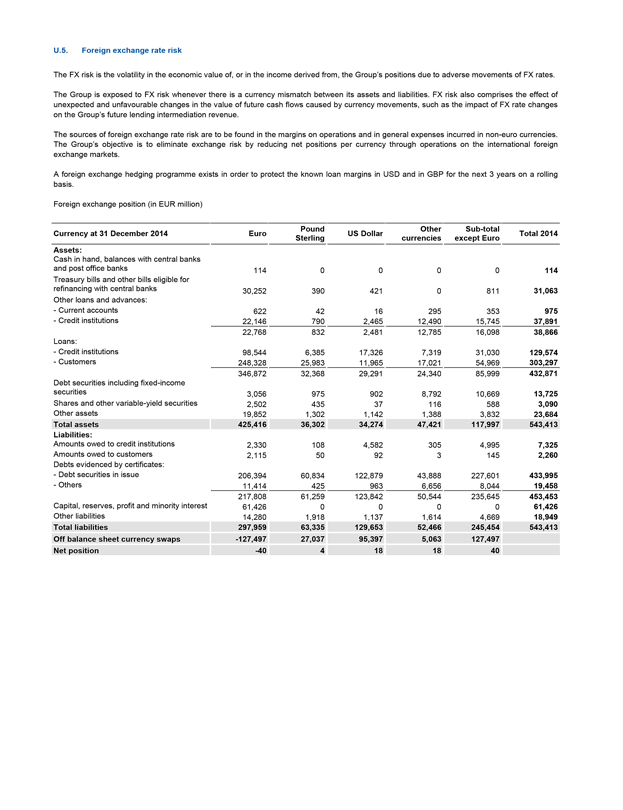
U.5. Foreign exchange rate risk
The FX risk is the volatility in the economic value of, or in the income derived from, the Group’s positions due to adverse movements of FX rates.
The Group is exposed to FX risk whenever there is a currency mismatch between its assets and liabilities. FX risk also comprises the effect of unexpected and unfavourable changes in the value of future cash flows caused by currency movements, such as the impact of FX rate changes on the Group’s future lending intermediation revenue.
The sources of foreign exchange rate risk are to be found in the margins on operations and in general expenses incurred in non-euro currencies. The Group’s objective is to eliminate exchange risk by reducing net positions per currency through operations on the international foreign exchange markets.
A foreign exchange hedging programme exists in order to protect the known loan margins in USD and in GBP for the next 3 years on a rolling basis.
Foreign exchange position (in EUR million)
Currency at 31 December 2014 Euro Pound Sterling US Dollar Other currencies Sub-total except Euro Total 2014
Assets:
Cash in hand, balances with central banks and post office banks 114 0 0 0 0 114
Treasury bills and other bills eligible for refinancing with central banks 30,252 390 421 0 811 31,063
Other loans and advances:
- Current accounts 622 42 16 295 353 975
- Credit institutions 22,146 790 2,465 12,490 15,745 37,891
22,768 832 2,481 12,785 16,098 38,866
Loans:
- Credit institutions 98,544 6,385 17,326 7,319 31,030 129,574
- Customers 248,328 25,983 11,965 17,021 54,969 303,297
346,872 32,368 29,291 24,340 85,999 432,871
Debt securities including fixed-income securities 3,056 975 902 8,792 10,669 13,725
Shares and other variable-yield securities 2,502 435 37 116 588 3,090
Other assets 19,852 1,302 1,142 1,388 3,832 23,684
Total assets 425,416 36,302 34,274 47,421 117,997 543,413
Liabilities:
Amounts owed to credit institutions 2,330 108 4,582 305 4,995 7,325
Amounts owed to customers 2,115 50 92 3 145 2,260
Debts evidenced by certificates:
- Debt securities in issue 206,394 60,834 122,879 43,888 227,601 433,995
- Others 11,414 425 963 6,656 8,044 19,458
217,808 61,259 123,842 50,544 235,645 453,453
Capital, reserves, profit and minority interest 61,426 0 0 0 0 61,426
Other liabilities 14,280 1,918 1,137 1,614 4,669 18,949
Total liabilities 297,959 63,335 129,653 52,466 245,454 543,413
Off balance sheet currency swaps -127,497 27,037 95,397 5,063 127,497
Net position -40 4 18 18 40
116
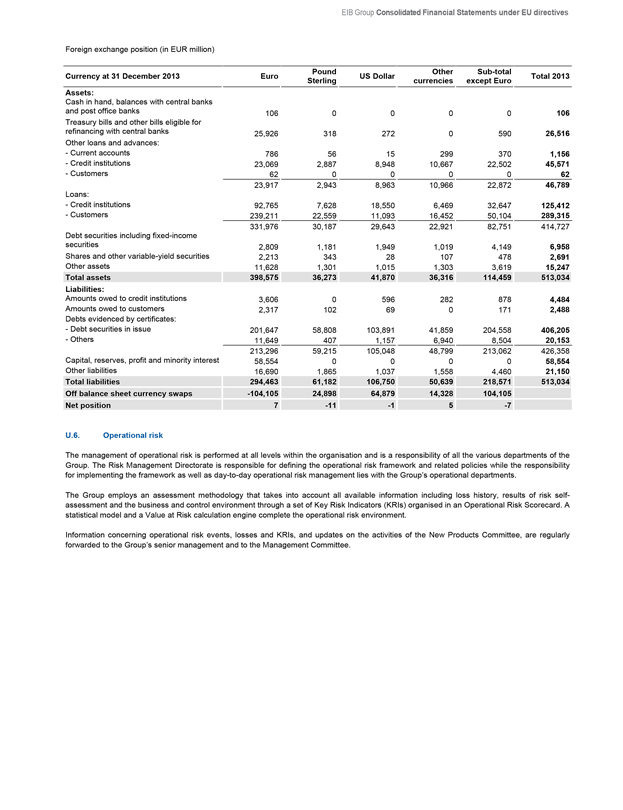
EIB Group Consolidated Financial Statements under EU directives
Foreign exchange position (in EUR million)
Currency at 31 December 2013 Euro Pound Sterling US Dollar Other currencies Sub-total except Euro Total 2013
Assets:
Cash in hand, balances with central banks and post office banks 106 0 0 0 0 106
Treasury bills and other bills eligible for refinancing with central banks 25,926 318 272 0 590 26,516
Other loans and advances:
- Current accounts 786 56 15 299 370 1,156
- Credit institutions 23,069 2,887 8,948 10,667 22,502 45,571
- Customers 62 0 0 0 0 62
23,917 2,943 8,963 10,966 22,872 46,789
Loans:
- Credit institutions 92,765 7,628 18,550 6,469 32,647 125,412
- Customers 239,211 22,559 11,093 16,452 50,104 289,315
331,976 30,187 29,643 22,921 82,751 414,727
Debt securities including fixed-income securities 2,809 1,181 1,949 1,019 4,149 6,958
Shares and other variable-yield securities 2,213 343 28 107 478 2,691
Other assets 11,628 1,301 1,015 1,303 3,619 15,247
Total assets 398,575 36,273 41,870 36,316 114,459 513,034
Liabilities:
Amounts owed to credit institutions 3,606 0 596 282 878 4,484
Amounts owed to customers 2,317 102 69 0 171 2,488
Debts evidenced by certificates:
- Debt securities in issue 201,647 58,808 103,891 41,859 204,558 406,205
- Others 11,649 407 1,157 6,940 8,504 20,153
213,296 59,215 105,048 48,799 213,062 426,358
Capital, reserves, profit and minority interest 58,554 0 0 0 0 58,554
Other liabilities 16,690 1,865 1,037 1,558 4,460 21,150
Total liabilities 294,463 61,182 106,750 50,639 218,571 513,034
Off balance sheet currency swaps -104,105 24,898 64,879 14,328 104,105
Net position 7 -11 -1 5 -7
U.6. Operational risk
The management of operational risk is performed at all levels within the organisation and is a responsibility of all the various departments of the Group. The Risk Management Directorate is responsible for defining the operational risk framework and related policies while the responsibility for implementing the framework as well as day-to-day operational risk management lies with the Group’s operational departments.
The Group employs an assessment methodology that takes into account all available information including loss history, results of risk self-assessment and the business and control environment through a set of Key Risk Indicators (KRIs) organised in an Operational Risk Scorecard. A statistical model and a Value at Risk calculation engine complete the operational risk environment.
Information concerning operational risk events, losses and KRIs, and updates on the activities of the New Products Committee, are regularly forwarded to the Group’s senior management and to the Management Committee.
117
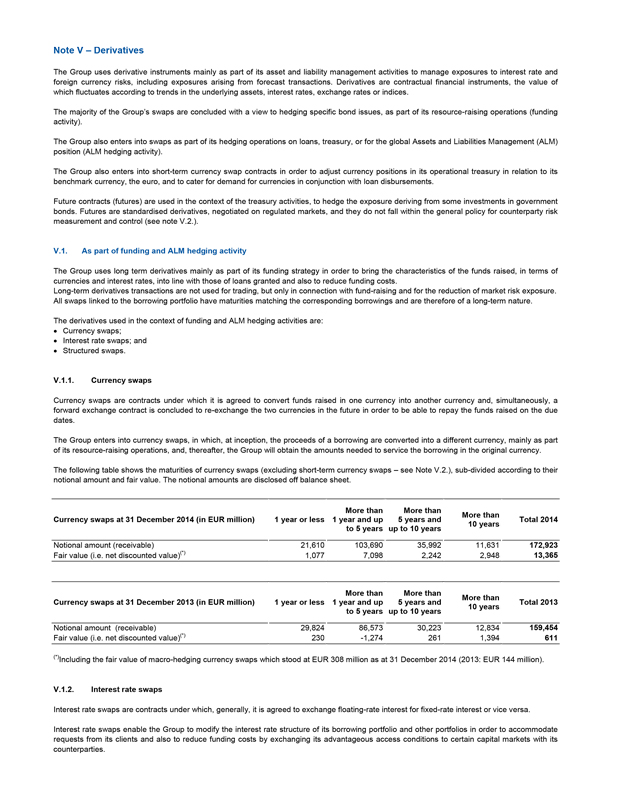
Note V – Derivatives
The Group uses derivative instruments mainly as part of its asset and liability management activities to manage exposures to interest rate and foreign currency risks, including exposures arising from forecast transactions. Derivatives are contractual financial instruments, the value of which fluctuates according to trends in the underlying assets, interest rates, exchange rates or indices.
The majority of the Group’s swaps are concluded with a view to hedging specific bond issues, as part of its resource-raising operations (funding activity).
The Group also enters into swaps as part of its hedging operations on loans, treasury, or for the global Assets and Liabilities Management (ALM) position (ALM hedging activity).
The Group also enters into short-term currency swap contracts in order to adjust currency positions in its operational treasury in relation to its benchmark currency, the euro, and to cater for demand for currencies in conjunction with loan disbursements.
Future contracts (futures) are used in the context of the treasury activities, to hedge the exposure deriving from some investments in government bonds. Futures are standardised derivatives, negotiated on regulated markets, and they do not fall within the general policy for counterparty risk measurement and control (see note V.2.).
V.1. As part of funding and ALM hedging activity
The Group uses long term derivatives mainly as part of its funding strategy in order to bring the characteristics of the funds raised, in terms of currencies and interest rates, into line with those of loans granted and also to reduce funding costs.
Long-term derivatives transactions are not used for trading, but only in connection with fund-raising and for the reduction of market risk exposure. All swaps linked to the borrowing portfolio have maturities matching the corresponding borrowings and are therefore of a long-term nature.
The derivatives used in the context of funding and ALM hedging activities are:
Currency swaps;
Interest rate swaps; and
Structured swaps.
V.1.1. Currency swaps
Currency swaps are contracts under which it is agreed to convert funds raised in one currency into another currency and, simultaneously, a forward exchange contract is concluded to re-exchange the two currencies in the future in order to be able to repay the funds raised on the due dates.
The Group enters into currency swaps, in which, at inception, the proceeds of a borrowing are converted into a different currency, mainly as part of its resource-raising operations, and, thereafter, the Group will obtain the amounts needed to service the borrowing in the original currency.
The following table shows the maturities of currency swaps (excluding short-term currency swaps – see Note V.2.), sub-divided according to their notional amount and fair value. The notional amounts are disclosed off balance sheet.
Currency swaps at 31 December 2014 (in EUR million) 1 year or less More than 1 year and up to 5 years More than 5 years and up to 10 years More than 10 years Total 2014
Notional amount (receivable) 21,610 103,690 35,992 11,631 172,923
Fair value (i.e. net discounted value)(*) 1,077 7,098 2,242 2,948 13,365
Currency swaps at 31 December 2013 (in EUR million) 1 year or less More than 1 year and up to 5 years More than 5 years and up to 10 years More than 10 years Total 2013
Notional amount (receivable) 29,824 86,573 30,223 12,834 159,454
Fair value (i.e. net discounted value)(*) 230 -1,274 261 1,394 611
(*)Including the fair value of macro-hedging currency swaps which stood at EUR 308 million as at 31 December 2014 (2013: EUR 144 million).
V.1.2. Interest rate swaps
Interest rate swaps are contracts under which, generally, it is agreed to exchange floating-rate interest for fixed-rate interest or vice versa.
Interest rate swaps enable the Group to modify the interest rate structure of its borrowing portfolio and other portfolios in order to accommodate requests from its clients and also to reduce funding costs by exchanging its advantageous access conditions to certain capital markets with its counterparties.
118
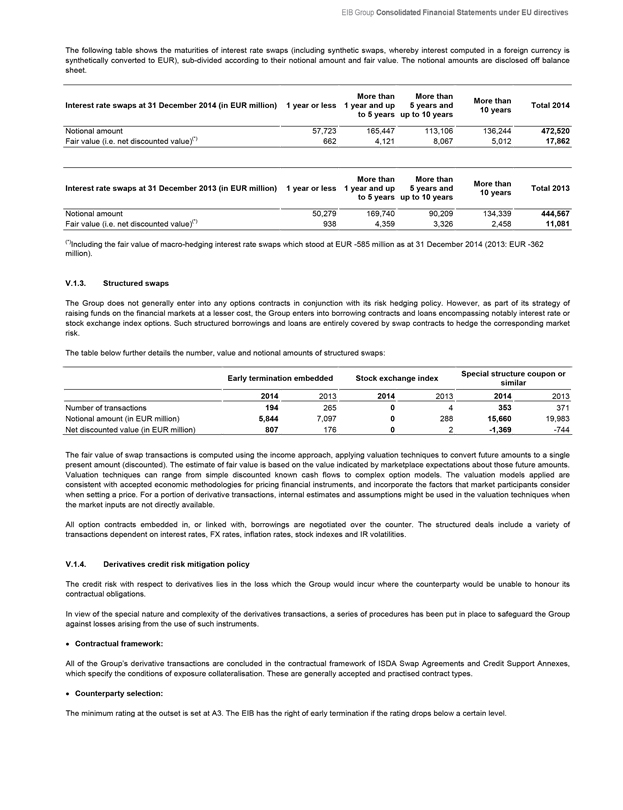
EIB Group Consolidated Financial Statements under EU directives
The following table shows the maturities of interest rate swaps (including synthetic swaps, whereby interest computed in a foreign currency is synthetically converted to EUR), sub-divided according to their notional amount and fair value. The notional amounts are disclosed off balance sheet.
Interest rate swaps at 31 December 2014 (in EUR million) 1 year or less More than 1 year and up to 5 years More than 5 years and up to 10 years More than 10 years Total 2014
Notional amount 57,723 165,447 113,106 136,244 472,520
Fair value (i.e. net discounted value)(*) 662 4,121 8,067 5,012 17,862
Interest rate swaps at 31 December 2013 (in EUR million) 1 year or less More than 1 year and up to 5 years More than 5 years and up to 10 years More than 10 years Total 2013
Notional amount 50,279 169,740 90,209 134,339 444,567
Fair value (i.e. net discounted value)(*) 938 4,359 3,326 2,458 11,081
(*)Including the fair value of macro-hedging interest rate swaps which stood at EUR -585 million as at 31 December 2014 (2013: EUR -362 million).
V.1.3. Structured swaps
The Group does not generally enter into any options contracts in conjunction with its risk hedging policy. However, as part of its strategy of raising funds on the financial markets at a lesser cost, the Group enters into borrowing contracts and loans encompassing notably interest rate or stock exchange index options. Such structured borrowings and loans are entirely covered by swap contracts to hedge the corresponding market risk.
The table below further details the number, value and notional amounts of structured swaps:
Notional amount (in EUR million) 5,844 7,097 0 288 15,660 19,983
Net discounted value (in EUR million) 807 176 0 2 -1,369 -744
The fair value of swap transactions is computed using the income approach, applying valuation techniques to convert future amounts to a single present amount (discounted). The estimate of fair value is based on the value indicated by marketplace expectations about those future amounts. Valuation techniques can range from simple discounted known cash flows to complex option models. The valuation models applied are consistent with accepted economic methodologies for pricing financial instruments, and incorporate the factors that market participants consider when setting a price. For a portion of derivative transactions, internal estimates and assumptions might be used in the valuation techniques when the market inputs are not directly available.
All option contracts embedded in, or linked with, borrowings are negotiated over the counter. The structured deals include a variety of transactions dependent on interest rates, FX rates, inflation rates, stock indexes and IR volatilities.
V.1.4. Derivatives credit risk mitigation policy
The credit risk with respect to derivatives lies in the loss which the Group would incur where the counterparty would be unable to honour its contractual obligations.
In view of the special nature and complexity of the derivatives transactions, a series of procedures has been put in place to safeguard the Group against losses arising from the use of such instruments.
• Contractual framework:
All of the Group’s derivative transactions are concluded in the contractual framework of ISDA Swap Agreements and Credit Support Annexes, which specify the conditions of exposure collateralisation. These are generally accepted and practised contract types.
• Counterparty selection:
The minimum rating at the outset is set at A3. The EIB has the right of early termination if the rating drops below a certain level.
119
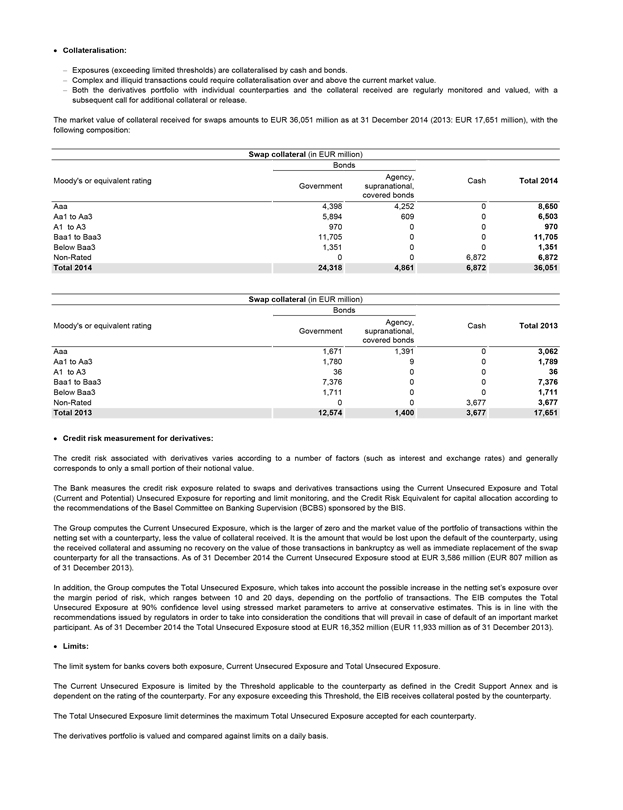
• Collateralisation:
- Exposures (exceeding limited thresholds) are collateralised by cash and bonds.
- Complex and illiquid transactions could require collateralisation over and above the current market value.
- Both the derivatives portfolio with individual counterparties and the collateral received are regularly monitored and valued, with a subsequent call for additional collateral or release.
The market value of collateral received for swaps amounts to EUR 36,051 million as at 31 December 2014 (2013: EUR 17,651 million), with the following composition:
Swap collateral (in EUR million)
Bonds
Moody’s or equivalent rating Agency, Cash Total 2014
Government supranational,
covered bonds
Aaa 4,398 4,252 0 8,650
Aa1 to Aa3 5,894 609 0 6,503
A1 to A3 970 0 0 970
Baa1 to Baa3 11,705 0 0 11,705
Below Baa3 1,351 0 0 1,351
Non-Rated 0 0 6,872 6,872
Total 2014 24,318 4,861 6,872 36,051
Swap collateral (in EUR million)
Bonds
Moody’s or equivalent rating Agency, Cash Total 2013
Government supranational,
covered bonds
Aaa 1,671 1,391 0 3,062
Aa1 to Aa3 1,780 9 0 1,789
A1 to A3 36 0 0 36
Baa1 to Baa3 7,376 0 0 7,376
Below Baa3 1,711 0 0 1,711
Non-Rated 0 0 3,677 3,677
Total 2013 12,574 1,400 3,677 17,651
• Credit risk measurement for derivatives:
The credit risk associated with derivatives varies according to a number of factors (such as interest and exchange rates) and generally corresponds to only a small portion of their notional value.
The Bank measures the credit risk exposure related to swaps and derivatives transactions using the Current Unsecured Exposure and Total (Current and Potential) Unsecured Exposure for reporting and limit monitoring, and the Credit Risk Equivalent for capital allocation according to the recommendations of the Basel Committee on Banking Supervision (BCBS) sponsored by the BIS.
The Group computes the Current Unsecured Exposure, which is the larger of zero and the market value of the portfolio of transactions within the netting set with a counterparty, less the value of collateral received. It is the amount that would be lost upon the default of the counterparty, using the received collateral and assuming no recovery on the value of those transactions in bankruptcy as well as immediate replacement of the swap counterparty for all the transactions. As of 31 December 2014 the Current Unsecured Exposure stood at EUR 3,586 million (EUR 807 million as of 31 December 2013).
In addition, the Group computes the Total Unsecured Exposure, which takes into account the possible increase in the netting set’s exposure over the margin period of risk, which ranges between 10 and 20 days, depending on the portfolio of transactions. The EIB computes the Total Unsecured Exposure at 90% confidence level using stressed market parameters to arrive at conservative estimates. This is in line with the recommendations issued by regulators in order to take into consideration the conditions that will prevail in case of default of an important market participant. As of 31 December 2014 the Total Unsecured Exposure stood at EUR 16,352 million (EUR 11,933 million as of 31 December 2013).
• Limits:
The limit system for banks covers both exposure, Current Unsecured Exposure and Total Unsecured Exposure.
The Current Unsecured Exposure is limited by the Threshold applicable to the counterparty as defined in the Credit Support Annex and is dependent on the rating of the counterparty. For any exposure exceeding this Threshold, the EIB receives collateral posted by the counterparty.
The Total Unsecured Exposure limit determines the maximum Total Unsecured Exposure accepted for each counterparty.
The derivatives portfolio is valued and compared against limits on a daily basis.
120
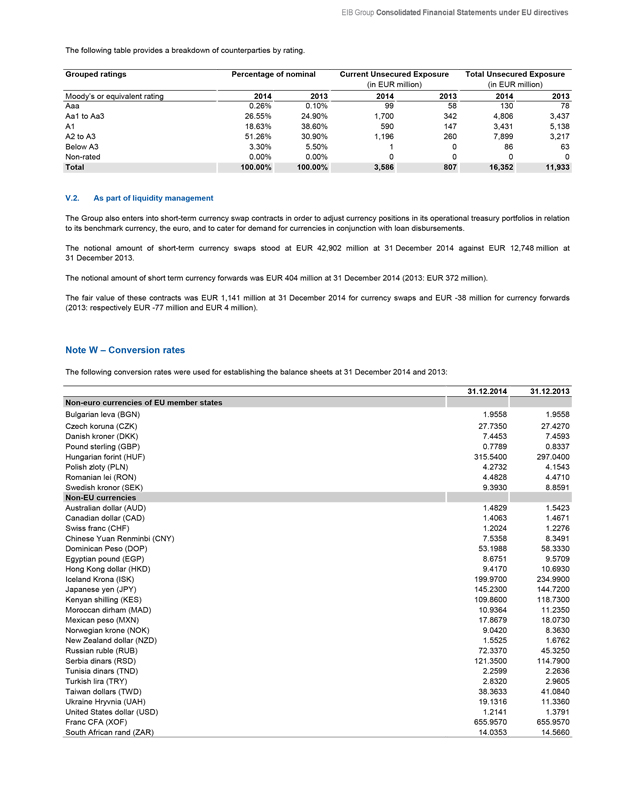
EIB Group Consolidated Financial Statements under EU directives
The following table provides a breakdown of counterparties by rating.
Grouped ratings Percentage of nominal Current Unsecured Exposure Total Unsecured Exposure
(in EUR million) (in EUR million)
Moody’s or equivalent rating 2014 2013 2014 2013 2014 2013
Aaa 0.26% 0.10% 99 58 130 78
Aa1 to Aa3 26.55% 24.90% 1,700 342 4,806 3,437
A1 18.63% 38.60% 590 147 3,431 5,138
A2 to A3 51.26% 30.90% 1,196 260 7,899 3,217
Below A3 3.30% 5.50% 1 0 86 63
Non-rated 0.00% 0.00% 0 0 0 0
Total 100.00% 100.00% 3,586 807 16,352 11,933
V.2. As part of liquidity management
The Group also enters into short-term currency swap contracts in order to adjust currency positions in its operational treasury portfolios in relation to its benchmark currency, the euro, and to cater for demand for currencies in conjunction with loan disbursements.
The notional amount of short-term currency swaps stood at EUR 42,902 million at 31 December 2014 against EUR 12,748 million at
31 December 2013.
The notional amount of short term currency forwards was EUR 404 million at 31 December 2014 (2013: EUR 372 million).
The fair value of these contracts was EUR 1,141 million at 31 December 2014 for currency swaps and EUR -38 million for currency forwards (2013: respectively EUR -77 million and EUR 4 million).
Note W – Conversion rates
The following conversion rates were used for establishing the balance sheets at 31 December 2014 and 2013:
31.12.2014 31.12.2013
Non-euro currencies of EU member states
Bulgarian leva (BGN) 1.9558 1.9558
Czech koruna (CZK) 27.7350 27.4270
Danish kroner (DKK) 7.4453 7.4593
Pound sterling (GBP) 0.7789 0.8337
Hungarian forint (HUF) 315.5400 297.0400
Polish zloty (PLN) 4.2732 4.1543
Romanian lei (RON) 4.4828 4.4710
Swedish kronor (SEK) 9.3930 8.8591
Non-EU currencies
Australian dollar (AUD) 1.4829 1.5423
Canadian dollar (CAD) 1.4063 1.4671
Swiss franc (CHF) 1.2024 1.2276
Chinese Yuan Renminbi (CNY) 7.5358 8.3491
Dominican Peso (DOP) 53.1988 58.3330
Egyptian pound (EGP) 8.6751 9.5709
Hong Kong dollar (HKD) 9.4170 10.6930
Iceland Krona (ISK) 199.9700 234.9900
Japanese yen (JPY) 145.2300 144.7200
Kenyan shilling (KES) 109.8600 118.7300
Moroccan dirham (MAD) 10.9364 11.2350
Mexican peso (MXN) 17.8679 18.0730
Norwegian krone (NOK) 9.0420 8.3630
New Zealand dollar (NZD) 1.5525 1.6762
Russian ruble (RUB) 72.3370 45.3250
Serbia dinars (RSD) 121.3500 114.7900
Tunisia dinars (TND) 2.2599 2.2636
Turkish lira (TRY) 2.8320 2.9605
Taiwan dollars (TWD) 38.3633 41.0840
Ukraine Hryvnia (UAH) 19.1316 11.3360
United States dollar (USD) 1.2141 1.3791
Franc CFA (XOF) 655.9570 655.9570
South African rand (ZAR) 14.0353 14.5660
121
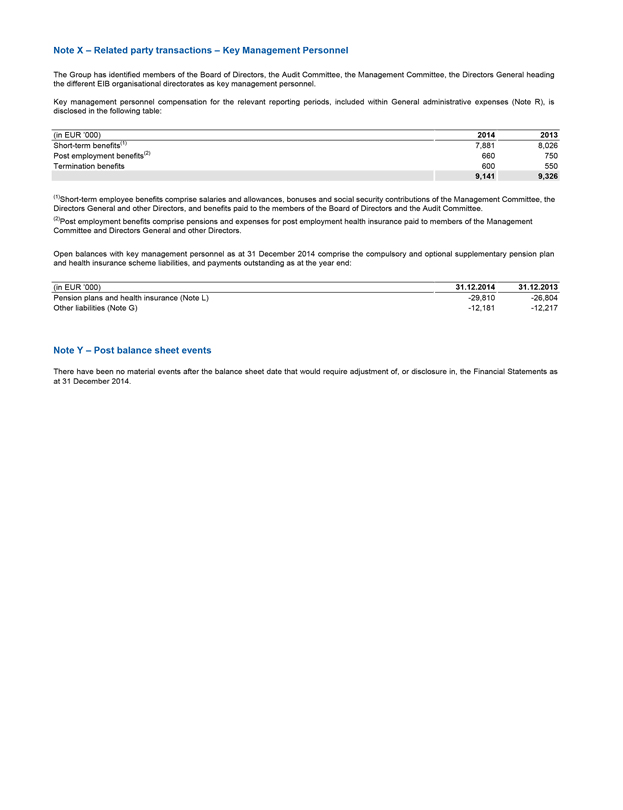
Note X – Related party transactions – Key Management Personnel
The Group has identified members of the Board of Directors, the Audit Committee, the Management Committee, the Directors General heading the different EIB organisational directorates as key management personnel.
Key management personnel compensation for the relevant reporting periods, included within General administrative expenses (Note R), is disclosed in the following table:
| | | | |
| (in EUR ’000) | | 2014 | | 2013 |
| Short-term benefits(1) | | 7,881 | | 8,026 |
| Post employment benefits(2) | | 660 | | 750 |
| Termination benefits | | 600 | | 550 |
| | 9,141 | | 9,326 |
(1)Short-term employee benefits comprise salaries and allowances, bonuses and social security contributions of the Management Committee, the Directors General and other Directors, and benefits paid to the members of the Board of Directors and the Audit Committee.
(2)Post employment benefits comprise pensions and expenses for post employment health insurance paid to members of the Management Committee and Directors General and other Directors.
Open balances with key management personnel as at 31 December 2014 comprise the compulsory and optional supplementary pension plan and health insurance scheme liabilities, and payments outstanding as at the year end:
| | | | |
| (in EUR ’000) | | 31.12.2014 | | 31.12.2013 |
| Pension plans and health insurance (Note L) | | -29,810 | | -26,804 |
| Other liabilities (Note G) | | -12,181 | | -12,217 |
Note Y – Post balance sheet events
There have been no material events after the balance sheet date that would require adjustment of, or disclosure in, the Financial Statements as at 31 December 2014.
122
EIB Group Consolidated Financial Statements under EU directives
Note Z – Management of third party funds
Z.1. Investment Facility – Cotonou
The Investment Facility, which is managed by the EIB, has been established within the framework of the Cotonou Agreement on cooperation and development of the African, Caribbean and Pacific Group of States and the European Union and its Member States on 23 June 2000 and subsequently revised. The EIB prepares separate financial statements for the Investment Facility.
Z.2. Guarantee Fund
The Guarantee Fund for External Actions was set up in 1994 to cover defaults on loans and loan guarantees granted to non-Member States or for projects in non-Member States. The European Commission (‘EC’) entrusted financial management of the Guarantee Fund to the EIB under an agreement signed between the two parties in November 1994. The EIB prepares separate financial statements for the Guarantee Fund.
Z.3. NER300
The EIB supports the EC as an agent in the implementation of the NER 300 initiative - a funding programme for carbon capture and storage demonstration projects and innovative renewable energy technologies. The EIB prepares separate financial statements for NER300.
Z.4. JESSICA (Contribution and Holding Funds)
JESSICA (The Joint European Support for Sustainable Investment in City Area) is an initiative developed by the EC and the EIB, in collaboration with the Council of Europe Development Bank.
Under new procedures, Managing Authorities are being given the option of using some of their EU grant funding to make repayable investments in projects forming part of an integrated plan for sustainable urban development. These investments are delivered to projects via Urban Development Funds or if required Holding Funds (JESSICA Holding Funds).
JESSICA Holding Funds are used in the context of the JESSICA initiative. As Manager, EIB gathers the funding received from the Managing Authorities and invests it in Urban Development Funds, according to investment guidelines agreed with the donors. The EIB prepares separate financial statements for JESSICA.
Z.5. Risk-Sharing Finance Facility (‘RSFF’)
The RSFF has been established within the framework of the Co-operation Agreement, entered into force on 5 June 2007 between the EC on behalf of the European Union and the EIB. The RSFF aims at fostering investment in research, technological development and demonstration, and innovation. As part of the RSFF, the EIF set up the Risk Sharing Instrument for Innovative and Research oriented SMEs and small Mid-Caps (‘RSI’). The RSI provides guarantees to banks and leasing companies for loans and financial leases to research-based small and medium-sized enterprises (SMEs) and small Mid-Caps. The EIB prepares separate financial statements for the RSFF.
Z.6. EU-Africa Infrastructure Trust Fund (the ‘Trust Fund’)
The Trust Fund has been created within the framework of the Trust Fund Agreement between the EC on behalf of the European Union as the Founding Donor and the EIB as Manager, also open to Member States of the European Union which subsequently accede to this agreement as Donors. On 9 February 2006, the EC and the EIB Group signed a Memorandum of Understanding to promote jointly the EU-Africa Infrastructure Partnership and, in particular, to establish a supporting EU-Africa Infrastructure Trust Fund. The EIB prepares separate financial statements for the Trust Fund.
Z.7. Special Section
The Special Section was set up by the Board of Governors on 27 May 1963. Under a decision taken on 4 August 1977, its purpose was redefined as being that of recording financing operations carried out by the EIB for the account of and under mandate from third parties. It includes the FED, MED/FEMIP, IPA (Instrument for Pre-Accession) and Turkey mandates.
Z.8. InnovFin (incl. InnovFin SME Guarantee)
The InnovFin or “InnovFin-EU Finance for Innovators” is a joint initiative between the EIB, the EIF and the European Commission under the new EU research programme for 2014-2020 “Horizon 2020”. On 11 December 2013, Regulation (EU) N 1291/2013 of the European Parliament and the Council establishing Horizon 2020 – the Framework Programme for Research and Innovation (2014-2020) and repealing Decision N 1982/2006/EC (“Horizon 2020 Regulation”) was adopted. On 12 June 2014 the European Commission, the EIB and the EIF signed a Delegation Agreement establishing the financial instrument InnovFin. InnovFin consists of a series of integrated and complementary financing tools and advisory services offered by the EIB Group, covering the entire value chain of research and innovation (R&I) in order to support investments from the smallest to the largest enterprise. The EIB prepares separate financial statements for the InnovFin.
123
Z.9. JEREMIE
JEREMIE (The Joint European Resources for Micro to Medium Enterprises) is an initiative of the European Commission’s Directorate General for Regional Policy (DG Regio) and the EIB Group.
Z.10. GF Greece
The Fund is a joint initiative between the Hellenic Republic, the EC and the EIB and was set up to support the lending to SMEs in Greece. Established by using unabsorbed Structural Funds for Greece, the Fund will guarantee EIB loans to SMEs via partner banks in Greece.
Z.11. Loan Guarantee Instrument for Ten-T Projects (’LGTT’)
The LGTT has been established within the framework of the Co-operation Agreement, entered into force on 11 January 2008 between the EC on behalf of the European Union and the EIB. The LGTT aims at facilitating a greater private sector involvement in the financing of Trans-European transport networks infrastructure. The EIB prepares separate financial statements for the LGTT.
Z.12. European Neighbourhood and Partnership Instrument (‘ENPI’)
The Framework Agreement between the European Union and the EIB on the implementation of operations financed from the general budget of the European Union in the countries covered by the European Neighbourhood Policy is channelled through the ENPI. The EIB prepares separate financial statements for ENPI.
Z.13. SMEG 2007
In the SMEG 2007 under the Competitiveness and Innovation Framework Programme (CIP/SMEG 2007), the EIF is empowered to issue guarantees in its own name but on behalf and at the risk of the Commission.
Z.14. Project Bond Initiative (‘PBI’)
A Cooperation Agreement between the EC and the EIB in respect of the Project Bond Instrument: Pilot Phase was signed in November 2012. The PBI is designed to stimulate capital market financing for infrastructure delivered under ‘project finance’ structures, including Public Private Partnerships (PPPs). The initiative will seek to enhance the credit rating of bonds issued by project companies to a rating level that is attractive for investors and to lower the project’s overall financing costs.
Z.15. AECID
This partnership agreement signed between the Kingdom of Spain (the Spanish Agency for International Development Cooperation (AECID) and the EIB was set up to invest in operations in the countries covered by the FEMIP together with Mauritania (the “Southern Mediterranean region”), targeting mainly risk capital activities for micro and small/medium enterprises as well as engaging in the wider development of the private sector in the region.
Z.16. GIF 2007
In the GIF 2007 under the Competitiveness and Innovation Framework Programme and the Technology Transfer Pilot Project (CIP/GIF 2007), the EIF is empowered to acquire, manage and dispose of investments, in its own name but on behalf and at the risk of the Commission.
Z.17. COSME LGF & EFG
The Programme of COSME EFG provides the establishment of the Equity Facility for Growth and the establishment of the Loan Guarantee Facility. The financial instruments aim to improve access to finance for small and medium-sized enterprises in the form of debt and equity exclusively. In that context, an Equity For Growth has been structured in the form of an equity financial instrument supporting Union enterprises growth and Research Innovation.
The Programme of COSME LGF provides the establishment of the Loan Guarantee Facility. The financial instrument aim to improve access to finance for small and medium-sized enterprises in the form of debt and equity exclusively. The Loan Guarantee Facility has been structured in the form of a direct and indirect guarantee financial instrument. The objective of LGF is to contribute to the reduction of the structural shortcoming of the SME financing market and to support the creation of a more diversified SME finance market. Through direct and indirect guarantee, LGF aims to guarantee debt financing which addresses the particular difficulties that viable SMEs face in accessing finance. Furthermore, by guaranteeing the mezzanine tranche of eligible and transparent securitisation transactions, LGF aims to provide new avenues of financing for SMEs.
124

EIB Group Consolidated Financial Statements under EU directives
Z.18. InnovFin SME Guarantee
In the context of the “Access to Risk Finance Programme” of Horizon 2020 and specific programme provides for the establishment of a financial instrument for debt and a financial instrument for equity. A Risk-Sharing facility called InnovFin SME Guarantee has been structured in the form of a guarantee, using the EU’s contribution for first defaulted amount taking and the risk-taking capacity of the EIF for second-Defaulted Amount taking. The objective of the Facility is to incentivise Intermediaries to extend loans or financial leases to small and medium sized enterprises and Small Mid-caps with significant activities in Research, Development and Innovation.
Z.19. Neighbourhood Investment Facility (‘NIF’) Trust Fund
The NIF Trust Fund managed by the EIB was set up to achieve the strategic objective of the European Neighbourhood Partnership Instrument through targeted funding aimed at strengthening infrastructure interconnection between the EU and its neighbours in the areas of Transport and Energy, at addressing common environmental concerns and at supporting other relevant activities. The EIB prepares separate financial statements for the NIF Trust Fund.
Z.20. SME Guarantee Facility
The EIF is empowered to issue guarantees in its own name but on behalf and at the risk of the European Union according to the Fiduciary and Management Agreement concluded with the European Union.
Z.21. Greater Anatolia Guarantee Facility (‘GAGF’)
Under the GAGF signed in May 2010, the EIF manages the Instrument for Pre-Accession Assistance (IPA) funds allocated for the Regional Competitiveness Operational Programme by the European Union and Turkey. The facility provides tailor-made financial help to SMEs and micro-enterprises in Turkey’s least developed provinces in partnership with major Turkish banks.
Z.22. WB EDIF
The Western Balkan Enterprise Development & Innovation Facility (“WB EDIF”) is a joint initiative signed in December 2012 by the EC (DG ELARG), EIB Group and the European Bank for Reconstruction and Development (EBRD). It aims at improving access to finance for SMEs in the Western Balkans and to foster economic development in the region through the deployment of the Instrument for Pre-Accession Assistance (IPA) funds. Within WB EDIF, EIF acts as platform coordinator, Trustee on behalf of the EC for the Enterprise Expansion Fund (ENEF), Trustee on behalf of the EC for the Enterprise Innovation Fund (ENIF), and manager of the Guarantee Facility.
Z.23. MAP Equity
Under the Multi-Annual Programme (MAP) for enterprises and entrepreneurship, the EIF manages resources on behalf and at the risk of the EC.
Z.24. Heavily Indebted Poor Countries (‘HIPC’) Initiative
The HIPC Initiative (the ’Initiative’) is an international debt relief mechanism that provides special assistance to the world’s poorest countries. It was launched in 1996 following a proposal from the World Bank and the International Monetary Fund. The principal objective of the Initiative is to reduce the debt burden of poor countries to sustainable levels. The EIB prepares separate financial statements for the Initiative.
Z.25. RSI
In the context of the Risk Sharing Finance Facility (RSFF), a joint initiative of the EC (DG Research & Innovation) and the EIB, EIF has been managing the Risk Sharing Instrument (RSI Facility) since December 2011. The aim of the RSI Facility is to create a pilot guarantee scheme for the benefit of innovative and research oriented SMEs and mid-caps.
Z.26. FEMIP Trust Fund
The FEMIP (Facility for Euro-Mediterranean Investment and Partnership) Trust Fund, which is also managed by the EIB, was set up to enhance the existing activities of the EIB in the Mediterranean Partner Countries, with the support of a number of donor countries and with a view of directing resources to operations in certain priority sectors through the provision of technical assistance and risk capital. The EIB prepares separate financial statements for the FEMIP Trust Fund.
Z.27. MAP Guarantee
This resource is split equally between private equity and guarantee products. The equity segment known as ESU 1998 (G&E) and ESU 2001 (MAP) covers the ETF start-up investments. The guarantees segment known as SMEG 1998 (G&E) and SMEG 2001 (MAP), provides guarantees against the beneficiary’s undertaking.
125
Z.28. EPTA Trust Fund
EPTA (The Eastern Partnership Technical Assistance) Trust Fund is focused on increasing the quality and development impact of EIB Eastern Partnership operations by offering a multi-purpose, multi-sector funding facility for technical assistance. It will be complementary to the Neighbourhood Investment Facility. The EIB prepares separate financial statements for EPTA Trust Fund.
Z.29. G43 Trust Fund
Under G43 Anatolian Venture Capital Fund, signed in August 2012, the EIF is entrusted with a mandate by Central Finance Unit of Turkey (CFCU). It is dedicated to make investments in SMEs in South-Eastern Anatolia region of Turkey.
Z.30. European Progress Microfinance Facility (‘EPMF’)
The EPMF aims to increase access to finance for individuals who have difficulties entering the labour market and to promote the start-up and growth of micro-enterprises with a particular view to providing jobs for the unemployed or the disadvantaged.
Z.31. European Technology Facility (‘ETF’)
Under the ETF Start-Up Facility, the EIF is empowered to acquire, manage and dispose of ETF start-up investments, in its own name but on behalf of and at the risk of the EC.
Z.32. Private Finance for Energy Efficiency Instrument
The Private Finance for Energy Efficiency (PF4EE) instrument is a joint agreement between the EIB and the European Commission with aims to address the limited access to adequate and affordable commercial financing for energy efficiency investments. The instrument targets projects which support the implementation of National Energy Efficiency Action Plans or other energy efficiency programmes of EU Member States. In December 2014 the European Commission and the EIB signed a Delegation Agreement establishing the financial Instrument PF4EE.
Z.33. RDI Advisory
RDI Advisory was set up in partnership with the European Commission under a 7 year framework agreement signed in June 2014, as part of the InnovFin programme under Horizon 2020. It has two main lines of activity: (i) upstream project related advisory and (ii) horizontal activities destined to improve the overall framework conditions for RDI investments as well as the financing tools under Horizon 2020.
Z.34. Fi Compass Advisory Platform
The fi-compass advisory platform provides EU Member States and their managing authorities as well as microcredit providers with advisory support and learning opportunities for developing financial instruments, within the scope of European Structural Investment Funds (ESIF) and the Programme for Employment and Social Innovation (EaSI). It is implemented by the EIB and funded by the EC under a Framework Contract for the period 2014-2020.
Z.35. BIF
The Baltic Innovation Fund (“BIF”), signed in September 2012, is a fund-of-funds, structured as a partnership, which invests in venture capital and private equity funds and focused on the Baltic region. It is funded jointly by the EIB Group and the following Baltic national agencies: Fund KredEx in Estonia, Latvijas Garantiju Agentiira in Latvia and lnvesticiju ir verslo garantijosin Lithuania.
Z.36. PGFF
The Polish Growth Fund-of-Funds (“PGFF”), signed in April 2013, is a fund-of-funds, structured as a partnership, which invests in venture capital and private equity funds and focused on Poland. It is funded jointly by the EIB Group and the Bank Gospodarstwa Krajowego.
Z.37. GEEREF (Fund and Technical Support Facility)
GEEREF (Global Energy Efficiency and Renewable Energy Fund) is a fund of funds set-up at the initiative of the EC. Its objective is to make investments in private equity funds that focus on the fields of renewable energy and energy efficiency in emerging markets (ACP, ALA and European Neighbour countries). The EIF also holds a technical assistance mandate for which related activities are implemented by the GEEREF front office.
126

EIB Group Consolidated Financial Statements under EU directives
Z.38. Bundesministerium für Wirtschaft und Technologie
The EIF manages funds on behalf of the German Bundesministerium für Wirtschaft und Technologie (Federal Ministry of Economics and Technology) and the European Recovery Programme.
Z.39. Technology Transfer Pilot Project (‘TTP’)
Under the TTP, financed by the EC and signed in November 2008, the EIF has supported a technology transfer structure through pre-seed funding and seed funding.
Z.40. JASPERS
JASPERS (The Joint Assistance to Support Projects in European Regions) is a major joint policy initiative of the EIB, EC (Regional Policy Directorate-General - DG Regio) and the European Bank for Reconstruction and Development. It provides advice to the 12 Central and Eastern EU Member States and Croatia during project preparation to help improve the quality of the major projects to be submitted for grant financing under the Structural and Cohesion Funds.
Z.41. European Parliament Preparatory Action (‘EPPA’)
In 2010, the EIF signed the EPPA with DG REGIO. The EIF is providing risk capital and financial support for capacity building purposes in order to help a select number of microfinance institutions to reach a meaningful size and improve their prospects for sustainability.
Z.42. Mezzanine Dachfonds fur Deutschland (‘MDD’)
The MDD in an investment programme signed in June 2013 and funded by the German Federal Ministry of Economics and Technology (BMWi) and various institutions of the Federal states to subscribe into hybrid debt and equity funds investing in German MidCaps.
Z.43. LfA-EIF Facility
LfA-EIF Facility, signed in 2009, is a joint EIF and LfA Förderbank Bayern venture providing investments to support technology-oriented early and expansion stage companies in the region of Bavaria, Germany.
Z.44. GEEREF
Under the Global Energy Efficiency and Renewable Energy Fund (GEEREF), EIF has been acting since December 2007 as investment advisor. GEEREF is supported by the EC, the Federal Government of Germany and the Kingdom of Norway and its objective is to invest primarily in regional funds with assets in projects and companies involved in energy efficiency and renewable energy enhancing access to clean energy in developing countries and economies in transition. The GEEREF business development is formally delegated to the EIB under a sub-advisory agreement.
Z.45. Green for Growth Fund (‘GGF’)
The Green for Growth Fund was set up by the EIF in December 2009 and focuses on energy efficiency financings in South East Europe including Turkey.
Z.46. FP7 Guarantee Fund
The 7th Framework Programme (‘FP7’) is designed to support research, technological development and demonstration projects all over Europe. The rules and principles for the management of the FP7 are laid out in the Agreement between the EC on behalf of the European Atomic Energy Community and the EIB. The EC entrusted financial management of the FP7 Guarantee Fund to the EIB under an agreement signed between the two parties in December 2007. The EIB prepared separate financial statements for FP7 Guarantee Fund until 2013 and the FP7 Guarantee Fund was transferred back to the European Commission in 2014.
Z.47. ECHA
On 1 April 2011 the EIB entered into an asset management agreement with the European Chemicals Agency (ECHA). Under this agreement the EIB manages the investment portfolio of ECHA in accordance with the pre-agreed Asset Management Guidelines.
127
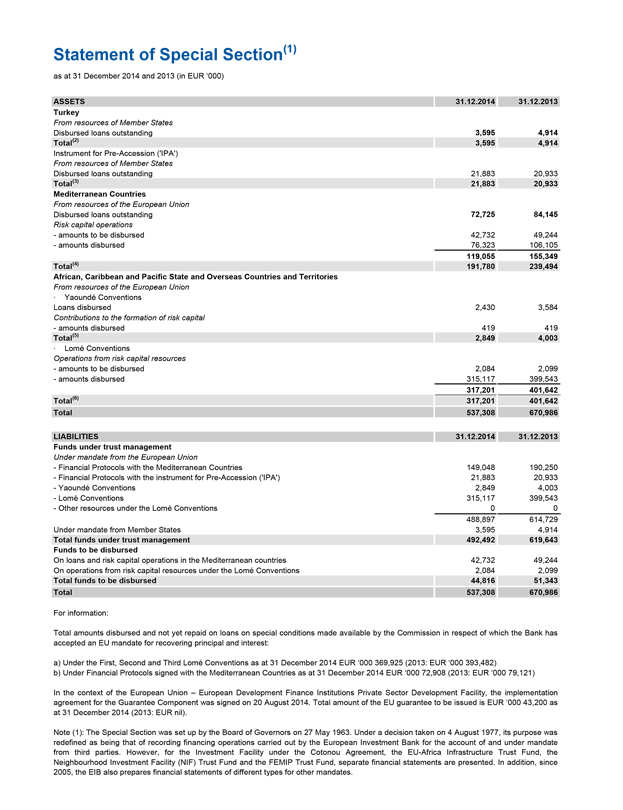
Statement of Special Section(1)
as at 31 December 2014 and 2013 (in EUR ‘000)
ASSETS 31.12.2014 31.12.2013
Turkey
From resources of Member States
Disbursed loans outstanding 3,595 4,914
Total(2) 3,595 4,914
Instrument for Pre-Accession (‘IPA’)
From resources of Member States
Disbursed loans outstanding 21,883 20,933
Total(3) 21,883 20,933
Mediterranean Countries
From resources of the European Union
Disbursed loans outstanding 72,725 84,145
Risk capital operations
- amounts to be disbursed 42,732 49,244
- amounts disbursed 76,323 106,105
119,055 155,349
Total(4) 191,780 239,494
African, Caribbean and Pacific State and Overseas Countries and Territories
From resources of the European Union
· Yaoundé Conventions
Loans disbursed 2,430 3,584
Contributions to the formation of risk capital
- amounts disbursed 419 419
Total(5) 2,849 4,003
· Lomé Conventions
Operations from risk capital resources
- amounts to be disbursed 2,084 2,099
- amounts disbursed 315,117 399,543
317,201 401,642
Total(6) 317,201 401,642
Total 537,308 670,986
LIABILITIES 31.12.2014 31.12.2013
Funds under trust management
Under mandate from the European Union
- Financial Protocols with the Mediterranean Countries 149,048 190,250
- Financial Protocols with the instrument for Pre-Accession (‘IPA’) 21,883 20,933
- Yaoundé Conventions 2,849 4,003
- Lomé Conventions 315,117 399,543
- Other resources under the Lomé Conventions 0 0
488,897 614,729
Under mandate from Member States 3,595 4,914
Total funds under trust management 492,492 619,643
Funds to be disbursed
On loans and risk capital operations in the Mediterranean countries 42,732 49,244
On operations from risk capital resources under the Lomé Conventions 2,084 2,099
Total funds to be disbursed 44,816 51,343
Total 537,308 670,986
For information:
Total amounts disbursed and not yet repaid on loans on special conditions made available by the Commission in respect of which the Bank has accepted an EU mandate for recovering principal and interest:
a) Under the First, Second and Third Lomé Conventions as at 31 December 2014 EUR ‘000 369,925 (2013: EUR ‘000 393,482) b) Under Financial Protocols signed with the Mediterranean Countries as at 31 December 2014 EUR ‘000 72,908 (2013: EUR ‘000 79,121)
In the context of the European Union – European Development Finance Institutions Private Sector Development Facility, the implementation agreement for the Guarantee Component was signed on 20 August 2014. Total amount of the EU guarantee to be issued is EUR ‘000 43,200 as at 31 December 2014 (2013: EUR nil).
Note (1): The Special Section was set up by the Board of Governors on 27 May 1963. Under a decision taken on 4 August 1977, its purpose was redefined as being that of recording financing operations carried out by the European Investment Bank for the account of and under mandate from third parties. However, for the Investment Facility under the Cotonou Agreement, the EU-Africa Infrastructure Trust Fund, the Neighbourhood Investment Facility (NIF) Trust Fund and the FEMIP Trust Fund, separate financial statements are presented. In addition, since 2005, the EIB also prepares financial statements of different types for other mandates.
128
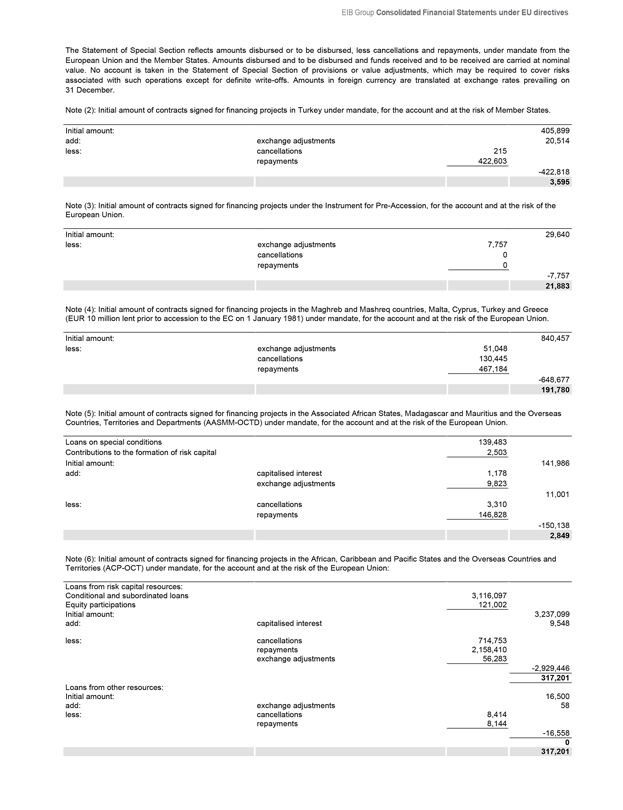
EIB Group Consolidated Financial Statements under EU directives
The Statement of Special Section reflects amounts disbursed or to be disbursed, less cancellations and repayments, under mandate from the European Union and the Member States. Amounts disbursed and to be disbursed and funds received and to be received are carried at nominal value. No account is taken in the Statement of Special Section of provisions or value adjustments, which may be required to cover risks associated with such operations except for definite write-offs. Amounts in foreign currency are translated at exchange rates prevailing on 31 December.
Note (2): Initial amount of contracts signed for financing projects in Turkey under mandate, for the account and at the risk of Member States.
Initial amount: 405,899
add: exchange adjustments 20,514
less: cancellations 215
repayments 422,603
-422,818
3,595
Note (3): Initial amount of contracts signed for financing projects under the Instrument for Pre-Accession, for the account and at the risk of the European Union.
Initial amount: 29,640
less: exchange adjustments 7,757
cancellations 0
repayments 0
-7,757
21,883
Note (4): Initial amount of contracts signed for financing projects in the Maghreb and Mashreq countries, Malta, Cyprus, Turkey and Greece (EUR 10 million lent prior to accession to the EC on 1 January 1981) under mandate, for the account and at the risk of the European Union.
Initial amount: 840,457
less: exchange adjustments 51,048
cancellations 130,445
repayments 467,184
-648,677
191,780
Note (5): Initial amount of contracts signed for financing projects in the Associated African States, Madagascar and Mauritius and the Overseas Countries, Territories and Departments (AASMM-OCTD) under mandate, for the account and at the risk of the European Union.
Loans on special conditions 139,483
Contributions to the formation of risk capital 2,503
Initial amount: 141,986
add: capitalised interest 1,178
exchange adjustments 9,823
11,001
less: cancellations 3,310
repayments 146,828
-150,138
2,849
Note (6): Initial amount of contracts signed for financing projects in the African, Caribbean and Pacific States and the Overseas Countries and Territories (ACP-OCT) under mandate, for the account and at the risk of the European Union:
Loans from risk capital resources:
Conditional and subordinated loans 3,116,097
Equity participations 121,002
Initial amount: 3,237,099
add: capitalised interest 9,548
less: cancellations 714,753
repayments 2,158,410
exchange adjustments 56,283
-2,929,446
317,201
Loans from other resources:
Initial amount: 16,500
add: exchange adjustments 58
less: cancellations 8,414
repayments 8,144
-16,558
0
317,201
129
Independent Auditor’s Report
To the Chairman of the Audit Committee of EUROPEAN INVESTMENT BANK
98-100, Boulevard Konrad Adenauer L-2950 LUXEMBOURG
REPORT OF THE REVISEUR D’ENTREPRISES AGREE
We have audited the accompanying consolidated financial statements of EUROPEAN INVESTMENT BANK, which comprise the consolidated balance sheet as at 31 December 2014, the consolidated profit and loss account and the consolidated cash flow statement for the year then ended, and a summary of significant accounting policies and other explanatory information.
Management’s responsibility for the consolidated financial statements
The Management is responsible for the preparation and fair presentation of these consolidated financial statements in accordance with the general principles of the Directive 86/635/EEC of the Council of the European Communities of 8 December 1986 on the annual accounts and consolidated accounts of banks and other financial institutions, as amended by Directive 2001/65/EC of 27 September 2001, by Directive 2003/51/EC of 18 June 2003 and by Directive 2006/46/EC of 14 June 2006 (the ‘Directives’), and for such internal control as the Management determines is necessary to enable the preparation of consolidated financial statements that are free from material misstatement, whether due to fraud or error.
Responsibility of the Réviseur d’Entreprises agréé
Our responsibility is to express an opinion on these consolidated financial statements based on our audit. We conducted our audit in accordance with International Standards on Auditing as adopted for Luxembourg by the Commission de Surveillance du Secteur Financier. Those standards require that we comply with ethical requirements and plan and perform the audit to obtain reasonable assurance about whether the consolidated financial statements are free from material misstatement.
An audit involves performing procedures to obtain audit evidence about the amounts and disclosures in the consolidated financial statements. The procedures selected depend on the judgement of the Réviseur d’Entreprises agréé, including the assessment of the risks of material misstatement of the consolidated financial statements, whether due to fraud or error. In making those risk assessments, the Réviseur d’Entreprises agréé considers internal control relevant to the entity’s preparation and fair presentation of the consolidated financial statements in order to design audit procedures that are appropriate in the circumstances, but not for the purpose of expressing an opinion on the effectiveness of the entity’s internal control. An audit also includes evaluating the appropriateness of accounting policies used and the reasonableness of accounting estimates made by the Management, as well as evaluating the overall presentation of the consolidated financial statements.
We believe that the audit evidence we have obtained is sufficient and appropriate to provide a basis for our audit opinion.
Opinion
In our opinion, the consolidated financial statements give a true and fair view of the consolidated financial position of EUROPEAN INVESTMENT BANK as of 31 December 2014, and of the consolidated results of its operations and its consolidated cash flows for the year then ended in accordance with the general principles of the Directives.
Luxembourg, 12 March 2015
KPMG Luxembourg, Société coopérative
39, Avenue John F. Kennedy L-1855 Luxembourg
Société coopérative de droit luxembourgeois R.C.S. Luxembourg B 149133 Capital EUR 12 503
KPMG Luxembourg, Société coopérative Cabinet de révision agréé
E. DOLLÉ
130
EIB Group
Consolidated Financial Statements under EU Directives
Statement by The Audit Committee
The Audit Committee reports to the Board of Governors, the following statement being communicated to the Governors prior to their approval of the Annual Report and the financial statements for the past financial year.
Statement by the Audit Committee on the EIB’s consolidated financial statements prepared in accordance with the general principles of the EU Directives
The Committee, instituted in pursuance of Article 12 of the Statute and Chapter V of the Rules of Procedure of the European Investment Bank for the purpose of verifying that the operations of the Bank are conducted and its books kept in a proper manner, having
- designated KPMG as external auditors, reviewed their audit planning process, examined and discussed their reports,
- noted that the opinion of KPMG on the consolidated financial statements of the European Investment Bank, prepared in accordance with the general principles of the EU Directives, for the year ended 31 December 2014 is unqualified,
- convened on a regular basis with the Heads of Directorates and relevant services including,
the Financial Controller,
the Directors General of Risk Management and Transaction Monitoring and Restructuring,
- met regularly the Head of Internal Audit and discussed the relevant internal audit reports, and studied the documents which it deemed necessary to examine in the discharge of its duties,
- received assurance from the Management Committee concerning the effectiveness of the internal control structure and internal administration,
and considering
- the consolidated financial statements for the financial year ended 31 December 2014 as drawn up by the Board of Directors at its meeting on 12 March 2015;
- that the foregoing provides a reasonable basis for its statement and,
- Articles 24, 25 & 26 of the Rules of Procedure, to the best of its knowledge and judgement:
confirms that the consolidated financial statements, comprising the consolidated balance sheet, the consolidated profit and loss account and the consolidated cash flow statement and a summary of significant accounting policies and other explanatory information give a true and fair view of the consolidated financial position of the Bank as at 31 December 2014 in respect of its assets and liabilities, and of the consolidated results of its operations and its consolidated cash flows for the year then ended, in accordance with the general principles of the EU Directives.
Luxembourg, 12 March 2015
The Audit Committee
M. MATEJ M. ÜÜRIKE B. JAKOBSEN
J.N. SCHAUS D. PITTA FERRAZ J. SUTHERLAND
131

132
EIB Group
Consolidated Financial Statements under IFRS
EIB Group
Consolidated
Financial Statements under IFRS
as at 31 December 2014
133
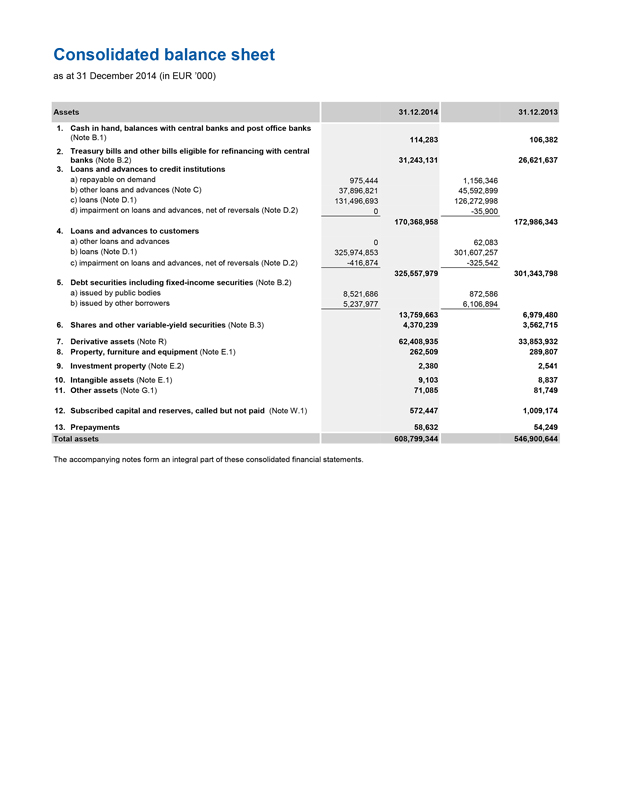
Consolidated balance sheet
as at 31 December 2014 (in EUR ’000)
Assets 31.12.2014 31.12.2013
1. Cash in hand, balances with central banks and post office banks
(Note B.1) 114,283 106,382
2. Treasury bills and other bills eligible for refinancing with central
banks (Note B.2) 31,243,131 26,621,637
3. Loans and advances to credit institutions
a) repayable on demand 975,444 1,156,346
b) other loans and advances (Note C) 37,896,821 45,592,899
c) loans (Note D.1) 131,496,693 126,272,998
d) impairment on loans and advances, net of reversals (Note D.2) 0 -35,900
170,368,958 172,986,343
4. Loans and advances to customers
a) other loans and advances 0 62,083
b) loans (Note D.1) 325,974,853 301,607,257
c) impairment on loans and advances, net of reversals (Note D.2) -416,874 -325,542
325,557,979 301,343,798
5. Debt securities including fixed-income securities (Note B.2)
a) issued by public bodies 8,521,686 872,586
b) issued by other borrowers 5,237,977 6,106,894
13,759,663 6,979,480
6. Shares and other variable-yield securities (Note B.3) 4,370,239 3,562,715
7. Derivative assets (Note R) 62,408,935 33,853,932
8. Property, furniture and equipment (Note E.1) 262,509 289,807
9. Investment property (Note E.2) 2,380 2,541
10. Intangible assets (Note E.1) 9,103 8,837
11. Other assets (Note G.1) 71,085 81,749
12. Subscribed capital and reserves, called but not paid (Note W.1) 572,447 1,009,174
13. Prepayments 58,632 54,249
Total assets 608,799,344 546,900,644
The accompanying notes form an integral part of these consolidated financial statements.
134
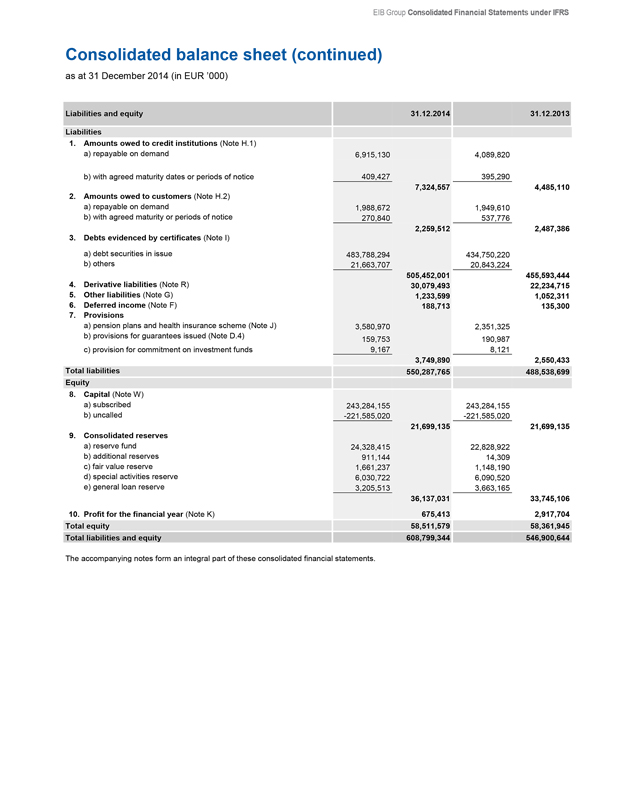
EIB Group Consolidated Financial Statements under IFRS
Consolidated balance sheet (continued)
as at 31 December 2014 (in EUR ’000)
Liabilities and equity 31.12.2014 31.12.2013
Liabilities
1. Amounts owed to credit institutions (Note H.1)
a) repayable on demand 6,915,130 4,089,820
b) with agreed maturity dates or periods of notice 409,427 395,290
7,324,557 4,485,110
2. Amounts owed to customers (Note H.2)
a) repayable on demand 1,988,672 1,949,610
b) with agreed maturity or periods of notice 270,840 537,776
2,259,512 2,487,386
3. Debts evidenced by certificates (Note I)
a) debt securities in issue 483,788,294 434,750,220
b) others 21,663,707 20,843,224
505,452,001 455,593,444
4. Derivative liabilities (Note R) 30,079,493 22,234,715
5. Other liabilities (Note G) 1,233,599 1,052,311
6. Deferred income (Note F) 188,713 135,300
7. Provisions
a) pension plans and health insurance scheme (Note J) 3,580,970 2,351,325
b) provisions for guarantees issued (Note D.4) 159,753 190,987
c) provision for commitment on investment funds 9,167 8,121
3,749,890 2,550,433
Total liabilities 550,287,765 488,538,699
Equity
8. Capital (Note W)
a) subscribed 243,284,155 243,284,155
b) uncalled -221,585,020 -221,585,020
21,699,135 21,699,135
9. Consolidated reserves
a) reserve fund 24,328,415 22,828,922
b) additional reserves 911,144 14,309
c) fair value reserve 1,661,237 1,148,190
d) special activities reserve 6,030,722 6,090,520
e) general loan reserve 3,205,513 3,663,165
36,137,031 33,745,106
10. Profit for the financial year (Note K) 675,413 2,917,704
Total equity 58,511,579 58,361,945
Total liabilities and equity 608,799,344 546,900,644
The accompanying notes form an integral part of these consolidated financial statements.
135
Consolidated income statement
for the year ended 31 December 2014 (in EUR ‘000)
1. Interest and similar income (Note L)
2. Interest expense and similar charges (Note L)
3. Income from shares and other variable-yield securities
4. Fee and commission income (Note O)
5. Fee and commission expense
6. Result on financial operations (Note M)
7. Other operating income (Note N)
8. Change in impairment on loans and advances and provisions for guarantees, net of reversals (Notes D.2, D.4)
9. Change in impairment on shares and other variable-yield securities, net of reversals (Note B.3)
10. General administrative expenses (Notes J, P)
a) staff costs (Note J)
b) other administrative costs
11. Depreciation and amortisation: property, furniture and equipment, investment property and intangible assets (Note E)
a) property, furniture and equipment
b) investment property
c) intangible assets
12. Profit for the financial year
Attributable to:
Equity holders of the Bank
2014 2013
22,713,082 23,157,568
-19,488,889 -20,042,846
110,404 54,344
204,078 237,963
-1,196 -21
-2,126,906 307,024
18,063 3,332
-30,428 -109,463
-44,999 -49,299
-475,024 -471,030
-172,236 -139,017
-647,260 -610,047
-23,703 -24,191
-161 -161
-6,672 -6,499
-30,536 -30,851
675,413 2,917,704
675,413 2,917,704
The accompanying notes form an integral part of these consolidated financial statements.
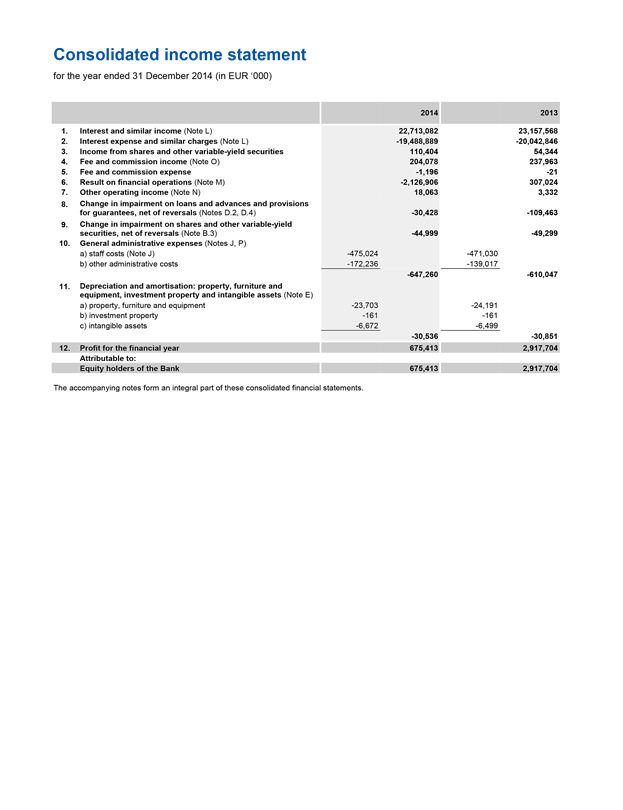
136
EIB Group Consolidated Financial Statements under IFRS
Consolidated statement of profit or loss and other comprehensive income
for the year ended 31 December 2014 (in EUR ’000)
| | | | |
| | 2014 | | 2013 |
| Profit for the financial year | | 675,413 | | 2,917,704 |
| Other comprehensive income/loss | | | | |
| Items that will never be reclassified to profit or loss: | | | | |
| Remeasurements of the defined benefit liability | | -1,042,241 | | 308,424 |
| Items that are or may be reclassified to profit or loss: | | | | |
| Available for sale financial assets – fair value reserve | | | | |
| 1. Net unrealised gains and losses on financial assets available for sale | | 516,376 | | 200,919 |
| 2. Impairment charges transferred to the consolidated income statement | | 9,020 | | 14,511 |
| 3. Realised gains and losses transferred to the consolidated income | | | | |
| statement | | -12,349 | | 4,818 |
| Total available for sale financial assets | | 513,047 | | 220,248 |
| Total other comprehensive income/loss | | -529,194 | | 528,672 |
| Total comprehensive income | | 146,219 | | 3,446,376 |
| Attributable to: | | | | |
| Equity holders of the Bank | | 146,219 | | 3,446,376 |
The accompanying notes form an integral part of these consolidated financial statements.
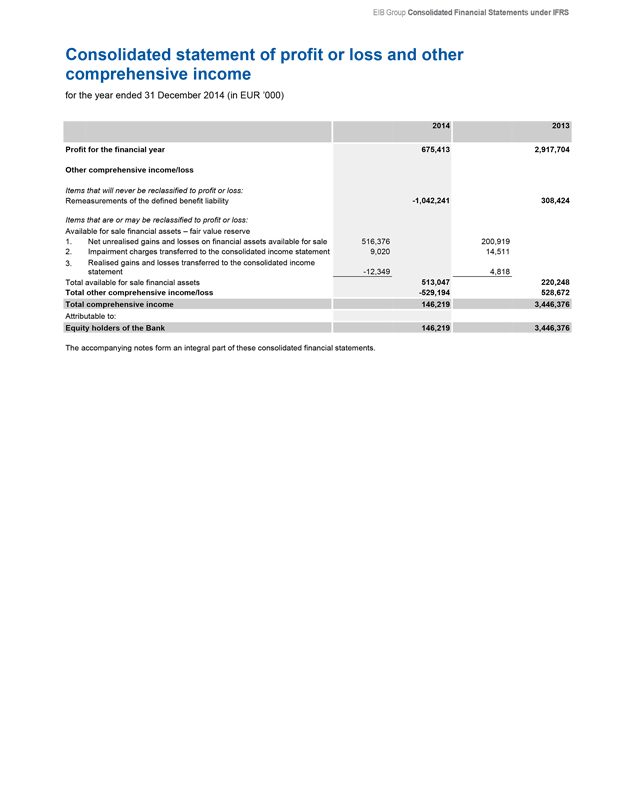
137
Consolidated statement of changes in equity
for the year ended 31 December 2014 (in EUR ’000)
| | | | | | | | | | | | | | | | | | |
| | Subscribed capital | | Callable capital | | Reserve Fund | | Additional reserves | | Fair value reserve | | Special activities reserve | | General loan reserve | | Profit for the year before appropriation | | Total consolidated equity |
| Balance at 1 January 2013 | | 242,392,989 | | -220,773,340 | | 21,596,628 | | 2,156,886 | | 927,942 | | 5,140,386 | | 2,976,909 | | 289,318 | | 54,707,718 |
| Profit | | 0 | | 0 | | 0 | | 0 | | 0 | | 0 | | 0 | | 2,917,704 | | 2,917,704 |
| Other comprehensive income | | 0 | | 0 | | 0 | | 308,424 | | 220,248 | | 0 | | 0 | | 0 | | 528,672 |
| Total comprehensive income | | 0 | | 0 | | 0 | | 308,424 | | 220,248 | | 0 | | 0 | | 2,917,704 | | 3,446,376 |
| Appropriation of prior year’s profit | | 0 | | 0 | | 1,103,914 | | -2,450,986 | | 0 | | 950,134 | | 686,256 | | -289,318 | | 0 |
| Transactions with owners of the Group | | | | | | | | | | | | | | | | | | |
| Contribution of Croatia as of July 2013 (*) | | 891,166 | | -811,680 | | 128,380 | | 0 | | 0 | | 0 | | 0 | | 0 | | 207,866 |
| Other | | 0 | | 0 | | 0 | | -15 | | 0 | | 0 | | 0 | | 0 | | -15 |
| Total transactions with owners of the | | | | | | | | | | | | | | | | | | |
| Group | | 891,166 | | -811,680 | | 128,380 | | -15 | | 0 | | 0 | | 0 | | 0 | | 207,851 |
| Balance at 31 December 2013 | | 243,284,155 | | -221,585,020 | | 22,828,922 | | 14,309 | | 1,148,190 | | 6,090,520 | | 3,663,165 | | 2,917,704 | | 58,361,945 |
| Profit | | 0 | | 0 | | 0 | | 0 | | 0 | | 0 | | 0 | | 675,413 | | 675,413 |
| Other comprehensive income | | 0 | | 0 | | 0 | | -1,042,241 | | 513,047 | | 0 | | 0 | | 0 | | -529,194 |
| Total comprehensive income | | 0 | | 0 | | 0 | | -1,042,241 | | 513,047 | | 0 | | 0 | | 675,413 | | 146,219 |
| Appropriation of prior year’s profit | | 0 | | 0 | | 1,499,493 | | 1,935,661 | | 0 | | -59,798 | | -457,652 | | -2,917,704 | | 0 |
| Transactions with owners of the Group | | | | | | | | | | | | | | | | | | |
| Other | | 0 | | 0 | | 0 | | 3,415 | | 0 | | 0 | | 0 | | 0 | | 3,415 |
| Total transactions with owners of the | | | | | | | | | | | | | | | | | | |
| Group | | 0 | | 0 | | 0 | | 3,415 | | 0 | | 0 | | 0 | | 0 | | 3,415 |
| Balance at 31 December 2014 | | 243,284,155 | | -221,585,020 | | 24,328,415 | | 911,144 | | 1,661,237 | | 6,030,722 | | 3,205,513 | | 675,413 | | 58,511,579 |
(*) On 1 July 2013, the subscribed capital increased from EUR 242,392,989,000 to EUR 243,284,154,500 by virtue of the contributions of Croatia, a new Member State that joined on 1 July 2013. The contributions of the new Member State to the Paid-in capital and to the Reserves amount to EUR 79.5 million and EUR 128.4 million respectively. The total amount to be paid by the new Member State has been equally spread over 8 instalments due on
30 November 2013, 30 November 2014, 30 November 2015, 31 May 2016, 30 November 2016, 31 May 2017, 30 November 2017 and 31 May 2018. The instalments up to and including 30 November 2014 were settled in full (see Note W1).
The accompanying notes form an integral part of these consolidated financial statements.
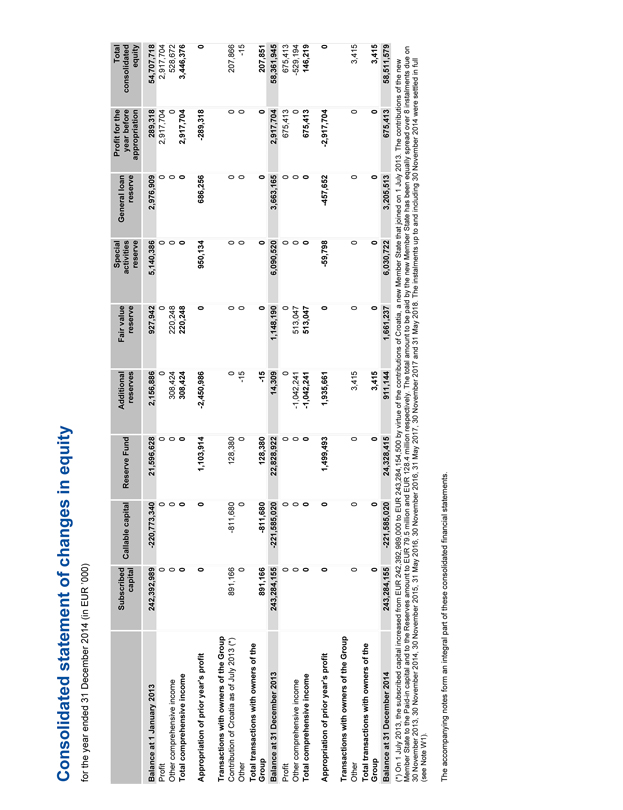
138
EIB Group Consolidated Financial Statements under IFRS
Consolidated cash flow statement
for the year ended 31 December 2014 (in EUR ‘000)
| | | | |
| A. Cash flows from operating activities: Profit for the financial year Adjustments for: Changes in impairment on loans and advances, net of reversals Change in provisions for pension plans and health insurance scheme Unwinding of discount relating to capital and reserve called, but not paid in Change in provisions for commitment on investment funds and guarantees on venture capital operations Depreciation/amortisation on property, furniture and equipment, investment property and intangible assets Changes in impairment of shares and other variable-yield securities Held to maturity portfolio amortisation and accrued interest Change in fair value of available for sale and trading debt securities Change in fair value of put option Net results on loans under the fair value option and associated swaps Net results on borrowings under the fair value option and associated swaps Change in fair value of other derivatives Interest expense on non-controlling interest Effect of exchange rate changes Profit on operating activities Disbursements of loans and advances to credit institutions and customers Repayments of loans and advances to credit institutions and customers Change in deposits with central banks Net additions to treasury securities liquidity portfolios Net additions to available for sale venture capital operations Net additions to available for sale shares and other variable-yield securities Change in amounts owed to credit institutions and customers Change in interest accrued on cash and cash equivalents Change in prepayments Change in other assets Change in deferred income Change in other liabilities (excluding non-controlling interest) Net cash used in operating activities B. Cash flows from investing activities: Securities in Long Term Hedge Portfolio purchased during the year Securities from Long Term Hedge Portfolio matured during the year Purchase of loan substitutes included in the debt securities portfolios Redemption of loan substitutes included in the debt securities portfolios Purchase and disposal of property, furniture and equipment, investment property and intangible assets Net cash used in investing activities C. Cash flows from financing activities: Issuance of debts evidenced by certificates Redemption of debts evidenced by certificates Member States contribution Net change in cash related to acquisitions and disposals of share in subsidiary undertakings Dividend paid to non-controlling interest Net cash from financing activities Summary statement of cash flows: Cash and cash equivalents at beginning of financial year Net cash from: Operating activities Investing activities Financing activities Effect of exchange rate changes on cash held Cash and cash equivalents at end of financial year Cash and cash equivalents are composed of: Cash in hand, balances with central banks and post office banks, excluding deposits with Central Bank of Luxembourg to cover minimum reserve requirement (Note B.1) Treasury bills maturing within three months of issue (Note B.2: A1 portfolio excluding accrued interest) Loans and advances to credit institutions: Repayable on demand Other loans and advances (Note C) | | 2014 675,413 53,693 233,625 -2,514 -25,134 30,536 44,999 9,232 -9,206 3,651 -869,236 -7,472,471 12,874,790 23,730 257,815 5,828,923 -58,566,783 45,238,126 -7,615 -3,712,646 -345,173 -12,412 2,611,573 -34,598 -4,383 10,664 53,413 12,850 -8,928,061 -1,569,501 207,082 -5,085,395 1,867,351 -3,343 -4,583,806 102,581,251 -94,263,539 446,180 143,257 -5,923 8,901,226 60,475,846 -8,928,061 -4,583,806 8,901,226 -173,972 55,691,233 410 18,162,126 975,444 36,553,253 55,691,233 | | 2013 2,917,704 83,627 165,763 13,103 20,103 30,851 49,299 23,976 40,225 4,340 -598,263 10,305,335 -9,629,449 13,610 -2,742,857 697,367 -52,915,750 33,990,545 51,000 171,964 -187,308 -57,780 -7,418,797 -61,746 8,034 -8,677 -1,164 56,379 -25,675,933 0 261,000 -2,045,921 1,439,864 -25,426 -370,483 84,933,795 -69,500,489 9,178,016 -56 -2,322 24,608,944 60,518,141 -25,675,933 -370,483 24,608,944 1,395,177 60,475,846 124 15,288,392 1,156,346 44,030,984 60,475,846 |
The accompanying notes form an integral part of these consolidated financial statements.
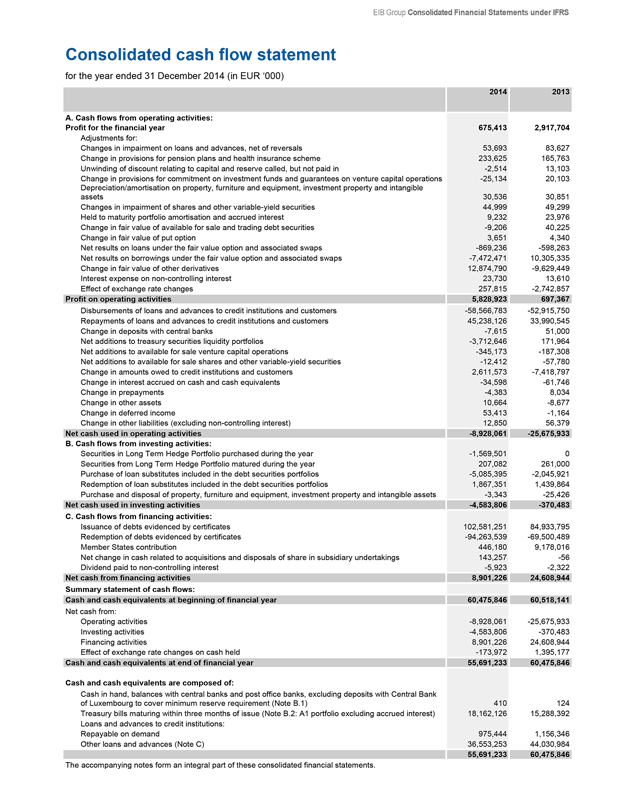
139
European Investment Bank Group
Notes to the consolidated financial statements
as at 31 December 2014
The European Investment Bank (the ‘Bank’ or ‘EIB’) was created by the Treaty of Rome in 1958 as the long term lending bank of the European Union (‘EU’). The task of the Bank is to contribute towards the integration, balanced development and economic and social cohesion of the EU Member States. The EIB raises substantial volumes of funds on the capital markets and lends these funds on favourable terms to projects furthering EU policy objectives. The EIB continuously adapts its activities to developments in EU policies.
The Bank has its registered office at 98-100, boulevard Konrad Adenauer, Luxembourg.
The European Investment Fund (the ‘Fund’ or ‘EIF’) was incorporated on 14 June 1994, in Luxembourg, as an international financial institution. The address of its registered office is 37 B avenue J.F. Kennedy, L-2968, Luxembourg.
The primary task of the Fund, while providing adequate return on equity, is to contribute to the pursuit of EU objectives through:
the provision of guarantees to financial institutions that cover credits to small and medium sized entities (‘SME’);
the acquisition, holding, managing and disposal of equity participations;
the administration of special resources entrusted by third parties; and related activities.
The Bank holds 63.69% (2013: 62.10%) of the subscribed capital of the EIF. The Bank and the Fund together are defined as the ‘Group’.
Note A – Significant accounting policies
A.1. Basis of preparation
A.1.1. Statement of compliance
The European Investment Bank consolidated financial statements (the ’Financial Statements’) have been prepared in accordance with International Financial Reporting Standards (‘IFRS’), as adopted by the European Union.
On a proposal from the Management Committee, the Board of Directors adopted the Financial Statements on 12 March 2015 and authorised their submission to the Board of Governors for approval by 28 April 2015.
A.1.2. Basis of measurement
The Financial Statements have been prepared on an historical cost basis, except for derivative financial instruments, available-for-sale financial assets and assets and liabilities designated at fair value through profit or loss that have been measured at fair value. The liability for defined benefit obligation is recognised as the present value of the defined benefit obligation, plus any unrecognised actuarial gains, less any unrecognised past service cost or unrecognised actuarial losses. The Financial Statements are presented in euro rounded to the nearest thousand, unless otherwise indicated.
A.2. Significant accounting judgements and estimates
In preparing the Financial Statements, the Management Committee is required to make estimates and assumptions that affect reported income, expenses, assets, liabilities and disclosure of contingent assets and liabilities. Use of available information and application of judgement are inherent in the formation of estimates. Actual results in the future could differ from such estimates and the differences may be material to the Financial Statements.
The most significant use of judgements and estimates are as follows:
Fair value of financial instruments
Where the fair values of financial assets and financial liabilities recorded on the balance sheet cannot be derived from active markets, they are determined using a variety of valuation techniques that include the use of mathematical models. The input to these models is taken from observable markets where possible, but where this is not feasible, a degree of judgement is required in establishing fair values. The judgements include considerations of liquidity and model inputs such as correlation and volatility for longer dated derivatives.
Impairment losses on loans and advances
The Group reviews its loans and advances at each reporting date to assess whether an allowance for impairment should be recorded. In particular, judgement by management is required in the estimation of the amount and timing of future cash flows when determining the level of allowance required. Such estimates are based on assumptions about a number of factors and actual results may differ, resulting in future
140
EIB Group Consolidated Financial Statements under IFRS
changes to the allowance. In addition to specific allowance against individually significant loans and advances, the Group also makes a collective impairment test on exposures which, although not specifically identified as requiring a specific allowance, have a greater risk of default than when originally granted.
Provisions on financial guarantees
The Group recognizes a liability at the fair value of the obligation at the inception of a financial guarantee contract. The guarantee is subsequently measured at the higher of the best estimate of the obligation or the amount initially recognized. Financial guarantee provisions correspond to the cost of settling the obligation, which is the expected loss, estimated on the basis of all relevant factors and information existing at the statement of financial position date.
Valuation of unquoted equity investments
Valuation of unquoted equity investments is normally based on one of the following:
recent arm’s length market transactions;
current fair value of another instrument that is substantially the same;
the expected cash flows discounted at current rates applicable for items with similar terms and risk characteristics; or
other valuation models.
The determination of the cash flows and discount factors for unquoted equity investments requires significant estimation. The Group calibrates the valuation techniques periodically and tests them for validity using either prices from observable current market transactions in the same instrument or from other available observable market data.
Impairment of equity investments
The Group treats available-for-sale equity investments as impaired when there has been a significant or prolonged decline in the fair value below its cost or where other objective evidence of impairment exists. The determination of what is “significant” or “prolonged” requires judgement. The Group treats “significant” generally as 30% or more and “prolonged” greater than 24 months. In addition, the Group evaluates other factors, including normal volatility in share price for quoted equities and the future cash flows and the discount factors for unquoted equities.
Pension and other post-employment benefits
The cost of defined benefit pension plans and other post-employment medical benefits is determined using actuarial valuations. The actuarial valuation involves making assumptions about discount rates, mortality rates and future salary and pension increases. Due to the long term nature of these plans, such estimates are subject to significant uncertainty.
Consolidation of entities in which the Group holds interest
The Group made significant judgements that none of the entities (except the EIF) in which it holds interest, are controlled by the Group. This is due to the fact that in all such entities, either the General Partner or the Fund Manager or the Management Board have the sole responsibility for the management and control of the activities and affairs of the partnership and have the power and authority to do all things necessary to carry out the purpose and objectives of the partnership complying with the investment and policy guidelines.
A.3. Changes in accounting policies
Except for the changes below, the Group has consistently applied the accounting policies set out in Note A.4. to all periods presented in these consolidated financial statements. The Group has adopted the following new standards and amendments to standards.
Standards adopted
The following standards, amendments to standards and interpretations were adopted in the preparation of these consolidated financial statements:
IFRS 10, Consolidated Financial Statements
IFRS 10 replaces the part of IAS 27 ‘Consolidated and Separate Financial Statements’ that deals with consolidated financial statements and SIC 12 ‘Consolidation-Special Purpose Entities’. Under IFRS 10, there is a new definition of control, providing a single basis for consolidation for all entities. This basis is built on the concept of power over the investee, variability of returns from the involvement with the investee and their linkage, thus focusing on legal control or exposure to risks and rewards, depending on the nature of the entity.
The adoption of IFRS 10 had no material impact on the consolidation of investments held by the Group nor on the Group’s consolidated financial statements. Therefore no restatements are necessary on application of IFRS 10.
IFRS 11, Joint Arrangements
IFRS 11 replaces IAS 31 ‘Interests in Joint Ventures’ and SIC-13 ‘Jointly Controlled Entities - Non – monetary Contributions by Ventures’ and establishes principles for financial reporting by entities that have an interest in arrangements that are controlled jointly.
Under IFRS 11, there are only two types of joint arrangements, joint operations and joint ventures and their classification is based on the parties’ rights and obligations arising from the arrangement, rather than its legal form. The adoption of this standard had no impact on the Group’s consolidated financial statements.
IFRS 12, Disclosure of Interests in Other Entities
IFRS 12 specifies the disclosures required in annual financial statements to enable users of financial statements to evaluate the nature of and risks associated with the reporting entity’s interests in subsidiaries, associates, joint arrangements and unconsolidated structured entities.
141
The disclosure requirements of IFRS 12 do not require comparative information to be provided for periods prior to initial application. New disclosures are provided in Note B4.
IFRS 10, 11 and 12 Amendments - Consolidated Financial Statements, Joint Arrangements and Disclosure of Interests in Other Entities: Transition Guidance
The amendments clarify the transition guidance in IFRS 10 and provide additional transition relief in IFRS 10, 11 and 12, requiring adjusted comparative information to be limited only to the preceding comparative period. In addition, for disclosures related to unconsolidated structured entities, the requirement to present comparative information for periods before IFRS 12 is first applied, is removed.
The adoption of the amendment had no impact on the Group’s consolidated financial statements.
IAS 36, Amendment - Recoverable Amount Disclosures for Non-Financial Assets
The amendments restrict the requirement to disclose the recoverable amount of an asset or cash generating unit only to periods in which an impairment loss has been recognized or reversed.
They also include detailed disclosure requirements applicable when an asset or cash generating unit’s recoverable amount has been determined on the basis of fair value less costs of disposal and an impairment loss has been recognized or reversed during the period.
The adoption of the amendment had no impact on the Group’s consolidated financial statements.
IAS 32, Amendments - Offsetting Financial Assets and Financial Liabilities
As a result of the amendments to IAS 32, the Group has changed its accounting policy for offsetting financial assets and financial liabilities. The amendments clarify when an entity currently has a legally enforceable right to set-off and when gross settlement is equivalent to net settlement. The adoption of the amendment had no impact on the Group’s consolidated financial statements.
Standards issued but not yet effective
The following standards, amendments to standards and interpretations are effective for annual periods beginning after 1 January 2014. The Group has not applied the following new or amended standards in preparing these consolidated financial statements.
IFRS 9 Financial instruments
The last part of the standard was issued on 24 July 2014 and replaces the existing guidance in IAS 39 Financial Instruments: Recognition and Measurement. IFRS 9 includes revised guidance on the classification and measurement of financial instruments, including a new expected credit loss model for calculating impairment on financial assets, and the new general hedge accounting requirements. It also carries forward the guidance on recognition and derecognition of financial instruments from IAS 39. IFRS 9 is effective for annual reporting periods beginning on or after 1 January 2018, with early adoption permitted. IFRS 9 has not yet been adopted by the EU.
The Group does not plan to adopt this standard early and the impact analysis is currently in progress.
IFRS 15 Revenue from Contracts with Customers
IFRS 15 establishes a comprehensive framework for determining whether, how much and when revenue is recognised. It replaces existing revenue recognition guidance, including IAS 18 Revenue, IAS 11 Construction Contracts and IFRIC 13 Customer Loyalty Programmes. IFRS 15 is effective for annual reporting periods beginning on or after 1 January 2017, with early adoption permitted. IFRS 15 has not yet been adopted by the EU. The Group has not yet determined the extent of the impact of this standard.
A.4. Summary of significant accounting policies
A.4.1. Basis of consolidation
Subsidiaries
Subsidiaries are entities controlled by the Group. The Group controls an entity when it is exposed to, or has rights to, variable returns from its involvement with the entity and has the ability to affect those returns though its power over the entity. The financial statements of subsidiaries are included in the consolidated financial statements from the date of which control commences until the date of which control ceases.
The Financial Statements comprise those of the European Investment Bank and those of its subsidiary, the European Investment Fund. The financial statements of the Fund are prepared for the same reporting year as the Bank, using consistent accounting policies.
The Bank holds 63.69% (2013: 62.10%) of the subscribed capital of the EIF and therefore has applied the principles pronounced by IFRS 10 in preparing consolidated financial statements. Hence, the Group consolidates the financial statements of the EIB and the EIF line by line by adding together like items of assets, liabilities, equity, income and expenses.
After aggregation of the balance sheets and income statements, all intra-group balances, transactions, income and expenses resulting from intra-group transactions are eliminated.
Commitment on EIF shares held by third party investors
Under the terms of a replacement share purchase undertaking in respect of the 1,511 shares held by EIF’s non-controlling shareholders (2013: 1,137 shares), the EIB is offering to buy these on an annual basis. The exercise price is determined on the basis of the audited annual accounts of EIF and corresponds to the part of each share in the called capital of EIF, increased by the share premium account, the statutory reserves, the fair value reserve, the retained earnings and profit of the year, net of the dividend decided by the EIF’s General Meeting. The commitment to purchase is shown in the consolidated balance sheet as a debt item under “Other liabilities” (see also Note G).
142
EIB Group Consolidated Financial Statements under IFRS
IFRS 10 requires that the acquisition of non-controlling interest be accounted for as an equity transaction. The carrying amounts of the controlling and non-controlling interests are adjusted to reflect the change in their relative interests in EIF net assets. Any difference between the amount by which the non-controlling interest is adjusted and the fair value of the financial liability is recognised directly in equity under “Other” and attributed to owners of the parent. Any changes in fair value of the financial liability subsequent to the acquisition date are recognised in the income statement under “Interest expense and similar charges”.
Interests in associates and joint ventures
The Group’s interests in investees comprise interests in associates and joint ventures. Associates are those entities in which the Group has significant influence, but not control or joint control, over the financial and operating policies. A joint venture is an arrangement in which the Group has joint control, whereby the Group has rights to the net assets of the arrangement, rather than the rights to its assets and obligations for its liabilities.
The accounting treatment for associates and joint ventures is further explained in Note A.4.7.3.
Transactions eliminated on consolidation
Intra-group balances and transactions, and any unrealised income and expenses arising from intra-group transactions are eliminated. Unrealised gains arising from transactions with equity-accounted investees are eliminated against the investment to the extent of the Group’s interest in the investee. Unrealised losses are eliminated in the same way as unrealised gains, but only to the extent that there is no evidence of impairment.
A.4.2. Foreign currency translation
The Financial Statements are presented in euro (EUR), as the functional currency of the Bank and the unit of measure for the capital accounts of the Member States.
The Group conducts its operations in euro, in other currencies of the Member States and in non-EU currencies. Its resources are derived from its capital, borrowings and accumulated earnings in various currencies.
Foreign currency transactions are translated at the exchange rate prevailing on the date of the transaction.
Monetary assets and liabilities denominated in currencies other than euro are translated into euro at the exchange rate prevailing at the balance sheet date. The gain or loss arising from such translation is recorded in the consolidated income statement.
Non-monetary items that are measured in terms of historical cost in a foreign currency are translated using the exchange rates at the dates of the initial transactions. Non-monetary items measured at fair value in a foreign currency are translated using the exchange rates at the date when the fair value was determined.
Exchange differences on non-monetary financial assets are a component of the change in their fair value. Depending on the classification of a non-monetary financial asset, exchange differences are either recognised in the income statement or within the equity reserves.
Exchange differences arising on the settlement of transactions at rates different from those at the date of the transaction and unrealised foreign exchange differences on unsettled foreign currency monetary assets and liabilities are recognised in the consolidated income statement.
A.4.3. Derivatives
All derivative instruments of the Group are measured at fair value through profit or loss and are reported as derivative assets or liabilities. Fair values are obtained from quoted market prices, discounted cash flow models and option pricing models, which consider current market and contractual prices for the underlying instrument, as well as time value of money, yield curve and volatility of the underlying.
The Group uses derivative instruments mainly for hedging market exposure on borrowings and lending transactions, and also as part of its asset and liability management activities to manage exposures to interest rate and foreign currency risk, including exposures arising from forecast transactions. The Group applies the amended Fair Value Option of IAS 39 when balance sheet items together with one or more derivative transactions meet the eligibility criteria of the amended Fair Value Option and a significant reduction of the accounting mismatch is thus obtained.
The Group currently does not use any of the hedge accounting possibilities available under IAS 39.
Derivatives are recorded at fair value and carried as assets when their fair value is positive and as liabilities when their fair value is negative. Changes in the fair value of derivatives are included in “Result on financial operations”.
The majority of the Group’s swaps are concluded with a view to hedging specific bond issues. The Group enters into currency swaps, whereby the proceeds of a borrowing are initially converted into a different currency and on maturity the Bank will obtain the amounts needed to service the borrowing in the original currency.
Macro-hedging swaps used as part of asset/liability management are marked to market (fair value) using internal valuation models. Realised and unrealised gains and losses are recognised in “Result on financial operations”. Accrued interest on derivatives is part of the fair value recorded.
A derivative may be embedded in a “host contract”. Such combinations are known as hybrid instruments and arise predominantly from the issuance of certain structured debt instruments. If the host contract is not carried at fair value with changes in fair value reported in the consolidated income statement, the embedded derivative is separated from the host contract and accounted for as a stand-alone derivative instrument at fair value if, and only if, the economic characteristics and risks of the embedded derivative are not closely related to the economic characteristics and risks of the host contract and the embedded derivative actually meets the definition of a derivative.
143
A.4.4. Financial instruments
Derivative financial instruments are initially recognised using the trade date basis. Non-derivative financial instruments are initially recognised using the settlement date basis.
Fair value of financial instruments
Fair value is the price that would be received to sell an asset or paid to transfer a liability in an orderly transaction between market participants at the measurement date in the principal, or in its absence, the most advantageous market to which the Group has access at that date. The fair value of a liability reflects its non-performance risk.
When applicable, the Group measures the fair value of an instrument using the quoted price in an active market for that instrument. A market is regarded as active if transactions for the asset or liability take place with sufficient frequency and volume to provide pricing information on an on-going basis.
Where the fair values of financial assets and financial liabilities recorded on the balance sheet cannot be derived from active markets, they are determined using a variety of valuation techniques that include the use of mathematical models. The input to these models is taken from observable markets where possible, but where this is not feasible, a degree of judgement is required in establishing fair values. The chosen valuation technique incorporates all the factors that market participants would take into account in pricing a transaction.
Portfolios of financial assets or financial liabilities that are exposed to market or credit risk that are managed by the Group on the basis of the net exposure to either market or credit risk are measured on the basis of a price that would be received to sell a net long position or paid to transfer a net short position for a particular risk exposure. These portfolio level adjustments are allocated to the individual assets and liabilities on the basis of the relative risk adjustment of each of the individual instrument in the portfolio.
The Group measures fair values using the following fair value hierarchy that reflects the significance of the inputs used in making the measurements:
Level 1: inputs that are unadjusted quoted market prices in active markets for identical instruments to which the Group has access
Level 2: inputs other than quoted prices included within Level 1 that are observable either directly (i.e. as prices) or indirectly (i.e. derived from prices). This category includes instruments valued using quoted market prices in active markets for similar instruments, quoted prices for identical or similar instruments in markets that are considered less than active or other valuation techniques where all significant inputs are directly or indirectly observable from market data.
Level 3: inputs that are not observable. This category includes all instruments where the valuation technique includes inputs not based on observable data and the unobservable inputs have a significant effect on the instrument’s valuation. This category includes instruments that are valued based on quoted prices for similar instruments where significant unobservable adjustments or assumptions are required to reflect differences between the instruments.
The Group recognises transfers between levels of the fair value hierarchy as of the end of the reporting period during which the change has occurred.
A.4.5. Cash and cash equivalents
The Group defines cash and cash equivalents as short term, highly liquid securities and interest-earning deposits with maturities of 90 days or less.
A.4.6. Fee income
The Group earns fee income from a diverse range of services it provides to its customers. Fee income can be divided into two broad categories:
income earned from services that are provided over a certain period of time, for which customers are generally billed on an annual or semi-annual basis; and
income earned from providing transaction-type services.
Fees earned from services that are provided over a certain period of time are recognised on an accruals basis over the service period. Fees earned from providing transaction-type services are recognised when the service has been completed. Fees or components of fees that are performance linked are recognised when the performance criteria are fulfilled.
A.4.7. Treasury bills and other bills eligible for refinancing with central banks and debt securities including fixed-income securities and shares and other variable-yield securities
The Group changed its debt securities portfolio structure during 2014, in order to reduce the portfolio complexity and optimise allocation of liquid assets. As a result, three new portfolios were created: Securities liquidity portfolios P1 and P2, classified as held for trading (except for remaining securities of former A2 and B1 portfolio which remain classified as AFS), and Group long term hedge portfolio, classified as held to maturity. Four former portfolios are phased out (Operational bond portfolio A2, B1, B3 and B4 and the Group investment portfolio).
144
EIB Group Consolidated Financial Statements under IFRS
A.4.7.1. Held for trading portfolio
The held for trading portfolio (Operational portfolios P1 and P2; formerly Operational portfolios B3 and B4 in Note B.2) comprises listed debt securities issued and guaranteed by financial institutions. The debt securities are owned by the Group. Securities held in this portfolio are marked to market in the consolidated balance sheet, any gain or loss arising from a change in fair value being included in the consolidated income statement in the period in which it arises.
Gains and losses realised on disposal or redemption and unrealised gains and losses from changes in the fair value of trading portfolio assets are reported as Net trading income in the account “Result on financial operations”. Interest income on trading portfolio assets is included in
“Interest and similar income”.
The determination of fair values of trading portfolio assets is based on quoted market prices in active markets or dealer price quotations, pricing models (using assumptions based on market and economic conditions), or management estimates, as applicable.
A.4.7.2. Held-to-maturity portfolio
The held-to-maturity portfolio comprises of the Group long term hedge portfolio (LTHP), the operational money market portfolio A1 and the Loan substitutes portfolio (see Note B.2).
The Group long term hedge portfolio contains securities of the Bank’s LTHP portfolio and the EIF investment portfolio and consists of securities purchased with the intention of holding them to maturity. These securities are issued or guaranteed by:
- Governments of the European Union Member States, G10 countries and their agencies; or
- Supranational public institutions, including multinational development banks.
These securities are initially recorded at fair value plus any directly attributable transaction costs. The difference between entry price and redemption value is amortised in accordance with the effective interest method over the remaining life of the securities.
The Operational portfolio A1 of the Group is held for the purpose of maintaining an adequate level of liquidity in the Group and comprises money market products with a maximum maturity of three months, including treasury bills and negotiable debt securities issued by public bodies or credit institutions. The securities are held until their final maturity and presented in the Financial Statements at their amortised cost.
The Loan substitutes portfolio mainly consists of obligations in the form of bonds, notes or certificates issued by Special Purpose Vehicles (SPV) or trust vehicles. These securities are classified as held-to-maturity and recorded at amortised cost.
The Group assesses at each balance sheet date whether there is any objective evidence that a financial asset or a group of financial assets is impaired. A financial asset or a group of financial assets is deemed to be impaired if, and only if, there is objective evidence of impairment as a result of one or more events that has occurred after the initial recognition of the asset (an incurred “loss event”) and that loss event (or events) has an impact on the estimated future cash flows of the financial asset or the group of financial assets that can be reliably estimated. Impairment loss is recognised in profit and loss and the amount of the loss is measured as the difference between the carrying value and the present value of estimated future cash flows discounted at the instrument’s original effective interest rate.
A.4.7.3. Available-for-sale portfolio
The available-for-sale portfolio comprises of the remaining securities formerly held in the operational money market portfolio A2 and of the operational bond portfolio B1 (currently SLP portfolio, see Note B.2), of the Unitary Fund and operational portfolio of the Fund and of shares and other variable-yield securities (see Note B.3). Securities are classified as available-for-sale where they do not appropriately belong to one of the other categories of financial instruments recognised under IAS 39, i.e. “held for trading” or “held-to-maturity”. The Management Committee determines the appropriate classification of its investments at the time of the constitution of a portfolio. Financial instruments within one portfolio always have the same classification. Available-for-sale financial investments may be sold in response to or in anticipation of needs for liquidity or changes in interest rates, credit quality, foreign exchange rates or equity prices.
Available-for-sale financial investments are carried at fair value. They are initially recorded at fair value plus transaction costs. Unrealised gains or losses, excluding foreign currency translation gains and losses, are reported in comprehensive income and accumulated in the fair value reserve until such investment is sold, collected or otherwise disposed of, or until such investment is determined to be impaired. Foreign currency translation gains and losses are reported in the consolidated income statement. If an available-for-sale investment is determined to be impaired, the cumulative unrealised gain or loss previously recognised in the fair value reserve is included in consolidated income statement for the period. A financial investment is considered impaired if its carrying value exceeds the recoverable amount. Quoted financial investments are considered impaired if the decline in market price below cost is of such a magnitude that recovery of the cost value cannot be reasonably expected within the foreseeable future. For non-quoted equity investments, the recoverable amount is determined by applying recognised valuation techniques.
Financial assets are derecognised when the right to receive cash flows from the financial assets has expired or where the Group has transferred substantially all risks and rewards of ownership. On disposal of an available-for-sale investment, the accumulated unrealised gain or loss included in the fair value reserve is transferred to consolidated income statement for the period. Gains and losses on disposal are determined using the weighted average cost method. Interest and dividend income on available-for-sale financial investments are included in “Interest and similar income” and “Income from shares and other variable-yield securities”. Interest on available-for-sale debt securities and other fixed income securities is recognised in the income statement using the effective interest method. Dividends on equity investments are recognised in the income statement when the Group’s right to receive payment is established.
The determination of fair values of available-for-sale financial investments is based on quoted market rates in active markets, dealer price quotations, discounted expected cash flows using market rates that are commensurate with the credit quality and maturity of the investment or based upon review of the investee’s financial results, condition and prospects including comparisons to similar companies for which quoted market prices are available.
145
Venture capital operations and investment funds held represent medium and long term investments. They are measured at fair value, which is determined by applying the aggregated Net Asset Value (NAV) method. This valuation method implicitly assumes that if the NAVs of underlying funds can be considered as equivalent to the fair value as determined under IAS 39, then the aggregation of the NAVs of all funds will itself be equivalent to the fair value as determined under IAS 39. For specific investments where NAV cannot readily be determined, other guidelines (for example the international private equity and venture capital valuation guidelines, IPEV Guidelines, as published by the EVCA) might be used and more detailed monitoring and review will be required. In accordance with this method, the venture capital funds are internally classified into three categories:
Category I – funds that have adopted the fair value requirements of IAS 39 or IPEV Guidelines for which a specific review is performed to ensure that the NAV is a reliable estimate of fair value.
Category II – funds that have adopted other valuation guidelines (such as the former 2001 EVCA) or standards that can be considered as in line with IAS 39, for which a specific review is performed to ensure that the NAV is a reliable estimate of fair value.
Category III – funds that have not adopted the fair value requirements of IAS 39 or any other valuation guidelines in line with IAS 39.
The Group assesses at each balance sheet date whether there is any objective evidence that a financial asset or a group of financial assets is impaired. A financial asset or a group of financial assets is deemed to be impaired if, and only if, there is objective evidence of impairment as a result of one or more events that have occurred after the initial recognition of the asset (an incurred “loss event”) and that loss event (or events) has an impact on the estimated future cash flows of the financial asset or the group of financial assets that can be reliably estimated.
In the case of equity investments classified as available-for-sale, this would include a significant or prolonged decline in the fair value of the investments below its cost. Where there is evidence of impairment, the cumulative loss measured as the difference between the acquisition cost and the current fair value, less any impairment loss on that financial asset previously recognised in the consolidated income statement, is removed from equity and recognised in the income statement. Impairment losses on equity investments are not reversed through the consolidated income statement; increases in their fair value after impairment are recognised directly in equity. In contrast, if in a subsequent period, the fair value of a debt instrument classified as available-for-sale increases and the increase can be objectively related to an event occurring after the impairment loss was recognised, the impairment loss is reversed through the income statement.
The Group complies with conditions to use the private equity and similar entities exemption in IAS 28 and IFRS 11 and does not use equity accounting on, or proportionately consolidate investments in joint ventures, if any. Upon initial recognition, any holdings in joint ventures or associates are designated at fair value through profit or loss, and measured subsequently at fair value in accordance with IAS 39, with changes in fair value recognised in profit or loss during the period of the change.
Joint ventures are contractual agreements whereby the Group and other parties undertake an economic activity that is subject to joint control. A joint control is the contractually agreed sharing of control over an economic activity, and exists only when the strategic financial and operating decisions relating to the activity require the unanimous consent of the parties sharing the control (the venturers). The participations acquired by the Group for its own account or on behalf of its mandate providers typically represent investments in private equity or venture capital funds. According to industry practice, such investments are generally investments jointly subscribed by a number of investors, none of whom is in a position to individually influence the daily operations and the investment activity of such fund. As a consequence, any membership by an investor in a governing body of such fund does not in principle entitle such investor to influence the day-to-day operations of the fund. In addition, individual investors in a private equity or a venture capital fund do not determine policies of a fund such as distribution policies on dividends or other distributions. Such decisions are typically taken by the management of a fund on the basis of the shareholders agreement governing the rights and obligations of the management and all shareholders of the fund. The shareholders’ agreement also generally prevents individual investors from bilaterally executing material transactions with the fund, interchanging managerial personnel or obtaining privileged access to essential technical information. The Group’s investments, made for its own account or on behalf of its mandate providers, are executed in line with the above stated industry practice, ensuring that the Group neither controls nor exercises any form of significant influence within the meaning of IFRS 10, IFRS 11 and IAS 28 over any of these investments, including those investments in which the Group holds over 20 % of the voting rights either on its own account or on behalf of any of its mandates.
A.4.8. Loans and advances to credit institutions and customers
Loans and advances to credit institutions and customers (or “Loans and receivables”) include loans where money is provided directly to the borrower.
Loans and receivables are recognised when cash is advanced to borrowers. They are initially recorded at cost (their net disbursed amounts), which is the fair value of the cash given to originate the loan, including any transaction costs, and are subsequently measured at amortised cost using the effective interest rate method. Undisbursed parts of loans are recorded in the memorandum items at their nominal value.
Where loans meet the eligibility criteria of the amended Fair Value Option and have been designated on initial recognition as at fair value through profit or loss, they are measured at their fair value. The fair value measurement technique used is based on a discounted cash flow technique. Loans designated at fair value are recorded at fair value in the balance sheet. Changes in fair value are recorded in “Result on financial operations”.
A.4.8.1. Interest on loans
Interest on loans originated by the Group is recorded in the consolidated income statement under “Interest and similar income” using the effective interest rate method and on the consolidated balance sheet under “Loans and advances”. From 1 January 2014, commitment fees are classified under “Interest and similar income” while those fees were previously classified under “Fees and commission income”. See note A.4.21.
146
EIB Group Consolidated Financial Statements under IFRS
A.4.8.2. Reverse repurchase operations (reverse repos)
A reverse repurchase operation is one under which the Group lends liquid funds to a credit institution which provides collateral in the form of securities. The two parties enter into an irrevocable commitment to complete the operation on a date and at a price fixed at the outset.
The operation is based on the principle of delivery against payment: the borrower of the liquid funds transfers the securities to the Group’s custodian in exchange for settlement at the agreed price, which generates a return for the Group linked to the money market.
This type of operation is considered for the purposes of the Group to be a loan at a guaranteed rate of interest. Generally treated as collateralised financing transactions, they are carried at the amounts of cash advanced or received, plus accrued interest. Reverse repos are entered on the assets side of the consolidated balance sheet under “Loans and advances to credit institutions - b) other loans and advances”.
Securities received under reverse repurchase agreements are not recognised in the consolidated balance sheet, unless control of the contractual rights comprised in these securities is assumed. The Group monitors the market value of the securities received on a daily basis and requests additional collateral in accordance with the underlying agreements.
Interest earned on reverse repurchase agreements is recognised as interest income over the life of each agreement.
A.4.8.3. Fees on loans
Front-end fees on loans are deferred, together with the related direct costs of originating and maintaining the commitment, and are recognised as an adjustment to the effective yield, being recorded in the consolidated income statement over the period from disbursement to repayment of the related loan. If the commitment expires without the loan being drawn down, the fee is recognised as income on expiry. The front-end fees are deferred and recognised under “Interest and similar income” in the income statement over the life of the underlying loan. Those front-end fees were previously recognised in the income statement under “Fee and commission income” when received. See note A.4.21.
A.4.8.4. Interest subsidies
Interest subsidies received in advance (see Note F) are deferred in accordance with IAS 18, and are recognised as an adjustment to the effective yield, being recorded in the consolidated income statement over the period from disbursement to repayment of the subsidised loan.
A.4.9. Impairment on loans and advances and provisions on guarantees
Impairment on loans and advances or provisions on commitments are recorded if there is objective evidence that the Group will be unable to collect all amounts due on a claim according to the original contractual terms or an equivalent value. A “claim” means a loan, a commitment such as a letter of credit, a guarantee, a commitment to extend credit, or other credit product.
Impairment is reported as a reduction of the carrying amount of a claim on the consolidated balance sheet, whereas for an off-balance sheet item such as a commitment a provision for credit loss is reported in “Provisions”. Additional impairment or provisions for credit losses are made through “Change in impairment on loans and advances and provisions on guarantees, net of reversals”.
A.4.9.1. Impairment allowances related to individual loans and advances
Impairment losses have been made for individual loans and advances outstanding at the end of the financial year where objective evidence exists of risks of non-recovery of all or part of the amounts outstanding according to the original contractual terms or the equivalent value. Changes to these provisions are recorded in the consolidated income statement as “Change in impairment on loans and advances and provisions on guarantees, net of reversals”. Allowances and provisions for credit losses are evaluated on the following counterparty-specific principles.
A claim is considered impaired when the Bank determines that it is probable that the Group will not be able to collect all amounts due according to the original contractual terms or an equivalent value. Individual credit exposures are evaluated based upon the borrower’s character, overall financial condition, resources and payment record, the prospects for support from any financially responsible guarantors and, where applicable, the realisable value of any collateral. The estimated recoverable amount is the present value of expected future cash flows, which may result from restructuring or liquidation. Impairment is measured and allowances for credit losses are established for the difference between the carrying amount and the estimated recoverable amount of any claim considered as impaired. The amount of the loss is the difference between the asset’s carrying amount and the present value of expected future cash flows discounted at the financial instrument’s original effective interest rate.
All impaired claims are reviewed and analysed at least semi-annually. Any subsequent changes to the amounts and timing of the expected future cash flows compared to the prior estimates will result in a change in the provision for credit losses and be charged or credited to credit loss expense. An allowance for impairment is reversed only when the credit quality has improved such that there is reasonable assurance of timely collection of principal and interest in accordance with the original contractual terms of the claim agreement. A write-off is made when all or part of a claim is deemed uncollectible or forgiven. Write-offs are charged against previously established provisions for credit losses or directly to credit loss expense and reduce the principal amount of a claim. Recoveries in part or in full of amounts previously written off are credited to credit loss expense.
For non-performing loans, upon impairment the accrual of interest income based on the original terms of the claim is discontinued.
A.4.9.2. Guarantees
In the normal course of business, the Group issues various forms of guarantees.
147
Under the existing rules, these guarantees do not meet the definition of an insurance contract (IFRS 4 Insurance Contracts) and are accounted for under IAS 39 Financial Instruments: Recognition and Measurement, either as “Derivatives” or as “Financial Guarantees”, depending on their features and characteristics as defined by IAS 39.
The accounting policy for Derivatives is disclosed under Note A.4.3.
When a guarantee operation measured under IAS 39 is derecognised and treated under IAS 37, its value previously recorded under Financial guarantees is transferred to the caption “Provisions for guarantees” on the balance sheet.
Financial guarantees are initially recognised at fair value, being the premium received, in the consolidated balance sheet under “Other liabilities”.
Subsequent to initial recognition, the Group’s liabilities under each financial guarantee are measured at the higher of 1) the amount initially recognised less, when appropriate, cumulative amortisation recognised in accordance with IAS 18 and 2) the best estimate of expenditure required to settle any present financial obligation arising as a result of the guarantee in accordance with IAS 37.
Any increase in the liability relating to financial guarantee is taken to the consolidated income statement in “Change in impairment on loans and advances and provisions for guarantees, net of reversals”. The premium received is recognised in the consolidated income statement in “Fee and commission income” on the basis of an amortisation schedule in accordance with IAS 18 over the life of the financial guarantee.
A.4.10. Property, furniture and equipment
Property, furniture and equipment include land, Group-occupied properties and other machines and equipment.
Property, furniture and equipment are reviewed periodically for impairment.
Land is stated at acquisition cost and buildings are stated at acquisition cost less accumulated depreciation. The value of the Group’s headquarters building in Luxembourg-Kirchberg and its building in Luxembourg-Weimershof are depreciated on a straight-line basis as set out below.
Permanent equipment, fixtures and fittings, furniture, office equipment and vehicles are recorded in the consolidated balance sheet at their acquisition cost, less accumulated depreciation.
Depreciation is calculated on a straight-line basis over the estimated life of each item purchased, as set out below:
Buildings in Kirchberg and Weimershof: 30 years
Permanent equipment, fixtures and fittings: 10 years
Furniture: 5 years
Office equipment and vehicles: 3 years
A.4.11. Investment property
Investment property is property held to earn rentals or for capital appreciation or both. Investment property is stated at cost less accumulated depreciation and impairment losses and is reviewed for signs of impairment at the balance sheet date.
Depreciation is calculated on a straight-line basis using the same estimated useful lives as property, furniture and equipment.
A.4.12. Intangible assets
Intangible assets comprise internally developed computer software. Software development costs are capitalised if they meet certain criteria relating to identifiability, to the probability that future economic benefits will flow to the enterprise, and to the reliability of cost measurement.
Intangible assets are recognised as assets and are amortised on a straight-line basis over their estimated useful economic lives. At each consolidated balance sheet date, intangible assets are reviewed for indications of impairment or changes in estimated future benefits. If such indications exist, an analysis is performed to assess whether the carrying amounts are fully recoverable. A write-down is made if the carrying amount exceeds the recoverable amount.
Internally developed software meeting these criteria is carried at cost less accumulated amortisation calculated on a straight-line basis over three years from completion.
A.4.13. Pension plans and health insurance scheme
The Group operates defined benefit pension plans to provide retirement benefits to its entire staff. The Group also provides certain additional post-employment healthcare benefits to former employees of the EIB. These benefits are unfunded, as defined by IAS 19. The cost of providing benefits under the plans is determined separately for each plan using the projected unit credit actuarial valuation method. The charge to the consolidated income statement in respect of the defined benefit pension plan is based on the current service cost and interest cost as determined by qualified external actuaries.
148
EIB Group Consolidated Financial Statements under IFRS
A.4.13.1. Pension plan for staff
The Bank’s main pension plan is a defined benefit pension plan funded by contributions from staff and from the Bank, covering all Bank employees.
Commitments for retirement benefits are valued at least every year using the projected unit credit method, in order to ensure that the liability entered in the accounts is adequate. The latest valuation was performed as at 30 September 2014, with an extrapolation to 31 December 2014. The main actuarial assumptions used by the actuary are set out in Note J.
Cumulative actuarial surpluses and deficits are recognised in full in Other comprehensive income. Net interest cost is recognised in the income statement under “Interest expense and similar charges”.
The main pension plan of the EIF is a defined benefit plan funded by contributions from staff and from the EIF, covering all EIF employees. The scheme entered into force in March 2003, replacing the previous defined contribution scheme.
A.4.13.2. Health insurance plan
The Bank has set up its own health insurance plan for the benefit of staff, financed by contributions from the Bank and its employees. The plan is an unfunded plan treated as a defined benefit plan. A specific provision is set aside on the liability side of the consolidated balance sheet for staff at retirement age. The Fund has subscribed to a health insurance scheme with an insurance company for the benefit of staff at retirement age, financed by contribution from the Fund and its employees.
The entitlement to these benefits is based on the employees remaining in service up to retirement age and the completion of a minimum service period. The expected costs of these benefits are accrued over the period of employment, using a methodology similar to that for defined benefit pension plans. The health insurance liabilities are determined based on actuarial calculations as per the same dates as the pension plans.
A.4.13.3. Pension plan for members of the Management Committee
The related provision shown on the liability side of the Group’s balance sheet is determined, as for all plans, in conformity with IAS 19. Benefits are based on years of service and a percentage of final gross base salary as defined under the plan. The Pension plan for members of the Management Committee is managed and accounted for under the same principles as the pension plan for staff (Note A.4.13.1).
A.4.13.4. Optional Supplementary provident scheme
The optional supplementary provident scheme is a defined contribution pension scheme, funded by voluntary staff contributions and employer contributions. It is accounted for on the basis of the contributions from staff and employer and the corresponding liability is recorded in “Other liabilities”.
A.4.14. Amounts owed to credit institutions and customers
Amounts owed to credit institutions and customers are initially recorded at cost and are presented in the financial statements at amortised cost. Interest on amounts owed to credit institutions and customers is recorded in the income statement as Interest expense and similar charges using the effective interest method.
A.4.15. Debts evidenced by certificates
Debts evidenced by certificates are initially measured at cost, which is the fair value of the consideration received. Transaction costs and net premiums (discounts) are included in the initial measurement. Subsequent measurement is at amortised cost, and any difference between net proceeds and the redemption value is recognised in the consolidated income statement over the period of the borrowings using the effective interest method. Where borrowings meet the eligibility criteria of the amended Fair Value Option and have been designated on initial recognition as at fair value through profit or loss, they are measured at their fair value and are recorded in the balance sheet at fair value. Changes in fair value are recorded in “Result on financial operations”. The fair value measurement technique used, in the case of absence of liquid market prices, is a discounted cash flow technique, using current yield curves.
Combined debt instruments that are related to foreign exchange rates or indices are considered structured instruments. For all the debt instruments including embedded derivatives, the Group has concluded a swap agreement to fully hedge the exposure.
It is the Group policy to hedge the fixed interest rate risk on debt issues and to apply the amended Fair Value Option when this results in a significant reduction of an accounting mismatch. The effect is such that the carrying value of the thus elected debt instruments is adjusted for changes in fair value rather than carried and accrued at cost (see Note Q – Derivative financial instruments).
Interest expense on debt instruments is included in the account “Interest expense and similar charges” in the consolidated income statement and in the liabilities caption including the underlying debt instruments in the consolidated balance sheet.
Issuance fees and redemption premiums or discounts are amortised over the period to maturity of the related borrowings, unless those borrowings are measured at fair value, in which case the recognition in the consolidated income statement is immediate.
149
A.4.16. Prepayments – Deferred income
These accounts comprise:
Prepayments: expenditure incurred during the financial year but relating to a subsequent financial year.
Deferred income: income received before the balance sheet date but relating to a subsequent financial year.
A.4.17. Reserves
A.4.17.1. Reserve fund
As foreseen by Article 22.1 of the Statute, “a reserve fund of up to 10% of the subscribed capital shall be built up progressively” from the retained profit of the Bank.
A.4.17.2. Additional reserves
Additional reserves contain the remaining retained earnings of the Group.
A.4.17.3. Fair value reserve
The fair value reserve includes the change in fair value of available for sale financial assets (other than impairments).
A.4.17.4. Special activities reserve
As foreseen by Article 16.5 of the Statute, “the special activities of the Bank […] will have a specific allocation of reserve”. The reserve will be based on the capital allocation of each operation.
A.4.17.5. General loan reserve
In 2009 a “general loan reserve” was introduced for the expected loss of the Bank’s loan and guarantees portfolio, modelled upon the Group’s policy guidelines.
A.4.18. Taxation
The Protocol on the privileges and Immunities of the European Union appended to the treaty on European Union and the treaty on the functioning of the European Union, stipulates that the assets, revenues, and other property of the Institutions of the Union are exempt from all direct taxes.
A.4.19. Interest income and expense
Interest income and interest expense are recognised in the income statement for all interest bearing instruments on an accruals basis using the effective interest method based on the actual purchase price including direct transaction costs. This is a method of calculating the amortised cost of a financial asset and allocating the interest income over the relevant period. The effective interest rate is the rate that exactly discounts estimated future cash receipts through the expected life of the financial instrument to the net carrying amount of the financial asset.
In addition to interest and commission on loans, deposits and other revenue from the securities portfolio, this heading includes the indemnities received by the Group in respect of early loan reimbursement payments made by its borrowers.
In accordance with the provisions of IAS 39 – Financial Instruments: Recognition and Measurement - the Group records the indemnities received for early repayment of loans immediately in the consolidated income statement at the time of derecognition of the related loans.
In accordance with IAS 32 – Financial Instruments: Presentation, as a result of the replacement share purchase undertaking (Note A.4.1), non-controlling interests are presented under “Interest expense and similar charges”, in conformity with the anticipated acquisition method.
A.4.20. Dividend income
Dividends are recognised in the income statement when the entity’s right to receive payment is established.
A.4.21. Reclassification of prior year figures
Certain prior year figures have been reclassified to conform with the current year’s presentation. The reclassifications principally relate to:
Commitment fees and front-end fees on loans:
From: Fee and commission income EUR‘000 119,634
To: Interest and similar income EUR‘000 119,634
Loan instalments receivable:
From: Other assets EUR‘000 129,713
To: Loans and advances to credit institutions c) loans EUR’000 2,691/ Loans and advances to customers b) loans EUR‘000 127,022
150
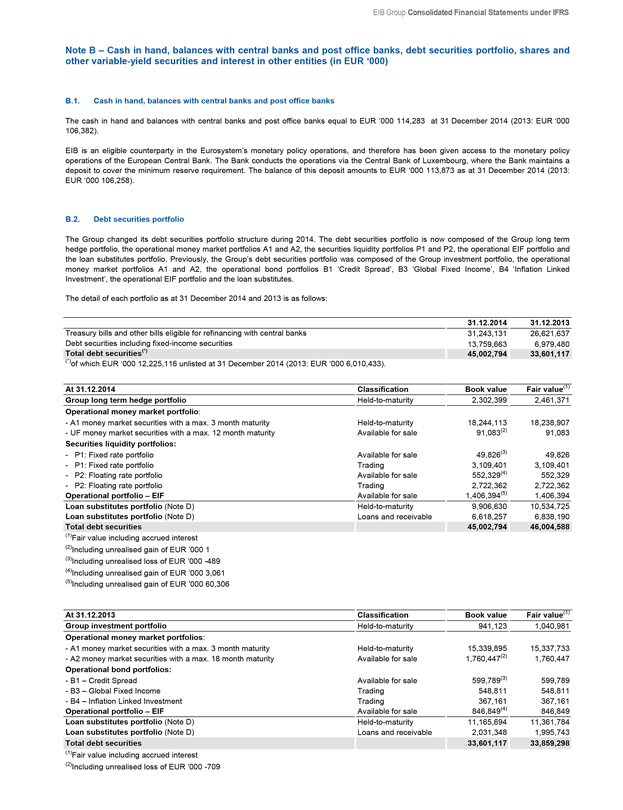
EIB Group Consolidated Financial Statements under IFRS
Note B – Cash in hand, balances with central banks and post office banks, debt securities portfolio, shares and other variable-yield securities and interest in other entities (in EUR ‘000)
B.1. Cash in hand, balances with central banks and post office banks
The cash in hand and balances with central banks and post office banks equal to EUR ’000 114,283 at 31 December 2014 (2013: EUR ‘000 106,382).
EIB is an eligible counterparty in the Eurosystem’s monetary policy operations, and therefore has been given access to the monetary policy operations of the European Central Bank. The Bank conducts the operations via the Central Bank of Luxembourg, where the Bank maintains a deposit to cover the minimum reserve requirement. The balance of this deposit amounts to EUR ‘000 113,873 as at 31 December 2014 (2013: EUR ‘000 106,258).
B.2. Debt securities portfolio
The Group changed its debt securities portfolio structure during 2014. The debt securities portfolio is now composed of the Group long term hedge portfolio, the operational money market portfolios A1 and A2, the securities liquidity portfolios P1 and P2, the operational EIF portfolio and the loan substitutes portfolio. Previously, the Group’s debt securities portfolio was composed of the Group investment portfolio, the operational money market portfolios A1 and A2, the operational bond portfolios B1 ‘Credit Spread’, B3 ‘Global Fixed Income’, B4 ‘Inflation Linked Investment’, the operational EIF portfolio and the loan substitutes.
The detail of each portfolio as at 31 December 2014 and 2013 is as follows:
31.12.2014
31.12.2013
Treasury bills and other bills eligible for refinancing with central banks
31,243,131
26,621,637
Debt securities including fixed-income securities
13,759,663
6,979,480
Total debt securities(*)
45,002,794
33,601,117
(*)of which EUR ‘000 12,225,116 unlisted at 31 December 2014 (2013: EUR ‘000 6,010,433).
At 31.12.2014 Classification Book value Fair value(1)
Group long term hedge portfolio Held-to-maturity 2,302,399 2,461,371
Operational money market portfolio:
- A1 money market securities with a max. 3 month maturity Held-to-maturity 18,244,113 18,238,907
- UF money market securities with a max. 12 month maturity Available for sale 91,083(2) 91,083
Securities liquidity portfolios:
- P1: Fixed rate portfolio Available for sale 49,826(3) 49,826
- P1: Fixed rate portfolio Trading 3,109,401 3,109,401
- P2: Floating rate portfolio Available for sale 552,329(4) 552,329
- P2: Floating rate portfolio Trading 2,722,362 2,722,362
Operational portfolio – EIF Available for sale 1,406,394(5) 1,406,394
Loan substitutes portfolio (Note D) Held-to-maturity 9,906,630 10,534,725
Loan substitutes portfolio (Note D) Loans and receivable 6,618,257 6,838,190
Total debt securities 45,002,794 46,004,588
(1)Fair value including accrued interest
(2)Including unrealised gain of EUR ’000 1
(3)Including unrealised loss of EUR ’000 -489
(4)Including unrealised gain of EUR ’000 3,061
(5)Including unrealised gain of EUR ’000 60,306
At 31.12.2013 Classification Book value Fair value(1)
Group investment portfolio Held-to-maturity 941,123 1,040,981
Operational money market portfolios:
- A1 money market securities with a max. 3 month maturity Held-to-maturity 15,339,895 15,337,733
- A2 money market securities with a max. 18 month maturity Available for sale 1,760,447(2) 1,760,447
Operational bond portfolios:
- B1 – Credit Spread Available for sale 599,789(3) 599,789
- B3 – Global Fixed Income Trading 548,811 548,811
- B4 – Inflation Linked Investment Trading 367,161 367,161
Operational portfolio – EIF Available for sale 846,849(4) 846,849
Loan substitutes portfolio (Note D) Held-to-maturity 11,165,694 11,361,784
Loan substitutes portfolio (Note D) Loans and receivable 2,031,348 1,995,743
Total debt securities 33,601,117 33,859,298
(1)Fair value including accrued interest
(2)Including unrealised loss of EUR ’000 -709
151
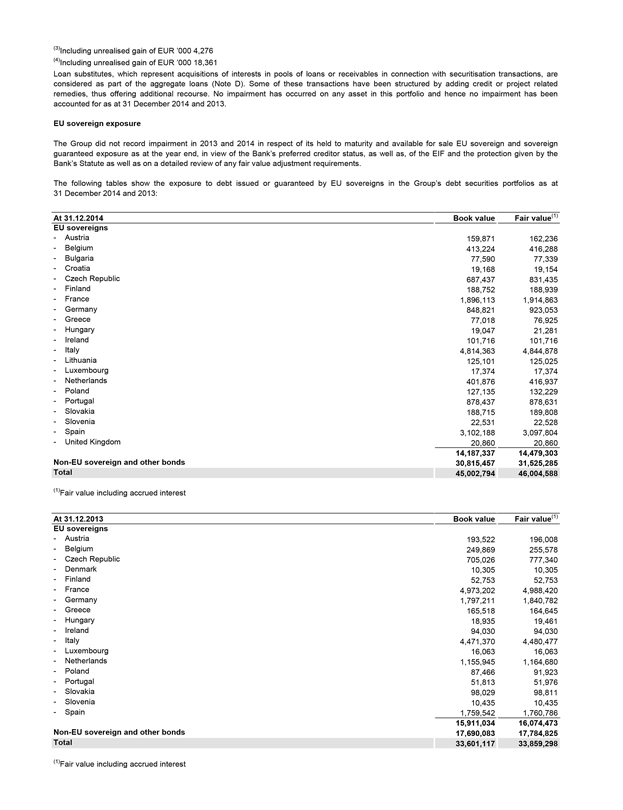
(3)Including unrealised gain of EUR ’000 4,276
(4)Including unrealised gain of EUR ’000 18,361
Loan substitutes, which represent acquisitions of interests in pools of loans or receivables in connection with securitisation transactions, are considered as part of the aggregate loans (Note D). Some of these transactions have been structured by adding credit or project related remedies, thus offering additional recourse. No impairment has occurred on any asset in this portfolio and hence no impairment has been accounted for as at 31 December 2014 and 2013.
EU sovereign exposure
The Group did not record impairment in 2013 and 2014 in respect of its held to maturity and available for sale EU sovereign and sovereign guaranteed exposure as at the year end, in view of the Bank’s preferred creditor status, as well as, of the EIF and the protection given by the Bank’s Statute as well as on a detailed review of any fair value adjustment requirements.
The following tables show the exposure to debt issued or guaranteed by EU sovereigns in the Group’s debt securities portfolios as at
31 December 2014 and 2013:
At 31.12.2014 Book value Fair value (1)
EU sovereigns
- Austria 159,871 162,236
- Belgium 413,224 416,288
- Bulgaria 77,590 77,339
- Croatia 19,168 19,154
- Czech Republic 687,437 831,435
- Finland 188,752 188,939
- France 1,896,113 1,914,863
- Germany 848,821 923,053
- Greece 77,018 76,925
- Hungary 19,047 21,281
- Ireland 101,716 101,716
- Italy 4,814,363 4,844,878
- Lithuania 125,101 125,025
- Luxembourg 17,374 17,374
- Netherlands 401,876 416,937
- Poland 127,135 132,229
- Portugal 878,437 878,631
- Slovakia 188,715 189,808
- Slovenia 22,531 22,528
- Spain 3,102,188 3,097,804
- United Kingdom 20,860 20,860
14,187,337 14,479,303
Non-EU sovereign and other bonds 30,815,457 31,525,285
Total 45,002,794 46,004,588
(1)Fair value including accrued interest
At 31.12.2013 Book value Fair value(1)
EU sovereigns
- Austria 193,522 196,008
- Belgium 249,869 255,578
- Czech Republic 705,026 777,340
- Denmark 10,305 10,305
- Finland 52,753 52,753
- France 4,973,202 4,988,420
- Germany 1,797,211 1,840,782
- Greece 165,518 164,645
- Hungary 18,935 19,461
- Ireland 94,030 94,030
- Italy 4,471,370 4,480,477
- Luxembourg 16,063 16,063
- Netherlands 1,155,945 1,164,680
- Poland 87,466 91,923
- Portugal 51,813 51,976
- Slovakia 98,029 98,811
- Slovenia 10,435 10,435
- Spain 1,759,542 1,760,786
15,911,034 16,074,473
Non-EU sovereign and other bonds 17,690,083 17,784,825
Total 33,601,117 33,859,298
(1)Fair value including accrued interest
152
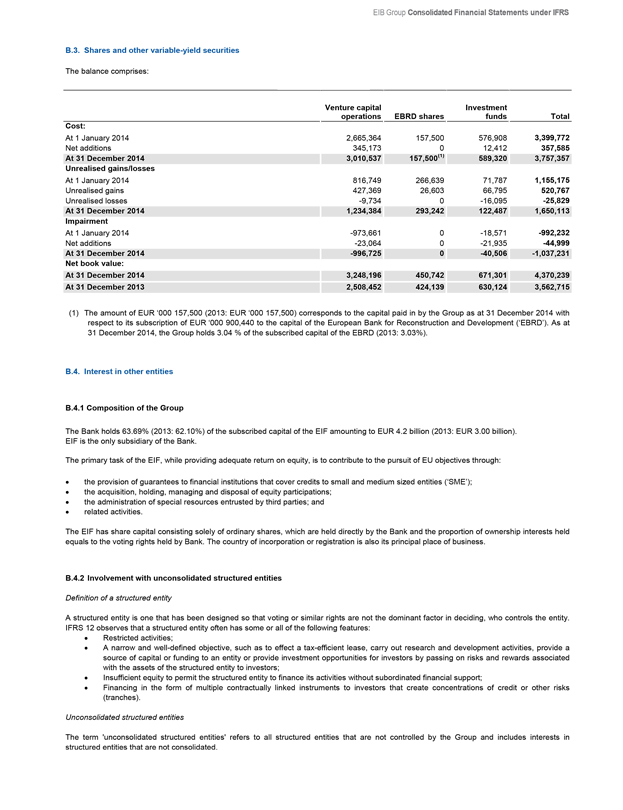
EIB Group Consolidated Financial Statements under IFRS
B.3. Shares and other variable-yield securities
The balance comprises:
Venture capital operations EBRD shares Investment funds Total
Cost:
At 1 January 2014 2,665,364 157,500 576,908 3,399,772
Net additions 345,173 0 12,412 357,585
At 31 December 2014 3,010,537 157,500(1) 589,320 3,757,357
Unrealised gains/losses
At 1 January 2014 816,749 266,639 71,787 1,155,175
Unrealised gains 427,369 26,603 66,795 520,767
Unrealised losses -9,734 0 -16,095 -25,829
At 31 December 2014 1,234,384 293,242 122,487 1,650,113
Impairment
At 1 January 2014 -973,661 0 -18,571 -992,232
Net additions -23,064 0 -21,935 -44,999
At 31 December 2014 -996,725 0 -40,506 -1,037,231
Net book value:
At 31 December 2014 3,248,196 450,742 671,301 4,370,239
At 31 December 2013 2,508,452 424,139 630,124 3,562,715
(1) The amount of EUR ‘000 157,500 (2013: EUR ‘000 157,500) corresponds to the capital paid in by the Group as at 31 December 2014 with respect to its subscription of EUR ‘000 900,440 to the capital of the European Bank for Reconstruction and Development (‘EBRD’). As at 31 December 2014, the Group holds 3.04 % of the subscribed capital of the EBRD (2013: 3.03%).
B.4. Interest in other entities
B.4.1 Composition of the Group
The Bank holds 63.69% (2013: 62.10%) of the subscribed capital of the EIF amounting to EUR 4.2 billion (2013: EUR 3.00 billion). EIF is the only subsidiary of the Bank.
The primary task of the EIF, while providing adequate return on equity, is to contribute to the pursuit of EU objectives through:
the provision of guarantees to financial institutions that cover credits to small and medium sized entities (‘SME’);
the acquisition, holding, managing and disposal of equity participations;
the administration of special resources entrusted by third parties; and
related activities.
The EIF has share capital consisting solely of ordinary shares, which are held directly by the Bank and the proportion of ownership interests held equals to the voting rights held by Bank. The country of incorporation or registration is also its principal place of business.
B.4.2 Involvement with unconsolidated structured entities
Definition of a structured entity
A structured entity is one that has been designed so that voting or similar rights are not the dominant factor in deciding, who controls the entity. IFRS 12 observes that a structured entity often has some or all of the following features:
Restricted activities;
A narrow and well-defined objective, such as to effect a tax-efficient lease, carry out research and development activities, provide a source of capital or funding to an entity or provide investment opportunities for investors by passing on risks and rewards associated with the assets of the structured entity to investors;
Insufficient equity to permit the structured entity to finance its activities without subordinated financial support;
Financing in the form of multiple contractually linked instruments to investors that create concentrations of credit or other risks (tranches).
Unconsolidated structured entities
The term ‘unconsolidated structured entities’ refers to all structured entities that are not controlled by the Group and includes interests in structured entities that are not consolidated.
153
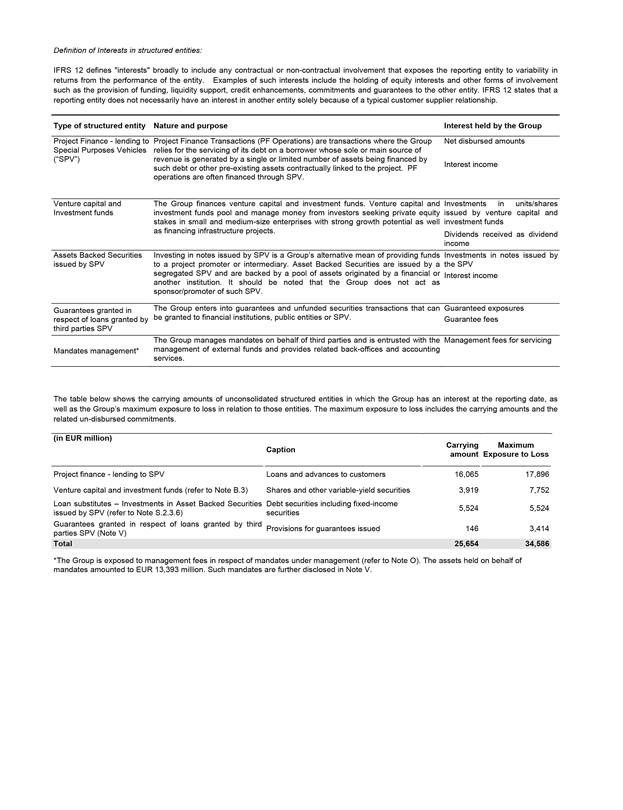
Definition of Interests in structured entities:
IFRS 12 defines “interests” broadly to include any contractual or non-contractual involvement that exposes the reporting entity to variability in returns from the performance of the entity. Examples of such interests include the holding of equity interests and other forms of involvement such as the provision of funding, liquidity support, credit enhancements, commitments and guarantees to the other entity. IFRS 12 states that a reporting entity does not necessarily have an interest in another entity solely because of a typical customer supplier relationship.
Type of structured entity
Project Finance - lending to Special Purposes Vehicles (“SPV”)
Venture capital and Investment funds
Assets Backed Securities issued by SPV
Guarantees granted in respect of loans granted by third parties SPV
Mandates management*
Nature and purpose
Project Finance Transactions (PF Operations) are transactions where the Group relies for the servicing of its debt on a borrower whose sole or main source of revenue is generated by a single or limited number of assets being financed by such debt or other pre-existing assets contractually linked to the project. PF operations are often financed through SPV.
The Group finances venture capital and investment funds. Venture capital and investment funds pool and manage money from investors seeking private equity stakes in small and medium-size enterprises with strong growth potential as well as financing infrastructure projects.
Investing in notes issued by SPV is a Group’s alternative mean of providing funds to a project promoter or intermediary. Asset Backed Securities are issued by a segregated SPV and are backed by a pool of assets originated by a financial or another institution. It should be noted that the Group does not act as sponsor/promoter of such SPV.
The Group enters into guarantees and unfunded securities transactions that can be granted to financial institutions, public entities or SPV.
The Group manages mandates on behalf of third parties and is entrusted with the management of external funds and provides related back-offices and accounting services.
Interest held by the Group
Net disbursed amounts
Interest income
Investments in units/shares issued by venture capital and investment funds
Dividends received as dividend income
Investments in notes issued by the SPV
Interest income
Guaranteed exposures
Guarantee fees
Management fees for servicing
The table below shows the carrying amounts of unconsolidated structured entities in which the Group has an interest at the reporting date, as well as the Group’s maximum exposure to loss in relation to those entities. The maximum exposure to loss includes the carrying amounts and the related un-disbursed commitments.
(in EUR million)
Project finance - lending to SPV
Venture capital and investment funds (refer to Note B.3)
Loan substitutes – Investments in Asset Backed Securities issued by SPV (refer to Note S.2.3.6)
Guarantees granted in respect of loans granted by third parties SPV (Note V)
Total
Caption
Loans and advances to customers
Shares and other variable-yield securities
Debt securities including fixed-income securities
Provisions for guarantees issued
Carrying amount
16,065
3,919
5,524
146
25,654
Maximum Exposure to Loss
17,896
7,752
5,524
3,414
34,586
* The Group is exposed to management fees in respect of mandates under management (refer to Note O). The assets held on behalf of mandates amounted to EUR 13,393 million. Such mandates are further disclosed in Note V.
160 Financial Report 2014
154
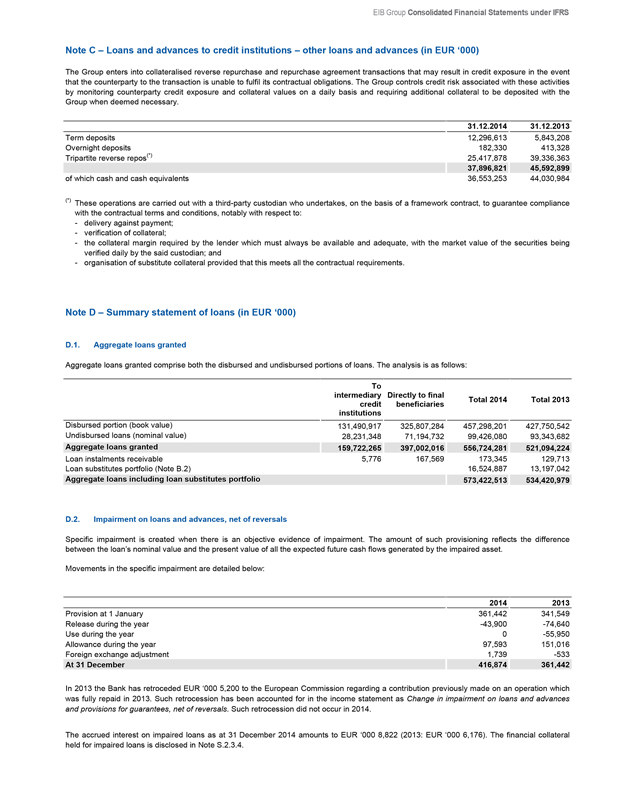
EIB Group Consolidated Financial Statements under IFRS
Note C – Loans and advances to credit institutions – other loans and advances (in EUR ‘000)
The Group enters into collateralised reverse repurchase and repurchase agreement transactions that may result in credit exposure in the event that the counterparty to the transaction is unable to fulfil its contractual obligations. The Group controls credit risk associated with these activities by monitoring counterparty credit exposure and collateral values on a daily basis and requiring additional collateral to be deposited with the Group when deemed necessary.
31.12.2014 31.12.2013
Term deposits 12,296,613 5,843,208
Overnight deposits 182,330 413,328
Tripartite reverse repos(*) 25,417,878 39,336,363
37,896,821 45,592,899
of which cash and cash equivalents 36,553,253 44,030,984
(*) These operations are carried out with a third-party custodian who undertakes, on the basis of a framework contract, to guarantee compliance with the contractual terms and conditions, notably with respect to:
delivery against payment;
verification of collateral;
the collateral margin required by the lender which must always be available and adequate, with the market value of the securities being verified daily by the said custodian; and
organisation of substitute collateral provided that this meets all the contractual requirements.
Note D – Summary statement of loans (in EUR ‘000)
D.1. Aggregate loans granted
Aggregate loans granted comprise both the disbursed and undisbursed portions of loans. The analysis is as follows:
To intermediary credit institutions
Directly to final beneficiaries
Total 2014
Total 2013
Disbursed portion (book value) 131,490,917 325,807,284 457,298,201 427,750,542
Undisbursed loans (nominal value) 28,231,348 71,194,732 99,426,080 93,343,682
Aggregate loans granted 159,722,265 397,002,016 556,724,281 521,094,224
Loan instalments receivable 5,776 167,569 173,345 129,713
Loan substitutes portfolio (Note B.2) 16,524,887 13,197,042
Aggregate loans including loan substitutes portfolio 573,422,513 534,420,979
D.2. Impairment on loans and advances, net of reversals
Specific impairment is created when there is an objective evidence of impairment. The amount of such provisioning reflects the difference between the loan’s nominal value and the present value of all the expected future cash flows generated by the impaired asset.
Movements in the specific impairment are detailed below:
2014 2013
Provision at 1 January 361,442 341,549
Release during the year -43,900 -74,640
Use during the year 0 -55,950
Allowance during the year 97,593 151,016
Foreign exchange adjustment 1,739 -533
At 31 December 416,874 361,442
In 2013 the Bank has retroceded EUR ‘000 5,200 to the European Commission regarding a contribution previously made on an operation which was fully repaid in 2013. Such retrocession has been accounted for in the income statement as Change in impairment on loans and advances and provisions for guarantees, net of reversals. Such retrocession did not occur in 2014.
The accrued interest on impaired loans as at 31 December 2014 amounts to EUR ‘000 8,822 (2013: EUR ‘000 6,176). The financial collateral held for impaired loans is disclosed in Note S.2.3.4.
2014 Financial Report 161
155
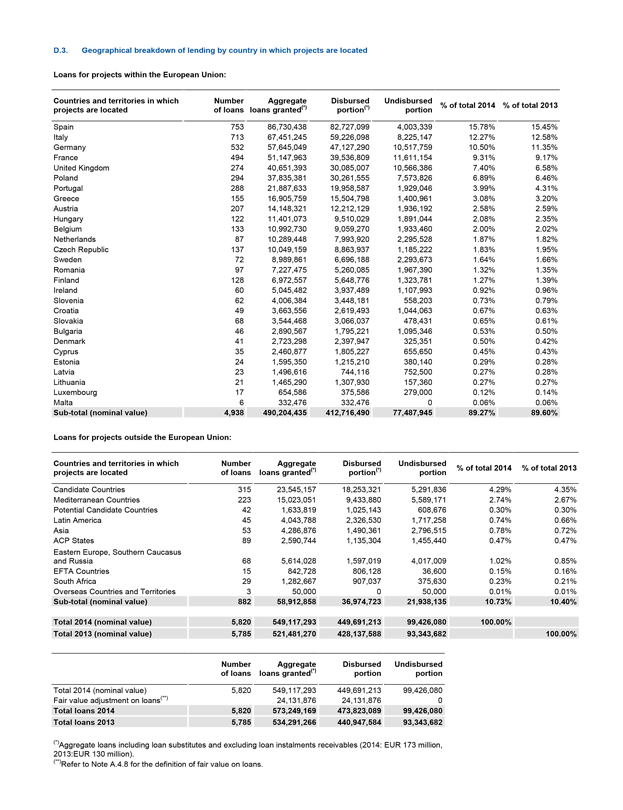
D.3. Geographical breakdown of lending by country in which projects are located
Loans for projects within the European Union:
Countries and territories in which projects are located
Number of loans
Aggregate loans granted(*)
Disbursed portion(*)
Undisbursed portion
% of total 2014
% of total 2013
Spain 753 86,730,438 82,727,099 4,003,339 15.78% 15.45%
Italy 713 67,451,245 59,226,098 8,225,147 12.27% 12.58%
Germany 532 57,645,049 47,127,290 10,517,759 10.50% 11.35%
France 494 51,147,963 39,536,809 11,611,154 9.31% 9.17%
United Kingdom 274 40,651,393 30,085,007 10,566,386 7.40% 6.58%
Poland 294 37,835,381 30,261,555 7,573,826 6.89% 6.46%
Portugal 288 21,887,633 19,958,587 1,929,046 3.99% 4.31%
Greece 155 16,905,759 15,504,798 1,400,961 3.08% 3.20%
Austria 207 14,148,321 12,212,129 1,936,192 2.58% 2.59%
Hungary 122 11,401,073 9,510,029 1,891,044 2.08% 2.35%
Belgium 133 10,992,730 9,059,270 1,933,460 2.00% 2.02%
Netherlands 87 10,289,448 7,993,920 2,295,528 1.87% 1.82%
Czech Republic 137 10,049,159 8,863,937 1,185,222 1.83% 1.95%
Sweden 72 8,989,861 6,696,188 2,293,673 1.64% 1.66%
Romania 97 7,227,475 5,260,085 1,967,390 1.32% 1.35%
Finland 128 6,972,557 5,648,776 1,323,781 1.27% 1.39%
Ireland 60 5,045,482 3,937,489 1,107,993 0.92% 0.96%
Slovenia 62 4,006,384 3,448,181 558,203 0.73% 0.79%
Croatia 49 3,663,556 2,619,493 1,044,063 0.67% 0.63%
Slovakia 68 3,544,468 3,066,037 478,431 0.65% 0.61%
Bulgaria 46 2,890,567 1,795,221 1,095,346 0.53% 0.50%
Denmark 41 2,723,298 2,397,947 325,351 0.50% 0.42%
Cyprus 35 2,460,877 1,805,227 655,650 0.45% 0.43%
Estonia 24 1,595,350 1,215,210 380,140 0.29% 0.28%
Latvia 23 1,496,616 744,116 752,500 0.27% 0.28%
Lithuania 21 1,465,290 1,307,930 157,360 0.27% 0.27%
Luxembourg 17 654,586 375,586 279,000 0.12% 0.14%
Malta 6 332,476 332,476 0 0.06% 0.06%
Sub-total (nominal value) 4,938 490,204,435 412,716,490 77,487,945 89.27% 89.60%
Loans for projects outside the European Union:
Countries and territories in which projects are located
Number of loans
Aggregate loans granted(*)
Disbursed portion(*)
Undisbursed portion
% of total 2014
% of total 2013
Candidate Countries 315 23,545,157 18,253,321 5,291,836 4.29% 4.35%
Mediterranean Countries 223 15,023,051 9,433,880 5,589,171 2.74% 2.67%
Potential Candidate Countries 42 1,633,819 1,025,143 608,676 0.30% 0.30%
Latin America 45 4,043,788 2,326,530 1,717,258 0.74% 0.66%
Asia 53 4,286,876 1,490,361 2,796,515 0.78% 0.72%
ACP States 89 2,590,744 1,135,304 1,455,440 0.47% 0.47%
Eastern Europe, Southern Caucasus and Russia 68 5,614,028 1,597,019 4,017,009 1.02% 0.85%
EFTA Countries 15 842,728 806,128 36,600 0.15% 0.16%
South Africa 29 1,282,667 907,037 375,630 0.23% 0.21%
Overseas Countries and Territories 3 50,000 0 50,000 0.01% 0.01%
Sub-total (nominal value) 882 58,912,858 36,974,723 21,938,135 10.73% 10.40%
Total 2014 (nominal value) 5,820 549,117,293 449,691,213 99,426,080 100.00%
Total 2013 (nominal value) 5,785 521,481,270 428,137,588 93,343,682 100.00%
Number of loans
Aggregate loans granted(*)
Disbursed portion
Undisbursed portion
Total 2014 (nominal value) 5,820 549,117,293 449,691,213 99,426,080
Fair value adjustment on loans(**) 24,131,876 24,131,876 0
Total loans 2014 5,820 573,249,169 473,823,089 99,426,080
Total loans 2013 5,785 534,291,266 440,947,584 93,343,682
(*) Aggregate loans including loan substitutes and excluding loan instalments receivables (2014: EUR 173 million, 2013: EUR 130 million).
(**) Refer to Note A.4.8 for the definition of fair value on loans.
162 Financial Report 2014
156
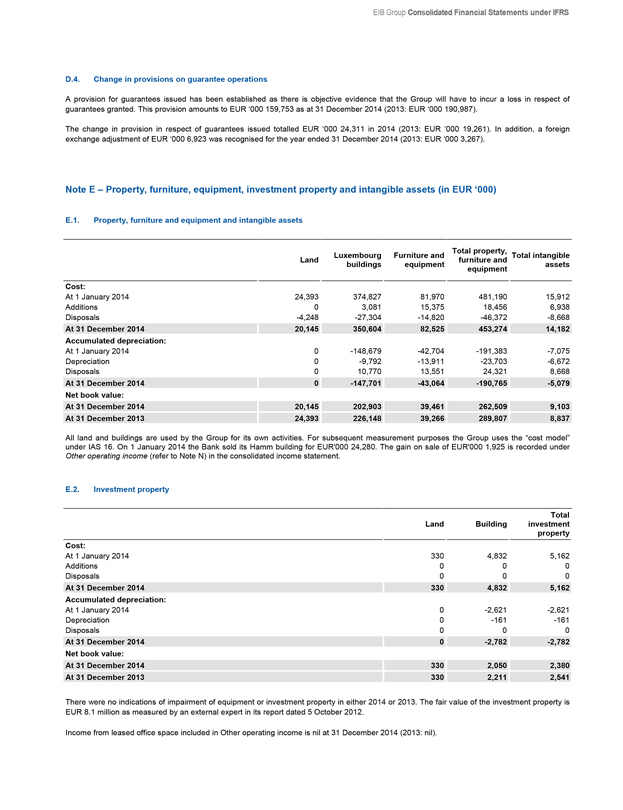
EIB Group Consolidated Financial Statements under IFRS
D.4. Change in provisions on guarantee operations
A provision for guarantees issued has been established as there is objective evidence that the Group will have to incur a loss in respect of guarantees granted. This provision amounts to EUR ‘000 159,753 as at 31 December 2014 (2013: EUR ‘000 190,987).
The change in provision in respect of guarantees issued totalled EUR ‘000 24,311 in 2014 (2013: EUR ‘000 19,261). In addition, a foreign exchange adjustment of EUR ‘000 6,923 was recognised for the year ended 31 December 2014 (2013: EUR ‘000 3,267).
Note E – Property, furniture, equipment, investment property and intangible assets (in EUR ‘000)
E.1. Property, furniture and equipment and intangible assets
Land
Luxembourg buildings
Furniture and equipment
Total property, furniture and Equipment
Total intangible assets
Cost:
At 1 January 2014 24,393 374,827 81,970 481,190 15,912
Additions 0 3,081 15,375 18,456 6,938
Disposals -4,248 -27,304 -14,820 -46,372 -8,668
At 31 December 2014 20,145 350,604 82,525 453,274 14,182
Accumulated depreciation:
At 1 January 2014 0 -148,679 -42,704 -191,383 -7,075
Depreciation 0 -9,792 -13,911 -23,703 -6,672
Disposals 0 10,770 13,551 24,321 8,668
At 31 December 2014 0 -147,701 -43,064 -190,765 -5,079
Net book value:
At 31 December 2014 20,145 202,903 39,461 262,509 9,103
At 31 December 2013 24,393 226,148 39,266 289,807 8,837
All land and buildings are used by the Group for its own activities. For subsequent measurement purposes the Group uses the “cost model” under IAS 16. On 1 January 2014 the Bank sold its Hamm building for EUR’000 24,280. The gain on sale of EUR’000 1,925 is recorded under Other operating income (refer to Note N) in the consolidated income statement.
E.2. Investment property
Land Building Total investment property
Cost:
At 1 January 2014 330 4,832 5,162
Additions 0 0 0
Disposals 0 0 0
At 31 December 2014 330 4,832 5,162
Accumulated depreciation:
At 1 January 2014 0 -2,621 -2,621
Depreciation 0 -161 -161
Disposals 0 0 0
At 31 December 2014 0 -2,782 -2,782
Net book value:
At 31 December 2014 330 2,050 2,380
At 31 December 2013 330 2,211 2,541
There were no indications of impairment of equipment or investment property in either 2014 or 2013. The fair value of the investment property is EUR 8.1 million as measured by an external expert in its report dated 5 October 2012.
Income from leased office space included in Other operating income is nil at 31 December 2014 (2013: nil).
2014 Financial Report 163
157
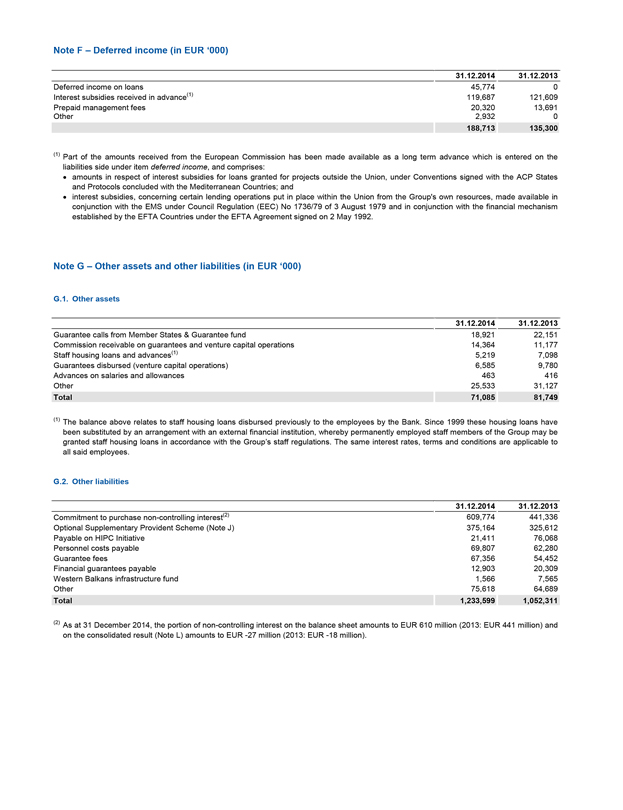
Note F – Deferred income (in EUR ‘000)
31.12.2014 31.12.2013
Deferred income on loans 45,774 0
Interest subsidies received in advance(1) 119,687 121,609
Prepaid management fees 20,320 13,691
Other 2,932 0
188,713 135,300
(1) Part of the amounts received from the European Commission has been made available as a long term advance which is entered on the liabilities side under item deferred income, and comprises:
amounts in respect of interest subsidies for loans granted for projects outside the Union, under Conventions signed with the ACP States and Protocols concluded with the Mediterranean Countries; and
interest subsidies, concerning certain lending operations put in place within the Union from the Group’s own resources, made available in conjunction with the EMS under Council Regulation (EEC) No 1736/79 of 3 August 1979 and in conjunction with the financial mechanism established by the EFTA Countries under the EFTA Agreement signed on 2 May 1992.
Note G – Other assets and other liabilities (in EUR ‘000)
G.1. Other assets
31.12.2014 31.12.2013
Guarantee calls from Member States & Guarantee fund 18,921 22,151
Commission receivable on guarantees and venture capital operations 14,364 11,177
Staff housing loans and advances(1) 5,219 7,098
Guarantees disbursed (venture capital operations) 6,585 9,780
Advances on salaries and allowances 463 416
Other 25,533 31,127
Total 71,085 81,749
(1) The balance above relates to staff housing loans disbursed previously to the employees by the Bank. Since 1999 these housing loans have been substituted by an arrangement with an external financial institution, whereby permanently employed staff members of the Group may be granted staff housing loans in accordance with the Group’s staff regulations. The same interest rates, terms and conditions are applicable to all said employees.
G.2. Other liabilities
31.12.2014 31.12.2013
Commitment to purchase non-controlling interest(2) 609,774 441,336
Optional Supplementary Provident Scheme (Note J) 375,164 325,612
Payable on HIPC Initiative 21,411 76,068
Personnel costs payable 69,807 62,280
Guarantee fees 67,356 54,452
Financial guarantees payable 12,903 20,309
Western Balkans infrastructure fund 1,566 7,565
Other 75,618 64,689
Total 1,233,599 1,052,311
(2) As at 31 December 2014, the portion of non-controlling interest on the balance sheet amounts to EUR 610 million (2013: EUR 441 million) and on the consolidated result (Note L) amounts to EUR -27 million (2013: EUR -18 million).
164 Financial Report 2014
158
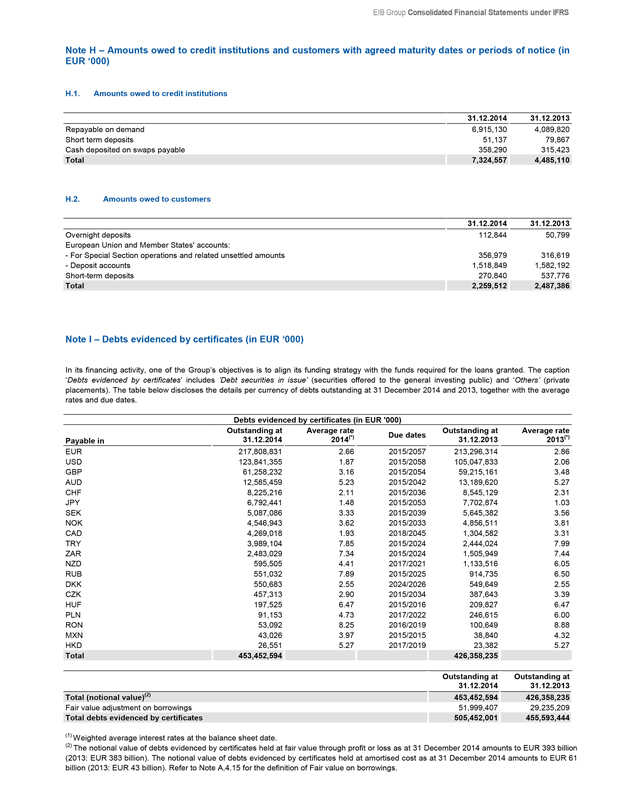
EIB Group Consolidated Financial Statements under IFRS
Note H – Amounts owed to credit institutions and customers with agreed maturity dates or periods of notice (in EUR ‘000)
H.1. Amounts owed to credit institutions
31.12.2014 31.12.2013
Repayable on demand 6,915,130 4,089,820
Short term deposits 51,137 79,867
Cash deposited on swaps payable 358,290 315,423
Total 7,324,557 4,485,110
H.2. Amounts owed to customers
31.12.2014 31.12.2013
Overnight deposits 112,844 50,799
European Union and Member States’ accounts:
- For Special Section operations and related unsettled amounts 356,979 316,619
- Deposit accounts 1,518,849 1,582,192
Short-term deposits 270,840 537,776
Total 2,259,512 2,487,386
Note I – Debts evidenced by certificates (in EUR ‘000)
In its financing activity, one of the Group’s objectives is to align its funding strategy with the funds required for the loans granted. The caption ‘Debts evidenced by certificates’ includes ’Debt securities in issue’ (securities offered to the general investing public) and ‘Others’ (private placements). The table below discloses the details per currency of debts outstanding at 31 December 2014 and 2013, together with the average rates and due dates.
Debts evidenced by certificates (in EUR ‘000)
Outstanding at Average rate Outstanding at Average rate
Payable in 31.12.2014 2014(*) Due dates 31.12.2013 2013(*)
EUR 217,808,831 2.66 2015/2057 213,296,314 2.86
USD 123,841,355 1.87 2015/2058 105,047,833 2.06
GBP 61,258,232 3.16 2015/2054 59,215,161 3.48
AUD 12,585,459 5.23 2015/2042 13,189,620 5.27
CHF 8,225,216 2.11 2015/2036 8,545,129 2.31
JPY 6,792,441 1.48 2015/2053 7,702,874 1.03
SEK 5,087,086 3.33 2015/2039 5,645,382 3.56
NOK 4,546,943 3.62 2015/2033 4,856,511 3.81
CAD 4,269,018 1.93 2018/2045 1,304,582 3.31
TRY 3,989,104 7.85 2015/2024 2,444,024 7.99
ZAR 2,483,029 7.34 2015/2024 1,505,949 7.44
NZD 595,505 4.41 2017/2021 1,133,516 6.05
RUB 551,032 7.89 2015/2025 914,735 6.50
DKK 550,683 2.55 2024/2026 549,649 2.55
CZK 457,313 2.90 2015/2034 387,643 3.39
HUF 197,525 6.47 2015/2016 209,827 6.47
PLN 91,153 4.73 2017/2022 246,615 6.00
RON 53,092 8.25 2016/2019 100,649 8.88
MXN 43,026 3.97 2015/2015 38,840 4.32
Outstanding at Outstanding at
31.12.2014 31.12.2013
Total (notional value)(2) 453,452,594 426,358,235
Fair value adjustment on borrowings 51,999,407 29,235,209
Total debts evidenced by certificates 505,452,001 455,593,444
HKD 26,551 5.27 2017/2019 23,382 5.27
Total 453,452,594 426,358,235
(1) Weighted average interest rates at the balance sheet date.
(2) The notional value of debts evidenced by certificates held at fair value through profit or loss as at 31 December 2014 amounts to EUR 393 billion (2013: EUR 383 billion). The notional value of debts evidenced by certificates held at amortised cost as at 31 December 2014 amounts to EUR 61 billion (2013: EUR 43 billion). Refer to Note A.4.15 for the definition of Fair value on borrowings.
2014 Financial Report 165
159
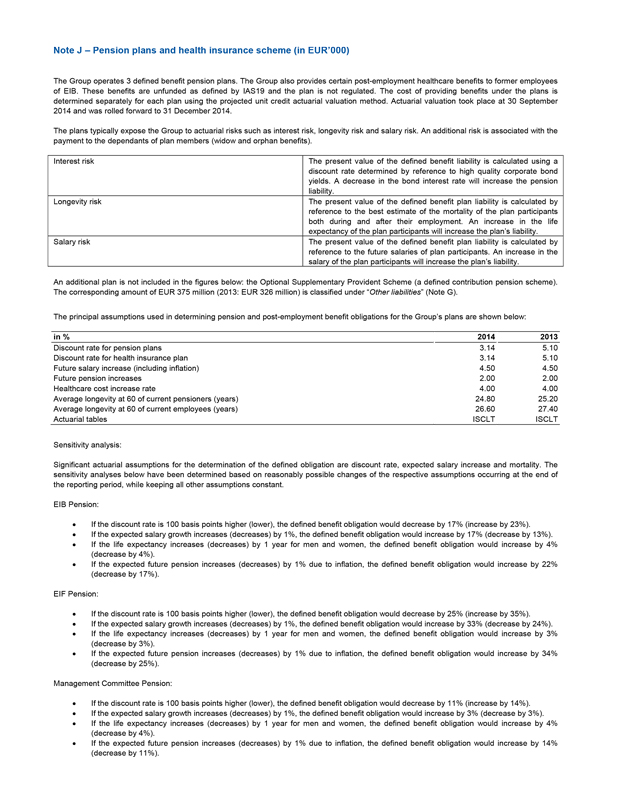
Note J – Pension plans and health insurance scheme (in EUR’000)
The Group operates 3 defined benefit pension plans. The Group also provides certain post-employment healthcare benefits to former employees of EIB. These benefits are unfunded as defined by IAS19 and the plan is not regulated. The cost of providing benefits under the plans is determined separately for each plan using the projected unit credit actuarial valuation method. Actuarial valuation took place at 30 September 2014 and was rolled forward to 31 December 2014.
The plans typically expose the Group to actuarial risks such as interest risk, longevity risk and salary risk. An additional risk is associated with the payment to the dependants of plan members (widow and orphan benefits).
Interest risk The present value of the defined benefit liability is calculated using a discount rate determined by reference to high quality corporate bond yields. A decrease in the bond interest rate will increase the pension liability.
Longevity risk The present value of the defined benefit plan liability is calculated by reference to the best estimate of the mortality of the plan participants both during and after their employment. An increase in the life expectancy of the plan participants will increase the plan’s liability.
Salary risk The present value of the defined benefit plan liability is calculated by reference to the future salaries of plan participants. An increase in the salary of the plan participants will increase the plan’s liability.
An additional plan is not included in the figures below: the Optional Supplementary Provident Scheme (a defined contribution pension scheme). The corresponding amount of EUR 375 million (2013: EUR 326 million) is classified under “Other liabilities” (Note G).
The principal assumptions used in determining pension and post-employment benefit obligations for the Group’s plans are shown below:
in % 2014 2013
Discount rate for pension plans 3.14 5.10
Discount rate for health insurance plan 3.14 5.10
Future salary increase (including inflation) 4.50 4.50
Future pension increases 2.00 2.00
Healthcare cost increase rate 4.00 4.00
Average longevity at 60 of current pensioners (years) 24.80 25.20
Average longevity at 60 of current employees (years) 26.60 27.40
Actuarial tables ISCLT ISCLT
Sensitivity analysis:
Significant actuarial assumptions for the determination of the defined obligation are discount rate, expected salary increase and mortality. The sensitivity analyses below have been determined based on reasonably possible changes of the respective assumptions occurring at the end of the reporting period, while keeping all other assumptions constant.
EIB Pension:
If the discount rate is 100 basis points higher (lower), the defined benefit obligation would decrease by 17% (increase by 23%).
If the expected salary growth increases (decreases) by 1%, the defined benefit obligation would increase by 17% (decrease by 13%).
If the life expectancy increases (decreases) by 1 year for men and women, the defined benefit obligation would increase by 4% (decrease by 4%).
If the expected future pension increases (decreases) by 1% due to inflation, the defined benefit obligation would increase by 22% (decrease by 17%).
EIF Pension:
If the discount rate is 100 basis points higher (lower), the defined benefit obligation would decrease by 25% (increase by 35%).
If the expected salary growth increases (decreases) by 1%, the defined benefit obligation would increase by 33% (decrease by 24%).
If the life expectancy increases (decreases) by 1 year for men and women, the defined benefit obligation would increase by 3% (decrease by 3%).
If the expected future pension increases (decreases) by 1% due to inflation, the defined benefit obligation would increase by 34% (decrease by 25%).
Management Committee Pension:
If the discount rate is 100 basis points higher (lower), the defined benefit obligation would decrease by 11% (increase by 14%).
If the expected salary growth increases (decreases) by 1%, the defined benefit obligation would increase by 3% (decrease by 3%).
If the life expectancy increases (decreases) by 1 year for men and women, the defined benefit obligation would increase by 4% (decrease by 4%).
If the expected future pension increases (decreases) by 1% due to inflation, the defined benefit obligation would increase by 14% (decrease by 11%).
166 Financial Report 2014
160
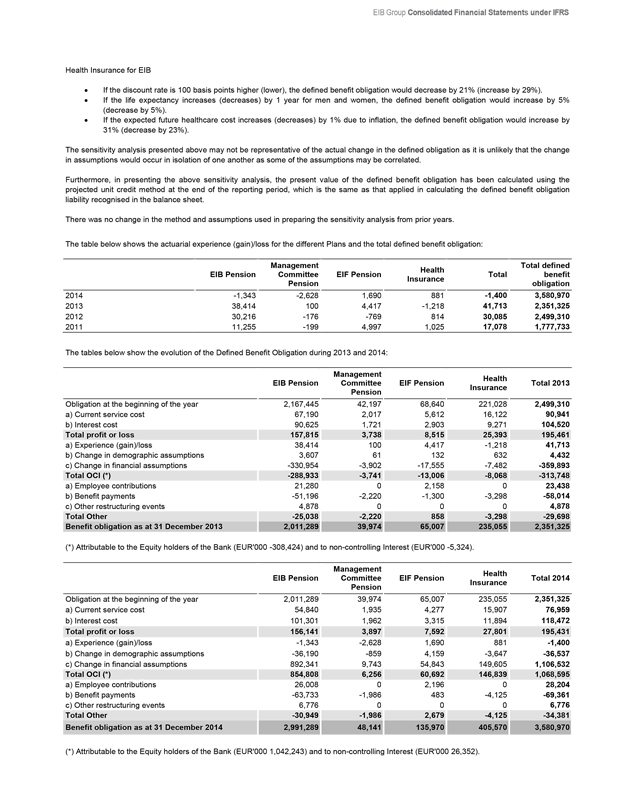
EIB Group Consolidated Financial Statements under IFRS
Health Insurance for EIB
If the discount rate is 100 basis points higher (lower), the defined benefit obligation would decrease by 21% (increase by 29%).
If the life expectancy increases (decreases) by 1 year for men and women, the defined benefit obligation would increase by 5% (decrease by 5%).
If the expected future healthcare cost increases (decreases) by 1% due to inflation, the defined benefit obligation would increase by 31% (decrease by 23%).
The sensitivity analysis presented above may not be representative of the actual change in the defined obligation as it is unlikely that the change in assumptions would occur in isolation of one another as some of the assumptions may be correlated.
Furthermore, in presenting the above sensitivity analysis, the present value of the defined benefit obligation has been calculated using the projected unit credit method at the end of the reporting period, which is the same as that applied in calculating the defined benefit obligation liability recognised in the balance sheet.
There was no change in the method and assumptions used in preparing the sensitivity analysis from prior years. The table below shows the actuarial experience (gain)/loss for the different Plans and the total defined benefit obligation:
EIB Pension Management Committee Pension EIF Pension Health Insurance Total Total defined benefit obligation
2014 -1,343 -2,628 1,690 881 -1,400 3,580,970
2013 38,414 100 4,417 -1,218 41,713 2,351,325
2012 30,216 -176 -769 814 30,085 2,499,310
2011 11,255 -199 4,997 1,025 17,078 1,777,733
The tables below show the evolution of the Defined Benefit Obligation during 2013 and 2014:
EIB Pension Management Committee Pension EIF Pension Health Insurance Total 2013
Obligation at the beginning of the year 2,167,445 42,197 68,640 221,028 2,499,310
a) Current service cost 67,190 2,017 5,612 16,122 90,941
b) Interest cost 90,625 1,721 2,903 9,271 104,520
Total profit or loss 157,815 3,738 8,515 25,393 195,461
a) Experience (gain)/loss 38,414 100 4,417 -1,218 41,713
b) Change in demographic assumptions 3,607 61 132 632 4,432
c) Change in financial assumptions -330,954 -3,902 -17,555 -7,482 -359,893
Total OCI (*) -288,933 -3,741 -13,006 -8,068 -313,748
a) Employee contributions 21,280 0 2,158 0 23,438
b) Benefit payments -51,196 -2,220 -1,300 -3,298 -58,014
c) Other restructuring events 4,878 0 0 0 4,878
Total Other -25,038 -2,220 858 -3,298 -29,698
Benefit obligation as at 31 December 2013 2,011,289 39,974 65,007 235,055 2,351,325
(*) Attributable to the Equity holders of the Bank (EUR’000 -308,424) and to non-controlling Interest (EUR’000 -5,324).
EIB Pension Management Committee Pension EIF Pension Health Insurance Total 2014
Obligation at the beginning of the year 2,011,289 39,974 65,007 235,055 2,351,325
a) Current service cost 54,840 1,935 4,277 15,907 76,959
b) Interest cost 101,301 1,962 3,315 11,894 118,472
Total profit or loss 156,141 3,897 7,592 27,801 195,431
a) Experience (gain)/loss -1,343 -2,628 1,690 881 -1,400
b) Change in demographic assumptions -36,190 -859 4,159 -3,647 -36,537
c) Change in financial assumptions 892,341 9,743 54,843 149,605 1,106,532
Total OCI (*) 854,808 6,256 60,692 146,839 1,068,595
a) Employee contributions 26,008 0 2,196 0 28,204
b) Benefit payments -63,733 -1,986 483 -4,125 -69,361
c) Other restructuring events 6,776 0 0 0 6,776
Total Other -30,949 -1,986 2,679 -4,125 -34,381
Benefit obligation as at 31 December 2014 2,991,289 48,141 135,970 405,570 3,580,970
(*) Attributable to the Equity holders of the Bank (EUR’000 1,042,243) and to non-controlling Interest (EUR’000 26,352).
161

EIB employees pay a fixed contribution of 10.9% of their pensionable salary. The residual contribution (including back service payments) is paid by the Group. All contributions of the Group and its staff are invested in the assets of the Group. The funding requirements are based on the local actuarial measurement framework. In this framework the discount rate is set on a risk free rate. Furthermore, premiums are determined on a current salary base. The Group is liable for all pension payments stemming from the defined benefit plan.
The average duration of the benefit obligation at 31 December 2014 is split as follows:
EIB Pension:
active members: 24.78 years (2013: 23.71 years)
deferred members (*): 24.04 years (2013: 22.62 years)
retired members: 11.57 years (2013: 11.12 years)
EIF Pension:
active members: 30.22 years (2013: 29.06 years)
deferred members (*): 33.54 years (2013: 33.70 years)
retired members: 15.40 years (2013: 13.82)
Management Committee Pension:
active members: 17.43 years (2013: 17.01 years)
deferred members (*): 16.44 years (2013: 15.67 years)
retired members: 9.83 years (2013: 8.82 years)
Health Insurance for EIB
active members: 29.05 years (2013: 28.46 years)
retired members: 13.69 years (2013: 13.33 years)
The amount that the Group expects to recognise in the profit or loss relating to the defined benefit plans during the next financial year is EUR ‘000 262,740.
(*) Staff members who have left the Group before retirement age and have a right to a deferred pension.
Note K - Result for the financial year
The appropriation of the profit of the stand-alone financial statements of the Bank for the year ended 31 December 2014, prepared under EU Accounting Directives, which amounts to EUR’000 2,625,851 will be submitted for approval by the Board of Governors by 28 April 2015.
162
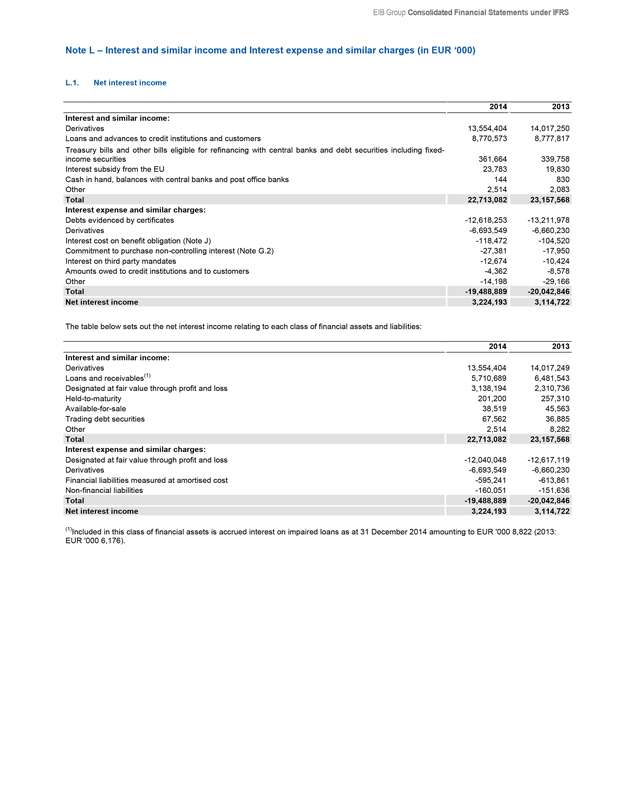
EIB Group Consolidated Financial Statements under IFRS
Note L - Interest and similar income and Interest expense and similar charges (in EUR ‘000)
L.1. Net interest income
Interest and similar income: 2014 2013
Derivatives 13,554,404 14,017,250
Loans and advances to credit institutions and customers 8,770,573 8,777,817
Treasury bills and other bills eligible for refinancing with central banks and debt securities including fixed-income securities 361,664 339,758
Interest subsidy from the EU 23,783 19,830
Cash in hand, balances with central banks and post office banks 144 830
Other 2,514 2,083
Total 22,713,082 23,157,568
Interest expense and similar charges:
Debts evidenced by certificates -12,618,253 -13,211,978
Derivatives -6,693,549 -6,660,230
Interest cost on benefit obligation (Note J) -118,472 -104,520
Commitment to purchase non-controlling interest (Note G.2) -27,381 -17,950
Interest on third party mandates -12,674 -10,424
Amounts owed to credit institutions and to customers -4,362 -8,578
Other -14,198 -29,166
Total -19,488,889 -20,042,846
Net interest income 3,224,193 3,114,722
The table below sets out the net interest income relating to each class of financial assets and liabilities:
Interest and similar income: 2014 2013
Derivatives 13,554,404 14,017,249
Loans and receivables(1) 5,710,689 6,481,543
Designated at fair value through profit and loss 3,138,194 2,310,736
Held-to-maturity 201,200 257,310
Available-for-sale 38,519 45,563
Trading debt securities 67,562 36,885
Other 2,514 8,282
Total 22,713,082 23,157,568
Interest expense and similar charges:
Designated at fair value through profit and loss -12,040,048 -12,617,119
Derivatives -6,693,549 -6,660,230
Financial liabilities measured at amortised cost -595,241 -613,861
Non-financial liabilities -160,051 -151,636
Total -19,488,889 -20,042,846
Net interest income 3,224,193 3,114,722
(1)Included in this class of financial assets is accrued interest on impaired loans as at 31 December 2014 amounting to EUR ‘000 8,822 (2013: EUR ‘000 6,176).
163
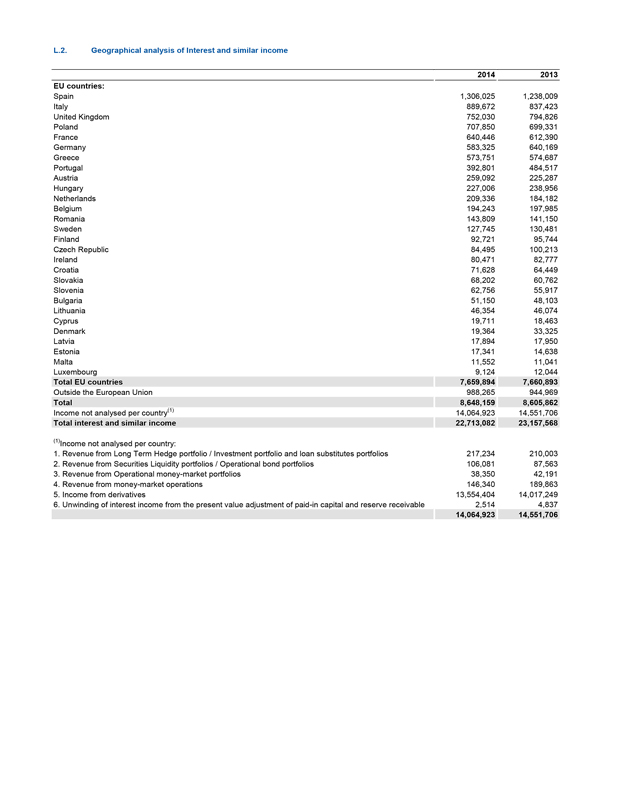
L.2. Geographical analysis of Interest and similar income
EU countries: 2014 2013
Spain 1,306,025 1,238,009
Italy 889,672 837,423
United Kingdom 752,030 794,826
Poland 707,850 699,331
France 640,446 612,390
Germany 583,325 640,169
Greece 573,751 574,687
Portugal 392,801 484,517
Austria 259,092 225,287
Hungary 227,006 238,956
Netherlands 209,336 184,182
Belgium 194,243 197,985
Romania 143,809 141,150
Sweden 127,745 130,481
Finland 92,721 95,744
Czech Republic 84,495 100,213
Ireland 80,471 82,777
Croatia 71,628 64,449
Slovakia 68,202 60,762
Slovenia 62,756 55,917
Bulgaria 51,150 48,103
Lithuania 46,354 46,074
Cyprus 19,711 18,463
Denmark 19,364 33,325
Latvia 17,894 17,950
Estonia 17,341 14,638
Malta 11,552 11,041
Luxembourg 9,124 12,044
Total EU countries 7,659,894 7,660,893
Outside the European Union 988,265 944,969
Total 8,648,159 8,605,862
Income not analysed per country(1) 14,064,923 14,551,706
Total interest and similar income 22,713,082 23,157,568
(1)Income not analysed per country:
1. Revenue from Long Term Hedge portfolio / Investment portfolio and loan substitutes portfolios 217,234 210,003
2. Revenue from Securities Liquidity portfolios / Operational bond portfolios 106,081 87,563
3. Revenue from Operational money-market portfolios 38,350 42,191
4. Revenue from money-market operations 146,340 189,863
5. Income from derivatives 13,554,404 14,017,249
6. Unwinding of interest income from the present value adjustment of paid-in capital and reserve receivable 2,514 4,837
14,064,923 14,551,706
164
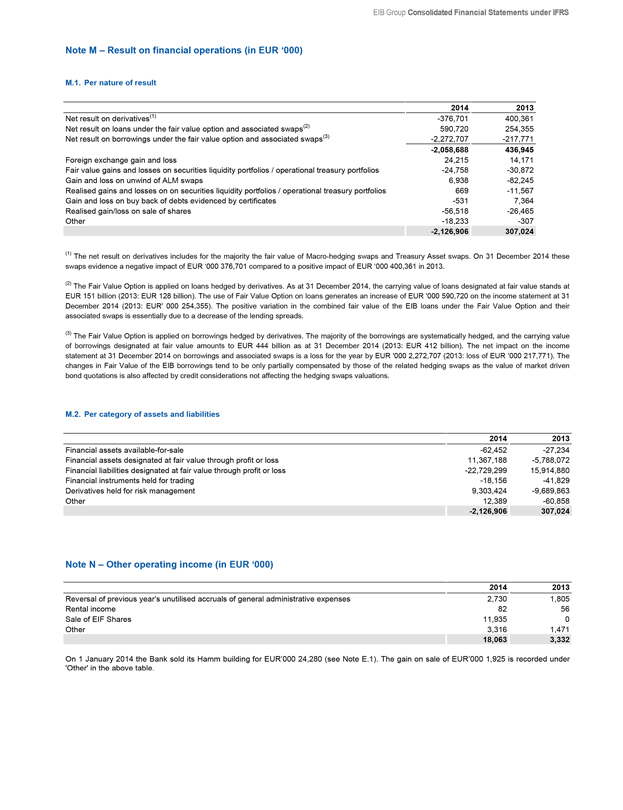
EIB Group Consolidated Financial Statements under IFRS
Note M - Result on financial operations (in EUR ‘000)
M.1. Per nature of result
2014 2013
Net result on derivatives(1) -376,701 400,361
Net result on loans under the fair value option and associated swaps(2) 590,720 254,355
Net result on borrowings under the fair value option and associated swaps(3) -2,272,707 -217,771
-2,058,688 436,945
Foreign exchange gain and loss 24,215 14,171
Fair value gains and losses on securities liquidity portfolios / operational treasury portfolios -24,758 -30,872
Gain and loss on unwind of ALM swaps 6,938 -82,245
Realised gains and losses on on securities liquidity portfolios / operational treasury portfolios 669 -11,567
Gain and loss on buy back of debts evidenced by certificates -531 7,364
Realised gain/loss on sale of shares -56,518 -26,465
Other -18,233 -307
-2,126,906 307,024
(1) The net result on derivatives includes for the majority the fair value of Macro-hedging swaps and Treasury Asset swaps. On 31 December 2014 these swaps evidence a negative impact of EUR ‘000 376,701 compared to a positive impact of EUR ‘000 400,361 in 2013.
(2) The Fair Value Option is applied on loans hedged by derivatives. As at 31 December 2014, the carrying value of loans designated at fair value stands at EUR 151 billion (2013: EUR 128 billion). The use of Fair Value Option on loans generates an increase of EUR ‘000 590,720 on the income statement at 31 December 2014 (2013: EUR’ 000 254,355). The positive variation in the combined fair value of the EIB loans under the Fair Value Option and their associated swaps is essentially due to a decrease of the lending spreads.
(3) The Fair Value Option is applied on borrowings hedged by derivatives. The majority of the borrowings are systematically hedged, and the carrying value of borrowings designated at fair value amounts to EUR 444 billion as at 31 December 2014 (2013: EUR 412 billion). The net impact on the income statement at 31 December 2014 on borrowings and associated swaps is a loss for the year by EUR ‘000 2,272,707 (2013: loss of EUR ’000 217,771). The changes in Fair Value of the EIB borrowings tend to be only partially compensated by those of the related hedging swaps as the value of market driven bond quotations is also affected by credit considerations not affecting the hedging swaps valuations.
M.2. Per category of assets and liabilities
2014 2013
Financial assets available-for-sale -62,452 -27,234
Financial assets designated at fair value through profit or loss 11,367,188 -5,788,072
Financial liabilities designated at fair value through profit or loss -22,729,299 15,914,880
Financial instruments held for trading -18,156 -41,829
Derivatives held for risk management 9,303,424 -9,689,863
Other 12,389 -60,858
-2,126,906 307,024
Note N - Other operating income (in EUR ‘000)
2014 2013
Reversal of previous year’s unutilised accruals of general administrative expenses 2,730 1,805
Rental income 82 56
Sale of EIF Shares 11,935 0
Other 3,316 1,471
18,063 3,332
On 1 January 2014 the Bank sold its Hamm building for EUR’000 24,280 (see Note E.1). The gain on sale of EUR’000 1,925 is recorded under ‘Other’ in the above table.
165
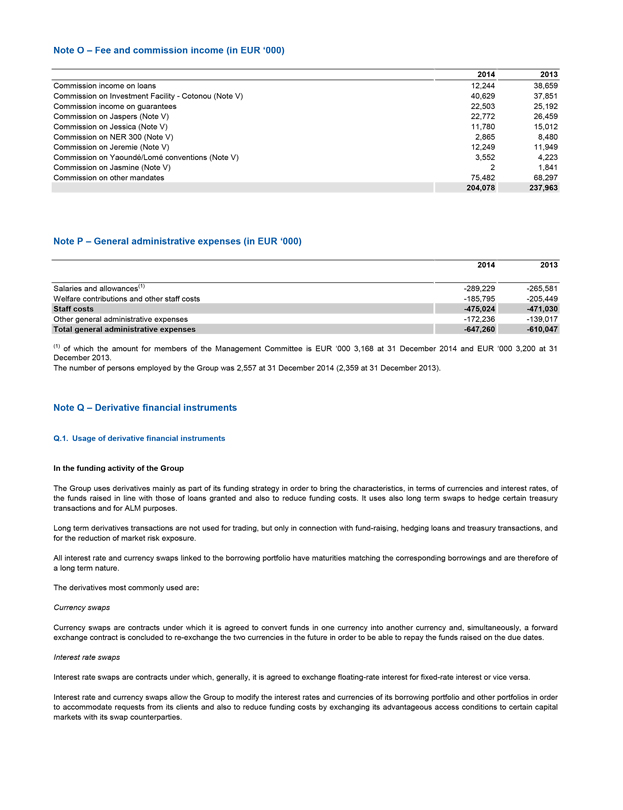
Note O - Fee and commission income (in EUR ‘000)
2014 2013
Commission income on loans 12,244 38,659
Commission on Investment Facility - Cotonou (Note V) 40,629 37,851
Commission income on guarantees 22,503 25,192
Commission on Jaspers (Note V) 22,772 26,459
Commission on Jessica (Note V) 11,780 15,012
Commission on NER 300 (Note V) 2,865 8,480
Commission on Jeremie (Note V) 12,249 11,949
Commission on Yaoundé/Lomé conventions (Note V) 3,552 4,223
Commission on Jasmine (Note V) 2 1,841
Commission on other mandates 75,482 68,297
204,078 237,963
Note P - General administrative expenses (in EUR ‘000)
2014 2013
Salaries and allowances(1) -289,229 -265,581
Welfare contributions and other staff costs -185,795 -205,449
Staff costs -475,024 -471,030
Other general administrative expenses -172,236 -139,017
Total general administrative expenses -647,260 -610,047
(1) of which the amount for members of the Management Committee is EUR ‘000 3,168 at 31 December 2014 and EUR ‘000 3,200 at 31 December 2013.
The number of persons employed by the Group was 2,557 at 31 December 2014 (2,359 at 31 December 2013).
Note Q - Derivative financial instruments
Q.1. Usage of derivative financial instruments
In the funding activity of the Group
The Group uses derivatives mainly as part of its funding strategy in order to bring the characteristics, in terms of currencies and interest rates, of the funds raised in line with those of loans granted and also to reduce funding costs. It uses also long term swaps to hedge certain treasury transactions and for ALM purposes.
Long term derivatives transactions are not used for trading, but only in connection with fund-raising, hedging loans and treasury transactions, and for the reduction of market risk exposure.
All interest rate and currency swaps linked to the borrowing portfolio have maturities matching the corresponding borrowings and are therefore of a long term nature.
The derivatives most commonly used are:
Currency swaps
Currency swaps are contracts under which it is agreed to convert funds in one currency into another currency and, simultaneously, a forward exchange contract is concluded to re-exchange the two currencies in the future in order to be able to repay the funds raised on the due dates.
Interest rate swaps
Interest rate swaps are contracts under which, generally, it is agreed to exchange floating-rate interest for fixed-rate interest or vice versa.
Interest rate and currency swaps allow the Group to modify the interest rates and currencies of its borrowing portfolio and other portfolios in order to accommodate requests from its clients and also to reduce funding costs by exchanging its advantageous access conditions to certain capital markets with its swap counterparties.
166
EIB Group Consolidated Financial Statements under IFRS
In the liquidity management of the Group
The Group enters into short term currency swap contracts in order to adjust currency positions in its operational treasury in relation to its benchmark currency, the euro, and to cater for demand for currencies in conjunction with loan disbursements.
The notional amount of short term currency swaps stood at EUR 42,902 million at 31 December 2014 against EUR 12,748 million at 31 December 2013. The notional amount of short term currency forwards was EUR 404 million at 31 December 2014 (2013: EUR 372 million).
The fair value of these contracts was EUR 1,141 million at 31 December 2014 for currency swaps and EUR -38 million for currency forwards (2013: respectively EUR -77 million and EUR 4 million).
In the Asset Liability Management (ALM) of the Group
The Group’s ALM policy aims to maintain a high and stable level of income as well as to limit the volatility of the economic value of the Group.
Accordingly, the Group:
has adopted an own funds investment profile ensuring a stable and high flow of income; and
manages residual interest rate risks in relation to this investment profile.
With a view of managing residual interest rate risks, the Group operates natural hedges in respect of loans and borrowings or concludes global hedging operations (interest rate swaps).
Macro hedging swaps used as part of asset/liability management are fair valued in accordance with IAS 39.
Q.2. Fair value of derivative financial instruments
Financial instruments measured at fair value require disclosure of fair value measurements by level of the following hierarchy:
Level 1 - Quoted (unadjusted) prices in active markets for identical assets or liabilities.
Level 2 - Valuation techniques with inputs other than quoted prices included within Level 1 that are observable for the asset or liability, either directly (i.e. as prices) or indirectly (i.e. derived from prices).
Level 3 - Valuation techniques which use inputs for the asset or liability that are not based on observable market data (unobservable inputs). Internal valuation models are used to determine the fair values of these instruments.
Valuation techniques include net present value and discounted cash flow models, Hull-White and Libor Market Model interest rate models and Black-Scholes option model. Assumptions and inputs used in valuation techniques include risk-free interest rates, basis swap spreads and currency basis swaps spreads, foreign currency exchange rates and forward exchange rates, equity and equity index prices and expected price volatilities and correlations, Consumer Price Indices values and expected volatilities and correlations. The objective of valuation techniques is to arrive at a fair value determination that reflects the price of the financial instrument at the reporting date that would have been determined by market participants acting at arm’s length. The valuation models applied are consistent with accepted economic methodologies for pricing financial instruments and incorporate the factors that market participants consider when setting a price. For a portion of derivative transactions, internal estimates and assumptions might be used in the valuation techniques when the market inputs are not directly available, typically in the estimation of correlations in some interest rate and cross currency models and in the estimation of volatilities for some long dated equity linked and inflation linked transactions.
The table below shows the net fair value of derivative financial instruments, recorded as assets or liabilities (between those whose fair value is based on quoted market prices, those whose valuation technique where all the model inputs are observable in the market and those where the valuation techniques involve the use of non-market observable inputs) together with their nominal amounts. The nominal amounts indicate the volume of transactions outstanding at the year end and are indicative of neither the market risk nor the credit risk.
167
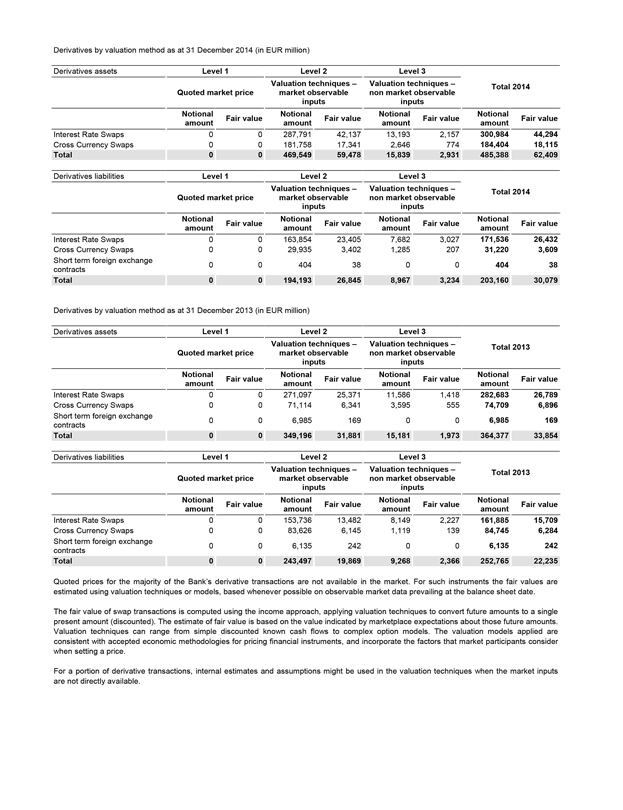
Derivatives by valuation method as at 31 December 2014 (in EUR million)
Derivatives assets Level 1 Level 2 Level 3
Quoted market price Valuation techniques – market observable inputs Valuation techniques – non market observable inputs Total 2014
Notional amount Fair value Notional amount Fair value Notional amount Fair value Notional amount Fair value
Interest Rate Swaps 0 0 287,791 42,137 13,193 2,157 300,984 44,294
Cross Currency Swaps 0 0 181,758 17,341 2,646 774 184,404 18,115
Total 0 0 469,549 59,478 15,839 2,931 485,388 62,409
Derivatives liabilities Level 1 Level 2 Level 3
Quoted market price Valuation techniques – market observable inputs Valuation techniques – non market observable inputs Total 2014
Notional amount Fair value Notional amount Fair value Notional amount Fair value Notional amount Fair value
Interest Rate Swaps 0 0 163,854 23,405 7,682 3,027 171,536 26,432
Cross Currency Swaps 0 0 29,935 3,402 1,285 207 31,220 3,609
Short term foreign exchange contracts 0 0 404 38 0 0 404 38
Total 0 0 194,193 26,845 8,967 3,234 203,160 30,079
Derivatives by valuation method as at 31 December 2013 (in EUR million)
Derivatives assets Level 1 Level 2 Level 3
Quoted market price Valuation techniques – market observable inputs Valuation techniques – non market observable inputs Total 2013
Notional amount Fair value Notional amount Fair value Notional amount Fair value Notional amount Fair value
Interest Rate Swaps 0 0 271,097 25,371 11,586 1,418 282,683 26,789
Cross Currency Swaps 0 0 71,114 6,341 3,595 555 74,709 6,896
Short term foreign exchange contracts 0 0 6,985 169 0 0 6,985 169
Total 0 0 349,196 31,881 15,181 1,973 364,377 33,854
Derivatives liabilities Level 1 Level 2 Level 3
Quoted market price Valuation techniques – market observable inputs Valuation techniques – non market observable inputs Total 2013
Notional amount Fair value Notional amount Fair value Notional amount Fair value Notional amount Fair value
Interest Rate Swaps 0 0 153,736 13,482 8,149 2,227 161,885 15,709
Cross Currency Swaps 0 0 83,626 6,145 1,119 139 84,745 6,284
Short term foreign exchange contracts 0 0 6,135 242 0 0 6,135 242
Total 0 0 243,497 19,869 9,268 2,366 252,765 22,235
Quoted prices for the majority of the Bank’s derivative transactions are not available in the market. For such instruments the fair values are estimated using valuation techniques or models, based whenever possible on observable market data prevailing at the balance sheet date.
The fair value of swap transactions is computed using the income approach, applying valuation techniques to convert future amounts to a single present amount (discounted). The estimate of fair value is based on the value indicated by marketplace expectations about those future amounts. Valuation techniques can range from simple discounted known cash flows to complex option models. The valuation models applied are consistent with accepted economic methodologies for pricing financial instruments, and incorporate the factors that market participants consider when setting a price.
For a portion of derivative transactions, internal estimates and assumptions might be used in the valuation techniques when the market inputs are not directly available.
168
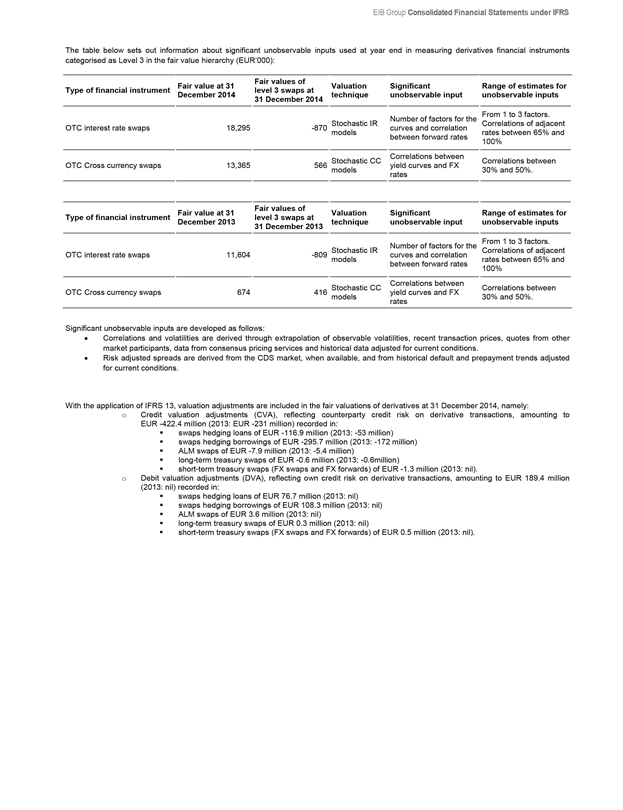
EIB Group Consolidated Financial Statements under IFRS
The table below sets out information about significant unobservable inputs used at year end in measuring derivatives financial instruments categorised as Level 3 in the fair value hierarchy (EUR’000):
Type of financial instrument Fair value at 31 December 2014 Fair values of level 3 swaps at 31 December 2014 Valuation technique Significant unobservable input Range of estimates for unobservable inputs
OTC interest rate swaps 18,295 -870 Stochastic IR models Number of factors for the curves and correlation between forward rates From 1 to 3 factors. Correlations of adjacent rates between 65% and 100%
OTC Cross currency swaps 13,365 566 Stochastic CC models Correlations between yield curves and FX rates Correlations between 30% and 50%.
Type of financial instrument Fair value at 31 December 2013 Fair values of level 3 swaps at 31 December 2013 Valuation technique Significant unobservable input Range of estimates for unobservable inputs
OTC interest rate swaps 11,604 -809 Stochastic IR models Number of factors for the curves and correlation between forward rates From 1 to 3 factors. Correlations of adjacent rates between 65% and 100%
OTC Cross currency swaps 674 416 Stochastic CC models Correlations between yield curves and FX rates Correlations between 30% and 50%.
Significant unobservable inputs are developed as follows:
Correlations and volatilities are derived through extrapolation of observable volatilities, recent transaction prices, quotes from other market participants, data from consensus pricing services and historical data adjusted for current conditions.
Risk adjusted spreads are derived from the CDS market, when available, and from historical default and prepayment trends adjusted for current conditions.
With the application of IFRS 13, valuation adjustments are included in the fair valuations of derivatives at 31 December 2014, namely:
Credit valuation adjustments (CVA), reflecting counterparty credit risk on derivative transactions, amounting to EUR -422.4 million (2013: EUR -231 million) recorded in:
swaps hedging loans of EUR -116.9 million (2013: -53 million)
swaps hedging borrowings of EUR -295.7 million (2013: -172 million)
ALM swaps of EUR -7.9 million (2013: -5.4 million)
long-term treasury swaps of EUR -0.6 million (2013: -0.6million)
short-term treasury swaps (FX swaps and FX forwards) of EUR -1.3 million (2013: nil).
Debit valuation adjustments (DVA), reflecting own credit risk on derivative transactions, amounting to EUR 189.4 million (2013: nil) recorded in:
swaps hedging loans of EUR 76.7 million (2013: nil)
swaps hedging borrowings of EUR 108.3 million (2013: nil)
ALM swaps of EUR 3.6 million (2013: nil)
long-term treasury swaps of EUR 0.3 million (2013: nil)
short-term treasury swaps (FX swaps and FX forwards) of EUR 0.5 million (2013: nil).
169
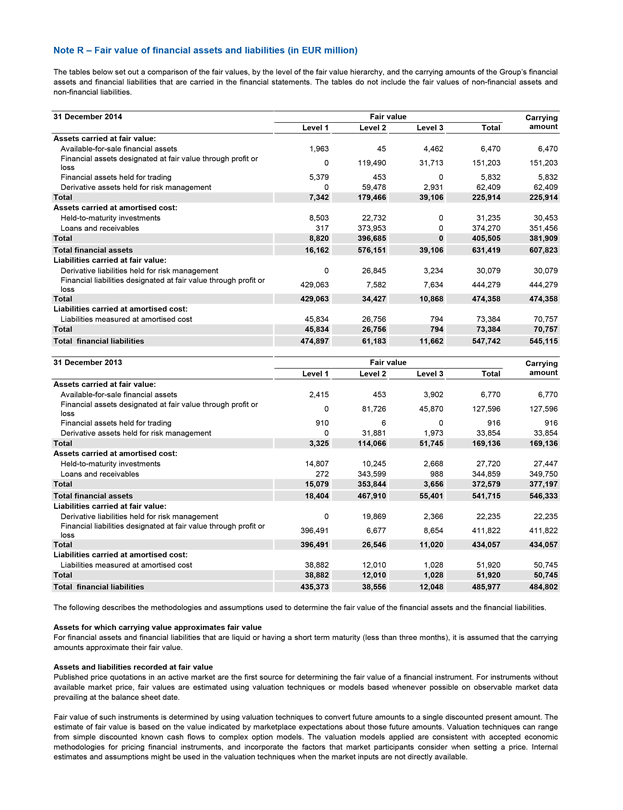
Note R – Fair value of financial assets and liabilities (in EUR million)
The tables below set out a comparison of the fair values, by the level of the fair value hierarchy, and the carrying amounts of the Group’s financial assets and financial liabilities that are carried in the financial statements. The tables do not include the fair values of non-financial assets and non-financial liabilities.
31 December 2014 Fair value Carrying amount
Level 1 Level 2 Level 3 Total
Assets carried at fair value:
Available-for-sale financial assets 1,963 45 4,462 6,470 6,470
Financial assets designated at fair value through profit or loss 0 119,490 31,713 151,203 151,203
Financial assets held for trading 5,379 453 0 5,832 5,832
Derivative assets held for risk management 0 59,478 2,931 62,409 62,409
Total 7,342 179,466 39,106 225,914 225,914
Assets carried at amortised cost:
Held-to-maturity investments 8,503 22,732 0 31,235 30,453
Loans and receivables 317 373,953 0 374,270 351,456
Total 8,820 396,685 0 405,505 381,909
Total financial assets 16,162 576,151 39,106 631,419 607,823
Liabilities carried at fair value:
Derivative liabilities held for risk management 0 26,845 3,234 30,079 30,079
Financial liabilities designated at fair value through profit or loss 429,063 7,582 7,634 444,279 444,279
Total 429,063 34,427 10,868 474,358 474,358
Liabilities carried at amortised cost:
Liabilities measured at amortised cost 45,834 26,756 794 73,384 70,757
Total 45,834 26,756 794 73,384 70,757
Total financial liabilities 474,897 61,183 11,662 547,742 545,115
31 December 2013 Fair value Carrying amount
Level 1 Level 2 Level 3 Total
Assets carried at fair value:
Available-for-sale financial assets 2,415 453 3,902 6,770 6,770
Financial assets designated at fair value through profit or loss 0 81,726 45,870 127,596 127,596
Financial assets held for trading 910 6 0 916 916
Derivative assets held for risk management 0 31,881 1,973 33,854 33,854
Total 3,325 114,066 51,745 169,136 169,136
Assets carried at amortised cost:
Held-to-maturity investments 14,807 10,245 2,668 27,720 27,447
Loans and receivables 272 343,599 988 344,859 349,750
Total 15,079 353,844 3,656 372,579 377,197
Total financial assets 18,404 467,910 55,401 541,715 546,333
Liabilities carried at fair value:
Derivative liabilities held for risk management 0 19,869 2,366 22,235 22,235
Financial liabilities designated at fair value through profit or loss 396,491 6,677 8,654 411,822 411,822
Total 396,491 26,546 11,020 434,057 434,057
Liabilities carried at amortised cost:
Liabilities measured at amortised cost 38,882 12,010 1,028 51,920 50,745
Total 38,882 12,010 1,028 51,920 50,745
Total financial liabilities 435,373 38,556 12,048 485,977 484,802
The following describes the methodologies and assumptions used to determine the fair value of the financial assets and the financial liabilities.
Assets for which carrying value approximates fair value
For financial assets and financial liabilities that are liquid or having a short term maturity (less than three months), it is assumed that the carrying amounts approximate their fair value.
Assets and liabilities recorded at fair value
Published price quotations in an active market are the first source for determining the fair value of a financial instrument. For instruments without available market price, fair values are estimated using valuation techniques or models based whenever possible on observable market data prevailing at the balance sheet date.
Fair value of such instruments is determined by using valuation techniques to convert future amounts to a single discounted present amount. The estimate of fair value is based on the value indicated by marketplace expectations about those future amounts. Valuation techniques can range from simple discounted known cash flows to complex option models. The valuation models applied are consistent with accepted economic methodologies for pricing financial instruments, and incorporate the factors that market participants consider when setting a price. Internal estimates and assumptions might be used in the valuation techniques when the market inputs are not directly available.
170
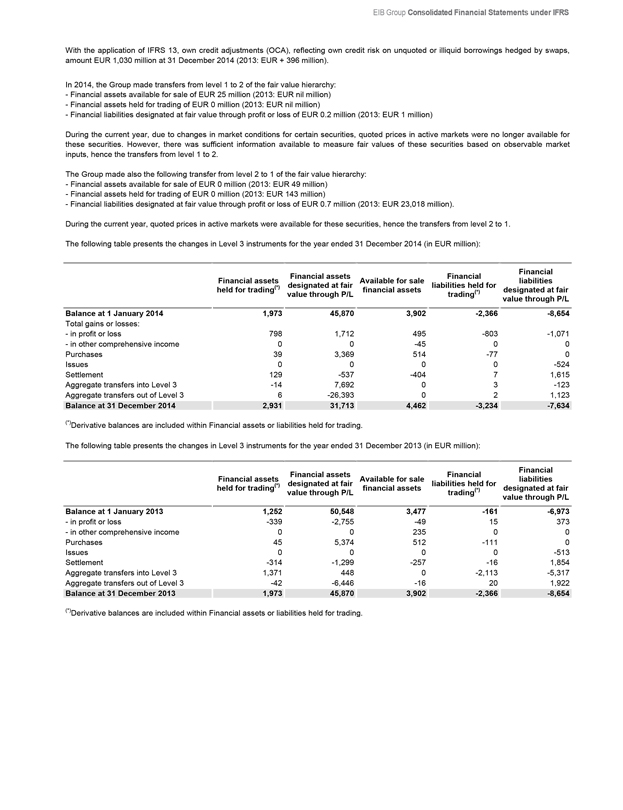
EIB Group Consolidated Financial Statements under IFRS
With the application of IFRS 13, own credit adjustments (OCA), reflecting own credit risk on unquoted or illiquid borrowings hedged by swaps, amount EUR 1,030 million at 31 December 2014 (2013: EUR + 396 million).
In 2014, the Group made transfers from level 1 to 2 of the fair value hierarchy:
- Financial assets available for sale of EUR 25 million (2013: EUR nil million)
- Financial assets held for trading of EUR 0 million (2013: EUR nil million)
- Financial liabilities designated at fair value through profit or loss of EUR 0.2 million (2013: EUR 1 million)
During the current year, due to changes in market conditions for certain securities, quoted prices in active markets were no longer available for these securities. However, there was sufficient information available to measure fair values of these securities based on observable market inputs, hence the transfers from level 1 to 2.
The Group made also the following transfer from level 2 to 1 of the fair value hierarchy:
- Financial assets available for sale of EUR 0 million (2013: EUR 49 million)
- Financial assets held for trading of EUR 0 million (2013: EUR 143 million)
- Financial liabilities designated at fair value through profit or loss of EUR 0.7 million (2013: EUR 23,018 million).
During the current year, quoted prices in active markets were available for these securities, hence the transfers from level 2 to 1.
The following table presents the changes in Level 3 instruments for the year ended 31 December 2014 (in EUR million):
Financial assets held for trading(*) Financial assets designated at fair value through P/L Available for sale financial assets Financial liabilities held for trading(*) Financial liabilities designated at fair value through P/L
Balance at 1 January 2014 1,973 45,870 3,902 -2,366 -8,654
Total gains or losses:
- in profit or loss 798 1,712 495 -803 -1,071
- in other comprehensive income 0 0 -45 0 0
Purchases 39 3,369 514 -77 0
Issues 0 0 0 0 -524
Settlement 129 -537 -404 7 1,615
Aggregate transfers into Level 3 -14 7,692 0 3 -123
Aggregate transfers out of Level 3 6 -26,393 0 2 1,123
Balance at 31 December 2014 2,931 31,713 4,462 -3,234 -7,634
(*)Derivative balances are included within Financial assets or liabilities held for trading.
The following table presents the changes in Level 3 instruments for the year ended 31 December 2013 (in EUR million):
Financial assets held for trading(*) Financial assets designated at fair value through P/L Available for sale financial assets Financial liabilities held for trading(*) Financial liabilities designated at fair value through P/L
Balance at 1 January 2013 1,252 50,548 3,477 -161 -6,973
- in profit or loss -339 -2,755 -49 15 373
- in other comprehensive income 0 0 235 0 0
Purchases 45 5,374 512 -111 0
Issues 0 0 0 0 -513
Settlement -314 -1,299 -257 -16 1,854
Aggregate transfers into Level 3 1,371 448 0 -2,113 -5,317
Aggregate transfers out of Level 3 -42 -6,446 -16 20 1,922
Balance at 31 December 2013 1,973 45,870 3,902 -2,366 -8,654
(*)Derivative balances are included within Financial assets or liabilities held for trading.
171
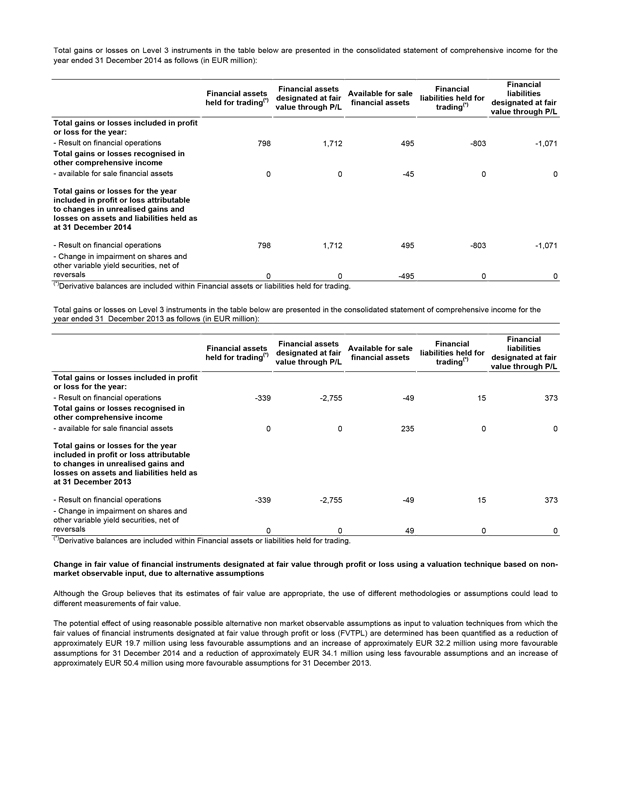
Total gains or losses on Level 3 instruments in the table below are presented in the consolidated statement of comprehensive income for the year ended 31 December 2014 as follows (in EUR million):
Financial assets held for trading(*) Financial assets designated at fair value through P/L Available for sale financial assets Financial liabilities held for trading(*) Financial liabilities designated at fair value through P/L
Total gains or losses included in profit or loss for the year:
- Result on financial operations 798 1,712 495 -803 -1,071
Total gains or losses recognised in other comprehensive income
- available for sale financial assets 0 0 -45 0 0
Total gains or losses for the year included in profit or loss attributable to changes in unrealised gains and losses on assets and liabilities held as at 31 December 2014
- Result on financial operations 798 1,712 495 -803 -1,071
- Change in impairment on shares and other variable yield securities, net of reversals 0 0 -495 0 0
(*)Derivative balances are included within Financial assets or liabilities held for trading.
Total gains or losses on Level 3 instruments in the table below are presented in the consolidated statement of comprehensive income for the year ended 31 December 2013 as follows (in EUR million):
Financial assets held for trading(*) Financial assets designated at fair value through P/L Available for sale financial assets Financial liabilities held for trading(*) Financial liabilities designated at fair value through P/L
Total gains or losses included in profit or loss for the year:
- Result on financial operations -339 -2,755 -49 15 373
Total gains or losses recognised in other comprehensive income
- available for sale financial assets 0 0 235 0 0
Total gains or losses for the year included in profit or loss attributable to changes in unrealised gains and losses on assets and liabilities held as at 31 December 2013
- Result on financial operations -339 -2,755 -49 15 373
- Change in impairment on shares and other variable yield securities, net of reversals 0 0 49 0 0
(*)Derivative balances are included within Financial assets or liabilities held for trading.
Change in fair value of financial instruments designated at fair value through profit or loss using a valuation technique based on non-market observable input, due to alternative assumptions
Although the Group believes that its estimates of fair value are appropriate, the use of different methodologies or assumptions could lead to different measurements of fair value.
The potential effect of using reasonable possible alternative non market observable assumptions as input to valuation techniques from which the fair values of financial instruments designated at fair value through profit or loss (FVTPL) are determined has been quantified as a reduction of approximately EUR 19.7 million using less favourable assumptions and an increase of approximately EUR 32.2 million using more favourable assumptions for 31 December 2014 and a reduction of approximately EUR 34.1 million using less favourable assumptions and an increase of approximately EUR 50.4 million using more favourable assumptions for 31 December 2013.
172
EIB Group Consolidated Financial Statements under IFRS
The alternative assumptions are used to calculate the fair value of derivatives, borrowings and loans belonging to the level 3 valuation category. Fair value of borrowings and loans in Level 3 is derived from the value of derivatives which hedge these borrowings and loans. Hence the alternative assumptions are first applied to valuation of Level 3 derivatives and then the impact is applied to Level 3 borrowings and loans. Level 3 derivatives can be grouped in four swap types according to underlying asset and valuation model:
a. Single currency, multiple-rate swaps
b. Cross currency and FX-linked swaps
c. Inflation-linked swaps
d. Equity-linked swaps
For single currency, multiple rate swaps, alternative assumptions are applied to forward rate correlations used in calibration of BGM models. For cross currency and FX-linked swaps alternative assumptions are applied to correlations between interest and FX rates used in the calibration of hybrid Black Scholes / Hull & White models. For inflation-linked swaps alternative assumptions are applied to inflation index and real rate volatilities used in the calibration of hybrid Black Scholes / Hull & White models. For equity-linked swaps alternative assumptions are applied to equity or index volatilities and dividend yields (forwards) used in the calibration of hybrid Black Scholes / Hull & White models.
Financial assets designated at fair value through profit or loss
Included in financial assets designated at fair value through profit or loss is a portfolio of loans hedged by Interest Rates Swaps and Currency Swaps.
The maximum credit exposure of the disbursed loans and advances to customers and to credit institutions designated at fair value through profit or loss amounts to EUR 132,259 million (2013: EUR 116,998 million). The cumulative change in fair value of the loans attributable to change in credit risk of Group’s counterparts amounts to a loss of EUR 715.5 million (2013: loss of EUR 402 million). The changes in fair value of financial assets designated at fair value through profit or loss attributable to changes in credit risk have been calculated by determining the change in the Expected Credit Loss on these loans.
No credit derivatives have been concluded to hedge the credit risk of the financial assets designated at fair value through profit or loss.
Financial liabilities designated at fair value through profit or loss
The financial liabilities designated at fair value through profit or loss comprise debts evidenced by certificates issued by the Group and hedged by Interest Rate Swaps and Currency Swaps.
The cumulative change in fair value of the financial liabilities designated at fair value through profit or loss attributable to change in credit risk of the Group amounts to a profit of EUR - 1,444 million (2013: EUR 503 million).
The amount that the Group would contractually be requested to pay at maturity of financial instruments designated at fair value through profit or loss is EUR 42,798 million (2013: EUR 20,340 million) less than the carrying amount as at 31 December 2014.
Offsetting financial assets and financial liabilities
The disclosures set out in the tables below include financial assets and financial liabilities that:
are offset in the Group’s balance sheet; or
are subject to an enforceable master netting arrangement or similar agreement that covers similar financial instruments, irrespective of whether they are offset in the statement of financial position.
The similar agreements include global master repurchase agreements. Similar financial instruments include repurchase agreements and reverse repurchase agreements. Financial instruments such as loans and deposits are not disclosed in the tables below unless they are offset in the balance sheet.
The Group’s derivative transactions that are not transacted on an exchange are entered into under International Swaps and Derivatives Association (ISDA) Master Agreements. In general, under such agreements the amounts payable by each party on any day in respect of the same transaction and in the same currency are aggregated into a single net amount being payable by one party to the other. In certain circumstances, for example when an event of default occurs, all outstanding transactions under the agreement are terminated, the termination value is assessed and only a single net amount is payable in settlement of all transactions.
The Group’s repurchase and reverse repurchase transactions are covered by master agreements with netting terms similar to those of ISDA Master Agreements.
The above ISDA and similar master netting arrangements do not meet the criteria for offsetting in the balance sheet. This is because they create a right of set-off of recognised amounts that is enforceable only after termination of outstanding transactions following an event of default, including insolvency or bankruptcy, of either party.
The Group receives and accepts collateral in the form of cash and marketable securities in respect of the following transactions:
derivatives; and
repurchase and reverse repurchase agreements.
173
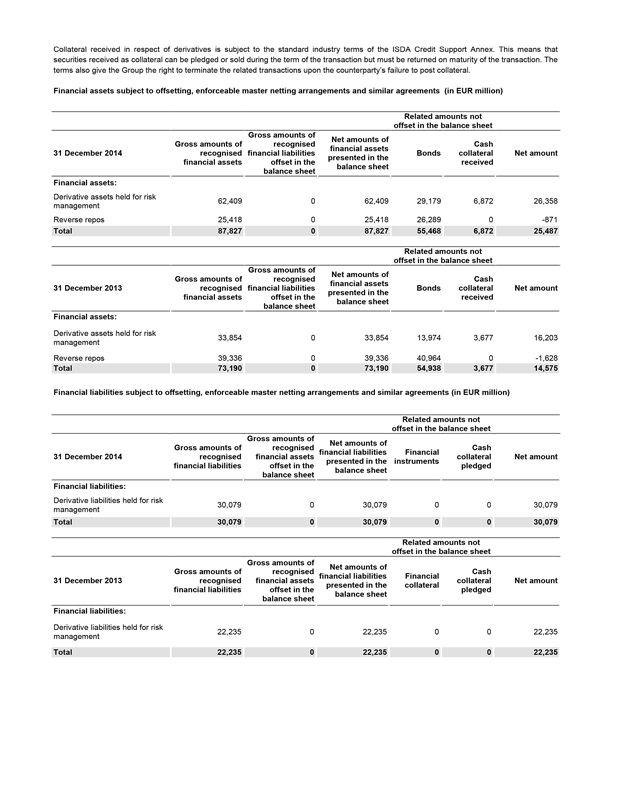
Collateral received in respect of derivatives is subject to the standard industry terms of the ISDA Credit Support Annex. This means that securities received as collateral can be pledged or sold during the term of the transaction but must be returned on maturity of the transaction. The terms also give the Group the right to terminate the related transactions upon the counterparty’s failure to post collateral.
Financial assets subject to offsetting, enforceable master netting arrangements and similar agreements (in EUR million)
Related amounts not offset in the balance sheet
31 December 2014 Gross amounts of recognised financial assets Gross amounts of recognised financial liabilities offset in the balance sheet Net amounts of financial assets presented in the balance sheet Bonds Cash collateral received Net amount
Financial assets:
Derivative assets held for risk management 62,409 0 62,409 29,179 6,872 26,358
Reverse repos 25,418 0 25,418 26,289 0 -871
Total 87,827 0 87,827 55,468 6,872 25,487
Related amounts not offset in the balance sheet
31 December 2013 Gross amounts of recognised financial assets Gross amounts of recognised financial liabilities offset in the balance sheet Net amounts of financial assets presented in the balance sheet Bonds Cash collateral received Net amount
Financial assets:
Derivative assets held for risk management 33,854 0 33,854 13,974 3,677 16,203
Reverse repos 39,336 0 39,336 40,964 0 -1,628
Total 73,190 0 73,190 54,938 3,677 14,575
Financial liabilities subject to offsetting, enforceable master netting arrangements and similar agreements (in EUR million)
Related amounts not offset in the balance sheet
31 December 2014 Gross amounts of recognised financial liabilities Gross amounts of recognised financial assets offset in the balance sheet Net amounts of financial liabilities presented in the balance sheet Financial instruments Cash collateral pledged Net amount
Financial liabilities:
Derivative liabilities held for risk management 30,079 0 30,079 0 0 30,079
Total 30,079 0 30,079 0 0 30,079
Related amounts not offset in the balance sheet
31 December 2013 Gross amounts of recognised financial liabilities Gross amounts of recognised financial assets offset in the balance sheet Net amounts of financial liabilities presented in the balance sheet Financial collateral Cash collateral pledged Net amount
Financial liabilities:
Derivative liabilities held for risk management 22,235 0 22,235 0 0 22,235
Total 22,235 0 22,235 0 0 22,235
174
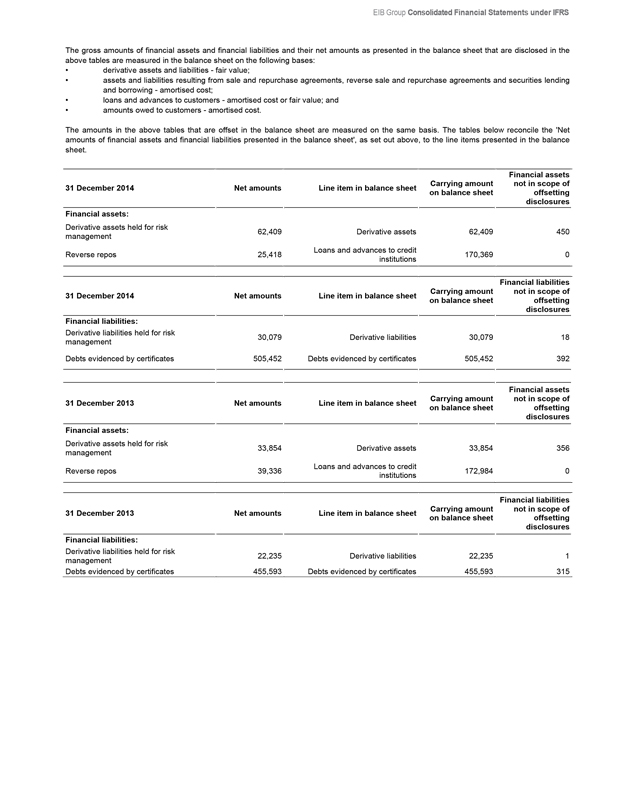
EIB Group Consolidated Financial Statements under IFRS
The gross amounts of financial assets and financial liabilities and their net amounts as presented in the balance sheet that are disclosed in the above tables are measured in the balance sheet on the following bases:
derivative assets and liabilities - fair value;
assets and liabilities resulting from sale and repurchase agreements, reverse sale and repurchase agreements and securities lending and borrowing - amortised cost;
loans and advances to customers - amortised cost or fair value; and
amounts owed to customers - amortised cost.
The amounts in the above tables that are offset in the balance sheet are measured on the same basis. The tables below reconcile the ‘Net amounts of financial assets and financial liabilities presented in the balance sheet’, as set out above, to the line items presented in the balance sheet.
31 December 2014 Net amounts Line item in balance sheet Carrying amount on balance sheet Financial assets not in scope of offsetting disclosures
Financial assets:
Derivative assets held for risk management 62,409 Derivative assets 62,409 450
Reverse repos 25,418 Loans and advances to credit institutions 170,369 0
31 December 2014 Net amounts Line item in balance sheet Carrying amount on balance sheet Financial liabilities not in scope of offsetting disclosures
Financial liabilities: Derivative liabilities held for risk management 30,079 Derivative liabilities 30,079 18
Debts evidenced by certificates 505,452 Debts evidenced by certificates 505,452 392
31 December 2013 Net amounts Line item in balance sheet Carrying amount on balance sheet Financial assets not in scope of offsetting disclosures
Financial assets: Derivative assets held for risk management 33,854 Derivative assets 33,854 356
Reverse repos 39,336 Loans and advances to credit institutions 172,984 0
31 December 2013 Net amounts Line item in balance sheet Carrying amount on balance sheet Financial liabilities not in scope of offsetting disclosures
Financial liabilities: Derivative liabilities held for risk management 22,235 Derivative liabilities 22,235 1
Debts evidenced by certificates 455,593 Debts evidenced by certificates 455,593 315
175
Note S – Risk management
This note presents information about the Group’s exposure to and its management and control of risks, in particular the primary risks associated with its use of financial instruments. These are:
Credit risk - the risk of loss resulting from client or counterparty default and arising on credit exposure in all forms, including settlement risk;
Market risk - exposure to observable market variables such as interest rates, exchange rates and equity market prices;
Liquidity and funding risk - the risk that the Group is unable to fund assets or meet obligations at a reasonable price or, in extreme situations, at any price; and
Operational risk - the potential loss resulting from inadequate or failed internal processes, people and systems or from external events.
Within the Group, the management and control of risks are handled separately by each entity. As a consequence, risk management information presented in this note distinguishes between the Bank and the Fund.
The Bank has established a group risk function to strengthen the risk management of the overall Group and to provide oversight of all the risks which the Group is subject to. The high-level principles of the Bank’s risk management on a consolidated level are set out in the Group Risk Management Charter. The Group Risk Management Charter aims at ensuring a group-wide view of the Bank’s risks and integrated approach to risk management.
S.1. Risk Management Organisation
S.1.1. Risk Management Organisation of the Bank
The Bank aligns its risk management systems to changing economic conditions and evolving regulatory standards. It adapts them on an ongoing basis as best market practice develops. Systems are in place to control and report on the main risks inherent in its operations, i.e. credit, market and operational risks.
The Bank’s objective is to analyse and manage risks so as to obtain the strongest protection for its assets, its financial result, and consequently its capital. While the Bank is not subject to full regulation, it aims to comply with the relevant EU banking directives and the recommendations of the banking supervisors of the EU Member States, EU legislation and the competent supranational bodies, such as the Basel Committee on Banking Supervision (BCBS).
The following sections disclose the credit, market and liquidity risks to which the Bank is exposed on its activities performed on own resources.
The Risk Management Directorate (RM) independently identifies, assesses, monitors and reports credit, market and operational risks to which the Bank is exposed in a comprehensive and consistent way and under a consistent approach. Within a commonly defined framework, whereby the segregation of duties is preserved, RM is independent of the Front Offices and provides second opinion on all proposals made which have risk implications. The Director General of RM reports, for credit, market and operational risks, to the Management Committee and meets regularly with the Audit Committee to discuss topics relating to credit, market and operational risks. He is also responsible for overseeing risk reporting to the Management Committee and the Board of Directors.
Two risk-oriented committees support the implementation of the Bank’s risk policies.
The Credit Risk Assessment Group (CRAG) is a high-level forum for discussing relevant credit risk issues arising in the course of the Bank’s activities and for advising the Management Committee on these. Its members are the Directors General of the Operations, Projects, RM, Transaction Monitoring & Restructuring (TMR), Finance and Legal Affairs Directorates. The CRAG is intended to complement, and does not replace, the existing case-by-case review of lending operations, which remains central to the loan approval process.
An Asset / Liability Committee (ALCO), made up of the Directors General of the Operations, Finance and RM Directorates, the Head of Financial Control and the Chief Economist, provides a high-level forum for debating the Bank’s Asset / Liability Management (ALM) matters and for making proposals in this field to the Management Committee. It promotes and facilitates the dialogue among the Directorates represented in it, while providing a wider perspective on, and enhancing their understanding of, the main financial risks.
The Bank continues to develop its capacity to manage loans post signature. For significant parts of the portfolio this is the responsibility of TMR, a Directorate independent from RM. TMR is focusing on monitoring higher risk counterparts and certain forms of security and it also manages transactions requiring particular attention. All of its proposals which have credit risk implications are subject to an independent second opinion by RM.
S.1.1.1 Risk measurement and reporting system
Risks are assessed both under normal circumstances and possible stressed conditions, with the purpose to quantify their impact on the Bank’s solvency, liquidity and operations. Risk measurements combine metrics such as expected and unexpected loss estimations based on historical default probabilities together with scenario-based and sensitivity analyses. Worst case scenarios aim at capturing extreme, low probability events which could impact the Bank.
Information on the risk measures described above are presented and explained to the Management Committee and to the Board of Directors on a monthly basis. The reports include aggregate credit exposures, credit concentration analyses and other key portfolio risk indicators, as well as Value at Risk (VaR), sensitivity analyses, liquidity indicators and cumulative funding gaps.
176
EIB Group Consolidated Financial Statements under IFRS
The Bank maintains two reserves for the expected and unexpected losses – the General Loan Reserve (GLR) and the Special Activities Reserve (SAR), respectively. The General Loan Reserve is a dedicated reserve for the expected loss of the Bank’s loan portfolio. It is calculated monthly according to the evolution of the underlying assets and reported to the Bank’s senior management. The Special Activities Reserve is a dedicated reserve for the capital allocation covering the unexpected loss of those activities which have a risk profile higher than what is generally accepted by the Bank, including venture capital activities undertaken by the EIF on the Bank’s behalf. It is calculated monthly according to the evolution of the underlying assets.
S.1.1.2. The Bank’s financial risk tolerance
As a public institution, the Bank does not aim to make profits from speculative exposures to financial risks, setting its financial risk tolerance to a minimum level as defined by approved limits, and applying a conservative financial framework.
As a consequence, the Bank does not consider its treasury or funding activities as profit- maximising centres, even though performance objectives are attached to these activities. Investment activities are conducted within the primary objective of protection of the capital invested. With respect to exposures arising from the Bank’s lending and borrowing operations, the main principle of the Bank’s financial risk policy is therefore to ensure that all material financial risks are hedged.
All new types of transactions introducing operational or financial risks must be authorised by the Management Committee, after the approval of the New Products Committee, and are managed within approved limits.
S.1.1.3. Sustainability of revenue and self-financing capacity
The Bank’s ALM policy forms an integral part of the Bank’s overall financial risk management. It reflects the expectations of the main stakeholders of the Bank in terms of stability of earnings, preservation of the economic value of own funds, and the self-financing of the Bank’s growth in the long term.
To achieve these aims, the ALM policy employs medium to long term indexation for the investment of own funds to promote stability of revenues and enhance overall returns. This indexation policy implies an exposure to medium to long term yields and is not influenced by any short term views on trends in interest rates.
This is accomplished by targeting a duration for the Bank’s own funds of between 4.5 and 5.5 years.
S.1.2. Risk Management Organisation of the Fund (EIF)
Most of the Private Equity (PE), Venture Capital and Portfolio Guarantees, Securitisation & Microfinance (GSM) operations for both entities of the Group are managed by the Fund. The mandate of the Fund is to support small and mid-size enterprise (SME) finance for start-up, growth and development within European Union objectives for SME.
The Fund aligns its risk management systems to changing economic conditions and evolving regulatory standards. It therefore adapts them on an on-going basis. Credit, market and operational systems are in place to control and report on the main risks inherent to its operations.
Risk management is embedded in the corporate culture of EIF, based on a three-lines-of-defence model permeating all areas of EIF’s business functions and processes: (i) front office, (ii) independent risk functions and (iii) audit and assurance. Investment and Risk Committees (IRCs) chaired by the Head of Risk and Portfolio Management advice the Chief Executive and the Deputy Chief Executive on each and every transaction. IRCs also oversee risk and investment-related aspects of the EIF portfolio, inter alia: approving transaction rating/grading, impairment and provisioning actions, relevant market risk events and potential stress testing. Finally, the IRCs oversee the Enterprise Risk arising from EIF’s role as a fund manager. Risk and Portfolio Management actions form part of the assurance process presided by the EIF Audit Board.
Moreover, within the EIB Group context, the Fund’s Risk and Portfolio Management Department operates in close contact with the European Investment Bank’s Risk Management Directorate, particularly with regard to Group risk exposure relating to guarantee operations, the PE operations under the Bank’s Risk Capital Resources mandate (RCR) and general EIF policy matters.
The Fund’s treasury management has been fully outsourced to the Bank under a treasury management agreement signed by both parties and mandating the responsible EIB services to perform selection, execution, settlement and monitoring of transactions. Management follows treasury guidelines annexed to the agreement, which mirror closely the relevant sections of the EIB’s own treasury guidelines.
S.1.2.1. Risk assessment private equity
Under its private equity operations, the Fund has a fund-of-funds approach, taking minority equity participations in venture capital, private equity and mezzanine funds managed by mostly independent teams in order to leverage further commitments from a wide range of investors. The Fund’s PE operations include investments in funds focussed on seed- and early-stage capital, but also investments in well-established funds targeting mid- and later-stage or mezzanine investments, which, generally speaking, have a lower risk profile.
Over the last years, the Fund has developed a tool-set to design, manage and monitor portfolios of PE funds tailored to the dynamics of this market place, going beyond investing in top quartile funds. This tool-set is based on an internal model, the Grading-based Economic Model (GEM), which allows the Fund to better assess and verify each funds’ but also each portfolio of funds’ valuations, risks and expected future cash flows and performances. Before committing to a PE fund, the Fund assigns a grading which is based on the outcome of an extensive due diligence performed by the Fund’s transaction team and reviewed by its risk management team. During the funds’ lifetimes, gradings are periodically reviewed with a frequency and intensity depending on the level of risk.
177
These efforts, supported by the development of a proprietary IT system and an integrated software (front to back), improve the investment decision-making process and the management of the portfolio’s financial risks and of liquidity, in particular enabling forward-looking and stress-test based decision making.
S.1.2.2. Risk assessment guarantees
The Fund extends portfolio guarantees to financial intermediaries involved in SME financing and provides credit enhancement to SME securitisation transactions. By taking on these risks, it facilitates access to funding, and, in turn, it helps to finance SMEs.
For its guarantee & securitisation business, over the last years, the Fund has developed a tool-set to analyse portfolio guarantees and structured finance transactions in line with best market practices. Before the Fund enters legally into a guarantee transaction, an internal rating is assigned to each new own risk guarantee transaction in accordance with the Fund’s Credit Risk Policy and Model Review Guidelines. The rating is based on internal models, which analyse and summarise the transaction’s credit quality (expected loss concept), considering not only quantitative parameters but also qualitative aspects. Guarantee transactions are monitored regularly, at least quarterly; their statuses are regularly reviewed by EIF IRCs which, depending on their performances, may review their internal ratings. A four-eye principle applies throughout the process, with actions initiated by the front office and reviewed by Risk Management.
The guarantees portfolio is valued according to a mark-to model approach under the IFRS principles. The main impact on the valuation of the transactions in the portfolio stems from the assigned ratings (internal and external as the case may be) and the possible subsequent rating changes.
The EIF’s monitoring follows potential negative rating migrations and provides the basis for appropriate management of transactions. The Fund’s stress testing methodology is applied at the outset of a transaction and throughout the life of the portfolio, i.e. its scenario analysis with regard to downgrades and defaults in the portfolio and related impacts on capital allocation, expected losses, as well as on the profit and loss. As is the case for PE, stress tests on the guarantee portfolio are presented regularly to the EIF Board of Directors.
Moreover, within the EIB Group context, the Fund’s Risk and Portfolio Management Department operates in close contact with the European Investment Bank’s Risk Management Directorate, particularly with regard to Group risk exposure relating to guarantee and securitisation operations, the PE operations under the Bank’s Risk Capital Resources mandate (RCR), the different windows under the Bank’s EIB Group Risk Enhancement Mandate (EREM) and general EIF policy matters.
S.2. Credit risk
S.2.1. Credit risk policies
Credit risk concerns mainly the Group’s lending activities and, to a lesser extent, treasury instruments such as fixed-income securities held in the investment and operational portfolios, certificates of deposit and interbank term deposits as well as the derivative transactions of the Group and the Fund’s guarantee transactions funded by own resources. No credit risk is attached to the Group’s venture capital operations, which are performed entirely through equity participations and are, hence, only exposed to market risk. As regards lending, treasury and derivatives operations, credit risk is managed by an independent Risk Management Directorate under the direct responsibility of the Management Committee of the Bank. The Group has thus established an operationally independent structure for determining and monitoring credit risk.
The Group’s policies on credit risk are approved by the respective governing bodies. They set out minimum credit quality levels for both borrowers and guarantors in lending operations and identify the types of security that are deemed acceptable. They also detail the minimum requirements which loan contracts must meet in terms of key legal clauses and other contractual stipulations to ensure that the Bank’s position ranks at least equal to that of other senior lenders, with prompt access to security when required. In addition, via a counterparty and sector limit system, the credit policies ensure an acceptable degree of diversification in the Group’s loan portfolio. The Group’s limit system draws its inspiration from the traditional prudential regulations on concentration and large exposure management contained in the EU banking directives, though the Group generally adopts a more restrictive approach to risk-taking than commercial banks. The Group’s policies on credit risk also set out the minimum credit quality of counterparties of derivatives and treasury transactions as well as the contractual framework for each type of transaction.
As regards lending, treasury and derivatives operations, credit risk is managed by the independent Risk Management Directorate (RM) under the direct responsibility of the Management Committee of the Bank. The Bank has thus established an operationally independent structure for determining and monitoring credit risk.
Following the capital increase in 2012, the Bank expanded its Credit Risk Policy Guidelines by a dedicated chapter on the remedy of non-compliance events with bank intermediaries, and a dedicated chapter for incremental new lending in connection with the additional capital.
The Fund manages exposures and risks in the frame of conservative policies deriving from statutory provisions and Credit Risk Policy Guidelines approved by the Fund’s Board of Directors or guidelines as set out under mandates.
Credit policies undergo periodic adaptations to incorporate evolving operational circumstances and respond to new mandates that the Group may receive from its shareholders.
Management of credit risk is based, firstly, on the level of credit risk vis-à-vis counterparties and, secondly, on an analysis of the solvency of counterparties.
178
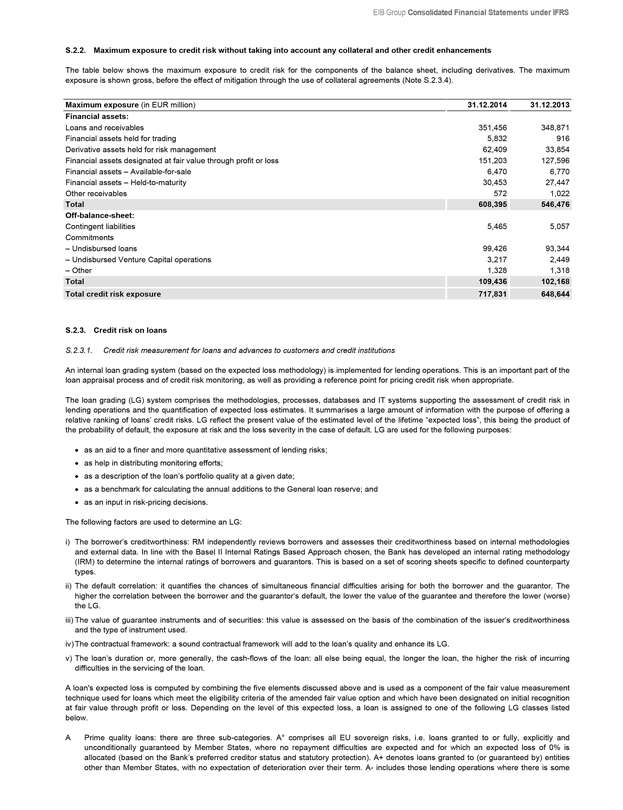
EIB Group Consolidated Financial Statements under IFRS
S.2.2. Maximum exposure to credit risk without taking into account any collateral and other credit enhancements
The table below shows the maximum exposure to credit risk for the components of the balance sheet, including derivatives. The maximum exposure is shown gross, before the effect of mitigation through the use of collateral agreements (Note S.2.3.4).
Maximum exposure (in EUR million) 31.12.2014 31.12.2013
Financial assets:
Loans and receivables 351,456 348,871
Financial assets held for trading 5,832 916
Derivative assets held for risk management 62,409 33,854
Financial assets designated at fair value through profit or loss 151,203 127,596
Financial assets – Available-for-sale 6,470 6,770
Financial assets – Held-to-maturity 30,453 27,447
Other receivables 572 1,022
Total 608,395 546,476
Off-balance-sheet:
Contingent liabilities 5,465 5,057
Commitments
– Undisbursed loans 99,426 93,344
– Undisbursed Venture Capital operations 3,217 2,449
– Other 1,328 1,318
Total 109,436 102,168
Total credit risk exposure 717,831 648,644
S.2.3. Credit risk on loans
S.2.3.1. Credit risk measurement for loans and advances to customers and credit institutions
An internal loan grading system (based on the expected loss methodology) is implemented for lending operations. This is an important part of the loan appraisal process and of credit risk monitoring, as well as providing a reference point for pricing credit risk when appropriate.
The loan grading (LG) system comprises the methodologies, processes, databases and IT systems supporting the assessment of credit risk in lending operations and the quantification of expected loss estimates. It summarises a large amount of information with the purpose of offering a relative ranking of loans’ credit risks. LG reflect the present value of the estimated level of the lifetime “expected loss”, this being the product of the probability of default, the exposure at risk and the loss severity in the case of default. LG are used for the following purposes:
as an aid to a finer and more quantitative assessment of lending risks;
as help in distributing monitoring efforts;
as a description of the loan’s portfolio quality at a given date;
as a benchmark for calculating the annual additions to the General loan reserve; and
as an input in risk-pricing decisions.
The following factors are used to determine an LG:
i) The borrower’s creditworthiness: RM independently reviews borrowers and assesses their creditworthiness based on internal methodologies and external data. In line with the Basel II Internal Ratings Based Approach chosen, the Bank has developed an internal rating methodology (IRM) to determine the internal ratings of borrowers and guarantors. This is based on a set of scoring sheets specific to defined counterparty types.
ii) The default correlation: it quantifies the chances of simultaneous financial difficulties arising for both the borrower and the guarantor. The higher the correlation between the borrower and the guarantor’s default, the lower the value of the guarantee and therefore the lower (worse) the LG.
iii) The value of guarantee instruments and of securities: this value is assessed on the basis of the combination of the issuer’s creditworthiness and the type of instrument used.
iv) The contractual framework: a sound contractual framework will add to the loan’s quality and enhance its LG.
v) The loan’s duration or, more generally, the cash-flows of the loan: all else being equal, the longer the loan, the higher the risk of incurring difficulties in the servicing of the loan.
A loan’s expected loss is computed by combining the five elements discussed above and is used as a component of the fair value measurement technique used for loans which meet the eligibility criteria of the amended fair value option and which have been designated on initial recognition at fair value through profit or loss. Depending on the level of this expected loss, a loan is assigned to one of the following LG classes listed below.
A Prime quality loans: there are three sub-categories. A° comprises all EU sovereign risks, i.e. loans granted to or fully, explicitly and unconditionally guaranteed by Member States, where no repayment difficulties are expected and for which an expected loss of 0% is allocated (based on the Bank’s preferred creditor status and statutory protection). A+ denotes loans granted to (or guaranteed by) entities other than Member States, with no expectation of deterioration over their term. A- includes those lending operations where there is some
179
doubt about the maintenance of their current status (for instance because of a long maturity, or for the high volatility of the future price of an otherwise excellent collateral), but where any downside is expected to be limited.
B High quality loans: these represent an asset class with which the EIB feels comfortable, although a minor deterioration is not ruled out in the future. B+ and B- are used to denote the relative likelihood of the possibility of such deterioration occurring.
C Good quality loans: an example could be unsecured loans to solid banks and corporates with a 7-year bullet, or equivalent amortising, maturity at disbursement, with adequate protective clauses.
D This rating class represents the borderline between “acceptable quality” loans (D+) and those that have a risk profile worse than generally accepted by the Bank (D-) and which are classified as Special Activities. These are undertaken under specific policies, including size restrictions, the allocation of Special Activity Reserve (SAR) and dedicated risk pricing rules. Loans in the D- category, which have experienced deterioration from their original better classification, are subject to heightened monitoring
E This LG category includes loans that have explicitly been approved as Special Activities with a risk profile worse than generally accepted, and loans which in the course of their lives have experienced severe problems and their sliding into a situation of loss cannot be excluded. A corresponding allocation to the Special Activities Reserve is being made and the loans are subject to close monitoring. The sub-classes E+ and E- further differentiate the risk profile of the loans, with those operations graded E- being in a position where there is a possibility that debt service cannot be maintained on a timely basis and therefore some form of debt restructuring may be required, possibly leading to an impairment loss.
F F (fail) denotes loans representing unacceptable risks. F- graded loans can only arise out of outstanding transactions that have experienced unforeseen, exceptional and dramatic adverse circumstances after signature. All operations where there is a loss of principal are graded F and a specific provision is raised.
Generally, loans internally graded D- or below are placed on the Watch List. However, if a loan was originally approved with a risk profile of D- or weaker, it will only be placed on the Watch List as a result of a material credit event causing a deterioration of its LG classification below the one at approval.
In addition to the deal-by-deal analysis of each loan, the EIB, also developed a portfolio view of credit exposures via its Economic Capital framework, integrating the concentration and correlation effects created by the dependence of various obligors on common risk factors. By adding a portfolio dimension of credit risks and by focussing on unexpected losses (i.e. losses which may occur on top of the expected ones up to a certain level of confidence), it is possible to complement the LG’s deal-by-deal approach and thus provide a finer and more comprehensive risk assessment of the credit risks in the EIB’s loan book.
S.2.3.2. Loans secured by Guarantees of the European Union budget or the Member States
Loans outside the European Union (apart from those under the Facilities(1)) are, in the last resort, secured by guarantees of the European Union budget or the Member States (loans in the ACP Countries and the OCT). The agreements decided by the Council of the European Union on
14 April 1997 (Decision 97/256/EC) introduced the concept of risk sharing whereby certain loans of the Bank, including some which are secured by third-party guarantees with respect to the commercial risk, are covered by the budgetary guarantee applying in the case of political risks solely arising from currency non-transferability, expropriation, war and civil disturbance.
In accordance with the terms of the Guarantees, the European Union and the Member States secure up to 65%, 70%, 75% and 100% of pool of signed(2) operations in each portfolio. This results in an effectively full coverage of the Group’s exposure. For this reason, the Group deems the credit risk associated to each individual loan as fully covered and therefore excludes them from the section S.2.3 (Group’s lending activities). The carrying value of the disbursed part of loans signed under this category amounts to EUR 23,795 million as at 31 December 2014 (2013: EUR 22,340 million) and the undisbursed part amount to EUR 15,372 million as at 31 December 2014 (2013: EUR 13,718 million). These amounts also include loans granted to current European Union Member States but granted before their accession to the European Union and are guaranteed by the European Union budget or Member States.
S.2.3.3. Analysis of lending credit risk exposure
In order to limit the credit risk on its loan portfolio, the Group lends only to counterparties with demonstrated creditworthiness over the longer term and with sound guarantees.
In detail, the tables below show the maximum exposure to credit risk on loans (the repayable on demand and other loans and advances to credit institutions are not included) signed and disbursed as well as the part of the exposure that has been signed but not disbursed yet for all exposure where the Group is at risk. Therefore, loans outside the European Union secured by the European Union budget or the Member States are not included (Note S.2.3.2).
(1) Loans granted under Article 16 (previously Article 18) of the Bank’s statute and loans granted under the Pre Accession Facility, the Mediterranean Partnership Facility, the Energy Sustainability Facility and the EFTA Facility. These loans, granted under the Facilities, are not secured by guarantees of the European Union budget or the Member States. Therefore, lending under the Facilities is from the Bank’s own resources and at the Bank’s own risk.
(2) Under the Guarantee Agreement with the Commission signed on 1 and 29 August 2007, all European Union guaranteed operations signed on and after 17 April 2007 shall be covered up to 65% of “the aggregate amount of credits disbursed”. The residual risk borne by the Group in connection with operations is managed in accordance with the Group’s fundamental credit rules and procedures.
180
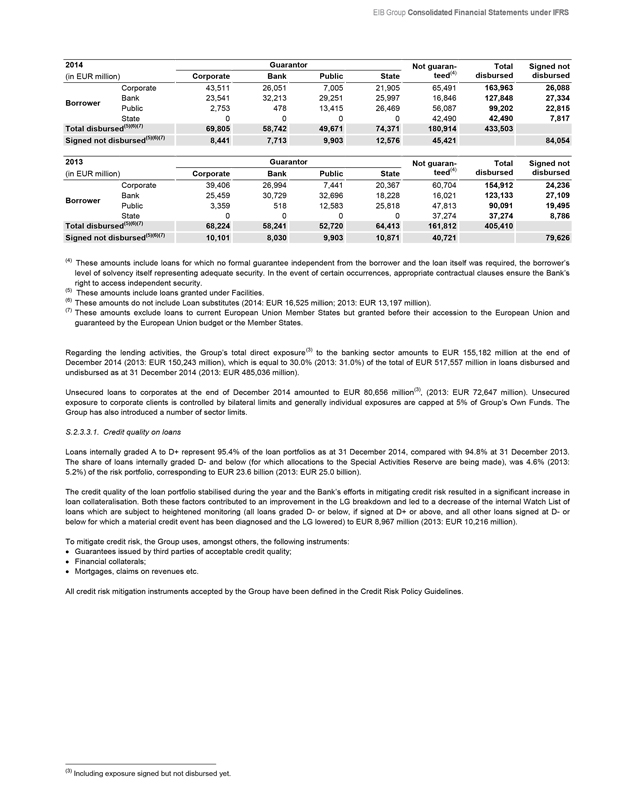
EIB Group Consolidated Financial Statements under IFRS
2014 (in EUR million) Guarantor Corporate Bank Public State Not guaranteed(4) Total disbursed Signed not disbursed
Borrower Corporate Bank Public State
43,511 26,051 7,005 21,905 65,491 163,963 26,088
23,541 32,213 29,251 25,997 16,846 127,848 27,334
2,753 478 13,415 26,469 56,087 99,202 22,815
0 0 0 0 42,490 42,490 7,817
Total disbursed(5)(6)(7) 69,805 58,742 49,671 74,371 180,914 433,503
Signed not disbursed(5)(6)(7) 8,441 7,713 9,903 12,576 45,421 84,054
2013 (in EUR million) Guarantor Corporate Bank Public State Not guaranteed(4) Total disbursed Signed not disbursed
Borrower Corporate Bank Public State
39,406 26,994 7,441 20,367 60,704 154,912 24,236
25,459 30,729 32,696 18,228 16,021 123,133 27,109
3,359 518 12,583 25,818 47,813 90,091 19,495
0 0 0 0 37,274 37,274 8,786
Total disbursed(5)(6)(7) 68,224 58,241 52,720 64,413 161,812 405,410
Signed not disbursed(5)(6)(7) 10,101 8,030 9,903 10,871 40,721 79,626
(4) These amounts include loans for which no formal guarantee independent from the borrower and the loan itself was required, the borrower’s level of solvency itself representing adequate security. In the event of certain occurrences, appropriate contractual clauses ensure the Bank’s right to access independent security.
(5) These amounts include loans granted under Facilities.
(6) These amounts do not include Loan substitutes (2014: EUR 16,525 million; 2013: EUR 13,197 million).
(7) These amounts exclude loans to current European Union Member States but granted before their accession to the European Union and guaranteed by the European Union budget or the Member States.
Regarding the lending activities, the Group’s total direct exposure(3) to the banking sector amounts to EUR 155,182 million at the end of December 2014 (2013: EUR 150,243 million), which is equal to 30.0% (2013: 31.0%) of the total of EUR 517,557 million in loans disbursed and undisbursed as at 31 December 2014 (2013: EUR 485,036 million).
Unsecured loans to corporates at the end of December 2014 amounted to EUR 80,656 million(3), (2013: EUR 72,647 million). Unsecured exposure to corporate clients is controlled by bilateral limits and generally individual exposures are capped at 5% of Group’s Own Funds. The Group has also introduced a number of sector limits.
S.2.3.3.1. Credit quality on loans
Loans internally graded A to D+ represent 95.4% of the loan portfolios as at 31 December 2014, compared with 94.8% at 31 December 2013. The share of loans internally graded D- and below (for which allocations to the Special Activities Reserve are being made), was 4.6% (2013:
5.2%) of the risk portfolio, corresponding to EUR 23.6 billion (2013: EUR 25.0 billion).
The credit quality of the loan portfolio stabilised during the year and the Bank’s efforts in mitigating credit risk resulted in a significant increase in loan collateralisation. Both these factors contributed to an improvement in the LG breakdown and led to a decrease of the internal Watch List of loans which are subject to heightened monitoring (all loans graded D- or below, if signed at D+ or above, and all other loans signed at D- or below for which a material credit event has been diagnosed and the LG lowered) to EUR 8,967 million (2013: EUR 10,216 million).
To mitigate credit risk, the Group uses, amongst others, the following instruments:
Guarantees issued by third parties of acceptable credit quality;
Financial collaterals;
Mortgages, claims on revenues etc.
All credit risk mitigation instruments accepted by the Group have been defined in the Credit Risk Policy Guidelines.
(3) Including exposure signed but not disbursed yet.
181
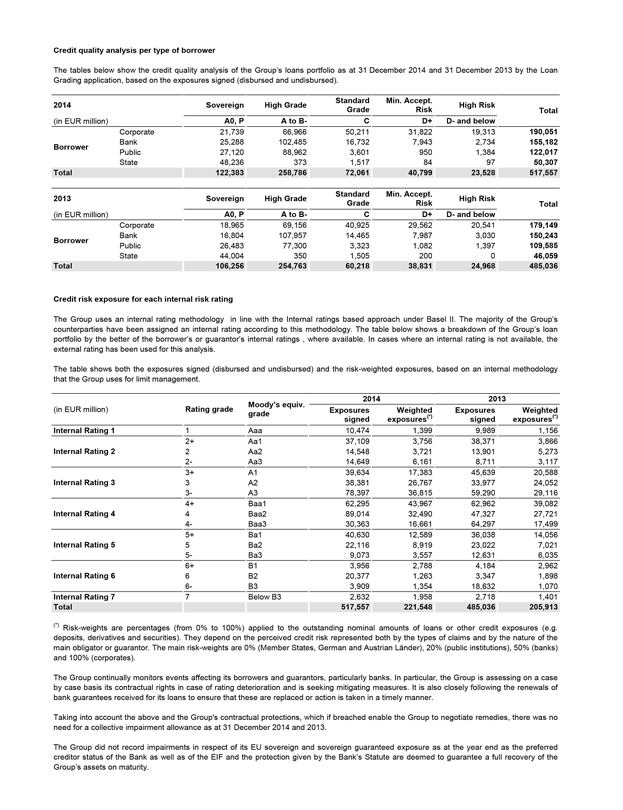
Credit quality analysis per type of borrower
The tables below show the credit quality analysis of the Group’s loans portfolio as at 31 December 2014 and 31 December 2013 by the Loan Grading application, based on the exposures signed (disbursed and undisbursed).
2014 Sovereign High Grade Standard Grade Min. Accept. Risk High Risk Total
(in EUR million) A0, P A to B- C D+ D- and below
Borrower Corporate Bank Public State
21,739 66,966 50,211 31,822 19,313 190,051
25,288 102,485 16,732 7,943 2,734 155,182
27,120 88,962 3,601 950 1,384 122,017
48,236 373 1,517 84 97 50,307
Total 122,383 258,786 72,061 40,799 23,528 517,557
2013 Sovereign High Grade Standard Grade Min. Accept. Risk High Risk Total
(in EUR million) A0, P A to B- C D+ D- and below
Borrower Corporate Bank Public State
18,965 69,156 40,925 29,562 20,541 179,149
16,804 107,957 14,465 7,987 3,030 150,243
26,483 77,300 3,323 1,082 1,397 109,585
44,004 350 1,505 200 0 46,059
Total 106,256 254,763 60,218 38,831 24,968 485,036
Credit risk exposure for each internal risk rating
The Group uses an internal rating methodology in line with the Internal ratings based approach under Basel II. The majority of the Group’s counterparties have been assigned an internal rating according to this methodology. The table below shows a breakdown of the Group’s loan portfolio by the better of the borrower’s or guarantor’s internal ratings , where available. In cases where an internal rating is not available, the external rating has been used for this analysis.
The table shows both the exposures signed (disbursed and undisbursed) and the risk-weighted exposures, based on an internal methodology that the Group uses for limit management.
(in EUR million) Rating grade Moody’s equiv. grade 2014 2013 Exposures signed Weighted exposures(*) Exposures signed Weighted exposures(*)
Internal Rating 1 1 Aaa 10,474 1,399 9,989 1,156
Internal Rating 2 2+ Aa1 37,109 3,756 38,371 3,866
2 Aa2 14,548 3,721 13,901 5,273
2- Aa3 14,649 6,161 8,711 3,117
Internal Rating 3 3+ A1 39,634 17,383 45,639 20,588
3 A2 38,381 26,767 33,977 24,052
3- A3 78,397 36,815 59,290 29,116
Internal Rating 4 4+ Baa1 62,295 43,967 62,962 39,082
4 Baa2 89,014 32,490 47,327 27,721
4- Baa3 30,363 16,661 64,297 17,499
Internal Rating 5 5+ Ba1 40,630 12,589 36,038 14,056
5 Ba2 22,116 8,919 23,022 7,021
5- Ba3 9,073 3,557 12,631 6,035
Internal Rating 6 6+ B1 3,956 2,788 4,184 2,962
6 B2 20,377 1,263 3,347 1,898
6- B3 3,909 1,354 18,632 1,070
Internal Rating 7 7 Below B3 2,632 1,958 2,718 1,401
Total 517,557 221,548 485,036 205,913
(*) Risk-weights are percentages (from 0% to 100%) applied to the outstanding nominal amounts of loans or other credit exposures (e.g. deposits, derivatives and securities). They depend on the perceived credit risk represented both by the types of claims and by the nature of the main obligator or guarantor. The main risk-weights are 0% (Member States, German and Austrian Länder), 20% (public institutions), 50% (banks) and 100% (corporates).
The Group continually monitors events affecting its borrowers and guarantors, particularly banks. In particular, the Group is assessing on a case by case basis its contractual rights in case of rating deterioration and is seeking mitigating measures. It is also closely following the renewals of bank guarantees received for its loans to ensure that these are replaced or action is taken in a timely manner.
Taking into account the above and the Group’s contractual protections, which if breached enable the Group to negotiate remedies, there was no need for a collective impairment allowance as at 31 December 2014 and 2013.
The Group did not record impairments in respect of its EU sovereign and sovereign guaranteed exposure as at the year end as the preferred creditor status of the Bank as well as of the EIF and the protection given by the Bank’s Statute are deemed to guarantee a full recovery of the Group’s assets on maturity.
182
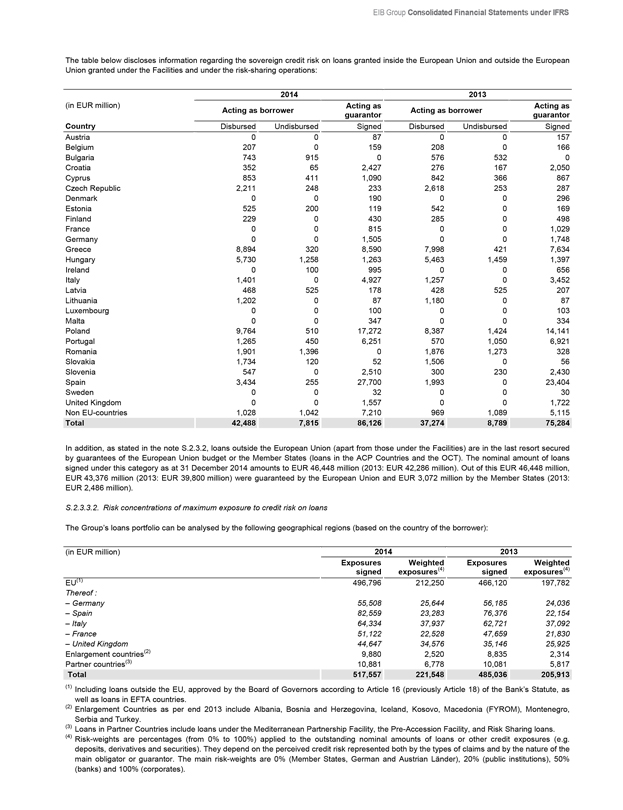
EIB Group Consolidated Financial Statements under IFRS
The table below discloses information regarding the sovereign credit risk on loans granted inside the European Union and outside the European Union granted under the Facilities and under the risk-sharing operations:
2014 2013
(in EUR million) Acting as borrower Acting as guarantor Acting as borrower Acting as guarantor
Country Disbursed Undisbursed Signed Disbursed Undisbursed Signed
Austria 0 0 87 0 0 157
Belgium 207 0 159 208 0 166
Bulgaria 743 915 0 576 532 0
Croatia 352 65 2,427 276 167 2,050
Cyprus 853 411 1,090 842 366 867
Czech Republic 2,211 248 233 2,618 253 287
Denmark 0 0 190 0 0 296
Estonia 525 200 119 542 0 169
Finland 229 0 430 285 0 498
France 0 0 815 0 0 1,029
Germany 0 0 1,505 0 0 1,748
Greece 8,894 320 8,590 7,998 421 7,634
Hungary 5,730 1,258 1,263 5,463 1,459 1,397
Ireland 0 100 995 0 0 656
Italy 1,401 0 4,927 1,257 0 3,452
Latvia 468 525 178 428 525 207
Lithuania 1,202 0 87 1,180 0 87
Luxembourg 0 0 100 0 0 103
Malta 0 0 347 0 0 334
Poland 9,764 510 17,272 8,387 1,424 14,141
Portugal 1,265 450 6,251 570 1,050 6,921
Romania 1,901 1,396 0 1,876 1,273 328
Slovakia 1,734 120 52 1,506 0 56
Slovenia 547 0 2,510 300 230 2,430
Spain 3,434 255 27,700 1,993 0 23,404
Sweden 0 0 32 0 0 30
United Kingdom 0 0 1,557 0 0 1,722
Non EU-countries 1,028 1,042 7,210 969 1,089 5,115
Total 42,488 7,815 86,126 37,274 8,789 75,284
In addition, as stated in the note S.2.3.2, loans outside the European Union (apart from those under the Facilities) are in the last resort secured by guarantees of the European Union budget or the Member States (loans in the ACP Countries and the OCT). The nominal amount of loans signed under this category as at 31 December 2014 amounts to EUR 46,448 million (2013: EUR 42,286 million). Out of this EUR 46,448 million, EUR 43,376 million (2013: EUR 39,800 million) were guaranteed by the European Union and EUR 3,072 million by the Member States (2013: EUR 2,486 million).
S.2.3.3.2. Risk concentrations of maximum exposure to credit risk on loans
The Group’s loans portfolio can be analysed by the following geographical regions (based on the country of the borrower):
(in EUR million) 2014 2013
Exposures signed Weighted exposures(4) Exposures signed Weighted exposures(4)
EU(1) 496,796 212,250 466,120 197,782
Thereof :
– Germany 55,508 25,644 56,185 24,036
– Spain 82,559 23,283 76,376 22,154
– Italy 64,334 37,937 62,721 37,092
– France 51,122 22,528 47,659 21,830
– United Kingdom 44,647 34,576 35,146 25,925
Enlargement countries(2) 9,880 2,520 8,835 2,314
Partner countries(3) 10,881 6,778 10,081 5,817
Total 517,557 221,548 485,036 205,913
(1) Including loans outside the EU, approved by the Board of Governors according to Article 16 (previously Article 18) of the Bank’s Statute, as well as loans in EFTA countries.
(2) Enlargement Countries as per end 2013 include Albania, Bosnia and Herzegovina, Iceland, Kosovo, Macedonia (FYROM), Montenegro, Serbia and Turkey.
(3) Loans in Partner Countries include loans under the Mediterranean Partnership Facility, the Pre-Accession Facility, and Risk Sharing loans.
(4) Risk-weights are percentages (from 0% to 100%) applied to the outstanding nominal amounts of loans or other credit exposures (e.g. deposits, derivatives and securities). They depend on the perceived credit risk represented both by the types of claims and by the nature of the main obligator or guarantor. The main risk-weights are 0% (Member States, German and Austrian Länder), 20% (public institutions), 50% (banks) and 100% (corporates).
183
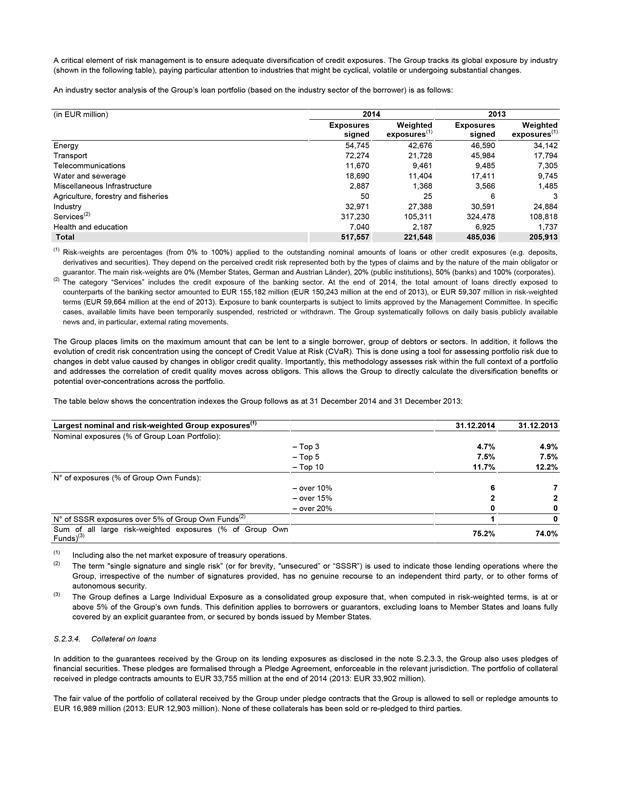
A critical element of risk management is to ensure adequate diversification of credit exposures. The Group tracks its global exposure by industry (shown in the following table), paying particular attention to industries that might be cyclical, volatile or undergoing substantial changes.
An industry sector analysis of the Group’s loan portfolio (based on the industry sector of the borrower) is as follows:
(in EUR million) 2014 2013
Exposures signed Weighted exposures(1) Exposures signed Weighted exposures(1)
Energy 54,745 42,676 46,590 34,142
Transport 72,274 21,728 45,984 17,794
Telecommunications 11,670 9,461 9,485 7,305
Water and sewerage 18,690 11,404 17,411 9,745
Miscellaneous Infrastructure 2,887 1,368 3,566 1,485
Agriculture, forestry and fisheries 50 25 6 3
Industry 32,971 27,388 30,591 24,884
Services(2) 317,230 105,311 324,478 108,818
Health and education 7,040 2,187 6,925 1,737
Total 517,557 221,548 485,036 205,913
(1) Risk-weights are percentages (from 0% to 100%) applied to the outstanding nominal amounts of loans or other credit exposures (e.g. deposits, derivatives and securities). They depend on the perceived credit risk represented both by the types of claims and by the nature of the main obligator or guarantor. The main risk-weights are 0% (Member States, German and Austrian Länder), 20% (public institutions), 50% (banks) and 100% (corporates).
(2) The category “Services” includes the credit exposure of the banking sector. At the end of 2014, the total amount of loans directly exposed to counterparts of the banking sector amounted to EUR 155,182 million (EUR 150,243 million at the end of 2013), or EUR 59,307 million in risk-weighted terms (EUR 59,664 million at the end of 2013). Exposure to bank counterparts is subject to limits approved by the Management Committee. In specific cases, available limits have been temporarily suspended, restricted or withdrawn. The Group systematically follows on daily basis publicly available news and, in particular, external rating movements.
The Group places limits on the maximum amount that can be lent to a single borrower, group of debtors or sectors. In addition, it follows the evolution of credit risk concentration using the concept of Credit Value at Risk (CVaR). This is done using a tool for assessing portfolio risk due to changes in debt value caused by changes in obligor credit quality. Importantly, this methodology assesses risk within the full context of a portfolio and addresses the correlation of credit quality moves across obligors. This allows the Group to directly calculate the diversification benefits or potential over-concentrations across the portfolio.
The table below shows the concentration indexes the Group follows as at 31 December 2014 and 31 December 2013:
Largest nominal and risk-weighted Group exposures(1) 31.12.2014 31.12.2013
Nominal exposures (% of Group Loan Portfolio):
– Top 3 4.7% 4.9%
– Top 5 7.5% 7.5%
– Top 10 11.7% 12.2%
N° of exposures (% of Group Own Funds):
– over 10% 6 7
– over 15% 2 2
– over 20% 0 0
N° of SSSR exposures over 5% of Group Own Funds(2) 1 0
Sum of all large risk-weighted exposures (% of Group Own Funds)(3) 75.2% 74.0%
(1) Including also the net market exposure of treasury operations.
(2) The term “single signature and single risk” (or for brevity, “unsecured” or “SSSR”) is used to indicate those lending operations where the Group, irrespective of the number of signatures provided, has no genuine recourse to an independent third party, or to other forms of autonomous security.
(3) The Group defines a Large Individual Exposure as a consolidated group exposure that, when computed in risk-weighted terms, is at or above 5% of the Group’s own funds. This definition applies to borrowers or guarantors, excluding loans to Member States and loans fully covered by an explicit guarantee from, or secured by bonds issued by Member States.
S.2.3.4. Collateral on loans
In addition to the guarantees received by the Group on its lending exposures as disclosed in the note S.2.3.3, the Group also uses pledges of financial securities. These pledges are formalised through a Pledge Agreement, enforceable in the relevant jurisdiction. The portfolio of collateral received in pledge contracts amounts to EUR 33,755 million at the end of 2014 (2013: EUR 33,902 million).
The fair value of the portfolio of collateral received by the Group under pledge contracts that the Group is allowed to sell or repledge amounts to EUR 16,989 million (2013: EUR 12,903 million). None of these collaterals has been sold or re-pledged to third parties.
184
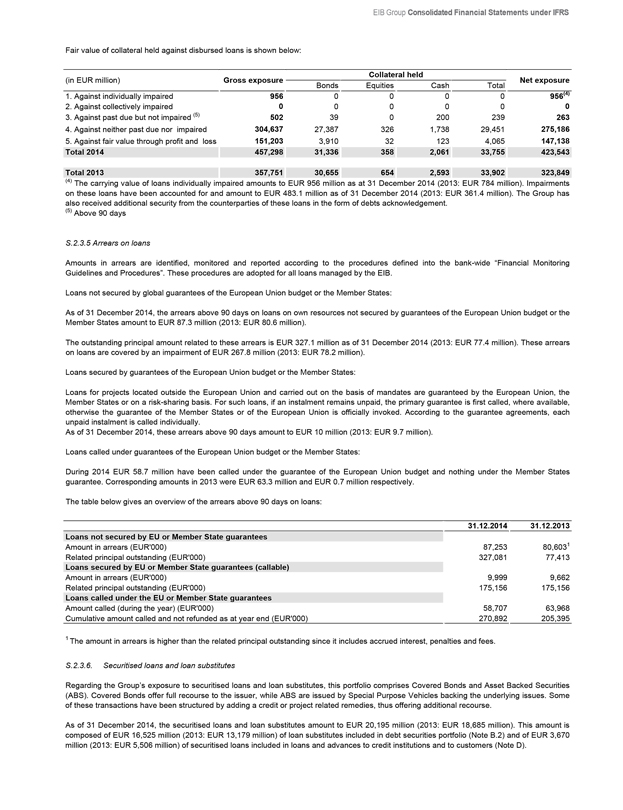
EIB Group Consolidated Financial Statements under IFRS
Fair value of collateral held against disbursed loans is shown below:
Collateral held
(in EUR million) Gross exposure Bonds Equities Cash Total Net exposure
1. Against individually impaired 956 0 0 0 0 956(4)
2. Against collectively impaired 0 0 0 0 0 0
3. Against past due but not impaired (5) 502 39 0 200 239 263
4. Against neither past due nor impaired 304,637 27,387 326 1,738 29,451 275,186
5. Against fair value through profit and loss 151,203 3,910 32 123 4,065 147,138
Total 2014 457,298 31,336 358 2,061 33,755 423,543
Total 2013 357,751 30,655 654 2,593 33,902 323,849
(4) The carrying value of loans individually impaired amounts to EUR 956 million as at 31 December 2014 (2013: EUR 784 million). Impairments on these loans have been accounted for and amount to EUR 483.1 million as of 31 December 2014 (2013: EUR 361.4 million). The Group has also received additional security from the counterparties of these loans in the form of debts acknowledgement.
(5) Above 90 days
S.2.3.5 Arrears on loans
Amounts in arrears are identified, monitored and reported according to the procedures defined into the bank-wide “Financial Monitoring Guidelines and Procedures”. These procedures are adopted for all loans managed by the EIB.
Loans not secured by global guarantees of the European Union budget or the Member States:
As of 31 December 2014, the arrears above 90 days on loans on own resources not secured by guarantees of the European Union budget or the Member States amount to EUR 87.3 million (2013: EUR 80.6 million).
The outstanding principal amount related to these arrears is EUR 327.1 million as of 31 December 2014 (2013: EUR 77.4 million). These arrears on loans are covered by an impairment of EUR 267.8 million (2013: EUR 78.2 million).
Loans secured by guarantees of the European Union budget or the Member States:
Loans for projects located outside the European Union and carried out on the basis of mandates are guaranteed by the European Union, the Member States or on a risk-sharing basis. For such loans, if an instalment remains unpaid, the primary guarantee is first called, where available, otherwise the guarantee of the Member States or of the European Union is officially invoked. According to the guarantee agreements, each unpaid instalment is called individually.
As of 31 December 2014, these arrears above 90 days amount to EUR 10 million (2013: EUR 9.7 million).
Loans called under guarantees of the European Union budget or the Member States:
During 2014 EUR 58.7 million have been called under the guarantee of the European Union budget and nothing under the Member States guarantee. Corresponding amounts in 2013 were EUR 63.3 million and EUR 0.7 million respectively.
The table below gives an overview of the arrears above 90 days on loans:
31.12.2014 31.12.2013
Loans not secured by EU or Member State guarantees
Amount in arrears (EUR’000) 87,253 80,6031
Related principal outstanding (EUR’000) 327,081 77,413
Loans secured by EU or Member State guarantees (callable)
Amount in arrears (EUR’000) 9,999 9,662
Related principal outstanding (EUR’000) 175,156 175,156
Amount called (during the year) (EUR’000) 58,707 63,968
Cumulative amount called and not refunded as at year end (EUR’000) 270,892 205,395
1 The amount in arrears is higher than the related principal outstanding since it includes accrued interest, penalties and fees.
S.2.3.6. Securitised loans and loan substitutes
Regarding the Group’s exposure to securitised loans and loan substitutes, this portfolio comprises Covered Bonds and Asset Backed Securities (ABS). Covered Bonds offer full recourse to the issuer, while ABS are issued by Special Purpose Vehicles backing the underlying issues. Some of these transactions have been structured by adding a credit or project related remedies, thus offering additional recourse.
As of 31 December 2014, the securitised loans and loan substitutes amount to EUR 20,195 million (2013: EUR 18,685 million). This amount is composed of EUR 16,525 million (2013: EUR 13,179 million) of loan substitutes included in debt securities portfolio (Note B.2) and of EUR 3,670 million (2013: EUR 5,506 million) of securitised loans included in loans and advances to credit institutions and to customers (Note D).
185
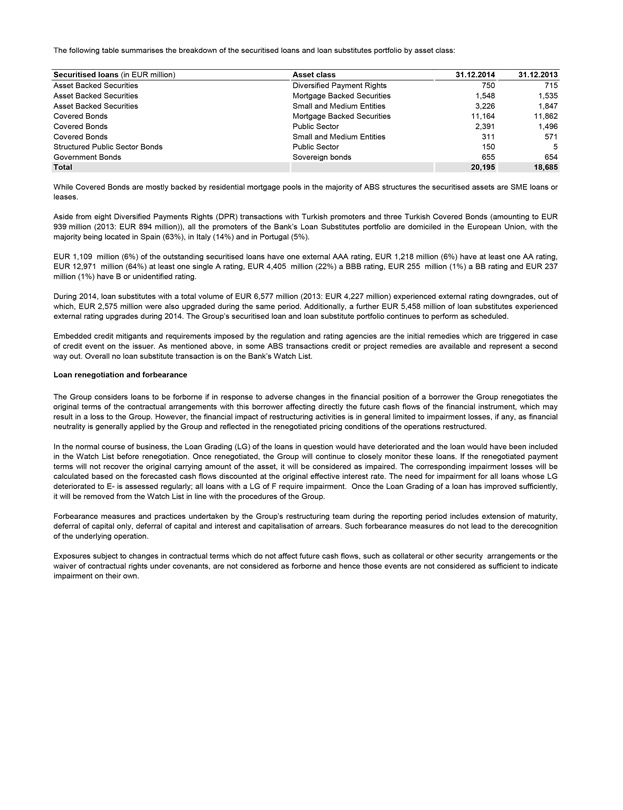
The following table summarises the breakdown of the securitised loans and loan substitutes portfolio by asset class:
Securitised loans (in EUR million) Asset class 31.12.2014 31.12.2013
Asset Backed Securities Diversified Payment Rights 750 715
Asset Backed Securities Mortgage Backed Securities 1,548 1,535
Asset Backed Securities Small and Medium Entities 3,226 1,847
Covered Bonds Mortgage Backed Securities 11,164 11,862
Covered Bonds Public Sector 2,391 1,496
Covered Bonds Small and Medium Entities 311 571
Structured Public Sector Bonds Public Sector 150 5
Government Bonds Sovereign bonds 655 654
Total 20,195 18,685
While Covered Bonds are mostly backed by residential mortgage pools in the majority of ABS structures the securitised assets are SME loans or leases.
Aside from eight Diversified Payments Rights (DPR) transactions with Turkish promoters and three Turkish Covered Bonds (amounting to EUR 939 million (2013: EUR 894 million)), all the promoters of the Bank’s Loan Substitutes portfolio are domiciled in the European Union, with the majority being located in Spain (63%), in Italy (14%) and in Portugal (5%).
EUR 1,109 million (6%) of the outstanding securitised loans have one external AAA rating, EUR 1,218 million (6%) have at least one AA rating, EUR 12,971 million (64%) at least one single A rating, EUR 4,405 million (22%) a BBB rating, EUR 255 million (1%) a BB rating and EUR 237 million (1%) have B or unidentified rating.
During 2014, loan substitutes with a total volume of EUR 6,577 million (2013: EUR 4,227 million) experienced external rating downgrades, out of which, EUR 2,575 million were also upgraded during the same period. Additionally, a further EUR 5,458 million of loan substitutes experienced external rating upgrades during 2014. The Group’s securitised loan and loan substitute portfolio continues to perform as scheduled.
Embedded credit mitigants and requirements imposed by the regulation and rating agencies are the initial remedies which are triggered in case of credit event on the issuer. As mentioned above, in some ABS transactions credit or project remedies are available and represent a second way out. Overall no loan substitute transaction is on the Bank’s Watch List.
Loan renegotiation and forbearance
The Group considers loans to be forborne if in response to adverse changes in the financial position of a borrower the Group renegotiates the original terms of the contractual arrangements with this borrower affecting directly the future cash flows of the financial instrument, which may result in a loss to the Group. However, the financial impact of restructuring activities is in general limited to impairment losses, if any, as financial neutrality is generally applied by the Group and reflected in the renegotiated pricing conditions of the operations restructured.
In the normal course of business, the Loan Grading (LG) of the loans in question would have deteriorated and the loan would have been included in the Watch List before renegotiation. Once renegotiated, the Group will continue to closely monitor these loans. If the renegotiated payment terms will not recover the original carrying amount of the asset, it will be considered as impaired. The corresponding impairment losses will be calculated based on the forecasted cash flows discounted at the original effective interest rate. The need for impairment for all loans whose LG deteriorated to E- is assessed regularly; all loans with a LG of F require impairment. Once the Loan Grading of a loan has improved sufficiently, it will be removed from the Watch List in line with the procedures of the Group.
Forbearance measures and practices undertaken by the Group’s restructuring team during the reporting period includes extension of maturity, deferral of capital only, deferral of capital and interest and capitalisation of arrears. Such forbearance measures do not lead to the derecognition of the underlying operation.
Exposures subject to changes in contractual terms which do not affect future cash flows, such as collateral or other security arrangements or the waiver of contractual rights under covenants, are not considered as forborne and hence those events are not considered as sufficient to indicate impairment on their own.
186
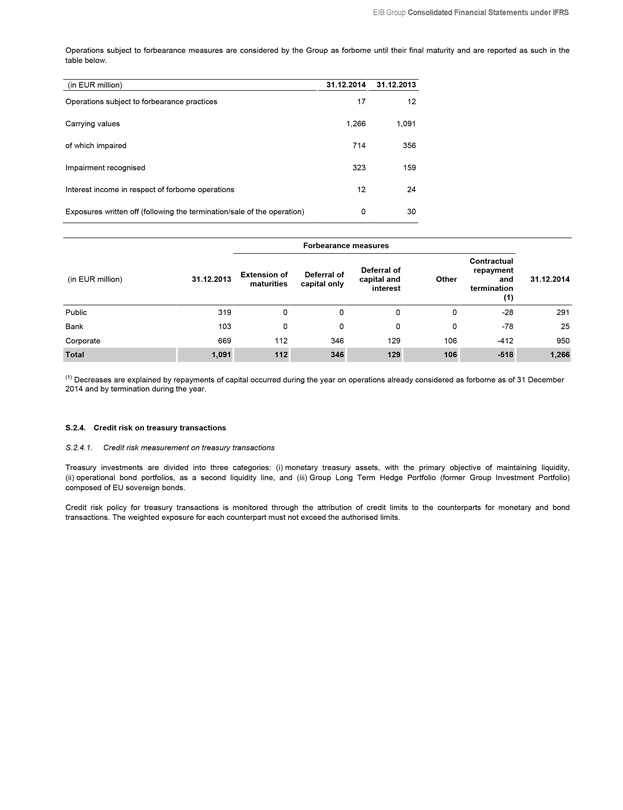
EIB Group Consolidated Financial Statements under IFRS
Operations subject to forbearance measures are considered by the Group as forborne until their final maturity and are reported as such in the table below.
(in EUR million) 31.12.2014 31.12.2013
Operations subject to forbearance practices 17 12
Carrying values 1,266 1,091
of which impaired 714 356
Impairment recognised 323 159
Interest income in respect of forborne operations 12 24
Exposures written off (following the termination/sale of the operation) 0 30
Forbearance measures
(in EUR million) 31.12.2013 Extension of maturities Deferral of capital only Deferral of capital and interest Other Contractual repayment and termination (1) 31.12.2014
Public 319 0 0 0 0 -28 291
Bank 103 0 0 0 0 -78 25
Corporate 669 112 346 129 106 -412 950
Total 1,091 112 346 129 106 -518 1,266
(1) Decreases are explained by repayments of capital occurred during the year on operations already considered as forborne as of 31 December 2014 and by termination during the year.
S.2.4. Credit risk on treasury transactions
S.2.4.1. Credit risk measurement on treasury transactions
Treasury investments are divided into three categories: (i) monetary treasury assets, with the primary objective of maintaining liquidity, (ii) operational bond portfolios, as a second liquidity line, and (iii) Group Long Term Hedge Portfolio (former Group Investment Portfolio) composed of EU sovereign bonds.
Credit risk policy for treasury transactions is monitored through the attribution of credit limits to the counterparts for monetary and bond transactions. The weighted exposure for each counterpart must not exceed the authorised limits.
187
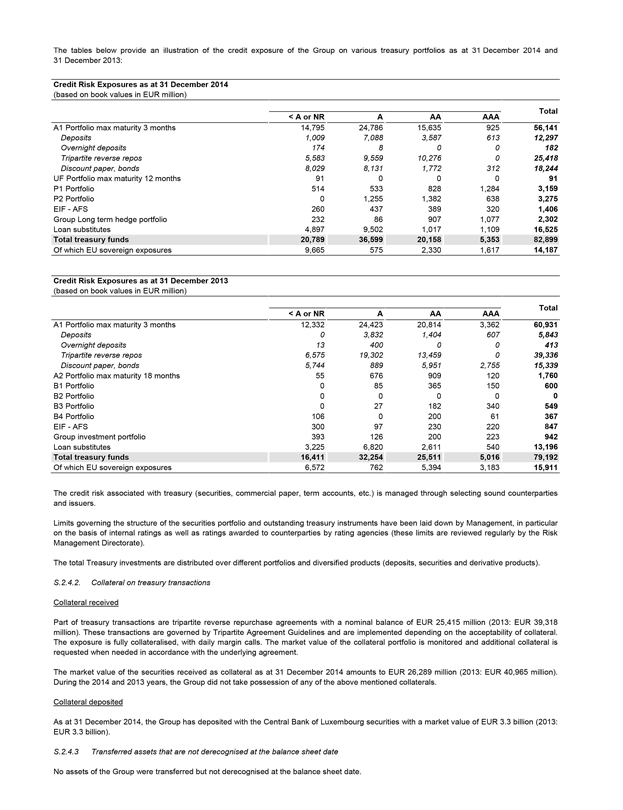
The tables below provide an illustration of the credit exposure of the Group on various treasury portfolios as at 31 December 2014 and
31 December 2013:
Credit Risk Exposures as at 31 December 2014
(based on book values in EUR million)
< A or NR A AA AAA Total
A1 Portfolio max maturity 3 months 14,795 24,786 15,635 925 56,141
Deposits 1,009 7,088 3,587 613 12,297
Overnight deposits 174 8 0 0 182
Tripartite reverse repos 5,583 9,559 10,276 0 25,418
Discount paper, bonds 8,029 8,131 1,772 312 18,244
UF Portfolio max maturity 12 months 91 0 0 0 91
P1 Portfolio 514 533 828 1,284 3,159
P2 Portfolio 0 1,255 1,382 638 3,275
EIF - AFS 260 437 389 320 1,406
Group Long term hedge portfolio 232 86 907 1,077 2,302
Loan substitutes 4,897 9,502 1,017 1,109 16,525
Total treasury funds 20,789 36,599 20,158 5,353 82,899
Of which EU sovereign exposures 9,665 575 2,330 1,617 14,187
Credit Risk Exposures as at 31 December 2013
(based on book values in EUR million)
< A or NR A AA AAA Total
A1 Portfolio max maturity 3 months 12,332 24,423 20,814 3,362 60,931
Deposits 0 3,832 1,404 607 5,843
Overnight deposits 13 400 0 0 413
Tripartite reverse repos 6,575 19,302 13,459 0 39,336
Discount paper, bonds 5,744 889 5,951 2,755 15,339
A2 Portfolio max maturity 18 months 55 676 909 120 1,760
B1 Portfolio 0 85 365 150 600
B2 Portfolio 0 0 0 0 0
B3 Portfolio 0 27 182 340 549
B4 Portfolio 106 0 200 61 367
EIF - AFS 300 97 230 220 847
Group investment portfolio 393 126 200 223 942
Loan substitutes 3,225 6,820 2,611 540 13,196
Total treasury funds 16,411 32,254 25,511 5,016 79,192
Of which EU sovereign exposures 6,572 762 5,394 3,183 15,911
The credit risk associated with treasury (securities, commercial paper, term accounts, etc.) is managed through selecting sound counterparties and issuers.
Limits governing the structure of the securities portfolio and outstanding treasury instruments have been laid down by Management, in particular on the basis of internal ratings as well as ratings awarded to counterparties by rating agencies (these limits are reviewed regularly by the Risk Management Directorate).
The total Treasury investments are distributed over different portfolios and diversified products (deposits, securities and derivative products).
S.2.4.2. Collateral on treasury transactions
Collateral received
Part of treasury transactions are tripartite reverse repurchase agreements with a nominal balance of EUR 25,415 million (2013: EUR 39,318 million). These transactions are governed by Tripartite Agreement Guidelines and are implemented depending on the acceptability of collateral. The exposure is fully collateralised, with daily margin calls. The market value of the collateral portfolio is monitored and additional collateral is requested when needed in accordance with the underlying agreement.
The market value of the securities received as collateral as at 31 December 2014 amounts to EUR 26,289 million (2013: EUR 40,965 million). During the 2014 and 2013 years, the Group did not take possession of any of the above mentioned collaterals.
Collateral deposited
As at 31 December 2014, the Group has deposited with the Central Bank of Luxembourg securities with a market value of EUR 3.3 billion (2013: EUR 3.3 billion).
S.2.4.3 Transferred assets that are not derecognised at the balance sheet date
No assets of the Group were transferred but not derecognised at the balance sheet date.
188
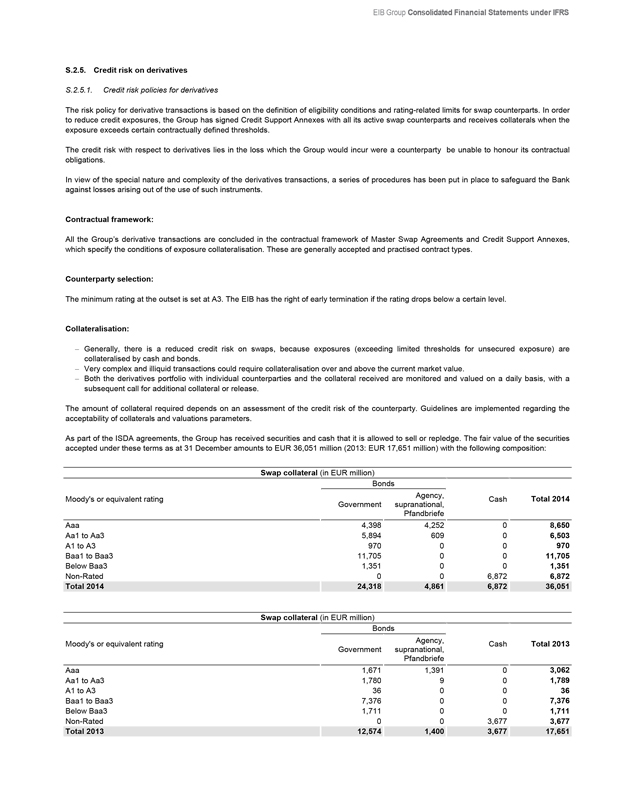
EIB Group Consolidated Financial Statements under IFRS
S.2.5. Credit risk on derivatives
S.2.5.1. Credit risk policies for derivatives
The risk policy for derivative transactions is based on the definition of eligibility conditions and rating-related limits for swap counterparts. In order to reduce credit exposures, the Group has signed Credit Support Annexes with all its active swap counterparts and receives collaterals when the exposure exceeds certain contractually defined thresholds.
The credit risk with respect to derivatives lies in the loss which the Group would incur were a counterparty be unable to honour its contractual obligations.
In view of the special nature and complexity of the derivatives transactions, a series of procedures has been put in place to safeguard the Bank against losses arising out of the use of such instruments.
Contractual framework:
All the Group’s derivative transactions are concluded in the contractual framework of Master Swap Agreements and Credit Support Annexes, which specify the conditions of exposure collateralisation. These are generally accepted and practised contract types.
Counterparty selection:
The minimum rating at the outset is set at A3. The EIB has the right of early termination if the rating drops below a certain level.
Collateralisation:
– Generally, there is a reduced credit risk on swaps, because exposures (exceeding limited thresholds for unsecured exposure) are collateralised by cash and bonds.
– Very complex and illiquid transactions could require collateralisation over and above the current market value.
– Both the derivatives portfolio with individual counterparties and the collateral received are monitored and valued on a daily basis, with a subsequent call for additional collateral or release.
The amount of collateral required depends on an assessment of the credit risk of the counterparty. Guidelines are implemented regarding the acceptability of collaterals and valuations parameters.
As part of the ISDA agreements, the Group has received securities and cash that it is allowed to sell or repledge. The fair value of the securities accepted under these terms as at 31 December amounts to EUR 36,051 million (2013: EUR 17,651 million) with the following composition:
Swap collateral (in EUR million)
Bonds
Moody’s or equivalent rating Government Agency, supranational, Pfandbriefe Cash Total 2014
Aaa 4,398 4,252 0 8,650
Aa1 to Aa3 5,894 609 0 6,503
A1 to A3 970 0 0 970
Baa1 to Baa3 11,705 0 0 11,705
Below Baa3 1,351 0 0 1,351
Non-Rated 0 0 6,872 6,872
Total 2014 24,318 4,861 6,872 36,051
Swap collateral (in EUR million)
Bonds
Moody’s or equivalent rating Government Agency, supranational, Pfandbriefe Cash Total 2013
Aaa 1,671 1,391 0 3,062
Aa1 to Aa3 1,780 9 0 1,789
A1 to A3 36 0 0 36
Baa1 to Baa3 7,376 0 0 7,376
Below Baa3 1,711 0 0 1,711
Non-Rated 0 0 3,677 3,677
Total 2013 12,574 1,400 3,677 17,651
189
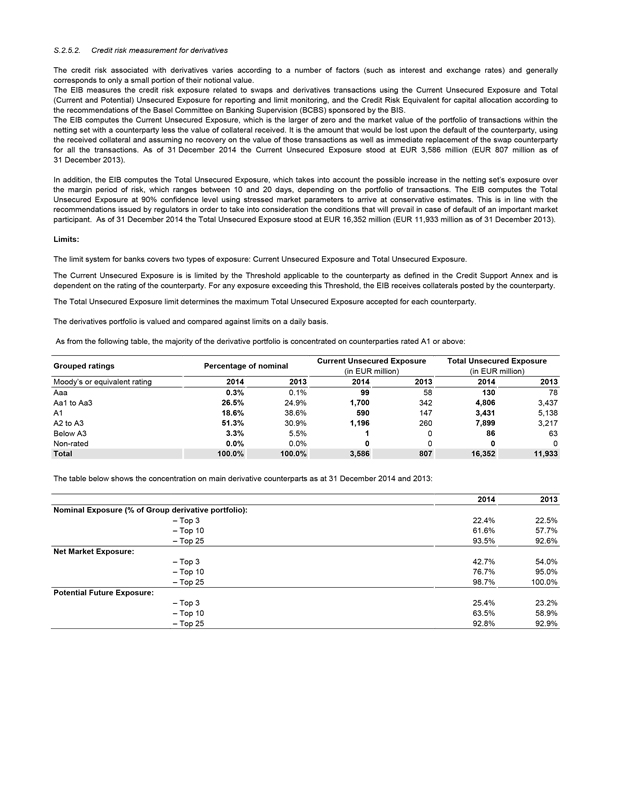
S.2.5.2. Credit risk measurement for derivatives
The credit risk associated with derivatives varies according to a number of factors (such as interest and exchange rates) and generally corresponds to only a small portion of their notional value.
The EIB measures the credit risk exposure related to swaps and derivatives transactions using the Current Unsecured Exposure and Total (Current and Potential) Unsecured Exposure for reporting and limit monitoring, and the Credit Risk Equivalent for capital allocation according to the recommendations of the Basel Committee on Banking Supervision (BCBS) sponsored by the BIS.
The EIB computes the Current Unsecured Exposure, which is the larger of zero and the market value of the portfolio of transactions within the netting set with a counterparty less the value of collateral received. It is the amount that would be lost upon the default of the counterparty, using the received collateral and assuming no recovery on the value of those transactions as well as immediate replacement of the swap counterparty for all the transactions. As of 31 December 2014 the Current Unsecured Exposure stood at EUR 3,586 million (EUR 807 million as of
31 December 2013).
In addition, the EIB computes the Total Unsecured Exposure, which takes into account the possible increase in the netting set’s exposure over the margin period of risk, which ranges between 10 and 20 days, depending on the portfolio of transactions. The EIB computes the Total Unsecured Exposure at 90% confidence level using stressed market parameters to arrive at conservative estimates. This is in line with the recommendations issued by regulators in order to take into consideration the conditions that will prevail in case of default of an important market participant. As of 31 December 2014 the Total Unsecured Exposure stood at EUR 16,352 million (EUR 11,933 million as of 31 December 2013).
Limits:
The limit system for banks covers two types of exposure: Current Unsecured Exposure and Total Unsecured Exposure.
The Current Unsecured Exposure is is limited by the Threshold applicable to the counterparty as defined in the Credit Support Annex and is dependent on the rating of the counterparty. For any exposure exceeding this Threshold, the EIB receives collaterals posted by the counterparty. The Total Unsecured Exposure limit determines the maximum Total Unsecured Exposure accepted for each counterparty.
The derivatives portfolio is valued and compared against limits on a daily basis.
As from the following table, the majority of the derivative portfolio is concentrated on counterparties rated A1 or above:
Grouped ratings Percentage of nominal Current Unsecured Exposure (in EUR million) Total Unsecured Exposure (in EUR million)
Moody’s or equivalent rating 2014 2013 2014 2013 2014 2013
Aaa 0.3% 0.1% 99 58 130 78
Aa1 to Aa3 26.5% 24.9% 1,700 342 4,806 3,437
A1 18.6% 38.6% 590 147 3,431 5,138
A2 to A3 51.3% 30.9% 1,196 260 7,899 3,217
Below A3 3.3% 5.5% 1 0 86 63
Non-rated 0.0% 0.0% 0 0 0 0
Total 100.0% 100.0% 3,586 807 16,352 11,933
The table below shows the concentration on main derivative counterparts as at 31 December 2014 and 2013:
2014 2013
Nominal Exposure (% of Group derivative portfolio):
– Top 3 22.4% 22.5%
– Top 10 61.6% 57.7%
– Top 25 93.5% 92.6%
Net Market Exposure:
– Top 3 42.7% 54.0%
– Top 10 76.7% 95.0%
– Top 25 98.7% 100.0%
Potential Future Exposure:
– Top 3 25.4% 23.2%
– Top 10 63.5% 58.9%
– Top 25 92.8% 92.9%
190
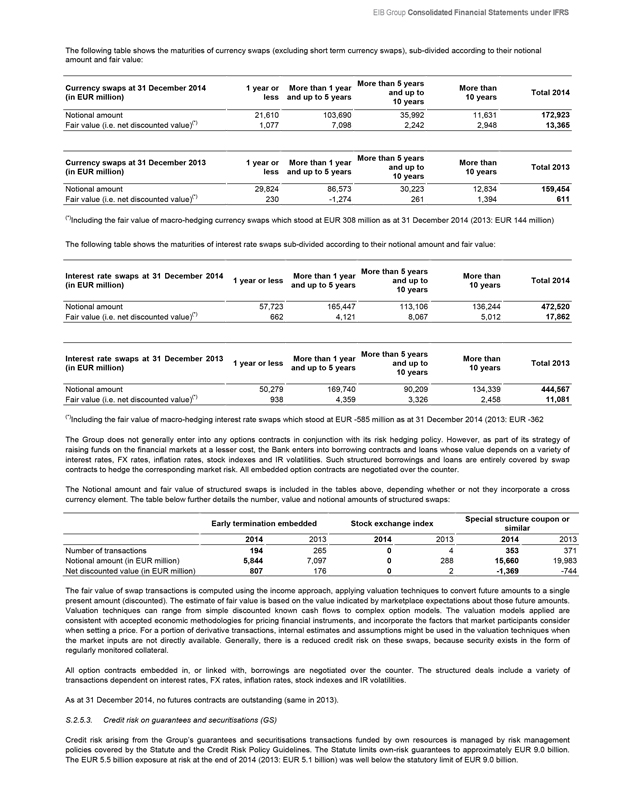
EIB Group Consolidated Financial Statements under IFRS
The following table shows the maturities of currency swaps (excluding short term currency swaps), sub-divided according to their notional amount and fair value:
Currency swaps at 31 December 2014
(in EUR million) 1 year or less More than 1 year and up to 5 years More than 5 years and up to 10 years More than 10 years Total 2014
Notional amount 21,610 103,690 35,992 11,631 172,923
Fair value (i.e. net discounted value)(*) 1,077 7,098 2,242 2,948 13,365
Currency swaps at 31 December 2013 (in EUR million) 1 year or less More than 1 year and up to 5 years More than 5 years and up to 10 years More than 10 years Total 2013
Notional amount 29,824 86,573 30,223 12,834 159,454
Fair value (i.e. net discounted value)(*) 230 -1,274 261 1,394 611
(*)Including the fair value of macro-hedging currency swaps which stood at EUR 308 million as at 31 December 2014 (2013: EUR 144 million)
The following table shows the maturities of interest rate swaps sub-divided according to their notional amount and fair value:
Interest rate swaps at 31 December 2014 (in EUR million) 1 year or less More than 1 year and up to 5 years More than 5 years and up to 10 years More than 10 years Total 2014
Notional amount 57,723 165,447 113,106 136,244 472,520
Fair value (i.e. net discounted value)(*) 662 4,121 8,067 5,012 17,862
Interest rate swaps at 31 December 2013 (in EUR million) 1 year or less More than 1 year and up to 5 years More than 5 years and up to 10 years More than 10 years Total 2013
Notional amount 50,279 169,740 90,209 134,339 444,567
Fair value (i.e. net discounted value)(*) 938 4,359 3,326 2,458 11,081
(*)Including the fair value of macro-hedging interest rate swaps which stood at EUR -585 million as at 31 December 2014 (2013: EUR -362
The Group does not generally enter into any options contracts in conjunction with its risk hedging policy. However, as part of its strategy of raising funds on the financial markets at a lesser cost, the Bank enters into borrowing contracts and loans whose value depends on a variety of interest rates, FX rates, inflation rates, stock indexes and IR volatilities. Such structured borrowings and loans are entirely covered by swap contracts to hedge the corresponding market risk. All embedded option contracts are negotiated over the counter.
The Notional amount and fair value of structured swaps is included in the tables above, depending whether or not they incorporate a cross currency element. The table below further details the number, value and notional amounts of structured swaps:
Early termination embedded Stock exchange index Special structure coupon or similar
2014 2013 2014 2013 2014 2013
Number of transactions 194 265 0 4 353 371
Notional amount (in EUR million) 5,844 7,097 0 288 15,660 19,983
Net discounted value (in EUR million) 807 176 0 2 -1,369 -744
The fair value of swap transactions is computed using the income approach, applying valuation techniques to convert future amounts to a single present amount (discounted). The estimate of fair value is based on the value indicated by marketplace expectations about those future amounts. Valuation techniques can range from simple discounted known cash flows to complex option models. The valuation models applied are consistent with accepted economic methodologies for pricing financial instruments, and incorporate the factors that market participants consider when setting a price. For a portion of derivative transactions, internal estimates and assumptions might be used in the valuation techniques when the market inputs are not directly available. Generally, there is a reduced credit risk on these swaps, because security exists in the form of regularly monitored collateral.
All option contracts embedded in, or linked with, borrowings are negotiated over the counter. The structured deals include a variety of transactions dependent on interest rates, FX rates, inflation rates, stock indexes and IR volatilities.
As at 31 December 2014, no futures contracts are outstanding (same in 2013).
S.2.5.3. Credit risk on guarantees and securitisations (GS)
Credit risk arising from the Group’s guarantees and securitisations transactions funded by own resources is managed by risk management policies covered by the Statute and the Credit Risk Policy Guidelines. The Statute limits own-risk guarantees to approximately EUR 9.0 billion. The EUR 5.5 billion exposure at risk at the end of 2014 (2013: EUR 5.1 billion) was well below the statutory limit of EUR 9.0 billion.
2014 Financial Report 197
191
The Credit Risk Policy Guidelines ensure that the Group continues to develop a diversified guarantee portfolio in terms of product range, geographic coverage, counterparty exposure, obligor exposure, industry concentration and also set out the capital allocation rules based on the ratings of the exposures.
Concentration risk is limited because of the granular nature of the Group’s transactions; typically the underlying portfolios are highly diversified in terms of single obligor concentration, sectors, and also with regard to regional diversification. To cover concentration risk, the Group has strict limits (based on capital allocation) for individual transactions and on originator level (maximum aggregate exposures for originators and originator groups).
In the context of the Group’s own risk guarantee operations, the credit risk is tracked from the very beginning on a deal-by-deal basis whilst adopting a different model analysis approach depending on the granularity and homogeneity of the underlying portfolios. The industry sector exposures are analysed on a deal-by-deal basis through their impact on the ratings assigned by the Group to each transaction or tranche. For instance, dependent on the financial model to analyse the transaction, industry exposures can be reflected in implicit correlation or can be indirectly captured through the assumption on default rate volatility, as a key model input variable.
Furthermore, concentration exposures are analysed in the context of each deal using qualitative measures such as current status and forecast for sectors with high concentrations in the portfolio. Exceptionally, some deals have a concentrated exposure in the same (broad) sector. This is typically captured through increased credit enhancement (e.g. subordination) to the benefit of the Group. Typically, deals with replenishing features have portfolio criteria, such as maximum single obligor, maximum top five obligors, and maximum industry concentration levels. Furthermore, the consideration of sector exposures is part of the Group’s overall portfolio analysis.
Counterparty risk is mitigated by the quality of the Group’s counterparties which are usually major market players. The Group performs additional on-site monitoring visits to ensure compliance with procedures and processes during the transaction life. Stress-test scenarios for the portfolio of guarantees, including extreme case assumptions, are regularly carried out to determine the ability of the capital base to sustain adverse shocks.
The exposure on guarantees granted by the Group in respect of venture capital operations amounts to EUR nil as at 31 December 2014 (2013: EUR nil).
S.3. Liquidity risk
Liquidity risk refers to the ability of the Group to fund increases in assets and meet obligations as they come due, without incurring unacceptable losses. It can be further split into funding liquidity risk and market liquidity risk.
Funding liquidity risk is connected to the risk for the Group to be unable to refinance the asset side of its balance sheet and to meet payment obligations punctually and in full out of readily available liquid resources. Funding liquidity risk may have an impact on the volatility in the economic value of, or in the income derived from Group’s positions, due to potentially increasing immediate risks to meet payment obligations and the consequent need to borrow at unattractive conditions.
Market liquidity risk is the volatility in the economic value of, or in the income derived from, the Group’s positions due to potential inability to execute a transaction to offset, eliminate or reduce outstanding positions at reasonable market prices. Such an inability may force early liquidation of assets at unattractive prices when it would be better to avoid such liquidation. This risk is tied to the size of the position compared to the liquidity of the instrument being transacted, as well as to potential deterioration of market availability and efficiency.
S.3.1. Liquidity risk management
Liquidity risk management of the Bank
Liquidity risk is managed prudently in order to ensure the regular functioning of the Bank’s core activities at reasonable cost. The main objective of liquidity policy is to ensure that the Bank can always meet its payment obligations punctually and in full. In contrast to commercial banks, the EIB does not have retail deposits but relies on its access to capital markets to raise the funds it on-lends to its clients.
The Bank manages the calendar of its new issues so as to maintain a prudential liquidity buffer. Liquidity planning takes into account the Bank’s needs to service its debt, disbursements on loans and cash flows from the loan portfolio. It also takes into account the sizeable amount of signed but un-disbursed loans, whose disbursements typically take place at the borrowers’ request.
The Bank further assures management of liquidity risk by maintaining a sufficient level of short term liquid assets, and by spreading the maturity dates of its placements according to the forecasts of liquidity needs. Liquidity risk policy also incorporates a floor on treasury levels. The Bank’s total liquidity ratio (defined as a target percentage of annual projected net cash flows) must at all times exceed 25% of the average forecast net annual cash flows for the following year.
The Bank has in place a Contingency Liquidity Plan (CLP), which specifies appropriate decision making procedures and corresponding responsibilities. The CLP has been benchmarked against the “Principles for Sound Liquidity Risk Management and Supervision” by the Basel Committee on Banking Supervision (September 2008). The CLP is subject to ad-hoc updates and is presented to the Management Committee annually for approval.
Regular stress-testing analyses tailored to the specific business model of the EIB are executed as a part of the liquidity risk monitoring and drive the size of the Bank’s liquidity buffer.
192
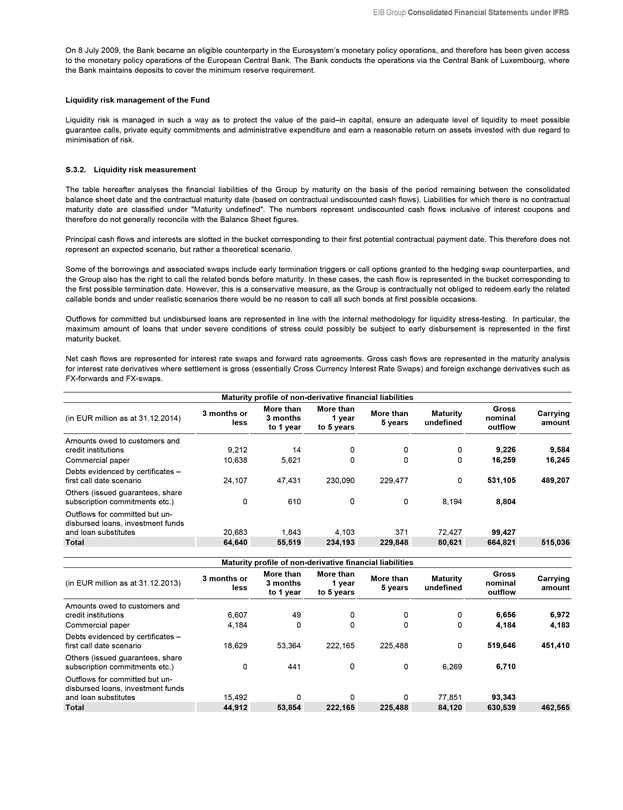
EIB Group Consolidated Financial Statements under IFRS
On 8 July 2009, the Bank became an eligible counterparty in the Eurosystem’s monetary policy operations, and therefore has been given access to the monetary policy operations of the European Central Bank. The Bank conducts the operations via the Central Bank of Luxembourg, where the Bank maintains deposits to cover the minimum reserve requirement.
Liquidity risk management of the Fund
Liquidity risk is managed in such a way as to protect the value of the paid–in capital, ensure an adequate level of liquidity to meet possible guarantee calls, private equity commitments and administrative expenditure and earn a reasonable return on assets invested with due regard to minimisation of risk.
S.3.2. Liquidity risk measurement
The table hereafter analyses the financial liabilities of the Group by maturity on the basis of the period remaining between the consolidated balance sheet date and the contractual maturity date (based on contractual undiscounted cash flows). Liabilities for which there is no contractual maturity date are classified under “Maturity undefined”. The numbers represent undiscounted cash flows inclusive of interest coupons and therefore do not generally reconcile with the Balance Sheet figures.
Principal cash flows and interests are slotted in the bucket corresponding to their first potential contractual payment date. This therefore does not represent an expected scenario, but rather a theoretical scenario.
Some of the borrowings and associated swaps include early termination triggers or call options granted to the hedging swap counterparties, and the Group also has the right to call the related bonds before maturity. In these cases, the cash flow is represented in the bucket corresponding to the first possible termination date. However, this is a conservative measure, as the Group is contractually not obliged to redeem early the related callable bonds and under realistic scenarios there would be no reason to call all such bonds at first possible occasions.
Outflows for committed but undisbursed loans are represented in line with the internal methodology for liquidity stress-testing. In particular, the maximum amount of loans that under severe conditions of stress could possibly be subject to early disbursement is represented in the first maturity bucket.
Net cash flows are represented for interest rate swaps and forward rate agreements. Gross cash flows are represented in the maturity analysis for interest rate derivatives where settlement is gross (essentially Cross Currency Interest Rate Swaps) and foreign exchange derivatives such as FX-forwards and FX-swaps.
Maturity profile of non-derivative financial liabilities
(in EUR million as at 31.12.2014) 3 months or less More than 3 months to 1 year More than 1 year to 5 years More than 5 years Maturity undefined Gross nominal outflow Carrying amount
Amounts owed to customers and credit institutions 9,212 14 0 0 0 9,226 9,584
Commercial paper 10,638 5,621 0 0 0 16,259 16,245
Debts evidenced by certificates – first call date scenario 24,107 47,431 230,090 229,477 0 531,105 489,207
Others (issued guarantees, share subscription commitments etc.) 0 610 0 0 8,194 8,804
Outflows for committed but un-disbursed loans, investment funds and loan substitutes 20,683 1,843 4,103 371 72,427 99,427
Total 64,640 55,519 234,193 229,848 80,621 664,821 515,036
Maturity profile of non-derivative financial liabilities
(in EUR million as at 31.12.2013) 3 months or less More than 3 months to 1 year More than 1 year to 5 years More than 5 years Maturity undefined Gross nominal outflow Carrying amount
Amounts owed to customers and credit institutions 6,607 49 0 0 0 6,656 6,972
Commercial paper 4,184 0 0 0 0 4,184 4,183
Debts evidenced by certificates – first call date scenario 18,629 53,364 222,165 225,488 0 519,646 451,410
Others (issued guarantees, share subscription commitments etc.) 0 441 0 0 6,269 6,710
Outflows for committed but un-disbursed loans, investment funds and loan substitutes 15,492 0 0 0 77,851 93,343
Total 44,912 53,854 222,165 225,488 84,120 630,539 462,565
193
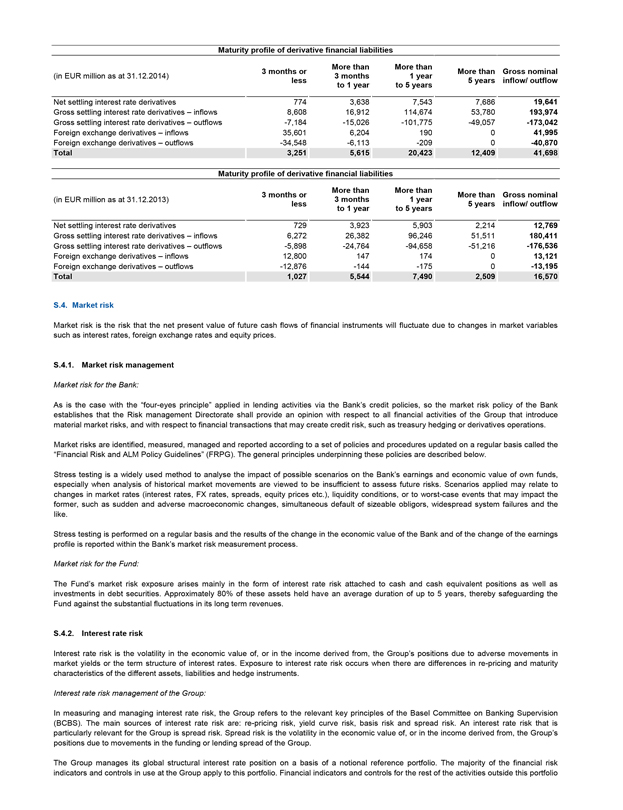
Maturity profile of derivative financial liabilities
(in EUR million as at 31.12.2014) 3 months or less More than 3 months to 1 year More than 1 year to 5 years More than 5 years Gross nominal inflow/ outflow
Net settling interest rate derivatives 774 3,638 7,543 7,686 19,641
Gross settling interest rate derivatives – inflows 8,608 16,912 114,674 53,780 193,974
Gross settling interest rate derivatives – outflows -7,184 -15,026 -101,775 -49,057 -173,042
Foreign exchange derivatives – inflows 35,601 6,204 190 0 41,995
Foreign exchange derivatives – outflows -34,548 -6,113 -209 0 -40,870
Total 3,251 5,615 20,423 12,409 41,698
Maturity profile of derivative financial liabilities
(in EUR million as at 31.12.2013) 3 months or less More than 3 months to 1 year More than 1 year to 5 years More than 5 years Gross nominal inflow/ outflow
Net settling interest rate derivatives 729 3,923 5,903 2,214 12,769
Gross settling interest rate derivatives – inflows 6,272 26,382 96,246 51,511 180,411
Gross settling interest rate derivatives – outflows -5,898 -24,764 -94,658 -51,216 -176,536
Foreign exchange derivatives – inflows 12,800 147 174 0 13,121
Foreign exchange derivatives – outflows -12,876 -144 -175 0 -13,195
Total 1,027 5,544 7,490 2,509 16,570
S.4. Market risk
Market risk is the risk that the net present value of future cash flows of financial instruments will fluctuate due to changes in market variables such as interest rates, foreign exchange rates and equity prices.
S.4.1. Market risk management
Market risk for the Bank:
As is the case with the “four-eyes principle” applied in lending activities via the Bank’s credit policies, so the market risk policy of the Bank establishes that the Risk management Directorate shall provide an opinion with respect to all financial activities of the Group that introduce material market risks, and with respect to financial transactions that may create credit risk, such as treasury hedging or derivatives operations.
Market risks are identified, measured, managed and reported according to a set of policies and procedures updated on a regular basis called the “Financial Risk and ALM Policy Guidelines” (FRPG). The general principles underpinning these policies are described below.
Stress testing is a widely used method to analyse the impact of possible scenarios on the Bank’s earnings and economic value of own funds, especially when analysis of historical market movements are viewed to be insufficient to assess future risks. Scenarios applied may relate to changes in market rates (interest rates, FX rates, spreads, equity prices etc.), liquidity conditions, or to worst-case events that may impact the former, such as sudden and adverse macroeconomic changes, simultaneous default of sizeable obligors, widespread system failures and the like.
Stress testing is performed on a regular basis and the results of the change in the economic value of the Bank and of the change of the earnings profile is reported within the Bank’s market risk measurement process.
Market risk for the Fund:
The Fund’s market risk exposure arises mainly in the form of interest rate risk attached to cash and cash equivalent positions as well as investments in debt securities. Approximately 80% of these assets held have an average duration of up to 5 years, thereby safeguarding the Fund against the substantial fluctuations in its long term revenues.
S.4.2. Interest rate risk
Interest rate risk is the volatility in the economic value of, or in the income derived from, the Group’s positions due to adverse movements in market yields or the term structure of interest rates. Exposure to interest rate risk occurs when there are differences in re-pricing and maturity characteristics of the different assets, liabilities and hedge instruments.
Interest rate risk management of the Group:
In measuring and managing interest rate risk, the Group refers to the relevant key principles of the Basel Committee on Banking Supervision (BCBS). The main sources of interest rate risk are: re-pricing risk, yield curve risk, basis risk and spread risk. An interest rate risk that is particularly relevant for the Group is spread risk. Spread risk is the volatility in the economic value of, or in the income derived from, the Group’s positions due to movements in the funding or lending spread of the Group.
The Group manages its global structural interest rate position on a basis of a notional reference portfolio. The majority of the financial risk indicators and controls in use at the Group apply to this portfolio. Financial indicators and controls for the rest of the activities outside this portfolio
194
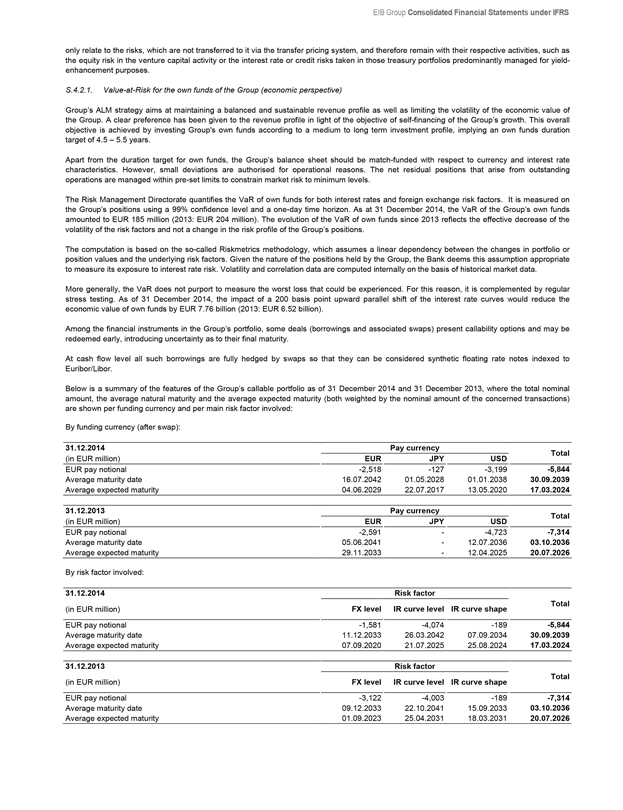
EIB Group Consolidated Financial Statements under IFRS
only relate to the risks, which are not transferred to it via the transfer pricing system, and therefore remain with their respective activities, such as the equity risk in the venture capital activity or the interest rate or credit risks taken in those treasury portfolios predominantly managed for yield-enhancement purposes.
S.4.2.1. Value-at-Risk for the own funds of the Group (economic perspective)
Group’s ALM strategy aims at maintaining a balanced and sustainable revenue profile as well as limiting the volatility of the economic value of the Group. A clear preference has been given to the revenue profile in light of the objective of self-financing of the Group’s growth. This overall objective is achieved by investing Group’s own funds according to a medium to long term investment profile, implying an own funds duration target of 4.5 – 5.5 years.
Apart from the duration target for own funds, the Group’s balance sheet should be match-funded with respect to currency and interest rate characteristics. However, small deviations are authorised for operational reasons. The net residual positions that arise from outstanding operations are managed within pre-set limits to constrain market risk to minimum levels.
The Risk Management Directorate quantifies the VaR of own funds for both interest rates and foreign exchange risk factors. It is measured on the Group’s positions using a 99% confidence level and a one-day time horizon. As at 31 December 2014, the VaR of the Group’s own funds amounted to EUR 185 million (2013: EUR 204 million). The evolution of the VaR of own funds since 2013 reflects the effective decrease of the volatility of the risk factors and not a change in the risk profile of the Group’s positions.
The computation is based on the so-called Riskmetrics methodology, which assumes a linear dependency between the changes in portfolio or position values and the underlying risk factors. Given the nature of the positions held by the Group, the Bank deems this assumption appropriate to measure its exposure to interest rate risk. Volatility and correlation data are computed internally on the basis of historical market data.
More generally, the VaR does not purport to measure the worst loss that could be experienced. For this reason, it is complemented by regular stress testing. As of 31 December 2014, the impact of a 200 basis point upward parallel shift of the interest rate curves would reduce the economic value of own funds by EUR 7.76 billion (2013: EUR 6.52 billion).
Among the financial instruments in the Group’s portfolio, some deals (borrowings and associated swaps) present callability options and may be redeemed early, introducing uncertainty as to their final maturity.
At cash flow level all such borrowings are fully hedged by swaps so that they can be considered synthetic floating rate notes indexed to Euribor/Libor.
Below is a summary of the features of the Group’s callable portfolio as of 31 December 2014 and 31 December 2013, where the total nominal amount, the average natural maturity and the average expected maturity (both weighted by the nominal amount of the concerned transactions) are shown per funding currency and per main risk factor involved:
By funding currency (after swap):
31.12.2014 Pay currency
(in EUR million) EUR JPY USD Total
EUR pay notional -2,518 -127 -3,199 -5,844
Average maturity date 16.07.2042 01.05.2028 01.01.2038 30.09.2039
Average expected maturity 04.06.2029 22.07.2017 13.05.2020 17.03.2024
31.12.2013 Pay currency
(in EUR million) EUR JPY USD Total
EUR pay notional -2,591 - -4,723 -7,314
Average maturity date 05.06.2041 - 12.07.2036 03.10.2036
Average expected maturity 29.11.2033 - 12.04.2025 20.07.2026
By risk factor involved:
31.12.2014 Risk factor
(in EUR million) FX level IR curve level IR curve shape Total
EUR pay notional -1,581 -4,074 -189 -5,844
Average maturity date 11.12.2033 26.03.2042 07.09.2034 30.09.2039
Average expected maturity 07.09.2020 21.07.2025 25.08.2024 17.03.2024
31.12.2013 Risk factor
(in EUR million) FX level IR curve level IR curve shape Total
EUR pay notional -3,122 -4,003 -189 -7,314
Average maturity date 09.12.2033 22.10.2041 15.09.2033 03.10.2036
Average expected maturity 01.09.2023 25.04.2031 18.03.2031 20.07.2026
195
S.4.2.2. Interest rate risk management for the Group (Earnings perspective)
The sensitivity of earnings quantifies the change in the Group’s net interest income over the forthcoming 12 months if all interest rate curves rose by one percentage point or decreased by one percentage point. Such exposure stems from the mismatches that the Group accepts, within approved limits, between interest rate re-pricing periods, volumes and rates of assets and liabilities.
With the positions in place as of 31 December 2014, the earnings would increase by EUR 73.2 million (2013: EUR 152.5 million) if interest rates increased by 100 basis points and decrease by EUR 83.1 million (2013: EUR 129.3 million) if interest rates decreased by 100 basis points.
The Group computes the sensitivity measure with dedicated software that simulates earnings on a deal by deal basis. The sensitivity of earnings is measured on an accrual basis and is calculated under the ‘’ongoing’’ assumption that, over the time horizon analysed, the Group realises the new loan business forecast in the Corporate Operational Plan, maintains exposures within approved limits and executes monetary trades to refinance funding shortages or invest cash excesses. Earnings are simulated on monthly time steps, assuming that all the fixed rate items carry their contractual rate and that all floating rate items are subject to interest rate repricings according to the interest rate scenario applied in the simulation. The monetary trades to refinance funding shortages or invest cash excesses carry rates equal to the money market rates prevailing according to the interest rate scenario applied in the simulation. In line with the current practice of the Group, the model uses the hypothesis that simulated earnings are not distributed to the shareholders, but are used to refinance the Group’s business. The administrative costs are projected according to the forecasts of the Corporate Operational Plan.
The sensitivity of the EIF is computed by taking into consideration the coupon re-pricing of all the positions present in the EIF treasury portfolio managed by the Group on a deal-by-deal basis. Each fixed rate asset is assumed to be reinvested at maturity in a new asset with the same residual life of the previous one as of end of year’s date. Positions in floating rate assets are assumed to have quarterly repricings.
S.4.3. Foreign exchange risk (in EUR million)
The FX risk is the volatility in the economic value of, or in the income derived from, the Group’s positions due to adverse movements of FX rates.
The Group’s is exposed to FX risk whenever there is a currency mismatch between its assets and liabilities. FX risk also comprises the effect of unexpected and unfavourable changes in the value of future cash flows caused by currency movements, such as the impact of FX rate changes on the Group’s future lending intermediation revenue.
The sources of foreign exchange rate risk are to be found in the margins on operations and in general expenses incurred in non-euro currencies. The Group’s objective is to eliminate exchange risk by reducing net positions per currency through operations on the international foreign exchange markets. A foreign exchange hedging programme exists in order to protect the known loan margins in USD and in GBP for the next 3 years on a rolling basis.
S.4.3.1. Foreign exchange position
Net position (in million) 2014 2013
Euro (EUR) -40 7
Pound Sterling (GBP) 4 -11
US Dollar (USD) 18 -1
Other currencies 18 5
Subtotal except Euro 40 -7
S.4.3.2. Foreign exchange risk management
In compliance with its statute, the Bank actively hedges its FX risk exposures.
The main objective of the Bank’s FX risk management policy is to minimise the impact of a variation of FX rates on the income statement by keeping FX positions within the limits approved by the Management Committee.
Related to the quantification of the VaR of own funds for both interest rates and foreign exchange risk factors, refer to Note S.4.2.1.
S.4.4. Equity price risk
Equity price risk is the risk that the fair values of equities decrease as the result of changes in the levels of equity indices and the value of individual equity investments.
As of 31 December 2014, equity price risk was limited to those strategic activities approved by the Board of Directors (venture capital investments made by the Fund on behalf of the Bank and on its own resources; infrastructure funds; equity-like investments as Special Activity; participation in the EBRD). These activities are subject to special forms of monitoring and the resulting exposures are supported by sound capitalisation.
The value of privately held equity positions is not readily available for the purposes of monitoring and control on a continuous basis. For such positions, the best indications available include prices for similar assets and the results of any relevant valuation techniques.
The effect on Own Funds for the Group (as a result of a change in the fair value of equity investments at 31 December 2014 and 31 December 2013) due to a reasonable possible change in equity indices, with all other variables held constant is as follows:
196

EIB Group Consolidated Financial Statements under IFRS
2014 2013
Change in equity price % Effect on Own Funds EUR ’000 Change in equity price % Effect on Own Funds EUR ’000
Venture Capital Operations (1) -10 -212,644 -10 -192,402
EBRD shares -10 -45,880 -10 -42,410
Investment funds -10 -54,766 -10 -54,501
(1)The sensitivity of Venture Capital operations is calculated by the EIF based on the market risk of the positions on the public market.
S.5. Operational risk
The management of operational risk is performed at all levels within the organisation and is a responsibility of all the various departments of the Group. The Risk Management Directorate is responsible for defining the operational risk framework and related policies while the responsibility for implementing the framework as well as day-to-day operational risk management lies with the Group’s operational departments.
The Group employs an assessment methodology that takes into account all available information including loss history, results of risk self-assessment and the business and control environment through a set of Key Risk Indicators (KRIs) organised in an Operational Risk Scorecard. A statistical model and a Value at Risk calculation engine complete the operational risk environment.
Information concerning operational risk events, losses and KRIs, and updates on the activities of the New Products Committee, are regularly forwarded to the Group’s senior management and to the Management Committee.
Note T – Accounting classifications and fair values of assets and liabilities (in EUR million)
The table below sets out the Group’s classification of each class and category of assets and liabilities:
31 December 2014 Note Cash and cash equivalents Trading Designated at fair value through P/L Held to maturity Loans and receivables Available for sale Financial liabilities measured at amortised cost Non financial assets/ liabilities Total carrying amount
Cash in hand, balances with central banks and post office banks B.1 114 0 0 0 0 0 0 0 114
Treasury bills and debt securities portfolios B.2 0 5,832 0 30,453 6,618 2,100 0 0 45,003
Loans and advances to credit institutions and customers C/D 0 0 151,203 0 344,724 0 0 0 495,927
Shares and other variable-yield securities B.3 0 0 0 0 0 4,370 0 0 4,370
Derivative assets held for risk management R 0 62,409 0 0 0 0 0 0 62,409
Property, furniture and equipment E.1 0 0 0 0 0 0 0 263 263
Investment property E.2 0 0 0 0 0 0 0 2 2
Intangible assets E.1 0 0 0 0 0 0 0 9 9
Other assets G/W.1 0 0 0 0 572 0 0 71 643
Prepayments 0 0 0 0 0 0 0 59 59
114 68,241 151,203 30,453 351,914 6,470 0 404 608,799
Amounts owed to credit institutions and customers H 0 0 0 0 0 0 9,584 0 9,584
Debts evidenced by certificates I 0 0 444,279 0 0 0 61,173 0 505,452
Derivative liabilities held for risk management R 0 30,079 0 0 0 0 0 0 30,079
Other liabilities G 0 0 0 0 0 0 0 1,234 1,234
Deferred income F 0 0 0 0 0 0 0 188 188
Provisions J 0 0 0 0 0 0 0 3,750 3,750
0 30,079 444,279 0 0 0 70,757 5,172 550,287
197
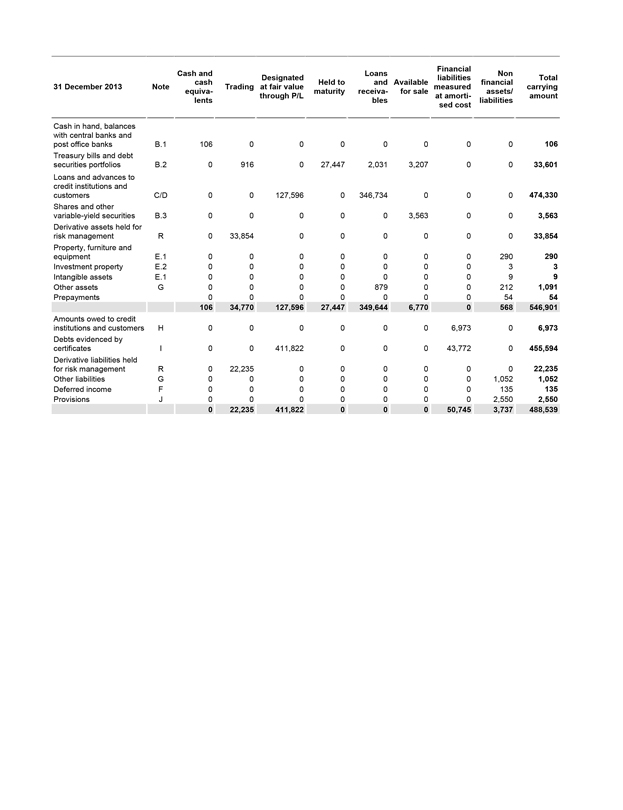
31 December 2013 Note Cash and cash equivalents Trading Designated at fair value through P/L Held to maturity Loans and receivables Available for sale Financial liabilities measured at amortised cost Non financial assets/liabilities Total carrying amount
Cash in hand, balances with central banks and post office banks B.1 106 0 0 0 0 0 0 0 106
Treasury bills and debt securities portfolios B.2 0 916 0 27,447 2,031 3,207 0 0 33,601
Loans and advances to credit institutions and customers C/D 0 0 127,596 0 346,734 0 0 0 474,330
Shares and other variable-yield securities B.3 0 0 0 0 0 3,563 0 0 3,563
Derivative assets held for risk management R 0 33,854 0 0 0 0 0 0 33,854
Property, furniture and equipment E.1 0 0 0 0 0 0 0 290 290
Investment property E.2 0 0 0 0 0 0 0 3 3
Intangible assets E.1 0 0 0 0 0 0 0 9 9
Other assets G 0 0 0 0 879 0 0 212 1,091
Prepayments 0 0 0 0 0 0 0 54 54
106 34,770 127,596 27,447 349,644 6,770 0 568 546,901
Amounts owed to credit institutions and customers H 0 0 0 0 0 0 6,973 0 6,973
Debts evidenced by certificates I 0 0 411,822 0 0 0 43,772 0 455,594
Derivative liabilities held for risk management R 0 22,235 0 0 0 0 0 0 22,235
Other liabilities G 0 0 0 0 0 0 0 1,052 1,052
Deferred income F 0 0 0 0 0 0 0 135 135
Provisions J 0 0 0 0 0 0 0 2,550 2,550
0 22,235 411,822 0 0 0 50,745 3,737 488,539
198
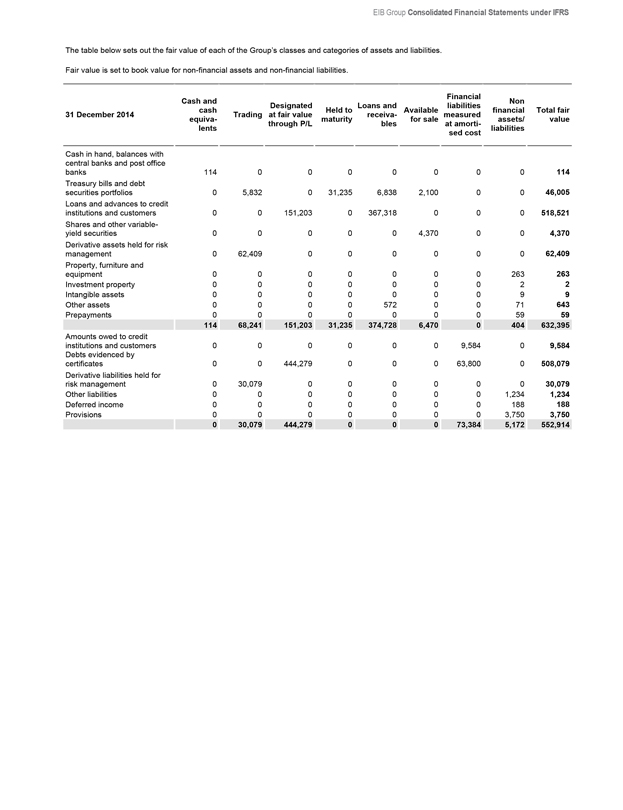
EIB Group Consolidated Financial Statements under IFRS
The table below sets out the fair value of each of the Group’s classes and categories of assets and liabilities.
Fair value is set to book value for non-financial assets and non-financial liabilities.
31 December 2014 Cash and cash equivalents Trading Designated at fair value through P/L Held to maturity Loans and receivables Available for sale Financial liabilities measured at amortised cost Non financial assets/liabilities Total fair value
Cash in hand, balances with central banks and post office banks 114 0 0 0 0 0 0 0 114
Treasury bills and debt securities portfolios 0 5,832 0 31,235 6,838 2,100 0 0 46,005
Loans and advances to credit institutions and customers 0 0 151,203 0 367,318 0 0 0 518,521
Shares and other variable- yield securities 0 0 0 0 0 4,370 0 0 4,370
Derivative assets held for risk management 0 62,409 0 0 0 0 0 0 62,409
Property, furniture and equipment 0 0 0 0 0 0 0 263 263
Investment property 0 0 0 0 0 0 0 2 2
Intangible assets 0 0 0 0 0 0 0 9 9
Other assets 0 0 0 0 572 0 0 71 643
Prepayments 0 0 0 0 0 0 0 59 59
114 68,241 151,203 31,235 374,728 6,470 0 404 632,395
Amounts owed to credit institutions and customers 0 0 0 0 0 0 9,584 0 9,584
Debts evidenced by certificates 0 0 444,279 0 0 0 63,800 0 508,079
Derivative liabilities held for risk management 0 30,079 0 0 0 0 0 0 30,079
Other liabilities 0 0 0 0 0 0 0 1,234 1,234
Deferred income 0 0 0 0 0 0 0 188 188
Provisions 0 0 0 0 0 0 0 3,750 3,750
0 30,079 444,279 0 0 0 73,384 5,172 552,914
199
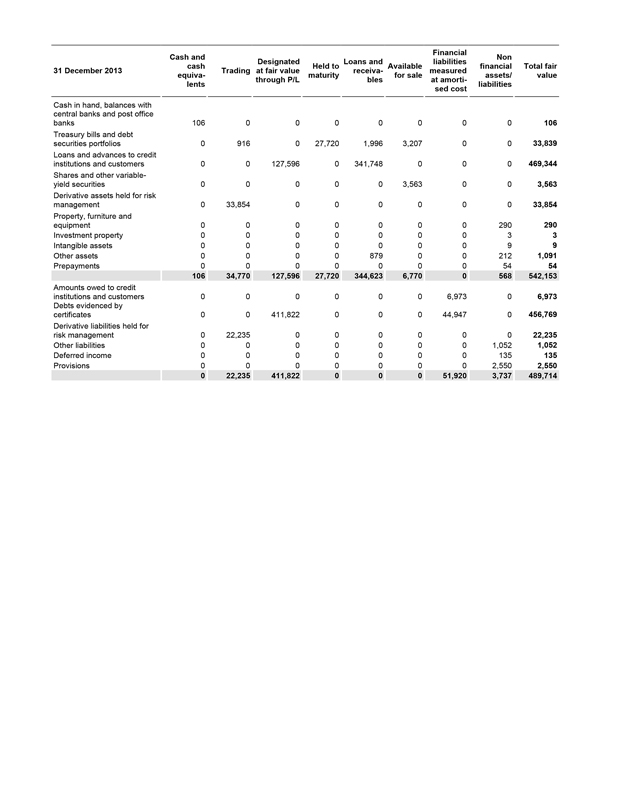
31 December 2013 Cash and cash equivalents Trading Designated at fair value through P/L Held to maturity Loans and receivables Available for sale Financial liabilities measured at amortised cost Non financial assets/liabilities Total fair value
Cash in hand, balances with central banks and post office banks 106 0 0 0 0 0 0 0 106
Treasury bills and debt securities portfolios 0 916 0 27,720 1,996 3,207 0 0 33,839
Loans and advances to credit institutions and customers 0 0 127,596 0 341,748 0 0 0 469,344
Shares and other variable-yield securities 0 0 0 0 0 3,563 0 0 3,563
Derivative assets held for risk management 0 33,854 0 0 0 0 0 0 33,854
Property, furniture and equipment 0 0 0 0 0 0 0 290 290
Investment property 0 0 0 0 0 0 0 3 3
Intangible assets 0 0 0 0 0 0 0 9 9
Other assets 0 0 0 0 879 0 0 212 1,091
Prepayments 0 0 0 0 0 0 0 54 54
106 34,770 127,596 27,720 344,623 6,770 0 568 542,153
Amounts owed to credit institutions and customers 0 0 0 0 0 0 6,973 0 6,973
Debts evidenced by certificates 0 0 411,822 0 0 0 44,947 0 456,769
Derivative liabilities held for risk management 0 22,235 0 0 0 0 0 0 22,235
Other liabilities 0 0 0 0 0 0 0 1,052 1,052
Deferred income 0 0 0 0 0 0 0 135 135
Provisions 0 0 0 0 0 0 0 2,550 2,550
0 22,235 411,822 0 0 0 51,920 3,737 489,714
200
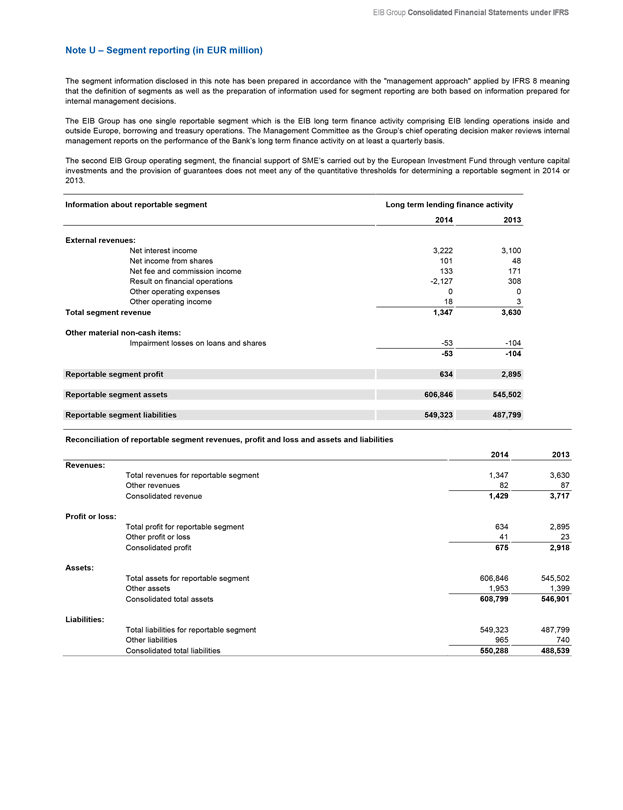
EIB Group Consolidated Financial Statements under IFRS
Note U – Segment reporting (in EUR million)
The segment information disclosed in this note has been prepared in accordance with the “management approach” applied by IFRS 8 meaning that the definition of segments as well as the preparation of information used for segment reporting are both based on information prepared for internal management decisions.
The EIB Group has one single reportable segment which is the EIB long term finance activity comprising EIB lending operations inside and outside Europe, borrowing and treasury operations. The Management Committee as the Group’s chief operating decision maker reviews internal management reports on the performance of the Bank’s long term finance activity on at least a quarterly basis.
The second EIB Group operating segment, the financial support of SME’s carried out by the European Investment Fund through venture capital investments and the provision of guarantees does not meet any of the quantitative thresholds for determining a reportable segment in 2014 or 2013.
Information about reportable segment Long term lending finance activity
2014 2013
External revenues:
Net interest income 3,222 3,100
Net income from shares 101 48
Net fee and commission income 133 171
Result on financial operations -2,127 308
Other operating expenses 0 0
Other operating income 18 3
Total segment revenue 1,347 3,630
Other material non-cash items:
Impairment losses on loans and shares -53 -104
-53 -104
Reportable segment profit 634 2,895
Reportable segment assets 606,846 545,502
Reportable segment liabilities 549,323 487,799
Reconciliation of reportable segment revenues, profit and loss and assets and liabilities
2014 2013
Revenues:
Total revenues for reportable segment 1,347 3,630
Other revenues 82 87
Consolidated revenue 1,429 3,717
Profit or loss:
Total profit for reportable segment 634 2,895
Other profit or loss 41 23
Consolidated profit 675 2,918
Assets:
Total assets for reportable segment 606,846 545,502
Other assets 1,953 1,399
Consolidated total assets 608,799 546,901
Liabilities:
Total liabilities for reportable segment 549,323 487,799
Other liabilities 965 740
Consolidated total liabilities 550,288 488,539
201

Note V – Commitments, contingent liabilities, pledged assets and other memorandum items (in EUR ’000)
The Group utilises various lending-related financial instruments in order to meet the financial needs of its customers. The Group issues commitments to extend credit, standby and other letters of credit, guarantees, commitments to enter into repurchase agreements, note issuance facilities and revolving underwriting facilities. Guarantees represent irrevocable assurances, subject to the satisfaction of certain conditions, that the Group will make payment in the event that the customer fails to fulfil its obligation to third parties.
The contractual amount of these instruments is the maximum amount at risk for the Group if the customer fails to meet its obligations. The risk is similar to the risk involved in extending loan facilities and is monitored with the same risk control processes and specific credit risk policies.
202
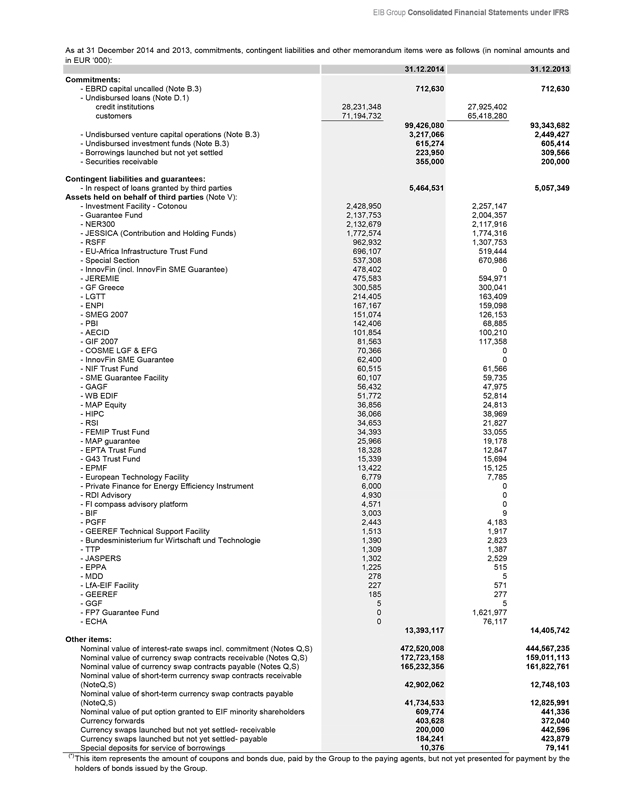
EIB Group Consolidated Financial Statements under IFRS
As at 31 December 2014 and 2013, commitments, contingent liabilities and other memorandum items were as follows (in nominal amounts and in EUR ‘000):
31.12.2014 31.12.2013
Commitments:
- EBRD capital uncalled (Note B.3) 712,630 712,630
- Undisbursed loans (Note D.1)
credit institutions 28,231,348 27,925,402
customers 71,194,732 65,418,280
99,426,080 93,343,682
- Undisbursed venture capital operations (Note B.3) 3,217,066 2,449,427
- Undisbursed investment funds (Note B.3) 615,274 605,414
- Borrowings launched but not yet settled 223,950 309,566
- Securities receivable 355,000 200,000
Contingent liabilities and guarantees:
- In respect of loans granted by third parties 5,464,531 5,057,349
Assets held on behalf of third parties (Note V):
- Investment Facility - Cotonou 2,428,950 2,257,147
- Guarantee Fund 2,137,753 2,004,357
- NER300 2,132,679 2,117,916
- JESSICA (Contribution and Holding Funds) 1,772,574 1,774,316
- RSFF 962,932 1,307,753
- EU-Africa Infrastructure Trust Fund 696,107 519,444
- Special Section 537,308 670,986
- InnovFin (incl. InnovFin SME Guarantee) 478,402 0
- JEREMIE 475,583 594,971
- GF Greece 300,585 300,041
- LGTT 214,405 163,409
- ENPI 167,167 159,098
- SMEG 2007 151,074 126,153
- PBI 142,406 68,885
- AECID 101,854 100,210
- GIF 2007 81,563 117,358
- COSME LGF & EFG 70,366 0
- InnovFin SME Guarantee 62,400 0
- NIF Trust Fund 60,515 61,566
- SME Guarantee Facility 60,107 59,735
- GAGF 56,432 47,975
- WB EDIF 51,772 52,814
- MAP Equity 36,856 24,813
- HIPC 36,066 38,969
- RSI 34,653 21,827
- FEMIP Trust Fund 34,393 33,055
- MAP guarantee 25,966 19,178
- EPTA Trust Fund 18,328 12,847
- G43 Trust Fund 15,339 15,694
- EPMF 13,422 15,125
- European Technology Facility 6,779 7,785
- Private Finance for Energy Efficiency Instrument 6,000 0
- RDI Advisory 4,930 0
- FI compass advisory platform 4,571 0
- BIF 3,003 9
- PGFF 2,443 4,183
- GEEREF Technical Support Facility 1,513 1,917
- Bundesministerium fur Wirtschaft und Technologie 1,390 2,823
- TTP 1,309 1,387
- JASPERS 1,302 2,529
- EPPA 1,225 515
- MDD 278 5
- LfA-EIF Facility 227 571
- GEEREF 185 277
- GGF 5 5
- FP7 Guarantee Fund 0 1,621,977
- ECHA 0 76,117
13,393,117 14,405,742
Other items:
Nominal value of interest-rate swaps incl. commitment (Notes Q,S) 472,520,008 444,567,235
Nominal value of currency swap contracts receivable (Notes Q,S) 172,723,158 159,011,113
Nominal value of currency swap contracts payable (Notes Q,S) 165,232,356 161,822,761
Nominal value of short-term currency swap contracts receivable
(NoteQ,S) 42,902,062 12,748,103
Nominal value of short-term currency swap contracts payable
(NoteQ,S) 41,734,533 12,825,991
Nominal value of put option granted to EIF minority shareholders 609,774 441,336
Currency forwards 403,628 372,040
Currency swaps launched but not yet settled- receivable 200,000 442,596
Currency swaps launched but not yet settled- payable 184,241 423,879
Special deposits for service of borrowings 10,376 79,141
(*) This item represents the amount of coupons and bonds due, paid by the Group to the paying agents, but not yet presented for payment by the holders of bonds issued by the Group.
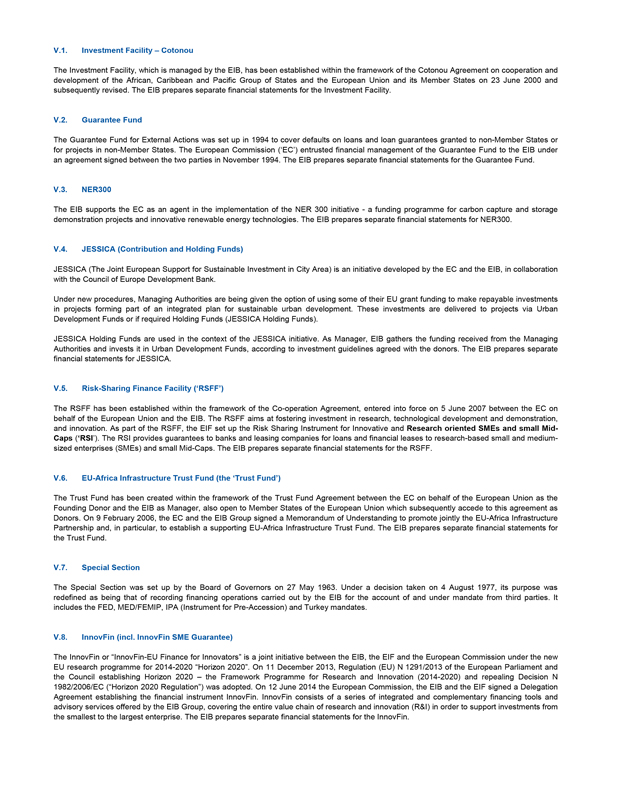
V.1. Investment Facility – Cotonou
The Investment Facility, which is managed by the EIB, has been established within the framework of the Cotonou Agreement on cooperation and development of the African, Caribbean and Pacific Group of States and the European Union and its Member States on 23 June 2000 and subsequently revised. The EIB prepares separate financial statements for the Investment Facility.
V.2. Guarantee Fund
The Guarantee Fund for External Actions was set up in 1994 to cover defaults on loans and loan guarantees granted to non-Member States or for projects in non-Member States. The European Commission (‘EC’) entrusted financial management of the Guarantee Fund to the EIB under an agreement signed between the two parties in November 1994. The EIB prepares separate financial statements for the Guarantee Fund.
V.3. NER300
The EIB supports the EC as an agent in the implementation of the NER 300 initiative - a funding programme for carbon capture and storage demonstration projects and innovative renewable energy technologies. The EIB prepares separate financial statements for NER300.
V.4. JESSICA (Contribution and Holding Funds)
JESSICA (The Joint European Support for Sustainable Investment in City Area) is an initiative developed by the EC and the EIB, in collaboration with the Council of Europe Development Bank.
Under new procedures, Managing Authorities are being given the option of using some of their EU grant funding to make repayable investments in projects forming part of an integrated plan for sustainable urban development. These investments are delivered to projects via Urban Development Funds or if required Holding Funds (JESSICA Holding Funds).
JESSICA Holding Funds are used in the context of the JESSICA initiative. As Manager, EIB gathers the funding received from the Managing Authorities and invests it in Urban Development Funds, according to investment guidelines agreed with the donors. The EIB prepares separate financial statements for JESSICA.
V.5. Risk-Sharing Finance Facility (‘RSFF’)
The RSFF has been established within the framework of the Co-operation Agreement, entered into force on 5 June 2007 between the EC on behalf of the European Union and the EIB. The RSFF aims at fostering investment in research, technological development and demonstration, and innovation. As part of the RSFF, the EIF set up the Risk Sharing Instrument for Innovative and Research oriented SMEs and small Mid-Caps (‘RSI’). The RSI provides guarantees to banks and leasing companies for loans and financial leases to research-based small and medium-sized enterprises (SMEs) and small Mid-Caps. The EIB prepares separate financial statements for the RSFF.
V.6. EU-Africa Infrastructure Trust Fund (the ‘Trust Fund’)
The Trust Fund has been created within the framework of the Trust Fund Agreement between the EC on behalf of the European Union as the Founding Donor and the EIB as Manager, also open to Member States of the European Union which subsequently accede to this agreement as Donors. On 9 February 2006, the EC and the EIB Group signed a Memorandum of Understanding to promote jointly the EU-Africa Infrastructure Partnership and, in particular, to establish a supporting EU-Africa Infrastructure Trust Fund. The EIB prepares separate financial statements for the Trust Fund.
V.7. Special Section
The Special Section was set up by the Board of Governors on 27 May 1963. Under a decision taken on 4 August 1977, its purpose was redefined as being that of recording financing operations carried out by the EIB for the account of and under mandate from third parties. It includes the FED, MED/FEMIP, IPA (Instrument for Pre-Accession) and Turkey mandates.
V.8. InnovFin (incl. InnovFin SME Guarantee)
The InnovFin or “InnovFin-EU Finance for Innovators” is a joint initiative between the EIB, the EIF and the European Commission under the new EU research programme for 2014-2020 “Horizon 2020”. On 11 December 2013, Regulation (EU) N 1291/2013 of the European Parliament and the Council establishing Horizon 2020 – the Framework Programme for Research and Innovation (2014-2020) and repealing Decision N 1982/2006/EC (“Horizon 2020 Regulation”) was adopted. On 12 June 2014 the European Commission, the EIB and the EIF signed a Delegation Agreement establishing the financial instrument InnovFin. InnovFin consists of a series of integrated and complementary financing tools and advisory services offered by the EIB Group, covering the entire value chain of research and innovation (R&I) in order to support investments from the smallest to the largest enterprise. The EIB prepares separate financial statements for the InnovFin.
204
EIB Group Consolidated Financial Statements under IFRS
V.9. JEREMIE
JEREMIE (The Joint European Resources for Micro to Medium Enterprises) is an initiative of the European Commission’s Directorate General for Regional Policy (DG Regio) and the EIB Group.
V.10. GF Greece
The Fund is a joint initiative between the Hellenic Republic, the EC and the EIB and was set up to support the lending to SMEs in Greece. Established by using unabsorbed Structural Funds for Greece, the Fund will guarantee EIB loans to SMEs via partner banks in Greece.
V.11. Loan Guarantee Instrument for Ten-T Projects (’LGTT’)
The LGTT has been established within the framework of the Co-operation Agreement, entered into force on 11 January 2008 between the EC on behalf of the European Union and the EIB. The LGTT aims at facilitating a greater private sector involvement in the financing of Trans-European transport networks infrastructure. The EIB prepares separate financial statements for the LGTT.
V.12. European Neighbourhood and Partnership Instrument (‘ENPI’)
The Framework Agreement between the European Union and the EIB on the implementation of operations financed from the general budget of the European Union in the countries covered by the European Neighbourhood Policy is channelled through the ENPI. The EIB prepares separate financial statements for ENPI.
V.13. SMEG 2007
In the SMEG 2007 under the Competitiveness and Innovation Framework Programme (CIP/SMEG 2007), the EIF is empowered to issue guarantees in its own name but on behalf and at the risk of the Commission.
V. 14. Project Bond Initiative (‘PBI’)
A Cooperation Agreement between the EC and the EIB in respect of the Project Bond Instrument: Pilot Phase was signed in November 2012. The PBI is designed to stimulate capital market financing for infrastructure delivered under ‘project finance’ structures, including Public Private Partnerships (PPPs). The initiative will seek to enhance the credit rating of bonds issued by project companies to a rating level that is attractive for investors and to lower the project’s overall financing costs.
V.15. AECID
This partnership agreement signed between the Kingdom of Spain (the Spanish Agency for International Development Cooperation (AECID) and the EIB was set up to invest in operations in the countries covered by the FEMIP together with Mauritania (the “Southern Mediterranean region”), targeting mainly risk capital activities for micro and small/medium enterprises as well as engaging in the wider development of the private sector in the region.
V.16. GIF 2007
In the GIF 2007 under the Competitiveness and Innovation Framework Programme and the Technology Transfer Pilot Project (CIP/GIF 2007), the EIF is empowered to acquire, manage and dispose of investments, in its own name but on behalf and at the risk of the Commission.
V.17. COSME LGF & EFG
The Programme of COSME EFG provides the establishment of the Equity Facility for Growth and the establishment of the Loan Guarantee Facility. The financial instruments aim to improve access to finance for small and medium-sized enterprises in the form of debt and equity exclusively. In that context, an Equity For Growth has been structured in the form of an equity financial instrument supporting Union enterprises growth and Research Innovation.
The Programme of COSME LGF provides the establishment of the Loan Guarantee Facility. The financial instrument aim to improve access to finance for small and medium-sized enterprises in the form of debt and equity exclusively. The Loan Guarantee Facility has been structured in the form of a direct and indirect guarantee financial instrument. The objective of LGF is to contribute to the reduction of the structural shortcoming of the SME financing market and to support the creation of a more diversified SME finance market. Through direct and indirect guarantee, LGF aims to guarantee debt financing which addresses the particular difficulties that viable SMEs face in accessing finance. Furthermore, by guaranteeing the mezzanine tranche of eligible and transparent securitisation transactions, LGF aims to provide new avenues of financing for SMEs.
205

V.18. InnovFin SME Guarantee
In the context of the “Access to Risk Finance Programme” of Horizon 2020 and specific programme provides for the establishment of a financial instrument for debt and a financial instrument for equity. A Risk-Sharing facility called InnovFin SME Guarantee has been structured in the form of a guarantee, using the EU’s contribution for first defaulted amount taking and the risk-taking capacity of the EIF for second-Defaulted Amount taking. The objective of the Facility is to incentivise Intermediaries to extend loans or financial leases to small and medium sized enterprises and Small Mid-caps with significant activities in Research, Development and Innovation.
V.19. Neighbourhood Investment Facility (‘NIF’) Trust Fund
The NIF Trust Fund managed by the EIB was set up to achieve the strategic objective of the European Neighbourhood Partnership Instrument through targeted funding aimed at strengthening infrastructure interconnection between the EU and its neighbours in the areas of Transport and Energy, at addressing common environmental concerns and at supporting other relevant activities. The EIB prepares separate financial statements for the NIF Trust Fund.
V.20. SME Guarantee Facility
The EIF is empowered to issue guarantees in its own name but on behalf and at the risk of the European Union according to the Fiduciary and Management Agreement concluded with the European Union.
V.21. Greater Anatolia Guarantee Facility (‘GAGF’)
Under the GAGF signed in May 2010, the EIF manages the Instrument for Pre-Accession Assistance (IPA) funds allocated for the Regional Competitiveness Operational Programme by the European Union and Turkey. The facility provides tailor-made financial help to SMEs and micro-enterprises in Turkey’s least developed provinces in partnership with major Turkish banks.
V.22. WB EDIF
The Western Balkan Enterprise Development & Innovation Facility (“WB EDIF”) is a joint initiative signed in December 2012 by the EC (DG ELARG), EIB Group and the European Bank for Reconstruction and Development (EBRD). It aims at improving access to finance for SMEs in the Western Balkans and to foster economic development in the region through the deployment of the Instrument for Pre-Accession Assistance (IPA) funds. Within WB EDIF, EIF acts as platform coordinator, Trustee on behalf of the EC for the Enterprise Expansion Fund (ENEF), Trustee on behalf of the EC for the Enterprise Innovation Fund (ENIF), and manager of the Guarantee Facility.
V.23. MAP Equity
Under the Multi-Annual Programme (MAP) for enterprises and entrepreneurship, the EIF manages resources on behalf and at the risk of the EC.
V.24. Heavily Indebted Poor Countries (‘HIPC’) Initiative
The HIPC Initiative (the ’Initiative’) is an international debt relief mechanism that provides special assistance to the world’s poorest countries. It was launched in 1996 following a proposal from the World Bank and the International Monetary Fund. The principal objective of the Initiative is to reduce the debt burden of poor countries to sustainable levels. The EIB prepares separate financial statements for the Initiative.
V.25. RSI
In the context of the Risk Sharing Finance Facility (RSFF), a joint initiative of the EC (DG Research & Innovation) and the EIB, EIF has been managing the Risk Sharing Instrument (RSI Facility) since December 2011. The aim of the RSI Facility is to create a pilot guarantee scheme for the benefit of innovative and research oriented SMEs and mid-caps.
V.26. FEMIP Trust Fund
The FEMIP (Facility for Euro-Mediterranean Investment and Partnership) Trust Fund, which is also managed by the EIB, was set up to enhance the existing activities of the EIB in the Mediterranean Partner Countries, with the support of a number of donor countries and with a view of directing resources to operations in certain priority sectors through the provision of technical assistance and risk capital. The EIB prepares separate financial statements for the FEMIP Trust Fund.
V.27. MAP Guarantee
This resource is split equally between private equity and guarantee products. The equity segment known as ESU 1998 (G&E) and ESU 2001 (MAP) covers the ETF start-up investments. The guarantees segment known as SMEG 1998 (G&E) and SMEG 2001 (MAP), provides guarantees against the beneficiary’s undertaking.
206

EIB Group Consolidated Financial Statements under IFRS
V.28. EPTA Trust Fund
EPTA (The Eastern Partnership Technical Assistance) Trust Fund is focused on increasing the quality and development impact of EIB Eastern Partnership operations by offering a multi-purpose, multi-sector funding facility for technical assistance. It will be complementary to the Neighbourhood Investment Facility. The EIB prepares separate financial statements for EPTA Trust Fund.
V.29. G43 Trust Fund
Under G43 Anatolian Venture Capital Fund, signed in August 2012, the EIF is entrusted with a mandate by Central Finance Unit of Turkey (CFCU). It is dedicated to make investments in SMEs in South-Eastern Anatolia region of Turkey.
V.30. European Progress Microfinance Facility (‘EPMF’)
The EPMF aims to increase access to finance for individuals who have difficulties entering the labour market and to promote the start-up and growth of micro-enterprises with a particular view to providing jobs for the unemployed or the disadvantaged.
V.31. European Technology Facility (‘ETF’)
Under the ETF Start-Up Facility, the EIF is empowered to acquire, manage and dispose of ETF start-up investments, in its own name but on behalf of and at the risk of the EC.
V.32. Private Finance for Energy Efficiency Instrument
The Private Finance for Energy Efficiency (PF4EE) instrument is a joint agreement between the EIB and the European Commission with aims to address the limited access to adequate and affordable commercial financing for energy efficiency investments. The instrument targets projects which support the implementation of National Energy Efficiency Action Plans or other energy efficiency programmes of EU Member States. In December 2014 the European Commission and the EIB signed a Delegation Agreement establishing the financial Instrument PF4EE.
V.33. RDI Advisory
RDI Advisory was set up in partnership with the European Commission under a 7 year framework agreement signed in June 2014, as part of the InnovFin programme under Horizon 2020. It has two main lines of activity: (i) upstream project related advisory and (ii) horizontal activities destined to improve the overall framework conditions for RDI investments as well as the financing tools under Horizon 2020.
V.34. Fi Compass Advisory Platform
The fi-compass advisory platform provides EU Member States and their managing authorities as well as microcredit providers with advisory support and learning opportunities for developing financial instruments, within the scope of European Structural Investment Funds (ESIF) and the Programme for Employment and Social Innovation (EaSI). It is implemented by the EIB and funded by the EC under a Framework Contract for the period 2014-2020.
V.35. BIF
The Baltic Innovation Fund (“BIF”), signed in September 2012, is a fund-of-funds, structured as a partnership, which invests in venture capital and private equity funds and focused on the Baltic region. It is funded jointly by the EIB Group and the following Baltic national agencies: Fund KredEx in Estonia, Latvijas Garantiju Agentiira in Latvia and lnvesticiju ir verslo garantijosin Lithuania.
V.36. PGFF
The Polish Growth Fund-of-Funds (“PGFF”), signed in April 2013, is a fund-of-funds, structured as a partnership, which invests in venture capital and private equity funds and focused on Poland. It is funded jointly by the EIB Group and the Bank Gospodarstwa Krajowego.
V.37. GEEREF (Fund and Technical Support Facility)
GEEREF (Global Energy Efficiency and Renewable Energy Fund) is a fund of funds set-up at the initiative of the EC. Its objective is to make investments in private equity funds that focus on the fields of renewable energy and energy efficiency in emerging markets (ACP, ALA and European Neighbour countries). The EIF also holds a technical assistance mandate for which related activities are implemented by the GEEREF front office.
V.38. Bundesministerium für Wirtschaft und Technologie
The EIF manages funds on behalf of the German Bundesministerium für Wirtschaft und Technologie (Federal Ministry of Economics and Technology) and the European Recovery Programme.
207

V.39. Technology Transfer Pilot Project (‘TTP’)
Under the TTP, financed by the EC and signed in November 2008, the EIF has supported a technology transfer structure through pre-seed funding and seed funding.
V.40. JASPERS
JASPERS (The Joint Assistance to Support Projects in European Regions) is a major joint policy initiative of the EIB, EC (Regional Policy Directorate-General - DG Regio) and the European Bank for Reconstruction and Development. It provides advice to the 12 Central and Eastern EU Member States and Croatia during project preparation to help improve the quality of the major projects to be submitted for grant financing under the Structural and Cohesion Funds.
V.41. European Parliament Preparatory Action (‘EPPA’)
In 2010, the EIF signed the EPPA with DG REGIO. The EIF is providing risk capital and financial support for capacity building purposes in order to help a select number of microfinance institutions to reach a meaningful size and improve their prospects for sustainability.
V.42. Mezzanine Dachfonds fur Deutschland (‘MDD’)
The MDD in an investment programme signed in June 2013 and funded by the German Federal Ministry of Economics and Technology (BMWi) and various institutions of the Federal states to subscribe into hybrid debt and equity funds investing in German MidCaps.
V.43. LfA-EIF Facility
LfA-EIF Facility, signed in 2009, is a joint EIF and LfA Förderbank Bayern venture providing investments to support technology-oriented early and expansion stage companies in the region of Bavaria, Germany.
V.44. GEEREF
Under the Global Energy Efficiency and Renewable Energy Fund (GEEREF), EIF has been acting since December 2007 as investment advisor. GEEREF is supported by the EC, the Federal Government of Germany and the Kingdom of Norway and its objective is to invest primarily in regional funds with assets in projects and companies involved in energy efficiency and renewable energy enhancing access to clean energy in developing countries and economies in transition. The GEEREF business development is formally delegated to the EIB under a sub-advisory agreement.
V.45. Green for Growth Fund (‘GGF’)
The Green for Growth Fund was set up by the EIF in December 2009 and focuses on energy efficiency financings in South East Europe including Turkey.
V.46. FP7 Guarantee Fund
The 7th Framework Programme (‘FP7’) is designed to support research, technological development and demonstration projects all over Europe. The rules and principles for the management of the FP7 are laid out in the Agreement between the EC on behalf of the European Atomic Energy Community and the EIB. The EC entrusted financial management of the FP7 Guarantee Fund to the EIB under an agreement signed between the two parties in December 2007. The EIB prepared separate financial statements for FP7 Guarantee Fund until 2013 and the FP7 Guarantee Fund was transferred back to the European Commission in 2014.
V.47. ECHA
On 1 April 2011 the EIB entered into an asset management agreement with the European Chemicals Agency (ECHA). Under this agreement the EIB manages the investment portfolio of ECHA in accordance with the pre-agreed Asset Management Guidelines.
208
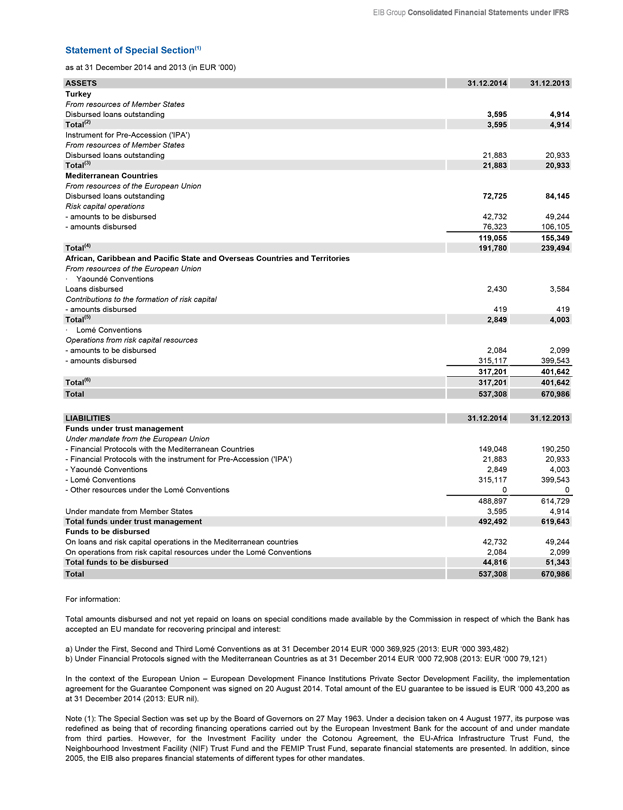
EIB Group Consolidated Financial Statements under IFRS
Statement of Special Section(1)
as at 31 December 2014 and 2013 (in EUR ‘000)
ASSETS 31.12.2014 31.12.2013
Turkey
From resources of Member States
Disbursed loans outstanding 3,595 4,914
Total(2) 3,595 4,914
Instrument for Pre-Accession (‘IPA’)
From resources of Member States
Disbursed loans outstanding 21,883 20,933
Total(3) 21,883 20,933
Mediterranean Countries
From resources of the European Union
Disbursed loans outstanding 72,725 84,145
Risk capital operations
- amounts to be disbursed 42,732 49,244
- amounts disbursed 76,323 106,105
119,055 155,349
Total(4) 191,780 239,494
African, Caribbean and Pacific State and Overseas Countries and Territories
From resources of the European Union
· Yaoundé Conventions
Loans disbursed 2,430 3,584
Contributions to the formation of risk capital
- amounts disbursed 419 419
Total(5) 2,849 4,003
· Lomé Conventions
Operations from risk capital resources
- amounts to be disbursed 2,084 2,099
- amounts disbursed 315,117 399,543
317,201 401,642
Total(6) 317,201 401,642
Total 537,308 670,986
LIABILITIES 31.12.2014 31.12.2013
Funds under trust management
Under mandate from the European Union
- Financial Protocols with the Mediterranean Countries 149,048 190,250
- Financial Protocols with the instrument for Pre-Accession (‘IPA’) 21,883 20,933
- Yaoundé Conventions 2,849 4,003
- Lomé Conventions 315,117 399,543
- Other resources under the Lomé Conventions 0 0
488,897 614,729
Under mandate from Member States 3,595 4,914
Total funds under trust management 492,492 619,643
Funds to be disbursed
On loans and risk capital operations in the Mediterranean countries 42,732 49,244
On operations from risk capital resources under the Lomé Conventions 2,084 2,099
Total funds to be disbursed 44,816 51,343
Total 537,308 670,986
For information:
Total amounts disbursed and not yet repaid on loans on special conditions made available by the Commission in respect of which the Bank has accepted an EU mandate for recovering principal and interest:
a) Under the First, Second and Third Lomé Conventions as at 31 December 2014 EUR ‘000 369,925 (2013: EUR ‘000 393,482)
b) Under Financial Protocols signed with the Mediterranean Countries as at 31 December 2014 EUR ‘000 72,908 (2013: EUR ‘000 79,121)
In the context of the European Union – European Development Finance Institutions Private Sector Development Facility, the implementation agreement for the Guarantee Component was signed on 20 August 2014. Total amount of the EU guarantee to be issued is EUR ‘000 43,200 as at 31 December 2014 (2013: EUR nil).
Note (1): The Special Section was set up by the Board of Governors on 27 May 1963. Under a decision taken on 4 August 1977, its purpose was redefined as being that of recording financing operations carried out by the European Investment Bank for the account of and under mandate from third parties. However, for the Investment Facility under the Cotonou Agreement, the EU-Africa Infrastructure Trust Fund, the Neighbourhood Investment Facility (NIF) Trust Fund and the FEMIP Trust Fund, separate financial statements are presented. In addition, since 2005, the EIB also prepares financial statements of different types for other mandates.
209
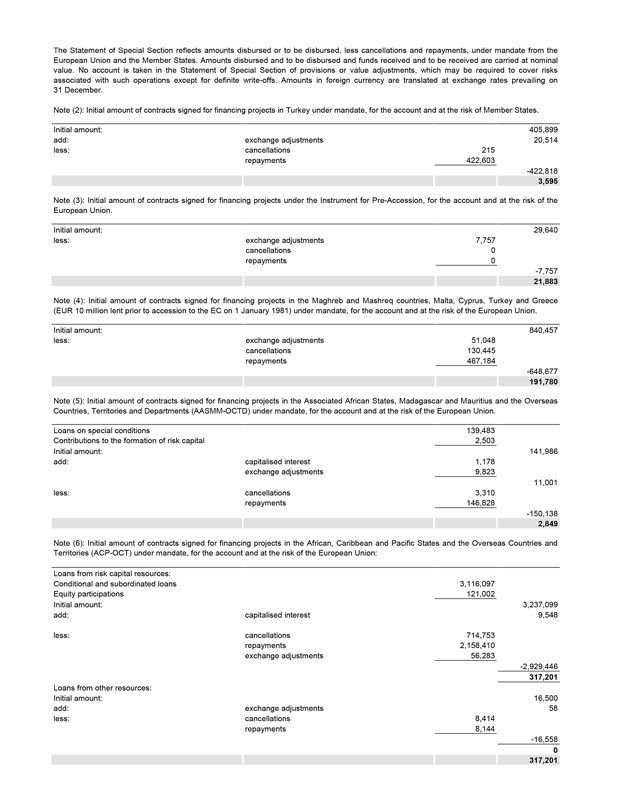
The Statement of Special Section reflects amounts disbursed or to be disbursed, less cancellations and repayments, under mandate from the European Union and the Member States. Amounts disbursed and to be disbursed and funds received and to be received are carried at nominal value. No account is taken in the Statement of Special Section of provisions or value adjustments, which may be required to cover risks associated with such operations except for definite write-offs. Amounts in foreign currency are translated at exchange rates prevailing on 31 December.
Note (2): Initial amount of contracts signed for financing projects in Turkey under mandate, for the account and at the risk of Member States.
Initial amount: 405,899
add: exchange adjustments 20,514
less: cancellations 215
repayments 422,603
-422,818
3,595
Note (3): Initial amount of contracts signed for financing projects under the Instrument for Pre-Accession, for the account and at the risk of the European Union.
Initial amount: 29,640
less: exchange adjustments 7,757
cancellations 0
repayments 0
-7,757
21,883
Note (4): Initial amount of contracts signed for financing projects in the Maghreb and Mashreq countries, Malta, Cyprus, Turkey and Greece (EUR 10 million lent prior to accession to the EC on 1 January 1981) under mandate, for the account and at the risk of the European Union.
Initial amount: 840,457
less: exchange adjustments 51,048
cancellations 130,445
repayments 467,184
-648,677
191,780
Note (5): Initial amount of contracts signed for financing projects in the Associated African States, Madagascar and Mauritius and the Overseas Countries, Territories and Departments (AASMM-OCTD) under mandate, for the account and at the risk of the European Union.
Loans on special conditions 139,483
Contributions to the formation of risk capital 2,503
Initial amount: 141,986
add: capitalised interest 1,178
exchange adjustments 9,823
11,001
less: cancellations 3,310
repayments 146,828
-150,138
2,849
Note (6): Initial amount of contracts signed for financing projects in the African, Caribbean and Pacific States and the Overseas Countries and Territories (ACP-OCT) under mandate, for the account and at the risk of the European Union:
Loans from risk capital resources:
Conditional and subordinated loans 3,116,097
Equity participations 121,002
Initial amount: 3,237,099
add: capitalised interest 9,548
less: cancellations 714,753
repayments 2,158,410
exchange adjustments 56,283
-2,929,446
317,201
Loans from other resources:
Initial amount: 16,500
add: exchange adjustments 58
less: cancellations 8,414
repayments 8,144
-16,558
0
317,201
210
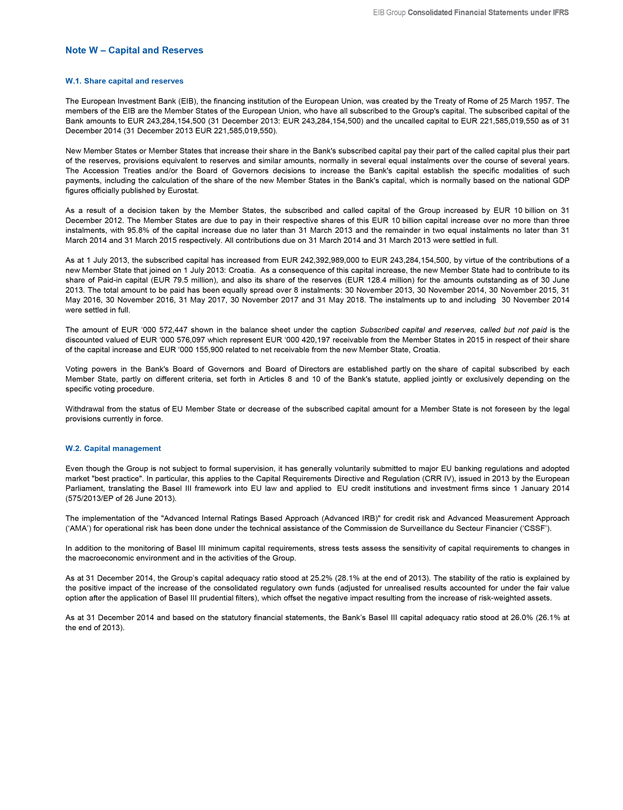
EIB Group Consolidated Financial Statements under IFRS
Note W – Capital and Reserves
W.1. Share capital and reserves
The European Investment Bank (EIB), the financing institution of the European Union, was created by the Treaty of Rome of 25 March 1957. The members of the EIB are the Member States of the European Union, who have all subscribed to the Group’s capital. The subscribed capital of the Bank amounts to EUR 243,284,154,500 (31 December 2013: EUR 243,284,154,500) and the uncalled capital to EUR 221,585,019,550 as of 31 December 2014 (31 December 2013 EUR 221,585,019,550).
New Member States or Member States that increase their share in the Bank’s subscribed capital pay their part of the called capital plus their part of the reserves, provisions equivalent to reserves and similar amounts, normally in several equal instalments over the course of several years. The Accession Treaties and/or the Board of Governors decisions to increase the Bank’s capital establish the specific modalities of such payments, including the calculation of the share of the new Member States in the Bank’s capital, which is normally based on the national GDP figures officially published by Eurostat.
As a result of a decision taken by the Member States, the subscribed and called capital of the Group increased by EUR 10 billion on 31 December 2012. The Member States are due to pay in their respective shares of this EUR 10 billion capital increase over no more than three instalments, with 95.8% of the capital increase due no later than 31 March 2013 and the remainder in two equal instalments no later than 31 March 2014 and 31 March 2015 respectively. All contributions due on 31 March 2014 and 31 March 2013 were settled in full.
As at 1 July 2013, the subscribed capital has increased from EUR 242,392,989,000 to EUR 243,284,154,500, by virtue of the contributions of a new Member State that joined on 1 July 2013: Croatia. As a consequence of this capital increase, the new Member State had to contribute to its share of Paid-in capital (EUR 79.5 million), and also its share of the reserves (EUR 128.4 million) for the amounts outstanding as of 30 June 2013. The total amount to be paid has been equally spread over 8 instalments: 30 November 2013, 30 November 2014, 30 November 2015, 31 May 2016, 30 November 2016, 31 May 2017, 30 November 2017 and 31 May 2018. The instalments up to and including 30 November 2014 were settled in full.
The amount of EUR ‘000 572,447 shown in the balance sheet under the caption Subscribed capital and reserves, called but not paid is the discounted valued of EUR ‘000 576,097 which represent EUR ‘000 420,197 receivable from the Member States in 2015 in respect of their share of the capital increase and EUR ‘000 155,900 related to net receivable from the new Member State, Croatia.
Voting powers in the Bank’s Board of Governors and Board of Directors are established partly on the share of capital subscribed by each Member State, partly on different criteria, set forth in Articles 8 and 10 of the Bank’s statute, applied jointly or exclusively depending on the specific voting procedure.
Withdrawal from the status of EU Member State or decrease of the subscribed capital amount for a Member State is not foreseen by the legal provisions currently in force.
W.2. Capital management
Even though the Group is not subject to formal supervision, it has generally voluntarily submitted to major EU banking regulations and adopted market “best practice”. In particular, this applies to the Capital Requirements Directive and Regulation (CRR IV), issued in 2013 by the European Parliament, translating the Basel III framework into EU law and applied to EU credit institutions and investment firms since 1 January 2014 (575/2013/EP of 26 June 2013).
The implementation of the “Advanced Internal Ratings Based Approach (Advanced IRB)” for credit risk and Advanced Measurement Approach (‘AMA’) for operational risk has been done under the technical assistance of the Commission de Surveillance du Secteur Financier (‘CSSF’).
In addition to the monitoring of Basel III minimum capital requirements, stress tests assess the sensitivity of capital requirements to changes in the macroeconomic environment and in the activities of the Group.
As at 31 December 2014, the Group’s capital adequacy ratio stood at 25.2% (28.1% at the end of 2013). The stability of the ratio is explained by the positive impact of the increase of the consolidated regulatory own funds (adjusted for unrealised results accounted for under the fair value option after the application of Basel III prudential filters), which offset the negative impact resulting from the increase of risk-weighted assets.
As at 31 December 2014 and based on the statutory financial statements, the Bank’s Basel III capital adequacy ratio stood at 26.0% (26.1% at the end of 2013).
211
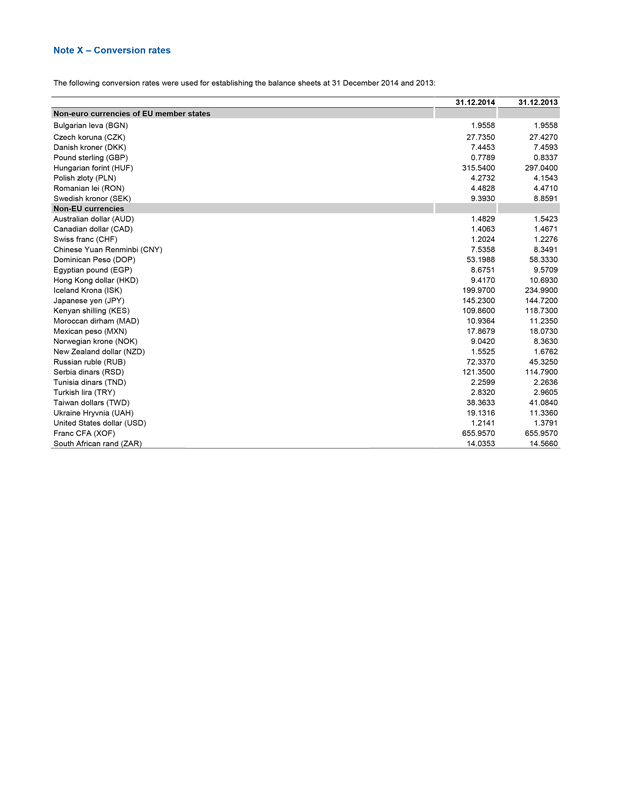
Note X – Conversion rates
The following conversion rates were used for establishing the balance sheets at 31 December 2014 and 2013:
31.12.2014 31.12.2013
Non-euro currencies of EU member states
Bulgarian leva (BGN) 1.9558 1.9558
Czech koruna (CZK) 27.7350 27.4270
Danish kroner (DKK) 7.4453 7.4593
Pound sterling (GBP) 0.7789 0.8337
Hungarian forint (HUF) 315.5400 297.0400
Polish zloty (PLN) 4.2732 4.1543
Romanian lei (RON) 4.4828 4.4710
Swedish kronor (SEK) 9.3930 8.8591
Non-EU currencies
Australian dollar (AUD) 1.4829 1.5423
Canadian dollar (CAD) 1.4063 1.4671
Swiss franc (CHF) 1.2024 1.2276
Chinese Yuan Renminbi (CNY) 7.5358 8.3491
Dominican Peso (DOP) 53.1988 58.3330
Egyptian pound (EGP) 8.6751 9.5709
Hong Kong dollar (HKD) 9.4170 10.6930
Iceland Krona (ISK) 199.9700 234.9900
Japanese yen (JPY) 145.2300 144.7200
Kenyan shilling (KES) 109.8600 118.7300
Moroccan dirham (MAD) 10.9364 11.2350
Mexican peso (MXN) 17.8679 18.0730
Norwegian krone (NOK) 9.0420 8.3630
New Zealand dollar (NZD) 1.5525 1.6762
Russian ruble (RUB) 72.3370 45.3250
Serbia dinars (RSD) 121.3500 114.7900
Tunisia dinars (TND) 2.2599 2.2636
Turkish lira (TRY) 2.8320 2.9605
Taiwan dollars (TWD) 38.3633 41.0840
Ukraine Hryvnia (UAH) 19.1316 11.3360
United States dollar (USD) 1.2141 1.3791
Franc CFA (XOF) 655.9570 655.9570
South African rand (ZAR) 14.0353 14.5660
212
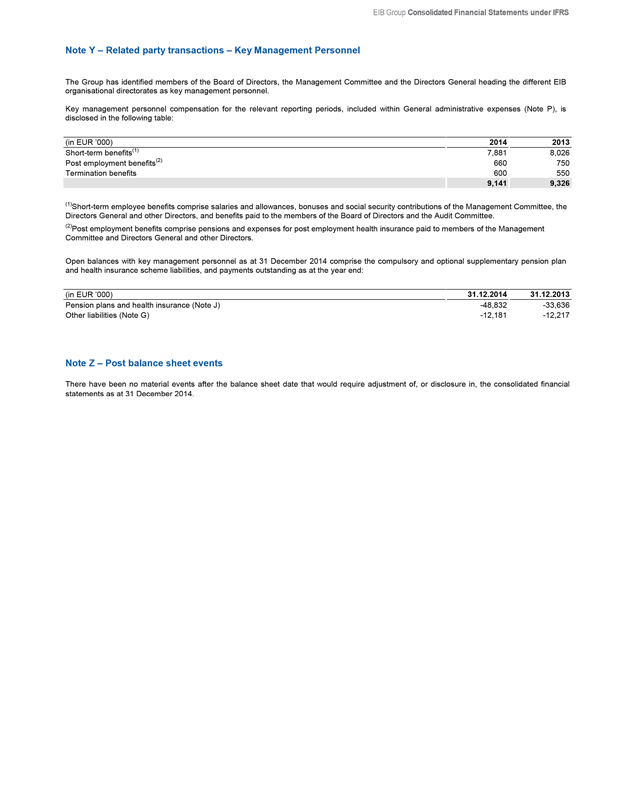
EIB Group Consolidated Financial Statements under IFRS
Note Y – Related party transactions – Key Management Personnel
The Group has identified members of the Board of Directors, the Management Committee and the Directors General heading the different EIB organisational directorates as key management personnel.
Key management personnel compensation for the relevant reporting periods, included within General administrative expenses (Note P), is disclosed in the following table:
(in EUR ’000) 2014 2013
Short-term benefits(1) 7,881 8,026
Post employment benefits(2) 660 750
Termination benefits 600 550
9,141 9,326
(1)Short-term employee benefits comprise salaries and allowances, bonuses and social security contributions of the Management Committee, the Directors General and other Directors, and benefits paid to the members of the Board of Directors and the Audit Committee.
(2)Post employment benefits comprise pensions and expenses for post employment health insurance paid to members of the Management Committee and Directors General and other Directors.
Open balances with key management personnel as at 31 December 2014 comprise the compulsory and optional supplementary pension plan and health insurance scheme liabilities, and payments outstanding as at the year end:
(in EUR ’000) 31.12.2014 31.12.2013
Pension plans and health insurance (Note J) -48,832 -33,636
Other liabilities (Note G) -12,181 -12,217
Note Z – Post balance sheet events
There have been no material events after the balance sheet date that would require adjustment of, or disclosure in, the consolidated financial statements as at 31 December 2014.
213
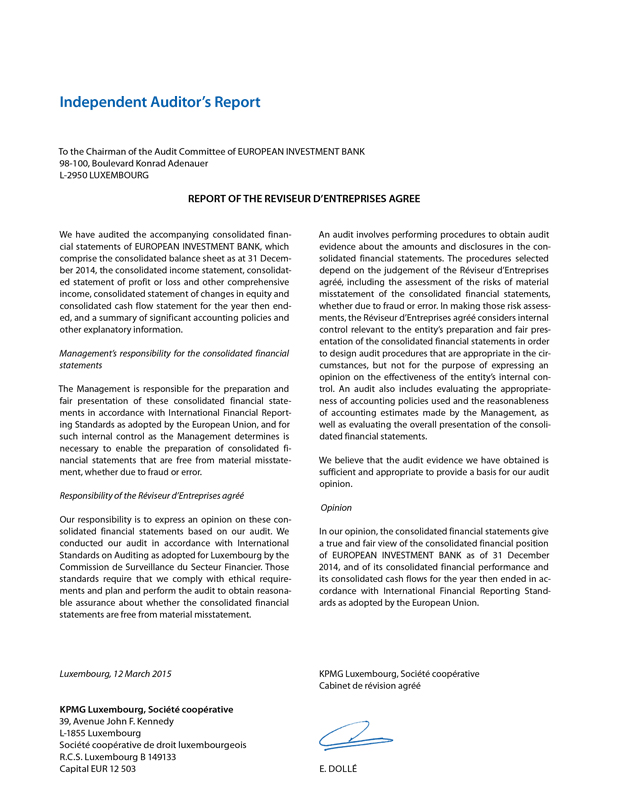
Independent Auditor’s Report
To the Chairman of the Audit Committee of EUROPEAN INVESTMENT BANK
98-100, Boulevard Konrad Adenauer
L-2950 LUXEMBOURG
REPORT OF THE REVISEUR D’ENTREPRISES AGREE
We have audited the accompanying consolidated financial statements of EUROPEAN INVESTMENT BANK, which comprise the consolidated balance sheet as at 31 December 2014, the consolidated income statement, consolidated statement of profit or loss and other comprehensive income, consolidated statement of changes in equity and consolidated cash flow statement for the year then ended, and a summary of significant accounting policies and other explanatory information.
Management’s responsibility for the consolidated financial statements
The Management is responsible for the preparation and fair presentation of these consolidated financial statements in accordance with International Financial Reporting Standards as adopted by the European Union, and for such internal control as the Management determines is necessary to enable the preparation of consolidated financial statements that are free from material misstatement, whether due to fraud or error.
Responsibility of the Réviseur d’Entreprises agréé
Our responsibility is to express an opinion on these consolidated financial statements based on our audit. We conducted our audit in accordance with International Standards on Auditing as adopted for Luxembourg by the Commission de Surveillance du Secteur Financier. Those standards require that we comply with ethical requirements and plan and perform the audit to obtain reasonable assurance about whether the consolidated financial statements are free from material misstatement.
An audit involves performing procedures to obtain audit evidence about the amounts and disclosures in the consolidated financial statements. The procedures selected depend on the judgement of the Réviseur d’Entreprises agréé, including the assessment of the risks of material misstatement of the consolidated financial statements, whether due to fraud or error. In making those risk assessments, the Réviseur d’Entreprises agréé considers internal control relevant to the entity’s preparation and fair presentation of the consolidated financial statements in order to design audit procedures that are appropriate in the circumstances, but not for the purpose of expressing an opinion on the effectiveness of the entity’s internal control. An audit also includes evaluating the appropriateness of accounting policies used and the reasonableness of accounting estimates made by the Management, as well as evaluating the overall presentation of the consolidated financial statements.
We believe that the audit evidence we have obtained is sufficient and appropriate to provide a basis for our audit opinion.
Opinion
In our opinion, the consolidated financial statements give a true and fair view of the consolidated financial position of EUROPEAN INVESTMENT BANK as of 31 December 2014, and of its consolidated financial performance and its consolidated cash flows for the year then ended in accordance with International Financial Reporting Standards as adopted by the European Union.
Luxembourg, 12 March 2015
KPMG Luxembourg, Société coopérative
39, Avenue John F. Kennedy
L-1855 Luxembourg
Société coopérative de droit luxembourgeois
R.C.S. Luxembourg B 149133
Capital EUR 12 503
KPMG Luxembourg, Société coopérative
Cabinet de révision agréé
E. DOLLÉ
214
EIB Group
Consolidated Financial Statements under IFRS
Statement by The Audit Committee
The Audit Committee reports to the Board of Governors, the following statement being communicated to the Governors prior to their approval of the Annual Report and the financial statements for the past financial year.
Statement by the Audit Committee on the EIB’s consolidated financial statements prepared in accordance with the International Financial Reporting Standards as adopted by the EU (IFRS)
The Committee, instituted in pursuance of Article 12 of the Statute and Chapter V of the Rules of Procedure of the European Investment Bank for the purpose of verifying that the operations of the Bank are conducted and its books kept in a proper manner, having
- designated KPMG as external auditors, reviewed their audit planning process, examined and discussed their reports,
- noted that the opinion of KPMG on the consolidated financial statements of the European Investment Bank for the year ended 31 December 2014 is unqualified,
- convened on a regular basis with the Heads of Directorates and relevant services including,
• the Financial Controller,
• the Directors General of Risk Management and Transaction Monitoring and Restructuring,
- met regularly the Head of Internal Audit and discussed the relevant internal audit reports, and studied the documents which it deemed necessary to examine in the discharge of its duties,
- received assurance from the Management Committee concerning the effectiveness of the internal control structure and internal administration,
and considering
- the consolidated financial statements for the financial year ended 31 December 2014 as drawn up by the Board of Directors at its meeting on 12 March 2015,
- that the foregoing provides a reasonable basis for its statement and,
- Articles 24, 25 & 26 of the Rules of Procedure,
to the best of its knowledge and judgement: confirms that the consolidated financial statements, comprising the consolidated balance sheet, the consolidated income statement, the consolidated statement of profit or loss and other comprehensive income, the consolidated statement of changes in equity, the consolidated cash flow statement, and a summary of significant accounting policies and other explanatory information give a true and fair view of the financial position of the Bank as at 31 December 2014 in respect of its assets and liabilities, and of its consolidated financial performance and its consolidated cash flows for the year then ended, in accordance with IFRS.
Luxembourg, 12 March 2015
The Audit Committee
M. MATEJ
J.N. SCHAUS
M. ÜÜRIKE
D. PITTA FERRAZ
B. JAKOBSEN
J. SUTHERLAND
The EIB wishes to thank the following promoters and suppliers for the photographs illustrating this report: © Senvion S.A.
Printed in Luxembourg (LU) by Imprimerie Centrale on MagnoSatin paper using vegetable oil-based inks. Certified in accordance with
Forest Stewardship Council (FSC) rules, the paper consists of 100% virgin fibre (of which at least 50% from well-managed forests).
MIX
Paper from
responsible sources
FSC
www.fsc.org
FSC® C103749
215