 2014 ICR XChange Conference January 13, 2014 1 Exhibit 99.1 Steve Davis, Chairman and Chief Executive Officer Paul DeSantis, Chief Financial Officer Scott Taggart, VP, Investor Relations |
 Safe Harbor Statement 2 Under the Private Securities Litigation Reform Act of 1995 Certain statements in this presentation that are not historical facts are forward-looking statements. Forward-looking statements involve various important assumptions, risks and uncertainties. Actual results may differ materially from those predicted by the forward-looking statements because of various factors and possible events, including, without limitation: Negative publicity or litigation regarding allegations of food-related illness, Failure to achieve and maintain positive same-store sales, Changing business conditions, including energy costs, Overall macroeconomic conditions that may affect consumer spending, either nationwide or in one or more of the Company’s major markets Competition in the restaurant and food products industries, Ability to control restaurant operating costs, which are impacted by market changes in the cost or availability of labor and food, minimum wage and other employment laws, health care costs, fuel and utility costs, Changes in the cost or availability of acceptable new restaurant sites, Adverse weather conditions in locations where we operate our restaurants, Consumer acceptance of changes in menu offerings, price, atmosphere and/or service procedures, Consumer acceptance of our restaurant concepts in new geographic areas, and Changes in hog and other commodity costs. We also bear the risk of incorrectly analyzing these risks or developing strategies to address them that prove to be unsuccessful. Certain risks, uncertainties and assumptions are discussed under the heading “Risk Factors” in Item 1A of our Annual Report on Form 10-K for the fiscal year ended April 26, 2013. We note these factors for investors as contemplated by the Private Securities Litigation Reform Act of 1995. It is impossible to predict or identify all such risk factors. Consequently, you should not consider any such list to be a complete set of all potential risks and uncertainties. Forward-looking statements speak only as of the date on which they are made, and we undertake no obligation to update any forward-looking statement to reflect circumstances or events that occur after the date on which the statement is made to reflect unanticipated events. Any further disclosures in our filings with the Securities and Exchange Commission should also be consulted. All subsequent written and oral forward-looking statements attributable to us or any person acting on behalf of the company are qualified by the cautionary statements in this section. |
 IMPORTANT ADDITIONAL INFORMATION 3 The Company and certain of its directors and executive officers may be deemed to be participants in the solicitation of consent revocations from stockholders in connection with the potential consent solicitation by Sandell Asset Management and its affiliates. The Company may file a preliminary consent revocation statement with the Securities and Exchange Commission (the "SEC") in connection with such potential consent solicitation (the "Consent Revocation Statement"). Information regarding the names of the Company's directors and executive officers and their respective interests in the Company by security holdings or otherwise is set forth in the Company's proxy statement for its 2013 annual meeting of stockholders and its Annual Report on Form 10-K for the fiscal year ended April 26, 2013, which were filed with the SEC on July 12, 2013 and June 21, 2013, respectively. These documents are available free of charge at the SEC's website at www.sec.gov. Detailed information regarding the identity and direct and indirect interests, by security holdings and otherwise, of potential participants will be included in any Consent Revocation Statement and any other relevant documents filed with the SEC in connection with the possible consent solicitation. If the Company files a definitive Consent Revocation Statement with the SEC, the Company promptly will mail the definitive Consent Revocation Statement and a form of consent revocation to each stockholder entitled to deliver a written consent in connection with the possible consent solicitation. WE URGE INVESTORS TO READ ANY CONSENT REVOCATION STATEMENT (INCLUDING ANY SUPPLEMENTS THERETO) AND ANY OTHER RELEVANT DOCUMENTS THAT THE COMPANY MAY FILE WITH THE SEC CAREFULLY AND IN THEIR ENTIRETY WHEN THEY BECOME AVAILABLE BECAUSE THEY WILL CONTAIN IMPORTANT INFORMATION. Stockholders will be able to obtain, free of charge, copies of any Revocation Statement and any other documents filed by the Company with the SEC in connection with the possible consent solicitation at the SEC's website at www.sec.gov. In addition, copies will also be available at no charge at the Investors section of the Company's website at http://investors.bobevans.com/sec.cfm. |
 Non-GAAP Financial Measures 4 The Company uses non-GAAP financial measures within this presentation. These financial measures are used by management to monitor and evaluate the ongoing performance of the Company. The Company believes that the additional measures are useful to investors for financial analysis. However, non-GAAP measures are not in accordance with, nor are they a substitute for, GAAP measures. Reconciliations of non-GAAP financial measures to the most directly comparable GAAP financial measures are provided in the Appendix to this presentation. |
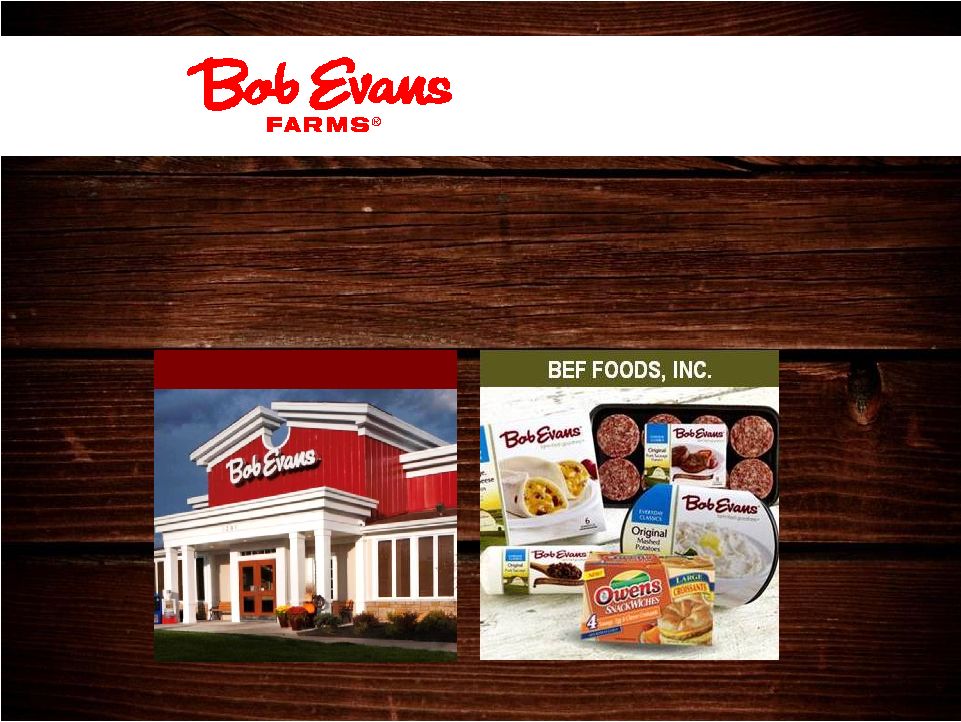
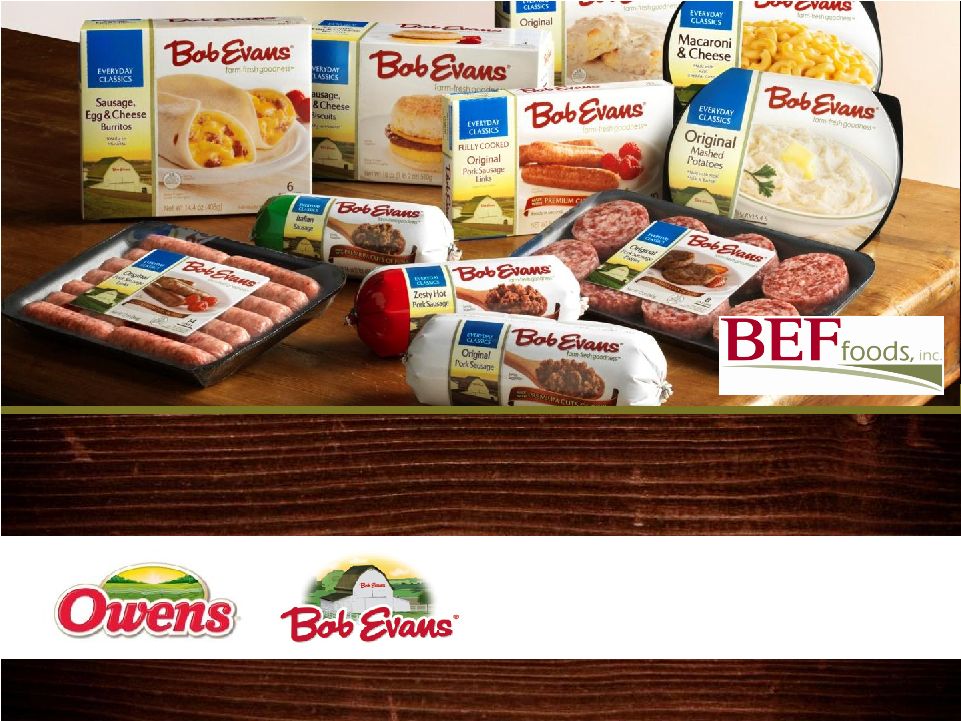
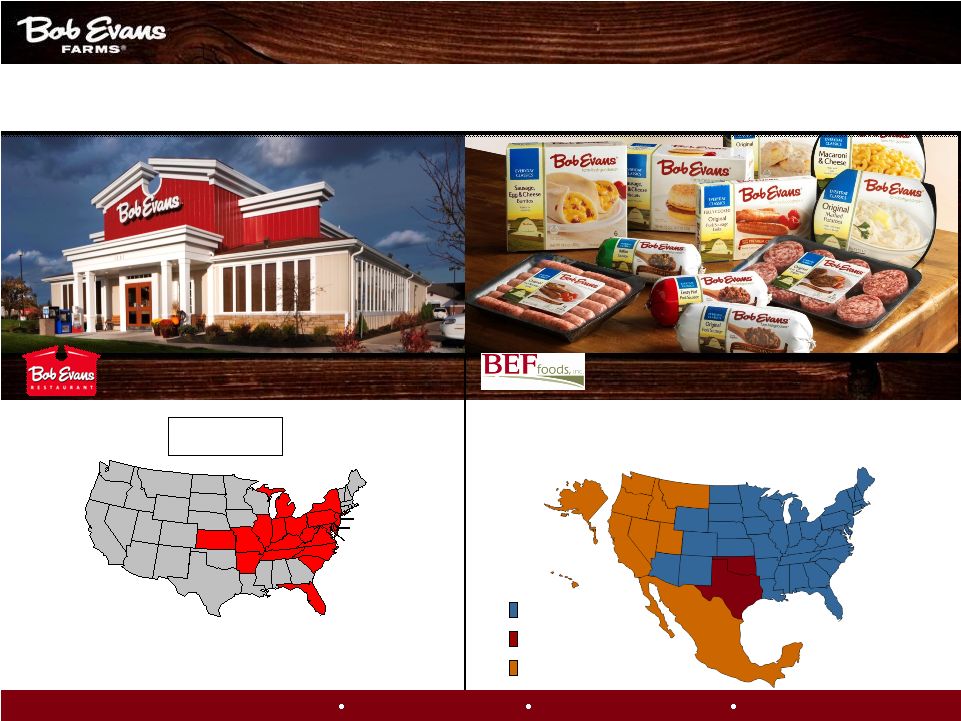 GROWING OUR REGIONAL BRANDS INTO POWERFUL NATIONAL BRANDS COMPANY FACT SHEET FISCAL 2014 Q2 NASDAQ: BOBE NEW RESTAURANTS FY’14 4 FY’15E up to 10 561 Restaurants 19 States As of 10/25/13 191 60 16 21 3 51 31 38 8 3 7 28 23 3 17 7 4 48 REMODELS FY’14 228 AVERAGE UNIT VOLUME $1.74 million (FY’ 13) “Discover farm-fresh goodness” “Come see what’s cooking” 2 Bob Evans Farms, Inc. is comprised of two key business segments: Bob Evans Restaurants and BEF Foods. Bob Evans Restaurants operates 561 full-service restaurants located in 19 states with a heavy concentration in the Midwest. BEF Foods produces and distributes refrigerated side dishes, pork sausage and a variety of refrigerated and frozen convenience food items through retail and food service channels. . FOUR KEY LINES OF BUSINESS Sausage, Refrigerated Sides, Frozen and Food Service Sold at 30,000+ retail locations in 50 states and Mexico Bob Evans/Owens Bob Evans Growth Markets Bob Evans 5 Bob Evans Farms Investor Relations www.bobevans.com 8111 Smith’s Mill Road New Albany, Ohio 43054 |
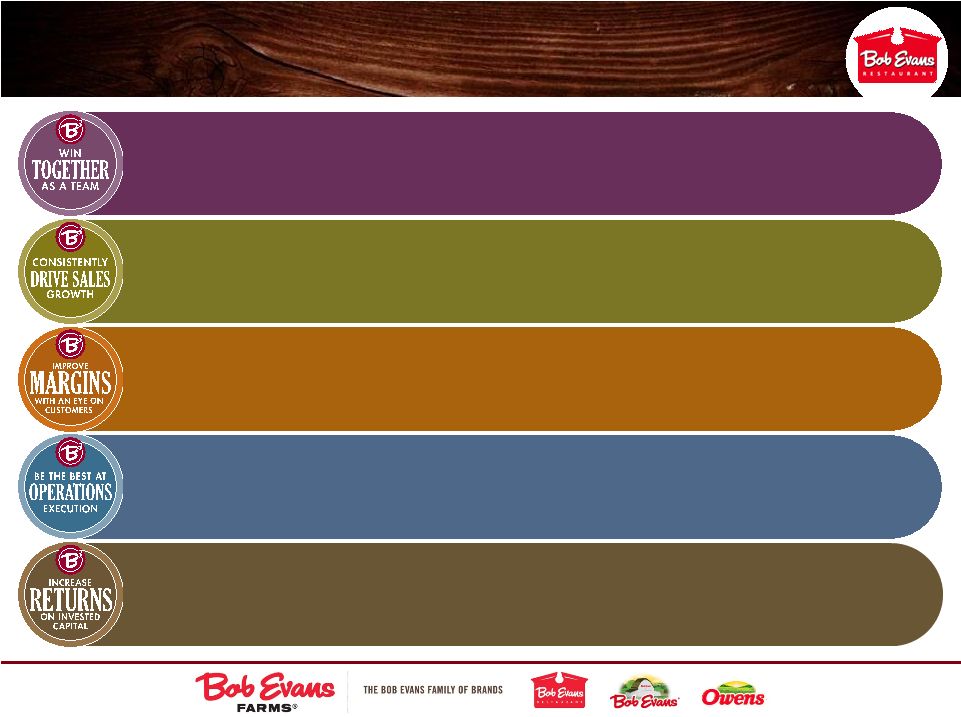
 BOB EVANS RESTAURANTS 6 Powerful NATIONAL BRANDS Make Our REGIONAL BRANDS VISION |
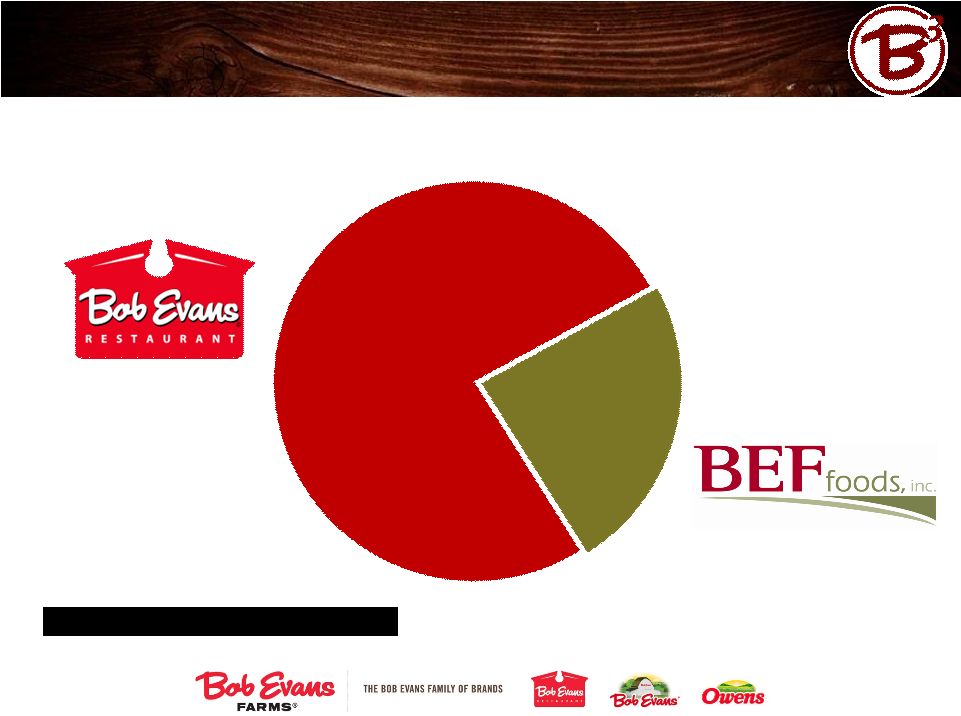 Business Segments (FY 2013) 7 26% * 74% * * Excludes Mimi’s Café segment (sold 2-15-13) |
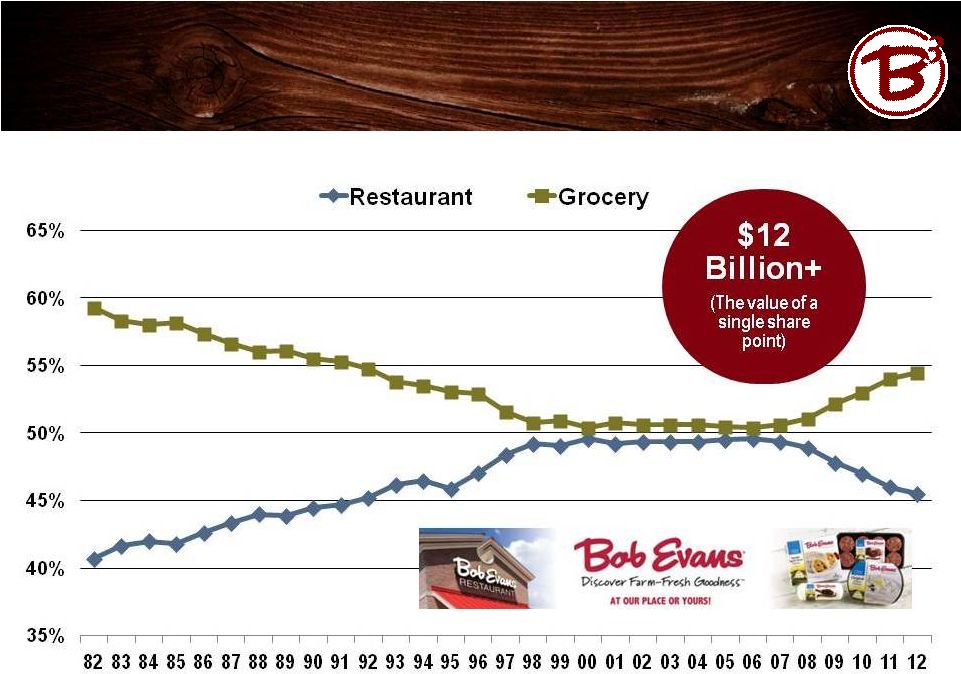 Source: IFMA Forecast & Outlook ‘82-’11 Technomic ‘12 Bob Evans is Well-Positioned to Capture Both Grocery and Restaurant Consumption Percent Dollars Spent Over Time 8 |
 Our Shareholder Value Creation Goal: 8 to 12 Percent Annual Earnings Growth 9 |
 10 BOBE Employs a Strategic and Balanced Approach to Capital Allocation By the end of FY 2014, BOBE expects to return over $800 million to shareholders since FY 2007 through strong dividend and share repurchase performance. INTERNAL FACTORS Potential future investment opportunities Lifecycle stage of firm Projected operating performance Regularity and certainty of income Structure of assets Financial covenants Desire to return capital Period and purpose of financing EXTERNAL FACTORS Macroeconomic environment Economic fluctuations Seasonal variations Nature of industry competition Capital market conditions Bank market conditions Nature/orientation of investors Statutory requirements Taxation policy Maximize flexibility Minimize financial risk Minimize cost of capital Maximize return to shareholders Minimize complexity DRIVE OPTIMAL CAPITAL STRUCTURE |
 A Track Record of Balanced Capital Allocation 11 Dividends $270M $270M $401M $401M $110M $110M Share Repurchases Debt Repayment $163M $163M CapEx Fiscal 2008-2012 Fiscal 2008-2012 Fiscal 2013 Fiscal 2013 Dividends $52M $52M $30M $30M Share Repurchases $124M $124M Acquisition CapEx $63M $63M |
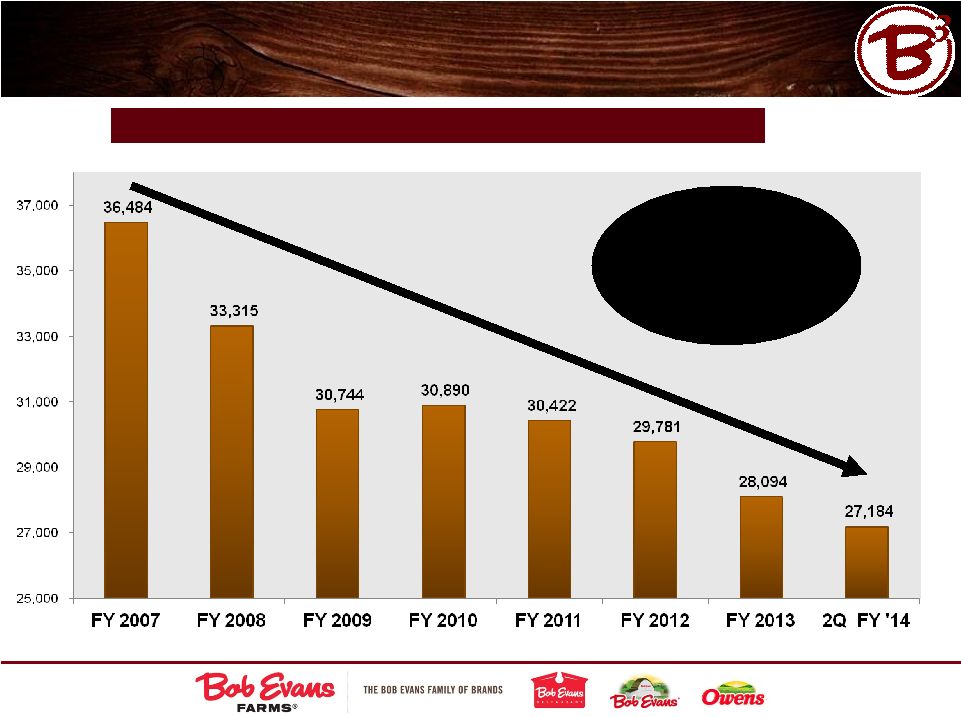 12 Weighted Average Diluted Shares Outstanding (000’s) Ongoing Share Repurchase Programs have Reduced Diluted Shares Outstanding by 25% Since Fiscal 2007 Projected share count reduction of ~33% by FYE’14 |
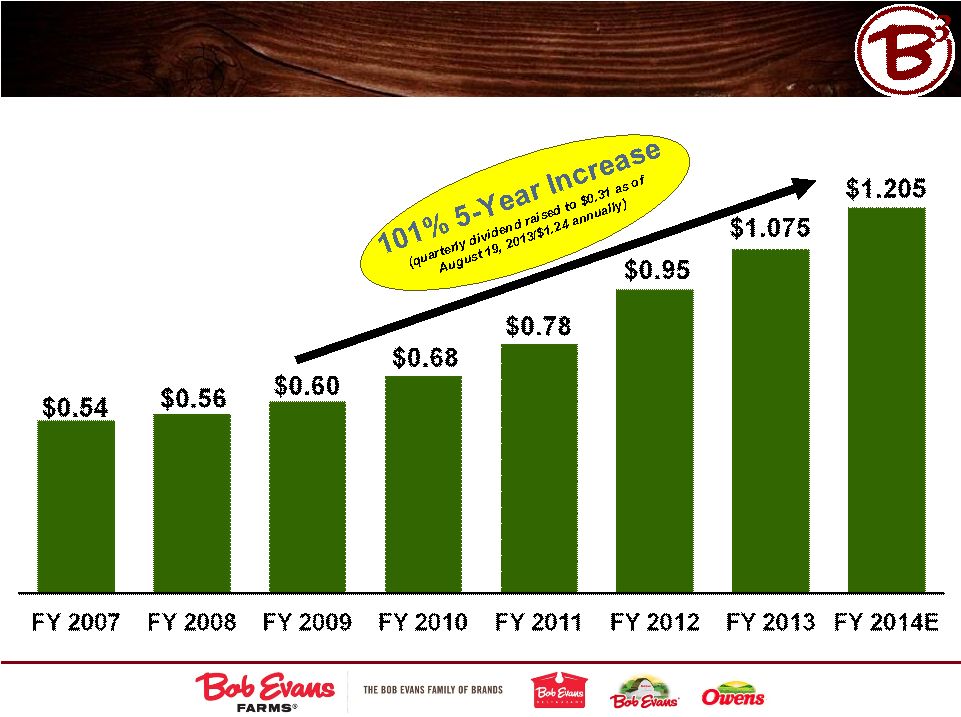 Annual Dividend has Doubled Over the Last Five Years 13 |
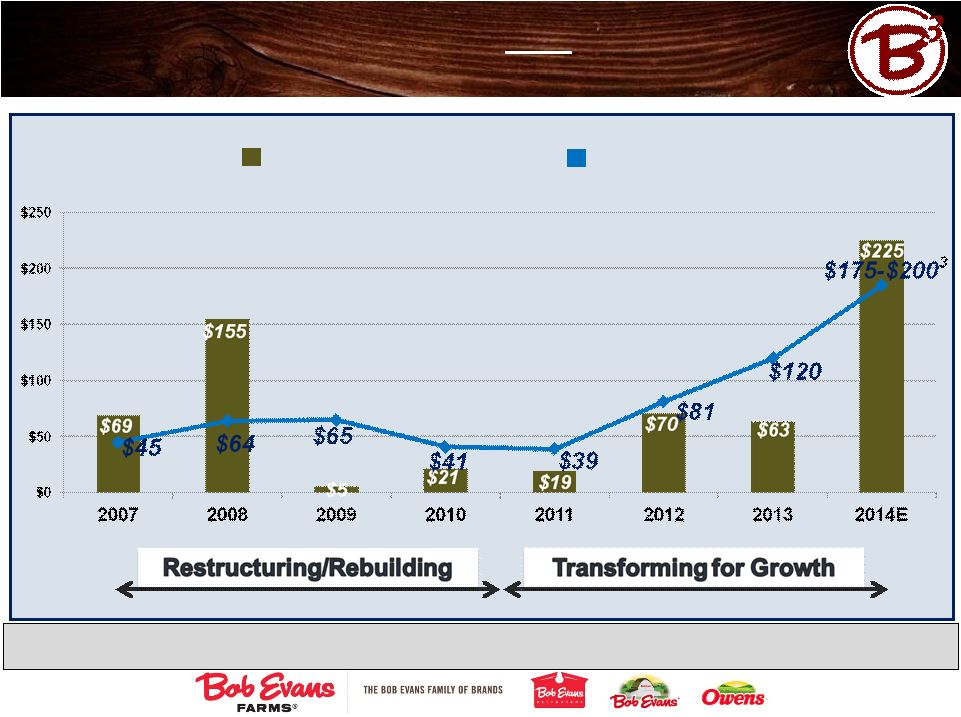 14 ($ millions) Capital Expenditures 2 Transforming our Company and Rewarding Shareholders 1 For additional details concerning FY 2014 guidance, see the Company’s 2Q Fiscal 2014 earnings release dated December 3, 2013. 2 Note: excludes Mimi’s Café. 3 See appendix for details concerning transformational investments. 1 Share Repurchases |
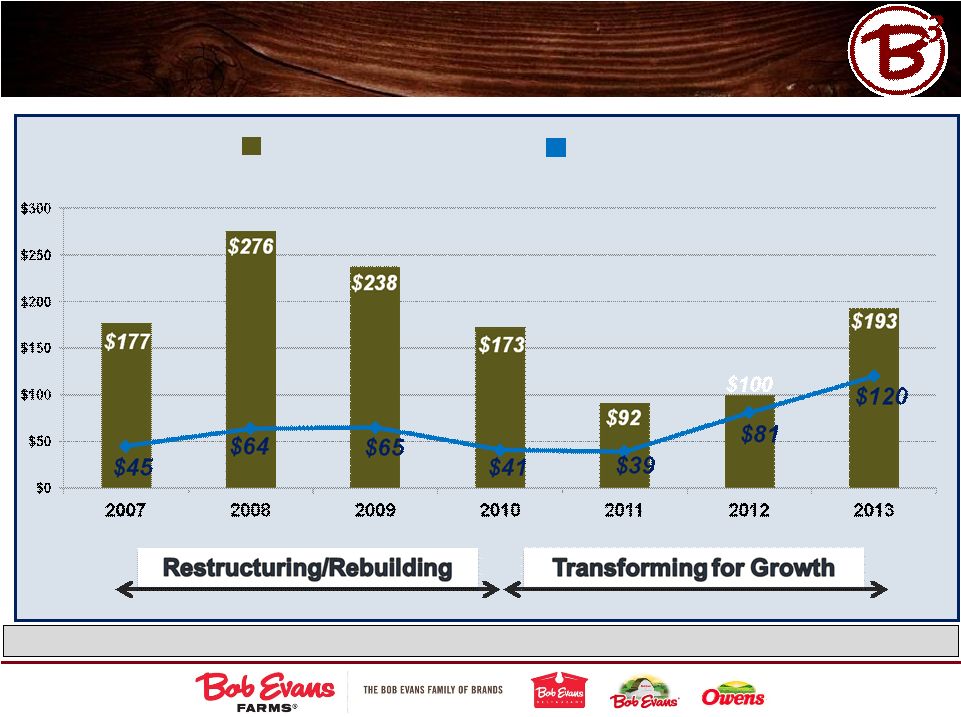 15 ($ millions) Investing Efficiently with Prudent Debt Management Capital Expenditures 1 Note: excludes Mimi’s Café. Net Debt 1 |
 Evolution of our Capital Allocation Strategy 16 After significant capital investment in fiscal 2014 ($175-$200M), we expect to: increase free cash flow for share repurchase and dividend programs reduce annual capital expenditures to maintenance levels plus provision for future growth investments target a 3.0x debt/EBITDAR ratio, with additional leverage capacity for restaurant incubator or bolt-on foods acquisitions |
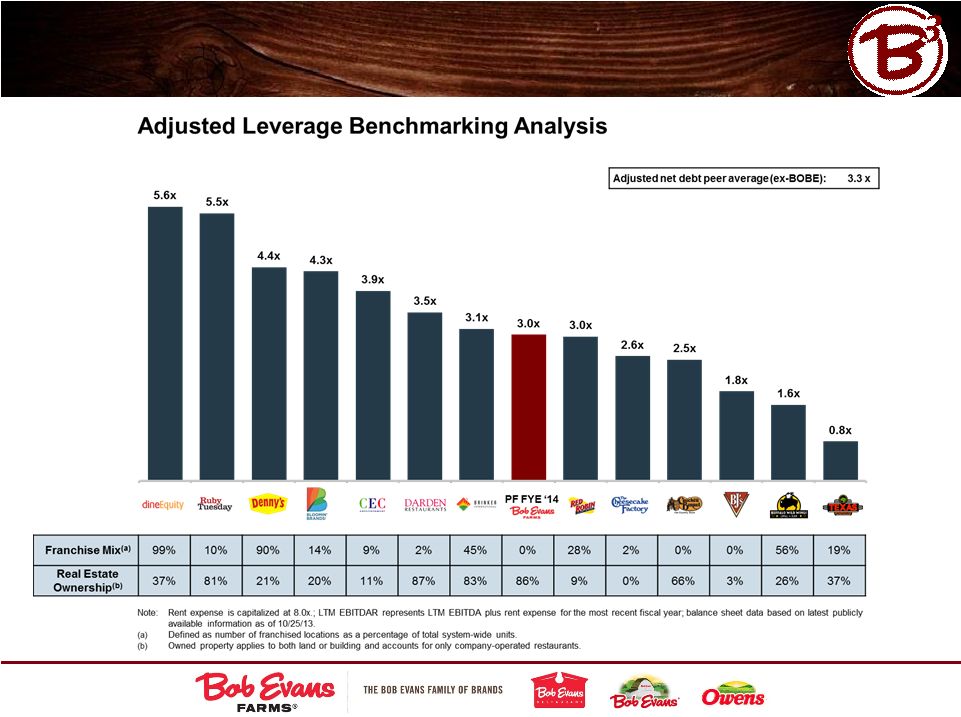 Target Leverage Ratio In-line with Other Restaurant Companies 17 |
 18 Evaluation of Debt Financing Alternatives Revolving Credit Facility Incremental Term Debt Secured Financing Unsecured Bonds Sale Leaseback Minimally Minimally restrictive restrictive Highly Highly restrictive restrictive Low Low cost cost High High cost cost |
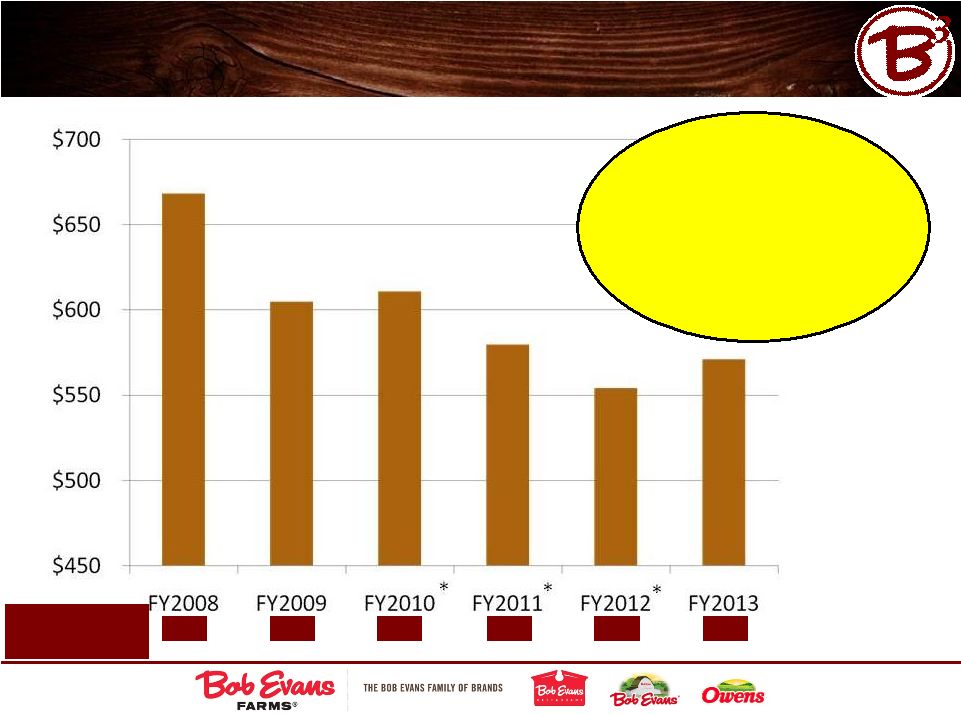
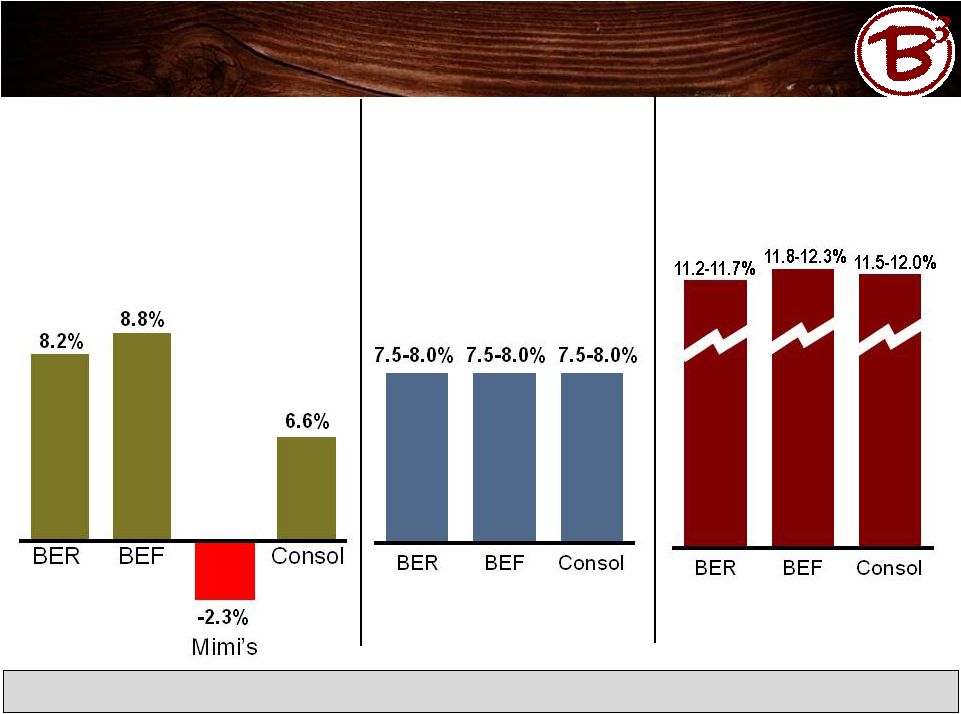
 1 See reconciliation of Adjusted Operating Income (non-GAAP) to Reported Operating Income (GAAP) in the Appendix of this presentation. 2 For additional details concerning FY 2014 guidance, see the Company’s 2Q Fiscal 2014 earnings release dated December 3, 2013. Mimi’s Café Divestiture Improves Adjusted Operating Margin 1 Profile FY 2004 (pre-Mimi’s) FY 2013 FY 2014 Guidance 2 Mimi’s -2.3% 19 |
 Key Components of 8-12% Long-Term Earnings Growth Guidance 20 3.0% to 3.5% up to 10 new restaurants annually beginning FY 2015 workforce management food cost optimization menu management FFR 2.0 side dish vertical integration implement Lean manufacturing w/side dish production transformational systems upgrades $6 to $7 million of S, G & A formerly allocated to Mimi’s Café eliminated by fiscal year 2015 Refinancing/interest reduction ERP implementation 6.0% to 7.0% refrigerated side dish and food service products to drive growth Avg. Annual Net Avg. Annual Net Sales Growth: Sales Growth: Margin Innovation: (300-350 basis point improvement) |
 * 40% sales flow-through assumed Farm Fresh Refresh Financial Impact Improves Free Cash Flow in FY2015 -$2.7 -$5.9 -$6.8 21 Impact to P&L ($ millions) $0.0 ** Includes incremental repair and maintenance expense associated with remodel construction. |
 1 See reconciliation of Adjusted Operating Income (non-GAAP) to Reported Operating Income (GAAP) in the Appendix of this presentation. Strategic Plant Network Optimization Leading to a New Adjusted Operating Margin 1 Trajectory at BEF Foods 22 8.8% 7.5-8.0% 11.8-12.3% 7.5-8.0% +2.5% 10.0-10.5% FY13 FY14E FY15E FY18E 2Q’14: Richardson, Texas, fresh sausage plant closure 3Q’14: Completion of Bidwell and Springfield, Ohio plant consolidations to state-of-the-art Sulphur Springs, Texas plant FY’14: Vertical integration and expansion of Kettle Creations’ Lima, Ohio, plant |
 300-350 Basis Point Margin Improvement Backed by Past Productivity Performance 23 Fiscal Yr. Fiscal Yr. 2013 2009 Consolidated Cost of Sales 30.3% 30.7% Consolidated Op. Wages 31.7% 34.1% Total Prime Costs 62.0% 64.8% Sources of Recent Cost Savings Initiatives Reflect Enterprise-Wide Focus on Productivity supply chain cost of sales labor Categorization of cost savings initiatives reflects company estimates. Improvement 40bps 240bps 280bps |
 Aggressively Managing Labor Costs 24 *BOBE officers went without annual pay increases ($ millions) COST PER FULL TIME EQUIVALENT ($ 000’s) $20.6 $20.2 $19.0 $19.6 $19.6 $19.2 Source: Total Rewards Department, Bob Evans Farms, Inc. $6 to $ 7 million of the $10 million of annual overhead costs formerly allocated to Mimi’s Café to be eliminated by the end of FY 2015. |
 1 See reconciliation of Adjusted Operating Income (non-GAAP) to Reported Operating Income (GAAP) in the Appendix of this presentation. 2 For additional details concerning FY 2014 guidance, see the Company’s 2Q Fiscal 2014 earnings release dated December 3, 2013. FY 2018E FY 2013 25 FY 2014 Guidance 2 Transformations Drive Estimated Five-Year 300-350 Adjusted Operating Margin 1 Basis Point Improvement |
 26 “Come see what’s cooking ” 561 restaurants in 19 states as of 10/25/13 Full-service family restaurants featuring a wide variety of menu items for both on-and-off premise dining TM |
 Net Sales (FY 2013) $981 million (74% of total * ) Average Annual Unit Sales (FY 2013) $1.74 million Overview: Bob Evans Restaurants ALL THREE DAY PARTS SERVED (2Q FY 2014) Breakfast Lunch Dinner 27 33% 37% 30% Avg. Dine-In Guest Check/Per Guest (2Q FY 2014) $17.98/$9.18 Average Carryout Check (2Q FY 2014) $14.54 * Excludes Mimi’s Café segment (sold 2-15-13) |
 28 Build bench strength and staffing to enable profitable expansion Drive profitable guest counts – dine-in and off-premise (bakery, carryout, and catering) Improve controllable expenses: Cost of Sales, Cost of Labor, Direct Operating Expenses Elevate the guest experience through execution of “Best for My Guest” programs Complete Farm Fresh Refresh remodels and prepare for accelerated new restaurant growth FY 2014: ‘Vital Few’ Priorities |
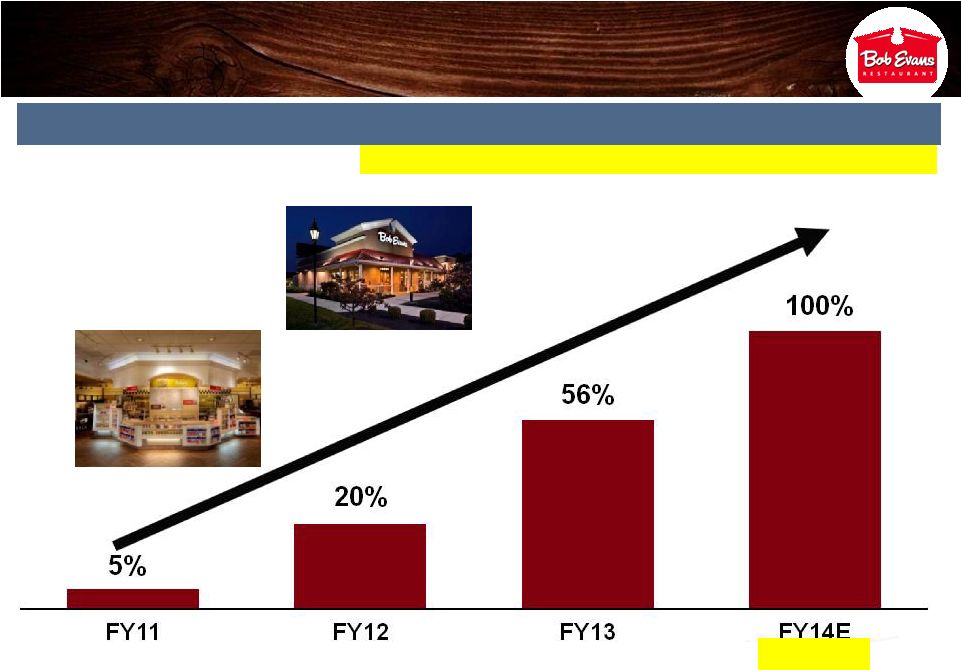 Accelerated Farm Fresh Refresh Program Complete by FY2014 29 Approximate % of Chain Remodeled by Fiscal Year (32 units) (87 units) (195 units) (228 units) Average capital investment per remodeled restaurant: ~$225k |
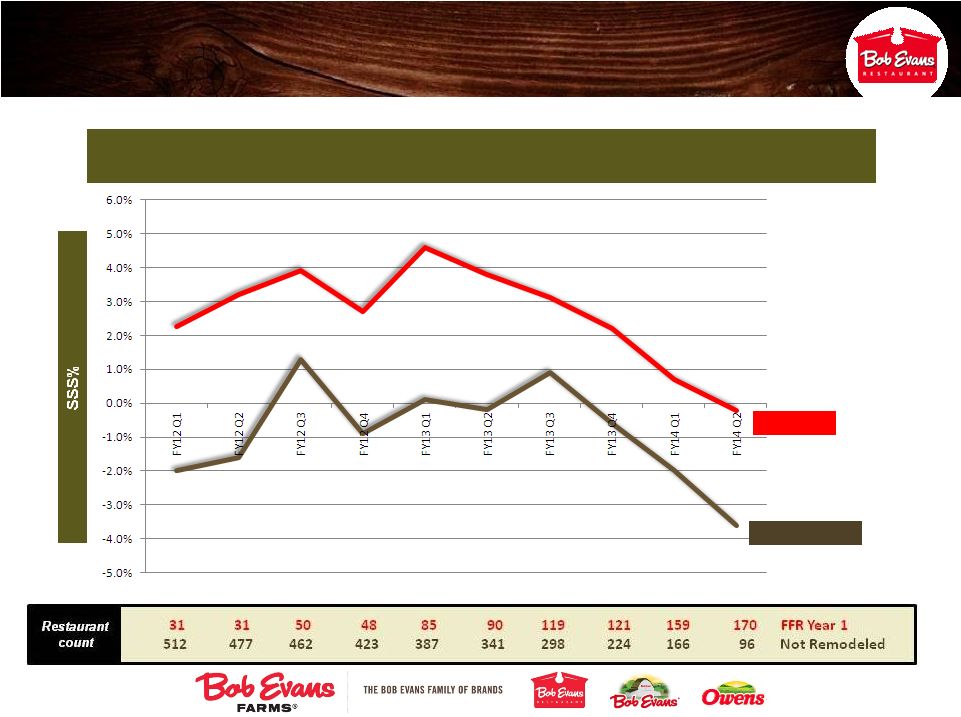 Farm Fresh Refresh: Consistent Outperformance 30 Farm Fresh Refresh Outperformance vs. Non-remodeled Farm Fresh Refresh Outperformance vs. Non-remodeled Restaurants Restaurants FFR Year 1 FFR Year 1 Not Remodeled Not Remodeled |
 Bakery Bakery Farm Fresh Refresh: Enabling an Aggressive Off-Premise Strategy 31 Dine-in Carryout Catering Retail Total 2013 87.7% 11.1% 0.5% 0.7% 100.0% 1.4% (embedded in dine- in and carryout sales mix above) 2018E ~75% 100.0% ~ 7% 25% 25% 2009 90.1% 7.9% 0.0% 2.0% 100.0% 0.6% Total off-premise sales to reach 25% of sales mix by fiscal 2018. |
 Bob Evans’ Off-Premise Opportunity 32 Annual Consumption of Restaurant Meals (per capita) Dine-In 39% Off-Premise 61% QSR 74% Source: NPD Group - 12 months ending 3/31/13 |
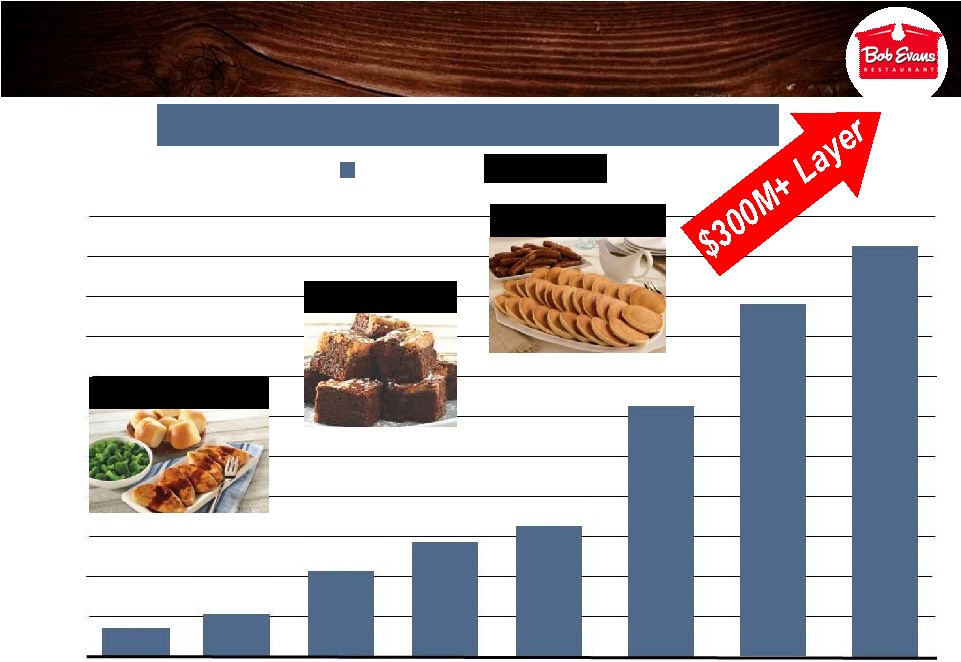 Bold Goal: Drive Off-Premise to 25% of Sales Mix Off-Premise Sales Mix and Growth % by Year Off-Premise Sales Mix and Growth % by Year Sales Mix Growth % +7.9% +7.9% +12.9% +12.9% +15.4% +15.4% +8.6% +8.6% +5.3% +5.3% +8.5% +8.5% +3.9% +3.9% +0.6% +0.6% 8.0% 7.5% 6.5% 7.0% 8.5% 9.0% 9.5% 12.0% 11.5% 11.0% 10.5% 10.0% 2006 2007 2008 2009 2010 2011 2012 2013 Catering/Carryout Bakery Family Meals to Go 33 |
 New Restaurant Opening Strategy 34 NEW CONTIGUOUS MARKETS FILL-IN EXISTING MARKETS Up to 4 new restaurants planned for FY 2014. Up to 4 new restaurants planned for FY 2014. Up to 10 new restaurants annually beginning FY 2015. Up to 10 new restaurants annually beginning FY 2015. Fort Smith, AR New Albany, IN |
 New Restaurant Prototype: Finneytown, Ohio 35 Objectives: • Accentuate Farm heritage • Leverage Farm Fresh Refresh program insights • Test new “back-of-the- house” technologies and layouts Reduced building cost by approximately 13% through efficient design in Finneytown, OH and Altoona, PA Opened September 30, 2013 |
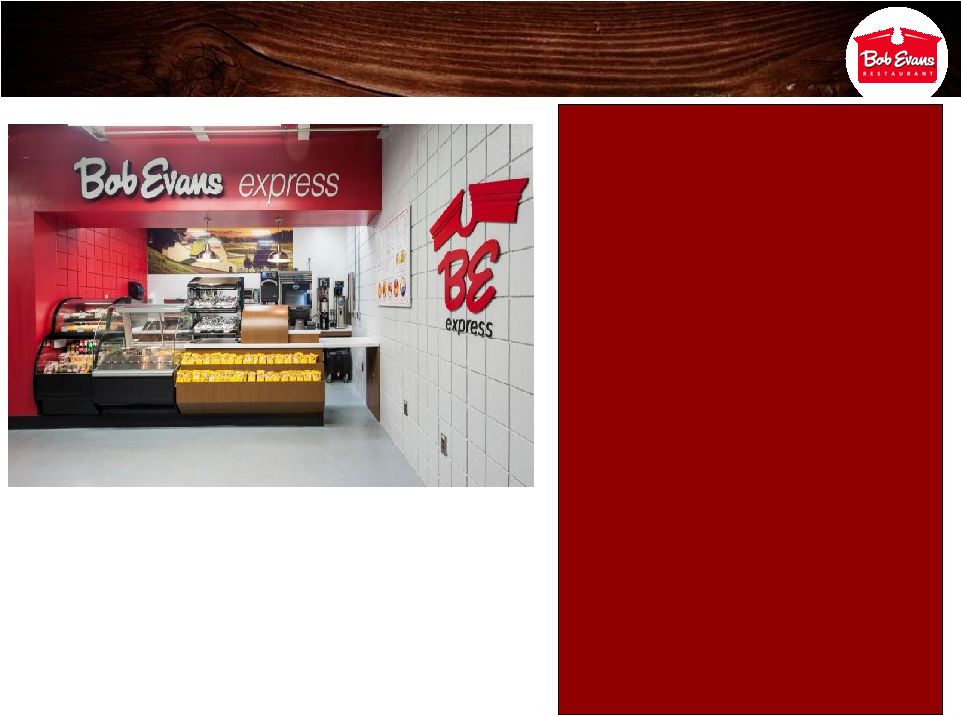 Bob Evans Express Licensing Opportunity • Partnering with AVI Food Systems, Inc. • Increases brand awareness in existing and new geographies and new venues • Popular favorites covering all day parts • High quality menu to ensure serving guests in a quick manner • Targeting approximately 20 new locations by the end of FY 2015 • Potential to independently develop locations 36 • • First location, BMW USA manufacturing plant First location, BMW USA manufacturing plant in Spartanburg, SC, opened August 2013 in Spartanburg, SC, opened August 2013 • • Second location, Bob Evans Farms, Inc. Second location, Bob Evans Farms, Inc. corporate headquarters, opened October 2013 corporate headquarters, opened October 2013 |
 37 “Discover farm-fresh goodness ” TWO BRANDS distinct geographic strengths TM |
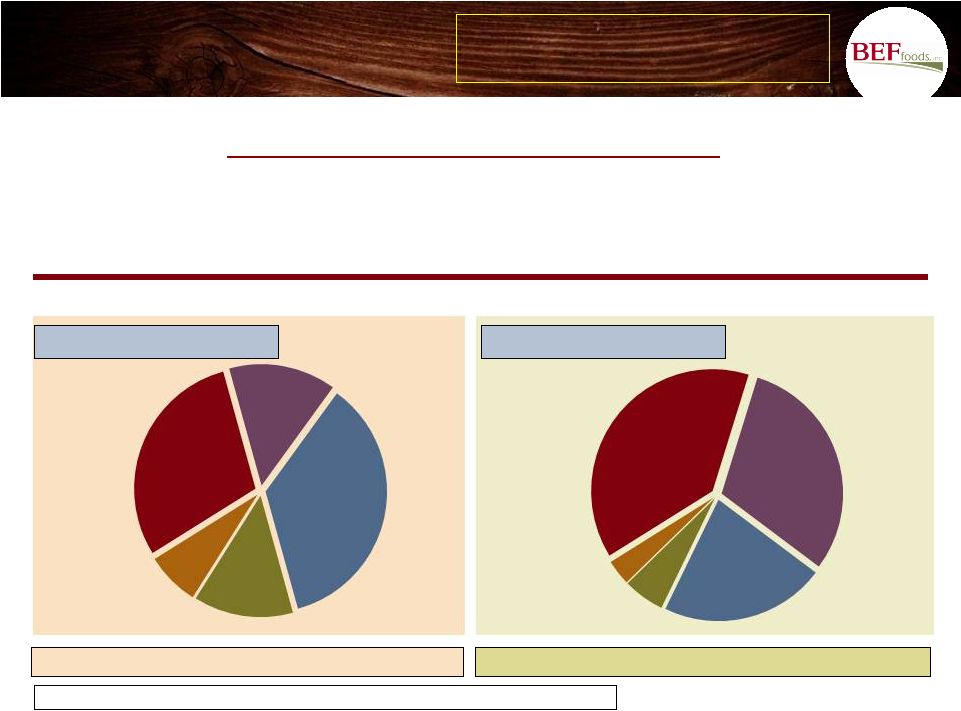 Overview: BEF Foods 38 FOUR KEY LINES OF BUSINESS Sausage, Refrigerated Side Dishes, Frozen and Food Service Sold at 30,000+ retail locations in 50 states and Mexico Side Dishes Other 3% Frozen 5% Food Service (5% insourced*) Retail Sausage 29% 24% 39% FY 2013 Sales Mix (pounds) sausage mix (% of total sales): 43% sausage mix (% of total sales): 30% Net Net Sales Sales (FY’13) (FY’13) $349 $349 million million 26% of total (excluding Mimi’s Café Segment) *Note: Insourced sales data reflects sales to Bob Evans Restaurants only (Mimi’s Café excluded). Side Dishes Other Frozen Retail Sausage 14% 36% 29% FY 2009 Sales Mix (pounds) 14% 7% Food Service (1% insourced*) |
 FY 2014: Vital Few Priorities 39 Expand “in-source” supplier relationships for the restaurant segments and the food service industry Drive sales through new authorizations and geographic expansion Drive margin expansion through Lean efficiencies Optimize our plant and distribution network Drive best-in-class ROIC |
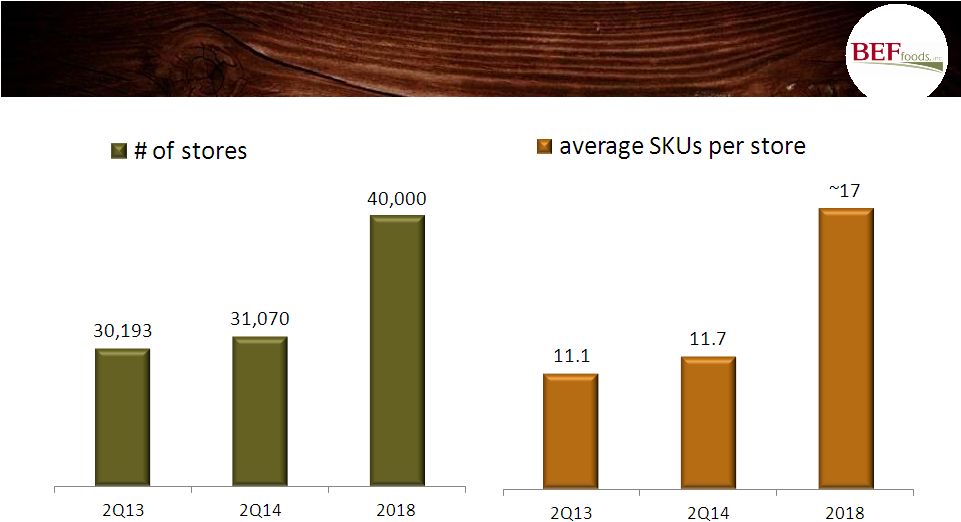 Source: IRI BEF Foods: Store/SKU Count 40 |
 CORE MARKETS NON CORE MARKETS SKUs/Store ACV SKUs/Store ACV BEF Foods: SKU Count and ACV Distribution Core vs. Non-Core 41 SOURCE: IRI, FY14 Q2 - 13 weeks ending 10/20/13 Core Market: Chicago, Cincinnati, Cleveland, Columbus, Toledo, Detroit, Grand Rapids, Indianapolis, Peoria/Springfield, Pittsburgh, Philadelphia, Baltimore/Washington, Buffalo/Rochester Opportunity in Non-Core Markets |
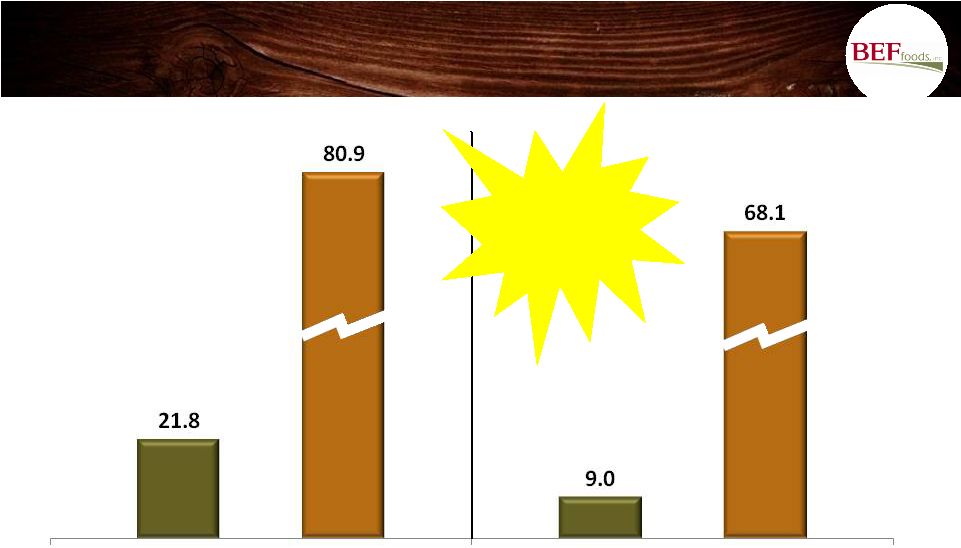
 1 See reconciliation of Adjusted Operating Income (non-GAAP) to Reported Operating Income (GAAP) in the Appendix of this presentation. BEF Foods’ Transformations Offset $20-$25 Million Estimated Impact in Fiscal 2014 42 Adjusted Operating Income ($ millions) Launched lean mfg. program Transitioned from DSD to warehouse Expanded side dish products (Kettle Creations acquisition) Optimized sausage plant network Avg Sow Cost Est. Sow cost impact vs 2009 ($ millions) NOTE: daily sow cost information available at: http://www.ams.usda.gov/mnreports/lm_hg230.txt 1 |
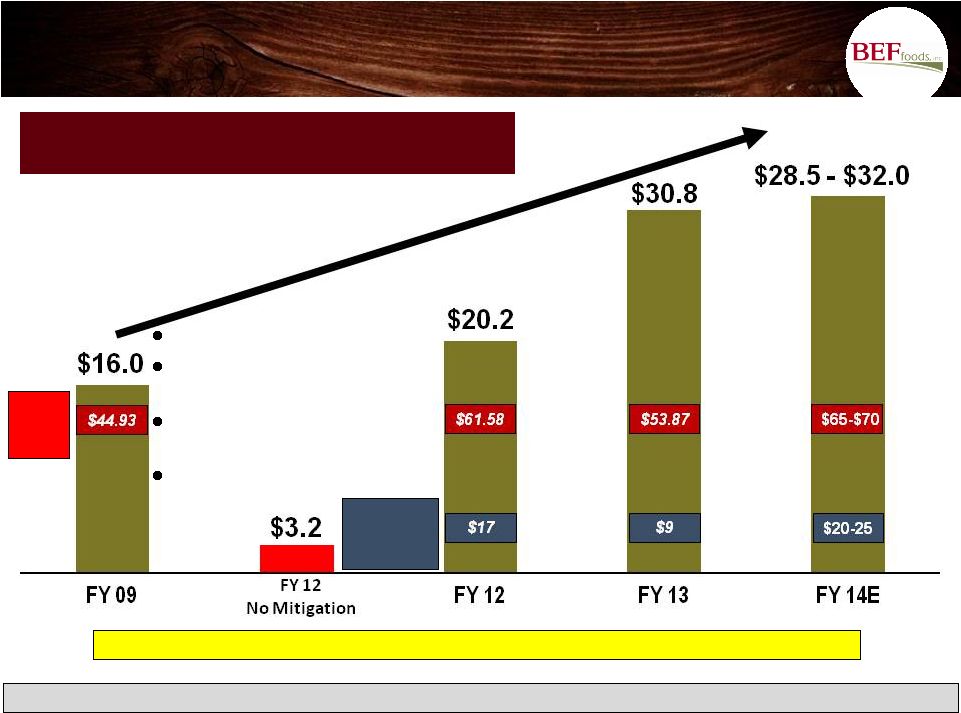
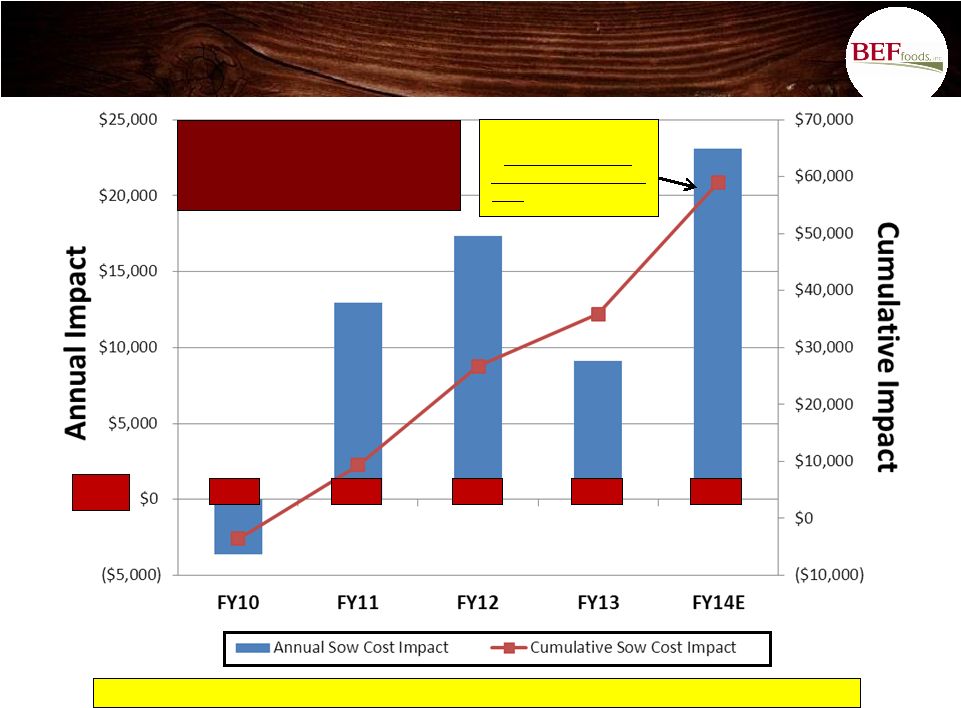 $60 Million Cumulative Sow Cost Impact on BEF’s P&L: Versus Fiscal 2009 Average Sow Cost of $44.93/cwt 43 Nearly $60 million cumulative annual cost impact relative to 2009 sow price levels. $ avg cost/cwt ($ 000’s) $65-70E $53.87 $42.18 $61.58 $57.17 NOTE: daily sow cost information available at: http://www.ams.usda.gov/mnreports/lm_hg230.txt A $1 change in average annual sow costs is estimated to impact annual operating profit by approximately $1 million. |
 1.1 million shares beneficially owned and held 1.1 million shares beneficially owned and held in deferred compensation plans in deferred compensation plans (1) (1) by officers by officers and directors and directors Represents approximately 2x company’s share Represents approximately 2x company’s share ownership guidelines ownership guidelines Collective ownership position places Collective ownership position places management and the Board well within the management and the Board well within the “top 10” “top 10” of all shareholders of all shareholders (1) Reflects share ownership as of 9-27-13. Management and the Board are Aligned with Shareholders 44 |
 45 Appendix |
 Board Composition and Governance Track Record 46 • Board Composition, Skills and Tenure • Peer Group Comparisons |
 Bob Evans Farms, Inc. Board of Directors Pre - FY2007 FY2007 - Present Larry C. Corbin • Elected 1981. Retired Chief Executive Officer, Bob Evans Farms, Inc. • Has significant experience in real estate, restaurant retail and food products operations and margin improvement through labor and food cost control. Paul S. Williams • Elected 2007. Managing Director, Major Lindsey & Africa. • Extensive experience in legal and regulatory matters, healthcare, human resources, leadership development and executive compensation policy matters. G. Robert Lucas • Elected 1986. Trustee, The Jeffrey Trusts. • Extensive knowledge and significant experience in legal, regulatory and government affairs, restaurant operations, real estate, mergers and acquisitions, consumer products, auditing, finance and executive compensation. Cheryl L. Krueger • Elected 1993. Chief Executive Officer, Krueger & Co., LLC. • Extensive knowledge and significant experience in marketing and branding, retail sales, business operations, on-line marketing and sales, manufacturing, as well as auditing and finance. Michael J. Gasser • Elected 1997. Chairman of the Board, Greif, Inc. • Extensive knowledge and significant global experience and perspective in auditing, finance, manufacturing, enterprise risk management, strategic planning, taxation and merger and acquisitions. E.W. (Bill) Ingram III • Elected 1998. Chief Executive Officer, White Castle System, Inc. • Extensive knowledge and significant experience in the areas of restaurant operations, real estate, food service and production, as well as auditing and finance. Mary Kay Haben • Elected 2012. Former President-North America, Wm. Wrigley Jr. Company. • Substantial experience as a brand builder and consumer products business leader, experience in marketing, social media, marketing innovation and brand positioning. Dr. E. Gordon Gee • Elected 2009. Interim President of West Virginia University • Extensive knowledge and significant experience in government affairs and regulatory matters, as well as auditing and finance. Eileen A. Mallesch • Elected 2008. Former Senior Vice President, Chief Financial Officer, Nationwide Property & Casualty Insurance. • Extensive knowledge and significant experience in auditing, finance, enterprise risk management, taxation and mergers and acquisitions. Steven A. Davis • Elected 2006. Chief Executive Officer and Chairman of the Board, Bob Evans Farms, Inc. • Significant experience in restaurant operations, marketing and branding, retail food products, strategic planning, as well as mergers, acquisitions, real estate, auditing and finance. 47 Bryan Stockton • Elected 2006. Left BOBE board 2012 when promoted from COO to Chief Executive Officer at Mattel, Inc. Replaced by Mary Kay Haben. • Significant global experience in the areas of marketing and branding, strategy, consumer products and retail, manufacturing, and mergers and acquisitions. |
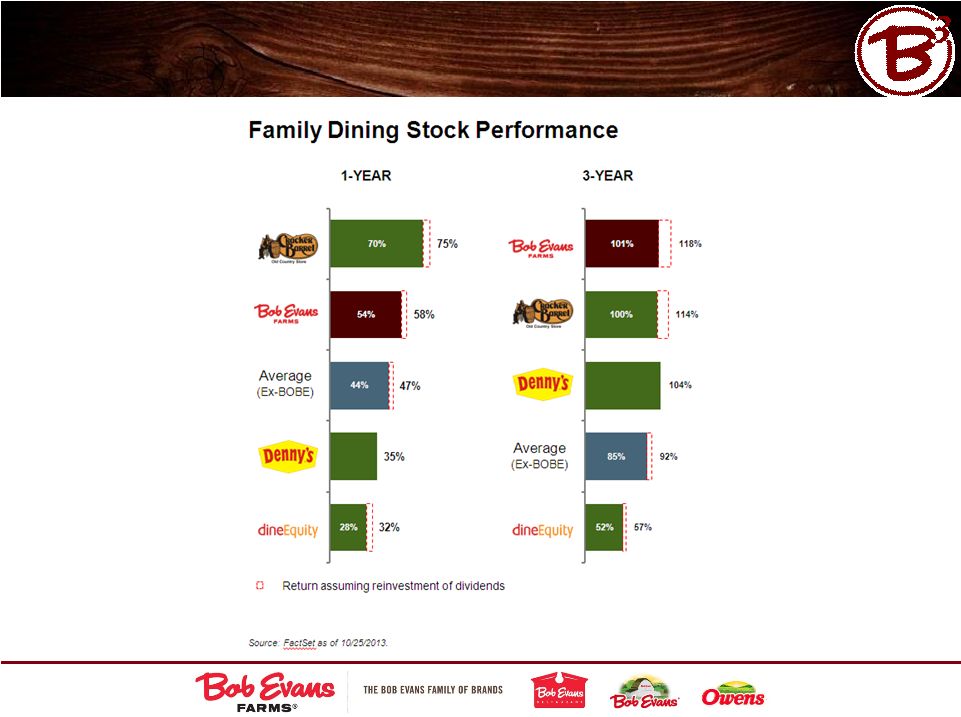 48 Family Dining Stock Performance: Transformational Investments Leading to Recent Outperformance |
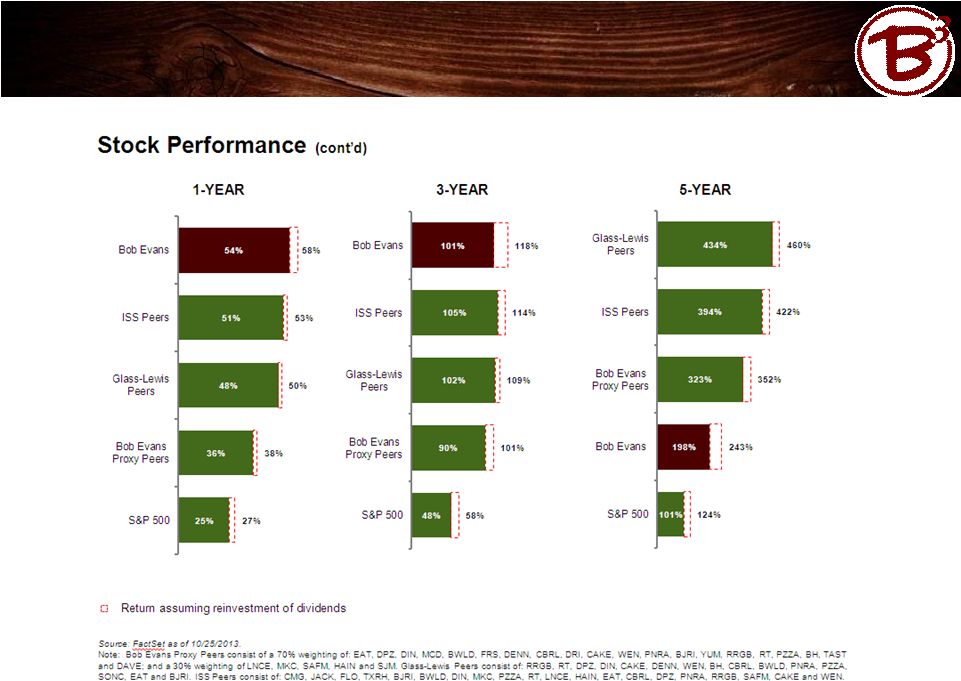 49 Transformational Investments also Leading to Improved Relative Performance to Peer Groups and Overall Market |
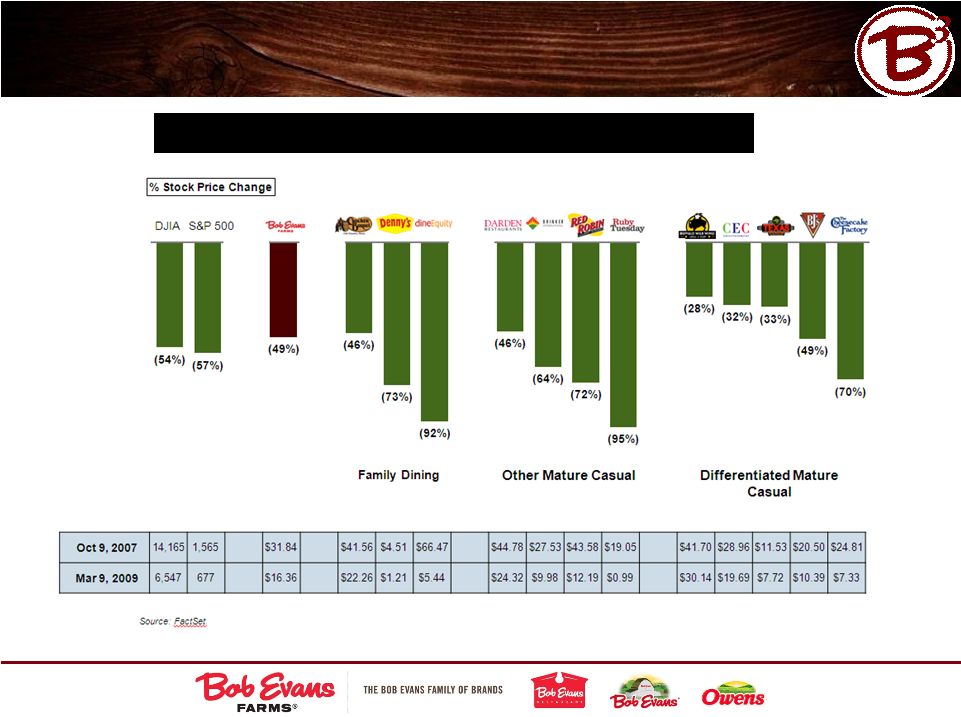 50 Strong Balance Sheet and P&L Discipline Enabled BOBE to Weather the Most Recent Significant Market Decline Well STOCK PRICE PERFORMANCE (10/9/07 to 3/9/09) |
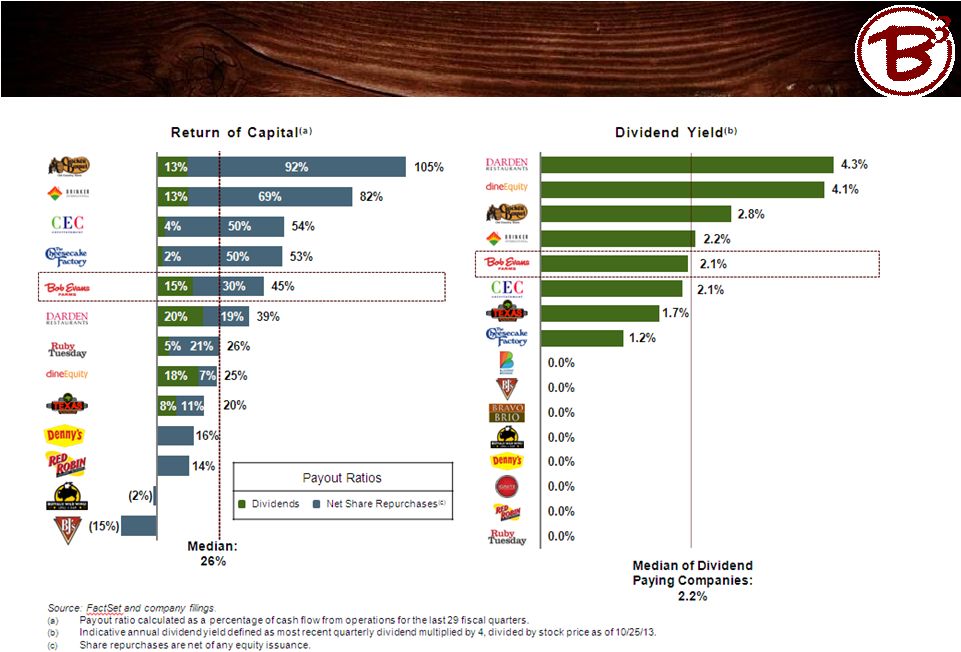 BOBE’s Strong Balance Sheet Enables Above- Average Returns of Capital 51 |
 52 BOBE’s Valuation Relative to other Restaurant and Branded Protein Companies: |
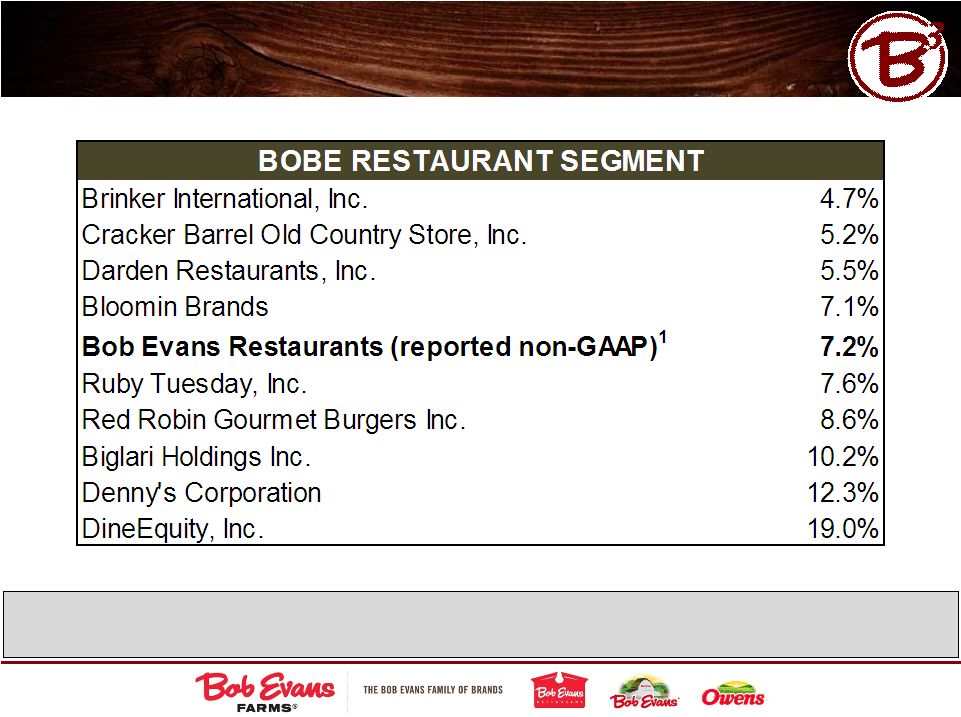 Restaurant Segment SG&A Rank Relative to Other Restaurant Companies 2 53 1 See reconciliation of Adjusted Operating Income (non-GAAP) to Reported Operating Income (GAAP) in the Appendix of this presentation. 2 All data reflects most recent fiscal year except Darden and Ruby Tuesday sourced from 2013 PiperJaffray Cookbook: 8 th Annual Restaurant Benchmark Analysis, July 2013. |
 Sales Growth Drivers 54 • Dine-in Value • Off-Premise • Back of House Improvements • Digital Marketing |
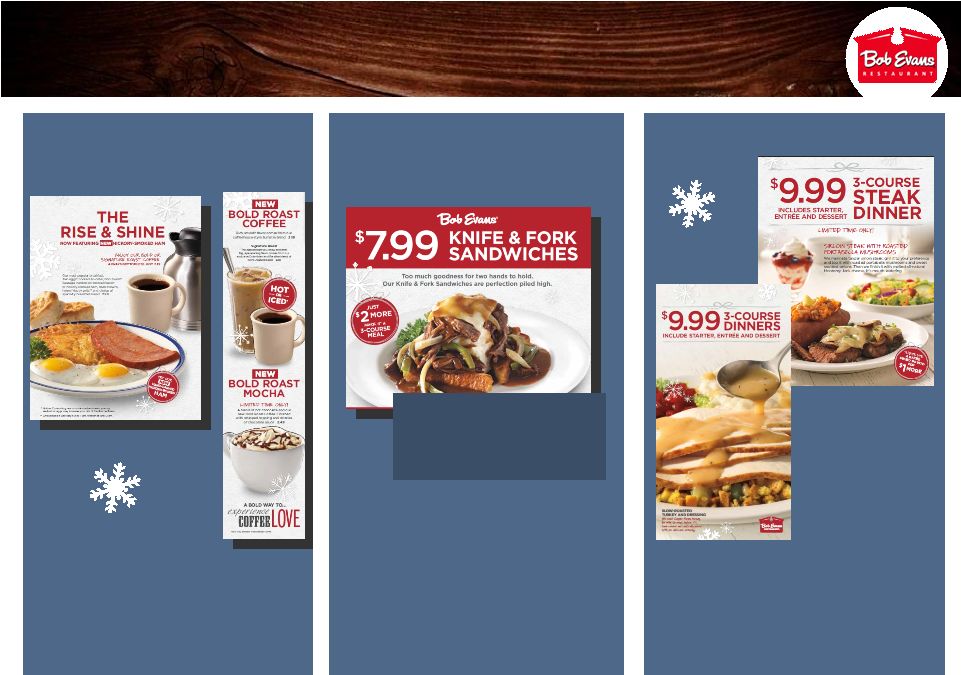 Dine-In Value Sales Layers 55 BREAKFAST The Rise & Shine Breakfast currently drives ~ $75 million / 7.6% of annual revenue. DINNER 3-Course Dinners currently drive ~$70 million / 7.2% of annual revenue. LUNCH $6.99 Lunch Combos currently drive ~ $36 million / 3.7% of annual revenue. $7.99 Knife and Fork Sandwiches Available December 5 ! th |
 Off-Premise Sales Layers 56 FY 2013 Growth / Mix 30.5% / 1.4% BAKERY CARRYOUT FY 2013 Growth / Mix 7.4% / 11.1% CATERING FY 2013 Growth / Mix 20.4% / 0.5% |
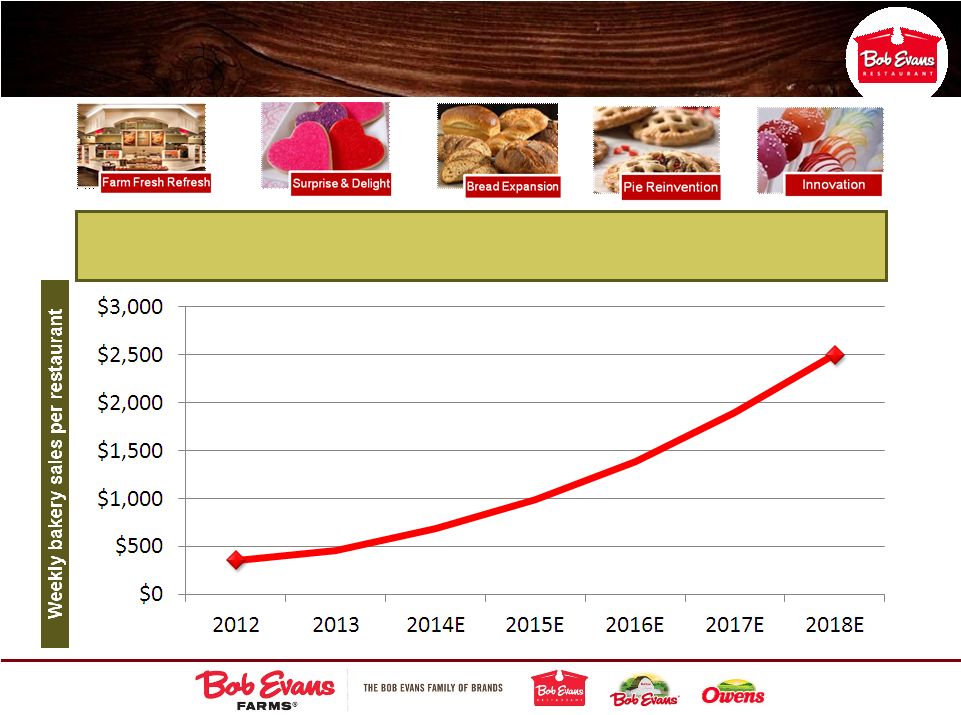 BER Bakery: A Sales Layer with $75M+ Potential 57 Incorporating a variety of elements to achieve estimated weekly bakery sales of $2,500 per restaurant by FY 2018. |
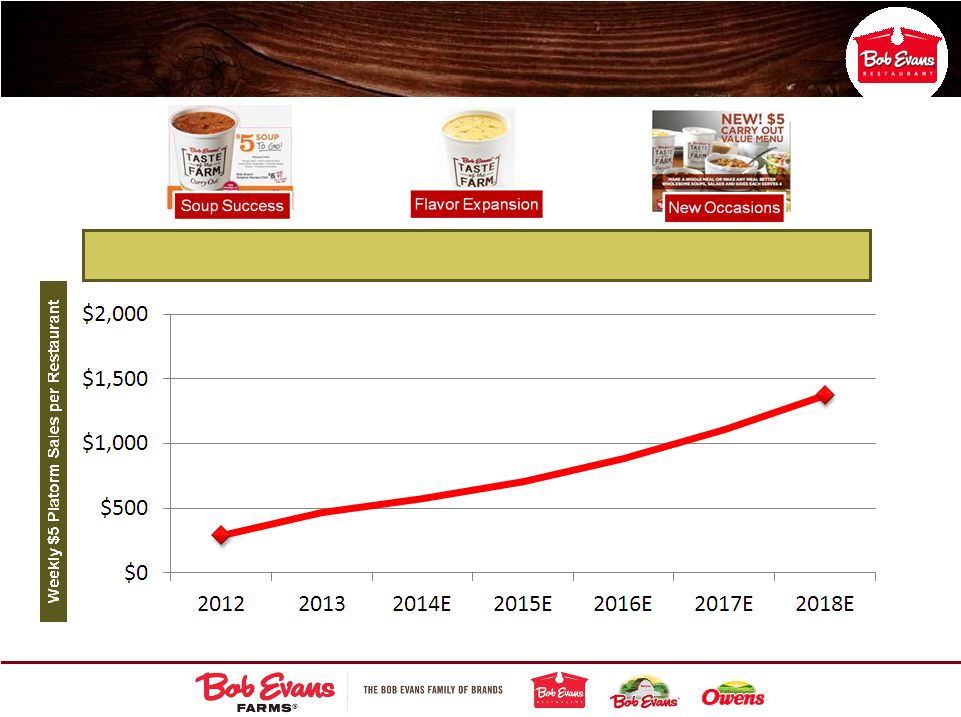 $5 Platform: A Sales Layer with $40M+ Potential 58 Making Bob Evans a destination for home meal replacement. |
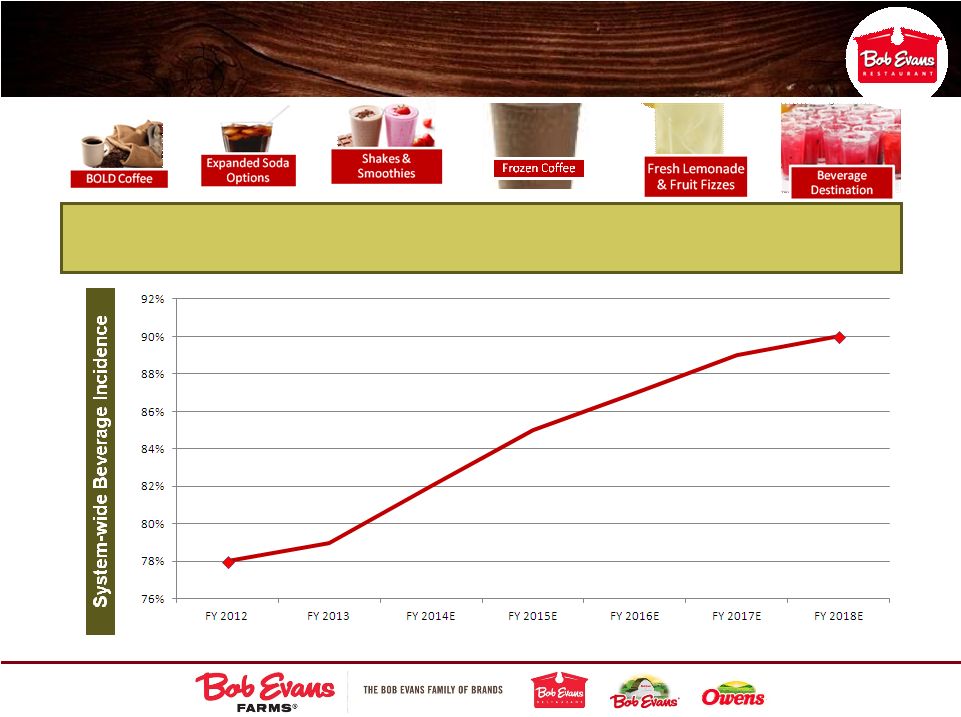 Beverages: A $20M+ Incremental Sales Opportunity 59 Executing a multi-faceted beverage platform to achieve 90% beverage incidence by FY 2018. |
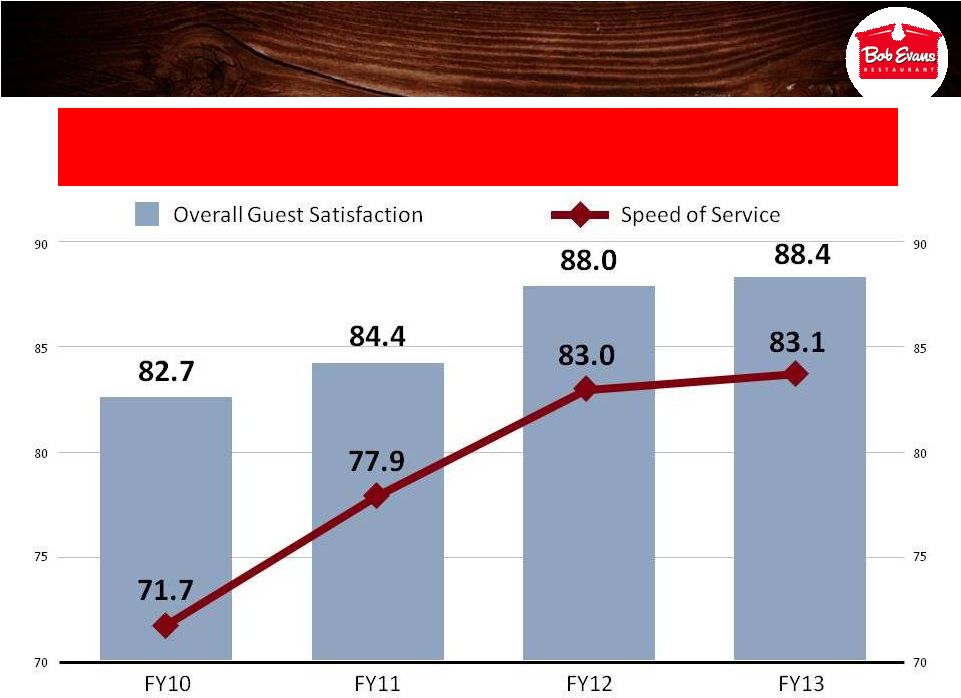 Back of the House Improvements Required to Drive Further Guest Satisfaction Gains Farm Farm Fresh Fresh Refresh Refresh 2.0 2.0 Designed Designed to to Further Further Elevate Elevate the the Guest Guest Experience through Back of the House Upgrades Experience through Back of the House Upgrades 60 |
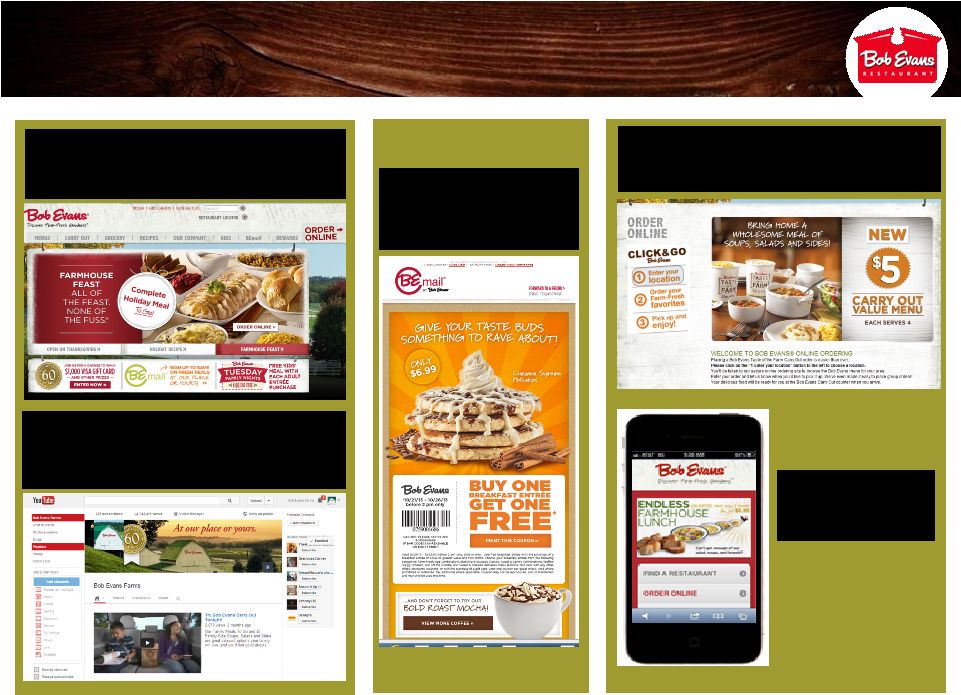 Mobile Site Mobile Site 46,595 46,595 100% increase 100% increase Driving Sales Across Multiple Digital Platforms FY14 – Q2 Digital BOBEVANS.COM 2,095,451 Visits -6.6% Email Database Email Database 976,284 Subscribers 976,284 Subscribers Subscribers +107,148 email names +107,148 email names Online Ordering Online Ordering 125,119 Orders 125,119 Orders +15.6% increase +15.6% increase YouTube Channel YouTube Channel 342,419 Video Views 342,419 Video Views 61 |
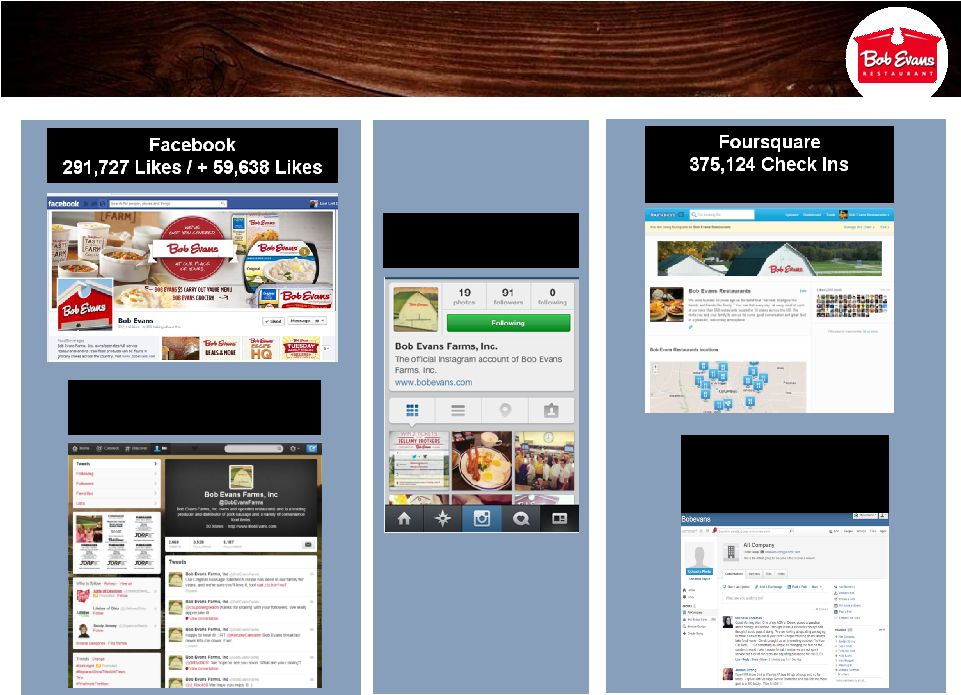 Social Media: A Key Component of Our Digital Strategy FY14 – Q2 Digital 62 Instagram Instagram 635 followers / +315 635 followers / +315 Twitter Twitter 9,222 Followers / + 268 9,222 Followers / + 268 Yammer Yammer Internal Sales Blog Internal Sales Blog |
 Strategic Transformation Investments 63 • Farm Fresh Refresh Remodel Program • Kettle Creations Vertical Integration Strategy • Sulphur Springs Ready-to-Eat Plant Expansion • Enterprise Resource Planning (ERP) |
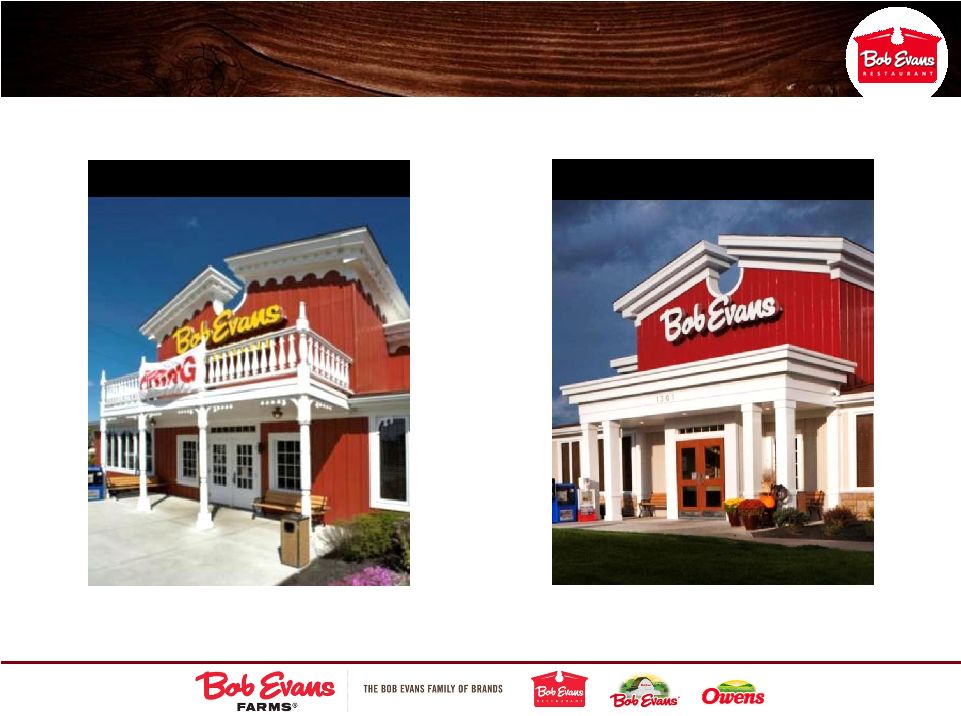 New Exterior Design Restaurant Remodels 64 Original Exterior Design |
 Restaurant Remodels 65 New Center Entrance Original Center Entrance Since Technomic began polling consumers about their most recent visits to Bob Evans in Q1 2011, consumers increasingly indicate that several aspects of the brand’s unit appearance and ambiance are good or very good: Overall atmosphere and ambiance A welcoming and comfortable atmosphere Décor Restaurant interior cleanliness Source: September 2013 Bob Evans Farms, Inc. Consumer Brand Metrics Analysis, Technomic, Inc. |
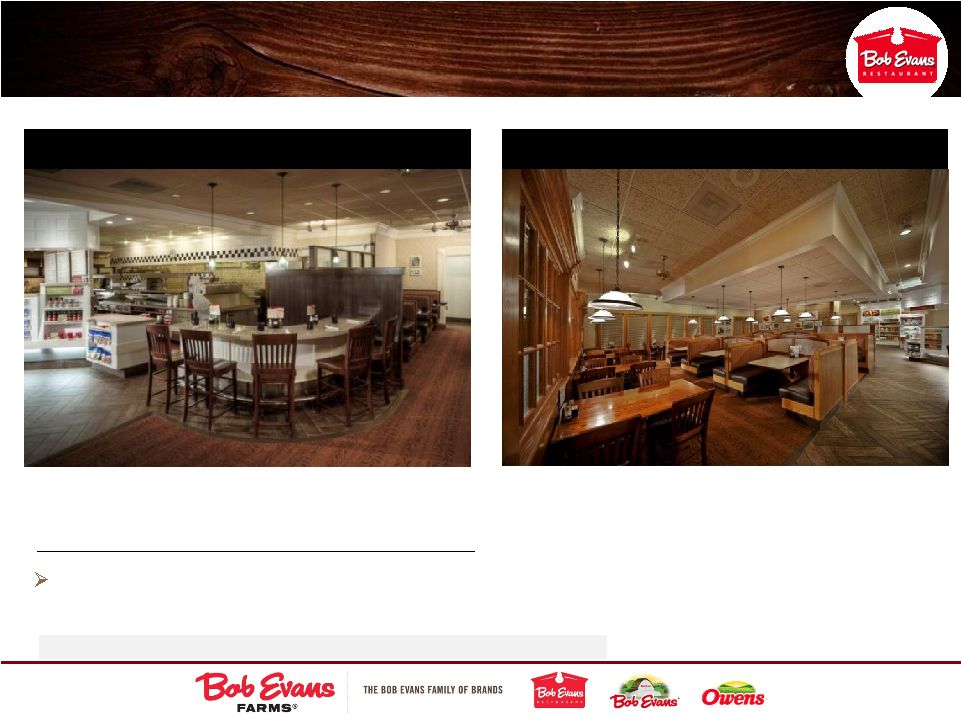 Restaurant Remodels 66 New Expanded Dining Room New Counter Source: September 2013 Bob Evans Farms, Inc. Consumer Brand Metrics Analysis, Technomic, Inc. The increases on these four distinct metrics of store atmosphere suggest that consumers are responding positively to the brand’s “Farm Fresh Refresh” efforts to refurbish its stores. Technomic Farm Fresh Refresh Commentary (continued): |
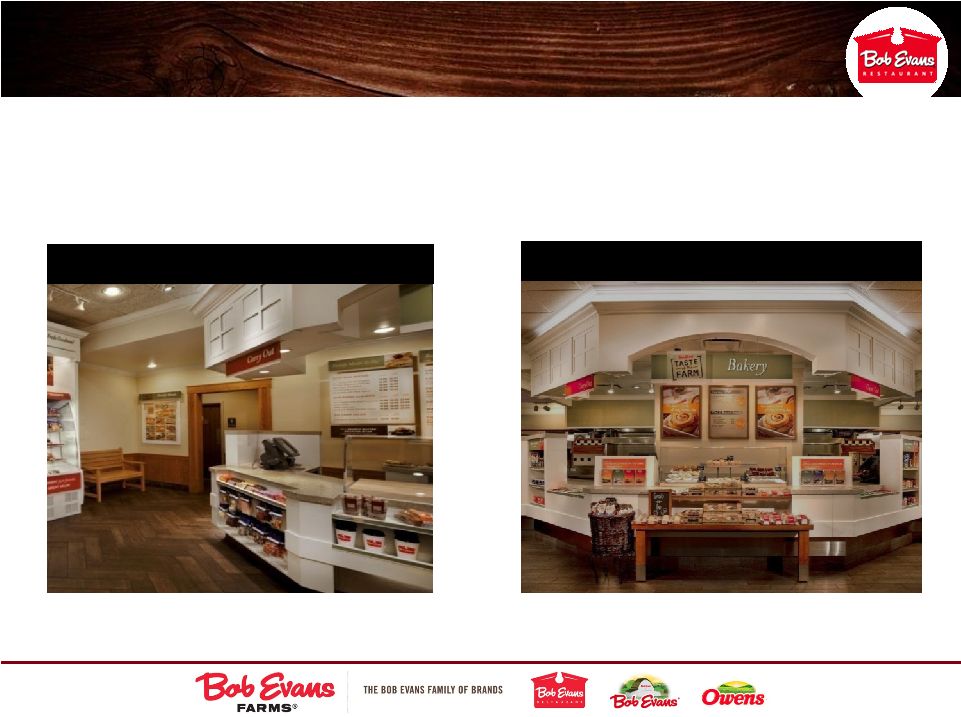 New Bakery Restaurant Remodels 67 New Carryout “Taste of the Farm ” Retail and Carryout Areas Designed to Drive Sales Layers with On-Brand Offerings ® |
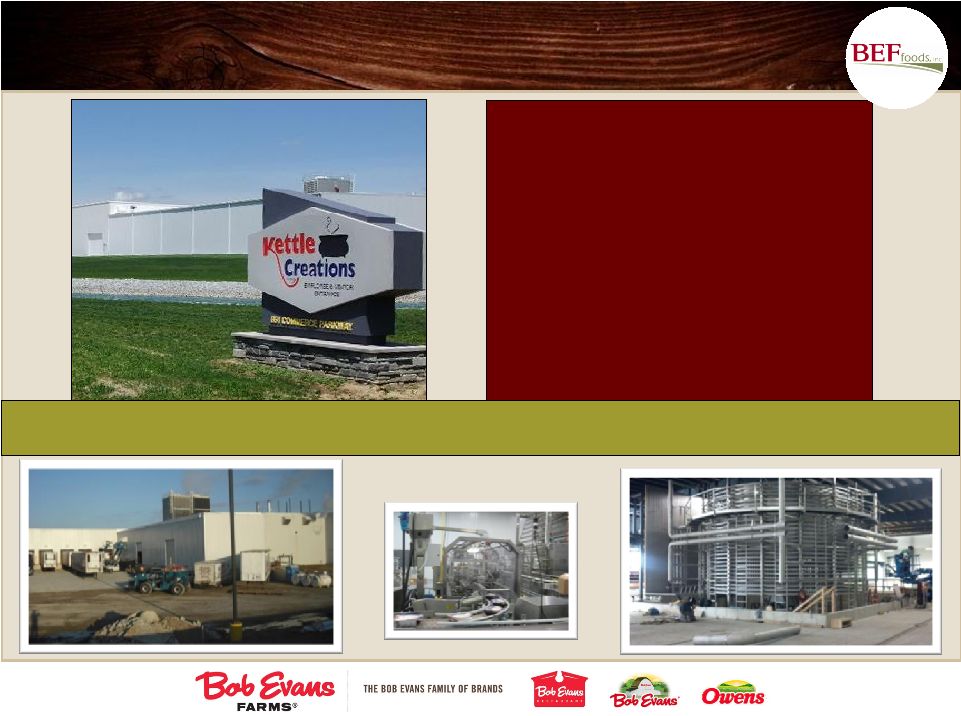  68 Kettle Creations Plant Expansion Drives Vertical Integration • Accelerated product innovation • Proprietary manufacturing capability • Opportunities to drive food service business during off- peak production • Profitable growth reduces reliance on sausage business • • Accelerated product Accelerated product innovation innovation • • Proprietary manufacturing Proprietary manufacturing capability capability • • Opportunities to drive food Opportunities to drive food service business during off- service business during off- peak production peak production • • Profitable growth reduces Profitable growth reduces reliance on sausage business reliance on sausage business Completed October 2013 Completed October 2013 |
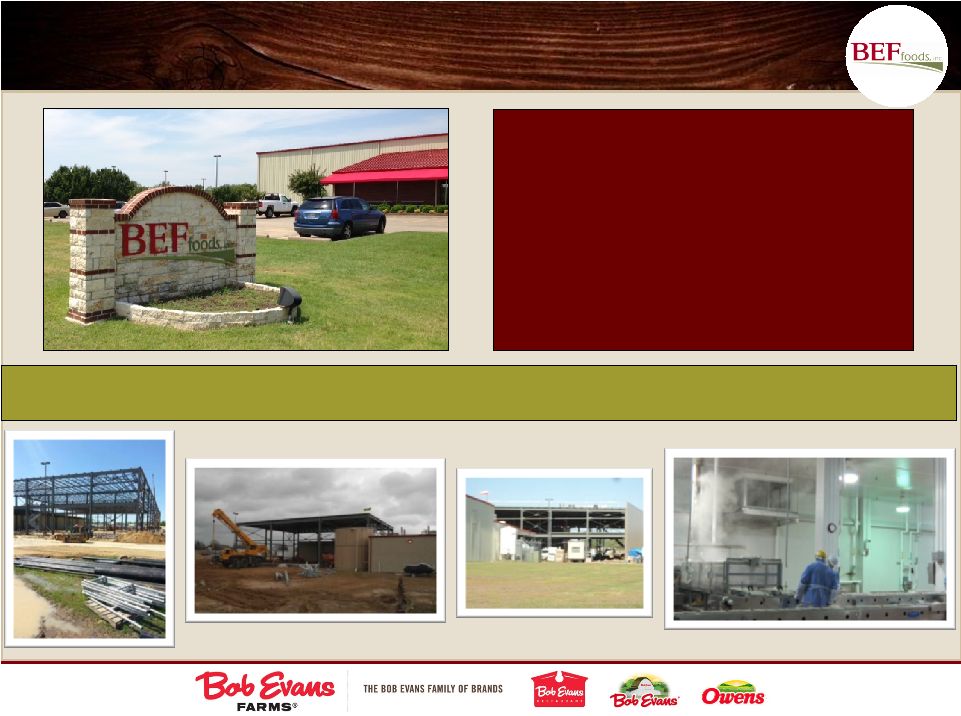 • • Adds 60,000 sq. feet to facility Adds 60,000 sq. feet to facility • • 165,000 total sq. feet after 165,000 total sq. feet after expansion expansion • • Two new 57,000 sq. foot Two new 57,000 sq. foot production lines, with a third to production lines, with a third to be added later be added later 69 Sulphur Springs Plant Expansion Enables Sales Growth and New Distribution Completed October 2013 |
 ERP Implementation Schedule 70 Fiscal Yr Key Actions Estimated Impact ($ millions) Capex Expense Benefits - RFP Completed & Software Puchased - Team Formulation (3.8) (1.0) 0.0 - Detailed Project Planning - Phase 1 - Core GL, Manufacturing, Procurement (7.5) (2.8) 0.0 - Phase 2 Begins - Order to Cash, HR/Payroll, Planning - Phase 2 Completed (14.3) (6.9) 2.3 - Learning Management, Detailed Reporting - Phase 3 Implementation - Transportation, Product Lifecycle, Others (6.9) (6.7) 5.1 - Prioritized Based on Detailed Project Plan - Implementations Complete 0.0 (5.9) 7.4 - Impact of Benefits Phased in 2018 - Expenses and Benefits Stabilize 0.0 (5.9) 9.1 2013 2014 2015 2016 2017 |
 Strategic Asset Dispositions 71 • Restaurant Closures • Business Dispositions • Plant Closures/Consolidations • Real Estate Sales and Disposals • Business Transformations • DSD to warehouse conversion • Distribution center sale |
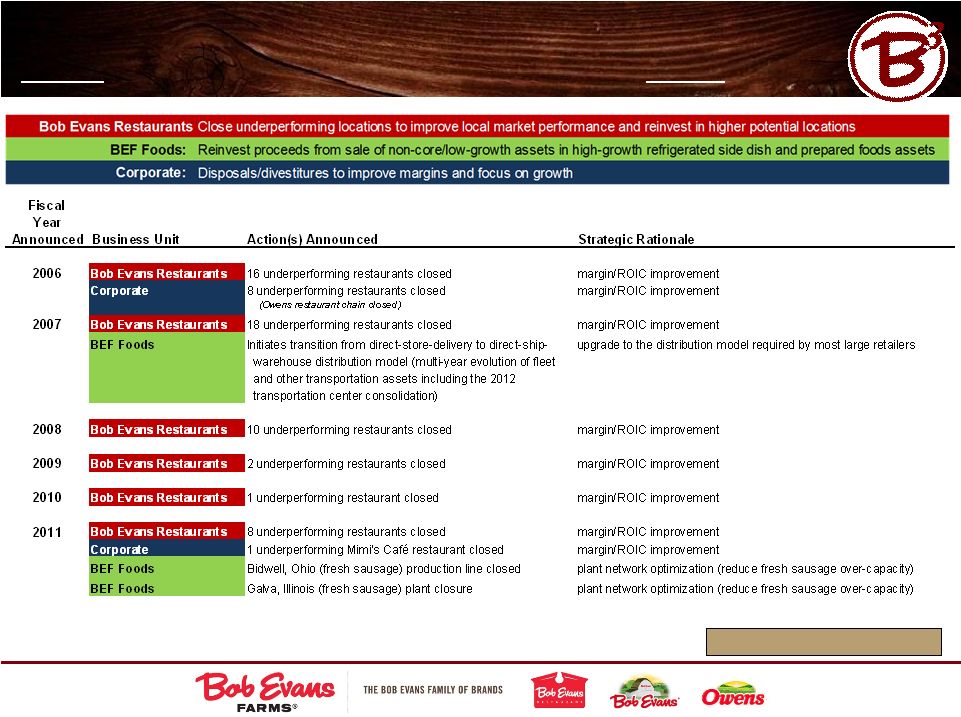 Significant Asset Closures/Dispositions: Every business segment subject to review every quarter. 72 continued on following page… |
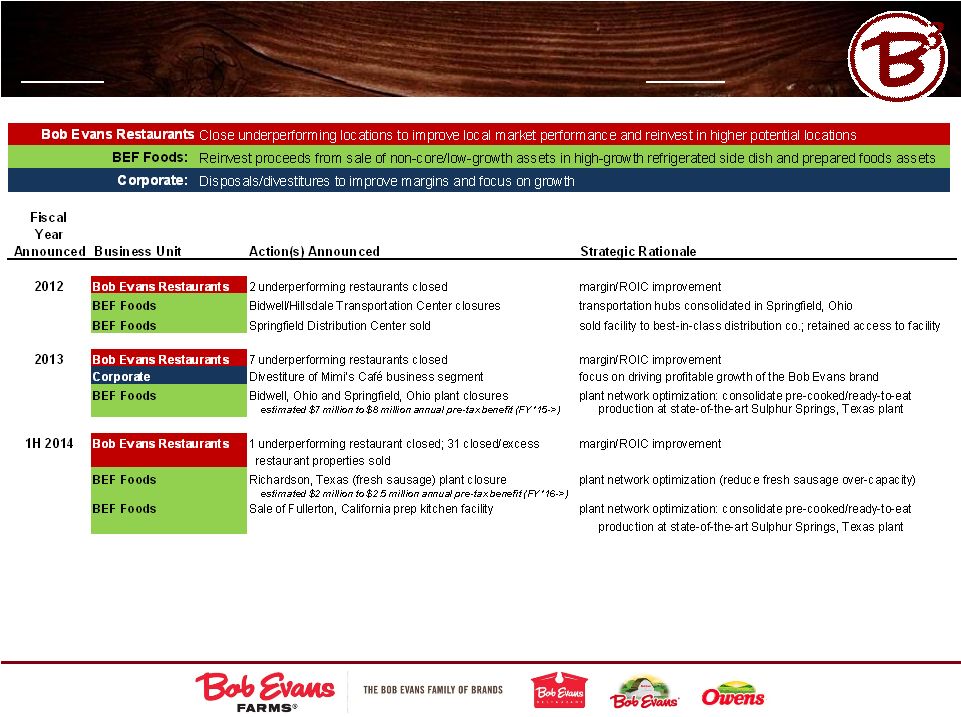 Significant Asset Closures/Dispositions: Every business segment subject to review every quarter. 73 |
 Additional Information 74 • Quarterly Sow Cost Purchases • Reconciliation of Adjusted Operating Income (Non-GAAP) to Reported Operating Income (GAAP) |
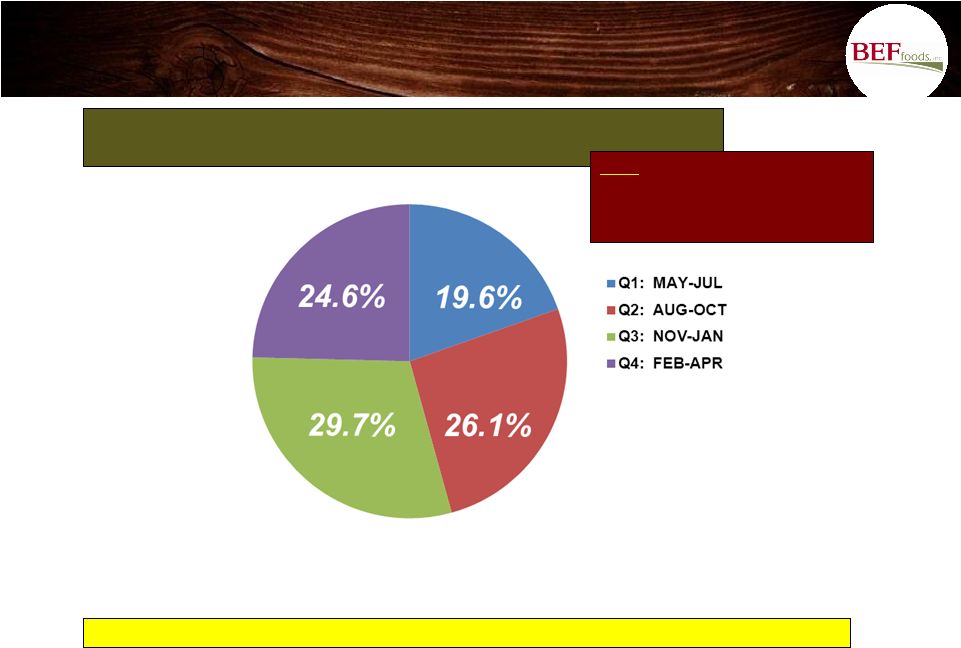 Sow Cost: Nearly 200K Head Purchased in Fiscal 2013 75 NOTE: daily sow cost information available at: http://www.ams.usda.gov/mnreports/lm_hg230.txt Fiscal 2013 Quarterly Sow Purchases (% of annual purchases) note: A $1 change in average annual sow costs is estimated to impact annual operating profit by approximately $1 million. |
 Bob Evans BEF Mimi's Bob Evans BEF Mimi's Consolidated Restaurants Foods Café Consolidated Restaurants Foods Café GAAP Segments as reported Net Sales 1,608,909 $ 981,418 $ 348,808 $ 278,683 $ 1,654,413 $ 973,678 $ 314,720 $ 366,015 $ Cost of sales 486,856 236,822 177,095 72,939 509,816 230,795 180,940 98,081 Operating wages and fringe benefit expenses 512,292 367,136 37,259 107,897 535,069 370,995 27,787 136,287 Other operating expenses 267,826 172,393 28,094 67,339 268,799 168,164 19,182 81,453 Selling, general and administrative 180,157 75,772 231,428 (127,043) 150,743 65,832 56,857 28,054 Depreciation and amortization 79,482 53,719 12,419 13,344 82,112 49,082 9,454 23,576 Intangible impairment 68,409 68,409 Loss on sale of Mimi's Cafe 57,743 57,743 Operating (Loss) Income (43,856) 75,576 (137,487) 18,055 107,874 88,810 20,500 (1,436) Operating (Loss) Income: % of sales -2.7% 7.7% -39.4% 6.5% 6.5% 9.1% 6.5% -0.4% GAAP Segments as adjusted Net Sales 1,608,909 981,418 348,808 278,683 1,652,928 972,787 314,423 365,718 Cost of sales 486,856 236,822 177,095 72,939 509,816 230,795 180,940 98,081 Operating wages and fringe benefit expenses 513,190 367,675 37,439 108,077 533,030 369,922 27,429 135,679 Other operating expenses 265,800 172,101 27,997 65,702 266,730 166,923 18,768 81,039 Selling, general and administrative 180,157 75,772 231,428 (127,043) 150,743 65,832 56,857 28,054 Depreciation and amortization 79,694 53,931 12,419 13,344 82,598 49,568 9,454 23,576 Intangible impairment 68,409 68,409 Loss on sale of Mimi's Cafe 57,743 57,743 Operating (Loss) Income (42,940) 75,117 (137,569) 19,513 110,011 89,748 20,975 (711) Operating (Loss) Income: % of sales -2.7% 7.7% -39.4% 7.0% 6.7% 9.2% 6.7% -0.2% April 26, 2013 April 27, 2012 Reconciliation of Adjusted Operating Income (Non-GAAP) to Reported Operating Income (GAAP) This schedule continues on the following page. ($ thousands) 76 |
 Reconciliation of Adjusted Operating Income (Non-GAAP) to Reported Operating Income (GAAP) ($ thousands) 77 Bob Evans BEF Mimi's Bob Evans BEF Mimi's Consolidated Restaurants Foods Café Consolidated Restaurant Foods Café Non-GAAP Adjustments Net Sales (19,968) (19,968) (6,985) (5,086) (1,899) Cost of sales (5,259) (5,259) (1,709) (1,204) (505) Operating wages and fringe benefit expenses (9,276) (9,276) (2,252) (1,350) (902) Other operating expenses (4,641) (4,641) (502) (364) (138) Selling, general and administrative (26,485) (5,083) (168,324) 146,922 (6,401) (4,400) 760 (2,761) Depreciation and amortization 3,924 3,924 Intangible impairment (68,409) (68,409) Loss on sale of Mimi's Cafe (57,743) (57,743) Operating (Loss) Income 147,921 5,083 168,324 (25,486) 3,879 2,232 (760) 2,407 Non-GAAP Segments as adjusted Net Sales 1,588,941 981,418 348,808 258,715 1,645,943 967,701 314,423 363,819 Cost of sales 481,597 236,822 177,095 67,680 508,107 229,591 180,940 97,576 Operating wages and fringe benefit expenses 503,914 367,675 37,439 98,801 530,778 368,572 27,429 134,777 Other operating expenses 261,159 172,101 27,997 61,061 266,228 166,559 18,768 80,901 Selling, general and administrative 153,672 70,689 63,104 19,879 144,342 61,432 57,617 25,293 Depreciation and amortization 83,618 53,931 12,419 17,268 82,598 49,568 9,454 23,576 Intangible impairment 0 0 0 0 0 0 0 0 Loss on sale of Mimi's Cafe 0 0 0 0 0 0 0 0 Operating (Loss) Income 104,981 80,200 30,755 (5,973) 113,890 91,980 20,215 1,696 Operating (Loss) Income: % of sales 6.6% 8.2% 8.8% -2.3% 6.9% 9.5% 6.4% 0.5% April 26, 2013 April 27, 2012 |
 Reconciliation of Adjusted Operating Income (Non-GAAP) to Reported Operating Income (GAAP) 2009 BEF Foods’ (formerly “Food Products”) Operating Income Reconciliation Fiscal 2009 BEF reported operating income (GAAP) $15,571 Non-GAAP adjustment: Other operating expenses 400 Fiscal 2009 BEF reported operating income (GAAP) $15,971 ($ thousands) 78 |