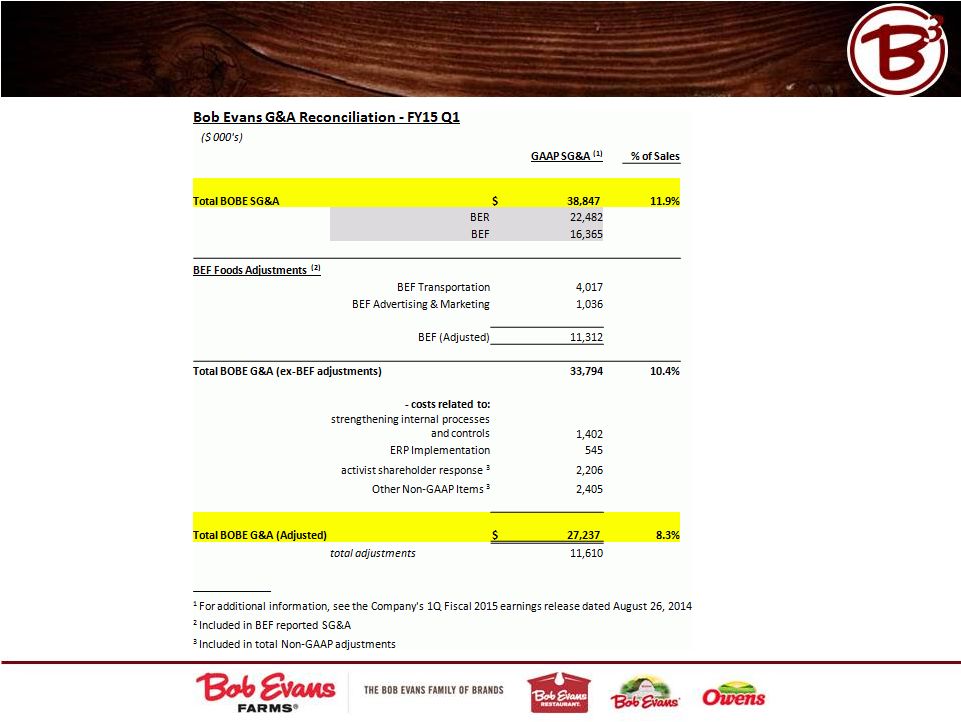
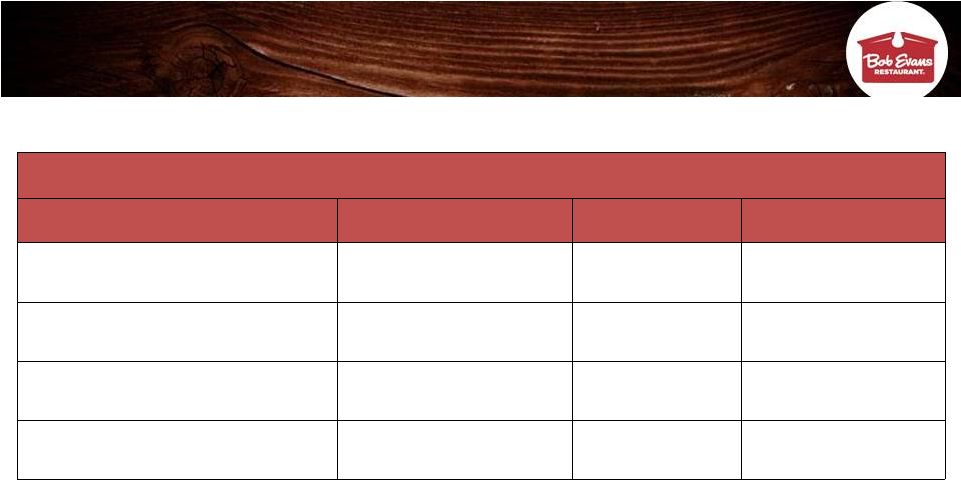
69 Consolidated Results Bob Evans Restaurants BEF Foods Three Months Ended Three Months Ended Three Months Ended July 25, % of 2014 Sales July 26, % of 2013 Sales July 25, % of 2014 Sales July 26, 2013 % of Sales July 25, % of 2014 Sales July 26, 2013 % of Sales Operating income as reported Net sales 326,341 329,449 240,151 244,551 86,190 84,898 Cost of sales 113,463 34.8% 106,641 32.4% 63,211 26.3% 62,653 25.6% 50,252 58.3% 43,988 51.8% Operating wage and fringe benefit expenses 104,228 31.9% 102,847 31.2% 94,639 39.4% 93,221 38.1% 9,589 11.1% 9,626 11.3% Other operating expenses 49,508 15.2% 48,847 14.8% 42,505 17.7% 41,313 16.9% 7,003 8.1% 7,534 8.9% Selling, general and administrative expenses 38,847 11.9% 33,276 10.1% 22,482 9.4% 18,082 7.4% 16,365 19.0% 15,194 17.9% Depreciation and amortization expense 19,973 6.1% 17,230 5.2% 15,341 6.4% 14,191 5.8% 4,632 5.4% 3,039 3.6% Impairment of assets held for sale 258 0.1% 8,609 2.6% 258 0.1% 8,609 0.0% - 0.0% - 0.0% Total as Reported 64 0.0% 11,999 3.6% 1,715 0.7% 6,482 2.7% (1,651) -1.9% 5,517 6.5% Adjustments Net sales - - - - - - Cost of sales - - - - - - Operating wage and fringe benefit expenses (14) - (14) - - - Other operating expenses (149) 107 (149) - - 107 Selling, general and administrative expenses (4,611) (2,258) (3,381) (963) (1,230) (1,295) Depreciation and amortization expense - 51 - 51 - - Impairment of assets held for sale (258) (8,609) (258) (8,609) - - Total adjustments 5,032 10,709 3,802 9,521 1,230 1,188 Non-GAAP operating income Net sales 326,341 329,449 240,151 244,551 86,190 84,898 Cost of sales 113,463 34.8% 106,641 32.4% 63,211 26.3% 62,653 25.6% 50,252 58.3% 43,988 51.8% Operating wage and fringe benefit expenses 104,214 31.9% 102,847 31.2% 94,625 39.4% 93,221 38.1% 9,589 11.1% 9,626 11.3% Other operating expenses 49,359 15.1% 48,954 14.9% 42,356 17.6% 41,313 16.9% 7,003 8.1% 7,641 9.0% Selling, general and administrative expenses 34,236 10.5% 31,018 9.4% 19,101 8.0% 17,119 7.0% 15,135 17.6% 13,899 16.4% Depreciation and amortization expense 19,973 6.1% 17,281 5.2% 15,341 6.4% 14,242 5.8% 4,632 5.4% 3,039 3.6% Impairment of assets held for sale - 0.0% - 0.0% - 0.0% - 0.0% - 0.0% - 0.0% Total non-GAAP operating income 5,096 1.6% 22,708 6.9% 5,517 2.3% 16,003 6.5% (421) -0.5% 6,705 7.9% Reconciliation of Adjusted Operating Income (Non-GAAP) to Reported Operating Income (GAAP) |