UNITED STATES
SECURITIES AND EXCHANGE COMMISSION
Washington, D.C. 20549
FORM N-CSR
CERTIFIED SHAREHOLDER REPORT
OF
REGISTERED MANAGEMENT INVESTMENT COMPANIES
| | |
| Investment Company Act file number: | 811-01530 |
Name of Registrant: | Vanguard Explorer Fund |
Address of Registrant: | P.O. Box 2600 |
| | Valley Forge, PA 19482 |
Name and address of agent for service: | Anne E. Robinson, Esquire |
| | P.O. Box 876 |
| | Valley Forge, PA 19482 |
Registrant’s telephone number, including area code: (610) 669-1000 |
Date of fiscal year end: October 31 | |
Date of reporting period: November 1, 2016 – October 31, 2017 |
Item 1: Reports to Shareholders | |

Annual Report | October 31, 2017
Vanguard Explorer™ Fund
Vanguard’s Principles for Investing Success
We want to give you the best chance of investment success. These principles, grounded in Vanguard’s research and experience, can put you on the right path.
Goals. Create clear, appropriate investment goals.
Balance. Develop a suitable asset allocation using broadly diversified funds. Cost. Minimize cost.
Discipline. Maintain perspective and long-term discipline.
A single theme unites these principles: Focus on the things you can control.
We believe there is no wiser course for any investor.
| |
| Contents | |
| Your Fund’s Performance at a Glance. | 1 |
| Chairman’s Perspective. | 3 |
| Advisors’ Report. | 6 |
| Fund Profile. | 12 |
| Performance Summary. | 14 |
| Financial Statements. | 16 |
| Your Fund’s After-Tax Returns. | 33 |
| About Your Fund’s Expenses. | 34 |
| Glossary. | 36 |
Please note: The opinions expressed in this report are just that—informed opinions. They should not be considered promises
or advice. Also, please keep in mind that the information and opinions cover the period through the date on the front of this
report. Of course, the risks of investing in your fund are spelled out in the prospectus.
See the Glossary for definitions of investment terms used in this report.
About the cover: Nautical images have been part of Vanguard’s rich heritage since its start in 1975. For an
incoming ship, a lighthouse offers a beacon and safe path to shore. You can similarly depend on Vanguard to put
you first––and light the way––as you strive to meet your financial goals. Our client focus and low costs,
stemming from our unique ownership structure, assure that your interests are paramount.
Your Fund’s Performance at a Glance
• For the 12 months ended October 31, 2017, Vanguard Explorer Fund returned 27.10% for Investor Shares and 27.25% for Admiral Shares. It trailed its benchmark, the Russell 2500 Growth Index, and the average return of its small-capitalization growth fund peers.
• During the fiscal year, small-caps outpaced large-caps. Growth stocks surpassed their value counterparts.
• Consumer staples and industrial holdings did well. Consumer discretionary stocks contributed the least to relative performance.
• Each of the Explorer Fund’s five independent advisors employs a growth-oriented strategy and manages its piece of the portfolio with a long-term focus.
• Please note that the fund made several changes to its management during the period.
Granahan Investment Management, Chartwell Investment Partners, and Kalmar Investment Advisers are no longer managing portions of your fund. The assets they managed were allocated to existing fund managers and ClearBridge Investments, a new relationship for the fund and Vanguard.
| |
| Total Returns: Fiscal Year Ended October 31, 2017 | |
| | Total |
| | Returns |
| Vanguard Explorer Fund | |
| Investor Shares | 27.10% |
| Admiral™ Shares | 27.25 |
| Russell 2500 Growth Index | 30.07 |
| Small-Cap Growth Funds Average | 28.91 |
| Small-Cap Growth Funds Average: Derived from data provided by Lipper, a Thomson Reuters Company. | |
| Admiral Shares carry lower expenses and are available to investors who meet certain account-balance requirements. | |
| |
| Total Returns: Ten Years Ended October 31, 2017 | |
| | Average |
| | Annual Return |
| Explorer Fund Investor Shares | 7.57% |
| Russell 2500 Growth Index | 8.56 |
| Small-Cap Growth Funds Average | 6.50 |
| Small-Cap Growth Funds Average: Derived from data provided by Lipper, a Thomson Reuters Company. | |
The figures shown represent past performance, which is not a guarantee of future results. (Current
performance may be lower or higher than the performance data cited. For performance data current to the
most recent month-end, visit our website at vanguard.com/performance.) Note, too, that both investment
returns and principal value can fluctuate widely, so an investor’s shares, when sold, could be worth more
or less than their original cost.
1
| | | |
| Expense Ratios | | | |
| Your Fund Compared With Its Peer Group | | | |
| | Investor | Admiral | Peer Group |
| | Shares | Shares | Average |
| Explorer Fund | 0.46% | 0.34% | 1.34% |
The fund expense ratios shown are from the prospectus dated May 19, 2017, and represent estimated costs for the current fiscal year. For
the fiscal year ended October 31, 2017, the fund’s expense ratios were 0.43% for Investor Shares and 0.31% for Admiral Shares. The
peer-group expense ratio is derived from data provided by Lipper, a Thomson Reuters Company, and captures information through
year-end 2016.
Peer group: Small-Cap Growth Funds.
2
Chairman’s Perspective

Bill McNabb
Chairman and Chief Executive Officer
Dear Shareholder,
When I find outstanding products or services, I’m likely to be loyal to them. And my loyalty usually gets rewarded as I experience consistently high quality––whether it’s from a favorite restaurant or a favorite author. What’s past, in most cases, is prologue.
As tempting as it is to apply this rationale to investing—for example, if technology stocks have done well this year, they’re bound to do well the next—it’s not all that helpful and can actually be counterproductive. You’ve heard it many times: Past performance cannot be used to predict future returns.
Taking a new approach
The caution about past performance is so familiar that investors are apt to treat it as mere background noise. That’s why past-performance bias merited a fresh look from Vanguard’s Investment Strategy Group, which tackled the issue last year in a research paper. (I encourage you to read the full paper, Reframing Investor Choices: Right Mindset, Wrong Market, at vanguard.com/research.)
Our strategists were hardly the first to delve into the topic, but they approached it in a new way. They started with the premise that it’s perfectly understandable for investors to lean heavily on past performance, because that works well in many areas of life. After all, as the paper describes, in lots of other industries and realms, performance from one time period
3
to another is extremely consistent. The researchers looked at everything from cars to fine restaurants to heart surgeons, and in all these examples, past performance was a good predictor of later outcomes.
It’s different with investing
In a nutshell, our brains typically are rewarded and our satisfaction is boosted when we use past performance as a guide for navigating decisions, big and small. But when applied to investing, this method breaks down.
Why? Among other reasons, top-performing asset classes one year tend not to repeat as leaders the next. Strong past performance leads to higher valuations, making an investment, all else being equal, less attractive in the future. The data are quite overwhelming in this regard.
By allowing past performance to inform their decisions, individual and institutional investors inadvertently end up as momentum investors, putting them on a treadmill of buying high and selling low.
A path to better decision-making
Of course, many investors are already aware of the pitfalls of projecting past performance into the future. The real question is, what can we all do about it? What does it take to go from having a general awareness to actually changing our behavior?
| | | |
| Market Barometer | | | |
| | Average Annual Total Returns |
| | Periods Ended October 31, 2017 |
| | One Year | Three Years | Five Years |
| Stocks | | | |
| Russell 1000 Index (Large-caps) | 23.67% | 10.58% | 15.18% |
| Russell 2000 Index (Small-caps) | 27.85 | 10.12 | 14.49 |
| Russell 3000 Index (Broad U.S. market) | 23.98 | 10.53 | 15.12 |
| FTSE All-World ex US Index (International) | 23.48 | 6.12 | 7.67 |
| |
| Bonds | | | |
| Bloomberg Barclays U.S. Aggregate Bond Index | | | |
| (Broad taxable market) | 0.90% | 2.40% | 2.04% |
| Bloomberg Barclays Municipal Bond Index | | | |
| (Broad tax-exempt market) | 2.19 | 3.04 | 3.00 |
| Citigroup Three-Month U.S. Treasury Bill Index | 0.71 | 0.31 | 0.20 |
| |
| CPI | | | |
| Consumer Price Index | 2.04% | 1.28% | 1.29% |
4
Acknowledging that such change isn’t easy, our strategists offered a few ideas for reframing how investors approach their decisions. These recommendations were targeted at advisors working with clients, but they apply equally to individuals and institutions:
• Educate yourself. The more investors understand why a method that works so well in other areas of life—relying on past performance to drive decisions—doesn’t carry over to investing, the better off they’ll be.
• Be disciplined. The bias toward past performance is ingrained in everybody, professionals included, and shifting away from it can be difficult. But the long-term benefits make the effort worthwhile.
• Focus on what you can control. It’s always most constructive for investors to concentrate on what’s actually within their control, such as setting goals, following long-term portfolio construction principles, selecting low-cost investments, and rebalancing periodically.
Here’s to keeping the past in the rearview mirror. And, as always, thank you for investing with Vanguard.
Sincerely,

F. William McNabb III
Chairman and Chief Executive Officer
November 14, 2017
5
Advisors’ Report
For the 12 months ended October 31, 2017, Vanguard Explorer Fund returned 27.10% for Investor Shares and 27.25% for Admiral Shares. It trailed its benchmark, the Russell 2500 Growth Index, and the average return of its small-capitalization growth fund peers.
Your fund is managed by five independent advisors, a strategy that enhances its diversification by providing exposure to distinct yet complementary investment approaches. It’s not uncommon for different advisors to have different views about individual securities or the broader investment environment.
The advisors, the amount and percentage of fund assets each manages, and brief descriptions of their investment strategies are presented in the table on page 10.
Please note that during the fiscal year there were several changes to the fund’s management. Granahan Investment Management and Kalmar Investment Advisers are no longer managing portions of your fund. The assets managed by those two firms have been allocated to Stephens Investment Management Group, Vanguard Quantitative Equity Group, and ClearBridge Investments—a new relationship for your fund and Vanguard.
Also, as mentioned in previous reports, Chartwell Investment Partners no longer serves as an advisor to the fund. Assets formerly managed by Chartwell were allocated to Stephens and ArrowMark Partners in December.
The advisors have provided the following assessment of the investment environment during the past 12 months and the notable successes and shortfalls in their portfolios. These comments were prepared on November 13, 2017.
Wellington Management Company llp
Portfolio Managers:
Kenneth L. Abrams, Senior Managing
Director and Equity Portfolio Manager
Daniel J. Fitzpatrick, CFA, Senior Managing
Director and Equity Portfolio Manager
For the 12 months ended October 31, 2017, small- and mid-capitalization stocks rebounded strongly. Despite postelection headline volatility and environmental catastrophes, small-caps continued to rally, boosted by sustained increases in domestic growth, better-than-expected earnings, and the prospect of supportive fiscal policy.
The portfolio’s benchmark, the Russell 2500 Growth Index, returned 30.07% for the period. Nine of its eleven sectors posted positive returns, with telecommunication services, financials, and information technology leading the way. Energy and consumer staples lagged.
6
The portfolio had robust positive returns but trailed its benchmark index. Our bottom-up stock selection in health care, consumer discretionary, financials, and industrials was the largest drag on our portion. Sector allocation, a result of our selection process, modestly detracted. Our overweighted positions in consumer staples and energy also hurt, as did an underweighted allocation to information technology.
Cardtronics, a U.S.-based provider of ATMs and financial services kiosks, was the top relative and absolute detractor. Its stock struggled over the last year as fee cuts in the United Kingdom and an exit from its relationship with 7-Eleven affected earnings more sharply than anticipated. Nevertheless, we have confidence in its management, which has done a good job navigating these hurdles, and believe the company’s long-term prospects are favorable.
Negative returns were partially offset by strong stock selection in consumer staples and energy, as well as a large overweighted allocation to financials, a top-performing sector.
The leading relative contributor for the year was a new position in cloud-based software-as-a-service provider 2U, which delivers educational programming to nonprofit universities through online learning platforms. The company is growing rapidly and developing well-received, innovative programming.
Vanguard Quantitative Equity Group
Portfolio Managers:
James Stetler
Binbin Guo, Principal, Head of Alpha
Equity Investments
For the 12 months ended October 31, 2017, our stock selection models effectively identified industry group leaders. All five of our signals boosted absolute returns; valuation, sentiment, and growth did best.
Stock selection was positive in 5 out of 11 sectors; health care added the most to returns. Materials and industrials were also strong contributors. Standouts included Chemours, Extreme Networks, Square, Scientific Games, and FibroGen.
Holdings in the consumer discretionary and information technology sectors detracted. Cardtronics, Brinker International, and Windstream were among the worst performers.
7
ArrowMark Partners
Portfolio Managers:
Chad Meade, Partner
Brian Schaub, CFA, Partner
The U.S. stock market posted strong gains during the period, driven by growing optimism for the completion of a tax reform bill. Healthy economic data also aided market momentum as GDP growth accelerated to a 3.1% annualized rate during the second quarter of 2017. Volatility remained scarce; the Russell 2500 Growth Index registered only two daily declines greater than 2%. Though the lack of volatility has been a surprise, we continue to prepare for a market pullback. We will look to add companies with predictable and recurring revenue streams, strong competitive advantages, large addressable markets, and attractive risk/reward profiles when volatility picks up.
The industrial sector was our top performer. Our exposure to the commercial and professional services industry group significantly outpaced that of the benchmark index. Strong contributors included TriNet and CEB. TriNet’s pricing improvement and EBITDA margin expansion boosted the company’s strong performance. CEB, a longtime holding, was acquired by Gartner, another portfolio holding, at a 25% premium in January.
The consumer discretionary and materials sectors lagged. Weakness in the retailing industry group, driven by a slowdown in store traffic, was the largest detractor.
Companies directly affected during the period included Sally Beauty and Hibbett Sports. Our lack of exposure to materials also hurt, as the sector returned 32%. We typically avoid materials companies, which tend to be influenced by commodity price swings and have levered balance sheets.
ClearBridge Investments, LLC
Portfolio Managers:
Brian Angerame, Managing Director
Derek Deutsch, CFA, Managing Director
Aram Green, Managing Director
Jeffrey Russell, CFA, Managing Director
ClearBridge Investments began managing a portion of the fund on March 20, 2017. Since then, the small- and mid-cap Russell 2500 Growth benchmark has surged nearly 13%. Financial markets have been resilient, underpinned by accelerating U.S. and global economic growth, supportive corporate earnings, and accommodative interest rates. The most recent data (including consumer sentiment and industrial purchasing intent) suggest continued optimism toward corporate earnings dynamics.
Underneath the surface, we found sharp sector dispersion. Top benchmark sectors included health care and information technology; laggards included consumer discretionary and energy.
Holdings in industrials, real estate, consumer staples, and health care added to performance, while investments in
8
consumer discretionary and financials detracted. Leading contributors IPG Photonics, Trex Company, and Grubhub were all powered by vibrant earnings gains and increased market share. Underperformance was concentrated in the consumer discretionary sector, including holdings Advance Auto Parts, Buffalo Wild Wings, and Tractor Supply Company (which we exited during the period).
We continue to be optimistic about the companies held by the fund. We are confident in the ability of their managements to navigate both rapidly changing industry environments (such as consumer discretionary/retail) and huge opportunities for growth.
Stephens Investment Management
Group, LLC
Portfolio Manager:
Ryan E. Crane, CFA,
Chief Investment Officer
The fiscal year ended October 31, 2017, was characterized by very strong absolute returns. A great deal of enthusiasm about potential tax reform and a reduction in the regulatory burden arose after the U.S. presidential election. The strong returns led to a rising-tide-lifts-all-boats environment. Simultaneously, continued improvement in the economy allowed the Federal Reserve to begin moving toward a more normalized interest rate policy. Volatility in the broad market remained surprisingly low despite some troubling geopolitical developments. Toward the end of the period, we began to notice more volatility among individual stocks, although it still wasn’t evident in the large market indexes.
We had great success with Cognex Corporation, Proto Labs, and other holdings in the technology and industrial sectors. Our video-game-related holdings also contributed. They benefited from a growing user base, mobile platforms, and improving margins as they sold directly to consumers online.
Consumer discretionary was a challenging sector. The box office was softer than expected, and our media-related holdings struggled. The impact of Amazon—both real and perceived—continued to stress retailers. We made changes to our energy holdings and reduced our exposure, but not before it began to detract from returns. Short-term weakness in crude oil prices and the advent of dozens of electric vehicle offerings have tempered our enthusiasm for the industry.
9
| | | |
| Vanguard Explorer Fund Investment Advisors | |
| |
| | Fund Assets Managed | |
| Investment Advisor | % | $ Million | Investment Strategy |
| Wellington Management | 35 | 4,557 | Conducts research and analysis of individual |
| Company LLP | | | companies to select stocks believed to have |
| | | | exceptional growth potential relative to their market |
| | | | valuations. Each stock is considered individually |
| | | | before purchase, and company developments are |
| | | | continually monitored for comparison with |
| | | | expectations for growth. |
| Vanguard Quantitative Equity | 18 | 2,338 | Employs a quantitative fundamental management |
| Group | | | approach, using models that assess valuation, growth |
| | | | prospects, management decisions, market sentiment, |
| | | | and earnings and balance-sheet quality of companies |
| | | | as compared with their peers. |
| ArrowMark Partners | 16 | 2,066 | The firm uses in-depth fundamental research to |
| | | | uncover companies that, in its opinion, can control |
| | | | their own economic destiny. The portfolio managers |
| | | | start by identifying businesses with strong |
| | | | competitive advantages in industries with high barriers |
| | | | to entry, then narrow their focus to companies with |
| | | | large potential markets and high-quality business |
| | | | models focused on the future. Finally, considerations |
| | | | are made for potential downside risk, resulting in a |
| | | | diversified portfolio of 75–100 stocks. |
| ClearBridge Investments, LLC | 15 | 1,999 | The firm seeks to invest in quality growth companies |
| | | | that are category leaders (or have the ability to |
| | | | become market leaders), and display capital allocation |
| | | | discipline aimed at fueling long-term sustainable |
| | | | growth. ClearBridge focuses on cash-flow-based |
| | | | metrics to value companies, as well as revenue or |
| | | | earnings multiples, relying on the most appropriate |
| | | | valuation metrics for each company. This approach |
| | | | aligns with the team’s style of investing in |
| | | | cash-generative, quality growth companies. The |
| | | | research process is disciplined and collaborative, with |
| | | | each member of the team executing on a shared |
| | | | investment philosophy and process. |
10
| | | |
| | Fund Assets Managed | |
| Investment Advisor | % | $ Million | Investment Strategy |
| Stephens Investment | 15 | 1,908 | Employs a disciplined, bottom-up investment |
| Management Group, LLC | | | selection process that combines rigorous fundamental |
| | | | analysis with quantitative screening to identify |
| | | | companies with superior earnings growth potential. |
| | | | The approach screens for core growth stocks and for |
| | | | catalyst stocks. Core growth stocks have strong |
| | | | growth franchises, recurring revenue, and |
| | | | above-average growth rates; catalyst stocks are |
| | | | experiencing changes that could lead to accelerated |
| | | | earnings growth. |
| Cash Investments | 1 | 166 | These short-term reserves are invested by Vanguard |
| | | | in equity index products to simulate investment in |
| | | | stocks. Each advisor also may maintain a modest cash |
| | | | position. |
11
Explorer Fund
Fund Profile
As of October 31, 2017
| | |
| Share-Class Characteristics | |
| | Investor | Admiral |
| | Shares | Shares |
| Ticker Symbol | VEXPX | VEXRX |
| Expense Ratio1 | 0.46% | 0.34% |
| 30-Day SEC Yield | 0.35% | 0.47% |
| | | |
| Portfolio Characteristics | | |
| | | | DJ |
| | | | U.S. |
| | | Russell | Total |
| | | 2500 | Market |
| | | Growth | FA |
| | Fund | Index | Index |
| Number of Stocks | 548 | 1,423 | 3,787 |
| Median Market Cap | $4.3B | $4.7B | $62.0B |
| Price/Earnings Ratio | 25.5x | 27.0x | 22.0x |
| Price/Book Ratio | 3.6x | 4.8x | 2.9x |
| Return on Equity | 10.9% | 12.5% | 15.1% |
| Earnings Growth | | | |
| Rate | 13.1% | 13.7% | 9.8% |
| Dividend Yield | 0.8% | 0.8% | 1.8% |
| Foreign Holdings | 4.7% | 0.0% | 0.0% |
| Turnover Rate | 76% | — | — |
| Short-Term Reserves | 1.7% | — | — |
| | | |
| Sector Diversification (% of equity exposure) |
| | | Russell | DJ |
| | | 2500 | U.S. Total |
| | | Growth | Market |
| | Fund | Index | FA Index |
| Consumer Discretionary | 14.1% | 14.5% | 12.2% |
| Consumer Staples | 3.0 | 2.2 | 7.1 |
| Energy | 1.8 | 1.6 | 5.6 |
| Financials | 8.0 | 7.5 | 15.1 |
| Health Care | 17.8 | 17.5 | 13.5 |
| Industrials | 19.2 | 19.1 | 10.7 |
| Information Technology | 26.1 | 26.1 | 23.5 |
| Materials | 5.3 | 6.7 | 3.5 |
| Real Estate | 3.5 | 3.6 | 3.9 |
| Telecommunication | | | |
| Services | 0.6 | 0.8 | 1.7 |
| Utilities | 0.6 | 0.4 | 3.2 |
Sector categories are based on the Global Industry Classification
Standard (“GICS”), except for the “Other” category (if applicable),
which includes securities that have not been provided a GICS
classification as of the effective reporting period.
| | |
| Volatility Measures | | |
| | | DJ |
| | | U.S. Total |
| | Russell 2500 | Market |
| | Growth Index | FA Index |
| R-Squared | 0.97 | 0.82 |
| Beta | 0.98 | 1.16 |
These measures show the degree and timing of the fund’s
fluctuations compared with the indexes over 36 months.
1 The expense ratios shown are from the prospectus dated May 19, 2017, and represent estimated costs for the current fiscal year. For the fiscal
year ended October 31, 2017, the expense ratios were 0.43% for Investor Shares and 0.31% for Admiral Shares.
12
Explorer Fund
| | |
| Ten Largest Holdings (% of total net assets) |
| |
| ICON plc | Life Sciences Tools | |
| | & Services | 1.0% |
| Insulet Corp. | Health Care | |
| | Equipment | 1.0 |
| Cadence Design | | |
| Systems Inc. | Application Software | 0.9 |
| athenahealth Inc. | Health Care | |
| | Technology | 0.9 |
| TriNet Group Inc. | Human Resources & | |
| | Employment | |
| | Services | 0.8 |
| 2U Inc. | Internet Software & | |
| | Services | 0.8 |
| Medidata Solutions Inc. | Health Care | |
| | Technology | 0.8 |
| Carter's Inc. | Apparel, Accessories | |
| | & Luxury Goods | 0.7 |
| Kirby Corp. | Marine | 0.7 |
| Sensata Technologies | Electrical | |
| Holding NV | Components & | |
| | Equipment | 0.7 |
| Top Ten | | 8.3% |
| The holdings listed exclude any temporary cash investments and equity index products. |
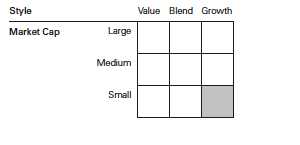
Investment Focus
13
Explorer Fund
Performance Summary
All of the returns in this report represent past performance, which is not a guarantee of future results that may be achieved by the fund. (Current performance may be lower or higher than the performance data cited. For performance data current to the most recent month-end, visit our website at vanguard.com/performance.) Note, too, that both investment returns and principal value can fluctuate widely, so an investor’s shares, when sold, could be worth more or less than their original cost. The returns shown do not reflect taxes that a shareholder would pay on fund distributions or on the sale of fund shares.
Cumulative Performance: October 31, 2007, Through October 31, 2017
Initial Investment of $10,000

| | | | | |
| | | Average Annual Total Returns | |
| | | Periods Ended October 31, 2017 | |
| | | | | | Final Value |
| | | One | Five | Ten | of a $10,000 |
| | | Year | Years | Years | Investment |
| | Explorer Fund*Investor Shares | 27.10% | 14.88% | 7.57% | $20,745 |
| • • • • • • • • | Russell 2500 Growth Index | 30.07 | 15.50 | 8.56 | 22,738 |
| – – – – | Small-Cap Growth Funds Average | 28.91 | 13.68 | 6.50 | 18,772 |
| | Dow Jones U.S. Total Stock Market | | | | |
| | Float Adjusted Index | 23.96 | 15.05 | 7.67 | 20,939 |
| Small-Cap Growth Funds Average: Derived from data provided by Lipper, a Thomson Reuters Company. | | |
| | | | |
| | | | | Final Value |
| | One | Five | Ten | of a $50,000 |
| | Year | Years | Years | Investment |
| |
| Explorer Fund Admiral Shares | 27.25% | 15.05% | 7.74% | $105,361 |
| |
| Russell 2500 Growth Index | 30.07 | 15.50 | 8.56 | 113,692 |
| Dow Jones U.S. Total Stock Market Float | | | | |
| Adjusted Index | 23.96 | 15.05 | 7.67 | 104,695 |
See Financial Highlights for dividend and capital gains information.
14
Explorer Fund
Fiscal-Year Total Returns (%): October 31, 2007, Through October 31, 2017

Average Annual Total Returns: Periods Ended September 30, 2017
This table presents returns through the latest calendar quarter—rather than through the end of the fiscal period.
Securities and Exchange Commission rules require that we provide this information.
| | | | |
| | Inception | One | Five | Ten |
| | Date | Year | Years | Years |
| Investor Shares | 12/11/1967 | 18.69% | 13.95% | 7.66% |
| Admiral Shares | 11/12/2001 | 18.83 | 14.11 | 7.83 |
15
Explorer Fund
Financial Statements
Statement of Net Assets—Investments Summary
As of October 31, 2017
This Statement summarizes the fund’s holdings by asset type. Details are reported for each of the fund’s 50 largest individual holdings and for investments that, in total for any issuer, represent more than 1% of the fund’s net assets. The total value of smaller holdings is reported as a single amount within each category.
The fund reports a complete list of its holdings in regulatory filings four times in each fiscal year, at the quarter-ends. For the second and fourth fiscal quarters, the complete listing of the fund’s holdings is available electronically on vanguard.com and on the Securities and Exchange Commission’s website (sec.gov), or you can have it mailed to you without charge by calling 800-662-7447. For the first and third fiscal quarters, the fund files the lists with the SEC on Form N-Q. Shareholders can look up the fund’s Forms N-Q on the SEC’s website. Forms N-Q may also be reviewed and copied at the SEC’s Public Reference Room (see the back cover of this report for further information).
| | | |
| | | Market | Percentage |
| | | Value• | of Net |
| | Shares | ($000) | Assets |
| Common Stocks | | | |
| Consumer Discretionary | | | |
| Carter’s Inc. | 996,117 | 96,354 | 0.7% |
| * Live Nation Entertainment Inc. | 1,671,498 | 73,178 | 0.6% |
| * Burlington Stores Inc. | 758,216 | 71,189 | 0.6% |
| New York Times Co. Class A | 3,033,454 | 57,939 | 0.4% |
| Consumer Discretionary—Other † | | 1,478,263 | 11.3% |
| | | 1,776,923 | 13.6% |
| |
| Consumer Staples † | | 379,827 | 2.9% |
| |
| Energy † | | 217,191 | 1.7% |
| |
| Financials | | | |
| * SVB Financial Group | 340,670 | 74,702 | 0.6% |
| Nasdaq Inc. | 890,982 | 64,730 | 0.5% |
| LPL Financial Holdings Inc. | 1,282,201 | 63,610 | 0.5% |
| Assured Guaranty Ltd. | 1,637,196 | 60,740 | 0.5% |
| * MGIC Investment Corp. | 4,034,571 | 57,694 | 0.4% |
| * Western Alliance Bancorp | 1,012,311 | 56,487 | 0.4% |
| Financials—Other † | | 625,845 | 4.8% |
| | | 1,003,808 | 7.7% |
| Health Care | | | |
| * ICON plc | 1,120,455 | 133,177 | 1.0% |
| * Insulet Corp. | 2,146,528 | 126,237 | 1.0% |
| * athenahealth Inc. | 886,162 | 113,322 | 0.9% |
| * Medidata Solutions Inc. | 1,302,577 | 97,993 | 0.8% |
| * Mettler-Toledo International Inc. | 100,756 | 68,779 | 0.5% |
| HealthSouth Corp. | 1,270,837 | 58,636 | 0.4% |
| 1 Kindred Healthcare Inc. | 5,066,659 | 30,653 | 0.2% |
16
| | | | | |
| Explorer Fund | | | | |
| |
| |
| |
| | | | | Market | Percentage |
| | | | | Value• | of Net |
| | | | Shares | ($000) | Assets |
| | Health Care—Other † | | | 1,616,681 | 12.4% |
| | | | | 2,245,478 | 17.2% |
| Industrials | | | | |
| * | TriNet Group Inc. | | 3,188,722 | 110,712 | 0.9% |
| * | Kirby Corp. | | 1,358,315 | 96,237 | 0.7% |
| * | Sensata Technologies Holding NV | | 1,853,394 | 90,649 | 0.7% |
| * | Clean Harbors Inc. | | 1,670,063 | 89,365 | 0.7% |
| * | Teledyne Technologies Inc. | | 421,507 | 71,639 | 0.6% |
| * | Trex Co. Inc. | | 640,600 | 70,114 | 0.5% |
| * | United Rentals Inc. | | 486,023 | 68,763 | 0.5% |
| * | TransUnion | | 1,243,105 | 65,251 | 0.5% |
| | John Bean Technologies Corp. | | 587,807 | 62,837 | 0.5% |
| | Orbital ATK Inc. | | 456,578 | 60,693 | 0.5% |
| | Woodward Inc. | | 771,748 | 59,679 | 0.5% |
| * | Middleby Corp. | | 497,741 | 57,688 | 0.4% |
| | Terex Corp. | | 1,224,200 | 57,672 | 0.4% |
| | HEICO Corp. Class A | | 745,922 | 56,765 | 0.4% |
| | Industrials—Other † | | | 1,404,718 | 10.8% |
| | | | | 2,422,782 | 18.6% |
| Information Technology | | | | |
| * | Cadence Design Systems Inc. | | 2,765,192 | 119,346 | 0.9% |
| *,^ | 2U Inc. | | 1,599,176 | 101,756 | 0.8% |
| | MAXIMUS Inc. | | 1,180,888 | 78,446 | 0.6% |
| * | BroadSoft Inc. | | 1,415,700 | 77,651 | 0.6% |
| * | First Solar Inc. | | 1,204,921 | 66,054 | 0.5% |
| | MercadoLibre Inc. | | 269,936 | 64,868 | 0.5% |
| * | Callidus Software Inc. | | 2,547,761 | 64,586 | 0.5% |
| | Entegris Inc. | | 1,944,107 | 63,669 | 0.5% |
| * | HubSpot Inc. | | 732,710 | 63,416 | 0.5% |
| * | ServiceNow Inc. | | 501,050 | 63,318 | 0.5% |
| * | Atlassian Corp. plc Class A | | 1,293,460 | 62,565 | 0.5% |
| | CSRA Inc. | | 1,923,783 | 61,542 | 0.5% |
| | CDW Corp. | | 869,286 | 60,850 | 0.5% |
| * | GoDaddy Inc. Class A | | 1,291,284 | 60,303 | 0.5% |
| * | Cavium Inc. | | 862,082 | 59,475 | 0.4% |
| | Power Integrations Inc. | | 729,971 | 58,653 | 0.4% |
| *,^ | GrubHub Inc. | | 940,422 | 57,385 | 0.4% |
| * | Fortinet Inc. | | 1,451,058 | 57,186 | 0.4% |
| | Information Technology—Other † | | | 2,048,943 | 15.7% |
| | | | | 3,290,012 | 25.2% |
| Materials | | | | |
| | Graphic Packaging Holding Co. | | 3,998,503 | 61,937 | 0.5% |
| | Materials—Other † | | | 612,450 | 4.7% |
| | | | | 674,387 | 5.2% |
| Other | | | | |
| 2 | Vanguard Small-Cap ETF | | 478,332 | 68,655 | 0.5% |
| ^,2 | Vanguard Small-Cap Growth ETF | | 384,700 | 60,086 | 0.5% |
| 3,4 | Other—Other † | | | 4,979 | 0.0% |
| | | | | 133,720 | 1.0% |
| Real Estate | | | | |
| * | SBA Communications Corp. Class A | | 443,554 | 69,718 | 0.6% |
| | Real Estate—Other † | | | 355,292 | 2.7% |
| | | | | 425,010 | 3.3% |
| |
| 17 |
Explorer Fund
| | | |
| | | Market | Percentage |
| | | Value• | of Net |
| | | ($000) | Assets |
| Telecommunication Services † | | 69,304 | 0.5% |
| |
| Utilities † | | 75,697 | 0.6% |
| Total Common Stocks (Cost $10,155,697) | | 12,714,139 | 97.5%5 |
| |
| Coupon | Shares | | |
| Temporary Cash Investments | | | |
| Money Market Fund | | | |
| 6,7 Vanguard Market Liquidity Fund 1.246% | 5,653,386 | 565,395 | 4.3% |
| | | | | |
| | | | Face | | |
| | | Maturity | Amount | | |
| | | Date | ($000) | | |
| Repurchase Agreement | | | | | |
| Deutsche Bank Securities, Inc. | | | | |
| (Dated 10/31/17, Repurchase | | | | |
| Value $46,901,000, collateralized | | | | |
| by U.S. Treasury Note/Bond | | | | | |
| 1.500%, 10/31/19, with a | | | | | |
| value of $47,838,000) | 1.060% | 11/1/17 | 46,900 | 46,900 | 0.4% |
| |
| 8U.S. Government and Agency Obligations† | | | 9,087 | 0.1% |
| Total Temporary Cash Investments (Cost $621,380) | | | 621,382 | 4.8%5 |
| Total Investments (Cost $10,777,077) | | | 13,335,521 | 102.3% |
| Other Assets and Liabilities | | | | | |
| Other Assets7 | | | | 32,939 | 0.3% |
| Liabilities7 | | | | (334,269) | (2.6%) |
| | | | | (301,330) | (2.3%) |
| Net Assets | | | | 13,034,191 | 100.0% |
18
Explorer Fund
| |
| | Amount |
| | ($000) |
| Statement of Assets and Liabilities | |
| Assets | |
| Investments in Securities, at Value | |
| Unaffiliated Issuers | 12,606,179 |
| Collateral for Futures Contracts | 4,553 |
| Affiliated Vanguard Funds | 694,136 |
| Other Affiliated Issuers | 30,653 |
| Total Investments in Securities | 13,335,521 |
| Investment in Vanguard | 790 |
| Receivables for Investment Securities Sold | 14,570 |
| Receivables for Accrued Income | 1,626 |
| Variation Margin Receivable–Futures Contracts | 753 |
| Receivables for Capital Shares Issued | 4,490 |
| Other Assets7 | 10,710 |
| Total Assets | 13,368,460 |
| Liabilities | |
| Payables for Investment Securities Purchased | 13,234 |
| Collateral for Securities on Loan | 290,432 |
| Payables to Investment Advisor | 5,022 |
| Payables for Capital Shares Redeemed | 4,194 |
| Payables to Vanguard | 21,387 |
| Total Liabilities | 334,269 |
| Net Assets | 13,034,191 |
| |
| At October 31, 2017, net assets consisted of: | |
| | Amount |
| | ($000) |
| Paid-in Capital | 9,060,304 |
| Undistributed Net Investment Income | 28,685 |
| Accumulated Net Realized Gains | 1,382,483 |
| Unrealized Appreciation (Depreciation) | |
| Investment Securities | 2,558,444 |
| Futures Contracts | 4,276 |
| Foreign Currencies | (1) |
| Net Assets | 13,034,191 |
19
Explorer Fund
| | | |
| | | Market | Percentage |
| | | Value• | of Net |
| | Shares | ($000) | Assets |
| Investor Shares—Net Assets | | | |
| Applicable to 34,474,998 outstanding $.001 par value shares of | | | |
| beneficial interest (unlimited authorization) | | | 3,520,041 |
| Net Asset Value Per Share—Investor Shares | | | $102.10 |
| |
| Admiral Shares—Net Assets | | | |
| Applicable to 100,161,493 outstanding $.001 par value shares of | | | |
| beneficial interest (unlimited authorization) | | | 9,514,150 |
| Net Asset Value Per Share—Admiral Shares | | | $94.99 |
• See Note A in Notes to Financial Statements.
* Non-income-producing security.
^ Includes partial security positions on loan to broker-dealers. The total value of securities on loan is $283,374,000.
† Represents the aggregate value, by category, of securities that are not among the 50 largest holdings and, in total for any issuer,
represent 1% or less of net assets.
1 Considered an affiliated company of the fund as the fund owns more than 5% of the outstanding voting securities of such company.
2 Considered an affiliated company of the fund as the issuer is another member of The Vanguard Group.
3 Certain of the fund’s securities are valued using significant unobservable inputs.
4 Includes restricted security, representing 0.0% of net assets.
5 The fund invests a portion of its cash reserves in equity markets through the use of index futures contracts. After giving effect to
futures investments, the fund’s effective common stock and temporary cash investment positions represent 98.4% and 3.9%,
respectively, of net assets.
6 Affiliated money market fund available only to Vanguard funds and certain trusts and accounts managed by Vanguard. Rate shown
is the 7-day yield.
7 Collateral of $290,432,000 was received for securities on loan, of which $281,586,000 is held in Vanguard Market Liquidity Fund
and $8,846,000 is held in cash.
8 Securities with a value of $4,553,000 have been segregated as initial margin for open futures contracts.
| | | | |
| Derivative Financial Instruments Outstanding as of Period End | | |
| |
| Futures Contracts | | | | |
| | | | ($000) |
| | | | | Value and |
| | | Number of | | Unrealized |
| | | Long (Short) | Notional | Appreciation |
| | Expiration | Contracts | Amount | (Depreciation) |
| Long Futures Contracts | | | | |
| E-mini Russell 2000 Index | December 2017 | 1,507 | 113,228 | 4,276 |
Unrealized appreciation (depreciation) on open futures contracts is required to be treated as realized gain (loss) for tax purposes.
See accompanying Notes, which are an integral part of the Financial Statements.
20
Explorer Fund
Statement of Operations
| |
| | Year Ended |
| | October 31, 2017 |
| | ($000) |
| Investment Income | |
| Income | |
| Dividends1 | 96,022 |
| Interest | 4,014 |
| Securities Lending—Net | 5,578 |
| Total Income | 105,614 |
| Expenses | |
| Investment Advisory Fees—Note B | |
| Basic Fee | 21,997 |
| Performance Adjustment | (897) |
| The Vanguard Group—Note C | |
| Management and Administrative—Investor Shares | 8,156 |
| Management and Administrative—Admiral Shares | 10,295 |
| Marketing and Distribution—Investor Shares | 500 |
| Marketing and Distribution—Admiral Shares | 583 |
| Custodian Fees | 167 |
| Auditing Fees | 45 |
| Shareholders’ Reports and Proxy—Investor Shares | 258 |
| Shareholders’ Reports and Proxy—Admiral Shares | 203 |
| Trustees’ Fees and Expenses | 24 |
| Total Expenses | 41,331 |
| Expenses Paid Indirectly | (169) |
| Net Expenses | 41,162 |
| Net Investment Income | 64,452 |
| Realized Net Gain (Loss) | |
| Investment Securities Sold | 1,474,103 |
| Futures Contracts | 24,732 |
| Foreign Currencies | (17) |
| Realized Net Gain (Loss) | 1,498,818 |
| Change in Unrealized Appreciation (Depreciation) | |
| Investment Securities | 1,279,866 |
| Futures Contracts | 5,284 |
| Foreign Currencies | 1 |
| Change in Unrealized Appreciation (Depreciation) | 1,285,151 |
| Net Increase (Decrease) in Net Assets Resulting from Operations | 2,848,421 |
| 1 Dividends are net of foreign withholding taxes of $352,000. | |
See accompanying Notes, which are an integral part of the Financial Statements.
21
Explorer Fund
Statement of Changes in Net Assets
| | |
| | Year Ended October 31, |
| | 2017 | 2016 |
| | ($000) | ($000) |
| Increase (Decrease) in Net Assets | | |
| Operations | | |
| Net Investment Income | 64,452 | 59,390 |
| Realized Net Gain (Loss) | 1,498,818 | 514,943 |
| Change in Unrealized Appreciation (Depreciation) | 1,285,151 | (308,838) |
| Net Increase (Decrease) in Net Assets Resulting from Operations | 2,848,421 | 265,495 |
| Distributions | | |
| Net Investment Income | | |
| Investor Shares | (12,371) | (11,268) |
| Admiral Shares | (37,862) | (34,000) |
| Realized Capital Gain1 | | |
| Investor Shares | (138,868) | (348,212) |
| Admiral Shares | (311,675) | (688,442) |
| Total Distributions | (500,776) | (1,081,922) |
| Capital Share Transactions | | |
| Investor Shares | (495,947) | (262,647) |
| Admiral Shares | 362,658 | 458,694 |
| Net Increase (Decrease) from Capital Share Transactions | (133,289) | 196,047 |
| Total Increase (Decrease) | 2,214,356 | (620,380) |
| Net Assets | | |
| Beginning of Period | 10,819,835 | 11,440,215 |
| End of Period2 | 13,034,191 | 10,819,835 |
1 Includes fiscal 2017 and 2016 short-term gain distributions totaling $0 and $74,171,000, respectively. Short-term gain distributions
are treated as ordinary income dividends for tax purposes.
2 Net Assets—End of Period includes undistributed (overdistributed) net investment income of $28,685,000 and $17,943,000.
See accompanying Notes, which are an integral part of the Financial Statements.
22
Explorer Fund
Financial Highlights
| | | | | |
| Investor Shares | | | | | |
| |
| For a Share Outstanding | Year Ended October 31, |
| Throughout Each Period | 2017 | 2016 | 2015 | 2014 | 2013 |
| Net Asset Value, Beginning of Period | $83.91 | $90.55 | $105.28 | $107.96 | $78.03 |
| Investment Operations | | | | | |
| Net Investment Income | . 4211 | .393 | .281 | .120 | .2192 |
| Net Realized and Unrealized Gain (Loss) | | | | | |
| on Investments | 21.657 | 1.581 | (.900) | 8.062 | 32.286 |
| Total from Investment Operations | 22.078 | 1.974 | (.619) | 8.182 | 32.505 |
| Distributions | | | | | |
| Dividends from Net Investment Income | (.318) | (.270) | (.152) | (.040) | (.272) |
| Distributions from Realized Capital Gains | (3.570) | (8.344) | (13.959) | (10.822) | (2.303) |
| Total Distributions | (3.888) | (8.614) | (14.111) | (10.862) | (2.575) |
| Net Asset Value, End of Period | $102.10 | $83.91 | $90.55 | $105.28 | $107.96 |
| |
| Total Return 3 | 27.10% | 2.47% | -0.62% | 8.20% | 42.89% |
| |
| Ratios/Supplemental Data | | | | | |
| Net Assets, End of Period (Millions) | $3,520 | $3,324 | $3,863 | $4,623 | $5,573 |
| Ratio of Total Expenses to Average Net Assets4 | 0.43% | 0.45% | 0.48% | 0.51% | 0.50% |
| Ratio of Net Investment Income to | | | | | |
| Average Net Assets | 0.45% | 0.46% | 0.27% | 0.12% | 0.27%2 |
| Portfolio Turnover Rate | 76% | 66% | 62% | 66% | 65% |
1 Calculated based on average shares outstanding.
2 Net investment income per share and the ratio of net investment income to average net assets include $.038 and 0.03%, respectively,
resulting from a special dividend from HFF Inc. in December 2012.
3 Total returns do not include account service fees that may have applied in the periods shown. Fund prospectuses provide information
about any applicable account service fees.
4 Includes performance-based investment advisory fee increases (decreases) of (0.01%), (0.02%), (0.02%), 0.00%, and 0.00%.
See accompanying Notes, which are an integral part of the Financial Statements.
23
Explorer Fund
Financial Highlights
| | | | | |
| Admiral Shares | | | | | |
| |
| For a Share Outstanding | Year Ended October 31, |
| Throughout Each Period | 2017 | 2016 | 2015 | 2014 | 2013 |
| Net Asset Value, Beginning of Period | $78.07 | $84.28 | $98.03 | $100.54 | $72.68 |
| Investment Operations | | | | | |
| Net Investment Income | . 4951 | .473 | .402 | .302 | .3752 |
| Net Realized and Unrealized Gain (Loss) | | | | | |
| on Investments | 20.145 | 1.455 | (.853) | 7.466 | 30.019 |
| Total from Investment Operations | 20.640 | 1.928 | (.451) | 7.768 | 30.394 |
| Distributions | | | | | |
| Dividends from Net Investment Income | (.403) | (.383) | (.324) | (.216) | (.392) |
| Distributions from Realized Capital Gains | (3.317) | (7.755) | (12.975) | (10.062) | (2.142) |
| Total Distributions | (3.720) | (8.138) | (13.299) | (10.278) | (2.534) |
| Net Asset Value, End of Period | $94.99 | $78.07 | $84.28 | $98.03 | $100.54 |
| |
| Total Return 3 | 27.25% | 2.60% | -0.48% | 8.37% | 43.13% |
| |
| Ratios/Supplemental Data | | | | | |
| Net Assets, End of Period (Millions) | $9,514 | $7,496 | $7,577 | $7,670 | $6,497 |
| Ratio of Total Expenses to Average Net Assets4 | 0.31% | 0.33% | 0.34% | 0.35% | 0.34% |
| Ratio of Net Investment Income to | | | | | |
| Average Net Assets | 0.57% | 0.58% | 0.41% | 0.28% | 0.43%2 |
| Portfolio Turnover Rate | 76% | 66% | 62% | 66% | 65% |
1 Calculated based on average shares outstanding.
2 Net investment income per share and the ratio of net investment income to average net assets include $.019 and 0.03%, respectively,
resulting from a special dividend from HFF Inc. in December 2012.
3 Total returns do not include account service fees that may have applied in the periods shown. Fund prospectuses provide information
about any applicable account service fees.
4 Includes performance-based investment advisory fee increases (decreases) of (0.01%), (0.02%), (0.02%), 0.00%, and 0.00%.
See accompanying Notes, which are an integral part of the Financial Statements.
24
Explorer Fund
Notes to Financial Statements
Vanguard Explorer Fund is registered under the Investment Company Act of 1940 as an open-end investment company, or mutual fund. The fund offers two classes of shares: Investor Shares and Admiral Shares. Investor Shares are available to any investor who meets the fund’s minimum purchase requirements. Admiral Shares are designed for investors who meet certain administrative, service, and account-size criteria.
A. The following significant accounting policies conform to generally accepted accounting principles for U.S. investment companies. The fund consistently follows such policies in preparing its financial statements.
1. Security Valuation: Securities are valued as of the close of trading on the New York Stock Exchange (generally 4 p.m., Eastern time) on the valuation date. Equity securities are valued at the latest quoted sales prices or official closing prices taken from the primary market in which each security trades; such securities not traded on the valuation date are valued at the mean of the latest quoted bid and asked prices. Securities for which market quotations are not readily available, or whose values have been affected by events occurring before the fund’s pricing time but after the close of the securities’ primary markets, are valued at their fair values calculated according to procedures adopted by the board of trustees. These procedures include obtaining quotations from an independent pricing service, monitoring news to identify significant market-or security-specific events, and evaluating changes in the values of foreign market proxies (for example, ADRs, futures contracts, or exchange-traded funds), between the time the foreign markets close and the fund’s pricing time. When fair-value pricing is employed, the prices of securities used by a fund to calculate its net asset value may differ from quoted or published prices for the same securities. Investments in Vanguard Market Liquidity Fund are valued at that fund’s net asset value. Temporary cash investments are valued using the latest bid prices or using valuations based on a matrix system (which considers such factors as security prices, yields, maturities, and ratings), both as furnished by independent pricing services.
2. Foreign Currency: Securities and other assets and liabilities denominated in foreign currencies are translated into U.S. dollars using exchange rates obtained from an independent third party as of the fund’s pricing time on the valuation date. Realized gains (losses) and unrealized appreciation (depreciation) on investment securities include the effects of changes in exchange rates since the securities were purchased, combined with the effects of changes in security prices. Fluctuations in the value of other assets and liabilities resulting from changes in exchange rates are recorded as unrealized foreign currency gains (losses) until the assets or liabilities are settled in cash, at which time they are recorded as realized foreign currency gains (losses).
3. Futures Contracts: The fund uses index futures contracts to a limited extent, with the objective of maintaining full exposure to the stock market while maintaining liquidity. The fund may purchase or sell futures contracts to achieve a desired level of investment, whether to accommodate portfolio turnover or cash flows from capital share transactions. The primary risks associated with the use of futures contracts are imperfect correlation between changes in market values of stocks held by the fund and the prices of futures contracts, and the possibility of an illiquid market. Counterparty risk involving futures is mitigated because a regulated clearinghouse is the counterparty instead of the clearing broker. To further mitigate counterparty risk, the fund trades futures contracts on an exchange, monitors the financial strength of its clearing brokers and clearinghouse, and has
25
Explorer Fund
entered into clearing agreements with its clearing brokers. The clearinghouse imposes initial margin requirements to secure the fund’s performance and requires daily settlement of variation margin representing changes in the market value of each contract.
Futures contracts are valued at their quoted daily settlement prices. The notional amounts of the contracts are not recorded in the Statement of Net Assets. Fluctuations in the value of the contracts are recorded in the Statement of Assets and Liabilities as an asset (liability) and in the Statement of Operations as unrealized appreciation (depreciation) until the contracts are closed, when they are recorded as realized futures gains (losses).
During the year ended October 31, 2017, the fund’s average investments in long and short futures contracts represented 2% and 0% of net assets, respectively, based on the average of the notional amounts at each quarter-end during the period.
4. Repurchase Agreements: The fund enters into repurchase agreements with institutional counterparties. Securities pledged as collateral to the fund under repurchase agreements are held by a custodian bank until the agreements mature, and in the absence of a default, such collateral cannot be repledged, resold, or rehypothecated. Each agreement requires that the market value of the collateral be sufficient to cover payments of interest and principal. The fund further mitigates its counterparty risk by entering into repurchase agreements only with a diverse group of prequalified counterparties, monitoring their financial strength, and entering into master repurchase agreements with its counterparties. The master repurchase agreements provide that, in the event of a counterparty’s default (including bankruptcy), the fund may terminate any repurchase agreements with that counterparty, determine the net amount owed, and sell or retain the collateral up to the net amount owed to the fund. Such action may be subject to legal proceedings, which may delay or limit the disposition of collateral.
5. Federal Income Taxes: The fund intends to continue to qualify as a regulated investment company and distribute all of its taxable income. Management has analyzed the fund’s tax positions taken for all open federal income tax years (October 31, 2014–2017), and has concluded that no provision for federal income tax is required in the fund’s financial statements.
6. Distributions: Distributions to shareholders are recorded on the ex-dividend date.
7. Securities Lending: To earn additional income, the fund lends its securities to qualified institutional borrowers. Security loans are subject to termination by the fund at any time, and are required to be secured at all times by collateral in an amount at least equal to the market value of securities loaned. Daily market fluctuations could cause the value of loaned securities to be more or less than the value of the collateral received. When this occurs, the collateral is adjusted and settled on the next business day. The fund further mitigates its counterparty risk by entering into securities lending transactions only with a diverse group of prequalified counterparties, monitoring their financial strength, and entering into master securities lending agreements with its counterparties. The master securities lending agreements provide that, in the event of a counterparty’s default (including bankruptcy), the fund may terminate any loans with that borrower, determine the net amount owed, and sell or retain the collateral up to the net amount owed to the fund; however, such actions may be subject to legal proceedings. While collateral mitigates counterparty risk, in the event of a default, the fund may experience delays and costs in recovering the securities loaned. The fund invests cash
26
Explorer Fund
collateral received in Vanguard Market Liquidity Fund, and records a liability in the Statement of Assets and Liabilities for the return of the collateral, during the period the securities are on loan. Securities lending income represents fees charged to borrowers plus income earned on invested cash collateral, less expenses associated with the loan. During the term of the loan, the fund is entitled to all distributions made on or in respect of the loaned securities.
8. Credit Facility: The fund and certain other funds managed by The Vanguard Group (“Vanguard”) participate in a $3.1 billion committed credit facility provided by a syndicate of lenders pursuant to a credit agreement that may be renewed annually; each fund is individually liable for its borrowings, if any, under the credit facility. Borrowings may be utilized for temporary and emergency purposes, and are subject to the fund’s regulatory and contractual borrowing restrictions. The participating funds are charged administrative fees and an annual commitment fee of 0.10% of the undrawn amount of the facility; these fees are allocated to the funds based on a method approved by the fund’s board of trustees and included in Management and Administrative expenses on the fund’s Statement of Operations. Any borrowings under this facility bear interest at a rate based upon the higher of the one-month London Interbank Offered Rate, federal funds effective rate, or overnight bank funding rate plus an agreed-upon spread.
The fund had no borrowings outstanding at October 31, 2017, or at any time during the period then ended.
9. Other: Dividend income is recorded on the ex-dividend date. Interest income includes income distributions received from Vanguard Market Liquidity Fund and is accrued daily. Premiums and discounts on debt securities purchased are amortized and accreted, respectively, to interest income over the lives of the respective securities. Security transactions are accounted for on the date securities are bought or sold. Costs used to determine realized gains (losses) on the sale of investment securities are those of the specific securities sold.
Each class of shares has equal rights as to assets and earnings, except that each class separately bears certain class-specific expenses related to maintenance of shareholder accounts (included in Management and Administrative expenses), shareholder reporting, and the proxy. Marketing and distribution expenses are allocated to each class of shares based on a method approved by the board of trustees. Income, other non-class-specific expenses, and gains and losses on investments are allocated to each class of shares based on its relative net assets.
B. The investment advisory firms Wellington Management Company LLP, ArrowMark Colorado Holdings, LLC (formerly Arrowpoint Asset Management, LLC), beginning March 2017, ClearBridge Investments, LLC, and Stephens Investment Management Group, LLC, each provide investment advisory services to a portion of the fund for a fee calculated at an annual percentage rate of average net assets managed by the advisor. The basic fee of Wellington Management Company LLP is subject to quarterly adjustments based on performance relative to the Russell 2500 Growth Index for the preceding three years. The basic fee of ArrowMark Colorado Holdings, LLC, is subject to quarterly adjustments based on performance relative to the Russell 2500 Growth Index since July 31, 2014. In accordance with the advisory contract entered into with ClearBridge Investments, LLC, beginning May 1, 2018, the basic fee will be subject to quarterly
27
Explorer Fund
adjustments based on performance relative to the Russell 2500 Growth Index since April 30, 2017. The basic fee of Stephens Investment Management Group, LLC, is subject to quarterly adjustments based on performance relative to the Russell 2500 Growth Index since October 31, 2013.
Until December 2016, a portion of the fund was managed by Chartwell Investment Partners, LLC. The basic fee paid to Chartwell Investment Partners, LLC, was subject to quarterly adjustments based on performance relative to the Russell 2000 Growth Index for the preceding three years. Until March 2017, a portion of the fund was managed by Granahan Investment Management, Inc., and Kalmar Investment Advisers. The basic fee of Granahan Investment Management, Inc., was subject to quarterly adjustments based on performance relative to a 50/50 blend of the Russell 2500 Growth Index and the Russell 2000 Growth Index for the preceding three years. The basic fee of Kalmar Investment Advisers was subject to quarterly adjustments based on performance relative to the Russell 2500 Growth Index for the preceding three years.
Vanguard provides investment advisory services to a portion of the fund as described below; the fund paid Vanguard advisory fees of $1,021,000 for the year ended October 31, 2017.
For the year ended October 31, 2017, the aggregate investment advisory fee paid to all advisors represented an effective annual basic rate of 0.18% of the fund’s average net assets, before a decrease of $897,000 (0.01%) based on performance.
C. In accordance with the terms of a Funds’ Service Agreement (the “FSA”) between Vanguard and the fund, Vanguard furnishes to the fund investment advisory, corporate management, administrative, marketing, and distribution services at Vanguard’s cost of operations (as defined by the FSA). These costs of operations are allocated to the fund based on methods and guidelines approved by the board of trustees. Vanguard does not require reimbursement in the current period for certain costs of operations (such as deferred compensation/benefits and risk/insurance costs); the fund’s liability for these costs of operations is included in Payables to Vanguard on the Statement of Assets and Liabilities.
Upon the request of Vanguard, the fund may invest up to 0.40% of its net assets as capital in Vanguard. At October 31, 2017, the fund had contributed to Vanguard capital in the amount of $790,000, representing 0.01% of the fund’s net assets and 0.32% of Vanguard’s capitalization. The fund’s trustees and officers are also directors and employees, respectively, of Vanguard.
D. The fund has asked its investment advisor to direct certain security trades, subject to obtaining the best price and execution, to brokers who have agreed to rebate to the fund part of the commissions generated. Such rebates are used solely to reduce the fund’s management and administrative expenses. The fund’s custodian bank has also agreed to reduce its fees when the fund maintains cash on deposit in the non-interest-bearing custody account. For the year ended October 31, 2017, these arrangements reduced the fund’s management and administrative expenses by $166,000 and custodian fees by $3,000. The total expense reduction represented an effective annual rate of 0.00% of average net assets.
28
Explorer Fund
E. Various inputs may be used to determine the value of the fund’s investments. These inputs are summarized in three broad levels for financial statement purposes. The inputs or methodologies used to value securities are not necessarily an indication of the risk associated with investing in those securities.
Level 1—Quoted prices in active markets for identical securities.
Level 2—Other significant observable inputs (including quoted prices for similar securities, interest rates, prepayment speeds, credit risk, etc.).
Level 3—Significant unobservable inputs (including the fund’s own assumptions used to determine the fair value of investments). Any investments valued with significant unobservable inputs are
noted on the Statement of Net Assets.
The following table summarizes the market value of the fund’s investments as of October 31, 2017, based on the inputs used to value them:
| | | |
| | Level 1 | Level 2 | Level 3 |
| Investments | ($000) | ($000) | ($000) |
| Common Stocks | 12,614,606 | 94,554 | 4,979 |
| Temporary Cash Investments | 565,395 | 55,987 | — |
| Futures Contracts—Assets1 | 753 | — | — |
| Total | 13,180,754 | 150,541 | 4,979 |
| 1 Represents variation margin on the last day of the reporting period. | | | |
F. Distributions are determined on a tax basis and may differ from net investment income and realized capital gains for financial reporting purposes. Differences may be permanent or temporary. Permanent differences are reclassified among capital accounts in the financial statements to reflect their tax character. Temporary differences arise when certain items of income, expense, gain, or loss are recognized in different periods for financial statement and tax purposes. These differences will reverse at some time in the future. Differences in classification may also result from the treatment of short-term gains as ordinary income for tax purposes.
The fund used a tax accounting practice to treat a portion of the price of capital shares redeemed during the year as distributions from net investment income and realized capital gains. Accordingly, the fund has reclassified $4,541,000 from undistributed net investment income and $107,245,000 from accumulated net realized gains to paid-in capital.
For tax purposes, at October 31, 2017, the fund had $347,477,000 of ordinary income and $1,087,501,000 of long-term capital gains available for distribution.
At October 31, 2017, the cost of investment securities for tax purposes was $10,777,625,000. Net unrealized appreciation of investment securities for tax purposes was $2,557,896,000, consisting of unrealized gains of $3,055,395,000 on securities that had risen in value since their purchase and $497,499,000 in unrealized losses on securities that had fallen in value since their purchase.
29
Explorer Fund
G. During the year ended October 31, 2017, the fund purchased $8,855,403,000 of investment securities and sold $9,286,249,000 of investment securities, other than temporary cash investments.
H. Capital share transactions for each class of shares were:
| | | | |
| | Year Ended October 31, |
| | 2017 | 2016 |
| | Amount | Shares | Amount | Shares |
| | ($000) | (000) | ($000) | (000) |
| Investor Shares | | | | |
| Issued | 241,157 | 2,593 | 217,700 | 2,731 |
| Issued in Lieu of Cash Distributions | 148,985 | 1,706 | 354,130 | 4,350 |
| Redeemed | (886,089) | (9,437) | (834,477) | (10,127) |
| Net Increase (Decrease)—Investor Shares | (495,947) | (5,138) | (262,647) | (3,046) |
| Admiral Shares | | | | |
| Issued | 1,314,009 | 15,041 | 1,001,585 | 13,146 |
| Issued in Lieu of Cash Distributions | 325,490 | 4,011 | 683,869 | 9,039 |
| Redeemed | (1,276,841) | (14,911) | (1,226,760) | (16,073) |
| Net Increase (Decrease)—Admiral Shares | 362,658 | 4,141 | 458,694 | 6,112 |
30
Explorer Fund
I. Certain of the fund’s investments are in companies that are considered to be affiliated companies of the fund because the fund owns more than 5% of the outstanding voting securities of the company or the issuer is another member of The Vanguard Group. Transactions during the period in securities of these companies were as follows:
| | | | | | | | |
| | | Current Period Transactions | |
| | Oct. 31, | | Proceeds | Realized | | | | Oct. 31, |
| | 2016 | | from | Net | Change in | | Capital Gain | 2017 |
| | Market | Purchases | Securities | Gain | Unrealized | | Distributions | Market |
| | Value | at Cost | Sold | (Loss) | App.(Dep.) Income | | Received | Value |
| | ($000) | ($000) | ($000) | ($000) | ($000) | ($000) ($000) | ($000) |
| BroadSoft Inc. | NA1 | 56,860 | 35,160 | 2,520 | 18,788 | — | — | NA1 |
| Cardtronics plc | | | | | | | | |
| Class A | NA1 | 86,704 | 76,508 | (3,001) | (53,013) | — | — | NA1 |
| eHealth Inc. | 7,324 | — | 10,555 | (1,538) | 4,769 | — | — | — |
| H&E Equipment | | | | | | | | |
| Services Inc. | 27,559 | — | 32,223 | (6,856) | 11,520 | 274 | — | — |
| Information Services | | | | | | | | |
| Group Inc. | 8,649 | 3,963 | 11,994 | 628 | (1,246) | — | — | — |
| Kindred Healthcare | | | | | | | | |
| Inc. | NA2 | 12,552 | — | — | (16,784) | — | — | 30,653 |
| MarineMax Inc. | 28,588 | 1,467 | 24,880 | (5,168) | (7) | — | — | — |
| National CineMedia | | | | | | | | |
| Inc. | NA1 | 29,502 | 26,659 | (6,733) | (18,724) | — | — | NA1 |
| Vanguard Market | | | | | | | | |
| Liquidity Fund | 504,433 | NA 3 | NA 3 | 30 | (20) | 3,586 | — | 565,395 |
| Vanguard | | | | | | | | |
| Small-Cap ETF | 90,564 | 625,959 | 665,990 | 15,418 | 2,704 | 1,592 | — | 68,655 |
| Vanguard Small- | | | | | | | | |
| Cap Growth ETF | 47,964 | — | — | — | 12,122 | 531 | — | 60,086 |
| Total | 715,081 | | | (4,700) | (39,891) | 5,983 | — | 724,789 |
1 Not applicable—at October 31, 2016, and October 31, 2017, the issuer was not an affiliated company of the fund, but it was
affiliated during the year.
2 Not applicable—at October 31, 2016, the issuer was not an affiliated company of the fund.
3 Not applicable—purchases and sales are for temporary cash investment purposes.
J. Management has determined that no material events or transactions occurred subsequent to October 31, 2017, that would require recognition or disclosure in these financial statements.
31
Report of Independent Registered
Public Accounting Firm
To the Board of Trustees and Shareholders of Vanguard Explorer Fund
In our opinion, the accompanying statement of net assets – investments summary and statement of assets and liabilities, and the related statements of operations and of changes in net assets and the financial highlights present fairly, in all material respects, the financial position of Vanguard Explorer Fund (the “Fund”) as of October 31, 2017, the results of its operations for the year then ended, the changes in its net assets for each of the two years in the period then ended and the financial highlights for each of the five years in the period then ended, in conformity with accounting principles generally accepted in the United States of America. These financial statements and financial highlights (hereafter referred to as “financial statements”) are the responsibility of the Fund’s management. Our responsibility is to express an opinion on these financial statements based on our audits. We conducted our audits of these financial statements in accordance with the standards of the Public Company Accounting Oversight Board (United States). Those standards require that we plan and perform the audit to obtain reasonable assurance about whether the financial statements are free of material misstatement. An audit includes examining, on a test basis, evidence supporting the amounts and disclosures in the financial statements, assessing the accounting principles used and significant estimates made by management, and evaluating the overall financial statement presentation. We believe that our audits, which included confirmation of securities as of October 31, 2017 by correspondence with the custodian and brokers and by agreement to the underlying ownership records of the transfer agent, provide a reasonable basis for our opinion.
/s/PricewaterhouseCoopers LLP
Philadelphia, Pennsylvania
December 19, 2017

Special 2017 tax information (unaudited) for Vanguard Explorer Fund
This information for the fiscal year ended October 31, 2017, is included pursuant to provisions of
the Internal Revenue Code.
The fund distributed $543,610,000 as capital gain dividends (20% rate gain distributions) to
shareholders during the fiscal year.
The fund distributed $50,233,000 of qualified dividend income to shareholders during the fiscal year.
For corporate shareholders, 15.3% of investment income (dividend income plus short-term gains,
if any) qualifies for the dividends-received deduction.
32
Your Fund’s After-Tax Returns
This table presents returns for your fund both before and after taxes. The after-tax returns are shown in two ways: (1) assuming that an investor owned the fund during the entire period and paid taxes on the fund’s distributions, and (2) assuming that an investor paid taxes on the fund’s distributions and sold all shares at the end of each period.
Calculations are based on the highest individual federal income tax and capital gains tax rates in effect at the times of the distributions and the hypothetical sales. State and local taxes were not considered. After-tax returns reflect any qualified dividend income, using actual prior-year figures and estimates for 2017. (In the example, returns after the sale of fund shares may be higher than those assuming no sale. This occurs when the sale would have produced a capital loss. The calculation assumes that the investor received a tax deduction for the loss.)
The table shows returns for Investor Shares only; returns for other share classes will differ. Please note that your actual after-tax returns will depend on your tax situation and may differ from those shown. Also note that if you own the fund in a tax-deferred account, such as an individual retirement account or a 401(k) plan, this information does not apply to you. Such accounts are not subject to current taxes.
Finally, keep in mind that a fund’s performance—whether before or after taxes—does not guarantee future results.
| | | |
| Average Annual Total Returns: Explorer Fund Investor Shares | | | |
| Periods Ended October 31, 2017 | | | |
| | One | Five | Ten |
| | Year | Years | Years |
| Returns Before Taxes | 27.10% | 14.88% | 7.57% |
| Returns After Taxes on Distributions | 25.81 | 12.59 | 6.28 |
| Returns After Taxes on Distributions and Sale of Fund Shares | 16.14 | 11.44 | 5.82 |
33
About Your Fund’s Expenses
As a shareholder of the fund, you incur ongoing costs, which include costs for portfolio management, administrative services, and shareholder reports (like this one), among others. Operating expenses, which are deducted from a fund’s gross income, directly reduce the investment return of the fund.
A fund’s expenses are expressed as a percentage of its average net assets. This figure is known as the expense ratio. The following examples are intended to help you understand the ongoing costs (in dollars) of investing in your fund and to compare these costs with those of other mutual funds. The examples are based on an investment of $1,000 made at the beginning of the period shown and held for the entire period.
The accompanying table illustrates your fund’s costs in two ways:
• Based on actual fund return. This section helps you to estimate the actual expenses that you paid over the period. The ”Ending Account Value“ shown is derived from the fund‘s actual return, and the third column shows the dollar amount that would have been paid by an investor who started with $1,000 in the fund. You may use the information here, together with the amount you invested, to estimate the expenses that you paid over the period.
To do so, simply divide your account value by $1,000 (for example, an $8,600 account value divided by $1,000 = 8.6), then multiply the result by the number given for your fund under the heading ”Expenses Paid During Period.“
• Based on hypothetical 5% yearly return. This section is intended to help you compare your fund‘s costs with those of other mutual funds. It assumes that the fund had a yearly return of 5% before expenses, but that the expense ratio is unchanged. In this case—because the return used is not the fund’s actual return—the results do not apply to your investment. The example is useful in making comparisons because the Securities and Exchange Commission requires all mutual funds to calculate expenses based on a 5% return. You can assess your fund’s costs by comparing this hypothetical example with the hypothetical examples that appear in shareholder reports of other funds.
Note that the expenses shown in the table are meant to highlight and help you compare ongoing costs only and do not reflect transaction costs incurred by the fund for buying and selling securities. Further, the expenses do not include any purchase, redemption, or account service fees described in the fund prospectus. If such fees were applied to your account, your costs would be higher. Your fund does not carry a “sales load.”
The calculations assume no shares were bought or sold during the period. Your actual costs may have been higher or lower, depending on the amount of your investment and the timing of any purchases or redemptions.
You can find more information about the fund’s expenses, including annual expense ratios, in the Financial Statements section of this report. For additional information on operating expenses and other shareholder costs, please refer to your fund’s current prospectus.
34
| | | |
| Six Months Ended October 31, 2017 | | | |
| | Beginning | Ending | Expenses |
| | Account Value | Account Value | Paid During |
| Explorer Fund | 4/30/2017 | 10/31/2017 | Period |
| Based on Actual Fund Return | | | |
| Investor Shares | $1,000.00 | $1,093.26 | $2.22 |
| Admiral Shares | 1,000.00 | 1,093.98 | 1.64 |
| Based on Hypothetical 5% Yearly Return | | | |
| Investor Shares | $1,000.00 | $1,023.09 | $2.14 |
| Admiral Shares | 1,000.00 | 1,023.64 | 1.58 |
The calculations are based on expenses incurred in the most recent six-month period. The fund’s annualized six-month expense ratios for
that period are 0.42% for Investor Shares and 0.31% for Admiral Shares. The dollar amounts shown as “Expenses Paid” are equal to the
annualized expense ratio multiplied by the average account value over the period, multiplied by the number of days in the most recent
six-month period, then divided by the number of days in the most recent 12-month period (184/365).
35
Glossary
30-Day SEC Yield. A fund’s 30-day SEC yield is derived using a formula specified by the U.S. Securities and Exchange Commission. Under the formula, data related to the fund’s security holdings in the previous 30 days are used to calculate the fund’s hypothetical net income for that period, which is then annualized and divided by the fund’s estimated average net assets over the calculation period. For the purposes of this calculation, a security’s income is based on its current market yield to maturity (for bonds), its actual income (for asset-backed securities), or its projected dividend yield (for stocks). Because the SEC yield represents hypothetical annualized income, it will differ—at times significantly—from the fund’s actual experience. As a result, the fund’s income distributions may be higher or lower than implied by the SEC yield.
Beta. A measure of the magnitude of a fund’s past share-price fluctuations in relation to the ups and downs of a given market index. The index is assigned a beta of 1.00. Compared with a given index, a fund with a beta of 1.20 typically would have seen its share price rise or fall by 12% when the index rose or fell by 10%. For this report, beta is based on returns over the past 36 months for both the fund and the index. Note that a fund’s beta should be reviewed in conjunction with its R-squared (see definition). The lower the R-squared, the less correlation there is between the fund and the index, and the less reliable beta is as an indicator of volatility.
Dividend Yield. Dividend income earned by stocks, expressed as a percentage of the aggregate market value (or of net asset value, for a fund). The yield is determined by dividing the amount of the annual dividends by the aggregate value (or net asset value) at the end of the period. For a fund, the dividend yield is based solely on stock holdings and does not include any income produced by other investments.
Earnings Growth Rate. The average annual rate of growth in earnings over the past five years for the stocks now in a fund.
Equity Exposure. A measure that reflects a fund’s investments in stocks and stock futures. Any holdings in short-term reserves are excluded.
Expense Ratio. A fund’s total annual operating expenses expressed as a percentage of the fund’s average net assets. The expense ratio includes management and administrative expenses, but does not include the transaction costs of buying and selling portfolio securities.
Foreign Holdings. The percentage of a fund represented by securities or depositary receipts of companies based outside the United States.
Inception Date. The date on which the assets of a fund (or one of its share classes) are first invested in accordance with the fund’s investment objective. For funds with a subscription period, the inception date is the day after that period ends. Investment performance is measured from the inception date.
Median Market Cap. An indicator of the size of companies in which a fund invests; the midpoint of market capitalization (market price x shares outstanding) of a fund’s stocks, weighted by the proportion of the fund’s assets invested in each stock. Stocks representing half of the fund’s assets have market capitalizations above the median, and the rest are below it.
Price/Book Ratio. The share price of a stock divided by its net worth, or book value, per share.
For a fund, the weighted average price/book ratio of the stocks it holds.
36
Price/Earnings Ratio. The ratio of a stock’s current price to its per-share earnings over the past year. For a fund, the weighted average P/E of the stocks it holds. P/E is an indicator of market expectations about corporate prospects; the higher the P/E, the greater the expectations for a company’s future growth.
R-Squared. A measure of how much of a fund’s past returns can be explained by the returns from the market in general, as measured by a given index. If a fund’s total returns were precisely synchronized with an index’s returns, its R-squared would be 1.00. If the fund’s returns bore no relationship to the index’s returns, its R-squared would be 0. For this report, R-squared is based on returns over the past 36 months for both the fund and the index.
Return on Equity. The annual average rate of return generated by a company during the past five years for each dollar of shareholder’s equity (net income divided by shareholder’s equity). For a fund, the weighted average return on equity for the companies whose stocks it holds.
Short-Term Reserves. The percentage of a fund invested in highly liquid, short-term securities that can be readily converted to cash.
Turnover Rate. An indication of the fund’s trading activity. Funds with high turnover rates incur higher transaction costs and may be more likely to distribute capital gains (which may be taxable to investors). The turnover rate excludes in-kind transactions, which have minimal impact on costs.
37
The Global Industry Classification Standard (“GICS”) was developed by and is the exclusive property and a service mark
of MSCI Inc. (“MSCI”) and Standard and Poor’s, a division of McGraw-Hill Companies, Inc. (“S&P”), and is licensed for use
by Vanguard. Neither MSCI, S&P nor any third party involved in making or compiling the GICS or any GICS classification
makes any express or implied warranties or representations with respect to such standard or classification (or the results
to be obtained by the use thereof), and all such parties hereby expressly disclaim all warranties of originality, accuracy,
completeness, merchantability or fitness for a particular purpose with respect to any such standard or classification.
Without limiting any of the foregoing, in no event shall MSCI, S&P, any of its affiliates or any third party involved in
making or compiling the GICS or any GICS classification have any liability for any direct, indirect, special, punitive,
consequential or any other damages (including lost profits) even if notified of the possibility of such damages.
38
The People Who Govern Your Fund
The trustees of your mutual fund are there to see that the fund is operated and managed in your best interests since, as a shareholder, you are a part owner of the fund. Your fund’s trustees also serve on the board of directors of The Vanguard Group, Inc., which is owned by the Vanguard funds and provides services to them on an at-cost basis.
A majority of Vanguard’s board members are independent, meaning that they have no affiliation with Vanguard or the funds they oversee, apart from the sizable personal investments they have made as private individuals. The independent board members have distinguished backgrounds in business, academia, and public service. Each of the trustees and executive officers oversees 200 Vanguard funds.
Information for each trustee and executive officer of the fund appears below. The mailing address of the trustees and officers is P.O. Box 876, Valley Forge, PA 19482. More information about the trustees is in the Statement of Additional Information, which can be obtained, without charge, by contacting Vanguard at 800-662-7447, or online at vanguard.com.
Interested Trustee1
F. William McNabb III
Born 1957. Trustee Since July 2009. Chairman of the Board. Principal Occupation(s) During the Past Five Years and Other Experience: Chairman of the Board of The Vanguard Group, Inc., and of each of the investment companies served by The Vanguard Group, since January 2010; Chief Executive Officer and Director of The Vanguard Group and President and Chief Executive Officer of each of the investment companies served by The Vanguard Group, since 2008; Director of Vanguard Marketing Corporation; President of The Vanguard Group (2008–2017); Managing Director of The Vanguard Group (1995–2008).
Independent Trustees
Emerson U. Fullwood
Born 1948. Trustee Since January 2008. Principal Occupation(s) During the Past Five Years and Other Experience: Executive Chief Staff and Marketing Officer for North America and Corporate Vice President (retired 2008) of Xerox Corporation (document management products and services); Executive in Residence and 2009–2010 Distinguished Minett Professor at the Rochester Institute of Technology; Lead Director of SPX FLOW, Inc. (multi-industry manufacturing); Director of the United Way of Rochester, the University of Rochester Medical Center, Monroe Community College Foundation, North Carolina A&T University, and Roberts Wesleyan College; Trustee of the University of Rochester.
Rajiv L. Gupta
Born 1945. Trustee Since December 2001.2 Principal Occupation(s) During the Past Five Years and Other Experience: Chairman and Chief Executive Officer (retired 2009) and President (2006–2008) of Rohm and Haas Co. (chemicals); Director of Arconic Inc. (diversified manufacturer), HP Inc. (printer and personal computer manufacturing), and Delphi Automotive plc (automotive components); Senior Advisor at New Mountain Capital.
Amy Gutmann
Born 1949. Trustee Since June 2006. Principal Occupation(s) During the Past Five Years and Other Experience: President of the University of Pennsylvania; Christopher H. Browne
1 Mr. McNabb is considered an “interested person,” as defined in the Investment Company Act of 1940, because he is an officer of the Vanguard funds.
2 December 2002 for Vanguard Equity Income Fund, the Vanguard Municipal Bond Funds, and the Vanguard State Tax-Exempt Funds.
Distinguished Professor of Political Science, School of Arts and Sciences, and Professor of Communication, Annenberg School for Communication, with secondary faculty appointments in the Department of Philosophy, School of Arts and Sciences, and at the Graduate School of Education, University of Pennsylvania; Trustee of the National Constitution Center.
JoAnn Heffernan Heisen
Born 1950. Trustee Since July 1998. Principal Occupation(s) During the Past Five Years and Other Experience: Corporate Vice President and Member of the Executive Committee (1997–2008), Chief Global Diversity Officer (retired 2008), Vice President and Chief Information Officer (1997–2006), Controller (1995–1997), Treasurer (1991–1995), and Assistant Treasurer (1989–1991) of Johnson & Johnson (pharmaceuticals/medical devices/ consumer products); Director of Skytop Lodge Corporation (hotels) and the Robert Wood Johnson Foundation; Member of the Advisory Board of the Institute for Women’s Leadership at Rutgers University.
F. Joseph Loughrey
Born 1949. Trustee Since October 2009. Principal Occupation(s) During the Past Five Years and Other Experience: President and Chief Operating Officer (retired 2009) of Cummins Inc. (industrial machinery); Chairman of the Board of Hillenbrand, Inc. (specialized consumer services), Oxfam America, and the Lumina Foundation for Education; Director of the V Foundation for Cancer Research; Member of the Advisory Council for the College of Arts and Letters and Chair of the Advisory Board to the Kellogg Institute for International Studies, both at the University of Notre Dame.
Mark Loughridge
Born 1953. Trustee Since March 2012. Principal Occupation(s) During the Past Five Years and Other Experience: Senior Vice President and Chief Financial Officer (retired 2013) at IBM (information technology services); Fiduciary Member of IBM’s Retirement Plan Committee (2004–2013); Member of the Council on Chicago Booth.
Scott C. Malpass
Born 1962. Trustee Since March 2012. Principal Occupation(s) During the Past Five Years and Other Experience: Chief Investment Officer and Vice President at the University of Notre Dame; Assistant Professor of Finance at the Mendoza College of Business at Notre Dame; Member of the Notre Dame 403(b) Investment Committee, the Board of Advisors for Spruceview Capital Partners, the Board of Catholic Investment Services, Inc. (investment advisor), and the Board of Superintendence of the Institute for the Works of Religion; Chairman of the Board of TIFF Advisory Services, Inc. (investment advisor).
André F. Perold
Born 1952. Trustee Since December 2004. Principal Occupation(s) During the Past Five Years and Other Experience: George Gund Professor of Finance and Banking, Emeritus at the Harvard Business School (retired 2011); Chief Investment Officer and Co-Managing Partner of HighVista Strategies LLC (private investment firm); Overseer of the Museum of Fine Arts Boston.
Peter F. Volanakis
Born 1955. Trustee Since July 2009. Principal Occupation(s) During the Past Five Years and Other Experience: President and Chief Operating Officer (retired 2010) of Corning Incorporated (communications equipment); Chairman of the Board of Trustees of Colby-Sawyer College; Member of the Board of Hypertherm, Inc. (industrial cutting systems, software, and consumables).
Executive Officers
Glenn Booraem
Born 1967. Investment Stewardship Officer Since February 2017. Principal Occupation(s) During the Past Five Years and Other Experience: Principal of The Vanguard Group, Inc.; Treasurer (2015–2017), Controller (2010–2015), and Assistant Controller (2001–2010) of each of the investment companies served by The Vanguard Group.
Thomas J. Higgins
Born 1957. Chief Financial Officer Since September 2008. Principal Occupation(s) During the Past Five Years and Other Experience: Principal of The Vanguard Group, Inc.; Chief Financial Officer of each of the investment companies served by The Vanguard Group; Treasurer of each of the investment companies served by The Vanguard Group (1998–2008).
Peter Mahoney
Born 1974. Controller Since May 2015. Principal Occupation(s) During the Past Five Years and Other Experience: Principal of The Vanguard Group, Inc.; Controller of each of the investment companies served by The Vanguard Group; Head of International Fund Services at The Vanguard Group (2008–2014).
Anne E. Robinson
Born 1970. Secretary Since September 2016. Principal Occupation(s) During the Past Five Years and Other Experience: Managing Director of The Vanguard Group, Inc.; General Counsel of The Vanguard Group; Secretary of The Vanguard Group and of each of the investment companies served by The Vanguard Group; Director and Senior Vice President of Vanguard Marketing Corporation; Managing Director and General Counsel of Global Cards and Consumer Services at Citigroup (2014–2016); Counsel at American Express (2003–2014).
Michael Rollings
Born 1963. Treasurer Since February 2017. Principal Occupation(s) During the Past Five Years and Other Experience: Managing Director of The Vanguard Group, Inc.; Treasurer of each of the investment companies served by The Vanguard Group; Director of Vanguard Marketing Corporation; Executive Vice President and Chief Financial Officer of MassMutual Financial Group (2006–2016).
| |
| Vanguard Senior Management Team |
| |
| Mortimer J. Buckley | Chris D. McIsaac |
| Gregory Davis | James M. Norris |
| John James | Thomas M. Rampulla |
| Martha G. King | Karin A. Risi |
| John T. Marcante | |
| |
| |
| Chairman Emeritus and Senior Advisor |
| |
| John J. Brennan | |
| Chairman, 1996–2009 | |
| Chief Executive Officer and President, 1996–2008 |
| |
| |
| Founder | |
| |
| John C. Bogle | |
| Chairman and Chief Executive Officer, 1974–1996 |
|  |
| | P.O. Box 2600 |
| | Valley Forge, PA 19482-2600 |
| |
| |
| |
| Connect with Vanguard® > vanguard.com |
| |
| |
| |
| Fund Information > 800-662-7447 | CFA® is a registered trademark owned by CFA Institute. |
| Direct Investor Account Services > 800-662-2739 |
| Institutional Investor Services > 800-523-1036 |
| Text Telephone for People | |
| Who Are Deaf or Hard of Hearing> 800-749-7273 |
| |
| This material may be used in conjunction |
| with the offering of shares of any Vanguard |
| fund only if preceded or accompanied by |
| the fund’s current prospectus. | |
| |
| All comparative mutual fund data are from Lipper, a |
| Thomson Reuters Company, or Morningstar, Inc., unless |
| otherwise noted. | |
| |
| You can obtain a free copy of Vanguard’s proxy voting |
| guidelines by visiting vanguard.com/proxyreporting or by |
| calling Vanguard at 800-662-2739. The guidelines are |
| also available from the SEC’s website, sec.gov. In |
| addition, you may obtain a free report on how your fund |
| voted the proxies for securities it owned during the 12 |
| months ended June 30. To get the report, visit either |
| vanguard.com/proxyreporting or sec.gov. |
| |
| You can review and copy information about your fund at |
| the SEC’s Public Reference Room in Washington, D.C. To |
| find out more about this public service, call the SEC at |
| 202-551-8090. Information about your fund is also |
| available on the SEC’s website, and you can receive |
| copies of this information, for a fee, by sending a |
| request in either of two ways: via email addressed to |
| publicinfo@sec.gov or via regular mail addressed to the |
| Public Reference Section, Securities and Exchange |
| Commission, Washington, DC 20549-1520. |
| | © 2017 The Vanguard Group, Inc. |
| | All rights reserved. |
| | Vanguard Marketing Corporation, Distributor. |
| |
| | Q240 122017 |
Item 2: Code of Ethics. The Registrant has adopted a code of ethics that applies to the Registrant’s principal executive officer, principal financial officer, principal accounting officer or controller or persons performing similar functions. The Code of Ethics was amended during the reporting period covered by this report to make certain technical, non-material changes.
Item 3: Audit Committee Financial Expert. All members of the Audit Committee have been determined by the Registrant’s Board of Trustees to be Audit Committee Financial Experts and to be independent: Rajiv L. Gupta, JoAnn Heffernan Heisen, F. Joseph Loughrey, Mark Loughridge, and Peter F. Volanakis.
Item 4: Principal Accountant Fees and Services.
(a) Audit Fees.
Audit Fees of the Registrant
Fiscal Year Ended October 31, 2017: $45,000
Fiscal Year Ended October 31, 2016: $46,000
Aggregate Audit Fees of Registered Investment Companies in the Vanguard Group.
Fiscal Year Ended October 31, 2017: $8,424,459
Fiscal Year Ended October 31, 2016: $9,629,849
Includes fees billed in connection with audits of the Registrant, other registered investment companies in the Vanguard complex, The Vanguard Group, Inc. and Vanguard Marketing Corporation.
(b) Audit-Related Fees.
Fiscal Year Ended October 31, 2017: $3,194,093
Fiscal Year Ended October 31, 2016: $2,717,627
Includes fees billed in connection with assurance and related services provided to the Registrant, other registered investment companies in the Vanguard complex, The Vanguard Group, Inc., and Vanguard Marketing Corporation.
(c) Tax Fees.
Fiscal Year Ended October 31, 2017: $274,313
Fiscal Year Ended October 31, 2016: $254,050
Includes fees billed in connection with tax compliance, planning, and advice services provided to the Registrant, other registered investment companies in the Vanguard complex, The Vanguard Group, Inc., and Vanguard Marketing Corporation.
(d) All Other Fees.
Fiscal Year Ended October 31, 2017: $0
Fiscal Year Ended October 31, 2016: $214,225
Includes fees billed for services related to tax reported information provided to the Registrant, other registered investment companies in the Vanguard complex, The Vanguard Group, Inc., and Vanguard Marketing Corporation.
(e) (1) Pre-Approval Policies. The policy of the Registrant’s Audit Committee is to consider and, if appropriate, approve before the principal accountant is engaged for such services, all specific audit and non-audit services provided to: the Registrant, other registered investment companies in the Vanguard complex, The Vanguard Group, Inc., and entities controlled by The Vanguard Group, Inc. that provide ongoing services to the Registrant. In making a determination, the Audit Committee considers whether the services are consistent with maintaining the principal accountant’s independence.
In the event of a contingency situation in which the principal accountant is needed to provide services in between scheduled Audit Committee meetings, the Chairman of the Audit Committee would be called on to consider and, if appropriate, pre-approve audit or permitted non-audit services in an amount sufficient to complete services through the next Audit Committee meeting, and to determine if such services would be consistent with maintaining the accountant’s independence. At the next scheduled Audit Committee meeting, services and fees would be presented to the Audit Committee for formal consideration, and, if appropriate, approval by the entire Audit Committee. The Audit Committee would again consider whether such services and fees are consistent with maintaining the principal accountant’s independence.
The Registrant’s Audit Committee is informed at least annually of all audit and non-audit services provided by the principal accountant to the Vanguard complex, whether such services are provided to: the Registrant, other registered investment companies in the Vanguard complex, The Vanguard Group, Inc., or other entities controlled by The Vanguard Group, Inc. that provide ongoing services to the Registrant.
(2) No percentage of the principal accountant’s fees or services were approved pursuant to the waiver provision of paragraph (c)(7)(i)(C) of Rule 2-01 of Regulation S-X.
(f) For the most recent fiscal year, over 50% of the hours worked under the principal accountant’s engagement were not performed by persons other than full-time, permanent employees of the principal accountant.
(g) Aggregate Non-Audit Fees.
Fiscal Year Ended October 31, 2017: $274,313
Fiscal Year Ended October 31, 2016: $468,275
Includes fees billed for non-audit services provided to the Registrant, other registered investment companies in the Vanguard complex, The Vanguard Group, Inc., and Vanguard Marketing Corporation.
(h) For the most recent fiscal year, the Audit Committee has determined that the provision of all non-audit services was consistent with maintaining the principal accountant’s independence.
Item 5: Audit Committee of Listed Registrants.
Not Applicable.
Item 6: Investments.
| | | |
| Vanguard® Explorer Fund | | |
| Schedule of Investments | | |
| October 31, 2017 | | |
| |
| | | | Market |
| | | | Value |
| | | Shares | ($000) |
| |
| Common Stocks (97.5%)1 | | |
| Consumer Discretionary (13.6%) | | |
| | Carter's Inc. | 996,117 | 96,354 |
| * | Live Nation Entertainment Inc. | 1,671,498 | 73,178 |
| * | Burlington Stores Inc. | 758,216 | 71,189 |
| | New York Times Co. Class A | 3,033,454 | 57,939 |
| ^ | Monro Inc. | 1,075,002 | 53,051 |
| | Bloomin' Brands Inc. | 2,945,706 | 52,375 |
| * | Deckers Outdoor Corp. | 714,200 | 48,737 |
| * | ServiceMaster Global Holdings Inc. | 990,662 | 46,670 |
| | Papa John's International Inc. | 680,176 | 46,286 |
| * | Sally Beauty Holdings Inc. | 2,556,830 | 44,259 |
| ^ | Acushnet Holdings Corp. | 2,368,806 | 43,752 |
| | Cinemark Holdings Inc. | 1,192,958 | 43,352 |
| | Lennar Corp. Class A | 778,291 | 43,327 |
| | Chico's FAS Inc. | 5,147,307 | 41,127 |
| *,^ | TripAdvisor Inc. | 1,070,700 | 40,151 |
| | Polaris Industries Inc. | 338,375 | 40,074 |
| | La-Z-Boy Inc. | 1,437,410 | 38,738 |
| | Wolverine World Wide Inc. | 1,394,060 | 38,058 |
| * | Lululemon Athletica Inc. | 582,624 | 35,837 |
| | Core-Mark Holding Co. Inc. | 1,000,230 | 34,068 |
| * | Buffalo Wild Wings Inc. | 284,610 | 33,641 |
| | Dunkin' Brands Group Inc. | 568,028 | 33,553 |
| *,^ | Under Armour Inc. | 2,896,237 | 33,394 |
| * | Lions Gate Entertainment Corp. Class A | 1,013,718 | 29,418 |
| | Tenneco Inc. | 492,585 | 28,624 |
| * | Grand Canyon Education Inc. | 319,397 | 28,589 |
| | Cooper Tire & Rubber Co. | 706,400 | 23,170 |
| | Domino's Pizza Inc. | 125,650 | 22,994 |
| | Lear Corp. | 129,848 | 22,800 |
| ^ | Wingstop Inc. | 604,013 | 20,458 |
| | Expedia Inc. | 161,692 | 20,157 |
| * | LKQ Corp. | 515,098 | 19,414 |
| ^ | Signet Jewelers Ltd. | 281,880 | 18,483 |
| * | NVR Inc. | 5,618 | 18,435 |
| *,^ | Carvana Co. | 1,297,428 | 18,398 |
| *,^ | Ollie's Bargain Outlet Holdings Inc. | 411,926 | 18,393 |
| | Ross Stores Inc. | 284,317 | 18,051 |
| | Advance Auto Parts Inc. | 206,250 | 16,859 |
| | National CineMedia Inc. | 2,503,991 | 16,852 |
| * | Ulta Beauty Inc. | 82,053 | 16,557 |
| ^ | Cheesecake Factory Inc. | 364,202 | 16,294 |
| * | Scientific Games Corp. Class A | 342,277 | 16,292 |
| * | Bright Horizons Family Solutions Inc. | 183,988 | 15,878 |
| | Children's Place Inc. | 134,128 | 14,593 |
| * | Taylor Morrison Home Corp. Class A | 595,091 | 14,371 |
| * | Dave & Buster's Entertainment Inc. | 282,950 | 13,638 |
| ^ | KB Home | 494,469 | 13,563 |
| *,^ | IMAX Corp. | 557,758 | 13,526 |
| * | Helen of Troy Ltd. | 139,077 | 12,920 |
| * | Chuy's Holdings Inc. | 536,760 | 12,077 |
| | H&R Block Inc. | 487,906 | 12,071 |
| | Tailored Brands Inc. | 778,384 | 12,026 |
| * | Netflix Inc. | 56,422 | 11,083 |
| | Nutrisystem Inc. | 205,809 | 10,280 |
| | Aaron's Inc. | 272,262 | 10,019 |
| ^ | PetMed Express Inc. | 277,432 | 9,810 |
| *,^ | iRobot Corp. | 141,430 | 9,503 |
| | Ruth's Hospitality Group Inc. | 437,159 | 9,224 |
| | Dick's Sporting Goods Inc. | 363,574 | 8,897 |
| | Sinclair Broadcast Group Inc. Class A | 268,373 | 8,507 |
| * | Pinnacle Entertainment Inc. | 328,028 | 8,486 |
1
| | | |
| Vanguard® Explorer Fund | | |
| Schedule of Investments | | |
| October 31, 2017 | | |
| |
| | | | Market |
| | | | Value |
| | | Shares | ($000) |
| * | Cooper-Standard Holdings Inc. | 70,878 | 7,902 |
| * | Weight Watchers International Inc. | 174,089 | 7,820 |
| | Service Corp. International | 213,681 | 7,577 |
| * | MCBC Holdings Inc. | 326,591 | 7,469 |
| * | Fox Factory Holding Corp. | 138,768 | 5,905 |
| * | Malibu Boats Inc. Class A | 188,977 | 5,896 |
| | MDC Holdings Inc. | 154,548 | 5,724 |
| * | Chegg Inc. | 331,143 | 5,136 |
| * | Visteon Corp. | 37,075 | 4,673 |
| ^ | Brinker International Inc. | 128,533 | 3,949 |
| * | Sotheby's | 75,888 | 3,933 |
| | Capella Education Co. | 38,600 | 3,144 |
| * | MSG Networks Inc. | 148,220 | 2,572 |
| | Bassett Furniture Industries Inc. | 41,700 | 1,618 |
| * | Lumber Liquidators Holdings Inc. | 47,782 | 1,471 |
| * | Gray Television Inc. | 81,585 | 1,270 |
| * | Hemisphere Media Group Inc. Class A | 85,560 | 1,044 |
| | | | 1,776,923 |
| Consumer Staples (2.9%) | | |
| | Nu Skin Enterprises Inc. Class A | 868,363 | 55,236 |
| | Casey's General Stores Inc. | 432,190 | 49,516 |
| * | Post Holdings Inc. | 568,516 | 47,147 |
| * | Performance Food Group Co. | 1,589,500 | 44,983 |
| *,^ | Herbalife Ltd. | 508,957 | 36,960 |
| * | Blue Buffalo Pet Products Inc. | 1,095,441 | 31,691 |
| * | Monster Beverage Corp. | 473,203 | 27,413 |
| ^ | Calavo Growers Inc. | 323,131 | 23,815 |
| ^ | MGP Ingredients Inc. | 240,445 | 16,341 |
| *,^ | Pilgrim's Pride Corp. | 389,216 | 12,369 |
| * | HRG Group Inc. | 750,356 | 12,171 |
| | National Beverage Corp. | 115,613 | 11,318 |
| * | US Foods Holding Corp. | 241,037 | 6,575 |
| | John B Sanfilippo & Son Inc. | 31,420 | 1,849 |
| * | Sprouts Farmers Market Inc. | 65,875 | 1,218 |
| ^ | Natural Health Trends Corp. | 37,583 | 724 |
| | Ingles Markets Inc. Class A | 21,487 | 501 |
| | | | 379,827 |
| Energy (1.7%) | | |
| | Delek US Holdings Inc. | 1,634,199 | 42,571 |
| * | Energen Corp. | 580,278 | 30,000 |
| ^ | Core Laboratories NV | 255,680 | 25,542 |
| ^ | RPC Inc. | 897,744 | 21,824 |
| * | Parsley Energy Inc. Class A | 706,520 | 18,793 |
| * | RigNet Inc. | 716,013 | 12,494 |
| * | Forum Energy Technologies Inc. | 761,360 | 10,964 |
| *,^ | Chesapeake Energy Corp. | 2,585,401 | 10,083 |
| | Cabot Oil & Gas Corp. | 363,377 | 10,066 |
| | Oceaneering International Inc. | 373,752 | 7,557 |
| * | Newfield Exploration Co. | 164,171 | 5,055 |
| * | Rice Energy Inc. | 177,805 | 5,041 |
| | Range Resources Corp. | 234,391 | 4,245 |
| * | Carrizo Oil & Gas Inc. | 211,842 | 3,748 |
| | CVR Energy Inc. | 127,378 | 3,497 |
| * | Abraxas Petroleum Corp. | 1,109,464 | 2,363 |
| * | ProPetro Holding Corp. | 110,134 | 1,677 |
| * | SRC Energy Inc. | 175,158 | 1,671 |
| | | | 217,191 |
| Financials (7.7%) | | |
| * | SVB Financial Group | 340,670 | 74,702 |
| | Nasdaq Inc. | 890,982 | 64,730 |
| | LPL Financial Holdings Inc. | 1,282,201 | 63,610 |
| | Assured Guaranty Ltd. | 1,637,196 | 60,740 |
| * | MGIC Investment Corp. | 4,034,571 | 57,694 |
2
| | | |
| Vanguard® Explorer Fund | | |
| Schedule of Investments | | |
| October 31, 2017 | | |
| |
| | | | Market |
| | | | Value |
| | | Shares | ($000) |
| * | Western Alliance Bancorp | 1,012,311 | 56,487 |
| | Sterling Bancorp | 1,944,045 | 48,698 |
| | Financial Engines Inc. | 1,225,944 | 44,257 |
| | Assurant Inc. | 415,808 | 41,851 |
| | Redwood Trust Inc. | 2,661,054 | 41,805 |
| ^ | WisdomTree Investments Inc. | 3,759,864 | 41,697 |
| | MFA Financial Inc. | 4,982,519 | 41,056 |
| | Hannon Armstrong Sustainable Infrastructure Capital Inc. | 1,663,403 | 40,022 |
| | Solar Capital Ltd. | 1,434,019 | 30,416 |
| | Affiliated Managers Group Inc. | 155,250 | 28,954 |
| * | Signature Bank | 212,760 | 27,661 |
| | MarketAxess Holdings Inc. | 144,765 | 25,189 |
| | MSCI Inc. Class A | 197,754 | 23,208 |
| | Investment Technology Group Inc. | 972,144 | 22,816 |
| | Bank of the Ozarks | 454,878 | 21,207 |
| | Primerica Inc. | 192,799 | 17,063 |
| * | Essent Group Ltd. | 374,592 | 15,965 |
| * | Walker & Dunlop Inc. | 250,937 | 13,774 |
| | Hilltop Holdings Inc. | 584,300 | 13,766 |
| *,^ | Credit Acceptance Corp. | 47,670 | 13,669 |
| | East West Bancorp Inc. | 204,094 | 12,213 |
| | Evercore Inc. Class A | 104,474 | 8,368 |
| * | Green Dot Corp. Class A | 136,125 | 7,707 |
| | BGC Partners Inc. Class A | 434,171 | 6,586 |
| | Universal Insurance Holdings Inc. | 270,027 | 6,440 |
| | Legg Mason Inc. | 134,721 | 5,144 |
| * | World Acceptance Corp. | 55,284 | 4,837 |
| | National Bank Holdings Corp. Class A | 136,594 | 4,483 |
| | Moelis & Co. Class A | 87,983 | 3,761 |
| * | Regional Management Corp. | 145,437 | 3,591 |
| *,^ | BofI Holding Inc. | 121,962 | 3,281 |
| * | Nationstar Mortgage Holdings Inc. | 115,182 | 2,243 |
| *,^ | Health Insurance Innovations Inc. Class A | 81,501 | 1,752 |
| * | NMI Holdings Inc. Class A | 81,379 | 1,184 |
| | Cboe Global Markets Inc. | 10,446 | 1,181 |
| | | | 1,003,808 |
| Health Care (17.2%) | | |
| * | ICON plc | 1,120,455 | 133,177 |
| * | Insulet Corp. | 2,146,528 | 126,237 |
| * | athenahealth Inc. | 886,162 | 113,322 |
| * | Medidata Solutions Inc. | 1,302,577 | 97,993 |
| * | Mettler-Toledo International Inc. | 100,756 | 68,779 |
| | HealthSouth Corp. | 1,270,837 | 58,636 |
| * | Haemonetics Corp. | 1,149,676 | 54,679 |
| * | Molina Healthcare Inc. | 757,500 | 51,381 |
| | STERIS plc | 506,608 | 47,282 |
| * | INC Research Holdings Inc. Class A | 783,949 | 44,803 |
| * | IDEXX Laboratories Inc. | 260,758 | 43,330 |
| * | Bluebird Bio Inc. | 295,480 | 41,101 |
| | Cooper Cos. Inc. | 165,980 | 39,878 |
| * | LifePoint Health Inc. | 803,974 | 38,711 |
| * | Globus Medical Inc. | 1,207,953 | 38,498 |
| | Hill-Rom Holdings Inc. | 450,500 | 36,360 |
| * | ABIOMED Inc. | 184,971 | 35,685 |
| * | BioMarin Pharmaceutical Inc. | 422,820 | 34,709 |
| * | HealthEquity Inc. | 684,933 | 34,397 |
| 2 | Kindred Healthcare Inc. | 5,066,659 | 30,653 |
| * | Prestige Brands Holdings Inc. | 601,748 | 28,222 |
| * | Ligand Pharmaceuticals Inc. | 192,530 | 27,984 |
| * | Illumina Inc. | 132,784 | 27,246 |
| * | Neogen Corp. | 334,395 | 26,819 |
| * | PRA Health Sciences Inc. | 322,370 | 26,251 |
| * | Blueprint Medicines Corp. | 388,500 | 25,804 |
| * | Exelixis Inc. | 968,229 | 24,002 |
3
| | | |
| Vanguard® Explorer Fund | | |
| Schedule of Investments | | |
| October 31, 2017 | | |
| |
| | | | Market |
| | | | Value |
| | | Shares | ($000) |
| * | Cerner Corp. | 348,540 | 23,533 |
| *,^ | MiMedx Group Inc. | 1,790,761 | 22,707 |
| * | Momenta Pharmaceuticals Inc. | 1,598,200 | 22,535 |
| * | Spark Therapeutics Inc. | 277,500 | 22,450 |
| * | Intuitive Surgical Inc. | 59,631 | 22,383 |
| * | Exact Sciences Corp. | 402,277 | 22,121 |
| * | WellCare Health Plans Inc. | 110,315 | 21,814 |
| * | HMS Holdings Corp. | 1,123,532 | 21,617 |
| * | TESARO Inc. | 185,102 | 21,429 |
| | ResMed Inc. | 253,981 | 21,380 |
| * | Ignyta Inc. | 1,383,100 | 21,300 |
| * | Dermira Inc. | 781,200 | 20,913 |
| *,^ | Teladoc Inc. | 623,265 | 20,599 |
| * | MEDNAX Inc. | 469,082 | 20,541 |
| * | Veeva Systems Inc. Class A | 316,072 | 19,261 |
| *,^ | Glaukos Corp. | 545,200 | 19,251 |
| * | DexCom Inc. | 423,886 | 19,062 |
| * | Charles River Laboratories International Inc. | 161,560 | 18,788 |
| * | Catalent Inc. | 419,498 | 17,866 |
| * | Premier Inc. Class A | 539,740 | 17,633 |
| * | NuVasive Inc. | 310,454 | 17,612 |
| * | Hologic Inc. | 445,564 | 16,865 |
| * | Masimo Corp. | 178,973 | 15,707 |
| * | Nevro Corp. | 175,995 | 15,414 |
| * | Repligen Corp. | 412,603 | 15,349 |
| * | Align Technology Inc. | 63,947 | 15,282 |
| | Chemed Corp. | 67,834 | 15,156 |
| *,^ | Revance Therapeutics Inc. | 575,783 | 14,970 |
| * | Aduro Biotech Inc. | 1,845,707 | 14,673 |
| * | Corcept Therapeutics Inc. | 731,237 | 14,398 |
| | Bruker Corp. | 434,687 | 13,649 |
| *,^ | Acadia Healthcare Co. Inc. | 420,837 | 13,197 |
| * | Pacira Pharmaceuticals Inc. | 410,343 | 13,152 |
| * | Array BioPharma Inc. | 1,227,344 | 12,826 |
| * | Juno Therapeutics Inc. | 278,921 | 12,526 |
| * | OraSure Technologies Inc. | 633,431 | 12,510 |
| * | Ultragenyx Pharmaceutical Inc. | 270,000 | 12,444 |
| * | FibroGen Inc. | 221,016 | 12,344 |
| * | Neurocrine Biosciences Inc. | 198,380 | 12,321 |
| *,^ | Evolent Health Inc. Class A | 741,009 | 12,041 |
| *,^ | Endologix Inc. | 2,262,109 | 11,989 |
| * | Inogen Inc. | 118,690 | 11,742 |
| * | Penumbra Inc. | 114,820 | 11,545 |
| * | Quintiles IMS Holdings Inc. | 105,638 | 11,420 |
| * | Cambrex Corp. | 240,960 | 10,422 |
| * | Alnylam Pharmaceuticals Inc. | 83,365 | 10,157 |
| *,^ | Atara Biotherapeutics Inc. | 712,284 | 10,114 |
| | PerkinElmer Inc. | 137,695 | 9,958 |
| * | Emergent BioSolutions Inc. | 242,732 | 9,950 |
| *,^ | DBV Technologies SA ADR | 422,562 | 9,896 |
| * | Cytokinetics Inc. | 614,302 | 8,385 |
| * | Heska Corp. | 85,041 | 8,292 |
| * | ImmunoGen Inc. | 1,351,858 | 7,841 |
| *,^ | Immunomedics Inc. | 702,309 | 7,529 |
| * | Vanda Pharmaceuticals Inc. | 353,378 | 5,548 |
| * | Cardiovascular Systems Inc. | 191,158 | 4,601 |
| * | BioCryst Pharmaceuticals Inc. | 1,004,062 | 4,518 |
| * | Lantheus Holdings Inc. | 209,776 | 4,175 |
| * | Cotiviti Holdings Inc. | 118,303 | 4,160 |
| * | Medpace Holdings Inc. | 107,710 | 4,036 |
| *,^ | AAC Holdings Inc. | 478,980 | 3,794 |
| * | Amphastar Pharmaceuticals Inc. | 195,271 | 3,529 |
| | LeMaitre Vascular Inc. | 104,468 | 3,344 |
| * | Coherus Biosciences Inc. | 231,192 | 2,601 |
4
| | |
| Vanguard® Explorer Fund | | |
| Schedule of Investments | | |
| October 31, 2017 | | |
| |
| | | Market |
| | | Value |
| | Shares | ($000) |
| * PTC Therapeutics Inc. | 118,056 | 2,212 |
| * Sangamo Therapeutics Inc. | 104,089 | 1,291 |
| * AMN Healthcare Services Inc. | 28,331 | 1,244 |
| * Cross Country Healthcare Inc. | 79,771 | 1,089 |
| * Civitas Solutions Inc. | 54,436 | 1,015 |
| * Ophthotech Corp. | 420,409 | 980 |
| Utah Medical Products Inc. | 11,070 | 835 |
| * Genomic Health Inc. | 24,132 | 791 |
| * Progenics Pharmaceuticals Inc. | 92,182 | 571 |
| * Merrimack Pharmaceuticals Inc. | 29,493 | 346 |
| | | 2,245,478 |
| Industrials (18.6%) | | |
| * TriNet Group Inc. | 3,188,722 | 110,712 |
| * Kirby Corp. | 1,358,315 | 96,237 |
| * Sensata Technologies Holding NV | 1,853,394 | 90,649 |
| * Clean Harbors Inc. | 1,670,063 | 89,365 |
| * Teledyne Technologies Inc. | 421,507 | 71,639 |
| * Trex Co. Inc. | 640,600 | 70,114 |
| * United Rentals Inc. | 486,023 | 68,763 |
| * TransUnion | 1,243,105 | 65,251 |
| John Bean Technologies Corp. | 587,807 | 62,837 |
| Orbital ATK Inc. | 456,578 | 60,693 |
| Woodward Inc. | 771,748 | 59,679 |
| * Middleby Corp. | 497,741 | 57,688 |
| Terex Corp. | 1,224,200 | 57,672 |
| HEICO Corp. Class A | 745,922 | 56,765 |
| * Proto Labs Inc. | 642,959 | 56,098 |
| IDEX Corp. | 434,150 | 55,662 |
| * AerCap Holdings NV | 1,032,670 | 54,360 |
| MSC Industrial Direct Co. Inc. Class A | 629,943 | 52,222 |
| * Copart Inc. | 1,339,400 | 48,607 |
| AGCO Corp. | 691,900 | 47,444 |
| Timken Co. | 999,800 | 47,141 |
| Watts Water Technologies Inc. Class A | 629,938 | 42,458 |
| * XPO Logistics Inc. | 585,856 | 40,629 |
| Multi-Color Corp. | 487,858 | 40,346 |
| GATX Corp. | 654,133 | 38,862 |
| Kennametal Inc. | 885,769 | 38,664 |
| Schneider National Inc. Class B | 1,469,637 | 38,490 |
| Forward Air Corp. | 655,822 | 37,670 |
| Advanced Drainage Systems Inc. | 1,911,199 | 37,364 |
| * Masonite International Corp. | 556,240 | 37,324 |
| Heartland Express Inc. | 1,597,728 | 34,080 |
| * Advisory Board Co. | 574,548 | 30,982 |
| Tennant Co. | 394,913 | 27,387 |
| * WageWorks Inc. | 406,208 | 25,896 |
| ^ Wabtec Corp. | 338,380 | 25,886 |
| Allegion plc | 286,324 | 23,877 |
| * Spirit Airlines Inc. | 628,310 | 23,304 |
| * Verisk Analytics Inc. Class A | 268,691 | 22,852 |
| Huntington Ingalls Industries Inc. | 94,225 | 21,938 |
| * MRC Global Inc. | 1,201,350 | 20,603 |
| Allison Transmission Holdings Inc. | 445,798 | 18,942 |
| Graco Inc. | 140,400 | 18,503 |
| * SiteOne Landscape Supply Inc. | 270,162 | 17,158 |
| * Beacon Roofing Supply Inc. | 291,419 | 16,147 |
| Ritchie Bros Auctioneers Inc. | 557,632 | 15,630 |
| Brink's Co. | 196,085 | 14,922 |
| * MasTec Inc. | 341,662 | 14,879 |
| Argan Inc. | 204,188 | 14,038 |
| Toro Co. | 221,447 | 13,918 |
| Spirit AeroSystems Holdings Inc. Class A | 156,464 | 12,533 |
| * Continental Building Products Inc. | 465,437 | 12,427 |
| Wabash National Corp. | 548,850 | 12,349 |
5
| | | |
| Vanguard® Explorer Fund | | |
| Schedule of Investments | | |
| October 31, 2017 | | |
| |
| | | | Market |
| | | | Value |
| | | Shares | ($000) |
| | JB Hunt Transport Services Inc. | 115,890 | 12,330 |
| | Quad/Graphics Inc. | 534,130 | 12,173 |
| * | Meritor Inc. | 465,694 | 12,113 |
| * | Hawaiian Holdings Inc. | 346,693 | 11,614 |
| | Global Brass & Copper Holdings Inc. | 330,707 | 11,575 |
| | Copa Holdings SA Class A | 90,777 | 11,183 |
| * | Aerojet Rocketdyne Holdings Inc. | 335,419 | 10,592 |
| | Air Lease Corp. Class A | 233,650 | 10,152 |
| * | IHS Markit Ltd. | 234,332 | 9,985 |
| | Applied Industrial Technologies Inc. | 150,897 | 9,605 |
| * | TrueBlue Inc. | 340,022 | 9,215 |
| | Lincoln Electric Holdings Inc. | 96,728 | 8,867 |
| *,^ | Axon Enterprise Inc. | 375,449 | 8,624 |
| * | Atkore International Group Inc. | 408,539 | 7,889 |
| *,^ | Kornit Digital Ltd. | 502,780 | 7,818 |
| | Greenbrier Cos. Inc. | 139,627 | 7,288 |
| *,^ | KeyW Holding Corp. | 949,886 | 7,172 |
| | Kimball International Inc. Class B | 346,641 | 6,645 |
| | BWX Technologies Inc. | 108,424 | 6,497 |
| * | SP Plus Corp. | 161,955 | 6,276 |
| | Barnes Group Inc. | 94,170 | 6,129 |
| * | Univar Inc. | 202,718 | 6,031 |
| * | Ply Gem Holdings Inc. | 328,603 | 5,553 |
| * | YRC Worldwide Inc. | 372,642 | 5,019 |
| * | Harsco Corp. | 203,587 | 4,326 |
| * | Moog Inc. Class A | 45,359 | 3,981 |
| | MSA Safety Inc. | 48,111 | 3,825 |
| * | Roadrunner Transportation Systems Inc. | 406,412 | 3,576 |
| * | Builders FirstSource Inc. | 192,897 | 3,476 |
| | LSC Communications Inc. | 185,641 | 3,004 |
| * | Vectrus Inc. | 95,962 | 2,928 |
| | Donaldson Co. Inc. | 58,421 | 2,758 |
| | Barrett Business Services Inc. | 44,878 | 2,728 |
| | Brady Corp. Class A | 64,973 | 2,472 |
| | Herman Miller Inc. | 71,043 | 2,387 |
| * | WABCO Holdings Inc. | 14,650 | 2,162 |
| | HEICO Corp. | 21,030 | 1,907 |
| * | Generac Holdings Inc. | 23,075 | 1,202 |
| * | Kratos Defense & Security Solutions Inc. | 90,597 | 1,091 |
| * | On Assignment Inc. | 15,647 | 958 |
| | | | 2,422,782 |
| Information Technology (25.2%) | | |
| * | Cadence Design Systems Inc. | 2,765,192 | 119,346 |
| *,^ | 2U Inc. | 1,599,176 | 101,756 |
| | MAXIMUS Inc. | 1,180,888 | 78,446 |
| * | BroadSoft Inc. | 1,415,700 | 77,651 |
| * | First Solar Inc. | 1,204,921 | 66,054 |
| | MercadoLibre Inc. | 269,936 | 64,868 |
| * | Callidus Software Inc. | 2,547,761 | 64,586 |
| | Entegris Inc. | 1,944,107 | 63,669 |
| * | HubSpot Inc. | 732,710 | 63,416 |
| * | ServiceNow Inc. | 501,050 | 63,318 |
| * | Atlassian Corp. plc Class A | 1,293,460 | 62,565 |
| | CSRA Inc. | 1,923,783 | 61,542 |
| | CDW Corp. | 869,286 | 60,850 |
| * | GoDaddy Inc. Class A | 1,291,284 | 60,303 |
| * | Cavium Inc. | 862,082 | 59,475 |
| | Power Integrations Inc. | 729,971 | 58,653 |
| *,^ | GrubHub Inc. | 940,422 | 57,385 |
| * | Fortinet Inc. | 1,451,058 | 57,186 |
| * | Take-Two Interactive Software Inc. | 481,070 | 53,230 |
| * | New Relic Inc. | 964,281 | 49,497 |
| * | Tableau Software Inc. Class A | 603,404 | 48,930 |
| * | Ciena Corp. | 2,296,238 | 48,841 |
6
| | | |
| Vanguard® Explorer Fund | | |
| Schedule of Investments | | |
| October 31, 2017 | | |
| |
| | | | Market |
| | | | Value |
| | | Shares | ($000) |
| * | Square Inc. | 1,284,490 | 47,770 |
| * | Cardtronics plc Class A | 2,059,028 | 47,152 |
| * | IPG Photonics Corp. | 216,000 | 45,989 |
| * | CoStar Group Inc. | 146,800 | 43,416 |
| | SS&C Technologies Holdings Inc. | 1,066,348 | 42,867 |
| * | Cornerstone OnDemand Inc. | 1,010,680 | 38,770 |
| * | Zendesk Inc. | 1,234,341 | 38,265 |
| * | Euronet Worldwide Inc. | 390,926 | 37,779 |
| * | Arrow Electronics Inc. | 448,200 | 37,465 |
| * | Aspen Technology Inc. | 542,276 | 34,988 |
| * | Check Point Software Technologies Ltd. | 295,070 | 34,733 |
| * | MACOM Technology Solutions Holdings Inc. | 813,715 | 33,265 |
| | Microchip Technology Inc. | 338,561 | 32,096 |
| * | Envestnet Inc. | 579,913 | 30,967 |
| * | Trimble Inc. | 754,079 | 30,827 |
| * | Wix.com Ltd. | 441,325 | 30,804 |
| * | ON Semiconductor Corp. | 1,402,281 | 29,897 |
| | Cognex Corp. | 241,909 | 29,791 |
| * | Proofpoint Inc. | 322,303 | 29,784 |
| | Teradyne Inc. | 684,782 | 29,370 |
| | FLIR Systems Inc. | 591,842 | 27,710 |
| * | Shutterstock Inc. | 699,412 | 27,270 |
| * | Guidewire Software Inc. | 334,745 | 26,773 |
| ^ | Cimpress NV | 238,329 | 26,011 |
| *,^ | Inphi Corp. | 630,830 | 25,851 |
| *,^ | Cloudera Inc. | 1,559,424 | 23,594 |
| * | RealPage Inc. | 531,195 | 23,001 |
| *,^ | Acacia Communications Inc. | 537,500 | 22,742 |
| * | WEX Inc. | 179,649 | 22,203 |
| * | Descartes Systems Group Inc. | 748,131 | 21,733 |
| * | Ultimate Software Group Inc. | 106,052 | 21,485 |
| *,^ | Oclaro Inc. | 2,546,500 | 21,060 |
| *,^ | Stratasys Ltd. | 925,932 | 20,852 |
| * | Semtech Corp. | 492,814 | 20,230 |
| * | CyberArk Software Ltd. | 469,964 | 19,912 |
| * | Advanced Micro Devices Inc. | 1,788,134 | 19,643 |
| * | Stamps.com Inc. | 87,510 | 19,637 |
| * | Zebra Technologies Corp. | 165,833 | 19,235 |
| | Alliance Data Systems Corp. | 85,680 | 19,169 |
| | Harris Corp. | 132,869 | 18,511 |
| | Booz Allen Hamilton Holding Corp. Class A | 475,921 | 17,985 |
| * | Imperva Inc. | 402,360 | 17,181 |
| * | Tyler Technologies Inc. | 95,855 | 16,994 |
| * | Red Hat Inc. | 134,139 | 16,208 |
| * | Barracuda Networks Inc. | 672,763 | 15,682 |
| * | Microsemi Corp. | 288,025 | 15,372 |
| * | RingCentral Inc. Class A | 364,675 | 15,371 |
| * | Integrated Device Technology Inc. | 484,475 | 15,053 |
| * | Yelp Inc. Class A | 318,740 | 14,892 |
| * | PTC Inc. | 222,498 | 14,785 |
| * | Five9 Inc. | 575,069 | 14,509 |
| * | Match Group Inc. | 538,854 | 14,409 |
| * | Shopify Inc. Class A | 143,828 | 14,309 |
| * | Gartner Inc. | 113,581 | 14,233 |
| * | Itron Inc. | 180,868 | 14,135 |
| * | Extreme Networks Inc. | 1,165,121 | 13,981 |
| * | KEMET Corp. | 541,275 | 13,905 |
| | National Instruments Corp. | 308,157 | 13,867 |
| * | Q2 Holdings Inc. | 312,751 | 13,308 |
| * | Manhattan Associates Inc. | 313,004 | 13,102 |
| | Travelport Worldwide Ltd. | 821,166 | 12,884 |
| *,^ | ANGI Homeservices Inc. Class A | 984,815 | 12,310 |
| *,^ | TrueCar Inc. | 755,008 | 12,216 |
| * | Qualys Inc. | 224,918 | 11,898 |
7
| | | |
| Vanguard® Explorer Fund | | |
| Schedule of Investments | | |
| October 31, 2017 | | |
| |
| | | | Market |
| | | | Value |
| | | Shares | ($000) |
| * | Ultra Clean Holdings Inc. | 464,462 | 11,853 |
| * | ANSYS Inc. | 86,459 | 11,820 |
| * | Synaptics Inc. | 313,578 | 11,640 |
| * | ChannelAdvisor Corp. | 1,019,143 | 11,465 |
| *,^ | Ambarella Inc. | 202,001 | 11,401 |
| * | Electronic Arts Inc. | 93,756 | 11,213 |
| * | Palo Alto Networks Inc. | 74,950 | 11,033 |
| * | Hortonworks Inc. | 663,603 | 10,956 |
| * | Cirrus Logic Inc. | 195,269 | 10,935 |
| * | Carbonite Inc. | 479,287 | 10,880 |
| *,^ | Unisys Corp. | 1,215,999 | 10,640 |
| *,^ | 3D Systems Corp. | 858,031 | 10,622 |
| | TeleTech Holdings Inc. | 252,880 | 10,532 |
| * | Switch Inc. | 547,458 | 10,473 |
| * | Box Inc. | 474,453 | 10,414 |
| * | Amkor Technology Inc. | 855,830 | 9,902 |
| * | Arista Networks Inc. | 47,405 | 9,476 |
| | SYNNEX Corp. | 68,393 | 9,225 |
| | Pegasystems Inc. | 145,586 | 8,488 |
| * | A10 Networks Inc. | 1,089,577 | 7,965 |
| * | TTM Technologies Inc. | 499,354 | 7,880 |
| * | 8x8 Inc. | 588,129 | 7,852 |
| * | Workiva Inc. | 305,226 | 6,822 |
| | CSG Systems International Inc. | 147,097 | 6,228 |
| | Hackett Group Inc. | 384,389 | 5,935 |
| * | ePlus Inc. | 61,177 | 5,849 |
| * | Blackhawk Network Holdings Inc. | 167,520 | 5,687 |
| * | Varonis Systems Inc. | 127,362 | 5,553 |
| * | NCR Corp. | 171,979 | 5,519 |
| * | Blucora Inc. | 253,605 | 5,503 |
| * | Control4 Corp. | 174,157 | 5,129 |
| | Science Applications International Corp. | 62,857 | 4,610 |
| * | Sykes Enterprises Inc. | 142,978 | 4,138 |
| | Brooks Automation Inc. | 102,410 | 3,522 |
| * | Web.com Group Inc. | 137,278 | 3,308 |
| * | Care.com Inc. | 207,580 | 3,190 |
| * | MINDBODY Inc. Class A | 88,773 | 2,863 |
| * | IAC/InterActiveCorp | 20,667 | 2,667 |
| * | Axcelis Technologies Inc. | 78,793 | 2,592 |
| * | Plexus Corp. | 41,383 | 2,542 |
| * | Alarm.com Holdings Inc. | 51,390 | 2,399 |
| | Progress Software Corp. | 55,409 | 2,345 |
| * | MuleSoft Inc. Class A | 89,826 | 2,101 |
| * | Advanced Energy Industries Inc. | 21,304 | 1,805 |
| | MKS Instruments Inc. | 16,230 | 1,763 |
| * | Glu Mobile Inc. | 416,892 | 1,672 |
| * | PROS Holdings Inc. | 67,159 | 1,517 |
| * | Brightcove Inc. | 179,662 | 1,437 |
| * | Etsy Inc. | 74,020 | 1,236 |
| * | Zillow Group Inc. Class A | 29,432 | 1,216 |
| * | Avid Technology Inc. | 239,521 | 1,063 |
| * | Travelzoo | 54,221 | 363 |
| | | | 3,290,012 |
| Materials (5.2%) | | |
| | Graphic Packaging Holding Co. | 3,998,503 | 61,937 |
| * | Berry Global Group Inc. | 938,069 | 55,768 |
| | Orion Engineered Carbons SA | 2,283,900 | 54,014 |
| | RPC Group plc | 4,315,609 | 54,008 |
| | PolyOne Corp. | 1,170,438 | 53,922 |
| | Carpenter Technology Corp. | 993,300 | 49,456 |
| | Methanex Corp. | 919,536 | 44,827 |
| | Smurfit Kappa Group plc | 1,359,569 | 40,546 |
| * | Ferro Corp. | 1,686,903 | 40,182 |
| | Minerals Technologies Inc. | 554,450 | 39,865 |
8
| | | |
| Vanguard® Explorer Fund | | |
| Schedule of Investments | | |
| October 31, 2017 | | |
| |
| | | | Market |
| | | | Value |
| | | Shares | ($000) |
| | Chemours Co. | 426,141 | 24,124 |
| | Packaging Corp. of America | 197,923 | 23,013 |
| | Huntsman Corp. | 538,818 | 17,253 |
| * | Louisiana-Pacific Corp. | 565,686 | 15,375 |
| * | Owens-Illinois Inc. | 622,963 | 14,883 |
| * | Summit Materials Inc. Class A | 454,221 | 14,263 |
| * | Koppers Holdings Inc. | 285,286 | 13,851 |
| | Balchem Corp. | 162,824 | 13,724 |
| | Avery Dennison Corp. | 75,854 | 8,053 |
| | Kronos Worldwide Inc. | 193,762 | 5,098 |
| | Albemarle Corp. | 34,135 | 4,809 |
| | Stepan Co. | 55,269 | 4,414 |
| | Greif Inc. Class A | 73,212 | 4,066 |
| | Rayonier Advanced Materials Inc. | 270,362 | 3,885 |
| | A Schulman Inc. | 80,708 | 3,172 |
| * | Century Aluminum Co. | 194,379 | 2,721 |
| | Innophos Holdings Inc. | 53,316 | 2,609 |
| | Trinseo SA | 24,808 | 1,761 |
| * | AdvanSix Inc. | 31,598 | 1,462 |
| | Valvoline Inc. | 55,187 | 1,326 |
| | | | 674,387 |
| Other (1.0%) | | |
| 3 | Vanguard Small-Cap ETF | 478,332 | 68,655 |
| ^,3 | Vanguard Small-Cap Growth ETF | 384,700 | 60,086 |
| *,4,5 | Dropbox Private Placement | 361,745 | 4,710 |
| *,4 | Dyax Corp CVR Exp. 12/31/2019 | 134,316 | 269 |
| | | | 133,720 |
| Real Estate (3.3%) | | |
| * | SBA Communications Corp. Class A | 443,554 | 69,718 |
| | Life Storage Inc. | 574,300 | 46,415 |
| | Jones Lang LaSalle Inc. | 342,800 | 44,389 |
| | PS Business Parks Inc. | 332,075 | 43,944 |
| | LaSalle Hotel Properties | 1,309,300 | 36,935 |
| | Douglas Emmett Inc. | 917,616 | 36,512 |
| | Outfront Media Inc. | 1,096,800 | 25,720 |
| * | Five Point Holdings LLC Class A | 1,930,500 | 24,807 |
| | National Storage Affiliates Trust | 824,236 | 20,433 |
| | Ryman Hospitality Properties Inc. | 228,631 | 15,119 |
| ^ | Omega Healthcare Investors Inc. | 361,366 | 10,429 |
| | Sabra Health Care REIT Inc. | 417,485 | 8,316 |
| | Gaming and Leisure Properties Inc. | 219,020 | 8,003 |
| | GEO Group Inc. | 286,878 | 7,445 |
| | Senior Housing Properties Trust | 401,850 | 7,394 |
| | CoreSite Realty Corp. | 64,561 | 7,150 |
| | Iron Mountain Inc. | 98,281 | 3,931 |
| | National Health Investors Inc. | 48,996 | 3,733 |
| | Hersha Hospitality Trust Class A | 75,404 | 1,334 |
| | Potlatch Corp. | 22,034 | 1,141 |
| | Washington Prime Group Inc. | 144,219 | 1,129 |
| | RMR Group Inc. Class A | 19,309 | 1,013 |
| | | | 425,010 |
| Telecommunication Services (0.5%) | | |
| * | Vonage Holdings Corp. | 6,072,971 | 49,373 |
| * | Boingo Wireless Inc. | 553,962 | 12,952 |
| * | Zayo Group Holdings Inc. | 158,389 | 5,711 |
| | Cogent Communications Holdings Inc. | 23,521 | 1,268 |
| | | | 69,304 |
| Utilities (0.6%) | | |
| | Pattern Energy Group Inc. Class A | 1,721,600 | 39,717 |
| ^ | 8Point3 Energy Partners LP Class A | 1,728,749 | 26,173 |
| | NRG Energy Inc. | 319,016 | 7,976 |
9
| | | | | |
| Vanguard® Explorer Fund | | | | |
| Schedule of Investments | | | | |
| October 31, 2017 | | | | |
| |
| | | | | | Market |
| | | | | | Value |
| | | | | Shares | ($000) |
| ^ | Spark Energy Inc. Class A | | | 130,773 | 1,831 |
| | | | | | 75,697 |
| Total Common Stocks (Cost $10,155,697) | | | | 12,714,139 |
| |
| | | Coupon | | | |
| Temporary Cash Investments (4.8%)1 | | | | |
| Money Market Fund (4.3%) | | | | |
| 6,7 | Vanguard Market Liquidity Fund | 1.246% | | 5,653,386 | 565,395 |
| |
| |
| | | | | Face | |
| | | | Maturity | Amount | |
| | | | Date | ($000) | |
| Repurchase Agreement (0.4%) | | | | |
| | Deutsche Bank Securities, Inc. | | | | |
| | (Dated 10/31/17, Repurchase Value $46,901,000, | | | | |
| | collateralized by U.S. Treasury Note/Bond 1.500%, | | | | |
| | 10/31/19, with a value of $47,838,000) | 1.060% | 11/1/17 | 46,900 | 46,900 |
| |
| U.S. Government and Agency Obligations (0.1%) | | | | |
| 8 | United States Cash Management Bill | 1.480% | 1/2/18 | 5,000 | 4,991 |
| 8 | United States Treasury Bill | 1.052% | 11/24/17 | 3,500 | 3,498 |
| | United States Treasury Bill | 1.008% | 1/4/18 | 200 | 200 |
| 8 | United States Treasury Bill | 1.169% | 3/22/18 | 400 | 398 |
| | | | | | 9,087 |
| Total Temporary Cash Investments (Cost $621,380) | | | | 621,382 |
| Total Investments (102.3%) (Cost $10,777,077) | | | | 13,335,521 |
| Other Assets and Liabilities—Net (-2.3%)7 | | | | (301,330) |
| Net Assets (100%) | | | | 13,034,191 |
* Non-income-producing security.
^ Includes partial security positions on loan to broker-dealers. The total value of securities on loan is $283,374,000.
1 The fund invests a portion of its cash reserves in equity markets through the use of index futures contracts. After giving effect to futures
investments, the fund's effective common stock and temporary cash investment positions represent 98.4% and 3.9%, respectively, of net
assets.
2 Considered an affiliated company of the fund as the fund owns more than 5% of the outstanding voting securities of such company.
3 Considered an affiliated company of the fund as the issuer is another member of The Vanguard Group.
4 Security value determined using significant unobservable inputs.
5 Restricted security represents 0.0% of net assets.
6 Affiliated money market fund available only to Vanguard funds and certain trusts and accounts managed by Vanguard. Rate shown is the 7-day
yield.
7 Collateral of $290,432,000 was received for securities on loan, of which $281,586,000 is held in Vanguard Market Liquidity Fund and $8,846,000
is held in cash.
8 Securities with a value of $4,553,000 have been segregated as initial margin for open futures contracts.
ADR—American Depositary Receipt.
CVR—Contingent Value Rights.
REIT—Real Estate Investment Trust.
10
This page intentionally left blank.
11
© 2017 The Vanguard Group, Inc.
All rights reserved.
Vanguard Marketing Corporation, Distributor.
SNA240 122017

Report of Independent Registered Public Accounting Firm
To the Board of Trustees and Shareholders of Vanguard Explorer Fund
In our opinion, the accompanying statement of net assets investments summary and the related statements of operations and of changes in net assets and the financial highlights (included in Item 1 of this Form N-CSR) and the schedule of investments (included in Item 6 of this Form N-CSR) present fairly, in all material respects, the financial position of Vanguard Explorer Fund (the "Fund") as of October 31, 2017, the results of its operations for the year then ended, the changes in its net assets for each of the two years in the period then ended and the financial highlights for each of the five years in the period then ended, in conformity with accounting principles generally accepted in the United States of America. These financial statements, financial highlights, and schedule of investments (hereafter referred to as "financial statements") are the responsibility of the Fund's management. Our responsibility is to express an opinion on these financial statements based on our audits. We conducted our audits of these financial statements in accordance with the standards of the Public Company Accounting Oversight Board (United States). Those standards require that we plan and perform the audit to obtain reasonable assurance about whether the financial statements are free of material misstatement. An audit includes examining, on a test basis, evidence supporting the amounts and disclosures in the financial statements, assessing the accounting principles used and significant estimates made by management, and evaluating the overall financial statement presentation. We believe that our audits, which included confirmation of securities as of October 31, 2017 by correspondence with the custodian and brokers and by agreement to the underlying ownership records of the transfer agent, provide a reasonable basis for our opinion.

December 19, 2017
PricewaterhouseCoopers LLP, Two Commerce Square, Suite 1800, 2001 Market Street, Philadelphia, PA 19103-7042
T: (267) 330 3000, F: (267) 330 3300, www.pwc.com/us
Item 7: Disclosure of Proxy Voting Policies and Procedures for Closed-End Management
Investment Companies.
Not Applicable.
Item 8: Portfolio Managers of Closed-End Management Investment Companies.
Not Applicable.
Item 9: Purchase of Equity Securities by Closed-End Management Investment Company and
Affiliated Purchasers.
Not Applicable.
Item 10: Submission of Matters to a Vote of Security Holders.
Not Applicable.
Item 11: Controls and Procedures.
(a) Disclosure Controls and Procedures. The Principal Executive and Financial Officers concluded that the Registrant’s Disclosure Controls and Procedures are effective based on their evaluation of the Disclosure Controls and Procedures as of a date within 90 days of the filing date of this report.
(b) Internal Control Over Financial Reporting. There were no significant changes in Registrant’s Internal Control Over Financial Reporting or in other factors that could significantly affect this control subsequent to the date of the evaluation, including any corrective actions with regard to significant deficiencies and material weaknesses.
Item 12: Disclosure of Securities Lending Activities for Closed-End Management Investment Companies.
Not Applicable.
Item 13: Exhibits.
(a) Code of Ethics.
(b) Certifications.
Pursuant to the requirements of the Securities Exchange Act of 1934 and the Investment Company Act of 1940, the registrant has duly caused this report to be signed on its behalf by the undersigned, thereunto duly authorized.
| |
| | VANGUARD EXPLORER FUND |
| |
| |
| BY: | /s/ F. WILLIAM MCNABB III* |
| | F. WILLIAM MCNABB III |
| | CHIEF EXECUTIVE OFFICER |
| |
| Date: December 21, 2017 |
Pursuant to the requirements of the Securities Exchange Act of 1934 and the Investment Company Act of 1940, this report has been signed below by the following persons on behalf of the registrant and in the capacities and on the dates indicated.
| |
| | VANGUARD EXPLORER FUND |
| |
| BY: | /s/ F. WILLIAM MCNABB III* |
| | F. WILLIAM MCNABB III |
| | CHIEF EXECUTIVE OFFICER |
| Date: December 21, 2017 |
| | VANGUARD EXPLORER FUND |
BY: | /s/ THOMAS J. HIGGINS* |
| | THOMAS J. HIGGINS |
| | CHIEF FINANCIAL OFFICER |
| Date: December 21, 2017 |
* By: /s/ Anne E. Robinson
Anne E. Robinson, pursuant to a Power of Attorney filed on October 4, 2016 see file Number
33-32548, Incorporated by Reference.