Table of Contents
 |
| 1 | ||||
| 3 | ||||
| 14 | ||||
| 16 | ||||
| 60 | ||||
| 74 | ||||
| 84 | ||||
| 93 | ||||
| 96 | ||||
| 97 |
Statements of future events or conditions
in this report, including projections, targets,
expectations, estimates, and business plans, are
forward-looking statements. Actual future results,
including demand growth and energy mix; capacity
growth; the impact of new technologies; capital
expenditures; project plans, dates, costs, and capacities;
production rates and resource recoveries; efficiency gains;
cost savings; product sales; and financial results could differ
materially due to, for example, changes in oil and gas prices
or other market conditions affecting the oil and gas industry;
reservoir performance; timely completion of development
projects; war and other political or security disturbances; changes
in law or government regulation; the actions of competitors and
customers; unexpected technological developments; the occurrence
and duration of economic recessions; the outcome of commercial
negotiations; unforeseen technical difficulties; unanticipated
operational disruptions; and other factors discussed in this report
and in Item 1A of ExxonMobil’s most recent Form 10-K.
Definitions of certain financial and operating measures and other terms used
in this report are contained in the section titled “Frequently Used Terms” on
pages 93 through 95. In the case of financial measures, the definitions also
include information required by SEC Regulation G.
“Factors Affecting Future Results” and “Frequently Used Terms” are also available on
the “investors” section of our website.
Prior years’ data have been reclassified in certain cases to conform to the 2012 presentation basis.
The term “project” as used in this publication does not necessarily have the same meaning as under SEC Rule 13q-1 relating to government
payment reporting. For example, a single project for purposes of the rule may encompass numerous properties, agreements, investments,
developments, phases, work efforts, activities, and components, each of which we may also informally describe herein as a “project.”
Table of Contents
2012:Financial & Operating Summary
FINANCIAL HIGHLIGHTS
| Average | Return on | Capital and | ||||||||||||||
| Earnings After | Capital | Average Capital | Exploration | |||||||||||||
| (millions of dollars, unless noted) | Income Taxes | Employed | (1) | Employed (%) | (1) | Expenditures | (1) | |||||||||
| Upstream | 29,895 | 139,442 | 21.4 | 36,084 | ||||||||||||
| Downstream | 13,190 | 24,031 | 54.9 | 2,262 | ||||||||||||
| Chemical | 3,898 | 20,148 | 19.3 | 1,418 | ||||||||||||
| Corporate and Financing | (2,103 | ) | (4,527 | ) | N.A. | 35 | ||||||||||
Total | 44,880 | 179,094 | 25.4 | 39,799 | ||||||||||||
OPERATING HIGHLIGHTS
Liquids production(net, thousands of barrels per day) | 2,185 | |||
Natural gas production available for sale(net, millions of cubic feet per day) | 12,322 | |||
Oil-equivalent production(2)(net, thousands of oil-equivalent barrels per day) | 4,239 | |||
Refinery throughput(thousands of barrels per day) | 5,014 | |||
Petroleum product sales(thousands of barrels per day) | 6,174 | |||
Chemical prime product sales(1)(thousands of tonnes) | 24,157 |
Dividend Growth Since 1983(3) | Total Shareholder Returns(1) | |
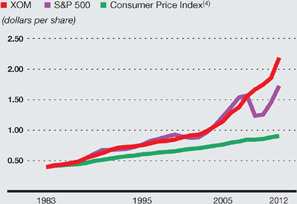 | 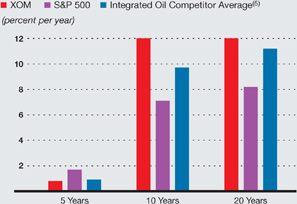 |
| (1) | See Frequently Used Terms on pages 93 through 95. | |
| (2) | Natural gas converted to oil-equivalent at 6 million cubic feet per 1 thousand barrels. | |
| (3) | S&P and CPI indexed to 1983 Exxon dividend. | |
| (4) | CPI based on historical yearly average from Bureau of Labor Statistics. | |
| (5) | Royal Dutch Shell, BP, and Chevron values are on a consistent basis with ExxonMobil, based on public information. |
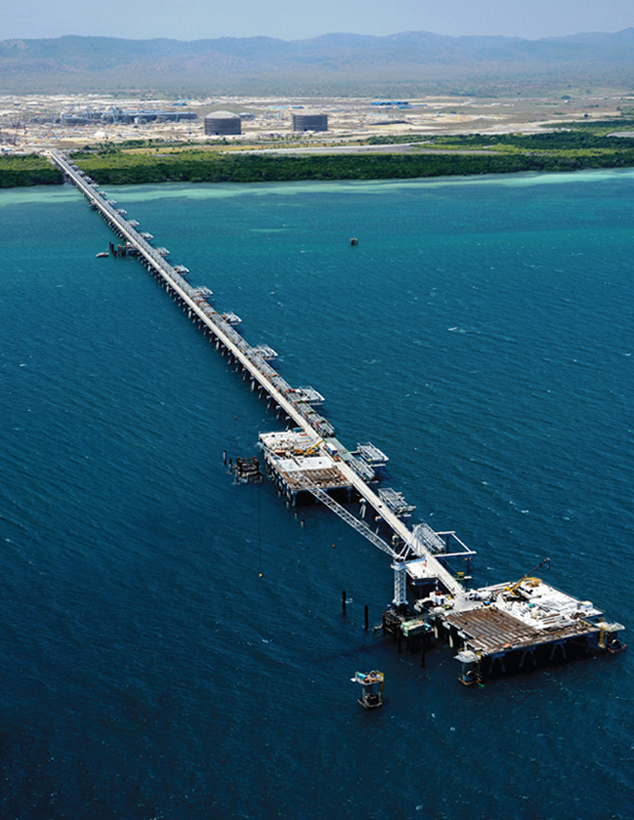
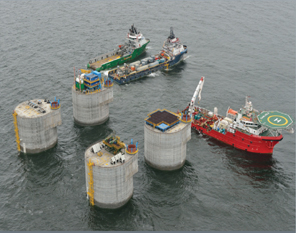
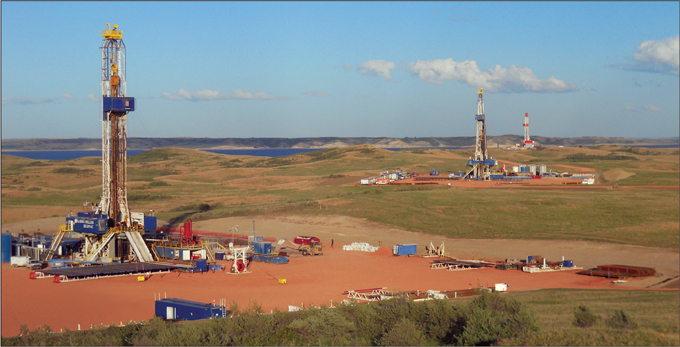
Photo:Construction and fabrication activities are progressing on the Papua New Guinea Liquefied Natural Gas project with start-up scheduled for 2014. | |
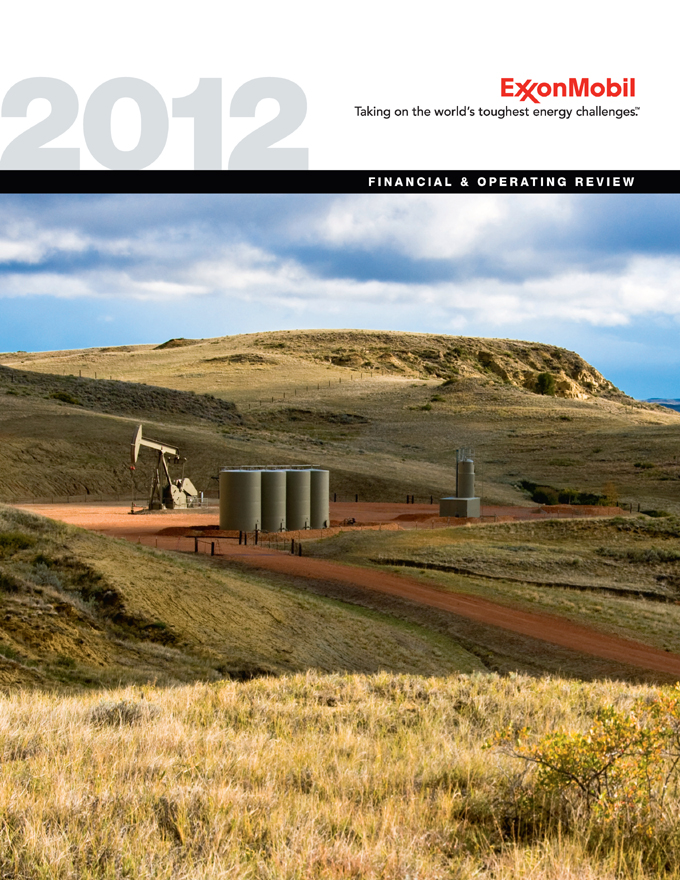
Cover Photo:Unconventional resources, such as those at our Bakken Shale play in Montana and North Dakota, are a key part of our portfolio. In 2012, we expanded our Bakken position to approximately 585,000 net acres. | |
Table of Contents
| 2 | EXXONMOBIL 2012 FINANCIAL & OPERATING REVIEW | ||||
Our competitive advantages formed the framework for solid financial and operating results across all key measures and businesses in 2012. We achieved strong earnings and generated robust returns for our shareholders. We also continued to invest in attractive projects that position the company for sustained long-term growth and profitability. Rex W. Tillerson,Chairman and CEO |  | ||||
RESULTS & HIGHLIGHTS
Strong safety and operations performance supported by effective risk management
Earnings of $45 billion and an industry-leading return on average capital employed of 25 percent
Total shareholder distributions of $30 billion(1)
Dividends per share increased by 21 percent in the second quarter of 2012, the 30th consecutive year
of dividend per share increases
of dividend per share increases
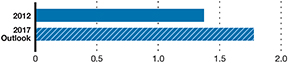
Proved oil and gas reserves additions of 1.8 billion oil-equivalent barrels, replacing more
than 100 percent of production for the 19th consecutive year
than 100 percent of production for the 19th consecutive year
Progressed Strategic Cooperation Agreement with Rosneft
Started up three major Upstream liquids projects in West Africa with capacity of 350 thousand gross
barrels of oil per day
barrels of oil per day
Completed construction and began commissioning activities of the Kearl Initial Development project
and the Singapore Chemical Expansion project
and the Singapore Chemical Expansion project
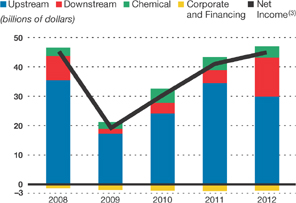
Functional Earnings and Net Income(2) | Return on Average Capital Employed(1) | |
 | 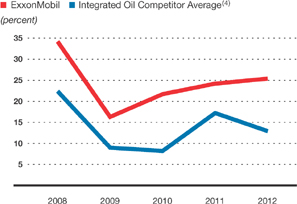 |
| (1) | See Frequently Used Terms on pages 93 through 95. | |
| (2) | Earnings after income taxes including special items (2008 and 2009). | |
| (3) | Net income attributable to ExxonMobil. | |
| (4) | Royal Dutch Shell, BP, and Chevron values are on a consistent basis with ExxonMobil, based on public information. |
Table of Contents
| 3 |
Competitive Advantages
ExxonMobil’s competitive advantages set us apart from industry and serve as the foundation for creating and maximizing long-term shareholder value.
Balanced PortfolioThe quality, size, and diversity of our portfolio are unparalleled and lead to strong financial and operating results in a wide range of market conditions. Within each of our global businesses – Upstream, Downstream, and Chemical – we have balanced and highly competitive resources, assets, products, and projects.
Disciplined InvestingWe carefully evaluate investment opportunities across a range of potential market conditions, and advance only those projects likely to provide long-term shareholder value. We focus on the efficient use of capital to achieve superior investment returns.
High-Impact TechnologiesWe are an industry leader in the development and application of technology. We pursue high-impact technologies that unlock new energy sources, reduce the cost of our projects, improve the efficiency of our operations, and increase the value of our products.
Operational ExcellenceMaximizing shareholder value requires a relentless focus on operational excellence. Driven by our talented and committed workforce, management systems are consistently deployed to improve our business performance and ensure that our high operating standards are met.
Global IntegrationThe global integration of our business allows us to capture significant value by leveraging our organizational structure to maximize the value of every molecule and rapidly implement best practices. Our level of integration results in structural advantages that are difficult for competitors to replicate.
Table of Contents
| 4 | EXXONMOBIL 2012 FINANCIAL & OPERATING REVIEW |
COMPETITIVE ADVANTAGES:
Balanced Portfolio
The quality, size, and diversity of our portfolio are evident across all three of our global businesses. With operations in 47 countries, we participate in the development of all major resource types and supply key markets with high-value petroleum and petrochemical products.
UPSTREAM
ExxonMobil’s Upstream portfolio includes high-quality exploration opportunities, an industry-leading resource base, a broad range of world-class projects, and a diverse set of producing assets.The size and diversity of our resource base are unmatched and offer strategic flexibility in our investment options. Our exploration organization focuses on expanding our base of oil and gas resources by exploring for all resource types around the globe. We combine world-class technical expertise and leading research capabilities to provide a distinct competitive advantage in discovering new resources. We also actively pursue discovered but not yet developed resources.
Our success in 2012 included by-the-bit exploration discoveries in seven countries that added 2.9 billion oil-equivalent barrels to our resource base. These included discoveries in Australia, Canada, Nigeria, Papua New Guinea, Romania, Tanzania, and the United States. After adjusting for annual production, asset sales, and revisions to existing field estimates, the resource base now totals 87 billion oil-equivalent barrels. These resources represent a diverse global portfolio distributed across all geographic regions and resource types, including conventional, unconventional, and heavy oil.
In addition to our balanced resource base and project portfolio, our existing oil and gas production is diversified across all major regions, including North America, Europe, Africa, the Middle East, Asia, and Australia. In North America, we produce oil and gas in Texas, Louisiana, the Gulf of Mexico, California, the mid-continent states, Alaska, offshore eastern Canada, and onshore western Canada. We also have a significant presence in Europe, including the United Kingdom, the Norwegian North Sea, the Netherlands, and Germany. In other regions, we participate in a similarly large number of countries.
DOWNSTREAM
ExxonMobil’s Downstream portfolio includes a network of 32 refineries.We are one of the most geographically balanced petroleum refiners in the world, with approximately 45 percent of our refining capacity in North America, 30 percent in Europe, and the remainder in Asia Pacific and the Middle East. We have significant refining capacity in the mid-continent region of the United States and Canada, which positions us well to capture benefits from growing North American crude oil production. This geographic diversity provides flexibility in acquiring advantaged feedstocks and supplying refined products to major markets. In addition, we have the largest lubricant basestock production capacity in the world.
We sell a wide range of petroleum products in more than 120 countries, including transportation fuels such as gasoline and diesel that are sold under our global brands Exxon, Mobil, and Esso. We are a market leader in high-value synthetic lubricants, including our Mobil 1 product line, and we continue to grow the business in key markets at rates considerably faster than that of the industry. Our high-quality products, combined with a strong refining and distribution network, position us as a leading supplier around the world.
CHEMICAL
ExxonMobil’s Chemical business produces and sells a broad portfolio of products around the globe. Efficiently produced, high-volume commodity chemicals, such as many general-purpose plastics, capture upside earnings when margins are strong and provide a low cost structure for co-located specialties production. Specialty products, including high-end polymers and lubricant additives, command a market premium due to their usefulness in higher-value applications. They also provide a stable and steadily growing earnings base throughout the market cycles that characterize the chemical business.
Not unlike our Upstream and Downstream portfolios, our Chemical manufacturing operations are geographically diverse. This diversity provides us with access to a wide variety of feedstocks, and enables us to competitively supply the global market and capture regional differences in demand. For example, our U.S. Gulf Coast plants have access to ethane feedstock that is currently advantaged, allowing us to competitively supply high-demand growth markets around the world.
Table of Contents
| 5 |
 | ||||
ROSNEFT STRATEGIC COOPERATION AGREEMENT | ||||
In 2012, ExxonMobil continued to progress our Strategic Cooperation Agreement with Rosneft covering 31 million acres in the Kara Sea – an area similar to the size of the entire leased area in the Gulf of Mexico – and nearly 2.7 million acres in West Siberia. We are also working with Rosneft to jointly assess and develop oil and gas in the United States and Canada. | ||||
Right:Seismic data were collected in the Kara Sea in 2012, and exploration drilling is expected to begin in 2014. | ||||
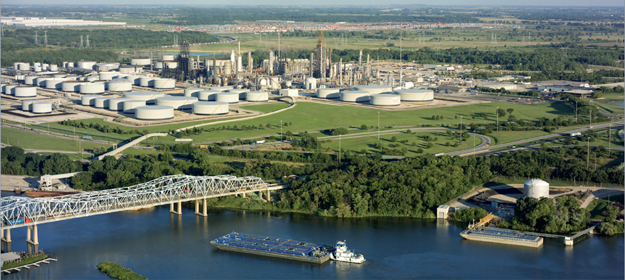
Our geographically diverse Downstream portfolio includes a network of 32 refineries around the globe. With five refineries located in the mid-continent region of North America, including Joliet, Illinois (above), ExxonMobil is well positioned to benefit from growing crude oil production in the United States and Canada. | ||
Chemical Segment Earnings | Chemical 2012 Prime Product Sales | |
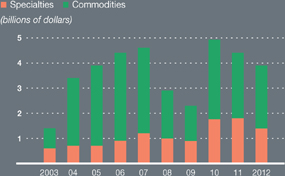 | 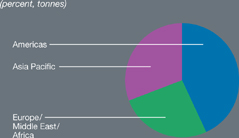 | |
Our unique Chemical portfolio captures the benefits of scale from commodity chemicals while maximizing the value of specialty chemicals. High-volume commodities capture upside earnings when industry margins are strong, while lower-volume specialties products command a market premium and provide a stable earnings base. | ||
Table of Contents
| 6 | EXXONMOBIL 2012 FINANCIAL & OPERATING REVIEW |
COMPETITIVE ADVANTAGES:
Disciplined Investing
ExxonMobil’s disciplined approach to investing focuses on the efficient use of capital. By combining rigorous standards for project assessment with proven project development expertise, we gain advantage in our investments over the long term. This discipline is applied across our entire portfolio and includes identification of key growth opportunities and divestment of assets that no longer meet our long-term objectives. Across our worldwide operations, our return on capital employed has averaged 24 percent over the last five years, and we continue to lead competition in this important measure of long-term shareholder value.
RIGOROUS STANDARDS, LONG-TERM RETURNS
Investment decisions in the energy industry are characterized by time horizons measured in decades. We test projects over a wide range of scenarios to ensure that all relevant risks – including financial, commercial, environmental, technical, and others – are properly identified, thoroughly evaluated, and effectively managed.
In 2012, ExxonMobil invested nearly $40 billion to bring new energy supplies and products to the market. Exploration investments are drawn from a diverse portfolio of opportunities, allowing us to effectively manage risk. From a portfolio of more than 120 Upstream projects, we expect to develop 23 billion oil-equivalent barrels across a variety of resource types and geographic regions. Our scale and diversity allow us to selectively invest in projects most likely to deliver superior financial performance and profitable volumes growth. We plan to start up 28 major Upstream projects between 2013 and 2017, which are expected to deliver approximately 1 million net oil-equivalent barrels per day of production by 2017.
Our proven project management systems ensure the efficient use of capital and lead to successful start-ups by incorporating best practices that are rigorously and consistently applied to projects around the globe. These systems employ a demanding gate review process overseen by experienced global project teams whose expertise lies in optimizing value from initial discovery through start-up. We also consider the role of technology to maximize capital efficiency. Project economics are carefully assessed, budgets are closely monitored, and reappraisals are routinely performed to further improve our performance. As a result, ExxonMobil-operated projects continue to perform at better cost and schedule certainty than those projects operated by others in which we have an interest.
KEY MARKETS GUIDE DECISIONS
Investment decisions are guided by our energy outlook, which evaluates future demands and identifies key growth markets.Our Singapore Chemical Expansion project illustrates how we identify and approach new capital commitments. The project doubled our steam-cracking capacity at the site, added unparalleled feedstock flexibility, and delivered world-class energy and cost efficiencies. Our manufacturing capacity of premium products grew significantly, including several products that ExxonMobil has never before produced in this important region.
The Singapore expansion was undertaken because petroleum and chemical demand is expected to rise rapidly in the Asia Pacific region. China’s petrochemical demand has grown by 15 percent per year from 1990 through 2010 and is expected to nearly double this decade. The Singapore plant positions ExxonMobil to participate in Asia’s rapidly growing markets. We are also expanding ultra-low sulfur diesel production capacity in Singapore, as well as lube oil blending capacity in China, to support rising demand for these high-value products in the region.
PORTFOLIO MANAGEMENT
Our disciplined approach applies not only to new investments, but also to our willingness to divest assets that no longer meet our criteria for providing long-term returns.We have a long-standing practice of regularly reviewing assets to ensure they contribute to our operational and financial objectives, and we divest assets when the sale is deemed to enhance long-term shareholder value.
During 2012, we completed the sale of some of our Upstream assets, including a portion of our acreage in Angola and Norway. We also divested our Downstream and Chemical assets in Argentina, Uruguay, Paraguay, Central America, Malaysia, and Switzerland, and restructured and reduced our holdings in Japan. The transition of our U.S. retail fuel business to a more capital-efficient branded wholesaler model is also nearly complete.
Over the last 10 years, we have divested or restructured Downstream interests in 19 refineries, 6,000 miles of pipeline, 191 product terminals, 37 lube oil blend plants, and more than 22,000 retail service stations. These Downstream portfolio improvements resulted in a nearly 4-percentage-point improvement in our Downstream return on capital employed.
Table of Contents
| 7 |
 | ||
Major Upstream Project Start-Ups 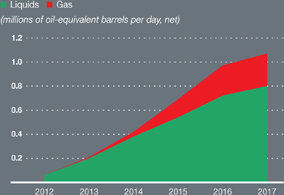 | ||
INVESTING FOR GROWTH AND VALUE | ||
| Our disciplined approach to investing encompasses everything from initial project screening to the divestment of assets that no longer meet our criteria. Rigorous standards are consistently applied across our global portfolio. Our Upstream project portfolio is geographically diverse and represents all major resource types. Near-term major Upstream project start-ups, including our Arkutun-Dagi development in Russia (top right), are expected to deliver approximately 1 million net oil-equivalent barrels per day of production by 2017. Our Papua New Guinea Liquefied Natural Gas project (below) is scheduled to start up in 2014 and will support rapidly growing global demand for natural gas. | Upstream Projects by Resource Type (percent, oil-equivalent barrels) 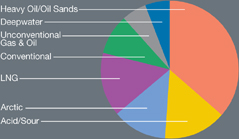 |
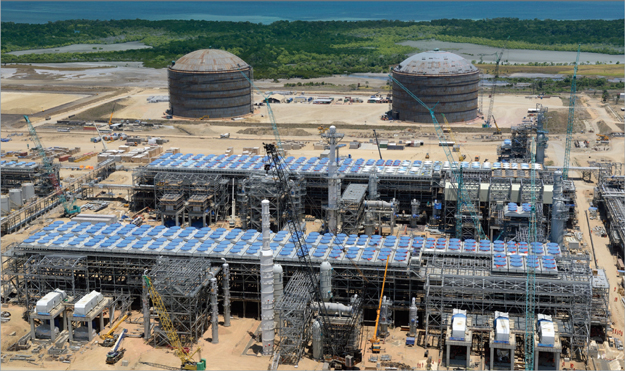
Table of Contents
| 8 | EXXONMOBIL 2012 FINANCIAL & OPERATING REVIEW |
COMPETITIVE ADVANTAGES:
High-Impact Technologies
The pursuit of new technologies is vital to our long-term success. We make substantial investments in research and development to unlock new resources, improve the efficiency of our operations, and increase the value of our products. Our ongoing commitment to advancing science and technology leads to significant competitive advantage and strengthens our reputation as a partner of choice.
UNLOCKING RESOURCE VALUE
Our Upstream technologies provide advantages across the entire value chain, from early reservoir modeling to the drilling and completion of record-length wells, to safely producing oil and gas in some of the world’s harshest environments.Technology not only unlocks significant value in previously uneconomic resources, but it also reduces our environmental footprint and increases capital efficiency. For example, our patented full-wavefield inversion seismic technology, combined with high-performance computing capabilities, yields unparalleled high-definition subsurface images, a key advantage in identifying new resources and optimizing drilling and reservoir development plans.
Extended-reach drilling technology enables access to challenging and complex reservoirs, reducing the number of wells needed to produce oil and gas. Notably, we have drilled 26 of the world’s 30 longest-reach wells. This includes the world-record 7.7-mile-long horizontal well that we drilled in 2012 in the challenging arctic environment near Sakhalin Island in Russia.
ExxonMobil’s Subsea Technology project focuses on the development of new systems and equipment to support the development of ultra-deepwater and arctic resources. The project scope consists of more than 20 technologies for subsea processing, power generation, surveillance, and intervention that can be readily deployed. We have developed a compact separation system capable of separating oil, gas, and water at depths of up to 10,000 feet. In ultra-deep water, high external pressures prohibit subsea activities using conventional facilities. However, our advances in subsea separation are expected to provide significant safety, technical, and business benefits to ExxonMobil’s deepwater portfolio, and enable access to isolated fields that otherwise would not be developed.
IMPROVING OPERATIONAL EFFICIENCY
Margin improvement is a strategic priority.Advantaged technologies in our Downstream and Chemical businesses enable us to reduce our raw material cost, improve catalyst performance, and optimize utilization of our facilities. We reduce raw material cost through the application of proprietary technology in the design and operation of our integrated facilities, which expands our flexibility and allows us to process the most economic feedstocks available. For example, our advanced modeling and characterization tools enable new, lower-cost feeds to be processed while obtaining greater yields of higher-value products.
Technology also supports increased production by improving reliability, removing operating constraints, and expanding market outlets. For example, our robust systems and supply chain models help us place molecules in the right market at the right time, aided by molecule management tools that enable real-time optimization of operational variables and product dispositions. In addition, advantages in catalyst technology enable “step skipping” versus traditional production routes, resulting in lower energy consumption and processing cost for the same amount of production.
INCREASING PRODUCT VALUE
An understanding of our products at the molecular level enables the development of leading-edge technologies to further improve their value to our customers.For example, we have several active programs focused on providing significant fuel economy benefits in our flagship Mobil 1 AFE products, while maintaining outstanding engine protection and reducing emissions. We also employ models that help us understand how each molecule can be best utilized to produce high-value products.
Technology breakthroughs also lead to the development of advanced catalysts to more efficiently upgrade a wide variety of feedstocks into higher-value proprietary products. For example, our metallocene catalysts are being used to manufacture premium chemical products for a wide range of applications including flexible packaging, consumer products, and lubricants. These products deliver sustainability benefits to customers that include reduced raw material use, improved performance, and greater energy efficiency.
Table of Contents
| 9 |

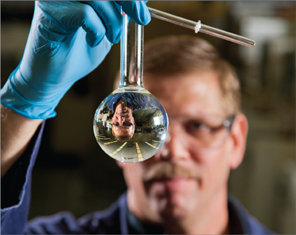
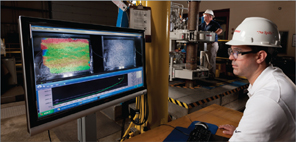
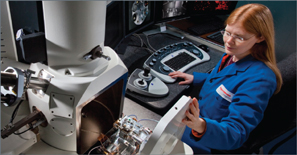
ADVANTAGE THROUGH TECHNOLOGY
Technology advances will continue to reshape the world’s energy landscape. ExxonMobil’s research in fundamental science fosters safe and economic development of existing and next-generation energy sources. From solving arctic environment metallurgy challenges to developing state-of-the-art technology to better understand the molecular composition of crude oil, our research activity helps maximize the value of every molecule we produce. Technological advances in our Downstream and Chemical businesses enable us to generate a molecular-level understanding of our products in order to further improve their value to our customers.
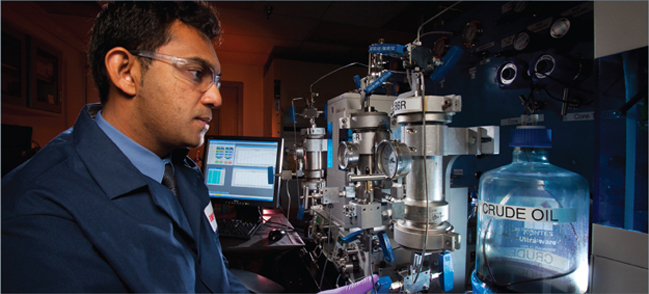
Table of Contents
| 10 | EXXONMOBIL 2012 FINANCIAL & OPERATING REVIEW |
COMPETITIVE ADVANTAGES:
Operational Excellence
Sustaining operational excellence is critical to maximizing long-term shareholder value. Driven by our talented and committed workforce, our proven management systems are rigorously deployed around the world to improve our business performance and ensure that our high operating standards are met. These systems enable continuous improvement in our safety performance, increased reliability, and lower operating cost.
CULTURE OF EXCELLENCE
Operational excellence begins with exceptional employees.Backed by comprehensive management systems, the men and women of ExxonMobil form the foundation for strong operational performance. We are proud of the culture of excellence reflected in the daily accomplishments of our employees around the world. It is a culture built by decades of past and current employees’ dedication to doing the right things, the right way, and not accepting compromises to our values.
Maintaining our culture of excellence begins the day a new employee starts working for ExxonMobil. In addition to having access to the depth and breadth of experiences of employees in similar positions around the world, new employees receive intensive training that is designed to incorporate our proven best practices.
Employees also receive diverse experiences and assignments enabled by our global functional organization, which encourages the sharing of information and talent. Our goal is to position employees for a long-term career so they can continue to grow and contribute to our strong experience base and develop into our next generation of leaders. This philosophy applies equally to local workforce development, where we hire and build the skills of nationals in the developing countries in which we operate.
OPERATIONS INTEGRITY MANAGEMENT SYSTEM
Management systems are deployed throughout our global operations to ensure the consistent application of high operating standards.Widely regarded as a model for exceptional operational performance, ExxonMobil’s Operations Integrity Management System (OIMS) forms the cornerstone of our commitment to operational excellence and provides a solid framework to achieve safe and reliable operations.
OIMS also establishes the framework for managing the safety, security, health, and environmental risks inherent in our business, and provides the structure to ensure that we meet or exceed local regulations. We continually assess the framework and its effectiveness, and incorporate learnings to further improve performance. OIMS is used consistently around the world in all of our business lines, and compliance is tested on a regular basis.
RELIABILITY AND EFFICIENCY
Operational excellence also involves a steadfast commitment to continuously improve the reliability and efficiency of our assets, which leads to improved profitability.We deploy rigorous reliability systems that define our high expectations for operating and maintaining equipment to preserve its integrity. Our Upstream reliability performance over the last five years demonstrates the effectiveness of our approach, with uptime more than 3 percent higher at ExxonMobil-operated assets versus assets in our portfolio operated by others. This equates to approximately 45 thousand net oil-equivalent barrels per day of additional production.
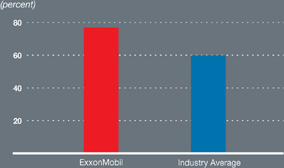
Another way that our commitment to operational excellence improves our profitability is demonstrated by the efficiency of our Downstream assets. Cash operating costs at ExxonMobil refineries have been well below the industry average, driven in large part by energy efficiency. With energy representing about one-third of the operating cost of a refinery, every incremental improvement in energy efficiency results in increased margins and profitability. In 2012, we achieved best-ever energy efficiency for our global refining network, and since 2002 we have improved our refinery energy efficiency by 10 percent.
Table of Contents
| 11 |


SYSTEMATIC APPROACH
Comprehensive management systems are rigorously and consistently applied around the globe, including at the Baton Rouge Refinery (above, left). These systems ensure that our high operational standards are met in all of our operations. Each of the 11 elements of ExxonMobil’s Operations Integrity Management System (below) contains an underlying principle and a set of expectations that apply to all ExxonMobil operations worldwide. Management is responsible for ensuring that robust systems are in place to satisfy these expectations, and compliance is tested on a regular basis.
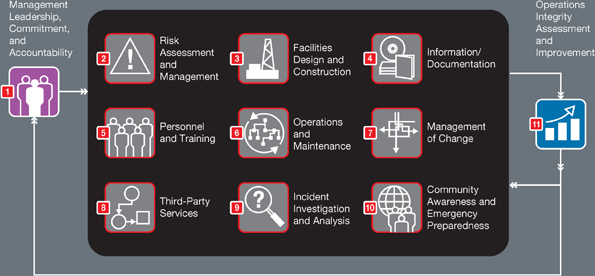
Table of Contents
| 12 | EXXONMOBIL 2012 FINANCIAL & OPERATING REVIEW |
COMPETITIVE ADVANTAGES:
Global Integration
We derive significant value from our globally integrated business model, which enables us to maximize the value of every molecule that we produce, leverage the advantages of our organizational structure, and optimize co-located manufacturing. Our level of integration results in structural and market advantages that are difficult for competitors to replicate.
OPTIMIZING VALUE IN MANUFACTURING
Integration enables us to maximize the value of every molecule from wellhead to consumer.For example, more than 75 percent of our refining operations are integrated with chemical or lubes manufacturing. At these integrated sites, complex models are used to decide in real-time whether molecules should be manufactured into gasoline, diesel, jet fuel, chemicals, lubricants, or other products based on current market conditions. To take advantage of the wide variety of feedstocks available at these co-located sites, we have engineered additional flexibility into our assets to further reduce our input cost. We also leverage Integrated Business Teams with representation from various business functions to ensure optimal placement of our products.
Our integrated power generation and purchasing expertise enables the capture of additional value by increasing efficiency and reducing emissions. We are an industry leader in the application of cogeneration technology, with interest in five gigawatts of capacity across more than 100 installations. In 2012, we started up a new 220-megawatt cogeneration plant in Singapore and progressed projects that are expected to add more than 300 megawatts of additional cogeneration capacity in Canada and Europe.
MAXIMIZING RESOURCE VALUE
Integration also maximizes value during Upstream resource evaluation and development.During the early stages of an Upstream project, our Downstream business provides technical and commercial expertise as well as world-class refining and logistics assets to enhance resource value. Commercial, technical, and supply chain support is provided to develop potential market outlets, identify and resolve challenging crude properties, and optimize logistics.
Our Kearl oil sands project demonstrates the benefits of successful integration between our Upstream and Downstream organizations. Our global supply team has a broad understanding of the marketing options for new crudes, while our refining and technology organizations have the technical knowledge to optimize the processing of Kearl production. Sharing and integrating this expertise across our supply chain adds value at every stage and enhances overall resource value and returns.
Our Upstream Gas and Power Marketing organization employs a worldwide team of commercial experts that maximize the value of our natural gas and natural gas liquids production. In the United Kingdom, for example, we maximize the throughput from our North Sea natural gas liquids extraction plants to provide feedstocks to our onshore Fife Ethylene Plant in Scotland. We have similar opportunities at our North American facilities that take advantage of increasing liquids-rich unconventional natural gas production.
LEVERAGING ORGANIZATIONAL STRUCTURE
Our integrated organizational structure also reduces our cost and improves our operations.For example, at each of our integrated sites, we have a shared site management and support services structure, which reduces overhead and administrative cost. We also leverage common utilities and infrastructure to reduce our energy and maintenance expense.
Common global processes and a global functional organization also capture value by enabling the rapid deployment of best practices across our global networks, resulting in improved operations. Lessons learned and expertise gained at one site are quickly transferred to other sites, resulting in continuous improvement in all aspects of our business.
Table of Contents
| 13 | |||
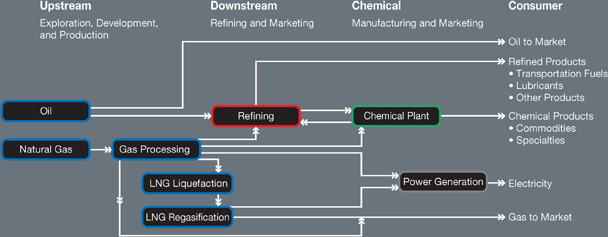
GREATER THAN THE
SUM OF THE PARTS
SUM OF THE PARTS
Integration boosts the profit margin of each of our global businesses by maximizing the value of every molecule while minimizing cost. The value of integration between the Upstream and Downstream is demonstrated by the success of our Kearl project (right). From initial development through production, we are leveraging our world-class refining and logistics expertise to maximize the value of Kearl production. Also, with more than 75 percent of our refining operations integrated with chemicals or lubes, the combined ROCE of our Downstream and Chemical businesses consistently outperforms the competition.
Refining Integration with Chemicals and Lubes | Downstream and Chemical Combined ROCE(1) | |
 Source: Parpinelli Tecnon, PIRA data |  (1) See Frequently Used Terms on pages 93 through 95. (2) Royal Dutch Shell, BP, and Chevron values are on a consistent basis with ExxonMobil, based on public information. |
Table of Contents
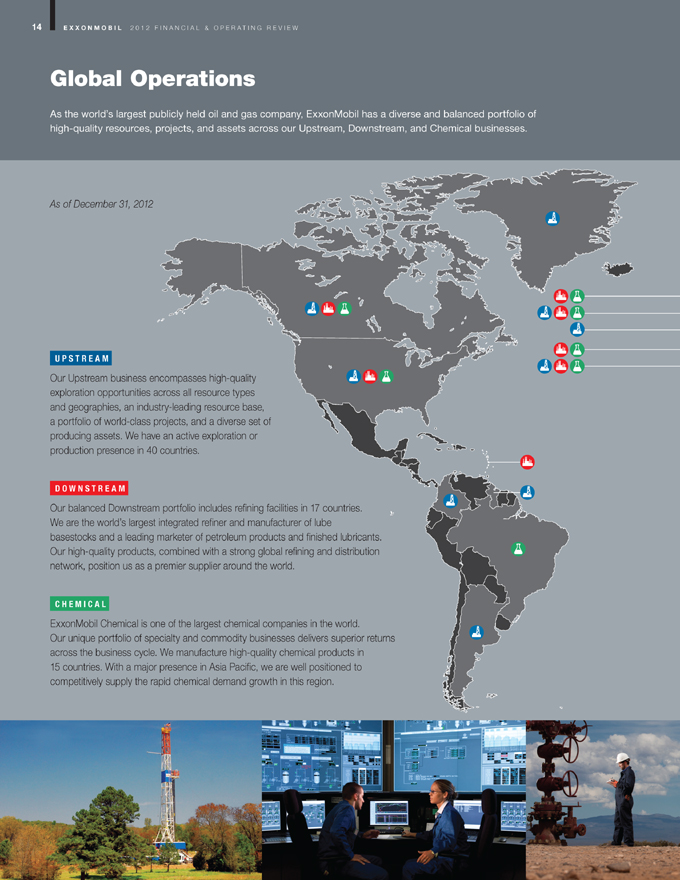
Table of Contents
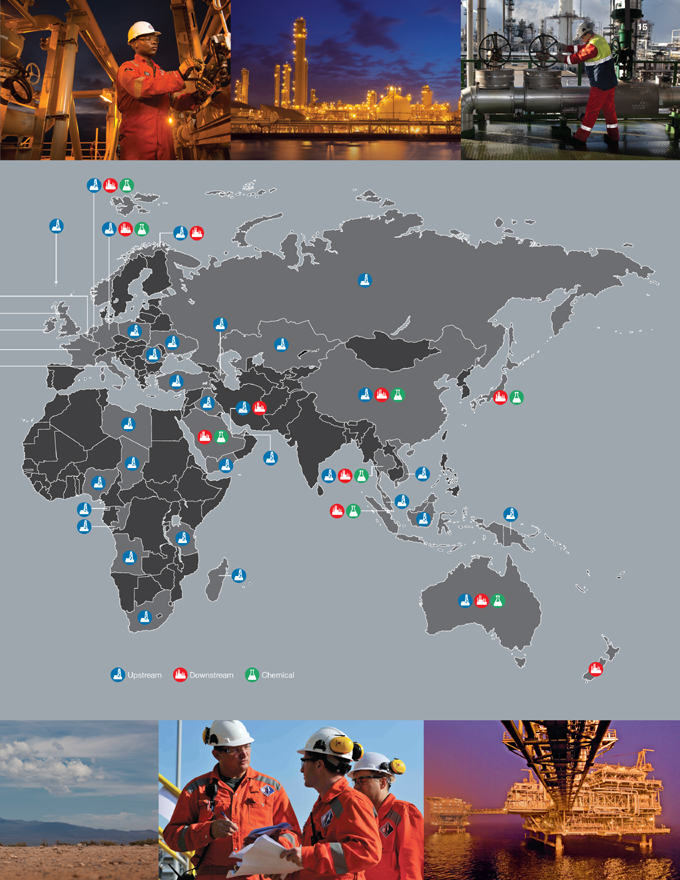
Table of Contents
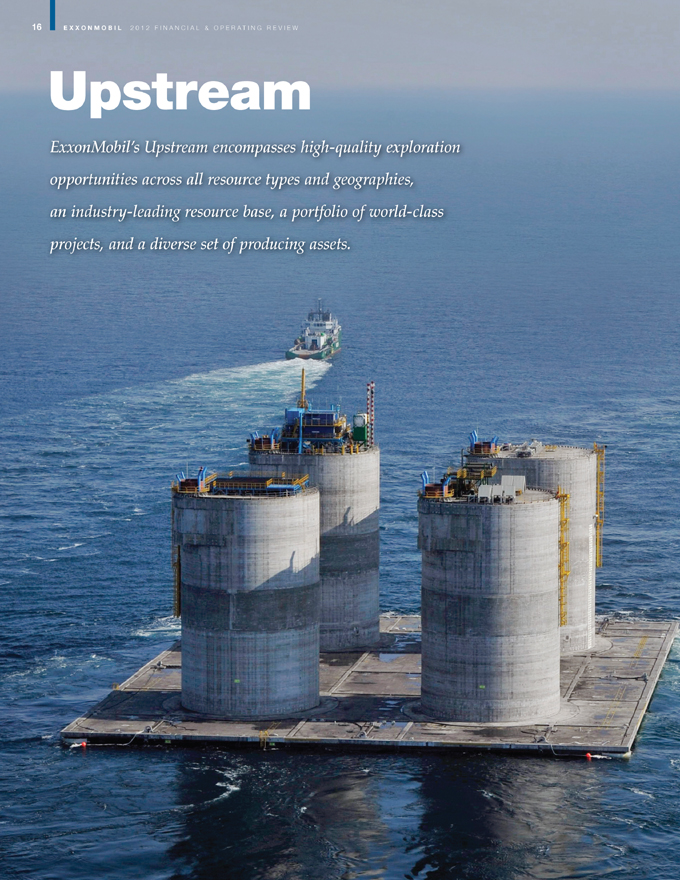
Table of Contents
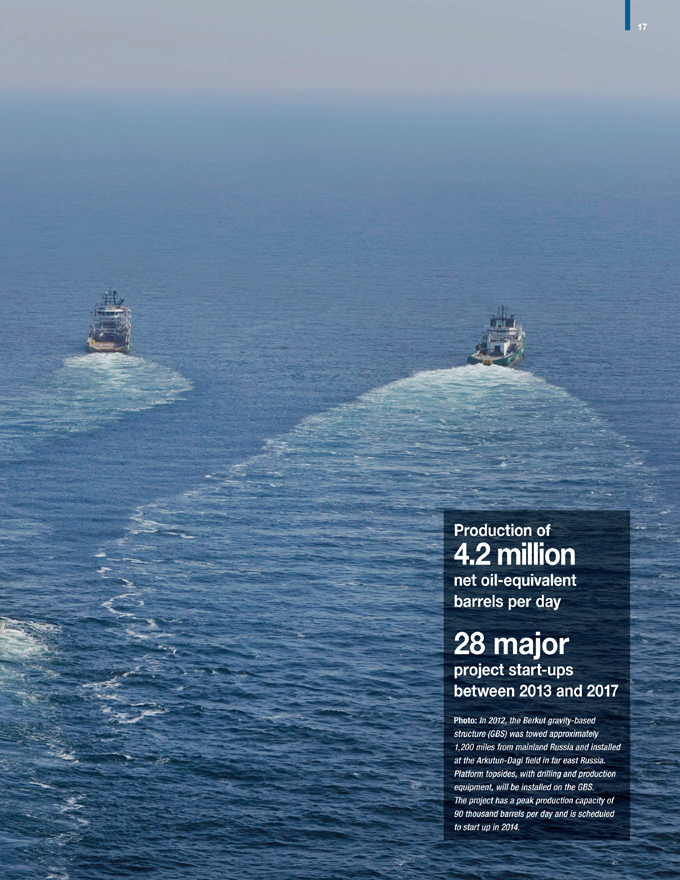
Table of Contents
| 18 | EXXONMOBIL 2012 FINANCIAL & OPERATING REVIEW |
Upstream
The disciplined execution of ExxonMobil’s Upstream strategies, underpinned by a relentless focus on operational excellence, drives delivery of our competitive advantages and superior results.
RESULTS & HIGHLIGHTS
Strong safety and operational performance
Industry-leading earnings of $29.9 billion
Proved oil and natural gas reserve additions of 1.8 billion
oil-equivalent barrels, replacing more than 100 percent
of production for the 19th consecutive year
oil-equivalent barrels, replacing more than 100 percent
of production for the 19th consecutive year
STRATEGIES
| • | Apply effective risk management, safety, and operational excellence | |
| • | Identify and selectively capture the highest-quality resources | |
| • | Exercise a disciplined approach to investing and cost management | |
| • | Develop and apply high-impact technologies | |
| • | Maximize profitability of existing oil and gas production | |
| • | Capitalize on growing natural gas and power markets |
Exploration discoveries totaling 2.9 billion oil-equivalent barrelsin Australia, Canada, Nigeria,
Papua New Guinea, Romania, Tanzania, and the United States
Papua New Guinea, Romania, Tanzania, and the United States
Three major liquids project start-upsin West Africa with a capacity of 350 thousand barrels of oil per day
Commenced commissioning activitiesat the 110-thousand-barrel-per-day Kearl Initial Development project
Drilled the world’s longest horizontal well(40,604 feet) at the Chayvo field, offshore Russia
Signed agreements to assess tight oil reserves in West Siberia covering nearly 2.7 million acres
Expanded our United States unconventional acreage positionin the prolific Bakken and emerging
liquids-rich Woodford Ardmore plays by more than 275,000 net acres
liquids-rich Woodford Ardmore plays by more than 275,000 net acres
Signed an agreement to acquire nearly 650,000 net acresin the Montney and Duvernay unconventional
plays in western Canada
plays in western Canada
| UPSTREAM STATISTICAL RECAP | 2012 | 2011 | 2010 | 2009 | 2008 | |||||||||||||||
Earnings(millions of dollars) | 29,895 | 34,439 | 24,097 | 17,107 | 35,402 | |||||||||||||||
Liquids production(net, thousands of barrels per day) | 2,185 | 2,312 | 2,422 | 2,387 | 2,405 | |||||||||||||||
Natural gas production available for sale (net, millions of cubic feet per day) | 12,322 | 13,162 | 12,148 | 9,273 | 9,095 | |||||||||||||||
Oil-equivalent production(1)(net, thousands of barrels per day) | 4,239 | 4,506 | 4,447 | 3,932 | 3,921 | |||||||||||||||
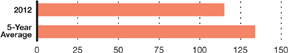
Proved reserves replacement ratio(2)(3)(percent) | 124 | 116 | 211 | 100 | 143 | |||||||||||||||
Resource additions(2)(millions of oil-equivalent barrels) | 4,012 | 4,086 | 14,580 | 2,860 | 2,230 | |||||||||||||||
Average capital employed(2)(millions of dollars) | 139,442 | 129,807 | 103,287 | 73,201 | 66,064 | |||||||||||||||
Return on average capital employed(2)(percent) | 21.4 | 26.5 | 23.3 | 23.4 | 53.6 | |||||||||||||||
Capital and exploration expenditures(2)(millions of dollars) | 36,084 | 33,091 | 27,319 | 20,704 | 19,734 | |||||||||||||||
| (1) | Natural gas converted to oil-equivalent at 6 million cubic feet per 1 thousand barrels. | |
| (2) | See Frequently Used Terms on pages 93 through 95. | |
| (3) | Proved reserves exclude asset sales. Includes non-consolidated interests and Canadian oil sands. | |
| Note: Unless otherwise stated, production rates, project capacities, and acreage values referred to on pages 16 through 49 are gross. | ||
Table of Contents
 | 19 |
BUSINESS OVERVIEW
Demand for oil and other liquid fuels is forecast to increase by about 30 percent from 2010 to 2040. Meeting this demand will require replacing normal conventional resource decline while also increasing production from deepwater, tight oil, oil sands, and natural gas liquids. In total, approximately 113 million oil-equivalent barrels per day will be required to meet liquids demand in 2040. At the same time, global demand for natural gas is likely to increase by about 65 percent. Growth in unconventional supplies is expected to account for approximately 60 percent of that increase and approach one-third of global gas supply by 2040. Meeting growing demand presents a tremendous challenge that will require a long-term view, significant investment, and continuing innovation to develop conventional and unconventional resources.
Through the disciplined execution of our Upstream strategies, ExxonMobil is well positioned to help meet this challenge while delivering long-term value for our shareholders. We start by identifying and selectively capturing the highest-quality resources around the globe. In 2012, these efforts added nearly 1.8 million net acres to our exploration portfolio across all resource types and in some of the world’s most prospective areas.
We then apply a disciplined approach to investing and cost management. Proven project management systems incorporate best practices from around the globe to rigorously manage our project portfolio from initial discovery to start-up. In 2012, we participated in the start-up of three major liquids projects. We plan to bring 28 major projects online between 2013 and 2017, which are expected to deliver approximately 1 million net oil-equivalent barrels per day of production by 2017.
Our steadfast commitment to develop and apply high-impact technologies in areas such as subsurface imaging and well completions, allows us to find, develop, and produce new resources from some of the most challenging reservoirs and extreme environments on earth.
We apply robust operations and risk management systems to maximize the profitability of our existing oil and gas production. Over the last five years, our operated facility uptime was more than 3 percent, or more than 45 thousand net oil-equivalent barrels per day, higher than fields operated by others in which we hold an interest.
With our detailed knowledge of global energy markets we are also able to capitalize on growing natural gas and power markets. In 2012, we sold more than 15.2 billion net cubic feet per day of gas across 33 countries including participating in liquefied natural gas operations that delivered 61 million tonnes to global markets.
Overall, our Upstream business continues to apply effective risk management, safety, and operational excellence across our integrated global businesses.
| Global Liquids Supply by Type | Global Natural Gas Production by Type | |
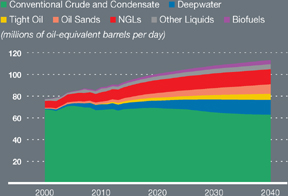 | 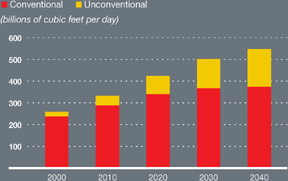 | |
Source: ExxonMobil, 2013 The Outlook for Energy: A View to 2040 |
Table of Contents
| 20 | EXXONMOBIL 2012 FINANCIAL & OPERATING REVIEW |
UPSTREAM:
Opportunity Capture
The combination of technical expertise, extensive global databases, and industry-leading research facilities allows ExxonMobil Upstream to identify, pursue, and selectively capture the highest-quality opportunities across all resource types and environments. Our ability to fully integrate and leverage these skills, combined with our worldwide experience, provides ExxonMobil a competitive advantage in the commercialization of new resources. Recognition of these capabilities creates opportunities for us as a partner of choice for other organizations.
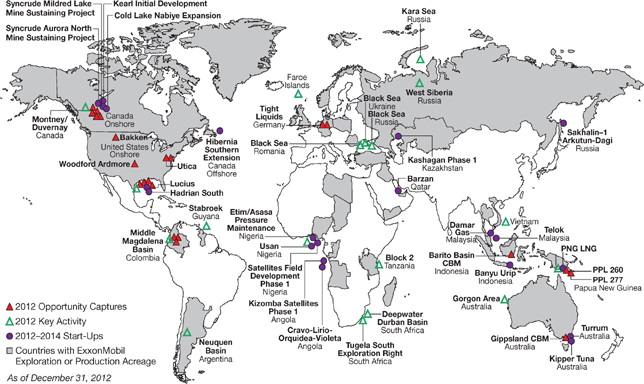
2012 OPPORTUNITY CAPTURES
In 2012, we captured 22 new opportunities spanning unconventional and conventional plays to build on our industry-leading resource base. At year-end 2012, our exploration acreage totaled 60 million net acres in 32 countries. Our successful efforts leveraged our North America unconventional experience to capture new unconventional acreage positions in Australia, Canada, Colombia, Germany, and Indonesia. These additions underpin future resource additions and production growth.
Australia • ExxonMobil entered into an unconventional coal bed methane (CBM) play by gaining equity in 91,000 net acres in the onshore portion of the Gippsland Basin. Efforts to evaluate and assess the natural gas potential in the coal seams is expected to commence in 2013.
Canada • We expanded our acreage position in the Montney and Nordegg plays by 32,000 net acres though participation in government land sales. These acquisitions complement our existing North America unconventional portfolio. Leveraging our extensive U.S. unconventional resource development experience will enable us to maximize value from these assets.
Colombia • ExxonMobil established a significant position in the emerging unconventional tight liquids play in the Middle Magdalena Basin area through entry into four blocks covering 404,000 net acres and one technical evaluation agreement covering an additional 160,000 net acres. Exploration drilling and seismic data acquisition programs started in 2012 and will continue into 2013.
Germany•Three licenses totaling 68,000 net acres were awarded to ExxonMobil in 2012, expanding our acreage position in unconventional tight liquids.
Indonesia•We increased our exploration acreage position in the Barito coal bed methane basin by an additional 227,000 net acres.
Papua New Guinea•We expanded our exploration position in the Papuan Highlands by adding 544,000 net acres in PPL 260 and PPL 277 adjacent to our Papua New Guinea Liquefied Natural Gas (LNG) project.
U.S. Offshore•We expanded our position in the Gulf of Mexico by a combined 395,000 net acres through participation in GOM Lease Sale 218, GOM Lease Sale 216/222, and two farm-ins.
WOODFORD SHALE BASIN DEVELOPMENT | ||
| In 2012, ExxonMobil completed our fifth acquisition in southern Oklahoma since 2010, expanding our acreage position to more than 270,000 net acres in the Woodford Shale play in the Ardmore and Marietta Basins. Both basins are attractive due to their liquids yield and higher per-well recoveries. With a high-quality acreage position and active drilling operations, we have the potential to recover more than 1.5 billion oil-equivalent barrels from this liquids-rich play at an attractive development cost. | ||
| Gross operated production more than doubled in 2012 to approximately 19 thousand oil-equivalent barrels per day. In 2012, construction was completed on a 117-mile gathering pipeline from our operations to processing facilities in North Texas. We are continuing delineation efforts of the Woodford Shale and other shales in the Marietta Basin to the southwest. Current development plans could grow production to more than 150 thousand net oil-equivalent barrels per day. ExxonMobil’s systematic approach to development is key to delivering maximum value from unconventional resources, which involves leveraging unparalleled experience from more mature plays, optimizing drilling and completion practices, and maximizing capital efficiency through pad drilling. | 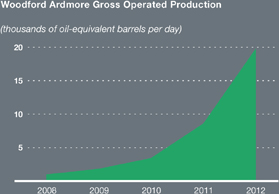 | |
Table of Contents
| 21 |
GLOBAL UPSTREAM PORTFOLIO
U.S. Onshore • ExxonMobil acquired 192,000 net acres in the Bakken Shale play, increasing our position by nearly 50 percent. We further expanded our industry-leading position in the liquids-rich Woodford Ardmore Shale in southern Oklahoma to more than 270,000 net acres through acquisition and leasing. We also increased our acreage position to nearly 90,000 net acres in the emerging Utica Shale play.
2012 KEY AGREEMENTS
In 2012, we signed several agreements which, when finalized, will underpin future resource additions and production growth.
Canada • ExxonMobil entered into an agreement with Celtic Exploration Ltd. to acquire 545,000 net acres in the liquids-rich Montney play, 104,000 net acres in the Duvernay play, and additional acreage in other areas of Alberta. Imperial Oil will acquire a 50-percent working interest in this acreage.
Russia • ExxonMobil is working with Rosneft to evaluate the exploration potential of the Kara Sea, Black Sea, and West Siberia. In West Siberia, a Pilot Development Agreement was signed that will lead to a joint venture to execute a pilot program and develop potential commercial production of tight oil reserves at the Achimov and Bazhenov formations with equity interests of 51 percent Rosneft and 49 percent ExxonMobil. Work will be carried out on Rosneft’s 23 license blocks covering 2.7 million acres.
South Africa • ExxonMobil signed an agreement to acquire a 75-percent interest in the Tugela South Exploration Right (2.8 million acres). Under the agreement, we also have the option to acquire a 75-percent interest in future exploration rights in three offshore areas covering 12 million net acres. In addition, ExxonMobil executed a technical cooperation permit with the South African government to study the hydrocarbon potential of the Deepwater Durban Basin, covering approximately 12.3 million acres.
Ukraine • In August 2012, an ExxonMobil-led consortium won the tender for the Skifska offshore block in the Black Sea totaling 1.65 million net acres (ExxonMobil interest, 40 percent). We are working with our co-venturers and the Ukrainian government to finalize the Production Sharing Agreement.
Table of Contents
| 22 | EXXONMOBIL2012 FINANCIAL & OPERATING REVIEW |
RESOURCES
| In 2012, we continued to build our diverse global portfolio of resources and reserves by adding 4 billion oil-equivalent barrels. After adjusting for production, asset sales, and revisions to existing fields, the resource base totals more than 87 billion oil-equivalent barrels. Proved reserves comprise approximately 29 percent of the resource base, or 25.2 billion oil-equivalent barrels. | 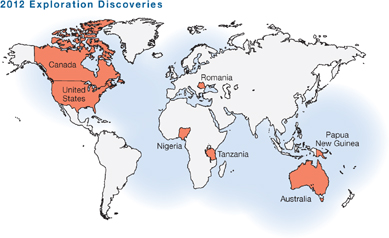 | |
| The addition of an average of 4.3 billion oil-equivalent barrels to our resource base per year over the last decade demonstrates the success of our global strategy to identify, evaluate, pursue, and capture high-quality opportunities. Today, ExxonMobil holds the largest global resource base among international oil companies. The size and diversity of our resource base afford further advantage by supporting global risk management and offering unequaled investment flexibility. |
We continue to increase and expand the quality of our resources through successful by-the-bit drilling, capture of undeveloped resources, strategic acquisitions, and increased recovery from existing fields. In 2012, resources were added in Australia, Canada, Nigeria, Papua New Guinea, Romania, Tanzania, and the United States.
Our by-the-bit drilling exploration program added 2.9 billion oil-equivalent barrels in 2012, with additions from multiple resource types around the world. Additions from exploration drilling averaged approximately 2.1 billion oil-equivalent barrels per year over the last decade.
Our resource base is assessed annually to include new discoveries and changes in estimates for existing resources. Changes may result from additional drilling, revisions to recovery estimates, application of new technologies, or ongoing and rigorous geoscience and engineering evaluations. Resource base volumes are adjusted downward for volumes produced during the year and resources associated with asset divestments. Adjustments may also occur with changes to fiscal regime, equity, or depletion plans.
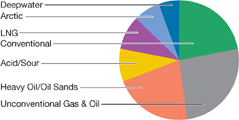
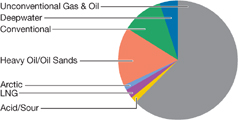
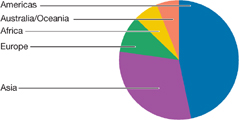
The largest components of ExxonMobil’s resource base remain conventional, unconventional gas and oil, and heavy oil/oil sands, which comprise 70 percent of the total. LNG and deepwater account for about 14 percent of the total resource base. The remaining 16 percent is made up of arctic and acid/sour gas resources.
PROVED RESERVES
ExxonMobil’s resource base includes 25.2 billion oil-equivalent barrels of proved oil and gas reserves, equating to 16 years of reserves life at current production rates. These reserves represent a diverse global portfolio distributed across all geographic regions and resource types, with a higher proportion of liquids.
Resource Base Distribution(1) | Resource Base Distribution(1) | |
(percent, oil-equivalent barrels) By Region | (percent, oil-equivalent barrels) By Resource Type | |
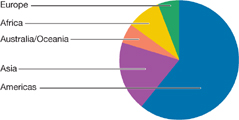 |  |
(1) See Frequently Used Terms on pages 93 through 95.
Table of Contents
| 23 |
In 2012, we replaced 115 percent of the reserves we produced, including the impact of asset sales. We added 1.8 billion oil-equivalent barrels to proved reserves (76 percent liquids) while producing 1.6 billion oil-equivalent barrels. Excluding asset sales, our proved reserves replacement ratio was 124 percent. Key proved reserve additions resulted from liquids-rich unconventional assets in North America and funding of new liquids projects.
ExxonMobil added 10.7 billion oil-equivalent barrels to proved reserves over the last five years, more than replacing production over that time period. The development of new fields and extensions of existing fields have resulted in the addition of an average of 1.2 billion oil-equivalent barrels per year to proved reserves.
| ExxonMobil has established a significant presence of approximately 585,000 net acres in the prolific Bakken play in North Dakota and Montana. |
Proved Reserves Replacement Ratio(1)(2)
(percent of annual production replaced with proved reserves additions)
Revisions to proved reserves have averaged about 0.4 billion oil-equivalent barrels per year over the last five years, driven by effective reservoir management and the application of new technologies. We have more than replaced our production for 19 consecutive years. Proved reserve estimates are managed by a team of experienced reserve experts and are the result of a rigorous and structured management review process.
Resource Additions/Acquisitions(1) | Proved Reserves Distribution(1) | ||
(percent, oil-equivalent barrels added, 2008-2012) By Resource Type | (percent, oil-equivalent barrels) By Region | ||
 |  |
(1) See Frequently Used Terms on pages 93 through 95.
(2) Includes asset sales.
(2) Includes asset sales.
Table of Contents
| 24 | EXXONMOBIL2012 FINANCIAL & OPERATING REVIEW |
UPSTREAM:
Technology
ExxonMobil’s commitment to research and development is a key contributor to our long-term success. We develop and apply innovative solutions to increasingly complex technical challenges. Our breakthrough technologies enable the discovery of new resources, access to harsh environments, and the economic development of challenging reservoirs never before thought possible.
DISCOVERING NEW RESOURCES
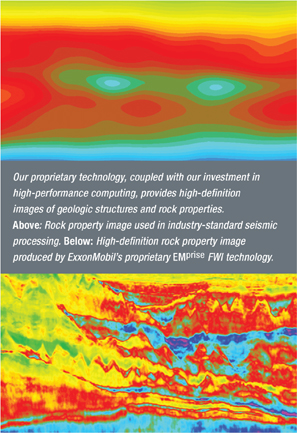
ExxonMobil’s patented full-wavefield inversion (FWI) seismic technology provides industry-leading high-definition subsurface images of geologic structures and rock properties, making oil and gas resources easier to identify and target during exploration, development, and production. FWI is central to ExxonMobil’s EMprise seismic technology platform and establishes us as an industry leader in subsurface imaging.
Standard 3D seismic processing technology uses only a small fraction of the sound signal, or “wavefield”, generated during a seismic survey. The rest of the signal is discarded because processing techniques and computing capacity cannot effectively handle the data complexity and quantity.
ExxonMobil’s proprietary algorithms coupled with our petascale computing capability, which can perform more than a quadrillion operations per second, accomplish the massive computational task of incorporating the “full wavefield” into the seismic image. The integration of these capabilities has dramatically reduced computational time so that images are delivered in a timeframe that is practical for business decisions.
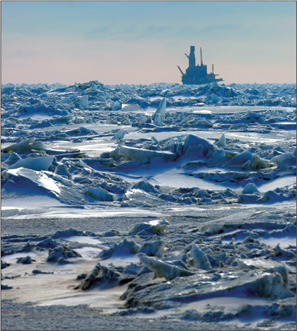
| Our Ice Management and Arctic Characterization research programs are developing technologies to take on the challenges of arctic development. |
ACCESSING HARSH ENVIRONMENTS
With more than 90 years of arctic technology innovation and a commitment to environmental responsibility, ExxonMobil is well positioned to take on the extremes of arctic environments. Exploration, development, and production in these regions are subject to extraordinary challenges including remote locations, harsh weather, and dynamic ice cover. Our comprehensive, integrated arctic research program is addressing these challenges to unlock the potential of arctic resources.
ExxonMobil’s Ice Management and Arctic Characterization research programs are developing technologies to accurately characterize, track, forecast, and manage the movement of ice features. Our integrated ice-management technology platform combines remote-sensing capabilities with advanced simulation and forecasting to support real-time operational decisions. We are also extending the
Table of Contents
| 25 |
application of gravity-based structures and developing new concepts for drilling, offshore loading, and subsea production. Technological advancements in these areas are expected to address many of the unique challenges associated with oil and gas development in arctic environments. Elements of these programs are being worked cooperatively with Rosneft as part of our effort to increase knowledge of the Kara Sea arctic environment.
DEVELOPING CHALLENGING RESERVOIRS
ExxonMobil’s advanced technologies in the areas of reservoir characterization and drilling and completions enable us to find and develop challenging reservoirs.
Accurately measuring and characterizing rock properties in unconventional reservoirs is essential to designing effective and economic developments. The properties of the ultra-low permeability rocks found in unconventional reservoirs are difficult to measure. ExxonMobil’s expertise in this area is enabled by our cutting-edge laboratory and analytical capability and our unmatched dataset of unconventional assets. We are leveraging this expertise to develop new standards for characterizing rock properties in low-permeability reservoirs, allowing us to better predict their production behavior over time.
ExxonMobil’s new patent-pending acoustic fluid inclusion volatile technology enables the evaluation of production intervals within tight liquid and shale gas systems. The acoustic signals generated during the crushing of rock samples are correlated to specific rock properties. We use this innovative technology to distinguish brittle, silica-rich shales, which are more productive, from softer, clay-rich shales. This information allows us to optimize our design and development plans to maximize profitable recovery.
| We are also leveraging our drilling and completions technologies to increase recovery from challenged reservoirs. Combining our industry-leading extended-reach drilling capability with our proprietary stimulation technology has significantly enhanced profitable recovery. By optimizing how and where stimulation fluid interacts with rock, we are able to sustain production rates along the length of the wellbore, delay | ||
compression investments, and increase recovery. Additionally, our proprietary MazeFlo technology enhances economic recovery from reservoirs with sand control issues. The self-healing MazeFlo sand screen increases production by improving sand control reliability. This new technology is currently being applied in Nigeria where we anticipate improved recovery and significant cost savings through extended well life and reduced downtime. | ||
Our proprietary MazeFlo technology, which is incorporated into our sand screen designs, is installed across a well’s producing interval. This technology extends well life and reduces downtime, resulting in increased recovery and significant cost savings. | ||
Table of Contents
| 26 | EXXONMOBIL2012 FINANCIAL & OPERATING REVIEW |
UPSTREAM:
Portfolio
Our disciplined investment approach combines rigorous project evaluation and tactical development with technical and commercial expertise. We deploy this approach across the project life cycle, from initial resource capture and project implementation to ongoing process and operational improvements. Utilizing proven project management systems, experienced global teams rigorously manage our portfolio from initial discovery to start-up, resulting in superior cost and schedule performance. We have a singular focus: to drive superior investment returns for the long term.
2012 MAJOR DEVELOPMENT PROJECTS
ExxonMobil participated in three major start-ups in 2012 and we plan to bring 28 major projects online between 2013 and 2017, which are expected to deliver approximately 1 million net oil-equivalent barrels per day to our production volumes by 2017.
Project Execution Performance –
ExxonMobil Projects
| (percent of plan, 2008-2012 average) | Cost | Schedule | ||||||
| ExxonMobil Operated | 103 | 108 | ||||||
| Operated by Others | 122 | 123 | ||||||
Usan • (ExxonMobil interest, 30 percent) Usan started up in
February 2012 utilizing a floating production, storage, and offloading (FPSO) vessel located approximately 60 miles offshore Nigeria in Block OML138. The facility has the capacity to produce 180 thousand barrels per day.
February 2012 utilizing a floating production, storage, and offloading (FPSO) vessel located approximately 60 miles offshore Nigeria in Block OML138. The facility has the capacity to produce 180 thousand barrels per day.
Kizomba Satellites Phase 1 • (ExxonMobil interest, 40 percent) Kizomba Satellites Phase 1 started up in May 2012 as a subsea tieback to existing FPSO facilities in Angola Block 15. Development drilling is expected to continue until 2014 toward a production target of 100 thousand barrels per day.
Nigeria Satellite Field Development Phase 1 • (ExxonMobil interest, 40 percent) Nigeria Satellite Field Development Phase 1 started up in October 2012. The project will have a peak capacity of 70 thousand barrels per day. The three wellhead platforms are the first offshore structures of this scale to be designed, procured, and constructed in Nigeria.
Kearl Initial Development • (combined ExxonMobil and Imperial Oil interest, 100 percent) Kearl Initial Development commenced commissioning activities in late 2012, with first oil anticipated in early 2013. The initial development is anticipated to produce 110 thousand barrels of bitumen per day, with future potential of up to 170 thousand barrels of bitumen per day after debottlenecking. The Kearl Expansion project and debottlenecking have the potential to increase total Kearl production up to 345 thousand barrels per day. Kearl represents the first mining operation to employ a new proprietary paraffinic froth treatment technology, which produces a salable crude oil without the need for an upgrader. As a result, Kearl’s life cycle greenhouse gas emissions will be similar to many other crude oils processed in the United States.
ADDED ADVANTAGE: BUILDING THE PRODUCING ORGANIZATION
Project success is built from the ground up and begins by incorporating our “Building the Producing Organization” philosophy into each new venture. This philosophy provides a framework for engaging the full operations team from the project’s outset. Team members provide input on design, engineering, and construction, and work to establish management systems and training of personnel, including nationals. The operations team’s early and ongoing involvement builds knowledge of the project over the course of its development, and results in high standards for completion. It also provides start-up efficiencies and operability improvements that further drive long-term shareholder value.
Projects by Geographic Region (percent, number of projects) | Projects by Resource Type (percent, oil-equivalent barrels) | Projects by Hydrocarbon Type (percent, oil-equivalent barrels) | ||
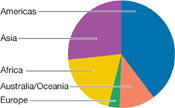 | 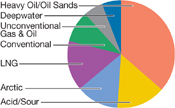 |  |
Table of Contents
| 27 |
MAJOR PROJECT START-UPS(1)
| Facility Capacity | ||||||||||||||||
| (Gross) | ExxonMobil | |||||||||||||||
| Liquids | Gas | Working | ||||||||||||||
| (KBD) | (MCFD) | Interest (%) | ||||||||||||||
| 2012(Actual) | ||||||||||||||||
Angola | Kizomba Satellites Phase 1 | 100 | – | 40 | n | |||||||||||
Nigeria | Satellite Field Development | 70 | – | 40 | n | |||||||||||
| Phase 1 | ||||||||||||||||
| Usan | 180 | – | 30 | l | ||||||||||||
| 2013-2015(Projected) | ||||||||||||||||
Angola | Cravo-Lirio-Orquidea-Violeta | 160 | – | 20 | l | |||||||||||
| (CLOV) | ||||||||||||||||
| Kizomba Satellites Phase 2 | 70 | – | 40 | n | ||||||||||||
Australia | Gorgon Jansz | 20 | 2,765 | 25 | l | |||||||||||
| Kipper Tuna | 15 | 175 | 40 | n | ||||||||||||
| Turrum | 20 | 200 | 50 | n | ||||||||||||
Canada | Cold Lake Nabiye Expansion | 50 | – | 100 | n | |||||||||||
| Hibernia Southern Extension | 55 | – | 27 | n | ||||||||||||
| Kearl Initial Development | 170 | – | 100 | n | ||||||||||||
| Kearl Expansion | 175 | – | 100 | n | ||||||||||||
| Syncrude Aurora North Mine | 215 | – | 25 | ▲ | ||||||||||||
| Sustaining Project | ||||||||||||||||
| Syncrude Mildred Lake Mine | 180 | – | 25 | ▲ | ||||||||||||
| Sustaining Project | ||||||||||||||||
Indonesia | Banyu Urip | 165 | 15 | 45 | n | |||||||||||
Kazakhstan | Kashagan Phase 1 | 370 | 450 | 17 | l | |||||||||||
Malaysia | Damar Gas | 5 | 200 | 50 | n | |||||||||||
| Telok | – | 430 | 50 | n | ||||||||||||
Nigeria | Etim/Asasa Pressure | 50 | – | 40 | n | |||||||||||
| Maintenance | ||||||||||||||||
Papua | PNG LNG | 30 | 1,000 | 33 | n | |||||||||||
New Guinea | ||||||||||||||||
Qatar | Barzan | 90 | 1,400 | 7 | ▲ | |||||||||||
Russia | Sakhalin-1 Arkutun-Dagi | 90 | – | 30 | n | |||||||||||
U.K. | Fram | 40 | 210 | 68 | l | |||||||||||
U.S. | Hadrian South | – | 300 | 47 | n | |||||||||||
| Lucius | 100 | 85 | 15 | l | ||||||||||||
| 2016+(Projected) | ||||||||||||||||
Angola | AB32 Kaombo Split Hub | 200 | – | 15 | l | |||||||||||
Australia | Gorgon Area Expansion | 10 | 915 | 25 | l | |||||||||||
| Scarborough | – | 1,030 | 50 | n | ||||||||||||
| Facility Capacity | |||||||||||||||
| (Gross) | ExxonMobil | ||||||||||||||
| Liquids | Gas | Working | |||||||||||||
| (KBD) | (MCFD) | Interest (%) | |||||||||||||
| 2016+(Projected, continued) | |||||||||||||||
Canada | Aspen | 90 | – | 100 | n | ||||||||||
| Cold Lake Grand Rapids | 40 | – | 100 | n | |||||||||||
| Firebag | 380 | – | 70 | n | |||||||||||
| Hebron | 150 | – | 36 | n | |||||||||||
| Mackenzie Gas Project | 10 | 830 | 56 | n | |||||||||||
| Syncrude Aurora South | 210 | – | 25 | ▲ | |||||||||||
| Phases 1 and 2 | |||||||||||||||
| Syncrude Mildred Lake | 210 | – | 25 | ▲ | |||||||||||
| Extension | |||||||||||||||
Indonesia | Cepu Gas | 5 | 220 | 41 | ▲ | ||||||||||
| Natuna | – | 1100 | * | * | n | ||||||||||
Iraq | West Qurna I | 2,825 | – | 60 | ▲ | ||||||||||
Kazakhstan | Aktote | 50 | 850 | 17 | l | ||||||||||
| Kashagan Future Phases | 1,260 | – | 17 | l | |||||||||||
| Tengiz Expansion | 260 | – | 25 | l | |||||||||||
| Tengiz Sustaining Project | 395 | – | 25 | l | |||||||||||
Nigeria | Bonga North | 100 | 60 | 20 | l | ||||||||||
| Bonga Southwest | 225 | 15 | 16 | l | |||||||||||
| Bosi | 140 | 260 | 56 | n | |||||||||||
| Erha North Phase 2 | 60 | – | 56 | n | |||||||||||
| Satellite Field Development | 80 | – | 40 | n | |||||||||||
| Phase 2 | |||||||||||||||
| Uge | 110 | 20 | 20 | n | |||||||||||
| Usan Future Phases | 50 | – | 30 | l | |||||||||||
Norway | Aasgard Subsea Compression | 40 | 415 | 14 | l | ||||||||||
Romania | Domino | – | 630 | 50 | n | ||||||||||
Russia | Sakhalin-1 Future Phases | 30 | 800 | 30 | n | ||||||||||
Tanzania | Tanzania Block 2 | – | TBD | 35 | l | ||||||||||
United Arab | Upper Zakum 750 | 750 | – | 28 | ▲ | ||||||||||
Emirates | |||||||||||||||
U.S. | Alaska Gas | 60 | 3500 | 36 | ** | ||||||||||
| Hadrian North | 100 | 100 | 50 | n | |||||||||||
| Julia Phase 1 | 30 | – | 50 | n | |||||||||||
KBD = Thousand barrels per day MCFD = Million cubic feet per day
n ExxonMobil Operated▲ Joint Operationl Co-Venturer-Operated
** Pending Final Agreements
n ExxonMobil Operated▲ Joint Operationl Co-Venturer-Operated
** Pending Final Agreements
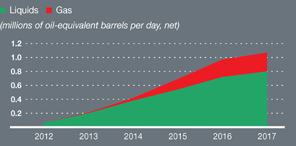
Major Project Start-Ups – Production outlook
Production by Start-Up Year
Production by Start-Up Year
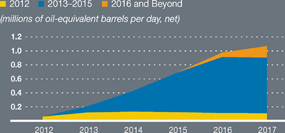
Production by Type
| (1) | The term “project” as used in this publication does not necessarily have the same meaning as under SEC Rule 13q-1 relating to government payment reporting. For example, a single project for purposes of the rule may encompass numerous properties, agreements, investments, developments, phases, work efforts, activities and components, each of which we may also informally describe herein as a “project.” |
Table of Contents
| 28 | EXXONMOBIL 2012 FINANCIAL & OPERATING REVIEW |
PRODUCTION VOLUMES
Net oil-equivalent production in 2012 of 4.2 million barrels per day decreased 6 percent versus 2011 levels. Excluding the impacts associated with entitlement volume effects, quotas, and divestments, net oil-equivalent production decreased by 2 percent versus 2011, as new project start-ups in Angola and Nigeria and increasing unconventional liquids were more than offset by decline.
Near-term activity will focus on starting up 18 projects in 2013 and 2014, including 16 that are liquids or gas with liquids-linked pricing. These include the Kearl Initial Development, Kashagan Phase 1, Angola Block 17 Cravo-Lirio-Orquidea-Violeta, Banyu Urip, Sakhalin-1 Arkutun-Dagi, Kipper Tuna, Turrum, and Papua New Guinea Liquefied Natural Gas (LNG). Additionally, we will continue to develop our material North American unconventional resources. Longer term, we will continue to pursue profitable growth by leveraging our technical expertise to develop a diverse global project portfolio. We are already pursuing several of these projects, many of which will result in long-life, low-decline production profiles.
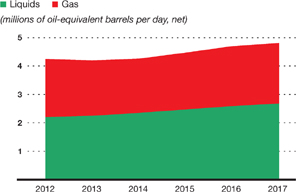
Our production outlook is geographically diverse, reflecting our balanced portfolio with strong contributions from both liquids and gas. Major projects and strong work programs, including our liquids-rich unconventional resources, will drive the growth. Through 2017, liquids production is anticipated to grow by 4 percent per year on average, and gas production is anticipated to grow by 1 percent per year.
The forward-looking projections of production volumes in this document are reflective of our best assumptions regarding technical, commercial, and regulatory aspects of existing operations and new projects. Factors that could impact actual volumes include project start-up timing, regulatory changes, quotas, changes in market conditions, asset sales, operational outages, severe weather, and entitlement volume effects under certain production sharing contracts and royalty agreements.
OPERATIONAL EXCELLENCE –
WORK MANAGEMENT
WORK MANAGEMENT
ExxonMobil’s approach to operational excellence allows us to maintain the integrity and maximize the profitability of existing oil and gas production. During 2012, we completed the deployment of a new work management system that leverages best practices from our global operations and computing technology. Today, operations and maintenance activities are planned and executed in the same structured and controlled manner using an electronic work permit process. The new system is delivering improved work planning, increased supervisor oversight, and improved communication within and across work teams. The result is superior safety performance and operational efficiency.
| More than 22,000 personnel across 14 countries have been trained in our new Work Management System. |
Production Outlook
By Type
By Geographic Region
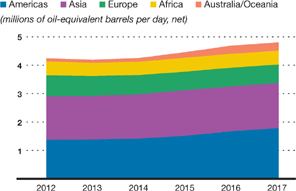
Table of Contents
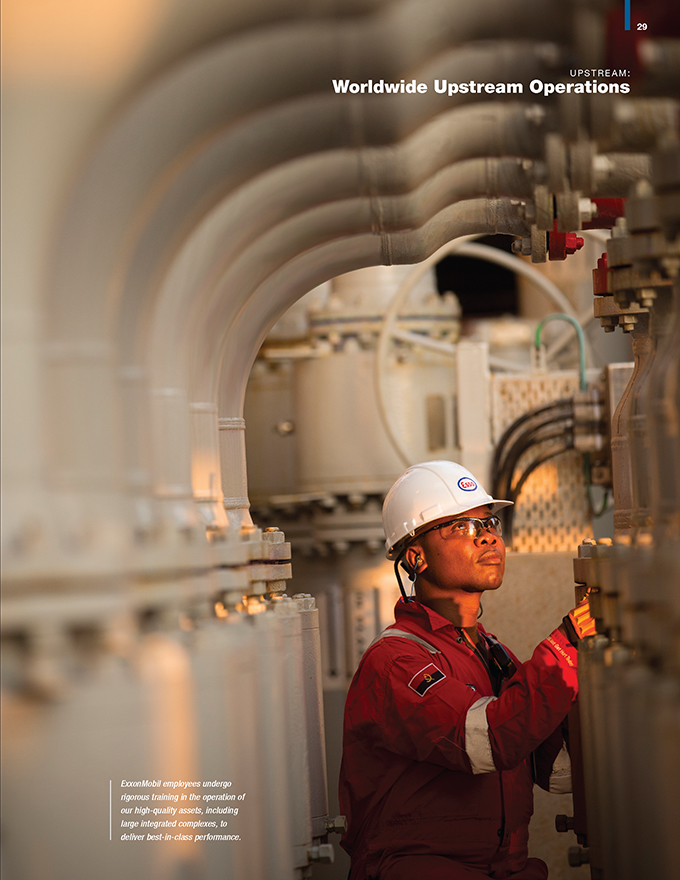
Table of Contents
| 30 | EXXONMOBIL 2012 FINANCIAL & OPERATING REVIEW |
UPSTREAM:
Worldwide Upstream Operations
ExxonMobil has an interest in exploration and production acreage in 36 countries and production operations
in 23 countries.
in 23 countries.
THE AMERICAS
Our Americas portfolio includes conventional onshore fields, ultra-deepwater developments, various unconventional gas and oil opportunities, and oil sands and heavy oil plays. Operations in the Americas accounted for 32 percent of net oil-equivalent production and 18 percent of Upstream earnings in 2012.
UNITED STATES
ExxonMobil is a leading reserves holder and producer of oil and natural gas in the United States. We maintain a significant position in all major producing regions, including offshore Gulf of Mexico (GOM), the Gulf Coast, the mid-continent, California, Alaska, and Appalachia.
| Americas Highlights | 2012 | 2011 | 2010 | |||||||||
Earnings(billions of dollars) | 5.5 | 7.8 | 5.9 | |||||||||
Proved Reserves(BOEB) | 11.8 | 10.8 | 9.8 | |||||||||
Acreage(gross acres, million) | 47.0 | 50.2 | 51.4 | |||||||||
Net Liquids Production(MBD) | 0.7 | 0.7 | 0.7 | |||||||||
Net Gas Available for Sale(BCFD) | 4.2 | 4.3 | 3.2 | |||||||||
Americas Production
(millions of oil-equivalent barrels per day, net)
With a focus on technological improvements,
operational efficiency,
and high-quality drilling programs,
we are extending the lives of our
base producing fields, some of
which have been onstream
operational efficiency,
and high-quality drilling programs,
we are extending the lives of our
base producing fields, some of
which have been onstream
for decades. Our portfolio
is further augmented by
activity in unconventional
plays, seven of which
are estimated to
contain recoverable
reserves of greater
than 1 billion
oil-equivalent
barrels. Future developments
are also planned from
ExxonMobil’s
extensive deepwater Gulf of Mexico acreage position.
is further augmented by
activity in unconventional
plays, seven of which
are estimated to
contain recoverable
reserves of greater
than 1 billion
oil-equivalent
barrels. Future developments
are also planned from
ExxonMobil’s
extensive deepwater Gulf of Mexico acreage position.
Gulf of Mexico/Gulf Coast
2012 average net production
in the Gulf of Mexico
was 52 thousand barrels
of liquids per day and
208 million cubic feet of gas.
in the Gulf of Mexico
was 52 thousand barrels
of liquids per day and
208 million cubic feet of gas.
Deepwater•In the deepwater Gulf of Mexico, we
operate the Hoover
platform that is located
in more than 4,800 feet of water
and produces oil and gas
from the Hoover field and
several subsea tiebacks. In addition, we are a partner in six deepwater fields,
including the co-venturer-operated Thunder Horse field (ExxonMobil interest, 25 percent) where active drilling is ongoing.
Activity also continues in the Keathley Canyon (KC) area. We are developing the 2011 Hadrian-5 discovery under a unit agreement as part of the co-venturer-operated Lucius development (initial ExxonMobil interest, 15 percent). The Hadrian South project (ExxonMobil interest, 47 percent), which is situated in KC-963 and KC-964, is being developed as a subsea tieback to the Lucius platform. Both projects are expected to start up in 2014.
We continue to progress engineering for development of the Hadrian North oil discovery (ExxonMobil interest, 50 percent), situated on blocks KC-918 and KC-919. The Hadrian-6 and Hadrian-7 appraisal wells were drilled in the second half of 2012.
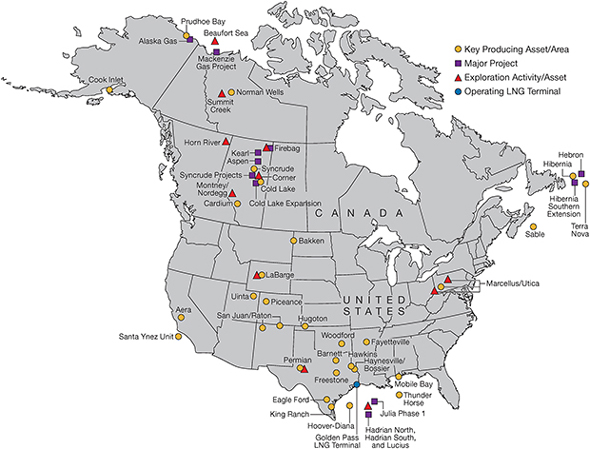 |
Table of Contents
| 31 |

A third appraisal well is planned for early 2013 to better define the Hadrian North resource. Activity continues on the Julia Phase 1 project (ExxonMobil interest, 50 percent) in the Walker Ridge area, which is a subsea tieback to the co-venturer-operated Jack-St. Malo host facility. Engineering, contracting, and technology qualification activities are progressing, with full funding planned in 2013.
ExxonMobil also began participating in early engineering and procurement activities for development of the co-venturer-operated Heidelberg discovery located in a five-block unit in Green Canyon (ExxonMobil interest, 9 percent).
Our substantial exploration portfolio of 1.7 million net acres in the deepwater Gulf of Mexico continues to expand with investments in advanced seismic data to further enhance understanding of the subsurface. ExxonMobil was the high bidder on 66 deepwater blocks in GOM Lease Sale 218 and GOM Lease Sale 216/222. We also expanded our acreage position through farm-ins at the Thorn (ExxonMobil interest, 35 percent) and Phobos (ExxonMobil interest, 20 percent) prospects.
Conventional•The Mobile Bay development offshore Alabama contributed net production of 136 million cubic feet of gas per day during 2012. We are now realizing the cost efficiency and environmental benefits associated with the consolidation of our sour gas plants in late 2010.
LNG•Golden Pass Products, LLC, a partnership of ExxonMobil and Qatar Petroleum International, initiated federal permitting to add up to 15.6 million tonnes per annum of proposed export capabilities to the existing Golden Pass LNG terminal, a liquefied natural gas (LNG) import terminal at Sabine Pass, Texas. This project affords this world-class LNG terminal the opportunity to import or export natural gas in response to market conditions.
U.S. Onshore Texas and Louisiana
ExxonMobil is a leading producer in Louisiana and Texas with a strong position in multiple unconventional gas plays and the Permian Basin. In 2012, onshore net production in Texas and Louisiana averaged 101 thousand barrels of liquids per day and 2 billion cubic feet of gas per day.
Conventional•In the Permian Basin, we completed more than 100 wells across multiple legacy fields, primarily Goldsmith, Russell Clearfork, and Nash. We are evaluating the results of the Means Residual Oil Zone project that started up in late 2011 and are developing other enhanced oil recovery projects in East Texas. ExxonMobil also started up the Hawkins Nitrogen Recovery Unit project in 2012. In South Texas, the King Ranch gas plant processed an average of more than 500 million cubic feet of inlet gas per day.
Unconventional•ExxonMobil holds approximately 240,000 net acres in the Haynesville/Bossier Shale of East Texas and Louisiana where we continued to realize the benefits of our drilling and completion efficiency efforts. We also continued the assessment of the overlying Bossier Shale reservoir that is present across much of the southern area of the Haynesville play.
Table of Contents
| 32 | EXXONMOBIL 2012 FINANCIAL & OPERATING REVIEW |
Upstream: Worldwide Upstream Operations, continued
In the Barnett Shale play in North Texas, we completed more than 170 wells in 2012 across a leasehold of approximately 230,000 net acres spanning 24 counties. In the Freestone tight gas play, ExxonMobil holds approximately 320,000 net acres. We brought 95 wells online in 2012, and continue to progress infrastructure projects designed to handle high-volume horizontal completions. In the South Texas Eagle Ford Shale play, ExxonMobil drilled 11 wells in 2012. In the Permian Basin, we continued to evaluate multiple unconventional reservoirs, including the Bone Springs, Avalon, and Wolfcamp tight oil plays.
Mid-Continent and Appalachia
ExxonMobil produces oil and gas throughout the mid-continent states, including Wyoming, Utah, North Dakota, Montana, Colorado, Kansas, Oklahoma, Arkansas, and New Mexico, as well as the Appalachian states of Pennsylvania and West Virginia. Average net production from these areas in 2012 was 66 thousand barrels of liquids per day and more than 1.5 billion cubic feet of gas per day.
Conventional•The LaBarge development (ExxonMobil interest, 100 percent) in Wyoming comprises the Madison, Tip Top, and Hogsback fields and the Shute Creek gas processing plant. It includes the longest sour gas pipeline in the United States. Implementation of a project to improve environmental performance of the Shute Creek plant’s compressor engines started up in 2012. The LaBarge facilities processed an average of 620 million cubic feet of inlet gas per day in 2012.
A demonstration plant at the Shute Creek facility has been testing ExxonMobil’s proprietaryControlled Freeze Zone (CFZ) technology since 2011 and will continue into 2013. TheCFZ cryogenic separation process has the potential to make carbon capture and storage more affordable and significantly reduce greenhouse gas emissions. Stable and robust operations have been established over a wide range of carbon dioxide compositions in the natural gas feed. The unit’s performance has met or exceeded design purity specifications for the methane and carbon dioxide products.
Unconventional•In 2012, our legacy Bakken production increased approximately 40 percent versus 2011. ExxonMobil acquired Bakken Shale assets consisting of 192,000 net acres in North Dakota and Montana and approximately 16 thousand net oil-equivalent barrels per day of production. The acquisition increases our holdings in the Bakken region by nearly 50 percent to approximately 585,000 net acres, resulting in a more significant presence in one of the major U.S. growth areas for onshore oil
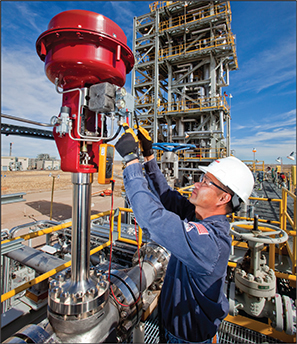
| Field testing of our proprietary Controlled Freeze Zonetechnology is achieving stable operations across a wide range of gas compositions. |
production. Additionally, this acreage is located close to our current development areas, generating further efficiencies. The Woodford Ardmore Shale play in southern Oklahoma was our most active unconventional drilling program in 2012, with 12 operated rigs delineating and developing more than 270,000 net acres of leasehold. In addition, infrastructure projects are advancing to optimize the liquids-rich production from this area. Construction was completed on a 117-mile natural gas gathering pipeline from our operations in southern Oklahoma to processing facilities in North Texas.
In the Fayetteville Shale, pad drilling, optimized well spacing, and improved drilling processes are increasing efficiencies as development continues on our 505,000 net acre leasehold. In 2012, we completed a pilot to assess the potential to reduce completion cost and increase well productivity and recovery utilizing ExxonMobil’sJust-In-Time Perforating (JITP) fracture stimulation process.
ExxonMobil also holds a material acreage position in the Marcellus Shale (approximately 625,000 net acres) and the promising Utica Shale in West Virginia and Ohio (approximately 90,000 net acres). We drilled our first wells in the Utica Shale in 2012, with completions planned in early 2013.
In Colorado, the Piceance development (ExxonMobil interest, 100 percent) contributed net production of approximately 100 million cubic feet of gas per day in 2012. ExxonMobil has approximately 300,000 net acres in the Piceance Basin.
Table of Contents
| 33 |
California
Net production from fields both onshore and offshore California averaged 88 thousand barrels of liquids per day and 19 million cubic feet of gas per day during 2012.
The Santa Ynez Unit (SYU) development (ExxonMobil interest, 100 percent) consists of three platforms located 5 miles offshore Santa Barbara and a processing plant in Las Flores Canyon. We continue to successfully employ world-class extended-reach drilling from these platforms to increase recovery. In 2012, development drilling continued at the SYU Heritage platform. Onshore California, we are finalizing plans to commence further development drilling in 2013. ExxonMobil also has a 48-percent equity share in Aera Energy LLC’s operations, comprising eight fields and approximately 11,000 wells that produce a mixture of heavy and conventional oil with associated natural gas.
Alaska
Average net production in Alaska was 110 thousand barrels of liquids per day in 2012. ExxonMobil is the largest holder of discovered natural gas resources on the North Slope of Alaska. In early 2012, ExxonMobil, along with the other owners, finalized a settlement agreement with the State of Alaska regarding the Point Thomson Unit. The agreement commits the parties to the initial development phase of the Point Thomson project. Additionally, the major producers and TransCanada commenced concept selection work to assess LNG exports from southcentral Alaska as an alternative to a natural gas pipeline to Alberta.
CANADA
ExxonMobil is one of the leading oil and gas producers in Canada through our wholly owned affiliate, ExxonMobil Canada, and majority-owned affiliate Imperial Oil (ExxonMobil interest, 69.6 percent). Through these entities, we have one of the largest resource positions in Canada and possess a significant portfolio of major projects, both onshore and offshore.
Offshore Canada Operations
The Hibernia field (ExxonMobil interest, 33 percent) offshore Newfoundland is operated by Hibernia Management and Development Company Ltd., using ExxonMobil personnel and processes. Hibernia’s net production averaged 27 thousand barrels of oil per day in 2012. Progress continued on the Hibernia Southern Extension project (ExxonMobil interest 27 percent) with the commencement of subsea equipment fabrication and preparation to commence subsea drilling in 2013. The project consists of a subsea tieback to the existing Hibernia platform and is estimated to recover 170 million gross oil-equivalent barrels.
The co-venturer-operated Terra Nova development (ExxonMobil interest, 19 percent) produced 3 thousand net barrels of oil per day in 2012. Located in 300 feet of water, Terra Nova consists of a unique, harsh-environment-equipped floating production, storage, and offloading (FPSO) vessel. In 2012, dry-dock scheduled maintenance of the FPSO vessel was completed, and it was returned to station later in the year.
The ExxonMobil-operated Sable Offshore Energy project
| The Hibernia Southern Extension project, offshore Newfoundland, will recover approximately 170 million gross oil-equivalent barrels via a subsea tie-back to the existing Hibernia platform (below). |
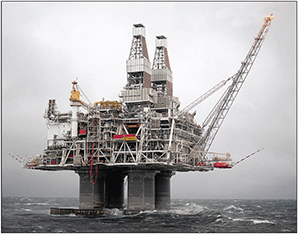
(ExxonMobil interest, 51 percent; Imperial Oil interest, 9 percent) in Nova Scotia comprises five producing fields. Net production in 2012 averaged 92 million cubic feet of gas per day and 5 thousand barrels of associated natural gas liquids per day.
The Hebron project (ExxonMobil interest, 36 percent) is an ExxonMobil-operated oil development located in 300 feet of water offshore Newfoundland. The planned gravity-based structure with topsides facilities and drill rig will have a capacity of 150 thousand barrels per day. In 2012, the Hebron project development plan was approved by the Canada-Newfoundland and Labrador Offshore Petroleum Board, and the project was fully funded. Additionally, site preparation activities were completed for construction of the concrete gravity-based structure and contracts were awarded for construction of topsides modules. Start-up is expected around the end of 2017.
Table of Contents
| 34 | EXXONMOBIL 2012 FINANCIAL & OPERATING REVIEW |
Upstream: Worldwide Upstream Operations, continued
ExxonMobil and Imperial Oil continue to progress the assessment of blocks EL476 and EL477 (formerly EL446 and EL449) in the arctic Beaufort Sea, covering 500,000 net acres (combined ExxonMobil and Imperial Oil interest, 50 percent). In 2012, license extensions were granted. Interpretation of 3D seismic data continues and planning for the first exploration well is progressing.
Onshore Canada Operations
In 2012, the Cold Lake heavy oil field in Alberta (Imperial Oil interest, 100 percent) achieved production of 123 thousand net barrels of oil per day. Cold Lake is the largest thermal in situ heavy oil project in the world. It has more than 4,000 wells directionally drilled from multiple satellite pads tied back to central facilities, which reduces surface land requirements. Cyclic steam stimulation is used to recover bitumen, and recovery is increased through the use of leading-edge thermal recovery technologies. Since the inception of the Cold Lake project, continuous improvements and advances in technology have allowed us to more than double the expected recovery from the initial commercial development area. Engineering is complete and drilling and construction work have commenced on the Nabiye project, the next expansion phase of the Cold Lake development, which will add an additional capacity of 50 thousand barrels of bitumen per day.
The Syncrude oil sands mining operation (Imperial Oil interest, 25 percent) produced synthetic crude averaging 69 thousand net barrels per day in 2012. We are progressing several projects to sustain production and continue to evaluate future developments including Mildred Lake Extension and Aurora South Phases 1 and 2.
The Kearl oil sands project (combined ExxonMobil and Imperial Oil interest, 100 percent) is developing a world-class resource in northern Alberta expected to exceed 4 billion barrels. Commissioning of the initial development commenced in late 2012 and is expected to deliver approximately 110 thousand barrels of bitumen per day. Fabrication and construction is well under way on the expansion project, which is expected to produce an additional 110 thousand barrels of bitumen per day. Future debottlenecking of both the initial development and expansion project is expected to increase total production to 345 thousand barrels of bitumen per day.
In 2012, we also continued to evaluate oil sands acreage in the Athabasca region on both in situ and mining leases including Aspen, Corner, Grand Rapids, and Firebag. We acquired an additional 2,880 net acres of high-quality oil sands leasehold in 2012 through Imperial Oil to support future mining developments. ExxonMobil is continually leveraging our extensive acreage position in Canada to maximize value through selective swaps, farm-ins, and divestments.
The Mackenzie Gas project received regulatory approvals from the Canadian government in 2011. Once sanctioned, the project will develop three fields containing approximately 6 trillion cubic feet of natural gas and will deliver natural gas to North American markets through a 740-mile pipeline system across the Mackenzie Valley. ExxonMobil and Imperial Oil hold interests in two of the three fields.
In the Horn River Basin in northeast British Columbia (combined ExxonMobil and Imperial Oil interest, 100 percent) we currently hold approximately 340,000 net acres and are one of the largest landholders in the basin. Evaluation of our acreage position has progressed with the start-up of a pilot project consisting of eight horizontal production wells and associated facilities. Production started in August 2012 from the 30-million-cubic-feet-per-day capacity facility.
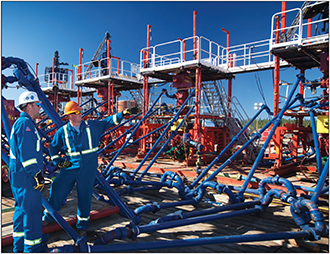
In 2011, ExxonMobil and Imperial Oil acquired a 100-percent interest in EL471 and EL472 in the Summit Creek Area of the Northwest Territories and are assessing plans for exploration activity. These two blocks cover approximately 445,000 net acres and are located near the Imperial Oil-operated Norman Wells field.
ExxonMobil and Imperial Oil continued development drilling in our Cardium acreage holdings, which commenced in 2011. Year-end production reached nearly 3 thousand net oil-equivalent barrels per day.
| Production started in August 2012 at the Horn River project in British Columbia. |
Table of Contents
| 35 |
In addition, RN Cardium Oil Inc., an independent Rosneft subsidiary, acquired 30 percent of ExxonMobil’s stake in the Cardium acreage in the Harmattan area. ExxonMobil and Imperial Oil also acquired a 100-percent interest in an additional 32,000 net acres in Alberta across a variety of plays.
In October 2012, ExxonMobil entered into an agreement to acquire Celtic Exploration Ltd. Under the terms of the agreement, ExxonMobil Canada will acquire 545,000 net acres in the liquids-rich Montney play, 104,000 net acres in the Duvernay play, and additional acreage in other areas of Alberta. Leveraging our extensive U.S. unconventional resource development experience will enable us to maximize value of these resources. Imperial Oil will acquire a 50-percent interest in these plays.
SOUTH AMERICA
Argentina
In Argentina, ExxonMobil holds a 51-percent interest in the Chihuidos concession and a 23-percent interest in the Aguarague concession. In 2012, we sold net daily gas production of 38 million cubic feet from these concessions into markets in Argentina. We also continued our exploration drilling and well-testing campaign in the highly prospective Neuquen Basin where ExxonMobil holds more than 850,000 net acres. Drilling commenced on six wells with additional wells planned for 2013. Drilling and testing results are being evaluated.
Colombia
ExxonMobil holds a technical evaluation agreement for heavy oil resources in Block CPE-3 onshore Colombia covering more than 3.2 million net acres (ExxonMobil interest, 50 percent). In 2012, we commenced exploratory core hole drilling to evaluate the prospectivity of the acreage. Additional 2D seismic data acquisition and core hole drilling are planned for 2013.
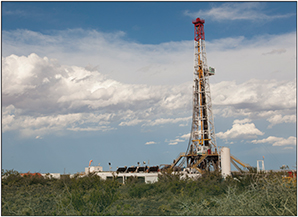
| In 2012, we continued our Argentina exploration drilling program in the highly prospective Neuquen Basin. |
We also acquired rights to explore four blocks for unconventional tight liquids in the emerging La Luna play in the Middle Magdalena Basin area totaling 404,000 net acres. Two blocks were acquired through farm-in agreements (VMM-2 and VMM-37), (ExxonMobil interest, 70 percent) and two blocks (COR-62 and VMM-29) were awarded to ExxonMobil and
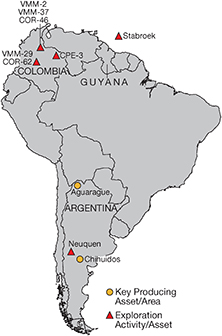
Ecopetrol during the 2012 licensing round (ExxonMobil interest, 50 percent). The first exploration well was drilled in VMM-2 in late 2012, and further drilling is planned for 2013.
Additionally, ExxonMobil and Ecopetrol were granted a technical evaluation agreement on a prospective tight liquids block (COR-46) covering 160,000 net acres in the Middle Magdalena Basin area (ExxonMobil interest, 50 percent). Exploration drilling and seismic data acquisition are planned to commence in 2013.
Guyana
ExxonMobil holds a 50-percent operating interest in the Stabroek deepwater block (3.3 million net acres) offshore Guyana. In 2012, 3D seismic data acquisition commenced to evaluate the block potential.
Venezuela
The Cerro Negro and La Ceiba assets of ExxonMobil affiliates were expropriated without compensation by Venezuela on June 27, 2007. Prior to expropriation, ExxonMobil affiliates owned a 41.67-percent interest in Cerro Negro and a 50-percent interest in La Ceiba. ExxonMobil affiliates filed arbitration against Venezuela with the International Centre for Settlement of Investment Disputes (ICSID) in September 2007. The ICSID arbitration is ongoing.
Table of Contents
| 36 | EXXONMOBIL 2012 FINANCIAL & OPERATING REVIEW |
Upstream: Worldwide Upstream Operations, continued
EUROPE
ExxonMobil is one of Europe’s largest producers of oil and gas. In 2012, European operations accounted for 18 percent of ExxonMobil’s net oil and natural gas production and 13 percent of Upstream earnings.
ExxonMobil continues to progress exploration activities and development projects in Europe. We also continue to increase recovery from existing producing assets through work programs and the implementation of new technology. We made a material gas discovery in the Romanian Black Sea and continued to evaluate significant unconventional natural gas and oil opportunities in Germany. Additionally, ExxonMobil provides natural gas supply to the European market through liquefied natural gas (LNG) receiving terminals in the United Kingdom and Italy.
| Europe Highlights | 2012 | 2011 | 2010 | |||||||||
Earnings(billions of dollars) | 4.0 | 7.1 | 3.8 | |||||||||
Proved Reserves(BOEB) | 2.5 | 2.7 | 2.9 | |||||||||
Acreage(gross acres, million) | 43.7 | 44.1 | 43.1 | |||||||||
Net Liquids Production(MBD) | 0.2 | 0.3 | 0.3 | |||||||||
Net Gas Available for Sale(BCFD) | 3.2 | 3.4 | 3.8 | |||||||||
Europe Production
(millions of oil-equivalent barrels per day, net)
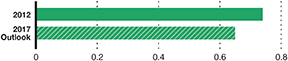
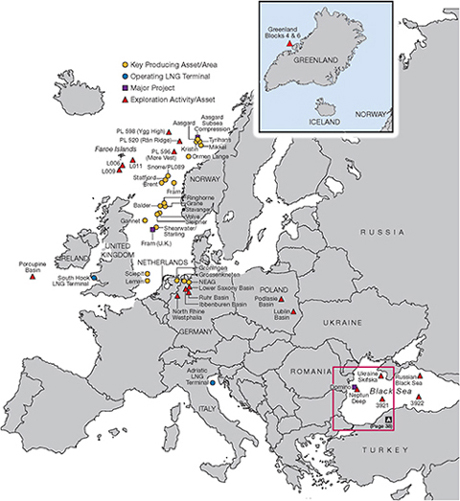 |
Norway
ExxonMobil is among the largest oil and gas producers in Norway,
with average net production of 177 thousand barrels of liquids per day and
605 million cubic feet of gas per day in 2012. We operate producing
fields in Norway, including Ringhorne (ExxonMobil
interest, 100 percent), Ringhorne East (ExxonMobil
interest, 77 percent), and Balder (ExxonMobil interest,
100 percent), which are located approximately 110 miles
west of Stavanger.
Ringhorne has produced more than 240 million oil-equivalent
barrels since coming onstream in 2003, with Balder yielding
more than 180 million oil-equivalent barrels since its start-up in
1999. In 2012, production averaged 43 thousand net
oil-equivalent barrels per day for Balder and Ringhorne
combined.
barrels since coming onstream in 2003, with Balder yielding
more than 180 million oil-equivalent barrels since its start-up in
1999. In 2012, production averaged 43 thousand net
oil-equivalent barrels per day for Balder and Ringhorne
combined.
We continued drilling operations from the Ringhorne
platform in 2012, following a 4D seismic program
in 2010. During the year, we also conducted an
additional seismic survey in the Balder/Ringhorne
area to support continued field development.
A drilling program for the Balder field is
planned to begin in 2013.
platform in 2012, following a 4D seismic program
in 2010. During the year, we also conducted an
additional seismic survey in the Balder/Ringhorne
area to support continued field development.
A drilling program for the Balder field is
planned to begin in 2013.
ExxonMobil is also a partner in more than 20
co-venturer-operated fields. There are active
drilling programs in several core areas,
with approximately 25 new wells drilled per year,
as well as field extensions designed to fill
available facility capacity as mature
fields decline.
co-venturer-operated fields. There are active
drilling programs in several core areas,
with approximately 25 new wells drilled per year,
as well as field extensions designed to fill
available facility capacity as mature
fields decline.
In 2012, ExxonMobil also completed an equity
swap with Total SA. The transaction increased
our equity in the producing Snorre, Statfjord East,
and PL089 (Tordis/Vigdis) licenses in exchange
for our equity interest in the Dagny license,
swap with Total SA. The transaction increased
our equity in the producing Snorre, Statfjord East,
and PL089 (Tordis/Vigdis) licenses in exchange
for our equity interest in the Dagny license,
Table of Contents
| 37 |
Oseberg field, and the Oseberg transportation system. The exchange strengthens our equity in these assets and positions us, with our advanced technologies and operating expertise, to work with the operator and partners to maximize economic resource recovery.
Progress continues on new subsea technology with the execution of the Aasgard Subsea Compression (ASC) project (ExxonMobil interest, 13.5 percent) and advancement of a subsea compression pilot at Ormen Lange. The ASC project will help to maximize recovery from the Aasgard and Mikkel fields. This project is in the execution phase and represents an industry first in the application of subsea compression.
ExxonMobil holds three exploration licenses covering 766,000 net acres over Rån Ridge (ExxonMobil interest, 50 percent) and Ygg High (ExxonMobil interest, 30 percent) in the deepwater outer Vøring Basin and Møre Vest (ExxonMobil interest, 35 percent) in the Møre Basin. A 3D seismic survey was acquired over the Ygg High acreage in the third quarter of 2012 and is currently being processed. The primary exploration target is located beneath thick basalt layers that will require the application of specialized imaging technology to identify potential future drilling opportunities.
In October 2012, we sold our 15-percent interest in the Aasta Hansteen (formerly Luva) development.
United Kingdom
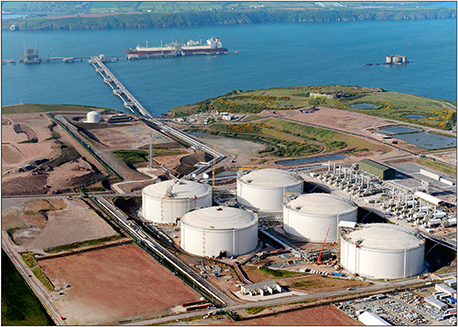
ExxonMobil has significant equity participation in more than 40 producing fields in the North Sea. In 2012, the ExxonMobil net production from these fields yielded 20 thousand barrels of liquids per day and 306 million cubic feet of gas per day, primarily from a joint venture operated by Shell.
Also in 2012, the Fram offshore development project (ExxonMobil interest, 68 percent) was fully funded and the field development plan was approved. Drilling commenced in July 2012.
The South Hook LNG regasification terminal (ExxonMobil interest, 24 percent) located in Milford Haven, Wales, delivers gas to the United Kingdom’s natural gas grid. In 2012, 67 LNG cargoes were delivered, providing more than 7 million tonnes of LNG.
| The South Hook LNG terminal in the United Kingdom is a key asset in our global LNG portfolio. |
Germany
ExxonMobil is Germany’s largest natural gas producer, with production from ExxonMobil-operated fields accounting for approximately 70 percent of all natural gas produced in the country. In 2012, these fields generated an average net production of 468 million cubic feet per day. During the year, we also reduced our operational footprint through a series of infrastructure rationalization and upgrade projects.
Our subsidiaries in Germany hold nine exploration licenses in Lower Saxony, Hamburg, and North Rhine Westphalia. These licenses cover 2.8 million net acres and include potential shale gas, tight liquids, and coal bed methane exploration plays. Future exploration activities await the outcome of ongoing discussions with regulators and communities on the subject of hydraulic fracturing.
Table of Contents
| 38 | EXXONMOBIL 2012 FINANCIAL & OPERATING REVIEW |
Upstream: Worldwide Upstream Operations, continued
Netherlands
Nederlandse Aardolie Maatschappij (NAM), a 50-percent ExxonMobil equity company with Shell as the operator, is the largest natural gas producer in the Netherlands. Gas is produced from more than 100 fields located both onshore and offshore. Daily net production in the Netherlands averaged 1.8 billion cubic feet of gas in 2012. The majority of this production comes from the Groningen field (ExxonMobil interest, 30 percent), which is Europe’s largest natural gas field. In 2012, NAM commenced the Underground Storage Expansion project at Norg, which will help to sustain peak Groningen gas deliveries.
Italy
The Adriatic LNG terminal (ExxonMobil interest, 71 percent) located 10 miles offshore of Porto Levante, Italy, in the northern Adriatic Sea, is the world’s only fixed offshore LNG storage and regasification terminal. In 2012, 70 LNG cargoes were delivered, providing 4.3 million tonnes of LNG to the Italian natural gas grid.
Other Europe
Faroe Islands•ExxonMobil holds 535,000 net acres through a 49-percent interest in license L006 and a 50-percent interest in licenses L009 and L011. The three licenses are operated by Statoil. Drilling of the Brugdan-2 wildcat well on license L006 began in June 2012 and was subsequently suspended due to the onset of winter weather.
Greenland•In 2012, ExxonMobil completed the geological evaluation of Blocks 4 and 6 in the Disko West area, offshore Greenland.
Ireland•ExxonMobil has interests in two Frontier Exploration Licenses (FEL): Dunquin FEL 3/04 (ExxonMobil interest, 27.5 percent); and Cuchulain FEL 1/99 (ExxonMobil interest, 36 percent). These licenses cover approximately 225,000 net acres in the Porcupine Basin, approximately 125 miles off the southwest coast of Ireland.
Poland•Our interest in Poland includes four Podlasie Basin licenses (ExxonMobil interest, 100 percent) and two Lublin Basin licenses (ExxonMobil interest, 51 percent). In 2012, we commenced the process to withdraw from our Polish licenses, having met all commitments.
Romania•ExxonMobil has a 50-percent working interest covering 932,000 net acres in the Neptun Deep block in the Black Sea. In early 2012, the ExxonMobil-operated Domino-1 wildcat was drilled approximately 110 miles offshore and encountered gas. New 3D seismic data acquisition commenced in late 2012 to further assess the Domino discovery potential and the remainder of the Neptun Deep block. Appraisal activities are progressing with additional drilling anticipated to commence in 2013.
Turkey•ExxonMobil interests in the Turkish Black Sea include the Kastamonu sub-block of license 3921 (ExxonMobil interest, 50 percent), the Samsun sub-block of license 3922 (ExxonMobil interest, 50 percent) and the Sinop, Ayancik, and Carsamba sub-blocks in the Petrobras-operated license 3922 (each with ExxonMobil interest, 25 percent). In 2012, we commenced the process to withdraw from our Turkish licenses having met all commitments.
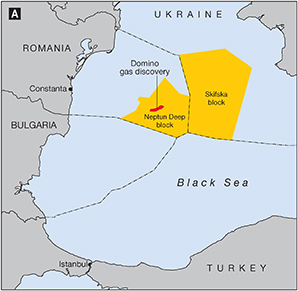
Ukraine•In August 2012, an ExxonMobil-led consortium won the tender for the Skifska offshore block in the Black Sea totaling 1.65 million net acres (ExxonMobil interest, 40 percent). We are working with our co-venturers and the Ukrainian government to finalize the Production Sharing Agreement.
| In 2012, ExxonMobil announced the Domino gas discovery offshore Romania, and was awarded 1.65 million net acres offshore Ukraine. |
Table of Contents
| 39 |
AFRICA
ExxonMobil is one of Africa’s leading oil producers. Our operations in Africa accounted for 12 percent of our 2012 net oil and natural gas production and 24 percent of total Upstream earnings. In addition to producing activities, we have ongoing exploration activities. ExxonMobil holds interests in 22 deepwater blocks offshore Africa totaling approximately 13 million acres.
Angola
We have interests in three deepwater blocks covering 2 million acres in Angola. These world-class development opportunities have a gross recoverable resource potential of approximately 11 billion oil-equivalent barrels. Including production from the co-venturer-operated Block 17, our net production in Angola averaged 120 thousand barrels of oil per day in 2012. Several new projects are under construction or in development planning.
Block 15•ExxonMobil has a 40-percent interest in Block 15. We have discovered total resources of approximately 5 billion gross oil-equivalent barrels on the block. With daily output of more than 400 thousand barrels of oil, Block 15 was Angola’s second-highest-producing block in 2012.
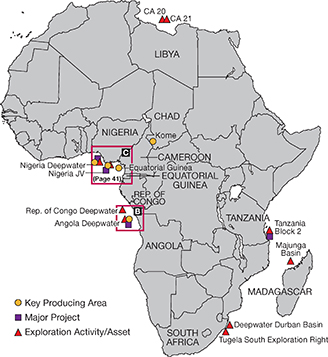
Additional Block 15 development focuses on the Kizomba Satellites projects. Kizomba Satellites Phase 1 successfully started up in May 2012. The Kizomba Satellites Phase 2 project, which includes subsea tiebacks to the Kizomba B and Mondo floating production, storage, and offloading (FPSO) vessels, was fully funded. The Phase 2 project is expected to produce nearly 190 million barrels of oil, and production is anticipated to start in 2015. Through collaborative development efforts, we continue to utilize the local workforce to enhance Angolan economic development and competitiveness.
Block 17•ExxonMobil has a 20-percent interest in Block 17. Through year-end 2012, 15 discoveries have been made on the block with a gross recoverable resource potential of approximately 5 billion oil-equivalent barrels. During 2012, production averaged more than 600 thousand barrels of oil per day from the Girassol, Dalia, Rosa, and Pazflor projects.
The Pazflor project (ExxonMobil interest, 20 percent) started up in August 2011. Pazflor is located 100 miles offshore in 2,600 feet of water and utilizes an FPSO vessel to produce up to 220 thousand barrels of oil per day. Project execution activities continued for the Cravo-Lirio-Orquidea-Violeta (CLOV) project, which was sanctioned in 2010. CLOV is located in
4,100 feet of water and will use a new FPSO vessel to produce 160 thousand barrels of oil per day. The project is expected to start production in 2014.
| Africa Highlights | 2012 | 2011 | 2010 | |||||||||
Earnings (billions of dollars) | 7.2 | 5.4 | 4.4 | |||||||||
Proved Reserves (BOEB) | 1.7 | 1.8 | 2.0 | |||||||||
Acreage (gross acres, million) | 14.1 | 15.1 | 16.5 | |||||||||
Net Liquids Production (MBD) | 0.5 | 0.5 | 0.6 | |||||||||
Net Gas Available for Sale (BCFD) | – | – | – | |||||||||
Africa Production
(millions of oil-equivalent barrels per day, net)
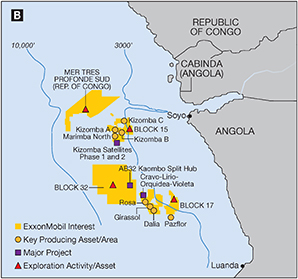
Table of Contents
| 40 | EXXONMOBIL 2012 FINANCIAL & OPERATING REVIEW |
Upstream: Worldwide Upstream Operations, continued
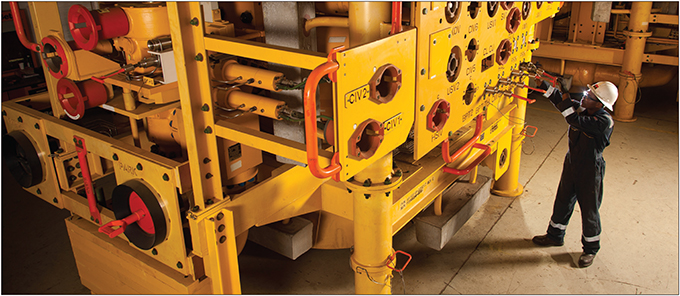
Also within Block 17, development planning activities continue for the Pazflor Satellites project, a subsea tieback to the Pazflor FPSO vessel. The project is expected to start production in 2017.
| A subsea control module is inspected as part of the Kizomba Satellites Phase 1 project. The project started up in 2012. |
Block 31•The sale of our 25-percent interest in Block 31 to Sonangol E&P closed in June 2012.
Block 32•Development planning activities continue for Block 32 (ExxonMobil interest, 15 percent). Through year-end 2012, 12 discoveries have been announced with a total gross resource of approximately 1.4 billion oil-equivalent barrels. The first FPSO vessel development planned for Block 32 is the Kaombo Split Hub project in the southeastern section of the block, with estimated recovery of approximately 560 million barrels of oil. The water depths on this block range from 4,700 to 5,600 feet. An appraisal well was drilled in 2012 to further define the resource.
Nigeria
ExxonMobil continues to develop our interest in offshore Nigeria, both in shallow and deepwater acreage. We operate a shallow-water joint venture with the Nigerian National Petroleum Corporation (NNPC) offshore southeastern Nigeria (ExxonMobil interest, 40 percent for crude and condensate; 51 percent for natural gas liquids) and the deepwater Erha and Erha North fields. ExxonMobil also produces from co-venturer-operated fields. Development drilling and project activities using Nigeria’s expanding capabilities are under way to further develop our interests. In 2012, net production in Nigeria averaged 293 thousand barrels of liquids per day.
Nigeria – Deepwater
Erha/Erha North•The Erha development (ExxonMobil interest, 56 percent) is located 60 miles offshore in 3,900 feet of water. The development consists of more than 30 subsea wells tied back to an FPSO vessel, with a capacity in excess of 200 thousand barrels per day.
The Erha North Phase 2 project (ExxonMobil interest, 56 percent) is a subsea tieback to the existing Erha FPSO vessel. The project will further develop the currently producing Erha North field, with a peak production rate of approximately 60 thousand barrels of oil per day. Start-up is targeted for 2016.
Bonga Northwest•Bonga Northwest (ExxonMobil interest, 20 percent) is planned as a subsea tieback to the existing Bonga FPSO vessel, which began production from the Bonga field in 2005. Project execution activities continue on Bonga Northwest, which is expected to develop approximately 125 million barrels of oil.
Bonga Southwest•The Bonga Southwest project (ExxonMobil interest, 16 percent) is planned as an FPSO vessel development with a dedicated gas export pipeline. The project is anticipated to develop more than 800 million barrels of oil.
Bonga North•The Bonga North development (ExxonMobil interest, 20 percent) is planned as a new-build FPSO vessel using a “design one, build multiple” approach with Bonga Southwest. It is anticipated that the project will develop more than 350 million barrels of oil.
Table of Contents
| 41 |
Bosi•The Bosi development (ExxonMobil interest, 56 percent) is planned as a spread-moored FPSO vessel with associated subsea developments. The Bosi project phases are expected to develop approximately 500 million barrels of oil and up to 2.5 trillion cubic feet of natural gas. Project concept selection activities are progressing in participation with the Nigerian government and co-venture partner Shell.
OPL 214•ExxonMobil was awarded operatorship of OPL 214 in 2001 (ExxonMobil interest, 20 percent) and discovered the Uge field in 2005. Development planning for Uge continues. Phase III exploration drilling commenced in late 2011 and continued through early 2012.
OPL 223 / OML 138 / OML 139•Following the Owowo South-B1 discovery in 2009, we entered into the second exploration phase in OPL 223 (ExxonMobil interest, 27 percent) in July 2010. In 2012, we participated in the drilling of the Owowo West exploration well, which encountered hydrocarbons. We are planning additional wells to further assess the potential of this area.
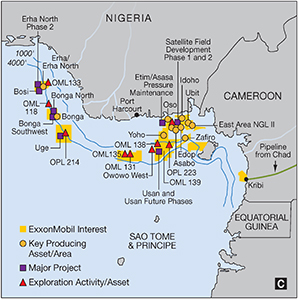
Usan•First production from the Usan project (ExxonMobil interest, 30 percent) was achieved in February 2012. Usan is located 60 miles offshore Nigeria in 2,500 feet of water. Full development is designed to recover up to 500 million barrels of oil using subsea wells connected to a 180-thousand-barrel-per-day capacity FPSO vessel. Drilling to increase capacity continues and evaluation of concepts to develop future phases is under way.
Nigeria Shelf – Joint Venture
ExxonMobil’s portfolio on the Nigerian shelf encompasses 69 fields. We have ongoing activities to increase liquids volumes, including an active development drilling program, installation of new platforms, enhanced oil recovery projects, and a series of platform upgrades. In addition, seismic data acquisition and exploration activities continue in an effort to identify new opportunities within the joint venture.
Satellite Field Development•Execution of ExxonMobil’s “design one, build multiple” approach for the Satellite Field Development project (ExxonMobil interest, 40 percent) is progressing. Phase 1 achieved first oil in October 2012 with the installation of three new platforms. These additional offshore facilities will allow drilling in undeveloped areas of the joint venture and provide pipeline connections to existing infrastructure. Peak production from Phase 1 is anticipated to reach 70 thousand barrels of liquids per day and recover more than 120 million barrels of oil and natural gas liquids. Project activities are progressing on Phase 2 of the Satellite Field Development.
Natural Gas Liquids•Production of natural gas liquids occurs from the Oso Natural Gas Liquids project and the East Area Natural Gas Liquids II project (ExxonMobil interest, 51 percent). Production from these two projects averaged 35 thousand barrels per day in 2012. The projects are expected to recover approximately 400 million barrels of natural gas liquids. In
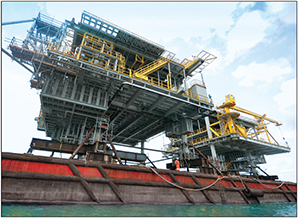
addition, they have contributed to a 77-percent reduction in flaring since 2007.
Domestic Power Generation and Natural Gas Supply•
Development of a nominal 500-megawatt power plant is under way. Engineering, procurement, and construction contract proposals are currently being evaluated and commercial agreements are being advanced. The plant is a central component of an integrated plan to increase gas utilization and power generation capacity in Nigeria.
| The Itut platform (left) was installed in 2012 as part of the Nigeria Satellite Field Development Phase 1 project. The project consists of three new offshore platforms that are the first offshore structures to be designed, procured, and constructed in Nigeria. |
Table of Contents
| 42 | EXXONMOBIL 2012 FINANCIAL & OPERATING REVIEW |
Upstream: Worldwide Upstream Operations, continued
Equatorial Guinea
ExxonMobil operates the Zafiro field in Equatorial Guinea (ExxonMobil interest, 71 percent) in water depths between 400 and 2,800 feet. The Zafiro field has produced more than 900 million barrels in its 16 years of production. In 2012, net production averaged 38 thousand barrels of oil per day. A successful multiyear drilling program concluded in 2011 with the addition of more than 25 million barrels of reserves.
Chad
ExxonMobil is Chad’s leading oil producer (ExxonMobil interest, 40 percent) with average net production of 36 thousand barrels of oil per day in 2012. An active two-rig development drilling program continued in 2012, focused on the Kome, Bolobo, and Miandoum fields.
Tanzania
ExxonMobil holds a 35-percent working interest in deepwater Block 2 in Tanzania. A 3D seismic survey was completed in 2010 and identified multiple deepwater drilling prospects. Three successful exploration wells were drilled in 2012 (Zafarani-1x, Lavani-1, and Lavani-2). These wells discovered gas in multiple reservoir intervals with an estimated recoverable resource range of 7 to 9 trillion gross cubic feet of natural gas. Additional drilling and 3D seismic data acquisition are planned to further assess the potential of the block.
Other Africa
Republic of Congo•Through year-end 2012, five discoveries were announced in the Mer Tres Profonde Sud block (ExxonMobil interest, 30 percent) with a total resource of approximately 400 million gross oil-equivalent barrels. Additional exploration activity is planned for 2013.
Libya•We relinquished our interest in Contract Area 44 in November 2010. ExxonMobil has been under force majeure since March 2011 in Contract Areas 20 and 21.
Madagascar•ExxonMobil affiliates have three Production Sharing Contracts in the deepwater Majunga Basin offshore northwestern Madagascar. After a period of suspension, ExxonMobil is pursuing ratification of extensions to the contracts. We continue to evaluate the basin’s potential.
South Africa•ExxonMobil entered into a participation agreement with Impact Africa Limited for a 75-percent interest in the Tugela South Exploration Right (2.8 million acres) and a 75-percent interest in potential exploration rights for additional blocks offshore South Africa. Additionally, ExxonMobil was granted a Technical Cooperation Permit that provides exclusive rights to evaluate the resource potential of the Deepwater Durban
Basin, totaling more than 12.3 million acres, over the next year.
| The ocean rig Poseidondrillship works with support vessels offshore Tanzania where three deepwater discoveries were made in 2012. |
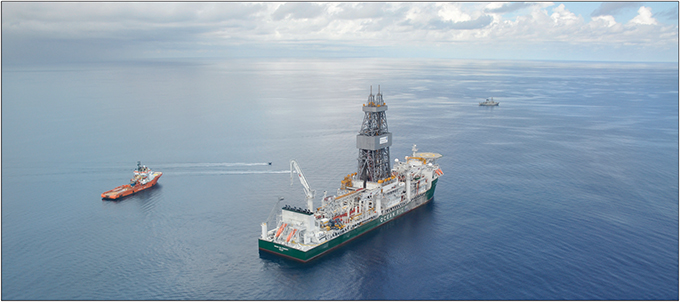
Table of Contents
| 43 |
ASIA
In Asia, ExxonMobil is participating in the development of some of the world’s largest oil and gas projects. Overall, ExxonMobil’s Asian operations accounted for 36 percent of our net oil and gas production and 43 percent of Upstream earnings.
Qatar
ExxonMobil participates in development and production of the North Field, the largest non-associated gas field in the world, through our joint ventures with Qatar Petroleum. These projects are expected to yield resources exceeding 25 billion gross oil-equivalent barrels to competitively supply liquefied natural gas (LNG) to worldwide customers.
ExxonMobil is a joint owner of RasGas, and participates in all seven LNG trains in partnership with Qatar Petroleum. ExxonMobil also participates in five Qatargas LNG trains
| Asia Highlights | 2012 | 2011 | 2010 | |||||||||
Earnings (billions of dollars) | 12.7 | 13.4 | 9.4 | |||||||||
Proved Reserves (BOEB) | 7.7 | 8.1 | 8.6 | |||||||||
Acreage (gross acres, million) | 31.5 | 31.0 | 31.4 | |||||||||
Net Liquids Production (MBD) | 0.8 | 0.8 | 0.7 | |||||||||
Net Gas Available for Sale (BCFD) | 4.5 | 5.0 | 4.8 | |||||||||
Asia Production
(millions of oil-equivalent barrels per day, net)
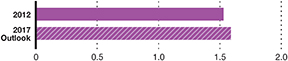
and the Barzan gas project. LNG production from ExxonMobil-interest trains in Qatar was 61 million tonnes in 2012.
Al Khaleej Gas•The Al Khaleej Gas (AKG) Phase 1 and 2 project facilities are helping to meet growing domestic demand in Qatar. The combined capacity of these facilities is 2 billion cubic feet per day.
Barzan•The initial phase of the Barzan project, scheduled to start up in 2014, will supply up to 1.4 billion cubic feet per day of natural gas, primarily to meet the demand driven by Qatar’s rapidly growing infrastructure and industry requirements. Onshore and offshore construction activities are on schedule, and a large portion of the development drilling is complete.
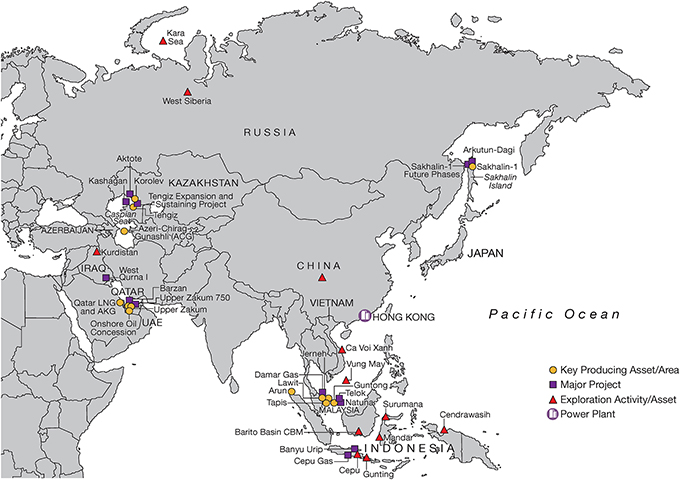
Table of Contents
| 44 | EXXONMOBIL 2012 FINANCIAL & OPERATING REVIEW |
Upstream: Worldwide Upstream Operations, continued
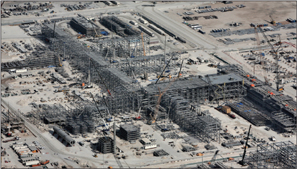
| The Barzan project, Qatar, will supply up to 1.4 billion cubic feet of gas per day. |
Qatargas•ExxonMobil participates in the Qatargas 1 and Qatargas 2 joint ventures with interests ranging from 10 to 30 percent. Qatargas 1 consists of three trains with a total nominal capacity of 9.9 million tonnes per year, delivering LNG primarily to Japan and Western Europe. Qatargas 2 consists of two 7.8-million-tonnes-per-year trains. Deliveries of LNG from Qatargas 2 utilize a fleet of Q-Flex and Q-Max vessels, the world’s largest LNG carriers. Shipments are delivered primarily to the United Kingdom through the South Hook LNG terminal. The Qatargas operations also produce associated products including condensate, liquefied petroleum gas, helium, and sulfur. In 2012, Qatargas completed major planned maintenance on both Qatargas 2 LNG trains.
RasGas•RasGas is a joint venture between Qatar Petroleum and ExxonMobil, with 70-percent and 30-percent interests, respectively. RasGas operates a total of seven LNG trains with capacities ranging from 3.3 million to 7.8 million tonnes per year with a combined production capacity of 36 million tonnes per year. LNG from the seven trains is sold predominantly to the Asian and European markets. RasGas also employs a fleet of LNG carriers including Q-Flex and Q-Max vessels. In addition to LNG, RasGas also produces substantial volumes of associated products including condensate, liquefied petroleum gas, helium, and sulfur.
Common Facilities•Qatargas and RasGas also participate in common facilities for the storage and loading of LNG, condensate, liquefied petroleum gas, and sulfur on behalf of the Ras Laffan Industrial City joint venture companies. Sharing common facilities enables all participants to benefit from economies of scale.
United Arab Emirates
ExxonMobil holds two oil concessions in the United Arab Emirates. In 2012, net production from the onshore oil concession was 128 thousand barrels of oil per day. Net production from the Upper Zakum offshore concession was 163 thousand barrels of oil per day.
Our ability to deliver superior technology and project execution excellence afforded us entry into Upper Zakum in 2006. Upper Zakum (ExxonMobil interest, 28 percent) is one of the world’s largest oil fields, with an initial resource estimate of approximately 50 billion gross barrels of oil.
The offshore Upper Zakum field covers more than 450 square miles with production capacity exceeding 550 thousand barrels per day. In association with our joint venture partners, we are applying leading-edge reservoir simulation and extended-reach drilling technology that will increase daily field production capacity nearly 40 percent to 750 thousand barrels per day. The project is utilizing an innovative artificial island approach to efficiently gain access to the reservoir. In 2012, the south island construction was completed and onshore drilling from the island commenced. Additionally, front-end engineering and design activities were also completed. Construction continues on the remaining three artificial islands, with completion expected in 2013.
| An innovative artificial island approach is being applied to efficiently gain access to new reserves at the Upper Zakum field in the United Arab Emirates. |
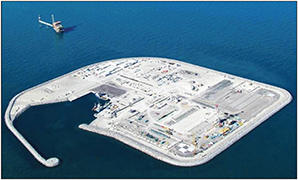
Iraq
ExxonMobil signed agreements with the South Oil Company of the Iraqi Ministry of Oil in 2010 to redevelop and expand production from the West Qurna I oil field in southern Iraq (ExxonMobil interest, 60 percent). Located in one of Iraq’s most prolific producing areas, West Qurna I field redevelopment and expansion will entail extensive infill drilling, reservoir pressure support, development of undeveloped reservoirs, extensive new production facilities, and associated support infrastructure.
In 2012, we continued with redevelopment activities and the finalization of long-term development plans. Seismic data acquisition and water injection activities are under way.
Table of Contents
| 45 |
At year-end 2012, production from West Qurna I exceeded 460 thousand barrels per day, representing an increase of nearly 90 percent since the contract award.
In October 2011, ExxonMobil signed six Production Sharing Contracts (PSC) (ExxonMobil interest, 100 percent) covering 848,000 acres in the Kurdistan region of Iraq. In 2012, we continued to meet our obligations under the PSCs, including planning activities for seismic data acquisition and drilling.
Russia
ExxonMobil operates the Sakhalin-1 project (ExxonMobil interest, 30 percent), which comprises the Chayvo, Odoptu, and Arkutun-Dagi fields. The Sakhalin-1 project, which is being developed in phases, represents one of the largest foreign investments in Russia.
In 2012, ExxonMobil and Rosneft continued to progress the Strategic Cooperation Agreement to jointly participate in exploration and development activities in Russia, the United States, and other parts of the world. This includes 31 million acres in the Kara Sea, one of the world’s most prospective hydrocarbon provinces with high potential for liquids, 3 million acres in the Black Sea, and 2.7 million acres in West Siberia.
Sakhalin-1 Chayvo and Odoptu•Oil production and gas sales to far east Russia commenced in 2005 with production from the initial development phase of the Chayvo field. Exports of crude oil to international markets from the De-Kastri terminal started in 2006.
Production from the Odoptu field started up in 2010. The Odoptu development utilized the Yastreb rig, one of the world’s most powerful land-based rigs, to drill nine extended-reach wells. Following Odoptu drilling, the Yastreb rig was moved to the Chayvo field where it drilled the world-record 7.7-mile-long horizontal well in 2012.
In 2012, daily production from Chayvo and Odoptu averaged 145 thousand barrels of oil and 190 million cubic feet of natural gas. Since the initial start-up of Sakhalin-1 in 2005, nearly 410 million barrels of oil have been produced and exported to world markets. Additionally, more than 365 billion cubic feet of natural gas have been supplied to Russian domestic customers.
Sakhalin-1 Arkutun-Dagi•Arkutun-Dagi is the next phase of the Sakhalin-1 development. In 2012, the Berkut gravity-based platform, the largest offshore platform in Russia, was successfully installed offshore. Fabrication of the platform topsides is scheduled to be completed in 2013. The development will have a peak production capacity of 90 thousand barrels per day and is anticipated to start up in 2014.
Sakhalin-1 Future Phases•Supported by a Heads of Agreement (HOA) signed with China National Petroleum Corporation in 2006, ExxonMobil continues to work toward gas pipeline sales from Sakhalin-1 to China. We are also evaluating other regional gas sales options, including sales to domestic gas markets and LNG alternatives.
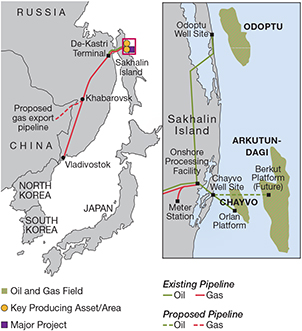
| The Yastreb rig, Sakhalin Island, Russia, is one of the most powerful land rigs in the industry. In 2012, the rig drilled the world-record 7.7-mile-long horizontal well. |
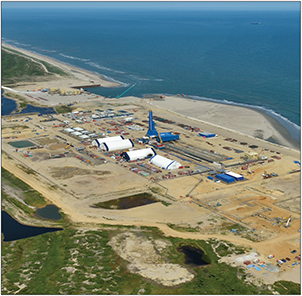
Table of Contents
| 46 | EXXONMOBIL 2012 FINANCIAL & OPERATING REVIEW |
Upstream: Worldwide Upstream Operations, continued
Rosneft Strategic Cooperation Agreement•Initial seismic data acquisition was completed in 2012 in the Black Sea and the Kara Sea.
We also signed agreements with Rosneft to establish a joint Arctic Research Center for Offshore Developments. The Center will provide a full range of services to support all stages of oil and gas development on the Arctic Shelf, including ice monitoring and management and design of ice-resistant offshore vessels, structures, and pipelines.
Additionally, ExxonMobil and Rosneft signed a Pilot Development Agreement establishing a joint project to assess the possibility of commercial production of tight oil reserves from the Bazhenov and Achimov formations in West Siberia (ExxonMobil interest, 49 percent). The pilot program will encompass broad-reaching work, including drilling new horizontal and vertical wells using the latest fracturing technologies, deepening existing wells, and redeveloping idle wells. Drilling is scheduled to begin in 2013.
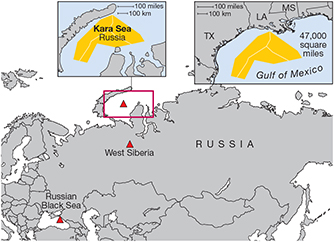
Azerbaijan
The Azeri-Chirag-Gunashli (ACG) megafield (ExxonMobil interest, 8 percent) has produced 2.1 billion barrels of oil since its 1997 start-up. In 2012, ACG production averaged 664 thousand barrels of oil per day. A sixth producing platform is slated for installation in 2013, which will contribute an additional 185 thousand barrels per day of production capacity.
Kazakhstan
Tengiz•ExxonMobil participates in the Tengizchevroil (TCO) joint venture (ExxonMobil interest, 25 percent), which includes a production license area encompassing the super-giant Tengiz field, an associated processing complex, and the nearby Korolev field. The Tengiz field has produced more than 2 billion barrels of oil from a total gross resource of approximately 6 billion barrels. In 2012, TCO produced 528 thousand oil-equivalent barrels per day. Projects are under way to increase production by as much as 260 thousand barrels of oil per day and extend current production rates as reservoir pressure declines.
Kashagan•As a participant in the North Caspian Production Sharing Agreement (ExxonMobil interest, 17 percent), we are working with consortium members to progress phased development of the massive Kashagan field located offshore in the Caspian Sea. Phase 1 includes an offshore production and separation hub on an artificial island, several drilling islands, and an onshore processing plant. The facilities for commercial production are approaching completion, and first oil is anticipated in 2013. In 2012, the partners continued compression facility studies that would raise Phase 1 capacity to 450 thousand barrels per day and signed a gas sales preliminary agreement. Plans for future phases are under evaluation.
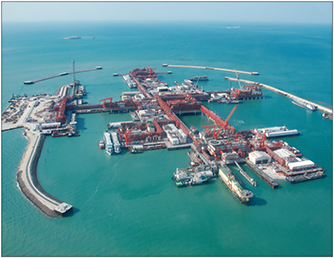
Caspian Pipeline Consortium•The Caspian Pipeline Consortium (ExxonMobil interest, 7.5 percent), is constructing an expansion project that will increase system capacity from 0.6 million to 1.4 million barrels per day. The pipeline system runs from Kazakhstan to the Novorossiysk marine terminal on the coast of the Russian Black Sea. Expansion capacity is expected to start up in phases from 2013 through 2015. This pipeline system represents the lowest-cost export option for Kazakhstan, with both Tengizchevroil and future Kashagan developments as major shippers.
| The Kashagan project facilities offshore Caspian Sea are approaching completion. First oil is anticipated in 2013. |
Table of Contents
| 47 |
Indonesia
ExxonMobil operates the onshore Arun and Arun satellite fields and the North Sumatra offshore field that supply natural gas to the PT Arun LNG Plant. In 2012, net production from these fields averaged 131 million cubic feet of gas per day and 1.3 thousand barrels of associated liquids per day.
In 2009, early oil production facilities were brought online for the Banyu Urip development in the Cepu Contract Area, onshore Java (ExxonMobil interest, 45 percent). Production averaged 22 thousand barrels per day in 2012. The 165 thousand-barrel-per-day full field development is progressing and consists of 49 wells, an onshore central processing facility, and a 60-mile pipeline to transport oil to a floating storage and offloading (FSO) vessel. In 2012, we progressed the central processing facility site preparation and grading of the pipeline right-of-way, and completed the first of two dry dock upgrades to the FSO vessel.
Exploration drilling activity continued in the Cepu block in 2012 with the drilling of the Alas Tua East wildcat. Evaluation of the drilling results is ongoing. We continue to evaluate the 2011 Kedung Keris oil discovery.
In August 2011, we signed an HOA with Pertamina that included principles for unitization of the Jambaran and Tiung Biru gas fields and the appointment of PT Pertamina EP Cepu as the operator of the Jambaran-Tiung Biru Unit. An integrated gas project development concept has been selected to develop the Jambaran-Tiung Biru Unit along with the Cendana gas field. The project will support Indonesia’s domestic energy needs.
In November 2012, our Indonesian affiliate, Esso Natuna Ltd., signed a Third Restated Principles of Agreement with the government of Indonesia on key terms and conditions for a new PSC to develop Natuna’s hydrocarbon resources. Discussions to finalize an East Natuna PSC continue.
In 2012, we continued our multiyear exploration program to assess the coal bed methane potential of our acreage in the Barito Basin in Kalimantan (613,000 net acres). Exploration drilling and corehole sampling is anticipated to continue in 2013. During 2012, we completed the integration of the aeromagnetic survey and core data in the Cendrawasih PSC offshore Papua.
Malaysia
ExxonMobil operates 43 platforms in 17 fields in Malaysia, and is one of the country’s major suppliers of crude oil and natural gas. Net production in 2012 averaged 40 thousand barrels of liquids per day and 376 million cubic feet of gas per day.
During 2012, fabrication work continued on the Tapis Enhanced Oil Recovery and Telok Gas projects. Two platforms and nine pipelines were installed. Design work on Damar, the next planned gas development in support of meeting Malaysia’s power and industrial needs, was completed. Fabrication of associated offshore facilities is under way. In addition, we continued development planning work on the Guntong Enhanced Oil Recovery project.
Other Asia
China•In July 2011, ExxonMobil signed a Joint Study Agreement covering 900,000 acres in the Sichuan Basin. We are working with Sinopec to evaluate the shale gas potential on the block.
Vietnam•ExxonMobil drilled one exploration well offshore Da Nang in Block 118 and acquired 3D seismic data in 2012. The Ca Voi Xanh-3X well encountered hydrocarbons and successfully tested the extent of the Ca Voi Xanh resource. We are progressing seismic data processing and evaluation of the well results.
| The Telok project offshore Malaysia will provide approximately 430 million cubic feet per day of gas capacity. |
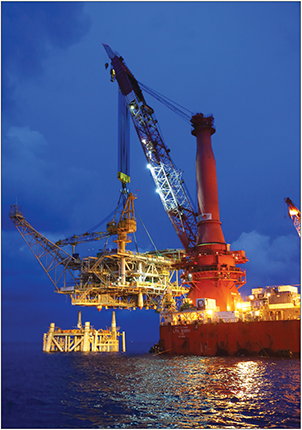
Table of Contents
| 48 | EXXONMOBIL 2012 FINANCIAL & OPERATING REVIEW |
Upstream: Worldwide Upstream Operations, continued
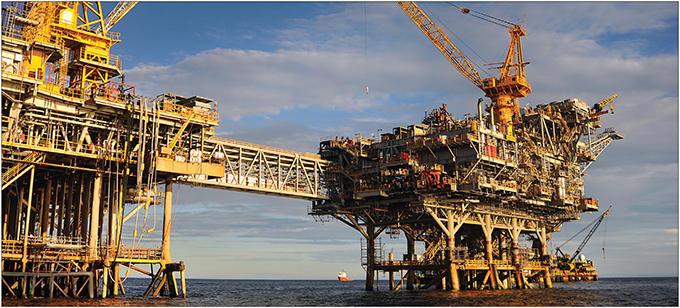
AUSTRALIA/OCEANIA
ExxonMobil is a leading oil and gas producer in the Australia/Oceania region. In 2012, net production averaged 50 thousand barrels of liquids and 363 million cubic feet of gas per day. The offshore Gippsland Basin in Australia produces the majority of these resources. The start-up of the Papua New Guinea (PNG) Liquefied Natural Gas (LNG) and Gorgon Jansz projects will significantly build future volume contribution from the region.
Australia
Gippsland Basin•The Kipper Tuna and Turrum projects are new developments in the Gippsland Basin (ExxonMobil interest, Kipper 32.5 percent; Tuna and Turrum 50 percent). The projects include installation of an additional offshore platform (Marlin B) and a subsea tie back to existing facilities. During 2012, Kipper facilities installation and commissioning was completed, and significant progress was made in the installation and hookup of the Marlin B topsides.
Gorgon Jansz•In 2012, execution activities continued on the 15.6-million-tonnes-per-year Gorgon Jansz LNG project (ExxonMobil interest, 25 percent), which will develop 25 trillion cubic feet of offshore gas resources. The development consists of subsea infrastructure for offshore production and transportation of the gas, three 5.2-million-tonnes-per-year LNG trains (nominal capacity), and a 280-million-cubic-feet-per-day domestic gas plant located on Barrow Island. The development includes the world’s largest carbon dioxide sequestration project. The first LNG cargo is planned for 2015.
In 2012, the first two gas processing modules and pipe rack units were delivered to Barrow Island and LNG tank construction progressed with the raising of two tank roofs. Additionally, 270 miles of the offshore pipeline were installed, and construction commenced on the onshore pipeline.
| The Marlin B production platform (far right) was installed in 2012 as part of the Turrum field development in the Bass Strait of Australia. Scheduled for a 2014 start-up, the Turrum development is expected to recover more than 270 million oil-equivalent barrels. |
| Australia/Oceania Highlights | 2012 | 2011 | 2010 | |||||||||
Earnings (billions of dollars) | 0.5 | 0.8 | 0.6 | |||||||||
Proved Reserves (BOEB) | 1.5 | 1.5 | 1.5 | |||||||||
Acreage (gross acres, million) | 9.5 | 7.8 | 7.1 | |||||||||
Net Liquids Production (MBD) | 0.1 | 0.1 | 0.1 | |||||||||
Net Gas Available for Sale (BCFD) | 0.4 | 0.3 | 0.3 | |||||||||
Australia/Oceania Production
(millions of oil-equivalent barrels per day, net)
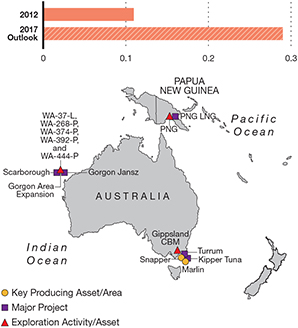
Table of Contents
| 49 |
ExxonMobil, as work operator for the Jansz-Io drilling and completion program, has spud all 10 development wells. Drilling and completion operations are ongoing. Gas will be produced via one of the world’s longest subsea tiebacks, located in 4,430 feet of water.
Gorgon Area Expansion•The exploration and appraisal drilling programs in the Greater Gorgon area continued in 2012. These programs targeted additional high-quality gas resources for a potential expansion of the Gorgon project. In 2012, ExxonMobil participated in three wells on the Northwest Shelf (ExxonMobil interest, 25 percent). Satyr-3 wildcat drilling began in December 2011 and encountered gas in an extension of the existing Satyr-1 discovery in WA-374-P. In July 2012, Satyr-2 encountered gas in subsequent testing of the extent of the Satyr discovery. The third well in the 2012 program, Helene-1, located in WA-37-L, encountered gas in a separate accumulation adjacent to the Gorgon field currently under development. Additional wildcats are planned for 2013.
Scarborough•Development and execution planning continues for the Scarborough LNG project (ExxonMobil interest, 50 percent). Development concepts are being evaluated, including floating LNG.
Papua New Guinea
In 2012, ExxonMobil’s net production from Papua New Guinea averaged 5 thousand barrels of oil per day and 5 million cubic feet of gas per day.
The PNG LNG project (ExxonMobil interest, 33 percent) is scheduled to start up in 2014. At year-end 2012, the project was more than 70 percent complete. Construction milestones in 2012 included completion of the 1.5-mile jetty, the outer shells and roofs of the two LNG tanks, steel erection for the two process trains, and installation of all heavy equipment. The 250-mile offshore pipeline was also completed. Progress continues on the 180-mile onshore pipeline, with more than 125 miles now welded. Drilling has commenced at the Hides natural gas field. Foundation and steelworks at the Hides gas conditioning plant are progressing, and construction has begun at the Gobe production facility. With construction activity at its peak, more than 21,200 people are working together to deliver on project commitments across multiple sites. Forty percent of the workforce are Papua New Guinea citizens.
In 2012, ExxonMobil resumed its exploration program in the Papua New Guinea Highlands. The P’nyang South wildcat encountered gas. Additional development studies have been initiated to assess potential design concepts for the P’nyang resource, which may include a potential PNG LNG third train.
In addition to the PNG LNG project and exploration drilling activities, we continued acquisition of a multiyear seismic program in the Papua New Guinea Highlands to further evaluate our expanding acreage portfolio. More than 55 miles of 2D seismic data were acquired during 2012 to guide future exploration drilling. Planning is under way to acquire additional 2D seismic data in 2013.
| The PNG LNG project is scheduled to start up in 2014, delivering 6.9 million tonnes per annum. |
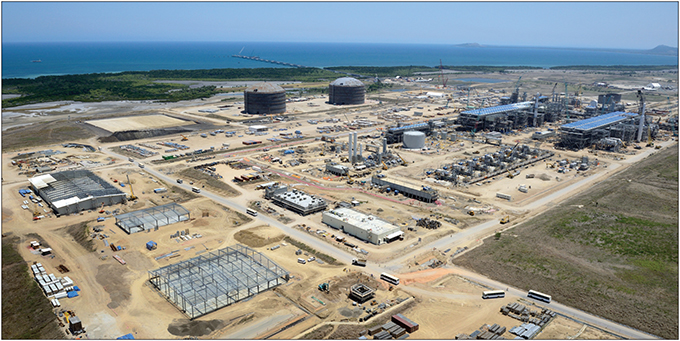
Table of Contents
| 50 | EXXONMOBIL 2012 FINANCIAL & OPERATING REVIEW |
UPSTREAM OPERATING STATISTICS
NET LIQUIDS PRODUCTION(1) – Including Oil Sands and Non-Consolidated Operations
| (thousands of barrels per day) | 2012 | 2011 | 2010 | 2009 | 2008 | |||||||||||||||
United States | ||||||||||||||||||||
| Alaska | 110 | 114 | 117 | 123 | 130 | |||||||||||||||
| Lower 48 | 308 | 309 | 291 | 261 | 237 | |||||||||||||||
| Total United States | 418 | 423 | 408 | 384 | 367 | |||||||||||||||
Canada/South America | 251 | 252 | 263 | 267 | 292 | |||||||||||||||
| Total Americas | 669 | 675 | 671 | 651 | 659 | |||||||||||||||
Europe | ||||||||||||||||||||
| United Kingdom | 20 | 55 | 80 | 90 | 123 | |||||||||||||||
| Norway | 177 | 205 | 246 | 280 | 295 | |||||||||||||||
| Other | 10 | 10 | 9 | 9 | 10 | |||||||||||||||
| Total Europe | 207 | 270 | 335 | 379 | 428 | |||||||||||||||
Africa | ||||||||||||||||||||
| Nigeria | 293 | 324 | 391 | 391 | 364 | |||||||||||||||
| Angola | 120 | 99 | 141 | 194 | 181 | |||||||||||||||
| Equatorial Guinea | 38 | 45 | 53 | 55 | 60 | |||||||||||||||
| Other | 36 | 40 | 43 | 45 | 47 | |||||||||||||||
| Total Africa | 487 | 508 | 628 | 685 | 652 | |||||||||||||||
Asia | ||||||||||||||||||||
| Malaysia | 40 | 38 | 48 | 52 | 56 | |||||||||||||||
| Middle East | 548 | 567 | 478 | 368 | 381 | |||||||||||||||
| Russia/Caspian | 179 | 191 | 191 | 182 | 160 | |||||||||||||||
| Other | 5 | 12 | 13 | 5 | 2 | |||||||||||||||
| Total Asia | 772 | 808 | 730 | 607 | 599 | |||||||||||||||
Australia/Oceania | 50 | 51 | 58 | 65 | 67 | |||||||||||||||
Total worldwide | 2,185 | 2,312 | 2,422 | 2,387 | 2,405 | |||||||||||||||
Gas Plant Liquids Included Above | ||||||||||||||||||||
| United States | 83 | 78 | 59 | 50 | 49 | |||||||||||||||
| Non-U.S. | 184 | 213 | 207 | 173 | 164 | |||||||||||||||
Total worldwide | 267 | 291 | 266 | 223 | 213 | |||||||||||||||
| Oil Sands and Non-Consolidated Volumes Included Above | ||||||||||||||||||||
| United States | 63 | 66 | 69 | 73 | 78 | |||||||||||||||
| Canada/South America – Bitumen | 123 | 120 | 115 | 120 | 124 | |||||||||||||||
| Canada/South America – Synthetic Oil | 69 | 67 | 67 | 65 | 62 | |||||||||||||||
| Europe | 4 | 5 | 5 | 5 | 5 | |||||||||||||||
| Asia | 410 | 425 | 404 | 320 | 280 | |||||||||||||||
Total worldwide | 669 | 683 | 660 | 583 | 549 | |||||||||||||||
| (1) | Net liquids production quantities are the volumes of crude oil and natural gas liquids withdrawn from ExxonMobil’s oil and gas reserves, excluding royalties and quantities due to others when produced, and are based on the volumes delivered from the lease or at the point measured for royalty and/or severance tax purposes. Volumes include 100 percent of the production of majority-owned affiliates, including liquids production from oil sands operations in Canada, and ExxonMobil’s ownership of the production by companies owned 50 percent or less. |
Table of Contents
| 51 |
NET NATURAL GAS PRODUCTION AVAILABLE FOR SALE(1) – Including Non-Consolidated Operations
| (millions of cubic feet per day) | 2012 | 2011 | 2010 | 2009 | 2008 | |||||||||||||||
United States | 3,822 | 3,917 | 2,596 | 1,275 | 1,246 | |||||||||||||||
Canada/South America | 362 | 412 | 569 | 643 | 640 | |||||||||||||||
| Total Americas | 4,184 | 4,329 | 3,165 | 1,918 | 1,886 | |||||||||||||||
Europe | ||||||||||||||||||||
| Netherlands | 1,841 | 1,826 | 2,041 | 1,676 | 1,748 | |||||||||||||||
| United Kingdom | 306 | 441 | 550 | 594 | 750 | |||||||||||||||
| Norway | 605 | 663 | 700 | 786 | 764 | |||||||||||||||
| Germany | 468 | 518 | 545 | 633 | 687 | |||||||||||||||
| Total Europe | 3,220 | 3,448 | 3,836 | 3,689 | 3,949 | |||||||||||||||
Africa | 17 | 7 | 14 | 19 | 32 | |||||||||||||||
Asia | ||||||||||||||||||||
| Indonesia | 131 | 164 | 215 | 245 | 239 | |||||||||||||||
| Malaysia | 376 | 420 | 513 | 545 | 582 | |||||||||||||||
| Middle East | 3,835 | 4,261 | 3,865 | 2,367 | 1,911 | |||||||||||||||
| Russia/Caspian | 177 | 184 | 187 | 153 | 114 | |||||||||||||||
| Other | 19 | 18 | 21 | 22 | 24 | |||||||||||||||
| Total Asia | 4,538 | 5,047 | 4,801 | 3,332 | 2,870 | |||||||||||||||
Australia/Oceania | 363 | 331 | 332 | 315 | 358 | |||||||||||||||
Total worldwide | 12,322 | 13,162 | 12,148 | 9,273 | 9,095 | |||||||||||||||
| Non-Consolidated Natural Gas Volumes Included Above | ||||||||||||||||||||
| United States | 3 | – | 1 | 1 | 1 | |||||||||||||||
| Europe | 1,774 | 1,747 | 1,977 | 1,618 | 1,696 | |||||||||||||||
| Asia | 3,093 | 3,168 | 2,954 | 1,918 | 1,433 | |||||||||||||||
Total worldwide | 4,870 | 4,915 | 4,932 | 3,537 | 3,130 | |||||||||||||||
NATURAL GAS SALES(2)
| (millions of cubic feet per day) | 2012 | 2011 | 2010 | 2009 | 2008 | |||||||||||||||
| United States | 4,816 | 5,002 | 3,166 | 1,321 | 1,292 | |||||||||||||||
| Canada/South America | 407 | 517 | 696 | 739 | 845 | |||||||||||||||
| Europe | 5,727 | 6,254 | 6,401 | 5,854 | 5,665 | |||||||||||||||
| Africa | 17 | 7 | 14 | 19 | 32 | |||||||||||||||
| Asia | 3,865 | 4,289 | 4,102 | 2,760 | 2,612 | |||||||||||||||
| Australia/Oceania | 370 | 338 | 339 | 322 | 366 | |||||||||||||||
Total worldwide | 15,202 | 16,407 | 14,718 | 11,015 | 10,812 | |||||||||||||||
| (1) | Net natural gas available for sale quantities are the volumes withdrawn from ExxonMobil’s natural gas reserves, excluding royalties and volumes due to others when produced, and excluding gas purchased from others, gas consumed in producing operations, field processing plant losses, volumes used for gas lift, gas injection and cycling operations, quantities flared, and volume shrinkage due to the removal of condensate or natural gas liquids fractions. | |
| (2) | Natural gas sales include 100 percent of the sales of ExxonMobil and majority-owned affiliates and ExxonMobil’s ownership of sales by companies owned 50 percent or less. Numbers include sales of gas purchased from third parties. |
Table of Contents
| 52 | EXXONMOBIL 2012 FINANCIAL & OPERATING REVIEW |
Upstream Operating Statistics, continued
NUMBER OF NET WELLS DRILLED ANNUALLY(1)
| (net wells drilled) | 2012 | 2011 | 2010 | 2009 | 2008 | |||||||||||||||
Productive | ||||||||||||||||||||
Exploratory(2) | 16 | 25 | 37 | 20 | 19 | |||||||||||||||
| Development | 1,310 | 1,554 | 1,200 | 829 | 731 | |||||||||||||||
Total | 1,326 | 1,579 | 1,237 | 849 | 750 | |||||||||||||||
Dry | ||||||||||||||||||||
Exploratory(2) | 8 | 11 | 7 | 9 | 9 | |||||||||||||||
| Development | 8 | 16 | 5 | 5 | 4 | |||||||||||||||
Total | 16 | 27 | 12 | 14 | 13 | |||||||||||||||
Net Wells Drilled | ||||||||||||||||||||
Exploratory(2) | 24 | 36 | 44 | 29 | 28 | |||||||||||||||
| Development | 1,318 | 1,570 | 1,205 | 834 | 735 | |||||||||||||||
Total | 1,342 | 1,606 | 1,249 | 863 | 763 | |||||||||||||||
NET ACREAGE AT YEAR END(3)
| (thousands of net acres) | 2012 | 2011 | 2010 | 2009 | 2008 | |||||||||||||||
Undeveloped | ||||||||||||||||||||
| United States | 5,185 | 5,326 | 4,914 | 5,111 | 5,691 | |||||||||||||||
| Canada/South America | 8,700 | 9,877 | 11,977 | 17,107 | 19,953 | |||||||||||||||
| Europe | 16,123 | 16,107 | 16,118 | 13,470 | 7,913 | |||||||||||||||
| Africa | 7,707 | 8,100 | 8,612 | 10,555 | 26,439 | |||||||||||||||
| Asia | 20,244 | 19,919 | 19,086 | 20,457 | 6,824 | |||||||||||||||
| Australia/Oceania | 1,991 | 1,476 | 1,352 | 5,216 | 5,738 | |||||||||||||||
Total worldwide | 59,950 | 60,805 | 62,059 | 71,916 | 72,558 | |||||||||||||||
Developed | ||||||||||||||||||||
| United States | 10,366 | 10,311 | 9,919 | 5,120 | 5,148 | |||||||||||||||
| Canada/South America | 1,940 | 1,959 | 2,439 | 2,460 | 2,488 | |||||||||||||||
| Europe | 2,872 | 2,868 | 2,986 | 3,806 | 4,026 | |||||||||||||||
| Africa | 780 | 700 | 684 | 758 | 756 | |||||||||||||||
| Asia | 1,165 | 1,230 | 1,271 | 1,160 | 1,048 | |||||||||||||||
| Australia/Oceania | 719 | 719 | 719 | 719 | 719 | |||||||||||||||
Total worldwide | 17,842 | 17,787 | 18,018 | 14,023 | 14,185 | |||||||||||||||
NET CAPITALIZED COSTS AT YEAR END(3)
| (millions of dollars) | 2012 | 2011 | 2010 | 2009 | 2008 | |||||||||||||||
| United States | 80,135 | 76,363 | 70,011 | 20,363 | 18,542 | |||||||||||||||
| Canada/South America | 28,683 | 21,721 | 18,089 | 13,408 | 9,967 | |||||||||||||||
| Europe | 13,042 | 11,399 | 12,845 | 14,357 | 11,477 | |||||||||||||||
| Africa | 23,010 | 24,790 | 22,563 | 20,917 | 17,797 | |||||||||||||||
| Asia | 26,852 | 25,594 | 23,765 | 21,859 | 19,191 | |||||||||||||||
| Australia/Oceania | 9,230 | 6,864 | 5,284 | 3,725 | 2,407 | |||||||||||||||
Total worldwide | 180,952 | 166,731 | 152,557 | 94,629 | 79,381 | |||||||||||||||
| (1) | A regional breakout of this data is included on pages 11 and 12 of ExxonMobil’s 2012 Form 10-K. | |
| (2) | These include near-field and appraisal wells classified as exploratory for SEC reporting. | |
| (3) | Includes non-consolidated interests and Canadian oil sands operations. |
Table of Contents
| 53 |
COSTS INCURRED IN PROPERTY ACQUISITION, EXPLORATION, AND DEVELOPMENT ACTIVITIES(1)
| Property | ||||||||||||||||
| Acquisition | Exploration | Development | Total | |||||||||||||
| (millions of dollars) | Costs | Costs | Costs | Costs | ||||||||||||
During 2012 | ||||||||||||||||
| United States | 1,923 | 646 | 7,676 | 10,245 | ||||||||||||
| Canada/South America | 76 | 405 | 7,601 | 8,082 | ||||||||||||
| Europe | 119 | 488 | 2,793 | 3,400 | ||||||||||||
| Africa | 15 | 520 | 3,081 | 3,616 | ||||||||||||
| Asia | 43 | 554 | 3,998 | 4,595 | ||||||||||||
| Australia/Oceania | 31 | 248 | 2,333 | 2,612 | ||||||||||||
Total worldwide | 2,207 | 2,861 | 27,482 | 32,550 | ||||||||||||
During 2011 | ||||||||||||||||
| United States | 2,967 | 484 | 8,505 | 11,956 | ||||||||||||
| Canada/South America | 178 | 372 | 5,478 | 6,028 | ||||||||||||
| Europe | – | 672 | 2,063 | 2,735 | ||||||||||||
| Africa | – | 303 | 4,316 | 4,619 | ||||||||||||
| Asia | 642 | 518 | 3,618 | 4,778 | ||||||||||||
| Australia/Oceania | – | 154 | 1,710 | 1,864 | ||||||||||||
Total worldwide | 3,787 | 2,503 | 25,690 | 31,980 | ||||||||||||
During 2010 | ||||||||||||||||
| United States | 45,143 | 694 | 8,270 | 54,107 | ||||||||||||
| Canada/South America | 136 | 527 | 4,757 | 5,420 | ||||||||||||
| Europe | 64 | 606 | 1,452 | 2,122 | ||||||||||||
| Africa | 3 | 453 | 4,390 | 4,846 | ||||||||||||
| Asia | 115 | 547 | 3,195 | 3,857 | ||||||||||||
| Australia/Oceania | – | 228 | 1,146 | 1,374 | ||||||||||||
Total worldwide | 45,461 | 3,055 | 23,210 | 71,726 | ||||||||||||
During 2009 | ||||||||||||||||
| United States | 205 | 549 | 2,787 | 3,541 | ||||||||||||
| Canada/South America | 353 | 498 | 2,394 | 3,245 | ||||||||||||
| Europe | 1 | 525 | 3,639 | 4,165 | ||||||||||||
| Africa | 605 | 880 | 4,596 | 6,081 | ||||||||||||
| Asia | 121 | 529 | 2,946 | 3,596 | ||||||||||||
| Australia/Oceania | – | 130 | 768 | 898 | ||||||||||||
Total worldwide | 1,285 | 3,111 | 17,130 | 21,526 | ||||||||||||
During 2008 | ||||||||||||||||
| United States | 281 | 453 | 2,739 | 3,473 | ||||||||||||
| Canada/South America | 126 | 325 | 1,421 | 1,872 | ||||||||||||
| Europe | 25 | 401 | 1,863 | 2,289 | ||||||||||||
| Africa | 82 | 686 | 4,783 | 5,551 | ||||||||||||
| Asia | 73 | 307 | 3,384 | 3,764 | ||||||||||||
| Australia/Oceania | 76 | 100 | 443 | 619 | ||||||||||||
Total worldwide | 663 | 2,272 | 14,633 | 17,568 | ||||||||||||
| (1) | Includes non-consolidated interests and Canadian oil sands operations. |
Table of Contents
| 54 | EXXONMOBIL 2012 FINANCIAL & OPERATING REVIEW |
Upstream Operating Statistics, continued
PROVED OIL AND GAS RESERVES(1)
| 2012 | 2011 | 2010 | 2009 | 2008 | ||||||||||||||||
| Liquids, Including Oil Sands and Non-Consolidated Reserves(millions of barrels at year end) | ||||||||||||||||||||
Net proved developed and undeveloped reserves | ||||||||||||||||||||
| United States | 2,758 | 2,372 | 2,303 | 1,972 | 1,971 | |||||||||||||||
| Canada/South America | 4,446 | 3,894 | 2,946 | 2,918 | 2,683 | |||||||||||||||
| Europe | 373 | 405 | 454 | 517 | 560 | |||||||||||||||
| Africa | 1,501 | 1,675 | 1,799 | 1,907 | 2,137 | |||||||||||||||
| Asia | 3,488 | 3,620 | 3,896 | 4,049 | 4,424 | |||||||||||||||
| Australia/Oceania | 250 | 262 | 275 | 288 | 231 | |||||||||||||||
Total worldwide | 12,816 | 12,228 | 11,673 | 11,651 | 12,006 | |||||||||||||||
Proportional interest in oil sands and non-consolidated reserves included above | ||||||||||||||||||||
| United States | 348 | 353 | 351 | 356 | 327 | |||||||||||||||
Canada/South America (bitumen)(2) | 3,560 | 3,106 | 2,102 | 2,055 | 1,767 | |||||||||||||||
Canada/South America (synthetic oil)(2) | 599 | 653 | 681 | 691 | 734 | |||||||||||||||
| Europe | 28 | 29 | 31 | 30 | 27 | |||||||||||||||
| Asia | 1,726 | 1,733 | 1,873 | 2,050 | 2,205 | |||||||||||||||
Net proved developed reserves included above | ||||||||||||||||||||
| United States | 1,753 | 1,722 | 1,749 | 1,490 | 1,521 | |||||||||||||||
| Canada/South America | 1,266 | 1,281 | 1,333 | 1,311 | 1,315 | |||||||||||||||
| Europe | 296 | 330 | 382 | 386 | 419 | |||||||||||||||
| Africa | 1,004 | 1,050 | 1,055 | 1,122 | 1,284 | |||||||||||||||
| Asia | 2,503 | 2,617 | 2,929 | 2,876 | 2,514 | |||||||||||||||
| Australia/Oceania | 116 | 126 | 139 | 153 | 165 | |||||||||||||||
Total worldwide | 6,938 | 7,126 | 7,587 | 7,338 | 7,218 | |||||||||||||||
| Natural Gas, Including Non-Consolidated Reserves(billions of cubic feet at year end) | ||||||||||||||||||||
Net proved developed and undeveloped reserves | ||||||||||||||||||||
| United States | 26,370 | 26,366 | 26,111 | 11,802 | 11,890 | |||||||||||||||
| Canada/South America | 925 | 835 | 1,258 | 1,368 | 1,383 | |||||||||||||||
| Europe | 12,784 | 13,755 | 14,788 | 16,173 | 17,284 | |||||||||||||||
| Africa | 929 | 982 | 908 | 920 | 918 | |||||||||||||||
| Asia | 25,515 | 27,037 | 28,399 | 30,304 | 32,383 | |||||||||||||||
| Australia/Oceania | 7,568 | 7,247 | 7,351 | 7,440 | 2,021 | |||||||||||||||
Total worldwide | 74,091 | 76,222 | 78,815 | 68,007 | 65,879 | |||||||||||||||
Proportional interest in non-consolidated reserves included above | ||||||||||||||||||||
| United States | 155 | 112 | 117 | 114 | 112 | |||||||||||||||
| Europe | 9,535 | 10,169 | 10,746 | 11,450 | 11,839 | |||||||||||||||
| Asia | 19,670 | 20,566 | 21,139 | 22,001 | 22,526 | |||||||||||||||
Net proved developed reserves included above | ||||||||||||||||||||
| United States | 14,597 | 15,533 | 15,441 | 7,582 | 7,931 | |||||||||||||||
| Canada/South America | 670 | 658 | 1,077 | 1,200 | 1,148 | |||||||||||||||
| Europe | 9,583 | 10,629 | 11,683 | 12,782 | 13,710 | |||||||||||||||
| Africa | 814 | 853 | 711 | 739 | 738 | |||||||||||||||
| Asia | 23,581 | 25,067 | 27,087 | 25,206 | 17,876 | |||||||||||||||
| Australia/Oceania | 1,012 | 1,070 | 1,174 | 1,262 | 1,346 | |||||||||||||||
Total worldwide | 50,257 | 53,810 | 57,173 | 48,771 | 42,749 | |||||||||||||||
| (1) | ExxonMobil reserves using SEC historical price bases. Proved reserves as defined by the SEC are based on historical market prices: prior to 2009, the SEC defined price as the market price on December 31; beginning in 2009, the SEC changed the definition to the average of the market prices on the first day of each calendar month during the year. Mining and equity company reserves are included for all periods. See Frequently Used Terms on pages 93 through 95. | |
| (2) | Proved reserves classified as bitumen are associated with the Cold Lake and Kearl projects in Canada. Proved reserves classified as synthetic oil are associated with the Syncrude project in Canada. Cold Lake uses in situ methods, and hydrocarbons are produced from wells drilled into the subsurface. Syncrude is an oil sands mining project which includes an upgrader that converts the mined hydrocarbons into a higher gravity crude oil. Kearl is an oil sands mining project that does not incorporate an upgrader. |
Table of Contents
| 55 |
PROVED OIL AND GAS RESERVES(1)
| 2012 | 2011 | 2010 | 2009 | 2008 | ||||||||||||||||
| Oil Equivalent, Including Oil Sands and Non-Consolidated Reserves(millions of barrels at year end) | ||||||||||||||||||||
| Net proved developed and undeveloped reserves | ||||||||||||||||||||
| United States | 7,153 | 6,766 | 6,654 | 3,939 | 3,953 | |||||||||||||||
| Canada/South America | 4,600 | 4,033 | 3,155 | 3,146 | 2,914 | |||||||||||||||
| Europe | 2,504 | 2,698 | 2,919 | 3,212 | 3,441 | |||||||||||||||
| Africa | 1,656 | 1,839 | 1,951 | 2,060 | 2,290 | |||||||||||||||
| Asia | 7,740 | 8,126 | 8,630 | 9,100 | 9,820 | |||||||||||||||
| Australia/Oceania | 1,511 | 1,470 | 1,500 | 1,528 | 568 | |||||||||||||||
Total worldwide | 25,164 | 24,932 | 24,809 | 22,985 | 22,986 | |||||||||||||||
PROVED OIL AND GAS RESERVES REPLACEMENT(1)
| (million barrels of oil or billion cubic feet of gas | Average | |||||||||||||||||||||||
| unless specified otherwise) | 2012 | 2011 | 2010 | 2009 | 2008 | 2008-2012 | ||||||||||||||||||
| Liquids(millions of barrels) | ||||||||||||||||||||||||
| Revisions | 471 | 270 | 358 | 361 | 583 | 409 | ||||||||||||||||||
| Improved recovery | 23 | – | 5 | 15 | 6 | 10 | ||||||||||||||||||
| Extensions/discoveries | 760 | 1,166 | 185 | 142 | 1,308 | 712 | ||||||||||||||||||
| Purchases | 219 | 16 | 378 | – | – | 123 | ||||||||||||||||||
| Sales | (86 | ) | (54 | ) | (21 | ) | (3 | ) | (86 | ) | (50 | ) | ||||||||||||
| Total additions | 1,387 | 1,398 | 905 | 515 | 1,811 | 1,204 | ||||||||||||||||||
| Production | 799 | 843 | 883 | 870 | 879 | 855 | ||||||||||||||||||
Reserves replacement ratio, excluding sales(percent) | 184 | 172 | 105 | 60 | 216 | 147 | ||||||||||||||||||
Reserves replacement ratio, including sales(percent) | 174 | 166 | 102 | 59 | 206 | 141 | ||||||||||||||||||
Natural Gas(billions of cubic feet) | ||||||||||||||||||||||||
| Revisions | (1,873 | ) | 64 | 879 | 135 | 643 | (30 | ) | ||||||||||||||||
| Improved recovery | – | – | – | – | 1 | – | ||||||||||||||||||
| Extensions/discoveries | 4,383 | 2,682 | 1,988 | 5,694 | 692 | 3,087 | ||||||||||||||||||
| Purchases | 509 | 303 | 12,789 | 8 | – | 2,722 | ||||||||||||||||||
| Sales | (353 | ) | (523 | ) | (106 | ) | (13 | ) | (82 | ) | (215 | ) | ||||||||||||
| Total additions | 2,666 | 2,526 | 15,550 | 5,824 | 1,254 | 5,564 | ||||||||||||||||||
| Production | 4,797 | 5,119 | 4,742 | 3,696 | 3,637 | 4,398 | ||||||||||||||||||
Reserves replacement ratio, excluding sales(percent) | 63 | 60 | 330 | 158 | 37 | 131 | ||||||||||||||||||
Reserves replacement ratio, including sales(percent) | 56 | 49 | 328 | 158 | 34 | 127 | ||||||||||||||||||
Oil Equivalent(millions of barrels) | ||||||||||||||||||||||||
| Revisions | 159 | 281 | 505 | 383 | 690 | 404 | ||||||||||||||||||
| Improved recovery | 23 | – | 5 | 15 | 7 | 10 | ||||||||||||||||||
| Extensions/discoveries | 1,490 | 1,613 | 516 | 1,091 | 1,423 | 1,227 | ||||||||||||||||||
| Purchases | 304 | 67 | 2,510 | 1 | – | 576 | ||||||||||||||||||
| Sales | (145 | ) | (141 | ) | (38 | ) | (5 | ) | (100 | ) | (86 | ) | ||||||||||||
| Total additions | 1,831 | 1,820 | 3,498 | 1,485 | 2,020 | 2,131 | ||||||||||||||||||
| Production | 1,599 | 1,697 | 1,674 | 1,486 | 1,485 | 1,588 | ||||||||||||||||||
Reserves replacement ratio, excluding sales(percent) | 124 | 116 | 211 | 100 | 143 | 140 | ||||||||||||||||||
Reserves replacement ratio, including sales(percent) | 115 | 107 | 209 | 100 | 136 | 134 | ||||||||||||||||||
| (1) | ExxonMobil reserves using SEC historical price bases. Proved reserves as defined by the SEC are based on historical market prices: prior to 2009, the SEC defined price as the market price on December 31; beginning in 2009, the SEC changed the definition to the average of the market prices on the first day of each calendar month during the year. Mining and equity company reserves are included for all periods. See Frequently Used Terms on pages 93 through 95. |
Table of Contents
| 56 | EXXONMOBIL 2012 FINANCIAL & OPERATING REVIEW |
Upstream Operating Statistics, continued
2012 RESERVES CHANGES BY REGION(1)
| Crude Oil and Natural Gas Liquids | Bitumen | Synthetic Oil | ||||||||||||||||||||||||||||||||||||||
| Canada/ | Canada/ | Canada/ | ||||||||||||||||||||||||||||||||||||||
| (million barrels of oil or billion cubic feet of gas | United | South | Australia/ | South | South | Liquids | ||||||||||||||||||||||||||||||||||
| unless noted) | States | America | Europe | Africa | Asia | Oceania | Total | America | America | Total | ||||||||||||||||||||||||||||||
| Liquids(millions of barrels) | ||||||||||||||||||||||||||||||||||||||||
| Revisions | 5 | 38 | 25 | 21 | 140 | 6 | 235 | 265 | (29 | ) | 471 | |||||||||||||||||||||||||||||
| Improved recovery | 22 | – | – | – | 1 | – | 23 | – | – | 23 | ||||||||||||||||||||||||||||||
| Extensions/discoveries | 330 | 138 | 8 | 41 | 9 | – | 526 | 234 | – | 760 | ||||||||||||||||||||||||||||||
| Purchases | 199 | – | 20 | – | – | – | 219 | – | – | 219 | ||||||||||||||||||||||||||||||
| Sales | (18 | ) | (2 | ) | (8 | ) | (58 | ) | – | – | (86 | ) | – | – | (86 | ) | ||||||||||||||||||||||||
| Total additions | 538 | 174 | 45 | 4 | 150 | 6 | 917 | 499 | (29 | ) | 1,387 | |||||||||||||||||||||||||||||
| Production | 152 | 22 | 77 | 178 | 282 | 18 | 729 | 45 | 25 | 799 | ||||||||||||||||||||||||||||||
| Net change | 386 | 152 | (32 | ) | (174 | ) | (132 | ) | (12 | ) | 188 | 454 | (54 | ) | 588 | |||||||||||||||||||||||||
Reserves replacement ratio, excluding sales(percent) | 366 | 800 | 69 | 35 | 53 | 33 | 138 | 1,109 | – | 184 | ||||||||||||||||||||||||||||||
Reserves replacement ratio, including sales(percent) | 354 | 791 | 58 | 2 | 53 | 33 | 126 | 1,109 | – | 174 | ||||||||||||||||||||||||||||||
| Natural Gas(billions of cubic feet) | ||||||||||||||||||||||||||||||||||||||||
| Revisions | (2,839 | ) | 168 | 185 | 2 | 146 | 465 | (1,873 | ) | |||||||||||||||||||||||||||||||
| Improved recovery | – | – | – | – | – | – | – | |||||||||||||||||||||||||||||||||
| Extensions/discoveries | 4,045 | 95 | 184 | – | 59 | – | 4,383 | |||||||||||||||||||||||||||||||||
| Purchases | 503 | – | 6 | – | – | – | 509 | |||||||||||||||||||||||||||||||||
| Sales | (181 | ) | (20 | ) | (140 | ) | (12 | ) | – | – | (353 | ) | ||||||||||||||||||||||||||||
| Total additions | 1,528 | 243 | 235 | (10 | ) | 205 | 465 | 2,666 | ||||||||||||||||||||||||||||||||
| Production | 1,524 | 153 | 1,206 | 43 | 1,727 | 144 | 4,797 | |||||||||||||||||||||||||||||||||
| Net change | 4 | 90 | (971 | ) | (53 | ) | (1,522 | ) | 321 | (2,131 | ) | |||||||||||||||||||||||||||||
Reserves replacement ratio, excluding sales(percent) | 112 | 172 | 31 | 5 | 12 | 323 | 63 | |||||||||||||||||||||||||||||||||
Reserves replacement ratio, including sales(percent) | 100 | 159 | 19 | – | 12 | 323 | 56 | |||||||||||||||||||||||||||||||||
| (1) | See Frequently Used Terms on pages 93 through 95. |
Table of Contents
| 57 |
PROVED OIL AND GAS RESERVES REPLACEMENT(1)
| (million barrels of oil or billion cubic feet of gas | Average | |||||||||||||||||||||||
| unless noted) | 2012 | 2011 | 2010 | 2009 | 2008 | 2008-2012 | ||||||||||||||||||
Non-U.S. | ||||||||||||||||||||||||
E&P costs(millions of dollars) | 22,305 | 20,024 | 17,619 | 17,985 | 14,095 | 18,406 | ||||||||||||||||||
| Liquids reserves additions | 849 | 1,175 | 426 | 375 | 1,933 | 952 | ||||||||||||||||||
| Liquids production | 647 | 689 | 735 | 731 | 747 | 710 | ||||||||||||||||||
| Gas reserves additions | 1,138 | 712 | 179 | 5,340 | 2,099 | 1,894 | ||||||||||||||||||
| Gas production | 3,273 | 3,560 | 3,680 | 3,124 | 3,075 | 3,342 | ||||||||||||||||||
| Oil-equivalent reserves additions, excluding sales | 1,135 | 1,425 | 459 | 1,266 | 2,377 | 1,333 | ||||||||||||||||||
| Oil-equivalent reserves additions, including sales | 1,038 | 1,295 | 456 | 1,264 | 2,283 | 1,267 | ||||||||||||||||||
| Oil-equivalent production | 1,193 | 1,283 | 1,348 | 1,252 | 1,259 | 1,267 | ||||||||||||||||||
Reserves replacement ratio, excluding sales(percent) | 95 | 111 | 34 | 101 | 189 | 105 | ||||||||||||||||||
Reserves replacement ratio, including sales(percent) | 87 | 101 | 34 | 101 | 181 | 100 | ||||||||||||||||||
Reserves replacement costs(2)(dollars per barrel) | 19.65 | 14.05 | 38.39 | 14.21 | 5.93 | 13.81 | ||||||||||||||||||
United States | ||||||||||||||||||||||||
E&P costs(millions of dollars) | 10,245 | 11,956 | 54,107 | 3,541 | 3,473 | 16,664 | ||||||||||||||||||
| Liquids reserves additions | 538 | 223 | 479 | 140 | (122 | ) | 252 | |||||||||||||||||
| Liquids production | 152 | 154 | 148 | 139 | 132 | 145 | ||||||||||||||||||
| Gas reserves additions | 1,528 | 1,814 | 15,371 | 484 | (845 | ) | 3,670 | |||||||||||||||||
| Gas production | 1,524 | 1,559 | 1,062 | 572 | 562 | 1,056 | ||||||||||||||||||
| Oil-equivalent reserves additions, excluding sales | 841 | 536 | 3,077 | 224 | (257 | ) | 884 | |||||||||||||||||
| Oil-equivalent reserves additions, including sales | 793 | 525 | 3,041 | 221 | (263 | ) | 864 | |||||||||||||||||
| Oil-equivalent production | 406 | 414 | 325 | 234 | 226 | 321 | ||||||||||||||||||
Reserves replacement ratio, excluding sales(percent) | 207 | 129 | 947 | 96 | – | 275 | ||||||||||||||||||
Reserves replacement ratio, including sales(percent) | 195 | 127 | 936 | 94 | – | 269 | ||||||||||||||||||
Reserves replacement costs(2)(dollars per barrel) | 12.18 | 22.31 | 17.58 | 15.81 | – | 18.85 | ||||||||||||||||||
Worldwide | ||||||||||||||||||||||||
E&P costs(millions of dollars) | 32,550 | 31,980 | 71,726 | 21,526 | 17,568 | 35,070 | ||||||||||||||||||
| Liquids reserves additions | 1,387 | 1,398 | 905 | 515 | 1,811 | 1,204 | ||||||||||||||||||
| Liquids production | 799 | 843 | 883 | 870 | 879 | 855 | ||||||||||||||||||
| Gas reserves additions | 2,666 | 2,526 | 15,550 | 5,824 | 1,254 | 5,564 | ||||||||||||||||||
| Gas production | 4,797 | 5,119 | 4,742 | 3,696 | 3,637 | 4,398 | ||||||||||||||||||
| Oil-equivalent reserves additions, excluding sales | 1,976 | 1,961 | 3,536 | 1,490 | 2,120 | 2,217 | ||||||||||||||||||
| Oil-equivalent reserves additions, including sales | 1,831 | 1,820 | 3,497 | 1,485 | 2,020 | 2,131 | ||||||||||||||||||
| Oil-equivalent production | 1,599 | 1,697 | 1,673 | 1,486 | 1,485 | 1,588 | ||||||||||||||||||
Reserves replacement ratio, excluding sales(percent) | 124 | 116 | 211 | 100 | 143 | 140 | ||||||||||||||||||
Reserves replacement ratio, including sales(percent) | 115 | 107 | 209 | 100 | 136 | 134 | ||||||||||||||||||
Reserves replacement costs(2)(dollars per barrel) | 16.47 | 16.31 | 20.28 | 14.45 | 8.29 | 15.82 | ||||||||||||||||||
| (1) | ExxonMobil reserves using SEC historical price bases. Proved reserves as defined by the SEC are based on historical market prices: prior to 2009, the SEC defined price as the market price on December 31; beginning in 2009, the SEC changed the definition to the average of the market prices on the first day of each calendar month during the year. Mining and equity company reserves are included for all periods. See Frequently Used Terms on pages 93 through 95. | |
| (2) | Calculation based on exploration and production costs divided by oil-equivalent reserves additions. All values exclude the impact of asset sales; i.e., reserves sold and proceeds received. |
Table of Contents
| 58 | EXXONMOBIL 2012 FINANCIAL & OPERATING REVIEW |
Upstream Operating Statistics, continued
OIL AND GAS EXPLORATION AND PRODUCTION EARNINGS
The revenue, cost, and earnings data are shown both on a total dollar and a unit basis, and are inclusive of non-consolidated and Canadian oil sands operations.
| Total Revenues and Costs, Including Non-Consolidated Interests and Oil Sands | Revenues and Costs per Unit of Sales or Production(1) | |||||||||||||||||||||||||||||||||||||||||||
| Canada/ | Canada/ | |||||||||||||||||||||||||||||||||||||||||||
| United | South | Australia/ | United | South | Outside | |||||||||||||||||||||||||||||||||||||||
| States | America | Europe | Africa | Asia | Oceania | Total | States | America | Americas | Worldwide | ||||||||||||||||||||||||||||||||||
| 2012 | (millions of dollars) | (dollars per unit of sales) | ||||||||||||||||||||||||||||||||||||||||||
| Revenue | ||||||||||||||||||||||||||||||||||||||||||||
| Liquids | 13,362 | 6,997 | 7,652 | 20,560 | 28,798 | 1,624 | 78,993 | 87.43 | 75.90 | 104.66 | 98.10 | |||||||||||||||||||||||||||||||||
| Natural gas | 3,003 | 264 | 10,996 | 17 | 12,689 | 583 | 27,552 | 2.15 | 1.98 | 8.15 | 6.11 | |||||||||||||||||||||||||||||||||
| (dollars per barrel of net oil-equivalent production) | ||||||||||||||||||||||||||||||||||||||||||||
| Total revenue | 16,365 | 7,261 | 18,648 | 20,577 | 41,487 | 2,207 | 106,545 | 42.39 | 63.54 | 78.89 | 68.68 | |||||||||||||||||||||||||||||||||
| Less costs: | ||||||||||||||||||||||||||||||||||||||||||||
| Production costs excluding taxes | 4,511 | 3,079 | 2,812 | 2,395 | 2,090 | 488 | 15,375 | 11.68 | 26.94 | 7.41 | 9.91 | |||||||||||||||||||||||||||||||||
| Depreciation and depletion | 5,038 | 848 | 1,711 | 2,879 | 2,461 | 264 | 13,201 | 13.05 | 7.42 | 6.96 | 8.51 | |||||||||||||||||||||||||||||||||
| Exploration expenses | 400 | 292 | 291 | 234 | 513 | 136 | 1,866 | 1.04 | 2.56 | 1.12 | 1.20 | |||||||||||||||||||||||||||||||||
| Taxes other than income | 2,005 | 89 | 4,082 | 1,702 | 8,906 | 446 | 17,230 | 5.20 | 0.78 | 14.39 | 11.12 | |||||||||||||||||||||||||||||||||
| Related income tax | 1,561 | 720 | 6,307 | 8,091 | 14,850 | 281 | 31,810 | 4.04 | 6.30 | 28.10 | 20.50 | |||||||||||||||||||||||||||||||||
| Results of producing activities | 2,850 | 2,233 | 3,445 | 5,276 | 12,667 | 592 | 27,063 | 7.38 | 19.54 | 20.91 | 17.44 | |||||||||||||||||||||||||||||||||
Other earnings(2) | 1,084 | (703 | ) | 526 | 1,943 | (200 | ) | (59 | ) | 2,591 | 2.81 | (6.15 | ) | 2.11 | 1.68 | |||||||||||||||||||||||||||||
| Total earnings, excluding power and coal | 3,934 | 1,530 | 3,971 | 7,219 | 12,467 | 533 | 29,654 | 10.19 | 13.39 | 23.02 | 19.12 | |||||||||||||||||||||||||||||||||
| Power and coal | (9 | ) | – | – | – | 250 | – | 241 | ||||||||||||||||||||||||||||||||||||
Total earnings | 3,925 | 1,530 | 3,971 | 7,219 | 12,717 | 533 | 29,895 | |||||||||||||||||||||||||||||||||||||
| 2011 | (millions of dollars) | (dollars per unit of sales) | ||||||||||||||||||||||||||||||||||||||||||
| Revenue | ||||||||||||||||||||||||||||||||||||||||||||
| Liquids | 14,362 | 7,584 | 10,149 | 20,204 | 29,411 | 1,793 | 83,503 | 92.80 | 83.06 | 102.99 | 98.97 | |||||||||||||||||||||||||||||||||
| Natural gas | 4,926 | 494 | 11,278 | 7 | 11,311 | 481 | 28,497 | 3.45 | 3.29 | 7.16 | 5.93 | |||||||||||||||||||||||||||||||||
| (dollars per barrel of net oil-equivalent production) | ||||||||||||||||||||||||||||||||||||||||||||
| Total revenue | 19,288 | 8,078 | 21,427 | 20,211 | 40,722 | 2,274 | 112,000 | 49.10 | 69.25 | 74.58 | 68.11 | |||||||||||||||||||||||||||||||||
| Less costs: | ||||||||||||||||||||||||||||||||||||||||||||
| Production costs excluding taxes | 4,589 | 2,751 | 3,037 | 2,608 | 2,050 | 497 | 15,532 | 11.68 | 23.58 | 7.22 | 9.45 | |||||||||||||||||||||||||||||||||
| Depreciation and depletion | 4,815 | 980 | 2,088 | 2,159 | 2,256 | 236 | 12,534 | 12.26 | 8.40 | 5.94 | 7.62 | |||||||||||||||||||||||||||||||||
| Exploration expenses | 278 | 290 | 612 | 233 | 618 | 73 | 2,104 | 0.71 | 2.49 | 1.35 | 1.28 | |||||||||||||||||||||||||||||||||
| Taxes other than income | 2,193 | 79 | 3,626 | 2,055 | 8,337 | 295 | 16,585 | 5.58 | 0.68 | 12.61 | 10.08 | |||||||||||||||||||||||||||||||||
| Related income tax | 2,445 | 969 | 7,689 | 7,888 | 14,062 | 353 | 33,406 | 6.22 | 8.31 | 26.43 | 20.32 | |||||||||||||||||||||||||||||||||
| Results of producing activities | 4,968 | 3,009 | 4,375 | 5,268 | 13,399 | 820 | 31,839 | 12.65 | 25.79 | 21.03 | 19.36 | |||||||||||||||||||||||||||||||||
Other earnings(2) | 133 | (322 | ) | 2,729 | 88 | (259 | ) | (9 | ) | 2,360 | 0.33 | (2.76 | ) | 2.24 | 1.44 | |||||||||||||||||||||||||||||
| Total earnings, excluding power and coal | 5,101 | 2,687 | 7,104 | 5,356 | 13,140 | 811 | 34,199 | 12.98 | 23.03 | 23.27 | 20.80 | |||||||||||||||||||||||||||||||||
| Power and coal | (5 | ) | – | – | – | 245 | – | 240 | ||||||||||||||||||||||||||||||||||||
Total earnings | 5,096 | 2,687 | 7,104 | 5,356 | 13,385 | 811 | 34,439 | |||||||||||||||||||||||||||||||||||||
| (1) | The per-unit data are divided into two sections: (a) revenue per unit of sales from ExxonMobil’s own production; and, (b) operating costs and earnings per unit of net oil-equivalent production. Units for crude oil and natural gas liquids are barrels, while units for natural gas are thousands of cubic feet. The volumes of crude oil and natural gas liquids production and net natural gas production available for sale used in this calculation are shown on pages 50 and 51. The volumes of natural gas were converted to oil-equivalent barrels based on a conversion factor of 6 thousand cubic feet per barrel. | |
| (2) | Includes earnings related to transportation operations, LNG liquefaction and transportation operations, sale of third-party purchases, technical services agreements, other nonoperating activities, and adjustments for minority interests. |
Table of Contents
| 59 |
Oil and Gas Exploration and Production Earnings (continued)
| Total Revenues and Costs, Including Non-Consolidated Interests and Oil Sands | Revenues and Costs per Unit of Sales or Production(1) | |||||||||||||||||||||||||||||||||||||||||||
| Canada/ | Canada/ | |||||||||||||||||||||||||||||||||||||||||||
| United | South | Australia/ | United | South | Outside | |||||||||||||||||||||||||||||||||||||||
| States | America | Europe | Africa | Asia | Oceania | Total | States | America | Americas | Worldwide | ||||||||||||||||||||||||||||||||||
| 2010 | (millions of dollars) | (dollars per unit of sales) | ||||||||||||||||||||||||||||||||||||||||||
| Revenue | ||||||||||||||||||||||||||||||||||||||||||||
| Liquids | 10,567 | 6,343 | 8,935 | 17,511 | 19,118 | 1,418 | 63,892 | 70.98 | 66.27 | 74.67 | 73.12 | |||||||||||||||||||||||||||||||||
| Natural gas | 3,716 | 707 | 9,358 | 11 | 7,990 | 401 | 22,183 | 3.92 | 3.41 | 5.42 | 5.00 | |||||||||||||||||||||||||||||||||
| (dollars per barrel of net oil-equivalent production) | ||||||||||||||||||||||||||||||||||||||||||||
| Total revenue | 14,283 | 7,050 | 18,293 | 17,522 | 27,108 | 1,819 | 86,075 | 46.53 | 54.18 | 54.59 | 53.04 | |||||||||||||||||||||||||||||||||
| Less costs: | ||||||||||||||||||||||||||||||||||||||||||||
| Production costs excluding taxes | 3,275 | 2,612 | 3,011 | 2,215 | 1,628 | 462 | 13,203 | 10.67 | 20.07 | 6.17 | 8.14 | |||||||||||||||||||||||||||||||||
| Depreciation and depletion | 3,507 | 1,015 | 2,719 | 2,580 | 1,596 | 219 | 11,636 | 11.43 | 7.80 | 6.00 | 7.17 | |||||||||||||||||||||||||||||||||
| Exploration expenses | 287 | 464 | 413 | 587 | 362 | 56 | 2,169 | 0.94 | 3.57 | 1.20 | 1.34 | |||||||||||||||||||||||||||||||||
| Taxes other than income | 1,220 | 86 | 2,997 | 1,742 | 5,142 | 204 | 11,391 | 3.96 | 0.67 | 8.49 | 7.02 | |||||||||||||||||||||||||||||||||
| Related income tax | 2,093 | 715 | 5,543 | 6,068 | 9,147 | 262 | 23,828 | 6.82 | 5.49 | 17.73 | 14.68 | |||||||||||||||||||||||||||||||||
| Results of producing activities | 3,901 | 2,158 | 3,610 | 4,330 | 9,233 | 616 | 23,848 | 12.71 | 16.58 | 15.00 | 14.69 | |||||||||||||||||||||||||||||||||
Other earnings(2) | 379 | (538 | ) | 216 | 96 | (120 | ) | (15 | ) | 18 | 1.23 | (4.13 | ) | 0.15 | 0.02 | |||||||||||||||||||||||||||||
| Total earnings, excluding power and coal | 4,280 | 1,620 | 3,826 | 4,426 | 9,113 | 601 | 23,866 | 13.94 | 12.45 | 15.15 | 14.71 | |||||||||||||||||||||||||||||||||
| Power and coal | (8 | ) | – | – | – | 239 | – | 231 | ||||||||||||||||||||||||||||||||||||
Total earnings | 4,272 | 1,620 | 3,826 | 4,426 | 9,352 | 601 | 24,097 | |||||||||||||||||||||||||||||||||||||
| 2009 | (millions of dollars) | (dollars per unit of sales) | ||||||||||||||||||||||||||||||||||||||||||
| Revenue | ||||||||||||||||||||||||||||||||||||||||||||
| Liquids | 7,573 | 5,135 | 7,739 | 14,868 | 12,941 | 1,311 | 49,567 | 54.02 | 51.88 | 58.53 | 57.04 | |||||||||||||||||||||||||||||||||
| Natural gas | 1,442 | 748 | 9,080 | 12 | 4,237 | 341 | 15,860 | 3.10 | 3.19 | 5.09 | 4.69 | |||||||||||||||||||||||||||||||||
| (dollars per barrel of net oil-equivalent production) | ||||||||||||||||||||||||||||||||||||||||||||
| Total revenue | 9,015 | 5,883 | 16,819 | 14,880 | 17,178 | 1,652 | 65,427 | 41.41 | 43.02 | 46.74 | 45.58 | |||||||||||||||||||||||||||||||||
| Less costs: | ||||||||||||||||||||||||||||||||||||||||||||
| Production costs excluding taxes | 2,736 | 2,428 | 2,923 | 2,027 | 1,498 | 386 | 11,998 | 12.57 | 17.75 | 6.32 | 8.36 | |||||||||||||||||||||||||||||||||
| Depreciation and depletion | 1,833 | 948 | 2,246 | 2,293 | 1,182 | 195 | 8,697 | 8.42 | 6.93 | 5.47 | 6.06 | |||||||||||||||||||||||||||||||||
| Exploration expenses | 220 | 339 | 387 | 662 | 393 | 33 | 2,034 | 1.01 | 2.48 | 1.36 | 1.42 | |||||||||||||||||||||||||||||||||
| Taxes other than income | 767 | 78 | 2,826 | 1,343 | 3,111 | 252 | 8,377 | 3.52 | 0.57 | 6.97 | 5.83 | |||||||||||||||||||||||||||||||||
| Related income tax | 1,127 | 597 | 5,179 | 4,667 | 5,943 | 237 | 17,750 | 5.18 | 4.37 | 14.83 | 12.37 | |||||||||||||||||||||||||||||||||
| Results of producing activities | 2,332 | 1,493 | 3,258 | 3,888 | 5,051 | 549 | 16,571 | 10.71 | 10.92 | 11.79 | 11.54 | |||||||||||||||||||||||||||||||||
Other earnings(2) | 565 | (605 | ) | 325 | 81 | (86 | ) | 36 | 316 | 2.60 | (4.43 | ) | 0.33 | 0.22 | ||||||||||||||||||||||||||||||
| Total earnings, excluding power and coal | 2,897 | 888 | 3,583 | 3,969 | 4,965 | 585 | 16,887 | 13.31 | 6.49 | 12.12 | 11.76 | |||||||||||||||||||||||||||||||||
| Power and coal | (4 | ) | – | – | – | 224 | – | 220 | ||||||||||||||||||||||||||||||||||||
Total earnings | 2,893 | 888 | 3,583 | 3,969 | 5,189 | 585 | 17,107 | |||||||||||||||||||||||||||||||||||||
| 2008 | (millions of dollars) | (dollars per unit of sales) | ||||||||||||||||||||||||||||||||||||||||||
| Revenue | ||||||||||||||||||||||||||||||||||||||||||||
| Liquids | 11,788 | 8,540 | 13,910 | 20,606 | 20,288 | 2,111 | 77,243 | 87.95 | 81.43 | 91.66 | 89.84 | |||||||||||||||||||||||||||||||||
| Natural gas | 3,296 | 1,834 | 15,230 | 39 | 7,005 | 389 | 27,793 | 7.23 | 7.82 | 8.59 | 8.35 | |||||||||||||||||||||||||||||||||
| (dollars per barrel of net oil-equivalent production) | ||||||||||||||||||||||||||||||||||||||||||||
| Total revenue | 15,084 | 10,374 | 29,140 | 20,645 | 27,293 | 2,500 | 105,036 | 71.73 | 71.23 | 73.74 | 73.19 | |||||||||||||||||||||||||||||||||
| Less costs: | ||||||||||||||||||||||||||||||||||||||||||||
| Production costs excluding taxes | 2,675 | 2,625 | 3,051 | 1,603 | 1,392 | 332 | 11,678 | 12.72 | 18.03 | 5.91 | 8.14 | |||||||||||||||||||||||||||||||||
| Depreciation and depletion | 1,427 | 1,043 | 2,662 | 2,471 | 1,231 | 179 | 9,013 | 6.79 | 7.16 | 6.06 | 6.28 | |||||||||||||||||||||||||||||||||
| Exploration expenses | 189 | 251 | 183 | 439 | 292 | 109 | 1,463 | 0.90 | 1.72 | 0.95 | 1.02 | |||||||||||||||||||||||||||||||||
| Taxes other than income | 2,021 | 81 | 4,248 | 1,815 | 5,457 | 665 | 14,287 | 9.61 | 0.55 | 11.29 | 9.95 | |||||||||||||||||||||||||||||||||
| Related income tax | 3,191 | 1,813 | 11,979 | 8,119 | 10,691 | 399 | 36,192 | 15.17 | 12.45 | 28.90 | 25.22 | |||||||||||||||||||||||||||||||||
| Results of producing activities | 5,581 | 4,561 | 7,017 | 6,198 | 8,230 | 816 | 32,403 | 26.54 | 31.32 | 20.63 | 22.58 | |||||||||||||||||||||||||||||||||
Other earnings(2) | 687 | (997 | ) | 2,860 | 212 | (45 | ) | 29 | 2,746 | 3.27 | (6.85 | ) | 2.83 | 1.91 | ||||||||||||||||||||||||||||||
| Total earnings, excluding power and coal | 6,268 | 3,564 | 9,877 | 6,410 | 8,185 | 845 | 35,149 | 29.81 | 24.47 | 23.46 | 24.49 | |||||||||||||||||||||||||||||||||
| Power and coal | (25 | ) | – | – | – | 278 | – | 253 | ||||||||||||||||||||||||||||||||||||
Total earnings | 6,243 | 3,564 | 9,877 | 6,410 | 8,463 | 845 | 35,402 | |||||||||||||||||||||||||||||||||||||
| See footnotes on page 58. | ||
Table of Contents
| Downstream ExxonMobil is the world’s largest integrated refiner and manufacturer of lube basestocks. We are also a leading marketer of petroleum products and finished lubricants. |
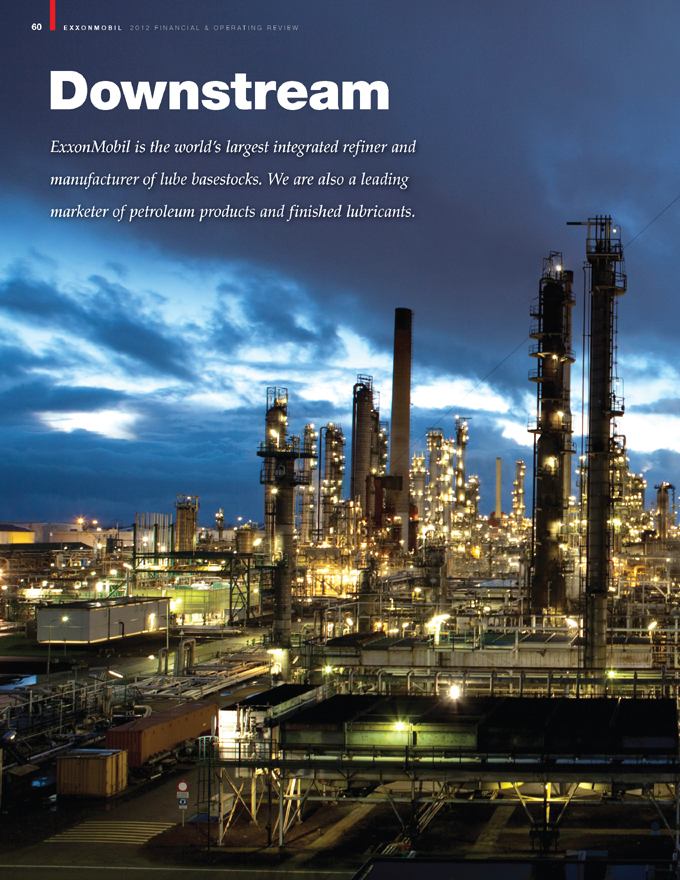
Table of Contents
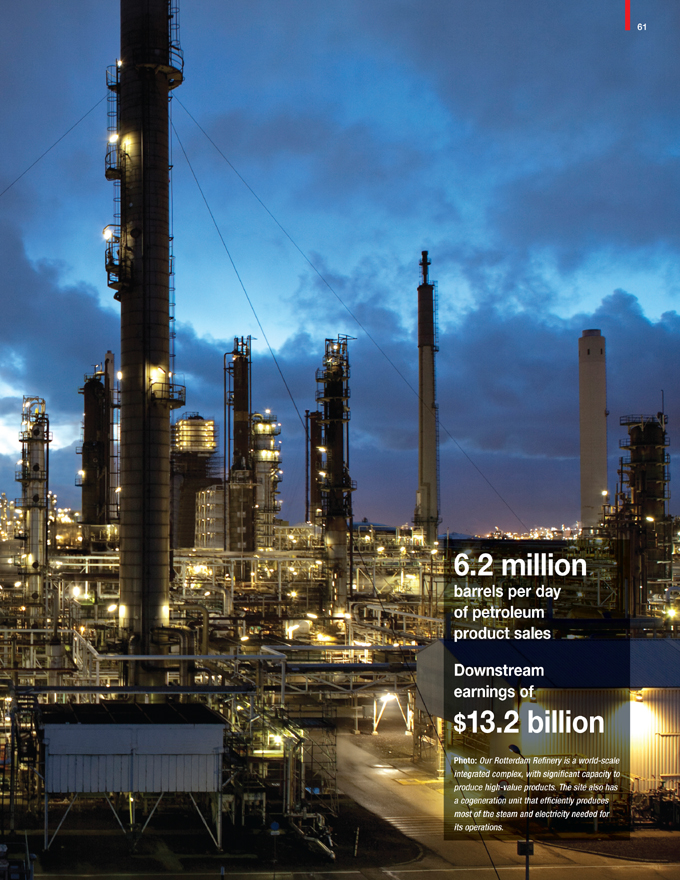
Table of Contents
| 62 | EXXONMOBIL 2012 FINANCIAL & OPERATING REVIEW |
Downstream
ExxonMobil’s premier Downstream business comprises Refining & Supply; Fuels, Lubricants & Specialties Marketing; and a world-class Research and Engineering organization. Our integrated business model and strategies underpin our continued success throughout the business cycle. | ||
RESULTS & HIGHLIGHTS | ||
STRATEGIES
| • | Maintain best-in-class operations | |
| • | Provide quality, valued products and services to our customers | |
| • | Lead industry in efficiency and effectiveness | |
| • | Capitalize on integration across ExxonMobil businesses | |
| • | Maintain capital discipline | |
| • | Maximize value from leading-edge technologies |
Industry-leading safety performance
Zero hydrocarbon spillsfrom owned/operated and long-term leased marine vessels
Best-ever refinery energy efficiency,driven by our Global Energy Management System
and cogeneration facilities
and cogeneration facilities
Record production of ultra-low sulfur diesel (ULSD),reflecting strong operations and
new hydrotreating investments
new hydrotreating investments
Record sales of our industry-leading lubricants,Mobil 1, Mobil Delvac 1, andMobil SHC
Strong earnings of $13.2 billion,reflecting an improved business environment,
continued margin and efficiency capture, and portfolio optimization
continued margin and efficiency capture, and portfolio optimization
Return on average capital employed of 54.9 percent,consistently leading industry
throughout the business cycle
throughout the business cycle
Downstream capital expenditures of $2.3 billion,including investments in growth markets,
higher-value products, efficiency, and environmental improvements
higher-value products, efficiency, and environmental improvements
Completed the upgrade of refinery facilities in Fawley, United Kingdom,increasing ULSD production
by more than 10 thousand barrels per day
by more than 10 thousand barrels per day
| DOWNSTREAM STATISTICAL RECAP | 2012 | 2011 | 2010 | 2009 | 2008 | |||||||||||||||
Earnings(millions of dollars) | 13,190 | 4,459 | 3,567 | 1,781 | 8,151 | |||||||||||||||
Refinery throughput(thousands of barrels per day) | 5,014 | 5,214 | 5,253 | 5,350 | 5,416 | |||||||||||||||
Petroleum product sales(thousands of barrels per day) | 6,174 | 6,413 | 6,414 | 6,428 | 6,761 | |||||||||||||||
Average capital employed(1)(millions of dollars) | 24,031 | 23,388 | 24,130 | 25,099 | 25,627 | |||||||||||||||
Return on average capital employed(1)(percent) | 54.9 | 19.1 | 14.8 | 7.1 | 31.8 | |||||||||||||||
Capital expenditures(1)(millions of dollars) | 2,262 | 2,120 | 2,505 | 3,196 | 3,529 | |||||||||||||||
| (1) | See Frequently Used Terms on pages 93 through 95. |
Table of Contents
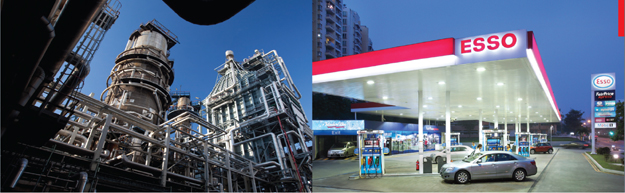 | 63 |
BUSINESS OVERVIEW
ExxonMobil Downstream is a diverse business with a global portfolio of world-class refining and distribution facilities, lube oil blend plants, and marketing operations. We are the world’s largest refiner and lube basestock manufacturer, with a balanced portfolio of assets and flexible operations that position us to capture opportunities in the high-growth Asia Pacific region as well as mature markets in North America and Europe.
We hold an ownership interest in 32 refineries with distillation capacity of 5.4 million barrels per day and lubricant basestock capacity of 126 thousand barrels per day. We are an industry leader in integration with more than 75 percent of our refining operations integrated with chemicals or lubes, which provides unique optimization capability across the entire value chain.
Our fuels and lubricants marketing businesses have global reach and a portfolio of world-renowned brands, includingExxon, Mobil, andEsso. Our long-standing record of technology leadership underpins the innovative products and services that deliver superior performance for customers and long-term value for shareholders.
BUSINESS ENVIRONMENT
By 2040, demand for transportation fuel is expected to increase by more than 40 percent versus 2010. Relatively flat demand in developed markets is expected to be overshadowed by growth in developing markets, such as China, India, and Latin America. Transportation fuel mix will continue to shift from gasoline to diesel, driven by the expansion of commercial transportation, primarily in developing countries. Gasoline demand growth is expected to flatten with improved passenger vehicle efficiency. Lubricant demand is expected to grow by more than 1 percent per year on increased industrial activity, particularly in Asia. Within the high-value synthetic lubricants sector where we have a leading market position, demand is growing significantly faster at 6 percent per year.
The addition of new refining capacity is currently outpacing global demand growth, resulting in a challenging business environment. However, with our integrated business model, world-class assets, and feedstock flexibility, we are able to capture strong downstream margins at the top of the cycle while outperforming competition at the bottom of the cycle. The benefit of these competitive advantages to our shareholders is demonstrated by our sustained industry-leading returns.
Downstream Return on Average Capital Employed(1)
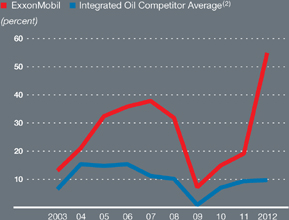
(1) See Frequently Used Terms on pages 93 through 95.
(2) Royal Dutch Shell, BP, and Chevron values are estimated on a consistent
basis with ExxonMobil, based on public information.
basis with ExxonMobil, based on public information.

Table of Contents
| 64 | EXXONMOBIL 2012 FINANCIAL & OPERATING REVIEW |
DOWNSTREAM:
Global Operations
ExxonMobil is the world’s largest integrated refiner and manufacturer of lube basestocks, and a leading marketer of petroleum products. We have a balanced portfolio of world-class facilities and access to key petroleum markets. Our products are sold in more than 120 countries around the globe.
NORTH AMERICA
United States
ExxonMobil operates seven refineries in the United States with a total processing capacity of nearly 2 million barrels of crude oil per day, representing approximately 35 percent of our global refining capacity. These world-class facilities have significant feed flexibility and are highly integrated with chemical and lubes manufacturing.
We also have a major presence in the logistics and distribution sector, including approximately 8,000 miles of operated pipeline that transport more than 2.6 million barrels per day of crude oil, refined products, liquefied petroleum gases, natural gas liquids, and chemical feedstocks. We operate 22 distribution terminals and three salt dome storage facilities.
In the lubricants business, ExxonMobil operates five lube oil blend plants in the United States, which supply high-quality finished lubricants, including ourMobil 1 product line, to customers around the world. Lubricant basestocks are sourced from our refineries and chemical plants. Our fuels and lubes marketing operations in the United States include a mix of more than 9,000 branded retail sites and business-to-business activities, serving the needs of a diverse range of customers while providing secure, ratable outlets for our refineries.
Canada
With more than 500 thousand barrels per day of refining capacity, ExxonMobil is Canada’s largest refiner of petroleum products through our majority-owned affiliate, Imperial Oil (ExxonMobil interest, 69.6 percent). In our fuels marketing business, we sell high-quality products through about 1,800Esso-branded retail service stations, the largest network of service stations in Canada.
Largest Global Refiner
| Refinery interests | 32 | |||
Distillation capacity(barrels per day) | 5.4 million | |||
Lube basestock capacity(barrels per day) | 126 thousand | |||
Diverse Fuels Marketing Customer Base
with Global Reach
with Global Reach
| Retail service stations | ~19,000 | |||
| Commercial customers | ~300,000 |
Global Lubricants Leadership Position
| Market position | No.1 supplier of lube basestocks | |||
| and marketer of synthetic lubricants | ||||
Lubricants Market Position(1)
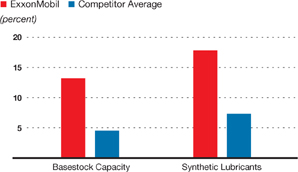
(1) ExxonMobil estimate of key competitor market position based on Kline industry data and public information. Competitor average includes Royal Dutch Shell, BP, and Chevron.
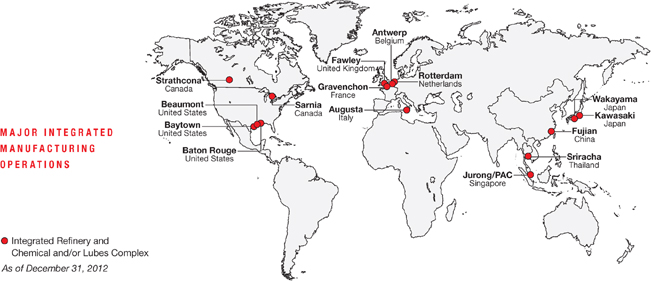
Table of Contents
| 65 |
We also market quality fuels and lubricants to a wide range of commercial customers, including those in the mining, manufacturing, forestry, construction, agriculture, and transportation industries.
Mid-Continent Refining Advantage
North American crude supplies are increasing due to growth in unconventional tight oil and heavier Canadian oil sands. Refiners in the mid-continent region are benefiting from this growth as logistical constraints have resulted in lower-cost crude supplies, making this region an advantaged refining location.
ExxonMobil is a leader in mid-continent refining capacity in the United States and Canada. The flexibility and efficiency created by integration and advanced technologies position us to capture advantaged crude opportunities in this region.
United States/Canada Mid-Continent Equity Refining Capacities
(thousands of barrels per day)
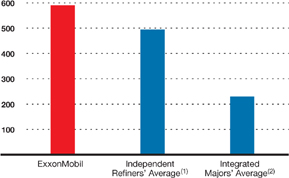
Source: PIRA data, 3Q12
(1) Marathon Petroleum, Valero, HollyFrontier, and Phillips 66.
(2) Royal Dutch Shell, BP, and Chevron.
(1) Marathon Petroleum, Valero, HollyFrontier, and Phillips 66.
(2) Royal Dutch Shell, BP, and Chevron.
EUROPE
European operations represent about 30 percent of ExxonMobil’s global refining capacity. Our integrated manufacturing circuit and business approach, including world-scale refineries in Antwerp, Fawley, and Rotterdam, allow us to optimize our operations and maximize value in a competitive marketplace. We continue to invest in resilient and advantaged projects – including the installation of new facilities and the upgrade of existing facilities – to increase the production of high-value products such as ultra-low sulfur diesel.
We market products across the region through a retail network of more than 6,000 service stations. We also market directly to commercial segments, such as aviation, industrial and wholesale, equipment manufacturers, and marine. We are also expanding our synthetic lubricant manufacturing capacity to serve the growing demand in Russia and other European countries.
ASIA PACIFIC
Approximately 20 percent of ExxonMobil’s global refining capacity is located in the Asia Pacific region. Our network of five lube oil blend plants supplies products throughout the region, including key growth markets such as China and India.
Singapore serves as the Asia Pacific hub for our Downstream and Chemical businesses. Our Singapore Refinery, the largest in our global network, has nearly 600 thousand barrels per day of crude distillation capacity and is the largest lubricant basestock refinery in the region. The site produces a range of products as well as feedstocks for our integrated chemical manufacturing facilities. A key 2013 initiative is the completion of the diesel hydrotreater project, which will increase the site’s production capacity for ultra-low sulfur diesel fuel to meet increasing demand in the region.
Our world-scale integrated manufacturing facilities in Singapore are well positioned to capture opportunities presented by growing demand in the Asia Pacific region. |
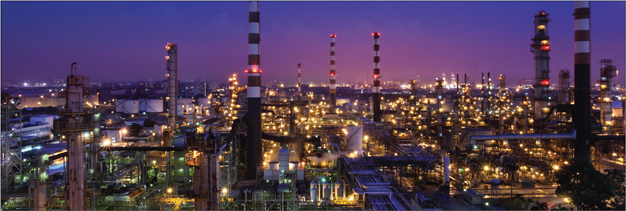
Table of Contents
| 66 | EXXONMOBIL 2012 FINANCIAL & OPERATING REVIEW |
DOWNSTREAM:
Technology
High-impact, leading-edge technology platforms allow us to maximize value in every phase of our Downstream business, from feedstock acquisition and refining to product distribution and sale.
DELIVERING HIGH – VALUE PRODUCTS
ExxonMobil’s advanced analytical and modeling capabilities generate a molecular-level understanding of our products, enabling the development of leading-edge technologies to further improve value to our customers. For example, in our industry-leadingMobil 1AFE product line, application of our advanced research and development programs has yielded enhanced fuel economy while simultaneously lowering emissions, improving engine protection, and extending equipment life. Endorsements by the makers of premier brands such asPorsche,Mercedes AMG,Cadillac,Corvette, andLexus are a testament to our lubricant technology leadership.
REDUCING RAW MATERIAL COST
Our leading-edge technology platforms also facilitate improved refining margins. We leverage our expertise in process technology, catalysts, modeling, and optimization to increase the flexibility of our facilities and reduce our raw material costs. Improved understanding of the properties of potential feed sources allows us to optimize raw material selection and maximize high-value product yields.
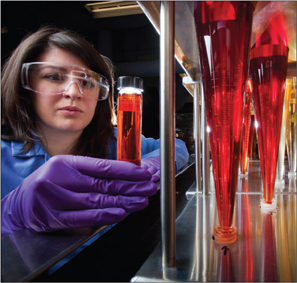
Our fuels and lubricant products are rigorously tested at our research laboratories to ensure excellent quality and performance, including engine wear resiliency and fuel economy. |
Our industry leadership in the processing of challenged crudes illustrates our technological advantage. Challenged crudes are more difficult to process, mainly due to their chemical properties, and thus are typically sold at a discount. Due in large part to our technology, ExxonMobil is able to process about 55 percent more challenged crudes than industry, which provides a significant cost advantage and higher margins.
Another example of how ExxonMobil’s technology results in lower raw material cost is our proprietary compositional lubes crude approval system, which significantly increases the mix of crudes used in lubes manufacturing. On average, ExxonMobil refineries are able to produce conventional lubricant basestocks from 15 different types of crude oil per site, three times higher than the industry average, which results in lower cost and higher margins.
Mobil 1filling line at our facility in Taicang, China, ideally located to serve the high-growth markets in that area. |
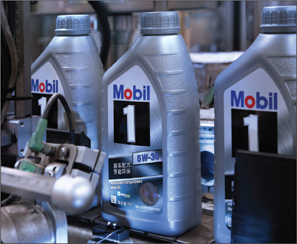
Challenged Crudes
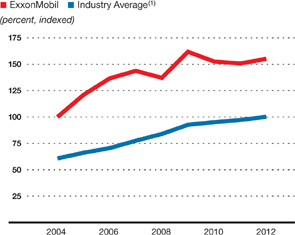
| (1) | ExxonMobil estimate based on public information. |
Table of Contents
| 67 |
DOWNSTREAM:
Opportunity Capture
Our balanced portfolio, best-in-class operations, and integration allow us to capture unique opportunities across a broad range of market conditions.
MAXIMIZING VALUE ACROSS THE SUPPLY CHAIN
ExxonMobil’s globally integrated business model allows us to maximize value across the supply chain. We are an industry leader in integration with more than 75 percent of our refining operations integrated with chemical or lubes manufacturing. Our fuels marketing channels provide a secure outlet for our refinery production.
Global scale and integration provide us with unique structural advantages. At manufacturing sites, we leverage computer models to optimize operations, including the selection of the most economic crudes and feedstocks, to produce the highest-value fuel products, chemicals, and lubricants. On the product side, Integrated Business Teams combine expertise in manufacturing, supply chain, technology, logistics, and marketing to optimize the placement of finished products and maximize margins across a broad range of market conditions.
The advantageous placement of approximately 2 million barrels per day of equity crude by our Downstream global supply organization is a significant advantage of our integrated business model. During Upstream project development, the Downstream offers technical and commercial expertise, global marketing, and refining backstop processing. Our integrated approach gives us the option of placing equity crudes in the open market or at our
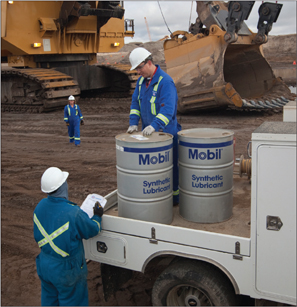
Mobil SHCindustrial lubricants are valued by customers around the world due to their superior performance under severe heavy equipment operating conditions such as our Kearl operations. |
own refineries, allowing us to continuously optimize resource value based on real-time market conditions.
The Kearl oil sands project is an example of our success in enhancing value through integration. A collaborative effort between the Upstream and Downstream resulted in the first mining operation to employ a new proprietary paraffinic froth treatment technology, which produces a salable crude oil without the need for an upgrader, significantly reducing project cost. We have also developed a comprehensive marketing strategy that leverages our integrated assets and expansive geographic reach to maximize the value of Kearl production.
The Kearl oil sands project is an example of our success in enhancing value through integration. A collaborative effort between the Upstream and Downstream resulted in the first mining operation to employ a new proprietary paraffinic froth treatment technology, which produces a salable crude oil without the need for an upgrader, significantly reducing project cost. We have also developed a comprehensive marketing strategy that leverages our integrated assets and expansive geographic reach to maximize the value of Kearl production.
Refining Energy Intensity(1)(2)(3)
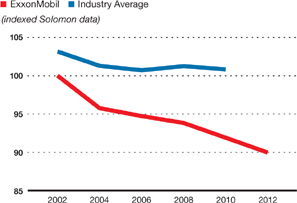
| (1) | Solomon Associates fuels refining data available for even years only. | |
| (2) | 2012 data estimated by ExxonMobil. | |
| (3) | Constant year-end 2012 portfolio. | |
| (4) | Constant foreign exchange rates and energy price. |
Refinery Unit Cash Operating Expenses(1)(2)(3)(4)
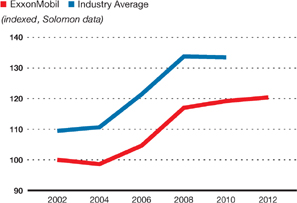
Table of Contents
| 68 | EXXONMOBIL 2012 FINANCIAL & OPERATING REVIEW |
OPTIMIZING REFINERY OPERATIONS
Our continuous pursuit of increasing high-value product yield is matched by a relentless focus on maintaining best-in-class operational efficiency. Our refineries are more than 70-percent larger than the industry average, enabling us to reduce unit production costs by sharing services and capitalizing on operational synergies at sites integrated with chemical facilities.
We also focus on maximizing energy efficiency. With energy representing about one-third of the operating costs of a manufacturing plant, every incremental efficiency improvement enhances margins. Since 2002, we have improved refinery energy efficiency by 10 percent, enabled by the application of our proven Global Energy Management System and investment in energy-efficient cogeneration facilities.
Worldwide cash operating costs for our portfolio of refineries have been well below the industry average and consistently outperform major competitors. This provides us with a significant competitive advantage that continues to deliver exceptional long-term results.
PORTFOLIO MANAGEMENT
Disciplined capital management includes a continuous assessment and optimization of our asset portfolio. We divest when a buyer offers us more for an asset than its long-term value in our portfolio. During 2012, we divested our Downstream assets in Argentina, Uruguay, Paraguay, Central America, Malaysia, and Switzerland. We also restructured and reduced our holdings in Japan. In addition, the transition of our U.S. retail fuel business to a more capital-efficient branded wholesaler model is nearly complete.
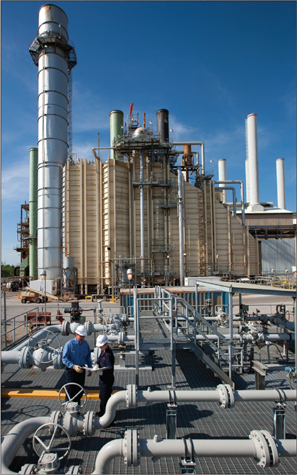
The Baton Rouge Refinery’s cogeneration unit generates enough electricity to fully power the complex plus 30,000 homes on the regional power grid. |
Over the last 10 years, we have divested or restructured our interests in 19 refineries, 6,000 miles of pipeline, 191 product terminals, 37 lube oil blend plants, and more than 22,000 retail service stations. These portfolio improvements resulted in a nearly 4-percentage-point improvement in our Downstream return on capital employed.
FLEXIBILITY DRIVES PROFITS
In addition to our attention to cost efficiencies, we also focus on identifying and capitalizing on new margin opportunities presented by the dynamic business environment. For example, we continue to increase margin capture brought about by the recent availability of logistically constrained unconventional crudes in North America.
Our mid-continent refineries are processing essentially all advantaged crudes. We have been increasing value capture from processing advantaged light and heavy crudes at our U.S. Gulf Coast refineries, and we have the capacity to further increase value capture as industry logistics improve.
ExxonMobil U.S. Gulf Coast Advantaged Crude Refining
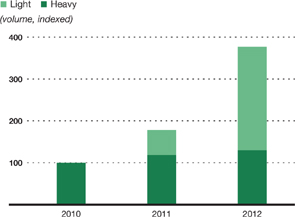
Table of Contents
| 69 |
INVESTING IN GROWTH
We continue to selectively invest in downstream growth opportunities where ExxonMobil’s technology, scale, and integration result in strong project returns. For example, in the last five years, we have invested nearly $2 billion to increase ultra-low sulfur diesel (ULSD) capacity to meet growing global demand for this high-value product, resulting in record ULSD production in 2012.
Our Singapore Hydrotreater and Saudi Arabia Clean Fuels projects are slated for completion in 2013. These investments will substantially increase production of high-value fuels to support growing demand.
We also continue to expand our lubricants business, with planned investments to increase high-value lube basestock production and lube

There are more than 1,000 Mobil 1car care centers in China, to meet the needs of this fast-growing vehicle market. |
oil blending capacity. Sales of our
industry-leading products,Mobil 1, Mobil SHC, andMobil Delvac 1, have more than doubled over the last 10 years and are growing at a rate faster than that of the industry. To further capture profitable growth, we are increasing our capacity to produce synthetic lubricant components at our chemical facilities in Baytown, Texas, and Baton Rouge, Louisiana. We are also expanding our lube oil blending capacities in Finland and China. These projects will increase our lube oil blending capacity by more than 50 percent in those countries, supporting the growing demand for lubricants in key markets.
industry-leading products,Mobil 1, Mobil SHC, andMobil Delvac 1, have more than doubled over the last 10 years and are growing at a rate faster than that of the industry. To further capture profitable growth, we are increasing our capacity to produce synthetic lubricant components at our chemical facilities in Baytown, Texas, and Baton Rouge, Louisiana. We are also expanding our lube oil blending capacities in Finland and China. These projects will increase our lube oil blending capacity by more than 50 percent in those countries, supporting the growing demand for lubricants in key markets.
Mobil 1Sales Growth
(volume, indexed)
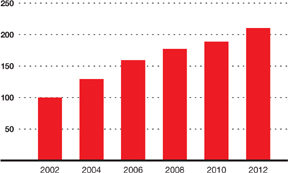
GROWING CAPACITY TO DELIVER HIGHER-VALUE PRODUCTS
Lower-Sulfur Diesel Projects: 2011-2013
(production capacity, thousands of barrels per day)
Asia Pacific | ||||
| Sriracha Clean Fuels Project | 60 | |||
| Singapore Hydrotreater | 62 | |||
Europe | ||||
| Antwerp Hydrotreater | 67 | |||
| Fawley Hydrotreater Conversion | 11 | |||
Middle East | ||||
| SAMREF Hydrotreating and Sulfur Recovery | ||||
| Facilities (ExxonMobil share) | 31 |
| * | Ultra-Low Sulfur Diesel: Sulfur content is less than or equal to 15 parts per million. | |
| Data is stated on constant year-end 2012 portfolio basis. | ||
Ultra-Low Sulfur Diesel Production*
(ExxonMobil production, indexed)
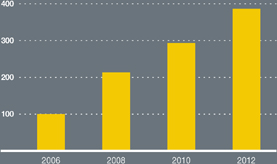
Table of Contents
| 70 | EXXONMOBIL 2012 FINANCIAL & OPERATING REVIEW |
DOWNSTREAM OPERATING STATISTICS
THROUGHPUT, CAPACITY, AND UTILIZATION(1)
| 2012 | 2011 | 2010 | 2009 | 2008 | ||||||||||||||||
Refinery Throughput(2)(thousands of barrels per day) | ||||||||||||||||||||
| United States | 1,816 | 1,784 | 1,753 | 1,767 | 1,702 | |||||||||||||||
| Canada | 435 | 430 | 444 | 413 | 446 | |||||||||||||||
| Europe | 1,504 | 1,528 | 1,538 | 1,548 | 1,601 | |||||||||||||||
| Asia Pacific | 998 | 1,180 | 1,249 | 1,328 | 1,352 | |||||||||||||||
| Middle East/Other | 261 | 292 | 269 | 294 | 315 | |||||||||||||||
Total worldwide | 5,014 | 5,214 | 5,253 | 5,350 | 5,416 | |||||||||||||||
Average Refining Capacity(3)(thousands of barrels per day) | ||||||||||||||||||||
| United States | 1,951 | 1,952 | 1,962 | 1,970 | 1,967 | |||||||||||||||
| Canada | 506 | 506 | 505 | 502 | 502 | |||||||||||||||
| Europe | 1,761 | 1,752 | 1,744 | 1,742 | 1,740 | |||||||||||||||
| Asia Pacific | 1,285 | 1,685 | 1,711 | 1,686 | 1,694 | |||||||||||||||
| Middle East/Other | 274 | 331 | 331 | 331 | 330 | |||||||||||||||
Total worldwide | 5,777 | 6,226 | 6,253 | 6,231 | 6,233 | |||||||||||||||
Utilization of Refining Capacity(percent) | ||||||||||||||||||||
| United States | 93 | 91 | 89 | 90 | 87 | |||||||||||||||
| Canada | 86 | 85 | 88 | 82 | 89 | |||||||||||||||
| Europe | 85 | 87 | 88 | 89 | 92 | |||||||||||||||
| Asia Pacific | 78 | 70 | 73 | 79 | 80 | |||||||||||||||
| Middle East/Other | 95 | 88 | 81 | 89 | 95 | |||||||||||||||
Total worldwide | 87 | 84 | 84 | 86 | 87 | |||||||||||||||
| (1) | Excludes ExxonMobil’s interest in the Laffan Refinery in Qatar and ExxonMobil’s minor interests in certain small refineries. | |
| (2) | Refinery throughput includes 100 percent of crude oil and feedstocks sent directly to atmospheric distillation units in operations of ExxonMobil and majority-owned subsidiaries. For companies owned 50 percent or less, throughput includes the greater of either crude and feedstocks processed for ExxonMobil or ExxonMobil’s equity interest in raw material inputs. | |
| (3) | Refining capacity is the stream-day capability to process inputs to atmospheric distillation units under normal operating conditions, less the impact of shutdowns for regular repair and maintenance activities, averaged over an extended period of time. These annual averages include partial-year impacts for capacity additions or deletions during the year. Any idle capacity that cannot be made operable in a month or less has been excluded. Capacity volumes include 100 percent of the capacity of refinery facilities managed by ExxonMobil or majority-owned subsidiaries. At facilities of companies owned 50 percent or less, the greater of either that portion of capacity normally available to ExxonMobil or ExxonMobil’s equity interest is included. |
Distillation Capacity by Region
(percent, year-end 2012)
Conversion Capacity by Region
(percent, year-end 2012)
Table of Contents
| 71 |
REFINING CAPACITY AT YEAR-END 2012(1)
| Capacity at 100% | ExxonMobil | |||||||||||||||||||||||||||||||||||||||
| ExxonMobil | Atmospheric | Catalytic | Residuum | Interest | ||||||||||||||||||||||||||||||||||||
| (thousands of barrels per day) | Share | (2) | Distillation | Cracking | Hydrocracking | Conversion(3) | Lubricants(4) | % | ||||||||||||||||||||||||||||||||
United States | ||||||||||||||||||||||||||||||||||||||||
| Torrance | California | l | 150 | 150 | 83 | 21 | 50 | 0 | 100 | |||||||||||||||||||||||||||||||
| Joliet | Illinois | l | 238 | 238 | 94 | 0 | 56 | 0 | 100 | |||||||||||||||||||||||||||||||
| Baton Rouge | Louisiana | n | l | 502 | 502 | 232 | 25 | 117 | 16 | 100 | ||||||||||||||||||||||||||||||
| Chalmette | Louisiana | l | 5 | 95 | 189 | 72 | 0 | 29 | 0 | 50 | ||||||||||||||||||||||||||||||
| Billings | Montana | l | 60 | 60 | 18 | 6 | 10 | 0 | 100 | |||||||||||||||||||||||||||||||
| Baytown | Texas | n | l | 561 | 561 | 204 | 27 | 90 | 22 | 100 | ||||||||||||||||||||||||||||||
| Beaumont | Texas | n | l | 345 | 345 | 113 | 60 | 46 | 10 | 100 | ||||||||||||||||||||||||||||||
| Total United States | 1,951 | 2,045 | 816 | 139 | 398 | 48 | ||||||||||||||||||||||||||||||||||
Canada | ||||||||||||||||||||||||||||||||||||||||
| Strathcona | Alberta | 189 | 189 | 63 | 0 | 0 | 2 | 69.6 | ||||||||||||||||||||||||||||||||
| Dartmouth | Nova Scotia | 5 | 85 | 85 | 31 | 0 | 0 | 0 | 69.6 | |||||||||||||||||||||||||||||||
| Nanticoke | Ontario | 5 | 113 | 113 | 48 | 0 | 0 | 0 | 69.6 | |||||||||||||||||||||||||||||||
| Sarnia | Ontario | n | l | 119 | 119 | 30 | 18 | 25 | 0 | 69.6 | ||||||||||||||||||||||||||||||
| Total Canada | 506 | 506 | 172 | 18 | 25 | 2 | ||||||||||||||||||||||||||||||||||
Europe | ||||||||||||||||||||||||||||||||||||||||
| Antwerp | Belgium | n | l | 307 | 307 | 35 | 0 | 0 | 0 | 100 | ||||||||||||||||||||||||||||||
| Fos-sur-Mer | France | l | 5 | 131 | 131 | 31 | 0 | 0 | 0 | 82.9 | ||||||||||||||||||||||||||||||
| Gravenchon | France | n | l | 235 | 235 | 39 | 0 | 0 | 13 | 82.9 | ||||||||||||||||||||||||||||||
| Karlsruhe | Germany | l | 5 | 78 | 310 | 86 | 0 | 30 | 0 | 25 | ||||||||||||||||||||||||||||||
| Augusta | Italy | l | 5 | 198 | 198 | 50 | 0 | 0 | 14 | 100 | ||||||||||||||||||||||||||||||
| Trecate | Italy | l | 5 | 126 | 126 | 35 | 0 | 0 | 0 | 75.5 | ||||||||||||||||||||||||||||||
| Rotterdam | Netherlands | n | l | 191 | 191 | 0 | 52 | 41 | 0 | 100 | ||||||||||||||||||||||||||||||
| Slagen | Norway | 116 | 116 | 0 | 0 | 32 | 0 | 100 | ||||||||||||||||||||||||||||||||
| Fawley | United Kingdom | n | l | 258 | 258 | 89 | 0 | 37 | 9 | 100 | ||||||||||||||||||||||||||||||
| Total Europe | 1,640 | 1,872 | 365 | 52 | 140 | 36 | ||||||||||||||||||||||||||||||||||
| Refining Capacity at Year-End 2012, continued on page 72 | ||
| n Integrated Refinery and Chemical Complex | l Cogeneration Capacity | 5 Refineries with Some Chemical Production |
| (1) | Capacity data is based on 100 percent of rated refinery process unit stream-day capacities under normal operating conditions, less the impact of shutdowns for regular repair and maintenance activities, averaged over an extended period of time. | |
| (2) | ExxonMobil share reflects 100 percent of atmospheric distillation capacity in operations of ExxonMobil and majority-owned subsidiaries. For companies owned 50 percent or less, ExxonMobil share is the greater of ExxonMobil’s equity interest or that portion of distillation capacity normally available to ExxonMobil. | |
| (3) | Includes thermal cracking, visbreaking, coking, and hydrorefining processes. | |
| (4) | Lubricant capacity based on dewaxed oil production. | |
| (5) | Financial results incorporated into Upstream business. |
Table of Contents
| 72 | EXXONMOBIL 2012 FINANCIAL & OPERATING REVIEW |
Downstream Operating Statistics, continued
REFINING CAPACITY AT YEAR-END 2012(1)
| Capacity at 100% | ExxonMobil | |||||||||||||||||||||||||||||||||||||||
| ExxonMobil | Atmospheric | Catalytic | Residuum | Interest | ||||||||||||||||||||||||||||||||||||
| (thousands of barrels per day) | Share | (2) | Distillation | Cracking | Hydrocracking | Conversion(3) | Lubricants(4) | % | ||||||||||||||||||||||||||||||||
Asia Pacific | ||||||||||||||||||||||||||||||||||||||||
| Altona | Australia | 5 | 79 | 79 | 27 | 0 | 0 | 0 | 100 | |||||||||||||||||||||||||||||||
| Fujian | China | n | l | 63 | 252 | 37 | 41 | 10 | 0 | 25 | ||||||||||||||||||||||||||||||
| Chiba | Japan | l | 5 | 19 | 172 | 33 | 39 | 0 | 0 | 11 | ||||||||||||||||||||||||||||||
| Kawasaki | Japan | n | l | 53 | 240 | 87 | 23 | 0 | 0 | 21.9 | ||||||||||||||||||||||||||||||
| Sakai | Japan | l | 5 | 30 | 139 | 40 | 0 | 0 | 0 | 21.9 | ||||||||||||||||||||||||||||||
| Wakayama | Japan | l | 5 | 28 | 127 | 37 | 0 | 0 | 7 | 21.9 | ||||||||||||||||||||||||||||||
| Whangarei | New Zealand | 27 | 134 | 0 | 31 | 0 | 0 | 19.2 | ||||||||||||||||||||||||||||||||
| Jurong/PAC | Singapore | n | l | 592 | 592 | 0 | 35 | 103 | 38 | 100 | ||||||||||||||||||||||||||||||
| Sriracha | Thailand | n | l | 170 | 170 | 41 | 0 | 0 | 0 | 66 | ||||||||||||||||||||||||||||||
| Total Asia Pacific | 1,061 | 1,905 | 302 | 169 | 113 | 45 | ||||||||||||||||||||||||||||||||||
Middle East /Other | ||||||||||||||||||||||||||||||||||||||||
| Martinique | Martinique | 2 | 17 | 0 | 0 | 0 | 0 | 14.5 | ||||||||||||||||||||||||||||||||
Laffan(5) | Qatar | 15 | 153 | 0 | 0 | 0 | 0 | 10 | ||||||||||||||||||||||||||||||||
| Yanbu | Saudi Arabia | 200 | 400 | 91 | 0 | 46 | 0 | 50 | ||||||||||||||||||||||||||||||||
| Total Middle East/Other | 217 | 570 | 91 | 0 | 46 | 0 | ||||||||||||||||||||||||||||||||||
Total worldwide | 5,375 | 6,898 | 1,746 | 378 | 722 | 131 | ||||||||||||||||||||||||||||||||||
| n Integrated Refinery and Chemical Complex | l Cogeneration Capacity | 5 Refineries with Some Chemical Production |
RETAIL SITES
| (number of sites at year end) | 2012 | 2011 | 2010 | 2009 | 2008 | |||||||||||||||
Worldwide | ||||||||||||||||||||
| Owned/leased | 5,593 | 7,753 | 8,710 | 9,965 | 10,516 | |||||||||||||||
| Distributors/resellers | 13,789 | 17,267 | 17,568 | 17,755 | 18,158 | |||||||||||||||
Total worldwide | 19,382 | 25,020 | 26,278 | 27,720 | 28,674 | |||||||||||||||
| See footnotes on page 71. | ||
ExxonMobil offers consumers premium products carrying the branding of Exxon, Mobil,and Esso.Additional lines include our industry-leading family of lubricant products Mobil 1, Mobil SHC,and Mobil Delvac 1. |
Global Fuels Marketing Sales*
(percent)
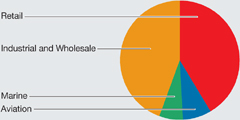
| * Fuels marketing petroleum product sales are to retail sites as well as commercial and wholesale accounts. | ||
Table of Contents
| 73 |
PETROLEUM PRODUCT SALES(1)BY GEOGRAPHIC AREA
| (thousands of barrels per day) | 2012 | 2011 | 2010 | 2009 | 2008 | |||||||||||||||
United States | ||||||||||||||||||||
| Motor gasoline, naphthas | 1,416 | 1,372 | 1,445 | 1,425 | 1,449 | |||||||||||||||
| Heating oils, kerosene, diesel oils | 565 | 564 | 480 | 517 | 501 | |||||||||||||||
| Aviation fuels | 184 | 178 | 181 | 207 | 224 | |||||||||||||||
| Heavy fuels | 113 | 129 | 122 | 106 | 108 | |||||||||||||||
| Lubricants, specialty, and other petroleum products | 291 | 287 | 283 | 268 | 258 | |||||||||||||||
| Total United States | 2,569 | 2,530 | 2,511 | 2,523 | 2,540 | |||||||||||||||
Canada | ||||||||||||||||||||
| Motor gasoline, naphthas | 219 | 219 | 217 | 199 | 203 | |||||||||||||||
| Heating oils, kerosene, diesel oils | 121 | 126 | 125 | 119 | 131 | |||||||||||||||
| Aviation fuels | 31 | 31 | 27 | 23 | 25 | |||||||||||||||
| Heavy fuels | 30 | 29 | 27 | 27 | 30 | |||||||||||||||
| Lubricants, specialty, and other petroleum products | 52 | 50 | 54 | 45 | 55 | |||||||||||||||
| Total Canada | 453 | 455 | 450 | 413 | 444 | |||||||||||||||
Europe | ||||||||||||||||||||
| Motor gasoline, naphthas | 423 | 433 | 423 | 409 | 409 | |||||||||||||||
| Heating oils, kerosene, diesel oils | 722 | 706 | 707 | 710 | 730 | |||||||||||||||
| Aviation fuels | 106 | 116 | 116 | 127 | 149 | |||||||||||||||
| Heavy fuels | 158 | 166 | 179 | 175 | 183 | |||||||||||||||
| Lubricants, specialty, and other petroleum products | 162 | 175 | 186 | 204 | 241 | |||||||||||||||
| Total Europe | 1,571 | 1,596 | 1,611 | 1,625 | 1,712 | |||||||||||||||
Asia Pacific | ||||||||||||||||||||
| Motor gasoline, naphthas | 269 | 347 | 365 | 379 | 378 | |||||||||||||||
| Heating oils, kerosene, diesel oils | 345 | 405 | 432 | 455 | 467 | |||||||||||||||
| Aviation fuels | 91 | 102 | 95 | 116 | 123 | |||||||||||||||
| Heavy fuels | 172 | 213 | 209 | 234 | 238 | |||||||||||||||
| Lubricants, specialty, and other petroleum products | 139 | 137 | 140 | 145 | 153 | |||||||||||||||
| Total Asia Pacific | 1,016 | 1,204 | 1,241 | 1,329 | 1,359 | |||||||||||||||
Latin America | ||||||||||||||||||||
| Motor gasoline, naphthas | 60 | 79 | 80 | 83 | 139 | |||||||||||||||
| Heating oils, kerosene, diesel oils | 80 | 111 | 113 | 113 | 161 | |||||||||||||||
| Aviation fuels | 24 | 31 | 29 | 28 | 45 | |||||||||||||||
| Heavy fuels | 16 | 31 | 34 | 33 | 47 | |||||||||||||||
| Lubricants, specialty, and other petroleum products | 20 | 24 | 24 | 22 | 27 | |||||||||||||||
| Total Latin America | 200 | 276 | 280 | 279 | 419 | |||||||||||||||
Middle East/Africa | ||||||||||||||||||||
| Motor gasoline, naphthas | 102 | 91 | 81 | 78 | 76 | |||||||||||||||
| Heating oils, kerosene, diesel oils | 114 | 107 | 94 | 99 | 106 | |||||||||||||||
| Aviation fuels | 37 | 34 | 28 | 35 | 41 | |||||||||||||||
| Heavy fuels | 26 | 20 | 32 | 23 | 30 | |||||||||||||||
| Lubricants, specialty, and other petroleum products | 86 | 100 | 86 | 24 | 34 | |||||||||||||||
| Total Middle East/Africa | 365 | 352 | 321 | 259 | 287 | |||||||||||||||
Worldwide | ||||||||||||||||||||
| Motor gasoline, naphthas | 2,489 | 2,541 | 2,611 | 2,573 | 2,654 | |||||||||||||||
| Heating oils, kerosene, diesel oils | 1,947 | 2,019 | 1,951 | 2,013 | 2,096 | |||||||||||||||
| Aviation fuels | 473 | 492 | 476 | 536 | 607 | |||||||||||||||
| Heavy fuels | 515 | 588 | 603 | 598 | 636 | |||||||||||||||
| Lubricants, specialty, and other petroleum products | 750 | 773 | 773 | 708 | 768 | |||||||||||||||
Total worldwide | 6,174 | 6,413 | 6,414 | 6,428 | 6,761 | |||||||||||||||
| (1) | Petroleum product sales include 100 percent of the sales of ExxonMobil and majority-owned subsidiaries, and the ExxonMobil equity interest in sales by companies owned 50 percent or less. |
Table of Contents
| Chemical ExxonMobil Chemical is one of the largest chemical companies in the world. Our unique portfolio of specialty and commodity businesses delivers superior returns across the business cycle. |
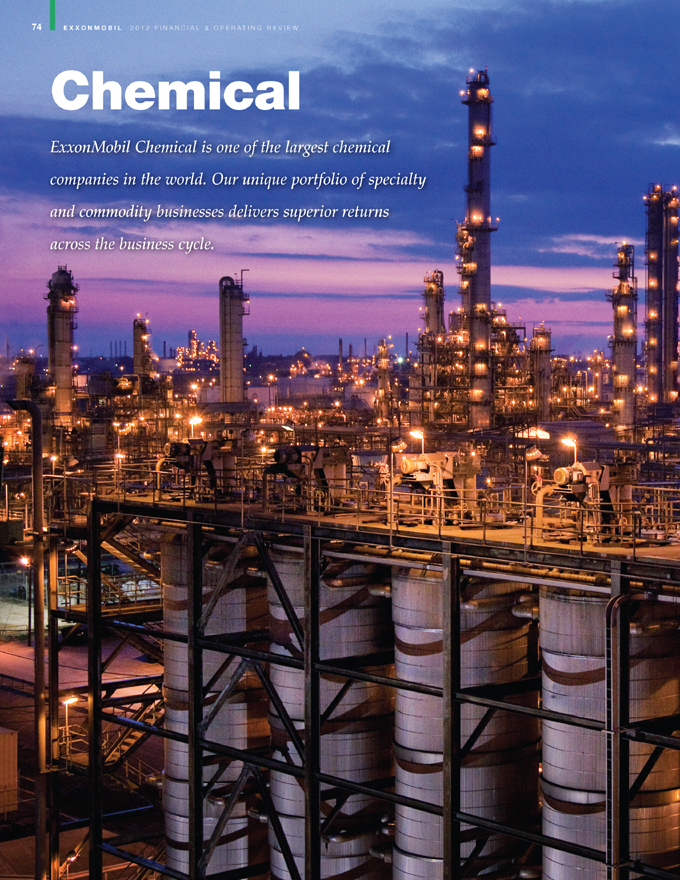
Table of Contents
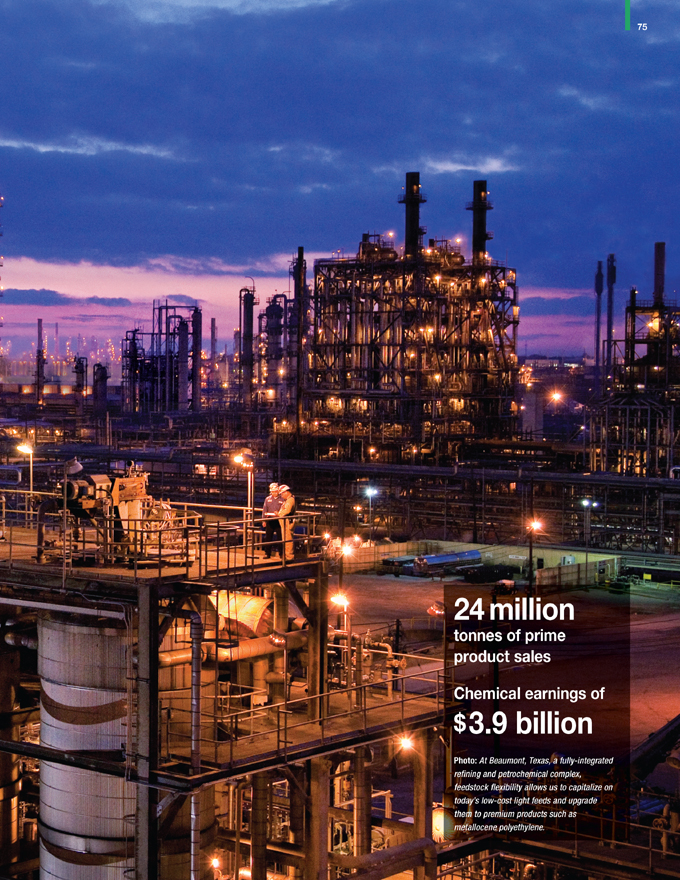
Table of Contents
| 76 | EXXONMOBIL 2012 FINANCIAL & OPERATING REVIEW |
Chemical
ExxonMobil Chemical has highly competitive assets,
proprietary technologies, and a unique and balanced
global business portfolio. Additionally, integration with
ExxonMobil’s Downstream and Upstream businesses is a
key differentiator that allows us to consistently outperform
competition, as demonstrated by our 2012 results.
proprietary technologies, and a unique and balanced
global business portfolio. Additionally, integration with
ExxonMobil’s Downstream and Upstream businesses is a
key differentiator that allows us to consistently outperform
competition, as demonstrated by our 2012 results.
STRATEGIES
| • | Consistently deliver best-in-class operational performance | |
| • | Focus on businesses that capitalize on core competencies | |
| • | Build proprietary technology positions | |
| • | Capture full benefits of integration across ExxonMobil operations | |
| • | Selectively invest in advantaged projects |
RESULTS & HIGHLIGHTS
Industry-leading safety performance, including an exemplary record at our Singapore Chemical Expansion project
Earnings of $3.9 billion, supported by strong and growing premium product contributions, Middle East assets,
and North America feed flexibility, allowing capture of low-cost feed and energy benefits
and North America feed flexibility, allowing capture of low-cost feed and energy benefits
Return on average capital employed of 19.3 percent, averaging 23 percent over the last 10 years and outperforming competition throughout the business cycle
Prime product sales of 24.2 million tonnes, including record sales of metallocene products that provide value-added performance advantages in target applications
Capital expenditures of $1.4 billion, with selective investments in specialty business growth, advantaged feeds, high-return efficiency projects, and low-cost debottlenecks
Completed construction of our Singapore Chemical Expansion project, the largest integrated complex in the ExxonMobil circuit
Approved construction of a 400,000-tonnes-per-year specialty elastomers plant in Saudi Arabia, with our joint venture partner, to supply a broad range of synthetic rubber and related products to meet growing demand in the Middle East and Asia
Filed permit applications for a major expansion at our Texas facilities, including a new world-scale ethane cracker and polyethylene trains to meet rapidly growing global demand for premium polymers
| CHEMICAL STATISTICAL RECAP | 2012 | 2011 | 2010 | 2009 | 2008 | |||||||||||||||
Earnings(millions of dollars) | 3,898 | 4,383 | 4,913 | 2,309 | 2,957 | |||||||||||||||
Prime product sales(1)(thousands of tonnes) | 24,157 | 25,006 | 25,891 | 24,825 | 24,982 | |||||||||||||||
Average capital employed(1)(millions of dollars) | 20,148 | 19,798 | 18,680 | 16,560 | 14,525 | |||||||||||||||
Return on average capital employed(1)(percent) | 19.3 | 22.1 | 26.3 | 13.9 | 20.4 | |||||||||||||||
Capital expenditures(1)(millions of dollars) | 1,418 | 1,450 | 2,215 | 3,148 | 2,819 | |||||||||||||||
| (1) | See Frequently Used Terms on pages 93 through 95. |
Table of Contents
 | 77 |
BUSINESS OVERVIEW
ExxonMobil Chemical is one of the largest chemical companies in the world, with a unique portfolio of commodity and specialty businesses and annual sales of more than 24 million tonnes. We have world-scale manufacturing facilities in all major regions of the world, and our products serve as the building blocks for a wide variety of everyday consumer and industrial products.
We process feedstocks from ExxonMobil’s Upstream and refining operations and other market sources to manufacture chemical products for higher-value end uses. We focus on product lines that capitalize on scale and technology advantages, building on an unmatched combination of advantaged feedstocks, lower-cost processes, and premium products. As a result, we have strong positions in the markets we serve, and we generate industry-leading returns throughout the business cycle.
BUSINESS ENVIRONMENT
Worldwide chemical demand growth was relatively flat in 2012, but we anticipate this to strengthen over time, linked to the growth of the broader economy. Most chemical demand growth is in Asia, driven by manufacturing of consumer products for both worldwide export and to serve the growing Asian middle class. These consumers are expected to purchase more packaged goods, appliances, cars, tires, and clothing, many of which are manufactured from the chemicals we produce. Asia Pacific has accounted for more than two-thirds of global demand growth since 2000, and we expect this trend to continue. Over the next decade, we expect global chemical demand to grow by 50 percent, driven by improving prosperity in developing countries.
The significant Asian chemical demand growth is spurring new capacity investments around the globe, particularly in North America tied to growing supplies of ethane. Unconventional natural gas development in North America has brought significant feedstock and energy benefits to domestic chemical producers by providing both low-cost ethane feedstock as well as steam and energy savings. This has enabled North American producers to export chemical products competitively to growth markets around the world.
With our global supply network of highly competitive world-scale facilities, ExxonMobil Chemical is well positioned to meet the needs of China, India, and other major growth markets. While the relative attractiveness of feedstocks changes over time, our feed flexibility and integration allow us to adapt to changing market conditions and consistently outperform competition.
Industry Global Chemical Demand
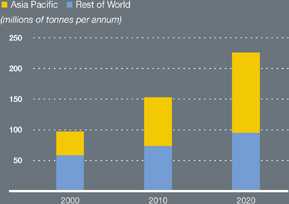
Source: IHS Chemical and ExxonMobil estimates
Industry U.S. Ethane Supply
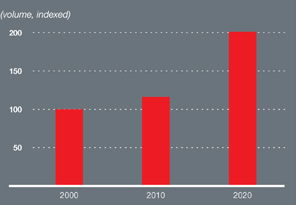
Source: ExxonMobil and consultant estimates
Table of Contents
| 78 | EXXONMOBIL 2012 FINANCIAL & OPERATING REVIEW |
CHEMICAL:
Portfolio
ExxonMobil Chemical has both specialty and commodity manufacturing capacity in every major region of the world to serve large and growing markets. These world-scale assets, supported by common systems and a global supply chain, afford us significant competitive advantages.
NORTH AMERICA – PREMIUM PRODUCTS FROM ADVANTAGED FEEDS
Nearly half of our global capacity is located in North America, where we manufacture products for all of our business lines. Our three largest U.S. chemical plants in Baytown and Beaumont, Texas, and Baton Rouge, Louisiana, are integrated with refineries and have access to feedstocks ranging from light gases to heavy liquids. These plants are also tied into the region’s natural gas liquid supply hubs, giving us unmatched capacity to process low-cost ethane. This level of downstream and upstream integration maximizes our flexibility to process advantaged feeds into premium products.
Baytown and Mont Belvieu• Our Baytown facility is the largest integrated refining and petrochemical complex in the United States. It is also our largest ethylene production facility in the world, and is closely integrated with our nearby Mont Belvieu Plastics Plant that produces premium metallocene polyolefins.
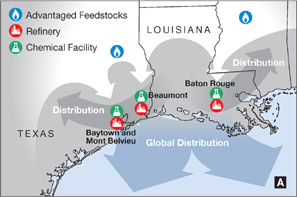
| Our Gulf Coast chemical complexes are able to capitalize on advantaged feedstocks, such as ethane and refinery gas, to provide premium chemical products to the Americas and worldwide. |
Baytown also houses our largest aromatics production facility in North America, multiple polypropylene units, a halobutyl rubber plant, and facilities that produce a wide range of premium hydrocarbon fluids for use in applications such as drilling, water treatment, and agriculture. The complex generates its own low-cost electricity and high-pressure steam via high-efficiency cogeneration plants.
Beaumont• Our Beaumont plant is a large producer of aromatics in addition to having significant steam-cracking and derivatives capacity. Beaumont also produces proprietary synthetic basestocks for our high-quality branded motor oils, such asMobil 1.
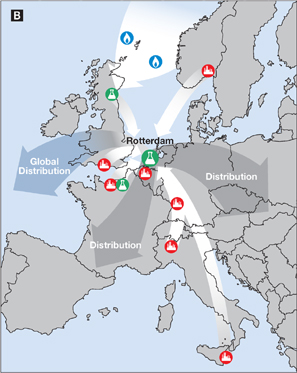
Baton Rouge• In operation for more than 100 years, our Baton Rouge plant has world-scale manufacturing capacity in nearly all of our commodity and specialty businesses. It is home to the world’s largest production facilities for halobutyl rubber and isopropyl alcohol. The complex also includes two nearby polymer plants and is located at the northernmost point in the Mississippi River accessible to large vessels, giving the site protection from Gulf storm activity.
EUROPE – UNIQUE REGIONAL INTEGRATION
Europe represents approximately 20 percent of our global capacity. Major facilities in Scotland, the Channel Zone, and northwest France are tightly integrated with ExxonMobil refineries and upstream facilities across the region. This level of integration provides economies of scale, access to low-cost feedstock, and logistics advantages.
| The Rotterdam Aromatics Plant receives feed from refineries and chemical plants throughout Europe, allowing ExxonMobil to be the largest aromatics producer in Europe. |
Table of Contents
| 79 |
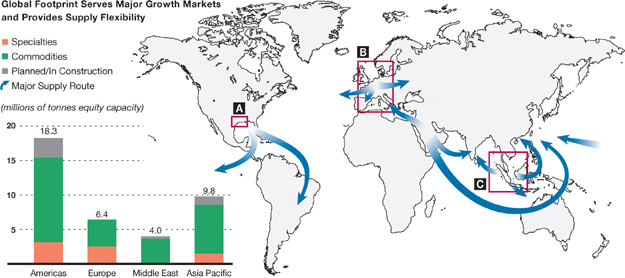
Rotterdam, Netherlands• Our Rotterdam plant processes feedstocks from ExxonMobil’s European refineries across the region, and is the largest producer of aromatics in Europe. In addition, the site manufactures oxo alcohol-based specialty products.
Fife, United Kingdom• Our Fife Ethylene Plant is integrated with our Upstream business by using natural gas liquids from North Sea gas fields as feedstock. Ethylene produced at Fife is transported to our polyethylene plants at Antwerp and Meerhout, Belgium, where premium polyolefins account for a large share of production. The high degree of integration between the two polyethylene plants generates significant workforce synergies and cost savings.
ASIA PACIFIC / MIDDLE EAST – POSITIONED TO SERVE GROWTH MARKETS
Our Asia Pacific and Middle East facilities are positioned to serve growth markets and are centered in our expanding integrated Singapore complex. In addition, we have significant manufacturing facilities in Saudi Arabia, Thailand, and China. Our joint-venture Fujian facility is China’s first fully integrated refining, petrochemical, and fuels marketing complex with foreign company participation. An expansion is being progressed that will increase the site’s polymer capacity and add ethylene glycol production. Our Shanghai Technology Center supports premium product sales throughout the region.
Singapore• We have invested significant capital over the last 15 years to expand capacity at the site, which serves as a regional hub. The recent Singapore Chemical Expansion project increases our regional capacity by more than 50 percent, adding production capacity across six product lines. Singapore is now our largest integrated petrochemical complex, positioned to serve growth markets from China to the Indian sub-continent and beyond.
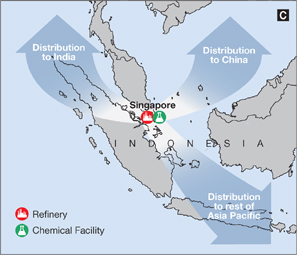
| The integrated Singapore chemical complex is able to competitively provide premium and specialty products to high-growth markets. |
Saudi Arabia• In association with our joint venture partner, Saudi Basic Industries Corporation (SABIC), we have two chemical facilities in Saudi Arabia that utilize local ethane and other feedstocks to produce chemical products for local demand and export. Manufacturing units at these sites include steam crackers and derivative units that produce polyethylene, polypropylene, and ethylene glycol. We are in the process of expanding our Al Jubail manufacturing joint venture to produce high-value rubbers and elastomers to enable the development of downstream businesses in the Kingdom and to supply global markets.
Table of Contents
| 80 | EXXONMOBIL 2012 FINANCIAL & OPERATING REVIEW |
CHEMICAL:
Technology
Our proprietary technology, combined with integration of our Chemical facilities with Downstream and Upstream operations, enables optimization of our manufacturing processes and delivers breakthrough products that command a premium in growth markets around the globe. We accomplish this by focusing on advantaged feedstock, process optimization, and premium product development.
ADVANTAGED FEEDSTOCK
To maximize value creation, we capitalize on a broad range of proprietary process technologies. Our integrated manufacturing network has the greatest feedstock flexibility in the industry, from light feeds such as ethane to naphtha and heavy liquids. Through integration we are well positioned to optimize feed selection on a real-time basis. Since 2008, we have qualified more than 320 new feedstocks for our steam crackers.
PROCESS OPTIMIZATION
Cost performance is further improved through process innovation, such as advanced catalyst technologies that enhance energy efficiency, achieve greater reliability, and produce higher yields. We also maximize value creation with a broad range of proprietary process technologies.
For example, a high-potential opportunity on the horizon is a revolutionary proprietary technology to produce two major benzene derivatives. This technology features catalyst and other process innovations that significantly reduce feedstock, energy, and capital costs while improving yields. Evaluation of commercial-scale facilities is under way.
PREMIUM PRODUCTS
Breakthroughs in catalyst and product technologies help us to deliver new, higher-value, and more sustainable products that provide performance advantages and cost savings to our customers. These benefits include increased strength, ease of processing, recyclability, lower raw material usage, and improved energy efficiency.
Our commitment to technology has yielded breakthrough product platforms with broad market applicability. For example, we developedVistamaxx propylene-based elastomers that deliver additional value to a broad range of consumer applications. This versatile product line has enabled countless end-use innovations through improved elasticity, softness, adhesion, and toughness. Product demand has been strong, and our recent Singapore Chemical Expansion project includes significant additional capacity to produceVistamaxx elastomers for growth markets worldwide.
VISTAMAXXPROPYLENE-BASED ELASTOMERS
We provide technology solutions that utilize our proprietary metallocene resins, state-of-the-art processing equipment, and advanced formulations.
• Elasticity | • Adhesion | • Toughness | ||
 |  |  | ||
• Softness | •Sealability | • Transparency | ||
 |  |  |
Table of Contents
| 81 |
Thinner Packaging Films with ExxonMobil Metallocene Resins
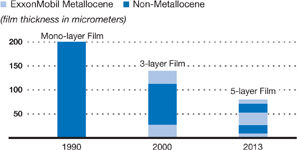
| At our technology center in Machelen, Belgium, we demonstrate the unique performance advantages of our metallocene polymers in state-of-the-art, five-layer film technology that result in cost savings and sustainability benefits for our customers. |
Another recent breakthrough, developed in conjunction with leading film line manufacturers, is use ofEnable andExceed metallocene polyethylene resins in state-of-the-art, five-layer film technology. This innovation allows production of high-performance films using significantly less raw material and energy versus standard three-layer construction and contributes to more sustainable solutions for food and industrial packaging uses.
With our high-impact technologies, we are offering customers cost-effective, sustainable solutions, driving growth in high-margin premium products, and increasing shareholder value in the process.
CHEMICAL:
Opportunity Capture
We capture market opportunities by developing projects that process advantaged feedstocks, deploy lower-cost processes, and increase premium product sales, particularly targeting growth markets. Our disciplined investment approach delivers superior returns throughout the business cycle and across a variety of market conditions.
In Singapore, we recently completed the largest expansion in the history of our Chemical business. The project more than doubles steam-cracking capacity at the site and significantly increases specialties capacity such asExxal alcohols,Vistamaxx elastomers, andExceed polyethylene. TheVistamaxx elastomer unit is the largest of its kind in the world and expands our global capacity by 300 percent.
In Saudi Arabia, we are working with our joint venture partner Saudi Basic Industries Corporation (SABIC) to build a 400,000-tonnes-per-year specialty elastomers plant that will produce a broad range of synthetic rubber and related products. The project, based on a platform of advantaged feedstock, will be integrated with the existing complex at Jubail Industrial City.
At the Fujian complex in China, a capacity expansion will add 75,000 tonnes per year of ethylene to our equity interest at the site, along with associated derivatives. Units will start up in phases in 2014 and 2015.
In North America, we have filed permit applications for a proposed world-scale petrochemical expansion at our Baytown, Texas, complex. The project includes a new ethane cracker and two premium polyethylene lines at the nearby Mont Belvieu Plastics Plant. The project would expand our capacity to produce premium products from low-cost ethane feedstock, as well as leverage our scale and integration advantages to serve domestic and export markets.
| A significant expansion of premium product capacity is under way at Al Jubail, Saudi Arabia, where specialty rubbers will be produced to meet growing local and global demand. |
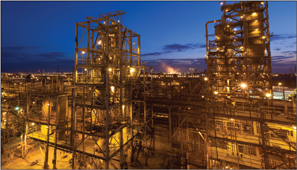
Table of Contents
| 82 | EXXONMOBIL 2012 FINANCIAL & OPERATING REVIEW |
CHEMICAL OPERATING STATISTICS
LARGE/INTEGRATED PRODUCTION COMPLEX CAPACITY – AT YEAR-END 2012(1)(2)
| (millions of tonnes per year) | Ethylene | Polyethylene | Polypropylene | Paraxylene | Additional Products | |||||||||||||
North America | ||||||||||||||||||
| Baton Rouge, Louisiana | 1.0 | 1.3 | 0.4 | – | P B E A F O | |||||||||||||
| Baytown, Texas | 2.2 | – | 0.8 | 0.6 | P B F | |||||||||||||
| Beaumont, Texas | 0.9 | 1.0 | – | 0.3 | P S | |||||||||||||
| Mont Belvieu, Texas | – | 1.0 | – | – | ||||||||||||||
| Sarnia, Ontario | 0.3 | 0.5 | – | – | P F O | |||||||||||||
Europe | ||||||||||||||||||
| Antwerp, Belgium | – | 0.4 | – | – | F O | |||||||||||||
| Fawley, United Kingdom | – | – | – | – | B F O | |||||||||||||
| Fife, United Kingdom | 0.4 | – | – | – | ||||||||||||||
| Meerhout, Belgium | – | 0.5 | – | – | ||||||||||||||
| Gravenchon, France | 0.4 | 0.4 | 0.3 | – | P B E A O S Z | |||||||||||||
| Rotterdam, Netherlands | – | – | – | 0.7 | O | |||||||||||||
Middle East | ||||||||||||||||||
| Al Jubail, Saudi Arabia | 0.6 | 0.6 | – | – | ||||||||||||||
| Yanbu, Saudi Arabia | 1.0 | 0.7 | 0.2 | – | P | |||||||||||||
Asia Pacific | ||||||||||||||||||
| Fujian, China | 0.2 | 0.2 | 0.1 | 0.2 | P | |||||||||||||
| Kawasaki, Japan | 0.1 | – | – | – | P B A F | |||||||||||||
| Singapore | 0.9 | (3) | 1.9 | 0.9 | 0.9 | P E F O Z | ||||||||||||
| Sriracha, Thailand | – | – | – | 0.5 | F | |||||||||||||
| All other | – | – | – | 0.2 | ||||||||||||||
Total worldwide | 8.0 | 8.5 | 2.7 | 3.4 | ||||||||||||||
P Propylene B Butyl E Specialty Elastomers A Adhesive Polymers F Fluids O Oxo Alcohols S Synthetics Z Petroleum Additives
| (1) | Based on size or breadth of product slate. | |
| (2) | Capacity reflects 100 percent for operations of ExxonMobil and majority-owned subsidiaries. For companies owned 50 percent or less, capacity is ExxonMobil’s interest. | |
| (3) | Excludes 1.0 million tonnes of new ethylene capacity that fully starts up in 2013. |
OTHER MANUFACTURING LOCATIONS – AT YEAR-END 2012(1)
| Location | Product | |
| North America | ||
| Bayway, New Jersey(1) | 5l | |
| Belleville, Ontario | u | |
| Chalmette, Louisiana | n | |
| Dartmouth, Nova Scotia | l | |
| Edison, New Jersey | l | |
| LaGrange, Georgia(2) | u | |
| Pensacola, Florida | 5 | |
| Shawnee, Oklahoma(2) | u | |
| Location | Product | |
| Europe | ||
| Augusta, Italy | n | |
| Berre, France(1) | l | |
| Brindisi, Italy(2) | u | |
| Cologne, Germany(1) | 5l | |
| Fos-sur-Mer, France | n | |
| Geleen, Netherlands(2) | 5 | |
| Karlsruhe, Germany | n | |
| Kerkrade, Netherlands(2) | u | |
| Newport, United Kingdom | 5 | |
| Trecate, Italy | l | |
| Vado Ligure, Italy(1) | l | |
| Virton, Belgium(2) | u | |
| Location | Product | |
| Asia Pacific | ||
| Altona, Australia | n | |
| Chiba, Japan | n | |
| Jinshan, China | 5 | |
| Kashima, Japan | 5 | |
| Panyu, China | l | |
| Sakai, Japan | n l | |
| Wakayama, Japan | n | |
| Latin America | ||
| Paulinia, Brazil | l | |
| Rio de Janeiro, Brazil(1) | l | |
| (1) | Includes joint-venture plants. | |
| (2) | Announced divestment. |
n Olefins/Aromatics 5 Polymers l Other Chemicals u Films
Table of Contents
| 83 |
VOLUMES
| Includes ExxonMobil’s share of equity companies | 2012 | 2011 | 2010 | 2009 | 2008 | |||||||||||||||
| Worldwide Production Volumes(thousands of tonnes) | ||||||||||||||||||||
| Ethylene | 6,911 | 7,855 | 7,973 | 7,381 | 7,540 | |||||||||||||||
| Polyethylene | 6,572 | 6,482 | 6,506 | 6,120 | 6,088 | |||||||||||||||
| Polypropylene | 1,937 | 1,870 | 1,945 | 1,864 | 1,897 | |||||||||||||||
| Paraxylene | 2,875 | 2,935 | 2,973 | 2,758 | 2,472 | |||||||||||||||
| Prime Product Sales Volumes(1)by Region(thousands of tonnes) | ||||||||||||||||||||
Americas(2) | 10,450 | 10,268 | 10,826 | 10,665 | 10,628 | |||||||||||||||
| Europe/Middle East/Africa | 6,310 | 6,555 | 6,654 | 6,433 | 6,635 | |||||||||||||||
| Asia Pacific | 7,397 | 8,183 | 8,411 | 7,727 | 7,719 | |||||||||||||||
Total worldwide | 24,157 | 25,006 | 25,891 | 24,825 | 24,982 | |||||||||||||||
| Prime Product Sales Volumes(1)by Business(thousands of tonnes) | ||||||||||||||||||||
| Specialties | 5,219 | 5,471 | 5,586 | 5,183 | 5,618 | |||||||||||||||
| Commodities | 18,938 | 19,535 | 20,305 | 19,642 | 19,364 | |||||||||||||||
Total | 24,157 | 25,006 | 25,891 | 24,825 | 24,982 | |||||||||||||||
| (1) | See Frequently Used Terms on pages 93 through 95. | |
| (2) | Includes North America and Latin America. |
Chemical Return on Average Capital Employed(1)
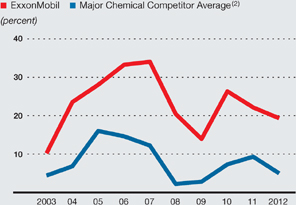
(1) See Frequently Used Terms on pages 93 through 95.
(2) Competitor values are estimated on a consistent basis with ExxonMobil and are based on public information. Chemical segments only: Royal Dutch Shell, Dow Chemical, Chevron (through 2009), BP (through 2004).
Global ExxonMobil Metallocene Product Sales
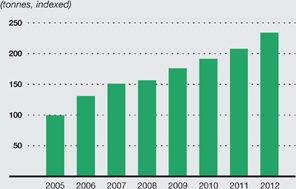
Table of Contents
| 84 | EXXONMOBIL 2012 FINANCIAL & OPERATING REVIEW |
Financial Information
FINANCIAL HIGHLIGHTS
| (millions of dollars, unless noted) | 2012 | 2011 | 2010 | 2009 | 2008 | |||||||||||||||
| Net income attributable to ExxonMobil | 44,880 | 41,060 | 30,460 | 19,280 | 45,220 | |||||||||||||||
Cash flow from operations and asset sales(1) | 63,825 | 66,478 | 51,674 | 29,983 | 65,710 | |||||||||||||||
Capital and exploration expenditures(1) | 39,799 | 36,766 | 32,226 | 27,092 | 26,143 | |||||||||||||||
| Research and development costs | 1,042 | 1,044 | 1,012 | 1,050 | 847 | |||||||||||||||
| Total debt at year end | 11,581 | 17,033 | 15,014 | 9,605 | 9,425 | |||||||||||||||
Average capital employed(1) | 179,094 | 170,721 | 145,217 | 125,050 | 129,683 | |||||||||||||||
| Market valuation at year end | 389,680 | 401,249 | 364,035 | 322,329 | 397,239 | |||||||||||||||
Regular employees at year end(thousands) | 76.9 | 82.1 | 83.6 | 80.7 | 79.9 | |||||||||||||||
KEY FINANCIAL RATIOS
| 2012 | 2011 | 2010 | 2009 | 2008 | ||||||||||||||||
Return on average capital employed(1)(percent) | 25.4 | 24.2 | 21.7 | 16.3 | 34.2 | |||||||||||||||
Earnings to average ExxonMobil share of equity(percent) | 28.0 | 27.3 | 23.7 | 17.3 | 38.5 | |||||||||||||||
Debt to capital(2)(percent) | 6.3 | 9.6 | 9.0 | 7.7 | 7.4 | |||||||||||||||
Net debt to capital(3)(percent) | 1.2 | 2.6 | 4.5 | (1.0 | ) | (23.0 | ) | |||||||||||||
Current assets to current liabilities(times) | 1.01 | 0.94 | 0.94 | 1.06 | 1.47 | |||||||||||||||
Fixed charge coverage(times) | 62.4 | 53.4 | 42.2 | 25.8 | 54.6 | |||||||||||||||
DIVIDEND AND SHAREHOLDER RETURN INFORMATION
| 2012 | 2011 | 2010 | 2009 | 2008 | ||||||||||||||||
Dividends per common share(dollars) | 2.18 | 1.85 | 1.74 | 1.66 | 1.55 | |||||||||||||||
Dividends per share growth(annual percent) | 17.8 | 6.3 | 4.8 | 7.1 | 13.1 | |||||||||||||||
Number of common shares outstanding(millions) | ||||||||||||||||||||
| Average | 4,628 | 4,870 | 4,885 | 4,832 | 5,194 | |||||||||||||||
| Average – assuming dilution | 4,628 | 4,875 | 4,897 | 4,848 | 5,221 | |||||||||||||||
| Year end | 4,502 | 4,734 | 4,979 | 4,727 | 4,976 | |||||||||||||||
Total shareholder return(1)(annual percent) | 4.7 | 18.7 | 10.1 | (12.6 | ) | (13.2 | ) | |||||||||||||
Common stock purchases(millions of dollars) | 21,068 | 22,055 | 13,093 | 19,703 | 35,734 | |||||||||||||||
Market quotations for common stock(dollars) | ||||||||||||||||||||
| High | 93.67 | 88.23 | 73.69 | 82.73 | 96.12 | |||||||||||||||
| Low | 77.13 | 67.03 | 55.94 | 61.86 | 56.51 | |||||||||||||||
| Average daily close | 86.53 | 79.71 | 64.99 | 70.95 | 82.68 | |||||||||||||||
| Year-end close | 86.55 | 84.76 | 73.12 | 68.19 | 79.83 | |||||||||||||||
| (1) | See Frequently Used Terms on pages 93 through 95. | |
| (2) | Debt includes short-term and long-term debt. Capital includes short-term and long-term debt and total equity. | |
| (3) | Debt net of cash and cash equivalents, excluding restricted cash. |
Table of Contents
| 85 |
FUNCTIONAL EARNINGS(1)
| 2012 Quarters | ||||||||||||||||||||||||||||||||||||
| (millions of dollars) | First | Second | Third | Fourth | 2012 | 2011 | 2010 | 2009 | 2008 | |||||||||||||||||||||||||||
| Earnings (U.S. GAAP) | ||||||||||||||||||||||||||||||||||||
Upstream | ||||||||||||||||||||||||||||||||||||
| United States | 1,010 | 678 | 633 | 1,604 | 3,925 | 5,096 | 4,272 | 2,893 | 6,243 | |||||||||||||||||||||||||||
| Non-U.S. | 6,792 | 7,680 | 5,340 | 6,158 | 25,970 | 29,343 | 19,825 | 14,214 | 29,159 | |||||||||||||||||||||||||||
| Total | 7,802 | 8,358 | 5,973 | 7,762 | 29,895 | 34,439 | 24,097 | 17,107 | 35,402 | |||||||||||||||||||||||||||
Downstream | ||||||||||||||||||||||||||||||||||||
| United States | 603 | 834 | 1,441 | 697 | 3,575 | 2,268 | 770 | (153 | ) | 1,649 | ||||||||||||||||||||||||||
| Non-U.S. | 983 | 5,812 | 1,749 | 1,071 | 9,615 | 2,191 | 2,797 | 1,934 | 6,502 | |||||||||||||||||||||||||||
| Total | 1,586 | 6,646 | 3,190 | 1,768 | 13,190 | 4,459 | 3,567 | 1,781 | 8,151 | |||||||||||||||||||||||||||
Chemical | ||||||||||||||||||||||||||||||||||||
| United States | 433 | 494 | 565 | 728 | 2,220 | 2,215 | 2,422 | 769 | 724 | |||||||||||||||||||||||||||
| Non-U.S. | 268 | 955 | 225 | 230 | 1,678 | 2,168 | 2,491 | 1,540 | 2,233 | |||||||||||||||||||||||||||
| Total | 701 | 1,449 | 790 | 958 | 3,898 | 4,383 | 4,913 | 2,309 | 2,957 | |||||||||||||||||||||||||||
Corporate and financing | (639 | ) | (543 | ) | (383 | ) | (538 | ) | (2,103 | ) | (2,221 | ) | (2,117 | ) | (1,917 | ) | (1,290 | ) | ||||||||||||||||||
Net income attributable to | ||||||||||||||||||||||||||||||||||||
ExxonMobil (U.S. GAAP) | 9,450 | 15,910 | 9,570 | 9,950 | 44,880 | 41,060 | 30,460 | 19,280 | 45,220 | |||||||||||||||||||||||||||
Special Items | ||||||||||||||||||||||||||||||||||||
Upstream | ||||||||||||||||||||||||||||||||||||
| Non-U.S. | – | – | – | – | – | – | – | – | 1,620 | |||||||||||||||||||||||||||
Corporate and financing | – | – | – | – | – | – | – | (140 | ) | (460 | ) | |||||||||||||||||||||||||
Corporate total | – | – | – | – | – | – | – | (140 | ) | 1,160 | ||||||||||||||||||||||||||
| Earnings Excluding Special Items(2) | ||||||||||||||||||||||||||||||||||||
Upstream | ||||||||||||||||||||||||||||||||||||
| United States | 1,010 | 678 | 633 | 1,604 | 3,925 | 5,096 | 4,272 | 2,893 | 6,243 | |||||||||||||||||||||||||||
| Non-U.S. | 6,792 | 7,680 | 5,340 | 6,158 | 25,970 | 29,343 | 19,825 | 14,214 | 27,539 | |||||||||||||||||||||||||||
| Total | 7,802 | 8,358 | 5,973 | 7,762 | 29,895 | 34,439 | 24,097 | 17,107 | 33,782 | |||||||||||||||||||||||||||
Downstream | ||||||||||||||||||||||||||||||||||||
| United States | 603 | 834 | 1,441 | 697 | 3,575 | 2,268 | 770 | (153 | ) | 1,649 | ||||||||||||||||||||||||||
| Non-U.S. | 983 | 5,812 | 1,749 | 1,071 | 9,615 | 2,191 | 2,797 | 1,934 | 6,502 | |||||||||||||||||||||||||||
| Total | 1,586 | 6,646 | 3,190 | 1,768 | 13,190 | 4,459 | 3,567 | 1,781 | 8,151 | |||||||||||||||||||||||||||
Chemical | ||||||||||||||||||||||||||||||||||||
| United States | 433 | 494 | 565 | 728 | 2,220 | 2,215 | 2,422 | 769 | 724 | |||||||||||||||||||||||||||
| Non-U.S. | 268 | 955 | 225 | 230 | 1,678 | 2,168 | 2,491 | 1,540 | 2,233 | |||||||||||||||||||||||||||
| Total | 701 | 1,449 | 790 | 958 | 3,898 | 4,383 | 4,913 | 2,309 | 2,957 | |||||||||||||||||||||||||||
Corporate and financing | (639 | ) | (543 | ) | (383 | ) | (538 | ) | (2,103 | ) | (2,221 | ) | (2,117 | ) | (1,777 | ) | (830 | ) | ||||||||||||||||||
Corporate total | 9,450 | 15,910 | 9,570 | 9,950 | 44,880 | 41,060 | 30,460 | 19,420 | 44,060 | |||||||||||||||||||||||||||
| (1) | Total corporate earnings means net income attributable to ExxonMobil (U.S. GAAP) from the consolidated income statement. Unless indicated, references to earnings, special items, Upstream, Downstream, Chemical, and Corporate and Financing segment earnings, and earnings per share are ExxonMobil’s share after excluding amounts attributable to noncontrolling interests. | |
| (2) | See Frequently Used Terms on pages 93 through 95. |
Table of Contents
| 86 | EXXONMOBIL 2012 FINANCIAL & OPERATING REVIEW |
RETURN ON AVERAGE CAPITAL EMPLOYED(1) BY BUSINESS
| (percent) | 2012 | 2011 | 2010 | 2009 | 2008 | |||||||||||||||
Upstream | ||||||||||||||||||||
| United States | 6.8 | 9.3 | 12.2 | 18.2 | 42.6 | |||||||||||||||
| Non-U.S. | 31.7 | 39.2 | 29.0 | 24.8 | 56.7 | |||||||||||||||
| Total | 21.4 | 26.5 | 23.3 | 23.4 | 53.6 | |||||||||||||||
Downstream | ||||||||||||||||||||
| United States | 77.2 | 42.5 | 12.5 | (2.1 | ) | 23.7 | ||||||||||||||
| Non-U.S. | 49.6 | 12.1 | 15.6 | 10.9 | 34.8 | |||||||||||||||
| Total | 54.9 | 19.1 | 14.8 | 7.1 | 31.8 | |||||||||||||||
Chemical | ||||||||||||||||||||
| United States | 47.5 | 46.2 | 53.0 | 17.6 | 16.0 | |||||||||||||||
| Non-U.S. | 10.8 | 14.4 | 17.6 | 12.6 | 22.4 | |||||||||||||||
| Total | 19.3 | 22.1 | 26.3 | 13.9 | 20.4 | |||||||||||||||
Corporate and financing | N.A. | N.A. | N.A. | N.A. | N.A. | |||||||||||||||
Corporate total | 25.4 | 24.2 | 21.7 | 16.3 | 34.2 | |||||||||||||||
AVERAGE CAPITAL EMPLOYED(2) BY BUSINESS
| (millions of dollars) | 2012 | 2011 | 2010 | 2009 | 2008 | |||||||||||||||
Upstream | ||||||||||||||||||||
| United States | 57,631 | 54,994 | 34,969 | 15,865 | 14,651 | |||||||||||||||
| Non-U.S. | 81,811 | 74,813 | 68,318 | 57,336 | 51,413 | |||||||||||||||
| Total | 139,442 | 129,807 | 103,287 | 73,201 | 66,064 | |||||||||||||||
Downstream | ||||||||||||||||||||
| United States | 4,630 | 5,340 | 6,154 | 7,306 | 6,963 | |||||||||||||||
| Non-U.S. | 19,401 | 18,048 | 17,976 | 17,793 | 18,664 | |||||||||||||||
| Total | 24,031 | 23,388 | 24,130 | 25,099 | 25,627 | |||||||||||||||
Chemical | ||||||||||||||||||||
| United States | 4,671 | 4,791 | 4,566 | 4,370 | 4,535 | |||||||||||||||
| Non-U.S. | 15,477 | 15,007 | 14,114 | 12,190 | 9,990 | |||||||||||||||
| Total | 20,148 | 19,798 | 18,680 | 16,560 | 14,525 | |||||||||||||||
Corporate and financing | (4,527 | ) | (2,272 | ) | (880 | ) | 10,190 | 23,467 | ||||||||||||
Corporate total | 179,094 | 170,721 | 145,217 | 125,050 | 129,683 | |||||||||||||||
Average capital employed applicable to equity companies included above | 32,962 | 31,626 | 30,524 | 27,684 | 25,651 | |||||||||||||||
| (1) | Capital employed consists of ExxonMobil’s share of equity and consolidated debt, including ExxonMobil’s share of amounts applicable to equity companies. See Frequently Used Terms on pages 93 through 95. | |
| (2) | Average capital employed is the average of beginning-of-year and end-of-year business segment capital employed, including ExxonMobil’s share of amounts applicable to equity companies. See Frequently Used Terms on pages 93 through 95. |
Table of Contents
| 87 |
NET INVESTMENT IN PROPERTY, PLANT AND EQUIPMENT AT YEAR END
| (millions of dollars) | 2012 | 2011 | 2010 | 2009 | 2008 | |||||||||||||||
Upstream | ||||||||||||||||||||
| United States | 78,352 | 75,140 | 69,003 | 19,601 | 17,920 | |||||||||||||||
| Non-U.S. | 103,443 | 88,835 | 79,149 | 68,718 | 55,493 | |||||||||||||||
| Total | 181,795 | 163,975 | 148,152 | 88,319 | 73,413 | |||||||||||||||
Downstream | ||||||||||||||||||||
| United States | 9,119 | 9,516 | 10,585 | 11,013 | 10,492 | |||||||||||||||
| Non-U.S. | 13,934 | 19,285 | 19,510 | 19,486 | 18,762 | |||||||||||||||
| Total | 23,053 | 28,801 | 30,095 | 30,499 | 29,254 | |||||||||||||||
Chemical | ||||||||||||||||||||
| United States | 3,846 | 3,928 | 4,068 | 4,274 | 4,396 | |||||||||||||||
| Non-U.S. | 10,239 | 10,541 | 10,187 | 9,237 | 7,034 | |||||||||||||||
| Total | 14,085 | 14,469 | 14,255 | 13,511 | 11,430 | |||||||||||||||
Other | 8,016 | 7,419 | 7,046 | 6,787 | 7,249 | |||||||||||||||
Total net investment | 226,949 | 214,664 | 199,548 | 139,116 | 121,346 | |||||||||||||||
DEPRECIATION AND DEPLETION EXPENSES
| (millions of dollars) | 2012 | 2011 | 2010 | 2009 | 2008 | |||||||||||||||
Upstream | ||||||||||||||||||||
| United States | 5,104 | 4,879 | 3,506 | 1,768 | 1,391 | |||||||||||||||
| Non-U.S. | 7,340 | 7,021 | 7,574 | 6,376 | 7,266 | |||||||||||||||
| Total | 12,444 | 11,900 | 11,080 | 8,144 | 8,657 | |||||||||||||||
Downstream | ||||||||||||||||||||
| United States | 594 | 650 | 681 | 687 | 656 | |||||||||||||||
| Non-U.S. | 1,280 | 1,560 | 1,565 | 1,665 | 1,672 | |||||||||||||||
| Total | 1,874 | 2,210 | 2,246 | 2,352 | 2,328 | |||||||||||||||
Chemical | ||||||||||||||||||||
| United States | 376 | 380 | 421 | 400 | 410 | |||||||||||||||
| Non-U.S. | 508 | 458 | 432 | 457 | 422 | |||||||||||||||
| Total | 884 | 838 | 853 | 857 | 832 | |||||||||||||||
Other | 686 | 635 | 581 | 564 | 562 | |||||||||||||||
Total depreciation and depletion expenses | 15,888 | 15,583 | 14,760 | 11,917 | 12,379 | |||||||||||||||
OPERATING COSTS(1)
| (millions of dollars) | 2012 | 2011 | 2010 | 2009 | 2008 | |||||||||||||||
| Production and manufacturing expenses | 38,521 | 40,268 | 35,792 | 33,027 | 37,905 | |||||||||||||||
| Selling, general, and administrative | 13,877 | 14,983 | 14,683 | 14,735 | 15,873 | |||||||||||||||
| Depreciation and depletion | 15,888 | 15,583 | 14,760 | 11,917 | 12,379 | |||||||||||||||
| Exploration | 1,840 | 2,081 | 2,144 | 2,021 | 1,451 | |||||||||||||||
| Subtotal | 70,126 | 72,915 | 67,379 | 61,700 | 67,608 | |||||||||||||||
| ExxonMobil’s share of equity company expenses | 12,239 | 11,401 | 9,049 | 6,670 | 7,204 | |||||||||||||||
Total operating costs | 82,365 | 84,316 | 76,428 | 68,370 | 74,812 | |||||||||||||||
| (1) | See Frequently Used Terms on pages 93 through 95. | |
Table of Contents
| 88 | EXXONMOBIL 2012 FINANCIAL & OPERATING REVIEW |
CAPITAL AND EXPLORATION EXPENDITURES(1)
| (millions of dollars) | 2012 | 2011 | 2010 | 2009 | 2008 | |||||||||||||||
Upstream | ||||||||||||||||||||
| Exploration | ||||||||||||||||||||
| United States | 2,386 | 2,720 | 1,607 | 735 | 734 | |||||||||||||||
| Non-U.S. | 2,354 | 2,744 | 2,514 | 2,983 | 2,137 | |||||||||||||||
| Total | 4,740 | 5,464 | 4,121 | 3,718 | 2,871 | |||||||||||||||
Production(2) | ||||||||||||||||||||
| United States | 8,694 | 8,021 | 4,742 | 2,850 | 2,600 | |||||||||||||||
| Non-U.S. | 22,395 | 19,387 | 18,214 | 13,877 | 14,011 | |||||||||||||||
| Total | 31,089 | 27,408 | 22,956 | 16,727 | 16,611 | |||||||||||||||
| Power and Coal | ||||||||||||||||||||
| United States | – | – | – | – | – | |||||||||||||||
| Non-U.S. | 255 | 219 | 242 | 259 | 252 | |||||||||||||||
| Total | 255 | 219 | 242 | 259 | 252 | |||||||||||||||
Total Upstream | 36,084 | 33,091 | 27,319 | 20,704 | 19,734 | |||||||||||||||
Downstream | ||||||||||||||||||||
| Refining | ||||||||||||||||||||
| United States | 482 | 370 | 833 | 1,300 | 1,430 | |||||||||||||||
| Non-U.S. | 1,233 | 1,088 | 1,000 | 1,146 | 1,248 | |||||||||||||||
| Total | 1,715 | 1,458 | 1,833 | 2,446 | 2,678 | |||||||||||||||
| Marketing | ||||||||||||||||||||
| United States | 118 | 117 | 98 | 171 | 176 | |||||||||||||||
| Non-U.S. | 385 | 514 | 520 | 536 | 638 | |||||||||||||||
| Total | 503 | 631 | 618 | 707 | 814 | |||||||||||||||
| Pipeline/Marine | ||||||||||||||||||||
| United States | 34 | 31 | 51 | 40 | 30 | |||||||||||||||
| Non-U.S. | 10 | – | 3 | 3 | 7 | |||||||||||||||
| Total | 44 | 31 | 54 | 43 | 37 | |||||||||||||||
Total Downstream | 2,262 | 2,120 | 2,505 | 3,196 | 3,529 | |||||||||||||||
Chemical | ||||||||||||||||||||
| United States | 408 | 290 | 279 | 319 | 441 | |||||||||||||||
| Non-U.S. | 1,010 | 1,160 | 1,936 | 2,829 | 2,378 | |||||||||||||||
Total Chemical | 1,418 | 1,450 | 2,215 | 3,148 | 2,819 | |||||||||||||||
Other | ||||||||||||||||||||
| United States | 35 | 105 | 187 | 44 | 61 | |||||||||||||||
| Non-U.S. | – | – | – | – | – | |||||||||||||||
Total other | 35 | 105 | 187 | 44 | 61 | |||||||||||||||
Total capital and exploration expenditures | 39,799 | 36,766 | 32,226 | 27,092 | 26,143 | |||||||||||||||
| (1) | See Frequently Used Terms on pages 93 through 95. | |
| (2) | Including related transportation. |
Table of Contents
| 89 |
TOTAL CAPITAL AND EXPLORATION EXPENDITURES BY GEOGRAPHY
| (millions of dollars) | 2012 | 2011 | 2010 | 2009 | 2008 | |||||||||||||||
| United States | 12,157 | 11,654 | 7,797 | 5,459 | 5,472 | |||||||||||||||
| Canada/Latin America | 8,616 | 6,186 | 5,732 | 3,448 | 1,926 | |||||||||||||||
| Europe | 3,111 | 2,914 | 3,901 | 3,251 | 3,727 | |||||||||||||||
| Africa | 3,907 | 4,291 | 4,915 | 6,182 | 5,422 | |||||||||||||||
| Asia | 6,704 | 7,066 | 6,693 | 7,535 | 8,845 | |||||||||||||||
| Australia/Oceania | 5,304 | 4,655 | 3,188 | 1,217 | 751 | |||||||||||||||
Total worldwide | 39,799 | 36,766 | 32,226 | 27,092 | 26,143 | |||||||||||||||
DISTRIBUTION OF CAPITAL AND EXPLORATION EXPENDITURES
| (millions of dollars) | 2012 | 2011 | 2010 | 2009 | 2008 | |||||||||||||||
Consolidated Companies’ Expenditures | ||||||||||||||||||||
| Capital expenditures | 35,375 | 32,425 | 27,343 | 22,441 | 19,841 | |||||||||||||||
| Exploration costs charged to expense | ||||||||||||||||||||
| United States | 392 | 268 | 283 | 219 | 189 | |||||||||||||||
| Non-U.S. | 1,441 | 1,802 | 1,855 | 1,795 | 1,252 | |||||||||||||||
Depreciation on support equipment(1) | 7 | 11 | 6 | 7 | 10 | |||||||||||||||
Total exploration expenses | 1,840 | 2,081 | 2,144 | 2,021 | 1,451 | |||||||||||||||
Total consolidated companies’ capital and exploration expenditures (excluding depreciation on support equipment) | 37,208 | 34,495 | 29,481 | 24,455 | 21,282 | |||||||||||||||
ExxonMobil’s Share of Non-Consolidated | ||||||||||||||||||||
Companies’ Expenditures | ||||||||||||||||||||
| Capital expenditures | 2,565 | 2,248 | 2,720 | 2,624 | 4,845 | |||||||||||||||
| Exploration costs charged to expense | 26 | 23 | 25 | 13 | 16 | |||||||||||||||
Total non-consolidated companies’ capital and exploration expenditures | 2,591 | 2,271 | 2,745 | 2,637 | 4,861 | |||||||||||||||
Total capital and exploration expenditures | 39,799 | 36,766 | 32,226 | 27,092 | 26,143 | |||||||||||||||
| (1) | Not included as part of total capital and exploration expenditures, but included as part of exploration expenses, including dry holes, in the Summary Statement of Income, page 90. |
Table of Contents
| 90 | EXXONMOBIL 2012 FINANCIAL & OPERATING REVIEW |
SUMMARY STATEMENT OF INCOME
| (millions of dollars) | 2012 | 2011 | 2010 | 2009 | 2008 | |||||||||||||||
Revenues and Other Income | ||||||||||||||||||||
Sales and other operating revenue(1) | 453,123 | 467,029 | 370,125 | 301,500 | 459,579 | |||||||||||||||
| Income from equity affiliates | 15,010 | 15,289 | 10,677 | 7,143 | 11,081 | |||||||||||||||
Other income(2) | 14,162 | 4,111 | 2,419 | 1,943 | 6,699 | |||||||||||||||
Total revenues and other income | 482,295 | 486,429 | 383,221 | 310,586 | 477,359 | |||||||||||||||
Costs and Other Deductions | ||||||||||||||||||||
| Crude oil and product purchases | 265,149 | 266,534 | 197,959 | 152,806 | 249,454 | |||||||||||||||
| Production and manufacturing expenses | 38,521 | 40,268 | 35,792 | 33,027 | 37,905 | |||||||||||||||
| Selling, general, and administrative expenses | 13,877 | 14,983 | 14,683 | 14,735 | 15,873 | |||||||||||||||
| Depreciation and depletion | 15,888 | 15,583 | 14,760 | 11,917 | 12,379 | |||||||||||||||
| Exploration expenses, including dry holes | 1,840 | 2,081 | 2,144 | 2,021 | 1,451 | |||||||||||||||
| Interest expense | 327 | 247 | 259 | 548 | 673 | |||||||||||||||
Sales-based taxes(1) | 32,409 | 33,503 | 28,547 | 25,936 | 34,508 | |||||||||||||||
| Other taxes and duties | 35,558 | 39,973 | 36,118 | 34,819 | 41,719 | |||||||||||||||
Total costs and other deductions | 403,569 | 413,172 | 330,262 | 275,809 | 393,962 | |||||||||||||||
| Income before income taxes | 78,726 | 73,257 | 52,959 | 34,777 | 83,397 | |||||||||||||||
| Income taxes | 31,045 | 31,051 | 21,561 | 15,119 | 36,530 | |||||||||||||||
Net income including noncontrolling interests | 47,681 | 42,206 | 31,398 | 19,658 | 46,867 | |||||||||||||||
| Net income attributable to noncontrolling interests | 2,801 | 1,146 | 938 | 378 | 1,647 | |||||||||||||||
Net income attributable to ExxonMobil | 44,880 | 41,060 | 30,460 | 19,280 | 45,220 | |||||||||||||||
Earnings per common share(dollars) | 9.70 | 8.43 | 6.24 | 3.99 | 8.70 | |||||||||||||||
Earnings per common share – assuming dilution(dollars) | 9.70 | 8.42 | 6.22 | 3.98 | 8.66 | |||||||||||||||
| (1) | Sales and other operating revenue includes sales-based taxes of $32,409 million for 2012, $33,503 million for 2011, $28,547 million for 2010, $25,936 million for 2009, and $34,508 million for 2008. | |
| (2) | Other income for 2008 includes a $62 million gain from the sale of a non-U.S. investment and a related $143 million foreign exchange loss. |
The information in the Summary Statement of Income (for 2010 to 2012), the Summary Balance Sheet (for 2011 and 2012), and the Summary Statement of Cash Flows (for 2010 to 2012), shown on pages 90 through 92, corresponds to the information in the Consolidated Statement of Income, Consolidated Balance Sheet, and the Consolidated Statement of Cash Flows in the financial statements of ExxonMobil’s 2012 Form 10-K. See also Management’s Discussion and Analysis of Financial Condition and Results of Operations and other information in the Financial Section of the 2012 Form 10-K.
Table of Contents
| 91 |
SUMMARY BALANCE SHEET AT YEAR END
| (millions of dollars) | 2012 | 2011 | 2010 | 2009 | 2008 | |||||||||||||||
Assets | ||||||||||||||||||||
| Current assets | ||||||||||||||||||||
| Cash and cash equivalents | 9,582 | 12,664 | 7,825 | 10,693 | 31,437 | |||||||||||||||
| Cash and cash equivalents – restricted | 341 | 404 | 628 | – | – | |||||||||||||||
| Notes and accounts receivable, less estimated doubtful amounts | 34,987 | 38,642 | 32,284 | 27,645 | 24,702 | |||||||||||||||
| Inventories | ||||||||||||||||||||
| Crude oil, products and merchandise | 10,836 | 11,665 | 9,852 | 8,718 | 9,331 | |||||||||||||||
| Materials and supplies | 3,706 | 3,359 | 3,124 | 2,835 | 2,315 | |||||||||||||||
| Other current assets | 5,008 | 6,229 | 5,271 | 5,344 | 4,481 | |||||||||||||||
| Total current assets | 64,460 | 72,963 | 58,984 | 55,235 | 72,266 | |||||||||||||||
| Investments, advances and long-term receivables | 34,718 | 34,333 | 35,338 | 31,665 | 28,556 | |||||||||||||||
| Property, plant and equipment, at cost, less accumulated depreciation and depletion | 226,949 | 214,664 | 199,548 | 139,116 | 121,346 | |||||||||||||||
| Other assets, including intangibles, net | 7,668 | 9,092 | 8,640 | 7,307 | 5,884 | |||||||||||||||
Total assets | 333,795 | 331,052 | 302,510 | 233,323 | 228,052 | |||||||||||||||
Liabilities | ||||||||||||||||||||
| Current liabilities | ||||||||||||||||||||
| Notes and loans payable | 3,653 | 7,711 | 2,787 | 2,476 | 2,400 | |||||||||||||||
| Accounts payable and accrued liabilities | 50,728 | 57,067 | 50,034 | 41,275 | 36,643 | |||||||||||||||
| Income taxes payable | 9,758 | 12,727 | 9,812 | 8,310 | 10,057 | |||||||||||||||
| Total current liabilities | 64,139 | 77,505 | 62,633 | 52,061 | 49,100 | |||||||||||||||
| Long-term debt | 7,928 | 9,322 | 12,227 | 7,129 | 7,025 | |||||||||||||||
| Postretirement benefits reserves | 25,267 | 24,994 | 19,367 | 17,942 | 20,729 | |||||||||||||||
| Deferred income tax liabilities | 37,570 | 36,618 | 35,150 | 23,148 | 19,726 | |||||||||||||||
| Long-term obligations to equity companies | 3,555 | 1,808 | 962 | 65 | 41 | |||||||||||||||
| Other long-term obligations | 23,676 | 20,061 | 19,492 | 17,586 | 13,908 | |||||||||||||||
Total liabilities | 162,135 | 170,308 | 149,831 | 117,931 | 110,529 | |||||||||||||||
| Commitments and contingencies | See footnote 1 | |||||||||||||||||||
Equity | ||||||||||||||||||||
| Common stock without par value | 9,653 | 9,512 | 9,371 | 5,503 | 5,314 | |||||||||||||||
| Earnings reinvested | 365,727 | 330,939 | 298,899 | 276,937 | 265,680 | |||||||||||||||
| Accumulated other comprehensive income | (12,184 | ) | (9,123 | ) | (4,823 | ) | (5,461 | ) | (9,931 | ) | ||||||||||
| Common stock held in treasury | (197,333 | ) | (176,932 | ) | (156,608 | ) | (166,410 | ) | (148,098 | ) | ||||||||||
| ExxonMobil share of equity | 165,863 | 154,396 | 146,839 | 110,569 | 112,965 | |||||||||||||||
| Noncontrolling interests | 5,797 | 6,348 | 5,840 | 4,823 | 4,558 | |||||||||||||||
Total equity | 171,660 | 160,744 | 152,679 | 115,392 | 117,523 | |||||||||||||||
Total liabilities and equity | 333,795 | 331,052 | 302,510 | 233,323 | 228,052 | |||||||||||||||
| (1) | For more information, please refer to Note 16 in the Financial Section of ExxonMobil’s 2012 Form 10-K. |
The information in the Summary Statement of Income (for 2010 to 2012), the Summary Balance Sheet (for 2011 and 2012), and the Summary Statement of Cash Flows (for 2010 to 2012), shown on pages 90 through 92, corresponds to the information in the Consolidated Statement of Income, Consolidated Balance Sheet, and the Consolidated Statement of Cash Flows in the financial statements of ExxonMobil’s 2012 Form 10-K. See also Management’s Discussion and Analysis of Financial Condition and Results of Operations and other information in the Financial Section of the 2012 Form 10-K.
Table of Contents
| 92 | EXXONMOBIL 2012 FINANCIAL & OPERATING REVIEW |
SUMMARY STATEMENT OF CASH FLOWS
| (millions of dollars) | 2012 | 2011 | 2010 | 2009 | 2008 | |||||||||||||||
Cash Flows from Operating Activities | ||||||||||||||||||||
| Net income including noncontrolling interests | 47,681 | 42,206 | 31,398 | 19,658 | 46,867 | |||||||||||||||
| Adjustments for noncash transactions | ||||||||||||||||||||
| Depreciation and depletion | 15,888 | 15,583 | 14,760 | 11,917 | 12,379 | |||||||||||||||
| Deferred income tax charges/(credits) | 3,142 | 142 | (1,135 | ) | – | 1,399 | ||||||||||||||
| Postretirement benefits expense in excess of/ (less than) net payments | (315 | ) | 544 | 1,700 | (1,722 | ) | 57 | |||||||||||||
| Other long-term obligation provisions in excess of/(less than) payments | 1,643 | (151 | ) | 160 | 731 | (63 | ) | |||||||||||||
| Dividends received greater than/(less than) equity in current earnings of equity companies | (1,157 | ) | (273 | ) | (596 | ) | (483 | ) | 921 | |||||||||||
| Changes in operational working capital, excluding cash and debt Reduction/(increase) – Notes and accounts receivable | (1,082 | ) | (7,906 | ) | (5,863 | ) | (3,170 | ) | 8,641 | |||||||||||
| – Inventories | (1,873 | ) | (2,208 | ) | (1,148 | ) | 459 | (1,285 | ) | |||||||||||
| – Other current assets | (42 | ) | 222 | 913 | 132 | (509 | ) | |||||||||||||
| Increase/(reduction) – Accounts and other payables | 3,624 | 8,880 | 9,943 | 1,420 | (5,415 | ) | ||||||||||||||
| Net (gain) on asset sales | (13,018 | ) | (2,842 | ) | (1,401 | ) | (488 | ) | (3,757 | ) | ||||||||||
| All other items – net | 1,679 | 1,148 | (318 | ) | (16 | ) | 490 | |||||||||||||
Net cash provided by operating activities | 56,170 | 55,345 | 48,413 | 28,438 | 59,725 | |||||||||||||||
Cash Flows from Investing Activities | ||||||||||||||||||||
| Additions to property, plant and equipment | (34,271 | ) | (30,975 | ) | (26,871 | ) | (22,491 | ) | (19,318 | ) | ||||||||||
| Proceeds associated with sales of subsidiaries, property, plant and equipment, and sales and returns of investments | 7,655 | 11,133 | 3,261 | 1,545 | 5,985 | |||||||||||||||
| Decrease/(increase) in restricted cash and cash equivalents | 63 | 224 | (628 | ) | – | – | ||||||||||||||
| Additional investments and advances | (972 | ) | (3,586 | ) | (1,239 | ) | (2,752 | ) | (2,495 | ) | ||||||||||
| Collection of advances | 1,924 | 1,119 | 1,133 | 724 | 574 | |||||||||||||||
| Additions to marketable securities | – | (1,754 | ) | (15 | ) | (16 | ) | (2,113 | ) | |||||||||||
| Sales of marketable securities | – | 1,674 | 155 | 571 | 1,868 | |||||||||||||||
Net cash used in investing activities | (25,601 | ) | (22,165 | ) | (24,204 | ) | (22,419 | ) | (15,499 | ) | ||||||||||
Cash Flows from Financing Activities | ||||||||||||||||||||
| Additions to long-term debt | 995 | 702 | 1,143 | 225 | 79 | |||||||||||||||
| Reductions in long-term debt | (147 | ) | (266 | ) | (6,224 | ) | (68 | ) | (192 | ) | ||||||||||
| Additions to short-term debt | 958 | 1,063 | 598 | 1,336 | 1,067 | |||||||||||||||
| Reductions in short-term debt | (4,488 | ) | (1,103 | ) | (2,436 | ) | (1,575 | ) | (1,624 | ) | ||||||||||
| Additions/(reductions) in debt with three months or less maturity | (226 | ) | 1,561 | 709 | (71 | ) | 143 | |||||||||||||
| Cash dividends to ExxonMobil shareholders | (10,092 | ) | (9,020 | ) | (8,498 | ) | (8,023 | ) | (8,058 | ) | ||||||||||
| Cash dividends to noncontrolling interests | (327 | ) | (306 | ) | (281 | ) | (280 | ) | (375 | ) | ||||||||||
| Changes in noncontrolling interests | 204 | (16 | ) | (7 | ) | (113 | ) | (419 | ) | |||||||||||
| Tax benefits related to stock-based awards | 130 | 260 | 122 | 237 | 333 | |||||||||||||||
| Common stock acquired | (21,068 | ) | (22,055 | ) | (13,093 | ) | (19,703 | ) | (35,734 | ) | ||||||||||
| Common stock sold | 193 | 924 | 1,043 | 752 | 753 | |||||||||||||||
Net cash used in financing activities | (33,868 | ) | (28,256 | ) | (26,924 | ) | (27,283 | ) | (44,027 | ) | ||||||||||
| Effects of exchange rate changes on cash | 217 | (85 | ) | (153 | ) | 520 | (2,743 | ) | ||||||||||||
| Increase/(decrease) in cash and cash equivalents | (3,082 | ) | 4,839 | (2,868 | ) | (20,744 | ) | (2,544 | ) | |||||||||||
| Cash and cash equivalents at beginning of year | 12,664 | 7,825 | 10,693 | 31,437 | 33,981 | |||||||||||||||
Cash and cash equivalents at end of year | 9,582 | 12,664 | 7,825 | 10,693 | 31,437 | |||||||||||||||
The information in the Summary Statement of Income (for 2010 to 2012), the Summary Balance Sheet (for 2011 and 2012), and the Summary Statement of Cash Flows (for 2010 to 2012), shown on pages 90 through 92, corresponds to the information in the Consolidated Statement of Income, Consolidated Balance Sheet, and the Consolidated Statement of Cash Flows in the financial statements of ExxonMobil’s 2012 Form 10-K. See also Management’s Discussion and Analysis of Financial Condition and Results of Operations and other information in the Financial Section of the 2012 Form 10-K.
Table of Contents
| 93 |
Frequently Used Terms
Listed below are definitions of several of ExxonMobil’s key business and financial performance measures and other terms. These definitions are provided to facilitate understanding of the terms and their calculation. In the case of financial measures that we believe constitute “non-GAAP financial measures” under Securities and Exchange Commission Regulation G, we provide a reconciliation to the most comparable Generally Accepted Accounting Principles (GAAP) measure and other information required by that rule.
Earnings Excluding Special Items•In addition to reporting U.S. GAAP defined net income, ExxonMobil also presents a measure of earnings that excludes earnings from special items quantified and described in our quarterly and annual earnings press releases. Earnings excluding special items is a non-GAAP financial measure, and is included to facilitate comparisons of base business performance across periods. A reconciliation to net income attributable to ExxonMobil is shown on page 85. We also refer to earnings excluding special items as normalized earnings. Earnings per share amounts use the same average common shares outstanding as used for the calculation of earnings per common share and earnings per common share – assuming dilution.
Total Shareholder Return • Measures the change in value of an investment in stock over a specified period of time, assuming dividend reinvestment. We calculate shareholder return over a particular measurement period by: dividing (1) the sum of (a) the cumulative value of dividends received during the measurement period, assuming reinvestment, plus (b) the difference between the stock price at the end and at the beginning of the measurement period; by (2) the stock price at the beginning of the measurement period. For this purpose, we assume dividends are reinvested in stock at market prices at approximately the same time actual dividends are paid. Shareholder return is usually quoted on an annualized basis.
Capital and Exploration Expenditures (Capex)•Represents the combined total of additions at cost to property, plant and equipment and exploration expenses on a before-tax basis from the Summary Statement of Income. ExxonMobil’s Capex includes its share of similar costs for equity companies. Capex excludes depreciation on the cost of exploration support equipment and facilities recorded to property, plant and equipment when acquired. While ExxonMobil’s management is responsible for all investments and elements of net income, particular focus is placed on managing the controllable aspects of this group of expenditures.
Entitlement Volume Effects•Production Sharing Contract (PSC) net interest reductions are contractual reductions in ExxonMobil’s share of production volumes covered by PSCs. These reductions typically occur when cumulative investment returns or production volumes achieve thresholds as specified in the PSCs. Once a net interest reduction has occurred, it typically will not be reversed by subsequent events, such as lower crude oil prices. Price and Spend Impacts on Volumes are fluctuations in ExxonMobil’s share of production volumes caused by changes in oil and gas prices or spending levels from one period to another. For example, at higher prices, fewer barrels are required for ExxonMobil to recover its costs. According to the terms of contractual arrangements or government royalty regimes, price or spending variability can increase or decrease royalty burdens and/or volumes attributable to ExxonMobil. These effects generally vary from period to period with field spending patterns or market prices for crude oil or natural gas.
Heavy Oil and Oil Sands•Heavy oil, for the purpose of this report, includes heavy oil, extra heavy oil, and bitumen, as defined by the World Petroleum Congress in 1987 based on American Petroleum Institute (API) gravity and viscosity at reservoir conditions. Heavy oil has an API gravity between 10 and 22.3 degrees. The API gravity of extra heavy oil and bitumen is less than 10 degrees. Extra heavy oil has a viscosity less than 10 thousand centipoise, whereas the viscosity of bitumen is greater than 10 thousand centipoise. The term “oil sands” is used to indicate heavy oil (generally bitumen) that is recovered in a mining operation.
Proved Reserves•Proved reserves in this publication for 2009 and later years are based on current SEC definitions, but for prior years, the referenced proved reserve volumes are determined on bases that differ from SEC definitions in effect at the time. Specifically, for years prior to 2009 included in our five-year average replacement ratio, reserves are determined using the SEC pricing basis but including oil sands and our pro-rata share of equity company reserves for all periods. Prior to 2009, oil sands and equity company reserves were not included in proved oil and gas reserves as defined by the SEC. In addition, prior to 2009, the SEC defined price as the market price on December 31; beginning in 2009, the SEC changed the definition to the average of the market prices on the first day of each calendar month during the year. For years prior to 2009 included in our 19 straight years of at least 100-percent replacement, reserves are determined using the price and cost assumptions we use in managing the business, not the historical prices used in SEC definitions. Reserves determined on ExxonMobil’s pricing basis also include oil sands and equity company reserves for all periods.
Resources, Resource Base, and Recoverable Resources•Along with similar terms used in this report, refers to the total remaining estimated quantities of oil and gas that are expected to be ultimately recoverable. ExxonMobil refers to new discoveries and acquisitions of discovered resources as resource additions. The resource base includes quantities of oil and gas that are not yet classified as proved reserves, but which ExxonMobil believes will likely be moved into the proved reserves category and produced in the future. The term “resource base” is not intended to correspond to SEC definitions such as “probable” or “possible” reserves.
Proved Reserves Replacement Ratio•The reserves replacement ratio is calculated for a specified period utilizing the applicable proved oil-equivalent reserves additions divided by oil-equivalent production. See “Proved Reserves” above.
Prime Product Sales•Prime product sales are total product sales excluding carbon black oil and sulfur. Prime product sales include ExxonMobil’s share of equity-company volumes and finished-product transfers to the Downstream.
| CASH FLOW FROM OPERATIONS AND ASSET SALES | 2012 | 2011 | 2010 | 2009 | 2008 | ||||||||||||||
(millions of dollars) | |||||||||||||||||||
| Net cash provided by operating activities | 56,170 | 55,345 | 48,413 | 28,438 | 59,725 | ||||||||||||||
| Proceeds associated with sales of subsidiaries, property, plant and equipment, and sales and returns of investments | 7,655 | 11,133 | 3,261 | 1,545 | 5,985 | ||||||||||||||
| Cash flow from operations and asset sales | 63,825 | 66,478 | 51,674 | 29,983 | 65,710 | ||||||||||||||
Cash flow from operations and asset sales is the sum of the net cash provided by operating activities and proceeds associated with sales of subsidiaries, property, plant and equipment, and sales and returns of investments from the Summary Statement of Cash Flows. This cash flow is the total sources of cash from both operating the Corporation’s assets and from the divesting of assets. The Corporation employs a long-standing and regular disciplined review process to ensure that all assets are contributing to the Corporation’s strategic objectives. Assets are divested when they are no longer meeting these objectives or are worth considerably more to others. Because of the regular nature of this activity, we believe it is useful for investors to consider proceeds associated with asset sales together with cash provided by operating activities when evaluating cash available for investment in the business and financing activities, including shareholder distributions.
Table of Contents
| 94 | EXXONMOBIL 2012 FINANCIAL & OPERATING REVIEW |
| PROVED RESERVES REPLACEMENT COSTS | 2012 | 2011 | 2010 | 2009 | 2008 | ||||||||||||||
Costs incurred (millions of dollars) | |||||||||||||||||||
| Property acquisition costs | 2,207 | 3,787 | 45,461 | 1,285 | 663 | ||||||||||||||
| Exploration costs | 2,861 | 2,503 | 3,055 | 3,111 | 2,272 | ||||||||||||||
| Development costs | 27,482 | 25,690 | 23,210 | 17,130 | 14,633 | ||||||||||||||
| Total costs incurred | 32,550 | 31,980 | 71,726 | 21,526 | 17,568 | ||||||||||||||
Proved oil-equivalent reserves additions (millions of barrels) | |||||||||||||||||||
| Revisions | 159 | 281 | 505 | 383 | 690 | ||||||||||||||
| Improved recovery | 23 | – | 5 | 15 | 7 | ||||||||||||||
| Extensions/discoveries | 1,490 | 1,613 | 516 | 1,091 | 1,423 | ||||||||||||||
| Purchases | 304 | 67 | 2,510 | 1 | – | ||||||||||||||
| Total oil-equivalent reserves additions | 1,976 | 1,961 | 3,536 | 1,490 | 2,120 | ||||||||||||||
Proved reserves replacement costs (dollars per barrel) | 16.47 | 16.31 | 20.28 | 14.45 | 8.29 | ||||||||||||||
Proved reserves replacement costs per oil-equivalent barrel is a performance measure ratio and includes costs incurred in property acquisition and exploration, plus costs incurred in development activities, divided by proved oil-equivalent reserves additions, excluding sales. Unless otherwise specified, ExxonMobil reports these costs based on proved reserves using SEC historical prices and costs. See “Proved Reserves” on previous page.
| EXPLORATION RESOURCE ADDITION COST | 2012 | 2011 | 2010 | 2009 | 2008 | ||||||||||||||
Exploration portion of Upstream Capex (millions of dollars) | 4,740 | 5,464 | 4,121 | 3,718 | 2,871 | ||||||||||||||
Exploration resource additions (millions of oil-equivalent barrels) | 3,734 | 3,906 | 4,725 | 2,860 | 2,230 | ||||||||||||||
Exploration resource addition cost per OEB (dollars) | 1.27 | 1.40 | 0.87 | 1.30 | 1.29 | ||||||||||||||
Exploration resource addition cost per oil-equivalent barrel is a performance measure that is calculated using the Exploration portion of Upstream capital and exploration expenditures (Capex) divided by exploration resource additions (in oil-equivalent barrels – OEB). ExxonMobil refers to new discoveries, and the non-proved portion of discovered resources that were acquired, as exploration resource additions. Exploration resource additions include quantities of oil and gas that are not yet classified as proved reserves, but which ExxonMobil believes will likely be moved into the proved reserves category and produced in the future. The impact of the XTO Energy Inc. merger transaction is excluded in 2010.
| OPERATING COSTS | 2012 | 2011 | 2010 | 2009 | 2008 | ||||||||||||||
(millions of dollars) | |||||||||||||||||||
Reconciliation of Operating Costs | |||||||||||||||||||
| From ExxonMobil’s Consolidated Statement of Income | |||||||||||||||||||
| Total costs and other deductions | 403,569 | 413,172 | 330,262 | 275,809 | 393,962 | ||||||||||||||
| Less: | |||||||||||||||||||
| Crude oil and product purchases | 265,149 | 266,534 | 197,959 | 152,806 | 249,454 | ||||||||||||||
| Interest expense | 327 | 247 | 259 | 548 | 673 | ||||||||||||||
| Sales-based taxes | 32,409 | 33,503 | 28,547 | 25,936 | 34,508 | ||||||||||||||
| Other taxes and duties | 35,558 | 39,973 | 36,118 | 34,819 | 41,719 | ||||||||||||||
| Subtotal | 70,126 | 72,915 | 67,379 | 61,700 | 67,608 | ||||||||||||||
| ExxonMobil’s share of equity-company expenses | 12,239 | 11,401 | 9,049 | 6,670 | 7,204 | ||||||||||||||
| Total operating costs | 82,365 | 84,316 | 76,428 | 68,370 | 74,812 | ||||||||||||||
Components of Operating Costs | |||||||||||||||||||
| From ExxonMobil’s Consolidated Statement of Income | |||||||||||||||||||
| Production and manufacturing expenses | 38,521 | 40,268 | 35,792 | 33,027 | 37,905 | ||||||||||||||
| Selling, general, and administrative expenses | 13,877 | 14,983 | 14,683 | 14,735 | 15,873 | ||||||||||||||
| Depreciation and depletion | 15,888 | 15,583 | 14,760 | 11,917 | 12,379 | ||||||||||||||
| Exploration expenses, including dry holes | 1,840 | 2,081 | 2,144 | 2,021 | 1,451 | ||||||||||||||
| Subtotal | 70,126 | 72,915 | 67,379 | 61,700 | 67,608 | ||||||||||||||
| ExxonMobil’s share of equity-company expenses | 12,239 | 11,401 | 9,049 | 6,670 | 7,204 | ||||||||||||||
| Total operating costs | 82,365 | 84,316 | 76,428 | 68,370 | 74,812 | ||||||||||||||
Operating costs are the costs during the period to produce, manufacture, and otherwise prepare the company’s products for sale – including energy, staffing, and maintenance costs. They exclude the cost of raw materials, taxes, and interest expense and are on a before-tax basis. While ExxonMobil’s management is responsible for all revenue and expense elements of net income, operating costs, as defined above, represent the expenses most directly under management’s control and therefore, are useful for investors and ExxonMobil management in evaluating management’s performance.
Table of Contents
| 95 |
| CAPITAL EMPLOYED | 2012 | 2011 | 2010 | 2009 | 2008 | |||||||||||||||
(millions of dollars) | ||||||||||||||||||||
Business Uses: Asset and Liability Perspective | ||||||||||||||||||||
| Total assets | 333,795 | 331,052 | 302,510 | 233,323 | 228,052 | |||||||||||||||
| Less liabilities and noncontrolling interests share of assets and liabilities | ||||||||||||||||||||
| Total current liabilities excluding notes and loans payable | (60,486 | ) | (69,794 | ) | (59,846 | ) | (49,585 | ) | (46,700 | ) | ||||||||||
| Total long-term liabilities excluding long-term debt | (90,068 | ) | (83,481 | ) | (74,971 | ) | (58,741 | ) | (54,404 | ) | ||||||||||
| Noncontrolling interests share of assets and liabilities | (6,235 | ) | (7,314 | ) | (6,532 | ) | (5,642 | ) | (6,044 | ) | ||||||||||
| Add ExxonMobil share of debt-financed equity-company net assets | 5,775 | 4,943 | 4,875 | 5,043 | 4,798 | |||||||||||||||
| Total capital employed | 182,781 | 175,406 | 166,036 | 124,398 | 125,702 | |||||||||||||||
Total Corporate Sources: Debt and Equity Perspective | ||||||||||||||||||||
| Notes and loans payable | 3,653 | 7,711 | 2,787 | 2,476 | 2,400 | |||||||||||||||
| Long-term debt | 7,928 | 9,322 | 12,227 | 7,129 | 7,025 | |||||||||||||||
| ExxonMobil share of equity | 165,863 | 154,396 | 146,839 | 110,569 | 112,965 | |||||||||||||||
| Less noncontrolling interests share of total debt | (438 | ) | (966 | ) | (692 | ) | (819 | ) | (1,486 | ) | ||||||||||
| Add ExxonMobil share of equity-company debt | 5,775 | 4,943 | 4,875 | 5,043 | 4,798 | |||||||||||||||
| Total capital employed | 182,781 | 175,406 | 166,036 | 124,398 | 125,702 | |||||||||||||||
Capital employed is a measure of net investment. When viewed from the perspective of how the capital is used by the businesses, it includes ExxonMobil’s net share of property, plant and equipment and other assets less liabilities, excluding both short-term and long-term debt. When viewed from the perspective of the sources of capital employed in total for the Corporation, it includes ExxonMobil’s share of total debt and equity. Both of these views include ExxonMobil’s share of amounts applicable to equity companies, which the Corporation believes should be included to provide a more comprehensive measure of capital employed.
| RETURN ON AVERAGE CAPITAL EMPLOYED (ROCE) | 2012 | 2011 | 2010 | 2009 | 2008 | |||||||||||||||
(millions of dollars) | ||||||||||||||||||||
| Net income attributable to ExxonMobil | 44,880 | 41,060 | 30,460 | 19,280 | 45,220 | |||||||||||||||
| Financing costs (after tax) | ||||||||||||||||||||
| Gross third-party debt | (401 | ) | (153 | ) | (803 | ) | (303 | ) | (343 | ) | ||||||||||
| ExxonMobil share of equity companies | (257 | ) | (219 | ) | (333 | ) | (285 | ) | (325 | ) | ||||||||||
| All other financing costs – net | 100 | 116 | 35 | (483 | ) | 1,485 | ||||||||||||||
| Total financing costs | (558 | ) | (256 | ) | (1,101 | ) | (1,071 | ) | 817 | |||||||||||
| Earnings excluding financing costs | 45,438 | 41,316 | 31,561 | 20,351 | 44,403 | |||||||||||||||
| Average capital employed | 179,094 | 170,721 | 145,217 | 125,050 | 129,683 | |||||||||||||||
| Return on average capital employed – corporate total | 25.4% | 24.2% | 21.7% | 16.3% | 34.2% | |||||||||||||||
ROCE is a performance measure ratio. From the perspective of the business segments, ROCE is annual business segment earnings divided by average business segment capital employed (average of beginning and end-of-year amounts). These segment earnings include ExxonMobil’s share of segment earnings of equity companies, consistent with our capital employed definition, and exclude the cost of financing. The Corporation’s total ROCE is net income attributable to ExxonMobil excluding the after-tax cost of financing, divided by total corporate average capital employed. The Corporation has consistently applied its ROCE definition for many years and views it as the best measure of historical capital productivity in our capital-intensive, long-term industry, both to evaluate management’s performance and to demonstrate to shareholders that capital has been used wisely over the long term. Additional measures, which are more cash flow based, are used to make investment decisions. See pages 85 and 86 for segment information relevant to ROCE.
| DISTRIBUTIONS TO SHAREHOLDERS | 2012 | 2011 | 2010 | 2009 | 2008 | |||||||||||||||
(millions of dollars) | ||||||||||||||||||||
| Dividends paid to ExxonMobil shareholders | 10,092 | 9,020 | 8,498 | 8,023 | 8,058 | |||||||||||||||
| Cost of shares purchased to reduce shares outstanding | 20,000 | 20,000 | 11,200 | 18,000 | 32,000 | |||||||||||||||
| Distributions to ExxonMobil shareholders | 30,092 | 29,020 | 19,698 | 26,023 | 40,058 | |||||||||||||||
| Memo: Gross cost of shares purchased to offset shares issued under benefit plans and programs | 1,068 | 2,055 | 1,893 | 1,703 | 3,734 | |||||||||||||||
The Corporation distributes cash to shareholders in the form of both dividends and share purchases. Shares are purchased both to reduce shares outstanding and to offset shares issued in conjunction with company benefit plans and programs. For purposes of calculating distributions to shareholders, the Corporation only includes the cost of those shares purchased to reduce shares outstanding.
Table of Contents
| 96 | EXXONMOBIL 2012 FINANCIAL & OPERATING REVIEW |
Index
| Africa | 39-42 | |||
| Asia Pacific | 43-47, 65, 79 | |||
| Australia/Oceania | 48-49 | |||
| Balance Sheet | 91 | |||
| Business strategies | 18, 62, 76 | |||
| Canada | 20, 21, 33-35, 64, 65 | |||
| Capital and exploration expenditures | 1, 6, 18, 84, 88, 89, 93, 94 | |||
| Capital employed | 1, 2, 6, 18, 62, 63, 68, 76, 83, 84, 86, 95 | |||
| Cash flow | 84, 92, 93 | |||
| Cash Flow Statement | 92 | |||
| Chemical results | 76 | |||
| Chemical volumes | 83 | |||
| Depreciation and depletion | 58, 59, 87, 90, 92, 94 | |||
| Dividend and shareholder distributions | 1, 2, 84, 95 | |||
| Downstream results | 62 | |||
| Earnings | 1, 2, 18, 58-59, 62, 76, 85, 90 | |||
| Earnings per barrel | 58-59 | |||
| Entitlement volumes | 28 | |||
| Europe | 36-38, 65, 78-79 | |||
| Financial Highlights | 84 | |||
| Frequently Used Terms | 93-95 | |||
| Fuels, Lubricants & Specialties | 62 | |||
| Fuels Marketing | 64, 66, 72, 79 | |||
| Heavy oil and oil sands | 12, 19, 22, 30, 34, 65, 67, 93 | |||
| Income Statement | 90 | |||
| Integration | 3, 12, 13, 62-63, 65, 67, 69, 76-81 | |||
| Key financial ratios | 84 | |||
| LNG | 20, 22, 28, 31, 33, 36-38, 43-45, 48-49 | |||
| Middle East | 79 | |||
| Molecule Management | 8-9, 12-13 | |||
| Natural gas and power marketing | 12 | |||
| Operating costs | 10, 68, 87, 94 | |||
| Operations Integrity Management System (OIMS) | 10-11 | |||
| Opportunity captures | 20-21, 67-69, 81 | |||
| Petroleum product sales | 73 | |||
| Price and spend impacts | 93 | |||
| Production sharing contract | 21, 28, 38, 42, 47 | |||
| Production volumes | 18, 28, 50-51 | |||
| Property, plant and equipment | 87, 91 | |||
| Qatar | 43-44 | |||
| Refinery utilization | 70 | |||
| Refining capacity | 65, 69, 70-72 | |||
| Reserves and resources | 22, 23, 54-57, 93 | |||
| Reserves replacement costs | 94 | |||
| Reserves replacement ratio | 18, 23, 55, 93 | |||
| Retail sites | 64, 72 | |||
| Return on average capital employed | 1, 2, 18, 62, 63, 76, 83, 84, 86, 95 | |||
| Russia/Caspian | 21, 45, 46 | |||
| Safety, Security, Health & Environment | 10-11, 28 | |||
| Share purchases | 95 | |||
| Shareholder return | 1, 84, 93 | |||
| South America | 35 | |||
| Technology | 3, 8-9, 24, 25, 66, 80-81 | |||
| Unconventional | 32 | |||
| United States | 20, 21, 30-33, 64, 78 | |||
| Upstream development project summary | 26-27 | |||
| Upstream production outlook | 28 | |||
| Upstream results | 18 | |||
| Wells, net drilled | 52 | |||
Data Tables | ||||
Corporate Financial Tables | ||||
| Capital and Exploration Expenditures | 88-89 | |||
| Capital Employed/ROCE | 86 | |||
| Financial Statements | 90-92 | |||
| Functional Earnings | 85 | |||
Business Tables | ||||
| Upstream | 50-59 | |||
| Downstream | 70-73 | |||
| Chemical | 82-83 |
Exxon Mobil Corporation has numerous affiliates, many with names that include ExxonMobil, Exxon, Mobil, Esso, and XTO. For convenience and simplicity, those terms and terms such as Corporation, company, our, we, and its are sometimes used as abbreviated references to specific affiliates or affiliate groups. Abbreviated references describing global or regional operational organizations, and global or regional business lines are also sometimes used for convenience and simplicity. Similarly, ExxonMobil has business relationships with thousands of customers, suppliers, governments, and others. For convenience and simplicity, words such as venture, joint venture, partnership, co-venturer, and partner are used to indicate business and other relationships involving common activities and interests, and those words may not indicate precise legal relationships.
The following are trademarks, service marks, or proprietary process names of Exxon Mobil Corporation or one of its affiliates: ExxonMobil, EMprise, Esso, Exxon, Mobil, Mobil 1, Mobil Delvac 1, Mobil SHC, Controlled Freeze Zone, Enable, Exceed, Mazeflo, Exxal, Vistamaxx, Just-In-Time Perforating, and Taking on the World’s Toughest Energy Challenges.
The following third-party trademarks or service marks referenced in the text of the report are owned by the entities indicated:Porsche (Dr. Ing. H.c.F. Porsche AG), Mercedes AMG (Daimler AG), Cadillac and Corvette (General Motors LLC), andLexus (Toyota Jidosha KK).
Table of Contents


General Information
Corporate Headquarters
Exxon Mobil Corporation
5959 Las Colinas Boulevard
Irving, TX 75039-2298
Additional copies may be
obtained by writing or phoning:
Phone: 972-444-1000
Fax: 972-444-1505
Shareholder Relations
Exxon Mobil Corporation
P.O. Box 140369
Irving, TX 75014-0369
Market Information
The New York Stock Exchange is the principal exchange
on which Exxon Mobil Corporation common stock
(symbol XOM) is traded.
on which Exxon Mobil Corporation common stock
(symbol XOM) is traded.
Annual Meeting
The 2013 Annual Meeting of Shareholders will be held at
9:00 a.m. Central Time on Wednesday, May 29, 2013, at:
9:00 a.m. Central Time on Wednesday, May 29, 2013, at:
The Morton H. Meyerson Symphony Center
2301 Flora Street
Dallas, TX 75201
The meeting will be audiocast live on the Internet.
Instructions for listening to this audiocast will be
available on the Internet at exxonmobil.com
approximately one week prior to the event.
Instructions for listening to this audiocast will be
available on the Internet at exxonmobil.com
approximately one week prior to the event.

EXXONMOBIL ON THE INTERNET
A quick, easy way to get information about ExxonMobil
ExxonMobil publications and important shareholder information are available on the Internet atexxonmobil.com:
• Publications
• Stock Quote
• Dividend Information
• Contact Information
• Speeches
• News Releases
• Investor Presentations
• Corporate Governance
Table of Contents

Corporate Headquarters
5959 Las Colinas Blvd.
Irving, Texas 75039-2298
exxonmobil.com
5959 Las Colinas Blvd.
Irving, Texas 75039-2298
exxonmobil.com