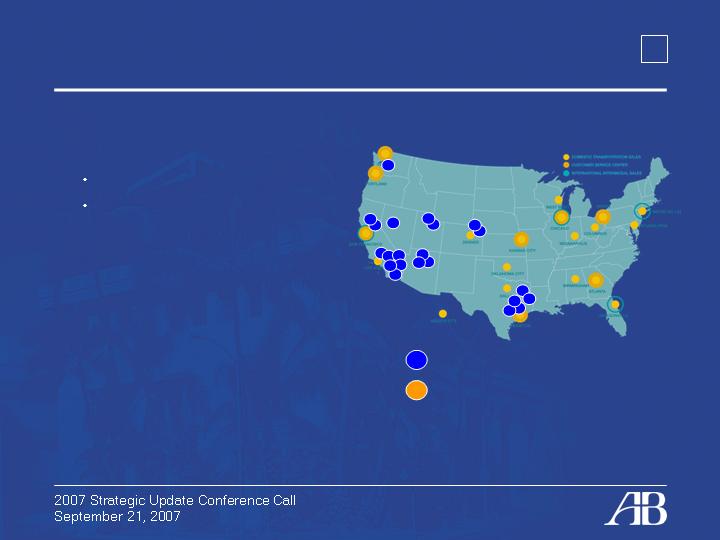
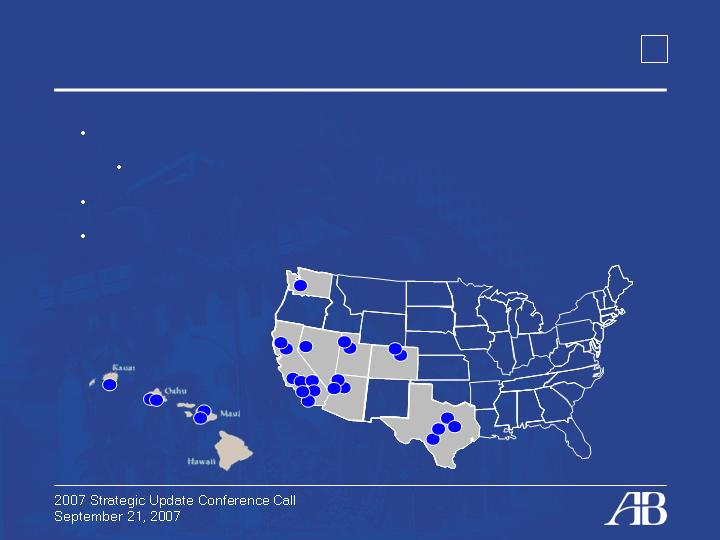
Strategic Update
Conference Call
September 21, 2007
1

“Statements in this presentation and conference call that set forth
expectations or predictions are based on facts and situations that
are known to us as of today, September 21, 2007.
“Actual results may differ materially, due to risks and uncertainties,
such as those described on pages 16-22 of the Form 10-K in our
2006 annual report and our other subsequent filings with the SEC.
Statements in this presentation and conference call are not
guarantees of future performance.”
Disclosure
2
2007 Update
Key Takeaways from Strategic Plan
Economic Environments
Inside the Supply Chain
Targeted Real Estate Investment
Leveraging our Financial Strength
Call Agenda
3
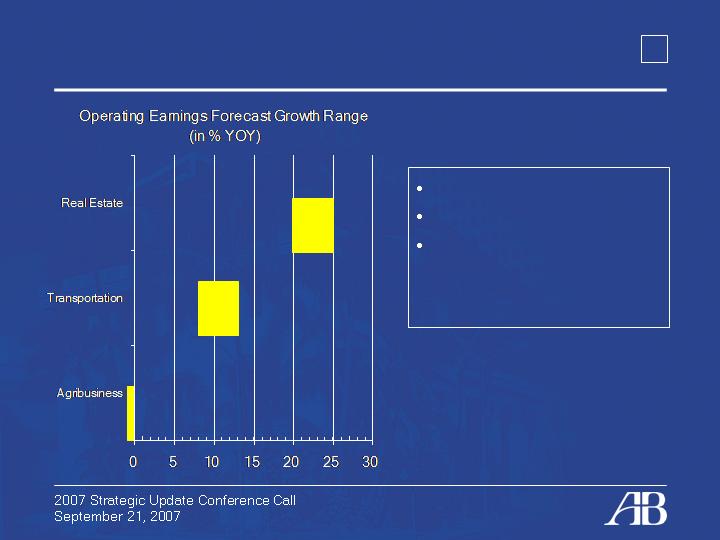
Real Estate: 20 - 25%
Transportation: 8 – 13%
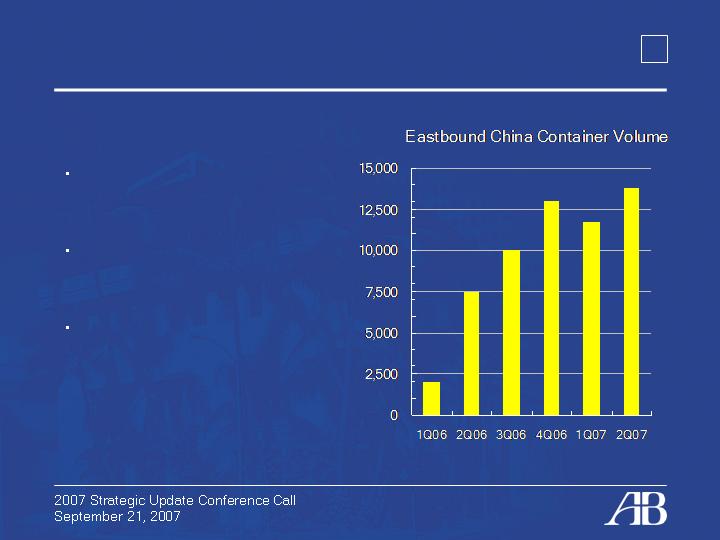
3Q Earnings webcast
scheduled for 10/26
from Shanghai
2007 Business Outlook
4
2007 Update
Key Takeaways from Strategic Plan
Economic Environments
Inside the Supply Chain
Targeted Real Estate Investment
Leveraging our Financial Strength
Call Agenda
5

Strategic Plan Overview
Biennial strategic plan complete
Six-month iterative process from ground up
Solid growth prospects characterize plan
Key goal is to sustain growth in shareholder value
6

Common Strengths
Growing with what we know
Established brands and expertise are
essential to growth initiatives
Strong asset base and competitive positions
Debt capacity and projected cash flows will
again provide opportunities
Growth with a balanced risk profile
7

Key Elements of our Plan
Capitalize on investment opportunities caused by
less robust economic environments
Build on increasing international transportation
perspective and reputation
Pursuing “door-to-door” via logistics and RE
Exploring additional “port-to-port” strategies
Develop opportunities on U.S. mainland
Increase commitment to grow commercial portfolio
via land monetization
Maintain position of strength in Hawaii
8
Creating Shareholder Value
*Through September 14, 2007. ALEX vs. indices in basis points.
+130
+40
+1440
A&B vs. SPREIT
19.6
17.6
1.8
SPREIT Index
+ 320
+ 260
+ 650
A&B vs. TRAN
17.7
15.4
9.7
TRAN Index
12.8
11.6
14.9
S&P 500 (SPX)
+ 810
+ 640
+ 130
A&B vs. S&P
18.0
3 Yr
20.9
16.2
ALEX
5 Yr
1 Yr
(Total Shareholder Return %)
9

Shareholder Value Objectives
10 – 12% annual earnings growth – non-linear
Commitment to sustained dividend growth
Opportunistic share repurchases
Focused growth in higher-value segments
10
2007 Update
Key Takeaways from Strategic Plan
Economic Environments
Inside the Supply Chain
Targeted Real Estate Investment
Leveraging our Financial Strength
Call Agenda
11
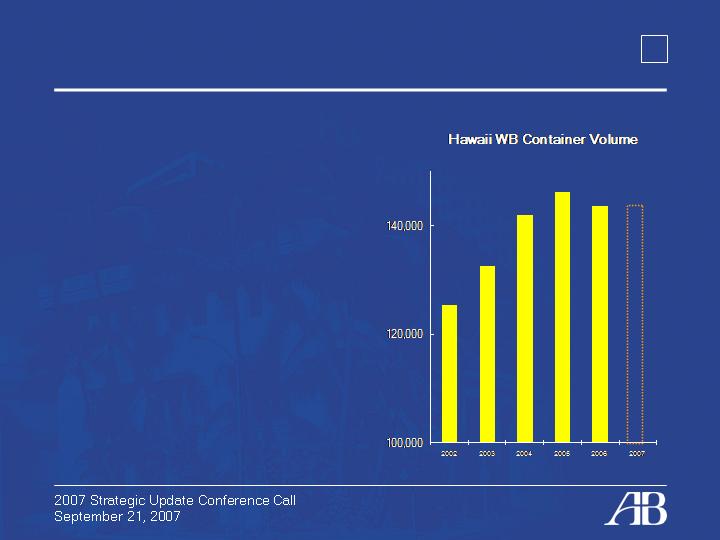
Economic Environment/Opportunities
Hawaii Transportation
Economic growth plateau;
container/auto volumes flat
Continued Matson strength
and market depth
Manage costs, seek reductions
Fleet deployment efficiency
Economic Environment
Opportunities
12
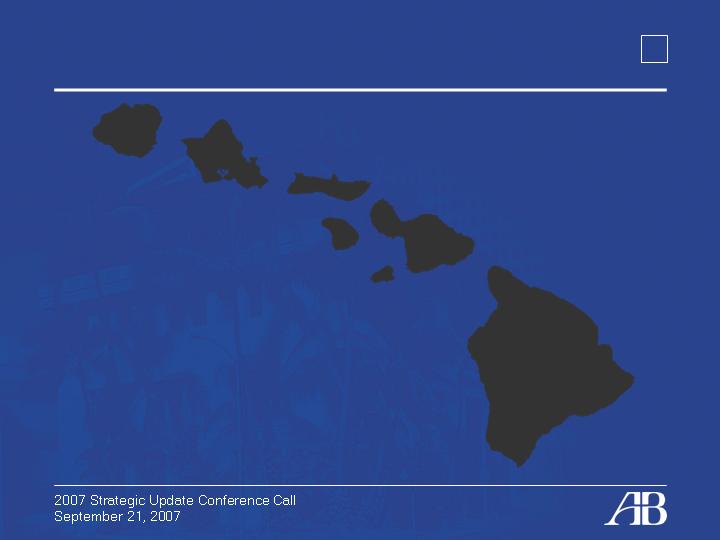
Economic Environment/Opportunities
Hawaii Real Estate
Residential markets cyclically impacted
Modest to moderate impact on development pipeline
Commercial markets robust and stable
Continued supply constraint in all asset classes
Investment opportunities may accelerate
Economic Environment
Opportunities
13

Economic Environment/Opportunities
Real Estate Scenarios & Response
Modest impact on residential sales through 2008
Greater impact if prolonged to 2009 and beyond
Good environment for opportunistic investments
Little impact on short/mid-term performance
Investment environment remains challenging
III. Residential and commercial markets stable
Note: Entitlement velocity relatively independent of market cycles
II. Rise in commercial cap rates
Turnover of commercial properties sales might slow
Better environment for long-term investments
+
-
+
-
=
-
+
I. Contraction in residential markets
14

Economic Environment/Opportunities
International
Global trade prospects strong
Asian economies projected to expand by 8% in 2007, 2008
China economy strong
PRC projected to expand by 9% from 2007 - 2011
Guam outlook positive with military influx
$10B military build-up for 8K Marines
$2.6B infrastructure build-out
Economic Environment
Opportunities
Expand Asian business model
Guam infrastructure/real estate
15
Economic Environment/Opportunities
United States
MIL markets/volumes
Short-term weakness
Long-term expansion
Real Estate backbone to global trade
Supply chain outsourcing growing
Well-located logistics properties
increasingly valuable
Logistics/Real Estate links forming
Leasing portfolio
MIL offices/network
Economic Environment
Opportunities
16
2007 Update
Key Takeaways from Strategic Plan
Economic Environments
Inside the Supply Chain
Targeted Real Estate Investment
Leveraging our Financial Strength
Call Agenda
17

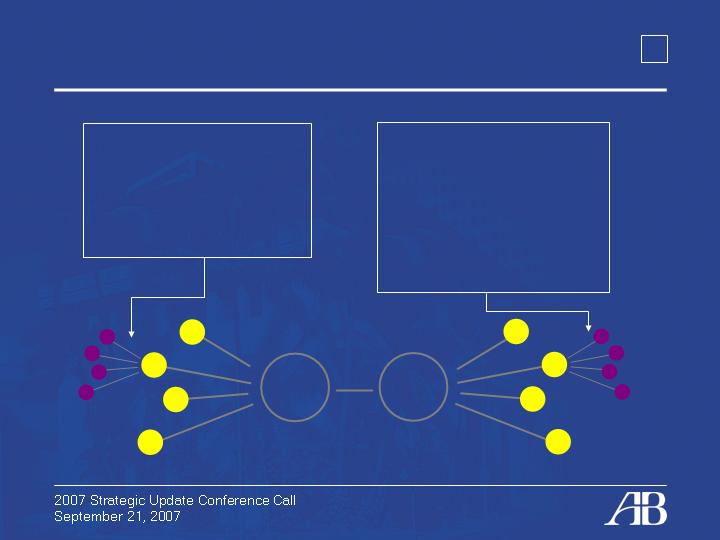
Inside the Supply Chain
Evolution versus Revolution
Value creation shifts from “port-to-port” to “door-to-door”
based on ALEX asset, market and financial strength
Port to Port
Matson Navigation
China/Asia
Port to DC
Matson
Integrated
Logistics
DC to Retail
Matson Global
United States
DC to Port
Matson
Integrated
Logistics
Factory to
Distribution Center
Matson Global
PORT
PORT
18
Inside the Supply Chain
China Service – Port to Port
Reaching full capacity with
current deployment
Growing yields primary focus:
progress in 2007
Exploring other port to port
options
19
Inside the Supply Chain
Matson Integrated Logistics – Domestic Port to Door
Rail Highway Expedited Specialty Warehousing
Favorable Industry
Growth
Core Competency
(A&B Properties
Warehousing)
Acquisition Appetite
20
Inside the Supply Chain
Matson Global Distribution Services – Door to Door
Asia
Warehousing
NVOCC
Freight Forwarding
Inland Transportation
United States
Guaranteed China-U.S.
Deconsolidation/Transload
Warehousing
Value Added Services
NVOCC/Freight Forwarding
Network Design
Local Distribution
21
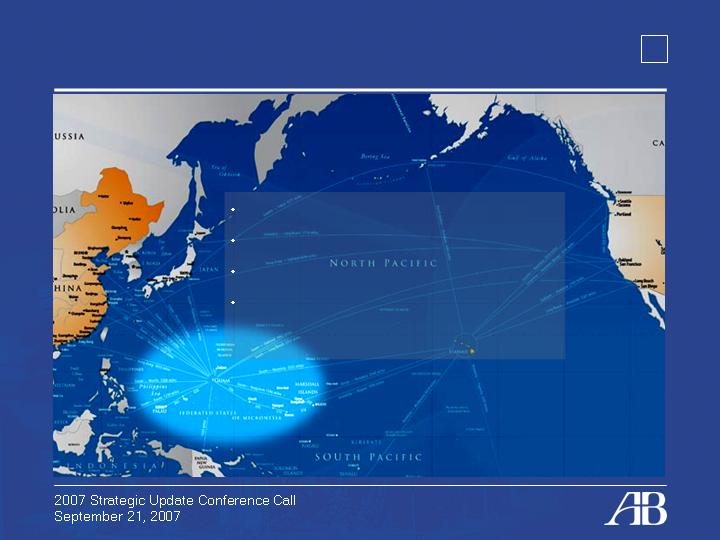
A Rising Guam Market
Military redeployment provides opportunity
Rising volume tide evidenced in 2007
Significant infrastructure requirements
Potential to grow as transshipment center
22
2007 Update
Key Takeaways from Strategic Plan
Economic Environments
Inside the Customer Supply Chain
Targeted Real Estate Investment
Leveraging our Financial Strength
Call Agenda
23

Targeted Real Estate Investments
Earn
Operate, realize value of current development
pipeline investments & leasing portfolio
Grow
Dedicated development expansion; Hawaii first,
mainland second, but increasing
Allocate
Leasing portfolio expansion from land monetization
Continued use of 1031 exchange
24
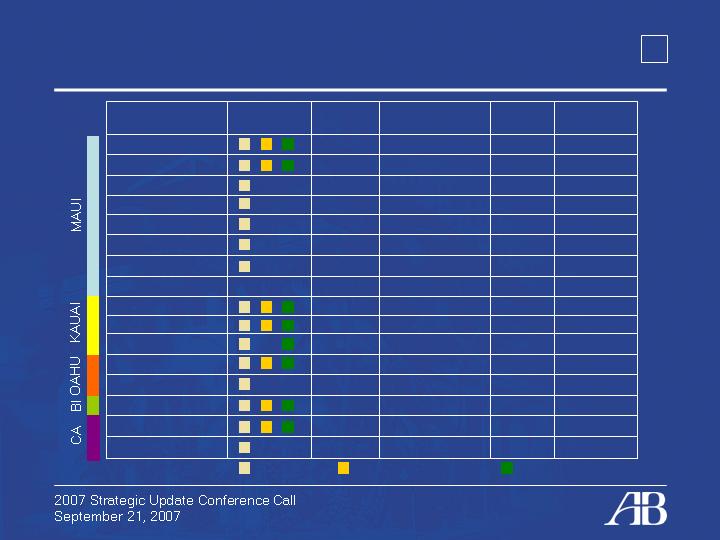
Targeted Real Estate Investments
Development Pipeline – Earn
137
31
SF/MF Homes
J.V.
Ka Milo
5
57
Commercial
J.V.
Valencia
TBD
30
Commercial
J.V.
Bakersfield
5,000
352
24
132
1,200
TBD
440R/200K s.f.
103
TBD
75
9
1C/12R
150
Total Units
325
SF Lots
A&B
Brydeswood
17
SF Homes
A&B
Port Allen
4
Condominium
A&B
Kane Street
20
Mixed Use
A&B
Kahului Town Center
180
Commercial
A&B
Maui Business Park II
1,000
3
1,000
145
13
7
11
25
Acreage
J.V.
A&B
J.V.
TBD
A&B
A&B
A&B
J.V.
Structure
Master Community
Condominium
Mixed Use
TBD
MF Homes
SF Lots
Comm/Res.
MF Homes
Asset
Class
Waiawa
Keola La'i
Kukui'ula
Additional Wailea
Wailea MF-7
Wailea MF-19
Wailea MF-11
Kai Malu at Wailea
Status
Entitled
Under construction
Sales Commenced
25

Targeted Real Estate Investments
Development Pipeline – Earn
Current diversified pipeline strength
valuable in down cycle
Diversified portfolio across geography, asset class
No direct exposure to credit market contagion
Income generation relatively secure
Free cash flow significant
26

Targeted Real Estate Investments
Project X - Grow
Hawaii projects first
Initial mainland focus in Southern California
Continue to exploit historical areas of strength:
resort and lifestyle communities
secondary, strengthening markets
Expand joint venture activities
Patience: cyclical opportunities will emerge
27
Targeted Real Estate Investments
Leasing Portfolio Reinvestment – Earn, Grow & Allocate
Strength of current model
Growing historical/prospective earnings streams
Portfolio expansion through 1031 exchanges
Concentration and asset-class focus possible
28
Targeted Real Estate Investments
Recycling Assets into Earnings Streams – Grow & Allocate
Target bulk land sales to accelerate capture of
underlying value
Reinvest proceeds to grow commercial portfolio
29
Targeted Real Estate Investments
Capital Deployment in Strategic Plan - Allocate
New Capital
Recycled Capital
1031 Exchanges
New
Investments
(Project X)
Pipeline
Development
30

Agribusiness
Sugar/coffee still best use of agricultural lands
Return to historical sugar production levels of 200K
tons annually
Triple specialty sugar capacity to 60K tons
Determine role of energy initiatives in HC&S’ future
31
2007 Update
Key Takeaways from Strategic Plan
Economic Environments
Inside the Customer Value & Supply Chain
Targeted Real Estate Investment
Leveraging our Financial Strength
Call Agenda
32
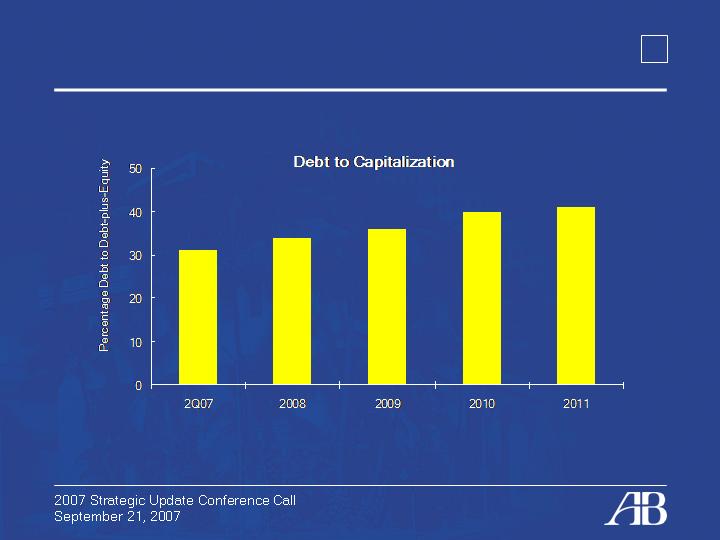
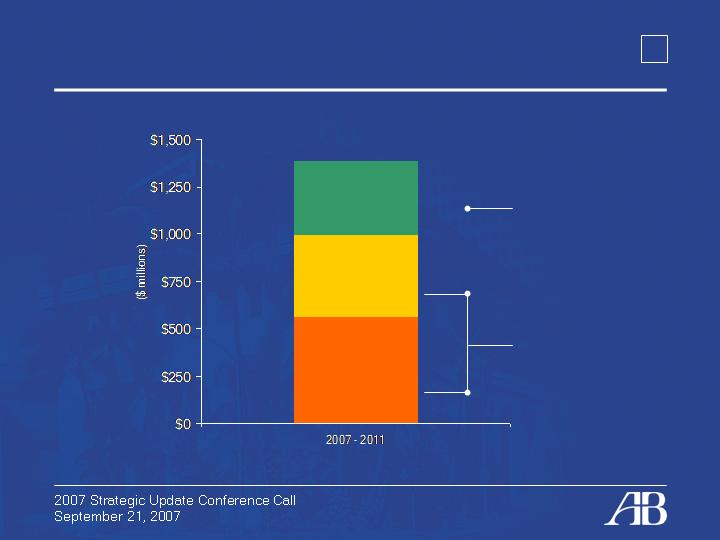
Leveraging Our Financial Strength
Projected Debt
33
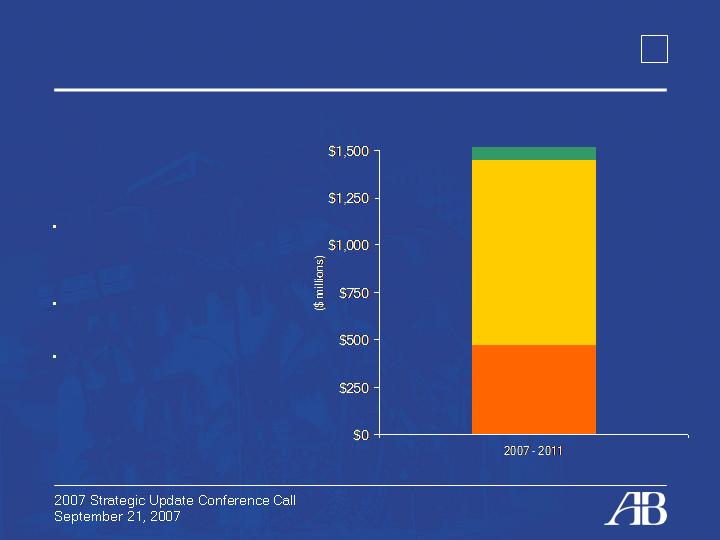
Leveraging Our Financial Strength
Capital Allocation (excluding 1031 Exchanges*)
$1.5 Billion at work:
2/3 allocated to growth
capital, mostly real
estate
Allocation for MIL
acquisitions
Matson vessel
investment cycle
mostly outside of Plan
Excludes $400MM of 1031 exchange capital
Agribusiness
Real Estate
Transportation
34
Leveraging Our Financial Strength
Free Cash Flow
Core businesses generate significant FCF above
and beyond replacement capital growth, creates
opportunities
Properties capital budget includes large amount of
“quick turn” capital. Asset base grows more slowly
as cash is recycled
35

Conclusion
We will create supply chain solutions by leveraging
and expanding our transportation and real estate
businesses
We will accelerate and intensify development
investment, land monetization and income
portfolio expansion
We will leverage our financial strength
We are committed to double digit earnings growth
36

Q&A
Questions & Answers
37