Exhibit 99.2
Third Quarter 2012 Earnings Conference Call - November 7, 2012 |
Forward Looking Statements Statements made during this call and presentation that set forth expectations, predictions, projections or are about future events are based on facts and situations that are known to us as of today, November 7, 2012. We believe that our expectations and assumptions are reasonable. Actual results may differ materially, due to risks and uncertainties, such as those described on pages 19-29 of the 2011 Form 10-K filed by Alexander & Baldwin, Inc. on February 28, 2012, and other subsequent filings by Matson with the SEC. Statements made during this call and presentation are not guarantees of future performance. We do not undertake any obligation to update our forward-looking statements. |
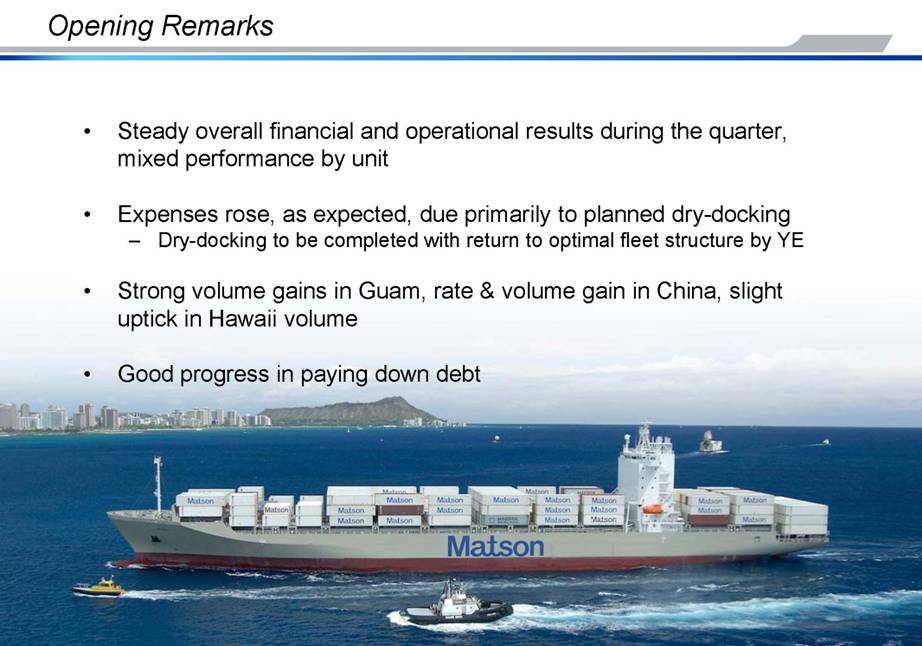
Steady overall financial and operational results during the quarter, mixed performance by unit Expenses rose, as expected, due primarily to planned dry-docking Dry-docking to be completed with return to optimal fleet structure by YE Strong volume gains in Guam, rate & volume gain in China, slight uptick in Hawaii volume Good progress in paying down debt Opening Remarks |
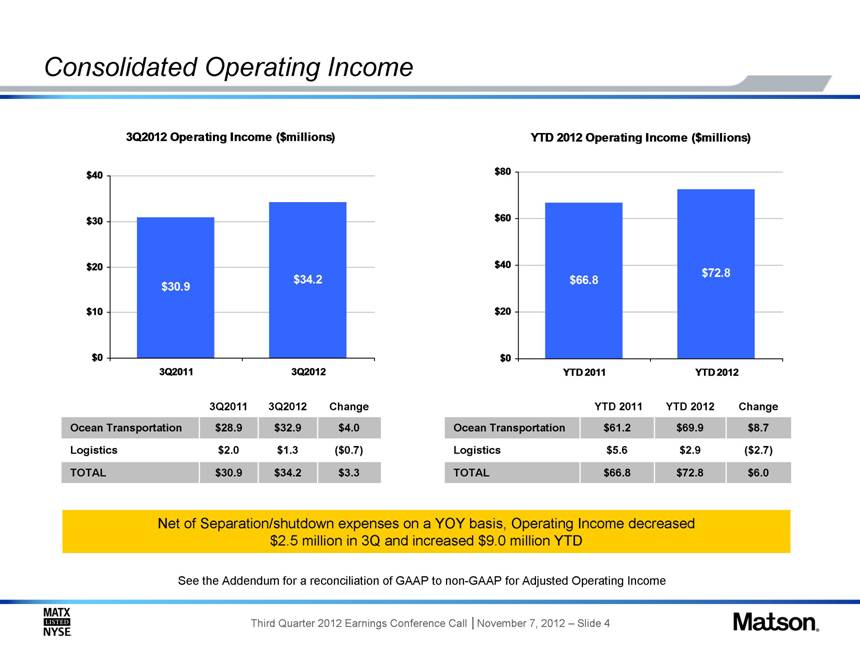
Consolidated Operating Income $34.2 $1.3 $32.9 3Q2012 ($0.7) $2.0 Logistics $3.3 $30.9 TOTAL Change 3Q2011 $4.0 Ocean Transportation $28.9 Net of separation/shutdown expenses on a YOY basis, Operating Income decreased $2.5 million in 3Q and increased $9.0 million YTD $72.8 $2.9 $69.9 YTD 2012 ($2.7) $5.6 Logistics $6.0 $66.8 TOTAL Change YTD 2011 $8.7 Ocean Transportation $61.2 See the Addendum for a reconciliation of GAAP to non-GAAP for Adjusted Operating Income 3Q2012 Operating Income ($millions) $30.9 $34.2 $0 $10 $20 $30 $40 3Q2011 3Q2012 YTD 2012 Operating Income ($millions) $66.8 $72.8 $0 $20 $40 $60 $80 YTD 2011 YTD 2012 |
Ocean Transportation Net of separation/shutdown expenses, Operating Income decreased $1.8 million in 3Q2012 and increased $11.7 million YTD on a YOY basis SSAT contributed $0.7 million in 3Q and $3.1 million YTD on a YOY basis 10.7% $32.9 $307.1 3Q2012 $4.0 $28.9 Operating Income 10.3% Oper. Income Margin Change 3Q2011 $25.7 Revenue $281.4 7.9% $69.9 $886.1 YTD 2012 $8.7 $61.2 Operating Income 0.2% 7.7% Oper. Income Margin Change YTD 2011 $92.0 Revenue $794.1 See the Addendum for a reconciliation of GAAP to non-GAAP for Adjusted Ocean Transportation Operating Income 3Q2012 Operating Income ($millions) $28.9 $32.9 $0 $10 $20 $30 $40 3Q2011 3Q2012 YTD 2012 Operating Income ($millions) $61.2 $69.9 $40 $50 $60 $70 $80 YTD 2011 YTD 2012 |
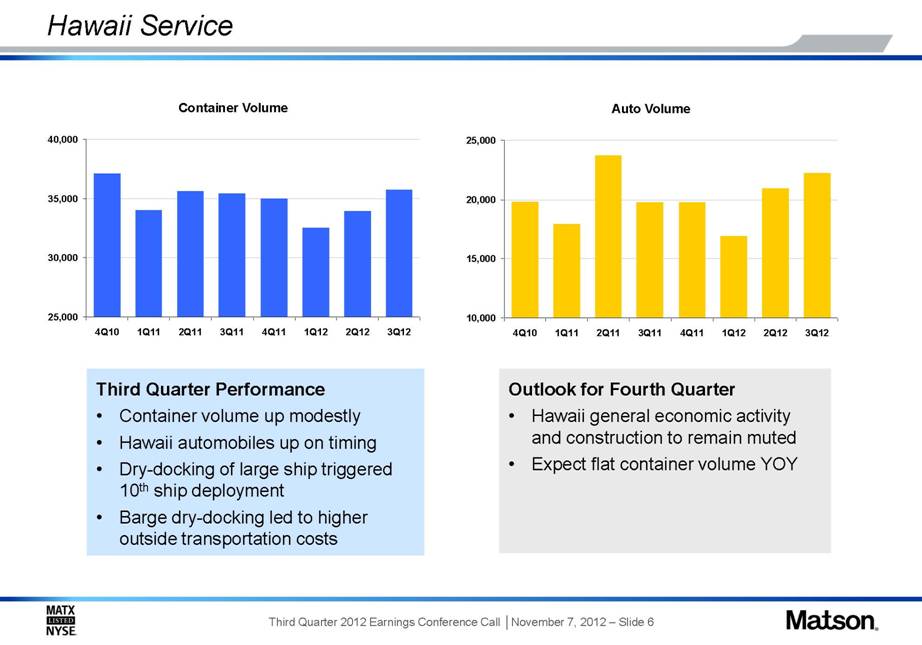
Hawaii Service Third Quarter Performance Container volume up modestly Hawaii automobiles up on timing Dry-docking of large ship triggered 10th ship deployment Barge dry-docking led to higher outside transportation costs Outlook for Fourth Quarter Hawaii general economic activity and construction to remain muted Expect flat container volume YOY Container Volume 25,000 30,000 35,000 40,000 4Q10 1Q11 2Q11 3Q11 4Q11 1Q12 2Q12 3Q12 Auto Volume 10,000 15,000 20,000 25,000 4Q10 1Q11 2Q11 3Q11 4Q11 1Q12 2Q12 3Q12 |
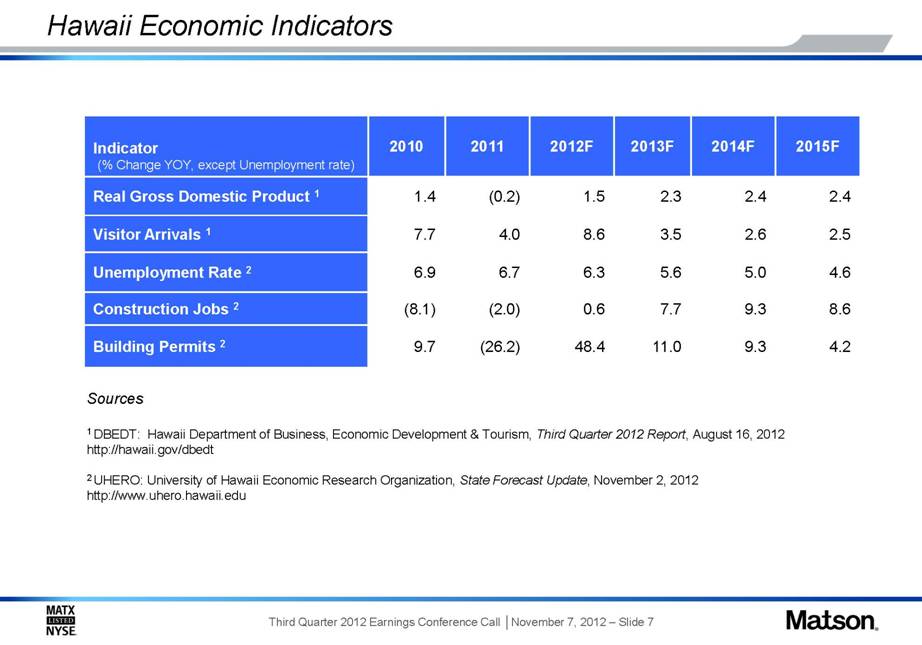
Hawaii Economic Indicators 8.6 9.3 7.7 0.6 (2.0) (8.1) Construction Jobs 2 9.3 5.0 2.6 2.4 2014F 4.2 4.6 2.5 2.4 2015F 3.5 8.6 4.0 7.7 Visitor Arrivals 1 Indicator (% Change YOY, except Unemployment rate) 2010 2011 2012F 2013F Real Gross Domestic Product 1 1.4 (0.2) 1.5 2.3 Unemployment Rate 2 6.9 6.7 6.3 5.6 Building Permits 2 9.7 (26.2) 48.4 11.0 Sources 1 DBEDT: Hawaii Department of Business, Economic Development & Tourism, Third Quarter 2012 Report, August 16, 2012 http://hawaii.gov/dbedt 2 UHERO: University of Hawaii Economic Research Organization, State Forecast Update, November 2, 2012 http://www.uhero.hawaii.edu |
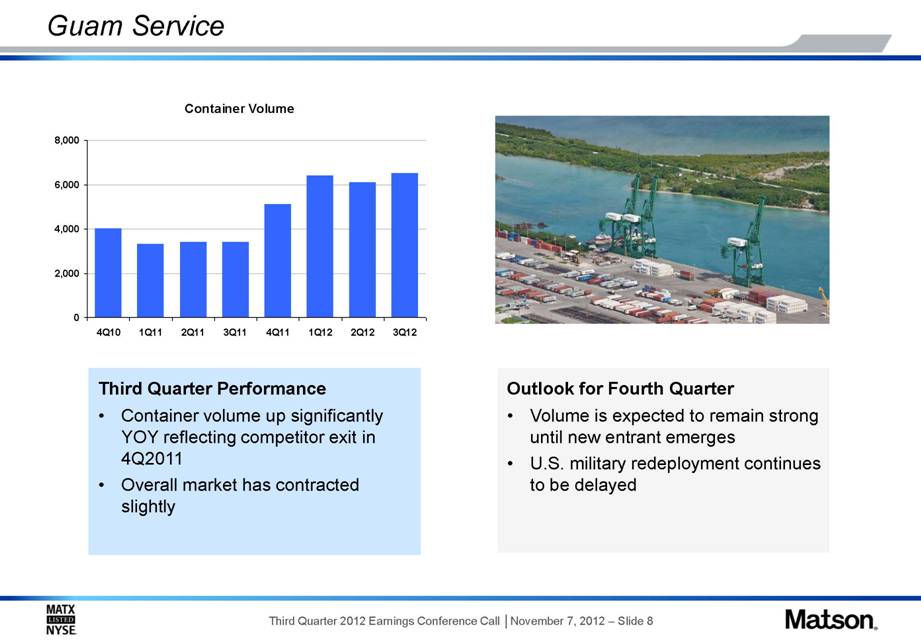
Guam Service Outlook for Fourth Quarter Volume is expected to remain strong until new entrant emerges U.S. military redeployment continues to be delayed Third Quarter Performance Container volume up significantly YOY reflecting competitor exit in 4Q2011 Overall market has contracted slightly Container Volume 0 2,000 4,000 6,000 8,000 4Q10 1Q11 2Q11 3Q11 4Q11 1Q12 2Q12 3Q12 |
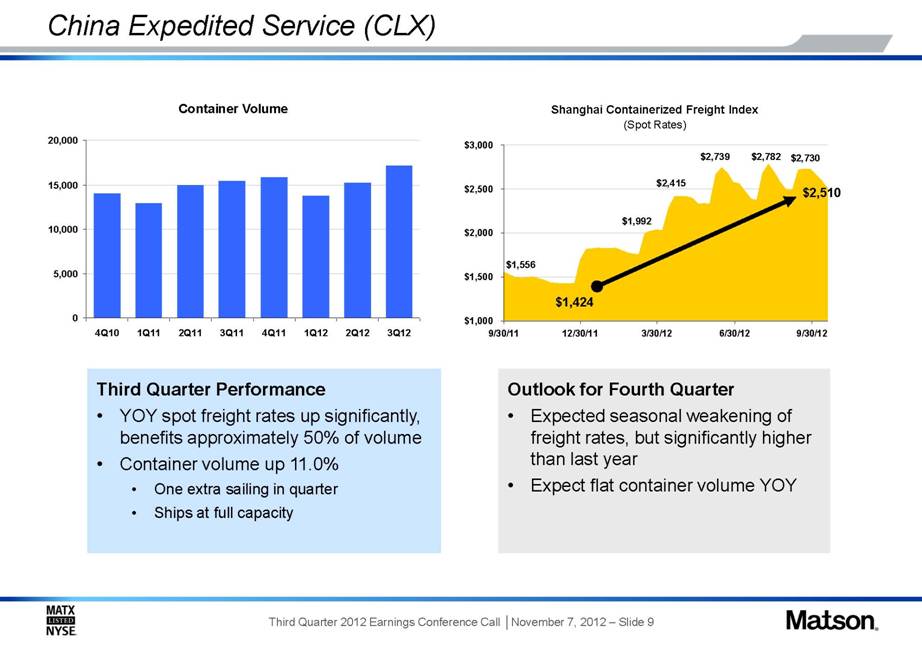
China Expedited Service (CLX) Third Quarter Performance YOY spot freight rates up significantly, benefits approximately 50% of volume Container volume up 11.0% One extra sailing in quarter Ships at full capacity Outlook for Fourth Quarter Expected seasonal weakening of freight rates, but significantly higher than last year Expect flat container volume YOY Container Volume 0 5,000 10,000 15,000 20,000 4Q10 1Q11 2Q11 3Q11 4Q11 1Q12 2Q12 3Q12 Shanghai Containerized Freight Index (Spot Rates) $1,424 $2,510 $2,730 $2,782 $2,739 $2,415 $1,992 $1,556 $1,000 $1,500 $2,000 $2,500 $3,000 9/30/11 12/30/11 3/30/12 6/30/12 9/30/12 |
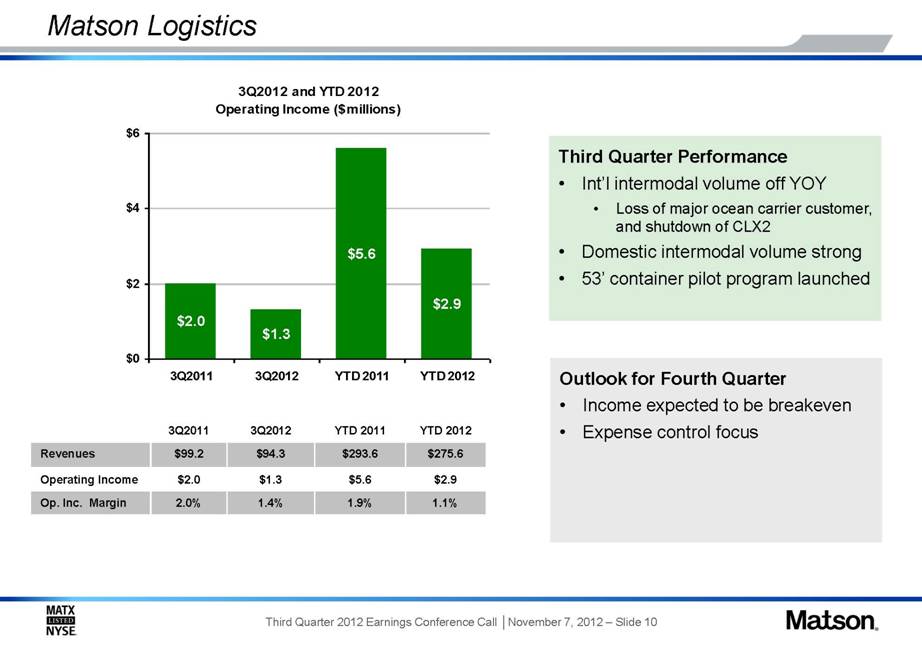
Matson Logistics Third Quarter Performance Int’l intermodal volume off YOY Loss of major ocean carrier customer, and shutdown of CLX2 Domestic intermodal volume strong 53’ container pilot program launched Outlook for Fourth Quarter Income expected to be breakeven Expense control focus 1.1% $2.9 $275.6 YTD 2012 1.9% $5.6 $293.6 YTD 2011 1.4% $1.3 $94.3 3Q2012 3Q2011 $2.0 Operating Income 2.0% Op. Inc. Margin Revenues $99.2 3Q2012 and YTD 2012 Operating Income ($millions) $2.0 $1.3 $5.6 $2.9 $0 $2 $4 $6 3Q2011 3Q2012 YTD 2011 YTD 2012 |
Income Statement (Unaudited) A clean quarter, with minimal separation costs or discontinued operations Interest expense increased as expected with full quarter of debt now on balance sheet; provides good run rate estimate for future Effective tax rate of 37.1% modestly lower than expected due primarily to a state tax refund $0.77 $0.71 $0.21 $0.45 Earnings per diluted share $32.6 $30.3 $8.7 $19.1 Net Income $0.94 $0.85 $0.44 $0.45 Earnings per diluted share, Continuing Operations (6.5) (6.0) (9.7) 0.1 Income (Loss) from Disc. Operations (net of income taxes) 66.8 72.8 30.9 34.2 Operating Income (11.2) (4.0) (367.2) 401.4 3Q2012 Dollars in millions, except per share 3Q2011 YTD 2012 YTD 2011 Revenues 380.6 1,161.7 1,087.7 Operating costs and expenses (349.7) (1,088.9) (1,020.9) Interest expense (1.9) (7.9) (5.7) Income tax (10.6) (28.6) (22.0) |
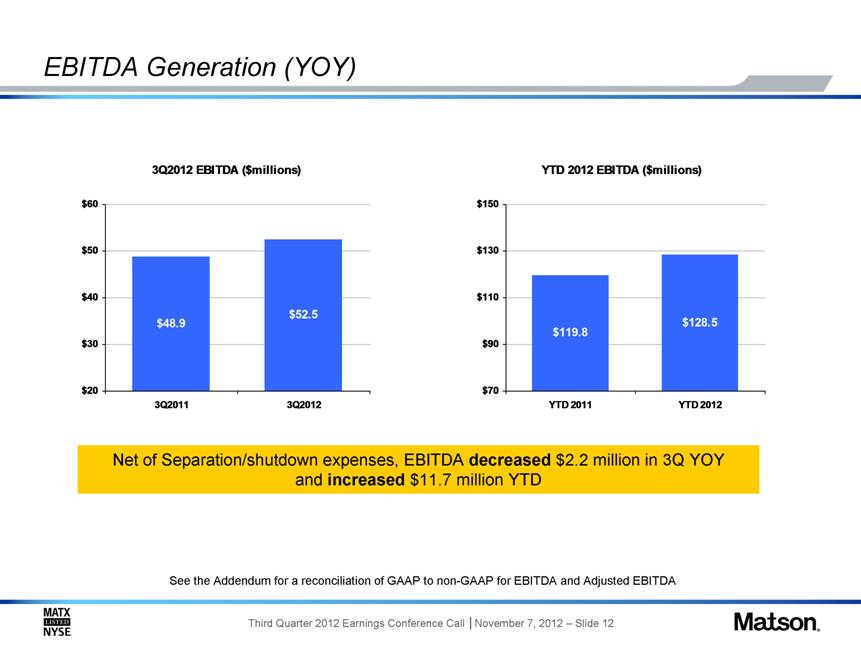
EBITDA Generation (YOY) Net of separation/shutdown expenses, EBITDA decreased $2.2 million in 3Q YOY and increased $11.7 million YTD See the Addendum for a reconciliation of GAAP to non-GAAP for EBITDA and Adjusted EBITDA 3Q2012 EBITDA ($millions) $48.9 $52.5 $20 $30 $40 $50 $60 3Q2011 3Q2012 YTD 2012 EBITDA ($millions) $119.8 $128.5 $70 $90 $110 $130 $150 YTD 2011 YTD 2012 |
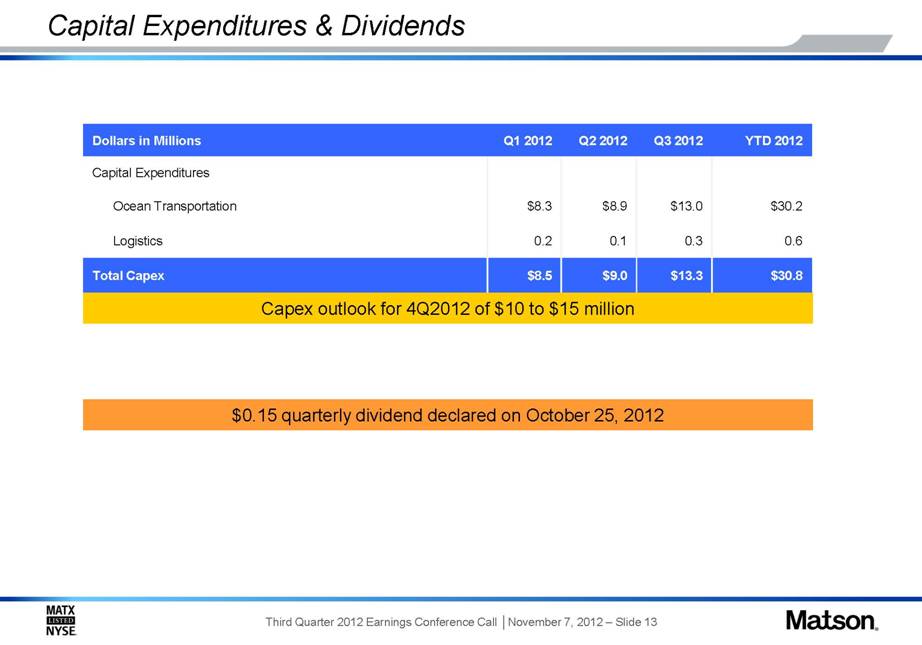
Capital Expenditures & Dividends $9.0 0.1 $8.9 Q2 2012 0.6 0.3 0.2 Logistics $30.8 $13.3 $8.5 Total Capex $13.0 Q3 2012 Dollars in Millions Q1 2012 YTD 2012 Capital Expenditures Ocean Transportation $8.3 $30.2 Capex outlook for 4Q2012 of $10 to $15 million $0.15 quarterly dividend declared on October 25, 2012 |
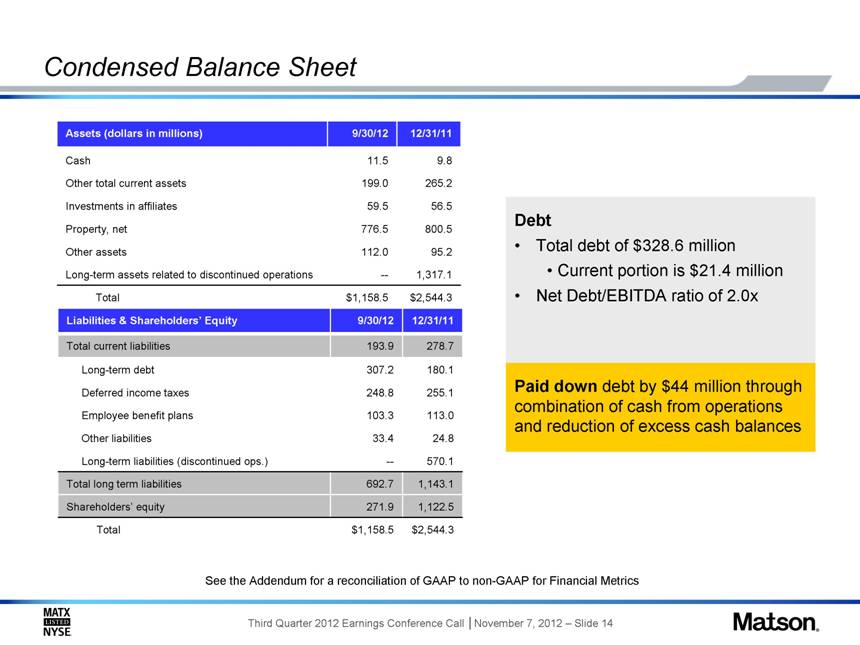
Condensed Balance Sheet 9.8 11.5 Cash Assets (dollars in millions) 9/30/12 12/31/11 Other total current assets 199.0 265.2 Investments in affiliates 59.5 56.5 Property, net 776.5 800.5 Other assets 112.0 95.2 LT assets related to A&B discontinued operations -- 1,317.1 Total $1,158.5 $2,544.3 24.8 33.4 Other liabilities 255.1 248.8 Deferred income taxes Liabilities & Shareholders’ Equity 9/30/12 12/31/11 Total current liabilities 193.9 278.7 Long term debt 307.2 180.1 Employee benefit plans 103.3 113.0 Long-term liabilities ( A&B discontinued ops.) -- 570.1 Total long term liabilities 692.7 1,143.1 Shareholders’ equity 271.9 1,122.5 Total $1,158.5 $2,544.3 Debt Total debt of $328.6 million Current portion is $21.4 million Net Debt/EBITDA ratio of 2.0x Paid down debt by $44 million through combination of cash from operations and reduction of excess cash balances See the Addendum for a reconciliation of GAAP to non-GAAP for Financial Metrics |
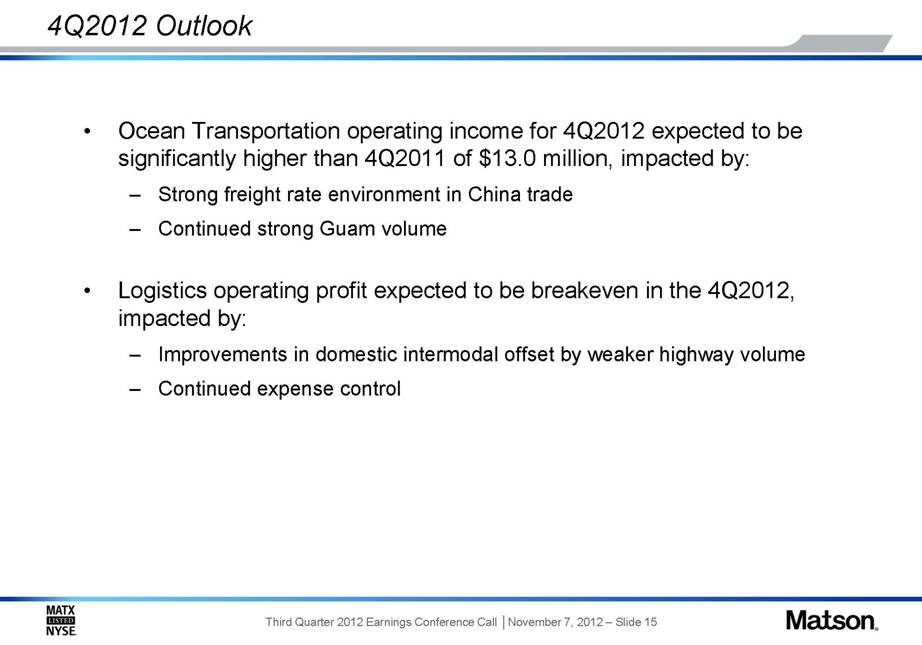
4Q2012 Outlook Ocean Transportation operating income for 4Q2012 expected to be significantly higher than 4Q2011 of $13.0 million, impacted by: Strong freight rate environment in China trade Continued strong Guam volume Logistics operating profit expected to be breakeven in the 4Q2012, impacted by: Improvements in domestic intermodal offset by weaker highway volume Continued expense control |
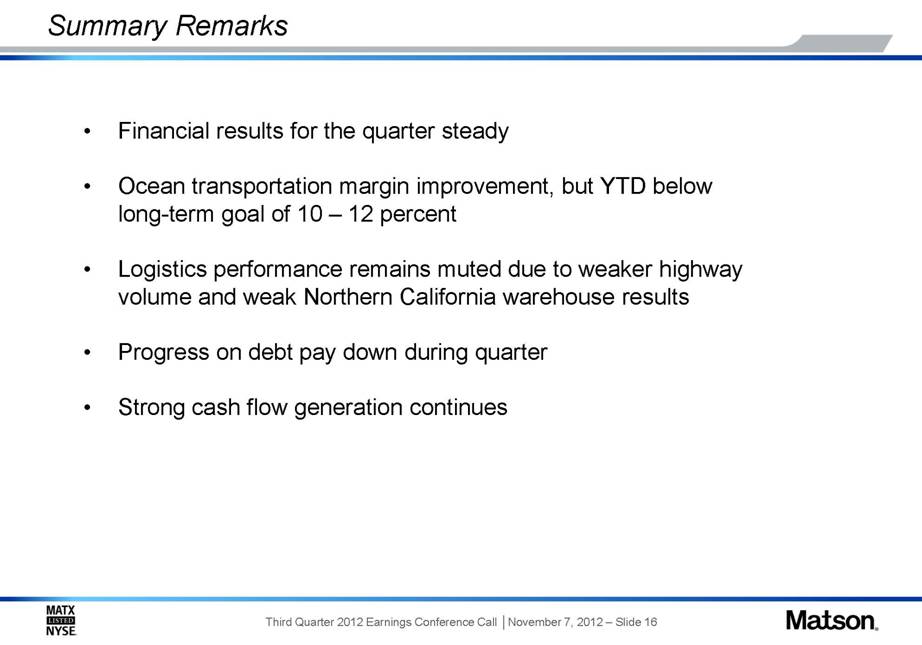
Summary Remarks Financial results for the quarter steady Ocean transportation margin improvement, but YTD below long-term goal of 10 – 12 percent Logistics performance remains muted due to weaker highway volume and weak Northern California warehouse results Progress on debt pay down during quarter Strong cash flow generation continues |
Addendum |
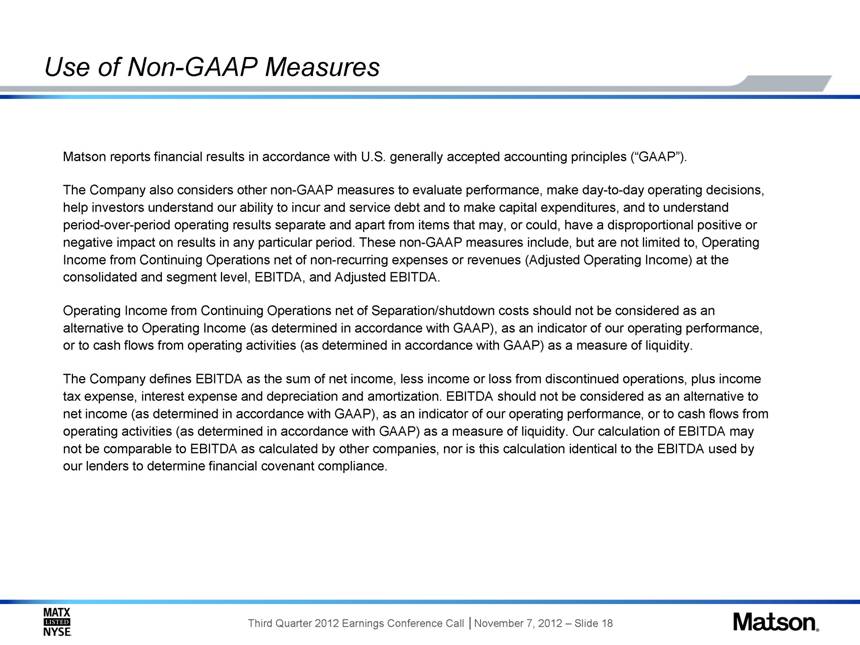
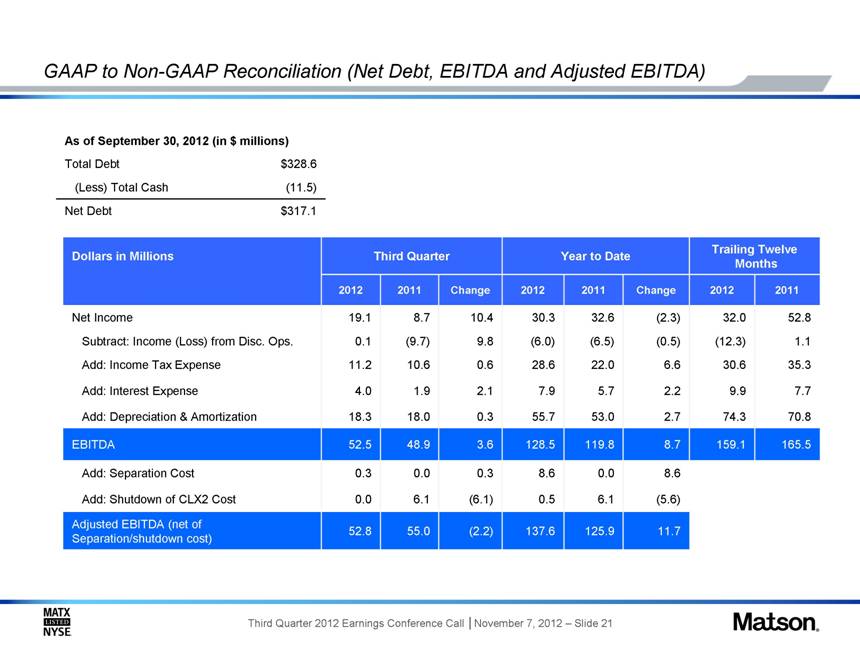
Use of Non-GAAP Measures Matson reports financial results in accordance with U.S. generally accepted accounting principles (“GAAP”). The Company also considers other non-GAAP measures to evaluate performance, make day-to-day operating decisions, help investors understand our ability to incur and service debt and to make capital expenditures, and to understand period-over-period operating results separate and apart from items that may, or could, have a disproportional positive or negative impact on results in any particular period. These non-GAAP measures include, but are not limited to, Operating Income from Continuing Operations net of non-recurring expenses or revenues (Adjusted Operating Income) at the consolidated and segment level, EBITDA, and Adjusted EBITDA. Operating Income from Continuing Operations net of separation/shutdown costs should not be considered as an alternative to Operating Income (as determined in accordance with GAAP), as an indicator of our operating performance, or to cash flows from operating activities (as determined in accordance with GAAP) as a measure of liquidity. The Company defines EBITDA as the sum of net income, less income or loss from discontinued operations, plus income tax expense, interest expense and depreciation and amortization. EBITDA should not be considered as an alternative to net income (as determined in accordance with GAAP), as an indicator of our operating performance, or to cash flows from operating activities (as determined in accordance with GAAP) as a measure of liquidity. Our calculation of EBITDA may not be comparable to EBITDA as calculated by other companies, nor is this calculation identical to the EBITDA used by our lenders to determine financial covenant compliance. |
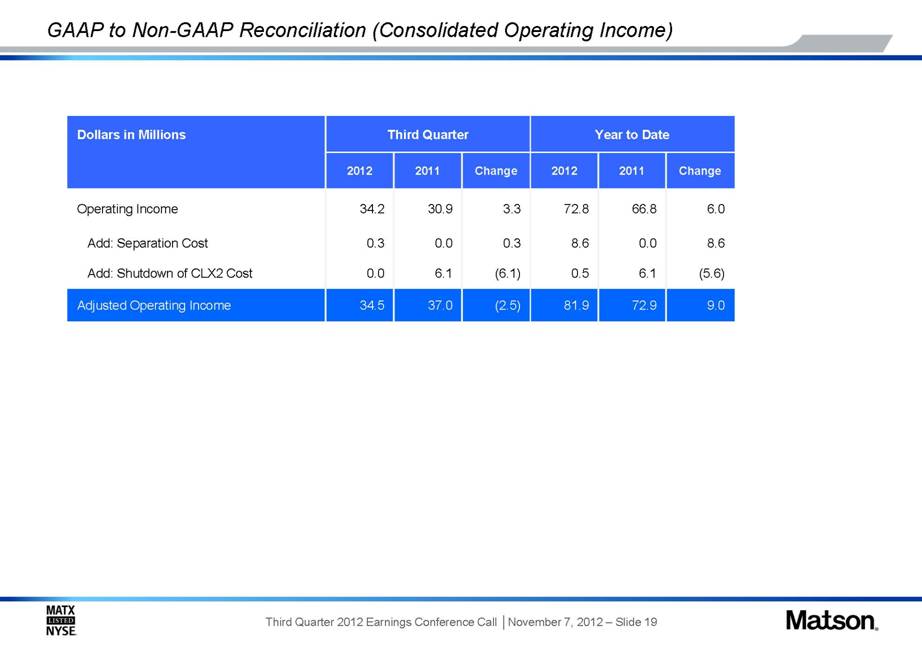
GAAP to Non-GAAP Reconciliation (Consolidated Operating Income) 8.6 0.0 8.6 0.3 0.0 0.3 Add: Separation Cost 81.9 0.5 72.8 2012 Year to Date 72.9 6.1 66.8 2011 9.0 (5.6) 6.0 Change Third Quarter Dollars in Millions 34.5 0.0 34.2 2012 37.0 6.1 30.9 2011 (2.5) (6.1) 3.3 Change Operating Income Add: Shutdown of CLX2 Cost Adjusted Operating Income |
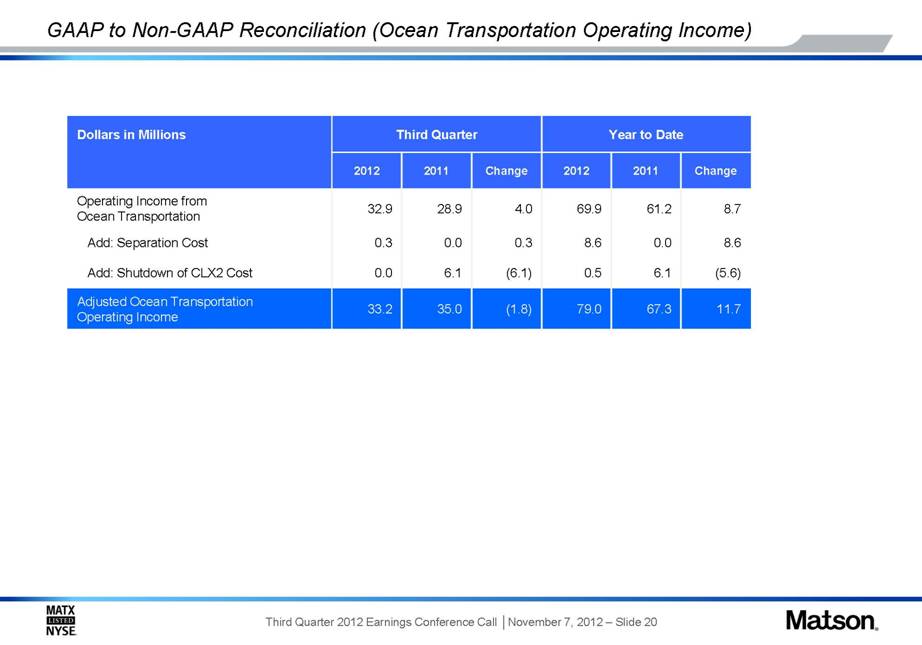
GAAP to Non-GAAP Reconciliation (Ocean Transportation Operating Income) 8.6 0.0 8.6 0.3 0.0 0.3 Add: Separation Cost 79.0 0.5 69.9 2012 Year to Date 67.3 6.1 61.2 2011 11.7 (5.6) 8.7 Change Third Quarter Dollars in Millions 33.2 0.0 32.9 2012 35.0 6.1 28.9 2011 (1.8) (6.1) 4.0 Change Operating Income from Ocean Transportation Add: Shutdown of CLX2 Cost Adjusted Ocean Transportation Operating Income |
GAAP to Non-GAAP Reconciliation (Net Debt, EBITDA and Adjusted EBITDA) 165.5 70.8 7.7 35.3 1.1 52.8 2011 159.1 74.3 9.9 30.6 (12.3) 32.0 2012 Trailing Twelve Months 11.7 125.9 137.6 (2.2) 55.0 52.8 Adjusted EBITDA (net of separation/shutdown cost) 8.7 119.8 128.5 3.6 48.9 52.5 EBITDA 8.6 0.0 8.6 0.3 0.0 0.3 Add: Separation Cost 0.5 (6.5) (6.0) 9.8 (9.7) 0.1 Subtract: Income (Loss) from Disc. Ops. 6.6 22.0 28.6 0.6 10.6 11.2 Add: Income Tax Expense (2.3) 32.6 30.3 10.4 8.7 19.1 Net Income (5.6) 6.1 0.5 (6.1) 6.1 0.0 Add: Shutdown of CLX2 Cost 55.7 7.9 2012 Year to Date 53.0 5.7 2011 2.7 2.2 Change Third Quarter Dollars in Millions 18.3 4.0 2012 18.0 1.9 2011 0.3 2.1 Change Add: Interest Expense Add: Depreciation & Amortization $328.6 Total Debt $317.1 Net Debt (11.5) (Less) Total Cash As of September 30, 2012 (in $ millions) |