Exhibit 99.2
| Fourth Quarter and Full Year 2013 Earnings Conference Call – February 25, 2014 |
| Forward Looking Statements Statements made during this call and presentation that set forth expectations, predictions, projections or are about future events are based on facts and situations that are known to us as of today, February 25, 2014. We believe that our expectations and assumptions are reasonable. Actual results may differ materially, due to risks and uncertainties, such as those described on pages 9-15 of the 2012 Form 10-K filed on March 1, 2013, and other subsequent filings by Matson with the SEC. Statements made during this call and presentation are not guarantees of future performance. We do not undertake any obligation to update our forward-looking statements. |
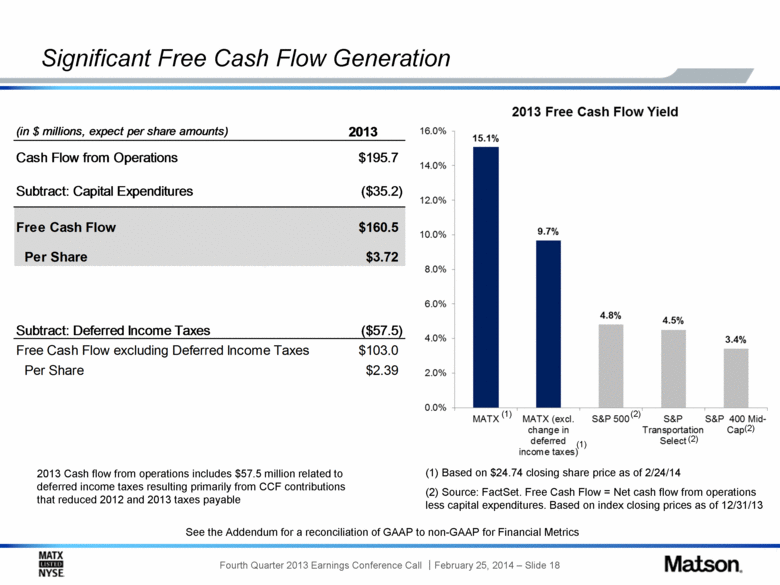
| Solid fourth quarter performance in core operations Continued stability in Ocean Transportation business Marked improvement in our Logistics unit warehouse operations Achieved improved YOY financial results in 2013, excluding the Litigation Charge below Hawaii freight volume growth in the first half of the year Continued strong demand for expedited China service Improvements in Logistics operations Results negatively impacted by one-time $9.95 million False Claims Act litigation settlement charge (the “Litigation Charge”) $6.2 million or $0.14 per share after-tax impact Strong cash flow from operations per share of $4.54 Free cash flow per share of $3.72 Opening Remarks |
| June 10, 2013 – Matson served with complaint alleging violations of the False Claims Act Complaint alleged that freight forwarders improperly assessed surcharges on inland shipments of military household goods Federal government declined to pursue the case earlier in the year February 14, 2014 – Matson and plaintiff commenced non-binding mediation discussions which resulted in a proposed $9.95 million settlement February 23, 2014 – Matson BOD approved the recommended settlement Settlement contingent upon approval of the U.S. government and dismissal of the case with prejudice Matson accrued for this settlement as of December 31, 2013 Litigation Charge |
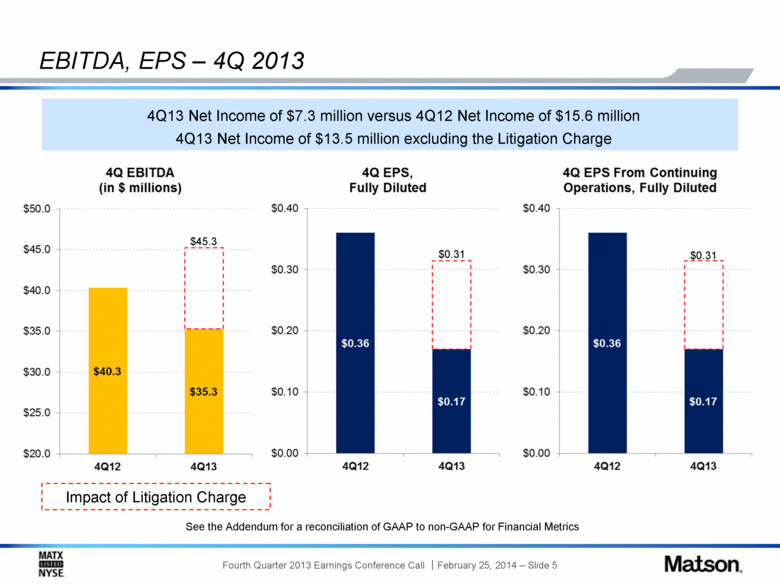
| EBITDA, EPS – 4Q 2013 4Q13 Net Income of $7.3 million versus 4Q12 Net Income of $15.6 million 4Q13 Net Income of $13.5 million excluding the Litigation Charge See the Addendum for a reconciliation of GAAP to non-GAAP for Financial Metrics Impact of Litigation Charge $45.3 $0.31 $0.31 |
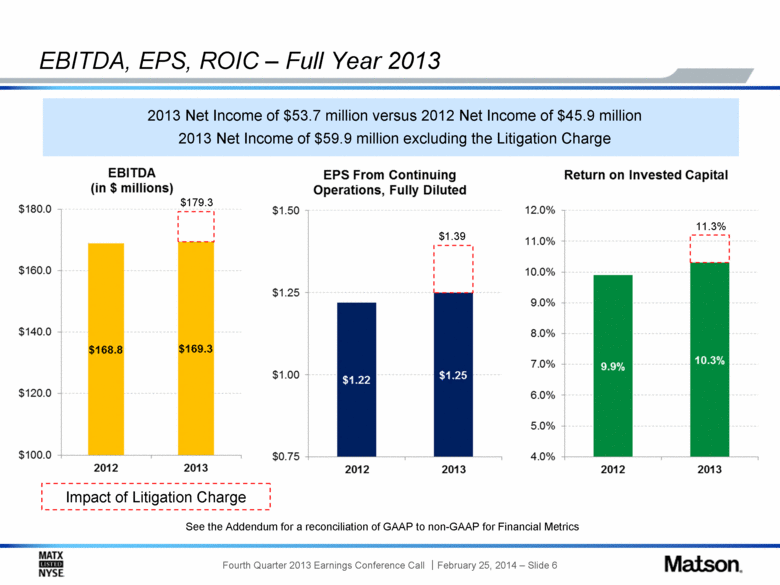
| EBITDA, EPS, ROIC – Full Year 2013 2013 Net Income of $53.7 million versus 2012 Net Income of $45.9 million 2013 Net Income of $59.9 million excluding the Litigation Charge See the Addendum for a reconciliation of GAAP to non-GAAP for Financial Metrics Impact of Litigation Charge $179.3 $1.39 11.3% |
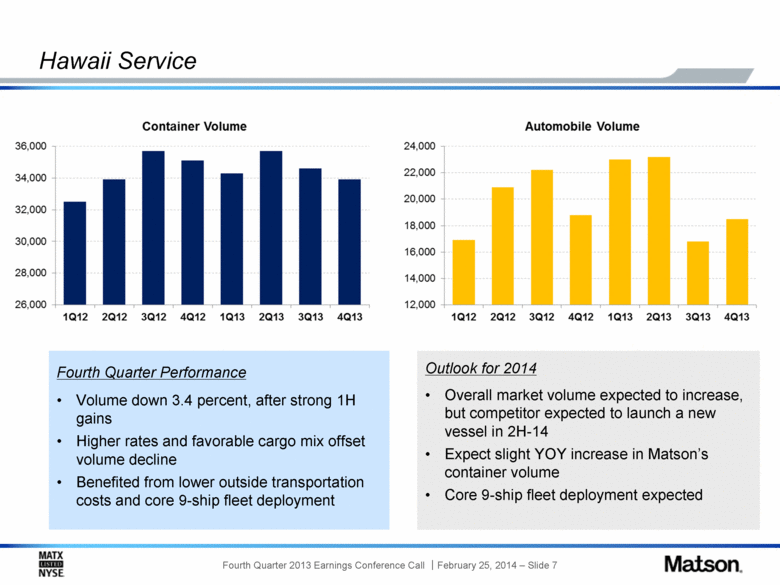
| Hawaii Service Fourth Quarter Performance Volume down 3.4 percent, after strong 1H gains Higher rates and favorable cargo mix offset volume decline Benefited from lower outside transportation costs and core 9-ship fleet deployment Outlook for 2014 Overall market volume expected to increase, but competitor expected to launch a new vessel in 2H-14 Expect slight YOY increase in Matson’s container volume Core 9-ship fleet deployment expected |
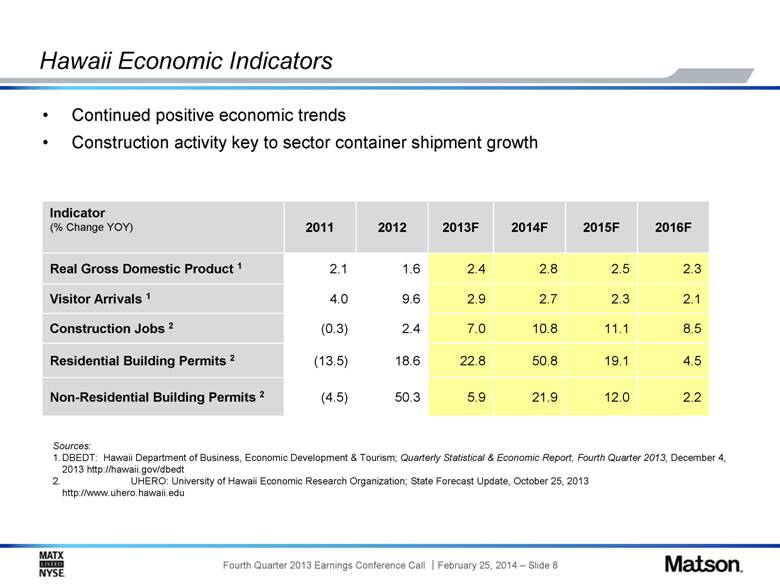
| Hawaii Economic Indicators Indicator (% Change YOY) 2011 2012 2013F 2014F 2015F 2016F Real Gross Domestic Product 1 2.1 1.6 2.4 2.8 2.5 2.3 Visitor Arrivals 1 4.0 9.6 2.9 2.7 2.3 2.1 Construction Jobs 2 (0.3) 2.4 7.0 10.8 11.1 8.5 Residential Building Permits 2 (13.5) 18.6 22.8 50.8 19.1 4.5 Non-Residential Building Permits 2 (4.5) 50.3 5.9 21.9 12.0 2.2 Sources: 1. DBEDT: Hawaii Department of Business, Economic Development & Tourism; Quarterly Statistical & Economic Report, Fourth Quarter 2013, December 4, 2013 http://hawaii.gov/dbedt 2. UHERO: University of Hawaii Economic Research Organization; State Forecast Update, October 25, 2013 http://www.uhero.hawaii.edu Continued positive economic trends Construction activity key to sector container shipment growth |
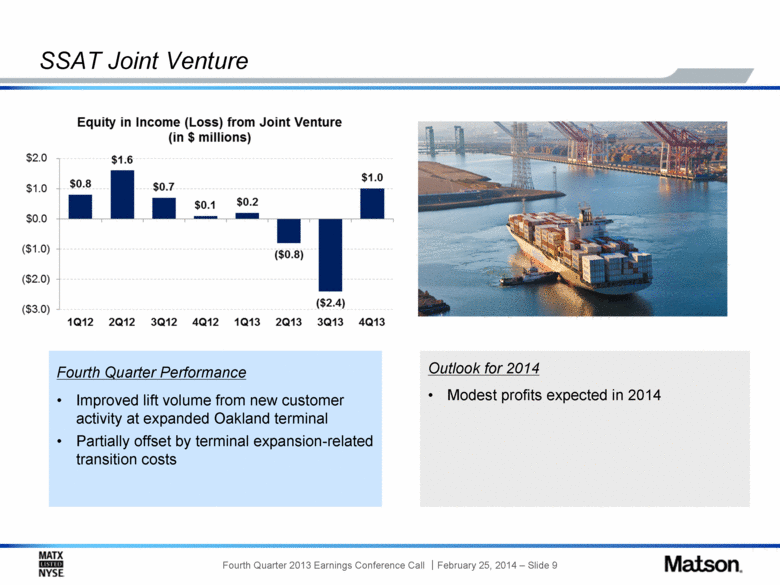
| SSAT Joint Venture Fourth Quarter Performance Improved lift volume from new customer activity at expanded Oakland terminal Partially offset by terminal expansion-related transition costs Outlook for 2014 Modest profits expected in 2014 |
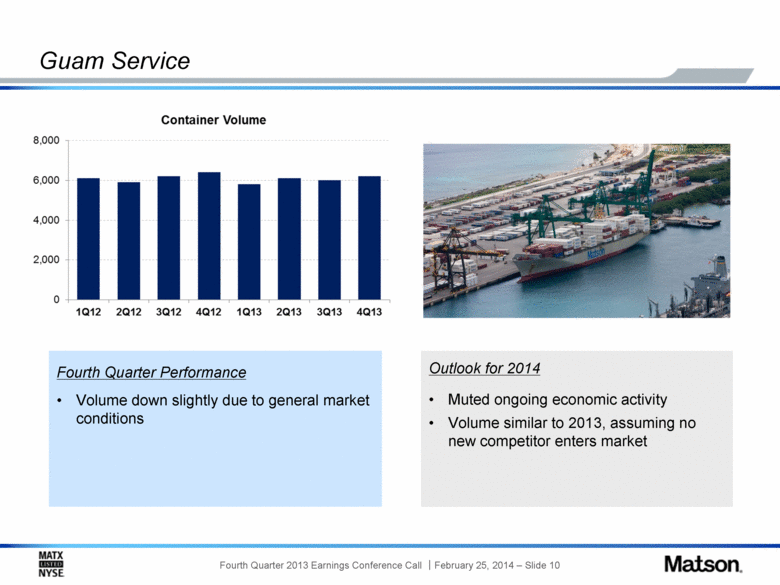
| Guam Service Outlook for 2014 Muted ongoing economic activity Volume similar to 2013, assuming no new competitor enters market Fourth Quarter Performance Volume down slightly due to general market conditions |
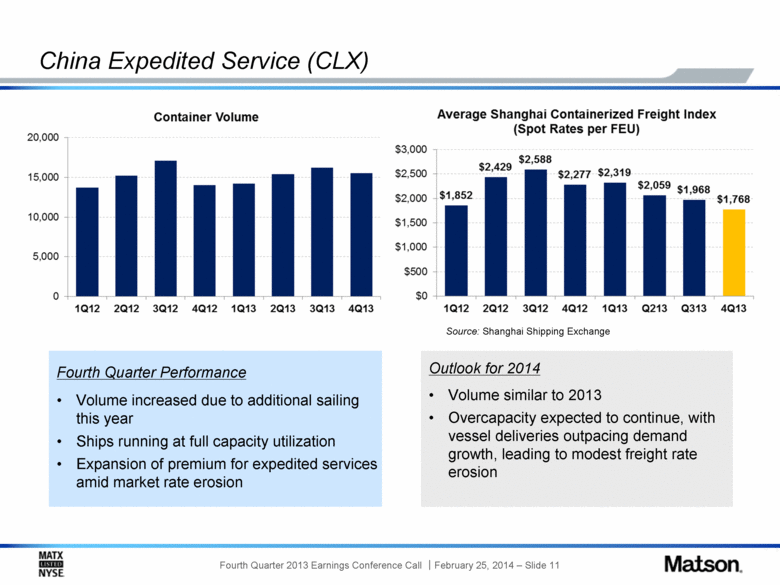
| China Expedited Service (CLX) Source: Shanghai Shipping Exchange Fourth Quarter Performance Volume increased due to additional sailing this year Ships running at full capacity utilization Expansion of premium for expedited services amid market rate erosion Outlook for 2014 Volume similar to 2013 Overcapacity expected to continue, with vessel deliveries outpacing demand growth, leading to modest freight rate erosion |
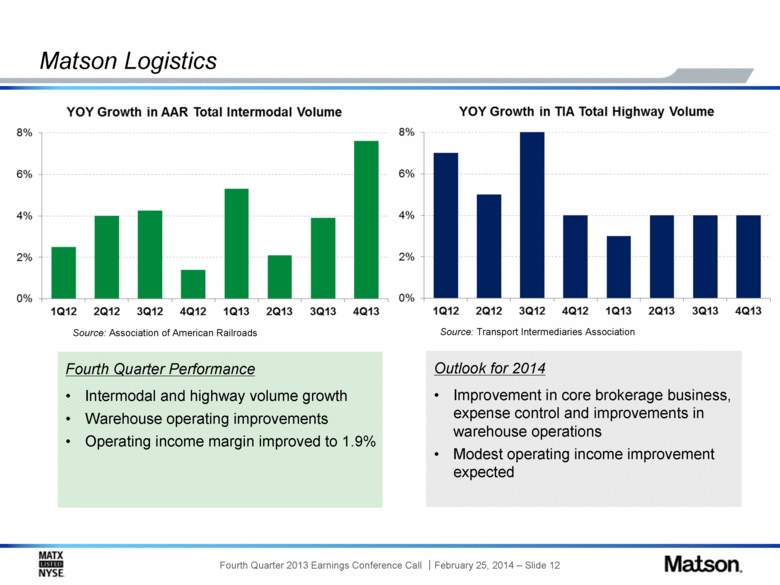
| Matson Logistics Fourth Quarter Performance Intermodal and highway volume growth Warehouse operating improvements Operating income margin improved to 1.9% Source: Association of American Railroads Outlook for 2014 Improvement in core brokerage business, expense control and improvements in warehouse operations Modest operating income improvement expected Source: Transport Intermediaries Association |
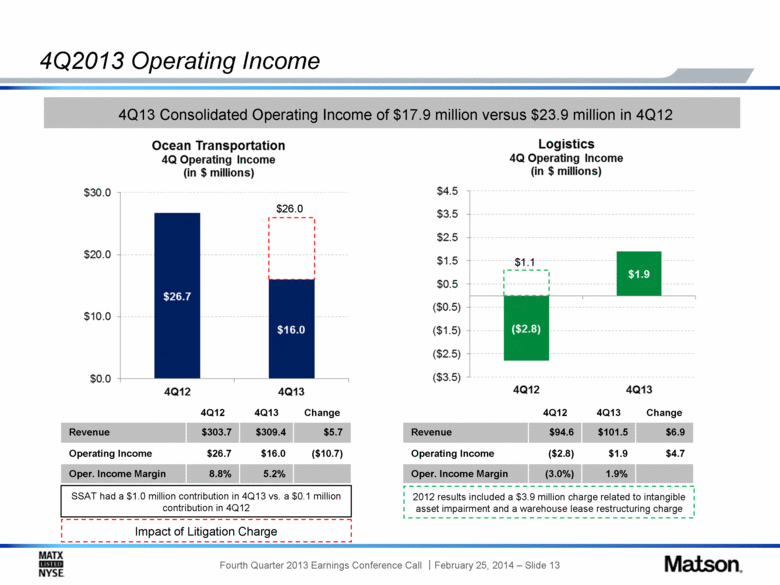
| 4Q2013 Operating Income SSAT had a $1.0 million contribution in 4Q13 vs. a $0.1 million contribution in 4Q12 4Q12 4Q13 Change Revenue $303.7 $309.4 $5.7 Operating Income $26.7 $16.0 ($10.7) Oper. Income Margin 8.8% 5.2% 4Q12 4Q13 Change Revenue $94.6 $101.5 $6.9 Operating Income ($2.8) $1.9 $4.7 Oper. Income Margin (3.0%) 1.9% 4Q13 Consolidated Operating Income of $17.9 million versus $23.9 million in 4Q12 Impact of Litigation Charge $26.0 2012 results included a $3.9 million charge related to intangible asset impairment and a warehouse lease restructuring charge $1.1 |
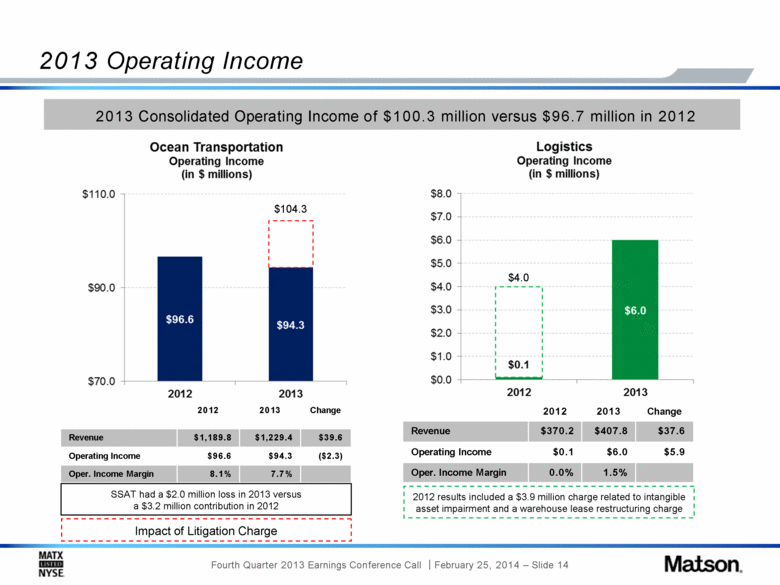
| 2013 Operating Income SSAT had a $2.0 million loss in 2013 versus a $3.2 million contribution in 2012 2012 2013 Change Revenue $1,189.8 $1,229.4 $39.6 Operating Income $96.6 $94.3 ($2.3) Oper. Income Margin 8.1% 7.7% 2012 2013 Change Revenue $370.2 $407.8 $37.6 Operating Income $0.1 $6.0 $5.9 Oper. Income Margin 0.0% 1.5% 2013 Consolidated Operating Income of $100.3 million versus $96.7 million in 2012 Impact of Litigation Charge $104.3 2012 results included a $3.9 million charge related to intangible asset impairment and a warehouse lease restructuring charge $4.0 |
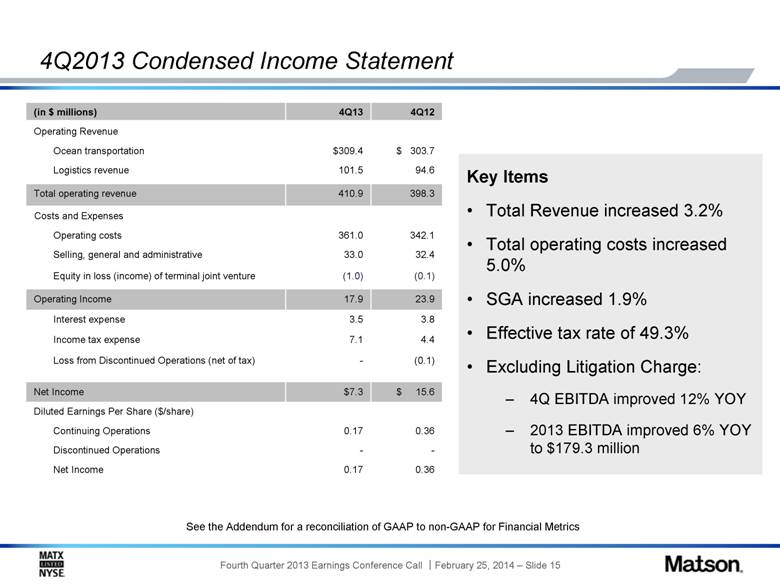
| 4Q2013 Condensed Income Statement (in $ millions) 4Q13 4Q12 Operating Revenue Ocean transportation $309.4 $ 303.7 Logistics revenue 101.5 94.6 Total operating revenue 410.9 398.3 Costs and Expenses Operating costs 361.0 342.1 Selling, general and administrative 33.0 32.4 Equity in loss (income) of terminal joint venture (1.0) (0.1) Operating Income 17.9 23.9 Interest expense 3.5 3.8 Income tax expense 7.1 4.4 Loss from Discontinued Operations (net of tax) - (0.1) Net Income $7.3 $ 15.6 Diluted Earnings Per Share ($/share) Continuing Operations 0.17 0.36 Discontinued Operations - - Net Income 0.17 0.36 Key Items Total Revenue increased 3.2% Total operating costs increased 5.0% SGA increased 1.9% Effective tax rate of 49.3% Excluding Litigation Charge: 4Q EBITDA improved 12% YOY 2013 EBITDA improved 6% YOY to $179.3 million See the Addendum for a reconciliation of GAAP to non-GAAP for Financial Metrics |
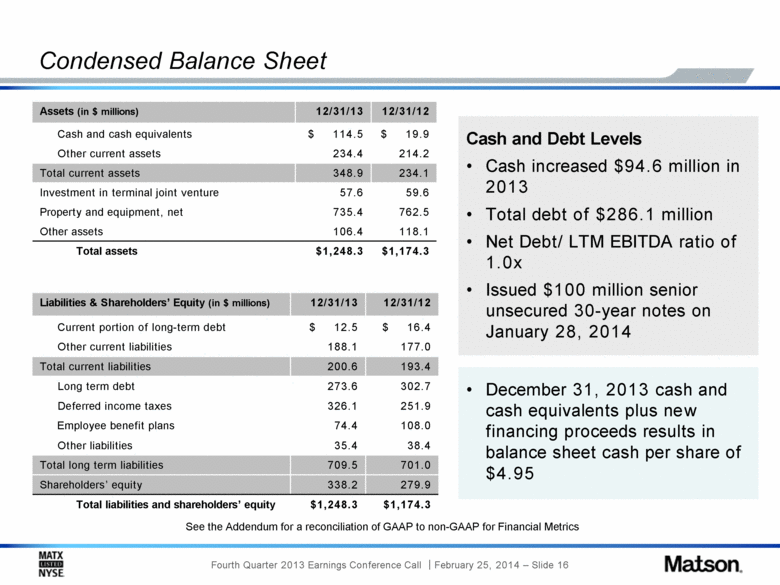
| Condensed Balance Sheet Assets (in $ millions) 12/31/13 12/31/12 Cash and cash equivalents $ 114.5 $ 19.9 Other current assets 234.4 214.2 Total current assets 348.9 234.1 Investment in terminal joint venture 57.6 59.6 Property and equipment, net 735.4 762.5 Other assets 106.4 118.1 Total assets $1,248.3 $1,174.3 Liabilities & Shareholders’ Equity (in $ millions) 12/31/13 12/31/12 Current portion of long-term debt $ 12.5 $ 16.4 Other current liabilities 188.1 177.0 Total current liabilities 200.6 193.4 Long term debt 273.6 302.7 Deferred income taxes 326.1 251.9 Employee benefit plans 74.4 108.0 Other liabilities 35.4 38.4 Total long term liabilities 709.5 701.0 Shareholders’ equity 338.2 279.9 Total liabilities and shareholders’ equity $1,248.3 $1,174.3 Cash and Debt Levels Cash increased $94.6 million in 2013 Total debt of $286.1 million Net Debt/ LTM EBITDA ratio of 1.0x Issued $100 million senior unsecured 30-year notes on January 28, 2014 See the Addendum for a reconciliation of GAAP to non-GAAP for Financial Metrics December 31, 2013 cash and cash equivalents plus new financing proceeds results in balance sheet cash per share of $4.95 |
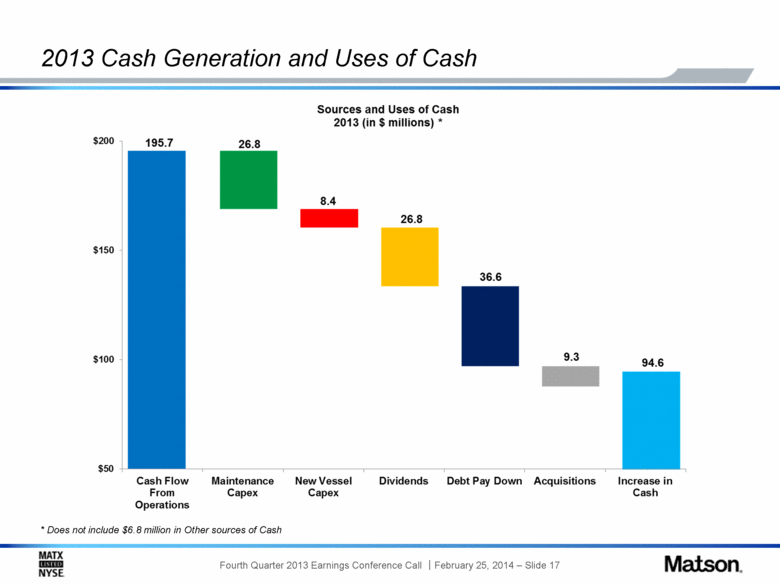
| 2013 Cash Generation and Uses of Cash * Does not include $6.8 million in Other sources of Cash |
| Significant Free Cash Flow Generation 2013 Cash flow from operations includes $57.5 million related to deferred income taxes resulting primarily from CCF contributions that reduced 2012 and 2013 taxes payable See the Addendum for a reconciliation of GAAP to non-GAAP for Financial Metrics (1) Based on $24.74 closing share price as of 2/24/14 (2) Source: FactSet. Free Cash Flow = Net cash flow from operations less capital expenditures. Based on index closing prices as of 12/31/13 (1) (2) (1) (2) (2) (in $ millions, expect per share amounts) 2013 Cash Flow from Operations $195.7 Subtract: Capital Expenditures ($35.2) Free Cash Flow $160.5 Per Share $3.72 Subtract: Deferred Income Taxes ($57.5) Free Cash Flow excluding Deferred Income Taxes $103.0 Per Share $2.39 |
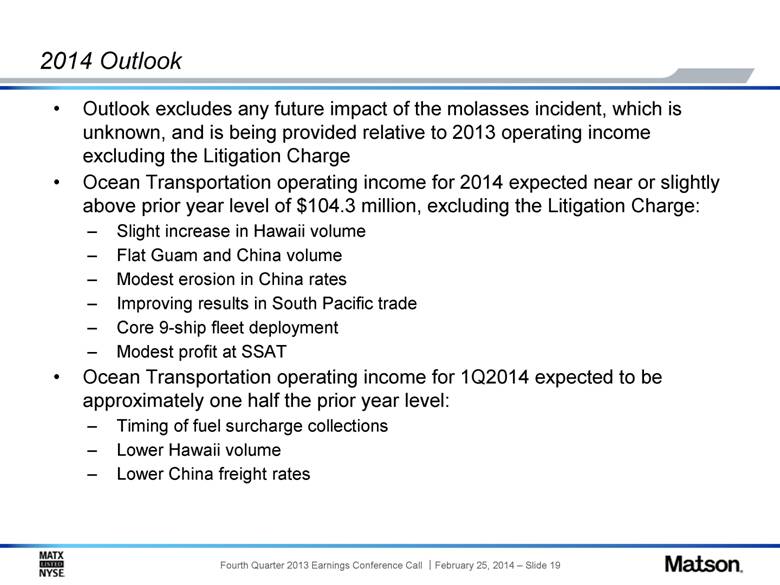
| Outlook excludes any future impact of the molasses incident, which is unknown, and is being provided relative to 2013 operating income excluding the Litigation Charge Ocean Transportation operating income for 2014 expected near or slightly above prior year level of $104.3 million, excluding the Litigation Charge: Slight increase in Hawaii volume Flat Guam and China volume Modest erosion in China rates Improving results in South Pacific trade Core 9-ship fleet deployment Modest profit at SSAT Ocean Transportation operating income for 1Q2014 expected to be approximately one half the prior year level: Timing of fuel surcharge collections Lower Hawaii volume Lower China freight rates 2014 Outlook |
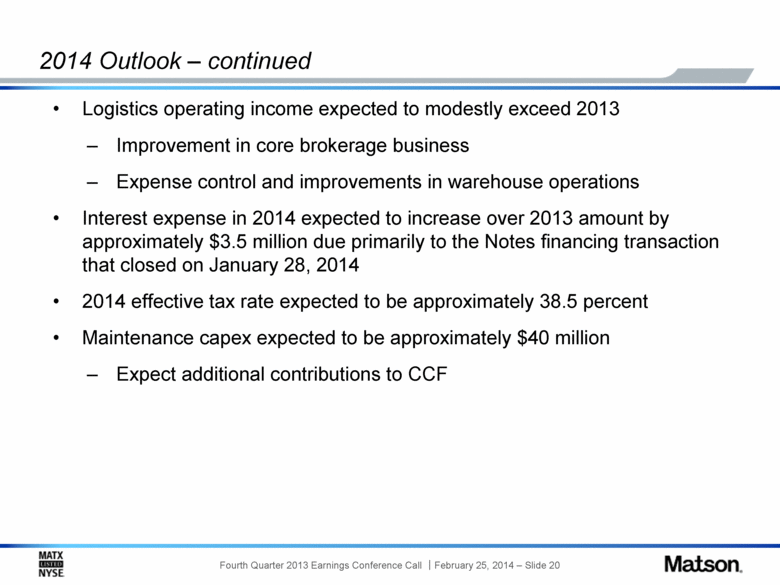
| Logistics operating income expected to modestly exceed 2013 Improvement in core brokerage business Expense control and improvements in warehouse operations Interest expense in 2014 expected to increase over 2013 amount by approximately $3.5 million due primarily to the Notes financing transaction that closed on January 28, 2014 2014 effective tax rate expected to be approximately 38.5 percent Maintenance capex expected to be approximately $40 million Expect additional contributions to CCF 2014 Outlook – continued |
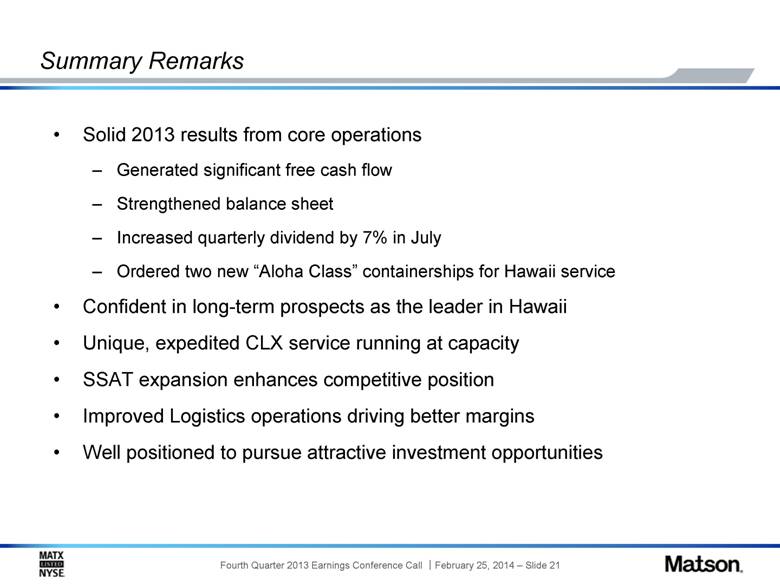
| Summary Remarks Solid 2013 results from core operations Generated significant free cash flow Strengthened balance sheet Increased quarterly dividend by 7% in July Ordered two new “Aloha Class” containerships for Hawaii service Confident in long-term prospects as the leader in Hawaii Unique, expedited CLX service running at capacity SSAT expansion enhances competitive position Improved Logistics operations driving better margins Well positioned to pursue attractive investment opportunities |
| Addendum |
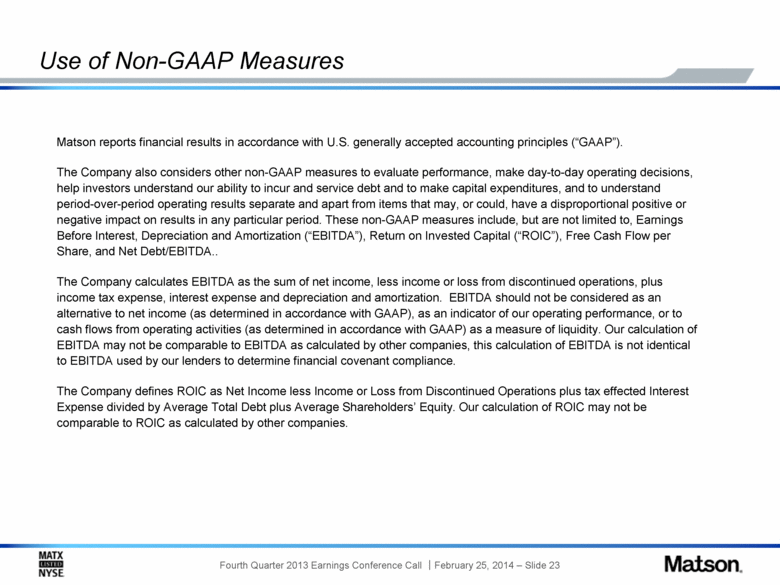
| Use of Non-GAAP Measures Matson reports financial results in accordance with U.S. generally accepted accounting principles (“GAAP”). The Company also considers other non-GAAP measures to evaluate performance, make day-to-day operating decisions, help investors understand our ability to incur and service debt and to make capital expenditures, and to understand period-over-period operating results separate and apart from items that may, or could, have a disproportional positive or negative impact on results in any particular period. These non-GAAP measures include, but are not limited to, Earnings Before Interest, Depreciation and Amortization (“EBITDA”), Return on Invested Capital (“ROIC”), Free Cash Flow per Share, and Net Debt/EBITDA The Company calculates EBITDA as the sum of net income, less income or loss from discontinued operations, plus income tax expense, interest expense and depreciation and amortization. EBITDA should not be considered as an alternative to net income (as determined in accordance with GAAP), as an indicator of our operating performance, or to cash flows from operating activities (as determined in accordance with GAAP) as a measure of liquidity. Our calculation of EBITDA may not be comparable to EBITDA as calculated by other companies, this calculation of EBITDA is not identical to EBITDA used by our lenders to determine financial covenant compliance. The Company defines ROIC as Net Income less Income or Loss from Discontinued Operations plus tax effected Interest Expense divided by Average Total Debt plus Average Shareholders’ Equity. Our calculation of ROIC may not be comparable to ROIC as calculated by other companies. |
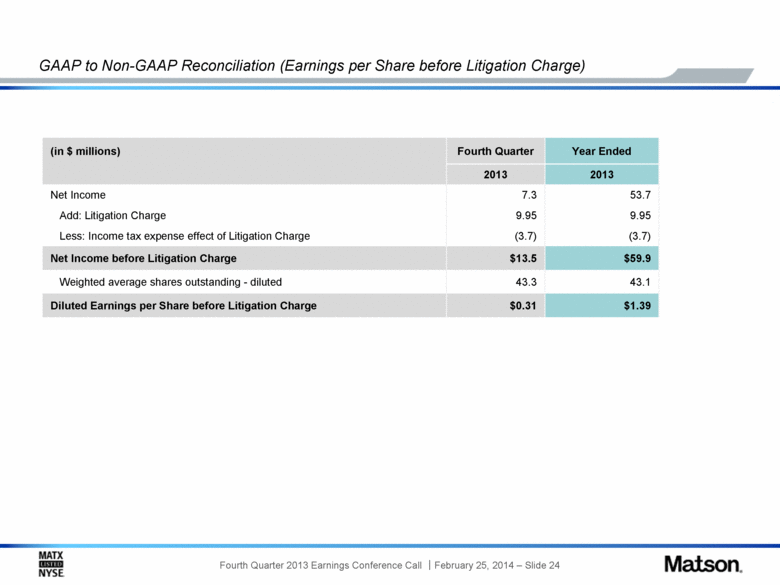
| GAAP to Non-GAAP Reconciliation (Earnings per Share before Litigation Charge) (in $ millions) Fourth Quarter Year Ended 2013 2013 Net Income 7.3 53.7 Add: Litigation Charge 9.95 9.95 Less: Income tax expense effect of Litigation Charge (3.7) (3.7) Net Income before Litigation Charge $13.5 $59.9 Weighted average shares outstanding - diluted 43.3 43.1 Diluted Earnings per Share before Litigation Charge $0.31 $1.39 |
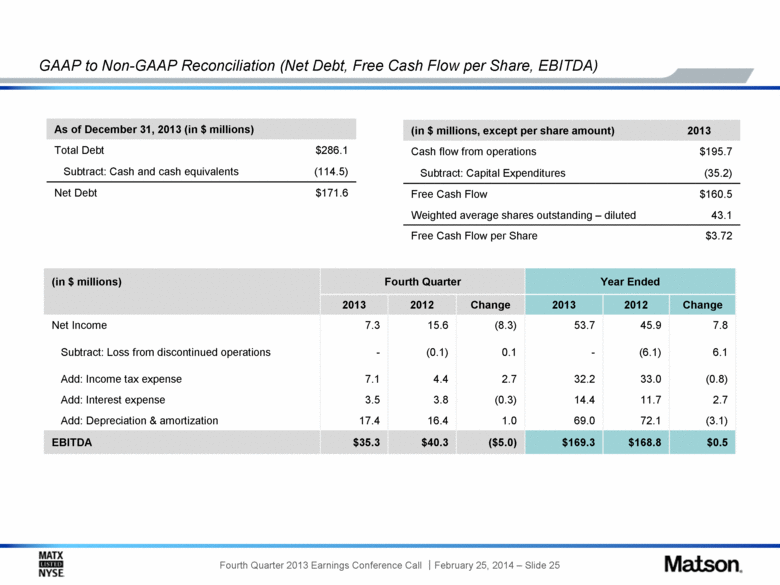
| GAAP to Non-GAAP Reconciliation (Net Debt, Free Cash Flow per Share, EBITDA) (in $ millions) Fourth Quarter Year Ended 2013 2012 Change 2013 2012 Change Net Income 7.3 15.6 (8.3) 53.7 45.9 7.8 Subtract: Loss from discontinued operations - (0.1) 0.1 - (6.1) 6.1 Add: Income tax expense 7.1 4.4 2.7 32.2 33.0 (0.8) Add: Interest expense 3.5 3.8 (0.3) 14.4 11.7 2.7 Add: Depreciation & amortization 17.4 16.4 1.0 69.0 72.1 (3.1) EBITDA $35.3 $40.3 ($5.0) $169.3 $168.8 $0.5 As of December 31, 2013 (in $ millions) Total Debt $286.1 Subtract: Cash and cash equivalents (114.5) Net Debt $171.6 (in $ millions, except per share amount) 2013 Cash flow from operations $195.7 Subtract: Capital Expenditures (35.2) Free Cash Flow $160.5 Weighted average shares outstanding – diluted 43.1 Free Cash Flow per Share $3.72 |
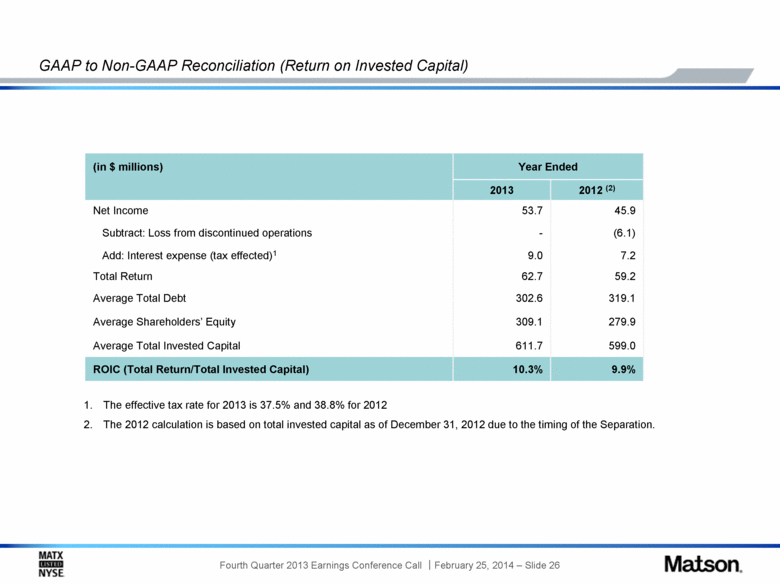
| GAAP to Non-GAAP Reconciliation (Return on Invested Capital) (in $ millions) Year Ended 2013 2012 (2) Net Income 53.7 45.9 Subtract: Loss from discontinued operations - (6.1) Add: Interest expense (tax effected)1 9.0 7.2 Total Return 62.7 59.2 Average Total Debt 302.6 319.1 Average Shareholders’ Equity 309.1 279.9 Average Total Invested Capital 611.7 599.0 ROIC (Total Return/Total Invested Capital) 10.3% 9.9% The effective tax rate for 2013 is 37.5% and 38.8% for 2012 The 2012 calculation is based on total invested capital as of December 31, 2012 due to the timing of the Separation. |
