Alexander & Baldwin, Inc. Strategic Update 9/30/05 |
Statements in this presentation that set forth expectations and predictions are based on facts and situations that are known to us as of today, September 30, 2005. Actual results may differ materially due to risks and uncertainties, such as those described on page 22 of the Form 10-K in our 2004 annual report and our other subsequent filings with the SEC. Statements in this call are not guarantees of future performance. |
Strategic Direction Matson A&B Properties Agribusiness Financial Overview, Summary |
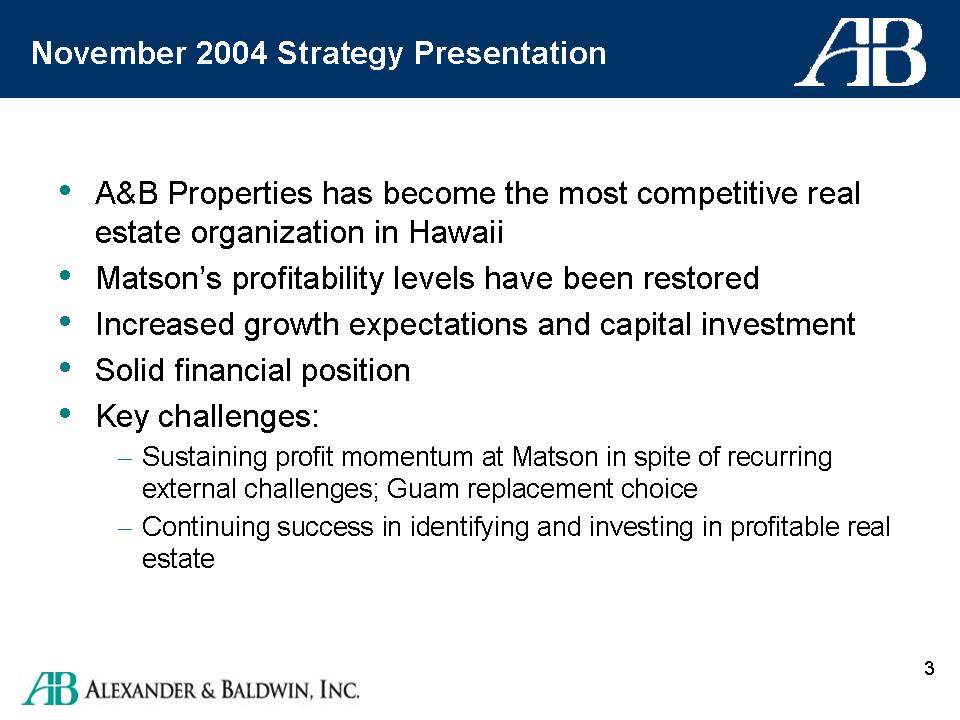
| A&B Properties has become the most competitive real estate organization in Hawaii Matson’s profitability levels have been restored Increased growth expectations and capital investment Solid financial position Key challenges: Sustaining profit momentum at Matson in spite of recurring external challenges; Guam replacement choice Continuing success in identifying and investing in profitable real estate |
| Context: Hawaii economic pace strong, sustainable Real estate markets strong; price growth moderating Matson: Guam-China service Startup challenges and risks Excellent long-term potential Auto competitor Responded to new entrant Expect ongoing Matson actions to reduce cost of auto business Properties: Solid outlook for existing developments Increased confidence in investment pipeline |
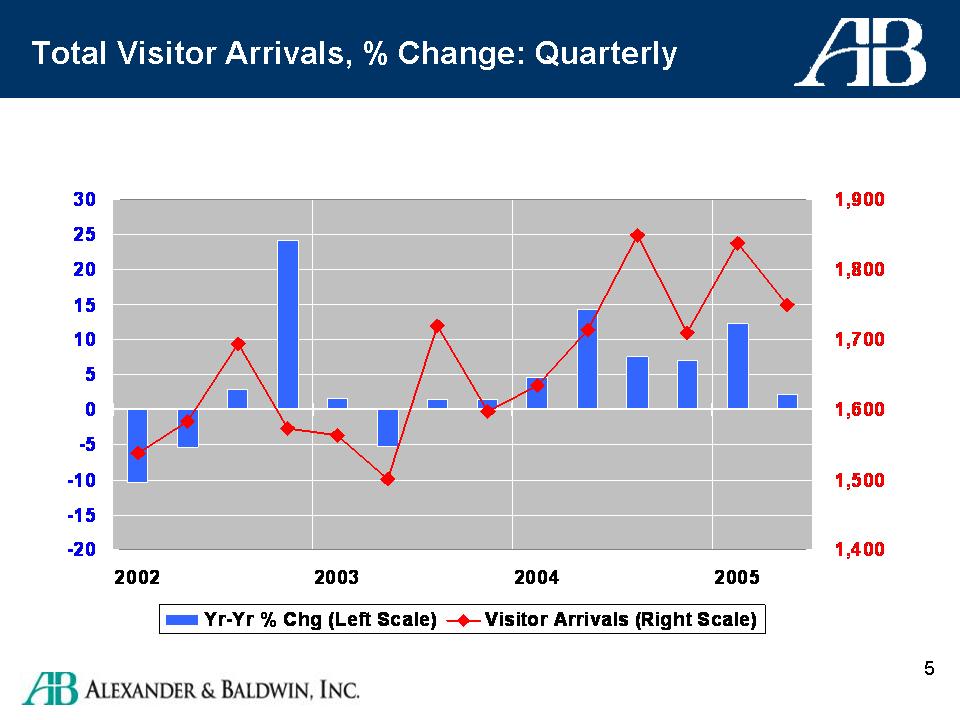
| | 2001 | | | | 2002 | | | | 2003 | | | | 2004 | | | | 2005 | |
| | 1st Qtr | 2nd Qtr | 3rd Qtr | 4th Qtr | 1st Qtr | 2nd Qtr | 3rd Qtr | 4th Qtr | 1st Qtr | 2nd Qtr | 3rd Qtr | 4th Qtr | 1st Qtr | 2nd Qtr | 3rd Qtr | 4th Qtr | 1st Qtr | |
| Yr-Yr % Chg (Left Scale) | | | | | -10.3 | -5.4 | 2.9 | 24.2 | 1.6 | -5.2 | 1.5 | 1.5 | 4.6 | 14.2 | 7.6 | 7 | 12.3 | 2.2 |
| Visitor Arrivals (Right Scale) | 1,715 | 1,674 | 1,647 | 1,268 | 1,538 | 1,583 | 1,694 | 1,574 | 1,563 | 1,501 | 1,719 | 1,597 | 1,635 | 1,714 | 1,849 | 1,709 | 1,837 | 1750 |
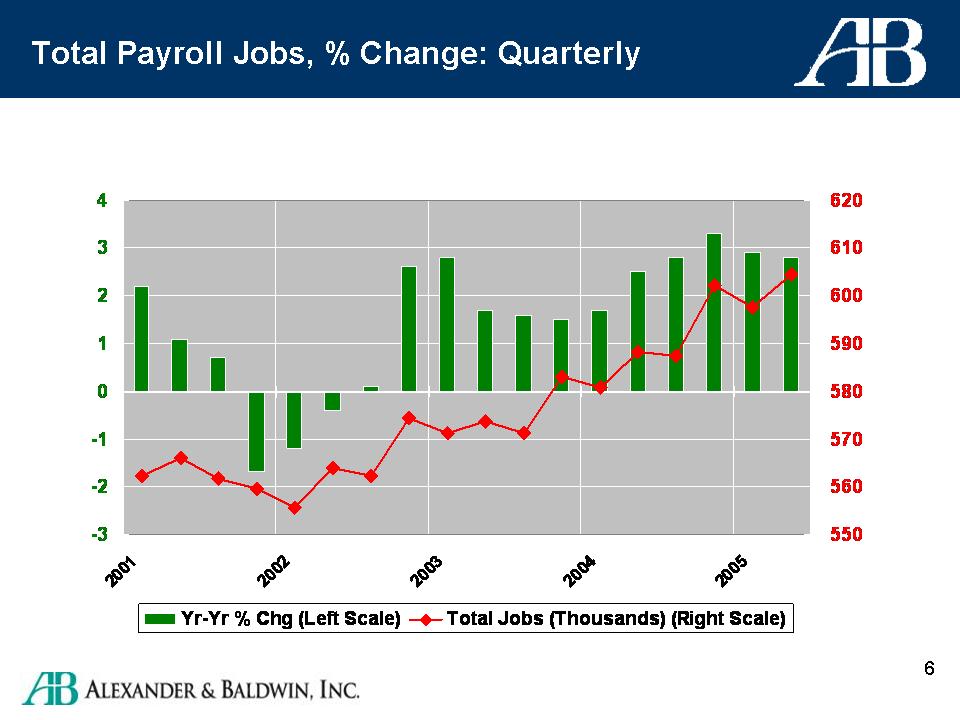
| | 2001 | | | | 2002 | | | | 2003 | | | | 2004 | | | | 2005 | |
| | 1st Qtr | 2nd Qtr | 3rd Qtr | 4th Qtr | 1st Qtr | 2nd Qtr | 3rd Qtr | 4th Qtr | 1st Qtr | 2nd Qtr | 3rd Qtr | 4th Qtr | 1st Qtr | 2nd Qtr | 3rd Qtr | 4th Qtr | 1st Qtr | |
| Yr-Yr % Chg (Left Scale) | 2.2 | 1.1 | 0.7 | -1.7 | -1.2 | -0.4 | 0.1 | 2.6 | 2.8 | 1.7 | 1.6 | 1.5 | 1.7 | 2.5 | 2.8 | 3.3 | 2.9 | 2.8 |
| Total Jobs (Thousands) (Right Scale) | 562 | 566 | 562 | 560 | 556 | 564 | 562 | 574 | 571 | 574 | 571 | 583 | 581 | 588 | 587 | 602 | 598 | 604.5 |
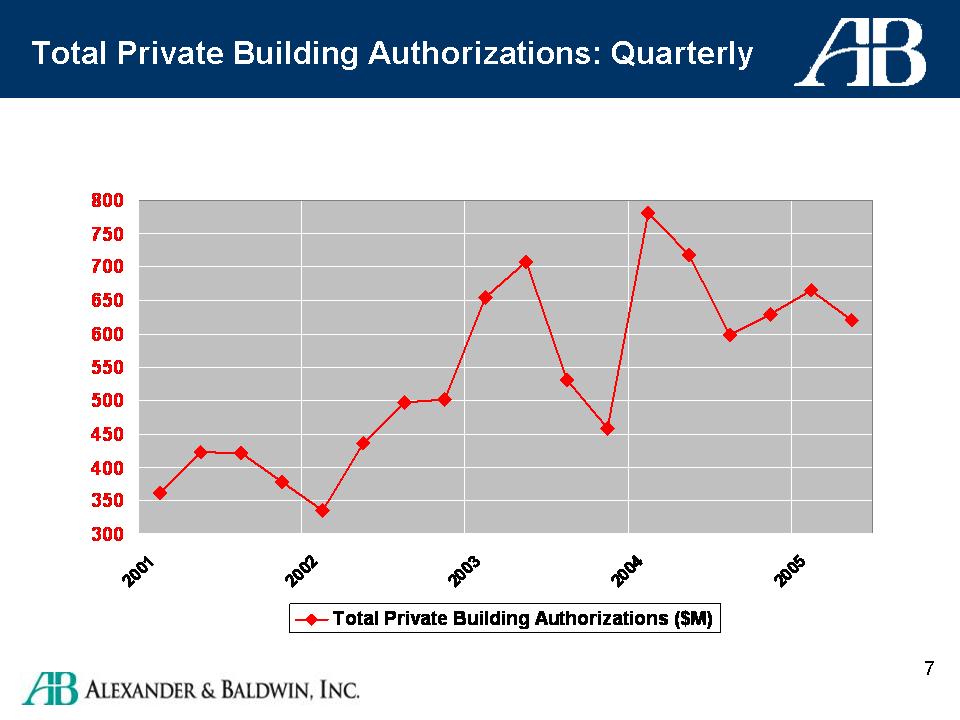
| | 2001 | | | | 2002 | | | | 2003 | | | | 2004 | | | | 2005 | |
| | 1st Qtr | 2nd Qtr | 3rd Qtr | 4th Qtr | 1st Qtr | 2nd Qtr | 3rd Qtr | 4th Qtr | 1st Qtr | 2nd Qtr | 3rd Qtr | 4th Qtr | 1st Qtr | 2nd Qtr | 3rd Qtr | 4th Qtr | 1st Qtr | |
| Yr-Yr % Chg (Left Scale) | | | | | | | | | | | | | | | | | | |
| Total Private Building Authorizations ($M) | 363 | 424 | 421 | 379 | 336 | 437 | 498 | 501 | 655 | 708 | 531 | 458 | 781 | 719 | 598 | 629 | 665 | 620.3 |
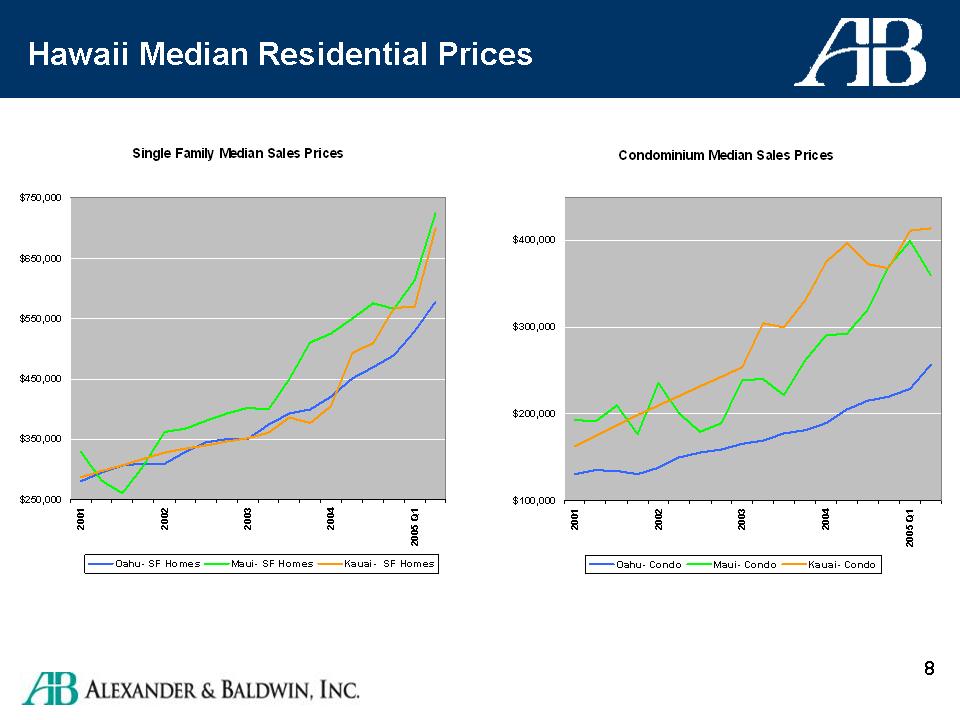
Single Family Media Sales Prices Condominium Median Sales Prices |
Strategic Direction Matson A&B Properties AgribusinessFinancial Overview, Summary |
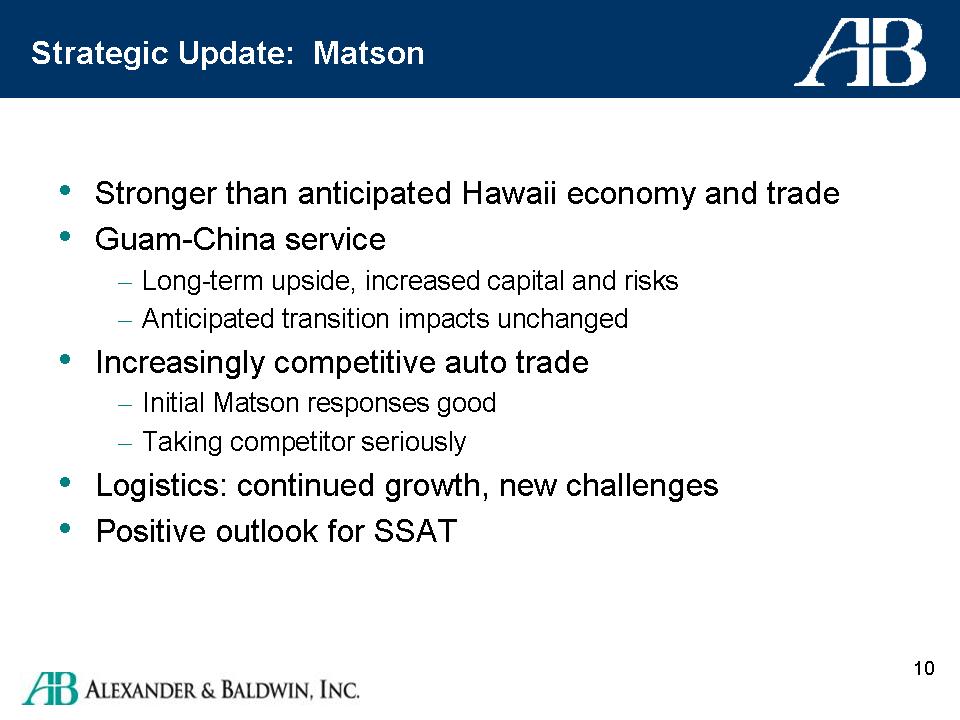
Stronger than anticipated Hawaii economy and trade Guam-China service Long-term upside, increased capital and risks Anticipated transition impacts unchanged Increasingly competitive auto trade Initial Matson responses good Taking competitor seriously Logistics: continued growth, new challenges Positive outlook for SSAT |
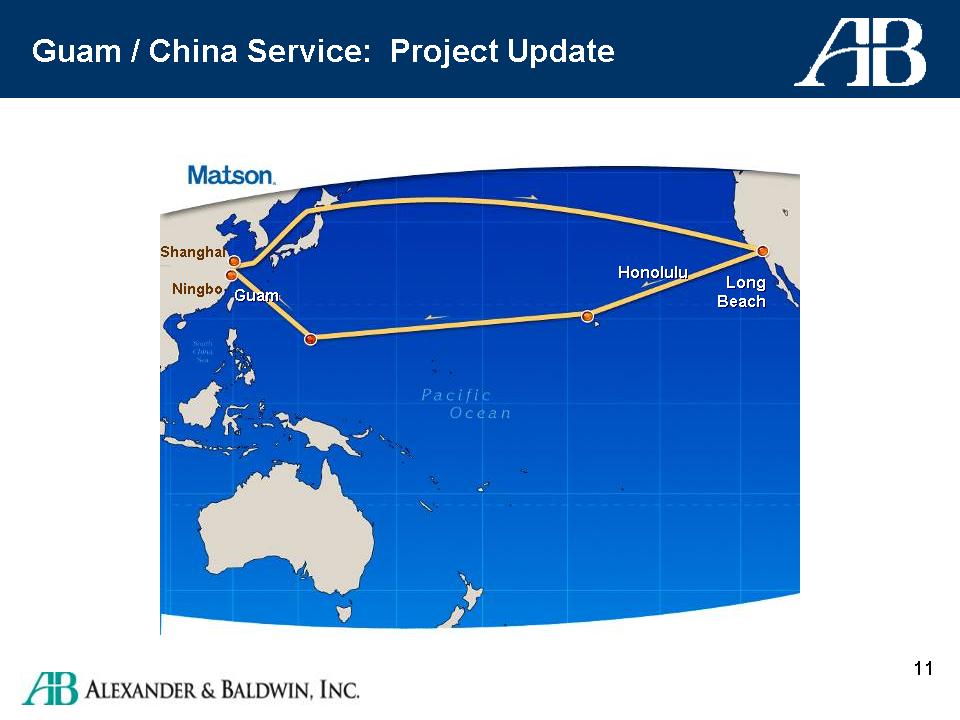
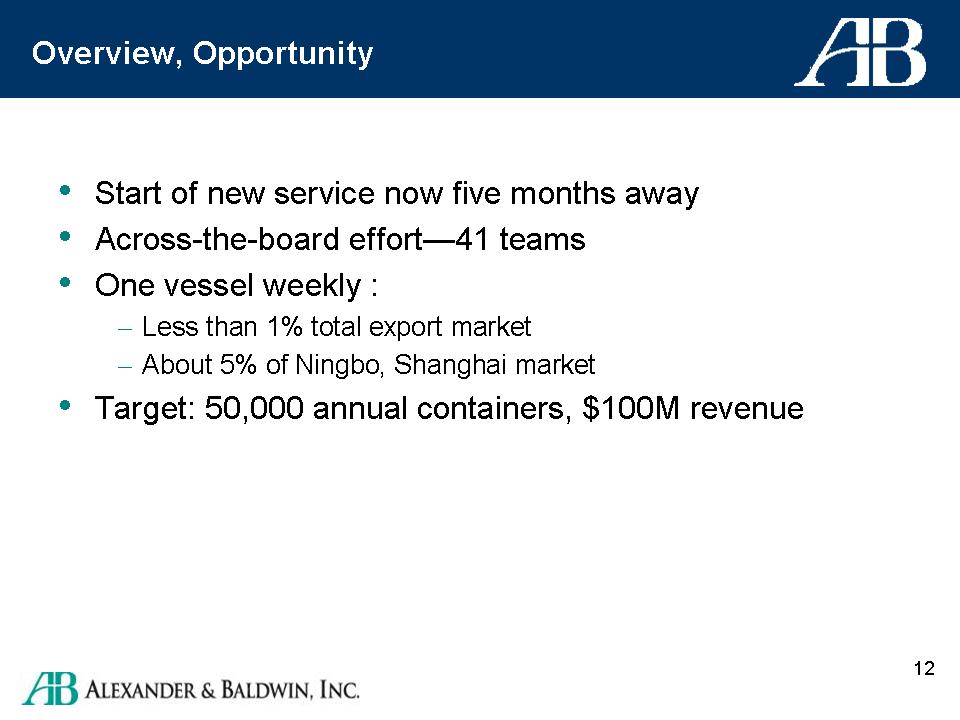
Guam/China Service: Project Update
Start of new service now five months away Across-the-board effort--41 teams One vessel weekly: Less than 1% total export market About 5% of Ningbo, Shanghai market Target: 50,000 annual containers, $100M revenue |
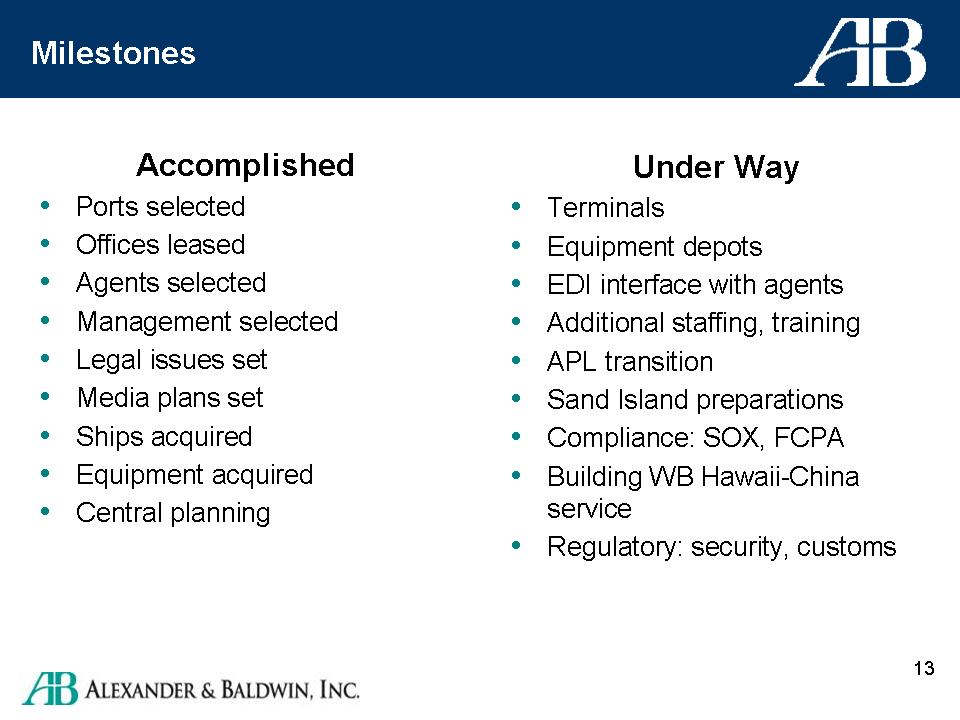
| Accomplished | Under Way |
| Ports selected | Terminals |
| Offices leased | Equipment depots |
| Agents selected | EDI interface with agents |
| Management selected | Additional staffing, training |
| Legal issues set | APL transition |
| Media plans set | Sand Island preparations |
| Ships acquired | Compliance: SOX, FCPA |
| Equipment acquired | Building WB Hawaii-China service |
| Central planning | Regulatory: security, customs |
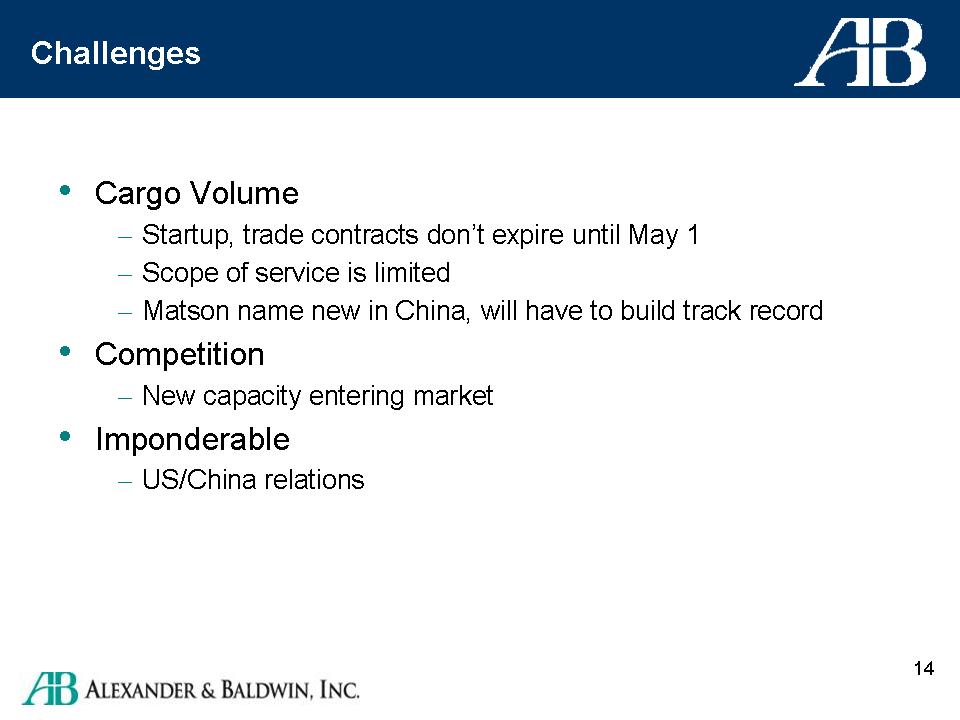
Cargo Volume Startup, trade contracts don't expire until May 1 Scope of service is limited Matson name new in China, will have to build track record Competition New capacity entering market ImponderableUS/China relations |
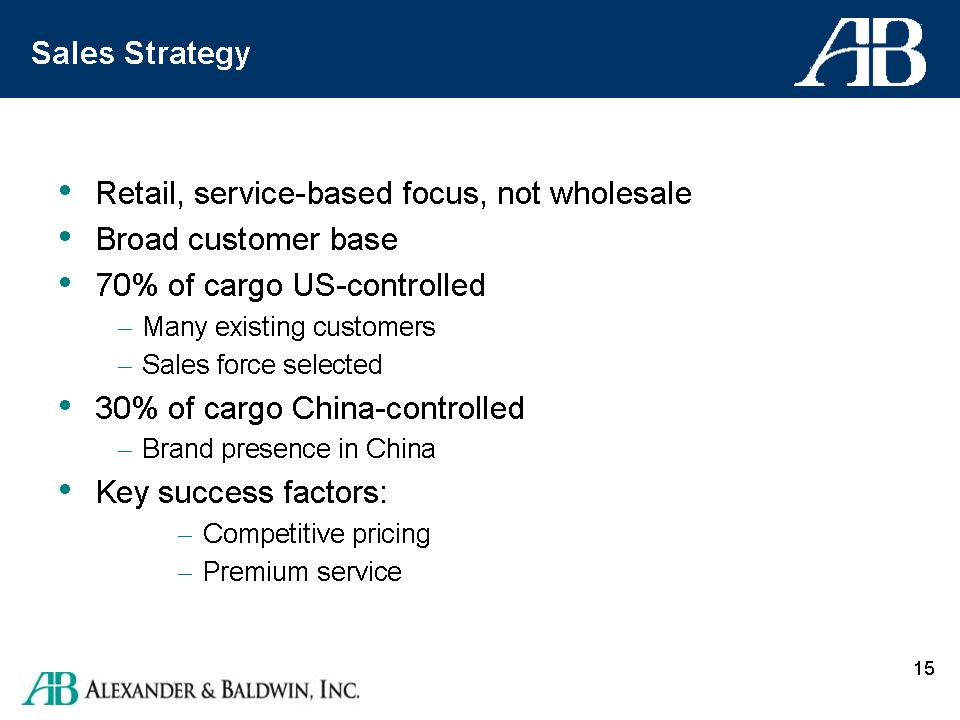
Sales Strategy Retail, service-based focus, not wholesale Broad customer base 70% of cargo US-controlled Many existing customers Sales force selected 30% of cargo China-controlled Brand presence in China Key success factors: Competitive pricingPremium service |
Service Advantages Timeliness Fast transit time Faster cargo throughput, dedicated terminal Faster vessel loading/unloading Reliability Convenience of off-dock facility Seamless intermodal services, MIL Customer Service Dedicated US-based China customer service team Dedicated China staff in Shanghai and NingboBuild a stable niche position |
Automobile Strategy Pasha initial impact muted Strong auto market Matson's long term contracts with manufacturers Strategic investments planned to lower business cost, improve service Vessel conversions: add Ro/Ro capacityTerminal improvements in Oakland & Honolulu |
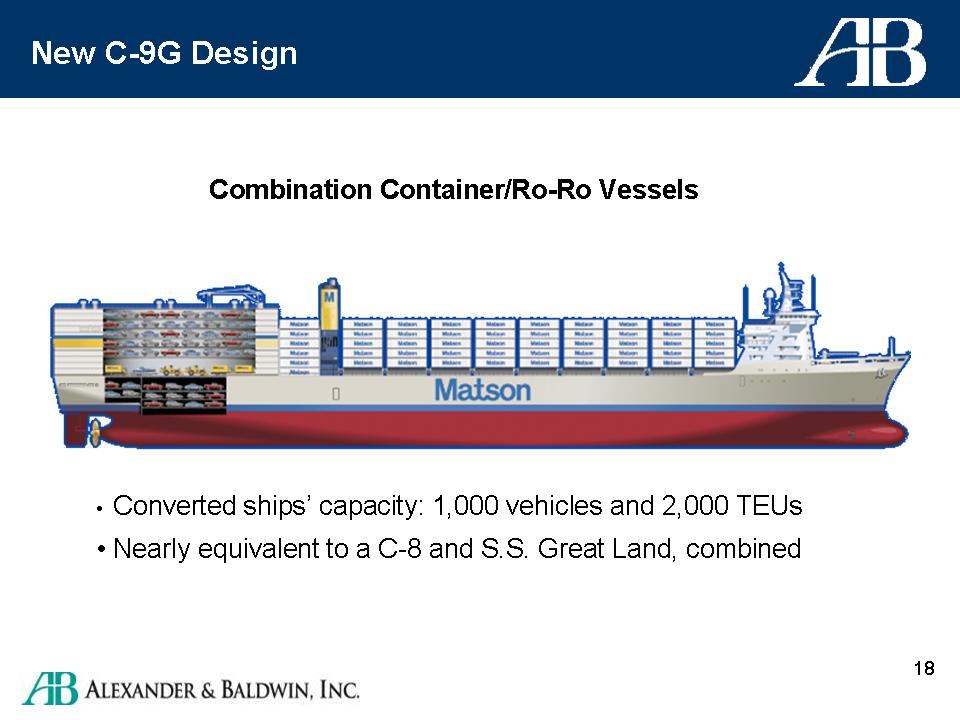
New C-9G Design Converted ships’ capacity: 1,000 vehicles and 2,000 TEUsNearly equivalent to a C-8 and S.S. Great Land, combined |
Matson Integrated Logistics Continued growth in earnings and margins Scale driven; consolidation of industry underway Rail segment problematic; highway more favorableActive acquisition program |
Agenda Strategic Direction Matson A&B Properties AgribusinessFinancial Overview, Summary |
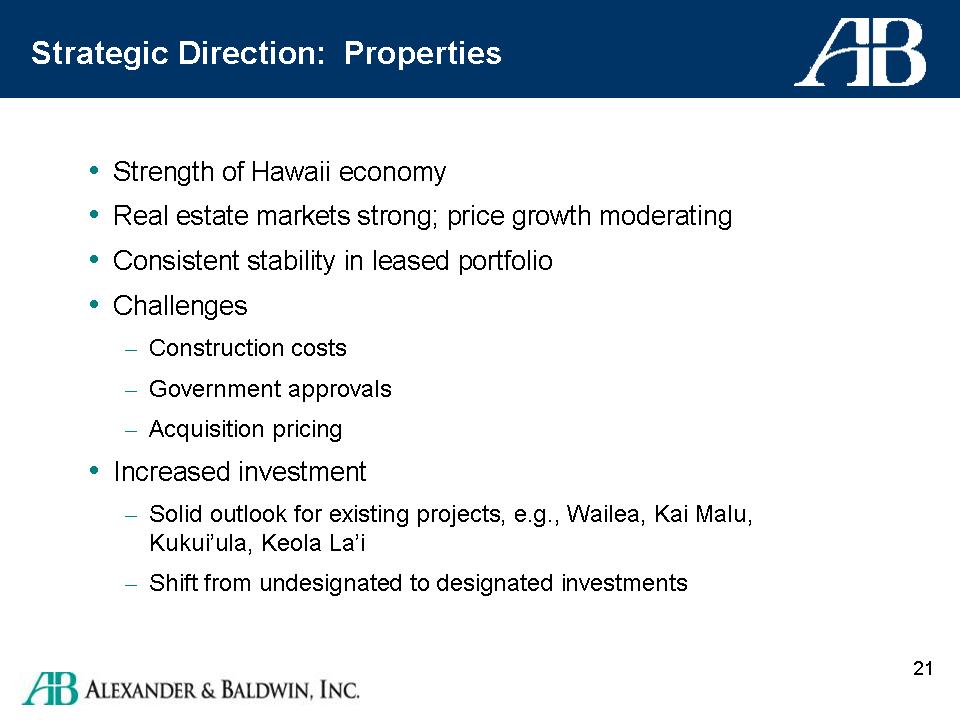
Strategic Direction: Properties Strength of Hawaii economy Real estate markets strong; price growth moderating Consistent stability in leased portfolio Challenges Construction costs Government approvals Acquisition pricing Increased investment Solid outlook for existing projects, e.g., Wailea, Kai Malu, Kukui'ula, Keola La'iShift from undesignated to designated investments |
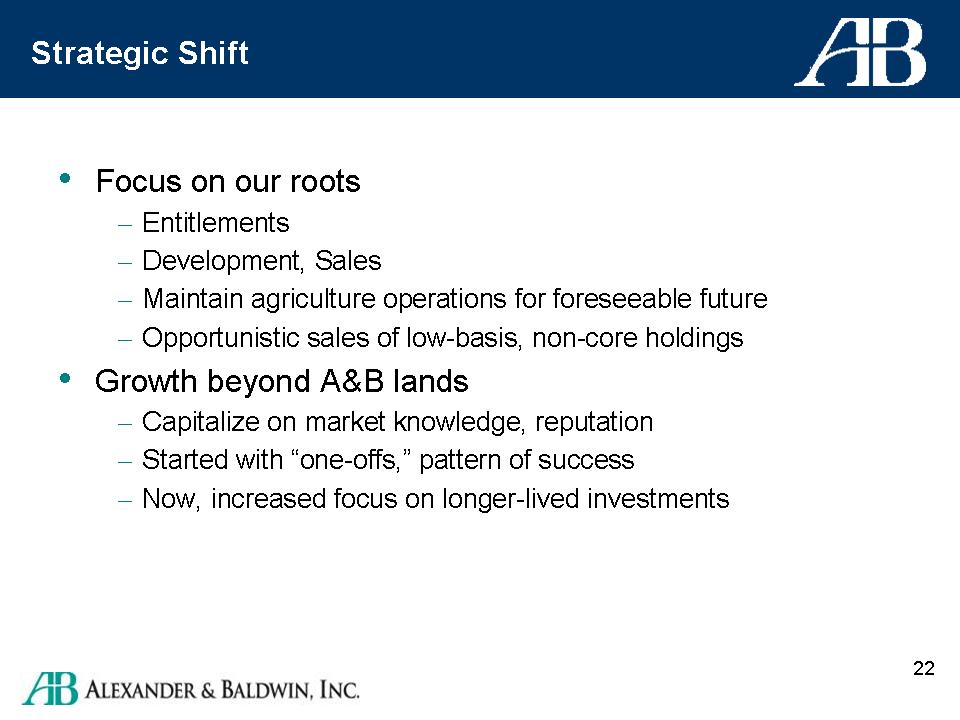
Strategic Shift Focus on our roots Entitlements Development, Sales Maintain agriculture operations for foreseeable future Opportunistic sales of low-basis, non-core holdings Growth beyond A&B lands Capitalize on market knowledge, reputation Started with "one-offs," pattern of successNow, increased focus on longer-lived investments |
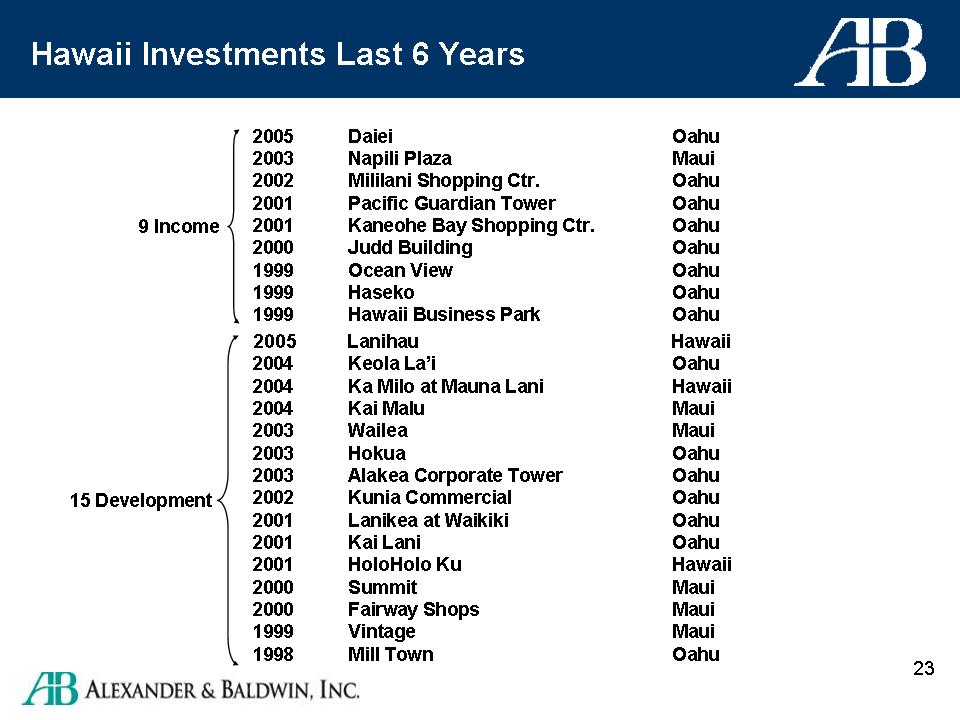
| | 2005 | | Daiei | | Oahu |
| | 2003 | | Napili Plaza | | Maui |
| | 2002 | | Mililani Shopping Ctr. | | Oahu |
| | 2001 | | Pacific Guardian Tower | | Oahu |
9 Income | 2001 | | Kaneohe Bay Shopping Ctr. | | Oahu |
| | 2000 | | Judd Building | | Oahu |
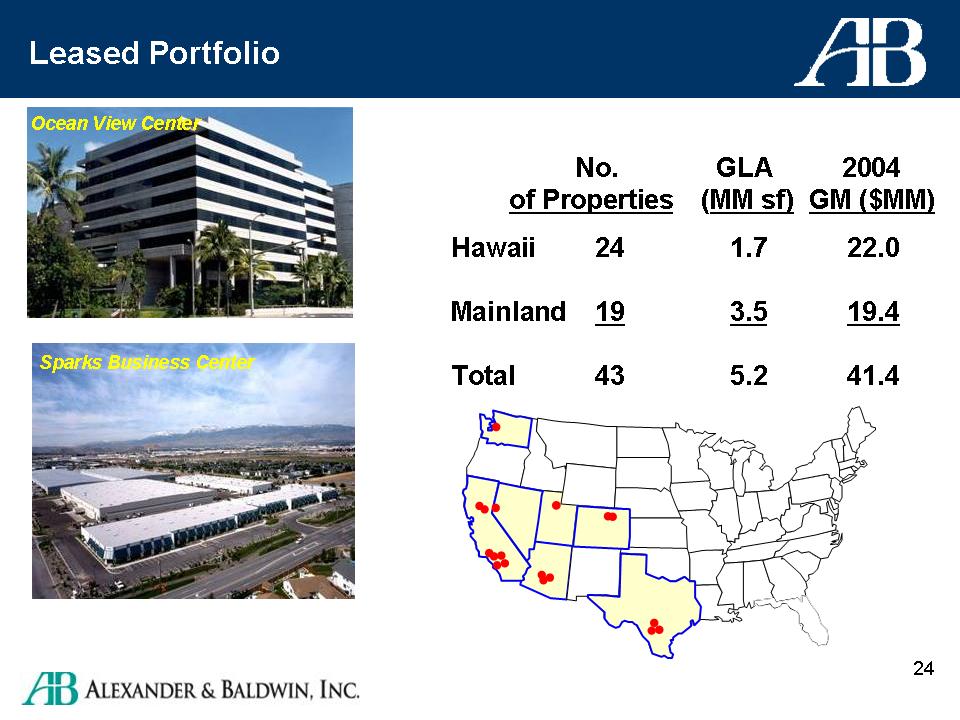
| | 1999 | | Ocean View | | Oahu |
| | 1999 | | Haseko | | Oahu |
| | 1999 | | Hawaii Business Park | | Oahu |
| | | | | | |
| 2005 | | Lanihau | | Hawaii |
| | 2004 | | Keola La’i | | Oahu |
| | 2004 | | Ka Milo at Mauna Lani | | Hawaii |
| | 2004 | | Kai Malu | | Maui |
| | 2003 | | Wailea | | Maui |
| | 2003 | | Hokua | | Oahu |
| | 2003 | | Alakea Corporate Tower | | Oahu |
15 Development | 2002 | | Kunia Commercial | | Oahu |
| | 2001 | | Lanikea at Waikiki | | Oahu |
| | 2001 | | Kai Lani | | Oahu |
| | 2001 | | HoloHolo Ku | | Hawaii |
| | 2000 | | Summit | | Maui |
| | 2000 | | Fairway Shops | | Maui |
| | 1999 | | Vintage | | Maui |
| | 1998 | | Mill Town | | Oahu |
| | | No. | | GLA | | 2004 | |
| | | of Properties | | | (MM sf) | | | GM ($MM) | |
| | | | | | | | | | | |
Hawaii | | | 24 | | | 1.7 | | | 22 | |
Mainland | | | 19 | | | 3.5 | | | 19.4 | |
Total | | | 43 | | | 5.2 | | | 41.4 | |
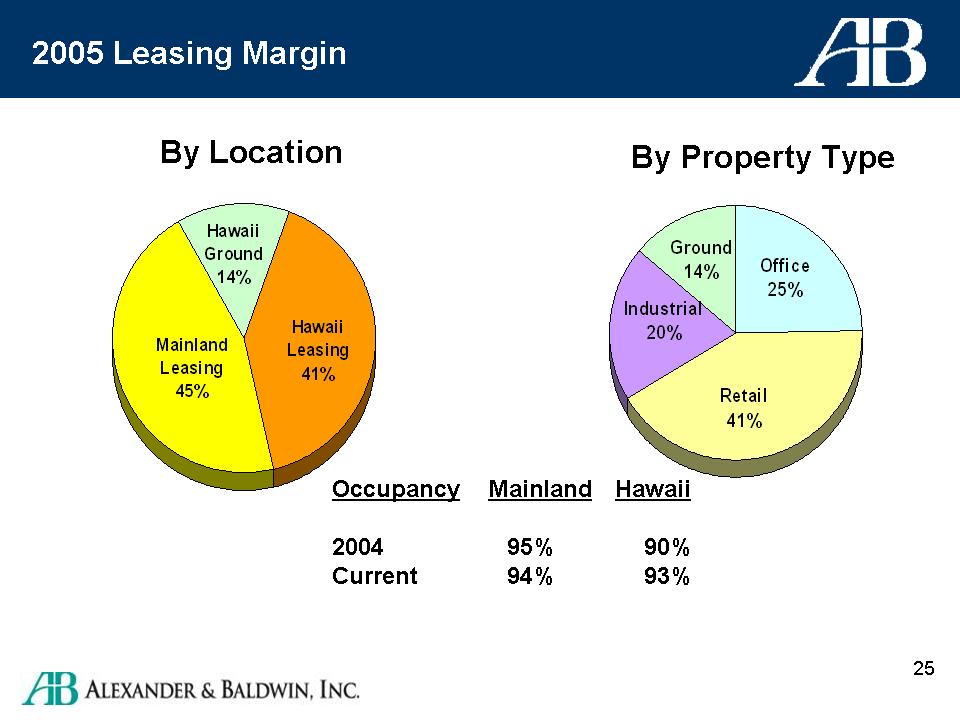
2005 Leasing Margin
Occupancy | Mainland | Hawaii |
| | | |
2004 | 95% | 90% |
Current | 94% | 93% |
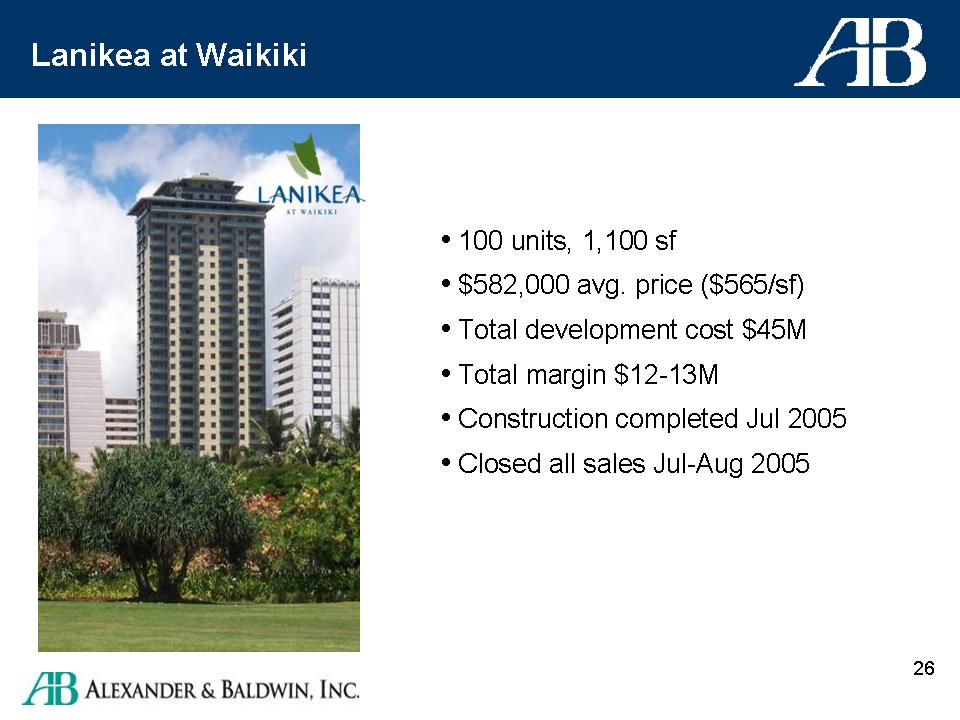
Lanikea at Waikiki 100 units, 1,100 sf $582,000 avg. price ($565/sf) Total development cost $45M Total margin $12-13M Construction completed Jul 2005 Closed all sales Jul-Aug 2005 |
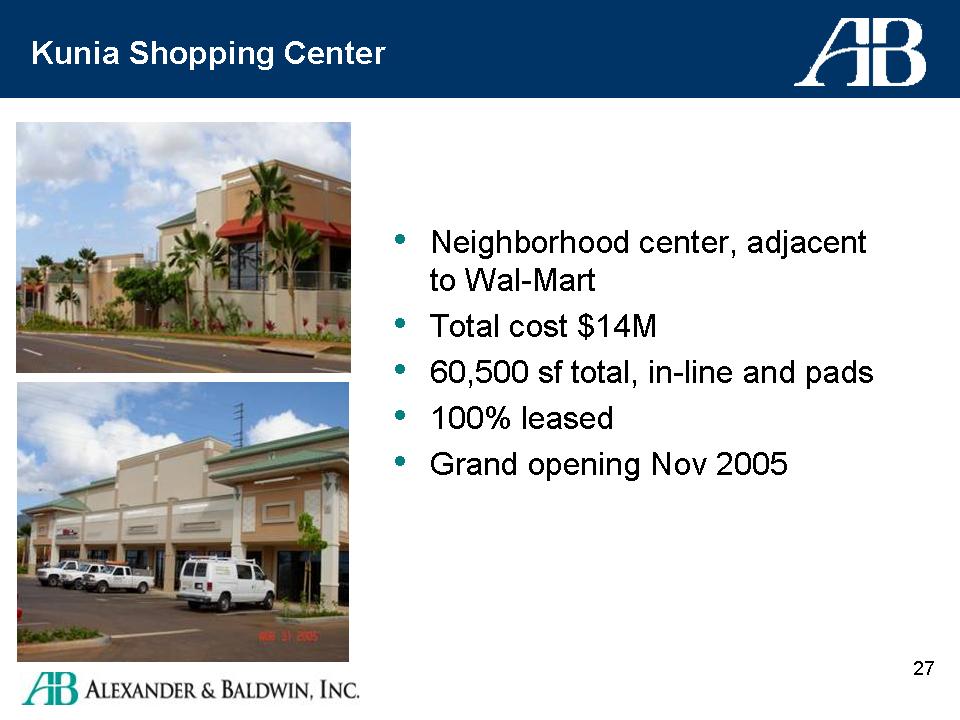
Kunia Shopping Center Neighborhood center, adjacent to Wal-Mart Total cost $14M 60,500 sf total, in-line and pads 100% leased Grand opening Nov 2005 |
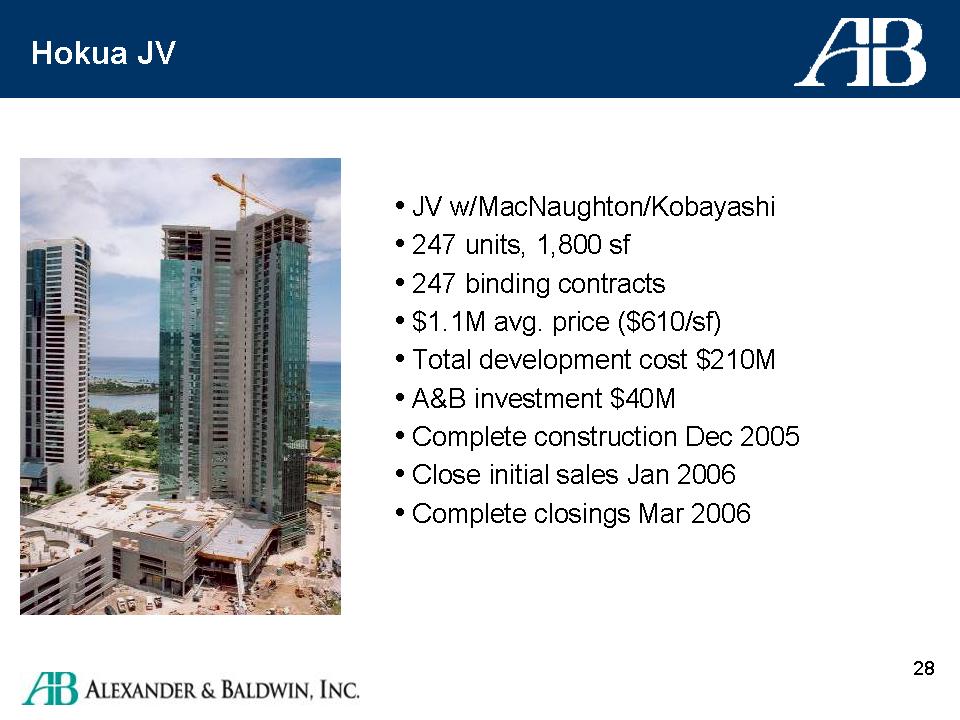
Kohua JV JV w/MacNaughton/Kobayashi 247 units, 1,800 sf 247 binding contracts $1.1M avg. price ($610/sf) Total development cost $210M A&B investment $40M Complete construction Dec 2005 Close initial sales Jan 2006 Complete closings Mar 2006 |
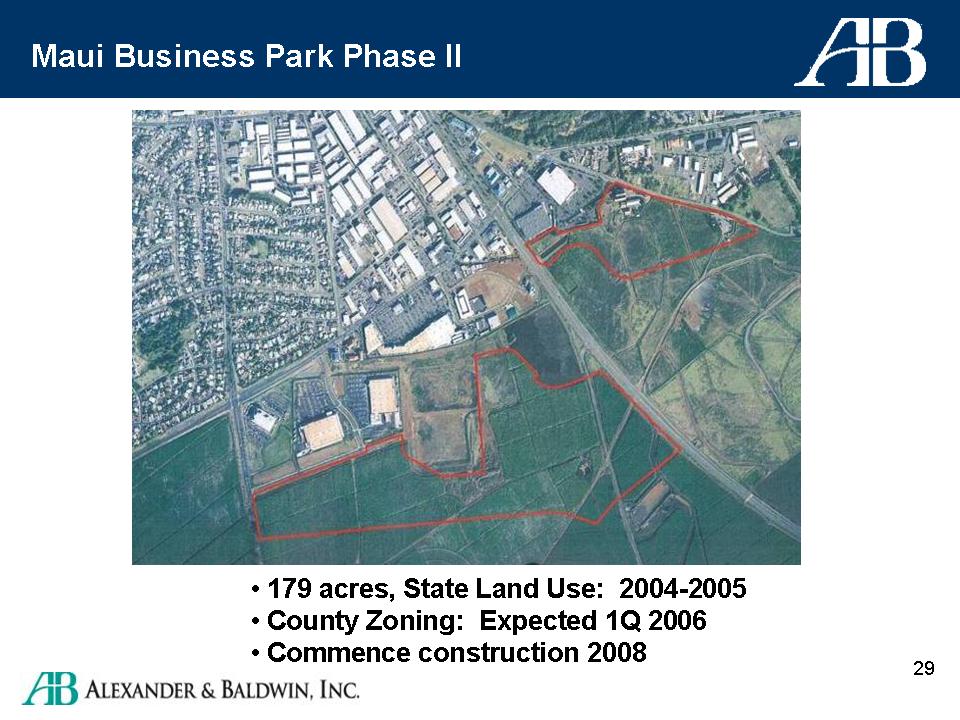
Maui Business Park Phase II 179 acres, State Land Use: 2004-2005 County Zoning: Expected 1Q 2006 Commence construction 2008 |
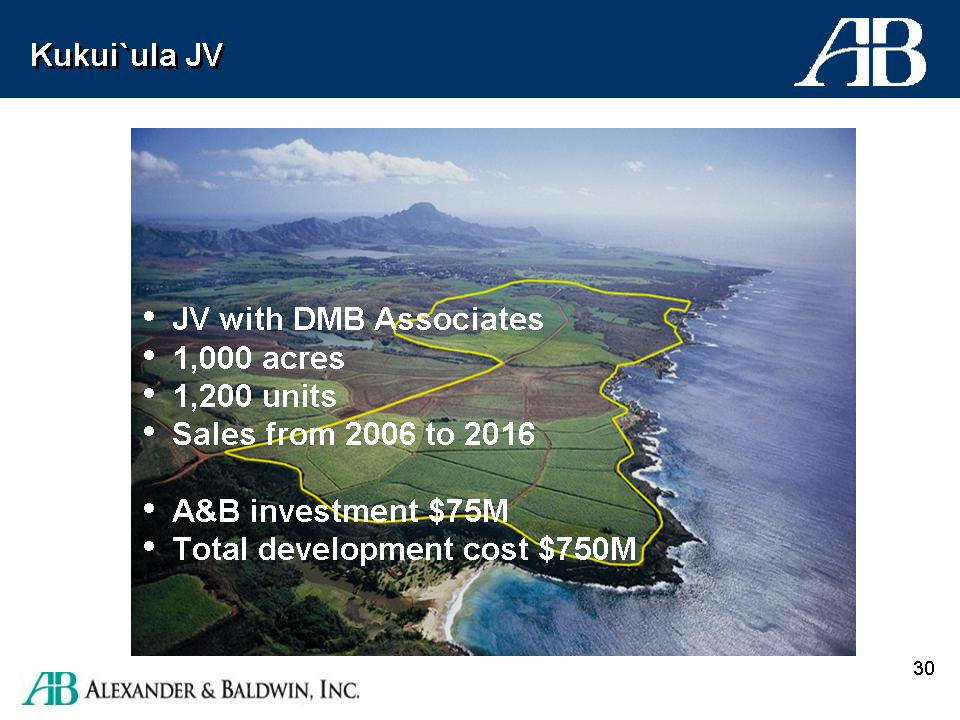
Kukui`ula JV JV with DMB Associates 1,000 acres 1,200 units Sales from 2006 to 2016 A&B investment $75M Total development cost $750M |
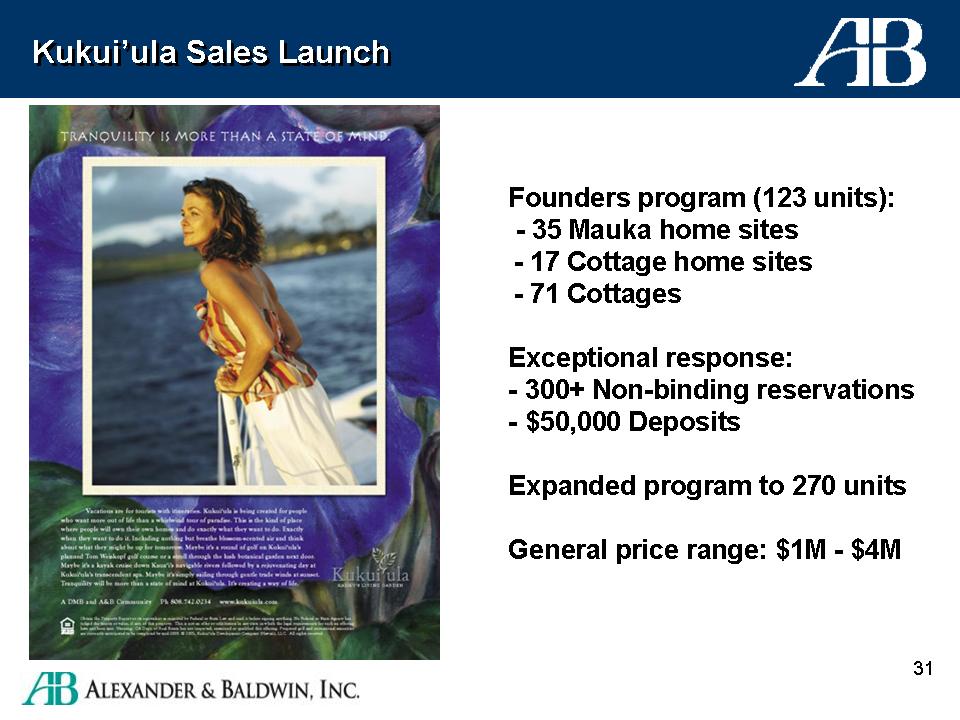
Kukui'ula Sales Launch Founders program (123 units): 35 Mauka home sites 17 Cottage home sites 71 Cottages Exceptional response: 300+ non-binding reservations $50,000 Deposits Expanded program to 270 units General price range: $1M - $4M |
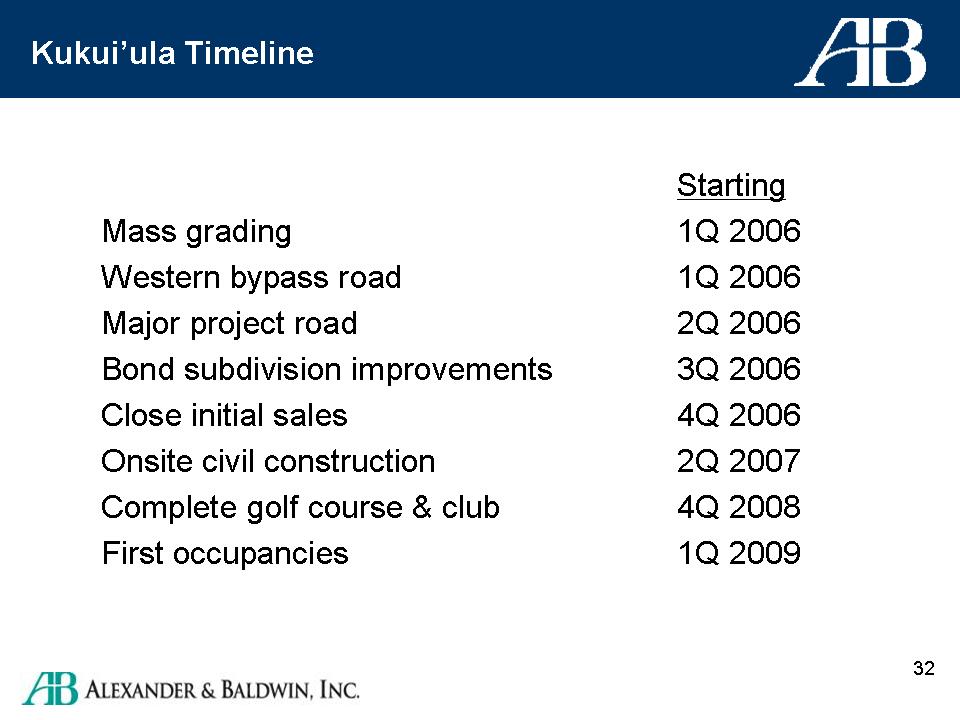
| | Starting |
| Mass grading | 1Q 2006 |
| Western bpass road | 1Q 2006 |
| Major project road | 2Q 2006 |
| Bond subdivision improvements | 3Q 2006 |
| Close initial sales | 4Q 2006 |
| Onsite civil construction | 2Q 2007 |
| Complete golf course & club | 4Q 2008 |
| First occupancies | 1Q 2009 |
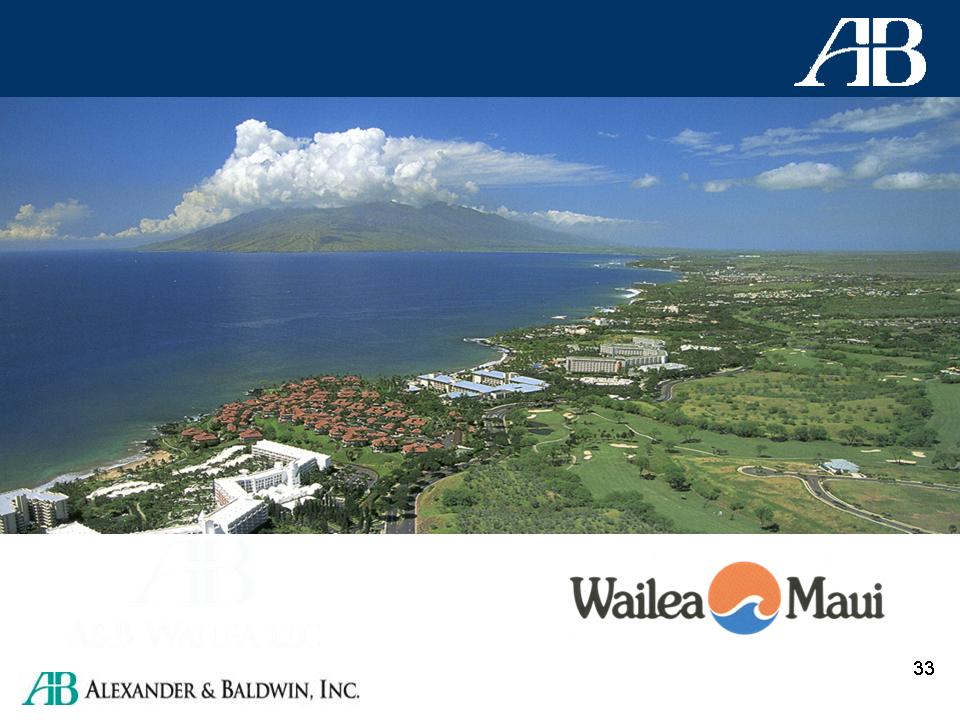
Wailea Maui
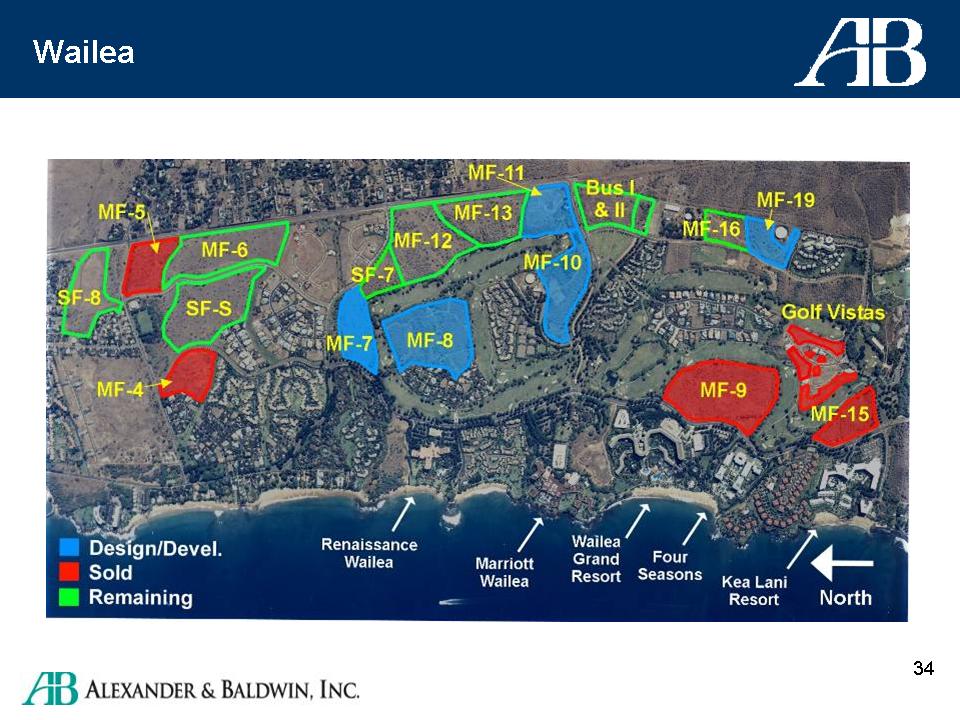
Wailea
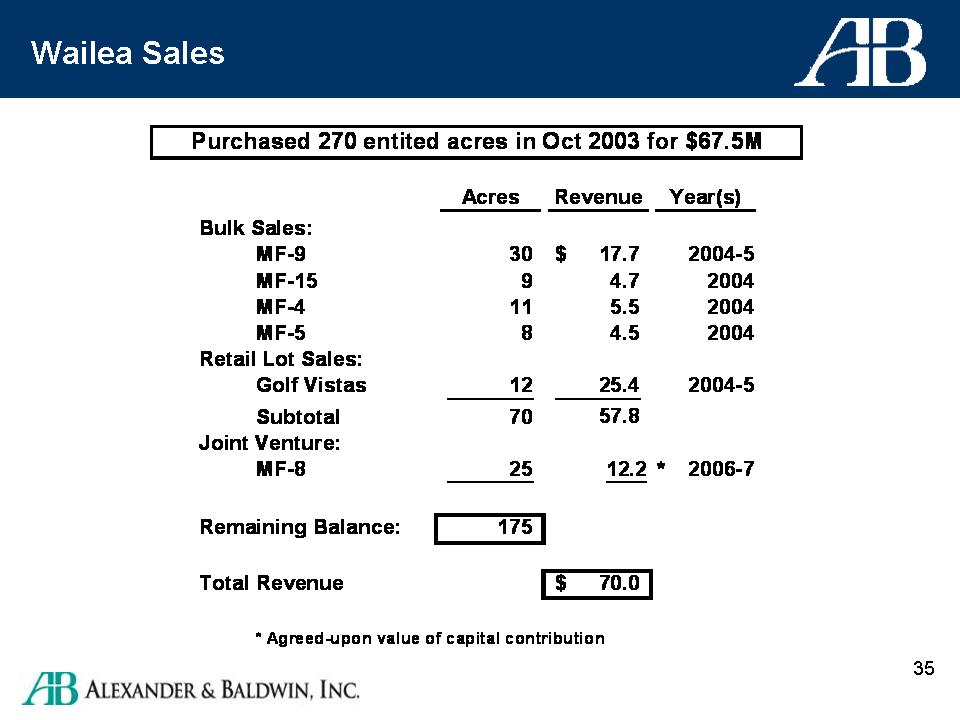
| | Acres | Revenue | Year(s) |
| Bulk Sales: | | $17.7 | 2004-5 |
| MF-9 | 30 | 4.7 | 2004 |
| MF-15 | 9 | 5.5 | 2004 |
| MF-4 | 11 | 4.5 | 2004 |
| MF-5 | 8 | | |
| Retail Lot Sales: | | 25.4 | 2004-5 |
| Golf Vistas | 12 | 57.8 | |
| Subtotal | 70 | | |
| Joint Venture: | | 12.2* | 2006-7 |
| MF-8 | 25 | | |
| | | | |
| Remaining Balance: | 175 | | |
| | | | |
| Total Revenue | | $70.0 | |
| | | | |
| *Agreed-upon value of capital contribution |
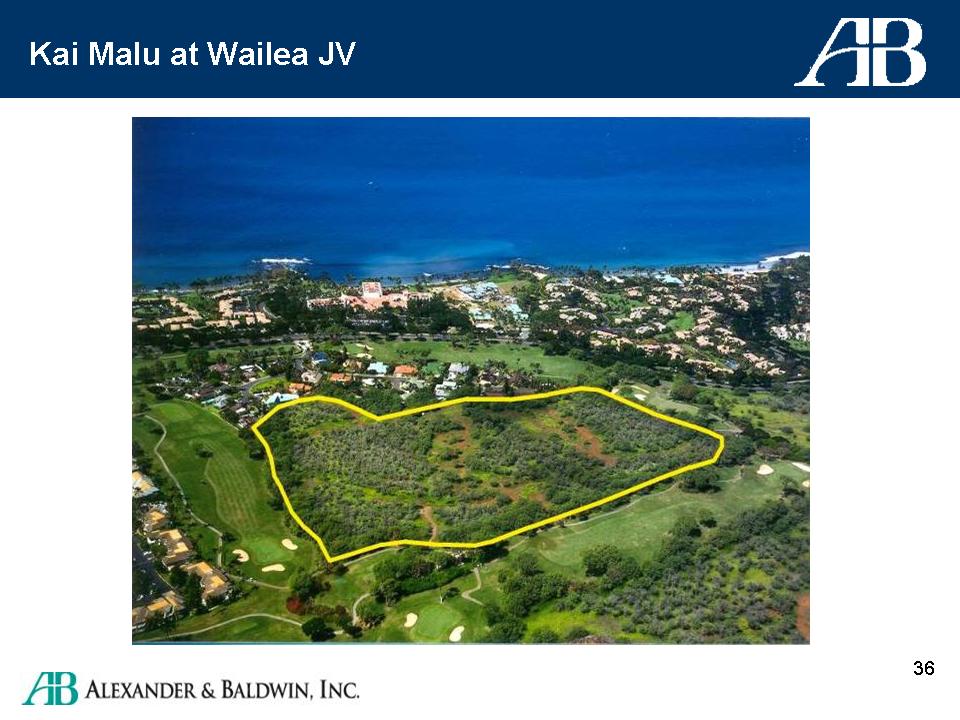
Kai Malu at Wailea JV
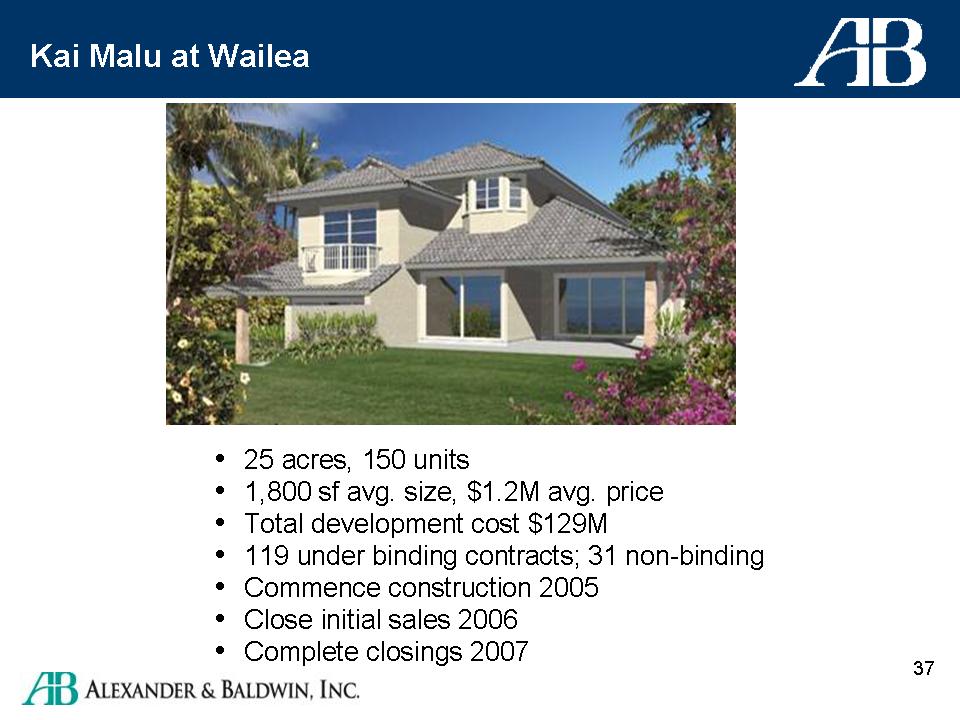
Kai Malu at Wailea
25 acres, 150 units
1,800 sf avg. size, $1.2M avg. price
Total development cost $129M
119 under binding contracts; 31 non-binding
Commence construction 2005
Close initial sales 2006
Complete closings 2007
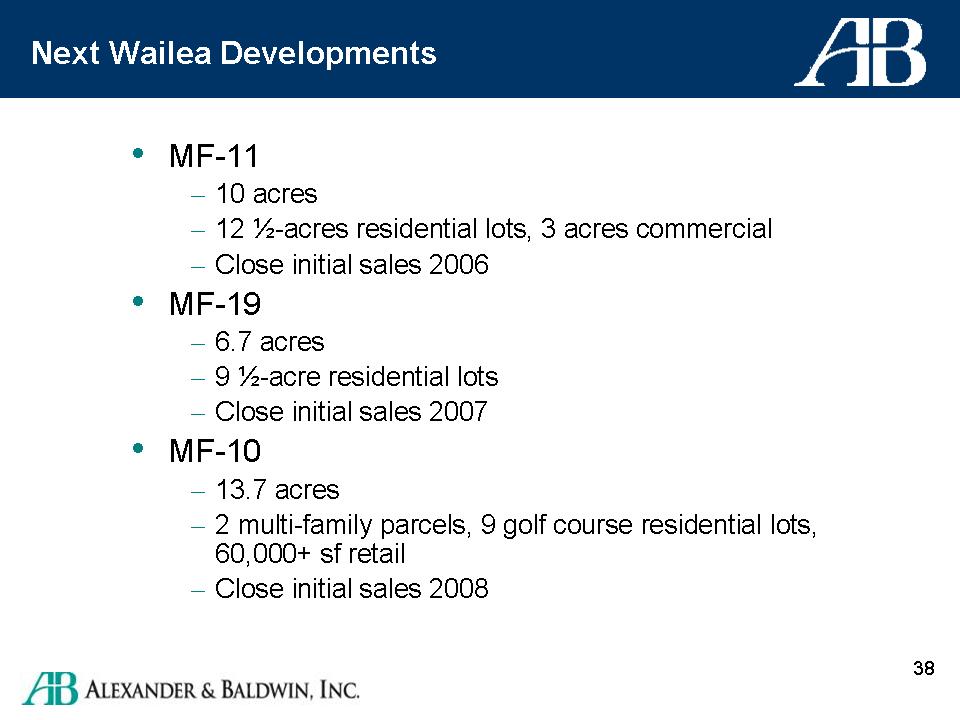
Next Wailea Development MF-11 10 acres 12 1/2-acres residential lots, 3 acres commercial Close initial sales 2006 MF-19 6.7 acres 9 1/2-acre residential lots Close initial sales 2007 MF-10 13.7 acres 2 multi-family parcels, 9 golf course residential lots, 60,000+ sf retail Close initial sales 2008 |
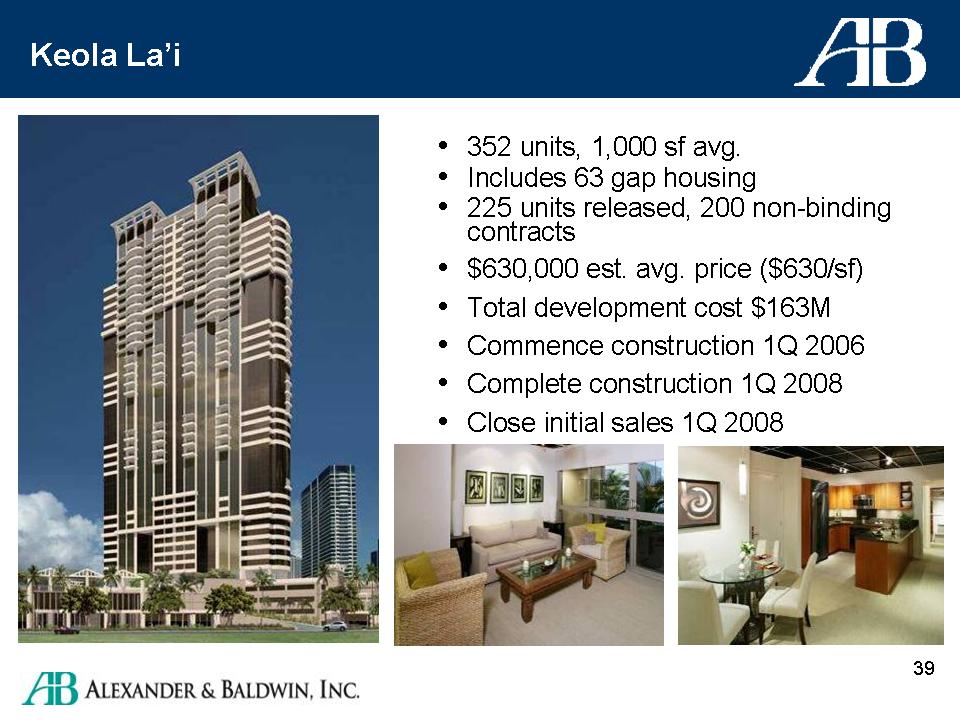
Keola La'i 352 units, 1,000 sf avg. Includes 63 gap housing 225 units released, 200 non-binding contracts $630,000 est. avg. price ($630/sf) Total development cost $163M Commence construction 1Q 2006 Complete construction 1Q 2008 Close initial sales 1Q 008 |
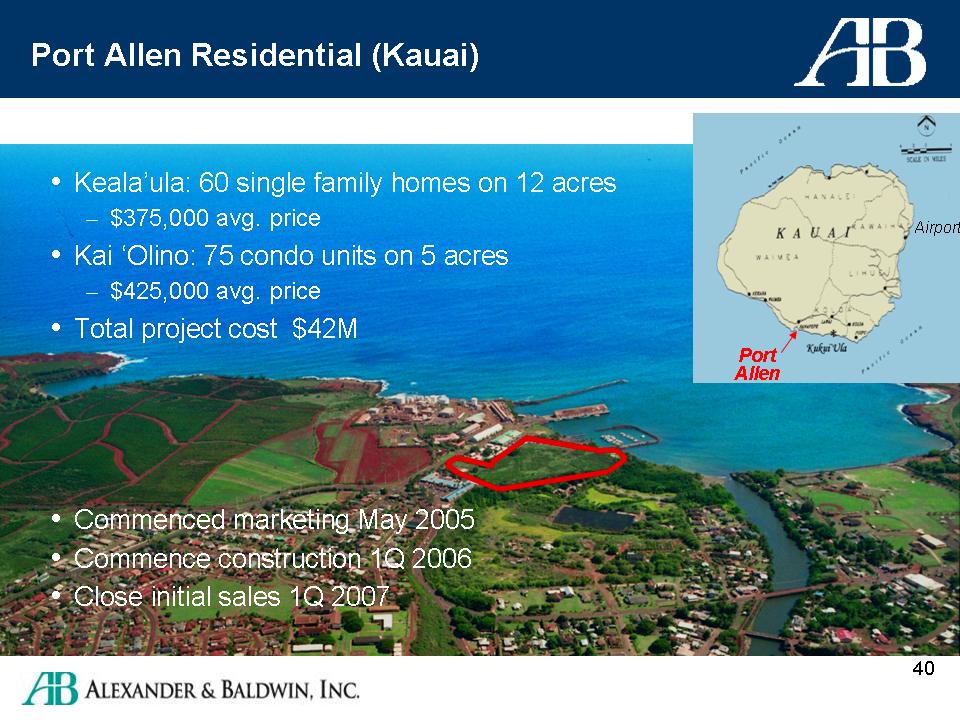
Port Allen Residential (Kauai) Keala'ula: 60 single family homes on 12 acres -- $375,000 avg. price Kai `Olino: 75 condo units on 5 acres -- $425,000 avg. price Total project cost $42M Commenced marketing May 2005 Commence construction 1Q 2006 Close initial sales 1Q 2007 |
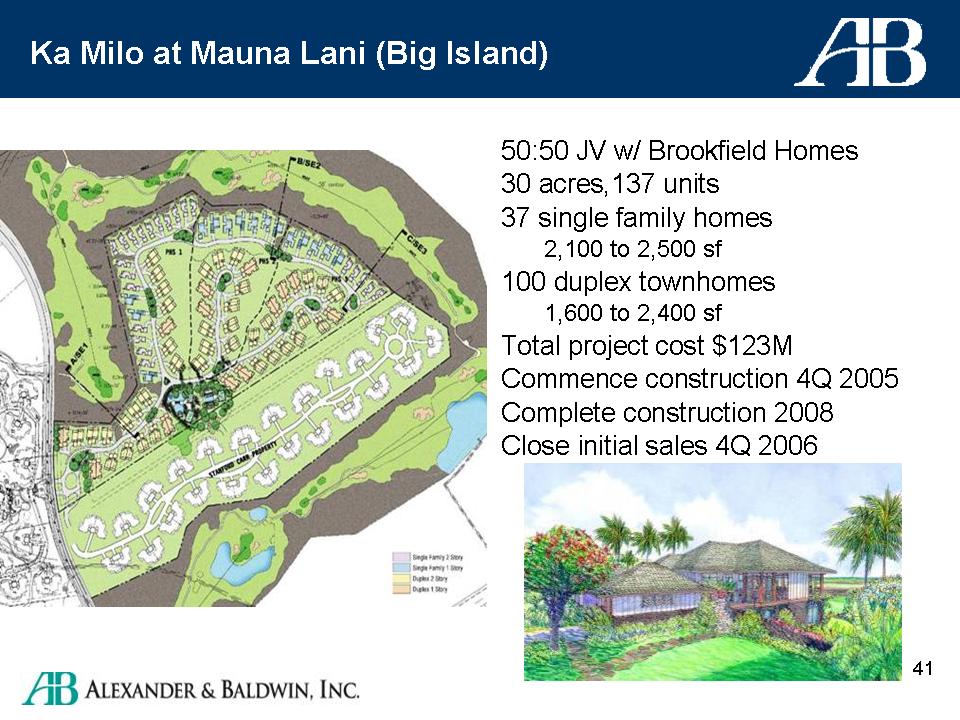
Ka Milo at Mauna Laniu (Big Island) 50:50 JV w/Brookfield Homes 30 acres, 137 units 37 single family homes 2,100 to 2,500 sf 100 duplex townhomes 1,600 to 2,400 sf Total project cost $123M Commence construction 4Q 2005 Complete construction 2008 Close initial sales 4Q 2006 |
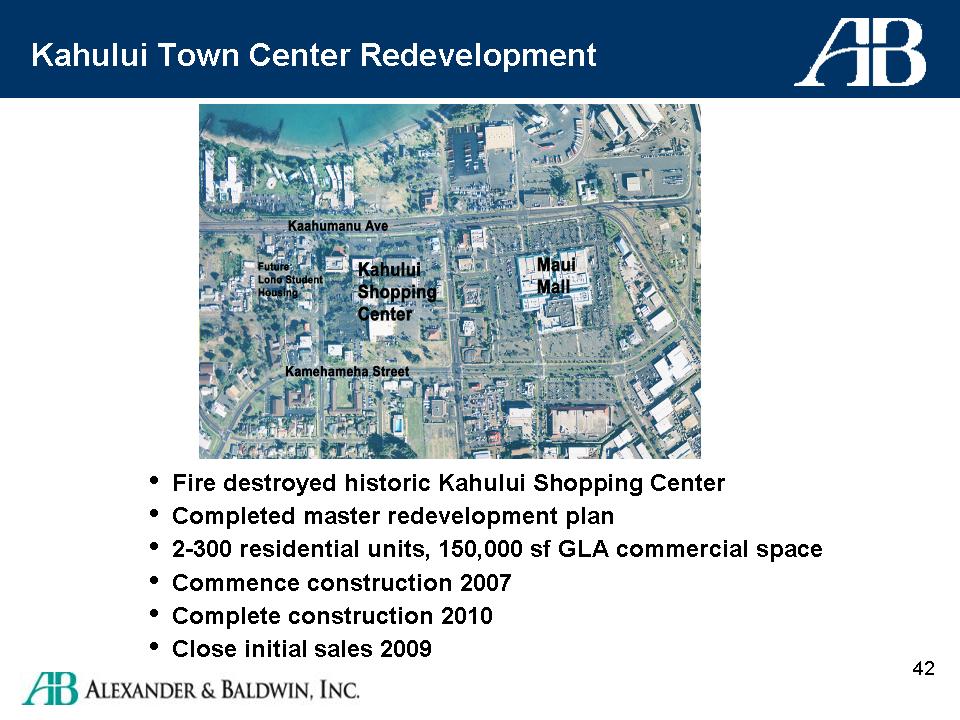
Kahului Town Center Redevelopment Fire destroyed historic Kahului Shopping Center Completed master redevelopment plan 2-300 residential units, 150,000 sf GLA commercial space Commence construction 2007 Complete construction 2010 Close initial sales 2009 |
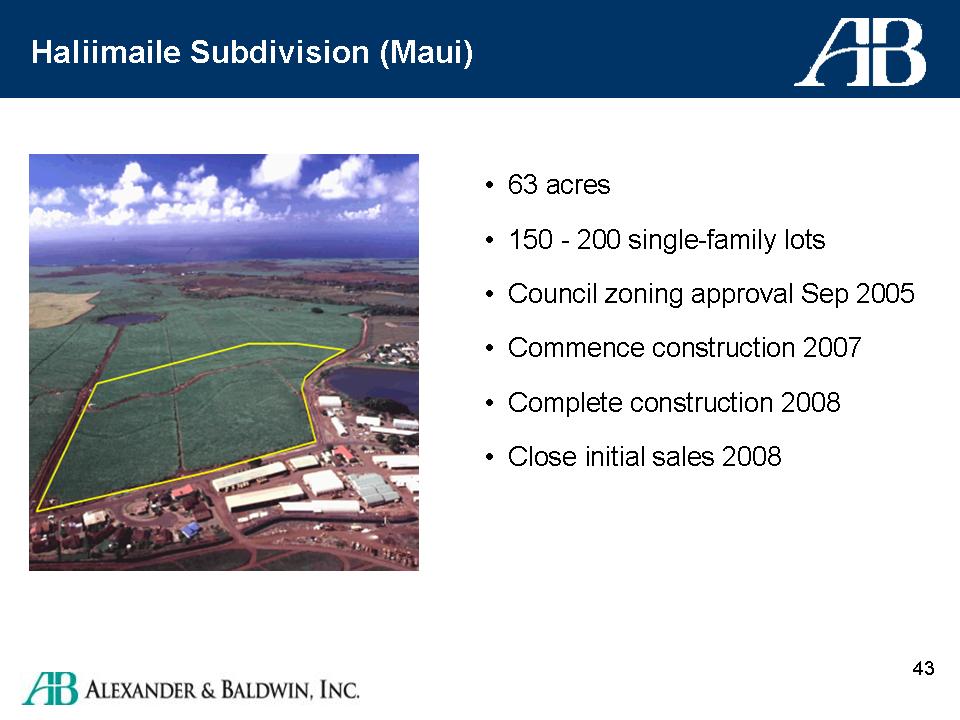
Haliimaile Subdivision (Maui) 63 acres 150-200 single-family lots Council zoning approval Sep 2005 Commence construction 2007 Complete construction 2008 Close initial sales 2008 |
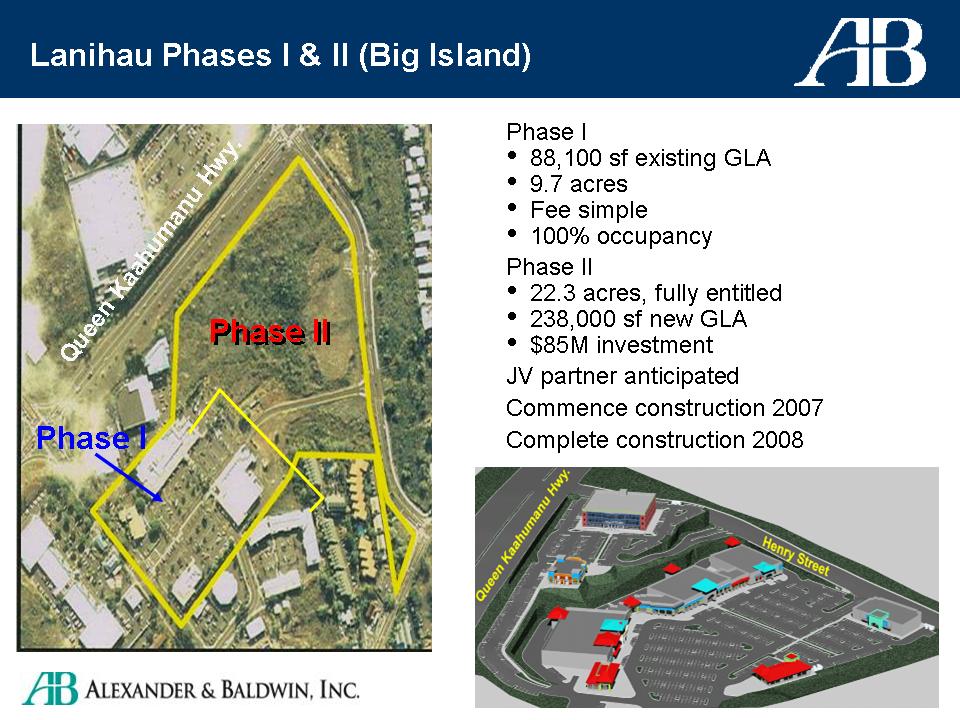
Lanihau Phases I & II (Big Island) Phase I 88,100 sf existing GLA 9.7 acres Fee simple 100% occupancy Phase II 22.3 acres, fully settled 238,000 sf new GLA $85M investment JV partner anticipated Commence construction 2007 Complete construction 2008 |
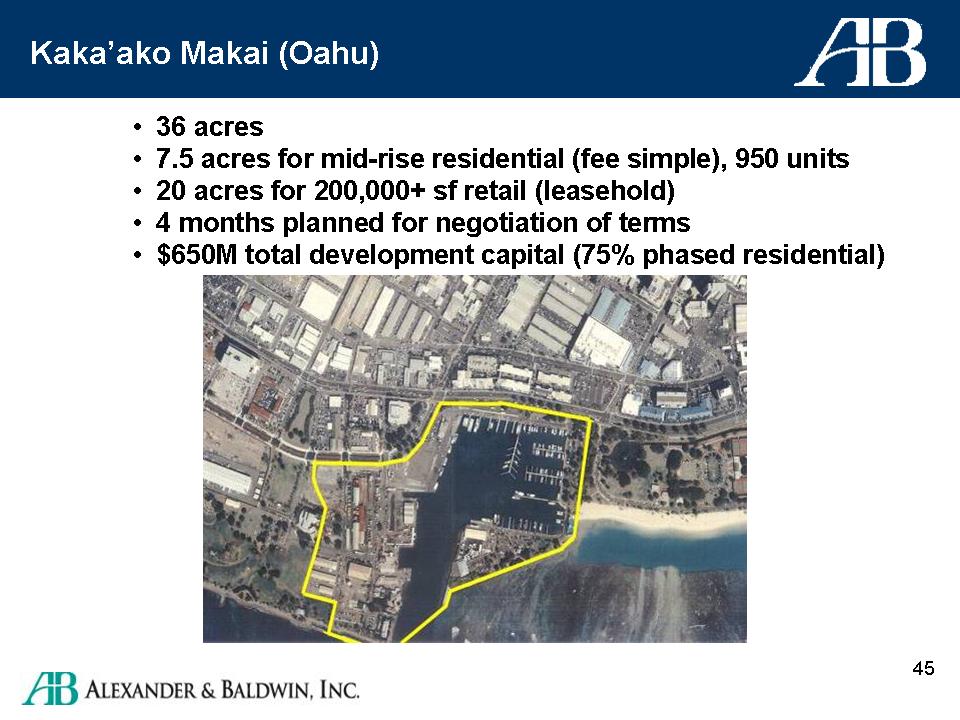
Kaka'ako Makai (Oahu) 36 acres 7.5 acres for mid-rise residential (fee simple), 950 units 20 acres for 200,000+ sf retail (leasehold) 4 months planned for negotiation of terms $650M total development capital (75% phased residential) |
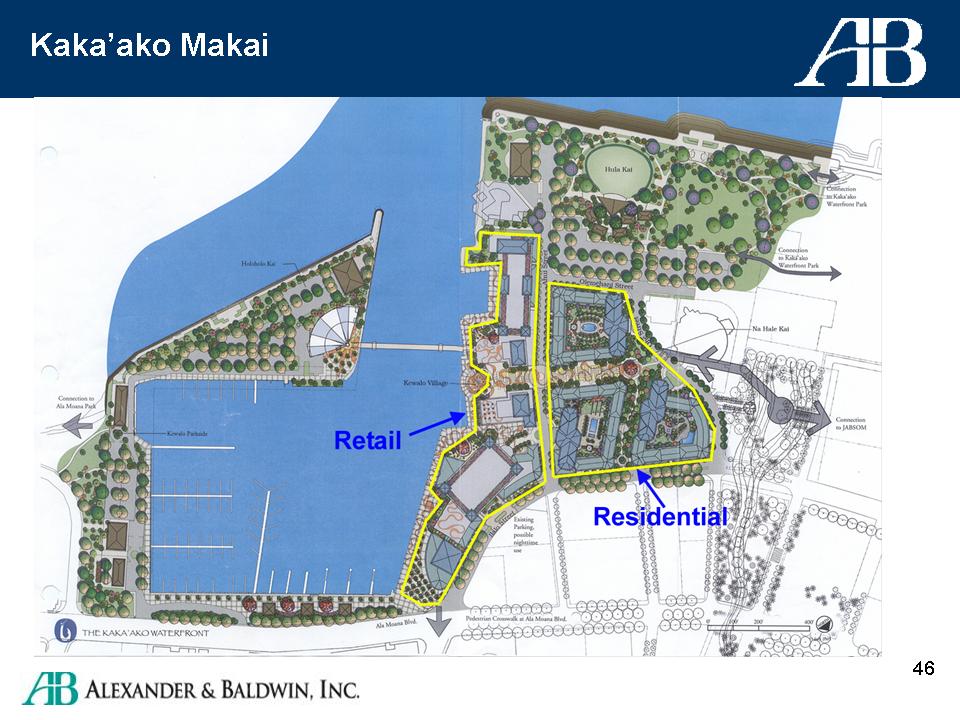
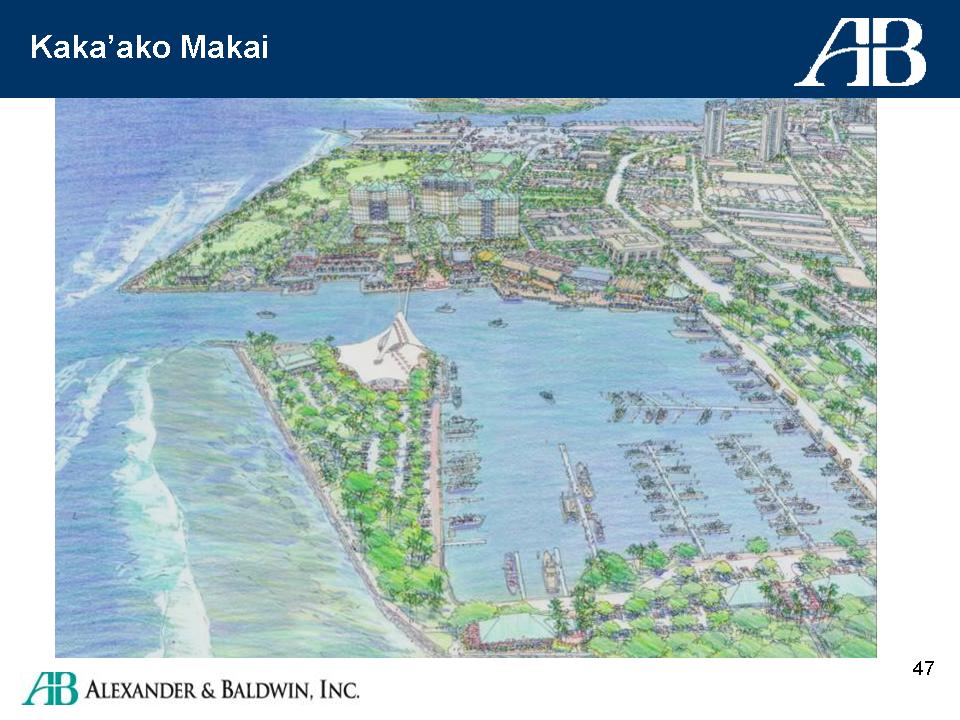
Kaka'ako Makai
Kaka'ako Makai
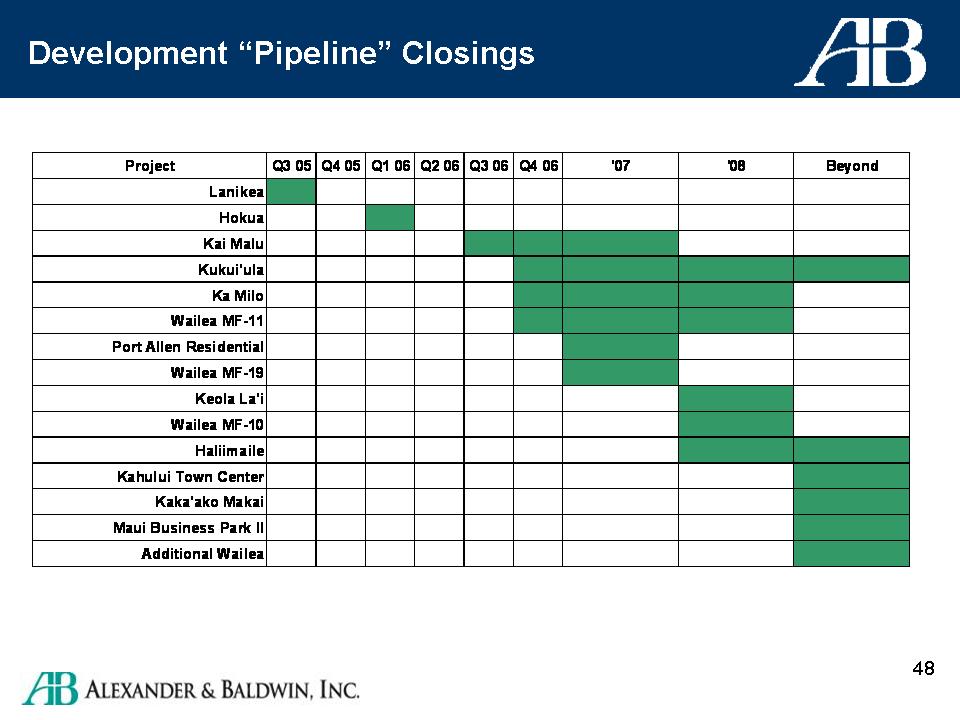
Development "Pipeline" Closings
Agenda Strategic Direction Matson A&B Properties Agribusiness Financial Overview, Summary |
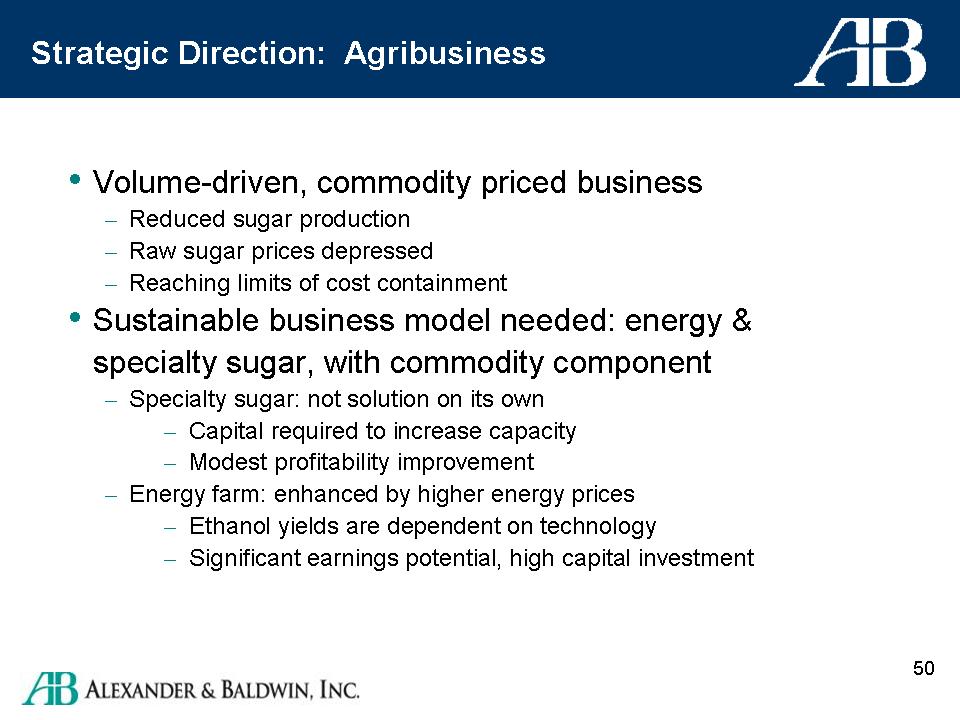
Strategic Direction: Agribusiness Volume-driven, commodity priced business --Reduced sugar production --Raw sugar prices depressed --Reaching limits of cost containment Sustainable business model needed: energy & specialty sugar, with commodity component --Specialty sugar: not solution on its own --Capital required to increase capacity --Modest profitability improvement --Energy farm: enhanced by higher energy prices --Ethanol yields are dependent on technology --Significant earnings potential, high capital investment |
Agenda Strategic Direction Matson A&B Properties Agribusiness Financial Overview, Summary |
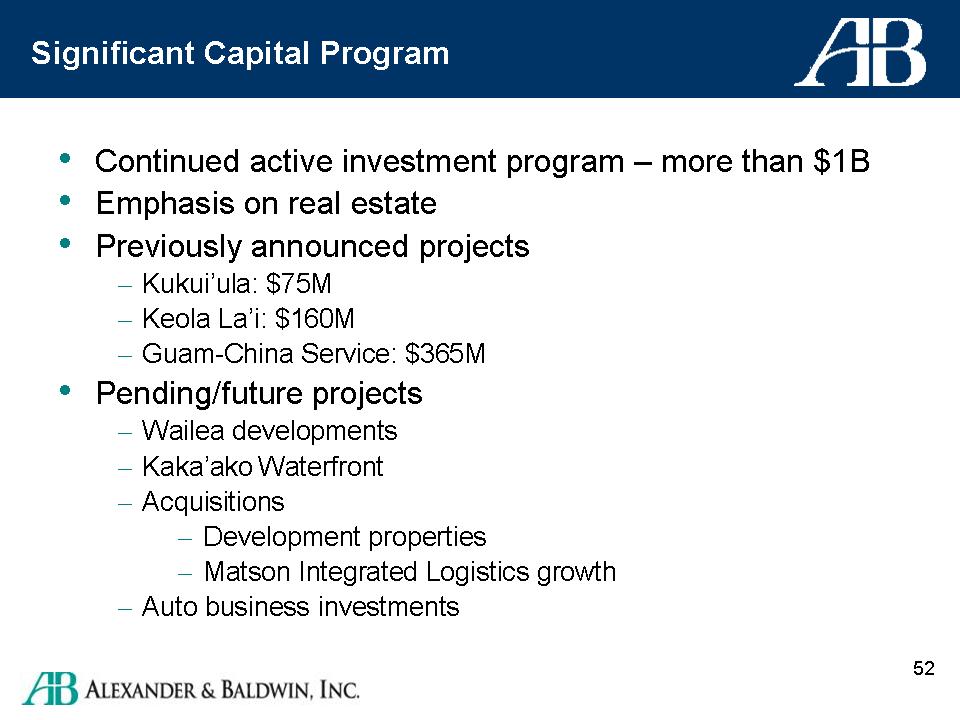
Significant Capital Program Continued active investment program -- more than $1B Emphasis on real estate Previously announced projects --Kukui'ula: $75M --Keola La'i: $160M --Guam-China Service: $365M Pending/future projects --Wailea developments --Kaka'ako Waterfront --Acquisitions --Development properties --Matson Integrated Logistics growth --Auto business investments |
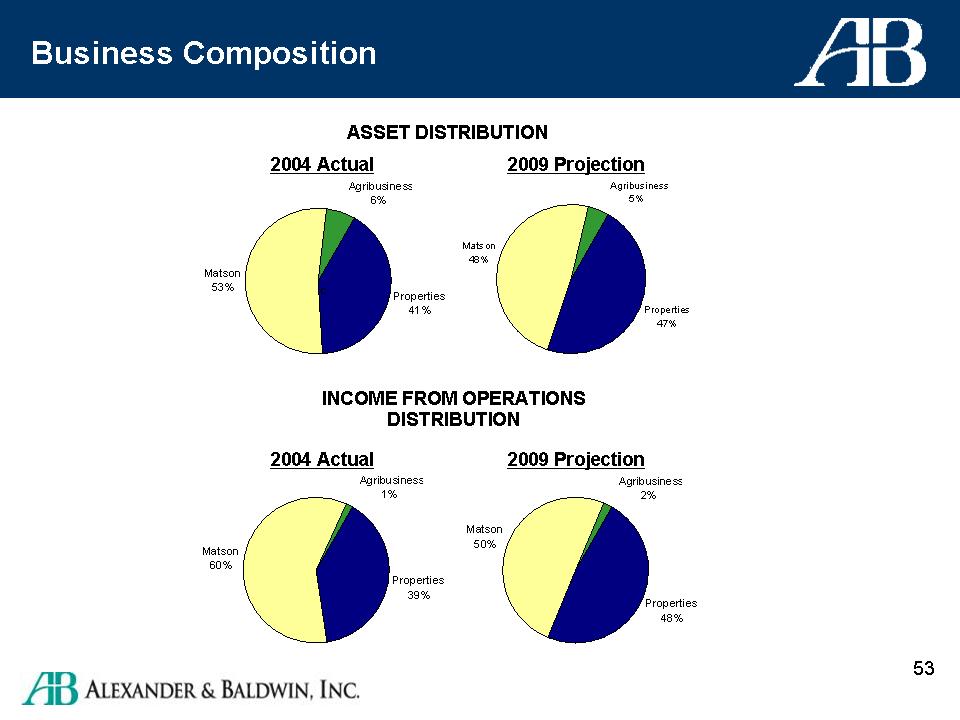
Business Composition ASSET DISTRIBUTION 2004 Actual: Matson 53% Properties 41% Agribusiness 6% 2009 Projection Matson 48% Properties 47% Agribusiness 5% INCOME FROM OPERATIONS DISTRIBUTION 2004 Actual Matson 60% Properties 39% Agribusiness 1% 2009 Projection Matson 50% Properties 48% Agribusiness 2% |
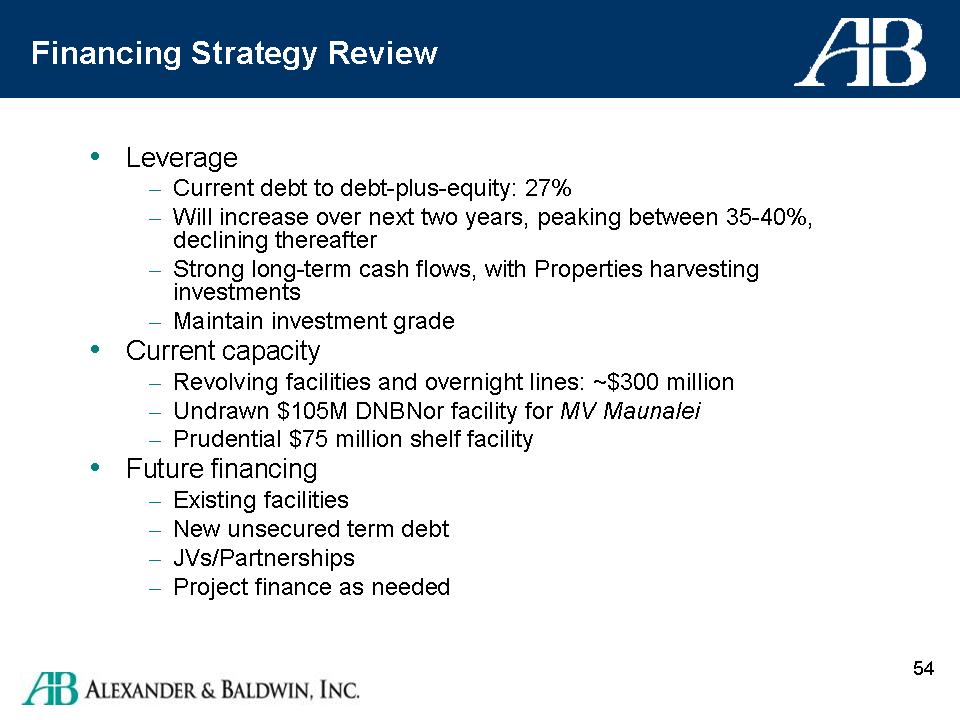
Financing Strategy Review Leverage Current debt to debt-plus-equity: 27% Will increase over next two years, peaking between 35-40%, declining thereafter Strong long-term cash flows, with Properties harvesting investments Maintain investment grade Current capacity Revolving facilities and overnight lines: ~$300 million Undrawn $105M DNBNor facility for MV Maunalei Prudential $75 million shelf facility Future financing Existing facilities New unsecured term debt JVs/Partnerships Project finance as needed |
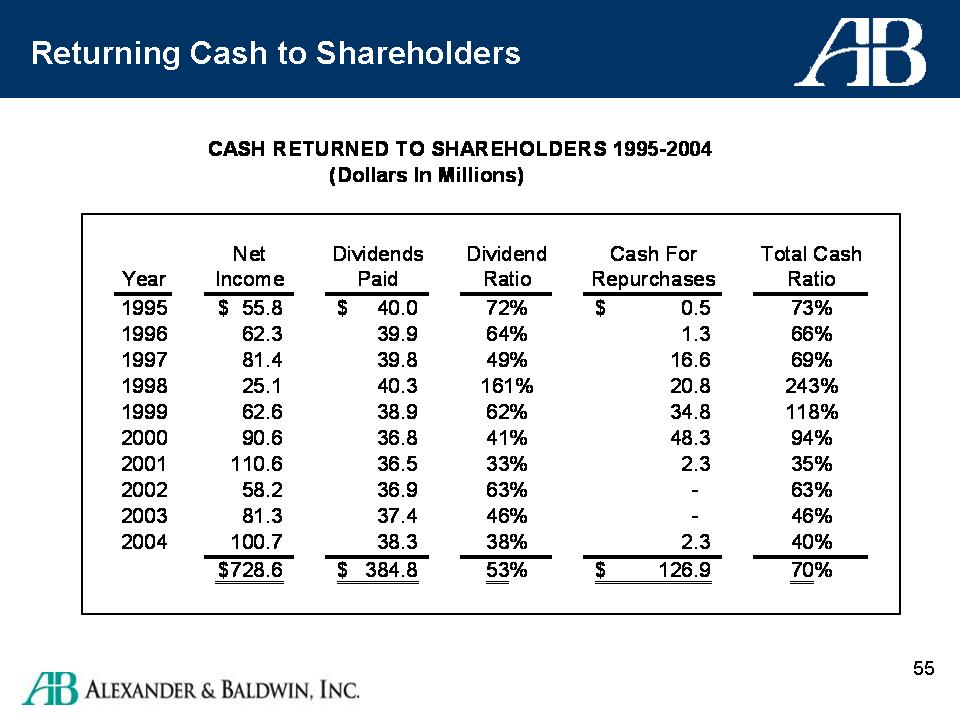
| | Net | Dividends | Dividend | Cash For | Total Cash |
Year | Income | Paid | Ratio | Repurchases | Ratio |
| 1995 | $55.8 | $40.0 | 72% | $0.5 | 73% |
| 1996 | 62.3 | 39.9 | 64% | 1.3 | 66% |
| 1997 | 81.4 | 39.8 | 49% | 16.6 | 69% |
| 1998 | 25.1 | 40.3 | 161% | 20.8 | 243% |
| 1999 | 62.6 | 38.9 | 62% | 34.8 | 118% |
| 2000 | 90.6 | 36.8 | 41% | 48.3 | 94% |
| 2001 | 110.6 | 36.5 | 33% | 2.3 | 35% |
| 2002 | 58.2 | 36.9 | 63% | -- | 63% |
| 2003 | 81.3 | 37.4 | 46% | -- | 46% |
| 2004 | 100.7 | 38.3 | 38% | 2.3 | 40% |
| | $728.6 | $ 384.8 | 53% | $126.9 | 70% |
Summary: Outlook For 2006 Consistenet with prior guidance Transportation -- 8-10% earnings growth objective, excluding Guam-China -- $20-25M operating profit impact of Guam-China, $12M interest expense Agriculture -- Minimal to moderate profitability Real Estate: -- 13-15% earnings growth objective -- Lower in income portfolio -- Higher in development, sales Overall: -- Expect 2006 earnings below 2005 |
Beyond 2006 Sustainable growth -- Guam-China upside -- Multi-year development projects Progress toward balance between segments Financial capacity to pursue growth opportunities |