|
|
Matson Second Quarter 2016 Earnings Conference Call MATX Matson. Second Quarter 2016 Earnings Conference Call IAugust 2, 2016-Slide 1 111111111 NYSE |
Forw ard Looking St at ement s St at ement s made during t his call and present at ion t hat set f ort h expect at ions, predict ions, project ions or are about f ut ure event s are based on f act s and sit uat ions t hat are know n t o us as of t oday, A ugust 2 , 2016. We believe t hat our expect at ions and assumpt ions are reasonable. A ct ual result s may dif f er mat erially, due t o risks and uncert aint ies, such as t hose described on pages 8 -15 of our 2015 Form 10 -K f iled on February 2 6 , 2 0 1 6 , and ot her subsequent f ilings by M at son w it h t he SEC. St at ement s made during t his call and present at ion are not guarant ees of f ut ure perf ormance. We do not undert ake any obligat ion t o updat e our f orw ard-looking st at ement s. Second Quart er 2 0 1 6 Earnings Conf erence Call A ugust 2, 2016 – Slide 2 |
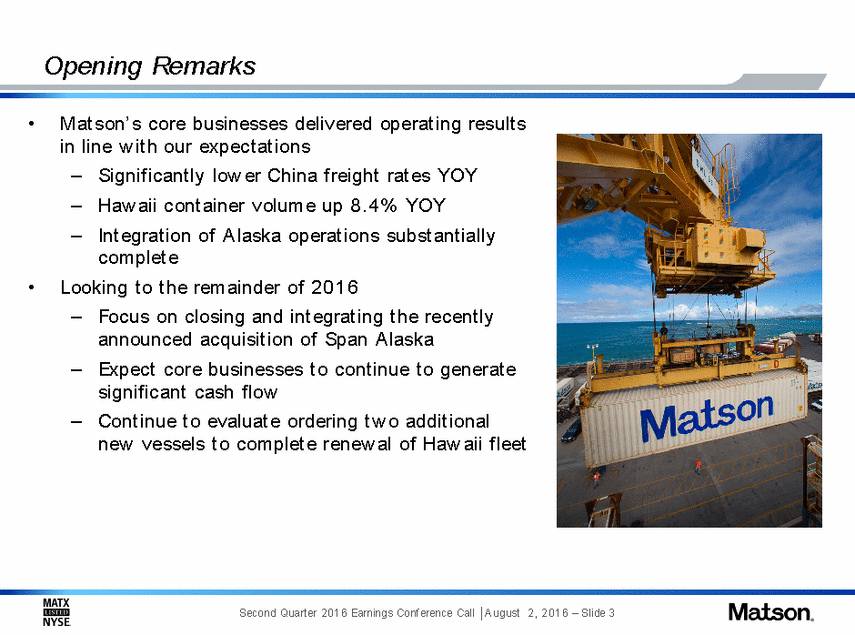
Opening Remarks • M at son’ s core businesses delivered operat ing result s in line w it h our expect at ions – – – Signif icant ly low er China f reight rat es YOY Haw aii cont ainer volume up 8 .4 % YOY Int egrat ion of A laska operat ions subst ant ially complet e • Looking t o t he remainder of 2 0 1 6 – Focus on closing and int egrat ing t he recent ly announced acquisit ion of Span A laska Expect core businesses t o cont inue t o generat e signif icant cash f low Cont inue t o evaluat e ordering t w o addit ional new vessels t o complet e renew al of Haw aii f leet – – Second Quart er 2 0 1 6 Earnings Conf erence Call A ugust 2, 2016 – Slide 3 |
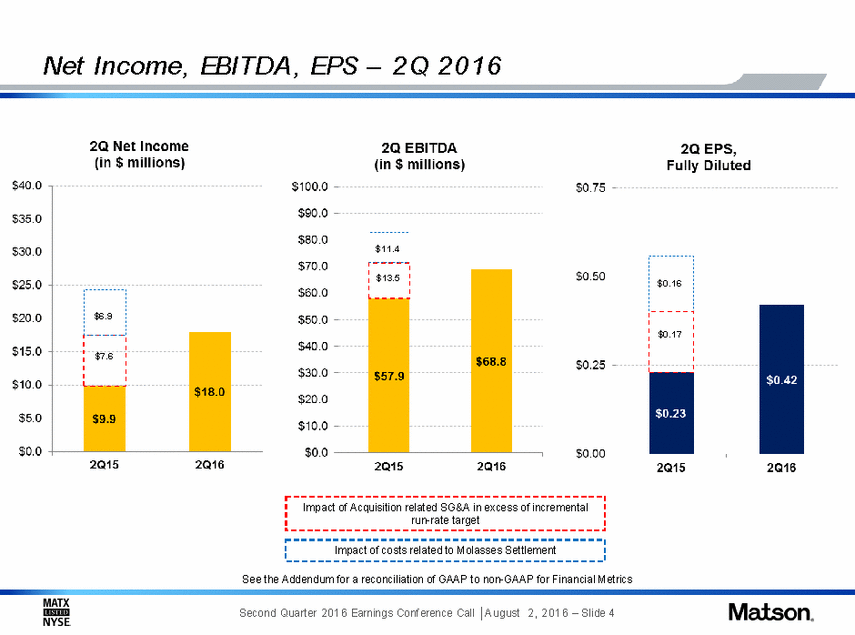
Net Income, EBITDA , EPS – 2Q 2016 $11.4 $13.5 $0.16 $6.9 $0.17 $7.6 See the Addendum for a reconciliation of GAAP to non-GAAP for Financial Metrics Second Quart er 2 0 1 6 Earnings Conf erence Call A ugust 2, 2016 – Slide 4 Impact of costs related to Molasses Settlement Impact of Acquisition related SG&A in excess of incremental run-rate target |
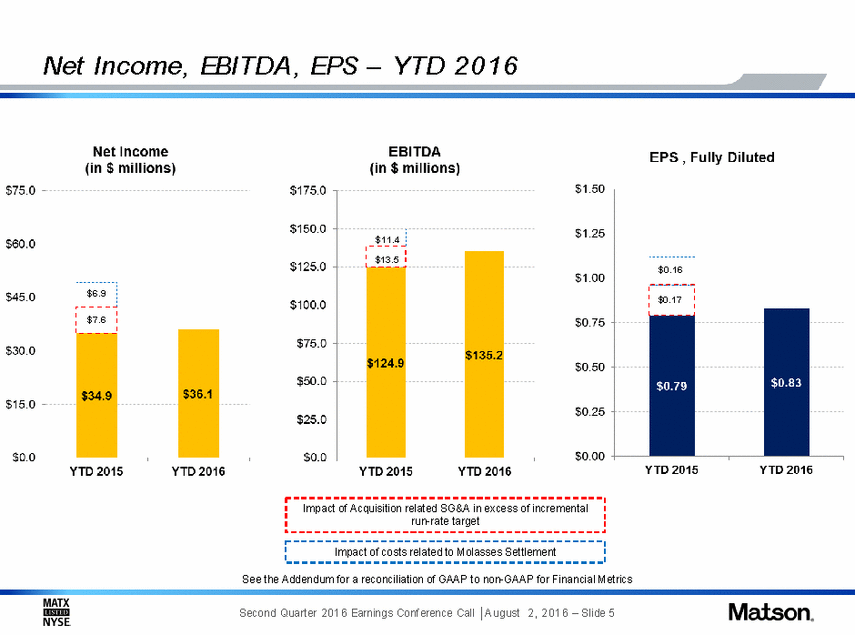
Net Income, EBITDA , EPS – YTD 2016 $11.4 $13.5 $0.16 $6.9 $0.17 $7.6 See the Addendum for a reconciliation of GAAP to non-GAAP for Financial Metrics Second Quart er 2 0 1 6 Earnings Conf erence Call A ugust 2, 2016 – Slide 5 Impact of costs related to Molasses Settlement Impact of Acquisition related SG&A in excess of incremental run-rate target |
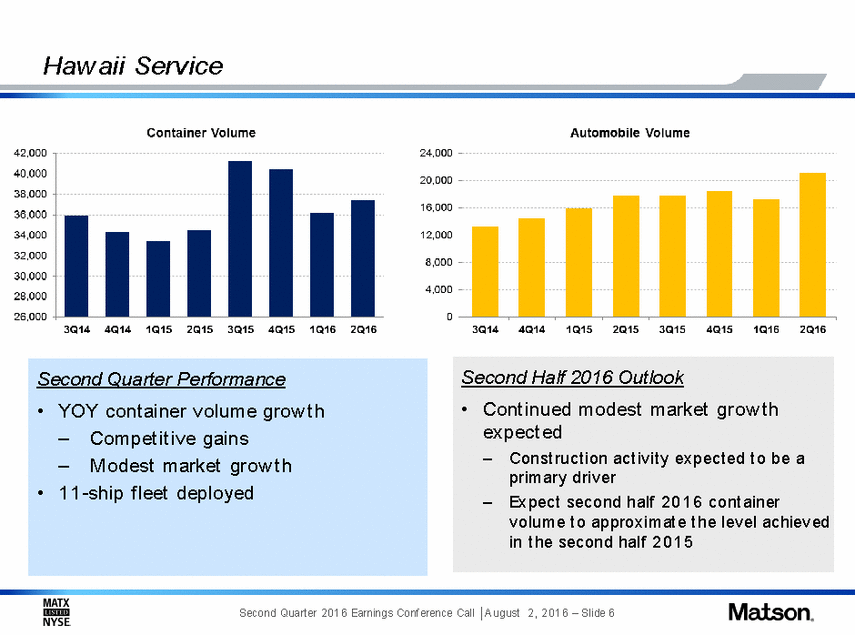
Haw aii Service primary driver Second Quart er 2 0 1 6 Earnings Conf erence Call A ugust 2, 2016 – Slide 6 Second Half 2016 Outlook •Cont inued modest market grow t h expect ed –Const ruct ion act ivit y expect ed t o be a –Expect second half 2 0 1 6 cont ainer volume t o approximat e t he level achieved in t he second half 2 0 1 5 Second Quarter Performance •YOY cont ainer volume grow t h –Compet it ive gains –M odest market grow t h •1 1 -ship f leet deployed |
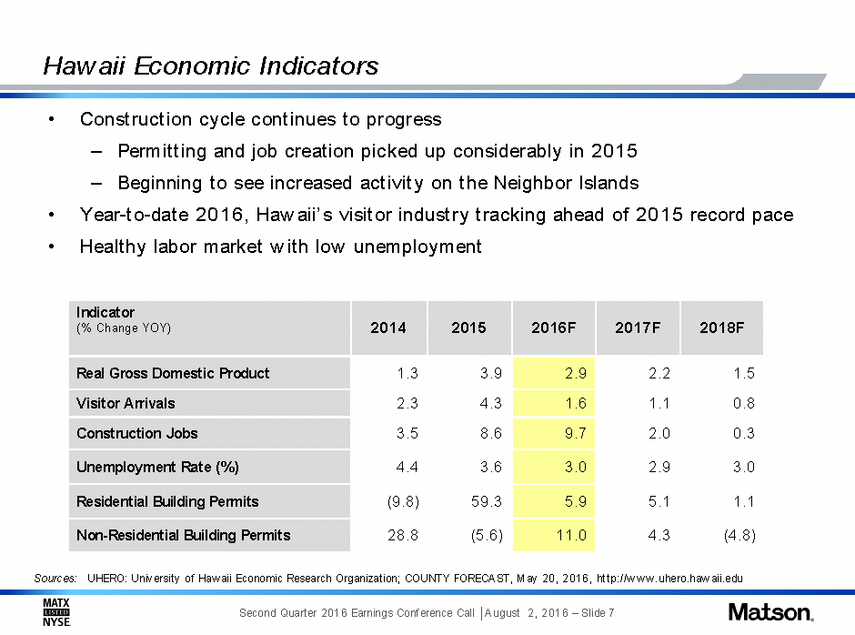
Haw aii Economic Indicat ors • Const ruct ion cycle cont inues t o progress – – Permit t ing and job creat ion picked up considerably in 2 0 1 5 Beginning t o see increased act ivit y on t he Neighbor Islands • • Year-t o-dat e 2 0 1 6 , Haw aii’ s visit or indust ry t racking ahead of 2 0 1 5 record pace Healt hy labor market w it h low unemployment Sources: UHERO: Universit y of Haw aii Economic Research Organizat ion; COUNTY FORECA ST, M ay 2 0 , 2 0 1 6 , ht t p://w w w .uhero.haw aii.edu Second Quart er 2 0 1 6 Earnings Conf erence Call A ugust 2, 2016 – Slide 7 Indicator (% Change YOY) 2014 20152016F 2017F2018F Real Gross Domestic Product 1 .3 3 .9 2 .9 2 .21 .5 Visitor Arrivals 2 .3 4 .3 1 .6 1 .10 .8 Construction Jobs 3 .5 8 .6 9 .7 2 .00 .3 Unemployment Rate (% ) 4 .4 3 .6 3 .0 2 .93 .0 Residential Building Permits (9.8) 59.3 5 .9 5 .11 .1 Non-Residential Building Permits 28.8 (5.6) 11.0 4 .3(4.8) |
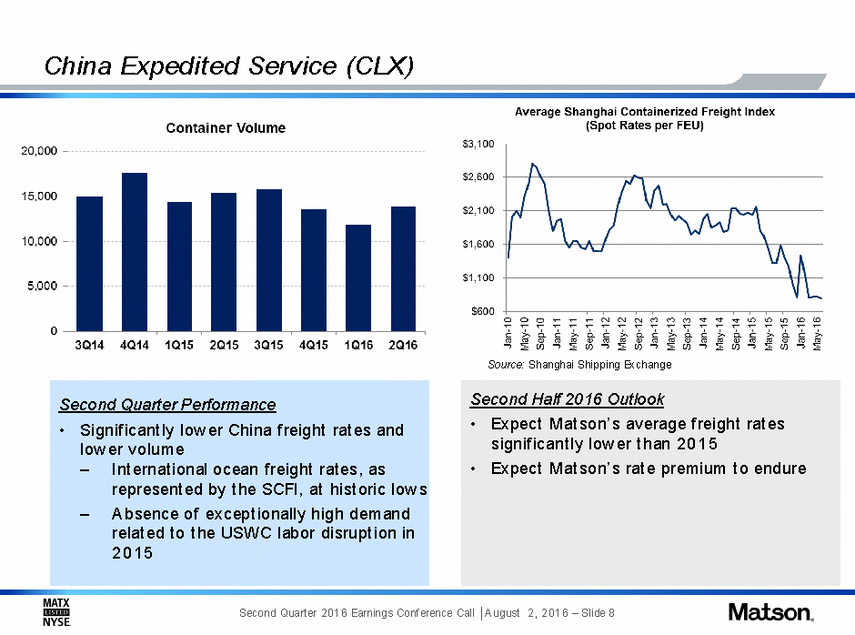
China Expedit ed Service (CLX) Source: Shanghai Shipping Exchange signif icant ly low er t han 2 0 1 5 Second Quart er 2 0 1 6 Earnings Conf erence Call A ugust 2, 2016 – Slide 8 Second Half 2016 Outlook •Expect M at son’ s average f reight rat es •Expect M at son’ s rat e premium t o endure Second Quarter Performance •Signif icant ly low er China f reight rat es and low er volume –Int ernat ional ocean f reight rat es, as represent ed by t he SCFI, at hist oric low s –A bsence of except ionally high demand relat ed t o t he USWC labor disrupt ion in 2015 |
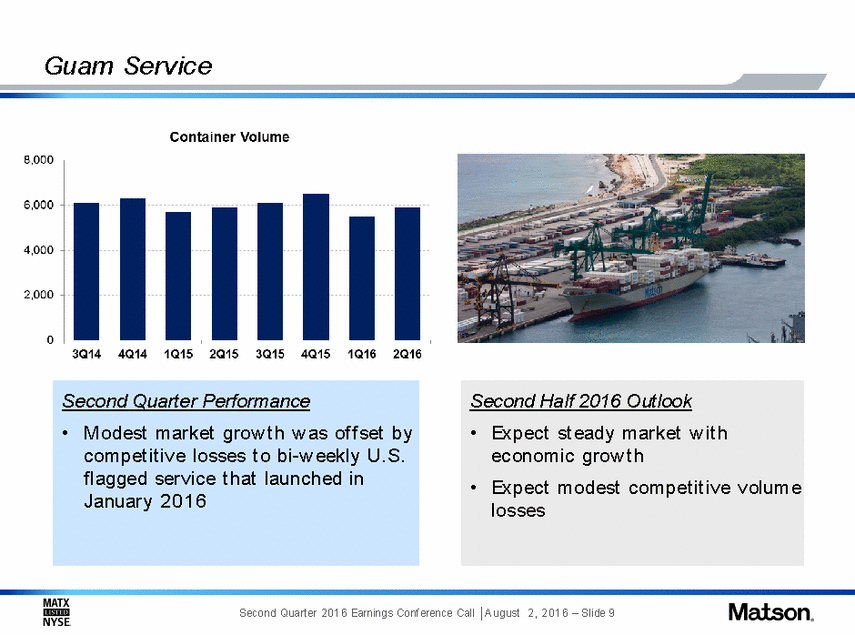
Guam Service January 2 01 6 Second Quart er 2 0 1 6 Earnings Conf erence Call A ugust 2, 2016 – Slide 9 Second Quarter Performance •M odest market grow t h w as of f set by compet it ive losses t o bi-w eekly U.S. f lagged service t hat launched in Second Half 2016 Outlook •Expect st eady market w it h economic grow t h •Expect modest compet it ive volume losses |
A laska Service Volume included in Matson’s results post-closing of Alaska Acquisition on May 29, 2015 Volume included in Horizon’s results Horizon/M at son volume in 2 Q1 5 • Subst ant ially complet ed int egrat ion Second Quart er 2 0 1 6 Earnings Conf erence Call A ugust 2, 2016 – Slide 10 Second Quarter Performance •2 Q1 6 volume moderat ely low er t han –M ut ed economic act ivit y Second Half 2016 Outlook •Expect economic headw inds t o cont inue •Expect M at son’ s cont ainer volume t o be modest ly low er t han second half 2 0 1 5 |
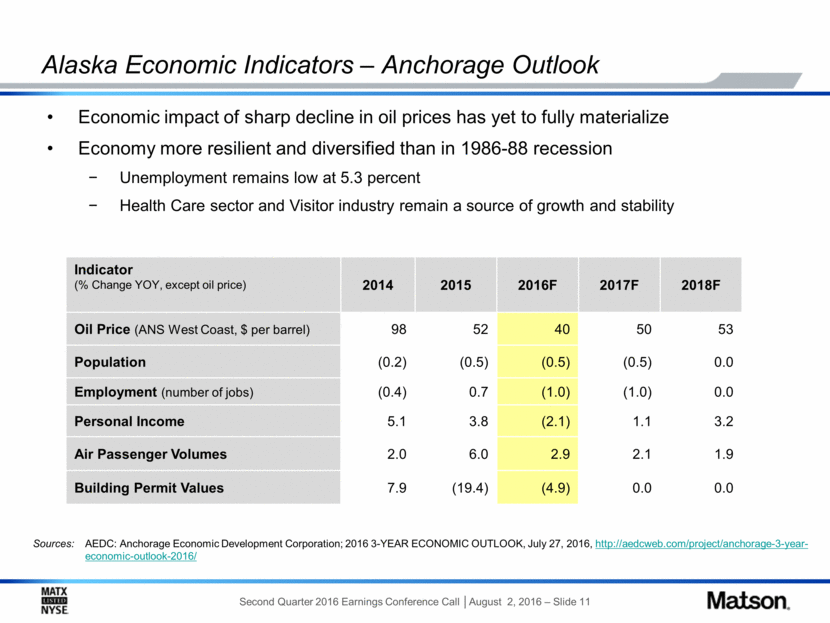
Alaska Economic Indicators – Anchorage Outlook Economic impact of sharp decline in oil prices has yet to fully materialize Economy more resilient and diversified than in 1986-88 recession Unemployment remains low at 5.3 percent Health Care sector and Visitor industry remain a source of growth and stability Indicator (% Change YOY, except oil price) 2014 2015 2016F 2017F 2018F Oil Price (ANS West Coast, $ per barrel) 98 52 40 50 53 Population (0.2) (0.5) (0.5) (0.5) 0.0 Employment (number of jobs) (0.4) 0.7 (1.0) (1.0) 0.0 Personal Income 5.1 3.8 (2.1) 1.1 3.2 Air Passenger Volumes 2.0 6.0 2.9 2.1 1.9 Building Permit Values 7.9 (19.4) (4.9) 0.0 0.0 Sources: AEDC: Anchorage Economic Development Corporation; 2016 3-YEAR ECONOMIC OUTLOOK, July 27, 2016, http://aedcweb.com/project/anchorage-3-year-economic-outlook-2016/ Second Quarter 2016 Earnings Conference Call August 2, 2016 - Slide 11 |
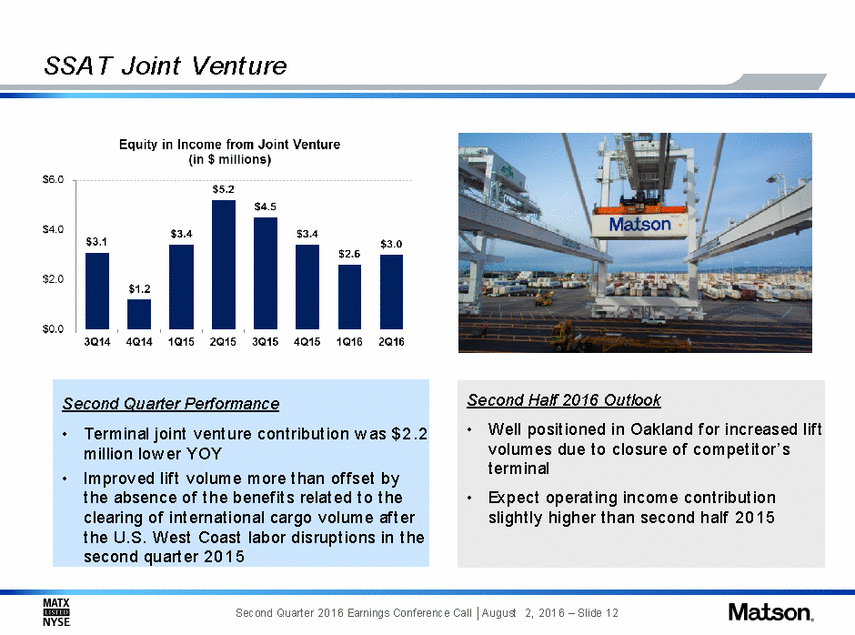
SSA T Joint Vent ure volumes due t o closure of compet it or’ s Second Quart er 2 0 1 6 Earnings Conf erence Call A ugust 2, 2016 – Slide 12 Second Half 2016 Outlook •Well posit ioned in Oakland f or increased lif t t erminal •Expect operat ing income cont ribut ion slight ly higher t han second half 2 0 1 5 Second Quarter Performance •Terminal joint vent ure cont ribut ion w as $2.2 million low er YOY •Improved lif t volume more t han of f set by t he absence of t he benef it s relat ed t o t he clearing of int ernat ional cargo volume af t er t he U.S. West Coast labor disrupt ions in t he second quart er 2015 |
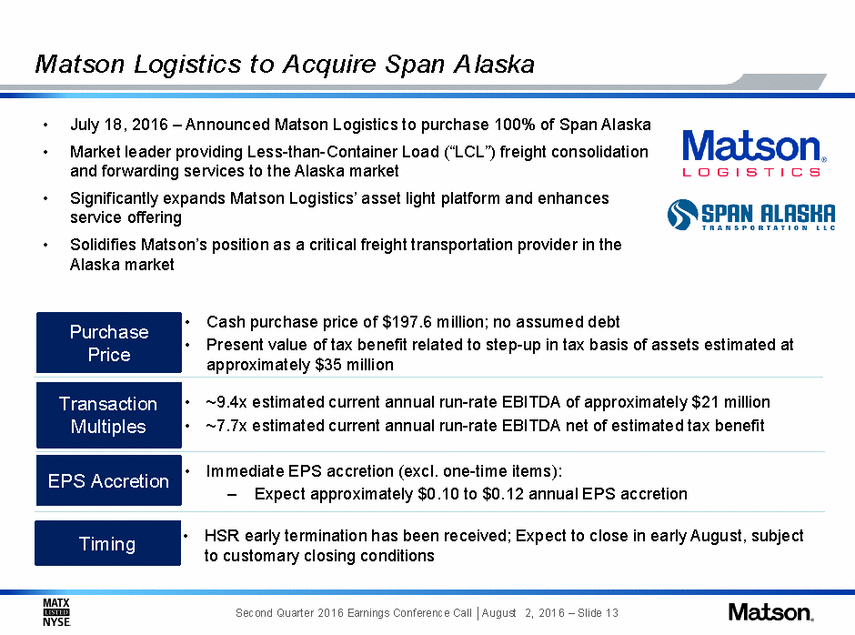
M at son Logist ics t o A cquire Span A laska • • July 18, 2016 – Announced Matson Logistics to purchase 100% of Span Alaska Market leader providing Less-than-Container Load (“LCL”) freight consolidation and forwarding services to the Alaska market Significantly expands Matson Logistics’ asset light platform and enhances service offering Solidifies Matson’s position as a critical freight transportation provider in the Alaska market • • • • Cash purchase price of $197.6 million; no assumed debt Present value of tax benefit related to step-up in tax basis of assets estimated at approximately $35 million • • ~9.4x estimated current annual run-rate EBITDA of approximately $21 million ~7.7x estimated current annual run-rate EBITDA net of estimated tax benefit • Immediate EPS accretion (excl. one-time items): – Expect approximately $0.10 to $0.12 annual EPS accretion • HSR early termination has been received; Expect to close in early August, subject to customary closing conditions Second Quart er 2 0 1 6 Earnings Conf erence Call A ugust 2, 2016 – Slide 13 Timing EPS Accretion Transaction Multiples Purchase Price |
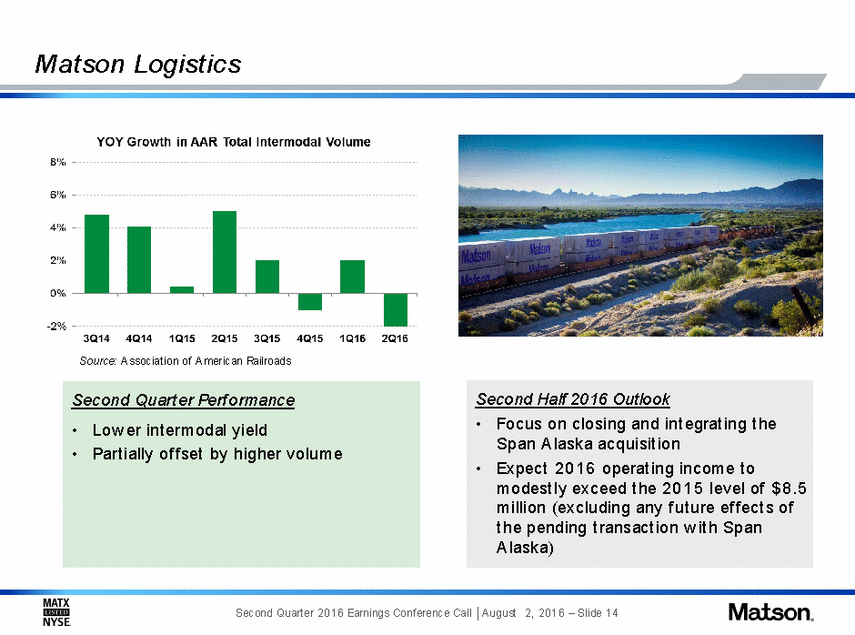
M at son Logist ics Source: A ssociat ion of A merican Railroads Span A laska acquisit ion Second Quart er 2 0 1 6 Earnings Conf erence Call A ugust 2, 2016 – Slide 14 Second Half 2016 Outlook •Focus on closing and int egrat ing t he •Expect 2 0 1 6 operat ing income t o modest ly exceed t he 2 0 1 5 level of $ 8 .5 million (excluding any f ut ure ef f ect s of t he pending t ransact ion w it h Span A laska) Second Quart er Perf ormance •Low er int ermodal yield •Part ially of f set by higher volume |
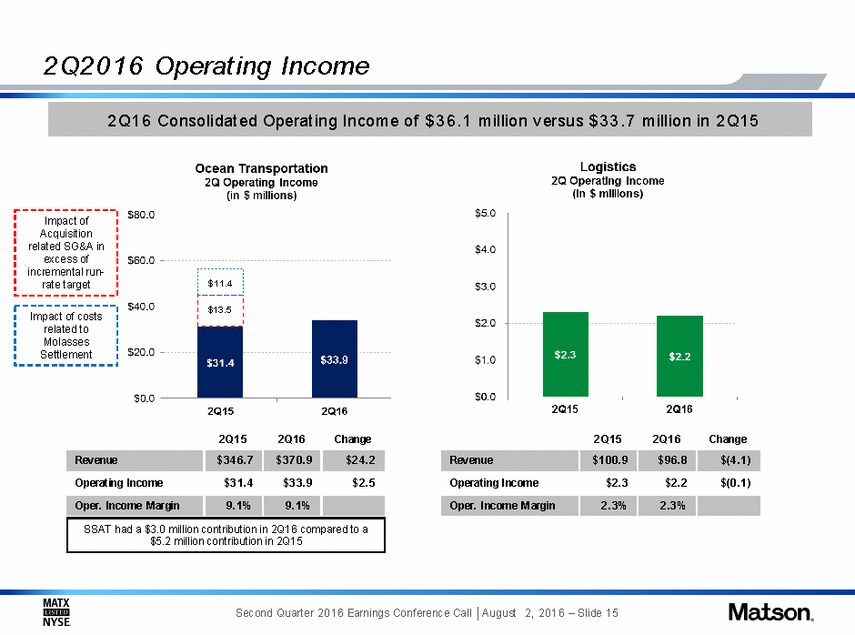
2 Q2 0 1 6 Operat ing Income $11.4 $13.5 Second Quart er 2 0 1 6 Earnings Conf erence Call A ugust 2, 2016 – Slide 15 2Q15 2Q16 Change Revenue $100.9 $96.8 $(4.1) Operating Income $2.3 $2.2 $(0.1) Oper. Income M argin 2.3% 2.3% 2Q15 2Q16 Change Revenue $346.7 $370.9 $24.2 Operating Income $31.4 $33.9 $2.5 Oper. Income M argin 9.1% 9.1% SSAT had a $3.0 million contribution in 2Q16 compared to a $5.2 million contribution in 2Q15 Impact of costs related to Molasses Settlement Impact of Acquisition related SG&A in excess of incremental run-rate target 2 Q16 Consolidat ed Operat ing Income of $ 36.1 million versus $ 3 3 .7 million in 2 Q15 |
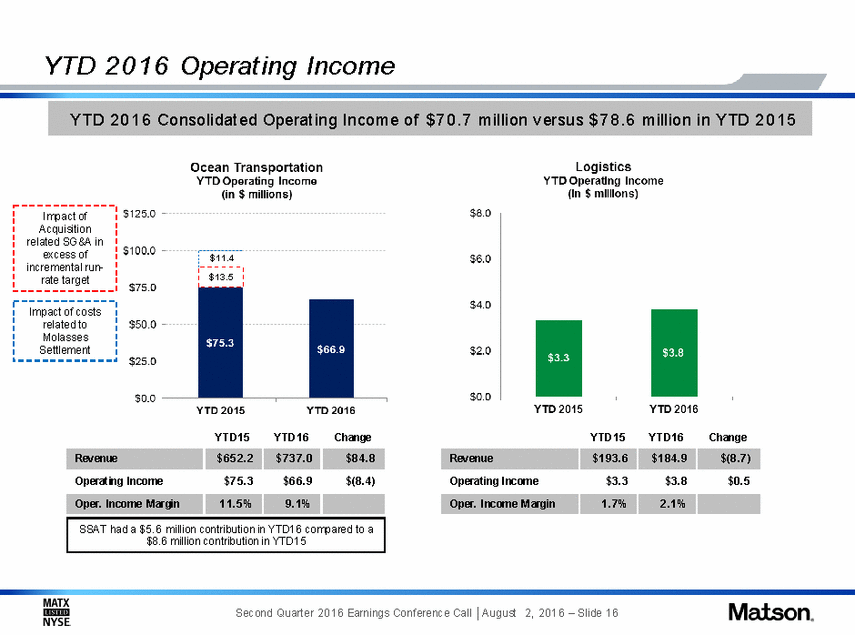
YTD 2 0 1 6 Operat ing Income $11.4 $13.5 Second Quart er 2 0 1 6 Earnings Conf erence Call A ugust 2, 2016 – Slide 16 SSAT had a $5.6 million contribution in YTD16 compared to a $8.6 million contribution in YTD15 YTD1 5 YTD1 6 Change Revenue $193.6 $ 184.9 $ (8.7) Operating Income $3.3 $3.8 $ 0 .5 Oper. Income M argin 1.7% 2.1% YTD1 5 YTD1 6 Change Revenue $652.2 $ 737.0 $ 84.8 Operating Income $75.3 $ 66.9 $ (8.4) Oper. Income M argin 11.5% 9 .1 % Impact of costs related to Molasses Settlement Impact of Acquisition related SG&A in excess of incremental run-rate target YTD 2 0 1 6 Consolidat ed Operat ing Income of $ 70.7 million versus $ 7 8 .6 million in YTD 2 0 1 5 |
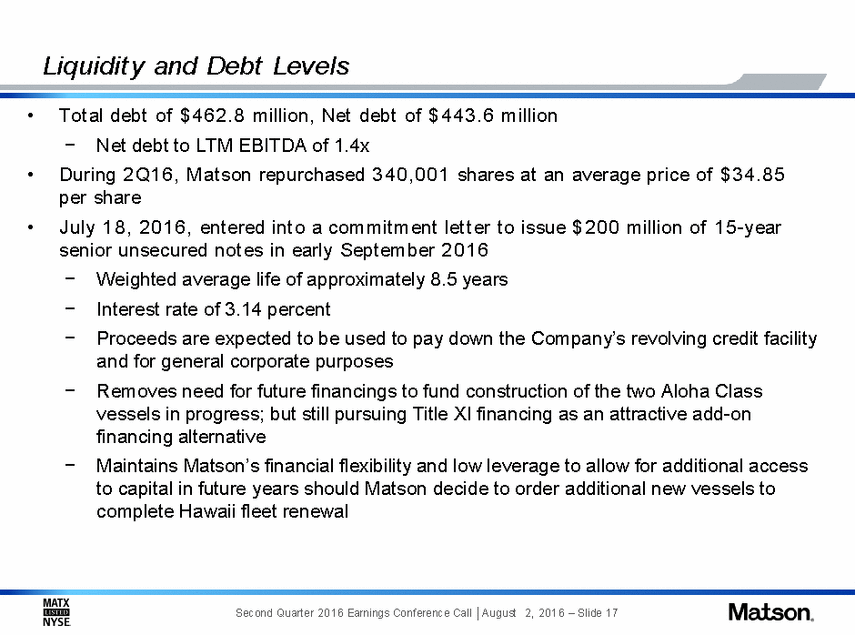
Liquidit y and Debt Levels • Tot al debt of $ 4 6 2 .8 million, Net debt of $ 4 4 3 .6 million − Net debt to LTM EBITDA of 1.4x • During 2 Q1 6 , M at son repurchased 3 4 0 ,0 0 1 shares at an average price of $ 3 4 .8 5 per share July 1 8 , 2 0 1 6 , ent ered int o a commit ment let t er t o issue $ 2 0 0 million of 1 5 -year senior unsecured not es in early Sept ember 2 0 1 6 • − − − Weighted average life of approximately 8.5 years Interest rate of 3.14 percent Proceeds are expected to be used to pay down the Company’s revolving credit facility and for general corporate purposes Removes need for future financings to fund construction of the two Aloha Class vessels in progress; but still pursuing Title XI financing as an attractive add-on financing alternative Maintains Matson’s financial flexibility and low leverage to allow for additional access to capital in future years should Matson decide to order additional new vessels to complete Hawaii fleet renewal − − Second Quart er 2 0 1 6 Earnings Conf erence Call A ugust 2, 2016 – Slide 17 |
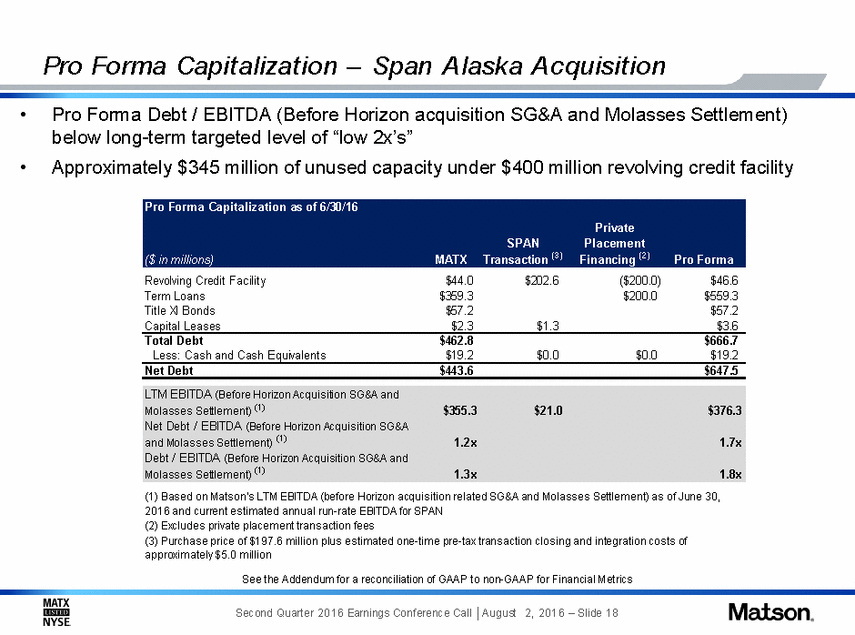
Pro Forma Capit alizat ion – Span A laska A cquisit ion Pro Forma Debt / EBITDA (Before Horizon acquisition SG&A and Molasses Settlement) below long-term targeted level of “low 2x’s” Approximately $345 million of unused capacity under $400 million revolving credit facility • • Revolving Credit Facility Term Loans Title XI Bonds Capital Leases $44.0 $359.3 $57.2 $2.3 $202.6 ($200.0) $200.0 $46.6 $559.3 $57.2 $3.6 $1.3 Total Debt Less: Cash and Cash Equivalents $462.8 $19.2 $666.7 $19.2 $0.0 $0.0 Net Debt $443.6 $647.5 (1) Bas ed on Mats on's LTM EBITDA (before Horizon acquis ition related SG&A and Molas s es Settlem ent) as of June 30, 2016 and current es tim ated annual run-rate EBITDA for SPAN (2) Excludes private placem ent trans action fees (3) Purchas e price of $197.6 m illion plus es tim ated one-tim e pre-tax trans action clos ing and integration cos ts of approxim ately $5.0 m illion See the Addendum for a reconciliation of GAAP to non-GAAP for Financial Metrics Second Quart er 2 0 1 6 Earnings Conf erence Call A ugust 2, 2016 – Slide 18 LTM EBITDA (Before Horizon Acquis ition SG&A and Molas s es Settlem ent) (1) $355.3 $21.0 $376.3 Net Debt / EBITDA (Before Horizon Acquis ition SG&A and Molas s es Settlem ent) (1) 1.2x 1.7x Debt / EBITDA (Before Horizon Acquis ition SG&A and Molas s es Settlem ent) (1) 1.3x 1.8x Pro Forma Capitalization as of 6/30/16 Private SPAN Placement ($ in millions) MATX Transaction (3) Financing (2) Pro Forma |
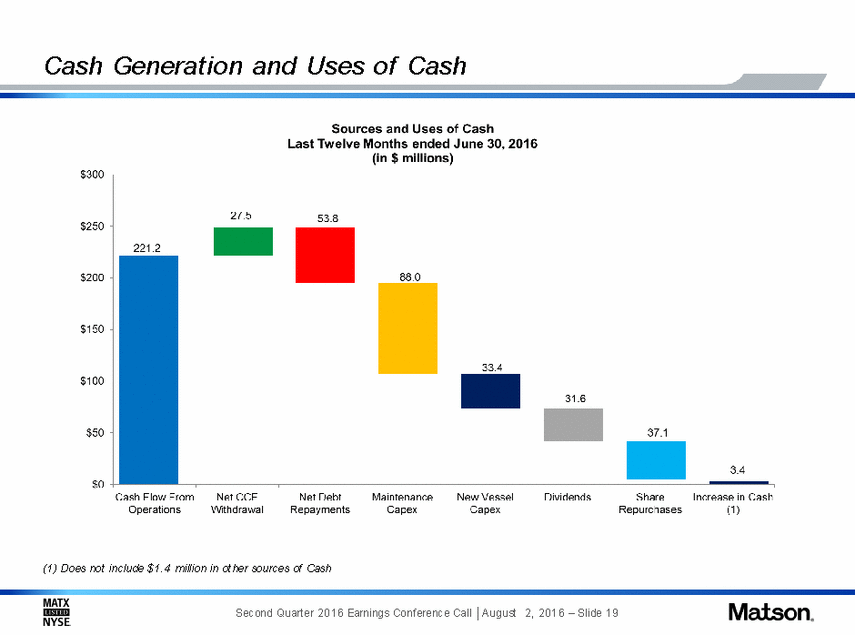
Cash Generation and Uses of Cash Sources and Uses of Cash last Twelve Months ended June 30, 2016 (in $ millions) $300 27.5 53.8 $250 221.2 $200 880 $150 33A $100 31.6 sso 37.1 3.4 $0 Cash low -rom Oplaliom Net OCt-\"iitln.llawal New Vessel CapE::l'x Share RefJUlli'Ja tt Increase m Cash (1) Net Uebt RtiiJC:t:fUIE::ml Mamtenance CctJ.:ex UIVIdends (1) Does not include $1.4 miHion incAher oources ct Gash MATX Matson. Second Quarter 2016 Earnings Conference Call IAugust 111111111 NYSE 2, 2016-Slide 19 |
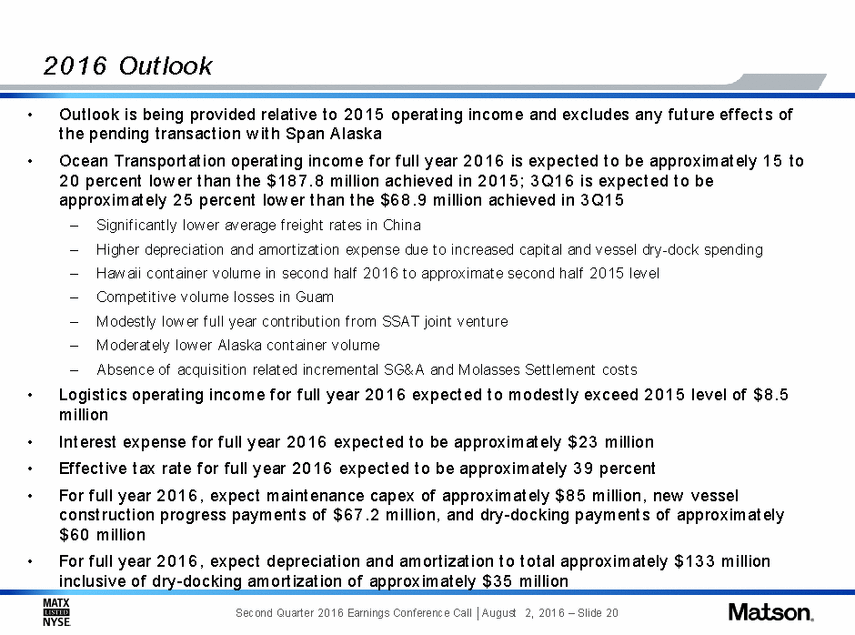
2 0 1 6 Out look • Out look is being provided relat ive t o 2 0 1 5 operat ing income and excludes any f ut ure eff ect s of t he pending t ransact ion w it h Span A laska • Ocean Transport at ion operat ing income f or f ull year 2 0 1 6 is expect ed t o be approximat ely 1 5 2 0 percent low er t han t he $ 1 8 7 .8 million achieved in 2 0 1 5 ; 3 Q1 6 is expect ed t o be approximat ely 2 5 percent low er t han t he $ 6 8 .9 million achieved in 3 Q1 5 t o – – – – – – – Signif icant ly low er average f reight rat es in China Higher depreciat ion and amort izat ion expense due t o increased capit al and vessel dry-dock spending Haw aii cont ainer volume in second half 2 0 1 6 t o approximat e second half 2 0 1 5 level Compet it ive volume losses in Guam M odest ly low er f ull year cont ribut ion f rom SSA T joint vent ure M oderat ely low er A laska cont ainer volume A bsence of acquisit ion relat ed increment al SG& A and M olasses Set t lement cost s • Logist ics operat ing income f or f ull year 2 0 1 6 expect ed t o modest ly exceed 2 0 1 5 million Int erest expense f or f ull year 2 0 1 6 expect ed t o be approximat ely $ 2 3 million Ef f ect ive t ax rat e f or f ull year 2 0 1 6 expect ed t o be approximat ely 3 9 percent For f ull year 2 0 1 6 , expect maint enance capex of approximat ely $ 8 5 million, new level of $ 8 .5 • • • vessel const ruct ion progress payment s of $ 6 7 .2 million, and dry-docking payment s of approximat ely $60 million For f ull year 2 0 1 6 , expect depreciat ion and amort izat ion t o t ot al approximat ely $ 1 3 3 million inclusive of dry-docking amort izat ion of approximat ely $ 3 5 million • Second Quart er 2 0 1 6 Earnings Conf erence Call A ugust 2, 2016 – Slide 20 |
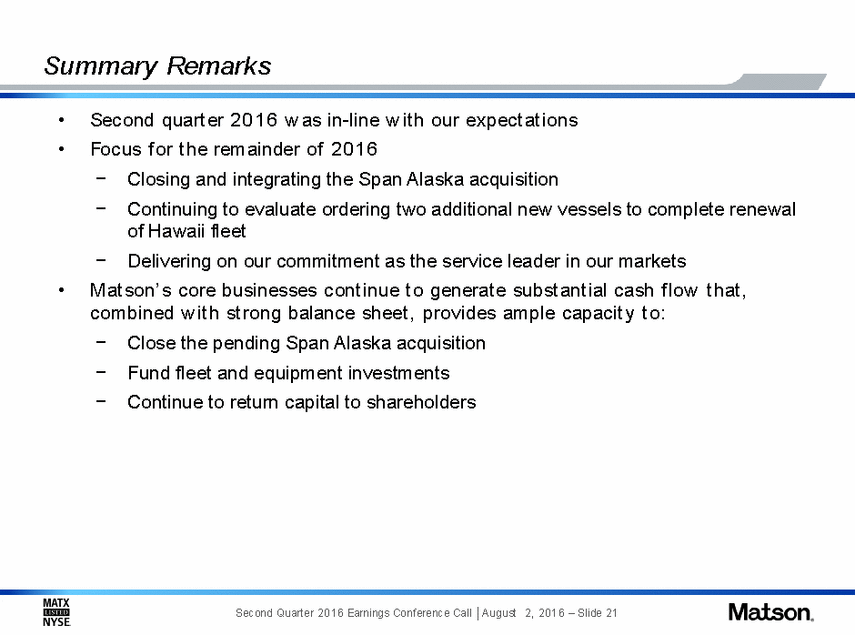
Summary Remarks • • Second quart er 2 0 1 6 w as in-line w it h our expect at ions Focus f or t he remainder of 2 0 16 − − Closing and integrating the Span Alaska acquisition Continuing to evaluate ordering two additional new vessels to complete renewal of Hawaii fleet Delivering on our commitment as the service leader in our markets − • M at son’ s core businesses cont inue t o generat e subst ant ial cash f low t hat , combined w it h st rong balance sheet , provides ample capacit y t o: − − − Close the pending Span Alaska acquisition Fund fleet and equipment investments Continue to return capital to shareholders Second Quart er 2 0 1 6 Earnings Conf erence Call A ugust 2, 2016 – Slide 21 |
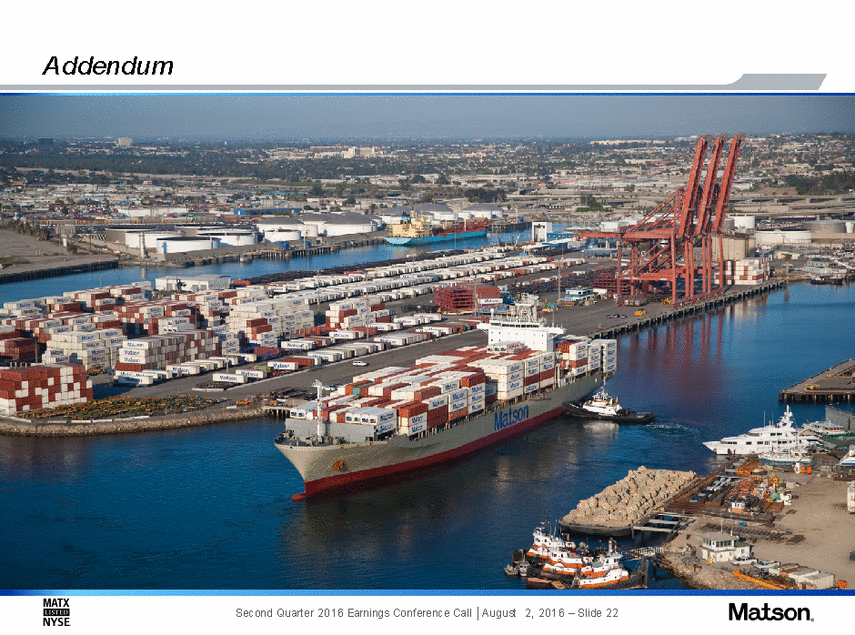
Addendum Second Quarter 2016 Earnings Conference Call IAugust 2, 2016-Slide 22 |
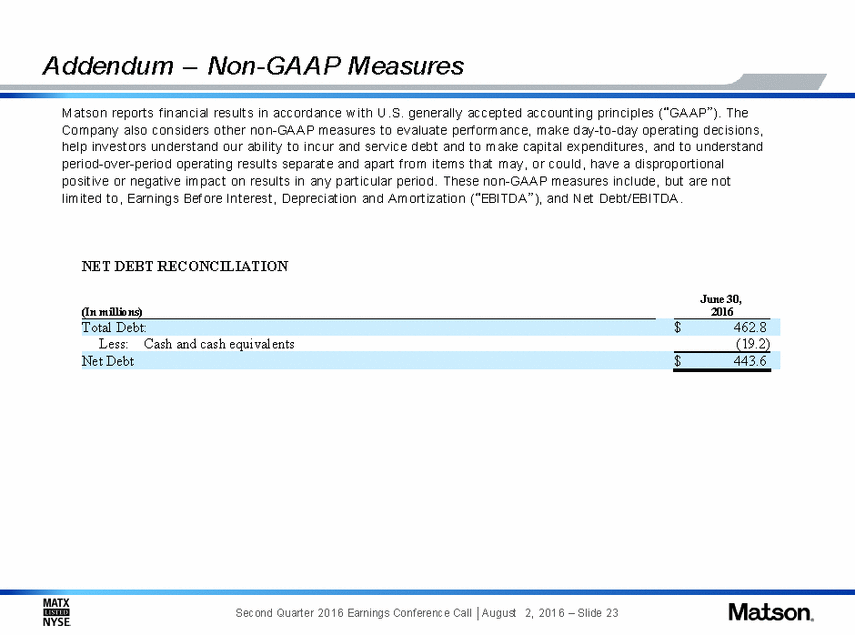
A ddendum – Non-GA A P M easures Mat son report s f inancial result s in accordance w it h U.S. generally accept ed account ing principles (“GAA P”). The Company also considers ot her non-GA A P measures t o evaluat e perf ormance, make day-to-day operat ing decisions, help invest ors underst and our abilit y t o incur and service debt and t o make capit al expendit ures, and t o underst and period-over-period operat ing result s separat e and apart f rom it ems t hat may, or could, have a disproport ional posit ive or negat ive impact on result s in any part icular period. These non-GA A P measures include, but are not limit ed t o, Earnings Bef ore Int erest , Depreciat ion and A mort izat ion (“EBITDA ”), and Net Debt /EBITDA . NET DEBT RECONCILIATION June 30, 2016 (In millions) Less: Cash and cash equivalents (19.2) Second Quart er 2 0 1 6 Earnings Conf erence Call A ugust 2, 2016 – Slide 23 Net Debt$443.6 Total Debt:$462.8 |
A ddendum – Non-GA A P EBITDA RECONCILIATION M easures Three Months Ended June 30, Last Twelve Months (In millions) 2016 2015 Change Add: Income tax expense 11.6 19.2 (7.6) 63.2 Add: Depreciation and amortization 23.6 18.6 5.0 94.8 EBITDA (1) $ 68.8 $ 57.9 $ 10.9 $ 312.4 Six Months Ended June 30, (In millions) 2016 2015 Change Add: Income tax expense 23.2 34.8 (11.6) Add: Depreciation and amortization 47.3 35.2 12.1 EBITDA (1) $ 135.2 $124.9 $ 10.3 (1) EBITDA is defined as the sum of net income, less income or loss from discontinued operations, plus income tax expense, interest expense and depreciation and amortization (including deferred dry-docking amortization). EBITDA should not be considered as an alternative to net income (as determined in accordance with GAAP), as an indicator of our operating performance, or to cash flows from operating activities (as determined in accordance with GAAP) as a measure of liquidity. Our calculation of EBITDA may not be comparable to EBITDA as calculated by other companies, nor is this calculation identical to the EBITDA used by our lenders to determine financial covenant compliance. Second Quart er 2 0 1 6 Earnings Conf erence Call A ugust 2, 2016 – Slide 24 Add:Dry-dock amortization17.211.16.1 Add:Interest expense11.48.92.5 Net Income$36.1$34.9$1.2 Add:Dry-dock amortization9.15.63.529.2 Add:Interest expense6.54.61.921.0 Net Income$18.0$9.9$8.1$104.2 |
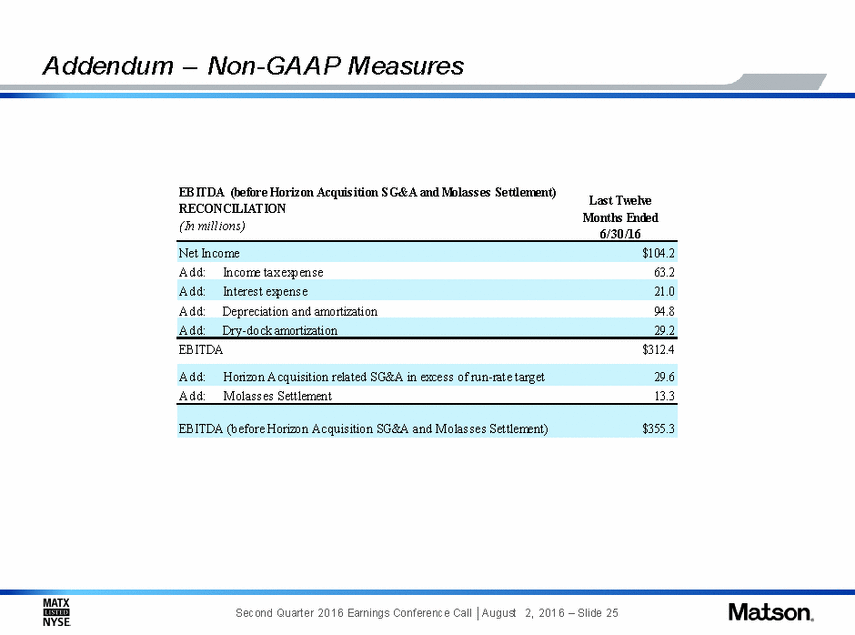
A ddendum – Non-GA A P M easures EBITDA (before Horizon Acquis ition SG&A and Molas s es Settlement) RECONCILIATION (In millions) Las t Twelve Months Ended 6/30/16 Add: Income tax expens e 63.2 Add: Depreciation and amortization 94.8 EBITDA $312.4 Add: Molas s es Settlement 13.3 Second Quart er 2 0 1 6 Earnings Conf erence Call A ugust 2, 2016 – Slide 25 EBITDA (before Horizon Acquis ition SG&A and Molas s es Settlement) $355.3 Add: Horizon Acquis ition related SG&A in exces s of run-rate target 29.6 Add: Dry-dock amortization 29.2 Add: Interes t expens e 21.0 Net Income $104.2 |