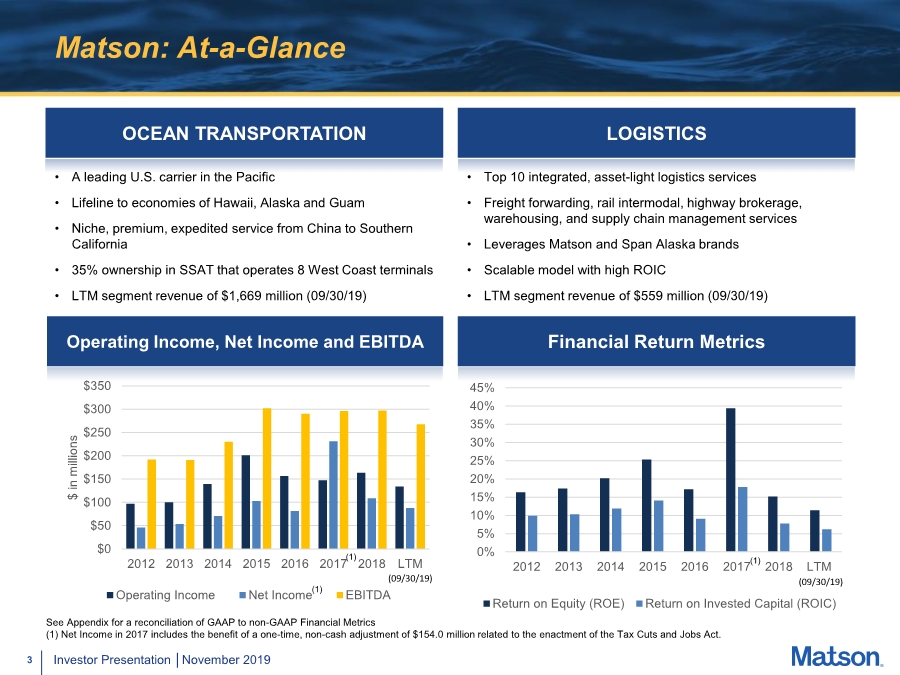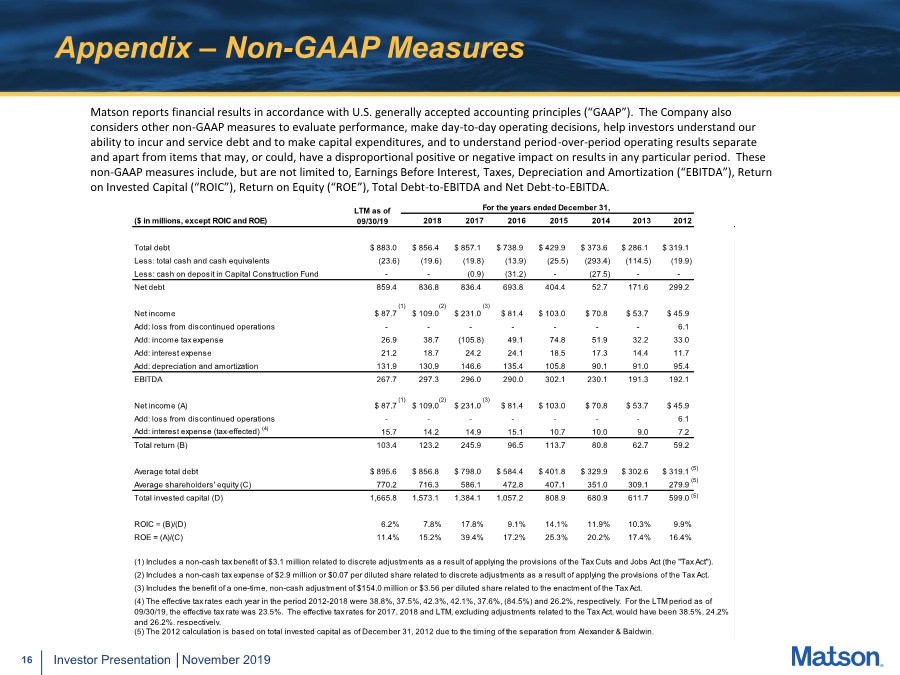
| 16 Investor Presentation │November 2019 Appendix – Non-GAAP Measures Matson reports financial results in accordance with U.S. generally accepted accounting principles (“GAAP”). The Company also considers other non-GAAP measures to evaluate performance, make day-to-day operating decisions, help investors understand our ability to incur and service debt and to make capital expenditures, and to understand period-over-period operating results separate and apart from items that may, or could, have a disproportional positive or negative impact on results in any particular period. These non-GAAP measures include, but are not limited to, Earnings Before Interest, Taxes, Depreciation and Amortization (“EBITDA”), Return on Invested Capital (“ROIC”), Return on Equity (“ROE”), Total Debt-to-EBITDA and Net Debt-to-EBITDA. For the years ended December 31, ($ in millions, except ROIC and ROE) 2018 2017 2016 2015 2014 2013 2012 Total debt $ 883.0 $ 856.4 $ 857.1 $ 738.9 $ 429.9 $ 373.6 $ 286.1 $ 319.1 Less: total cash and cash equivalents (23.6) (19.6) (19.8) (13.9) (25.5) (293.4) (114.5) (19.9) Less: cash on deposit in Capital Construction Fund - - (0.9) (31.2) - (27.5) - - Net debt 859.4 836.8 836.4 693.8 404.4 52.7 171.6 299.2 Net income $ 87.7 $ 109.0 $ 231.0 $ 81.4 $ 103.0 $ 70.8 $ 53.7 $ 45.9 Add: loss from discontinued operations - - - - - - - 6.1 Add: income tax expense 26.9 38.7 (105.8) 49.1 74.8 51.9 32.2 33.0 Add: interest expense 21.2 18.7 24.2 24.1 18.5 17.3 14.4 11.7 Add: depreciation and amortization 131.9 130.9 146.6 135.4 105.8 90.1 91.0 95.4 EBITDA 267.7 297.3 296.0 290.0 302.1 230.1 191.3 192.1 Net income (A) $ 87.7 $ 109.0 $ 231.0 $ 81.4 $ 103.0 $ 70.8 $ 53.7 $ 45.9 Add: loss from discontinued operations - - - - - - - 6.1 Add: interest expense (tax-effected) (4) 15.7 14.2 14.9 15.1 10.7 10.0 9.0 7.2 Total return (B) 103.4 123.2 245.9 96.5 113.7 80.8 62.7 59.2 Average total debt $ 895.6 $ 856.8 $ 798.0 $ 584.4 $ 401.8 $ 329.9 $ 302.6 $ 319.1 Average shareholders' equity (C) 770.2 716.3 586.1 472.8 407.1 351.0 309.1 279.9 Total invested capital (D) 1,665.8 1,573.1 1,384.1 1,057.2 808.9 680.9 611.7 599.0 ROIC = (B)/(D) 6.2% 7.8% 17.8% 9.1% 14.1% 11.9% 10.3% 9.9% ROE = (A)/(C) 11.4% 15.2% 39.4% 17.2% 25.3% 20.2% 17.4% 16.4% (5) The 2012 calculation is based on total invested capital as of December 31, 2012 due to the timing of the separation from Alexander & Baldwin. LTM as of 09/30/19 (1) Includes a non-cash tax benefit of $3.1 million related to discrete adjustments as a result of applying the provisions of the Tax Cuts and Jobs Act (the "Tax Act"). (2) Includes a non-cash tax expense of $2.9 million or $0.07 per diluted share related to discrete adjustments as a result of applying the provisions of the Tax Act. (3) Includes the benefit of a one-time, non-cash adjustment of $154.0 million or $3.56 per diluted share related to the enactment of the Tax Act. (4) The effective tax rates each year in the period 2012-2018 were 38.8%, 37.5%, 42.3%, 42.1%, 37.6%, (84.5%) and 26.2%, respectively. For the LTM period as of 09/30/19, the effective tax rate was 23.5%. The effective tax rates for 2017, 2018 and LTM, excluding adjustments related to the Tax Act, would have been 38.5%, 24.2% and 26.2%, respectively. (2) (3) (3) (2) (5) (5) (5) (1) (1) |