Exhibit 99.2
1 Fourth Quarter 2019 Earnings Conference Call Fourth Quarter 2019 Earnings Conference Call February 25, 2020 |
2 Fourth Quarter 2019 Earnings Conference Call Forward-Looking Statements Statements made during this presentation that set forth expectations, predictions, projections or are about future events are based on facts and situations that are known to us as of February 25, 2020. We believe that our expectations and assumptions are reasonable. Actual results may differ materially, due to risks and uncertainties, such as those described on pages 11-20 of our 2018 Form 10-K filed on March 4, 2019, in the Appendix to this presentation, and in other subsequent filings by Matson with the SEC. Statements made during this presentation are not guarantees of future performance. We do not undertake any obligation to update our forward-looking statements. |
3 Fourth Quarter 2019 Earnings Conference Call Opening Remarks • In 4Q19, tradelanes performed as expected, but consolidated results came in below expectations: – CLX service outperformed a difficult comparison – Modest rebound in Hawaii tradelane – Logistics in line with expectations – SSAT contribution fell short of expectations • Recap of FY 2019: – An important transition year with: delivery of two new vessels, three new gantry cranes at Sand Island, scrubber installation program, new Span Alaska Anchorage service facility – China and Alaska tradelanes made solid contributions – Logistics had another good year – SSAT and Hawaii tradelane were the primary negative contributors |
4 Fourth Quarter 2019 Earnings Conference Call Current Priorities Priority Commentary Complete Hawaii service fleet renewal • Lurline delivered in 4Q19 and in service; stepped down to 9-ship fleet • Matsonia scheduled delivery in 4Q20 Upgrade Sand Island terminal • Three existing cranes demolished; fourth crane to be demolished in 2H20 • Modifications on three older cranes have begun • Phase I to be complete this year • Phase II work to begin later this year IMO 2020 / Fuel Strategy • Third scrubber installed; vessel back in service • Fourth of six vessels in scrubber program is in dry-dock • Current scrubber program on track to be completed in 2020 De-lever the balance sheet beginning in 2020 • 4Q19 leverage covenant level below 3.5x • Expect leverage to peak in 1Q20 Organic growth opportunities • Leverage the combined services of Ocean Transportation and Logistics |
5 Fourth Quarter 2019 Earnings Conference Call Potential Impacts of COVID-19 • Expected to negatively impact transpacific import volume from Asia – Elongation of post Lunar New Year period due to factory start-up delays and disruption in supply chain logistics – Expected to negatively impact SSAT and international intermodal volumes – Expected to negatively impact Matson Logistics supply chain services in China • CLX’s differentiated service tends to do well when there are supply chain disruptions • COVID-19 negative financial impact included in 2020 Outlook: – Negative impact to FY 2020 consolidated operating income estimated to be approximately $15 million – Vast majority of COVID-19 financial impact is factored into the Ocean Transportation operating income outlook for the first quarter 2020 – Modest financial impact to Logistics operating income COVID-19 situation is highly dynamic with a number of possible impacts, positive and negative, on Matson’s operations. |
6 Fourth Quarter 2019 Earnings Conference Call Hawaii Service Fourth Quarter 2019 Performance • Container volume increased 1.1% YoY – Positive container market growth Container Volume (FEU Basis) 30,000 32,000 34,000 36,000 38,000 40,000 Q1 Q2 Q3 Q4 2018 2019 Full Year 2020 Outlook • Expect volume to be higher compared to level achieved in 2019 – Favorable economic conditions and stable market share Full Year 2019 Performance • Container volume declined 1.4% YoY – Negative container market growth |
7 Fourth Quarter 2019 Earnings Conference Call Hawaii Economic Indicators Real GDP Growth Construction Jobs Growth Select Hawaii Economic Indicators Hawaii’s economy remains in a slowing trend, but conditions remain favorable for continued economic growth. Source: https://www.uhero.hawaii.edu/assets/20Q1_StateUpdate_Public.pdf. • Modest GDP growth expected next couple of years • Muted population growth • Unemployment rate expected to increase, although remains low by historical standards • Visitor arrivals by air expected to hit a new high in 2020 – Modest impact from COVID-19 • Construction remains a bright spot – Good pipeline of residential and non-residential projects should sustain current level of activity 2018 2019P 2020P 2021P Population Growth (0.3)% (0.3)% (0.1)% 0.0% Unemployment Rate 2.5% 2.7% 2.8% 3.1% Growth in Visitor Arrivals by Air 5.2% 5.3% 1.8% 1.9% Growth in Real Visitor Expenditures 3.1% (0.3)% 0.0% 0.0% Market Commentary |
8 Fourth Quarter 2019 Earnings Conference Call China Expedited Service (CLX) Fourth Quarter 2019 Performance • Container volume increased 4.3% YoY – Deployed larger vessel capacity • Continued to realize a sizeable rate premium Container Volume (FEU Basis) Full Year 2020 Outlook • Expect 1H20 impact from COVID-19, but expect 2H20 to be comparable to strong 2H19 • FY 2020, expect modestly lower volume and average freight rates to approximate levels achieved in 2019 8,000 10,000 12,000 14,000 16,000 18,000 20,000 Q1 Q2 Q3 Q4 2018 2019 Full Year 2019 Performance • Container volume increased 3.9% YoY – Stronger volume post Lunar New Year |
9 Fourth Quarter 2019 Earnings Conference Call Guam Service Fourth Quarter 2019 Performance • Container volume decreased 7.7% YoY – Typhoon relief volume in 4Q18 Container Volume (FEU Basis) Full Year 2020 Outlook • Expect volume to approximate the 2019 level – Highly competitive environment remains • Matson’s transit advantage expected to remain with significantly better on-time performance 3,000 3,500 4,000 4,500 5,000 5,500 Q1 Q2 Q3 Q4 2018 2019 Full Year 2019 Performance • Container volume declined 1.5% YoY – Typhoon relief volume in 4Q18 Note: 4Q 2018 and 1Q 2019 volume figures includes typhoon relief-related volume. |
10 Fourth Quarter 2019 Earnings Conference Call Alaska Service Fourth Quarter 2019 Performance • Container volume declined 0.7% YoY – Slightly lower NB volume – Modestly higher SB volume Container Volume (FEU Basis) 10,000 12,000 14,000 16,000 18,000 20,000 Q1 Q2 Q3 Q4 2018 2019 Full Year 2020 Outlook • Expect volume to be modestly higher than the level achieved in 2019 – Higher NB volume and slightly lower SB volume compared to levels achieved in 2019 – Benefit of TOTE dry-dock volume in 1Q20 Note: 1Q 2018 volume figure includes volume related to a competitor’s vessel dry- docking. Full Year 2019 Performance • Container volume increased 0.4% YoY – Higher NB volume, partially offset by absence of TOTE dry-dock volume in FY18 – Lower SB volume |
11 Fourth Quarter 2019 Earnings Conference Call Alaska Economic Indicators Anchorage and Alaska Employment Growth(1)(2) Anchorage Population Growth(1) -2.0% -1.5% -1.0% -0.5% 0.0% 0.5% 1.0% 1.5% 2.0% 2009 2010 2011 2012 2013 2014 2015 2016 2017 2018 2019E 2020P YoY Growth in Employment Anchorage (AEDC) Alaska (Alaska Dept. of Labor) (1) Source: http://aedcweb.com/wp-content/uploads/2020/01/AEDC_Economic-Forecast-Report-2020_fnl.pdf (2) Source: http://labor.alaska.gov/trends/jan20.pdf Alaska’s economy continues to gradually recover as employment growth returns. -1.5% -1.0% -0.5% 0.0% 0.5% 1.0% 1.5% 2.0% 2.5% 2009 2010 2011 2012 2013 2014 2015 2016 2017 2018 2019E 2020P YoY Growth in Anchorage Population |
12 Fourth Quarter 2019 Earnings Conference Call SSAT Joint Venture Fourth Quarter 2019 Performance • Terminal joint venture contribution was $3.0 million, $5.0 million lower than last year – Higher terminal operating costs – Lower lift volume YoY Income from SSAT $ 0.0 $ 2.0 $ 4.0 $ 6.0 $ 8.0 $ 10.0 $ 12.0 Q1 Q2 Q3 Q4 $ in millions 2018 2019 Full Year 2020 Outlook • Expect terminal joint venture contribution to be lower than the 2019 level – Lower lift volume, partially offset by improved operating cost efficiencies Note: 1Q 2018 Income from SSAT figure includes favorable one-time items. Full Year 2019 Performance • Terminal joint venture contribution was $20.8 million, $16.0 million lower than last year – Higher terminal operating costs and absence of favorable items in FY 2018, partially offset by higher lift volume |
13 Fourth Quarter 2019 Earnings Conference Call Matson Logistics Fourth Quarter 2019 Performance • Operating income decreased $1.5 million YoY to $7.6 million – Lower contribution from transportation brokerage Operating Income Full Year 2020 Outlook • Expect operating income to be lower than the level achieved in 2019 $ 0.0 $ 2.0 $ 4.0 $ 6.0 $ 8.0 $ 10.0 $ 12.0 Q1 Q2 Q3 Q4 $ in millions 2018 2019 Full Year 2019 Performance • Operating income increased $5.6 million YoY to $38.3 million – Higher contributions from freight forwarding and transportation brokerage |
14 Fourth Quarter 2019 Earnings Conference Call Matson Logistics 0% 1% 2% 3% 4% 5% 6% 7% 8% $0 $5 $10 $15 $20 $25 $30 $35 $40 $45 2012 2013 2014 2015 2016 2017 (1) 2018 2019 Operating Income Margin $ in millions Operating Income and Margin Operating Income Operating Income Margin (1) First full year of Span Alaska. |
15 Fourth Quarter 2019 Earnings Conference Call Financial Results – Summary Income Statement See the Addendum for a reconciliation of GAAP to non-GAAP Financial Metrics. (1) Includes a non-cash tax expense reversal of $2.9 million resulting from discrete adjustments in applying the provisions of the Tax Cuts and Jobs Act of 2017 (“Tax Act”). (2) Includes a non-cash tax expense of $2.9 million resulting from discrete adjustments in applying the provisions of the Tax Act. |
16 Fourth Quarter 2019 Earnings Conference Call Cash Generation and Uses of Cash $ 0.0 $ 50.0 $ 100.0 $ 150.0 $ 200.0 $ 250.0 $ 300.0 $ 350.0 $ 400.0 Cash Flow from Operations Net Borrowings Maint. Capex New Vessel Capex (1) Dividends Other Cash Flows Net increase in cash $ in millions Last Twelve Months Ended December 31, 2019 $ 248.8 $ 102.0 ($ 91.2) ($ 219.1) ($ 37.2) $ 3.9 $ 0.6 (1) Includes capitalized interest and owner’s items. |
17 Fourth Quarter 2019 Earnings Conference Call Financial Results – Summary Balance Sheet • Total debt of $958.4 million • Net debt of $937.2 million • Net debt-to-LTM EBITDA of 3.5x • Continuing to look at capital structure optimization alternatives, including Title XI financing See the Addendum for a reconciliation of GAAP to non-GAAP Financial Metrics. Debt Levels |
18 Fourth Quarter 2019 Earnings Conference Call New Vessel Payments and Percent of Completion Actual and Estimated Vessel Progress Payments(1) FY 2019 ($ in millions) 1Q 2Q 3Q 4Q FY Cash Capital Expenditures $ 16.2 $ 6.4 $ 74.6 $ 106.3 $ 203.5 Capitalized Interest 4.7 3.3 3.5 4.1 15.6 Capitalized Vessel Construction Expenditures $ 20.9 $ 9.7 $ 78.1 $ 110.4 $ 219.1 ($ in millions) Cumulative through 12/31/19 FY 2020 Total Two Aloha Class Containerships(2) $ 403.1 $ 5.2 $ 408.3 Two Kanaloa Class Con-Ro Vessels 459.2 59.0 518.2 Total New Vessel Progress Payments $ 862.3 $ 64.2 $ 926.5 Matsonia, February 2020. Percent of Completion: 66%(3) Current Delivery Timing: 4Q 2020 Vessel Construction Expenditures (1) Excludes owner’s items, capitalized interest and other cost items associated with final milestone payments. (2) Remaining progress payments on Aloha Class vessels held in restricted cash on balance sheet. (3) As of February 21, 2020. |
19 Fourth Quarter 2019 Earnings Conference Call 2020 Outlook FY 2020 Outlook Items Full Year First Quarter Operating income: Ocean Transportation To be higher than the $90.8 million achieved in 2019 To be approximately breakeven compared to $9.4 million achieved in the first quarter 2019 Logistics To be lower than the $38.3 million achieved in 2019 To be lower than the $8.1 million achieved in the first quarter 2019 Consolidated Approximately $143 million - Depreciation and Amortization Approximately $135 million, including $25 million in dry-dock amortization - EBITDA Approximately $280 million - Other Income/(Expense) Approximately $2 million - Interest Expense (excluding capitalized interest) Approximately $33 million - GAAP Effective Tax Rate Approximately 26% - |
20 Fourth Quarter 2019 Earnings Conference Call Appendix |
21 Fourth Quarter 2019 Earnings Conference Call Appendix – Non-GAAP Measures Matson reports financial results in accordance with U.S. generally accepted accounting principles (“GAAP”). The Company also considers other non-GAAP measures to evaluate performance, make day-to-day operating decisions, help investors understand our ability to incur and service debt and to make capital expenditures, and to understand period-over-period operating results separate and apart from items that may, or could, have a disproportional positive or negative impact on results in any particular period. These non-GAAP measures include, but are not limited to, Earnings Before Interest, Income Taxes, Depreciation and Amortization (“EBITDA”), and Net Debt/EBITDA. |
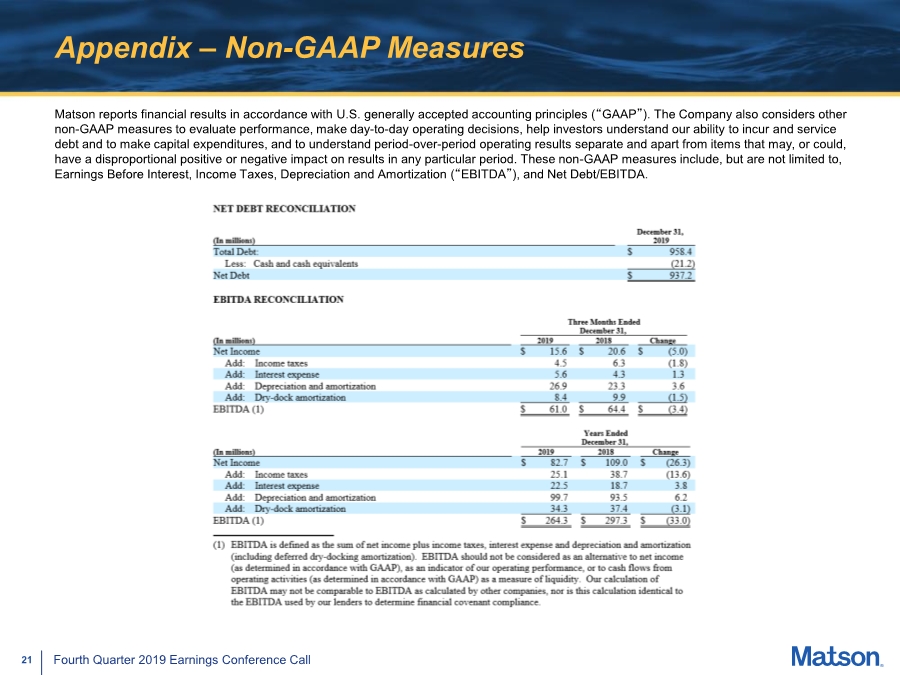
22 Fourth Quarter 2019 Earnings Conference Call Appendix – Forward Looking Statements Statements in this presentation that are not historical facts are “forward-looking statements,” within the meaning of the Private Securities Litigation Reform Act of 1995, including without limitation those statements regarding earnings, net income, operating income, depreciation and amortization including dry-dock amortization, other income (expense), interest expense, profitability, cash flow expectations and uses of cash and cash flows, fleet renewal progress, vessel deployments and operating efficiencies, vessel transit times, fuel strategy and scrubber program, organic growth opportunities, economic effects of competitors’ services, trends in volumes, rate premiums and market conditions in the China service, economic growth and drivers in Hawaii and Alaska, Sand Island terminal upgrades, lift volumes and operating costs at SSAT, timing and amount of SSAT income and cash distributions, debt leverage levels, and effective tax rates. These statements involve a number of risks and uncertainties that could cause actual results to differ materially from those contemplated by the relevant forward-looking statement, including but not limited to risks and uncertainties relating to repeal, substantial amendment or waiver of the Jones Act or its application, or our failure to maintain our status as a United States citizen under the Jones Act; regional, national and international economic conditions; new or increased competition or improvements in competitors’ service levels; fuel prices, our ability to collect fuel-related surcharges and/or the cost or limited availability of low-sulfur fuel; delays or cost overruns related to the installation of scrubbers; our relationship with vendors, customers and partners and changes in related agreements; the actions of our competitors; our ability to offer a differentiated service in China for which customers are willing to pay a significant premium; the imposition of tariffs or a change in international trade policies; the magnitude and timing of the impact of public health crises, including COVID-19; the ability of the NASSCO shipyard to construct and deliver Matsonia on the contemplated timeframe; any unanticipated dry-dock or repair expenses; any delays or cost overruns related to the modernization of terminals; consummating and integrating acquisitions; changes in general economic and/or industry-specific conditions; competition and growth rates within the logistics industry; freight levels and increasing costs and availability of truck capacity or alternative means of transporting freight; changes in relationships with existing truck, rail, ocean and air carriers; changes in customer base due to possible consolidation among customers; conditions in the financial markets; changes in our credit profile and our future financial performance; our ability to obtain future debt financings; continuation of the Title XI and CCF programs; the impact of future and pending legislation, including environmental legislation; government regulations and investigations; relations with our unions; satisfactory negotiation and renewal of expired collective bargaining agreements without significant disruption to Matson’s operations; war, terrorist attacks or other acts of violence; the use of our information technology and communication systems and cybersecurity attacks; and the occurrence of marine accidents, poor weather or natural disasters. These forward-looking statements are not guarantees of future performance. This presentation should be read in conjunction with our Annual Report on Form 10-K and our other filings with the SEC through the date of this report, which identify important factors that could affect the forward-looking statements in this report. We do not undertake any obligation to update our forward-looking statements. |