1 Fourth Quarter 2022 Earnings Conference Call Fourth Quarter 2022 Earnings Conference Call February 21, 2023 |
2 Fourth Quarter 2022 Earnings Conference Call Forward-Looking Statements Statements made during this presentation that set forth expectations, predictions, projections or are about future events are based on facts and situations that are known to us as of February 21, 2023. We believe that our expectations and assumptions are reasonable. Actual results may differ materially, due to risks and uncertainties, such as those described on pages 26-37 of our Form 10-Q filed on November 3, 2022 and other subsequent filings by Matson with the SEC. Statements made during this presentation are not guarantees of future performance. We do not undertake any obligation to update our forward-looking statements. |
3 Fourth Quarter 2022 Earnings Conference Call Opening Remarks • In 4Q22, Matson’s Ocean Transportation and Logistics business segments performed well in a difficult business environment • Matson is in a solid financial position – Low leverage – Currently, ~$622 million in Capital Construction Fund for new vessel program(1) – In FY2022, returned $445 million in cash to shareholders • Ocean Transportation 4Q22: – Our China service achieved lower year-over-year volume and freight rates which contributed to the decline in our consolidated operating income – Lower year-over-year volumes in Hawaii, Alaska and Guam compared to year ago period • Logistics 4Q22: – Lower YoY operating income primarily due to lower contribution from supply chain management consistent with lower demand in Transpacific tradelane (1) Based on CCF balance of ~$518 million as of December 31, 2022, ~$4 million in interest income on CCF cash deposits year-to-date in 2023 and $100 million cash deposit in February 2023. |
4 Fourth Quarter 2022 Earnings Conference Call Hawaii Service Fourth Quarter 2022 Performance • Container volume decreased 13.0% YoY – Lower retail- and hospitality-related demand compared to elevated pandemic levels in 4Q21 – Extra week in 4Q21 – 4Q22 volume lower than volume achieved in 4Q19 • During 4Q22, tourist arrivals remained relatively strong although a little softer in December Container Volume (FEU Basis) 25,000 27,000 29,000 31,000 33,000 35,000 37,000 39,000 41,000 Q1 Q2 Q3 Q4 2021 2022 Note: 4Q21 volume figure includes the benefit of a 53rd week. (13.0)% Full Year 2022 Performance • Container volume decreased 5.8% YoY – Lower retail-related demand compared to elevated pandemic levels in FY2021 – Extra week in 4Q21 |
5 Fourth Quarter 2022 Earnings Conference Call Hawaii Service – Current Business Trends UHERO Projections (2) (1) Source: https://files.hawaii.gov/dbedt/economic/data_reports/mei/2022-12-state.xls (2) Source: https://uhero.hawaii.edu/wp-content/uploads/2022/12/22Q4_Forecast.pdf 2021 2022 2023P 2024P Real GDP 6.3% 2.0% 2.8% 1.3% Construction Jobs Growth 0.6% (1.1)% 2.5% 1.0% Population Growth (0.7)% (0.2)% 0.0% 0.1% Unemployment Rate 5.8% 3.8% 3.6% 3.8% Visitor Arrivals (‘000s) % change 6,777.0 150.2% 9,277.0 36.9% 9,652.9 4.1% 9,491.6 (1.7)% 0 100 200 300 400 500 600 700 800 900 1,000 3.0% 4.0% 5.0% 6.0% 7.0% 8.0% 9.0% Jan-21 Mar-21 May-21 Jul-21 Sep-21 Nov-21 Jan-22 Mar-22 May-22 Jul-22 Sep-22 Nov-22 Jan-23 Unemployment Rate Visitor Arrivals (‘000s) Unemployment Rate and Visitor Arrivals by Air Unemployment Rate (not seasonally adjusted) (1) Visitor Arrivals by Air (1) Select Hawaii Economic Indicators • To date in 2023, have seen a steadier level of retail-related freight demand consistent with pre-pandemic trends • Expect economic growth in near-term supported by: – Continued strength in tourism – Low unemployment rate • Economic growth trajectory is uncertain given negative trends as a result of higher inflation, higher interest rates and the end of the pandemic-era stimulus helping personal income Commentary |
6 Fourth Quarter 2022 Earnings Conference Call China Service Fourth Quarter 2022 Performance Container Volume (FEU Basis) 8,000 13,000 18,000 23,000 28,000 33,000 38,000 43,000 48,000 53,000 58,000 Q1 Q2 Q3 Q4 2021 2022 Note: CCX service started in 3Q21 and ended in 3Q22. 4Q21 volume figure includes the benefit of a 53rd week. • Container volume decreased 47.2% YoY – Lower demand for our CLX and CLX+ services – No CCX service in 4Q22 • CCX service discontinued in 3Q22 – Extra week in 4Q21 (47.2)% • Container volume decreased 11.7% YoY – Lower demand for the CLX and CLX+ services and an extra week in 4Q21 – Partially offset by incremental volume on the CCX service Full Year 2022 Performance |
7 Fourth Quarter 2022 Earnings Conference Call China Service – Current Business Trends • Currently in the Transpacific marketplace, business conditions remain challenging – Retailers continue to right-size inventories amid weakening consumer demand, increasing interest rates and economic uncertainty • Expect our CLX and CLX+ services in 1Q23 and 1H23 to reflect freight demand levels below normalized conditions with lower YoY volumes and a lower rate environment • Absent an economic “hard landing” in the U.S., expect improved trade dynamics in 2H23 as the Transpacific marketplace transitions to a more normalized level of demand • Regardless of the economic environment, we operate the two fastest and most reliable ocean services and, as a result, we expect to continue to earn a significant rate premium to the SCFI |
8 Fourth Quarter 2022 Earnings Conference Call Guam Service Fourth Quarter 2022 Performance Container Volume (FEU Basis) 3,000 3,500 4,000 4,500 5,000 5,500 6,000 Q1 Q2 Q3 Q4 2021 2022 • Container volume decreased 14.0% YoY primarily due to lower retail-related demand – No impact from 53rd week in 4Q21 – 4Q22 volume higher than volume achieved in 4Q19 (14.0)% • Expect continued improvement in economy with increasing tourism and a low unemployment rate • Economic growth trajectory is uncertain given negative trends as a result of higher inflation, higher interest rates and the end of the pandemic-era stimulus helping personal income Full Year 2022 Performance • Container volume decreased 3.7% YoY primarily due to lower retail-related demand Current Business Trends |
9 Fourth Quarter 2022 Earnings Conference Call Alaska Service Fourth Quarter 2022 Performance • Container volume decreased 7.7% YoY – Lower northbound volume primarily due to one less sailing and one less week – Lower southbound volume primarily due to lower domestic seafood volume and one less week – Higher Alaska-Asia Express (AAX) export seafood volume • 4Q22 volume higher than volume achieved in 4Q19 Container Volume (FEU Basis) 10,000 12,000 14,000 16,000 18,000 20,000 22,000 24,000 26,000 Q1 Q2 Q3 Q4 2021 2022 Note: 4Q21 volume figure includes the benefit of a 53rd week. (7.7)% Full Year 2022 Performance • Container volume increased 8.6% YoY – Higher export seafood volume from AAX – Higher northbound volume primarily due to: • Higher retail-related demand and volume related to a competitor’s dry-docking • Partially offset by one less week – Higher southbound volume primarily due to higher domestic seafood volume |
10 Fourth Quarter 2022 Earnings Conference Call Alaska Service – Current Business Trends • Alaska economy continues to show good growth and improvement in key indicators from the depths of the pandemic – Low unemployment rate • In the near-term, we expect continued economic growth in the State – Continued jobs growth • Federal infrastructure bill expected to lead to more employment growth – Increased energy-related exploration and production activity as a result of elevated oil prices • However, economic growth trajectory is uncertain given negative trends as a result of higher inflation, higher interest rates and the end of the pandemic-era stimulus helping personal income -10.0% -8.0% -6.0% -4.0% -2.0% 0.0% 2.0% 4.0% 2011 2012 2013 2014 2015 2016 2017 2018 2019 2020 2021 2022E 2023P YoY Growth in Employment Alaska Employment Growth(1)(2) (1) Source: https://labor.alaska.gov/trends/jan23.pdf (2) Source: https://live.laborstats.alaska.gov/labforce/000000/01/ces.html (3) Source: https://live.laborstats.alaska.gov/pop/estimates/data/ComponentsOfChangeAK.xls Alaska Population Growth and Net Migration(3) (10,000) (5,000) 0 5,000 10,000 15,000 20,000 25,000 -0.6% -0.4% -0.2% 0.0% 0.2% 0.4% 0.6% 0.8% 1.0% 1.2% 1.4% 2011 2012 2013 2014 2015 2016 2017 2018 2019 2020 2021 2022 Net Migration YoY Growth in Population Population Growth Net Migration |
11 Fourth Quarter 2022 Earnings Conference Call SSAT Joint Venture Fourth Quarter 2022 Performance Equity in Income of Joint Venture $ 0.0 $ 5.0 $ 10.0 $ 15.0 $ 20.0 $ 25.0 $ 30.0 $ 35.0 $ 40.0 Q1 Q2 Q3 Q4 $ in millions 2021 2022 • Terminal joint venture contribution was $1.0 million; YoY decrease of $20.3 million – Primarily due to lower other terminal revenue, lower lift volume and higher operating costs Current Business Trends • Expect 1H23 lift volume to reflect challenging environment in Transpacific tradelane • Absent an economic “hard landing,” expect to trend to pre-pandemic profitability levels in 2H23 • For the year, expect significantly lower other terminal revenue due to easing of port congestion Full Year 2022 Performance • Terminal joint venture contribution was $83.1 million; YoY increase of $26.8 million – Primarily due to higher other terminal revenue |
12 Fourth Quarter 2022 Earnings Conference Call Matson Logistics Fourth Quarter 2022 Performance Operating Income $ 0.0 $ 5.0 $ 10.0 $ 15.0 $ 20.0 $ 25.0 Q1 Q2 Q3 Q4 $ in millions 2021 2022 • Operating income of $12.8 million; YoY decrease of $2.0 million – Primarily due to lower contribution from supply chain management consistent with lower demand in Transpacific tradelane • Operating income of $72.4 million; YoY increase of $22.6 million – Higher contributions from transportation brokerage and freight forwarding Current Business Trends • Expect continued growth in Alaska to be supportive of freight forwarding demand • Expect supply chain management to track the China service – challenging 1H23 • Expect transportation brokerage to weaken from pandemic highs as freight demand normalizes, modal shifts with improved rail conditions and retail customers continue to manage down inventories Full Year 2022 Performance |
13 Fourth Quarter 2022 Earnings Conference Call Financial Results – Summary Income Statement See the Addendum for a reconciliation of GAAP to non-GAAP Financial Metrics. Year-to-Date Fourth Quarter YTD Ended 12/31 D Quarters Ended 12/31 D ($ in millions, except per share data) 2022 2021 $ 2022 2021 $ Revenue Ocean Transportation $ 3,544.6 $ 3,132.8 $ 411.8 $ 633.0 $ 1,025.9 ($ 392.9) Logistics 798.4 792.5 5.9 168.6 241.1 ( 72.5) Total Revenue $ 4,343.0 $ 3,925.3 $ 417.7 $ 801.6 $ 1,267.0 ($ 465.4) Operating Income Ocean Transportation $ 1,281.2 $ 1,137.7 $ 143.5 $ 79.8 $ 460.7 ($ 380.9) Logistics 72.4 49.8 22.6 12.8 14.8 ( 2.0) Total Operating Income $ 1,353.6 $ 1,187.5 $ 166.1 $ 92.6 $ 475.5 ($ 382.9) Interest income 8.2 — 6.9 — Interest expense ( 18.0) ( 22.6) ( 3.7) ( 4.7) Other income (expense), net 8.5 6.4 2.2 1.7 Income taxes ( 288.4) ( 243.9) ( 20.0) ( 78.0) Net Income $ 1,063.9 $ 927.4 $ 136.5 $ 78.0 $ 394.5 ($ 316.5) GAAP EPS, diluted $ 27.07 $ 21.47 $ 5.60 $ 2.10 $ 9.39 ($ 7.29) $ 164.1 $ 156.4 $ 7.7 $ 41.6 $ 40.5 $ 1.1 EBITDA $ 1,526.2 $ 1,350.3 $ 175.9 $ 136.4 $ 517.7 ($ 381.3) Depreciation and Amortization (incl. dry-dock amortization) |
14 Fourth Quarter 2022 Earnings Conference Call Cash Generation and Uses of Cash ($ 200.0) $ 0.0 $ 200.0 $ 400.0 $ 600.0 $ 800.0 $ 1,000.0 $ 1,200.0 $ 1,400.0 Cash Flow from Operations Paydown of Borrowings, net Maintenance & Other Capex New Vessel Capex (1) Capital Construction Fund (2) Dividends Share Repurchase Other Cash Flows Net Change in Cash $ in millions Last Twelve Months Ended December 31, 2022 $ 1,271.9 ($ 111.5) ($ 146.9) ($ 518.2) ($ 21.9) ($ 397.0) ($ 62.4) ($ 34.0) (1) Includes capitalized interest and owner’s items. (2) Includes cash deposits into Capital Construction Fund (CCF) and interest income on cash deposits in CCF, net of withdrawals for milestone payments. ($ 48.0) |
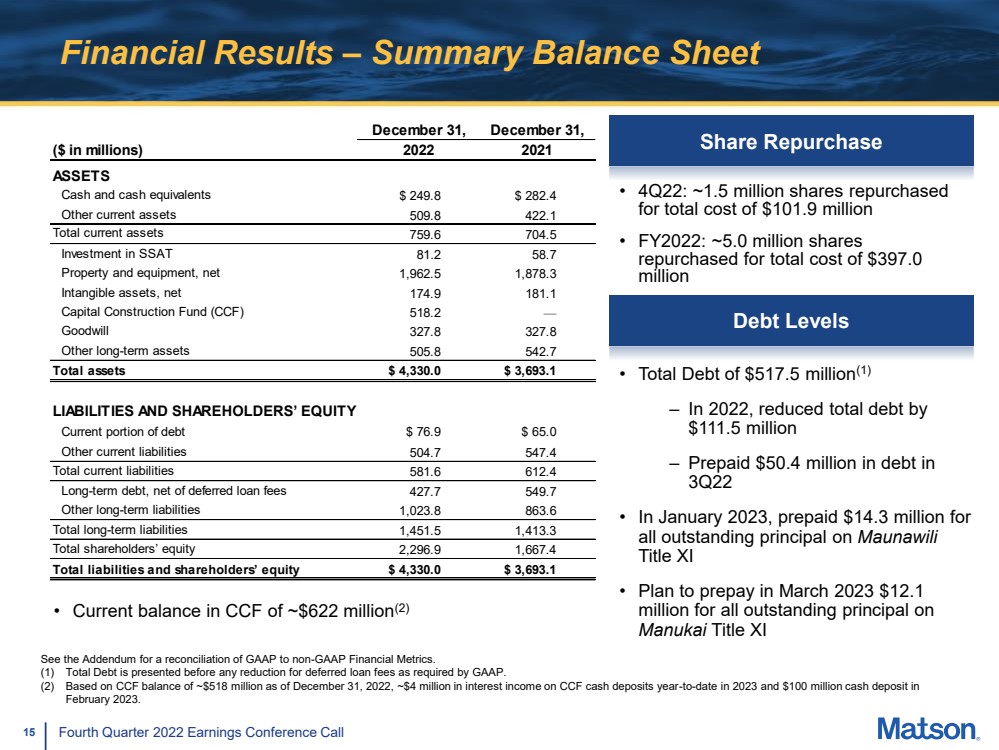
15 Fourth Quarter 2022 Earnings Conference Call Financial Results – Summary Balance Sheet • Total Debt of $517.5 million(1) – In 2022, reduced total debt by $111.5 million – Prepaid $50.4 million in debt in 3Q22 • In January 2023, prepaid $14.3 million for all outstanding principal on Maunawili Title XI • Plan to prepay in March 2023 $12.1 million for all outstanding principal on Manukai Title XI See the Addendum for a reconciliation of GAAP to non-GAAP Financial Metrics. (1) Total Debt is presented before any reduction for deferred loan fees as required by GAAP. (2) Based on CCF balance of ~$518 million as of December 31, 2022, ~$4 million in interest income on CCF cash deposits year-to-date in 2023 and $100 million cash deposit in February 2023. Debt Levels Share Repurchase • 4Q22: ~1.5 million shares repurchased for total cost of $101.9 million • FY2022: ~5.0 million shares repurchased for total cost of $397.0 million • Current balance in CCF of ~$622 million(2) ($ in millions) ASSETS Cash and cash equivalents $ 249.8 $ 282.4 Other current assets 509.8 422.1 Total current assets 759.6 704.5 Investment in SSAT 81.2 58.7 Property and equipment, net 1,962.5 1,878.3 Intangible assets, net 174.9 181.1 Capital Construction Fund (CCF) 518.2 — Goodwill 327.8 327.8 Other long-term assets 505.8 542.7 Total assets $ 4,330.0 $ 3,693.1 LIABILITIES AND SHAREHOLDERS’ EQUITY Current portion of debt $ 76.9 $ 65.0 Other current liabilities 504.7 547.4 Total current liabilities 581.6 612.4 Long-term debt, net of deferred loan fees 427.7 549.7 Other long-term liabilities 1,023.8 863.6 Total long-term liabilities 1,451.5 1,413.3 Total shareholders’ equity 2,296.9 1,667.4 Total liabilities and shareholders’ equity $ 4,330.0 $ 3,693.1 December 31, December 31, 2022 2021 |
16 Fourth Quarter 2022 Earnings Conference Call Capital Construction Fund (CCF) • In February 2023, deposited $100 million in cash into CCF and pledged accounts receivable to reduce taxable income in 2022 – Following $100 million cash deposit, will have cash deposits in the CCF to cover ~66%(1) of the current remaining milestone payments for new vessel program • Currently don’t expect to make additional cash contributions to the CCF for milestone payments until 2026 • Interest income on CCF cash deposits to be tax-advantaged and help pay for milestone payments • Continue to expect a tax refund for the $565 million in cash deposited into the CCF last year CCF Cash Balance (12/31/2022) ~$518 million CCF Interest Income YTD 2023 ~$4 million CCF Cash Deposit in February 2023 $100 million Total Restricted Cash ~$622 million Current Remaining Milestone Payments ~$949 million % Funded with Restricted Cash ~66%(1) (1) Calculation excludes cash and cash equivalents on the balance sheet, which was $249.8 million as of December 31, 2022. |
17 Fourth Quarter 2022 Earnings Conference Call Review of 2022 Capital Expenditures FY 2022 Comments Capitalized vessel construction expenditures $62.4 million • $11.9 million for new inter-island barge placed into service in 3Q22 • $50.5 million for new vessel milestone payment in 4Q22 and other related costs Maintenance and other capital expenditures $146.9 million • $60.5 million in equipment capex to support new tradelane services and provide fluidity in the network • $21.3 million in capex for LNG installations on Daniel K. Inouye, Kaimana Hila and Manukai • $65.1 million in other maintenance capex for a variety of projects Total capital expenditures $209.3 million |
18 Fourth Quarter 2022 Earnings Conference Call Capital Expenditures Update ($ in millions) FY 2023 FY 2024 FY 2025 Comments Maintenance and other capital expenditures $80 – 90 $80 – 90 $80 – 90 • Includes Phase II and III work at Sand Island, Honolulu New vessel construction milestone payments and related costs $55 $75 $360 • Cash on deposit in CCF to pay for milestone payments in 2023 through 2025 • Includes owner’s items and capitalized interest expense LNG installations and reengining on existing vessels $60 – 65 $50 – 55 - • Daniel K. Inouye LNG install started in early 1Q23 and expected to last ~5 months (current estimated total cost ~$35 million) • Re-engine Manukai to operate on LNG and conventional fuels (current estimated total cost ~$60 million) – currently scheduled following Daniel K. Inouye install and to take ~1 year to complete • Kaimana Hila LNG install currently expected to start in 2Q24 and last ~5 months (current estimated total cost ~$35 million) Total $195 – 210 $205 – 220 $440 – 450 |
19 Fourth Quarter 2022 Earnings Conference Call Closing Thoughts • We expect the financial performance in 1Q23 to be the weakest of the year – Normal seasonality returns to our domestic tradelanes and Logistics – Expect our China service to experience freight demand below normalized conditions • In the near-term, we expect: – Continued economic growth in Hawaii, Alaska and Guam to be supportive of freight demand, but recognize the potential economic overhang – Continued challenges in Transpacific tradelane in 1H23 with freight demand below normalized conditions; improved trade dynamics in 2H23 as the market transitions to a more normalized level of demand |
20 Fourth Quarter 2022 Earnings Conference Call Closing Thoughts (continued) • Matson is well-positioned financially and operationally to capitalize on opportunities as they emerge – The Matson brand has never been stronger – Matson is in a solid financial position • Investment grade balance sheet with low leverage • Nearly two-thirds of current remaining milestone payments for new vessel program funded with cash deposits in the CCF • Regardless of the economic environment, we will continue to maintain discipline in our capital allocation strategy – Invest for the long-term to create value for shareholders – Find opportunities to extend the Matson brand and drive organic growth – Look for unique acquisition opportunities that meet our investment criteria – Return capital to shareholders • In the last 2 years, repurchased ~7.5 million shares for nearly $600 million |
21 Fourth Quarter 2022 Earnings Conference Call Appendix |
22 Fourth Quarter 2022 Earnings Conference Call Appendix – Non-GAAP Measures Matson reports financial results in accordance with U.S. generally accepted accounting principles (“GAAP”). The Company also considers other non-GAAP measures to evaluate performance, make day-to-day operating decisions, help investors understand our ability to incur and service debt and to make capital expenditures, and to understand period-over-period operating results separate and apart from items that may, or could, have a disproportional positive or negative impact on results in any particular period. These non-GAAP measures include, but are not limited to, Earnings Before Interest, Income Taxes, Depreciation and Amortization (“EBITDA”). |