| 1 Third Quarter 2024 Earnings Conference Call Third Quarter 2024 Earnings Conference Call October 30, 2024 |

| 2 Third Quarter 2024 Earnings Conference Call Forward-Looking Statements Statements made during this presentation that set forth expectations, predictions, projections or are about future events are based on facts and situations that are known to us as of October 30, 2024. We believe that our expectations and assumptions are reasonable. Actual results may differ materially, due to risks and uncertainties, such as those described on pages 13-25 of our Form 10-K filed on February 23, 2024 and other subsequent filings by Matson with the SEC. Statements made during this presentation are not guarantees of future performance. We do not undertake any obligation to update our forward-looking statements. |
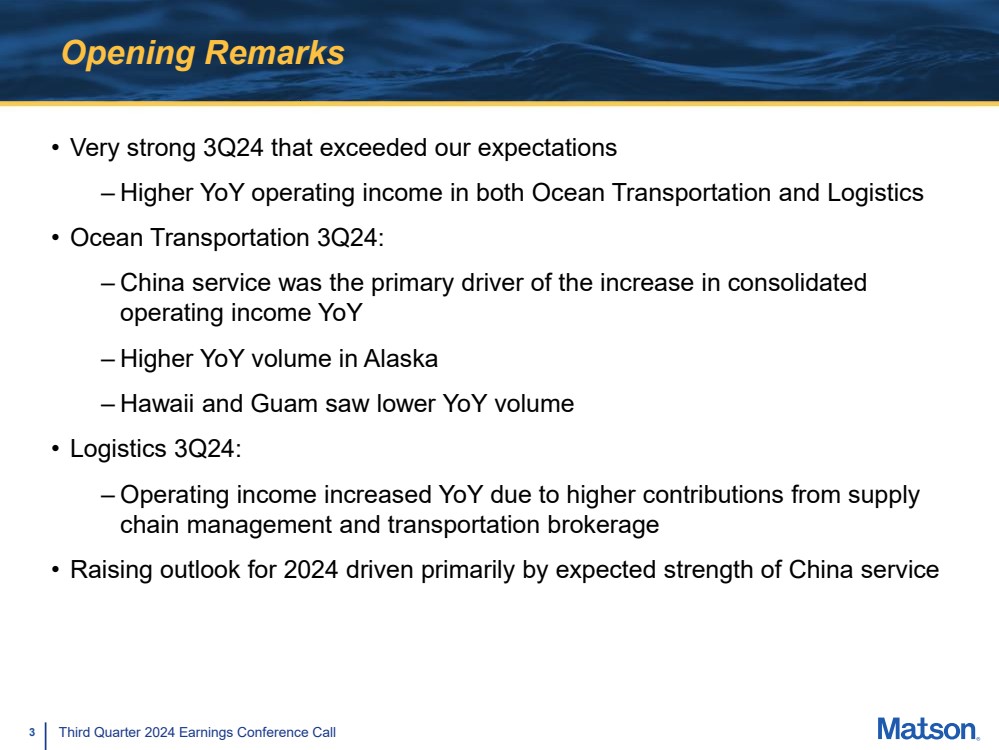
| 3 Third Quarter 2024 Earnings Conference Call Opening Remarks • Very strong 3Q24 that exceeded our expectations – Higher YoY operating income in both Ocean Transportation and Logistics • Ocean Transportation 3Q24: – China service was the primary driver of the increase in consolidated operating income YoY – Higher YoY volume in Alaska – Hawaii and Guam saw lower YoY volume • Logistics 3Q24: – Operating income increased YoY due to higher contributions from supply chain management and transportation brokerage • Raising outlook for 2024 driven primarily by expected strength of China service |
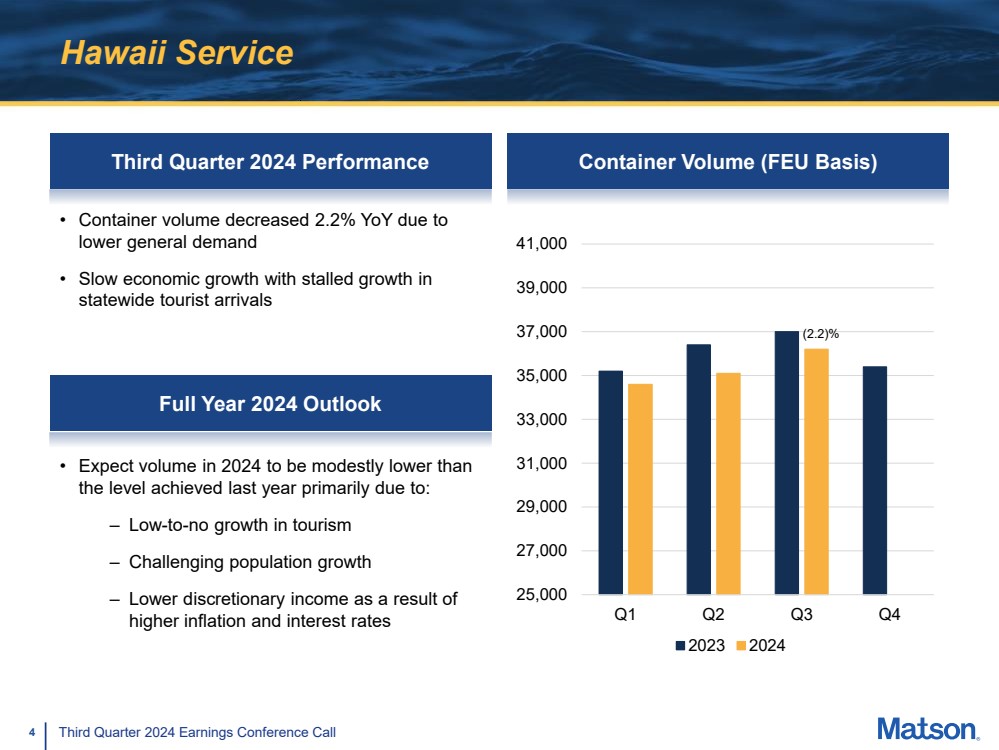
| 4 Third Quarter 2024 Earnings Conference Call Hawaii Service Third Quarter 2024 Performance • Container volume decreased 2.2% YoY due to lower general demand • Slow economic growth with stalled growth in statewide tourist arrivals Container Volume (FEU Basis) 25,000 27,000 29,000 31,000 33,000 35,000 37,000 39,000 41,000 Q1 Q2 Q3 Q4 2023 2024 (2.2)% Full Year 2024 Outlook • Expect volume in 2024 to be modestly lower than the level achieved last year primarily due to: – Low-to-no growth in tourism – Challenging population growth – Lower discretionary income as a result of higher inflation and interest rates |
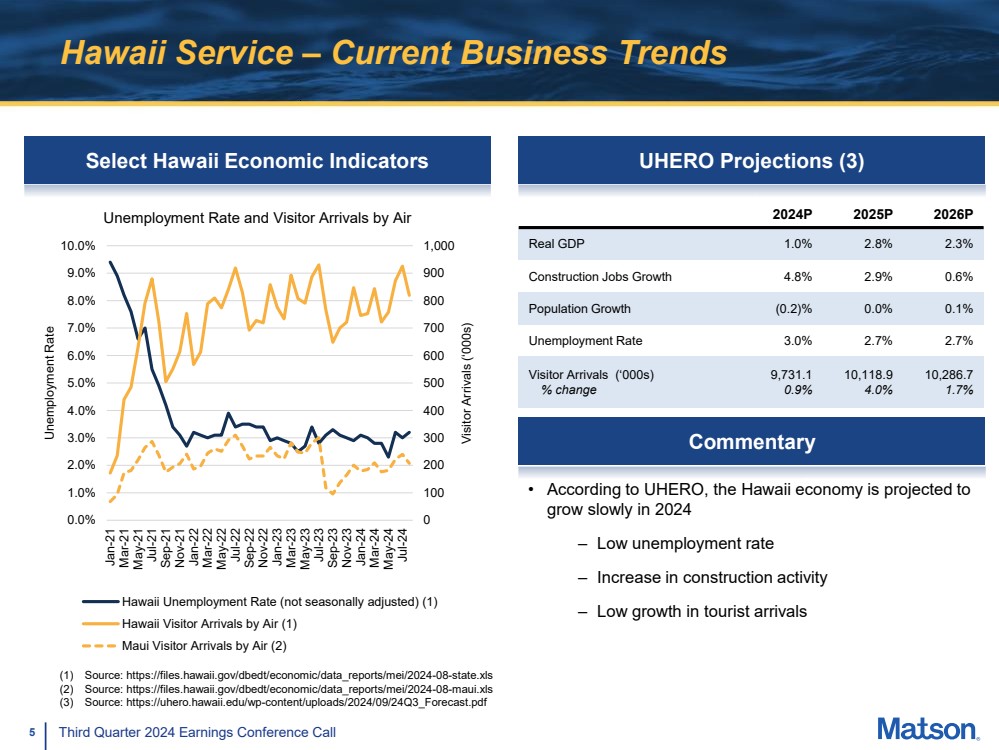
| 5 Third Quarter 2024 Earnings Conference Call Hawaii Service – Current Business Trends UHERO Projections (3) (1) Source: https://files.hawaii.gov/dbedt/economic/data_reports/mei/2024-08-state.xls (2) Source: https://files.hawaii.gov/dbedt/economic/data_reports/mei/2024-08-maui.xls (3) Source: https://uhero.hawaii.edu/wp-content/uploads/2024/09/24Q3_Forecast.pdf 2024P 2025P 2026P Real GDP 1.0% 2.8% 2.3% Construction Jobs Growth 4.8% 2.9% 0.6% Population Growth (0.2)% 0.0% 0.1% Unemployment Rate 3.0% 2.7% 2.7% Visitor Arrivals (‘000s) % change 9,731.1 0.9% 10,118.9 4.0% 10,286.7 1.7% Select Hawaii Economic Indicators • According to UHERO, the Hawaii economy is projected to grow slowly in 2024 – Low unemployment rate – Increase in construction activity – Low growth in tourist arrivals Commentary 0 100 200 300 400 500 600 700 800 900 1,000 0.0% 1.0% 2.0% 3.0% 4.0% 5.0% 6.0% 7.0% 8.0% 9.0% 10.0% Jan-21 Mar-21 May-21 Jul-21 Sep-21 Nov-21 Jan-22 Mar-22 May-22 Jul-22 Sep-22 Nov-22 Jan-23 Mar-23 May-23 Jul-23 Sep-23 Nov-23 Jan-24 Mar-24 May-24 Jul-24 Unemployment Rate Visitor Arrivals (‘000s) Unemployment Rate and Visitor Arrivals by Air Hawaii Unemployment Rate (not seasonally adjusted) (1) Hawaii Visitor Arrivals by Air (1) Maui Visitor Arrivals by Air (2) |
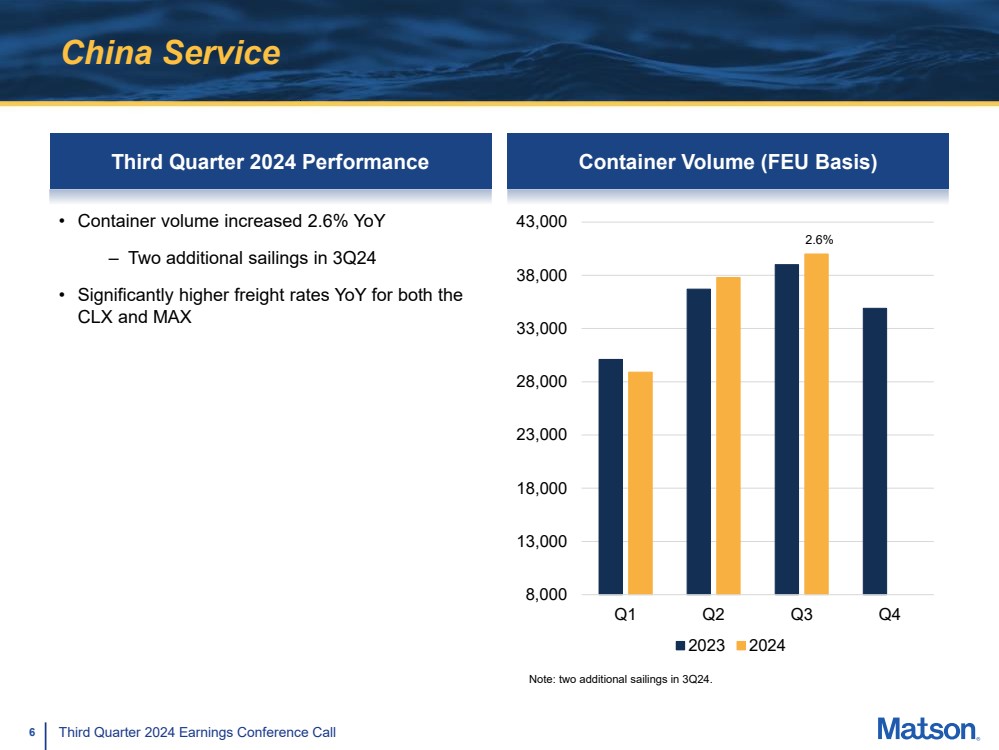
| 6 Third Quarter 2024 Earnings Conference Call China Service Third Quarter 2024 Performance Container Volume (FEU Basis) 8,000 13,000 18,000 23,000 28,000 33,000 38,000 43,000 Q1 Q2 Q3 Q4 2023 2024 • Container volume increased 2.6% YoY – Two additional sailings in 3Q24 • Significantly higher freight rates YoY for both the CLX and MAX 2.6% Note: two additional sailings in 3Q24. |
| 7 Third Quarter 2024 Earnings Conference Call China Service – Current Business Trends • The elevated freight rates in 3Q24 were primarily due to a traditional peak season with strong freight demand and additional factors including: – A resilient U.S. economy and a stable consumer demand environment coupled with tighter supply chain conditions • Solid U.S. retail sales during 3Q24 • E-commerce continued to grow faster than the overall retail market – Continued Red Sea disruptions – Impacts from East Coast / Gulf ILA negotiations • For 4Q24, we expect our China service freight rates to be significantly higher than the levels achieved in the year ago period, as long as the underlying economic, supply chain, and geopolitical conditions persist, but lower than the average rates achieved in 3Q24 as the peak season demand eases Our CLX and MAX services continue to be the two fastest and most reliable expedited ocean services in the Transpacific |
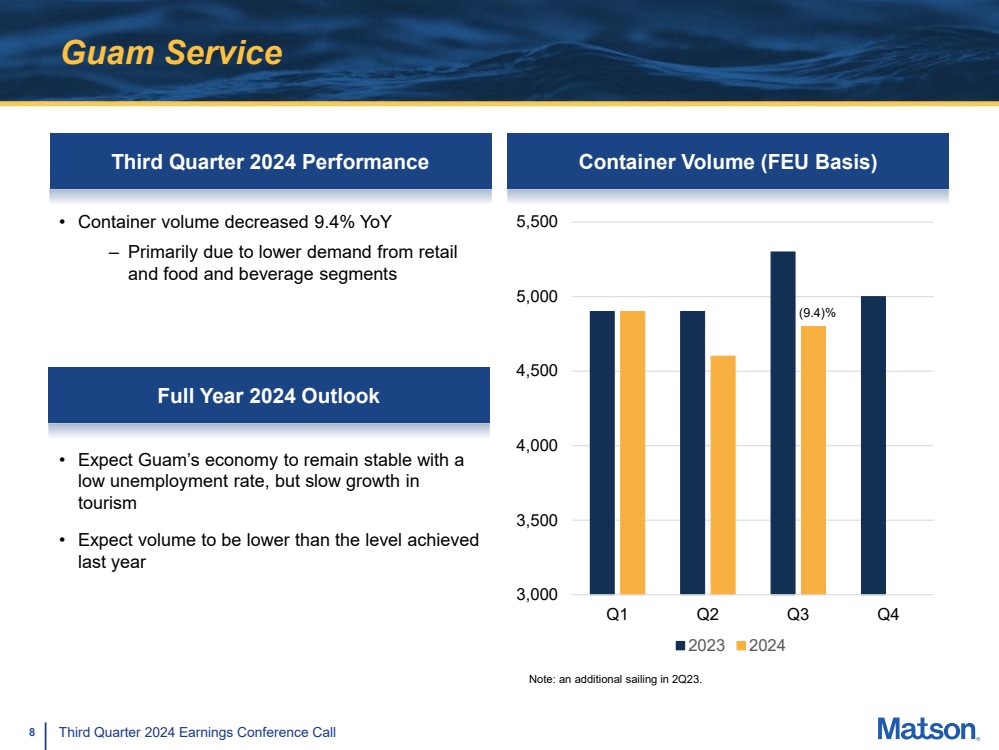
| 8 Third Quarter 2024 Earnings Conference Call Guam Service Third Quarter 2024 Performance Container Volume (FEU Basis) 3,000 3,500 4,000 4,500 5,000 5,500 Q1 Q2 Q3 Q4 2023 2024 • Container volume decreased 9.4% YoY – Primarily due to lower demand from retail and food and beverage segments (9.4)% Full Year 2024 Outlook • Expect Guam’s economy to remain stable with a low unemployment rate, but slow growth in tourism • Expect volume to be lower than the level achieved last year Note: an additional sailing in 2Q23. |
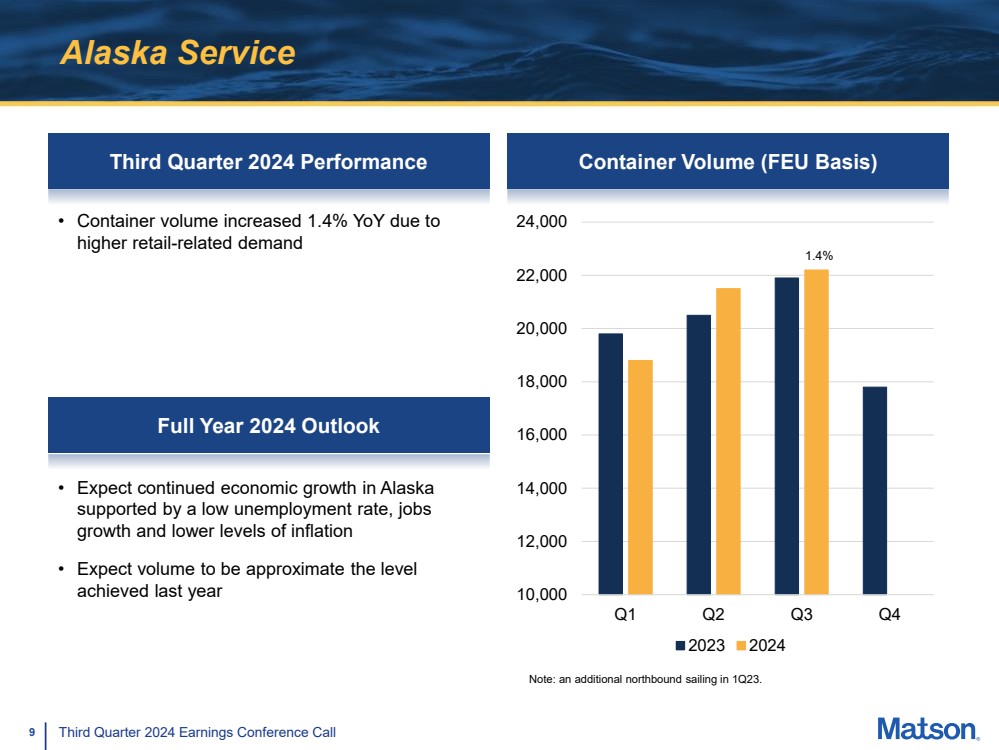
| 9 Third Quarter 2024 Earnings Conference Call Alaska Service Third Quarter 2024 Performance • Container volume increased 1.4% YoY due to higher retail-related demand Container Volume (FEU Basis) 10,000 12,000 14,000 16,000 18,000 20,000 22,000 24,000 Q1 Q2 Q3 Q4 2023 2024 Full Year 2024 Outlook • Expect continued economic growth in Alaska supported by a low unemployment rate, jobs growth and lower levels of inflation • Expect volume to be approximate the level achieved last year Note: an additional northbound sailing in 1Q23. 1.4% |
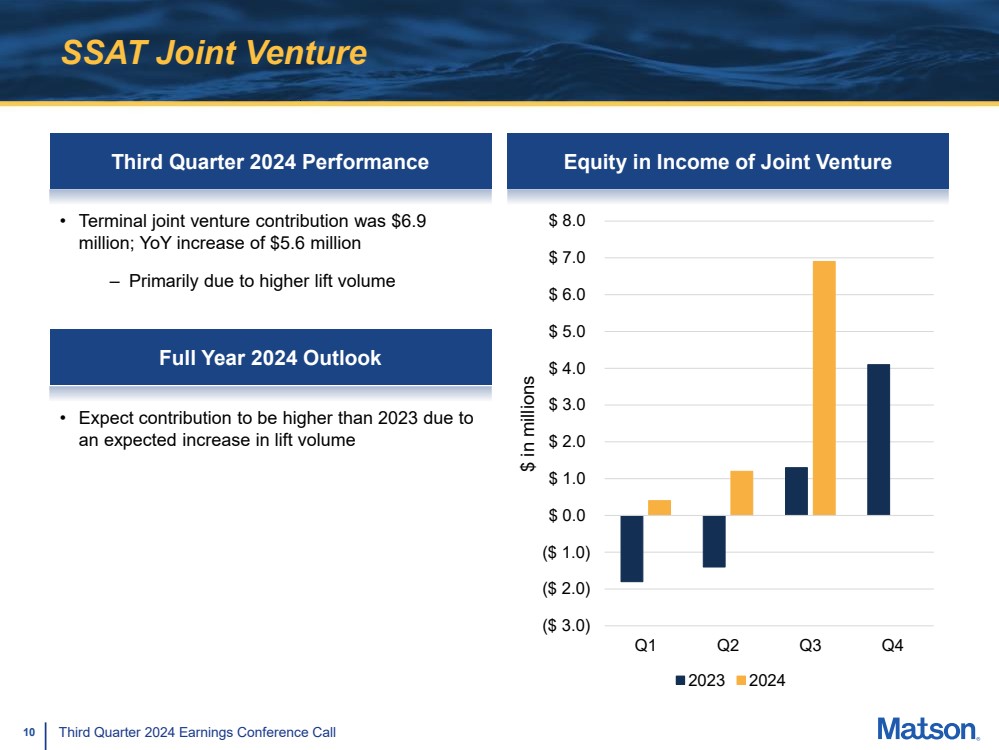
| 10 Third Quarter 2024 Earnings Conference Call SSAT Joint Venture Third Quarter 2024 Performance Equity in Income of Joint Venture ($ 3.0) ($ 2.0) ($ 1.0) $ 0.0 $ 1.0 $ 2.0 $ 3.0 $ 4.0 $ 5.0 $ 6.0 $ 7.0 $ 8.0 Q1 Q2 Q3 Q4 $ in millions 2023 2024 • Terminal joint venture contribution was $6.9 million; YoY increase of $5.6 million – Primarily due to higher lift volume Full Year 2024 Outlook • Expect contribution to be higher than 2023 due to an expected increase in lift volume |
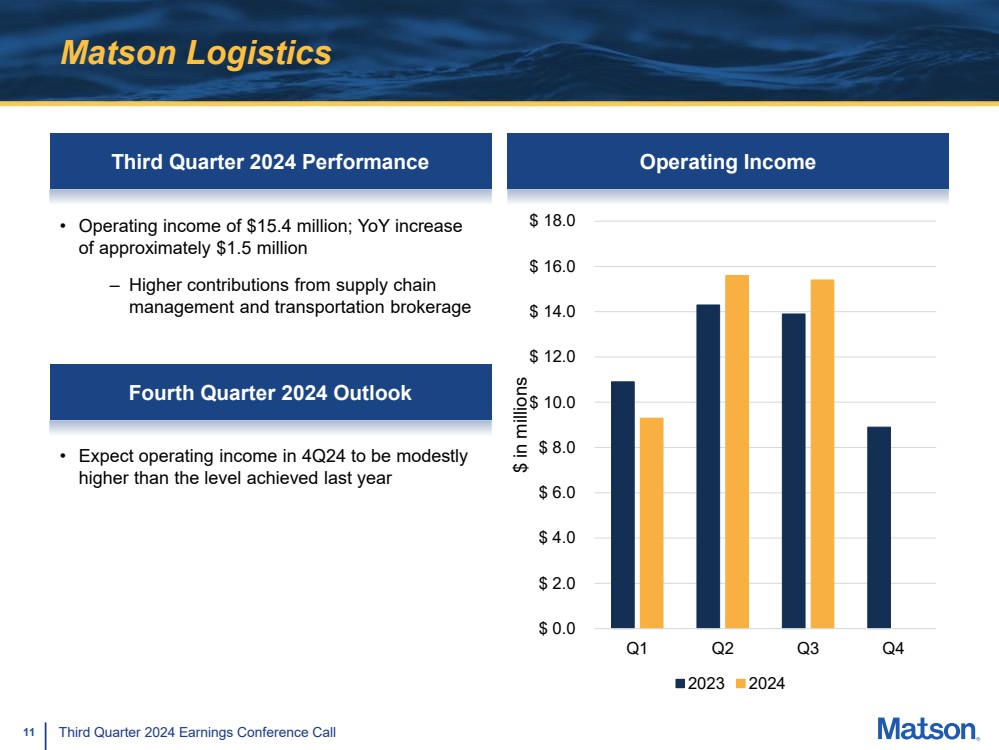
| 11 Third Quarter 2024 Earnings Conference Call Matson Logistics Third Quarter 2024 Performance Operating Income $ 0.0 $ 2.0 $ 4.0 $ 6.0 $ 8.0 $ 10.0 $ 12.0 $ 14.0 $ 16.0 $ 18.0 Q1 Q2 Q3 Q4 $ in millions 2023 2024 • Operating income of $15.4 million; YoY increase of approximately $1.5 million – Higher contributions from supply chain management and transportation brokerage Fourth Quarter 2024 Outlook • Expect operating income in 4Q24 to be modestly higher than the level achieved last year |
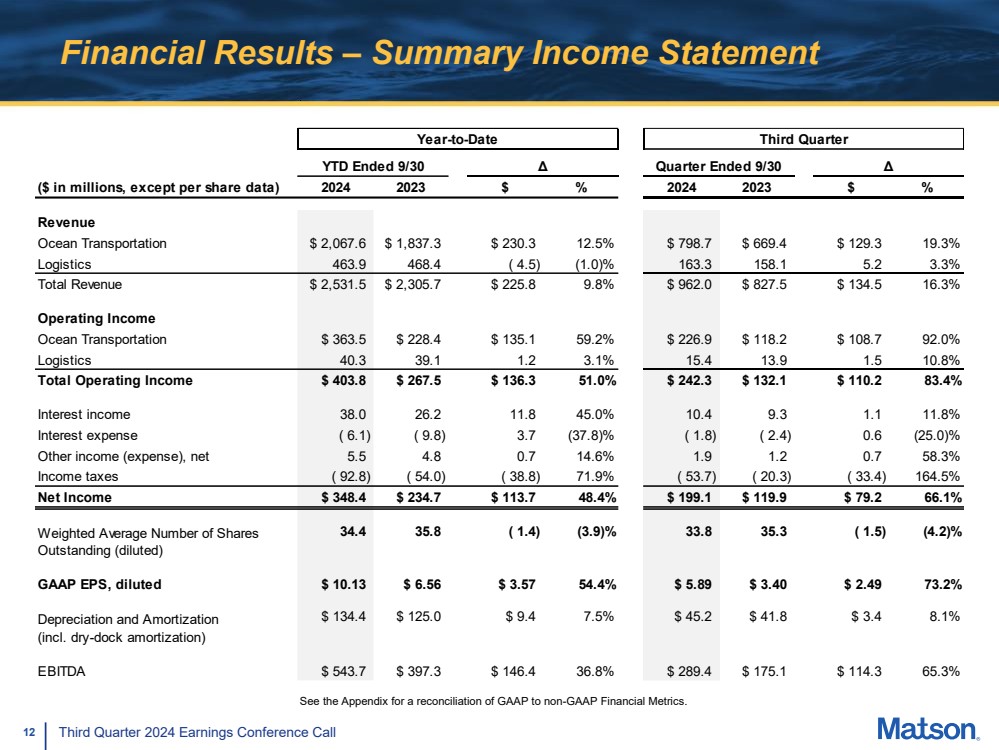
| 12 Third Quarter 2024 Earnings Conference Call Financial Results – Summary Income Statement See the Appendix for a reconciliation of GAAP to non-GAAP Financial Metrics. Year-to-Date Third Quarter YTD Ended 9/30 Δ Quarter Ended 9/30 Δ ($ in millions, except per share data) 2024 2023 $ % 2024 2023 $ % Revenue Ocean Transportation $ 2,067.6 $ 1,837.3 $ 230.3 12.5% $ 798.7 $ 669.4 $ 129.3 19.3% Logistics 463.9 468.4 ( 4.5) (1.0)% 163.3 158.1 5.2 3.3% Total Revenue $ 2,531.5 $ 2,305.7 $ 225.8 9.8% $ 962.0 $ 827.5 $ 134.5 16.3% Operating Income Ocean Transportation $ 363.5 $ 228.4 $ 135.1 59.2% $ 226.9 $ 118.2 $ 108.7 92.0% Logistics 40.3 39.1 1.2 3.1% 15.4 13.9 1.5 10.8% Total Operating Income $ 403.8 $ 267.5 $ 136.3 51.0% $ 242.3 $ 132.1 $ 110.2 83.4% Interest income 38.0 26.2 11.8 45.0% 10.4 9.3 1.1 11.8% Interest expense ( 6.1) ( 9.8) 3.7 (37.8)% ( 1.8) ( 2.4) 0.6 (25.0)% Other income (expense), net 5.5 4.8 0.7 14.6% 1.9 1.2 0.7 58.3% Income taxes ( 92.8) ( 54.0) ( 38.8) 71.9% ( 53.7) ( 20.3) ( 33.4) 164.5% Net Income $ 348.4 $ 234.7 $ 113.7 48.4% $ 199.1 $ 119.9 $ 79.2 66.1% 34.4 35.8 ( 1.4) (3.9)% 33.8 35.3 ( 1.5) (4.2)% GAAP EPS, diluted $ 10.13 $ 6.56 $ 3.57 54.4% $ 5.89 $ 3.40 $ 2.49 73.2% $ 134.4 $ 125.0 $ 9.4 7.5% $ 45.2 $ 41.8 $ 3.4 8.1% EBITDA $ 543.7 $ 397.3 $ 146.4 36.8% $ 289.4 $ 175.1 $ 114.3 65.3% Depreciation and Amortization (incl. dry-dock amortization) Weighted Average Number of Shares Outstanding (diluted) |
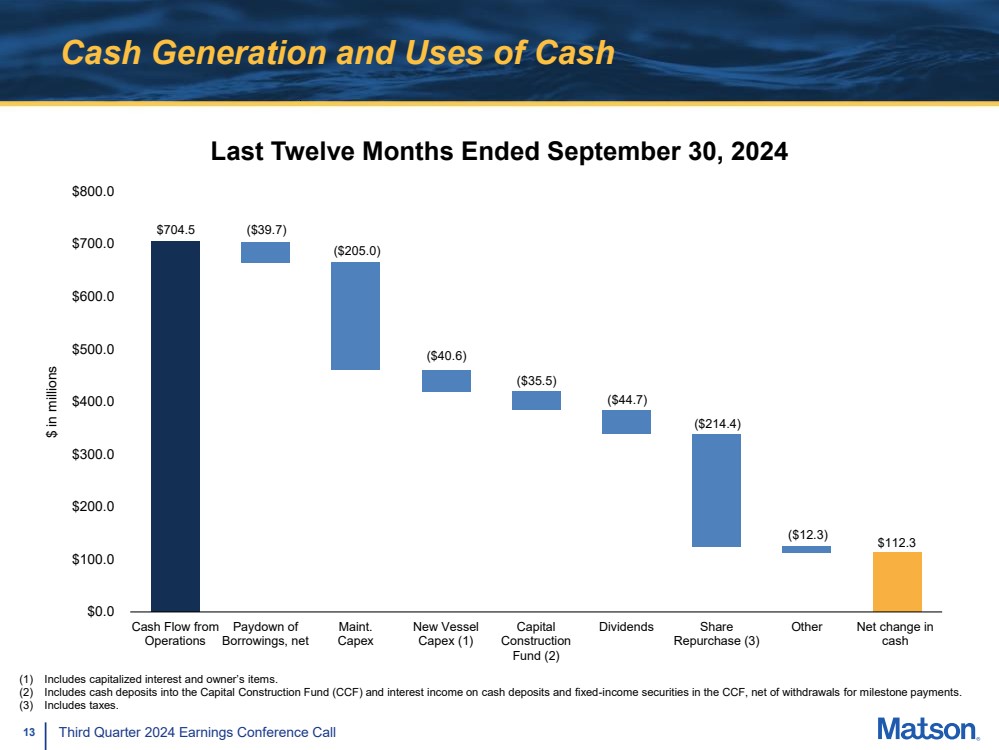
| 13 Third Quarter 2024 Earnings Conference Call Cash Generation and Uses of Cash $0.0 $100.0 $200.0 $300.0 $400.0 $500.0 $600.0 $700.0 $800.0 Cash Flow from Operations Paydown of Borrowings, net Maint. Capex New Vessel Capex (1) Capital Construction Fund (2) Dividends Share Repurchase (3) Other Net change in cash $ in millions Last Twelve Months Ended September 30, 2024 $704.5 ($39.7) ($205.0) ($35.5) ($40.6) ($44.7) ($214.4) ($12.3) $112.3 (1) Includes capitalized interest and owner’s items. (2) Includes cash deposits into the Capital Construction Fund (CCF) and interest income on cash deposits and fixed-income securities in the CCF, net of withdrawals for milestone payments. (3) Includes taxes. |
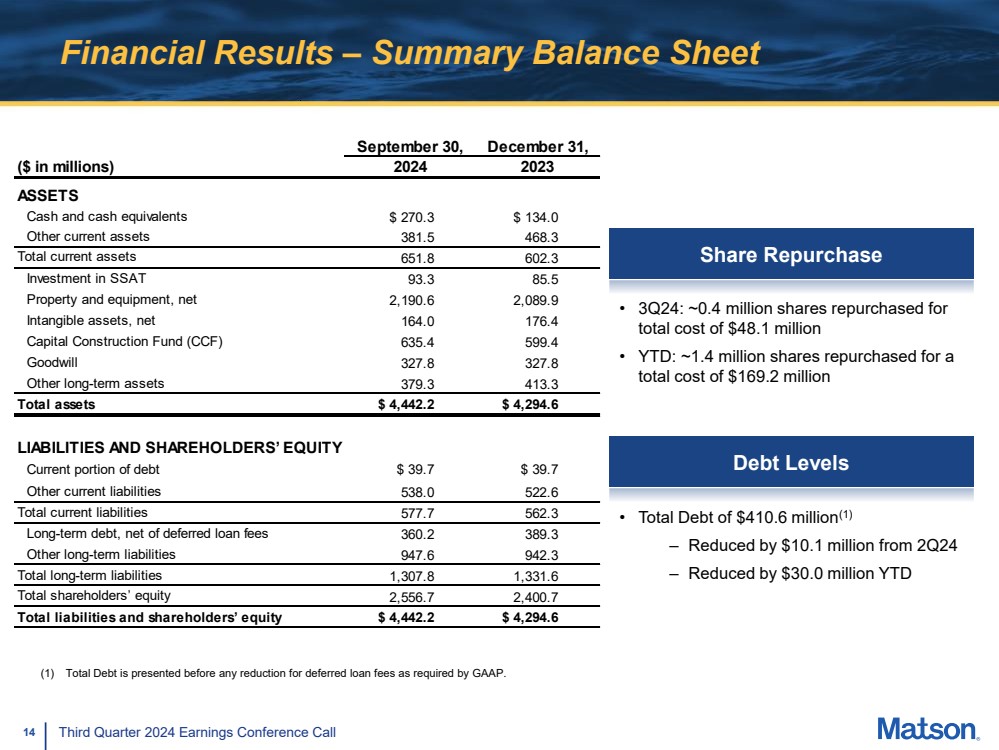
| 14 Third Quarter 2024 Earnings Conference Call Financial Results – Summary Balance Sheet • Total Debt of $410.6 million(1) – Reduced by $10.1 million from 2Q24 – Reduced by $30.0 million YTD (1) Total Debt is presented before any reduction for deferred loan fees as required by GAAP. Debt Levels Share Repurchase • 3Q24: ~0.4 million shares repurchased for total cost of $48.1 million • YTD: ~1.4 million shares repurchased for a total cost of $169.2 million ($ in millions) ASSETS Cash and cash equivalents $ 270.3 $ 134.0 Other current assets 381.5 468.3 Total current assets 651.8 602.3 Investment in SSAT 93.3 85.5 Property and equipment, net 2,190.6 2,089.9 Intangible assets, net 164.0 176.4 Capital Construction Fund (CCF) 635.4 599.4 Goodwill 327.8 327.8 Other long-term assets 379.3 413.3 Total assets $ 4,442.2 $ 4,294.6 LIABILITIES AND SHAREHOLDERS’ EQUITY Current portion of debt $ 39.7 $ 39.7 Other current liabilities 538.0 522.6 Total current liabilities 577.7 562.3 Long-term debt, net of deferred loan fees 360.2 389.3 Other long-term liabilities 947.6 942.3 Total long-term liabilities 1,307.8 1,331.6 Total shareholders’ equity 2,556.7 2,400.7 Total liabilities and shareholders’ equity $ 4,442.2 $ 4,294.6 September 30, December 31, 2024 2023 |
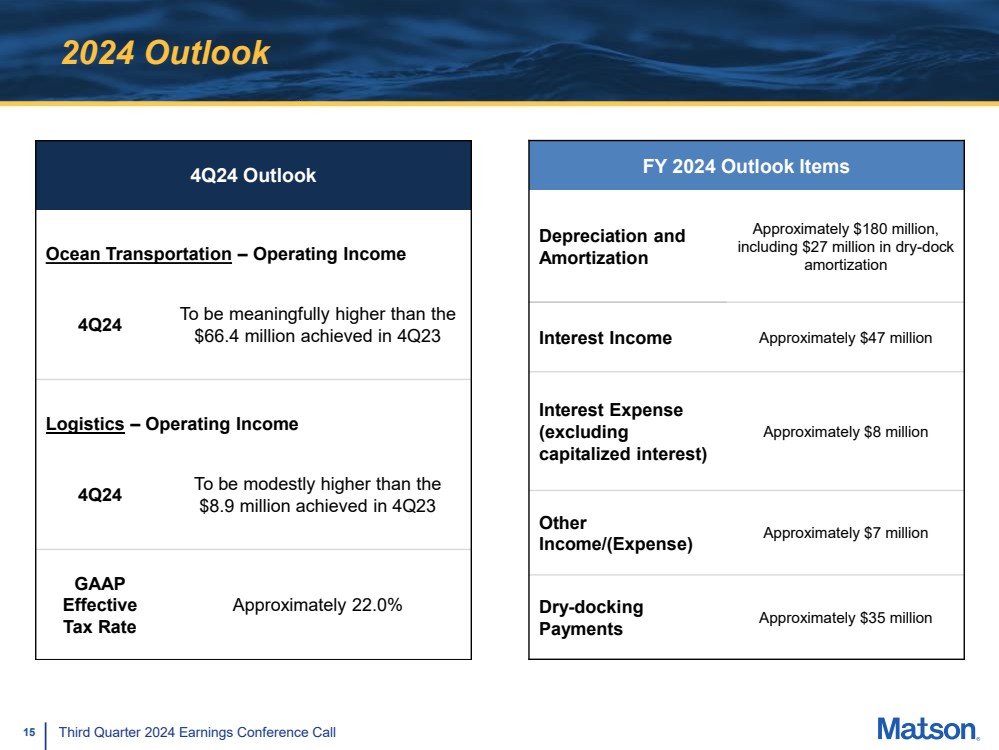
| 15 Third Quarter 2024 Earnings Conference Call 2024 Outlook 4Q24 Outlook Ocean Transportation – Operating Income 4Q24 To be meaningfully higher than the $66.4 million achieved in 4Q23 Logistics – Operating Income 4Q24 To be modestly higher than the $8.9 million achieved in 4Q23 GAAP Effective Tax Rate Approximately 22.0% FY 2024 Outlook Items Depreciation and Amortization Approximately $180 million, including $27 million in dry-dock amortization Interest Income Approximately $47 million Interest Expense (excluding capitalized interest) Approximately $8 million Other Income/(Expense) Approximately $7 million Dry-docking Payments Approximately $35 million |
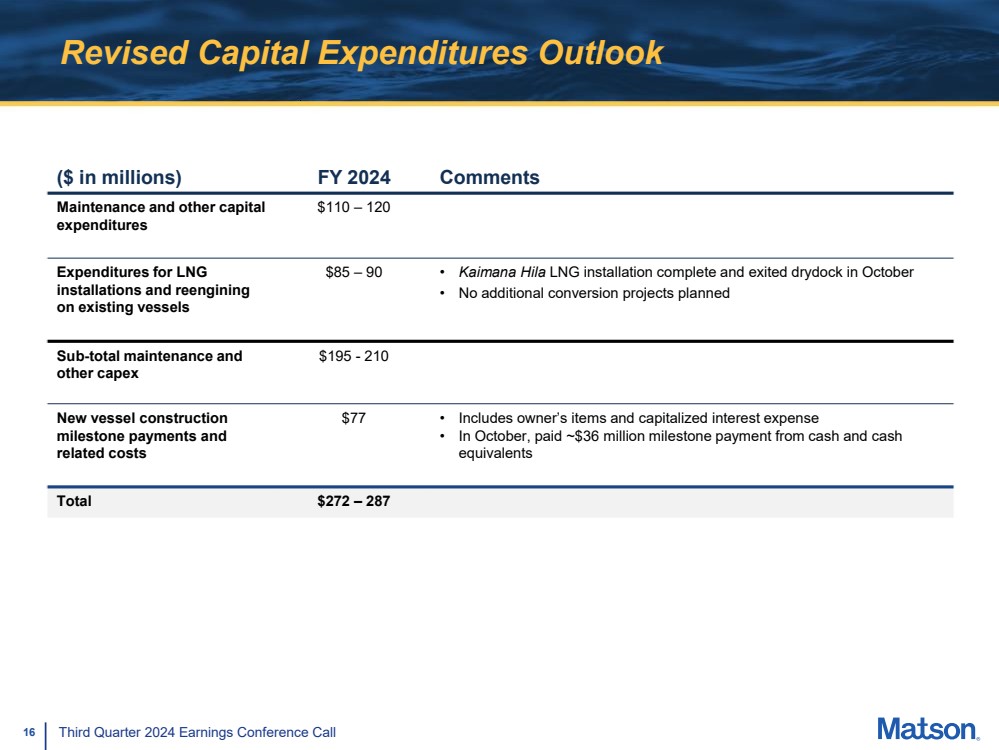
| 16 Third Quarter 2024 Earnings Conference Call Revised Capital Expenditures Outlook ($ in millions) FY 2024 Comments Maintenance and other capital expenditures $110 – 120 Expenditures for LNG installations and reengining on existing vessels $85 – 90 • Kaimana Hila LNG installation complete and exited drydock in October • No additional conversion projects planned Sub-total maintenance and other capex $195 - 210 New vessel construction milestone payments and related costs $77 • Includes owner’s items and capitalized interest expense • In October, paid ~$36 million milestone payment from cash and cash equivalents Total $272 – 287 |
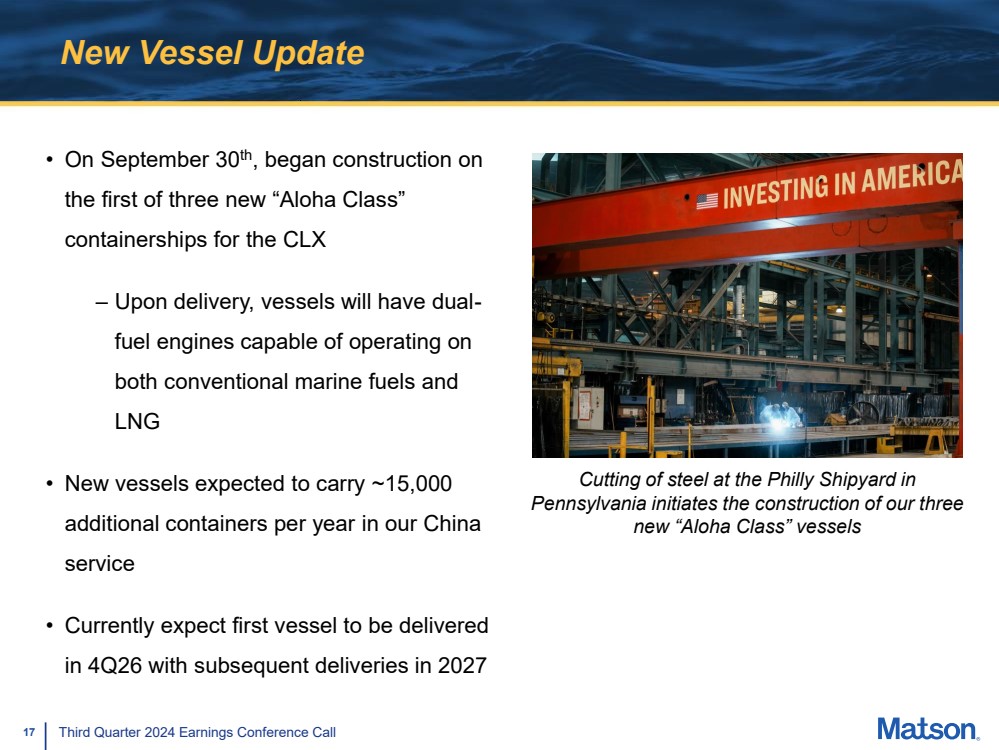
| 17 Third Quarter 2024 Earnings Conference Call New Vessel Update • On September 30th, began construction on the first of three new “Aloha Class” containerships for the CLX – Upon delivery, vessels will have dual-fuel engines capable of operating on both conventional marine fuels and LNG • New vessels expected to carry ~15,000 additional containers per year in our China service • Currently expect first vessel to be delivered in 4Q26 with subsequent deliveries in 2027 Cutting of steel at the Philly Shipyard in Pennsylvania initiates the construction of our three new “Aloha Class” vessels |
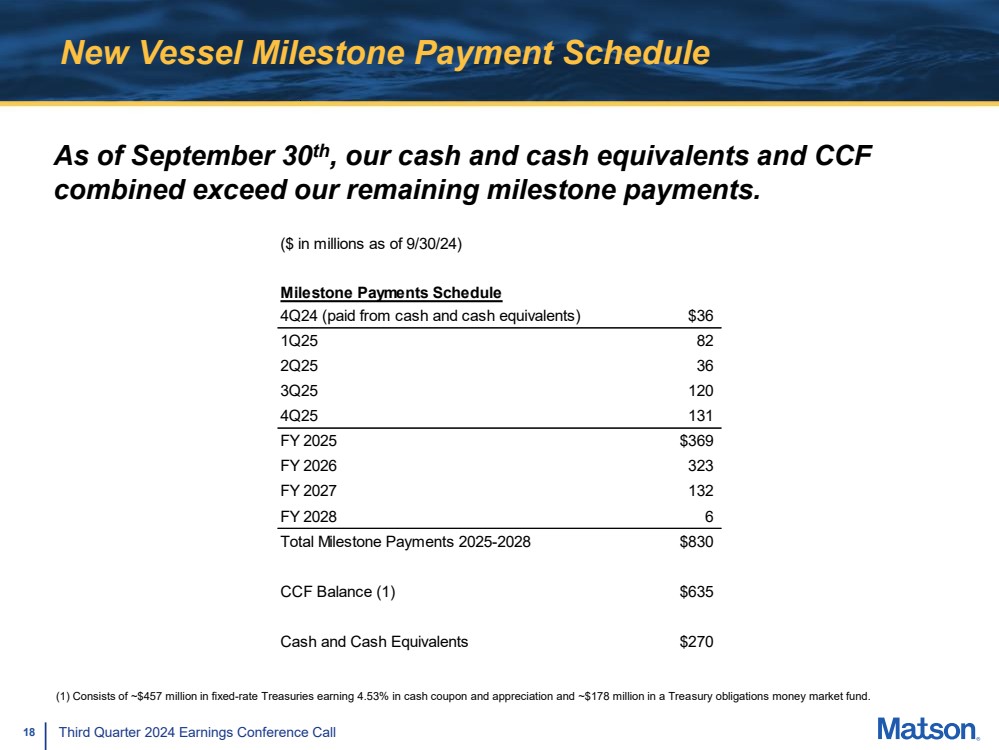
| 18 Third Quarter 2024 Earnings Conference Call New Vessel Milestone Payment Schedule As of September 30th, our cash and cash equivalents and CCF combined exceed our remaining milestone payments. (1) (1) Consists of ~$457 million in fixed-rate Treasuries earning 4.53% in cash coupon and appreciation and ~$178 million in a Treasury obligations money market fund. ($ in millions as of 9/30/24) Milestone Payments Schedule 4Q24 (paid from cash and cash equivalents) $36 1Q25 82 2Q25 36 3Q25 120 4Q25 131 FY 2025 $369 FY 2026 323 FY 2027 132 FY 2028 6 Total Milestone Payments 2025-2028 $830 CCF Balance (1) $635 Cash and Cash Equivalents $270 |
| 19 Third Quarter 2024 Earnings Conference Call Appendix |
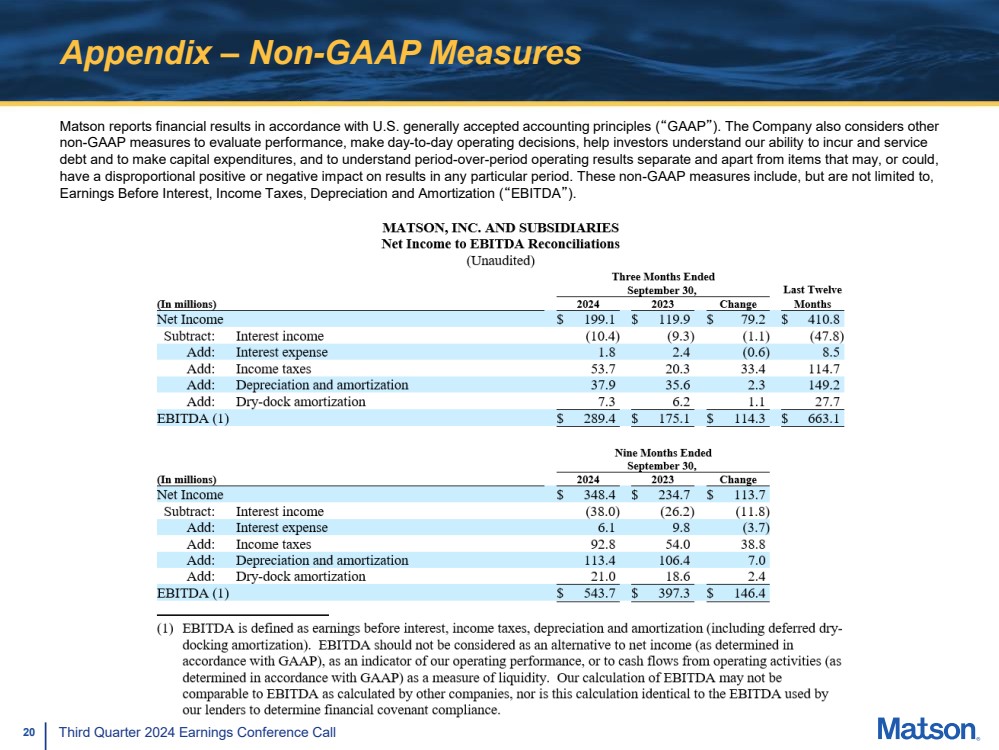
| 20 Third Quarter 2024 Earnings Conference Call Appendix – Non-GAAP Measures Matson reports financial results in accordance with U.S. generally accepted accounting principles (“GAAP”). The Company also considers other non-GAAP measures to evaluate performance, make day-to-day operating decisions, help investors understand our ability to incur and service debt and to make capital expenditures, and to understand period-over-period operating results separate and apart from items that may, or could, have a disproportional positive or negative impact on results in any particular period. These non-GAAP measures include, but are not limited to, Earnings Before Interest, Income Taxes, Depreciation and Amortization (“EBITDA”). |