Third quarter fiscal 2023 letter to shareholders
May 10, 2023
 1
1
Third quarter fiscal 2023 highlights
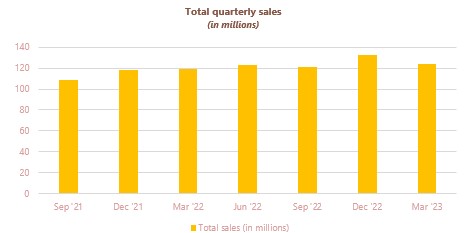
•Net sales totaled $124.2 million, a 4% increase compared to $119.4 million in Q3 fiscal 2022 and a 6% decrease over the fiscal second quarter 2023 from $132.7 million.
•Gross margin was up slightly to 23.1% and was virtually flat compared to the fiscal second quarter 2023 in the company’s direct store delivery (DSD) and direct sales (DS) divisions.
•Net loss was $11.4 million in the third quarter, an improvement from a loss of $13.6 million in the fiscal second quarter 2023.
•Adjusted EBITDA* loss was $800,000 for the third quarter, compared to an adjusted EBITDA loss of $3.1 million in fiscal second quarter 2023.
•Made significant progress in optimizing customer pricing structure and production operations.
•Launched SHOTT line of shelf-stable, real fruit syrup concentrates with DSD customers.
(*Adjusted EBITDA, a non-GAAP financial measure, is reconciled to its corresponding GAAP measure at the end of this letter.)
2
CEO discussion
Dear shareholders,
Our third quarter performance reflected sales and gross margin progress offset by near-term operating headwinds as we implemented critical long-term system enhancements and optimized our customer pricing structure. These investments are already beginning to deliver the intended operational improvements. This, combined with favorable pricing dynamics and healthy DSD customer activity, well positions us as we move toward fiscal 2024.
Total revenue for the fiscal third quarter was $124.2 million, a slight increase year-over-year, but down on a quarter-over-quarter basis. Gross margin increased 20 basis points to 23.1% compared with the second quarter of fiscal 2023. We are beginning to see increasing success selling through higher priced coffee as our recent price increases take hold across our broader customer base. We are also seeing an improving pipeline of new customer opportunities in our DSD business as various business sectors are better targeted by our selling team.
While our results did reflect growing pains from the aforementioned systems investments, they are also already showing their promise. We have begun receiving improved, actionable data from our new artificial intelligence (AI)-based pricing engine project, which was launched in the second quarter. This re-engineering will enable us to optimize pricing structures with our customers and, we believe, facilitate margin expansion. In fact, the first pricing flow through from this re-engineering is already in place as we implemented a coffee price increase using the data from this tool early in our fiscal fourth quarter.
Moreover, we have implemented strategic changes to our customer ordering process, including adopting a longer lead time ordering approach. This effort involves holding more finished goods to enable us to better plan for and meet fluctuating customer demand for key items, while also improving our cost structure due to manufacturing efficiency gains.
As expected, this shift has resulted in some short-term challenges, such as lowered DS sales, increased inventory and temporary stockouts for specific items. While we face these initial obstacles and catch up on certain orders, our focus remains on the long-term benefits these changes will bring. We are making steady progress and anticipate, as time goes on, we will achieve improved efficiency in production and inventory management, which we believe will support higher profit margins, increased cash generation and lower costs per pound.
Last, but certainly not least, we are excited to have successfully launched our incredibly promising new offering, SHOTT. An innovative line of premium shelf-stable, real fruit syrup concentrates, SHOTT provides an excellent upgrade option for our network of DSD customers. We are already seeing solid demand from our West Coast customers and are busily expanding its availability nationwide. This is just another example of how we are working to deliver innovations, which will help differentiate our customers’ offerings while leveraging our distribution capacity with additional penetration to new day parts and customer channels.
3
We remain committed to and are making significant progress toward our financial, operational and strategic goals, which include:
•Returning our business to gross margins in the high 20% range in the short term and into the low 30% range longer term.
•Improving IT applications and supply chain optimization and flexibility.
•Launching systems initiatives to optimize cash utilization and process improvements.
•Executing customer growth opportunities within our DSD business and catalytic growth initiatives.
•Selectively optimizing our asset portfolio, including our real estate footprint.
Importantly, in addition to these goals, the Strategy and Capital Allocation Committee of the Farmer Brothers Board of Directors is actively evaluating strategic and financial options to enhance our capital structure to ensure that we are in a strong financial position to create value for shareholders.
Altogether, while we have significant work to do to deliver sustainably stronger results, we are proud of the progress made on multiple fronts in the quarter and expect to end the fiscal 2023 year with a stronger operating and financial foundation.
4
Q3 FY23 financial results
Net sales in the fiscal third quarter of 2023 were $124.2 million, an increase of $4.8 million, or 4%, compared to the prior year period. This included an increase in DSD revenues, which saw just over a double-digit percentage increase, reflecting increased realization of recent pricing increases, which were up in the low double-digit percentage range. Additionally, we saw lower coffee costs and better pound volumes for DSD customers compared to last quarter, as well as several new customer wins and a lower customer churn rate.
We observed a mid-single-digit, year-over-year sales decrease in our DS unit, primarily due to the previously mentioned near-term disruptions as we shifted our production planning process from a “make-to-order” to “make-to-stock” focus, as discussed above. These disruptions caused a temporary reduction in fulfillment throughout the quarter while we built our DSD coffee inventories. We are now operating at full capacity and anticipate we will recover the majority of the paused sales before the end of this fiscal year as we catch up on those orders.
Our cost of sales increased 14% to $95.6 million for the three months ended March 31, 2023, compared to $83.8 million for the three months ended March 31, 2022. The increase in cost of sales is primarily due to higher priced products and an increase in the underlying commodity pricing compared to the prior year.
Gross profit was $28.7 million for the quarter. We observed a slight improvement in gross margin on a quarter-over-quarter basis for the second consecutive quarter, reaching 23.1% compared to 22.9% in the previous quarter. The fiscal third quarter marked the first recent three-month period, where the average cost per pound did not increase compared to the prior period, a trend we, as previously mentioned, expect to continue to benefit from.
In the three months ended March 31, 2023, operating expenses decreased $1.2 million to $38.3 million, or 30.8% of net sales, from $39.5 million, or 33.1% of net sales in the prior year period. This decrease was due to a $1.1 million decrease in general and administrative (G&A) expenses and a $1 million increase in net gain resulting from the sale of branch properties, which was partially offset by an $800,000 increase in selling expenses. The decrease in G&A expenses during the quarter was primarily due to a payroll tax refund. Farmer Brothers continues to manage inflationary pressures on costs, including wages, transportation and other core operating expenses.
Interest expense in the third quarter of fiscal 2023 increased to $4.2 million from $1.6 million in the third quarter of 2022. The increase was driven by significantly higher interest rates on our debt instruments compared to the prior period.
Other net income during the quarter was $2.5 million, which was approximately $900,000 more than the prior year period and an improvement from an expense of $3.3 million in the preceding quarter. The positive quarter-over-quarter impact was primarily a result of lower hedging losses as we continue to manage our hedging program to mitigate risk.
Overall, the company’s net loss was $11.4 million in the third quarter, which was a more than $2.2 million improvement compared to a loss of $13.6 million in the previous quarter.
Farmer Brothers reported an adjusted EBITDA loss of $800,000 in the third quarter of fiscal 2023, a significant improvement over the previous quarter’s $3.1 million loss. This compares to adjusted EBITDA earnings of $5 million in the prior year period.
Adjusted EBITDA margin was (0.6)% in the third quarter of fiscal 2023, improving 170 basis points on a quarter-over-quarter basis and compared to an adjusted EBITDA margin of 4.2% in the prior year period. Adjusted EBITDA and adjusted EBITDA margin, which are non-GAAP
5
financial measures, are reconciled to their corresponding GAAP measures at the end of this letter in the reconciliation tables beginning on page 15. Our unrestricted cash balance decreased by $2.5 million, from $9.8 million as of June 30, 2022, to $7.3 million as of March 31, 2023. As of March 31, 2023, Farmer Brothers had $16.4 million available on our revolver credit facility. The outstanding principal on our revolver and term loan credit facilities was $112.4 million, an increase of $3.8 million from June 30, 2022. As of and through March 31, 2023, we were in compliance with all of the covenants under the credit facilities. Our continued compliance with the debt covenants depends on many factors. If we are unable to cure, obtain a waiver from the lenders or refinance the credit facilities, we anticipate not being able to meet the current contractual covenant beginning June 30, 2023. We consider it probable management’s plans, including the options described above, will be able to alleviate the potential noncompliance with the debt covenant before June 30, 2023, in compliance with all of the covenants under the credit facilities.
6
Strategic and operations updates
We are pleased to report continued progress with our catalytic growth initiatives, particularly our REVIVE equipment service and restoration business and our newly launched SHOTT shelf-stable, real fruit syrup concentrate line.
We have seen a strong, early response to the launch of our SHOTT partnership, which is now selling across many outlets and is fully rolled out on the West Coast. Initial sales have been encouraging, and we are working with our partner on training and sales efforts and customer education about this innovative new product as we expand eastward and focus on growing the demand across our customer base.
SHOTT’s real fruit, shelf-stable makeup makes it a true market differentiator and is yet another example of the premium, high-quality products we are committed to providing our customers with to help drive demand among their clientele.
While still in the early growth stage, our REVIVE offering saw strong results in the third quarter, securing several national accounts. These accounts will come online in the fourth quarter of 2023 and the first and second quarters of 2024 and will help drive additional revenue for the company. We anticipate REVIVE will continue to grow rapidly and are highly focused on staffing and training to ensure we have a pipeline of qualified technicians and representatives to serve this growing customer base.
Both of these initiatives, as well as other early-stage efforts, meet what we see as immediate industry needs for innovation and product diversity. They also offer profitable growth opportunities leveraging our strong distribution network and growing base of DSD customer relationships.
In addition during the first part of this calendar year, we have been focused on realigning our operating departments and leadership with our business priorities. These moves will create agility and swifter decision-making at the corporate level and streamline our sales and customer-facing leadership across regions to drive consistent alignment with corporate activities, leading to better operational performance in the field as we grow our DSD network.
7
8
Environmental, social and governmental initiatives
Farmer Brothers recently published its 2022 sustainability report. Focused on our environmental and community efforts, the report underlined our industry-leading commitment to sustainable practices and responsible sourcing as we continue to provide high-quality, flavor-rich coffee, tea and culinary products.
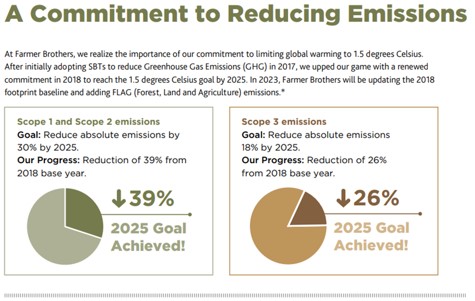
Farmer Brothers is the first coffee company to align our carbon-reduction targets to the Science Based Targets Initiative (SBTi), as such we have set several aggressive 2025 sustainability goals and are pleased to say we’ve made tremendous strides - achieving our emission reduction target three years ahead of schedule.
Other report highlights included:
•More than 30 million pounds of fully traceable green coffee produced in 2022.
•Early achievement of our 2025 greenhouse gas (GHGs) emission reduction goal of 30% in Scope 1 and 2 and 18% in Scope 3 emissions, respectively. We achieved a 39% reduction in Scope 1 and 2 emissions and a 26% decrease in Scope 3 emissions in 2022.
•A 47% reduction in the pounds of waste sent to the landfill since 2018, which includes a 90% diversion of waste at our roasting facilities, a 79% decrease in corporate waste and the upcycling of more than 600,000 pounds of burlap in the last two years.
•The refurbishment of more than 8,000 pieces of beverage equipment in 2022 saved more than half a million pounds of waste from the landfill.
Farmer Brothers was also one of only 300 companies, out of nearly 15,000 firms worldwide, to have been included on the Carbon Disclosure Projects (CDP) 2022 A-List and was also honored for the fourth consecutive year by Texan by Nature as one of 20 recipients of their TxN20 award, which is given based on environmental protection and sustainability efforts. In addition, we were also welcomed to the U.S. Environmental Protection Agency’s (EPA) Green Power Partnership and became a member of the We Mean Business Coalition, a global nonprofit coalition working with the world’s most influential businesses to take action on climate change.
[Note: Our sustainability report, including any documents or sections thereof, shall not be deemed incorporated by reference into this letter or incorporated by reference into any of our other filings with the Securities and Exchange Commission.]
9
10
Outlook and closing
The last several quarters have been demanding for Farmer Brothers as we have been diligently focused on executing the final stages of our three-year turnaround and optimization program, managing the cost and business pressures of a challenging post-pandemic macro environment, and navigating recent coffee pricing volatility. We believe, as we approach the end of our fiscal 2023 year, we are on the right side of the pricing environment, and this, along with the efficiency enhancements we are making in production planning, price optimization and organizational structure, should position us well to meet our margin improvement goals in the near future.
We believe our progress along with the capital structure focus of our board committee on strategic alternatives and capital allocation, have us well positioned as we move toward fiscal 2024.
11
Investor conference call
The company will host an audio-only investor conference call today, May 10, 2023, at 8:30 a.m. Eastern to review the company’s financial results for the third fiscal quarter ended March 31, 2023.
Interested parties may access the webcast via the Investor Relations section of the Farmer Brothers’ website. Participants who pre-register will receive an email with dial-in information, which will allow them to bypass the live operator. A replay of the webcast will be available shortly after and for at least 30 days on the Investor Relations section of the Farmer Brothers’ website.
A copy of the company’s 10-Q and corresponding shareholder letter will also be available on the Investor section of the company’s website, as well as the Securities and Exchange Commission’s website at sec.gov.
About Farmer Brothers
Founded in 1912, Farmer Brothers is a national coffee roaster, wholesaler, equipment servicer and distributor of coffee, tea and culinary products. The company’s product lines, include organic, Direct Trade and sustainably produced coffee. With a robust line of coffee, hot and iced teas, cappuccino mixes, spices and baking/biscuit mixes, Farmer Brothers delivers extensive beverage planning services and culinary products to its U.S.-based customers. It serves a wide variety of customers, from small independent restaurants and foodservice operators to large institutional buyers, such as restaurant, department and convenience store chains, hotels, casinos, healthcare facilities and gourmet coffee houses, as well as grocery chains with private brand coffee and consumer branded coffee and tea products, and foodservice distributors.
Headquartered in Northlake, Texas, Farmer Brothers generated net sales of $469.2 million in fiscal 2022. The company’s primary brands include Farmer Brothers, Artisan Collection by Farmer Brothers, Superior, Metropolitan, China Mist and Boyd's.
12
Forward-looking statements
This letter and other documents we file with the Securities and Exchange Commission (“SEC”) contain forward-looking statements that are based on current expectations, estimates, forecasts and projections about us, our future performance, our financial condition, our products, our business strategy, our beliefs and our management’s assumptions. In addition, we, or others on our behalf, may make forward-looking statements in press releases or written statements, or in our communications and discussions with investors and analysts in the normal course of business through meetings, webcasts, phone calls and conference calls. These forward-looking statements can be identified by the use of words like “anticipates,” “estimates,” “projects,” “expects,” “plans,” “believes,” “intends,” “will,” “could,” “may,” “assumes” and other words of similar meaning. These statements are based on management’s beliefs, assumptions, estimates and observations of future events based on information available to our management at the time the statements are made and include any statements that do not relate to any historical or current fact. These statements are not guarantees of future performance and they involve certain risks, uncertainties and assumptions that are difficult to predict. Actual outcomes and results may differ materially from what is expressed, implied or forecast by our forward-looking statements due in part to the risks, uncertainties and assumptions set forth in Part I, Item 1A of our Annual Report on Form 10-K for the fiscal year ended June 30, 2022 filed with the SEC on September 2, 2022 (the “2022 Form 10-K”) as amended by Amendment No. 1 to the 2022 Form 10-K, filed with the SEC on October 27, 2022, as well as other factors described from time to time in our filings with the SEC.
Factors that could cause actual results to differ materially from those in forward-looking statements include, but are not limited to, severe weather, levels of consumer confidence in national and local economic business conditions, the impact of labor shortages, the increase of costs due to inflation, an economic downturn caused by any pandemic, epidemic or other disease outbreak, comparable or similar to COVID-19, the success of our turnaround strategy, the impact of capital improvement projects, the adequacy and availability of capital resources to fund our existing and planned business operations and our capital expenditure requirements, the relative effectiveness of compensation-based employee incentives in causing improvements in our performance, the capacity to meet the demands of our large national account customers, the extent of execution of plans for the growth of our business and achievement of financial metrics related to those plans, our success in retaining and/or attracting qualified employees, our success in adapting to technology and new commerce channels, the effect of the capital markets as well as other external factors on stockholder value, fluctuations in availability and cost of green coffee, competition, organizational changes, the effectiveness of our hedging strategies in reducing price and interest rate risk, changes in consumer preferences, our ability to provide sustainability in ways that do not materially impair profitability, changes in the strength of the economy, including any effects from inflation, business conditions in the coffee industry and food industry in general, our continued success in attracting new customers, variances from budgeted sales mix and growth rates, weather and special or unusual events, as well as other risks, uncertainties and assumptions described from time to time in our filings with the SEC.
Given these risks and uncertainties, you should not rely on forward-looking statements as a prediction of actual results. Any or all of the forward-looking statements contained in this letter and any other public statement made by us, including by our management, may turn out to be incorrect. We are including this cautionary note to make applicable and take advantage of the safe harbor provisions of the Private Securities Litigation Reform Act of 1995 for forward-looking
13
statements. We expressly disclaim any obligation to update or revise any forward-looking statements, whether as a result of new information, future events, changes in assumptions or otherwise, except as required under federal securities laws and the rules and regulations of the SEC.
14
FARMER BROS. CO.
CONSOLIDATED STATEMENTS OF OPERATIONS (UNAUDITED)
(In thousands, except share and per share data)
| | | | | | | | | | | | | | | | | | | | | | | | | | |
| | | Three Months Ended March 31, | | Nine Months Ended March 31, |
| | | 2023 | | 2022 | | 2023 | | 2022 |
| Net sales | | $ | 124,234 | | | $ | 119,398 | | | $ | 378,306 | | | $ | 346,205 | |
| Cost of goods sold | | 95,563 | | | 83,838 | | | 292,648 | | | 244,197 | |
| Gross profit | | 28,671 | | | 35,560 | | | 85,658 | | | 102,008 | |
| Selling expenses | | 28,325 | | | 27,477 | | | 83,136 | | | 81,505 | |
| General and administrative expenses | | 10,539 | | | 11,595 | | | 30,858 | | | 34,796 | |
| Net (gains) losses from sale of assets | | (557) | | | 426 | | | (7,685) | | | (4,003) | |
| | | | | | | | |
| Operating expenses | | 38,307 | | | 39,498 | | | 106,309 | | | 112,298 | |
| Loss from operations | | (9,636) | | | (3,938) | | | (20,651) | | | (10,290) | |
| Other (expense) income: | | | | | | | | |
| Interest expense | | (4,210) | | | (1,591) | | | (12,431) | | | (7,106) | |
| Other, net | | 2,453 | | | 1,579 | | | 791 | | | 5,790 | |
| Total other expense | | (1,757) | | | (12) | | | (11,640) | | | (1,316) | |
| Loss before taxes | | (11,393) | | | (3,950) | | | (32,291) | | | (11,606) | |
| Income tax expense | | 30 | | | 90 | | | 113 | | | 278 | |
| Net loss | | $ | (11,423) | | | $ | (4,040) | | | $ | (32,404) | | | $ | (11,884) | |
| Less: Cumulative preferred dividends, undeclared and unpaid | | — | | | 149 | | | — | | | 444 | |
| Net loss available to common stock holders | | $ | (11,423) | | | $ | (4,189) | | | $ | (32,404) | | | $ | (12,328) | |
| Net loss available to common stockholders per common share—basic | | $ | (0.57) | | | $ | (0.23) | | | $ | (1.66) | | | $ | (0.68) | |
| Net loss available to common stockholders per common share—diluted | | $ | (0.57) | | | $ | (0.23) | | | $ | (1.66) | | | $ | (0.68) | |
| Weighted average common shares outstanding—basic | | 19,923,577 | | | 18,289,815 | | | 19,467,022 | | | 18,118,469 | |
| Weighted average common shares outstanding—diluted | | 19,923,577 | | | 18,289,815 | | | 19,467,022 | | | 18,118,469 | |
15
FARMER BROS. CO.
CONSOLIDATED BALANCE SHEETS (UNAUDITED)
(In thousands, except share and per share data)
| | | | | | | | | | | | | |
| March 31 | | June 30, | | |
| 2023 | | 2022 | | |
| | | | | |
| ASSETS | | | | | |
| Current assets: | | | | | |
| Cash and cash equivalents | $ | 7,256 | | | $ | 9,819 | | | |
| Restricted cash | 175 | | | 175 | | | |
| | | | | |
| Accounts and notes receivable, net of allowance for credit losses of $439 and $195, respectively | 54,098 | | | 46,935 | | | |
| Inventories | 82,255 | | | 99,618 | | | |
| | | | | |
| | | | | |
| Short-term derivative assets | 1,766 | | | 3,022 | | | |
| Prepaid expenses | 4,757 | | | 4,491 | | | |
| Assets held for sale | — | | | 1,032 | | | |
| Total current assets | 150,307 | | | 165,092 | | | |
| Property, plant and equipment, net | 131,399 | | | 138,150 | | | |
| | | | | |
| Intangible assets, net | 14,086 | | | 15,863 | | | |
| Right-of-use operating lease assets | 26,202 | | | 27,957 | | | |
| | | | | |
| | | | | |
| Other assets | 3,053 | | | 3,009 | | | |
| Total assets | $ | 325,047 | | | $ | 350,071 | | | |
| LIABILITIES AND STOCKHOLDERS’ EQUITY | | | | | |
| Current liabilities: | | | | | |
| Accounts payable | 65,145 | | | 52,877 | | | |
| Accrued payroll expenses | 8,329 | | | 14,761 | | | |
| | | | | |
| Right-of-use operating lease liabilities - current | 8,040 | | | 7,721 | | | |
| Term loan - current | 3,133 | | | 3,800 | | | |
| Short-term derivative liability | 1,560 | | | 2,349 | | | |
| | | | | |
| Other current liabilities | 4,525 | | | 6,095 | | | |
| Total current liabilities | 90,732 | | | 87,603 | | | |
| Long-term borrowings under revolving credit facility | 67,000 | | | 63,000 | | | |
| Term loan - noncurrent | 41,412 | | | 40,123 | | | |
| Accrued pension liabilities | 28,476 | | | 28,540 | | | |
| Accrued postretirement benefits | 816 | | | 787 | | | |
| Accrued workers’ compensation liabilities | 2,704 | | | 3,169 | | | |
| Right-of-use operating lease liabilities | 18,750 | | | 20,762 | | | |
| Other long-term liabilities | 1,314 | | | 1,339 | | | |
| | | | | |
| Total liabilities | $ | 251,204 | | | $ | 245,323 | | | |
| Commitments and contingencies | | | | | |
| Stockholders’ equity: | | | | | |
| Preferred stock, $1.00 par value, 500,000 shares authorized; Series A Convertible Participating Cumulative Perpetual Preferred Stock, 21,000 shares authorized; no shares outstanding as of March 31, 2023 and 14,700 shares issued and outstanding as of June 30, 2022; liquidation preference of $17,346 as of June 30, 2022 | — | | | 15 | | | |
| Common stock, $1.00 par value, 50,000,000 shares authorized; 19,953,781 and 18,464,966 shares issued and outstanding as of March 31, 2023 and June 30, 2022, respectively | 19,955 | | | 18,466 | | | |
| Additional paid-in capital | 75,395 | | | 71,997 | | | |
| Retained earnings | 20,296 | | | 52,701 | | | |
| | | | | |
| Less accumulated other comprehensive loss | (41,803) | | | (38,431) | | | |
| Total stockholders’ equity | $ | 73,843 | | | $ | 104,748 | | | |
| Total liabilities and stockholders’ equity | $ | 325,047 | | | $ | 350,071 | | | |
16
| | | | | | | | | | | | | |
| FARMER BROS. CO. |
| CONSOLIDATED STATEMENTS OF CASH FLOWS (UNAUDITED) |
| (In thousands) |
| | Nine Months Ended March 31, | | |
| 2023 | | 2022 | | |
| Cash flows from operating activities: | | | | | |
| Net loss | $ | (32,404) | | | $ | (11,884) | | | |
| Adjustments to reconcile net loss to net cash (used in) provided by operating activities | | | | | |
| Depreciation and amortization | 16,725 | | | 18,119 | | | |
| | | | | |
| Gain on settlement related to Boyd's acquisition | (1,917) | | | — | | | |
| | | | | |
| Net gains from sale of assets | (7,685) | | | (4,003) | | | |
| Net losses (gains) on derivative instruments | 1,189 | | | (12,798) | | | |
| 401(k), ESOP and share-based compensation expense | 6,237 | | | 4,526 | | | |
| Provision for credit losses | 535 | | | 437 | | | |
| Change in operating assets and liabilities: | | | | | |
| Accounts receivable | (7,698) | | | (7,559) | | | |
| Inventories | 17,363 | | | (25,610) | | | |
| Derivative (liabilities) assets, net | (3,751) | | | 13,223 | | | |
| Other assets | (510) | | | 1,989 | | | |
| Accounts payable | 12,101 | | | 16,921 | | | |
| Accrued expenses and other | (6,468) | | | (2,988) | | | |
| Net cash used in operating activities | (6,283) | | | (9,627) | | | |
| Cash flows from investing activities: | | | | | |
| Purchases of property, plant and equipment | (11,113) | | | (8,896) | | | |
| Proceeds from sales of property, plant and equipment | 11,507 | | | 9,062 | | | |
| Net cash provided by investing activities | 394 | | | 166 | | | |
| Cash flows from financing activities: | | | | | |
| Proceeds from Credit Facilities | 54,000 | | | 15,000 | | | |
| Repayments on Credit Facilities | (50,167) | | | (4,950) | | | |
| Payments of finance lease obligations | (144) | | | (144) | | | |
| Payment of financing costs | (363) | | | (330) | | | |
| Net cash provided by financing activities | 3,326 | | | 9,576 | | | |
| Net (decrease) increase in cash and cash equivalents and restricted cash | (2,563) | | | 115 | | | |
| Cash and cash equivalents and restricted cash at beginning of period | 9,994 | | | 10,438 | | | |
| Cash and cash equivalents and restricted cash at end of period | $ | 7,431 | | | $ | 10,553 | | | |
17
Non-GAAP financial measures
In addition to net loss determined in accordance with U.S. generally accepted accounting principles (“GAAP”), we use the following non-GAAP financial measures in assessing our operating performance:
“EBITDA” is defined as net loss excluding the impact of:
•income tax expense;
•interest expense; and
•depreciation and amortization expense.
“EBITDA Margin” is defined as EBITDA expressed as a percentage of net sales.
“Adjusted EBITDA” is defined as net loss excluding the impact of:
•income tax expense;
•interest expense;
•depreciation and amortization expense;
•401(k), ESOP and share-based compensation expense;
•gain on settlement with Boyd's sellers;
•net loss (gains) from sales of assets; and
•severance costs.
“Adjusted EBITDA Margin” is defined as Adjusted EBITDA expressed as a percentage of net sales.
For purposes of calculating EBITDA and EBITDA Margin and Adjusted EBITDA and Adjusted EBITDA Margin, we have not adjusted for the impact of interest expense on our pension and postretirement benefit plans.
We believe these non-GAAP financial measures provide a useful measure of the Company’s operating results, a meaningful comparison with historical results and with the results of other companies, and insight into the Company’s ongoing operating performance. Further, management utilizes these measures, in addition to GAAP measures, when evaluating and comparing the Company’s operating performance against internal financial forecasts and budgets.
We believe that EBITDA facilitates operating performance comparisons from period to period by isolating the effects of certain items that vary from period to period without any correlation to core operating performance or that vary widely among similar companies. These potential differences may be caused by variations in capital structures (affecting interest expense), tax positions (such as the impact on periods or companies of changes in effective tax rates or net operating losses) and the age and book depreciation of facilities and equipment (affecting relative depreciation expense). We also present EBITDA and EBITDA Margin because (i) we believe that these measures are frequently used by securities analysts, investors and other interested parties to evaluate companies in our industry, (ii) we believe that investors will find these measures useful in assessing our ability to service or incur indebtedness, and (iii) we use these measures internally as benchmarks to compare our performance to that of our competitors.
EBITDA, EBITDA Margin, Adjusted EBITDA and Adjusted EBITDA Margin, as defined by us, may not be comparable to similarly titled measures reported by other companies. We do not intend for non-GAAP financial measures to be considered in isolation or as a substitute for other measures prepared in accordance with GAAP.
Set forth below is a reconciliation of reported net loss to EBITDA (unaudited):
| | | | | | | | | | | | | | | | | | | | | | | | | | |
| | Three Months Ended March 31, | | Nine Months Ended March 31, |
| (In thousands) | | 2023 | | 2022 | | 2023 | | 2022 |
| Net loss, as reported | | $ | (11,423) | | | $ | (4,040) | | | $ | (32,404) | | | $ | (11,884) | |
| Income tax expense | | 30 | | | 90 | | | 113 | | | 278 | |
| Interest expense (1) | | 3,044 | | | 736 | | | 8,935 | | | 4,542 | |
| Depreciation and amortization expense | | 5,409 | | | 5,791 | | | 16,725 | | | 18,119 | |
| EBITDA | | $ | (2,940) | | | $ | 2,577 | | | $ | (6,631) | | | $ | 11,055 | |
| EBITDA Margin | | (2.4) | % | | 2.2 | % | | (1.8) | % | | 3.2 | % |
____________
(1)Excludes interest expense related to pension plans and postretirement benefit plan.
18
Set forth below is a reconciliation of reported net loss to Adjusted EBITDA (unaudited):
| | | | | | | | | | | | | | | | | | | | | | | | | | |
| | Three Months Ended March 31, | | Nine Months Ended March 31, |
| (In thousands) | | 2023 | | 2022 | | 2023 | | 2022 |
| Net loss, as reported | | $ | (11,423) | | | $ | (4,040) | | | $ | (32,404) | | | $ | (11,884) | |
| Income tax expense | | 30 | | | 90 | | | 113 | | | 278 | |
| Interest expense (1) | | 3,044 | | | 736 | | | 8,935 | | | 4,542 | |
| Depreciation and amortization expense | | 5,409 | | | 5,791 | | | 16,725 | | | 18,119 | |
| 401(k), ESOP and share-based compensation expense | | 1,572 | | | 2,018 | | | 6,071 | | | 5,015 | |
| Gain on settlement with Boyd's sellers (2) | | — | | | — | | | (1,917) | | | — | |
| Net (gains) losses from sale of assets | | (557) | | | 426 | | | (7,685) | | | (4,003) | |
| Severance costs | | 1,149 | | | — | | | 1,441 | | | 942 | |
| | | | | | | | |
| | | | | | | | |
| | | | | | | | |
| Adjusted EBITDA | | $ | (776) | | | $ | 5,021 | | | $ | (8,721) | | | $ | 13,009 | |
| Adjusted EBITDA Margin | | (0.6) | % | | 4.2 | % | | (2.3) | % | | 3.8 | % |
________
(1) Excludes interest expense related to pension plans and postretirement benefit plans.
(2) Result of the settlement related to the acquisition of Boyd Coffee Company which included the cancellation of shares of Series A Preferred Stock and settlement of liabilities.
19