First quarter fiscal 2024 letter to shareholders
November 9, 2023
 1
1
Dear shareholders,
We find ourselves at a pivotal moment, characterized by the strategic divestiture of our direct ship business and a model refocused on what we have always done best – direct store delivery (DSD). While there is still work to be done, we are confident we are well positioned to deliver improving operational and financial results in the coming quarters as we focus on generating long-term shareholder value.
The first quarter of fiscal 2024 was a step in the right direction, as revenue was up slightly year over year, gross margins improved and adjusted EBITDA approached breakeven. Results were, as expected, impacted by costs associated with our direct ship sale and internal reorganization efforts, as well as slightly sluggish coffee volumes. We however, remain optimistic we will continue to see improvement in our revenue, gross margins and operating costs.
In terms of costs, we recently completed a targeted reduction of our operating expenses, which appropriately sizes our organization. We are also making progress on centralizing our roasting and production activities to our Portland, Oregon facility, which once completed will provide significant efficiency and cost savings benefits.
In addition, our average cost per pound of coffee in the quarter decreased approximately 12% compared to the first quarter of 2023 and 1.6% versus the prior quarter. We are continuing to bring in new supply at a meaningfully lower price. We are also working to evaluate and reduce brand and SKU redundancies across our coffee lines to simplify our customer-facing lineup and further streamline production and sales operations. We believe these efforts will help drive down our cost of goods sold (COGs) throughout the coming quarters.
2
First quarter fiscal 2024 financial results
As a reminder, results for the fiscal 2024 first quarter are reported on a continuing operations basis, reflecting the performance of our DSD business in the respective periods. Please refer to our Form 10-Q, which was filed with the Securities and Exchange Commission (SEC) today, Nov. 9, 2023, for further information regarding the respective performance of our discontinued and continuing operations.
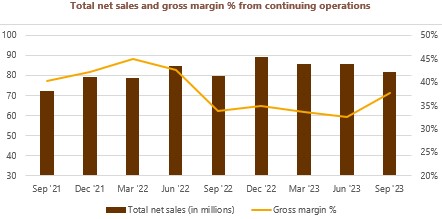
First quarter fiscal 2024 net sales were $81.9 million, which increased slightly on a year-over-year basis compared to $79.8 million in the first quarter of fiscal 2023. Overall, net sales were positively impacted by higher pricing compared to prior periods, but were offset by transitional costs and a slight decrease in coffee volume.
Gross profit during the quarter increased to $30.8 million compared to $27.0 million for the first quarter of fiscal 2023. Gross margin increased 380 basis points on a year-over-year basis to 37.6%. The increase in gross profit was primarily due to improved pricing and a decrease in underlying costs.
Operating expenses were $32.9 million in the first quarter of fiscal 2024, up from $27.8 million in the prior year period. This increase was due to a $3.6 million increase in general and administrative (G&A) expenses, a $400,000 decrease in net gains from the sale of branch properties and other assets and a $1.1 million increase in selling expenses. The increase in selling expenses during the first quarter was primarily due to additional spend on vehicles, fleet and freight. The increase in G&A expenses was primarily due to severance costs of $2.3 million related to executive management transitions and the non-recurrence of a $1.9 million gain related to the Boyd settlement in the prior year.
Net loss from continuing operations was $1.3 million compared to a loss of $1.6 million in the first quarter of 2023.
For the three months ended September 30, 2023, our capital expenditures were $3.5 million compared to $2.8 million in the prior year period. In fiscal 2024, we anticipate paying between $16 and $18 million in capital expenditures. We expect to finance these expenditures through cash flow from operations and borrowings under our credit facility.
Adjusted EBITDA approached breakeven for the fiscal first quarter at a loss of $452,000 compared to a loss of $3.9 million on a year-over-year basis.
3
Turning to the balance sheet, as of September 30, 2023, we had $4 million of unrestricted cash and cash equivalents. As of September 30, 2023, we had outstanding borrowings of $23.3 million, utilized $4.6 million of the letters of credit sub-limit and had $25.4 million of availability under our credit facility. We believe we are adequately capitalized to finance our operations in fiscal 2024.
Strategic and operational updates
With a local branch network covering 49 states and equipment servicing capabilities across the country, Farmer Brothers remains an industry leader in size, service and product offerings. We are uniquely positioned to meet the ever-changing needs of our nationwide DSD customer base. Our renewed and complete focus on this base not only better aligns our sales strategy, but also allows for enhanced logistical planning throughout the organization.
Already during the first quarter, we are seeing a positive turnaround as customer retention is flattening. We believe it will begin to turn positive as we continue to improve our performance. Meanwhile, our operational and transitional cost impacts are expected to continue to decline on a quarter-over-quarter basis throughout the year as we appropriately size our cost structure.
In addition, our new AI-backed pricing approach is helping optimize our pricing strategy by establishing companywide pricing models and informing necessary and timely changes in pricing. We will be rolling out additional modules throughout fiscal 2024 using AI insights targeted at increasing customer retention, driving market-based sales gains and further simplifying our DSD pricing tiers to drive better margin performance.
We are also making headway with several growth initiatives. Our new, on-trend product additions, including our SHOTT natural flavored syrups and Boyd’s ambient liquid coffee, are performing well in their early stages. Our Revive equipment and service business also continues to be a differentiator for our DSD business.
4
Outlook and closing
Overall, we are pleased with the early transition results and believe Farmer Brothers’ focus on DSD will better enable us to generate sustainable top line growth with a goal of generating free cash flow early in our fiscal 2025 year. We are continuing to see improvements in our cost structure and overall operational efficiency, but we know progress will not be 100% linear across all areas.
Moving into the second quarter and beyond, we will continue to explore avenues to:
•Leverage our nationwide DSD customer network
•Appropriately size our cost structure
•Continue to optimize pricing
•Drive customer growth and retention
•Increase market penetration for on-trend products
•Complete the transitional services associated with our direct ship sale
In closing, we would like to thank our dedicated team members, partners, customers and shareholders for their support. Your continued dedication and confidence in our business is instrumental. Together, we are confident we will achieve our goals and create long-term value for our stakeholders.
5
Investor conference call
The company will host an audio-only investor conference call today, Thursday, Nov. 9, 2023, at 5 p.m. Eastern to review the company’s financial results for the fiscal first quarter ended Sept. 30, 2023.
Interested parties may access the webcast via the Investor Relations section of the Farmer Brothers’ website. Participants who pre-register will receive an email with dial-in information, which will allow them to bypass the live operator. A replay of the webcast will be available shortly after and for at least 30 days on the Investor Relations section of the Farmer Brothers’ website.
A copy of the company’s 10-Q and corresponding materials are available on the Investor section of the company’s website, as well as the SEC website.
About Farmer Brothers
Founded in 1912, Farmer Brothers is a national coffee roaster, wholesaler, equipment servicer and distributor of coffee, tea and culinary products. The company’s product lines, include organic, Direct Trade and sustainably produced coffee, as well as tea, cappuccino mixes, spices and baking/biscuit mixes. Farmer Brothers delivers extensive beverage planning services and culinary products to a wide variety of U.S.-based customers, ranging from small independent restaurants and foodservice operators to large institutional buyers, such as restaurant, department and convenience store chains, hotels, casinos, healthcare facilities and gourmet coffee houses, as well as grocery chains with private brand coffee and consumer branded coffee and tea products and foodservice distributors. The company’s primary brands include Farmer Brothers, Boyd’s, Cain’s, China Mist and West Coast Coffee.
Forward-looking statements
This letter and other documents we file with the Securities and Exchange Commission SEC) contain forward-looking statements within the meaning of Section 27A of the Securities Act of 1933, as amended (Securities Act), and Section 21E of the Securities Exchange Act of 1934, as amended (Exchange Act), that are based on current expectations, estimates, forecasts and projections about us, our future performance, financial condition, products, business strategy, beliefs and management’s assumptions. In addition, we, or others on our behalf, may make forward-looking statements in press releases or written statements, or in our communications and discussions with investors and analysts in the normal course of business through meetings, webcasts, phone calls and conference calls. These forward-looking statements can be identified by the use of words, such as anticipates, estimates, projects, expects, plans, believes, intends, will, could, may, assumes and other words of similar meaning. These statements are based on management’s beliefs, assumptions, estimates and observations of future events based on information available to our management team at the time the statements are made and include any statements that do not relate to any historical or current fact. These statements are not guarantees of future performance and they involve certain risks, uncertainties and assumptions that are difficult to predict. Actual outcomes and results may differ materially from what is expressed, implied or forecast by our forward-looking statements due in part to the risks, uncertainties and assumptions set forth in Part I, Item 1A. Risk Factors as well as Part II, Item 7, Management’s Discussion and Analysis of Financial Condition and Results of Operations, of our annual report on Form 10-K for the fiscal year ended June 30, 2023, filed with the SEC on Sept. 2, 2023 (2023 Form 10-K), as amended by Amendment No. 1 to the 2023 Form 10-K, filed with the SEC on Oct. 27, 2022, as well as other factors described from time to time in our filings with the SEC.
6
Factors that could cause actual results to differ materially from those in forward-looking statements include, but are not limited to, severe weather, levels of consumer confidence in national and local economic business conditions, the impact of labor shortages, the increase of costs due to inflation, an economic downturn caused by any pandemic, epidemic or other disease outbreak, comparable or similar to COVID-19, the success of our turnaround strategy, the impact of capital improvement projects, the adequacy and availability of capital resources to fund our existing and planned business operations and our capital expenditure requirements, our ability to meet financial covenant requirements in our credit facility, which could impact, among other things, our liquidity, the relative effectiveness of compensation-based employee incentives in causing improvements in our performance, the capacity to meet the demands of our large national account customers, the extent of execution of plans for the growth of our business and achievement of financial metrics related to those plans, our success in retaining and/or attracting qualified employees, our success in adapting to technology and new commerce channels, the effect of the capital markets, as well as other external factors on stockholder value, fluctuations in availability and cost of green coffee, competition, organizational changes, the effectiveness of our hedging strategies in reducing price and interest rate risk, changes in consumer preferences, our ability to provide sustainability in ways that do not materially impair profitability, changes in the strength of the economy, including any effects from inflation, business conditions in the coffee and food industries in general, our continued success in attracting new customers, variances from budgeted sales mix and growth rates, weather and special or unusual events, as well as other risks, uncertainties and assumptions described in the 2023 Form 10-K or otherwise described from time to time in our filings with the SEC.
Given these risks and uncertainties, you should not rely on forward-looking statements as a prediction of actual results. Any or all of the forward-looking statements contained in this letter and any other public statement made by us, including by our management, may turn out to be incorrect. We are including this cautionary note to make applicable and take advantage of the safe harbor provisions of the Private Securities Litigation Reform Act of 1995 for forward-looking statements. We expressly disclaim any obligation to update or revise any forward-looking statements, whether as a result of new information, future events, changes in assumptions or otherwise, except as required under federal securities laws and the rules and regulations of the SEC.
7
FARMER BROS. CO.
CONSOLIDATED STATEMENTS OF OPERATIONS (UNAUDITED)
(In thousands, except share and per share data)
| | | | | | | | | | | | | | | | | | |
| | | | | Three Months Ended September 30, |
| | | | | | | 2023 | | 2022 |
| Net sales | | | | | | $ | 81,888 | | | $ | 79,826 | |
| Cost of goods sold | | | | | | 51,100 | | | 52,808 | |
| Gross profit | | | | | | 30,788 | | | 27,018 | |
| Selling expenses | | | | | | 26,829 | | | 25,755 | |
| General and administrative expenses | | | | | | 12,832 | | | 9,228 | |
| Net gains from sale of assets | | | | | | (6,785) | | | (7,182) | |
| | | | | | | | |
| Operating expenses | | | | | | 32,876 | | | 27,801 | |
| Loss from operations | | | | | | (2,088) | | | (783) | |
| Other (expense) income: | | | | | | | | |
| Interest expense | | | | | | (2,222) | | | (2,070) | |
| Other, net | | | | | | 2,871 | | | 1,316 | |
| Total other expense | | | | | | 649 | | | (754) | |
| Loss before taxes | | | | | | (1,439) | | | (1,537) | |
| Income tax (benefit) expense | | | | | | (132) | | | 43 | |
| Loss from continuing operations | | | | | | $ | (1,307) | | | $ | (1,580) | |
| Loss from discontinued operations, net of income taxes | | | | | | — | | | (5,794) | |
| Net loss | | | | | | (1,307) | | | (7,374) | |
| Loss from continuing operations available to common stockholders per common share, basic and diluted | | | | | | (0.06) | | | (0.08) | |
| Loss from discontinued operations available to common stockholders per common share, basic and diluted | | | | | | $ | — | | | (0.31) | |
| Net loss available to common stockholders per common share, basic and diluted | | | | | | $ | (0.06) | | | (0.39) | |
| Weighted average common shares outstanding—basic and diluted | | | | | | 20,366,017 | | | 18,948,453 | |
8
FARMER BROS. CO.
CONSOLIDATED BALANCE SHEETS (UNAUDITED)
(In thousands, except share and per share data)
| | | | | | | | | | | | | |
| September 30 | | June 30, | | |
| 2023 | | 2023 | | |
| | | | | |
| ASSETS | | | | | |
| Current assets: | | | | | |
| Cash and cash equivalents | $ | 4,038 | | | $ | 5,244 | | | |
| Restricted cash | 175 | | | 175 | | | |
| | | | | |
| Accounts and notes receivable, net of allowance for credit losses of $418 and $416, respectively | 35,009 | | | 45,129 | | | |
| Inventories | 54,291 | | | 49,276 | | | |
| | | | | |
| | | | | |
| Short-term derivative assets | 5 | | | 68 | | | |
| Prepaid expenses | 5,119 | | | 5,334 | | | |
| Assets held for sale | 6,362 | | | 7,770 | | | |
| Total current assets | 104,999 | | | 112,996 | | | |
| Property, plant and equipment, net | 33,778 | | | 33,782 | | | |
| | | | | |
| Intangible assets, net | 12,900 | | | 13,493 | | | |
| Right-of-use operating lease assets | 23,758 | | | 24,593 | | | |
| | | | | |
| | | | | |
| Other assets | 2,675 | | | 2,917 | | | |
| Total assets | $ | 178,110 | | | $ | 187,781 | | | |
| LIABILITIES AND STOCKHOLDERS’ EQUITY | | | | | |
| Current liabilities: | | | | | |
| Accounts payable | 52,608 | | | 60,088 | | | |
| Accrued payroll expenses | 11,276 | | | 10,082 | | | |
| | | | | |
| Right-of-use operating lease liabilities - current | 8,040 | | | 8,040 | | | |
| Term loan - current | — | | | — | | | |
| Short-term derivative liability | 890 | | | 2,636 | | | |
| | | | | |
| Other current liabilities | 3,846 | | | 4,519 | | | |
| Total current liabilities | 76,660 | | | 85,365 | | | |
| Long-term borrowings under revolving credit facility | 23,300 | | | 23,021 | | | |
| Term loan - noncurrent | — | | | — | | | |
| Accrued pension liabilities | 19,585 | | | 19,761 | | | |
| Accrued postretirement benefits | 774 | | | 763 | | | |
| Accrued workers’ compensation liabilities | 3,155 | | | 3,065 | | | |
| Right-of-use operating lease liabilities | 16,332 | | | 17,157 | | | |
| Other long-term liabilities | 506 | | | 537 | | | |
| | | | | |
| Total liabilities | $ | 140,312 | | | $ | 149,669 | | | |
| Commitments and contingencies | | | | | |
| Stockholders’ equity: | | | | | |
| Preferred stock, $1.00 par value, 500,000 shares authorized; Series A Convertible Participating Cumulative Perpetual Preferred Stock, 21,000 shares authorized; no shares outstanding as of September 30, 2023 and June 30, 2023 | — | | | — | | | |
| Common stock, $1.00 par value, 50,000,000 shares authorized; 20,576,483 and 20,142,973 shares issued and outstanding as of September 30, 2023 and June 30, 2023, respectively | 20,578 | | | 20,144 | | | |
| Additional paid-in capital | 78,465 | | | 77,278 | | | |
| Accumulated deficit | (27,786) | | | (26,479) | | | |
| | | | | |
| Less accumulated other comprehensive loss | (33,459) | | | (32,831) | | | |
| Total stockholders’ equity | $ | 37,798 | | | $ | 38,112 | | | |
| Total liabilities and stockholders’ equity | $ | 178,110 | | | $ | 187,781 | | | |
9
| | | | | | | | | | | | | |
| FARMER BROS. CO. |
| CONSOLIDATED STATEMENTS OF CASH FLOWS (UNAUDITED) |
| (In thousands) |
| | Three Months Ended September 30, | | |
| 2023 | | 2022 | | |
| Cash flows from operating activities: | | | | | |
| Net loss | $ | (1,307) | | | $ | (7,374) | | | |
| Adjustments to reconcile net loss to net cash (used in) provided by operating activities | | | | | |
| Depreciation and amortization | 2,948 | | | 5,652 | | | |
| | | | | |
| Gain on settlement related to Boyd's acquisition | — | | | (1,917) | | | |
| | | | | |
| Net gains from sale of assets | (6,785) | | | (7,182) | | | |
| Net gains on derivative instruments | (1,551) | | | (2,011) | | | |
| 401(k) and share-based compensation expense | 1,621 | | | 2,362 | | | |
| Provision for (recovery of) credit losses | 53 | | | (43) | | | |
| Change in operating assets and liabilities: | | | | | |
| Accounts receivable, net | 10,067 | | | (339) | | | |
| Inventories | (5,015) | | | 3,859 | | | |
| Derivative (liabilities) assets, net | (760) | | | 1,069 | | | |
| Other assets | 504 | | | (67) | | | |
| Accounts payable | (7,470) | | | (7,243) | | | |
| Accrued expenses and other | 558 | | | (185) | | | |
| Net cash used in operating activities | (7,137) | | | (13,419) | | | |
| Cash flows from investing activities: | | | | | |
| Purchases of property, plant and equipment | (3,511) | | | (2,988) | | | |
| Proceeds from sales of property, plant and equipment | 9,258 | | | 9,061 | | | |
| Net cash provided by investing activities | 5,747 | | | 6,073 | | | |
| Cash flows from financing activities: | | | | | |
| Proceeds from Credit Facilities | 2,279 | | | 54,000 | | | |
| Repayments on Credit Facilities | (2,000) | | | (48,600) | | | |
| Payments of finance lease obligations | (48) | | | (48) | | | |
| Payment of financing costs | (47) | | | (262) | | | |
| Net cash provided by financing activities | 184 | | | 5,090 | | | |
| Net decrease in cash and cash equivalents and restricted cash | (1,206) | | | (2,256) | | | |
| Cash and cash equivalents and restricted cash at beginning of period | 5,419 | | | 9,994 | | | |
| Cash and cash equivalents and restricted cash at end of period | $ | 4,213 | | | $ | 7,738 | | | |
10
Non-GAAP financial measures
In addition to net loss determined in accordance with U.S. generally accepted accounting principles (“GAAP”), we use the following non-GAAP financial measures in assessing our operating performance:
“EBITDA” is defined as net loss from continuing operations excluding the impact of:
•income tax expense;
•interest expense; and
•depreciation and amortization expense.
“EBITDA Margin” is defined as EBITDA expressed as a percentage of net sales.
“Adjusted EBITDA” is defined as net loss from continuing operations excluding the impact of:
•income tax expense;
•interest expense;
•depreciation and amortization expense;
•401(k), ESOP and share-based compensation expense;
•gain on settlement with Boyd’s sellers;
•net (gains) losses from sales of assets; and
•severance costs.
“Adjusted EBITDA Margin” is defined as Adjusted EBITDA expressed as a percentage of net sales.
For purposes of calculating EBITDA and EBITDA Margin and Adjusted EBITDA and Adjusted EBITDA Margin, we have not adjusted for the impact of interest expense on our pension and postretirement benefit plans.
We believe these non-GAAP financial measures provide a useful measure of the Company’s operating results, a meaningful comparison with historical results and with the results of other companies, and insight into the Company’s ongoing operating performance. Further, management utilizes these measures, in addition to GAAP measures, when evaluating and comparing the Company’s operating performance against internal financial forecasts and budgets.
We believe that EBITDA facilitates operating performance comparisons from period to period by isolating the effects of certain items that vary from period to period without any correlation to core operating performance or that vary widely among similar companies. These potential differences may be caused by variations in capital structures (affecting interest expense), tax positions (such as the impact on periods or companies of changes in effective tax rates or net operating losses) and the age and book depreciation of facilities and equipment (affecting relative depreciation expense). We also present EBITDA and EBITDA Margin because (i) we believe that these measures are frequently used by securities analysts, investors and other interested parties to evaluate companies in our industry, (ii) we believe that investors will find these measures useful in assessing our ability to service or incur indebtedness, and (iii) we use these measures internally as benchmarks to compare our performance to that of our competitors.
EBITDA, EBITDA Margin, Adjusted EBITDA and Adjusted EBITDA Margin, as defined by us, may not be comparable to similarly titled measures reported by other companies. We do not intend for non-GAAP financial measures to be considered in isolation or as a substitute for other measures prepared in accordance with GAAP.
Set forth below is a reconciliation of reported net loss to EBITDA (unaudited):
| | | | | | | | | | | | | | | | | | |
| | | | Three Months Ended September 30, |
| (In thousands) | | | | | | 2023 | | 2022 |
| Net loss from continuing operations, as reported | | | | | | $ | (1,307) | | | $ | (1,580) | |
| Income tax (benefit) expense | | | | | | (132) | | | 43 | |
| Interest expense (1) | | | | | | 1,007 | | | 904 | |
| Depreciation and amortization expense | | | | | | 2,948 | | | 3,381 | |
| EBITDA | | | | | | $ | 2,516 | | | $ | 2,748 | |
| EBITDA Margin | | | | | | 3.1 | % | | 3.4 | % |
____________
(1)Excludes interest expense related to pension plans and postretirement benefit plan.
11
Set forth below is a reconciliation of reported net loss to Adjusted EBITDA (unaudited):
| | | | | | | | | | | | | | | | | | |
| | | | Three Months Ended September 30, |
| (In thousands) | | | | | | 2023 | | 2022 |
| Net loss from continuing operations, as reported | | | | | | $ | (1,307) | | | $ | (1,580) | |
| Income tax (benefit) expense | | | | | | (132) | | | 43 | |
| Interest expense (1) | | | | | | 1,007 | | | 904 | |
| Depreciation and amortization expense | | | | | | 2,948 | | | 3,381 | |
| 401(k), ESOP and share-based compensation expense | | | | | | 1,552 | | | 2,197 | |
| Gain on settlement with Boyd's sellers (2) | | | | | | — | | | (1,917) | |
| Net gains from sale of assets | | | | | | (6,785) | | | (7,182) | |
| Severance costs | | | | | | 2,265 | | | 234 | |
| | | | | | | | |
| | | | | | | | |
| | | | | | | | |
| Adjusted EBITDA | | | | | | $ | (452) | | | $ | (3,920) | |
| Adjusted EBITDA Margin | | | | | | (0.6) | % | | (4.9) | % |
________
(1) Excludes interest expense related to pension plans and postretirement benefit plans.
(2) Result of the settlement related to the acquisition of Boyd Coffee Company which included the cancellation of shares of Series A Preferred Stock and settlement of liabilities.
12