
Inter-Tel Supplemental Discussion Slides
October 2006
1

Review of Key Themes
Where is the Plan to enhance stockholder value?
Lots of generic, qualitative points which amount in our view to a “Just Trust Us” plan
No detailed financial guidance in our view for stockholders to evaluate vs. proposed $23.25 offer (or
higher potential competing offer)
We believe our Resolution calls for a fair sale process to maximize stockholder value
Not a “fire sale”; plenty of time to demonstrate to buyers the “full value” of INTL
Company has stated that they have been “actively exploring strategic options” since August 11,
allowing for plenty of time including time allowed under the Resolution
What has the Board been doing since Mr. Mihaylo’s first 13D on March 3?
We believe our proposed offer of $23.25 delivers compelling value TODAY
Significant premium across a number of valuation metrics
INTL would have to significantly outperform consensus estimates to support stand-alone values
at/above $23.25
We believe adopting the Resolution is in stockholders’ best interests
Consistent with Special Committee’s statement to explore options
Steve Mihaylo, and his 19.4% vote, will support higher offers from other parties, should they exist
We believe if the Company is not sold, INTL will give back a meaningful acquisition premium
INTL stock up nearly twice the S&P500 -- and other indices are actually down – since Mr. Mihaylo’s
initial 13D
Current PE multiples suggest nearly a 20% decline based on where INTL has historically traded
2

How Can the Special Committee Not Support the
Resolution?
INTL has not provided data or financial guidance to support their opposition to
the Resolution in our view
We did not even receive projections in our due diligence
Thus, we are left with having to figure out what the Board must believe in order
to not support the Resolution
Based on its historical 17x forward PE multiple, INTL would have to believe
that it can generate 2007 EPS of at least $1.37 to support standalone value of
$23.25 per share
Consensus estimate = $1.17(1)
The Special Committee must believe that INTL will outperform consensus
expectations by nearly 20% -- even before factoring in risk and timing to achieve
these results
This translates to 2007 revenue of ~ $550 million(2), which is $62 million more
than the consensus estimate of $488 million(1)
We are only left to conclude that the Special Committee believes INTL can significantly
outperform revenue and EPS estimates -- this seems highly risky to us, and more
importantly, where is the plan to support this conclusion?
(1) I/B/E/S consensus estimate as of 10/5/06.
(2) Assumes 28.6M shares, 35% tax rate and ~$8M in other income and D&A.
3
Putting INTL’s “Just Trust Us” In To Perspective
We believe INTL would need to believe that 2007 EPS = $1.37 to support stand-alone value equal to
our offer
17% above consensus estimates of $1.17 (1)
37% above 2006 consensus estimates of $1.00(1)
Implies nearly 20% revenue growth over 2007
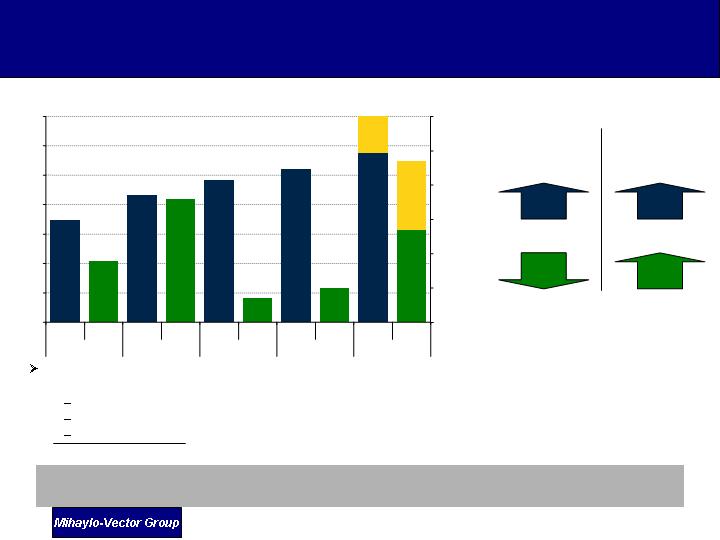
INTL Revenue and EPS(1)
Where’s the plan for this?
EPS
Revenue
(2)
37.0%
(2.5%)
19.2%
7.3%
EPS
Revs
Growth needed
to match our
proposed offer
(2006E-2007E)
CAGR
(2003-2006E)
(1) Forward revenues and EPS from I/B/E/S as of 10/5/06. Historical EPS are consensus estimates from FactSet as of 10/6/06.
(2) Assumes 28.6M shares, 35% tax rate and ~$8M in other income and D&A.
$488.0
$461.3
$442.9
$416.8
$373.6
$550.0
$1.17
$1.08
$1.26
$0.97
$1.00
$1.37
$200.0
$250.0
$300.0
$350.0
$400.0
$450.0
$500.0
$550.0
Revenue
EPS
Revenue
EPS
Revenue
EPS
Revenue
EPS
Revenue
EPS
2003A
2004A
2005A
2006E
2007E
$0.90
$1.00
$1.10
$1.20
$1.30
$1.40
$1.50
4
Gross Margin
YoY Revenue
Growth
We believe that Inter-Tel has not performed like a company that deserves your trust
to grow revenues by 20% and EPS by 37% in 2007
Recent Financial Performance of Inter-Tel
16.3%
7.9%
11.4%
10.8%
7.9%
12.3%
5.7%
(0.1%)
1.2%
0.6%
53.1%
52.6%
52.9%
53.8%
51.1%
52.1%
50.5%
50.6%
49.8%
49.0%
(1.0%)
4.0%
9.0%
14.0%
19.0%
24.0%
Q1 '04
Q2 '04
Q3 '04
Q4 '04
Q1 '05
Q2 '05
Q3 '05
Q4 '05
Q1 '06
Q2 '06
47.0%
48.0%
49.0%
50.0%
51.0%
52.0%
53.0%
54.0%
5
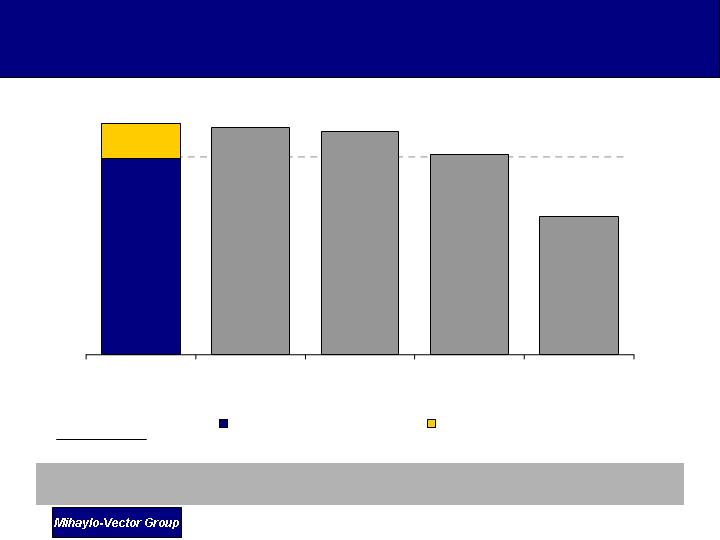
Compelling Proposed Offer vs. What Plan?
26% premium to Enterprise Value, which adjusts for the distorting effects of
current cash balance
Premium valuation to peer group – 17% premium above the average of peer
group
Even a premium to the comparables group (presumably selectively chosen by the
Special Committee) used to benchmark value in the Special Committee’s
presentation
Premium valuation to INTL’s own historic PE multiples – 25% premium to the
one year average prior to original 13D
Higher premium than the average for all comparably sized LBOs in the last
year
Premium to a majority of analyst price targets
Moreover, Resolution allows the Company to seek even higher offers in a sale
process – consistent with stated “exploration of alternatives”
The Special Committee is asking you to oppose the Resolution in return for a
“Just Trust Us ” plan that they will not disclose that we can only believe must be
based on forecasts that are well ahead of consensus estimates
6

Our Proposed Offer is a Premium to INTL’s Own
Selected Valuation Benchmark
Source: Consensus estimates from FactSet as of 10/5/06.
(1) Peer group represents comparable companies used for Inter-Tel by the Morgan Keegan research analyst.
Our proposed offer is higher than the median
of the Morgan Keegan peer group on every
relevant date
We believe:
They say:
INTL alluded to our proposed offer being a
discount to Morgan Keegan peer group
Calendar Year 2006E P/E as of:
06/16/06
09/21/06
10/03/06
10/05/06
Morgan Keegan
Report
Mihaylo-Vector
Presentation
Inter-Tel
Presentation
Current
Morgan Keegan Peers Median
(1)
:
19.6x
21.3x
20.8x
21.3x
Inter-Tel @ $23.25
INTL
23.1x
23.5x
23.5x
23.5x
Inter-Tel Premium to Morgan Keegan Peers
18.2%
10.5%
13.0%
10.2%
7
Offer represents 17% premium to the average of this peer group
Source: FactSet and I/B/E/S estimates as of 10/5/06.
(1) INTL’s unaffected stock price based on pre-13D closing price of $19.74 on March 3, 2006.
(1)
Non- Inter-Tel
Average: 17.4x
2007E PE Multiple
Proposed Offer Also a Significant Premium to More
Relevant Peer Group
20.0x
17.3x
19.7x
17.7x
12.2x
20.4x
Inter-Tel at
Proposed
$23.25 Offer
Nortel
Avaya
Cisco
Aastra
Unaffected INTL P/E Multiple
Premium
8

25% premium to Inter-Tel’s average NTM PE for the 12 months prior to the 13D
Further, Our Proposed Offer is a Meaningful
Premium to Inter-Tel’s own Historical Multiples
Source: FactSet as of 10/5/06.
NTM PE Multiples
21.1x
18.0x
16.9x
16.9x
10.0x
13.0x
16.0x
19.0x
22.0x
25.0x
Mihaylo-Vector
Proposed $23.25
Offer
24 Months Average
Pre-13D
12 Month Average
Pre-13D
1 Day Prior to 13D
9
Our offer is a significantly higher premium over enterprise value than the average for
comparable LBOs in the last year – and even given the large component of cash --
represents a premium to the average based on equity value
Premia Comparison vs. the Relevant Transaction Set(1)
(1) Source: Dealogic as of 10/5/06. Based on 35 LBO transactions > $500M and 14 transactions between $500M and $1.5B in the last 12 months.
(2) Enterprise values sourced from FactSet as of 10/5/06.
We believe comparing INTL to a broad list of technology precedent transactions is
inappropriate
Includes stock/stock deals, strategic acquirers, smaller transactions, etc.
If INTL believes this “selected” group is the appropriate premium, then in our opinion they
should find a strategic acquirer to pay such prices
Our resolution allows for a process to sell to other buyers
Given an LBO appears in our view to be the most viable alternative for INTL, we believe a
premium comparison to comparably sized LBO transactions is more appropriate
Equity Premium
Enterprise Value Premium
(2)
1 Day
1 Week
1 Day
1 Week
All LBOs > $500M
Median:
14.0%
16.2%
9.6%
10.3%
Mean:
16.9%
18.8%
10.1%
10.5%
All LBOs $500M - $1.5B
Median:
14.8%
19.1%
9.9%
10.3%
Mean:
17.0%
18.4%
9.3%
9.7%
Inter-Tel @ $23.25
Inter-Tel:
17.8%
16.3%
25.9%
25.1%
10

Proposed Offer Above Most Analyst Price Targets
Most analysts have 12 month price targets below the Mihaylo-Vector proposed offer
Proposed Mihaylo-Vector Offer: $23.25
Avg. 12 Mo. Price Target: $21.75
___________________________
(1) Companies, ratings and price targets sourced from Thomson Analytics and Thomson Research.
Company
(1)
Last Update
Rating
Price Target
Wedbush Morgan
8/28/06
Hold
$21.00
Morgan Keegan
8/28/06
Outperform
N/A
Kaufman Bros.
8/22/06
Hold
$22.00
Brean Murray
8/14/06
Stong Buy
$26.00
JP Morgan
8/11/06
Underweight
N/A
Canaccord Adams
7/27/06
Hold
N/A
Bear Stearns
7/27/06
Peer Perform
N/A
Lehman Brothers
7/27/06
Equal Weight
$18.00
11

Appendix
12

2007 EPS needed to support share price at historical multiples
What Do You Need to Believe to Not Vote for the
Resolution?
(1) Source: I/B/E/S consensus estimate as of 10/5/06.
(2) Source: FactSet as of 10/5/06.
At 1-year average NTM PE multiple of ~17x, INTL would need to deliver FY2007
EPS of $1.37 to support a share price of $23.25
$1.37 is 17% higher than FY2007 consensus EPS estimates of $1.17(1)
We feel that our proposed offer of $23.25 delivers considerable cash value TODAY
FY2007 EPS would have to be >17% above consensus estimates to generate values
in excess of our proposed offer
13
1 Day Prior to 13D
Pre-13D
12 Month Average
Pre-13D
24 Months Average
20.0x
18.0x
16.0x
14.0x
12.0x
10.0x
16.9x
16.9x
18.0x
INTL’s NTM PE Multiples
(2)
2007
PE
Stock Price
$23.25
$25.00
$27.00
16.0x
$1.45
$1.56
$1.69
17.0x
$1.37
$1.47
$1.59
18.0x
$1.29
$1.39
$1.50

What Would INTL Have to Do to Outperform EPS
by 20%?
Target 2007 EPS of $1.37 * 17x PE = $23.25 per share
Implies ~ $68M of EBITDA(1)
Consensus(2)
At the consensus EBITDA margin estimate of 12%, INTL would need to generate
revenue of approximately $550 million to generate EBITDA of $68 million, which is
consistent with 2007 EPS of $1.37. Again, where is the plan to do this?
_______________________
(1) Assumes 28.6M shares, 35% tax rate and ~$8M in other income and D&A.
(2) I/B/E/S consensus estimates as of 10/5/06.
Revenue
Target EBITDA
Implied EBITDA
Margin
$488
$68
14%
$550
$68
12%
14
Revenue
=
$488M
EBITDA
=
$60M
EBITDA Margin
=
12%