
June 1, 2007
Inter-Tel Leveraged
Recapitalization Proposal and
Analysis
1

About This Presentation
This presentation contains forward looking statements, including estimates, projections and pro forma information,
which are included solely for the purpose of illustrating how Mr. Mihaylo believes the recapitalization plan can maximize
shareholder value so that you can cast an informed vote at the June 29, 2007 Special Meeting of Shareholders. As you
know, predictions of future results are inherently uncertain and future results may differ materially from those set forth
in these forward looking statements. While these forward looking statements were prepared based on the best
information available to Steven Mihaylo, they were not prepared with the benefit of access to the Company’s books and
records and the accuracy and completeness of financial and other information obtained from publicly available sources
and used in preparing these forward looking statements has not been independently verified. As a result, there can be
no assurance that the estimates and assumptions underlying these forward looking statements conform to the current
state of affairs at the Company and that the implementation of the recapitalization plan, whether or not modified, will not
differ materially from the forward looking statements contained in this presentation.
This presentation constitutes proxy solicitation material and is intended solely to inform shareholders so that they may
cast an informed vote at the Special Meeting of Shareholders. Except as provided by the federal securities laws, this
presentation may not be relied upon or used for any other purpose, including for purposes of making an investment
decision with respect to the Company’s securities.
Shareholders are advised to read the proxy statement and other documents related to the solicitation of proxies filed by
Steven Mihaylo for use at the June 29, 2007 Special Meeting of Shareholders because they contain important
information. The preliminary proxy statement was filed on June 8, 2007, and along with other relevant documents, is
available at no charge at the Securities and Exchange Commission’s website at http://www.sec.gov or by contacting
MacKenzie Partners, Inc. by telephone at (800) 322-2885 or by e-mail at proxy@mackenziepartners.com . Information
relating to the participants in the solicitation of proxies by Mr. Mihaylo is contained in the preliminary proxy statement
filed by Mr. Mihaylo with the Securities and Exchange Commission and can be obtained as described above.
2

Agenda
I.
Why Are We Here
II.
Transaction Overview
III.
Buyback Transaction Impact Analysis
3

I. Why Are We Here
4

Background
Mihaylo owns almost 20% of the outstanding shares compared with the rest of the Board and
management which owns less than 1%
August, 2006 Mihaylo and Vector indicate interest in purchasing INTL for $23.25/share; After a lengthy
delay, Special Committee rejects proposal; Mihaylo then initiates Special Meeting to vote on a
resolution urging Board to undertake a process to sell the Company to the highest bidder
Company aggressively lobbies shareholders against proposal to run an auction and sell the Company
October, 2006 shareholders vote at Special Meeting on “Sell the Company Resolution”; proposal
rejected by a slight margin
Shortly after the Special Meeting Company secretly entertains “business opportunities”
April, 2007 INTL Board approves Mitel $25.60 buy-out with a $20M break-up fee (1); neither Mihaylo nor
Vector were approached for competing bids prior to committing to the sale
May, 2007 Vector expresses interest at $26.50 subject to due diligence; following diligence period,
Vector withdraws
June, 2007 Mihaylo obtains “highly confident” letter from RBC with respect to financing a proposed
$400M recapitalization
________________________
(1) Mr. Mihaylo voted “No”, and Mr. Puri and Mr. Urish Abstained.
5

Current Proposal is Inadequate
INTL Special Committee did not run a process open for all to participate
INTL vehement opposition to “Sell the Company Resolution” potentially
deterred other interested parties
INTL Special Committee did not contact Vector or Mihaylo to solicit a bid,
despite their past interest in acquiring the Company
Breakup fee of $20M (3%) may chill potential suitors
Premium of proposed Mitel buy-out is 7.6% (1)
Proposed tender offer premium of 17.7% (1)
Proposed recapitalization blended premium of 21.9% (1)
Recent buy out bid for Avaya premium of 22% (2)
(1)
Computed from Nasdaq INTL closing price of $23.79 on April 4, 2007 (the day before the Mitel transaction was announced).
(2)
Computed from NYSE closing price of $13.67 on May 25, 2007, when the Company was identified by the WSJ as a target of a bidding war.
6

II. Transaction Overview
7

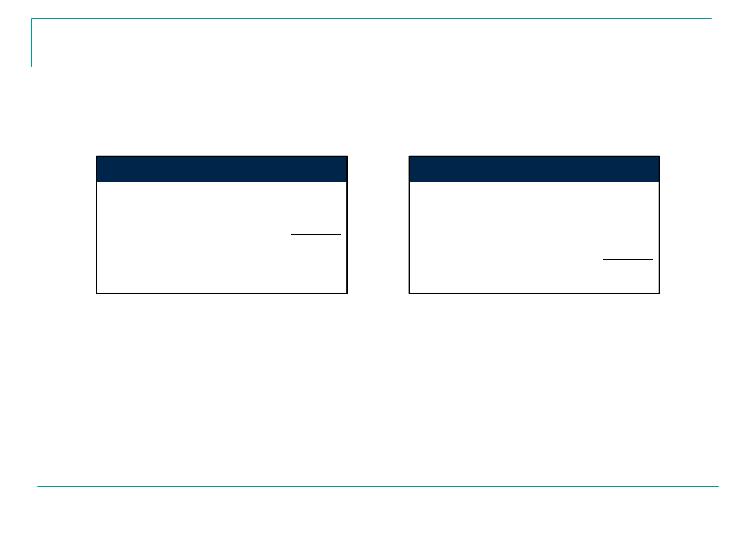
Transaction Overview
Share repurchase (“Buyback”) by Inter-Tel
(“Company”), with the following parameters:
Transaction
$400 million share repurchase by Company
Offer Price
per Share
$28.00 per share assuming a share tender
Source of
Funds
$200 million from cash on Company Balance Sheet
$200 million in new Term debt raised by Company
Other
Mitel Networks Corporation (“Mitel”) acquisition not consummated
$20 million break-up fee paid to Mitel
8
Sources & Uses
___________________________
(1) Per the Agreement and Plan of Merger dated April 26, 2007 among Inter-Tel, Mitel and Arsenal Acquisition Corp. (“Agreement and Plan of Merger”).
(2) Assumes fees of 2.5% of total debt capital raised.
9
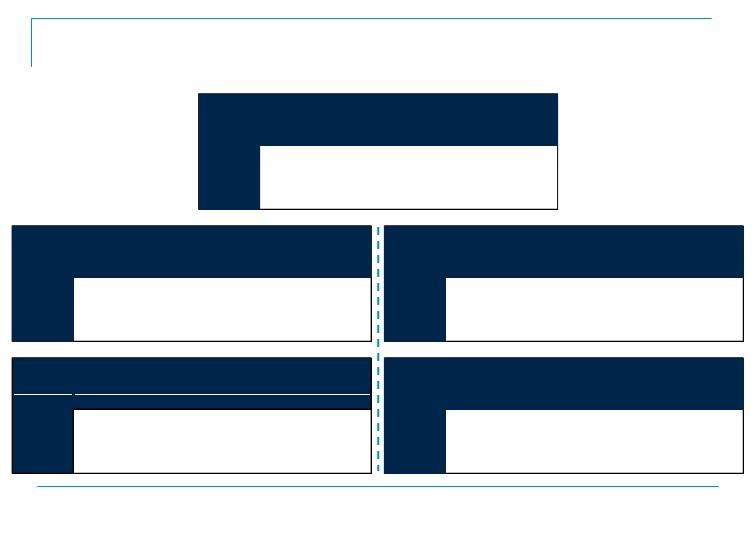
Sources of Funds
Uses of Funds
Cash from Balance Sheet
$200.0
Repurchase of Company Shares
$375.0
New Term Loan Debt
200.0
Mitel Breakup Fee
(1)
20.0
Transaction Expenses
(2)
5.0
Total Sources
$400.0
Total Uses
$400.0

III. Buyback Transaction Impact
Analysis
10

Buyback Transaction Assumptions
Transaction assumed to close on 9/30/2007
Analysis included for 2008 to review a full-year impact
Financial projections based on Inter-Tel Management’s projections in the
Inter-Tel proxy filed May 29, 2007
$20 million break-up fee payment to Mitel
Implied interest income on Balance Sheet cash of 3.1% assuming an
average 2008 cash balance of $242 million (1)
Interest rate on debt of 7.86% (LIBOR + 250bps)(2)
P/E multiple pre- and post- Buyback assumed to be similar
Pre-Buyback P/E multiple based on unaffected closing price of $23.79
on April 26, 2007, the last closing price before the Mitel offer
___________________________
(1) Average cash balance based on average of research estimates for 2008.
(2) Indicative terms provided by RBC Debt Capital Markets as of June 1, 2007, in conjunction with the Highly Confident letter provided by RBC.
11

Inter-Tel Management Financial
Projections
12
___________________________
(1) From Inter-Tel’s proxy dated May 29, 2007.
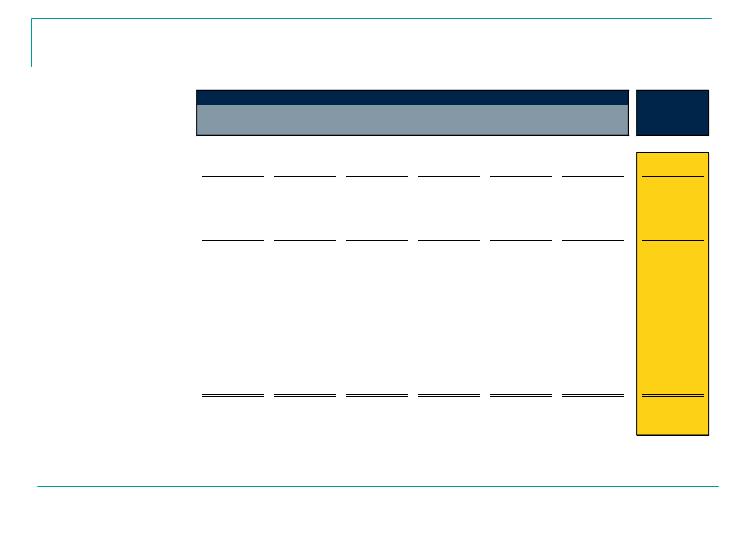
Inter-Tel Projections from Proxy
(1)
Q2-Q4 2007E
CY 2007E
CY 2008E
INCOME STATEMENT
Net Sales
$388.7
$498.1
$530.4
Cost of Sales
189.4
245.5
263.1
Gross Profit
199.3
252.6
267.3
R&D
27.8
35.8
35.0
SG&A
130.7
171.2
176.3
Operating Expenses
158.5
207.0
211.3
Operating Income
40.8
45.6
56.0
Other Income
4.2
6.0
7.5
PreTax Income
45.0
51.6
63.5
Taxes
(16.5)
(18.6)
(22.9)
% Tax Rate
36.6%
36.0%
36.0%
Net Income
$28.5
$33.0
$40.6
Fully Diluted Shares
28.1
28.0
28.2
Diluted EPS
$1.01
$1.18
$1.44

Impact of Buyback on Management
FY2008 Income Statement Projections
___________________________
(1) From Inter-Tel’s proxy dated May 29, 2007.
(2) Assumes $375 million Buyback using $200 million of balance sheet cash and $200 million of debt. $5 million of transaction expenses and $20 million of break-up fee also paid.
(3) Assumes average cash balance for Q4 2007 and CY 2008 of $19.7 million, calculated as average Q4 2007 cash balance from research less $200 million of cash used for Buyback.
(4) Assumes $7.2 million of principal is paid down in Q4 2007 and an average debt balance of $177 million in 2008. Q4 2007 financial projections calculated as 1/3rd of Q2-Q4 2007 projections in Inter-Tel’s May 29, 2007 proxy.
(5) Assumes 13.4 million shares repurchased at $28.00 per share for a total amount of $375 million.
(6) Based on unaffected closing price of $23.79 on April 26, 2007.
13
2008 Projections per Inter-Tel Proxy
(1)
2008 Projections Post-Buyback
(2)
Total Revenue
$530.4
Total Revenue
$530.4
COGS
263.1
COGS
263.1
Gross Margin
$267.3
Gross Margin
$267.3
R&D
$35.0
R&D
$35.0
SG&A
176.3
SG&A
176.3
Total Operating Expenses
$211.3
Total Operating Expenses
$211.3
Operating Income
$56.0
Operating Income
$56.0
Interest Income
$7.5
Interest Income
(3)
$0.6
Interest Expense
---
Interest Expense
(4)
(13.9)
Total Other Income (Expenses)
$7.5
Total Other Income (Expenses)
($13.3)
Income Before Taxes
$63.5
Income Before Taxes
$42.7
Income Taxes
($22.9)
Income Taxes
($15.4)
Income Tax Rate
36.0%
Income Tax Rate
36.0%
Net Income
$40.6
Net Income
$27.3
Diluted Shares Outstanding
28.2
Diluted Shares Outstanding
(5)
14.8
EPS - Diluted (Non-GAAP)
$1.44
EPS - Diluted (Non-GAAP)
$1.84
2008E Accretion / Dilution
Stock Price Analysis
2008 Diluted EPS from Proxy
(1)
$1.44
2008E P/E from Proxy
(6)
16.5x
Pro Forma Diluted EPS
$1.84
Pro Forma Diluted EPS
$1.84
Accretion (Dilution)
$0.40
Assumed 2008E P/E Post-Buyback
16.5x
Accretion (Dilution) %
28.0%
Pro Forma Stock Price
$30.46
% Change from Unaffected Price
28.0%
Sensitivity Analyses (Management Case)
___________________________
(1) Cash from Balance Sheet of $200 million is assumed fixed. Any amount above or below $400 million is achieved by adjusting the debt amount. Actual Buyback amount equals sources of funds less transaction fees and breakup fee.
(2) Assumes P/E multiple pre- and post-Buyback remains constant at 16.5x.
(3) Assumes $400 million in sources of funds.
(4) Number of shares bought back based on total Buyback amount less transaction expenses and breakup fee. Calculated as the weighted-average of shares tendered in the Buyback multiplied by Buyback price per share and basic
shares remaining after Buyback multiplied by post-Buyback price.
14
26.6%
25.3%
24.2%
23.1%
22.2%
29.00
29.0%
27.4%
26.0%
24.8%
23.7%
28.50
31.7%
29.7%
28.0%
26.5%
25.2%
28.00
34.5%
32.2%
30.2%
28.4%
26.8%
27.50
37.6%
34.9%
32.5%
30.4%
28.5%
$27.00
$450.0
$425.0
$400.0
$375.0
$350.0
28.0%
(1)
Total Sources of Funds
Price
Buyback
2008 Accretion (Dilution)
31.15
30.21
29.28
28.35
27.41
29.00
31.13
30.19
29.26
28.33
27.40
28.50
31.10
30.17
29.24
28.31
27.38
28.00
31.08
30.15
29.22
28.29
27.36
27.50
$31.05
$30.12
$29.20
$28.27
$27.34
$27.00
18.5x
17.5x
16.5x
15.5x
14.5x
P/E Multiple Post-Buyback
Price
Buyback
(3), (4)
Blended Share Price
30.11
29.81
29.54
29.29
29.08
29.00
30.69
30.32
29.98
29.68
29.42
28.50
31.32
30.86
30.46
30.10
29.78
28.00
32.00
31.45
30.97
30.54
30.16
27.50
$32.73
$32.08
$31.51
$31.01
$30.57
$27.00
$450.0
$425.0
$400.0
$375.0
$350.0
3045.7%
(1)
Total Sources of Funds
Price
Buyback
(2)
Post-Buyback Stock Price
33.11
31.32
29.54
27.75
25.96
29.00
33.61
31.80
29.98
28.16
26.35
28.50
34.15
32.30
30.46
28.61
26.77
28.00
34.72
32.84
30.97
29.09
27.21
27.50
$35.33
$33.42
$31.51
$29.60
$27.69
$27.00
18.5x
17.5x
16.5x
15.5x
14.5x
3045.7%
P/E Multiple Post-Buyback
Price
Buyback
(3)
Post-Buyback Stock Price
Blended Share Price
(2), (4)
Buyback
Price
Total Sources of Funds
(1)
$350.0
$375.0
$400.0
$425.0
$450.0
$27.00
$28.98
$29.09
$29.20
$29.30
$29.40
27.50
29.00
29.11
29.22
29.33
29.43
28.00
29.02
29.13
29.24
29.35
29.46
28.50
29.03
29.15
29.26
29.37
29.48
29.00
29.04
29.16
29.28
29.40
29.51

Buyback Assumptions based upon
Average Research Projections
Buyback Transaction Model made identical assumptions as in model
based upon Inter-Tel management projections, except:
Financial projections based on blended average of projections from
most recent research reports of six analysts: Bear Stearns, Brean
Murray Carret & Co., Canaccord Adams, Morgan Keegan, Sidoti & Co.
and Wedbush Morgan
Pre-Buyback P/E multiple based on unaffected closing price of $23.79
on April 26, 2007, the last closing price before the Mitel offer and street
projections for earnings
15
Research Average Financial Projections
16
___________________________
(1) Source: ThomsonOne Analytics and Thomson Research. Companies who have reported 2008 estimates since Inter-Tel announced Q1 2007 earnings. Projections exclude the effects of stock-based compensation.
(2) Research report dates: Bear Stearns - 4/27/07, Brean Murray Carret - 4/27/07, Canaccord Adams - 5/1/07, Morgan Keegan - 4/27/07, Sidoti & Co. - 4/27/07, Wedbush Morgan - 4/27/07. JPMorgan has not released a model since Inter-Tel
announced Q1 earnings.
(3) Morgan Keegan COGS, R&D and SG&A accounts adjusted to exclude the effects of stock-based compensation in order to reach their EPS from Operations excluding stock-based comp. of $1.45 per share.
Inter-Tel Wall Street Research Estimates for FY 2008
(1) (2)
Average of
Bear Stearns
Brean Murray
Carret & Co.
Canaccord
Adams
Morgan
Keegan
(3)
Sidoti & Co.
Wedbush
Morgan
Research
Estimates
INCOME STATEMENT
Net Sales
$474.4
��
$518.9
$520.1
$516.8
$510.9
$482.5
$504.0
Cost of Sales
240.9
261.5
252.6
250.4
255.6
246.6
251.3
Gross Profit
$233.5
$257.4
$267.6
$266.5
$255.4
$235.9
$252.7
R&D
$32.5
$37.9
$34.2
$36.2
$32.4
$33.3
$34.4
SG&A
175.7
167.0
179.0
175.4
166.7
168.3
172.0
Amortization
4.8
4.4
4.5
4.5
4.7
4.9
4.6
Operating Expenses
$213.0
$209.3
$217.7
$216.0
$203.9
$206.6
$211.1
Operating Income
$20.5
$48.1
$49.8
$50.4
$51.5
$29.4
$41.6
Interest Income
(8.5)
(7.2)
(8.0)
(10.1)
(7.5)
(7.7)
(8.2)
Interest Expense
---
---
---
0.1
---
0.2
0.1
Foreign Currency Transaction
---
---
(0.1)
---
---
(0.1)
(0.0)
PreTax Income
$29.0
$55.3
$57.8
$60.5
$59.0
$37.1
$49.8
Taxes
8.6
19.4
17.4
19.4
17.8
11.0
15.6
% Tax Rate
29.8%
35.1%
30.0%
32.1%
30.2%
29.7%
31.4%
Net Income
$20.3
$35.9
$40.5
$41.1
$41.1
$26.1
$34.2
Fully Diluted Shares
28.4
28.7
28.4
28.3
27.7
28.6
28.4
Diluted EPS
$0.72
$1.25
$1.42
$1.45
$1.49
$0.91
$1.20

Impact of Buyback on Research FY2008
Income Statement Projections
17
___________________________
(1) From Average Street Estimate from previous page.
(2) Assumes $375 million Buyback using $200 million of balance sheet cash and $200 million of debt. $5 million of transaction expenses and $20 million of break-up fee also paid.
(3) Assumes average cash balance for Q4 2007 and CY 2008 of $19.7 million, calculated as average Q4 2007 cash balance from research less $200 million of cash used for Buyback.
(4) Assumes $9.2 million of principal is paid down in Q4 2007 and an average debt balance of $175.4 million in 2008. Q4 2007 financial projections calculated from average research.
(5) Assumes 13.4 million shares repurchased at $28.00 per share for a total amount of $375 million.
(6) Based on unaffected closing price of $23.79 on April 26, 2007.
2008 Research Average Pre-Buyback
(1)
2008 Research Average Projections Post-Buyback
(2)
Total Revenue
$504.0
Total Revenue
$504.0
COGS
251.3
COGS
251.3
Gross Margin
$252.7
Gross Margin
$252.7
R&D
$34.4
R&D
$34.4
SG&A
172.0
SG&A
172.0
Amort. Of Purchased Intangibles
4.6
Amort. Of Purchased Intangibles
4.6
Total Operating Expenses
$211.1
Total Operating Expenses
$211.1
Operating Income
$41.6
Operating Income
$41.6
Interest Income
$8.2
Interest Income
(3)
$0.6
Interest Expense
(0.1)
Interest Expense
(4)
(13.8)
Foreign Currency Transaction
0.0
Foreign Currency Transaction
0.0
Total Other Income (Expenses)
$8.1
Total Other Income (Expenses)
($13.2)
Income Before Taxes
$49.8
Income Before Taxes
$28.5
Income Taxes
($15.6)
Income Taxes
($8.9)
Income Tax Rate
31.4%
Income Tax Rate
31.4%
Net Income (excl. stock-based comp.)
$34.2
Net Income (excl. stock-based comp.)
$19.5
Diluted Shares Outstanding
28.4
Diluted Shares Outstanding
(5)
15.0
EPS - Diluted (Non-GAAP)
$1.20
EPS - Diluted (Non-GAAP)
$1.31
2008E Accretion / Dilution
Stock Price Analysis
2008 Diluted EPS from Research
(1)
$1.20
2008E P/E from Research
(6)
19.75x
Pro Forma Diluted EPS
$1.31
Pro Forma Diluted EPS
$1.31
Accretion (Dilution)
$0.10
Assumed 2008E P/E Post-Buyback
19.75x
Accretion (Dilution) %
8.4%
Pro Forma Stock Price
$25.79
% Change from Pre-Buyback Price
8.4%

18
28.41
27.75
26.92
26.42
25.76
29.00
26.76
26.84
26.92
27.00
27.09
29.00
28.39
27.73
26.90
26.41
25.75
28.50
26.74
26.82
26.90
26.99
27.07
28.50
28.37
27.71
26.88
26.39
25.73
28.00
26.71
26.80
26.88
26.97
27.06
28.00
28.34
27.68
26.86
26.37
25.71
27.50
26.69
26.77
26.86
26.95
27.04
27.50
$28.32
$27.66
$26.84
$26.35
$25.69
$27.00
$26.66
$26.75
$26.84
$26.93
$27.03
$27.00
22.0x
21.0x
19.8x
19.0x
18.0x
$450.0
$425.0
$400.0
$375.0
$350.0
P/E Multiple Post-Buyback
Price
(1)
Total Sources of Funds
Price
Buyback
Buyback
(2),(4)
Blended Share Price
(2),(4)
Blended Share Price
27.86
26.60
25.02
24.06
22.80
29.00
24.11
24.59
25.02
25.40
25.74
29.00
28.28
26.99
25.39
24.42
23.14
28.50
24.57
25.01
25.39
25.73
26.04
28.50
28.72
27.42
25.79
24.81
23.50
28.00
25.07
25.45
25.79
26.09
26.35
28.00
29.20
27.87
26.21
25.22
23.89
27.50
25.61
25.93
26.21
26.47
26.69
27.50
$29.71
$28.36
$26.67
$25.66
$24.31
$27.00
$26.19
$26.45
$26.67
$26.87
$27.05
$27.00
22.0x
21.0x
19.8x
19.0x
18.0x
$450.0
$425.0
$400.0
$375.0
$350.0
P/E Multiple Post-Buyback
Price
(1)
Total Sources of Funds
Price
Buyback
Buyback
(3)
Post-Buyback Stock Price
(2)
Post-Buyback Stock Price
Sensitivity Analyses (Research Case)
___________________________
(1) Cash from Balance Sheet of $200 million is assumed fixed. Any amount above or below $400 million is achieved by adjusting the debt amount. Actual Buyback amount equals sources of funds less transaction fees and breakup fee.
(2) Assumes P/E multiple pre- and post-Buyback remains constant at 19.8x.
(3) Assumes $400 million in sources of funds.
(4) Number of shares bought back based on total Buyback amount less transaction expenses and breakup fee. Blended Share Price calculated as the weighted-average of shares tendered in the Buyback multiplied by Buyback price
per share and basic shares remaining after Buyback multiplied by post-Buyback price.
2008 Accretion (Dilution)
Buyback
Price
Total Amount of Buyback
(1)
$350.0
$375.0
$400.0
$425.0
$450.0
$27.00
13.7%
12.9%
12.1%
11.2%
10.1%
27.50
12.2%
11.2%
10.2%
9.0%
7.6%
28.00
10.8%
9.7%
8.4%
7.0%
5.4%
28.50
9.4%
8.2%
6.7%
5.1%
3.3%
29.00
8.2%
6.7%
5.2%
3.4%
1.4%

Conclusion
INTER-TEL STOCKHOLDERS SHOULD
VOTE
AGAINST
THE MITEL BUY-OUT
19