UNITED STATES
SECURITIES AND EXCHANGE COMMISSION
WASHINGTON, D.C. 20549
FORM N-CSR
CERTIFIED SHAREHOLDER REPORT OF REGISTERED
MANAGEMENT INVESTMENT COMPANIES
Investment Company Act file number: 811-03131
ALLIANCEBERNSTEIN GLOBAL THEMATIC GROWTH FUND, INC.
(Exact name of registrant as specified in charter)
1345 Avenue of the Americas, New York, New York 10105
(Address of principal executive offices) (Zip code)
Joseph J. Mantineo
AllianceBernstein L.P.
1345 Avenue of the Americas
New York, New York 10105
(Name and address of agent for service)
Registrant’s telephone number, including area code: (800) 221-5672
Date of fiscal year end: July 31, 2013
Date of reporting period: July 31, 2013
ITEM 1. REPORTS TO STOCKHOLDERS.
ANNUAL REPORT
AllianceBernstein
Global Thematic Growth Fund
Annual Report

Investment Products Offered
|
• Are Not FDIC Insured • May Lose Value • Are Not Bank Guaranteed |
Investors should consider the investment objectives, risks, charges and expenses of the Fund carefully before investing. For copies of our prospectus or summary prospectus, which contain this and other information, visit us online at www.alliancebernstein.com or contact your AllianceBernstein Investments representative. Please read the prospectus and/or summary prospectus carefully before investing.
This shareholder report must be preceded or accompanied by the Fund’s prospectus for individuals who are not current shareholders of the Fund.
You may obtain a description of the Fund’s proxy voting policies and procedures, and information regarding how the Fund voted proxies relating to portfolio securities during the most recent 12-month period ended June 30, without charge. Simply visit AllianceBernstein’s website at www.alliancebernstein.com, or go to the Securities and Exchange Commission’s (the “Commission”) website at www.sec.gov, or call AllianceBernstein at (800) 227-4618.
The Fund files its complete schedule of portfolio holdings with the Commission for the first and third quarters of each fiscal year on Form N-Q. The Fund’s Forms N-Q are available on the Commission’s website at www.sec.gov. The Fund’s Forms N-Q may also be reviewed and copied at the Commission’s Public Reference Room in Washington, DC; information on the operation of the Public Reference Room may be obtained by calling (800) SEC-0330. AllianceBernstein publishes full portfolio holdings for the Fund monthly at www.alliancebernstein.com.
AllianceBernstein Investments, Inc. (ABI) is the distributor of the AllianceBernstein family of mutual funds. ABI is a member of FINRA and is an affiliate of AllianceBernstein L.P., the manager of the funds.
AllianceBernstein® and the AB Logo are registered trademarks and service marks used by permission of the owner, AllianceBernstein L.P.
September 12, 2013
Annual Report
This report provides management’s discussion of fund performance for AllianceBernstein Global Thematic Growth Fund (the “Fund”) for the annual reporting period ended July 31, 2013.
Investment Objective and Policies
The Fund’s investment objective is long-term growth of capital. The Fund pursues opportunistic growth by investing in a global universe of companies in multiple industries that may benefit from innovation.
AllianceBernstein L.P. (the “Adviser”) employs a combination of “top-down” and “bottom-up” investment processes with the goal of identifying the most attractive securities worldwide, fitting into broader themes, which are developments that have broad effects across industries and companies. Drawing on the global fundamental and quantitative research capabilities of the Adviser, the Adviser seeks to identify long-term secular growth trends that will affect multiple industries. The Adviser will assess the effects of these trends, in the context of the business cycle, on entire industries and on individual companies. Through this process, the Adviser intends to identify key investment themes, which will be the focus of the Fund’s investments and which are expected to change over time based on the Adviser’s research.
In addition to this “top-down” thematic approach, the Adviser will also use a “bottom-up” analysis of individual companies that focuses on prospective earnings growth, valuation and quality of company management. The Adviser normally considers a large universe of mid- to large-capitalization companies worldwide for investment.
The Fund invests in securities issued by U.S. and non-U.S. companies from multiple industry sectors in an attempt to maximize opportunity, which should also tend to reduce risk. The Fund invests in both developed and emerging market countries. Under normal market conditions, the Fund invests significantly (at least 40%—unless market conditions are not deemed favorable by the Adviser) in securities of non-U.S. companies. In addition, the Fund invests, under normal circumstances, in the equity securities of companies located in at least three countries. The percentage of the Fund’s assets invested in securities of companies in a particular country or denominated in a particular currency varies in accordance with the Adviser’s assessment of the appreciation potential of such securities. The Fund may invest in any company and industry and in any type of security, listed and unlisted, with potential for capital appreciation. It invests in well-known, established companies as well as new, smaller or less-seasoned companies. Investments in new, smaller or less-seasoned companies may offer more reward but may also entail more risk than is generally true of larger, established companies. The Fund may also invest in synthetic foreign equity securities, real estate investment trusts and zero coupon bonds.
The Fund may, at times, invest in shares of exchange-traded funds (“ETFs”) in lieu of making direct
| | | | |
| ALLIANCEBERNSTEIN GLOBAL THEMATIC GROWTH FUND • | | | 1 | |
investments in securities. ETFs may provide more efficient and economical exposure to the types of companies and geographic locations in which the Fund seeks to invest than direct investments.
Currencies can have a dramatic impact on equity returns, significantly adding to returns in some years and greatly diminishing them in others. Currency and equity positions are evaluated separately. The Adviser may seek to hedge the currency exposure resulting from securities positions when it finds the currency exposure unattractive. To hedge a portion of its currency risk, the Fund may from time to time invest in currency-related derivatives, including forward currency exchange contracts, futures, options on futures, swaps and options. The Adviser may also seek investment opportunities by taking long or short positions in currencies through the use of currency-related derivatives.
The Fund may enter into other derivatives transactions, such as options, futures contracts, forwards and swaps. The Fund may use options strategies involving the purchase and/or writing of various combinations of call and/or put options, including on individual securities and stock indexes, futures contracts (including futures contracts on individual securities and stock indexes) or shares of ETFs. These transactions may be used, for example, in an effort to earn extra income, to adjust exposure to individual securities or markets, or to protect all or a portion of the Fund’s portfolio from a decline in value, sometimes within certain ranges.
Investment Results
The table on page 6 shows the Fund’s performance compared to its benchmark, the Morgan Stanley Capital International All Country (“MSCI AC”) World Index (net), for the six- and 12-month periods ended July 31, 2013.
During the twelve-month period, all share classes of the Fund gained in absolute terms and outperformed the benchmark, with security selection responsible for most of the outperformance, though net currency exposure also contributed. Sector allocation was negative. Stock selection in the technology sector (embedded in the Web 3.0-themed holdings) boosted relative performance. Stock selection in the materials sector (embedded in the now-liquidated ZIRPonomics theme) offset some of the gains.
For the six-month period, all share classes of the Fund gained in absolute terms, yet underperformed the benchmark, with security selection driving the underperformance. Sector allocation was positive and currency exposure was net positive. Stock selection in the technology sector (embedded in the Web 3.0-themed holdings) undercut relative performance, as did stock selection in the materials sector, which was embedded mostly in the ZIRPonomics theme. Stock selection in the energy sector (embedded in the Energy Transformation-themed holdings) mitigated some of the losses, as did overweight exposure to the consumer discretionary sector.
The Fund utilized derivatives (all for hedging and investment purposes) including forward currency exchange contracts, which detracted from performance during
| | |
| 2 | | • ALLIANCEBERNSTEIN GLOBAL THEMATIC GROWTH FUND |
both periods; purchased options, which had an immaterial impact during the six-month period and detracted during the 12-month period; and written options, which had an immaterial impact during both periods.
Market Review and Investment Strategy
The behavior of global equity markets during the 12-month period ended July 31, 2013 has been marked by activist central bank actions. Central banks in Europe, Australia, South Korea and India cut interest rates to fend off economic stagnation, while Brazil’s central bank raised interest rates to combat rising inflation. Japan’s central bank initiated aggressive reflationary policies to pull the country out of its decades-long deflationary spiral. Meanwhile, in a move to restructure the country’s financial system and rein in speculators, China’s central bank refused to provide large amounts of additional cash to the Chinese credit markets, resulting in a situation whereby interbank lending rates spiked, and financial institutions were afraid of lend to one another. However, the actions of
the U.S. Federal Reserve (the “Fed”) had the most impact on the capital markets: first, by implementing aggressive stimulus measures in September 2012 to spur the struggling American economic recovery, which sparked a liquidity-driven rally that supported risk assets; and later by announcing in June that it intended to wind down its massive bond-buying program in the near- to medium term, which sparked a worldwide selloff in equity, bond and currency markets on fears of rising global interest rates. Markets recouped some losses after the Fed gave assurances that monetary support would not be ending soon.
The Global Thematic Growth Investment Team (the “Team”) continues to identify companies involved in disruptive themes and offering valuations that, in the Team’s view, do not adequately capture their upside potential. The Team continues to focus on trends that persist regardless of the economic cycle, possessing what its analysis suggests to be longer-term growth fundamentals.
| | | | |
| ALLIANCEBERNSTEIN GLOBAL THEMATIC GROWTH FUND • | | | 3 | |
DISCLOSURES AND RISKS
Benchmark Disclosure
The unmanaged MSCI AC World Index (net) does not reflect fees and expenses associated with the active management of a mutual fund portfolio. The MSCI AC World Index (net; free float-adjusted, market capitalization weighted) represents the equity market performance of developed and emerging markets. Net returns include the reinvestment of dividends after deduction of non-U.S. withholding tax. MSCI makes no express or implied warranties or representations, and shall have no liability whatsoever with respect to any MSCI data contained herein. The MSCI data may not be further redistributed or used as a basis for other indices, any securities or financial products. This report is not approved, reviewed or produced by MSCI. An investor cannot invest directly in an index, and its results are not indicative of the performance for any specific investment, including the Fund.
A Word About Risk
Market Risk: The value of the Fund’s assets will fluctuate as the stock or bond market fluctuates. The value of its investments may decline, sometimes rapidly and unpredictably, simply because of economic changes or other events that affect large portions of the market. It includes the risk that a particular style of investing, such as growth, may underperform the market generally.
Foreign (Non-U.S.) Risk: Investments in securities of non-U.S. issuers may involve more risk than those of U.S. issuers. These securities may fluctuate more widely in price and may be less liquid due to adverse market, economic, political, regulatory or other factors.
Emerging Market Risk: Investments in emerging market countries may have more risk because the markets are less developed and less liquid as well as being subject to increased economic, political, regulatory, or other uncertainties.
Currency Risk: Fluctuations in currency exchange rates may negatively affect the value of the Fund’s investments or reduce its returns.
Capitalization Risk: Investments in small- and mid-capitalization companies may be more volatile than investments in large-capitalization companies. Investments in small-capitalization companies may have additional risks because these companies have limited product lines, markets or financial resources.
Focused Portfolio Risk: Investments in a limited number of companies may have more risk because changes in the value of a single security may have a more significant effect, either negative or positive, on the Fund’s net asset value (“NAV”).
Derivatives Risk: Investments in derivatives may be illiquid, difficult to price, and leveraged so that small changes may produce disproportionate losses for the Fund, and may be subject to counterparty risk to a greater degree than more traditional investments.
Management Risk: The Fund is subject to management risk because it is an actively managed investment fund. The Adviser will apply its investment techniques and risk analyses in making investment decisions for the Fund, but there is no guarantee that its techniques will produce the intended results.
These risks are fully discussed in the Fund’s prospectus.
An Important Note About Historical Performance
The investment return and principal value of an investment in the Fund will fluctuate, so that shares, when redeemed, may be worth more or less than their original cost. Performance shown on the following pages represents past performance and does not guarantee future results. Current performance may be lower or higher than the performance information shown. You may obtain performance information current to the most recent month-end by visiting www.alliancebernstein.com.
(Disclosures, Risks and Note about Historical Performance continued on next page)
| | |
| 4 | | • ALLIANCEBERNSTEIN GLOBAL THEMATIC GROWTH FUND |
Disclosures and Risks
DISCLOSURES AND RISKS
(continued from previous page)
All fees and expenses related to the operation of the Fund have been deducted. NAV returns do not reflect sales charges; if sales charges were reflected, the Fund’s quoted performance would be lower. SEC returns reflect the applicable sales charges for each share class: a 4.25% maximum front-end sales charge for Class A shares; the applicable contingent deferred sales charge for Class B shares (4% year 1, 3% year 2, 2% year 3, 1% year 4); a 1% 1-year contingent deferred sales charge for Class C shares. Returns for the different share classes will vary due to different expenses associated with each class. Performance assumes reinvestment of distributions and does not account for taxes.
| | | | |
| ALLIANCEBERNSTEIN GLOBAL THEMATIC GROWTH FUND • | | | 5 | |
Disclosures and Risks
HISTORICAL PERFORMANCE
| | | | | | | | | | |
| | | | | | | | | | |
THE FUND VS. ITS BENCHMARK PERIODS ENDED JULY 31, 2013 (unaudited) | | NAV Returns | | | |
| | 6 Months | | | 12 Months | | | |
| AllianceBernstein Global Thematic Growth Fund* | | | | | | | | | | |
Class A | | | 3.39% | | | | 22.59% | | | |
|
Class B† | | | 2.99% | | | | 21.64% | | | |
|
Class C | | | 3.02% | | | | 21.72% | | | |
|
Advisor Class‡ | | | 3.52% | | | | 22.95% | | | |
|
Class R‡ | | | 3.30% | | | | 22.45% | | | |
|
Class K‡ | | | 3.47% | | | | 22.86% | | | |
|
Class I‡ | | | 3.63% | | | | 23.33% | | | |
|
| MSCI AC World Index (net) | | | 6.23% | | | | 20.50% | | | |
|
* Includes the impact of proceeds received and credited to the Fund resulting from class action settlements, which enhanced the performance of all share classes of the Fund for the six- and 12-month periods ended July 31, 2013 by 0.01% and 0.05%, respectively. † Effective January 31, 2009, Class B shares are no longer available for purchase to new investors. Please see Note A for additional information. ‡ Please note that these share classes are for investors purchasing shares through accounts established under certain fee-based programs sponsored and maintained by certain broker-dealers and financial intermediaries, institutional pension plans and/or investment advisory clients of, and certain other persons associated with, the Adviser and its affiliates or the Fund. Please keep in mind that high, double-digit returns are highly unusual and cannot be sustained. Investors should also be aware that these returns were primarily achieved during favorable market conditions. |
| | | | | | | | | | |
See Disclosures, Risks and Note about Historical Performance on pages 4-5.
(Historical Performance continued on next page)
| | |
| 6 | | • ALLIANCEBERNSTEIN GLOBAL THEMATIC GROWTH FUND |
Historical Performance
HISTORICAL PERFORMANCE
(continued from previous page)
GROWTH OF A $10,000 INVESTMENT IN THE FUND 7/31/03 TO 7/31/13 (unaudited)
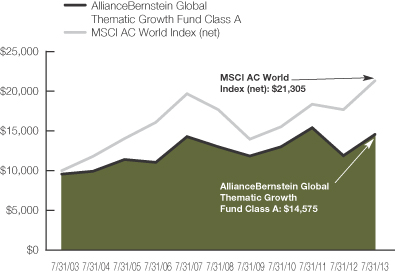
This chart illustrates the total value of an assumed $10,000 investment in AllianceBernstein Global Thematic Growth Fund Class A shares (from 7/31/03 to 7/31/13) as compared to the performance of the Fund’s benchmark. The chart reflects the deduction of the maximum 4.25% sales charge from the initial $10,000 investment in the Fund and assumes the reinvestment of dividends and capital gains distributions.
See Disclosures, Risks and Note about Historical Performance on pages 4-5.
(Historical Performance continued on next page)
| | | | |
| ALLIANCEBERNSTEIN GLOBAL THEMATIC GROWTH FUND • | | | 7 | |
Historical Performance
HISTORICAL PERFORMANCE
(continued from previous page)
| | | | | | | | |
| AVERAGE ANNUAL RETURNS AS OF JULY 31, 2013 (unaudited) | |
| | | NAV Returns | | | SEC Returns
(reflects applicable
sales charges) | |
| | | | | | | | |
| Class A Shares | | | | | | | | |
1 Year | | | 22.59 | % | | | 17.38 | % |
5 Years | | | 2.34 | % | | | 1.45 | % |
10 Years | | | 4.29 | % | | | 3.84 | % |
| | | | | | | | |
| Class B Shares | | | | | | | | |
1 Year | | | 21.64 | % | | | 17.64 | % |
5 Years | | | 1.51 | % | | | 1.51 | % |
10 Years(a) | | | 3.63 | % | | | 3.63 | % |
| | | | | | | | |
| Class C Shares | | | | | | | | |
1 Year | | | 21.72 | % | | | 20.72 | % |
5 Years | | | 1.58 | % | | | 1.58 | % |
10 Years | | | 3.53 | % | | | 3.53 | % |
| | | | | | | | |
| Advisor Class Shares† | | | | | | | | |
1 Year | | | 22.95 | % | | | 22.95 | % |
5 Years | | | 2.64 | % | | | 2.64 | % |
10 Years | | | 4.61 | % | | | 4.61 | % |
| | | | | | | | |
| Class R Shares† | | | | | | | | |
1 Year | | | 22.45 | % | | | 22.45 | % |
5 Years | | | 2.30 | % | | | 2.30 | % |
Since Inception* | | | 2.94 | % | | | 2.94 | % |
| | | | | | | | |
| Class K Shares† | | | | | | | | |
1 Year | | | 22.86 | % | | | 22.86 | % |
5 Years | | | 2.62 | % | | | 2.62 | % |
Since Inception* | | | 3.77 | % | | | 3.77 | % |
| | | | | | | | |
| Class I Shares† | | | | | | | | |
1 Year | | | 23.33 | % | | | 23.33 | % |
5 Years | | | 2.99 | % | | | 2.99 | % |
Since Inception* | | | 4.12 | % | | | 4.12 | % |
The Fund’s current prospectus fee table shows the Fund’s total annual operating expense ratios as 1.57%, 2.41%, 2.32%, 1.27%, 1.62%, 1.31% and 0.91% for Class A, Class B, Class C, Advisor Class, Class R, Class K and Class I shares, respectively. The Financial Highlights section of this report sets forth expense ratio data for the current reporting period; the expense ratios shown above may differ from the expense ratios in the Financial Highlights section since they are based on different time periods.
| (a) | | Assumes conversion of Class B shares into Class A shares after eight years. |
| † | | These share classes are offered at NAV to eligible investors and their SEC returns are the same as their NAV returns. Please note that these share classes are for investors purchasing shares through accounts established under certain fee-based programs sponsored and maintained by certain broker-dealers and financial intermediaries, institutional pension plans and/or investment advisory clients of, and certain other persons associated with, the Adviser and its affiliates or the Fund. The inception dates for Class R, Class K and Class I shares are listed below. |
| * | | Inception dates: 11/3/2003 for Class R shares; 3/1/2005 for Class K and Class I shares. |
See Disclosures, Risks and Note about Historical Performance on pages 4-5.
(Historical Performance continued on next page)
| | |
| 8 | | • ALLIANCEBERNSTEIN GLOBAL THEMATIC GROWTH FUND |
Historical Performance
HISTORICAL PERFORMANCE
(continued from previous page)
| | | | |
SEC AVERAGE ANNUAL RETURNS AS OF THE MOST RECENT CALENDAR QUARTER-END JUNE 30, 2013 (unaudited) | |
| | | SEC Returns
(reflects applicable
sales charges) | |
| | | | |
| Class A Shares | | | | |
1 Year | | | 7.60 | % |
5 Years | | | -0.01 | % |
10 Years | | | 4.05 | % |
| | | | |
| Class B Shares | | | | |
1 Year | | | 7.51 | % |
5 Years | | | 0.04 | % |
10 Years(a) | | | 3.84 | % |
| | | | |
| Class C Shares | | | | |
1 Year | | | 10.57 | % |
5 Years | | | 0.11 | % |
10 Years | | | 3.74 | % |
| | | | |
| Advisor Class Shares† | | | | |
1 Year | | | 12.72 | % |
5 Years | | | 1.16 | % |
10 Years | | | 4.82 | % |
| | | | |
| Class R Shares† | | | | |
1 Year | | | 12.26 | % |
5 Years | | | 0.83 | % |
Since Inception* | | | 2.47 | % |
| | | | |
| Class K Shares† | | | | |
1 Year | | | 12.62 | % |
5 Years | | | 1.14 | % |
Since Inception* | | | 3.23 | % |
| | | | |
| Class I Shares† | | | | |
1 Year | | | 13.06 | % |
5 Years | | | 1.51 | % |
Since Inception* | | | 3.58 | % |
| (a) | | Assumes conversion of Class B shares into Class A shares after eight years. |
| † | | Please note that these share classes are for investors purchasing shares through accounts established under certain fee-based programs sponsored and maintained by certain broker-dealers and financial intermediaries, institutional pension plans and/or investment advisory clients of, and certain other persons associated with, the Adviser and its affiliates or the Fund. The inception dates for Class R, Class K and Class I shares are listed below. |
| * | | Inception dates: 11/3/2003 for Class R shares; 3/1/2005 for Class K and Class I shares. |
See Disclosures, Risks and Note about Historical Performance on page 4-5.
| | | | |
| ALLIANCEBERNSTEIN GLOBAL THEMATIC GROWTH FUND • | | | 9 | |
Historical Performance
EXPENSE EXAMPLE
(unaudited)
As a shareholder of the Fund, you incur two types of costs: (1) transaction costs, including sales charges (loads) on purchase payments, contingent deferred sales charges on redemptions and (2) ongoing costs, including management fees; distribution (12b-1) fees; and other Fund expenses. This example is intended to help you understand your ongoing costs (in dollars) of investing in the Fund and to compare these costs with the ongoing costs of investing in other mutual funds.
The Example is based on an investment of $1,000 invested at the beginning of the period and held for the entire period as indicated below.
Actual Expenses
The table below provides information about actual account values and actual expenses. You may use the information, together with the amount you invested, to estimate the expenses that you paid over the period. Simply divide your account value by $1,000 (for example, an $8,600 account value divided by $1,000 = 8.6), then multiply the result by the number under the heading entitled “Expenses Paid During Period” to estimate the expenses you paid on your account during this period.
Hypothetical Example for Comparison Purposes
The table below also provides information about hypothetical account values and hypothetical expenses based on the Fund’s actual expense ratio and an assumed annual rate of return of 5% before expenses, which is not the Fund’s actual return. The hypothetical account values and expenses may not be used to estimate the actual ending account balance or expenses you paid for the period. You may use this information to compare the ongoing costs of investing in the Fund and other funds by comparing this 5% hypothetical example with the 5% hypothetical examples that appear in the shareholder reports of other funds.
Please note that the expenses shown in the table are meant to highlight your ongoing costs only and do not reflect any transactional costs, such as sales charges (loads), or contingent deferred sales charges on redemptions. Therefore, the hypothetical example is useful in comparing ongoing costs only, and will not help you determine the relative total costs of owning different funds. In addition, if these transactional costs were included, your costs would have been higher.
| | | | | | | | | | | | | | | | |
| | | Beginning
Account Value
February 1, 2013 | | | Ending
Account Value
July 31, 2013 | | | Expenses Paid
During Period* | | | Annualized
Expense Ratio* | |
| Class A | | | | | | | | | | | | | | | | |
Actual | | $ | 1,000 | | | $ | 1,033.90 | | | $ | 7.36 | | | | 1.46 | % |
Hypothetical** | | $ | 1,000 | | | $ | 1,017.55 | | | $ | 7.30 | | | | 1.46 | % |
| Class B | | | | | | | | | | | | | | | | |
Actual | | $ | 1,000 | | | $ | 1,029.90 | | | $ | 11.22 | | | | 2.23 | % |
Hypothetical** | | $ | 1,000 | | | $ | 1,013.74 | | | $ | 11.13 | | | | 2.23 | % |
| Class C | | | | | | | | | | | | | | | | |
Actual | | $ | 1,000 | | | $ | 1,030.20 | | | $ | 10.97 | | | | 2.18 | % |
Hypothetical** | | $ | 1,000 | | | $ | 1,013.98 | | | $ | 10.89 | | | | 2.18 | % |
| Advisor Class | | | | | | | | | | | | | | | | |
Actual | | $ | 1,000 | | | $ | 1,035.20 | | | $ | 5.90 | | | | 1.17 | % |
Hypothetical** | | $ | 1,000 | | | $ | 1,018.99 | | | $ | 5.86 | | | | 1.17 | % |
| Class R | | | | | | | | | | | | | | | | |
Actual | | $ | 1,000 | | | $ | 1,033.00 | | | $ | 8.07 | | | | 1.60 | % |
Hypothetical** | | $ | 1,000 | | | $ | 1,016.86 | | | $ | 8.00 | | | | 1.60 | % |
| Class K | | | | | | | | | | | | | | | | |
Actual | | $ | 1,000 | | | $ | 1,034.70 | | | $ | 6.41 | | | | 1.27 | % |
Hypothetical** | | $ | 1,000 | | | $ | 1,018.50 | | | $ | 6.36 | | | | 1.27 | % |
| Class I | | | | | | | | | | | | | | | | |
Actual | | $ | 1,000 | | | $ | 1,036.30 | | | $ | 4.54 | | | | 0.90 | % |
Hypothetical** | | $ | 1,000 | | | $ | 1,020.33 | | | $ | 4.51 | | | | 0.90 | % |
| * | | Expenses are equal to the classes’ annualized expense ratios multiplied by the average account value over the period, multiplied by 181/365 (to reflect the one-half year period). |
| ** | | Assumes 5% annual return before expenses. |
| | |
| 10 | | • ALLIANCEBERNSTEIN GLOBAL THEMATIC GROWTH FUND |
Expense Example
PORTFOLIO SUMMARY
July 31, 2013 (unaudited)
PORTFOLIO STATISTICS
Net Assets ($mil): $739.6
-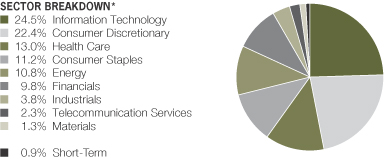
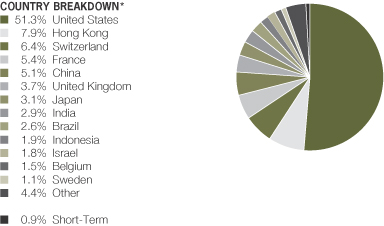
| * | | All data are as of July 31, 2013. The Fund’s sector and country breakdowns are expressed as a percentage of total investments (excluding the security lending) and may vary over time. The Fund also enters into derivative transactions, which may be used for hedging or investment purposes (see “Portfolio of Investments” section of the report for additional details). “Other” country weightings represent 1.1% or less in the following countries: Luxembourg, Mexico, Netherlands, Russia and Singapore. |
Please note: The sector classifications presented herein are based on the Global Industry Classification Standard (GICS) which was developed by Morgan Stanley Capital International and Standard & Poor’s. The components are divided into sector, industry group, and industry sub-indices as classified by the GICS for each of the market capitalization indices in the broad market. These sector classifications are broadly defined. The “Portfolio of Investments” section of the report reflects more specific industry information and is consistent with the investment restrictions discussed in the Fund’s prospectus.
| | | | |
| ALLIANCEBERNSTEIN GLOBAL THEMATIC GROWTH FUND • | | | 11 | |
Portfolio Summary
TEN LARGEST HOLDINGS*
July 31, 2013 (unaudited)
| | | | | | | | |
| Company | | U.S. $ Value | | | Percent of
Net Assets | |
Illumina, Inc. | | $ | 21,675,121 | | | | 2.9 | % |
Amazon.com, Inc. | | | 19,857,025 | | | | 2.7 | |
Cie Financiere Richemont SA (SWX Europe) | | | 15,842,362 | | | | 2.1 | |
Ctrip.com International Ltd. (ADR) | | | 15,798,519 | | | | 2.1 | |
AIA Group Ltd. | | | 14,184,864 | | | | 1.9 | |
Mellanox Technologies Ltd. | | | 13,143,594 | | | | 1.8 | |
Apple, Inc. | | | 12,923,400 | | | | 1.8 | |
Roche Holding AG | | | 12,754,792 | | | | 1.7 | |
Tencent Holdings Ltd. | | | 12,629,774 | | | | 1.7 | |
Red Hat, Inc. | | | 12,264,468 | | | | 1.7 | |
| | $ | 151,073,919 | | | | 20.4 | % |
| | |
| 12 | | • ALLIANCEBERNSTEIN GLOBAL THEMATIC GROWTH FUND |
Ten Largest Holdings
PORTFOLIO OF INVESTMENTS
July 31, 2013
| | | | | | | | |
| Company | | Shares | | | U.S. $ Value | |
| |
| | | | | | | | |
COMMON STOCKS – 99.2% | | | | | | | | |
Information Technology – 24.6% | | | | | | | | |
Communications Equipment – 0.7% | | | | | | | | |
QUALCOMM, Inc. | | | 84,710 | | | $ | 5,468,030 | |
| | | | | | | | |
| | |
Computers & Peripherals – 5.5% | | | | | | | | |
Apple, Inc. | | | 28,560 | | | | 12,923,400 | |
Fusion-io, Inc.(a)(b) | | | 651,688 | | | | 9,397,341 | |
Silicon Graphics International Corp.(a)(b) | | | 608,522 | | | | 11,452,384 | |
Stratasys Ltd.(a)(b) | | | 74,600 | | | | 6,613,290 | |
| | | | | | | | |
| | | | | | | 40,386,415 | |
| | | | | | | | |
Internet Software & Services – 7.5% | | | | | | | | |
Cornerstone OnDemand, Inc.(a) | | | 221,853 | | | | 9,770,406 | |
eBay, Inc.(a) | | | 137,580 | | | | 7,111,510 | |
Google, Inc. – Class A(a) | | | 10,648 | | | | 9,451,165 | |
LinkedIn Corp. – Class A(a) | | | 42,804 | | | | 8,723,027 | |
Tencent Holdings Ltd. | | | 279,000 | | | | 12,629,774 | |
Yelp, Inc.(a) | | | 181,917 | | | | 7,604,131 | |
| | | | | | | | |
| | | | | | | 55,290,013 | |
| | | | | | | | |
IT Services – 1.9% | | | | | | | | |
QIWI PLC (Sponsored ADR) | | | 183,388 | | | | 5,263,236 | |
Visa, Inc. – Class A | | | 50,730 | | | | 8,979,717 | |
| | | | | | | | |
| | | | | | | 14,242,953 | |
| | | | | | | | |
Semiconductors & Semiconductor
Equipment – 3.8% | | | | | | | | |
Mellanox Technologies Ltd.(a)(b) | | | 287,921 | | | | 13,143,594 | |
NVIDIA Corp. | | | 507,502 | | | | 7,323,254 | |
NXP Semiconductor NV(a) | | | 238,740 | | | | 7,794,861 | |
| | | | | | | | |
| | | | | | | 28,261,709 | |
| | | | | | | | |
Software – 5.2% | | | | | | | | |
NetSuite, Inc.(a) | | | 88,608 | | | | 8,319,405 | |
Red Hat, Inc.(a) | | | 236,903 | | | | 12,264,468 | |
Salesforce.com, Inc.(a) | | | 203,280 | | | | 8,893,500 | |
Splunk, Inc.(a) | | | 172,377 | | | | 8,620,574 | |
| | | | | | | | |
| | | | | | | 38,097,947 | |
| | | | | | | | |
| | | | | | | 181,747,067 | |
| | | | | | | | |
Consumer Discretionary – 22.5% | | | | | | | | |
Automobiles – 2.9% | | | | | | | | |
Harley-Davidson, Inc. | | | 169,360 | | | | 9,614,567 | |
Nissan Motor Co., Ltd. | | | 709,200 | | | | 7,405,595 | |
Tesla Motors, Inc.(a)(b) | | | 35,821 | | | | 4,810,044 | |
| | | | | | | | |
| | | | | | | 21,830,206 | |
| | | | | | | | |
Diversified Consumer Services – 1.0% | | | | | | | | |
Kroton Educacional SA | | | 534,400 | | | | 7,613,036 | |
| | | | | | | | |
| | |
Hotels, Restaurants & Leisure – 2.5% | | | | | | | | |
Melco Crown Entertainment Ltd. (ADR)(a)(b) | | | 375,290 | | | | 9,337,215 | |
Yum! Brands, Inc. | | | 124,140 | | | | 9,052,289 | |
| | | | | | | | |
| | | | | | | 18,389,504 | |
| | | | | | | | |
| | | | |
| ALLIANCEBERNSTEIN GLOBAL THEMATIC GROWTH FUND • | | | 13 | |
Portfolio of Investments
| | | | | | | | |
| Company | | Shares | | | U.S. $ Value | |
| |
| | | | | | | | |
Internet & Catalog Retail – 6.4% | | | | | | | | |
Amazon.com, Inc.(a) | | | 65,922 | | | $ | 19,857,025 | |
Ctrip.com International Ltd. (ADR)(a) | | | 431,300 | | | | 15,798,519 | |
priceline.com, Inc.(a) | | | 13,430 | | | | 11,760,248 | |
| | | | | | | | |
| | | | | | | 47,415,792 | |
| | | | | | | | |
Media – 1.0% | | | | | | | | |
Walt Disney Co. (The) | | | 112,620 | | | | 7,280,883 | |
| | | | | | | | |
| | |
Multiline Retail – 1.0% | | | | | | | | |
Matahari Department Store Tbk PT(a) | | | 5,851,000 | | | | 7,080,288 | |
| | | | | | | | |
| | |
Specialty Retail – 3.0% | | | | | | | | |
Belle International Holdings Ltd. | | | 4,537,000 | | | | 6,542,167 | |
L’Occitane International SA | | | 2,551,000 | | | | 5,714,023 | |
Zhongsheng Group Holdings Ltd.(b) | | | 9,364,000 | | | | 9,708,952 | |
| | | | | | | | |
| | | | | | | 21,965,142 | |
| | | | | | | | |
Textiles, Apparel & Luxury Goods – 4.7% | | | | | | | | |
Cie Financiere Richemont SA (SWX Europe) | | | 161,950 | | | | 15,842,362 | |
NIKE, Inc. – Class B | | | 174,500 | | | | 10,979,540 | |
Samsonite International SA | | | 2,832,300 | | | | 7,751,762 | |
| | | | | | | | |
| | | | | | | 34,573,664 | |
| | | | | | | | |
| | | | | | | 166,148,515 | |
| | | | | | | | |
Health Care – 13.0% | | | | | | | | |
Biotechnology – 2.4% | | | | | | | | |
Cepheid, Inc.(a) | | | 254,452 | | | | 8,872,741 | |
Quintiles Transnational Holdings, Inc.(a) | | | 203,937 | | | | 9,146,575 | |
| | | | | | | | |
| | | | | | | 18,019,316 | |
| | | | | | | | |
Health Care Equipment & Supplies – 3.6% | | | | | | | | |
Elekta AB(b) | | | 469,550 | | | | 8,040,836 | |
Essilor International SA | | | 99,550 | | | | 11,141,336 | |
Intuitive Surgical, Inc.(a) | | | 18,576 | | | | 7,207,488 | |
| | | | | | | | |
| | | | | | | 26,389,660 | |
| | | | | | | | |
Life Sciences Tools & Services – 2.9% | | | | | | | | |
Illumina, Inc.(a) | | | 271,550 | | | | 21,675,121 | |
| | | | | | | | |
| | |
Pharmaceuticals – 4.1% | | | | | | | | |
Bristol-Myers Squibb Co. | | | 230,810 | | | | 9,980,224 | |
Roche Holding AG | | | 51,830 | | | | 12,754,792 | |
Sun Pharmaceutical Industries Ltd. | | | 840,140 | | | | 7,762,800 | |
| | | | | | | | |
| | | | | | | 30,497,816 | |
| | | | | | | | |
| | | | | | | 96,581,913 | |
| | | | | | | | |
Consumer Staples – 11.2% | | | | | | | | |
Beverages – 4.2% | | | | | | | | |
Anheuser-Busch InBev NV | | | 115,990 | | | | 11,153,750 | |
Diageo PLC | | | 360,680 | | | | 11,303,283 | |
Pernod-Ricard SA | | | 73,120 | | | | 8,724,429 | |
| | | | | | | | |
| | | | | | | 31,181,462 | |
| | | | | | | | |
| | |
| 14 | | • ALLIANCEBERNSTEIN GLOBAL THEMATIC GROWTH FUND |
Portfolio of Investments
| | | | | | | | |
| Company | | Shares | | | U.S. $ Value | |
| |
| | | | | | | | |
Food & Staples Retailing – 0.8% | | | | | | | | |
Raia Drogasil SA | | | 679,800 | | | $ | 5,751,042 | |
| | | | | | | | |
| | |
Food Products – 4.1% | | | | | | | | |
Danone SA | | | 145,210 | | | | 11,499,982 | |
Mead Johnson Nutrition Co. – Class A | | | 132,660 | | | | 9,662,954 | |
Nestle SA | | | 136,030 | | | | 9,206,864 | |
| | | | | | | | |
| | | | | | | 30,369,800 | |
| | | | | | | | |
Personal Products – 1.2% | | | | | | | | |
Estee Lauder Cos., Inc. (The) – Class A | | | 134,050 | | | | 8,800,383 | |
| | | | | | | | |
| | |
Tobacco – 0.9% | | | | | | | | |
British American Tobacco PLC | | | 133,020 | | | | 7,096,187 | |
| | | | | | | | |
| | | | | | | 83,198,874 | |
| | | | | | | | |
Energy – 10.7% | | | | | | | | |
Energy Equipment & Services – 5.6% | | | | | | | | |
National Oilwell Varco, Inc. | | | 124,880 | | | | 8,762,830 | |
Oceaneering International, Inc. | | | 149,400 | | | | 12,114,846 | |
Schlumberger Ltd. | | | 144,410 | | | | 11,744,865 | |
Technip SA | | | 81,490 | | | | 8,991,484 | |
| | | | | | | | |
| | | | | | | 41,614,025 | |
| | | | | | | | |
Oil, Gas & Consumable Fuels – 5.1% | | | | | | | | |
BG Group PLC | | | 502,590 | | | | 9,062,785 | |
Concho Resources, Inc.(a) | | | 102,190 | | | | 9,165,421 | |
EOG Resources, Inc. | | | 68,860 | | | | 10,018,441 | |
Noble Energy, Inc. | | | 155,710 | | | | 9,730,318 | |
| | | | | | | | |
| | | | | | | 37,976,965 | |
| | | | | | | | |
| | | | | | | 79,590,990 | |
| | | | | | | | |
Financials – 9.8% | | | | | | | | |
Capital Markets – 1.3% | | | | | | | | |
UBS AG(a) | | | 502,810 | | | | 9,890,273 | |
| | | | | | | | |
| | |
Commercial Banks – 2.3% | | | | | | | | |
BOC Hong Kong Holdings Ltd. | | | 3,402,500 | | | | 10,674,512 | |
Grupo Financiero Banorte SAB de CV – Class O | | | 980,140 | | | | 6,182,684 | |
| | | | | | | | |
| | | | | | | 16,857,196 | |
| | | | | | | | |
Insurance – 1.9% | | | | | | | | |
AIA Group Ltd. | | | 2,996,800 | | | | 14,184,864 | |
| | | | | | | | |
| | |
Real Estate Management & Development – 3.2% | | | | | | | | |
BR Malls Participacoes SA | | | 641,600 | | | | 5,686,612 | |
Global Logistic Properties Ltd. | | | 3,392,000 | | | | 7,564,252 | |
Hang Lung Group Ltd. | | | 1,931,000 | | | | 9,953,140 | |
| | | | | | | | |
| | | | | | | 23,204,004 | |
| | | | | | | | |
Thrifts & Mortgage Finance – 1.1% | | | | | | | | |
Housing Development Finance Corp. | | | 628,190 | | | | 8,284,178 | |
| | | | | | | | |
| | | | | | | 72,420,515 | |
| | | | | | | | |
| | | | |
| ALLIANCEBERNSTEIN GLOBAL THEMATIC GROWTH FUND • | | | 15 | |
Portfolio of Investments
| | | | | | | | |
| Company | | Shares | | | U.S. $ Value | |
| |
| | | | | | | | |
Industrials – 3.8% | | | | | | | | |
Construction & Engineering – 0.8% | | | | | | | | |
Larsen & Toubro Ltd. | | | 389,610 | | | $ | 5,423,651 | |
| | | | | | | | |
| | |
Electrical Equipment – 1.1% | | | | | | | | |
Babcock & Wilcox Co. (The) | | | 273,465 | | | | 8,351,621 | |
| | | | | | | | |
| | |
Machinery – 1.9% | | | | | | | | |
FANUC Corp. | | | 36,700 | | | | 5,556,838 | |
Proto Labs, Inc.(a)(b) | | | 129,130 | | | | 8,738,227 | |
| | | | | | | | |
| | | | | | | 14,295,065 | |
| | | | | | | | |
| | | | | | | 28,070,337 | |
| | | | | | | | |
Telecommunication Services – 2.3% | | | | | | | | |
Wireless Telecommunication
Services – 2.3% | | | | | | | | |
Softbank Corp. | | | 152,700 | | | | 9,692,842 | |
Tower Bersama Infrastructure Tbk PT(a) | | | 12,913,500 | | | | 7,157,947 | |
| | | | | | | | |
| | | | | | | 16,850,789 | |
| | | | | | | | |
Materials – 1.3% | | | | | | | | |
Chemicals – 1.3% | | | | | | | | |
Monsanto Co. | | | 96,981 | | | | 9,579,783 | |
| | | | | | | | |
| | |
Total Common Stocks
(cost $650,296,527) | | | | | | | 734,188,783 | |
| | | | | | | | |
| | | | | | | | |
SHORT-TERM INVESTMENTS – 0.9% | | | | | | | | |
Investment Companies – 0.9% | | | | | | | | |
AllianceBernstein Fixed-Income Shares, Inc. – Government STIF Portfolio, 0.09%(c)
(cost $6,419,248) | | | 6,419,248 | | | | 6,419,248 | |
| | | | | | | | |
Total Investments Before Security Lending Collateral for Securities Loaned – 100.1% (cost $656,715,775) | | | | | | | 740,608,031 | |
| | | | | | | | |
INVESTMENTS OF CASH COLLATERAL FOR SECURITIES LOANED – 6.5% | | | | | | | | |
Investment Companies – 6.5% | | | | | | | | |
AllianceBernstein Exchange Reserves – Class I,
0.07%(c) (cost $47,965,221) | | | 47,965,221 | | | | 47,965,221 | |
| | | | | | | | |
| | |
Total Investments – 106.6%
(cost $704,680,996) | | | | | | | 788,573,252 | |
Other assets less liabilities – (6.6)% | | | | | | | (48,936,511 | ) |
| | | | | | | | |
| | |
Net Assets – 100.0% | | | | | | $ | 739,636,741 | |
| | | | | | | | |
| | |
| 16 | | • ALLIANCEBERNSTEIN GLOBAL THEMATIC GROWTH FUND |
Portfolio of Investments
FORWARD CURRENCY EXCHANGE CONTRACTS (see Note D)
| | | | | | | | | | | | | | | | |
| Counterparty | | Contracts to
Deliver (000) | | | In Exchange
For (000) | | | Settlement
Date | | | Unrealized
Appreciation/
(Depreciation) | |
Barclays Bank PLC Wholesale | | | EUR 29,137 | | | | USD 38,483 | | | | 9/17/13 | | | $ | (285,903 | ) |
Barclays Bank PLC Wholesale | | | USD 13,425 | | | | CAD 13,812 | | | | 9/17/13 | | | | 7,050 | |
BNP Paribas SA | | | AUD 23,165 | | | | USD 21,139 | | | | 9/17/13 | | | | 381,329 | |
BNP Paribas SA | | | USD 43,341 | | | | AUD 46,656 | | | | 9/17/13 | | | | (1,534,987 | ) |
BNP Paribas SA | | | USD 25,787 | | | | CAD 26,328 | | | | 9/17/13 | | | | (182,115 | ) |
BNP Paribas SA | | | USD 16,993 | | | | JPY 1,676,641 | | | | 9/17/13 | | | | 135,587 | |
Citibank, NA | | | USD 10,432 | | | | EUR 7,867 | | | | 9/17/13 | | | | 35,641 | |
Goldman Sachs Capital Markets LP | | | USD 12,611 | | | | JPY 1,236,154 | | | | 9/17/13 | | | | 17,785 | |
HSBC Bank USA | | | GBP 10,328 | | | | USD 15,953 | | | | 9/17/13 | | | | 246,273 | |
JPMorgan Chase Bank, NA | | | JPY 689,983 | | | | USD 7,041 | | | | 9/17/13 | | | | (7,398 | ) |
Morgan Stanley & Co., Inc. | | | USD 38,369 | | | | GBP 24,675 | | | | 9/17/13 | | | | (843,848 | ) |
Royal Bank of Canada | | | CAD 26,328 | | | | USD 25,324 | | | | 9/17/13 | | | | (280,074 | ) |
Royal Bank of Scotland PLC | | | GBP 7,956 | | | | USD 12,211 | | | | 9/17/13 | | | | 111,425 | |
Royal Bank of Scotland PLC | | | USD 49,603 | | | | EUR 37,425 | | | | 9/17/13 | | | | 193,015 | |
Standard Chartered Bank | | | HKD 333,030 | | | | USD 42,937 | | | | 9/17/13 | | | | (11,829 | ) |
UBS AG | | | CHF 20,109 | | | | USD 21,642 | | | | 9/17/13 | | | | (94,685 | ) |
| | | | | | | | | | | | | | | | |
| | | | | | | | | | | | | | $ | (2,112,734 | ) |
| | | | | | | | | | | | | | | | |
| (a) | | Non-income producing security. |
| (b) | | Represents entire or partial securities out on loan. See Note E for securities lending information. |
| (c) | | Investment in affiliated money market mutual fund. The rate shown represents the 7-day yield as of period end. |
Currency Abbreviations:
AUD – Australian Dollar
CAD – Canadian Dollar
CHF – Swiss Franc
EUR – Euro
GBP – Great British Pound
HKD – Hong Kong Dollar
JPY – Japanese Yen
USD – United States Dollar
Glossary:
ADR – American Depositary Receipt
See notes to financial statements.
| | | | |
| ALLIANCEBERNSTEIN GLOBAL THEMATIC GROWTH FUND • | | | 17 | |
Portfolio of Investments
STATEMENT OF ASSETS & LIABILITIES
July 31, 2013
| | | | |
| Assets | | | | |
Investments in securities, at value | | | | |
Unaffiliated issuers (cost $650,296,527) | | $ | 734,188,783 | (a) |
Affiliated issuers (cost $54,384,469—including investment of cash collateral for securities loaned of $47,965,221) | | | 54,384,469 | |
Foreign currencies, at value (cost $2,267,563) | | | 2,327,583 | |
Receivable for investment securities sold | | | 3,689,900 | |
Unrealized appreciation of forward currency exchange contracts | | | 1,128,105 | |
Dividends and interest receivable | | | 624,078 | |
Receivable for capital stock sold | | | 160,711 | |
| | | | |
Total assets | | | 796,503,629 | |
| | | | |
| Liabilities | | | | |
Payable for collateral received on securities loaned | | | 47,965,221 | |
Unrealized depreciation of forward currency exchange contracts | | | 3,240,839 | |
Payable for capital stock redeemed | | | 1,882,128 | |
Payable for investment securities purchased | | | 1,722,156 | |
Advisory fee payable | | | 1,389,403 | |
Distribution fee payable | | | 229,481 | |
Transfer Agent fee payable | | | 136,405 | |
Administrative fee payable | | | 17,341 | |
Accrued expenses | | | 283,914 | |
| | | | |
Total liabilities | | | 56,866,888 | |
| | | | |
Net Assets | | $ | 739,636,741 | |
| | | | |
| Composition of Net Assets | | | | |
Capital stock, at par | | $ | 106,440 | |
Additional paid-in capital | | | 1,042,048,015 | |
Distributions in excess of net investment income | | | (13,780,695 | ) |
Accumulated net realized loss on investment
and foreign currency transactions | | | (370,607,815 | ) |
Net unrealized appreciation on investments
and foreign currency denominated assets and liabilities | | | 81,870,796 | |
| | | | |
| | $ | 739,636,741 | |
| | | | |
Net Asset Value Per Share—21 billion shares of capital stock authorized, $.01 par value
| | | | | | | | | | | | |
| Class | | Net Assets | | | Shares
Outstanding | | | Net Asset
Value | |
| |
| A | | $ | 569,052,921 | | | | 8,042,473 | | | $ | 70.76 | * |
| |
| B | | $ | 22,077,323 | | | | 366,457 | | | $ | 60.25 | |
| |
| C | | $ | 74,285,497 | | | | 1,225,106 | | | $ | 60.64 | |
| |
| Advisor | | $ | 59,189,095 | | | | 799,260 | | | $ | 74.05 | |
| |
| R | | $ | 5,829,284 | | | | 82,868 | | | $ | 70.34 | |
| |
| K | | $ | 8,810,462 | | | | 122,532 | | | $ | 71.90 | |
| |
| I | | $ | 392,159 | | | | 5,325 | | | $ | 73.64 | |
| |
| (a) | | Includes securities on loan with a value of $46,607,139 (see Note E). |
| * | | The maximum offering price per share for Class A shares was $73.90 which reflects a sales charge of 4.25%. |
See notes to financial statements.
| | |
| 18 | | • ALLIANCEBERNSTEIN GLOBAL THEMATIC GROWTH FUND |
Statement of Assets & Liabilities
STATEMENT OF OPERATIONS
Year Ended July 31, 2013
| | | | | | | | |
| Investment Income | | | | | | | | |
Dividends | | | | | | | | |
Unaffiliated issuers (net of foreign taxes withheld of $193,708) | | $ | 5,807,622 | | | | | |
Affiliated issuers | | | 203,027 | | | | | |
Securities lending income | | | 6,576,431 | | | $ | 12,587,080 | |
| | | | | | | | |
| Expenses | | | | | | | | |
Advisory fee (see Note B) | | | 5,848,594 | | | | | |
Distribution fee—Class A | | | 1,775,723 | | | | | |
Distribution fee—Class B | | | 253,755 | | | | | |
Distribution fee—Class C | | | 794,296 | | | | | |
Distribution fee—Class R | | | 35,391 | | | | | |
Distribution fee—Class K | | | 22,416 | | | | | |
Transfer agency—Class A | | | 2,140,528 | | | | | |
Transfer agency—Class B | | | 115,502 | | | | | |
Transfer agency—Class C | | | 310,318 | | | | | |
Transfer agency—Advisor Class | | | 257,379 | | | | | |
Transfer agency—Class R | | | 18,404 | | | | | |
Transfer agency—Class K | | | 16,889 | | | | | |
Transfer agency—Class I | | | 1,385 | | | | | |
Custodian | | | 242,677 | | | | | |
Printing | | | 193,885 | | | | | |
Registration fees | | | 78,583 | | | | | |
Audit | | | 68,377 | | | | | |
Directors’ fees | | | 63,227 | | | | | |
Administrative | | | 42,070 | | | | | |
Legal | | | 35,945 | | | | | |
Miscellaneous | | | 73,081 | | | | | |
| | | | | | | | |
Total expenses | | | | | | | 12,388,425 | |
| | | | | | | | |
Net investment income | | | | | | | 198,655 | |
| | | | | | | | |
| Realized and Unrealized Gain (Loss) on Investment and Foreign Currency Transactions | | | | | | | | |
Net realized gain (loss) on: | | | | | | | | |
Investment transactions | | | | | | | 24,635,532 | |
Options written | | | | | | | 780,876 | |
Foreign currency transactions | | | | | | | (4,859,288 | ) |
Net change in unrealized appreciation/depreciation of: | | | | | | | | |
Investments | | | | | | | 145,338,702 | |
Options written | | | | | | | (82,731 | ) |
Foreign currency denominated assets and liabilities | | | | | | | (4,226,474 | ) |
| | | | | | | | |
Net gain on investment and foreign currency transactions | | | | | | | 161,586,617 | |
| | | | | | | | |
Contributions from Adviser (see Note B) | | | | | | | 419 | |
| | | | | | | | |
Net Increase in Net Assets from Operations | | | | | | $ | 161,785,691 | |
| | | | | | | | |
See notes to financial statements.
| | | | |
| ALLIANCEBERNSTEIN GLOBAL THEMATIC GROWTH FUND • | | | 19 | |
Statement of Operations
STATEMENT OF CHANGES IN NET ASSETS
| | | | | | | | |
| | | Year Ended
July 31,
2013 | | | Year Ended
July 31,
2012 | |
| Increase (Decrease) in Net Assets from Operations | | | | | | | | |
Net investment income | | $ | 198,655 | | | $ | 297,462 | |
Net realized gain (loss) on investment and foreign currency transactions | | | 20,557,120 | | | | (257,601,858 | ) |
Net change in unrealized appreciation/depreciation of investments and foreign currency denominated assets and liabilities | | | 141,029,497 | | | | (4,783,129 | ) |
Contributions from Adviser (see Note B) | | | 419 | | | | – 0 | – |
| | | | | | | | |
Net increase (decrease) in net assets from operations | | | 161,785,691 | | | | (262,087,525 | ) |
| Dividends to Shareholders from | | | | | | | | |
Net investment income | | | | | | | | |
Class A | | | – 0 | – | | | (4,229,265 | ) |
Class B | | | – 0 | – | | | 246 | |
Advisor Class | | | – 0 | – | | | (866,048 | ) |
Class R | | | – 0 | – | | | (38,530 | ) |
Class K | | | – 0 | – | | | (104,238 | ) |
Class I | | | – 0 | – | | | (176,960 | ) |
| Capital Stock Transactions | | | | | | | | |
Net decrease | | | (205,081,820 | ) | | | (152,291,175 | ) |
| Capital Contributions | | | | | | | | |
Proceeds from third party regulatory settlement (see Note F) | | | – 0 | – | | | 28,898 | |
| | | | | | | | |
Total decrease | | | (43,296,129 | ) | | | (419,764,597 | ) |
| Net Assets | | | | | | | | |
Beginning of period | | | 782,932,870 | | | | 1,202,697,467 | |
| | | | | | | | |
End of period (including distributions in excess of net investment income of ($13,780,695) and ($11,980,251), respectively) | | $ | 739,636,741 | | | $ | 782,932,870 | |
| | | | | | | | |
See notes to financial statements.
| | |
| 20 | | • ALLIANCEBERNSTEIN GLOBAL THEMATIC GROWTH FUND |
Statement of Changes in Net Assets
NOTES TO FINANCIAL STATEMENTS
July 31, 2013
NOTE A
Significant Accounting Policies
AllianceBernstein Global Thematic Growth Fund, Inc. (the “Fund”), organized as a Maryland corporation on December 24, 1980, is registered under the Investment Company Act of 1940 as a diversified, open-end management investment company. The Fund offers Class A, Class B, Class C, Advisor Class, Class R, Class K and Class I shares. Class A shares are sold with a front-end sales charge of up to 4.25% for purchases not exceeding $1,000,000. With respect to purchases of $1,000,000 or more, Class A shares redeemed within one year of purchase may be subject to a contingent deferred sales charge of 1%. Class B shares are currently sold with a contingent deferred sales charge which declines from 4% to zero depending on the period of time the shares are held. Effective January 31, 2009, sales of Class B shares of the Fund to new investors were suspended. Class B shares will only be issued (i) upon the exchange of Class B shares from another AllianceBernstein Mutual Fund, (ii) for purposes of dividend reinvestment, (iii) through the Fund’s Automatic Investment Program (the “Program”) for accounts that established the Program prior to January 31, 2009, and (iv) for purchases of additional shares by Class B shareholders as of January 31, 2009. The ability to establish a new Program for accounts containing Class B shares was suspended as of January 31, 2009. Class B shares will automatically convert to Class A shares eight years after the end of the calendar month of purchase. Class C shares are subject to a contingent deferred sales charge of 1% on redemptions made within the first year after purchase. Class R and Class K shares are sold without an initial or contingent deferred sales charge. Advisor Class and Class I shares are sold without an initial or contingent deferred sales charge and are not subject to ongoing distribution expenses. All seven classes of shares have identical voting, dividend, liquidation and other rights, except that the classes bear different distribution and transfer agency expenses. Each class has exclusive voting rights with respect to its distribution plan. The financial statements have been prepared in conformity with U.S. generally accepted accounting principles (“U.S. GAAP”) which require management to make certain estimates and assumptions that affect the reported amounts of assets and liabilities in the financial statements and amounts of income and expenses during the reporting period. Actual results could differ from those estimates. The following is a summary of significant accounting policies followed by the Fund.
1. Security Valuation
Portfolio securities are valued at their current market value determined on the basis of market quotations or, if market quotations are not readily available or are deemed unreliable, at “fair value” as determined in accordance with procedures established by and under the general supervision of the Fund’s Board of Directors (the “Board”).
In general, the market values of securities which are readily available and deemed reliable are determined as follows: securities listed on a national securities exchange (other than securities listed on the NASDAQ Stock Market, Inc.
| | | | |
| ALLIANCEBERNSTEIN GLOBAL THEMATIC GROWTH FUND • | | | 21 | |
Notes to Financial Statements
(“NASDAQ”)) or on a foreign securities exchange are valued at the last sale price at the close of the exchange or foreign securities exchange. If there has been no sale on such day, the securities are valued at the last traded price from the previous day. Securities listed on more than one exchange are valued by reference to the principal exchange on which the securities are traded; securities listed only on NASDAQ are valued in accordance with the NASDAQ Official Closing Price; listed or over the counter (“OTC”) market put or call options are valued at the mid level between the current bid and ask prices. If either a current bid or current ask price is unavailable, AllianceBernstein L.P. (the “Adviser”) will have discretion to determine the best valuation (e.g. last trade price in the case of listed options); open futures are valued using the closing settlement price or, in the absence of such a price, the most recent quoted bid price. If there are no quotations available for the day of valuation, the last available closing settlement price is used; U.S. government securities and other debt instruments having 60 days or less remaining until maturity are valued at amortized cost if their original maturity was 60 days or less; or by amortizing their fair value as of the 61st day prior to maturity if their original term to maturity exceeded 60 days; fixed-income securities, including mortgage backed and asset backed securities, may be valued on the basis of prices provided by a pricing service or at a price obtained from one or more of the major broker/dealers. In cases where broker/dealer quotes are obtained, the Adviser may establish procedures whereby changes in market yields or spreads are used to adjust, on a daily basis, a recently obtained quoted price on a security. Swaps and other derivatives are valued daily, primarily using independent pricing services, independent pricing models using market inputs, as well as third party broker-dealers or counterparties. Investments in money market funds are valued at their net asset value each day.
Securities for which market quotations are not readily available (including restricted securities) or are deemed unreliable are valued at fair value. Factors considered in making this determination may include, but are not limited to, information obtained by contacting the issuer, analysts, analysis of the issuer’s financial statements or other available documents. In addition, the Fund may use fair value pricing for securities primarily traded in non-U.S. markets because most foreign markets close well before the Fund values its securities at 4:00 p.m., Eastern Time. The earlier close of foreign markets gives rise to the possibility that significant events, including broad market moves, may have occurred between the close of the foreign markets and the time at which the Fund values its securities which may materially affect the value of securities trading in such markets. To account for this, the Fund may frequently value many of its foreign equity securities using fair value prices based on third party vendor modeling tools to the extent available.
2. Fair Value Measurements
In accordance with U.S. GAAP regarding fair value measurements, fair value is defined as the price that the Fund would receive to sell an asset or pay to transfer a liability in an orderly transaction between market participants at the measurement
| | |
| 22 | | • ALLIANCEBERNSTEIN GLOBAL THEMATIC GROWTH FUND |
Notes to Financial Statements
date. U.S. GAAP establishes a framework for measuring fair value, and a three-level hierarchy for fair value measurements based upon the transparency of inputs to the valuation of an asset or liability (including those valued based on their market values as described in Note A.1 above). Inputs may be observable or unobservable and refer broadly to the assumptions that market participants would use in pricing the asset or liability. Observable inputs reflect the assumptions market participants would use in pricing the asset or liability based on market data obtained from sources independent of the Fund. Unobservable inputs reflect the Fund’s own assumptions about the assumptions that market participants would use in pricing the asset or liability based on the best information available in the circumstances. Each investment is assigned a level based upon the observability of the inputs which are significant to the overall valuation. The three-tier hierarchy of inputs is summarized below.
| | • | | Level 1—quoted prices in active markets for identical investments |
| | • | | Level 2—other significant observable inputs (including quoted prices for similar investments, interest rates, prepayment speeds, credit risk, etc.) |
| | • | | Level 3—significant unobservable inputs (including the Fund’s own assumptions in determining the fair value of investments) |
Where readily available market prices or relevant bid prices are not available for certain equity investments, such investments may be valued based on similar publicly traded investments, movements in relevant indices since last available prices or based upon underlying company fundamentals and comparable company data (such as multiples to earnings or other multiples to equity). Where an investment is valued using an observable input, such as another publicly traded security, the investment will be classified as Level 2. If management determines that an adjustment is appropriate based on restrictions on resale, illiquidity or uncertainty, and such adjustment is a significant component of the valuation, the investment will be classified as Level 3. An investment will also be classified as Level 3 where management uses company fundamentals and other significant inputs to determine the valuation.
The following table summarizes the valuation of the Fund’s investments by the above fair value hierarchy levels as of July 31, 2013:
| | | | | | | | | | | | | | | | |
Investments in Securities: | | Level 1 | | | Level 2 | | | Level 3 | | | Total | |
Assets: | | | | | | | | | | | | | | | | |
Common Stocks: | | | | | | | | | | | | | | | | |
Information Technology | | $ | 169,117,293 | | | $ | 12,629,774 | | | $ | – 0 | – | | $ | 181,747,067 | |
Consumer Discretionary | | | 106,103,366 | | | | 60,045,149 | | | | – 0 | – | | | 166,148,515 | |
Health Care | | | 56,882,149 | | | | 39,699,764 | | | | – 0 | – | | | 96,581,913 | |
Consumer Staples | | | 24,214,379 | | | | 58,984,495 | | | | – 0 | – | | | 83,198,874 | |
Energy | | | 61,536,721 | | | | 18,054,269 | | | | – 0 | – | | | 79,590,990 | |
Financials | | | 21,759,569 | | | | 50,660,946 | | | | – 0 | – | | | 72,420,515 | |
Industrials | | | 17,089,848 | | | | 10,980,489 | | | | – 0 | – | | | 28,070,337 | |
Telecommunication Services | | | – 0 | – | | | 16,850,789 | | | | – 0 | – | | | 16,850,789 | |
Materials | | | 9,579,783 | | | | – 0 | – | | | – 0 | – | | | 9,579,783 | |
Short-Term Investments | | | 6,419,248 | | | | – 0 | – | | | – 0 | – | | | 6,419,248 | |
| | | | |
| ALLIANCEBERNSTEIN GLOBAL THEMATIC GROWTH FUND • | | | 23 | |
Notes to Financial Statements
| | | | | | | | | | | | | | | | |
Investments in Securities: | | Level 1 | | | Level 2 | | | Level 3 | | | Total | |
Investments of Cash Collateral for Securities Loaned in Affiliated Money Market Fund | | $ | 47,965,221 | | | $ | – 0 | – | | $ | – 0 | – | | $ | 47,965,221 | |
| | | | | | | | | | | | | | | | |
Total Investments in Securities | | | 520,667,577 | | | | 267,905,675 | | | | – 0 | – | | | 788,573,252 | |
Other Financial Instruments* : | | | | | | | | | | | | | | | | |
Assets: | | | | | | | | | | | | | | | | |
Forward Currency Exchange Contracts | | | – 0 | – | | | 1,128,105 | | | | – 0 | – | | | 1,128,105 | |
Liabilities: | | | | | | | | | | | | | | | | |
Forward Currency Exchange Contracts | | | – 0 | – | | | (3,240,839 | ) | | | – 0 | – | | | (3,240,839 | ) |
| | | | | | | | | | | | | | | | |
Total^ | | $ | 520,667,577 | | | $ | 265,792,941 | | | $ | – 0 | – | | $ | 786,460,518 | |
| | | | | | | | | | | | | | | | |
| * | | Other financial instruments are derivative instruments, such as futures, forwards and swap contracts, which are valued at the unrealized appreciation/depreciation on the instrument. |
| + | | A significant portion of the Fund’s foreign equity investments are categorized as Level 2 investments since they are valued using fair value prices based on third party vendor modeling tools to the extent available, see Note A.1. |
| ^ | | There were no transfers between Level 1 and Level 2 during the reporting period. |
The Fund recognizes all transfers between levels of the fair value hierarchy assuming the financial instruments were transferred at the beginning of the reporting period.
The Adviser has established a Valuation Committee (the “Committee”) which is responsible for overseeing the pricing and valuation of all securities held in the Fund. The Committee operates under pricing and valuation policies and procedures established by the Adviser and approved by the Board, including pricing policies which set forth the mechanisms and processes to be employed on a daily basis to implement these policies and procedures. In particular, the pricing policies describe how to determine market quotations for securities and other instruments. The Committee’s responsibilities include: 1) fair value and liquidity determinations (and oversight of any third parties to whom any responsibility for fair value and liquidity determinations is delegated), and 2) regular monitoring of the Adviser’s pricing and valuation policies and procedures and modification or enhancement of these policies and procedures (or recommendation of the modification of these policies and procedures) as the Committee believes appropriate.
The Committee is also responsible for monitoring the implementation of the pricing policies by the Adviser’s Pricing Group (the “Pricing Group”) and a third party which performs certain pricing functions in accordance with the pricing policies. The Pricing Group is responsible for the oversight of the third party on a day-to-day basis. The Committee and the Pricing Group perform a series of activities to provide reasonable assurance of the accuracy of prices including: 1) periodic vendor due diligence meetings, review of methodologies, new developments and process at vendors, 2) daily compare of security valuation
| | |
| 24 | | • ALLIANCEBERNSTEIN GLOBAL THEMATIC GROWTH FUND |
Notes to Financial Statements
versus prior day for all securities that exceeded established thresholds, and 3) daily review of unpriced, stale, and variance reports with exceptions reviewed by senior management and the Committee.
In addition, several processes outside of the pricing process are used to monitor valuation issues including: 1) performance and performance attribution reports are monitored for anomalous impacts based upon benchmark performance, and 2) portfolio managers review all portfolios for performance and analytics (which are generated using the Adviser’s prices).
3. Currency Translation
Assets and liabilities denominated in foreign currencies and commitments under forward currency exchange contracts are translated into U.S. dollars at the mean of the quoted bid and ask prices of such currencies against the U.S. dollar. Purchases and sales of portfolio securities are translated into U.S. dollars at the rates of exchange prevailing when such securities were acquired or sold. Income and expenses are translated into U.S. dollars at rates of exchange prevailing when accrued.
Net realized gain or loss on foreign currency transactions represents foreign exchange gains and losses from sales and maturities of foreign fixed income investments, foreign currency exchange contracts, holding of foreign currencies, currency gains or losses realized between the trade and settlement dates on foreign investment transactions, and the difference between the amounts of dividends, interest and foreign withholding taxes recorded on the Fund’s books and the U.S. dollar equivalent amounts actually received or paid. Net unrealized currency gains and losses from valuing foreign currency denominated assets and liabilities at period end exchange rates are reflected as a component of net unrealized appreciation or depreciation of foreign currency denominated assets and liabilities.
4. Taxes
It is the Fund’s policy to meet the requirements of the Internal Revenue Code applicable to regulated investment companies and to distribute all of its investment company taxable income and net realized gains, if any, to shareholders. Therefore, no provisions for federal income or excise taxes are required. The Fund may be subject to taxes imposed by countries in which it invests. Such taxes are generally based on income and/or capital gains earned or repatriated. Taxes are accrued and applied to net investment income, net realized gains and net unrealized appreciation/depreciation as such income and/or gains are earned.
In accordance with U.S. GAAP requirements regarding accounting for uncertainties in income taxes, management has analyzed the Fund’s tax positions taken or expected to be taken on federal and state income tax returns for all
| | | | |
| ALLIANCEBERNSTEIN GLOBAL THEMATIC GROWTH FUND • | | | 25 | |
Notes to Financial Statements
open tax years (the current and the prior three tax years) and has concluded that no provision for income tax is required in the Fund’s financial statements.
5. Investment Income and Investment Transactions
Dividend income is recorded on the ex-dividend date or as soon as the Fund is informed of the dividend. Interest income is accrued daily. Investment transactions are accounted for on the date the securities are purchased or sold. Investment gains or losses are determined on the identified cost basis. The Fund amortizes premiums and accretes discounts as adjustments to interest income.
6. Class Allocations
All income earned and expenses incurred by the Fund are borne on a pro-rata basis by each outstanding class of shares, based on the proportionate interest in the Fund represented by the net assets of such class, except for class specific expenses which are allocated to the respective class. Realized and unrealized gains and losses are allocated among the various share classes based on respective net assets.
7. Dividends and Distributions
Dividends and distributions to shareholders, if any, are recorded on the ex-dividend date. Income dividends and capital gains distributions are determined in accordance with federal tax regulations and may differ from those determined in accordance with U.S. GAAP. To the extent these differences are permanent, such amounts are reclassified within the capital accounts based on their federal tax basis treatment; temporary differences do not require such reclassification.
NOTE B
Advisory Fee and Other Transactions with Affiliates
Under the terms of the investment advisory agreement, the Fund pays the Adviser a quarterly advisory fee equal to the following percentages of the value of the Fund’s aggregate net assets at the close of business on the last business day of the previous quarter: .25 of .75% of the first $2.5 billion, .25 of .65% of the next $2.5 billion, and ..25 of .60% of the net assets in excess of $5 billion. The fee is accrued daily and paid quarterly.
During the year ended July 31, 2013, the Adviser reimbursed the Fund $419 for trading losses incurred due to a trade entry error.
Pursuant to the investment advisory agreement, the Fund may reimburse the Adviser for certain legal and accounting services provided to the Fund by the Adviser. For the year ended July 31, 2013, the reimbursement for such services amounted to $42,070.
The Fund compensates AllianceBernstein Investor Services, Inc. (“ABIS”), a wholly-owned subsidiary of the Adviser, under a Transfer Agency Agreement for providing personnel and facilities to perform transfer agency services for the
| | |
| 26 | | • ALLIANCEBERNSTEIN GLOBAL THEMATIC GROWTH FUND |
Notes to Financial Statements
Fund. ABIS may make payments to intermediaries that provide omnibus account services, sub-accounting services and/or networking services. Such compensation retained by ABIS amounted to $1,597,401 for the year ended July 31, 2013.
AllianceBernstein Investments, Inc. (the “Distributor”), a wholly-owned subsidiary of the Adviser, serves as the distributor of the Fund’s shares. The Distributor has advised the Fund that it has retained front-end sales charges of $7,047 from the sale of Class A shares and received $9,969, $20,741 and $2,328 in contingent deferred sales charges imposed upon redemptions by shareholders of Class A, Class B and Class C shares, respectively, for the year ended July 31, 2013.
The Fund may invest in the AllianceBernstein Fixed-Income Shares, Inc. — Government STIF Portfolio (“Government STIF Portfolio”), an open-end management investment company managed by the Adviser. The Government STIF Portfolio is offered as a cash management option to mutual funds and other institutional accounts of the Adviser, and is not available for direct purchase by members of the public. The Government STIF Portfolio pays no investment management fees but does bear its own expenses. A summary of the Fund’s transactions in shares of the Government STIF Portfolio for the year ended July 31, 2013 is as follows:
| | | | | | | | | | | | | | | | |
Market Value July 31, 2012 (000) | | Purchases
at Cost
(000) | | | Sales
Proceeds
(000) | | | Market Value
July 31, 2013
(000) | | | Dividend
Income
(000) | |
| $ 683 | | $ | 205,687 | | | $ | 199,951 | | | $ | 6,419 | | | $ | 3 | |
Brokerage commissions paid on investment transactions for the year ended July 31, 2013 amounted to $2,162,380, of which $4,429 and $4,214, respectively, was paid to Sanford C. Bernstein & Co. LLC and Sanford C. Bernstein Limited, affiliates of the Adviser.
NOTE C
Distribution Services Agreement
The Fund has adopted a Distribution Services Agreement (the “Agreement”) pursuant to Rule 12b-1 under the Investment Company Act of 1940. Under the Agreement, the Fund pays distribution and servicing fees to the Distributor at an annual rate of up to .30% of the Fund’s average daily net assets attributable to Class A shares, 1% of the Fund’s average daily net assets attributable to both Class B and Class C shares, .50% of the Fund’s average daily net assets attributable to Class R shares and .25% of the Fund’s average daily net assets attributable to Class K shares. There are no distribution and servicing fees on the Advisor Class and Class I shares. The fees are accrued daily and paid monthly. The Agreement provides that the Distributor will use such payments in their entirety for distribution assistance and promotional activities. Since the commencement of the Fund’s operations, the Distributor has incurred expenses in excess of the
| | | | |
| ALLIANCEBERNSTEIN GLOBAL THEMATIC GROWTH FUND • | | | 27 | |
Notes to Financial Statements
distribution costs reimbursed by the Fund in the amounts of $64,723,388, $7,959,211, $264,263 and $67,897 for Class B, Class C, Class R and Class K shares, respectively. While such costs may be recovered from the Fund in future periods so long as the Agreement is in effect, the rate of the distribution and servicing fees payable under the Agreement may not be increased without a shareholder vote. In accordance with the Agreement, there is no provision for recovery of unreimbursed distribution costs incurred by the Distributor beyond the current fiscal year for Class A shares. The Agreement also provides that the Adviser may use its own resources to finance the distribution of the Fund’s shares.
NOTE D
Investment Transactions
Purchases and sales of investment securities (excluding short-term investments) for the year ended July 31, 2013 were as follows:
| | | | | | | | |
| | | Purchases | | | Sales | |
Investment securities (excluding
U.S. government securities) | | $ | 1,023,160,366 | | | $ | 1,238,983,904 | |
U.S. government securities | | | – 0 | – | | | – 0 | – |
The cost of investments for federal income tax purposes, gross unrealized appreciation and unrealized depreciation (excluding foreign currency transactions) are as follows:
| | | | |
Cost | | $ | 715,501,028 | |
| | | | |
Gross unrealized appreciation | | $ | 106,596,616 | |
Gross unrealized depreciation | | | (33,524,392 | ) |
| | | | |
Net unrealized appreciation | | $ | 73,072,224 | |
| | | | |
1. Derivative Financial Instruments
The Fund may use derivatives in an effort to earn income and enhance returns, to replace more traditional direct investments, to obtain exposure to otherwise inaccessible markets (collectively, “investment purposes”), or to hedge or adjust the risk profile of its portfolio.
The principal types of derivatives utilized by the Fund, as well as the methods in which they may be used are:
| | • | | Forward Currency Exchange Contracts |
The Fund may enter into forward currency exchange contracts in order to hedge its exposure to changes in foreign currency exchange rates on its foreign portfolio holdings, to hedge certain firm purchase and sale commitments denominated in foreign currencies and for non-hedging purposes as a means of making direct investments in foreign currencies, as described below under “Currency Transactions”.
| | |
| 28 | | • ALLIANCEBERNSTEIN GLOBAL THEMATIC GROWTH FUND |
Notes to Financial Statements
A forward currency exchange contract is a commitment to purchase or sell a foreign currency at a future date at a negotiated forward rate. The gain or loss arising from the difference between the original contract and the closing of such contract would be included in net realized gain or loss on foreign currency transactions. Fluctuations in the value of open forward currency exchange contracts are recorded for financial reporting purposes as unrealized appreciation and/or depreciation by the Fund. Risks may arise from the potential inability of a counterparty to meet the terms of a contract and from unanticipated movements in the value of a foreign currency relative to the U.S. dollar.
During the year ended July 31, 2013, the Fund held forward currency exchange contracts for hedging and non-hedging purposes.
For hedging and investment purposes, the Fund may purchase and write (sell) put and call options on U.S. and foreign securities, including government securities, and foreign currencies that are traded on U.S. and foreign securities exchanges and over-the-counter markets. Among other things, the Fund may use options transactions for non-hedging purposes as a means of making direct investments in foreign currencies, as described below under “Currency Transactions” and may use options strategies involving the purchase and/or writing of various combinations of call and/or put options, for hedging and investment purposes.
The risk associated with purchasing an option is that the Fund pays a premium whether or not the option is exercised. Additionally, the Fund bears the risk of loss of the premium and change in market value should the counterparty not perform under the contract. Put and call options purchased are accounted for in the same manner as portfolio securities. The cost of securities acquired through the exercise of call options is increased by premiums paid. The proceeds from securities sold through the exercise of put options are decreased by the premiums paid.
When the Fund writes an option, the premium received by the Fund is recorded as a liability and is subsequently adjusted to the current market value of the option written. Premiums received from written options which expire unexercised are recorded by the Fund on the expiration date as realized gains from options written. The difference between the premium received and the amount paid on effecting a closing purchase transaction, including brokerage commissions, is also treated as a realized gain, or if the premium received is less than the amount paid for the closing purchase transaction, as a realized loss. If a call option is exercised, the premium received is added to the proceeds from the sale of the underlying security or currency in determining whether the Fund has realized a gain or loss. If a put option is exercised, the premium received reduces the cost basis of the security or currency purchased by the Fund. In writing an option, the
| | | | |
| ALLIANCEBERNSTEIN GLOBAL THEMATIC GROWTH FUND • | | | 29 | |
Notes to Financial Statements
Fund bears the market risk of an unfavorable change in the price of the security or currency underlying the written option. Exercise of an option written by the Fund could result in the Fund selling or buying a security or currency at a price different from the current market value.
During the year ended July 31, 2013, the Fund held purchased options for hedging and non-hedging purposes. During the year ended July 31, 2013, the Fund held written options for hedging and non-hedging purposes.
For the year ended July 31, 2013, the Fund had the following transactions in written options:
| | | | | | | | |
| | | Number of
Contracts | | | Premiums
Received | |
Options written outstanding as of 7/31/12 | | | 29,555 | | | $ | 812,947 | |
Options written | | | 11,495 | | | | 128,744 | |
Options expired | | | (18,060 | ) | | | (525,572 | ) |
Options bought back | | | (22,990 | ) | | | (416,119 | ) |
Options exercised | | | – 0 | – | | | – 0 | – |
| | | | | | | | |
Options written outstanding as of 7/31/13 | | | – 0 | – | | $ | – 0 | – |
| | | | | | | | |
Documentation governing the Fund’s OTC derivatives may contain provisions for early termination of such transaction in the event the net assets of the Fund decline below specific levels set forth in the documentation (“net asset contingent features”). If these levels are triggered, the Fund’s counterparty has the right to terminate such transaction and require the Fund to pay or receive a settlement amount in connection with the terminated transaction. As of July 31, 2013, the Fund had OTC derivatives with contingent features in net liability positions in the amount of $2,716,873. If a trigger event had occurred at July 31, 2013, for those derivatives in a net liability position, an amount of $2,716,873 would be required to be posted by the Fund.
At July 31, 2013, the Fund had entered into the following derivatives:
| | | | | | | | | | | | |
| | | Asset Derivatives | | | Liability Derivatives | |
Derivative Type | | Statement of
Assets and
Liabilities
Location | | Fair Value | | | Statement of
Assets and
Liabilities
Location | | Fair Value | |
Foreign exchange contracts | | Unrealized appreciation of forward currency exchange contracts | | $ | 1,128,105 | | | Unrealized depreciation of forward currency exchange contracts | | $ | 3,240,839 | |
| | | | | | | | | | | | |
Total | | | | $ | 1,128,105 | | | | | $ | 3,240,839 | |
| | | | | | | | | | | | |
| | |
| 30 | | • ALLIANCEBERNSTEIN GLOBAL THEMATIC GROWTH FUND |
Notes to Financial Statements
The effect of derivative instruments on the statement of operations for the year ended July 31, 2013:
| | | | | | | | | | |
Derivative Type | | Location of Gain or (Loss) on
Derivatives | | Realized Gain
or (Loss) on
Derivatives | | | Change in
Unrealized
Appreciation or
(Depreciation) | |
Foreign exchange contracts | | Net realized gain (loss) on foreign currency transactions; Net change in unrealized appreciation/depreciation of foreign currency denominated assets and liabilities | | $ | (4,185,103 | ) | | $ | (4,332,743 | ) |
| | | |
Equity contracts | | Net realized gain (loss) on investment transactions; Net change in unrealized appreciation/depreciation of investments | | | (12,601,930 | ) | | | 10,087,778 | |
| | | |
Equity contracts | | Net realized gain (loss) on options written; Net change in unrealized appreciation/depreciation of options written | | | 780,876 | | | | (82,731 | ) |
| | | | | | | | | | |
Total | | | | $ | (16,006,157 | ) | | $ | 5,672,304 | |
| | | | | | | | | | |
The following table represents the volume of the Fund’s derivative transactions during the year ended July 31, 2013:
| | | | |
Forward Currency Exchange Contracts: | | | | |
Average principal amount of buy contracts | | $ | 186,319,841 | |
Average principal amount of sale contracts | | $ | 73,246,522 | (a) |
| |
Purchased Options: | | | | |
Average monthly cost | | $ | 6,912,725 | (b) |
| (a) | | Positions were open for five months during the year. |
| (b) | | Positions were open for eleven months during the year. |
2. Currency Transactions
The Fund may invest in non-U.S. Dollar securities on a currency hedged or unhedged basis. The Fund may seek investment opportunities by taking long or short positions in currencies through the use of currency-related derivatives, including forward currency exchange contracts, futures and options on futures, swaps, and other options. The Fund may enter into transactions for investment opportunities when it anticipates that a foreign currency will appreciate or depreciate in value but securities denominated in that currency are not held by the Fund and do not present attractive investment opportunities. Such transactions
| | | | |
| ALLIANCEBERNSTEIN GLOBAL THEMATIC GROWTH FUND • | | | 31 | |
Notes to Financial Statements
may also be used when the Adviser believes that it may be more efficient than a direct investment in a foreign currency-denominated security. The Fund may also conduct currency exchange contracts on a spot basis (i.e., for cash at the spot rate prevailing in the currency exchange market for buying or selling currencies).
NOTE E
Securities Lending
The Fund may enter into securities lending transactions. Under the Fund’s securities lending program, all loans of securities will be collateralized continually by cash. The Fund will be compensated for the loan from a portion of the net return from the income earned on cash collateral after a rebate is paid to the borrower (in some cases, this rebate may be a “negative rebate” or fee paid by the borrower to the Fund in connection with the loan), and payments are made for fees of the securities lending agent and for certain other administrative expenses. It is the policy of the Fund to receive collateral consisting of cash in an amount exceeding the value of the securities loaned. The Fund will have the right to call a loan and obtain the securities loaned at any time on notice to the borrower within the normal and customary settlement time for the securities. While the securities are on loan, the borrower is obligated to pay the Fund amounts equal to any income or other distributions from the securities. The Fund will not have the right to vote on any securities during the existence of a loan, but will have the right to regain ownership of loaned securities in order to exercise voting or other ownership rights. The lending agent has agreed to indemnify the Fund in the case of default of any securities borrower. Collateral received and securities loaned are marked to market daily to ensure that the securities loaned are secured by collateral. The lending agent will invest the cash collateral received in AllianceBernstein Exchange Reserves, an eligible money market vehicle, in accordance with the investment restrictions of the Fund, and as approved by the Board. The collateral received on securities loaned is recorded as an asset as well as a corresponding liability in the statement of assets and liabilities. When the Fund lends securities, its investment performance will continue to reflect changes in the value of the securities loaned. At July 31, 2013, the Fund had securities on loan with a value of $46,607,139 and had received cash collateral which has been invested into AllianceBernstein Exchange Reserves of $47,965,221. The cash collateral will be adjusted on the next business day to maintain the required collateral amount. The Fund earned securities lending income of $6,576,431 and $199,528 from the borrowers and AllianceBernstein Exchange Reserves, respectively, for the year ended July 31, 2013; these amounts are reflected in the statement of operations. A principal risk of lending portfolio securities is that the borrower will fail to return the loaned securities upon termination of the loan and that the collateral will not be sufficient to replace the loaned securities. A summary of the Fund’s transactions in shares of AllianceBernstein Exchange Reserves for the year ended July 31, 2013 is as follows:
| | | | | | | | | | | | | | | | |
Market Value July 31, 2012 (000) | | Purchases
at Cost
(000) | | | Sales
Proceeds
(000) | | | Market Value
July 31, 2013
(000) | | | Dividend
Income
(000) | |
| $ 211,991 | | $ | 699,495 | | | $ | 863,521 | | | $ | 47,965 | | | $ | 200 | |
| | |
| 32 | | • ALLIANCEBERNSTEIN GLOBAL THEMATIC GROWTH FUND |
Notes to Financial Statements
NOTE F
Capital Stock
Each class consists of 3,000,000,000 authorized shares. Transactions in capital shares for each class were as follows:
| | | | | | | | | | | | | | | | | | | | |
| | | | | | | | | | | | | | | | | | | | |
| | | Shares | | | | | Amount | | | |
| | | Year Ended
July 31, 2013 | | | Year Ended
July 31, 2012 | | | | | Year Ended
July 31, 2013 | | | Year Ended
July 31, 2012 | | | |
| | | | | | |
| Class A | | | | | | | | | | | | | | | | | | | | |
Shares sold | | | 332,267 | | | | 626,061 | | | | | $ | 22,026,285 | | | $ | 39,580,769 | | | |
| | | |
Shares issued in reinvestment of dividends | | | – 0 | – | | | 69,049 | | | | | | – 0 | – | | | 3,880,628 | | | |
| | | |
Shares converted from Class B | | | 99,268 | | | | 187,612 | | | | | | 6,554,426 | | | | 11,979,038 | | | |
| | | |
Shares redeemed | | | (2,375,147 | ) | | | (2,636,916 | ) | | | | | (156,966,638 | ) | | | (165,535,315 | ) | | |
| | | |
Net decrease | | | (1,943,612 | ) | | | (1,754,194 | ) | | | | $ | (128,385,927 | ) | | $ | (110,094,880 | ) | | |
| | | |
| | | | | | | | | | | | | | | | | | | | |
| Class B | | | | | | | | | | | | | | | | | | | | |
Shares sold | | | 28,949 | | | | 43,177 | | | | | $ | 1,630,050 | | | $ | 2,342,906 | | | |
| | | |
Shares issued in reinvestment of dividends | | | – 0 | – | | | (4 | ) | | | | | – 0 | – | | | (245 | ) | | |
| | | |
Shares converted to Class A | | | (116,127 | ) | | | (218,151 | ) | | | | | (6,554,426 | ) | | | (11,979,038 | ) | | |
| | | |
Shares redeemed | | | (90,719 | ) | | | (138,703 | ) | | | | | (5,085,765 | ) | | | (7,557,132 | ) | | |
| | | |
Net decrease | | | (177,897 | ) | | | (313,681 | ) | | | | $ | (10,010,141 | ) | | $ | (17,193,509 | ) | | |
| | | |
| | | | | | | | | | | | | | | | | | | | |
| Class C | | | | | | | | | | | | | | | | | | | | |
Shares sold | | | 29,722 | | | | 56,419 | | | | | $ | 1,683,611 | | | $ | 3,098,551 | | | |
| | | |
Shares issued in reinvestment of dividends | | | – 0 | – | | | – 0 | – | | | | | – 0 | – | | | (13 | ) | | |
| | | |
Shares redeemed | | | (378,399 | ) | | | (473,871 | ) | | | | | (21,548,472 | ) | | | (25,714,024 | ) | | |
| | | |
Net decrease | | | (348,677 | ) | | | (417,452 | ) | | | | $ | (19,864,861 | ) | | $ | (22,615,486 | ) | | |
| | | |
| | | | | | | | | | | | | | | | | | | | |
| Advisor Class | | | | | | | | | | | | | | | | | | | | |
Shares sold | | | 152,269 | | | | 621,495 | | | | | $ | 10,554,794 | | | $ | 40,337,890 | | | |
| | | |
Shares issued in reinvestment of dividends | | | – 0 | – | | | 11,877 | | | | | | – 0 | – | | | 695,166 | | | |
| | | |
Shares redeemed | | | (589,581 | ) | | | (745,876 | ) | | | | | (40,844,717 | ) | | | (48,307,310 | ) | | |
| | | |
Net decrease | | | (437,312 | ) | | | (112,504 | ) | | | | $ | (30,289,923 | ) | | $ | (7,274,254 | ) | | |
| | | |
| | | | | | | | | | | | | | | | | | | | |
| Class R | | | | | | | | | | | | | | | | | | | | |
Shares sold | | | 24,444 | | | | 86,341 | | | | | $ | 1,581,879 | | | $ | 5,277,164 | | | |
| | | |
Shares issued in reinvestment of dividends | | | – 0 | – | | | 688 | | | | | | – 0 | – | | | 38,481 | | | |
| | | |
Shares redeemed | | | (72,987 | ) | | | (58,857 | ) | | | | | (4,801,096 | ) | | | (3,652,954 | ) | | |
| | | |
Net increase (decrease) | | | (48,543 | ) | | | 28,172 | | | | | $ | (3,219,217 | ) | | $ | 1,662,691 | | | |
| | | |
| | | | | | | | | | | | | | | | | | | | |
| | | | |
| ALLIANCEBERNSTEIN GLOBAL THEMATIC GROWTH FUND • | | | 33 | |
Notes to Financial Statements
| | | | | | | | | | | | | | | | | | | | |
| | | Shares | | | | | Amount | | | |
| | | Year Ended
July 31, 2013 | | | Year Ended
July 31, 2012 | | | | | Year Ended
July 31, 2013 | | | Year Ended
July 31, 2012 | | | |
| | | | | | |
| Class K | | | | | | | | | | | | | | | | | | | | |
Shares sold | | | 13,253 | | | | 103,576 | | | | | $ | 892,716 | | | $ | 6,585,214 | | | |
| | | |
Shares issued in reinvestment of dividends | | | – 0 | – | | | 1,832 | | | | | | – 0 | – | | | 104,237 | | | |
| | | |
Shares redeemed | | | (36,245 | ) | | | (31,924 | ) | | | | | (2,442,986 | ) | | | (2,036,586 | ) | | |
| | | |
Net increase (decrease) | | | (22,992 | ) | | | 73,484 | | | | | $ | (1,550,270 | ) | | $ | 4,652,865 | | | |
| | | |
| | | | | | | | | | | | | | | | | | | | |
| Class I | | | | | | | | | | | | | | | | | | | | |
Shares sold | | | 4,431 | | | | 33,021 | | | | | $ | 302,916 | | | $ | 2,163,714 | | | |
| | | |
Shares issued in reinvestment of dividends | | | – 0 | – | | | 2,499 | | | | | | – 0 | – | | | 144,691 | | | |
| | | |
Shares redeemed | | | (177,660 | ) | | | (57,869 | ) | | | | | (12,064,397 | ) | | | (3,737,007 | ) | | |
| | | |
Net decrease | | | (173,229 | ) | | | (22,349 | ) | | | | $ | (11,761,481 | ) | | $ | (1,428,602 | ) | | |
| | | |
For the year ended July 31, 2012, the Fund received $28,898 related to a third-party’s settlement of regulatory proceedings involving allegations of improper trading. This amount is presented in the Fund’s statement of changes in net assets. Neither the Fund nor its affiliates were involved in the proceedings or the calculation of the payment.
NOTE G
Risks Involved in Investing in the Fund
Foreign Securities Risk—Investing in securities of foreign companies or foreign governments involves special risks which include changes in foreign currency exchange rates and the possibility of future political and economic developments which could adversely affect the value of such securities. Moreover, securities of many foreign companies or foreign governments and their markets may be less liquid and their prices more volatile than those of comparable U.S. companies or of the U.S. government.
Emerging Market Risk—Investments in emerging market countries may have more risk because the markets are less developed and less liquid, and because these investments may be subject to increased economic, political, regulatory and other uncertainties.
Currency Risk—This is the risk that changes in foreign currency exchange rates may negatively affect the value of the Fund’s investments or reduce the returns of the Fund. For example, the value of the Fund’s investments in foreign currency-denominated securities or currencies may decrease if the U.S. Dollar is strong (i.e., gaining value relative to other currencies) and other currencies are weak (i.e., losing value relative to the U.S. Dollar). Currency markets are generally not as regulated as securities markets. Independent of the Fund’s
| | |
| 34 | | • ALLIANCEBERNSTEIN GLOBAL THEMATIC GROWTH FUND |
Notes to Financial Statements
investments denominated in foreign currencies, the Fund’s positions in various foreign currencies may cause the Fund to experience investment losses due to the changes in exchange rates and interest rates.
Capitalization Risk—Investments in small- and mid-capitalization companies may be more volatile than investments in large-capitalization companies. Investments in small-capitalization companies may have additional risks because these companies have limited product lines, markets or financial resources.
Focused Portfolio Risk—Investments in a limited number of companies may have more risk because changes in the value of a single security may have a more significant effect, either negative or positive, on the Fund’s NAV.
Derivatives Risk—The Fund may enter into derivative transactions such as forwards, options, futures and swaps. Derivatives may be illiquid, difficult to price, and leveraged so that small changes may produce disproportionate losses for the Fund, and subject to counterparty risk to a greater degree than more traditional investments. Derivatives may result in significant losses, including losses that are far greater than the value of the derivatives reflected in the statement of assets and liabilities.
Indemnification Risk—In the ordinary course of business, the Fund enters into contracts that contain a variety of indemnifications. The Fund’s maximum exposure under these arrangements is unknown. However, the Fund has not had prior claims or losses pursuant to these indemnification provisions and expects the risk of loss thereunder to be remote. Therefore, the Fund has not accrued any liability in connection with these indemnification provisions.
NOTE H
Joint Credit Facility
A number of open-end mutual funds managed by the Adviser, including the Fund, participate in a $140 million revolving credit facility (the “Facility”) intended to provide short-term financing, if necessary, subject to certain restrictions in connection with abnormal redemption activity. Commitment fees related to the Facility are paid by the participating funds and are included in miscellaneous expenses in the statement of operations. The Fund did not utilize the Facility during the year ended July 31, 2013.
NOTE I
Distributions to Shareholders
The tax character of distributions paid during the fiscal years ended July 31, 2013 and July 31, 2012 were as follows:
| | | | | | | | |
| | | 2013 | | | 2012 | |
Distributions paid from: | | | | | | | | |
Ordinary income | | $ | – 0 | – | | $ | 5,414,795 | |
| | | | | | | | |
Total distributions paid | | $ | – 0 | – | | $ | 5,414,795 | |
| | | | | | | | |
| | | | |
| ALLIANCEBERNSTEIN GLOBAL THEMATIC GROWTH FUND • | | | 35 | |
Notes to Financial Statements
As of July 31, 2013, the components of accumulated earnings/(deficit) on a tax basis were as follows:
| | | | |
Accumulated capital and other losses | | $ | (375,669,382 | )(a) |
Unrealized appreciation/(depreciation) | | | 73,151,669 | (b) |
| | | | |
Total accumulated earnings/(deficit) | | $ | (302,517,713 | ) |
| | | | |
| (a) | | On July 31, 2013, the Fund had a net capital loss carryforward of $359,787,782. At July 31, 2013, the Fund had a qualified late-year ordinary loss deferral of $15,881,600, which is deemed to arise on August 1, 2013. During the fiscal year, the Fund utilized $27,873,703 of capital loss carryforwards to offset current year net realized gains. |
| (b) | | The differences between book-basis and tax-basis unrealized appreciation/(depreciation) are attributable primarily to the tax deferral of losses on wash sales and the realization for tax purposes of gains/losses on certain derivative instruments. |
For tax purposes, net capital losses may be carried over to offset future capital gains, if any. Under the Regulated Investment Company Modernization Act of 2010, funds are permitted to carry forward capital losses incurred in taxable years beginning after December 22, 2010 for an indefinite period. These post-enactment capital losses must be utilized prior to the pre-enactment capital losses, which are subject to expiration. Post-enactment capital loss carryforwards will retain their character as either short-term or long-term capital losses rather than being considered short-term as under previous regulation.
As of July 31, 2013, the Fund had a net capital loss carryforward of $359,787,782 which will expire as follows:
| | | | | | | | |
| | | SHORT-TERM
AMOUNT | | LONG-TERM
AMOUNT | | EXPIRATION | | |
| | $ 147,558,432 | | n/a | | 2017 | | |
| | 84,998,137 | | $ 127,231,213 | | No expiration | | |
During the current fiscal year, permanent differences primarily due to reclassifications of foreign currency losses, the tax treatment of partnerships and the tax treatment of passive foreign investment companies (PFICs), and a net operating loss disallowance resulted in a net increase in distributions in excess of net investment income, a net decrease in accumulated net realized loss on investment and foreign currency transactions, and a net decrease in additional paid-in capital. These reclassifications had no effect on net assets.
NOTE J
Recent Accounting Pronouncements
In December 2011, the Financial Accounting Standards Board (“FASB”) issued an Accounting Standards Update (“ASU”) related to disclosures about offsetting assets and liabilities in financial statements. The amendments in this update require an entity to disclose both gross and net information for derivatives and other financial instruments that are either offset in the statement of assets and
| | |
| 36 | | • ALLIANCEBERNSTEIN GLOBAL THEMATIC GROWTH FUND |
Notes to Financial Statements
liabilities or subject to an enforceable master netting arrangement or similar agreement. In January 2013, the FASB issued an ASU to clarify the scope of disclosures about offsetting assets and liabilities. The ASU limits the scope of the new balance sheet offsetting disclosures to derivatives, repurchase agreements and securities lending transactions. The ASU is effective during interim or annual reporting periods beginning on or after January 1, 2013. At this time, management is evaluating the implication of this ASU and its impact on the financial statements has not been determined.
NOTE K
Subsequent Events
Management has evaluated subsequent events for possible recognition or disclosure in the financial statements through the date the financial statements are issued. Management has determined that there are no material events that would require disclosure in the Fund’s financial statements through this date.
| | | | |
| ALLIANCEBERNSTEIN GLOBAL THEMATIC GROWTH FUND • | | | 37 | |
Notes to Financial Statements
FINANCIAL HIGHLIGHTS
Selected Data For A Share Of Capital Stock Outstanding Throughout Each Period
| | | | | | | | | | | | | | | | | | | | |
| | | Class A | |
| | | Year Ended July 31, | |
| | | 2013 | | | 2012 | | | 2011 | | | 2010 | | | 2009 | |
| | | | |
| | | | | | | | | | | | | | | | | | | | |
Net asset value,
beginning of period | | | $ 57.72 | | | | $ 75.21 | | | | $ 63.67 | | | | $ 58.61 | | | | $ 64.34 | |
| | | | |
Income From Investment Operations | | | | | | | | | | | | | | | | | | | | |
Net investment income (loss)(a) | | | .06 | | | | .07 | | | | (.41 | ) | | | .04 | | | | (.11 | ) |
Net realized and unrealized gain (loss) on investment and foreign currency transactions | | | 12.98 | | | | (17.18 | ) | | | 12.02 | | | | 5.83 | | | | (5.64 | ) |
Contributions from Adviser | | | .00 | (b) | | | – 0 | – | | | – 0 | – | | | – 0 | – | | | .02 | |
| | | | |
Net increase (decrease) in net asset value from operations | | | 13.04 | | | | (17.11 | ) | | | 11.61 | | | | 5.87 | | | | (5.73 | ) |
| | | | |
Less: Dividends | | | | | | | | | | | | | | | | | | | | |
Dividends from net investment income | | | – 0 | – | | | (.38 | ) | | | (.07 | ) | | | (.81 | ) | | | – 0 | – |
| | | | |
Net asset value, end of period | | | $ 70.76 | | | | $ 57.72 | | | | $ 75.21 | | | | $ 63.67 | | | | $ 58.61 | |
| | | | |
Total Return | | | | | | | | | | | | | | | | | | | | |
Total investment return based on net asset value(c)* | | | 22.59 | % | | | (22.74 | )% | | | 18.25 | %† | | | 10.03 | % | | | (8.91 | )% |
Ratios/Supplemental Data | | | | | | | | | | | | | | | | | | | | |
Net assets, end of period (000’s omitted) | | | $569,053 | | | | $576,361 | | | | $882,945 | | | | $843,840 | | | | $834,209 | |
Ratio to average net
assets of: | | | | | | | | | | | | | | | | | | | | |
Expenses | | | 1.50 | % | | | 1.55 | % | | | 1.50 | %+ | | | 1.55 | %+ | | | 1.70 | % |
Net investment income (loss) | | | .09 | % | | | .10 | % | | | (.55 | )%+ | | | .07 | %+ | | | (.23 | )% |
Portfolio turnover rate | | | 131 | % | | | 154 | % | | | 164 | % | | | 193 | % | | | 201 | % |
See footnote summary on page 45.
| | |
| 38 | | • ALLIANCEBERNSTEIN GLOBAL THEMATIC GROWTH FUND |
Financial Highlights
Selected Data For A Share Of Capital Stock Outstanding Throughout Each Period
| | | | | | | | | | | | | | | | | | | | |
| | | Class B | |
| | | Year Ended July 31, | |
| | | 2013 | | | 2012 | | | 2011 | | | 2010 | | | 2009 | |
| | | | |
| | | | | | | | | | | | | | | | | | | | |
Net asset value,
beginning of period | | | $ 49.53 | | | | $ 64.65 | | | | $ 55.11 | | | | $ 51.23 | | | | $ 56.71 | |
| | | | |
Income From Investment Operations | | | | | | | | | | | | | | | | | | | | |
Net investment loss(a) | | | (.39 | ) | | | (.41 | ) | | | (.85 | ) | | | (.46 | ) | | | (.47 | ) |
Net realized and unrealized gain (loss) on investment and foreign currency transactions | | | 11.11 | | | | (14.71 | ) | | | 10.39 | | | | 5.15 | | | | (5.02 | ) |
Contributions from Adviser | | | .00 | (b) | | | – 0 | – | | | – 0 | – | | | – 0 | – | | | .01 | |
| | | | |
Net increase (decrease) in net asset value from operations | | | 10.72 | | | | (15.12 | ) | | | 9.54 | | | | 4.69 | | | | (5.48 | ) |
| | | | |
Less: Dividends | | | | | | | | | | | | | | | | | | | | |
Dividends from net investment income | | | – 0 | – | | | – 0 | – | | | – 0 | – | | | (.81 | ) | | | – 0 | – |
| | | | |
Net asset value, end of period | | | $ 60.25 | | | | $ 49.53 | | | | $ 64.65 | | | | $ 55.11 | | | | $ 51.23 | |
| | | | |
Total Return | | | | | | | | | | | | | | | | | | | | |
Total investment return based on net asset value(c)* | | | 21.64 | % | | | (23.39 | )% | | | 17.31 | %† | | | 9.16 | % | | | (9.66 | )% |
Ratios/Supplemental Data | | | | | | | | | | | | | | | | | | | | |
Net assets, end of period (000’s omitted) | | | $22,077 | | | | $26,962 | | | | $55,473 | | | | $72,741 | | | | $104,726 | |
Ratio to average net
assets of: | | | | | | | | | | | | | | | | | | | | |
Expenses | | | 2.30 | % | | | 2.39 | % | | | 2.30 | %+ | | | 2.35 | %+ | | | 2.54 | % |
Net investment loss | | | (.69 | )% | | | (.76 | )% | | | (1.33 | )%+ | | | (.84 | )%+ | | | (1.12 | )% |
Portfolio turnover rate | | | 131 | % | | | 154 | % | | | 164 | % | | | 193 | % | | | 201 | % |
See footnote summary on page 45.
| | | | |
| ALLIANCEBERNSTEIN GLOBAL THEMATIC GROWTH FUND • | | | 39 | |
Financial Highlights
Selected Data For A Share Of Capital Stock Outstanding Throughout Each Period
| | | | | | | | | | | | | | | | | | | | |
| | | Class C | |
| | | Year Ended July 31, | |
| | | 2013 | | | 2012 | | | 2011 | | | 2010 | | | 2009 | |
| | | | |
| | | | | | | | | | | | | | | | | | | | |
Net asset value,
beginning of period | | | $ 49.82 | | | | $ 64.96 | | | | $ 55.35 | | | | $ 51.42 | | | | $ 56.88 | |
| | | | |
Income From Investment Operations | | | | | | | | | | | | | | | | | | | | |
Net investment loss(a) | | | (.36 | ) | | | (.35 | ) | | | (.83 | ) | | | (.36 | ) | | | (.42 | ) |
Net realized and unrealized gain (loss) on investment and foreign currency transactions | | | 11.18 | | | | (14.79 | ) | | | 10.44 | | | | 5.10 | | | | (5.06 | ) |
Contributions from Adviser | | | .00 | (b) | | | – 0 | – | | | – 0 | – | | | – 0 | – | | | .02 | |
| | | | |
Net increase (decrease) in net asset value from operations | | | 10.82 | | | | (15.14 | ) | | | 9.61 | | | | 4.74 | | | | (5.46 | ) |
| | | | |
Less: Dividends | | | | | | | | | | | | | | | | | | | | |
Dividends from net investment income | | | – 0 | – | | | – 0 | – | | | – 0 | – | | | (.81 | ) | | | – 0 | – |
| | | | |
Net asset value, end of period | | | $ 60.64 | | | | $ 49.82 | | | | $ 64.96 | | | | $ 55.35 | | | | $ 51.42 | |
| | | | |
Total Return | | | | | | | | | | | | | | | | | | | | |
Total investment return based on net asset value(c)* | | | 21.72 | % | | | (23.31 | )% | | | 17.36 | %† | | | 9.22 | % | | | (9.60 | )% |
Ratios/Supplemental Data | | | | | | | | | | | | | | | | | | | | |
Net assets, end of period (000’s omitted) | | | $74,286 | | | | $78,410 | | | | $129,354 | | | | $121,020 | | | | $117,334 | |
Ratio to average net
assets of: | | | | | | | | | | | | | | | | | | | | |
Expenses | | | 2.23 | % | | | 2.30 | % | | | 2.24 | %+ | | | 2.29 | %+ | | | 2.45 | % |
Net investment loss | | | (.64 | )% | | | (.65 | )% | | | (1.28 | )%+ | | | (.66 | )%+ | | | (.99 | )% |
Portfolio turnover rate | | | 131 | % | | | 154 | % | | | 164 | % | | | 193 | % | | | 201 | % |
See footnote summary on page 45.
| | |
| 40 | | • ALLIANCEBERNSTEIN GLOBAL THEMATIC GROWTH FUND |
Financial Highlights
Selected Data For A Share Of Capital Stock Outstanding Throughout Each Period
| | | | | | | | | | | | | | | | | | | | |
| | | Advisor Class | |
| | | Year Ended July 31, | |
| | | 2013 | | | 2012 | | | 2011 | | | 2010 | | | 2009 | |
| | | | |
| | | | | | | | | | | | | | | | | | | | |
Net asset value,
beginning of period | | | $ 60.23 | | | | $ 78.60 | | | | $ 66.53 | | | | $ 61.03 | | | | $ 66.80 | |
| | | | |
Income From Investment Operations | | | | | | | | | | | | | | | | | | | | |
Net investment income (loss)(a) | | | .28 | | | | .27 | | | | (.19 | ) | | | .35 | | | | .05 | |
Net realized and unrealized gain (loss) on investment and foreign currency transactions | | | 13.54 | | | | (17.98 | ) | | | 12.54 | | | | 5.96 | | | | (5.84 | ) |
Contributions from Adviser | | | .00 | (b) | | | – 0 | – | | | – 0 | – | | | – 0 | – | | | .02 | |
| | | | |
Net increase (decrease) in net asset value from operations | | | 13.82 | | | | (17.71 | ) | | | 12.35 | | | | 6.31 | | | | (5.77 | ) |
| | | | |
Less: Dividends | | | | | | | | | | | | | | | | | | | | |
Dividends from net investment income | | | – 0 | – | | | (.66 | ) | | | (.28 | ) | | | (.81 | ) | | | – 0 | – |
| | | | |
Net asset value, end of period | | | $ 74.05 | | | | $ 60.23 | | | | $ 78.60 | | | | $ 66.53 | | | | $ 61.03 | |
| | | | |
Total Return | | | | | | | | | | | | | | | | | | | | |
Total investment return based on net asset value(c)* | | | 22.95 | % | | | (22.50 | )% | | | 18.58 | %† | | | 10.35 | % | | | (8.64 | )% |
Ratios/Supplemental Data | | | | | | | | | | | | | | | | | | | | |
Net assets, end of period (000’s omitted) | | | $59,189 | | | | $74,474 | | | | $106,042 | | | | $63,376 | | | | $40,770 | |
Ratio to average net
assets of: | | | | | | | | | | | | | | | | | | | | |
Expenses | | | 1.21 | % | | | 1.25 | % | | | 1.19 | %+ | | | 1.25 | %+ | | | 1.40 | % |
Net investment income (loss) | | | .40 | % | | | .41 | % | | | (.25 | )%+ | | | .54 | %+ | | | .11 | % |
Portfolio turnover rate | | | 131 | % | | | 154 | % | | | 164 | % | | | 193 | % | | | 201 | % |
See footnote summary on page 45.
| | | | |
| ALLIANCEBERNSTEIN GLOBAL THEMATIC GROWTH FUND • | | | 41 | |
Financial Highlights
Selected Data For A Share Of Capital Stock Outstanding Throughout Each Period
| | | | | | | | | | | | | | | | | | | | |
| | | Class R | |
| | | Year Ended July 31, | |
| | | 2013 | | | 2012 | | | 2011 | | | 2010 | | | 2009 | |
| | | | |
| | | | | | | | | | | | | | | | | | | | |
Net asset value,
beginning of period | | | $ 57.44 | | | | $ 74.85 | | | | $ 63.46 | | | | $ 58.46 | | | | $ 64.10 | |
| | | | |
Income From Investment Operations | | | | | | | | | | | | | | | | | | | | |
Net investment income (loss)(a) | | | .00 | (b) | | | .06 | | | | (.50 | ) | | | .03 | | | | (.04 | ) |
Net realized and unrealized gain (loss) on investment and foreign currency transactions | | | 12.90 | | | | (17.10 | ) | | | 11.99 | | | | 5.78 | | | | (5.62 | ) |
Contributions from Adviser | | | .00 | (b) | | | – 0 | – | | | – 0 | – | | | – 0 | – | | | .02 | |
| | | | |
Net increase (decrease) in net asset value from operations | | | 12.90 | | | | (17.04 | ) | | | 11.49 | | | | 5.81 | | | | (5.64 | ) |
| | | | |
Less: Dividends | | | | | | | | | | | | | | | | | | | | |
Dividends from net investment income | | | – 0 | – | | | (.37 | ) | | | (.10 | ) | | | (.81 | ) | | | – 0 | – |
| | | | |
Net asset value, end of period | | | $ 70.34 | | | | $ 57.44 | | | | $ 74.85 | | | | $ 63.46 | | | | $ 58.46 | |
| | | | |
Total Return | | | | | | | | | | | | | | | | | | | | |
Total investment return based on net asset value(c)* | | | 22.45 | % | | | (22.75 | )% | | | 18.11 | %† | | | 9.95 | % | | | (8.80 | )% |
Ratios/Supplemental Data | | | | | | | | | | | | | | | | | | | | |
Net assets, end of period (000’s omitted) | | | $5,829 | | | | $7,548 | | | | $7,728 | | | | $5,896 | | | | $5,192 | |
Ratio to average net
assets of: | | | | | | | | | | | | | | | | | | | | |
Expenses | | | 1.60 | % | | | 1.60 | % | | | 1.61 | %+ | | | 1.62 | %+ | | | 1.61 | % |
Net investment income (loss) | | | .00 | %(d) | | | .09 | % | | | (.68 | )%+ | | | .05 | %+ | | | (.09 | )% |
Portfolio turnover rate | | | 131 | % | | | 154 | % | | | 164 | % | | | 193 | % | | | 201 | % |
See footnote summary on page 45.
| | |
| 42 | | • ALLIANCEBERNSTEIN GLOBAL THEMATIC GROWTH FUND |
Financial Highlights
Selected Data For A Share Of Capital Stock Outstanding Throughout Each Period
| | | | | | | | | | | | | | | | | | | | |
| | | Class K | |
| | | Year Ended July 31, | |
| | | 2013 | | | 2012 | | | 2011 | | | 2010 | | | 2009 | |
| | | | |
| | | | | | | | | | | | | | | | | | | | |
Net asset value,
beginning of period | | | $ 58.52 | | | | $ 76.47 | | | | $ 64.80 | | | | $ 59.49 | | | | $ 65.02 | |
| | | | |
Income From Investment Operations | | | | | | | | | | | | | | | | | | | | |
Net investment income (loss)(a) | | | .21 | | | | .30 | | | | (.26 | ) | | | .22 | | | | .11 | |
Net realized and unrealized gain (loss) on investment and foreign currency transactions | | | 13.17 | | | | (17.54 | ) | | | 12.21 | | | | 5.90 | | | | (5.66 | ) |
Contributions from Adviser | | | .00 | (b) | | | – 0 | – | | | – 0 | – | | | – 0 | – | | | .02 | |
| | | | |
Net increase (decrease) in net asset value from operations | | | 13.38 | | | | (17.24 | ) | | | 11.95 | | | | 6.12 | | | | (5.53 | ) |
| | | | |
Less: Dividends | | | | | | | | | | | | | | | | | | | | |
Dividends from net investment income | | | – 0 | – | | | (.71 | ) | | | (.28 | ) | | | (.81 | ) | | | – 0 | – |
| | | | |
Net asset value, end of period | | | $ 71.90 | | | | $ 58.52 | | | | $ 76.47 | | | | $ 64.80 | | | | $ 59.49 | |
| | | | |
Total Return | | | | | | | | | | | | | | | | | | | | |
Total investment return based on net asset value(c)* | | | 22.86 | % | | | (22.53 | )% | | | 18.44 | %† | | | 10.30 | % | | | (8.50 | )% |
Ratios/Supplemental Data | | | | | | | | | | | | | | | | | | | | |
Net assets, end of period (000’s omitted) | | | $8,811 | | | | $8,516 | | | | $5,509 | | | | $4,719 | | | | $4,352 | |
Ratio to average net
assets of: | | | | | | | | | | | | | | | | | | | | |
Expenses | | | 1.28 | % | | | 1.29 | % | | | 1.32 | %+ | | | 1.30 | %+ | | | 1.31 | % |
Net investment income (loss) | | | .31 | % | | | .46 | % | | | (.34 | )%+ | | | .35 | %+ | | | .23 | % |
Portfolio turnover rate | | | 131 | % | | | 154 | % | | | 164 | % | | | 193 | % | | | 201 | % |
See footnote summary on page 45.
| | | | |
| ALLIANCEBERNSTEIN GLOBAL THEMATIC GROWTH FUND • | | | 43 | |
Financial Highlights
Selected Data For A Share Of Capital Stock Outstanding Throughout Each Period
| | | | | | | | | | | | | | | | | | | | |
| | | Class I | |
| | | Year Ended July 31, | |
| | | 2013 | | | 2012 | | | 2011 | | | 2010 | | | 2009 | |
| | | | |
| | | | | | | | | | | | | | | | | | | | |
| | | | | | | | | | | | | | | | | | | | |
Net asset value,
beginning of period | | | $ 59.71 | | | | $ 77.88 | | | | $ 65.92 | | | | $ 60.31 | | | | $ 65.67 | |
| | | | |
Income From Investment Operations | | | | | | | | | | | | | | | | | | | | |
Net investment income (loss)(a) | | | .66 | | | | .50 | | | | (.02 | ) | | | .44 | | | | .34 | |
Net realized and unrealized gain (loss) on investment and foreign currency transactions | | | 13.27 | | | | (17.83 | ) | | | 12.44 | | | | 5.98 | | | | (5.73 | ) |
Contributions from Adviser | | | .00 | (b) | | | – 0 | – | | | – 0 | – | | | – 0 | – | | | .03 | |
| | | | |
Net increase (decrease) in net asset value from operations | | | 13.93 | | | | (17.33 | ) | | | 12.42 | | | | 6.42 | | | | (5.36 | ) |
| | | | |
Less: Dividends | | | | | | | | | | | | | | | | | | | | |
Dividends from net investment income | | | – 0 | – | | | (.84 | ) | | | (.46 | ) | | | (.81 | ) | | | – 0 | – |
| | | | |
Net asset value, end of period | | | $ 73.64 | | | | $ 59.71 | | | | $ 77.88 | | | | $ 65.92 | | | | $ 60.31 | |
| | | | |
Total Return | | | | | | | | | | | | | | | | | | | | |
Total investment return based on net asset value(c)* | | | 23.33 | % | | | (22.22 | )% | | | 18.86 | %† | | | 10.66 | % | | | (8.16 | )% |
Ratios/Supplemental Data | | | | | | | | | | | | | | | | | | | | |
Net assets, end of period (000’s omitted) | | | $392 | | | | $10,662 | | | | $15,646 | | | | $5,146 | | | | $2,977 | |
Ratio to average net
assets of: | | | | | | | | | | | | | | | | | | | | |
Expenses | | | .86 | % | | | .89 | % | | | .96 | %+ | | | .98 | %+ | | | 1.01 | % |
Net investment income (loss) | | | .97 | % | | | .77 | % | | | (.02 | )%+ | | | .64 | %+ | | | .71 | % |
Portfolio turnover rate | | | 131 | % | | | 154 | % | | | 164 | % | | | 193 | % | | | 201 | % |
See footnote summary on page 45.
| | |
| 44 | | • ALLIANCEBERNSTEIN GLOBAL THEMATIC GROWTH FUND |
Financial Highlights
| (a) | | Based on average shares outstanding. |
| (b) | | Amount is less than $.005. |
| (c) | | Total investment return is calculated assuming an initial investment made at the net asset value at the beginning of the period, reinvestment of all dividends and distributions at net asset value during the period, and redemption on the last day of the period. Initial sales charges or contingent deferred sales charges are not reflected in the calculation of total investment return. Total return does not reflect the deduction of taxes that a shareholder would pay on fund distributions or the redemption of fund shares. Total investment return calculated for a period of less than one year is not annualized. |
| (d) | | Amount is less than .005%. |
| * | | Includes the impact of proceeds received and credited to the Fund resulting from class action settlements, which enhanced the Fund’s performance for the years ended July 31, 2013, July 31, 2012, July 31, 2011, July 31, 2010 and July 31, 2009 by 0.05%, 0.07%, 0.04%, 0.42% and 0.24%, respectively. |
| † | | Includes the impact of proceeds received and credited to the Fund resulting from third party regulatory settlements, which enhanced the Fund’s performance for the year ended July 31, 2011 by 0.03%. |
| + | | The ratio includes expenses attributable to costs of proxy solicitation. |
See notes to financial statements.
| | | | |
| ALLIANCEBERNSTEIN GLOBAL THEMATIC GROWTH FUND • | | | 45 | |
Financial Highlights
REPORT OF INDEPENDENT REGISTERED
PUBLIC ACCOUNTING FIRM
To the Shareholders and Board of Directors of
AllianceBernstein Global Thematic Growth Fund, Inc.
We have audited the accompanying statement of assets and liabilities of AllianceBernstein Global Thematic Growth Fund, Inc. (the “Fund”), including the portfolio of investments, as of July 31, 2013, and the related statement of operations for the year then ended, the statements of changes in net assets for each of the two years in the period then ended, and the financial highlights for each of the five years in the period then ended. These financial statements and financial highlights are the responsibility of the Fund’s management. Our responsibility is to express an opinion on these financial statements and financial highlights based on our audits.
We conducted our audits in accordance with the standards of the Public Company Accounting Oversight Board (United States). Those standards require that we plan and perform the audit to obtain reasonable assurance about whether the financial statements and financial highlights are free of material misstatement. We were not engaged to perform an audit of the Fund’s internal control over financial reporting. Our audits included consideration of internal control over financial reporting as a basis for designing audit procedures that are appropriate in the circumstances, but not for the purpose of expressing an opinion on the effectiveness of the Fund’s internal control over financial reporting. Accordingly, we express no such opinion. An audit includes examining, on a test basis, evidence supporting the amounts and disclosures in the financial statements and financial highlights, assessing the accounting principles used and significant estimates made by management, and evaluating the overall financial statement presentation. Our procedures included confirmation of securities owned as of July 31, 2013, by correspondence with the custodian and others, or by other appropriate auditing procedures where replies from others were not received. We believe that our audits provide a reasonable basis for our opinion.
In our opinion, the financial statements and financial highlights referred to above present fairly, in all material respects, the financial position of AllianceBernstein Global Thematic Growth Fund, Inc. at July 31, 2013, the results of its operations for the year then ended, the changes in its net assets for each of the two years in the period then ended, and the financial highlights for each of the five years in the period then ended, in conformity with U.S. generally accepted accounting principles.

New York, New York
September 26, 2013
| | |
| 46 | | • ALLIANCEBERNSTEIN GLOBAL THEMATIC GROWTH FUND |
Report of Independent Registered Public Accounting Firm
2013 FEDERAL TAX INFORMATION
(unaudited)
For Federal income tax purposes, the following information is furnished with respect to the distributions paid by the Fund during the taxable year ended July 31, 2013.
For the taxable year ended July 31, 2013, the Fund designates $3,067,124 as the maximum amount that may be considered qualified dividend income for individual shareholders.
Shareholders should not use the above information to prepare their income tax returns. The information necessary to complete your income tax returns will be included with your Form 1099-DIV which will be sent to you separately in January 2014.
| | | | |
| ALLIANCEBERNSTEIN GLOBAL THEMATIC GROWTH FUND • | | | 47 | |
2013 Federal Tax Information
BOARD OF DIRECTORS
| | |
William H. Foulk, Jr.(1), Chairman John H. Dobkin(1) Michael J. Downey(1) D. James Guzy(1) Nancy P. Jacklin(1) | | Robert M. Keith, President and Chief Executive Officer Garry L. Moody(1) Marshall C. Turner, Jr.(1) Earl D. Weiner(1) |
OFFICERS
| | |
Philip L. Kirstein, Senior Vice President and Independent Compliance Officer Amy P. Raskin(2), Vice President Daniel C. Roarty(2), Vice President Tassos M. Stassopoulos(2), Vice President | | Vadim Zlotnikov(2), Vice President Emilie D. Wrapp, Secretary Joseph J. Mantineo, Treasurer and Chief Financial Officer Phyllis J. Clarke, Controller |
| | |
Custodian and Accounting Agent State Street Bank and Trust Company One Lincoln Street Boston, MA 02111 Principal Underwriter AllianceBernstein Investments, Inc. 1345 Avenue of the Americas New York, NY 10105 Legal Counsel Seward & Kissel LLP One Battery Park Plaza New York, NY 10004 | | Transfer Agent AllianceBernstein Investor
Services, Inc. P.O. Box 786003 San Antonio, TX 78278-6003 Toll-Free (800) 221-5672 Independent Registered Public Accounting Firm Ernst & Young LLP 5 Times Square New York, NY 10036 |
| (1) | | Member of the Audit Committee, the Governance and Nominating Committee and the Independent Directors Committee. Mr. Foulk is the sole member of the Fair Value Pricing Committee. |
| (2) | | The day-to-day management of, and investment decisions for, the Fund are made by the Adviser’s Global Growth and Thematic Investment Team. Ms. Amy P. Raskin, Mr. Daniel C. Roarty, Mr. Tassos M. Stassopoulos and Mr. Vadim Zlotnikov, are the investment professionals with the most significant responsibility for the day-to-day management of the Fund. |
| | |
| 48 | | • ALLIANCEBERNSTEIN GLOBAL THEMATIC GROWTH FUND |
Board of Directors
MANAGEMENT OF THE FUND
Board of Directors Information
The business and affairs of the Fund are managed under the direction of the Board of Directors. Certain information concerning the Fund’s Directors is set forth below.
| | | | | | | | |
NAME,
ADDRESS* AND AGE
(YEAR FIRST ELECTED**) | | PRINCIPAL
OCCUPATION(S)
DURING PAST FIVE YEARS
AND OTHER RELEVANT
QUALIFICATIONS*** | | PORTFOLIOS
IN FUND
COMPLEX
OVERSEEN BY
DIRECTOR | | | OTHER
DIRECTORSHIPS
HELD BY
DIRECTOR IN THE
PAST FIVE YEARS |
| INTERESTED DIRECTOR | | | | | | |
Robert M. Keith,+ 1345 Avenue of the Americas New York, NY 10105 53 (2010) | | Senior Vice President of AllianceBernstein L.P. (the “Adviser”) and the head of AllianceBernstein Investments, Inc. (“ABI”) since July 2008; Director of ABI and President of the AllianceBernstein Mutual Funds. Previously, he served as Executive Managing Director of ABI from December 2006 to June 2008. Prior to joining ABI in 2006, Executive Managing Director of Bernstein Global Wealth Management, and prior thereto, Senior Managing Director and Global Head of Client Service and Sales of the Adviser‘s institutional investment management business since 2004. Prior thereto, he was Managing Director and Head of North American Client Service and Sales in the Adviser’s institutional investment management business, with which he had been associated since prior to 2004. | | | 100 | | | None |
| | | | | | | | |
| DISINTERESTED DIRECTORS | | | | | | |
William H. Foulk, Jr., #, ## Chairman of the Board 81 (1992) | | Investment Adviser and an Independent Consultant since prior to 2008. Previously, he was Senior Manager of Barrett Associates, Inc., a registered investment adviser. He was formerly Deputy Comptroller and Chief Investment Officer of the State of New York and, prior thereto, Chief Investment Officer of the New York Bank for Savings. He has served as a director or trustee of various AllianceBernstein Funds since 1983 and has been Chairman of the AllianceBernstein Funds and of the Independent Directors Committee of such Funds since 2003. He is also active in a number of mutual fund related organizations and committees. | | | 100 | | | None |
| | | | |
| ALLIANCEBERNSTEIN GLOBAL THEMATIC GROWTH FUND • | | | 49 | |
Management of the Fund
| | | | | | | | |
NAME,
ADDRESS* AND AGE
(YEAR FIRST ELECTED**) | | PRINCIPAL
OCCUPATION(S)
DURING PAST FIVE YEARS
AND OTHER RELEVANT
QUALIFICATIONS*** | | PORTFOLIOS
IN FUND
COMPLEX
OVERSEEN BY
DIRECTOR | | | OTHER
DIRECTORSHIPS
HELD BY
DIRECTOR IN THE
PAST FIVE YEARS |
DISINTERESTED DIRECTORS (continued) | | | | | | |
John H. Dobkin, # 71 (2005) | | Independent Consultant since prior to 2008. Formerly, President of Save Venice, Inc. (preservation organization) from 2001-2002; Senior Advisor from June 1999-June 2000 and President of Historic Hudson Valley (historic preservation) from December 1989-May 1999. Previously, Director of the National Academy of Design. He has served as a director or trustee of various AllianceBernstein Funds since 1992, and as Chairman of the Audit Committees of a number of such Funds from 2001-2008. | | | 100 | | | None |
| | | | | | | | |
Michael J. Downey, # 69 (2005) | | Private Investor since prior to 2008. Formerly, managing partner of Lexington Capital, LLC (investment advisory firm) from December 1997 until December 2003. From 1987 until 1993, Chairman and CEO of Prudential Mutual Fund Management, director of the Prudential mutual funds, and member of the Executive Committee of Prudential Securities, Inc. He has served as a director or trustee of the AllianceBernstein Funds since 2005 and is a director and Chairman of one other registered investment company. | | | 100 | | | Asia Pacific Fund, Inc. since prior to 2008, Prospectus Acquisition Corporation (financial services) from 2007 until 2009, and The Merger Fund since prior to 2008 until 2013 |
| | | | | | | | |
D. James Guzy, # 77 (1982) | | Chairman of the Board of PLX Technology (semi-conductors) and of SRC Computers, Inc., with which he has been associated since prior to 2008. He was a director of Intel Corporation (semi-conductors) from 1969 until 2008, and served as Chairman of the Finance Committee of such company for several years until May 2008. He has served as a director or trustee of one or more of the AllianceBernstein Funds since 1982. | | | 100 | | | PLX technology (semi-conductors) since prior to 2008, Cirrus Logic corporation (semi-conductors) since prior to 2008 until July 2011, and Intel Corporation (semi-conductors) until 2008 |
| | |
| 50 | | • ALLIANCEBERNSTEIN GLOBAL THEMATIC GROWTH FUND |
Management of the Fund
| | | | | | | | |
NAME,
ADDRESS* AND AGE
(YEAR FIRST ELECTED**) | | PRINCIPAL
OCCUPATION(S)
DURING PAST FIVE YEARS
AND OTHER RELEVANT
QUALIFICATIONS*** | | PORTFOLIOS
IN FUND
COMPLEX
OVERSEEN BY
DIRECTOR | | | OTHER
DIRECTORSHIPS
HELD BY
DIRECTOR IN THE
PAST FIVE YEARS |
DISINTERESTED DIRECTORS (continued) | | | | | | |
Nancy P. Jacklin, # 65 (2006) | | Professorial Lecturer at the Johns Hopkins School of Advanced International Studies since 2008. Formerly, U.S. Executive Director of the International Monetary Fund (December 2002-May 2006; Partner, Clifford Chance (1992-2002); Sector Counsel, International Banking and Finance, and Associate General Counsel, Citicorp (1985-1992); Assistant General Counsel (International), Federal Reserve Board of Governors (1982-1985); and Attorney Advisor, U.S. Department of the Treasury (1973-1982). Member of the Bar of the District of Columbia and of New York; and member of the Council on Foreign Relations. She has served as a director or trustee of the AllianceBernstein Funds since 2006. | | | 100 | | | None |
| | | | | | | | |
Garry L. Moody, # 61 (2008) | | Independent Consultant. Formerly, Partner, Deloitte & Touche LLP (1995-2008) where he held a number of senior positions, including Vice Chairman, and U.S. and Global Investment Management Practice Managing Partner; President, Fidelity Accounting and Custody Services Company (1993-1995); and Partner, Ernst & Young LLP (1975-1993), where he served as the National Director of Mutual Fund Tax Services, and Managing Partner of its Chicago Office Tax Department. He is also a member of both the Governing Council of the Independent Directors Council (IDC), an organization of independent directors of mutual funds, and the Trustee Advisory Board of BoardIQ, a biweekly publication focused on issues and news affecting directors of mutual funds. He has served as a director or trustee, and as Chairman of the Audit Committee, of the AllianceBernstein Funds since 2008. | | | 100 | | | Greenbacker Renewable Energy Company, LLC (renewable energy and energy efficiency projects) since August 2013 |
| | | | |
| ALLIANCEBERNSTEIN GLOBAL THEMATIC GROWTH FUND • | | | 51 | |
Management of the Fund
| | | | | | | | |
NAME,
ADDRESS* AND AGE
(YEAR FIRST ELECTED**) | | PRINCIPAL
OCCUPATION(S)
DURING PAST FIVE YEARS
AND OTHER RELEVANT
QUALIFICATIONS*** | | PORTFOLIOS
IN FUND
COMPLEX
OVERSEEN BY
DIRECTOR | | | OTHER
DIRECTORSHIPS
HELD BY
DIRECTOR IN THE
PAST FIVE YEARS |
DISINTERESTED DIRECTORS (continued) | | | | | | |
Marshall C. Turner, Jr, # 71 (1992) | | Private Investor since prior to 2008. Interim CEO of MEMC Electronic Materials, Inc. (semi-conductor and solar cell substrates) from November 2008 until March 2009. He was Chairman and CEO of Dupont Photomasks, Inc. (components of semi-conductor manufacturing), 2003-2005, and President and CEO, 2005-2006, after the company was acquired and renamed Toppan Photomasks, Inc. He has extensive experience in venture capital investing including prior service as general partner of three institutional venture capital partnerships, and serves on the boards of a number of education and science-related non-profit organizations. He has served as a director or trustee of one or more of the AllianceBernstein Funds since 1992. | | | 100 | | | Xilinx, Inc. (programmable logic semi-conductors) and MEMC Electronic Materials, Inc. (semi-conductor and solar cell substrates) since prior to 2008 |
| | | | | | | | |
Earl D. Weiner, # 74 (2007) | | Of Counsel, and Partner prior to January 2007, of the law firm Sullivan & Cromwell LLP and member of ABA Federal Regulation of Securities Committee Task Force to draft editions of the Fund Director’s Guidebook. He also serves as a director or trustee of various non-profit organizations and has served as Chairman or Vice Chairman of a number of them. He has served as a director or trustee of the AllianceBernstein Funds since 2007 and is Chairman of the Governance and Nominating Committees of the Funds. | | | 100 | | | None |
| * | | The address for each of the Fund’s disinterested Directors is c/o AllianceBernstein L.P., Attention: Philip L. Kirstein, 1345 Avenue of the Americas, New York, NY 10105. |
| ** | | There is no stated term of office for the Fund’s Directors. |
| *** | | The information above includes each Director’s principal occupation during the last five years and other information relating to the experience, attributes, and skills relevant to each Director’s qualifications to serve as a Director, which led to the conclusion that each Director should serve as a Director for the Fund. |
| + | | Mr. Keith is an “interested person” of the Fund, as defined in the 1940 Act, due to his position as a Senior Vice President of the Adviser. |
| # | | Member of the Audit Committee, the Governance and Nominating Committee and the Independent Directors Committee. |
| ## | | Member of the Fair Value Pricing Committee. |
| | |
| 52 | | • ALLIANCEBERNSTEIN GLOBAL THEMATIC GROWTH FUND |
Management of the Fund
Officers of The Fund
Certain information concerning the Fund’s Officers is listed below.
| | | | |
NAME, ADDRESS*
AND AGE | | POSITION(S)
HELD WITH FUND | | PRINCIPAL OCCUPATION
DURING PAST FIVE YEARS |
Robert M. Keith 53 | | President and Chief Executive Officer | | See biography above. |
| | | | |
Philip L. Kirstein 68 | | Senior Vice President and Independent Compliance Officer | | Senior Vice President and Independent Compliance Officer of the AllianceBernstein Funds, with which he has been associated since October 2004. Prior thereto, he was Of Counsel to Kirkpatrick & Lockhart, LLP from October 2003 to October 2004, and General Counsel of Merrill Lynch Investment Managers, L.P. since prior to March 2003. |
| | | | |
Amy P. Raskin 42 | | Vice President | | Senior Vice President of the Adviser,** with which she has been associated since prior to 2008. |
| | | | |
Daniel C. Roarty 42 | | Vice President | | Senior Vice President of the Adviser** and Team Leader of Global Growth and Thematic Investment, with which he has been associated since July 1, 2011. Prior thereto, he was in research and portfolio management at Nuveen Investments since prior to 2008. |
| | | | |
Tassos M. Stassopoulos 45 | | Vice President | | Senior Vice President of the Adviser,** with which he has been associated since prior to 2008. |
| | | | |
Vadim Zlotnikov 51 | | Vice President | | Senior Vice President of the Adviser,** with which he has been associated since prior to 2008. |
| | | | |
Emilie D. Wrapp 57 | | Secretary | | Senior Vice President, Assistant General Counsel and Assistant Secretary of ABI,** with which she has been associated since prior to 2008. |
| | | | |
Joseph J. Mantineo 54 | | Treasurer and Chief Financial Officer | | Senior Vice President of AllianceBernstein Investor Services, Inc. (“ABIS”),** with which he has been associated since prior to 2008. |
| | | | |
Phyllis J. Clarke 52 | | Controller | | Vice President of ABIS,** with which she has been associated since prior to 2008. |
| * | | The address for each of the Fund’s Officers is 1345 Avenue of the Americas, New York, NY 10105. |
| ** | | The Adviser, ABI and ABIS are affiliates of the Fund. |
| | | The Fund’s Statement of Additional Information (“SAI”) has additional information about the Fund’s Directors and Officers and is available without charge upon request. Contact your financial representative or AllianceBernstein at 800-227-4618, or visit www.alliancebernstein.com, for a free prospectus or SAI. |
| | | | |
| ALLIANCEBERNSTEIN GLOBAL THEMATIC GROWTH FUND • | | | 53 | |
Management of the Fund
Information Regarding the Review and Approval of the Fund’s Advisory Agreement
The disinterested directors (the “directors”) of AllianceBernstein Global Thematic Growth Fund, Inc. (the “Fund”) unanimously approved the continuance of the Fund’s Advisory Agreement with the Adviser at a meeting held on April 30-May 2, 2013 (the “May 2013 meeting”).
Prior to approval of the continuance of the Advisory Agreement, the directors had requested from the Adviser, and received and evaluated, extensive materials. They reviewed the proposed continuance of the Advisory Agreement with the Adviser and with experienced counsel who are independent of the Adviser, who advised on the relevant legal standards. The directors also reviewed an independent evaluation prepared by the Fund’s Senior Officer (who is also the Fund’s Independent Compliance Officer) of the reasonableness of the advisory fee, in which the Senior Officer concluded that the contractual fee for the Fund was reasonable. The directors also discussed the proposed continuance in private sessions with counsel and the Fund’s Senior Officer.
The directors considered their knowledge of the nature and quality of the services provided by the Adviser to the Fund gained from their experience as directors or trustees of most of the registered investment companies advised by the Adviser, their overall confidence in the Adviser’s integrity and competence they have gained from that experience, the Adviser’s initiative in identifying and raising potential issues with the directors and its responsiveness, frankness and attention to concerns raised by the directors in the past, including the Adviser’s willingness to consider and implement organizational and operational changes designed to improve investment results and the services provided to the AllianceBernstein Funds. The directors noted that they have four regular meetings each year, at each of which they receive presentations from the Adviser on the investment results of the Fund and review extensive materials and information presented by the Adviser.
The directors also considered all other factors they believed relevant, including the specific matters discussed below. In their deliberations, the directors did not identify any particular information that was all-important or controlling, and different directors may have attributed different weights to the various factors. The directors determined that the selection of the Adviser to manage the Fund and the overall arrangements between the Fund and the Adviser, as provided in the Advisory Agreement, including the advisory fee, were fair and reasonable in light of the services performed, expenses incurred and such other matters as the directors considered relevant in the exercise of their business judgment. The material factors and conclusions that formed the basis for the directors’ determinations included the following:
Nature, Extent and Quality of Services Provided
The directors considered the scope and quality of services provided by the Adviser under the Advisory Agreement, including the quality of the investment
| | |
| 54 | | • ALLIANCEBERNSTEIN GLOBAL THEMATIC GROWTH FUND |
research capabilities of the Adviser and the other resources it has dedicated to performing services for the Fund. They also noted the professional experience and qualifications of the Fund’s portfolio management team and other senior personnel of the Adviser. The directors also considered that the Advisory Agreement provides that the Fund will reimburse the Adviser for the cost to it of providing certain clerical, accounting, administrative and other services to the Fund by employees of the Adviser or its affiliates. Requests for these reimbursements are made on a quarterly basis and subject to approval by the directors and, to the extent requested and paid, result in a higher rate of total compensation from the Fund to the Adviser than the fee rate stated in the Fund’s Advisory Agreement. The directors noted that the methodology used to determine the reimbursement amounts had been reviewed by an independent consultant retained by the Fund’s Senior Officer. The quality of administrative and other services, including the Adviser’s role in coordinating the activities of the Fund’s other service providers, also were considered. The directors concluded that, overall, they were satisfied with the nature, extent and quality of services provided to the Fund under the Advisory Agreement.
Costs of Services Provided and Profitability
The directors reviewed a schedule of the revenues, expenses and related notes indicating the profitability of the Fund to the Adviser for calendar years 2011 and 2012 that had been prepared with an expense allocation methodology arrived at in consultation with an independent consultant retained by the Fund’s Senior Officer. The directors reviewed the assumptions and methods of allocation used by the Adviser in preparing fund-specific profitability data and noted that there are a number of potentially acceptable allocation methodologies for information of this type. The directors noted that the profitability information reflected all revenues and expenses of the Adviser’s relationship with the Fund, including those relating to its subsidiaries that provide transfer agency, distribution and brokerage services to the Fund. The directors recognized that it is difficult to make comparisons of the profitability of the Advisory Agreement with the profitability of fund advisory contracts for unaffiliated funds because comparative information is not generally publicly available and is affected by numerous factors. The directors focused on the profitability of the Adviser’s relationship with the Fund before taxes and distribution expenses. The directors were satisfied that the Adviser’s level of profitability from its relationship with the Fund was not unreasonable.
Fall-Out Benefits
The directors considered the other benefits to the Adviser and its affiliates from their relationships with the Fund, including but not limited to benefits relating to soft dollar arrangements (whereby the Adviser receives brokerage and research services from brokers that execute transactions for certain clients, including the Fund); 12b-1 fees and sales charges received by the Fund’s principal underwriter (which is a wholly owned subsidiary of the Adviser) in respect of certain classes
| | | | |
| ALLIANCEBERNSTEIN GLOBAL THEMATIC GROWTH FUND • | | | 55 | |
of the Fund’s shares; transfer agency fees paid by the Fund to a wholly owned subsidiary of the Adviser; and brokerage commissions paid by the Fund to brokers affiliated with the Adviser. The directors recognized that the Adviser’s profitability would be somewhat lower without these benefits. The directors understood that the Adviser also might derive reputational and other benefits from its association with the Fund.
Investment Results
In addition to the information reviewed by the directors in connection with the meeting, the directors receive detailed performance information for the Fund at each regular Board meeting during the year. At the May 2013 meeting, the directors reviewed information prepared by Lipper showing the performance of the Class A Shares of the Fund as compared with that of an array of funds selected by Lipper (the “Performance Universe”), and information prepared by the Adviser showing performance of the Class A Shares as compared with the Morgan Stanley Capital International (MSCI) All Country (AC) World Index (Net) (the “Index”), in each case for the 1-, 3-, 5- and 10-year periods ended February 28, 2013. The directors noted that the Fund was 4th out of 4 of the Performance Group and in the 5th quintile of the Performance Universe for the 1- and 3-year periods, 1st out of 2 of the Performance Group and in the 2nd quintile of the Performance Universe for the 5-year period, and 2nd out of 2 of the Performance Group and in the 5th quintile of the Performance Universe for the 10-year period. The directors noted the small number of other funds in the Performance Group. The Fund lagged the Index in all periods. The directors also noted that at the August 2008 meetings, they had approved modifications to the Fund’s investment strategy and policies, including a new benchmark, the MSCI AC World Index, and a name change to AllianceBernstein Global Thematic Growth Fund, Inc. from AllianceBernstein Global Technology Fund, Inc. effective November 2008. As a result, the directors gave less weight to the Fund’s investment performance prior to November 2008. Based on their review and their discussion with the Adviser of the reasons for the Fund’s performance, the directors retained confidence in the Adviser’s ability to manage the Fund’s assets. The directors determined to continue to monitor the Fund’s performance closely.
Advisory Fees and Other Expenses
The directors considered the advisory fee rate paid by the Fund to the Adviser and information prepared by Lipper concerning advisory fee rates paid by other funds in the same Lipper category as the Fund at a common asset level. The directors recognized that it is difficult to make comparisons of advisory fees because there are variations in the services that are included in the fees paid by other funds.
The directors also considered the advisory fees the Adviser charges other clients pursuing a substantially similar investment style. For this purpose, they reviewed
| | |
| 56 | | • ALLIANCEBERNSTEIN GLOBAL THEMATIC GROWTH FUND |
the relevant advisory fee information from the Adviser’s Form ADV and the evaluation from the Fund’s Senior Officer. The directors noted that, although the institutional fee schedule started at a rate different from the Fund’s starting fee rate, it had more breakpoints at lower asset levels than the fee schedule applicable to the Fund. The application of the institutional fee schedule to the level of assets of the Fund would result in a fee rate lower than the rate being paid by the Fund. The directors noted that the Adviser may, in some cases, agree to fee rates with large institutional clients that are lower than those reviewed by the directors and that they had previously discussed with the Adviser its policies in respect of such arrangements. The directors also noted that the Adviser advises a portfolio of another AllianceBernstein fund with a substantially similar investment style for the same fee schedule as the Fund except that the Fund’s fee rate is a quarterly fee based on net asset value at the end of each quarter and the portfolio’s fee rate is a monthly fee based on average daily net assets.
The Adviser reviewed with the directors the significantly greater scope of the services it provides to the Fund relative to institutional clients. The Adviser also noted that because mutual funds are constantly issuing and redeeming shares, they are more difficult to manage than an institutional account, where the assets tend to be relatively stable. In light of the substantial differences in services rendered by the Adviser to institutional clients as compared to funds such as the Fund, the directors considered these fee comparisons inapt and did not place significant weight on them in their deliberations.
The directors also considered the total expense ratio of the Class A shares of the Fund in comparison to the fees and expenses of funds within two comparison groups created by Lipper: an Expense Group and an Expense Universe. Lipper described an Expense Group as a representative sample of funds similar to the Fund and an Expense Universe as a broader group, consisting of all funds in the Fund’s investment classification/objective with a similar load type as the Fund. The directors noted that, because of the small number of funds in the Fund’s Lipper category, Lipper had expanded the Fund’s Expense Group to include peers that had a similar (but not the same) Lipper investment classification/objective. The Fund’s Expense Universe had also been expanded by Lipper pursuant to Lipper’s standard guidelines. The Class A expense ratio of the Fund was based on the Fund’s latest fiscal year. The directors noted that it was likely that the expense ratios of some of the other funds in the Fund’s Lipper category were lowered by waivers or reimbursements by those funds’ investment advisers, which in some cases might be voluntary or temporary. The directors view expense ratio information as relevant to their evaluation of the Adviser’s services since the Adviser is responsible for coordinating services provided to the Fund by others.
The directors noted that, at the Fund’s current size, its contractual effective advisory fee rate of 75 basis points, plus the 1 basis point impact of the administrative expense reimbursement in the latest fiscal year, was lower than the
| | | | |
| ALLIANCEBERNSTEIN GLOBAL THEMATIC GROWTH FUND • | | | 57 | |
Expense Group median. The directors noted that the Fund’s total expense ratio was higher than the Expense Group and the Expense Universe medians. The directors noted that the average account size of the Fund was smaller than the size of the average account of the funds in its Expense Group, and that this adversely affects the Fund’s relative expense ratio because transfer agency fees are determined on an account by account basis. The directors concluded that the Fund’s expense ratio was acceptable.
Economies of Scale
The directors noted that the advisory fee schedule for the Fund contains breakpoints that reduce the fee rates on assets above specified levels. The directors took into consideration prior presentations by an independent consultant on economies of scale in the mutual fund industry and for the AllianceBernstein Funds, and by the Adviser concerning certain of its views on economies of scale. The directors also had requested and received from the Adviser certain updates on economies of scale at the May 2013 meeting. The directors believe that economies of scale may be realized (if at all) by the Adviser across a variety of products and services, and not only in respect of a single fund. The directors noted that there is no established methodology for setting breakpoints that give effect to the fund-specific services provided by a fund’s adviser and to the economies of scale that an adviser may realize in its overall mutual fund business or those components of it which directly or indirectly affect a fund’s operations. The directors observed that in the mutual fund industry as a whole, as well as among funds similar to the Fund, there is no uniformity or pattern in the fees and asset levels at which breakpoints (if any) apply. The directors also noted that the advisory agreements for many funds do not have breakpoints at all. Having taken these factors into account, the directors concluded that the Fund’s shareholders would benefit from a sharing of economies of scale in the event the Fund’s net assets exceed a breakpoint in the future.
| | |
| 58 | | • ALLIANCEBERNSTEIN GLOBAL THEMATIC GROWTH FUND |
THE FOLLOWING IS NOT PART OF THE SHAREHOLDER REPORT OF THE FINANCIAL STATEMENTS
SUMMARY OF SENIOR OFFICER’S EVALUATION OF INVESTMENT ADVISORY AGREEMENT1
The following is a summary of the evaluation of the Investment Advisory Agreement between AllianceBernstein L.P. (the “Adviser”) and the AllianceBernstein Global Thematic Growth Fund, Inc. (the “Fund”).2,3 The evaluation of the Investment Advisory Agreement was prepared by Philip L. Kirstein, the Senior Officer of the Fund, for the Directors of the Fund, as required by a September 2004 agreement between the Adviser and the New York State Attorney General (the “NYAG”). The Senior Officer’s evaluation of the Investment Advisory Agreement is not meant to diminish the responsibility or authority of the Board of Directors of the Fund to perform its duties pursuant to Section 15 of the Investment Company Act of 1940 (the “40 Act”) and applicable state law. The purpose of the summary is to provide shareholders with a synopsis of the independent evaluation of the reasonableness of the advisory fees proposed to be paid by the Fund which was provided to the Directors in connection with their review of the proposed approval of the continuance of the Investment Advisory Agreement. The Senior Officer’s evaluation considered the following factors:
| | 1. | Advisory fees charged to institutional and other clients of the Adviser for like services; |
| | 2. | Advisory fees charged by other mutual fund companies for like services; |
| | 3. | Costs to the Adviser and its affiliates of supplying services pursuant to the advisory agreement, excluding any intra-corporate profit; |
| | 4. | Profit margins of the Adviser and its affiliates from supplying such services; |
| | 5. | Possible economies of scale as the Fund grows larger; and |
| | 6. | Nature and quality of the Adviser’s services including the performance of the Fund. |
These factors, with the exception of the first factor, are generally referred to as the “Gartenberg factors,” which were articulated by the United States Court of Appeals for the Second Circuit in 1982. Gartenberg v. Merrill Lynch Asset Management, Inc., 694 F. 2d 923 (2d Cir. 1982). The first factor is an additional factor required to be considered by the AoD. On March 30, 2010, the Supreme
| 1 | | The information in the fee summary was completed on April 22, 2013 and discussed with the Board of Directors on April 30-May 2, 2013. |
| 2 | | Future references to the Fund do not include “AllianceBernstein.” References in the fee summary pertaining to performance and expense ratio rankings refer to the Class A shares of the Fund. |
| 3 | | On November 3, 2008, Global Technology Fund, Inc. merged with Global Health Care Fund, Inc. and was renamed Global Thematic Growth Fund, Inc. Also at this time, the Fund’s non-fundamental investment policy was changed to allow the Fund to pursue a broader mandate across multiple industry sectors worldwide. In connection with the change in investment strategy, the Fund’s portfolio management team was changed. |
| | | | |
| ALLIANCEBERNSTEIN GLOBAL THEMATIC GROWTH FUND • | | | 59 | |
Court held the Gartenberg decision was correct in its basic formulation of what §36(b) requires: to face liability under §36(b), “an investment adviser must charge a fee that is so disproportionately large that it bears no reasonable relationship to the services rendered and could not have been the product of arm’s length bargaining.” Jones v. Harris Associates L.P., 130 S. Ct. 1418 (2010). In the Jones decision, the Court stated the Gartenberg approach fully incorporates the correct understanding of fiduciary duty within the context of section 36(b) and noted with approval that “Gartenberg insists that all relevant circumstances be taken into account” and “uses the range of fees that might result from arm’s-length bargaining as the benchmark for reviewing challenged fees.”4
FUND ADVISORY FEES, NET ASSETS, & EXPENSE RATIOS
The Adviser proposed that the Fund pays the advisory fee set forth in the table below for receiving the services to be provided pursuant to the Investment Advisory Agreement. The fee schedule below, implemented in January 2004 in consideration of the Adviser’s settlement with the NYAG in December 2003, is based on a master schedule that contemplates eight categories of funds with almost all funds in each category having the same advisory fee schedule.5
| | | | | | | | |
| Category | | Advisory Fee6 | | Net Assets 3/31/13 ($MIL) | | | Fund |
| Specialty | | 0.75% on 1st $2.5 billion 0.65% on next $2.5 billion 0.60% on the balance | | $ | 773.9 | | | Global Thematic Growth Fund, Inc. |
The Adviser is reimbursed as specified in the Investment Advisory Agreement for certain clerical, legal, accounting, administrative and other services provided to the Fund. During the Fund’s most recently completed fiscal year, the Adviser received $63,990 (0.007% of the Fund’s average daily net assets) for such services.
Set forth below are the Fund’s total expense ratios for the most recently completed semi-annual period:7
| | | | | | | | |
| Fund | | Total Expense
Ratio8 | | | Fiscal
Year |
| Global Thematic Growth Fund, Inc. | | Advisor Class A Class B Class C Class R Class K Class I | |
| 1.25
1.55 2.35 2.29 1.61 1.30 0.86 | %
% % % % % % | | July 31
(ratio as of
January 31, 2013) |
| 4 | | Jones v. Harris at 1427. |
| 5 | | Most of the AllianceBernstein Mutual Funds, which the Adviser manages, were affected by the Adviser’s settlement with the NYAG. |
| 6 | | The advisory fee is based on the percentage of the Fund’s net assets at quarter end and is paid on a quarterly basis. |
| 7 | | Semi-annual total expense ratios are unaudited. |
| | |
| 60 | | • ALLIANCEBERNSTEIN GLOBAL THEMATIC GROWTH FUND |
| I. | MANAGEMENT FEES CHARGED TO INSTITUTIONAL AND OTHER CLIENTS |
The advisory fees charged to investment companies which the Adviser manages and sponsors are normally higher than those charged to similar sized institutional accounts, including pension plans and sub-advised investment companies. The fee differential reflects, among other things, different services provided to such clients, and different liabilities assumed. Services provided by the Adviser to the Fund that are not provided to non-investment company clients and sub-advised investment companies include providing office space and personnel to serve as Fund Officers, who among other responsibilities make the certifications required under the Sarbanes–Oxley Act of 2002, and coordinating with and monitoring the Fund’s third party service providers such as Fund counsel, auditors, custodians, transfer agents and pricing services. The accounting, administrative, legal and compliance requirements for the Fund are more costly than those for institutional assets due to the greater complexities and time required for investment companies, although as previously noted, the Adviser is reimbursed for providing such services. Also, retail mutual funds managed by the Adviser are widely held. Servicing the Fund’s investors is more time consuming and labor intensive compared to institutional clients since the Adviser needs to communicate with a more extensive network of financial intermediaries and shareholders. The Adviser also believes that it incurs substantial entrepreneurial risk when offering a new mutual fund since establishing a new mutual fund requires a large upfront investment and it may take a long time for the fund to achieve profitability since the fund must be priced to scale from inception in order to be competitive and assets are acquired one account at a time. In addition, managing the cash flow of an investment company may be more difficult than managing that of a stable pool of assets, such as an institutional account with little cash movement in either direction, particularly, if a fund is in net redemption and the Adviser is frequently forced to sell securities to raise cash for redemptions. However, managing a fund with positive cash flow may be easier at times than managing a stable pool of assets. Finally, in recent years, investment advisers have been sued by institutional clients and have suffered reputational damage both by the attendant publicity and outcomes other than complete victories. Accordingly, the legal and reputational risks associated with institutional accounts are greater than previously thought, although still not equal to those related to the mutual fund industry.
Notwithstanding the Adviser’s view that managing an investment company is not comparable to managing other institutional accounts because the services provided are different, the Supreme Court has indicated consideration should be given to the advisory fees charged to institutional accounts with a similar investment style as the Fund.9 In addition to the AllianceBernstein institutional
| 9 | | The Supreme Court stated that “courts may give such comparisons the weight that they merit in light of the similarities and differences between the services that the clients in question require, but the courts must be wary of inapt comparisons.” Among the significant differences the Supreme Court noted that may exist between services provided to mutual funds and institutional accounts are “higher marketing costs.” Jones v. Harris at 1428. |
| | | | |
| ALLIANCEBERNSTEIN GLOBAL THEMATIC GROWTH FUND • | | | 61 | |
fee schedule, set forth below is what would have been the effective advisory fee of the Fund had the AllianceBernstein institutional fee schedule been applicable to the Fund based on March 31, 2013 net assets:10
| | | | | | | | | | | | |
| Fund | | Net Assets 3/31/13 ($MIL) | | | AllianceBernstein
Institutional Fee Schedule | | Effective
AB Inst.
Adv. Fee | | | Fund Advisory
Fee |
| Global Thematic Growth Fund, Inc. | | | $773.9 | | | Global Thematic Research 0.80% on 1st $25 million 0.60% on next $25 million 0.50% on next $50 million 0.40% on the balance Minimum Account Size: $25 m | | | 0.426% | | | 0.750% |
The adviser also manages the AllianceBernstein Variable Products Series Fund, Inc. (“AVPS”), which is available through variable annuity and variable life contracts offered by other financial institutions and offers policyholders the option to utilize certain AVPS portfolios as the investment option underlying their insurance contracts. Set forth below is the fee schedule of the AVPS portfolio that has a substantially similar investment style as the Fund.11 Also shown is the Fund’s advisory fee and what would have been the effective advisory fee of the Fund had the AVPS fee schedule been applicable to the Fund based on March 31, 2013 net assets:
| | | | | | | | | | | | |
| Fund | | AVPS Portfolio | | Fee Schedule | | Effective
AVPS
Adv. Fee | | | Portfolio Advisory
Fee | |
| Global Thematic Growth Fund, Inc.12 | | Global Thematic Growth Portfolio | | 0.75% on first $2.5 billion 0.65% on next $2.5 billion 0.60% on the balance | | | 0.750% | | | | 0.750% | |
| 10 | | The Adviser has indicated that with respect to institutional accounts with assets greater than $300 million, it will negotiate a fee schedule. Discounts that are negotiated vary based upon each client relationship. |
| 11 | | The AVPS portfolio was also affected by the settlement between the Adviser and the NYAG. As a result, the Fund has the same breakpoints in its advisory fee schedule as the AVPS portfolio. |
| 12 | | The advisory fee of AVPS Global Thematic Growth Portfolio is based on the portfolio’s average daily net assets and is paid on a monthly basis, in contrast to the Fund, whose fee is based on the Fund’s net assets at the end of each quarter and is paid to the Adviser quarterly. |
| | |
| 62 | | • ALLIANCEBERNSTEIN GLOBAL THEMATIC GROWTH FUND |
The Adviser also manages and sponsors retail mutual funds, which are organized in jurisdictions outside the United States, generally Luxembourg and Japan, and sold to non-United States resident investors. The Adviser charges the fees set forth below for Global Thematic Research Portfolio, which is a Luxembourg fund that has a somewhat similar investment style as the Fund:
| | | | |
| Fund | | Luxembourg Fund | | Fee13 |
| Global Thematic Growth Fund, Inc. | | Thematic Research Growth Portfolio | | |
| | Class A | | 1.70% |
| | Class I | | 0.90% |
The Adviser represented that it does not sub-advise any registered investment company with a substantially similar investment style as the Fund.
| II. | MANAGEMENT FEES CHARGED BY OTHER MUTUAL FUND COMPANIES FOR LIKE SERVICES. |
Lipper, Inc. (“Lipper”), an analytical service that is not affiliated with the Adviser, compared the fees charged to the Fund with fees charged to other investment companies for similar services offered by other investment advisers.14 Lipper’s analysis included the comparison of the Fund’s contractual management fee, estimated at the approximate current asset level of the Fund, to the median of the Fund’s Lipper Expense Group (“EG”)15 and the Fund’s contractual management fee ranking.16
Lipper describes an EG as a representative sample of comparable funds. Lipper’s standard methodology for screening funds to be included in an EG entails the consideration of several fund criteria, including fund type, investment
| 13 | | Class A shares of the Luxembourg funds are charged an “all-in” fee, which includes investment advisory and distribution related services, unlike class I shares, whose fee is for only investment advisory services. |
| 14 | | The Supreme Court cautioned against accepting mutual fund fee comparisons without careful scrutiny since “these comparisons are problematic because these fees, like those challenged, may not be the product of negotiations conducted at arm’s length.” Jones v. Harris at 1429. |
| 15 | | Lipper does not consider average account size when constructing EGs. Funds with relatively small average account sizes tend to have higher transfer agent expense ratio than comparable sized funds that have relatively large average account sizes. Note that there are limitations on Lipper expense category data because different funds categorize expenses differently. |
| 16 | | The contractual management fee is calculated by Lipper using the Fund’s contractual management fee rate at a hypothetical asset level. The hypothetical asset level is based on the combined net assets of all classes of the Fund, rounded up to the next $25 million. Lipper’s total expense ratio information is based on the most recent annual report except as otherwise noted. A ranking of “1” would mean that the Fund had the lowest effective fee rate in the Lipper peer group. |
| | | | |
| ALLIANCEBERNSTEIN GLOBAL THEMATIC GROWTH FUND • | | | 63 | |
classification/objective, load type and similar 12b-1/non-12b-1 service fees, asset (size) comparability, expense components and attributes. An EG will typically consist of seven to twenty funds.
The Fund’s original EG had an insufficient number of peers in the view of the Senior Officer and the Adviser. Consequently, Lipper expanded the EG of the Fund to include peers that had a similar but not the same Lipper investment classification/objective.
| | | | | | | | | | | | |
| Fund | | Contractual
Management
Fee (%)17 | | | Lipper EG
Median (%) | | | Lipper EG
Rank | |
| Global Thematic Growth Fund, Inc.18 | | | 0.750 | | | | 0.848 | | | | 4/11 | |
However, because Lipper had expanded the EG of the Fund, under Lipper’s standard guidelines, the Lipper Expense Universe (“EU”) was also expanded to include the universe of those peers that had a similar but not the same Lipper investment classification/objective. A “normal” EU will include funds that have the same investment classification/objective as the subject Fund.19
| | | | | | | | | | | | | | | | | | | | |
| Fund | | Total Expense Ratio (%)20 | | | Lipper EG Median (%) | | | Lipper EG Rank | | | Lipper EU Median (%) | | | Lipper EU Rank | |
| Global Thematic Growth Fund, Inc.21 | | | 1.551 | | | | 1.388 | | | | 11/11 | | | | 1.436 | | | | 34/48 | |
Based on this analysis, the Fund has a more favorable ranking on a contractual management fee basis than it does on a total expense ratio basis.
| III. | COSTS TO THE ADVISER AND ITS AFFILIATES OF SUPPLYING SERVICES PURSUANT TO THE MANAGEMENT FEE ARRANGEMENT, EXCLUDING ANY INTRA-CORPORATE PROFIT. |
The Adviser utilizes two profitability reporting systems, which operate independently but are aligned with each other, to estimate the Adviser’s profitability in connection with investment advisory services provided to the Fund. The Senior Officer has retained a consultant to provide independent advice
| 17 | | The contractual management fee does not reflect any expense reimbursements made by the Fund to the Adviser for certain clerical, legal, accounting, administrative and other services. |
| 18 | | The Fund’s EG includes the Fund, three other Global Multi-Cap Growth Fund (“GMLG”), three Global Multi-Cap Core Cap Funds (“GMLC”) and four Global Multi-cap Funds (“GMLV”). |
| 19 | | Except for asset (size) comparability, Lipper uses the same criteria for selecting an EG peer when selecting an EU peer. Unlike the EG, the EU allows for the same adviser to be represented by more than just one fund. |
| 20 | | Most recently completed fiscal year end Class A total expense ratio. |
| 21 | | The Fund’s EU includes the Fund, EG and all other GMLG, GMLC and GMLV, excluding outliers. |
| | |
| 64 | | • ALLIANCEBERNSTEIN GLOBAL THEMATIC GROWTH FUND |
regarding the alignment of the two profitability systems as well as the methodologies and allocations utilized by both profitability systems. See Section IV for additional discussion.
| IV. | PROFIT MARGINS OF THE ADVISER AND ITS AFFILIATES FOR SUPPLYING SUCH SERVICES. |
The Fund’s profitability information, prepared by the Adviser for the Board of Directors, was reviewed by the Senior Officer and the consultant. The Adviser’s profitability from providing investment advisory services to the Fund increased during calendar year 2012, relative to 2011.
In addition to the Adviser’s direct profits from managing the Fund, certain of the Adviser’s affiliates have business relationships with the Fund and may earn a profit from providing other services to the Fund. The courts have referred to this type of business opportunity as “fall-out benefits” to the Adviser and indicated that such benefits should be factored into the evaluation of the total relationship between the Fund and the Adviser. Neither case law nor common business practice precludes the Adviser’s affiliates from earning a reasonable profit on this type of relationship provided the affiliates’ charges and services are competitive and the relationship otherwise complies with the 40 Act restrictions. These affiliates provide transfer agent, distribution and brokerage related services to the Fund and receive transfer agent fees, Rule 12b-1 payments, front-end sales loads, contingent deferred sales charges (“CDSC”) and brokerage commissions. In addition, the Adviser benefits from soft dollar arrangements which offset expenses the Adviser would otherwise incur.
AllianceBernstein Investments, Inc. (“ABI”), an affiliate of the Adviser, is the Fund’s principal underwriter. ABI and the Adviser have disclosed in the Fund’s prospectus that they may make revenue sharing payments from their own resources, in addition to resources derived from sales loads and Rule 12b-1 fees, to firms that sell shares of the Fund. In 2012, ABI paid approximately 0.05% of the average monthly assets of the AllianceBernstein Mutual Funds or approximately $19 million for distribution services and educational support (revenue sharing payments).
During the Fund’s most recently completed fiscal year, ABI received from the Fund $9,828, $3,458,698 and $49,622 in front-end sales charges, Rule 12b-1 and CDSC fees, respectively.
Fees and reimbursements for out of pocket expenses charged by AllianceBernstein Investor Services, Inc. (“ABIS”), the affiliated transfer agent for the Fund, are charged on a per account basis, based on the level of service provided and the class of share held by the account. ABIS also receives a fee per shareholder sub-account for each account maintained by an intermediary on an omnibus basis. During the Fund’s most recently completed fiscal year, ABIS received $1,903,444 in fees from the Fund.
| | | | |
| ALLIANCEBERNSTEIN GLOBAL THEMATIC GROWTH FUND • | | | 65 | |
The Fund effected brokerage transactions through the Adviser’s affiliate, Sanford C. Bernstein & Co., LLC (“SCB & Co.”) and/or its U.K. affiliate, Sanford C. Bernstein Limited (“SCB Ltd.”), collectively “SCB,” and paid commissions during the Fund’s most recently completed fiscal year. The Adviser represented that SCB’s profitability from business conducted with the Fund is comparable to the profitability of SCB’s dealings with other similar third party clients. In the ordinary course of business, SCB receives and pays liquidity rebates from electronic communications networks (“ECNs”) derived from trading for its clients, including the Fund. These credits and charges are not being passed onto any SCB client. The Adviser also receives certain soft dollar benefits from brokers that execute agency trades for the Fund and other clients. These soft dollar benefits reduce the Adviser’s cost of doing business and increase its profitability.
| V. | POSSIBLE ECONOMIES OF SCALE |
The Adviser has indicated that economies of scale are being shared with shareholders through pricing to scale, breakpoints, fee reductions/waivers and enhancement to services.
In May 2012, an independent consultant, retained by the Senior Officer, provided the Board of Directors information on the Adviser’s firm-wide average costs from 2005 through 2011 and the potential economies of scale. The independent consultant noted that from 2005 through 2007 the Adviser experienced significant growth in assets under management (“AUM”). During this period, operating expenses increased, in part to keep up with growth, and in part reflecting market returns. However, from 2008 through the first quarter of 2009, AUM rapidly and significantly decreased due to declines in market value and client withdrawals. When AUM rapidly decreased, some operating expenses categories, including base compensation and office space, adjusted more slowly during this period, resulting in an increase in average costs. Since 2009, AUM has experienced less significant changes. The independent consultant noted that changes in operating expenses reflect changes in business composition and business practices in response to changes in financial markets. Finally, the independent consultant concluded that the increase in average cost and the decline in net operating margin across the Adviser since late 2008 are inconsistent with the view that there are currently reductions in average costs due to economies of scale that can be shared with the AllianceBernstein Mutual Funds managed by the Adviser through lower fees.
Previously, in February 2008, the independent consultant provided the Board of Directors an update of the Deli22 study on advisory fees and various fund
| 22 | | The Deli study, originally published in 2002 based on 1997 data and updated for the February 2008 Presentation, may be of diminished value due to the age of the data used in the presentation and the changes experienced in the industry over the last four years. |
| | |
| 66 | | • ALLIANCEBERNSTEIN GLOBAL THEMATIC GROWTH FUND |
characteristics.23 The independent consultant first reiterated the results of his previous two dimensional comparison analysis (fund size and family size) with the Board of Directors.24 The independent consultant then discussed the results of the regression model that was utilized to study the effects of various factors on advisory fees. The regression model output indicated that the bulk of the variation in fees predicted were explained by various factors, but substantially by fund AUM, family AUM, index fund indicator and investment style. The independent consultant also compared the advisory fees of the AllianceBernstein Mutual Funds to similar funds managed by 19 other large asset managers, regardless of the fund size and each Adviser’s proportion of mutual fund assets to non-mutual fund assets.
| VI. | NATURE AND QUALITY OF THE ADVISER’S SERVICES, INCLUDING THE PERFORMANCE OF THE FUND |
With assets under management of approximately $433 billion as of March 31, 2013, the Adviser has the investment experience to manage and provide non-investment services (described in Section I) to the Fund.
The information prepared by Lipper shows the 1, 3, 5 and 10 year performance returns and rankings of the Fund25 relative to its Lipper Performance Group (“PG”) and Lipper Performance Universe (“PU”)26 for the periods ended February 28, 2013.27
| | | | | | | | | | | | | | | | |
| | | Fund (%) | | | PG
Median (%) | | | PU
Median (%) | | | PG
Rank | | PU
Rank |
| Global Thematic Growth Fund, Inc.28 | | | | | | | | | | | | | | | | |
1 year | | | -1.47 | | | | 9.45 | | | | 8.57 | | | 4/4 | | 38/42 |
3 year | | | 2.75 | | | | 9.17 | | | | 9.79 | | | 4/4 | | 27/28 |
5 year | | | 1.04 | | | | 0.74 | | | | 0.44 | | | 1/2 | | 6/15 |
10 year | | | 6.08 | | | | 7.35 | | | | 6.99 | | | 2/2 | | 6/6 |
| 23 | | As mentioned previously, the Supreme Court cautioned against accepting mutual fund fee comparisons without careful scrutiny since the fees may not be the product of negotiations conducted at arm’s length. See Jones V. Harris at 1429. |
| 24 | | The two dimensional analysis showed patterns of lower advisory fees for funds with larger asset sizes and funds from larger family sizes compared to funds with smaller asset sizes and funds from smaller family sizes, which according to the independent consultant is indicative of a sharing of economies of scale and scope. However, in less liquid and active markets, such is not the case, as the empirical analysis showed potential for diseconomies of scale in those markets. The empirical analysis also showed diminishing economies of scale and scope as funds surpassed a certain high level of assets. |
| 25 | | The performance rankings are for the Class A shares of the Fund. The Fund’s performance returns shown were provided by Lipper. |
| 26 | | The Fund’s PG/PU is not identical to the Fund’s EG/EU as the criteria for including/excluding a fund in/from a PG/PU is somewhat different from that of an FG/EU. |
| 27 | | Note that the current Lipper investment classification/objective dictates the PG and PU throughout the life of the fund even if a fund had a different investment classification/objective at a different point in time. |
| 28 | | The Fund’s Lipper classification changed in 2008 from Technology Funds to GMLG (Global Multi-Cap Growth Funds) as are result of changes to the Fund’s strategy. |
| | | | |
| ALLIANCEBERNSTEIN GLOBAL THEMATIC GROWTH FUND • | | | 67 | |
Set forth below are the 1, 3, 5, 10 year and since inception performance returns of the Fund (in bold)29 versus its benchmark.30 Fund and benchmark volatility and reward-to-variability ratio (“Sharpe Ratio”) information is also shown.31
| | | | | | | | | | | | | | | | | | | | | | | | | | | | | | | | |
| | | | | | | | | Periods Ending February 28, 2013 Annualized Performance | | | | | | | |
| | | 1 Year
(%) | | | 3 Year
(%) | | | 5 Year
(%) | | | 10 Year
(%) | | | Since
Inception
(%) | | | Annualized | | | Risk
Period
(Year) | |
| | | | | | | Volatility
(%) | | | Sharpe
(%) | | |
| Global Thematic Growth Fund, Inc. | | | -1.47 | | | | 2.75 | | | | 1.04 | | | | 6.08 | | | | 11.31 | | | | 25.50 | | | | 0.15 | | | | 5 | |
| MSCI AC World Index (Net) | | | 9.29 | | | | 9.38 | | | | 1.39 | | | | 9.12 | | | | N/A | | | | 21.18 | | | | 0.15 | | | | 5 | |
| Inception Date: March 1, 1982 | |
CONCLUSION:
Based on the factors discussed above the Senior Officer’s conclusion is that the proposed advisory fee for the Fund is reasonable and within the range of what would have been negotiated at arm’s-length in light of all the surrounding circumstances. This conclusion in respect of the Fund is based on an evaluation of all of these factors and no single factor was dispositive.
Dated: May 29, 2013
| 29 | | The performance returns and risk measures shown in the table are for the Class A shares of the Fund. |
| 30 | | The Adviser provided Fund and benchmark performance return information for periods through February 28, 2013. |
| 31 | | Fund and benchmark volatility and Sharpe Ratio information was obtained through Lipper LANA, a database maintained by Lipper. Volatility is a statistical measure of the tendency of a market price or yield to vary over time. The Sharpe Ratio is a risk adjusted measure of return that divides a fund’s return in excess of the riskless return by the fund’s standard deviation. A fund with a greater volatility would be viewed as more risky than a fund with equivalent performance but lower volatility; for that reason, a greater return would be demanded for the more risky fund. A fund with a higher Sharpe Ratio would be viewed as better performing than a fund with a lower Sharpe Ratio. |
| | |
| 68 | | • ALLIANCEBERNSTEIN GLOBAL THEMATIC GROWTH FUND |
THIS PAGE IS NOT PART OF THE SHAREHOLDER REPORT OR THE FINANCIAL STATEMENTS
ALLIANCEBERNSTEIN FAMILY OF FUNDS
US Equity
US Core
Core Opportunities Fund
Growth & Income Fund
Select US Equity Portfolio
US Growth
Discovery Growth Fund*
Growth Fund
Large Cap Growth Fund
Small Cap Growth Portfolio
US Value
Discovery Value Fund*
Equity Income Fund
Value Fund
International/Global Equity
International/Global Core
Global Thematic Growth Fund
International Portfolio
Tax-Managed International Portfolio
International/Global Growth
International Discovery Equity Portfolio
International Growth Fund
International/Global Value
Emerging Markets Equity Portfolio
Global Value Fund
International Value Fund
Fixed Income
Municipal
High Income Municipal Portfolio
Intermediate California Portfolio
Intermediate Diversified Portfolio
Intermediate New York Portfolio
Municipal Bond Inflation Strategy
National Portfolio
Arizona Portfolio
California Portfolio
Massachusetts Portfolio
Michigan Portfolio
Minnesota Portfolio
New Jersey Portfolio
New York Portfolio
Ohio Portfolio
Pennsylvania Portfolio
Virginia Portfolio
Fixed Income (continued)
Taxable
Bond Inflation Strategy
Global Bond Fund
High Income Fund
Intermediate Bond Portfolio
Limited Duration High Income Portfolio
Short Duration Portfolio
Alternatives
Dynamic All Market Fund
Global Real Estate Investment Fund
Global Risk Allocation Fund*
Market Neutral Strategy-Global
Market Neutral Strategy-U.S.
Real Asset Strategy
Select US Long/Short Portfolio
Unconstrained Bond Fund
Asset Allocation/Multi-Asset
Multi-Asset
Emerging Markets Multi-Asset Portfolio
Retirement Strategies
2000 Retirement Strategy
2005 Retirement Strategy
2010 Retirement Strategy
2015 Retirement Strategy
2020 Retirement Strategy
2025 Retirement Strategy
2030 Retirement Strategy
2035 Retirement Strategy
2040 Retirement Strategy
2045 Retirement Strategy
2050 Retirement Strategy
2055 Retirement Strategy
Wealth Strategies
Balanced Wealth Strategy
Conservative Wealth Strategy
Wealth Appreciation Strategy
Tax-Managed Balanced Wealth Strategy
Tax-Managed Conservative Wealth Strategy
Tax-Managed Wealth Appreciation Strategy
Closed-End Funds
Alliance California Municipal Income Fund
Alliance New York Municipal Income Fund
AllianceBernstein Global High Income Fund
AllianceBernstein Income Fund
AllianceBernstein National Municipal Income Fund
We also offer Exchange Reserves, which serves as the money market fund exchange vehicle for the AllianceBernstein mutual funds. An investment in Exchange Reserves is not a deposit in a bank and is not insured or guaranteed by the Federal Deposit Insurance Corporation or any other government agency. Although the Fund seeks to preserve the value of your investment at $1.00 per share, it is possible to lose money by investing in the Fund.
Investors should consider the investment objectives, risks, charges and expenses of the Fund carefully before investing. For copies of our prospectus or summary prospectus, which contain this and other information, visit us online at www.alliancebernstein.com or contact your AllianceBernstein investments representative. Please read the prospectus and/or summary prospectus carefully before investing.
| * | | Prior to November 1, 2012, Discovery Growth Fund was named Small/Mid Cap Growth Fund and Discovery Value Fund was named Small/Mid Cap Value Fund. Prior to October 8, 2012, Global Risk Allocation Fund was named Balanced Shares. |
| | | | |
| ALLIANCEBERNSTEIN GLOBAL THEMATIC GROWTH FUND • | | | 69 | |
AllianceBernstein Family of Funds
NOTES
| | |
| 70 | | • ALLIANCEBERNSTEIN GLOBAL THEMATIC GROWTH FUND |
NOTES
| | | | |
| ALLIANCEBERNSTEIN GLOBAL THEMATIC GROWTH FUND • | | | 71 | |
NOTES
| | |
| 72 | | • ALLIANCEBERNSTEIN GLOBAL THEMATIC GROWTH FUND |
NOTES
| | | | |
| ALLIANCEBERNSTEIN GLOBAL THEMATIC GROWTH FUND • | | | 73 | |
NOTES
| | |
| 74 | | • ALLIANCEBERNSTEIN GLOBAL THEMATIC GROWTH FUND |
NOTES
| | | | |
| ALLIANCEBERNSTEIN GLOBAL THEMATIC GROWTH FUND • | | | 75 | |
NOTES
| | |
| 76 | | • ALLIANCEBERNSTEIN GLOBAL THEMATIC GROWTH FUND |
ALLIANCEBERNSTEIN GLOBAL THEMATIC GROWTH FUND
1345 Avenue of the Americas
New York, NY 10105
800.221.5672
| | |
| |
| GTG-0151-0713 | |  |
ITEM 2. CODE OF ETHICS.
(a) The registrant has adopted a code of ethics that applies to its principal executive officer, principal financial officer and principal accounting officer. A copy of the registrant’s code of ethics is filed herewith as Exhibit 12(a)(1).
(b) During the period covered by this report, no material amendments were made to the provisions of the code of ethics adopted in 2(a) above.
(c) During the period covered by this report, no implicit or explicit waivers to the provisions of the code of ethics adopted in 2(a) above were granted.
ITEM 3. AUDIT COMMITTEE FINANCIAL EXPERT.
The registrant’s Board of Directors has determined that independent directors William H. Foulk, Jr. and Garry L. Moody qualify as audit committee financial experts.
ITEM 4. PRINCIPAL ACCOUNTANT FEES AND SERVICES.
(a) - (c) The following table sets forth the aggregate fees billed by the independent registered public accounting firm Ernst & Young LLP, for the Fund���s last two fiscal years for professional services rendered for: (i) the audit of the Fund’s annual financial statements included in the Fund’s annual report to stockholders; (ii) assurance and related services that are reasonably related to the performance of the audit of the Fund’s financial statements and are not reported under (i), which include advice and education related to accounting and auditing issues and quarterly press release review (for those Funds which issue press releases), and preferred stock maintenance testing (for those Funds that issue preferred stock); and (iii) tax compliance, tax advice and tax return preparation.
| | | | | | | | | | | | |
| | | | | Audit Fees | | Audit-Related
Fees | | | Tax Fees | |
| | 2012 | | $29,000 | | $ | 551 | | | $ | 20,540 | |
| | 2013 | | $29,000 | | $ | — | | | $ | 25,319 | |
(d) Not applicable.
(e) (1) Beginning with audit and non-audit service contracts entered into on or after May 6, 2003, the Fund’s Audit Committee policies and procedures require the pre-approval of all audit and non-audit services provided to the Fund by the Fund’s independent registered public accounting firm. The Fund’s Audit Committee policies and procedures also require pre-approval of all audit and non-audit services provided to the Adviser and Service Affiliates to the extent that these services are directly related to the operations or financial reporting of the Fund.
(e) (2) All of the amounts for Audit Fees, Audit-Related Fees and Tax Fees in the table under Item 4 (a) – (c) are for services pre-approved by the Fund’s Audit Committee.
(f) Not applicable.
(g) The following table sets forth the aggregate non-audit services provided to the Fund, the Fund’s Adviser and entities that control, are controlled by or under common control with the Adviser that provide ongoing services to the Fund:
| | | | | | | | | | | | |
| | | | | | All Fees for
Non-Audit Services
Provided to the
Portfolio, the Adviser
and Service Affiliates | | | Total Amount of
Foregoing Column Pre-
approved by the Audit
Committee
(Portion Comprised of
Audit Related Fees)
(Portion Comprised of
Tax Fees) | |
| | | 2012 | | | $ | 936,291 | | | $ | 21,091 | |
| | | | | | | | | | $ | (551 | ) |
| | | | | | | | | | $ | (20,540 | ) |
| | | 2013 | | | $ | 444,990 | | | $ | 25,319 | |
| | | | | | | | | | $ | — | |
| | | | | | | | | | $ | (25,319 | ) |
(h) The Audit Committee of the Fund has considered whether the provision of any non-audit services not pre-approved by the Audit Committee provided by the Fund’s independent registered public accounting firm to the Adviser and Service Affiliates is compatible with maintaining the auditor’s independence.
ITEM 5. AUDIT COMMITTEE OF LISTED REGISTRANTS.
Not applicable to the registrant.
ITEM 6. SCHEDULE OF INVESTMENTS.
Please see Schedule of Investments contained in the Report to Shareholders included under Item 1 of this Form N-CSR.
ITEM 7. DISCLOSURE OF PROXY VOTING POLICIES AND PROCEDURES FOR CLOSED-END MANAGEMENT INVESTMENT COMPANIES.
Not applicable to the registrant.
ITEM 8. PORTFOLIO MANAGERS OF CLOSED-END MANAGEMENT INVESTMENT COMPANIES.
Not applicable to the registrant.
ITEM 9. PURCHASES OF EQUITY SECURITIES BY CLOSED-END MANAGEMENT INVESTMENT COMPANY AND AFFILIATED PURCHASERS.
Not applicable to the registrant.
ITEM 10. SUBMISSION OF MATTERS TO A VOTE OF SECURITY HOLDERS.
There have been no material changes to the procedures by which shareholders may recommend nominees to the Fund’s Board of Directors since the Fund last provided disclosure in response to this item.
ITEM 11. CONTROLS AND PROCEDURES.
(a) The registrant’s principal executive officer and principal financial officer have concluded that the registrant’s disclosure controls and procedures (as defined in Rule 30a-2(c) under the Investment Company Act of 1940, as amended) are effective at the reasonable assurance level based on their evaluation of these controls and procedures as of a date within 90 days of the filing date of this document.
(b) There were no changes in the registrant’s internal controls over financial reporting that occurred during the second fiscal quarter of the period that has materially affected, or is reasonably likely to materially affect, the registrant’s internal control over financial reporting.
ITEM 12. EXHIBITS.
The following exhibits are attached to this Form N-CSR:
| | |
EXHIBIT NO. | | DESCRIPTION OF EXHIBIT |
| |
| 12 (a) (1) | | Code of Ethics that is subject to the disclosure of Item 2 hereof |
| |
| 12 (b) (1) | | Certification of Principal Executive Officer Pursuant to Section 302 of the Sarbanes-Oxley Act of 2002 |
| |
| 12 (b) (2) | | Certification of Principal Financial Officer Pursuant to Section 302 of the Sarbanes-Oxley Act of 2002 |
| |
| 12 (c) | | Certification of Principal Executive Officer and Principal Financial Officer Pursuant to Section 906 of the Sarbanes-Oxley Act of 2002 |
SIGNATURES
Pursuant to the requirements of the Securities Exchange Act of 1934 and the Investment Company Act of 1940, the registrant has duly caused this report to be signed on its behalf by the undersigned, thereunto duly authorized.
(Registrant): AllianceBernstein Global Thematic Growth Fund, Inc.
| | |
| By: | | /s/ Robert M. Keith |
| | Robert M. Keith |
| | President |
|
| Date: September 23, 2013 |
Pursuant to the requirements of the Securities Exchange Act of 1934 and the Investment Company Act of 1940, this report has been signed below by the following persons on behalf of the registrant and in the capacities and on the dates indicated.
| | |
| By: | | /s/ Robert M. Keith |
| | Robert M. Keith |
| | President |
|
| Date: September 23, 2013 |
| |
| By: | | /s/ Joseph J. Mantineo |
| | Joseph J. Mantineo |
| | Treasurer and Chief Financial Officer |
|
| Date: September 23, 2013 |