Free signup for more
- Track your favorite companies
- Receive email alerts for new filings
- Personalized dashboard of news and more
- Access all data and search results
Filing tables
Filing exhibits
CTBI similar filings
- 25 Jan 24 Departure of Directors or Certain Officers
- 17 Jan 24 Community Trust Bancorp, Inc. Reports Earnings for the 4TH Quarter and Year 2023
- 4 Dec 23 Departure of Directors or Certain Officers
- 15 Nov 23 Regulation FD Disclosure
- 18 Oct 23 Community Trust Bancorp, Inc. Reports Earnings for the 3RD Quarter 2023
- 23 Aug 23 Regulation FD Disclosure
- 11 Aug 23 Other Events
Filing view
External links
Exhibit 99.1
November 2023
Cautionary Statement Information provided herein by CTBI contains “forward-looking” information. CTBI cautions that any forward-looking statements made are not guarantees of future performance and that actual results may differ materially from those in the forward-looking statements. Please refer to CTBI’s 2022 Annual Report on Form 10-K, Cautionary Statement Regarding Forward Looking Statements for additional information. 2
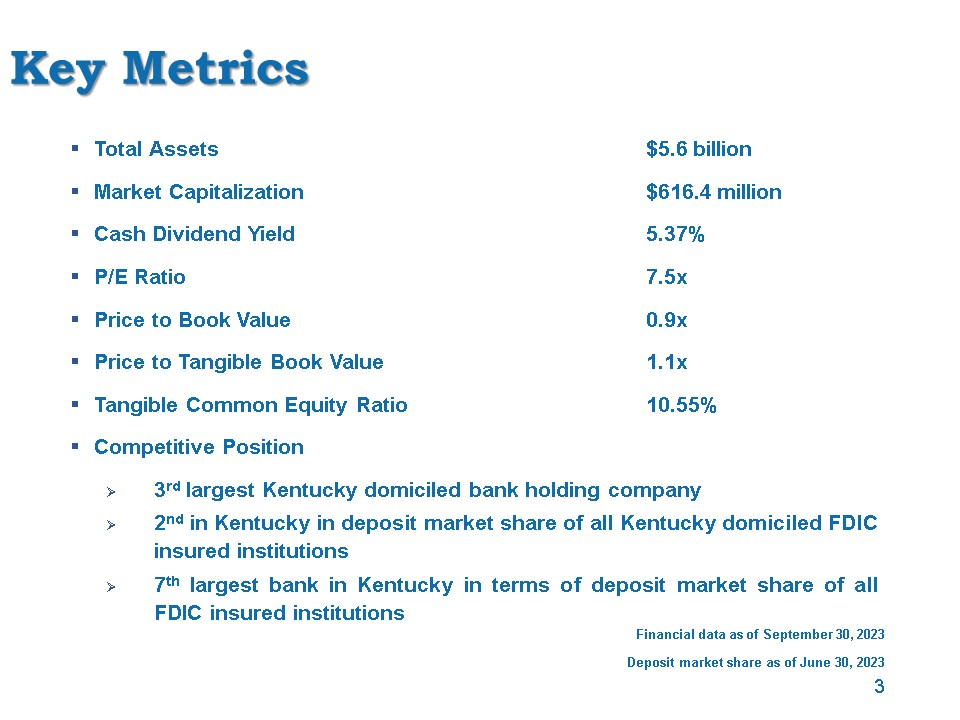
Key Metrics Total Assets $5.6 billion Market Capitalization $616.4 million Cash Dividend Yield 5.37% P/E Ratio 7.5x Price to Book Value 0.9x Price to Tangible Book Value 1.1x Tangible Common Equity Ratio 10.55% Competitive Position 3rd largest Kentucky domiciled bank holding company 2nd in Kentucky in deposit market share of all Kentucky domiciled FDIC insured institutions 7th largest bank in Kentucky in terms of deposit market share of all FDIC insured institutions Financial data as of September 30, 2023 Deposit market share as of June 30, 2023 3
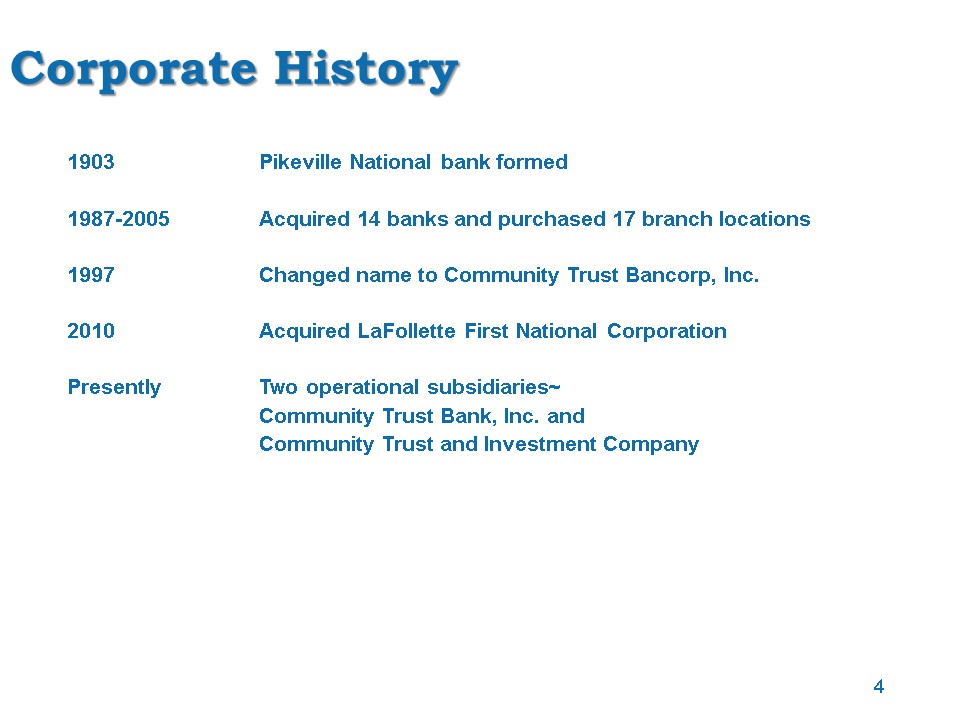
Corporate History 1903 Pikeville National bank formed 1987-2005 Acquired 14 banks and purchased 17 branch locations 1997 Changed name to Community Trust Bancorp, Inc. 2010 Acquired LaFollette First National Corporation Presently Two operational subsidiaries~ Community Trust Bank, Inc. and Community Trust and Investment Company 4
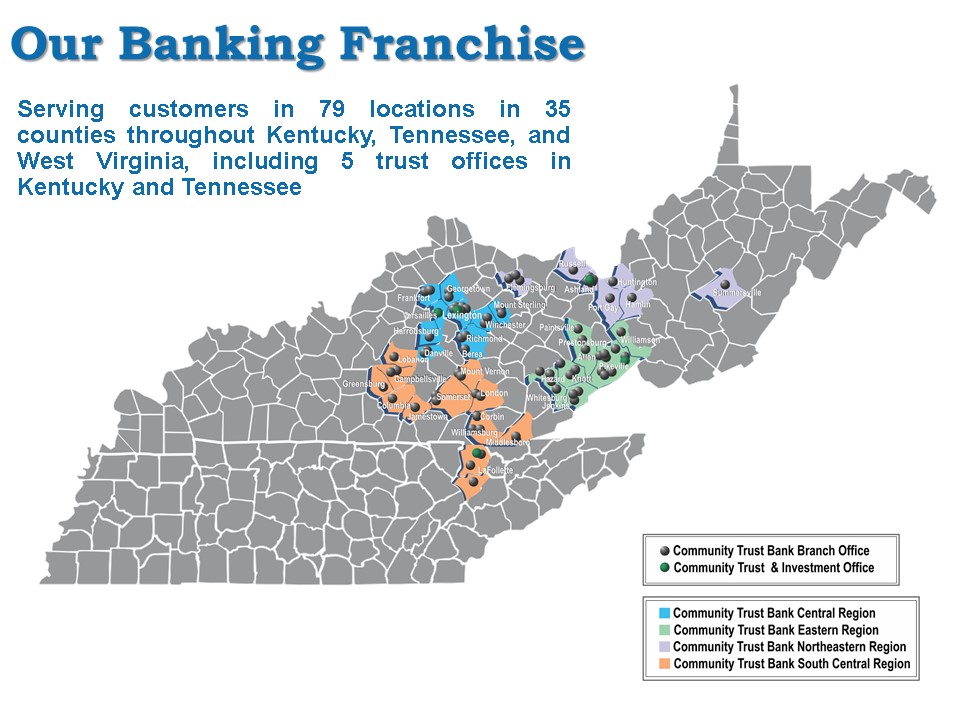
Our Banking Franchise Serving customers in 79 locations in 35 counties throughout Kentucky, Tennessee, and West Virginia, including 5 trust offices in Kentucky and Tennessee
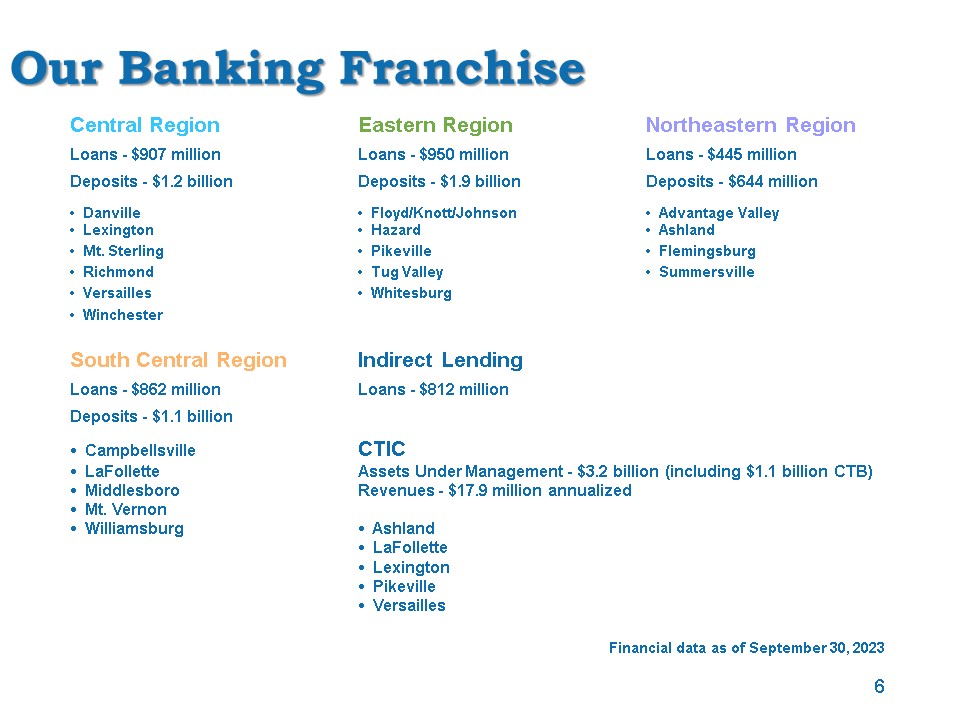
Our Banking Franchise Central Region Eastern Region Northeastern Region Loans - $907 million Loans - $950 million Loans - $445 million Deposits - $1.2 billion Deposits - $1.9 billion Deposits - $644 million • Danville • Floyd/Knott/Johnson • Advantage Valley • Lexington • Hazard • Ashland • Mt. Sterling • Pikeville • Flemingsburg • Richmond • Tug Valley • Summersville • Versailles • Whitesburg • Winchester South Central Region Indirect Lending Loans - $862 million Loans - $812 million Deposits - $1.1 billion • Campbellsville CTIC • LaFollette Assets Under Management - $3.2 billion (including $1.1 billion CTB) • Middlesboro Revenues - $17.9 million annualized • Mt. Vernon • Williamsburg • Ashland • LaFollette • Lexington • Pikeville • Versailles Financial data as of September 30, 2023 6
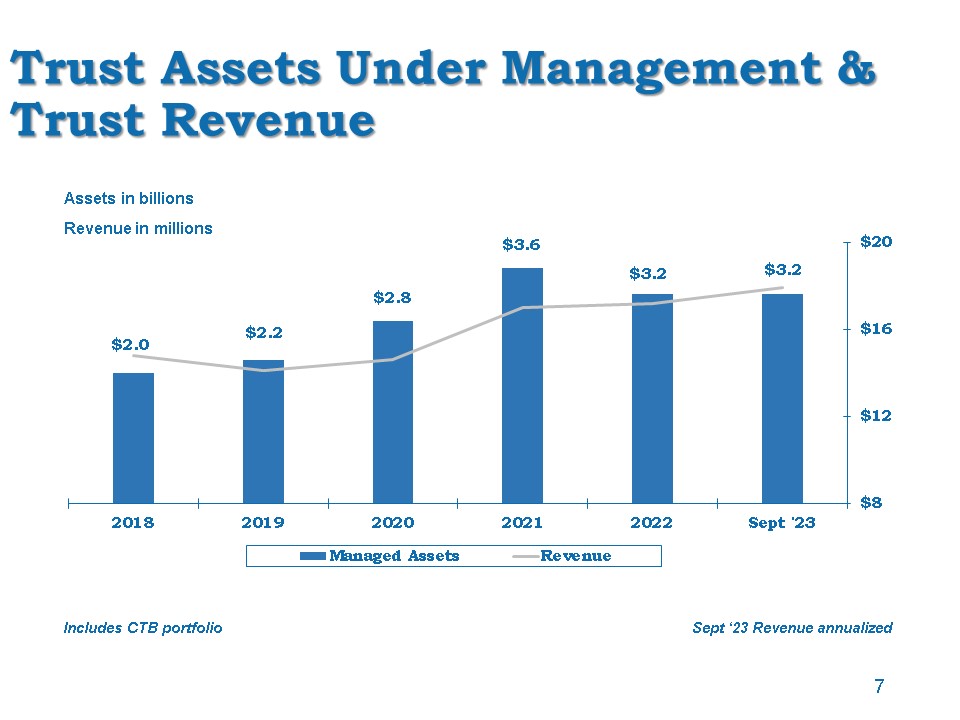
Trust Assets Under Management & Trust Revenue Includes CTB portfolio Assets in billions Revenue in millions 7 Sept ‘23 Revenue annualized
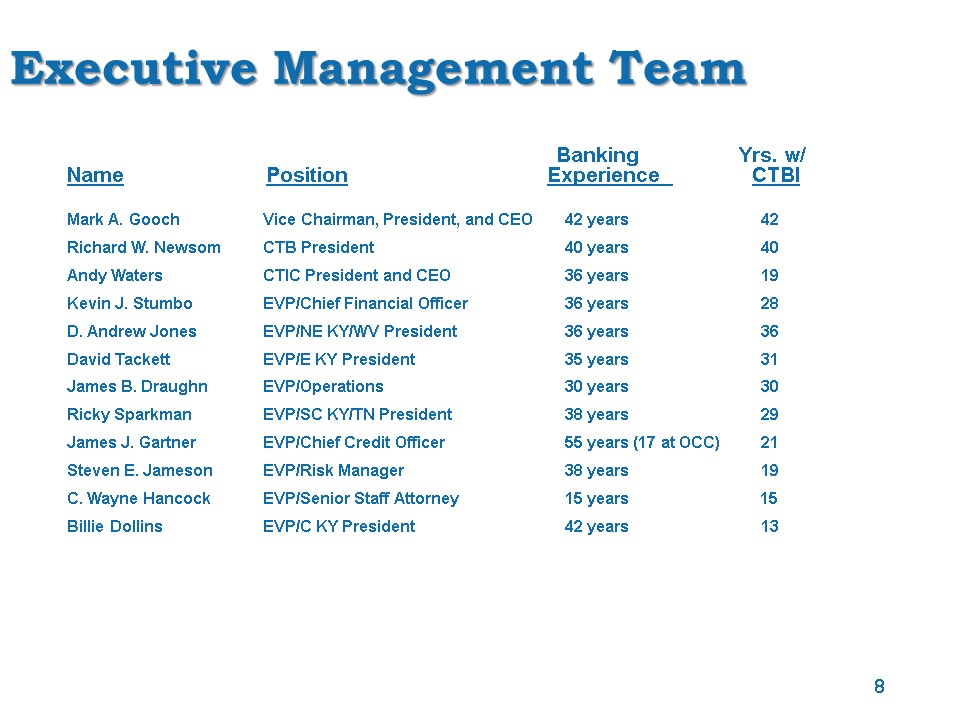
Executive Management Team Banking Yrs. w/ Name Position Experience CTBI Mark A. Gooch Vice Chairman, President, and CEO 42 years 42 Richard W. Newsom CTB President 40 years 40 Andy Waters CTIC President and CEO 36 years 19 Kevin J. Stumbo EVP/Chief Financial Officer 36 years 28 D. Andrew Jones EVP/NE KY/WV President 36 years 36 David Tackett EVP/E KY President 35 years 31 James B. Draughn EVP/Operations 30 years 30 Ricky Sparkman EVP/SC KY/TN President 38 years 29 James J. Gartner EVP/Chief Credit Officer 55 years (17 at OCC) 21 Steven E. Jameson EVP/Risk Manager 38 years 19 C. Wayne Hancock EVP/Senior Staff Attorney 15 years 15 Billie Dollins EVP/C KY President 42 years 13 8
Operational Philosophy Traditional community banking business model Executive management and board of director commitment to strong corporate governance Decentralized decision making and centralized operations and risk management Strong loan portfolio risk management process Specialized product offerings Maintain a strong tangible equity position Organic growth expectations combined with de novo branching and acquisition Consistent long-term performance 9
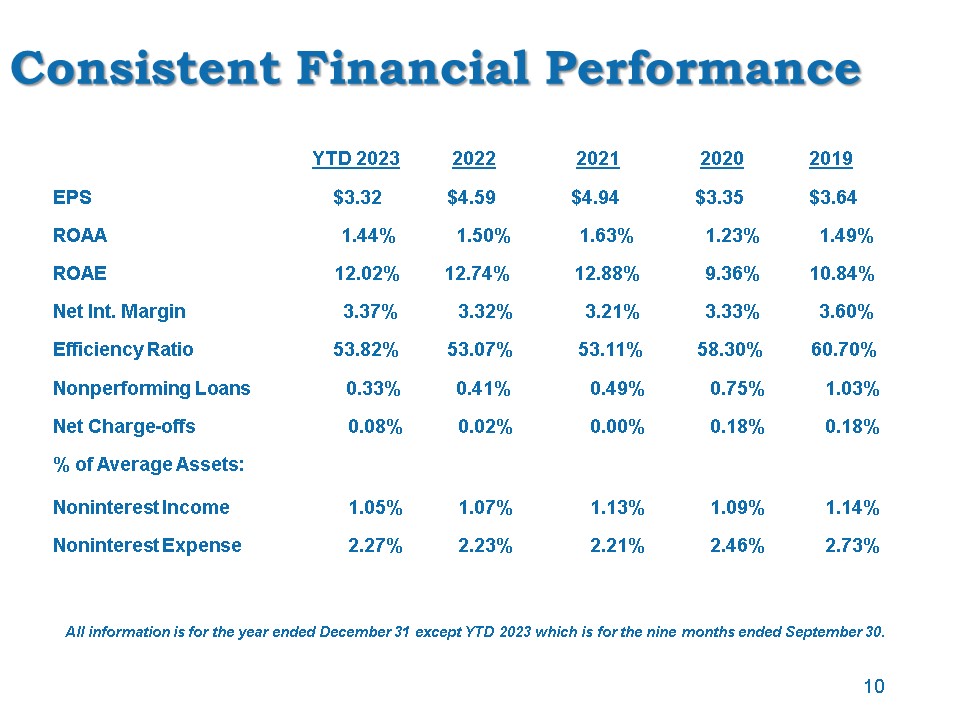
Consistent Financial Performance YTD 2023 2022 2021 2020 2019 EPS $3.32 $4.59 $4.94 $3.35 $3.64 ROAA 1.44% 1.50% 1.63% 1.23% 1.49% ROAE 12.02% 12.74% 12.88% 9.36% 10.84% Net Int. Margin 3.37% 3.32% 3.21% 3.33% 3.60% Efficiency Ratio 53.82% 53.07% 53.11% 58.30% 60.70% Nonperforming Loans 0.33% 0.41% 0.49% 0.75% 1.03% Net Charge-offs 0.08% 0.02% 0.00% 0.18% 0.18% % of Average Assets: Noninterest Income 1.05% 1.07% 1.13% 1.09% 1.14% Noninterest Expense 2.27% 2.23% 2.21% 2.46% 2.73% 10 All information is for the year ended December 31 except YTD 2023 which is for the nine months ended September 30.
Earnings Review
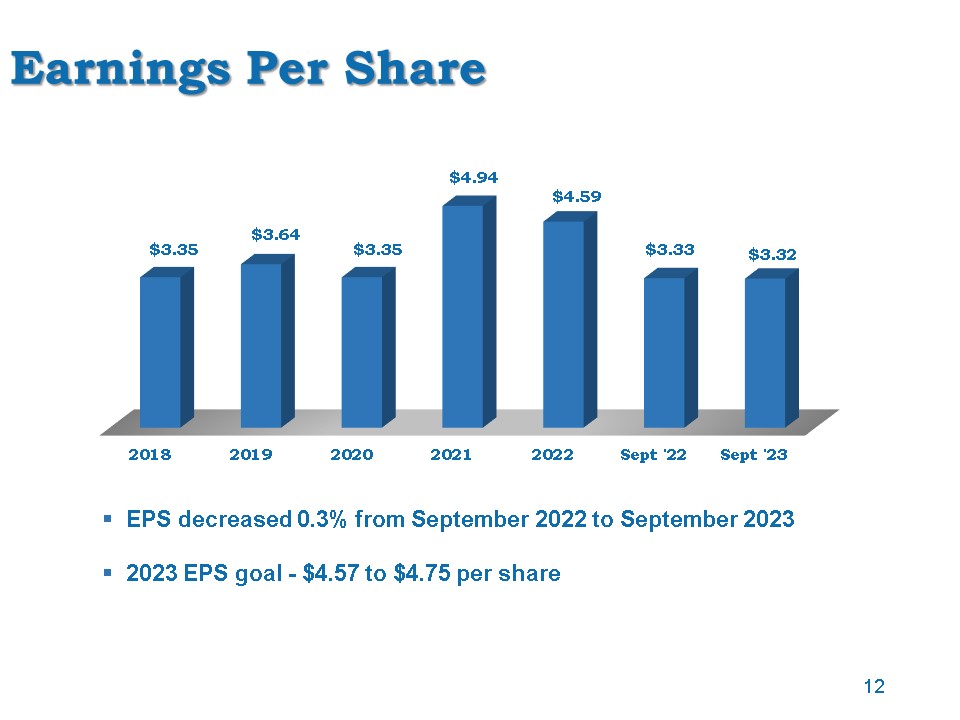
Earnings Per Share EPS decreased 0.3% from September 2022 to September 2023 2023 EPS goal - $4.57 to $4.75 per share 12
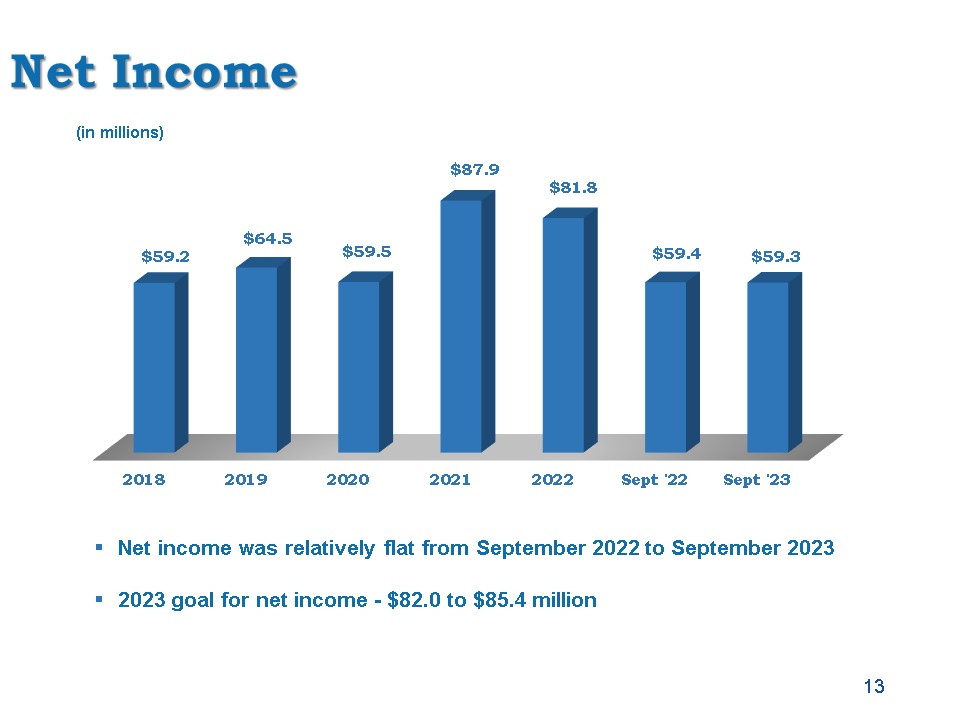
Net Income Net income was relatively flat from September 2022 to September 2023 2023 goal for net income - $82.0 to $85.4 million (in millions) 13
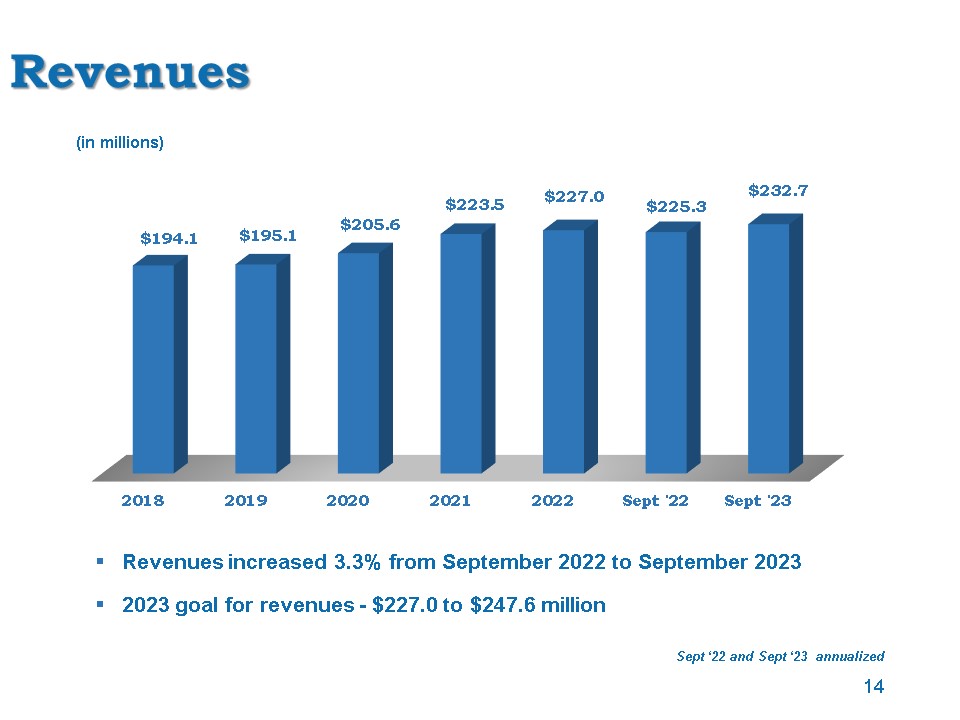
Revenues Revenues increased 3.3% from September 2022 to September 2023 2023 goal for revenues - $227.0 to $247.6 million (in millions) 14 Sept ‘22 and Sept ‘23 annualized
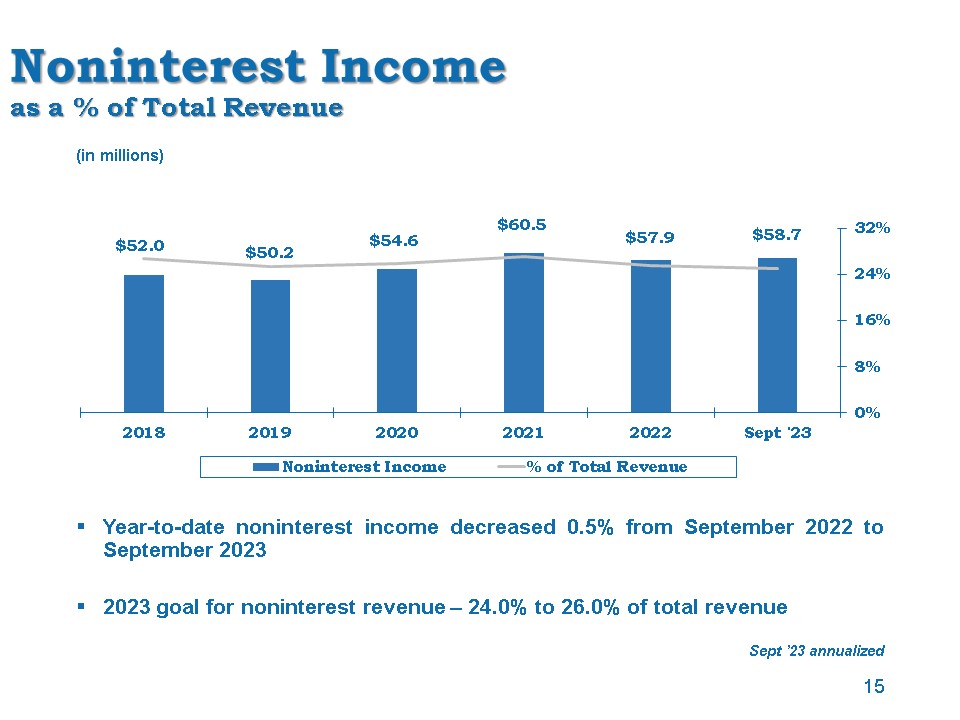
Noninterest Incomeas a % of Total Revenue Year-to-date noninterest income decreased 0.5% from September 2022 to September 2023 2023 goal for noninterest revenue – 24.0% to 26.0% of total revenue (in millions) 15 Sept ’23 annualized
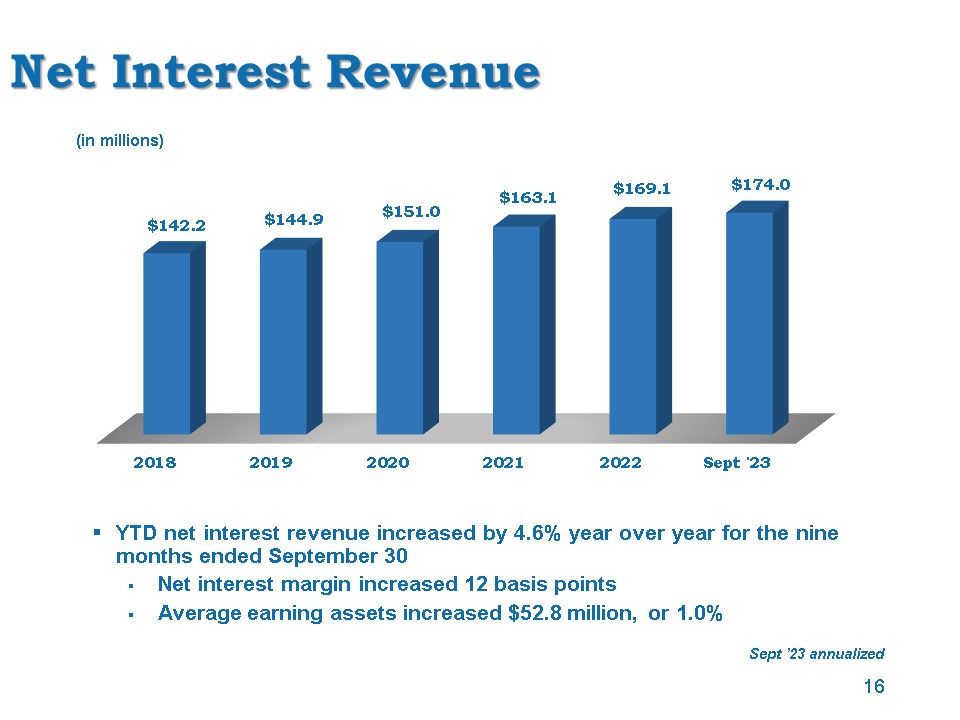
Net Interest Revenue YTD net interest revenue increased by 4.6% year over year for the nine months ended September 30 Net interest margin increased 12 basis points Average earning assets increased $52.8 million, or 1.0% (in millions) 16 Sept ’23 annualized
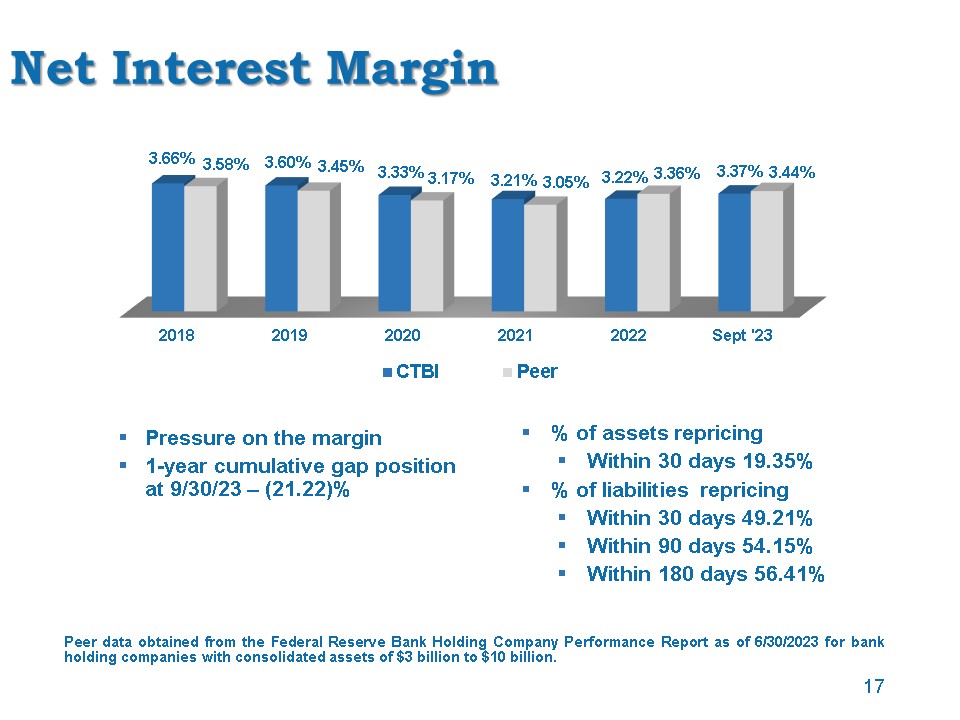
Net Interest Margin Pressure on the margin 1-year cumulative gap position at 9/30/23 – (21.22)% Peer data obtained from the Federal Reserve Bank Holding Company Performance Report as of 6/30/2023 for bank holding companies with consolidated assets of $3 billion to $10 billion. % of assets repricing Within 30 days 19.35% % of liabilities repricing Within 30 days 49.21% Within 90 days 54.15% Within 180 days 56.41% 17
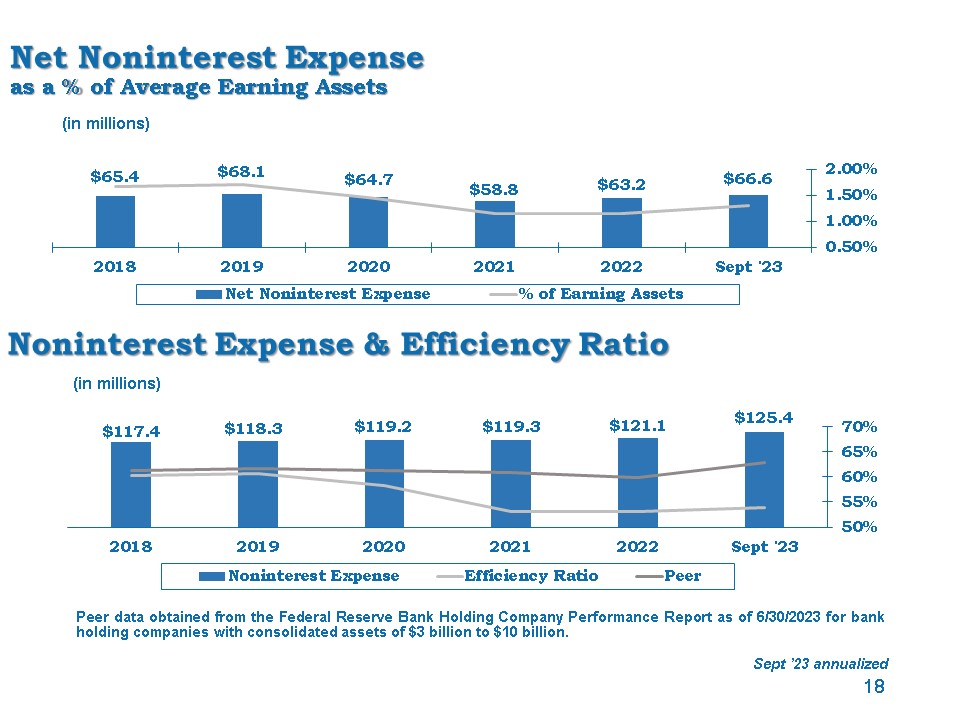
Net Noninterest Expenseas a % of Average Earning Assets Peer data obtained from the Federal Reserve Bank Holding Company Performance Report as of 6/30/2023 for bank holding companies with consolidated assets of $3 billion to $10 billion. (in millions) 18 Noninterest Expense & Efficiency Ratio (in millions) Sept ’23 annualized
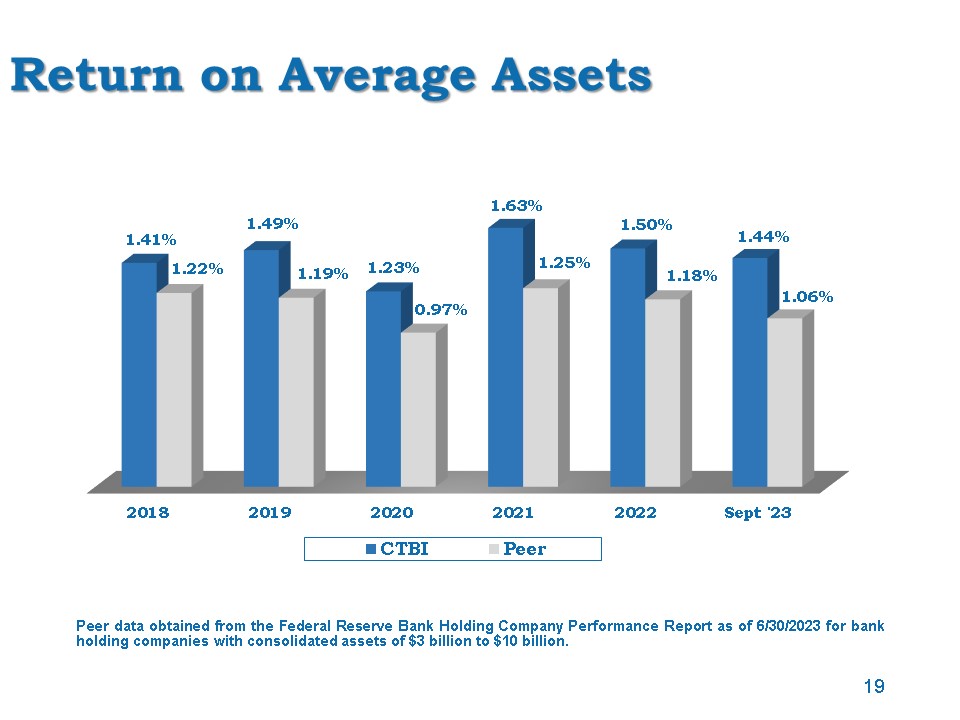
Return on Average Assets Peer data obtained from the Federal Reserve Bank Holding Company Performance Report as of 6/30/2023 for bank holding companies with consolidated assets of $3 billion to $10 billion. 19

Balance Sheet Review
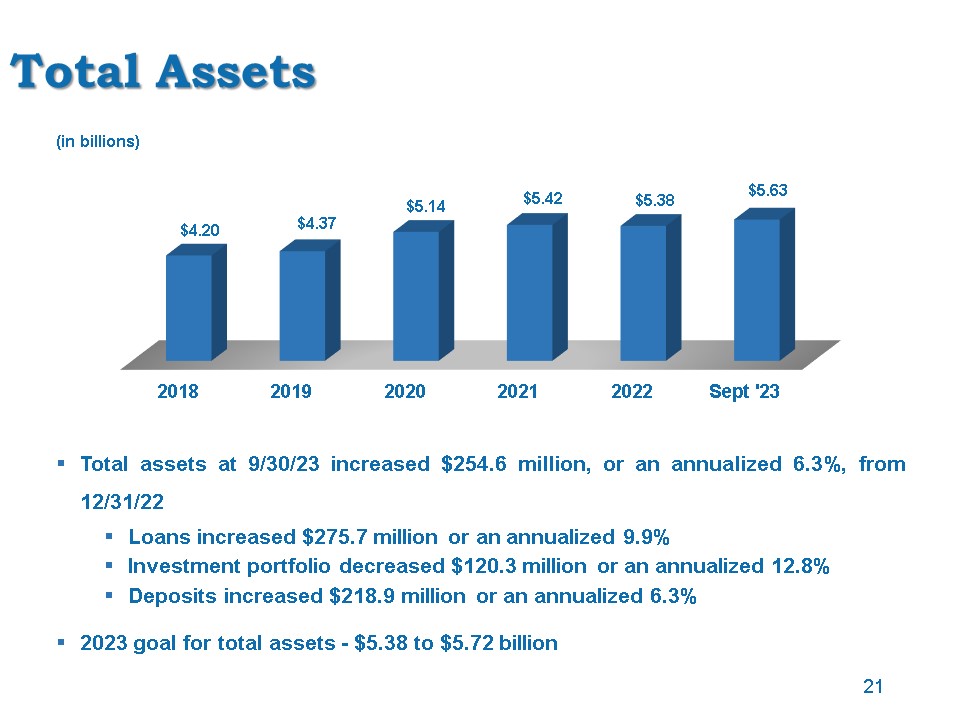
Total Assets Total assets at 9/30/23 increased $254.6 million, or an annualized 6.3%, from 12/31/22 Loans increased $275.7 million or an annualized 9.9% Investment portfolio decreased $120.3 million or an annualized 12.8% Deposits increased $218.9 million or an annualized 6.3% 2023 goal for total assets - $5.38 to $5.72 billion (in billions) 21
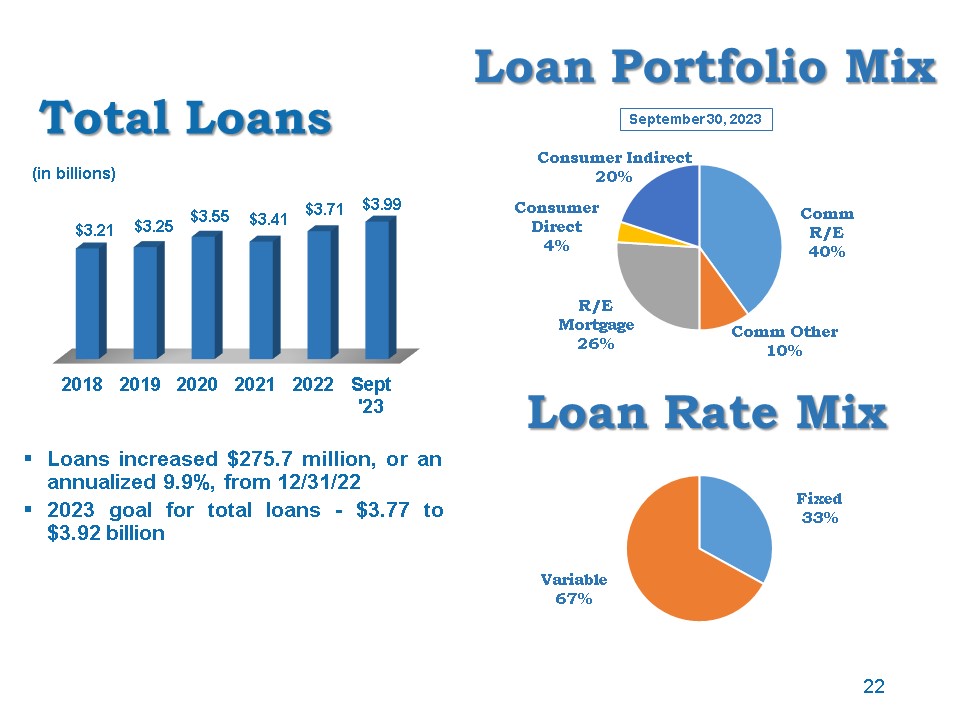
Total Loans Loans increased $275.7 million, or an annualized 9.9%, from 12/31/22 2023 goal for total loans - $3.77 to $3.92 billion (in billions) 22 Loan Portfolio Mix September 30, 2023 Loan Rate Mix
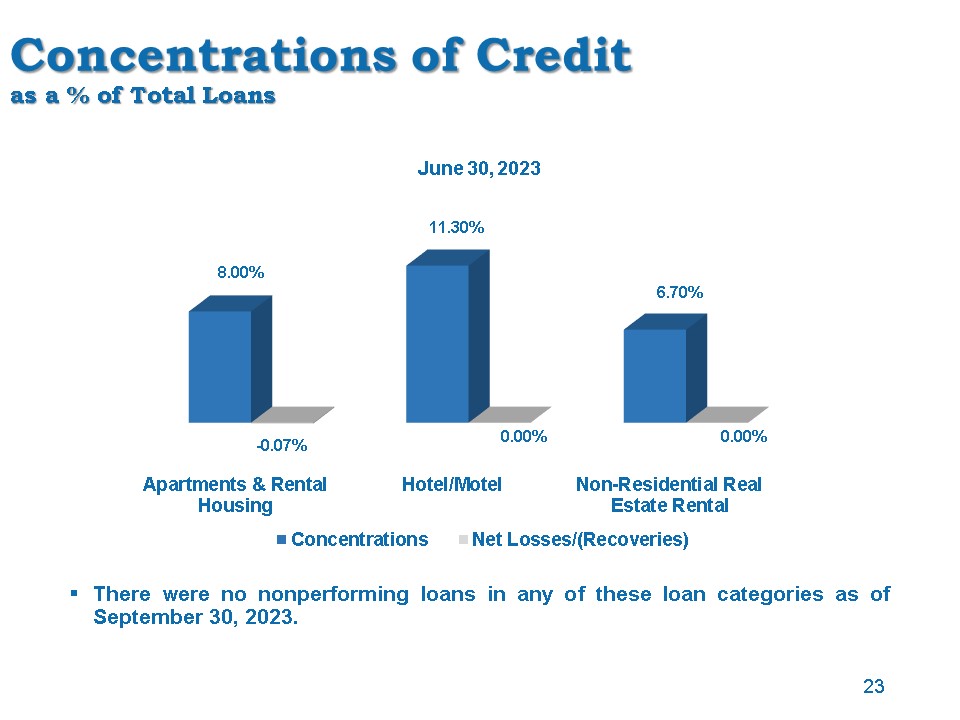
Concentrations of Creditas a % of Total Loans June 30, 2023 23 There were no nonperforming loans in any of these loan categories as of September 30, 2023.
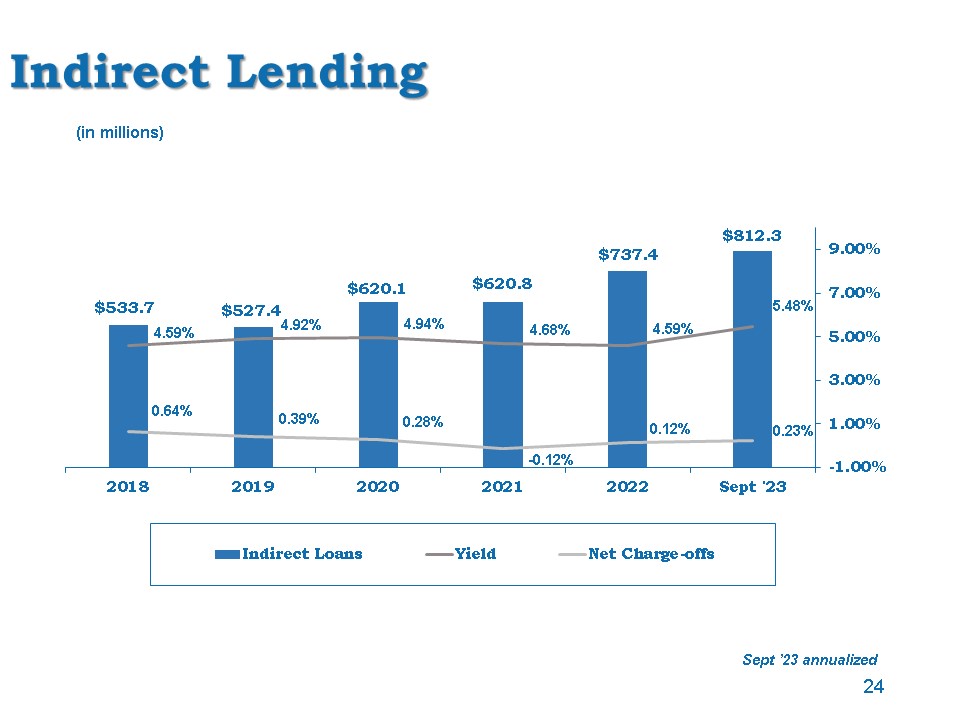
Indirect Lending (in millions) 24 Sept ’23 annualized
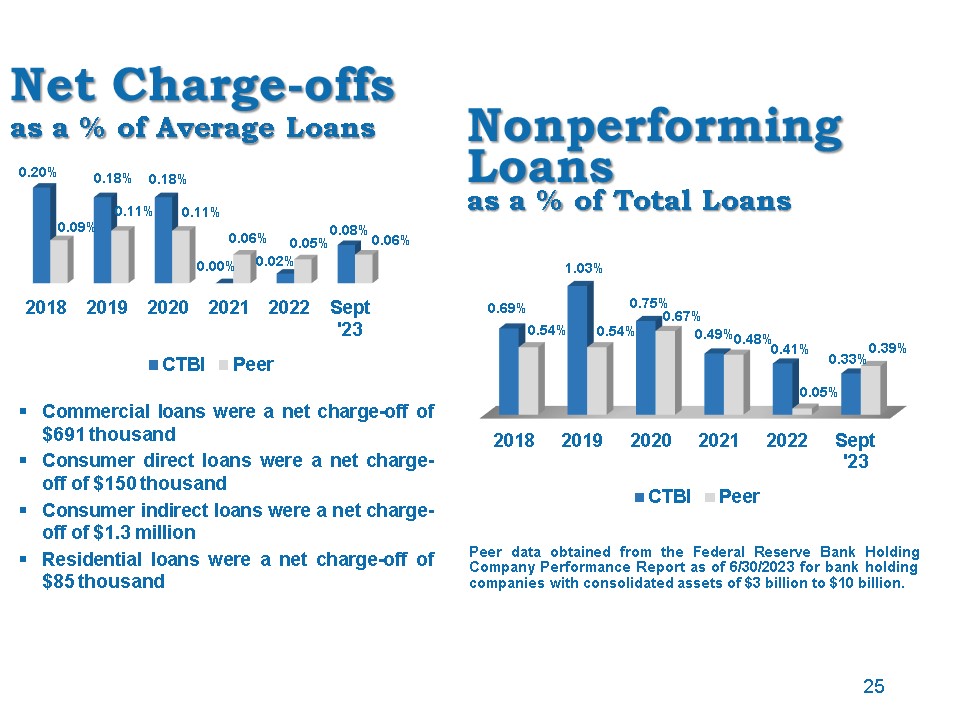
Net Charge-offsas a % of Average Loans Peer data obtained from the Federal Reserve Bank Holding Company Performance Report as of 6/30/2023 for bank holding companies with consolidated assets of $3 billion to $10 billion. 25 Nonperforming Loansas a % of Total Loans Commercial loans were a net charge-off of $691 thousand Consumer direct loans were a net charge-off of $150 thousand Consumer indirect loans were a net charge-off of $1.3 million Residential loans were a net charge-off of $85 thousand
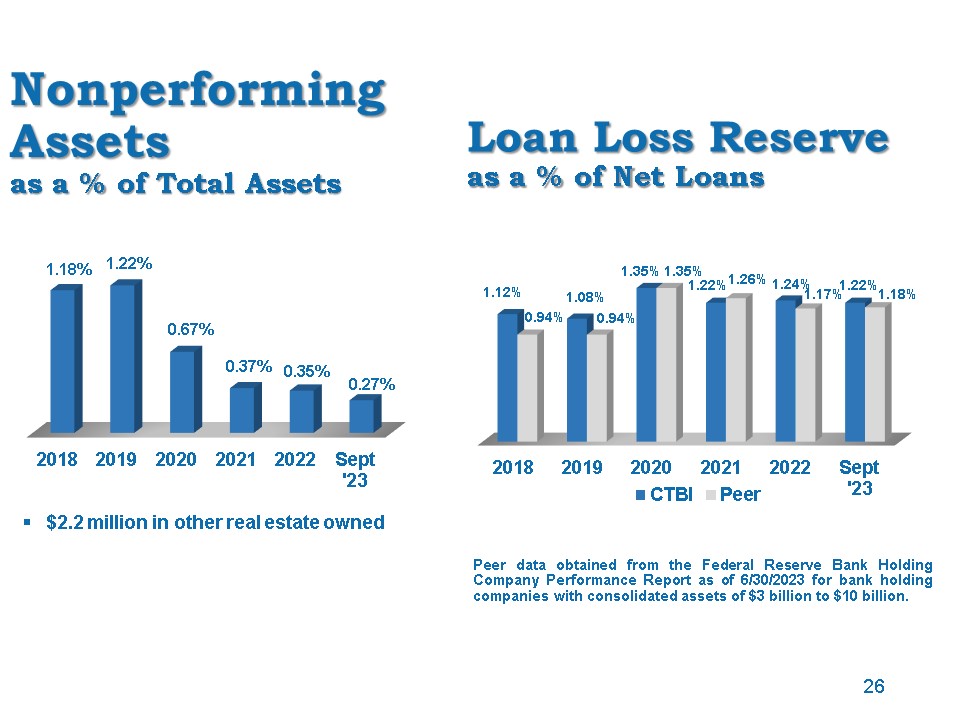
Nonperforming Assetsas a % of Total Assets $2.2 million in other real estate owned 26 Loan Loss Reserve as a % of Net Loans Peer data obtained from the Federal Reserve Bank Holding Company Performance Report as of 6/30/2023 for bank holding companies with consolidated assets of $3 billion to $10 billion.
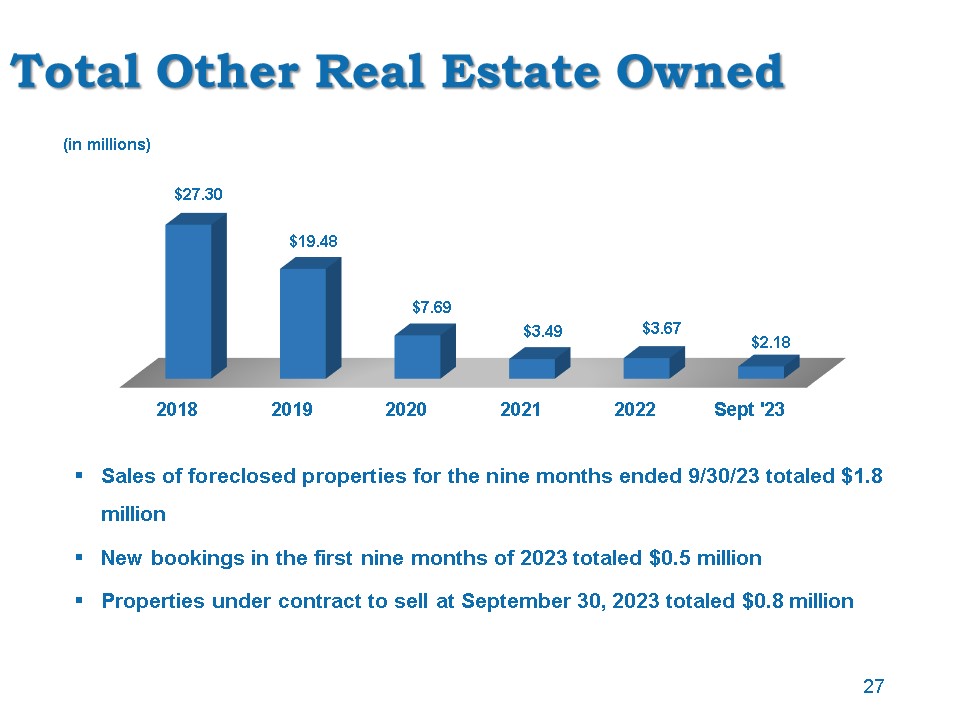
Total Other Real Estate Owned Sales of foreclosed properties for the nine months ended 9/30/23 totaled $1.8 million New bookings in the first nine months of 2023 totaled $0.5 million Properties under contract to sell at September 30, 2023 totaled $0.8 million (in millions) 27
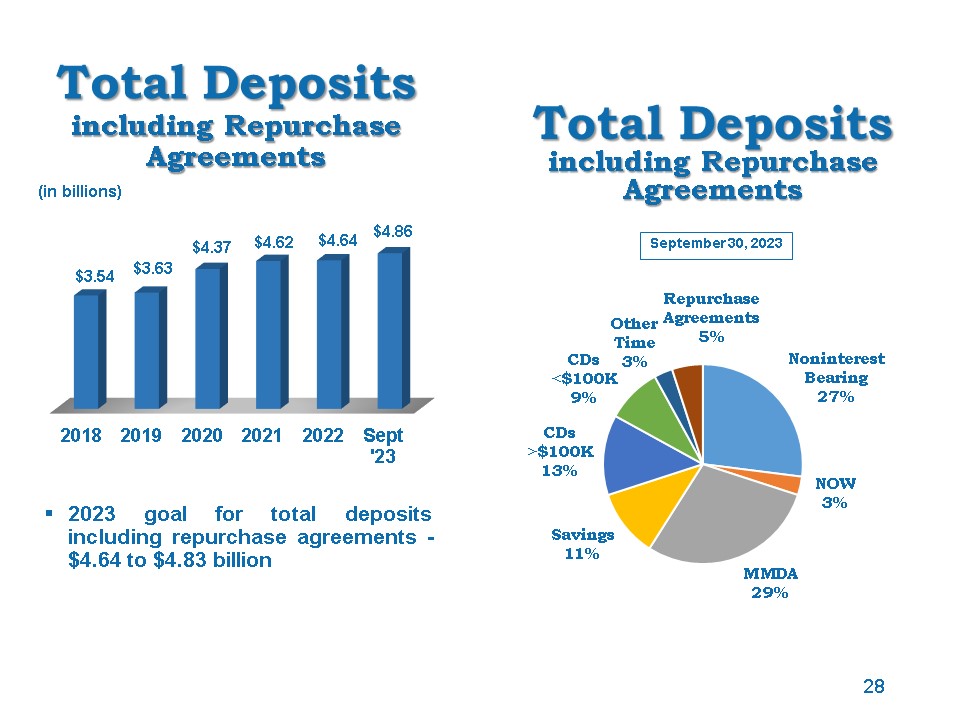
Total Depositsincluding Repurchase Agreements 2023 goal for total deposits including repurchase agreements - $4.64 to $4.83 billion (in billions) 28 Total Depositsincluding Repurchase Agreements September 30, 2023
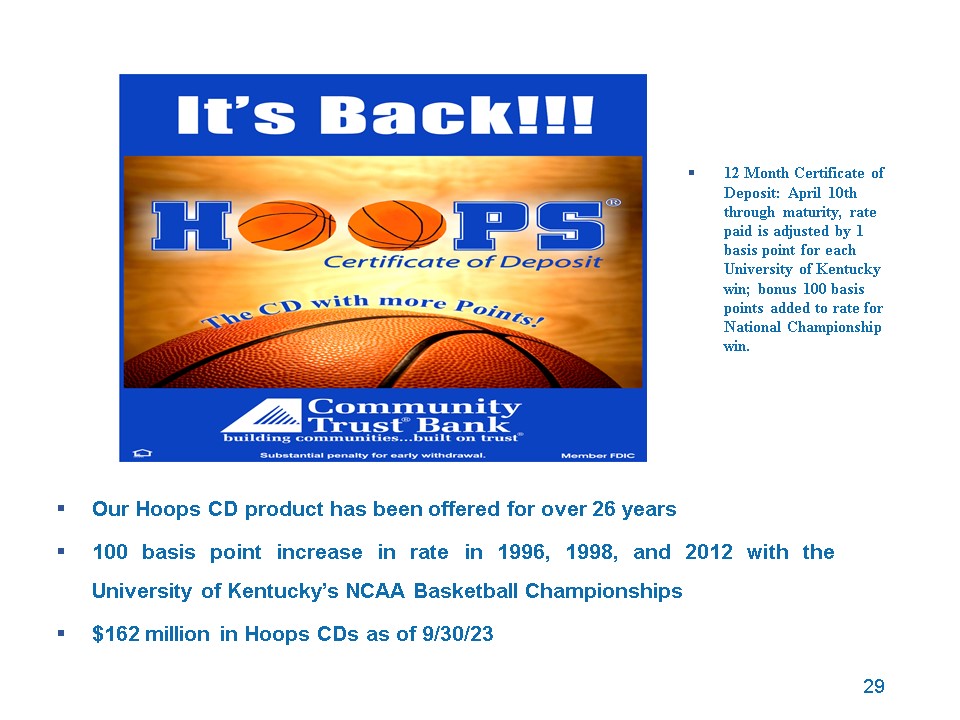
Our Hoops CD product has been offered for over 26 years 100 basis point increase in rate in 1996, 1998, and 2012 with the University of Kentucky’s NCAA Basketball Championships $162 million in Hoops CDs as of 9/30/23 12 Month Certificate of Deposit: April 10th through maturity, rate paid is adjusted by 1 basis point for each University of Kentucky win; bonus 100 basis points added to rate for National Championship win. 29

Shareholder Value
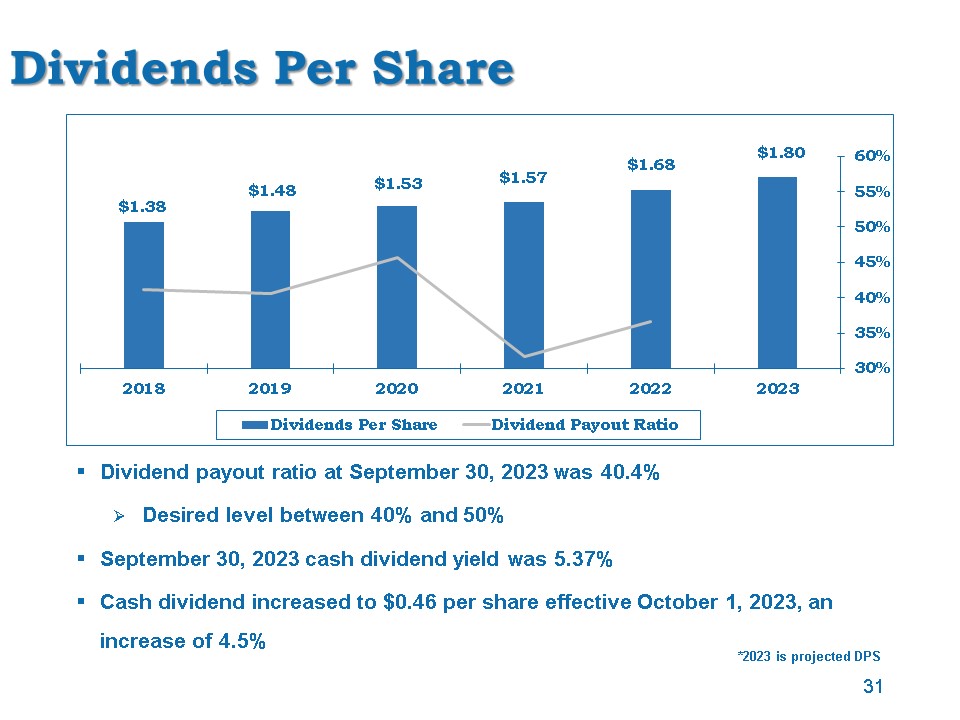
Dividends Per Share Dividend payout ratio at September 30, 2023 was 40.4% Desired level between 40% and 50% September 30, 2023 cash dividend yield was 5.37% Cash dividend increased to $0.46 per share effective October 1, 2023, an increase of 4.5% 31 *2023 is projected DPS
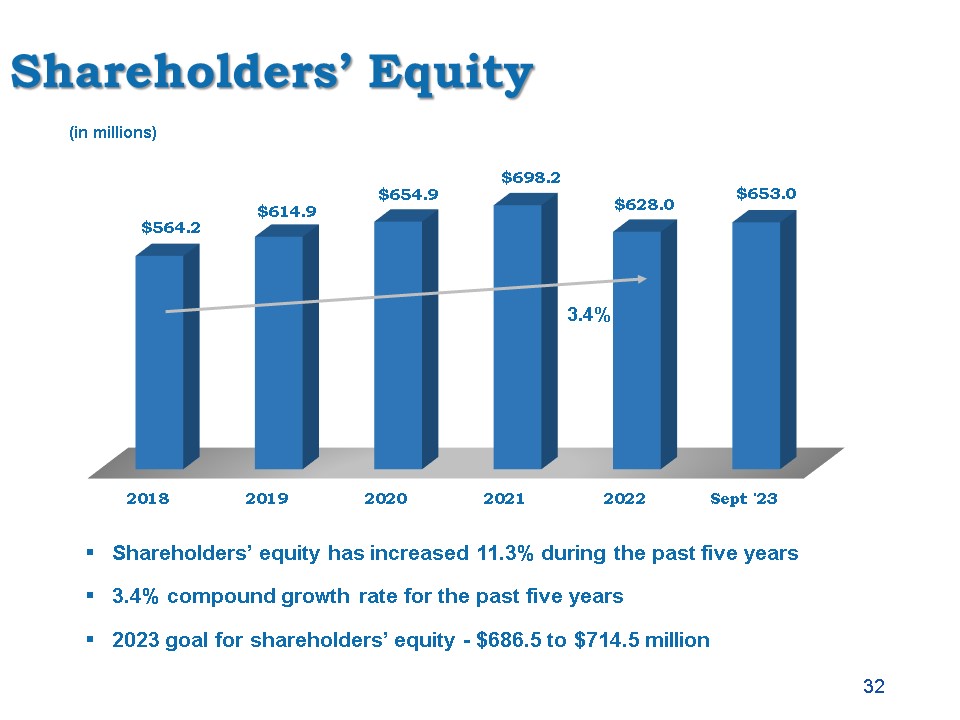
Shareholders’ Equity Shareholders’ equity has increased 11.3% during the past five years 3.4% compound growth rate for the past five years 2023 goal for shareholders’ equity - $686.5 to $714.5 million (in millions) 32 3.4%
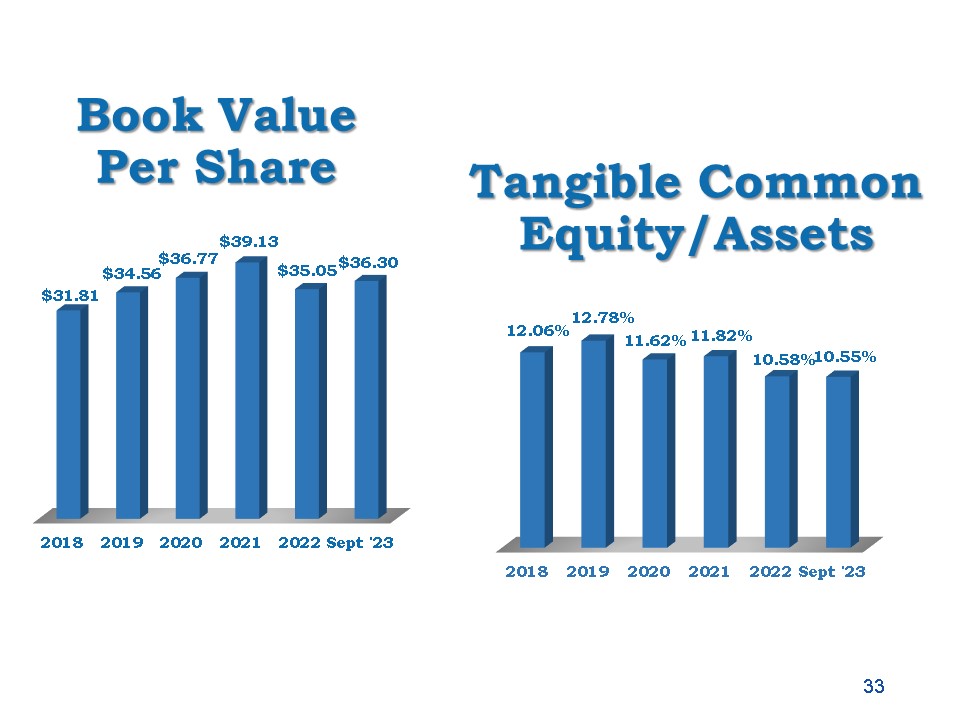
Book Value Per Share Tangible Common Equity/Assets 33
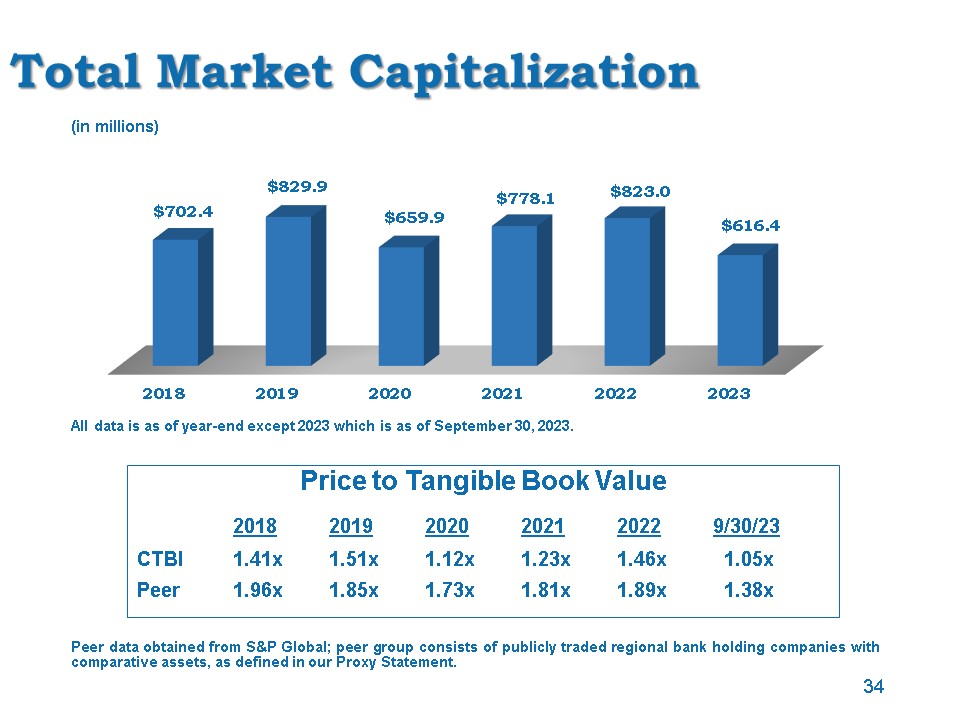
Total Market Capitalization Peer data obtained from S&P Global; peer group consists of publicly traded regional bank holding companies with comparative assets, as defined in our Proxy Statement. 34 Price to Tangible Book Value 2018 2019 2020 2021 2022 9/30/23 CTBI 1.41x 1.51x 1.12x 1.23x 1.46x 1.05x Peer 1.96x 1.85x 1.73x 1.81x 1.89x 1.38x All data is as of year-end except 2023 which is as of September 30, 2023. (in millions)
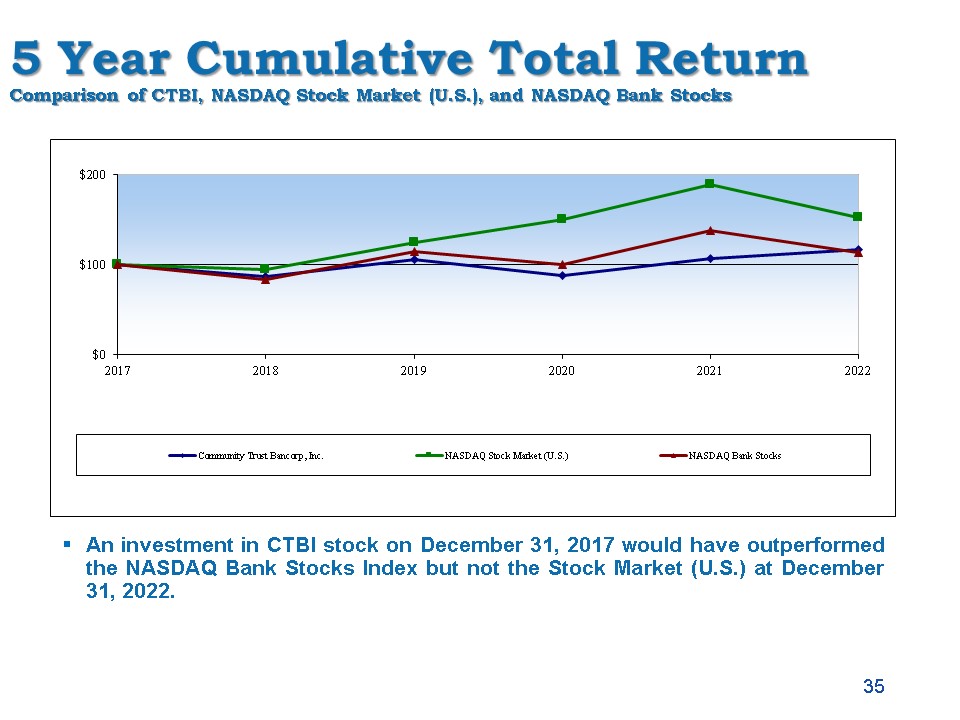
5 Year Cumulative Total ReturnComparison of CTBI, NASDAQ Stock Market (U.S.), and NASDAQ Bank Stocks An investment in CTBI stock on December 31, 2017 would have outperformed the NASDAQ Bank Stocks Index but not the Stock Market (U.S.) at December 31, 2022. 35
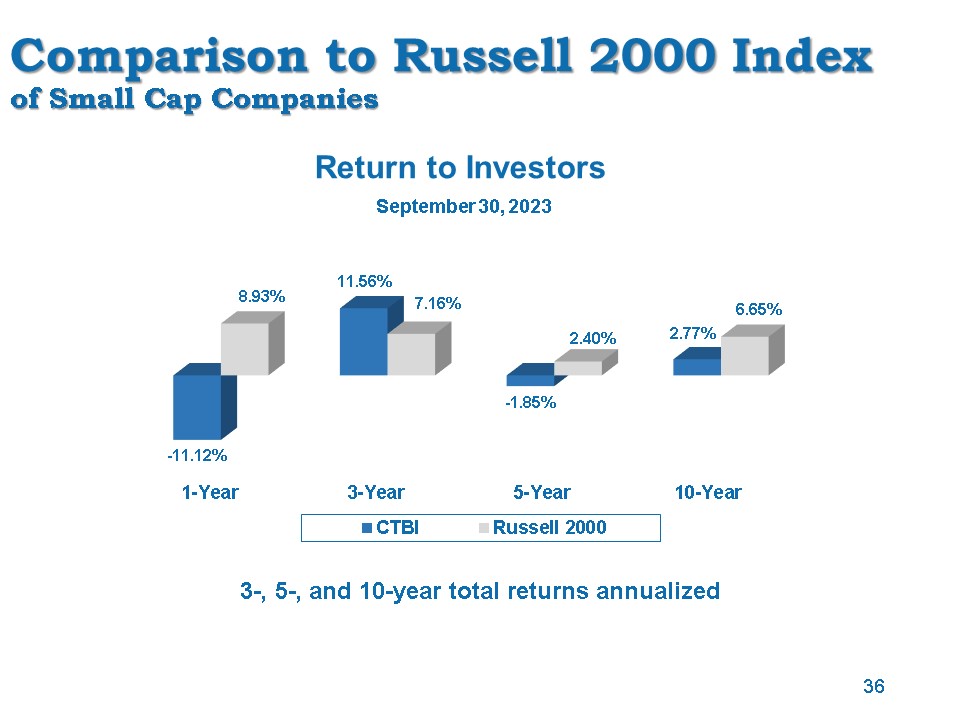
Comparison to Russell 2000 Indexof Small Cap Companies 3-, 5-, and 10-year total returns annualized Return to Investors 36 September 30, 2023
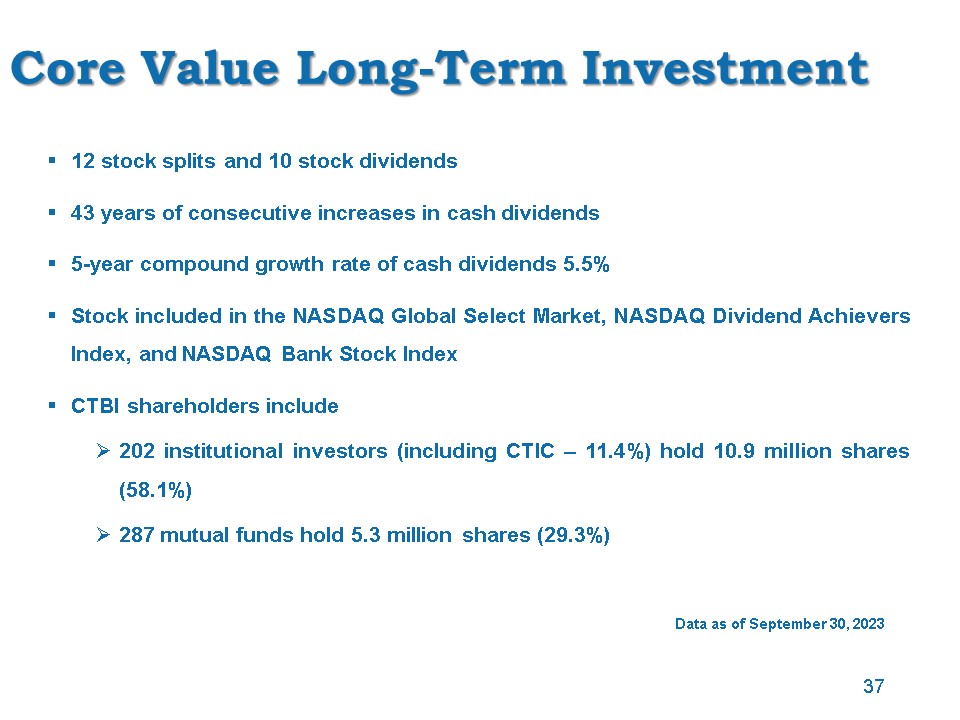
Core Value Long-Term Investment 12 stock splits and 10 stock dividends 43 years of consecutive increases in cash dividends 5-year compound growth rate of cash dividends 5.5% Stock included in the NASDAQ Global Select Market, NASDAQ Dividend Achievers Index, and NASDAQ Bank Stock Index CTBI shareholders include 202 institutional investors (including CTIC – 11.4%) hold 10.9 million shares (58.1%) 287 mutual funds hold 5.3 million shares (29.3%) Data as of September 30, 2023 37
Key Strategic Initiatives
Operational Priorities Build core earnings capacity Quality loan growth Low cost deposit growth Branch expansion in growth markets Maintain net interest margin Operational efficiency Expense control Noninterest revenue growth Compliance management Increase noninterest income Wealth management Brokerage Insurance Continuing focus on improving asset quality 39

CTBI’s Franchise Value History of solid investor returns Historically strong capital position Investor focused dividend policy Dividend Achievers Index Consistent financial performance Community banking strategy Economic diversity in the markets we serve Strong experienced management team and nearly 1,000 dedicated employees Our shareholders 40
41