Exhibit 99.1
Link to searchable text of slide shown above
Link to searchable text of slide shown above

Link to searchable text of slide shown above
Link to searchable text of slide shown above
Link to searchable text of slide shown above

Link to searchable text of slide shown above

Link to searchable text of slide shown above

Link to searchable text of slide shown above
Link to searchable text of slide shown above
Link to searchable text of slide shown above
Link to searchable text of slide shown above
Link to searchable text of slide shown above

Link to searchable text of slide shown above
Link to searchable text of slide shown above
Link to searchable text of slide shown above
Link to searchable text of slide shown above
Link to searchable text of slide shown above
Link to searchable text of slide shown above

Link to searchable text of slide shown above

Link to searchable text of slide shown above
Link to searchable text of slide shown above
Link to searchable text of slide shown above

Link to searchable text of slide shown above

Link to searchable text of slide shown above
Link to searchable text of slide shown above
Searchable text section of graphics shown above
Community Trust
Bancorp, Inc.
“A Century of Service”
Analyst
Presentation
September 23, 2003
1
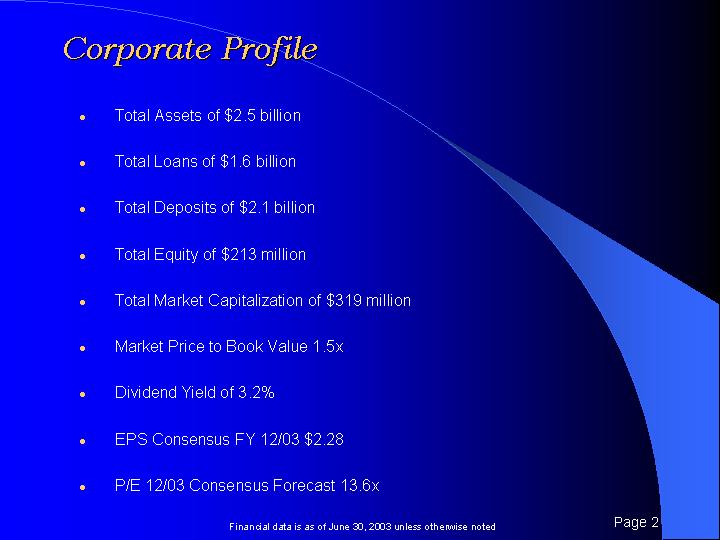
Corporate Profile
• Total Assets of $2.5 billion
• Total Loans of $1.6 billion
• Total Deposits of $2.1 billion
• Total Equity of $213 million
• Total Market Capitalization of $319 million
• Market Price to Book Value 1.5x
• Dividend Yield of 3.2%
• EPS Consensus FY 12/03 $2.28
• P/E 12/03 Consensus Forecast 13.6x
Financial data is as of June 30, 2003 unless otherwise noted
2
• Headquarters Pikeville, KY
• 69 banking locations throughout Kentucky excluding western Kentucky
• 5 banking locations in southern West Virginia
[GRAPHIC]
3
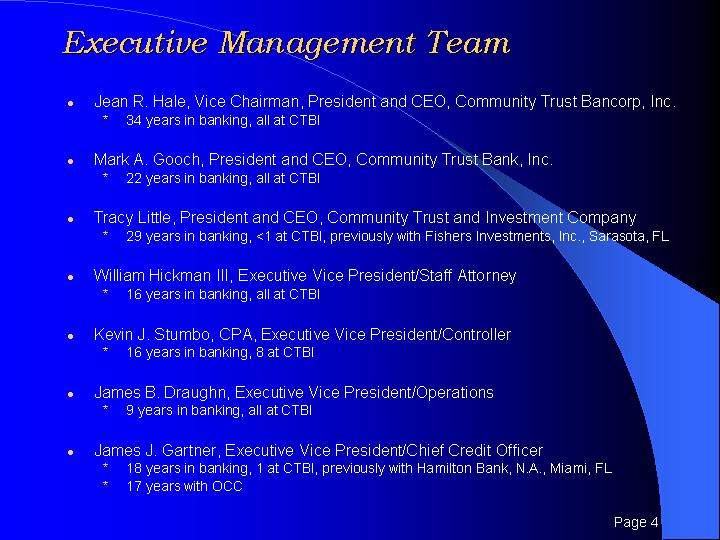
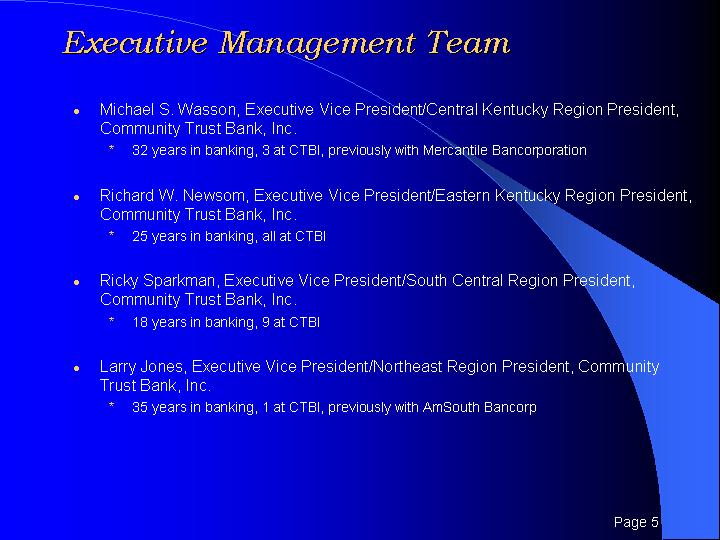
Executive Management Team
• Jean R. Hale, Vice Chairman, President and CEO, Community Trust Bancorp, Inc.
* 34 years in banking, all at CTBI
• Mark A. Gooch, President and CEO, Community Trust Bank, Inc.
* 22 years in banking, all at CTBI
• Tracy Little, President and CEO, Community Trust and Investment Company
* 29 years in banking, <1 at CTBI, previously with Fishers Investments, Inc., Sarasota, FL
• William Hickman III, Executive Vice President/Staff Attorney
* 16 years in banking, all at CTBI
• Kevin J. Stumbo, CPA, Executive Vice President/Controller
* 16 years in banking, 8 at CTBI
• James B. Draughn, Executive Vice President/Operations
* 9 years in banking, all at CTBI
• James J. Gartner, Executive Vice President/Chief Credit Officer
* 18 years in banking, 1 at CTBI, previously with Hamilton Bank, N.A., Miami, FL
* 17 years with OCC
4
• Michael S. Wasson, Executive Vice President/Central Kentucky Region President, Community Trust Bank, Inc.
* 32 years in banking, 3 at CTBI, previously with Mercantile Bancorporation
• Richard W. Newsom, Executive Vice President/Eastern Kentucky Region President, Community Trust Bank, Inc.
* 25 years in banking, all at CTBI
• Ricky Sparkman, Executive Vice President/South Central Region President, Community Trust Bank, Inc.
* 18 years in banking, 9 at CTBI
• Larry Jones, Executive Vice President/Northeast Region President, Community Trust Bank, Inc.
* 35 years in banking, 1 at CTBI, previously with AmSouth Bancorp
5
Organizational History
“A Century of Service”
• | 1903 |
| The Pikeville National Bank founded |
|
|
|
|
• | 1936 |
| Pikeville National Bank & Trust Company incorporated |
|
|
|
|
• | 1981 |
| Formed Pikeville National Corporation |
|
|
|
|
• | 1987-2002 |
| Acquired 13 banks and purchased 17 branches |
|
|
|
|
• | 1997 |
| Changed name from Pikeville National Corporation to Community Trust Bancorp, Inc. |
|
|
|
|
• | 1997-2002 |
| Merged all banks into lead bank, Community Trust Bank, Inc. |
|
|
|
|
• | 2003 |
| Two operational subsidiaries, Community Trust Bank, Inc. and Community Trust and Investment Company |
6
Organizational Structure
Community Trust Bancorp, Inc. | ||
|
|
|
Community Trust Bank, Inc. |
| Community Trust and Investment Company |
• Community Trust Bank, Inc.
* Regional structure provides synergies
• Community Trust and Investment Company
* Assets under Management $856 million
* Includes CTB investment portfolio of $554 million
Financial data is as of December 31, 2002
7
A Century of Service
founded in 1903
100 years of increasing return to investors
• Initial public offering 1981
• 12 stock splits
• 7 stock dividends, last one 10% on December 15, 2002
• 22 years of consecutive increases in cash dividends—10% increase on October 1, 2003
• 5-year Compound Growth Rate of cash dividend 8%
• Recognized by Mergent, Inc. as 2003 Dividend Achiever
8
Strategic Direction
Operational Philosophy
Mission Statement
• Offer industry competitive and profitable financial products
• Deliver “community bank” customer service
• Provide a productive work environment
• Remain a good corporate citizen
CTBI’s operational philosophy supports our mission
• Decentralized decision making
• Centralized operations
• Local Market Presidents
• Specialized product offerings
• Maximized use of technology
9
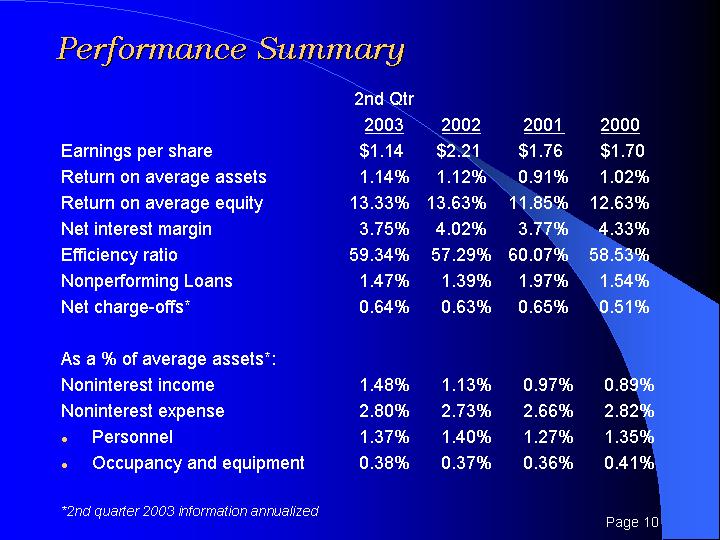
Performance Summary
|
| 2nd Qtr |
|
|
|
|
|
|
| ||||
|
|
| 2002 |
| 2001 |
| 2000 |
| |||||
Earnings per share |
| $ | 1.14 |
| $ | 2.21 |
| $ | 1.76 |
| $ | 1.70 |
|
Return on average assets |
| 1.14 | % | 1.12 | % | 0.91 | % | 1.02 | % | ||||
Return on average equity |
| 13.33 | % | 13.63 | % | 11.85 | % | 12.63 | % | ||||
Net interest margin |
| 3.75 | % | 4.02 | % | 3.77 | % | 4.33 | % | ||||
Efficiency ratio |
| 59.34 | % | 57.29 | % | 60.07 | % | 58.53 | % | ||||
Nonperforming Loans |
| 1.47 | % | 1.39 | % | 1.97 | % | 1.54 | % | ||||
Net charge-offs* |
| 0.64 | % | 0.63 | % | 0.65 | % | 0.51 | % | ||||
|
|
|
|
|
|
|
|
|
| ||||
As a% of average assets*: |
|
|
|
|
|
|
|
|
| ||||
Noninterest income |
| 1.48 | % | 1.13 | % | 0.97 | % | 0.89 | % | ||||
Noninterest expense |
| 2.80 | % | 2.73 | % | 2.66 | % | 2.82 | % | ||||
• Personnel |
| 1.37 | % | 1.40 | % | 1.27 | % | 1.35 | % | ||||
• Occupancy and equipment |
| 0.38 | % | 0.37 | % | 0.36 | % | 0.41 | % | ||||
*2nd quarter 2003 information annualized
10
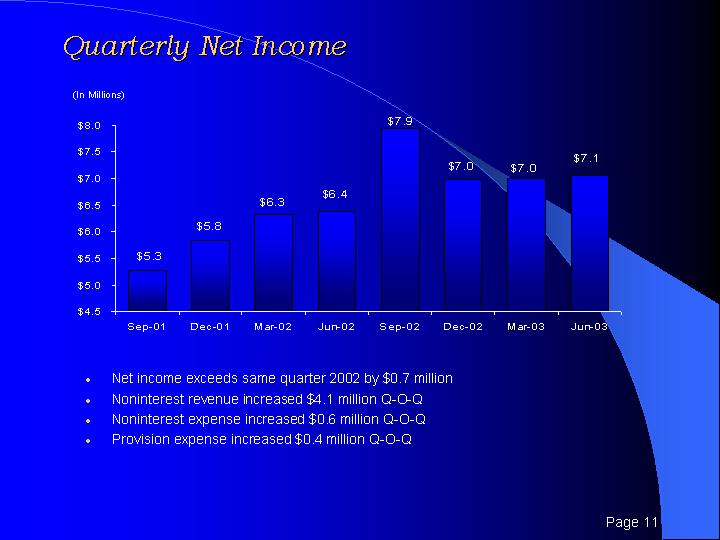
Quarterly Net Income
[CHART]
• Net income exceeds same quarter 2002 by $0.7 million
• Noninterest revenue increased $4.1 million Q-O-Q
• Noninterest expense increased $0.6 million Q-O-Q
• Provision expense increased $0.4 million Q-O-Q
11
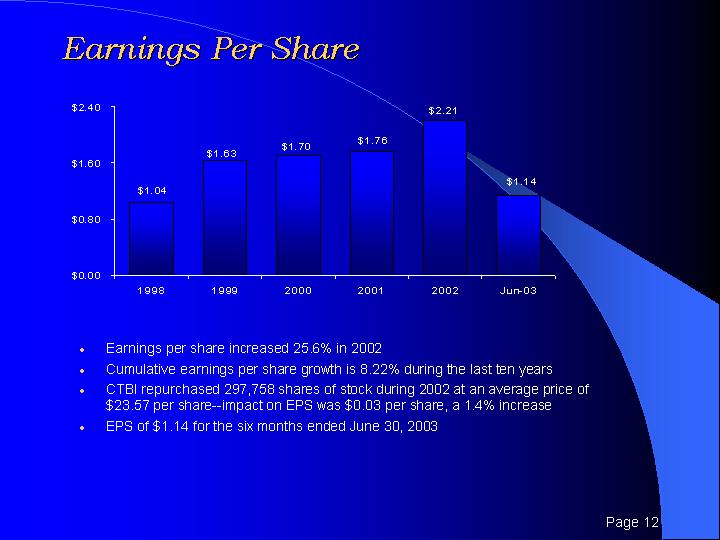
Earnings Per Share
[CHART]
• Earnings per share increased 25.6% in 2002
• Cumulative earnings per share growth is 8.22% during the last ten years
• CTBI repurchased 297,758 shares of stock during 2002 at an average price of $23.57 per share—impact on EPS was $0.03 per share, a 1.4% increase
• EPS of $1.14 for the six months ended June 30, 2003
12
Total Assets
[CHART]
• All data is as of year-end except 2003 which is as of June 30, 2003
13
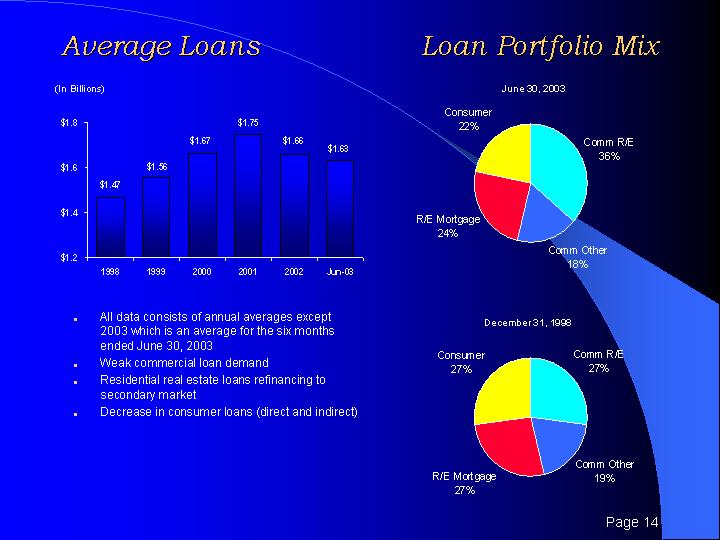
Average Loans
[CHART]
• All data consists of annual averages except 2003 which is an average for the six months ended June 30, 2003
• Weak commercial loan demand
• Residential real estate loans refinancing to secondary market
• Decrease in consumer loans (direct and indirect)
Loan Portfolio Mix
June 30, 2003
[CHART]
December 31, 1998
[CHART]
14
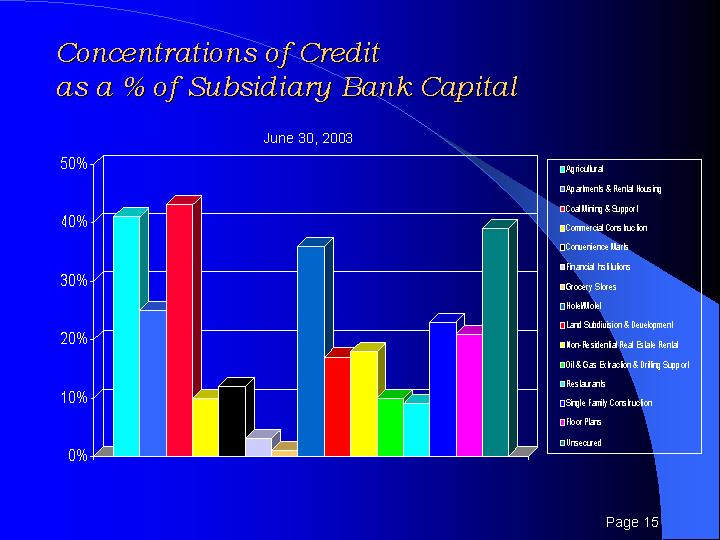
Concentrations of Credit
as a % of Subsidiary Bank Capital
June 30, 2003
[CHART]
15
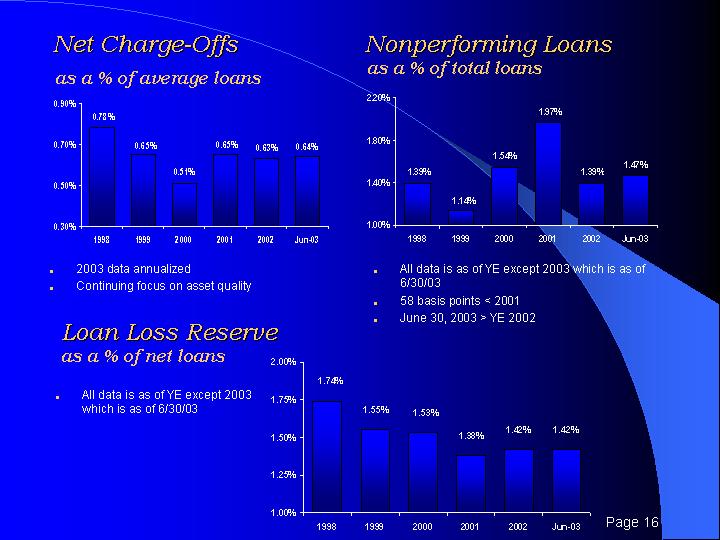
Net Charge-Offs
as a % of average loans
[CHART]
• 2003 data annualized
• Continuing focus on asset quality
Loan Loss Reserve
as a % of net loans
• All data is as of YE except 2003 which is as of 6/30/03
[CHART]
Nonperforming Loans
as a % of total loans
[CHART]
• All data is as of YE except 2003 which is as of 6/30/03
• 58 basis points < 2001
• June 30, 2003 > YE 2002
16
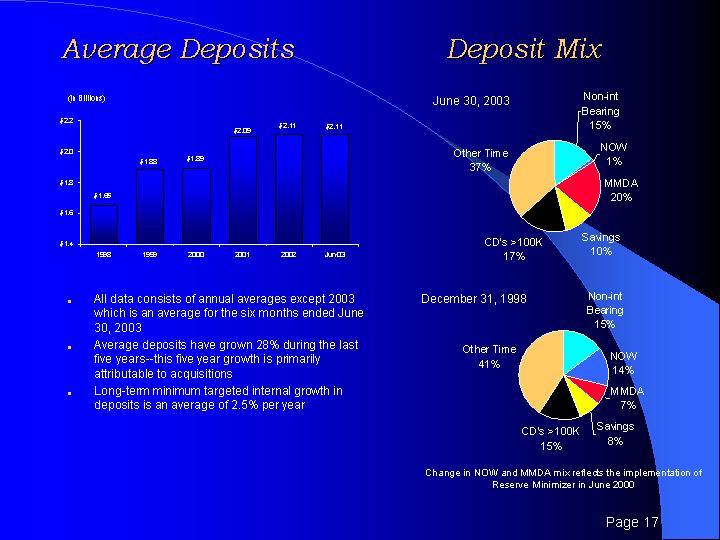
[CHART]
• All data consists of annual averages except 2003 which is an average for the six months ended June 30, 2003
• Average deposits have grown 28% during the last five years—this five year growth is primarily attributable to acquisitions
• Long-term minimum targeted internal growth in deposits is an average of 2.5% per year
Deposit Mix
June 30, 2003
[CHART]
December 31, 1998
[CHART]
Change in NOW and MMDA mix reflects the implementation of Reserve Minimizer in June 2000
17
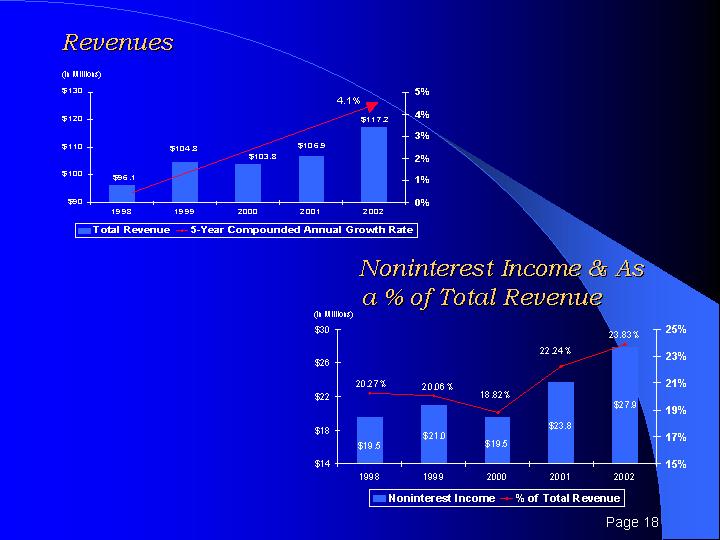
[CHART]
Noninterest Income & As a % of Total Revenue
[CHART]
18
Net Noninterest Expense
& as a % of Average Earning Assets
[CHART]
Noninterest Expense &
Efficiency Ratio
[CHART]
19
What are the goals?
• 12% annual increase in earnings and EPS
• Improve operational efficiency
• Decrease nonperforming loans
• Increase noninterest income
Risks to attaining goals
• Weak economic conditions
• Historically low interest rates
• Pressure on net interest margin
• High level of liquidity
• Weak loan demand
• Limited investment options
• Increasingly competitive operating environment
20
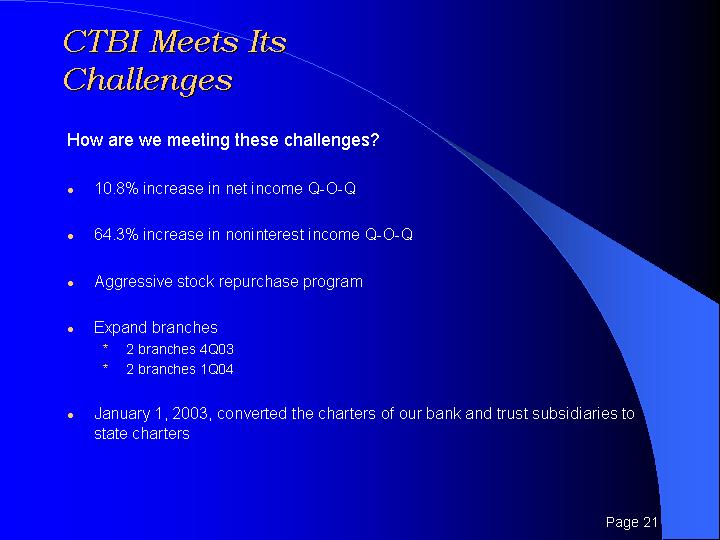
How are we meeting these challenges?
• 10.8% increase in net income Q-O-Q
• 64.3% increase in noninterest income Q-O-Q
• Aggressive stock repurchase program
• Expand branches
• 2 branches 4Q03
• 2 branches 1Q04
• January 1, 2003, converted the charters of our bank and trust subsidiaries to state charters
21
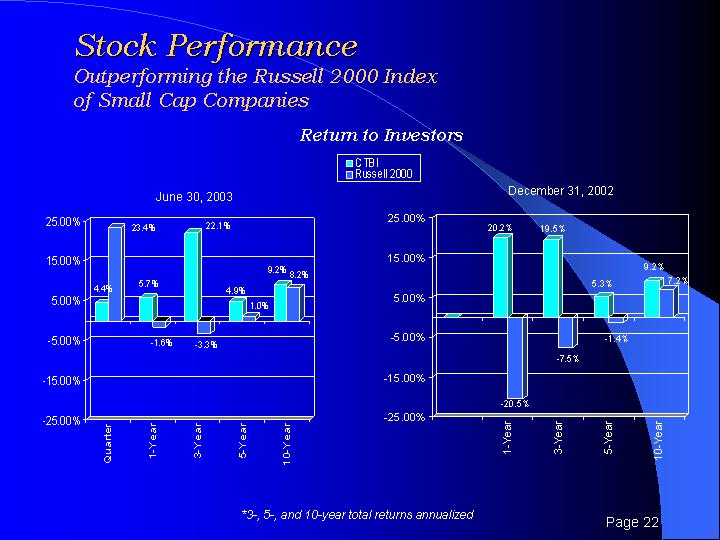
Outperforming the Russell 2000 Index of Small Cap Companies
Return to Investors
June 30, 2003
[CHART]
December 31, 2002
[CHART]
*3-, 5-, and 10-year total returns annualized
22
[CHART]
2003 data is stated corporate goal
• Cash dividends per share increased on average greater than 6% per year since 1998
• 2002 cash dividends were increased by 5.4%
• December 31, 2002 cash dividend yield was 3.34%
• 10% stock dividend on December 15, 2002
• 9.5% increase in cash dividend effective October 1, 2003
23
Comparison of 5 Year Cumulative Total Return
among CTBI, NASDAQ, and BANK
[CHART]
Fiscal Year Ending December 31 ($)
|
| 1998 |
| 1999 |
| 2000 |
| 2001 |
| 2002 |
| 2003 |
|
CTBI |
| 100.00 |
| 97.34 |
| 83.68 |
| 138.10 |
| 165.80 |
| 178.06 |
|
NASDAQ |
| 100.00 |
| 185.47 |
| 111.90 |
| 88.82 |
| 61.41 |
| 74.48 |
|
BANK |
| 100.00 |
| 96.13 |
| 109.65 |
| 118.72 |
| 121.37 |
| 133.26 |
|
24
Community Trust Bancorp, Inc.
“Building Communities . . .
Built on Trust”
25