UNITED STATES SECURITIES AND EXCHANGE COMMISSION
Washington, D.C. 20549
Form 10-K
(Mark One)
| | þ | ANNUAL REPORT PURSUANT TO SECTION 13 OR 15(d) |
| | | OF THE SECURITIES EXCHANGE ACT OF 1934 |
For the fiscal year ended July 1, 2012
Or
| | ¨ | TRANSITION REPORT PURSUANT TO SECTION 13 OR 15(d) |
| | | OF THE SECURITIES EXCHANGE ACT OF 1934 |
For the transition period from to
Commission File No. 001-31353
EMULEX CORPORATION
(Exact name of registrant as specified in its charter)
| | |
| Delaware | | 51-0300558 |
(State or other jurisdiction of incorporation or organization) | | (I.R.S. Employer Identification No.) |
| |
3333 Susan Street Costa Mesa, California | | 92626 |
| (Address of principal executive offices) | | (Zip Code) |
(714) 662-5600
(Registrant’s telephone number, including area code)
Securities registered pursuant to Section 12(b) of the Act:
| | |
Title of Each Class | | Name of Each Exchange on Which Registered |
Common Stock, Par Value $0.10 Per Share Preferred Stock Purchase Rights | | New York Stock Exchange New York Stock Exchange |
Securities registered pursuant to Section 12(g) of the Act:
NONE
Indicate by check mark if the registrant is a well-known seasoned issuer, as defined in Rule 405 of the Securities Act. Yes ¨ No þ
Indicate by check mark if the registrant is not required to file reports pursuant to Section 13 or 15(d) of the Act. Yes ¨ No þ
Indicate by check mark whether the registrant (1) has filed all reports required to be filed by Section 13 or 15(d) of the Securities Exchange Act of 1934 during the preceding 12 months (or for such shorter period that the registrant was required to file such reports), and (2) has been subject to such filing requirements for the past 90 days. Yes þ No ¨
Indicate by check mark if disclosure of delinquent filers pursuant to Item 405 of Regulation S-K is not contained herein, and will not be contained, to the best of the registrant’s knowledge, in the definitive proxy or information statements incorporated by reference in Part III of this Form 10-K or any amendment to this Form 10-K. þ
Indicate by check mark whether the registrant has submitted electronically and posted on its corporate Web site, if any, every Interactive Data File required to be submitted and posted pursuant to Rule 405 of Regulation S-T (§ 232.405 of this chapter) during the preceding 12 months (or for such shorter period that the registrant was required to submit and post such files). Yes þ No ¨
Indicate by check mark whether the registrant is a large accelerated filer, an accelerated filer, a non-accelerated filer, or a smaller reporting company. See the definitions of “large accelerated filer,” “accelerated filer” and “smaller reporting company” in Rule 12b-2 of the Exchange Act. (Check one):
| | | | | | |
| Large accelerated filer þ | | Accelerated filer ¨ | | Non-accelerated filer ¨ | | Smaller reporting company ¨ |
| | | | (Do not check if a smaller reporting company) | | |
Indicate by check mark whether the registrant is a shell company (as defined in Rule 12b-2 of the Act). Yes ¨ No þ
The aggregate market value of the voting stock held by non-affiliates of the registrant, based on the closing price of the registrant’s common stock on the New York Stock Exchange on December 30, 2011, which was the last trading day of the second quarter of fiscal 2012, of $6.86 was $583,969,484.
As of August 20, 2012, the registrant had 89,289,620 shares of common stock outstanding.
DOCUMENTS INCORPORATED BY REFERENCE
Portions of the registrant’s definitive proxy statement relating to the registrant’s 2012 Annual Meeting of Stockholders expected to be held on November 20, 2012, are incorporated by reference into Part III of this Annual Report on Form 10-K.
CAUTIONARY STATEMENT RELATED TO FORWARD LOOKING STATEMENTS
Certain statements contained in this Form 10-K may constitute “forward-looking statements” within the meaning of the Private Securities Litigation Reform Act of 1995. We may also make forward-looking statements in other reports filed with the Securities and Exchange Commission, in materials delivered to stockholders and in press releases. In addition, our representatives may from time to time make oral forward-looking statements. Forward-looking statements provide current expectations of future events based on certain assumptions and include any statement that does not directly relate to any historical or current fact. Words such as “anticipates,” “in the opinion,” “believes,” “intends,” “expects,” “may,” “will,” “should,” “could,” “plans,” “forecasts,” “estimates,” “predicts,” “projects,” “potential,” “continue,” and similar expressions may be intended to identify forward-looking statements.
Actual future results could differ materially from those described in the forward-looking statements as a result of a variety of factors, including those discussed in the section entitled “Risk Factors” in Part I, Item 1A, “Legal Proceedings” in Part I, Item 3, and “Management’s Discussion and Analysis of Financial Condition and Results of Operations” in Part II, Item 7 of this Annual Report on Form 10-K included elsewhere herein. We expressly disclaim any obligation or undertaking to release publicly any updates or changes to these forward-looking statements that may be made to reflect any future events or circumstances. We wish to caution readers that a number of important factors could cause actual results to differ materially from those in the forward-looking statements. These factors include intellectual property claims, with or without merit, that could result in costly litigation, cause product shipment delays, require us to indemnify customers, or require us to enter into royalty or licensing agreements, which may or may not be available. Furthermore, we have in the past obtained, and may be required in the future to obtain, licenses of technology owned by other parties. We cannot be certain that the necessary licenses will be available or that they can be obtained on commercially reasonable terms. If we were to fail to obtain such royalty or licensing agreements in a timely manner and on reasonable terms, our business, results of operations and financial condition could be materially adversely affected. Ongoing lawsuits, such as the action brought by Broadcom Corporation (Broadcom) described elsewhere in this Annual Report on Form 10-K, present inherent risks, any of which could have a material adverse effect on our business, financial condition, or results of operations. Such potential risks include continuing expenses of litigation, risk of loss of patent rights and/or monetary damages, risk of further injunction against the sale of products incorporating the technology in question, counterclaims, attorneys’ fees, incremental costs associated with product or component redesigns, and diversion of management’s attention from other business matters. With respect to the continuing Broadcom litigation, such potential risks also include the adequacy of any sunset period to make design changes, the ability to implement any design changes, the availability of customer resources to complete any re-qualification or re-testing that may be needed, the ability to maintain favorable working relationships with Emulex suppliers of serializer/deserializer (SerDes) modules, and the ability to obtain a settlement which does not put us at a competitive disadvantage. In addition, the fact that the economy generally, and the technology and storage market segments specifically, have been in a state of uncertainty makes it difficult to determine if past experience is a good guide to the future and makes it impossible to determine if markets will grow or shrink in the short term. The current weakness in domestic and worldwide economic conditions and related disruptions in world credit and equity markets that are creating economic uncertainty for our customers, as well as the storage and converged networking market as a whole, has and could continue to adversely affect our revenues and results of operations. Furthermore, the effect of any actual or potential unsolicited offers to acquire us may have an adverse effect on our operations. As a result of these uncertainties, we are unable to predict our future results with any accuracy. Other factors affecting these forward-looking statements include but are not limited to the following: faster than anticipated declines in the storage networking market, slower than expected growth of the converged networking market or the failure of our Original Equipment Manufacturer (OEM) customers to successfully incorporate our products into their systems; our dependence on a limited number of customers and the effects of the loss of, decrease in or delays of orders by any such customers, or the failure of such customers to make timely payments; the emergence of new or stronger competitors as a result of consolidation movements in the market; the timing and market acceptance of our products or our OEM customers’ new or enhanced products; costs associated with entry into new areas of the server and storage technology markets; the variability in the level of our backlog and the variable and seasonal procurement patterns of our customers; any inadequacy of our intellectual property protection and the costs of actual or potential third-party claims of infringement and any related indemnity obligations or adverse judgments; impairment charges, including but not limited to goodwill and
2
intangible assets; changes in tax rates or legislation; the effects of acquisitions; the effects of terrorist activities; natural disasters, such as the earthquake and resulting tsunami off the coast of Japan in March 2011 and the significant flooding in various parts of Thailand in October 2011, and any resulting disruption in our supply chain or customer purchasing patterns or any other resulting economic or political instability; the highly competitive nature of the markets for our products as well as pricing pressures that may result from such competitive conditions; the effects of changes in our business model to separately charge for software; the effect of rapid migration of customers towards newer, lower cost product platforms; possible transitions from board or box level to application specific integrated circuit (ASIC) solutions for selected applications; a shift in unit product mix from higher-end to lower-end or mezzanine card products; a faster than anticipated decrease in the average unit selling prices or an increase in the manufactured cost of our products; delays in product development; our reliance on third-party suppliers and subcontractors for components and assembly; our ability to attract and retain key technical personnel; our ability to benefit from our research and development activities; our dependence on international sales and internationally produced products; changes in accounting standards; and any resulting regulatory changes on our business. These and other factors could cause actual results to differ materially from those in the forward-looking statements and are discussed elsewhere in this Annual Report on Form 10-K, in our other filings with the Securities and Exchange Commission or in materials incorporated therein by reference.
3
PART I
All references contained in this Annual Report on Form 10-K to years refer to our fiscal years ended July 1, 2012, July 3, 2011, and June 27, 2010, as applicable, unless the calendar year is specified. References to “Emulex,” the “Company,” the “Registrant,” “we,” “our” and “us,” refer to Emulex Corporation and its subsidiaries.
Introduction and Company History
Emulex is a global provider of a broad range of enterprise-class connectivity solutions for servers, networks and storage devices within the data center. Our product portfolio of Fibre Channel (FC) Host Bus Adapters (HBAs), 10Gb Ethernet (10GbE) Network Interface Cards (NICs), Ethernet-based Converged Network Adapters (CNAs), controllers, embedded bridges and switches, and connectivity management solutions are proven, tested and trusted by the world’s largest and most demanding Information Technology (IT) environments.
Emulex was organized as a California corporation in 1979 and changed its state of incorporation from California to Delaware in 1987. We completed our initial public offering in 1981 and additional public offerings of our common stock in 1983 and 1989. Emulex’s common stock trades on the New York Stock Exchange (NYSE) under symbol ELX.
Emulex’s corporate headquarters are located at 3333 Susan Street, Costa Mesa, California 92626, and our telephone number is (714) 662-5600. Our Internet address is www.emulex.com. Our periodic and current reports filed with or furnished to the Securities and Exchange Commission (SEC) pursuant to the requirements of the Securities and Exchange Act of 1934 are available free of charge through our website as soon as reasonably practicable after such reports are electronically filed with, or furnished to, the SEC.
Industry Protocols Overview
Fibre Channel (FC)
Beginning in the late 1990s, FC emerged as the first storage networking technology to be widely adopted by the world’s leading server and storage systems manufacturers and is now available in two, four, eight and 16 gigabit per second (Gb/s) FC solutions. Initially used primarily in the supercomputing field, FC offered the connectivity, distance, and scalability benefits of networking architectures combined with the high performance and low latency needed for input/output (I/O) intensive applications. Its advanced capabilities enabled new architectures such as Storage Area Networks (SANs) which connect multiple host computers to one or more storage arrays. Additionally, FC has been deployed within storage arrays to provide internal connectivity for disk drives, enabling enhanced performance and greater scalability.
A SAN essentially transforms dedicated servers and storage devices into network resources, greatly improving the performance and scalability beyond the capabilities of direct attached enterprise storage. By providing shared server access, the cost of expensive enterprise servers and storage can be spread across entire organizations. SANs are deployed to support a wide range of applications such as Local Area Network (LAN) free and serverless back up, storage virtualization and disaster recovery.
Additionally, Network Attached Storage (NAS) appliances have gained acceptance in the storage marketplace. The NAS architecture offers an easily deployable and scalable storage solution by providing hard disk storage that is set up with its own network address rather than being attached to a department computer that is serving applications to network workstation users. In high-end environments characterized by NAS file delivery to servers, a SAN may be deployed behind a NAS, making NAS and SAN solutions complementary. The majority of NAS and SAN solutions installed today are delivered to end users via integrated systems solutions offered by storage and computer system Original Equipment Manufacturers (OEMs).
Internet Small Computer System Interface (iSCSI)
The iSCSI protocol, ratified by the Internet Engineering Task Force (IETF) in 2003, brought SANs within the reach of small and mid-sized businesses. The protocol encapsulates native Small Computer System Interface (SCSI) commands using Transmission Control Protocol over Internet Protocol (TCP/IP) and transmits the
4
packets over the Ethernet network infrastructure. The range of iSCSI connectivity solutions spans simple Ethernet NICs that are commonly used for Ethernet LAN applications, up to high performance 10GbE NICs that offer full protocol processing offload from the host computer. The emergence of 10GbE addresses the bandwidth and latency issues of 1GbE and is laying the foundation for more widespread adoption of network convergence in the data center.
Internet Protocol (IP) and Fibre Channel Over Ethernet (FCoE)
There are two key standards in the FCoE CNA market that have been developed by the International Committee for Information Technology Standards (INCITS) T11.3 working group. One is for host-based CNAs and the other is for 10GbE networking, both of which are finalized. A complementary standard, DCB (Data Center Bridging), which covers multi-hop switching (IEEE 802.1Qaz) has also been developed. FCoE combines the efficiency and enterprise hardened features of the FC protocol with the ubiquity of an Ethernet network, while leveraging the robust storage management software and tools available with FC. FCoE transports native FC frames over a “no drop” or lossless Ethernet infrastructure, allowing existing FC SAN management tools, skills, and processes to remain intact. It allows an evolutionary approach toward I/O consolidation by preserving all FC constructs, maintaining the same latency, security, and traffic management attributes of FC while preserving investments in FC drivers, tools, training, and SANs. The main value proposition of FCoE is, therefore, the ability to streamline server connectivity using lossless Ethernet while protecting the substantial investments made in FC SANs during the past 15 years. The emergence of FCoE is accelerating the adoption of Ethernet as the medium of network convergence.
Storage I/O Interconnects
In recent years, the hard disk drive (HDD) industry has utilized I/O interconnects, such as Serial Attached SCSI (SAS) and Serial Advanced Technology Attachment (SATA) for the disk drive I/O interface. Serial I/O technologies utilize a single wire over which all control and user data passes, providing higher performance, expanded connectivity and lower cost.
SATA has already increased in line speed from 1.5 Gb/s to 3 Gb/s and 6 Gb/s. SAS is designed for the corporate and enterprise market as a replacement for parallel SCSI, allowing for much higher speed data transfers than previously available. Though SAS uses serial communication instead of the parallel method found in traditional SCSI devices, it still uses SCSI commands for interacting with SAS end devices.
Our Products
We are a leading designer, developer and supplier of FC HBAs, 10GbE NICs, Ethernet-based CNAs, embedded storage bridges and controllers, Integrated Baseboard Management Controllers (iBMCs) and connectivity management solutions that enhance access to, and storage of, electronic data and applications. In fiscal year 2004, the acquisition of Vixel Corporation (Vixel) enabled us to enter the embedded storage market. In fiscal year 2006, the acquisition of Aarohi Communications, Inc. (Aarohi) facilitated the addition of intelligent data center infrastructure products, such as our CNAs. In fiscal 2007, we broadened our embedded footprint adding embedded storage bridges with the acquisition of Sierra Logic, Inc. (Sierra Logic). In fiscal year 2009, we entered into a multi-year partnership (including a multi-year joint development and supply agreement) with ServerEngines Corporation (ServerEngines) to deliver converged networking solutions. In fiscal 2011, we acquired ServerEngines. The combination of Emulex and ServerEngines’ technology created a unique offering that delivers a foundation for converged networking solutions, including adapter, LAN on Motherboard (LOM) and iBMC solutions.
Leveraging our expertise and experience in networking and I/O technology, we have approached the storage market opportunity with a networking perspective to maximize the performance and management capabilities of our solutions. We believe the performance of our products is among the highest in the industry. Furthermore, our products support high performance connectivity features to enhance data integrity. Lastly, our products offer investment protection for our OEM customers, who often develop specialized software to interface with our adapters, as we have maintained a stable application programming interface (API) since our first generation of
5
HBAs was introduced in 1996. More recently, we have expanded the functionality in our products to deliver high availability and remote centralized management that may be embedded in OEM and independent software vendors (ISV) SAN management products.
Network Connectivity Products
Our Network Connectivity Products (NCP) provide server Input/Output (I/O) and target storage array connectivity to create networks for mission critical enterprise and cloud data centers. These products enable servers to reliably and efficiently connect to LANs, SANs, and Network Attached Storage (NAS) by offloading data communication processing tasks from the server as information is delivered and sent to the network. NCP includes the development of chip level and board level server-based I/O adapters including HBAs, NICs, CNAs and LOMs that connect servers and storage to networks using a variety of industry standard protocols, including TCP/IP, iSCSI, NAS, FC and FCoE.
Our Ethernet-based products include OneConnect® Universal Converged Network Adapters (UCNAs), custom form factor solutions for OEM blade servers and LOM application specific integrated circuits, all of which enable high performance, scalable networks and convergence. The OneConnect® UCNA is a multi-function adapter that provides server connectivity for network and storage traffic and is designed to address the key challenges of evolving data center networks and improve the overall efficiency of data center operations. Unlike first generation CNAs that only provide FCoE convergence, the OneConnect® UCNA provides optimized performance for all protocols (TCP/IP, FCoE, and, iSCSI) enabling one card for all applications and all leading server architectures. The OneConnect® UCNA platform enables data center managers to consolidate multiple 1GbE links on to a single 10GbE link. The use of multiple protocol accelerators/offload engines allows the OneConnect® UCNAs to deliver maximum performance, regardless of the mix of protocol traffic. This diverse applicability of the OneConnect® UCNA simplifies server hardware configurations and reduces server sprawl in the data center.
In fiscal 2012, we introduced our new OneConnect® 10GbE Network Xceleration™ solutions. The Emulex OneConnect® Network Xceleration™ solutions are designed for enterprise applications with ultra-low latency, superior message rate or packet pacing requirements, such as financial/high frequency trading (HFT) network analytics (security, financial, and network optimization) and video content delivery (Video on Demand, Peer-to-Peer IPTV), and leverage kernel bypass operations that reduce latency and transaction times.
Our FC based products include FC application specific integrated circuits (ASICs), LightPulse® HBAs, and custom -form factor solutions for OEM blade servers. Our LightPulse® FC HBAs connect host computers to a FC network. Our adapters support a wide range of operating systems and host computer system interfaces, including Peripheral Component Interconnect (PCI) and PCI Express-based platforms. Our FC HBA offerings include single, dual, and quad port adapters at throughput speeds of two, four, eight and 16Gb/s FC for use in enterprise data centers.
Storage Connectivity Products
Our Storage Connectivity Products (SCP) include our InSpeed® switch-on-a-chip (SOC) and back-end connectivity bridge products. SCP are deployed inside storage arrays, tape libraries, and other storage appliances, and connect storage controllers to storage capacity, delivering improved performance, reliability, and connectivity. Our products use industry standard protocols including FC, SAS, and SATA. The continued demands for increased storage array capacity and system scalability, and the performance and reliability deterioration resulting from such demand have emerged as significant issues facing the storage industry.
To help storage system manufacturers address the issues related to arbitrated loop architectures, we have developed a highly integrated SOC that incorporates our InSpeed® technology. InSpeed® is an advanced switching architecture that results in a single chip capable of handling multiple FC devices operating at 2 Gb/s, 4 Gb/s, or 8 Gb/s FC speeds. InSpeed® intelligently connects storage capacity to either servers, redundant array of independent disks (RAID) controllers or filers. The InSpeed® switch supports a broad range of HDD and Solid State Drives (SSD) technologies, including 6 Gb/s SAS, 6 Gb/s SATA and 4 Gb/s FC. Maximum performance is achieved with eight GFC link speed connectivity, and per port speed agility with bandwidth aggregation. We
6
deliver InSpeed® technology as an embedded board or chip-level solution that is molded to unique customer requirements. These capabilities enable OEMs to quickly and confidently integrate both SAS and SATA protocol-based HDDs and SSDs into either SAS or FC storage arrays delivering industry-leading system resiliency, stability and performance through its trusted abstraction layer, isolating enterprise storage systems from the idiosyncrasies associated with different drive protocols and formats.
Advanced Technology and Other Products
Our Advanced Technology and Other Products (ATP) category primarily consists of our Pilot™ iBMCs, OneCommand® Vision products, certain legacy products and other products and services.
Baseboard Management Controllers (BMCs) are at the heart of reducing costs associated with managing servers. Our Pilot™ iBMC solutions revolutionized the industry for enterprise servers by integrating the BMC, super I/O, graphics controller and Remote Keyboard, Video, Mouse and Storage (KVMS) functionality into a single ASIC, providing significant cost savings to data center managers. Like a standard BMC, when embedded in a server system or appliance, the iBMC simplifies the management of the remote server systems and appliances, whether physical or virtual servers, thereby reducing operational costs.
OneCommand® Vision is an I/O performance management solution designed for monitoring and managing I/O performance in data center and cloud environments from the application perspective. Administrators can leverage OneCommand® Vision’s powerful logical unit number (LUN) service level agreements (SLAs) to monitor the performance and availability of storage resources supporting critical business functions. OneCommand® Vision gives IT and cloud administrators the ability to maximize I/O resource utilization and proactively enhance performance and availability by monitoring and analyzing various I/O performance metrics within the infrastructure. OneCommand® Vision’s non-intrusive software architecture integrates easily into existing data center environments, providing immediate I/O performance and availability data for baselining, tracking, alerting, and troubleshooting complex performance problems.
Intellectual Property
Our ability to compete depends in part upon our ability to protect our proprietary information and intellectual property. Emulex primarily relies on patent, copyright, trademark, and trade secret laws, as well as contractual agreements with our employees, customers, suppliers and consultants that include confidentiality and non-disclosure provisions for such protection. Despite these precautions, no assurance can be made that the laws of certain countries outside of United States in which our products are developed, manufactured or sold will protect our intellectual property rights and that competitors or unauthorized third parties will not otherwise be able to infringe or misappropriate our intellectual property.
We have a number of issued patents and pending patent applications in the U.S. and abroad. Most of our issued patents and pending patent applications relate to our storage and networking technology or products. We maintain an active program of obtaining patent protection for our inventions as development occurs and as new products are introduced. As a result of the rate of change of technology in our industry, we believe that the duration of the patent protection available to us for our products is adequate to cover the expected market duration for such products.
All of our software, drivers, and firmware, which are embedded within or provided exclusively for use with our hardware products, are marked with copyright notices listing our company as the copyright owner. We have been granted a number of registrations of trademarks in the U.S. and abroad. We also have a number of pending trademark registrations in the U.S. and abroad. We maintain an active practice of marking our products with trademark notices and renewing trademarks so that the duration of trademark protection is maintained for as long as needed. Additionally, we rely on trade secret law and contractual provisions to protect unique intellectual property we possess which we have determined unnecessary or uneconomical to patent or copyright, or which is not otherwise capable of more formal protection.
We have received third party claims of intellectual property infringement in the past and are currently involved in litigation related to certain infringement claims. Furthermore, there can be no assurance that we will
7
not receive additional claims of intellectual property infringement from competitors or other third parties in the future. Such litigation may result in substantial costs and diversion of resources, and may result in an injunction against the sale or distribution of our products incorporating the underlying intellectual property or require the licensing of such intellectual property from the third party initiating the lawsuit, all of which could have a material adverse effect on our business, financial condition and results of operations. See Note 10 in the accompanying notes to consolidated financial statements included in Part IV, Item 15(a) of this Annual Report on Form 10-K for additional information on our current intellectual property litigation. Also see “Risk Factors” in Part I, Item 1A of this Annual Report on Form 10-K for additional discussion of our intellectual property risks.
Engineering and Development
Emulex operates in an industry that is subject to rapid and frequent technological developments, evolving industry standards and changing customer requirements. Our ability to successfully compete in this industry is dependent upon our ability to timely design, develop and introduce products that support current and emerging industry standards that enhance the performance of storage and server networks for our customers. As a result, we plan to continue to invest in research and development activities for the foreseeable future.
We maintain several design centers throughout the United States and abroad including California, Texas, Massachusetts, and India. At July 1, 2012, we employed 657 engineers, other technicians, and support personnel engaged in the development of new products and the improvement of existing products. Engineering and development expenses were approximately $163.6 million, $170.8 million, and $126.9 million in fiscal 2012, fiscal 2011, and fiscal 2010, respectively.
Selling and Marketing
We sell our products worldwide to OEMs, Original Design Manufacturers (ODMs), end users, and through other distribution channels including value added resellers (VARs), systems integrators, industrial distributors, direct market resellers and other resellers. As the storage and networking markets are dominated by OEMs, our focus is to use sales specialists to expand opportunities with our existing OEMs, as well as to develop new OEM and ODM relationships. However, we are also expanding our distribution efforts, leveraging worldwide distribution channels through technical distributors such as VARs and systems integrators, to complement our core OEM relationships. In some cases, OEM partners leverage the distribution channel to deliver solutions to end users, making our distribution efforts complementary with our OEM focused strategy.
During fiscal 2012, most of our revenues were derived from a mix of connectivity products based largely on Fibre Channel and Ethernet technologies. Emulex’s products have been selected by many of the world’s leading server and storage providers, including Cisco Systems, Inc. (Cisco), Dell Inc. (Dell), EMC Corporation (EMC), Fujitsu Ltd. (Fujitsu), Groupe Bull (Bull), Hewlett-Packard Company (Hewlett-Packard), Hitachi Data Systems (HDS), Hitachi Limited (Hitachi), Huawei Technologies Company Ltd. (Huawei), Intel Corporation (Intel), International Business Machines Corporation (IBM), NEC Corporation (NEC), Network Appliance, Inc. (NetApp), Oracle Corporation (Oracle), Quantum Corporation (Quantum), Unisys Corporation (Unisys), and Xyratex Ltd. (Xyratex). Our significant distribution partners include ASI Computer Technologies, Inc. (ASI), Avnet, Inc. (Avnet), Digital China Technology Limited, Info X Distribution, LLC (Info X), Ingram Micro Inc. (Ingram Micro), Macnica Networks Corporation (Macnica), Netmarks Inc. (Netmarks), SYNNEX Corporation (SYNNEX), Tech Data Corporation (Tech Data), and Tokyo Electron Device Ltd. (TED).
Seasonality
Our business fluctuates as a result of various factors, including but not limited to economic conditions, new product introductions, IT spending, industry demand, and seasonality. Although we do not consider our business to be highly seasonal, we do believe that seasonality has and may impact our business. To the extent that we do experience seasonality in our business, it would most likely have a negative impact on the sequential growth rate of our net revenues during the first and third quarters of our fiscal year.
Order Backlog
Due to an industry practice that allows customers to cancel or change orders with limited advance notice prior to shipment, we do not believe that backlog is a reliable indicator of future revenue levels. Furthermore,
8
purchase order release lead times depend upon the scheduling practices of the individual customer, and the rate of booking new orders fluctuates from month to month. Therefore, the level of backlog at any one time is not necessarily indicative of trends in our business nor is it a meaningful indicator of future long-term revenues.
Concentration of Customers, Revenue by Product Families and Geographic Area
See Note 13 in the accompanying notes to consolidated financial statements included in Part IV, Item 15(a) of this Annual Report on Form 10-K for information regarding concentration of our customers as well as information regarding our revenue by product family and geographic area. Also see “Risk Factors” contained within Part I, Item 1A of this Annual Report on Form 10-K for a discussion of the risks associated with the concentration of our customers, as well as the risks associated with our revenue by product family and geographic area.
Competition
The market for our products remains intensely competitive and is characterized by frequent new product introductions, rapid technological change, changing customer preferences, evolving technology, and industry standards.
We believe the competitive factors for our Network Connectivity Products include price/performance, interoperability, reliability, scalability, silicon integration, technical support, time to market, product roadmap, and the extent of the installed base. We believe that we compete favorably with respect to these factors. We also believe that we have a competitive strength in the alliances we have built with OEM distribution channels with broad industry support. Some of our other competitive advantages include our robust time-proven Fibre Channel drivers, our single chip multi protocol architecture, our workforce of highly experienced researchers and designers, and our intellectual property.
One of our largest competitors for HBA and CNA products is QLogic Corporation (QLogic). In addition, Brocade Communications Systems, Inc. (Brocade) competes in the CNA market.
In some markets, CNAs face competition from NIC/iSCSI suppliers that are supplied by established Ethernet and Fibre Channel competitors as well as new entrants, including Broadcom Corporation (Broadcom), Intel Corporation (Intel), Chelsio Communications, Inc. (Chelsio), Mellanox Technologies, Ltd. (Mellanox) and other private and public companies who have invested in various aspects of data center networking. Across all storage networking technologies, we face the threat of potential competition from new entrants into the storage networking market, including large technology companies that may develop or acquire differentiating technology and then apply their resources, including established distribution channels and brand recognition, to obtain significant market share.
We believe that the principal basis of competition for our Storage Connectivity Products presently includes interoperability, reliability, scalability, price, silicon integration, performance, technical support, and backwards compatible Application Programmable Interfaces (APIs). We believe that we compete favorably with respect to these factors. We also believe that we have a competitive strength in our close relationships with OEM customers and our OEMs’ investment in storage software.
Our Storage Connectivity Products, including InSpeed®, bridge and router products compete against products supplied by LSI, Marvell Technology Group Ltd. (Marvell), Maxim Integrated Products, Inc. (Maxim), and PMC-Sierra, Inc. (PMC-Sierra). Across all embedded storage technologies, we face the threat of potential competition from new entrants into the embedded storage market, including large technology companies that may develop or acquire differentiating technology and then apply their resources, including established distribution channels and brand recognition, to obtain significant market share.
Manufacturing and Suppliers
Our products include board level assemblies that consist primarily of electronic component parts assembled on printed circuit boards (PCBs) and box level products consisting of board level assemblies, cables, and power sources contained within an enclosure. Most component parts can be purchased from two or more sources. However, some key components that we use in our products (including our ASICs) may only be available from
9
single sources with which we may not have contracts. In addition, we design ASICs that are embedded in our assembled products and are also sold directly to OEM customers. These ASICs are typically sole-sourced and manufactured by third party semiconductor foundries. The majority of our ASICs are manufactured under the direction of LSI, using a variety of qualified semiconductor, assembly, and test suppliers. We also purchase ASICs from Marvell, Intel Corporation, Renesas Electronics America Inc., and Toshiba Corporation. In addition to hardware, we design software and firmware, which are provided as embedded programs within our hardware products.
The Company utilizes third party electronic manufacturing service (EMS) providers for the manufacturing and assembling of the majority of our products. The assembly operations required by our products are typical of the electronics industry, and no unusual methods, procedures or equipment are required. The sophisticated nature of the products, in most cases, requires extensive testing by specialized test devices operated by skilled personnel. Our providers perform this testing. However, we also maintain an internal test-engineering group for continuing support of test operations. As of July 1, 2012, we had a total of 68 regular full time manufacturing employees.
During fiscal 2012, Benchmark Electronics, Inc. (Benchmark) manufactured for us at their facilities in Ayudhaya and Korat, Thailand, Venture Corporation Limited (Venture) manufactured for us at their facility in Jahor-Bahru, Malaysia and Flextronics Telecom Systems, LTD. (Flextronics) manufactured for us at their facility in Zhuhai, China. Through our continuing strategic relationships with our EMS suppliers, we believe we have a strong global manufacturing operation that supports our growing global customer base and provides us with increased supply chain efficiency, flexibility, and security.
Employees
As of July 1, 2012, we employed 1,011 employees as follows: 657 in engineering and development, 150 in selling and marketing, 136 in general and administrative, and 68 in manufacturing. Other than the employee in our Brazil office, none of our employees are represented by a labor union, and we believe our employee relations are good.
Executive Officers of the Registrant
The executive and certain other officers of the Company or its principal operating subsidiaries as of July 1, 2012 were as follows:
| | | | | | |
Name | | Position | | Age | |
James M. McCluney | | Chief Executive Officer | | | 61 | |
Jeffrey W. Benck | | President and Chief Operating Officer | | | 47 | |
Michael J. Rockenbach | | Executive Vice President, Chief Financial Officer, Secretary, and Treasurer | | | 51 | |
Margie Evashenk(1) | | Senior Vice President, Chief Development Executive | | | 46 | |
Jeffery L. Hoogenboom(1) | | Senior Vice President, Worldwide Sales | | | 47 | |
John J. Warwick(1) | | Senior Vice President, Operations | | | 47 | |
Randall G. Wick(2) | | Senior Vice President, General Counsel | | | 58 | |
| (1) | These persons serve in the indicated capacities as SEC Section 16 officers of the Registrant, but are not officers of the Registrant or its subsidiaries, and are considered a “significant employee.” |
| (2) | Mr. Wick serves as an officer of the Registrant’s principal operating subsidiaries; he is not an officer of the Registrant. Also, Mr. Wick serves in the indicated capacity as a SEC Section 16 officer of the Registrant. |
Mr. McCluneyjoined the Company in November 2003 as President and Chief Operating Officer, was subsequently appointed to the position of President and Chief Executive Officer in September 2006, and in August 2010, relinquished his President title but retained his Chief Executive Officer title. Prior to Emulex’s acquisition of Vixel Corporation (Vixel) in November 2003, Mr. McCluney had served as Vixel’s Chairman, President and
10
Chief Executive Officer. From October 1997 to January 1999, Mr. McCluney served as President and Chief Operating Officer of Crag Technologies, formerly Ridge Technologies, a storage system manufacturer. From October 1994 to September 1997, Mr. McCluney served in various positions at Apple Computer, Inc., including Senior Vice President of Worldwide Operations and Vice President of European Operations.
Mr. Benckjoined the Company in May 2008 as Executive Vice President and Chief Operating Officer, and in August 2010, was appointed President and Chief Operating Officer of the Company. From April 2007 to March 2008, prior to joining the Company, Mr. Benck was President and Chief Operating Officer of QLogic Corporation, a supplier of storage networking solutions. Prior to joining QLogic Corporation, Mr. Benck worked for International Business Machines Corporation, a global leader in information technology and services, for 18 years.
Mr. Rockenbachjoined the Company in 1991 and has served as Executive Vice President and Chief Financial Officer since 1997. From 1991 to 1996, Mr. Rockenbach served in senior finance and accounting positions within the Company. Prior to joining the Company, Mr. Rockenbach served in various manufacturing finance and financial planning positions at Western Digital Corporation.
Ms. Evashenk joined the Company in October 2006 as Senior Vice President of Engineering and was subsequently promoted to Senior Vice President, Chief Development Executive of the Company in May 2011. Prior to Emulex’s acquisition of Sierra Logic, Inc. (Sierra Logic) in October 2006, Ms. Evashenk was a Co-Founder and Vice President of Engineering for Sierra Logic. Prior to joining Sierra Logic, Ms. Evashenk held various positions in engineering and management at Hewlett-Packard Company and Agilent Technologies, Inc.
Mr. Hoogenboomjoined the Company in January 2009 as Senior Vice President of Worldwide Sales. From January 2008 to December 2008, prior to joining the Company, Mr. Hoogenboom was Vice President of Emerging Business Sales of Cadence Design Systems, Inc. From January 2007 to January 2008, prior to joining Cadence Design Systems, Inc., Mr. Hoogenboom was Executive Vice President of Sales of LSI Corporation. Prior to joining LSI Corporation, Mr. Hoogenboom spent 18 years at Intel Corporation where he held multiple sales and marketing positions including Vice President, General Manager of Reseller Channel Sales and Vice President of Embedded Sales.
Mr. Warwickjoined the Company in August 2006 as Senior Vice President of Operations. From January 2003 to August 2006, prior to joining the Company, Mr. Warwick was Senior Vice President of Operations for Lantronix Inc. From April 2000 to January 2003, Mr. Warwick was a Principal Consultant for Pittiglio, Rabin Todd and McGrath, a management consulting firm for high technology industries. From January 1997 to April 2000, Mr. Warwick was Senior Director of Materials at Western Digital Corporation. Prior to Western Digital Corporation, Mr. Warwick served in general management and operations management positions for companies in the personal computer industry.
Mr. Wickjoined the Company in June 2002 and serves as Senior Vice President and General Counsel. Prior to joining the Company, Mr. Wick served as Vice President, Chief Operating Officer and General Counsel of TelOptics Corporation, a high technology privately held company, since November 2000. The prior year, he served as a legal consultant for his own firm. Previously, Mr. Wick held the positions of Vice President and General Counsel for Samsung Electronics America, Inc. from 1998 to 1999 and AST Research, Inc. from 1990 to 1998.
None of the executive officers of the parent Company or officers of its principal operating subsidiaries has any family relationship with any other executive officer of the Company, other officer of its principal operating subsidiaries, or director of the Company.
Third party claims of intellectual property infringement could adversely affect our business.
On occasion, we receive communications from third parties alleging patent infringement, and there is always the chance that third parties may assert infringement claims against us. We are entering technology markets where we have not participated before, where there are entrenched incumbents, and where our entrance into the market is disruptive and may cause such incumbents to assert infringement claims in order to deter our
11
competition. Any such claims, with or without merit, could result in costly litigation, cause product shipment delays, result in temporary restraining orders or injunctions concerning the sale of products in certain countries, require the redesign of products to design around asserted claims, require us to indemnify customers, or require us to enter into royalty or licensing agreements, which may or may not be available on commercially reasonable terms. Any such claims, with or without merit, may also cause customers to be deterred from purchasing products from us. We have obtained contractual commitments from our suppliers concerning the defense and indemnification of claims relating to certain technology provided by such suppliers, but we cannot be certain that such defense and indemnification obligations will be promptly honored by such suppliers. Furthermore, we have in the past obtained, and may be required in the future to obtain, licenses of technology owned by other parties. We cannot be certain that the necessary licenses will be available or that they can be obtained on commercially reasonable terms. We have participated in technology standardization activities which provide for licenses being available on reasonable and non-discriminatory terms, but we cannot be certain that such licenses will actually and promptly be made available to us. If we were to fail to obtain such royalty or licensing agreements in a timely manner and on reasonable terms, our business, results of operations, and financial condition could be materially adversely affected.
Broadcom Corporation (Broadcom) filed a consolidated patent infringement suit against us in fiscal 2010 and after a nearly three week trial that ended October 6, 2011, the jury reached a partial verdict involving two out of the six patents. The Court determined that one of the patents (U.S. Patent 7,058,150) [the ‘150 patent] had been infringed by us, and the jury rendered an advisory verdict to the Court that the ‘150 patent is not invalid, and awarded approximately $0.4 million in damages related to that patent. The jury reached a unanimous verdict of non-infringement on another patent relating to Emulex Fibre Channel switch products. A mistrial was declared on the remaining four patents for which no unanimous verdict was reached. Subsequent to the trial, the Court issued orders consistent with the advisory verdicts of invalidity, and also issued an order that one of the four remaining patents (U.S. Patent 7,471,691) [the’691 patent] had been infringed by us. On April 4, 2012, we filed a notice of appeal with respect to the ‘150 patent and the ‘691 patent infringement findings.
On March 16, 2012, the Court issued a decision concerning injunctive relief for the ‘150 and the ‘691 patents. The decision provided, in part, for a sunset period of 18 months relating to the ‘150 patent, starting on October 12, 2011. The decision further provided for a sunset period of 18 months relating to the ‘691 patent, starting on December 16, 2011. The affected products for the ‘150 patent include the BE2, BE3, XE201, and SOC 442 ASICs, products containing them, and products not colorably different from them. The affected products for the ‘691 patent include the SOC 320, SOC 422, and SOC 442 ASICs, products containing them, and products not colorably different from them. The sunset period allows Emulex to sell the affected products to existing customers for specific customer devices, subject to limitations relating to when the products had been qualified and when certain firm orders had been placed. The decision further provided for Emulex to pay a royalty of nine percent on all sales of such products made during the sunset period. The decision also clarified that foreign sales (outside the U.S.) are beyond the scope of the suit. On April 3, 2012, the Court issued a Permanent Injunction which, with respect to both the ‘150 and ‘691 patents, further describe the prohibited activities, contain sunset provision terms including royalty rates and computations, limit the territory to allow sales of products that are manufactured outside the U.S. to customers located outside the U.S., permit design around efforts including modifications and design, development, and testing to eliminate infringement, and permit service and technical support for certain products. The Permanent Injunction refers to an Appendix to that Order specifically to identify permitted sunset sales, but no appendix was included when the Permanent Injunction was issued on April 3, 2012. On April 23, 2012, the Court stated that the Appendix is to be in final form by June 4, 2012. On May 30, 2012, the Court issued an order requiring the parties to submit the Appendix to the April 3, 2012 Permanent Injunction, and excluded from the sunset provision any customer who is a distributor and not an OEM, with distributor exceptions for needs of an end user affecting health of the public, public safety, and governmental agencies engaged in the national defense. The May 30, 2012 order provided that, not later than 90 days from the date of that order, Broadcom may move the Court for exclusion of certain device/customer product combinations from the Appendix. An Appendix was filed by Emulex and Broadcom with the Court under seal on June 10, 2012.
12
On April 12, 2012, the Court scheduled the start of the re-trial relating to the ‘194 family of patents that the previous jury could not reach a unanimous verdict on for April 2, 2013. The previous trial involved the following patents in the ‘194 family: U.S. Patent 6,424,194, Claim 1; U.S. Patent 7,486,124, Claim 5; and U.S. Patent 7,724,057, Claim 42, all of which pertain to circuitry used to deserialize signals.
On July 3, 2012, the Company and Broadcom entered into a Patent License and Release Agreement (Settlement Agreement) pursuant to which Emulex and Broadcom agreed to settle and release certain claims related to the patent infringement litigation. The Settlement Agreement provided for certain amendments to the April 3, 2012 Permanent Injunction, and dismissals of certain allegations of the lawsuit, including portions of the scheduled re-trial and a limited worldwide license under the patents for specific fields of use. See Note 10 in the notes to the consolidated financial statements under the caption“Litigation” in Part IV, Item 15(a) of this Annual Report on Form 10-K. Also see“We are dependent on sole source and limited source third party suppliers and EMS providers for our products”elsewhere in this Item 1A — Risk Factors.
Specific risks related to the Broadcom infringement suit include:
| | • | | Design changes (sometimes referred to as design-arounds) that may be used as alternatives for the two patents for which there have been findings of infringement, may present unforeseen technical problems for implementation or result in significant internal design costs, as well as third party non-recurring engineering costs; |
| | • | | Total costs related to our product redesign activities may exceed our current expectations. |
| | • | | The sunset periods may not be long enough to permit us, our suppliers, our OEM customers and end users to implement, test, qualify, and certify replacement products containing design changes that eliminate the patent infringement; |
| | • | | There may be technical resource and equipment availability shortages impeding our ASIC component suppliers from completing chip spins, and our OEM customers and end users from completing testing of redesigned products; |
| | • | | Our suppliers, on whom we rely for SerDes changes for chip spins, may require more time than what is available under the sunset periods to complete redesigns of clock and data recovery (CDR) in SerDes modules; |
| | • | | Our sales and support for products sold outside the United States may be made subject to the Permanent Injunction, although such sales were previously found to be outside the scope of the suit; |
| | • | | Our continuing support and sales for products previously provided to customers and end users may be made restricted by the Permanent Injunction, although technical support is not prohibited by the Permanent Injunction for products subject to the jury verdict award of damages, or permitted under the sunset period; |
| | • | | The Permanent Injunction provisions limiting sunset period sales by when each customer qualified our products and when each customer first submitted its orders to us for products, and provisions requiring written certification by customers, may cause our customers to exclude us from new product opportunities; |
| | • | | The Permanent Injunction royalties may make our costs too high to meet market pricing requirements set by our customers; |
| | • | | Our July 3, 2012 Settlement Agreement with Broadcom requires us to provide reports and take additional steps, and such activities may cause additional costs and limitations for us not borne by our competitors; |
| | • | | Any settlement terms, beyond the July 3, 2012 Settlement Agreement, we may reach in the suit brought by Broadcom may be less favorable to us than were settlements in other patent litigation involving companies; |
| | • | | We may reach a settlement, including the July 3, 2012 Settlement Agreement and other potential settlements, of the lawsuit brought by Broadcom, and incur a settlement burden, but Broadcom may not assert the patents against our competitors, thus leaving us with a competitive disadvantage relative to future business that may not be borne by our competitors; |
13
| | • | | Delays in the time taken to reach any settlement, beyond the July 3, 2012 Settlement Agreement, in the suit brought by Broadcom may cause us to expend additional defense costs until a settlement is reached; |
| | • | | Broadcom may be unwilling to settle the remaining lawsuit with us, beyond the July 3, 2012 Settlement Agreement, for strategic or tactical reasons that we are unable to determine; |
| | • | | A settlement, beyond the July 3, 2012 Settlement Agreement, in the suit brought by Broadcom may never be reached, and a permanent injunction may be issued and remain in place for the life of the patents in the lawsuit; |
| | • | | The interpretation of the provisions of the Permanent Injunction may be unfavorable to us, resulting in part because of the complexity of the business practices used by our customers, including a large quantity of different customer product models, customer platforms, and design configurations, and the complexity of the supply chains, support implementations, and product distribution networks used by our customers, each of which may result in the need for further hearings before the Court; |
| | • | | Our supply to customers in the United States may be disrupted by the Permanent Injunction affecting our Ethernet based products that include our BE2 or BE3 chips (collectively referred to as the affected products); |
| | • | | Our total net revenues may be reduced by our inability to sell the affected products in the United States after any injunction; |
| | • | | The content of the Permanent Injunction, and its Appendix, may be modified by the Court in ways that are unfavorable to us; |
| | • | | The Court may amend the Appendix to the Permanent Injunction to exclude certain device/customer product combinations; |
| | • | | The Court may determine that we have not adequately proven the extent of the injuries that may occur to our customers and the end users due to a sunset period that is too short, and the Court may not modify the Permanent Injunction to provide for a longer time period; |
| | • | | The Court may determine that we have not adequately proven reasons for delays in completing product redesigns and retesting, and the Court may not modify the Permanent Injunction to provide for a longer time period; |
| | • | | The re-trial may result in significant additional defense costs, and the outcome for such a re-trial is uncertain, but may include a further injunction and may result in further product redesign activities; |
| | • | | Broadcom could file additional lawsuits against us, asserting additional claims from the same patents involved in the lawsuit, or additional patents, or file other proceedings with commissions such as the International Trade Commission; and |
| | • | | Any appeals we make with respect to the determinations made by the jury or the Court may not be successful; any requests for stay of the Permanent Injunction that we make pending the resolution of any appeal may not be granted; and royalties we pay pending an appeal may not be promptly reimbursed to us even if we are successful with any appeal. |
Ongoing lawsuits, such as the action brought by Broadcom, present inherent risks, including continuing expenses of litigation; risk of loss of patent rights and/or monetary damages; risk of injunction against the sale of products incorporating the technology in question, including substantial costs and difficulties in implementing design changes and the associated customer re-qualification thereof or maintaining favorable working relationships with our suppliers of SerDes modules; counterclaims, attorneys’ fees, and diversion of management’s attention from other business matters. Such lawsuits and the related risks thereof could have a material adverse effect on our business, financial condition, or results of operations.
The current macro-economic environment continues to result in a reduction in information technology spending.
The demand for our network storage products has been driven by the demand for high performance storage networking products and solutions that support enterprise computing applications, including on-line transaction
14
processing, data mining, data warehousing, multimedia, and Internet applications. The current weakness in domestic and worldwide economic conditions and related disruptions in world credit and equity markets, as well as the European debt crisis, have resulted in a global downturn in spending on information technology. If the continuing weakness and uncertainty in the global economy result in significant reductions in the demand for our products, solutions, and applications, it will adversely affect our business, results of operations, and financial condition in the near term and possibly beyond. The adverse effects of any sustained reductions in information technology spending on our operating results may be exacerbated by our research and development investments, strategic investments and merger and acquisition activity, as well as customer service and support, which we may need to continue despite any such reductions in demand.
Our business is highly competitive.
The markets for our products are highly competitive and are characterized by rapid technological advances, price erosion, frequent new product introductions, and evolving industry standards. Our current and potential competition consists of major domestic and international companies, some of which have substantially greater financial, technical, marketing, and distribution resources than we have. We currently compete against QLogic Corporation (QLogic), Brocade Communications Systems, Inc. (Brocade) and PMC Sierra, Inc (PMC Sierra). for our Fibre Channel (FC) products. For Ethernet technology, we compete against the leading integrated circuits (IC) vendors including Intel Corporation (Intel), Broadcom, QLogic and Mellanox Technologies, LTD (Mellanox). Our competitors for Ethernet and FC products include Brocade and QLogic.
We expect that our markets will continue to attract new competition. Additional companies, including but not limited to our suppliers, strategic partners, Original Equipment Manufacturer (OEM) customers and emerging companies, may enter the markets in which we compete and new or stronger competitors may emerge as a result of consolidation in the marketplace. Additionally, our existing competitors continue to introduce products with improved price/performance characteristics, and we may have to do the same to remain competitive. Furthermore, competitors may introduce new products to the market before we do, and thus obtain a first to market advantage over us. Increased competition could result in increased price competition, reduced revenues, lower profit margins or loss of market share, any of which could have a material adverse effect on our business, results of operations, and financial condition.
A significant portion of our business depends upon the continued growth of the networking market.
The size of our potential market is largely dependent on the overall demand for networking products and in particular upon the broadening acceptance of our converged network technologies. We believe that our investment in multi-protocol solutions that address the high performance needs of the converged networking market provides the greatest opportunity for our future revenue growth and profitability. However, the market for converged networking products may not gain broader acceptance and customers may choose alternative technologies that we are not investing in, or products supplied by other companies. Interest continues for other storage networking technologies such as Internet Small Computer Systems Interface (iSCSI), which may satisfy some Input/Output (I/O) connectivity requirements through standard Ethernet adapters and software at little to no incremental cost to end users. These software only iSCSI solutions compete with our Network Connectivity Products, particularly in the low end of the market. We have also launched Converged Network Adapters (CNAs) using Fibre Channel over Ethernet (FCoE) or iSCSI protocols which may be used by the same customers impacting our network product revenues more than we anticipate.
In addition, the market for FC products may shrink as more storage subsystems adopt SAS based connectivity for external and direct attached storage devices. Furthermore, FCoE may not be adopted at the rate or extent that we anticipate, and adoption of FCoE is largely dependent on third-party vendors and end users. While the usage of FCoE has increased since its first specifications were completed in 2009, continued adoption of FCoE is dependent on continued collaboration and cooperation among information technology solutions providers.
Since our products are sold as parts of integrated systems, demand for our products is driven by the demand for such integrated systems, including other companies’ complementary products. A lack of demand for these integrated systems or a lack of complementary products required for these integrated systems to be deployed
15
could have a material adverse effect on our business, results of operations, and financial condition. If the converged networking market does not grow, grows more slowly than we anticipate, declines, or attracts more competitors than we expect, or if our products do not achieve continued market acceptance, our business, results of operations, and financial condition could be materially adversely affected.
A significant portion of our revenue is generated from sales to a limited number of customers, none of which are subject to exclusive or long-term contracts.
We rely almost exclusively on OEMs and sales through distribution channels for our revenue. For the fiscal year ended July 1, 2012, we derived approximately 91% of our net revenues from sales to OEM customers and approximately 9% from sales through distribution. Furthermore, as some of our sales through distribution channels consist of OEM products, OEM customers effectively generated approximately 95% of our revenue for the fiscal year ended July 1, 2012. Moreover, direct and indirect sales to our top five customers (including customer-specific models purchased or marketed indirectly through distributors, resellers and other third parties) accounted for approximately 81% of our net revenues for the fiscal year ended July 1, 2012. If we are unable to retain our current OEM and distributor customers, recruit additional or replacement customers, or timely collect amounts due from our customers, or if demand from our customers is reduced due to difficulties in their ability to acquire components or other products such as microprocessors, disk drives, switches and optical modules used in conjunction with our products or in the deployments of their products, our business, results of operations, and financial condition could be materially adversely affected.
As is common in the technology industry, our agreements with OEMs and distributors are typically non-exclusive, have no volume commitments, and often may be terminated by either party without cause. It is increasingly commonplace for our OEM and distributor customers to utilize or carry competing product lines. If we were to lose business from one or more significant OEM or distributor customers to a competitor, our business, results of operations, and financial condition could be materially adversely affected. In addition, our OEMs may elect to change their business practices in ways that affect the timing of our revenues, which may materially adversely affect our business, results of operations, and financial condition.
Although we continue to expand our base of customers, we believe our revenues in the future will still be derived from a limited number of customers. As a result, to the extent that sales to any of our significant customers do not increase in accordance with our expectations or are reduced or delayed, or if we are unable to collect our accounts receivables from our customers, our business, results of operations, and financial condition could be materially adversely affected.
Our operating results are difficult to forecast resulting in significant fluctuations from quarter to quarter.
Our revenues and results of operations have varied on a quarterly basis in the past and may vary significantly in the future. Accordingly, we believe that period-to-period comparisons of our results of operations are not necessarily meaningful, and you should not rely on such comparisons as indications of our future performance. We may be unable to maintain our current levels of growth or profitability in the future. Our revenues and results of operations are difficult to forecast and could be adversely affected in any given quarter by many factors, including, but not limited to:
| | • | | Changes in the size, mix, timing and terms of OEM or other customer orders; |
| | • | | Changes in the sales and deployment cycles for our products or desired inventory levels for our products; |
| | • | | Acquisitions or strategic investments by our customers, competitors or us; |
| | • | | Timing and market acceptance of new or enhanced product introductions, including the timing of server chipset refresh cycles related to new server chipsets, such as Intel Corporation’s Romley chipset, by us, our OEM customers or competitors; |
| | • | | Market share losses or difficulty in gaining incremental market share; |
| | • | | Reduced demand from our customers if there is a shortage of, or difficulties in, acquiring components or other products, such as microprocessors, disk drives, switches, and optical modules, used in conjunction with our products in the deployment of systems; |
16
| | • | | Changes in general social and economic conditions, including but not limited to natural disasters, terrorism, public health crises, slower than expected market growth, reduced economic activity, delayed economic recovery, loss of consumer confidence, increased energy costs, adverse business conditions and liquidity concerns, concerns about inflation or deflation, recession, and reduced business profits and capital spending, with resulting changes in customer technology budgeting and spending; |
| | • | | Fluctuations in product development, procurement, resource utilization and other operating expenses; |
| | • | | Inability to realize anticipated efficiencies resulting from increased revenues; |
| | • | | Difficulties controlling unanticipated costs, including operating expenses, as revenues increase; |
| | • | | Inability of our electronics manufacturing service providers (EMS) or suppliers to produce and distribute our products in a timely fashion; |
| | • | | Difficulties with updates, changes or additions to our information technology systems; and |
| | • | | Breaches of our network security, including viruses. |
Order deferrals and cancellations by our customers, declining average sales prices, changes in the mix of products sold, shortages of materials, delays in the introduction of new products and longer than anticipated sales cycles for our products have adversely affected our business, financial condition and results of operations in the past. Despite these factors, we, along with our EMS providers, maintain significant finished goods, work-in-progress and raw materials inventory to meet estimated order forecasts. If our customers purchase less than their forecasted orders or cancel or delay existing purchase orders, there will be higher levels of inventory that face a greater risk of obsolescence. If our customers choose to purchase products in excess of the forecasted amounts or in a different product mix, there might be inadequate inventory or manufacturing capacity to fill their orders.
As a result of these and other unexpected factors or developments, future operating results may be, from time to time, below the expectations of investors or market analysts, which would have a material adverse effect on our stock price.
Our industry is subject to rapid technological change.
The markets for our products are characterized by rapidly changing technology, evolving industry standards, and the frequent introduction of new products and enhancements. Our future success depends in large part on our ability to enhance our existing products and to introduce new products on a timely basis to meet changes in customer preferences and evolving industry standards. Currently, new and proposed technologies such as 16 Gb/s and 32 Gb/s Fibre Channel solutions; FCoE; 40GbE and 100GbE solutions; Infiniband; Remote Direct Memory Access (RDMA) over Converged Ethernet (RoCE) and low latency Ethernet Solutions; PCI Express 3.0; PCI Express Advanced Switching; 10G base T; 6 Gb/s and 12 Gb/s SAS; and Solid State Drives (SSDs) are in development by many companies and their ultimate acceptance and deployment in the market is uncertain. We are developing some, but not all of these technologies, and we cannot be sure that the technologies we chose to develop will achieve market acceptance, or that technologies that we chose not to develop will be available for purchase or license from third parties or will be immaterial to our business.
These developments or enhancements, such as the migration of our next generation products from 65nm to 40nm or lower geometry process technologies, may be late, may have technical problems, may fail to meet customer or market specifications and may not be competitive with other products using alternative technologies that offer comparable performance and functionality. We may be unable to successfully develop additional next generation products, new products or product enhancements. Our next generation products or any new products or product enhancements may not be accepted in new or existing markets. Our business will suffer if we fail to continue to develop and introduce new products or product enhancements in a timely manner or on a cost-effective basis.
Furthermore, if our products are not available in time for the qualification cycle at an OEM, we may be forced to wait for the next qualification cycle or may miss the market window. In addition, new products and
17
enhancements developed by us may not be backwards compatible to existing equipment already installed in the market. If we are unable, for technological or other reasons, to develop new products, enhance or sell existing products, or consume raw materials in a timely and cost effective manner in response to technological and market changes, our business, results of operations, and financial condition may be materially adversely affected.
We may be unsuccessful in our expansion into new segments of the storage and server technology market, and the costs associated with our expansion may be greater than anticipated.
To remain a significant supplier of networking technologies, we will need to continue to expand the range of products and solutions offered to our OEM customers. Expansion into other areas of the storage and server technology market, whether by acquisition or through internal growth, and the resulting increases in expenditures to support these new areas may be greater than anticipated. If we fail to successfully expand into new areas of the storage and server technology market with products that we do not currently offer, and effectively address these new market opportunities, we may lose market share and revenue opportunities to our competitors. Any such loss of opportunities or any failure by us to effectively manage the costs associated with expanding into new markets may have an adverse effect on our business and financial condition.
Further, although most of our revenues have historically been derived from products based on Fibre Channel technology, we expect to continue to grow our business by offering converged networking solutions. We believe that our Fibre Channel products and our converged networking solutions will, at least initially, have similar customers and other marketing requirements that should produce certain synergies and cost savings as we expand our converged network solutions business. However, if the expansion of our converged networking solutions business does not produce the synergies and cost savings with our core Fibre Channel business that we anticipate, our marketing and other business expenses relating to our converged network solutions business could be greater than anticipated and our financial condition could be adversely affected.
The timing of migration by our customers toward emerging technologies and newer product platforms varies. Any failure of our OEM customers to keep up with rapid technological change and to successfully market and sell systems that incorporate new technologies could adversely affect our business.
Our revenues depend significantly upon the ability and willingness of our OEM customers to commit significant resources to develop, promote, and deliver products that incorporate our technology. In addition, if our customers’ products are not commercially successful, it would have a materially adverse effect on our business, results of operations, and financial condition.
As our customers migrate from one platform to the enhanced price/performance of the next platform, we may experience reduced revenue, gross profit, or gross margin levels associated with lower average selling prices or higher relative product costs associated with improved performance. While we regularly compare forecasted demand for our products against inventory on hand and open purchase commitments, to the extent that customers migrate more quickly than anticipated, the corresponding reduction in demand for older product platforms may result in excess or obsolete inventory and related charges which could potentially have a material adverse effect on our financial condition and results of operations.
Our customers may elect to substitute low-end adapter card solutions and chip only options for use in high-end environments or applications.
We supply FC and Ethernet I/O solutions that target separate high-end, midrange and small to medium sized end users. Historically, the majority of our revenues have come from our high-end enterprise server and storage solutions. If customers elect to utilize midrange HBA and CNAs in higher-end environments or applications, or migrate to chip only solutions faster than we anticipate, our business and financial condition could be negatively affected.
Advancement of storage device capacity technology may not allow for additional revenue growth.
Storage device density continues to improve rapidly and at some point in the future, the industry may experience a period where the advancement in technology may increase storage device capacity to a level that may equal or exceed the need for digital data storage requirements. This would result in a situation where the number
18
of units of storage devices required in the marketplace may level out or even decrease. To the extent that growth in storage device unit demand slows or decreases, our financial condition and results of operations may be materially adversely affected.
Our average unit selling prices may decrease at a faster rate than we are able to realize cost reductions in our products.
We continue to experience downward pressure on the average unit selling prices of our products. Furthermore, we may provide pricing discounts to customers based upon volume purchase criteria, and achievement of such discounts may reduce our average unit selling prices. To the extent that growth in unit demand fails to offset decreases in average unit selling prices, our revenues and financial performance could be materially adversely affected. Although we have historically achieved offsetting cost reductions, to the extent that average unit selling prices of our products decrease without a corresponding decrease in the costs of such products, our gross margins and financial performance could be materially adversely affected. Our gross margins could also be adversely affected by a shift in the mix of product sales to lower gross margin products. Furthermore, as our products are manufactured internationally, cost reductions would be more difficult to achieve if the value of the U.S. dollar were to deteriorate. Moreover, if the manufactured cost of our products were to increase due to inflation or other factors and we cannot pass along the increase in our costs to our customers, our gross margins and financial performance could be materially adversely affected.
We may experience delays in our product development cycle and the introduction of new products.
We have experienced delays in product development in the past and may experience similar delays in the future. Such delays may result from numerous factors, which include, but are not limited to:
| | • | | Difficulties in hiring and retaining necessary employees and independent contractors; |
| | • | | Difficulties in reallocating engineering resources and other resource limitations; |
| | • | | Unanticipated or lengthy redevelopment efforts to make design changes resulting from unintentional intellectual product infringement and related injunctions; |
| | • | | Unanticipated engineering or manufacturing complexity, including complexity arising from third party suppliers of intellectual property such as foundries of our ASICs; |
| | • | | Undetected errors or failures in our products; |
| | • | | Changing OEM product specifications; |
| | • | | Delays in the acceptance or shipment of products by OEM customers; and |
| | • | | Changing market or competitive product requirements. |
We expect to continue to engage in product development alignment activities with customers, companies we have investments in and receivables from, and other third parties. These product development alignment activities can magnify several risks for us, including the loss of control over development activities and the timing of product availability. Accordingly, we face increased risk that such product development alignment activities will result in products that are not commercially successful or that are not available in a timely fashion.
Given the short product life cycles in the markets for our products and the relatively long product development cycles, any delay or unanticipated difficulty associated with new product introductions or product enhancements could have a material adverse effect on our business, results of operations, and financial condition.
Changes in our business model to separately charge for software may not result in expected revenue increases.
We recently began charging separate license fees for software associated with our product offerings. The success of this strategy to generate software revenues is subject to numerous risks, including:
| | • | | We may be unable to develop and market these new software products successfully; |
| | • | | The software products we develop may not be well received by customers; |
19
| | • | | Our software products may have quality problems or other defects in the early stages that were not anticipated in the design of those products; and |
| | • | | Software products developed and new technologies offered by others may affect demand for our products. |
While revenues related to such software activities recognized during our fiscal year ended July 1, 2012 have not been significant, any failure to successfully implement this new strategy could have an adverse effect on our results of operations in the future.
We are dependent on sole source and limited source third party suppliers and EMS providers for our products.
We rely on third party suppliers for components and the manufacture of our products. A number of these components and products are only available from a single or limited number of suppliers. We also purchase certain components and products from single or limited suppliers and EMS providers to drive volume discounts. As a result, we have experienced delays or difficulty in securing components and finished goods in the past, as well as additional costs related to such issues. Delays or difficulty in securing components or finished goods at reasonable cost may be caused by numerous factors including, but not limited to:
| | • | | Natural disasters, such as the significant flooding in Thailand in October 2011; |
| | • | | Discontinued production by a supplier; |
| | • | | Required long-term purchase commitments; |
| | • | | Undetected errors, failures or production quality issues, including projected failures that may constitute epidemic failure rates specified in agreements with our customers or that may require us to make concessions or accommodations for continuing customer relationships; |
| | • | | Timeliness of product delivery; |
| | • | | Increases in manufacturing costs due to lower volumes or more complex manufacturing process; |
| | • | | Sole sourcing of components made by a small number of suppliers, including the inability to obtain components and finished goods at reasonable cost from such sources and suppliers; |
| | • | | Changes in business strategies of our suppliers and EMS providers; |
| | • | | Financial stability and viability of our suppliers and EMS providers; |
| | • | | Inability or unwillingness of our suppliers or EMS providers to continue their business with us; |
| | • | | Environmental, tax or legislative changes in the location where our products are produced or delivered; |
| | • | | Disruption in shipping channels; |
| | • | | Labor shortages or labor strikes at our suppliers or EMS providers; |
| | • | | Intellectual property controversies; and |
| | • | | Difficulties associated with international operations. |
We utilize third-party EMS providers located outside the United States to manufacture and test the majority of our products. These EMS providers also procure and manage most of the components used in our board and box level products. As a result of our reliance on third-party EMS providers, we may not be able to directly control product delivery schedules and the quality of our products which could have a material adverse effect on our business, results of operations, and financial condition. If our EMS providers are unable to respond in a timely fashion to changes in customer demand, we may be unable to produce enough products to respond to sudden increases in demand, resulting in lost revenues. Alternatively, in the case of order cancellations or decreases in demand, we may be liable for excess or obsolete inventory or cancellation charges resulting from contractual purchase commitments that we have with our EMS providers. We regularly provide rolling forecasts of our
20
requirements to our EMS providers for planning purposes, pursuant to our agreements, a portion of which is binding upon us. Additionally, we are committed to accept delivery on the forecasted terms for a portion of the rolling forecast. Cancellations of orders or changes to the forecasts provided to any of our EMS providers may result in cancellation costs payable by us. In the past, we have been required to take delivery of materials from our EMS providers that were in excess of our requirements, and we have previously recognized charges and expenses related to such excess material. We expect that we will continue to incur such costs in the future.
We also purchase ASICs from sole source suppliers, including LSI Corporation, Marvell Technology Group Ltd., Intel Corporation, Renesas Electronics America Inc., and Toshiba Corporation, who in turn rely on a limited number of suppliers and foundries to manufacture the ASICs. This creates risks in assuring the availability of such ASICs. While we have multiple ASIC suppliers, we sole source each of our ASIC, and we use the same ASIC supplier for more than one of our ASICs. The inability of the Company or our EMS providers to obtain these ASICs in sufficient quantities or in the desired time periods could delay the production and delivery of our products which, in turn, could result in lost revenue due to customer cancellations and have a material adverse effect on our business, results of operations, and financial condition.
The use of a sole source ASIC supplier may also create risks relating to intellectual property controversies including the need to prepare for design changes by the ASIC component supplier in response to such controversies. For example, on September 14, 2009, Broadcom Corporation filed a patent infringement lawsuit against the Company in the United States District Court in the Central District of California. The original complaint alleged infringement by the Company of ten Broadcom patents covering certain data and storage networking technologies. On February 23, 2010, Broadcom filed a first amended complaint adding allegations of infringement for one additional Broadcom patent. On May 26, 2010, Broadcom Corporation filed a separate patent infringement lawsuit against the Company in the United States District Court in the Central District of California. Broadcom sought a judgment for damages, injunctive relief, and an award of attorneys’ fees and costs. See Note 10 in the notes to the consolidated financial statements under the caption “Litigation” in Part IV, Item 15(a) of this Annual Report on Form 10-K. Also see“Third party claims of intellectual property infringement could adversely affect our business” elsewhere in this Item 1A — Risk Factors.
The Broadcom lawsuit includes allegations, amongst others, that our ASICs include SerDes modules obtained from our ASIC suppliers that infringe upon Broadcom’s patents. Specifically, the allegations assert that the SerDes modules provided by our ASIC suppliers use a kind of CDR phase interpolator design covered by such patents, two of which the Court has found Emulex to be infringing. We are in the process of working with our ASIC suppliers to redesign certain infringing ASICs in order to change out the CDR implementation, and certain of our ASICs may be superseded by redesigned ASICs containing alternative CDR designs. However, changing the CDR implementation for an existing ASIC may require a full layer metal spin. Expenses for non-recurring engineering costs paid to our suppliers for spins of other ASICs in the past have generally been in the range of $1 million to $2 million for each ASIC. Such chip spins also require significant time and effort by our personnel and the personnel of our ASIC supplier to develop and validate the new ASIC design. These efforts generally encompass some or all of the following activities:
| | • | | ASIC Development — As a fabless ASIC company, we rely heavily on our ASIC suppliers to supply us with various pre-designed functional modules for the design of our ASICs. These pre-designed functional modules are sometimes called cores, and are sole sourced from each ASIC supplier and available for specific geometries of line widths (referred to as process nodes) which are available from a particular silicon foundry. The library of pre-designed functional modules from an ASIC component supplier include computer processors (such as those from ARM, Ltd. and Tensilica Inc.), static memory, buses, SerDes (serializers/deserializers), PCIe logic, dynamic memory, and interfaces. Our engineering personnel use computer tools from the ASIC supplier and third parties such as Magma Design Automation, Inc. and Synopsys, Inc. to create application logic that combines various of the pre-designed functional modules together with Emulex custom logic in order to form the ASIC design. The particular pre-designed functional modules are sole sourced, and are each specific to a particular process node; and the same pre-designed functional modules are used by many other companies as customers of the same ASIC component supplier. |
21
| | • | | Firmware and Application Development — At the same time that ASIC logic design is being developed, our engineering personnel prepare ASIC firmware that operates on the computer processor included as a pre-designed functional module in the ASIC design, and host driver software that operates on a host computer to which the ASIC will be connected. The ASIC firmware is based on the instruction set implemented by the computer processor, and that instruction set is sole sourced to the supplier of the computer processor included as a pre-designed functional module. Also, at the same time as the ASIC logic design is being developed, our engineering personnel design circuit boards and cards into which the ASIC may be inserted for testing and for connection to host computers and external networks. |
| | • | | Functional and Physical Design and Verification (Design & Verification) — The purpose of Design & Verification is to ensure that the ASIC design meets its specification. The Design & Verification process involves the computer simulation of the ASIC design, including the sole source pre-designed functional modules contained in the ASIC design. The ASIC component supplier assists our engineering personnel with the use of the computer tools and the performance of the Design & Verification process. Such assistance includes the implementation of a layout or tape-out of the design pattern to be created on the silicon die, and the simulation of the electrical effects of such a layout or tape-out. The preparation of a layout or tape-out involves the use of sole source computer tools which our engineering personnel do not have. Partial testing of the ASIC firmware and host drivers can be performed as a part of the Design & Verification process. |
| | • | | Pre-production Manufacturing — After our engineering personnel complete the Design & Verification process, the ASIC component supplier is asked to prepare the ASIC design for the production of the ASIC wafers and die at the silicon foundry. Such preparation includes the creation of multiple masks used in manufacturing of the ASIC wafers and die. The preparation of masks involves the use of sole source computer tools which our engineering personnel do not have. Once the layout and masks have been completed, the ASIC component supplier provides the masks to the silicon foundry which initiates the manufacturing of the ASIC wafers and die. Our engineering personnel provide information about the ASIC design to allow the preparation of foundry tests for the ASIC wafers and die, and for the preparation of supplier tests for the ASICs after packaging. The silicon foundry and the ASIC component supplier perform tests on the wafers and die, and causes the die to be packaged, before they are shipped to us. The initial manufacturing of the ASIC wafers is in a smaller quantity, referred to as prototypes or pre-production units, which are provided to us for further testing by us and our customers. |
| | • | | Design Verification and Test (DVT) — Once our engineering personnel have received prototypes or pre-production units of the ASICs, we begin the DVT process. As a part of the DVT process, we have a contract manufacturer prepare boards and cards containing the ASICs. The first phase of DVT involves bring-up testing to check the performance of the ASIC when connected to a host computer, but without extensive testing of the ASIC firmware and host driver software. The second phase of the DVT involves extensive testing of the ASIC together with its ASIC firmware and host driver software. The third phase of DVT involves exhaustive testing of the ASIC, ASIC firmware, and host driver software using a test specification requiring unfailing operation in many different host computer operating systems, including current and past versions of server computers and storage subsystems from all of our major OEM customers, using many different versions of network switches, disk, tape and solid state memory storage systems, and under network disruption and failure modes with many different permutations of error conditions and network traffic problems. The third phase of DVT takes many weeks of time. If bugs are found during DVT, our engineering personnel determine the root cause of the bug, and may make changes to the ASIC firmware and driver software to correct the bugs under an engineering change order (ECO) procedure. Such ECO changes to the ASIC firmware and driver software are followed by more limited third phase testing, referred to as regression testing, which tests the parts of the functions affected by the ECO. If the root cause review of the bug determines that the bug cannot be corrected by the ASIC firmware or driver software, then our engineering personnel determine what portion of the ASIC design needs to be changed, resulting in a chip spin. If the bug requires changes to the custom logic designed by our personnel, then we proceed with making a re-design of the applicable parts of the ASIC design. If the bug requires changes to any of the pre-designed functional modules, those changes are made by or for the ASIC |
22
| | component provider, and updated simulation information is provided to our engineering personnel. Once the chip has been redesigned, we go back to EVT for the changed design. |
| | • | | Customer Certification and Qualification — Customer certification and qualification includes testing by our OEM customers to approve our product for purchase and use with their systems. Certification and qualification testing includes exhaustive testing by the OEM of our ASIC, ASIC firmware, driver software and/or board-level applications in networks with the newest products made by the OEM, including products not yet provided to us or to end users. The certification and qualification testing by an OEM may take many weeks. If bugs are discovered during the certification and qualification testing, the bugs are reported to us, we perform a root cause analysis, and proceed with redesign as described earlier with respect to the DVT process. |
As a result, the cost of implementing ASIC design changes to mitigate actual or alleged intellectual property infringement claims, and/or the failure of our customers to qualify and adopt the replacement ASIC chips could have a material adverse impact on our business, results of operations, and financial condition.
Our intellectual property protections may be inadequate.
We believe that our continued success depends primarily on continuing innovation, marketing, and technical expertise, as well as the quality of product support and customer relations. At the same time, our success is partially dependent on the proprietary technology contained in our products. We currently rely on a combination of patents, copyrights, trademarks, trade secret laws, and contractual provisions to establish and protect our intellectual property rights in our products.
We cannot be certain that the steps we take to protect our intellectual property will adequately protect our proprietary rights, that others will not independently develop or otherwise acquire equivalent or superior technology, or that we can maintain such technology as trade secrets. In addition, the laws of some of the countries in which our products are or may be developed, manufactured, or sold may not protect our products and intellectual property rights to the same extent as the laws of the United States, or at all. Furthermore, we enter into various development projects and arrangements with other companies. In some cases, these arrangements allow for the sharing or use of our intellectual property. Our failure to protect our intellectual property rights could have a material adverse effect on our business, results of operations, and financial condition. We attempt to mitigate this risk by obtaining indemnification from others, where possible.
Certain of our software (as well as that of our customers) may be derived from “open source” software that is generally made available to the public by its authors and/or other third parties. Such open source software is often made available to us under licenses, such as the GNU General Public License (GPL), which impose certain obligations on us in the event we were to distribute derivative works of the open source software. These obligations may require us to make source code for the derivative works available to the public, or license such derivative works under a particular type of license, rather than the forms of licenses customarily used to protect our intellectual property. In the event the copyright holder of any open source software were to successfully establish in court that we had not complied with the terms of a license for a particular work, we could be required to release the source code of that work to the public and/or stop distribution of that work.
We may be unable to attract, motivate or retain key managerial and technical personnel.
Our success depends to a significant degree upon the performance and continued service of key managers, as well as engineers involved in the development of our storage networking technologies and technical support of our storage networking products and customers. Competition for such highly skilled employees is intense in the communities in which we operate, as well as our industry, and we cannot be certain that we will be successful in recruiting, training, and retaining such personnel. In addition, employees may leave us and subsequently compete against us, and we may incur costs relating to their departure. Also, many of these key managerial and technical personnel receive stock-based compensation incentives as part of our employee retention initiatives. The number of shares authorized under stock based plans may be insufficient and shareholders may not approve to increase the number of authorized shares. New regulations, volatility in the stock market, and other factors could diminish the value of our stock-based compensation incentives, putting us at a competitive disadvantage and forcing us to
23
use more cash compensation. If we are unable to attract new managerial and technical employees, or are unable to retain and motivate our current key managerial and technical employees, or are forced to use more cash compensation to retain or replace key personnel, our business, results of operations, and financial condition could be materially adversely affected.
Our international business activities subject us to increased business risks.
For the fiscal year ended July 1, 2012, sales in Asia Pacific accounted for approximately 57% of our total net revenues, sales in the United States accounted for approximately 28% of our total net revenues, and sales in Europe, Middle East, Africa and the rest of the world accounted for approximately 15%, of our total net revenues based on billed-to address. We expect that our sales will continue to increase outside of the United States as our customers are migrating towards using contract manufacturers located internationally, predominantly in Asia Pacific. However, because we sell to OEMs and distributors who ultimately resell our products to their customers, the geographic mix of our sales based on billed-to address may not be reflective of the geographic mix of end-user demand or installations. All of our sales are currently denominated in U.S. dollars. As a result, if the value of the U.S. dollar increases relative to foreign currencies, our products could become less competitive in international markets. In addition, as we continue to expand our international operations, an increasing amount of our expenses will be incurred in currencies other than U.S. dollars, and as a result, we will be required from time to time to convert currencies to meet our obligations. Additionally, our suppliers are increasingly located outside of the U.S., and a significant portion of our products is produced at our EMS providers’ production facilities in Thailand, Malaysia, and China. As a result, we are subject to the risks inherent in international operations. Our international business activities could be affected, limited or disrupted by a variety of factors, including, but not limited to:
| | • | | Fluctuations in freight costs and potential disruptions in the transportation infrastructure for our products and components; |
| | • | | Longer accounts receivable payment cycles; |
| | • | | Increased travel, infrastructure, accounting, and legal compliance costs associated with multiple international locations; |
| | • | | Difficulty in locating, hiring and retaining personnel with requisite skill sets and knowledge; |
| | • | | Difficulty maintaining management oversight and control of remote locations; |
| | • | | Changes in the value of local currencies relative to our functional currency; |
| | • | | Costs and risks of localizing products for international countries; |
| | • | | Import and export restrictions; |
| | • | | Limitations on the amount and nature of foreign investment, including restrictions on the structure and/or permissible forms of investment; |
| | • | | Imposition of or changes in governmental controls, taxes, tariffs, trade restrictions, and regulatory requirements to our current or future operations; |
| | • | | Potential restrictions on transferring funds between countries and difficulties associated with repatriating cash generated or held outside of the U.S. in a tax-efficient manner; |
| | • | | Taxation in multiple jurisdictions; |
| | • | | Bureaucratic intrusions and delays, government corruption, political instability, war, and/or terrorism; and |
| | • | | General economic and social conditions within international countries. |
All of these factors could harm future sales of our products to international customers or production of our products outside of the United States, and have a material adverse effect on our business, results of operations, and financial condition.
24
Our stock price is volatile, which has and may result in lawsuits against us and our officers and directors.
The stock market in general, and the stock prices of technology companies in particular, have experienced extreme volatility that often has been unrelated to the operating performance of any specific public company. The market price of our common stock has fluctuated in the past and is likely to continue to fluctuate in the future. For example, during calendar year 2012 through July 1, 2012, the closing sales price of our common stock ranged from a low of $6.45 per share to a high of $11.01 per share. Factors that could have a significant impact on the market price of our stock include, but are not limited to, the following:
| | • | | Actual or alleged intellectual property infringement; |
| | • | | Quarterly variations in customer demand and operating results; |
| | • | | The gain or loss of significant customers or design wins; |
| | • | | General conditions in the computer, storage, or communications markets; |
| | • | | Events affecting other companies that investors deem to be comparable to us; |
| | • | | Announcements of new products by us or our competitors; |
| | • | | Offers to buy us or a competitor for a premium over recent trading prices; |
| | • | | Changes in analysts’ earnings estimates; |
| | • | | Changes in analyst recommendations, price targets, or other parameters that may not be related to earnings estimates; |
| | • | | Rumors or dissemination of false information; and |
| | • | | Short selling of our common stock. |
In addition, a takeover proposal by any third party to acquire the outstanding shares of our common stock may result in further volatility in the price of our common stock. If a takeover does not occur following announcement of a takeover proposal, for any reason, the market price of our common stock may decline.
In the past, companies, including us, that have experienced volatility in the market price of their stock have been subject to securities class action litigation. If we were to be the subject of similar litigation in the future or experience unfavorable outcomes in any of our pending litigation, as discussed in Note 10 in the accompanying notes to our consolidated financial statements under the caption “ Litigation” in Part IV, Item 15(a) of this Annual Report on Form 10-K, it could have a material adverse effect on our business, results of operations, and financial condition. Such litigation would also divert management’s attention from other business matters.
Our results of operations could vary as a result of the methods, estimates, and judgments that we use in applying our accounting policies.
The methods, estimates, and judgments that we use in applying our accounting policies have a significant impact on our results of operations. Such methods, estimates, and judgments are, by their nature, subject to substantial risks, uncertainties, and assumptions, and factors may arise over time that lead us to change our methods, estimates, and judgments. Changes in those methods, estimates, and judgments could significantly affect our results of operations. Also see “Critical Accounting Policies” contained in Part II, Item 7 of this Annual Report on Form 10-K.
The final determination of our income tax liability may be materially different from our income tax provisions and accruals and our tax liabilities may be adversely affected by changes in applicable tax laws.
We are subject to income taxes in both the United States and international jurisdictions. Significant judgment is required in determining our worldwide provision for income taxes. In the ordinary course of our business, there are many transactions where the ultimate tax determination is uncertain. Additionally, our calculations of income taxes are based on our interpretations of applicable tax laws in the jurisdictions in which we file.
25
Our provision for income taxes is subject to volatility and could be adversely affected by numerous factors including:
| | • | | Earnings being lower than anticipated in countries that have lower tax rates and higher than anticipated in countries that have higher tax rates; |
| | • | | Changes in the allocation of income and expenses related to cost sharing arrangements, including adjustments related to changes in our corporate structure, acquisitions or tax law changes; |
| | • | | Tax effects of increases in nondeductible compensation; |
| | • | | Changes in transfer pricing regulations; |
| | • | | Changes in domestic and foreign tax laws including possible U.S. changes to the taxation of earnings of foreign subsidiaries, the deductibility of expenses attributable to foreign income and changes to foreign tax credit rules; |
| | • | | Changes in accounting rules or principles, including the potential adoption of international financial reporting standards (IFRS) and changes in the valuation of deferred tax assets and liabilities; |
| | • | | Unfavorable results from income tax audits; and |
| | • | | Expiration or lapses of federal and state research credits. |
We have adopted transfer-pricing procedures between our subsidiaries to regulate intercompany transfers. Our procedures call for the licensing of intellectual property, the provision of services, and the sale of products from one subsidiary to another at prices that we believe are equivalent to an arm’s length negotiated price. We have established these procedures due to the fact that some of our assets, such as intellectual property, developed in the U.S., will be utilized by other affiliated companies. If the U.S. Internal Revenue Service (IRS) or the taxing authorities of any other jurisdiction were to successfully require changes to our transfer pricing practices, we could become subject to higher taxes and our earnings would be adversely affected. Any determination of income reallocation or modification of transfer pricing laws can result in an income tax assessment on the portion of income deemed to be derived from the U.S. or other taxing jurisdiction.
Although we believe our tax estimates are reasonable, there is no assurance that the final determination of our income tax liability will not be materially different than what is reflected in our income tax provisions and accruals. Significant judgment is required to determine the recognition and measurement attribute prescribed in the accounting guidance for uncertainty in income taxes. The accounting guidance for uncertainty in income taxes applies to all income tax positions, including the potential recovery of previously paid taxes, which if settled unfavorably could adversely impact our provision for income taxes. In addition, we are subject to the continuous examination of our income tax returns by the IRS and other foreign, state and local tax authorities. We are currently under audit by the IRS for fiscal years 2008 and 2009 and an amended return for fiscal 2007, and by the California Franchise Tax Board for fiscal years 2008 and 2009 . We regularly assess the likelihood of adverse outcomes resulting from these examinations to determine the adequacy of our provision for income taxes. There can be no assurance that the outcomes from these continuous examinations will not have an adverse effect on our operating results and financial condition.
We may fail to realize the anticipated benefits of future acquisitions and strategic investments.
Our future performance will depend in part on our ability to realize the anticipated benefits from acquisitions and strategic investments, and whether we can successfully integrate, operate or partner with these businesses with our existing operations in an effective and efficient manner. Integrating our operations with acquired businesses is a complex, time-consuming and expensive process and involves a number of risks and uncertainties. In addition, in order to position ourselves to take advantage of growth opportunities, we have made, and may continue to make, other strategic acquisitions that involve significant risks and uncertainties. The risks and uncertainties relating to acquisitions and/or strategic investments include, but are not limited to:
| | • | | The difficulty in integrating any newly acquired businesses and operations in an efficient and effective manner; |
| | • | | The risk of diverting our resources and the attention of our senior management from the operations of our business; |
26
| | • | | Additional demands on management related to the increase in the size and scope of our company following the acquisition; |
| | • | | Difficulties in combining corporate cultures; |
| | • | | Difficulties in the assimilation and retention of key employees; |
| | • | | The risks of potential disputes concerning indemnities and other obligations that could result in substantial costs; |
| | • | | Unknown defects of an acquired company’s products or assets that may not be identified due to the inherent limitations involved in the due diligence process of an acquisition; |
| | • | | Costs and expenses associated with any undisclosed or potential liabilities of acquired businesses; |
| | • | | Delays, difficulties or unexpected costs in the integration, assimilation, implementation or modification of platforms, business information systems, functions, technologies and infrastructure to support the combined business, as well as maintaining uniform standards, controls (including internal accounting controls), procedures and policies; |
| | • | | The challenges in achieving strategic objectives, cost savings and other benefits expected from any acquisitions; |
| | • | | The risk that the returns on acquisitions will not support the expenditures incurred to acquire such businesses or the capital expenditures needed to develop such businesses; |
| | • | | The risks of entering markets in which we have less experience; |
| | • | | The risk that our markets do not evolve as anticipated and the technologies acquired do not prove to be those needed to be successful in those markets; and |
| | • | | Difficulties in maintaining relationships with present and potential customers, distributors and suppliers of the acquired business. |
Furthermore, to complete future acquisitions or strategic investments, we may need to issue equity securities, incur debt, assume contingent liabilities or have amortization expenses and write-downs of acquired assets, which could cause our earnings per share to decline.
Unsolicited takeover proposals may be disruptive to our business.
We have received an unsolicited takeover proposal in the past, and there can be no assurance a third party will not make an unsolicited takeover proposal in the future. The review and consideration of any takeover proposal may be a significant distraction for our management and employees and could require the expenditure of significant time and resources by us.
Moreover, any unsolicited takeover proposal may create uncertainty for our employees and this uncertainty may adversely affect our ability to retain key employees and to hire new talent. Any such takeover proposal may also create uncertainty for our customers, suppliers and other business partners, which may cause them to terminate, or not to renew or enter into, arrangements with us. The uncertainty arising from unsolicited takeover proposals and any related costly litigation may disrupt our business, which could result in an adverse effect on our operating results. Management and employee distraction related to any such takeover proposal also may adversely impact our ability to optimally conduct our business and pursue our strategic objectives.
We have entered into Key Employee Retention Agreements with three of our current executive officers, and adopted a Change in Control Retention Plan, in which currently an additional 26 key employees participate. The participants of these retention arrangements may be entitled to severance payments and benefits, based on a period of between twelve months and two years, upon a termination of their employment by us without cause or by them for good reason in connection with a change of control of our company (each as defined in the applicable agreement or plan). These retention arrangements may not be adequate to allow us to retain critical employees during a time when a change in control is being proposed or is imminent.
27
Our corporate offices, principal product development facilities, EMS providers, suppliers and customers are located in regions that are subject to earthquakes and other natural disasters.
Our California facilities, which include our corporate offices and principal product development facilities, are located near major earthquake faults. Any disruption in our business activities, personal injury, or damage to the facilities in excess of our currently insured amounts as a result of earthquakes or other such natural disasters, could have a material adverse effect on our business, results of operations, and financial condition. In addition, natural disasters such as hurricanes, tsunamis, flooding, and earthquakes, such as the flooding in Thailand in October 2011 and the earthquake off the coast of Japan and the resulting tsunami in March 2011, can disrupt manufacturing operations of our EMS providers, component suppliers and customers or the downstream suppliers that are located in such impacted areas, resulting in lost revenue opportunities in the near term and/or long term.
We currently do not carry earthquake insurance. However, we do carry various other lines of insurance that may or may not be adequate to protect our business in the case of a natural disaster.
Our certificate of incorporation and the related provisions under Delaware law could adversely affect the performance of our stock.
Provisions of our certificate of incorporation and Delaware General Corporation Law could make it more difficult for a third party to acquire us, even if doing so would be beneficial to our shareholders. In addition, although we do not currently maintain a shareholders rights plan, we have maintained such a plan in the past and it is possible that we may adopt a shareholders rights plan in the future should general business, market and other conditions, opportunities and risks arise. The provisions of our certificate of incorporation, Delaware law, and any shareholders rights plan are generally intended to encourage potential acquirers to negotiate with us and allow our board of directors the opportunity to consider alternative proposals in the interest of maximizing shareholder value. However, such provisions may also discourage acquisition proposals or delay or prevent a change in control, which could harm our stock price.
We may be subject to theft or misuse of our electronic data, which could result in third-party claims and harm our business and results of operations.
We may experience attempts by others that try to gain unauthorized access through the Internet to our information technology systems, such as when they masquerade as authorized users or surreptitiously introduce software. These attempts, which might be the result of industrial or other espionage, or actions by hackers seeking to harm us, our products, or our end users. We seek to detect and investigate these security incidents and to prevent their recurrence, but in some cases we might be unaware of an incident or its magnitude and effects. The theft or unauthorized use or publication of our trade secrets and other confidential business information as a result of such cyber threats could adversely affect our competitive position and reduce marketplace acceptance of our products; the value of our investment in research and development and marketing could be reduced; and third parties might assert against us or our customers claims related to resulting losses of confidential or proprietary information or end-user data, or system reliability. Any such event could have a material adverse effect on our business, results of operations, and financial condition.
Our system of internal controls may be inadequate.
We maintain a system of internal controls in order to ensure we are able to collect, process, summarize, and disclose the information required by the Securities and Exchange Commission within the time periods specified. Any system of controls, however well designed and operated, can provide only reasonable, and not absolute, assurance that the objectives of the system are met. In addition, the design of any control system is based in part upon certain assumptions about the likelihood of future events. Due to these and other inherent limitations of control systems, there can be no assurance that any design will succeed in achieving its stated goals under all potential future conditions, regardless of how remote. Additionally, public companies in the United States are required to review their internal controls under the Sarbanes-Oxley Act of 2002. If the internal controls put in place by us are not adequate or fail to perform as anticipated, we may be required to restate our financial statements, receive an adverse audit opinion on the effectiveness of our internal controls, or take other actions that
28
will divert significant financial and managerial resources, as well as be subject to fines or other government enforcement actions. Furthermore, the price of our stock could be adversely affected.
We may need additional capital in the future and such additional financing may not be available on favorable terms.
While we believe we have adequate working capital to meet our expected cash requirements for the next 12 months, we may need to raise additional funds through public or private debt or equity financings in the future for various purposes, including:
| | • | | Acquisitions of or strategic investments in complementary businesses or technologies; |
| | • | | International expansion; |
| | • | | Development of new products or services; |
| | • | | Unanticipated competitive pressures; and |
| | • | | Unexpected tax or litigation costs and settlements. |
Furthermore, because a significant portion of our investment portfolio consists of U.S. government and U.S. government sponsored entity securities, any default by the U.S. government in its obligations or any downgrade in the rating of U.S. government securities could adversely affect the value of our investment portfolio and our overall liquidity and the liquidity of our customers.
Any additional financing we may need may not be available on terms favorable to us, or at all. If adequate funds are not available or are not available on acceptable terms, we may not be able to take advantage of business opportunities, develop new products or services, or otherwise respond to unanticipated competitive pressures. In any such case, our business, results of operations, and financial condition could be materially adversely affected.
Changes in laws, regulations, and financial accounting standards may affect our reported results of operations.
As our common stock is publicly traded, we are subject to certain rules and regulations of federal, state and financial market exchange entities charged with the protection of investors and the oversight of companies whose securities are publicly traded. These entities, including the Public Company Accounting Oversight Board, the SEC, and NYSE have implemented requirements and regulations and continue developing additional regulations and requirements in response to corporate scandals and laws enacted by Congress, most notably the Sarbanes-Oxley Act of 2002. Our efforts to comply with these regulations have resulted in, and are likely to continue resulting in, increased general and administrative expenses and diversion of management time and attention from revenue-generating activities to compliance activities.
A change in accounting standards or practices and varying interpretations of existing accounting pronouncements, such as the increased use of fair value measures, proposed changes to revenue recognition, lease accounting, financial instruments and other accounting standards, and the potential requirement that U.S. registrants prepare financial statements in accordance with International Financial Reporting Standards (IFRS), could have a significant effect on our reported financial results or the way we conduct our business. Implementation of accounting regulations and related interpretations and policies, particularly those related to revenue and expense recognition, could cause us to defer revenue recognition or accelerate the timing of expense recognition, which would adversely affect our reported financial results, and could have an adverse effect on our stock price.
As new and modified laws, regulations, and standards are subject to varying interpretations in many cases due to their lack of specificity, their application in practice may evolve over time as new guidance is provided by regulatory and governing bodies. This evolution may result in continuing uncertainty regarding compliance matters and additional costs necessitated by ongoing revisions to our disclosure and governance practices.
Global warming issues may cause us to alter the way we conduct our business.
The general public is becoming more aware of global warming issues, and as a result, governments around the world are beginning to focus on addressing this issue. This may result in new environmental regulations that
29
may unfavorably impact us, our suppliers, and our customers in how we conduct our business including the design, development, and manufacturing of our products. The cost of meeting these requirements may have an adverse impact on our results of operations and financial condition.
| Item 1B. | Unresolved Staff Comments. |
None.
Our corporate offices and principal product development facilities are currently located in approximately 180,000 square feet of buildings in Costa Mesa, California. We lease facilities in California, Colorado, Massachusetts, Texas, Washington, Bangalore, India and Hyderabad, India primarily for engineering and development and approximately 11 other remote offices throughout the world, primarily for sales.
Our future facilities requirements will depend upon our business, but we believe additional space, if required, may be obtained on reasonable terms.
| Item 3. | Legal Proceedings. |
The information set forth under Note 10 in the notes to the consolidated financial statements under the caption “Litigation” included in Part IV, Item 15(a) of this Annual Report on Form 10-K is incorporated herein by reference.
| Item 4. | Mine Safety Disclosures |
Not applicable.
PART II
| Item 5. | Market for Registrant’s Common Equity, Related Stockholder Matters, and Issuer Purchases of Equity Securities. |
Principal Market and Prices
The Company’s common stock is traded on the New York Stock Exchange under the symbol ELX. The following table sets forth the high and low per share sales prices for our common stock for the indicated periods, as reported on the New York Stock Exchange.
| | | | | | | | |
| | | High | | | Low | |
2012 | | | | | | | | |
Fourth Quarter | | $ | 10.37 | | | $ | 6.45 | |
Third Quarter | | | 11.01 | | | | 7.03 | |
Second Quarter | | | 8.68 | | | | 6.01 | |
First Quarter | | | 9.20 | | | | 6.34 | |
2011 | | | | | | | | |
Fourth Quarter | | $ | 10.67 | | | $ | 8.08 | |
Third Quarter | | | 12.76 | | | | 9.93 | |
Second Quarter | | | 12.23 | | | | 10.09 | |
First Quarter | | | 10.58 | | | | 8.30 | |
Number of Common Stockholders
The approximate number of holders of record of our common stock as of August 20, 2012 was 448.
Dividends
We have never paid cash dividends on our common stock and do not anticipate paying any cash dividends in the foreseeable future. We currently intend to retain our earnings for the development of our business.
30
Issuer Purchases of Equity Securities
In early August 2008, our Board of Directors authorized a plan to repurchase up to $100.0 million of our outstanding common stock. In April 2009, upon receipt of an unsolicited takeover proposal and related tender offer from Broadcom Corporation to acquire us, our Board of Directors elected to temporarily suspend any activity under the share repurchase plan. In light of Broadcom allowing its tender offer to expire on July 14, 2009, Emulex’s Board of Directors elected to reactivate the $100.0 million share repurchase plan effective July 15, 2009. Through July 1, 2012, the Company has repurchased approximately 9.0 million shares of its common stock for an aggregate purchase price of approximately $78.4 million at an average purchase price of $8.67 per share under this plan. We may repurchase additional shares under this plan from time-to-time in open market purchases or privately negotiated transactions. The share repurchases will be financed by available cash balances and cash from operations.
| | | | | | | | | | | | | | | | |
Period | | Total
Number
of Shares
Purchased | | | Average
Price
Paid
per
Share | | | Total
Number of
Shares
Purchased
as Part of
Publicly
Announced
Plans
or Programs | | | Approximate
Dollar Value
of Shares
That May
Yet Be
Purchased
Under the
Plans
or Programs | |
April 2, 2012 — April 29, 2012 | | | — | | | | — | | | | — | | | $ | 21,619,430 | |
April 30, 2012 — May 27, 2012 | | | — | | | | — | | | | — | | | $ | 21,619,430 | |
May 28, 2012 — July 1, 2012 | | | — | | | | — | | | | — | | | $ | 21,619,430 | |
| | | | | | | | | | | | | | | | |
Total | | | — | | | | — | | | | — | | | $ | 21,619,430 | |
| | | | | | | | | | | | | | | | |
Sales of Unregistered Securities
There were no sales of unregistered securities for the three months ended July 1, 2012.
Equity Compensation Plan Information
See Part III, Item 12 — “Security Ownership of Certain Beneficial Owners and Management” of this Annual Report on Form 10-K for certain information regarding our equity compensation plans.
31
Stock Performance Graph
The graph below compares the cumulative total stockholder return on the Company’s common stock with the cumulative total return on the Standard & Poor’s 500 Index and the S&P 500 Computer Storage and Peripherals Index for the period of five fiscal years commencing July 2, 2007 and ended July 1, 2012.
COMPARISON OF FIVE-YEAR CUMULATIVE TOTAL RETURN*
EMULEX CORPORATION COMMON STOCK, S&P 500 INDEX AND
S&P 500 COMPUTER STORAGE AND PERIPHERALS INDEX
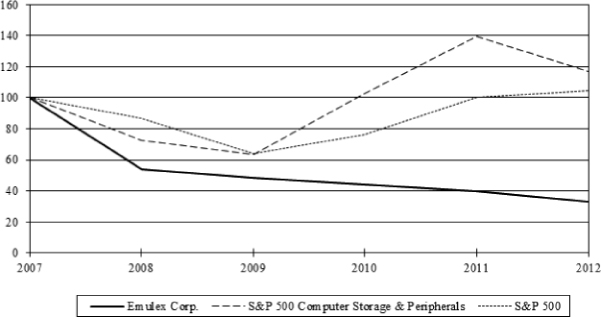
| * | Assumes the value of the investment in the Company’s common stock and each index was $100 on July 2, 2007. |
32
| Item 6. | Selected Financial Data. |
The following table summarizes certain selected consolidated financial data. On October 2, 2006, we completed the acquisition of Sierra Logic, Inc. (Sierra Logic) and on August 25, 2010, we completed the acquisition of ServerEngines Corporation (ServerEngines).
Selected Consolidated Statements of Operations Data
| | | | | | | | | | | | | | | | | | | | |
| | | Year Ended | |
| | | July 1,
2012 | | | July 3,
2011 | | | June 27,
2010 | | | June 28,
2009 | | | June 29,
2008 | |
| | | (In thousands, except per share data) | |
Net revenues: | | | | | | | | | | | | | | | | | | | | |
Network Connectivity Products | | $ | 362,315 | | | $ | 346,665 | | | $ | 289,990 | | | $ | 279,480 | | | $ | 352,504 | |
Storage Connectivity Products | | | 112,117 | | | | 80,024 | | | | 97,278 | | | | 85,333 | | | | 125,851 | |
Advanced Technology & Other Products | | | 27,337 | | | | 25,854 | | | | 11,882 | | | | 13,409 | | | | 9,946 | |
| | | | | | | | | | | | | | | | | | | | |
Total net revenues | | | 501,769 | | | | 452,543 | | | | 399,150 | | | | 378,222 | | | | 488,301 | |
| | | | | | | | | | | | | | | | | | | | |
Cost of sales: | | | | | | | | | | | | | | | | | | | | |
Cost of goods sold | | | 184,593 | | | | 167,280 | | | | 133,554 | | | | 127,545 | | | | 164,035 | |
Amortization of core and developed technology intangible assets | | | 24,031 | | | | 33,127 | | | | 18,904 | | | | 18,920 | | | | 23,042 | |
Patent litigation settlement, damages and sunset period royalties | | | 37,310 | | | | — | | | | — | | | | — | | | | — | |
| | | | | | | | | | | | | | | | | | | | |
Total cost of sales | | | 245,934 | | | | 200,407 | | | | 152,458 | | | | 146,465 | | | | 187,077 | |
| | | | | | | | | | | | | | | | | | | | |
Gross profit | | | 255,835 | | | | 252,136 | | | | 246,692 | | | | 231,757 | | | | 301,224 | |
| | | | | | | | | | | | | | | | | | | | |
Operating expenses: | | | | | | | | | | | | | | | | | | | | |
Engineering and development | | | 163,552 | | | | 170,845 | | | | 126,850 | | | | 129,795 | | | | 129,232 | |
Selling and marketing | | | 59,990 | | | | 58,635 | | | | 56,554 | | | | 53,460 | | | | 57,946 | |
General and administrative | | | 35,658 | | | | 56,133 | | | | 50,454 | | | | 41,888 | | | | 38,531 | |
Amortization of other intangible assets | | | 6,569 | | | | 9,334 | | | | 6,792 | | | | 5,337 | | | | 9,260 | |
In-process research and development impairment | | | — | | | | 6,000 | | | | — | | | | — | | | | — | |
| | | | | | | | | | | | | | | | | | | | |
Total operating expenses | | | 265,769 | | | | 300,947 | | | | 240,650 | | | | 230,480 | | | | 234,969 | |
| | | | | | | | | | | | | | | | | | | | |
Operating (loss) income | | | (9,934 | ) | | | (48,811 | ) | | | 6,042 | | | | 1,277 | | | | 66,255 | |
| | | | | | | | | | | | | | | | | | | | |
Non-operating income (expense), net: | | | | | | | | | | | | | | | | | | | | |
Interest income | | | 97 | | | | 96 | | | | 286 | | | | 4,362 | | | | 11,672 | |
Interest expense | | | (15 | ) | | | (373 | ) | | | (7 | ) | | | (29 | ) | | | (27 | ) |
Impairment of strategic investment | | | — | | | | (9,184 | ) | | | — | | | | — | | | | — | |
Other income (expense), net | | | 350 | | | | (575 | ) | | | 23 | | | | (4 | ) | | | 17 | |
| | | | | | | | | | | | | | | | | | | | |
Total non-operating income (expense), net | | | 432 | | | | (10,036 | ) | | | 302 | | | | 4,329 | | | | 11,662 | |
| | | | | | | | | | | | | | | | | | | | |
(Loss) income before income taxes | | | (9,502 | ) | | | (58,847 | ) | | | 6,344 | | | | 5,606 | | | | 77,917 | |
Income tax provision (benefit) | | | 1,578 | | | | 24,763 | | | | (17,276 | ) | | | (1,938 | ) | | | 84,988 | |
| | | | | | | | | | | | | | | | | | | | |
Net (loss) income | | $ | (11,080 | ) | | $ | (83,610 | ) | | $ | 23,620 | | | $ | 7,544 | | | $ | (7,071 | ) |
| | | | | | | | | | | | | | | | | | | | |
Net (loss) income per share: | | | | | | | | | | | | | | | | | | | | |
Basic | | $ | (0.13 | ) | | $ | (0.97 | ) | | $ | 0.29 | | | $ | 0.09 | | | $ | (0.09 | ) |
| | | | | | | | | | | | | | | | | | | | |
Diluted | | $ | (0.13 | ) | | $ | (0.97 | ) | | $ | 0.29 | | | $ | 0.09 | | | $ | (0.09 | ) |
| | | | | | | | | | | | | | | | | | | | |
Number of shares used in per share computations: | | | | | | | | | | | | | | | | | | | | |
Basic | | | 86,585 | | | | 86,038 | | | | 80,097 | | | | 80,770 | | | | 82,323 | |
| | | | | | | | | | | | | | | | | | | | |
Diluted | | | 86,585 | | | | 86,038 | | | | 81,282 | | | | 81,113 | | | | 82,323 | |
| | | | | | | | | | | | | | | | | | | | |
33
Selected Consolidated Balance Sheet Data
| | | | | | | | | | | | | | | | | | | | |
| | | Year Ended | |
| | | July 1,
2012 | | | July 3,
2011 | | | June 27,
2010 | | | June 28,
2009 | | | June 29,
2008 | |
| | | (In thousands) | |
Total current assets | | $ | 363,238 | | | $ | 302,152 | | | $ | 417,551 | | | $ | 406,553 | | | $ | 457,047 | |
Total current liabilities | | | 102,589 | | | | 71,242 | | | | 60,430 | | | | 52,240 | | | | 87,605 | |
| | | | | | | | | | | | | | | | | | | | |
Working capital | | | 260,649 | | | | 230,910 | | | | 357,121 | | | | 354,313 | | | | 369,442 | |
Total assets | | | 712,959 | | | | 702,839 | | | | 689,450 | | | | 658,918 | | | | 699,056 | |
Accumulated deficit | | | (467,140 | ) | | | (456,060 | ) | | | (372,450 | ) | | | (396,070 | ) | | | (403,614 | ) |
Total stockholders’ equity | | | 575,103 | | | | 588,691 | | | | 591,182 | | | | 569,444 | | | | 575,839 | |
| Item 7. | Management’s Discussion and Analysis of Financial Condition and Results of Operations. |
The following discussion and analysis should be read in conjunction with the “Selected Financial Data” included in Part I, Item 6, and the consolidated financial statements and the accompanying notes included in Part IV, Item 15 of this Annual Report on Form 10-K. This discussion and analysis contains certain forward-looking statements. The realization of which may be impacted by various factors including, but not limited to, the “Risk Factors” included in Part I, Item 1A of this Annual Report on Form 10-K.
Executive Overview
Emulex designs and markets high speed enterprise-class products that are used to connect servers and storage arrays. The world’s leading server and storage Original Equipment Manufacturers (OEMs) depend on our broad range of products to help build high performance, highly reliable, and scalable Fibre Channel Storage Area Networks (SAN) and Ethernet Converged Networking solutions.
Our Company operates within a single business segment that has two primary market-focused product lines. Beginning the first quarter of fiscal 2012, these primary product lines are Network Connectivity Products (NCP) and Storage Connectivity Products (SCP). We believe this new product line reporting is more consistent with how third party analysts view our addressable markets, and will provide a more transparent view of our business.
Customers in the NCP market use our industry standard Fibre Channel and Ethernet solutions to provide server Input/Output (I/O) and target storage array connectivity to create networks for mission critical enterprise and cloud data centers. These products enable servers to reliably and efficiently connect to Local Area Networks (LANs), SANs, and Network Attached Storage (NAS) by offloading data communication processing tasks from the server as information is delivered and sent to the network. Our products use industry standard protocols including Fibre Channel Protocol (FCP), Internet Protocol (IP), Transmission Control Protocol (TCP)/IP, Internet Small Computer System Interface (iSCSI), NAS, and Fibre Channel over Ethernet (FCoE).
Our Ethernet products include Universal Local Area Network on Motherboard application specific integrated circuits (ULOMs), OneConnect® Universal Converged Network Adapters (UCNAs), and custom form factor solutions for OEM blade servers that enable high performance, scalable networks and convergence. Our Fibre Channel based products include Fibre Channel application specific integrated circuits (ASICs), LightPulse® Host Bus Adaptors (HBAs), and custom form factor solutions for OEM blade servers.
SCP includes our InSpeed®, switch-on-a-chip (SOC) or backend connectivity, bridge, and router products. SCP are deployed inside storage arrays, tape libraries, and other storage appliances, and connect storage controllers to storage capacity, delivering improved performance, reliability, and connectivity. Our products use industry standard protocols including Fibre Channel, Serial Attached Small Computer Interface (SAS), and Serial Advanced Technology Attachment (SATA).
Our Advanced Technology and Other Products (ATP) category primarily consists of Integrated Baseboard Management Controllers (iBMC), OneCommand® Vision products, certain legacy products and other products and services.
34
We rely almost exclusively on OEMs and sales through distribution channels for our revenue. Our significant OEM customers include the world’s leading server and storage providers, including Cisco Systems, Inc. (Cisco), Dell Inc. (Dell), EMC Corporation (EMC), Fujitsu Ltd. (Fujitsu), Groupe Bull (Bull), Hewlett-Packard Company (Hewlett-Packard), Hitachi Data Systems (HDS), Hitachi Limited (Hitachi), Huawei Technologies Company Ltd. (Huawei), Intel Corporation (Intel), International Business Machines Corporation (IBM), NEC Corporation (NEC), Network Appliance, Inc. (NetApp), Oracle Corporation (Oracle), Quantum Corporation (Quantum), Unisys Corporation (Unisys), and Xyratex Ltd. (Xyratex). Our significant distributors include ASI Computer Technologies, Inc. (ASI), Avnet, Inc. (Avnet), Digital China Technology Limited, Info X Distribution, LLC (Info X), Ingram Micro Inc. (Ingram Micro), Macnica Networks Corporation (Macnica), Netmarks Inc. (Netmarks), SYNNEX Corporation (SYNNEX), Tech Data Corporation (Tech Data), and Tokyo Electron Device Ltd. (TED). The market for networking infrastructure solutions is concentrated among large OEMs, and as such, a significant portion of our revenues are generated from sales to a limited number of customers.
As of July 1, 2012, we had a total of 1,011 employees.
We use a 52 to 53 week fiscal year that ends on the Sunday nearest to June 30. Therefore, every fifth or sixth fiscal year will be a 53-week fiscal year. The last 53 week fiscal year was fiscal 2011.
Consolidation of Facilities
During fiscal 2011, we commenced the consolidation of certain leased facilities in Colorado and Washington. The consolidation of facilities was completed during the first quarter of fiscal 2012. Total charges related to the facility consolidation and related workforce reductions were approximately $4.2 million, of which $1.1 million was recorded in fiscal 2012 and $3.1 million was recorded in fiscal 2011. The charges consisted primarily of salaries and benefits based on continuous employment of affected employees through the facility closure dates. In fiscal 2012, the charges were comprised of salaries and benefits expense of approximately $0.4 million, acceleration of rent expense of approximately $0.5 million, and other costs of approximately $0.2 million. In fiscal 2011, the charges were comprised of salaries and benefits expense of approximately $2.6 million, acceleration of fixed assets depreciation expense of approximately $0.3 million, and other costs of approximately $0.2 million.
Business Combination
On August 25, 2010, we acquired 100% of the outstanding common shares of ServerEngines Corporation (ServerEngines), a privately-held, fabless semiconductor company located in Sunnyvale, California. The combination of Emulex and ServerEngines’ technology create a unique offering to deliver I/O connectivity for converged networking solutions, including adapters, mezzanine cards and LAN on Motherboard (LOM) solutions. In addition, the acquisition adds the ServerEngines’ Pilot™ family of Baseboard Management Controllers, which reside on the motherboard, enabling remote IP based “lights out” management capabilities.
Patent Litigation
Broadcom Corporation (Broadcom) filed a consolidated patent infringement suit against us during fiscal 2010. After a nearly three week trial that ended October 6, 2011, the jury reached a partial verdict involving two out of the six patents. The Court determined that one of the patents (U.S. Patent 7,058,150) [the ‘150 patent] had been infringed by us, and the jury rendered an advisory verdict on October 12, 2011 to the Court that the ‘150 patent is not invalid, and awarded approximately $0.4 million in damages related to that patent. The jury reached a unanimous verdict of non-infringement on another patent relating to Emulex Fibre Channel switch products. A mistrial was declared on the remaining four patents (including U.S. Patent 6,424,194 [the ‘194 patent]) for which no unanimous verdict was reached. Subsequent to the trial, the Court issued orders consistent with the advisory verdicts of invalidity, and issued an order that one additional patent (U.S. Patent 7,471,691) [the ‘691 patent] had been infringed by us. On March 16, 2012, the Court issued a decision concerning injunctive relief for the ‘150 and the ‘691 patents. The decision provided, in part, for a sunset period of 18 months relating to the ‘150 patent, starting on October 12, 2011. The decision further provided for a sunset period of 18 months relating to the ‘691 patent, starting on December 16, 2011. The sunset period allows Emulex to sell the affected products to existing customers for specific customer devices, subject to limitations relating to when the products had been qualified
35
by the customers and when certain firm orders had been placed. The decision further provided for Emulex to pay a royalty of nine percent on all sales of such products made during the sunset period. The decision also clarified that foreign sales (outside the U.S.) are beyond the scope of the suit. On April 3, 2012, the Court issued a Permanent Injunction which, with respect to both the ‘150 and ‘691 patents, further describe the prohibited activities, contain sunset provision terms including royalty rates and computations, limit the territory to allow sales of products that are manufactured outside the U.S. to customers located outside the U.S., permit design around efforts including modifications and design, development, and testing to eliminate infringement, and permit service and technical support for certain products. On April 4, 2012, we filed a notice of appeal for both the ‘150 patent and ‘691 patent infringement findings.
On July 3, 2012, we entered into a Patent License and Release Agreement (Settlement Agreement) with Broadcom pursuant to which both parties agreed to settle and release certain claims related to the patent infringement litigation. The Settlement Agreement provided for certain amendments to the April 3, 2012 Permanent Injunction, and dismissals of certain allegations of the lawsuit, including portions of the scheduled re-trial. We also received a worldwide limited license to the ‘691 patent, the ‘150 patent, the ‘194 patent and related families for certain fields of use including Fibre Channel applications. Under the terms of the Settlement Agreement, we paid to Broadcom a lump sum release and license fee of $58.0 million in cash subsequent to fiscal 2012. On July 18, 2012, pursuant to the Settlement Agreement, the Court issued an amended Permanent Injunction with an amended appendix and approved a stipulation to dismiss certain allegations in the lawsuit in light of the Settlement Agreement.
During fiscal 2012, we accrued approximately $0.4 million in damages related to the October 12, 2011 verdict and approximately $0.1 million of sunset period royalty liability related to the July 18, 2012 amended injunction. At the end of fiscal 2012, we also accrued $36.8 million to cost of goods sold pursuant to the Settlement Agreement related to settlement costs for our past sales of products. The remaining $21.2 million of the $58.0 million settlement payment was determined to be related to patent license fees forour expected future sales of products and will be recorded as prepaid license fees in fiscal 2013 when the payment is made, and amortized to cost of goods sold over the license term in proportion to the estimated future revenues to such licensed technology.
We expect to incur incremental mitigation, product redesign and appeal related expenses during the next 12 months related to the unsettled infringement findings in the range of $15 million — $20 million. Engineering and development costs will include expenses for activities to redesign, design around, modify, design, develop, test and requalify certain of our affected products during the sunset period, and to implement our end of life processes in the U.S. for certain other affected products. Sales and marketing costs are likely to include expenses for customer support, pre-production samples, education and training, and other miscellaneous costs. General and administrative costs will include expenses for our appeal of the previous verdicts and judgments. See Note 10 in the notes to the consolidated financial statements under the caption “Litigation” in Part IV, Item 15(a) of this Annual Report on Form 10-K.
36
Results of Operations for Emulex Corporation and Subsidiaries
The following discussion and analysis should be read in conjunction with the selected consolidated financial data set forth in Item 6 — “Selected Consolidated Financial Data,” and our Consolidated Financial Statements and notes thereto included elsewhere in this Annual Report on Form 10-K. All references to years refer to our fiscal years ended July 1, 2012, July 3, 2011, and June 27, 2010, as applicable, unless the calendar year is specified. The following table sets forth certain financial data for the years indicated as a percentage of net revenues.
| | | | | | | | | | | | |
| | | Percentage of Net Revenues | |
| | | 2012 | | | 2011 | | | 2010 | |
Net revenues: | | | | | | | | | | | | |
Network Connectivity Products | | | 72 | % | | | 76 | % | | | 73 | % |
Storage Connectivity Products | | | 22 | | | | 18 | | | | 24 | |
Advanced Technology & Other Products | | | 6 | | | | 6 | | | | 3 | |
| | | | | | | | | | | | |
Total net revenues | | | 100 | | | | 100 | | | | 100 | |
| | | | | | | | | | | | |
Cost of sales: | | | | | | | | | | | | |
Cost of goods sold | | | 37 | | | | 37 | | | | 33 | |
Amortization of core and developed technology intangible assets | | | 5 | | | | 7 | | | | 5 | |
Patent litigation settlement, damages and sunset period royalties | | | 7 | | | | — | | | | — | |
| | | | | | | | | | | | |
Total cost of sales | | | 49 | | | | 44 | | | | 38 | |
| | | | | | | | | | | | |
Gross profit | | | 51 | | | | 56 | | | | 62 | |
| | | | | | | | | | | | |
Operating expenses: | | | | | | | | | | | | |
Engineering and development | | | 33 | | | | 38 | | | | 32 | |
Selling and marketing | | | 12 | | | | 13 | | | | 14 | |
General and administrative | | | 7 | | | | 13 | | | | 12 | |
Amortization of other intangible assets | | | 1 | | | | 2 | | | | 2 | |
In process research and development impairment | | | — | | | | 1 | | | | — | |
| | | | | | | | | | | | |
Total operating expenses | | | 53 | | | | 67 | | | | 60 | |
| | | | | | | | | | | | |
Operating (loss) income | | | (2 | ) | | | (11 | ) | | | 2 | |
| | | | | | | | | | | | |
Non-operating income (expense), net: | | | | | | | | | | | | |
Interest income | | | — | | | | — | | | | — | |
Interest expense | | | — | | | | ��� | | | | — | |
Impairment of strategic investment | | | — | | | | (2 | ) | | | — | |
Other income (expense), net | | | — | | | | — | | | | — | |
| | | | | | | | | | | | |
Total non-operating income (expense), net | | | — | | | | (2 | ) | | | — | |
| | | | | | | | | | | | |
(Loss) income before income taxes | | | (2 | ) | | | (13 | ) | | | 2 | |
Income tax provision (benefit) | | | — | | | | 5 | | | | (4 | ) |
| | | | | | | | | | | | |
Net (loss) income | | | (2 | )% | | | (18 | )% | | | 6 | % |
| | | | | | | | | | | | |
Fiscal 2012 versus Fiscal 2011
Net Revenues. Net revenues for fiscal 2012 increased approximately $49.2 million, or 11%, to approximately $501.8 million, compared to approximately $452.5 million in fiscal 2011.
37
Net Revenues by Product Line
The following chart details our net revenues by product line for fiscal years 2012 and 2011:
| | | | | | | | | | | | | | | | | | | | | | | | |
| | | Net Revenues by Product Line | |
| | | 2012 | | | Percentage of
Net Revenues | | | 2011 | | | Percentage of
Net Revenues | | | Increase/
(Decrease) | | | Percentage
Change | |
| | | (Dollars in thousands) | |
Network Connectivity Products | | $ | 362,315 | | | | 72 | % | | $ | 346,665 | | | | 76 | % | | $ | 15,650 | | | | 5 | % |
Storage Connectivity Products | | | 112,117 | | | | 22 | % | | | 80,024 | | | | 18 | % | | | 32,093 | | | | 40 | % |
Advanced Technology & Other Products | | | 27,337 | | | | 6 | % | | | 25,854 | | | | 6 | % | | | 1,483 | | | | 6 | % |
| | | | | | | | | | | | | | | | | | | | | | | | |
Total net revenues | | $ | 501,769 | | | | 100 | % | | $ | 452,543 | | | | 100 | % | | $ | 49,226 | | | | 11 | % |
| | | | | | | | | | | | | | | | | | | | | | | | |
NCP primarily consists of standup HBAs, mezzanine cards, I/O ASICs, ULOMs, and UCNAs. For fiscal year 2012, our Fibre Channel based products accounted for approximately 75% of total NCP revenues, however, our Ethernet based products revenue grew by more than 70% compared to fiscal 2011. The increase in our NCP net revenue for fiscal 2012 compared to fiscal 2011 was primarily due to an increase in units shipped of approximately 17% which was partially offset by a decrease in average selling price of approximately 11%. We expect our NCP revenue to continue to grow in fiscal 2013 primarily due to sales of converged network products.
SCP primarily consists of our InSpeed®, SOC or backend connectivity, and bridge and router products. The 40% increase in our SCP net revenue in fiscal 2012 compared to fiscal 2011 was primarily due to a ramp in shipments related to previously awarded design wins for certain bridging products and last time buys of certain end-of-life legacy products driving an increase in units shipped of approximately 48%. This increase in unit volume was partially offset by a decrease in average selling price of approximately 5%. We expect our SCP revenue to return to normal levels in fiscal 2013, and primarily relate to bridging products.
ATP primarily consists of our iBMCs, which are products previously sold by ServerEngines prior to our acquisition on August 25, 2010, OneCommand® Vision software products, certain legacy products and other products and services. For fiscal 2012, our iBMC based products accounted for the majority of total ATP revenues. The increase in our ATP revenue in fiscal 2012 was primarily due to an increase in units shipped of approximately 22%, partially offset by a decrease in average selling price of approximately 13%.
Net Revenues by Major Customers
In addition to direct sales, some of our larger OEM customers purchase or market products indirectly through distributors, resellers or other third parties. If these indirect sales are purchases of customer-specific models, we are able to track these sales. However, if these indirect sales are purchases of our standard models, we are not able to distinguish them by OEM customer. Customers whose direct net revenues, or total direct and indirect net revenues (including customer-specific models purchased or marketed indirectly through distributors, resellers and other third parties), exceeded 10% of our fiscal year net revenues were as follows:
| | | | | | | | | | | | | | | | |
Net Revenues by Major Customers | |
| | | Direct
Revenues | | | Total Direct
and Indirect
Revenues(2) | |
| | | 2012 | | | 2011 | | | 2012 | | | 2011 | |
Net revenue percentage(1) | | | | | | | | | | | | | | | | |
OEM: | | | | | | | | | | | | | | | | |
Hewlett-Packard | | | 22 | % | | | 19 | % | | | 24 | % | | | 21 | % |
IBM | | | 32 | % | | | 25 | % | | | 37 | % | | | 34 | % |
| (1) | Amounts less than 10% are not presented. |
38
| (2) | Customer-specific models purchased or marketed indirectly through distributors, resellers, and other third parties are included with the OEM’s revenues in these columns rather than as revenue for the distributors, resellers or other third parties. |
Direct sales to our top five customers accounted for approximately 70% and 64% of total net revenues for fiscal years 2012 and 2011, respectively. Direct and indirect sales to our top five customers accounted for approximately 81% and 79% of total net revenues for fiscal years 2012 and 2011, respectively. We believe the continued increase in the concentration of net revenues to our top customers is a result of the continuing consolidation of companies in our markets. Our net revenues from customers can be significantly impacted by changes to our customers’ business and their business models.
Net Revenues by Sales Channel
Net revenues by sales channel were as follows:
| | | | | | | | | | | | | | | | | | | | | | | | |
| | | Net Revenues by Sales Channel | |
| | | 2012 | | | Percentage of
Net Revenues | | | 2011 | | | Percentage of
Net Revenues | | | Increase/
(Decrease) | | | Percentage
Change | |
| | | (Dollars in thousands) | |
OEM | | $ | 455,141 | | | | 91 | % | | $ | 392,144 | | | | 87 | % | | $ | 62,997 | | | | 16 | % |
Distribution | | | 46,385 | | | | 9 | % | | | 60,364 | | | | 13 | % | | | (13,979 | ) | | | (23 | )% |
Other | | | 243 | | | | — | | | | 35 | | | | — | | | | 208 | | | | 594 | % |
| | | | | | | | | | | | | | | | | | | | | | | | |
Total net revenues | | $ | 501,769 | | | | 100 | % | | $ | 452,543 | | | | 100 | % | | $ | 49,226 | | | | 11 | % |
| | | | | | | | | | | | | | | | | | | | | | | | |
The increase in OEM net revenues for fiscal 2012 compared to fiscal 2011 was primarily due to an increase of approximately 42% in SCP revenues combined with an increase of approximately 10% in NCP revenues generated through our OEMs. The decrease in distribution net revenues for fiscal 2012 compared to fiscal 2011 was primarily due to a decrease of approximately 21% in NCP net revenues generated through distribution partners. We believe that our net revenues are driven by product certifications and qualifications with our OEM customers, which take products directly and indirectly through distribution and contract manufacturers. We view product certifications and qualifications as an important indicator of future revenue opportunities and growth for the Company. However, product certifications and qualifications do not necessarily ensure continued market acceptance of our products by our OEM customers. It is also very difficult to determine the future impact, if any, of product certifications and qualifications on our revenues.
Net Revenues by Geographic Territory
Our net revenues by geographic territory based on billed-to location were as follows:
| | | | | | | | | | | | | | | | | | | | | | | | |
| | | Net Revenues by Geographic Territory | |
| | | 2012 | | | Percentage of
Net Revenues | | | 2011 | | | Percentage of
Net Revenues | | | Increase/
(Decrease) | | | Percentage
Change | |
| | | (Dollars in thousands) | |
Asia Pacific | | $ | 286,572 | | | | 57 | % | | $ | 226,877 | | | | 50 | % | | $ | 59,695 | | | | 26 | % |
United States | | | 137,504 | | | | 28 | % | | | 135,900 | | | | 30 | % | | | 1,604 | | | | 1 | % |
Europe, Middle East, and Africa | | | 76,394 | | | | 15 | % | | | 83,751 | | | | 19 | % | | | (7,357 | ) | | | (9 | )% |
Rest of the world | | | 1,299 | | | | — | | | | 6,015 | | | | 1 | % | | | (4,716 | ) | | | (78 | )% |
| | | | | | | | | | | | | | | | | | | | | | | | |
Total net revenues | | $ | 501,769 | | | | 100 | % | | $ | 452,543 | | | | 100 | % | | $ | 49,226 | | | | 11 | % |
| | | | | | | | | | | | | | | | | | | | | | | | |
We believe the decrease in Europe, Middle East, Africa and rest of the world net revenues and the increase in Asia Pacific net revenues in fiscal 2012 compared to fiscal 2011 was primarily due to our OEM customers continuing to migrate production to contract manufacturers located predominantly in Asia Pacific. However, as we sell to OEMs and distributors who ultimately resell our products to their customers, the geographic mix of our net revenues may not be reflective of the geographic mix of end-user demand or installations.
39
Gross Profit. Gross profit consists of net revenues less cost of sales. Our gross profit for fiscal 2012 and fiscal 2011 were as follows (in thousands):
| | | | | | | | | | |
Gross Profit |
2012 | | Percentage of Net Revenues | | 2011 | | Percentage of Net Revenues | | Increase/ (Decrease) | | Percentage Points Change |
$255,835 | | 51% | | $252,136 | | 56% | | $3,699 | | (5)% |
Cost of sales includes the cost of producing, supporting, and managing our supply of quality finished products. Cost of sales also included approximately $24.0 million and $33.1 million of amortization of technology intangible assets for fiscal 2012 and fiscal 2011, respectively, with approximately $20.6 million and $17.0 million being related to the ServerEngines acquisition for fiscal 2012 and fiscal 2011, respectively. Approximately $1.3 million and $1.7 million of share-based compensation expense was included in cost of sales for fiscal 2012 and fiscal 2011, respectively. Our gross margin percentage for fiscal 2012 was unfavorably impacted by the patent litigation settlement expense of approximately $36.8 million related to the Settlement Agreement entered into with Broadcom on July 3, 2012 (See Note 10), approximately $0.4 million of patent litigation damages as a result of the jury’s determination rendered on October 12, 2011, and approximately $0.1 million of sunset period royalty expense related to the July 18, 2012 amended injunction. During fiscal 2012, we also incurred approximately $2.3 million of additional expedite and freight charges in connection with our activities to mitigate the impact of the October 2011 flooding in Thailand that affected one of our contract manufacturers. The additional expenses in fiscal 2012 were partially offset by higher volume and favorable product mix. We will continue to recognize license fee amortization related to the Settlement Agreement entered into with Broadcom on July 3, 2012, over the remaining patent license term and sunset period royalties expense related to the amended injunction during fiscal 2013. However, we do not expect to incur any significant costs related to the Thailand flood mitigation activities going forward. We also expect the trend toward increased sales of lower margin products to continue in the future.
Engineering and Development. Engineering and development expenses consisted primarily of salaries and related expenses for personnel engaged in the design, development, and support of our products. These expenses included third-party fees paid to consultants, prototype development expenses, and computer service costs related to supporting computer tools used in the design process. Expenses for fiscal 2012 and fiscal 2011 were as follows (in thousands):
| | | | | | | | | | |
Engineering and Development |
2012 | | Percentage of Net Revenues | | 2011 | | Percentage of Net Revenues | | Increase/ (Decrease) | | Percentage Points Change |
$163,552 | | 33% | | $170,845 | | 38% | | $(7,293) | | (5)% |
Engineering and development expenses for fiscal 2012 compared to fiscal 2011 decreased approximately $7.3 million, or 4%. Approximately $11.9 million and $16.1 million of share-based compensation expense was included in engineering and development costs for fiscal 2012 and fiscal 2011, respectively, with approximately $4.0 million and $6.3 million being related to the ServerEngines acquisition in fiscal 2012 and fiscal 2011, respectively. Engineering and development headcount increased to 657 at the end of fiscal 2012 from 617 at the end of fiscal 2011. The increase in headcount resulted in a net increase of approximately $1.8 million in salary and related expenses primarily due to recognizing one full year of salary and related expenses from the ServerEngines acquisition in fiscal 2012 compared to approximately 10 months of salary and related expenses in fiscal 2011. The decrease in expenses compared to fiscal 2011 was also due to lower non-recurring engineering, prototypes, and related costs associated with new product development of approximately $2.4 million and lower depreciation of approximately $2.0 million. As a result of the Permanent Injunction granted by the Court to Broadcom on March 16, 2012, which was later amended on July 18, 2012, we expect to incur incremental engineering and development expenses to redesign our impacted products over the next 12 months. See “Patent Litigation” elsewhere in Part II, Item 7 of this Annual Report on Form 10-K.
40
Selling and Marketing. Selling and marketing expenses consisted primarily of salaries, commissions, and related expenses for personnel engaged in the marketing and sales of our products, as well as trade shows, product literature, promotional support costs, and other advertising related costs. Expenses for fiscal 2012 and fiscal 2011 were as follows (in thousands):
| | | | | | | | | | |
Selling and Marketing |
2012 | | Percentage of Net Revenues | | 2011 | | Percentage of Net Revenues | | Increase/ (Decrease) | | Percentage Points Change |
$59,990 | | 12% | | $58,635 | | 13% | | $1,355 | | (1)% |
Selling and marketing expenses for fiscal 2012 compared to fiscal 2011 increased approximately $1.4 million, or 2%. Approximately $3.6 million and $5.1 million of share-based compensation expense was included in selling and marketing costs for fiscal 2012 and 2011, respectively. Selling and marketing headcount increased to 150 at the end of fiscal 2012 from 142 at the end of fiscal 2011. The increase in headcount resulted in a net increase of approximately $1.0 million in salary and related expenses compared to fiscal 2011. The remaining change in selling and marketing expenses in fiscal 2012 was primarily due to an increase in marketing and advertising costs of approximately $1.3 million and an increase in performance based compensation of approximately $0.9 million. As a result of the Permanent Injunction granted by the Court to Broadcom on March 16, 2012, which was later amended on July 18, 2012, we expect to incur incremental sales and marketing expenses to requalify and recertify our impacted products with customers over the next 12 months. See “Patent Litigation” elsewhere in Part II, Item 7 of this Annual Report on Form 10-K.
General and Administrative. Ongoing general and administrative expenses consisted primarily of salaries and related expenses for executives, financial accounting support, human resources, administrative services, professional fees, and other corporate expenses. Expenses for fiscal 2012 and fiscal 2011 were as follows (in thousands):
| | | | | | | | | | |
General and Administrative |
2012 | | Percentage of Net Revenues | | 2011 | | Percentage of Net Revenues | | Increase/ (Decrease) | | Percentage Points Change |
$35,658 | | 7% | | $56,133 | | 13% | | $(20,475) | | (6)% |
General and administrative expenses for fiscal 2012 compared to fiscal 2011 decreased approximately $20.5 million, or 36%. Approximately $5.4 million and $16.4 million of share-based compensation expense was included in general and administrative costs for fiscal 2012 and 2011, respectively, with approximately $0.1 million and $10.4 million being related to the ServerEngines acquisition in fiscal 2012 and fiscal 2011, respectively. The remaining decrease was primarily due to lower litigation costs of approximately $9.4 million, which included reimbursements received from our suppliers related to the Broadcom litigation of approximately $2.4 million, and the non-recurrence of acquisition related costs that were incurred in fiscal 2011 for the acquisition of ServerEngines of approximately $1.5 million. General and administrative headcount decreased to 136 at the end of fiscal 2012 compared to 144 at the end of fiscal 2011. Although headcount decreased at the end of fiscal 2012, salary and related expenses increased approximately $0.4 million.
Amortization of Other Intangible Assets. Amortization of other intangible assets consisted of amortization of intangible assets such as patents, customer relationships, and tradenames with estimable lives. Our amortization expense for fiscal 2012 and fiscal 2011 were as follows (in thousands):
| | | | | | | | | | |
Amortization of Other Intangible Assets |
2012 | | Percentage of Net Revenues | | 2011 | | Percentage of Net Revenues | | Increase/ (Decrease) | | Percentage Points Change |
$6,569 | | 1% | | $9,334 | | 2% | | $(2,765) | | (1)% |
Amortization of other intangible assets for fiscal 2012 compared to fiscal 2011 decreased approximately $2.8 million, or 30%. The decrease was primarily due to a lower intangible assets balance in fiscal 2012 as a result of certain intangible assets being fully amortized during fiscal 2012.
41
In-Process Research and Development Impairment. In process research and development impairment represents the impairment charge for an in-process research and development intangible asset. Our impairment of in process research and development for fiscal 2012 and fiscal 2011 was as follows (in thousands):
| | | | | | | | | | |
Impairment of Other Intangible Assets |
2012 | | Percentage of Net Revenues | | 2011 | | Percentage of Net Revenues | | Increase/ (Decrease) | | Percentage Points Change |
$— | | —% | | $6,000 | | 1% | | $(6,000) | | (1)% |
We did not record any impairment charges for in-process research and development (IPR&D) in fiscal 2012. In fiscal 2011, the business climate for the product associated with the IPR&D from the acquisition of a privately-held company in fiscal 2010, deteriorated significantly as the technology was no longer expected to be designed into customer products and was determined to be other than temporary and thus, the entire amount of the IPR&D of approximately $6.0 million was impaired in fiscal 2011.
Non-operating Income (Expense), net. Non-operating income (expense), net, consisted primarily of interest income, interest expense, and other non-operating income and expense items. Our non-operating (expense) income, net for fiscal 2012 and fiscal 2011 was as follows (in thousands):
| | | | | | | | | | |
Non-operating (Expense) Income, Net |
2012 | | Percentage of Net Revenues | | 2011 | | Percentage of Net Revenues | | Increase/ (Decrease) | | Percentage Points Chang |
$432 | | —% | | $(10,036) | | (2)% | | $10,468 | | 2% |
Our non-operating income (expense), net, for fiscal 2012 compared to fiscal 2011 increased approximately $10.5 million, or 104%. The increase in non-operating income (expense), net was primarily due to a non-recurring impairment charge of approximately $9.2 million related to our equity investment in a privately-held company in fiscal 2011. In fiscal 2011, the business climate of the privately-held company deteriorated significantly as the technology was no longer expected to be designed into customer products and was determined to be other than temporary and thus, the fair value of the privately-held company was deemed to be zero. As a result, the entire investment of approximately $9.2 million in the privately-held company was impaired. In addition, the net increase was also due the absence of a one-time charge recorded in fiscal 2011 for the settlement of our notes receivable from ServerEngines in connection with the acquisition in August 2010, as required by the authoritative guidance for business combinations of approximately $0.4 million.
Income taxes. Our income tax provision for fiscal 2012 and fiscal 2011 was as follows (in thousands):
| | | | | | | | | | |
Income Taxes |
2012 | | Percentage of Net Revenues | | 2011 | | Percentage of Net Revenues | | Increase/ (Decrease) | | Percentage Points Change |
$1,578 | | —% | | $24,763 | | 5% | | $(23,185) | | (5)% |
Our effective tax expense rate was approximately 17% and 42% for fiscal 2012 and fiscal 2011, respectively. Our effective tax rate was lower than the U.S. federal statutory rate primarily due to the majority of our earnings were generated from countries other than the U.S., including India, Ireland, and Isle of Man, where such earnings are generally subject to significantly lower tax rates than the U.S. We expect this trend to continue in the future. We have made no provision for U.S. income taxes or foreign withholding taxes on the earnings of our foreign subsidiaries as these amounts are intended to be indefinitely reinvested in operations outside the U.S.
The decrease in our income tax expense rate was primarily due to a platform contribution transaction entered into by our U.S. and international subsidiaries during fiscal 2011 that resulted in incremental U.S. tax expense of approximately $36.7 million. In addition, income taxes decreased in fiscal 2012 due to a reduction in non-deductible stock-based compensation expense related to the ServerEngines acquisition. During fiscal 2012 and fiscal 2011, the Company recorded a valuation allowance against certain U.S. federal and state deferred tax assets that impacted tax expense by approximately $14.6 million and $17.3 million, respectively, based on our determination of the amount of deferred tax assets that were more likely than not to be realized.
42
As a result of the global scope of our operations and the complexity of global tax and transfer pricing rules and regulations, the tax liabilities in each of the countries in which we operate may differ materially from our estimates and impact our expected tax rate in the future. In addition, our future effective tax rate may be impacted by other items including newly enacted tax legislation, stock-based compensation, uncertain tax positions and examinations by various tax authorities.
Fiscal 2011 versus Fiscal 2010
Net Revenues. Net revenues for fiscal 2011 increased approximately $53.4 million, or 13%, to approximately $452.5 million, compared to approximately $399.1 million in fiscal 2010. Since the acquisition date in fiscal 2011, we have recorded approximately $15.7 million in revenues related to the ServerEngines business in our consolidated net revenues.
Net Revenues by Product Line
The following chart details our net revenues by product line for fiscal years 2011 and 2010:
| | | | | | | | | | | | | | | | | | | | | | | | |
| | | Net Revenues by Product Line | |
| | | 2011 | | | Percentage of
Net Revenues | | | 2010 | | | Percentage of
Net Revenues | | | Increase/
(Decrease) | | | Percentage
Change | |
| | | (Dollars in thousands) | |
Network Connectivity Products | | $ | 346,665 | | | | 76 | % | | $ | 289,990 | | | | 73 | % | | $ | 56,675 | | | | 20 | % |
Storage Connectivity Products | | | 80,024 | | | | 18 | % | | | 97,278 | | | | 24 | % | | | (17,254 | ) | | | (18 | )% |
Advanced Technology & Other Products | | | 25,854 | | | | 6 | % | | | 11,882 | | | | 3 | % | | | 13,972 | | | | 118 | % |
| | | | | | | | | | | | | | | | | | | | | | | | |
Total net revenues | | $ | 452,543 | | | | 100 | % | | $ | 399,150 | | | | 100 | % | | $ | 53,393 | | | | 13 | % |
| | | | | | | | | | | | | | | | | | | | | | | | |
Fibre Channel based products accounted for approximately 85% of our total NCP revenues in fiscal 2011. However, our Ethernet based products revenue within NCP grew by more than 200% compared to fiscal 2010. The increase in our NCP revenue in fiscal 2011 compared to fiscal 2010 was primarily due to an increase in units shipped of approximately 68%, partially offset by a decrease in average selling price of approximately 29%. The significant increase in units shipped and decrease in average selling price was primarily due to the inclusion of sales resulting from the acquisition of ServerEngines on August 25, 2010, which accounted for no revenues in the prior year and the products of which had a significantly lower average selling price compared to other Emulex products, as well as significant increased unit shipments of ULOM and UCNA products.
Within SCP, Bridging products revenue declined by more than 15% in fiscal 2011. The decrease in our SCP net revenue in fiscal compared to fiscal 2010 was primarily due to a decrease in units shipped of approximately 13% combined with a decrease in average selling price of approximately 6%.
For fiscal 2011, our iBMC based products accounted for the majority of total ATP revenues. The increase in our ATP revenue in fiscal 2011 was primarily due to an increase in units shipped of approximately 1,564%, partially offset by a decrease in average selling price of approximately 87%. The significant increase in units shipped and decrease in average selling price was primarily due to the inclusion of sales resulting from the acquisition of ServerEngines on August 25, 2010, which accounted for no revenues in the prior year and the products of which had a significantly lower average selling price compared to other Emulex products.
43
Net Revenues by Major Customers
Customers whose direct net revenues, or total direct and indirect net revenues (including customer-specific models purchased or marketed indirectly through distributors, resellers and other third parties), exceeded 10% of our fiscal year net revenues were as follows:
| | | | | | | | | | | | | | | | |
Net Revenues by Major Customers | |
| | | Direct
Revenues | | | Total Direct
and Indirect
Revenues(2) | |
| | | 2011 | | | 2010 | | | 2011 | | | 2010 | |
Net revenue percentage(1) | | | | | | | | | | | | | | | | |
OEM: | | | | | | | | | | | | | | | | |
EMC | | | — | | | | — | | | | — | | | | 12 | % |
Hewlett-Packard | | | 19 | % | | | 13 | % | | | 21 | % | | | 14 | % |
IBM | | | 25 | % | | | 22 | % | | | 34 | % | | | 31 | % |
| (1) | Amounts less than 10% are not presented. |
| (2) | Customer-specific models purchased indirectly through distributors, resellers, and other third parties are included with the OEM’s revenues in these columns rather than as revenue for the distributors, resellers or other third parties. |
Direct sales to our top five customers accounted for approximately 64% and 58% of total net revenues for fiscal years 2011 and 2010, respectively. Direct and indirect sales to our top five customers accounted for approximately 79% and 72% of total net revenues for fiscal years 2011 and 2010, respectively. Our net revenues from customers can be significantly impacted by changes to our customers’ business and their business models.
Net Revenues by Sales Channel
Net revenues by sales channel were as follows:
| | | | | | | | | | | | | | | | | | | | | | | | |
| | | Net Revenues by Sales Channel | |
| | | 2011 | | | Percentage of
Net Revenues | | | 2010 | | | Percentage of
Net Revenues | | | Increase/
(Decrease) | | | Percentage
Change | |
| | | (Dollars in thousands) | |
OEM | | $ | 392,144 | | | | 87 | % | | $ | 335,122 | | | | 84 | % | | $ | 57,022 | | | | 17 | % |
Distribution | | | 60,364 | | | | 13 | % | | | 63,681 | | | | 16 | % | | | (3,317 | ) | | | (5 | )% |
Other | | | 35 | | | | — | | | | 347 | | | | — | | | | (312 | ) | | | (90 | )% |
| | | | | | | | | | | | | | | | | | | | | | | | |
Total net revenues | | $ | 452,543 | | | | 100 | % | | $ | 399,150 | | | | 100 | % | | $ | 53,393 | | | | 13 | % |
| | | | | | | | | | | | | | | | | | | | | | | | |
The increase in OEM net revenues for fiscal 2011 compared to fiscal 2010 was primarily due to an increase of approximately 26% in NCP revenues generated through our OEMs. Distribution net revenues for fiscal 2011 did not change significantly compared to fiscal 2010. We believe that our net revenues are driven by product certifications and qualifications with our OEM customers, which take products directly and indirectly through distribution and contract manufacturers. We view product certifications and qualifications as an important indicator of future revenue opportunities and growth for the Company. However, product certifications and qualifications do not necessarily ensure continued market acceptance of our products by our OEM customers. It is also very difficult to determine the future impact, if any, of product certifications and qualifications on our revenues.
44
Net Revenues by Geographic Territory
Our net revenues by geographic territory based on billed-to location were as follows:
| | | | | | | | | | | | | | | | | | | | | | | | |
| | | Net Revenues by Geographic Territory | |
| | | 2011 | | | Percentage of
Net Revenues | | | 2010 | | | Percentage of
Net Revenues | | | Increase/
(Decrease) | | | Percentage
Change | |
| | | (Dollars in thousands) | |
Asia Pacific | | $ | 226,877 | | | | 50 | % | | $ | 141,105 | | | | 35 | % | | $ | 85,772 | | | | 61 | % |
United States | | | 135,900 | | | | 30 | % | | | 130,511 | | | | 33 | % | | | 5,389 | | | | 4 | % |
Europe, Middle East, and Africa | | | 83,751 | | | | 19 | % | | | 121,757 | | | | 31 | % | | | (38,006 | ) | | | (31 | )% |
Rest of the world | | | 6,015 | | | | 1 | % | | | 5,777 | | | | 1 | % | | | 238 | | | | 4 | % |
| | | | | | | | | | | | | | | | | | | | | | | | |
Total net revenues | | $ | 452,543 | | | | 100 | % | | $ | 399,150 | | | | 100 | % | | $ | 53,393 | | | | 13 | % |
| | | | | | | | | | | | | | | | | | | | | | | | |
We believe the significant decrease in Europe, Middle East, and Africa net revenues and the significant increase in Asia Pacific net revenues in absolute dollars and as a percentage of total net revenues in fiscal 2011 compared to fiscal 2010 was primarily due to our OEM customers migrating production to contract manufacturers located predominantly in Asia Pacific. However, as we sell to OEMs and distributors who ultimately resell our products to their customers, the geographic mix of our net revenues may not be reflective of the geographic mix of end-user demand or installations.
Gross Profit. Gross profit consists of net revenues less cost of sales. Our gross profit for fiscal 2011 and fiscal 2010 were as follows (in thousands):
| | | | | | | | | | |
Gross Profit |
2011 | | Percentage of Net Revenues | | 2010 | | Percentage of Net Revenues | | Increase/ (Decrease) | | Percentage Points Change |
$252,136 | | 56% | | $246,692 | | 62% | | $5,444 | | (6)% |
Cost of sales includes the cost of producing, supporting, and managing our supply of quality finished products. Cost of sales also included approximately $33.1 million and $18.9 million of amortization of technology intangible assets for fiscal 2011 and fiscal 2010, respectively, with approximately $17.0 million in fiscal 2011 being related to the ServerEngines acquisition. Approximately $1.7 million and $1.3 million of share-based compensation expense was included in cost of sales for fiscal 2011 and fiscal 2010, respectively. The remaining change was primarily due to an unfavorable mix of lower margin products sold in fiscal 2011.
Engineering and Development. Engineering and development expenses for fiscal 2011 and fiscal 2010 were as follows (in thousands):
| | | | | | | | | | |
Engineering and Development |
2011 | | Percentage of Net Revenues | | 2010 | | Percentage of Net Revenues | | Increase/ (Decrease) | | Percentage Points Change |
$170,845 | | 38% | | $126,850 | | 32% | | $43,995 | | 6% |
Engineering and development expenses for fiscal 2011 compared to fiscal 2010 increased approximately $44.0 million, or 35%. Approximately $16.1 million and $7.3 million of share-based compensation expense was included in engineering and development costs for fiscal 2011 and fiscal 2010, respectively, with approximately $6.3 million in fiscal 2011 being related to the ServerEngines acquisition. Engineering and development headcount increased to 617 at the end of fiscal 2011 from 463 at the end of fiscal 2010, primarily due to the acquisition of ServerEngines. The increase in headcount resulted in a net increase of approximately $22.1 million in salary and related expenses compared to fiscal 2010. The remaining increase was primarily due to an increase in costs associated with new product development of approximately $6.8 million and an increase in performance based compensation of approximately $6.7 million.
45
Selling and Marketing. Selling and marketing expenses for fiscal 2011 and fiscal 2010 were as follows (in thousands):
| | | | | | | | | | |
Selling and Marketing |
2011 | | Percentage of Net Revenues | | 2010 | | Percentage of Net Revenues | | Increase/ (Decrease) | | Percentage Points Change |
$58,635 | | 13% | | $56,554 | | 14% | | $2,081 | | (1)% |
Selling and marketing expenses for fiscal 2011 compared to fiscal 2010 increased approximately $2.1 million, or 4%. Approximately $5.1 million and $4.0 million of share-based compensation expense was included in selling and marketing costs for fiscal 2011 and 2010, respectively. Selling and marketing headcount increased to 142 at the end of fiscal 2011 from 130 at the end of fiscal 2010. The increase in headcount resulted in a net increase of approximately $2.4 million in salary and related expenses compared to fiscal 2010. The remaining change in selling and marketing expenses in fiscal 2011 was primarily due to an increase in travel related expenses of approximately $0.4 million, an increase in rent expense of approximately $0.2 million, an increase in other expense of approximately $0.2 million, partially offset by a decrease in performance based compensation of approximately $1.9 million, and a decrease in outside services of approximately $0.8 million.
General and Administrative. General and administrative expenses for fiscal 2011 and fiscal 2010 were as follows (in thousands):
| | | | | | | | | | |
General and Administrative |
2011 | | Percentage of Net Revenues | | 2010 | | Percentage of Net Revenues | | Increase/ (Decrease) | | Percentage Points Change |
$56,133 | | 13% | | $50,454 | | 12% | | $5,679 | | 1% |
General and administrative expenses for fiscal 2011 compared to fiscal 2010 increased approximately $5.7 million, or 11%. Approximately $16.4 million and $5.5 million of share-based compensation expense was included in general and administrative costs for fiscal 2011 and 2010, respectively, with approximately $10.4 million in fiscal 2011 being related to the ServerEngines acquisition. General and administrative headcount increased to 144 at the end of fiscal 2011 compared to 128 at the end of fiscal 2010. The increase in headcount resulted in a net increase of approximately $1.8 million in salary and related expenses compared to fiscal 2010. The remaining change was primarily due to a decrease in litigation costs of approximately $3.6 million, a decrease in loss on disposal of fixed assets of approximately $0.7 million, and a decrease in performance based compensation of approximately $0.4 million.
Amortization of Other Intangible Assets. Amortization of other intangible assets for fiscal 2011 and fiscal 2010 were as follows (in thousands):
| | | | | | | | | | |
Amortization of Other Intangible Assets |
2011 | | Percentage of Net Revenues | | 2010 | | Percentage of Net Revenues | | Increase/ (Decrease) | | Percentage Points Change |
$9,334 | | 2% | | $6,792 | | 2% | | $2,542 | | —% |
Amortization of other intangible assets for fiscal 2011 compared to fiscal 2010 increased approximately $2.5 million, or 37%. The increase was primarily due to amortization expense of intangible assets acquired from the ServerEngines acquisition of approximately $2.8 million.
In-Process Research and Development Impairment. In-process research and development impairment represents the impairment charge for an in-process research and development intangible asset. Our impairment of in process research and development for fiscal 2011 and fiscal 2010 was as follows (in thousands):
| | | | | | | | | | |
Impairment of Other Intangible Assets |
2011 | | Percentage of Net Revenues | | 2010 | | Percentage of Net Revenues | | Increase/ (Decrease) | | Percentage Points Change |
$6,000 | | 1% | | $— | | —% | | $6,000 | | 1% |
In fiscal 2011, the business climate for the product associated with the IPR&D from the acquisition of a privately-held company in fiscal 2010, deteriorated significantly as the technology was no longer expected to be designed into customer products and was determined to be other than temporary and thus, the entire amount of the IPR&D of approximately $6.0 million was impaired in fiscal 2011.
46
Non-operating Income (Expense), net. Non-operating income (expense), net, for fiscal 2011 and fiscal 2010 was as follows (in thousands):
| | | | | | | | | | |
Non-operating (Expense) Income, Net |
2011 | | Percentage of Net Revenues | | 2010 | | Percentage of Net Revenues | | Increase/ (Decrease) | | Percentage Points Chang |
$(10,036) | | (2)% | | $302 | | —% | | $(10,338) | | (2)% |
Our non-operating income (expense), net, for fiscal 2011 compared to fiscal 2010 decreased approximately $10.3 million, or 3,423%. The net decrease was primarily due to the impairment of our equity investment in a privately-held company of approximately $9.2 million. During fiscal 2011, the business climate of the privately-held company deteriorated significantly as the technology was no longer expected to be designed into customer products and was determined to be other than temporary and thus, the fair value of our equity investment in the privately-held company was deemed to be zero. As a result, the entire investment of approximately $9.2 million in the privately-held company was impaired.
Income taxes. Income tax provision (benefit) for fiscal 2011 and fiscal 2010 was as follows (in thousands):
| | | | | | | | | | |
Income Taxes |
2011 | | Percentage of Net Revenues | | 2010 | | Percentage of Net Revenues | | Increase/ (Decrease) | | Percentage Points Change |
$24,763 | | 5% | | $(17,276) | | (4)% | | $42,039 | | 9% |
Income taxes for fiscal 2011 compared to fiscal 2010 increased approximately $42.0 million, or 243%. Our effective tax rate was approximately 42% for fiscal 2011 compared to a benefit of approximately 272% for fiscal 2010. During fiscal 2011, one of our domestic entities entered into a technology platform contribution transaction with an international subsidiary to license the recently acquired ServerEngines technology, resulting in an increase in U.S. income taxes of approximately $36.7 million. Our fiscal 2011 effective tax rate was also impacted by an increase in our valuation allowance related to our capital loss carryforwards, California and Massachusetts research credits, and other California deferred tax assets, net of unrecognized tax benefits, of approximately $24.4 million, and an increase in taxes from non-deductible stock-based compensation expense for contingent shares related to the ServerEngines acquisition of approximately $6.3 million. The increase in income taxes was partially offset by an increase in tax benefits due to changes in the geographic mix of taxable income between domestic and foreign jurisdictions of approximately $15.6 million, an increase in state tax benefits, excluding the impact of the state valuation allowance, of approximately $9.1 million, an increase in tax benefits from Federal research credits due to a retroactive extension of the Federal research credit in December 2010 as part of the Tax Relief, Unemployment Insurance Reauthorization and Job Creation Act of 2010 of approximately $6.5 million, and an increase in tax benefit related to a release of FIN 48 liabilities as a result of an expiration of statute of limitations of approximately $2.8 million. In addition, the fiscal 2010 effective tax rate included a non-recurring tax benefit related to domestic production activities deduction for tax years 2005 through 2007 of approximately $6.4 million and a non-recurring tax benefit to the stock option exchange program of approximately $4.0 million.
Critical Accounting Policies
The preparation of our consolidated financial statements requires estimation and judgment that affect the reported amounts of net revenues, expenses, assets, and liabilities in accordance with accounting principles generally accepted in the United States. We base our estimates on historical experience and on various other assumptions that we believe to be reasonable under the circumstances and which form the basis for making judgments about the carrying values of assets and liabilities at the date of the financial statements and the reported amounts of revenues and expenses for the periods presented. Critical accounting policies are defined as those that are reflective of significant judgments and uncertainties.
47
Changes in judgments and uncertainties relating to these estimates could potentially result in materially different results under different assumptions and conditions. If these estimates differ significantly from actual results, the impact to the consolidated financial statements may be material. We believe that the critical accounting policies that are the most significant for purposes of fully understanding and evaluating our reported financial results include the following:
Revenue Recognition. We generally recognize revenue at the time of shipment when title and risk of loss have passed, evidence of an arrangement has been obtained, pricing is fixed or determinable, and collectability is reasonably assured. We make certain sales through two tier distribution channels using selected distributors and Master Value Added Resellers (collectively, Distributors). These Distributors are subject to distribution agreements that may be terminated upon written notice by either party and that generally provide privileges to return a portion of inventory and to participate in price protection and cooperative marketing programs. Therefore, we recognize revenue on our standard non-OEM specific products sold to our Distributors based on a sell through model. OEM specific models sold to our Distributors are generally governed under the related OEM agreements rather than under these distribution agreements; and accordingly, we generally recognize revenue at the time of shipment for OEM specific products shipped to our Distributors.
We also maintain sales related reserves for our sales incentive programs. Based on the benefit received, we classify the costs of these incentive programs as a reduction of revenue, a cost of sale, or an operating expense.
Allowance for Doubtful Accounts. We maintain an allowance for doubtful accounts based upon historical write-offs as a percentage of net revenues and management’s review of outstanding accounts receivable. Amounts due from customers are charged against the allowance for doubtful accounts when management believes that collectibility of the amount is unlikely. Although we have not historically experienced significant losses on accounts receivable, our accounts receivable are concentrated with a small number of customers. Consequently, any write-off associated with one of these customers could have a significant impact on our allowance for doubtful accounts and results of operations.
Inventories. Inventories are stated at the lower of cost, on a first-in, first-out basis, or market. We use a standard cost system to determine cost. The standard costs are adjusted periodically to represent actual cost. We regularly compare forecasted demand and the composition of the forecast against inventory on hand and open purchase commitments in an effort to ensure that the carrying value of inventory does not exceed net realizable value. Accordingly, we may have to reduce the carrying value of excess and obsolete inventory if forecasted demand decreases.
Intangible Assets and Other Long-Lived Assets. Intangible assets resulting from acquisitions or licensing agreements are carried at cost less accumulated amortization and impairment charges, if any. For assets with determinable useful lives, amortization is computed using the straight-line method over the estimated economic lives of the respective intangible assets, ranging from two to ten years. Furthermore, we assess whether our intangible assets and other long-lived assets should be tested for recoverability periodically and whenever events or circumstances indicate that their carrying value may not be recoverable. The amount of impairment, if any, is measured based on fair value, which is determined using projected discounted future operating cash flows. Assets to be disposed of are reported at the lower of the carrying amount or fair value less selling costs.
Goodwill. Goodwill is not amortized, but instead, is tested at least annually for impairment, or more frequently when events or changes in circumstances indicate that goodwill might be impaired. Management considers our business as a whole to be its reporting unit for purposes of testing for impairment. The annual impairment test is performed during the fourth fiscal quarter.
We early adopted Financial Accounting Standards Board’s (FASB) Accounting Standards Update 2011-08, “Intangibles — Goodwill and Other (Topic 350): Testing Goodwill for Impairment” (ASU 2011-08) guidance during the first quarter of fiscal 2012. There was no financial statement impact as a result of our early adoption of this guidance.
Under ASU 2011-08, we have the option to first assess the qualitative factors to determine whether the existence of events or circumstances leads to a determination that it is more likely than not that the fair value of a reporting unit is less than its carrying amount. If, after assessing the totality of events or circumstances, we determine it is not more likely than not that the fair value of a reporting unit is less than its carrying amount, then
48
performing the two-step impairment test is unnecessary. However, if we conclude otherwise, then we are required to perform the first step of the two-step impairment test by comparing the fair value of the reporting unit with its carrying amount, including goodwill. If the fair value of the reporting unit exceeds its carrying amount, goodwill is not considered impaired; otherwise, goodwill is considered impaired and the loss is measured by performing step two. Under step two, the impairment loss is measured by comparing the implied fair value of the reporting unit goodwill with the carrying amount of goodwill. We also have the option to bypass the qualitative assessment under ASU 2011-08 and proceed directly to performing the first step of the two-step goodwill impairment test. We may resume performing the qualitative assessment in any subsequent period. See Note 7 in the accompanying notes to consolidated financial statements included in Part IV, Item 15(a) of this Annual Report on Form 10-K for additional information.
Income Taxes. We account for income taxes using the asset and liability method, under which we recognize deferred tax assets and liabilities for the future tax consequences attributable to temporary differences between the financial statement carrying amounts of existing assets and liabilities and their respective tax bases and for net operating loss and tax credit carryforwards. Tax positions that meet a more-likely-than-not recognition threshold are recognized in the first reporting period that it becomes more-likely-than-not such tax position will be sustained upon examination. A tax position that meets this more-likely-than-not recognition threshold is recorded at the largest amount of tax benefit that has a greater than 50% likelihood of being realized upon ultimate settlement. Previously recognized income tax positions that fail to meet the recognition threshold in a subsequent period are derecognized in that period. Differences between actual results and our assumptions, or changes in our assumptions in future periods, are recorded in the period they become known. We record potential accrued interest and penalties related to unrecognized tax benefits in income tax expense.
As a multinational corporation, we are subject to complex tax laws and regulations in various jurisdictions. The application of tax laws and regulations is subject to legal and factual interpretation, judgment, and uncertainty. Tax laws themselves are subject to change as a result of changes in fiscal policy, changes in legislation, evolution of regulations and court rulings. Therefore, the actual liability for U.S. or foreign taxes may be materially different from our estimates, which could result in the need to record additional liabilities or potentially to reverse previously recorded tax liabilities.
Deferred tax assets and liabilities are measured using enacted tax rates expected to apply to taxable income in the years in which those temporary differences are expected to be recovered or settled. The effect on deferred tax assets and liabilities of a change in tax rates is recognized in the period that includes the enactment date. A valuation allowance is recorded against any deferred tax assets when, in the judgment of management, it is more likely than not that all of or part of a deferred tax asset will not be realized. In assessing the need for a valuation allowance, we consider all positive and negative evidence, including recent financial performance, scheduled reversals of temporary differences, projected future taxable income, availability of taxable income in carryback periods and tax planning strategies. Based on a review of such information, we believe that insufficient positive evidence exists to support that we will more likely than not be able to realize the majority of our U.S. federal and state deferred tax assets. Therefore, we have recorded a valuation allowance against our deferred tax assets to the extent that they are not expected to be recoverable against taxes previously paid in available carryback periods.
Stock-Based Compensation. We account for our stock-based awards to employees and non-employees using the fair value method. Although we grant both unvested stock awards and stock options, the majority of the awards granted and stock based compensation recognized consists of unvested stock awards. The fair value of each unvested stock award is determined based on the closing price of our common stock at grant date. For stock options, the fair value of each option is based on several criteria including, but not limited to, the valuation model used and associated input factors including principally stock price volatility and, to a lesser extent, expected term, dividend rate, and risk free interest rate. The input factors used in the valuation model are based on subjective future expectations combined with management judgment. Stock-based compensation expense is recognized on a straight-line basis over the requisite service period for each separate vesting tranche of the award. A forfeiture rate assumption is applied in determining the fair value of our stock-based compensation related to both unvested stock awards and stock options based on future expectations and may be revised as significant differences become known. These adjustments may materially impact our results of operations in the period such changes are made.
49
Litigation Costs. We record a charge equal to at least the minimum estimated liability for a loss contingency or litigation settlement when both of the following conditions are met: (i) information available prior to issuance of the financial statements indicates that it is probable that a liability had been incurred at the date of the financial statements and (ii) the range of loss can be reasonably estimated. Liabilities related to litigation settlements with multiple elements are recorded based on the fair value of each element. Legal and other litigation related costs are recognized as the services are provided. We record insurance and other indemnity recoveries for litigation costs when both of the following conditions are met: (i) the recovery is probable and (ii) collectability is reasonably assured. The insurance recoveries recorded are only to the extent the litigation costs have been incurred and recognized in the financial statements; however, it is reasonably possible that the actual recovery may be significantly different from our estimates. There are many uncertainties associated with any litigation, and we cannot provide assurance that any actions or other third party claims against us will be resolved without costly litigation or substantial settlement charges. If any of those events were to occur, our business, financial condition and results of operations could be materially and adversely affected. See Note 10 in the notes to consolidated financial statements in Part IV, Item 15(a) of this Annual Report on Form 10-K.
Recently Issued Accounting Standards
See Note 1 in the accompanying notes to consolidated financial statements included in Part IV, Item 15(a) of this Annual Report on Form 10-K for a description of the recently issued accounting standards.
Liquidity and Capital Resources
Our principal sources of liquidity consist of our existing cash balances and investments, as well as funds expected to be generated from operations. At July 1, 2012, we had approximately $260.6 million in working capital and approximately $229.9 million in cash and cash equivalents and current investments. At July 3, 2011, we had approximately $230.9 million in working capital and approximately $168.2 million in cash and cash equivalents and current investments. We maintain an investment portfolio of various security holdings, types, and maturities. We invest in instruments that meet credit quality standards in accordance with our investment guidelines. We limit our exposure to any one issuer or type of investment with the exception of U.S. Government issued or U.S. Government sponsored entity securities. Our investments consisted mostly of marketable certificates of deposits and fixed income securities as of July 1, 2012 and we did not hold any auction rate securities or direct investments in mortgage-backed securities.
Our cash balances and investments are held in numerous locations throughout the world. As of July 1, 2012, our international subsidiaries held approximately 10% of our total cash, cash equivalents and investment securities, the majority of which will be used to repay obligations to U.S. affiliate entities that arise in the normal course of business and would not result in additional U.S. tax liabilities upon repatriation.
Our accounts receivable are primarily with large multinational OEM customers and denominated in U.S. dollars. As of July 1, 2012, approximately 11% of our accounts receivable are related to customers with a European billing address. However, we do not believe that the ongoing European Sovereign debt crisis will materially impact the collectability of our accounts receivable or adversely affect our financial position or liquidity.
Cash Flows
The following table summarizes our cash flows for fiscal years 2012 and 2011:
| | | | | | | | |
| | | 2012 | | | 2011 | |
| | | (In thousands) | |
Net cash provided by (used in): | | | | | | | | |
Operating activities | | $ | 79,044 | | | $ | 29,888 | |
Investing activities | | | 8,356 | | | | (84,158 | ) |
Financing activities | | | (16,910 | ) | | | (63,643 | ) |
Effect of foreign currency translation on cash and cash equivalents | | | (602 | ) | | | 260 | |
| | | | | | | | |
Increase (decrease) in cash and cash equivalents: | | $ | 69,888 | | | $ | (117,653 | ) |
| | | | | | | | |
50
Operating Activities
Cash provided by operating activities during fiscal 2012 was approximately $79.0 million compared to approximately $29.9 million for fiscal 2011. The current period cash provided by operating activities was primarily due to a net loss of approximately $11.1 million before adjustments for amortization of intangible assets of approximately $30.6 million, share-based compensation expense of approximately $22.2 million, depreciation and amortization of property and equipment of approximately $18.1 million, an increase in accounts payable, accrued liabilities and other liabilities of approximately $25.7 million (approximately $36.8 million of which related to the Settlement Agreement [See Note 10 in the accompanying notes to consolidated financial statements included in Part IV, Item 15(a) of this Annual Report on Form 10-K]), and a decrease in prepaid expenses, other assets and prepaid income taxes of approximately $10.8 million, which was partially offset by an increase in accounts receivables, net, of approximately $10.0 million.
Investing Activities
Cash provided by investing activities during fiscal 2012 was approximately $8.4 million compared to cash used of approximately $84.2 million for fiscal 2011. The current period addition to cash was primarily due to maturities of investments that were not reinvested of approximately $52.1 million, partially offset by purchases of investments of approximately $28.9 million, and purchases of property and equipment of approximately $14.9 million.
Financing Activities
Cash used in financing activities for fiscal 2012 was approximately $16.9 million compared to approximately $63.6 million for fiscal 2011. The current period usage of cash was primarily due to the purchase of treasury stock of approximately $20.1 million.
Prospective Capital Needs
In early August 2008, our Board of Directors authorized a plan to repurchase up to $100.0 million of our outstanding common stock. In April 2009, upon receipt of an unsolicited takeover proposal and related tender offer of Broadcom to acquire us, our Board of Directors elected to temporarily suspend any activity under the share repurchase plan. In light of Broadcom allowing its tender offer to expire on July 14, 2009, Emulex’s Board of Directors elected to reactivate the $100.0 million share repurchase plan effective July 15, 2009. From June 29, 2009 through July 1, 2012, the Company repurchased 9.0 million shares of its common stock for an aggregate purchase price of approximately $78.4 million at an average purchase price of $8.67 per share under this plan. Approximately 2.9 million shares for an aggregate purchase price of approximately $20.1 million at an average purchase price of $6.83 per share were purchased in fiscal 2012. Our Board of Directors has not set an expiration date for the plan. Therefore, we may repurchase additional shares under this plan from time to time through open market purchases or privately negotiated transactions. It is expected that any future share repurchases will be financed by available cash and cash from operations.
We plan to continue our strategic investment in research and development, sales and marketing, capital equipment, and facilities. We may also consider internal and external investment opportunities in order to achieve our growth and market leadership goals, including licensing and joint-development agreements with our suppliers, customers, and other third parties. We believe that our existing cash and cash equivalents, current investments, and anticipated cash flows from operating activities will be sufficient to support our working capital needs, capital expenditure requirements and stock repurchasing expenditures for at least the next 12 months. We currently do not have any outstanding lines of credit or other borrowings.
We have disclosed outstanding legal proceedings in Note 10 in the accompanying notes to consolidated financial statements included in Part IV, Item 15(a) of this Annual Report on Form 10-K, including the consolidated patent infringement lawsuit filed by Broadcom against us. This lawsuit continues to present risks that could have a material adverse effect on our business, financial condition, or results of operations, including loss of patent rights, monetary damages, and injunction against the sale of accused products. We continue to present a vigorous post-trial defense against this lawsuit, and have appealed the trial verdict. On July 3, 2012, we entered into a Settlement Agreement pursuant to which both parties agreed to settle and release certain claims related to the patent infringement litigation. The Settlement Agreement provided for certain amendments to the April 3, 2012 Permanent Injunction, and dismissals of certain allegations of the lawsuit, including portions of the scheduled re-trial. We also received a worldwide limited license to the ‘691 patent, the ‘150 patent, the ‘194 patent and
51
related families for certain fields of use including Fibre Channel applications. Under the term of Settlement Agreement, we paid to Broadcom a lump sum release and license fee of $58.0 million in cash subsequent to fiscal 2012. On July 18, 2012, pursuant to the Settlement Agreement, the Court issued an amended Permanent Injunction and a stipulation to dismiss certain allegations in the lawsuit in light of the Settlement Agreement.
At the end of fiscal 2012, we accrued approximately $36.8 million under the Settlement Agreement for the fair value of the settlement of claims related to the past sales of products and expensed this to cost of goods sold. The remaining $21.2 million was allocated to the fair value of the patent license fees related to the future sales of products which will be recorded as prepaid license fees in the first quarter of fiscal 2013 when the payment is made, and amortized to cost of goods sold over the license term in proportion to the estimated future revenues of the licensed technology. In addition, we expect to incur incremental costs over the next 12 months in the range of $15 million - $20 million related to the retrial and to redesign, design around, modify, design, develop, test and requalify certain products that were not covered by the Settlement Agreement and have previously been found to infringe on the ‘150 and ‘691 patents. See “Patent Litigation” in Part II, Item 7 of this Annual Report on Form 10-K. Also see “Third party claims of intellectual property infringement could adversely affect our business” and “We are dependent on sole source and limited source third party suppliers and EMS providers for our products” in Part I, Item 1A— Risk Factors, of this Annual Report on Form 10-K for a description of certain risks relating to the litigation with Broadcom that could impact our liquidity and prospective capital needs.
Off-Balance Sheet Arrangements
As part of our ongoing business, we do not participate in transactions that generate material relationships with unconsolidated entities or financial partnerships, such as entities often referred to as structured finance or special purpose entities, which would have been established for the purpose of facilitating off-balance sheet arrangements or for other contractually narrow or limited purposes. As of July 1, 2012, we did not have any significant off-balance sheet arrangements, as defined in Item 303(a)(4)(ii) of SEC Regulation S-K.
Contractual Obligations and Commercial Commitments
The following summarizes our contractual obligations as of July 1, 2012, and the effect such obligations are expected to have on our liquidity in future periods. The estimated payments reflected in this table are based on management’s estimates and assumptions about these obligations. Because these estimates and assumptions are necessarily subjective, the actual cash outflows in future periods will vary, possibly materially, from those reflected in the table.
| | | | | | | | | | | | | | | | | | | | | | | | | | | | |
| | | Payments Due by Period | |
| | | Total | | | 2013 | | | 2014 | | | 2015 | | | 2016 | | | 2017 | | | Thereafter | |
| | | (In thousands) | |
Leases(1) | | $ | 18,687 | | | $ | 4,959 | | | $ | 3,506 | | | $ | 2,937 | | | $ | 2,688 | | | $ | 1,868 | | | $ | 2,729 | |
Purchase commitments(2) | | | 58,748 | | | | 58,748 | | | | — | | | | — | | | | — | | | | — | | | | — | |
Other commitments(3) | | | 73,632 | | | | 66,447 | | | | 3,065 | | | | 2,471 | | | | 942 | | | | 707 | | | | — | |
| | | | | | | | | | | | | | | | | | | | | | | | | | | | |
Total(4)(5) | | $ | 151,067 | | | $ | 130,154 | | | $ | 6,571 | | | $ | 5,408 | | | $ | 3,630 | | | $ | 2,575 | | | $ | 2,729 | |
| | | | | | | | | | | | | | | | | | | | | | | | | | | | |
| (1) | Lease payments include common area maintenance (CAM) charges. |
| (2) | Purchase commitments represent an estimate of all open purchase orders and contractual obligations in the ordinary course of business for which we have not received the goods or services as of July 1, 2012. Although open purchase orders are considered enforceable and legally binding, the terms generally allow us the option to cancel, reschedule and adjust our requirements based on our business needs prior to the delivery of goods or performance of services. |
| (3) | Other commitments consist primarily of $58.0 million related to the Settlement Agreement entered into with Broadcom on July 3, 2012 (see Note 10), commitments for software license fees of approximately $8.9 million and non-recurring engineering services of approximately $3.8 million. |
52
| (4) | Excludes approximately $39.8 million of liabilities for uncertain tax positions for which we cannot make a reasonably reliable estimate of the period of payment. See Note 12 in the accompanying notes to consolidated financial statements. |
| (5) | The expected timing of payments for the obligations discussed above is estimated based on current information. Timing of payment and actual amounts paid may be different depending on the time of receipt of goods or services or changes to agreed-upon amounts for some obligations. Amounts disclosed as contingent or milestone based obligations depend on the achievement of the milestones or the occurrence of the contingent events and can vary significantly. |
| Item 7A. | Qualitative and Quantitative Disclosures about Market Risk. |
Interest Rate Sensitivity
We do not believe our cash and cash equivalents are subject to significant interest rate risk due to their short terms to maturity. As of July 1, 2012, the carrying value of our cash and cash equivalents approximated fair value.
As of July 1, 2012, our investment portfolio consisted primarily of fixed income securities of approximately $28.9 million. We have the positive intent and ability to hold these securities to maturity. We did not hold any auction rate securities or direct investments in mortgage-backed securities as of July 1, 2012.
The fair market value of our investment portfolio is subject to interest rate risk and would decline in value if market interest rates increased. If market interest rates were to increase immediately and uniformly by 10% from the levels existing as of July 1, 2012, the decline in the fair value of the portfolio would not be material to our financial position, results of operations and cash flows. However, if interest rates decreased and securities within our portfolio were re-invested in securities with lower interest rates, interest income would decrease in the future.
Exchange Rate Risk
We consider our direct exposure to foreign exchange rate fluctuations to be minimal. Currently, sales to customers and arrangements with third-party manufacturers provide for pricing and payment in U.S. dollars, and, therefore, are not subject to exchange rate fluctuations. Increases in the value of the U.S. dollar relative to other currencies could make our products more expensive, which could negatively impact our ability to compete. Conversely, decreases in the value of the U.S. dollar relative to other currencies could result in our suppliers raising their prices to continue doing business with us. Our exposure to foreign exchange rate fluctuations is also limited by the relatively low amount of operating expenses denominated in foreign currencies. Fluctuations in currency exchange rates could affect our business in the future.
| Item 8. | Financial Statements and Supplementary Data. |
The information required by this Item is included herein as part of Part IV — Item 15(a) Financial Statements and Schedules of this Annual Report on Form 10-K.
| Item 9. | Changes in and Disagreements with Accountants on Accounting and Financial Disclosure. |
None.
| Item 9A. | Controls and Procedures. |
Conclusion Regarding the Effectiveness of Disclosure Controls and Procedures
The Company maintains disclosure controls and procedures to ensure that information we are required to disclose in reports that we file or submit under the Securities Exchange Act of 1934, as amended (Exchange Act) is recorded, processed, summarized and reported within the time periods specified in Securities and Exchange Commission rules and forms. Our management evaluated, with the participation of our Chief Executive Officer and our Chief Financial Officer, the effectiveness of our disclosure controls and procedures, as such term is defined under Rule 13a-15(e) promulgated under the Exchange Act, to ensure that information required to be disclosed is accumulated and communicated to our management, including our principal executive and financial
53
officers, as appropriate to allow timely decisions regarding required disclosure. Based on this evaluation, our Chief Executive Officer and our Chief Financial Officer have concluded that our disclosure controls and procedures were effective as of July 1, 2012.
Management’s Report on Internal Control Over Financial Reporting
Our management is responsible for establishing and maintaining adequate internal control over financial reporting, as defined in Rule 13a-15(f) promulgated under the Exchange Act. Internal control over financial reporting is designed to provide reasonable assurance regarding the reliability of financial reporting and the preparation of financial statements for external purposes in accordance with generally accepted accounting principles. Because of its inherent limitations, internal control over financial reporting may not prevent or detect misstatements. Also, projections of any evaluation of effectiveness to future periods are subject to the risk that controls may become inadequate because of changes in conditions, or that the degree of compliance with the policies or procedures may deteriorate.
Our management evaluated the effectiveness of our internal control over financial reporting using the criteria set forth by the Committee of Sponsoring Organizations of the Treadway Commission inInternal Control — Integrated Framework.Based on our evaluation, our management concluded that our internal control over financial reporting was effective as of July 1, 2012.
The independent registered public accounting firm that audited the consolidated financial statements included in this annual report has issued an audit report on management’s assessment of our internal control over financial reporting. See Part IV — Item 15(a) Financial Statement and Schedules of this Annual Report on Form 10-K.
Changes in Internal Control Over Financial Reporting
There were no changes in our internal controls over financial reporting, as defined in Rule 13a-15(f) promulgated under the Exchange Act, that occurred during the fourth quarter of fiscal 2012 that has materially affected, or is reasonably likely to materially affect, our internal control over financial reporting.
| Item 9B. | Other Information. |
None.
PART III
| Item 10. | Directors, Executive Officers, and Corporate Governance. |
There is incorporated herein by reference the information required by this Item in the Company’s definitive proxy statement for the 2012 Annual Meeting of Stockholders, which will be filed with the Securities and Exchange Commission no later than 120 days after the close of the year ended July 1, 2012. See Part I, Item 1 — “Executive Officers of the Registrant” for information regarding the executive and certain other officers of the Company or its principal operating subsidiaries.
We have adopted the Emulex Corporation Business Ethics and Confidentiality Policy (the Code of Ethics), a code of ethics that applies to all of our directors and officers, including our Chief Executive Officer, Chief Financial Officer, Corporate Controller, and other finance organization employees. This Code of Ethics is publicly available on our website at www.emulex.com. If we make any substantive amendments to the Code of Ethics or grant any waiver, including any implicit waiver, from a provision of the Code of Ethics to our Chief Executive Officer, Chief Financial Officer or Corporate Controller, we will disclose the nature of such amendment or waiver on that website or in a report on Form 8-K.
| Item 11. | Executive Compensation. |
There is incorporated herein by reference the information required by this Item in our definitive proxy statement for the 2012 Annual Meeting of Stockholders that will be filed with the Securities and Exchange Commission no later than 120 days after the close of the fiscal year ended July 1, 2012.
54
| Item 12. | Security Ownership of Certain Beneficial Owners and Management. |
The following table gives information about our common stock that may be issued upon the exercise of options, warrants and rights under all of our equity compensation plans as of July 1, 2012.
| | | | | | | | | | | | |
Plan Category | | Number of Securities
to be Issued Upon
Exercise of
Outstanding Options,
Warrants and Rights | | | Weighted-Average
Exercise Price of
Outstanding Options,
Warrants and Rights | | | Number of Securities
Remaining Available
for Future Issuance
Under Equity
Compensation Plans
(Excluding Securities
Related in Column (a)) | |
| | | (a) | | | (b) | | | (c) | |
Equity compensations plans approved by security holders(1) | | | 3,891,032 | | | $ | 14.03 | | | | 8,709,455 | (4) |
Employee stock purchase plan approved by security holders(2) | | | — | | | | — | | | | 2,126,424 | |
Equity compensations plans not approved by security holders(3) | | | 425,234 | | | $ | 7.47 | | | | 3,412 | |
| | | | | | | | | | | | |
Total | | | 4,316,266 | | | $ | 13.38 | | | | 10,839,291 | |
| | | | | | | | | | | | |
| (1) | Consists of the Emulex Corporation Employee Stock Option Plan, the Emulex Corporation 2005 Equity Incentive Plan, the Emulex Corporation 2004 Employee Stock Incentive Plan, and the Emulex Corporation 1997 Stock Option Plan for Non-Employee Directors. |
| (2) | The Emulex Employee Stock Purchase Plan enables employees to purchase our common stock at a 15% discount to the lower of market value at the beginning or end of each six month offering period. As such, the number of shares that may be issued during a given six month period and the purchase price of such shares cannot be determined in advance. See Note 11 in the accompanying notes to consolidated financial statements. |
| (3) | Consists of the ServerEngines Corporation (ServerEngines) Amended and Restated 2008 Stock Option Plan, Sierra Logic, Inc. (Sierra Logic) 2001 Stock Option Plan, Aarohi Communications Inc. (Aarohi) 2001 Stock Option Plan, the Vixel Corporation (Vixel) 2000 Non-Officer Equity Incentive Plan, the Vixel Corporation 1999 Equity Incentive Plan, the Vixel Corporation Amended and Restated 1995 Stock Option Plan. Options issued under these plans were converted into options to purchase Emulex Corporation common stock as a result of the acquisitions of ServerEngines, Sierra Logic, Aarohi, and Vixel. |
| (4) | Includes net unvested stock granted of 3,319,507 shares that are not deemed issued for accounting purposes until vested. |
| Item 13. | Certain Relationships and Related Transactions. |
There is incorporated herein by reference the information required by this Item in our definitive proxy statement for the 2012 Annual Meeting of Stockholders that will be filed with the Securities and Exchange Commission no later than 120 days after the close of the fiscal year ended July 1, 2012.
| Item 14. | Principal Accountant Fees and Services. |
There is incorporated herein by reference the information required by this Item in our definitive proxy statement for the 2012 Annual Meeting of Stockholders that will be filed with the Securities and Exchange Commission no later than 120 days after the close of the fiscal year ended July 1, 2012.
55
PART IV
| Item 15. | Exhibits and Financial Statement Schedules. |
(a) Financial Statements and Schedules
1. Consolidated Financial Statements
The consolidated financial statements listed in the accompanying Index to Consolidated Financial Statements and Schedule are filed as part of this report.
2. Financial Statement Schedule
The financial statement schedule listed in the accompanying Index to Consolidated Financial Statements and Schedule is filed as part of this report.
3. Exhibits
See Item 15(b) below.
(b) Exhibits
See Exhibit Index attached to this report and incorporated herein by this reference.
56
EMULEX CORPORATION AND SUBSIDIARIES
ANNUAL REPORT — FORM 10-K
Items 8, 15(a)(1) and 15(a)(2)
Index to Consolidated Financial Statements and Schedule
July 1, 2012, July 3, 2011, and June 27, 2010
(With Report of Independent Registered Public Accounting Firm Thereon)
| | | | |
| | | Page Number | |
Consolidated Financial Statements | | | | |
Reports of Independent Registered Public Accounting Firm | | | 58 | |
Consolidated Balance Sheets — July 1, 2012 and July 3, 2011 | | | 60 | |
Consolidated Statements of Operations — Years ended July 1, 2012, July 3, 2011, and June 27, 2010 | | | 61 | |
Consolidated Statements of Stockholders’ Equity and Comprehensive Income (Loss) — Years ended July 1, 2012, July 3, 2011, and June 27, 2010 | | | 62 | |
Consolidated Statements of Cash Flows — Years ended July 1, 2012, July 3, 2011, and June 27, 2010 | | | 63 | |
Notes to Consolidated Financial Statements | | | 64 | |
Schedule | | | | |
Schedule II — Valuation and Qualifying Accounts | | | 95 | |
All other schedules are omitted because the required information is not applicable or the information is presented in the consolidated financial statements or notes thereto.
57
REPORT OF INDEPENDENT REGISTERED PUBLIC ACCOUNTING FIRM
The Board of Directors and Stockholders
Emulex Corporation:
We have audited the accompanying consolidated balance sheets of Emulex Corporation and subsidiaries as of July 1, 2012 and July 3, 2011, and the related consolidated statements of operations, stockholders’ equity and comprehensive income (loss), and cash flows for each of the years in the three-year period ended July 1, 2012. In connection with our audits of the consolidated financial statements, we also have audited the financial statement schedule of valuation and qualifying accounts listed in the accompanying index. These consolidated financial statements and financial statement schedule are the responsibility of the Company’s management. Our responsibility is to express an opinion on these consolidated financial statements and financial statement schedule based on our audits.
We conducted our audits in accordance with the standards of the Public Company Accounting Oversight Board (United States). Those standards require that we plan and perform the audit to obtain reasonable assurance about whether the financial statements are free of material misstatement. An audit includes examining, on a test basis, evidence supporting the amounts and disclosures in the financial statements. An audit also includes assessing the accounting principles used and significant estimates made by management, as well as evaluating the overall financial statement presentation. We believe that our audits provide a reasonable basis for our opinion.
In our opinion, the consolidated financial statements referred to above present fairly, in all material respects, the financial position of Emulex Corporation and subsidiaries as of July 1, 2012 and July 3, 2011, and the results of their operations and their cash flows for each of the years in the three-year period ended July 1, 2012, in conformity with U.S. generally accepted accounting principles. Also in our opinion, the related financial statement schedule, when considered in relation to the basic consolidated financial statements taken as a whole, presents fairly, in all material respects, the information set forth therein.
We also have audited, in accordance with the standards of the Public Company Accounting Oversight Board (United States), Emulex Corporation’s internal control over financial reporting as of July 1, 2012, based on criteria established inInternal Control — Integrated Frameworkissued by the Committee of Sponsoring Organizations of the Treadway Commission (COSO), and our report dated August 30, 2012, expressed an unqualified opinion on the effectiveness of the Company’s internal control over financial reporting.
/s/ KPMG LLP
Irvine, California
August 30, 2012
58
REPORT OF INDEPENDENT REGISTERED PUBLIC ACCOUNTING FIRM
The Board of Directors and Stockholders
Emulex Corporation:
We have audited Emulex Corporation’s internal control over financial reporting as of July 1, 2012 based on criteria established inInternal Control — Integrated Frameworkissued by the Committee of Sponsoring Organizations of the Treadway Commission (COSO). Emulex Corporation’s management is responsible for maintaining effective internal control over financial reporting and for its assessment of the effectiveness of internal control over financial reporting, included in the accompanying Management’s Report on Internal Control Over Financial Reporting appearing under Item 9A. Our responsibility is to express an opinion on the Company’s internal control over financial reporting based on our audit.
We conducted our audit in accordance with the standards of the Public Company Accounting Oversight Board (United States). Those standards require that we plan and perform the audit to obtain reasonable assurance about whether effective internal control over financial reporting was maintained in all material respects. Our audit included obtaining an understanding of internal control over financial reporting, assessing the risk that a material weakness exists, and testing and evaluating the design and operating effectiveness of internal control based on the assessed risk. Our audit also included performing such other procedures as we considered necessary in the circumstances. We believe that our audit provides a reasonable basis for our opinion.
A company’s internal control over financial reporting is a process designed to provide reasonable assurance regarding the reliability of financial reporting and the preparation of financial statements for external purposes in accordance with generally accepted accounting principles. A company’s internal control over financial reporting includes those policies and procedures that (1) pertain to the maintenance of records that, in reasonable detail, accurately and fairly reflect the transactions and dispositions of the assets of the company; (2) provide reasonable assurance that transactions are recorded as necessary to permit preparation of financial statements in accordance with generally accepted accounting principles, and that receipts and expenditures of the company are being made only in accordance with authorizations of management and directors of the company; and (3) provide reasonable assurance regarding prevention or timely detection of unauthorized acquisition, use, or disposition of the company’s assets that could have a material effect on the financial statements.
Because of its inherent limitations, internal control over financial reporting may not prevent or detect misstatements. Also, projections of any evaluation of effectiveness to future periods are subject to the risk that controls may become inadequate because of changes in conditions, or that the degree of compliance with the policies or procedures may deteriorate.
In our opinion, Emulex Corporation maintained, in all material respects, effective internal control over financial reporting as of July 1, 2012, based on criteria established inInternal Control — Integrated Frameworkissued by the Committee of Sponsoring Organizations of the Treadway Commission (COSO).
We also have audited, in accordance with the standards of the Public Company Accounting Oversight Board (United States), the consolidated balance sheets of Emulex Corporation and subsidiaries as of July 1, 2012 and July 3, 2011, and the related consolidated statements of operations, stockholders’ equity and comprehensive income (loss), and cash flows for each of the years in the three-year period ended July 1, 2012, and our report dated August 30, 2012 expressed an unqualified opinion on those consolidated financial statements.
/s/ KPMG LLP
Irvine, California
August 30, 2012
59
EMULEX CORPORATION AND SUBSIDIARIES
CONSOLIDATED BALANCE SHEETS
July 1, 2012 and July 3, 2011
| | | | | | | | |
| | | 2012 | | | 2011 | |
| | | (In thousands, except share data) | |
| ASSETS | |
Current assets: | | | | | | | | |
Cash and cash equivalents | | $ | 201,048 | | | $ | 131,160 | |
Investments | | | 28,879 | | | | 37,025 | |
Accounts receivable, net of allowance for doubtful accounts of $1,766 and $1,743 at July 1, 2012 and July 3, 2011, respectively | | | 84,106 | | | | 74,147 | |
Inventories | | | 20,319 | | | | 20,508 | |
Prepaid income taxes | | | 10,784 | | | | 12,709 | |
Prepaid expenses and other current assets | | | 7,380 | | | | 9,684 | |
Deferred income taxes | | | 10,722 | | | | 16,919 | |
| | | | | | | | |
Total current assets | | | 363,238 | | | | 302,152 | |
Property and equipment, net | | | 60,118 | | | | 64,095 | |
Investments | | | — | | | | 15,165 | |
Goodwill | | | 177,290 | | | | 177,290 | |
Intangible assets, net | | | 105,002 | | | | 135,602 | |
Other assets | | | 7,311 | | | | 8,535 | |
| | | | | | | | |
Total assets | | $ | 712,959 | | | $ | 702,839 | |
| | | | | | | | |
| LIABILITIES AND STOCKHOLDERS’ EQUITY | |
Current liabilities: | | | | | | | | |
Accounts payable | | $ | 26,889 | | | $ | 29,043 | |
Accrued and other current liabilities | | | 75,700 | | | | 42,199 | |
| | | | | | | | |
Total current liabilities | | | 102,589 | | | | 71,242 | |
Other liabilities | | | 3,878 | | | | 3,344 | |
Deferred income taxes | | | 3,876 | | | | 11,362 | |
Accrued taxes | | | 27,513 | | | | 28,200 | |
| | | | | | | | |
Total liabilities | | | 137,856 | | | | 114,148 | |
| | | | | | | | |
Commitments and contingencies (Note 10) | | | | | | | | |
Subsequent event (Notes 8 and 10) | | | | | | | | |
Stockholders’ equity: | | | | | | | | |
Preferred stock, $0.01 par value; 1,000,000 shares authorized (150,000 shares designated as Series A Junior Participating Preferred Stock); none issued and outstanding | | | — | | | | — | |
Common stock, $0.10 par value; 240,000,000 shares authorized; 106,771,909 and 102,655,094 issued at July 1, 2012 and July 3, 2011, respectively | | | 10,677 | | | | 10,266 | |
Additional paid-in capital | | | 1,261,619 | | | | 1,243,045 | |
Accumulated deficit | | | (467,140 | ) | | | (456,060 | ) |
Accumulated comprehensive loss | | | (1,673 | ) | | | (238 | ) |
Treasury stock, at cost; 17,592,322 and 14,656,242 shares at July 1, 2012 and July 3, 2011, respectively | | | (228,380 | ) | | | (208,322 | ) |
| | | | | | | | |
Total stockholders’ equity | | | 575,103 | | | | 588,691 | |
| | | | | | | | |
Total liabilities and stockholders’ equity | | $ | 712,959 | | | $ | 702,839 | |
| | | | | | | | |
See accompanying notes to consolidated financial statements.
60
EMULEX CORPORATION AND SUBSIDIARIES
CONSOLIDATED STATEMENTS OF OPERATIONS
Years Ended July 1, 2012, July 3, 2011, and June 27, 2010
| | | | | | | | | | | | |
| | | 2012 | | | 2011 | | | 2010 | |
| | | (In thousands, except per share data) | |
Net revenues | | $ | 501,769 | | | $ | 452,543 | | | $ | 399,150 | |
Cost of sales: | | | | | | | | | | | | |
Cost of goods sold | | | 184,593 | | | | 167,280 | | | | 133,554 | |
Amortization of core and developed technology intangible assets | | | 24,031 | | | | 33,127 | | | | 18,904 | |
Patent litigation settlement, damages, and sunset period royalties | | | 37,310 | | | | — | | | | — | |
| | | | | | | | | | | | |
Total cost of sales | | | 245,934 | | | | 200,407 | | | | 152,458 | |
| | | | | | | | | | | | |
Gross profit | | | 255,835 | | | | 252,136 | | | | 246,692 | |
| | | | | | | | | | | | |
Operating expenses: | | | | | | | | | | | | |
Engineering and development | | | 163,552 | | | | 170,845 | | | | 126,850 | |
Selling and marketing | | | 59,990 | | | | 58,635 | | | | 56,554 | |
General and administrative | | | 35,658 | | | | 56,133 | | | | 50,454 | |
Amortization of other intangible assets | | | 6,569 | | | | 9,334 | | | | 6,792 | |
In-process research and development impairment | | | — | | | | 6,000 | | | | — | |
| | | | | | | | | | | | |
Total operating expenses | | | 265,769 | | | | 300,947 | | | | 240,650 | |
| | | | | | | | | | | | |
Operating (loss) income | | | (9,934 | ) | | | (48,811 | ) | | | 6,042 | |
| | | | | | | | | | | | |
Non-operating income (expense), net: | | | | | | | | | | | | |
Interest income | | | 97 | | | | 96 | | | | 286 | |
Interest expense | | | (15 | ) | | | (373 | ) | | | (7 | ) |
Impairment of strategic investment | | | — | | | | (9,184 | ) | | | — | |
Other income (expense), net | | | 350 | | | | (575 | ) | | | 23 | |
| | | | | | | | | | | | |
Total non-operating income (expense), net | | | 432 | | | | (10,036 | ) | | | 302 | |
| | | | | | | | | | | | |
(Loss) income before income taxes | | | (9,502 | ) | | | (58,847 | ) | | | 6,344 | |
Income tax provision (benefit) | | | 1,578 | | | | 24,763 | | | | (17,276 | ) |
| | | | | | | | | | | | |
Net (loss) income | | $ | (11,080 | ) | | $ | (83,610 | ) | | $ | 23,620 | |
| | | | | | | | | | | | |
Net (loss) income per share: | | | | | | | | | | | | |
Basic | | $ | (0.13 | ) | | $ | (0.97 | ) | | $ | 0.29 | |
| | | | | | | | | | | | |
Diluted | | $ | (0.13 | ) | | $ | (0.97 | ) | | $ | 0.29 | |
| | | | | | | | | | | | |
Number of shares used in per share computations: | | | | | | | | | | | | |
Basic | | | 86,585 | | | | 86,038 | | | | 80,097 | |
| | | | | | | | | | | | |
Diluted | | | 86,585 | | | | 86,038 | | | | 81,282 | |
| | | | | | | | | | | | |
See accompanying notes to consolidated financial statements.
61
EMULEX CORPORATION AND SUBSIDIARIES
CONSOLIDATED STATEMENTS OF STOCKHOLDERS’ EQUITY AND COMPREHENSIVE INCOME (LOSS)CONSOLIDATED STATEMENTS OF STOCKHOLDERS’ EQUITY
AND COMPREHENSIVE INCOME (LOSS)
Years Ended July 1, 2012, July 3, 2011, and June 27, 2010
| | | | | | | | | | | | | | | | | | | | | | | | | | | | |
| | | Common Stock | | | Additional
Paid-In
Capital | | | Accumulated
Deficit | | | Accumulated
Comprehensive
Loss | | | Treasury
Stock | | | Total
Stock-
holders’
Equity | |
| | Shares
Out-
standing | | | Amount | | | | | | |
| | | (In thousands, except per share data) | |
Balance at June 28, 2009 | | | 81,117,284 | | | | 8,967 | | | | 1,106,990 | | | | (396,070 | ) | | | (443 | ) | | | (150,000 | ) | | | 569,444 | |
| | | | | | | | | | | | | | | | | | | | | | | | | | | | |
Net income | | | — | | | | — | | | | — | | | | 23,620 | | | | — | | | | — | | | | 23,620 | |
Foreign currency translation adjustment | | | — | | | | — | | | | — | | | | — | | | | (172 | ) | | | — | | | | (172 | ) |
| | | | | | | | | | | | | | | | | | | | | | | | | | | | |
Comprehensive income | | | — | | | | — | | | | — | | | | — | | | | — | | | | — | | | | 23,448 | |
| | | | | | | | | | | | | | | | | | | | | | | | | | | | |
Share-based compensation expense | | | — | | | | — | | | | 18,152 | | | | — | | | | — | | | | — | | | | 18,152 | |
Stock awards vested | | | 1,206,210 | | | | 121 | | | | (121 | ) | | | — | | | | — | | | | — | | | | — | |
Payroll tax withholdings on behalf of employees for restricted stock | | | (419,792 | ) | | | (42 | ) | | | (4,287 | ) | | | — | | | | — | | | | — | | | | (4,329 | ) |
Tax shortfall from exercise of stock options | | | — | | | | — | | | | (3,366 | ) | | | — | | | | — | | | | — | | | | (3,366 | ) |
Issuance of common stock under employee stock purchase plan | | | 634,375 | | | | 63 | | | | 5,307 | | | | — | | | | — | | | | — | | | | 5,370 | |
Exercise of stock options | | | 128,745 | | | | 13 | | | | 690 | | | | — | | | | — | | | | — | | | | 703 | |
Purchase of treasury stock | | | (2,000,000 | ) | | | — | | | | — | | | | — | | | | — | | | | (18,240 | ) | | | (18,240 | ) |
| | | | | | | | | | | | | | | | | | | | | | | | | | | | |
Balance at June 27, 2010 | | | 80,666,822 | | | | 9,122 | | | | 1,123,365 | | | | (372,450 | ) | | | (615 | ) | | | (168,240 | ) | | | 591,182 | |
| | | | | | | | | | | | | | | | | | | | | | | | | | | | |
Net loss | | | — | | | | — | | | | — | | | | (83,610 | ) | | | — | | | | — | | | | (83,610 | ) |
Foreign currency translation adjustment | | | — | | | | — | | | | — | | | | — | | | | 377 | | | | — | | | | 377 | |
| | | | | | | | | | | | | | | | | | | | | | | | | | | | |
Comprehensive loss | | | — | | | | — | | | | — | | | | — | | | | — | | | | — | | | | (83,233 | ) |
| | | | | | | | | | | | | | | | | | | | | | | | | | | | |
Share-based compensation expense | | | — | | | | — | | | | 39,211 | | | | — | | | | — | | | | — | | | | 39,211 | |
Stock awards vested | | | 1,534,589 | | | | 153 | | | | (153 | ) | | | — | | | | — | | | | — | | | | — | |
Payroll tax withholdings on behalf of employees for restricted stock | | | (540,774 | ) | | | (53 | ) | | | (5,624 | ) | | | — | | | | — | | | | — | | | | (5,677 | ) |
Tax shortfall from exercise of stock options | | | — | | | | — | | | | (1,648 | ) | | | — | | | | — | | | | — | | | | (1,648 | ) |
Issuance of common stock under employee stock purchase plan | | | 721,462 | | | | 72 | | | | 6,313 | | | | — | | | | — | | | | — | | | | 6,385 | |
Exercise of stock options | | | 252,979 | | | | 25 | | | | 1,666 | | | | — | | | | — | | | | — | | | | 1,691 | |
Issuance of common stock to acquire ServerEngines | | | 7,527,010 | | | | 753 | | | | 66,614 | | | | — | | | | — | | | | — | | | | 67,367 | |
Issuance of contingent consideration related to ServerEngines acquisition (Note 2) | | | 1,942,035 | | | | 194 | | | | 11,306 | | | | — | | | | — | | | | — | | | | 11,500 | |
Stock options assumed from ServerEngines acquisition | | | — | | | | — | | | | 1,995 | | | | — | | | | — | | | | — | | | | 1,995 | |
Purchase of treasury stock | | | (4,105,271 | ) | | | — | | | | — | | | | — | | | | — | | | | (40,082 | ) | | | (40,082 | ) |
| | | | | | | | | | | | | | | | | | | | | | | | | | | | |
Balance at July 3, 2011 | | | 87,998,852 | | | | 10,266 | | | | 1,243,045 | | | | (456,060 | ) | | | (238 | ) | | | (208,322 | ) | | | 588,691 | |
| | | | | | | | | | | | | | | | | | | | | | | | | | | | |
Net loss | | | — | | | | — | | | | — | | | | (11,080 | ) | | | — | | | | — | | | | (11,080 | ) |
Foreign currency translation adjustment | | | — | | | | — | | | | — | | | | — | | | | (1,435 | ) | | | — | | | | (1,435 | ) |
| | | | | | | | | | | | | | | | | | | | | | | | | | | | |
Comprehensive loss | | | — | | | | — | | | | — | | | | — | | | | — | | | | — | | | | (12,515 | ) |
| | | | | | | | | | | | | | | | | | | | | | | | | | | | |
Share-based compensation expense | | | — | | | | — | | | | 22,084 | | | | — | | | | — | | | | — | | | | 22,084 | |
Stock awards vested | | | 1,708,164 | | | | 170 | | | | (170 | ) | | | — | | | | — | | | | — | | | | — | |
Payroll tax withholdings on behalf of employees for restricted stock | | | (661,663 | ) | | | (66 | ) | | | (5,153 | ) | | | — | | | | — | | | | — | | | | (5,219 | ) |
Tax shortfall from exercise of stock options | | | — | | | | — | | | | (5,619 | ) | | | — | | | | — | | | | — | | | | (5,619 | ) |
Issuance of common stock under employee stock purchase plan | | | 830,199 | | | | 83 | | | | 5,689 | | | | — | | | | — | | | | — | | | | 5,772 | |
Exercise of stock options | | | 242,638 | | | | 24 | | | | 1,943 | | | | — | | | | — | | | | — | | | | 1,967 | |
Issuance of contingent consideration related to ServerEngines acquisition (Notes 2 and 11) | | | 1,997,477 | | | | 200 | | | | (200 | ) | | | — | | | | — | | | | — | | | | — | |
Purchase of treasury stock | | | (2,936,080 | ) | | | — | | | | — | | | | — | | | | — | | | | (20,058 | ) | | | (20,058 | ) |
| | | | | | | | | | | | | | | | | | | | | | | | | | | | |
Balance at July 1, 2012 | | | 89,179,587 | | | $ | 10,677 | | | $ | 1,261,619 | | | $ | (467,140 | ) | | $ | (1,673 | ) | | $ | (228,380 | ) | | $ | 575,103 | |
| | | | | | | | | | | | | | | | | | | | | | | | | | | | |
See accompanying notes to consolidated financial statements.
62
EMULEX CORPORATION AND SUBSIDIARIES
CONSOLIDATED STATEMENTS OF CASH FLOWS
July 1, 2012, July 3, 2011, and June 27, 2010
| | | | | | | | | | | | |
| | | 2012 | | | 2011 | | | 2010 | |
| | | (In thousands) | |
Cash flows from operating activities: | | | | | | | | | | | | |
Net (loss) income | | $ | (11,080 | ) | | $ | (83,610 | ) | | $ | 23,620 | |
Adjustments to reconcile net (loss) income to net cash provided by operating activities: | | | | | | | | | | | | |
Depreciation and amortization of property and equipment | | | 18,064 | | | | 21,216 | | | | 20,915 | |
Share-based compensation expense | | | 22,169 | | | | 39,260 | | | | 18,114 | |
Amortization of intangible assets | | | 30,600 | | | | 42,461 | | | | 25,696 | |
Impairment of strategic investment | | | — | | | | 9,184 | | | | — | |
In-process research and development impairment | | | — | | | | 6,000 | | | | — | |
Provision for losses on accounts receivables | | | 23 | | | | 90 | | | | 100 | |
Accrued interest income, net | | | 177 | | | | 59 | | | | 35 | |
Loss on disposal of assets, net | | | 142 | | | | 322 | | | | 512 | |
Deferred income taxes | | | (6,757 | ) | | | 16,770 | | | | (14,304 | ) |
Excess tax benefits from share-based compensation | | | (246 | ) | | | (937 | ) | | | (658 | ) |
Foreign currency adjustments | | | 51 | | | | (55 | ) | | | 49 | |
Changes in assets and liabilities: | | | | | | | | | | | | |
Accounts receivables, net | | | (9,982 | ) | | | (13,037 | ) | | | (5,344 | ) |
Inventories | | | 105 | | | | (6,457 | ) | | | (2,764 | ) |
Prepaid expenses, other assets and prepaid income taxes | | | 10,757 | | | | 13,396 | | | | (10,215 | ) |
Accounts payable, accrued liabilities, and other liabilities (Note 8) | | | 25,708 | | | | (8,303 | ) | | | 4,092 | |
Accrued taxes | | | (687 | ) | | | (6,471 | ) | | | 2,143 | |
| | | | | | | | | | | | |
Net cash provided by operating activities | | | 79,044 | | | | 29,888 | | | | 61,991 | |
| | | | | | | | | | | | |
Cash flows from investing activities: | | | | | | | | | | | | |
Net proceeds from sale of property and equipment | | | 158 | | | | 89 | | | | 261 | |
Purchases of property and equipment | | | (14,936 | ) | | | (20,920 | ) | | | (11,637 | ) |
Purchases of intangible assets | | | — | | | | (4,000 | ) | | | (21,200 | ) |
Payments for the purchase of ServerEngines Corporation, net of cash acquired | | | — | | | | (53,068 | ) | | | — | |
Loans to privately-held companies | | | — | | | | (1,000 | ) | | | (12,000 | ) |
Cash received from escrow for prior business combination | | | — | | | | 1,000 | | | | — | |
Cash disbursed for business acquisition | | | — | | | | — | | | | (8,817 | ) |
Purchases of investments | | | (28,938 | ) | | | (97,489 | ) | | | (120,425 | ) |
Maturities of investments | | | 52,072 | | | | 91,230 | | | | 82,689 | |
| | | | | | | | | | | | |
Net cash provided by (used in) investing activities | | | 8,356 | | | | (84,158 | ) | | | (91,129 | ) |
| | | | | | | | | | | | |
Cash flows from financing activities: | | | | | | | | | | | | |
Repurchase of common stock | | | (20,058 | ) | | | (40,082 | ) | | | (18,240 | ) |
Payroll tax withholdings on behalf of employees for restricted stock | | | (4,837 | ) | | | (5,677 | ) | | | (4,329 | ) |
Repayment of debt to the Founders of ServerEngines Corporation | | | — | | | | (26,897 | ) | | | — | |
Proceeds from issuance of common stock under stock plans | | | 7,739 | | | | 8,076 | | | | 6,073 | |
Excess tax benefits from share-based compensation | | | 246 | | | | 937 | | | | 658 | |
| | | | | | | | | | | | |
Net cash used in financing activities | | | (16,910 | ) | | | (63,643 | ) | | | (15,838 | ) |
| | | | | | | | | | | | |
Effect of exchange rates on cash and cash equivalents | | | (602 | ) | | | 260 | | | | (347 | ) |
| | | | | | | | | | | | |
Net increase (decrease) in cash and cash equivalents | | | 69,888 | | | | (117,653 | ) | | | (45,323 | ) |
Cash and cash equivalents at beginning of year | | | 131,160 | | | | 248,813 | | | | 294,136 | |
| | | | | | | | | | | | |
Cash and cash equivalents at end of year | | $ | 201,048 | | | $ | 131,160 | | | $ | 248,813 | |
| | | | | | | | | | | | |
See accompanying notes to consolidated financial statements.
63
EMULEX CORPORATION AND SUBSIDIARIES
NOTES TO CONSOLIDATED FINANCIAL STATEMENTS
Note 1. Summary of Significant Accounting Policies
Description of Business
Emulex Corporation (Emulex or the Company), a Delaware corporation, creates enterprise-class products that connect storage, servers and networks. Emulex supplies a broad range of advanced storage and server networking infrastructure solutions. The Company’s products and technologies leverage flexible multi protocol architectures that extend from deep within the storage array to the server edge of storage area networks (SANs). Emulex’s storage and server networking offerings include host bus adapters (HBAs), mezzanine cards for blade servers, Converged Network Adapters (CNAs), Universal Converged Network Adapters (UCNAs), Universal Local Area Network on Motherboards (ULOMs), embedded storage bridges, routers, and switches, storage Input/Output controllers (IOCs), and data center networking solutions. HBAs and mezzanine cards are the data communication products that enable servers to connect to storage networks by offloading communication processing tasks as information is delivered and sent to the storage network. CNAs efficiently move data between local area networks and storage area networks using Ethernet and Fibre Channel over Ethernet protocols. UCNAs provide for efficiency of data center operations by consolidating the usage of single protocol cards into using a single card to handle multiple protocol traffic for all applications and leading server architectures. ULOMs are Ethernet Controllers targeting enterprise applications requiring high wire-speed performance, multi-protocol offload capabilities, and advanced Input/Output virtualization. Embedded storage bridges, routers, switches, and IOCs are deployed inside storage arrays, tape libraries and other storage appliances.
Consolidation of Facilities
During fiscal 2011, the Company commenced the consolidation of certain leased facilities in Colorado and Washington. The consolidation of facilities was completed during the first quarter of fiscal 2012. Total charges related to the facility consolidation and related workforce reductions were approximately $4.2 million, of which $1.1 million was recorded in fiscal 2012 and $3.1 million was recorded in fiscal 2011. The charges consisted primarily of salaries and benefits based on continuous employment of affected employees through the facility closure dates. In fiscal 2012, the charges were comprised of salaries and benefits expense of approximately $0.4 million, acceleration of rent expense of approximately $0.5 million, and other costs of approximately $0.2 million. In fiscal 2011, the charges were comprised of salaries and benefits expense of approximately $2.6 million, acceleration of fixed assets depreciation expense of approximately $0.3 million, and other costs of approximately $0.2 million.
Principles of Consolidation
The consolidated financial statements include the accounts of Emulex Corporation, and its wholly owned subsidiaries and do not include any noncontrolling interests. All intercompany balances and transactions have been eliminated in consolidation.
Basis of Presentation
The Company operates under a 52 to 53 week fiscal year that ends on the Sunday nearest to June 30. Accordingly, every fifth or sixth fiscal year will be a 53-week fiscal year. The last 53 week fiscal year was fiscal 2011. All references to years in these notes to consolidated financial statements represent fiscal years unless otherwise noted.
Certain reclassifications have been made to prior year amounts to conform to current year’s presentation.
Use of Estimates
The preparation of the consolidated financial statements, notes, and related disclosures in conformity with U.S. generally accepted accounting principles requires management to make a number of estimates and assumptions relating to the reported amount of assets and liabilities, and the disclosure of contingent assets and liabilities at the date of the consolidated financial statements and the reported amounts of revenues and expenses during the
64
EMULEX CORPORATION AND SUBSIDIARIES
NOTES TO CONSOLIDATED FINANCIAL STATEMENTS — (Continued)
period. Estimates are used for, but not limited to, revenue recognition and cost of sales; the useful life and valuation of property and equipment and intangibles; valuation of goodwill; deferred taxes and any associated valuation allowances; tax uncertainties; allowances for doubtful accounts and sales related reserves; inventory valuation; stock-based compensation; warranty and other accrued liabilities; cost of an acquired entity and allocation of purchase price; fair value measurement; and litigation costs and related accruals. Actual results could differ materially from management’s estimates.
Foreign Currency Translation
Assets and liabilities are translated into U.S. dollars at the exchange rate at the balance sheet date, whereas revenues and expenses are translated into U.S. dollars at the average exchange rate for the reporting period. Translation adjustments are included in accumulated other comprehensive income (loss) and realized transaction gains and losses are recorded in the results of operations.
Cash Equivalents
The Company classifies highly liquid debt instruments, excluding corporate bonds and commercial paper with original maturities of three months or less, and deposits in money market funds, as cash equivalents. The carrying amounts of cash and cash equivalents approximate their fair values.
Additionally, not all investments that qualify as cash equivalents are required to be treated as cash equivalents. Pursuant to the Company’s investment policy, the Company classifies all corporate bonds and commercial paper with original maturities of three months or less as short-term investments.
Investments
The Company determines the appropriate balance sheet classification of its investments based on maturity date at the time of purchase and evaluates the classification at each balance sheet date. Investments are classified as held to maturity as the Company has both the positive intent and ability to hold the securities to maturity. Held to maturity securities are stated at amortized cost plus accrued interest. The amortized cost of debt securities is adjusted for amortization of premiums and accretion of discounts to maturity value. Such amortization and accretion are included in interest income.
Equity Investments in Privately-Held Companies
From time to time, the Company makes equity investments in non-publicly traded companies, where the Company is unable to exercise significant influence over the investee. These investments are accounted for under the cost method. Under the cost method, investments are carried at cost and are adjusted for other-than-temporary declines in fair value, distributions of earnings, or additional investments. The Company monitors its investments for impairment on a quarterly basis and makes appropriate reductions in carrying values when such impairments are determined to be other-than-temporary. Impairment charges are included in other (expense) income, net in the consolidated statements of operations. Factors used in determining an impairment include, but are not limited to, the current business environment including competition and uncertainty of financial condition; going concern considerations such as the rate at which the investee utilizes cash, and the investee’s ability to obtain additional financing. In fiscal 2011, the business climate surrounding the Company’s equity investment in a privately-held company deteriorated significantly. Since the underlying technology of such company was no longer expected to be designed into customer products, the Company determined that such equity investment was other than temporarily impaired. As a result, the fair value of the privately-held company was deemed to be zero and the entire investment of approximately $9.2 million in the privately-held company was impaired in fiscal 2011.
Accounts Receivable
Accounts receivable are recorded at the invoiced amount and do not bear interest. Amounts collected on accounts receivable are included in net cash provided by operating activities in the accompanying consolidated
65
EMULEX CORPORATION AND SUBSIDIARIES
NOTES TO CONSOLIDATED FINANCIAL STATEMENTS — (Continued)
statements of cash flows. The Company maintains an allowance for doubtful accounts for estimated losses resulting from the inability of the Company’s customers to make requested payments based upon historical write-offs as a percentage of net revenues and management’s review of outstanding accounts receivable. Amounts due from customers are charged against the allowance for doubtful accounts when management believes the collectibility of the amount is unlikely. Although the Company has not experienced significant losses on accounts receivable historically, its accounts receivable are concentrated with a small number of customers. Consequently, any write off associated with one of these customers could have a significant impact on the Company’s allowance for doubtful accounts and results of operations.
Inventories
Inventories are stated at the lower of cost on a first-in, first-out basis or market. The Company uses a standard cost system for purposes of determining cost. The standards are adjusted periodically to approximate actual cost. The Company regularly compares forecasted demand for its products against inventory on hand and open purchase commitments to adjust the carrying value of inventories to their net realizable value.
Property and Equipment
Property and equipment are stated at cost. Depreciation is calculated using the straight-line method over estimated useful lives of 1 to 39 years for buildings, building improvements and land improvements, 1 to 7 years for production and test equipment, and 1 to 10 years for furniture and fixtures. Leasehold improvements are amortized using the straight-line method over the shorter of the remaining lease term or the estimated useful life of the asset. Depreciation expense related to property and equipment used in the production process is recorded in cost of sales. Depreciation expense related to property and equipment used in all other activities is recorded in operating expenses.
Goodwill
Goodwill is not amortized, but instead, is tested annually for impairment, or more frequently when events or changes in circumstances indicate that the assets might be impaired. Management considers the Company’s business as a whole to be its reporting unit for purposes of testing for impairment. This impairment test is performed annually during the fourth fiscal quarter.
The Company early adopted the Financial Accounting Standards Board’s (FASB) Accounting Standards Update 2011-08, “Intangibles — Goodwill and Other (Topic 350): Testing Goodwill for Impairment” (ASU 2011-08) guidance during the first quarter of fiscal 2012. There was no financial statement impact as a result of the Company’s early adoption of this guidance.
Under ASU 2011-08, the Company has the option to first assess the qualitative factors to determine whether the existence of events or circumstances leads to a determination that it is more likely than not that the fair value of a reporting unit is less than its carrying amount. If, after assessing the totality of events or circumstances, the Company determines it is not more likely than not that the fair value of a reporting unit is less than its carrying amount, then performing the two-step impairment test is unnecessary. However, if the Company concludes otherwise, then the Company is required to perform the first step of the two-step impairment test by comparing the fair value of the reporting unit with its carrying amount, including goodwill. If the fair value of the reporting unit exceeds its carrying amount, goodwill is not considered impaired; otherwise, goodwill is considered impaired and the loss is measured by performing step two. Under step two, the impairment loss is measured by comparing the implied fair value of the reporting unit goodwill with the carrying amount of goodwill. The Company also has the option to bypass the qualitative assessment under ASU 2011-08 and proceed directly to performing the first step of the two-step goodwill impairment test. The Company may resume performing the qualitative assessment in any subsequent period ..
66
EMULEX CORPORATION AND SUBSIDIARIES
NOTES TO CONSOLIDATED FINANCIAL STATEMENTS — (Continued)
Intangible Assets, Net
Intangible assets resulting from acquisitions are carried at cost less accumulated amortization. For intangible assets with determinable useful lives, amortization is computed using the straight-line method over the estimated economic lives of the respective intangible assets, ranging from two to ten years.
Long-Lived Assets
The recoverability of long-lived assets, including property and equipment and intangible assets, is assessed whenever events or changes in circumstances indicate that the Company may not be able to recover the asset’s carrying value. The amount of impairment, if any, is measured based on the difference between the carrying value of an asset and it’s fair value, which is determined using projected discounted operating cash flows over an asset’s remaining useful life. Assets to be disposed of are reported at the lower of their carrying amount or their fair value less selling costs.
Revenue Recognition
The Company generally recognizes revenue at the time of shipment when title and risk of loss have passed, evidence of an arrangement has been obtained, pricing is fixed or determinable, and collectability is reasonably assured. The Company makes certain sales through two tier distribution channels using selected distributors and Master Value Added Resellers (collectively, Distributors). These Distributors are subject to distribution agreements that may be terminated upon written notice by either party and that generally provide privileges to return a portion of inventory and to participate in price protection and cooperative marketing programs. Therefore, the Company recognizes revenue on their standard non-Original Equipment Manufacturer (OEM) products sold to its Distributors based on a sell through model. OEM-specific models sold to Distributors are generally governed under the related OEM agreements rather than under these distribution agreements; and accordingly, the Company generally recognizes revenue at the time of shipment for OEM specific products shipped to its Distributors.
Additionally, the Company maintains sales related reserves and accruals for its sales incentive programs. Based on the benefit received, the costs of these incentive programs are recorded as a reduction to revenue, a cost of sale, or an operating expense ..
Warranty
The Company provides a warranty of between one and five years on its products. The Company records a provision for estimated warranty related costs at the time of sale based on historical product return rates and management’s estimates of expected future costs to fulfill the Company’s warranty obligations. The Company evaluates its ongoing warranty obligation on a quarterly basis.
Research and Development
Research and development costs, including costs related to the development of new products and process technology, are expensed as incurred.
67
EMULEX CORPORATION AND SUBSIDIARIES
NOTES TO CONSOLIDATED FINANCIAL STATEMENTS — (Continued)
Advertising Expenses
Advertising costs are expensed as incurred. Advertising expenses amounted to approximately $6.3 million, $4.6 million, and $5.3 million for fiscal years 2012, 2011, and 2010, respectively.
Income Taxes
The Company accounts for income taxes using the asset and liability method, under which the Company recognizes deferred tax assets and liabilities for the future tax consequences attributable to temporary differences between the financial statement carrying amounts of existing assets and liabilities and their respective tax bases and for net operating loss and tax credit carryforwards. Tax positions that meet a more-likely-than-not recognition threshold are recognized in the first reporting period that it becomes more-likely-than-not such tax position will be sustained upon examination. A tax position that meets this more-likely-than-not recognition threshold is recorded at the largest amount of tax benefit that has a greater than 50% likelihood of being realized upon ultimate settlement. Previously recognized income tax positions that fail to meet the recognition threshold in a subsequent period are derecognized in that period. Differences between actual results and our assumptions, or changes in our assumptions in future periods, are recorded in the period they become known. The Company records potential accrued interest and penalties related to unrecognized tax benefits in income tax expense.
As a multinational corporation, the Company is subject to complex tax laws and regulations in various jurisdictions. The application of tax laws and regulations is subject to legal and factual interpretation, judgment, and uncertainty. Tax laws themselves are subject to change as a result of changes in fiscal policy, changes in legislation, evolution of regulations and court rulings. Therefore, the actual liability for U.S. or foreign taxes may be materially different from our estimates, which could result in the need to record additional liabilities or potentially to reverse previously recorded tax liabilities.
Deferred tax assets and liabilities are measured using enacted tax rates expected to apply to taxable income in the years in which those temporary differences are expected to be recovered or settled. The effect on deferred tax assets and liabilities of a change in tax rates is recognized in the period that includes the enactment date. A valuation allowance is recorded against any deferred tax assets when, in the judgment of management, it is more likely than not that all of or part of a deferred tax asset will not be realized. In assessing the need for a valuation allowance, the Company considers all positive and negative evidence, including recent financial performance, scheduled reversals of temporary differences, projected future taxable income, availability of taxable income in carryback periods and tax planning strategies.
Litigation Costs
The Company records a charge equal to at least the minimum estimated liability for a loss contingency or litigation settlement when both of the following conditions are met: (i) information available prior to issuance of the financial statements indicates that it is probable that a liability had been incurred at the date of the financial statements and (ii) the range of loss can be reasonably estimated. Liabilities related to litigation settlements with multiple elements are recorded based on the fair value of each element. Legal and other litigation related costs are recognized as the services are provided. The Company records recoveries for litigation costs when both of the following conditions are met: (i) the recovery is probable and (ii) collectability is reasonably assured. Recoveries are recorded only to the extent the litigation costs have been incurred and recognized in the financial statements; however, it is reasonably possible that the actual recovery may be significantly different from the Company’s estimates. There are many uncertainties associated with any litigation, and the Company cannot provide assurance that these actions or other third party claims against the Company will be resolved without costly litigation and/or substantial settlement charges. If any of those events were to occur, the Company’s business, financial condition and results of operations could be materially and adversely affected.
68
EMULEX CORPORATION AND SUBSIDIARIES
NOTES TO CONSOLIDATED FINANCIAL STATEMENTS — (Continued)
Net Income (Loss) per Share
Basic net income (loss) per share is computed by dividing net income (loss) by the weighted average number of common shares outstanding during the period. Diluted net income (loss) per share is computed by dividing adjusted net income (loss) by the weighted average number of common shares outstanding during the period increased to include, if dilutive, the number of additional common shares that would be outstanding if the dilutive potential common shares and unvested stock from stock option plans. The dilutive effect of outstanding stock options and unvested stock is reflected in diluted net income (loss) per share by application of the treasury stock method.
Supplemental Cash Flow Information
Cash paid during the year for:
| | | | | | | | | | | | |
| | | 2012 | | | 2011 | | | 2010 | |
| | | (In thousands) | |
Interest | | $ | 14 | | | $ | 17 | | | $ | 7 | |
Income taxes | | $ | 6,966 | | | $ | 11,620 | | | $ | 4,668 | |
Non-cash activities: | | | | | | | | | | | | |
Purchases of property and equipment not paid, net | | $ | 336 | | | $ | 94 | | | $ | 1,104 | |
Settlement of other assets in conjunction with business acquisition | | $ | — | | | $ | 24,466 | (1) | | $ | 4,000 | |
Accrued payroll tax withholdings for shares issued to employees | | $ | 382 | | | $ | — | | | $ | — | |
| (1) | Related to the ServerEngines acquisition. See Note 2. |
Comprehensive Income (Loss)
Comprehensive income (loss) represents the net change in stockholders’ equity during a period from sources other than transactions with stockholders and, as such, includes net income (loss) and other specified components. For the Company, the only component of comprehensive income (loss), other than net income (loss), is the change in the cumulative foreign currency translation adjustments recognized in stockholders’ equity.
Stock-Based Compensation
The Company’s stock-based awards are measured and recognized at fair value. The fair value of each stock option is estimated on the date of grant using the Black-Scholes-Merton option pricing model (Black-Scholes model) based on the market price of the underlying common stock as of the date of grant, the expected term, stock price volatility, and expected risk-free interest rates. Expected volatilities are based on methodologies utilizing equal weighting involving both historical periods equal to the expected term and implied volatilities based on traded options to buy the Company’s shares. The fair value of each unvested stock award is based on the market price as of the date of the grant. Stock-based compensation expense is recognized on a straight-line basis over the requisite service period for each separately vesting tranche of the award. A forfeiture rate assumption is applied based on future expectations and may be revised as significant differences from actual forfeitures become known over time.
Fair Value of Financial Instruments
The Company’s financial instruments consist primarily of cash and cash equivalents, and current investments as of July 1, 2012. The fair values of cash and cash equivalents and current investments are determined based on “Level 1” inputs, consisting of quoted prices in active markets for identical assets, and “Level 2” inputs, consisting of observable inputs other than Level 1 inputs.
69
EMULEX CORPORATION AND SUBSIDIARIES
NOTES TO CONSOLIDATED FINANCIAL STATEMENTS — (Continued)
Business and Credit Concentration
Financial instruments that potentially subject the Company to concentrations of credit risk consist primarily of cash and cash equivalents, investments, and accounts receivable. Cash, cash equivalents, and investments, are primarily maintained at three major financial institutions in the United States. Deposits held with banks may exceed the amount of insurance provided on such deposits, if any. The Company principally invests in U.S. Government issued securities, U.S. Government sponsored entity securities and corporate bonds and with the exception of the U.S. Government issued or U.S. Government sponsored entity securities, limits the amount of credit exposure to any one entity.
The Company sells its products to OEMs and distributors in the computer storage and server industry. Consequently, the Company’s net revenues and accounts receivable are highly concentrated among a few customers. Direct sales to the Company’s top five customers accounted for 70%, 64%, and 58% of total net revenues in fiscal years 2012, 2011, and 2010, respectively. The level of sales to any single customer may vary and the loss of any one of these customers, or a decrease in the level of sales to any one of these customers, could have a material adverse impact on the Company. Furthermore, although the Company sells to customers throughout the world, sales in the United States and Asia Pacific accounted for approximately 85%, 80%, and 68% of the Company’s net revenues in fiscal years 2012, 2011, and 2010, respectively and the Company expects for the foreseeable future, these sales will account for the substantial majority of the Company’s revenues. The Company maintains an allowance for doubtful accounts, and has not historically experienced significant loss on its accounts receivable. Sales are denominated in U.S. dollars. Consequently, the Company believes its foreign currency risk is minimal. The Company performs ongoing credit evaluations of its customers’ financial condition and generally requires no collateral from its customers.
Additionally, the Company currently relies on limited supply sources for several key components used in the manufacturing of its products. Also, the Company relies on three Electronics Manufacturing Services (EMS) providers for the manufacturing of its products. The inability or unwillingness of any single and limited source suppliers or the inability or unwillingness of any of the Company’s EMS providers to fulfill supply and production requirements, respectively, could materially impact future operating results.
Segment Information
The Company operates in one operating segment, networking products.
Recently Adopted Accounting Standards
In December 2010, the FASB issued ASU 2010-29, “Business Combinations (Topic 805): Disclosure of Supplementary Pro Forma Information for Business Combinations.” ASU 2010-29 affects any public entity that enters into business combinations that are material on an individual or aggregate basis. The comparative financial statements should present and disclose revenue and earnings of the combined entity as though the business combination(s) that occurred during the current year had occurred as of the beginning of the comparable prior annual reporting period only. The amendments also expand the supplemental pro forma disclosures to include a description of the nature and amount of material, nonrecurring pro forma adjustments directly attributable to the business combination included in the reported pro forma revenue and earnings. The amendments are effective prospectively for business combinations for which the acquisition date is on or after the beginning of the first annual reporting period beginning on or after December 15, 2010, or the Company’s 2012 fiscal year. There was no financial statement impact of the Company’s adoption of this guidance on July 4, 2011.
In January 2010, the FASB issued ASU 2010-06, “Improving Disclosures about Fair Value Measurements” amending ASC 820, “Fair Value Measurements and Disclosures” requiring additional disclosure and clarifying existing disclosure requirements about fair value measurements. ASU 2010-06 requires entities to provide fair value disclosures by each class of assets and liabilities, which may be a subset of assets and liabilities within a line item in the statement of financial position. The additional requirements also include disclosure regarding the
70
EMULEX CORPORATION AND SUBSIDIARIES
NOTES TO CONSOLIDATED FINANCIAL STATEMENTS — (Continued)
amounts and reasons for significant transfers in and out of Level 1 and 2 of the fair value hierarchy and separate presentation of purchases, sales, issuances and settlements of items within Level 3 of the fair value hierarchy. The guidance clarifies existing disclosure requirements regarding the inputs and valuation techniques used to measure fair value for measurements that fall in either Level 2 or Level 3 of the hierarchy. ASU 2010-06 was effective for interim and annual reporting periods beginning after December 15, 2009, or the third quarter of the Company’s 2010 fiscal year, except for the disclosures about purchases, sales, issuances and settlements of items within Level 3, which is effective for fiscal years beginning after December 15, 2010, or the Company’s 2012 fiscal year, and for interim periods within those fiscal years. There was no impact to the Company’s financial statements disclosures upon adoption of this guidance.
In May 2011, the FASB issued ASU 2011-04, “Fair Value Measurement (Topic 820): Amendments to Achieve Common Fair Value Measurement and Disclosure Requirements in U.S. GAAP and IFRS.” The amendments result in a consistent definition of fair value and common requirements for measurement of and disclosure about fair value between U.S. GAAP and IFRS. The amendments clarify the application of existing fair value measurement and disclosure requirements, including: a) application of the highest and best use and valuation premise concepts, b) measurement of the fair value of an instrument classified in a reporting entity’s shareholders’ equity, and c) quantitative disclosure about the unobservable inputs used in a fair value measurement that is categorized within Level 3 of the fair value hierarchy. The amendments also change particular principles or requirements for fair value measurement and disclosure including: a) measurement of the fair value of financial instruments that are managed within a portfolio, b) application of premiums and discounts in a fair value measurement, and c) additional disclosure about fair value measurements. The amendments are to be applied prospectively. For public entities, the amendments are effective during interim and annual periods beginning after December 15, 2011, or the Company’s third quarter of fiscal 2012. There was no significant impact to the Company’s financial statement disclosures upon adoption of this guidance in the third quarter of fiscal 2012.
In September 2011, the FASB issued ASU 2011-08, “Intangibles — Goodwill and Other (Topic 350): Testing Goodwill for Impairment.” Under ASU 2011-08, an entity has the option to first assess qualitative factors to determine whether the existence of events or circumstances leads to a determination that it is more likely than not that the fair value of a reporting unit is less than its carrying amount. If, after assessing the totality of events or circumstances, an entity determines it is not more likely than not that the fair value of a reporting unit is less than its carrying amount, then performing the two-step impairment test is unnecessary. However, if an entity concludes otherwise, then it is required to perform the first step of the two-step impairment test by calculating the fair value of the reporting unit and comparing the fair value with the carrying amount of the reporting unit. If the carrying amount of a reporting unit exceeds its fair value, then the entity is required to perform the second step of the goodwill impairment test to measure the amount of the impairment loss, if any. An entity also has the option to bypass the qualitative assessment for any reporting unit in any period and proceed directly to performing the first step of the two-step goodwill impairment test. An entity may resume performing the qualitative assessment in any subsequent period. The Company elected to early adopt this guidance during the first quarter of fiscal 2012. There was no financial statement impact as a result of the Company’s early adoption of this guidance. The Company will continue to perform its annual impairment test during the fourth fiscal quarter.
Recently Issued Accounting Standards
In June 2011, the FASB issued ASU 2011-05, “Comprehensive Income (Topic 220): Presentation of Comprehensive Income” which eliminates the option to report other comprehensive income and its components in the statement of changes in equity. Instead, an entity can elect to present items of net income and other comprehensive income in one continuous statement (referred to as the statement of comprehensive income) or in two separate, but consecutive, statements. Each component of net income and each component of other comprehensive income, together with totals for comprehensive income and its two parts (i.e., net income and other comprehensive income), would need to be displayed under either alternative. The amendments are to be applied retrospectively. In December 2011, the FASB issued ASU 2011-12, “Comprehensive Income (Topic 220):
71
EMULEX CORPORATION AND SUBSIDIARIES
NOTES TO CONSOLIDATED FINANCIAL STATEMENTS — (Continued)
Deferral of the Effective Date for Amendments to the Presentation of Reclassifications of Items Out of Accumulated Other Comprehensive Income in Accounting Standards Update No. 2011-05” which deferred the changes in ASU 2011-05 that related to the presentation of reclassification adjustments. For public entities, these amendments are effective for fiscal years, and interim periods within those years, beginning after December 15, 2011. The Company is currently assessing the impact of this disclosure guidance that will be effective for fiscal 2013 but does not expect any financial impact of adopting this guidance.
Note 2. Business Combinations
On August 25, 2010, the Company acquired 100% of the outstanding common stock of ServerEngines Corporation (ServerEngines), a privately-held, fabless semiconductor company located in Sunnyvale, California. The Company accounted for the acquisition using the purchase method of accounting in accordance with ASC 805, “Business Combinations.” The aggregate purchase price was approximately $135.7 million, including $54.8 million in cash, $67.4 million in common stock, $11.5 million in contingent consideration and $2.0 million in options assumed. Included in the common stock issued and contingent consideration was approximately 2.2 million shares of Emulex common stock held in escrow for up to 18 months from the acquisition date subject to certain standard representations and warranties defined in the merger agreement. The first half of the common stock in escrow was released on August 25, 2011 and the second half of the common stock in escrow was released on February 25, 2012.
The contingent consideration was related to 4.0 million shares that are issuable upon achievement of two post-closing milestones. Approximately 2.5 million shares were tied to the continued employment of three of the ServerEngines founders, and were therefore accounted for as stock-based compensation over the service period. The first post-closing milestone was met during the quarter ended December 26, 2010 in fiscal 2011. ServerEngines and the Company agreed, as a part of the merger agreement, that a review and potential adjustment of the second post-closing milestone could be made for changes that result from conditions out of their control. The Company evaluated these changes and adjusted the second post-closing milestone in January 2011 by extending the milestone achievement date to July 1, 2012. While the Company believes that significant progress had been made towards the adjusted milestone, conditions and the situation continued to evolve through fiscal year 2012. Pursuant to a provision in the merger agreement, the contractual conditions concerning the second post-closing milestone were waived by the Company during fiscal 2012. The Company proceeded with the payment of shares relating to the second post-closing milestone during fiscal 2012. Such action resulted in a stock-based compensation accounting modification pursuant to ASC 718, “Compensation – Stock Compensation,” with respect to the share recipients. In addition, each of the three ServerEngines founders, and eleven additional former ServerEngines employees agreed to repay the Company in cash or shares for the value of the shares received relating to the second post-closing milestone if certain continuing employment conditions were not satisfied. The modification resulted in total incremental stock-based compensation expense of approximately $3.3 million. In fiscal 2012, approximately $3.9 million of previously recognized expense was reversed and approximately $4.0 million of expense was recognized as a result of the modification. In addition, the Company will recognize approximately $4.6 million of stock-based compensation expense related to such modification in fiscal 2013. The Company has recognized approximately $4.1 million and $16.7 million of stock based compensation related to the contingent consideration and modification in fiscal 2012 and fiscal 2011, respectively.
The merger agreement provided that, in addition to certain cash, the ServerEngines former stockholders and option holders were to be paid in part through shares of common stock of the Company, of which one sixth of the shares related to the first post-closing milestone, and an additional one sixth of the shares related to the second post-closing milestone. With the payment of the shares relating to the second post-closing milestone, and the release of the first and second half of the common stock in escrow, the entire amount of shares of common stock of the Company provided in the merger agreement has been issued to the ServerEngines former stockholders and option holders.
72
EMULEX CORPORATION AND SUBSIDIARIES
NOTES TO CONSOLIDATED FINANCIAL STATEMENTS — (Continued)
The Company has allocated the purchase price to the assets acquired and liabilities assumed at estimated fair values. The excess of the purchase price over the aggregate fair values was recorded as goodwill. This acquisition has been included in the consolidated balance sheet of the Company and the operating results have been included in the consolidated statement of income since the date of acquisition.
Note 3. Fair Value of Financial Instruments
Fair value is defined as the exchange price that would be received for an asset or paid to transfer a liability (an exit price) in the principal or most advantageous market for the asset or liability in an orderly transaction between market participants on the measurement date. Valuation techniques used to measure fair value must maximize the use of observable inputs and minimize the use of unobservable inputs. The fair value hierarchy is based on three levels of inputs, of which the first two are considered observable and the last unobservable, that may be used to measure fair value. A description of the three levels of inputs is as follows:
Level 1 — Quoted prices in active markets for identical assets or liabilities;
Level 2 — Observable inputs other than Level 1 prices, such as quoted prices for similar assets or liabilities; quoted prices in markets that are not active; or other inputs that are observable or can be corroborated by observable market data for substantially the full term of the assets or liabilities; and
Level 3 — Unobservable inputs that are supported by little or no market activity and that are significant to the fair value of the assets or liabilities.
Financial instruments measured at fair value on a recurring basis as of July 1, 2012 and July 3, 2011 are as follows:
| | | | | | | | | | | | | | | | |
| | | Level 1 | | | Level 2 | | | Level 3 | | | Total | |
| | | (In thousands) | |
July 1, 2012 | | | | | | | | | | | | | | | | |
Cash and cash equivalents | | $ | 201,048 | | | $ | — | | | $ | — | | | $ | 201,048 | |
U.S. government securities | | | 22,602 | | | | — | | | | — | | | | 22,602 | |
U.S. government sponsored entity securities | | | 2,110 | | | | — | | | | — | | | | 2,110 | |
Marketable certificates of deposit | | | — | | | | 4,169 | | | | — | | | | 4,169 | |
| | | | | | | | | | | | | | | | |
| | $ | 225,760 | | | $ | 4,169 | | | $ | — | | | $ | 229,929 | |
| | | | | | | | | | | | | | | | |
July 3, 2011 | | | | | | | | | | | | | | | | |
Cash and cash equivalents | | $ | 131,160 | | | $ | — | | | $ | — | | | $ | 131,160 | |
U.S. government securities | | | 42,928 | | | | — | | | | — | | | | 42,928 | |
U.S. government sponsored entity securities | | | 4,678 | | | | — | | | | — | | | | 4,678 | |
Corporate bonds | | | 1,588 | | | | — | | | | — | | | | 1,588 | |
Marketable certificates of deposit | | | — | | | | 2,989 | | | | — | | | | 2,989 | |
| | | | | | | | | | | | | | | | |
| | $ | 180,354 | | | $ | 2,989 | | | $ | — | | | $ | 183,343 | |
| | | | | | | | | | | | | | | | |
The Company’s Level 2 securities were primarily valued based on information obtained from a third-party pricing service. To estimate fair value, the pricing service utilizes a pricing model for which all significant inputs are observable, either directly or indirectly from market data. These inputs include reported trades and broker/dealer quotes of the same or similar securities, issuer credit spreads, benchmark securities and other observable inputs.
There were no transfers between Level 1, Level 2, or Level 3 securities in either fiscal 2012 or fiscal 2011.
73
EMULEX CORPORATION AND SUBSIDIARIES
NOTES TO CONSOLIDATED FINANCIAL STATEMENTS — (Continued)
Note 4. Cash, Cash Equivalents, and Investments
The Company’s portfolio of cash, cash equivalents, and held-to-maturity investments consists of the following:
| | | | | | | | | | | | | | | | |
| | | Cost | | | Gross
Unrealized
Gains | | | Gross
Unrealized
Losses | | | Fair Value | |
| | | (In thousands) | |
July 1, 2012 | | | | | | | | | | | | | | | | |
Cash | | $ | 39,864 | | | $ | — | | | $ | — | | | $ | 39,864 | |
Money market funds | | | 161,184 | | | | — | | | | — | | | | 161,184 | |
U.S. government securities | | | 22,600 | | | | 2 | | | | — | | | | 22,602 | |
U.S. government sponsored entity securities | | | 2,110 | | | | — | | | | — | | | | 2,110 | |
Marketable certificates of deposit | | | 4,169 | | | | — | | | | — | | | | 4,169 | |
| | | | | | | | | | | | | | | | |
| | $ | 229,927 | | | $ | 2 | | | $ | — | | | $ | 229,929 | |
| | | | | | | | | | | | | | | | |
July 3, 2011 | | | | | | | | | | | | | | | | |
Cash | | $ | 50,281 | | | $ | — | | | $ | — | | | $ | 50,281 | |
Money market funds | | | 80,879 | | | | — | | | | — | | | | 80,879 | |
U.S. government securities | | | 42,934 | | | | — | | | | (6 | ) | | | 42,928 | |
U.S. government sponsored entity securities | | | 4,680 | | | | — | | | | (2 | ) | | | 4,678 | |
Corporate bonds | | | 1,587 | | | | 1 | | | | — | | | | 1,588 | |
Marketable certificates of deposit | | | 2,989 | | | | — | | | | — | | | | 2,989 | |
| | | | | | | | | | | | | | | | |
| | $ | 183,350 | | | $ | 1 | | | $ | (8 | ) | | $ | 183,343 | |
| | | | | | | | | | | | | | | | |
Cash, cash equivalents and investments were classified as follows:
| | | | | | | | |
| | | 2012 | | | 2011 | |
| | | (In thousands) | |
Cash and cash equivalents | | $ | 201,048 | | | $ | 131,160 | |
Short-term investments (maturities less than one year) | | | 28,879 | | | | 37,025 | |
Long-term investments (maturities greater than one year) | | | — | | | | 15,165 | |
| | | | | | | | |
| | $ | 229,927 | | | $ | 183,350 | |
| | | | | | | | |
Note 5. Inventories
Inventories are summarized as follows:
| | | | | | | | |
| | | 2012 | | | 2011 | |
| | | (In thousands) | |
Raw materials | | $ | 5,084 | | | $ | 6,352 | |
Finished goods | | | 15,235 | | | | 14,156 | |
| | | | | | | | |
| | $ | 20,319 | | | $ | 20,508 | |
| | | | | | | | |
As of July 1, 2012 and July 3, 2011, finished goods inventory includes approximately $1.6 million and $0.4 million, respectively, related to inventory owned by customers for which revenue has been deferred due to right of return and such return amount cannot be reasonably estimated.
74
EMULEX CORPORATION AND SUBSIDIARIES
NOTES TO CONSOLIDATED FINANCIAL STATEMENTS — (Continued)
Note 6. Property and Equipment
Components of property and equipment, net, are as follows:
| | | | | | | | |
| | | 2012 | | | 2011 | |
| | | (In thousands) | |
Equipment | | $ | 93,471 | | | $ | 99,669 | |
Furniture and fixtures | | | 47,666 | | | | 48,713 | |
Buildings and improvements | | | 42,813 | | | | 44,809 | |
Land | | | 12,532 | | | | 12,532 | |
| | | | | | | | |
| | | 196,482 | | | | 205,723 | |
Less: accumulated depreciation and amortization | | | (136,364 | ) | | | (141,628 | ) |
| | | | | | | | |
| | $ | 60,118 | | | $ | 64,095 | |
| | | | | | | | |
Note 7. Goodwill and Intangible Assets, net
Goodwill relates to the purchase of Sierra Logic, Inc. in fiscal 2007, the purchase of a business from a privately-held storage networking company in fiscal 2010 and the purchase of ServerEngines Corporation in fiscal 2011.
The activities in goodwill during the twelve months ended July 1, 2012 and July 3, 2011 are as follows:
| | | | | | | | |
| | | 2012 | | | 2011 | |
| | | (In thousands) | |
Balance at the beginning of the period | | $ | 177,290 | | | $ | 93,835 | |
Goodwill from acquisition during the period | | | — | | | | 83,455 | |
| | | | | | | | |
Balance at the end of the period | | $ | 177,290 | | | $ | 177,290 | |
| | | | | | | | |
Although the Company’s market capitalization exceeded its book value for the majority of the fiscal year, as of the date of the Company’s annual impairment test on May 27, 2012, its market capitalization declined below book value by approximately 3%. The fair value of the Company’s reporting unit is estimated using its market capitalization along with a control premium that has historically ranged from 20% to 25%. After evaluating all factors, including its market capitalization, the Company determined no goodwill impairment had occurred as of May 27, 2012. Subsequent to the annual impairment test date and as of the end of fiscal 2012, the Company’s market capitalization increased and exceed its book value. Since the Company’s stock price has continued to be volatile subsequent to the end of fiscal 2012, it is reasonably possible that the Company’s determination that goodwill is not impaired could change in the near term if the Company’s stock price and estimated control premium decrease below its book value.
75
EMULEX CORPORATION AND SUBSIDIARIES
NOTES TO CONSOLIDATED FINANCIAL STATEMENTS — (Continued)
Intangible assets, net, are as follows:
| | | | | | | | | | | | | | | | | | | | | | | | |
| | | July 1, 2012 | | | July 3, 2011 | |
| | | Gross | | | Accumulated
Amortization | | | Net | | | Gross | | | Accumulated
Amortization | | | Net | |
| | | (In thousands) | |
Intangible assets subject to amortization: | | | | | | | | | | | | | | | | | | | | | | | | |
Core technology and patents | | $ | 77,345 | | | $ | (66,092 | ) | | $ | 11,253 | | | $ | 77,345 | | | $ | (61,052 | ) | | $ | 16,293 | |
Developed technology | | | 198,100 | | | | (106,134 | ) | | | 91,966 | | | | 198,100 | | | | (82,116 | ) | | | 115,984 | |
Customer relationships | | | 5,100 | | | | (4,942 | ) | | | 158 | | | | 5,100 | | | | (3,831 | ) | | | 1,269 | |
Tradename | | | 6,339 | | | | (4,951 | ) | | | 1,388 | | | | 6,339 | | | | (4,781 | ) | | | 1,558 | |
Backlog | | | — | | | | — | | | | — | | | | 1,660 | | | | (1,660 | ) | | | — | |
Other | | | 707 | | | | (470 | ) | | | 237 | | | | 707 | | | | (209 | ) | | | 498 | |
| | | | | | | | | | | | | | | | | | | | | | | | |
| | $ | 287,591 | | | $ | (182,589 | ) | | $ | 105,002 | | | $ | 289,251 | | | $ | (153,649 | ) | | $ | 135,602 | |
| | | | | | | | | | | | | | | | | | | | | | | | |
Aggregated amortization expense for intangible assets for fiscal years 2012, 2011, and 2010, was approximately $30.6 million, $42.5 million, and $25.7 million respectively. Approximately $24.0 million, $33.1 million, and $18.9 million of such amortization expense related to core technology and developed technology for fiscal years 2012, 2011 and 2010, respectively, and has been included in cost of sales within the consolidated statements of operations.
The following table presents the estimated aggregated future amortization expense of intangible assets as of the end of fiscal 2012 (in thousands):
| | | | |
2013 | | $ | 26,137 | |
2014 | | | 25,832 | |
2015 | | | 21,832 | |
2016 | | | 20,901 | |
2017 | | | 4,860 | |
Thereafter | | | 5,440 | |
| | | | |
| | $ | 105,002 | |
| | | | |
Note 8. Accrued and Other Current Liabilities
Components of accrued and other current liabilities are as follows:
| | | | | | | | |
| | | 2012 | | | 2011 | |
| | | (In thousands) | |
Payroll and related costs | | $ | 19,990 | | | $ | 21,327 | |
Accrued warranty liabilities | | | 2,463 | | | | 2,166 | |
Accrued rebates | | | 7,378 | | | | 10,546 | |
Patent litigation settlement, damages and sunset period royalties payable to Broadcom Corporation(1) | | | 37,310 | | | | — | |
Other | | | 8,559 | | | | 8,160 | |
| | | | | | | | |
| | $ | 75,700 | | | $ | 42,199 | |
| | | | | | | | |
76
EMULEX CORPORATION AND SUBSIDIARIES
NOTES TO CONSOLIDATED FINANCIAL STATEMENTS — (Continued)
Changes to the warranty liability in fiscal years 2012 and 2011 are as follows:
| | | | | | | | |
| | | 2012 | | | 2011 | |
| | | (In thousands) | |
Balance at beginning of period | | $ | 2,166 | | | $ | 1,637 | |
Accrual for warranties issued | | | 2,100 | | | | 2,039 | |
Changes to pre-existing warranties (including changes in estimates) | | | (476 | ) | | | (75 | ) |
Settlements made (in cash or in kind) | | | (1,327 | ) | | | (1,435 | ) |
| | | | | | | | |
Balance at end of period | | $ | 2,463 | | | $ | 2,166 | |
| | | | | | | | |
Note 9. Employee Retirement Savings Plans
The Company maintains a pretax savings and profit sharing plan under Section 401(k) of the Internal Revenue Code (IRC) (the Plan) covering substantially all U.S. domestic employees. Under the Plan, eligible employees are able to contribute up to 15% of their compensation not to exceed the maximum IRC deferral amount. In addition, Company discretionary contributions match up to four percent of a participant’s compensation. Company discretionary contributions to the 401(k) plan were suspended in March 2009 due to the downturn in the economy. Effective in February 2010, the Company discretionary contributions match was reinstated to 50% of the first four percent of a participant’s eligible compensation. The Company’s matching contributions under this plan were approximately $1.6 million, $1.7 million, and $0.6 million in fiscal years 2012, 2011, and 2010, respectively. Under the terms of the Plan, the Company may also make discretionary profit sharing contributions. The Company’s discretionary profit sharing contributions under this Plan were approximately $0.7 million in fiscal year 2012. The Company did not make any discretionary profit sharing contributions during fiscal years 2011 and 2010.
The Company also maintains similar retirement plans in certain international locations. The total expense and total obligation of the Company for these plans were not material to the accompanying consolidated financial statements for any period presented.
Note 10. Commitments and Contingencies
Leases
The Company leases certain facilities and equipment under long-term non-cancelable operating lease agreements, which expire at various dates through 2019. Rent expense for the Company under operating leases, including month-to-month rentals, totaled approximately $5.2 million, $6.1 million, and $5.2 million in fiscal years 2012, 2011, and 2010, respectively. The Company records rent expense on a straight-line basis based on contractual lease payments. Allowances from lessors for tenant improvements have been included in the straight-line rent expense for the applicable locations.
Future minimum non-cancelable operating lease commitments are as follows (in thousands):
| | | | |
| | | Operating
Leases | |
Fiscal year: | | | | |
2013 | | $ | 4,955 | |
2014 | | | 3,502 | |
2015 | | | 2,933 | |
2016 | | | 2,684 | |
2017 | | | 1,866 | |
Thereafter | | | 2,729 | |
| | | | |
Total minimum lease payments | | $ | 18,669 | |
| | | | |
77
EMULEX CORPORATION AND SUBSIDIARIES
NOTES TO CONSOLIDATED FINANCIAL STATEMENTS — (Continued)
Litigation
Broadcom Patent Infringement Litigation
On September 14, 2009, Broadcom Corporation (Broadcom) filed a patent infringement lawsuit against the Company in the United States District Court in the Central District of California. The original complaint alleged infringement by the Company of ten Broadcom patents covering certain data and storage networking technologies. On January 11, 2010, the Court set a trial date of September 20, 2011. On February 23, 2010, Broadcom filed a first amended complaint adding allegations of infringement for one additional Broadcom patent. The first amended complaint sought unspecified damages and injunctive relief. On March 25, 2010, the Company filed its answer and affirmative defenses to the first amended complaint alleging that it believed that the Broadcom patents at issue were invalid or not infringed, or both. In addition, the Company asserted counterclaims for declaratory judgment of invalidity and non-infringement against each of the Broadcom patents at issue, and sought award of attorneys’ fees, costs, and expenses.
On May 26, 2010, Broadcom filed a separate patent infringement lawsuit against the Company in the United States District Court in the Central District of California. The 2010 lawsuit alleged infringement of a Broadcom patent covering certain data and storage networking technologies by certain Emulex products. Broadcom sought a judgment for damages, injunctive relief, and an award of attorneys’ fees and costs.
On June 30, 2010, the Court consolidated the 2009 and 2010 patent cases into a single case. On October 14, 2010, the Court issued an order on the parties’ joint stipulation dismissing three patents from the case. On November 1, 2010, the Court issued an order allowing Broadcom to make infringement assertions against additional Emulex products. In a Court ruling dated December 17, 2010, the Court provided interpretations of certain terms contained in the claims of the patents being asserted by Broadcom. In February and May 2011, the Court issued separate orders on the parties’ joint stipulations collectively dismissing two patents from the case (leaving seven patents in the case). The Court heard the parties’ respective motions for summary judgment and subsequently issued a ruling on August 3, 2011 barring Broadcom’s claim for infringement on one patent, leaving six patents in the case. On August 25, 2011, the Company met with a mediator and representatives of Broadcom concerning potential settlement of the case. On September 2, 2011, the parties submitted a joint summary of the mediation proceedings, in which they stated that the mediation proceedings continued for a full day, that the parties were unable to reach a settlement agreement, and that although both parties remained available for further discussions, the parties did not believe that further settlement discussions prior to the September 20, 2011 trial would be likely to lead to agreement.
After a nearly three week trial that ended October 6, 2011, the jury reached a partial verdict involving two out of the six patents. The Court determined that one of the patents (U.S. Patent 7,058,150) [the ‘150 patent] had been infringed by Emulex, and the jury rendered an advisory verdict on October 12, 2011 to the Court that it is not invalid, and awarded approximately $0.4 million in damages with respect to that patent. The jury reached a unanimous verdict of non-infringement on another patent relating to Emulex Fibre Channel switch products. A mistrial was declared concerning the remaining four patents for which no unanimous verdict was reached. On December 15, 2011, the Court issued judgments as a matter of law (JMOL) that the two patents, on which the jury had rendered advisory verdicts, were not invalid. On December 16, 2011, the Court issued an additional JMOL that one of the patents (U.S. Patent 7,471,691) [the ‘691 patent] had been infringed by Emulex. The ‘150 patent, particularly Claim 8 considered at the trial, pertains to the use of multiple lanes of phase interpolators, and products that utilize clock and data recovery (CDR) circuits in SerDes modules on an application specific integrated circuit (ASIC). The ‘691 patent, particularly Claim 7 considered at the trial, pertains to fibre channel arbitrated loop switch crossbars and scoreboards, and products that utilize specialized ASICs used in storage arrays and pass-through modules. The Company has filed an appeal for both the ‘150 patent and ‘691 patent infringement findings.
On March 16, 2012, the Court issued a decision concerning injunctive relief for the ‘150 and the ‘691 patents. The decision provided, in part, for a sunset period of 18 months relating to the ‘150 patent, starting on
78
EMULEX CORPORATION AND SUBSIDIARIES
NOTES TO CONSOLIDATED FINANCIAL STATEMENTS — (Continued)
October 12, 2011. The decision further provided for a sunset period of 18 months relating to the ‘691 patent, starting on December 16, 2011. The affected products for the ‘150 patent include the BE2, BE3, XE201, and SOC 442 ASICs, products containing them, and products not colorably different from them. The affected products for the ‘691 patent include the SOC 320, SOC 422, and SOC 442 ASICs, products containing them, and products not colorably different from them. The sunset period allows the Company to sell the affected products to existing customers for specific customer devices, subject to limitations relating to when the products had been qualified and when certain firm orders had been placed. The decision further provided for the Company to pay a royalty of nine percent on all sales of such products made during the sunset period, and also provided that foreign sales (outside the U.S.) are beyond the scope of the suit. On April 3, 2012, the Court issued a Permanent Injunction which, with respect to both the ‘150 and ‘691 patents, further describe the prohibited activities, contain sunset provision terms including royalty rates and computations, limit the territory to allow sales of products that are manufactured outside the U.S. to customers located outside the U.S., permit design around efforts including modifications and design, development, and testing to eliminate infringement, and permit service and technical support for certain products. The Permanent Injunction refers to an Appendix to that Order, but no appendix was included when the Permanent Injunction was issued on April 3, 2012. The Appendix is to identify the permitted sunset sales, which would include the existing Emulex customers, the particular customer platform and the Emulex product or devices. On April 23, 2012, the Court stated that the Appendix is to be in final form by June 4, 2012.
On April 12, 2012, the Court scheduled the start of the re-trial relating to the ‘194 family of patents that the previous jury could not reach a unanimous verdict on for April 2, 2013. The previous trial involved the following patents in the ‘194 family: U.S. Patent 6,424,194 [the ‘194 patent], Claim 1; U.S. Patent 7,486,124, Claim 5; and U.S. Patent 7,724,057, Claim 42, all of which pertain to circuitry used to deserialize signals. The Court has not issued any rulings with respect to these remaining three patents.
On May 30, 2012, the Court issued an order requiring the parties to submit the Appendix to the April 3, 2012 Permanent Injunction, and excluded from the sunset provision any customer who is a distributor and not an OEM, with an distributor exceptions for needs of an end user affecting health of the public, public safety, and governmental agencies engaged in the national defense. The May 30, 2012 order provided that, not later than 90 days from the date of that order, Broadcom may move the Court for exclusion of certain device/customer product combinations from the Appendix. An Appendix was filed by Emulex and Broadcom with the Court under seal on June 10, 2012.
On July 3, 2012, Broadcom and the Company entered into a Patent License and Release Agreement (Settlement Agreement) pursuant to which both parties agreed to settle and release certain claims related to patent infringement litigation. The Settlement Agreement provides for certain amendments to the April 3, 2012 Permanent Injunction, and dismissals of certain allegations of the lawsuit, including portions of the scheduled re-trial. The Company also received a worldwide limited license to the ‘691 patent, the ‘150 patent, the ‘194 patent and related families for certain fields of use including Fibre Channel applications. The fields of use licensed to Emulex are related, in part, to the Emulex XE201 (Lancer) ASICs, that are capable of Fibre Channel and Ethernet, 16Gbps Fiber Channel HBAs, Fibre Channel SOCs and other Fibre Channel products. Pursuant to the Settlement Agreement, the Company has paid Broadcom a release and license fee of $58.0 million in cash subsequent to fiscal 2012. On July 18, 2012, pursuant to the Settlement Agreement, the Court issued an amended Permanent Injunction with an amended appendix, and approved a stipulation to dismiss certain allegations in the lawsuit.
While the Company has contractual commitments from its suppliers concerning the defense and indemnification of certain Broadcom claims relating to certain technology provided by such suppliers, it cannot be certain that such defense and indemnification obligations will be promptly honored by such suppliers. This lawsuit continues to present risks that could have a material adverse effect on the Company’s business, financial condition, or results of operations, including loss of patent rights, monetary damages, and injunction against the sale of accused products. The Company continues to present a vigorous post-trial defense against this lawsuit, and has filed a formal appeal of the previous infringement verdicts, damages and judgments.
79
EMULEX CORPORATION AND SUBSIDIARIES
NOTES TO CONSOLIDATED FINANCIAL STATEMENTS — (Continued)
The Company accrued approximately $0.4 million in damages related to the October 12, 2011 verdict and approximately $0.1 million of sunset period royalty liability related to the July 18, 2012 amended injunction in fiscal 2012. At the end of fiscal 2012, the Company accrued current liabilities of approximately $36.8 million related to the Settlement Agreement. The Company determined there were two elements to the Settlement Agreement: (1) settlement of claims related to the past sales of products and (2) patent license fees related to the future sales of certain products. The Company estimated the fair value of each element using the income approach, relief from royalty method, which includes level three fair value inputs including historical and future royalty base, royalty rates, probability of infringement factors, and discount rate. This resulted in approximately $36.8 million being assigned to the settlement of claims related to the past sales of products element and expensed to cost of goods sold in fiscal 2012. The remaining $21.2 million was assigned to the patent license fees related to the future sales of products element that will be recorded as prepaid license fees in the first quarter of fiscal 2013 when the payment is made, and amortized to cost of goods sold over the license term in proportion to the estimated future revenues of the licensed technology. The Company is currently unable to determine whether any further loss will occur related to the ongoing portion of this litigation or to estimate the range of any such further loss.
Other Litigation
On November 9, 2009, the Company filed a lawsuit against Broadcom alleging that Broadcom had acted in an anticompetitive manner in violation of federal antitrust laws, as well as made defamatory statements and engaged in acts of unfair competition. The complaint seeks actual and punitive damages, attorneys’ fees and costs, and injunctive relief against Broadcom. On January 4, 2010, the Company filed an amended complaint. The amended complaint alleges that Broadcom has acted in an anticompetitive manner in violation of federal antitrust laws and made defamatory statements. The amended complaint seeks actual and punitive damages, attorneys’ fees and costs, and injunctive relief. On June 7, 2010, the Court denied Broadcom’s motion to dismiss the Company’s first amended complaint and to strike the Company’s defamation claim. On April 4, 2012, the Court granted the parties order on joint stipulation to dismiss this lawsuit without prejudice.
On November 15, 2001, prior to the Company’s acquisition of Vixel Corporation, a securities class action lawsuit was filed in the United States District Court in the Southern District of New York as Case No. 01 CIV. 10053 (SAS), Master File No. 21 MC92 (SAS) against Vixel and two of its officers and directors (one of which is James M. McCluney, the Company’s current Chief Executive Officer) and certain underwriters who participated in the Vixel initial public offering in late 1999. The amended complaint alleged violations under Section 10(b) of the Exchange Act and Section 11 of the Securities Act and sought unspecified damages on behalf of persons who purchased Vixel stock during the period October 1, 1999 through December 6, 2000. On April 2, 2009, the parties signed a Stipulation and Agreement of Settlement (the 2009 Settlement) to the District Court for preliminary approval. The District Court granted the plaintiffs’ motion for preliminary approval and preliminarily certified the settlement classes on June 10, 2009. The settlement “fairness” hearing was held on September 10, 2009. On October 6, 2009, the District Court entered an opinion granting final approval to the settlement and directing that the Clerk of the District Court close these actions. The 2009 Settlement provides for Emulex to pay zero and for insurers to pay the entire settlement amount of $586 million for all defendants. Notices of appeal of the opinion granting final approval were originally filed by six groups of appellants. On January 10, 2012, the last remaining appellant dismissed his appeal, permitting the 2009 Settlement to close and conclude this litigation.
In addition to the ongoing litigation discussed above, the Company is involved in various claims and legal actions arising in the ordinary course of business. In the opinion of management, the ultimate disposition of the open matters will not have a material adverse effect on the Company’s consolidated financial position, results of operations or liquidity.
80
EMULEX CORPORATION AND SUBSIDIARIES
NOTES TO CONSOLIDATED FINANCIAL STATEMENTS — (Continued)
Other Commitments and Contingencies
As of July 1, 2012, the Company has approximately $39.8 million of liabilities for uncertain tax positions for which a reasonably reliable estimate of the period of payment cannot be made. See Note 12.
The Company has entered into various agreements, including agreements for professional services, product development alignment activities, non-recurring engineering, and purchases of inventory. As of July 1, 2012, the Company’s obligation associated with such agreements was approximately $74.4 million.
In addition, the Company provides limited indemnification in selected circumstances within its various customer contracts whereby the Company indemnifies the parties to whom it sells its products with respect to the Company’s product infringement of certain intellectual property, and in some limited cases against bodily injury or damage to real or tangible personal property caused by a defective Company product. It is not possible to predict the maximum potential amount of future payments under these or similar agreements, due to the conditional nature of the Company’s obligations and the unique facts and circumstances involved in each particular agreement. As of July 1, 2012, the Company has not incurred any significant costs related to indemnification of its customers.
Note 11. Shareholders’ Equity
Stock Repurchase Program
In early August 2008, the Company’s Board of Directors authorized a plan to repurchase up to $100.0 million of its outstanding common stock. As of July 1, 2012, the Company has repurchased approximately 9.0 million shares of its common stock for an aggregate purchase price of approximately $78.4 million at an average purchase price of $8.67 per share under this plan. Approximately 2.9 million shares for an aggregate purchase price of approximately $20.1 million at an average purchase price of $6.83 per share were purchased in fiscal 2012. Approximately $21.6 million is available under this program after these repurchases. The Company may repurchase additional shares from time to time in open market purchases or privately negotiated transactions. It is expected that any future share repurchases will be financed by available cash balances and cash from operations. The Company’s Board of Directors has not set an expiration date for the plan.
Stock-Based Compensation
As of July 1, 2012, the Company had three stock-based plans for employees and directors that are open for future awards and are described below. In addition, the Company had nine stock-based plans, including seven plans assumed in connection with acquisitions, each of which is closed for future grants but has options outstanding.
Amounts recognized in the financial statements with respect to these plans for fiscal 2012, 2011, and 2010 are as follows:
| | | | | | | | | | | | |
| | | 2012 | | | 2011 | | | 2010 | |
| | | (In thousands) | |
Cost of stock-based payment plans during the period | | $ | 22,084 | | | $ | 39,211 | | | $ | 18,152 | |
Stock-based cost related to ServerEngines stock awards acceleration during the period | | | — | | | | 50 | | | | — | |
Amounts capitalized in inventory during the period | | | (527 | ) | | | (737 | ) | | | (517 | ) |
Amounts recognized in income for amounts previously capitalized in inventory | | | 612 | | | | 736 | | | | 479 | |
| | | | | | | | | | | | |
Amounts charged against income, before income tax benefit | | $ | 22,169 | | | $ | 39,260 | | | $ | 18,114 | |
| | | | | | | | | | | | |
Amount of related income tax benefit recognized in income | | $ | 5,494 | | | $ | 7,204 | | | $ | 5,797 | |
| | | | | | | | | | | | |
81
EMULEX CORPORATION AND SUBSIDIARIES
NOTES TO CONSOLIDATED FINANCIAL STATEMENTS — (Continued)
In fiscal 2012, pursuant to a provision in the merger agreement, the contractual conditions concerning the second post-closing milestone were waived by the Company (see Note 2). Such action resulted in a stock-based compensation accounting modification pursuant to ASC 718, “Compensation – Stock Compensation,” with respect to the share recipients. In addition, each of the three ServerEngines founders, and eleven additional former ServerEngines employees agreed to repay the Company in cash or shares for the value of the shares received relating to the second post-closing milestone if certain continuing employment conditions were not satisfied. The modification resulted in total incremental stock-based compensation expense of approximately $3.3 million. In fiscal 2012, approximately $3.9 million of previously recognized expense was reversed and approximately $4.0 million of expense was recognized as a result of the modification. In addition, the Company will recognize approximately $4.6 million of stock-based compensation expense related to such modification in fiscal 2013. The Company has recognized approximately $4.1 million and $16.7 million of stock based compensation related to the contingent consideration and modification in fiscal 2012 and fiscal 2011, respectively.
Employee Stock Purchase Plan
The Employee Stock Purchase Plan (the ESPP) was adopted by the Board of Directors and approved by the stockholders in 2000 and became effective on January 1, 2001. The ESPP was further amended in 2007 and became effective on November 15, 2007 (Amended ESPP). The Compensation Committee of the Board of Directors administers the Amended ESPP. Under the Amended ESPP, employees of the Company who elect to participate have the right to purchase common stock at a 15% discount from the lower of the market value of the common stock at the beginning or the end of each six month offering period. The six month offering periods are May 1 to October 31 and November 1 to April 30 of each year. Employees purchase common stock using payroll deductions, which may not exceed 10% of their eligible compensation (the amount may be increased from time to time by the Company but may not exceed 15% of eligible compensation). In addition, the maximum number of shares that an employee may purchase in each six month period is 1,000 shares with the maximum dollar amount of $25,000 in any calendar year. On November 29, 2011, the Company’s stockholders approved an amendment to increase the number of shares authorized for issuance under the Amended ESPP by 1,500,000 shares. The Company has reserved a total of 6,450,000 shares of common stock for issuance under the Amended ESPP. As of July 1, 2012, there are 2,126,424 shares available for future award grants under the Amended ESPP.
2005 Equity Incentive Plans
On December 1, 2005, the Company’s shareholders ratified and approved the Emulex Corporation 2005 Equity Incentive Plan (the Equity Incentive Plan). The Company’s Equity Incentive Plan permits the grant of stock options, restricted stock awards and restricted stock units (collectively, unvested stock awards), and stock appreciation rights to its domestic and international employees. The aggregate number of shares that may be granted under the Equity Incentive Plan consists of 2,937,475 shares of common stock, plus the number of shares underlying options that were outstanding on the effective date of the Equity Incentive Plan (October 24, 2005) that expire, are forfeited, cancelled or terminate for any reason under the Employee Stock Option Plan and the 2004 Employee Stock Incentive Plan without having been exercised in full. From fiscal 2007 to fiscal 2011, the Company’s stockholders approved an aggregate of 5,000,000 in shares authorized for issuance under the Equity Incentive Plan.
The Equity Incentive Plan is administered by the Board of Directors, or at the discretion of the Board, by a committee consisting of two or more independent directors of the Company (the Committee). As of July 1, 2012, there were 5,011,001 shares available for future award grants under the Equity Incentive Plan, including the shares available for grant under the Employee Stock Option Plan, 2004 Employee Stock Incentive Plan, Aarohi Communications, Inc. 2001 Stock Option Plan (the Aarohi Plan) and the Sierra Logic, Inc. 2001 Stock Option Plan (the Sierra Plan) and the ServerEngines Corporation Amended and Restated 2008 Stock Option Plan (the ServerEngines Plan).
Stock option awards are granted with an exercise price not less than fair market value of the Company’s stock at the date of grant; these awards generally vest over three years of continuous service and have a six year
82
EMULEX CORPORATION AND SUBSIDIARIES
NOTES TO CONSOLIDATED FINANCIAL STATEMENTS — (Continued)
contractual term. Certain stock option awards provide for accelerated vesting if there is a change in control (as defined in the Equity Incentive Plan) or achieving certain performance targets within the meaning of Section 162(m) of the Internal Revenue Code and the regulations thereunder.
Unvested stock awards may be awarded (or sold at a purchase price determined by the Board or Committee) upon terms established by the Board or Committee at its sole discretion. The vesting provisions of unvested stock awards will be determined individually by the Board or Committee for each grant, but generally vest 30%, 30%, and 40% on the first, second and third anniversaries of the date of grant, respectively. As of July 1, 2012, there were 3,319,507 shares of unvested stock awards outstanding.
Unrestricted stock awards are free of any vesting provisions. As of July 1, 2012, there were no unrestricted stock awards outstanding.
Performance awards are subject to the attainment of performance goals established by the Board or Committee, the periods during which performance is to be measured, and all other limitations and conditions applicable to the awarded shares. Performance goals are based on a pre-established objective formula or standard that specifies the manner of determining the number of performance awards that will be granted or will vest if the performance goal is attained. The Company started granting performance stock awards to certain employees in August 2010 under the Equity Incentive Plan. As of July 1, 2012, there were 171,000 shares of performance awards outstanding.
Stock appreciation rights entitle the holder to receive the appreciation in the value of common stock underlying the stock appreciation right. The Board or Committee may grant a stock appreciation right either as a standalone right, or if such right does not provide for the deferral of compensation within the meaning of Section 409A of the Internal Revenue Code of 1986, as amended, in tandem with all or any part of the shares of common stock that may be purchased by the exercise of a stock option. As of July 1, 2012, there were no stock appreciation rights outstanding.
Non-Employee Director Plan
The Company’s 1997 Stock Option Plan for Non-Employee Directors (the Director Plan) was amended and approved by the stockholders on November 30, 2006 to allow for a maximum of 1,880,000 shares of common stock to be issued. Non-employee directors receive two annual grants. Beginning in fiscal 2011, the first annual grant is an unvested stock award with an aggregate market value on the date of grant equal to $200,000. In addition, on December 2 of each year, each non-employee director receives a second annual unvested stock award with an aggregate market value on the date of grant equal to $125,000; provided, however, that the first annual grant will be reduced pro rata (based on the percentage of a year served as a director prior to the date of the first annual grant) if the annual unvested stock award is granted within less than one year after the grant of the $200,000 initial unvested stock award described above. The annual unvested stock award grants to non-employee directors vest 50% on the date of grant and 50% six months thereafter. No options granted under the Director Plan shall be exercisable after the expiration of the earlier of (i) ten years following the date the option is granted or (ii) one year following the date the optionee ceases to be a director of the Company for any reason. The administrator of the Director Plan has the discretion to grant additional awards in the form of unvested stock awards and/or stock appreciation rights or to substitute unvested stock awards or stock appreciation rights for the formula grants described above. Options granted under the Director Plan are non-qualified stock awards. As of July 1, 2012, there were 382,359 shares available for future award grants under the Director Plan.
Employee Stock Option Plan and 2004 Employee Stock Incentive Plan
The Company’s shareholders approved Employee Stock Option Plan (the Plan) permitted the grant of stock options and unvested stock to its domestic and international employees for up to approximately 33.7 million shares of common stock. Stock option awards were granted under the plan with an exercise price not less than the fair market value of the Company’s stock at the date of grant. With the approval and adoption of the Equity Incentive Plan on December 1, 2005, the Plan became closed for future grants of options.
83
EMULEX CORPORATION AND SUBSIDIARIES
NOTES TO CONSOLIDATED FINANCIAL STATEMENTS — (Continued)
The Company’s shareholders approved 2004 Employee Stock Incentive Plan (the 2004 Plan) permitted the grant of stock options and unvested or unrestricted shares to its employees for up to 2,000,000 shares of common stock. The purchase price for the shares subject to any option granted under the 2004 Plan was not permitted to be less than 100% of the fair market value of the shares of common stock of the Company on the date the option was granted. With the approval and adoption of the Equity Incentive Plan on December 1, 2005, the 2004 Plan became closed for future award grants.
Options granted under the Plan and the 2004 Plan prior to August 2005 had a 10 year contractual term and vested 25% on the first anniversary of the date of grant with an additional 6.25% vesting after the end of each consecutive calendar quarter thereafter with continuous service, except when otherwise provided by the Board of Directors or the Compensation Committee. Beginning with awards granted in August 2005, each option granted generally has a six year contractual term and vests 30% on the first anniversary of the grant date, 7.5% vesting at the end of each of the next four consecutive calendar quarters and 10% vesting at the end of each of the next four consecutive quarters thereafter with continuous service, except when otherwise provided by the Board of Directors or the Compensation Committee.
Acquisition Plans
In connection with the acquisition of ServerEngines on August 25, 2010, the Company assumed the ServerEngines Plan. The ServerEngines options were replaced with Emulex options based on the acquisition exchange ratio and continue to be subject to the terms of the ServerEngines Plan. The options have lives of up to 10 years and generally vest over a 4 or 5 year period. The ServerEngines Plan is closed for future grants. There were 472,732 options issued in exchange for the options assumed. The Company also assumed the Sierra Plan, the Aarohi Plan, the Vixel Corporation Amended and Restated 1995 Stock Option Plan, the Vixel Corporation 1999 Equity Incentive Plan, the Vixel Corporation 2000 Non-Officer Equity Incentive Plan, and the Giganet, Inc. 1995 Stock Option Plan (collectively, the Acquisition Plans). Shares previously authorized for issuance under the Acquisition Plans are no longer available for future grants, but options previously granted under these plans remain outstanding. Shares that expire, are forfeited, cancelled or terminate for any reason under the ServerEngines Plan, the Sierra Plan and the Aarohi Plan may be granted under the Equity Incentive Plan.
Adequacy of Available Shares for All Plans
As of July 1, 2012, we anticipate that the number of shares authorized under the Equity Incentive Plan, the Director Plan, and the Amended ESPP are sufficient to cover future stock option exercises and shares that will be purchased during the next six month option period from May 1, 2012 to October 31, 2012 under the Amended ESPP.
Valuation of Stock-Based Compensation
The Company accounts for stock-based compensation in accordance with ASC 718 “Compensation — Stock Compensation.” The fair value of stock options granted and the compensatory element of the shares to be purchased under the Amended ESPP is estimated on the date of grant using the Black-Scholes-Merton option-pricing model based on the market price of the underlying common stock on the date of grant, expected term, stock price volatility and expected risk-free interest rates. Expected volatilities are based on equal weighting of historical volatilities for periods equal to the expected term and implied volatilities based on traded options to buy the Company’s shares. The fair value of each unvested stock award is determined based on the closing price of the Company’s common stock on the grant date.
84
EMULEX CORPORATION AND SUBSIDIARIES
NOTES TO CONSOLIDATED FINANCIAL STATEMENTS — (Continued)
The assumptions used to compute the fair value of the compensatory element related to the shares to be purchased under the Purchase Plan for fiscal 2012, 2011, and 2010 were:
| | | | | | |
| | | 2012 | | 2011 | | 2010 |
Expected volatility | | 45% | | 31% - 37% | | 37% - 43% |
Weighted average expected volatility | | 45% | | 34% | | 40% |
Expected dividends | | — | | — | | — |
Expected term (in years) | | 0.5 | | 0.5 | | 0.5 |
Weighted average expected term (in years) | | 0.5 | | 0.5 | | 0.5 |
Risk-free interest rate | | 0.06% - 0.14% | | 0.11% - 0.18% | | 0.17% - 0.24% |
The assumptions used to compute the fair value of stock option grants under the Equity Incentive Plan for fiscal 2012, 2011, and 2010 were:
| | | | | | |
| | | 2012 | | 2011 | | 2010 |
Expected volatility | | 45% - 47% | | 39% - 45% | | 43% - 49% |
Weighted average expected volatility | | 46% | | 43% | | 47% |
Expected dividends | | — | | — | | — |
Expected term (in years) | | 3.6 - 5.6 | | 3.3 - 5.3 | | 3.0 - 5.0 |
Weighted average expected term (in years) | | 4.4 | | 4.2 | | 3.8 |
Risk-free interest rate | | 0.67% - 1.22% | | 0.69% - 1.8% | | 1.49% - 2.55% |
Stock-Based Awards Activity
A summary of stock option activity under the plans for fiscal 2012 is presented below:
| | | | | | | | | | | | | | | | |
| | | Options | | | Weighted
Average
Exercise Price | | | Weighted
Average
Remaining
Contractual
Term (Years) | | | Aggregate
Intrinsic
Value | |
| | | (In millions) | |
Options outstanding at July 3, 2011 | | | 7,099,171 | | | $ | 16.30 | | | | 2.82 | | | $ | 1.5 | |
Options granted | | | 189,000 | | | $ | 7.68 | | | | | | | | | |
Options exercised | | | (242,638 | ) | | $ | 8.09 | | | | | | | | | |
Options expired | | | (2,694,961 | ) | | $ | 21.23 | | | | | | | | | |
Options forfeited | | | (34,306 | ) | | $ | 8.28 | | | | | | | | | |
| | | | | | | | | | | | | | | | |
Options outstanding at July 1, 2012 | | | 4,316,266 | | | $ | 13.38 | | | | 2.94 | | | $ | 0.8 | |
| | | | | | | | | | | | | | | | |
Options vested and expected to vest at July 1, 2012 | | | 4,275,338 | | | $ | 13.42 | | | | 2.92 | | | $ | 0.8 | |
| | | | | | | | | | | | | | | | |
Options exercisable at July 1, 2012 | | | 3,526,306 | | | $ | 14.33 | | | | 2.56 | | | $ | 0.7 | |
| | | | | | | | | | | | | | | | |
A summary of unvested stock award activity for fiscal 2012 is presented below:
| | | | | | | | |
| | | Number of
Shares | | | Weighted
Average Grant
Date Fair
Value | |
Awards outstanding and unvested at July 3, 2011 | | | 3,615,080 | | | $ | 10.17 | |
Awards granted | | | 1,663,180 | | | $ | 7.59 | |
Awards vested | | | (1,708,164 | ) | | $ | 9.73 | |
Awards forfeited | | | (250,589 | ) | | $ | 9.93 | |
| | | | | | | | |
Awards outstanding and unvested at July 1, 2012 | | | 3,319,507 | | | $ | 9.12 | |
| | | | | | | | |
85
EMULEX CORPORATION AND SUBSIDIARIES
NOTES TO CONSOLIDATED FINANCIAL STATEMENTS — (Continued)
As of July 1, 2012, there was approximately $17.9 million of total unrecognized compensation cost related to nonvested share-based compensation arrangements granted under the plans. This cost is expected to be recognized over a weighted-average service period of approximately one year.
The weighted average grant date fair value of options granted in fiscal 2012, 2011, and 2010, was $2.95, $3.40, and $3.94 respectively. The weighted average grant date fair value of unvested stock awards granted in fiscal 2012, 2011, and 2010 was $7.59, $10.68, and $9.85 respectively. The total intrinsic value of stock options exercised in fiscal 2012, 2011, and 2010 was approximately $0.5 million, $1.2 million, and $0.9 million respectively. The total fair value of unvested stock awards that vested in fiscal 2012, 2011, and 2010 was approximately $13.3 million, $16.1 million, and $12.4 million, respectively. Cash received from stock option exercises under stock-based plans and shares purchased under the Purchase Plan in fiscal 2012, 2011, and 2010 was approximately $7.7 million, $8.1 million, and $6.1 million, respectively. The actual tax benefit realized for the tax deductions from option exercises and vested stock awards was approximately $5.2 million, $6.1 million, and $5.2 million in fiscal 2012, 2011, and 2010, respectively.
Note 12. Income Taxes
(Loss) income before income taxes consists of the following components:
| | | | | | | | | | | | |
| | | 2012 | | | 2011 | | | 2010 | |
| | | (In thousands) | |
United States | | $ | (60,627 | ) | | $ | 36,254 | | | $ | (29,922 | ) |
International | | | 51,125 | | | | (95,101 | ) | | | 36,266 | |
| | | | | | | | | | | | |
Total (loss) income before taxes | | $ | (9,502 | ) | | $ | (58,847 | ) | | $ | 6,344 | |
| | | | | | | | | | | | |
During fiscal 2011, one of the Company’s domestic entities entered into a technology platform contribution transaction with an international subsidiary to license the acquired ServerEngines technology for approximately $111.5 million. The income related to such transaction is included in the United States income before taxes and the expense is included in the international loss before taxes in the table above.
A reconciliation of the income tax provision (benefit) with the amount computed by applying the federal statutory tax rate to income before income taxes is as follows:
| | | | | | | | | | | | |
| | | 2012 | | | 2011 | | | 2010 | |
| | | (In thousands) | |
Expected income tax (benefit) expense at the statutory rate | | $ | (3,325 | ) | | $ | (20,596 | ) | | $ | 2,220 | |
State income tax (benefit) expense, net of federal tax | | | (38 | ) | | | 9,466 | | | | (1,877 | ) |
Change in valuation allowance | | | 12,730 | | | | 3,215 | | | | (211 | ) |
Tax rate differential on foreign (earnings) losses | | | (8,554 | ) | | | 37,228 | | | | (4,557 | ) |
Expiration of prior period tax matters | | | — | | | | (2,631 | ) | | | (4,258 | ) |
Research and other credits | | | (2,571 | ) | | | (7,353 | ) | | | (1,558 | ) |
Stock-based compensation | | | 1,921 | | | | 6,609 | | | | (3,157 | ) |
Section 199 deduction | | | — | | | | (1,647 | ) | | | (5,733 | ) |
Other | | | 1,415 | | | | 472 | | | | 1,855 | |
| | | | | | | | | | | | |
Total income tax expense (benefit) | | $ | 1,578 | | | $ | 24,763 | | | $ | (17,276 | ) |
| | | | | | | | | | | | |
In fiscal 2012, primarily as a result of its Settlement Agreement with Broadcom, the Company determined that there was insufficient positive evidence to support a more likely than not recovery of its remaining U.S. federal and state deferred tax assets in an amount greater than the amount of taxes previously paid in available carryback periods. As a result, the Company recorded an increase to its valuation allowance of approximately
86
EMULEX CORPORATION AND SUBSIDIARIES
NOTES TO CONSOLIDATED FINANCIAL STATEMENTS — (Continued)
$16.4 million. In addition, the Company was also only able to recognize tax benefits associated with the U.S. federal research credit for the first half of fiscal 2012 due to the expiration of such tax credit at the end of calendar year 2011.
In fiscal 2011, the technology platform contribution transaction resulted in an increase in U.S. income taxes of approximately $36.7 million with no corresponding benefit in foreign income taxes as the foreign jurisdiction had a zero percent tax rate. The Company recognized additional federal tax expense related to an increase to its capital loss valuation allowance of approximately $3.2 million. The Company also recognized additional state tax expense, net of federal benefit, related to an increase in its valuation allowance against Massachusetts research credits and California deferred tax assets of approximately $14.1 million which was partially offset by a combined federal and state tax benefit related to a release of uncertain tax positions as a result of an expiration of statute of limitations of approximately $3.4 million. In addition, the Company recognized a tax benefit related to the U.S. federal research credit that extended retroactively to calendar 2010 as part of the Tax Relief, Unemployment Insurance Reauthorization and Job Creation Act of 2010 of approximately $7.4 million.
The components of income taxes are as follows:
| | | | | | | | | | | | |
| | | 2012 | | | 2011 | | | 2010 | |
| | | (In thousands) | |
Current: | | | | | | | | | | | | |
Federal | | $ | 4,514 | | | $ | 7,240 | | | $ | (8,562 | ) |
State | | | 401 | | | | (3,945 | ) | | | 1,050 | |
Foreign | | | 3,420 | | | | 4,698 | | | | 4,540 | |
| | | | | | | | | | | | |
Total current | | | 8,335 | | | | 7,993 | | | | (2,972 | ) |
| | | | | | | | | | | | |
Deferred: | | | | | | | | | | | | |
Federal | | $ | (7,850 | ) | | $ | 3,692 | | | $ | (9,850 | ) |
State | | | (299 | ) | | | 13,411 | | | | (3,938 | ) |
Foreign | | | 1,392 | | | | (333 | ) | | | (516 | ) |
| | | | | | | | | | | | |
Total deferred | | | (6,757 | ) | | | 16,770 | | | | (14,304 | ) |
| | | | | | | | | | | | |
Total income tax expense (benefit) | | $ | 1,578 | | | $ | 24,763 | | | $ | (17,276 | ) |
| | | | | | | | | | | | |
87
EMULEX CORPORATION AND SUBSIDIARIES
NOTES TO CONSOLIDATED FINANCIAL STATEMENTS — (Continued)
The Company’s deferred tax assets and liabilities are comprised of the following major components:
| | | | | | | | |
| | | 2012 | | | 2011 | |
| | | (In thousands) | |
Deferred tax assets: | | | | | | | | |
Reserves and accruals not currently deductible | | $ | 14,086 | | | $ | 10,444 | |
Share-based compensation | | | 11,422 | | | | 18,081 | |
Net operating loss carryforwards | | | 20,517 | | | | 18,838 | |
General business credit carryforwards | | | 26,381 | | | | 20,028 | |
Capitalized research and development expenditures | | | 3,933 | | | | 885 | |
Property and equipment | | | — | | | | 119 | |
Capital loss carryforwards | | | 5,185 | | | | 5,656 | |
Intangible assets | | | 4,860 | | | | 5,546 | |
Other | | | 1,244 | | | | 1,394 | |
| | | | | | | | |
Total gross deferred tax assets | | $ | 87,628 | | | $ | 80,991 | |
Valuation allowance | | | (44,596 | ) | | | (28,231 | ) |
| | | | | | | | |
Total deferred tax assets, net of valuation allowance | | $ | 43,032 | | | $ | 52,760 | |
| | | | | | | | |
Deferred tax liabilities: | | | | | | | | |
Property and equipment | | $ | 1,931 | | | $ | — | |
Intangible assets | | | 34,255 | | | | 47,203 | |
| | | | | | | | |
Total gross deferred tax liabilities | | $ | 36,186 | | | $ | 47,203 | |
| | | | | | | | |
Net deferred tax assets | | $ | 6,846 | | | $ | 5,557 | |
| | | | | | | | |
Deferred income taxes reflect the net tax effects of tax carryforwards and temporary differences between the carrying amount of assets and liabilities for tax and financial reporting purposes. As of July 1, 2012, the Company has recorded approximately $0.4 million in deferred tax liabilities related to its foreign operations. Based on available positive and negative evidence including the Company’s historical results of operations, scheduled reversals of temporary differences, and available tax planning strategies, management concluded that there was insufficient positive evidence to support a more likely than not recovery of its remaining U.S. federal and state deferred tax assets at July 1, 2012 in an amount greater than approximately $7.2 million, which relates to U.S. federal taxes previously paid and recoverable in available carryback periods. Management concluded that it was more likely than not that the Company will not be able to realize its remaining U.S. federal and state deferred tax assets and, accordingly, has recorded a valuation allowance of $44.6 million as of July 1, 2012.
The Company had approximately $14.2 million of capital loss carryforwards available as of July 1, 2012. If unused, approximately $5.0 million and $9.2 million of the carryforwards will expire in fiscal years 2014 and 2016, respectively.
As of July 1, 2012, the Company had federal and state net operating loss carryforwards of approximately $45.4 million and $52.2 million, respectively, available to offset future federal and state taxable income. If unused, the federal net operating loss carryforwards will expire during the fiscal years 2022 through 2028, and the state net operating loss carryforwards will begin to expire in fiscal 2016. Included in the federal net operating loss carryforwards are ServerEngines losses of approximately $27.2 million, Aarohi Communications, Inc. losses of approximately $18.1 million and Sierra Logic, Inc. losses of approximately $0.1 million. The annual utilization of these net operating loss carryforwards is limited due to restrictions imposed under federal law due to a change in ownership.
88
EMULEX CORPORATION AND SUBSIDIARIES
NOTES TO CONSOLIDATED FINANCIAL STATEMENTS — (Continued)
The Company had federal and state research and experimentation credit carryforwards as of July 1, 2012, of approximately $4.6 million and $21.6 million, respectively, which are available to reduce federal and state income taxes. If unused, the federal carryforwards would expire during fiscal years 2013 through 2032, and certain state carryforwards will begin to expire in fiscal 2019.
The Company has made no provision for U.S. income taxes or foreign withholding taxes on the earnings of its foreign subsidiaries, as these amounts are intended to be indefinitely reinvested in operations outside the United States. As of July 1, 2012, there are no cumulative amounts of undistributed earnings at the Company’s foreign subsidiaries.
The Company files federal, state, and foreign income tax returns in jurisdictions with varying statutes of limitations. The Company’s federal income tax returns for fiscal years 2008 to 2011 and California income tax returns for fiscal years 2008 to 2011 are open as the statutes of limitations have not yet expired or have been extended. The Company’s federal income tax return for fiscal years 2008 and 2009 are currently under examination by the Internal Revenue Service (IRS). Additionally, the IRS is examining an amended return filed for fiscal year 2007. The Company’s California income tax return for fiscal years 2008 and 2009 are currently under examination by the California Franchise Tax Board. In addition, the Company is currently under audit by various state and international taxing authorities. The Company does not expect the results of these examinations will have a material adverse effect on our financial condition or results of operations; however, there is no assurance that the Company can accurately predict the outcomes of these audits. As a result, the amounts ultimately paid upon resolution of these audits could be materially different from the amounts previously included in our income tax expense and therefore, could have a material adverse impact on our tax provision, net income and cash flows.
For fiscal years ended July 1, 2012 and July 3, 2011, the Company had total unrecognized tax benefits of approximately $39.8 million and $33.8 million, respectively. If fully recognized, approximately $37.6 million of the $39.8 million would impact the Company’s effective tax rate. The Company does not expect that the liability for unrecognized tax benefits will change significantly within the next 12 months absent resolution of its current federal tax audit.
A rollforward of the activity in the gross unrecognized tax benefits for fiscal years 2012 and 2011 is as follows:
| | | | | | | | |
| | | 2012 | | | 2011 | |
| | | (In thousands) | |
Balance at beginning of year | | $ | 33,807 | | | $ | 33,551 | |
Additions based on tax positions related to the current year | | | 6,570 | | | | 1,915 | |
Additions for tax positions of prior years | | | 130 | | | | 2,604 | (1) |
Reductions for tax positions of prior years | | | (690 | ) | | | (667 | ) |
Reductions for tax positions due to a lapse in statute | | | (60 | ) | | | (3,469 | ) |
Reductions for tax positions due to settlements | | | — | | | | (127 | ) |
| | | | | | | | |
Balance at end of year | | $ | 39,757 | | | $ | 33,807 | |
| | | | | | | | |
| (1) | Includes approximately $1.3 million of ServerEngines assumed liabilities for unrecognized tax benefits for research and development credits. |
In addition to the unrecognized tax benefits noted above, the Company had accrued interest and penalties related to unrecognized tax benefits included in other liabilities of approximately $2.1 million and $1.4 million as of July 1, 2012 and July 3, 2011, respectively.
89
EMULEX CORPORATION AND SUBSIDIARIES
NOTES TO CONSOLIDATED FINANCIAL STATEMENTS — (Continued)
Note 13. Revenue by Product Families, Geographic Area and Significant Customers
Revenues by Product Families
The Company designs and markets two primary market-focused product lines. Beginning the first quarter of fiscal 2012, these primary product lines are Network Connectivity Products (NCP) and Storage Connectivity Products (SCP).
Customers in the NCP market use the Company’s industry standard Fibre Channel and Ethernet solutions to provide server Input/Output (I/O) and target storage array connectivity to create networks for mission critical enterprise and cloud data centers. These products enable servers to reliably and efficiently connect to Local Area Networks (LANs), Storage Area Networks (SANs), and Network Attached Storage (NAS) by offloading data communication processing tasks from the server as information is delivered and sent to the network. The Ethernet based NCP products include Universal Local Area Network on Motherboard application specific integrated circuits (ULOMs), OneConnect® Universal Converged Network Adapters (UCNAs), and custom form factor solutions for OEM blade servers that enable high performance, scalable networks and convergence. The Fibre Channel based NCP products include Fibre Channel application specific integrated circuits (ASICs), LightPulse® Host Bus Adaptors (HBAs), and custom form factor solutions for OEM blade servers.
SCP products include InSpeed®, switch-on-a-chip (SOC) or backend connectivity, bridge, and router products. SCP are deployed inside storage arrays, tape libraries, and other storage appliances, and connect storage controllers to storage capacity, delivering improved performance, reliability, and connectivity.
Advanced Technology and Other Products (ATP) primarily consist of Integrated Baseboard Management Controllers (iBMC), OneCommand® Vision products, certain legacy products and other products and services.
The Company’s net revenues by product lines are:
| | | | | | | | | | | | |
| | | 2012 | | | 2011 | | | 2010 | |
| | | (In thousands) | |
Net revenues: | | | | | | | | | | | | |
Network Connectivity Products | | $ | 362,315 | | | $ | 346,665 | | | $ | 289,990 | |
Storage Connectivity Products | | | 112,117 | | | | 80,024 | | | | 97,278 | |
Advanced Technology & Other Products | | | 27,337 | | | | 25,854 | | | | 11,882 | |
| | | | | | | | | | | | |
Total net revenues | | $ | 501,769 | | | $ | 452,543 | | | $ | 399,150 | |
| | | | | | | | | | | | |
Revenues by Geographic Area
The Company’s net revenues by geographic area based on bill-to location are:
| | | | | | | | | | | | | | | | | | | | | | | | |
| | | 2012 | | | 2011 | | | 2010 | |
| | | (In thousands) | |
Asia Pacific | | $ | 286,572 | | | | 57 | % | | $ | 226,877 | | | | 50 | % | | $ | 141,105 | | | | 35 | % |
United States | | | 137,504 | | | | 28 | % | | | 135,900 | | | | 30 | % | | | 130,511 | | | | 33 | % |
Europe, Middle East, and Africa | | | 76,394 | | | | 15 | % | | | 83,751 | | | | 19 | % | | | 121,757 | | | | 31 | % |
Rest of the world | | | 1,299 | | | | — | % | | | 6,015 | | | | 1 | % | | | 5,777 | | | | 1 | % |
| | | | | | | | | | | | | | | | | | | | | | | | |
Total net revenues | | $ | 501,769 | | | | 100 | % | | $ | 452,543 | | | | 100 | % | | $ | 399,150 | | | | 100 | % |
| | | | | | | | | | | | | | | | | | | | | | | | |
90
EMULEX CORPORATION AND SUBSIDIARIES
NOTES TO CONSOLIDATED FINANCIAL STATEMENTS — (Continued)
Individual international countries with more than 10% of net revenue based on bill-to location are:
| | | | | | | | | | | | |
| | | Net Revenues | |
| | | 2012 | | | 2011 | | | 2010 | |
Singapore | | | 39 | % | | | 27 | % | | | 13 | % |
Taiwan | | | 10 | % | | | — | % | | | — | % |
China | | | — | % | | | 10 | % | | | — | % |
United Kingdom | | | — | % | | | — | % | | | 13 | % |
No other individual country in Asia Pacific, Europe, Middle East, Africa or the rest of the world accounted for more than 10% of net revenues during these periods.
Significant Customers
The following table represents direct sales to customers accounting for greater than 10% of the Company’s net revenues or customer accounts receivable accounting for greater than 10% of the Company’s accounts receivable.
| | | | | | | | | | | | | | | | | | | | |
| | | Net Revenues | | | Accounts
Receivable | |
| | | 2012 | | | 2011 | | | 2010 | | | 2012 | | | 2011 | |
Hewlett-Packard | | | 22 | % | | | 19 | % | | | 13 | % | | | 19 | % | | | 19 | % |
IBM | | | 32 | % | | | 25 | % | | | 22 | % | | | 39 | % | | | 34 | % |
In addition to direct sales, some of the Company’s larger OEM customers purchase products indirectly through distributors, resellers, or other third parties. Customers with total direct and indirect revenues, including customer specific models purchased indirectly through distributors, resellers, and other third parties, of more than 10% in the current fiscal year were as follows:
| | | | | | | | | | | | |
| | | Net Revenues | |
| | | 2012 | | | 2011 | | | 2010 | |
EMC | | | — | % | | | — | % | | | 12 | % |
Hewlett-Packard | | | 24 | % | | | 21 | % | | | 14 | % |
IBM | | | 37 | % | | | 34 | % | | | 31 | % |
91
EMULEX CORPORATION AND SUBSIDIARIES
NOTES TO CONSOLIDATED FINANCIAL STATEMENTS — (Continued)
Note 14. Net (Loss) Income per Share
The following table sets forth the computation of basic and diluted net (loss) income per share:
| | | | | | | | | | | | |
| | | 2012 | | | 2011 | | | 2010 | |
| | | (In thousands, except per share
data) | |
Numerator — Net (loss) income | | $ | (11,080 | ) | | $ | (83,610 | ) | | $ | 23,620 | |
Less: Undistributed earnings allocated to participating securities | | | — | | | | — | | | | (317 | ) |
| | | | | | | | | | | | |
Undistributed earnings allocated to common shareholders for basic net (loss) income per share | | $ | (11,080 | ) | | $ | (83,610 | ) | | $ | 23,303 | |
| | | | | | | | | | | | |
Undistributed earnings allocated to common shareholders for diluted net (loss) income per share | | $ | (11,080 | ) | | $ | (83,610 | ) | | $ | 23,308 | |
| | | | | | | | | | | | |
Denominator: | | | | | | | | | | | | |
Denominator for basic net (loss) income per share — weighted average shares outstanding | | | 86,585 | | | | 86,038 | | | | 80,097 | |
Dilutive options outstanding, unvested stock units and ESPP | | | — | | | | — | | | | 1,185 | |
| | | | | | | | | | | | |
Denominator for diluted net (loss) income per share — adjusted weighted average shares outstanding | | | 86,585 | | | | 86,038 | | | | 81,282 | |
| | | | | | | | | | | | |
Basic net (loss) income per share | | $ | (0.13 | ) | | $ | (0.97 | ) | | $ | 0.29 | |
| | | | | | | | | | | | |
Diluted net (loss) income per share | | $ | (0.13 | ) | | $ | (0.97 | ) | | $ | 0.29 | |
| | | | | | | | | | | | |
Antidilutive options and unvested stock awards excluded from the computations | | | 7,226 | | | | 8,743 | | | | 8,203 | |
| | | | | | | | | | | | |
Average market price of common stock | | $ | 8.19 | | | $ | 10.31 | | | $ | 11.09 | |
| | | | | | | | | | | | |
The antidilutive stock options and unvested stock were excluded from the computation of diluted net (loss) income per share due to the assumed proceeds from the award’s exercise or vesting being greater than the average market price of the common shares or due to the Company incurring a net loss for the periods presented.
92
EMULEX CORPORATION AND SUBSIDIARIES
NOTES TO CONSOLIDATED FINANCIAL STATEMENTS — (Continued)
Note 15 Unaudited Quarterly Consolidated Financial Data
Selected unaudited quarterly consolidated financial data for fiscal years 2012 and 2011 are as follows:
| | | | | | | | | | | | | | | | |
| | | Net
Revenues | | | Gross Profit | | | Net Income
(Loss) | | | Diluted
Net Income
(Loss)
per Share | |
| | | (In thousands, except per share data) | |
2012: | | | | | | | | | | | | | | | | |
Fourth quarter | | $ | 128,955 | | | $ | 40,082 | | | $ | (27,594 | )(1) | | $ | (0.32 | ) |
Third quarter | | | 125,746 | | | | 74,759 | | | | 8,679 | | | | 0.10 | |
Second quarter | | | 128,671 | | | | 75,423 | | | | 14,994 | | | | 0.17 | |
First quarter | | | 118,397 | | | | 65,571 | | | | (7,159 | ) | | | (0.08 | ) |
| | | | | | | | | | | | | | | | |
Total | | $ | 501,769 | | | $ | 255,835 | | | $ | (11,080 | ) | | | | |
| | | | | | | | | | | | | | | | |
2011: | | | | | | | | | | | | | | | | |
Fourth quarter | | $ | 123,366 | | | $ | 70,817 | | | $ | (15,694 | )(2) | | $ | (0.18 | ) |
Third quarter | | | 112,082 | | | | 61,488 | | | | (18,316 | )(3) | | | (0.21 | ) |
Second quarter | | | 113,998 | | | | 62,934 | | | | (40,976 | )(4) | | | (0.47 | ) |
First quarter | | | 103,097 | | | | 56,897 | | | | (8,624 | ) | | | (0.10 | ) |
| | | | | | | | | | | | | | | | |
Total | | $ | 452,543 | | | $ | 252,136 | | | $ | (83,610 | ) | | | | |
| | | | | | | | | | | | | | | | |
| (1) | Includes (i) approximately $36.4 million of patent litigation settlement, damages and sunset period royalties expense related to the on-going Broadcom patent litigation as well as Settlement Agreement entered into with Broadcom on July 3, 2012 (See Note 10) and, (ii) a charge of approximately $14.6 million for income tax expense related to an increase in the deferred tax valuation allowance for certain U.S. federal and state deferred tax assets (See Note 12). |
| (2) | Includes a charge of approximately $13.4 million for income tax expense related to an increase in the deferred tax valuation allowance for California deferred tax assets and Massachusetts research credits. |
| (3) | Includes a charge of approximately $9.2 million related to the impairment of a strategic investment and approximately $6.0 million in-process research and development impairment. |
| (4) | Includes a charge of approximately $36.7 million for incremental income tax expense resulting from a technology platform contribution transaction. |
93
SCHEDULE OF EMULEX CORPORATION AND SUBSIDIARIES
94
ScheduleSchedule II
EMULEX CORPORATION AND SUBSIDIARIES
VALUATION AND QUALIFYING ACCOUNTS
Years ended July 1, 2012, July 3, 2011, and June 27, 2010
| | | | | | | | | | | | | | | | |
Classification | | Balance at
Beginning
of Period | | | Additions
Charged to
Costs and
Expenses
Including
Changes in
Estimates | | | Amounts
Charged
Against
Reserve | | | Balance
at End
of Period | |
| | | (In thousands) | |
Year ended July 1, 2012: | | | | | | | | | | | | | | | | |
Allowance for doubtful accounts | | $ | 1,743 | | | $ | 128 | | | $ | 105 | | | $ | 1,766 | |
| | | | | | | | | | | | | | | | |
Sales returns, allowances and reserves | | $ | 8,840 | | | $ | 15,279 | | | $ | 17,117 | | | $ | 7,002 | |
| | | | | | | | | | | | | | | | |
Year ended July 3, 2011: | | | | | | | | | | | | | | | | |
Allowance for doubtful accounts | | $ | 1,653 | | | $ | 91 | | | $ | 1 | | | $ | 1,743 | |
| | | | | | | | | | | | | | | | |
Sales returns, allowances and reserves | | $ | 3,774 | | | $ | 27,083 | (1) | | $ | 22,017 | | | $ | 8,840 | |
| | | | | | | | | | | | | | | | |
Year ended June 27, 2010: | | | | | | | | | | | | | | | | |
Allowance for doubtful accounts | | $ | 1,553 | | | $ | 100 | | | $ | — | | | $ | 1,653 | |
| | | | | | | | | | | | | | | | |
Sales returns, allowances and reserves | | $ | 2,989 | | | $ | 14,990 | | | $ | 14,205 | | | $ | 3,774 | |
| | | | | | | | | | | | | | | | |
| (1) | Includes approximately $5.9 million of reserves assumed from the ServerEngines acquisition. |
95
SIGNATURES
Pursuant to the requirements of Section 13 or 15(d) of the Securities Exchange Act of 1934, the Registrant has duly caused this report to be signed on its behalf by the undersigned, thereunto duly authorized.
EMULEX CORPORATION
| | |
By: | | /s/ JAMES M. MCCLUNEY |
| | James M. McCluney Chief Executive Officer |
Date: August 30, 2012
Pursuant to the requirements of the Securities Exchange Act of 1934, this report has been signed below by the following persons on behalf of the Registrant and in the capacities indicated on August 30, 2012.
| | |
Signature | | Title |
| |
/s/ JAMES M. MCCLUNEY (James M. McCluney) | | Chief Executive Officer and Director (Principal Executive Officer) |
| |
/s/ MICHAEL J. ROCKENBACH (Michael J. Rockenbach) | | Executive Vice President, Chief Financial Officer, Secretary and Treasurer (Principal Financial and Accounting Officer) |
| |
/s/ PAUL F. FOLINO (Paul F. Folino) | | Chairman of the Board of Directors |
| |
/s/ FRED B. COX (Fred B. Cox) | | Director and Chairman Emeritus |
| |
/s/ MICHAEL P. DOWNEY (Michael P. Downey) | | Director |
| |
/s/ BRUCE C. EDWARDS (Bruce C. Edwards) | | Director |
| |
/s/ ROBERT H. GOON (Robert H. Goon) | | Director |
| |
/s/ BEATRIZ V. INFANTE (Beatriz V. Infante) | | Director |
| |
/s/ DON M. LYLE (Don M. Lyle) | | Director |
| |
/s/ NERSI NAZARI (Nersi Nazari) | | Director |
| |
/s/ DEAN A. YOOST (Dean A. Yoost) | | Director |
96
EXHIBIT INDEX
| | |
Exhibit No. | | Description of Exhibit |
| 3.1 | | Certificate of Incorporation, as amended (incorporated by reference to Exhibit 3.1 to the Company’s 1997 Annual Report on Form 10-K). |
| 3.2 | | Certificate of Amendment of Certificate of Incorporation of the Company (incorporated by reference to Exhibit 3.4 to the Company’s Quarterly Report on Form 10-Q for the quarterly period ended December 31, 2000). |
| 3.3 | | Amended and Restated Bylaws of the Company (incorporated by reference to Exhibit 3.2 to the Company’s Current Report on Form 8-K filed with the Securities and Exchange Commission on January 16, 2009). |
| 3.4 | | Amended and Restated Certificate of Designations, Preferences and Rights of Series A Junior Participating Preferred Stock of Emulex Corporation, incorporated by reference to Exhibit 3.1 to the Company’s Form 8-K filed with the Securities and Exchange Commission on January 16, 2009. |
| 10.2* | | Emulex Corporation Employee Stock Option Plan, as amended (incorporated by reference to Appendix B to the Company’s Definitive Proxy Statement for its Annual Meeting of Stockholders held on November 21, 2002). |
| 10.3* | | Emulex Corporation 1997 Stock Option Plan for Non-Employee Directors, as amended (incorporated by reference to Appendix B to the Company’s Definitive Proxy Statement for its Annual Meeting of Stockholders held on November 30, 2006). |
| 10.4* | | Emulex Corporation Employee Stock Purchase Plan, as amended (incorporated by reference to Appendix A to Emulex Corporation’s proxy statement on Schedule 14A for the 2011 annual meeting of its stockholders filed with the Securities and Exchange Commission on October 18, 2011). |
| 10.5* | | Emulex Corporation 2004 Employee Stock Incentive Plan (incorporated by reference to Appendix B to the Company’s Definitive Proxy Statement for its Annual Meeting of Stockholders held on November 18, 2004). |
| 10.7* | | Form of Key Employee Retention Agreement between the Company and its executive officers other than James M. McCluney, Jeffrey W. Benck, and Michael J. Rockenbach (incorporated by reference to Exhibit 10.7 to the Company’s Quarterly Report on Form 10-Q for the quarterly period ended December 31, 2006). |
| 10.8* | | Form of Key Employee Retention Agreement for James M. McCluney, Jeffrey W. Benck, and Michael J. Rockenbach (incorporated by reference to Exhibit 10.1 to the Company’s Form 8-K filed with the Securities and Exchange Commission on January 16, 2009). |
| 10.9* | | Emulex Corporation Change in Control Retention Plan (incorporated by reference to Exhibit 10.4 to the Company’s Form 10-Q filed with the Securities and Exchange Commission on April 29, 2009). |
| 10.10 | | Form of Indemnification Agreement (incorporated by reference to Exhibit 10.1 to the Company’s current Report on Form 8-K filed May 17, 2005). |
| 10.13* | | Vixel Corporation Amended and Restated 1995 Stock Option Plan incorporated by reference to Exhibit 10.2 of Amendment No. 1 to the Registration Statement on Form S-1 of Vixel Corporation (File No. 333-81347 filed on August 16, 1999). |
| 10.14* | | Vixel Corporation 1999 Equity Incentive Plan (as amended) (incorporated by reference to Exhibit 10.23 of Amendment No. 1 to the Registration Statement on Form S-1 of Vixel Corporation (File No. 333-81347), filed on August 16, 1999). |
97
| | |
Exhibit No. | | Description of Exhibit |
| 10.15* | | Vixel Corporation 2000 Non-Officer Equity Incentive Plan (incorporate reference to Exhibit 99.1 of the Registration Statement on Form S-8/S-3 of Vixel Corporation (File No. 333-39000), filed on June 9, 2000). |
| 10.17* | | Form of Director Stock Option Agreement and related form of Grant Summary for grants made pursuant to the 1997 Non-Employee Director Stock Option Plan (incorporated by reference to Exhibit 10.1 to the Company’s Current Report on Form 8-K filed August 30, 2005). |
| 10.18* | | Form of Incentive Stock Option Agreement for grants made pursuant to the Employee Stock Option Plan (incorporated by reference to Exhibit 10.2 to the Company’s Current Report on Form 8-K filed August 30, 2005). |
| 10.19* | | Form of Non-Qualified Stock Option Agreement for grants made pursuant to the Employee Stock Option Plan (incorporated by reference to Exhibit 10.3 to the Company’s Current Report on Form 8-K filed August 30, 2005). |
| 10.20* | | Form of Incentive Stock Option Agreement for grants made pursuant to the 2004 Employee Stock Incentive Plan (incorporated by reference to Exhibit 10.4 to the Company’s Current Report on Form 8-K filed August 30, 2005). |
| 10.21* | | Form of Non-Qualified Stock Option Agreement for grants made pursuant to the 2004 Employee Stock Incentive Plan (incorporated by reference to Exhibit 10.5 to the Company’s Current Report on Form 8-K filed August 30, 2005). |
| 10.22* | | Form of Notice of Grant of Stock Options and Stock Option Agreement for grants made pursuant to both the Employee Stock Option Plan and 2004 Employee Stock Incentive Plan (incorporated by reference to Exhibit 10.6 to the Company’s Current Report on Form 8-K filed August 30, 2005). |
| 10.24* | | Description of Compensation Arrangements with Non-Employee Directors (incorporated by reference to Exhibit 10.24 to the Company’s 2011 Annual Report on Form 10-K, filed on August 22, 2011). |
| 10.25* | | Form of Amendment to Incentive Stock Option Agreements under the Amended and Restated 2005 Equity Incentive Plan (incorporated by reference to Exhibit 10.25 to the Company’s 2010 Annual Report on Form 10-K, filed August 26, 2010). |
| 10.26* | | Executive Incentive Plan of the Company, as amended, incorporated by reference to Exhibit 10.1 to the Company’s Form 10-Q filed with the Securities and Exchange Commission on November 3, 2011. |
| 10.27* | | Aarohi Communications, Inc. 2001 Stock Option Plan (incorporated by reference to Exhibit 99.1 to the Company’s Registration Statement on Form S-8 filed May 8, 2006). |
| 10.28* | | Form of Aarohi Communications, Inc. Stock Option Agreement (incorporated by reference to Exhibit 99.2 to the Company’s Registration Statement on Form S-8 filed May 8, 2006). |
| 10.29* | | Form of Aarohi Communications, Inc. Stock Option Agreement (alternate form) (incorporated by reference to Exhibit 99.3 to the Company’s Registration Statement on Form S-8 filed May 8, 2006). |
| 10.30* | | Form of Aarohi Communications, Inc. Notice of Grant of Stock Option (incorporated by reference to Exhibit 99.4 to the Company’s Registration Statement on Form S-8 filed May 8, 2006). |
| 10.31* | | Form of Emulex Corporation Stock Option Assumption Documents for holders of options granted under the Aarohi Communications, Inc. 2001 Stock Option Plan (incorporated by reference to Exhibit 99.5 to the Company’s Registration Statement on Form S-8 filed May 8, 2006). |
| 10.32* | | Amended and Restated Emulex Corporation 2005 Equity Incentive Plan (incorporated by reference to Appendix A to Emulex Corporation’s proxy statement on Schedule 14A for the 2010 annual meeting of its stockholders filed on October 12, 2010). |
| 10.33* | | Form of 2005 Equity Incentive Plan Restricted Stock Award Agreement (incorporated by reference to Exhibit 10.1 to the Company’s Quarterly Report on Form 10-Q for the period ended April 2, 2006). |
98
| | |
Exhibit No. | | Description of Exhibit |
| 10.34* | | Form of Notice of Grant of Restricted Stock Award under 2005 Equity (incorporated by reference to Exhibit 10.2 to the Company’s Quarterly Report on Form 10-Q for the period ended April 2, 2006). |
| 10.36* | | Sierra Logic, Inc. 2001 Stock Option Plan (incorporated by reference to Exhibit 99.1 to the Company’s Registration Statement on Form S-8 filed on October 5, 2006). |
| 10.37* | | Form of Sierra Logic, Inc. Stock Option Agreement and Notice of Grant of Stock Option (incorporated by reference to Exhibit 99.2 to the Company’s Registration Statement on Form S-8 filed on October 5, 2006). |
| 10.38* | | Form of Emulex Corporation Stock Option Assumption Documents for holders of options granted under the Sierra Logic, Inc. 2001 Stock Option Plan (incorporated by reference to Exhibit 99.3 to the Company’s Registration Statement on Form S-8 filed on October 5, 2006). |
| 10.41* | | Offer letter, dated May 4, 2008, from the Company to Jeffrey W. Benck (incorporated by reference to Exhibit 10.1 to the Company’s Current Report on Form 8-K filed on May 12, 2008). |
| 10.42* | | Form of Amendment to Non-Qualified Stock Option Agreement (incorporated by reference to Exhibit 10.2 to the Company’s Form 8-K filed with the Securities and Exchange Commission on January 16, 2009). |
| 10.43* | | Form of Amendment to Restricted Stock Award Agreement incorporated by reference to Exhibit 10.3 to the Company’s Form 8-K filed with the Securities and Exchange Commission on January 16, 2009. |
| 10.44* | | Form of Notice of Grant of Restricted Stock Unit under the Amended and Restated 2005 Equity Incentive Plan (incorporated by reference to Exhibit 10.3 to the Company’s Form 10-Q filed with the Securities and Exchange Commission on January 30, 2009). |
| 10.45* | | Form of Restricted Stock Unit Award Agreement under the Amended and Restated 2005 Equity Incentive Plan (incorporated by reference to Exhibit 10.4 to the Company’s Form 10-Q filed with the Securities and Exchange Commission on January 30, 2009). |
| 10.46* | | Form of Appendix to Restricted Stock Award Agreement, Restricted Stock Unit Award Agreement, Non-Qualified Stock Option Agreement, and Incentive Stock Option Agreement for Change in Control Retention Plan Participants or Employees Covered by a Key Employee Retention Agreement under the Amended and Restated 2005 Equity Incentive Plan (incorporated by reference to Exhibit 10.46 to the Company’s 2010 Annual Report on Form 10-K, filed August 26, 2010). |
| 10.47* | | Form of Restricted Stock Unit Award Agreement for Non-U.S. Grantees under the Amended and Restated 2005 Equity Incentive Plan (incorporated by reference to Exhibit 10.6 to the Company’s Form 10-Q filed with the Securities and Exchange Commission on January 30, 2009). |
| 10.48* | | Form of Appendix to Restricted Stock Unit Award Agreement for Non-U.S. Grantees under the Amended and Restated 2005 Equity Incentive Plan (incorporated by reference to Exhibit 10.48 to the Company’s 2010 Annual Report on Form 10-K, filed August 26, 2010). |
| |
| 10.51* | | Form of Amendment to Restricted Stock Unit Agreements under the Amended and Restated 2005 Equity Incentive Plan (incorporated by reference to Exhibit 10.52 to the Company’s 2010 Annual Report on Form 10-K, filed August 26, 2010). |
| |
| 10.52* | | Form of Performance Stock Unit Award Agreement under the Amended and Restated 2005 Equity Incentive Plan. |
| |
| 10.53* | | Amendment to Key Employee Retention Agreement between the Company and Jeffrey W. Benck, dated April 25, 2012. |
| |
| 10.54** | | Patent License and Release Agreement, dated July 3, 2012, between the Company and Broadcom Corporation. |
| 21 | | List of Company subsidiaries. |
| 23 | | Consent of Independent Registered Public Accounting Firm. |
99
| | |
Exhibit No. | | Description of Exhibit |
| 31A | | Certification of the Principal Executive Officer Pursuant to 17 CFR 240.13a-14(a), as Adopted Pursuant to §302 of the Sarbanes-Oxley Act of 2002. |
| 31B | | Certification of the Principal Financial Officer Pursuant to 17 CFR 240.13a-14(a), as Adopted Pursuant to §302 of the Sarbanes-Oxley Act of 2002. |
| 32 | | Certification Pursuant to 18 U.S.C. Section 1350, as Adopted Pursuant to §906 of the Sarbanes-Oxley Act of 2002. |
| 101.INS | | XBRL Instance Document |
| 101.SCH | | XBRL Taxonomy Extension Schema Document |
| 101.CAL | | XBRL Taxonomy Extension Calculation Linkbase Document |
| 101.DEF | | XBRL Taxonomy Extension Definition Linkbase Document |
| 101.LAB | | XBRL Taxonomy Extension Label Linkbase Document |
| 101.PRE | | XBRL Taxonomy Extension Presentation Linkbase Document |
| * | Indicates a management contract or compensation plan or arrangement. |
| ** | Confidential treatment has been requested with respect to the redacted portions of the referenced exhibit. |
100