Exhibit 99.2

| Investor Presentation Third Quarter 2009 |
| Safe Harbor Statement Discussions and statements in this presentation that are not statements of historical fact (including without limitation statements that include terms such as "will," "may," "should," "believe," "expect," "anticipate," "estimate," "project","intend," and "plan") and statements regarding Citizens' future financial and operating results, plans, objectives, expectations and intentions, are forward-looking statements that involve risks and uncertainties, many of which are beyond Citizens' control or are subject to change. No forward -looking statement is a guarantee of future performance and actual results could differ materially. Factors that could cause or contribute to such differences include, without limitation, risks and uncertainties detailed from time to time in Citizens' filings with the Securities and Exchange Commission. Other factors not currently anticipated may also materially and adversely affect Citizens' results of operations, cash flows, financial position and prospects. There can be no assurance that future results will meet expectations. While Citizens believes that the forward-looking statements in this presentation are reasonable, you should not place undue reliance on any forward-looking statement. In addition, these statements speak only as of the date made. Citizens does not undertake, and expressly disclaims any obligation to update or alter any statements, whether as a result of new information, future events or otherwise, except as required by applicable law. |
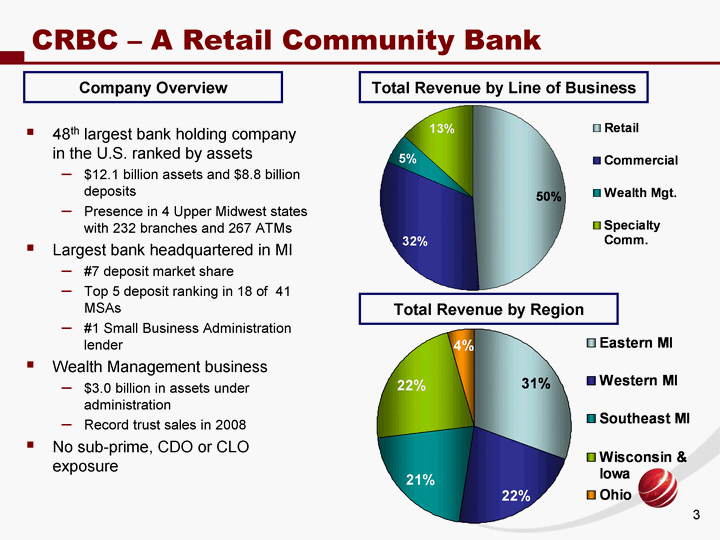
| CRBC - A Retail Community Bank Retail Commercial Wealth Mgt. Specialty Comm. East 139.331 92.244 15.477 37.896 48th largest bank holding company in the U.S. ranked by assets $12.1 billion assets and $8.8 billion deposits Presence in 4 Upper Midwest states with 232 branches and 267 ATMs Largest bank headquartered in MI #7 deposit market share Top 5 deposit ranking in 18 of 41 MSAs #1 Small Business Administration lender Wealth Management business $3.0 billion in assets under administration Record trust sales in 2008 No sub-prime, CDO or CLO exposure Company Overview Total Revenue by Region Total Revenue by Line of Business Eastern MI Western MI Southeast MI Wisconsin & Iowa Ohio East 70.827 50.843 47.776 51.813 10.316 |
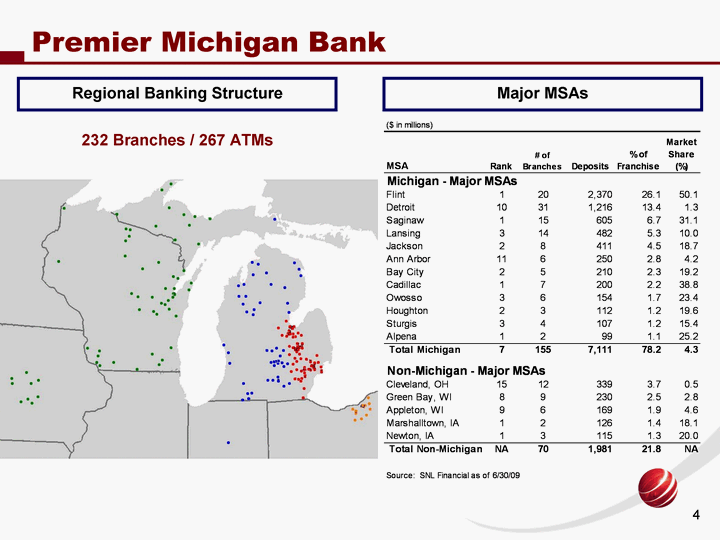
| Premier Michigan Bank Regional Banking Structure 232 Branches / 267 ATMs Major MSAs Excel.Sheet.8 |
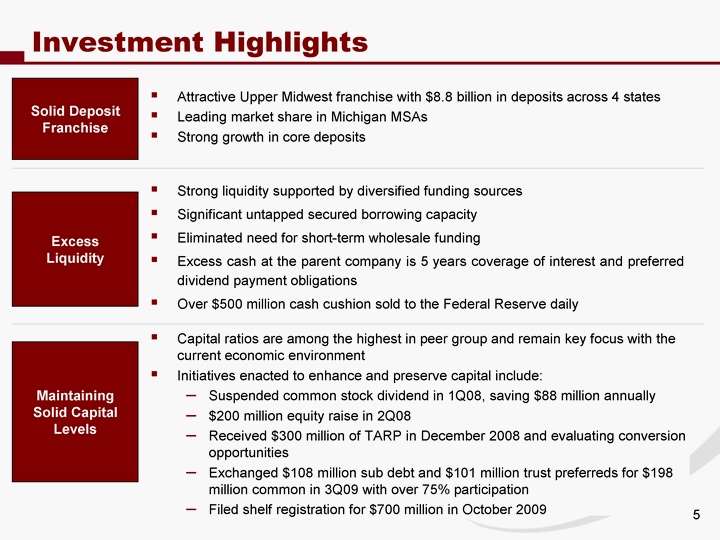
| Investment Highlights Solid Deposit Franchise Attractive Upper Midwest franchise with $8.8 billion in deposits across 4 states Leading market share in Michigan MSAs Strong growth in core deposits Maintaining Solid Capital Levels Capital ratios are among the highest in peer group and remain key focus with the current economic environment Initiatives enacted to enhance and preserve capital include: Suspended common stock dividend in 1Q08, saving $88 million annually $200 million equity raise in 2Q08 Received $300 million of TARP in December 2008 and evaluating conversion opportunities Exchanged $108 million sub debt and $101 million trust preferreds for $198 million common in 3Q09 with over 75% participation Filed shelf registration for $700 million in October 2009 Excess Liquidity Strong liquidity supported by diversified funding sources Significant untapped secured borrowing capacity Eliminated need for short-term wholesale funding Excess cash at the parent company is 5 years coverage of interest and preferred dividend payment obligations Over $500 million cash cushion sold to the Federal Reserve daily |

| Investment Highlights Favorable Growth Opportunities Attractive Valuation Key selling opportunities continue to exist across the retail delivery channel, small business, and lower middle market Market disruption in Michigan creates environment for good organic growth Positioned to build market share in attractive Midwest MSAs when appropriate CRBC trades at a significant discount to tangible book value and three times below that of its peers CRBC is well positioned to survive a continued eroding environment CRBC represents an attractive opportunity for investors interested in a financial services company with a compelling risk/reward profile Proactively Addressing Credit Issues Most of the outsized stress was inherited from acquisitions Diligently addressing credit issues Accelerated the recognition of losses and boosted loan loss reserve levels Use of third party servicer (PHH) for mortgage and loss mitigation strategies Tightened underwriting criteria where needed Strong Management Team Management team with broad large bank experience Strong track record of managing turnaround / workout situations in difficult operating environments |
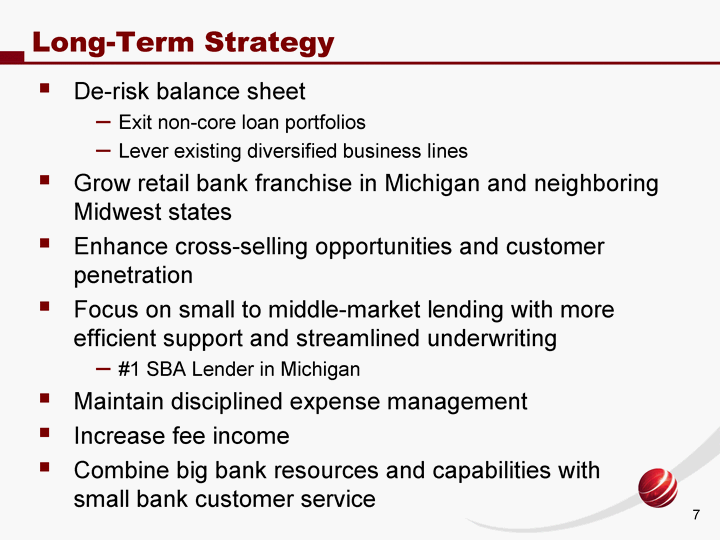
| Long-Term Strategy De-risk balance sheet Exit non-core loan portfolios Lever existing diversified business lines Grow retail bank franchise in Michigan and neighboring Midwest states Enhance cross-selling opportunities and customer penetration Focus on small to middle-market lending with more efficient support and streamlined underwriting #1 SBA Lender in Michigan Maintain disciplined expense management Increase fee income Combine big bank resources and capabilities with small bank customer service |
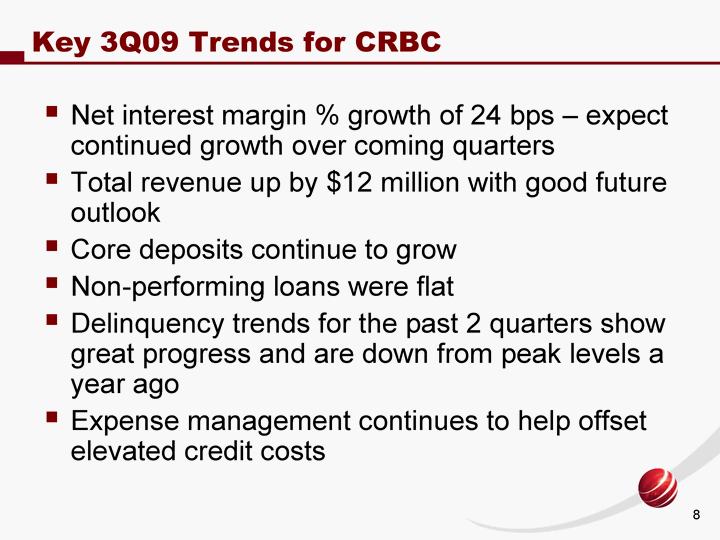
| Key 3Q09 Trends for CRBC Net interest margin % growth of 24 bps - expect continued growth over coming quarters Total revenue up by $12 million with good future outlook Core deposits continue to grow Non-performing loans were flat Delinquency trends for the past 2 quarters show great progress and are down from peak levels a year ago Expense management continues to help offset elevated credit costs |
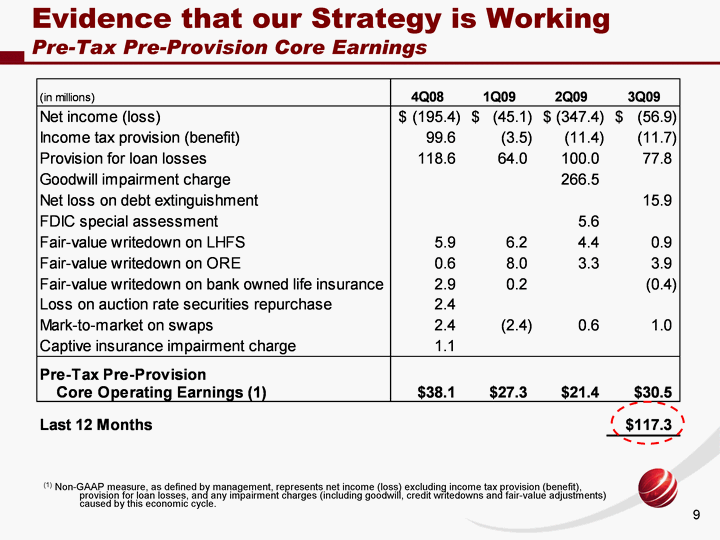
| Evidence that our Strategy is Working Pre-Tax Pre-Provision Core Earnings (1) Non-GAAP measure, as defined by management, represents net income (loss) excluding income tax provision (benefit), provision for loan losses, and any impairment charges (including goodwill, credit writedowns and fair-value adjustments) caused by this economic cycle. |
| Strong Balance Sheet Immediate Credit-Related Priorities Simple, Focused Approach Near-Term Priorities |
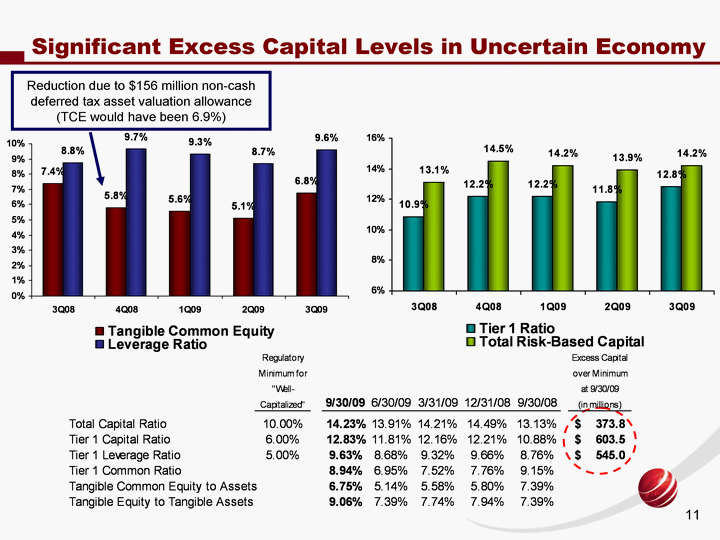
| 2002 2003 2004 2005 2006 2007 1Q08 2Q08 3Q08 4Q08 1Q09 2Q09 3Q09 Tangible Common Equity 0.0773 0.0738 0.0767 0.0769 0.0554 0.059 0.0607 0.0651 0.0739 0.058 0.0558 0.0514 0.0675 Leverage Ratio 0.0718 0.0745 0.0784 0.0798 0.0722 0.0753 0.074 0.0871 0.0876 0.0966 0.0932 0.0868 0.0963 2002 2003 2004 2005 2006 2007 1Q08 2Q08 3Q08 4Q08 1Q09 2Q09 3Q09 Tier 1 Ratio 0.0918 0.098 0.0996 0.0994 0.0941 0.0918 0.0904 0.108 0.1088 0.1221 0.1216 0.1181 0.1283 Total Risk-Based Capital 0.1043 0.1323 0.1332 0.1322 0.119 0.1166 0.1126 0.1303 0.1313 0.1449 0.1421 0.1391 0.1423 Significant Excess Capital Levels in Uncertain Economy Reduction due to $156 million non-cash deferred tax asset valuation allowance (TCE would have been 6.9%) |
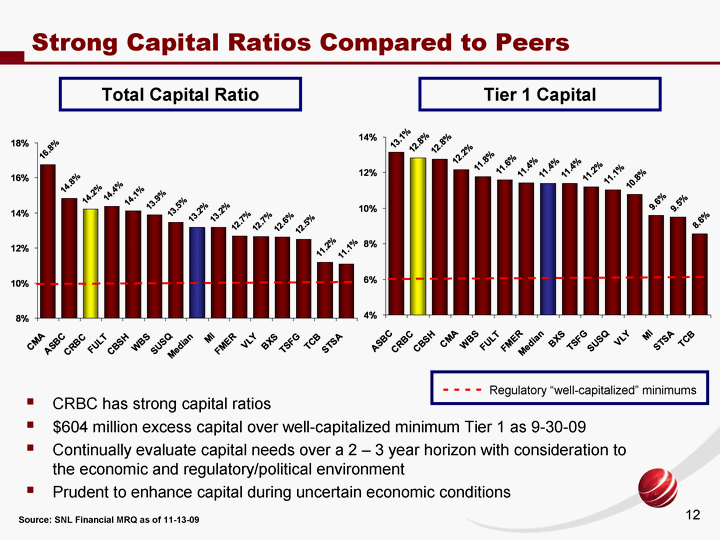
| Strong Capital Ratios Compared to Peers Source: SNL Financial MRQ as of 11-13-09 CMA ASBC CRBC FULT CBSH WBS SUSQ Median MI FMER VLY BXS TSFG TCB STSA East 0.1675 0.1483 0.1423 0.144 0.1414 0.1389 0.1348 0.1317 0.1317 0.1268 0.1266 0.1264 0.1249 0.1119 0.111 ASBC CRBC CBSH CMA WBS FULT FMER Median BXS TSFG SUSQ VLY MI STSA TCB East 0.1314 0.1283 0.1277 0.1218 0.1177 0.116 0.1143 0.1139 0.1139 0.1119 0.1105 0.1077 0.0961 0.095 0.0857 CRBC has strong capital ratios $604 million excess capital over well-capitalized minimum Tier 1 as 9-30-09 Continually evaluate capital needs over a 2 - 3 year horizon with consideration to the economic and regulatory/political environment Prudent to enhance capital during uncertain economic conditions - - - - - Regulatory "well-capitalized" minimums Total Capital Ratio Tier 1 Capital |

| 9/30/2007 12/31/2007 3/31/2008 6/30/2008 9/30/2008 12/31/2008 3/31/2009 6/30/2009 9/30/2009 Core Deposits 4037.024 4130.668 4457.117 4524.843 4532.859 4427.79 4723.258 4843.265 5077.567 Retail CDs 3604.675 3596.754 3454.811 3343.226 3445.801 3565.922 3460.208 3400.371 3186.682 Brokered CDs 300.04 574.503 575.049 793.069 1027.415 1058.694 936.058 669.845 527.62 (in millions) Factors Behind Excess Liquidity Strong Retail Deposit Growth $9,006 $8,487 $8,302 $9,052 $8,661 23% Core Deposit Growth since 12-31-07 $8,913 $9,119 $8,792 Less reliance on brokered CDs |

| Factors Behind Excess Liquidity Less Reliance on Wholesale Funding 3Q07 4Q07 1Q08 2Q08 3Q08 4Q08 1Q09 2Q09 3Q09 Avg. Loans 9163 9335 9499 9514 9456 9267 8908 8604.217 8310.831 Loans/Deposits 1.1384 1.1741 1.1285 1.10576 1.07005 1.02991 0.97708 0.95653 0.945923 Avg. Deposits 8049 7951 8417 8604 8837 8998 9117 8995.262 8785.945 (in millions) Loan to Deposit Ratio Declining |
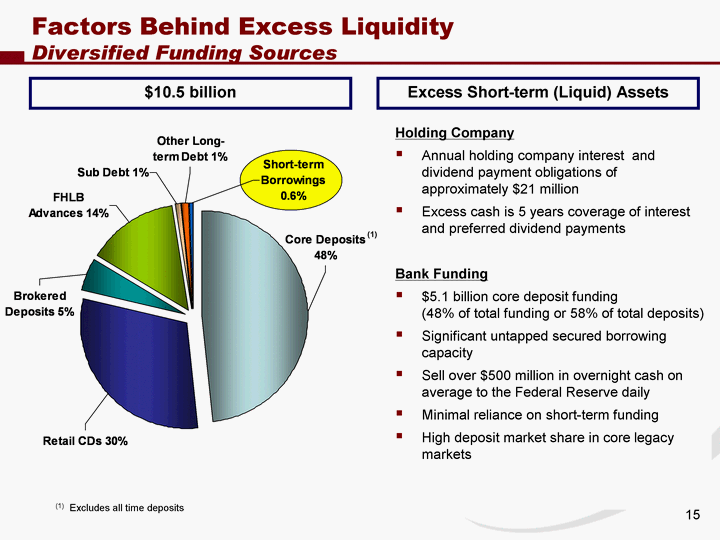
| Factors Behind Excess Liquidity Diversified Funding Sources Core Deposits 0.4825 Retail CDs 0.3028 Brokered Deposits 0.0501 FHLB Advances 0.1396 Sub Debt 0.0086 Other Long-term Debt 0.0105 Short-term Borrowings 0.0057 $10.5 billion Holding Company Annual holding company interest and dividend payment obligations of approximately $21 million Excess cash is 5 years coverage of interest and preferred dividend payments Bank Funding $5.1 billion core deposit funding (48% of total funding or 58% of total deposits) Significant untapped secured borrowing capacity Sell over $500 million in overnight cash on average to the Federal Reserve daily Minimal reliance on short-term funding High deposit market share in core legacy markets (1) Excludes all time deposits (1) Excess Short-term (Liquid) Assets |

| Factors Behind Excess Liquidity Structural Liquidity Source: SNL Financial MRQ as of 11-13-09 CRBC TCB CMA VLY TSFG MI FULT WFC ASBC CBSH WBS BXS SUSQ FMER STSA BAC C JPM East 0.98296 0.98 0.97 0.96 0.96 0.95 0.94 0.93 0.92 0.92 0.9 0.89 0.81 0.77 0.77 0.75 0.72 0.63 Structural Liquidity = Deposits + LT Debt + Equity as a % of Total Assets |

| Strong Balance Sheet Immediate Credit-Related Priorities Simple, Focused Approach |
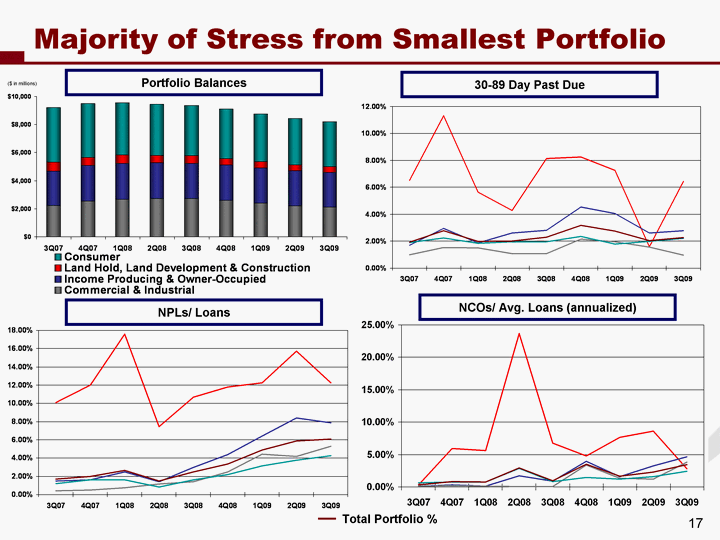
| 1Q07 2Q07 3Q07 4Q07 1Q08 2Q08 3Q08 4Q08 1Q09 2Q09 3Q09 Land Hold, Development & Construction 0.0016 0.0665 0.0032 0.0592 0.0561 0.2367 0.0677 0.0478 0.0767 0.0862 0.0282 Income Producing & Owner-Occupied 0 0.0052 0.0011 0.003 0.0012 0.0172 0.009 0.0393 0.0162 0.0326 0.0465 Commercial & Industrial 0 0.003 0.001 0.002 0.0014 0.0009 0.0006 0.0337 0.0134 0.0124 0.0384 Consumer 0.0039 0.0045 0.0062 0.0079 0.0079 0.029 0.008 0.0149 0.0119 0.0159 0.0242 Total 0.0015 0.0087 0.0034 0.0084 0.0074 0.0293 0.0094 0.0348 0.0167 0.023 0.0344 Majority of Stress from Smallest Portfolio 1Q07 2Q07 3Q07 4Q07 1Q08 2Q08 3Q08 4Q08 1Q09 2Q09 3Q09 Land Hold, Development & Construction 0.023 0.061 0.101 0.12 0.1757 0.0743 0.1066 0.1181 0.1226 0.1572 0.1226 Income Producing & Owner-Occupied 0.01 0.009 0.015 0.0163 0.0248 0.014 0.0297 0.0437 0.064 0.0841 0.0787 Commercial & Industrial 0.004 0.004 0.004 0.005 0.0076 0.0117 0.0141 0.0248 0.0442 0.0418 0.0529 Consumer 0.01 0.012 0.012 0.0163 0.0163 0.0083 0.0163 0.0218 0.0315 0.0378 0.0427 Total 0.0122 0.0126 0.0168 0.0199 0.0265 0.0147 0.0247 0.0336 0.049 0.0588 0.061 1Q07 2Q07 3Q07 4Q07 1Q08 2Q08 3Q08 4Q08 1Q09 2Q09 3Q09 Land Hold, Development & Construction 0.015 0.0581 0.0652 0.1132 0.0565 0.0427 0.0813 0.0825 0.0727 0.0159 0.0643 Income Producing & Owner-Occupied 0.008 0.017 0.017 0.0294 0.0187 0.026 0.0282 0.0453 0.0405 0.0261 0.0277 Commercial & Industrial 0.014 0.011 0.01 0.0153 0.015 0.0109 0.0108 0.0217 0.0197 0.0155 0.0096 Consumer 0.014 0.018 0.019 0.0225 0.0183 0.0196 0.0196 0.0236 0.0179 0.0198 0.022 Total 0.0122 0.0185 0.0193 0.0279 0.0199 0.0201 0.0229 0.0319 0.0276 0.0204 0.0226 30-89 Day Past Due Portfolio Balances NPLs/ Loans NCOs/ Avg. Loans (annualized) 12-31-06 1Q07 2Q07 3Q07 4Q07 1Q08 2Q08 3Q08 4Q08 1Q09 2Q09 3Q09 Commercial & Industrial 2004.9 1993.7 2153.2 2236.2 2557.1 2653.8 2703.8 2703.7 2602.4 2394.436 2198.3 2099.8 Income Producing & Owner-Occupied 1237.1 2429.4 2454.5 2452.3 2523 2582.9 2579.2 2532.8 2523.5 2511.2 2514 2502 Land Hold, Land Development & Construction 751.5 727.8 631.5 616.2 574.2 591.5 522.1 537.5 441.2 433.1 408.4 396.5 Consumer 4027.3 3976.7 3914.6 3846.9 3744.6 3643.9 3604.2 3535.5 3415.7 3304.8 3218.5 Total Portfolio % ($ in millions) 17 |

| Stressed Portion of CRE Portfolio Land Hold, Land Development and Construction Loans 30-89 Day Past Due 1Q07 2Q07 3Q07 4Q07 1Q08 2Q08 3Q08 4Q08 1Q09 2Q09 3Q09 $ 11 37 40 65 33.4 22.3 43.7 36.4 32.3 6.5 25.5 % 0.015 0.0581 0.0652 0.1132 0.056 0.0427 0.0813 0.0825 0.073 0.0159 0.0643 NPLs/ Loans NCOs/ Avg. Loans Portfolio Overview Small piece of overall portfolio contributing to large portion of NPLs and NCOs Total portfolio is down 33% from 1Q08 No new Land Hold or Land Development since January 2007 Less than 20% of residential development in construction 4Q07 1Q08 2Q08 3Q08 4Q08 1Q09 2Q09 3Q09 $ 8.5 8.3 30.9 9.1 21.1 8.3 8.8 2.8 % 0.0592 0.0561 0.2367 0.0677 0.1913 0.0767 0.0862 0.0282 1Q07 2Q07 3Q07 4Q07 1Q08 2Q08 3Q08 4Q08 1Q09 2Q09 3Q09 $ 17 39 62 69 104 38.8 57.3 52.1 53.1 64.2 48.6 % 0.023 0.061 0.101 0.12 0.175 0.0743 0.107 0.1181 0.123 0.157 0.123 % of Total 25% 18% 12% 20% 13% 13% 4% 14% % of Total 43% 47% 45% 41% 26% 23% 18% 4% % of Total 36% 41% 28% 25% 17% 12% 13% 10% CRBC 30-89 Days CRBC NCOs CRBC NPLs ($ in millions) ($ in millions) ($ in millions) YTD rate of 4.8% |
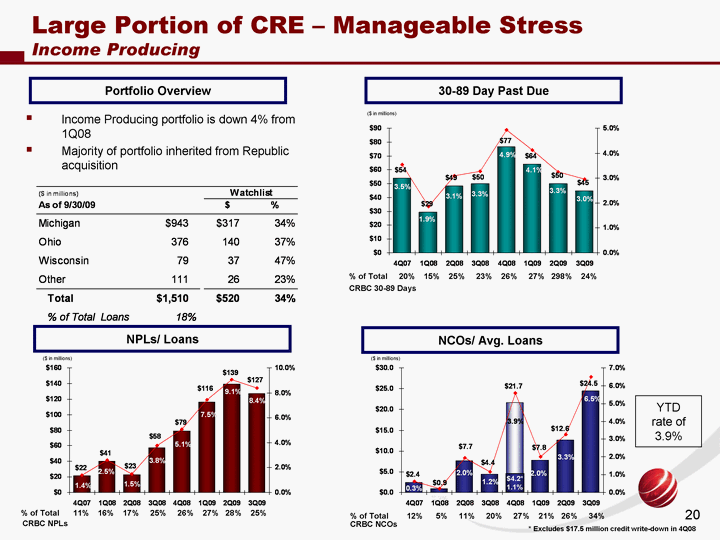
| 4Q07 1Q08 2Q08 3Q08 4Q08 1Q09 2Q09 3Q09 $ 2.4 0.9 7.7 4.4 21.7 7.8 12.6 24.5 % 0.0063 0.0023 0.0196 0.0115 0.0558 0.02 0.0328 0.065 Large Portion of CRE - Manageable Stress Income Producing 30-89 Day Past Due Portfolio Overview 4Q07 1Q08 2Q08 3Q08 4Q08 1Q09 2Q09 3Q09 $ 54 29.3 48.5 50.1 76.7 64.2 50 44.9 % 0.0354 0.0187 0.0309 0.0327 0.0493 0.0412 0.0326 0.0297 % of Total 20% 15% 25% 23% 26% 27% 298% 24% NPLs/ Loans 4Q07 1Q08 2Q08 3Q08 4Q08 1Q09 2Q09 3Q09 $ 21.5 40.5 23.1 57.6 78.6 116.3 139.4 126.7 % 0.0141 0.0258 0.0147 0.0376 0.0505 0.0746 0.0908 0.0839 % of Total 11% 16% 17% 25% 26% 27% 28% 25% NCOs/ Avg. Loans % of Total 12% 5% 11% 20% 27% 21% 26% 34% CRBC 30-89 Days CRBC NCOs CRBC NPLs ($ in millions) ($ in millions) ($ in millions) Income Producing portfolio is down 4% from 1Q08 Majority of portfolio inherited from Republic acquisition YTD rate of 3.9% * Excludes $17.5 million credit write-down in 4Q08 $4.2* 1.1% |
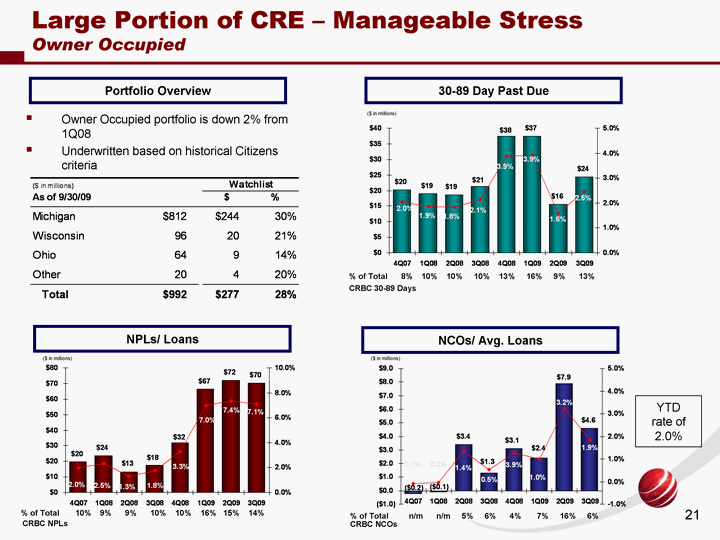
| 4Q07 1Q08 2Q08 3Q08 4Q08 1Q09 2Q09 3Q09 $ -0.2 -0.1 3.4 1.3 3.1 2.4 7.9 4.6 % -0.0008 -0.0004 0.0135 0.0052 0.0128 0.0101 0.0323 0.0185 Large Portion of CRE - Manageable Stress Owner Occupied 30-89 Day Past Due Portfolio Overview 4Q07 1Q08 2Q08 3Q08 4Q08 1Q09 2Q09 3Q09 $ 20.3 19 18.6 21.3 37.5 37.4 15.6 24.4 % 0.0204 0.0187 0.0184 0.0213 0.0388 0.0392 0.0159 0.0246 % of Total 8% 10% 10% 10% 13% 16% 9% 13% NPLs/ Loans 4Q07 1Q08 2Q08 3Q08 4Q08 1Q09 2Q09 3Q09 $ 19.7 23.5 13.1 17.7 31.8 66.5 72 70.2 % 0.0198 0.0231 0.013 0.0177 0.0329 0.0698 0.0735 0.0707 % of Total 10% 9% 9% 10% 10% 16% 15% 14% NCOs/ Avg. Loans % of Total n/m n/m 5% 6% 4% 7% 16% 6% CRBC 30-89 Days CRBC NCOs CRBC NPLs ($ in millions) ($ in millions) ($ in millions) Owner Occupied portfolio is down 2% from 1Q08 Underwritten based on historical Citizens criteria YTD rate of 2.0% |
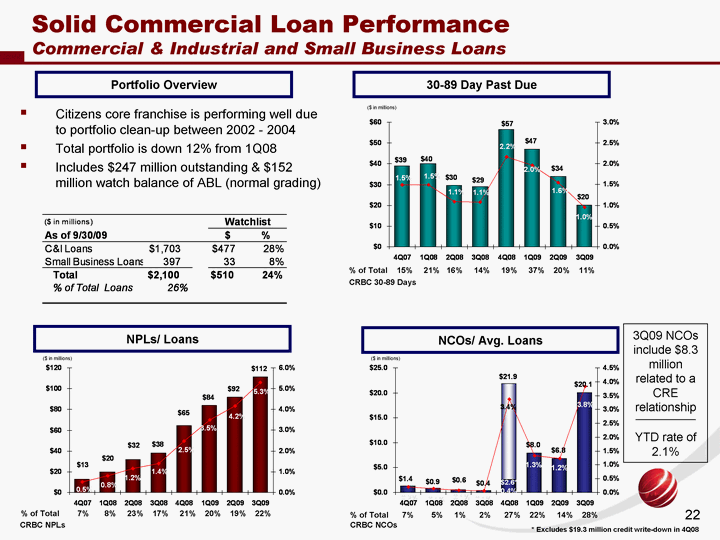
| Solid Commercial Loan Performance Commercial & Industrial and Small Business Loans 30-89 Day Past Due Portfolio Overview 1Q07 2Q07 3Q07 4Q07 1Q08 2Q08 3Q08 4Q08 1Q09 2Q09 3Q09 $ 27 23 22 39 40 29.5 29.1 56.5 47.1 34 20.2 % 0.014 0.011 0.01 0.015 0.015 0.01094 0.0108 0.0217 0.0197 0.0155 0.0096 % of Total 15% 21% 16% 14% 19% 37% 20% 11% NPLs/ Loans 1Q07 2Q07 3Q07 4Q07 1Q08 2Q08 3Q08 4Q08 1Q09 2Q09 3Q09 $ 9 9 9 13 20 31.6 38.2 64.6 83.7 91.8 111.5 % 0.004 0.004 0.004 0.005 0.008 0.0117 0.0141 0.0248 0.035 0.0418 0.0531 % of Total 7% 8% 23% 17% 21% 20% 19% 22% NCOs/ Avg. Loans 1Q07 2Q07 3Q07 4Q07 1Q08 2Q08 3Q08 4Q08 1Q09 2Q09 3Q09 $ 0 1.8 0.6 1.4 0.9 0.6 0.4 21.9 8 6.8 20.1 % 0 0.003 0.001 0.002 0.0014 0.0009 0.0006 0.0337 0.0133 0.0124 0.0384 % of Total 7% 5% 1% 2% 27% 22% 14% 28% CRBC 30-89 Days CRBC NCOs CRBC NPLs ($ in millions) ($ in millions) ($ in millions) Citizens core franchise is performing well due to portfolio clean-up between 2002 - 2004 Total portfolio is down 12% from 1Q08 Includes $247 million outstanding & $152 million watch balance of ABL (normal grading) * Excludes $19.3 million credit write-down in 4Q08 $2.6* 0.4% 3Q09 NCOs include $8.3 million related to a CRE relationship YTD rate of 2.1% |
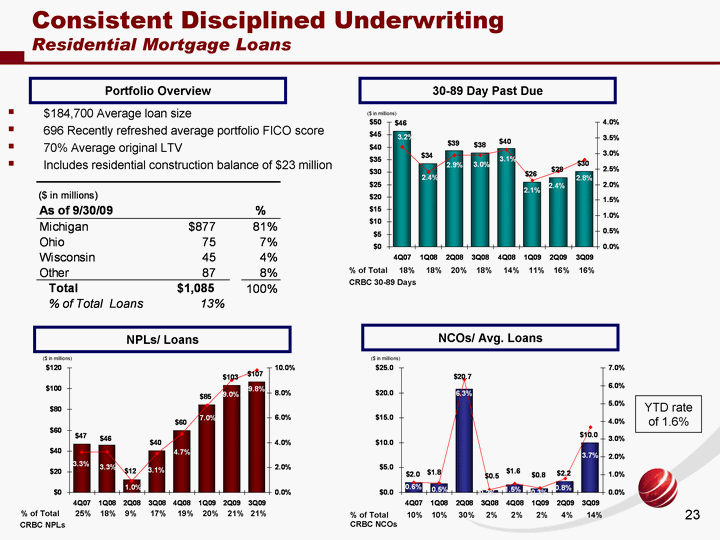
| 30-89 Day Past Due Portfolio Overview $184,700 Average loan size 696 Recently refreshed average portfolio FICO score 70% Average original LTV Includes residential construction balance of $23 million Consistent Disciplined Underwriting Residential Mortgage Loans 4Q07 1Q08 2Q08 3Q08 4Q08 1Q09 2Q09 3Q09 $ 46.4 33.5 38.5 37.7 39.5 25.9 27.7 30.3 % 0.0321 0.024 0.0294 0.0295 0.0313 0.0214 0.0242 0.028 % of Total 18% 18% 20% 18% 14% 11% 16% 16% NPLs/ Loans 4Q07 1Q08 2Q08 3Q08 4Q08 1Q09 2Q09 3Q09 $ 46.9 45.8 12.4 40.2 59.5 84.6 103.3 106.5 % 0.0325 0.0329 0.0095 0.0314 0.0471 0.07 0.0902 0.0982 % of Total 25% 18% 9% 17% 19% 20% 21% 21% NCOs/ Avg. Loans 4Q07 1Q08 2Q08 3Q08 4Q08 1Q09 2Q09 3Q09 $ 2 1.8 20.7 0.5 1.6 0.8 2.2 10 % 0.0055 0.0052 0.0633 0.0016 0.0051 0.0026 0.0077 0.0367 % of Total 10% 10% 30% 2% 2% 2% 4% 14% CRBC 30-89 Days CRBC NCOs CRBC NPLs ($ in millions) ($ in millions) ($ in millions) YTD rate of 1.6% |
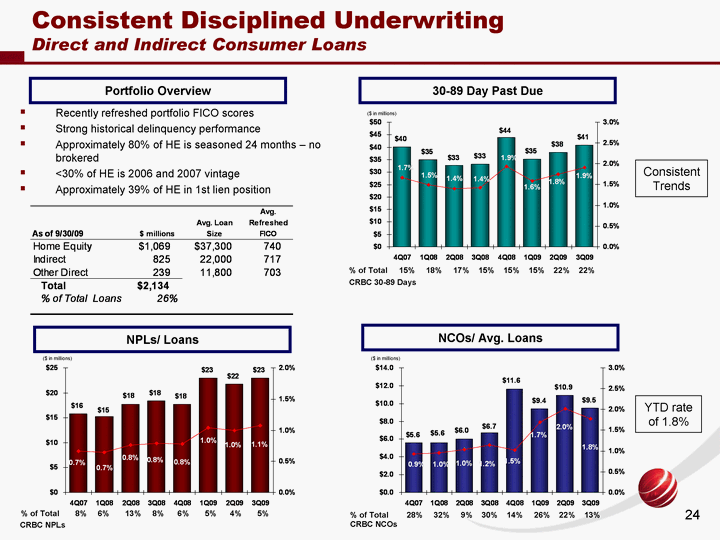
| 30-89 Day Past Due Portfolio Overview Recently refreshed portfolio FICO scores Strong historical delinquency performance Approximately 80% of HE is seasoned 24 months - no brokered <30% of HE is 2006 and 2007 vintage Approximately 39% of HE in 1st lien position Consistent Disciplined Underwriting Direct and Indirect Consumer Loans 4Q07 1Q08 2Q08 3Q08 4Q08 1Q09 2Q09 3Q09 $ 40.2 35 32.8 33.1 44 35.1 37.9 40.8 % 0.0167 0.0149 0.014 0.0142 0.0194 0.0159 0.0175 0.0191 % of Total 15% 18% 17% 15% 15% 15% 22% 22% NPLs/ Loans 4Q07 1Q08 2Q08 3Q08 4Q08 1Q09 2Q09 3Q09 $ 15.8 15.2 17.7 18.4 17.7 23 21.7 23 % 0.0066 0.0065 0.0076 0.0079 0.0078 0.0104 0.01 0.0108 % of Total 8% 6% 13% 8% 6% 5% 4% 5% NCOs/ Avg. Loans 4Q07 1Q08 2Q08 3Q08 4Q08 1Q09 2Q09 3Q09 $ 5.6 5.6 6 6.7 11.6 9.4 10.9 9.5 % 0.0093 0.0095 0.0103 0.0115 0.0102 0.017 0.0202 0.0178 % of Total 28% 32% 9% 30% 14% 26% 22% 13% CRBC 30-89 Days CRBC NCOs CRBC NPLs ($ in millions) ($ in millions) ($ in millions) YTD rate of 1.8% Consistent Trends |
| Strong Balance Sheet Immediate Credit-Related Priorities Simple, Focused Approach |
| Remain Client Focused We are still lending despite the decline in credit demand during 2009 Extended, renewed and approved $2.4 billion of loans year to date Citizens is the #1 SBA lender in Michigan for the 2nd year in a row Continue to lend responsibly based on creditworthiness of the borrower and collateral strength Aligned infrastructure to be more focused on consumer, small-business, and lower middle market relationships Continued cost management |

| Protect and Manage Liquidity Be aggressive, but not top of the market Grow deposits from our footprint, our clients Pick our spots Focus on where we can grow with less margin impact and a better return on advertising spend Understand impact of our strategy - might move some core into time Balance liquidity strategy within overall strategy Despite liquidity cost overhang, net interest margin spreads are strengthening |
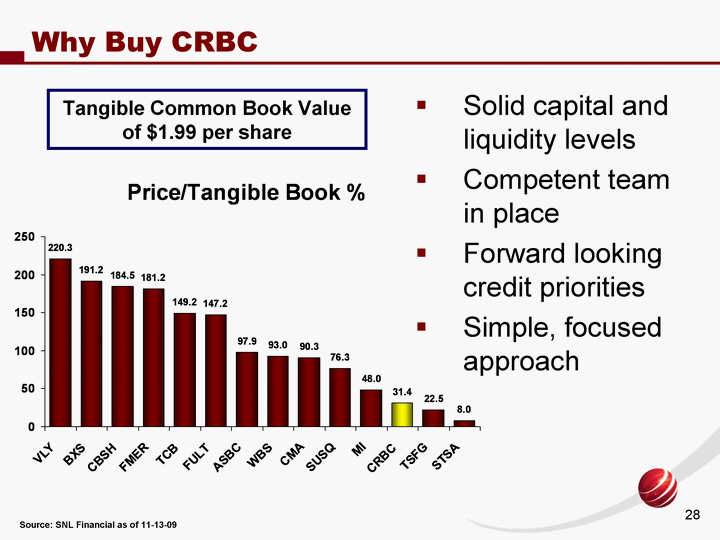
| Why Buy CRBC Solid capital and liquidity levels Competent team in place Forward looking credit priorities Simple, focused approach VLY BXS CBSH FMER TCB FULT ASBC WBS CMA SUSQ MI CRBC TSFG STSA East 220.3 191.2 184.5 181.2 149.2 147.2 97.9 93 90.3 76.3 48 31.4 22.5 8 Tangible Common Book Value of $1.99 per share Source: SNL Financial as of 11-13-09 |
| Appendix |
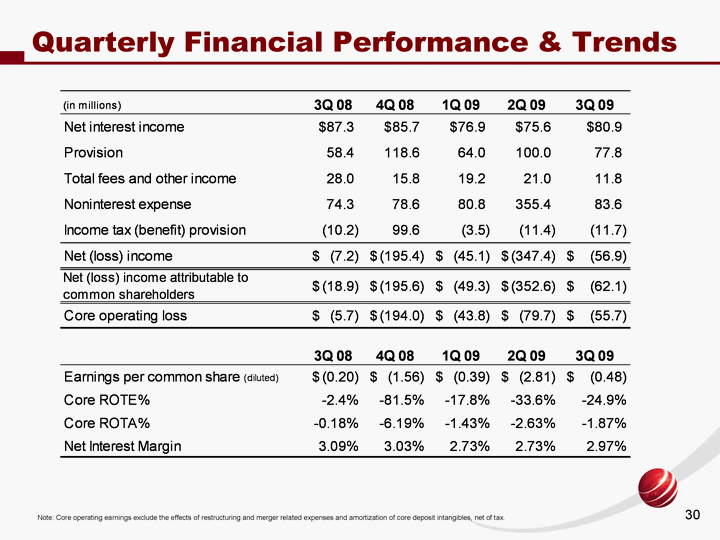
| Quarterly Financial Performance & Trends Note: Core operating earnings exclude the effects of restructuring and merger related expenses and amortization of core deposit intangibles, net of tax. |
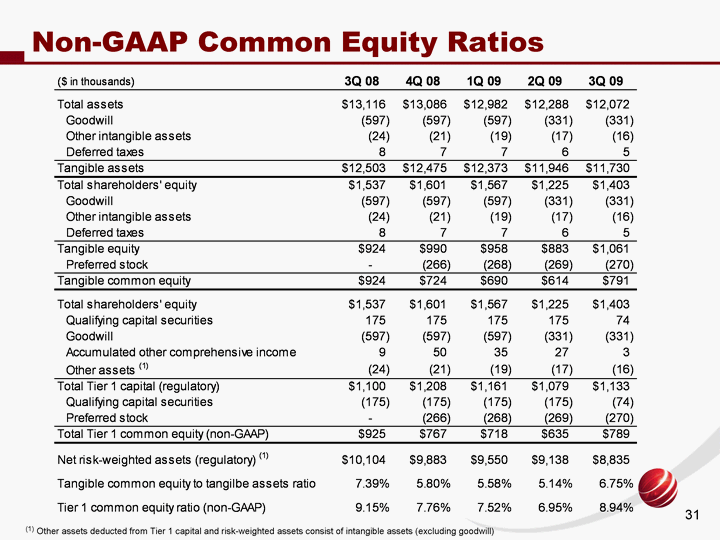
| Non-GAAP Common Equity Ratios (1) Other assets deducted from Tier 1 capital and risk-weighted assets consist of intangible assets (excluding goodwill) |
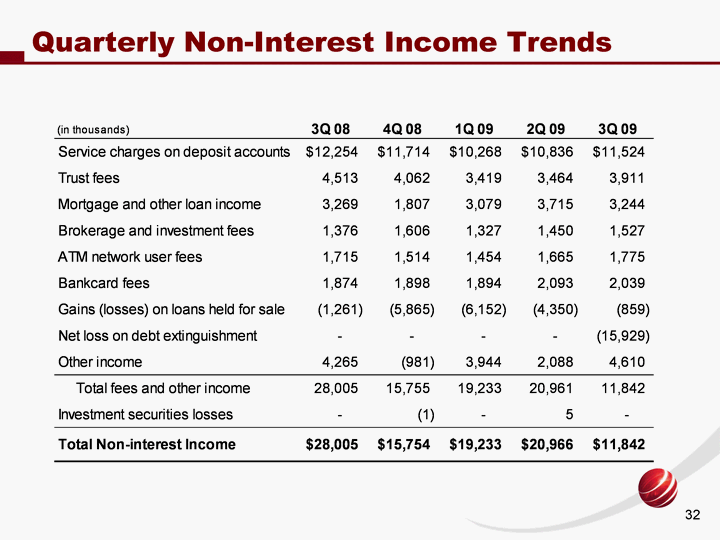
| Quarterly Non-Interest Income Trends |
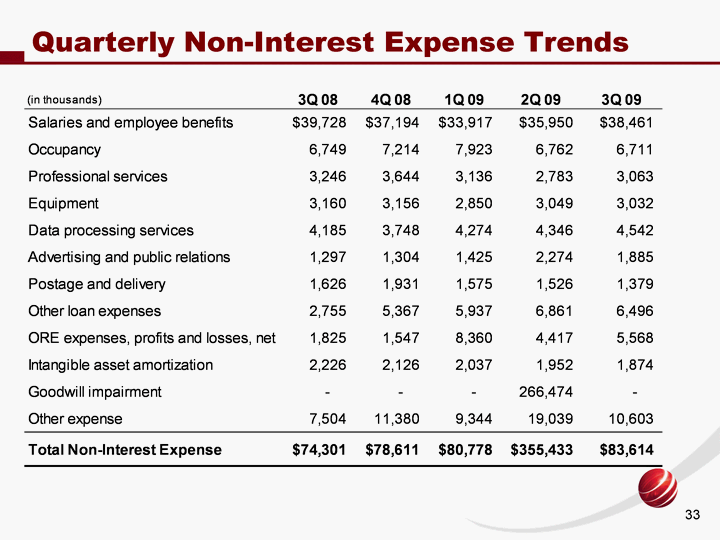
| Quarterly Non-Interest Expense Trends |

| $53 million reductions achieved / targeted $34 million related to Republic merger (21% greater than anticipated) $16 million identified during 3Q08 $3 million targeted in 2009 (excluding FDIC special assessment and additional ORE and HFS writedowns) 1,024 FTE reduction since 2005 Non-Interest Expense and FTE Reductions 2005* 2006 2007 2008 3Q09 North 3197 2920 2502 2232 2173 Number of FTE at end of period 32% decrease * 2005 Proforma: 2,124 Citizens FTE + 1,073 Republic FTE |

| Lower Expense Levels Compared to Peers 1Q05 2Q05 3Q05 4Q05 1Q06 2Q06 3Q06 4Q06 1Q07 2Q07 3Q07 4Q07 1Q08 2Q08 3Q08 4Q08 1Q09 2Q09 3Q09 Citizens* 0.0314 0.0312 0.031 0.0314 0.0322 0.0313 0.0308 0.0234 0.0234 0.0254 0.0232 0.0236 0.0228 0.025 0.0226 0.0241 0.0247 0.0279 0.0276 Peer Median 0.0287 0.0287 0.0288 0.0291 0.0268 0.0262 0.0256 0.0259 0.0282 0.0277 0.0285 0.0283 0.0273 0.0273 0.0272 0.0351 0.0266 0.0283 0.0288 Source: SNL Financial MRQ as of 11-13-09 * Citizens: 1Q05 - 3Q06 is legacy Citizens; 4Q06 is proforma for Republic merger; 2Q08& 2Q09 exclude goodwill impairment charges Non-Interest Expense / Average Assets % |
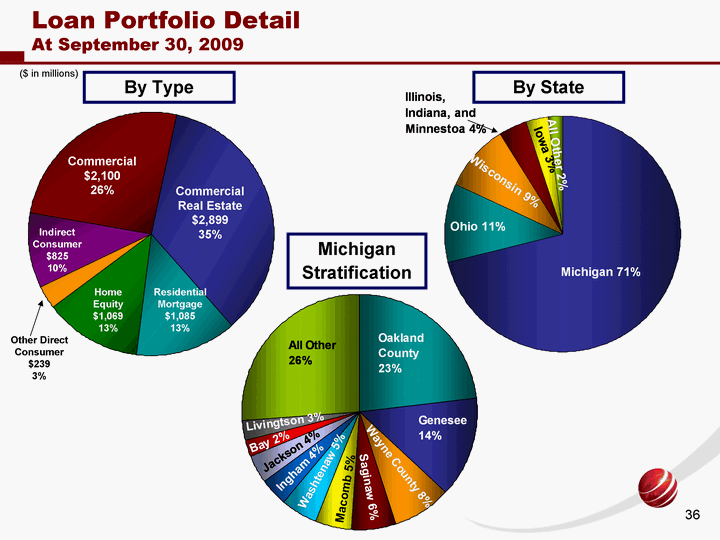
| Loan Portfolio Detail At September 30, 2009 Commercial Commercial Real Estate Residential Mortgage Home Equity Other Direct Consumer Indirect Consumer East 2099.779 2898.593 1084.872 1069.06 239.219 825.316 Michigan Ohio Wisconsin Illinois, Indiana, and Minnestoa Iowa All Other 0.71 0.11 0.09 0.04 0.03 0.02 Commercial Real Estate $2,899 35% Commercial $2,100 26% Residential Mortgage $1,085 13% Home Equity $1,069 13% Indirect Consumer $825 10% ($ in millions) Other Direct Consumer $239 3% Oakland County Genesee Wayne County Saginaw Macomb County Washtenaw Ingham Jackson Bay Livingtson All Other 0.23 0.14 0.08 0.06 0.05 0.05 0.04 0.04 0.02 0.03 0.26 By Type By State Michigan Stratification Macomb 5% |

| Commercial Loan Concentration and Auto Related Exposure Are Small Real Estate Manufacturing Contractors Wholesale Trade Retail Trade Health Services Travel & Food Transportation/Warehousing Professional Services Agriculture Finance & Insurance Other Services Commercial Loan Concentrations 2404791 400838 394347 297228 297062 296800 167514 112645 105678 92226 80745 367059 Loan Concentrations as of 9-30-09 (by NAICS Code) We define exposure as manufacturers and tier one suppliers with revenue from auto >25% vs. most banks of >50% Auto industry loans accounted for only 8.4% of total commercial outstandings Auto industry exposure accounted for 9.7% of total commercial loan exposure |

| < $3 million $3-$5 million $5-$10 million > $10 million East 0.5396 0.1402 0.1946 0.1256 Commercial Real Estate Portfolio At September 30, 2009 Southeast MI Western MI Ohio Mid-Michigan Wisonsin/Iowa East 0.3343 0.2595 0.1974 0.1258 0.0784 Land Hold Land Development Construction Income Producing Owner Occupied East 52 129.7 214.8 1509.6 992.4 Retail Office Warehouse/ Industrial Medical Multi-Family Residential Land Development Hotel Gas Station/ C.Store Vacant Land Other (<2%) East 0.2042 0.1341 0.1269 0.103 0.096 0.0452 0.0454 0.0343 0.0241 0.0203 0.1665 Income Producing $1,510 52% ($ in millions) Owner Occupied $992 34% Constr. $215 7% By Type By Collateral Land Development $130 4% Land Hold $52 2% By Region By Size |

| Commercial & Consumer Loans 5 Year Trends 2004 2005 2006 2007 2008 1Q09 2Q09 3Q09 Commercial & Industrial 1633.8 1688.1 2004.9 2557.1 2602.3 2394.4 2198.3 2099.8 Commercial Real Estate 1255.9 1402.1 3120.6 3097.2 2964.7 2944.3 2922.4 2898.6 $5,567 $5,654 $5,126 $3,090 $2,890 (in millions) Commercial Loans 2004 2005 2006 2007 2008 1Q09 2Q09 3Q09 Mortgage 508.2 539.8 1543.5 1445.2 1262.8 1208 1145 1084.872 Direct (primarily home equity) 1169.6 1142 1721.4 1572.3 1452.2 1405.7 1351.5 1308.279 Indirect 825.9 844.1 840.6 829.4 820.5 802.1 808.3 825.316 Consumer Loans (in millions) $3,536 $2,504 $2,526 $4,106 $3,847 $4,998 $3,218 |

| 12-31-06 3-31-07 6-30-07 9-30-07 12-31-07 3-31-08 6-30-08 9-30-08 12-31-08 3-31-09 6-30-09 9-30-09 Commercial & Industrial 2004.9 1993.7 2153.2 2236.2 2557.1 2653.8 2703.8 2703.7 2602.334 2394.4 2198.3 2099.8 Income Producing 1237.1 1351.7 1338.9 1338.8 1526 1567.3 1569.9 1533.2 1556.2 1558.2 1534.5 1509.6 Owner Occupied 1132 1077.7 1115.6 1113.5 997 1015.6 1009.3 999.6 967.3 953 979.5 992.4 Land Hold, Land Development & Construction 751.5 727.8 631.5 616.2 574.2 591.5 522.4 537.5 441.2 433.1 408.4 396.5 $5,828 $5,774 $5,567 $5,654 (in millions) Commercial Portfolio $5,805 Quarterly Trends $5,339 $5,121 $4,998 |

| 2003 2004 2005 2006 3/31/2007 6/30/2007 9/30/2007 12/31/2007 3/31/2008 6/30/2008 9/30/2008 12/31/2008 3/31/2009 6/30/2009 9/30/2009 Mortgage 492.7 508.2 539.8 1543.5 1518.198 1494.45 1460.993 1445.2 1393.801 1308.729 1279.696 1262.841 1207.973 1145.02 1084.872 Direct (primarily home equity) 998.3 1169.6 1142 1721.4 1677.842 1636.026 1602.126 1572.3 1531.905 1502.302 1481.38 1452.166 1405.659 1351.513 1308.279 Indirect 743.9 825.9 844.1 840.6 831.302 846.252 851.436 829.4 818.901 832.836 843.126 820.536 802.116 808.311 825.316 (in millions) Consumer Portfolio $3,604 $3,745 $3,847 $3,536 $3,644 Quarterly Trends $3,416 $3,305 $3,218 |
| Loss Mitigation and Workout Strategy Commercial loan workout teams (50 FTE) are focused on loss mitigation by specific asset classes, with account assignment based on asset liquidation expertise of personnel Enhanced collections efforts and administrative discipline led to improved near term delinquency results The focus of internal analysis of industry-related exposures is updated quarterly based on segments and asset classes facing the greatest potential recessionary impact (i.e. auto-related, income producing real estate) Continuously evaluate consumer payment histories and proactively seek to modify loan structures to mitigate potential loss given default |
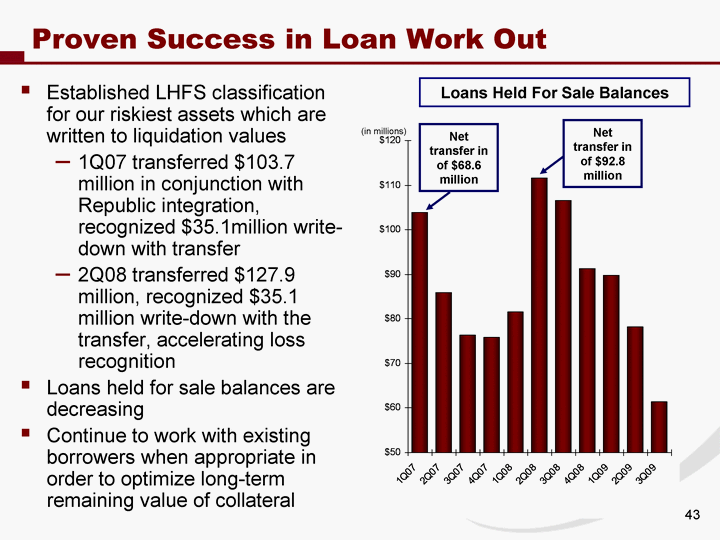
| Proven Success in Loan Work Out Established LHFS classification for our riskiest assets which are written to liquidation values 1Q07 transferred $103.7 million in conjunction with Republic integration, recognized $35.1million write- down with transfer 2Q08 transferred $127.9 million, recognized $35.1 million write-down with the transfer, accelerating loss recognition Loans held for sale balances are decreasing Continue to work with existing borrowers when appropriate in order to optimize long-term remaining value of collateral Loans Held For Sale Balances 1Q07 2Q07 3Q07 4Q07 1Q08 2Q08 3Q08 4Q08 1Q09 2Q09 3Q09 Loans Held for Sale 103.922 85.93 76.384 75.832 81.537 111.542 106.531 91.362 89.82 78.144 61.445 (in millions) Net transfer in of $68.6 million Net transfer in of $92.8 million |

| Aggressive Non-Performing Asset Management |

| Prudently Building Reserve in Uncertain Economy 1Q08 2Q08 3Q08 4Q08 1Q09 2Q09 3Q09 Net Charge-Offs 17.444 69.29 22.381 80.971 36.691 49.24 71.5 Reserve as % of loans 0.0184 0.0192 0.0232 0.028 0.0323 0.0396 0.0413 Reserve Increase 13.175 5.19 36.009 37.594 27.326 50.722 6.325 (in millions) 1Q08 2Q08 3Q08 4Q08 1Q09 2Q09 3Q09 Specific Allocated Allowance 17.395 17.627 35.61 39.885 46.567 69.5 65.525 Risk Allocated Allowance 159.133 164.091 182.117 215.437 236.08 263.9 274.17 (in millions) $283 $255 $218 $182 $177 92% increase in allowance while loans decreased 14% since 1Q08 Allowance for Loan Losses $333 Includes $35 million write-down for loans transferred to LHFS Includes $45 million charged-off on 4 commercial loans $340 |
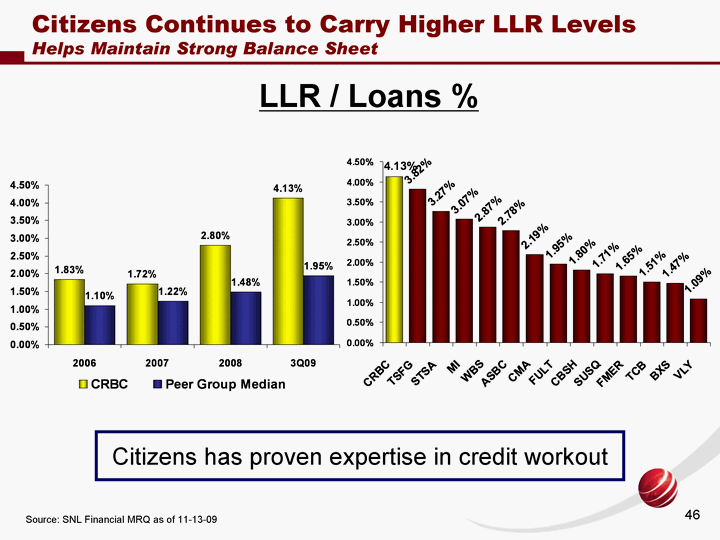
| LLR / Loans % Source: SNL Financial MRQ as of 11-13-09 Citizens Continues to Carry Higher LLR Levels Helps Maintain Strong Balance Sheet 2006 2007 2008 3Q09 CRBC 0.0183 0.0172 0.028 0.0413 Peer Group Median 0.011 0.0122 0.0148 0.0195 Citizens has proven expertise in credit workout CRBC TSFG STSA MI WBS ASBC CMA FULT CBSH SUSQ FMER TCB BXS VLY East 0.0413 0.0382 0.0327 0.0307 0.0287 0.0278 0.0219 0.0195 0.018 0.0171 0.0165 0.0151 0.0147 0.0109 |

| Peer Group Composition |
