Exhibit 99.1

| Citi 2009 Financial Services Conference January 27, 2009 |

| Safe Harbor Statement Discussions in this presentation that are not statements of historical fact (including statements that include terms such as "will," "may," "should," "believe," "expect," "anticipate," "estimate," "project","intend," and "plan") are forward-looking statements that involve risks and uncertainties, and Citizens' actual future results could differ materially from those discussed. Factors that could cause or contribute to such differences include, without limitation, risks and uncertainties detailed from time to time in Citizens' filings with the Securities and Exchange Commission. Other factors not currently anticipated may also materially and adversely affect Citizens' results of operations, cash flows, and financial position. There can be no assurance that future results will meet expectations. While Citizens believes that the forward-looking statements in this presentation are reasonable, you should not place undue reliance on any forward-looking statement. In addition, these statements speak only as of the date made. Citizens does not undertake, and expressly disclaims any obligation to update or alter any statements, whether as a result of new information, future events or otherwise, except as required by applicable law. |
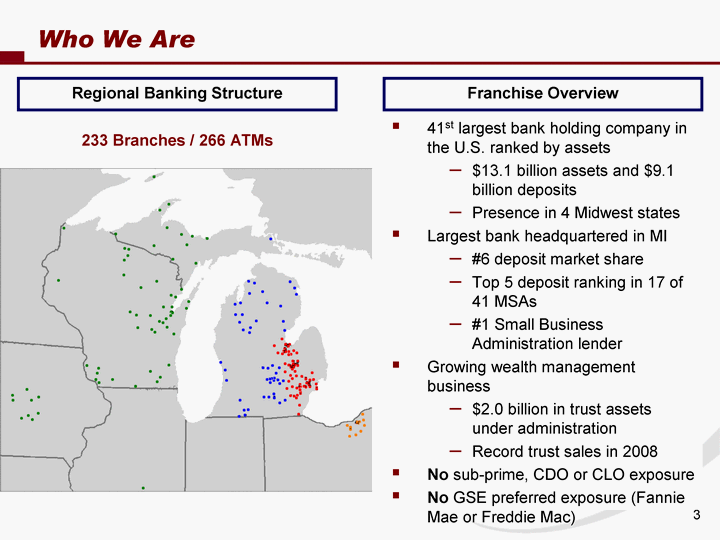
| Who We Are 41st largest bank holding company in the U.S. ranked by assets $13.1 billion assets and $9.1 billion deposits Presence in 4 Midwest states Largest bank headquartered in MI #6 deposit market share Top 5 deposit ranking in 17 of 41 MSAs #1 Small Business Administration lender Growing wealth management business $2.0 billion in trust assets under administration Record trust sales in 2008 No sub-prime, CDO or CLO exposure No GSE preferred exposure (Fannie Mae or Freddie Mac) Regional Banking Structure 233 Branches / 266 ATMs Franchise Overview Franchise Overview |

| Key Strengths Strong Management Team Management team with broad big bank experience Strong track record of managing turnaround/workout situations in difficult operating environments Great bench strength Prudent Credit Culture Significant Excess Capital Hallmark conservative credit culture Diversified loan portfolio Most of the outsized stress was inherited from acquisitions Diligently addressing credit issues Accelerated the recognition of losses Boosted loan loss reserve levels Use of third party servicer for mortgage Tightened underwriting criteria Capital ratios are among the highest in peer group Solid capital position to weather a prolonged credit/economic crisis in Michigan and Ohio markets Received approval for $300 million of TARP, a positive signal of CRBC's financial strength Recent initiatives enacted to enhance and preserve capital include: $200 million equity raise in second quarter of 2008 Suspended common stock dividend, saving $88 million annually Implemented new SVA/risk-adjusted incentive sales programs |

| Key Strengths Strong Liquidity Position Strong liquidity supported by diversified funding sources Solid core deposit base, with five consecutive quarters of total deposit growth Significant untapped secured borrowing capacity Reduced reliance on short-term wholesale funding Excess cash at the parent company is over 7 years coverage of interest and preferred dividend payment obligations Favorable Growth Opportunities Attractive Valuation New capital available to profitably grow the balance sheet over time Ability to acquire weaker players/failed institutions and build market share in attractive Midwest MSAs Key cross selling opportunities continue to exist across the retail delivery channel and the broader franchise CRBC trades at a significant discount to tangible book value and seven times below that of its peers at just 0.20x CRBC is well positioned to excel in a continued eroding environment CRBC represents an attractive opportunity for investors interested in a financial services company with a compelling risk/reward profile |
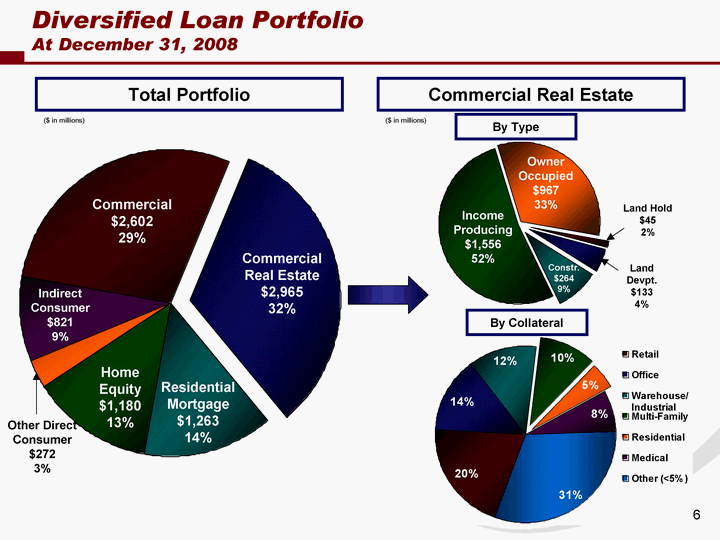
| Diversified Loan Portfolio At December 31, 2008 Commercial Commercial Real Estate Residential Mortgage Home Equity Other Direct Consumer Indirect Consumer East 2602.334 2964.721 1262.841 1180.101 272.065 820.536 Land Hold Land Development Construction Income Producing Owner Occupied East 45 132.7 263.5 1556.2 967.3 Commercial Real Estate $2,965 32% Commercial $2,602 29% Residential Mortgage $1,263 14% Home Equity $1,180 13% Indirect Consumer $821 9% Income Producing $1,556 52% Owner Occupied $967 33% ($ in millions) Total Portfolio Commercial Real Estate ($ in millions) Other Direct Consumer $272 3% Retail Office Warehouse/ Industrial Multi-Family Residential Medical Other (<5%) East 0.2038 0.1373 0.1237 0.1023 0.0459 0.0762 0.3108 Owner Occupied $967 33% Constr. $264 9% By Type By Collateral Land Devpt. $133 4% Land Hold $45 2% |
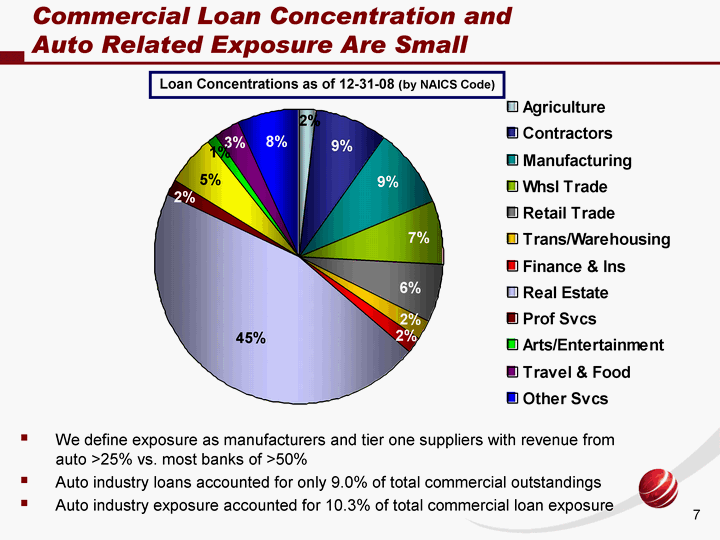
| Commercial Loan Concentration and Auto Related Exposure Are Small Agriculture Contractors Manufacturing Whsl Trade Retail Trade Trans/Warehousing Finance & Ins Real Estate Prof Svcs Health Svcs Arts/Entertainment Travel & Food Other Svcs Commercial Loan Concentrations 107035.774 456794.45 496335.147 391619.449 363664.278 133175.791 91965.84 2576383.158 97623.337 303001.263 62643.037 163805.624 391012.722 Loan Concentrations as of 12-31-08 (by NAICS Code) We define exposure as manufacturers and tier one suppliers with revenue from auto >25% vs. most banks of >50% Auto industry loans accounted for only 9.0% of total commercial outstandings Auto industry exposure accounted for 10.3% of total commercial loan exposure |

| 1Q07 2Q07 3Q07 4Q07 1Q08 2Q08 3Q08 4Q08 Land Hold, Development & Construction 0.0016 0.0665 0.0032 0.0592 0.0561 0.2367 0.0677 0.0478 Income Producing & Owner-Occupied 0 0.0052 0.0011 0.003 0.0012 0.0172 0.009 0.0393 Commercial & Industrial 0 0.003 0.001 0.002 0.0014 0.0009 0.0006 0.0337 Consumer 0.0039 0.0045 0.0062 0.0079 0.0079 0.029 0.008 0.0149 Total 0.0015 0.0087 0.0034 0.0084 0.0074 0.0293 0.0094 0.0348 Majority of Stress from Smallest Portfolio 1Q07 2Q07 3Q07 4Q07 1Q08 2Q08 3Q08 4Q08 Land Hold, Development & Construction 0.015 0.0581 0.0652 0.1132 0.057 0.0427 0.0813 0.0825 Income Producing & Owner-Occupied 0.008 0.017 0.017 0.029 0.019 0.026 0.028 0.045 Commercial & Industrial 0.014 0.011 0.01 0.015 0.015 0.011 0.011 0.022 Consumer 0.014 0.018 0.019 0.023 0.018 0.02 0.02 0.024 Total 0.0122 0.0185 0.0193 0.0279 0.0199 0.0201 0.0229 0.0319 1Q07 2Q07 3Q07 4Q07 1Q08 2Q08 3Q08 4Q08 Land Hold, Development & Construction 0.023 0.061 0.101 0.12 0.175 0.074 0.107 0.118 Income Producing & Owner-Occupied 0.01 0.009 0.015 0.016 0.025 0.014 0.03 0.044 Commercial & Industrial 0.004 0.004 0.004 0.005 0.008 0.012 0.014 0.025 Consumer 0.01 0.012 0.012 0.016 0.016 0.008 0.016 0.022 Total 0.0099 0.0126 0.0168 0.0199 0.0265 0.0147 0.0247 0.0336 30-89 Day Past Due Portfolio Balances NPLs/ Loans NCOs/ Avg. Loans (annualized) 12-31-06 1Q07 2Q07 3Q07 4Q07 1Q08 2Q08 3Q08 4Q08 Commercial & Industrial 2004.9 1993.7 2153.2 2236.2 2557.1 2653.8 2703.8 2703.7 2602.334 Income Producing & Owner-Occupied 1237.1 2429.4 2454.5 2452.3 2523 2582.9 2579.2 2532.8 2523.5 Land Hold, Land Development & Construction 751.5 727.8 631.5 616.2 574.2 591.5 522.4 537.5 441.2 Consumer 4027.3 3976.7 3914.6 3846.9 3744.6 3643.9 3604.2 3535.5 Total Portfolio % ($ in millions) 10 |

| Large Portion of CRE - Manageable Stress Income Producing and Owner Occupied 30-89 Day Past Due Portfolio Overview 1Q07 2Q07 3Q07 4Q07 1Q08 2Q08 3Q08 4Q08 $ 19 41 42 74.3 48.3 67.1 71.4 114.2 % 0.008 0.017 0.017 0.029 0.019 0.0259 0.0282 0.045 % of Total 28% 25% 35% 33% 39% NPLs/ Loans 1Q07 2Q07 3Q07 4Q07 1Q08 2Q08 3Q08 4Q08 $ 24 22 36 41.2 64 36.2 75.3 110.4 % 0.0098 0.009 0.0145 0.0163 0.0248 0.014 0.0297 0.044 % of Total 22% 25% 26% 33% 36% NCOs/ Avg. Loans 1Q07 2Q07 3Q07 4Q07 1Q08 2Q08 3Q08 4Q08 $ 0 3.2 0.7 2.2 0.8 11.1 5.7 24.8 % 0 0.0052 0.0011 0.0034 0.0012 0.0172 0.009 0.0393 % of Total 11% 5% 16% 25% 31% CRBC 30-89 Days CRBC NCOs CRBC NPLs ($ in millions) ($ in millions) ($ in millions) Income Producing portfolio is up 2% from 4Q07 Owner Occupied portfolio is down 3% from 4Q07 |

| Stressed Portion of CRE Portfolio Land Hold, Land Development and Construction Loans 30-89 Day Past Due 1Q07 2Q07 3Q07 4Q07 1Q08 2Q08 3Q08 4Q08 $ 11 37 40 65 33.4 22.3 43.7 36.4 % 0.015 0.0581 0.0652 0.1132 0.056 0.0427 0.0813 0.0825 NPLs/ Loans NCOs/ Avg. Loans Portfolio Overview Small piece of overall portfolio contributing to large portion of NPLs and NCOs Total portfolio is down 23% from 4Q07 No new Land Hold or Land Development since January 2007 Less than 19% of residential development in construction 4Q07 1Q08 2Q08 3Q08 4Q08 $ 8.5 8.3 30.9 9.1 21.1 % 0.0592 0.0561 0.2367 0.0677 0.0478 1Q07 2Q07 3Q07 4Q07 1Q08 2Q08 3Q08 4Q08 $ 17 39 62 69 104 38.8 57.3 52.1 % 0.023 0.061 0.101 0.12 0.175 0.0743 0.107 0.1181 % of Total 25% 18% 12% 20% 13% % of Total 43% 47% 45% 41% 26% % of Total 36% 41% 28% 25% 17% CRBC 30-89 Days CRBC NCOs CRBC NPLs ($ in millions) ($ in millions) ($ in millions) |
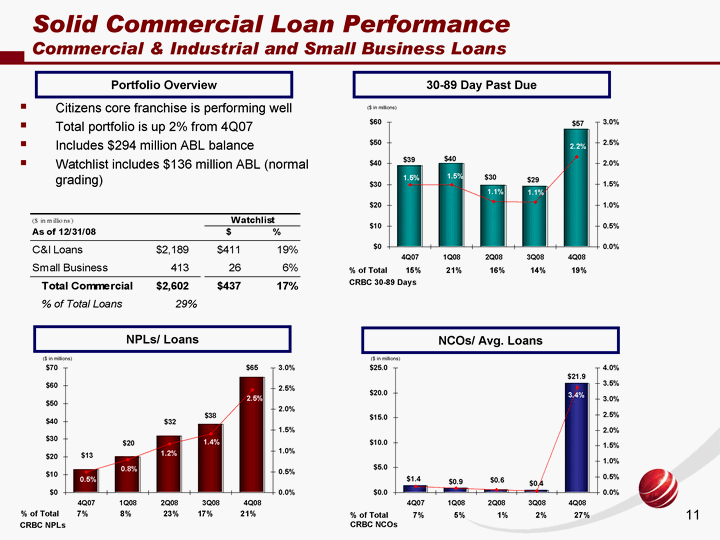
| Solid Commercial Loan Performance Commercial & Industrial and Small Business Loans 30-89 Day Past Due Portfolio Overview 1Q07 2Q07 3Q07 4Q07 1Q08 2Q08 3Q08 4Q08 $ 27 23 22 39 40 29.5 29.1 56.5 % 0.014 0.011 0.01 0.015 0.015 0.01094 0.0108 0.0217 % of Total 15% 21% 16% 14% 19% NPLs/ Loans 1Q07 2Q07 3Q07 4Q07 1Q08 2Q08 3Q08 4Q08 $ 9 9 9 13 20 31.6 38.2 64.6 % 0.004 0.004 0.004 0.005 0.008 0.0117 0.0141 0.0248 % of Total 7% 8% 23% 17% 21% NCOs/ Avg. Loans 1Q07 2Q07 3Q07 4Q07 1Q08 2Q08 3Q08 4Q08 $ 0 1.8 0.6 1.4 0.9 0.6 0.4 21.9 % 0 0.003 0.001 0.002 0.0014 0.0009 0.0006 0.0337 % of Total 7% 5% 1% 2% 27% CRBC 30-89 Days CRBC NCOs CRBC NPLs ($ in millions) ($ in millions) ($ in millions) Citizens core franchise is performing well Total portfolio is up 2% from 4Q07 Includes $294 million ABL balance Watchlist includes $136 million ABL (normal grading) |

| 30-89 Day Past Due Portfolio Overview Recently refreshed portfolio FICO scores Strong historical delinquency performance 77% of HE is seasoned 24 months - no brokered <30% of HE is 2006 and 2007 vintage Approximately 46% of HE in 1st lien position Includes residential construction balance of $44 million Disciplined Underwriting Showing Strong Results Consumer Loans 1Q07 2Q07 3Q07 4Q07 1Q08 2Q08 3Q08 4Q08 $ 55 70 74 87 68 71.3 70.8 83.5 % 0.014 0.018 0.019 0.023 0.018 0.0196 0.0197 0.0236 % of Total 33% 36% 37% 33% 29% NPLs/ Loans 1Q07 2Q07 3Q07 4Q07 1Q08 2Q08 3Q08 4Q08 $ 39 46 46 63 61 30.1 58.6 77.2 % 0.0098 0.0115 0.0116 0.0163 0.0163 0.0083 0.0163 0.0218 % of Total 33% 24% 22% 25% 25% NCOs/ Avg. Loans 1Q07 2Q07 3Q07 4Q07 1Q08 2Q08 3Q08 4Q08 $ 3.9 4.5 6.1 7.6 7.4 26.7 7.2 13.2 % 0.0039 0.0045 0.0062 0.0079 0.0079 0.029 0.00799 0.0149 % of Total 39% 43% 39% 32% 16% CRBC 30-89 Days CRBC NCOs CRBC NPLs ($ in millions) ($ in millions) ($ in millions) |

| Proven Success in Loan Work Out Established LHFS classification for our riskiest assets which are written to liquidation values 1Q07 transferred $68.6 million in conjunction with Republic integration 2Q08 transferred $92.8 million, recognizing $35.1 million write-down with the transfer, accelerating loss recognition Loans held for sale balances are decreasing Continue to work with existing borrowers when applicable in order to optimize long-term remaining value of collateral 1Q07 2Q07 3Q07 4Q07 1Q08 2Q08 3Q08 4Q08 Loans Held for Sale 103.922 85.93 76.384 75.832 81.537 111.542 106.531 91.362 Loans Held For Sale Balances (in millions) |

| Diligently Addressing Credit Issues Proactively accelerate the recognition of losses and continue to boost loan loss reserves Transitioned mortgage servicing and collection to PHH Mortgage Tightened underwriting criteria Commercial loans - revised approval levels to provide greater oversight Residential loans - streamlined collection and modification programs HE loans - lowered max LTV to 80% for primary residence and 70% for secondary residence and discontinued lending on rental properties Indirect loans - increased credit score cutoffs, increased pricing spreads, and reduced advance rates 50 FTE focused on commercial loan loss mitigation Centralized and upgraded CRE portfolio management team (total 22 FTE) Focused on servicing performance (age of appraisals, lot release schedules, rent roll updates, construction costs, guarantor liquidity affirmed with current financials) Expanded special loans workout team by 4 FTE (total 28 FTE) Continued internal analysis of auto-related exposure by widening focus to communities that could be negatively impacted Expanded quarterly review of non-watch credits to include commercial and industrial relationships |

| Prudently Building Reserve in Uncertain Economy 1Q08 2Q08 3Q08 4Q08 Net Charge-Offs 17.444 69.29 22.381 80.971 Reserve as % of loans 0.0184 0.0192 0.0232 0.028 Reserve Increase 13.175 5.19 36.009 37.594 (in millions) Includes $35 million write-down for loans transferred to LHFS Includes $45 million charged-off on 4 commercial loans |
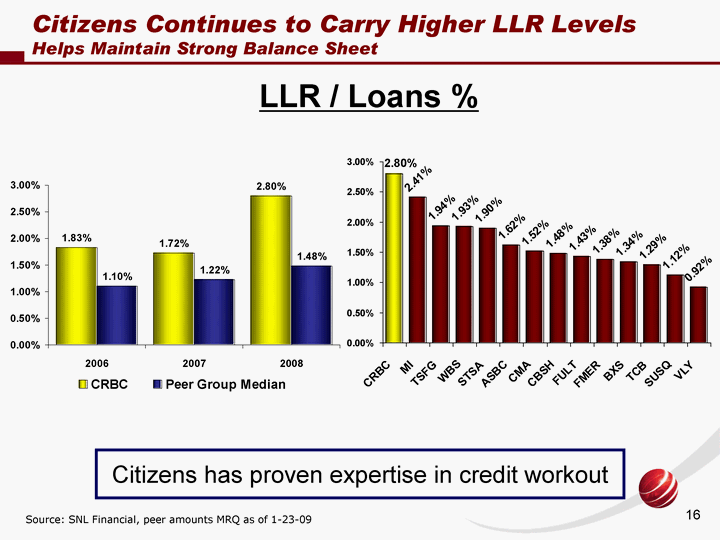
| LLR / Loans % Source: SNL Financial, peer amounts MRQ as of 1-23-09 Citizens Continues to Carry Higher LLR Levels Helps Maintain Strong Balance Sheet 2006 2007 2008 CRBC 0.0183 0.0172 0.028 Peer Group Median 0.011 0.0122 0.0148 Citizens has proven expertise in credit workout CRBC MI TSFG WBS STSA ASBC CMA CBSH FULT FMER BXS TCB SUSQ VLY East 0.028 0.0241 0.0194 0.0193 0.019 0.0162 0.0152 0.0148 0.0143 0.0138 0.0134 0.0129 0.0112 0.0092 |
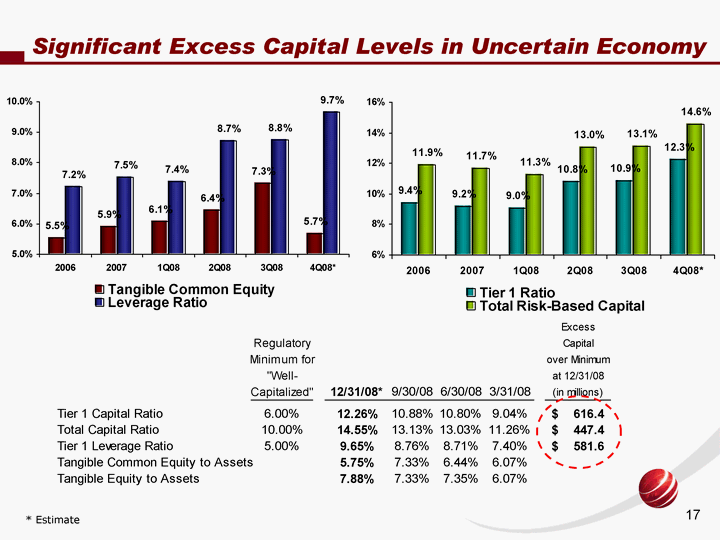
| 2002 2003 2004 2005 2006 2007 1Q08 2Q08 3Q08 4Q08* Tangible Common Equity 0.0773 0.0738 0.0767 0.0769 0.0554 0.059 0.0607 0.0644 0.0733 0.0569 Leverage Ratio 0.0718 0.0745 0.0784 0.0798 0.0722 0.0753 0.074 0.0871 0.0876 0.0965 2002 2003 2004 2005 2006 2007 1Q08 2Q08 3Q08 4Q08* Tier 1 Ratio 0.0918 0.098 0.0996 0.0994 0.0941 0.0918 0.0904 0.108 0.1088 0.1226 Total Risk-Based Capital 0.1043 0.1323 0.1332 0.1322 0.119 0.1166 0.1126 0.1303 0.1313 0.1455 Significant Excess Capital Levels in Uncertain Economy Significant Excess Capital Levels in Uncertain Economy * Estimate |

| Strong Capital Ratios Compared to Peers Source: SNL Financial as of 1-23-09 WBS CMA TCB CRBC MI VLY TSFG BXS Median FMER FULT CBSH STSA ASBC SUSQ East 0.152 0.1473 0.1465 0.1445 0.1407 0.1319 0.1268 0.1204 0.1204 0.119 0.119 0.1149 0.1098 0.1092 0.1086 CRBC TCB VLY TSFG BXS WBS CMA CBSH Median FMER MI STSA FULT ASBC SUSQ East 0.1226 0.1179 0.1145 0.1118 0.1079 0.1075 0.1067 0.1031 0.1031 0.103 0.1022 0.097 0.093 0.0906 0.0863 CRBC has strong capital ratios Prudent to enhance capital during uncertain economic conditions $616.4 million excess capital over well- capitalized minimum Tier 1 as 12-31-08 Tier 1 Regulatory Capital 4% - adequacy minimum 6% - well-capitalized minimum Total Capital Ratio Tier 1 Capital |
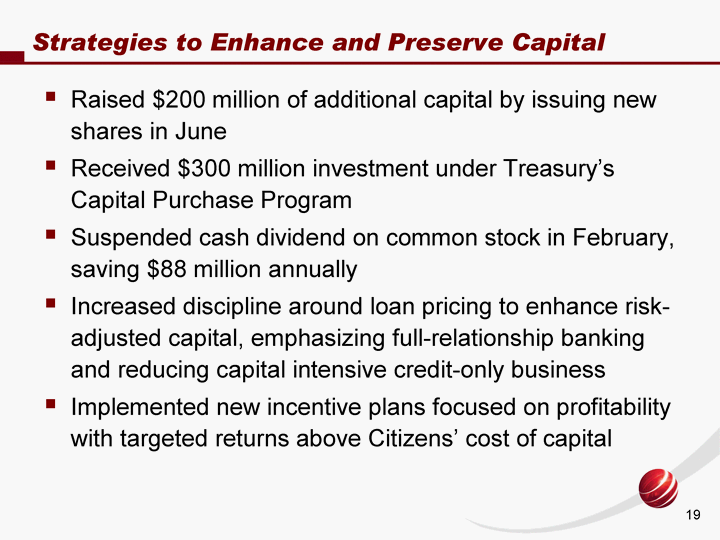
| Strategies to Enhance and Preserve Capital Raised $200 million of additional capital by issuing new shares in June Received $300 million investment under Treasury's Capital Purchase Program Suspended cash dividend on common stock in February, saving $88 million annually Increased discipline around loan pricing to enhance risk- adjusted capital, emphasizing full-relationship banking and reducing capital intensive credit-only business Implemented new incentive plans focused on profitability with targeted returns above Citizens' cost of capital |

| Pre-Tax Pre-Provision Earnings Power Consistent Pre-Tax Pre-Provision Operating Earnings (1) To Handle Credit Volatility (1) Non-GAAP measure, as defined by management, represents net income (loss) excluding income tax provision (benefit), provision for loan losses, and any impairment charges (including goodwill, credit writedowns and fair-value adjustments) caused by this economic cycle. |
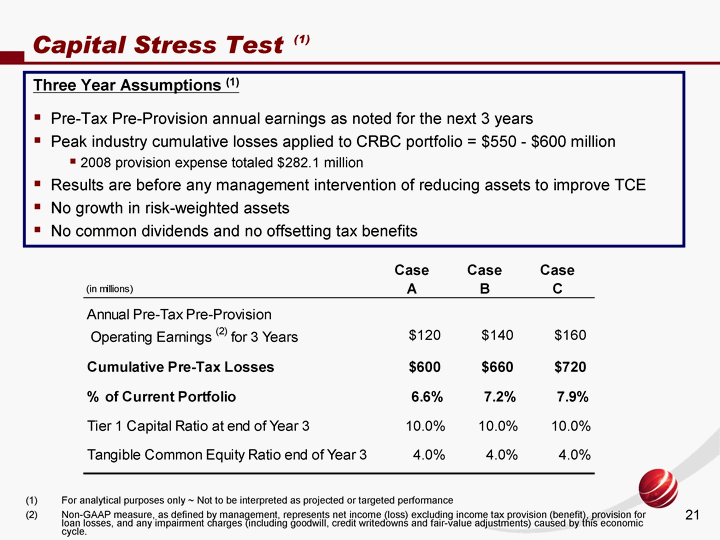
| Capital Stress Test (1) Three Year Assumptions (1) Pre-Tax Pre-Provision annual earnings as noted for the next 3 years Peak industry cumulative losses applied to CRBC portfolio = $550 - $600 million 2008 provision expense totaled $282.1 million Results are before any management intervention of reducing assets to improve TCE No growth in risk-weighted assets No common dividends and no offsetting tax benefits For analytical purposes only ~ Not to be interpreted as projected or targeted performance Non-GAAP measure, as defined by management, represents net income (loss) excluding income tax provision (benefit), provision for loan losses, and any impairment charges (including goodwill, credit writedowns and fair-value adjustments) caused by this economic cycle. |
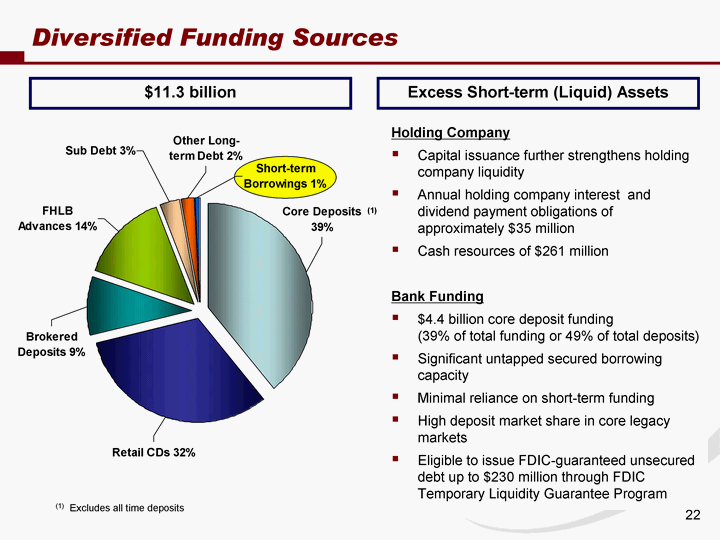
| Diversified Funding Sources Core Deposits 0.39 Retail CDs 0.32 Brokered Deposits 0.09 FHLB Advances 0.14 Sub Debt 0.03 Other Long-term Debt 0.02 Short-term Borrowings 0.007 $11.3 billion Holding Company Capital issuance further strengthens holding company liquidity Annual holding company interest and dividend payment obligations of approximately $35 million Cash resources of $261 million Bank Funding $4.4 billion core deposit funding (39% of total funding or 49% of total deposits) Significant untapped secured borrowing capacity Minimal reliance on short-term funding High deposit market share in core legacy markets Eligible to issue FDIC-guaranteed unsecured debt up to $230 million through FDIC Temporary Liquidity Guarantee Program (1) Excludes all time deposits (1) Excess Short-term (Liquid) Assets |
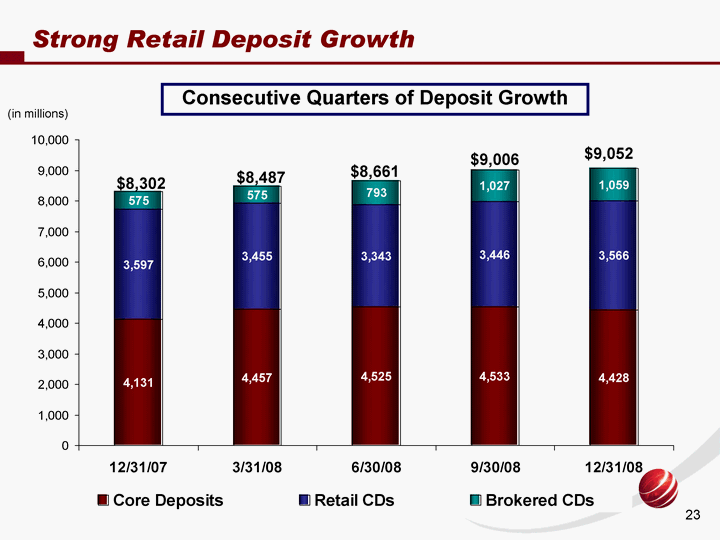
| 9/30/2007 12/31/2007 3/31/2008 6/30/2008 9/30/2008 12/31/2008 Core Deposits 4037.024 4130.668 4457.117 4524.843 4532.859 4427.79 Retail CDs 3604.675 3596.754 3454.811 3343.226 3445.801 3565.922 Brokered CDs 300.04 574.503 575.049 793.069 1027.415 1058.694 (in millions) Strong Retail Deposit Growth $9,006 $8,487 $8,302 $9,052 $8,661 Consecutive Quarters of Deposit Growth |
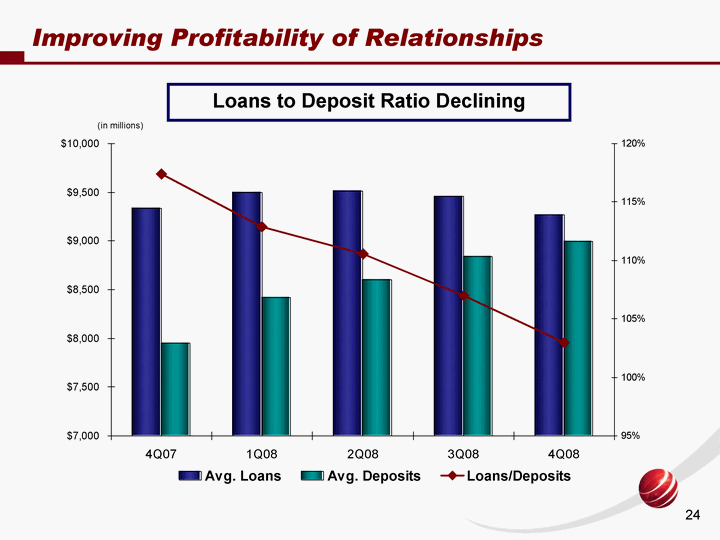
| Improving Profitability of Relationships 3Q07 4Q07 1Q08 2Q08 3Q08 4Q08 Avg. Loans 9163 9335 9499 9514 9456 9267 Loans/Deposits 1.1384 1.1741 1.1285 1.10576 1.07005 1.02991 Avg. Deposits 8049 7951 8417 8604 8837 8998 (in millions) Loans to Deposit Ratio Declining |

| Strong Liquidity Position Added longer-term brokered CDs Increased focus on cross-sales through retail delivery channel Conducted targeted marketing campaigns for deposits Increased available collateral for FHLB funding Increased discipline around loan funding and pricing to better align changes in loans outstanding with funding, liquidity, and profitability objectives Strengthened Balance Sheet and Reduced Reliance on Short-Term Wholesale Funding |
| Cathy Nash - President & CEO Joined Citizens in 2006 as EVP, Regional & Consumer Banking 13 years at Sun Trust: SVP, Director of Branch Banking - oversaw sales strategy of 1,700 branch locations EVP, Director of Retail Banking, Florida - over 425 branch locations, including small business & private banking SVP, Director of Marketing 7 years at Bank of Boston in marketing Over 22 years of banking experience |

| Other Key Priorities Continue Generating Revenue Growth Expanded wide array of products across the legacy Republic footprint Small Business deposits up 31% in 2008 vs. 2007 Branch operating model implemented in 2007 generates strong cross-sell opportunities Bankcard fee revenue up 21% in 2008 vs. 2007 Treasury Management revenue up 7% in 2008 vs. 2007 Wealth Management Financial consultants generated $1 million of incremental revenue in 2008 at legacy Republic branches Record trust sales in 2008 up 67% over 2007 4Q06 (Legacy Citizens Only) 1Q07 2Q07 3Q07 4Q07 1Q08 2Q08 3Q08 4Q08 NPA/Total Assets 14 25 33 42 43 46 50.61751 50.166 49.37 % of New Retail DDA Customer with Cross-Sell |

| Favorable Growth Opportunities New capital to prudently grow the balance sheet over time Key cross selling opportunities across the retail delivery channel and the broader franchise Ability to acquire weaker players / failed institutions inexpensively and build market share in attractive Midwest MSAs |
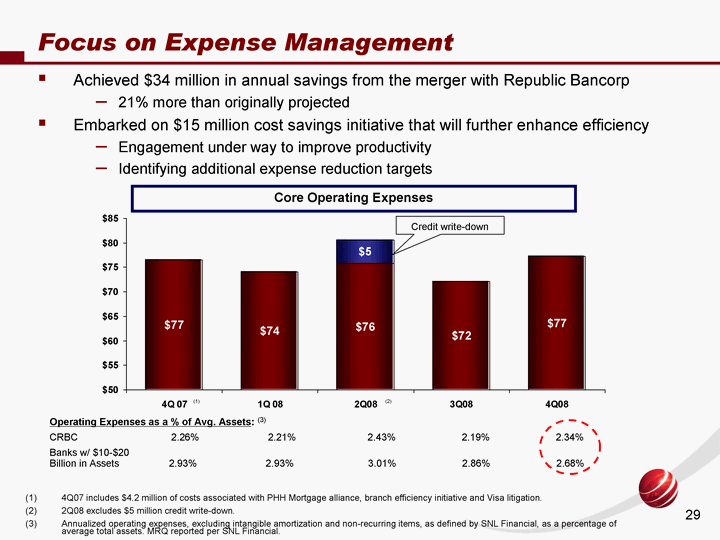
| Focus on Expense Management 2Q 07 3Q 07 4Q 07 1Q 08 2Q08 3Q08 4Q08 Core Operating Expenses 81.128 73.531 76.577 74.115 75.806 72.075 77.229 0 0 0 0 4.8 0 0 4Q07 includes $4.2 million of costs associated with PHH Mortgage alliance, branch efficiency initiative and Visa litigation. 2Q08 excludes $5 million credit write-down. Annualized operating expenses, excluding intangible amortization and non-recurring items, as defined by SNL Financial, as a percentage of average total assets. MRQ reported per SNL Financial. Achieved $34 million in annual savings from the merger with Republic Bancorp 21% more than originally projected Embarked on $15 million cost savings initiative that will further enhance efficiency Engagement under way to improve productivity Identifying additional expense reduction targets (1) CRBC 2.26% 2.21% 2.43% 2.19% 2.34% Banks w/ $10-$20 Billion in Assets 2.93% 2.93% 3.01% 2.86% 2.68% Operating Expenses as a % of Avg. Assets: (3) Core Operating Expenses Credit write-down (2) |

| CRBC - Trading at a Discount to Peers CRBC currently trading at a discount to Peers based on tangible book value Tangible book value of $7.80 per share Source: SNL Financial based on market closing prices on 1-23-09 VLY FMER CBSH TCB SUSQ ASBC FULT Median BXS CMA WBS MI TSFG CRBC STSA East 242.3 168.9 167.7 162 151.4 140.9 139.3 139.3 133.5 52.9 32.1 26.2 25.1 19.9 19.3 |
| Investor Takeaways Revenue synergy opportunities continue to exist within the Citizens franchise Focused on delivering results and creating long-term value for shareholders Talented team with significant expertise in managing credit Strong balance sheet to withstand a stressed credit cycle More than sufficient capital and liquidity to weather the cycle |

| Appendix |
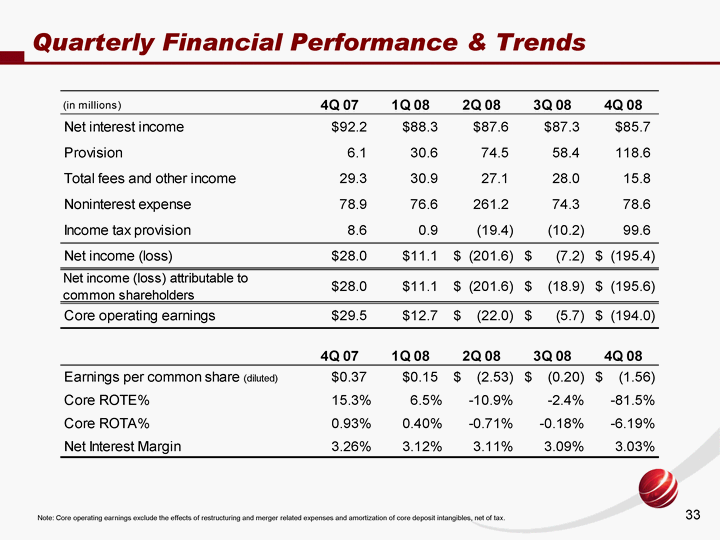
| Quarterly Financial Performance & Trends Note: Core operating earnings exclude the effects of restructuring and merger related expenses and amortization of core deposit intangibles, net of tax. |

| Quarterly Non-Interest Income Trends |

| Quarterly Non-Interest Expense Trends |
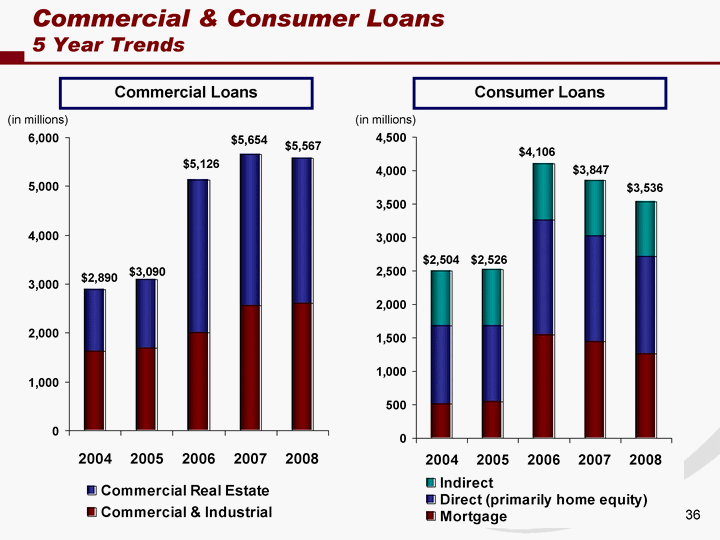
| Commercial & Consumer Loans 5 Year Trends 2004 2005 2006 2007 2008 Commercial & Industrial 1633.8 1688.1 2004.9 2557.1 2602.3 Commercial Real Estate 1255.9 1402.1 3120.6 3097.2 2964.7 $5,567 $5,654 $5,126 $3,090 $2,890 (in millions) Commercial Loans 2004 2005 2006 2007 2008 Mortgage 508.2 539.8 1543.5 1445.2 1262.8 Direct (primarily home equity) 1169.6 1142 1721.4 1572.3 1452.2 Indirect 825.9 844.1 840.6 829.4 820.5 Consumer Loans (in millions) $3,536 $2,504 $2,526 $4,106 $3,847 |
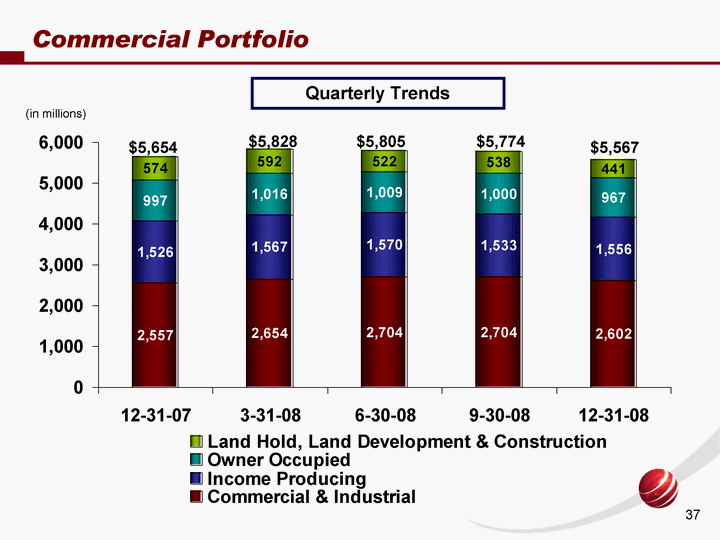
| 12-31-06 3-31-07 6-30-07 9-30-07 12-31-07 3-31-08 6-30-08 9-30-08 12-31-08 Commercial & Industrial 2004.9 1993.7 2153.2 2236.2 2557.1 2653.8 2703.8 2703.7 2602.334 Income Producing 1237.1 1351.7 1338.9 1338.8 1526 1567.3 1569.9 1533.2 1556.2 Owner Occupied 1132 1077.7 1115.6 1113.5 997 1015.6 1009.3 999.6 967.3 Land Hold, Land Development & Construction 751.5 727.8 631.5 616.2 574.2 591.5 522.4 537.5 441.2 $5,828 $5,774 $5,567 $5,654 (in millions) Commercial Portfolio $5,805 Quarterly Trends |
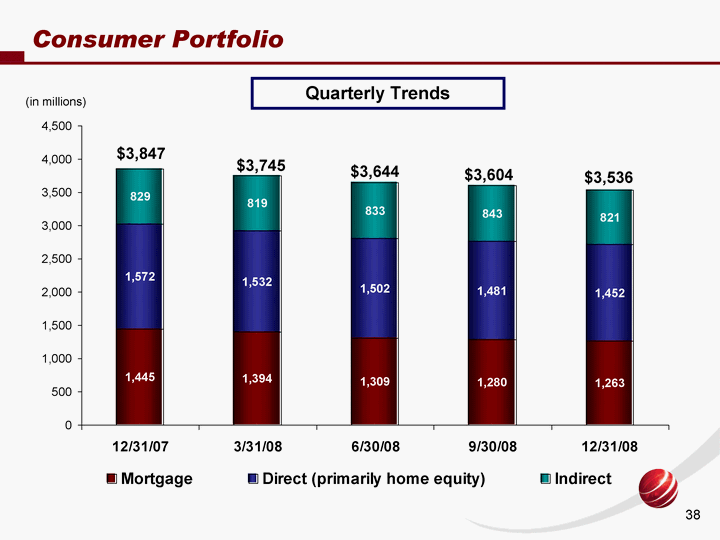
| 2003 2004 2005 2006 3/31/2007 6/30/2007 9/30/2007 12/31/2007 3/31/2008 6/30/2008 9/30/2008 12/31/2008 Mortgage 492.7 508.2 539.8 1543.5 1518.198 1494.45 1460.993 1445.2 1393.801 1308.729 1279.696 1262.841 Direct (primarily home equity) 998.3 1169.6 1142 1721.4 1677.842 1636.026 1602.126 1572.3 1531.905 1502.302 1481.38 1452.166 Indirect 743.9 825.9 844.1 840.6 831.302 846.252 851.436 829.4 818.901 832.836 843.126 820.536 (in millions) Consumer Portfolio $3,604 $3,745 $3,847 $3,536 $3,644 Quarterly Trends |
