Exhibit 99.1
Investor Presentation
Third Quarter 2011
Safe Harbor Statement
Discussions and statements in this presentation that are not statements of historical fact (including without limitation statements that include terms such as “will,” “may,” “should,” “believe,” “expect,” “anticipate,” “estimate,” “project”, “intend,” and “plan”) and statements regarding Citizens’ future financial and operating results, plans, objectives, expectations and intentions, are forward-looking statements that involve risks and uncertainties, many of which are beyond Citizens’ control or are subject to change. No forward –looking statement is a guarantee of future performance and actual results could differ materially.
Factors that could cause or contribute to such differences include, without limitation, risks and uncertainties detailed from time to time in Citizens’ filings with the Securities and Exchange Commission.
Other factors not currently anticipated may also materially and adversely affect Citizens’ results of operations, cash flows, financial position and prospects. There can be no assurance that future results will meet expectations. While Citizens believes that the forward-looking statements in this presentation are reasonable, you should not place undue reliance on any forward-looking statement. In addition, these statements speak only as of the date made. Citizens does not undertake, and expressly disclaims any obligation to update or alter any statements, whether as a result of new information, future events or otherwise, except as required by applicable law.
Who We Are
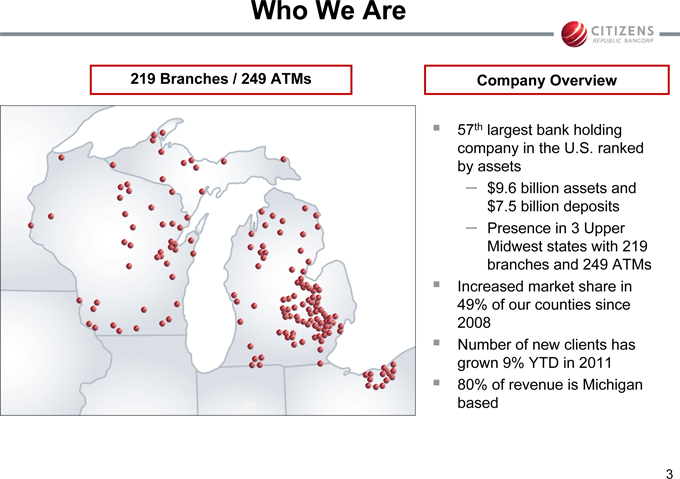
219 Branches / 249 ATMs
Company Overview
57th largest bank holding company in the U.S. ranked by assets
– $9.6 billion assets and $7.5 billion deposits
– Presence in 3 Upper Midwest states with 219 branches and 249 ATMs Increased market share in 49% of our counties since 2008 Number of new clients has grown 9% YTD in 2011 80% of revenue is Michigan based
How We Deliver Our Service
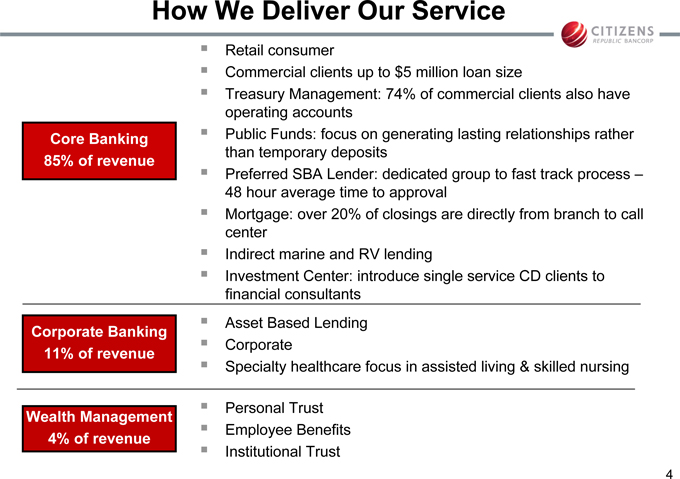
Core Banking 85% of revenue
Corporate Banking 11% of revenue
Wealth Management 4% of revenue
Retail consumer
Commercial clients up to $5 million loan size
Treasury Management: 74% of commercial clients also have operating accounts Public Funds: focus on generating lasting relationships rather than temporary deposits Preferred SBA Lender: dedicated group to fast track process – 48 hour average time to approval Mortgage: over 20% of closings are directly from branch to call center Indirect marine and RV lending Investment Center: introduce single service CD clients to financial consultants Asset Based Lending Corporate Specialty healthcare focus in assisted living & skilled nursing
Personal Trust Employee Benefits Institutional Trust
4
Local Delivery of Service
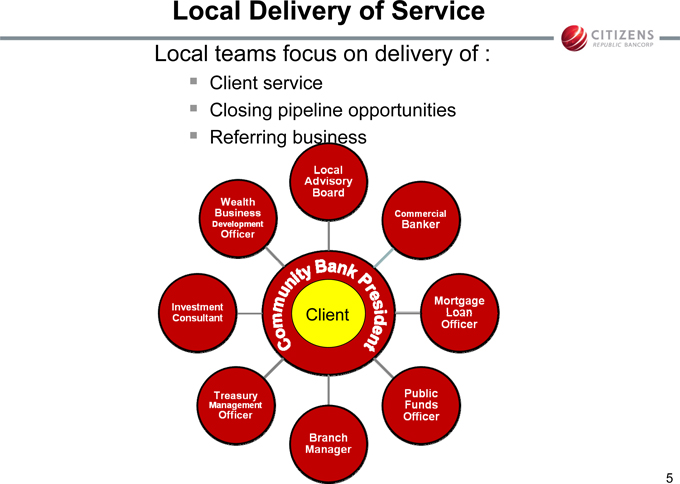
Local teams focus on delivery of :
Client service
Closing pipeline opportunities
Referring business
Community Bank President
Client
Local Advisory Board
Commercial Banker
Mortgage Loan Officer
Public Funds Officer
Branch Manager
Treasury Management Officer
Investment Consultant
Wealth Business Development Officer
Strategy From 2009 – 2010
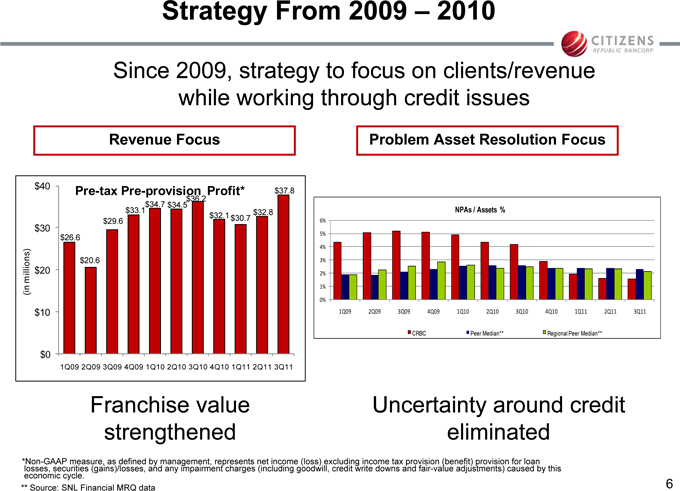
Since 2009, strategy to focus on clients/revenue while working through credit issues
Revenue Focus
$40 Pre-tax Pre-provision Profit* $37.8
$36.2
$30
$26.6
$20.6
millions) $20
(in
$10
$0
1Q09 2Q09 3Q09 4Q09 1Q10 2Q10 3Q10 4Q10 1Q11 2Q11 3Q11
Problem Asset Resolution Focus
NPAs / Assets %
6%
5%
4%
3%
2%
1%
0%
1Q09 2Q09 3Q09 4Q09 1Q10 2Q10 3Q10 4Q10 1Q11 2Q11 3Q11
CRBC Peer Median** Regional Peer Median**
Franchise value strengthened
Uncertainty around credit eliminated
Non-GAAP measure, as defined by management, represents net income (loss) excluding income tax provision (benefit) provision for loan losses, securities (gains)/losses, and any impairment charges (including goodwill, credit write downs and fair-value adjustments) caused by this economic cycle.
Source: SNL Financial MRQ data
Strategy from 2009 – 2010
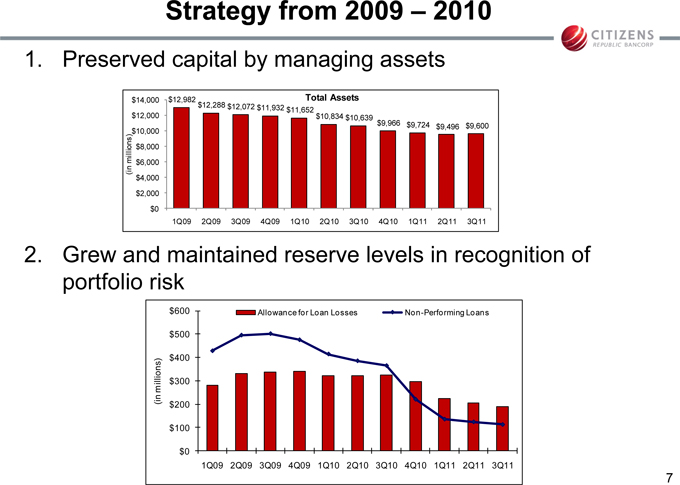
1. Preserved capital by managing assets
$14,000 $12,982 Total Assets
$12,288 $12,072 $11,932 $11,652
$12,000 $10,834 $10,639
$10,000 $9,966 $9,724 $9,496 $9,600
millions) $8,000
$6,000
(in $4,000
$2,000
$0
1Q09 2Q09 3Q09 4Q09 1Q10 2Q10 3Q10 4Q10 1Q11 2Q11 3Q11
2. Grew and maintained reserve levels in recognition of portfolio risk
$600 Allowance for Loan Losses Non-Performing Loans
$500
$400
millions) $300
(in $200
$100
$0
1Q09 2Q09 3Q09 4Q09 1Q10 2Q10 3Q10 4Q10 1Q11 2Q11 3Q11
Strategy from 2009 – 2010
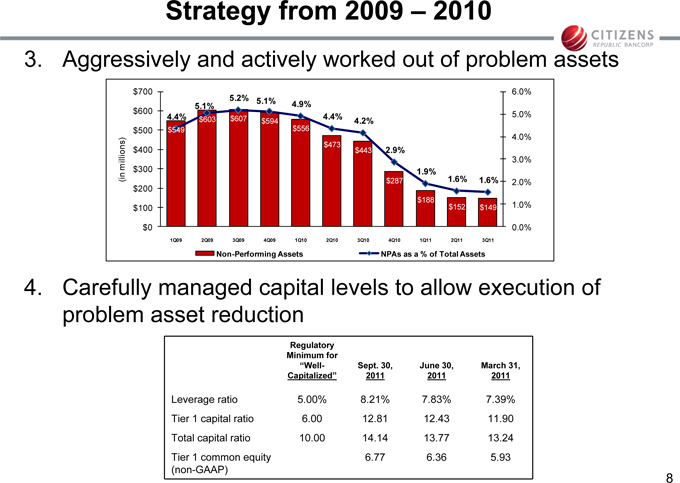
3. Aggressively and actively worked out of problem assets
$700 6.0%
$600 4.4% $603 $607 $594 4.4% 4.2% 5.0%
$500 $549 $556
4.0%
$473
$400 $443 2.9%
millions) 3.0%
$300 1.9%
(in $287 1.6% 1.6% 2.0%
$200
$188
$100 $152 $149 1.0%
$0 0.0%
1Q09 2Q09 3Q09 4Q09 1Q10 2Q10 3Q10 4Q10 1Q11 2Q11 3Q11
Non-Performing Assets NPAs as a % of Total Assets
4. Carefully managed capital levels to allow execution of problem asset reduction
Regulatory
Minimum for
“Well- Sept. 30, June 30, March 31,
Capitalized” 2011 2011 2011
Leverage ratio 5.00% 8.21% 7.83% 7.39%
Tier 1 capital ratio 6.00 12.81 12.43 11.90
Total capital ratio 10.00 14.14 13.77 13.24
Tier 1 common equity 6.77 6.36 5.93
(non-GAAP)
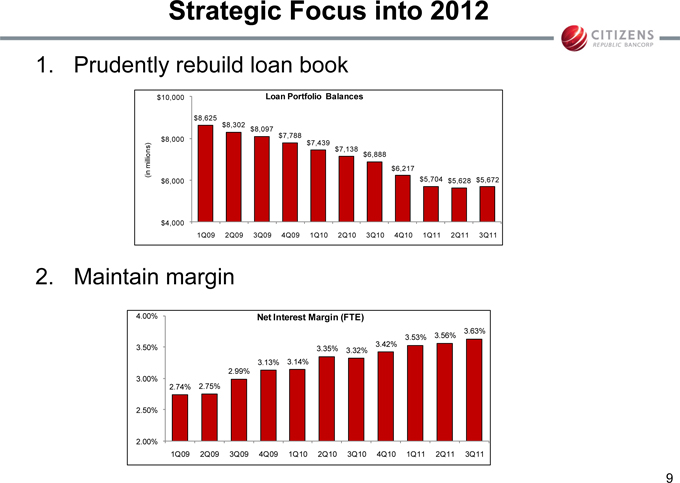
Strategic Focus into 2012
1. Prudently rebuild loan book
$10,000 Loan Portfolio Balances
$8,625
$8,302 $8,097
$7,788
$8,000 $7,439
$7,138
millions) $6,888
$6,217
(in $6,000 $5,704 $5,628 $5,672
$4,000
1Q09 2Q09 3Q09 4Q09 1Q10 2Q10 3Q10 4Q10 1Q11 2Q11 3Q11
2. Maintain margin
4.00% | | Net Interest Margin (FTE) |
2.99%
3.00%
2.50%
2.00%
1Q09 2Q09 3Q09 4Q09 1Q10 2Q10 3Q10 4Q10 1Q11 2Q11 3Q11
9
Strategic Focus into 2012
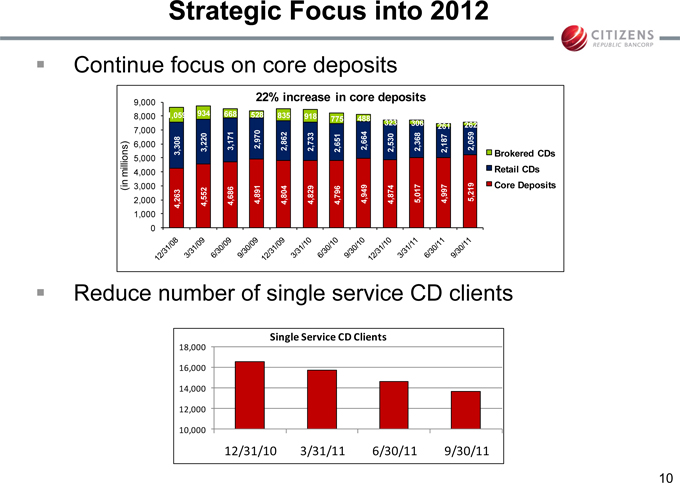
Continue focus on core deposits
9,000 22% increase in core deposits
8,000 1,059 934 668 528 835 918 775 488 323 306 262
7,000 261
6,000 3,308 3,220 3,171 2,970 2,862 2,733 2,651 2,664 2,530 2,368 2,187 2,059
5,000 Brokered CDs
millions) 4,000 Retail CDs
(in 3,000 Core Deposits
2,000 4,263 4,552 4,686 4,891 4,804 4,829 4,796 4,949 4,874 5,017 4,997 5,219
1,000
0
Reduce number of single service CD clients
Single Service CD Clients
18,000
16,000
14,000
12,000
10,000
12/31/10 3/31/11 6/30/11 9/30/11
10
Strategic Focus into 2012
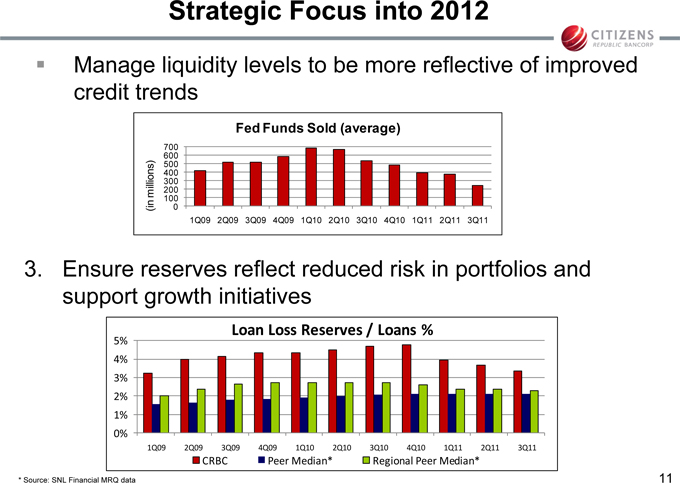
Manage liquidity levels to be more reflective of improved credit trends
Fed Funds Sold (average)
700
600
500
400
300
millions) 200
(in 100 0
1Q09 2Q09 3Q09 4Q09 1Q10 2Q10 3Q10 4Q10 1Q11 2Q11 3Q11
3. Ensure reserves reflect reduced risk in portfolios and support growth initiatives
Loan Loss Reserves / Loans %
5%
4%
3%
2%
1%
0%
1Q09 2Q09 3Q09 4Q09 1Q10 2Q10 3Q10 4Q10 1Q11 2Q11 3Q11
CRBC Peer Median* Regional Peer Median*
*Source: SNL Financial MRQ data
11
Strategic Focus into 2012
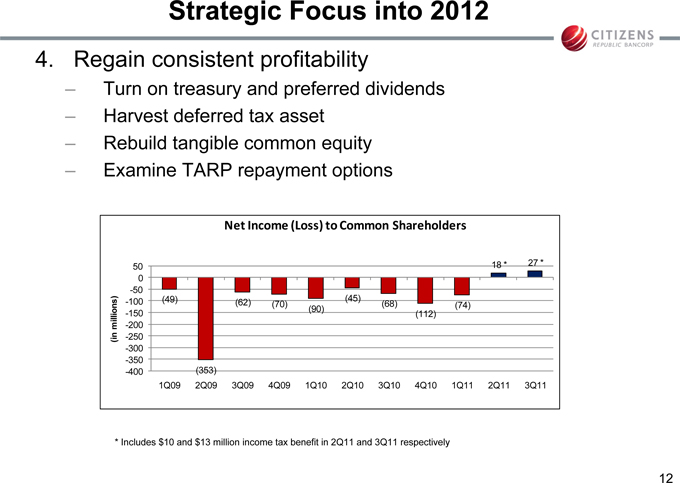
4. Regain consistent profitability
– Turn on treasury and preferred dividends
– Harvest deferred tax asset
– Rebuild tangible common equity
– Examine TARP repayment options
Net Income (Loss) to Common Shareholders
0
-50
-100(49)(62)(70)(45)(68)(74)
-150(112)
millions) -200
(in -250
-300
-350
-400(353)
1Q09 2Q09 3Q09 4Q09 1Q10 2Q10 3Q10 4Q10 1Q11 2Q11 3Q11
* | | Includes $10 and $13 million income tax benefit in 2Q11 and 3Q11 respectively |
12
Strategic Focus into 2012
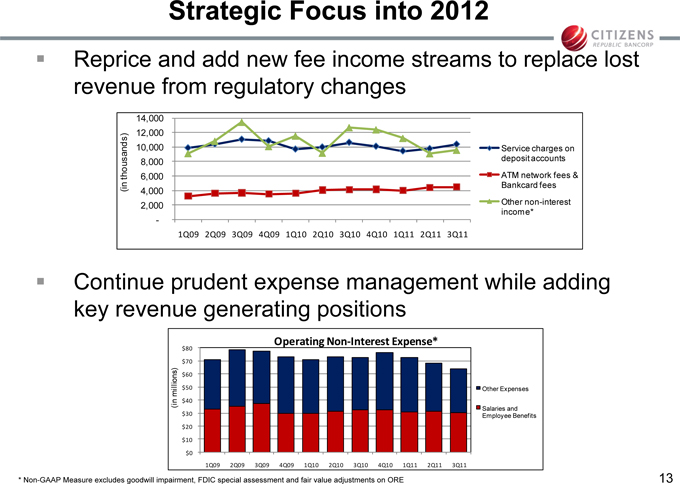
Reprice and add new fee income streams to replace lost revenue from regulatory changes
14,000
12,000
10,000 Service charges on
8,000 deposit accounts
thousands) 6,000 ATM network fees &
(in 4,000 Bankcard fees
2,000 Other non-interest
income*
-
1Q09 2Q09 3Q09 4Q09 1Q10 2Q10 3Q10 4Q10 1Q11 2Q11 3Q11
Continue prudent expense management while adding key revenue generating positions
Operating Non-Interest Expense*
$80
$70
$60
millions) $50 Other Expenses
(in $40
Salaries and
$30 Employee Benefits
$20
$10
$0
1Q09 2Q09 3Q09 4Q09 1Q10 2Q10 3Q10 4Q10 1Q11 2Q11 3Q11
* Non-GAAP Measure excludes goodwill impairment, FDIC special assessment and fair value adjustments on ORE
13
Strategic Focus into 2012
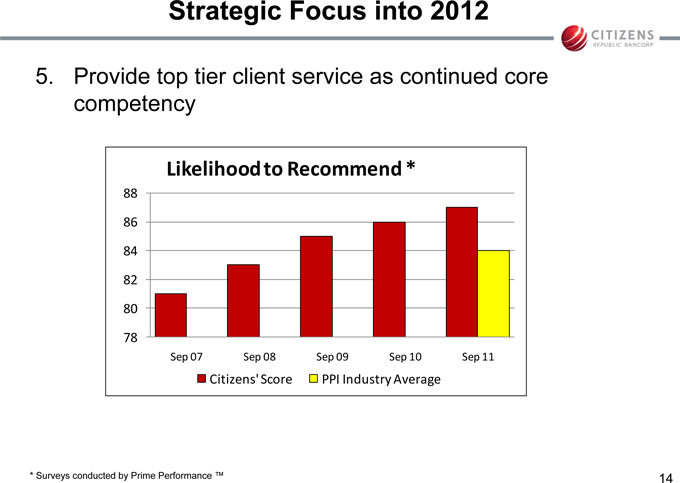
5. Provide top tier client service as continued core competency
Likelihood to Recommend *
Sep 07 Sep 08 Sep 09 Sep 10 Sep 11
Citizens’ Score PPI Industry Average
* | | Surveys conducted by Prime Performance ™ |
14
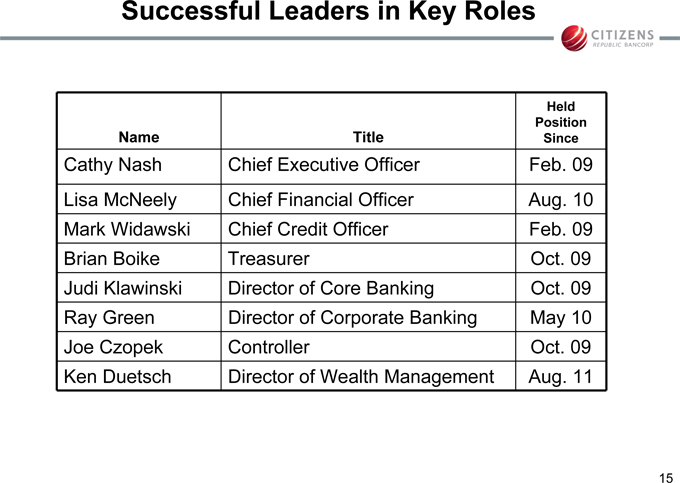
Successful Leaders in Key Roles
Held
Position
Name Title Since
Cathy Nash Chief Executive Officer Feb. 09
Lisa McNeely Chief Financial Officer Aug. 10
Mark Widawski Chief Credit Officer Feb. 09
Brian Boike Treasurer Oct. 09
Judi Klawinski Director of Core Banking Oct. 09
Ray Green Director of Corporate Banking May 10
Joe Czopek Controller Oct. 09
Ken Duetsch Director of Wealth Management Aug. 11
15
3Q 2011 Highlights
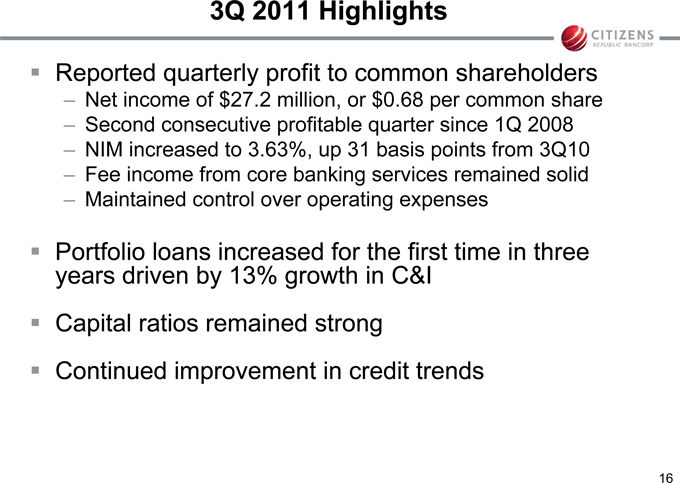
Reported quarterly profit to common shareholders
– Net income of $27.2 million, or $0.68 per common share
– Second consecutive profitable quarter since 1Q 2008
– NIM increased to 3.63%, up 31 basis points from 3Q10
– Fee income from core banking services remained solid
– Maintained control over operating expenses
Portfolio loans increased for the first time in three years driven by 13% growth in C&I
Capital ratios remained strong
Continued improvement in credit trends
16
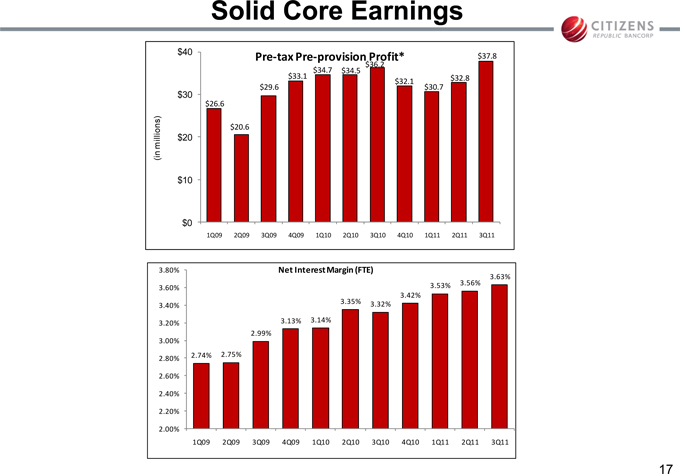
Solid Core Earnings
$40 Pre-tax Pre-provision Profit* $37.8
$36.2
$30
$26.6
$20.6
millions) $20
(in
$10
$0
1Q09 2Q09 3Q09 4Q09 1Q10 2Q10 3Q10 4Q10 1Q11 2Q11 3Q11
3.80% | | Net Interest Margin (FTE) |
3.63%
3.42%
2.99%
3.00%
2.60%
2.40%
2.20%
2.00%
1Q09 2Q09 3Q09 4Q09 1Q10 2Q10 3Q10 4Q10 1Q11 2Q11 3Q11
17
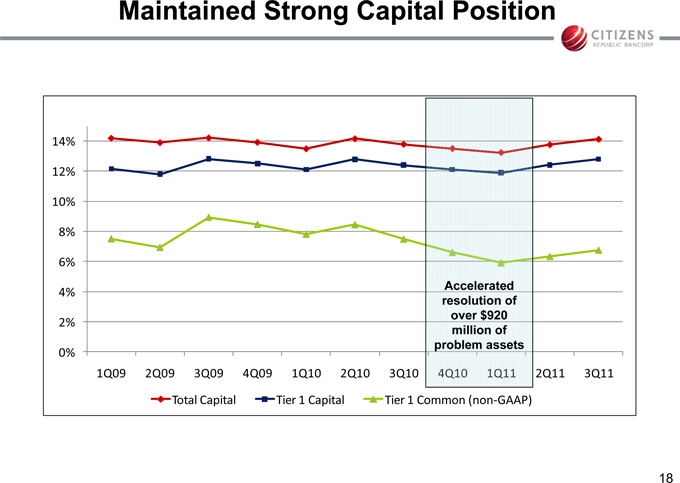
Maintained Strong Capital Position
14%
12%
10%
8%
6%
4% Accelerated
resolution of
2% over $920
million of
0% problem assets
1Q09 2Q09 3Q09 4Q09 1Q10 2Q10 3Q10 4Q10 1Q11 2Q11 3Q11
Total Capital Tier 1 Capital Tier 1 Common (non-GAAP)
18
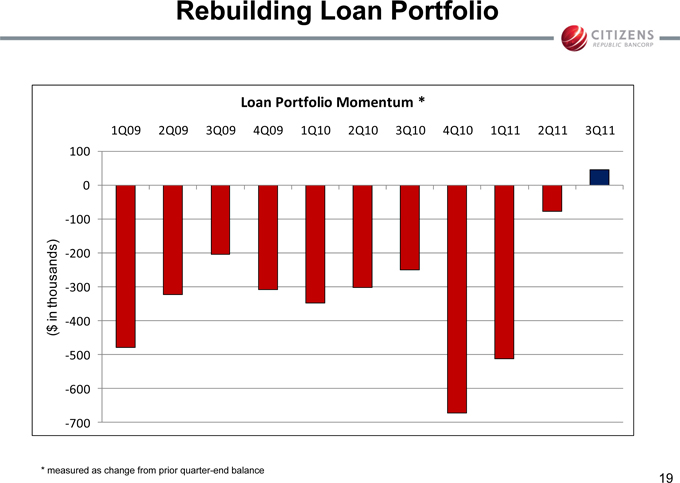
Rebuilding Loan Portfolio
Loan Portfolio Momentum *
1Q09 2Q09 3Q09 4Q09 1Q10 2Q10 3Q10 4Q10 1Q11 2Q11 3Q11
100
0
-100
-200
thousands) -300
in -400
$
(
-500
-600
-700
* | | measured as change from prior quarter-end balance |
19
Positioned for Growth
Successfully managed through credit cycle with a strategic focus on revenue generation and problem asset resolutions
Strategically focused into 2012 to
– Rebuild loan portfolio
– Maintain margin
– Evaluate reserve levels
– Regain consistent profitability
– Continue providing top tier client service
20
Appendix
21
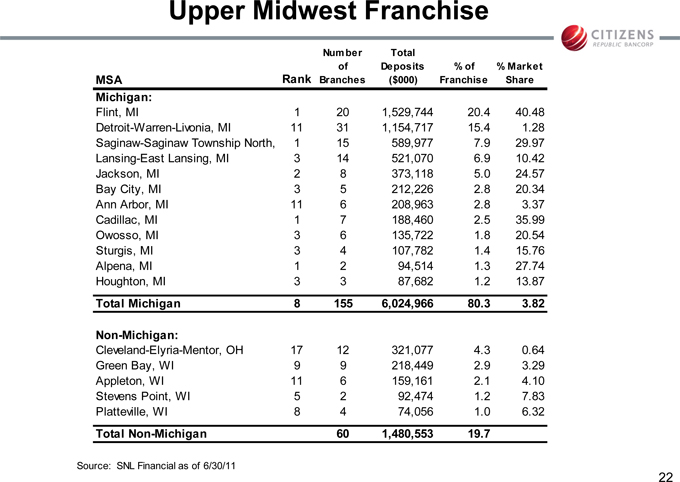
Upper Midwest Franchise
Number of Branches
Total Deposits ($000) % Market
MSA Rank Franchise Share % of
Michigan:
Flint, MI 1 20 1,529,744 20.4 40.48
Detroit-Warren-Livonia, MI 11 31 1,154,717 15.4 1.28
Saginaw-Saginaw Township North, 1 15 589,977 7.9 29.97
Lansing-East Lansing, MI 3 14 521,070 6.9 10.42
Jackson, MI 2 8 373,118 5.0 24.57
Bay City, MI 3 5 212,226 2.8 20.34
Ann Arbor, MI 11 6 208,963 2.8 3.37
Cadillac, MI 1 7 188,460 2.5 35.99
Owosso, MI 3 6 135,722 1.8 20.54
Sturgis, MI 3 4 107,782 1.4 15.76
Alpena, MI 1 2 94,514 1.3 27.74
Houghton, MI 3 3 87,682 1.2 13.87
Total Michigan 8 155 6,024,966 80.3 3.82
Non-Michigan:
Cleveland-Elyria-Mentor, OH 17 12 321,077 4.3 0.64
Green Bay, WI 9 9 218,449 2.9 3.29
Appleton, WI 11 6 159,161 2.1 4.10
Stevens Point, WI 5 2 92,474 1.2 7.83
Platteville, WI 8 4 74,056 1.0 6.32
Total Non-Michigan 60 1,480,553 19.7
Source: SNL Financial as of 6/30/11
22
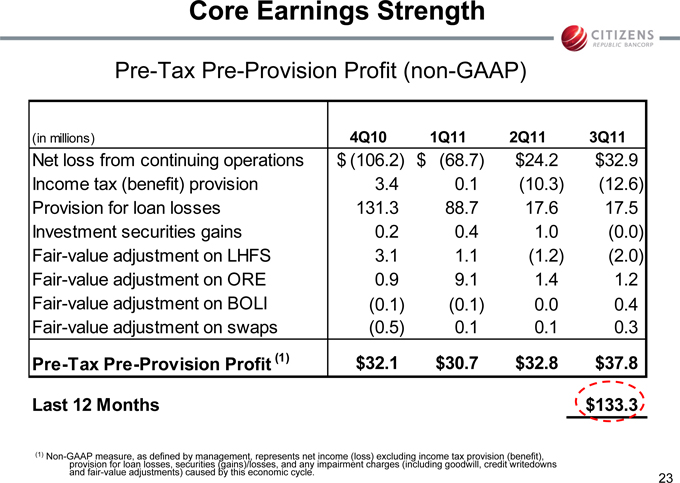
Core Earnings Strength
Pre-Tax Pre-Provision Profit (non-GAAP)
(in millions) 4Q10 1Q11 2Q11 3Q11
Net loss from continuing operations $ (106.2) $(68.7) $24.2 $32.9
Income tax (benefit) provision 3.4 0.1(10.3)(12.6)
Provision for loan losses 131.3 88.7 17.6 17.5
Investment securities gains 0.2 0.4 1.0(0.0)
Fair-value adjustment on LHFS 3.1 1.1(1.2)(2.0)
Fair-value adjustment on ORE 0.9 9.1 1.4 1.2
Fair-value adjustment on BOLI(0.1)(0.1) 0.0 0.4
Fair-value adjustment on swaps(0.5) 0.1 0.1 0.3
Pre-Tax Pre-Provision Profit (1) $32.1 $30.7 $32.8 $37.8
Last 12 Months $133.3
(1) | | Non-GAAP measure, as defined by management, represents net income (loss) excluding income tax provision (benefit), |
provision for loan losses, securities (gains)/losses, and any impairment charges (including goodwill, credit writedowns
and fair-value adjustments) caused by this economic cycle.
23
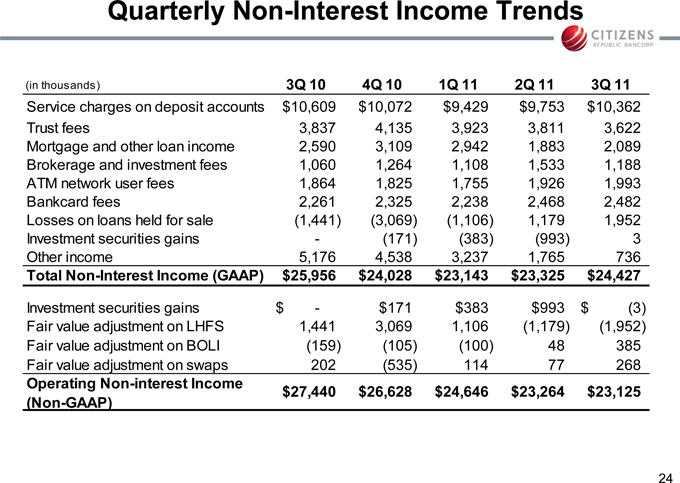
Quarterly Non-Interest Income Trends
(in thousands) 3Q 10 4Q 10 1Q 11 2Q 11 3Q 11
Service charges on deposit accounts $10,609 $10,072 $9,429 $9,753 $10,362
Trust fees 3,837 4,135 3,923 3,811 3,622
Mortgage and other loan income 2,590 3,109 2,942 1,883 2,089
Brokerage and investment fees 1,060 1,264 1,108 1,533 1,188
ATM network user fees 1,864 1,825 1,755 1,926 1,993
Bankcard fees 2,261 2,325 2,238 2,468 2,482
Losses on loans held for sale(1,441)(3,069)(1,106) 1,179 1,952
Investment securities gains -(171)(383)(993) 3
Other income 5,176 4,538 3,237 1,765 736
Total Non-Interest Income (GAAP) $25,956 $24,028 $23,143 $23,325 $24,427
Investment securities gains $—$171 $383 $993 $(3)
Fair value adjustment on LHFS 1,441 3,069 1,106(1,179)(1,952)
Fair value adjustment on BOLI(159)(105)(100) 48 385
Fair value adjustment on swaps 202(535) 114 77 268
Operating Non-interest Income $27,440 $26,628 $24,646 $23,264 $23,125
(Non-GAAP)
24
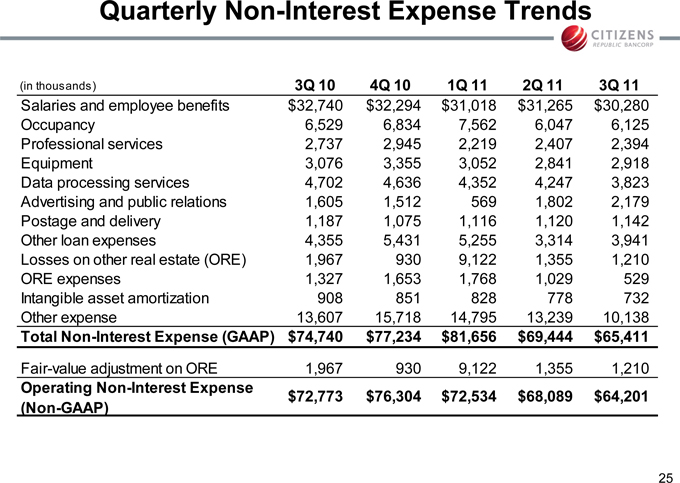
Quarterly Non-Interest Expense Trends
(in thousands) 3Q 10 4Q 10 1Q 11 2Q 11 3Q 11
Salaries and employee benefits $32,740 $32,294 $31,018 $31,265 $30,280
Occupancy 6,529 6,834 7,562 6,047 6,125
Professional services 2,737 2,945 2,219 2,407 2,394
Equipment 3,076 3,355 3,052 2,841 2,918
Data processing services 4,702 4,636 4,352 4,247 3,823
Advertising and public relations 1,605 1,512 569 1,802 2,179
Postage and delivery 1,187 1,075 1,116 1,120 1,142
Other loan expenses 4,355 5,431 5,255 3,314 3,941
Losses on other real estate (ORE) 1,967 930 9,122 1,355 1,210
ORE expenses 1,327 1,653 1,768 1,029 529
Intangible asset amortization 908 851 828 778 732
Other expense 13,607 15,718 14,795 13,239 10,138
Total Non-Interest Expense (GAAP) $74,740 $77,234 $81,656 $69,444 $65,411
Fair-value adjustment on ORE 1,967 930 9,122 1,355 1,210
Operating Non-Interest Expense $72,773 $76,304 $72,534 $68,089 $64,201
(Non-GAAP)
25
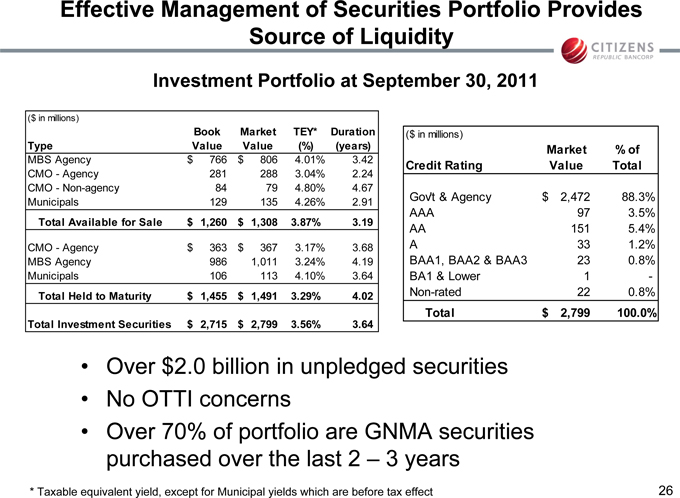
Effective Management of Securities Portfolio Provides Source of Liquidity
Investment Portfolio at September 30, 2011
($ in millions)
Book Market TEY* Duration
Type Value Value(%)(years)
MBS Agency $ 766 $ 806 4.01% 3.42
CMO—Agency 281 288 3.04% 2.24
CMO—Non-agency 84 79 4.80% 4.67
Municipals 129 135 4.26% 2.91
Total Available for Sale $ 1,260 $ 1,308 3.87% 3.19
CMO—Agency $ 363 $ 367 3.17% 3.68
MBS Agency 986 1,011 3.24% 4.19
Municipals 106 113 4.10% 3.64
Total Held to Maturity $ 1,455 $ 1,491 3.29% 4.02
Total Investment Securities $ 2,715 $ 2,799 3.56% 3.64
($ in millions)
Market% of
Credit Rating Value Total
Gov’t & Agency $ 2,472 88.3%
AAA 97 3.5%
AA 151 5.4%
A 33 1.2%
BAA1, BAA2 & BAA3 23 0.8%
BA1 & Lower 1 -
Non-rated 22 0.8%
Total $ 2,799 100.0%
• Over $2.0 billion in unpledged securities
• No OTTI concerns
• Over 70% of portfolio are GNMA securities purchased over the last 2 – 3 years
* | | Taxable equivalent yield, except for Municipal yields which are before tax effect |
26
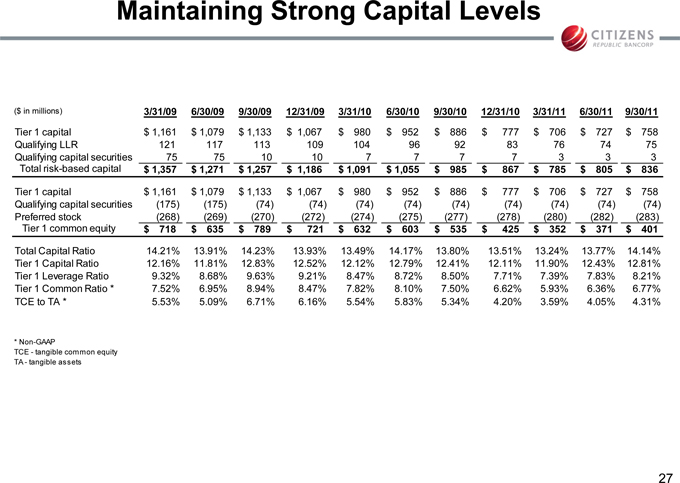
Maintaining Strong Capital Levels
($ in millions) 3/31/09 6/30/09 9/30/09 12/31/09 3/31/10 6/30/10 9/30/10 12/31/10 3/31/11 6/30/11 9/30/11
Tier 1 capital $ 1,161 $ 1,079 $ 1,133 $ 1,067 $ 980 $ 952 $ 886 $ 777 $ 706 $ 727 $ 758
Qualifying LLR 121 117 113 109 104 96 92 83 76 74 75
Qualifying capital securities 75 75 10 10 7 7 7 7 3 3 3
Total risk-based capital $ 1,357 $ 1,271 $ 1,257 $ 1,186 $ 1,091 $ 1,055 $ 985 $ 867 $ 785 $ 805 $ 836
Tier 1 capital $ 1,161 $ 1,079 $ 1,133 $ 1,067 $ 980 $ 952 $ 886 $ 777 $ 706 $ 727 $ 758
Qualifying capital securities(175)(175)(74)(74)(74)(74)(74)(74)(74)(74)(74)
Preferred stock(268)(269)(270)(272)(274)(275)(277)(278)(280)(282)(283)
Tier 1 common equity $ 718 $ 635 $ 789 $ 721 $ 632 $ 603 $ 535 $ 425 $ 352 $ 371 $ 401
Total Capital Ratio 14.21% 13.91% 14.23% 13.93% 13.49% 14.17% 13.80% 13.51% 13.24% 13.77% 14.14%
Tier 1 Capital Ratio 12.16% 11.81% 12.83% 12.52% 12.12% 12.79% 12.41% 12.11% 11.90% 12.43% 12.81%
Tier 1 Leverage Ratio 9.32% 8.68% 9.63% 9.21% 8.47% 8.72% 8.50% 7.71% 7.39% 7.83% 8.21%
Tier 1 Common Ratio * 7.52% 6.95% 8.94% 8.47% 7.82% 8.10% 7.50% 6.62% 5.93% 6.36% 6.77%
TCE to TA * 5.53% 5.09% 6.71% 6.16% 5.54% 5.83% 5.34% 4.20% 3.59% 4.05% 4.31%
TCE—tangible common equity
TA—tangible assets
27
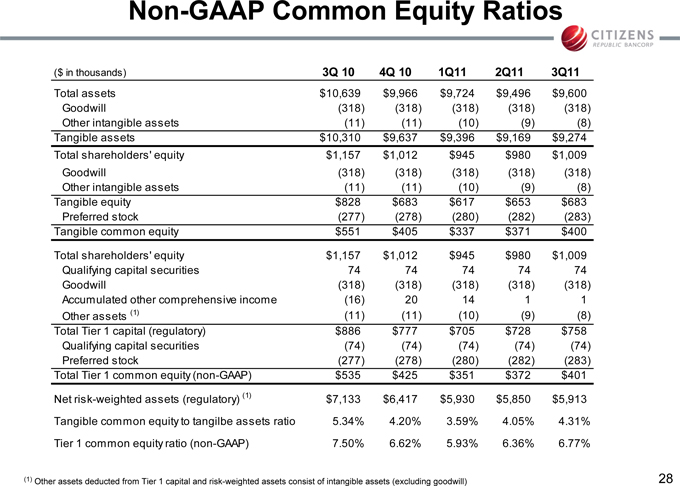
Non-GAAP Common Equity Ratios
($ in thousands) 3Q 10 4Q 10 1Q11 2Q11 3Q11
Total assets $10,639 $9,966 $9,724 $9,496 $9,600
Goodwill(318)(318)(318)(318)(318)
Other intangible assets(11)(11)(10)(9)(8)
Tangible assets $10,310 $9,637 $9,396 $9,169 $9,274
Total shareholders’ equity $1,157 $1,012 $945 $980 $1,009
Goodwill(318)(318)(318)(318)(318)
Other intangible assets(11)(11)(10)(9)(8)
Tangible equity $828 $683 $617 $653 $683
Preferred stock(277)(278)(280)(282)(283)
Tangible common equity $551 $405 $337 $371 $400
Total shareholders’ equity $1,157 $1,012 $945 $980 $1,009
Qualifying capital securities 74 74 74 74 74
Goodwill(318)(318)(318)(318)(318)
Accumulated other comprehensive income(16) 20 14 1 1
Other assets (1)(11)(11)(10)(9)(8)
Total Tier 1 capital (regulatory) $886 $777 $705 $728 $758
Qualifying capital securities(74)(74)(74)(74)(74)
Preferred stock(277)(278)(280)(282)(283)
Total Tier 1 common equity (non-GAAP) $535 $425 $351 $372 $401
Net risk-weighted assets (regulatory) (1) $7,133 $6,417 $5,930 $5,850 $5,913
Tangible common equity to tangilbe assets ratio 5.34% 4.20% 3.59% 4.05% 4.31%
Tier 1 common equity ratio (non-GAAP) 7.50% 6.62% 5.93% 6.36% 6.77%
(1) Other assets deducted from Tier 1 capital and risk-weighted assets consist of intangible assets (excluding goodwill)
28
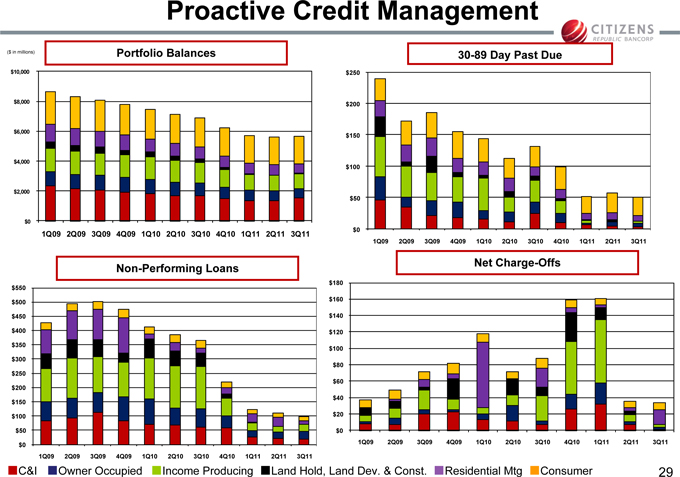
Proactive Credit Management
($ in millions) Portfolio Balances
$10,000
$8,000
$6,000
$4,000
$2,000
$0
1Q09 2Q09 3Q09 4Q09 1Q10 2Q10 3Q10 4Q10 1Q11 2Q11 3Q11
30-89 Day Past Due
$250
$200
$150
$100
$50
$0
1Q09 2Q09 3Q09 4Q09 1Q10 2Q10 3Q10 4Q10 1Q11 2Q11 3Q11
Non-Performing Loans
$550
$500
$450
$400
$350
$300
$250
$200
$150
$100
$50
$0
1Q09 2Q09 3Q09 4Q09 1Q10 2Q10 3Q10 4Q10 1Q11 2Q11 3Q11
Net Charge-Offs
$180
$160
$140
$120
$100
$80
$60
$40
$20
$0
1Q09 2Q09 3Q09 4Q09 1Q10 2Q10 3Q10 4Q10 1Q11 2Q11 3Q11
C&I Owner Occupied Income Producing Land Hold, Land Dev. & Const. Residential Mtg Consumer
29
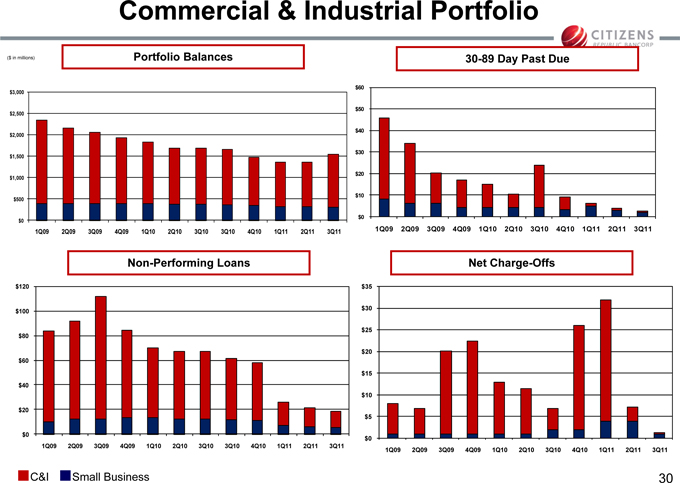
Commercial & Industrial Portfolio
($ in millions) Portfolio Balances
$3,000
$2,500
$2,000
$1,500
$1,000
$500
$0
1Q09 2Q09 3Q09 4Q09 1Q10 2Q10 3Q10 3Q10 4Q10 1Q11 2Q11 3Q11
30-89 Day Past Due
$60
$50
$40
$30
$20
$10
$0
1Q09 2Q09 3Q09 4Q09 1Q10 2Q10 3Q10 4Q10 1Q11 2Q11 3Q11
Non-Performing Loans
$120
$100
$80
$60
$40
$20
$0
1Q09 2Q09 3Q09 4Q09 1Q10 2Q10 3Q10 3Q10 4Q10 1Q11 2Q11 3Q11
Net Charge-Offs
$35
$30
$25
$20
$15
$10
$5
$0
1Q09 2Q09 3Q09 4Q09 1Q10 2Q10 3Q10 4Q10 1Q11 2Q11 3Q11
C&I Small Business
30
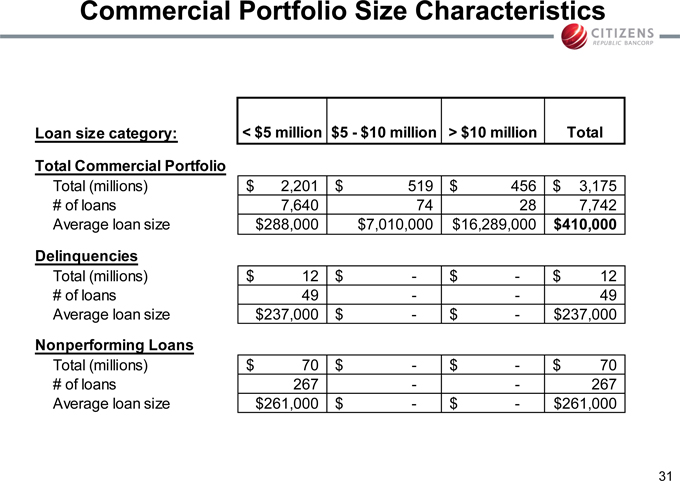
Commercial Portfolio Size Characteristics
Loan size category: < $5 million $5 - $10 million > $10 million Total
Total Commercial Portfolio
Total (millions) $ 2,201 $ 519 $ 456 $ 3,175
# of loans 7,640 74 28 7,742
Average loan size $288,000 $7,010,000 $16,289,000 $410,000
Delinquencies
Total (millions) $ 12 $- $- $ 12
# of loans 49 - 49
Average loan size $237,000 $- $- $237,000
Nonperforming Loans
Total (millions) $ 70 $- $- $ 70
# of loans 267 - 267
Average loan size $261,000 $- $- $261,000
31
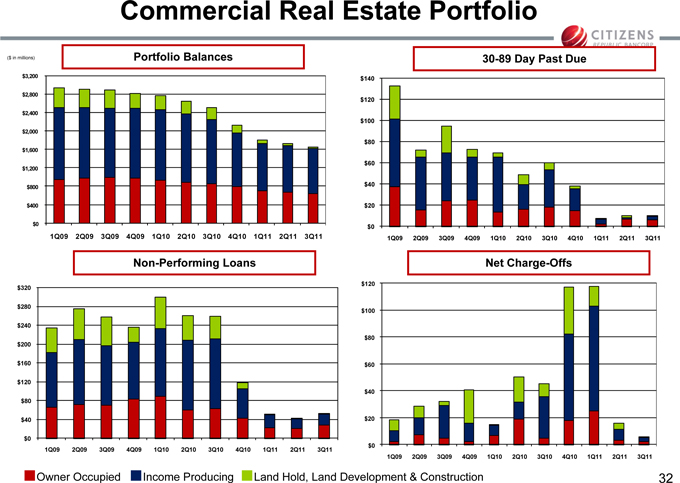
Commercial Real Estate Portfolio
($ in millions) Portfolio Balances
$3,200
$2,800
$2,400
$2,000
$1,600
$1,200
$800
$400
$0
1Q09 2Q09 3Q09 4Q09 1Q10 2Q10 3Q10 4Q10 1Q11 2Q11 3Q11
30-89 Day Past Due
$140
$120
$100
$80
$60
$40
$20
$0
1Q09 2Q09 3Q09 4Q09 1Q10 2Q10 3Q10 4Q10 1Q11 2Q11 3Q11
Non-Performing Loans
$320
$280
$240
$200
$160
$120
$80
$40
$0
1Q09 2Q09 3Q09 4Q09 1Q10 2Q10 3Q10 4Q10 1Q11 2Q11 3Q11
Net Charge-Offs
$120
$100
$80
$60
$40
$20
$0
1Q09 2Q09 3Q09 4Q09 1Q10 2Q10 3Q10 4Q10 1Q11 2Q11 3Q11
Owner Occupied Income Producing Land Hold, Land Development & Construction
32
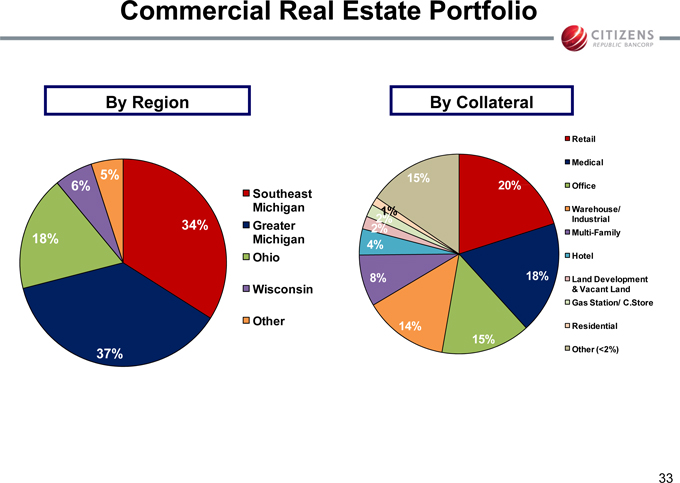
Commercial Real Estate Portfolio
By Region
6% 5%
Southeast
Michigan
34% Greater
18% Michigan
Ohio
Wisconsin
Other
37%
By Collateral
Retail
Medical
15% 20% Office
1% Warehouse/
2% Industrial
2% Multi-Family
4%
Hotel
8% 18% Land Development
& Vacant Land
Gas Station/ C.Store
14% Residential
15%
Other (<2%)
33
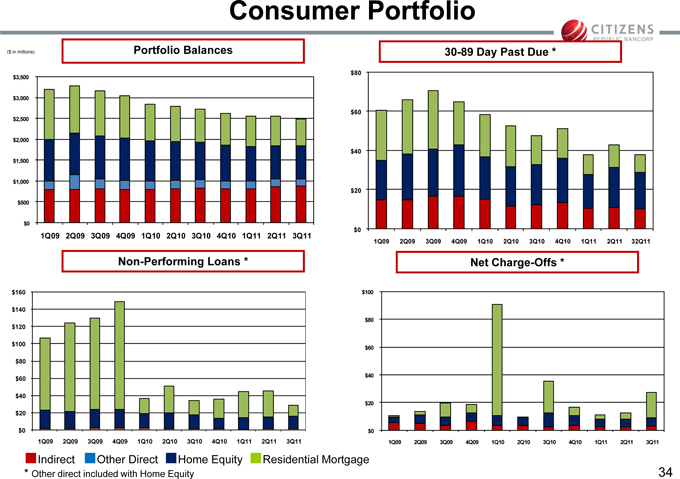
Consumer Portfolio
($ in millions) Portfolio Balances
$3,500
$3,000
$2,500
$2,000
$1,500
$1,000
$500
$0
1Q09 2Q09 3Q09 4Q09 1Q10 2Q10 3Q10 4Q10 1Q11 2Q11 3Q11
30-89 Day Past Due *
$80
$60
$40
$20
$0
1Q09 2Q09 3Q09 4Q09 1Q10 2Q10 3Q10 4Q10 1Q11 2Q11 32Q11
Non-Performing Loans *
$160
$140
$120
$100
$80
$60
$40
$20
$0
1Q09 2Q09 3Q09 4Q09 1Q10 2Q10 3Q10 4Q10 1Q11 2Q11 3Q11
Net Charge-Offs *
$100
$80
$60
$40
$20
$0
1Q09 2Q09 3Q09 4Q09 1Q10 2Q10 3Q10 4Q10 1Q11 2Q11 3Q11
Indirect Other Direct Home Equity Residential Mortgage
* Other direct included with Home Equity
34
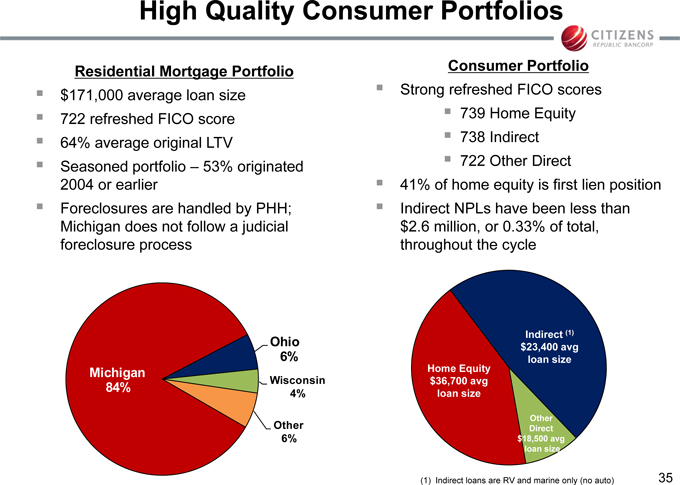
High Quality Consumer Portfolios
Residential Mortgage Portfolio
$171,000 average loan size
722 refreshed FICO score
64% average original LTV
Seasoned portfolio – 53% originated 2004 or earlier
Foreclosures are handled by PHH; Michigan does not follow a judicial foreclosure process
Consumer Portfolio
Strong refreshed FICO scores 739 Home Equity 738 Indirect 722 Other Direct
41% of home equity is first lien position
Indirect NPLs have been less than $2.6 million, or 0.33% of total, throughout the cycle
Ohio
6%
Michigan
84% Wisconsin
4%
Other
6%
Indirect (1)
$23,400 avg
loan size
Home Equity
$36,700 avg
loan size
Other
Direct
$18,500 avg
loan size
(1) | | Indirect loans are RV and marine only (no auto) |
35
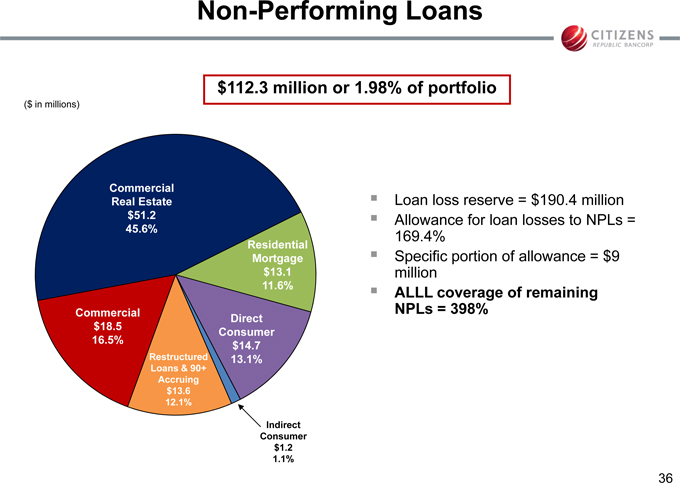
Non-Performing Loans
$112.3 million or 1.98% of portfolio
($ in millions)
Commercial
Real Estate
$51.2
45.6%
Residential
Mortgage
$13.1
11.6%
Commercial Direct
Restructured 13.1%
Loans & 90+
Accruing
$13.6
12.1%
Indirect
Consumer
$1.2
1.1%
Loan loss reserve = $190.4 million
Allowance for loan losses to NPLs = 169.4%
Specific portion of allowance = $9 million
ALLL coverage of remaining NPLs = 398%
36
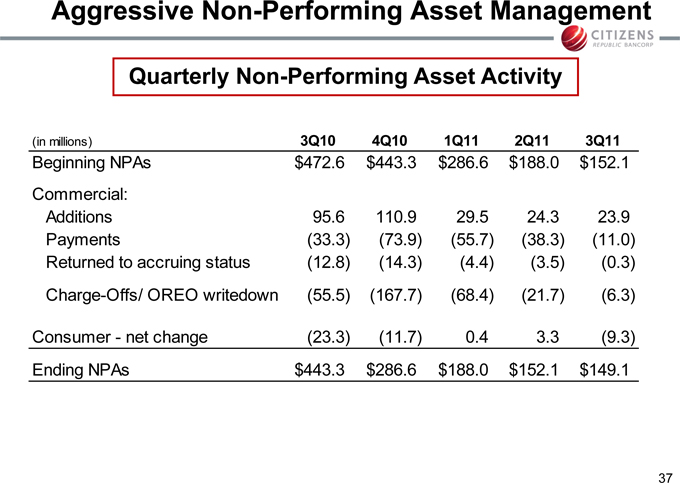
Aggressive Non-Performing Asset Management
Quarterly Non-Performing Asset Activity
(in millions) 3Q10 4Q10 1Q11 2Q11 3Q11
Beginning NPAs $472.6 $443.3 $286.6 $188.0 $152.1
Commercial:
Additions 95.6 110.9 29.5 24.3 23.9
Payments(33.3)(73.9)(55.7)(38.3)(11.0)
Returned to accruing status(12.8)(14.3)(4.4)(3.5)(0.3)
Charge-Offs/ OREO writedown(55.5)(167.7)(68.4)(21.7)(6.3)
Consumer—net change(23.3)(11.7) 0.4 3.3(9.3)
Ending NPAs $443.3 $286.6 $188.0 $152.1 $149.1
37
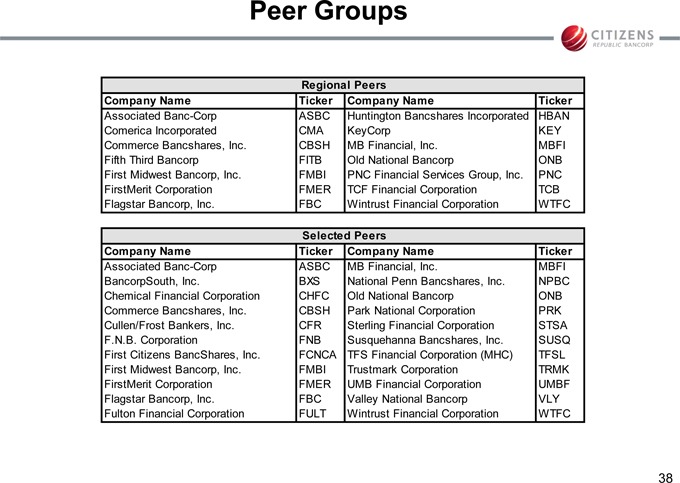
Peer Groups
Regional Peers
Company Name Ticker Company Name Ticker
Associated Banc-Corp ASBC Huntington Bancshares Incorporated HBAN
Comerica Incorporated CMA KeyCorp KEY
Commerce Bancshares, Inc. CBSH MB Financial, Inc. MBFI
Fifth Third Bancorp FITB Old National Bancorp ONB
First Midwest Bancorp, Inc. FMBI PNC Financial Services Group, Inc. PNC
FirstMerit Corporation FMER TCF Financial Corporation TCB
Flagstar Bancorp, Inc. FBC Wintrust Financial Corporation WTFC
Selected Peers
Company Name Ticker Company Name Ticker
Associated Banc-Corp ASBC MB Financial, Inc. MBFI
BancorpSouth, Inc. BXS National Penn Bancshares, Inc. NPBC
Chemical Financial Corporation CHFC Old National Bancorp ONB
Commerce Bancshares, Inc. CBSH Park National Corporation PRK
Cullen/Frost Bankers, Inc. CFR Sterling Financial Corporation STSA
F.N.B. Corporation FNB Susquehanna Bancshares, Inc. SUSQ
First Citizens BancShares, Inc. FCNCA TFS Financial Corporation (MHC) TFSL
First Midwest Bancorp, Inc. FMBI Trustmark Corporation TRMK
FirstMerit Corporation FMER UMB Financial Corporation UMBF
Flagstar Bancorp, Inc. FBC Valley National Bancorp VLY
Fulton Financial Corporation FULT Wintrust Financial Corporation WTFC
38
www.citizensbanking.com


