Exhibit 99.2

2 nd Quarter 2024 Results Investor Presentation

Cautionary Statements 1 This presentation contains forward - looking statements, as defined by federal securities laws, including, among other forward - looking statements, certain plans, expectations and goals . Words such as “may,” “believe,” “expect,” “anticipate,” “intend,” “will,” “should,” “plan,” “estimate,” “predict,” “continue” and “potential” or the negative of these terms or other comparable terminology, as well as similar expressions, are meant to identify forward - looking statements . The forward - looking statements in this presentation are based on current expectations and are provided to assist in the understanding of potential future performance . Such forward - looking statements involve numerous assumptions, risks and uncertainties that may cause actual results to differ materially from those expressed or implied in any such statements, including, without limitation, the following : general competitive, economic, unemployment, political and market conditions and fluctuations, including real estate market conditions, and the effects of such conditions and fluctuations on the creditworthiness of borrowers, collateral values, asset recovery values and the value of investment securities ; movements in interest rates and their impacts on net interest margin, investment security valuations and other performance measures ; expectations on credit quality and performance ; legislative and regulatory changes ; changes in U . S . government monetary and fiscal policy ; competitive pressures on product pricing and services ; the success and timing of other business strategies ; our outlook and long - term goals for future growth ; and natural disasters, geopolitical events, acts of war or terrorism or other hostilities, public health crises and other catastrophic events beyond our control . For a discussion of some of the other risks and other factors that may cause such forward - looking statements to differ materially from actual results, please refer to the Company’s filings with the Securities and Exchange Commission, including the Company’s Annual Report on Form 10 - K for the year ended December 31 , 2023 and the Company’s subsequently filed periodic reports and other filings . Forward - looking statements speak only as of the date they are made, and the Company undertakes no obligation to update or revise forward - looking statements .
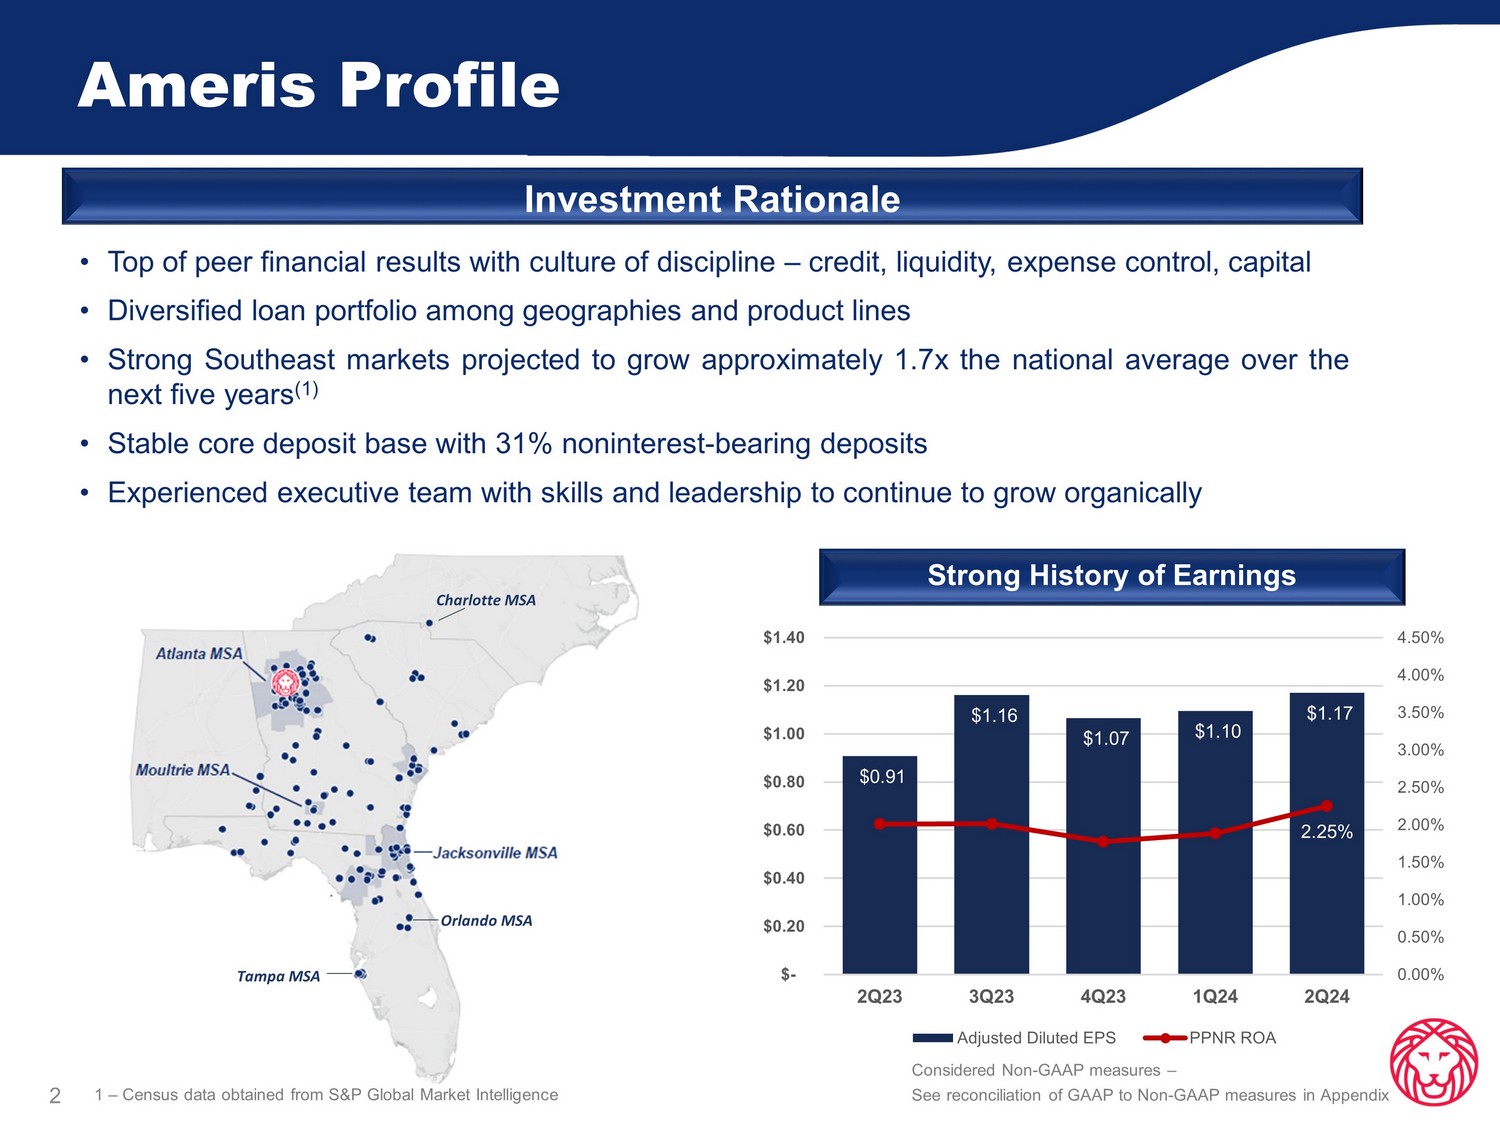
Ameris Profile Investment Rationale • Top of peer financial results with culture of discipline – credit, liquidity, expense control, capital • Diversified loan portfolio among geographies and product lines • Strong Southeast markets projected to grow approximately 1 . 7 x the national average over the next five years ( 1 ) • Stable core deposit base with 31 % noninterest - bearing deposits • Experienced executive team with skills and leadership to continue to grow organically Strong History of Earnings 2 Charlotte MSA Tampa MSA Orlando MSA $0.91 $1.16 $1.07 $1.10 $1.17 2.25% 0.00% 0.50% 1.00% 1.50% 2.00% 2.50% 3.00% 3.50% 4.00% 4.50% $- $0.20 $0.40 $0.60 $0.80 $1.00 $1.20 $1.40 2Q23 3Q23 4Q23 1Q24 2Q24 Adjusted Diluted EPS PPNR ROA 1 – Census data obtained from S&P Global Market Intelligence Considered Non - GAAP measures – See reconciliation of GAAP to Non - GAAP measures in Appendix
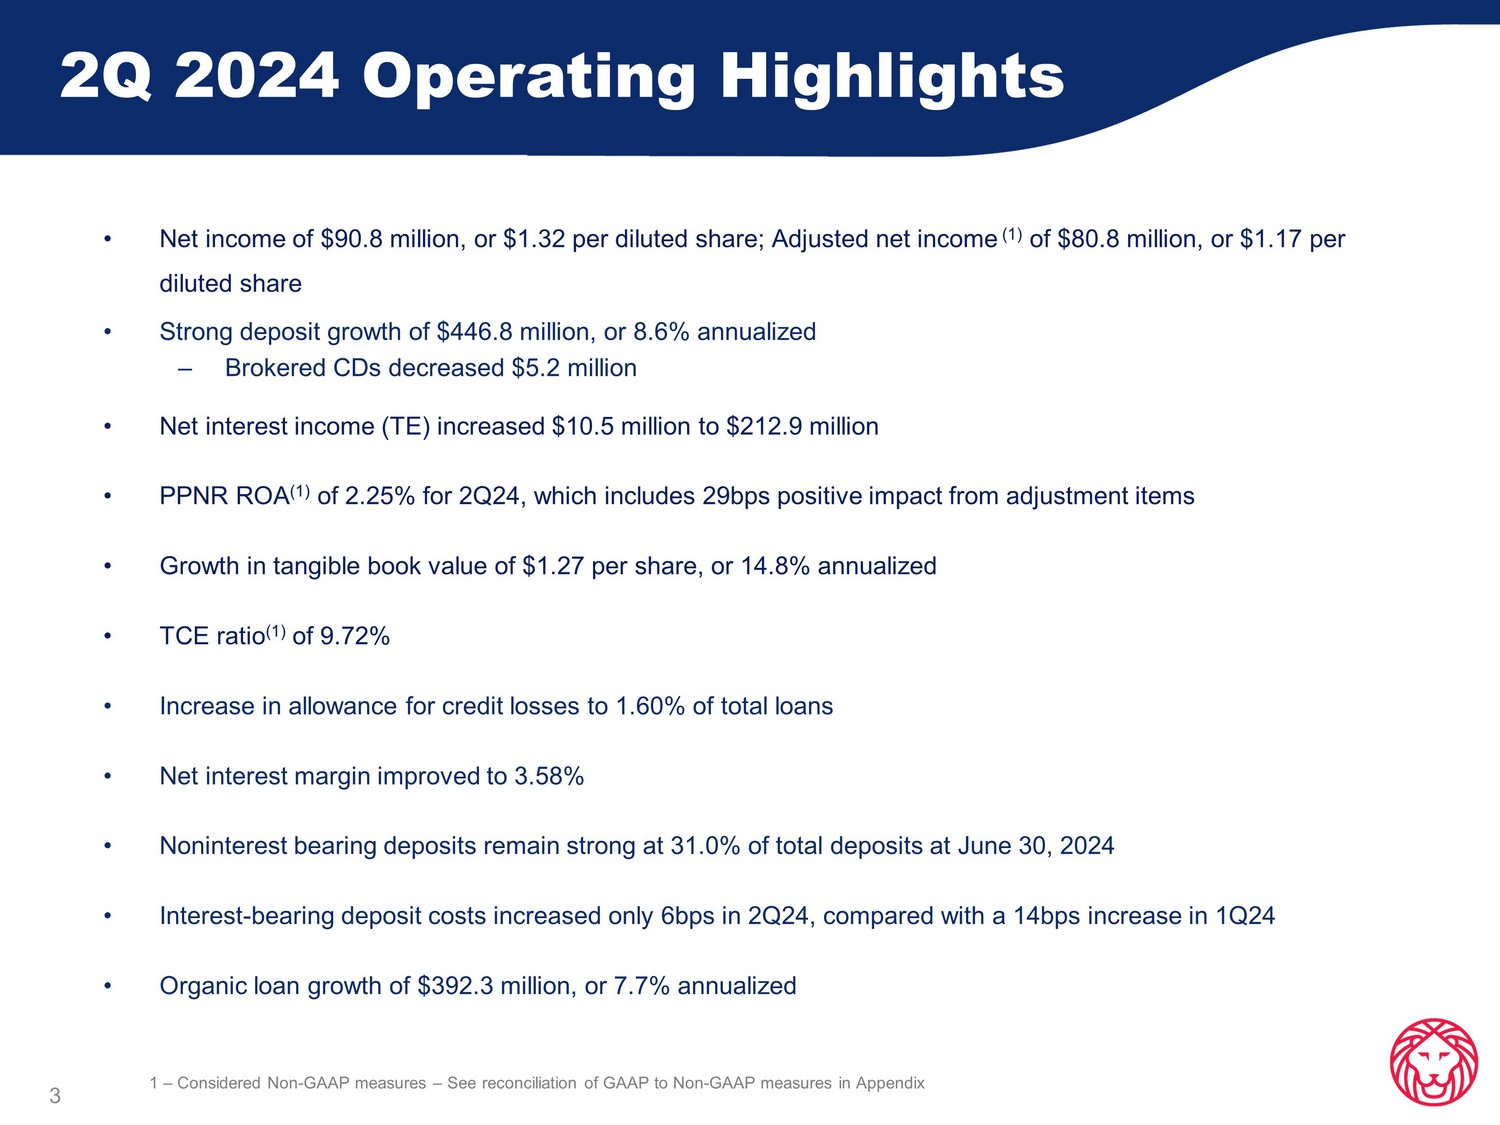
2Q 2024 Operating Highlights 3 • Net income of $90.8 million, or $1.32 per diluted share; Adjusted net income (1) of $80.8 million, or $1.17 per diluted share • Strong deposit growth of $446.8 million, or 8.6% annualized – Brokered CDs decreased $5.2 million • Net interest income (TE) increased $10.5 million to $212.9 million • PPNR ROA (1) of 2.25% for 2Q24, which includes 29bps positive impact from adjustment items • Growth in tangible book value of $1.27 per share, or 14.8% annualized • TCE ratio (1) of 9.72% • Increase in allowance for credit losses to 1.60% of total loans • Net interest margin improved to 3.58% • Noninterest bearing deposits remain strong at 31.0% of total deposits at June 30, 2024 • Interest - bearing deposit costs increased only 6bps in 2Q24, compared with a 14bps increase in 1Q24 • Organic loan growth of $392.3 million, or 7.7% annualized 1 – Considered Non - GAAP measures – See reconciliation of GAAP to Non - GAAP measures in Appendix
2Q 2024 Strategic Transactions 4 During the second quarter of 2024, the Company executed several strategic transactions: • The Company recognized a $4.7 million gain on sale of mortgage servicing rights – Sale represented approximately 18% of the Company’s MSR portfolio, targeting the most rate sensitive loans – Loss of servicing income will be offset by increased BOLI income from BOLI restructure – Accretive to risk - based capital ratios by approximately 6bps – Sale reduced exposure to fair value fluctuations in down rate scenarios – Provides additional capacity for the Company to add to MSR portfolio through origination activities • The Company recognized $4.8 million in additional tax expense relating to the restructuring of certain BOLI policies – Approximately $110 million in existing policies were surrendered (yield 2.41%) – Proceeds will be reinvested into higher yielding (4.50%) policies which will offset loss of servicing income from MSR sale and improve noninterest income • Ameris participated in the exchange offer by Visa to convert its Class B - 1 shares into Class B - 2 and Class C shares resulting in a gain of $12.6 million upon conversion – Class C shares received can be liquidated by the Company, subject to temporary transfer restrictions

Financial Highlights 5 1 – Considered Non - GAAP measures – See reconciliation of GAAP to Non - GAAP measures in Appendix (dollars in thousands, except per share data) Quarter to Date Results Year to Date Results 2Q24 1Q24 Change 2Q23 Change 2024 2023 Change Net Income $ 90,785 $ 74,312 22% $ 62,635 45% $ 165,097 $ 123,056 34% Adjusted Net Income (1) $ 80,763 $ 75,612 7% $ 62,635 29% $ 156,375 $ 122,570 28% Net Income Per Diluted Share $ 1.32 $ 1.08 22% $ 0.91 45% $ 2.39 $ 1.78 34% Adjusted Net Income Per Share (1) $ 1.17 $ 1.10 6% $ 0.91 29% $ 2.27 $ 1.77 28% Return on Assets 1.41% 1.18% 19% 0.98% 44% 1.30% 0.98% 32% Adjusted Return on Assets (1) 1.25% 1.20% 4% 0.98% 28% 1.23% 0.97% 26% Return on Equity 10.34% 8.63% 20% 7.63% 36% 9.49% 7.58% 25% Return on TCE (1) 15.00% 12.66% 19% 11.53% 30% 13.85% 11.52% 20% Adjusted Return on TCE (1) 13.35% 12.88% 4% 11.53% 16% 13.12% 11.47% 14% Efficiency Ratio 51.68% 55.64% - 7% 53.60% - 4% 53.54% 52.85% 1% Adjusted Efficiency Ratio (1) 55.00% 54.56% 1% 53.41% 3% 54.79% 52.72% 4% Net Interest Margin 3.58% 3.51% 2% 3.60% - 1% 3.54% 3.68% - 4%

Strong Net Interest Margin 6 • Net interest income (TE) of $212.9 million in 2Q24, compared with $202.3 million in 1Q24 – Interest income (TE) increased $17.9 million – Interest expense increased $7.3 million • Average earning assets increased $707.6 million • Positive inflation adjustments on TIPS and accelerated accretion on an early bond payoff of $2.3 million positively impacted margin by 0.04% • Noninterest bearing deposits remain above historical levels and were 31.0% of total deposits at quarter end Spread Income and Margin Interest Rate Sensitivity • Asset sensitivity is approaching neutrality in anticipation of a FOMC cut in rates: – - 0.9% asset sensitivity in - 100bps – - 0.4% asset sensitivity in - 50bps – +0.4% asset sensitivity in +50bps – +0.8% asset sensitivity in +100bps • Approximately $10.8 billion of total loans reprice within one year through either maturities or floating rate indices • Cumulative weighted - average beta for all non - maturity deposits through this cycle has been 34% $210.5 $208.7 $207.0 $202.3 $212.9 3.60% 3.54% 3.54% 3.51% 3.58% 3.25% 3.50% 3.75% 4.00% 4.25% 4.50% 4.75% 5.00% 5.25% $180.0 $185.0 $190.0 $195.0 $200.0 $205.0 $210.0 $215.0 $220.0 $225.0 $230.0 2Q23 3Q23 4Q23 1Q24 2Q24 Net Interest Income (TE) (in millions) NIM

Diversified Revenue Stream 7 • Strong revenue base of net interest income from core banking division • Additional revenue provided by our diversified lines of business Mortgage Banking Activity • Mortgage banking activity was 15% of total revenue in 2Q24 • Purchase business increased to 89% in 2Q24 due to strong core relationships with builders and realtors • Gain on sale margin decreased slightly to 2.45% in 2Q24 from 2.49% in 1Q24 Other Noninterest Income • Other Noninterest Income has been a stable contributor to total revenue • 2Q24 includes: – $4.7 million gain on sale of MSRs – $12.6 million gain on conversion of Visa stock • Other Noninterest Income includes: • Fee income from equipment finance group • Gains on sales of SBA loans • BOLI income 76% 77% 79% 75% 71% 15% 13% 12% 15% 15% 9% 10% 9% 10% 14% $277.8 $271.9 $263.3 $268.2 $301.6 0% 20% 40% 60% 80% 100% 120% 2Q23 3Q23 4Q23 1Q24 2Q24 FTE Revenue Sources (in millions) FTE Net Interest Income Mortgage Banking Activity Other Noninterest Income 2.18% 2.15% 1.93% 2.49% 2.45% 0.00% 1.00% 2.00% 3.00% 2Q23 3Q23 4Q23 1Q24 2Q24 Mortgage Gain on Sale Margin

Disciplined Expense Control Adjusted Operating Expenses (1) and Efficiency Ratio (1) Expense Highlights 8 • Management continues to deliver high performing operating efficiency • Adjusted efficiency ratio of 55.00% in 2Q24, compared with 54.56% in 1Q24 • Total adjusted operating expenses increased $10.5 million in 2Q24 compared with 1Q24 ‒ Increase of $5.3 million in 2Q24 banking division operating expenses primarily due to: ‒ $2.6 million reduction in deferred origination costs in our equipment finance division ‒ $1.0 million increase in advertising and marketing expense for new deposit campaign ‒ $1.0 million increase in fraud/forgery expense – Net increase of $5.2 million in 2Q24 lines of business primarily due to variable compensation related to production increases 1 – Considered Non - GAAP measures – See reconciliation of GAAP to Non - GAAP measures in Appendix $107.6 $101.2 $104.4 $105.4 $110.7 $40.8 $40.3 $35.0 $40.4 $45.6 20.0 40.0 60.0 80.0 100.0 120.0 140.0 160.0 180.0 2Q23 3Q23 4Q23 1Q24 2Q24 Adjusted Operating Expenses (in millions) Banking LOBs 53.41% 52.02% 52.87% 54.56% 55.00% 40.00% 45.00% 50.00% 55.00% 60.00% 65.00% 2Q23 3Q23 4Q23 1Q24 2Q24 Adjusted Efficiency Ratio

Strong Core Deposit Base 9 Deposits by Product Type Deposit Type Balance (in 000s) % of Total Count Average per account (in 000’s) NIB 6,649,220 31.0% 304,119 21.9 NOW 3,934,596 18.4% 43,732 90.0 MMDA 6,399,701 29.8% 32,404 197.5 Savings 773,512 3.6% 64,261 12.0 CD 3,687,114 17.2% 41,350 89.2 Total 21,444,143 100% 485,866 44.1 Managed Uninsured Deposit Exposure • Total deposits grew $446.8 million, or 8.6% annualized, during 2Q24 • Brokered deposits decreased $5.2 million • Noninterest bearing deposits remained strong at 31.0% of total deposits • Uninsured and uncollateralized deposits represent 30.5% of total deposits 2Q24 Highlights Consumer 36% Commercial 43% Public 15% Brokered 6% Deposits by Customer 2Q24 $9.46 (43.9%) $6.58 (30.5%) $0.0 $2.0 $4.0 $6.0 $8.0 $10.0 2Q23 3Q23 4Q23 1Q24 2Q24 Uninsured Deposits (in billions) Uninsured Deposits Uninsured Deposits Excl. Municipal Deposits

Capital Strength 10 Capital Highlights • The Company is well capitalized with minimal unrealized losses in the investment portfolio • CET1 ratio is strong at 11.4% • CET1, net of unrealized losses on bond portfolio, remains strong at 11.2% • Net unrealized losses in AFS portfolio were $47 million at June 30, 2024, representing approximately 3% of book value • No transfers to held - to - maturity (HTM) portfolio – all securities classified as HTM were previously purchased for CRA purposes • Earnings expected to add between 25 - 35 basis points to capital each quarter assuming flat balance sheet • Repurchase plan announced in October 2023 of $100 million with approximately $91.7 million remaining at June 30, 2024 • TCE Ratio of 9.72% at June 30, 2024 Capital ratios are estimated for most recent period end 9.3% 9.6% 9.9% 10.2% 10.2% 10.3% 10.8% 11.2% 11.4% 11.4% 13.4% 14.0% 14.5% 14.6% 14.6% 2Q23 3Q23 4Q23 1Q24 2Q24 Strong Capital Base Leverage Ratio CET1/Tier 1 Capital Ratio Total Capital Ratio

20.81 20.29 20.81 20.44 20.90 22.46 23.69 25.27 26.45 27.46 26.26 26.84 27.89 28.62 29.92 30.79 31.42 32.38 33.64 34.52 35.79 $5.00 $10.00 $15.00 $20.00 $25.00 $30.00 $35.00 $40.00 2Q19 3Q19 4Q19 1Q20 2Q20 3Q20 4Q20 1Q21 2Q21 3Q21 4Q21 1Q22 2Q22 3Q22 4Q22 1Q23 2Q23 3Q23 4Q23 1Q24 2Q24 Tangible Book Value Capital and TBV Proven Stewards of Shareholder Value 11 • Management focused on long term growth in TBV (1) , such that over the past five years TBV has grown by 11% annualized • TBV increased $1.27 per share in 2Q24: – $1.16 from retained earnings – $0.03 from impact of OCI – $0.08 from all other items including stock compensation and share repurchases • Repurchased 62,700 shares at an average cost of $47.12 during the quarter 1 – Considered Non - GAAP measures – See reconciliation of GAAP to Non - GAAP measures in Appendix Equipment Finance Acquisition LION Acquisition CECL Adoption

Loan Diversification and Credit Quality
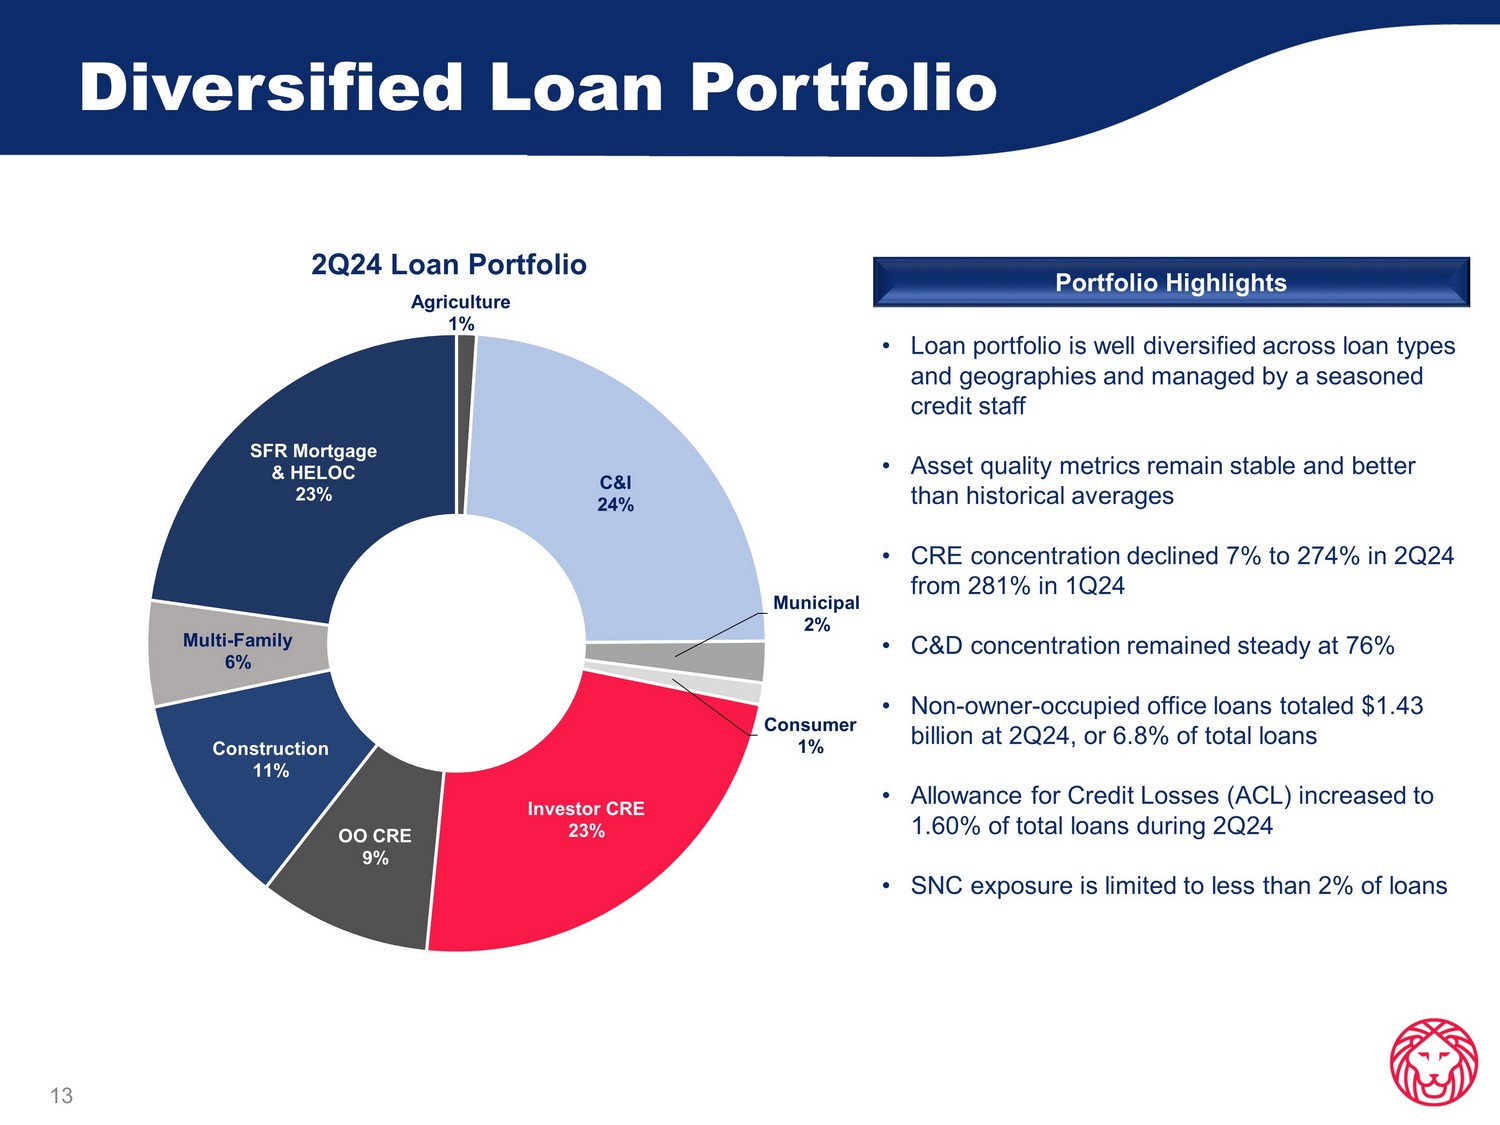
Diversified Loan Portfolio 2Q24 Loan Portfolio 13 • Loan portfolio is well diversified across loan types and geographies and managed by a seasoned credit staff • Asset quality metrics remain stable and better than historical averages • CRE concentration declined 7 % to 274% in 2Q24 from 281% in 1Q24 • C&D concentration remained steady at 76% • Non - owner - occupied office loans totaled $1.43 billion at 2Q24, or 6.8% of total loans • Allowance for Credit Losses (ACL) increased to 1.60% of total loans during 2Q24 • SNC exposure is limited to less than 2% of loans Portfolio Highlights Agriculture 1% C&I 24% Municipal 2% Consumer 1% Investor CRE 23% OO CRE 9% Construction 11% Multi - Family 6% SFR Mortgage & HELOC 23%
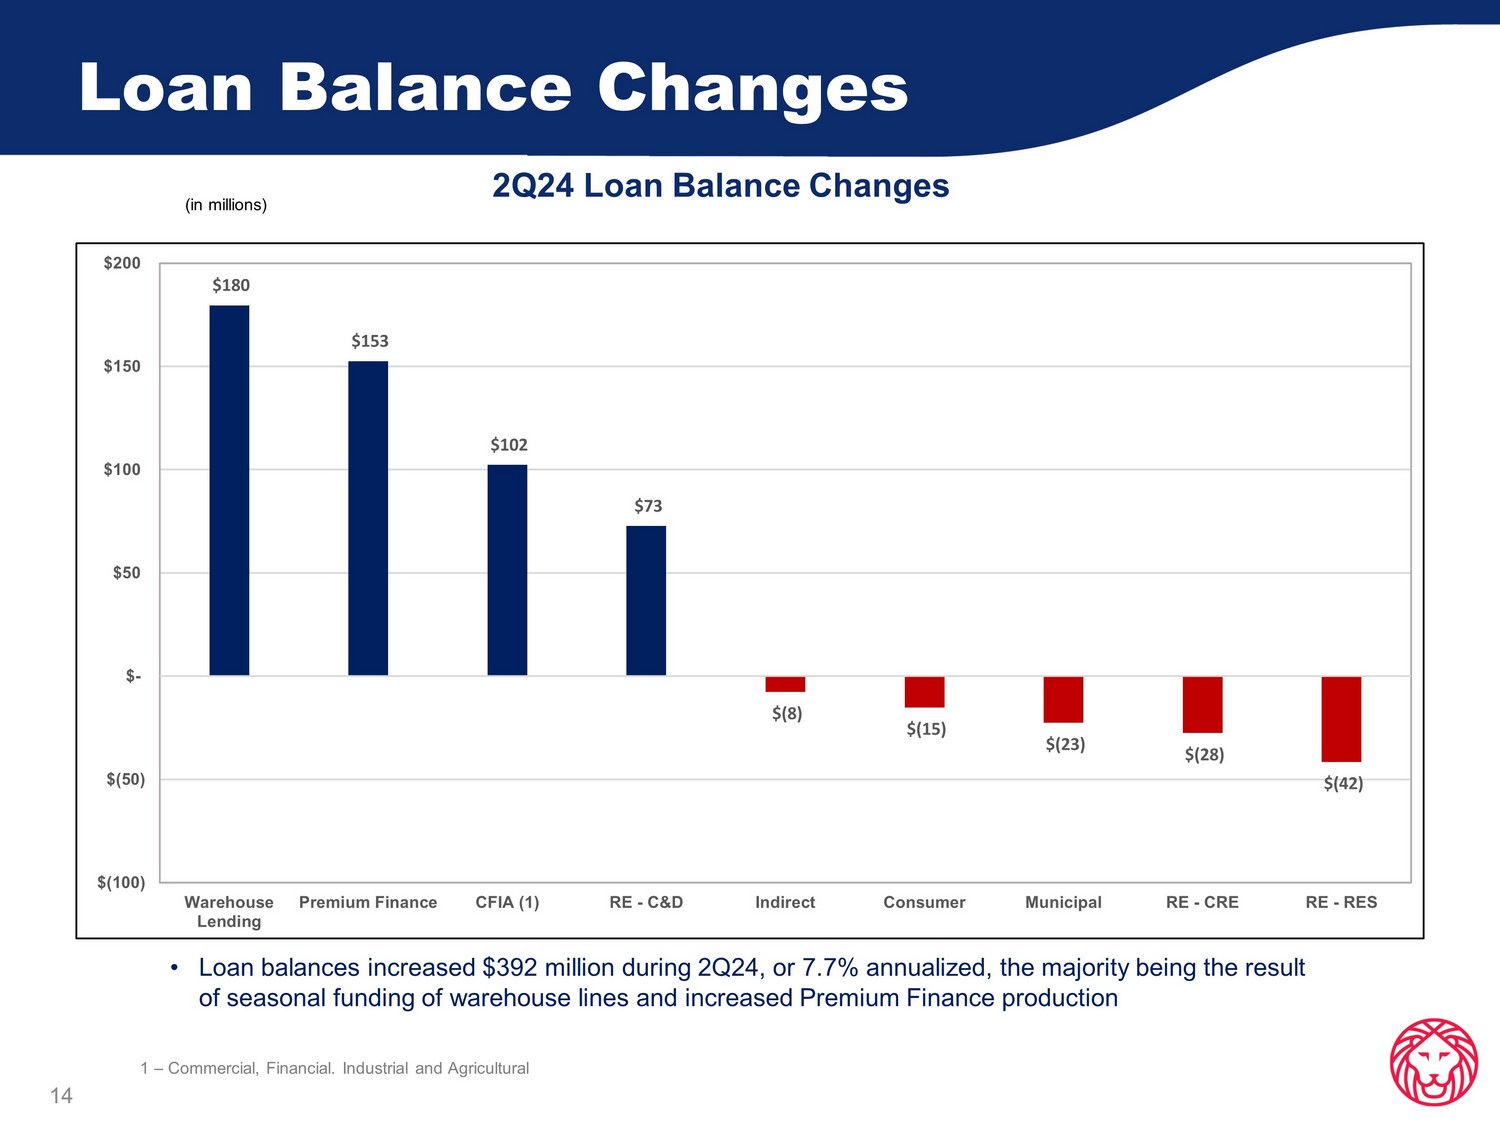
Loan Balance Changes 2Q24 Loan Balance Changes 14 • Loan balances increased $392 million during 2Q24, or 7.7% annualized, the majority being the result of seasonal funding of warehouse lines and increased Premium Finance production (in millions) $180 $153 $102 $73 $(8) $(15) $(23) $(28) $(42) $(100) $(50) $- $50 $100 $150 $200 Warehouse Lending Premium Finance CFIA (1) RE - C&D Indirect Consumer Municipal RE - CRE RE - RES 1 – Commercial, Financial. Industrial and Agricultural

Allowance for Credit Losses 15 • Increase in reserve during 2Q24 due to potential for negative economic conditions • The ACL on loans equated to 1.60% of total loans at 2Q24, compared with 1.55% at 1Q24 • The ACL on loans totaled $336.2 million at 2Q24, a net increase of $ 16.2 mil lion, or 5.1 %, from 1Q24 • During 2Q24, a provision expense of $18.8 million was recorded 2Q24 CECL Reserve Reserve Summary (in millions) 2Q24 Allowance Coverage Outstanding Balance (MM's) ACL (MM's) % ACL Gross Loans 20,992.6$ 336.2$ 1.60% Unfunded Commitments 3,920.9$ 30.6$ 0.78% ACL / Total Loans + Unfunded 24,913.5$ 366.8$ 1.47%
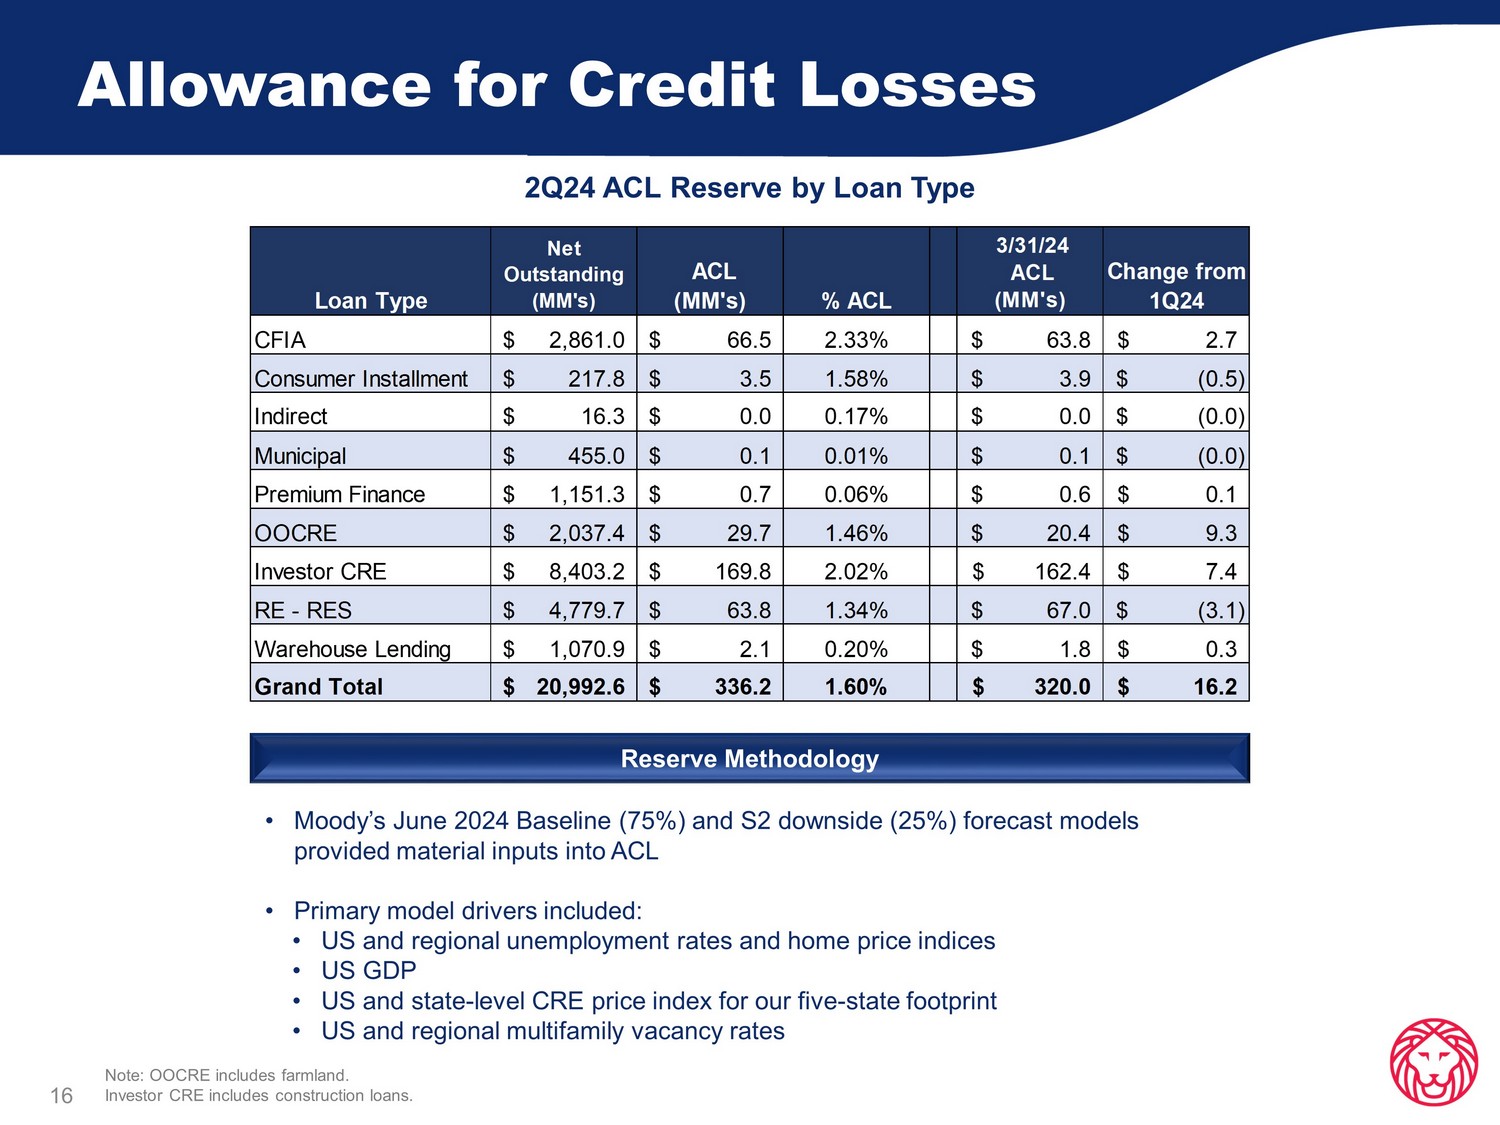
Allowance for Credit Losses 16 2 Q24 A CL Reserve by Loan Type Reserve Methodology • Moody’s June 2024 Baseline (75%) and S2 downside (25%) forecast models provided material inputs into ACL • Primary model drivers included: • US and regional unemployment rates and home price indices • US GDP • US and state - level CRE price index for our five - state footprint • US and regional multifamily vacancy rates Note: OOCRE includes farmland . Investor CRE includes construction loans. Loan Type Net Outstanding (MM's) ACL (MM's) % ACL 3/31/24 ACL (MM's) Change from 1Q24 CFIA 2,861.0$ 66.5$ 2.33% 63.8$ 2.7$ Consumer Installment 217.8$ 3.5$ 1.58% 3.9$ (0.5)$ Indirect 16.3$ 0.0$ 0.17% 0.0$ (0.0)$ Municipal 455.0$ 0.1$ 0.01% 0.1$ (0.0)$ Premium Finance 1,151.3$ 0.7$ 0.06% 0.6$ 0.1$ OOCRE 2,037.4$ 29.7$ 1.46% 20.4$ 9.3$ Investor CRE 8,403.2$ 169.8$ 2.02% 162.4$ 7.4$ RE - RES 4,779.7$ 63.8$ 1.34% 67.0$ (3.1)$ Warehouse Lending 1,070.9$ 2.1$ 0.20% 1.8$ 0.3$ Grand Total 20,992.6$ 336.2$ 1.60% 320.0$ 16.2$
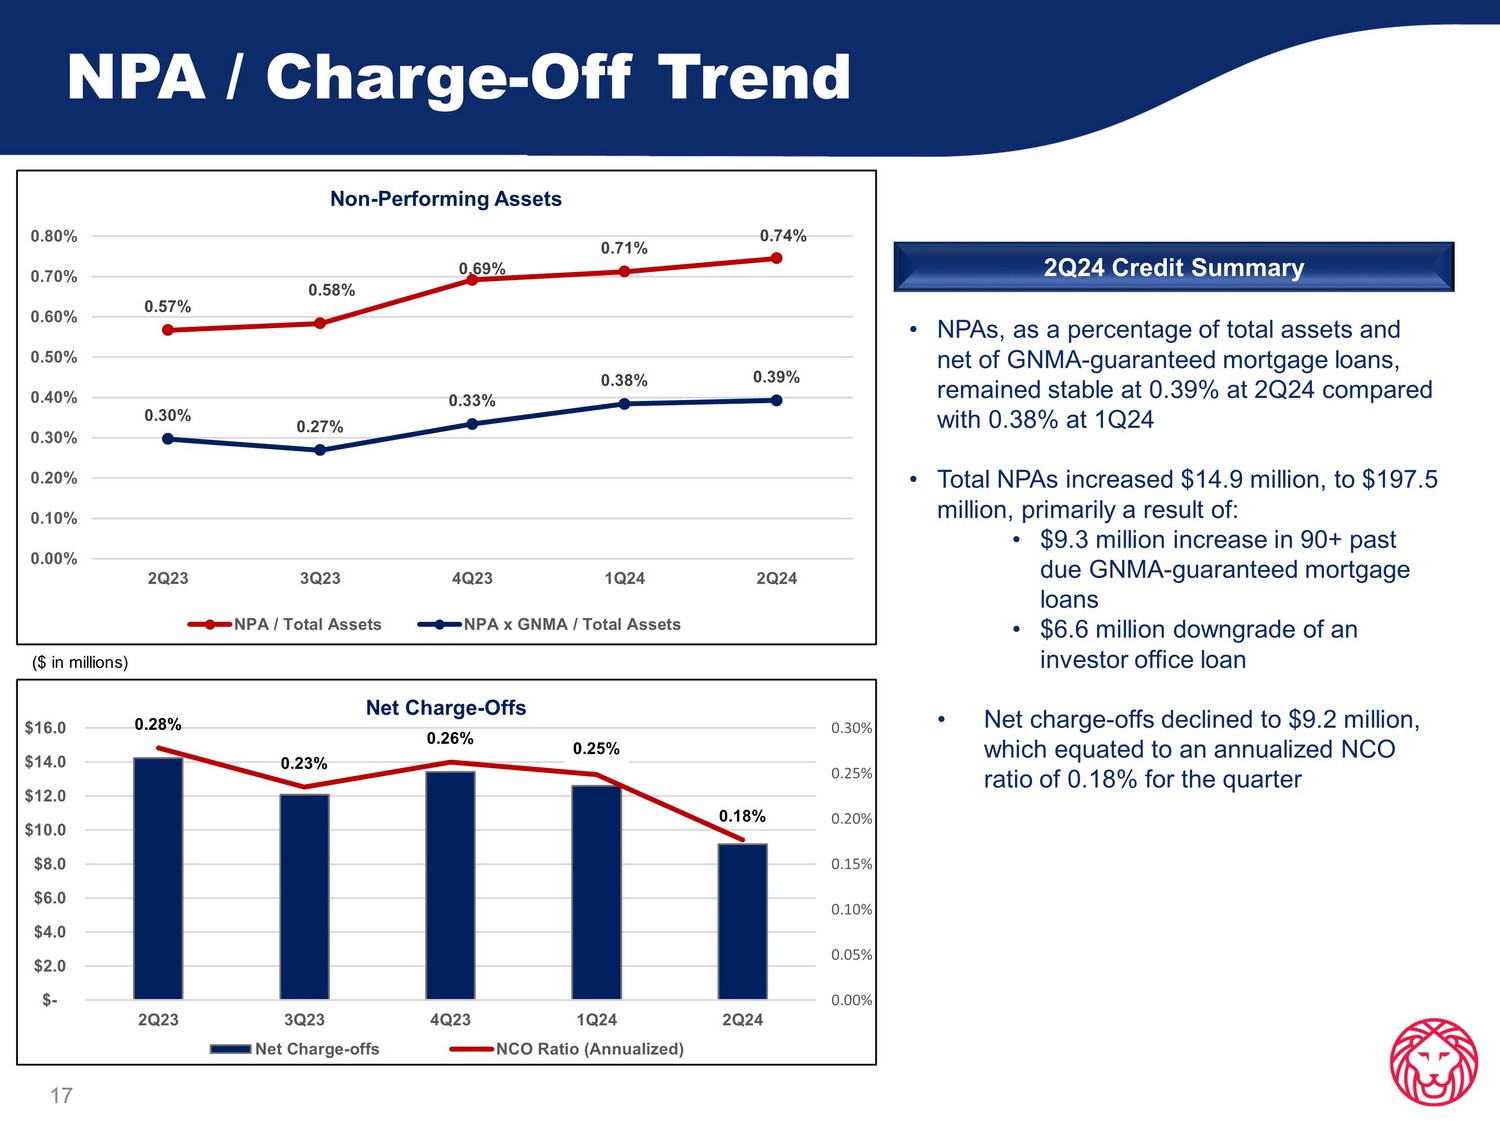
NPA / Charge - Off Trend 17 • NPAs, as a percentage of total assets and net of GNMA - guaranteed mortgage loans, remained stable at 0.39% at 2Q24 compared with 0.38% at 1Q24 • Total NPAs in creased $14.9 million, to $197.5 million, primarily a result of: • $9.3 million increase in 90+ past due GNMA - guaranteed mortgage loans • $6.6 million downgrade of an investor office loan • Net charge - offs declined to $9.2 million, which equated to an annualized NCO ratio of 0.18% for the quarter 2Q24 Credit Summary ($ in millions) 0.57% 0.58% 0.69% 0.71% 0.74% 0.30% 0.27% 0.33% 0.38% 0.39% 0.00% 0.10% 0.20% 0.30% 0.40% 0.50% 0.60% 0.70% 0.80% 2Q23 3Q23 4Q23 1Q24 2Q24 Non - Performing Assets NPA / Total Assets NPA x GNMA / Total Assets 0.28% 0.23% 0.26% 0.25% 0.18% 0.00% 0.05% 0.10% 0.15% 0.20% 0.25% 0.30% $- $2.0 $4.0 $6.0 $8.0 $10.0 $12.0 $14.0 $16.0 2Q23 3Q23 4Q23 1Q24 2Q24 Net Charge - Offs Net Charge-offs NCO Ratio (Annualized)
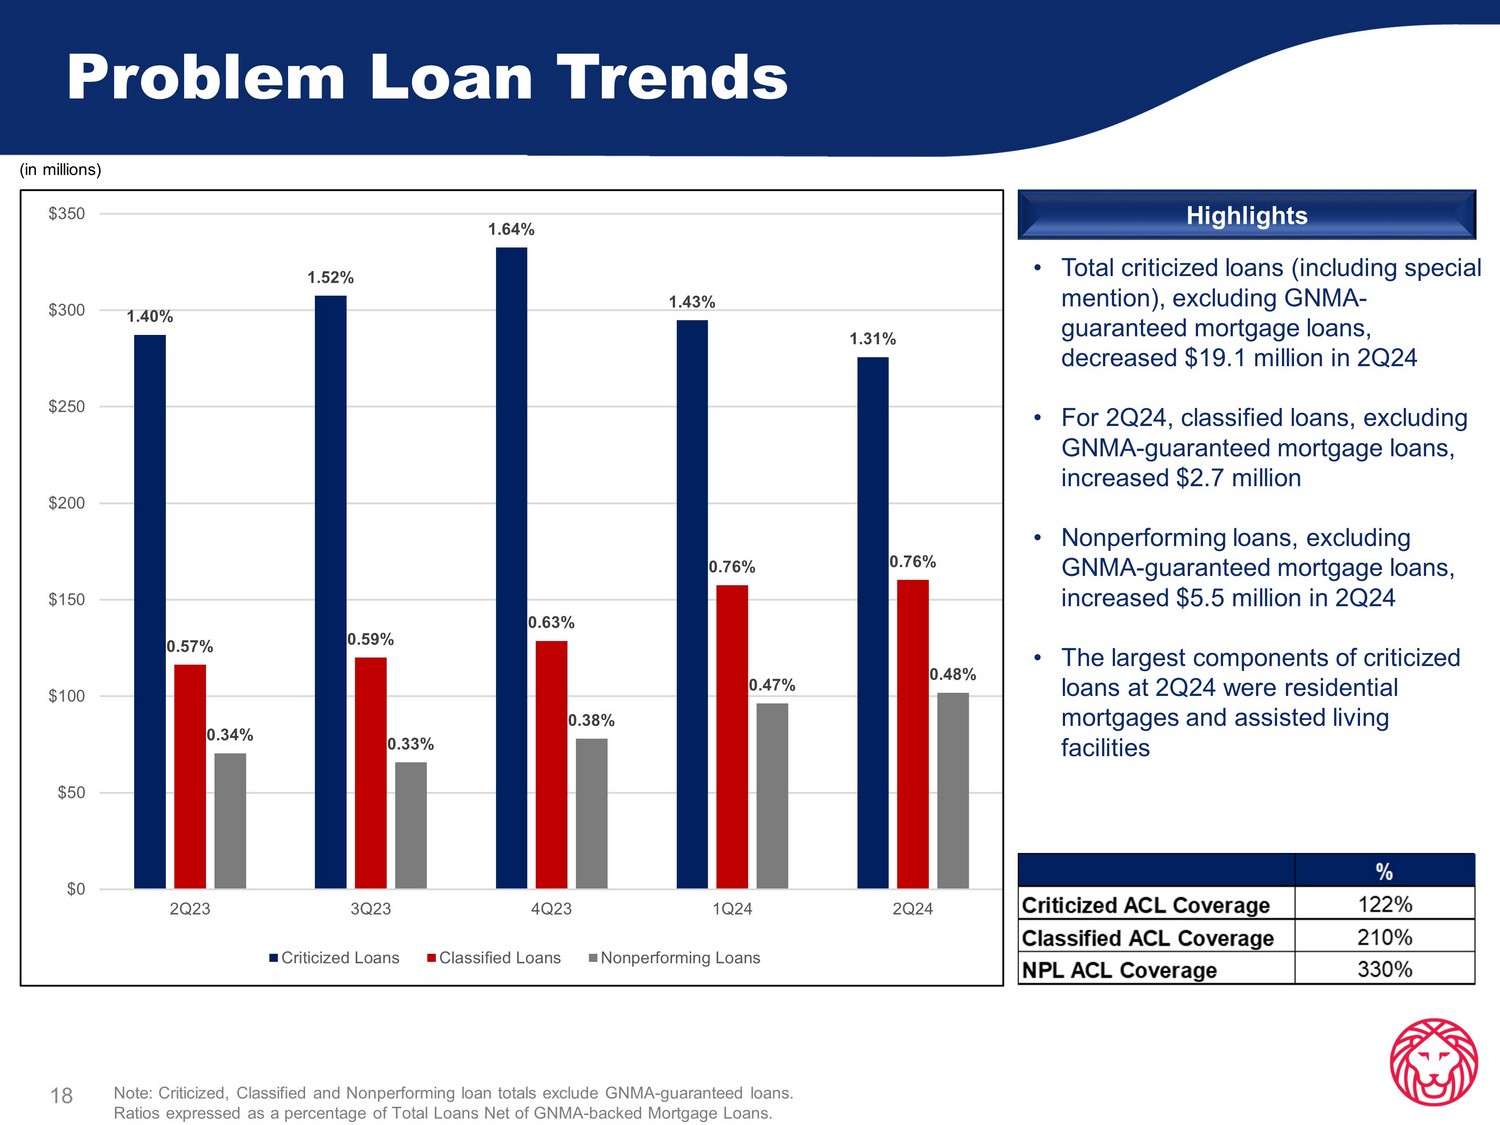
Problem Loan Trends 18 • Total criticized loans (including special mention ), excluding GNMA - guaranteed mortgage loans, de creased $19.1 million in 2Q24 • For 2Q24, classified loans, excluding GNMA - guaranteed mortgage loans, in creased $2.7 million • Nonperforming loans, excluding GNMA - guaranteed mortgage loans, increased $5.5 million in 2Q24 • The largest components of criticized loans at 2Q24 were residential mortgages and assisted living facilities Highlights (in millions) Note: Criticized, Classified and Nonperforming loan totals exclude GNMA - guaranteed loans. Ratios expressed as a percentage of Total Loans Net of GNMA - backed Mortgage Loans. 1.40% 1.52% 1.64% 1.43% 1.31% 0.57% 0.59% 0.63% 0.76% 0.76% 0.34% 0.33% 0.38% 0.47% 0.48% $0 $50 $100 $150 $200 $250 $300 $350 2Q23 3Q23 4Q23 1Q24 2Q24 Criticized Loans Classified Loans Nonperforming Loans

Investor CRE Loans 19 • Non - Owner Occupied CRE portfolio is well diversified • Over 80% of CRE loans are located in MSAs in the Company’s five - state footprint, which exhibit population growth forecasts exceeding the national average • Overall, past dues for investor CRE loans were 0.01% and NPLs 0.16% at 2Q24 Investor CRE 23% Construction 11% Multi - Family 6% Highlights Loan Type Outstanding (MM's) % NPL % PD Avg Size Commitment (000's) Construction Loans: RRE - Presold 308.9$ 1.15% 0.14% 257.4$ RRE - Spec & Models 220.0$ 0.00% 0.00% 250.0$ RRE - Lots & Land 119.6$ 0.01% 0.00% 446.2$ RRE - Subdivisions 20.6$ 0.00% 0.00% 1,084.9$ Sub-Total RRE Construction 669.2$ 0.54% 0.06% 282.7$ CML - Improved 1,620.6$ 0.00% 0.01% 9,704.1$ CML - Raw Land & Other 47.3$ 0.00% 0.71% 264.0$ Sub-Total CRE Construction 1,667.8$ 0.00% 0.03% 4,963.8$ Total Construction Loans 2,337.0$ 0.15% 0.04% 861.4$ Term Loans: Office 1,187.4$ 0.56% 0.00% 2,847.6$ Multi-Family 1,177.0$ 0.00% 0.00% 5,944.3$ Anchored Retail 1,064.8$ 0.00% 0.00% 5,377.7$ Warehouse / Industrial 687.3$ 0.00% 0.01% 2,949.9$ Strip Center, Non-Anchored 560.4$ 0.06% 0.03% 1,451.8$ Hotels / Motels 436.4$ 0.62% 0.00% 4,546.2$ General Retail 361.0$ 0.00% 0.00% 2,359.2$ Mini-Storage Warehouse 353.7$ 0.00% 0.00% 3,608.8$ Assisted Living Facilities 128.8$ 0.00% 0.00% 6,777.9$ Misc CRE (Church, etc) 109.5$ 0.00% 0.00% 1,042.5$ Sub-Total CRE Term Loans 6,066.2$ 0.16% 0.00% 3,249.2$ Grand Total Investor CRE Loans 8,403.2$ 0.16% 0.01% 1,834.8$
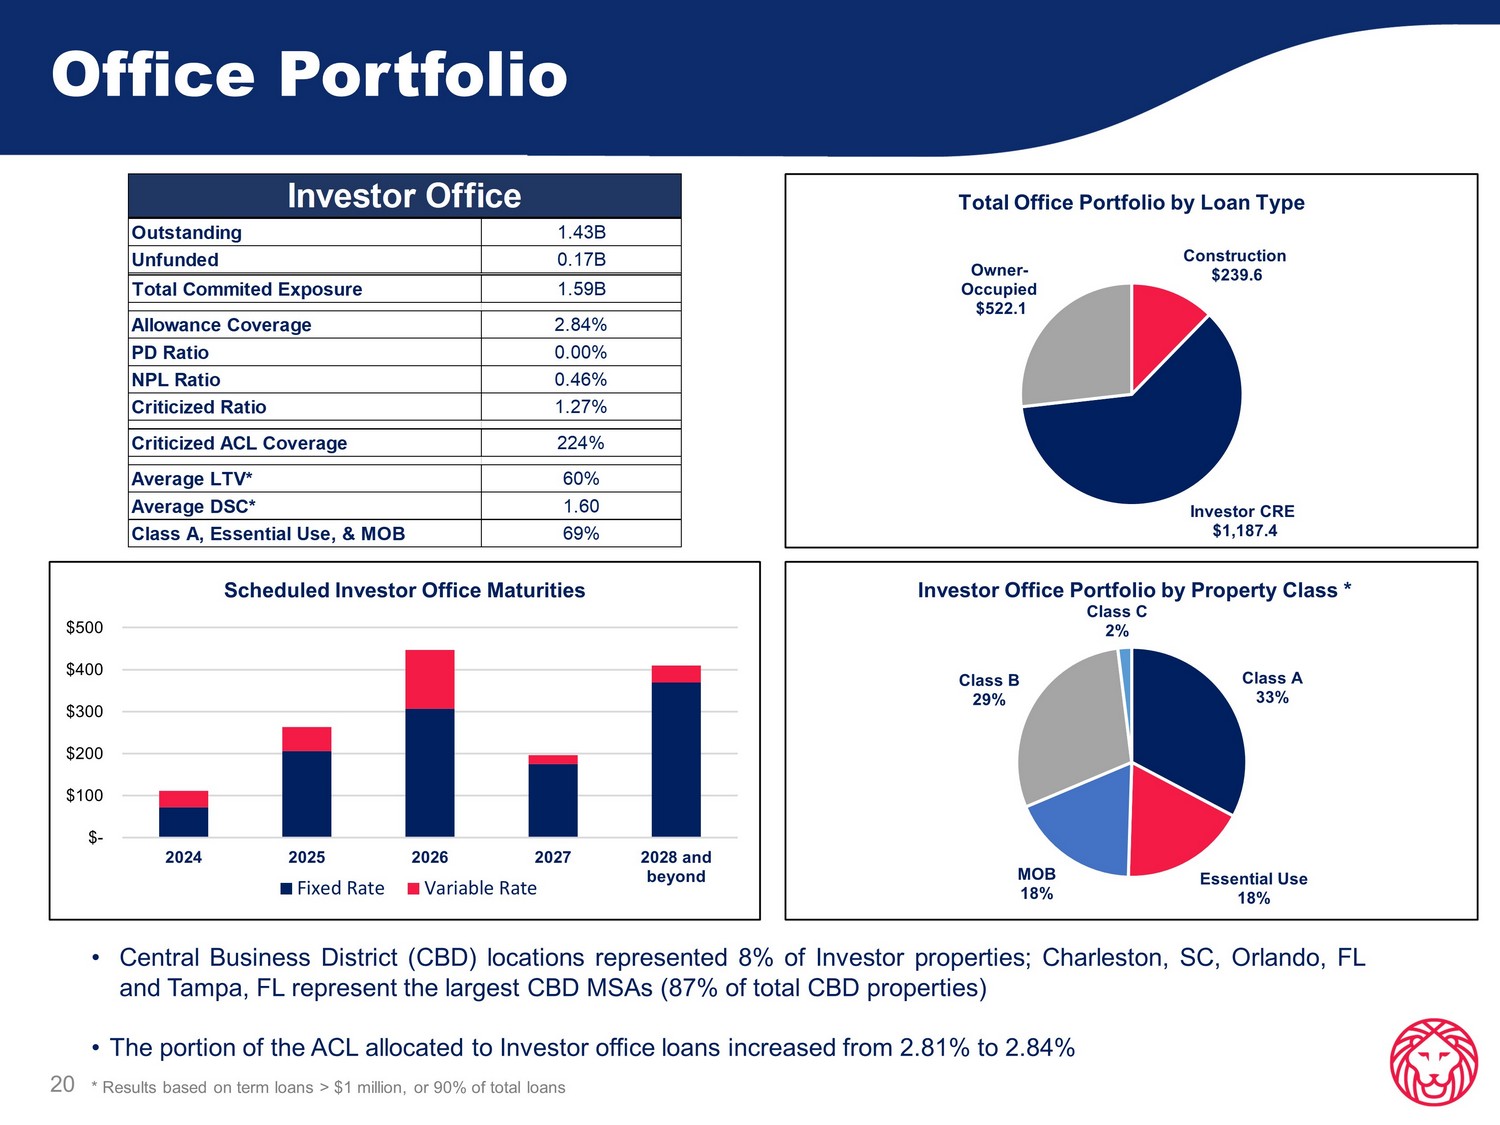
Office Portfolio • Central Business District (CBD) locations represented 8 % of Investor properties ; Charleston, SC, Orlando, FL and Tampa, FL represent the largest CBD MSAs ( 87 % of total CBD properties) • The portion of the ACL allocated to Investor office loans increased from 2 . 81 % to 2 . 84 % * Results based on term loans > $ 1 million, or 90 % of total loans 20 $- $100 $200 $300 $400 $500 2024 2025 2026 2027 2028 and beyond Scheduled Investor Office Maturities Fixed Rate Variable Rate Construction $239.6 Investor CRE $1,187.4 Owner - Occupied $522.1 Total Office Portfolio by Loan Type Class A 33% Essential Use 18% MOB 18% Class B 29% Class C 2% Investor Office Portfolio by Property Class * Outstanding 1.43B Unfunded 0.17B Total Commited Exposure 1.59B Allowance Coverage 2.84% PD Ratio 0.00% NPL Ratio 0.46% Criticized Ratio 1.27% Criticized ACL Coverage 224% Average LTV* 60% Average DSC* 1.60 Class A, Essential Use, & MOB 69% Investor Office
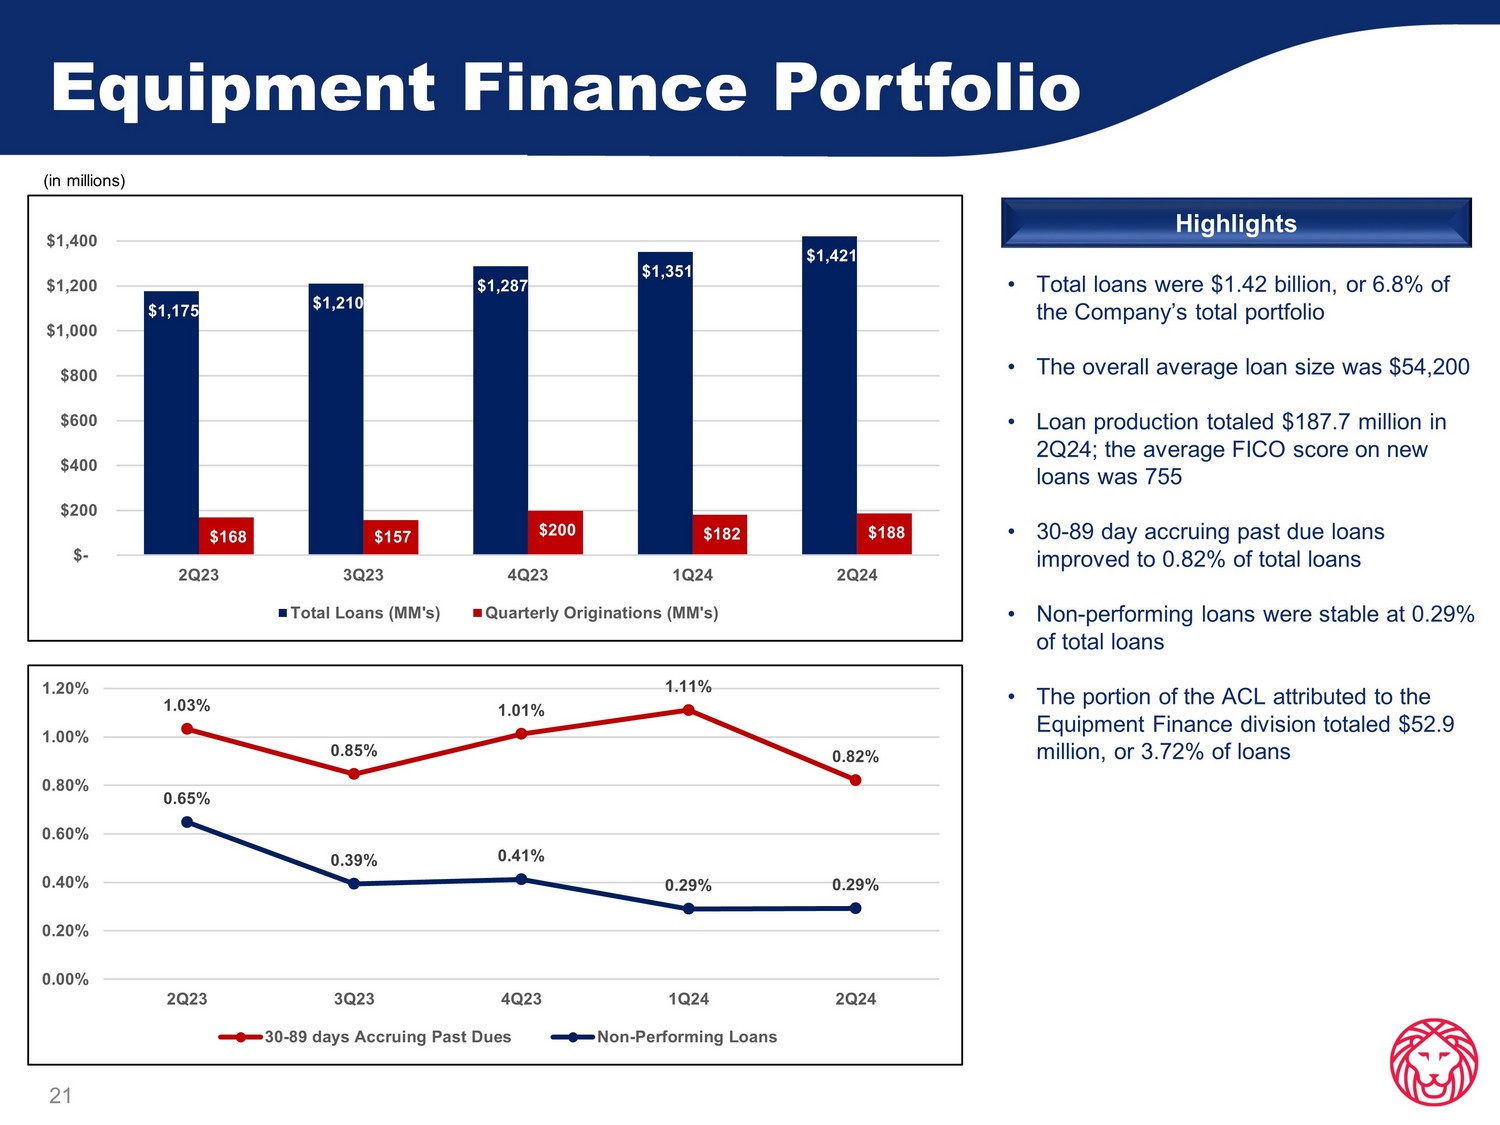
Equipment Finance Portfolio 21 • Total loans were $1.42 billion, or 6.8% of the Company’s total portfolio • The overall average loan size was $54,200 • Loan production totaled $187.7 million in 2Q24; the average FICO score on new loans was 755 • 30 - 89 day accruing past due loans improved to 0.82% of total loans • Non - performing loans were stable at 0.29% of total loans • The portion of the ACL attributed to the Equipment Finance division totaled $52.9 million, or 3.72% of loans Highlights (in millions) 1.03% 0.85% 1.01% 1.11% 0.82% 0.65% 0.39% 0.41% 0.29% 0.29% 0.00% 0.20% 0.40% 0.60% 0.80% 1.00% 1.20% 2Q23 3Q23 4Q23 1Q24 2Q24 30-89 days Accruing Past Dues Non-Performing Loans $1,175 $1,210 $1,287 $1,351 $1,421 $168 $157 $200 $182 $188 $- $200 $400 $600 $800 $1,000 $1,200 $1,400 2Q23 3Q23 4Q23 1Q24 2Q24 Total Loans (MM's) Quarterly Originations (MM's)

Appendix

23 Reconciliation of GAAP to Non - GAAP Measures (dollars in thousands) 2Q24 1Q24 2Q23 2024 2023 Net Income $ 90,785 $ 74,312 $ 62,635 $ 165,097 $ 123,056 Adjustment items Gain on sale of MSR (4,713) - - (4,713) - Gain on conversion of Visa Class B-1 stock (12,554) - - (12,554) - Gain on BOLI proceeds (466) (998) - (1,464) (486) FDIC special assessment (895) 2,909 - 2,014 - Tax effect of adjustment items 3,814 (611) - 3,203 - After tax adjustment items (14,814) 1,300 - (13,514) (486) Tax expense attributable to BOLI restructuring 4,792 - - 4,792 - Adjusted Net Income $ 80,763 $ 75,612 $ 62,635 $ 156,375 $ 122,570 Weighted average number of shares - diluted 69,013,834 69,014,116 69,034,763 69,010,010 69,191,512 Net income per diluted share $ 1.32 $ 1.08 $ 0.91 $ 2.39 $ 1.78 Adjusted net income per diluted share $ 1.17 $ 1.10 $ 0.91 $ 2.27 $ 1.77 Average assets 25,954,808 25,295,088 25,631,846 25,624,948 25,375,312 Return on average assets 1.41% 1.18% 0.98% 1.30% 0.98% Adjusted return on average assets 1.25% 1.20% 0.98% 1.23% 0.97% Average common equity 3,530,869 3,462,871 3,293,049 3,496,870 3,271,787 Average tangible common equity 2,433,958 2,361,544 2,178,323 2,397,751 2,154,720 Return on average common equity 10.34% 8.63% 7.63% 9.49% 7.58% Return on average tangible common equity 15.00% 12.66% 11.53% 13.85% 11.52% Adjusted return on average tangible common equity 13.35% 12.88% 11.53% 13.12% 11.47% Quarter to Date Year to Date

24 Reconciliation of GAAP to Non - GAAP Measures (dollars in thousands) 2Q24 1Q24 4Q23 3Q23 2Q23 2024 2023 Adjusted Noninterest Expense Total noninterest expense 155,357$ 148,711$ 149,011$ 141,446$ 148,403$ 304,068$ 287,824$ Adjustment items: FDIC special assessment 895 (2,909) (11,566) - - (2,014) - Gain on sale of premises - - 1,903 - - - - Adjusted noninterest expense 156,252$ 145,802$ 139,348$ 141,446$ 148,403$ 302,054$ 287,824$ Total Revenue Net interest income 211,921$ 201,388$ 206,101$ 207,751$ 209,540$ 413,309$ 421,192$ Noninterest income 88,711 65,878 56,248 63,181 67,349 154,589 123,399 Total revenue 300,632$ 267,266$ 262,349$ 270,932$ 276,889$ 567,898$ 544,591$ Adjusted Total Revenue Net interest income (TE) 212,881$ 202,338$ 207,048$ 208,701$ 210,488$ 415,219$ 423,075$ Noninterest income 88,711 65,878 56,248 63,181 67,349 154,589 123,399 Total revenue (TE) 301,592$ 268,216$ 263,296$ 271,882$ 277,837$ 569,808$ 546,474$ Adjustment items: (Gain) loss on securities (12,335) 7 288 16 6 (12,328) - Gain on BOLI proceeds (4,713) - - - - (4,713) - Gain on sale of mortgage servicing rights (466) (998) - - - (1,464) (486) Adjusted total revenue (TE) 284,078$ 267,225$ 263,584$ 271,898$ 277,843$ 551,303$ 545,988$ Efficiency ratio 51.68% 55.64% 56.80% 52.21% 53.60% 53.54% 52.85% Adjusted efficiency ratio (TE) 55.00% 54.56% 52.87% 52.02% 53.41% 54.79% 52.72% Year to DateQuarter to Date
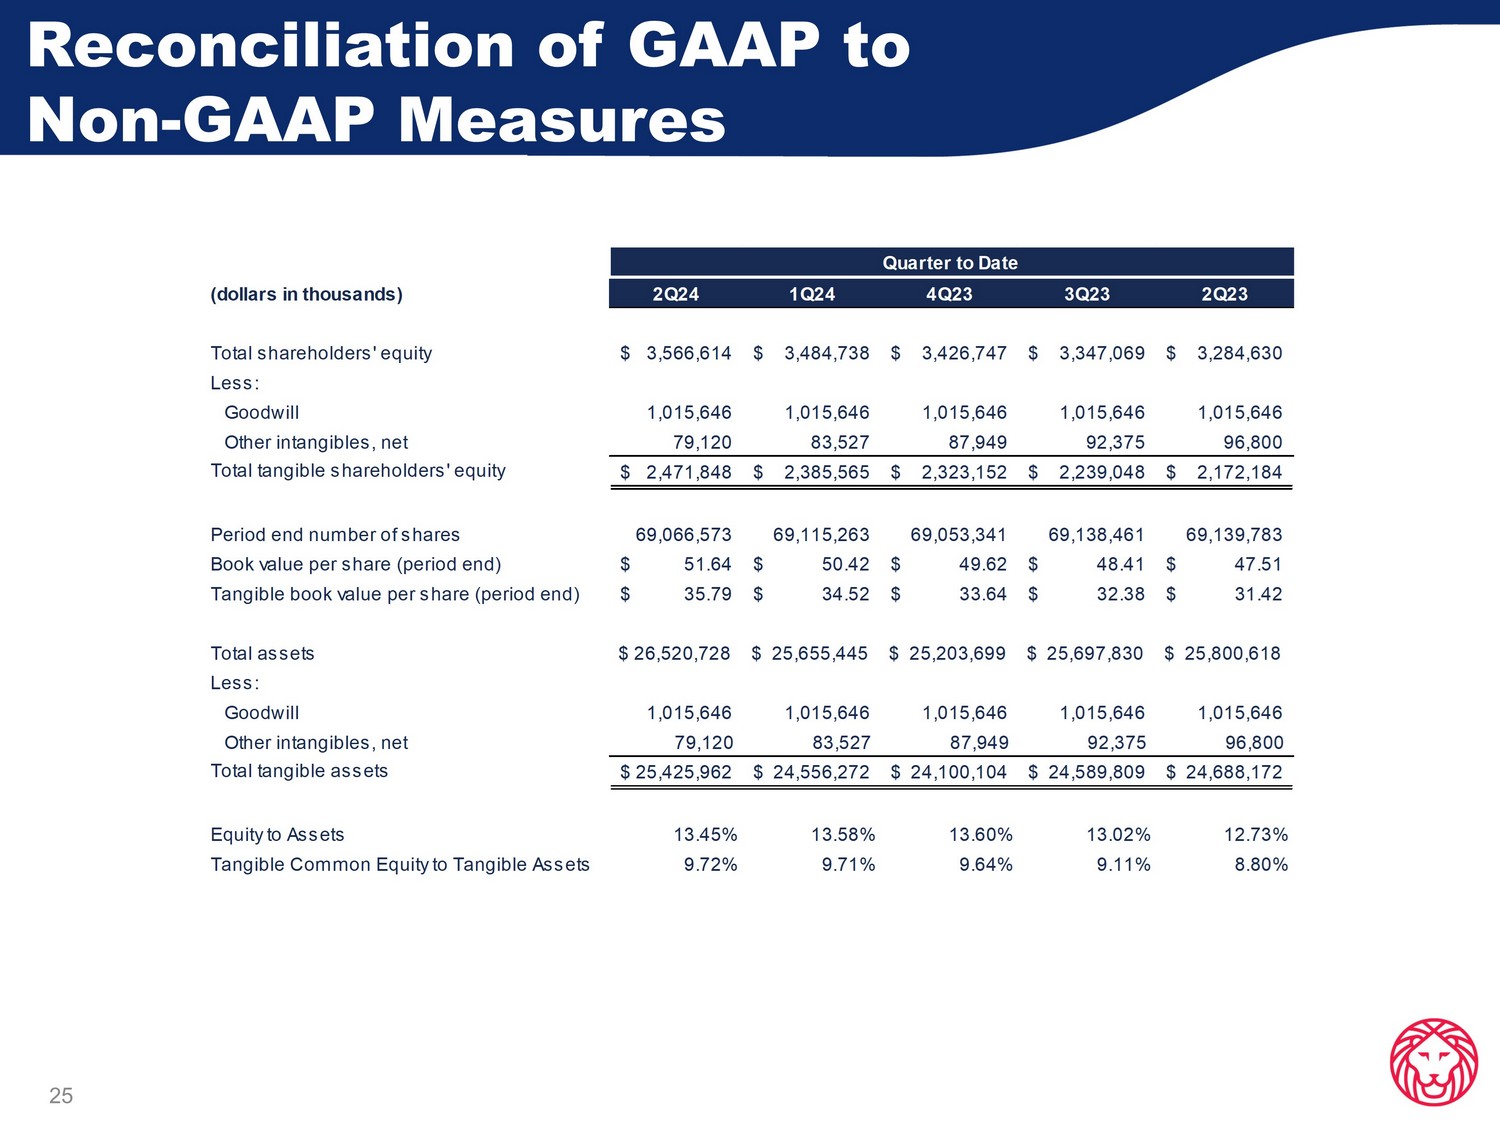
25 Reconciliation of GAAP to Non - GAAP Measures (dollars in thousands) 2Q24 1Q24 4Q23 3Q23 2Q23 Total shareholders' equity 3,566,614$ 3,484,738$ 3,426,747$ 3,347,069$ 3,284,630$ Less: Goodwill 1,015,646 1,015,646 1,015,646 1,015,646 1,015,646 Other intangibles, net 79,120 83,527 87,949 92,375 96,800 Total tangible shareholders' equity 2,471,848$ 2,385,565$ 2,323,152$ 2,239,048$ 2,172,184$ Period end number of shares 69,066,573 69,115,263 69,053,341 69,138,461 69,139,783 Book value per share (period end) 51.64$ 50.42$ 49.62$ 48.41$ 47.51$ Tangible book value per share (period end) 35.79$ 34.52$ 33.64$ 32.38$ 31.42$ Total assets $ 26,520,728 $ 25,655,445 $ 25,203,699 $ 25,697,830 $ 25,800,618 Less: Goodwill 1,015,646 1,015,646 1,015,646 1,015,646 1,015,646 Other intangibles, net 79,120 83,527 87,949 92,375 96,800 Total tangible assets 25,425,962$ 24,556,272$ 24,100,104$ 24,589,809$ 24,688,172$ Equity to Assets 13.45% 13.58% 13.60% 13.02% 12.73% Tangible Common Equity to Tangible Assets 9.72% 9.71% 9.64% 9.11% 8.80% Quarter to Date
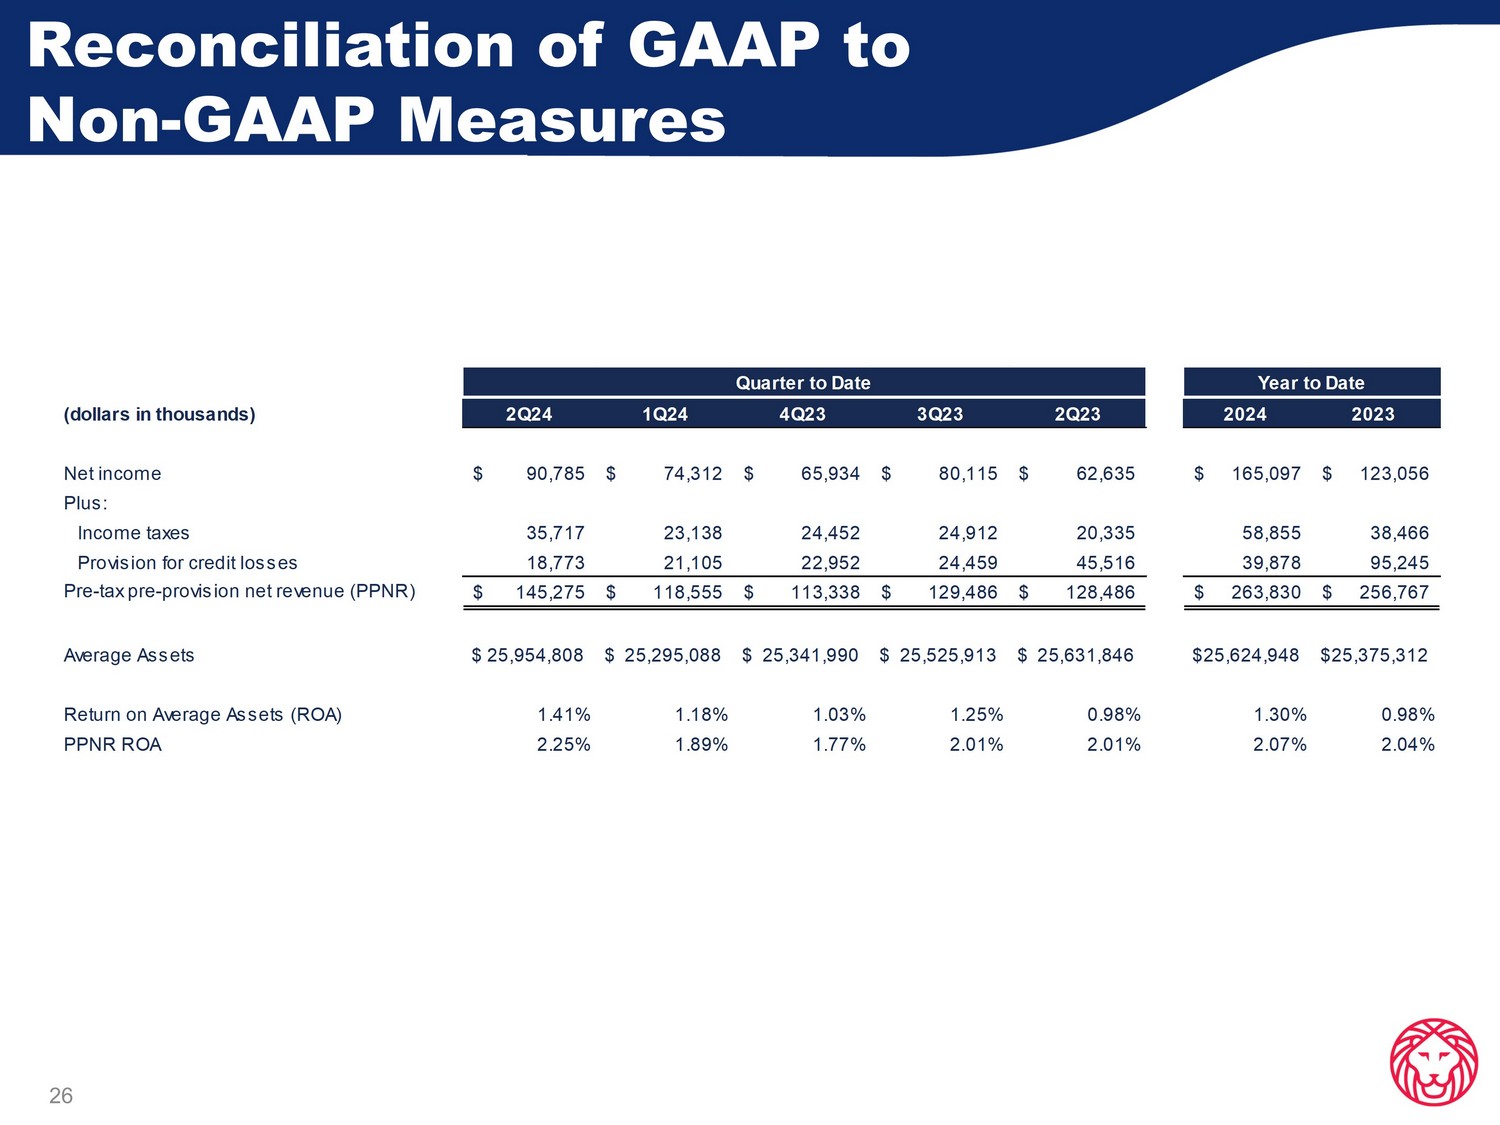
26 Reconciliation of GAAP to Non - GAAP Measures (dollars in thousands) 2Q24 1Q24 4Q23 3Q23 2Q23 2024 2023 Net income 90,785$ 74,312$ 65,934$ 80,115$ 62,635$ 165,097$ 123,056$ Plus: Income taxes 35,717 23,138 24,452 24,912 20,335 58,855 38,466 Provision for credit losses 18,773 21,105 22,952 24,459 45,516 39,878 95,245 Pre-tax pre-provision net revenue (PPNR) 145,275$ 118,555$ 113,338$ 129,486$ 128,486$ 263,830$ 256,767$ Average Assets $ 25,954,808 $ 25,295,088 $ 25,341,990 $ 25,525,913 $ 25,631,846 $25,624,948 $25,375,312 Return on Average Assets (ROA) 1.41% 1.18% 1.03% 1.25% 0.98% 1.30% 0.98% PPNR ROA 2.25% 1.89% 1.77% 2.01% 2.01% 2.07% 2.04% Quarter to Date Year to Date

27 Reconciliation of GAAP to Non - GAAP Measures (dollars in thousands) 2Q24 1Q24 4Q23 3Q23 2Q23 1Q23 4Q22 3Q22 2Q22 1Q22 4Q21 Total shareholders' equity 3,566,614$ 3,484,738$ 3,426,747$ 3,347,069$ 3,284,630$ 3,253,195$ 3,197,400$ 3,119,070$ 3,073,376$ 3,007,159$ 2,966,451$ Less: Goodwill 1,015,646 1,015,646 1,015,646 1,015,646 1,015,646 1,015,646 1,015,646 1,023,071 1,023,056 1,022,345 1,012,620 Other intangibles, net 79,120 83,527 87,949 92,375 96,800 101,488 106,194 110,903 115,613 120,757 125,938 Total tangible shareholders' equity 2,471,848$ 2,385,565$ 2,323,152$ 2,239,048$ 2,172,184$ 2,136,061$ 2,075,560$ 1,985,096$ 1,934,707$ 1,864,057$ 1,827,893$ Period end number of shares 69,066,573 69,115,263 69,053,341 69,138,461 69,139,783 69,373,863 69,369,050 69,352,709 69,360,461 69,439,084 69,609,228 Book value per share (period end) 51.64$ 50.42$ 49.62$ 48.41$ 47.51$ 46.89$ 46.09$ 44.97$ 44.31$ 43.31$ 42.62$ Tangible book value per share (period end) 35.79$ 34.52$ 33.64$ 32.38$ 31.42$ 30.79$ 29.92$ 28.62$ 27.89$ 26.84$ 26.26$ 3Q21 2Q21 1Q21 4Q20 3Q20 2Q20 1Q20 4Q19 3Q19 2Q19 Total shareholders' equity 2,900,770$ 2,837,004$ 2,757,596$ 2,647,088$ 2,564,683$ 2,460,130$ 2,437,150$ 2,469,582$ 2,420,723$ 1,537,121$ Less: Goodwill 928,005 928,005 928,005 928,005 928,005 928,005 931,947 931,637 911,488 501,140 Other intangibles, net 60,396 63,783 67,848 71,974 76,164 80,354 85,955 91,586 97,328 52,437 Total tangible shareholders' equity 1,912,369$ 1,845,216$ 1,761,743$ 1,647,109$ 1,560,514$ 1,451,771$ 1,419,248$ 1,446,359$ 1,411,907$ 983,544$ Period end number of shares 69,635,435 69,767,209 69,713,426 69,541,481 69,490,546 69,461,968 69,441,274 69,503,833 69,593,833 47,261,584 Book value per share (period end) 41.66$ 40.66$ 39.56$ 38.06$ 36.91$ 35.42$ 35.10$ 35.53$ 34.78$ 32.52$ Tangible book value per share (period end) 27.46$ 26.45$ 25.27$ 23.69$ 22.46$ 20.90$ 20.44$ 20.81$ 20.29$ 20.81$ As of As of

Ameris Bancorp Press Release & Financial Highlights June 30, 2024