UNITED STATES
SECURITIES AND EXCHANGE COMMISSION
WASHINGTON, D.C. 20549
SCHEDULE 14A
Proxy Statement Pursuant to Section 14(a) of the
Securities Exchange Act of 1934
Filed by the Registrant ☑
Filed by a Party other than the Registrant ☐
Check the appropriate box:
☐ | Preliminary Proxy Statement |
☐ | CONFIDENTIAL, FOR USE OF THE COMMISSION ONLY (AS PERMITTED BY RULE 14A-6(E)(2)) |
| ☑ | Definitive Proxy Statement |
☐ | Definitive Additional Materials |
☐ | Soliciting Material under Section 240.14a-12 |
AMERIS BANCORP
(Name of Registrant as Specified in its Charter)
(Name of Person(s) Filing Proxy Statement, if other than the Registrant)
Payment of Filing Fee (Check all boxes that apply):
| ☑ | No fee required. |
☐ | Fee paid previously with preliminary materials. |
☐ | Fee in exhibit required by Item 25(b) per Exchange Act Rules 14a-6(i)(1) and 0-11. |

April 23, 2024
Dear Shareholder:
It is my pleasure to invite you to the 2024 Annual Meeting of Shareholders of Ameris Bancorp, which will be held on Thursday, June 6, 2024, at 9:30 a.m. ET.
This year’s annual meeting will be completely virtual, held via live audio webcast. You will be able to attend the meeting online and vote your shares by visiting www.virtualshareholdermeeting.com/ABCB2024.
Details regarding how to attend the meeting online, how to vote your shares and the formal business to be conducted at the meeting are included in the accompanying Notice of the 2024 Annual Meeting of Shareholders.
The internet will be the primary means by which we furnish proxy materials to our shareholders. We will send shareholders a notice with instructions for how to access these materials. That notice will also include information for obtaining paper copies of our proxy materials if shareholders choose to do so. This process lowers costs and saves paper, adding convenience for shareholders and contributing to our sustainability efforts.
Whether or not you plan to attend the annual meeting virtually, please vote as soon as possible to ensure your shares are represented and voted at the meeting. You may vote online, via telephone or, if you receive a paper proxy card in the mail, by mailing the completed proxy card. If you attend the annual meeting virtually, then you may vote during the meeting even though you have previously voted your proxy.
On behalf of Ameris Bancorp, I thank you for your continued support.
| | | Sincerely, | |
| | |  | |
| | | H. Palmer Proctor, Jr. Chief Executive Officer |
NOTICE OF 2024 ANNUAL MEETING OF SHAREHOLDERS
TO BE HELD ON JUNE 6, 2024
To the Shareholders of Ameris Bancorp:
NOTICE IS HEREBY GIVEN that the 2024 Annual Meeting of Shareholders of Ameris Bancorp will be held virtually, via live audio webcast at www.virtualshareholdermeeting.com/ABCB2024, on Thursday, June 6, 2024, commencing at 9:30 a.m. ET, for the following items of business:
| (1) | To elect each of the 13 director nominees named in the accompanying Proxy Statement to serve as a director until our 2025 Annual Meeting of Shareholders and until his or her successor is duly elected and qualified; |
| (2) | To ratify the appointment of KPMG LLP as our independent registered public accounting firm for the fiscal year ending December 31, 2024; |
| (3) | To hold an advisory vote on the compensation of our named executive officers; |
| (4) | To hold an advisory vote on the frequency of the advisory vote on the compensation of our named executive officers; and |
| (5) | To transact any other business that may properly come before the Annual Meeting or any adjournment or postponement thereof. |
The close of business on March 28, 2024, has been fixed as the record date for the determination of shareholders entitled to notice of, and to vote at, the Annual Meeting or any adjournment or postponement thereof. Only shareholders of record as of the close of business on that date are entitled to notice of, and to vote at, the Annual Meeting.
To access the virtual Annual Meeting, visit www.virtualshareholdermeeting.com/ABCB2024. To participate in the Annual Meeting, including to vote and ask questions during the Annual Meeting, shareholders of record as of the close of business on the record date should go to the virtual meeting website at www.virtualshareholdermeeting.com/ABCB2024, enter the 16-digit control number found on your accompanying proxy card and follow the instructions on the website.
Beneficial owners of shares held in street name as of the close of business on the record date should check their voting instruction form for how to vote in advance of, and how to participate in, the Annual Meeting. Otherwise, shareholders who hold their shares in street name and do not have their Notice of Internet Availability of Proxy Materials or voting instruction form should contact their bank, broker or other nominee (preferably at least five days before the Annual Meeting) and obtain the 16-digit control number in order to be able to attend, participate in or vote at the Annual Meeting.
Online access to the virtual meeting website will open approximately 15 minutes prior to the Annual Meeting start time to allow time for you to log in and test your device’s audio system.
Your vote is important. Whether or not you plan to attend the Annual Meeting virtually, please vote as soon as possible to ensure that your shares will be represented and voted at the Annual Meeting.
| | | By Order of the Board of Directors, | |
| | |  | |
| | | Michael T. Pierson Corporate Secretary |
Atlanta, Georgia
April 23, 2024
PROXY STATEMENT
FOR 2024 ANNUAL MEETING OF SHAREHOLDERS
TO BE HELD ON JUNE 6, 2024
This summary highlights information contained elsewhere in this proxy statement (the “Proxy Statement”) and in our 2023 Annual Report to Shareholders, which includes our Annual Report on Form 10-K for the year ended December 31, 2023 (the “2023 Annual Report”) and accompanies this Proxy Statement. You should read the entire Proxy Statement and the 2023 Annual Report before voting. We are first making the proxy materials available to shareholders on or about April 23, 2024.
In this Proxy Statement: (i) Ameris Bancorp is referred to as “Ameris,” “we,” “our,” “us,” or the “Company”; (ii) Ameris Bank, Ameris’s wholly owned subsidiary, is referred to as “Ameris Bank” or the “Bank”; and (iii) the Company’s Board of Directors is referred to as the “Board.”
| Date: | | | June 6, 2024 |
| Time: | | | 9:30 a.m. ET |
| Location: | | | Virtual format only, via live audio webcast at www.virtualshareholdermeeting.com/ABCB2024. |
Record Date and Voting: | | | You are entitled to vote at the Annual Meeting if you were a shareholder of record of the Company’s common stock, $1.00 par value per share (the “Common Stock”), as of the close of business on March 28, 2024, the record date for the Annual Meeting (the “Record Date”). Each share of Common Stock represented at the Annual Meeting is entitled to one vote for each director nominee with respect to the proposal to elect directors and one vote for each of the other proposals to be voted on. |
| 1 |
| | Items of Business | | | Board Recommendation | | | Page Number | |
| | To elect each of the 13 director nominees named in this Proxy Statement to serve as a director until the Company’s 2025 Annual Meeting of Shareholders (the “2025 Annual Meeting”) and until his or her successor is duly elected and qualified (Proposal 1) | | | “FOR” | | | | |
| | To ratify the appointment of KPMG LLP (“KPMG”) as our independent registered public accounting firm for the fiscal year ending December 31, 2024 (Proposal 2) | | | “FOR” | | | | |
| | To hold an advisory vote on the compensation of our named executive officers (Proposal 3) | | | “FOR” | | | | |
| | To hold an advisory vote on the frequency of the advisory vote on the compensation of our named executive officers (Proposal 4) | | | “1 YEAR” | | | |
In addition to the above matters, we will transact any other business that may properly come before the Annual Meeting or any adjournment or postponement thereof.
Whether or not you plan to attend the Annual Meeting virtually, we urge you to vote as soon as possible to ensure that your shares will be represented and voted at the Annual Meeting. If you are a shareholder of record (meaning you hold your shares in your own name) as of the close of business on the Record Date, then you have four voting options. You may vote using one of the following methods:
| • | Over the internet at www.proxyvote.com, which you are encouraged to do if you have access to the internet; |
| • | By telephone at the number included in your proxy card or Notice of Internet Availability of Proxy Materials (the “Notice”) you previously received; |
| • | For those shareholders who request to receive a paper proxy card in the mail, by completing, signing and returning the proxy card; or |
| • | By attending the Annual Meeting virtually (by visiting www.virtualshareholdermeeting.com/ABCB2024 and entering your control number) and following the voting instructions on the virtual meeting website. |
Only shareholders of record as of the close of business on the Record Date, or beneficial owners of shares held in street name who follow the instructions below, will be able to attend and vote at the Annual Meeting. Guests will not be able to attend the Annual Meeting.
The Annual Meeting will be held virtually, via live audio webcast. To access the virtual Annual Meeting, visit the virtual meeting website at www.virtualshareholdermeeting.com/ABCB2024.
To participate in the Annual Meeting, including to vote and ask questions during the Annual Meeting, shareholders of record as of the close of business on the Record Date should go to the virtual meeting website at www.virtualshareholdermeeting.com/ABCB2024, enter the 16-digit control number found on your accompanying proxy card and follow the instructions on the website.
Beneficial owners of shares held in street name as of the close of business on the Record Date should check their voting instruction form for how to vote in advance of, and how to participate in, the Annual Meeting. Otherwise, shareholders who hold their shares in street name and do not have their Notice or voting instruction form should contact their bank, broker or other nominee (preferably at least five days before the Annual Meeting) and obtain the 16-digit control number in order to be able to attend, participate in or vote at the Annual Meeting.
| 2 |
Once you are admitted to the Annual Meeting, you may vote during the Annual Meeting by following the instructions on the virtual meeting website.
Online access to the virtual meeting website will open approximately 15 minutes prior to the Annual Meeting start time to allow time for you to log in and test your device’s audio system.
Shareholders of record and beneficial owners of shares held in street name who attend the Annual Meeting virtually can submit questions at the virtual meeting website, www.virtualshareholdermeeting.com/ABCB2024, by following the instructions available on the virtual meeting website during the meeting. During the Annual Meeting, we intend to answer questions so submitted that are pertinent to the Company and meeting matters, as time permits.
An electronic list of shareholders of record as of the Record Date will be available for examination by shareholders at www.virtualshareholdermeeting.com/ABCB2024 during the Annual Meeting, along with the proxy materials for the Annual Meeting.
Highlights of our results for 2023, include the following:
| • | Net income of $269.1 million, or $3.89 per diluted share; |
| • | Adjusted net income of $276.3 million, or $4.00 per diluted share; |
| • | Growth in tangible book value (“TBV Growth”) of $3.72 per share, or 12.4%, to $33.64 at December 31, 2023; |
| • | Increase in the allowance for credit losses to 1.52% of loans, from 1.04% at December 31, 2022, due to forecasted economic conditions, particularly related to commercial real estate price levels; |
| • | Nonperforming portfolio assets, excluding government-guaranteed loans, as a percentage of total assets improved to 0.33% at December 31, 2023, compared with 0.34% at December 31, 2022; |
| • | Adjusted efficiency ratio of 52.58%; |
| • | Organic growth in loans of $414.1 million, or 2.1%; |
| • | Growth in total deposits of $1.25 billion, or 6.4%; and |
| • | Growth in tangible common equity ratio of 97 basis points, or 11.2%, to 9.64% at December 31, 2023. |
Adjusted net income, tangible book value, nonperforming portfolio assets, adjusted efficiency ratio and tangible common equity ratio are performance measures determined by methods other than in accordance with accounting principles generally accepted in the United States of America (“GAAP”). See “Reconciliation of GAAP and Non-GAAP Financial Measures” in Exhibit A to this Proxy Statement for a reconciliation of the foregoing non-GAAP measures to the most comparable GAAP measures.
| 3 |
At the Annual Meeting, shareholders are being asked to elect each of the director nominees identified below to serve as a director until the 2025 Annual Meeting and until his or her successor is duly elected and qualified.
| | Name | | | Age | | | Ameris Director Since | | | Primary Occupation | | | Independent | |
| | William I. Bowen, Jr. | | | 59 | | | November 2014 | | | Partner and President of Bowen Donaldson Home for Funerals | | | ✔ | |
| | Rodney D. Bullard | | | 49 | | | July 2019 | | | Chief Executive Officer of The Same House | | | ✔ | |
| | Wm. Millard Choate | | | 71 | | | July 2019 | | | Founder and Chairman of Choate Construction Company | | | ✔ | |
| | R. Dale Ezzell | | | 74 | | | May 2010 | | | Founder and Owner of Wisecards Printing and Mailing | | | ✔ | |
| | Leo J. Hill | | | 68 | | | January 2013 | | | Founder and Owner of Advisor Network Solutions, LLC | | | ✔ | |
| | Daniel B. Jeter | | | 72 | | | April 1997 | | | Chairman and Co-Owner of Standard Discount Corporation | | | ✔ | |
| | Robert P. Lynch | | | 60 | | | February 2000 | | | Vice President and Chief Financial Officer of Lynch Management Company | | | ✔ | |
| | Elizabeth A. McCague | | | 74 | | | August 2016 | | | Chief Financial Officer for Jacksonville Port Authority | | | ✔ | |
| | Claire E. McLean | | | 44 | | | February 2024 | | | Chief Operating Officer and Executive Vice President of Preferred Capital Securities, LLC | | | ✔ | |
| | James B. Miller, Jr. | | | 84 | | | July 2019 | | | Chairman of the Ameris Board of Directors | | | | |
| | Gloria A. O’Neal | | | 74 | | | July 2019 | | | Community Leader | | | ✔ | |
| | H. Palmer Proctor, Jr. | | | 56 | | | July 2019 | | | Chief Executive Officer of Ameris and the Bank | | | | |
| | William H. Stern | | | 67 | | | November 2013 | | | President and Chief Executive Officer of Stern Development | | | ✔ | |
Mr. Jimmy D. Veal has served as a director since 2008 and will retire upon the Annual Meeting.
| 4 |
Our corporate governance and executive compensation policies promote the long-term interests of shareholders. Below are highlights of our corporate governance and executive compensation framework.
| Corporate Governance | | | Executive Compensation | |
• Annual Election of All Directors • Approximately 85% of Board Members are Independent • Strong Independent Lead Director of the Board • Independent Audit, Compensation, Corporate Governance and Nominating, and Enterprise Risk Committees of the Board • No Supermajority Voting Requirements in Articles of Incorporation or Bylaws • Formalized Annual Board and Committee Self-Assessments and Director Assessments • Majority Voting for Directors in Uncontested Elections • All Directors Attended at Least 75% of 2023 Meetings • Director Continuing Education • Regular Executive Sessions of Independent Directors • No Poison Pill in Effect | | | • Pay for Performance Philosophy • Independent Compensation Consultant Engaged by Compensation Committee • Annual Advisory Votes on Executive Compensation • Risk Oversight by Board and Committees, Including Enterprise Risk Committee • Limits Imposed on Maximum Incentive Award Payouts • Stock Ownership Requirements for Named Executive Officers and Directors • Insider Trading Policy Prohibits Hedging and Short Sales • Implementation of Mandatory Clawback Policy for Incentive Compensation Paid to Executive Officers | |
| 5 |
Why am I receiving these materials?
The Board has made these materials available to you on the internet or, upon your request, has delivered printed versions of these materials to you by mail, in connection with the solicitation of proxies by and on behalf of the Board for use at the Annual Meeting. The Annual Meeting will be held virtually, via live audio webcast at www.virtualshareholdermeeting.com/ABCB2024, on Thursday, June 6, 2024, commencing at 9:30 a.m. ET.
These materials will be first made available to shareholders on or about April 23, 2024. Shareholders of the Company are invited to attend the Annual Meeting virtually and are requested to vote on the proposals described in this Proxy Statement.
What is included in these materials?
These materials include:
| • | The Company’s Proxy Statement for the Annual Meeting; and |
| • | The 2023 Annual Report, which includes the Company’s audited consolidated financial statements. |
If you request printed versions of these materials by mail, then these materials will also include the proxy card for the Annual Meeting.
Why did I receive a one-page notice in the mail or e-mail notification regarding the internet availability of proxy materials instead of a full set of proxy materials?
Pursuant to rules adopted by the U.S. Securities and Exchange Commission (the “SEC”), the Company has provided access to its proxy materials over the internet. Accordingly, the Company is sending a Notice of Internet Availability of Proxy Materials. All shareholders will have the ability to access the proxy materials on the website referred to in the Notice, free of charge, or request to receive a printed set of the proxy materials. Instructions on how to access the proxy materials over the internet or to request a printed copy may be found in the Notice. In addition, shareholders may request to receive proxy materials electronically by e-mail on an ongoing basis.
How can I get electronic access to the proxy materials?
The Notice provides you with instructions regarding how to:
| • | View proxy materials for the Annual Meeting on the internet and execute a proxy; and |
| • | Instruct the Company to send future proxy materials to you electronically by e-mail. |
Choosing to receive future proxy materials by e-mail will save the Company the cost of printing and mailing documents to you and will reduce the impact of its annual meetings on the environment. If you choose to receive future proxy materials by e-mail, then you will receive an e-mail next year with instructions containing a link to those materials and a link to the proxy voting site. Your election to receive proxy materials by e-mail will remain in effect until you terminate it.
What is being voted on at the Annual Meeting?
Shareholders are being asked to vote on each of the following proposals:
| • | To elect each of the 13 director nominees named in this Proxy Statement to serve as a director until the 2025 Annual Meeting and until his or her successor is duly elected and qualified (Proposal 1); |
| • | To ratify the appointment of KPMG as our independent registered public accounting firm for the fiscal year ending December 31, 2024 (Proposal 2); |
| 6 |
| • | To hold an advisory vote on the compensation of our named executive officers (Proposal 3); and |
| • | To hold an advisory vote on the frequency of the advisory vote on the compensation of our named executive officers (Proposal 4). |
In addition to the above matters, we will transact any other business that may properly come before the Annual Meeting or any adjournment or postponement thereof. As of the date of this Proxy Statement, the Board knows of no other matters that will be brought before the Annual Meeting.
You may not cumulate your votes for any matter being voted on at the Annual Meeting, and you are not entitled to appraisal or dissenters’ rights.
Who can vote?
You may vote if you were a shareholder of record of the Common Stock as of the close of business on March 28, 2024, the Record Date for the Annual Meeting. Your shares can be voted at the Annual Meeting only if you are present or represented by a valid proxy. As of the Record Date, there were 69,011,444 shares of Common Stock outstanding and entitled to vote.
If you are a beneficial owner of shares of Common Stock held in street name as of the close of business on the Record Date, then you will receive voting instructions from the bank, broker or other nominee that holds your shares as the holder of record. You must follow the voting instructions of the holder of record in order for your shares to be voted.
What is the difference between a shareholder of record and a beneficial owner of shares held in street name?
Shareholder of Record. If your shares are registered directly in your name with the Company’s transfer agent, Computershare, then you are considered the shareholder of record with respect to those shares, and the proxy materials were sent directly to you by the Company.
Beneficial Owner of Shares Held in Street Name. If your shares are held in an account at a brokerage firm, bank, broker-dealer or other similar organization, then you are the beneficial owner of shares held in “street name,” and the proxy materials were forwarded to you by that organization. The organization holding your account is considered the shareholder of record for purposes of voting at the Annual Meeting. As a beneficial owner, you have the right to instruct that organization on how to vote the shares held in your account. Those instructions are contained in a “voting instruction form.”
How many votes am I entitled to?
Each share of Common Stock represented at the Annual Meeting is entitled to one vote for each director nominee with respect to the proposal to elect directors and one vote for each of the other proposals to be voted on.
How do I vote?
If you are a record holder, then you may vote by proxy or in person at the Annual Meeting at www.virtualshareholdermeeting.com/ABCB2024.
To vote by proxy, you may select one of the following options:
| • | Over the internet at www.proxyvote.com, which you are encouraged to do if you have access to the internet; |
| • | By telephone; or |
| • | For those shareholders who request to receive a paper proxy card in the mail, by completing, signing and returning the proxy card. |
| 7 |
The Notice provides instructions on how to access your proxy card, which contains instructions on how to vote via the internet or by telephone. For those shareholders who request to receive a paper proxy card in the mail, instructions for voting via the internet, by telephone or by mail are set forth on the proxy card. Please follow the directions on your proxy card carefully.
If you are a beneficial owner of shares held in street name, then you will receive voting instructions from the bank, broker or other nominee that holds your shares as the holder of record. You must follow the voting instructions of the holder of record in order for your shares to be voted. Although most banks, brokers and other nominees will offer telephone and internet voting, availability and specific procedures will depend on their voting arrangements. Please follow their voting instructions carefully.
How do I attend and participate in the Annual Meeting?
The Annual Meeting will be held virtually, via live audio webcast. To access the virtual Annual Meeting, visit the virtual meeting website at www.virtualshareholdermeeting.com/ABCB2024.
To participate in the Annual Meeting, including to vote and ask questions during the Annual Meeting, shareholders of record as of the close of business on the Record Date should go to the virtual meeting website at www.virtualshareholdermeeting.com/ABCB2024, enter the 16-digit control number found on your accompanying proxy card and follow the instructions on the website.
Beneficial owners of shares held in street name as of the close of business on the Record Date should check their voting instruction form for how to vote in advance of, and how to participate in, the Annual Meeting. Otherwise, shareholders who hold their shares in street name and do not have their Notice or voting instruction form should contact their bank, broker or other nominee (preferably at least five days before the Annual Meeting) and obtain the 16-digit control number in order to be able to attend, participate in or vote at the Annual Meeting.
Once you are admitted to the Annual Meeting, you may vote during the Annual Meeting by following the instructions on the virtual meeting website.
Online access to the virtual meeting website will open approximately 15 minutes prior to the Annual Meeting start time to allow time for you to log in and test your device’s audio system.
What if I have technical difficulties attending the Annual Meeting?
The virtual meeting platform is fully supported across most internet browsers (Microsoft Edge, Firefox, Chrome and Safari) and devices (desktops, laptops, tablets and cell phones) running the most up-to-date version of applicable software and plug-ins. You should ensure that you have a sufficient internet connection wherever you intend to participate in the Annual Meeting. If you encounter technical difficulties accessing the Annual Meeting, the virtual meeting website login page will include technical support line contact information.
Can I change my mind after I vote?
If you are a shareholder of record and vote by proxy, then you may revoke that proxy before it is voted at the Annual Meeting. You may do this by using one of the following methods:
| • | Voting again by telephone or over the internet by 11:59 p.m. ET on June 5, 2024, the day before the Annual Meeting; |
| • | Giving written notice to our Corporate Secretary at 3490 Piedmont Road N.E., Suite 1550, Atlanta, Georgia 30305; |
| • | Delivering a later-dated proxy; or |
| • | By attending the Annual Meeting virtually (by visiting www.virtualshareholdermeeting.com/ABCB2024 and entering your control number) and following the voting instructions on the virtual meeting website. |
| 8 |
If you are a beneficial owner of shares held in street name, then you must follow the instructions provided by the bank, broker or other nominee that holds your shares as the holder of record if you wish to change or revoke your vote.
How many votes must be present to hold the Annual Meeting?
In order for the Company to conduct the Annual Meeting, the holders of a majority of the shares of Common Stock outstanding and entitled to vote as of the Record Date must be present or represented by proxy at the Annual Meeting. This is referred to as a quorum.
Shares represented by valid proxies received but marked as abstentions, and shares represented by valid proxies received but reflecting broker non-votes (further discussed below), will be counted as present at the Annual Meeting for purposes of establishing a quorum.
What are broker non-votes?
Under certain circumstances, including the election of directors, matters involving executive compensation and other matters considered non-routine, banks and brokers are prohibited from exercising discretionary authority for beneficial owners of shares held in street name who have not provided voting instructions to the bank or broker. This is generally referred to as a “broker non-vote.” In these cases, as long as a routine matter is also being voted on, and in cases where the shareholder does not vote on such routine matter, those shares will be counted for the purpose of determining if a quorum is present, but will not be included as votes cast with respect to those matters. Whether a bank or broker has authority to vote its shares on uninstructed matters is determined by stock exchange rules. We expect that brokers will be allowed to exercise discretionary authority for beneficial owners of shares held in street name who have not provided voting instructions only with respect to Proposal 2 but not with respect to any of the other proposals to be voted on at the Annual Meeting.
What is the vote required to elect directors and to adopt each of the other proposals?
The following chart describes the proposals to be considered at the Annual Meeting, the vote required to elect directors and to adopt each of the other proposals, and the manner in which votes will be counted.
| | Proposal | | | Voting Options | | | Vote Required to Elect Directors or to Adopt Proposal | | | Effect of Abstentions | | | Effect of Broker Non-votes | |
| | Election of Directors (Proposal 1) | | | For, Against or Abstain with respect to each director nominee | | | A majority of votes cast (meaning the number of shares voted “for” a director nominee must exceed the votes cast “against” such director nominee)* | | | No effect | | | No effect No broker discretion to vote | |
| | Ratification of the Appointment of KPMG (Proposal 2) | | | For, Against or Abstain | | | Affirmative vote of the holders of a majority of the stock having voting power present in person or represented by proxy at the Annual Meeting | | | Same effect as a vote “against” | | | Brokers have discretion to vote | |
| | Advisory Vote on the Compensation of Our Named Executive Officers | | | For, Against or Abstain | | | Affirmative vote of the holders of a majority of the stock having voting power present in | | | Same effect as a vote “against” | | | No effect No broker discretion to vote | |
| 9 |
| | Proposal | | | Voting Options | | | Vote Required to Elect Directors or to Adopt Proposal | | | Effect of Abstentions | | | Effect of Broker Non-votes | |
| | (Proposal 3) | | | | | person or represented by proxy at the Annual Meeting | | | | | | |||
| | Advisory Vote on the Frequency of the Advisory Vote on the Compensation of Our Named Executive Officers (Proposal 4) | | | 1 Year, 2 Years, 3 Years or Abstain | | | The option of one year, two years or three years that receives the highest number of the votes cast by shareholders will be the frequency for the advisory vote on executive compensation that has been selected by shareholders | | | No effect | | | No effect No broker discretion to vote | |
| * | See “Matters To Be Voted On – Proposal 1 – Election of Directors” for a further description of the vote required to elect directors. |
What if my shares are registered in more than one person’s name?
If you own shares that are registered in the name of more than one person, then each person must sign the proxy. If an attorney, executor, administrator, trustee, guardian or any other person signs the proxy in a representative capacity, then the full title of the person signing the proxy should be given and a certificate should be furnished showing evidence of appointment.
What does it mean if I receive more than one Notice?
If you receive more than one Notice, then you have multiple accounts with brokers or the Company’s transfer agent, Computershare. Please vote all of these shares. It is recommended that you contact your broker or Computershare, as applicable, to consolidate as many accounts as possible under the same name and address. Computershare may be contacted by telephone at (800) 568-3476.
How are proxies solicited and who pays the cost?
The cost of preparing and mailing proxy materials will be borne by the Company. In addition to solicitation by internet or mail, solicitations may be made by directors, officers and other employees of the Company in person or by telephone, facsimile or e-mail without additional compensation. The Company may also solicit proxies through press releases and postings on its website at www.amerisbank.com. Brokerage houses, custodians, nominees and fiduciaries will be reimbursed for the expense of sending proxy materials to the beneficial owners of Common Stock held of record on behalf of such persons.
| 10 |
The Board is asking that our shareholders elect each of the 13 director nominees identified in the table below to serve as a director until the 2025 Annual Meeting and until his or her successor is duly elected and qualified or until his or her earlier resignation, removal from office or death. See “Board of Directors — Board Members” for more information regarding each of the director nominees.
The Company requires majority voting in uncontested director elections. As a result, each director will be elected by a majority of the votes cast at the Annual Meeting, meaning that the number of shares voted “for” a director nominee must exceed the votes cast “against” such director nominee.
In an uncontested election, if an incumbent director nominee does not receive a greater number of such shares voted “for” such director than the number of such shares voted “against” such director, then our Bylaws require that such director promptly tender his or her resignation to the Board, the effectiveness of which shall be conditioned upon, and subject to, acceptance by the Board. In that situation, the Corporate Governance and Nominating Committee of the Board (the “Corporate Governance and Nominating Committee”) would make a recommendation to the Board as to whether to accept or reject the tendered resignation, or whether to take other action. Within 90 days from the date the election results are certified, the Board will act on the Corporate Governance and Nominating Committee’s recommendation and will publicly disclose its decision and the rationale behind it.
In a contested election, which is an election in which the number of director nominees exceeds the number of directors to be elected ten days before the mailing of the Company’s definitive proxy statement, director nominees are elected by a plurality of the votes cast.
The following table provides summary information about each director nominee, all of whom currently serve on our Board.
| | Name | | | Age | | | Ameris Director Since | | | Primary Occupation | | | AC | | | CC | | | NC | | | EC | | | ERC | | | CRC | |
| | William I. Bowen, Jr.* | | | 59 | | | November 2014 | | | Partner and President of Bowen Donaldson Home for Funerals | | | | | | | ✔ | | | | | | | ✔ | | ||||
| | Rodney D. Bullard* | | | 49 | | | July 2019 | | | Chief Executive Officer of The Same House | | | | | ✔ | | | | | | | | | | |||||
| | Wm. Millard Choate* | | | 71 | | | July 2019 | | | Founder and Chairman of Choate Construction Company | | | ✔ | | | | | | | | | | | CH | | ||||
| | R. Dale Ezzell* | | | 74 | | | May 2010 | | | Founder and Owner of Wisecards Printing and Mailing | | | ✔ | | | ✔ | | | | | | | | | | ||||
| | Leo J. Hill* | | | 68 | | | January 2013 | | | Founder and Owner of Advisor Network Solutions, LLC | | | | | CH | | | ✔ | | | ✔ | | | | | | |||
| | Daniel B. Jeter* | | | 72 | | | April 1997 | | | Chairman and Co-Owner of Standard Discount Corporation | | | | | ✔ | | | | | | | ✔ | | | | ||||
| | Robert P. Lynch* | | | 60 | | | February 2000 | | | Vice President and Chief Financial Officer of Lynch Management Company | | | CH FE | | | | | | | | | | | ✔ | | ||||
| | Elizabeth A. McCague* | | | 74 | | | August 2016 | | | Chief Financial Officer for Jacksonville Port Authority | | | | | | | ✔ | | | ✔ | | | CH | | | | |||
| | Claire E. McLean* | | | 44 | | | February 2024 | | | Chief Operating Officer and Executive Vice President of Preferred Capital Securities, LLC | | | | | | | | | | | | | | ||||||
| | James B. Miller, Jr. | | | 84 | | | July 2019 | | | Chairman of the Ameris Board of Directors | | | | | | | | | ✔ | | | | | | |||||
| | Gloria A. O’Neal* | | | 74 | | | July 2019 | | | Community Leader | | | ✔ | | | | | | | | | ✔ | | | | ||||
| | H. Palmer Proctor, Jr. | | | 56 | | | July 2019 | | | Chief Executive Officer of Ameris and the Bank | | | | | | | | | CH | | | | | | |||||
| | William H. Stern* | | | 67 | | | November 2013 | | | President and Chief Executive Officer of Stern Development | | | | | ✔ | | | CH | | | ✔ | | | | | |
* Independent
AC = Audit Committee Member
| 11 |
CC = Compensation Committee Member
NC = Corporate Governance and Nominating Committee Member
EC = Executive Committee Member
ERC =Enterprise Risk Committee Member
CRC = Credit Risk Committee Member
CH = Committee Chair
FE = Audit Committee Financial Expert
Proxies cannot be voted at the Annual Meeting for a greater number of persons than the number of director nominees named above.
Unless otherwise directed, the persons named as proxies in the enclosed form of proxy intend to vote “FOR” the election of each director nominee. If any such nominee for any reason should not be available as a candidate for director, then votes will be cast pursuant to authority granted by the enclosed proxy for such other candidate or candidates as may be nominated by the Board. The Board is unaware of a nominee who is unable to serve as a director or will decline to serve as a director, if elected.
| | The Board recommends a vote “FOR” the election of the nominated directors. Proxies will be voted “FOR” the election of the director nominees named above unless otherwise specified. | |
The Audit Committee of the Board (the “Audit Committee”) has appointed KPMG as our independent registered public accounting firm for the current fiscal year, which ends December 31, 2024. Our shareholders are being asked to ratify such appointment at the Annual Meeting. In view of the difficulty and expense involved in changing our independent registered public accounting firm on short notice, should the shareholders not ratify the selection of KPMG, it is contemplated that the appointment of KPMG for the fiscal year ending December 31, 2024 will stand unless the Audit Committee finds other appropriate reasons for making a change. Disapproval by the shareholders will be considered a recommendation that the Audit Committee select another independent registered public accounting firm for the following fiscal year.
Representatives of KPMG (our independent registered public accounting firm for the current fiscal year as well as for the most recently completed fiscal year) are expected to be present at the Annual Meeting, will have the opportunity to make a statement if they desire to do so and will be available to respond to appropriate questions by shareholders submitted in accordance with the procedures discussed under “Proxy Statement Summary – Shareholder Questions.”
| | The Board recommends that you vote “FOR” the ratification of the appointment of KPMG LLP as our independent registered public accounting firm for the fiscal year ending December 31, 2024. Proxies will be voted “FOR” the ratification of this appointment unless otherwise specified. | |
With this Proposal 3, our shareholders are being asked to provide an advisory vote on the 2023 compensation of our named executive officers, as it is described under “Executive Compensation.” This proposal, commonly known as a “say-on-pay” proposal, gives each shareholder the opportunity to endorse or not endorse our executive compensation program. This vote is not intended to address any specific item of compensation, but rather the overall compensation of our named executive officers and the philosophy, policies and practices described in this Proxy Statement.
| 12 |
While this vote is advisory and not binding on the Company, it will provide us with information regarding investor sentiment about our executive compensation philosophy, policies and practices, which the Compensation Committee of the Board (the “Compensation Committee”) will be able to consider when determining executive compensation for the remainder of fiscal 2024 and beyond.
In response to the voting results for the frequency of the say-on-pay vote at our 2018 Annual Meeting of Shareholders, shareholders are being given the opportunity to provide a say-on-pay advisory vote on an annual basis. In 2023, over 64 million shares of Common Stock were voted on the shareholder say-on-pay resolution, with approximately 93% of all such votes cast in favor of the executive officer compensation program described in our 2023 proxy statement.
We believe that our executive compensation policies and procedures are competitive, focused on pay-for-performance principles, strongly aligned with the long-term interests of our shareholders and designed to attract and retain the talent needed to drive shareholder value and help us meet or exceed our financial and performance targets. We also believe that the compensation of our named executive officers for 2023 reflected our financial results for 2023. We employ an executive compensation program for our senior executives that emphasizes long-term compensation, with a significant portion weighted toward equity awards. This approach strongly aligns senior executive compensation with the interest of our shareholders. Accordingly, shareholders are being asked to vote on the following resolution to be presented at the Annual Meeting:
“RESOLVED, that the holders of the Common Stock hereby approve the compensation of the named executive officers as described in this Proxy Statement under “Executive Compensation,” including the “Compensation Discussion and Analysis,” the compensation tables and related material.”
The vote by the shareholders will be a non-binding, advisory vote, meaning that the voting results will not be binding on the Company, the Compensation Committee or the Board or overrule or affect any previous action or decision by the Compensation Committee or the Board or any compensation previously paid or awarded. However, the Compensation Committee and the Board will take the voting results into account when determining executive compensation matters in the future.
Unless the Board modifies its policy on the frequency of future say-on-pay advisory votes, the next say-on-pay advisory vote will be held at the 2025 Annual Meeting.
| | The Board recommends that you vote “FOR” the approval of the compensation of our named executive officers as set forth in this Proxy Statement under “Executive Compensation,” including the “Compensation Discussion and Analysis,” the compensation tables and related material. Proxies will be voted “FOR” the approval of the compensation of our named executive officers unless otherwise specified. | |
Proposal 4 – Advisory Vote on the Frequency of the Advisory Vote on the Compensation of Our Named Executive Officers
In addition to the advisory vote on our executive compensation program, we are also seeking a non-binding determination from our shareholders as to the frequency with which shareholders would have an opportunity to provide an advisory vote on our executive compensation program. We are providing shareholders the option of selecting a frequency of one, two or three years, or abstaining. For the reasons described below, we recommend that our shareholders select a frequency of one year, or an annual vote.
As described in Proposal 3 above, our shareholders are being provided the opportunity to cast an advisory vote on our executive compensation program. This Proposal 4 affords shareholders the opportunity to cast an advisory vote on how often we should include a say-on-pay advisory vote in our proxy materials for future annual shareholders meetings (or any special shareholders meeting for which we must include executive compensation information in the proxy statement for that meeting). Under this Proposal 4, shareholders may vote to have the say-on-pay advisory vote every year, every two years or every three years.
| 13 |
We provided our shareholders with the opportunity to cast a say-on-pay advisory vote every year from 2012 through 2023. An annual advisory vote on executive compensation will allow our shareholders to provide us with their direct input on our compensation philosophy, policies and practices as disclosed in our proxy statement every year. The Board believes that an annual vote better corresponds with the presentation of compensation information in this Proxy Statement and that such practice will provide an effective way to obtain current information on shareholder sentiment about our executive compensation program. We, therefore, request that our shareholders select the “1 YEAR” option when voting on the frequency of advisory votes on our executive compensation.
The option of one year, two years or three years that receives the highest number of votes cast by shareholders will be the frequency for the advisory vote on our executive compensation that has been selected by shareholders. The Compensation Committee values the opinions expressed by shareholders in these votes and will continue to consider the outcome of these votes in making its decisions on executive compensation. However, because this vote is advisory and not binding on our Board or the Company in any way, the Board may decide that it is in the best interests of our shareholders and the Company to hold an advisory vote on our executive compensation more or less frequently than the option approved by our shareholders.
The next advisory vote on the frequency of say-on-pay proposals is scheduled to occur at our 2030 Annual Meeting of Shareholders.
| | The Board recommends that you vote for the “1 YEAR” option with respect to the frequency of the advisory vote on the compensation of our named executive officers. Proxies will be voted for the “1 YEAR” option unless otherwise specified. | |
| 14 |
The Board has adopted Principles of Corporate Governance, which were most recently amended October 27, 2022 (our “Principles of Corporate Governance”), as a framework for the governance of the Company. The Corporate Governance and Nominating Committee reviews our Principles of Corporate Governance annually and recommends changes to the Board, as appropriate. The complete text of our Principles of Corporate Governance is available at www.amerisbank.com.
Pursuant to our Principles of Corporate Governance and the listing standards of The Nasdaq Stock Market (“Nasdaq”), a majority of the members of the Board must be independent of the Company. For a director to be considered independent, the Board must determine that the director meets the independence criteria of the SEC and Nasdaq, as well as any other independence standards applicable to independent Board members as may be in effect from time to time under applicable laws, rules and regulations. For a director to be considered independent, the Board must determine that the director does not have a relationship with the Company that would interfere with the exercise of independent judgment in carrying out the responsibilities of a director. In making this determination, the Board will consider all relevant facts and circumstances, including any transactions or relationships between the director and the Company or its subsidiaries.
The Board has determined that each member of the Board, other than Messrs. Miller and Proctor, is “independent,” as defined for purposes of the rules of the SEC and the listing standards of Nasdaq.
The Company is committed to having sound corporate governance principles and practices, and independent board oversight is valued as an essential component of our corporate governance framework. Our commitment to independent oversight is demonstrated by the fact that all of our directors, except our Chairman of the Board of Directors (our “Chairman”) and our Chief Executive Officer, are independent. In addition, all of the members of the Audit Committee, the Compensation Committee, the Corporate Governance and Nominating Committee, and the Enterprise Risk Committee of the Board (the “Enterprise Risk Committee”) are independent.
Pursuant to our Principles of Corporate Governance, if the positions of Chairman and Chief Executive Officer are held by the same person, or if the Chairman is otherwise employed by the Company, then the Board shall select an independent director to serve as Lead Independent Director. The Lead Independent Director consults as appropriate with the Chairman or the Chief Executive Officer, oversees the flow of information to the Board and acts as liaison between the non-employee directors and management. The Lead Independent Director also serves as a focal point for the independent directors, thereby enhancing and clarifying the Board’s independence from management. The Lead Independent Director also has such other responsibilities as may be delegated to the Lead Independent Director by the Board from time to time.
Messrs. Miller and Proctor serve as our Chairman and our Chief Executive Officer, respectively, in each case since the Company acquired Fidelity Southern Corporation (“Fidelity”) on July 1, 2019. Upon the acquisition, Mr. Miller became employed by the Company and his employment continued until June 30, 2022, when it terminated in accordance with the terms of his employment agreement. Mr. Jeter served as Lead Independent Director from July 2019 to September 2019, and Mr. Hill has served as Lead Independent Director since September 2019.
As stated in our Principles of Corporate Governance, the Board believes that it is in the best interests of the Company for the Board to periodically evaluate and make a determination regarding whether or not to separate the roles of Chairman and Chief Executive Officer based upon the circumstances. The Board believes that having a separate Chairman and Chief Executive Officer provides a depth of dependable, decisive and experienced leadership to execute the Company’s strategy and that having these separate (although non-independent) roles, together with an engaged and experienced Lead
| 15 |
Independent Director, is the most appropriate leadership structure for the Board at this time. The Board, however, retains the flexibility to revise this structure in the future based upon its evaluation of the circumstances, including consideration of relevant governance and strategic matters.
The Enterprise Risk Committee is primarily responsible for overseeing the Company’s risk management processes on behalf of the full Board, although the Board and all of its committees are sensitive to risks relating to the Company and its operations. Through its interaction with our Chief Risk Officer, the Enterprise Risk Committee oversees credit risk, market risk (including liquidity and interest rate risk) and operational risk (including compliance and legal risk). The Enterprise Risk Committee is also responsible for overseeing the Company’s information technology and cybersecurity awareness and posture. Executive and senior information technology management provide regular updates to the Enterprise Risk Committee and to the Board, no less frequently than each quarter. The Audit Committee focuses on financial reporting risk, oversees the entire audit function and evaluates the effectiveness of internal and external audit efforts. It receives reports from management regularly regarding the Company’s assessment of the adequacy and effectiveness of internal control systems. Our external auditors meet at least quarterly with the Audit Committee in executive session to discuss potential risk and control issues involving the Company. Our Chief Risk Officer meets with both the Enterprise Risk Committee and the Audit Committee as necessary to discuss potential risk or control issues. The Enterprise Risk Committee and the Audit Committee report regularly to the full Board, which also considers the Company’s entire risk profile, including additional strategic and reputational risks. While the Board oversees the Company’s risk management, management is responsible for the day-to-day risk management processes. We believe that this division of responsibility is the most effective approach for addressing the risks facing the Company; however, we will continue to re-examine our Board leadership structure on a regular basis, recognizing that different structures may be appropriate in different situations faced by the Company.
Pursuant to our Principles of Corporate Governance, the Corporate Governance and Nominating Committee is responsible for reviewing, at least annually, the appropriate skills and experience required of directors to enable the Board to successfully perform its role in corporate governance. The Corporate Governance and Nominating Committee reviews the composition and size of the Board to ensure that it has the proper expertise and independence; determines the criteria for the selection of Board members and Board committee members; plans for continuity on the Board as existing Board members retire or rotate off the Board; establishes criteria for qualifications as independent directors, consistent with applicable laws and listing standards; reviews Board candidates recommended by shareholders in compliance with all director nomination procedures for shareholders; and recommends to the Board the slate of nominees of directors to be elected by the shareholders and any directors to be elected by the Board to fill vacancies.
The Corporate Governance and Nominating Committee has not established specific minimum age, education, experience or skill requirements for potential candidates but, in general, expects qualified candidates will have ample experience and a proven record of business success and leadership. Pursuant to our Principles of Corporate Governance: (i) director candidates will be evaluated based on their financial literacy, business acumen and experience, independence, and willingness, ability and availability for service; and (ii) directors must have the highest personal and professional ethics, integrity and values, including respectfulness, honesty and a commitment to teamwork and high standards consistent with the core values of the Company, and must consistently exercise sound and objective business judgment. It is also anticipated that the Board as a whole has individuals with significant appropriate senior management or other leadership experience, a long-term and strategic perspective and the ability to advance constructive debate.
The Corporate Governance and Nominating Committee has not adopted a formal policy with regard to the consideration of diversity in identifying director nominees. Pursuant to our Principles of Corporate Governance, in determining whether to recommend a director nominee, the members of the Corporate Governance and Nominating Committee consider and discuss diversity, among other factors, with a view toward the role and needs of the Board as a whole. When identifying and
| 16 |
recommending director nominees, the members of the Corporate Governance and Nominating Committee generally view diversity expansively to include, without limitation, concepts such as race, gender, national origin, differences of viewpoint and perspective, professional experience, education, skill and other qualities or attributes that together contribute to the functioning of the Board. The Corporate Governance and Nominating Committee and the Board believe that the inclusion of diversity as one of many factors considered in selecting director nominees is consistent with the goal of creating a Board that best serves the needs of the Company and the interests of its shareholders. At present, 21% percent of our current directors self-identify as Black or African American, Hispanic or Latinx, Asian, Native American or Alaska Native, Native Hawaiian or Pacific Islander, two or more races or ethnicities, or as LGBTQ+. Additionally, 21% of our directors self-identify as female. The following table provides information about the diversity of the Board in a standardized matrix as required by Nasdaq Rule 5606.
| | | | Board Diversity Matrix (As of March 28, 2024) | | ||||||||||||||||||||||||||||||||||||||||
| | | | Bowen | | | Bullard | | | Choate | | | Ezzell | | | Hill | | | Jeter | | | Lynch | | | McCague | | | McLean | | | Miller | | | O'Neal | | | Proctor | | | Stern | | | Veal | | |
| | Total Number of Directors - 14 | | | | | | | | | | | | | | | | | | | | | | | | | | | | | | ||||||||||||||
| | Tenure and Independence | | | | | | | | | | | | | | | | | | | | | | | | | | | | | | ||||||||||||||
| | Tenure (years) | | | 9 | | | 5 | | | 5 | | | 14 | | | 11 | | | 27 | | | 24 | | | 8 | | | <1 | | | 5 | | | 5 | | | 5 | | | 10 | | | 16 | |
| | Independence | | | • | | | • | | | • | | | • | | | • | | | • | | | • | | | • | | | • | | | | | • | | | | | • | | | • | | ||
| | Demographics | | | | | | | | | | | | | | | | | | | | | | | | | | | | | | ||||||||||||||
| | Age | | | 59 | | | 49 | | | 71 | | | 74 | | | 68 | | | 72 | | | 60 | | | 74 | | | 44 | | | 84 | | | 74 | | | 56 | | | 67 | | | 75 | |
| | Gender Identity | | | M | | | M | | | M | | | M | | | M | | | M | | | M | | | F | | | F | | | M | | | F | | | M | | | M | | | M | |
| | African American or Black | | | | | • | | | | | | | • | | | | | | | | | | | | | | | | | | | | ||||||||||||
| | Native Hawaiian or Pacific Islander | | | | | | | | | | | | | | | • | | | | | | | | | | | | | | | | |||||||||||||
| | White | | | • | | | | | • | | | • | | | | | • | | | | | • | | | • | | | • | | | • | | | • | | | • | | | • | | |||
The Corporate Governance and Nominating Committee has performed a review of the experience, qualifications, attributes and skills of the Company’s current directors and nominees and believes that such persons possess a variety of complementary skills and characteristics, including the following:
| • | Personal characteristics, including leadership, character, integrity, accountability, sound business judgment and personal reputation; |
| • | Successful business or professional experience; |
| • | Various areas of expertise or experience, including financial, strategic and general management; |
| • | Expertise or experience in various industries, including banking and financial services, hospitality, construction, consumer finance, automotive, real estate, timber, agricultural and mediation services, as well as with various non-profit organizations; |
| • | Residence in the Bank’s market areas; |
| • | Willingness and ability to commit the necessary time to fully discharge the responsibilities of a director in connection with the affairs of the Company; and |
| • | A demonstrated commitment to the success of the Company. |
For a discussion of the specific backgrounds and qualifications of our current directors and director nominees, see “Board of Directors – Board Members.”
Although the Corporate Governance and Nominating Committee has authority to retain a search firm or consultant to assist in identifying director candidates, to date no such search firm or consultant has been engaged. Additionally, the Corporate Governance and Nominating Committee would consider any director candidate proposed by any shareholder of record who has given timely written notice to
| 17 |
our Corporate Secretary as required by Article II, Section 10 of our Bylaws. The proposing shareholder’s notice to our Corporate Secretary must set forth the information required by such section, including: (i) the director candidate’s name, credentials and contact information; an undertaking to deliver a director questionnaire and other information reasonably requested by the Company with respect to such director candidate; and his or her consent to be considered as a director candidate; and (ii) the proposing shareholder’s own contact information and information regarding the proposing shareholder’s share ownership, including derivative and hedging arrangements. To be timely, a proposing shareholder’s notice must be received at the Company’s principal executive office no earlier than, and no later than, the dates determined in accordance with our Bylaws. There are no differences in the manner in which the Corporate Governance and Nominating Committee evaluates director candidates it identifies and candidates who are recommended for nomination for membership on the Board by a shareholder.
As stated in our Principles of Corporate Governance, directors are encouraged to limit the number of other boards on which they serve so as not to interfere with their service as a director of the Company. Directors who are serving as chief executives of public companies may not serve on the boards of more than two other companies in addition to the Board. Service on the boards of subsidiary companies with no publicly traded stock, non-profit organizations and non-public, for-profit organizations is not included in this calculation. Moreover, if a director sits on several mutual fund boards within the same fund family, such boards will count as one board for purposes of this calculation. In addition, members of the Audit Committee may not serve on the audit committees of more than two other public companies.
Pursuant to our Principles of Corporate Governance, when a director’s principal occupation or business association changes substantially during the director’s tenure on the Board, the director must promptly notify the Board. The Corporate Governance and Nominating Committee will evaluate and recommend to the Board whether, in light of all the circumstances, the director should continue to serve. If the Board determines that such director’s continued service is not in the best interests of the Company and its shareholders, then he or she shall tender an offer of resignation.
Our shareholders may communicate with the Board by directing correspondence to the Board, any of its committees or one or more individual members, in care of the Corporate Secretary, Ameris Bancorp, 3490 Piedmont Road N.E., Suite 1550, Atlanta, Georgia 30305. Our Corporate Secretary will forward such correspondence to the persons to whom it is addressed.
The Board conducts a self-assessment annually, and individual directors are separately evaluated each year in connection with director performance reviews. The Corporate Governance and Nominating Committee reviews and discusses with the Board the results of these annual assessments.
Director education is an essential component of good governance and effective compliance practices for financial institutions. It increases the likelihood of retaining good directors and attracting more highly skilled candidates to serve on the boards of banks. The Board’s regular meetings often include an educational and strategic session focused on a variety of topics, such as legislative and regulatory developments, important banking industry trends and fundamental bank directorship knowledge. In addition, our Chief Governance Officer and Chief Legal Officer update the Board as appropriate on relevant developments with respect to corporate governance matters.
Reflecting our commitment to principles of director education, all directors completed compliance training during 2023. Topics included information security, including privacy requirements, cybersecurity and related threats, BSA/AML compliance, fair lending, Regulation O and related legislative and agency updates.
| 18 |
The Board has delegated to the Corporate Governance and Nominating Committee responsibility for oversight of the Company’s social, environmental and sustainability initiatives. Additionally, the Company has formed an ESG Management Committee at the Bank level to evaluate and consider risk and opportunities related to such initiatives. The ESG Management Committee regularly provides to the Corporate Governance and Nominating Committee updates on the Company’s efforts with respect to environmental, social and governance matters, as well as more specifically on employee engagement, support and growth opportunities, and efforts to improve diversity and inclusion.
We believe in the potential of our communities, neighbors and employees. We are committed to creating positive change. The Company proudly supports community engagement and sustainability initiatives across the Southeast and makes investing and growing a talented, diverse and inclusive team a key priority.
The Bank’s mortgage and technology teams have created automated and scalable, electronic and robotic solutions to maximize efficiencies and human capital engagement. The Bank continues to convert thousands of customers to e-statements, online banking, mobile banking and other digital offerings. At the Ameris headquarters, which opened in July 2020, LED lighting is used, and with the support of a third-party energy consultant, the Company has further plans to reduce energy consumption and greenhouse gases across all facilities.
The Company and its employees passionately give time, talents and resources to support our communities, with efforts focused on improving educational equality, housing affordability and the overall health and wellbeing of those within the community. In 2023, the Bank gave over $3.0 million to philanthropic and civic organizations. We made 11,319 home loans and are proud of our efforts to make homeownership a reality for 4,983 first-time homebuyers and 3,050 buyers through Veterans Affairs, Fair Housing Administration or U.S. Department of Agriculture programs.
Our employees are energetic, dynamic team players and problem-solvers who are committed to going the extra mile. Ameris supports our culture of learning and dedication to our teammates by offering leadership development, numerous health and wellness programs, mentorship, tuition reimbursement and career pathways. We are committed to empowering our people, diversifying our teams and building inclusion throughout our organization.
At Ameris, we consider our teammates to be our greatest strength. At December 31, 2023, the Company employed 2,765 full-time-equivalent employees, primarily located in our core markets of Georgia, Alabama, Florida, North Carolina and South Carolina.
We take pride in listening to our employees, welcoming unique perspectives, supporting personal and professional growth and developing natural strengths. For example, each year the Company administers an employee engagement survey to gather meaningful insights and data, which is used as we continue to make improvements at Ameris and build upon our strong culture. The input obtained from these surveys helps our Board and executive officers to execute on initiatives such as the Ameris Foundation, leadership training and diversity and inclusion initiatives.
| 19 |
Effective and frequent communication is critical to supporting our growing culture and teammate needs and is carried out through regular e-newsletters, executive announcements and bulletins, which provide access to information regarding Company news, alerts and updates, as well as educational opportunities and programs.
Providing employees with meaningful, competitive and supportive benefits to care for their lives and families is a top priority for the Company. We are proud to offer a comprehensive benefits package that includes medical, dental, vision and life insurance, paid time-off, 401(k) profit-sharing plan participation and an employee stock purchase plan. The Company’s 401(k) plan matches 50% of each employee’s elective deferral amount, up to the first 8% of the contribution.
The Company’s benefits programs also include access to a network of nearby providers with options for either in-person care or virtual visits at any time. Our behavioral health benefit offers support for such issues as alcohol and drug use recovery, medication management, coping with grief and loss, and depression, anxiety and stress management.
At Ameris, our leaders develop action plans and provide mentorship to help employees reach their aspirations. Our teammates are encouraged to share their goals and dreams, and we take pride in offering professional growth opportunities through our robust learning and development initiatives.
Mentorship at all levels is encouraged throughout our organization, as it supports our culture of learning and commitment to our teammates, new ideas and leadership development. Mentor Ameris is the Bank’s formal mentorship program, whereby annually, high potential colleagues are identified as mentees and paired with a selected mentor at the Bank. A total of 26 mentees were selected to participate in the program in 2023, of which 62% were female and 41% were minorities. The program is a nine-month commitment that is designed to encourage a lifelong mentee-mentor relationship.
Launched at the end of 2020, our Leadership Development Program is a self-paced, three-tiered program available to all employees, with coursework specific to leading self, leading others and leading leaders. We believe that effective and meaningful leadership development will further elevate the Company and support us in continuing to attract and retain top talent. At the end of 2023, we had a total of 424 teammates who were enrolled in or completed the program, of which 73% were female and 38% were minorities.
The development of our employees’ skills and knowledge is critical to the success of the Company. Our educational assistance program, which provides for reimbursement of certain education expenses up to $5,250, encourages personal development through formal education, such as a degree, licensing or certification, so that teammates can maintain and improve their skills or knowledge related to their current job or foreseeable-future position at Ameris. The importance of having career development discussions and guidance with employees is shared and reinforced during manager training sessions as well, as the Company recognizes these discussions are critical to establishing pathways for career growth.
Diversity, equity and inclusion represent an integral part of our strategic vision at Ameris. The Company is committed to fostering an equitable work environment that seeks to ensure fair treatment, equality of opportunity and fairness in access to information and resources for all employees. We believe this is only possible in an environment built on respect and equal dignity, and we believe inclusion builds a culture of belonging by actively inviting the contribution and participation of all people.
As part of that commitment, the Bank appointed its first Diversity and Inclusion Officer in 2020 and established a Diversity Task Force comprised of a diverse group of 29 teammates from across the Company. This group is dedicated to cultivating an environment that supports our strategy to engage, recruit, develop, retain and advance a diverse team of talent, inclusively and equitably. Leaders from this group have established employee resource groups which are meant to bring teammates together
| 20 |
from across the Company and offer strong networking opportunities and a forum to listen and to discuss and sponsor programs, activities and empowering resources that foster diversity and inclusion education and awareness. Employee resource groups currently include women in banking, LGBTQIA+, veterans, BIPOC (Black, Indigenous and People of Color), multigenerational, caregivers and mindfulness-mental health.
As of December 31, 2023, females represent 65% of the Company’s employee population, and minorities represent 32%. In addition, females represent 42% of the Company’s senior management staff, consisting of Vice Presidents and above, and minorities represent 18%.
| 21 |
Our Bylaws provide that the Board will consist of not fewer than seven directors nor more than 15 directors, with the specific number of directors within such range being fixed by action of the Board from time to time. We currently have 14 directors; however, the Board has fixed the number of directors on the Board at 13 effective upon the election of directors at the Annual Meeting. Mr. Jimmy D. Veal has served as a director since 2008 and will retire upon the Annual Meeting. We are grateful to Mr. Veal for his many years of distinguished service to the Company.
The individual biographies below provide information about each director nominee, including information about such individual’s business experience, director positions held currently or at any time during the last five years, and the experiences, attributes or skills that caused the Corporate Governance and Nominating Committee and our Board to determine that such individual should be nominated to serve as a director. Each of the director nominees has been recommended by the Corporate Governance and Nominating Committee, and nominated by the Board, for election as a director at the Annual Meeting.
WILLIAM I. BOWEN, JR. | ||||||
 | | | Age: 59 Ameris Bancorp director since November 2014 Ameris Bank director since November 2014 | | | Board Committees: Corporate Governance and Nominating Credit Risk |
| Mr. Bowen resides in our Tifton, Georgia market, and he currently serves as Chairman of the community board of the Bank for that market. He has served as a member of the community board since 2012. Mr. Bowen is a partner and the President of Bowenz Donaldson Home for Funerals. He also serves as managing partner of Bowen Farming Enterprises, LLC, a timber, cattle, cotton and peanut farming operation, Bowen Land and Timber, LLC, Bowen Family Partnership and Fulwood Family Partnership, a farming and real estate development firm. He also serves as Vice Chairman of Tift Regional Medical Center, Chairman of Southwell Ambulatory and Chairman of the Georgia Board of Funeral Service. Mr. Bowen holds a bachelor’s degree in business administration from the University of Georgia. His extensive business experience and knowledge of the local economy, as well as his expertise in the real estate and farming industries, make Mr. Bowen a valuable resource for the Board. | ||||||
| 22 |
RODNEY D. BULLARD | ||||||
 | | | Age: 49 Ameris Bancorp director since July 2019 Ameris Bank director since July 2019 | | | Board Committees: Compensation |
| Prior to the Company’s acquisition of Fidelity, Mr. Bullard served as a director of Fidelity and Fidelity Bank since 2018. He is the Chief Executive Officer of The Same House, a public benefit corporation dedicated to furthering economic mobility and bridging social division, which he established in January 2023. Previously, he led Global Social Responsibility at Chick-fil-A, Inc., which included Vice President of Corporate Social Responsibility for Chick-fil-A, Inc., and served as Executive Director of Chick-fil-A Foundation from 2011 to 2022. Mr. Bullard served as Assistant United States Attorney for the Northern District of Georgia from 2009 to 2011 and as Legislative Liaison/Counsel in the Office of the Secretary of the Air Force, The Pentagon from 2006 to 2009. Mr. Bullard’s qualifications to serve as director include degrees earned in the Advanced Management Program from Harvard Business School; master of business administration degree from Terry College of Business, University of Georgia; and juris doctor degree from Duke Law School, and his various business and legal positions held during his career. | ||||||
WM. MILLARD CHOATE | ||||||
 | | | Age: 71 Ameris Bancorp director since July 2019 Ameris Bank director since July 2019 | | | Board Committees: Audit Credit Risk (Chair) |
| Prior to the Company’s acquisition of Fidelity, Mr. Choate served as a director of Fidelity and Fidelity Bank since 2010. Mr. Choate is the founder and currently serves as Chairman of Choate Construction Company, a commercial construction and interior construction firm founded in Atlanta, Georgia in 1989. Mr. Choate holds bachelor’s degrees in economics and business from Vanderbilt University. The experience Mr. Choate received founding his company and establishing all operations, procedures, banking, insurance and bonding relationships, marketing, preconstruction estimating and technology, in addition to his degrees in economics and business, qualify him to serve as a director. | ||||||
| 23 |
R. DALE EZZELL | ||||||
 | | | Age: 74 Ameris Bancorp director since May 2010 Ameris Bank director since May 2010 | | | Board Committees: Audit Compensation |
| Mr. Ezzell served as a director of Southland Bank, formerly a wholly owned subsidiary of the Company, from 1983 until the merger of Southland Bank into the Bank in 2006. He also served as Southland Bank’s Chairman from 1995 until such merger. Mr. Ezzell currently serves as Chairman of the Bank’s community board in Dothan, Alabama. Mr. Ezzell is the founder and owner of Wisecards Printing and Mailing, a direct mail advertising business in Abbeville, Alabama. Prior to establishing Wisecards in 2001, he served as President and Chief Executive Officer of Ezzell’s Inc., which operated several department stores in southeast Alabama and southwest Georgia, from 1987 to 2000. Mr. Ezzell holds a bachelor’s degree in engineering from Auburn University and resides in our Abbeville, Alabama market. His years as a director of a subsidiary bank, along with his varied business and practical experience, give him a valuable understanding of the issues faced by the Company and its customers. | ||||||
LEO J. HILL | ||||||
 | | | Age: 68 Ameris Bancorp director since January 2013 Ameris Bank director since January 2013 | | | Board Committees: Compensation (Chair) Corporate Governance and Nominating Executive |
| Mr. Hill has served as the Board’s Lead Independent Director since September 2019. Mr. Hill is the founder and owner of Advisor Network Solutions, LLC, a consulting services firm, and he currently serves as Lead Independent Director of Transamerica Mutual Funds. Prior to his service with Transamerica, Mr. Hill held various positions in banking, including Senior Vice President and Senior Loan Administration Officer for Wachovia Bank of Georgia’s southeastern corporate lending unit, President and Chief Executive Officer of Barnett Treasure Coast Florida with Barnett Banks and Market President of Sun Coast Florida with Bank of America. He has a bachelor’s degree in management and a master’s degree in finance, both from Georgia State University, and he has completed Louisiana State University’s Graduate School of Banking. With his wide-ranging professional and banking background, he brings a wealth of business and management experience to the Board. | ||||||
| 24 |
DANIEL B. JETER | ||||||
 | | | Age: 72 Ameris Bancorp director since April 1997 Ameris Bank director since April 2002 | | | Board Committees: Compensation Enterprise Risk |
| Mr. Jeter served as the Board’s Lead Independent Director from July 2019 to September 2019, and from January 2018 to September 2018. Prior to first serving as Lead Independent Director in 2018, and again in late 2018 through June 2019, he served as Chairman of the Board of the Company and of the board of directors of the Bank from May 2007 through December 2017. He also serves on the community bank board for the Company’s Moultrie, Georgia market. Mr. Jeter is the Chairman and co-owner of Standard Discount Corporation, a family-owned consumer finance company. He joined Standard in 1979 and is an officer and director of each of Standard’s affiliates, including Colquitt Loan Company, Globe Loan Company of Hazelhurst, Globe Loan Company of Tifton, Globe Loan Company of Moultrie, Peach Finance Company, Personal Finance Service of Statesboro and Globe Financial Services of Thomasville. He is co-owner of Classic Insurance Company and President of Cavalier Insurance Company, both of which are re-insurance companies. Mr. Jeter is also a partner in a real estate partnership that develops owner-occupied commercial properties for office and professional use. He serves as a director and an officer of the Georgia Industrial Loan Corporation and as a director of Allied Business Systems. He received a bachelor’s degree in business administration from the University of Georgia. Mr. Jeter’s extensive experience in financial services, with a particular emphasis on lending activities, gives him invaluable insight into, and affords him a greater understanding of, the Company’s operations in his service as a director. | ||||||
ROBERT P. LYNCH | ||||||
 | | | Age: 60 Ameris Bancorp director since February 2000 Ameris Bank director since February 2006 | | | Board Committees: Audit (Chair) Credit Risk |
| Mr. Lynch is the Vice President and Chief Financial Officer of Lynch Management Company, which owns and manages seven automobile dealerships located in the Southeast. He has been with Lynch Management Company for more than 30 years. Mr. Lynch’s family also owns and operates Shady Dale Farm, a beef cattle operation located in Shady Dale, Georgia. He holds a bachelor’s degree in business administration from the University of Florida. Mr. Lynch resides in our Jacksonville, Florida market and currently serves as a member of the community board of the Bank for that market. His business experience is extensive and varied, which gives him a firsthand understanding of the challenges faced by not only the Company but also its commercial customers, as well as opportunities available to the Company and its commercial customers. This understanding informs his service as a director and is a key benefit to the Board. | ||||||
| 25 |
ELIZABETH A. MCCAGUE | ||||||
 | | | Age: 74 Ameris Bancorp director since August 2016 Ameris Bank director since August 2016 | | | Board Committees: Corporate Governance and Nominating Executive Enterprise Risk (Chair) |
| Ms. McCague currently serves as Chief Financial Officer for the Jacksonville Port Authority. She previously served as Interim Executive Director and Plan Administrator for the Jacksonville Police and Fire Pension Fund, where she was responsible for the management of the $1.6 billion pension portfolio and the administration of benefits. Ms. McCague provides mediation services for resolution of financial disputes through her business, McCague & Company, LLC. Ms. McCague has previously served on the UF Health Hospital Jacksonville board as the chair of the finance committee. She also has previously served as co-chair of the University of Florida Capital Campaign, a six-year, $1.5 billion effort, and chair of the North Florida Bank’s Advisory Board. She was also formerly the Chief Operating Officer of a software development company. She holds a bachelor’s degree in business administration from the University of Florida and a master of business administration degree from Jacksonville University. She resides in our Jacksonville, Florida market. Ms. McCague’s business experience is extensive and diverse, which provides valuable insight for the Bank and its customers. | ||||||
| CLAIRE E. MCLEAN | ||||||
 | | | Age: 44 Ameris Bancorp director since February 2024 Ameris Bank director since February 2024 | | | Board Committees: None |
| Ms. McLean has served as Chief Operating Officer and Executive Vice President of Preferred Capital Securities, LLC and as President of its affiliate, Preferred Shareholder Services, since September 2023. Preferred Capital Services is an independent, third-party managing broker-dealer focused on the wholesale distribution of alternative investments to independent broker-dealers and registered investment advisors across the United States and Puerto Rico. Ms. McLean began her career in public accounting in September 2003 at Ernst & Young LLP, where she ultimately served as managing director in the Assurance Services practice from July 2018 until September 2023. She holds a bachelor of science and a master of accountancy from Auburn University. Ms. McLean’s extensive finance and accounting experience qualifies her to serve as a director. | ||||||
| 26 |
JAMES B. MILLER, JR. | ||||||
 | | | Age: 84 Ameris Bancorp director since July 2019 Ameris Bank director since July 2019 | | | Board Committees: Executive |
Mr. Miller has served as Chairman of the Board since July 2019. Prior to the Company’s acquisition of Fidelity, Mr. Miller served as Chairman of the Board and Chief Executive Officer of Fidelity since its inception in 1979. He graduated from Florida State University and Vanderbilt Law School. Mr. Miller served as a civilian army lawyer at Redstone Arsenal Facility in Huntsville, Alabama. He clerked at the Florida Supreme Court and served as Chairman of Ageka Wohnungsbau GmbH in Berlin, Germany, and other family investment companies since 1971. Mr. Miller was elected a director of Fidelity Bank in 1976. He has served on many community boards including serving as Chairman of the Dekalb County pension board for 20 years. He previously served as a director of Interface, Inc. and now serves as a director of American Software, Inc. Mr. Miller’s employment agreement with the Company provides that Mr. Miller will serve as Chairman and a member of the boards of directors of the Company and the Bank until June 30, 2022 (which is the date his employment with the Company ended in accordance with his employment agreement) and that any age restrictions relating to membership on such boards shall be waived for Mr. Miller. Accordingly, in connection with the Company’s acquisition of Fidelity, the Board determined to exclude Mr. Miller from the Company’s requirement for directors to retire from the Board at the annual meeting of the shareholders following the date that the director reaches age 75. | ||||||
GLORIA A. O’NEAL | ||||||
 | | | Age: 74 Ameris Bancorp director since July 2019 Ameris Bank director since July 2019 | | | Board Committees: Audit Enterprise Risk |
| Prior to the Company’s acquisition of Fidelity, Ms. O’Neal served as director of Fidelity and Fidelity Bank since 2018. Ms. O’Neal is a community leader who brings unique experience to the Board. She has served on many non-profit boards, including Rotary, and was a Court Appointed Special Advocate for Dekalb County and Treasurer of a preschool in Dahlonega. She remains active in a number of community outreach activities. She directs a monthly food ministry that benefits the needs of the local community and is a member of Women of Jeremiah’s Place, a non-profit organization providing financial counseling and transitional housing to homeless families. In 2014, after 33 years of service, she retired from Fidelity Bank to pursue her volunteer work. Ms. O’Neal last served at Fidelity Bank as Executive Vice President and Chief Risk Officer, after having been Internal Auditor. She has extensive experience with risk management, regulatory requirements, credit administration, operations and financial reporting, among other aspects of banking. Ms. O’Neal’s extensive banking experience qualifies her to serve as a director. | ||||||
| 27 |
H. PALMER PROCTOR, JR. | ||||||
 | | | Age: 56 Ameris Bancorp director since July 2019 Ameris Bank director since July 2019 | | | Board Committees: Executive (Chair) |
Mr. Proctor has served as Chief Executive Officer of Ameris Bancorp and Ameris Bank since July 2019, and as Vice Chairman of the Board since July 2022. Prior to the Company’s acquisition of Fidelity, Mr. Proctor served as President of Fidelity since April 2006, as Chief Executive Officer of Fidelity Bank since April 2017, as President of Fidelity Bank since October 2004, and as a director of Fidelity and Fidelity Bank since 2004. Mr. Proctor also has served as a director of Brown and Brown, Inc., an independent insurance intermediary, since 2012, and serves as a member of the Advisory Board of Allied Financial and a director of Choate Construction Company. Mr. Proctor also served as Chairman of the Georgia Bankers Association from 2017 to 2018. With experience as an executive of Fidelity and the Company, Mr. Proctor offers expertise in financial services and a unique understanding of our markets, operations and competition, all of which qualifies him to serve as a director. Mr. Proctor’s employment agreement with the Company provides that Mr. Proctor will serve as a member of the boards of directors of Ameris and the Bank. | ||||||
WILLIAM H. STERN | ||||||
 | | | Age: 67 Ameris Bancorp director since November 2013 Ameris Bank director since November 2013 | | | Board Committees: Compensation Corporate Governance and Nominating (Chair) Executive |
| Mr. Stern has been President and Chief Executive Officer of Stern Development, a real estate development firm doing work throughout the Southeast, since 1980. He currently serves as Chairman of the Board of the South Carolina State Ports Authority and as a member of the board of the South Carolina Coordinating Council for Economic Development. Mr. Stern currently serves as Chairman of the Bank’s community board for the State of South Carolina. His knowledge of the real estate industry, in addition to his extensive business experience and economic background, makes Mr. Stern a valuable resource for the Board. | ||||||
| 28 |
The Audit Committee is currently comprised of four directors, none of whom is a current or former employee of the Company and all of whom are independent directors of the Company. The current members of the Audit Committee are Messrs. Choate, Ezzell and Lynch (Chairman) and Ms. O’Neal. The Audit Committee was established in accordance with Section 3(a)(58)(A) of the Securities Exchange Act of 1934, as amended (the “Exchange Act”). The Audit Committee, which operates under a written charter, represents the Board in discharging its responsibility relating to the accounting, reporting and financial practices of the Company and its subsidiaries. Its primary functions include:
| • | Monitoring the integrity of the Company’s financial reporting process and systems of internal controls of the Company regarding finance, accounting and associated legal compliance; |
| • | Monitoring compliance with legal and regulatory requirements in relation to accounting and financial reporting processes and reporting, internal controls and auditing matters; |
| • | Monitoring the independence, qualifications and performance of the Company’s independent registered public accounting firm and internal auditing services; and |
| • | Providing a vehicle for communication among the independent registered public accounting firm, management, internal audit and the Board. |
The complete text of the Audit Committee charter is available at www.amerisbank.com.
Compensation Committee
The Compensation Committee is currently comprised of five directors – Messrs. Bullard, Ezzell, Hill (Chairman), Jeter and Stern – none of whom is a current or former employee of the Company or any of its subsidiaries and all of whom are independent directors of the Company. The duties of the Compensation Committee, which operates under a written charter, are generally to:
| • | Establish the compensation for the Company’s executive officers; and |
| • | Act on such other matters relating to compensation as it deems appropriate, including an annual evaluation of our Chief Executive Officer and the design and oversight of all compensation and benefit programs in which the Company’s employees and officers are eligible to participate. |
Additional information regarding the Compensation Committee’s processes and procedures for consideration of executive officer compensation is provided under “Executive Compensation - Compensation Discussion and Analysis.” The complete text of the Compensation Committee charter is available at www.amerisbank.com.
Corporate Governance and Nominating Committee
The Corporate Governance and Nominating Committee is currently comprised of five directors, none of whom is a current or former employee of the Company and all of whom are independent directors of the Company. The members of the Corporate Governance and Nominating Committee are Messrs. Bowen, Hill, Stern (Chairman) and Veal and Ms. McCague. Pursuant to its written charter, the Corporate Governance and Nominating Committee is responsible for:
| • | Considering, and making recommendations to the Board regarding, the size and composition of the Board, |
| • | Recommending and nominating candidates to fill Board vacancies that may occur and |
| • | Recommending to the Board the director nominees for whom the Board will solicit proxies. |
| 29 |
Additional information regarding the Corporate Governance and Nominating Committee’s processes and procedures is provided under “Governance – Director Nomination Process and Diversity.” The complete text of the Corporate Governance and Nominating Committee charter is available at www.amerisbank.com.
Executive Committee
The Executive Committee of the Board (the “Executive Committee”) is currently comprised of five directors, two of whom are current or former employees of the Company. The current members of the Executive Committee are Messrs. Hill, Miller, Proctor (Chairman) and Stern and Ms. McCague. The Executive Committee is authorized to exercise all of the powers of the Board, except those that under the Georgia Business Corporation Code may not be exercised by a committee of directors. The complete text of the Executive Committee charter is available at www.amerisbank.com.
Enterprise Risk Committee
The Enterprise Risk Committee is currently comprised of three directors, none of whom is a current or former employee of the Company and all of whom are independent directors of the Company. The members of the Enterprise Rick Committee are Mr. Jeter, Ms. McCague (Chairman) and Ms. O’Neal. Pursuant to its written charter, the complete text of which is available at www.amerisbank.com, the Enterprise Risk Committee is responsible for the oversight and governance of risk management functions, programs and activities throughout the Company.
Credit Risk Committee
The Credit Risk Committee is a Bank-level committee currently comprised of four directors, none of whom is a current or former employee of the Company and all of whom are independent directors of the Company. The directors who are members of the Credit Risk Committee are Messrs. Bowen, Choate (Chairman), Lynch and Veal. Pursuant to its written charter, the complete text of which is available at www.amerisbank.com, the Credit Risk Committee oversees the Bank’s asset quality and credit administration practices by reviewing risk strategies for the loan portfolio, loan applications, overall credit quality standards and performance, new loan products and lending strategies and compliance and adequacy of the allowance for loan and lease losses.
The following table provides the number of meetings held by the Board and its committees during 2023.
| | Director Name | | | Number of Meetings in 2023 | |
| | Board of Directors | | | 6 | |
| | Audit Committee | | | 5 | |
| | Compensation Committee | | | 5 | |
| | Corporate Governance and Nominating Committee | | | 4 | |
| | Executive Committee | | | 3 | |
| | Enterprise Risk Committee | | | 4 | |
| | Credit Risk Committee | | | 4 | |
Each director attended at least 75% of all meetings of the full Board and of those committees on which he or she served and was eligible to attend in 2023. Additionally, the independent directors met in executive sessions, without any members of management or other employees present, six times in 2023. These executive sessions allow the Board to review key decisions and discuss matters in a manner that is independent of management.
| 30 |
All members of the Board then serving participated in the Company’s 2023 Annual Meeting of Shareholders (the “2023 Annual Meeting”). Pursuant to our Principles of Corporate Governance, directors are expected to attend the Company’s annual meeting shareholders absent unusual circumstances.
The objectives of our non-employee director compensation program are to attract highly qualified individuals to serve on the Board and to appropriately align the interests of the Company’s directors with those of our shareholders. The Compensation Committee reviews the non-employee director compensation program periodically to ensure that it continues to meet these objectives. In order to determine whether the director compensation program is competitive, the Compensation Committee considers peer group and general market information on program design provided by its independent compensation consultant, as well as the significant amount of time that directors expend in fulfilling their duties to the Company and the skill level required by members of the Board.
Directors who are employees of the Company do not receive additional compensation for serving as directors of the Company. Non-employee director compensation is comprised of the following components:
| • | Annual Cash Retainer — each non-employee director receives an annual cash retainer at a rate of $60,000 per year. |
| • | Annual Equity Retainer — each non-employee director receives an annual award of time-based restricted stock with a value of approximately $85,000 per year. The restricted stock award vests on the earlier of: (i) the one-year anniversary of the date of grant; and (ii) the date of the Company’s next annual meeting of shareholders. |
| • | Non-executive Chair — receives an additional annual cash retainer at a rate of $80,000 per year. |
| • | Lead Independent Director — receives an additional annual cash retainer at a rate of $45,000 per year. |
| • | Committee Chair Retainer — the chair of each committee, if not an employee of the Company, receives an additional annual cash retainer at the rate set forth below: |
| • | Audit Committee — $30,000 per year. |
| • | Compensation Committee — $20,000 per year. |
| • | Corporate Governance and Nominating Committee — $20,000 per year. |
| • | Enterprise Risk Committee — $30,000 per year. |
| • | Executive Committee — $10,000 per year. |
| • | Credit Risk Committee — $10,000 per year. |
| • | Community Boards — each non-employee director with membership on one of the Bank’s community boards receives an additional monthly fee of $400, or $600 if serving as chair. |
Cash retainers payable to non-employee directors are prorated in any year in which the Board or committee chair appointment is not effective for the entirety of such year.
| 31 |
Director Compensation Table
The following Director Compensation Table sets forth the total compensation earned by directors for the fiscal year ended December 31, 2023. Ms. McLean, who was appointed as a director in February 2024, and Mr. Proctor, who is also a named executive officer, are not included in the table below. Compensation paid to named executive officers for their service in a director capacity, if any, is presented in the supplementary table to the Summary Compensation Table included under “Executive Compensation – Compensation Tables – Summary Compensation Table.”
| | Name | | | Fees Earned or Paid in Cash | | | Stock Awards(1) | | | Option Awards | | | Non-Equity Incentive Plan Compensation | | | Change in Pension Value and Nonqualified Deferred Compensation Earnings | | | All Other Compensation | | | Total | |
| | William I. Bowen, Jr. | | | $67,200 | | | $85,024 | | | $ — | | | $ — | | | $ — | | | $1,034 | | | $153,258 | |
| | Rodney D. Bullard | | | $60,000 | | | $85,024 | | | $— | | | $— | | | $ — | | | $1,034 | | | $146,058 | |
| | Wm. Millard Choate | | | $70,000 | | | $85,024 | | | $— | | | $— | | | $ — | | | $1,034 | | | $156,058 | |
| | R. Dale Ezzell | | | $65,000 | | | $85,024 | | | $— | | | $— | | | $ — | | | $1,034 | | | $151,058 | |
| | Leo J. Hill | | | $125,000 | | | $85,024 | | | $— | | | $— | | | $ — | | | $1,034 | | | $211,058 | |
| | Daniel B. Jeter | | | $64,800 | | | $85,024 | | | $— | | | $— | | | $ — | | | $1,034 | | | $150,858 | |
| | Robert P. Lynch | | | $94,800 | | | $85,024 | | | $— | | | $— | | | $ — | | | $1,034 | | | $180,858 | |
| | Elizabeth A. McCague | | | $90,000 | | | $85,024 | | | $— | | | $— | | | $ — | | | $1,034 | | | $176,058 | |
| | James B. Miller, Jr. | | | $140,000 | | | $85,024 | | | $— | | | $— | | | $ — | | | $907,235 | | | $1,132,259 | |
| | Gloria A. O’Neal | | | $60,000 | | | $85,024 | | | $— | | | $— | | | $ — | | | $1,034 | | | $146,058 | |
| | William H. Stern | | | $87,200 | | | $85,024 | | | $— | | | $— | | | $ — | | | $1,034 | | | $173,258 | |
| | Jimmy D. Veal | | | $67,200 | | | $85,024 | | | $— | | | $— | | | $ — | | | $1,034 | | | $153,258 | |
| (1) | The stock award amount represents the fair value of the stock awards as calculated in accordance with GAAP. The shares were issued on June 5, 2023 and the fair value was $33.54 per share. The shares vest on the earlier of June 5, 2024 and the date of the Annual Meeting, provided that the grantee continues to serve as a director of the Company through the vesting date. |
| (2) | Includes the following amounts paid to Mr. Miller pursuant to the Miller Employment Agreement (as defined below): (i) $900,000 in respect of restrictive covenants; (ii) $6,833 for COBRA continuation benefits; and (iii) $402 for dividends on restricted stock. |
Agreements with James B. Miller, Jr.
In connection with the Company’s acquisition of Fidelity, the Company and the Bank entered into an employment agreement with Mr. Miller, which became effective upon the closing of the acquisition on July 1, 2019 (the “Miller Employment Agreement”). In accordance with the Miller Employment Agreement, Mr. Miller’s employment with the Company commenced on July 1, 2019 and ended on June 30, 2022 (the “employment period”). The Miller Employment Agreement provides, among other things, that Mr. Miller would serve as Chairman and a member of the boards of directors of the Company and the Bank during the employment period.
In consideration for his services, Mr. Miller was entitled to receive during the employment period: (i) an annual base salary of $1,000,000; (ii) incentive compensation opportunities that were no less favorable than those provided by Fidelity prior to its acquisition or, if more favorable, those provided to other senior executives of the Company, provided that the target annual incentive opportunities would not be less than 50% of Mr. Miller’s annual base salary; and (iii) employee benefits and fringe benefits (including life insurance, vacation, reimbursement of club dues and automobile benefits) that were no less favorable than those provided by Fidelity prior to its acquisition or, if more favorable, those provided to other senior executives of the Company.
| 32 |
The Miller Employment Agreement also contains certain restrictive covenants, including a perpetual nondisclosure covenant and covenants concerning noncompetition and nonsolicitation of clients, customers and employees, each of which apply until 18 months after the termination of Mr. Miller’s employment. Pursuant to the Miller Employment Agreement and in consideration of such covenants, the Company paid to Mr. Miller an aggregate of $900,000, as follows: (i) $300,000 on January 15, 2023; and (ii) $25,000 in semi-monthly installment payments, which commenced on January 15, 2023 and continued until the remaining $600,000 was paid.
The Miller Employment Agreement also provided that the Company would maintain, during Mr. Miller’s lifetime, life insurance policies in the aggregate face amount of $8.0 million; however, the Company and Mr. Miller entered into the Split Dollar Termination Agreement, dated as of March 1, 2023 (the “Miller Spilt Dollar Termination Agreement”), which amended the Miller Employment Agreement to terminate this obligation of the Company effective as of such date, with the Company entitled to receive the death benefits provided for under such policies as a result. The Miller Split Dollar Termination Agreement further provides that, in connection with such termination, the Company will pay to Mr. Miller an amount equal to approximately $3.8 million, subject to payroll withholding, payable in: (i) three installments of $1.0 million in each of July 2023, 2024 and 2025; and (ii) one installment of approximately $800,000 in July 2026. Payment of this amount is not expected to result in an expense to the Company, as it has been fully accrued and the policies’ aggregate net amount at risk is approximately half of the aggregate death benefits to which the Company would become entitled. Notwithstanding the payment schedule set out in the Miller Split Dollar Termination Agreement, if the Company reasonably believes that Section 162(m) of the Internal Revenue Code of 1986, as amended (the “Code”), would prevent the Company from receiving a deduction for any portion of such payments (the “Section 162(m) Limitation”), then such portion will instead be paid in the first calendar quarter of the year in which the Company reasonably anticipates being able to receive such deduction. The Company did not make the $1,000,000 payment to Mr. Miller in July 2023 due to the Section 162(m) Limitation and, in accordance with the Miller Split Dollar Termination Agreement, will pay such payment in the first calendar quarter of the year in which the Company reasonably anticipates being able to receive such deduction.
| 33 |
The following table sets forth certain information regarding each executive officer of the Company. Our executive officers serve at the discretion of the Board, and Mr. Proctor serves subject to his employment agreement with the Company.
| | Name, Age and Term as Officer | | | Position | | | Principal Occupation for the Last Five Years and Other Directorships | |
| | H. Palmer Proctor, Jr., 56 Officer since 2019 | | | Chief Executive Officer | | | Chief Executive Officer of the Company and the Bank since July 2019, and Vice Chairman of the Board since July 2022. Prior to the Company’s acquisition of Fidelity, President of Fidelity since April 2006; Chief Executive Officer of Fidelity Bank since April 2017; President of Fidelity Bank since October 2004; and a director of Fidelity and Fidelity Bank since 2004. Also, has served as a director of Brown and Brown, Inc., an independent insurance intermediary, since 2012, and serves as a member of the Advisory Board of Allied Financial and a director of Choate Construction Company and Inspire Brands. Mr. Proctor also served as Chairman of the Georgia Bankers Association from 2017 to 2018. | |
| | Lawton E. Bassett, III, 55 Officer since 2016 | | | Corporate Executive Vice President, Chief Banking Officer and Bank President | | | Chief Banking Officer of the Company and Bank President since February 2017; Corporate Executive Vice President since February 2016; Chief Banking Officer for Alabama and Georgia from February 2016 through January 2017; and Regional President and Market President from 2006 through January 2017. From 2003 through 2006, served as President and Chief Executive Officer of Citizens Security Bank, formerly a wholly owned subsidiary of the Company. Prior to joining the Company, served in various commercial lending and leadership roles at Barnett Bank and SunTrust. | |
| | Nicole S. Stokes, 49 Officer since 2018 | | | Corporate Executive Vice President and Chief Financial Officer | | | Corporate Executive Vice President and Chief Financial Officer of the Company and the Bank since January 2018; Chief Financial Officer of the Bank since June 2016; and Senior Vice President and Controller from December 2010 through May 2016. | |
| | Ross L. Creasy, 50 Officer since 2019 | | | Corporate Executive Vice President and Chief Information Officer | | | Corporate Executive Vice President and Chief Information Officer of the Company and the Bank since July 2019. Prior to the Company’s acquisition of Fidelity, Chief Information Officer of Fidelity Bank since July 2018, during which Mr. Creasy oversaw Technology and Operations. Prior to joining Fidelity, served in various positions with E*TRADE, Capital One and the Federal Reserve. | |
| 34 |
| | Name, Age and Term as Officer | | | Position | | | Principal Occupation for the Last Five Years and Other Directorships | |
| | James A. LaHaise, 63 Officer since 2014 | | | Corporate Executive Vice President and Chief Strategy Officer | | | Corporate Executive Vice President and Chief Strategy Officer of the Company and the Bank since October 2018; Executive Vice President and Corporate Banking Executive from February 2017 through September 2018; Executive Vice President and Chief Banking Officer for Florida and South Carolina from February 2016 through January 2017; Executive Vice President, Commercial Banking Executive from June 2014 until February 2016; President and Chief Executive Officer of Coastal Bankshares, Inc. and The Coastal Bank from January 2013 until they were acquired by the Company in June 2014; and Executive Vice President and Chief Banking Officer of The Coastal Bank from May 2007 through December 2012. | |
| | William D. McKendry, 55 Officer since 2017 | | | Corporate Executive Vice President and Chief Risk Officer | | | Corporate Executive Vice President and Chief Risk Officer of the Company and the Bank since September 2017; Executive Vice President and Chief Risk Officer for Bank of North Carolina from December 2011 to September 2017; and Deputy General Auditor for First Citizens Bancshares from June 2004 to October 2011. | |
| | Michael T. Pierson, 54 Officer since 2019 | | | Corporate Executive Vice President, Chief Governance Officer and Corporate Secretary | | | Corporate Executive Vice President and Chief Governance Officer of the Company and the Bank since March 2020; Corporate Secretary of the Company and the Bank since January 2022; and Executive Vice President and Chief Operations Officer of Ameris and Ameris Bank from July 2019 to March 2020. Prior to the Company’s acquisition of Fidelity, served in various leadership roles at Fidelity and Fidelity Bank for 21 years, including Head of Commercial Banking, Mergers and Acquisitions and Chief Risk Officer. | |
| | Jody L. Spencer, 52 Officer since 2019 | | | Corporate Executive Vice President and Chief Legal Officer | | | Corporate Executive Vice President and Chief Legal Officer of the Company and the Bank since July 2019; attorney at Rogers & Hardin LLP from March 2001 to July 2019, serving as a partner from January 2008 to July 2019. | |
| | Douglas D. Strange, 54 Officer since 2024 | | | Corporate Executive Vice President and Chief Credit Officer | | | Chief Credit Officer of the Company and the Bank since April 2024; Managing Director of Credit Administration from January 2018 through March 2024; Executive Vice President of Colquitt Regional Medical Center from 2016 through 2017; Regional Credit Officer of the Bank from 2008 through 2015; and Senior Lender for the Bank from 2005 through 2008, with several years’ experience prior to joining Ameris Bank in various lending and underwriting roles and as a certified public accountant. | |
| 35 |
The following Compensation Discussion and Analysis contains statements regarding future individual and Company performance targets or goals. We have disclosed these targets or goals in the limited context of the Company’s compensation program; therefore, you should not take these statements to be statements of management’s expectations or estimates of results or other guidance. We specifically caution investors not to apply such statements in other contexts.
This Compensation Discussion and Analysis is intended to assist our shareholders in understanding the Company’s compensation program. It presents and explains the philosophy underlying our compensation strategy and the fundamental elements of compensation paid to our named executive officers (collectively, “named executive officers” or “NEOs”) whose 2023 compensation information is provided in the tables following this discussion. Our 2023 NEOs are the following:
| | NEO | | | Position | |
| | H. Palmer Proctor, Jr. | | | Chief Executive Officer | |
| | Nicole S. Stokes | | | Corporate Executive Vice President and Chief Financial Officer | |
| | Lawton E. Bassett, III | | | Corporate Executive Vice President, Chief Banking Officer and Bank President | |
| | Jon S. Edwards | | | Corporate Executive Vice President and Chief Credit Officer | |
| | James A. LaHaise | | | Corporate Executive Vice President and Chief Strategy Officer | |
Specifically, this Compensation Discussion and Analysis addresses the following:
| • | Certain relevant 2023 business performance highlights; |
| • | Shareholder outreach; |
| • | Our compensation philosophy and the objectives of our compensation program; |
| • | What our compensation program is designed to reward; |
| • | Our process for determining executive officer compensation, including: |
| − | the role and responsibility of the Compensation Committee; |
| − | the role of the Chief Executive Officer and other NEOs; |
| − | the role of compensation consultants; and |
| − | benchmarking and other market analyses; |
| • | Elements of compensation provided to our executive officers, including: |
| − | the purpose of each element of compensation; |
| − | why we elect to pay each element of compensation; |
| − | how we determine the levels or payout opportunities for each element; |
| − | decisions on final payments for each element and how these align with performance; and |
| − | compensation program design changes for 2023; and |
| • | Other compensation and benefit policies affecting our executive officers. |
| 36 |
2023 Business Performance Highlights
The Company delivered strong financial results in 2023 due to the Ameris team’s continued focus and discipline and is well positioned for 2024 as it focuses on core fundamentals in its strong Southeastern markets. The Company is proud of the results achieved in 2023, including:
| • | Net income of $269.1 million, or $3.89 per diluted share; |
| • | Adjusted net income of $276.3 million, or $4.00 per diluted share; |
| • | TBV Growth of $3.72 per share, or 12.4%, to $33.64 at December 31, 2023; |
| • | Increase in the allowance for credit losses to 1.52% of loans, from 1.04% at December 31, 2022, due to forecasted economic conditions, particularly related to commercial real estate price levels; |
| • | Nonperforming portfolio assets, excluding government-guaranteed loans, as a percentage of total assets improved to 0.33% at December 31, 2023, compared with 0.34% at December 31, 2022; |
| • | Adjusted efficiency ratio of 52.58%; |
| • | Organic growth in loans of $414.1 million, or 2.1%; |
| • | Growth in total deposits of $1.25 billion, or 6.4%; and |
| • | Growth in tangible common equity ratio of 97 basis points, or 11.2%, to 9.64% at December 31, 2023. |
Adjusted net income, tangible book value, nonperforming portfolio assets, adjusted efficiency ratio and tangible common equity ratio are non-GAAP measures. See “Reconciliation of GAAP and Non-GAAP Financial Measures” in Exhibit A to this Proxy Statement for a reconciliation of the foregoing non-GAAP measures to the most comparable GAAP measures.
Shareholder Outreach
We communicate regularly with our shareholders about matters of importance to them, as well as our corporate strategy, financial performance, long-term objectives and business opportunities. Our shareholder outreach efforts also include responding to shareholder correspondence and inquiries; attending investor conferences; engaging with analysts who cover the Company to reinforce key themes regarding corporate strategy and financial performance; engaging with proxy advisory firms; and meeting with rating agencies.
The feedback we receive through our shareholder outreach program and our advisory votes on executive compensation (“say-on-pay”) enhances our understanding of our shareholders’ views. The Board and senior management remain committed to open and transparent communication and engagement with our shareholders and take all relevant feedback into consideration when evaluating our compensation program design.
At the 2023 Annual Meeting, approximately 93% of the votes cast approved the Company’s executive compensation program for the NEOs. The Compensation Committee believes our current program adequately and effectively addresses shareholder concerns, promotes the Company’s business strategy and aligns pay with performance and shareholder value.
Compensation Philosophy and the Objectives of Our Compensation Program
Our executive compensation program reflects the Company’s commitment to pay for performance and the alignment of the interests of the Company’s executives with those of our shareholders. Our executive compensation program is designed to encourage our executives to take actions that support the Company’s short-term financial goals as well as ensure the Company’s ability to sustain strong shareholder value creation over the long term. To drive the achievement of our short- and long-term goals, our executive compensation program is designed to accomplish the following objectives:
| • | Aligning the interests of our NEOs with those of our shareholders by delivering a substantial portion of each executive’s total compensation opportunity through performance-based incentives; |
| 37 |
| • | Attracting, retaining and motivating talented executives with significant industry knowledge and the experience and leadership capability to achieve success; and |
| • | Providing a strong link between pay and performance by using cash- and equity-based incentives to reward for the achievement of short- and long-term goals that align with the Company’s strategic priorities. |
To meet these objectives, the Compensation Committee has carefully structured the Company’s compensation program to reflect our pay for performance philosophy and support long-term shareholder value creation, as follows:
| • | Competitive Compensation Opportunity. Our compensation levels are benchmarked to peers and industry comparators that are comparable to the Company in terms of factors such as asset size, geography and business model. We target annual pay levels for our NEOs based on a competitive range between the 50th and 75th percentiles of this market data. |
| • | Well-Balanced Compensation Program. The structure of our executive compensation program includes a balanced mix of cash and equity compensation with a strong emphasis on performance-based and at-risk compensation. |
| • | Alignment with Annual Goals. We use cash-based incentives that reward our NEOs for the achievement of both the financial and operating objectives of the Company and individual performance objectives, which together support our business strategy. |
| • | Performance-Based Long-Term Incentives. To strengthen the alignment between pay and performance and ensure retention of key talent, 60% of our equity-based long-term incentive compensation awarded in 2023 is tied to the achievement of longer-term (three-year) financial and strategic goals, while 40% of our equity-based long-term incentive compensation awarded in 2023 is tied to restricted stock awards that vest in equal installments over a three-year period from the date of grant. |
| • | Limited Perquisites. We provide our NEOs with minimal perquisites that are consistent with competitive market practice. |
| • | Independent Decision Makers. Our Compensation Committee of independent directors works closely with an independent compensation consultant to monitor our executive compensation program to ensure alignment with market trends and practices, our business plans and long-term strategy, and the interests of our shareholders. |
In designing and administering the Company’s executive compensation program, the Compensation Committee strives to maintain an appropriate balance across all of the various compensation elements, realizing that at times some objectives may change. In addition, external factors, such as the general state of the economy and the banking industry or legislative changes impacting executive compensation, may impact the effectiveness of existing approaches to executive compensation. Such events require ongoing monitoring and a careful reconsideration of existing approaches by the Compensation Committee. On an annual basis the Compensation Committee carefully evaluates and, where appropriate, makes adjustments to future compensation programs in an effort to consistently implement the strategic objectives of executive compensation.
What Our Executive Compensation Program is Designed to Reward
Our executive officers’ compensation program uses different components to reward different performance considerations. Base salary is provided to reward each executive for daily contributions and the application of his or her knowledge, experience and talent to the success of the Company. Base salary is also a reflection of the external value of each executive’s position in the job market and the internal value of his or her assigned roles and responsibilities to the success and ongoing viability of the Company.
| 38 |
Annual incentives are provided to focus performance on the key strategic short-term objectives defined and established on an annual basis. These incentives are strongly linked to the success of achieving annual performance objectives and provide each executive with cash rewards commensurate with the Company’s annual performance and the Board’s assessment of the executive’s personal performance.
Long-term incentives reward executives for the longer-term success of the Company. In 2023, the Company granted long-term incentives in the form of time-based restricted stock and performance stock units. This equity-based compensation rewards executives for the long-term performance of the Company and maintains the alignment between executive compensation levels and shareholder value.
Benefits provided to each executive officer are in line with our broad-based employee benefits, which meet basic health and welfare needs. We also provide supplemental executive retirement programs for certain of our key executive officers. Perquisites for our executives remain conservative and primarily serve to enhance our executives’ business development activities.
The following charts show the relative value of the various compensation components for 2023 (base salary, annual incentive at target, long-term incentive value at grant date and other compensation, including supplemental retirement and perquisites), as a percentage of 2023 total compensation. For our Chief Executive Officer, 78% of his compensation mix is allocated to at-risk performance- and or stock-based incentives.
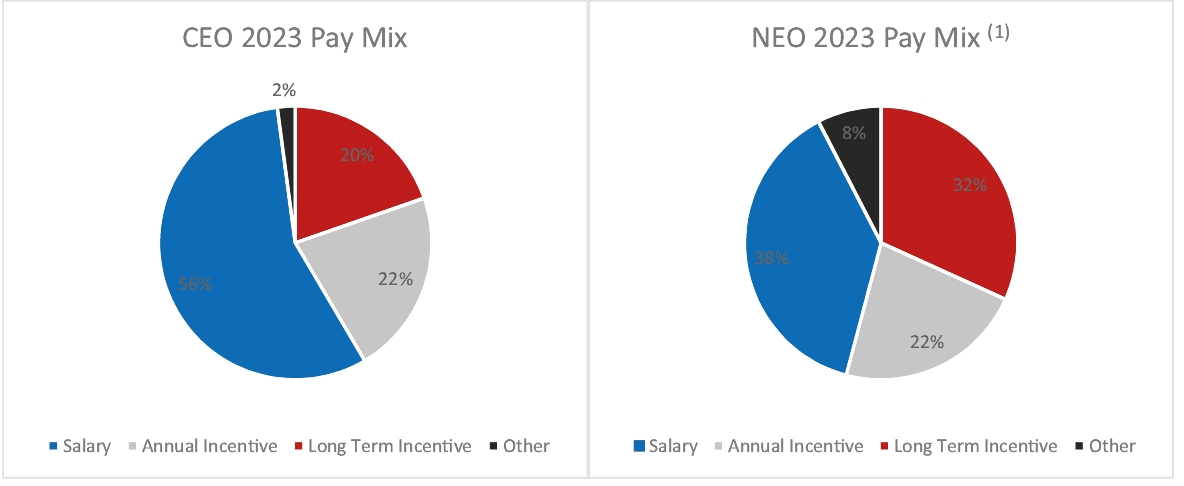
| (1) | The percentages in this graph exclude the compensation of the Chief Executive Officer. |
Process for Determining Executive Officer Compensation
Role of the Compensation Committee
The Compensation Committee administers the Company’s executive compensation program. Throughout 2023, the Compensation Committee included Messrs. Bullard, Hill (Chairman), Jeter and Stern. Mr. Ezzell was also added to the Compensation Committee in July 2023. The members of the Compensation Committee all qualify as independent, outside members of the Board in accordance with the requirements of Nasdaq and current SEC regulations.
The Compensation Committee is responsible for all compensation decisions for the Chief Executive Officer and the other NEOs. The Compensation Committee annually reviews the levels of compensation along with the performance results on goals and objectives relating to compensation for the NEOs. Based on this evaluation, the Compensation Committee makes decisions related to our executive compensation program with further approval by the Board, except where the Compensation Committee has been given final authority with respect to a specific component of compensation.
Additionally, the Compensation Committee periodically reviews our incentive plans and other equity-based plans. The Compensation Committee reviews, adopts and submits to the Board any proposed
| 39 |
arrangement or plan and any amendment to an existing arrangement or plan that provides or will provide benefits to the executive officers collectively or to an individual executive officer. The Compensation Committee has sole authority to retain and terminate compensation consultants and other advisors as it deems appropriate.
Role of the Executive Officers
The Chief Executive Officer, Chief Financial Officer and Chief Governance Officer work with the Compensation Committee to gather and compile data and supporting materials for review at Compensation Committee meetings and make recommendations about the design of our executive compensation program plans. The Chief Executive Officer annually reviews the performance of the other NEOs, after which the Chief Executive Officer presents his conclusions and recommendations to the Compensation Committee for approval. The Compensation Committee has absolute discretion as to whether it approves the recommendations of the Chief Executive Officer or makes adjustments, as it deems appropriate.
Role of the Compensation Consultant
The Compensation Committee has retained Frederic W. Cook & Co., Inc. (“FW Cook”) to serve as the Compensation Committee’s independent compensation consultant. The Compensation Committee has sole authority to retain, terminate and approve the fees of its compensation consultant. In its role as the Compensation Committee’s independent advisor, FW Cook regularly attends Compensation Committee meetings and advises on matters including compensation program design, benchmarking compensation and relative pay for performance. FW Cook also provides market data, analyses and advice regarding the compensation of our NEOs and other executive officers and our non-employee directors. FW Cook has not provided any services to the Company other than executive compensation consulting services provided to the Compensation Committee. The Compensation Committee considered the independence of FW Cook in light of current SEC rules and Nasdaq listing standards and concluded that the work of FW Cook did not raise any conflict of interest.
Benchmarking
The Compensation Committee reviews competitive data for comparable executive positions in the market. External market data is used by the Compensation Committee as a point of reference in its executive pay decisions in conjunction with financial and individual performance data. In considering the competitive environment, the Compensation Committee reviews compensation information disclosed by a peer group of comparably sized companies with which we compete for business and executive talent. In addition, information derived from published compensation surveys is used to supplement the peer group data and is used to compare the elements of each executive officer’s target total direct compensation to the market information for executives with similar roles. The Compensation Committee’s independent compensation consultant compiles this information and size-adjusts the published survey data to reflect our asset size in relation to the survey participants to more accurately reflect the scope of responsibility for each executive officer.
The Compensation Committee, with input from its independent compensation consultant, annually reviews and selects the peer companies, which generally consist of publicly traded regional commercial bank holding companies. For 2023, the peer companies were selected primarily based upon the following criteria: (i) similar business operations and geographic footprint; (ii) assets and market capitalization between approximately one-third and three times our assets and market capitalization, respectively; and (iii) competitors for executive talent.
| 40 |
For 2023 compensation actions, our peer group consisted of the following 16 companies:
| | Company | | | Total Assets (12/31/2023) | | | Company | | | Total Assets (12/31/2023) | |
| | Cadence Bank | | | $48.9 | | | Simmons First National Corporation | | | $27.3 | |
| | Pinnacle Financial Partners, Inc. | | | $48.0 | | | United Community Banks, Inc. | | | $27.3 | |
| | SouthState Corporation | | | $44.9 | | | Home Bancshares, Inc. | | | $22.7 | |
| | UMB Financial Corporation | | | $44.0 | | | Atlantic Union Bankshares Corporation | | | $21.2 | |
| | Hancock Whitney Corporation | | | $35.6 | | | Independent Bank Group, Inc. | | | $19.0 | |
| | Bank OZK | | | $34.2 | | | Trustmark Corporation | | | $18.7 | |
| | Commerce Bancshares, Inc. | | | $31.7 | | | Renasant Corporation | | | $17.4 | |
| | United Bankshares, Inc. | | | $29.9 | | | Hilltop Holdings Inc. | | | $16.5 | |
| | Median | | | $28.6 | | ||||||
| | Ameris Bancorp | | | $25.2 | | ||||||
Source: S&P Capital IQ. Data as of 12/31/2023.
(Dollars in billions)
Elements of Compensation
The components of the 2023 executive compensation program, as well as the type of compensation and the objectives of the compensation, are included in the table below.
| | Component | | | Type | | | Objectives | |
| | Base Salary | | | Fixed | | | • Attract and retain executives • Compensate executive for level of responsibility and experience | |
| | Short-Term (Annual) Incentives | | | Variable | | | • Reward achievement of the Company’s annual financial and operational goals • Promote accountability and strategic decision-making | |
| | Long-Term Incentives | | | Variable | | | • Align management and shareholder goals by linking management compensation to share price over extended period • Encourage long-term, strategic decision-making • Reward achievement of long-term Company performance goals • Promote accountability • Retain key executives | |
| | Perquisites and Other Personal Benefits | | | Fixed | | | • Foster the health and well-being of executives • Attract and retain executives | |
| | Retirement Income and Savings Plans | | | Fixed | | | • Retain key executives • Reward employee loyalty and long-term service | |
| | Post-Termination Compensation and Benefits | | | Fixed | | | • Attract and retain executives • Promote continuity in management • Promote equitable separations between the Company and its executives | |
Base Salary
It is the Company’s philosophy that employees be paid a base salary that is competitive with the salaries paid by comparable organizations based on each employee’s experience, performance and any other unique factors or qualifications. Generally, the Company has chosen to position cash compensation in a range around market median levels in order to remain competitive in attracting and
| 41 |
retaining executive talent. The range is also benchmarked, and employees are paid within the market benchmarked range based on their unique situation. Actual base salaries paid vary within a range based on performance over time. The allocation of total cash compensation between base salary and annual bonus or incentives is based on a variety of factors. In addition to the market positioning of the base salary and the mix of total compensation, the Compensation Committee also takes into consideration the following:
| • | The executive’s performance; |
| • | The performance of the Company; |
| • | The performance of the individual business or corporate function for which the executive is responsible; |
| • | The nature and importance of the position and role within the Company; |
| • | The scope of the executive’s responsibility; and |
| • | The current compensation package in place for the executive, including the executive’s current annual salary and potential awards under the Company’s incentive plan. |
After reviewing the total compensation targets for our NEOs against market data, the Compensation Committee approved the following 2023 base salary amounts, effective March 1, 2023:
| | | | 2022 Base Salary | | | 2023 Base Salary | | | Total Adjustment | | |
| | H. Palmer Proctor, Jr. | | | $885,000 | | | $925,000 | | | 5% | |
| | Nicole S. Stokes | | | $471,000 | | | $485,000 | | | 3% | |
| | Lawton E. Bassett, III | | | $500,000 | | | $500,000 | | | 0% | |
| | Jon S. Edwards | | | $402,000 | | | $414,000 | | | 3% | |
| | James A. LaHaise | | | $442,000 | | | $455,000 | | | 3% | |
Annual Incentives
The Compensation Committee believes a formalized annual incentive plan with well-defined and clearly communicated objectives strengthens the link between performance and compensation. The 2023 annual incentive plan was developed to subject a meaningful portion of our NEOs’ cash compensation to achievement of pre-established performance targets to ensure the continued alignment of executive compensation, Company performance and strategic goal attainment. Annual incentive cash payouts reflect the extent to which annual targets for performance goals are met or exceeded. Targets for performance goals are set with the intent that achievement will ultimately result in enhancement to shareholder value. When determining the targets, the Compensation Committee considers past financial performance of the Company and its internal estimates of the current year’s planned financial performance. Growth expectations as well as improved profitability and operating efficiencies are the gauge by which meaningful targets are set and executive performance is measured.
The Compensation Committee uses three performance levels when setting cash incentive targets: “Threshold”, “Target” and “Maximum”. The performance levels are set relative to the prior fiscal year’s actual results and current fiscal year projections. The Compensation Committee expects the Company to achieve or exceed the Target level of performance, which is intended to be a stretch target. The Threshold performance level is the minimum performance level required for any cash incentive payout, while the Maximum level of performance is set at a high level of performance that requires significant efforts and exceptional execution to achieve.
| 42 |
The performance measures used in 2023 were unchanged from the metrics used in 2022 as they continue to align with our internal operating plan and business strategy. The 2023 goals included the following:
| | Performance Measure | | | Weight | |
| | Credit Quality | | | 33.0% | |
| | ROA (Return on Assets) | | | 34.0% | |
| | Efficiency Ratio | | | 33.0% | |
For 2023, achievement by the NEOs at Threshold pays out at 50% of the performance goal’s weight. Achievement at Target pays out between a range of 100% and 120% of the performance goal’s weight. Achievement at Maximum pays out at 170% (the maximum achievement level or “cap”) of the performance goal’s weight. Actual results are prorated based on where they fall along the continuum from the Threshold amount through the Target amount, from the Target Minimum (100%) through the Target Maximum (120%), and from the Target amount through the Maximum amount.
In addition to the performance measures listed above, the Compensation Committee retains the ability to apply negative discretion to reduce the incentive payout, if needed. Also, total payouts can be adjusted by +/- 10% based on individual performance assessments in order to differentiate payouts based on individual contributions.
During the first quarter of 2023, the Compensation Committee established the Target percentage of base salary for each of the NEOs. The Compensation Committee used the 2023 base salary in calculating the annual incentive award payments. The following chart shows the range of annual incentive award opportunities expressed as a percentage of salary for the NEOs.
| | Named Executive Officer | | | Threshold (% of salary) | | | Target (% of salary) | | | Maximum (% of salary) | |
| | H. Palmer Proctor, Jr. | | | 55.00% | | | 110.00% | | | 187.00% | |
| | Nicole S. Stokes | | | 37.50% | | | 75.00% | | | 127.50% | |
| | Lawton E. Bassett, III | | | 32.50% | | | 65.00% | | | 110.50% | |
| | Jon S. Edwards | | | 32.50% | | | 65.00% | | | 110.50% | |
| | James A. LaHaise | | | 37.50% | | | 75.00% | | | 127.50% | |
Calculating Annual Incentive Awards
The following formula was used to calculate the payment that could be awarded to NEOs under the 2023 annual incentive award program:
Base Salary x Target Percentage of Base Salary x Company Achievement x Individual Performance
| 43 |
The 2023 performance goals for short-term incentive compensation were chosen because each of the goals strongly aligned with the overall business objectives of the Company for the year and were as follows:
| | | | 33% Weight Credit Quality | | | 34% Weight ROA(2) | | | 33% Weight Efficiency Ratio | | |
| | Threshold | | | 0.50% | | | 25th percentile | | | 59.00% | |
| | Target Minimum | | | 0.40% | | | 50th percentile | | | 56.00% | |
| | Target Maximum | | | 0.35% | | | 60th percentile | | | 55.00% | |
| | Maximum | | | 0.25% | | | 75th percentile | | | 52.00% | |
| | Actual | | | 0.33%(1) | | | 1.06% | | | 52.58% | |
| | Actual Payout Percentage | | | 130.00% | | | 97.12% | | | 160.33% | |
| | Total Weighted Payout = 128.83% | | | | | | |||||
| (1) | Excludes serviced mortgage nonaccrual loans guaranteed by The Government National Mortgage Association (“Ginnie Mae” or “GNMA”). Credit Quality, as adjusted for such loans, is a non-GAAP measure. See “Reconciliation of GAAP and Non-GAAP Financial Measures” in Exhibit A to this Proxy Statement for a reconciliation to the most comparable GAAP measure. |
| (2) | The Threshold, Target Minimum, Target Maximum and Maximum levels were calculated as 0.81%, 1.07%, 1.11% and 1.23%, respectively, based upon the indicated percentiles of the return on assets of companies comprising the KBW Regional Banking Index. |
The Company achieved: (i) above Target but below Maximum with respect to Credit Quality and Efficiency Ratio; and (ii) between Threshold and Target with respect to ROA. Based on the weighted operating performance results relative to the Targets established for 2023, a 128.83% achievement factor was reached, compared with the targeted payout factor of 100%. The Compensation Committee believes these incentive payments are aligned with the Company’s business results and compensation philosophy.
In deciding the amount of the incentive award, the Compensation Committee can consider, among other things, the Company’s overall performance and the individual participant’s specific contributions and performance throughout the performance period, as well as any actual or perceived inappropriate risks taken by participants. Individual performance criteria for all NEOs in 2023 was reviewed, and based on guidance from the Chief Executive Officer, the Compensation Committee determined to apply the 10% individual performance adjustment to the formulaic calculations for the NEOs, excluding the Chief Executive Officer. Without the Chief Executive Officer present, the Compensation Committee determined that his outstanding performance also warranted a 10% individual performance adjustment to the payout.
Annual incentive payouts for 2023 performance for the NEOs are listed below.
| | Named Executive Officer | | | Base Salary X | | | Target (% of salary) X | | | Company Achievement X | | | Individual Performance = | | | Actual Incentive Payout | |
| | H. Palmer Proctor, Jr. | | | $925,000 | | | 110% | | | 128.83% | | | 110% | | | $1,441,926 | |
| | Nicole S. Stokes | | | $485,000 | | | 75% | | | 128.83% | | | 110% | | | $515,480 | |
| | Lawton E. Bassett, III | | | $500,000 | | | 65% | | | 128.83% | | | 110% | | | $460,566 | |
| | Jon S. Edwards | | | $414,000 | | | 65% | | | 128.83% | | | 110% | | | $381,349 | |
| | James A. LaHaise | | | $455,000 | | | 75% | | | 128.83% | | | 110% | | | $483,594 | |
| 44 |
2023 Long-Term Equity Awards
The Compensation Committee believes that the Company’s executive compensation program should include a significant equity-based component because this best aligns the interests of our executives with those of our shareholders. The Company’s employees and non-employee directors may participate in the Ameris Bancorp 2021 Omnibus Equity Incentive Plan (the “2021 Plan”), under which the 2023 equity awards were issued.
Awards may be granted under the 2021 Plan from time to time and may be in the form options, stock appreciation rights, restricted shares, restricted share units, performance shares, performance units, performance awards and other stock-based awards. The 2021 Plan was approved by the Company’s shareholders at the 2021 Annual Meeting held on June 10, 2021, and amended by the Compensation Committee, effective July 26, 2022. Such amendment provides that a change in control under the 2021 Plan includes any reorganization, merger or consolidation in which a majority of the Company’s directors prior to such reorganization, merger or consolidation constitute less than a majority of the members of the board of directors (or equivalent governing body) of the company resulting from such reorganization, merger or consolidation. The 2021 Plan replaced the Ameris Bancorp 2014 Omnibus Equity Compensation Plan (the “2014 Plan”). All awards outstanding under the 2014 Plan as of June 10, 2021, the date of shareholder approval of the 2021 Plan, remained in full force and effect under the 2014 Plan according to their respective terms.
The Compensation Committee carefully considers the following factors when determining the type and amount of equity to award:
| • | Performance and contribution of the executive officer; |
| • | Prior awards issued to the executive officer; |
| • | The current amount and intrinsic value of unvested equity held by the executive officer; |
| • | Current number of shares owned by the executive officer; |
| • | Proportion of total compensation on an annual basis consisting of equity awards; and |
| • | Market data for the annual value of equity awarded to comparable positions. |
We consider long-term equity-based compensation to be critical to the alignment of executive compensation with shareholder value creation. Therefore, a market competitive, long-term equity-based incentive component is an integral part of our overall executive compensation program. The total long-term incentive award in a given year is based on a targeted dollar value that is then converted into the specific equity awards. The following chart reflects the 2023 Target award opportunities for each NEO.
| | Named Executive Officer | | | LTI Target | |
| | H. Palmer Proctor, Jr. | | | $2,600,000 | |
| | Nicole S. Stokes | | | $600,000 | |
| | Lawton E. Bassett, III | | | $500,000 | |
| | Jon S. Edwards | | | $500,000 | |
| | James A. LaHaise | | | $600,000 | |
Target long-term incentive opportunities are established based on competitive market practices, as well as the performance and contributions of the NEOs.
| 45 |
The fair value of 2023 long-term incentive awards is reflected in the Summary Compensation Table under “Executive Compensation – Compensation Tables.” In 2023, our long-term equity incentive program consisted of the following components:
| • | Performance Stock Units (60% of long-term incentive award) – All NEOs received performance stock units on February 23, 2023. These performance stock units are awards that will be earned based upon the Compensation Committee’s assessment of the performance achievement of two, equally-weighted long-term financial objectives. The following scale applies to all performance stock unit awards: (i) Threshold performance will result in the NEOs earning 25% of the shares; (ii) Target performance will result in the NEOs earning 100% of the shares; and (iii) Maximum performance will result in the NEOs earning 200% of the shares. Failure to attain the Threshold level of performance will result in the forfeiture of all shares potentially issuable in connection with such performance stock unit awards. |
| • | Fifty percent of the award was based on relative three-year TBV Growth, exclusive of the impact of changes in accumulated other comprehensive income (“AOCI”), of the Company ranked in terms of a percentile in relation to the three-year TBV Growth, exclusive of changes in AOCI, for the same period of a peer group consisting of the companies comprising the KBW Nasdaq Regional Banking Index (“KRX”) objectives. In addition, the performance stock units awards have a relative Total Shareholder Return (“TSR”) modifier comparing the TSR of the Company to that of the KRX. The Targets and corresponding performance range requires meaningful growth over the three-year performance period. Elsewhere in this Proxy Statement, we also refer to these awards as Internal Metric Performance Stock Units or “IM PSUs.” |
| • | Fifty percent of the award was based on relative return on tangible common equity (“ROTCE”), exclusive of changes in AOCI, of the Company ranked in terms of a percentile in relation to the three-year ROTCE, exclusive of changes in AOCI, for the same period of a peer group consisting of the companies comprising the KRX. In addition, the performance stock units awards have a relative TSR modifier comparing the TSR of the Company to that of the KRX. Elsewhere in this Proxy Statement, we also refer to these awards as Total Shareholder Return Performance Stock Units or “TSR PSUs.” Dividend equivalents accrue, and are credited, with respect to the IM PSU and TSR PSU awards to the extent dividends are paid on the Common Stock, but are paid out only when, and if, the award is earned. Awards earned will vest on December 31, 2025, which is the end of the three-year performance period, and shares in respect of such awards will become issuable upon the Compensation Committee’s certification of the Company’s performance for the performance period, which would be expected to occur in the first quarter of 2026. If the Company delivers three-year TSR that falls between the 25th and 75th percentiles, relative to the KRX, then no adjustment to the payout determined by the TBV Growth and ROTCE goals will be applied. However, if performance is below the 25th percentile of the KRX, then a 20% discount will be applied to the earned award. Further, if performance is above the 75th percentile of the KRX, then a 20% premium would be applied to the earned award. Regardless of performance, the total award cannot exceed 200% of Target. |
| • | Time-based Restricted Stock (40% of long-term incentive award) – Shares of restricted stock are awarded subject to transfer and vesting restrictions. Restricted stock awards are intended to build stock ownership and foster executive retention. All of the NEOs received restricted stock awards on February 23, 2023. All of these restricted stock awards have voting rights and vest in equal installments over a three-year period. Dividend equivalents on the restricted stock awards will accrue and be credited with respect to such awards to the extent dividends are paid on the Common Stock, but will only be paid out when, and if, such awards vest. |
| 46 |
2021 – 2023 Performance Stock Units
IM PSUs. On December 31, 2023, the IM PSUs which were issued to the NEOs on February 18, 2021 (the “2021 IM PSUs”) vested and exceeded the Threshold but below Target level of the TBV Growth performance condition, resulting in vesting of 93% of the target number of shares granted. A summary of the performance goals and actual results for the 2021 IM PSUs is set forth below.
| | Performance Condition | | | 2021 Internal Metric Performance Stock Units | | |||||||||
| | Threshold | | | Target | | | Maximum | | | Actual | | |||
| | TBV Growth | | | $31.53 | | | $36.03 | | | $40.94 | | | $35.60 | |
| | Incentive Payout | | | 25% | | | 100% | | | 200% | | | 93% | |
On February 15, 2024, the Compensation Committee certified the Company’s performance with respect to the IM PSUs for the 2021-2023 performance period and the following number of shares of Common Stock was subsequently issued to the NEOs pursuant to the 2021 IM PSUs to deliver a payout at approximately 93%:
| | NEO | | | Number of Shares Issued | |
| | H. Palmer Proctor, Jr. | | | 6,540 | |
| | Nicole S. Stokes | | | 2,012 | |
| | Lawton E. Bassett, III | | | 1,760 | |
| | Jon S. Edwards | | | 1,510 | |
| | James A. LaHaise | | | 1,760 | |
The calculation of TBV Growth for purposes of the 2021 IM PSUs was adjusted to exclude the impact of the Company’s acquisition of Balboa Capital Corporation in December 2021, which occurred after the performance conditions for the 2021 IM PSUs had been established.
TSR PSUs. On December 31, 2023, the TSR PSUs which were issued to the NEOs on February 18, 2021 (the “2021 TSR PSUs”) exceeded the Maximum level of the ROTCE performance condition, resulting in vesting of 200% of the target number of shares granted. A summary of the performance goals and actual results for the 2020 TSR PSUs is set forth below.
| | Performance Condition | | | 2021 Total Shareholder Return Performance Stock Units | | |||||||||
| | Threshold | | | Target | | | Maximum | | | Actual | | |||
| | ROTCE | | | 12.20% | | | 13.52% | | | 15.70% | | | 17.56% | |
| | Incentive Payout | | | 25% | | | 100% | | | 200% | | | 200% | |
On February 15, 2024, the Compensation Committee certified the Company’s performance with respect to the TSR PSUs for the 2021-2023 performance period and the following number of shares of Common Stock was subsequently issued to the NEOs pursuant to the 2021 TSR PSUs to deliver a payout at the Maximum level (200%):
| | NEO | | | Number of Shares Issued | |
| | H. Palmer Proctor, Jr. | | | 14,032 | |
| | Nicole S. Stokes | | | 4,318 | |
| | Lawton E. Bassett, III | | | 3,778 | |
| | Jon S. Edwards | | | 3,238 | |
| | James A. LaHaise | | | 3,778 | |
The 2021 TSR PSUs had a relative TSR modifier which compared the TSR of the Company to that of the KRX. If the Company’s three-year TSR was in the bottom quartile or the top quartile of the KRX, then the payout would be reduced by 20% or be increased by 20%, respectively. Regardless of
| 47 |
performance, the total award could not exceed 200% of Target. This modifier was not applied in calculating the payout for the 2021 TSR PSUs because the Company’s three-year TSR as of the end of the 2021-2023 performance period fell between the 25th and 75th percentiles relative to the KRX.
Perquisites
We provide our NEOs with minimal perquisites, such as a company car in limited instances. Additional details on perquisites are provided in a supplementary table to the Summary Compensation Table under “Executive Compensation – Compensation Tables.”
We view certain perquisites as being beneficial to the Company, in addition to being directly compensatory to the executive officers. For example, company cars, which are provided to certain executive officers based on business needs, are used primarily for business purposes. In addition, these perquisites, as a minor expense to the Company, provide a useful benefit in our efforts to recruit, attract and retain top executive talent.
Retirement Benefits
The Bank and certain executive officers and other employees of the Bank and the Company entered into Supplemental Executive Retirement Agreements (each, a “Retirement Agreement”), the purpose of which is to provide a select group of employees who are expected to contribute significantly to the future business success of the Company and the Bank with supplemental retirement income and death benefits. Such benefits are meant to retain quality executive talent over a long period of time, which is required in order to execute long-term strategy. Each Retirement Agreement provides for the payment of an annual retirement benefit, payable in monthly installments, commencing when the employee reaches age 65, provided that the employee remains employed by the Bank until the required age of 65. Included among the officers entering into a Retirement Agreement were Messrs. Bassett, Edwards and LaHaise and Ms. Stokes, all of whom are NEOs, and each of whom is to receive annual retirement benefits under his or her respective Retirement Agreement as follows: (i) Mr. Bassett, $75,000 for 15 years; (ii) Mr. Edwards $100,000 for 15 years; (iii) Mr. LaHaise $100,000 for 10 years; and (iv) Ms. Stokes, $50,000 for 15 years.
Each Retirement Agreement provides for a reduced benefit in the event that the employee terminates his or her employment prior to reaching the required age. If the termination is voluntary and without “good reason” (as defined in the Retirement Agreements), then the termination benefit is equal to the liability balance then accrued in the Company’s accounting records for the employee, to be paid out in monthly installments ratably over a period of 10 years; however, Mr. LaHaise will not become vested in this benefit until after the 10-year anniversary of the date of his Retirement Agreement. Messrs. Bassett and Edwards and Ms. Stokes vested with respect to this benefit in November 2022. If the termination of employment is involuntary and without “cause” (as defined in the Retirement Agreements), or is voluntary but with good reason, then the termination benefit is equal to the liability balance then accrued in the Company’s accounting records for the employee, to be paid out in monthly installments ratably over a period of 10 years commencing at retirement age. If the employee is terminated for cause at any time, then all remaining benefits under his or her Retirement Agreement will be forfeited.
Each Retirement Agreement also provides that if the applicable employee dies prior to reaching the required age, then the annual retirement benefit will be payable in monthly installments to the employee’s beneficiary for a period of 10 years, commencing upon the employee’s death. In addition, if the employee becomes disabled prior to reaching the required age, then the employee will be entitled to a benefit equal to the liability balance then accrued in the Company’s accounting records for the employee, to be paid out in monthly installments ratably over a period of 10 years, commencing at the time of disability.
Mr. Edwards retired from both the Company and the Bank on March 31, 2024, and will receive the retirement benefits in accordance his Retirement Agreement.
| 48 |
Under the Retirement Agreement, the following terms shall have the accompanied meanings:
| (i) | “cause” means: (a) the commission of an act by the employee involving gross negligence, willful misconduct or moral turpitude that is materially damaging to the business, customer relations, operations or prospects of the Company or the Bank that brings the Company or the Bank into public disrepute or disgrace; (b) the commission of an act by the employee constituting dishonesty or fraud against the Company or the Bank; (c) the employee is convicted of, or pleads guilty or nolo contendere to, any crime involving breach of trust or moral turpitude or any felony; or (d) a consistent pattern of failure by the employee to follow the reasonable written instructions or policies of the employee’s supervisor or the Board. |
| (ii) | “good reason” means: (a) a material reduction in the employee’s rate of regular compensation from the Bank; (b) a relocation of the employee’s principal place of employment by more than 50 miles, other than to an office or location closer to the employee’s home residence and except for required travel on Bank business to an extent substantially consistent with the employee’s business travel obligations as of the date of relocation; or (c) a material reduction in the employee’s authority, duties, title or responsibilities, other than any change resulting solely from a change in the publicly-traded status of the Company or the Bank; provided, however, that the employee must provide timely notice to the Company and the Bank of the condition the employee contends is Good Reason, and the Company and the Bank must have a period of 30 days to remedy the Good Reason. |
Executive officers are also eligible to participate in our 401(k) and profit sharing retirement plan, which is a Company-wide, tax-qualified retirement plan. The intent of this plan is to provide all employees with a tax-advantaged savings opportunity for retirement. We sponsor this plan to help employees in all levels of the Company save and accumulate assets for use during their retirement. As required, eligible pay under this plan is capped at annual limits in the Code. The Company offers a discretionary match to employee contributions based upon the performance of the Company and subject to the approval of the Board. Company contributions to the 401(k) and profit sharing plan vest in equal annual installments over a five-year period.
In addition, we also provide our employees with an employee stock purchase plan, which provides the employee with the opportunity to purchase shares of Common Stock via payroll deduction. The minimum purchase is $25, and the plan does not provide discounts or look-back features. The plan covers the administrative costs involved in the purchase of the stock.
Health and Welfare Plans
The NEOs are eligible to participate in Company-sponsored benefit plans on the same terms and conditions as those generally provided to salaried employees. Basic health benefits, dental benefits and similar programs are provided to make certain that access to healthcare and income protection is available to our employees and their family members. Health benefits also include a Section 125 plan or a health savings account to provide for pre-tax deferral for non-reimbursable health expenses. The cost of Company-sponsored benefit plans is negotiated with the providers of such benefits, and the executive officers contribute to the cost of the benefits.
Severance Agreements
On May 7, 2019, the Company and the Bank entered into a Severance Protection and Restrictive Covenants Agreement (each, a “Severance Agreement”) with each of Messrs. Bassett, Edwards and LaHaise and Ms. Stokes. In the case of each of Messrs. Bassett, Edwards and LaHaise, the Severance Agreement replaced and superseded his prior employment agreement, which automatically terminated with the execution of the Severance Agreement. The Severance Agreements were entered into following a review of executive compensation matters conducted by the Compensation Committee during which the Compensation Committee determined to provide similar terms to all executive officers for the payment of severance and other benefits upon any termination of their employment.
| 49 |
Each Severance Agreement provides that, in the event of termination of the executive’s employment by the Company without “cause” (as defined in the Severance Agreement) or by the executive for “good reason” (as defined in the Severance Agreement), the Company will pay to the executive, subject to the execution of a release of claims, certain accrued but unpaid amounts and the following severance benefits: (i) equal semi-monthly installments for two years in accordance with the Company’s normal payroll practices, totaling two times the sum of (a) the executive’s base salary and (b) the executive’s target cash bonus opportunity for the year in which the termination of employment occurred; (ii) a pro-rata portion of the cash bonus, if any, that the executive would have earned for the year during which the termination of employment occurred, based on the achievement of applicable performance goals; and (iii) reimbursement for any monthly COBRA premium paid for a period of as many as eighteen months. If a termination without cause or for good reason occurs at the time of, or within one year after, a “change of control” of the Company (as defined in the Severance Agreement), then the amounts described in clause (i) will be paid in a lump sum instead of installments.
In the event of termination of the executive’s employment on account of the executive’s death or disability, the executive (or his or her estate) will be entitled to receive, in addition to certain accrued but unpaid amounts, a pro-rata portion of the cash bonus, if any, that the executive would have otherwise earned for the year during which the termination of employment occurred, based on the achievement of applicable performance goals.
Each Severance Agreement also includes certain restrictive covenants that limit the executive’s ability to compete with the Company and the Bank and to solicit, or attempt to solicit, certain customers and employees for a period of two years after termination or to divulge certain confidential information concerning the Company or the Bank for any purpose other than as necessary in the executive’s performance of his or her duties.
Under the Severance Agreement, the following terms have the accompanied meanings:
| (i) | “cause” means: (a) the willful and continued failure of the employee to perform the employee’s duties with the Company and the Bank, other than any such failure resulting from disability, or to follow the directives of the Board or a more senior executive of the Company or the Bank, following written notice; (b) the employee’s willful misconduct or gross negligence in connection with the Company’s or the Bank’s business or relating to the employee’s duties under the Severance Agreement; (c) a willful act by the employee which constitutes a material breach of the employee’s fiduciary duty to the Company or the Bank; (d) the employee’s habitual substance abuse; (e) the employee’s being convicted of, or pleading guilty or nolo contendere to, a felony or a crime involving moral turpitude; (f) the employee’s willful theft, embezzlement or act of comparable dishonesty against the Company or the Bank; (g) a material breach by the employee of the Severance Agreement, which breach is not cured (if curable) by the employee within a specified period following notice; or (h) conduct by the employee that results in the permanent removal of the employee from the employee’s position as an officer or employee of the Company or the Bank pursuant to a written order by any banking regulatory agency with authority or jurisdiction over the Company or the Bank, as the case may be. |
| (ii) | “good reason” means: (a) a material reduction in the aggregate amount of the employee’s base salary plus annual and long-term incentive compensation opportunities; (b) a material diminution in the employee’s authority, duties or responsibilities; (c) a material change in the geographic location at which the employee must regularly perform the services to be performed by the employee pursuant to the Severance Agreement; and (d) any other action or inaction that constitutes a material breach by the Company and the Bank of the Severance Agreement; provided, however, that the employee must provide notice to the Company and the Bank of the condition the employee contends is good reason within 90 days after the initial existence of the condition, and the Company and the Bank must have a period of 30 days to remedy the condition. If the condition is not remedied within such 30-day period, then the employee must provide a notice of termination within 30 days after the end of the remedy period. |
| (iii) | “change of control” means, subject to certain exceptions, the occurrence of any of the following events: (a) any individual, entity or group (a “Person”) becomes the beneficial owner of 30% or |
| 50 |
more of either (1) the then-outstanding shares of Common Stock (the “Outstanding Company Common Stock”) or (2) the combined voting power of the then-outstanding voting securities of the Company entitled to vote generally in the election of directors (the “Outstanding Company Voting Securities”); provided, however, the following acquisitions shall not constitute a change of control: (w) any acquisition directly from the Company; (x) any acquisition by the Company; (y) any acquisition by any employee benefit plan (or related trust) sponsored or maintained by the Company; or (z) any acquisition pursuant to a transaction that complies with clauses (c)(1), (c)(2) and (c)(3) below; (b) individuals who, as of the effective date of the Severance Agreement, constitute the Board (the “Incumbent Board”) cease for any reason to constitute at least a majority of the Board; provided, however, that any individual becoming a director subsequent to the effective date whose election, or nomination for election by our shareholders, was approved by a vote of at least a majority of the directors then comprising the Incumbent Board shall be considered as though such individual was a member of the Incumbent Board, but excluding, for this purpose, any such individual whose initial assumption of office occurs as a result of an actual or threatened election contest with respect to the election or removal of directors or other actual or threatened solicitation of proxies or consents by or on behalf of a Person other than the Board; (c) consummation of a reorganization, merger, statutory share exchange or consolidation or similar transaction involving the Company or any of its subsidiaries, a sale or other disposition of all or substantially all of the assets of the Company, or the acquisition of assets or stock of another entity by the Company or any of its subsidiaries, in each case unless, following such business combination, (1) all or substantially all of the individuals and entities that were the beneficial owners of the Outstanding Company Common Stock and the Outstanding Company Voting Securities immediately prior to such business combination beneficially own, directly or indirectly, greater than 50% of the then-outstanding shares of common stock (or, for a non-corporate entity, equivalent securities) and the combined voting power of the then-outstanding voting securities entitled to vote generally in the election of directors (or equivalent governing body), as the case may be, of the entity resulting from such business combination (including, without limitation, an entity that, as a result of such transaction, owns the Company or all or substantially all of the Company’s assets either directly or through one or more subsidiaries) in substantially the same proportions as their ownership immediately prior to such business combination of the Outstanding Company Common Stock and the Outstanding Company Voting Securities, as the case may be, (2) no Person (excluding any entity resulting from such business combination or any employee benefit plan (or related trust) of the Company or such entity resulting from such business combination) beneficially owns, directly or indirectly, 30% or more of, respectively, the then-outstanding shares of common stock of the corporation (or equivalent securities) resulting from such business combination or the combined voting power of the then-outstanding voting securities of such entity, except to the extent that such ownership existed prior to the business combination, and (3) at least a majority of the members of the board of directors (or equivalent governing body) of the entity resulting from such business combination were members of the Incumbent Board at the time of the execution of the initial agreement or of the action of the Board providing for such business combination; or (d) approval by the shareholders of the Company of a complete liquidation or dissolution of the Company.
Mr. Edwards retired from the Company and the Bank effective March 31, 2024, and, as of such date, is no longer entitled to receive any payments under his Severance Agreement.
We do not maintain a separate severance plan for Mr. Proctor. Severance benefits for Mr. Proctor are limited to those set forth in the Company’s employment agreement with Mr. Proctor (the “Proctor Employment Agreement”). See “Executive Compensation – Employment Agreements.”
Other Compensation Program Aspects
Stock Ownership Requirements
To further ensure that the long-term interests of the Company’s senior management are aligned with those of our shareholders, the NEOs, as well as the Company’s non-employee directors, are required by the Company’s stock ownership guidelines to acquire and maintain a specified investment in the Company. Our current guidelines require our non-employee directors to own five times their annual
| 51 |
cash retainer in Company stock. We require our Chief Executive Officer to own stock with a market value equivalent to six times the executive’s base salary and all other NEOs to own stock with a market value equivalent to three times the executive’s base salary. All executives and non-employee directors must retain 50% of the net shares issued in the form of equity awards (after vesting, net of any tax withholdings) until the ownership requirements are attained. During the annual review conducted in 2023, it was determined that all conditions of our share ownership policy were being met at that time.
Insider Trading Policy; Hedging Restrictions
The Board has adopted an insider trading policy. The provisions of this policy expressly prohibit directors, officers and other employees of the Company and its subsidiaries from trading, either directly or indirectly, in securities of the Company after becoming aware of material nonpublic information related to the Company. To further ensure adherence with this policy, guidelines have been established for blackout periods and for appropriate disclosure of internal information to external parties. The insider trading policy provides guidance as to what constitutes material information and when information becomes public. The insider trading policy addresses transactions by family members and under Company plans, as well as other transactions which may be prohibited, such as short-term trading, short sales, publicly trading in options, hedging transactions and post-termination transactions. The policy discusses the consequences of an insider trading violation, additional trading restrictions and certain reporting requirements applicable to directors, officers and designated key employees.
The insider trading policy also expressly prohibits all officers, directors and employees of the Company and its subsidiaries from engaging in short sales of Company securities or engaging in any other type of transaction where they will earn a profit based on a decline in the Company’s stock price, or otherwise enter into any hedging or similar arrangement with respect to Company securities.
Clawback Policy
The Board approved a mandatory clawback policy, effective October 26, 2023, as required under the SEC and Nasdaq rules. Under this policy, erroneously awarded incentive compensation paid to executives must be repaid to the Company in the event of an accounting restatement.
Equity Grant Policy and Practices
A grant of equity compensation to eligible persons generally is awarded on an annual basis. The Compensation Committee has adopted a schedule and process of reviewing the program provisions and grant levels in the first quarter of the year to coincide with the annual performance management compensation review process established by the Company for all officers and other employees. The Compensation Committee specifically approves all grants of equity compensation to NEOs, other officers covered by Section 16(a) of the Exchange Act and other key employees, including the determination of the grant date for those awards.
Compensation Program Risk
We do not believe that our compensation program encourages excessive or inappropriate risk-taking. The Compensation Committee annually reviews, with the assistance of our Chief Risk Officer, compensation arrangements, agreements and benefit plans of the Company made available to the NEOs and to all other employees of the Company to ensure that such arrangements, agreements and benefit plans do not encourage those employees to take unnecessary and excessive risks that could threaten the financial condition of the Company.
In connection with this review, the Compensation Committee reviews an inventory of its executive and non-executive compensation programs, with particular emphasis on incentive compensation plans or programs. The Compensation Committee evaluates, with the assistance of appropriate officers of the Company, the primary components of its compensation plans and practices to identify whether those components, either alone or in combination, properly balance compensation opportunities and risk. The Compensation Committee considers various risk-mitigating policies and terms adopted by the
| 52 |
Company in connection with this analysis, including the Company’s stock ownership requirements, incentive compensation and clawback provisions. The Compensation Committee concluded, after such review, that the arrangements, agreements and benefit plans of the Company do not encourage those employees to take such risks. The Compensation Committee expects to continue monitoring and periodically evaluating these incentive compensation arrangements, agreements and benefit plans at least annually, as part of the Company’s oversight of risk management for the organization.
None of Messrs. Bullard, Ezzell, Hill, Jeter or Stern, each of whom is a member of the Compensation Committee, is or has been an officer or employee of the Company.
| 53 |
The Compensation Committee has reviewed and discussed the “Compensation Discussion and Analysis” in this Proxy Statement with the Company’s management and, based on such review and discussions, has recommended to the Board that the “Compensation Discussion and Analysis” be included in this Proxy Statement.
Submitted by the Compensation Committee:
Leo J. Hill (Chair)
Rodney D. Bullard
R. Dale Ezzell
Daniel B. Jeter
William H. Stern
| 54 |
The Summary Compensation Table below sets forth the total compensation awarded to, earned by or paid to our NEOs for 2021, 2022 and 2023.
| | Name and Principal Position | | | Year | | | Salary | | | Bonus | | | Stock Awards(1)(2) | | | Option Awards | | | Non-Equity Incentive Plan Compensation | | | Change in Pension Value and Nonqualified Deferred Compensation Earnings | | | All Other Compensation(3) | | | Total | |
| | H. Palmer Proctor, Jr. Chief Executive Officer | | | 2023 | | | $918,333 | | | $— | | | $2,629,751 | | | $— | | | $1,441,926 | | | $— | | | $98,204 | | | $5,088,214 | |
| | 2022 | | | $879,167 | | | $— | | | $2,008,597 | | | $— | | | $1,465,458 | | | $— | | | $50,201 | | | $4,403,423 | | |||
| | 2021 | | | $850,000 | | | $— | | | $1,317,066 | | | $— | | | $1,219,240 | | | $— | | | $51,200 | | | $3,437,506 | | |||
| | Nicole S. Stokes Corporate EVP and CFO | | | 2023 | | | $482,667 | | | $— | | | $606,862 | | | $— | | | $515,480 | | | $15,462 | | | $46,105 | | | $1,666,576 | |
| | 2022 | | | $468,000 | | | $— | | | $602,578 | | | $— | | | $531,765 | | | $19,745 | | | $30,059 | | | $1,652,147 | | |||
| | 2021 | | | $450,833 | | | $— | | | $405,266 | | | $— | | | $422,359 | | | $10,286 | | | $35,183 | | | $1,323,927 | | |||
| | Lawton E. Bassett, III EVP and Banking Group President | | | 2023 | | | $500,000 | | | $— | | | $505,709 | | | $— | | | $460,566 | | | $38,429 | | | $45,908 | | | $1,550,612 | |
| | 2022 | | | $500,000 | | | $— | | | $502,149 | | | $— | | | $489,239 | | | $46,576 | | | $25,028 | | | $1,562,992 | | |||
| | 2021 | | | $500,000 | | | $— | | | $354,584 | | | $— | | | $466,180 | | | $26,867 | | | $29,283 | | | $1,376,914 | | |||
| | Jon S. Edwards Corporate EVP and Chief Credit Officer | | | 2023 | | | $412,000 | | | $— | | | $505,709 | | | $— | | | $381,349 | | | $110,005 | | | $42,687 | | | $1,451,750 | |
| | 2022 | | | $399,333 | | | $— | | | $502,149 | | | $— | | | $393,348 | | | $134,560 | | | $24,707 | | | $1,454,097 | | |||
| | 2021 | | | $384,167 | | | $— | | | $303,994 | | | $— | | | $359,891 | | | $80,864 | | | $28,382 | | | $1,157,298 | | |||
| | James A. LaHaise Corporate EVP and Chief Strategy Officer | | | 2023 | | | $452,833 | | | $— | | | $606,862 | | | $— | | | $483,594 | | | $97,355 | | | $45,858 | | | $1,686,502 | |
| | 2022 | | | $439,167 | | | $— | | | $602,578 | | | $— | | | $499,024 | | | $110,444 | | | $27,775 | | | $1,678,988 | | |||
| | 2021 | | | $416,667 | | | $— | | | $354,584 | | | $— | | | $396,253 | | | $74,456 | | | $33,179 | | | $1,275,139 | |
| (1) | Represents the aggregate grant date fair values of the awards. For all years presented, grants were made in the form of: (i) restricted stock awards, which vest in equal installments over a three-year period; (ii) IM PSUs, which for 2023 are based on relative TBV Growth of the Company, exclusive of changes in AOCI, ranked in terms of a percentile in relation to the three-year TBV Growth, exclusive of changes in AOCI, for the same period of a peer group consisting of the companies comprising the KRX and are subject to a TSR modifier comparing the TSR of the Company to that of the KRX and prior to 2023 which were based on internal TBV Growth objectives over a three-year period; and (iii) TSR PSUs, which are based on relative ROTCE of the Company ranked in terms of a percentile in relation to the three-year ROTCE for the same period of a peer group consisting of the companies comprising the KRX and are subject to a TSR modifier comparing the TSR of the Company to that of the KRX. See the Grants of Plan-Based Awards under “Executive Compensation-Compensation Tables.” |
| (2) | The fair value of the performance stock units granted to each NEO as of the grant date, assuming maximum performance, is as follows: Mr. Proctor, $2,999,196; Ms. Stokes, $692,122; Mr. Bassett, $576,722; Mr. Edwards, $576,722; and Mr. LaHaise, $692,122. |
| (3) | Details on the amounts reported for All Other Compensation in 2023 are set forth in the following supplementary table. |
| | Named Executive Officer | | | Auto Provision(a) | | | Dividends | | | Employer 401(k) Match | | | Health and Welfare(b) | | | Life Insurance | |
| | H. Palmer Proctor, Jr. | | | $7,536 | | | $56,495 | | | $13,200 | | | $15,715 | | | $5,258 | |
| | Nicole S. Stokes | | | $— | | | $18,600 | | | $11,250 | | | $15,715 | | | $540 | |
| | Lawton E. Bassett, III | | | $3,300 | | | $20,969 | | | $13,200 | | | $6,891 | | | $1,548 | |
| | Jon S. Edwards | | | $— | | | $18,120 | | | $13,200 | | | $8,991 | | | $2,376 | |
| | James A. LaHaise | | | $— | | | $18,465 | | | $13,200 | | | $11,817 | | | $2,376 | |
| (a) | Amounts reported in the table reflect the personal-use levels of this perquisite. |
| (b) | Amounts incurred by the Company for the employer’s cost of providing health and welfare benefits. |
| 55 |
The Grants of Plan-Based Awards table below sets forth the total number of equity awards granted in 2023 and the grant date fair values of those awards. The Grants of Plan-Based Awards table should be read in conjunction with the Summary Compensation Table.
| | Name | | | Plan/Grant Date | | | Award Type | | | Estimated Future Payouts Under Non-Equity Incentive Plan Awards(1) | | | Estimated Future Payouts Under Equity Incentive Plan Awards(2) | | | All Other Stock Awards: Number of Shares of Stock or Units (#)(3) | | | Grant Date Fair Value of Stock Awards(4) | | ||||||||||||
| | Threshold ($) | | | Target ($) | | | Maximum ($) | | | Threshold (#) | | | Target (#) | | | Maximum (#) | | |||||||||||||||
| | H. Palmer Proctor, Jr. | | | 2/23/2023 | | | STI | | | 508,750 | | | 1,017,500 | | | 1,729,750 | | | — | | | — | | | — | | | — | | | — | |
| | | | 2/23/2023 | | | RSA | | | — | | | — | | | — | | | — | | | — | | | — | | | 21,537 | | | 1,040,022 | | |
| | | | 2/23/2023 | | | IM PSU | | | — | | | — | | | — | | | 4,038 | | | 16,152 | | | 32,304 | | | — | | | 794,840 | | |
| | | | 2/23/2023 | | | TSR PSU | | | — | | | — | | | — | | | 4,038 | | | 16,153 | | | 32,306 | | | — | | | 794,889 | | |
| | Nicole S. Stokes | | | 2/23/2023 | | | STI | | | 181,875 | | | 363,750 | | | 618,375 | | | — | | | — | | | — | | | — | | | — | |
| | | | 2/23/2023 | | | RSA | | | — | | | — | | | — | | | — | | | — | | | — | | | 4,970 | | | 240,001 | | |
| | | | 2/23/2023 | | | IM PSU | | | — | | | — | | | — | | | 932 | | | 3,727 | | | 7,454 | | | — | | | 183,406 | | |
| | | | 2/23/2023 | | | TSR PSU | | | — | | | — | | | — | | | 932 | | | 3,728 | | | 7,456 | | | — | | | 183,455 | | |
| | Lawton E. Bassett, III | | | 2/23/2023 | | | STI | | | 162,500 | | | 325,000 | | | 552,500 | | | — | | | — | | | — | | | — | | | — | |
| | | | 2/23/2023 | | | RSA | | | — | | | — | | | — | | | — | | | — | | | — | | | 4,142 | | | 200,017 | | |
| | | | 2/23/2023 | | | IM PSU | | | — | | | — | | | — | | | 777 | | | 3,106 | | | 6,212 | | | — | | | 152,846 | | |
| | | | 2/23/2023 | | | TSR PSU | | | — | | | — | | | — | | | 777 | | | 3,106 | | | 6,212 | | | — | | | 152,846 | | |
| | Jon S. Edwards | | | 2/23/2023 | | | STI | | | 134,550 | | | 269,100 | | | 457,470 | | | — | | | — | | | — | | | — | | | | |
| | | | 2/23/2023 | | | RSA | | | — | | | — | | | — | | | — | | | — | | | — | | | 4,142 | | | 200,017 | | |
| | | | 2/23/2023 | | | IM PSU | | | — | | | — | | | — | | | 777 | | | 3,106 | | | 6,212 | | | — | | | 152,846 | | |
| | | | 2/23/2023 | | | TSR PSU | | | — | | | — | | | — | | | 777 | | | 3,106 | | | 6,212 | | | — | | | 152,846 | | |
| | James A. LaHaise | | | 2/23/2023 | | | STI | | | 170,625 | | | 341,250 | | | 580,125 | | | — | | | — | | | — | | | — | | | — | |
| | | | 2/23/2023 | | | RSA | | | — | | | — | | | — | | | — | | | — | | | — | | | 4,970 | | | 240,001 | | |
| | | | 2/23/2023 | | | IM PSU | | | — | | | — | | | — | | | 932 | | | 3,727 | | | 7,454 | | | — | | | 183,406 | | |
| | | | 2/23/2023 | | | TSR PSU | | | — | | | — | | | — | | | 932 | | | 3,728 | | | 7,456 | | | — | | | 183,455 | | |
| STI | | | = Short Term (Annual) Incentives |
| RSA | | | = Restricted Stock Award |
| IM PSU | | | = Internal Metric Performance Stock Units |
| TSR PSU | | | = Total Shareholder Return Performance Stock Units |
| (1) | The amounts shown under the Target column reflect the possible payment if performance measures are achieved at Target level under the short-term incentive plan as approved by the Board on February 23, 2023. The amounts shown under the Threshold column reflect the possible minimum payment level under the short-term incentive plan, which is 50% of Target. The amounts shown under the Maximum column reflect the maximum possible payment under the short-term incentive plan, which is 170% of Target. |
| (2) | Amounts represent the estimated Threshold, Target and Maximum payouts as of the grant date for the NEOs’ 2023 awards of performance stock units. The actual value realized by the NEO for the 2023 performance stock units will not be determined until the time of vesting. |
| (3) | Amounts represent the NEOs’ 2023 restricted stock award. The grant date fair value of the restricted stock awards approved by the Board for all NEOs and granted on February 23, 2023 was $48.29 per share. |
| (4) | Amounts granted pursuant to the 2021 Plan as described in the “Executive Compensation-Compensation Discussion and Analysis.” Assumptions used to calculate fair market value are provided in Note 15 to the Company’s consolidated financial statement included in the Company’s Annual Report on Form 10-K for the year ended December 31, 2023. |
| 56 |
Outstanding Equity Awards at Fiscal Year-End
The Outstanding Equity Awards at Fiscal Year-End table below sets forth information regarding the outstanding equity awards held by the NEOs at December 31, 2023. The value of stock awards is based on $53.05, the reported closing price of one share of Common Stock on December 31, 2023.
| | Name | | | Award Type | | | Number of Shares or Units of Stock That Have Not Vested (#) | | | Market Value of Shares or Units of Stock That Have Not Vested | | | Equity Incentive Plan Awards: Number of Unearned Shares, Units or Other Rights That Have Not Vested (#) | | | Equity Incentive Plan Awards: Market or Payout Value of Unearned Shares, Units or Other Rights That Have Not Vested | | | Date Equity Fully Vests | |
| | H. Palmer Proctor, Jr. | | | RSA | | | 4,677 | | | $248,115 | | | | | | | 2/18/2024(1) | | ||
| | RSA | | | 14,166 | | | $751,506 | | | | | | | 2/24/2024(2)(7) | | |||||
| | IM PSU(8) | | | | | | | 10,480 | | | $555,964 | | | 12/31/2024(3) | | |||||
| | TSR PSU(8) | | | | | | | 10,480 | | | $555,964 | | | 12/31/2024(4) | | |||||
| | RSA | | | 14,166 | | | $751,506 | | | | | | | 2/24/2025(2)(7) | | |||||
| | IM PSU(8) | | | | | | | 16,152 | | | $856,864 | | | 12/31/2025(5) | | |||||
| | TSR PSU(8) | | | | | | | 16,153 | | | $856,917 | | | 12/31/2025(6) | | |||||
| | RSA | | | 7,179 | | | $380,846 | | | | | | | 2/24/2026(7) | | |||||
| | Nicole S. Stokes | | | RSA | | | 1,439 | | | $76,339 | | | | | | | 2/18/2024(1) | | ||
| | RSA | | | 3,753 | | | $199,097 | | | | | | | 2/24/2024(2)(7) | | |||||
| | IM PSU(8) | | | | | | | 3,144 | | | $166,789 | | | 12/31/2024(3) | | |||||
| | TSR PSU(8) | | | | | | | 3,144 | | | $166,789 | | | 12/31/2024(4) | | |||||
| | RSA | | | 3,753 | | | $199,097 | | | | | | | 2/24/2025(2)(7) | | |||||
| | IM PSU(8) | | | | | | | 3,727 | | | $197,717 | | | 12/31/2025(5) | | |||||
| | TSR PSU(8) | | | | | | | 3,728 | | | $197,770 | | | 12/31/2025(6) | | |||||
| | RSA | | | 1,656 | | | $87,851 | | | | | | | 2/24/2026(7) | | |||||
| | Lawton E. Bassett, III | | | RSA | | | 1,259 | | | $66,790 | | | | | | | 2/18/2024(1) | | ||
| | RSA | | | 3,128 | | | $165,940 | | | | | | | 2/24/2024(2)(7) | | |||||
| | IM PSU(8) | | | | | | | 2,620 | | | $138,991 | | | 12/31/2024(3) | | |||||
| | TSR PSU(8) | | | | | | | 2,620 | | | $138,991 | | | 12/31/2024(4) | | |||||
| | RSA | | | 3,128 | | | $165,940 | | | | | | | 2/24/2025(2)(7) | | |||||
| | IM PSU(8) | | | | | | | 3,106 | | | $164,773 | | | 12/31/2025(5) | | |||||
| | TSR PSU(8) | | | | | | | 3,106 | | | $164,773 | | | 12/31/2025(6) | | |||||
| | RSA | | | 1,380 | | | $73,209 | | | | | | | 2/24/2026(7) | | |||||
| | Jon S. Edwards | | | RSA | | | 1,079 | | | $57,241 | | | | | | | 2/18/2024(1) | | ||
| | RSA | | | 3,128 | | | $165,940 | | | | | | | 2/24/2024(2)(7) | | |||||
| | IM PSU(8) | | | | | | | 2,620 | | | $138,991 | | | 12/31/2024(3) | | |||||
| | TSR PSU(8) | | | | | | | 2,620 | | | $138,991 | | | 12/31/2024(4) | | |||||
| | RSA | | | 3,128 | | | $165,940 | | | | | | | 2/24/2025(2)(7) | | |||||
| | IM PSU(8) | | | | | | | 3,106 | | | $164,773 | | | 12/31/2025(5) | | |||||
| | TSR PSU(8) | | | | | | | 3,106 | | | $164,773 | | | 12/31/2025(6) | | |||||
| | RSA | | | 1,380 | | | $73,209 | | | | | | | 2/24/2026(7) | |
| 57 |
| | Name | | | Award Type | | | Number of Shares or Units of Stock That Have Not Vested (#) | | | Market Value of Shares or Units of Stock That Have Not Vested | | | Equity Incentive Plan Awards: Number of Unearned Shares, Units or Other Rights That Have Not Vested (#) | | | Equity Incentive Plan Awards: Market or Payout Value of Unearned Shares, Units or Other Rights That Have Not Vested | | | Date Equity Fully Vests | |
| | James A. LaHaise | | | RSA | | | 1,259 | | | $66,790 | | | | | | | 2/18/2024(1) | | ||
| | RSA | | | 3,753 | | | $199,097 | | | | | | | 2/24/2024(2)(7) | | |||||
| | IM PSU(8) | | | | | | | 3,144 | | | $166,789 | | | 12/31/2024(3) | | |||||
| | TSR PSU(8) | | | | | | | 3,144 | | | $166,789 | | | 12/31/2024(4) | | |||||
| | RSA | | | 3,753 | | | $199,097 | | | | | | | 2/24/2025(2)(7) | | |||||
| | IM PSU(8) | | | | | | | 3,727 | | | $197,717 | | | 12/31/2025(5) | | |||||
| | TSR PSU(8) | | | | | | | 3,728 | | | $197,770 | | | 12/31/2025(6) | | |||||
| | RSA | | | 1,656 | | | $87,851 | | | | | | | 2/24/2026(7) | |
| RSA | | | = Restricted Stock Award |
| IM PSU | | | = Internal Metric Performance Stock Unit |
| TSR PSU | | | = Total Shareholder Return Performance Stock Unit |
| (1) | RSA granted on February 18, 2021, which vests in equal installments over a three-year period. |
| (2) | RSA granted on February 24, 2022, which vests in equal installments over a three-year period. |
| (3) | IM PSUs granted on February 24, 2022, which are based on TBV Growth objectives over the three-year period. |
| (4) | TSR PSUs granted on February 24, 2022, which are based on relative ROTCE of the Company ranked in terms of a percentile in relation to the three-year ROTCE for the same period of a peer group consisting of the companies comprising the KRX and are subject to a TSR modifier comparing the TSR of the Company to that of the KRX. The fair values of the TSR PSUs at the grant date were determined using a Monte Carlo simulation method. |
| (5) | IM PSUs granted on February 23, 2023, which are based on relative TBV Growth of the Company, exclusive of changes in AOCI, ranked in terms of a percentile in relation to the three-year TBV Growth, exclusive of changes in AOCI, for the same period of a peer group consisting of the companies comprising the KRX and are subject to a TSR modifier comparing the TSR of the Company to that of the KRX. The fair values of the TSR PSUs at the grant date were determined using a Monte Carlo simulation method. |
| (6) | TSR PSUs granted on February 23, 2023, which are based on relative ROTCE of the Company ranked in terms of a percentile in relation to the three-year ROTCE for the same period of a peer group consisting of the companies comprising the KRX and are subject to a TSR modifier comparing the TSR of the Company to that of the KRX. The fair values of the TSR PSUs at the grant date were determined using a Monte Carlo simulation method. |
| (7) | RSA granted on February 23, 2023, which vests in equal installments over a three-year period. |
| (8) | Included at Target level. |
| 58 |
Stock Vested
The Stock Vested table below reflects restricted stock vesting during fiscal year 2023.
| | | | Number of Shares Acquired on Vesting (#) | | | Value Realized on Vesting | | |
| | H. Palmer Proctor, Jr. | | | 38,063 | | | $1,903,016(1)(6) | |
| | Nicole S. Stokes | | | 11,807 | | | $589,290(2)(6) | |
| | Lawton E. Bassett, III | | | 10,810 | | | $535,458(3)(6) | |
| | Jon S. Edwards | | | 9,516 | | | $470,996(4)(6) | |
| | James A. LaHaise | | | 10,835 | | | $538,469(5)(6) | |
| (1) | Reflects the value of 4,678 shares at the closing price of $48.92 for one share of Common Stock on February 18, 2023, the value of 6,986 shares at the closing price of $48.02 for one share of Common Stock on February 24, 2023, the value of 5,827 shares at the closing price of $42.45 for one share of Common Stock on March 11, 2023 and the value of 20,572 shares at the closing price of $53.05 for one share of Common Stock on December 31, 2023. |
| (2) | Reflects the value of 1,439 shares at the closing price of $48.92 for one share of Common Stock on February 18, 2023, the value of 2,096 shares at the closing price of $48.02 for one share of Common Stock on February 24, 2023, the value of 1,942 shares at the closing price of $42.45 for one share of Common Stock on March 11, 2023 and the value of 6,330 shares at the closing price of $53.05 for one share of Common Stock on December 31, 2023. |
| (3) | Reflects the value of 1,259 shares at the closing price of $48.92 for one share of Common Stock on February 18, 2023, the value of 1,746 shares at the closing price of $48.02 for one share of Common Stock on February 24, 2023, the value of 2,267 shares at the closing price of $42.45 for one share of Common Stock on March 11, 2023 and the value of 5,538 shares at the closing price of $53.05 for one share of Common Stock on December 31, 2023. |
| (4) | Reflects the value of 1,080 shares at the closing price of $48.92 for one share of Common Stock on February 18, 2023, the value of 1,746 shares at the closing price of $48.02 for one share of Common Stock on February 24, 2023, the value of 1,942 shares at the closing price of $42.45 for one share of Common Stock on March 11, 2023 and the value of 4,748 shares at the closing price of $53.05 for one share of Common Stock on December 31, 2023. |
| (5) | Reflects the value of 1,259 shares at the closing price of $48.92 for one share of Common Stock on February 18, 2023, the value of 2,096 shares at the closing price of $48.02 for one share of Common Stock on February 24, 2023, the value of 1,942 shares at the closing price of $42.45 for one share of Common Stock on March 11, 2023 and the value of 5,538 shares at the closing price of $53.05 for one share of Common Stock on December 31, 2023. |
| (6) | Includes the value of 20,572, 6,330, 5,538, 4,748, 5,538 shares for Proctor, Stokes, Bassett, Edwards and LaHaise, respectively, vested on December 31, 2023 pursuant to PSUs granted February 18, 2021. The shares were issued to each of the executives on February 21, 2024 following certification by the Compensation Committee and approval by the Board. |
Pension Benefits
The Pension Benefits table below provides information regarding the Retirement Agreements in effect during 2023.
| | Name | | | Plan Name | | | Number of Years Credited Service(1) | | | Present Value of Accumulated Benefit(2) | | | Payments During Last Fiscal Year | |
| | H. Palmer Proctor, Jr. | | | — | | | — | | | — | | | — | |
| | Nicole S. Stokes | | | SERP Agreement 11-7-2012 | | | 11 | | | $100,439 | | | — | |
| | Lawton E. Bassett, III. | | | SERP Agreement 11-7-2012 | | | 11 | | | $255,625 | | | — | |
| | Jon S. Edwards | | | SERP Agreement 11-7-2012 | | | 11 | | | $759,737 | | | — | |
| | James A. LaHaise | | | SERP Agreement 11-10-2015 | | | 8 | | | $566,369 | | | — | |
| (1) | The number of years credited service began on the respective date of the Retirement Agreement. |
| (2) | Present value amounts represent the current liability included in the Company’s accounting records for each of the NEOs under his or her respective Retirement Agreement. |
| 59 |
Nonqualified Deferred Compensation
Prior to January 2020, the Company did not maintain for the NEOs a defined contribution or other plan providing for the deferral of compensation on a nonqualified basis. Commencing with 2020, NEOs, as well as certain other officers whom the Board or its designee has specified as eligible for participation, may elect to defer amounts of compensation in addition to that which may be deferred under the Company’s 401(k) plan. Any amounts deferred by a participant would be deducted each pay period in which the participant has compensation during the period of participation. Upon written notice by December 31 of each year, a participant may increase, decrease or discontinue the deferral election for the following year. A participant’s interest in the account is 100% vested and non-forfeitable.
The Nonqualified Deferred Compensation table below provides information regarding deferred compensation during 2023.
| | Name | | | Executive Contributions in Last FY | | | Registrant Contributions in Last FY | | | Aggregate Earnings in Last FY | | | Aggregate Withdrawals/ Distributions | | | Aggregate Balance at Last FYE | |
| | H. Palmer Proctor, Jr. | | | — | | | — | | | — | | | — | | | — | |
| | Nicole S. Stokes | | | — | | | — | | | — | | | — | | | — | |
| | Lawton E. Bassett, III. | | | $73,386 | | | — | | | $46,408 | | | — | | | $344,643 | |
| | Jon S. Edwards | | | — | | | — | | | — | | | — | | | — | |
| | James A. LaHaise | | | — | | | — | | | — | | | — | | | — | |
Potential Payments Upon Termination or Change in Control
The following discussion presents the potential payments for each NEO upon a termination of employment or change in control. Pursuant to applicable SEC rules, the analysis contained in this discussion does not consider or include payments made to a NEO with respect to contracts, agreements, plans or arrangements to the extent they do not discriminate in scope, terms or operation in favor of NEOs of the Company and that are available generally to all salaried employees. The actual amounts that would be paid upon a NEO’s termination of employment can only be determined at the time of such executive officer’s termination. Due to the number of factors that affect the nature and amount of any compensation or benefits provided upon the termination events, any actual amounts paid or distributed may be higher or lower than reported below. Among other factors that could affect these amounts are the timing during the year of any such event and our stock price.
In accordance with applicable SEC rules, the following discussion assumes that: (i) the termination event in question occurred on December 31, 2023; and (ii) with respect to calculations based on our stock price, the applicable price is $53.05, which is the reported closing price of one share of Common Stock on December 31, 2023.
The Proctor Employment Agreement and the Severance Agreements between the Company and all of the NEOs (except for Mr. Proctor), require the Company to make certain severance payments and provide severance benefits to the applicable executive upon the termination of the executive’s employment with the Company by the executive for “good reason” or by the Company without “cause.” There are no severance payments otherwise required under the Proctor Employment Agreement or the Severance Agreements, including in connection with voluntary termination/early retirement or involuntary termination for cause. However, the Retirement Agreements provide for potential payments to certain of the NEOs upon a termination of their employment. These payments are discussed under “Executive Compensation – Compensation Discussion and Analysis – Process for Determining Executive Officer Compensation – Retirement Benefits” in this Proxy Statement.
| 60 |
The Proctor Employment Agreement provides that, in the event of termination of Mr. Proctor’s employment by the Company without cause or by Mr. Proctor for good reason, the Company will pay to Mr. Proctor, subject to the execution of a release of claims, certain accrued but unpaid amounts and the following severance benefits:
| • | A cash severance payment equal to the excess of: (i) the product of: (a) three multiplied by (b) the executive’s “Final Compensation” (which is defined generally as the sum of the executive’s annual base salary and target annual cash bonus opportunity) over (ii) the amount described in the immediately following bullet, payable in installments over 36 months. |
| • | A cash payment equal to 60% of the annual base salary that would have been payable to the executive during the 18-month restrictive covenant period, payable in installments over 18 months. |
| • | Continued participation in employee welfare benefit programs for 18 months after the date of termination on the same basis as other executives (the “Welfare Benefits”). |
| • | A pro-rated annual cash bonus for the year in which termination occurs, determined assuming performance goals are satisfied at the target level (the “Pro-rated Bonus”). |
| • | Full vesting of any equity or other long-term incentive awards, with any applicable performance goals deemed satisfied at the greater of target and actual performance and with any stock options exercisable for the full remaining term thereof (the “LTI Benefits”). |
In the event of termination of Mr. Proctor’s employment on account of his death or disability, Mr. Proctor (or his estate) will be entitled to receive, in addition to certain accrued but unpaid amounts, the Welfare Benefits, the Pro-rated Bonus and the LTI Benefits. The meanings of “cause” and “good reason” under Mr. Proctor’s Employment Agreement, and a further description of the terms of the Proctor Employment Agreement, are set forth under “Executive Compensation - Employment Agreements.”
Each Severance Agreement provides that, in the event of termination of the executive’s employment by the Company without cause or by the executive for good reason, the Company will pay to the executive, subject to the execution of a release of claims, certain accrued but unpaid amounts and the following severance benefits: (i) equal semi-monthly installments for two years in accordance with the Company’s normal payroll practices, totaling two times the sum of (a) the executive’s base salary and (b) the executive’s target cash bonus opportunity for the year in which the termination of employment occurred; (ii) a pro-rata portion of the cash bonus, if any, that the executive would have earned for the year during which the termination of employment occurred, based on the achievement of applicable performance goals; and (iii) reimbursement for any monthly COBRA premium paid for a period of as many as eighteen months. If a termination without cause or for good reason occurs at the time of, or within one year after, a “change of control” of the Company (as defined in the Severance Agreement), then the amounts described in clause (i) will be paid in a lump sum instead of installments. In the event of termination of the executive’s employment on account of the executive’s death or disability, the executive (or his or her estate) will be entitled to receive, in addition to certain accrued but unpaid amounts, a pro-rata portion of the cash bonus, if any, that the executive would have otherwise earned for the year during which the termination of employment occurred, based on the achievement of applicable performance goals.
Equity awards under the 2014 Plan and the 2021 Plan automatically become fully vested and, in the case of options, fully exercisable upon death, disability or the occurrence of a “change of control” (as defined in the 2014 Plan or the 2021 Plan, as applicable).
The foregoing payments and benefits may be subject to reduction under the NEOs’ respective agreements in connection with certain tax matters. Those agreements provide that if: (i) the severance payable to the executive would be subject to the excise tax imposed under Section 4999 of the Code; and (ii) the after-tax amount retained by the executive after taking into account the excise tax would have a lesser aggregate value than the after-tax amount retained by the executive if the total payments were reduced to avoid the imposition of such tax, then such benefit payments shall be reduced to be the largest amounts that will result in no portion of the benefit payments being subject to the tax imposed by Section 4999. For purposes of Section 409A of the Code, all of the NEOs’ respective agreements are structured to be in compliance with payment timing and other relevant requirements.
| 61 |
The estimated severance benefits payable to each of the NEOs (except Mr. Edwards) based upon a hypothetical termination of each such NEO on December 31, 2023, are presented in the following table. The following table also sets forth the benefits payable to each of the NEOs (except Mr. Edwards) following a change of control of the Company (without regard to whether such NEOs’ employment is terminated in connection with such change of control). The amounts include cash, equity, welfare benefits and retirement benefits. With respect to Mr. Edwards, the following table presents the severance benefits payable to him in connection with his retirement from the Company and the Bank, effective March 31, 2024.
| | Compensation and Benefits Payable Upon Termination | | | Qualifying Termination Within 12 Months Following Change in Control | | | Change in Control (excluding other applicable benefits for termination)(1) | | | Voluntary with Good Reason or Involuntary Without Cause | | | Voluntary or Involuntary With Cause | | | Death | | | Disability | |
| | H. Palmer Proctor, Jr. | | | | | | | | | | | | | | ||||||
| | Base Salary | | | $1,942,500 | | | $0 | | | $1,942,500 | | | $0 | | | $0 | | | $0 | |
| | Cash Bonus | | | $3,052,500 | | | $0 | | | $3,052,500 | | | $0 | | | $0 | | | $0 | |
| | Pro-Rata Bonus | | | $1,441,926 | | | $0 | | | $1,441,926 | | | $0 | | | $1,441,926 | | | $1,441,926 | |
| | Non-Compete Payment | | | $832,500 | | | $0 | | | $832,500 | | | $832,500 | | | $0 | | | $0 | |
| | SERP | | | $0 | | | $0 | | | $0 | | | $0 | | | $0 | | | $0 | |
| | Acceleration of Unvested Equity Awards(2) | | | $0 | | | $7,581,336 | | | $0 | | | $0 | | | $4,622,361 | | | $4,622,361 | |
| | Health & Welfare Benefits(3) | | | $30,432 | | | $0 | | | $30,432 | | | $0 | | | $30,432 | | | $30,432 | |
| | Total Benefit | | | $7,299,858 | | | $7,581,336 | | | $7,299,858 | | | $832,500 | | | $6,094,719 | | | $6,094,719 | |
| | Nicole Stokes | | | | | | | | | | | | | | ||||||
| | Base Salary | | | $970,000 | | | $0 | | | $970,000 | | | $0 | | | $0 | | | $0 | |
| | Cash Bonus | | | $727,500 | | | $0 | | | $727,500 | | | $0 | | | $0 | | | $0 | |
| | Pro-Rata Bonus | | | $515,480 | | | $0 | | | $515,480 | | | $0 | | | $515,480 | | | $515,480 | |
| | SERP | | | $100,439 | | | $0 | | | $100,439 | | | $100,439 | | | $500,000 | | | $100,439 | |
| | Acceleration of Unvested Equity Awards(2) | | | $0 | | | $1,959,900 | | | $0 | | | $0 | | | $1,230,403 | | | $1,230,403 | |
| | Health & Welfare Benefits(3) | | | $30,291 | | | $0 | | | $30,291 | | | $0 | | | $0 | | | $0 | |
| | Total Benefit | | | $2,343,710 | | | $1,959,900 | | | $2,343,710 | | | $100,439 | | | $2,245,883 | | | $1,846,322 | |
| | Lawton E. Bassett, III | | | | | | | | | | | | | | ||||||
| | Base Salary | | | $1,000,000 | | | $0 | | | $1,000,000 | | | $0 | | | $0 | | | $0 | |
| | Cash Bonus | | | $650,000 | | | $0 | | | $650,000 | | | $0 | | | $0 | | | $0 | |
| | Pro-Rata Bonus | | | $460,566 | | | $0 | | | $460,566 | | | $0 | | | $460,566 | | | $460,566 | |
| | SERP | | | $255,625 | | | $0 | | | $255,625 | | | $255,625 | | | $750,000 | | | $255,625 | |
| | Acceleration of Unvested Equity Awards(2) | | | $0 | | | $1,636,423 | | | $0 | | | $0 | | | $1,028,544 | | | $1,028,544 | |
| | Health & Welfare Benefits(3) | | | $11,345 | | | $0 | | | $11,345 | | | $0 | | | $0 | | | $0 | |
| | Total Benefit | | | $2,377,536 | | | $1,636,423 | | | $2,377,536 | | | $255,625 | | | $2,239,110 | | | $1,744,735 | |
| | Jon S. Edwards | | | | | | | | | | | | | | ||||||
| | Base Salary | | | $0 | | | $0 | | | $0 | | | $0 | | | $0 | | | $0 | |
| | Cash Bonus | | | $0 | | | $0 | | | $0 | | | $0 | | | $0 | | | $0 | |
| | Pro-Rata Bonus | | | $0 | | | $0 | | | $0 | | | $381,349 | | | $0 | | | $0 | |
| | SERP | | | $0 | | | $0 | | | $0 | | | $759,737 | | | $0 | | | $0 | |
| | Acceleration of Unvested Equity Awards(2) | | | $0 | | | $0 | | | $0 | | | $0 | | | $0 | | | $0 | |
| | Health & Welfare Benefits(3) | | | $0 | | | $0 | | | $0 | | | $0 | | | $0 | | | $0 | |
| | Total Benefit | | | $0 | | | $0 | | | $0 | | | $1,141,086 | | | $0 | | | $0 | |
| 62 |
| | Compensation and Benefits Payable Upon Termination | | | Qualifying Termination Within 12 Months Following Change in Control | | | Change in Control (excluding other applicable benefits for termination)(1) | | | Voluntary with Good Reason or Involuntary Without Cause | | | Voluntary or Involuntary With Cause | | | Death | | | Disability | |
| | James A. LaHaise | | | | | | | | | | | | | | ||||||
| | Base Salary | | | $910,000 | | | $0 | | | $910,000 | | | $ 0 | | | $0 | | | $0 | |
| | Cash Bonus | | | $682,500 | | | $0 | | | $682,500 | | | $0 | | | $0 | | | $0 | |
| | Pro-Rata Bonus | | | $483,594 | | | $0 | | | $483,594 | | | $0 | | | $483,594 | | | $583,594 | |
| | SERP | | | $566,369 | | | $0 | | | $566,369 | | | $0 | | | $1,000,000 | | | $566,369 | |
| | Acceleration of Unvested Equity Awards(2) | | | $0 | | | $1,950,351 | | | $0 | | | $0 | | | $1,220,854 | | | $1,220,854 | |
| | Health & Welfare | | | $21,591 | | | $0 | | | $21,591 | | | $0 | | | $0 | | | $0 | |
| | Total Benefit | | | $2,664,054 | | | $1,950,351 | | | $2,664,054 | | | $0 | | | $2,704,448 | | | $2,370,817 | |
| (1) | With respect to awards granted under either the 2014 Plan or the 2021 Plan, a termination of employment is not also required to receive the applicable benefit in the event of a change of control. |
| (2) | The intrinsic value of equity is based on a share price of $53.05, the closing price of the Common Stock as of December 31, 2023. The amounts presented for each NEO equal the total number of unvested awards that accelerate times the value of each award. The performance awards are generally included at the greater of actual performance or Target in each of the scenarios in which they are included, except in the case of death or disability, where performance awards are calculated based on prorated actual performance. |
| (3) | The value of health and welfare benefits is estimated based upon current premiums payable with respect to insurance coverage for each NEO as of December 31, 2023. |
At this time, Mr. Proctor is the only NEO who has an employment agreement with the Company. The Company and the Bank entered into the Proctor Employment Agreement in connection with the Company’s acquisition of Fidelity. The Proctor Employment Agreement became effective upon the closing of the acquisition on July 1, 2019. The Proctor Employment Agreement was amended on June 30, 2019 to provide that Mr. Proctor will serve as Chief Executive Officer of the Company and the Bank and as a member of the boards of directors of the Company and the Bank. The term of the Proctor Employment Agreement is three years; provided that commencing on the first anniversary of the effective date of the Proctor Employment Agreement, and on each annual anniversary thereafter (such date and each annual anniversary, a “Renewal Date”), unless previously terminated, the term of employment of Mr. Proctor will be automatically extended so as to terminate three years from such Renewal Date, unless at least 180 days prior to the Renewal Date, the Company gives notice to Mr. Proctor that his employment shall not be so extended. In consideration for his services, Mr. Proctor will be entitled to: (i) an annual base salary of $800,000 (which is subject to annual review for increase and has been increased to $925,00 effective March 1, 2023); (ii) incentive compensation opportunities that are no less favorable than those provided by Fidelity prior to its acquisition by the Company or, if more favorable, those provided to other senior executives of the Company, provided that the target annual incentive opportunities will not be less than 50% of Mr. Proctor’s annual base salary; and (iii) employee benefits and fringe benefits (including life insurance, vacation, reimbursement of club dues and automobile benefits) that are no less favorable than those provided by Fidelity prior to closing or, if more favorable, those provided to other senior executives of the Company.
| 63 |
The Proctor Employment Agreement provides that, in the event of termination of Mr. Proctor’s employment by the Company without “cause” (as defined in the Proctor Employment Agreement) or by Mr. Proctor for “good reason” (as defined in the Proctor Employment Agreement), the Company will pay to Mr. Proctor, subject to the execution of a release of claims, certain accrued but unpaid amounts and the following severance benefits:
| • | A cash severance payment equal to the excess of: (i) the product of (a) three multiplied by (b) the executive’s “Final Compensation” (which is defined generally as the sum of the executive’s annual base salary and target annual cash bonus opportunity) over (ii) the amount described in the immediately following bullet, payable in installments over 36 months. |
| • | A cash payment equal to 60% of the annual base salary that would have been payable to the executive during the 18-month restrictive covenant period (as described below), payable in installments over 18 months. |
| • | Continued participation in employee welfare benefit programs for 18 months after the date of termination on the same basis as other executives. |
| • | A prorated annual cash bonus for the year in which termination occurs, determined assuming performance goals are satisfied at the target level. |
| • | Full vesting of any equity or other long-term incentive awards, with any applicable performance goals deemed satisfied at the greater of target and actual performance and with any stock options exercisable for the full remaining term thereof. |
The Proctor Employment Agreement also provide that the Company will maintain, during Mr. Proctor’s lifetime, life insurance policies in the aggregate face amount of $1.5 million. The Proctor Employment Agreement contains certain restrictive covenants, including a perpetual nondisclosure covenant and covenants concerning noncompetition and nonsolicitation of clients, customers and employees, each of which apply for 18 months following Mr. Proctor’s termination of employment.
Under the Proctor Employment Agreement:
| • | “cause” means: (i) any act or omission requiring the Company to terminate the executive in order to comply with certain provisions of the Federal Deposit Insurance Act; (ii) the commission of a felony or any other crime involving moral turpitude or the pleading of nolo contendere to any such act; (iii) the commission of any act or acts of dishonesty when such acts are intended to result or result, directly or indirectly, in gain or personal enrichment of the executive or any related person or affiliated company and are intended to cause harm or damage to the Company or its subsidiaries; (iv) the illegal use of controlled substances; (v) the misappropriation or embezzlement of assets of the Company or its subsidiaries; (vi) the breach by the executive of certain restrictive covenants and confidentiality obligations set forth in the Proctor Employment Agreement; or (vii) the breach by the executive of any other material term or provision of the Proctor Employment Agreement; and |
| • | “good reason” means: (i) there is a material change in the executive’s position or responsibilities (including reporting responsibilities) which, in the executive’s reasonable judgment, represents an adverse change from the executive’s status, title, position or responsibilities; (ii) the assignment to the executive of any duties or responsibilities which are materially inconsistent with the position or responsibilities of the executive; (iii) any removal of the executive from or failure to reappoint or reelect the executive to any of the positions the executive held; (iv) there is a material reduction in the executive’s rate of base salary or a change in the manner the incentive compensation of the executive is calculated and such change will result in a reduction of the incentive compensation of the executive; (v) requiring the executive to relocate his principal business office to any place outside a 15-mile radius from the executive’s current place of employment in Atlanta, Georgia; (vi) the failure of the Company to continue in effect certain welfare plans, life insurance policies and other compensation plans or materially and adversely affecting certain fringe benefits; or (vii) the material breach of any provision of the Proctor Employment Agreement which is not timely corrected by the Company within a specified cure period. |
| 64 |
Consistent with the rules under the Dodd-Frank Wall Street Reform and Consumer Protection Act, we are providing the following information about the relationship between the annual total compensation of our employees and that of H. Palmer Proctor, Jr., our Chief Executive Officer (or “CEO”).
We identified our median employee based on the 2023 total gross earnings for all employees, excluding our CEO, who were employed by us as of December 31, 2023. We believe the use of total gross earnings is a consistently applied compensation measure in that it captures all of the components of earnings for all of our employees. We included full-time and part-time employees and annualized earnings for those employees who joined us during the year. We excluded contractors as they are used sparingly - representing less than one percent of our personnel.
After identifying the median employee based on total gross earnings, we calculated the annual total compensation for our median employee using the same methodology we use for our NEOs as set forth in the Summary Compensation Table included in “Executive Compensation – Compensation Tables.”
The median 2023 annual total compensation of all employees of the Company (other than our CEO) was $73,238, and the 2023 annual total compensation of our CEO was $5,088,214. Based on this information, for 2023, the ratio of the annual total compensation of our CEO to the median annual total compensation of all employees was 69:1.
| 65 |
PAY VERSUS PERFORMANCE
As required by Section 953(a) of the Dodd-Frank Wall Street Reform and Consumer Protection Act, and Item 402(v) of Regulation S-K, we are providing the following information about the relationship between our NEOs’ compensation and certain measures of our financial performance. Further information about our pay-for-performance philosophy and how we align executive compensation with our performance is provided under “Executive Compensation – Compensation Discussion and Analysis.” The Compensation Committee did not consider the information in this “Pay Versus Performance” section in making its pay decisions for any of the years shown below. Pursuant to SEC rules, the information in this “Pay Versus Performance” section shall not be deemed to be incorporated by reference into any filing made by the Company with the SEC under the Securities Act or Exchange Act, unless expressly incorporated by specific reference into such filing.
Pay Versus Performance Table
The table below reflects compensation of our principal executive officer (“PEO”), who is our CEO, and the average compensation of our non-PEO NEOs during 2020 through 2023, both as reported in the Total column set forth in the Summary Compensation Table under “Executive Compensation – Compensation Tables – Summary Compensation Table,” and with certain adjustments to reflect the “Compensation Actually Paid”, as defined under SEC rules. In addition, the table provides our cumulative TSR, the cumulative TSR of our peer group (using the KBW Nasdaq Bank Index), our net income and our TBV Growth, which is the “company selected measure” chosen for purposes of this disclosure.
| | Year | | | Summary Compensation Table Total for PEO(1) ($) | | | Compensation Actually Paid to PEO(1)(2)(3) ($) | | | Average Summary Compensation Table Total for Non-PEO NEOs(1) ($) | | | Average Compensation Actually Paid to Non-PEO NEOs(1)(2)(3) ($) | | | Value of Initial Fixed $100 Investment Based On: | | | Net Income ($ Millions) | | | TBV Growth(5) | | |||
| | Total Shareholder Return ($) | | | Peer Group Total Shareholder Return(4) ($) | | |||||||||||||||||||||
| | 2023 | | | 5,088,214 | | | 6,330,078 | | | 1,588,860 | | | 1,913,236 | | | 133.04 | | | 96.65 | | | 269.1 | | | 12.43% | |
| | 2022 | | | 4,403,423 | | | 3,955,720 | | | 1,587,056 | | | 1,444,538 | | | 116.43 | | | 97.52 | | | 346.5 | | | 13.94% | |
| | 2021 | | | 3,437,506 | | | 4,996,031 | | | 1,283,320 | | | 2,123,716 | | | 121.07 | | | 124.07 | | | 376.9 | | | 10.85% | |
| | 2020 | | | 2,740,301 | | | 3,177,626 | | | 1,221,967 | | | 1,266,202 | | | 91.70 | | | 89.69 | | | 262.0 | | | 13.84% | |
| (1) | For all years presented, H. Palmer Proctor, Jr. was our PEO and Nicole S. Stokes, Lawton E. Bassett, III, Jon S. Edwards and James A. LaHaise were our non-PEO NEOs. |
| (2) | The amounts shown for Compensation Actually Paid have been calculated in accordance with Item 402(v) of Regulation S‐K and do not reflect compensation actually earned, realized or received by our NEOs. These amounts reflect the amounts in the Total column of the Summary Compensation Table with certain adjustments as described in footnote 3 below. |
| (3) | Compensation Actually Paid reflects the exclusions and inclusions of certain amounts for the PEO and the Non‐PEO NEOs as set forth below. Equity values are calculated in accordance with FASB ASC Topic 718. Amounts in the Exclusion of Stock Awards columns are the totals from the Stock Awards columns set forth in the Summary Compensation Table. The equity value adjustments for each applicable year include the addition (or subtraction, as applicable) of the following: (i) the year-end fair value of any equity awards granted in the applicable year that are outstanding and unvested as of the end of the year; (ii) the amount of change as of the end of the applicable year (from the end of the prior fiscal year) in the fair value of any awards granted in prior years that are outstanding and unvested as of the end of the applicable year; and (iii) for awards granted in prior years that vest in the applicable year, the amount equal to the change as of the vesting date (from the end of the prior fiscal year) in fair value. The valuation assumptions used to calculate fair values did not materially differ from those disclosed at the time of grant. For each of the years presented there were no: (a) changes in the actuarial present value of the NEOs’ accumulated benefit under a defined benefit or actuarial pension plan except as were offset by like amounts of pension service costs for services rendered; (b) awards which were granted and vested in the same applicable year; (c) awards |
| 66 |
granted in prior years which failed to meet the applicable vesting conditions during the applicable year; and (d) dividends or other earnings paid on awards in the applicable year prior to the vesting date that were not otherwise reflected in the fair value of such award or included in any other component of total compensation for the applicable year.
| | Year | | | Summary Compensation Table Total for PEO ($) | | | Exclusion of Stock Awards for PEO ($) | | | Inclusion of Equity Values for PEO ($) | | | Compensation Actually Paid to PEO ($) | |
| | 2023 | | | 5,088,214 | | | (2,629,751) | | | 3,871,615 | | | 6,330,078 | |
| | 2022 | | | 4,403,423 | | | (2,008,597) | | | 1,560,894 | | | 3,955,720 | |
| | 2021 | | | 3,437,506 | | | (1,317,066) | | | 2,875,591 | | | 4,996,031 | |
| | 2020 | | | 2,740,301 | | | (893,793) | | | 1,331,118 | | | 3,177,626 | |
| | Year | | | Average Summary Compensation Table Total for Non-PEO NEOs ($) | | | Average Exclusion of Stock Awards for Non-PEO NEOs ($) | | | Average Inclusion of Equity Values for Non-PEO NEOs ($) | | | Average Compensation Actually Paid to Non-PEO NEOs ($) | |
| | 2023 | | | 1,588,860 | | | (556,286) | | | 880,662 | | | 1,913,236 | |
| | 2022 | | | 1,587,056 | | | (552,364) | | | 409,846 | | | 1,444,538 | |
| | 2021 | | | 1,283,320 | | | (354,607) | | | 1,195,003 | | | 2,123,716 | |
| | 2020 | | | 1,221,967 | | | (310,348) | | | 354,583 | | | 1,266,202 | |
| | The amounts in the Inclusion of Equity Values columns in the tables above are derived from the amounts set forth in the following tables. |
| | Year | | | Year-End Fair Value of Equity Awards Granted During Year That Remained Unvested as of Last Day of Year for PEO ($) | | | Change in Fair Value from Last Day of Prior Year to Last Day of Year of Unvested Equity Awards for PEO ($) | | | Change in Fair Value from Last Day of Prior Year to Vesting Date of Unvested Equity Awards that Vested During Year for PEO ($) | | | Total — Inclusion of Equity Values for PEO ($) | |
| | 2023 | | | 2,856,318 | | | 929,056 | | | 86,241 | | | 3,871,615 | |
| | 2022 | | | 1,976,109 | | | (92,027) | | | (323,188) | | | 1,560,894 | |
| | 2021 | | | 1,742,874 | | | 1,039,003 | | | 93,714 | | | 2,875,591 | |
| | 2020 | | | 1,331,118 | | | — | | | — | | | 1,331,118 | |
| | Year | | | Average Year-End Fair Value of Equity Awards Granted During Year That Remained Unvested as of Last Day of Year for Non-PEO NEOs ($) | | | Average Change in Fair Value from Last Day of Prior Year to Last Day of Year of Unvested Equity Awards for Non-PEO NEOs ($) | | | Average Change in Fair Value from Last Day of Prior Year to Vesting Date of Unvested Equity Awards that Vested During Year for Non-PEO NEOs ($) | | | Total — Average Inclusion of Equity Values for Non-PEO NEOs ($) | |
| | 2023 | | | 604,213 | | | 255,331 | | | 21,118 | | | 880,662 | |
| | 2022 | | | 543,430 | | | (25,930) | | | (107,654) | | | 409,846 | |
| | 2021 | | | 469,253 | | | 641,182 | | | 84,568 | | | 1,195,003 | |
| | 2020 | | | 462,199 | | | (61,265) | | | (46,351) | | | 354,583 | |
| 67 |
| (4) | The Peer Group Total Shareholder Return utilizes the KBW Nasdaq Bank Index, which we also utilize in the stock performance graph required by Item 201(e) of Regulation S-K included in our 2023 Annual Report. The comparison assumes $100 was invested for the period starting December 31, 2019, through the end of the listed year in the Company and in the KBW Nasdaq Bank Index, respectively, and that all dividends were reinvested. Historical stock performance is not necessarily indicative of future stock performance. The KBW Nasdaq Bank Index is different from the KRX, which we use in our executive compensation program. See “Executive Compensation.” |
| (5) | We determined TBV Growth to be the most important financial performance measure used to link Company performance to Compensation Actually Paid to our PEO and Non‐PEO NEOs in 2022 and 2023. TBV Growth may not have been the most important financial performance measure for years 2021 and 2020, and we may determine a different financial performance measure to be the most important financial performance measure in future years. TBV Growth is a non-GAAP measure. See “Pay Versus Performance – Tabular List of Most Important Financial Performance Measures” for a description of how TBV Growth is calculated. Also, see “Reconciliation of GAAP and Non-GAAP Financial Measurers” in Exhibit A to this Proxy Statement for a reconciliation of TBV Growth to the most directly comparable GAAP measure. |
Description of Relationship Between Compensation Actually Paid and Company Total Shareholder Return
The following chart sets forth the relationship between Compensation Actually Paid to our PEO, the average of Compensation Actually Paid to our Non-PEO NEOs and our cumulative TSR over the four most recently completed fiscal years.
| 68 |
Description of Relationship Between Compensation Actually Paid and Net Income
The following chart sets forth the relationship between Compensation Actually Paid to our PEO, the average of Compensation Actually Paid to our Non-PEO NEOs and our net income during each of the four most recently completed fiscal years.
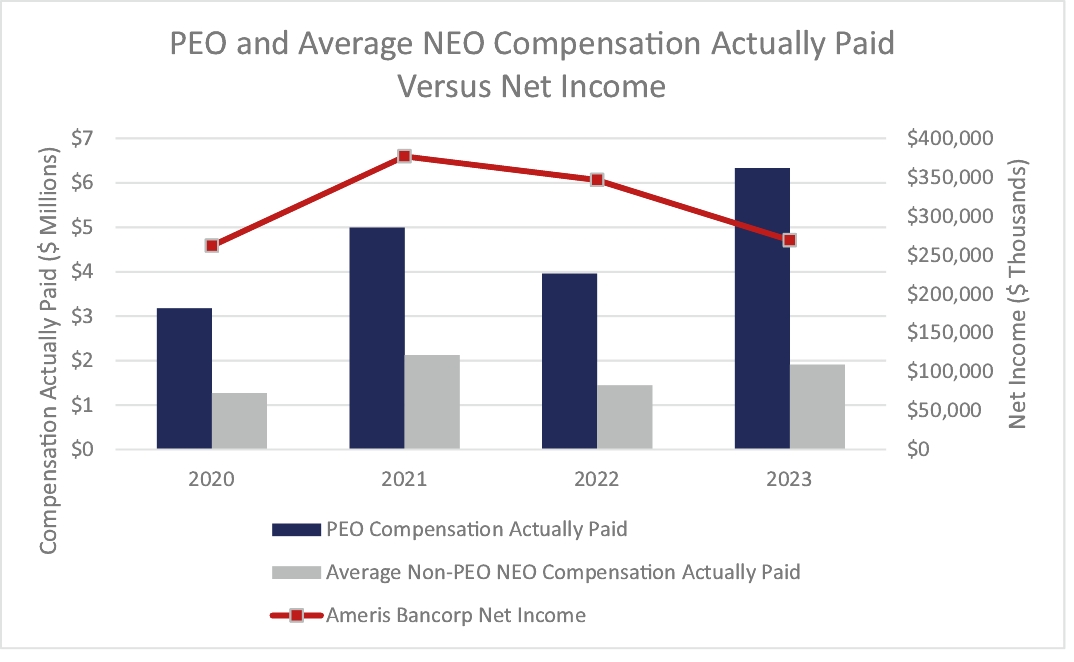
Description of Relationship Between Compensation Actually Paid and TBV Growth
The following chart sets forth the relationship between Compensation Actually Paid to our PEO, the average of Compensation Actually Paid to our Non-PEO NEOs and our TBV Growth during each of the four most recently completed fiscal years.
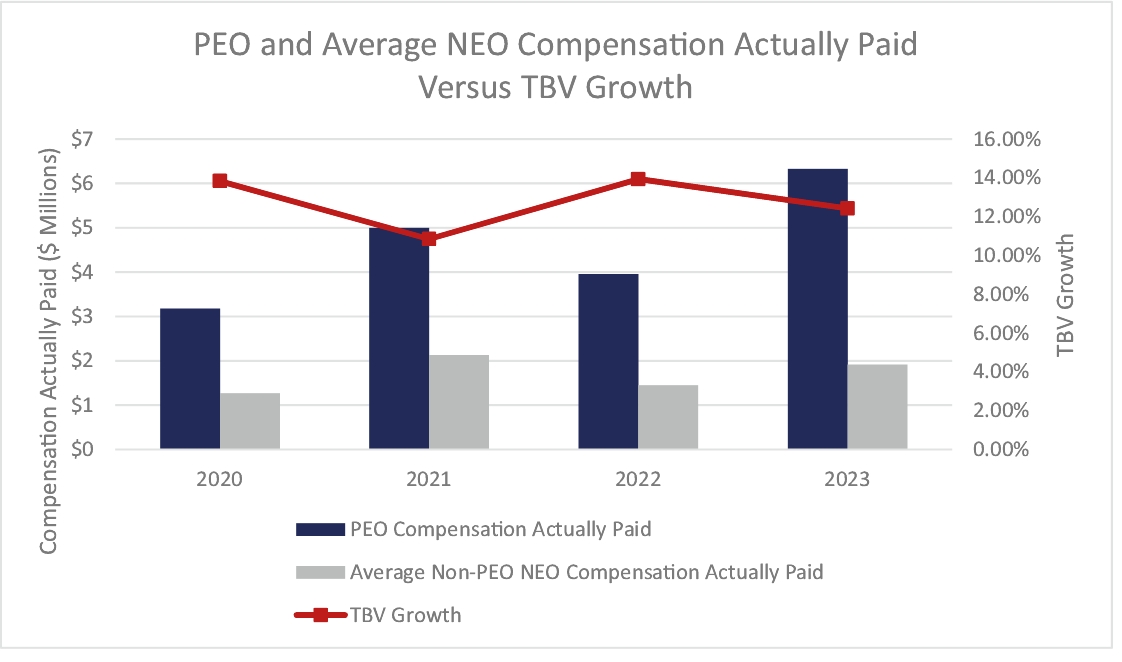
| 69 |
Description of Relationship Between Company TSR and Peer Group TSR
The following chart compares our cumulative TSR over each of the four most recently completed fiscal years to that of the KBW NASDAQ Bank Index over the same period.

Tabular List of Most Important Financial Performance Measures
The following table presents the financial performance measures that the Company considers to have been the most important in linking Compensation Actually Paid to our PEO and Non-PEO NEOs for 2023 to Company performance. The measures in this table are not ranked.
| | MOST IMPORTANT FINANCIAL MEASURES | |
| | Adjusted Efficiency Ratio | |
| | Adjusted Return on Average Assets | |
| | Adjusted ROTCE | |
| | Non-performing Assets/ Total Assets | |
| | TBV Growth | |
The financial performance measures listed in the table above are non-GAAP measures and are calculated as set forth below. Also, see “Reconciliation of GAAP and Non-GAAP Financial Measurers” in Exhibit A to this Proxy Statement for a reconciliation of the foregoing non-GAAP measures to the most directly comparable GAAP measures.
| • | Adjusted efficiency ratio is calculated as adjusted noninterest expense divided by adjusted total revenue. Adjusted noninterest expense and adjusted total revenue exclude the same items on a pre-tax basis as adjusted net income and additionally excludes (gain) loss on securities. |
| • | Adjusted return on average assets is calculated as adjusted net income divided by average assets. |
| • | Adjusted ROTCE is calculated as adjusted net income divided by average common shareholders’ equity less average goodwill and average intangible assets. Adjusted net income excludes the after-tax effect of merger and conversion charges, gain on sale of mortgage servicing rights, servicing right impairment (recovery), gain on BOLI proceeds, FDIC special assessment, natural disaster expenses and (gain) loss on bank premises. |
| • | Non-performing assets to total assets is calculated as total non-performing assets less serviced GNMA-guaranteed mortgage nonaccrual loans divided by total assets. |
| • | TBV Growth represents growth in tangible book value, which is calculated as the value of shareholders’ equity less goodwill and intangibles divided by common shares outstanding. |
| 70 |
The Board has established a separately designated standing Audit Committee and adopted an Audit Committee Charter. The Audit Committee is comprised solely of independent directors, as defined by the listing standards of Nasdaq. The Board has determined that Mr. Lynch is an audit committee financial expert, as defined by the rules of the SEC. The primary purpose of the Audit Committee is to assist the Board in its general oversight of the Company’s financial reporting, internal controls and audit functions.
As more fully described in its charter, the Audit Committee reviews the Company’s financial reporting process on behalf of the Board. The Company’s management has the primary responsibility for the financial statements and the reporting process, and KPMG LLP, the Company’s independent registered public accounting firm, is responsible for performing an audit in accordance with the standards of the Public Company Accounting Oversight Board to obtain reasonable assurance that the Company’s consolidated financial statements are free from material misstatement and for expressing an opinion on the conformity of the financial statements with generally accepted accounting principles. The Company’s internal auditors are responsible to the Audit Committee and the Board for testing the integrity of the financial accounting and reporting control systems and such other matters as the Audit Committee and Board determine.
The Audit Committee has met concerning, and has held discussions and reviewed with management, the Company’s internal auditors and KPMG LLP, the consolidated financial statements for the fiscal year ended December 31, 2023, management’s assessment of the effectiveness of the Company’s internal control over financial reporting and KPMG LLP’s evaluation of the Company’s internal control over financial reporting. Management has represented to the Audit Committee that the Company’s consolidated financial statements were prepared in accordance with GAAP, and the Audit Committee discussed with KPMG LLP the matters required to be discussed by Auditing Standard No. 1301 (Communication with Audit Committees), as adopted by the Public Company Accounting Oversight Board.
In addition, the Audit Committee received written communications from KPMG LLP required by the applicable requirements of the Public Company Accounting Oversight Board regarding KPMG LLP’s independence, and has discussed with KPMG LLP its independence from the Company.
Based on the review and discussions referred to above, the Audit Committee recommended to the Board that the audited financial statements be included in the Company’s Annual Report on Form 10-K for the fiscal year ended December 31, 2023, for filing with the SEC.
Submitted by the Audit Committee:
Robert P. Lynch (Chair)
Wm. Millard Choate
R. Dale Ezzell
Gloria A. O’Neal
| 71 |
Fees Paid
The following is a summary of the fees billed to the Company by KPMG for professional services rendered for the fiscal years ended December 31, 2023 and December 31, 2022.
| | | | 2023 | | | 2022 | | |
| | Audit Fees(1) | | | $1,758,328 | | | $1,822,582 | |
| | Audit-related Fees(2) | | | 23,000 | | | 24,500 | |
| | Tax Fees(3) | | | — | | | — | |
| | All Other Fees(4) | | | — | | | — | |
| | Total Fees | | | $1,781,328 | | | $1,847,082 | |
| (1) | Consists of fees billed for professional services rendered for the audit of the Company’s annual consolidated financial statements, review of the interim consolidated financial statements included in quarterly reports, attestation services related to management’s assertions related to internal controls and services that are normally provided by such accountants in connection with statutory and regulatory filings or engagements. |
| (2) | Consists of fees billed for assurance and related services that are reasonably related to the performance of the audit or review of the Company’s consolidated financial statements and are not reported under “Audit Fees.” These services include the issuance of comfort letters and work performed in connection with registration statements. |
| (3) | Consists of fees billed for professional services for tax compliance, tax advice and tax planning. These services include assistance regarding federal, state and local tax compliance and assistance with tax notices. |
| (4) | Consists of fees for products and services other than the services reported above. There were no fees paid to such accountants in fiscal 2023 or 2022 that are not included in the above classifications. |
All services provided by KPMG are subject to pre-approval by the Audit Committee. The Audit Committee may authorize any member of the Audit Committee to approve services by KPMG in the event there is a need for such approval prior to the next full Audit Committee meeting. However, the Audit Committee must review the decisions made by such authorized member of the Audit Committee at its next scheduled meeting. Before granting any approval, the Audit Committee gives due consideration to whether approval of the proposed service will have a detrimental impact on KPMG’s independence.
| 72 |
The following table sets forth certain information with respect to the beneficial ownership of Common Stock, as of the Record Date, by: (i) each person who, to the knowledge of the Company, is a beneficial owner of more than 5% of the outstanding Common Stock; (ii) directors; (iii) nominees for election as directors; (iv) named executive officers; and (v) all directors and executive officers as a group. For purposes of the following table, all fractional shares have been rounded up to the next whole number.
| | Name and Address of Beneficial Owner(1) | | | Common Stock Beneficially Owned as of March 28, 2024(2) | | | Percent of Class(3) | |
| | Beneficial Owners of 5% or More of Our Voting Securities | | | | | | ||
| | BlackRock, Inc.(4) 55 East 52nd Street New York, New York 10055 | | | 10,143,290 | | | 14.7% | |
| | The Vanguard Group(5) 100 Vanguard Boulevard Malvern, Pennsylvania 19355 | | | 7,467,880 | | | 10.8% | |
| | Dimensional Fund Advisors LP(6) 6300 Bee Cove Road, Building One Austin, Texas 78746 | | | 4,193,978 | | | 6.1% | |
| | Wellington Management Group LLP(7) c/o Wellington Management Company LLP 280 Congress Street Boston, Massachusetts 02210 | | | 3,767,907 | | | 5.5% | |
| | Directors and Nominees for Director | | | | | | ||
| | William I. Bowen, Jr.(8) | | | 26,955 | | | * | |
| | Rodney D. Bullard(9) | | | 12,381 | | | * | |
| | Wm. Millard Choate(10) | | | 233,173 | | | * | |
| | R. Dale Ezzell(11) | | | 33,656 | | | * | |
| | Leo J. Hill(12) | | | 30,584 | | | * | |
| | Daniel B. Jeter(13) | | | 48,206 | | | * | |
| | Robert P. Lynch(14) | | | 210,493 | | | * | |
| | Elizabeth A. McCague(15) | | | 19,589 | | | * | |
| | Claire E. McLean | | | 0 | | | | |
| | James B. Miller, Jr.(16) | | | 2,219,669 | | | 3.2% | |
| | Gloria A. O’Neal(17) | | | 13,481 | | | * | |
| | H. Palmer Proctor, Jr.(18) | | | 379,507 | | | * | |
| | William H. Stern(19) | | | 46,547 | | | * | |
| | Jimmy D. Veal(20) | | | 105,241 | | | * | |
| | Named Executive Officers (other than Mr. Proctor) | | | | | | ||
| | Lawton E. Bassett, III(21) | | | 83,495 | | | * | |
| | Jon S. Edwards(22) | | | 59,703 | | | * | |
| | James A. LaHaise (23) | | | 95,437 | | | * | |
| | Nicole S. Stokes(24) | | | 41,155 | | | * | |
| | All Directors and Executive Officers as a group (22) persons)(25) | | | 3,808,725 | | | 5.5% | |
| * | Less than 1%. |
| (1) | Unless otherwise noted in this table or the footnotes to this table, the address of each beneficial owner is 3490 Piedmont Road N.E., Suite 1550, Atlanta, Georgia 30305. |
| 73 |
| (2) | Under the rules of the SEC, the determination of “beneficial ownership” is based upon Rule 13d-3 under the Exchange Act. Under this Rule, shares will be deemed to be “beneficially owned” where a person has, either solely or with others, the power to vote or to direct the voting of shares and/or the power to dispose, or to direct the disposition, of shares, or where a person has the right to acquire any such power within 60 days after the date such beneficial ownership is determined. Except as otherwise specified, each beneficial owner has sole beneficial voting and investment power with respect to all shares of Common Stock indicated. |
| (3) | Percentage calculated based on 69,011,444 shares of Common Stock outstanding as of the Record Date. |
| (4) | Based on information contained in Schedule 13G/A filed by BlackRock, Inc. with the SEC on January 22, 2024, indicating sole voting power relative to 9,943,993 shares of Common Stock as of December 31, 2023 and sole dispositive power relative to 10,143,290 shares of Common Stock as of December 31, 2023, which would have comprised 14.0% and 14.7%, respectively, of the 69,053,341 shares of Common Stock outstanding as of December 31, 2023. |
| (5) | Based on information contained in Schedule 13G/A filed by The Vanguard Group with the SEC on February 13, 2024, indicating shared voting power relative to 56,621 shares of Common Stock as of December 29, 2023, sole dispositive power relative to 7,340,874 shares of Common Stock as of December 29, 2023 and shared dispositive power relative to 127,006 shares of Common Stock as of December 29, 2023, which would have comprised 0.1%, 10.6% and 0.2%, respectively, of the 69,053,341 shares of Common Stock outstanding as of December 29, 2023. |
| (6) | Based on information contained in Schedule 13G/A filed by Dimensional Fund Advisors LP with the SEC on February 9, 2024, indicating sole voting power relative to 4,112,164 shares of Common Stock as of December 29, 2023 and sole dispositive power relative to 4,193,978 shares of Common Stock as of December 29, 2023, which would have comprised 6.0% and 6.1%, respectively, of the 69,053,341 shares of Common Stock outstanding as of December 29, 2023. Dimensional Fund Advisors LP, a registered investment adviser, furnishes investment advice to four registered investment companies, and serves as investment manager or sub-adviser to certain other commingled funds, group trusts and separate accounts (such investment companies, trusts and accounts, collectively referred to as the “Funds”). In certain cases, subsidiaries of Dimensional Fund Advisors LP may act as an adviser or sub-adviser to certain Funds. In its role as investment advisor, sub-adviser and/or manager, Dimensional Fund Advisors LP or its subsidiaries (collectively, “Dimensional”) may possess voting and/or investment power over the securities of the Company that are owned by the Funds, and may be deemed to be the beneficial owner of the shares of the Company held by the Funds. However, all securities reported in this table are owned by the Funds. Dimensional disclaims beneficial ownership of such securities. |
| (7) | Based on information contained in Schedule 13G/A filed by Wellington Management Group LLP, Wellington Group Holdings LLP, Wellington Investment Advisors Holdings, LLP and Wellington Management Company LLP with the SEC on February 8, 2024, indicating: (i) with respect to each of Wellington Management Group LLP, Wellington Group Holdings LLP and Wellington Investment Advisors Holdings, LLP, shared voting power relative to 2,556,962 shares of Common Stock as of December 29, 2023 and shared dispositive power relative to 3,767,907 shares of Common Stock as of December 29, 2023, which would have comprised 3.7% and 5.5%, respectively, of the 69,053,341 shares of Common Stock outstanding as of December 29, 2023; and (ii) with respect to Wellington Management Company LLP, shared voting power relative to 2,462,737 shares of Common Stock as of December 29, 2023 and shared dispositive power relative to 3,467,965 shares of Common Stock as of December 29, 2023, which would have comprised 3.6% and 5.0%, respectively, of the 69,053,341 shares of Common Stock outstanding as of December 29, 2023. |
| (8) | Includes 2,535 shares of restricted Common Stock over which Mr. Bowen exercises voting but not investment power, 700 shares of Common Stock owned by trusts for Mr. Bowen’s children, and 700 shares owned by one of his children. |
| (9) | Includes 2,535 shares of restricted Common Stock over which Mr. Bullard exercises voting but not investment power. |
| (10) | Includes 2,535 shares of restricted Common Stock over which Mr. Choate exercises voting but not investment power and 7,490 shares of Common Stock owned indirectly by Mr. Choate’s wife, with whom he shares voting and investment power. |
| (11) | Includes 2,535 shares of restricted Common Stock over which Mr. Ezzell exercises voting but not investment power. |
| (12) | Includes 2,535 shares of restricted Common Stock over which Mr. Hill exercises voting but not investment power, 13,800 shares of Common Stock owned by a family trust and 467 shares of Common Stock owned by Mr. Hill’s wife, with whom Mr. Hill shares voting and investment power. |
| (13) | Includes 2,535 shares of restricted Common Stock over which Mr. Jeter exercises voting but not investment power, 5,395 shares of Common Stock owned by a family trust and 511 shares of Common Stock owned jointly with Mr. Jeter’s brother, with whom he shares voting and investment power. |
| 74 |
| (14) | Includes 2,535 shares of restricted Common Stock over which Mr. Lynch exercises voting but not investment power and 1,664 shares of Common Stock owned by Mr. Lynch’s wife, with whom Mr. Lynch shares voting and investment power. |
| (15) | Includes 2,535 shares of restricted Common Stock over which Ms. McCague exercises voting but not investment power. |
| (16) | Includes 2,535 shares of restricted Common Stock over which Mr. Miller exercises voting but not investment power, 96,576 shares of Common Stock owned by Mr. Miller’s wife’s trust, 212,922 shares of Common Stock owned by a family limited partnership (a company of which Mr. Miller and his wife's trust own 40%), 239,953 shares of Common Stock owned by a family foundation, two shares of Common Stock owned in a 401(k) plan, and 10,693 shares of Common Stock owned by Mr. Miller's grandchild. |
| (17) | Includes 2,535 shares of restricted Common Stock over which Ms. O'Neal exercises voting but not investment power. |
| (18) | Includes 45,483 shares of restricted Common Stock over which Mr. Proctor exercises voting but not investment power, 22,768 shares of Common Stock owned in a 401(k) plan, 17,978 shares of Common Stock owned by Mr. Proctor's wife, and 22,268 shares of Common Stock owned by Mr. Proctor's children. |
| (19) | Includes 2,535 shares of restricted Common Stock over which Mr. Stern exercises voting but not investment power, 2,777 shares of Common Stock owned by a family trust, 234 shares of Common Stock owned by a family foundation, 2,337 shares of Common Stock owned by Mr. Stern’s children and 337 shares of Common Stock owned by Mr. Stern’s wife. |
| (20) | Includes 2,535 shares of restricted Common Stock over which Mr. Veal exercises voting but not investment power and 13,020 shares of Common Stock owned by Mr. Veal’s wife, with whom he shares voting and investment power. |
| (21) | Includes 8,819 shares of restricted Common Stock over which Mr. Bassett exercises voting but not investment power, and 168 shares of Common Stock owned by Mr. Bassett's wife, with whom he shares voting and investment power. |
| (22) | Includes 4,508 shares of restricted Common Stock over which Mr. Edwards exercises voting but not investment power and 12 shares of Common Stock owned by Mr. Edwards's wife, with whom he shares voting and investment power. |
| (23) | Includes 10,582 shares of restricted Common Stock over which Mr. LaHaise exercises voting but not investment power, and 31,615 shares of Common Stock owned by Mr. LaHaise that are pledged as security for a loan with an unrelated financial institution. |
| (24) | Includes 10,582 shares of restricted Common Stock over which Ms. Stokes exercises voting but not investment power. |
| (25) | Includes 144,447 shares of restricted Common Stock over which certain members of the group exercise voting but not investment power. |
Section 16(a) of the Exchange Act requires the Company’s directors, executive officers and persons who own more than 10% of the Common Stock to file with the SEC initial reports of ownership and reports of changes in ownership of the Common Stock.
To the Company’s knowledge, based solely on its review of such reports and written representations that no other reports were required, during the fiscal year ended December 31, 2023, all of the Company’s officers, directors and greater than 10% shareholders complied with all applicable Section 16(a) filing requirements, except that Mr. Miller did not file a Form 4 with respect to the gifting of 470 shares of Common Stock in November 2023, but subsequently reported such transaction on a Form 4 filed on December 5, 2023.
| 75 |
The Company and the Bank have engaged in, and in the future expect to engage in, banking transactions in the ordinary course of business with directors and officers of the Company and the Bank and their family members and associates, including corporations, partnerships and other organizations in which such directors and officers have an interest. At December 31, 2023, certain executive officers, directors and their affiliates were indebted to the Bank in the aggregate amount of approximately $140.1 million. These loans were made in the ordinary course of business, on substantially the same terms (including interest rates, collateral and repayment terms) as those prevailing at the time for comparable transactions with others not related to the Company or the Bank and, in the opinion of management, do not involve more than the normal risk of collectability or present other unfavorable features.
The Board has adopted a policy with respect to related party transactions which provides procedures for the review, approval or ratification, and monitoring of certain transactions involving related parties required to be reported under applicable rules of the SEC. The policy, which is administered by the Corporate Governance and Nominating Committee, applies to any transaction or series of transactions in which the Company or any of its subsidiaries is or will be a participant, the amount involved will or may be expected to exceed $120,000 in any fiscal year, and any related party has or will have a direct or indirect material interest. Under the policy, a related party includes any person who is or was (since the beginning of the last fiscal year) an executive officer, director or nominee for director of the Company, any shareholder owning more than 5% of any class of the Company’s voting securities or an immediate family member of any such person.
Under the policy, our Chief Governance Officer is to be notified of the facts and circumstances of any proposed related party transaction prior to its being entered into. The Chief Governance Officer will undertake an evaluation of the related party transaction, and if such evaluation indicates that the transaction would require the approval of the Corporate Governance and Nominating Committee, then the Chief Governance Officer will provide a summary of the material facts of the transaction to the Committee for its consideration at its next regularly scheduled meeting. The Corporate Governance and Nominating Committee will review all of the relevant facts and circumstances of all related party transactions that are referred to the Committee by the Chief Governance Officer and will either approve or disapprove of entry into the transaction. The Corporate Governance and Nominating Committee may approve a related party transaction only if it determines in good faith that the transaction is in the best interest of the Company.
If the Chief Governance Officer determines it is impractical or undesirable to wait until the next Corporate Governance and Nominating Committee meeting to consummate a related party transaction, then the Chair of the Committee may review and approve the transaction in accordance with the policy, unless the aggregate amount involved will or may be expected to exceed $1,000,000. Alternatively, the Chair may call a special meeting for early consideration of the related party transaction. If the Company becomes aware of a related party transaction that has not been approved in accordance with the policy’s procedures, then the transaction will be reviewed in accordance with such procedures and, if the Corporate Governance and Nominating Committee determines it to be appropriate, ratified at the Committee’s next regularly scheduled meeting. If the Corporate Governance and Nominating Committee determines not to ratify a related party transaction that has been commenced without approval, then the Committee may direct additional actions, including immediate discontinuation or recession of the transaction.
The policy also contains a list of categories of transactions involving related persons that are deemed pre-approved or ratified under the policy.
| 76 |
We have entered into the Miller Employment Agreement and the Miller Split Dollar Termination Agreement with Mr. Miller, our Chairman. For a description of the transactions contemplated by these agreements, see “Board of Directors – Director Compensation – Agreements with James B. Miller, Jr.”
In addition, the Company entered into an agreement with FSM Energy for consulting and general contractor services related to the Company’s program to retrofit its owned real estate locations to LED lighting. Mr. Proctor’s brother is a partner and co-founder of FSM Energy. From January 1, 2023, through March 31, 2024, the Company paid to, or was invoiced by, FSM approximately $1.7 million, the majority of which related to the pass through of expenses FSM Energy paid to unrelated third parties for labor and materials.
The foregoing transactions were undertaken in accordance with the Board’s policy with respect to related party transactions.
| 77 |
The Board does not contemplate bringing before the Annual Meeting any matter other than those specified in the accompanying Notice of Annual Meeting of Shareholders, nor does it have information that other matters will be presented at the Annual Meeting. If other matters come before the Annual Meeting, then signed proxies will be voted upon such questions in the discretion of the persons named in the proxies as proxy holders.
Shareholders of record who intend to nominate a person for election as a director of the Company or to propose other business to be considered by the shareholders at the 2025 Annual Meeting must provide advance written notice to us in accordance with Article II, Section 10 of our Bylaws, which sets forth the procedures that must be followed and the information that must be provided in order for a shareholder to nominate a person for election as a director or to propose other business for consideration by shareholders at a meeting of shareholders. To be timely, a shareholder’s notice must be received by us no earlier than the close of business on November 25, 2024 and no later than the close of business on December 25, 2024. Such notice must include all the information set forth in Article II, Section 10 of our Bylaws and be addressed to: Corporate Secretary, Ameris Bancorp, 3490 Piedmont Road N.E., Suite 1550 Atlanta, Georgia 30305.
For a shareholder proposal to be considered for inclusion in the Company’s proxy statement for the 2025 Annual Meeting, in addition to being received by our Corporate Secretary at the address above no later than December 25, 2024, the proposal must also meet the requirements in the SEC’s regulations under Rule 14a-8.
In addition to satisfying the requirements of our Bylaws, to comply with the requirements set forth in Rule 14a-19 of the Exchange Act (the universal proxy rules), shareholders who intend to solicit proxies in support of director nominees other than the Board’s nominees must also provide written notice to our Corporate Secretary that sets forth all the information required by Rule 14a-19 of the Exchange Act.
No person shall be eligible for election as a director of the Company, and no business shall be conducted at any meeting of shareholders of the Company, unless nominated or proposed, respectively, in compliance with the procedures set forth in Article II, Section 10 of our Bylaws. You may obtain a copy of our Bylaws upon request by writing to our Corporate Secretary at the address indicated on the first page of this Proxy Statement.
A copy of the 2023 Annual Report is enclosed with this Proxy Statement. The 2023 Annual Report is not deemed a part of the proxy soliciting material. The Company’s Annual Report to the SEC on Form 10-K for the fiscal year ended December 31, 2023 was filed with the SEC on February 28, 2024. Upon receipt of a written request, the Company will, without charge, furnish any owner of Common Stock a copy of the Annual Report on Form 10-K, including financial statements and the footnotes thereto. Copies of exhibits to the Annual Report on Form 10-K are also available upon specific request and payment of a reasonable charge for reproduction. Such request should be directed to our Corporate Secretary at the address indicated on the first page of this Proxy Statement.
| 78 |
RECONCILIATION OF GAAP AND NON-GAAP FINANCIAL MEASURES
The Company reports its financial results in accordance with GAAP. In addition, we present certain performance measures determined by methods other than in accordance with GAAP, including tangible book value, adjusted efficiency ratio, adjusted return on tangible common equity, adjusted return on average assets, and non-performing portfolio assets as a percentage of total assets. Management of the Company uses these non-GAAP measures in its analysis of the Company’s performance. These measures are useful when evaluating the underlying performance and efficiency of the Company’s operations and balance sheet. The Company’s management believes that these non-GAAP measures provide a greater understanding of ongoing operations, enhance comparability of results with prior periods and demonstrate the effects of significant gains and charges in the current period. The Company’s management believes that investors may use these non-GAAP financial measures to evaluate the Company’s financial performance without the impact of unusual items that may obscure trends in the Company’s underlying performance. These disclosures should not be viewed as a substitute for financial measures determined in accordance with GAAP, nor are they necessarily comparable to non-GAAP performance measures that may be presented by other companies. The Company’s management uses these measures to assess the quality of capital and believes that investors may find them useful in their evaluation of the Company. These capital measures may or may not be necessarily comparable to similar capital measures that may be presented by other companies.
Reconciliations of GAAP to non-GAAP financial measures are set forth below.
| | | | Year Ended | | ||||
| | Adjusted Net Income | | | December 31 2023 | | | December 31 2022 | |
| | (dollars in thousands except per share data) | | | | | | ||
| | Net income available to common shareholders | | | $269,105 | | | $346,540 | |
| | Adjustment items: | | | | | | ||
| | Merger and conversion charges | | | — | | | 1,212 | |
| | Gain on sale of MSR | | | — | | | (1,356) | |
| | Servicing right impairment (recovery) | | | — | | | (21,824) | |
| | Gain on BOLI proceeds | | | (486) | | | (55) | |
| | FDIC special assessment | | | 11,566 | | | — | |
| | Natural disaster expenses | | | — | | | 151 | |
| | (Gain) loss on bank premises | | | (1,903) | | | (45) | |
| | Tax effect of adjustment items (Note 1) | | | (2,029) | | | 4,792 | |
| | After tax adjustment items | | | 7,148 | | | (17,125) | |
| | Adjusted net income | | | $276,253 | | | $329,415 | |
| | Weighted average number of shares − diluted | | | 69,104,158 | | | 69,419,721 | |
| | Net income per diluted share | | | $3.89 | | | $4.99 | |
| | Adjusted net income per diluted share | | | $4.00 | | | $4.75 | |
| | Average assets | | | $25,404,873 | | | $23,644,754 | |
| | Return on average assets | | | 1.06 % | | | 1.47 % | |
| | Adjusted return on average assets | | | 1.09 % | | | 1.39 % | |
| | Average common equity | | | $3,313,361 | | | $3,083,081 | |
| | Average tangible common equity | | | $2,200,883 | | | $1,947,222 | |
| | Return on average common equity | | | 8.12 % | | | 11.24 % | |
| | Adjusted return on average tangible common equity | | | 12.55 % | | | 16.92 % | |
Note 1: Tax effect is calculated utilizing a 21% rate for taxable adjustments. Gain on BOLI proceeds is non-taxable and no tax effect is included. A portion of the merger and conversion charges for the twelve months ended December 2022 is nondeductible for tax purposes.
| A-1 |
| | | | Year Ended | | ||||
| | Adjusted Efficiency Ratio (TE) | | | December 31 2023 | | | December 31 2022 | |
| | (dollars in thousands) | | | | | | ||
| | Adjusted Noninterest Expense | | | | | | ||
| | Total noninterest expense | | | $578,281 | | | $560,655 | |
| | Adjustment items: | | | | | | ||
| | Merger and conversion charges | | | — | | | (1,212) | |
| | FDIC Special Assessment | | | (11,566) | | | — | |
| | Natural disaster expenses | | | — | | | (151) | |
| | Gain (loss) on bank premises | | | 1,903 | | | 45 | |
| | Adjusted noninterest expense | | | $568,618 | | | $559,337 | |
| | Total Revenue | | | | | | ||
| | Net interest income | | | $835,044 | | | $801,026 | |
| | Noninterest income | | | 242,828 | | | 284,424 | |
| | Total revenue | | | $1,077,872 | | | $1,085,450 | |
| | Adjusted Total Revenue | | | | | | ||
| | Net interest income (TE) | | | $838,824 | | | $804,895 | |
| | Noninterest income | | | 242,828 | | | 284,424 | |
| | Total revenue (TE) | | | 1,081,652 | | | 1,089,319 | |
| | Adjustment items: | | | | | | ||
| | (Gain) loss on securities | | | 304 | | | (203) | |
| | Gain on sale of MSR | | | — | | | (1,356) | |
| | Gain on BOLI proceeds | | | (486) | | | (55) | |
| | Servicing right impairment (recovery) | | | — | | | (21,824) | |
| | Adjusted total revenue (TE) | | | $1,081,470 | | | $1,065,881 | |
| | Efficiency ratio | | | 53.65 % | | | 51.65 % | |
| | Adjusted efficiency ratio (TE) | | | 52.58 % | | | 52.54 % | |
| | | | Year Ended | | ||||
| | Tangible Book Value Per Share | | | December 31 2023 | | | December 31 2022 | |
| | (dollars in thousands except per share data) | | | | | | ||
| | Total shareholders’ equity | | | $3,426,747 | | | $3,197,400 | |
| | Less: | | | | | | ||
| | Goodwill | | | 1,015,646 | | | 1,015,646 | |
| | Other intangibles, net | | | 87,949 | | | 106,194 | |
| | Total tangible shareholders’ equity | | | $2,323,152 | | | $2,075,560 | |
| | Period end number of shares | | | 69,053,341 | | | 69,369,050 | |
| | Book value per share (period end) | | | $49.62 | | | $46.09 | |
| | Tangible book value per share (period end) | | | $33.64 | | | $29.92 | |
| A-2 |
| | | | Year Ended | | ||||
| | Non-Performing Assets | | | December 31 2023 | | | December 31 2022 | |
| | (dollars in thousands) | | | | | | ||
| | Nonaccrual portfolio loans | | | $60,961 | | | $65,221 | |
| | Other real estate owned | | | 6,199 | | | 843 | |
| | Repossessed assets | | | 17 | | | 28 | |
| | Accruing loans delinquent 90 days or more | | | 16,988 | | | 17,865 | |
| | Non-performing portfolio assets | | | $84,165 | | | $83,957 | |
| | Serviced GNMA-guaranteed mortgage nonaccrual loans | | | 90,156 | | | 69,587 | |
| | Total non-performing assets | | | $174,321 | | | $153,544 | |
| | | | Year Ended | | ||||
| | Asset Quality Ratios | | | December 31 2023 | | | December 31 2022 | |
| | (dollars in thousands) | | | | | | ||
| | Non-performing portfolio assets as a percent of total assets | | | 0.33% | | | 0.34% | |
| | Total non-performing assets as a percent of total assets | | | 0.69% | | | 0.61% | |
| A-3 |

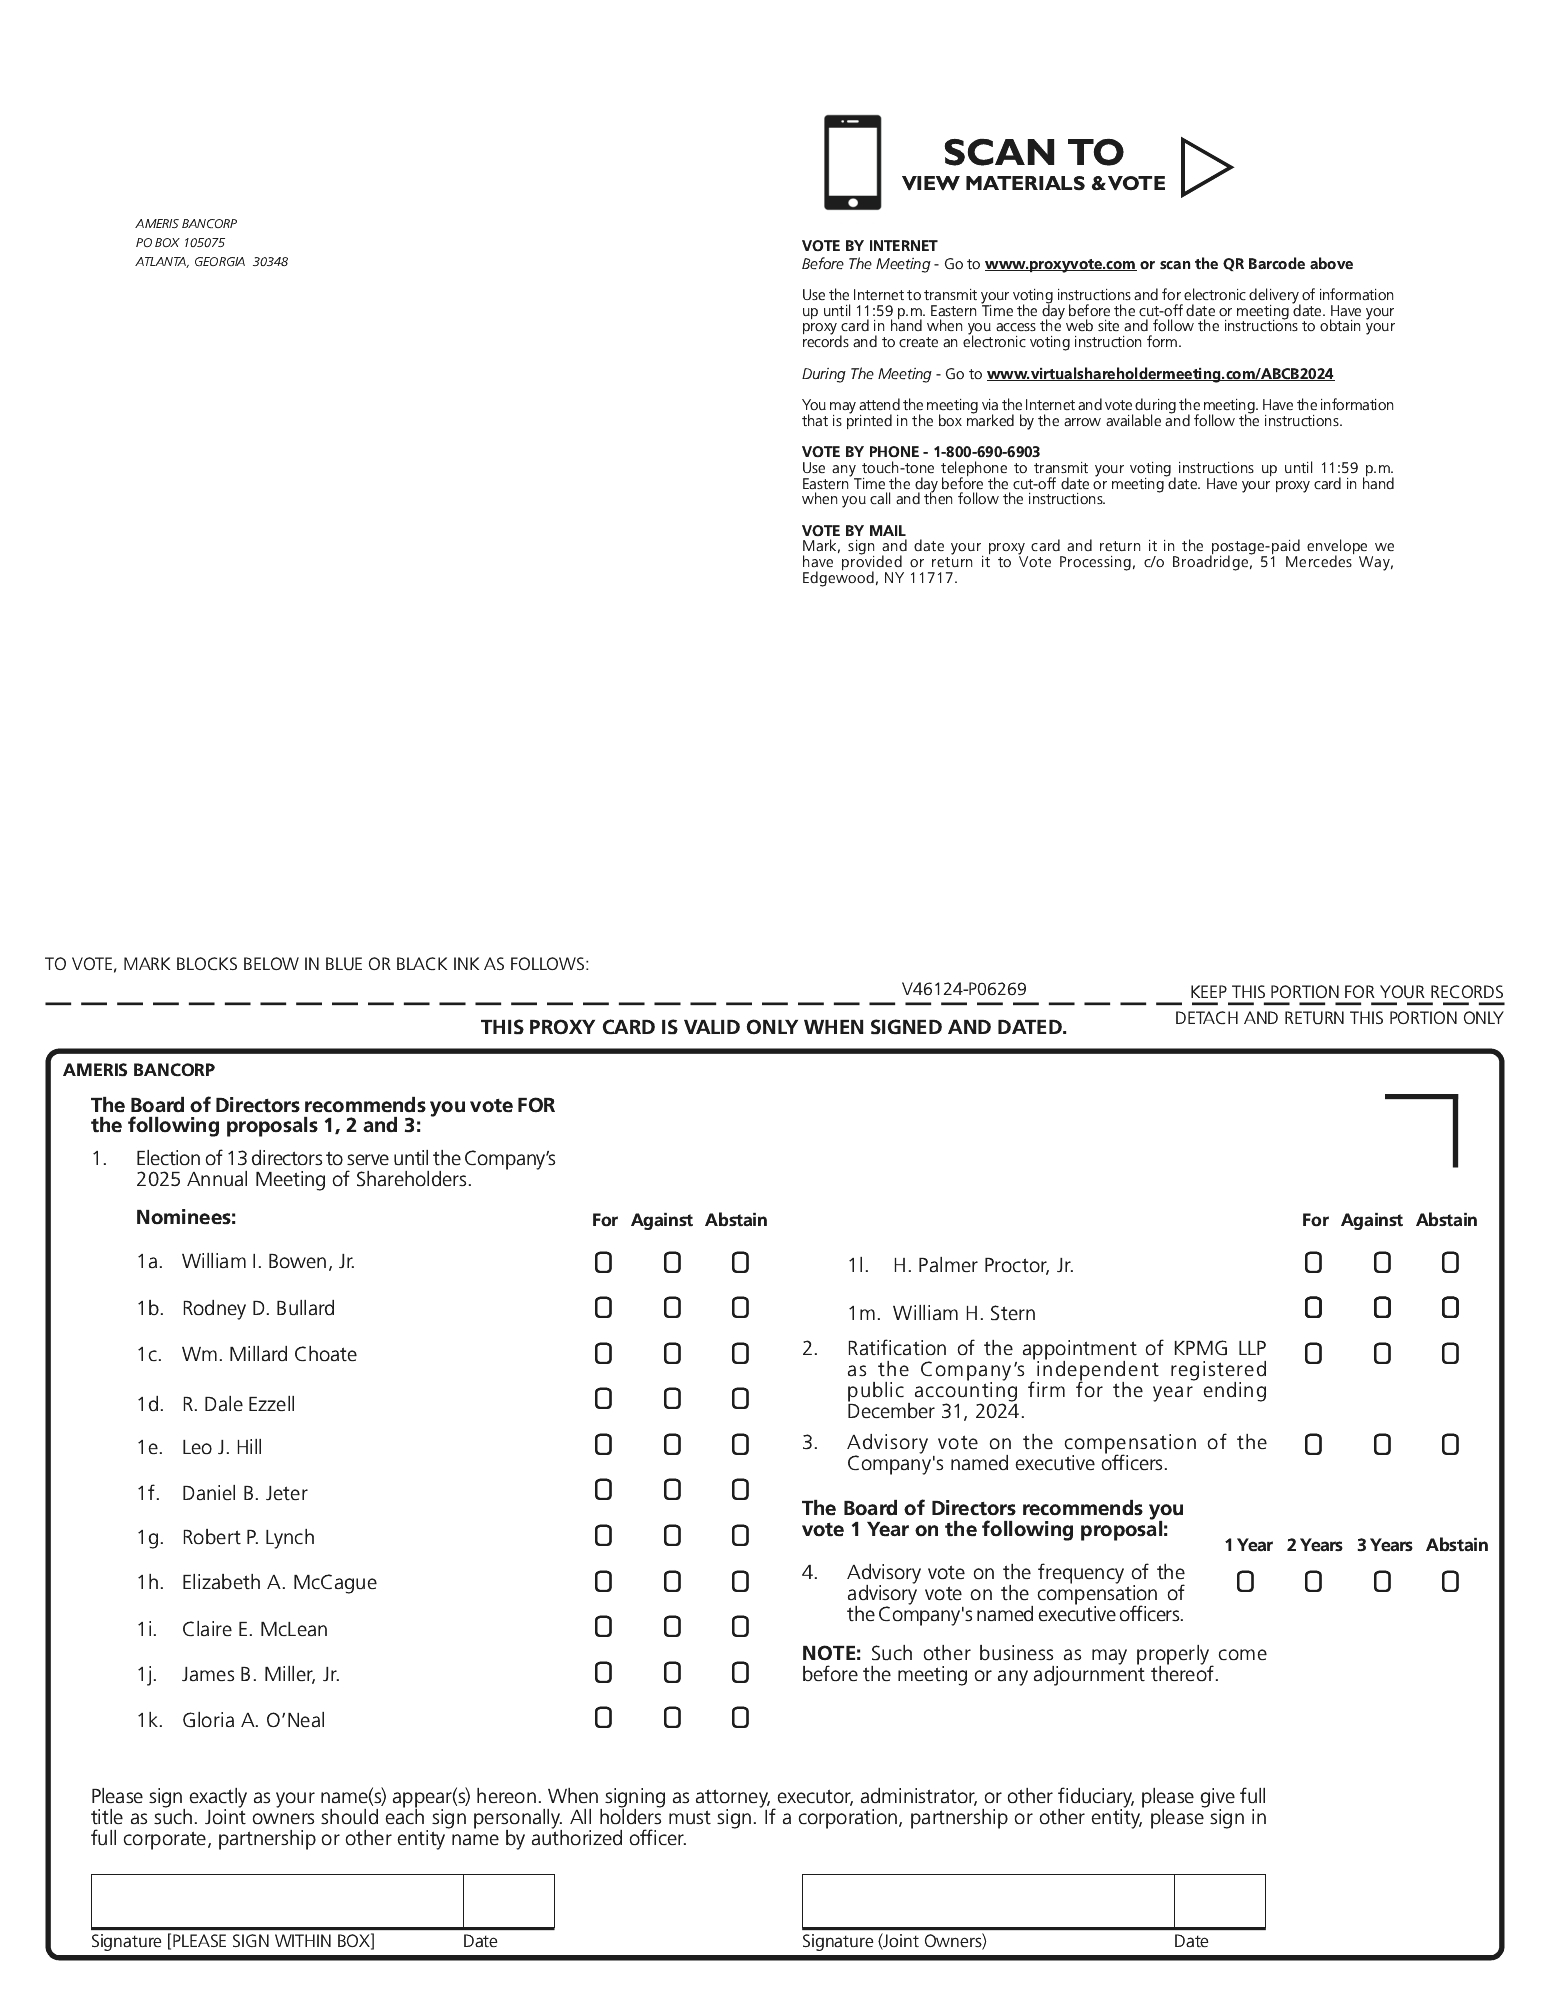

0000351569 5 2023-01-01 2023-12-31