Exhibit 99.2
Ameris Bancorp 3 rd Quarter 2018 Results Investor Presentation
This presentation contains certain performance measures determined by methods other than in accordance with accounting principles generally accepted in the United States of America (“GAAP”) . Management of Ameris Bancorp (the “Company”) uses these non - GAAP measures in its analysis of the Company’s performance . These measures are useful when evaluating the underlying performance and efficiency of the Company’s operations and balance sheet . The Company’s management believes that these non - GAAP measures provide a greater understanding of ongoing operations, enhance comparability of results with prior periods and demonstrate the effects of significant gains and charges in the current period . The Company’s management believes that investors may use these non - GAAP financial measures to evaluate the Company’s financial performance without the impact of unusual items that may obscure trends in the Company’s underlying performance . These disclosures should not be viewed as a substitute for financial measures determined in accordance with GAAP, nor are they necessarily comparable to non - GAAP performance measures that may be presented by other companies . Tangible common equity and Tier 1 capital ratios are non - GAAP measures . The Company calculates the Tier 1 capital ratio using current call report instructions . The Company’s management uses these measures to assess the quality of capital and believes that investors may find them useful in their evaluation of the Company . These capital measures may, or may not be necessarily comparable to similar capital measures that may be presented by other companies . This presentation may contain statements that constitute “forward - looking statements” within the meaning of Section 27 A of the Securities Act of 1933 , as amended, and Section 21 E of the Securities Exchange Act of 1934 , as amended . The words “believe”, “estimate”, “expect”, “intend”, “anticipate” and similar expressions and variations thereof identify certain of such forward - looking statements, which speak only as of the dates which they were made . The Company undertakes no obligation to publicly update or revise any forward - looking statements, whether as a result of new information, future events or otherwise . Readers are cautioned that any such forward - looking statements are not guarantees of future performance and involve risks and uncertainties and that actual results may differ materially from those indicated in the forward - looking statements as a result of various factors . Readers are cautioned not to place undue reliance on these forward - looking statements and are referred to the Company’s periodic filings with the Securities and Exchange Commission for a summary of certain factors that may impact the Company’s results of operations and financial condition . Cautionary Statements 1
• 11 . 3 % more profitable (using ROA) than this time last year, exclusive of the effects of the tax law . Managed a stable margin, aggressive growth goals in a hyper - competitive market and integrated two large M&A deals • Strong, attractive Southeastern markets and attractive LOBs give us the ability to safely grow faster than our peers . Expect double digit growth in loans and deposits • Maintain stable margin with loan product diversity and lines of business growth to offset compression effect of increasing deposit betas . Continue to invest our higher asset revenues in deposit rates and maintain stable margins . Managed to virtually zero rate sensitivity • 2019 earnings catalysts already announced and already in place . Sufficient to outperform on EPS growth regardless of M&A opportunities or outsized growth, both of which we expect • Growth prospects for TBV and Capital levels are very attractive . Consensus TBV at Dec 2019 is $ 22 . 41 per share, an increase of 26 % • CRE concentrations are moderate and afford the Company room to grow ; pipelines are strong and allow us to grow within regulatory guidance limits The Ameris Bancorp Story Top of Class Operating Results Leader in M&A in the Southeast • Safe M&A strategy for our investors . Willing to pass on even the best strategic deals if it does not fit our proven equation for good market reception • We like deals that are neutral on TBV, meaningful on EPS relative to new ownership levels, simple and reliable strategies that deliver promised economics, and neutral to positive to our top of class operating ratios • We believe there are deals that fit this equation with Boards that appreciate our discipline and track record 2

Clear Path to Future Increase in EPS Confidence in 2019 financial expectations: • Maintain margin through funding expertise, capacity and better mix • Double - digit balance sheet growth • Reliable and profitable growth in all segments of loan production • $20 million of operating efficiencies announced (to include data processing, branch realignment, etc.) • These cost - saving initiatives buffer the Company against investor concerns (that we are not experiencing) regarding: – Margin compression due to deposit betas (8 quarters of stable and improving margins) – Loan growth slowdown (over 15% average organic loan growth over past 8 quarters) – Market and economic slowdown (Southeast economy remains among strongest in U.S.) 3
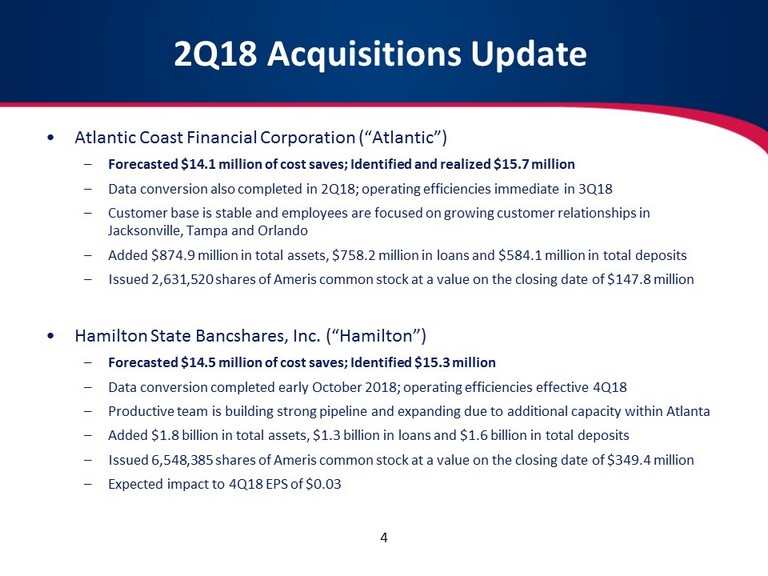
2Q18 Acquisitions Update • Atlantic Coast Financial Corporation (“Atlantic”) – Forecasted $14.1 million of cost saves; Identified and realized $15.7 million – Data conversion also completed in 2Q18; operating efficiencies immediate in 3Q18 – Customer base is stable and employees are focused on growing customer relationships in Jacksonville, Tampa and Orlando – Added $874.9 million in total assets, $758.2 million in loans and $584.1 million in total deposits – Issued 2,631,520 shares of Ameris common stock at a value on the closing date of $147.8 million • Hamilton State Bancshares, Inc. (“Hamilton”) – Forecasted $14.5 million of cost saves; Identified $15.3 million – Data conversion completed early October 2018; operating efficiencies effective 4Q18 – Productive team is building strong pipeline and expanding due to additional capacity within Atlanta – Added $1.8 billion in total assets, $1.3 billion in loans and $1.6 billion in total deposits – Issued 6,548,385 shares of Ameris common stock at a value on the closing date of $349.4 million – Expected impact to 4Q18 EPS of $0.03 4
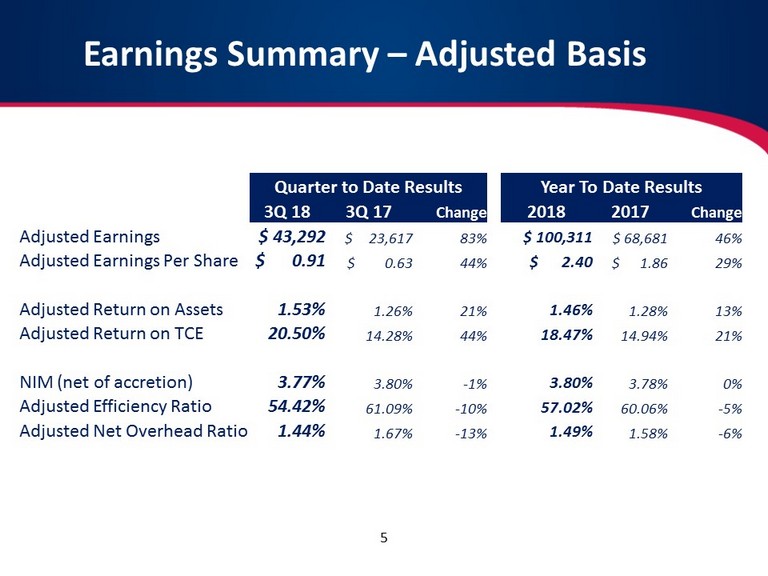
Earnings Summary – Adjusted Basis 5 Quarter to Date Results Year To Date Results 3Q 18 3Q 17 Change 2018 2017 Change Adjusted Earnings $ 43,292 $ 23,617 83% $ 100,311 $ 68,681 46% Adjusted Earnings Per Share $ 0.91 $ 0.63 44% $ 2.40 $ 1.86 29% Adjusted Return on Assets 1.53% 1.26% 21% 1.46% 1.28% 13% Adjusted Return on TCE 20.50% 14.28% 44% 18.47% 14.94% 21% NIM (net of accretion) 3.77% 3.80% - 1% 3.80% 3.78% 0% Adjusted Efficiency Ratio 54.42% 61.09% - 10% 57.02% 60.06% - 5% Adjusted Net Overhead Ratio 1.44% 1.67% - 13% 1.49% 1.58% - 6%
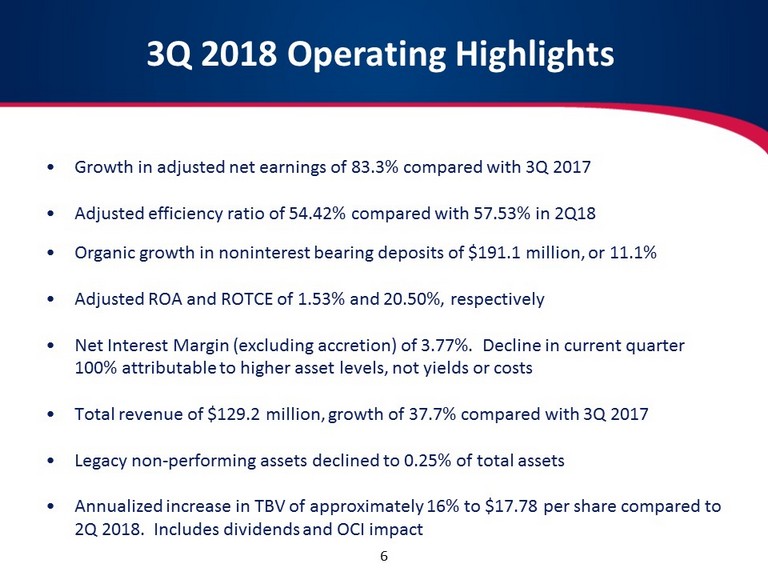
3Q 2018 Operating Highlights • Growth in adjusted net earnings of 83.3% compared with 3Q 2017 • Adjusted efficiency ratio of 54.42% compared with 57.53% in 2Q18 • Organic growth in noninterest bearing deposits of $191.1 million, or 11.1% • Adjusted ROA and ROTCE of 1.53% and 20.50%, respectively • Net Interest Margin (excluding accretion) of 3.77%. Decline in current quarter 100% attributable to higher asset levels, not yields or costs • Total revenue of $129.2 million, growth of 37.7% compared with 3Q 2017 • Legacy non - performing assets declined to 0.25% of total assets • Annualized increase in TBV of approximately 16% to $17.78 per share compared to 2Q 2018. Includes dividends and OCI impact 6

Credit Quality and Loan Diversification Agriculture 2.8% C&I 16.7% MUNI 7.1% Consumer 4.9% Investor CRE 19.9% Owner - Occupied CRE 11.9% AC&D 10.0% Multi - Family 3.4% SFR Mortgage 23.3% 3Q 2018 Loan Portfolio • Largest category of loans < 24% of total • Participations purchased < 1% of total loans • Average loan size = $207M • Only 10.0% of total loans in Construction or A&D • Net CRE and C&D concentrations are 259% and 78%, respectively • Approval authority vested in 6 Regional Credit Officers. Credit Admin team includes 34 Portfolio Managers, as well as credit support teams specifically for construction management, CRE underwriting and municipal loans. 7 Continued Diversity of Portfolio with No Concentration Expected
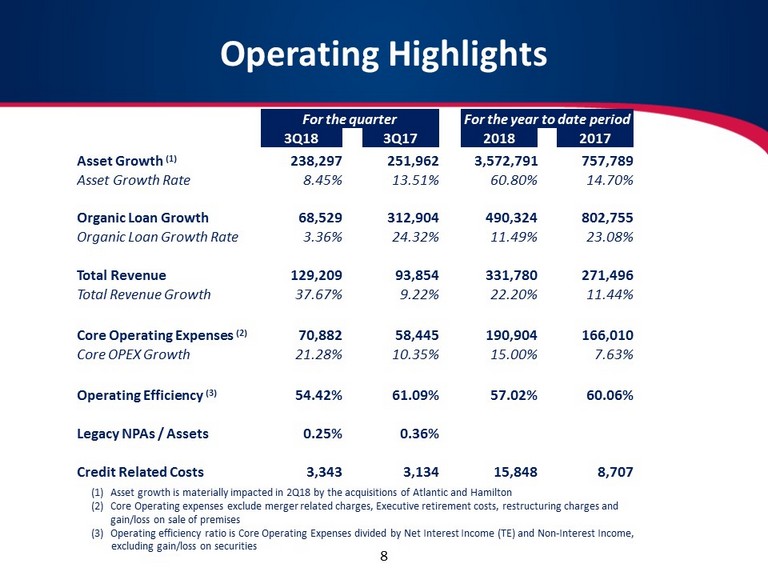
Operating Highlights (1) Asset growth is materially impacted in 2Q18 by the acquisitions of Atlantic and Hamilton (2) Core Operating expenses exclude merger related charges, Executive retirement costs, restructuring charges and gain/loss on sale of premises (3) Operating efficiency ratio is Core Operating Expenses divided by Net Interest Income (TE) and Non - Interest Income, excluding gain/loss on securities 8 For the quarter For the year to date period 3Q18 3Q17 2018 2017 Asset Growth (1) 238,297 251,962 3,572,791 757,789 Asset Growth Rate 8.45% 13.51% 60.80% 14.70% Organic Loan Growth 68,529 312,904 490,324 802,755 Organic Loan Growth Rate 3.36% 24.32% 11.49% 23.08% Total Revenue 129,209 93,854 331,780 271,496 Total Revenue Growth 37.67% 9.22% 22.20% 11.44% Core Operating Expenses (2) 70,882 58,445 190,904 166,010 Core OPEX Growth 21.28% 10.35% 15.00% 7.63% Operating Efficiency (3) 54.42% 61.09% 57.02% 60.06% Legacy NPAs / Assets 0.25% 0.36% Credit Related Costs 3,343 3,134 15,848 8,707
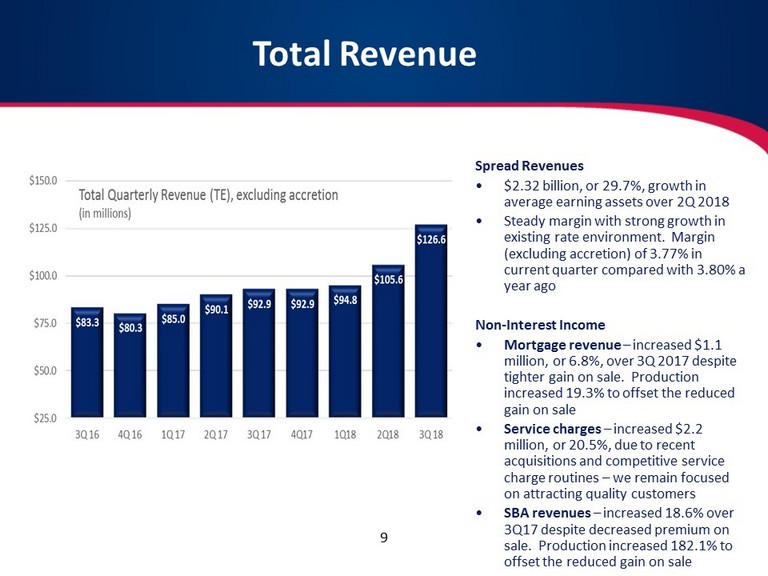
Total Revenue Spread Revenues • $2.32 billion, or 29.7%, growth in average earning assets over 2Q 2018 • Steady margin with strong growth in existing rate environment. Margin (excluding accretion) of 3.77% in current quarter compared with 3.80% a year ago Non - Interest Income • Mortgage revenue – increased $1.1 million, or 6.8%, over 3Q 2017 despite tighter gain on sale. Production increased 19.3% to offset the reduced gain on sale • Service charges – increased $2.2 million, or 20.5%, due to recent acquisitions and competitive service charge routines – we remain focused on attracting quality customers • SBA revenues – increased 18.6% over 3Q17 despite decreased premium on sale. Production increased 182.1% to offset the reduced gain on sale 9
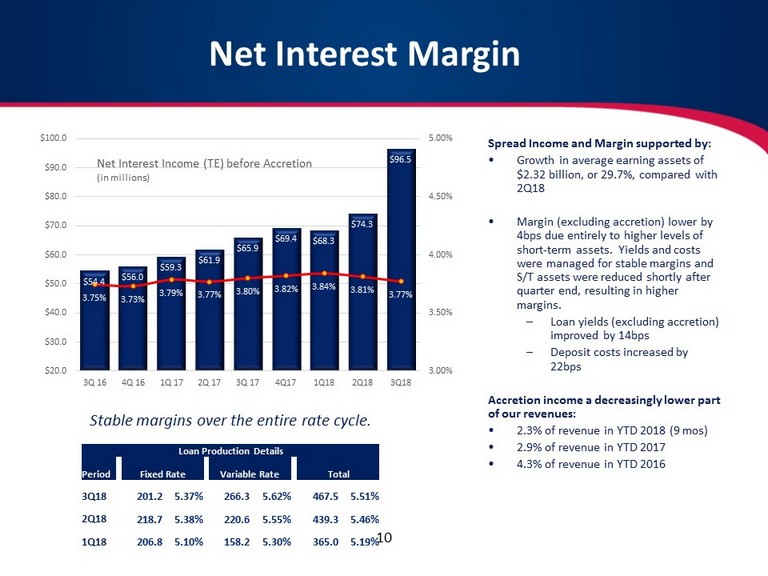
Net Interest Margin Spread Income and Margin supported by: • Growth in average earning assets of $2.32 billion, or 29.7%, compared with 2Q18 • Margin (excluding accretion) lower by 4bps due entirely to higher levels of short - term assets. Yields and costs were managed for stable margins and S/T assets were reduced shortly after quarter end, resulting in higher margins. – Loan yields (excluding accretion) improved by 14bps – Deposit costs increased by 22bps Accretion income a decreasingly lower part of our revenues: • 2.3% of revenue in YTD 2018 (9 mos ) • 2.9% of revenue in YTD 2017 • 4.3% of revenue in YTD 2016 Stable margins over the entire rate cycle. Loan Production Details Period Fixed Rate Variable Rate Total 3Q18 201.2 5.37% 266.3 5.62% 467.5 5.51% 2Q18 218.7 5.38% 220.6 5.55% 439.3 5.46% 1Q18 206.8 5.10% 158.2 5.30% 365.0 5.19% $54.4 $56.0 $59.3 $61.9 $65.9 $69.4 $68.3 $74.3 $96.5 3.75% 3.73% 3.79% 3.77% 3.80% 3.82% 3.84% 3.81% 3.77% 3.00% 3.50% 4.00% 4.50% 5.00% $20.0 $30.0 $40.0 $50.0 $60.0 $70.0 $80.0 $90.0 $100.0 3Q 16 4Q 16 1Q 17 2Q 17 3Q 17 4Q17 1Q18 2Q18 3Q18 Net Interest Income (TE) before Accretion (in millions) 10
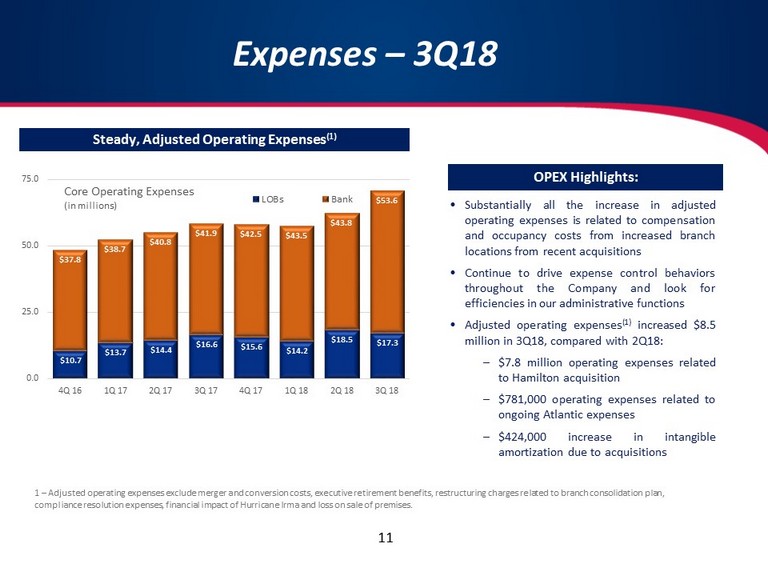
Expenses – 3Q18 • Substantially all the increase in adjusted operating expenses is related to compensation and occupancy costs from increased branch locations from recent acquisitions • Continue to drive expense control behaviors throughout the Company and look for efficiencies in our administrative functions • Adjusted operating expenses ( 1 ) increased $ 8 . 5 million in 3 Q 18 , compared with 2 Q 18 : – $ 7 . 8 million operating expenses related to Hamilton acquisition – $ 781 , 000 operating expenses related to ongoing Atlantic expenses – $ 424 , 000 increase in intangible amortization due to acquisitions 1 – Adjusted operating expenses exclude merger and conversion costs, executive retirement benefits, restructuring charges relate d to branch consolidation plan, compliance resolution expenses, financial impact of Hurricane Irma and loss on sale of premises. OPEX Highlights: Steady, Adjusted Operating Expenses (1) 11 $10.7 $13.7 $14.4 $16.6 $15.6 $14.2 $18.5 $17.3 $37.8 $38.7 $40.8 $41.9 $42.5 $43.5 $43.8 $53.6 0.0 25.0 50.0 75.0 4Q 16 1Q 17 2Q 17 3Q 17 4Q 17 1Q 18 2Q 18 3Q 18 Core Operating Expenses (in millions) LOBs Bank
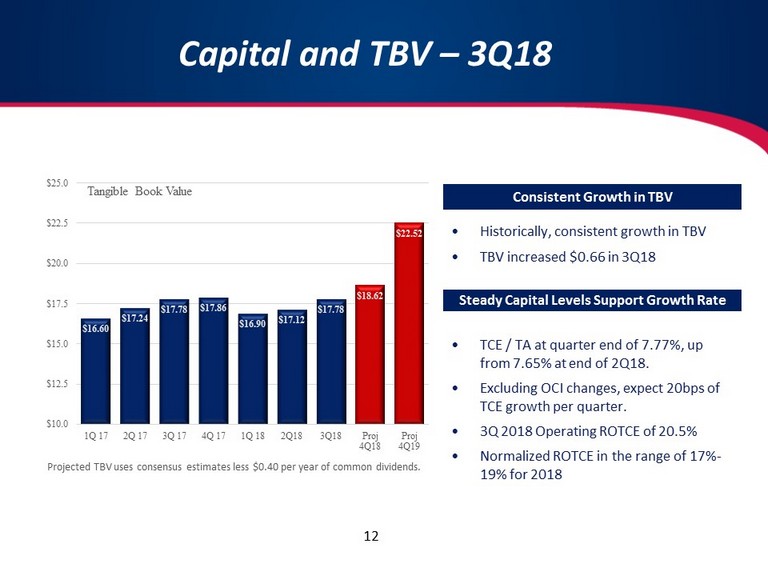
Capital and TBV – 3Q18 • Historically, consistent growth in TBV • TBV increased $0.66 in 3Q18 Consistent Growth in TBV • TCE / TA at quarter end of 7.77%, up from 7.65% at end of 2Q18. • Excluding OCI changes, expect 20bps of TCE growth per quarter. • 3Q 2018 Operating ROTCE of 20.5% • Normalized ROTCE in the range of 17% - 19% for 2018 Steady Capital Levels Support Growth Rate 12 $16.60 $17.24 $17.78 $17.86 $16.90 $17.12 $17.78 $18.62 $22.52 $10.0 $12.5 $15.0 $17.5 $20.0 $22.5 $25.0 1Q 17 2Q 17 3Q 17 4Q 17 1Q 18 2Q18 3Q18 Proj 4Q18 Proj 4Q19 Tangible Book Value Projected TBV uses consensus estimates less $0.40 per year of common dividends.
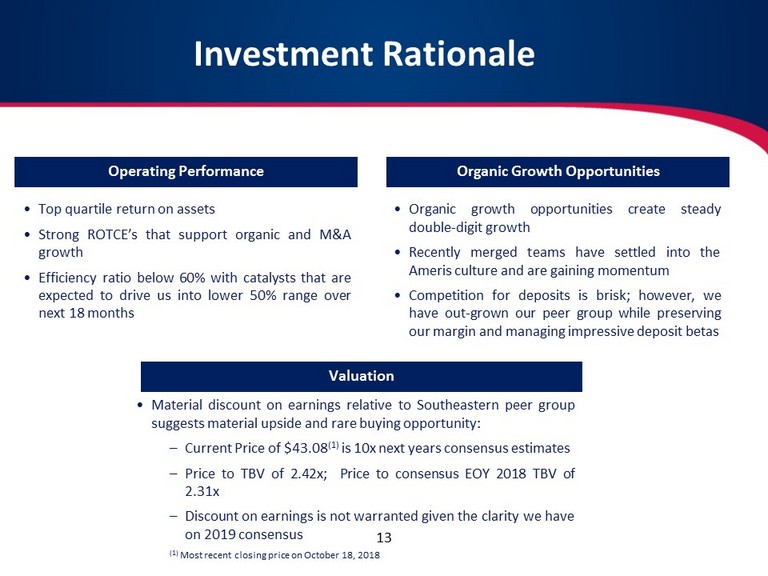
Investment Rationale Organic Growth Opportunities • Top quartile return on assets • Strong ROTCE’s that support organic and M&A growth • Efficiency ratio below 60 % with catalysts that are expected to drive us into lower 50 % range over next 18 months Operating Performance Valuation • Material discount on earnings relative to Southeastern peer group suggests material upside and rare buying opportunity : – Current Price of $ 43 . 08 ( 1 ) is 10 x next years consensus estimates – Price to TBV of 2 . 42 x ; Price to consensus EOY 2018 TBV of 2 . 31 x – Discount on earnings is not warranted given the clarity we have on 2019 consensus ( 1 ) Most recent closing price on October 18 , 2018 • Organic growth opportunities create steady double - digit growth • Recently merged teams have settled into the Ameris culture and are gaining momentum • Competition for deposits is brisk ; however, we have out - grown our peer group while preserving our margin and managing impressive deposit betas 13
Ameris Bancorp Press Release & Financial Highlights September 30, 2018