UNITED STATES
SECURITES AND EXCHANGE COMMISSION
Washington, DC 20549
FORM N-CSRS
CERTIFIED SHAREHOLDER REPORT OF
REGISTERED MANAGEMENT INVESTMENT COMPANIES
Investment Company Act file number: 811-03150
BMC FUND, INC.
(Exact name of registrant as specified in charter)
800 HICKORY BLVD. SW
LENOIR, NC 28645
(Address of principal executive offices) (Zip code)
WENDY SIMS
BMC FUND, INC.
800 HICKORY BLVD. SW
LENOIR, NC 28645
(Name and address of agent for service)
Registrant's telephone number including area code: 828-758-6100
Date of fiscal year end: October 31, 2021
Date of reporting period: April 30, 2021
Item 1. Report to Stockholders.
BMC FUND, INC.
FINANCIAL STATEMENTS AND
SUPPLEMENTARY INFORMATION
(UNAUDITED)
Six Months Ended April 30, 2021
BMC FUND, INC.
TABLE OF CONTENTS
| | | Page No. | |
| | | | |
| Letter to Shareholders | | 1 | |
| | | | |
| Graphic Presentation of Portfolio Holdings and Sector Diversification | | 2 | |
| | | | |
| Schedule of Investments | | 3 | |
| | | | |
| Schedule of Open Written Option Contracts | | 18 | |
| | | | |
| Statement of Assets and Liabilities | | 19 | |
| | | | |
| Statement of Operations | | 20 | |
| | | | |
| Statements of Changes In Net Assets | | 21 | |
| | | | |
| Financial Highlights | | 22 | |
| | | | |
| Notes to Financial Statements | | 23 | |
| | | | |
| Directors and Officers | | 32 | |
| | | | |
| Additional Information | | 35 | |
BMC FUND, INC.
LETTER TO SHAREHOLDERS
Six Months Ended April 30, 2021 (Unaudited)
TO OUR SHAREHOLDERS:
We are happy to present to you our semi-annual report (unaudited) for the six months ended April 30, 2021, which we believe contains complete and pertinent financial information.
BMC Fund, Inc. (the “Fund”) became a Regulated Investment Company (“RIC”) on April 1, 1981. During the six months ended April 30, 2021, the Fund paid the following dividends per share:
| December 10, 2020 to shareholders of record November 25, 2020 | | $ | .25 | |
| March 10, 2021 to shareholders of record February 25, 2021 | | | .25 | |
| | | | | |
| Total | | $ | .50 | |
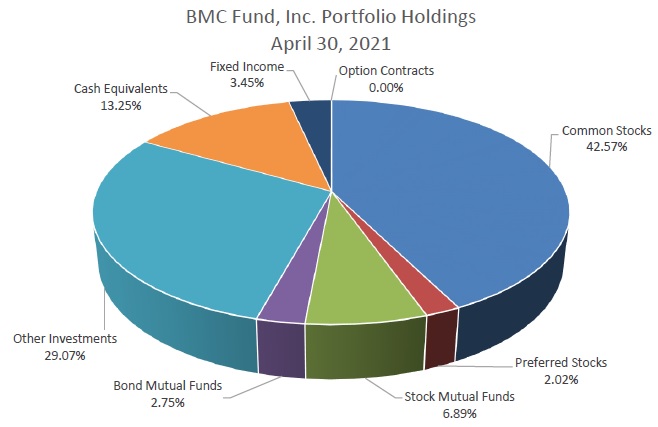
The attached Schedule of Investments is a listing of the entire Fund’s diversified securities at April 30, 2021, with a total market value of $109,888,520.
M. Hunt Broyhill
Chairman and President
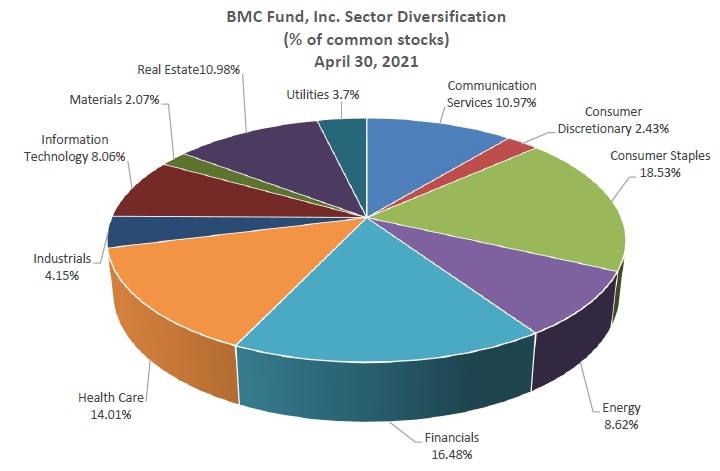
BMC FUND, INC.
GRAPHIC PRESENTATION OF PORTFOLIO HOLDINGS AND
SECTOR DIVERSIFICATION
Six Months Ended April 30, 2021 (Unaudited)
| BMC FUND, INC. | | | | | | | |
| SCHEDULE OF INVESTMENTS (Unaudited) | | | | | | |
| April 30, 2021 | | | | | | | |
| | | | | | Coupon | | | | | | | | | | | | | | | Percent | |
| | | | | | Interest | | | Maturity | | | Face | | | | | | Market | | | of Net | |
| Debt Issuer | | | | | Rate | | | Date | | | Amount | | | Cost | | | Value | | | Assets | |
| | | | | | | | | | | | | | | | | | | | | | |
| FIXED INCOME: | | | | | | | | | | | | | | | | | | | | | | | | | | | |
| CORPORATE BONDS: | | | | | | | | | | | | | | | | | | | | | | | | | | | |
| BRINKER INTL INC | | | | | | | 3.875 | % | | | 5/15/2023 | | | | 100,000 | | | | 99,320 | | | | 102,125 | | | | |
| INGLES MKTS INC | | | | | | | 5.750 | % | | | 6/15/2023 | | | | 112,000 | | | | 82,162 | | | | 82,795 | | | | |
| VOYA FINANCIAL INC | | | | | | | 5.650 | % | | | 5/15/2053 | | | | 150,000 | | | | 150,000 | | | | 160,875 | | | | |
| LINCOLN NATL CORP IND | | | | | | | 4.997 | % | | | 5/17/2066 | | | | 125,000 | | | | 94,860 | | | | 107,500 | | | | |
| FPL GROUP CAP INC | | | | | | | 6.350 | % | | | 10/1/2066 | | | | 586,000 | | | | 562,772 | | | | 540,585 | | | | |
| PP&L CAP FUNDING FLT RATE | | | | | | | 5.051 | % | | | 3/30/2067 | | | | 500,000 | | | | 500,000 | | | | 467,451 | | | | |
| WISCONSIN ENERGY | | | | | | | 4.728 | % | | | 5/15/2067 | | | | 250,000 | | | | 241,428 | | | | 228,133 | | | | |
| TRANSCANADA PIPELINES LTD | | | | | | | 6.350 | % | | | 5/15/2067 | | | | 250,000 | | | | 198,914 | | | | 204,592 | | | | |
| JP MORGAN CHASE CAP XXIII | | | 5 | | | | 3.700 | % | | | 5/15/2077 | | | | 250,000 | | | | 233,038 | | | | 217,738 | | | | |
| BUCKEYE PARTNERS LP | | | | | | | 6.375 | % | | | 1/22/2078 | | | | 450,000 | | | | 336,860 | | | | 369,000 | | | | |
| LEHMAN BROTHERS HLDGS NIKKEI INDEX | | | 1,2,3 | | | | 0.000 | % | | | 9/29/2008 | | | | 3,000,000 | | | | 1,607,047 | | | | - | | | | |
| LEHMAN BROTHERS HLDGS EAFE INDEX | | | 1,2,3 | | | | 0.000 | % | | | 11/15/2008 | | | | 1,000,000 | | | | 527,358 | | | | - | | | | |
| LEHMAN BROTHERS HLDGS MEDIUM TERM NOTE | | | 1,2,3 | | | | 0.000 | % | | | 3/15/2011 | | | | 2,500,000 | | | | 1,338,001 | | | | - | | | | |
| | | | | | | | | | | | | | | | 9,273,000 | | | | 5,971,760 | | | | 2,480,794 | | | 2.21 | % |
| MUNICIPAL BONDS: | | | | | | | | | | | | | | | | | | | | | | |
| VIRGIN ISLANDS PUB FIN AUTH | | | | | | | 6.625 | % | | | 10/1/2029 | | | | 100,000 | | | | 87,973 | | | | 100,812 | | | | |
| VIRGIN ISLANDS PUB FIN AUTH | | | | | | | 6.750 | % | | | 10/1/2037 | | | | 1,200,000 | | | | 1,005,349 | | | | 1,209,744 | | | | |
| | | | | | | | | | | | | | | | 1,300,000 | | | | 1,093,322 | | | | 1,310,556 | | | 1.17 | % |
| | | | | | | | | | | | | | | | | | | | | | | | | | | | |
| | | | | | | | | | | | | | | | | | | | | | | | | | | | |
| TOTAL INVESTMENTS IN FIXED INCOME | | | | | | | | | | | | | | $ | 10,573,000 | | | $ | 7,065,082 | | | $ | 3,791,350 | | | 3.38 | % |
| BMC FUND, INC. | | | | | | | | | | | | |
| SCHEDULE OF INVESTMENTS (Continued) (Unaudited) | | | | | | |
| April 30, 2021 | | | | | | | | | | | | |
| | | | | | | | | | | | | | | | Percent | |
| | | | Shares | | | | | | | | Market | | | | of Net | |
| Company Name | | | Held | | | | Cost | | | | Value | | | | Assets | |
| | | | | | | | | | | | | | | | | |
| MUTUAL FUNDS: | | | | | | | | | | | | | | | | |
| BOND MUTUAL FUNDS: | | | | | | | | | | | | | | | | |
| FPA NEW INCOME INC COM | | | 10,000.00 | | | | 100,000 | | | | 100,100 | | | | | |
| DOUBLELINE TOTAL RETURN BOND I | | | 129,763.65 | | | | 1,439,365 | | | | 1,365,114 | | | | | |
| PIMCO FDS INCOME FUND INSTL | | | 128,944.70 | | | | 1,500,000 | | | | 1,555,073 | | | | | |
| TOTAL BOND MUTUAL FUNDS | | | | | | | 3,039,365 | | | | 3,020,287 | | | | 2.70 | % |
| | | | | | | | | | | | | | | | | |
| STOCK MUTUAL FUNDS: | | | | | | | | | | | | | | | | |
| | | | | | | | | | | | | | | | | |
| INTERNATIONAL EQUITIES | | | | | | | | | | | | | | | | |
| Diversified Emerging Markets | | | | | | | | | | | | | | | | |
| PZENA EMERGING MARKETS VALUE FUND INST | | | 47,531.27 | | | | 500,000 | | | | 597,468 | | | | | |
| | | | | | | | 500,000 | | | | 597,468 | | | | 0.53 | % |
| | | | | | | | | | | | | | | | | |
| TOTAL INTERNATIONAL EQUITIES | | | | | | | 500,000 | | | | 597,468 | | | | 0.53 | % |
| | | | | | | | | | | | | | | | | |
| SPECIALTY FUNDS | | | | | | | | | | | | | | | | |
| Conservative Allocation | | | | | | | | | | | | | | | | |
| VANGUARD WELLESLEY INCOME INV | | | 20,045.04 | | | | 422,892 | | | | 581,507 | | | | 0.52 | % |
| | | | | | | | | | | | | | | | | |
| Diversified Emerging Markets | | | | | | | | | | | | | | | | |
| VANGUARD EMERGING MARKETS SEL STK INV SHRS | | | 22,255.64 | | | | 500,000 | | | | 634,063 | | | | 0.57 | % |
| | | | | | | | | | | | | | | | | |
| Large Cap Blend | | | | | | | | | | | | | | | | |
| COOK & BYNUM FUND | | | 65,145.23 | | | | 1,000,000 | | | | 889,884 | | | | 0.79 | % |
| | | | | | | | | | | | | | | | | |
| Mid Cap Blend | | | | | | | | | | | | | | | | |
| AKRE FOCUS FUND INSTL | | | 5,590.87 | | | | 128,758 | | | | 342,273 | | | | 0.31 | % |
| BMC FUND, INC. | | | | | | | | | | | | |
| SCHEDULE OF INVESTMENTS (Continued) (Unaudited) | | | | | | |
| April 30, 2021 | | | | | | | | | | | | |
| | | | | | | | | | | | | | | | | | Percent | |
| | | | | | Shares | | | | | | | | Market | | | | of Net | |
| Company Name | | | | | Held | | | | Cost | | | | Value | | | | Assets | |
| | | | | | | | | | | | | | | | | | | |
| MUTUAL FUNDS: | | | | | | | | | | | | | | | | | | |
| Moderate Allocation | | | | | | | | | | | | | | | | | | |
| FPA CRESCENT PORTFOLIO | | | | | 49,409.16 | | | | 1,525,303 | | | | 2,022,317 | | | | 1.80 | % |
| | | | | | | | | | | | | | | | | | | |
| Precious Metals | | | | | | | | | | | | | | | | | | |
| ISHARES SILVER TRUST | | 3 | | | 23,802.00 | | | | 399,993 | | | | 571,486 | | | | | |
| SPDR GOLD SHARES | | 3 | | | 5,000.00 | | | | 486,825 | | | | 828,300 | | | | | |
| VANECK VECTORS GOLD MINERS | | | | | 10,832.00 | | | | 277,635 | | | | 372,187 | | | | | |
| | | | | | | | | | 1,164,453 | | | | 1,771,973 | | | | 1.58 | % |
| | | | | | | | | | | | | | | | | | | |
| Utilities | | | | | | | | | | | | | | | | | | |
| UTIL SELECT SECTOR SPDR ET | | | | | 11,000.00 | | | | 357,288 | | | | 733,920 | | | | 0.65 | % |
| | | | | | | | | | | | | | | | | | | |
| TOTAL SPECIALTY FUNDS | | | | | | | | | 5,098,694 | | | | 6,975,937 | | | | 6.23 | % |
| | | | | | | | | | | | | | | | | | | |
| TOTAL STOCK MUTUAL FUNDS | | | | | | | | | 5,598,694 | | | | 7,573,405 | | | | 6.76 | % |
| | | | | | | | | | | | | | | | | | | |
| TOTAL INVESTMENTS IN MUTUAL FUNDS | | | | | | | | $ | 8,638,059 | | | $ | 10,593,692 | | | | 9.45 | % |
| BMC FUND, INC. | | | | |
| SCHEDULE OF INVESTMENTS (Continued) (Unaudited) | | | | |
| April 30, 2021 | | | | |
| | | | | | | | | Market | | | Percent of | |
| Company Name | | | | | Cost | | | Value | | | Net Assets | |
| | | | | | | | | | | | | |
| OTHER INVESTMENTS: | | | | | | | | | | | | | | | |
| | | | | | | | | | | | | | | | |
| LIMITED PARTNERSHIPS: | | | | | | | | | | | | | | | |
| BAM CREDIT OPPORTUNITIES FUND | | | 2, 3 | | | | 1,000,000 | | | | 994,627 | | | | |
| ELLIOTT ASSOCIATES LP CL B | | | 2, 3 | | | | 3,000,000 | | | | 7,729,627 | | | | |
| GRAHAM INSTITUTIONAL PARTNERS LP | | | 2, 3 | | | | 2,365,123 | | | | 2,639,495 | | | | |
| GREENLIGHT MASTERS QUALIFIED LP | | | 2, 3 | | | | 500,000 | | | | 2,572,181 | | | | |
| INFINITY PREMIER FUND, LP | | | 2, 3 | | | | 1,500,000 | | | | 2,761,176 | | | | |
| LITESPEED PARTNERS, LP | | | 2, 3 | | | | 664,400 | | | | 1,566,523 | | | | |
| MORROCROFT SPECIAL OPPORTUNITY FUND II, LP | | | 2, 3 | | | | - | | | | 51,367 | | | | |
| MUDRICK DISTRESSED OPPORTUNITY DRAWDOWN FUND II, L.P. | | | 2, 3 | | | | 3,496,363 | | | | 4,821,108 | | | | |
| OAKTREE ENHANCED INCOME FUND II, LP | | | 2, 3 | | | | (35,330 | ) | | | 23,348 | | | | |
| OLD WELL EMERGING MARKETS FUND | | | 2, 3 | | | | 1,000,000 | | | | 1,535,372 | | | | |
| PRIVET FUND LP | | | 2, 3 | | | | 1,000,000 | | | | 1,532,105 | | | | |
| SEGRA RESOURCE ONSHORE PARTNERS, LP | | | 2, 3 | | | | 250,000 | | | | 589,036 | | | | |
| SJC ONSHORE DIRECT LENDING FUND IV - 5 YEAR, L.P. | | | 2, 3 | | | | 985,535 | | | | 1,022,375 | | | | |
| STARK INVESTMENTS LP | | | 2, 3 | | | | 22,609 | | | | 58,514 | | | | |
| VIRGO SOCIETAS III (ONSHORE) LP | | | 2, 3 | | | | 970,119 | | | | 1,713,704 | | | | |
| WALNUT INVESTMENT PARTNERS | | | 2, 3 | | | | 235,567 | | | | - | | | | |
| WORLDWIDE OPPORTUNITY FUND (CAYMAN) LTD. CL A-A46 | | | 2, 3 | | | | 2,000,000 | | | | 2,331,762 | | | | |
| TOTAL LIMITED PARTNERSHIPS | | | | | | | 18,954,386 | | | | 31,942,320 | | | 28.51 | % |
| | | | | | | | | | | | | | | | |
| TOTAL OTHER INVESTMENTS | | | | | | $ | 18,954,386 | | | $ | 31,942,320 | | | 28.51 | % |
| BMC FUND, INC. | | | | | | |
| SCHEDULE OF INVESTMENTS (Continued) (Unaudited) | | | |
| April 30, 2021 | | | | | | |
| | | | | | | | | | | | | | | | Percent | |
| Sectors and | | Shares | | | Company Name | | | | | | | Market | | | of Net | |
| Industries | | Held | | | | | | | Cost | | | Value | | | Assets | |
| | | | | | | | | | | | | | | | | |
| COMMON STOCKS: | | | | | | | | | | | | | | | | | | | | |
| | | | | | | | | | | | | | | | | | | | | |
| COMMUNICATION SERVICES | | | | | | | | | | | | | | | | | | | | |
| Communication Services | | | 12,000.00 | | | AT&T CORP COM | | | | | 348,802 | | | | 376,920 | | | | | |
| | | | 4,500.00 | | | BCE INC COM | | | | | 191,785 | | | | 212,625 | | | | | |
| | | | 2,000.00 | | | SK TELECOM LTD SPONSORED A | | | | | 27,904 | | | | 60,080 | | | | | |
| | | | 10,000.00 | | | TELEFONICA BRASIL S.A. | | | | | 144,120 | | | | 79,300 | | | | | |
| | | | 7,062.00 | | | TELEFONICA S A SPONSORED ADR | | | | | 110,736 | | | | 33,121 | | | | | |
| | | | 6,500.00 | | | VODAFONE GROUP | | | | | 169,802 | | | | 123,175 | | | | | |
| | | | | | | | | | | | 993,149 | | | | 885,221 | | | | 0.79 | % |
| | | | | | | | | | | | | | | | | | | | | |
| Media and Entertainment | | | 1,151.00 | | | ALPHABET INC CAP STK CL C | | | | | 705,824 | | | | 2,774,048 | | | | | |
| | | | 700.00 | | | FACEBOOK INC CL A | | | | | 117,131 | | | | 227,556 | | | | | |
| | | | 250.00 | | | GRAHAM HOLDINGS CO COM CL B | | | | | 102,330 | | | | 158,902 | | | | | |
| | | | 6,155.00 | | | MADISON SQUARE GRDN EN CL | | | | | 523,839 | | | | 557,705 | | | | | |
| | | | 33,150.00 | | | MSG NETWORK INC CL A | | | | | 549,620 | | | | 526,091 | | | | | |
| | | | | | | | | | | | 1,998,744 | | | | 4,244,302 | | | | 3.79 | % |
| | | | | | | | | | | | | | | | | | | | | |
| TOTAL COMMUNICATION SERVICES | | | | | | | | | | | 2,991,893 | | | | 5,129,523 | | | | 4.58 | % |
| | | | | | | | | | | | | | | | | | | | | |
| | | | | | | | | | | | | | | | | | | | | |
| CONSUMER DISCRETIONARY | | | | | | | | | | | | | | | | | | | | |
| Consumer Discretionary | | | 500.00 | | | WHIRLPOOL CORP COM | | | | | 55,842 | | | | 118,225 | | | | | |
| | | | | | | | | | | | 55,842 | | | | 118,225 | | | | 0.11 | % |
| | | | | | | | | | | | | | | | | | | | | |
| Consumer Durables & Apparel | | | 55.00 | | | NVR INC COM | | | | | 267,491 | | | | 275,996 | | | | | |
| | | | | | | | | | | | 267,491 | | | | 275,996 | | | | 0.25 | % |
| | | | | | | | | | | | | | | | | | | | | |
| Hotels, Restaurants & Leisure | | | 1,500.00 | | | CAESARS ENTERTAINMENT COM | | | | | 121,293 | | | | 146,760 | | | | | |
| | | | 1,980.00 | | | STARBUCKS CORPORATION | | | | | 125,730 | | | | 226,690 | | | | | |
| | | | | | | | | | | | 247,023 | | | | 373,450 | | | | 0.33 | % |
| | | | | | | | | | | | | | | | | | | | | |
| Media & Entertainment | | | 1,330.00 | | | THE WALT DISNEY COMPANY | | | | | 145,582 | | | | 247,407 | | | | | |
| | | | | | | | | | | | 145,582 | | | | 247,407 | | | | 0.22 | % |
| BMC FUND, INC. | | | | | | |
| SCHEDULE OF INVESTMENTS (Continued) (Unaudited) | | | |
| April 30, 2021 | | | | | | |
| | | | | | �� | | | | | | | | | | | |
| | | | | | | | | | | | | | | | Percent | |
| Sectors and | | Shares | | | Company Name | | | | | | | Market | | | of Net | |
| Industries | | Held | | | | | | | Cost | | | Value | | | Assets | |
| | | | | | | | | | | | | | | | | |
| COMMON STOCKS: | | | | | | | | | | | | | | | | | | | | |
| Retailing | | | 5,000.00 | | | QURATE RETAIL INC COM SER | | | | | 51,275 | | | | 59,500 | | | | | |
| | | | | | | | | | | | 51,275 | | | | 59,500 | | | | 0.05 | % |
| | | | | | | | | | | | | | | | | | | | | |
| Specialty Retail | | | 500.00 | | | GENUINE PARTS CO COM | | | | | 47,272 | | | | 62,485 | | | | | |
| | | | | | | | | | | | 47,272 | | | | 62,485 | | | | 0.06 | % |
| | | | | | | | | | | | | | | | | | | | | |
| TOTAL CONSUMER DISCRETIONARY | | | | | | | | | | | 814,485 | | | | 1,137,063 | | | | 1.01 | % |
| | | | | | | | | | | | | | | | | | | | | |
| CONSUMER STAPLES | | | | | | | | | | | | | | | | | | | | |
| | | | | | | | | | | | | | | | | | | | | |
| Discount Stores | | | 900.00 | | | DOLLAR GEN CORP COM | | | | | 63,635 | | | | 193,275 | | | | | |
| | | | 4,665.00 | | | DOLLAR TREE INC COM | | 3 | | | 369,771 | | | | 536,008 | | | | | |
| | | | | | | | | | | | 433,406 | | | | 729,283 | | | | 0.65 | % |
| | | | | | | | | | | | | | | | | | | | | |
| Food & Staples Retailing | | | 2,500.00 | | | KROGER CO COM | | | | | 78,875 | | | | 91,350 | | | | | |
| | | | 1,500.00 | | | WAL-MART STORES INC COM | | | | | 193,790 | | | | 209,865 | | | | | |
| | | | | | | | | | | | 272,665 | | | | 301,215 | | | | 0.27 | % |
| BMC FUND, INC. | | | | | | |
| SCHEDULE OF INVESTMENTS (Continued) (Unaudited) | | | |
| April 30, 2021 | | | | | | |
| | | | | | | | | | | | | | | | | |
| | | | | | | | | | | | | | | | Percent | |
| Sectors and | | Shares | | | Company Name | | | | | | | Market | | | of Net | |
| Industries | | Held | | | | | | | Cost | | | Value | | | Assets | |
| | | | | | | | | | | | | | | | | |
| COMMON STOCKS: | | | | | | | | | | | | | | | | | | | | |
| Food, Beverage & Tobacco | | | 50,265.00 | | | ALTRIA GROUP INC COM | | | | | 2,160,828 | | | | 2,400,154 | | | | | |
| | | | 218,200.00 | | | AMBEV SA SPONSORED ADR | | | | | 496,970 | | | | 606,596 | | | | | |
| | | | 16,000.00 | | | ANHEUSER-BUSCH INBEV SA/NV | | | | | 1,089,597 | | | | 1,135,360 | | | | | |
| | | | 2,000.00 | | | COCA COLA CO COM | | | | | 95,569 | | | | 107,960 | | | | | |
| | | | 14,495.00 | | | COCA COLA FEMSA S A B SPON | | | | | 646,222 | | | | 680,830 | | | | | |
| | | | 1,500.00 | | | CONSTELLATION BRANDS CL A | | | | | 136,078 | | | | 360,480 | | | | | |
| | | | 8,260.00 | | | FOMENTO ECONOMICO MEXI SPO | | | | | 560,025 | | | | 640,150 | | | | | |
| | | | 500.00 | | | GENERAL MILLS INC COM | | | | | 20,240 | | | | 30,430 | | | | | |
| | | | 13,745.00 | | | PHILIP MORRIS INTL COM | | | | | 1,019,125 | | | | 1,305,775 | | | | | |
| | | | | | | | | | | | 6,224,654 | | | | 7,267,735 | | | | 6.49 | % |
| | | | | | | | | | | | | | | | | | | | | |
| Household & Personal Products | | | 2,500.00 | | | KIMBERLY CLARK CORP COM | | | | | 339,817 | | | | 333,300 | | | | | |
| | | | 275.00 | | | PROCTER & GAMBLE CO COM | | | | | 18,418 | | | | 36,690 | | | | | |
| | | | | | | | | | | | 358,235 | | | | 369,990 | | | | 0.33 | % |
| | | | | | | | | | | | | | | | | | | | | |
| TOTAL CONSUMER STAPLES | | | | | | | | | | | 7,288,960 | | | | 8,668,223 | | | | 7.74 | % |
| | | | | | | | | | | | | | | | | | | | | |
| ENERGY | | | | | | | | | | | | | | | | | | | | |
| Energy | | | 2,500.00 | | | BP PLC SPONSORED ADR | | | | | 98,185 | | | | 62,900 | | | | | |
| | | | 2,800.00 | | | CHEVRON CORP | | | | | 296,043 | | | | 288,596 | | | | | |
| | | | 5,404.00 | | | EXXON MOBIL CORP COM | | | | | 319,463 | | | | 309,325 | | | | | |
| | | | 5,800.00 | | | OCCIDENTAL PETROLEUM COM | | | | | 423,410 | | | | 147,088 | | | | | |
| | | | 5,000.00 | | | PHILLIPS 66 COM | | | | | 534,807 | | | | 404,550 | | | | | |
| | | | 3,200.00 | | | RENEWABLE ENERGY GROUP COM | | | | | 234,399 | | | | 177,664 | | | | | |
| | | | 3,000.00 | | | ROYAL DUTCH SHELL ADR A | | | | | 195,460 | | | | 114,000 | | | | | |
| | | | 2,000.00 | | | ROYAL DUTCH SHELL ADR B | | | | | 91,109 | | | | 71,620 | | | | | |
| | | | 3,000.00 | | | SUNCOR ENERGY INC COM | | | | | 95,203 | | | | 64,260 | | | | | |
| | | | 9,000.00 | | | SUNOCO INC COM | | | | | 215,850 | | | | 315,900 | | | | | |
| | | | 8,000.00 | | | VALERO ENERGY CORP COM STK | | | | | 586,371 | | | | 591,680 | | | | | |
| | | | | | | | | | | | 3,090,300 | | | | 2,547,583 | | | | 2.27 | % |
| BMC FUND, INC. | | | | | | |
| SCHEDULE OF INVESTMENTS (Continued) (Unaudited) | | | |
| April 30, 2021 | | | | | | |
| | | | | | | | | | | | | | | | Percent | |
| Sectors and | | Shares | | | Company Name | | | | | | | Market | | | of Net | |
| Industries | | Held | | | | | | | Cost | | | Value | | | Assets | |
| | | | | | | | | | | | | | | | | |
| COMMON STOCKS: | | | | | | | | | | | | | | | | | | | | |
| Natural Resources | | | 3,500.00 | | | OASIS MIDSTREAM PARTNERS COM | | | | | 64,813 | | | | 73,360 | | | | | |
| | | | | | | | | | | | 64,813 | | | | 73,360 | | | | 0.07 | % |
| | | | | | | | | | | | | | | | | | | | | |
| Pipelines | | | 3,500.00 | | | DELEK LOGISTICS PARTNERS LP | | | | | 103,142 | | | | 145,600 | | | | | |
| | | | 11,999.00 | | | ENBRIDGE INC | | | | | 390,852 | | | | 462,801 | | | | | |
| | | | 12,800.00 | | | ENERGY TRANSFER PARTNERS LP | | | | | 234,907 | | | | 110,208 | | | | | |
| | | | 10,000.00 | | | ENTERPRISE PRODUCTS PARTNERS LP | | | | | 289,870 | | | | 230,100 | | | | | |
| | | | 5,000.00 | | | GREEN PLAINS PARTNERS COM | | | | | 102,799 | | | | 59,400 | | | | | |
| | | | 3,000.00 | | | HOLLY ENERGY PARTNERS | | | | | 86,820 | | | | 37,200 | | | | | |
| | | | 2,000.00 | | | KNOT OFFSHORE PARTNERS COM | | | | | 41,752 | | | | 93,540 | | | | | |
| | | | 2,000.00 | | | MAGELLAN MIDSTREAM PARTNERS, LP | | | | | 120,307 | | | | 61,410 | | | | | |
| | | | 3,500.00 | | | MPLX LP COM UNIT REP LTD | | | | | 110,582 | | | | 94,465 | | | | | |
| | | | 7,500.00 | | | USA COMPRESSION PARTNERS COM | | | | | 125,969 | | | | 109,875 | | | | | |
| | | | | | | | | | | | 1,607,000 | | | | 1,404,599 | | | | 1.25 | % |
| | | | | | | | | | | | | | | | | | | | | |
| TOTAL ENERGY | | | | | | | | | | | 4,762,113 | | | | 4,025,542 | | | | 3.59 | % |
| BMC FUND, INC. | | | | | | |
| SCHEDULE OF INVESTMENTS (Continued) (Unaudited) | | | |
| April 30, 2021 | | | | | | |
| | | | | | | | | | | | | | | | Percent | |
| Sectors and | | Shares | | | Company Name | | | | | | | Market | | | of Net | |
| Industries | | Held | | | | | | | Cost | | | Value | | | Assets | |
| | | | | | | | | | | | | | | | | |
| COMMON STOCKS: | | | | | | | | | | | | | | | | | | | | |
| FINANCIALS | | | | | | | | | | | | | | | | | | | | |
| Banks | | | 5,000.00 | | | BANK OF AMERICA CORP COM | | | | | 96,603 | | | | 202,650 | | | | | |
| | | | 3,000.00 | | | PACWEST BANCORP DEL COM | | | | | 148,845 | | | | 130,230 | | | | | |
| | | | 300.00 | | | SVB FINANCIAL GROUP COM | | | | | 102,165 | | | | 171,549 | | | | | |
| | | | 7,500.00 | | | TRUIST FINANCIAL CORP COM | | | | | 303,297 | | | | 444,825 | | | | | |
| | | | | | | | | | | | 650,910 | | | | 949,254 | | | | 0.85 | % |
| | | | | | | | | | | | | | | | | | | | | |
| Diversified Financials | | | 6,000.00 | | | ALLIANCE BERNSTEIN HLDG UN | | | | | 179,730 | | | | 258,660 | | | | | |
| | | | 2,500.00 | | | ANNALY CAP MGMT INC COM | | | | | 41,062 | | | | 22,700 | | | | | |
| | | | 3,500.00 | | | BERKSHIRE HATHAWAY INC CL B | | 3 | | | 387,075 | | | | 962,325 | | | | | |
| | | | 23,000.00 | | | BLACKSTONE GROUP LP COM | | | | | 710,384 | | | | 2,035,270 | | | | | |
| | | | 13,000.00 | | | BLACKSTONE MTG TR INC COM | | | | | 415,992 | | | | 422,370 | | | | | |
| | | | 13,075.00 | | | CAPITALA FINANCE CORP COM | | | | | 1,363,703 | | | | 256,924 | | | | | |
| | | | 8,000.00 | | | CARLYLE GROUP LP COM | | | | | 194,150 | | | | 341,280 | | | | | |
| | | | 800.00 | | | CME GROUP | | | | | 129,728 | | | | 161,592 | | | | | |
| | | | 5,000.00 | | | COMPASS DIVERSIFIED HOLDINGS | | | | | 68,434 | | | | 127,200 | | | | | |
| | | | 16,042.00 | | | GOLUB CAPITAL BDC INC COM | | | | | 226,471 | | | | 251,218 | | | | | |
| | | | 1,000.00 | | | INTERNCONTINENTAL EXCHANGE COM | | | | | 74,845 | | | | 117,710 | | | | | |
| | | | 1,000.00 | | | MORGAN STANLEY COM NEW | | | | | 49,351 | | | | 82,550 | | | | | |
| | | | 5,000.00 | | | NEW YORK MTG TR INC COM PA | | | | | 35,055 | | | | 22,950 | | | | | |
| | | | 150.00 | | | QURATE RETAIL INC NT CAL 3 | | | | | - | | | | 15,690 | | | | | |
| | | | 12,700.00 | | | STARWOOD PPTY TR INC COM | | | | | 280,188 | | | | 327,914 | | | | | |
| | | | 2,000.00 | | | VIRTU FINL INC CL A | | | | | 56,931 | | | | 59,260 | | | | | |
| | | | | | | | | | | | 4,213,099 | | | | 5,465,613 | | | | 4.88 | % |
| | | | | | | | | | | | | | | | | | | | | |
| Insurance | | | 1,500.00 | | | AON PLC SHS CL A | | | | | 121,687 | | | | 377,160 | | | | | |
| | | | 5,000.00 | | | OLD REP INTL CORP COM | | | | | 84,276 | | | | 123,100 | | | | | |
| | | | 2,000.00 | | | PROGRESSIVE CORP OHIO | | | | | 188,910 | | | | 201,480 | | | | | |
| | | | 2,500.00 | | | TRAVELERS COMPANIES COM | | | | | 203,356 | | | | 386,650 | | | | | |
| | | | 5,000.00 | | | ZURICH INS GROUP LTD SPONS ARD | | | | | 148,815 | | | | 205,550 | | | | | |
| | | | | | | | | | | | 747,044 | | | | 1,293,940 | | | | 1.15 | % |
| TOTAL FINANCIALS | | | | | | | | | | | 5,611,053 | | | | 7,708,807 | | | | 6.88 | % |
| BMC FUND, INC. | | | | | | |
| SCHEDULE OF INVESTMENTS (Continued) (Unaudited) | | | |
| April 30, 2021 | | | | | | |
| | | | | | | | | | | | | | | | Percent | |
| Sectors and | | Shares | | | Company Name | | | | | | | Market | | | of Net | |
| Industries | | Held | | | | | | | Cost | | | Value | | | Assets | |
| | | | | | | | | | | | | | | | | |
| COMMON STOCKS: | | | | | | | | | | | | | | | | | | | | |
| HEALTH CARE | | | | | | | | | | | | | | | | | | | | |
| Health Care Equipment & Services | | | 3,000.00 | | | DAVITA HEALTHCARE PART COM | | 3 | | | 196,152 | | | | 349,590 | | | | | |
| | | | 7,000.00 | | | HOLOGIC INC COM | | 3 | | | 319,008 | | | | 458,850 | | | | | |
| | | | 3,550.00 | | | LABORATORY CORP AMER HLDGS | | 3 | | | 420,439 | | | | 943,838 | | | | | |
| | | | 5,500.00 | | | MCKESSON CORP COM | | | | | 718,504 | | | | 1,031,580 | | | | | |
| | | | 4,000.00 | | | QUEST DIAGNOSTICS INC COM | | | | | 284,804 | | | | 527,520 | | | | | |
| | | | 300.00 | | | QUEST DIAGNOSTICS INC COM | | | | | 63,754 | | | | 31,437 | | | | | |
| | | | 600.00 | | | STRYKER CORP | | | | | 112,156 | | | | 157,578 | | | | | |
| | | | | | | | | | | | 2,114,817 | | | | 3,500,393 | | | | 3.12 | % |
| | | | | | | | | | | | | | | | | | | | | |
| Pharmaceuticals & Biotechnology | | | 3,500.00 | | | ABBVIE INC | | | | | 310,988 | | | | 390,250 | | | | | |
| | | | 1,000.00 | | | AMGEN INC COM | | | | | 222,683 | | | | 239,640 | | | | | |
| | | | 10,000.00 | | | ASTRAZENECA PLC SPONSORED | | | | | 235,531 | | | | 530,700 | | | | | |
| | | | 25,000.00 | | | BAYER A G SPONSORED ADR | | | | | 418,325 | | | | 404,750 | | | | | |
| | | | 1,500.00 | | | BRISTOL MYERS SQUIBB CO CO | | | | | 86,655 | | | | 93,630 | | | | | |
| | | | 2,592.00 | | | ELI LILLY & CO COM | | | | | 114,185 | | | | 473,740 | | | | | |
| | | | 3,500.00 | | | GILEAD SCIENCES INC COM | | | | | 259,707 | | | | 222,145 | | | | | |
| | | | 500.00 | | | IQVIA HOLDINGS INC COM | | | | | 49,545 | | | | 117,345 | | | | | |
| | | | 3,000.00 | | | MERCK & CO INC COM | | | | | 224,002 | | | | 223,500 | | | | | |
| | | | 4,000.00 | | | PFIZER INC COM | | | | | 143,040 | | | | 154,600 | | | | | |
| | | | 1,000.00 | | | SEATTLE GENETICS INC COM | | | | | 49,131 | | | | 143,760 | | | | | |
| | | | 62.00 | | | VIATRIS INC COM | | | | | 630 | | | | 825 | | | | | |
| | | | | | | | | | | | 2,114,422 | | | | 2,994,885 | | | | 2.67 | % |
| | | | | | | | | | | | | | | | | | | | | |
| Specialty Retail | | | 2,000.00 | | | PETMED EXPRESS INC COM | | | | | 70,200 | | | | 58,850 | | | | | |
| | | | | | | | | | | | 70,200 | | | | 58,850 | | | | 0.05 | % |
| BMC FUND, INC. | | | | | | |
| SCHEDULE OF INVESTMENTS (Continued) (Unaudited) | | | |
| April 30, 2021 | | | | | | |
| | | | | | | | | | | | | | | | Percent | |
| Sectors and | | Shares | | | Company Name | | | | | | | Market | | | of Net | |
| Industries | | Held | | | | | | | Cost | | | Value | | | Assets | |
| | | | | | | | | | | | | | | | | |
| COMMON STOCKS: | | | | | | | | | | | | | | | | | | | | |
| TOTAL HEALTH CARE | | | | | | | | | | | 4,299,439 | | | | 6,554,128 | | | | 5.85 | % |
| | | | | | | | | | | | | | | | | | | | | |
| INDUSTRIALS | | | | | | | | | | | | | | | | | | | | |
| Capital Goods | | | 1,500.00 | | | 3M COMPANY | | | | | 222,931 | | | | 295,710 | | | | | |
| | | | 4,000.00 | | | ABB LTD SPONSORED ADR | | 3 | | | 100,795 | | | | 129,720 | | | | | |
| | | | 515.00 | | | LOCKHEED MARTIN CORP COM | | | | | 180,322 | | | | 195,988 | | | | | |
| | | | 1,500.00 | | | STURM RUGER & CO INC COM | | | | | 109,373 | | | | 97,410 | | | | | |
| | | | | | | | | | | | 613,421 | | | | 718,828 | | | | 0.64 | % |
| | | | | | | | | | | | | | | | | | | | | |
| Commercial Services & Supplies | | | 500.00 | | | WASTE MGMT INC DEL COM | | | | | 17,412 | | | | 68,985 | | | | | |
| | | | | | | | | | | | 17,412 | | | | 68,985 | | | | 0.06 | % |
| | | | | | | | | | | | | | | | | | | | | |
| Transportation | | | 500.00 | | | EXPEDITORS INTL OF WASHINGTON COM | | | | | 44,448 | | | | 54,930 | | | | | |
| | | | 6,000.00 | | | FORTRESS TRANS INFRST COM | | | | | 95,790 | | | | 169,440 | | | | | |
| | | | 5,000.00 | | | USD PARTNERS LP COM UT REP | | | | | 56,643 | | | | 29,000 | | | | | |
| | | | | | | | | | | | 196,881 | | | | 253,370 | | | | 0.23 | % |
| | | | | | | | | | | | | | | | | | | | | |
| Transportation Infrastructure | | | 7,500.00 | | | GRUPO AEROPORTUARIO DE SPO | | | | | 230,257 | | | | 372,975 | | | | | |
| | | | 2,500.00 | | | GRUPO AEROPORTUARIO DE SPO | | | | | 271,470 | | | | 425,250 | | | | | |
| | | | 1,000.00 | | | GRUPO AEROPUERTO DEL P SPO | | | | | 64,309 | | | | 102,700 | | | | | |
| | | | | | | | | | | | 566,036 | | | | 900,925 | | | | 0.80 | % |
| | | | | | | | | | | | | | | | | | | | | |
| TOTAL INDUSTRIALS | | | | | | | | | | | 1,393,750 | | | | 1,942,108 | | | | 1.73 | % |
| BMC FUND, INC. | | | | | | |
| SCHEDULE OF INVESTMENTS (Continued) (Unaudited) | | | |
| April 30, 2021 | | | | | | |
| | | | | | | | | | | | | | | | Percent | |
| Sectors and | | Shares | | | Company Name | | | | | | | Market | | | of Net | |
| Industries | | Held | | | | | | | Cost | | | Value | | | Assets | |
| | | | | | | | | | | | | | | | | |
| COMMON STOCKS: | | | | | | | | | | | | | | | | | | | | |
| INFORMATION TECHNOLOGY | | | | | | | | | | | | | | | | | | | | |
| | | | | | | | | | | | | | | | | | | | | |
| Hardware & Equipment | | | 10,200.00 | | | CISCO SYSTEMS INC | | | | | 400,934 | | | | 519,282 | | | | | |
| | | | 9,500.00 | | | CORNING INC COM | | | | | 215,855 | | | | 419,995 | | | | | |
| | | | | | | | | | | | 616,789 | | | | 939,277 | | | | 0.84 | % |
| | | | | | | | | | | | | | | | | | | | | |
| Software & Services | | | 1,500.00 | | | CITRIX SYS INC COM | | | | | 164,058 | | | | 185,775 | | | | | |
| | | | 1,250.00 | | | MICROSOFT CORP COM | | | | | 122,462 | | | | 315,225 | | | | | |
| | | | 4,500.00 | | | ORACLE CORP COM | | | | | 189,460 | | | | 341,055 | | | | | |
| | | | | | | | | | | | 475,980 | | | | 842,055 | | | | 0.75 | % |
| | | | | | | | | | | | | | | | | | | | | |
| Technology Hardware & Equipment | | | 12,000.00 | | | APPLE INC COM | | | | | 411,814 | | | | 1,577,520 | | | | | |
| | | | 1,500.00 | | | INTEL CORP COM | | | | | 75,707 | | | | 86,295 | | | | | |
| | | | 1,000.00 | | | NETAPP INC COM | | | | | 41,930 | | | | 74,690 | | | | | |
| | | | 2,700.00 | | | SEAGATE TECHNOLOGY SHS | | | | | 108,598 | | | | 250,668 | | | | | |
| | | | | | | | | | | | 638,049 | | | | 1,989,173 | | | | 1.78 | % |
| | | | | | | | | | | | | | | | | | | | | |
| TOTAL INFORMATION TECHNOLOGY | | | | | | | | | | | 1,730,818 | | | | 3,770,505 | | | | 3.37 | % |
| | | | | | | | | | | | | | | | | | | | | |
| MATERIALS | | | 3,000.00 | | | CHEMOURS CO COM | | | | | 48,440 | | | | 90,600 | | | | | |
| | | | 2,026.00 | | | DOW CHEM CO COM | | | | | 74,429 | | | | 126,625 | | | | | |
| | | | 526.00 | | | DU PONT E I DE NEMOURS COM | | | | | 48,574 | | | | 40,560 | | | | | |
| | | | 500.00 | | | ECOLAB INC COM | | | | | 52,645 | | | | 112,060 | | | | | |
| | | | 2,400.00 | | | F M C CORP COM | | | | | 192,996 | | | | 283,776 | | | | | |
| | | | 500.00 | | | MITSUI & CO LTD SPONSORED | | | | | 182,130 | | | | 210,375 | | | | | |
| | | | 5,000.00 | | | TECK RESOURCES LTD CL B | | | | | 109,332 | | | | 105,850 | | | | | |
| TOTAL MATERIALS | | | | | | | | | | | 708,546 | | | | 969,846 | | | | 0.87 | % |
| BMC FUND, INC. | | | | | | |
| SCHEDULE OF INVESTMENTS (Continued) (Unaudited) | | | |
| April 30, 2021 | | | | | | |
| | | | | | | | | | | | | | | | Percent | |
| Sectors and | | Shares | | | Company Name | | | | | | | Market | | | of Net | |
| Industries | | Held | | | | | | | Cost | | | Value | | | Assets | |
| | | | | | | | | | | | | | | | | |
| COMMON STOCKS: | | | | | | | | | | | | | | | | | | | | |
| REAL ESTATE | | | | | | | | | | | | | | | | | | | | |
| Real Estate | | | 4,500.00 | | | BROADMARK RLTY CAP INC COM | | | | | 50,675 | | | | 48,510 | | | | | |
| | | | 2,700.00 | | | BROOKFIELD PPTY REIT I CL | | | | | 47,426 | | | | 48,559 | | | | | |
| | | | 3,000.00 | | | CYRUSONE INC COM | | | | | 195,359 | | | | 218,490 | | | | | |
| | | | 2,000.00 | | | DIGITAL RLTY TR INC COM | | | | | 221,501 | | | | 308,620 | | | | | |
| | | | 12,000.00 | | | EASTERLY GOVT PPTYS COM | | | | | 214,136 | | | | 257,160 | | | | | |
| | | | 79,765.00 | | | EQUITY COMWLTH COM SH BEN | | | | | 2,223,635 | | | | 2,297,232 | | | | | |
| | | | 3,500.00 | | | GEO GROUP INC COM | | | | | 83,062 | | | | 19,285 | | | | | |
| | | | 10,000.00 | | | HANNON ARMSTRONG SUST COM | | | | | 153,105 | | | | 524,000 | | | | | |
| | | | 6,500.00 | | | IRON MTN INC NEW COM | | | | | 209,420 | | | | 260,780 | | | | | |
| | | | 4,000.00 | | | LTC PPTYS TR INC COM R | | | | | 159,295 | | | | 170,120 | | | | | |
| | | | 15,000.00 | | | MEDICAL PPTYS TR INC COM | | | | | 185,835 | | | | 330,750 | | | | | |
| | | | 2,000.00 | | | OMEGA HEALTHCARE INVS COM | | | | | 60,291 | | | | 76,000 | | | | | |
| | | | 6,000.00 | | | PHYSICIANS RLTY TR COM | | | | | 112,435 | | | | 112,380 | | | | | |
| | | | 3,000.00 | | | TANGER FACTORY OUTLET COM | | | | | 57,315 | | | | 52,350 | | | | | |
| | | | 3,000.00 | | | TRITON INTL LTD CL A | | | | | 143,190 | | | | 150,510 | | | | | |
| | | | 3,000.00 | | | VENTAS INC COM | | | | | 195,931 | | | | 166,380 | | | | | |
| | | | 500.00 | | | W P CAREY & CO LLC COM | | | | | 31,927 | | | | 37,445 | | | | | |
| | | | | | | | | | | | 4,344,538 | | | | 5,078,571 | | | | 4.53 | % |
| | | | | | | | | | | | | | | | | | | | | |
| REIT | | | 500.00 | | | PROLOGIS TR SH BEN INT | | | | | 41,266 | | | | 58,265 | | | | | |
| | | | | | | | | | | | 41,266 | | | | 58,265 | | | | 0.05 | % |
| | | | | | | | | | | | | | | | | | | | | |
| TOTAL REAL ESTATE | | | | | | | | | | | 4,385,804 | | | | 5,136,836 | | | | 4.58 | % |
| | | | | | | | | | | | | | | | | | | | | |
| UTILITIES | | | 500.00 | | | AMERICAN STS WTR CO COM | | | | | 19,159 | | | | 39,595 | | | | | |
| | | | 166.00 | | | BROOKFIELD INFRASTRUCT SB VTG SHS A | | | | | - | | | | 11,957 | | | | | |
| | | | 1,500.00 | | | BROOKFIELD INFRASTRUCTURE | | | | | 67,167 | | | | 80,655 | | | | | |
| | | | 6,500.00 | | | DOMINION RES INC VA COM | | | | | 330,756 | | | | 519,350 | | | | | |
| | | | 3,387.00 | | | DUKE ENERGY CORP COM | | | | | 284,791 | | | | 341,037 | | | | | |
| | | | 1,000.00 | | | ENTERGY CORP NEW COM | | | | | 69,388 | | | | 109,290 | | | | | |
| | | | 1,000.00 | | | NEXTERA ENERGY INC COM | | | | | 81,459 | | | | 77,510 | | | | | |
| | | | 5,000.00 | | | SOUTHERN CO COM | | | | | 209,871 | | | | 330,850 | | | | | |
| | | | 2,256.00 | | | WEC ENERGY GROUP INC COM | | | | | 89,900 | | | | 219,216 | | | | | |
| TOTAL UTILITIES | | | | | | | | | | | 1,152,491 | | | | 1,729,460 | | | | 1.54 | % |
| | | | | | | | | | | | | | | | | | | | | |
| RIGHTS ATTACHED TO COMMON STOCKS | | | | | | | | | | | | | | | | | | | | |
| | | | 725.00 | | | OCCIDENTAL PETROLEUM CORP COM | | | | | - | | | | 7,816 | | | | | |
| | | | | | | | | | | | - | | | | 7,816 | | | | 0.01 | % |
| | | | | | | | | | | | | | | | | | | | | |
| TOTAL INVESTMENTS IN COMMON STOCKS | | | | | | | | | | $ | 35,139,352 | | | $ | 46,779,857 | | | | 41.75 | % |
BMC FUND, INC.
SCHEDULE OF INVESTMENTS (Continued) (Unaudited)
April 30, 2021
| | | | | | Coupon | | | | | | | | | | | | | | | Percent | |
| | | | | | Interest | | | Maturity | | | Shares | | | | | | Market | | | of Net | |
| Company Name | | | | | Rate | | | Date | | | Held | | | Cost | | | Value | | | Assets | |
| | | | | | | | | | | | | | | | | | | | | | |
| PREFERRED STOCKS: | | | | | | | | | | | | | | | | | | | | | | | | | | | |
| CAPITAL ONE FINANCIAL CORP FIXED-FLOATING | | | 4, 5 | | | | 5.550 | % | | | N/A | | | | 100,000.00 | | | | 83,034 | | | | 99,220 | | | | |
| CIT GROUP INC-FLOATING | | | 4, 5 | | | | 5.800 | % | | | N/A | | | | 250,000.00 | | | | 252,500 | | | | 258,750 | | | | |
| CITIGROUP INC FIXED-FLOATING | | | 4, 5 | | | | 5.950 | % | | | N/A | | | | 350,000.00 | | | | 341,347 | | | | 350,350 | | | | |
| COMPASS DIVERSIFIED HOLDINGS PFD | | | 4, 5 | | | | 7.250 | % | | | N/A | | | | 7,500.00 | | | | 174,029 | | | | 190,500 | | | | |
| COMPASS DIVERSIFIED HOLDINGS | | | 4, 5 | | | | 7.880 | % | | | N/A | | | | 9,000.00 | | | | 208,121 | | | | 232,470 | | | | |
| GENERAL ELECTRIC CO PERP PFD SER B FIXED-FLOATING | | | 4, 5 | | | | 4.100 | % | | | N/A | | | | 250,000.00 | | | | 250,000 | | | | 216,375 | | | | |
| JP MORGAN CHASE & CO FIXED-FLOATING | | | 4, 5 | | | | 5.000 | % | | | N/A | | | | 150,000.00 | | | | 149,992 | | | | 150,187 | | | | |
| JP MORGAN CHASE & CO PFD | | | 4, 5 | | | | 4.625 | % | | | N/A | | | | 150,000.00 | | | | 148,409 | | | | 150,694 | | | | |
| NEW YORK MTG TR INC PFD | | | 4 | | | | 7.750 | % | | | N/A | | | | 2,000.00 | | | | 49,337 | | | | 48,840 | | | | |
| PNC FINANCIAL SERVICES GROUP INC-FLOATING | | | 4, 5 | | | | 4.850 | % | | | N/A | | | | 250,000.00 | | | | 257,440 | | | | 262,188 | | | | |
| SUNTRUST BANKS INC-FLOATING | | | 4, 5 | | | | 5.050 | % | | | N/A | | | | 250,000.00 | | | | 258,750 | | | | 258,992 | | | | |
| | | | | | | | | | | | | | | | | | | | | | | | | | | | |
| TOTAL INVESTMENTS IN PREFERRED STOCKS | | | | | | | | | | | | | | | | | | $ | 2,172,959 | | | $ | 2,218,566 | | | 1.98 | % |
BMC FUND, INC.
SCHEDULE OF INVESTMENTS (Concluded) (Unaudited)
April 30, 2021
| | | | | | | | Market | | | Percent of | |
| | | Company Name | | Cost | | | Value | | | Net Assets | |
| | | | | | | | | | | | |
| Short-term Investments | | MFB NI Treasury Money Market Fund | | $ | 14,562,735 | | | $ | 14,562,735 | | | | 13.00 | % |
| | | | | | | | | | | | | | | |
| TOTAL INVESTMENTS - MARKET VALUE | | | | | | | | | 109,888,520 | | | | 98.07 | % |
| | | | | | | | | | | | | | | |
| TOTAL OTHER ASSETS IN EXCESS OF LIABILITIES | | | | | | | | | 2,161,472 | | | | 1.93 | % |
| | | | | | | | | | | | | | | |
| TOTAL NET ASSETS | | | | | | | | $ | 112,049,992 | | | | 100.00 | % |
1In default
2Market value determined by the Fund's Board of Directors
3Non-income producing security
4Perpetual security. Maturity date is not applicable.
5Variable rate security. The rate shown is the coupon as of the end of the reporting period.
BMC FUND, INC.
SCHEDULE OF OPEN WRITTEN OPTION CONTRACTS (Unaudited)
April 30, 2021
| | | | | | | | | | | | | | | Percent | |
| | | | | | Contracts | | | | | | Market | | | of Net | |
| Company Name | | | | | Held | | | Cost | | | Value | | | Assets | |
| CALL OPTIONS: | | | | | | | | | | | | | | | | | | | |
| APPLE INC CALL OPTION, $150 EXP 7/16/21 | | | 3 | | | | (25.00 | ) | | | (17,336 | ) | | | (2,775 | ) | | | |
| COCA-COLA CO CALL OPTION, $52.50 EXP 5/21/21 | | | 3 | | | | (10.00 | ) | | | (1,477 | ) | | | (1,690 | ) | | | |
| MERCK & CO INC CALL OPTION, $80 EXP 7/16/21 | | | 3 | | | | (15.00 | ) | | | (2,768 | ) | | | (960 | ) | | | |
| NEXTERA ENERGY CALL OPTION, $85 EXP 6/18/21 | | | 3 | | | | (10.00 | ) | | | (4,129 | ) | | | (300 | ) | | | |
| PETMED EXPRESS CALL OPTION, $45 EXP 6/18/21 | | | 3 | | | | (10.00 | ) | | | (2,407 | ) | | | (150 | ) | | | |
| STURM RUGER CALL OPTION, $75 EXP 7/16/21 | | | 3 | | | | (15.00 | ) | | | (4,777 | ) | | | (1,650 | ) | | | |
| TOTAL CALL OPTIONS - LIABILITIES | | | | | | | | | | | (32,894 | ) | | | (7,525 | ) | | -0.01 | % |
| | | | | | | | | | | | | | | | | | | | |
| PUT OPTIONS: | | | | | | | | | | | | | | | | | | | |
| CONSTELLATION PUT OPTION, $205 EXP 10/15/21 | | | 3 | | | | (20.00 | ) | | | (12,969 | ) | | | (9,800 | ) | | | |
| DUKE ENERGY CO PUT OPTION, $95 EXP 10/15/21 | | | 3 | | | | (30.00 | ) | | | (10,154 | ) | | | (8,850 | ) | | | |
| FIREEYE INC PUT OPTION, $17 EXP 6/18/21 | | | 3 | | | | (30.00 | ) | | | (3,554 | ) | | | (600 | ) | | | |
| GENERAC HOLDINGS PUT OPTION, $220 EXP 5/21/21 | | | 3 | | | | (10.00 | ) | | | (11,484 | ) | | | (340 | ) | | | |
| LAKELAND INDS PUT OPTION, $25 EXP 7/16/21 | | | 3 | | | | (30.00 | ) | | | (11,354 | ) | | | (3,300 | ) | | | |
| MARTIN MARIETTA PUT OPTION, $290 EXP 7/16/21 | | | 3 | | | | (10.00 | ) | | | (11,285 | ) | | | (800 | ) | | | |
| MARTIN MARIETTA PUT OPTION, $300 EXP 7/16/21 | | | 3 | | | | (5.00 | ) | | | (7,642 | ) | | | (575 | ) | | | |
| NEXTERA ENERGY PUT OPTION, $75 EXP 6/18/21 | | | 3 | | | | (25.00 | ) | | | (8,461 | ) | | | (3,750 | ) | | | |
| PETMED EXPRESS PUT OPTION, $25 EXP 6/18/21 | | | 3 | | | | (20.00 | ) | | | (3,074 | ) | | | (1,340 | ) | | | |
| SPDR S&P 500 TR PUT OPTION, $350 EXP 5/21/21 | | | 3 | | | | (35.00 | ) | | | (26,021 | ) | | | (840 | ) | | | |
| VIRTU FINL INC PUT OPTION, $25 EXP 6/18/21 | | | 3 | | | | (20.00 | ) | | | (3,774 | ) | | | (200 | ) | | | |
| WALGREENS BOOT PUT OPTION, $42.50 EXP 7/16/21 | | | 3 | | | | (25.00 | ) | | | (6,789 | ) | | | (625 | ) | | | |
| WEYERHAEUSER PUT OPTION, $30 EXP 7/16/21 | | | 3 | | | | (25.00 | ) | | | (2,712 | ) | | | (1,250 | ) | | | |
| TOTAL PUT OPTIONS - LIABILITIES | | | | | | | | | | | (119,273 | ) | | | (32,270 | ) | | -0.03 | % |
| | | | | | | | | | | | | | | | | | | | |
| TOTAL CALL AND PUT OPTIONS - LIABILITIES | | | | | | | | | | $ | (152,167 | ) | | $ | (39,795 | ) | | -0.04 | % |
| BMC FUND, INC. |
| STATEMENT OF ASSETS AND LIABILITIES (Unaudited) |
| April 31, 2021 |
| ASSETS AT MARKET VALUE: | | | |
| Investment securities (cost - $86,532,573) | | $ | 109,888,520 | |
| Cash | | | 2,106,059 | |
| Receivables, accrued interest and dividends | | | 118,785 | |
| Other assets | | | 47,809 | |
| | | | | |
| Total assets | | | 112,161,173 | |
| | | | | |
| LIABILITIES: | | | | |
| Call and put options written, at fair value (premiums received $152,167) | | | 39,795 | |
| Accounts payable and accrued expenses | | | 1,155 | |
| Payable to broker | | | - | |
| Payable to custodian | | | 14,533 | |
| Accounts payable to affiliates | | | 55,698 | |
| | | | | |
| Total liabilities | | | 111,181 | |
| | | | | |
| NET ASSETS AT APRIL 30, 2021 - EQUIVALENT TO $22.71 PER SHARE ON 4,933,281 SHARES OF COMMON STOCK OUTSTANDING | | $ | 112,049,992 | |
| | | | | |
| SUMMARY OF SHAREHOLDERS' EQUITY: | | | | |
| Common stock, par value $5.00 per share - authorized 70,000,000 shares; outstanding, 4,933,281 shares | | $ | 24,666,405 | |
| Retained earnings prior to becoming an investment company | | | 65,065,969 | |
| Undistributed net investment income | | | 880,870 | |
| Realized gain on investments sold and foreign currency transactions | | | 1,519,877 | |
| Undistributed nontaxable gain | | | 5,194,714 | |
| Net unrealized appreciation of investments and call and put options written | | | 14,722,157 | |
| | | | | |
| NET ASSETS APPLICABLE TO COMMON STOCK OUTSTANDING | | $ | 112,049,992 | |
| See accompanying notes to financial statements. | | | | |
| BMC FUND, INC. |
| STATEMENT OF OPERATIONS |
| Six Months Ended April 30, 2021 |
| INVESTMENT INCOME: | | | | |
| Income: | | | | |
| Interest - fixed income | | $ | 137,312 | |
| Dividend income (net of $9,462 foreign tax) | | | 880,870 | |
| | | | | |
| Total income | | | 1,018,182 | |
| | | | | |
| Expenses: | | | | |
| Legal and professional fees | | | 135,381 | |
| Directors' fees (Note 7) | | | 25,250 | |
| Investment expense | | | 53,414 | |
| Salaries and related expenses | | | 336,027 | |
| Property and liability insurance | | | 24,121 | |
| Depreciation expense | | | 428 | |
| Rent | | | 14,730 | |
| Office expense and supplies | | | 15,126 | |
| Dues and subscriptions | | | 14,512 | |
| Travel and entertainment | | | - | |
| | | | | |
| Total expenses | | | 618,989 | |
| | | | | |
| Investment income, net | | | 399,193 | |
| | | | | |
| REALIZED AND UNREALIZED GAIN (LOSS) ON INVESTMENTS: | | | | |
| Realized gain from investments sold and foreign currency transactions | | | 1,149,295 | |
| Realized gain from expiration or closing of options contracts written | | | 370,582 | |
| Change in unrealized appreciation of investments and call and put options for the year | | | 14,722,157 | |
| | | | | |
| Net gain on investments | | | 16,242,034 | |
| | | | | |
| NET INCREASE IN NET ASSETS RESULTING FROM OPERATIONS | | $ | 16,641,227 | |
See accompanying notes to financial statements.
| BMC FUND, INC. |
| STATEMENTS OF CHANGES IN NET ASSETS |
| Six Months Ended April 30, 2021 and 2020 |
| | | 2021 | | | 2020 | |
| | | | | | | |
| INCREASE (DECREASE) IN NET ASSETS FROM OPERATIONS: | | | | | | | | |
| Net investment income | | $ | 399,193 | | | $ | 730,316 | |
| Net realized gains (losses) from investment securities sold, options and foreign currency transactions | | | 1,519,877 | | | | (1,541,794 | ) |
| Change in unrealized appreciation of investments and call and put options written for the year | | | 14,722,157 | | | | (5,992,446 | ) |
| | | | | | | | | |
| Net increase (decrease) in net assets resulting from operations | | | 16,641,227 | | | | (6,803,924 | ) |
| | | | | | | | | |
| Distributions to shareholders from: | | | | | | | | |
| Net realized losses on investment securities, options and foreign currency transactions | | | (615,002 | ) | | | (222,989 | ) |
| Net investment income | | | (475,050 | ) | | | (790,450 | ) |
| Retained earnings prior to becoming an investment company | | | (1,376,589 | ) | | | (1,453,202 | ) |
| | | | | | | | | |
| TOTAL INCREASE (DECREASE) IN NET ASSETS | | | 14,174,586 | | | | (9,270,565 | ) |
| | | | | | | | | |
| NET ASSETS AT BEGINNING OF PERIOD | | | 97,875,406 | | | | 104,394,807 | |
| | | | | | | | | |
| NET ASSETS AT END OF PERIOD (Including undistributed net investment income: | | | | | | | | |
| (2021 - $133,294, 2020 - $320,485) | | $ | 112,049,992 | | | $ | 95,124,242 | |
See accompanying notes to financial statements.
BMC FUND, INC.
FINANCIAL HIGHLIGHTS
Six months ended April 30, 2021 and Years Ended October 31, 2020, 2019, 2018, 2017, 2016, 2015, 2014, 2013 and 2012
The following table presents financial information divided into three parts: per share operating performance, total investment return and ratios and supplemental data for the six months ended April 30, 2021 and the years ended October 31, 2020, 2019, 2018, 2017, 2016, 2015, 2014, 2013 and 2012. The first part, per share operating performance, details the changes on a per share basis of the Company's beginning net asset value to its ending net asset value. The second part, total investment return, is based on the market price of the Company's shares of stock. Part three, ratios and supplemental data, provides additional financial information related to the Company's performance.
| | | Six Months | | | | | | | | | | | | | | | | | | | | | | | | | | | | |
| | | Ended | | | | | | | | | | | | | | | | | | | | | | | | | | | | |
| | | April 30, | | | | | | | | | | | | | | | | | | | | | | | | | | | | |
| PER SHARE OPERATING | | 2021 | | | | | | | | | | | | | | | | | | | | | | | | | | | | |
| PERFORMANCE | | (unaudited) | | | 2020 | | | 2019 | | | 2018 | | | 2017 | | | 2016 | | | 2015 | | | 2014 | | | 2013 | | | 2012 | |
| Net asset value, beginning of period | | $ | 19.84 | | | $ | 21.16 | | | $ | 20.77 | | | $ | 21.42 | | | $ | 20.83 | | | $ | 21.22 | | | $ | 22.62 | | | $ | 22.57 | | | $ | 22.58 | | | $ | 22.11 | |
| Net investment income | | | 0.08 | | | | 0.25 | | | | 0.34 | | | | 0.27 | | | | 0.27 | | | | 0.22 | | | | 0.35 | | | | 0.42 | | | | 0.46 | | | | 0.35 | |
| Net gains (losses) on investments | | | 3.29 | | | | (0.57 | ) | | | 1.05 | | | | 0.08 | | | | 1.32 | | | | 0.39 | | | | (0.73 | ) | | | 0.63 | | | | 0.60 | | | | 1.18 | |
| Total from investment operations | | | 3.37 | | | | (0.32 | ) | | | 1.39 | | | | 0.35 | | | | 1.59 | | | | 0.61 | | | | (0.38 | ) | | | 1.05 | | | | 1.06 | | | | 1.53 | |
| Less distributions: | | | | | | | | | | | | | | | | | | | | | | | | | | | | | | | | | | | | | | | | |
| Dividends from net investment income | | | 0.10 | | | | 0.05 | | | | 0.33 | | | | 0.32 | | | | 0.20 | | | | 0.23 | | | | 0.36 | | | | 0.44 | | | | 0.47 | | | | 0.56 | |
| Distributions from capital gains | | | 0.12 | | | | 0.28 | | | | 0.08 | | | | 0.37 | | | | 0.35 | | | | - | | | | 0.44 | | | | 0.42 | | | | 0.33 | | | | 0.48 | |
| Distributions from retained earnings | | | 0.28 | | | | 0.67 | | | | 0.59 | | | | 0.31 | | | | 0.45 | | | | 0.77 | | | | 0.22 | | | | 0.14 | | | | 0.27 | | | | 0.02 | |
| Total distributions | | | 0.50 | | | | 1.00 | | | | 1.00 | | | | 1.00 | | | | 1.00 | | | | 1.00 | | | | 1.02 | | | | 1.00 | | | | 1.07 | | | | 1.06 | |
| Net asset value, end of period | | $ | 22.71 | | | $ | 19.84 | | | $ | 21.16 | | | $ | 20.77 | | | $ | 21.42 | | | $ | 20.83 | | | $ | 21.22 | | | $ | 22.62 | | | $ | 22.57 | | | $ | 22.58 | |
| | | | | | | | | | | | | | | | | | | | | | | | | | | | | | | | | | | | | | | | | |
| Per share market value, end of period1 | | $ | 18.00 | | | $ | 18.00 | | | $ | 18.00 | | | $ | 18.00 | | | $ | 18.00 | | | $ | 18.00 | | | $ | 18.00 | | | $ | 18.00 | | | $ | 18.00 | | | $ | 18.00 | |
| | | | | | | | | | | | | | | | | | | | | | | | | | | | | | | | | | | | | | | | | |
| TOTAL INVESTMENT RETURN2 | | | 18.74 | % | | | (1.79 | )% | | | 7.74 | % | | | 1.95 | % | | | 8.83 | % | | | 3.39 | % | | | (2.11 | )% | | | 5.83 | % | | | 5.89 | % | | | 8.50 | % |
| | | | | | | | | | | | | | | | | | | | | | | | | | | | | | | | | | | | | | | | | |
| RATIOS/SUPPLEMENTAL DATA | | | | | | | | | | | | | | | | | | | | | | | | | | | | | | | | | | | | | | | | |
| | | | | | | | | | | | | | | | | | | | | | | | | | | | | | | | | | | | | | | | | |
| Net assets, end of period (in thousands) | | $ | 112,050 | | | $ | 97,875 | | | $ | 104,397 | | | $ | 102,458 | | | $ | 105,657 | | | $ | 102,751 | | | $ | 104,684 | | | $ | 111,568 | | | $ | 111,358 | | | $ | 111,379 | |
| Ratio of expenses to average net assets3 | | | 0.06 | % | | | 1.12 | % | | | 1.06 | % | | | 1.01 | % | | | 1.03 | % | | | 1.07 | % | | | 0.98 | % | | | 0.97 | % | | | 0.95 | % | | | 1.01 | % |
| Ratio of net investment income to average net assets3 | | | 0.38 | % | | | 1.21 | % | | | 1.64 | % | | | 1.28 | % | | | 1.26 | % | | | 1.06 | % | | | 1.59 | % | | | 1.83 | % | | | 2.04 | % | | | 1.57 | % |
| Portfolio turnover rate | | | 4.69 | % | | | 20.22 | % | | | 12.94 | % | | | 14.18 | % | | | 24.07 | % | | | 15.09 | % | | | 17.10 | % | | | 22.02 | % | | | 33.12 | % | | | 32.90 | % |
1Unaudited - Based on stock trades, which are very limited, during that year.
2Unaudited - Computed as follows: income from investment operations divided by per share market value.
3Average is computed on a quarterly basis.
See accompanying notes to financial statements.
BMC FUND, INC.
NOTES TO FINANCIAL STATEMENTS
Six Months Ended April 30, 2021 (Unaudited)
BMC Fund, Inc. (the “Fund”) is a closed-end, diversified investment company registered under the Investment Company Act of 1940, as amended. Prior to becoming a regulated investment company on April 1, 1981, BMC Fund, Inc. operated as a regular corporation. The following is a summary of significant accounting policies followed by the Fund in the preparation of its financial statements.
| 2. | SIGNIFICANT ACCOUNTING POLICIES |
A. Investment Valuations – The investment securities are stated at fair value as determined by closing prices on national securities exchanges. Investment securities include corporate bonds, mutual funds, and common and preferred stocks.
The investments in limited partnerships, other investments and venture capital are stated at estimated fair value as determined by the management of these investments and are approved by the Fund’s Valuation Committee after giving consideration to historical and projected financial results, economic conditions, financial condition of investee and other factors and events subject to change, and ratified by the Fund’s Board of Directors. Because of the inherent uncertainty of those valuations, the estimated values may differ significantly from the values that would have been used had a ready market value for the investments existed, and these differences could be material.
B. Basis of Presentation - The financial statements have been prepared in conformity with accounting principles generally accepted in the United States of America (“GAAP”) as detailed in the Financial Accounting Standards Board’s Accounting Standards Codification. The Fund evaluates subsequent events through the date of filing with the Securities and Exchange Commission (“SEC”).
C. Investment Transactions – Investment transactions are accounted for on the date the order to buy or sell is executed. Realized gains and losses on investments are determined on the basis of specific identification of issues sold or matured. Dividend income is recorded on the ex-dividend date and interest income is recorded on the accrual basis. Discounts and premiums on securities purchased are amortized over the lives of the respective securities. Realized gains and losses on foreign currency transactions are included with realized gains and losses on investments.
For the six months ended April 30, 2021, the Fund purchased and sold securities in the amount of $8,176,083 and $4,758,881 (excluding short-term investments and options), respectively.
BMC FUND, INC.
NOTES TO FINANCIAL STATEMENTS
Six Months Ended April 30, 2021 (Unaudited)
| 2. | SIGNIFICANT ACCOUNTING POLICIES (Continued) |
D. Option Writing – When the Fund writes an option, an amount equal to the premium received by the Fund is recorded as a liability and is subsequently adjusted to the current fair value of the option written. Premiums received from writing options that expire unexercised are treated by the Fund on the expiration date as realized gains from investments. The difference between the premium and the amount paid on effecting a closing purchase transaction, including brokerage commissions, is also treated as a realized gain, or, if the premium is less than the amount paid for the closing purchase transaction, as a realized loss. If a call option is exercised, the premium is added to the proceeds from the sale of the underlying security in determining whether the Fund has realized a gain or loss. If a put option is exercised, the premium reduces the cost basis of the securities purchased by the Fund. The Fund as writer of an option bears the market risk of an unfavorable change in the price of the security underlying the written option.
E. Income Taxes – No federal tax provision is required as it is the Fund’s policy to comply with the provisions of Subchapter M of the Internal Revenue Code of 1954, as amended, including the distribution to its shareholders of substantially all of its income and any capital gains not offset by capital losses. Also, no state income tax provision has been provided because the states in which the Fund has income recognize the tax exempt status of a regulated investment company.
The Fund did not have an accrual for uncertain tax positions as deductions taken and benefits accrued are based on widely understood administrative practices and procedures, and are based on clear and unambiguous tax law. Tax returns for all years 2017 and thereafter are subject to possible future examinations by tax authorities.
F. Dividend Policy – It is the Fund’s policy to pay dividends during the year in sufficient amounts to meet the requirements to maintain its status as a regulated investment company.
G. Cash and Short-Term Investments – For purposes of financial reporting, the Fund considers all investments at financial institutions with original maturities of three months or less to be equivalent to cash. Short-term money market investments managed by third party investors are included in investment securities.
H. Use of Estimates – The preparation of financial statements in conformity with accounting principles generally accepted in the United States of America requires management to make estimates and assumptions that affect the reported amounts of assets and liabilities and disclosure of contingent assets and liabilities at the date of the financial statements and the reported amounts of revenues and expenses during the reporting period. Actual results could differ from those estimates.
BMC FUND, INC.
NOTES TO FINANCIAL STATEMENTS
Six Months Ended April 30, 2021 (Unaudited)
| 2. | SIGNIFICANT ACCOUNTING POLICIES (Continued) |
I. Fair Value Measurements – Fair value is defined as the price that would be received to sell an asset or paid to transfer a liability (i.e., the "exit price") in an orderly transaction between market participants at the measurement date.
In determining fair value, the Fund uses various valuation techniques. A fair value hierarchy for inputs is used in measuring fair value that maximizes the use of observable inputs and minimizes the use of unobservable inputs by requiring that the most observable inputs are to be used when available. Valuation techniques that are consistent with the market or income approach are used to measure fair value. The fair value hierarchy is categorized into three levels based on the inputs as follows:
Level 1 - Valuations based on unadjusted quoted prices in active markets for identical assets or liabilities that the Fund has the ability to access.
Level 2 - Valuations based on inputs, other than quoted prices included in Level 1, that are observable either directly or indirectly.
Level 3 - Valuations based on inputs that are unobservable and significant to the overall fair value measurement.
Fair value is a market-based measure, based on assumptions of prices and inputs considered from the perspective of a market participant that are current as of the measurement date, rather than an entity-specific measure. Therefore, even when market assumptions are not readily available, the Fund's own assumptions are set to reflect those that market participants would use in pricing the asset or liability at the measurement date.
The availability of valuation techniques and observable inputs can vary from investment to investment and are affected by a wide variety of factors, including the type of investment, whether the investment is new and not yet established in the marketplace, the liquidity of markets, and other characteristics particular to the transaction. To the extent that valuation is based on models or inputs that are less observable or unobservable in the market, the determination of fair value requires more judgment. Because of the inherent uncertainty of valuation, those estimated values may be materially higher or lower than the values that would have been used had a ready market for the investments existed. Accordingly, the degree of judgment exercised by the Fund in determining fair value is greatest for investments categorized in Level 3. In certain cases, the inputs used to measure fair value may fall into different levels of the fair value hierarchy. In such cases, the level in the fair value hierarchy which the fair value measurement falls in its entirety is determined based on the lowest level input that is significant to the fair value measurement.
BMC FUND, INC.
NOTES TO FINANCIAL STATEMENTS
Six Months Ended April 30, 2021 (Unaudited)
| 2. | SIGNIFICANT ACCOUNTING POLICIES (Continued) |
The inputs or methodology used for valuing securities are not necessarily an indication of the risk associated with investing in those securities.
The following is a summary of the inputs used to value the Fund’s investments as of April 30, 2021.
Asset Description (1) | | Quoted Prices
in Active
Markets for
Identical Assets (Level 1) | | | Significant
Other
Observable
Inputs
(Level 2) | | | Significant
Unobservable
Inputs
(Level 3) | | | Total | |
| Fixed Income | | $ | 3,791,350 | | | $ | - | | | $ | - | | | $ | 3,791,350 | |
| Bond Mutual Funds | | | 3,020,287 | | | | - | | | | - | | | | 3,020,287 | |
| Stock Mutual Funds | | | 7,573,405 | | | | - | | | | - | | | | 7,573,405 | |
| Common Stocks – Publicly Traded | | | 46,779,857 | | | | - | | | | - | | | | 46,779,857 | |
| Preferred Stocks – Publicly Traded | | | 2,218,566 | | | | - | | | | - | | | | 2,218,566 | |
| Cash and Cash Equivalents | | | 14,562,735 | | | | - | | | | - | | | | 14,562,735 | |
| Limited Partnerships – Measured at NAV (2) | | | - | | | | - | | | | - | | | | 31,942,320 | |
| Total Investments | | $ | 77,946,200 | | | $ | - | | | $ | - | | | $ | 109,888,520 | |
| | | | | | | | | | | | | |
| Liability Description (1) | | Quoted Prices
in Active
Markets for
Identical Assets
(Level 1) | | | Significant
Other
Observable
Inputs
(Level 2) | | | Significant
Unobservable
Inputs
(Level 3) | | | Total | |
| Call Options | | $ | (7,525 | ) | | $ | - | | | $ | - | | | $ | (7,525 | ) |
| Put Options | | | (32,270 | ) | | | - | | | | - | | | | (32,270 | ) |
| Total Investments | | $ | (39,795 | ) | | $ | - | | | $ | - | | | $ | (39,795 | ) |
| | | |
| (1) | There were no transfers between Level 1, Level 2, and Level 3 during the period. |
| (2) | Certain investments measured at fair value using the net asset value per share (or its equivalent) practical expedient have not been categorized in the fair value hierarchy. The fair value amounts presented in these tables are intended to permit reconciliation of the fair value hierarchy to the amounts presented in the Schedule of Investments. |
BMC FUND, INC.
NOTES TO FINANCIAL STATEMENTS
Six Months Ended April 30, 2021 (Unaudited)
| 2. | SIGNIFICANT ACCOUNTING POLICIES (Continued) |
| J. | Correction of an Error – During the six months ended April 30, 2021, the Fund determined that the cost basis of one investment was understated at October 31, 2020 by $1,204,958. Due to immateriality, the Fund corrected the cost basis of that investment as of October 31, 2020 (as reported $158,745, as corrected $1,363,703) in the Schedule of Investments. Within the Summary of Shareholders Equity included in the Statement of Assets and Liabilities the Fund reclassified $1,204,958 from Net unrealized appreciation of investments and call and put options written (as reported $8,746,162, as corrected $7,541,204) to Realized gain (loss) on investments sold and foreign currency transactions (as reported $(648,656), as corrected $556,302). This reclassification had no impact on Net Assets Applicable to Common Stock Outstanding. The impact of the error in the Statement of Operations for the year ended October 31, 2020 was a reclassification of a $1,204,958 Realized loss from investments sold and foreign currency transactions (as reported ($1,493,730), as corrected ($288,772)) to the Change in unrealized appreciation of investments and call and put options for the year (as reported ($2,150,884), as corrected ($3,355,842)). The impact of the error in the Statement of Changes in Net Assets for the year ended October 31, 2020 was a reclassification of a $1,204,958 Realized loss from investments sold and foreign currency transactions (as reported ($648,656), as corrected $556,302) to the Change in unrealized appreciation of investments and call and put options for the year (as reported ($2,150,884), as corrected ($3,355,842)). The correction of the error did not change the Net loss on investments and the Net Decrease in Net Assets Resulting From Operations for the year ended October 31, 2020. |
| K. | Investments in Limited Partnerships - As of April 30, 2021, the Fund was invested in limited partnerships. Each of these investments has certain restrictions with respect to rights of withdrawal by the Fund as specified in the respective agreements. Generally, the Fund is required to provide notice of its intent to withdraw after the investment has been maintained for a certain period of time. The management agreements of the limited partnerships provide for compensation to the managers in the form of fees ranging from 0.5% to 2% annually of net assets and performance incentive allowances or fees ranging from 10% to 20% of net profits earned. |
BMC FUND, INC.
NOTES TO FINANCIAL STATEMENTS
Six Months Ended April 30, 2021 (Unaudited)
| 2. | SIGNIFICANT ACCOUNTING POLICIES (Continued) |
The following table summarizes the Fund's investments in other limited partnerships as of April 30, 2021. The Fund's investments in limited partnerships have certain redemption and liquidity restrictions which are described in the below table.
Investment
Limited Partnerships | | Redemptions
Notice Period | | Redemptions
Permitted | | Liquidity
Restrictions |
| BAM Credit Opportunities Fund | | N/A | | N/A | | See below (8) |
| Elliott Associates, LP | | 60 days | | Jan. 1 or July 1 | | See below (1) (2) |
| Graham Institutional Partners, LP | | 60 days | | Annually | | See below (3) |
| Greenlight Masters Qualified, LP | | 105 days | | December 31 | | See below (4) |
| Infinity Premier Fund, LP | | 95 days | | Quarterly | | See below (5) (6) |
| Litespeed Partners, LP | | 45 days | | Quarterly | | See below (6) |
| Morrocroft Special Opportunity Fund II, LP | | 90 days | | Quarterly | | See below (4) (7) |
| Mudrick Distressed Opportunity Drawdown Fund II, L.P. | | N/A | | N/A | | See below (8) |
| Oaktree Enhanced Income Fund II, LP | | N/A | | N/A | | See below (8) |
| Old Well Emerging Markets Fund, LP | | 60 days | | Quarterly | | See below (9) |
| Privet Fund LP | | 90 days | | Quarterly | | See below (10) |
| Segra Resource Onshore Partners, LP | | 60 days | | Quarterly | | See below (11) |
| Stark Investments LP | | N/A | | N/A | | See below (12) |
| Virgo Societas Partnership III (Onshore), LP | | N/A | | N/A | | See below (13) |
| Walnut Investment Partners, LP | | N/A | | N/A | | See below (14) |
| Worldwide Opportunity Fund (Cayman), Ltd. | | 90 days | | June 30 or Dec. 31 | | See below (15) |
(1) There is a gate provision if requests for redemptions would cause a decline in aggregate net asset value of 20%. In addition to the 20% withdrawal limitation, a partner may not withdraw more than 25% of the capital in its Class B capital account on any withdrawal date.
(2) There is a capital surcharge of 1 3/4% for a partial or full withdrawal which may be waived in whole or in part.
(3) Minimum withdrawal of $500,000 or for all of Limited Partner’s interest in the Partnership, if less. A Limited Partner may not take a partial withdrawal if it would cause the Partnership’s aggregate net asset value to be less than $5,000,000. General Partner may permit a smaller withdrawal or waive the latter requirement.
(4) There is a gate provision regarding requests for redemptions, subject to various unspecified terms.
(5) Withdrawals of capital contributed less than 12 months preceding the withdrawal date will be subject to a reduction equal to 3% of the requested withdrawal amount.
(6) There is a gate provision if aggregate requested withdrawal amounts exceed 25% of the aggregate partner capital of the partnership, each limited partner who has submitted a timely request will receive a pro rata portion of the requested withdrawal, and any balance will be considered a timely withdrawal request with respect to the next withdrawal date.
(7) Minimum withdrawal is $100,000, and subsequent withdrawals may only be made in increments of $100,000. Withdrawal maximum limits: up to 1/5 of investment on initial withdrawal date, up to 1/4 of the remainder as of any subsequent withdrawal date, up to 1/3 of the remainder as of any subsequent withdrawal date, up to 1/2 of the remainder as of any subsequent withdrawal date, and up to the remainder as of any subsequent withdrawal date.
(8) Redemptions are not permitted.
(9) Withdrawals of capital contributions may be up to ¼ of the balance of partner’s capital account.
(10) Redemptions from portions of capital balance attributable to special investments are permitted only in the general partner’s discretion.
(11) There is a gate provision regarding requests for more than 25% of its capital account.
(12) In liquidation.
(13) Redemptions are not permitted. Unless the general partner elects an earlier date, the partnership expired April 17, 2019, which is the seventy-two month anniversary date of the initial closing of April 17, 2013, subject to a discretionary extension by the general partner of up to two consecutive additional one-year periods.
(14) Walnut is in receivership.
(15) Partial redemption may not reduce capital account below the lesser of $100,000 or 1% of the capital accounts of all investors.
BMC FUND, INC.
NOTES TO FINANCIAL STATEMENTS
Six Months Ended April 30, 2021 (Unaudited)
| 2. | SIGNIFICANT ACCOUNTING POLICIES (Continued) |
The Fund is subject to credit risk to the extent that the investment managers of the underlying limited partnerships are unable to fulfill their obligations according to their organizational documents. The Fund, through its investments in limited partnerships, is subject to risk inherent when investing in securities and private investments. In connection with its investments, the Fund is subject to the market and credit risk of those investments held or sold short by the limited partnerships. Due to the nature of the Fund's investments, the above described risks are limited to the Fund's investment balances and unfunded commitments to limited partnerships.
| 3. | UNREALIZED APPRECIATION AND DEPRECIATION ON INVESTMENTS |
(tax basis)
The amount of net unrealized appreciation (depreciation) and the cost of investment securities for tax purposes, including short-term securities as April 30, 2021, were as follows:
| Gross appreciation (excess of value over tax cost) | | $ | 30,005,466 | |
| Gross depreciation (excess of tax cost over value) | | | (6,649,519 | ) |
| Net unrealized appreciation | | $ | 23,355,947 | |
| Cost of investments for income tax purposes | | $ | 86,532,573 | |
As of April 30, 2021, portfolio securities valued at $698,720 were held in escrow by the custodian as cover for call options written by the Fund.
Transactions in options written during the six months ended April 30, 2021 were as follows:
| | | Number of
Contracts | | | Premiums
Received | |
| Options outstanding at October 31, 2020 | | | 745 | | | $ | 447,627 | |
| Options written | | | 686 | | | | 274,099 | |
| Options terminated in closing purchase transactions | | | (263 | ) | | | (148,295 | ) |
| Options expired | | | (843 | ) | | | (421,264 | ) |
| Options exercised | | | 0 | | | | 0 | |
| Options outstanding at April 30, 2021 | | | 325 | | | $ | 152,167 | |
As of April 30, 2021, cash in the amount of $3,174,750 was pledged as collateral for put options sold by the Fund.
BMC FUND, INC.
NOTES TO FINANCIAL STATEMENTS
Six Months Ended April 30, 2021 (Unaudited)
| 6. | DISTRIBUTIONS TO SHAREHOLDERS |
Classifications of distributions, net investment income/(loss) and net realized gain/(loss) may differ for financial statement and tax purposes. The character of distributions made during the year from net investment income or net realized gains may differ from its ultimate characterization for federal income tax purposes. Also, due to the timing of dividend distributions, the fiscal year in which amounts are distributed may differ from the fiscal year in which the income or realized gain was recorded by the Fund.
On December 10, 2020, a distribution of $0.25 per share was paid to shareholders of record on November 25, 2020.
On March 10, 2021, a distribution of $0.25 per share was paid to shareholders of record on February 25, 2021.
The tax character of distributions paid during 2021 and 2020 was as follows:
| | | 2021 | | | 2020 | |
| Distributions paid from: | | | | | | | | |
| Ordinary income | | $ | 475,050 | | | $ | 790,450 | |
| Long-term capital gains | | | 615,002 | | | | 222,989 | |
| Retained earnings prior to becoming an investment company | | | 1,376,589 | | | | 1,453,202 | |
| | | $ | 2,466,641 | | | $ | 2,466,641 | |
| 7. | ADVISORY BOARD AND REMUNERATION OF DIRECTORS |
The Fund does not have an advisory board. The independent directors are paid an annual fee of $3,000 plus $1,000 for each meeting attended in person or $500 for each meeting attended by telephone. Each such independent director is paid an additional $1,000 for each day attending a committee meeting in person or $500 by telephone other than on the date of a board meeting. In addition, all directors are reimbursed for their reasonable expenses incurred in attending meetings.
The Fund leases office space from Broyhill Investments, Inc., which is controlled by M. Hunt Broyhill, an officer of BMC Fund, Inc. The expense associated with this related party lease for the six months ended April 30, 2021 amounted to $14,730. Broyhill Investments, Inc. also acts as a common paymaster for payroll and other shared services. This service is provided at no cost to the Fund. All amounts paid by Broyhill Investments, Inc. on behalf of the Fund are reimbursed by the Fund. The outstanding payable related to these transactions at April 30, 2021 was $55,698.
M. Hunt Broyhill is a director of Capitala Finance Corp., in which the Fund is invested.
BMC FUND, INC.
NOTES TO FINANCIAL STATEMENTS
Six Months Ended April 30, 2021 (Unaudited)
Selected securities at the end of the year have significant investment impairment issues. These selected securities have an aggregate cost basis of $3,707,973 and have been assigned no value at April 30, 2021.
There were no impairment charges during the six months ended April 30, 2021. The Fund received $18,384 which was treated as a return of capital.
| 10. | SUPPLEMENTAL INFORMATION |
M. Hunt Broyhill, President, and Christopher R. Pavese, CFA, Vice President and Chief Investment Officer, are primarily responsible for the day-to-day management of the Fund’s portfolio. Mr. Hunt Broyhill has had such responsibility since 2001. He has been engaged in asset management for various institutions and high net worth individuals for more than five years. Prior to joining the Fund on March 1, 2005, Mr. Pavese was a Vice President and Portfolio Manager at JP Morgan Private Bank from January 1999 until February 2005. At JP Morgan, Mr. Pavese was engaged in asset management, portfolio strategy, and asset allocation for high net worth individuals, personal trusts, endowments and foundations.
| 11. | SUPPLEMENTAL PROXY INFORMATION AND 2021 ANNUAL MEETING OF SHAREHOLDERS |
The Annual Meeting of Shareholders of BMC Fund, Inc. was held on February 19, 2021 at the Fund’s offices in Lenoir, North Carolina. The meeting was held for the following purposes:
1. To elect the following 5 directors to serve as follows:
| Director | | Term | | Expiring |
| Dale M. Brown | | 1 year | | 2022 |
| R. Donald Farmer | | 1 year | | 2022 |
| David B. Gilbert | | 1 year | | 2022 |
| Samuel P. McNeil, Jr. | | 1 year | | 2022 |
| Mark E. Roberts | | 1 year | | 2022 |
2. To vote upon such other business as may come before the meeting.
The directors of the Fund were elected for a one-year term at the 2021 annual meeting of shareholders of the Fund.
BMC FUND, INC.
DIRECTORS AND OFFICERS
Six Months Ended April 30, 2021 (Unaudited)
The following table provides information about the directors and the officers of the Fund:
Name,
Address and Age | | Position(s)
Held
with Fund | | Length of
Time
Served | | Principal
Occupation(s)
During Past 5 Years and
Other Biographical Information | | Other
Directorships
Held by
Director
During
Past 5 Years |
David Gilbert (78)
2734 Robinhood Road
Winston-Salem, NC 27104 | | Director
Chairman | | Since 2021
Since 2021 | | Executive Vice President and Wealth Manager, Sheets Smith Wealth Management (1994-present) | | Piedmont Select Equity Fund (Closed 2018) |
| | | | | | | | | |
Dale M. Brown (68)
131 Newcomb Lane
Lewisville, NC 27023 | | Director | | Since 2021 | | Salem Investment Counselors, a financial advisory firm (1988-present); President (2001-2017); Executive Vice President (2017-present); Chairman of the Board (2020-present) | | None |
| | | | | | | | | |
R. Donald Farmer (73)
375 River Haven Drive
Taylorsville, NC 28681 | | Director | | Since 2008 | | President of Don Farmer, CPA, PA, an independent public accounting firm and producer of federal income tax seminars and seminar materials (1984-present) | | None |
| | | | | | | | | |
Samuel P. McNeil, Jr (63)
2310 Rising Sun Lane
Matthews, NC 28104 | | Director | | Since 2021 | | Managing Director, Chief Executive Officer and Co-owner of River Capital Partners LLC, an investment manager (2001-present) | | None |
| | | | | | | | | |
Mark E. Roberts (57)
511 Tarrytown Center
Rocky Mount, NC 27804 | | Director | | Since 2014 | | Chief Investment Officer of Ironsides Asset Advisors, LLC, a registered investment advisory firm (2009-present); Chief Investment Officer of Biltmore Family Offices, LLC (2013- 2017); former Director of Global Equities and Hedged Strategies, State of North Carolina Retirement System (2003-2009) | | None |
BMC FUND, INC.
DIRECTORS AND OFFICERS
Six Months Ended April 30, 2021 (Unaudited)
Name,
Address and Age | | Position(s)
Held
with Fund | | Length of
Time
Served | | Principal
Occupation(s)
During Past 5 Years and
Other Biographical Information | | Other
Directorships
Held by
Director
During
Past 5 Years |
M. Hunt Broyhill (57)
1870 9th Street Court, NW
Hickory, NC 28601 | | Director
Chairman
President
Vice President | | 2008-2021
2014-2021
Since 2007
2001-2007 | | Former Chairman of the Fund (2014-2021); President of the Fund since February 2007; former Vice President of the Fund (2001-2007); Chief Executive of Broyhill Asset Management, LLC (1997-present); Director and President of Broyhill Investments, Inc. (1988-present); Director (1983-present) and President of Broyhill Family Foundation, Inc. (1988-present); Manager and Vice President of P. B. Realty, LLC (formerly P. B. Realty, Inc.) (1995-present) | | Capitala Finance Corp. (Feb. 2013-present) |
| | | | | | | | | |
Danny A. Gilbert (54)
603 Stonecroft Court SE
Lenoir, NC 28645 | | Vice President
Chief Financial Officer | | Since 2018
Since 2020 | | Vice President (since February 2018) and Chief Financial Officer of the Fund since January 2020; Chief Compliance Officer of the Fund (June 2017-December 2019); Vice President of Broyhill Family Foundation, Inc. (2019-present); Vice President of P. B. Realty, LLC (formerly P. B. Realty, Inc.) (2019-present); former Assistant City manager and Finance Director, City of Lenoir, NC (2006-2016) | | None |
| | | | | | | | | |
Christopher R. Pavese (44)
166 Pleasant Point Drive
Hickory, NC 28601 | | Vice President
Chief Investment Officer | | Since 2013
Since 2011 | | Vice President (since February 2013) and Chief Investment Officer of the Fund since March 2011; Portfolio Manager of the Fund (2005-2011); Chief Investment Officer of Broyhill Asset Management, LLC (2008-present) | | None |
| | | | | | | | | |
Alan R. Deal (56)
5304 Grace Drive
Hickory, NC 28601 | | Chief Compliance Officer | | Since 2020 | | Chief Compliance Officer of the Fund since January 2020; former Controller, Protect Plus and Imagine One Companies (August 2002-April 2019) | | None |
BMC FUND, INC.
DIRECTORS AND OFFICERS
Six Months Ended April 30, 2021 (Unaudited)
Name,
Address and Age | | Position(s)
Held
with Fund | | Length of
Time
Served | | Principal
Occupation(s)
During Past 5 Years and
Other Biographical Information | | Other
Directorships
Held by
Director
During
Past 5 Years |
Wendy S. Sims (35)
814 Rockhouse Way SE
Lenoir, NC 28645 | | Secretary and Treasurer | | Since 2018 | | Secretary and Treasurer of the Fund since December 2018; Secretary and Treasurer of Broyhill Investments, Inc. (December 2018-present); Secretary and Treasurer of P. B. Realty, LLC (formerly P. B. Realty, Inc.) (December 2018-present); Assistant Secretary and Assistant Treasurer of the Fund (August 2018-December 2018); Secretary and Treasurer of Broyhill Family Foundation, Inc. (2019-present); Senior Inventory Fulfillment Specialist, Lowe’s Companies, Inc. (October 2012- March 2018) | | None |
BMC FUND, INC.
ADDITIONAL INFORMATION
Six Months Ended April 30, 2021 (Unaudited)
Proxy Voting - The policies and procedures that the Fund uses to determine how to vote proxies relating to its portfolio securities are available without charge, upon request, by calling 828-758-6100; on the Fund’s website at http://www.bmcfund.com; and on the Securities and Exchange Commission’s website at http://www.sec.gov.
Information regarding how the Fund voted proxies relating to portfolio securities during the most recent 12-month period ended June 30 is available without charge, upon request, by calling 828-758-6100, and on the SEC’s website at http://www.sec.gov (see Form N-PX).
Portfolio Holdings - The Fund files a complete schedule of its portfolio holdings for the first and third quarters of its fiscal year with the SEC on Form N-Q. The Fund’s Form N-Q filings are available on the SEC’s website at http://www.sec.gov and may be reviewed and copied at the SEC’s Public Reference Room in Washington, DC. Information on the operation of the SEC’s Public Reference Room may be obtained by calling 1-202-551-8090.
Item. 2. Code of Ethics.
N/A
Item 3. Audit Committee Financial Expert.
N/A
Item 4. Principal Accountant Fees and Services.
N/A
Item 5. Audit Committee of Listed Registrants.
N/A
Item 6. Investments.
Included as a part of the report to shareholders filed under Item 1.
Item 7. Disclosure of Proxy Voting Policies and Procedures for Closed-End Management Investment Companies.
N/A
Item 8. Portfolio Managers of Closed-End Investment Companies.
N/A
Item 9. Purchases of Equity Securities by Closed-End Management Investment Company and Affiliated Purchasers.
None
Item 10. Submission of Matters to a Vote of Security Holders.
N/A
Item 11. Controls and Procedures.
Within the 90 days prior to the date of this report, the Registrant's management carried out an evaluation, under the supervision and with the participation of Registrant's President and Chief Financial Officer, of the effectiveness of the Registrant's disclosure controls and procedures pursuant to Rule 30a-3(b) of the Investment Company Act of 1940. Based upon the evaluation, the President and Chief Financial Officer concluded as of a date within 90 days of the filing of this report that the Registrant's disclosure controls and procedures are effective in timely alerting them to material information relating to the Registrant required to be included in the Registrant's periodic SEC filings.
There were no significant changes in the Registrant's internal control over financial reporting (as defined in Rule 30a-3(d) under the Investment Company Act of 1940) that occurred during the second fiscal quarter of the period covered by the report that have materially affected, or are reasonably likely to materially affect, the Registrant's internal control over financial reporting.
Item 12. Disclosure of Securities Lending Activities for Closed-End Management Investment Companies.
N/A
Item 13. Exhibits.
(a)(1) N/A
(a)(2) Certifications.
SIGNATURES
Pursuant to the requirements of the Securities Exchange Act of 1934 and the Investment Company Act of 1940, the Registrant has duly caused this report to be signed on its behalf by the undersigned, thereunto duly authorized.
| BMC Fund, Inc. | |
| | |
| By | |
| | |
| /s/ Danny A. Gilbert | |
| Danny A. Gilbert | |
| Vice President and | |
| Chief Financial Officer | |
| | |
| Date: July 6, 2021 | |
Pursuant to the requirements of the Securities Exchange Act of 1934 and the Investment Company Act of 1940, this report has been signed below by the following persons on behalf of the registrant and in the capacities and on the dates indicated.
| By | |
| | |
| /s/ M. Hunt Broyhill | |
| M. Hunt Broyhill | |
| Chairman and President | |
| | |
| Date: July 6, 2021 | |
| | |
| By | |
| | |
| /s/ Danny A. Gilbert | |
| Danny A. Gilbert | |
| Vice President and | |
| Chief Financial Officer | |
| | |
| Date: July 6, 2021 | |