UNITED STATES
SECURITES AND EXCHANGE COMMISSION
Washington, DC 20549
FORM N-CSR
CERTIFIED SHAREHOLDER REPORT OF
REGISTERED MANAGEMENT INVESTMENT COMPANIES
Investment Company Act file number: 811-03150
BMC FUND, INC.
(Exact name of registrant as specified in charter)
800 HICKORY BLVD. SW
LENOIR, NC 28645
(Address of principal executive offices) (Zip code)
ALAN DEAL
BMC FUND, INC.
800 HICKORY BLVD. SW
LENOIR, NC 28645
(Name and address of agent for service)
Registrant's telephone number including area code: 828-758-6100
Date of fiscal year end: October 31, 2024
Date of reporting period: October 31, 2024
Item 1. Report to Stockholders.
BMC FUND, INC.
FINANCIAL STATEMENTS AND
ADDITIONAL INFORMATION
Year Ended October 31, 2024
BMC FUND, INC.
TABLE OF CONTENTS
BMC FUND, INC.
LETTER TO SHAREHOLDERS – UNAUDITED
MANAGEMENT’S DISCUSSION OF FUND PERFORMANCE
Year Ended October 31, 2024
TO OUR SHAREHOLDERS: MANAGEMENT’S DISCUSSION OF FUND PERFORMANCE
BMC Fund, Inc. (the “Fund”) gained 13.4% during the fiscal year, underperforming the Fund’s Policy Index as defined on page 4 return of 22.9%. The Fund outperformed over the trailing three years, highlighting the Fund’s full-cycle return potential, including both the bear market in 2022 and the run-up since.
The overweight exposure to limited partnerships (LP), comprising almost 60% of investable assets at fiscal year-end, explains a large part of this dynamic. The LP Portfolio returned 10.6% during the fiscal year, compared to 21.7% for the equity portfolio. Consequently, the LP allocation being well in excess of the 45% benchmark weighting was a drag on relative returns despite continued redemptions over the course of the year. Several pending redemptions and distributions should significantly reduce the Fund’s exposure in the new year, improve overall liquidity, and provide cash on hand to redeploy as opportunities present themselves.
The equity portfolio had a similar impact on relative performance as it generated meaningful returns but lagged its benchmark. Like the overall Fund, the equity portfolio underperformed during the fiscal year, returning 21.7% versus MSCI ACWI 33.4%, but outperformed over the prior three years, returning 11.0% annualized versus 6.0% for the benchmark. This should not come as a surprise. Because valuations often overshoot during strong bull markets, we expect to underperform in the latter innings of bull markets. This approach, though, has been particularly helpful during drawdowns.
Meanwhile, macroeconomic data is sending mixed signals. The labor market remains strong but is incrementally weaker than several months ago. Inflation has returned to just above the Federal Reserve’s target range, but consumers are still being squeezed. Historically, this is a precursor to economic weakness, but recent consumer spending, which drives much of the domestic economy, suggests otherwise. Even with this mixed backdrop, markets continue to reach new highs as investors pile into the large-cap growth companies driving returns.
In the likely event that mixed signals translate into volatile markets rather than the steady upward trends of the last year, we believe the Fund is well positioned. The Fund is partially hedged, with rising liquidity, due to the dynamics previously discussed in the LP portfolio. Following the positive returns across asset classes in recent years and the top-heavy construction of the indices, we believe this sets the Fund up well going forward. However, taking advantage of these opportunities will demand a long-term time horizon and willingness to look quite different from consensus. Thankfully, we are in the unique position to enjoy both.
BMC FUND, INC.
LETTER TO SHAREHOLDERS – UNAUDITED
MANAGEMENT’S DISCUSSION OF FUND PERFORMANCE
Year Ended October 31, 2024
During the year ended October 31, 2024, the Company paid the following dividends per share:
| December 10, 2023 to shareholders of record November 25, 2023 | | $ | .20 | |
| March 10, 2024 to shareholders of record February 25, 2024 | | | .20 | |
| June 10, 2024 to shareholders of record May 25, 2024 | | | .20 | |
| September 10, 2024 to shareholders of record August 25, 2024 | | | .20 | |
| | | | | |
| Total | | $ | .80 | |
The Company paid a dividend of $1.10 per share on December 10, 2024 to shareholders of record November 25, 2024.
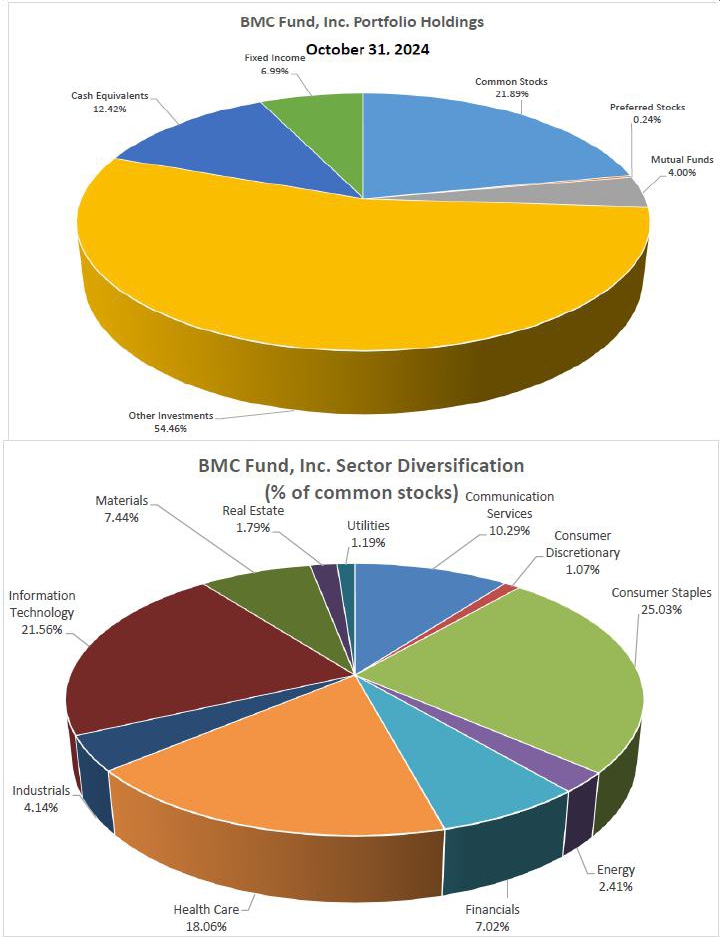
The attached Schedule of Investments is a listing of the entire Company’s diversified securities at October 31, 2024 with a total market value of $40,357,029.
| M. Hunt Broyhill |
| | Principal Executive Officer |
BMC FUND, INC.
LETTER TO SHAREHOLDERS – UNAUDITED
MANAGEMENT’S DISCUSSION OF FUND PERFORMANCE
Year Ended October 31, 2024
BMC FUND, INC.
LETTER TO SHAREHOLDERS – UNAUDITED
MANAGEMENT’S DISCUSSION OF FUND PERFORMANCE
Year Ended October 31, 2024
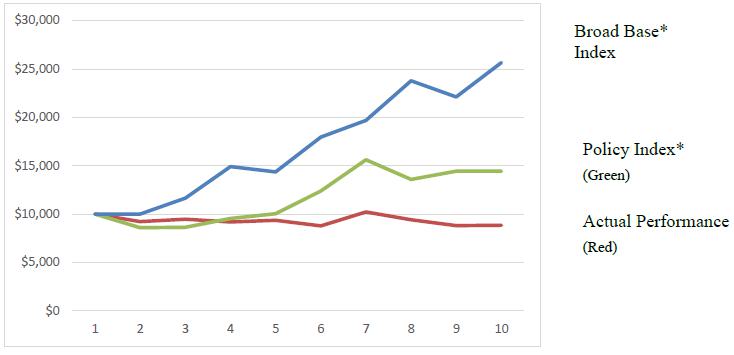
This chart assumes an initial gross investment of $10,000 made on 10/31/2014.
* Broad Base Index used is SPDR Dow Jones Industrial Average ETF Trust
* Policy Index is calculated as 50% MSCI ACWI, 25% Barclays Aggregate Bond Index, 20% HFRI Hedge Fund Index, 5% Cash
Past performance does not guarantee future results. Performance will fluctuate with changes in market conditions. Current performance may be lower or higher than the performance data shown. Performance information does not reflect the deduction of taxes that shareholders would pay on Company distributions or the sale of the Company shares. An investment in the Company involves risk, including loss of principal.
Past performance at a glance
(unaudited)
Average annual total returns for the periods ended 10/31/2024
| Market Value | | 1 year | | | 5 year | | | 10 year | |
| | | | | | | | | | |
| BMC Fund, Inc. | | | 11.3 | % | | | 7.0 | % | | | 5.5 | % |
| | | | | | | | | | | | | |
| Policy Index | | | 1.0 | % | | | 2.0 | % | | | 3.0 | % |
| | | | | | | | | | | | | |
| Broad Base Index | | | 15.0 | % | | | 10.6 | % | | | 11.6 | % |
BMC Fund, Inc. pays management fees to BAM, LLC.

REPORT OF INDEPENDENT REGISTERED PUBLIC ACCOUNTING FIRM
To the Shareholders and Board of Directors of BMC Fund, Inc.
Opinion on the Financial Statements
We have audited the accompanying statement of assets and liabilities, including the schedule of investments, of BMC Fund, Inc. (the “Fund”) as of October 31, 2024, the related statements of operations, changes in net assets, cash flows, and the financial highlights for the year then ended, and the related notes (collectively referred to as the “financial statements”). In our opinion, the financial statements present fairly, in all material respects, the financial position of the Fund as of October 31, 2024, the results of its operations, the changes in net assets, cash flows, and the financial highlights for the year then ended, in conformity with accounting principles generally accepted in the United States of America.
The Fund’s financial statements and financial highlights for the years ended October 31, 2023, and prior, were audited by other auditors whose report dated January 5, 2024, expressed an unqualified opinion on those financial statements and financial highlights.
Basis for Opinion
These financial statements are the responsibility of the Fund’s management. Our responsibility is to express an opinion on the Fund’s financial statements based on our audit. We are a public accounting firm registered with the Public Company Accounting Oversight Board (United States) (“PCAOB”) and are required to be independent with respect to the Fund in accordance with the U.S. federal securities laws and the applicable rules and regulations of the Securities and Exchange Commission and the PCAOB.
We conducted our audit in accordance with the standards of the PCAOB. Those standards require that we plan and perform the audit to obtain reasonable assurance about whether the financial statements are free of material misstatement whether due to error or fraud.
Our audit included performing procedures to assess the risks of material misstatement of the financial statements, whether due to error or fraud, and performing procedures that respond to those risks. Such procedures included examining, on a test basis, evidence regarding the amounts and disclosures in the financial statements. Our procedures included confirmation of securities owned as of October 31, 2024, by correspondence with the custodians and underlying portfolio funds. Our audit also included evaluating the accounting principles used and significant estimates made by management, as well as evaluating the overall presentation of the financial statements. We believe that our audit provides a reasonable basis for our opinion.
We have served as the Fund’s auditor since 2024.

COHEN & COMPANY, LTD.
Cleveland, Ohio
January 17, 2025

| BMC FUND, INC. | | | | | | | | |
| SCHEDULE OF INVESTMENTS | | | | | | | | |
| October 31, 2024 | |
| | | | | | | | | | | | | | | | | | | | | | Percent | |
| | | | | | Interest | | Base Rate | | | Maturity | | Face | | | | | | Market | | | of Net | |
| Debt Issuer | | | | | Rate | | Floor | | | Date | | Amount | | | Cost | | | Value | | | Assets | |
| | | | | | | | | | | | | | | | | | | | | | | |
| FIXED INCOME: | | | | | | | | | | | | | | | | | | | | | | | | | | | |
| CORPORATE BONDS: | | | | | | | | | | | | | | | | | | | | | | | | | | | |
| FIRST CITIZENS | | | | | | SOFR +423. | | | 5.800 | % | | 12/31/2049 | | $ | 250,000 | | | $ | 252,390 | | | $ | 254,998 | | | | |
| FPL GROUP CAP INC | | | | | | SOFR +233 | | | 6.350 | % | | 10/1/2066 | | | 586,000 | | | | 563,064 | | | | 564,013 | | | | |
| PP&L CAP FUNDING FLT RATE | | | | | | SOFR +293 | | | 5.051 | % | | 3/30/2067 | | | 250,000 | | | | 250,000 | | | | 249,325 | | | | |
| TRANSCANADA PIPELINES LTD | | | | | | SOFR +247 | | | 6.350 | % | | 5/15/2067 | | | 250,000 | | | | 199,356 | | | | 231,432 | | | | |
| LEHMAN BROTHERS HLDGS NIKKEI INDEX | | | 1,2,3 | | | | | | 0.000 | % | | 9/29/2008 | | | 3,000,000 | | | | 1,599,171 | | | | - | | | | |
| LEHMAN BROTHERS HLDGS EAFE INDEX | | | 1,2,3 | | | | | | 0.000 | % | | 11/15/2008 | | | 1,000,000 | | | | 524,515 | | | | - | | | | |
| LEHMAN BROTHERS HLDGS MEDIUM TERM NOTE | | | 1,2,3 | | | | | | 0.000 | % | | 3/15/2011 | | | 2,500,000 | | | | 1,331,013 | | | | - | | | | |
| | | | | | | | | | | | | | | | 7,836,000 | | | | 4,719,509 | | | | 1,299,768 | | | 3.22 | % |
| | | | | | | | | | | | | | | | | | | | | | | | | | | | |
| GOVERNMENT BONDS: | | | | | | | | | | | | | | | | | | | | | | | | | | | |
| US TREASURY NOTE | | | | | | | | | 5.000 | % | | 10/31/2025 | | | 500,000 | | | | 499,933 | | | | 503,205 | | | | |
| US TREASURY NOTE | | | | | | | | | 4.625 | % | | 10/15/2026 | | | 500,000 | | | | 497,885 | | | | 504,240 | | | | |
| US TREASURY NOTE | | | | | | | | | 4.875 | % | | 10/31/2028 | | | 500,000 | | | | 501,619 | | | | 512,930 | | | | |
| | | | | | | | | | | | | | | | 1,500,000 | | | | 1,499,437 | | | | 1,520,375 | | | 3.77 | % |
| | | | | | | | | | | | | | | | | | | | | | | | | | | | |
| | | | | | | | | | | | | | | | | | | | | | | | | | | | |
| | | | | | | | | | | | | | | | | | | | | | | | | | | | |
| TOTAL INVESTMENTS IN FIXED INCOME | | | | | | | | | | | | | | $ | 9,336,000 | | | $ | 6,218,946 | | | $ | 2,820,143 | | | 6.99 | % |
See accompanying notes to financial statements.
| BMC FUND, INC. | | | | | |
| SCHEDULE OF INVESTMENTS (Continued) | | | | | |
| October 31, 2024 | |
| | | | | | | | | | | | | | | | |
| | | | | | | | | | | | | | | Percent | |
| | | | | | Shares | | | | | | Market | | | of Net | |
| Company Name | | | | | | Held | | | Cost | | | Value | | | Assets | |
| | | | | | | | | | | | | | | | | | | | | |
| MUTUAL FUNDS: | | | | | | | | | | | | | | | | | | | | |
| | | | | | | | | | | | | | | | | | | | | |
| MFC BLACKROCK TAXABLE MUNICIPAL BOND TRUST | | | | | | | 67,658 | | | $ | 1,097,844 | | | $ | 1,124,476 | | | | | |
| PZENA EMERGING MARKETS VALUE INSTITUTIONAL | | | | | | | 27,010 | | | | 273,570 | | | | 362,473 | | | | | |
| ISHARES SILVER TRUST | | | 3 | | | | 1,252 | | | | 21,040 | | | | 37,322 | | | | | |
| SPDR GOLD SHARES | | | 3 | | | | 260 | | | | 25,315 | | | | 65,913 | | | | | |
| VANECK VECTORS GOLD MINERS | | | | | | | 571 | | | | 16,168 | | | | 23,034 | | | | | |
| | | | | | | | | | | | | | | | | | | | | |
| TOTAL INVESTMENTS IN MUTUAL FUNDS | | | | | | | | | | $ | 1,433,937 | | | $ | 1,613,218 | | | | 4.00 | % |
See accompanying notes to financial statements.
| BMC FUND, INC. | | | | | |
| SCHEDULE OF INVESTMENTS (Continued) | | | | | |
| October 31, 2024 | |
| | | Acquisition | | | | | | | | | Market | | | Percent of | |
| Company Name | | Date | | | | | | Cost | | | Value | | | Net Assets | |
| | | | | | | | | | | | | | | | |
| OTHER INVESTMENTS: | | | | | | | | | | | | | | | | | | | | |
| | | | | | | | | | | | | | | | | | | | | |
| LIMITED PARTNERSHIPS (NOTE 2): | | | | | | | | | | | | | | | | | | | | |
| BAM CREDIT OPPORTUNITIES FUND | | | 12/8/2020 | | | | 2, 3, 6, 7 | | | $ | 733,155 | | | $ | 939,348 | | | | | |
| ELLIOTT ASSOCIATES, L.P. CL B | | | 11/3/2008 | | | | 2, 3 | | | | 996,415 | | | | 6,885,204 | | | | | |
| GRAHAM INSTITUTIONAL PARTNERS, L.P. | | | 7/1/2016 | | | | 2, 3 | | | | 2,365,123 | | | | 3,338,902 | | | | | |
| GREENLIGHT MASTERS QUALIFIED, L.P. | | | 12/1/2010 | | | | 2, 3 | | | | 350,000 | | | | 2,561,375 | | | | | |
| INFINITY PREMIER FUND, L.P. | | | 11/1/2014 | | | | 2, 3 | | | | 250,000 | | | | 1,367,373 | | | | | |
| MUDRICK DISTRESSED OPPORTUNITY DRAWDOWN FUND II, L.P. | | | 3/1/2019 | | | | 2, 3 | | | | 2,173,117 | | | | 3,727,150 | | | | | |
| OAKTREE ENHANCED INCOME FUND II, L.P. | | | 4/8/2014 | | | | 2, 3 | | | | - | | | | 11,107 | | | | | |
| OLD WELL EMERGING MARKETS FUND, L.P. | | | 4/1/2018 | | | | 2, 3 | | | | 65,070 | | | | 51,126 | | | | | |
| OLD WELL SPECIAL OPPORTUNITIES FUND II, LLC | | | 11/4/2021 | | | | 2, 3 | | | | 113,322 | | | | 54,757 | | | | | |
| SEGRA RESOURCE ONSHORE PARTNERS, L.P. | | | 4/1/2018 | | | | 2, 3 | | | | 125,000 | | | | 740,401 | | | | | |
| SJC ONSHORE DIRECT LENDING FUND IV - 5 YEAR, L.P. | | | 10/1/2020 | | | | 2, 8 | | | | 2,271,862 | | | | 2,302,866 | | | | | |
| TOTAL LIMITED PARTNERSHIPS | | | | | | | | | | | 9,443,064 | | | | 21,979,609 | | | | 54.44 | % |
| | | | | | | | | | | | | | | | | | | | | |
| TOTAL OTHER INVESTMENTS | | | | | | | | | | $ | 9,443,064 | | | $ | 21,979,609 | | | | 54.44 | % |
See accompanying notes to financial statements.
| BMC FUND, INC. |
| SCHEDULE OF INVESTMENTS (Continued) |
| October 31, 2024 |
| | | | | | | | | | | | | Percent | |
| Sectors and | | Shares | | | | | | | Market | | | of Net | |
| Industries | | Held | | Company Name | | Cost | | | Value | | | Assets | |
| | | | | | | | | | | | | | |
| COMMON STOCKS: | | | | | | | | | | | | | | | | | |
| | | | | | | | | | | | | | | | | | |
| COMMUNICATION SERVICES | | | | | | | | | | | | | | | | | |
| Communication Services | | | 238 | | BCE INC COM | | $ | 10,963 | | | $ | 7,678 | | | | | |
| | | | 63 | | SK TELECOM LTD SPONSORED A | | | 1,262 | | | | 1,434 | | | | | |
| | | | 377 | | TELEFONICA S A SPONSORED A | | | 60 | | | | 1,745 | | | | | |
| | | | | | | | | 12,285 | | | | 10,857 | | | | 0.03 | % |
| | | | | | | | | | | | | | | | | | |
| Media and Entertainment | | | 740 | | ALPHABET INC CAP STK CL C | | | 47,706 | | | | 127,791 | | | | | |
| | | | 10,600 | | WARNER MUSIC GROUP CORP. | | | 329,656 | | | | 338,776 | | | | | |
| | | | | | | | | 377,362 | | | | 466,567 | | | | 1.16 | % |
| | | | | | | | | | | | | | | | | | |
| Interactive Home Entertainment | | | 32,322 | | NINTENDO LTD ADR | | | 348,971 | | | | 432,080 | | | | | |
| | | | | | | | | 348,971 | | | | 432,080 | | | | 1.07 | % |
| | | | | | | | | | | | | | | | | | |
| TOTAL COMMUNICATION SERVICES | | | | | | | | 738,618 | | | | 909,504 | | | | 2.25 | % |
| | | | | | | | | | | | | | | | | | |
| CONSUMER DISCRETIONARY | | | | | | | | | | | | | | | | | |
| Hotels, Restaurants & Leisure | | | 2,400 | | SIX FLAGS ENTERTAINMENT CORP | | | 95,287 | | | | 94,584 | | | | | |
| | | | | | | | | 95,287 | | | | 94,584 | | | | 0.24 | % |
| | | | | | | | | | | | | | | | | | |
| TOTAL CONSUMER DISCRETIONARY | | | | | | | | 95,287 | | | | 94,584 | | | | 0.24 | % |
| | | | | | | | | | | | | | | | | | |
| CONSUMER STAPLES | | | | | | | | | | | | | | | | | |
| Discount Stores | | | 3,100 | | DOLLAR GEN CORP NEW COM | | | 409,390 | | | | 248,124 | | | | | |
| | | | | | | | | 409,390 | | | | 248,124 | | | | 0.61 | % |
| | | | | | | | | | | | | | | | | | |
| Food & Staples Retailing | | | 131 | | KROGER CO COM | | | 4,133 | | | | 7,306 | | | | | |
| | | | 228 | | WAL-MART STORES INC COM | | | 10,261 | | | | 18,684 | | | | | |
| | | | | | | | | 14,394 | | | | 25,990 | | | | 0.06 | % |
| | | | | | | | | | | | | | | | | | |
| Food, Beverage & Tobacco | | | 104 | | COCA COLA CO COM | | | 4,970 | | | | 6,792 | | | | | |
| | | | 4,319 | | COCA COLA FEMSA S A B SPON | | | 325,234 | | | | 360,075 | | | | | |
| | | | 78 | | CONSTELLATION BRANDS CL A | | | 7,076 | | | | 18,123 | | | | | |
| | | | 100 | | GENERAL MILLS INC COM | | | 7,617 | | | | 6,802 | | | | | |
| | | | 10,046 | | PHILIP MORRIS INTL COM | | | 941,615 | | | | 1,333,104 | | | | | |
| | | | | | | | | 1,286,512 | | | | 1,724,896 | | | | 4.27 | % |
| | | | | | | | | | | | | | | | | | |
| Household & Personal Products | | | 126 | | KIMBERLY CLARK CORP COM | | | 17,492 | | | | 16,907 | | | | | |
| | | | 11 | | PROCTER & GAMBLE CO COM | | | 737 | | | | 1,817 | | | | | |
| | | | | | | | | 18,229 | | | | 18,724 | | | | 0.05 | % |
| | | | | | | | | | | | | | | | | | |
| Materials | | | 3,248 | | BALL CORP COM | | | 178,871 | | | | 192,444 | | | | | |
| | | | | | | | | 178,871 | | | | 192,444 | | | | 0.48 | % |
| | | | | | | | | | | | | | | | | | |
| TOTAL CONSUMER STAPLES | | | | | | | | 1,907,396 | | | | 2,210,178 | | | | 5.47 | % |
| | | | | | | | | | | | | | | | | | |
| ENERGY | | | | | | | | | | | | | | | | | |
| Energy | | | 250 | | CHENIERE ENERGY, INC. | | | 42,466 | | | | 47,845 | | | | | |
| | | | 1,200 | | CVR ENERGY, INC. | | | 43,491 | | | | 19,080 | | | | | |
| | | | 1,500 | | FREEHOLD ROYALTIES, LTD | | | 19,007 | | | | 14,775 | | | | | |
| | | | 2,000 | | FLEX LNG LTD. | | | 62,848 | | | | 49,000 | | | | | |
| | | | 473 | | SUNOCO INC COM | | | 13,246 | | | | 24,028 | | | | | |
| | | | | | | | | 181,058 | | | | 154,728 | | | | 0.38 | % |
| BMC FUND, INC. |
| SCHEDULE OF INVESTMENTS (Continued) |
| October 31, 2024 |
| | | | | | | | | | | | | Percent | |
| Sectors and | | Shares | | | | | | | Market | | | of Net | |
| Industries | | Held | | Company Name | | Cost | | | Value | | | Assets | |
| | | | | | | | | | | | | | |
| COMMON STOCKS: | | | | | | | | | | | | | | | | | |
| | | | | | | | | | | | | | | | | | |
| Pipelines | | | 181 | | DELEK LOGISTICS PARTNERS LP | | $ | 5,334 | | | $ | 6,981 | | | | | |
| | | | 630 | | ENBRIDGE INC | | | 18,339 | | | | 25,452 | | | | | |
| | | | 329 | | ENERGY TRANSFER OPERATING, L.P. | | | 3,369 | | | | 5,422 | | | | | |
| | | | | | | | | 27,042 | | | | 37,855 | | | | 0.09 | % |
| | | | | | | | | | | | | | | | | | |
| TOTAL ENERGY | | | | | | | | 208,100 | | | | 192,583 | | | | 0.48 | % |
| BMC FUND, INC. |
| SCHEDULE OF INVESTMENTS (Continued) |
| October 31, 2024 |
| | | | | | | | | | | | | Percent | |
| Sectors and | | Shares | | | | | | | Market | | | of Net | |
| Industries | | Held | | Company Name | | Cost | | | Value | | | Assets | |
| | | | | | | | | | | | | | |
| COMMON STOCKS: | | | | | | | | | | | | | | | | | |
| | | | | | | | | | | | | | | | | | |
| FINANCIALS | | | | | | | | | | | | | | | | | |
| Banks | | | 263 | | BANK OF AMERICA CORP COM | | $ | 6,063 | | | $ | 10,999 | | | | | |
| | | | 1 | 3 | SVB FINANCIAL GROUP COM | | | 340 | | | | - | | | | | |
| | | | | | | | | 6,403 | | | | 10,999 | | | | 0.03 | % |
| | | | | | | | | | | | | | | | | | |
| Diversified Financials | | | 1,312 | | ALLIANCE BERNSTEIN HLDG UN | | | 54,060 | | | | 48,610 | | | | | |
| | | | 179 | 3 | BERKSHIRE HATHAWAY INC CL B | | | 36,098 | | | | 80,715 | | | | | |
| | | | 756 | | BLACKSTONE GROUP LP COM | | | 24,342 | | | | 126,819 | | | | | |
| | | | 420 | | CARLYLE GROUP LP COM | | | 9,160 | | | | 21,013 | | | | | |
| | | | 36 | | CME GROUP | | | 5,993 | | | | 8,113 | | | | | |
| | | | 263 | | COMPASS DIVERSIFIED HOLDINGS | | | 3,600 | | | | 5,707 | | | | | |
| | | | 918 | | GOLUB CAPITAL BDC INC COM | | | - | | | | 13,898 | | | | | |
| | | | 51 | | INTERNCONTINENTAL EXCHANGE COM | | | 3,817 | | | | 7,949 | | | | | |
| | | | 52 | | MORGAN STANLEY COM NEW | | | 2,956 | | | | 6,045 | | | | | |
| | | | 2,895 | | THE CHARLES SCHWAB CORPORATION | | | 195,542 | | | | 205,053 | | | | | |
| | | | | | | | | 335,568 | | | | 523,922 | | | | 1.30 | % |
| | | | | | | | | | | | | | | | | | |
| Insurance | | | 79 | | AON PLC SHS CL A | | | 6,409 | | | | 28,983 | | | | | |
| | | | 263 | | OLD REP INTL CORP COM | | | 4,433 | | | | 9,187 | | | | | |
| | | | 129 | | TRAVELERS COMPANIES COM | | | 10,711 | | | | 31,726 | | | | | |
| | | | 526 | | ZURICH INS GROUP LTD SPONS ARD | | | 6,984 | | | | 15,536 | | | | | |
| | | | | | | | | 28,537 | | | | 85,432 | | | | 0.21 | % |
| | | | | | | | | | | | | | | | | | |
| TOTAL FINANCIALS | | | | | | | | 370,508 | | | | 620,353 | | | | 1.54 | % |
| BMC FUND, INC. |
| SCHEDULE OF INVESTMENTS (Continued) |
| October 31, 2024 |
| | | | | | | | | | | | | Percent | |
| Sectors and | | Shares | | | | | | | Market | | | of Net | |
| Industries | | Held | | Company Name | | Cost | | | Value | | | Assets | |
| | | | | | | | | | | | | | |
| COMMON STOCKS: | | | | | | | | | | | | | | | | | |
| | | | | | | | | | | | | | | | | | |
| HEALTH CARE | | | | | | | | | | | | | | | | | |
| Health Care Equipment & Services | | | 18,497 | | BAXTER INTL INC COM | | $ | 695,100 | | | $ | 660,343 | | | | | |
| | | | 157 | 3 | DAVITA HEALTHCARE PART COM | | | 12,098 | | | | 21,950 | | | | | |
| | | | 23,401 | | FRESENIUS MED CARE AG SPONSORED ADR | | | 457,217 | | | | 457,255 | | | | | |
| | | | 365 | 3 | HOLOGIC INC COM | | | 18,730 | | | | 29,518 | | | | | |
| | | | 48 | | LABORATORY CORP AMER HLDGS | | | 5,942 | | | | 10,957 | | | | | |
| | | | 331 | | MCKESSON CORP COM | | | 143,213 | | | | 165,695 | | | | | |
| | | | 206 | | QUEST DIAGNOSTICS INC COM | | | 24,052 | | | | 31,895 | | | | | |
| | | | 24 | | STRYKER CORP | | | 4,486 | | | | 8,551 | | | | | |
| | | | | | | | | 1,360,838 | | | | 1,386,164 | | | | 3.43 | % |
| | | | | | | | | | | | | | | | | | |
| Pharmaceuticals & Biotechnology | | | 180 | | ABBVIE INC | | | 14,611 | | | | 36,697 | | | | | |
| | | | 524 | | ASTRAZENECA PLC SPONSORED | | | 13,125 | | | | 37,283 | | | | | |
| | | | 79 | | BRISTOL MYERS SQUIBB CO CO | | | 4,564 | | | | 4,406 | | | | | |
| | | | 135 | | ELI LILLY & CO COM | | | 5,947 | | | | 112,015 | | | | | |
| | | | 48 | 3 | FORTREA HOLDINGS INC. | | | 980 | | | | 807 | | | | | |
| | | | 20 | 3 | IQVIA HOLDINGS INC COM | | | 1,982 | | | | 4,116 | | | | | |
| | | | 79 | | MERCK & CO INC COM | | | 5,654 | | | | 8,083 | | | | | |
| | | | 200 | | PFIZER INC COM | | | 7,864 | | | | 5,660 | | | | | |
| | | | | | | | | 54,727 | | | | 209,067 | | | | 0.52 | % |
| | | | | | | | | | | | | | | | | | |
| TOTAL HEALTH CARE | | | | | | | | 1,415,565 | | | | 1,595,231 | | | | 3.95 | % |
| | | | | | | | | | | | | | | | | | |
| INDUSTRIALS | | | | | | | | | | | | | | | | | |
| Capital Goods | | | 208 | | ABB LTD SPONSORED ADR | | | 5,057 | | | | 11,522 | | | | | |
| | | | | | | | | 5,057 | | | | 11,522 | | | | 0.03 | % |
| | | | | | | | | | | | | | | | | | |
| Commercial Services & Supplies | | | 12,000 | | RENTOKIL INITIAL PLC | | | 346,288.00 | | | | 304,200.00 | | | | | |
| | | | 24 | | WASTE MGMT INC DEL COM | | | 836 | | | | 5,180 | | | | | |
| | | | | | | | | 347,124 | | | | 309,380 | | | | 0.77 | % |
| | | | | | | | | | | | | | | | | | |
| Transportation | | | 313 | | FORTRESS TRANS INFRST COM | | | 4,997 | | | | 42,080 | | | | | |
| | | | 313 | | FTAI INFRASTRUCTURE INC. | | | - | | | | 2,526 | | | | | |
| | | | | | | | | 4,997 | | | | 44,606 | | | | 0.11 | % |
| | | | | | | | | | | | | | | | | | |
| TOTAL INDUSTRIALS | | | | | | | | 357,178 | | | | 365,508 | | | | 0.91 | % |
| BMC FUND, INC. |
| SCHEDULE OF INVESTMENTS (Continued) |
| October 31, 2024 |
| | | | | | | | | | | | | Percent | |
| Sectors and | | Shares | | | | | | | Market | | | of Net | |
| Industries | | Held | | Company Name | | Cost | | | Value | | | Assets | |
| | | | | | | | | | | | | | |
| COMMON STOCKS: | | | | | | | | | | | | | | | | | |
| INFORMATION TECHNOLOGY | | | | | | | | | | | | | | | | | |
| | | | | | | | | | | | | | | | | | |
| Hardware & Equipment | | | 535 | | CISCO SYSTEMS INC | | $ | 20,733 | | | $ | 29,302 | | | | | |
| | | | 498 | | CORNING INC COM | | | 10,201 | | | | 23,700 | | | | | |
| | | | | | | | | 30,934 | | | | 53,002 | | | | 0.13 | % |
| | | | | | | | | | | | | | | | | | |
| Software & Services | | | 2,000 | | EVOLUTION AB ADR | | | 198,382.00 | | | | 187,850.00 | | | | | |
| | | | 61 | | MICROSOFT CORP COM | | | 8,924 | | | | 24,787 | | | | | |
| | | | 1,750 | 3 | NICE, LTD | | | 304,442 | | | | 303,975 | | | | | |
| | | | 238 | | ORACLE CORP COM | | | 15,727 | | | | 39,946 | | | | | |
| | | | | | | | | 527,475 | | | | 556,558 | | | | 1.38 | % |
| | | | | | | | | | | | | | | | | | |
| Technology Hardware & Equipment | | | 629 | | APPLE INC COM | | | 44,179 | | | | 142,097 | | | | | |
| | | | 2,470 | | INTEL CORP COM | | | 101,920 | | | | 53,154 | | | | | |
| | | | 102 | | NETAPP INC COM | | | 5,350 | | | | 11,762 | | | | | |
| | | | 140 | | SEAGATE TECHNOLOGY SHS | | | 5,333 | | | | 14,052 | | | | | |
| | | | | | | | | 156,782 | | | | 221,065 | | | | 0.55 | % |
| | | | | | | | | | | | | | | | | | |
| Technology | | | 2,934 | 3 | FISERV INC COM | | | 342,866 | | | | 580,639 | | | | | |
| | | | 5,505 | | FIDELITY NATIONAL INFORMATION SERVICES | | | 333,442 | | | | 493,964 | | | | | |
| | | | | | | | | 676,308 | | | | 1,074,603 | | | | 2.66 | % |
| | | | | | | | | | | | | | | | | | |
| TOTAL INFORMATION TECHNOLOGY | | | | | | | | 1,391,499 | | | | 1,905,228 | | | | 4.72 | % |
| | | | | | | | | | | | | | | | | | |
| MATERIALS | | | 23,767 | 3 | AVANTOR, INC. | | | 490,490.00 | | | | 531,668.00 | | | | | |
| | | | 500 | | BHP GROUP LIMITED | | | 27,434 | | | | 27,730 | | | | | |
| | | | 158 | | CHEMOURS CO COM | | | 2,551 | | | | 2,869 | | | | | |
| | | | 400 | | CVR PARTNERS, LP | | | 50,841 | | | | 26,472 | | | | | |
| | | | 104 | | DOW CHEM CO COM | | | 5,163 | | | | 5,136 | | | | | |
| | | | 20 | | MITSUI & CO LTD SPONSORED | | | 3,643 | | | | 8,303 | | | | | |
| | | | 500 | | RIO TINTO GROUP | | | 30,368 | | | | 32,445 | | | | | |
| | | | 600 | | SOCIEDAD QUIMICA MINER SPON ADR | | | 49,514 | | | | 23,034 | | | | | |
| TOTAL MATERIALS | | | | | | | | 660,004 | | | | 657,657 | | | | 1.63 | % |
| BMC FUND, INC. |
| SCHEDULE OF INVESTMENTS (Continued) |
| October 31, 2024 |
| | | | | | | | | | | | | Percent | |
| Sectors and | | Shares | | | | | | | Market | | | of Net | |
| Industries | | Held | | Company Name | | Cost | | | Value | | | Assets | |
| | | | | | | | | | | | | | |
| COMMON STOCKS: | | | | | | | | | | | | | | | | | |
| REAL ESTATE | | | | | | | | | | | | | | | | | |
| Real Estate | | | 101 | | DIGITAL RLTY TR INC COM | | $ | 11,872 | | | $ | 18,001 | | | | | |
| | | | 630 | | EASTERLY GOVT PPTYS COM | | | 12,410 | | | | 8,543 | | | | | |
| | | | 524 | | HANNON ARMSTRONG SUST COM | | | 8,023 | | | | 18,335 | | | | | |
| | | | 840 | | IRON MTN INC NEW COM | | | 34,076 | | | | 103,933 | | | | | |
| | | | 789 | | MEDICAL PPTYS TR INC COM | | | 10,742 | | | | 3,653 | | | | | |
| | | | 1 | 3 | NET LEASE OFFICE PROPERTIES | | | - | | | | 30 | | | | | |
| | | | 104 | | OMEGA HEALTHCARE INVS COM | | | 3,026 | | | | 4,417 | | | | | |
| | | | 22 | | W P CAREY & CO LLC COM | | | 1,405 | | | | 1,226 | | | | | |
| | | | | | | | | 81,554 | | | | 158,138 | | | | 0.39 | % |
| | | | | | | | | | | | | | | | | | |
| TOTAL REAL ESTATE | | | | | | | | 81,554 | | | | 158,138 | | | | 0.39 | % |
| | | | | | | | | | | | | | | | | | |
| UTILITIES | | | 100 | | AMERICAN STS WTR CO COM | | | 8,027 | | | | 8,246 | | | | | |
| | | | 339 | | DOMINION RES INC VA COM | | | 17,456 | | | | 20,181 | | | | | |
| | | | 174 | | DUKE ENERGY CORP COM | | | 15,663 | | | | 20,057 | | | | | |
| | | | 51 | | ENTERGY CORP NEW COM | | | 3,539 | | | | 7,894 | | | | | |
| | | | 180 | | NEXTERA ENERGY INC COM | | | 13,503 | | | | 14,265 | | | | | |
| | | | 262 | | SOUTHERN CO COM | | | 11,431 | | | | 23,850 | | | | | |
| | | | 116 | | WEC ENERGY GROUP INC COM | | | 4,622 | | | | 11,081 | | | | | |
| TOTAL UTILITIES | | | | | | | | 74,241 | | | | 105,574 | | | | 0.26 | % |
| | | | | | | | | | | | | | | | | | |
| RIGHTS ATTACHED TO COMMON STOCKS | | | | | | | | | | | | | | | | | |
| | | | 725 | 3 | OCCIDENTAL PETROLEUM CORP COM | | | - | | | | 20,626 | | | | | |
| | | | | | | | | - | | | | 20,626 | | | | 0.05 | % |
| | | | | | | | | | | | | | | | | | |
| TOTAL INVESTMENTS IN COMMON STOCKS | | | | | | | $ | 7,299,950 | | | $ | 8,835,164 | | | | 21.89 | % |
See accompanying notes to financial statements.
| BMC FUND, INC. |
| SCHEDULE OF INVESTMENTS (Continued) |
| October 31, 2024 |
| | | | | | | Coupon | | | | | | | | | | | | | | | Percent | |
| | | | | | | Interest | | | Maturity | | | Shares | | | | | | Market | | | of Net | |
| Company Name | | | | | | Rate | | | Date | | | Held | | | Cost | | | Value | | | Assets | |
| | | | | | | | | | | | | | | | | | | | | | | |
| PREFERRED STOCKS: | | | | | | | | | | | | | | | | | | | | | | | | | | |
| COMPASS DIV HOLDINGS FIXED FLTG RAT CUM PFD | | | 4, 5 | | | | 7.875 | % | | N/A | | | | 4,000 | | | $ | 93,349 | | | $ | 97,880 | | | | |
| | | | | | | | | | | | | | | | | | | | | | | | | | | |
| TOTAL INVESTMENTS IN PREFERRED STOCKS | | | | | | | | | | | | | | | | | $ | 93,349 | | | $ | 97,880 | | | 0.24 | % |
See accompanying notes to financial statements.
| BMC FUND, INC. |
| SCHEDULE OF INVESTMENTS (Concluded) |
| October 31, 2024 |
| | | | | | | | Market | | | Percent of | |
| | | Company Name | | Cost | | | Value | | | Net Assets | |
| | | | | | | | | | | | |
| Short-term Investments | | MFB NI Treasury Money Market Fund | | $ | 5,011,015 | | | $ | 5,011,015 | | | | 12.41 | % |
| | | | | | | | | | | | | | | |
| TOTAL INVESTMENTS - MARKET VALUE | | | | | 29,500,261 | | | | 40,357,029 | | | | 99.97 | % |
| | | | | | | | | | | | | | | |
| TOTAL OTHER ASSETS IN EXCESS OF LIABILITIES | | | | | | | | | 13,656 | | | | 0.03 | % |
| | | | | | | | | | | | | | | |
| TOTAL NET ASSETS | | | | | | | | $ | 40,370,685 | | | | 100.00 | % |
1In default
2Market value ratified by the Company's Board of Directors per policy.
3Non-income producing security
4Perpetual security. Maturity date is not applicable.
5Variable rate security. The rate shown is the coupon as of the end of the reporting period.
6Affiliate Investment
7Unfunded Commitment of $250,000
8Unfunded Commitment of $268,471
See accompanying notes to financial statements.
BMC FUND, INC.
STATEMENT OF ASSETS AND LIABILITIES
October 31, 2024
| ASSETS | | | |
| Affiliated Investment security (cost - $733,155) | | $ | 939,348 | |
| Unaffiliated Investment securities (cost - $28,767,106) | | | 39,417,681 | |
| Cash | | | 110,509 | |
| Receivables, accrued interest and dividends | | | 73,955 | |
| Other assets | | | 1,863 | |
| | | | | |
| Total assets | | | 40,543,356 | |
| | | | | |
| LIABILITIES: | | | | |
| Accounts payable and accrued expenses | | | 89,111 | |
| Accounts payable to affiliates | | | 83,560 | |
| | | | | |
| Total liabilities | | | 172,671 | |
| | | | | |
| NET ASSETS AT OCTOBER 31, 2024 - EQUIVALENT TO $21.37 PER SHARE ON 1,888,788 SHARES OF COMMON STOCK OUTSTANDING | | $ | 40,370,685 | |
| | | | | |
| SUMMARY OF SHAREHOLDERS' EQUITY: | | | | |
| Common stock, par value $5.00 per share - authorized 70,000,000 shares; outstanding, 1,888,788 shares | | $ | 9,443,940 | |
| Additional paid in capital | | | 25,005,766 | |
| Total disributable earnings (loss) | | | 5,920,979 | |
| | | | | |
| NET ASSETS APPLICABLE TO COMMON STOCK OUTSTANDING | | $ | 40,370,685 | |
See accompanying notes to financial statements.
BMC FUND, INC.
STATEMENT OF OPERATIONS
Year Ended October 31, 2024
| INVESTMENT INCOME: | | | |
| Income: | | | |
| Interest - fixed income | | $ | 327,929 | |
| Dividend income (net of $9,631 foreign tax) | | | 502,790 | |
| | | | | |
| Total income | | | 830,719 | |
| | | | | |
| Expenses: | | | | |
| Legal and professional fees | | | 5,272 | |
| Audit fees | | | 141,032 | |
| Directors' fees (Note 6) | | | 14,000 | |
| Investment expense | | | 93,062 | |
| Investment advisor's fees (Note 7) | | | 258,664 | |
| Salaries and related expenses (Note 7) | | | 154,748 | |
| Other related party expenses (Note 7) | | | 74,871 | |
| Other expense | | | 18,789 | |
| | | | | |
| Total expenses | | | 760,438 | |
| | | | | |
| Net investment income (loss) | | | 70,281 | |
| | | | | |
| REALIZED AND UNREALIZED GAIN (LOSS) ON INVESTMENTS: | | | | |
| Realized gain from unaffiliated investments sold | | | 2,216,152 | |
| | | | | |
| Change in unrealized appreciation of affiliated investments | | | 60,427 | |
| Change in unrealized appreciation of unaffiliated investments | | | 1,907,129 | |
| Total change in unrealized appreciation of investments | | | 1,967,556 | |
| | | | | |
| Net realized and unrealized gain (loss) | | | 4,183,708 | |
| | | | | |
| NET INCREASE IN NET ASSETS RESULTING FROM OPERATIONS | | $ | 4,253,989 | |
See accompanying notes to financial statements.
BMC FUND, INC.
STATEMENTS OF CHANGES IN NET ASSETS
Years Ended October 31, 2024 and 2023
| | | 2024 | | | 2023 | |
| INCREASE (DECREASE) IN NET ASSETS FROM OPERATIONS: | | | | | | | | |
| Net investment income (loss) | | $ | 70,281 | | | $ | 103,038 | |
| Net realized gains from unaffiliated investment securities sold, | | | 2,216,152 | | | | 1,628,061 | |
| Change in unrealized appreciation of affiliated investments | | | 60,427 | | | | 51,672 | |
| Change in unrealized appreciation of unaffiliated investments | | | 1,907,129 | | | | 331,463 | |
| | | | | | | | | |
| Net increase (decrease) in net assets resulting from operations | | | 4,253,989 | | | | 2,114,234 | |
| | | | | | | | | |
| Distributions to shareholders from: | | | | | | | | |
| Distributable earnings | | | (1,511,030 | ) | | | (1,133,274 | ) |
| Return of capital | | | - | | | | (3,519,978 | ) |
| | | | | | | | | |
| TOTAL INCREASE (DECREASE) IN NET ASSETS | | | 2,742,959 | | | | (2,539,018 | ) |
| | | | | | | | | |
| NET ASSETS AT BEGINNING OF PERIOD | | | 37,627,726 | | | | 40,166,744 | |
| | | | | | | | | |
| NET ASSETS AT END OF PERIOD | | $ | 40,370,685 | | | $ | 37,627,726 | |
See accompanying notes to financial statements.
BMC FUND, INC.
STATEMENT OF CASH FLOWS
Year Ended October 31, 2024
| Cash flows from operating activities: | | | | |
| | | | | |
| Net increase in net assets from operations | | $ | 4,253,989 | |
| Realized (gains)/losses from investments sold | | | (2,216,152 | ) |
| Total change in unrealized (appreciation)/depreciation from affiliated and unaffilated investments | | | (1,967,556 | ) |
| (Increase)/decrease in short-term money market investments | | | (2,335,834 | ) |
| Purchases of investments securities | | | (5,209,592 | ) |
| Proceed from sales of investment securities | | | 7,028,492 | |
| Return of capital on securities | | | 1,551,509 | |
| Amortization of bond premiums | | | 401 | |
| Accretion of bond discounts | | | (80,752 | ) |
| Changes in assets and liabilities | | | | |
| (Increase)/Decrease in assets: | | | | |
| Receivables, accrued interest and dividends | | | 45,805 | |
| Other assets | | | 283 | |
| Increase/(Decrease) in liabilities: | | | | |
| Accounts payable to affiliates | | | 9,523 | |
| Accounts payable and accrued expenses | | | 80,999 | |
| Net cash provided by operating activities | | | 1,161,115 | |
| | | | | |
| Cash flows from financing activities: | | | | |
| Cash distributions paid | | | (1,511,030 | ) |
| Net cash used in financing activities | | | (1,511,030 | ) |
| | | | | |
| Net change in cash | | | (349,915 | ) |
| | | | | |
| Beginning cash as of October 31, 2023 | | | 460,424 | |
| | | | | |
| Ending cash as of October 31, 2024 | | $ | 110,509 | |
See accompanying notes to financial statements.
BMC FUND, INC.
FINANCIAL HIGHLIGHTS
Years Ended October 31, 2024, 2023, 2022, 2021, 2020, 20219, 20218, 2017, 2016 and 2015
The following table presents financial information divided into three parts: per share operating performance, total investment return and ratios and supplemental data for the years ended October 31, 2024, 2023, 2022, 2021, 2020, 2019, 2018, 2017, 2016 and 2015. The first part, per share operating performance, details the changes on a per share basis of the Company's beginning net asset value to its ending net asset value. The second part, total investment return, is based on the market price of the Company's shares of stock. Part three, ratios and supplemental data, provides additional financial information related to the Company's performance.
PER SHARE OPERATING
PERFORMANCE | | 2024 | | | 2023 | | | 2022 | | | 2021 | | | 2020 | | | 2019 | | | 2018 | | | 2017 | | | 2016 | | | 2015 | |
| Net asset value, beginning of period | | $ | 19.92 | | | $ | 21.27 | | | $ | 23.09 | | | $ | 19.84 | | | $ | 21.16 | | | $ | 20.77 | | | $ | 21.42 | | | $ | 20.83 | | | $ | 21.22 | | | $ | 22.62 | |
| Net investment income | | | 0.04 | | | | 0.05 | | | | (0.02 | ) | | | 0.04 | | | | 0.25 | | | | 0.34 | | | | 0.27 | | | | 0.27 | | | | 0.22 | | | | 0.35 | |
| Net gains (losses) on investments | | | 2.21 | | | | 1.06 | | | | (0.95 | ) | | | 4.21 | | | | (0.57 | ) | | | 1.05 | | | | 0.08 | | | | 1.32 | | | | 0.39 | | | | (0.73 | ) |
| Total from investment operations | | | 2.25 | | | | 1.11 | | | | (0.97 | ) | | | 4.25 | | | | (0.32 | ) | | | 1.39 | | | | 0.35 | | | | 1.59 | | | | 0.61 | | | | (0.38 | ) |
| Less distributions: | | | | | | | | | | | | | | | | | | | | | | | | | | | | | | | | | | | | | | | | |
| Dividends from net investment income | | | 0.02 | | | | - | | | | 0.05 | | | | 0.42 | | | | 0.05 | | | | 0.33 | | | | 0.32 | | | | 0.20 | | | | 0.23 | | | | 0.36 | |
| Distributions from capital gains | | | 0.71 | | | | 0.60 | | | | - | | | | 0.14 | | | | 0.28 | | | | 0.08 | | | | 0.37 | | | | 0.35 | | | | - | | | | 0.44 | |
| Distributions from return of capital | | | 0.07 | | | | 1.86 | | | | 0.80 | | | | 0.44 | | | | 0.67 | | | | 0.59 | | | | 0.31 | | | | 0.45 | | | | 0.77 | | | | 0.22 | |
| Total distributions | | | 0.80 | | | | 2.46 | | | | 0.85 | | | | 1.00 | | | | 1.00 | | | | 1.00 | | | | 1.00 | | | | 1.00 | | | | 1.00 | | | | 1.02 | |
| Net asset value, end of period | | $ | 21.37 | | | $ | 19.92 | | | $ | 21.27 | | | $ | 23.09 | | | $ | 19.84 | | | $ | 21.16 | | | $ | 20.77 | | | $ | 21.42 | | | $ | 20.83 | | | $ | 21.22 | |
| | | | | | | | | | | | | | | | | | | | | | | | | | | | | | | | | | | | | | | | | |
| Per share market value, end of period1 | | $ | 21.31 | | | $ | 20.13 | | | $ | 21.27 | | | $ | 22.79 | | | $ | 18.00 | | | $ | 18.00 | | | $ | 18.00 | | | $ | 18.00 | | | $ | 18.00 | | | $ | 18.00 | |
| | | | | | | | | | | | | | | | | | | | | | | | | | | | | | | | | | | | | | | | | |
| TOTAL INVESTMENT RETURN | | | 11.31 | % | | | 5.22 | % | | | -4.21 | % | | | 21.45 | % | | | -1.52 | % | | | 6.69 | % | | | 1.63 | % | | | 7.63 | % | | | 2.87 | % | | | -1.68 | % |
| | | | | | | | | | | | | | | | | | | | | | | | | | | | | | | | | | | | | | | | | |
| RATIOS/SUPPLEMENTAL DATA | | | | | | | | | | | | | | | | | | | | | | | | | | | | | | | | | | | | | | | | |
| | | | | | | | | | | | | | | | | | | | | | | | | | | | | | | | | | | | | | | | | |
| Net assets, end of period (in thousands) | | $ | 40,371 | | | $ | 37,628 | | | $ | 40,167 | | | $ | 43,609 | | | $ | 97,875 | | | $ | 104,397 | | | $ | 102,458 | | | $ | 105,657 | | | $ | 102,751 | | | $ | 104,684 | |
| Ratio of expenses to average net assets2 | | | 1.93 | % | | | 1.88 | % | | | 2.17 | % | | | 1.86 | % | | | 1.12 | % | | | 1.06 | % | | | 1.01 | % | | | 1.03 | % | | | 1.07 | % | | | 0.98 | % |
| Ratio of net investment income to average net assets3 | | | 0.18 | % | | | 0.27 | % | | | (0.12 | )% | | | 0.17 | % | | | 1.21 | % | | | 1.64 | % | | | 1.28 | % | | | 1.26 | % | | | 1.06 | % | | | 1.59 | % |
| Portfolio turnover rate | | | 13.97 | % | | | 22.38 | % | | | 17.88 | % | | | 9.79 | % | | | 20.22 | % | | | 12.94 | % | | | 14.18 | % | | | 24.07 | % | | | 15.09 | % | | | 17.10 | % |
1 Based on net asseet value for which transactions may have been sold in a private transaction recent sales. Prior years based on stock trades, which are very limited, during those years. Ratios do not reflect the Fund's proportionate share of income, expenses and incentive allocations of the underlying limited partnership investments.
2 Average is computed on a quarterly basis. The per share data is calculated using average outstanding shares.
3 Average is computed on a quarterly basis.
See accompanying notes to financial statements.
BMC FUND, INC.
NOTES TO FINANCIAL STATEMENTS
Year Ended October 31, 2023
BMC Fund, Inc. (the “Company”) is a closed-end, diversified investment company registered under the Investment Company Act of 1940, as amended. Prior to becoming a regulated investment company on April 1, 1981, BMC Fund, Inc. operated as a regular corporation. The following is a summary of significant accounting policies followed by the Company in the preparation of its financial statements.
Under the Company’s organizational documents, its officers and Board of Directors (“Board”) are indemnified against certain liabilities arising out of the performance of their duties to the fund. In addition, in the normal course of business, the Company may enter into contracts with vendors and others that provide for general indemnifications. The Company’s maximum exposure under these arrangements is unknown, as this would involve future claims that may be made against the Company. However, based on experience, the fund expects that risk of loss to be remote.
| 2. | SIGNIFICANT ACCOUNTING POLICIES |
A. Basis of Presentation - The financial statements have been prepared in conformity with accounting principles generally accepted in the United States of America (“GAAP”) as detailed in the Financial Accounting Standards Board’s (“FASB”) Accounting Standards Codification (“ASC”). The Company also follows the accounting and reporting guidance applicable to investment companies in ASC Topic 946, Financial Services – Investment Companies.
B. Investment Valuations – The investment securities and valuation of fixed income and mutual funds are stated at fair value as determined by closing prices on national securities exchanges or based on inputs other than quoted prices on national securities exchanges. Investment securities include corporate bonds, mutual funds, and common and preferred stocks.
Pursuant to rule 2a-5 under the 1940 Act, the Board has designated the Fund’s investment adviser Broyhill Asset Management (“BAM” or the “Adviser”), as the valuation designee with respect to the fair valuation of the fund’s portfolio securities, subject to oversight by and periodic reporting to the Board. Fair valued securities are those for which market quotations are not readily available, including circumstances under which the Adviser determines that prices received are not reflective of their market values.
The investments in limited partnerships, other investments and venture capital are stated at estimated fair value as determined by the management of these investments and are approved by the Company’s Valuation Committee after giving consideration to historical and projected financial results, economic conditions, financial condition of investee and other factors and events subject to change, and ratified by the Company’s Board of Directors. Because of the inherent uncertainty of those valuations, the estimated values may differ significantly from the values that would have been used had a ready market value for the investments existed, and these differences could be material.
BMC FUND, INC.
NOTES TO FINANCIAL STATEMENTS
Year Ended October 31, 2023
| 2. | SIGNIFICANT ACCOUNTING POLICIES (Continued) |
Pursuant to ASC Topic 820, Fair Value Measurement, the Fund may elect to use net asset value per share or its equivalent (“NAV”) as a practical expedient to measure the Company’s interest in Limited Partnerships at fair value, unless it is probable that the investment will be sold at a value different from its NAV. However, in order for the Company to use this methodology, the investment company must calculate NAV in a manner consistent with the measurement principles established by ASC Topic 820. The Company is using the practical expedient.
C. Investment Transactions – Investment transactions are accounted for on the date the order to buy or sell is executed. Realized gains and losses on investments are determined on the basis of specific identification of issues sold or matured. Dividend income is recorded on the ex-dividend date and interest income is recorded on the accrual basis. Discounts and premiums on securities purchased are amortized over the lives of the respective securities using the effective interest method. Realized gains and losses on foreign currency transactions are included with realized gains and losses on investments.
For the year ended October 31, 2024, the Company purchased and sold securities in the amount of $5,209,592 and $7,028,492, respectively.
D. Option Writing – When the Company writes an option, an amount equal to the premium received by the Company is recorded as a liability and is subsequently adjusted to the current fair value of the option written. Premiums received from writing options that expire unexercised are treated by the Company on the expiration date as realized gains from investments. No options were written in current year. The difference between the premium and the amount paid on effecting a closing purchase transaction, including brokerage commissions, is also treated as a realized gain, or, if the premium is less than the amount paid for the closing purchase transaction, as a realized loss. If a call option is exercised, the premium is added to the proceeds from the sale of the underlying security in determining whether the Company has realized a gain or loss. If a put option is exercised, the premium reduces the cost basis of the securities purchased by the Company. The Company as writer of an option bears the market risk of an unfavorable change in the price of the security underlying the written option.
E. Income Taxes – No federal tax provision is required as it is the Company’s policy to comply with the provisions of Subchapter M of the Internal Revenue Code of 1954, as amended, including the distribution to its shareholders of substantially all of its income and any capital gains not offset by capital losses. Also, no state income tax provision has been provided because the states in which the Company has income recognize the tax exempt status of a regulated investment company.
The Company did not have an accrual for uncertain tax positions as deductions taken and benefits accrued are based on widely understood administrative practices and procedures, and are based on clear and unambiguous tax law. Tax returns for all years 2021 and thereafter are subject to possible future examinations by tax authorities.
F. Dividend Policy – It is the Company’s policy to pay quarterly distributions during the year in sufficient amounts to meet the requirements to maintain its status as a regulated investment company.
BMC FUND, INC.
NOTES TO FINANCIAL STATEMENTS
Year Ended October 31, 2023
| 2. | SIGNIFICANT ACCOUNTING POLICIES (Continued) |
G. Cash and Short-Term Investments – For purposes of financial reporting, the Company considers all investments at financial institutions with original maturities of three months or less to be equivalent to cash. Short-term money market investments managed by third party investors are included in investment securities.
H. Use of Estimates – The preparation of financial statements in conformity with GAAP requires management to make estimates and assumptions that affect the reported amounts of assets and liabilities and disclosure of contingent assets and liabilities at the date of the financial statements and the reported amounts of revenues and expenses during the reporting period. Actual results could differ from those estimates.
I. Fair Value Measurements – Fair value is defined as the price that would be received to sell an asset or paid to transfer a liability (i.e., the "exit price") in an orderly transaction between market participants at the measurement date.
In determining fair value, the Company uses various valuation techniques. A fair value hierarchy for inputs is used in measuring fair value that maximizes the use of observable inputs and minimizes the use of unobservable inputs by requiring that the most observable inputs are to be used when available. Valuation techniques that are consistent with the market or income approach are used to measure fair value. The fair value hierarchy is categorized into three levels based on the inputs as follows:
Level 1 - Valuations based on unadjusted quoted prices in active markets for identical assets or liabilities that the Company has the ability to access.
Level 2 - Valuations based on inputs, other than quoted prices included in Level 1, that are observable either directly or indirectly.
Level 3 - Valuations based on inputs that are unobservable and significant to the overall fair value measurement.
Fair value is a market-based measure, based on assumptions of prices and inputs considered from the perspective of a market participant that are current as of the measurement date, rather than an entity-specific measure. Therefore, even when market assumptions are not readily available, the Company's own assumptions are set to reflect those that market participants would use in pricing the asset or liability at the measurement date.
The availability of valuation techniques and observable inputs can vary from investment to investment and are affected by a wide variety of factors, including the type of investment, whether the investment is new and not yet established in the marketplace, the liquidity of markets, and other characteristics particular to the transaction. To the extent that valuation is based on models or inputs that are less observable or unobservable in the market, the determination of fair value requires more judgment. Because of the inherent uncertainty of valuation, those estimated values may be materially higher or lower than the values that would have been used had a ready market for the investments existed. Accordingly, the degree of judgment exercised by the Company in determining fair value is greatest for investments categorized in Level 3. In certain cases, the inputs used to measure fair value may fall into different levels of the fair value hierarchy. In such cases, the level in the fair value hierarchy which the fair value measurement falls in its entirety is determined based on the lowest level input that is significant to the fair value measurement.
BMC FUND, INC.
NOTES TO FINANCIAL STATEMENTS
Year Ended October 31, 2023
| 2. | SIGNIFICANT ACCOUNTING POLICIES (Continued) |
The inputs or methodology used for valuing securities are not necessarily an indication of the risk associated with investing in those securities.
The following table summarizes fair value information for assets and liabilities measured on a recurring basis as of October 31, 2024.
| Asset Description | | Quoted Prices
in Active
Markets for
Identical Assets
(Level 1) | | | Significant
Other
Observable
Inputs
(Level 2) | | | Significant
Unobservable
Inputs
(Level 3) | | | Total | |
| Fixed Income | | $ | 2,820,143 | | | $ | - | | | $ | - | | | $ | 2,820,143 | (1) |
| Mutual Funds | | | 1,613,218 | | | | - | | | | - | | | | 1,613,218 | |
| Common Stocks – Publicly Traded | | | 8,835,164 | | | | - | | | | - | | | | 8,835,164 | |
| Preferred Stocks – Publicly Traded | | | 97,880 | | | | - | | | | - | | | | 97,880 | |
| Short-term Investments | | | 5,011,015 | | | | - | | | | - | | | | 5,011,015 | |
| Limited Partnerships – Measured at NAV (2) | | | - | | | | - | | | | - | | | | 21,979,609 | |
| Total Investments | | $ | 18,377,420 | | | $ | | | | $ | - | | | $ | 40,357,029 | |
(1) There are fixed income securities valued at $0.
(2) Certain investments measured at fair value using the net asset value per share (or its equivalent) as a practical expedient and have not been categorized in the fair value hierarchy. The fair value amounts presented in these tables are intended to permit reconciliation of the fair value hierarchy to the amounts presented in the Schedule of Investments.
BMC FUND, INC.
NOTES TO FINANCIAL STATEMENTS
Year Ended October 31, 2023
| 2. | SIGNIFICANT ACCOUNTING POLICIES (Continued) |
J. Investments in Limited Partnerships - As of October 31, 2024, the Company was invested in limited partnerships. Each of these investments has certain restrictions with respect to rights of withdrawal by the Company as specified in the respective agreements. Generally, the Company is required to provide notice of its intent to withdraw after the investment has been maintained for a certain period of time. The management agreements of the limited partnerships provide for compensation to the managers in the form of fees ranging from 0.5% to 2% annually of net assets and performance incentive allowances or fees ranging from 10% to 20% of net profits earned.
The following table summarizes the Company's investments in other limited partnerships as of October 31, 2024. The Company's investments in limited partnerships have certain redemption and liquidity restrictions which are described in the below table.
Investment
Limited Partnerships | | Redemptions
Notice Period | | Redemptions
Permitted | | Investment
Strategy |
| BAM Credit Opportunities Fund (7) | | N/A | | N/A | | Credit Fund of Funds |
| Elliott Associates, L.P. (1) (2) | | 60 days | | Jan. 1 or July 1 | | Multi-Strategy |
| Graham Institutional Partners, L.P. (3) | | 60 days | | Annually | | Long/Short Technology |
| Greenlight Masters Qualified, L.P. (4) | | 105 days | | December 31 | | Equity Fund of Funds |
| Infinity Premier Fund, L.P. (5) (6) | | 95 days | | Quarterly | | Fund of Funds |
| Mudrick Distressed Opportunity Drawdown Fund II, L.P. (5) (6) | | 90 days | | Quarterly | | Distressed Credit |
| Oaktree Enhanced Income Fund II, L.P. (7) (10) | | N/A | | N/A | | Credit |
| Old Well Emerging Markets Fund, L.P. (8) (10) | | 60 days | | Quarterly | | Emerging Market Equities |
| Old Well Special Opportunities Fund II, LLC (7) (10) | | N/A | | N/A | | Private Equity |
| Segra Resource Onshore Partners, L.P. (9) | | 60 days | | Quarterly | | Commodities |
| SJC Onshore Direct Lending Fund IV–5 Year, L.P. (7) | | N/A | | N/A | | Direct Credit |
| | | | | | | |
(1) There is a gate provision if requests for redemptions would cause a decline in aggregate net asset value of 20%. In addition to the 20% withdrawal limitation, a partner may not withdraw more than 25% of the capital in its Class B capital account on any withdrawal date.
(2) There is a capital surcharge of 1 3/4% for a partial or full withdrawal which may be waived in whole or in part.
(3) Minimum withdrawal of $500,000 or for all of limited partner’s interest in the partnership, if less. A limited partner may not take a partial withdrawal if it would cause the partnership’s aggregate net asset value to be less than $5,000,000. General partner may permit a smaller withdrawal or waive the latter requirement.
(4) There is a gate provision regarding requests for redemptions, subject to various unspecified terms.
(5) Withdrawals of capital contributed less than 12 months preceding the withdrawal date will be subject to a reduction equal to 3% of the requested withdrawal amount.
(6) There is a gate provision if aggregate requested withdrawal amounts exceed 25% of the aggregate partner capital of the partnership, each limited partner who has submitted a timely request will receive a pro rata portion of the requested withdrawal, and any balance will be considered a timely withdrawal request with respect to the next withdrawal date.
(7) Redemptions are not permitted.
(8) Withdrawals of capital contributions may be up to 1/4 of the balance of partner’s capital account.
(9) There is a gate provision regarding requests for more than 25% of its capital account.
(10) In liquidation.
BMC FUND, INC.
NOTES TO FINANCIAL STATEMENTS
Year Ended October 31, 2023
| 2. | SIGNIFICANT ACCOUNTING POLICIES (Continued) |
The Company is subject to credit risk to the extent that the investment managers of the underlying limited partnerships are unable to fulfill their obligations according to their organizational documents. The Company, through its investments in limited partnerships, is subject to risk inherent when investing in securities and private investments. In connection with its investments, the Company is subject to the market and credit risk of those investments held or sold short by the limited partnerships. Due to the nature of the Company's investments, the above described risks are limited to the Company's investment balances and unfunded commitment of $268,471 to the limited partnership of SJC Onshore Direct Lending Fund and $250,000 to the BAM Credit Opportunities Fund.
The Company is allocating operating expenses, including salaries and office rent on shared space with an affiliate, based on a reasonable basis of what is necessary to support the Company. See note 7 for further information.
| 3. | UNREALIZED APPRECIATION AND DEPRECIATION ON INVESTMENTS |
(tax basis)
The amount of net unrealized appreciation (depreciation) and the cost of investment securities for tax purposes, including short-term securities as of October 31, 2024, were as follows:
| Gross appreciation (excess of value over tax cost) | | $ | 14,399,857 | |
| Gross depreciation (excess of tax cost over value) | | | (9,683,155 | ) |
| Net unrealized appreciation | | $ | 4,716,702 | |
| Cost of investments for income tax purposes | | $ | 35,640,327 | |
The differences between book-basis and tax-basis unrealized appreciation/(depreciation) is attributable to the tax treatment of partnership investments.
The Company had $0 cash pledged as collateral for options on October 31, 2024. No options were written in the current year.
| 5. | DISTRIBUTIONS TO SHAREHOLDERS |
Classifications of distributions, net investment income/(loss) and net realized gain/(loss) may differ for financial statement and tax purposes. The character of distributions made during the year from net investment income or net realized gains may differ from its ultimate characterization for federal income tax purposes. Also, due to the timing of dividend distributions, the fiscal year in which amounts are distributed may differ from the fiscal year in which the income or realized gain was recorded by the Company.
On December 10, 2023, a distribution of $0.20 per share was paid to shareholders of record on November 25, 2023.
BMC FUND, INC.
NOTES TO FINANCIAL STATEMENTS
Year Ended October 31, 2023
On March 10, 2024, a distribution of $0.20 per share was paid to shareholders of record on February 25, 2024.
On June 10, 2024, a distribution of $0.20 per share was paid to shareholders of record on May 25, 2024.
On September 10, 2024, a distribution of $0.20 per share was paid to shareholders of record on August 25, 2024.
The tax character of distributions paid during the fiscal years 2024 and 2023 was as follows:
| | | 2024 | | | 2023 | |
| Distributions paid from: | | | | | | | | |
| Ordinary income | | $ | 1,205,032 | | | $ | 784,318 | |
| Long-term capital gains | | | 305,998 | | | | - | |
| | | $ | 1,511,030 | | | $ | 784,318 | |
The tax components of distributable earnings are determined in accordance with income tax regulations, which may differ from composition of net assets reported under generally accepted accounting principles. During the current fiscal year, permanent differences primarily due to a prior year true-up and the tax treatment of partnership investments resulted in a net decrease in distributable earnings of $11,153,462 and a net increase in additional paid-in capital of $ 11,153,462. These reclassifications had no effect on the net assets. Capital loss carryforwards utilized during the year ended October 31, 2024 was $336,007. As of October 31, 2024, the components of distributable earnings/(deficit) on a tax basis were as follows:
| Undistributed ordinary income | | $ | 1,204,277 | |
| Unrealized capital gains | | | 4,716,702 | |
| Total accumulated earnings (deficit) | | $ | 5,920,979 | |
| 6. | ADVISORY BOARD AND REMUNERATION OF DIRECTORS |
The Company does not have an advisory board. The independent directors are paid an annual fee of $3,000 plus $1,000 for each meeting attended in person or $500 for each meeting attended by telephone. In addition, all directors are reimbursed for their reasonable expenses incurred in attending meetings.
BMC FUND, INC.
NOTES TO FINANCIAL STATEMENTS
Year Ended October 31, 2023
The Company leases office space from Broyhill Investments, Inc., which is controlled by M. Hunt Broyhill, who is an officer of the Company. The expense associated with this related party lease for the year ended October 31, 2024 amounted to $29,460 (included in the other related party expenses on the statement of operations) and the lease is for a 12 month period. Broyhill Investments, Inc. also acts as a common paymaster for payroll and other shared services. This service is provided at no cost to the Company. All amounts paid by Broyhill Investments, Inc. on behalf of the Company are reimbursed by the Company. Hunt Broyhill also has ownership in Broyhill Asset Management, LLC which serves as the financial advisor for BMC, Fund, Inc. The outstanding payable related to these transactions at October 31, 2024 was $83,560. The expense to Broyhill Asset Management (“BAM”), LLC for financial advisory services was $258,664 for the year ended October 31, 2024, as governed by an agreement with BAM .The advisory expenses is calculated at .65% of the net asset value at the beginning of each quarter of the fund. Broyhill Investments, Inc. charges the Company a percentage of payroll for employees who are responsible for the Company’s operations. Also, allocated back to the Company is a 3% safe harbor amount of Broyhill Investment, Inc.’s 401k plan which amounted to $4,182 (included in the salaries and related expenses on the statement of operations) for the year ended October 31, 2024, based on the company match.
The Company has committed investing $1,000,000 in the BAM Credit Opportunities Fund which is partly managed by M. Hunt Broyhill. This is the affiliated investment in the financial statements.
| | | Fair Value | | | Purchases | | | Net Change In
Unrealized | | | Fair Value | |
| | | 10/31/2023 | | | at Cost | | | Appreciation | | | 10/31/2024 | |
| BAM Credit Ops | | $ | 878,921 | | | | - | | | $ | 60,427 | | | $ | 939,348 | |
Selected securities at the end of the year have significant investment impairment issues. These selected securities have an aggregate cost basis of $3,454,699 and have been assigned no value at October 31, 2024.
There were no impairment charges during the year. The Company received $6,801 in proceeds related to the impaired securities during the twelve months ended October 31, 2024, which was recognized as realized gains in the Statement of Operations.
9. SUBSEQUENT EVENTS
In preparing these financial statements, management has evaluated events and transactions for potential recognition or disclosure through the date the financial statements were issued. Management has determined there are no subsequent events that would require disclosure in the Fund’s financial statements.
BMC FUND, INC.
DIRECTORS AND OFFICERS (Unaudited)
Year Ended October 31, 2024
The following table provides information about the directors and the officers of the Fund:
Directors Who Are Interested Persons
Name,
Address and Age | | Position(s)
Held
with Fund | | Term of Office
and
Length of
Time Served | | Principal Occupation(s) During Past
5 Years | | Other
Directorships Held
by Director
During at Least
the Past 5 Years |
| M. Hunt Broyhill (60) 1870 9th Street Court, NW Hickory, NC 28601 | | Director
Chairman
President
Vice President | | Since 2008
Since 2014
Since 2007
2001-2007 | | Chairman of the Fund since October 2022 and February 2014 till February 2021; President of the Fund since February 2007; former Vice President of the Fund (2001-2007); Chief Executive of Broyhill Asset Management, LLC (1997-present); Director and President of Broyhill Investments, Inc. (1988-present); Director (1983-present) and President of Broyhill Family Foundation, Inc. (1988-present); | | Capitala Finance Corp. (Feb. 2013- 2021), Flagship REIT (2018 – Present) |
Directors Who Are Not Interested Persons
Name,
Address and Age | | Position(s)
Held
with Fund | | Term of
Office and
Length of
Time Served | | Principal
Occupation(s)
During Past
5 Years | | Other
Directorships Held
by Director
During at Least
the Past 5 Years |
| David Stevens (64) 422 Huntington Woods St. Lenoir, NC 28645 | | Director | | Since 2023 | | President of Smith, Stevens, and Ford, CPA | | None |
| | | | | | | | | |
Mark E. Roberts (62) 511 Tarrytown Center
Rocky Mount, NC 27804 | | Director | | Since 2014 | | Chief Investment Officer of Ironsides Asset Advisors, LLC, a registered investment advisory firm (2009-present); Chief Investment Officer of Biltmore Family Offices, LLC (May 2013-January 2017); former Director of Global Equities and Hedges Strategies, State of North Carolina Retirement System (2003-2009) | | None |
BMC FUND, INC.
DIRECTORS AND OFFICERS (Unaudited)
Year Ended October 31, 2024
Other Executive Officers
Name,
Address and Age | | Positions
Held
with Fund | | Length of
Time
Served | | Principal
Occupation
During Past
5 Years | | Directorships Held
by Officer
During at Least
the Past 5 Years |
| Danny A. Gilbert (58) 603 Stonecroft Court SE Lenoir, NC 28645 | | Vice President and Chief Financial Officer | | Since 2018
Since 2020 | | Vice President (since February 2018) and Chief Financial Officer of the Fund since January 2020; Chief Compliance Officer of the Fund (June 2017-December 2019); Vice President of Broyhill Family Foundation, Inc. (2019-present); former Assistant City manager and Finance Director, City of Lenoir, NC (2006-2016) | | None |
| | | | | | | | | |
| Alan R. Deal (60) 5304 Grace Drive Hickory, NC 28601 | | Chief Compliance Officer | | Since 2020 | | Chief Compliance Officer of the Fund since January 2020; former Controller, Protect Plus and Imagine One Companies (August 2002-April 2019) | | None |
| | | | | | | | | |
| Leah Geates (39) 802 Lower Creek Dr. NE Lenoir, NC 28645 | | Secretary | | Since 2022 | | Secretary of the Fund since February 2022 | | None |
BMC FUND, INC.
ADDITIONAL INFORMATION (Unaudited)
Year Ended October 31, 2024
| Investment Advisory Agreement Approval (Unaudited) |
The Board of Directors (the “Board”), including the Directors who are not “interested persons” (as that terms is defined in Section 2(a)(19) of the Investment Company Act of 1940, as amended) (the “Independent Directors”) voting separately, reviewed and approved the renewal of the Investment Advisory Agreement (the “Advisory Agreement”) between Broyhill Asset Management, LLC (the “Adviser”) and BMC Fund, Inc. a registered closed-end fund under the Investment Company Act of 1940, as amended (the “Trust”), on behalf of its sole series of the same name (the “Fund”). The approval took place at a meeting held on August 22, 2024 (the “Meeting”) at which all of the Independent Directors and the Interested Director participated in-person.
Prior to the meeting, the Board requested, received, reviewed and considered a substantial amount of information from the Adviser related to the renewal of the Advisory Agreement between the Adviser and the Trust (the “Support Materials”). The Support Materials included, among other things, information regarding: (1) the Adviser’s organizational structure, management, personnel and proposed services to the Fund; (2) the fees to be paid by the Fund to the Adviser for services rendered under the Advisory Agreement, and (3) the Adviser’s compliance program, including the Adviser’s Code of Ethics.
In considering the Support Materials and reaching its conclusion to approve the renewal of the Advisory Agreement, the Board reviewed and analyzed the Factors as set forth below. The Directors did not identify any particular Factor or information that was most relevant to their consideration to renew the Advisory Agreement.
Nature, Extent and Quality of Services. The Directors reviewed the services being provided by the Adviser to the Fund as set forth in the Advisory Agreement. The Directors also noted that during the past year, the Adviser had not experienced any issues under its compliance program, and that the Adviser has not been subject to any litigation. The Directors also considered the experience of the Adviser’s personnel servicing the Fund, as well as the Adviser’s compliance environment and the Fund’s performance. The Directors concluded that they are satisfied with the quality, extent, and nature of the services provided by the Adviser.
Cost of Advisory Services and Profitability. The Directors considered the cost of the advisory services that Broyhill Asset Management provides to the Fund and the Adviser’s profitability with respect to the Fund, as well as the Adviser’s overall financial condition as it relates to the Adviser’s ability to provide the services called for in the Advisory Agreement. The Directors also considered that the fee arrangement of the Fund with the Adviser currently involves a contractual advisory fee of .65%, based on the net asset value of the assets in the beginning balance of the fiscal year quarter. The Directors considered the advisory fees paid to the Adviser during a twelve-month period and the Adviser’s expenses incurred over that period, as well as an estimation of the Adviser’s operational overhead allocable to the services provided to the Fund.
BMC FUND, INC.
ADDITIONAL INFORMATION (Unaudited)
Year Ended October 31, 2024
SUPPLEMENTAL INFORMATION
M. Hunt Broyhill, Chairman and President/Chief Investment Officer, is primarily responsible for the day-to-day management of the Company’s portfolio. Mr. Hunt Broyhill has been President since 2001. He has been engaged in asset management for various institutions and high net worth individuals for more than five years.
Change in Independent Registered Public Accounting Firm
On June 19, 2024, FORVIS, LLC (“FORVIS”) was not re-appointed as the independent registered public accounting firm of BMC Fund, Inc. (the “Fund”). The Audit Committee of the Board of Directors approved the replacement of FORVIS.
The report of FORVIS on the financial statements of the Fund for the two fiscal years ended October 31, 2023 did not contain an adverse opinion or a disclaimer of opinion, and were not qualified or modified as to uncertainties, audit scope or accounting principles. During the fiscal year ended October 31, 2023 and during the subsequent interim period through June 19, 2024: (i) there were no disagreements between the registrant and FORVIS on any matter of accounting principles or practices, financial statement disclosure, or auditing scope or procedure, which disagreements, if not resolved to the satisfaction of FORVIS, would have caused it to make reference to the subject matter of the disagreements in its report on the financial statements of the Fund for such years or interim period; and (ii) there were no “reportable events,” as defined in Item 304(a)(1)(v) of Regulation S-K under the Securities Exchange Act of 1934, as amended.
On June 19, 2024, the Audit Committee of the Board of Trustees also approved the appointment of Cohen & Company, Ltd. (“Cohen”) as the Fund’s independent registered public accounting firm for the 2024 fiscal year.
During the two fiscal years ended October 31, 2023, and during the subsequent interim period through June 19, 2024, neither the registrant, nor anyone acting on its behalf, consulted with Cohen on behalf of the Fund regarding the application of accounting principles to a specified transaction (either completed or proposed), the type of audit opinion that might be rendered on the Fund’s financial statements, or any matter that was either: (i) the subject of a “disagreement,” as defined in Item 304(a)(1)(iv) of Regulation S-K and the instructions thereto; or (ii) “reportable events,” as defined in Item 304(a)(1)(v) of Regulation S-K.
BMC FUND, INC.
ADDITIONAL INFORMATION (Unaudited)
Year Ended October 31, 2024
Investment Objectives
The overall investment objective of the Fund is to provide a maximum level of income for shareholders consistent with maintaining the Fund’s long-term purchasing power. This investment objective may not be changed without shareholder approval. The specific goals of the Fund are in order of importance:
| 1) | Preservation of capital |
| 2) | Current income |
| 3) | Moderate growth |
Performance Objectives
A five percent return on the Fund’s assets is desired to be distributed annually for dividend income. Additional modest growth is desired to at least offset inflation risk.
| • | Investment Horizon: The Fund’s asset allocation and investment guidelines are driven by a long-term time horizon. Accordingly, interim fluctuations should be viewed with this perspective in mind. Short-term performance shortfalls are not of critical interest unless they suggest failures in strategy execution or impact required distributions. Notwithstanding that possibility, manager and asset class performance shall be evaluated on a rolling one, three and five year basis. |
| • | Liquidity Requirements: The Fund aims to distribute five percent of the value of its assets annually to shareholders. Therefore, a minimum of five percent of the value of the Fund should be held in cash and cash equivalents or instruments that can be quickly converted to cash with no significant adverse change in value as a result of the liquidation. |
| • | Risk Tolerance: The Fund seeks to generate returns that are proportional to its risk profile, recognizing that some level of risk must be assumed to achieve the fund’s long-term investment objectives. The objectives and structure of the Fund should be implemented and measured in a manner which seeks low volatility, accepting the possibility of less than average returns in the best years but seeking preservation of capital in the bad years. |
Asset Allocation Plan
The Asset Allocation Plan for the Fund is reported below. It reflects the Investment Committee’s consideration of expected returns for equity, fixed income, cash, and real asset classes in domestic and foreign markets as well as consideration of prevailing and expected levels of inflation. The Investment Committee has considered the expected correlation of asset returns and expected volatility of returns to determine an asset allocation with appropriate diversification and sufficient expected return to satisfy the investment objectives of the Fund.
BMC FUND, INC.
ADDITIONAL INFORMATION (Unaudited)
Year Ended October 31, 2024
A Policy Portfolio for the Fund has been established that reflects the analysis conducted by the Investment Committee for the Fund. The asset allocation study and resultant Policy Portfolio may be changed in the future, subject to approval by the Board. The Investment Committee is responsible for assuring that the assets of the Fund are deployed in a manner consistent with the Policy Portfolio, although this responsibility may be delegated to the Chief Investment Officer.
| Asset Class | | Policy Portfolio | | Policy Range |
| | | | | |
| Total Short Term Investments | | 0% | | 0% - 10% |
| Cash & Equivalents | | | | |
| | | | | |
| Total Fixed Income Investments | | 10% | | 0% - 40% |
| Domestic Fixed Income | | | | |
| International Fixed Income | | | | |
| | | | | |
| Total Equity Investments | | 45% | | 25% - 65% |
| Domestic Equities | | | | |
| International Equities | | | | |
| | | | | |
| Total Alternative Investments | | 45% | | 25% - 65% |
Hedge Funds
Absolute Return | | | | |
| | | | | |
| Total Investment Assets | | 100% | | |
Risk Factors
An investment in the Fund is not guaranteed to achieve its investment objective; is not a deposit with a bank; is not insured, endorsed or guaranteed by the Federal Deposit Insurance Corporation or any other government agency; and is subject to investment risks. The value of the Fund’s investments will increase or decrease based on changes in the prices of the investments it holds. You could lose money by investing in the Fund. By itself, the Fund does not constitute a balanced investment program. You should carefully consider the following principal and non-principal risks before investing in the Fund. There may be additional risks that the Fund does not currently foresee or consider material. You may wish to consult with your legal or tax advisors, before deciding whether to invest in the Fund. This section describes the risk factors associated with investment in the Fund specifically, as well as those factors generally associated with investment in an investment company with investment objectives, investment policies, capital structure or trading markets similar to the Fund’s. Each risk summarized below is a risk of investing in the Fund and different risks may be more significant at different times depending upon market conditions or other factors.
BMC FUND, INC.
ADDITIONAL INFORMATION (Unaudited)
Year Ended October 31, 2024
The Fund may invest in securities of other investment companies (“underlying funds”). The Fund may be subject to the risks of the securities and other instruments described below through its own direct investments and indirectly through investments in the underlying funds.
Principal Risks
Closed-End Investment Company Risk. The Fund invests in the securities of other closed-end investment companies. Investing in other closed-end investment companies involves substantially the same risks as investing directly in the underlying instruments, but the total return on such investments at the investment company level may be reduced by the operating expenses and fees of such other closed-end investment companies, including advisory fees. There can be no assurance that the investment objective of any investment company in which the Fund invests will be achieved. Closed-end investment companies are subject to the risks of investing in the underlying securities. The Fund, as a holder of the securities of another closed-end investment company, will bear its pro rata portion of the closed-end investment company’s expenses, including advisory fees. These expenses are in addition to the direct expenses of the Fund’s own operations. To the extent the Fund invests a portion of its assets in investment company securities, those assets will be subject to the risks of the purchased investment company’s portfolio securities, and a shareholder in the Fund will bear not only his proportionate share of the expenses of the Fund, but also, indirectly, the expenses of the purchased investment company. The market price of a closed-end investment company fluctuates and may be either higher or lower than the NAV of such closed-end investment company. In accordance with Section 12(d)(1)(F) of the 1940 Act, the Fund will be limited by provisions of the 1940 Act that limit the amount the Fund, together with its affiliated persons, can invest in other investment companies to 3% of any other investment company’s total outstanding stock. As a result, the Fund may hold a smaller position in a closed-end investment company than if it were not subject to this restriction.
Special Purpose Acquisition Companies Risk. The Fund may invest in stock, warrants, and other securities of special purpose acquisition companies or similar special purpose entities that pool funds to seek potential acquisition opportunities (“SPACs”). Unless and until an acquisition meeting the SPAC’s requirements is completed, a SPAC generally invests its assets (less a portion retained to cover expenses) in U.S. Government securities, money market securities and cash. If an acquisition that meets the requirements for the SPAC is not completed within a pre-established period of time, the invested funds are returned to the entity’s shareholders. Because SPACs and similar entities have no operating history or ongoing business other than seeking acquisitions, the value of their securities is particularly dependent on the ability of the entity’s management to identify and complete a profitable acquisition. Some SPACs may pursue acquisitions only within certain industries or regions, which may increase the volatility of their prices. In addition, these securities, which are typically traded in the over-the-counter market, may be considered illiquid, be subject to restrictions on resale, and/or may trade at a discount.
BMC FUND, INC.
ADDITIONAL INFORMATION (Unaudited)
Year Ended October 31, 2024
Management Risk. The Fund is subject to management risk because it is an actively managed portfolio. The Fund’s successful pursuit of its investment objective depends upon the Investment Committee’s ability to find and exploit market inefficiencies with respect to undervalued securities. Such situations occur infrequently and sporadically and may be difficult to predict and may not result in a favorable pricing opportunity that allows the Investment Committee to fulfill the Fund’s investment objective. The Investment Committee’s security selections and other investment decisions might produce losses or cause the Fund to underperform when compared to other funds with similar investment goals.
Market Risk. Overall market risk may affect the value of individual instruments in which the Fund invests. The Fund is subject to the risk that the securities markets will move down, sometimes rapidly and unpredictably, based on overall economic conditions and other factors, which may negatively affect the Fund’s performance. Factors such as domestic and foreign (non-U.S.) economic growth and market conditions, real or perceived adverse economic or political conditions, inflation, changes in interest rate levels, lack of liquidity in the markets, volatility in the securities markets, adverse investor sentiment affect the securities markets and political vents affect the securities markets. Securities markets also may experience long periods of decline in value. When the value of the Fund’s investments goes down, your investment in the Fund decreases in value and you could lose money.
Local, state, regional, national or global events such as war, acts of terrorism, the spread of infectious illness or other public health issues, recessions, or other events could have a significant impact on the Fund and its investments and could result in decreases to the Fund’s net asset value. Political, geopolitical, natural and other events, including war, terrorism, trade disputes, government shutdowns, market closures, natural and environmental disasters, epidemics, pandemics and other public health crises and related events and governments’ reactions to such events have led, and in the future may lead, to economic uncertainty, decreased economic activity, increased market volatility and other disruptive effects on U.S. and global economies and markets. Such events may have significant adverse direct or indirect effects on the Fund and its investments. For example, a widespread health crisis such as a global pandemic could cause substantial market volatility, exchange trading suspensions and closures, impact the ability to complete redemptions, and affect Fund performance. A health crisis may exacerbate other pre-existing political, social and economic risks. In addition, the increasing interconnectedness of markets around the world may result in many markets being affected by events or conditions in a single country or region or events affecting a single or small number of issuers.
BMC FUND, INC.
ADDITIONAL INFORMATION (Unaudited)
Year Ended October 31, 2024
Risk Related to Fixed Income Securities, including Non-Investment Grade Securities. The Fund may invest in fixed income securities, also referred to as debt securities. Fixed income securities are subject to credit risk and market risk. Credit risk is the risk of the issuer’s inability to meet its principal and interest payment obligations. Market risk is the risk of price volatility due to such factors as interest rate sensitivity, market perception of the creditworthiness of the issuer and general market liquidity. There is no limitation on the maturities or duration of fixed income securities in which the Fund invests. Securities having longer maturities generally involve greater risk of fluctuations in value resulting from changes in interest rates. The Fund’s credit quality policy with respect to investments in fixed income securities does not require the Fund to dispose of any debt securities owned in the event that such security’s rating declines to below investment grade, commonly referred to as “junk bonds.” Although lower quality debt typically pays a higher yield, such investments involve substantial risk of loss. Junk bonds are considered predominantly speculative with respect to the issuer’s ability to pay interest and principal and are susceptible to default or decline in market value due to adverse economic and business developments. The market values for junk bonds tend to be very volatile and those securities are less liquid than investment grade debt securities. Moreover, junk bonds pose a greater risk that exercise of any of their redemption or call provisions in a declining market may result in their replacement by lower-yielding bonds. In addition, bonds in the lowest two investment grade categories, despite being of higher credit rating than junk bonds, have speculative characteristics with respect to the issuer’s ability to pay interest and principal and their susceptibility to default or decline in market value. The Fund’s investments in securities of stressed, distressed or bankrupt issuers, including securities or obligations that are in default, generally trade significantly below par and are considered speculative. There is even a potential risk of loss by the Fund of its entire investment in such securities. There are a number of significant risks inherent in the bankruptcy process. A bankruptcy filing by an issuer may adversely and permanently affect the market position and operations of the issuer. If an issuer of securities held by the Fund declares bankruptcy or otherwise fails to pay principal or interest on such securities, the Fund would experience a decrease in income and a decline in the market value of its investments.
Interest Rate Risk. Debt securities have varying levels of sensitivity to changes in interest rates. In general, the price of a debt security can fall when interest rates rise and can rise when interest rates fall. Securities with longer maturities and mortgage securities can be more sensitive to interest rate changes although they usually offer higher yields to compensate investors for the greater risks. The longer the maturity of the security, the greater the impact a change in interest rates could have on the security’s price. In addition, short-term and long-term interest rates do not necessarily move in the same amount or the same direction. Short-term securities tend to react to changes in short-term interest rates and long-term securities tend to react to changes in long-term interest rates.
Credit Risk. Fixed income securities rated B or below by S&Ps or Moody’s may be purchased by the Fund. These securities have speculative characteristics and changes in economic conditions or other circumstances are more likely to lead to a weakened capacity of those issuers to make principal or interest payments, as compared to issuers of more highly rated securities.
BMC FUND, INC.
ADDITIONAL INFORMATION (Unaudited)
Year Ended October 31, 2024
Extension Risk. The Fund is subject to the risk that an issuer will exercise its right to pay principal on an obligation held by that Fund (such as mortgage-backed securities) later than expected. This may happen when there is a rise in interest rates. These events may lengthen the duration (i.e. interest rate sensitivity) and potentially reduce the value of these securities.
Debt Security Risk. In addition to interest rate risk, call risk and extension risk, debt securities are also subject to the risk that they may also lose value if the issuer fails to make principal or interest payments when due, or the credit quality of the issuer falls.
Market Discount from Net Asset Value Risk. Shares of closed-end investment companies frequently trade at a discount from their net asset value. This characteristic is a risk separate and distinct from the risk that the Fund’s net asset value could decrease as a result of its investment activities and may be greater for investors expecting to sell their Shares in a relatively short period following completion of the Offering. The net asset value of the Shares will be reduced immediately following the Offering as a result of (i) the Subscription Price likely being lower than NAV and (ii) the payment of certain costs of the Offering. Whether investors will realize gains or losses upon the sale of the Shares will depend not upon the Fund’s net asset value but entirely upon whether the market price of the Shares at the time of sale is above or below the investor’s purchase price for the Shares. Because the market price of the Shares will be determined by factors such as relative supply of and demand for the Shares in the market, general market and economic conditions, and other factors beyond the control of the Fund, the Fund cannot predict whether the Shares will trade at, below or above net asset value.
Leverage Risk. Transactions by underlying funds may give rise to a form of economic leverage. These transactions may include, among others, derivatives, and may expose the underlying fund to greater risk and increase its costs. The use of leverage by underlying funds may cause such funds to liquidate their portfolio positions when it may not be advantageous to do so to satisfy its obligations or to meet any required asset segregation requirements. Increases and decreases in the value of an underlying fund’s portfolio will be magnified when it uses leverage. Leverage, including borrowing, may cause an underlying fund to be more volatile than if such fund had not been leveraged.
Defensive Position Risk. During periods of adverse market or economic conditions, the Fund may temporarily invest all or a substantial portion of its net assets in cash or cash equivalents. The Fund would not be pursuing its investment objective in these circumstances and could miss favorable market developments.
Changes in Policies Risk. The Fund’s Directors may change the Fund’s investment objective, investment strategies and non-fundamental investment restrictions without shareholder approval, except as otherwise indicated.
BMC FUND, INC.
ADDITIONAL INFORMATION (Unaudited)
Year Ended October 31, 2024
Preferred Stock Risk. The Fund may invest in preferred stocks. Preferred stock, like common stock, represents an equity ownership in an issuer. Generally, preferred stock has a priority of claim over common stock in dividend payments and upon liquidation of the issuer. Unlike common stock, preferred stock does not usually have voting rights. Preferred stock in some instances is convertible into common stock. Although they are equity securities, preferred stocks have characteristics of both debt and common stock. Like debt, their promised income is contractually fixed. Like common stock, they do not have rights to precipitate bankruptcy proceedings or collection activities in the event of missed payments. Other equity characteristics are their subordinated position in an issuer’s capital structure and that their quality and value are heavily dependent on the profitability of the issuer rather than on any legal claims to specific assets or cash flows.
Investment in preferred stocks carries risks, including credit risk, deferral risk, redemption risk, limited voting rights, risk of subordination and lack of liquidity. Fully taxable or hybrid preferred securities typically contain provisions that allow an issuer, at its discretion, to defer distributions for up to 20 consecutive quarters. Distributions on preferred stock must be declared by the board of directors and may be subject to deferral, and thus they may not be automatically payable. Income payments on preferred stocks may be cumulative, causing dividends and distributions to accrue even if not declared by the company’s board or otherwise made payable, or they may be non-cumulative, so that skipped dividends and distributions do not continue to accrue. There is no assurance that dividends on preferred stocks in which the Fund invests will be declared or otherwise made payable. The Fund may invest in non-cumulative preferred stock, although the Fund’s Investment Committee would consider, among other factors, their non-cumulative nature in making any decision to purchase or sell such securities.
Shares of preferred stock have a liquidation value that generally equals the original purchase price at the date of issuance. The market values of preferred stock may be affected by favorable and unfavorable changes impacting the issuers’ industries or sectors, including companies in the utilities and financial services sectors, which are prominent issuers of preferred stock. They may also be affected by actual and anticipated changes or ambiguities in the tax status of the security and by actual and anticipated changes or ambiguities in tax laws, such as changes in corporate and individual income tax rates, and in the dividends received deduction for corporate taxpayers or the lower rates applicable to certain dividends.
Because the claim on an issuer’s earnings represented by preferred stock may become onerous when interest rates fall below the rate payable on the stock or for other reasons, the issuer may redeem preferred stock, generally after an initial period of call protection in which the stock is not redeemable. Thus, in declining interest rate environments in particular, the Fund’s holdings of higher dividend paying preferred stocks may be reduced and the Fund may be unable to acquire securities paying comparable rates with the redemption proceeds. In the event of a redemption, the Fund may not be able to reinvest the proceeds at comparable rates of return.
BMC FUND, INC.
ADDITIONAL INFORMATION (Unaudited)
Year Ended October 31, 2024
Convertible Securities Risk. The Fund may invest in convertible securities. Convertible securities include fixed income securities that may be exchanged or converted into a predetermined number of shares of the issuer’s underlying common stock at the option of the holder during a specified period. Convertible securities may take the form of convertible preferred stock, convertible bonds or debentures, units consisting of “usable” bonds and warrants or a combination of the features of several of these securities. The investment characteristics of each convertible security vary widely, which allows convertible securities to be employed for a variety of investment strategies. The Fund will exchange or convert convertible securities into shares of underlying common stock when, in the opinion of the Fund’s Investment Committee, the investment characteristics of the underlying common shares will assist the Fund in achieving its investment objective. The Fund may also elect to hold or trade convertible securities. In selecting convertible securities, the Fund’s Investment Committee evaluates the investment characteristics of the convertible security as a fixed income instrument, and the investment potential of the underlying equity security for capital appreciation. In evaluating these matters with respect to a particular convertible security, the Fund’s Investment Committee considers numerous factors, including the economic and political outlook, the value of the security relative to other investment alternatives, trends in the determinants of the issuer’s profits, and the issuer’s management capability and practices.
The value of a convertible security, including, for example, a warrant, is a function of its “investment value” (determined by its yield in comparison with the yields of other securities of comparable maturity and quality that do not have a conversion privilege) and its “conversion value” (the security’s worth, at market value, if converted into the underlying common stock). The investment value of a convertible security is influenced by changes in interest rates, with investment value declining as interest rates increase and increasing as interest rates decline. The credit standing of the issuer and other factors may also have an effect on the convertible security’s investment value. The conversion value of a convertible security is determined by the market price of the underlying common stock. If the conversion value is low relative to the investment value, the price of the convertible security is governed principally by its investment value. Generally, the conversion value decreases as the convertible security approaches maturity. To the extent the market price of the underlying common stock approaches or exceeds the conversion price, the price of the convertible security will be increasingly influenced by its conversion value. A convertible security generally will sell at a premium over its conversion value by the extent to which investors place value on the right to acquire the underlying common stock while holding a fixed income security. A convertible security may be subject to redemption at the option of the issuer at a price established in the convertible security’s governing instrument. If a convertible security held by the Fund is called for redemption, the Fund will be required to permit the issuer to redeem the security, convert it into the underlying common stock or sell it to a third party. Any of these actions could have an adverse effect on the Fund’s ability to achieve its investment objective.
Issuer Specific Changes Risk. Changes in the financial condition of an issuer, changes in the specific economic or political conditions that affect a particular type of security or issuer, and changes in general economic or political conditions can affect the credit quality or value of an issuer’s securities. Lower-quality debt securities tend to be more sensitive to these changes than higher-quality debt securities.
BMC FUND, INC.
ADDITIONAL INFORMATION (Unaudited)
Year Ended October 31, 2024
Non-Principal Risks
In addition to the principal risks set forth above, the following additional risks may apply to an investment in the Fund.
Anti-Takeover Provisions Risk. The Fund’s Charter and Bylaws include provisions that could limit the ability of other persons or entities to acquire control of the Fund or to cause it to engage in certain transactions or to modify its structure.
Common Stock Risk. The Fund invests in common stocks. Common stocks represent an ownership interest in a company. The Fund may also invest in securities that can be exercised for or converted into common stocks (such as convertible preferred stock). Common stocks and similar equity securities are more volatile and riskier than some other forms of investment. Therefore, the value of your investment in the Fund may sometimes decrease instead of increase. Common stock prices fluctuate for many reasons, including adverse events such as unfavorable earnings reports, changes in investors’ perceptions of the financial condition of an issuer, the general condition of the relevant stock market or when political or economic events affecting the issuers occur. In addition, common stock prices may be sensitive to rising interest rates, as the costs of capital rise and borrowing costs increase for issuers. Because convertible securities can be converted into equity securities, their values will normally increase or decrease as the values of the underlying equity securities increase or decrease. The common stocks in which the Fund invests are structurally subordinated to preferred securities, bonds and other debt instruments in a company’s capital structure in terms of priority to corporate income and assets and, therefore, will be subject to greater risk than the preferred securities or debt instruments of such issuers.
Exchange Traded Funds Risk. The Fund may invest in exchange-traded funds, which are investment companies that, in some cases, aim to track or replicate a desired index, such as a sector, market or global segment. ETFs are passively or, to a lesser extent, actively managed and their shares are traded on a national exchange. ETFs do not sell individual shares directly to investors and only issue their shares in large blocks known as “creation units.” The investor purchasing a creation unit may sell the individual shares on a secondary market. Therefore, the liquidity of ETFs depends on the adequacy of the secondary market. There can be no assurance that an ETF’s investment objective will be achieved, as ETFs based on an index may not replicate and maintain exactly the composition and relative weightings of securities in the index. ETFs are subject to the risks of investing in the underlying securities. The Fund, as a holder of the securities of the ETF, will bear its pro rata portion of the ETF’s expenses, including advisory fees. These expenses are in addition to the direct expenses of the Fund’s own operations.
BMC FUND, INC.
ADDITIONAL INFORMATION (Unaudited)
Year Ended October 31, 2024
Illiquid Securities Risk. The Fund may invest up to 10% of its net assets in illiquid securities. Illiquid securities may offer a higher yield than securities which are more readily marketable, but they may not always be marketable on advantageous terms. The sale of illiquid securities often requires more time and results in higher brokerage charges or dealer discounts than does the sale of securities eligible for trading on national securities exchanges or in the over-the-counter markets. A security traded in the U.S. that is not registered under the Securities Act will not be considered illiquid if Fund management determines that an adequate investment trading market exists for that security. However, there can be no assurance that a liquid market will exist for any security at a particular time.
Portfolio Turnover Risk. The Fund cannot predict its securities portfolio turnover rate with certain accuracy. Higher portfolio turnover rates could result in corresponding increases in brokerage commissions and may generate short-term capital gains taxable as ordinary income.
Small and Medium Cap Company Risk. Compared to investment companies that focus only on large capitalization companies, the Fund’s share price may be more volatile because it also invests in small and medium capitalization companies. Compared to large companies, small and medium capitalization companies are more likely to have (i) more limited product lines or markets and less mature businesses, (ii) fewer capital resources, (iii) more limited management depth and (iv) shorter operating histories. Further, compared to large cap stocks, the securities of small and medium capitalization companies are more likely to experience sharper swings in market values, be harder to sell at times and at prices that the Fund’s Investment Committee believes appropriate, and offer greater potential for gains and losses.
Proxy Voting - The policies and procedures that the Company uses to determine how to vote proxies relating to its portfolio securities are available without charge, upon request, by calling 828-758-6100; on the Company’s website at http://www.bmcfund.com; and on the Securities and Exchange Commission’s website at http://www.sec.gov.
Information regarding how the Company voted proxies relating to portfolio securities during the most recent 12-month period ended June 30 is available without charge, upon request, by calling 828-758-6100, and on the SEC’s website at http://www.sec.gov (see Form N-PX).
Portfolio Holdings - The Company files a complete schedule of its portfolio holdings for the first and third quarters of its fiscal year with the SEC on Form N-Port. The Company’s Form N-Port filings are available on the SEC’s website at http://www.sec.gov and may be reviewed and copied at the SEC’s Public Reference Room in Washington, DC. Information on the operation of the SEC’s Public Reference Room may be obtained by calling 1-202-551-8090.
Item. 2. Code of Ethics.
(a)-(b) On July 26, 2003, the Board of Directors of the Registrant adopted a Code of Ethics for the principal executive officer and principal financial and accounting officer. The Code was amended by the Board of Directors on February 24, 2007.
(c)-(e) N/A
(f) A copy of the Code of Ethics is attached as an exhibit.
Item 3. Audit Committee Financial Expert.
The Board of Directors of the Registrant has determined that David F. Stevens, a member of its Audit Committee, is an audit committee financial expert. Mr. Stevens is an independent director of the Registrant.
Item 4. Principal Accountant Fees and Services.
(a) Audit Fees: $110,000.00 for the fiscal year ended October 31, 2023; $75,000.00 for the fiscal year ended October 31, 2024.
(b) Audit-Related Fees: $8,102.58 for the fiscal year ended October 31, 2023; $833.00 for the fiscal year ended October 31, 2024. These fees were incurred for travel-related expenses.
(c) Tax Fees: $13,000.00 for the fiscal year ended October 31, 2023; $10,000.00 for the fiscal year ended October 31, 2024. These fees were incurred for preparation of the tax returns.
(d) All Other Fees: $0.00 for the fiscal year ended October 31, 2023; $0.00 for the fiscal year ended October 31, 2024.
(e)(1) A copy of the Audit Committee's pre-approval policies and procedures is attached as an exhibit.
(e)(2) One hundred percent of the services described in Items 4(b) through 4(d) were approved in accordance with the Audit Committee Pre-Approval Policy. As a result, none of such services was approved pursuant to paragraph (c)(7)(i)(C) of Rule 2-01 of Regulation S-X.
(f) None of the hours expended on the principal accountant's engagement to audit the Registrant's financial statements for the fiscal year ended October 31, 2024 was attributed to work performed by persons other than the principal accountant's full-time, permanent employees.
(g) N/A
(h) N/A
(i) N/A
(j) N/A
Item 5. Audit Committee of Listed Registrants.
N/A
Item 6. Schedule of Investments.
(a) Included as a part of the report to shareholders filed under Item 1.
(b) Not applicable.
Item 7. Financial Statements and Financial Highlights for Open-End Management Investment Companies.
Not applicable.
Item 8. Changes and Disagreements with Accountants for Open-End Management Investment Companies.
Not applicable.
Item 9. Proxy Disclosures for Open-End Management Investment Companies.
Not applicable.
Item 10. Remuneration Paid to Directors, Officers, and Others of Open-End Management Investment Companies.
Not applicable.
Item 11. Statement Regarding Basis for Approval of Investment Advisory Contract.
Not applicable.
Item 12. Disclosure of Proxy Voting Policies and Procedures for Closed-End Management Investment Companies.
The Board of Directors of the Registrant adopted Proxy Voting Policies and Procedures on July 26, 2003 and amended them October 30, 2003, April 5, 2004 and May 26, 2005. A copy as amended is attached as an exhibit.
Item 13. Portfolio Managers of Closed-End Investment Companies.
(a)(1) As of the date of filing of this report, M. Hunt Broyhill, Chairman is primarily responsible for the day-to-day management of BMC Fund, Inc. (the Fund). Mr. Hunt Broyhill has had such responsibility since 2001. He has been engaged in asset management for various institutions and high net worth individuals for more than five years.
(a)(2) The following tables provide information regarding registered investment companies other than the Registrant, other pooled investment vehicles, and other accounts over which the Registrant’s portfolio managers also have day-to-day management responsibilities. The tables provide the numbers of such accounts, the total assets in such accounts and the number of accounts and the total assets in the accounts with respect to which the fees are based on performance. The information is provided as of the Registrant’s fiscal year ended October 31, 2024.
M. Hunt Broyhill
| | Other Registered Investment Companies | Other Pooled Investment Vehicles | Other Accounts |
Number of Accounts Managed | None | 2 | 73 |
Number of Accounts Managed with Performance-Based Advisory Fees | None | 2 | None |
| Assets Managed | $0 | $23,779,301 | $134,558,994 |
Assets Managed with Performance-Based Advisory Fees | $0 | $17,565,141 | $0 |
Material Conflicts of Interest
The Fund recognizes that actual or potential conflicts of interest are inherent in our business. These actual or potential conflicts may arise when a portfolio manager has day-to-day portfolio management responsibilities with respect to more than one fund or account. Certain investments may be appropriate for the Fund and also for other clients advised by the portfolio manager. Investment decisions for the Fund and other clients are made with a view to achieving their respective investment objectives and after consideration of such factors as their current holdings, availability of cash for investment and the size of their investments generally. Therein lies the possibility that a particular security could be bought or sold for the Fund and also for other clients, along with the possibility that a particular security could be bought or sold for the Fund while the opposite transaction could be occurring for other clients due to their investment strategy.
To the extent that a portfolio manager has responsibilities for managing accounts in addition to the Fund, the portfolio manager will need to divide his time and attention among relevant accounts.
The Fund also recognizes that in some cases, an actual or potential conflict may arise where a portfolio manager may have an incentive, such as a performance-based fee.
On December 13, 2014, the Board of Directors of the Registrant adopted a Conflicts of Interest Policy for Portfolio Managers.
(a)(3)
Compensation Structure of Portfolio Managers
The compensation structure for each portfolio manager is based upon a fixed salary as well as a discretionary bonus determined by the senior management of the Registrant. Salaries are determined by the senior management and are based upon an individual’s position and overall value to the Registrant. Bonuses are also determined by management and are based upon an individual’s overall contribution to the success of the Fund and the profitability of the Registrant. Salaries and bonuses for portfolio managers are not based upon criteria such as performance of the Fund or the value of assets of the Registrant. Portfolio managers also have the opportunity to participate in other employee benefits available to all of the employees of the Registrant.
(a)(4) The dollar range of the Registrant’s equity securities owned beneficially by the Registrant’s portfolio managers as of the Registrant’s fiscal year ended October 31, 2024 is set forth below:
| Name of Portfolio Manager | | Dollar ($) Range of
Registrant’s Shares
Beneficially Owned |
| M. Hunt Broyhill | | Over $1,000,000 |
| | | |
(b) N/A
Item 14. Purchases of Equity Securities by Closed-End Management Investment Company and Affiliated Purchasers.
None
Item 15. Submission of Matters to a Vote of Security Holders.
N/A
Item 16. Controls and Procedures.
| (a) | Evaluation of Disclosure Controls and Procedures. |
BMC Fund, Inc. (the “Registrant” or the “Fund”) maintains disclosure controls and procedures that are designed to ensure that information required to be disclosed in the Registrant’s filings under the Securities Exchange Act of 1934, as amended (the “Exchange Act”), and the Investment Company Act of 1940, as amended (the “1940 Act”), is recorded, processed, summarized and reported within the periods specified in the rules and forms of the Securities and Exchange Commission (“SEC”). Such information is accumulated and communicated to the Registrant’s management, including its Principal Executive Officer and Principal Financial Officer, as appropriate, to allow timely decisions regarding required disclosure. The Registrant’s management recognizes that any set of controls and procedures, no matter how well designed and operated, can provide only reasonable assurance of achieving the desired control objectives.
Within 90 days prior to the filing date of this report on Form N-CSR, management, including the Registrant’s Principal Executive Officer and Principal Financial Officer, evaluated the effectiveness of the design and operation of the Registrant’s disclosure controls and procedures (as defined in Rule 30a-3(c) under the 1940 Act). Based upon that evaluation and subject to the foregoing, the Registrant’s Principal Executive Officer and Principal Financial Officer concluded that the Registrant’s disclosure controls and procedures were effective as of October 31, 2024.
| (b) | Changes in Internal Controls. |
There have been no changes in the Registrant’s internal controls or in other factors that could materially affect the internal controls over financial reporting subsequent to the date of their evaluation in connection with the preparation of this Form N-CSR.
Item 17. Disclosure of Securities Lending Activities for Closed-End Management Investment Companies.
None.
Item 18. Recovery of Erroneously Awarded Compensation.
(a) Not applicable.
(b) Not applicable.
Item 19. Exhibits.
(a)(1) The Registrant's Code of Ethics is attached as Exhibit 19(a)(1).
(a)(2) Not applicable.
(a)(3) Certifications pursuant to Rule 30a-2(a) under the 1940 Act and Section 302 of the Sarbanes-Oxley Act of 2002 are attached as Exhibit 19(a)(3)
(b) Certifications pursuant to Rule 30a-2(b) under the 1940 Act and Section 906 of the Sarbanes-Oxley Act of 2002 are attached as Exhibit 19(b)
SIGNATURES
Pursuant to the requirements of the Securities Exchange Act of 1934 and the Investment Company Act of 1940, the Registrant has duly caused this report to be signed on its behalf by the undersigned, thereunto duly authorized.
BMC Fund, Inc.
| By | |
| | |
| /s/ Danny A. Gilbert | |
| Danny A. Gilbert | |
| Principal Financial Officer | |
Date: January 21, 2025
Pursuant to the requirements of the Securities Exchange Act of 1934 and the Investment Company Act of 1940, this report has been signed below by the following persons on behalf of the registrant and in the capacities and on the dates indicated.
| By | |
| | |
| /s/ M. Hunt Broyhill | |
| M. Hunt Broyhill | |
| Principal Executive Officer | |
Date: January 21, 2025
| By | |
| | |
| /s/ Danny A. Gilbert | |
| Danny A. Gilbert | |
| Principal Financial Officer | |
| | |
| Date: January 21, 2025 | |