
SilverBow Resources Corporate Presentation November 2017 Exhibit 99.1

Forward-Looking Statements THE MATERIAL INCLUDED herein which is not historical fact constitutes “forward-looking statements” within the meaning of Section 27A of the Securities Act of 1933, as amended, and Section 21E of the Securities Exchange Act of 1934, as amended. These opinions, forecasts, scenarios and projections relate to, among other things, estimates of future commodity prices and operating and capital costs, capital expenditures, levels and costs of drilling activity, estimated production rates or forecasts of growth thereof, hydrocarbon reserve quantities and values, potential oil and gas reserves expressed as “EURs”, assumptions as to future hydrocarbon prices, liquidity, cash flows, operating results, availability of capital, internal rates of return, net asset values, drilling schedules and potential growth rates of reserves and production, all of which are forward-looking statements. These forward-looking statements are generally accompanied by words such as “estimated”, “projected”, “potential”, “anticipated”, “forecasted” or other words that convey the uncertainty of future events or outcomes. Although the Company believes that such forward-looking statements are reasonable, the matters addressed reflect management’s current plans and assumptions, are subject to numerous risks and uncertainties, many of which are beyond the Company’s control, and certain of which are set out in our most recent Form 10-K and Form 10-Q filed with the SEC. The Company can give no assurance that estimates and projections contained in such statements will prove to have been correct. For reconciliations of non-GAAP financial measures, see our website at sbow.com. CAUTIONARY NOTE Regarding Potential Reserves Disclosures – Current SEC rules regarding oil and gas reserve information allow oil and gas companies to disclose proved reserves, and optionally probable and possible reserves that meet the SEC’s definitions of such terms. In this presentation, we refer to estimates of resource “potential” or “EUR” (estimated ultimate recovery quantities) or “IP” (initial production rates) other descriptions of volumes potentially recoverable, which in addition to reserves generally classifiable as probable and possible include estimates of reserves that do not rise to the standards for possible reserves, and which SEC guidelines strictly prohibit us from including in filings with the SEC. These estimates are by their nature more speculative than estimates of proved reserves and are subject to greater uncertainties, and accordingly the likelihood of recovering those reserves is subject to substantially greater risk. THIS PRESENTATION has been prepared by the Company and includes market data and other statistical information from sources believed by it to be reliable, including independent industry publications, government publications or other published independent sources. Some data are also based on the Company’s good faith estimates, which are derived from its review of internal sources as well as the independent sources described above. Although the Company believes these sources are reliable, it has not independently verified the information and cannot guarantee its accuracy and completeness. THIS PRESENTATION includes information regarding our current drilling and completion costs and historical cost reductions. Future costs may be adversely impacted by increases in oil and gas prices which results in increased activity. THIS PRESENTATION includes information regarding our PV-10 at SEC and strip prices for year end 12/31/16 and 9/30/17 reserves. PV-10 represents the present value, discounted at 10% per year, of estimated future net cash flows. The Company’s calculation of PV-10 using strip prices herein differs from the standardized measure of discounted future net cash flows determined in accordance with the rules and regulations of the SEC in that it is calculated before income taxes using strip prices as of September 30, 2017, rather than after income taxes using the average price during the 12-month period, determined as an unweighted average of the first-day-of-the-month price for each month. The Company’s calculation of PV-10 using strip prices should not be considered as an alternative to the standardized measure of discounted future net cash flows determined in accordance with the rules and regulations of the SEC. Please see appendix for a reconciliation of PV-10 to standardized measure as well as a PV-10 value calculated at strip prices as of September 30, 2017. CORPORATE PRESENTATION • PAGE •
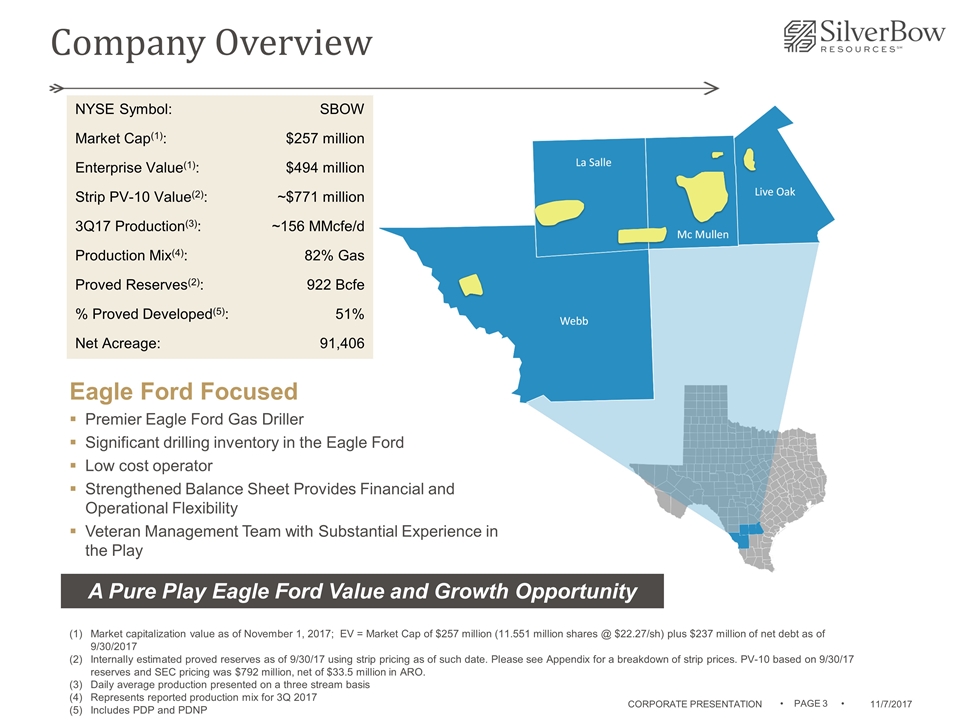
Company Overview NYSE Symbol: SBOW Market Cap(1): $257 million Enterprise Value(1): $494 million Strip PV-10 Value(2): ~$771 million 3Q17 Production(3): ~156 MMcfe/d Production Mix(4): 82% Gas Proved Reserves(2): 922 Bcfe % Proved Developed(5): 51% Net Acreage: 91,406 Market capitalization value as of November 1, 2017; EV = Market Cap of $257 million (11.551 million shares @ $22.27/sh) plus $237 million of net debt as of 9/30/2017 Internally estimated proved reserves as of 9/30/17 using strip pricing as of such date. Please see Appendix for a breakdown of strip prices. PV-10 based on 9/30/17 reserves and SEC pricing was $792 million, net of $33.5 million in ARO. Daily average production presented on a three stream basis Represents reported production mix for 3Q 2017 Includes PDP and PDNP A Pure Play Eagle Ford Value and Growth Opportunity Eagle Ford Focused Premier Eagle Ford Gas Driller Significant drilling inventory in the Eagle Ford Low cost operator Strengthened Balance Sheet Provides Financial and Operational Flexibility Veteran Management Team with Substantial Experience in the Play CORPORATE PRESENTATION • PAGE •
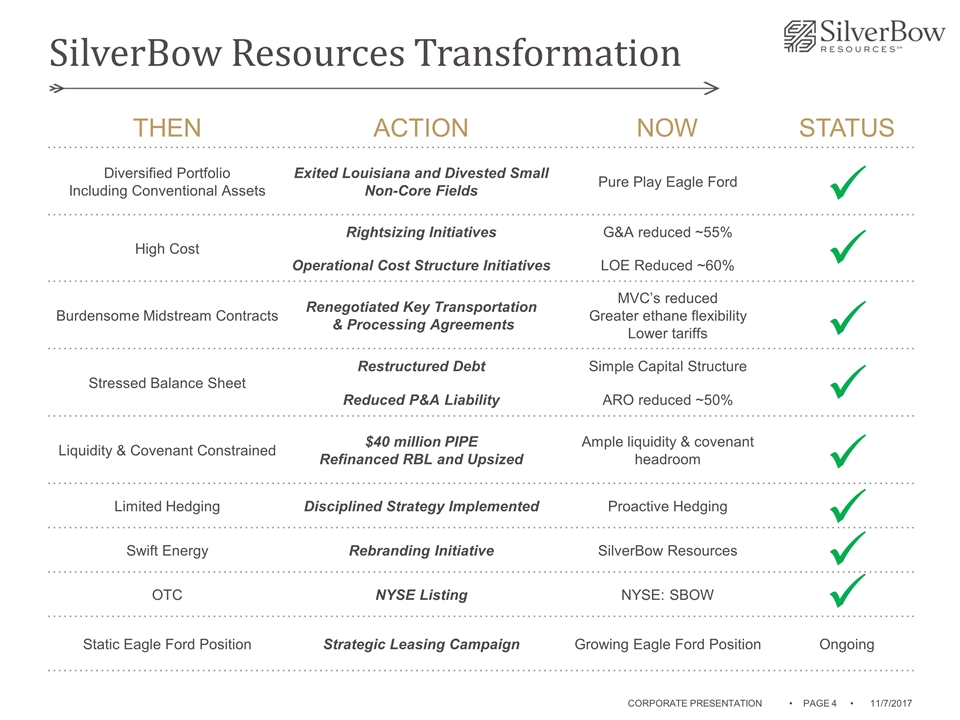
THEN ACTION NOW STATUS Diversified Portfolio Including Conventional Assets Exited Louisiana and Divested Small Non-Core Fields Pure Play Eagle Ford High Cost Rightsizing Initiatives G&A reduced ~55% Operational Cost Structure Initiatives LOE Reduced ~60% Burdensome Midstream Contracts Renegotiated Key Transportation & Processing Agreements MVC’s reduced Greater ethane flexibility Lower tariffs Stressed Balance Sheet Restructured Debt Simple Capital Structure Reduced P&A Liability ARO reduced ~50% Liquidity & Covenant Constrained $40 million PIPE Refinanced RBL and Upsized Ample liquidity & covenant headroom Limited Hedging Disciplined Strategy Implemented Proactive Hedging Swift Energy Rebranding Initiative SilverBow Resources OTC NYSE Listing NYSE: SBOW Static Eagle Ford Position Strategic Leasing Campaign Growing Eagle Ford Position Ongoing ü SilverBow Resources Transformation ü ü ü ü ü CORPORATE PRESENTATION • PAGE • ü ü
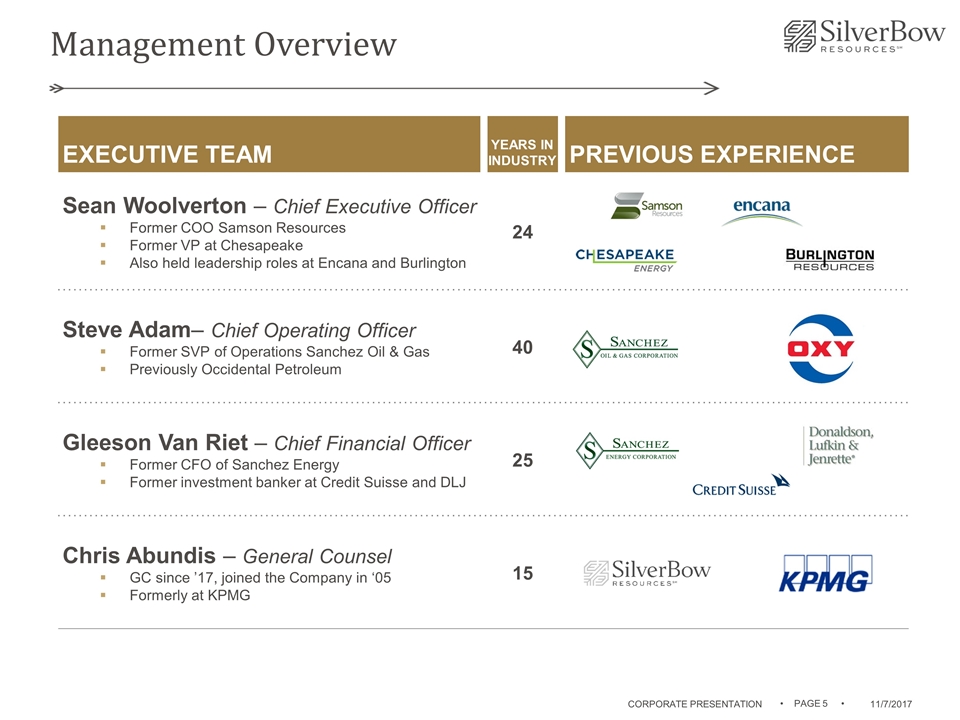
Management Overview EXECUTIVE TEAM YEARS IN INDUSTRY PREVIOUS EXPERIENCE Sean Woolverton – Chief Executive Officer Former COO Samson Resources Former VP at Chesapeake Also held leadership roles at Encana and Burlington 24 Steve Adam– Chief Operating Officer Former SVP of Operations Sanchez Oil & Gas Previously Occidental Petroleum 40 Gleeson Van Riet – Chief Financial Officer Former CFO of Sanchez Energy Former investment banker at Credit Suisse and DLJ 25 Chris Abundis – General Counsel GC since ’17, joined the Company in ‘05 Formerly at KPMG 15 CORPORATE PRESENTATION • PAGE •
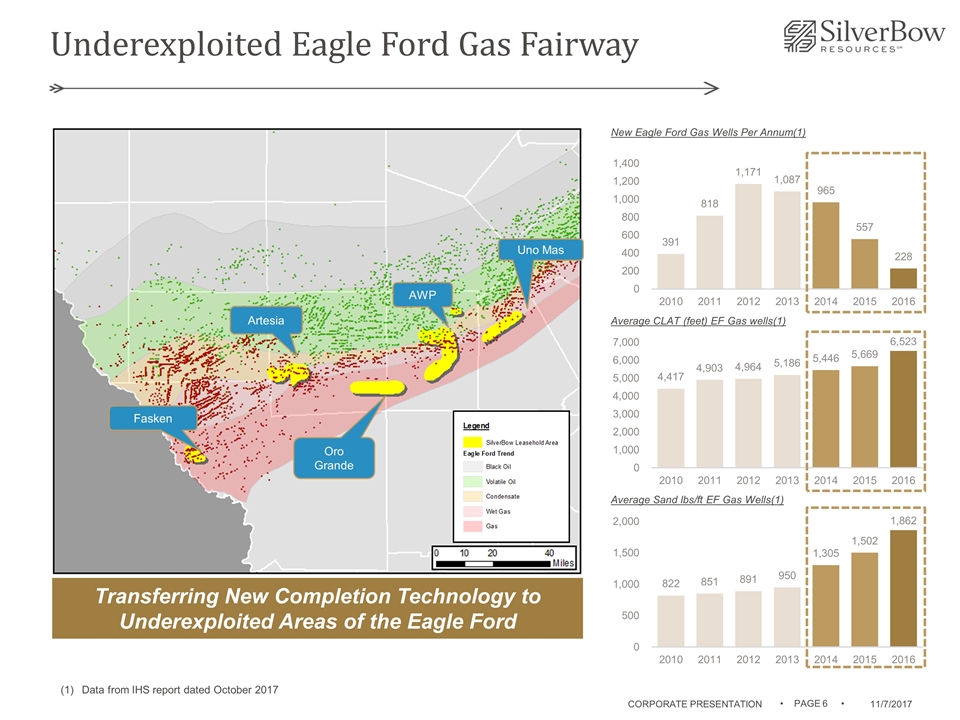
Underexploited Eagle Ford Gas Fairway Fasken Artesia AWP Uno Mas Oro Grande Transferring New Completion Technology to Underexploited Areas of the Eagle Ford Average Sand lbs/ft EF Gas Wells(1) Average CLAT (feet) EF Gas wells(1) New Eagle Ford Gas Wells Per Annum(1) Data from IHS report dated October 2017 CORPORATE PRESENTATION • PAGE •
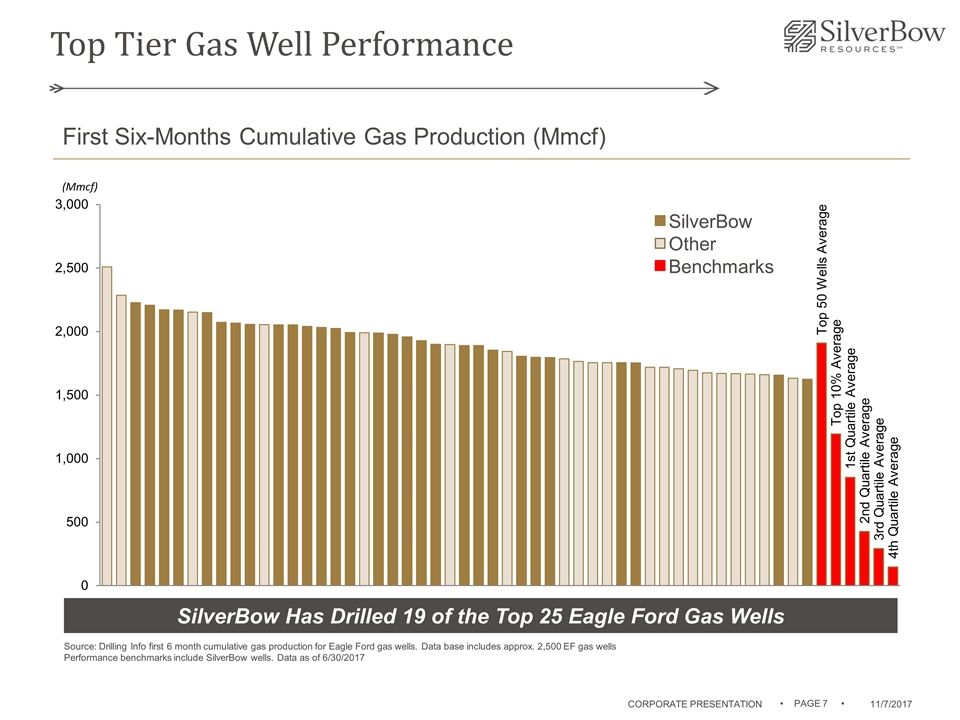
Top Tier Gas Well Performance SilverBow Other Benchmarks First Six-Months Cumulative Gas Production (Mmcf) SilverBow Has Drilled 19 of the Top 25 Eagle Ford Gas Wells Source: Drilling Info first 6 month cumulative gas production for Eagle Ford gas wells. Data base includes approx. 2,500 EF gas wells Performance benchmarks include SilverBow wells. Data as of 6/30/2017 CORPORATE PRESENTATION • PAGE •
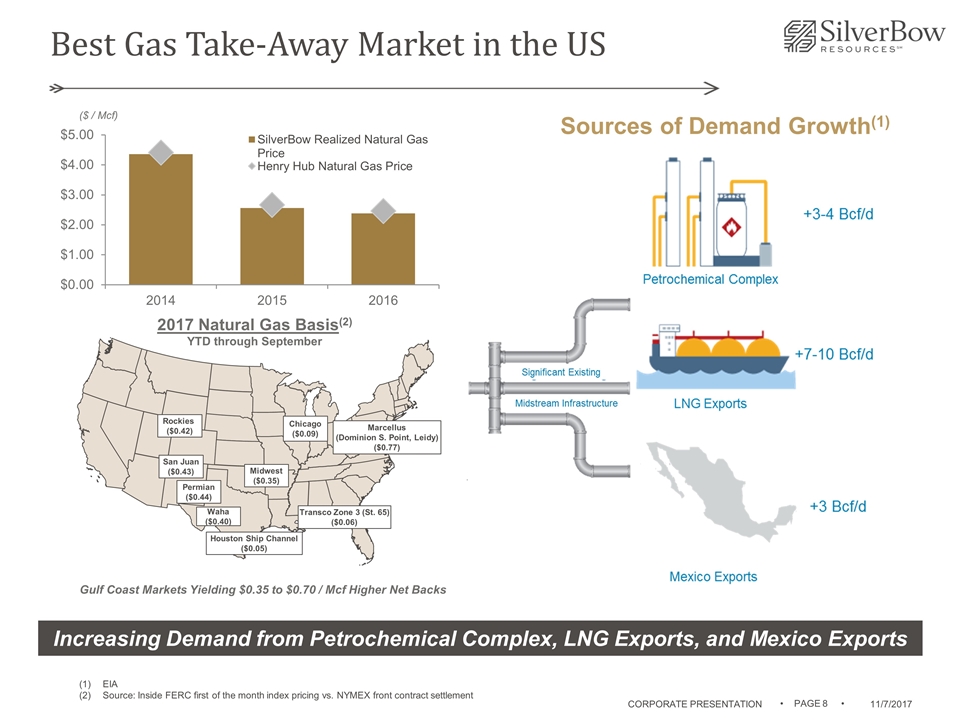
EIA Source: Inside FERC first of the month index pricing vs. NYMEX front contract settlement Increasing Demand from Petrochemical Complex, LNG Exports, and Mexico Exports ($ / Mcf) Sources of Demand Growth(1) Best Gas Take-Away Market in the US 2017 Natural Gas Basis(2) YTD through September Rockies ($0.42) San Juan ($0.43) Permian ($0.44) Waha ($0.40) Midwest ($0.35) Houston Ship Channel ($0.05) Transco Zone 3 (St. 65) ($0.06) Chicago ($0.09) Marcellus (Dominion S. Point, Leidy) ($0.77) Gulf Coast Markets Yielding $0.35 to $0.70 / Mcf Higher Net Backs CORPORATE PRESENTATION • PAGE •
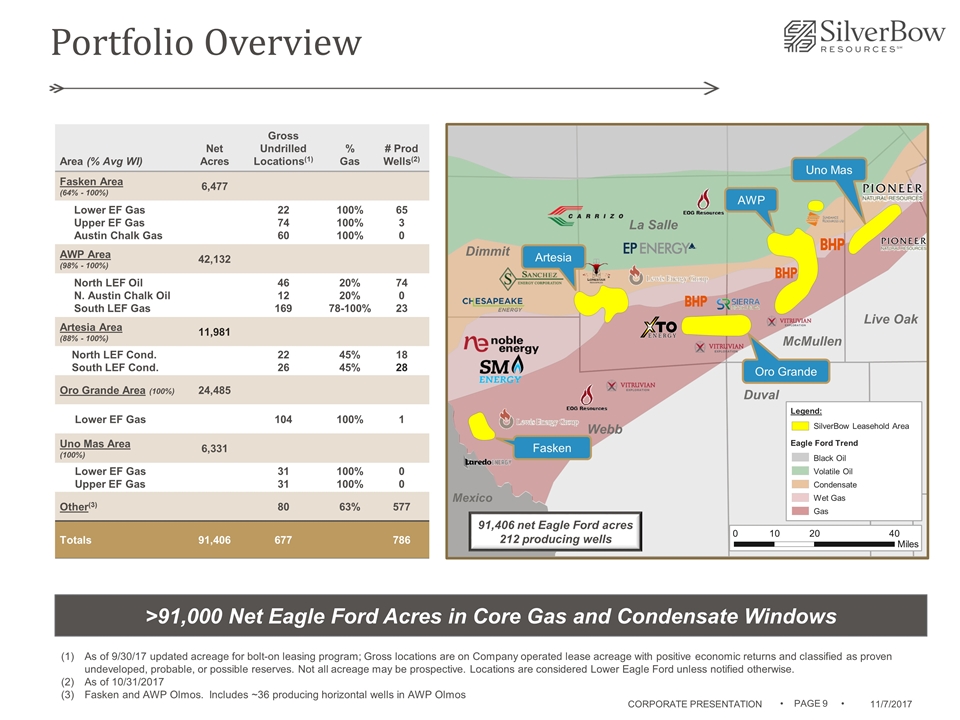
Portfolio Overview Area (% Avg WI) Net Acres Gross Undrilled Locations(1) % Gas # Prod Wells(2) Fasken Area (64% - 100%) 6,477 Lower EF Gas Upper EF Gas Austin Chalk Gas 22 74 60 100% 100% 100% 65 3 0 AWP Area (98% - 100%) 42,132 North LEF Oil N. Austin Chalk Oil South LEF Gas 46 12 169 20% 20% 78-100% 74 0 23 Artesia Area (88% - 100%) 11,981 North LEF Cond. South LEF Cond. 22 26 45% 45% 18 28 Oro Grande Area (100%) 24,485 Lower EF Gas 104 100% 1 Uno Mas Area (100%) 6,331 Lower EF Gas Upper EF Gas 31 31 100% 100% 0 0 Other(3) 80 63% 577 Totals 91,406 677 786 As of 9/30/17 updated acreage for bolt-on leasing program; Gross locations are on Company operated lease acreage with positive economic returns and classified as proven undeveloped, probable, or possible reserves. Not all acreage may be prospective. Locations are considered Lower Eagle Ford unless notified otherwise. As of 10/31/2017 Fasken and AWP Olmos. Includes ~36 producing horizontal wells in AWP Olmos SBOW Acreage >91,000 Net Eagle Ford Acres in Core Gas and Condensate Windows 91,406 net Eagle Ford acres 208 producing wells Fasken Artesia AWP Uno Mas Oro Grande SBOW Acreage Legend: SilverBow Leasehold Area Eagle Ford Trend Black Oil Volatile Oil Condensate Wet Gas Gas 0 10 20 40 Miles Dimmit Webb Duval Live Oak McMullen La Salle Mexico 91,406 net Eagle Ford acres 212 producing wells CORPORATE PRESENTATION • PAGE •
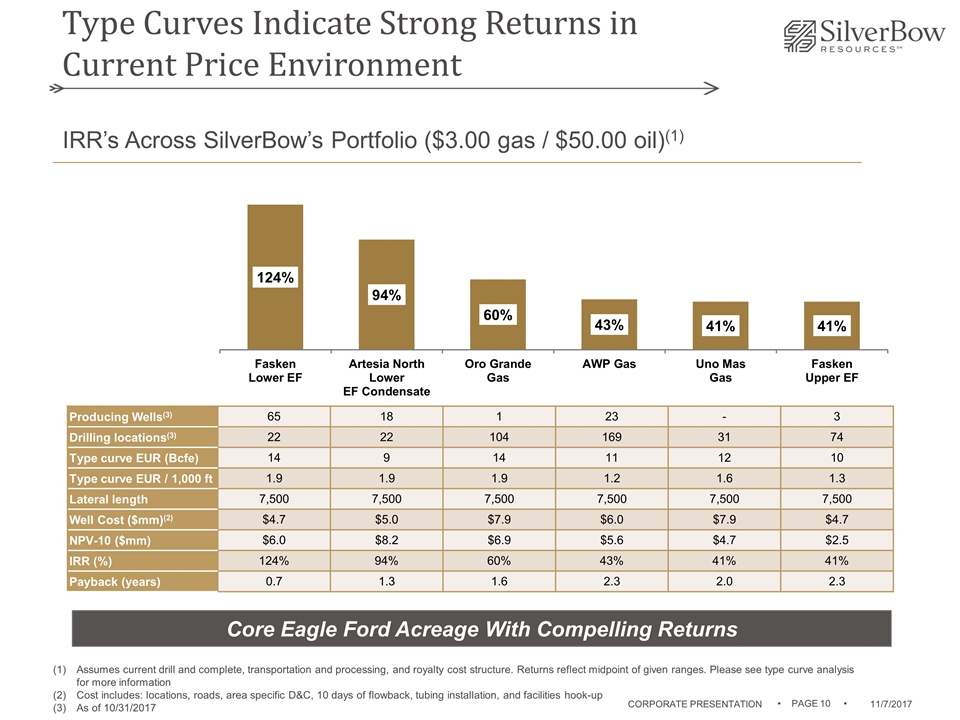
Type Curves Indicate Strong Returns in Current Price Environment Producing Wells(3) 65 18 1 23 - 3 Drilling locations(3) 22 22 104 169 31 74 Type curve EUR (Bcfe) 14 9 14 11 12 10 Type curve EUR / 1,000 ft 1.9 1.9 1.9 1.2 1.6 1.3 Lateral length 7,500 7,500 7,500 7,500 7,500 7,500 Well Cost ($mm)(2) $4.7 $5.0 $7.9 $6.0 $7.9 $4.7 NPV-10 ($mm) $6.0 $8.2 $6.9 $5.6 $4.7 $2.5 IRR (%) 124% 94% 60% 43% 41% 41% Payback (years) 0.7 1.3 1.6 2.3 2.0 2.3 Core Eagle Ford Acreage With Compelling Returns IRR’s Across SilverBow’s Portfolio ($3.00 gas / $50.00 oil)(1) Assumes current drill and complete, transportation and processing, and royalty cost structure. Returns reflect midpoint of given ranges. Please see type curve analysis for more information Cost includes: locations, roads, area specific D&C, 10 days of flowback, tubing installation, and facilities hook-up As of 10/31/2017 CORPORATE PRESENTATION • PAGE •
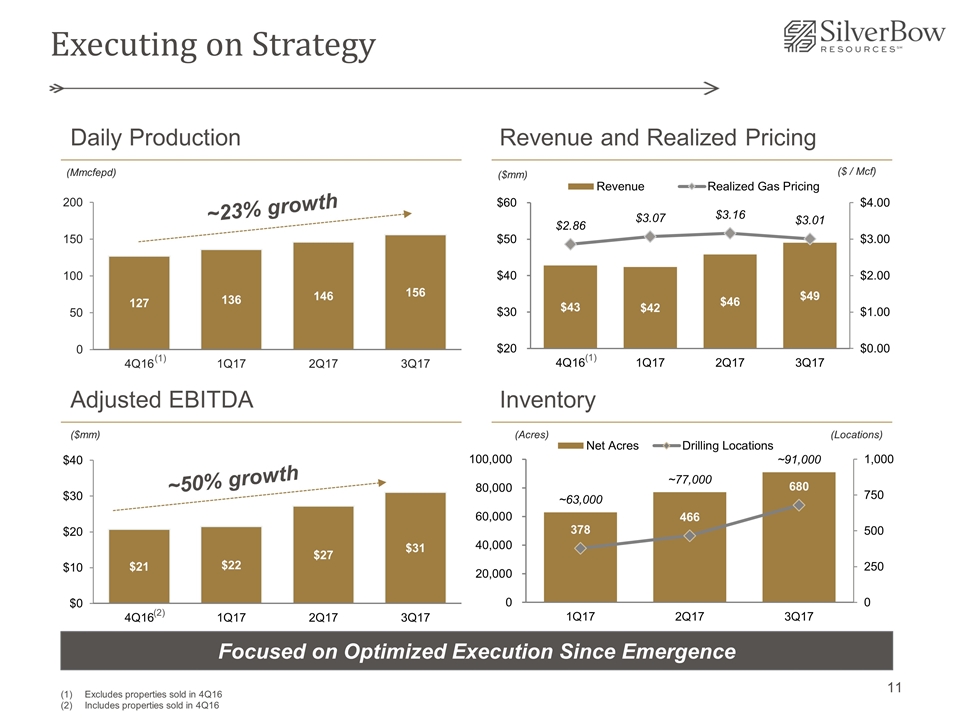
Executing on Strategy Daily Production Adjusted EBITDA Revenue and Realized Pricing (Mmcfepd) ($mm) ($ / Mcf) ~23% growth Focused on Optimized Execution Since Emergence Inventory (Locations) ($mm) (Acres) Excludes properties sold in 4Q16 Includes properties sold in 4Q16 ~50% growth (1) (1) (2)
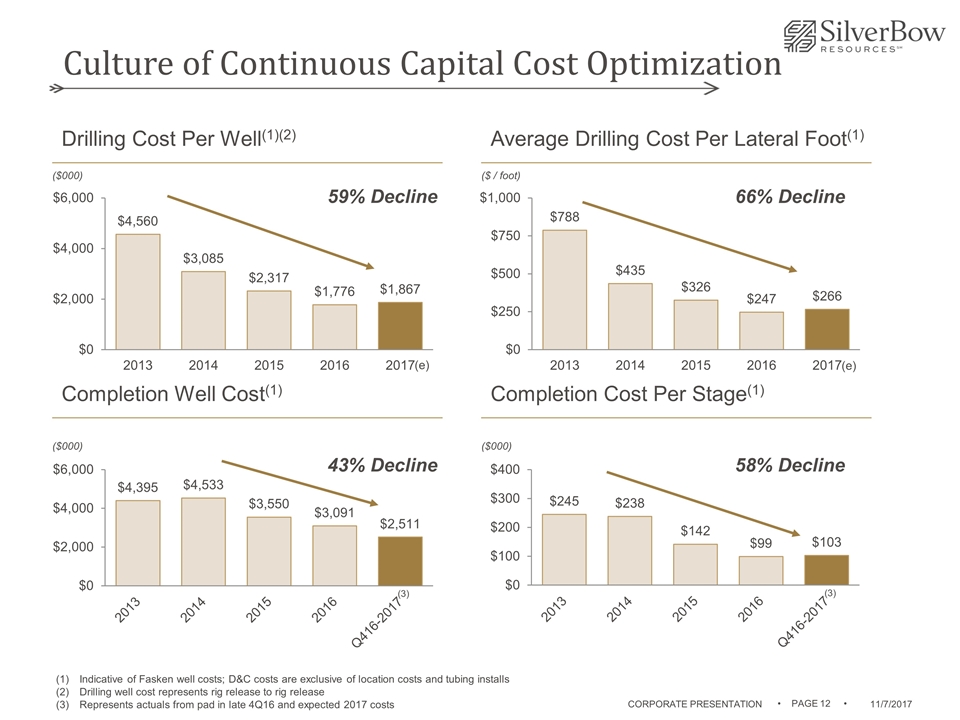
Culture of Continuous Capital Cost Optimization (e) 59% Decline 43% Decline 58% Decline Drilling Cost Per Well(1)(2) Average Drilling Cost Per Lateral Foot(1) ($000) ($ / foot) Completion Well Cost(1) ($000) ($000) Completion Cost Per Stage(1) Indicative of Fasken well costs; D&C costs are exclusive of location costs and tubing installs Drilling well cost represents rig release to rig release Represents actuals from pad in late 4Q16 and expected 2017 costs (e) 66% Decline CORPORATE PRESENTATION • PAGE • (3) (3)
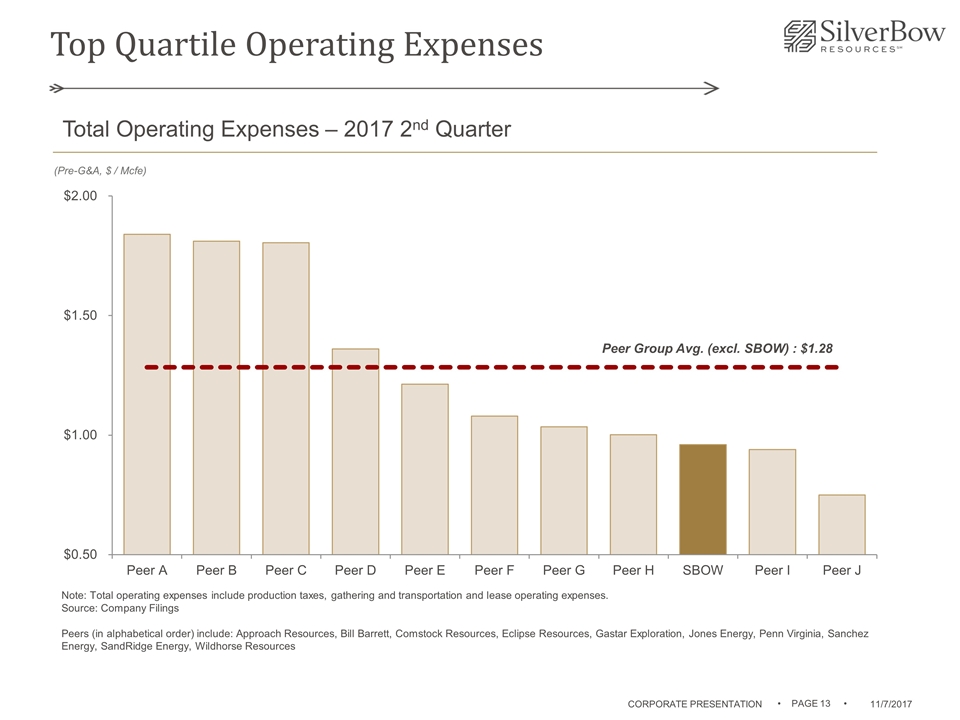
Top Quartile Operating Expenses Total Operating Expenses – 2017 2nd Quarter Note: Total operating expenses include production taxes, gathering and transportation and lease operating expenses. Source: Company Filings Peers (in alphabetical order) include: Approach Resources, Bill Barrett, Comstock Resources, Eclipse Resources, Gastar Exploration, Jones Energy, Penn Virginia, Sanchez Energy, SandRidge Energy, Wildhorse Resources Peer Group Avg. (excl. SBOW) : $1.28 (Pre-G&A, $ / Mcfe) CORPORATE PRESENTATION • PAGE •
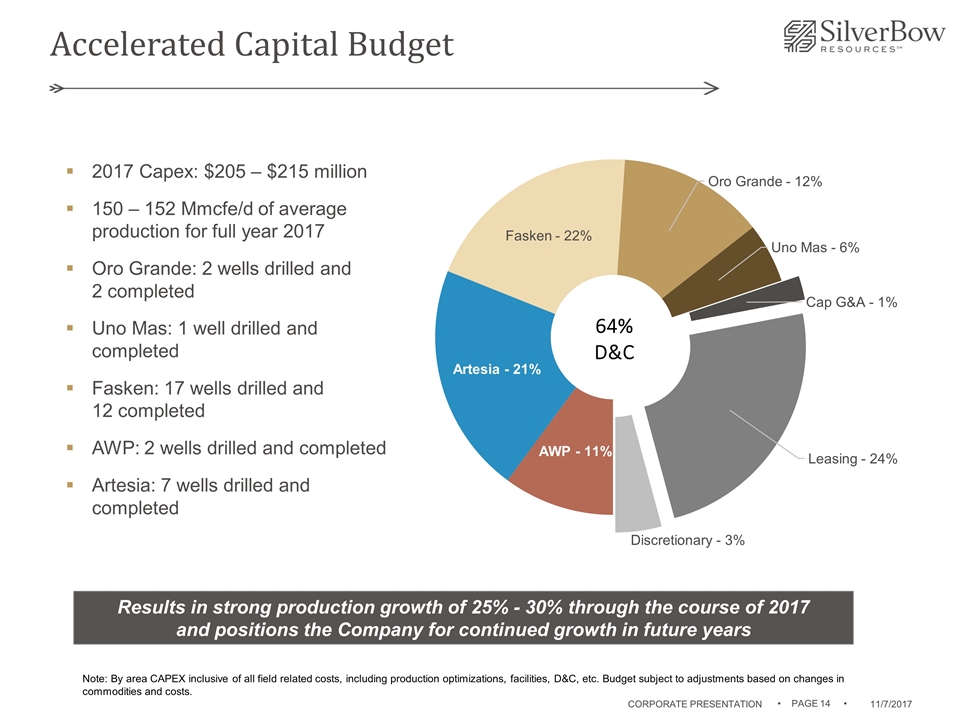
Accelerated Capital Budget Note: By area CAPEX inclusive of all field related costs, including production optimizations, facilities, D&C, etc. Budget subject to adjustments based on changes in commodities and costs. Results in strong production growth of 25% - 30% through the course of 2017 and positions the Company for continued growth in future years 64% D&C 2017 Capex: $205 – $215 million 150 – 152 Mmcfe/d of average production for full year 2017 Oro Grande: 2 wells drilled and 2 completed Uno Mas: 1 well drilled and completed Fasken: 17 wells drilled and 12 completed AWP: 2 wells drilled and completed Artesia: 7 wells drilled and completed CORPORATE PRESENTATION • PAGE •
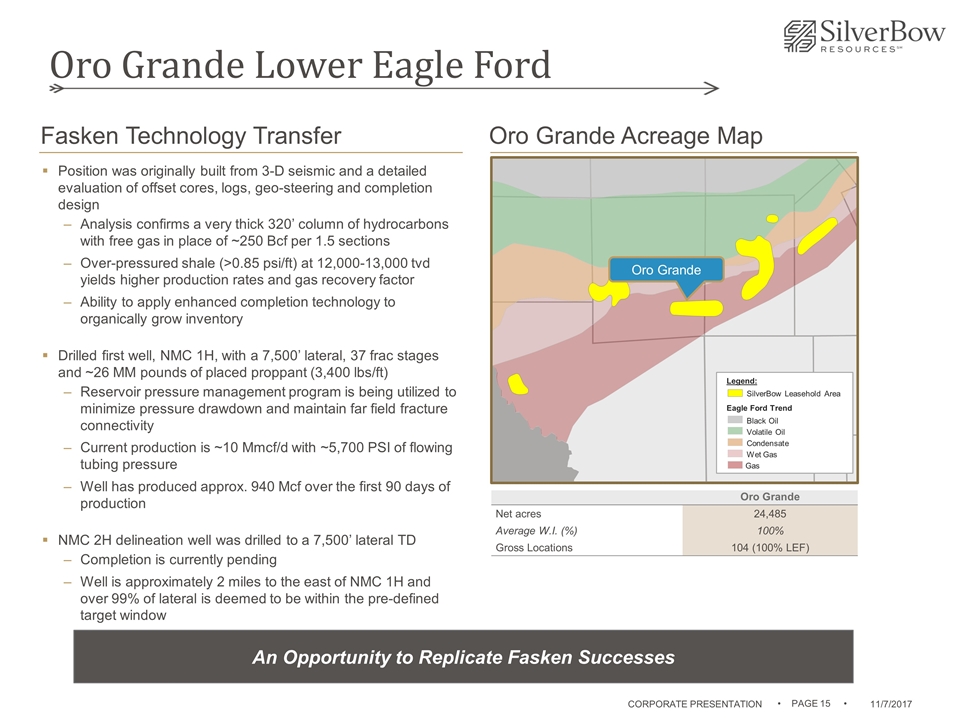
Oro Grande Lower Eagle Ford Fasken Technology Transfer Position was originally built from 3-D seismic and a detailed evaluation of offset cores, logs, geo-steering and completion design Analysis confirms a very thick 320’ column of hydrocarbons with free gas in place of ~250 Bcf per 1.5 sections Over-pressured shale (>0.85 psi/ft) at 12,000-13,000 tvd yields higher production rates and gas recovery factor Ability to apply enhanced completion technology to organically grow inventory Drilled first well, NMC 1H, with a 7,500’ lateral, 37 frac stages and ~26 MM pounds of placed proppant (3,400 lbs/ft) Reservoir pressure management program is being utilized to minimize pressure drawdown and maintain far field fracture connectivity Current production is ~10 Mmcf/d with ~5,700 PSI of flowing tubing pressure Well has produced approx. 940 Mcf over the first 90 days of production NMC 2H delineation well was drilled to a 7,500’ lateral TD Completion is currently pending Well is approximately 2 miles to the east of NMC 1H and over 99% of lateral is deemed to be within the pre-defined target window Oro Grande Acreage Map Legend: SilverBow Leasehold Area Eagle Ford Trend Black Oil Volatile Oil Condensate Wet Gas Gas Oro Grande Net acres 24,485 Average W.I. (%) 100% Gross Locations 104 (100% LEF) Oro Grande An Opportunity to Replicate Fasken Successes CORPORATE PRESENTATION • PAGE •
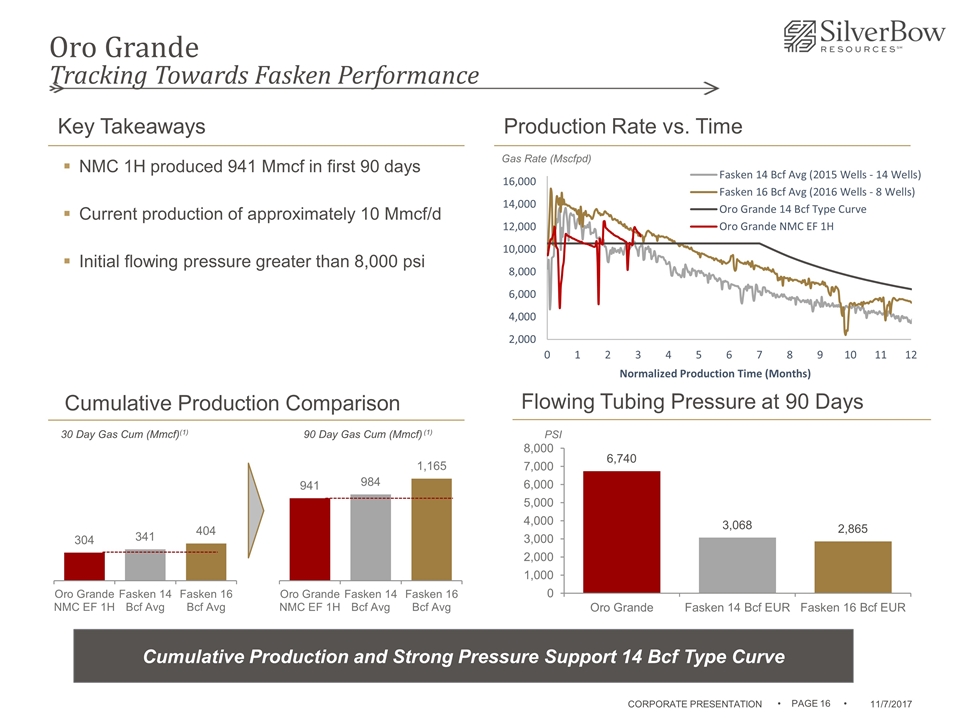
Oro Grande Tracking Towards Fasken Performance 30 Day Gas Cum (Mmcf)(1) 90 Day Gas Cum (Mmcf) (1) Cumulative Production Comparison Production Rate vs. Time Flowing Tubing Pressure at 90 Days NMC 1H produced 941 Mmcf in first 90 days Current production of approximately 10 Mmcf/d Initial flowing pressure greater than 8,000 psi Key Takeaways Gas Rate (Mscfpd) PSI Cumulative Production and Strong Pressure Support 14 Bcf Type Curve CORPORATE PRESENTATION • PAGE •
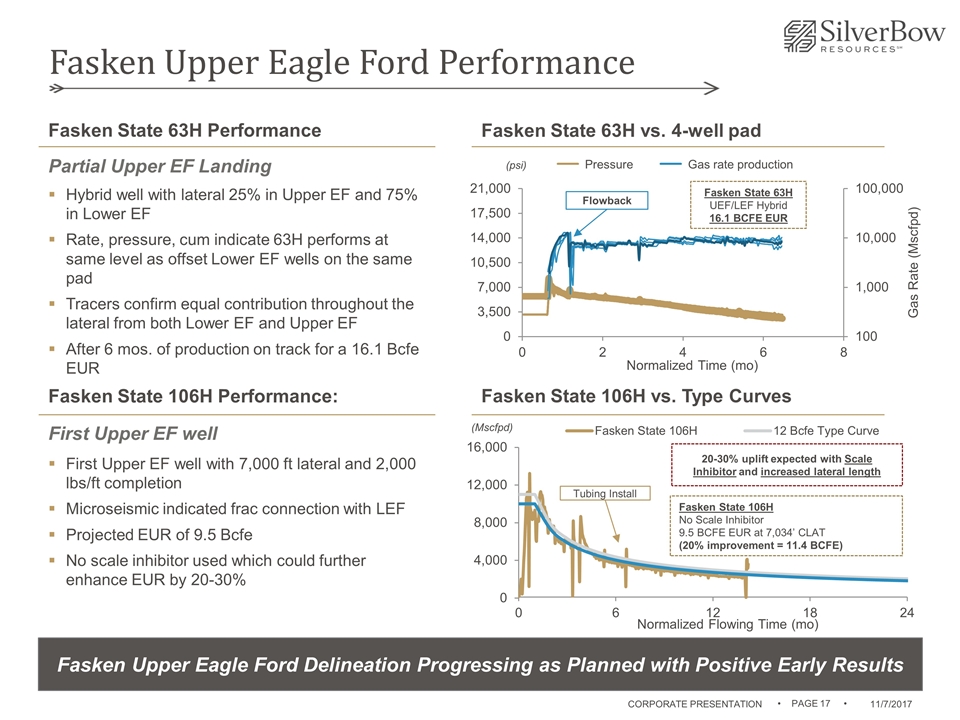
Fasken Upper Eagle Ford Performance Fasken State 63H vs. 4-well pad Fasken State 63H UEF/LEF Hybrid 16.1 BCFE EUR Flowback Gas rate production Pressure Hybrid well with lateral 25% in Upper EF and 75% in Lower EF Rate, pressure, cum indicate 63H performs at same level as offset Lower EF wells on the same pad Tracers confirm equal contribution throughout the lateral from both Lower EF and Upper EF After 6 mos. of production on track for a 16.1 Bcfe EUR Fasken State 63H Performance Fasken State 106H vs. Type Curves Rate vs. Time (psi) (Mscfpd) 20-30% uplift expected with Scale Inhibitor and increased lateral length Fasken State 106H No Scale Inhibitor 9.5 BCFE EUR at 7,034’ CLAT (20% improvement = 11.4 BCFE) Tubing Install Fasken State 106H Performance: First Upper EF well with 7,000 ft lateral and 2,000 lbs/ft completion Microseismic indicated frac connection with LEF Projected EUR of 9.5 Bcfe No scale inhibitor used which could further enhance EUR by 20-30% Partial Upper EF Landing First Upper EF well Fasken Upper Eagle Ford Delineation Progressing as Planned with Positive Early Results CORPORATE PRESENTATION • PAGE •
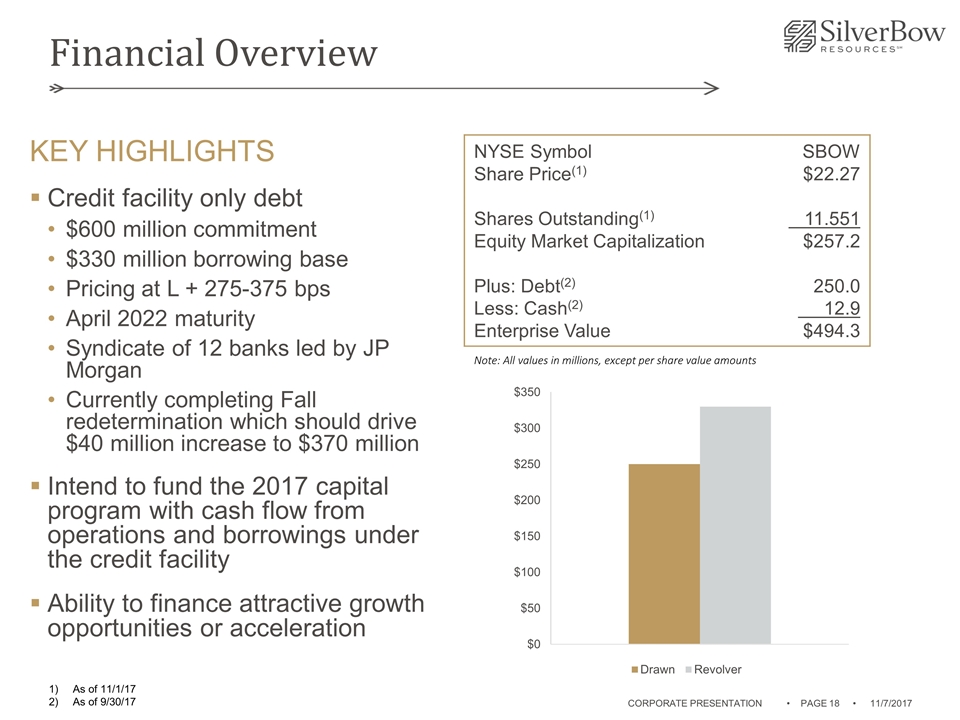
$250MM Conforming ~$172MM Outstanding NYSE Symbol Share Price(1) Shares Outstanding(1) Equity Market Capitalization Plus: Debt(2) Less: Cash(2) Enterprise Value SBOW $22.27 11.551 $257.2 250.0 12.9 $494.3 As of 11/1/17 As of 9/30/17 Note: All values in millions, except per share value amounts KEY HIGHLIGHTS Credit facility only debt $600 million commitment $330 million borrowing base Pricing at L + 275-375 bps April 2022 maturity Syndicate of 12 banks led by JP Morgan Currently completing Fall redetermination which should drive $40 million increase to $370 million Intend to fund the 2017 capital program with cash flow from operations and borrowings under the credit facility Ability to finance attractive growth opportunities or acceleration CORPORATE PRESENTATION • PAGE • Financial Overview
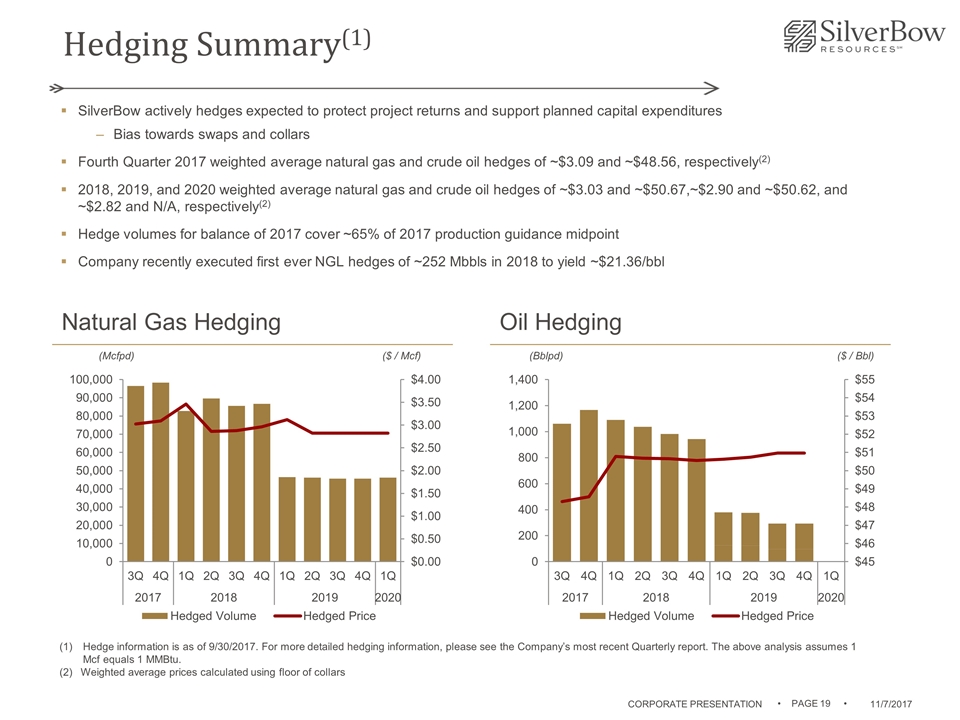
Hedging Summary(1) Hedge information is as of 9/30/2017. For more detailed hedging information, please see the Company’s most recent Quarterly report. The above analysis assumes 1 Mcf equals 1 MMBtu. Weighted average prices calculated using floor of collars SilverBow actively hedges expected to protect project returns and support planned capital expenditures Bias towards swaps and collars Fourth Quarter 2017 weighted average natural gas and crude oil hedges of ~$3.09 and ~$48.56, respectively(2) 2018, 2019, and 2020 weighted average natural gas and crude oil hedges of ~$3.03 and ~$50.67,~$2.90 and ~$50.62, and ~$2.82 and N/A, respectively(2) Hedge volumes for balance of 2017 cover ~65% of 2017 production guidance midpoint Company recently executed first ever NGL hedges of ~252 Mbbls in 2018 to yield ~$21.36/bbl Natural Gas Hedging Oil Hedging (Mcfpd) ($ / Mcf) (Bblpd) ($ / Bbl) CORPORATE PRESENTATION • PAGE •
Why Invest in SilverBow Resources? Pure Play Eagle Ford Operator with Premier Record of Drilling Gas Wells Best Gas Take-Away Market in USA Strong Balance Sheet, Low Cost Structure, and Favorable Midstream Contracts Positioned as Low Cost Operator with Strong Margins Strong Production and EBITDA growth Over 20 years of drilling inventory at current rig pace Currently Trading at Attractive Valuation Relative to Strip PV10 with Further Upside From: Fasken Upper Eagle Ford Oro Grande – successful proof of concept well Uno Mas – drilling first well in 4Q17 Organic Leasing Opportunities Accretive Acquisition Opportunities CORPORATE PRESENTATION • PAGE • Value and Growth Investment Opportunity
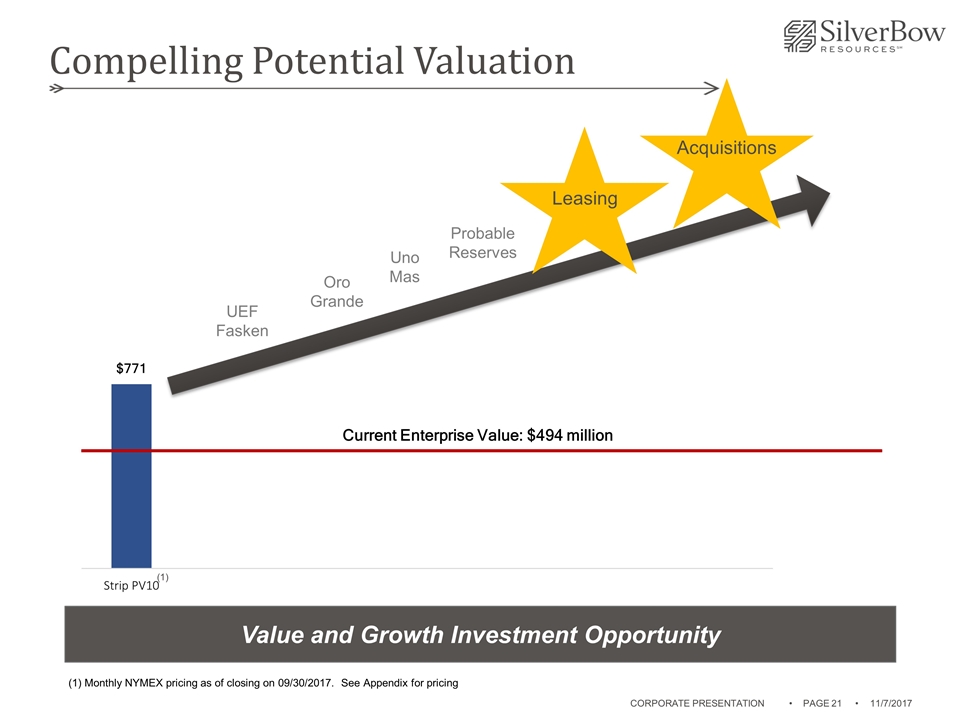
Compelling Potential Valuation UEF Fasken Oro Grande Uno Mas Probable Reserves (1) Monthly NYMEX pricing as of closing on 09/30/2017. See Appendix for pricing Leasing Acquisitions CORPORATE PRESENTATION • PAGE • Value and Growth Investment Opportunity (1)
Financial Summary CORPORATE PRESENTATION • PAGE •
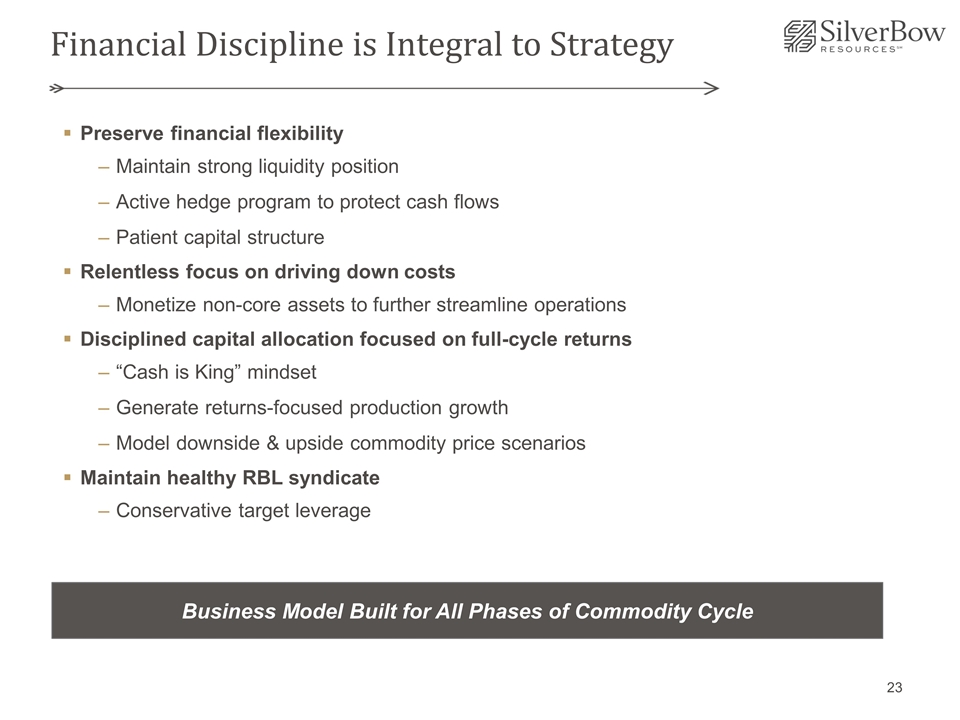
Preserve financial flexibility Maintain strong liquidity position Active hedge program to protect cash flows Patient capital structure Relentless focus on driving down costs Monetize non-core assets to further streamline operations Disciplined capital allocation focused on full-cycle returns “Cash is King” mindset Generate returns-focused production growth Model downside & upside commodity price scenarios Maintain healthy RBL syndicate Conservative target leverage Business Model Built for All Phases of Commodity Cycle Financial Discipline is Integral to Strategy
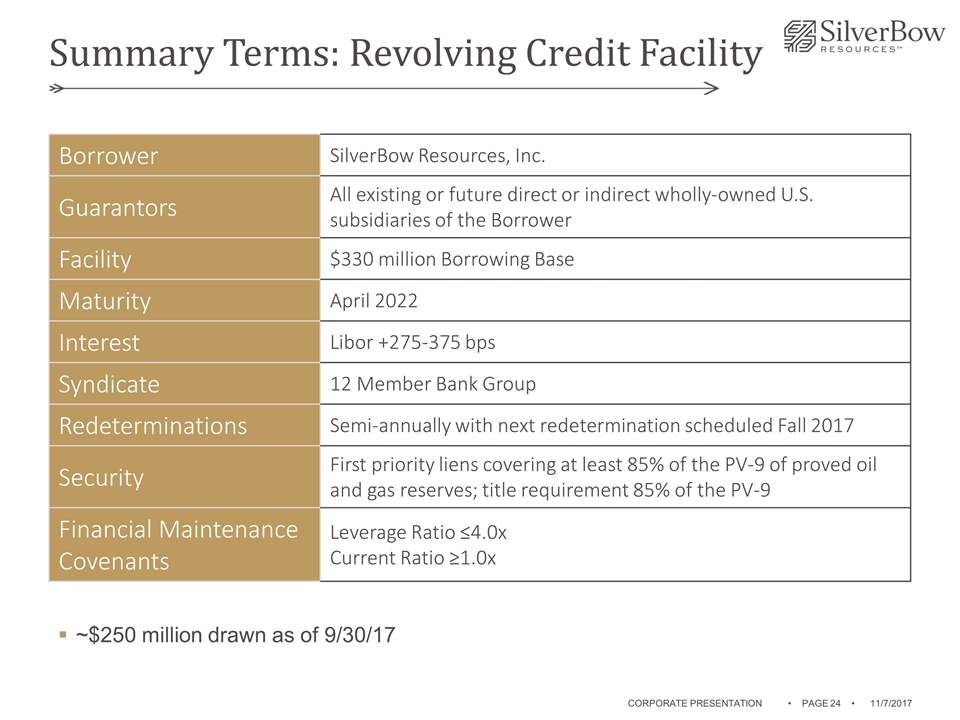
Borrower SilverBow Resources, Inc. Guarantors All existing or future direct or indirect wholly-owned U.S. subsidiaries of the Borrower Facility $330 million Borrowing Base Maturity April 2022 Interest Libor +275-375 bps Syndicate 12 Member Bank Group Redeterminations Semi-annually with next redetermination scheduled Fall 2017 Security First priority liens covering at least 85% of the PV-9 of proved oil and gas reserves; title requirement 85% of the PV-9 Financial Maintenance Covenants Leverage Ratio ≤4.0x Current Ratio ≥1.0x ~$250 million drawn as of 9/30/17 CORPORATE PRESENTATION • PAGE • Summary Terms: Revolving Credit Facility
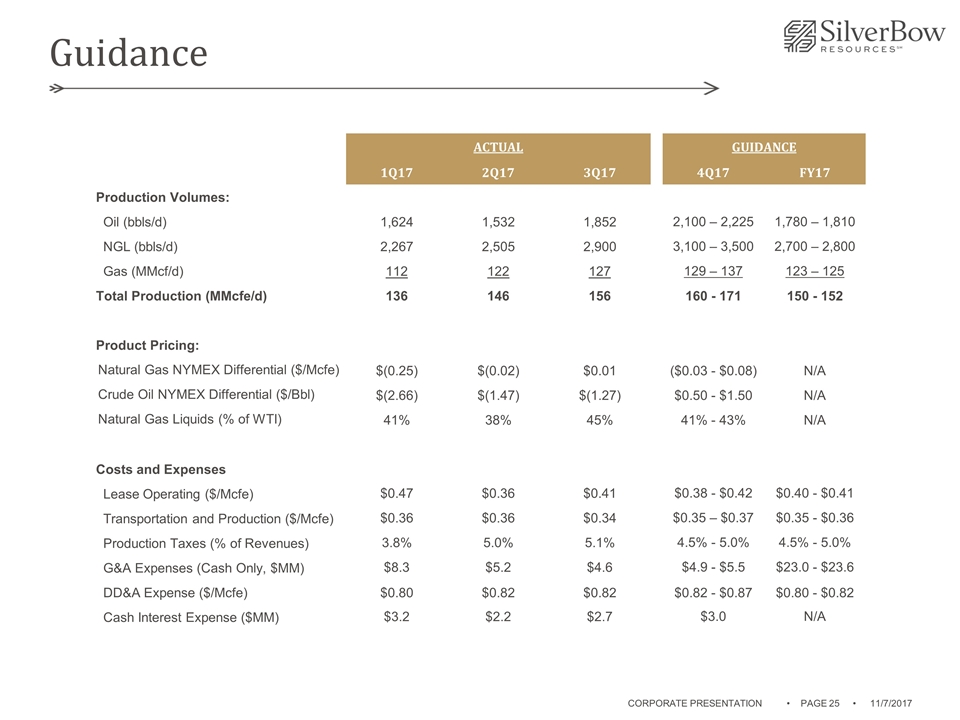
ACTUAL GUIDANCE 1Q17 2Q17 3Q17 4Q17 FY17 Production Volumes: Oil (bbls/d) 1,624 1,532 1,852 2,100 – 2,225 1,780 – 1,810 NGL (bbls/d) 2,267 2,505 2,900 3,100 – 3,500 2,700 – 2,800 Gas (MMcf/d) 112 122 127 129 – 137 123 – 125 Total Production (MMcfe/d) 136 146 156 160 - 171 150 - 152 Product Pricing: Natural Gas NYMEX Differential ($/Mcfe) $(0.25) $(0.02) $0.01 ($0.03 - $0.08) N/A Crude Oil NYMEX Differential ($/Bbl) $(2.66) $(1.47) $(1.27) $0.50 - $1.50 N/A Natural Gas Liquids (% of WTI) 41% 38% 45% 41% - 43% N/A Costs and Expenses Lease Operating ($/Mcfe) $0.47 $0.36 $0.41 $0.38 - $0.42 $0.40 - $0.41 Transportation and Production ($/Mcfe) $0.36 $0.36 $0.34 $0.35 – $0.37 $0.35 - $0.36 Production Taxes (% of Revenues) 3.8% 5.0% 5.1% 4.5% - 5.0% 4.5% - 5.0% G&A Expenses (Cash Only, $MM) $8.3 $5.2 $4.6 $4.9 - $5.5 $23.0 - $23.6 DD&A Expense ($/Mcfe) $0.80 $0.82 $0.82 $0.82 - $0.87 $0.80 - $0.82 Cash Interest Expense ($MM) $3.2 $2.2 $2.7 $3.0 N/A Guidance CORPORATE PRESENTATION • PAGE •
Appendix CORPORATE PRESENTATION • PAGE •
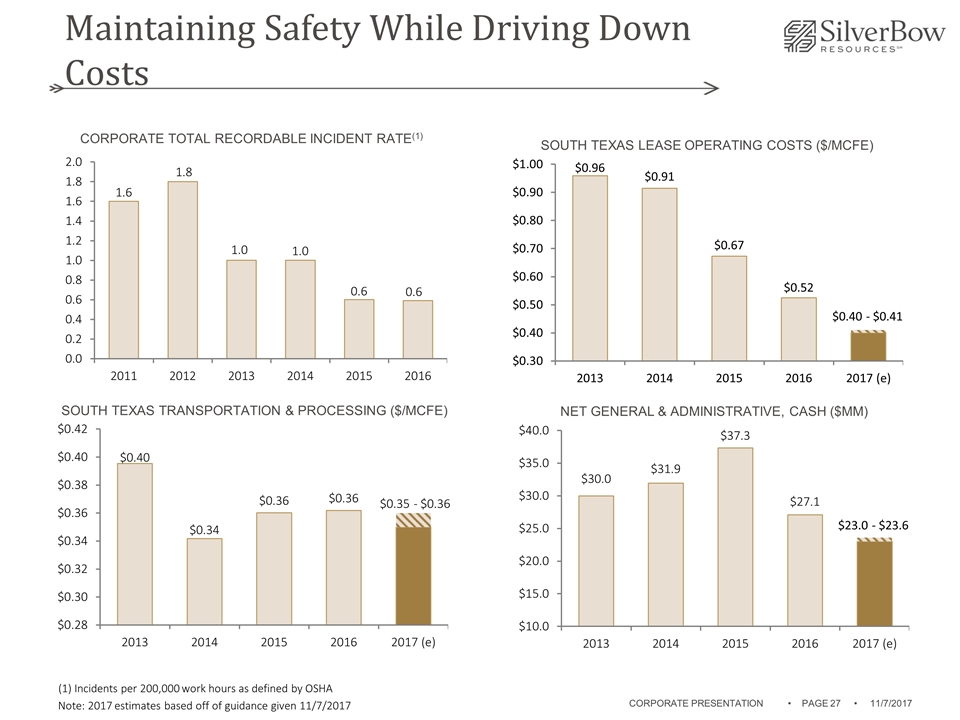
South Texas Lease operating costs ($/Mcfe) Net General & administrative, Cash ($MM) South Texas Transportation & processing ($/McfE) Note: 2017 estimates based off of guidance given 11/7/2017 Corporate total recordable incident rate(1) $0.35 - $0.36 $0.40 - $0.41 CORPORATE PRESENTATION • PAGE • Maintaining Safety While Driving Down Costs $23.0 - $23.6 (1) Incidents per 200,000 work hours as defined by OSHA
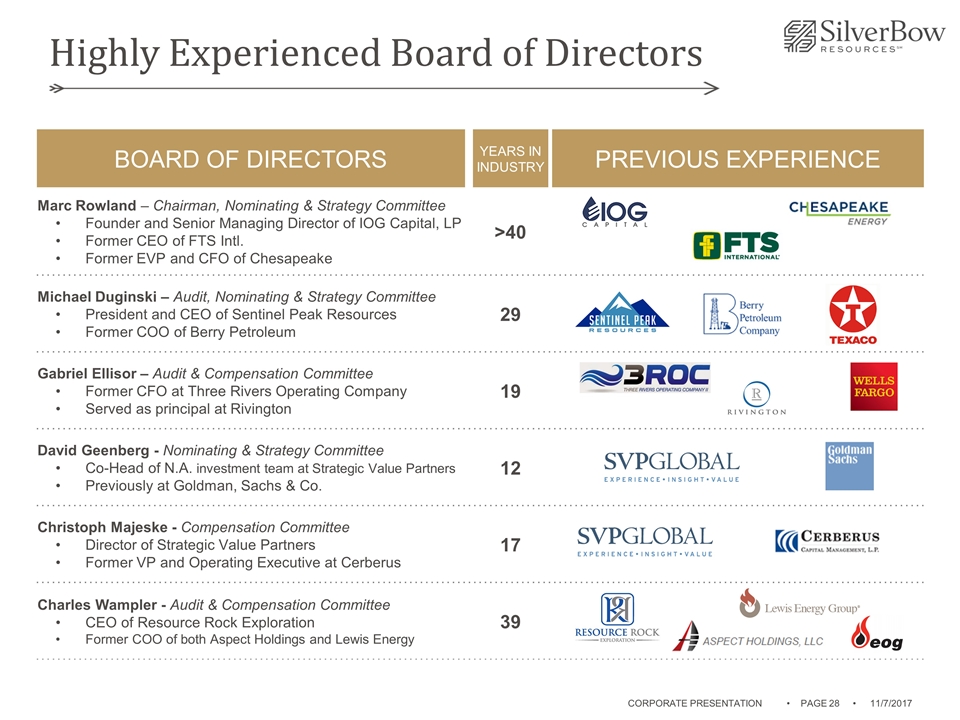
BOARD OF DIRECTORS YEARS IN INDUSTRY PREVIOUS EXPERIENCE Marc Rowland – Chairman, Nominating & Strategy Committee Founder and Senior Managing Director of IOG Capital, LP Former CEO of FTS Intl. Former EVP and CFO of Chesapeake >40 Michael Duginski – Audit, Nominating & Strategy Committee President and CEO of Sentinel Peak Resources Former COO of Berry Petroleum 29 Gabriel Ellisor – Audit & Compensation Committee Former CFO at Three Rivers Operating Company Served as principal at Rivington 19 David Geenberg - Nominating & Strategy Committee Co-Head of N.A. investment team at Strategic Value Partners Previously at Goldman, Sachs & Co. 12 Christoph Majeske - Compensation Committee Director of Strategic Value Partners Former VP and Operating Executive at Cerberus 17 Charles Wampler - Audit & Compensation Committee CEO of Resource Rock Exploration Former COO of both Aspect Holdings and Lewis Energy 39 Highly Experienced Board of Directors CORPORATE PRESENTATION • PAGE •
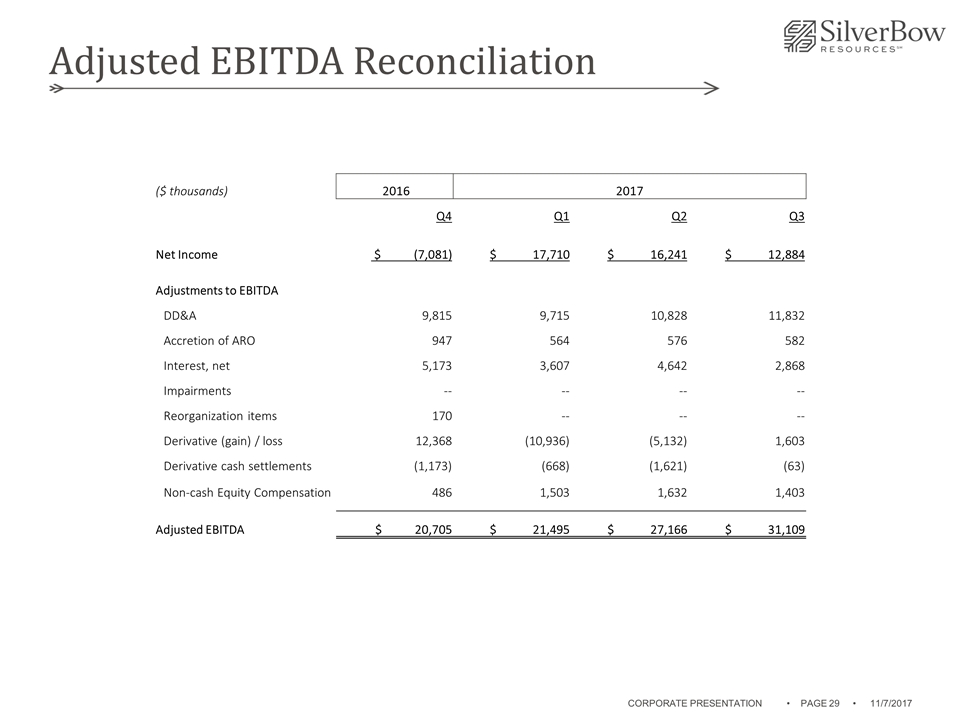
($ thousands) 2016 2017 Q4 Q1 Q2 Q3 Net Income $ (7,081) $ 17,710 $ 16,241 $ 12,884 Adjustments to EBITDA DD&A 9,815 9,715 10,828 11,832 Accretion of ARO 947 564 576 582 Interest, net 5,173 3,607 4,642 2,868 Impairments -- -- -- -- Reorganization items 170 -- -- -- Derivative (gain) / loss 12,368 (10,936) (5,132) 1,603 Derivative cash settlements (1,173) (668) (1,621) (63) Non-cash Equity Compensation 486 1,503 1,632 1,403 Adjusted EBITDA $ 20,705 $ 21,495 $ 27,166 $ 31,109 CORPORATE PRESENTATION • PAGE • Adjusted EBITDA Reconciliation
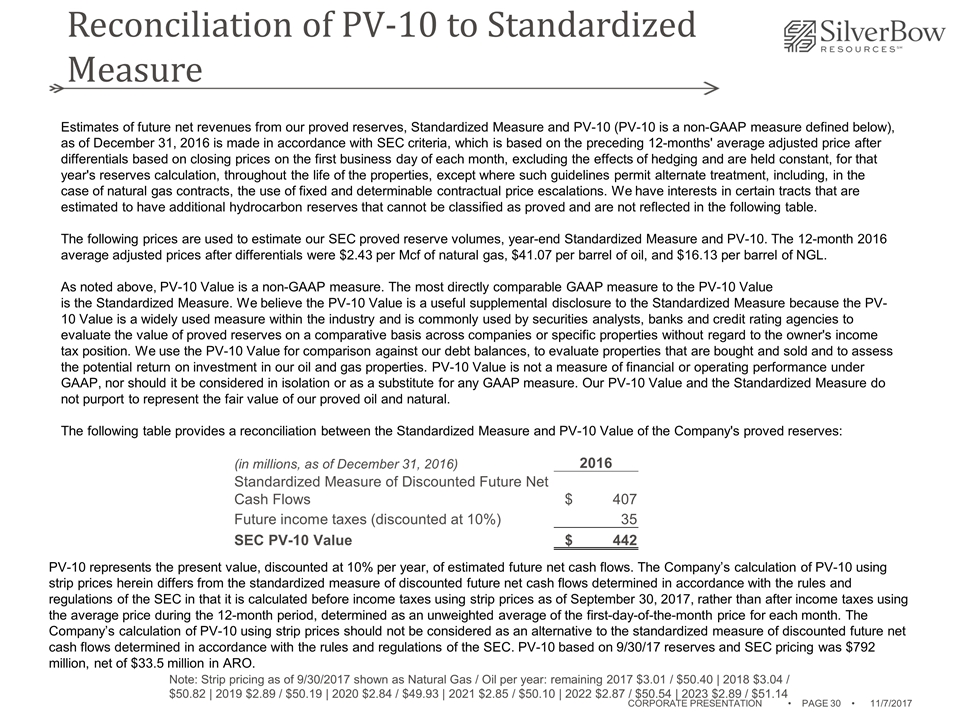
Estimates of future net revenues from our proved reserves, Standardized Measure and PV-10 (PV-10 is a non-GAAP measure defined below), as of December 31, 2016 is made in accordance with SEC criteria, which is based on the preceding 12-months' average adjusted price after differentials based on closing prices on the first business day of each month, excluding the effects of hedging and are held constant, for that year's reserves calculation, throughout the life of the properties, except where such guidelines permit alternate treatment, including, in the case of natural gas contracts, the use of fixed and determinable contractual price escalations. We have interests in certain tracts that are estimated to have additional hydrocarbon reserves that cannot be classified as proved and are not reflected in the following table. The following prices are used to estimate our SEC proved reserve volumes, year-end Standardized Measure and PV-10. The 12-month 2016 average adjusted prices after differentials were $2.43 per Mcf of natural gas, $41.07 per barrel of oil, and $16.13 per barrel of NGL. As noted above, PV-10 Value is a non-GAAP measure. The most directly comparable GAAP measure to the PV-10 Value is the Standardized Measure. We believe the PV-10 Value is a useful supplemental disclosure to the Standardized Measure because the PV-10 Value is a widely used measure within the industry and is commonly used by securities analysts, banks and credit rating agencies to evaluate the value of proved reserves on a comparative basis across companies or specific properties without regard to the owner's income tax position. We use the PV-10 Value for comparison against our debt balances, to evaluate properties that are bought and sold and to assess the potential return on investment in our oil and gas properties. PV-10 Value is not a measure of financial or operating performance under GAAP, nor should it be considered in isolation or as a substitute for any GAAP measure. Our PV-10 Value and the Standardized Measure do not purport to represent the fair value of our proved oil and natural. The following table provides a reconciliation between the Standardized Measure and PV-10 Value of the Company's proved reserves: (in millions, as of December 31, 2016) 2016 Standardized Measure of Discounted Future Net Cash Flows $ 407 Future income taxes (discounted at 10%) 35 SEC PV-10 Value $ 442 CORPORATE PRESENTATION • PAGE • Reconciliation of PV-10 to Standardized Measure PV-10 represents the present value, discounted at 10% per year, of estimated future net cash flows. The Company’s calculation of PV-10 using strip prices herein differs from the standardized measure of discounted future net cash flows determined in accordance with the rules and regulations of the SEC in that it is calculated before income taxes using strip prices as of September 30, 2017, rather than after income taxes using the average price during the 12-month period, determined as an unweighted average of the first-day-of-the-month price for each month. The Company’s calculation of PV-10 using strip prices should not be considered as an alternative to the standardized measure of discounted future net cash flows determined in accordance with the rules and regulations of the SEC. PV-10 based on 9/30/17 reserves and SEC pricing was $792 million, net of $33.5 million in ARO. Note: Strip pricing as of 9/30/2017 shown as Natural Gas / Oil per year: remaining 2017 $3.01 / $50.40 | 2018 $3.04 / $50.82 | 2019 $2.89 / $50.19 | 2020 $2.84 / $49.93 | 2021 $2.85 / $50.10 | 2022 $2.87 / $50.54 | 2023 $2.89 / $51.14
Type Curves CORPORATE PRESENTATION • PAGE •
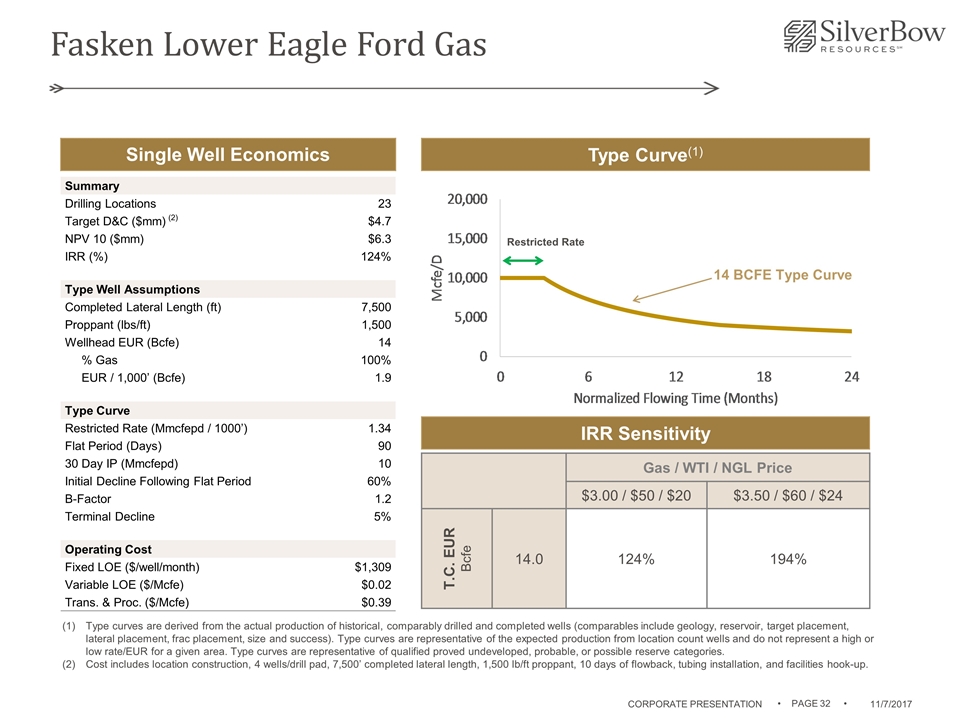
Fasken Lower Eagle Ford Gas Type Curve(1) Type curves are derived from the actual production of historical, comparably drilled and completed wells (comparables include geology, reservoir, target placement, lateral placement, frac placement, size and success). Type curves are representative of the expected production from location count wells and do not represent a high or low rate/EUR for a given area. Type curves are representative of qualified proved undeveloped, probable, or possible reserve categories. Cost includes location construction, 4 wells/drill pad, 7,500’ completed lateral length, 1,500 lb/ft proppant, 10 days of flowback, tubing installation, and facilities hook-up. Gas / WTI / NGL Price $3.00 / $50 / $20 $3.50 / $60 / $24 T.C. EUR Bcfe 14.0 124% 194% Restricted Rate 14 BCFE Type Curve Single Well Economics IRR Sensitivity Summary Drilling Locations 23 Target D&C ($mm) (2) $4.7 NPV 10 ($mm) $6.3 IRR (%) 124% Type Well Assumptions Completed Lateral Length (ft) 7,500 Proppant (lbs/ft) 1,500 Wellhead EUR (Bcfe) 14 % Gas 100% EUR / 1,000’ (Bcfe) 1.9 Type Curve Restricted Rate (Mmcfepd / 1000’) 1.34 Flat Period (Days) 90 30 Day IP (Mmcfepd) 10 Initial Decline Following Flat Period 60% B-Factor 1.2 Terminal Decline 5% Operating Cost Fixed LOE ($/well/month) $1,309 Variable LOE ($/Mcfe) $0.02 Trans. & Proc. ($/Mcfe) $0.39 CORPORATE PRESENTATION • PAGE •
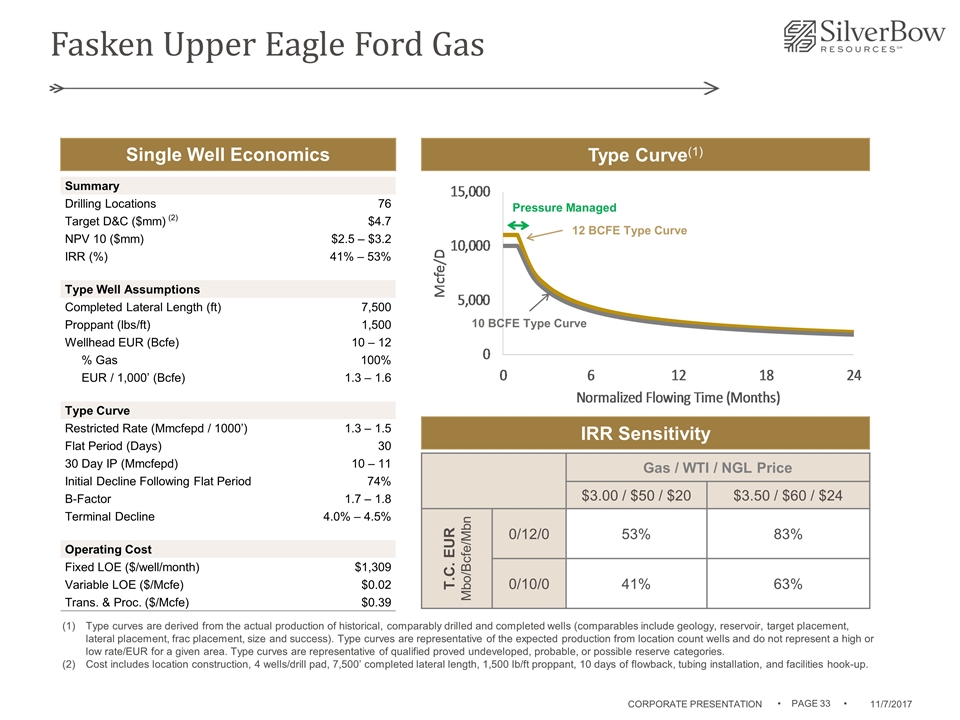
Fasken Upper Eagle Ford Gas Pressure Managed 10 BCFE Type Curve 12 BCFE Type Curve Type Curve(1) Single Well Economics IRR Sensitivity Summary Drilling Locations 76 Target D&C ($mm) (2) $4.7 NPV 10 ($mm) $2.5 – $3.2 IRR (%) 41% – 53% Type Well Assumptions Completed Lateral Length (ft) 7,500 Proppant (lbs/ft) 1,500 Wellhead EUR (Bcfe) 10 – 12 % Gas 100% EUR / 1,000’ (Bcfe) 1.3 – 1.6 Type Curve Restricted Rate (Mmcfepd / 1000’) 1.3 – 1.5 Flat Period (Days) 30 30 Day IP (Mmcfepd) 10 – 11 Initial Decline Following Flat Period 74% B-Factor 1.7 – 1.8 Terminal Decline 4.0% – 4.5% Operating Cost Fixed LOE ($/well/month) $1,309 Variable LOE ($/Mcfe) $0.02 Trans. & Proc. ($/Mcfe) $0.39 Type curves are derived from the actual production of historical, comparably drilled and completed wells (comparables include geology, reservoir, target placement, lateral placement, frac placement, size and success). Type curves are representative of the expected production from location count wells and do not represent a high or low rate/EUR for a given area. Type curves are representative of qualified proved undeveloped, probable, or possible reserve categories. Cost includes location construction, 4 wells/drill pad, 7,500’ completed lateral length, 1,500 lb/ft proppant, 10 days of flowback, tubing installation, and facilities hook-up. Gas / WTI / NGL Price $3.00 / $50 / $20 $3.50 / $60 / $24 T.C. EUR Mbo/Bcfe/Mbn 0/12/0 53% 83% 0/10/0 41% 63% CORPORATE PRESENTATION • PAGE •
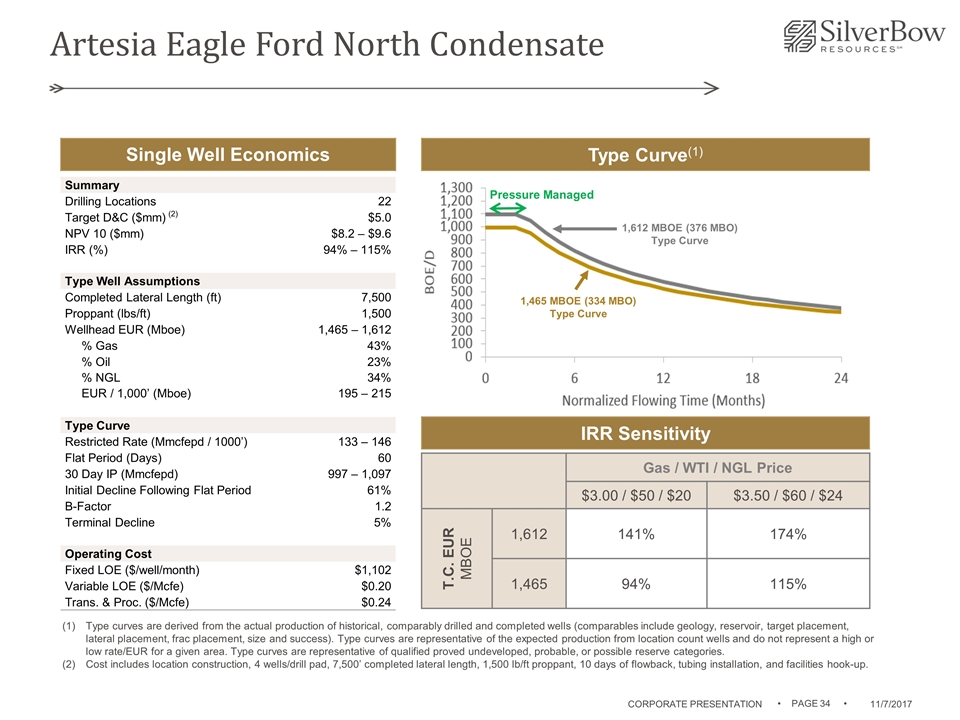
Artesia Eagle Ford North Condensate Pressure Managed 1,612 MBOE (376 MBO) Type Curve 1,465 MBOE (334 MBO) Type Curve Type Curve(1) Single Well Economics IRR Sensitivity Summary Drilling Locations 22 Target D&C ($mm) (2) $5.0 NPV 10 ($mm) $8.2 – $9.6 IRR (%) 94% – 115% Type Well Assumptions Completed Lateral Length (ft) 7,500 Proppant (lbs/ft) 1,500 Wellhead EUR (Mboe) 1,465 – 1,612 % Gas 43% % Oil 23% % NGL 34% EUR / 1,000’ (Mboe) 195 – 215 Type Curve Restricted Rate (Mmcfepd / 1000’) 133 – 146 Flat Period (Days) 60 30 Day IP (Mmcfepd) 997 – 1,097 Initial Decline Following Flat Period 61% B-Factor 1.2 Terminal Decline 5% Operating Cost Fixed LOE ($/well/month) $1,102 Variable LOE ($/Mcfe) $0.20 Trans. & Proc. ($/Mcfe) $0.24 Type curves are derived from the actual production of historical, comparably drilled and completed wells (comparables include geology, reservoir, target placement, lateral placement, frac placement, size and success). Type curves are representative of the expected production from location count wells and do not represent a high or low rate/EUR for a given area. Type curves are representative of qualified proved undeveloped, probable, or possible reserve categories. Cost includes location construction, 4 wells/drill pad, 7,500’ completed lateral length, 1,500 lb/ft proppant, 10 days of flowback, tubing installation, and facilities hook-up. Gas / WTI / NGL Price $3.00 / $50 / $20 $3.50 / $60 / $24 T.C. EUR MBOE 1,612 141% 174% 1,465 94% 115% CORPORATE PRESENTATION • PAGE •
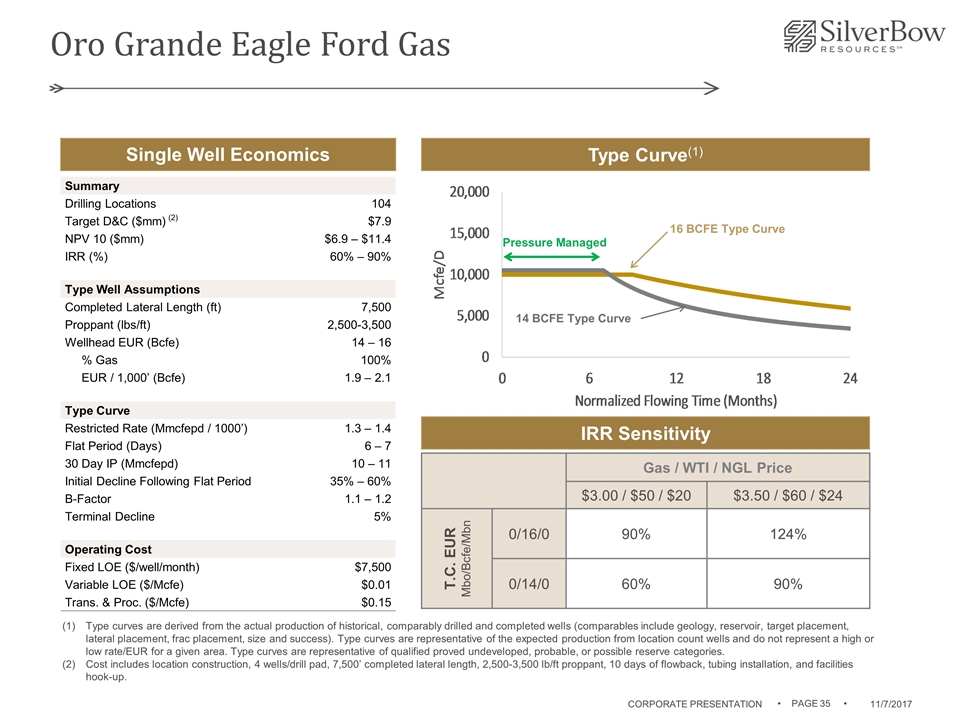
Pressure Managed 14 BCFE Type Curve 16 BCFE Type Curve Oro Grande Eagle Ford Gas Type Curve(1) Single Well Economics IRR Sensitivity Summary Drilling Locations 104 Target D&C ($mm) (2) $7.9 NPV 10 ($mm) $6.9 – $11.4 IRR (%) 60% – 90% Type Well Assumptions Completed Lateral Length (ft) 7,500 Proppant (lbs/ft) 2,500-3,500 Wellhead EUR (Bcfe) 14 – 16 % Gas 100% EUR / 1,000’ (Bcfe) 1.9 – 2.1 Type Curve Restricted Rate (Mmcfepd / 1000’) 1.3 – 1.4 Flat Period (Days) 6 – 7 30 Day IP (Mmcfepd) 10 – 11 Initial Decline Following Flat Period 35% – 60% B-Factor 1.1 – 1.2 Terminal Decline 5% Operating Cost Fixed LOE ($/well/month) $7,500 Variable LOE ($/Mcfe) $0.01 Trans. & Proc. ($/Mcfe) $0.15 Type curves are derived from the actual production of historical, comparably drilled and completed wells (comparables include geology, reservoir, target placement, lateral placement, frac placement, size and success). Type curves are representative of the expected production from location count wells and do not represent a high or low rate/EUR for a given area. Type curves are representative of qualified proved undeveloped, probable, or possible reserve categories. Cost includes location construction, 4 wells/drill pad, 7,500’ completed lateral length, 2,500-3,500 lb/ft proppant, 10 days of flowback, tubing installation, and facilities hook-up. Gas / WTI / NGL Price $3.00 / $50 / $20 $3.50 / $60 / $24 T.C. EUR Mbo/Bcfe/Mbn 0/16/0 90% 124% 0/14/0 60% 90% CORPORATE PRESENTATION • PAGE •
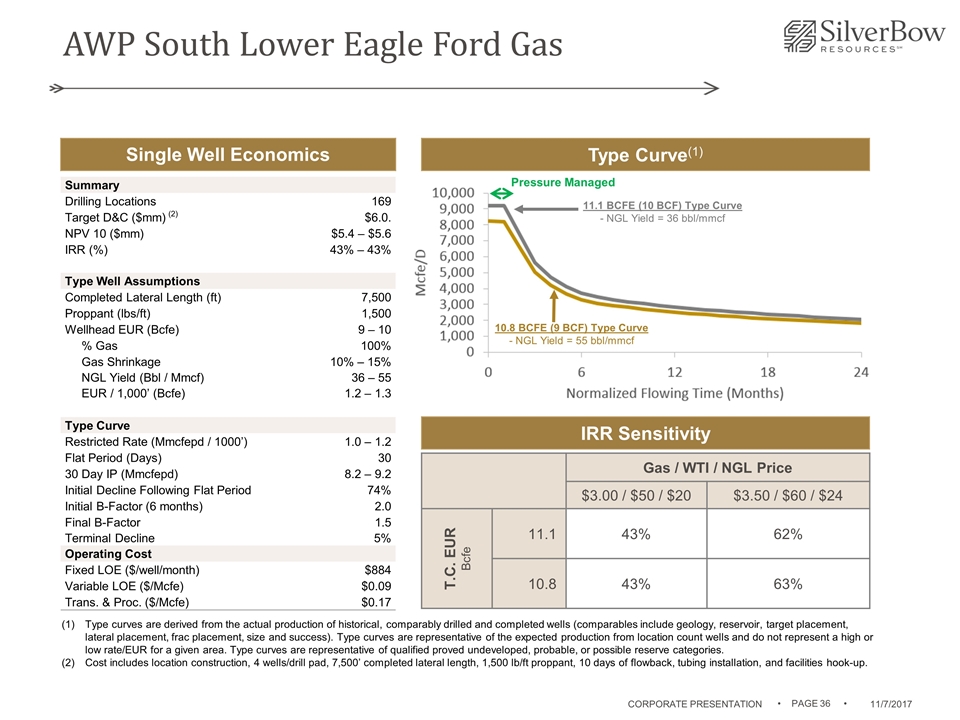
AWP South Lower Eagle Ford Gas Type curves are derived from the actual production of historical, comparably drilled and completed wells (comparables include geology, reservoir, target placement, lateral placement, frac placement, size and success). Type curves are representative of the expected production from location count wells and do not represent a high or low rate/EUR for a given area. Type curves are representative of qualified proved undeveloped, probable, or possible reserve categories. Cost includes location construction, 4 wells/drill pad, 7,500’ completed lateral length, 1,500 lb/ft proppant, 10 days of flowback, tubing installation, and facilities hook-up. Pressure Managed 10.8 BCFE (9 BCF) Type Curve - NGL Yield = 55 bbl/mmcf 11.1 BCFE (10 BCF) Type Curve - NGL Yield = 36 bbl/mmcf Type Curve(1) Single Well Economics IRR Sensitivity Gas / WTI / NGL Price $3.00 / $50 / $20 $3.50 / $60 / $24 T.C. EUR Bcfe 11.1 43% 62% 10.8 43% 63% Summary Drilling Locations 169 Target D&C ($mm) (2) $6.0. NPV 10 ($mm) $5.4 – $5.6 IRR (%) 43% – 43% Type Well Assumptions Completed Lateral Length (ft) 7,500 Proppant (lbs/ft) 1,500 Wellhead EUR (Bcfe) 9 – 10 % Gas 100% Gas Shrinkage 10% – 15% NGL Yield (Bbl / Mmcf) 36 – 55 EUR / 1,000’ (Bcfe) 1.2 – 1.3 Type Curve Restricted Rate (Mmcfepd / 1000’) 1.0 – 1.2 Flat Period (Days) 30 30 Day IP (Mmcfepd) 8.2 – 9.2 Initial Decline Following Flat Period 74% Initial B-Factor (6 months) 2.0 Final B-Factor 1.5 Terminal Decline 5% Operating Cost Fixed LOE ($/well/month) $884 Variable LOE ($/Mcfe) $0.09 Trans. & Proc. ($/Mcfe) $0.17 CORPORATE PRESENTATION • PAGE •
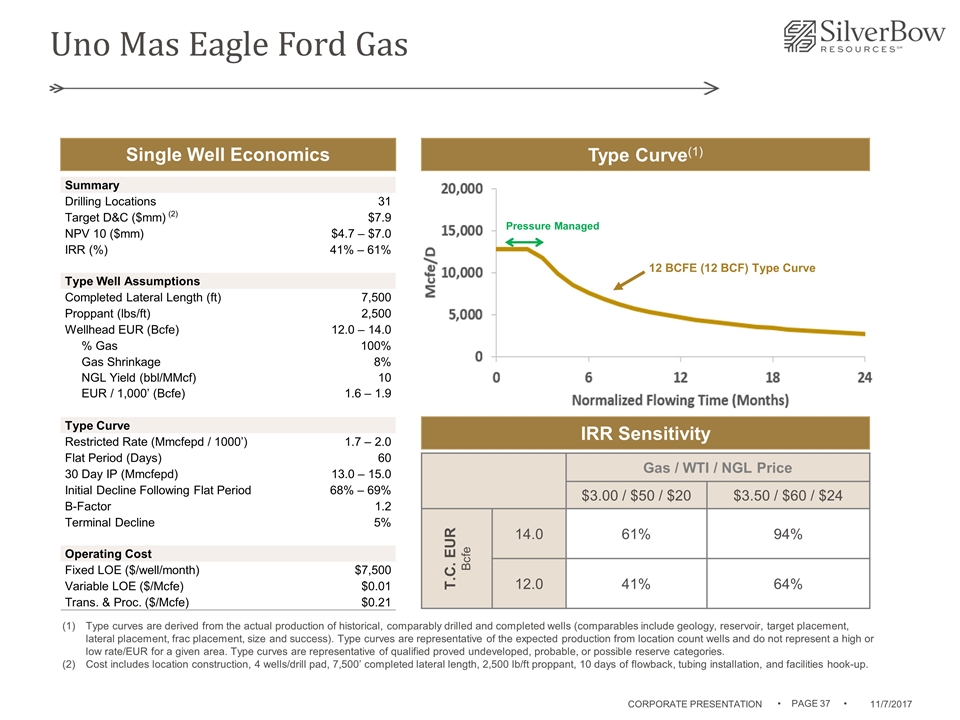
Uno Mas Eagle Ford Gas 12 BCFE (12 BCF) Type Curve Pressure Managed Type Curve(1) Single Well Economics IRR Sensitivity Summary Drilling Locations 31 Target D&C ($mm) (2) $7.9 NPV 10 ($mm) $4.7 – $7.0 IRR (%) 41% – 61% Type Well Assumptions Completed Lateral Length (ft) 7,500 Proppant (lbs/ft) 2,500 Wellhead EUR (Bcfe) 12.0 – 14.0 % Gas 100% Gas Shrinkage 8% NGL Yield (bbl/MMcf) 10 EUR / 1,000’ (Bcfe) 1.6 – 1.9 Type Curve Restricted Rate (Mmcfepd / 1000’) 1.7 – 2.0 Flat Period (Days) 60 30 Day IP (Mmcfepd) 13.0 – 15.0 Initial Decline Following Flat Period 68% – 69% B-Factor 1.2 Terminal Decline 5% Operating Cost Fixed LOE ($/well/month) $7,500 Variable LOE ($/Mcfe) $0.01 Trans. & Proc. ($/Mcfe) $0.21 Type curves are derived from the actual production of historical, comparably drilled and completed wells (comparables include geology, reservoir, target placement, lateral placement, frac placement, size and success). Type curves are representative of the expected production from location count wells and do not represent a high or low rate/EUR for a given area. Type curves are representative of qualified proved undeveloped, probable, or possible reserve categories. Cost includes location construction, 4 wells/drill pad, 7,500’ completed lateral length, 2,500 lb/ft proppant, 10 days of flowback, tubing installation, and facilities hook-up. Gas / WTI / NGL Price $3.00 / $50 / $20 $3.50 / $60 / $24 T.C. EUR Bcfe 14.0 61% 94% 12.0 41% 64% CORPORATE PRESENTATION • PAGE •

Corporate Information CORPORATE HEADQUARTERS SilverBow Resources, Inc. 575 North Dairy Ashford, Suite 1200 Houston, Texas 77079 (281) 874-2700 or (800) 777-2412 www.sbow.com CONTACT INFORMATION Doug Atkinson, CFA Senior Manager – Finance & Investor Relations (281) 423-0314 IR@sbow.com CORPORATE PRESENTATION • PAGE •


