
Transformational Step Forward Acquisition of Chesapeake’s South Texas Position August 2023 Exhibit 99.2
Forward-Looking Statements circumstances after the date of the presentation or to reflect the occurrence of unanticipated events, except as required by law. CAUTIONARY NOTE Regarding Potential Reserves Disclosures – Current SEC rules regarding oil and gas reserve information allow oil and gas companies to disclose proved reserves, and optionally probable and possible reserves that meet the SEC’s definitions of such terms. In this presentation, we refer to estimates of resource “potential” or “EUR” (estimated ultimate recovery quantities) or “IP” (initial production rates) or other descriptions of volumes potentially recoverable, which in addition to reserves generally classifiable as probable and possible include estimates of reserves that do not rise to the standards for possible reserves, and which SEC guidelines strictly prohibit us from including in filings with the SEC. Investors are urged to consider closely the oil and gas disclosures in our Form 10-K and other reports and filings with the SEC. These estimates are by their nature more speculative than estimates of proved reserves and are subject to greater uncertainties, and accordingly the likelihood of recovering those reserves is subject to greater risk. THIS PRESENTATION has been prepared by the Company and includes market data and other statistical information from sources believed by it to be reliable, including peer company public disclosure, independent industry publications, government publications or other published independent sources. Some data is also based on the Company’s good faith estimates, which is derived from its review of internal sources as well as the independent sources described above. Although the Company believes these sources are reliable, it has not independently verified the information and cannot guarantee its accuracy and completeness. THIS PRESENTATION references non-GAAP financial measures, such as EBITDA, Adjusted EBITDA, Adjusted EBITDA Margin, Leverage Ratio, Free Cash Flow, Free Cash Flow Yield, re-investment rate, return on capital employed ("ROCE") and PV-10. SilverBow believes these metrics and performance measures are widely used by the investment community, including investors, research analysts and others, to evaluate and useful in comparing investments among upstream oil and gas companies in making investment decisions or recommendations. These measures, as presented, may have differing calculations among companies and investment professionals and may not be directly comparable to the same measures provided by others. A non-GAAP measure should not be considered in isolation or as a substitute for the related GAAP measure or any other measure of a company’s financial or operating performance presented in accordance with GAAP. Please see the Appendix to this presentation for more information regarding the non-GAAP measures in this presentation. Non-GAAP measures should not be considered in isolation or as a substitute for related GAAP measures or any other measure of a Company’s financial or operating performance presented in accordance with GAAP. Please see the Company's press release issued on 8/2/23 for reconciliations of LTM Adjusted EBITDA, Free Cash Flow and Adjusted EBITDA for Leverage Ratio. THIS PRESENTATION includes information regarding SilverBow’s PV-10 as of 12/31/22 using strip pricing as of 8/4/23, except as otherwise indicated. We also include information regarding the Chesapeake South Texas asset’s PV-10 as of 2/1/23 using strip pricing as of 8/4/23. PV-10 represents the present value, discounted at 10% per year, of estimated future net cash flows. The Company’s calculation of PV-10 using SEC prices herein differs from the standardized measure of discounted future net cash flows determined in accordance with the rules and regulations of the SEC in that it is calculated before income taxes rather than after income taxes using the average price during the 12-month period, determined as an unweighted average of the first-day-of-the-month price for each month. The Company’s calculation of PV-10 using SEC prices should not be considered as an alternative to the standardized measure of discounted future net cash flows determined in accordance with the rules and regulations of the SEC. THE PRESENTATION MATERIAL INCLUDED herein which is not historical fact constitutes “forward-looking statements” within the meaning of Section 27A of the Securities Act of 1933, as amended, and Section 21E of the Securities Exchange Act of 1934, as amended.. These statements, opinions, forecasts, scenarios and projections relate to, among other things, the long-term objectives of SilverBow Resources, Inc. (“SilverBow” or the “Company”), the anticipated benefits from SilverBow's acquisition of Chesapeake's oil and gas assets in South Texas (the “Chesapeake South Texas assets”), estimated future operating and capital costs and expenditures, free cash flow and Adjusted EBITDA, future productions and reserves, including the present value thereof, of SilverBow and the Chesapeake South Texas assets, estimated liquidity, leverage ratio, availability of capital and return of capital, and assumptions as to future hydrocarbon prices, operating results, internal rates of returns, drilling schedules and potential growth rates of reserves and productions, all of which are forward-looking statements. These forward-looking statements are generally accompanied by words such as “could,” “believe,” “anticipate,” “intend,” “estimate,” “budgeted,” “guidance,” “forecast,” “expect,” “may,” “continue,” “predict,” “potential,” “plan,” “project,” “should” and similar expressions, although not all forward-looking statements, contain such identifying words. Although SilverBow believes that such forward-looking statements are reasonable, the matters addressed represent management's expectations or beliefs concerning future events, and it is possible that the results described in this presentation will not be achieved. These forward-looking statements are based on current expectations and assumptions and are subject to a number of risks and uncertainties, many of which are beyond the Company’s control, which could cause actual results to differ materially from the results and long-term strategic objectives discussed in the forward-looking statements, including among other things: further actions by the members of the Organization of the Petroleum Exporting Countries, Russia and other allied producing countries with respect to oil production levels and announcements of potential changes in such levels; risks related to the recently announced acquisition of the Chesapeake South Texas assets, including the timing, cost or financing of and the ability to obtain any necessary consents or approvals for such acquisition; volatility in natural gas, oil and NGL prices; ability to obtain permits and government approvals; our borrowing capacity, future covenant compliance; cash flow and liquidity, including our ability to satisfy our short- or long-term liquidity needs; amount, nature and timing of capital expenditures; timing, cost and amount of future production of oil and natural gas; availability and cost for transportation and storage of oil and natural gas; general economic and political conditions, including inflationary pressures, interest rates, a general economic slowdown or recession, instability in financial institutions, political tensions and war; the severity and related duration of world health events, including health crises and pandemics and related disruptions and operational challenges; our ability to execute on strategic initiatives; risk management activities, including hedging strategy; counterparty and credit market risk; pending legal and environmental matters, including potential impacts on our business related to climate change and related regulations; actions by third parties, including customers, service providers and shareholders; current and future governmental regulation and taxation of the oil and natural gas industry; and other factors discussed in the Company’s reports filed with the Securities and Exchange Commission (“SEC”), including its Annual Report on Form 10-K for the year ended 12/31/22 (“Form 10-K”), and subsequent quarterly reports on Form 10-Q and current reports on Form 8-K. All forward-looking statements speak only as of the date of this presentation. You should not place undue reliance on these forward-looking statements. We undertake no obligation to publicly release the results of any revisions to any such forward-looking statements that may be made to reflect events or Investor Presentation
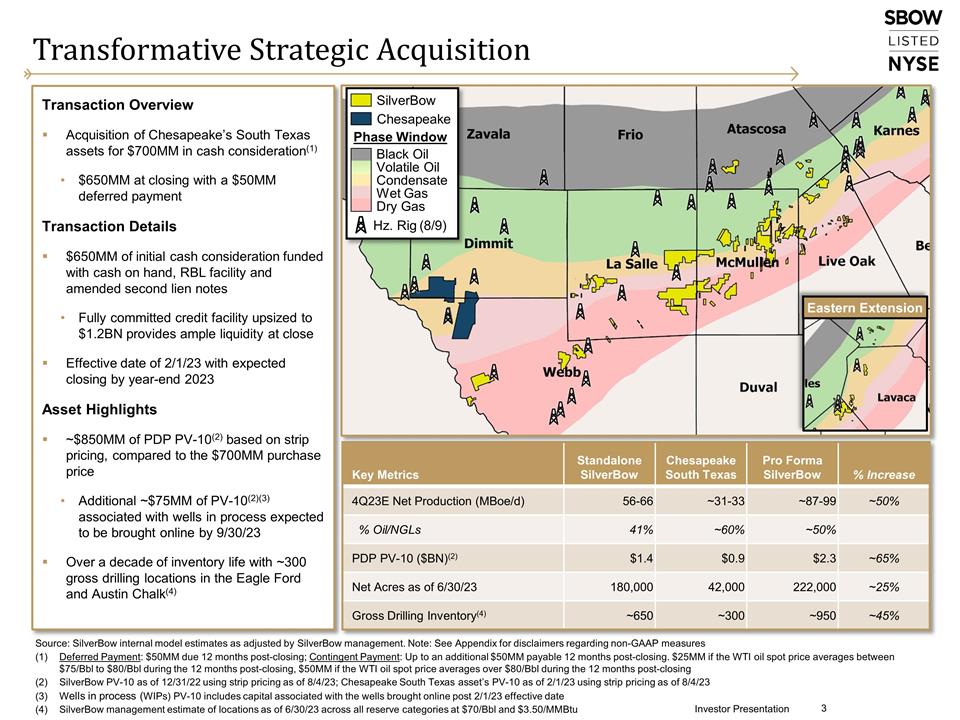
Source: SilverBow internal model estimates as adjusted by SilverBow management. Note: See Appendix for disclaimers regarding non-GAAP measures Deferred Payment: $50MM due 12 months post-closing; Contingent Payment: Up to an additional $50MM payable 12 months post-closing. $25MM if the WTI oil spot price averages between $75/Bbl to $80/Bbl during the 12 months post-closing, $50MM if the WTI oil spot price averages over $80/Bbl during the 12 months post-closing SilverBow PV-10 as of 12/31/22 using strip pricing as of 8/4/23; Chesapeake South Texas asset’s PV-10 as of 2/1/23 using strip pricing as of 8/4/23 Wells in process (WIPs) PV-10 includes capital associated with the wells brought online post 2/1/23 effective date SilverBow management estimate of locations as of 6/30/23 across all reserve categories at $70/Bbl and $3.50/MMBtu Transformative Strategic Acquisition Transaction Overview Acquisition of Chesapeake’s South Texas assets for $700MM in cash consideration(1) $650MM at closing with a $50MM deferred payment Transaction Details $650MM of initial cash consideration funded with cash on hand, RBL facility and amended second lien notes Fully committed credit facility upsized to $1.2BN provides ample liquidity at close Effective date of 2/1/23 with expected closing by year-end 2023 Asset Highlights ~$850MM of PDP PV-10(2) based on strip pricing, compared to the $700MM purchase price Additional ~$75MM of PV-10(2)(3) associated with wells in process expected to be brought online by 9/30/23 Over a decade of inventory life with ~300 gross drilling locations in the Eagle Ford and Austin Chalk(4) Key Metrics Standalone SilverBow Chesapeake South Texas Pro Forma SilverBow % Increase 4Q23E Net Production (MBoe/d) 56-66 ~31-33 ~87-99 ~50% % Oil/NGLs 41% ~60% ~50% PDP PV-10 ($BN)(2) $1.4 $0.9 $2.3 ~65% Net Acres as of 6/30/23 180,000 42,000 222,000 ~25% Gross Drilling Inventory(4) ~650 ~300 ~950 ~45% Investor Presentation SilverBow Chesapeake Phase Window Black Oil Volatile Oil Condensate Dry Gas Hz. Rig (8/9) Wet Gas Eastern Extension
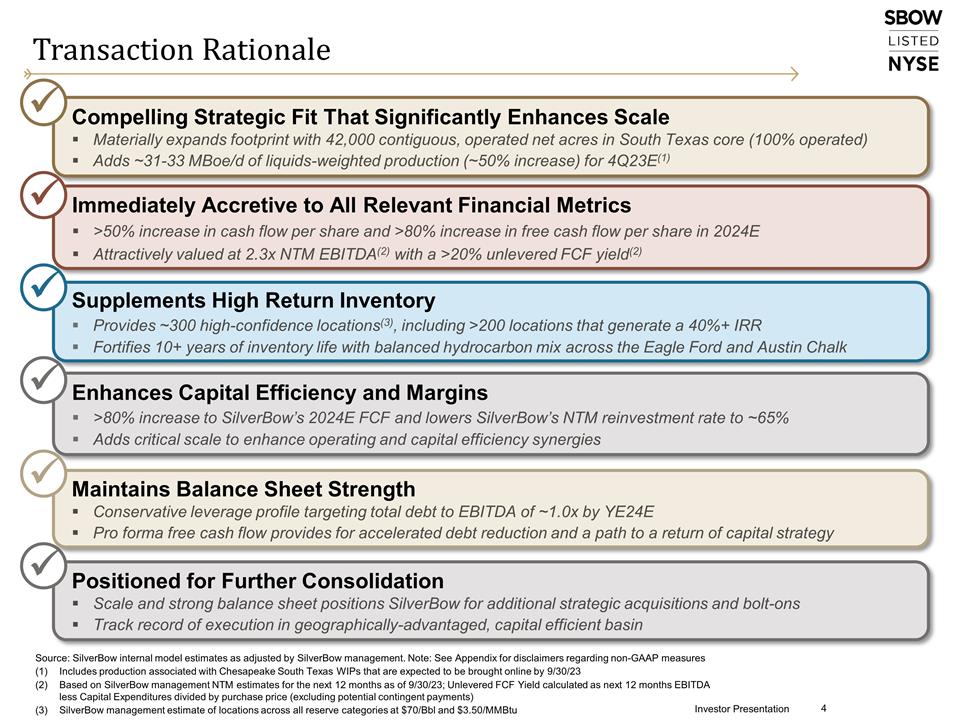
Transaction Rationale Compelling Strategic Fit That Significantly Enhances Scale Materially expands footprint with 42,000 contiguous, operated net acres in South Texas core (100% operated) Adds ~31-33 MBoe/d of liquids-weighted production (~50% increase) for 4Q23E(1) ü Positioned for Further Consolidation Scale and strong balance sheet positions SilverBow for additional strategic acquisitions and bolt-ons Track record of execution in geographically-advantaged, capital efficient basin ü Enhances Capital Efficiency and Margins >80% increase to SilverBow’s 2024E FCF and lowers SilverBow’s NTM reinvestment rate to ~65% Adds critical scale to enhance operating and capital efficiency synergies ü Immediately Accretive to All Relevant Financial Metrics >50% increase in cash flow per share and >80% increase in free cash flow per share in 2024E Attractively valued at 2.3x NTM EBITDA(2) with a >20% unlevered FCF yield(2) ü Maintains Balance Sheet Strength Conservative leverage profile targeting total debt to EBITDA of ~1.0x by YE24E Pro forma free cash flow provides for accelerated debt reduction and a path to a return of capital strategy ü Supplements High Return Inventory Provides ~300 high-confidence locations(3), including >200 locations that generate a 40%+ IRR Fortifies 10+ years of inventory life with balanced hydrocarbon mix across the Eagle Ford and Austin Chalk ü Source: SilverBow internal model estimates as adjusted by SilverBow management. Note: See Appendix for disclaimers regarding non-GAAP measures Includes production associated with Chesapeake South Texas WIPs that are expected to be brought online by 9/30/23 Based on SilverBow management NTM estimates for the next 12 months as of 9/30/23; Unlevered FCF Yield calculated as next 12 months EBITDA less Capital Expenditures divided by purchase price (excluding potential contingent payments) SilverBow management estimate of locations across all reserve categories at $70/Bbl and $3.50/MMBtu Investor Presentation
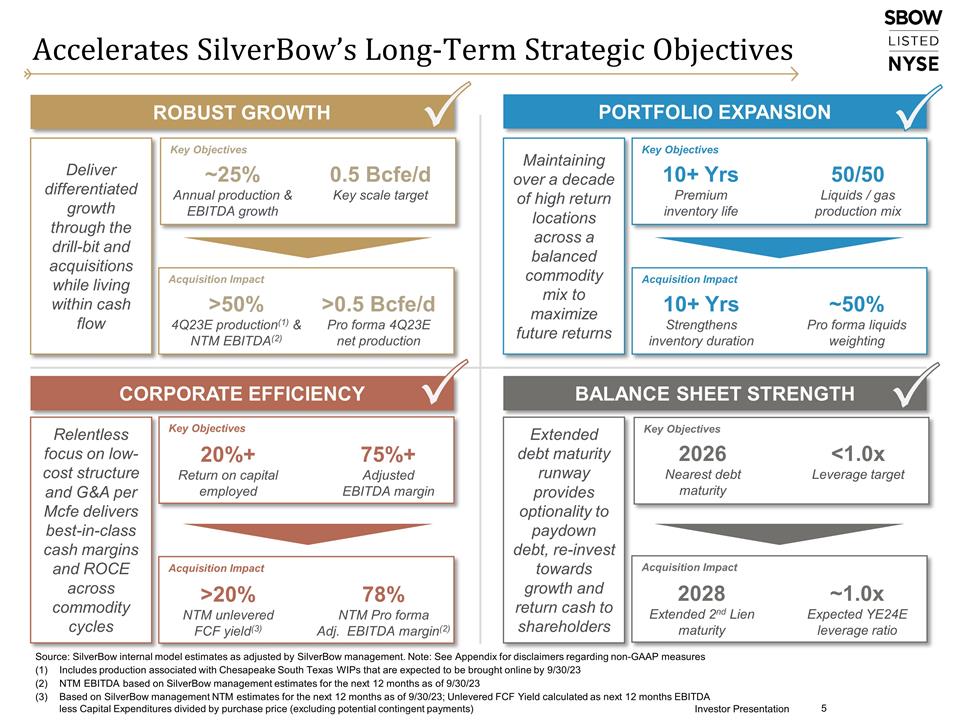
Accelerates SilverBow’s Long-Term Strategic Objectives Investor Presentation PORTFOLIO EXPANSION BALANCE SHEET STRENGTH Maintaining over a decade of high return locations across a balanced commodity mix to maximize future returns Extended debt maturity runway provides optionality to paydown debt, re-invest towards growth and return cash to shareholders ROBUST GROWTH CORPORATE EFFICIENCY Deliver differentiated growth through the drill-bit and acquisitions while living within cash flow Relentless focus on low-cost structure and G&A per Mcfe delivers best-in-class cash margins and ROCE across commodity cycles Acquisition Impact >50% 4Q23E production(1) & NTM EBITDA(2) >0.5 Bcfe/d Pro forma 4Q23E net production Acquisition Impact 10+ Yrs Strengthens inventory duration ~50% Pro forma liquids weighting Key Objectives ~25% Annual production & EBITDA growth 0.5 Bcfe/d Key scale target Key Objectives 10+ Yrs Premium inventory life 50/50 Liquids / gas production mix Acquisition Impact 2028 Extended 2nd Lien maturity ~1.0x Expected YE24E leverage ratio Acquisition Impact 78% NTM Pro forma Adj. EBITDA margin(2) Key Objectives 20%+ Return on capital employed 75%+ Adjusted EBITDA margin Key Objectives <1.0x Leverage target 2026 Nearest debt maturity >20% NTM unlevered FCF yield(3) Source: SilverBow internal model estimates as adjusted by SilverBow management. Note: See Appendix for disclaimers regarding non-GAAP measures Includes production associated with Chesapeake South Texas WIPs that are expected to be brought online by 9/30/23 NTM EBITDA based on SilverBow management estimates for the next 12 months as of 9/30/23 Based on SilverBow management NTM estimates for the next 12 months as of 9/30/23; Unlevered FCF Yield calculated as next 12 months EBITDA less Capital Expenditures divided by purchase price (excluding potential contingent payments) P P P P
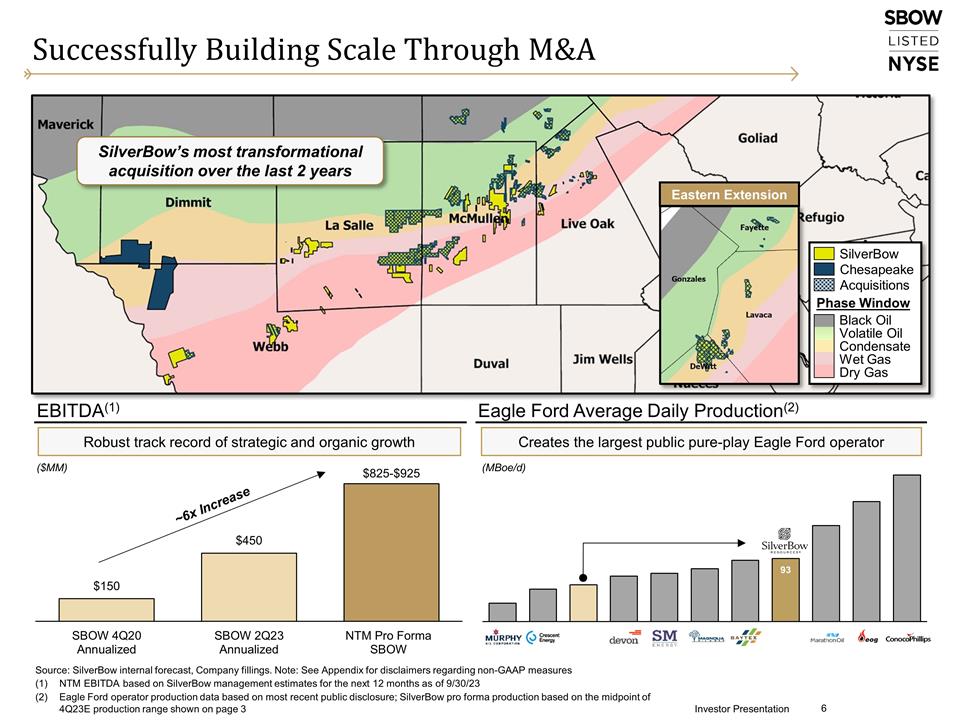
Successfully Building Scale Through M&A ~6x Increase ($MM) Investor Presentation EBITDA(1) Robust track record of strategic and organic growth Source: SilverBow internal forecast, Company fillings. Note: See Appendix for disclaimers regarding non-GAAP measures NTM EBITDA based on SilverBow management estimates for the next 12 months as of 9/30/23 Eagle Ford operator production data based on most recent public disclosure; SilverBow pro forma production based on the midpoint of 4Q23E production range shown on page 3 Eagle Ford Average Daily Production(2) Creates the largest public pure-play Eagle Ford operator (MBoe/d) SilverBow’s most transformational acquisition over the last 2 years SilverBow Chesapeake Phase Window Black Oil Volatile Oil Condensate Dry Gas Wet Gas Acquisitions Eastern Extension
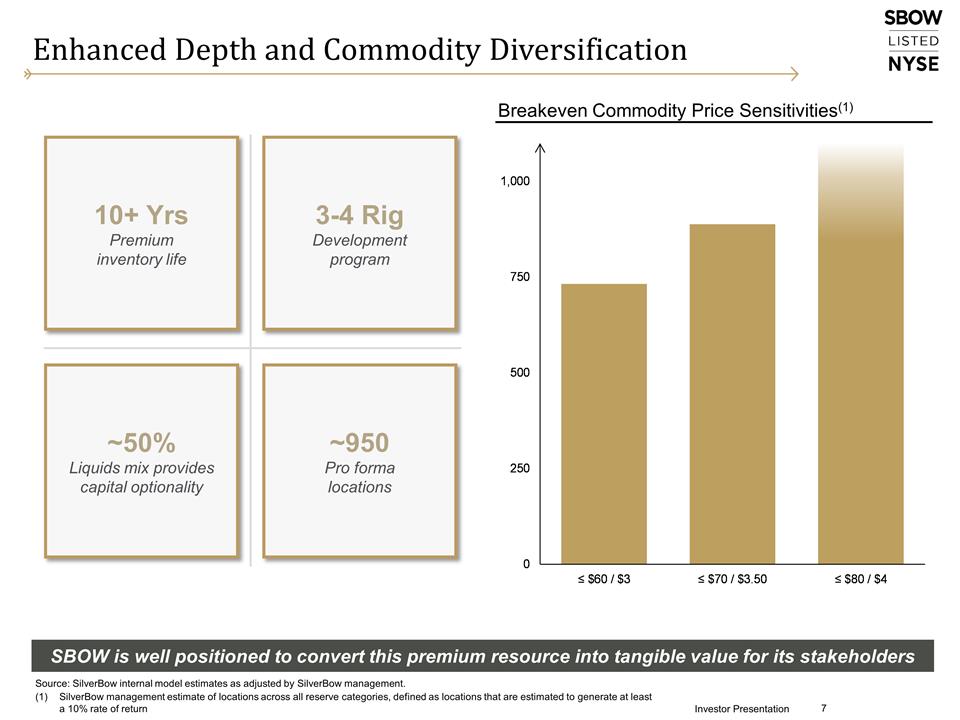
Enhanced Depth and Commodity Diversification 10+ Yrs Premium inventory life ~950 Pro forma locations ~50% Liquids mix provides capital optionality 3-4 Rig Development program Investor Presentation Source: SilverBow internal model estimates as adjusted by SilverBow management. SilverBow management estimate of locations across all reserve categories, defined as locations that are estimated to generate at least a 10% rate of return SBOW is well positioned to convert this premium resource into tangible value for its stakeholders Breakeven Commodity Price Sensitivities(1)
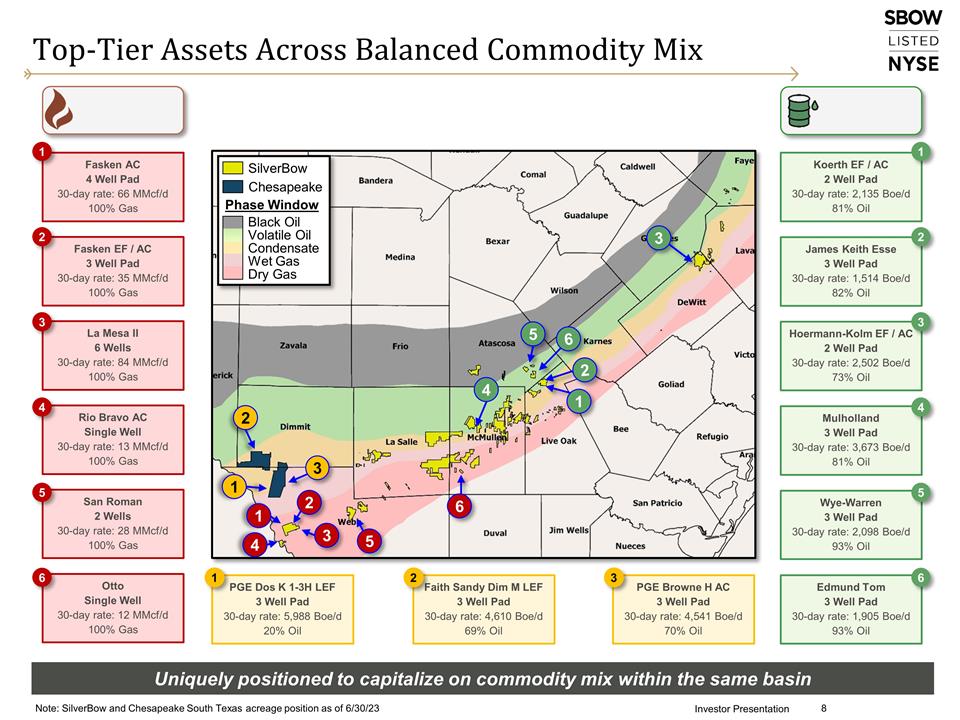
Top-Tier Assets Across Balanced Commodity Mix Investor Presentation Uniquely positioned to capitalize on commodity mix within the same basin Faith Sandy Dim M LEF 3 Well Pad 30-day rate: 4,610 Boe/d 69% Oil Rio Bravo AC Single Well 30-day rate: 13 MMcf/d 100% Gas La Mesa II 6 Wells 30-day rate: 84 MMcf/d 100% Gas Fasken EF / AC 3 Well Pad 30-day rate: 35 MMcf/d 100% Gas 4 Otto Single Well 30-day rate: 12 MMcf/d 100% Gas 2 3 Wye-Warren 3 Well Pad 30-day rate: 2,098 Boe/d 93% Oil San Roman 2 Wells 30-day rate: 28 MMcf/d 100% Gas 5 Fasken AC 4 Well Pad 30-day rate: 66 MMcf/d 100% Gas 1 3 2 5 4 3 2 5 6 4 James Keith Esse 3 Well Pad 30-day rate: 1,514 Boe/d 82% Oil Hoermann-Kolm EF / AC 2 Well Pad 30-day rate: 2,502 Boe/d 73% Oil Mulholland 3 Well Pad 30-day rate: 3,673 Boe/d 81% Oil Koerth EF / AC 2 Well Pad 30-day rate: 2,135 Boe/d 81% Oil Edmund Tom 3 Well Pad 30-day rate: 1,905 Boe/d 93% Oil 3 6 4 5 1 2 1 6 6 1 PGE Browne H AC 3 Well Pad 30-day rate: 4,541 Boe/d 70% Oil PGE Dos K 1-3H LEF 3 Well Pad 30-day rate: 5,988 Boe/d 20% Oil 1 2 3 1 3 2 Note: SilverBow and Chesapeake South Texas acreage position as of 6/30/23 SilverBow Chesapeake Phase Window Black Oil Volatile Oil Condensate Dry Gas Wet Gas
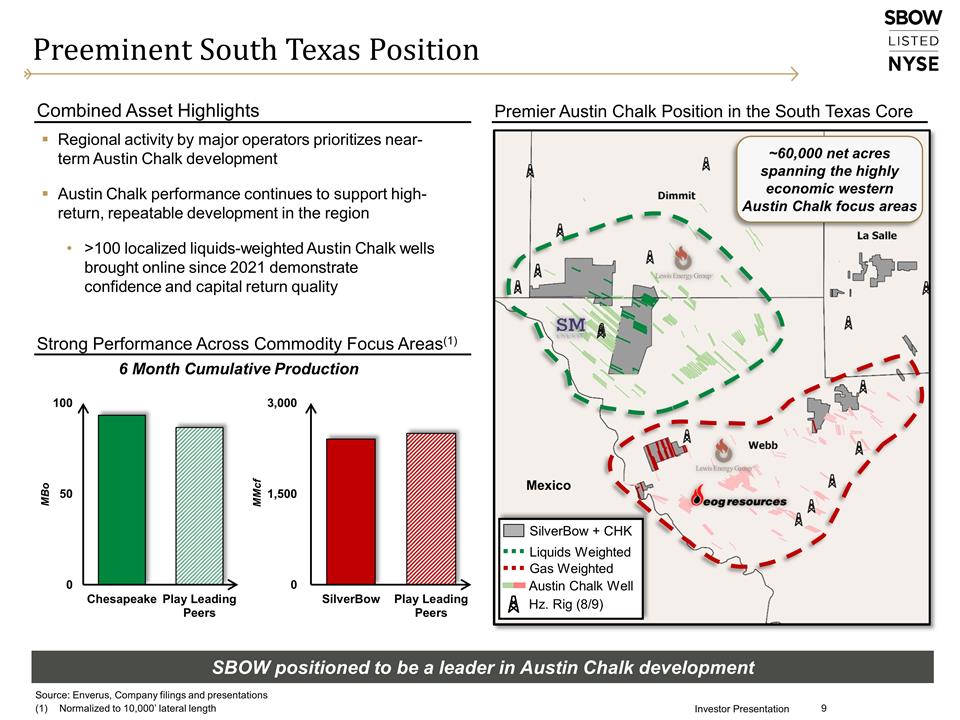
Preeminent South Texas Position Regional activity by major operators prioritizes near-term Austin Chalk development Austin Chalk performance continues to support high-return, repeatable development in the region >100 localized liquids-weighted Austin Chalk wells brought online since 2021 demonstrate confidence and capital return quality Investor Presentation Premier Austin Chalk Position in the South Texas Core Combined Asset Highlights Strong Performance Across Commodity Focus Areas(1) ~60,000 net acres spanning the highly economic western Austin Chalk focus areas 6 Month Cumulative Production Mexico MBo MMcf Source: Enverus, Company filings and presentations Normalized to 10,000’ lateral length SilverBow + CHK Austin Chalk Well Liquids Weighted Gas Weighted Hz. Rig (8/9) SBOW positioned to be a leader in Austin Chalk development
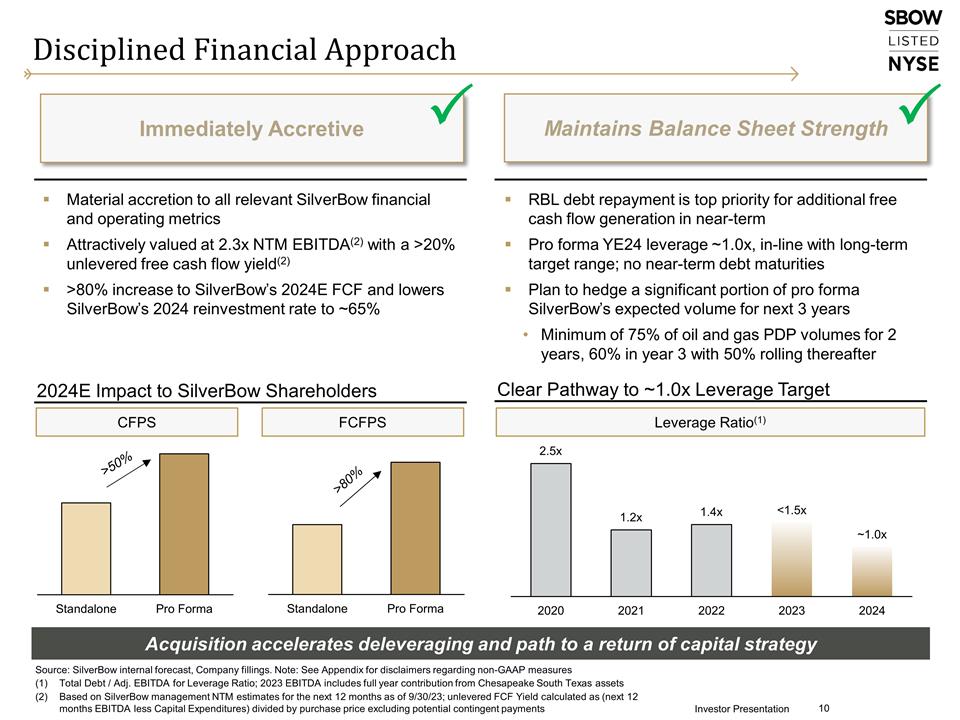
Disciplined Financial Approach >50% Immediately Accretive Maintains Balance Sheet Strength P P Material accretion to all relevant SilverBow financial and operating metrics Attractively valued at 2.3x NTM EBITDA(2) with a >20% unlevered free cash flow yield(2) >80% increase to SilverBow’s 2024E FCF and lowers SilverBow’s 2024 reinvestment rate to ~65% >80% 10 Investor Presentation 2024E Impact to SilverBow Shareholders Clear Pathway to ~1.0x Leverage Target CFPS FCFPS Source: SilverBow internal forecast, Company fillings. Note: See Appendix for disclaimers regarding non-GAAP measures Total Debt / Adj. EBITDA for Leverage Ratio; 2023 EBITDA includes full year contribution from Chesapeake South Texas assets Based on SilverBow management NTM estimates for the next 12 months as of 9/30/23; unlevered FCF Yield calculated as (next 12 months EBITDA less Capital Expenditures) divided by purchase price excluding potential contingent payments Acquisition accelerates deleveraging and path to a return of capital strategy RBL debt repayment is top priority for additional free cash flow generation in near-term Pro forma YE24 leverage ~1.0x, in-line with long-term target range; no near-term debt maturities Plan to hedge a significant portion of pro forma SilverBow’s expected volume for next 3 years Minimum of 75% of oil and gas PDP volumes for 2 years, 60% in year 3 with 50% rolling thereafter Leverage Ratio(1)
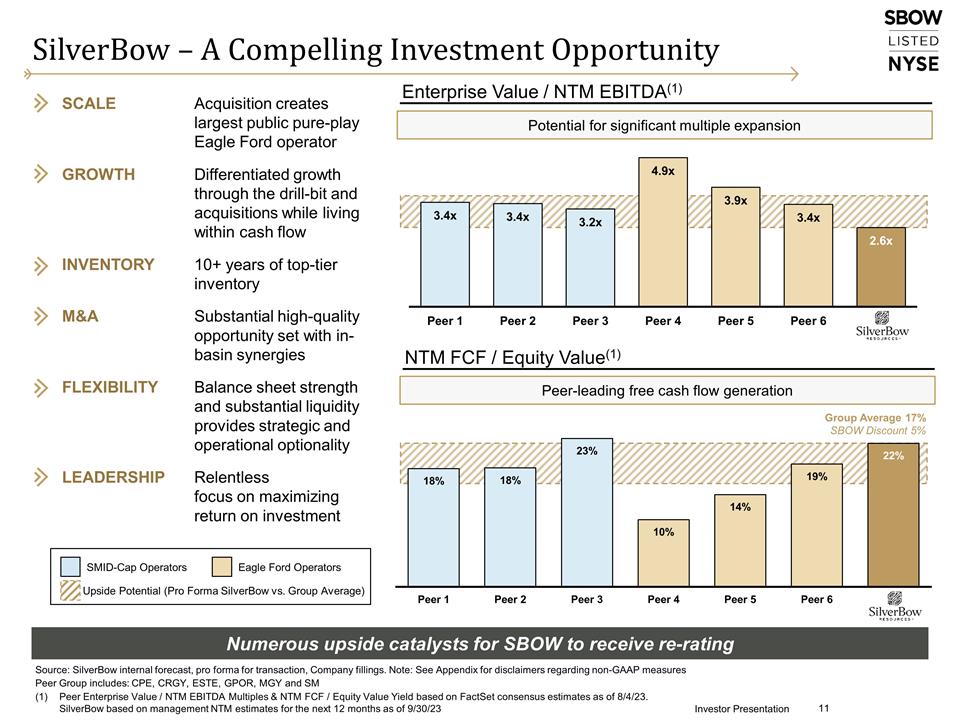
Enterprise Value / NTM EBITDA(1) SilverBow – A Compelling Investment Opportunity Investor Presentation Numerous upside catalysts for SBOW to receive re-rating Potential for significant multiple expansion NTM FCF / Equity Value(1) Peer-leading free cash flow generation Group Average 17% SBOW Discount 5% Source: SilverBow internal forecast, pro forma for transaction, Company fillings. Note: See Appendix for disclaimers regarding non-GAAP measures Peer Group includes: CPE, CRGY, ESTE, GPOR, MGY and SM Peer Enterprise Value / NTM EBITDA Multiples & NTM FCF / Equity Value Yield based on FactSet consensus estimates as of 8/4/23. SilverBow based on management NTM estimates for the next 12 months as of 9/30/23 SMID-Cap Operators Eagle Ford Operators SCALEAcquisition creates largest public pure-play Eagle Ford operator GROWTHDifferentiated growth through the drill-bit and acquisitions while living within cash flow INVENTORY10+ years of top-tier inventory M&ASubstantial high-quality opportunity set with in-basin synergies FLEXIBILITYBalance sheet strength and substantial liquidity provides strategic and operational optionality LEADERSHIPRelentless focus on maximizing return on investment Upside Potential (Pro Forma SilverBow vs. Group Average)
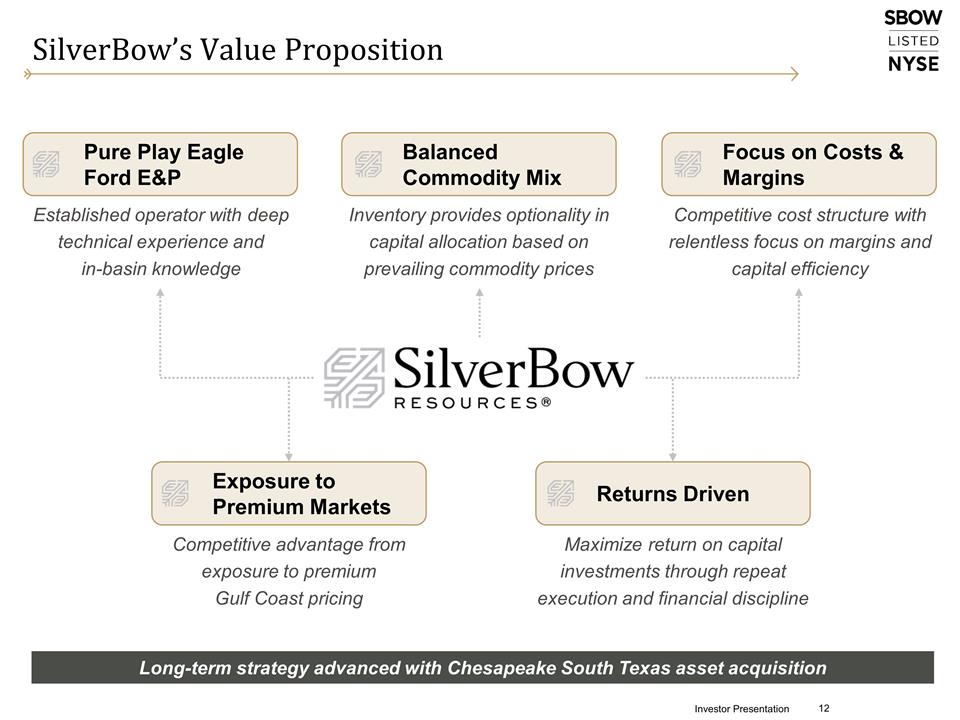
SilverBow’s Value Proposition Pure Play Eagle Ford E&P Balanced Commodity Mix Focus on Costs & Margins Exposure to Premium Markets Returns Driven Established operator with deep technical experience and in-basin knowledge Competitive cost structure with relentless focus on margins and capital efficiency Inventory provides optionality in capital allocation based on prevailing commodity prices Competitive advantage from exposure to premium Gulf Coast pricing Maximize return on capital investments through repeat execution and financial discipline Consistently generating free cash flow with high margins and a leading cost profile Long-term strategy advanced with Chesapeake South Texas asset acquisition Investor Presentation
Appendix Investor Presentation
Investor Presentation Definition of Non-GAAP Financial Measures EBITDA: The Company presents EBITDA attributable to common stockholders in addition to reported net income (loss) in accordance with GAAP. EBITDA is calculated as net income (loss) plus (less) depreciation, depletion and amortization, accretion of asset retirement obligations, interest expense, impairment of oil and natural gas properties, net losses (gains) on commodity derivative contracts, amounts collected (paid) for commodity derivative contracts held to settlement, income tax expense (benefit); and share-based compensation expense. EBITDA excludes certain items that SilverBow believes affect the comparability of operating results, including items that are generally non-recurring in nature or whose timing and/or amount cannot be reasonably estimated. EBITDA is used by the Company's management and by external users of SilverBow's financial statements, such as investors, commercial banks and others, to assess the Company's operating performance as compared to that of other companies, without regard to financing methods, capital structure or historical cost basis. It is also used to assess SilverBow's ability to incur and service debt and fund capital expenditures. EBITDA should not be considered an alternative to net income (loss), operating income (loss), cash flows provided by (used in) operating activities or any other measure of financial performance or liquidity presented in accordance with GAAP. Company has provided a forward-looking next 12 months EBITDA estimate; however, SilverBow is unable to provide a quantitative reconciliation of this forward-looking non-GAAP measure to the most directly comparable forward-looking GAAP measure because the items necessary to estimate such forward-looking GAAP measure are not accessible or estimable at this time without unreasonable efforts. The reconciling items in future periods could be significant. Free Cash Flow, Free Cash Flow Yield and Free Cash Flow per Share: Free cash flow is calculated as EBITDA (defined above) plus (less) monetized derivative contracts, cash interest expense, capital expenditures and current income tax (expense) benefit. The Company believes that free cash flow is useful to investors and analysts because it assists in evaluating SilverBow's operating performance, and the valuation, comparison, rating and investment recommendations of companies within the oil and gas industry. Free cash flow yield is calculated by taking free cash flow divided by the market capitalization of the Company at a given date. Free cash flow per share is calculated by taking free cash flow divided by the number of common shares outstanding of the Company at a given date. SilverBow uses this information as one of the bases for comparing its operating performance with other companies within the oil and gas industry. Free cash flow should not be considered an alternative to net income (loss), operating income (loss), cash flows provided by (used in) operating activities or any other measure of financial performance or liquidity presented in accordance with GAAP. The Company has provided forward-looking free cash flow, free cash flow yield and free cash flow per share estimates; however, SilverBow is unable to provide a quantitative reconciliation of these forward-looking non-GAAP measures to the most directly comparable forward-looking GAAP measure because the items necessary to estimate such forward-looking GAAP measure are not accessible or estimable at this time without unreasonable efforts. The reconciling items in future periods could be significant. Total Debt to EBITDA (Leverage Ratio): Leverage Ratio is calculated as total debt, defined as long-term debt excluding unamortized discount and debt issuance costs, divided by EBITDA (defined above) for the most recently completed 12-month period. The Company has provided a forward-looking Leverage Ratio estimate; however, SilverBow is unable to provide a quantitative reconciliation of this forward-looking non-GAAP measure to the most directly comparable forward-looking GAAP measure because the items necessary to estimate such forward-looking GAAP measure are not accessible or estimable at this time without unreasonable efforts. The reconciling items in future periods could be significant. PV-10: PV-10 is a non-GAAP measure that represents the estimated future net cash flows from estimated proved reserves discounted at an annual rate of 10 percent before giving effect to income taxes. PV-10 is most comparable to the Standardized Measure which represents the discounted future net cash flows of the after-tax estimated future cash flows from estimated proved reserves discounted at an annual rate of 10 percent, determined in accordance with GAAP. The Company uses non-GAAP PV-10 value as one measure of the value of its estimated proved reserves and to compare relative values of proved reserves amount exploration and production companies without regard to income taxes. Management believes PV-10 value is a useful measure for comparison of proved reserve values among companies because, unlike standardized measure, it excludes future income taxes that often depend principally on the characteristics of the owner of the reserves rather than on the nature, location and quality of the reserves themselves. The Company has provided a PV-10 estimate; however, SilverBow is unable to provide a quantitative reconciliation of this non-GAAP measure to the most directly comparable GAAP measure because the items necessary to estimate such GAAP measure are not accessible or estimable at this time without unreasonable efforts. The reconciling items in future periods could be significant. Re-Investment Rate: Re-investment rate is calculated as capital expenditures divided by the sum of capital expenditures and FCF (defined above) for a given time period. SilverBow believes that re-investment rate is useful to investors because it reflects the magnitude of capital needed to be invested back into the Company's operations, relative to the total potential cash flows to which stakeholders could have received. Within the oil and gas industry, shale development typically requires substantial, ongoing capital investments to sustain production due to the nature of high-decline rates in shale wells. SilverBow uses re-investment rate to supplement its analysis of future capital investments to the business against returns for stakeholders. Re-investment rate could vary in definition from company to company, and a higher or lower measure does not necessarily indicate better or worse; therefore re-investment rate should not be considered an alternative to operating income (loss), cash flows provided by (used in) operating activities, cash flows provided by (used in) investing activities or any other measure of financial performance or liquidity presented in accordance with GAAP. Return On Capital Employed ("ROCE"): ROCE is calculated as Adjusted EBITDA less DD&A expense, divided by the average of Capital Employed - Beginning of Year (Total Debt plus Shareholders Equity) and Capital Employed - Year-End. The Company believes ROCE presents a comparable metric across multiple business sectors and sizes and is a meaningful measure because it quantifies how well the Company generates Adjusted EBITDA relative to the capital it has employed in its business and illustrates the profitability of a business or project taking into account the capital employed. The Company uses ROCE to assist in capital resource allocation decisions and in evaluating business performance. Additionally, the Company also evaluates average ROCE over a trailing three-year period to adjust for short term (one year) fluctuations and illustrate profitability over a longer time period. Although ROCE is commonly used as a measure of capital efficiency, definitions of ROCE differ, and the Company's computation of ROCE may not be comparable to other similarly titled measures of other companies.

Corporate Information CORPORATE HEADQUARTERS SilverBow Resources, Inc. 920 Memorial City Way, Suite 850 Houston, Texas 77024 (281) 874-2700 or (888) 991-SBOW www.sbow.com CONTACT INFORMATION Jeff Magids Vice President of Finance & Investor Relations (281) 423-0314 IR@sbow.com Chris Denison Finance Associate (281) 423-0304 IR@sbow.com SBOWay Investor Presentation


